interpreting accounting information for decision-making
TRANSCRIPT


Accounting for Managers:Interpreting
accounting informationfor decision-making
Paul M. CollierAston Business School, Aston University


Accounting for Managers


Accounting for Managers:Interpreting
accounting informationfor decision-making
Paul M. CollierAston Business School, Aston University

Copyright 2003 John Wiley & Sons Ltd, The Atrium, Southern Gate, Chichester,West Sussex PO19 8SQ, England
Telephone (+44) 1243 779777
Email (for orders and customer service enquiries): [email protected] our Home Page on www.wileyeurope.com or www.wiley.com
All Rights Reserved. No part of this publication may be reproduced, stored in a retrieval systemor transmitted in any form or by any means, electronic, mechanical, photocopying, recording,scanning or otherwise, except under the terms of the Copyright, Designs and Patents Act 1988or under the terms of a licence issued by the Copyright Licensing Agency Ltd, 90 TottenhamCourt Road, London W1T 4LP, UK, without the permission in writing of the Publisher.Requests to the Publisher should be addressed to the Permissions Department, John Wiley &Sons Ltd, The Atrium, Southern Gate, Chichester, West Sussex PO19 8SQ, England, or emailedto [email protected], or faxed to (+44) 1243 770620.
This publication is designed to provide accurate and authoritative information in regard to thesubject matter covered. It is sold on the understanding that the Publisher is not engaged inrendering professional services. If professional advice or other expert assistance is required, theservices of a competent professional should be sought.
Other Wiley Editorial Offices
John Wiley & Sons Inc., 111 River Street, Hoboken, NJ 07030, USA
Jossey-Bass, 989 Market Street, San Francisco, CA 94103-1741, USA
Wiley-VCH Verlag GmbH, Boschstr. 12, D-69469 Weinheim, Germany
John Wiley & Sons Australia Ltd, 33 Park Road, Milton, Queensland 4064, Australia
John Wiley & Sons (Asia) Pte Ltd, 2 Clementi Loop #02-01, Jin Xing Distripark, Singapore 129809
John Wiley & Sons Canada Ltd, 22 Worcester Road, Etobicoke, Ontario, Canada M9W 1L1
Wiley also publishes its books in a variety of electronic formats. Some content that appearsin print may not be available in electronic books.
Library of Congress Cataloging-in-Publication Data
Collier, Paul M.Accounting for managers : interpreting accounting information for decision-making / Paul
M. Collier.p. cm.
Includes bibliographical references and index.ISBN 0-470-84502-3 (pbk. : alk. paper)1. Managerial accounting. I. Title.
HF5657.4 .C647 2003658.15’11--dc21 2002193369
British Library Cataloguing in Publication Data
A catalogue record for this book is available from the British Library
ISBN 0-470-84502-3
Typeset in 10/12pt Palatino by Laserwords Private Limited, Chennai, IndiaPrinted and bound in Great Britain by Antony Rowe Ltd, Chippenham, WiltshireThis book is printed on acid-free paper responsibly manufactured from sustainable forestryin which at least two trees are planted for each one used for paper production.

For Loredana and Alexis


Contents
Preface . . . . . . . . . . . . . . . . . . . . . . . . . . . . . . . . . . . . . . . . . . . . . . . . . xiii
Acknowledgements . . . . . . . . . . . . . . . . . . . . . . . . . . . . . . . . . . . . . . . . xvii
About the Author . . . . . . . . . . . . . . . . . . . . . . . . . . . . . . . . . . . . . . . . . xix
PART I
Context of Accounting . . . . . . . . . . . . . . . . . . . . . . . . . . . . . . . . . . . 1
1 Introduction to Accounting . . . . . . . . . . . . . . . . . . . . . . . . . . . . . . . 3
Accounting, accountability and the account . . . . . . . . . . . . . . . . . . . . 3A short history of accounting . . . . . . . . . . . . . . . . . . . . . . . . . . . . . . 5The role of management accounting . . . . . . . . . . . . . . . . . . . . . . . . . . 6Recent developments in management accounting . . . . . . . . . . . . . . . . 9A critical perspective . . . . . . . . . . . . . . . . . . . . . . . . . . . . . . . . . . . . 10Conclusion . . . . . . . . . . . . . . . . . . . . . . . . . . . . . . . . . . . . . . . . . . . 11References . . . . . . . . . . . . . . . . . . . . . . . . . . . . . . . . . . . . . . . . . . . . 12
2 Accounting and its Relationship to Shareholder Value and BusinessStructure . . . . . . . . . . . . . . . . . . . . . . . . . . . . . . . . . . . . . . . . . . . . 13
Capital and product markets . . . . . . . . . . . . . . . . . . . . . . . . . . . . . . . 13Value-based management . . . . . . . . . . . . . . . . . . . . . . . . . . . . . . . . . 14Accounting and strategy . . . . . . . . . . . . . . . . . . . . . . . . . . . . . . . . . . 17Structure of business organizations . . . . . . . . . . . . . . . . . . . . . . . . . . 19A critical perspective . . . . . . . . . . . . . . . . . . . . . . . . . . . . . . . . . . . . 21Conclusion . . . . . . . . . . . . . . . . . . . . . . . . . . . . . . . . . . . . . . . . . . . 23References . . . . . . . . . . . . . . . . . . . . . . . . . . . . . . . . . . . . . . . . . . . . 23

viii ACCOUNTING FOR MANAGERS
3 Recording Financial Transactions and the Limitationsof Accounting . . . . . . . . . . . . . . . . . . . . . . . . . . . . . . . . . . . . . . . . 25
Business events, transactions and the accounting system . . . . . . . . . . . 25The double entry: recording transactions . . . . . . . . . . . . . . . . . . . . . . 27Extracting financial information from the accounting system . . . . . . . . 29Principles and limitations of accounting . . . . . . . . . . . . . . . . . . . . . . . 31Cost terms and concepts . . . . . . . . . . . . . . . . . . . . . . . . . . . . . . . . . . 34Conclusion . . . . . . . . . . . . . . . . . . . . . . . . . . . . . . . . . . . . . . . . . . . 35References . . . . . . . . . . . . . . . . . . . . . . . . . . . . . . . . . . . . . . . . . . . . 35
4 Management Control, Management Accounting and itsRational-Economic Assumptions . . . . . . . . . . . . . . . . . . . . . . . . . . 37
Management control systems . . . . . . . . . . . . . . . . . . . . . . . . . . . . . . 37Management planning and control systems and management accounting 42Non-financial performance measurement . . . . . . . . . . . . . . . . . . . . . . 43Strategic management accounting . . . . . . . . . . . . . . . . . . . . . . . . . . . 47A theoretical framework for management accounting . . . . . . . . . . . . . 49Conclusion . . . . . . . . . . . . . . . . . . . . . . . . . . . . . . . . . . . . . . . . . . . 51References . . . . . . . . . . . . . . . . . . . . . . . . . . . . . . . . . . . . . . . . . . . . 51
5 Interpretive and Critical Perspectives on Accounting andDecision-Making . . . . . . . . . . . . . . . . . . . . . . . . . . . . . . . . . . . . . . 55
Alternative paradigms . . . . . . . . . . . . . . . . . . . . . . . . . . . . . . . . . . . 55The interpretive paradigm and the social construction perspective . . . . 59Culture, control and accounting . . . . . . . . . . . . . . . . . . . . . . . . . . . . . 60The radical paradigm and critical accounting . . . . . . . . . . . . . . . . . . . 61Power and accounting . . . . . . . . . . . . . . . . . . . . . . . . . . . . . . . . . . . 62Conclusion . . . . . . . . . . . . . . . . . . . . . . . . . . . . . . . . . . . . . . . . . . . 63References . . . . . . . . . . . . . . . . . . . . . . . . . . . . . . . . . . . . . . . . . . . . 64
6 Constructing Financial Statements and the Frameworkof Accounting . . . . . . . . . . . . . . . . . . . . . . . . . . . . . . . . . . . . . . . . 67
Financial accounting . . . . . . . . . . . . . . . . . . . . . . . . . . . . . . . . . . . . 67Reporting profitability . . . . . . . . . . . . . . . . . . . . . . . . . . . . . . . . . . . 69Reporting financial position . . . . . . . . . . . . . . . . . . . . . . . . . . . . . . . 70Accruals accounting . . . . . . . . . . . . . . . . . . . . . . . . . . . . . . . . . . . . . 72Depreciation . . . . . . . . . . . . . . . . . . . . . . . . . . . . . . . . . . . . . . . . . . 73Reporting cash flow . . . . . . . . . . . . . . . . . . . . . . . . . . . . . . . . . . . . . 74Working capital . . . . . . . . . . . . . . . . . . . . . . . . . . . . . . . . . . . . . . . . 75Managing debtors . . . . . . . . . . . . . . . . . . . . . . . . . . . . . . . . . . . . . . 76Managing stock . . . . . . . . . . . . . . . . . . . . . . . . . . . . . . . . . . . . . . . . 77Managing creditors . . . . . . . . . . . . . . . . . . . . . . . . . . . . . . . . . . . . . 77

CONTENTS ix
A theoretical perspective on financial statements . . . . . . . . . . . . . . . . . 78Agency theory . . . . . . . . . . . . . . . . . . . . . . . . . . . . . . . . . . . . . . . . . 78Conclusion . . . . . . . . . . . . . . . . . . . . . . . . . . . . . . . . . . . . . . . . . . . 79References . . . . . . . . . . . . . . . . . . . . . . . . . . . . . . . . . . . . . . . . . . . . 79
PART II
Using Accounting Information for Decision-Making, Planningand Control . . . . . . . . . . . . . . . . . . . . . . . . . . . . . . . . . . . . . . . . . . . . 81
7 Interpreting Financial Statements and Alternative TheoreticalPerspectives . . . . . . . . . . . . . . . . . . . . . . . . . . . . . . . . . . . . . . . . . 83
Interpreting financial statements . . . . . . . . . . . . . . . . . . . . . . . . . . . . 83Ratio analysis . . . . . . . . . . . . . . . . . . . . . . . . . . . . . . . . . . . . . . . . . 84Profitability . . . . . . . . . . . . . . . . . . . . . . . . . . . . . . . . . . . . . . . . . . . 84Liquidity . . . . . . . . . . . . . . . . . . . . . . . . . . . . . . . . . . . . . . . . . . . . . 85Gearing . . . . . . . . . . . . . . . . . . . . . . . . . . . . . . . . . . . . . . . . . . . . . . 85Activity/efficiency . . . . . . . . . . . . . . . . . . . . . . . . . . . . . . . . . . . . . . 86Shareholder return . . . . . . . . . . . . . . . . . . . . . . . . . . . . . . . . . . . . . . 87Interpreting financial information using ratios . . . . . . . . . . . . . . . . . . 88Case study: Ottakar’s – interpreting financial statements . . . . . . . . . . . 90Alternative theoretical perspectives on financial statements . . . . . . . . . 94Social and environmental reporting . . . . . . . . . . . . . . . . . . . . . . . . . . 94Intellectual capital . . . . . . . . . . . . . . . . . . . . . . . . . . . . . . . . . . . . . . 96Institutional theory . . . . . . . . . . . . . . . . . . . . . . . . . . . . . . . . . . . . . 96Case study: Carrington Printers – an accounting critique . . . . . . . . . . . 97Creative accounting and ethics . . . . . . . . . . . . . . . . . . . . . . . . . . . . . 99Conclusion . . . . . . . . . . . . . . . . . . . . . . . . . . . . . . . . . . . . . . . . . . . 100References . . . . . . . . . . . . . . . . . . . . . . . . . . . . . . . . . . . . . . . . . . . . 101
8 Marketing Decisions . . . . . . . . . . . . . . . . . . . . . . . . . . . . . . . . . . . . 103
Marketing strategy . . . . . . . . . . . . . . . . . . . . . . . . . . . . . . . . . . . . . . 103Cost behaviour . . . . . . . . . . . . . . . . . . . . . . . . . . . . . . . . . . . . . . . . 105Cost–volume–profit analysis . . . . . . . . . . . . . . . . . . . . . . . . . . . . . . 106Alternative approaches to pricing . . . . . . . . . . . . . . . . . . . . . . . . . . . 111Cost-plus pricing . . . . . . . . . . . . . . . . . . . . . . . . . . . . . . . . . . . . . . . 111Target rate of return pricing . . . . . . . . . . . . . . . . . . . . . . . . . . . . . . . 112Optimum selling price . . . . . . . . . . . . . . . . . . . . . . . . . . . . . . . . . . . 112Special pricing decisions . . . . . . . . . . . . . . . . . . . . . . . . . . . . . . . . . . 113Transfer pricing . . . . . . . . . . . . . . . . . . . . . . . . . . . . . . . . . . . . . . . . 115Segmental profitability . . . . . . . . . . . . . . . . . . . . . . . . . . . . . . . . . . . 115Case study: Retail Stores PLC – the loss-making division . . . . . . . . . . . 117Case study: SuperTech – using accounting information to win sales . . . 119

x ACCOUNTING FOR MANAGERS
Conclusion . . . . . . . . . . . . . . . . . . . . . . . . . . . . . . . . . . . . . . . . . . . 120References . . . . . . . . . . . . . . . . . . . . . . . . . . . . . . . . . . . . . . . . . . . . 120
9 Operating Decisions . . . . . . . . . . . . . . . . . . . . . . . . . . . . . . . . . . . . 121
The operations function . . . . . . . . . . . . . . . . . . . . . . . . . . . . . . . . . . 121Managing operations – manufacturing . . . . . . . . . . . . . . . . . . . . . . . . 122Managing operations – services . . . . . . . . . . . . . . . . . . . . . . . . . . . . . 125Accounting for the cost of spare capacity . . . . . . . . . . . . . . . . . . . . . . 126Capacity utilization and product mix . . . . . . . . . . . . . . . . . . . . . . . . . 127Theory of Constraints . . . . . . . . . . . . . . . . . . . . . . . . . . . . . . . . . . . . 128Operating decisions: relevant costs . . . . . . . . . . . . . . . . . . . . . . . . . . 129Make versus buy? . . . . . . . . . . . . . . . . . . . . . . . . . . . . . . . . . . . . . . 130Equipment replacement . . . . . . . . . . . . . . . . . . . . . . . . . . . . . . . . . . 131Relevant cost of materials . . . . . . . . . . . . . . . . . . . . . . . . . . . . . . . . . 131Other costing approaches . . . . . . . . . . . . . . . . . . . . . . . . . . . . . . . . . 133Total quality management . . . . . . . . . . . . . . . . . . . . . . . . . . . . . . . . 135Cost of quality . . . . . . . . . . . . . . . . . . . . . . . . . . . . . . . . . . . . . . . . . 136Case study: Quality Printing Company – pricing for capacityutilization . . . . . . . . . . . . . . . . . . . . . . . . . . . . . . . . . . . . . . . . . . . 137Case study: Vehicle Parts Co. – the effect of equipment replacementon costs and prices . . . . . . . . . . . . . . . . . . . . . . . . . . . . . . . . . . . . . 138Conclusion . . . . . . . . . . . . . . . . . . . . . . . . . . . . . . . . . . . . . . . . . . . 140References . . . . . . . . . . . . . . . . . . . . . . . . . . . . . . . . . . . . . . . . . . . . 140
10 Human Resource Decisions . . . . . . . . . . . . . . . . . . . . . . . . . . . . . . . 141
The cost of labour . . . . . . . . . . . . . . . . . . . . . . . . . . . . . . . . . . . . . . 142Relevant cost of labour . . . . . . . . . . . . . . . . . . . . . . . . . . . . . . . . . . . 144Business processes and activity-based costs . . . . . . . . . . . . . . . . . . . . 146Case study: The Database Management Company – labour costs andunused capacity . . . . . . . . . . . . . . . . . . . . . . . . . . . . . . . . . . . . . . . 148Case study: Trojan Sales – the cost of losing a customer . . . . . . . . . . . . 151Conclusion . . . . . . . . . . . . . . . . . . . . . . . . . . . . . . . . . . . . . . . . . . . 152References . . . . . . . . . . . . . . . . . . . . . . . . . . . . . . . . . . . . . . . . . . . . 152
11 Accounting Decisions . . . . . . . . . . . . . . . . . . . . . . . . . . . . . . . . . . . 155
Cost classification . . . . . . . . . . . . . . . . . . . . . . . . . . . . . . . . . . . . . . 155Calculating product/service costs . . . . . . . . . . . . . . . . . . . . . . . . . . . 158Shifts in management accounting thinking . . . . . . . . . . . . . . . . . . . . . 159Alternative methods of overhead allocation . . . . . . . . . . . . . . . . . . . . 161Contingency theory . . . . . . . . . . . . . . . . . . . . . . . . . . . . . . . . . . . . . 170International comparisons . . . . . . . . . . . . . . . . . . . . . . . . . . . . . . . . . 171Management accounting in Japan . . . . . . . . . . . . . . . . . . . . . . . . . . . 171Behavioural implications of management accounting . . . . . . . . . . . . . . 173
CONTENTS xi
Case study: Quality Bank – the overhead allocation problem . . . . . . . . 176Conclusion . . . . . . . . . . . . . . . . . . . . . . . . . . . . . . . . . . . . . . . . . . . 178References . . . . . . . . . . . . . . . . . . . . . . . . . . . . . . . . . . . . . . . . . . . . 178
12 Strategic Investment Decisions . . . . . . . . . . . . . . . . . . . . . . . . . . . . 181
Strategy . . . . . . . . . . . . . . . . . . . . . . . . . . . . . . . . . . . . . . . . . . . . . 181Investment appraisal . . . . . . . . . . . . . . . . . . . . . . . . . . . . . . . . . . . . 182Accounting rate of return . . . . . . . . . . . . . . . . . . . . . . . . . . . . . . . . . 184Payback . . . . . . . . . . . . . . . . . . . . . . . . . . . . . . . . . . . . . . . . . . . . . 186Case study: Goliath Co. – investment evaluation . . . . . . . . . . . . . . . . . 189Conclusion: a critical perspective . . . . . . . . . . . . . . . . . . . . . . . . . . . . 191References . . . . . . . . . . . . . . . . . . . . . . . . . . . . . . . . . . . . . . . . . . . . 192Appendix: Present value factors . . . . . . . . . . . . . . . . . . . . . . . . . . . . 193
13 Performance Evaluation of Business Units . . . . . . . . . . . . . . . . . . . . 195
The decentralized organization and divisional performancemeasurement . . . . . . . . . . . . . . . . . . . . . . . . . . . . . . . . . . . . . . . . . 195Return on investment . . . . . . . . . . . . . . . . . . . . . . . . . . . . . . . . . . . . 196Residual income . . . . . . . . . . . . . . . . . . . . . . . . . . . . . . . . . . . . . . . 197Controllability . . . . . . . . . . . . . . . . . . . . . . . . . . . . . . . . . . . . . . . . . 198Case study: Majestic Services – divisional performance measurement . . 199Transfer pricing . . . . . . . . . . . . . . . . . . . . . . . . . . . . . . . . . . . . . . . . 201Transaction cost economics . . . . . . . . . . . . . . . . . . . . . . . . . . . . . . . . 203Conclusion: a critical perspective . . . . . . . . . . . . . . . . . . . . . . . . . . . . 205References . . . . . . . . . . . . . . . . . . . . . . . . . . . . . . . . . . . . . . . . . . . . 206
14 Budgeting . . . . . . . . . . . . . . . . . . . . . . . . . . . . . . . . . . . . . . . . . . . . 207
What is budgeting? . . . . . . . . . . . . . . . . . . . . . . . . . . . . . . . . . . . . . 207The budgeting process . . . . . . . . . . . . . . . . . . . . . . . . . . . . . . . . . . . 209Retail budget example: Sports Stores Co-operative Ltd . . . . . . . . . . . . . 213Manufacturing budget example: Telcon Manufacturing . . . . . . . . . . . . 214Cash forecasting . . . . . . . . . . . . . . . . . . . . . . . . . . . . . . . . . . . . . . . 216Cash forecasting example: Retail News Group . . . . . . . . . . . . . . . . . . 217Theoretical perspectives on budgeting . . . . . . . . . . . . . . . . . . . . . . . . 219Case study: Svenska Handelsbanken – is budgeting necessary? . . . . . . 222Conclusion . . . . . . . . . . . . . . . . . . . . . . . . . . . . . . . . . . . . . . . . . . . 223References . . . . . . . . . . . . . . . . . . . . . . . . . . . . . . . . . . . . . . . . . . . . 223
15 Budgetary Control . . . . . . . . . . . . . . . . . . . . . . . . . . . . . . . . . . . . . . 225
What is budgetary control? . . . . . . . . . . . . . . . . . . . . . . . . . . . . . . . . 225Flexible budgeting . . . . . . . . . . . . . . . . . . . . . . . . . . . . . . . . . . . . . . 226Variance analysis . . . . . . . . . . . . . . . . . . . . . . . . . . . . . . . . . . . . . . . 227

xii ACCOUNTING FOR MANAGERS
Variance analysis example: Wood’s Furniture Co. . . . . . . . . . . . . . . . . 228Reconciling the variances . . . . . . . . . . . . . . . . . . . . . . . . . . . . . . . . . 237Criticism of variance analysis . . . . . . . . . . . . . . . . . . . . . . . . . . . . . . 238Cost control . . . . . . . . . . . . . . . . . . . . . . . . . . . . . . . . . . . . . . . . . . . 240Conclusion . . . . . . . . . . . . . . . . . . . . . . . . . . . . . . . . . . . . . . . . . . . 242References . . . . . . . . . . . . . . . . . . . . . . . . . . . . . . . . . . . . . . . . . . . . 242
PART III
Supporting Information . . . . . . . . . . . . . . . . . . . . . . . . . . . . . . . . . 245
16 Research in Management Accounting, Conclusions and FurtherReading . . . . . . . . . . . . . . . . . . . . . . . . . . . . . . . . . . . . . . . . . . . . 247
Research and theory in management accounting . . . . . . . . . . . . . . . . . 247Conclusion: revisiting the rationale . . . . . . . . . . . . . . . . . . . . . . . . . . 250References . . . . . . . . . . . . . . . . . . . . . . . . . . . . . . . . . . . . . . . . . . . . 251Further reading . . . . . . . . . . . . . . . . . . . . . . . . . . . . . . . . . . . . . . . . 251
17 Introduction to the Readings . . . . . . . . . . . . . . . . . . . . . . . . . . . . . . 253
A Cooper and Kaplan (1988). How cost accounting distorts productcosts . . . . . . . . . . . . . . . . . . . . . . . . . . . . . . . . . . . . . . . . . . . . 255
B Otley, Broadbent and Berry (1995). Research in managementcontrol: An overview of its development . . . . . . . . . . . . . . . . . . . 271
C Covaleski, Dirsmith and Samuel (1996). Managerial accountingresearch: The contributions of organizational and sociologicaltheories . . . . . . . . . . . . . . . . . . . . . . . . . . . . . . . . . . . . . . . . . . 293
D Dent (1991). Accounting and organizational cultures: A field studyof the emergence of a new organizational reality . . . . . . . . . . . . . 331
Glossary of Accounting Terms . . . . . . . . . . . . . . . . . . . . . . . . . . . . . . . . 369
Appendices: Questions and Case Studies . . . . . . . . . . . . . . . . . . . . . . . . 381
Appendix 1: Questions . . . . . . . . . . . . . . . . . . . . . . . . . . . . . . . . . . . 383Appendix 2: Solutions to Questions . . . . . . . . . . . . . . . . . . . . . . . . . . 407Appendix 3: Case Studies . . . . . . . . . . . . . . . . . . . . . . . . . . . . . . . . . 443Appendix 4: Solutions to Case Studies . . . . . . . . . . . . . . . . . . . . . . . . 457
Author Index . . . . . . . . . . . . . . . . . . . . . . . . . . . . . . . . . . . . . . . . . . . . . 467
Subject Index . . . . . . . . . . . . . . . . . . . . . . . . . . . . . . . . . . . . . . . . . . . . 469

Preface
Rationale for the book
This book was motivated by the author’s experience in teaching accounting atpostgraduate level (MBA and MSc) at Aston Business School and in-house trainingprovided for non-financial managers in many organizations to introduce them tothe use of financial tools and techniques.
My own education as an accountant was aimed at achieving professional recog-nition and emphasized an uncritical acceptance of the tools and techniques thatI was taught. It was only after moving from financial to a general managementposition in industry that I began to see the limitations and questionable assump-tions that underlay these tools and techniques. When I returned to study later inmy career, I was exposed for the first time to alternative paradigms from which toview accounting. This book is therefore as much a result of my practical experienceas a producer and user of accounting information as it is a result of my teachingand training experience.
As accounting increasingly becomes decentred from the accounting departmentin organizations, line managers in all functional areas of business are expectedto be able to prepare budgets, develop business cases for capital investment,and exercise cost control to ensure that profit targets are achieved. Managers arealso expected to be able to analyse and interpret accounting information so thatmarketing, operations and human resource decisions are made in the light of anunderstanding of the financial implications of those decisions.
I was disappointed by the books available to support teaching and trainingbecause most books on accounting have a similar format that is accounting-centric:chapters typically cover accounting techniques rather than the types of decisionsmade by non-financial managers. The emphasis in those books, many of whichare designed for people whose career aspirations are to become accountants, is ondoing accounting rather than using accounting. This book has been written for thevast majority of postgraduate students and practising managers who do not wantto become professional accountants. The book therefore has a practitioner-managerorientation.
The title of the book, Accounting for Managers: Interpreting Financial Informationfor Decision-Making, emphasizes the focus on accounting to meet the needs of

xiv ACCOUNTING FOR MANAGERS
managers. The material contained in the book stresses the interpretation (ratherthan the construction) of accounting information as well as a critical (ratherthan unthinking) acceptance of the underlying assumptions behind accounting.It is suitable for postgraduate and undergraduate students who are undertakingcourses in accounting that do not lead to professional accreditation, and topractising non-financial managers who need a better understanding of the role ofaccounting in their organizations.
There is a focus in most accounting books on manufacturing organizations,perhaps because many of those books have been issued as revised editionsfor many years and have not adequately reflected the changing nature of theeconomies in the developed world. The growth of service businesses and theknowledge economy is not sufficiently explored in most accounting texts. Thisbook uses examples, case studies and questions that are more equally balancedbetween the needs of organizations in manufacturing, retail and services.
In most accounting books there is also insufficient attention to theory, particu-larly for postgraduate students who should have a wider theoretical underpinning ofaccounting as it is used in organizations. Theory should encourage the reader toenquire more deeply into the alternative theoretical positions underlying account-ing as well as its social and behavioural consequences, both within their ownorganizations and in the wider society. This book therefore introduces the readerto some of the journal literature that is either fundamental to the role of accountingor is ‘path breaking’. The book is not intended to be deeply theoretical, but ratherprovides, through the ample references in each chapter, an accessible route forthose who want to reach into the wider literature.
Accounting books are often inaccessible to those from non-English-speakingbackgrounds, because of the complexity of the language used. Many of theexamples and questions in typical accounting books rely on a strong knowledgeof the nuances of the English language to interpret what the question is asking,before students can make any attempt to answer them. This book adopts a moreplain English style that addresses the needs of European and Asian students.
Finally, the examples in most accounting books focus on the calculations thataccountants perform to construct accounting reports, rather than on the interpretiveneeds of managers who use those reports. While some calculation questionsare needed to ensure that readers understand how information is produced,the emphasis for the non-financial manager should be on critical understandingand questioning of the accounting numbers and of the underlying assumptionsbehind those numbers, and on the need to supplement accounting reports withnon-financial performance measures and broader perspectives than satisfyingshareholder wealth alone.
Outline of the book
The book is arranged in four parts. The first part describes the context and roleof accounting in business. Some theoretical frameworks are provided. It is hopedthat this will provide a foundation for readers’ understanding that accounting

PREFACE xv
is more than a technical subject but is grounded in competing theories. Thesetheories are themselves rooted in historical, political, economic and social causes.The theoretical framework should help to make the subject more meaningful tostudents and practitioners alike. Although the reader is encouraged to read Part I,the arrangement of the book is such that the reader can commence in Part II, wherethe analysis and interpretation of accounting begin.
For example, those readers with a good business understanding may omitChapters 1 and 2. Those who understand the basics of accounting can omitChapter 3. These first three chapters are provided for those students who arecoming to a business studies course for the first time, although even the experiencedreader will find some value in them. Readers may not want to read the theoreticalChapters 4 and 5 until they are further into Part II; however, the theory in each ofthe chapters in Part II will be more understandable after reading Chapters 4 and5. Those readers who have undertaken a course in financial accounting may havealready covered much of the material in Chapters 6 and 7. Again, this book isintended to be a complete coverage of the subject for students and readers with noprior experience of accounting and Chapters 6 and 7 provide an important basisfor understanding management accounting.
The second part of the book shows the reader how accounting information isused in decision-making, planning and control. In this second part the accountingtools and techniques are explained, illustrated by straightforward examples. Casestudies, drawn mainly from real business examples, help draw out the concepts.Theory is integrated with the tools and techniques and the use of quotations fromoriginal sources should encourage the reader to access the academic accountingliterature. A critical approach to the assumptions underlying financial informationis presented, building on the theoretical framework provided in Chapters 4 and 5.
The third part provides a wealth of supporting material. Chapter 16 suggestsan approach to research in accounting.
Chapter 17 introduces four readings from the accounting literature. These coverthe spectrum of the literature and support the most important concepts in thebook. They present four different yet complementary perspectives on accountingin organizations. Each reading has several questions that the reader should thinkabout and try to answer in order to help understand the concepts.
The third part ends with an extensive glossary of accounting terms. The useof bold in the text highlights that the meaning of the term is outlined in theglossary.
The fourth part of the book contains an appendix of questions and casestudies to enable readers to test their understanding of the concepts described inthe book.
The questions in Appendix 1 cover each chapter and rely on knowledge gainedfrom reading that and preceding chapters. Consequently, there is a greater levelof detail involved in questions about the later chapters. Attempting these ques-tions will help the reader to understand how accountants produce informationneeded by non-accounting managers. An understanding of accounting tools andtechniques is important in using the results of these tools and techniques fordecision-making. Appendix 2 contains answers for all the questions.

xvi ACCOUNTING FOR MANAGERS
The case studies in Appendix 3 help in developing the ability to interpretand analyse financial information produced by an accountant for use by non-accounting managers in decision-making. Each is identified with the chapters thatwill aid understanding, interpretation and critical analysis of the case. Appendix 4contains a suggested answer for each case, although the nature of such cases isthat there is rarely a single correct answer, as different approaches to the problemcan highlight different aspects of the case and a range of possible solutions.

Acknowledgements
The author acknowledges the indirect contribution of Stan Brignall at Aston tothis text, which is in no small part the result of team teaching at Aston over thelast three years. The author is also grateful for the helpful suggestions made byAmanda Nayak of Birmingham and Mike Tayles of Bradford. He also thanks SteveHardman and Sarah Booth at John Wiley for their support and helpful advicethroughout the writing of the book.


About the Author
Dr Paul Collier Ph.D. (Warwick), B.Bus. (NSWIT), M.Comm. (NSW), Grad. Dip. Ed.(UTS), CPA (Aust.) is a lecturer in management accounting at Aston University’sBusiness School in Birmingham. Paul has worked in senior financial and generalmanagement roles in the UK and Australia. He was financial controller/companysecretary and subsequently general manager (operations) for one of Australia’slargest printing companies before moving to the UK in 1993. The book usesmaterial developed by the author based on his experience as a practitioner, inhis teaching at Aston and elsewhere, and in delivering financial training to non-financial managers in diverse industries over many years. Paul’s research interestsare in the use of management accounting information in decision-making and thebehavioural aspects of management accounting. He has published several articlesin academic journals.

Part I
Context of Accounting
Part I describes the context and role of accounting in business and provides sometheoretical frameworks. It is hoped that this will offer a foundation for readers’understanding that accounting is more than a technical subject and is groundedin competing theories. These theories are themselves rooted in historical, political,economic and social causes. The theoretical framework should help to make thesubject more meaningful to students and practitioners alike.
Chapter 1 provides an introduction to accounting, and an overview of account-ing history as well as describing how the role of accounting has changed, includingthe influence that this changed role has had on non-financial managers. Chap-ter 2 describes the context in which management accounting operates: the capitalmarket emphasis on shareholder value, and the strategic necessity of organizingcomplex businesses through divisions.
Chapter 3 describes how transactions are recorded by accounting systemsand the limitations that are imposed by these methods. Chapter 4 covers thetraditional theoretical approach to management accounting and control, whileChapter 5 offers alternative perspectives on accounting. The theoretical frameworkin Chapters 4 and 5 is important to support the interpretive analysis and criticalperspective taken by this book.
Chapter 6 shows how the most important financial reports are constructed.This introduction to financial accounting is an important building block for anunderstanding of management accounting.

1
Introduction to Accounting
This chapter introduces accounting and provides a short history of managementaccounting. It describes the early role of the management accountant and recentdevelopments that have influenced the role of non-financial managers in relation tothe use of financial information. The chapter concludes with a critical perspectiveon accounting history.
Accounting, accountability and the account
Businesses exist to provide goods or services to customers in exchange fora financial reward. Public-sector and not-for-profit organizations also provideservices, although their funding comes not from customers but from governmentor charitable donations. While this book is primarily concerned with profit-oriented businesses, most of the principles are equally applicable to the publicand not-for-profit sectors. Business is not about accounting. It is about markets,people and operations (the delivery of products or services), although accountingis implicated in all of these decisions because it is the financial representation ofbusiness activity.
The American Accounting Association defined accounting in 1966 as:
The process of identifying, measuring and communicating economic infor-mation to permit informed judgements and decisions by users of theinformation.
This is an important definition because:
ž it recognizes that accounting is a process: that process is concerned withcapturing business events, recording their financial effect, summarizing andreporting the result of those effects, and interpreting those results (we coverthis in Chapter 3);ž it is concerned with economic information: while this is predominantly financial,it also allows for non-financial information (which is covered in Chapter 4);ž its purpose is to support ‘informed judgements and decisions’ by users: thisemphasizes the decision usefulness of accounting information and the broadspectrum of ‘users’ of that information. While the primary concern of this bookis the use of accounting information for decision-making, the book takes a

4 ACCOUNTING FOR MANAGERS
stakeholder perspective that users of accounting information include all thosewho may have an interest in the survival, profitability and growth of a business:shareholders, employees, customers, suppliers, financiers, government andsociety as a whole.
The notion of accounting for a narrow (shareholders and financiers) or a broad(societal) group of users is an important philosophical debate to which we willreturn throughout this book. This debate derives from questions of accountability:to whom is the business accountable and for what, and what is the role ofaccounting in that accountability?
Boland and Schultze (1996) defined accountability as:
The capacity and willingness to give explanations for conduct, stating howone has discharged one’s responsibilities, an explaining of conduct witha credible story of what happened, and a calculation and balancing ofcompeting obligations, including moral ones. (p. 62)
Hoskin (1996) suggested that accountability is:
more total and insistent . . . [it] ranges more freely over space and time,focusing as much on future potential as past accomplishment. (p. 265)
Boland and Schultze argued that accountability entails both a narration of whattranspired and a reckoning of money, both meanings deriving from the originalmeanings of the word account.
Accounting is a collection of systems and processes used to record, report andinterpret business transactions. Accounting provides an account – an explanation orreport in financial terms – about the transactions of an organization. It enables man-agers to satisfy the stakeholders in the organization (owners, government, financiers,suppliers, customers, employees etc.) that they have acted in the best interestsof stakeholders rather than themselves. This is the notion of accountability toothers, a result of the stewardship function of managers that takes place throughthe process of accounting. Stewardship is an important concept because in all butvery small businesses, the owners of businesses are not the same as the managers.This separation of ownership from control makes accounting particularly influen-tial due to the emphasis given to increasing shareholder wealth (or shareholdervalue). Accountability results in the production of financial statements, primarilyfor those interested parties who are external to the business. This function is calledfinancial accounting.
Accounting is traditionally seen as fulfilling three functions:
ž Scorekeeping: capturing, recording, summarizing and reporting financial perfor-mance.ž Attention-directing: drawing the attention of managers to, and assisting in theinterpretation of, business performance, particularly in terms of the comparisonbetween actual and planned performance.ž Problem-solving: identifying the best choice from a range of alternative actions.

INTRODUCTION TO ACCOUNTING 5
In this book, we acknowledge the role of the scorekeeping function in Chapters 6and 7, while emphasizing attention-directing and problem-solving as taking placethrough three inter-related functions, all part of the role of functional as well asfinancial managers:
ž Planning: establishing goals and strategies to achieve those goals.ž Decision-making: using financial information to make decisions consistent withthose goals and strategies.ž Control: using financial information to maintain performance as close as possibleto plan, or using the information to modify the plan itself.
Planning, decision-making and control are particularly relevant as increasinglybusinesses have been decentralized into many business units, where much ofthe planning, decision-making and control is focused. Managers need financialand non-financial information to develop and implement strategy by planningfor the future (budgeting); making decisions about products, services, pricesand what costs to incur (decision-making using cost information); and ensuringthat plans are put into action and are achieved (control). This function is calledmanagement accounting.
This book is primarily concerned with the planning, decision-making andcontrol aspects, i.e. management accounting. However, it begins by setting therole of the manager and the use of accounting information in the context offinancial accounting.
A short history of accounting
The history of accounting is intertwined with the development of trade betweentribes and there are records of commercial transactions on stone tablets dating backto 3600 BC (Stone, 1969). The early accountants were ‘scribes’ who also practisedlaw. Stone (1969) noted:
In ancient Egypt in the pharaoh’s central finance department . . . scribesprepared records of receipts and disbursements of silver, corn and othercommodities. One recorded on papyrus the amount brought to the warehouseand another checked the emptying of the containers on the roof as it waspoured into the storage building. Audit was performed by a third scribe whocompared these two records. (p. 284)
However, accounting as we know it today began in the fourteenth century inthe Italian city-states of Florence, Genoa and Venice as a result of the growth ofmaritime trade and banking institutions. The first bank with customer facilitiesopened in Venice in 1149. The Lombards were Italian merchants who wereestablished as moneylenders in England at the end of the twelfth century.
Balance sheets were evident from around 1400 and the Medici family (who wereLombards) had accounting records of ‘cloth manufactured and sold’. The firsttreatise on accounting (although it was contained within a book on mathematics)

6 ACCOUNTING FOR MANAGERS
was the work of a monk, Luca Pacioli, in 1494. The first professional accountingbody was formed in Venice in 1581.
Much of the language of accounting is derived from Latin roots. ‘Debtor’ comesfrom the Latin debitum, something that is owed; ‘assets’ from the Latin ad + satis,to enough, i.e. to pay obligations; ‘liability’ from ligare, to bind; ‘capital’ fromcaput, a head (of wealth). Even ‘account’ derives initially from the Latin computare,to count, while ‘profit’ comes from profectus, advance or progress. ‘Sterling’ and‘shilling’ came from the Italian sterlino and scellino, while the pre-decimal currencyabbreviation ‘LSD’ (pounds, shillings and pence) stood for lire, soldi, denarii.
Chandler (1990) traced the development of the modern industrial enterprisefrom its agricultural and commercial roots as a result of the Industrial Revolution inthe last half of the nineteenth century. By 1870, the leading industrial nations – theUnited States, Great Britain and Germany – accounted for two-thirds of the world’sindustrial output. One of the consequences of growth was the separation ofownership from management. Although the corporation, as distinct from itsowners, had been in existence in Britain since 1650, the separation of ownershipand control was enabled by the first British Companies Act, which formalizedthe law in relation to ‘joint stock companies’ and introduced the limited liabilityof shareholders during the 1850s. The London Stock Exchange had been formedearlier in 1773 by stockbrokers, who had previously worked from coffee houses.
The second consequence of growth was the creation of new organizationalforms. Based on his extensive historical analysis, Chandler (1962) found that inlarge firms structure followed strategy and strategic growth and diversification ledto the creation of decentralized, multidivisional corporations like General Motors,where remotely located managers made decisions on behalf of absent owners andcentral head office functions. Ansoff (1988) emphasized that success in the first30 years of the mass-production era went to firms that had the lowest prices.However, in the 1930s General Motors ‘triggered a shift from production to amarket focus’ (p. 11).
In large firms such as General Motors, budgets were developed to co-ordinatediverse activities. In the first decades of the twentieth century, the DuPont companydeveloped a model to measure the return on investment (ROI). ROI (see Chapters 7,12 and 13) was used to make capital investment decisions and to evaluate theperformance of business units, including the managerial responsibility to usecapital efficiently.
The role of management accounting
The advent of mechanized production following the Industrial Revolutionincreased the size and complexity of production processes, which employedmore people and required larger sums of capital to finance machinery. Accountinghistorians suggest that the increase in the number of limited companies thatled to the separation of ownership from control caused the attention of costaccounting to shift from determining cost to exercising control by absent ownersover their managers.
INTRODUCTION TO ACCOUNTING 7
The predecessor of management accounting, ‘cost accounting’, was reflected inthe earlier title of management accountants as cost or works accountants. Typicallysituated in factories, these accountants tended to know the business and advisenon-financial managers in relation to operational decisions. Cost accounting wasconcerned with determining the cost of an object, whether a product, an activity, adivision of the organization or market segment. The first book on cost accountingis believed to be Garcke and Fell’s Factory Accounts, which was published in 1897.
Historians have argued that the new corporate structures that were developed inthe twentieth century – multidivisional organizations, conglomerates and multi-nationals – placed increased demands on accounting. These demands includeddivisional performance evaluation and budgeting. It has also been suggested thatdevelopments in cost accounting were driven by government demands for costinformation during both World Wars. It appears that ‘management accounting’ isa term used only after the Second World War.
In their acclaimed book Relevance Lost, Johnson and Kaplan (1987) tracedthe development of management accounting from its origins in the IndustrialRevolution supporting process-type industries such as textile and steel conversion,transportation and distribution. These systems were concerned with evaluating theefficiency of internal processes, rather than measuring organizational profitability.Financial reports were produced using a separate transactions-based systemthat reported financial performance. Johnson and Kaplan (1987) argued thatby 1925 ‘virtually all management accounting practices used today had beendeveloped’ (p. 12).
They also described how the early manufacturing firms attempted to improveperformance via economies of scale by reducing unit cost through increasing thevolume of output. This led to a concern with measuring the efficiency of theproduction process. Calculating the cost of different products was unnecessarybecause the product range was homogeneous.
Over time, the product range expanded and businesses sought economies ofscope through producing two or more products in a single facility. This led tothe need for better information about how the mix of products could improvetotal profits. However, after 1900 the production of accounting information waslargely for external reporting to shareholders and not to assist managerial decision-making.
Johnson and Kaplan (1987) described how
a management accounting system must provide timely and accurate informa-tion to facilitate efforts to control costs, to measure and improve productivity,and to devise improved production processes. The management accountingsystem must also report accurate product costs so that pricing decisions, intro-duction of new products, abandonment of obsolete products, and responseto rival products can be made. (p. 4)
The Chartered Institute of Management Accountants’ definition of the core activi-ties of management accounting includes:

8 ACCOUNTING FOR MANAGERS
ž participation in the planning process at both strategic and operational levels,involving the establishment of policies and the formulation of budgets;ž the initiation of and provision of guidance for management decisions, involvingthe generation, analysis, presentation and interpretation of relevant informa-tion;ž contributing to the monitoring and control of performance through the provi-sion of reports including comparisons of actual with budgeted performance,and their analysis and interpretation.
One of the earliest writers on management accounting described ‘different costsfor different purposes’ (Clark, 1923). This theme was developed by one of theearliest texts on management accounting (Vatter, 1950). Vatter distinguishedthe information needs of managers from those of external shareholders andemphasized that it was preferable to get less precise data to managers quickly thancomplete information too late to influence decision-making. Johnson and Kaplan(1987) commented that even today, organizations
with access to far more computational power . . . rarely distinguish betweeninformation needed promptly for managerial control and information pro-vided periodically for summary financial statements. (p. 161)
They argued that the developments in accounting theory in the first decades ofthe twentieth century came about by academics who
emphasized simple decision-making models in highly simplifiedfirms – those producing one or only a few products, usually in a one-stage production process. The academics developed their ideas by logic anddeductive reasoning. They did not attempt to study the problems actuallyfaced by managers of organizations producing hundreds or thousands ofproducts in complex production processes. (p. 175)
They concluded:
Not surprisingly, in this situation actual management accounting systemsprovided few benefits to organizations. In some instances, the informationreported by existing management accounting systems not only inhibitedgood decision-making by managers, it might actually have encouraged baddecisions. (p. 177)
Johnson and Kaplan (1987) described how the global competition that has takenplace since the 1980s has left management accounting behind in terms of itsdecision usefulness. Developments such as total quality management, just-in-timeinventory, computer-integrated manufacturing, shorter product life cycles (seeChapter 9) and the decline of manufacturing and rise of service industries haveled to the need for ‘accurate knowledge of product costs, excellent cost control,and coherent performance measurement’ (p. 220). And ‘the challenge for today’scompetitive environment is to develop new and more flexible approaches to
INTRODUCTION TO ACCOUNTING 9
the design of effective cost accounting, management control, and performancemeasurement systems’ (p. 224).
Recent developments in management accounting
Partly as a result of the stimulus of Relevance Lost but perhaps more so as aconsequence of rapidly changing business conditions, management accountinghas moved beyond its traditional concern with a narrow range of numbers toincorporate wider issues of performance measurement and management. Man-agement accounting is now implicated, to greater or lesser degrees in differentorganizations, with:
ž value-based management;ž non-financial performance measurement systems;ž quality management approaches;ž activity-based management; andž strategic management accounting.
Value-based management is more fully described in Chapter 2, but is in brief aconcern with improving the value of the business to its shareholders. Managementaccounting is implicated in this, as a fundamental role of non-financial managersis to make decisions that contribute to increasing the value of the business.
The limitations of accounting information, particularly as a lagging indicatorof performance, have led to an increasing emphasis on non-financial performancemeasures, which are described more fully in Chapter 4. Non-financial measuresare a major concern of both accountants and non-financial managers, as they tendto be leading indicators of the financial performance that will be reported at somefuture time.
Improving the quality of products and services is also a major concern, sinceadvances in production technology and the need to improve performance byreducing waste have led to management tools such as total quality management(TQM), just-in-time (JIT), business process re-engineering (BPR) and continu-ous improvement processes such as Six Sigma and the Business Excellence model.Management accounting has a role to play in these techniques (introduced in Chap-ters 9 and 15) and non-financial managers need to understand the relationshipsbetween accounting and new management techniques.
Activity-based management is an approach that emphasizes the underlyingbusiness processes that are required to produce goods and services and the needto identify the drivers or causes of those activities in order to be able to budgetfor and control costs more effectively. Activity-based approaches are introducedthroughout Part II.
Strategic management accounting, which is described more fully in Chapter 4,is an attempt to shift the perceptions of accountants and non-financial managersfrom an inward-looking to an outward-looking one, recognizing the need to lookbeyond the business along the value chain to its suppliers and customers and toseek ways of achieving and maintaining competitive advantage.
10 ACCOUNTING FOR MANAGERS
These changes to the narrow view of accountants, from ‘bean-counters’ to moreactive participants in formulating and implementing business strategy, have beenaccompanied by a shift in the collection, reporting and analysis of routine financialinformation from accountants to non-financial line managers. This decentring ofaccounting is evidenced by the delegation of responsibility for budgets and costcontrol to line managers and is the underlying reason that non-financial managersneed a better understanding of accounting information and how that informationcan be used in decision-making.
A critical perspective
Although the concepts and assumptions underlying accounting are yet to beintroduced, having begun this book with an introduction to accounting history itis worthwhile considering a contrasting viewpoint. While this viewpoint is onethat may not be accepted by many practising managers, it is worth knowing,because it does lie at the very basis of the capitalist economic system in which welive, and in which accounting plays such an important role.
The Marxist historian Hobsbawm (1962) argued that colonialism had beencreated by the cotton industry that dominated the UK economy, and this resultedin a shift from domestic production to factory production. Sales increased butprofits shrank, so labour (which was three times the cost of materials) wasreplaced by mechanization during the Industrial Revolution.
Entrepreneurs started with borrowings and small items of machinery andgrowth was largely financed by borrowings. The Industrial Revolution pro-duced ‘such vast quantities and at such rapidly diminishing cost, as to be nolonger dependent on existing demand, but to create its own market’ (Hobsbawm,1962: 32).
Advances in mass production followed the development of the assembly line,supported by railways and shipping to transport goods, and communicationsthrough the electric telegraph. At the same time, agriculture diminished in impor-tance. Due to the appetite of the railways for iron and steel, coal, heavy machinery,labour and capital investment, ‘the comfortable and rich classes accumulatedincome so fast and in such vast quantities as to exceed all available possibilities ofspending and investment’ (Hobsbawm, 1962, p. 45).
While the rich accumulated profits, labour was exploited with wages at subsis-tence levels. Labour had to learn how to work, unlike agriculture or craft industries,in a manner suited to industry, and the result was a draconian master/servantrelationship. In the 1840s a depression led to unemployment and high food pricesand 1848 saw the rise of the labouring poor in European cities, who threatenedboth the weak and obsolete regimes and the rich.
This resulted in a clash between the political (French) and industrial (British)revolutions, the ‘triumph of bourgeois-liberal capitalism’ and the domination ofthe globe by a few western regimes, especially the British in the mid-nineteenthcentury, which became a ‘world hegemony’ (Hobsbawm, 1962).
This ‘global triumph’ of capitalism in the 1850s (Hobsbawm, 1975) was aconsequence of the combination of cheap capital and rising prices. Stability and

INTRODUCTION TO ACCOUNTING 11
prosperity overtook political questions about the legitimacy of existing dynastiesand technology cheapened manufactured products. There was high demand butthe cost of living did not fall, so labour became dominated by the interests of thenew owners of the means of production. ‘Economic liberalism’ became the recipefor economic growth as the market ruled labour and helped national economicexpansion. Industrialization made wealth and industrial capacity decisive ininternational power, especially in the US, Japan and Germany.
This ‘British’ capitalist system was exported throughout the world, not leastwith the support of a colonial expansionist Empire that lent large sums of moneyin return for adopting the British system. This system has since been taken overby multinational corporations, largely based in the United States.
Armstrong (1987) traced the historical factors behind the comparative (inrelation to other professions) pre-eminence of accountants in British managementhierarchies and the emphasis on financial control. He concluded that accountingcontrols were installed by accountants as a result of their power base in globalcapital markets, which was achieved through their role in the allocation of theprofit surplus to shareholders. Armstrong argued that mergers led to controlproblems that were tackled by
American management consultants who tended to recommend the multi-divisional form of organization . . . [which] entirely divorce headquartersmanagement from operations. Functional departments and their managersare subjected to a battery of financial indicators and budgetary controls. . . [and] a subordination of operational to financial decision-making and amajor influx of accountants into senior management positions. (p. 433)
Roberts (1996) suggested that organizational accounting embodies the separationof instrumental and moral consequences, which is questionable. He argued:
The mystification of accounting information helps to fix, elevate and thenimpose upon others its own particular instrumental interests, without regardto the wider social and environmental consequences of the pursuit of suchinterests. Accounting thus serves as a vehicle whereby others are called toaccount, while the interests it embodies escape such accountability. (p. 59)
This is a more critical perspective than that associated with the traditional notionof accounting as a report to shareholders and managers, which is a result of thehistorical development of capitalism in the West.
Conclusion
While this book is designed to help non-financial managers understand the toolsand techniques of accounting, it is also intended to make readers think criticallyabout the role of accounting and the limitations of accounting, some of which havebeen historically defined. One intention is to reinforce to readers that:

12 ACCOUNTING FOR MANAGERS
accounting information provides a window through which the real activitiesof the organization may be monitored, but it should be noted also that otherwindows are used that do not rely upon accounting information. (Otley andBerry, 1994, p. 46)
References
American Accounting Association (1996). A Statement of Basic Accounting Theory. Saratosa,FL: American Accounting Association.
Ansoff, H. I. (1988). The New Corporate Strategy. New York: John Wiley & Sons.Armstrong, P. (1987). The rise of accounting controls in British capitalist enterprises.
Accounting, Organizations and Society, 12(5), 415–36.Boland, R. J. and Schultze, U. (1996). Narrating accountability: Cognition and the production
of the accountable self. In R. Munro and J. Mouritsen (eds), Accountability: Power, Ethosand the Technologies of Managing, London: International Thomson Business Press.
Chandler, A. D. J. (1962). Strategy and Structure: Chapters in the History of the AmericanIndustrial Enterprise. Cambridge, MA: Harvard University Press.
Chandler, A. D. J. (1990). Scale and Scope: The Dynamics of Industrial Capitalism. Cambridge,MA: Harvard University Press.
Clark, J. M. (1923). Studies in the Economics of Overhead Costs. Chicago, IL: University ofChicago Press.
Hobsbawm, E. (1962). The Age of Revolution: Europe 1789–1848. London: Phoenix Press.Hobsbawm, E. (1975). The Age of Capital: 1848–1875. London: Phoenix Press.Hoskin, K. (ed.) (1996). The ‘awful idea of accountability’: Inscribing people into the
measurement of objects. In R. Munro and J. Mouritsen (eds), Accountability: Power, Ethosand the Technologies of Managing, International Thomson Business Press.
Johnson, H. T. and Kaplan, R. S. (1987). Relevance Lost: The Rise and Fall of ManagementAccounting. Boston, MA: Harvard Business School Press.
Otley, D. T. and Berry, A. J. (1994). Case study research in management accounting andcontrol. Management Accounting Research, 5, 45–65.
Roberts, J. (ed.) (1996). From discipline to dialogue: Individualizing and socializing formsof accountability. In R. Munro and J. Mouritsen (eds), Accountability: Power, Ethos and theTechnologies of Managing, International Thomson Business Press.
Stone, W. E. (1969). Antecedents of the accounting profession. The Accounting Review, April,284–91.
Vatter, W. J. (1950). Managerial Accounting. New York, NY: Prentice Hall.

2
Accounting and its Relationshipto Shareholder Value and BusinessStructure
This chapter develops the two themes that were identified in Chapter 1 as beingimportant to the content of this book: the separation of ownership from controland the divisionalized form of business. The first is implicated in the emergence ofcapital markets and value-based management, the subject of this chapter, in whichseveral tools for measuring shareholder value are described. The link betweenshareholder value, strategy and accounting is then introduced.
The second theme is the shift towards a decentralized, multidivisional businessstructure and the measurement and management of divisional (i.e. business unit)performance that has influenced the development of management accounting. Thischapter introduces the structure of business organizations, with emphasis on thedivisionalized structure and decentralized profit responsibility. Part II developsthe divisional performance issue in much greater detail.
The chapter concludes with a critical perspective that questions the focus onshareholders alone and raises issues concerning accounting in the divisionalizedorganization.
Capital and product markets
Since the seventeenth century, companies have been formed by shareholdersin order to consolidate resources and invest in opportunities. Shareholders hadlimited liability through which their personal liability in the event of businessfailure was limited to their investment in shares. Shareholders appointed directorsto manage the business, who in turn employed managers. Shareholders have fewdirect rights in relation to the conduct of the business. Their main powers areto elect the directors and appoint the auditors in an annual general meeting ofshareholders. They are also entitled to an annual report containing details of thecompany’s financial performance (see Chapter 7).
The market in which investors buy and sell the shares of companies is called thecapital market, which is normally associated with the Stock Exchange. Companiesobtain funds raised from shareholders (equity) and borrowings from financiers(debt). Both of these constitute the capital employed in the business.

14 ACCOUNTING FOR MANAGERS
The cost of capital represents the cost incurred by the organization to fund allits investments, comprising the cost of equity and the cost of debt weighted bythe mix of debt and equity. The cost of debt is interest, which is the price chargedby the lender. The cost of equity is partly dividend and partly capital growth,because most shareholders expect both regular income from profits (the dividend)and an increase in the value of their shares over time in the capital market. Thusthe different costs of each form of capital, weighted by the proportions of differentforms of debt and equity, constitute the weighted average cost of capital. Themanagement of the business relationship with capital markets is called financialmanagement or corporate finance.
Companies use their capital to invest in technologies, people and materialsin order to make, buy and sell products or services to customers. This is calledthe product market. The focus of shareholder wealth, according to Rappaport(1998), is to obtain funds at competitive rates from capital markets and investthose funds to exploit imperfections in product markets. Where this takes place,shareholder wealth is increased through dividends and increases in the shareprice. The 1990s saw a growing concern with the role of accounting in improvingshareholder wealth.
The relationship between capital markets and product markets is shown inFigure 2.1.
Value-based management
Since the mid-1980s, there has been more and more emphasis on increasing thevalue of the business to its shareholders. Traditionally, business performance hasbeen measured through accounting ratios such as return on capital employed(ROCE), return on investment (ROI), earnings per share and so on (which aredescribed in Chapter 7). However, it has been argued that these are historicalrather than current measures, and they vary between companies as a result ofdifferent accounting treatments.
Rappaport (1998) described how companies with strong cash flows diversifiedin the mid-twentieth century, often into uneconomic businesses, which led tothe ‘value gap’ – the difference between the market value of the shares and thevalue of the business if it had been managed to maximize shareholder value.The consequence was the takeover movement and subsequent asset stripping ofthe 1980s, which provided a powerful incentive for managers to focus on creatingvalue for shareholders. The takeover movement itself led to problems as highacquisition premiums (the excess paid over and above the calculated value ofthe business, i.e. the goodwill) were paid to the owners and financed by highlevels of debt. During the 1990s institutional investors (pension funds, insurancecompanies, investment trusts etc.), through their dominance of share ownership,increased their pressure on management to improve the financial performanceof companies.
Value-based management (VBM) emphasizes shareholder value, on theassumption that this is the primary goal of every business. VBM approaches

ACCOUNTING AND ITS RELATIONSHIP TO SHAREHOLDER VALUE 15
Shareholders Financiers
invest in shares lend money
to earn dividendsand sell for higher price
for security,to earn interest
to a Limited Company (Ltd or PLC)
Shares (equity) Borrowings (debt)
Annualgeneralmeeting
Board ofdirectors
Companylaw
Stockexchange
Management Annual report and accounts
Product market Capital market
Decisions about shareholder value
Figure 2.1 Capital and product market structure and interaction
include total shareholder return, market value added, shareholder value added andeconomic value added. Recent research into the use of value-based managementapproaches by UK companies is covered by Cooper et al. (2001).
Total shareholder return (TSR) compares the dividends received by shareholdersand the increase in the share price with the original shareholder investment,expressing the TSR as a percentage of the initial investment.
Market value added (MVA) is the difference between total market capitalization(number of shares issued times share price plus the market value of debt) andthe total capital invested in the business by debt and equity providers. This is ameasure of the value generated by managers for shareholders.

16 ACCOUNTING FOR MANAGERS
Rappaport (1998) coined shareholder value added (SVA) to refer to the increasein shareholder value over time. He defines shareholder value as the economicvalue of an investment, which can be calculated by using the cost of capital todiscount forecast future cash flows (which he called free cash flows) into presentvalues (discounted cash flow techniques are described in detail in Chapter 12). Thebusiness must generate profits in product markets that exceed the cost of capitalin the capital market for value to be created (if not, shareholder value is eroded).
Rappaport developed a shareholder value network (see Figure 2.2). Throughthis diagram, he identified seven drivers of shareholder value: sales growth rate,operating profit margin, income tax rate, working capital investment, fixed capitalinvestment, cost of capital and forecast duration. Managers make three types ofdecisions that influence these value drivers and lead to shareholder value:
ž Operating decisions – product mix, pricing, promotion, customer service etc.,which are then reflected in the sales growth rate, operating profit margin andincome tax rate.ž Investment decisions – in both inventory and capacity, which are then reflectedin both working capital and fixed capital investment.ž Financing decisions – the mix of debt and equity and the choice of financialinstrument determine the cost of capital, which is assessed by capital marketsin terms of business risk.
The value growth duration is the estimated number of years over which the returnfrom investments is expected to exceed the cost of capital.
CORPORATEOBJECTIVE
ShareholderValue Added
(SVA)
Shareholder Return • Dividends • Capital Gains
VALUATIONCOMPONENTS
VALUEDRIVERS
MANAGEMENTDECISIONS
Cash Flow FromOperations
DiscountRate
Debt
ValueGrowthDuration
• Sales Growth• Operating Profit Margin• Income Tax Rate
• Working Capital Investment• Fixed Capital Investment
Cost of Capital
Operating Investment Financing
Figure 2.2 The shareholder value networkReprinted from Rappaport, A. (1998). Creating Shareholder Value: A Guide for Managers and Investors.(Revd. edn). New York, NY: Free Press.

ACCOUNTING AND ITS RELATIONSHIP TO SHAREHOLDER VALUE 17
The seven value drivers determine the cash flow from operations, the levelof debt and the cost of capital, all of which determine shareholder value. Adetrimental consequence of the emphasis on shareholder value is that it hasled to a continued focus on short-term financial performance at the expense oflonger-term strategy.
Economic Value Added (EVA) is a financial performance measure developedby consultants Stern Stewart & Co. It claims to capture the economic profit ofa business that leads to shareholder value creation. In simple terms, EVA is netoperating profit after deducting a charge to cover the opportunity cost of the capitalinvested in the business (when by taking one action you lose the opportunity toundertake any alternative; described in more detail in Chapter 3). EVA’s ‘economicprofit’ is the amount by which earnings exceed (or fall short of) the minimum rateof return that shareholders and financiers could get by investing in other securitieswith a comparable risk (see Stern Stewart’s website at www.sternstewart.com).
EVA accepts the assumption that the primary financial objective of any businessis to maximize the wealth of its shareholders. The value of the business dependson the extent to which investors expect future profits to be greater or less thanthe cost of capital. Returns over and above the cost of capital increase shareholderwealth, while returns below the cost of capital erode shareholder wealth.
Stern Stewart argues that managers understand this measure because it is basedon operating profits. By introducing a notional charge based on assets held bythe business, managers (whether at a corporate or divisional level) manage thoseassets as well as the profit generated.
EVA also has its critics. For example, the calculation of EVA allows up to 164adjustments to reported accounting profits in order to remove distortions causedby arbitrary accounting rules and estimates the risk-adjusted cost of capital, bothof which can be argued as subjective, although Stern Stewart argues that mostorganizations need only about a dozen of these. The increase in shareholder valueis reflected in compensation strategies for managers whose goals, argues SternStewart, are aligned to increasing shareholder wealth through bonus and shareoption schemes that are paid over a period of time to ensure consistent futureperformance.
Accounting and strategy
This book treats accounting as part of the broader business context of strategy,marketing, operations and human resources. The focus of accounting in businessorganizations is shareholder value – increasing the value of the business to itsshareholders – through dividends from profits and/or through capital growth.Strategy both influences and is influenced by shareholder value. Strategy isreflected in the functional business areas of marketing, operations and humanresources, through the actions the business wants to take to achieve, maintainand improve competitive advantage. The relationship between these elements isshown in Figure 2.3.

18 ACCOUNTING FOR MANAGERS
Strategy Shareholder value Financial accounting(stewardship)
MarketingoperationsHuman resources
Financialmanagement Management accounting
(information for planning,decision-making and control)
Figure 2.3 Shareholder value, strategy and accounting
Financial management (which is outside the scope of this book) is concernedwith raising funds from shareholders or financiers to provide the capital the busi-ness needs to sell and produce goods and services. Financial accounting representsthe stewardship function, that managers are accountable to those with a financialinterest in the business and produce financial reports to satisfy that accountability(Chapters 6 and 7). Management accounting provides the information for plan-ning, decision-making and control. Therefore, the main content of this book isthe interaction between the functional areas of marketing, operations and humanresources – driven by strategy – and how accounting provides a set of tools andtechniques to assist functional managers. Management accounting both influencesand is influenced by the functional areas and by business strategy.
The importance of strategy for management accounting and the information itprovides is that a strategic perspective involves taking a longer-term view about thebusiness than is usually provided by traditional accounting reports. Managementaccounting comprises a set of tools and techniques to support planning, decision-making and control in business organizations. Accounting is – or at least shouldbe – integrated with business strategy. However, these same accounting tools andtechniques can be used to help evaluate the performance of customers, suppliersand competitors in order to improve competitive advantage. This is called strategicmanagement accounting, which is described in Chapter 4.
Accounting should also extend beyond a narrow concern with financial mea-surement and encompass non-financial performance measurement, a subject ofsteadily increasing importance for those managers who are responsible for achiev-ing performance targets, as well as for accountants (performance measurement isalso described in Chapter 4).
Strategy is concerned with long-term direction, achieving and maintainingcompetitive advantage, identifying the scope and boundaries of the organizationand matching the activities of the organization to its environment. Strategy is alsoabout building on resources and competences to create new opportunities andtake advantage of those opportunities and manage change within the organization.There is also a link between strategy and operational decisions in order to turnstrategy formulation into strategy implementation (for a fuller description, see forexample Johnson and Scholes, 1997).

ACCOUNTING AND ITS RELATIONSHIP TO SHAREHOLDER VALUE 19
An economic perspective is added by Grant (1998), who saw the value createdby firms distributed among customers, suppliers and equity risk-takers. In order toprovide this value, business firms establish profit as the single dominant objective.The purpose of strategy ‘is to pursue profit over the long term’ (p. 34). Strategyis thus linked to performance by setting performance targets for the business as awhole and for individual business units and then measuring performance againstthose targets (this is the subject of Chapter 4).
It is to the divisionalized organizational form that we now turn.
Structure of business organizations
Organizations are typically considered to be of three types:
ž the private sector, comprising businesses whose prime goal is profit;ž the public sector, which is government funded (through various kinds oftaxation), providing services for the public, such as in health, education, lawand order etc.; andž the ‘third sector’ of not-for-profit organizations, providing a range of charitableor social services, funded by donations, lottery grants etc.
The accounting described in this book is primarily concerned with for-profitbusinesses, although many of the concepts are equally applicable to the othertwo sectors. Business organizations can be further subdivided into a number ofmajor types:
ž agriculture, or primary production;ž manufacturing, or secondary production;ž services, or tertiary production.
Again, our concern is with all businesses other than agriculture as the meansof production and the accounting requirements of that type of business aresignificantly different from the latter two, which in any event dominate theeconomy. Manufacturing and service businesses are concerned with satisfyingcustomer demand for products or services. Businesses produce products/servicesthrough a variety of organizational forms, but predominantly through either afunctional structure or a divisionalized structure.
The functional structure locates decision-making at the top of the corporate hier-archy, with functional responsibilities for marketing, operations, human resources,finance and so on allocated to departments, as shown in the typical organizationchart in Figure 2.4.
In the functional structure, accounting provides a staff function to the line func-tions, simplified here as marketing, operations and human resources. Accountingknowledge tends to be centralized in the accounting department, which collects,

20 ACCOUNTING FOR MANAGERS
Marketing Operations Human Resources Accounting
Chief Executive
Figure 2.4 Functional organization chart
produces, reports and analyses accounting information on behalf of its (internal)customer departments.
The functional structure may be suitable for smaller organizations with a narrowgeographic spread and a limited product/service range, but it is not generallysuitable for larger organizations.
The divisional structure is based on a head office with corporate specialistssupporting the chief executive, with divisions established for major elements ofthe business. These divisions may be based on geographic territories or differentproducts/services, and each division will typically have responsibility for allthe functional areas: marketing, operations, human resources and accounting. Atypical divisional structure is shown in Figure 2.5.
The advantage of the divisional structure is that while planning is centrally co-ordinated, the implementation of plans, decision-making and control is devolvedto local management who should have a better understanding of their localoperations. The divisions are often referred to as strategic business units (SBUs) todescribe their devolved responsibility for a segment of the business. These SBUsare, in accounting, termed responsibility centres.
Responsibility centres, through their managers, are held responsible for achiev-ing certain standards of performance (this is covered in more detail in Chapter 13).There are three types of responsibility centres:
ž cost centres, which are responsible for controlling costs;ž profit centres, which are responsible for achieving profit targets; andž investment centres, which are responsible for achieving an adequate return onthe capital invested in the division.
MarketingOperations
Human ResourcesAccounting
Division A
MarketingOperations
Human ResourcesAccounting
Division B
MarketingOperations
Human ResourcesAccounting
Division C
Chief Executive Head Office(specialist support)
Figure 2.5 Divisional organization chart
ACCOUNTING AND ITS RELATIONSHIP TO SHAREHOLDER VALUE 21
Management within divisions will carry out a significant function in analysingand interpreting financial information as part of their local management responsi-bilities, typically supported by locally based accounting support staff. Accountinginfluences and is influenced by the structure adopted and the extent of managerialresponsibility for business unit performance, a subject that will be developedfurther throughout Part II but in particular in Chapter 13, which considers howthe performance of business units and their managers can be evaluated.
Emmanuel et al. (1990) described organizational structure as:
a potent form of control because, by arranging people in a hierarchywith defined patterns of authority and responsibility, a great deal of theirbehaviour can be influenced or even pre-determined. (p. 39)
Child (1972) defined organization structure as ‘the formal allocation of workroles and the administrative mechanisms to control and integrate work activities’(p. 2), emphasizing that structure depends on the decision-makers’ evaluation ofenvironmental impacts, the standard of required performance and the level ofperformance actually achieved. This stresses the role of decision-makers, definedas the ‘power-holding group’ (p. 13).
Galbraith and Nathanson (1976) suggested that the choice of organizationalform was the result of choices about five design variables: task, people, struc-ture, reward systems and information and decision processes. These choicesshould be consistent with the firm’s product-market strategy, i.e. there shouldbe ‘fit’ or ‘congruence’. Galbraith and Nathanson applied Chandler’s (1962) fourgrowth strategies – expansion of volume, geographic dispersion, vertical integra-tion and product diversification – to see how each affects the form of organizationalstructure, based on Chandler’s thesis that structure follows strategy. They argued:
Variation in strategy should be matched with variation in processes andsystems as well as in structure, in order for organizations to implementstrategies successfully. (p. 10)
Galbraith and Nathanson further built on Chandler’s research, adding that diversi-fication leads to multidivisional forms, with competition as an important variable.
A critical perspective
The shareholder value movement has subsumed much consideration of the wideraccountability of business to other stakeholders. Shareholders’ interests dominatebusiness and accountants occupy a privileged position as those who establishthe rules and report business performance. This can be seen as a historicaldevelopment.
Stakeholder theory looks beyond shareholders to those groups who influence, orare influenced by, the organization. Shareholders are not representative of societyand stakes are held in the organization by employees, customers, suppliers,government and the community. Stakeholder theory is concerned with how

22 ACCOUNTING FOR MANAGERS
the power of stakeholders, with their competing interests, is managed by theorganization in terms of its broader accountability.
Dermer (1988) suggested a broader view of organizations with interdependentbut conflicting stakeholders, arguing:
Cognitive and/or political models view organizations as non-goal-oriented,non-instrumental social systems, enmeshed in broader socio-political con-texts. (p. 29)
Dermer contrasted the presumption of managerial authority and unitary purposewith a pluralistic governance model comprising four elements: leadership (man-agement); citizenship (stakeholders); institutions (formal and informal patterns ofrelating); and ideologies (patterns of belief).
Given that accountability (as we saw in Chapter 1) is the duty to provide anexplanation – an account – of the actions for which an organization is responsible,this implies a social accounting and a right to information by various stakeholdergroups in a democracy (which is discussed in Chapter 7).
Strategy is also open to criticism. Mintzberg (1994) was critical of strategicplanning because it is a ‘calculating style of management’ resulting in strategiesthat are extrapolated from the past or copied from others. Rather, Mintzberg sawsome strategy as deliberate but other strategy as an emergent process, whichshould lead to learning. He argued:
Strategic planning often spoils strategic thinking, causing managers to con-fuse real vision with the manipulation of numbers. (p. 107)
A critical stance can also be applied to the divisionalized form of organization.Roberts and Scapens (1985) argued that in a divisionalized company there isdistance between the division and the head office, such that ‘the context withinwhich accounting information is gathered will typically be quite different fromthe context in which it is interpreted’ (p. 452). This may result in manipulating theappearance of accounting reports. Roberts and Scapens concluded:
The image of an organization which is given through Accounts will be froma particular point of view, at a particular point in time and will be selectivein its focus. Events, actions, etc. which are significant for the organizationmay be out of focus, or not in the picture at all . . . the image conveyed by theAccounts may misrepresent the actual flow of events and practices that it isintended to record. (p. 454)
The separation of management from control, the creation of decentralized businessunits and the pursuit of shareholder value imply a particular goal-oriented,economic and rational theory of management behaviour and organizational action.We will consider the theoretical assumptions behind this perspective in Chapters 4and 5.

ACCOUNTING AND ITS RELATIONSHIP TO SHAREHOLDER VALUE 23
Conclusion
While Chapter 1 provided an introduction to accounting, its history and the chang-ing role of the management accountant, this chapter has provided the context inwhich the changing role of the accountant has taken shape. First, we consideredthe importance of capital markets and how they dictate the drive for shareholdervalue-based management. Second, we described how the strategy that is the resultof the shareholder value approach has led to the divisionalized form of organiza-tion that dictates much of the way in which management accounting is organized.Finally, we have added a critical perspective that challenges shareholder valuewith a stakeholder view and raises concerns about strategy and divisionalizationthat will be developed in later chapters.
References
Chardler, A. D. J. (1962). Strategy and Structure: Chapters in the History of the AmericanIndustrial Enterprise. Cambridge, MA: Harvard University Press.
Child, J. (1972). Organizational structure, environment and performance: The role ofstrategic choice. Sociology, 6, 1–22.
Cooper, S., Crowther, D., Davies, M. and Davis, E. W. (2001). Shareholder or StakeholderValue: The Development of Indicators for the Control and Measurement of Performance.London: Chartered Institute of Management Accountants.
Dermer, J. (1988). Control and organizational order. Accounting, Organizations and Society,13(1), 25–36.
Emmanuel, C., Otley, D. and Merchant, K. (1990). Accounting for Management Control. (2ndedn). London: Chapman & Hall.
Galbraith, J. R. and Nathanson, D. A. (1976). Strategy Implementation: The Role of Structureand Process. St Paul, MN: West Publishing Company.
Grant, R. M. (1998). Contemporary Strategy Analysis: Concepts, Techniques, Applications.Oxford: Blackwell Publishers.
Hopper, T., Otley, D. and Scapens, B. (2001). British management accounting research:Whence and whither: Opinions and recollections. British Accounting Review, 33, 263–91.
Johnson, G. and Scholes, K. (1997). Exploring Corporate Strategy. London: Prentice Hall.Mintzberg, H. (1994). The fall and rise of strategic planning. Harvard Business Review,
Jan–Feb, 107–14.Otley, D. (2001). Extending the boundaries of management accounting research: Developing
systems for performance management. British Accounting Review, 33, 243–61.Rappaport, A. (1998). Creating Shareholder Value: A Guide for Managers and Investors. (Revd.
edn). New York, NY: Free Press.Roberts, J. and Scapens, R. (1985). Accounting systems and systems of accountabil-
ity – Understanding accounting practices in their organizational contexts. Accounting,Organizations and Society, 10(4), 443–56.


3
Recording Financial Transactionsand the Limitations of Accounting
In order to understand the scorekeeping process, we need to understand howaccounting captures information that is subsequently used for planning, decision-making and control purposes. This chapter describes how business events arerecorded as transactions into an accounting system using the double-entry methodthat is the foundation of accounting. In this chapter we also show how the principlesunderlying accounting can limit the usefulness of accounting information as amanagement tool. Finally, the chapter introduces the notion of cost, and how costmay be interpreted in multiple ways.
Business events, transactions and the accounting system
Businesses exist to make a profit. They do this by producing goods and servicesand selling those goods and services at a price that covers their cost. Conductingbusiness involves a number of business events such as buying equipment, purchas-ing goods and services, paying expenses, making sales, distributing goods andservices etc. In accounting terms, each of these business events is a transaction. Atransaction is the financial description of each business event.
It is important to recognize that transactions are a financial representation ofthe business event, measured in monetary terms. This is only one perspectiveon business events, albeit the one considered most important for accountingpurposes. A broader view is that business events can also be recorded in non-financial terms, such as measures of product/service quality, speed of delivery,customer satisfaction etc. These non-financial performance measures (which aredescribed in detail in Chapter 4) are important elements of business events thatare not captured by financial transactions. This is a limitation of accounting as atool of business decision-making.
Each transaction is recorded on a source document that forms the basis forrecording in a business’s accounting system. Examples of source documents areinvoices and cheques. The accounting system, typically computer based (except forvery small businesses), comprises a set of accounts that summarize the transactionsthat have been recorded on source documents and entered into the accounting
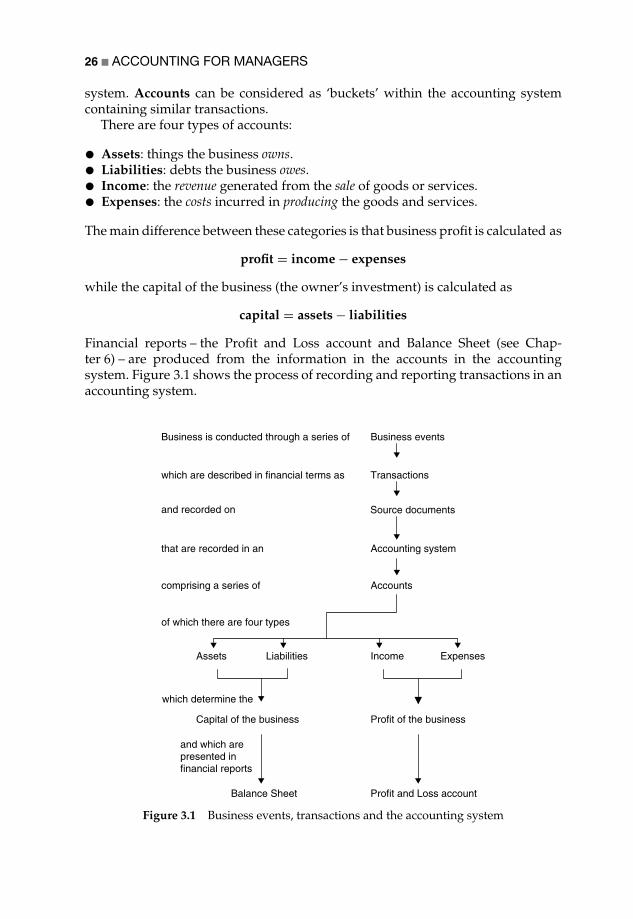
26 ACCOUNTING FOR MANAGERS
system. Accounts can be considered as ‘buckets’ within the accounting systemcontaining similar transactions.
There are four types of accounts:
ž Assets: things the business owns.ž Liabilities: debts the business owes.ž Income: the revenue generated from the sale of goods or services.ž Expenses: the costs incurred in producing the goods and services.
The main difference between these categories is that business profit is calculated as
profit = income − expenses
while the capital of the business (the owner’s investment) is calculated as
capital = assets − liabilities
Financial reports – the Profit and Loss account and Balance Sheet (see Chap-ter 6) – are produced from the information in the accounts in the accountingsystem. Figure 3.1 shows the process of recording and reporting transactions in anaccounting system.
Business is conducted through a series of Business events
which are described in financial terms as Transactions
and recorded on
that are recorded in an Accounting system
comprising a series of Accounts
of which there are four types
Assets Liabilities Income Expenses
which determine the
Capital of the business Profit of the business
and which arepresented infinancial reports
Balance Sheet Profit and Loss account
Source documents
Figure 3.1 Business events, transactions and the accounting system
RECORDING FINANCIAL TRANSACTIONS 27
The double entry: recording transactions
Businesses use a system of accounting called double entry, which derives from thelate fifteenth-century Italian city-states (see Chapter 1). The double entry meansthat every business transaction affects two accounts. Those accounts may increaseor decrease. Accountants record the increases or decreases as debits or credits, butit is not necessary for non-accountants to understand this distinction.
Transactions may take place in one of two forms:
ž Cash: If the business sells goods/services for cash, the double entry is an increasein income and an increase in the bank account (an asset). If the business buysgoods/services for cash, either an asset or an expense will increase (dependingon what is bought) and the bank account will decrease.ž Credit: If the business sells goods/services on credit, the double entry is anincrease in debts owed to the business (called debtors, an asset) and an increasein income. If the business buys goods/services on credit, either an asset or anexpense will increase (depending on what is bought) and the debts owed by thebusiness will increase (called creditors, a liability).
When goods are bought, they become an asset called inventory (or stock). Whenthe same goods are sold, there are two transactions:
1 The sale, either by cash or credit, as described above; and2 The transfer of the cost of those goods, now sold, from inventory to an expense,
called cost of sales.
In this way, the profit is the difference between the price at which the goods weresold (1 above) and the purchase cost of the same goods (2 above). Importantly, thepurchase of goods into inventory does not affect profit until the goods are sold.
To record transactions, we need to decide:
ž what type of account is affected (asset, liability, income or expense); andž whether the transaction increases or decreases that account.
Some examples of business transactions and how the double entry affects theaccounting system are shown in Table 3.1.
The accounts are all contained within a ledger, which is simply a collectionof all the different accounts for the business. The ledger would summarize thetransactions for each account, as shown in Table 3.2.
In the example in Table 3.2 there would be a separate account for each typeof expense (wages, cost of sales, advertising), but for ease of presentation theseaccounts have been placed in a single column. The ledger is the source of thefinancial reports that present the performance of the business. However, theledger would also contain the balance of each account brought forward fromthe previous period. In our simple example, assume that the business commencedwith £50,000 in the bank account that had been contributed by the owner (theowner’s capital). Table 3.3 shows the effect of the opening balances.
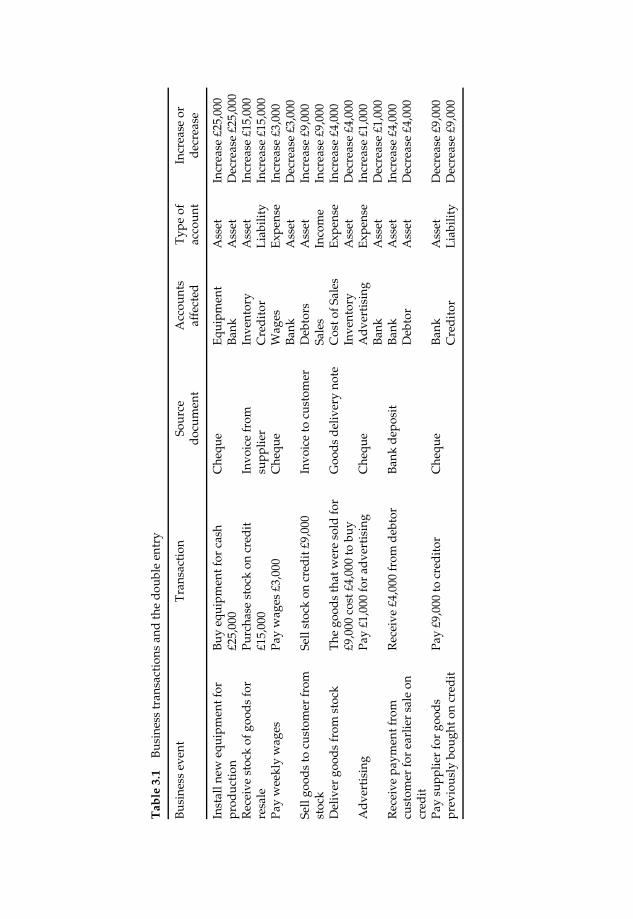
Tab
le3.
1B
usin
ess
tran
sact
ions
and
the
dou
ble
entr
y
Bus
ines
sev
ent
Tra
nsac
tion
Sour
ced
ocum
ent
Acc
ount
saf
fect
edT
ype
ofac
coun
tIn
crea
seor
dec
reas
e
Inst
alln
eweq
uipm
entf
orpr
oduc
tion
Buy
equi
pmen
tfor
cash
£25,
000
Che
que
Equ
ipm
ent
Ban
kA
sset
Ass
etIn
crea
se£2
5,00
0D
ecre
ase
£25,
000
Rec
eive
stoc
kof
good
sfo
rre
sale
Purc
hase
stoc
kon
cred
it£1
5,00
0In
voic
efr
omsu
pplie
rIn
vent
ory
Cre
dit
orA
sset
Lia
bilit
yIn
crea
se£1
5,00
0In
crea
se£1
5,00
0Pa
yw
eekl
yw
ages
Pay
wag
es£3
,000
Che
que
Wag
esB
ank
Exp
ense
Ass
etIn
crea
se£3
,000
Dec
reas
e£3
,000
Sell
good
sto
cust
omer
from
stoc
kSe
llst
ock
oncr
edit
£9,0
00In
voic
eto
cust
omer
Deb
tors
Sale
sA
sset
Inco
me
Incr
ease
£9,0
00In
crea
se£9
,000
Del
iver
good
sfr
omst
ock
The
good
sth
atw
ere
sold
for
£9,0
00co
st£4
,000
tobu
yG
ood
sd
eliv
ery
note
Cos
tofS
ales
Inve
ntor
yE
xpen
seA
sset
Incr
ease
£4,0
00D
ecre
ase
£4,0
00A
dve
rtis
ing
Pay
£1,0
00fo
rad
vert
isin
gC
hequ
eA
dve
rtis
ing
Ban
kE
xpen
seA
sset
Incr
ease
£1,0
00D
ecre
ase
£1,0
00R
ecei
vepa
ymen
tfro
mcu
stom
erfo
rea
rlie
rsa
leon
cred
it
Rec
eive
£4,0
00fr
omd
ebto
rB
ank
dep
osit
Ban
kD
ebto
rA
sset
Ass
etIn
crea
se£4
,000
Dec
reas
e£4
,000
Pay
supp
lier
for
good
spr
evio
usly
boug
hton
cred
itPa
y£9
,000
tocr
edit
orC
hequ
eB
ank
Cre
dit
orA
sset
Lia
bilit
yD
ecre
ase
£9,0
00D
ecre
ase
£9,0
00

RECORDING FINANCIAL TRANSACTIONS 29
Table 3.2 Summarizing business transactions in a ledger
Accounttransaction
Assetequipment
Assetinventory
Assetdebtor
Assetbank
Liability:creditors
Income:sales
Expenses
Buy equipment forcash £25,000
+25,000 −25,000
Purchase stock oncredit £15,000
+15,000 +15,000
Pay wages £3,000 −3,000 +3,000Sell stock on credit£9,000
+9,000 +9,000
The goods that weresold for £9,000 cost£4,000 to buy
−4,000 +4,000
Pay advertising£1,000
−1,000 +1,000
Receive £4,000 fromdebtor
−4,000 +4,000
Pay £9,000 to creditor −9,000 −9,000Total of transactionsfor this period
+25,000 +11,000 +5,000 −34,000 +6,000 +9,000 +8,000
Table 3.3 Summarizing business transactions with opening balances in a ledger
Account Capital Assetequipment
Assetinventory
Assetdebtor
Assetbank
Liability:creditors
Income:sales
Expenses
Investment byowner
+50,000 +50,000
Total oftransactions forthis period
+25,000 +11,000 +5,000 −34,000 +6,000 +9,000 +8,000
Totals of eachaccount at endof period
+50,000 +25,000 +11,000 +5,000 +16,000 +6,000 +9,000 +8,000
Extracting financial information from the accounting system
To produce financial reports we need to separate the accounts for income andexpenses from those for assets and liabilities. In this example, we would producea Profit and Loss account based on the income and expenses:
Income 9,000Less expenses:Cost of goods sold 4,000Wages 3,000Advertising 1,000 8,000
Profit 1,000

30 ACCOUNTING FOR MANAGERS
Table 3.4 Balance Sheet
Assets Liabilities
Equipment 25,000 Creditors 6,000Inventory 11,000 Capital –Debtors 5,000 Owner’s original investment 50,000Bank 16,000 Plus profit for period 1,000
Total capital 51,000Total assets 57,000 Total liabilities plus capital 57,000
The Balance Sheet lists the assets and liabilities of the business, as shown inTable 3.4.
The Balance Sheet must balance, i.e. assets are equal to liabilities. Althoughshown separately, capital is a type of liability as it is owed by the business to itsowners. The double-entry system records the profit earned by the business as anaddition to the owner’s investment in the business:
assets = liabilities + capital
This is called the accounting equation. However, a more common presentation ofthe Balance Sheet is in a vertical format, as follows:
Assets:Equipment 25,000Inventory 11,000Debtors 5,000Bank 16,000
57,000Less liabilities:Creditors 6,000
51,000
Capital:Owner’s original investment 50,000Plus profit for period 1,000
51,000
The accounting equation can therefore be restated as:
capital (£51,000) = assets (£57,000) − liabilities (£6,000)
There are some important points to note about the above example:
1 The purchase of equipment of £25,000 has not affected profit (although we willconsider depreciation in Chapter 6).
RECORDING FINANCIAL TRANSACTIONS 31
2 Profit is not the same as cash flow. Although there has been a profit of £1,000,the bank balance has reduced by £34,000 (from £50,000 to £16,000).
3 Most of the cash has gone into the new equipment (£25,000), but some has goneinto working capital (again, this is covered in Chapter 6). Working capital is theinvestment in assets (less liabilities) that continually revolve in and out of thebank, comprising debtors, inventory, creditors and the bank balance itself (inthis case £32,000 less £6,000 = £26,000).
The distinction between profit, cash flow and capital investment – the purchase ofassets – is a crucial one for accounting. Whether a payment is treated as an expense(which affects profit) or as a Balance Sheet item (called capitalizing the expense,and therefore not affecting profit) is important, as it can have a significant impacton profit, which is one of the main measures of business performance.
Both the Profit and Loss account and the Balance Sheet are described in moredetail in Chapter 6. In financial reporting, as Chapter 6 will show, there are strictrequirements for the content and presentation of these financial statements. Oneof these requirements is that the reports (produced from the ledger accounts) arebased on line items. Line items are the generic types of assets, liabilities, incomeand expenses that are common to all businesses. This is an important requirementas all businesses are required to report their expenses using the same accounts,such as rent, salaries, advertising, vehicle running costs etc. While this may notappear to be significant, it does cause a problem when a business is trying tomake decisions based on cost information, because cost information is needed forproducts and services, rather than for line items.
Principles and limitations of accounting
There are some basic accounting principles that are generally accepted by theaccounting profession as being essential for recording and reporting financialinformation. These are as follows.
Accounting entity
Financial reports are produced for the business, independent of the owners – thebusiness and its owners are separate entities. This is particularly important forowner-managed businesses where the personal finance of the owner must beseparated from the business finances. The problem caused by the entity principleis that complex organizational structures are not always clearly identifiable as an‘entity’. The treatment by Enron of joint-venture vehicles that were not part of theEnron group for financial reporting purposes enabled ‘off-Balance Sheet’ financingthat was a cause of that company’s collapse.
Accounting period
Financial information is produced for a financial year. The period is arbitrary andhas no relationship with business cycles. Businesses typically end their financial
32 ACCOUNTING FOR MANAGERS
year at the end of a calendar or national fiscal year. The business cycle is moreimportant than the financial year, which after all is nothing more than the timetaken for the Earth to revolve around the Sun. If we consider the early historyof accounting, merchant ships did not produce monthly accounting reports. Theyreported to the ships’ owners at the end of the business cycle, when the goods theyhad traded were all sold and profits could be calculated meaningfully.
Matching principle
Closely related is the matching (or accruals) principle, in which income is rec-ognized when it is earned and expenses when they are incurred, rather than ona cash basis. The accruals method of accounting provides a more meaningfulpicture of the financial performance of a business from year to year. However,the preparation of accounting reports requires certain assumptions to be madeabout the recognition of income and expenses. One of the criticisms made ofmany companies is that they attempt to ‘smooth’ their reported performance tosatisfy the expectations of stock market analysts in order to maintain shareholdervalue. This practice has become known as ‘earnings management’. This has beenparticularly difficult in the telecoms industry, where income that should have beenspread over several years has been taken up earlier, or where expenditure has beentreated as an asset in order to improve reported profits. When this last practicewas disclosed, it was a significant cause of the difficulties faced by WorldCom.
Monetary measurement
Despite the importance of market, human, technological and environmental fac-tors, accounting records transactions and reports information in financial terms.This provides a limited though important perspective on business performance.The criticism of accounting numbers is that they are lagging indicators of per-formance. In Chapter 4 we consider non-financial measures of performance thatare more likely to present leading indicators of performance. An emphasis onfinancial numbers tends to overlook important issues of customer satisfaction,product/service quality, innovation and employee morale, which have a majorimpact on business performance.
Historic cost
Accounting reports record transactions at their original cost less depreciation(which is explained in Chapter 6), not at market (realizable) value or at current(replacement) cost. The historic cost may be unrelated to market or replacementvalue. Under this principle, the Balance Sheet does not attempt to represent thevalue of the business and the owner’s capital is merely a calculated figure ratherthan a valuation of the business. The Balance Sheet excludes assets that have notbeen purchased by businesses but have been built up over time, such as customergoodwill, brand names etc. The market-to-book ratio (MBR) is the market value of thebusiness divided by the original capital invested. Major service-based companies

RECORDING FINANCIAL TRANSACTIONS 33
such as Microsoft, which have enormous goodwill and intellectual property buta low asset base, have high MBRs because the stock market takes account ofinformation that is not reflected in accounting reports.
Going concern
The financial statements are prepared on the basis that the business will continuein operation. Many businesses have failed soon after their financial reports havebeen prepared on a going concern basis, making the asset values in the BalanceSheet impossible to realize. As asset values after the liquidation of a businessare unlikely to equal historic cost, the continued operation of a business is animportant assumption.
Conservatism
Accounting is a prudent practice, in which the sometimes over-optimistic opinionsof non-financial managers are discounted. A conservative approach tends torecognize the downside of events rather than the upside. However, as mentionedabove, the pressure on listed companies from analysts to meet stock marketexpectations of profitability has resulted from time to time in ‘creative’ accountingpractices (discussed in Chapter 7), such as those that led to problems at Enronand WorldCom.
Disclosure
The accounting standards and principles that have been applied in the financialstatements are described in the financial reports. In the UK, there is a substantialbody of principles governing what information is to be disclosed in financialreports (see Chapter 6), although in the US the disclosure requirements are rulebased rather than principle based. As a result, it has been argued that it is easierto find ways to get around rules that are set in explicit terms than principlesthat are more general. The interpretation of the disclosure rules is important inauditing and led to criminal charges against accounting firm Arthur Andersen inthe United States.
Consistency
The application of accounting standards and principles should be consistent fromone year to the next. Where those principles vary, the effect on profits is separatelyreported under the disclosure principle. However, some businesses have tendedto change their rules, even with disclosure, in order to improve their reportedperformance, explaining the change as a once-only event.
These principles are applied in the collection, recording and reporting offinancial information. It therefore follows that information used by managersfor decision-making is subject to the same principles, and therefore to the samelimitations. One of the most important pieces of financial information for line

34 ACCOUNTING FOR MANAGERS
managers is cost, which forms the basis for most of the following chapters.The calculation of cost is determined in large part by accounting principles andthe requirements of financial reporting. The cost that is calculated under theseassumptions may have limited decision usefulness.
Cost terms and concepts
Cost can be defined as ‘a resource sacrificed or foregone to achieve a specificobjective’ (Horngren et al., 1999, p. 31).
Accountants define costs in monetary terms, and while we will focus onmonetary costs, readers should recognize that there are not only non-financialmeasures of performance but also human, social and environmental costs. Forexample, making employees redundant causes family problems (a human cost)and transfers to society the obligation to pay social security benefits (a socialcost). Pollution causes long-term environmental costs that are also transferred tosociety. These are as important as (and perhaps more important than) financialcosts, but they are not recorded by accounting systems (see Chapter 7 for a furtherdiscussion). The exclusion of human, social and environmental costs is a significantlimitation of accounting.
For planning, decision-making and control purposes, cost is typically definedin relation to a cost object, which is anything for which a measurement of costsis required. While the cost object is often an output – a product or service – it mayalso be a resource (an input to the production process), a process of convertingresources into outputs or an area of responsibility (a department or cost centre)within the organization. Examples of inputs are materials, labour, rent, marketingexpenses etc. Examples of processes are purchasing, customer order processing,order fulfilment, despatch etc.
Businesses typically report in relation to line items (the resource inputs) andresponsibility centres (departments or cost centres). This means that decisionsrequiring cost information on business processes and product/service outputs aredifficult, because most accounting systems (except activity-based systems, as willbe described in Chapter 11) do not provide adequate information about those costobjects. For example, in a project-based business, published financial reports donot provide cost and revenue information about each project, but instead reportinformation about salaries, rental, office costs etc.
Businesses may adopt a system of management accounting to provide thisinformation for management purposes, but rarely will this second system reconcilewith the external financial reports because the management information systemmay not follow the same accounting principles described earlier in this chapter.The requirement to produce financial reports based on line items, rather than costobjects, is a second limitation of accounting as a tool of decision-making.
The notion of cost is also problematic because we need to decide how costis to be defined. If, as Horngren et al. defined it, cost is a resource sacrificed orforgone, then one of the questions we must ask is whether that definition impliesa cash cost or an opportunity cost. A cash cost is the amount of cash expended

RECORDING FINANCIAL TRANSACTIONS 35
(a valuable resource), whereas an opportunity cost is the lost opportunity of notdoing something, which may be the loss of time or the loss of a customer, equallyvaluable resources. If it is the cash cost, is it the historical (past) cost or the futurecost with which we should be concerned?
For example, is the cost of an employee:
ž the historical, cash cost of salaries and benefits, training, recruitment etc.paid? orž the future cash cost of salaries and benefits to be paid? orž the lost opportunity cost of what we could have done with the money hadwe not employed that person, e.g. the benefits that could have resulted fromexpenditure of the same money on advertising, computer equipment, externalconsulting services etc.?
Wilson and Chua (1988) quoted the economist Jevons, writing in 1871, that pastcosts were irrelevant to decisions about the future because they are ‘gone andlost forever’. This is a difficult question, and the problematic nature of calculatingcosts may have been the source of the comment by Clark (1923) that there were‘different costs for different purposes’.
This, then, is our third limitation of accounting: what do we mean by cost andhow do we calculate it?
Conclusion
This chapter has described how an accounting system captures, records, summa-rizes and reports financial information using the double-entry system of recordingfinancial transactions in accounts. It has also identified how the principles underly-ing the accounting process can present limitations for managers in using financialinformation for decision-making. This has a particular effect in relation to cost,which as we will see throughout Part II is crucial for non-financial managers.
In this chapter we have also identified three particular limitations of accountingthat result from the domination of the scorekeeping function:
ž the exclusion of the wider human, social and environmental costs from thosereported by accounting systems;ž the focus on line items rather than cost objects, despite the latter having moremeaning for planning, decision-making and control; andž the problematic notion of defining cost as historic, future or opportunity.
Each of these is taken up in subsequent chapters.
References
Clark, J. M. (1923). Studies in the Economics of Overhead Costs. Chicago, IL: University ofChicago Press.
Horngren, C. T., Bhimani, A., Foster, G. and Datar, S. M. (1999). Management and CostAccounting. London: Prentice Hall Europe.
Wilson, R. M. S. and Chua, W. F. (1988). Managerial Accounting: Method and Meaning. Lon-don: VNR International.


4
Management Control, ManagementAccounting and its Rational-EconomicAssumptions
Management accounting needs to be understood as part of the broader contextof management control systems. In this chapter, we describe the theoretical back-ground of management control and management accounting and its most recentdevelopments: non-financial performance measurement and strategic manage-ment accounting.
Management control systems
In his seminal work on the subject, Anthony (1965) defined management control as:
The process by which managers assure that resources are obtained andused effectively and efficiently in the accomplishment of the organization’sobjectives.
Management control encompasses both financial and non-financial performancemeasurement. Anthony developed a model that differentiated three planning andcontrol functions:
ž Strategy formulation was concerned with goals, strategies and policies. Thisfed intož Management control, which was concerned with the implementation of strate-gies and in turn led tož Task control, which comprised the efficient and effective performance of indi-vidual tasks.
Anthony was primarily concerned with the middle function. Otley (1994) arguedthat such a separation was unrealistic and that management control was ‘intimatelybound up with both strategic decisions about positioning and operating decisionsthat ensure the effective implementation of such strategies’ (p. 298).
Building on Anthony’s earlier definition, Anthony and Govindarajan (2000)defined management control as a process by which managers at all levels ensurethat the people they supervise implement their intended strategies (p. 4).

38 ACCOUNTING FOR MANAGERS
Berry et al. (1995) defined management control as:
the process of guiding organizations into viable patterns of activity in achanging environment . . . managers are concerned to influence the behaviourof other organizational participants so that some overall organizational goalsare achieved. (p. 4)
Ouchi (1979) identified three mechanisms for control:
ž the market in which prices convey the information necessary for decisions;ž bureaucracy, characterized by rules and supervision; andž an informal social mechanism, called a clan, which operates through socializa-tion processes that may result in the formation of an organizational culture.
In this chapter we are concerned with management control as a system (a collectionof inter-related mechanisms) of rules.
Simons (1994) also took a broader view of management control systems in hisdescription of them as:
the formal, information-based routines and procedures used by managersto maintain or alter patterns in organizational activities. These systems areboth pervasive and unobtrusive, but are rarely recognized as potentiallysignificant levers of organizational change. (p. 185)
Simons described the actions taken by newly appointed top managers attemptingrevolutionary and evolutionary strategic change, all of whom used control sys-tems to overcome inertia; communicate the substance of their agenda; structureimplementation timetables; ensure continuing attention through incentives; andfocus organizational learning on strategic uncertainties.
Simons (1990) developed a model of the relationship between strategy, controlsystems and organizational learning in order to reduce strategic uncertainty. Themodel is reproduced in Figure 4.1.
Research by Simons (1990) found that the choice by top managers to makecertain control systems interactive provided signals to organizational participantsabout what should be monitored and where new ideas should be proposed andtested. This signal activates organizational learning.
We can distinguish systems for planning from systems for control. Planningsystems interpret environmental demands and constraints and use a set of numbersto provide a ‘common language which can be used to compare and contrast theresults obtained by each activity’ (Otley, 1987, p. 64). These numbers may befinancial (resource allocations or performance expectations). They are representedin accounting and in non-financial performance measurement. Otley et al. (1995)noted that:
accounting is still seen as a pre-eminent technology by which to integratediverse activities from strategy to operations and with which to renderaccountability. (p. S39)

MANAGEMENT CONTROL, MANAGEMENT ACCOUNTING 39
Business strategy Strategic uncertainties
Organizationallearning
Choice of interactive management controlsystems by top management
Figure 4.1 Process model of relationship between business strategy and managementcontrol systemsReprinted from Accounting, Organizations and Society, Vol. 15, No. 1/2, R. Simons, The role of manage-ment control systems in creating competitive advantage, pp. 127–43, Copyright 1990, with permissionfrom Elsevier Science.
Control systems are concerned with feedback control, in which ‘the observed erroris fed back into the process to instigate action to cause its reduction’ (Otley, 1987,p. 21). By contrast, planning systems are also concerned with feedforward control,‘because it is only an expected error that is used to stimulate the control process’(p. 21).
We can consider the management planning and control system as a singlesystem in which both feedback and feedforward are concerned with reducing theperformance gap (Downs, 1966). Downs defined this as ‘the difference in utility [anindividual] perceives between the actual and the satisfactory level of performance’(p. 169). According to Downs, the larger the gap, the greater the motivation toundertake more intensive search.
We can show this diagrammatically in Figure 4.2.Feedforward is the process of determining, prospectively, whether strategies
are likely to achieve the target results that are consistent with organizational goals.Feedback is the retrospective process of measuring performance, comparing itwith the plan and taking corrective action. The two systems need to be integratedas a management control system as they share common targets, the need for
Planning system(feedforward)
Control system(feedback)
Goal Resourceallocation
Strategyformulation
Action(strategyimplementationand resourceutilization)
Performancemeasurement
Target Compare to plan
Figure 4.2 Model of planning and control system

40 ACCOUNTING FOR MANAGERS
corrective action to be reflected either in goal adjustment or in changed behaviour,and the allocation or utilization of resources (i.e. budgeting and budgetary control,which are covered in Chapters 14 and 15).
According to Anthony and Govindarajan (2001), every control system has atleast four elements:
1 A detector or sensor that measures what is happening.2 An assessor that determines the significance of what is happening by comparing
it with a standard or expectation.3 An effector (feedback) that alters behaviour if the assessor indicates the need to
do so.4 A communication network that transmits information between the other ele-
ments.
This can be represented in the diagram in Figure 4.3.There are five major standards against which performance can be compared
(Emmanuel et al., 1990):
1 Previous time periods.2 Similar organizations.3 Estimates of future organizational performance ex ante.4 Estimates of what might have been achieved ex post.5 The performance necessary to achieve defined goals.
Hofstede (1981) provided a typology for management control: routine, expert,trial-and-error, intuitive, judgemental or political. The first three are cyberneticand these are described in this chapter. Non-cybernetic controls are described inChapter 5.
Controldevice
2. Assessor: Comparisonwith standard
1. Detector: Informationabout what is happening
3. Effector: Behaviouralteration, if needed
Entitybeingcontrolled
Figure 4.3 Elements of a control systemReprinted from Anthony, R. N. and Govindarajan, V. (2000). Management Control Systems. (10th edn),McGraw-Hill Irwin.
MANAGEMENT CONTROL, MANAGEMENT ACCOUNTING 41
A cybernetic control process involves four conditions (Berry et al., 1995, originallypublished in Otley and Berry, 1980):
1 The existence of an objective that is desired.2 A means of measuring process outputs in terms of this objective.3 The ability to predict the effect of potential control actions.4 The ability to take actions to reduce deviations from the objective.
However, Otley and Berry (1980) recognized that:
organizational objectives are often vague, ambiguous and change with time. . . measures of achievement are possible only in correspondingly vague andoften subjective terms . . . predictive models of organizational behaviour arepartial and unreliable, and . . . different models may be held by differentparticipants . . . the ability to act is highly constrained for most groups ofparticipants, including the so-called ‘controllers’. (p. 241)
Based on work by Berry et al. (1995), Emmanuel et al. (1990) presented a simplifieddiagram of the control process as a regulator. This is contained in Figure 4.4.
This model differs from that by Anthony as it emphasizes the importance forcontrol of a predictive model, which is necessary for both feedback (reactive)and feedforward (anticipatory) modes of control. The difficulty with each formof control is the reliability of the predictive model. A standard, such as a budget,requires a predictive model of the organization and how it interacts with itsenvironment.
Otley and Berry (1980) defined four types of control:
1 First-order control adjusts system inputs and causes behaviour to alter.2 Second-order control alters system objectives or the standards to be attained.
Figure 4.4 Necessary conditions for controlReprinted from Emmanuel, C., Otley, D. and Merchant, K. (1990). Accounting for Management Control.(2nd edn). London: Chapman & Hall.
[Image not available in this electronic edtion.]

42 ACCOUNTING FOR MANAGERS
3 Internal learning amends the predictive model on the basis of past experienceand the measurement and communication processes associated with it.
4 Systemic learning or adaptation changes the nature of the system itself – inputs,outputs and predictive models.
The problem of a predictive model is in understanding the complex and ambiguousrelationship between means and ends, or inputs and outputs. Ouchi (1977) arguedthat there were ‘only two phenomena which can be observed, monitored, andcounted: behavior and the outputs which result from behavior’ (p. 97).
To apply behaviour control, organizations need agreement or knowledge aboutmeans–ends relationships. To apply output control, a valid and reliable measureof the desired outputs must be available. Ouchi argued that as organizations growlarger and hierarchy increases, there is a shift from behaviour to output control.
Management planning and control systems and managementaccounting
Daft and Macintosh (1984) described six components of management controlsystems: strategic plan, long-range plan, annual operating budget, periodic sta-tistical reports, performance appraisal, and policies and procedures. Managementaccounting should be understood in this broader context of management con-trol. Emmanuel et al. (1990) believed that management accounting was importantbecause it represents ‘one of the few integrative mechanisms capable of summa-rizing the effect of an organization’s actions in quantitative terms’ (p. 4). Becausemanagement information can be expressed in monetary terms, it can be aggre-gated across time and diverse organizational units and provides a means ofintegrating activities.
Otley and Berry (1994) described how in management control:
accounting information provides a window through which the real activitiesof the organization may be monitored, but it should be noted also that otherwindows are used that do not rely upon accounting information. (p. 46)
Otley (1994) called for a wider view of management control, with less emphasis onaccounting-based controls. Criticizing Anthony’s model of planning and control,Otley argued that ‘[t]he split between strategic planning, management controland operational control, which was always tendentious, now becomes untenable’(p. 292).
Otley claimed that there was widespread agreement that undue emphasis wasgiven to financial controls rather than to a more ‘balanced scorecard’ approach,hence the increasing importance given to non-financial (or multidimensional)performance management in the study of management control systems.
Otley et al. (1995) argued for expanding management control beyond account-ing, distinguishing financial control from management control, the latter as:

MANAGEMENT CONTROL, MANAGEMENT ACCOUNTING 43
a general management function concerned with the achievement of overallorganizational aims and objectives . . . management control is concerned withlooking after the overall business with money being used as a convenientmeasure of a variety of other more complex dimensions, not as an end initself. (p. S33)
Otley (1999) proposed a framework for management control systems aroundfive central issues: objectives, strategies and plans, target-setting, incentive andreward structures, and information feedback loops. The framework was testedagainst three major systems of organizational control: budgeting, economic valueadded (EVA) and the Balanced Scorecard. Otley concluded that performancemanagement provides an important integrating framework.
Non-financial performance measurement
The limitations of financial measures were identified most clearly by Johnsonand Kaplan (1987), who argued that there was an excessive focus on short-termfinancial performance. They commented:
Managers discovered that profits could be ‘earned’ not just by selling more orproducing for less, but also by engaging in a variety of non-productive activ-ities: exploiting accounting conventions, engaging in financial entrepreneur-ship, and reducing discretionary expenditures. (p. 197)
such as:
R&D, promotion, distribution, quality improvement, applications engineer-ing, human resources, and customer relations – all of which, of course, arevital to a company’s long-term performance. The immediate effect of suchreductions is to boost reported profitability, but at the expense of sacrificingthe company’s long-term competitive position. (p. 201)
Johnson and Kaplan (1987) emphasized the importance of non-financial indicators,arguing:
Short-term financial measures will have to be replaced by a variety of non-financial indicators that provide better targets and predictors for the firm’slong-term profitability goals, signifying this as a return to the operations-based measures that were the origin of management accounting systems.(p. 259)
The development of the Balanced Scorecard (Kaplan and Norton, 1992; 1993; 1996;2001) has received extensive coverage in the business press. It presents four differ-ent perspectives and complements traditional financial indicators with measuresof performance for customers, internal processes and innovation/improvement.
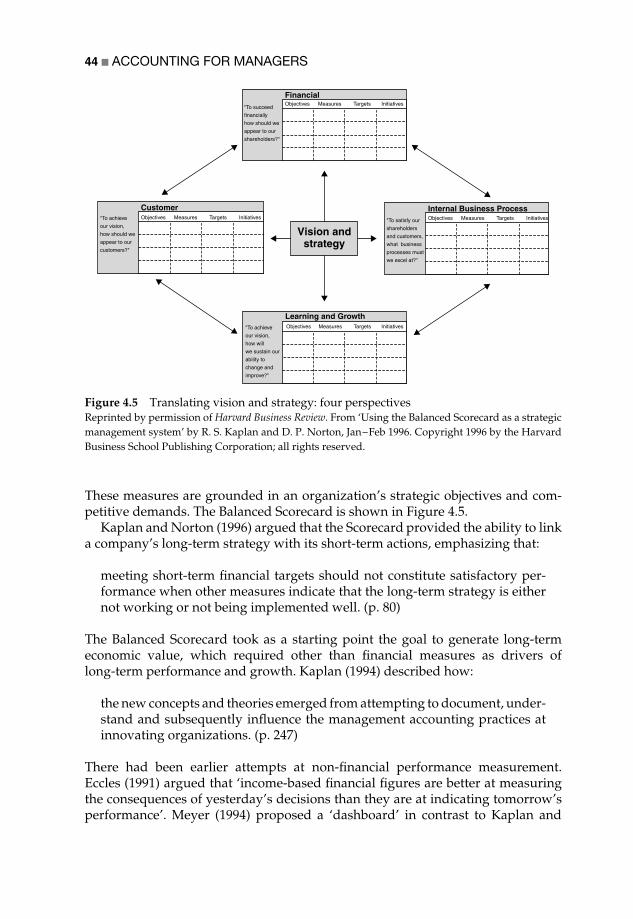
44 ACCOUNTING FOR MANAGERS
CustomerObjectives Measures Targets Initiatives"To achieve
our vision,
how should we
appear to our
customers?"
FinancialObjectives Measures Targets Initiatives
"To succeed
financially
how should we
appear to our
shareholders?"
Internal Business ProcessObjectives Measures Targets Initiatives"To satisfy our
shareholders
and customers,
what business
processes must
we excel at?"
Learning and GrowthObjectives Measures Targets Initiatives"To achieve
our vision,
how will
we sustain our
ability to
change and
improve?"
Vision andstrategy
Figure 4.5 Translating vision and strategy: four perspectivesReprinted by permission of Harvard Business Review. From ‘Using the Balanced Scorecard as a strategicmanagement system’ by R. S. Kaplan and D. P. Norton, Jan–Feb 1996. Copyright 1996 by the HarvardBusiness School Publishing Corporation; all rights reserved.
These measures are grounded in an organization’s strategic objectives and com-petitive demands. The Balanced Scorecard is shown in Figure 4.5.
Kaplan and Norton (1996) argued that the Scorecard provided the ability to linka company’s long-term strategy with its short-term actions, emphasizing that:
meeting short-term financial targets should not constitute satisfactory per-formance when other measures indicate that the long-term strategy is eithernot working or not being implemented well. (p. 80)
The Balanced Scorecard took as a starting point the goal to generate long-termeconomic value, which required other than financial measures as drivers oflong-term performance and growth. Kaplan (1994) described how:
the new concepts and theories emerged from attempting to document, under-stand and subsequently influence the management accounting practices atinnovating organizations. (p. 247)
There had been earlier attempts at non-financial performance measurement.Eccles (1991) argued that ‘income-based financial figures are better at measuringthe consequences of yesterday’s decisions than they are at indicating tomorrow’sperformance’. Meyer (1994) proposed a ‘dashboard’ in contrast to Kaplan and

MANAGEMENT CONTROL, MANAGEMENT ACCOUNTING 45
Norton’s Balanced Scorecard. He argued that traditional performance measure-ment systems don’t work as they track what happens within not across functions.The few cross-functional ‘results measures’ are financial. In contrast, ‘processmeasures’ monitor the activities that produce given results.
Innes (1996) described the tableaux de bord that had been developed by ‘sub-departments’ in French factories. These comprise non-financial measures thatmanagers identify as critical to success and that are developed and monitoredlocally, rather than being part of the formal reporting process.
There have been other efforts at Balanced Scorecard-type models, such asthe Performance Pyramid of Lynch and Cross (1991). Although the initial concernof most Balanced Scorecard-type systems was with manufacturing businesses,Fitzgerald et al. (1991) emphasized the needs of service businesses and developeda Results and Determinants Framework containing six performance dimensionsdivided into two different categories. Competitiveness and financial performanceas ‘ends’ reflected the success of the chosen strategy, while the others, the‘means’, determined competitive success. They applied this model to three ‘servicearchetypes’ – professional services, service shops and mass services – using thenumber of customers handled as the differentiating factor. Figure 4.6 shows theResults and Determinants Framework.
A further model, reflected in the practitioner rather than the academic litera-ture, is the ‘Business Excellence’ model developed by the European Foundation
Figure 4.6 Results and Determinants FrameworkReprinted from Fitzgerald, L., Johnston, R., Brignall, S., Silvestro, R. and Voss, C. (1991). PerformanceMeasurement in Service Businesses. London: Chartered Institute of Management Accountants.
[Image not available in this electronic edtion.]

46 ACCOUNTING FOR MANAGERS
for Quality Management (EFQM). This is an integrated self-assessment tool com-prising nine elements that are weighted and divided into two groups: resultsand enabling criteria. The results criteria are business results, people satisfaction,customer satisfaction and impact on society. The enablers are processes, peoplemanagement, policy and strategy, resources and leadership.
Another model used in industry is the ISO 9000 quality model, while in the UKChartermark is used in the public sector and Investors in People is used for humanresource and training and development strategies. All require external assessment.
The difficulty with performance measurement systems is that multiple measuresare a result of multiple stakeholders inside and outside the organization. Thereare inherent difficulties in the predictive model that a business explicitly orimplicitly uses to obtain resources and implement processes in order to deliverproduct/services to customers.
The Performance Prism was developed at Cranfield University by Neely et al.(2002). It differs from other non-financial performance measurement systems inthat it considers all stakeholders in the business, such as regulatory agencies, pres-sure groups and suppliers. This ensures that the performance measurement systemused presents a balanced picture of business performance. It also differs from Bal-anced Scorecard-type systems in that the performance measures are not developedfrom strategy, as Kaplan and Norton (2001) suggest, but informs managementwhether the business is going in the strategic direction that is intended.
A research study by the Chartered Institute of Management Accountants(1993) found that most companies tend to make decisions primarily on financialmonitors of performance. Boards, financiers and investors place overwhelmingreliance – often exclusively – on financial indicators such as profit, turnover, cashflow and return on capital. Managers mostly support the view that non-financialperformance information should only be used internally. There is no optimalmix of financial and non-financial performance measures and the non-financialindicators used are not fixed. The report argued that performance measures needto mirror operational complexity, but must be kept simple to be understood.
In order to compete in a global economy, manufacturers have had to movetowards higher quality, shorter cycle times, smaller batch sizes, greater variety inproduct mix and cost reduction. The development of new manufacturing philoso-phies such as computer integrated manufacturing (CIM), flexible manufacturingsystems (FMS), just-in-time (JIT), optimized production technology (OPT) and totalquality management (TQM) has shifted the balance from financial to non-financialperformance measurement.
However, Sinclair and Zairi (1995b) argued that performance measurement hasbeen dominated by management control systems that are focused on ‘control’rather than ‘improvement’. They saw management accounting and financialperformance as a limiting constraint rather than a tool for managing continuousimprovement. Sinclair and Zairi (1995a) undertook a survey of performancemeasurement in companies implementing TQM and found that despite the aimsof TQM being communicated to managers, performance measurement systemswere inappropriate.
MANAGEMENT CONTROL, MANAGEMENT ACCOUNTING 47
Research suggests that the management control paradigm may still be domi-nated by management accounting and that non-financial performance measure-ment is isolated from, rather than integrated with, management accounting.Despite the proliferation of non-financial measures, many remain rooted in short-term financial quantification.
Brignall and Ballantine (1996) described the concept and history of multidimen-sional performance measurement (PM):
PM systems are part of an attempt to give management accounting a morestrategic, outward-looking focus, incorporating non-financial, competitor-centred and customer-focused information into the search for a sustainablecompetitive advantage in services. (p. 27)
Otley (1999, see earlier in this chapter) concluded that performance management(which he contrasted with performance measurement) goes beyond the bound-aries of traditional management accounting. It could be achieved by accountantshaving a better understanding of the operational activities of the business andbuilding this understanding into control systems design; connecting control sys-tems with business strategy, which has to some extent been addressed by theproponents of strategic management accounting (see below); and focusing on theexternal environment within which the business operates, through a value-chain-based approach.
One avenue that may address the need for a holistic approach to performancemanagement is provided by strategic enterprise management (SEM). This is basedon an information system that supports the strategic management process, andaims to overcome the difficulties of integrating information from diverse systems.It is based on the concept of a data warehouse holding large amounts of datathat can be accessed by a range of analytical tools such as Balanced Scorecard-type measures, activity-based management, benchmarking or shareholder valuemeasures. The end result is argued to be faster and better managerial decision-making throughout the organization using information captured both from insideand outside the organization. The weakness of the SEM approach is its cost, as it isa systems-based solution that requires integration of data typically held in manysystems, often in different formats with overlapping and ambiguous connections.
This brings us to a further development in accounting that looks beyond theboundaries of the business organization.
Strategic management accounting
In their book Relevance Lost, Johnson and Kaplan (1987) argued that managementaccounting and control systems could not cope with the information demandsof the new manufacturing environment and the increased importance of serviceindustries. The notion of strategic management accounting (SMA) is linked withbusiness strategy and maintaining or increasing competitive advantage.
The term strategic management accounting was coined by Simmonds in 1981.Simmonds defined SMA as:
48 ACCOUNTING FOR MANAGERS
the provision and analysis of management accounting data about a businessand its competitors which is of use in the development and monitoring ofthe strategy of that business. (quoted in Drury, 2000, p. 924)
Simmonds argued that accounting should be more outward looking and helpthe firm evaluate its competitive position relative to its competitors by collectingand analysing data on costs, prices, sales volumes and market share, cash flowsand resources for its main competitors. Simmonds emphasized the learning curvethrough early experience with new products that led to cost reductions andlower prices.
Bromwich (1990) argued that SMA is the management accountant’s contributionto corporate strategy, while Bromwich and Bhimani (1994) drew attention toSMA as an area for future development. There is no comprehensive conceptualframework of what strategic management accounting is (Tomkins and Carr, 1996)or of how it relates to corporate strategy. Bromwich (1990) defined SMA as the:
provision and analysis of financial information on the firm’s product mar-kets and competitors’ costs and cost structures and the monitoring of theenterprise’s strategies and those of its competitors in these markets over anumber of periods. (p. 28)
Bromwich suggested that SMA should consider product benefits and how the costof providing these benefits related to the price the customer was willing to pay.
Wilson (1995) identified SMA as:
an approach to management accounting that explicitly highlights strategicissues and concerns. It sets management accounting in a broader context inwhich financial information is used to develop superior strategies as a meansof achieving sustainable competitive advantage. (p. 162)
Lord (1996) summarized the characteristics of SMA:
ž collection of competitor information: pricing, costs, volume, market share;ž exploitation of cost reduction opportunities: a focus on continuous improve-ment and on non-financial performance measures;ž matching the accounting emphasis with the firm’s strategic position.
There are various classifications to identify the strategic positions of firms. Themost recent contributions to SMA from the strategy literature are from Porter(1980; 1985):
ž The four forces model (the threat of new entrants; the threat of substitutes;rivalry among firms; bargaining power of suppliers and customers) that assessesindustry attractiveness from the perspective of long-term profitability.ž The generic strategies (cost leadership; differentiation; focus in market seg-ments) that lead to sustainable competitive advantage and the firm’s relativeposition within its industry.

MANAGEMENT CONTROL, MANAGEMENT ACCOUNTING 49
ž The value chain (the linked set of nine inter-related primary and supportfunctions, see Chapter 9) that compares the price customers are willing to payfor features with the costs associated with providing them.
Lord (1996) argued that firms place more emphasis on particular accountingtechniques depending on their strategic position. Dixon (1998) argued that strategyformulation and implementation:
is carried out using the techniques and language of the managementaccountant. In turn, the strategic decision-making process can influencethe procedures of management accounting and the design of managementcontrol systems. (p. 273)
SMA was a development of an earlier concern with strategic cost management(SCM), which is based on value chain analysis and conceives of the business asthe linked set of value-creating activities from raw material to the delivery of theproduct and its ancillary services to the final customer. The aim of SCM is:
to expand the domain of management accounting horizontally to includecritical elements external to the company with a particular emphasis onadding value for customers and suppliers. (Macintosh, 1994, pp. 204–5)
SCM also advocated lengthening the time horizon of management accountingreports over the entire life cycle of a product. Wilson (1995) suggested that SCMwas a variation of SMA that ‘aims to reduce unit costs continually in real termsover the long run’ (p. 163).
However, Lord (1996) questioned the role of accountants in strategic man-agement accounting, arguing that firms successfully collect and use competitorinformation without any input from the management accountant. Dixon (1998)argued that:
the costs of capturing, collating, interpreting and analysing the appropriatedata out-weighs the benefits . . . [and] that the collection and use of competitorinformation for strategic purposes can be achieved without implementing aformal SMA process. (p. 278)
One of the conclusions of unpublished research by Collier, Edwards and Shaw intoknowledge management found that the focus of strategic management accountinghas been external when it should have been internal. In ten organizations studied,all believed that knowledge acquired was not being effectively shared, retained orutilized. Management accountants do not recognize their role in broader issues ofknowledge management, and top management does not appear to appreciate thelink between knowledge management as a source of competitive advantage andfinancial performance.
A theoretical framework for management accounting
In this chapter we have identified management accounting as part of a broadermanagement control system that is driven by goals and strategy. We have also

50 ACCOUNTING FOR MANAGERS
expanded the notion of management control to incorporate non-financial perfor-mance measurement and a strategic perspective that monitors the behaviour ofother organizations in pursuit of competitive advantage. This description of man-agement control systems implies a cybernetic system of control, with feedforwardand feedback processes that influence behaviour.
There are certain assumptions underlying the cybernetic model that are based onwhat is called a rational or economic paradigm, or view of the world. Rational meansfollowing reasoning as opposed to experience or observation (which is calledempiricism). The traditional approach to decision-making for management controland management accounting has been from an economically rational perspective.Under this perspective alternatives can be evaluated and decisions computed as aresult of preferences.
March and Simon (1958) laid the basis for economic theories of the firm indistinguishing the neoclassical assumption that economic decisions were madeby perfectly rational actors possessing relatively complete information aimed atmaximizing with satisficing behaviour. Satisficing was based on bounded rationality:actors with general goals searching for whatever solution more or less attainedthose goals. March and Simon used the example of searching a haystack for thesharpest needle (maximizing) versus searching for a needle sharp enough to sewwith (satisficing). March and Simon’s notion of bounded rationality recognizedthat decision-makers have limited information and limited ability to process thatinformation in an uncertain and complex environment.
Scott (1998) described three perspectives on organizations: as rational systems,natural systems and open systems. The rational perspective is based largely on clas-sical management theory, which sees organizations as ‘purposeful collectivities’,i.e. the actions of participants are co-ordinated to achieve defined goals. Organiza-tions are highly formalized with rules governing behaviour and roles determinedindependent of the attributes of the people occupying those roles. Scott argued thatTaylor’s scientific management, Fayol’s administrative theory, Weber’s bureau-cracy and Simon’s theory of administrative behaviour are all examples of rationalsystems. Rational systems are predicated on the division of labour and special-ization of tasks, reducing transaction costs, efficiently processing information andmonitoring the work of agents.
Within the rational perspective, accounting has been dominated by the notion ofcontract, which is reflected in two theories: agency and transaction cost economics.Agency theory (see Chapter 6) focuses on the contractual relationship between theowners and managers and on the cost of the information needed by owners tomonitor contractual performance. The cost of information is also an importantaspect of transaction cost economics (see Chapter 13), which considers whethertransactions should take place in the marketplace or in an organizational hierarchy.
The rational perspective and the notion of contract will determine how orga-nizational structures, and in particular the management accounting and controlsystems used by organizations, are viewed. However, different perspectives willsuggest different interpretations of events, grounded in the different ways inwhich the preparers and users of accounting information may see the world. Thisis expanded in Chapter 5.

MANAGEMENT CONTROL, MANAGEMENT ACCOUNTING 51
Conclusion
In his review of management accounting in the UK, Otley (2001) argued thatwe need to ‘put the management back into management accounting’ (p. 259).Otley reinforced the Relevance Lost argument (Johnson and Kaplan, 1987) thatmanagement accounting had become ‘irrelevant to contemporary organizations,but worse that it was often actually counter-productive to good managementdecision-making’ (p. 243). Otley remarked that Johnson gave up on accountingwhile Kaplan (with Cooper) ‘has become a leader in the re-invention of man-agement accounting practices’ (p. 244), having developed activity-based costing(described later in this book).
Simultaneously, Kaplan and Norton developed the Balanced Scorecard, whichin turn came into conflict with Stern Stewart’s Economic Value Added, a share-holder value approach (see Chapter 2), although the two have to a large extentbeen reconciled as mutually reinforcing (Kaplan and Norton, 2001). Both activity-based costing and the Balanced Scorecard emphasize the transformation fromthe nineteenth-century Industrial Revolution to the twentieth-century InformationRevolution and a shift in many western countries to a knowledge-based economy.
These techniques are, however, still rooted in the rational, economics-basedparadigm, which emphasizes the goal orientation and control system basedon feedback and feedforward described in this chapter. The next chapter pro-vides alternative perspectives on the inter-relationship between accounting andorganizations.
References
Anthony, R. N. (1965). Planning and Control Systems: A Framework for Analysis. Boston, MA:Harvard Business School Press.
Anthony, R. N. and Govindarajan, V. (2000). Management Control Systems. (10th interna-tional edn). New York, NY: McGraw-Hill Irwin.
Berry, A. J., Broadbent, J. and Otley, D. (1995). The domain of organizational control. InA. J. Berry, J. Broadbent and D. Otley (eds), Management Control: Theories, Issues andPractices, London: Macmillan.
Brignall, S. and Ballantine, J. (1996). Performance measurement in service businesses revis-ited. International Journal of Service Industry Management, 7(1), 6–31.
Bromwich, M. (1990). The case for strategic management accounting: The role of accountinginformation for strategy in competitive markets. Accounting, Organizations and Society,15(1/2), 27–46.
Bromwich, M. and Bhimani, A. (1994). Management Accounting: Pathways to Progress. Lon-don: Chartered Institute of Management Accountants.
Chartered Institute of Management Accountants (1993). Performance Measurement in theManufacturing Sector. London: Chartered Institute of Management Accountants.
Daft, R. L. and Macintosh, N. B. (1984). The nature and use of formal control systems formanagement control and strategy implementation. Journal of Management, 10(1), 43–66.
Dixon, R. (1998). Accounting for strategic management: A practical application. Long RangePlanning, 31(2), 272–9.
Downs, A. (1966). Inside Bureaucracy. Boston, MA: Little, Brown and Company.

52 ACCOUNTING FOR MANAGERS
Drury, C. (2000). Management and Cost Accounting. (5th edn). London: Thomson Learning.Eccles, R. G. (1991). The Performance Measurement Manifesto, Getting Numbers You Can Trust:
The New Accounting. Boston, MA: Harvard Business Review Paperbacks.Emmanuel, C., Otley, D. and Merchant, K. (1990). Accounting for Management Control. (2nd
edn). London: Chapman & Hall.Fitzgerald, L., Johnston, R., Brignall, S., Silvestro, R. and Voss, C. (1991). Performance Mea-
surement in Service Businesses. London: Chartered Institute of Management Accountants.Hofstede, G. (1981). Management control of public and not-for-profit activities. Accounting,
Organizations and Society, 6(3), 193–211.Innes, J. (1996). Activity performance measures and tableaux de bord. In I. Lapsley and
F. Mitchell (eds), Accounting and Performance Measurement: Issues in the Private and PublicSectors, London: Paul Chapman Publishing.
Johnson, H. T. and Kaplan, R. S. (1987). Relevance Lost: The Rise and Fall of ManagementAccounting. Boston, MA: Harvard Business School Press.
Kaplan, R. S. (1994). Management accounting (1984–1994): Development of new practiceand theory. Management Accounting Research, 5(247–60).
Kaplan, R. S. and Norton, D. P. (1992). The Balanced Scorecard – Measures that drive per-formance. Harvard Business Review, Jan–Feb, 71–9.
Kaplan, R. S. and Norton, D. P. (1993). Putting the Balanced Scorecard to work. HarvardBusiness Review, Sept–Oct, 134–47.
Kaplan, R. S. and Norton, D. P. (1996). Using the Balanced Scorecard as a strategic manage-ment system. Harvard Business Review, Jan–Feb, 75–85.
Kaplan, R. S. and Norton, D. P. (2001). The Strategy-Focused Organization: How BalancedScorecard Companies Thrive in the New Business Environment. Boston, MA: HarvardBusiness School Press.
Lord, B. R. (1996). Strategic management accounting: The emperor’s new clothes? Manage-ment Accounting Research, 7, 347–66.
Lynch, R. L. and Cross, K. F. (1991). Measure Up! Yardsticks for Continuous Improvement.Oxford: Blackwell.
Macintosh, N. B. (1994). Management Accounting and Control Systems: An Organizational andBehavioral Approach. Chichester: John Wiley & Sons.
March, J. G. and Simon, H. A. (1958). Organizations. Chichester: John Wiley & Sons.Meyer, C. (1994). How the right measures help teams excel. Harvard Business Review,
May–June, 95–103.Neely, A., Adams, C. and Kennerly, M. (2002). The Performance Prism: The Scorecard for
Measuring and Managing Business Success. London: Prentice Hall.Otley, D. (1987). Accounting Control and Organizational Behaviour. London: Heinemann.Otley, D. (1994). Management control in contemporary organizations: Towards a wider
framework. Management Accounting Research, 5, 289–99.Otley, D. (1999). Performance management: A framework for management control systems
research. Management Accounting Research, 10, 363–82.Otley, D. (2001). Extending the boundaries of management accounting research: Developing
systems for performance management. British Accounting Review, 33, 243–61.Otley, D. T. and Berry, A. J. (1980). Control, organization and accounting. Accounting, Orga-
nizations and Society, 5(2), 231–44.Otley, D. T. and Berry, A. J. (1994). Case study research in management accounting and
control. Management Accounting Research, 5, 45–65.Otley, D. T., Berry, A. J. and Broadbent, J. (1995). Research in management control: An
overview of its development. British Journal of Management, 6, Special Issue, S31–S44.Ouchi, W. G. (1977). The relationship between organizational structure and organizational
control. Administrative Science Quarterly, 22, 95–113.
MANAGEMENT CONTROL, MANAGEMENT ACCOUNTING 53
Ouchi, W. G. (1979). A conceptual framework for the design of organizational controlmechanisms. Management Science, 25(9), 833–48.
Porter, M. E. (1980). Competitive Strategy: Techniques for Analyzing Industries and Competitors.New York, NY: Free Press.
Porter, M. E. (1985). Competitive Advantage: Creating and Sustaining Superior Performance.New York, NY: Free Press.
Scott, W. R. (1998). Organizations: Rational, Natural, and Open Systems. (4th edn). UpperSaddle River, NJ: Prentice Hall International.
Simons, R. (1990). The role of management control systems in creating competitive advan-tage: New perspectives. Accounting, Organizations and Society, 15(1/2), 127–43.
Simons, R. (1994). How new top managers use control systems as levers of strategic renewal.Strategic Management Journal, 15, 169–89.
Sinclair, D. and Zairi, M. (1995a). Benchmarking best-practice performance measurementwithin companies. Benchmarking for Quality Management and Technology, 2(3), 53–71.
Sinclair, D. and Zairi, M. (1995b). Effective process management through performancemeasurement. Business Process Re-engineering Journal, 1(1), 75–88.
Tomkins, C. and Carr, C. (1996). Reflections on the papers in this issue and a commentaryon the state of Strategic Management Accounting. Management Accounting Research, 7,271–80.
Wilson, R. M. S. (1995). Strategic management accounting. In D. Ashton, T. Hopper andR. W. Scapens (eds), Issues in Management Accounting (2nd edn), London: Prentice Hall.
A useful website on performance measurement and management is provided bythe Performance Measurement Association at www.performanceportal.org.
The Management Control Association promotes the study of managementcontrol and management accounting. Its website is www.managementcontrolassociation.ac.uk


5
Interpretive and Critical Perspectiveson Accounting and Decision-Making
In Chapter 4 we described the rational-economic perspective that underpinsmanagement control systems in general and management accounting in particular.There are, however, alternative perspectives. For example, Otley and Berry (1980)questioned the usefulness of cybernetic control given the limitations of accountingsystems as a result of organizational and environmental complexity. The problemwith cybernetic control, they say:
is the apparently inevitable division of labour between controllers andthose who are controlled . . . the primary function ascribed to the task ofmanagement is that of organization control. (p. 237)
While Chapter 4 assumed a rational paradigm, this chapter explores alternativeconceptions of the role of accounting in management. We review the interpretiveparadigm and the social constructionist perspective and how organizationalculture is implicated in accounting. We then consider the radical paradigm andhow power is a major concern of critical accounting theory. These alternativeperspectives to the rational-economic one described in Chapter 4 are an importantfocus of this book.
Alternative paradigms
One non-rational approach to decision-making is the ‘garbage can’, which Marchand Olsen (1976) described as the ‘fortuitous confluence’ whereby problems, solu-tions, participants and choice opportunities somehow come together. Cooper et al.(1981) detailed the rational model of financial and management accounting sys-tems as planning and control devices that measure, report and evaluate individualsand business units. In the bounded rationality model (see Chapter 4), accountingsystems are stabilizers, emphasizing consistency. By contrast, the garbage canview recognizes that systems provide an appearance of rationality and create anorganizational history, but that ‘the sequence whereby actions precede goals maywell be a more accurate portrayal of organizational functioning than the moretraditional goal-action paradigm’ (p. 181) and ‘accounting systems represent an ex

56 ACCOUNTING FOR MANAGERS
post rationalization of actions, rather than an ex ante statement of organizationalgoals’ (p. 188).
A non-rational (as opposed to irrational) perspective has also been takenin relation to non-financial performance measurement. For example, Waggoneret al. (1999) took a multidisciplinary approach to the drivers of performancemeasurement systems and identified four categories of force that can influencethe evolution of those systems: internal influences such as power relations anddominant coalition interests within the firm; external influences such as legislationand technology; process issues such as the implementation of innovation and themanagement of political processes; and transformational issues including the levelof top-down support for and risks from change.
Bourne et al. (2000) developed a framework for analysing the implementationof a performance measurement system and interpreted three case studies of man-ufacturing companies against that framework. They identified problems in eachcompany with IT infrastructure, resistance to measurement and management com-mitment that arose in designing, implementing, using and updating performancemeasurement systems.
These perspectives can be linked to Scott’s (1998) conceptualization of orga-nizations as rational, natural and open systems. Figure 5.1 shows the differentperspectives in diagrammatic form. The rational perspective is of the organizationas a goal-oriented collective that acts purposefully to achieve those goals througha formal structure governing behaviour and the roles of organizational members.The natural perspective is based on the human relations school and argues that rulesand roles do not significantly influence the actions of people in organizations. Inthis natural perspective people are motivated by self-interest and the informal rela-tions between them are more important than the formal organizational structurein understanding organizational behaviour. These informal relations emphasizethe social aspect of organizations, which may operate in consensus where commongoals are shared or in conflict. Conflictual approaches stress organizational struc-tures as systems of power where the weaker groups are dominated by the morepowerful ones.
Both rational and natural perspectives view the organization as a closed system,separate from its environment. By contrast, the open systems perspective empha-sizes the impact of the environment on organizations. In the open perspective,organizations are seen as shifting coalitions of participants and a collection ofinterdependent activities that are tightly or loosely coupled.
Thompson (1967) contrasted the technical core of the organization with itsgoal achievement and control-oriented rationality, implying a closed systemand the elimination of uncertainty, with the organization’s dependency andlack of control at an institutional level where the greatest uncertainty existed,implying an open system. Thompson argued that at a managerial level there wasmediation between the two, provided by a range of manoeuvring devices andorganizational structures.
Within the open systems perspective, contingency theory (see Chapter 11) sug-gests that there is no one best way of exercising management control or of

INTERPRETIVE AND CRITICAL PERSPECTIVES ON ACCOUNTING 57
The organization as aCLOSED SYSTEMprotected from its environmentby a protective boundary
RATIONAL perspective:goal-oriented collectivewith formal structure
NATURAL perspective:motivated by self-interest,informal relations moreimportant than formalones
Theories such as:
Theories such as:Scientific management (Taylor)Bureaucracy (Weber)Shareholder value (see Chapter 2)
Human relations (Mayo)AGIL (Parsons)
The organization as anOPEN SYSTEMwith activities that are looselycoupled to satisfy both the demandsof the environment and technicalwork activity
OPEN SYSTEMS perspective:impact of environment on organizationin which the organization isa shifting coalition of participants
Theories such as:Contingency theoryPopulation ecologyResource dependenceInstitutional
Figure 5.1 Organizations as closed or open systems: rational, natural and open systemsperspectivesBased on Scott (1998).
accounting. The appropriate systems emerge from the influence of the environ-ment (which may be turbulent or static), technology, organizational size and needto fit with the organizational strategy, structure and culture. Population ecologytheory is based on the biological analogy of natural selection and holds that

58 ACCOUNTING FOR MANAGERS
environments select organizations for survival on the basis of the fit between theorganizational form and the characteristics of the environment. Resource dependencetheory emphasizes adaptation as organizations act to improve their opportunityto survive, particularly through the relationships of power that exist. Institutionaltheory (see Chapter 7) stresses the rules that are imposed by external parties,especially by government; the values and norms that are internalized in roles aspart of socialization processes; and the cultural controls that underpin the beliefsystems that are supported by the professions.
In their categorization of the nature of knowledge, Burrell and Morgan (1979)proposed four paradigms – functionalist, interpretive, radical humanist and rad-ical structuralist – based on two dimensions – one subjective–objective, the otherregulation–radical change. Figure 5.2 shows a representation of rational, interpre-tive and radical (or critical) paradigms.
In his classification of the types of management control, Hofstede (1981)separated cybernetic (rational) models from non-cybernetic ones, which weredependent on values and rituals. The cybernetic model of control systems is locatedin the functional paradigm. Non-cybernetic systems are located in interpretive orcritical paradigms.
Functional Interpretive Radical/Critical
Objectively knowableworld
Subjectively createdreality that is ‘sociallyconstructed’
Power and conflictare central to howorganizations work
Aims to find the ‘one best way’to achieve shareholder value
Aims to explain howaccounting is used in the unique circumstances of the organization
Aims to highlight the role ofthe state, distribution of the surplus and class issues
Accounting is rational and based oneconomic principles emphasizingplanning and control mechanisms
Accounting as symbolAccounting reflects valuesand beliefs. Control throughculture
Role of accounting in maintainingexisting structures of powerUses an understanding of accountingto engage in changes in accountingpractices and processes
Cybernetic systems of controlRoutine, expert and trial-and-error(Chapter 4)
Non-cybernetic control systemsIntuition, judgement, ‘garbage can’, values based, political
Figure 5.2 Paradigms of understanding

INTERPRETIVE AND CRITICAL PERSPECTIVES ON ACCOUNTING 59
The functional paradigm relies on an ‘objectively knowable, empirically veri-fiable reality’ (Boland and Pondy, 1983, p. 223), which has been described inChapter 4.
The interpretive paradigm and the social constructionperspective
The interpretive view reflects a subjectively created, emergent social reality, whichChua (1986) links to an understanding of ‘accounting in action’. The interpretiveapproach offers ‘accounts of what happens as opposed to what should happen’(Chua, 1988, p. 73).
Hopwood (1983) coined the term accounting in action to describe the ‘waysin which accounting reflects, reinforces or even constrains the strategic posturesadopted by particular organizations’ (p. 302). Hopwood (1987) contrasted theconstitutive as well as reflective roles of accounting.
The aim of the interpretive perspective is:
to produce rich and deep understandings of how managers and employees inorganizations understand, think about, interact with, and use managementaccounting and control systems. (Macintosh, 1994, p. 4)
Preston (1995) described the social constructionist model of behaviour not as arational process but a product of the ‘creative individual’. Individuals act towardsthings on the basis of the meaning that things have for them. Preston describedthe critical process that takes place between encountering a situation or event andinterpreting it, in which the individual constructs a meaning of the situation orevent and acts in accordance with that meaning. Meaning is not inherent, it isbrought to the situation by the individual. These meanings are derived throughsocial interaction, the ways in which people meet, talk, work and play together andin doing so construct and share meanings. These meanings are socially constructed,internalized and shared between individuals.
Preston (1995) added that the social constructionist perspective does not pre-clude the existence of organizational structures and processes, but suggests thatthese are symbolic representations of a particular view of organizational reality.These meanings are also expressed symbolically through language. In this con-text accounting information is a symbolic representation of reality. Individualbehaviour is guided by the meanings, values and beliefs that are constructed andshared by organizational members. These symbols are then subject to interpreta-tion by individuals, who act towards them on the basis of the meaning they havefor them. However, Preston recognized that these structures and processes mayinfluence the development of an organizational culture – the shared values, beliefsand meanings that are collectively held by organizational participants.

60 ACCOUNTING FOR MANAGERS
Culture, control and accounting
Allaire and Firsirotu (1984) contrasted a sociostructural system based on formalstructures, strategies, policies and management processes with a cultural systembased on myths, ideology, values and artefacts and shaped by society, the historyof the organization and the contingency factors affecting it. Sociostructural andcultural systems were in a complex relationship, with potential for stress when anorganization is subject to sudden pressures for change.
The review of research on organizational culture undertaken by Smircich (1983)reflected a convergence of views around culture as ‘shared key values and beliefs’(p. 345). These values and beliefs convey a sense of identity, generate commitment,enhance social system stability, and serve as a sense-making device to guide andshape behaviour. Smircich also identified the existence of multiple organizationsubcultures – a multiplicity of cultures within an organization, rather than onepervading culture.
Handy (1978) described four different organizational cultures: club, based oninformal relationships; role, based on tightly defined jobs; task, a focus on solvingproblems; and existential, an orientation to individual purpose. Deal and Kennedy(1982) also identified four types of cultures: tough guy/macho (individualistswho take high risks); work hard/play hard (fun and action with low risk);bet-your-company (big stakes decisions); and process (bureaucratic emphasis).
As we saw in Chapter 4, Ouchi (1979) identified three mechanisms for con-trol: market (based on prices); bureaucracy (based on rules); and clan (basedon tradition). Clan mechanisms are represented in professions, where differentorganizations have the same values. Ouchi used the example of a hospital, wherea highly formalized and lengthy period of socialization leads to both skill andvalue training.
Schein (1988/1968) described the process that brings about change in the valuesand attitudes of different groups of people throughout their career as ‘organi-zational socialization’. It occurs whenever an individual enters an organization,changes departments or is promoted. Socialization determines employee loyalty,commitment, productivity and turnover. It is the process whereby a new mem-ber learns the values, norms and behaviour patterns – the ‘price of membership’(p. 54). These norms, values and behaviours are learned from organizationalpublications, from training, line managers, peers and role models, and from therewards and punishments that exist. Where the values of the immediate groupthat the individual joins are out of line with the value system of the organizationas a whole, the individual learns the values of the immediate group more quicklythan those of the organization. The essence of management, according to Schein,is that managers must understand organizations as social systems that socializetheir members, and then gain control over those forces.
Accounting can be one such element of control. Scott (1998) described accountingsystems as ‘one of the most important conventions connecting institutionallydefined belief systems with technical activities’ (p. 137). Scott argued that someorganizations rely less on formal controls and more on developing a set of beliefsand norms to guide behaviour.

INTERPRETIVE AND CRITICAL PERSPECTIVES ON ACCOUNTING 61
Langfield-Smith (1995) contrasted culture as the setting for control; as a controlmechanism itself; and as a filter for perceiving the environment. Langfield-Smithdescribed a model by Flamholtz, Das and Tsui in which culture facilitates controlwhen the control system is consistent with the social norms of the organization,or inhibits control when it is at variance with those norms. As Ouchi (1977)showed, culture can lead to a ritual form of control where knowledge of thetransformation process is imperfect and the ability to measure output is low.Langfield-Smith (1995) also described research by Birnberg and Snodgrass inwhich culture influences the effectiveness of a control system by influencingindividual perceptions and value judgements about those perceptions.
Hofstede (1981) argued that control systems must be sensitive to organizationalcultures and that those running counter to culture are unlikely to be successfullyimposed. Markus and Pfeffer (1983) suggested that resistance to and failure ofaccounting control systems was common, arguing that control systems will beimplemented when they are consistent with the dominant organizational cultureand paradigm in their implications for values and beliefs.
The radical paradigm and critical accounting
Radical approaches (Burrell and Morgan, 1979) emphasize broader structuralissues such as the role of the state, distribution of the surplus of production andclass difference (Hopper et al., 1987). Hopper and Powell (1985) claimed that thefunctional approach does not address issues of power and conflict and argued thatinterpretive approaches ‘indicate how accounting systems may promote change,albeit within a managerial conception of the term, rather than being stabilizers’(p. 449).
Hopper et al. (2001) argued that under Thatcherism:
accounting data and the consulting arms of accounting firms had been centralto economic and policy debates, involving privatization, industrial restruc-turing, reform of the public sector, and worries about de-industrialization . . .
it appeared apparent that accounting had to be studied in its broader social,political and institutional context. (p. 276)
Those writers who sought a more radical interpretation than the interpretive onedrew on the work of Marx. There are three groups within this perspective: politicaleconomy, labour process and critical theory (Roslender, 1995). All are concernedwith promoting change in the status quo.
The political economy approach recognizes power and conflict in society and theeffect that accounting has on the distribution of income, power and wealth. Labourprocess focuses on the corruption of human creativity in the pursuit of wealth,especially deskilling and management control as a reproducer of capitalism.Labour process theorists argue that:
the driving force for social change in capitalist society is the developmentand displacement (i.e. of impediments to capital accumulation and their res-olutions) . . . [that] are inherent in the structural instabilities that characterize

62 ACCOUNTING FOR MANAGERS
capitalism’s unequal and antagonistic social relations. (Neimark and Tinker,1986, p. 378)
Neimark and Tinker emphasized the ‘on-going conflict among and between socialclasses over the disposition and division of the social surplus’ (p. 379) and how‘[s]ocial and organizational control systems are not neutral mechanisms in thesestruggles but are attached to and legitimate concrete power interests’ (p. 380).
The third Marxist perspective, critical theory, emphasizes a critique of the statusquo and emancipation towards a better life. Hopper and Powell (1985) argued thatcritical studies show how ‘accounting measures alienate through subordinatingbehaviour to perceived imperatives which are in fact socially created’ (p. 454).
Laughlin (1999) defined critical accounting as providing:
a critical understanding of the role of accounting processes and practices andthe accounting profession in the functioning of society and organizationswith an intention to use that understanding to engage (where appropriate)in changing these processes, practices and the profession. (p. 73)
An example of the application of critical theory is provided by Perrow (1991), whoargued:
If one raised profits by externalizing many costs to the community, exploitingthe workforce, evading government controls by corrupting officials, manip-ulating stock values, and controlling the market by forming quasi-cartelsor other predatory practices – all common practices in the nineteenth andtwentieth century – then profits will not reflect the efficient use of labor,capital, and natural resources. (p. 746)
Much of critical theory is concerned with opening up the discourse from a narroweconomic-rational application of accounting to question its underlying assump-tions and its (often dysfunctional) consequences. Discourse is a conversation, albeitan informed one, through which arguments and counter-arguments are consid-ered. Accounting is implicated in discourse because in its written form, it presents‘facts’ that contain implicit assumptions. An accounting discourse of profit andreturn on investment is dominated by an economic-rational logic. Thus, account-ing ‘serves to construct a particular field of visibility’ (Miller and O’Leary, 1987,p. 239).
In promoting critical theory, Broadbent and Laughlin (1997) emphasized ‘arecognition of the choice between seeking to develop change through meaningfuldebate [rather than] through the application of power or coercion’ (p. 645).
Power and accounting
We have seen how control systems and management accounting in particular areaimed at influencing behaviour. This is inextricably bound up with consideration ofpower. Pfeffer (1992) defined power as ‘the potential ability to influence behavior,
INTERPRETIVE AND CRITICAL PERSPECTIVES ON ACCOUNTING 63
to change the course of events, to overcome resistance, and to get people to dothings that they would not otherwise do’ (p. 30).
Morgan (1986) identified power as either a resource or a social relation, definingit as ‘the medium through which conflicts of interest are ultimately resolved’(p. 158). As a social relation, power is concerned with domination of one person(or group) over another. As a resource, power is concerned with the dependencyof one party on particular allocations, and the control over the distribution of thatresource by another party. By contrast, Giddens (1976) argued that power doesnot of itself imply conflict. Because power is linked to the pursuit of interest, it isonly when interests do not coincide that power and conflict are related.
Power is implicit in organizational functioning and in the definition of what isimportant. Child (1972) concluded:
When incorporating strategic choice in a theory of organization, one is rec-ognizing the operation of an essentially political process in which constraintsand opportunities are functions of the power exercised by decision-makersin the light of ideological values. (p. 16)
Cooper et al. (1981) saw accounting systems having:
[an] impact on sustaining and influencing an organization’s culture andlanguage and in terms of their ideological and legitimizing influence inmaintaining systems of power and control in organizations. (p. 175)
Emmanuel et al. (1990) described control as taking two forms: control as dominationof one person or group over others; and control as regulation where the controllerdetects a variation between actual and planned results and creates a stimulusfor corrective action. While the latter is associated with the cybernetic systemdescribed in Chapter 4, control as domination is relevant to the interpretive andcritical perspective.
Markus and Pfeffer (1983) argued that accounting and control systems arerelated to intra-organizational power:
because they collect and manipulate information used in decision-making. . . [and] because they are used to change the performance of individuals andthe outcomes of organizational processes. (pp. 206–7)
Conclusion
We will return to interpretive and critical perspectives throughout this book.However, a major difficulty in adopting a non-rational paradigm is that organi-zational discourse suggests that the rational-economic paradigm of shareholdervalue is the only valid one, while individuals often act in the pursuit of power andself-interest.
Otley et al. (1995) suggested that while the definition of management controlwas ‘managerialist in focus . . . this should not preclude a critical stance and thusa broader choice of theoretical approaches’ (p. S42).

64 ACCOUNTING FOR MANAGERS
The aim of critical management accounting is to promote a greater level ofself-awareness in management accountants and so develop an improved form ofmanagement accounting that is more insightful as to its consequences (Roslender,1995). Readers should also be aware of the concern expressed by Power (1991), whodecried traditional accounting education and ‘the institutionalization of a formof discourse in which critical and reflective practices are regarded as ‘‘waffle’’ ’(p. 350).
An advantage in understanding interpretive and critical alternatives to therational economic one is what Covaleski et al. (1996) called ‘paradigmatic pluralism. . . alternative ways of understanding the multiple roles played by managementaccounting in organizations and society’ (p. 24). The full text of the Covaleski et al.paper is included as one of the readings in this book.
References
Allaire, Y. and Firsirotu, M. E. (1984). Theories of organizational culture. OrganizationStudies, 5(3), 193–226.
Boland, J. R. J. and Pondy, L. R. (1983). Accounting in organizations: A union of natural andrational perspectives. Accounting, Organizations and Society, 8(2/3), 223–34.
Bourne, M., Mills, J., Wilcox, M., Neely, A. and Platts, K. (2000). Designing, implementingand updating performance measurement systems. International Journal of Operations andProduction Management, 20(7), 754–71.
Broadbent, J. and Laughlin, R. (1997). Developing empirical research: An example informedby a Habermasian approach. Accounting, Auditing and Accountability Journal, 10(5), 622–48.
Burrell, G. and Morgan, G. (1979). Sociological Paradigms and Organizational Analysis. London:Heinemann.
Child, J. (1972). Organizational structure, environment and performance: The role of strate-gic choice. Sociology, 6, 1–22.
Chua, W. F. (1986). Radical developments in accounting thought. Accounting Review, LXI(4),601–32.
Chua, W. F. (1988). Interpretive sociology and management accounting research – A criticalreview. Accounting, Auditing and Accountability Journal, 1(2), 59–79.
Cooper, D. J., Hayes, D. and Wolf, F. (1981). Accounting in organized anarchies: Under-standing and designing accounting systems in ambiguous situations. Accounting,Organizations and Society, 6(3), 175–91.
Covaleski, M. A., Dirsmith, M. W. and Samuel, S. (1996). Managerial accounting research:The contributions of organizational and sociological theories. Journal of ManagementAccounting Research, 8, 1–35.
Deal, T. E. and Kennedy, A. A. (1982). Corporate Cultures. Reading, MA: Addison-Wesley.Emmanuel, C., Otley, D. and Merchant, K. (1990). Accounting for Management Control. (2nd
edn). London: Chapman & Hall.Giddens, A. (1976). New Rules of Sociological Method: A Positive Critique of Interpretative
Sociologies. London: Hutchinson.Handy, C. (1978). Understanding Organizations. Harmondsworth: Penguin.Hofstede, G. (1981). Management control of public and not-for-profit activities. Accounting,
Organizations and Society, 6(3), 193–211.Hopper, T. and Powell, A. (1985). Making sense of research into the organizational and
social aspects of management accounting: A review of its underlying assumptions.Journal of Management Studies, 22(5), 429–65.
INTERPRETIVE AND CRITICAL PERSPECTIVES ON ACCOUNTING 65
Hopper, T., Otley, D. and Scapens, B. (2001). British management accounting research:Whence and whither: Opinions and recollections. British Accounting Review (33), 263–91.
Hopper, T., Storey, J. and Willmott, H. (1987). Accounting for accounting: Towards thedevelopment of a dialectical view. Accounting, Organizations and Society, 12(5), 437–56.
Hopwood, A. G. (1983). On trying to study accounting in the contexts in which it operates.Accounting, Organizations and Society, 8(2/3), 287–305.
Hopwood, A. G. (1987). The archaeology of accounting systems. Accounting, Organizationsand Society, 12(3), 207–34.
Langfield-Smith, K. (1995). Organizational culture and control. In A. J. Berry, J. Broadbentand D. Otley (eds), Management Control: Theories, Issues and Practices, London: Macmillan.
Laughlin, R. (1999). Critical accounting: Nature, progress and prognosis. Accounting, Audit-ing and Accountability Journal, 12(1), 73–8.
Macintosh, N. B. (1994). Management Accounting and Control Systems: An Organizational andBehavioral Approach. Chichester: John Wiley & Sons.
March, J. G. and Olsen, J. P. (1976). Ambiguity and Choice in Organizations. Bergen: Univer-sitetsforiagen.
Markus, M. L. and Pfeffer, J. (1983). Power and the design and implementation of accountingand control systems. Accounting, Organizations and Society, 8(2/3), 205–18.
Miller, P. and O’Leary, T. (1987). Accounting and the construction of the governable person.Accounting, Organizations and Society, 12(3), 235–65.
Morgan, G. (1986). Images of Organization. Newbury Park, CA: Sage Publications.Neimark, M. and Tinker, T. (1986). The social construction of management control systems.
Accounting, Organizations and Society, 11(4/5), 369–95.Otley, D. T. and Berry, A. J. (1980). Control, organization and accounting. Accounting, Orga-
nizations and Society, 5(2), 231–44.Otley, D. T., Berry, A. J. and Broadbent, J. (1995). Research in management control: An
overview of its development. British Journal of Management, 6, Special Issue, S31–S44.Ouchi, W. G. (1977). The relationship between organizational structure and organizational
control. Administrative Science Quarterly, 22, 95–113.Ouchi, W. G. (1979). A conceptual framework for the design of organizational control
mechanisms. Management Science, 25(9), 833–48.Perrow, C. (1991). A society of organizations. Theory and Society, 20(6), 725–62.Pfeffer, J. (1992). Managing with Power: Politics and Influence in Organizations. Boston, MA:
Harvard Business School Press.Power, M. K. (1991). Educating accountants: Towards a critical ethnography. Accounting,
Organizations and Society, 16(4), 333–53.Preston, A. (1995). Budgeting, creativity and culture. In D. Ashton, T. Hopper and R. W.
Scapens (eds), Issues in Management Accounting (2nd edn), London: Prentice Hall.Roslender, R. (1995). Critical management accounting. In D. Ashton, T. Hopper and R. W.
Scapens (eds), Issues in Management Accounting (2nd edn), London: Prentice Hall.Schein, E. H. (1988/1968). Organizational socialization and the profession of management.
Sloan Management Review, Fall, 53–65.Scott, W. R. (1998). Organizations: Rational, Natural, and Open Systems. (4th edn). Upper
Saddle River, NJ: Prentice Hall International, Inc.Smircich, L. (1983). Concepts of culture and organizational analysis. Administrative Science
Quarterly, 28, 339–58.Thompson, J. (1967). Organizations in Action: Social Science Bases of Administrative Theory.
New York, NY: McGraw-Hill.Waggoner, D. B., Neely, A. D. and Kennerley, M. P. (1999). The forces that shape organi-
zational performance measurement systems: an interdisciplinary review. InternationalJournal of Production Economics, 60–91, 53–60.

6
Constructing Financial Statementsand the Framework of Accounting
This chapter introduces each of the principal financial statements, beginning withthe Profit and Loss account and Balance Sheet. It begins with an overview of theregulations governing financial statements and describes the matching principle,which emphasizes prepayments, accruals and provisions such as depreciation. Thechapter then describes the Cash Flow statement and the management of workingcapital. It concludes with an introduction to agency theory.
Financial accounting
Accounting provides an account – an explanation or report in financialterms – about the transactions of an organization. Accounting enables managersto satisfy the stakeholders in the organization (owners, government, financiers,suppliers, customers, employees etc.) that they have acted in the best interests ofstakeholders rather than themselves.
These explanations are provided to stakeholders through financial statementsor reports, often referred to as the company’s ‘accounts’. The main financial reportsare the Profit and Loss account, the Balance Sheet and the Cash Flow statement.The first two of these were introduced briefly in Chapter 3.
The presentation of financial reports must comply with Schedule 4 to the Com-panies Act, 1985, which prescribes the form and content of accounts. Section 226of the Act requires the financial reports to represent a ‘true and fair view’ of the stateof affairs of the company and its profits. The Companies Act requires directorsto state whether the accounts have been prepared in accordance with accountingstandards and to explain any significant departures from those standards. Forcompanies listed on the Stock Exchange, there are additional rules contained inthe Listing Requirements, commonly known as the Yellow Book, which requiresthe disclosure of additional information.
There is a legal requirement for the financial statements of companies (other thanvery small ones) to be audited. Auditors are professionally qualified accountantswho have to conduct an audit – an independent examination of the financialstatements – and form an opinion as to whether the financial statements form atrue and fair view and have been prepared in accordance with the Companies Act.
68 ACCOUNTING FOR MANAGERS
Although the requirement for a true and fair view is subjective and has never beentested at law, it takes precedence over accounting standards.
Accounting standards are principles to which accounting reports should con-form. They are aimed at:
ž achieving comparability between companies, through reducing the variety ofaccounting practice;ž providing full disclosure of material (i.e. significant) factors through the judge-ments made by the preparers of those financial reports; andž ensuring that the information provided is meaningful for the users of finan-cial reports.
However, a criticism of the standards is that they are set by the preparers(professional accountants) rather than the users (shareholders and financiers) offinancial reports.
Financial Reporting Standards (FRSs) are issued by the Accounting StandardsBoard (ASB) and Statements of Standard Accounting Practice (SSAPs) were issuedby the Accounting Standards Committee, which preceded the ASB. FRSs andSSAPs govern many aspects of the presentation of financial statements and thedisclosure of information (for a detailed coverage, see Blake, 1997). Examples ofcommonly applied standards include:
SSAP9 StocksSSAP13 Research and DevelopmentSSAP21 LeasesFRS10 GoodwillFRS12 ProvisionsFRS15 Fixed Assets and Depreciation
A Financial Reporting Review Panel has the power to seek revision of a company’saccounts where those accounts do not comply with the standards and if necessaryto seek a court order to ensure compliance.
Interestingly, the US equivalent of the true and fair view is for financialstatements to be presented fairly and in accordance with Generally AcceptedAccounting Principles (or GAAP). There is a move towards the harmonizationof accounting standards between countries through the work of the InternationalAccounting Standards Board (IASB). This has been a consequence of the global-ization of capital markets, with the consequent need for accounting rules that canbe understood by international investors. The dominance of multinational corpo-rations and the desire of companies to be listed on several stock exchanges haveled to the need to rationalize different reporting practices in different countries.In Europe, all listed companies of member states of the European Union have tocomply with IASB standards by 2005.
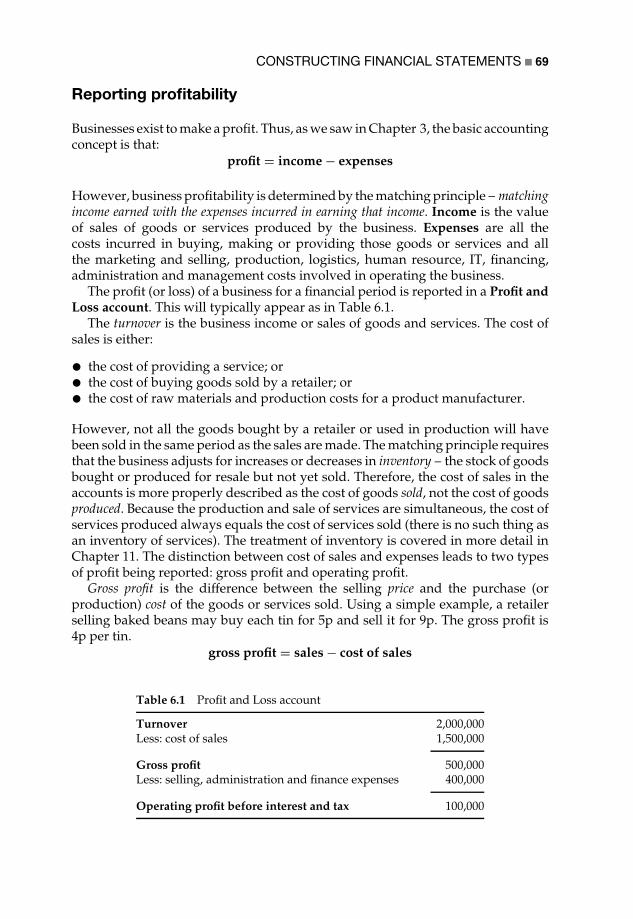
CONSTRUCTING FINANCIAL STATEMENTS 69
Reporting profitability
Businesses exist to make a profit. Thus, as we saw in Chapter 3, the basic accountingconcept is that:
profit = income − expenses
However, business profitability is determined by the matching principle – matchingincome earned with the expenses incurred in earning that income. Income is the valueof sales of goods or services produced by the business. Expenses are all thecosts incurred in buying, making or providing those goods or services and allthe marketing and selling, production, logistics, human resource, IT, financing,administration and management costs involved in operating the business.
The profit (or loss) of a business for a financial period is reported in a Profit andLoss account. This will typically appear as in Table 6.1.
The turnover is the business income or sales of goods and services. The cost ofsales is either:
ž the cost of providing a service; orž the cost of buying goods sold by a retailer; orž the cost of raw materials and production costs for a product manufacturer.
However, not all the goods bought by a retailer or used in production will havebeen sold in the same period as the sales are made. The matching principle requiresthat the business adjusts for increases or decreases in inventory – the stock of goodsbought or produced for resale but not yet sold. Therefore, the cost of sales in theaccounts is more properly described as the cost of goods sold, not the cost of goodsproduced. Because the production and sale of services are simultaneous, the cost ofservices produced always equals the cost of services sold (there is no such thing asan inventory of services). The treatment of inventory is covered in more detail inChapter 11. The distinction between cost of sales and expenses leads to two typesof profit being reported: gross profit and operating profit.
Gross profit is the difference between the selling price and the purchase (orproduction) cost of the goods or services sold. Using a simple example, a retailerselling baked beans may buy each tin for 5p and sell it for 9p. The gross profit is4p per tin.
gross profit = sales − cost of sales
Table 6.1 Profit and Loss account
Turnover 2,000,000Less: cost of sales 1,500,000
Gross profit 500,000Less: selling, administration and finance expenses 400,000
Operating profit before interest and tax 100,000

70 ACCOUNTING FOR MANAGERS
Expenses will include all the other (selling, administration, finance etc.) costs of thebusiness, that is those not directly concerned with buying, making or providinggoods or services, but supporting that activity. The same retailer may treat therent of the store, salaries of employees, distribution and computer costs and so onas expenses in order to determine the operating profit.
operating profit = gross profit − expenses
The operating profit is one of the most significant figures because it representsthe profit generated from the ordinary operations of the business. It is also callednet profit, profit before interest and taxes (PBIT) or earnings before interest andtaxes (EBIT).
The distinction between cost of sales and expenses can vary between industriesand organizations. A single store may treat only the product cost as the cost ofsales, and salaries and rent as expenses. A large retail chain may include thesalaries of staff and the store rental as cost of sales with expenses covering the headoffice, corporate costs. For any particular business, it is important to determine thedemarcation between cost of sales and expenses.
From operating profit, a company must pay interest to its lenders, income taxto the government and a dividend to shareholders (for their share of the profits asthey – unlike lenders – do not receive an interest rate for their investment). Theremaining profit is retained by the business as part of its capital (see Table 6.2).
Reporting financial position
Not all business transactions appear in the Profit and Loss account. The secondfinancial statement is the Balance Sheet. This shows the financial position of thebusiness – its assets, liabilities and capital – at the end of a financial period.
Some business payments are to acquire assets. Fixed assets are things thatthe business owns and uses as part of its infrastructure. There are two types offixed assets: tangible and intangible. Tangible fixed assets comprise those physicalassets that can be seen and touched, such as buildings, machinery, vehicles,computers etc. Intangible fixed assets comprise non-physical assets such as the
Table 6.2 Profit and Loss account (extended)
Operating profit before interest and tax 100,000Less: interest 16,000
Profit before tax 84,000Less: income tax 14,000
Profit after tax 70,000Less: dividend 30,000
Retained profit 40,000

CONSTRUCTING FINANCIAL STATEMENTS 71
customer goodwill of a business or its intellectual property, e.g. its ownership ofpatents and trademarks.
Current assets include money in the bank, debtors (the sales to customers oncredit, but unpaid) and inventory (the stock of goods bought or manufactured,but unsold). The word current in accounting means 12 months, so current assetsare those that will change their form during the next year (see working capitallater in this chapter).
Sometimes assets are acquired or expenses incurred without paying for themimmediately. In doing so, the business incurs liabilities. Liabilities are debtsthat the business owes. Liabilities – called creditors in the Balance Sheet – may becurrent liabilities such as bank overdrafts, trade creditors (purchases of goods oncredit, but unpaid) and amounts due for taxes etc. As for assets, the word currentmeans that the liabilities will be repaid within 12 months. Current liabilities alsoform part of working capital.
Long-term liabilities or creditors due after more than one year cover loansto finance the business that are repayable after 12 months and certain kinds ofprovisions (see later in this chapter). Capital is a particular kind of liability, as it isthe money invested by the owners in the business. As mentioned above, capital isincreased by the retained profits of the business (the profit after paying interest,tax and dividends).
The Balance Sheet will typically appear as in Table 6.3. In the Balance Sheet, theassets must agree with the total of liabilities and capital, because what the businessowns is represented by what it owes to outsiders (liabilities) and to the owners
Table 6.3 Balance Sheet
Fixed assets 1,150,000
Current assetsDebtors 300,000Stock 200,000
500,000
Less: creditors due within one yearCreditors 300,000Bank overdraft 50,000
350,000
Net current assets 150,000
Total assets less current liabilities 1,300,000Less: creditors due after one yearLong-term loans 300,000
Total net assets 1,000,000
Capital and reserves 1,000,000

72 ACCOUNTING FOR MANAGERS
(capital). This is called the accounting equation:
assets = liabilities + capital
or
assets − liabilities = capital
However, the capital of the business does not represent the value of the business – itis the result of the application of a number of accounting principles. In additionto the Financial Reporting Standards and Statements of Standard AccountingPractice referred to earlier, there are some basic accounting principles that aregenerally accepted by the accounting profession as being important in preparingaccounting reports. These were described in Chapter 3. However, an importantprinciple that is particularly relevant to the interpretation of accounting reports isthe matching principle.
The matching (or accruals) principle recognizes income when it is earnedand recognizes expenses when they are incurred (accrual accounting), not whenmoney is received or paid out (cash accounting). While cash is very important inbusiness, the accruals method provides a more meaningful picture of the financialperformance of a business from year to year.
Accruals accounting
Unlike a system of cash accounting, where receipts are treated as income andpayments as expenses (which is common in not-for-profit organizations), thematching principle requires a system of accrual accounting, which takes account ofthe timing differences between receipts and payments and when those cash flowsare treated as income earned and expenses incurred for the calculation of profit.
Accruals accounting makes adjustments for:
ž prepayments;ž accruals; andž provisions.
The matching principle requires that certain cash payments made in advance aretreated as prepayments, i.e. made in advance of when they are treated as anexpense for profit purposes. Other expenses are accrued, i.e. treated as expensesfor profit purposes even though no cash payment has yet been made.
A good example of a prepayment is insurance, which is paid 12 months inadvance. Assume that a business which has a financial year ending 31 March paysits 12 months insurance premium of £12,000 in advance on 1 January. At its yearend, the business will only treat £3,000 (3/12 of £12,000) as an expense and willtreat the remaining £9,000 as a prepayment (a current asset in the Balance Sheet).
A good example of an accrual is electricity, which like most utilities is paid(often quarterly) in arrears. If the same business usually receives its electricity billin May (covering the period March to May) it will need to accrue an expense for

CONSTRUCTING FINANCIAL STATEMENTS 73
the month of March, even if the bill has not yet been received. If the prior year’sbill was £2,400 for the same quarter (allowing for seasonal fluctuations in usage)then the business will accrue £800 (1/3 of £2,400).
The effect of prepayments and accruals on profit, the Balance Sheet and cashflow is shown in Table 6.4.
A further example of the matching principle is in the creation of provisions.Provisions are estimates of possible liabilities that may arise. An example of apossible future liability is a provision for warranty claims that may be payable onsales of products. The estimate will be based on the likely costs to be incurred inthe future.
Other types of provisions cover reductions in asset values. The mainexamples are:
ž Doubtful debts: customers may experience difficulty in paying their accountsand a provision may be made based on experience that a proportion of debtorswill never pay.ž Inventory: some stock may be obsolete but still held in the store. A provisionreduces the value of the obsolete stock to its sale or scrap value (if any).ž Depreciation: this is a charge against profits, intended to write off the value ofeach fixed asset over its useful life.
Provisions for likely future liabilities are shown in the Balance Sheet as liabilities,while provisions that reduce asset values are shown as deductions from the costof the asset. The most important provision, because it typically involves a largeamount of money, is for depreciation.
Depreciation
Fixed assets are capitalized in the Balance Sheet so that the purchase of fixedassets does not affect profit. However, depreciation is an expense that spreads thecost of the asset over its useful life. The following example illustrates the matchingprinciple in relation to depreciation.
An asset costs £100,000. It is expected to have a life of four years and have aresale value of £20,000 at the end of that time. The depreciation charge is:
asset cost − resale valueexpected life
100,000 − 20,0004
= 20,000 p.a.
Table 6.4 Prepayments and accruals
Profit effect Balance Sheet Cash flow
Prepayment Expense of £3,000 Prepayment (currentasset) of £9,000
Cash outflow of £12,000
Accrual Expense of £800 Accrual (creditor) of£800
No cash flow until quarterlybill received and paid

74 ACCOUNTING FOR MANAGERS
It is important to recognize that the cash outflow of £100,000 occurs when the assetis bought. The depreciation charge of £20,000 per annum is a non-cash expenseeach year. However, the value of the asset in the Balance Sheet reduces each yearas a result of the depreciation charge, as follows:
Original Provision for Net value inasset cost depreciation Balance Sheet
End of year 1 100,000 20,000 80,000End of year 2 100,000 40,000 60,000End of year 3 100,000 60,000 40,000End of year 4 100,000 80,000 20,000
If the asset is then sold, any profit or loss on sale is treated as a separate item in theProfit and Loss account. Alternatively, the asset can be depreciated to a nil valuein the Balance Sheet even though it is still in use.
A type of depreciation used for certain assets, such as goodwill or leaseholdproperty improvements, is called amortization, which has the same meaning andis calculated in the same way as depreciation.
In reporting profits, some companies show the profit before depreciation (oramortization) is deducted, because it can be a substantial cost, but one that doesnot result in any cash flow. A variation of EBIT (see earlier in this chapter) isEBITDA: earnings before interest, taxes, depreciation and amortization.
Reporting cash flow
The third financial statement is the cash flow. The Cash Flow statement shows themovement in cash for the business during a financial period. It includes:
ž cash flow from operations;ž interest receipts and payments;ž income taxes paid;ž capital expenditure (i.e. the purchase of new fixed assets);ž dividends paid to shareholders;ž new borrowings or repayment of borrowings.
The cash flow from operations differs from the operating profit because of:
ž depreciation, which as a non-cash expense is added back to profit (sinceoperating profit is the result after depreciation is deducted);ž increases (or decreases) in working capital (e.g. debtors, inventory, prepay-ments, creditors and accruals), which reduce (or increase) available cash.
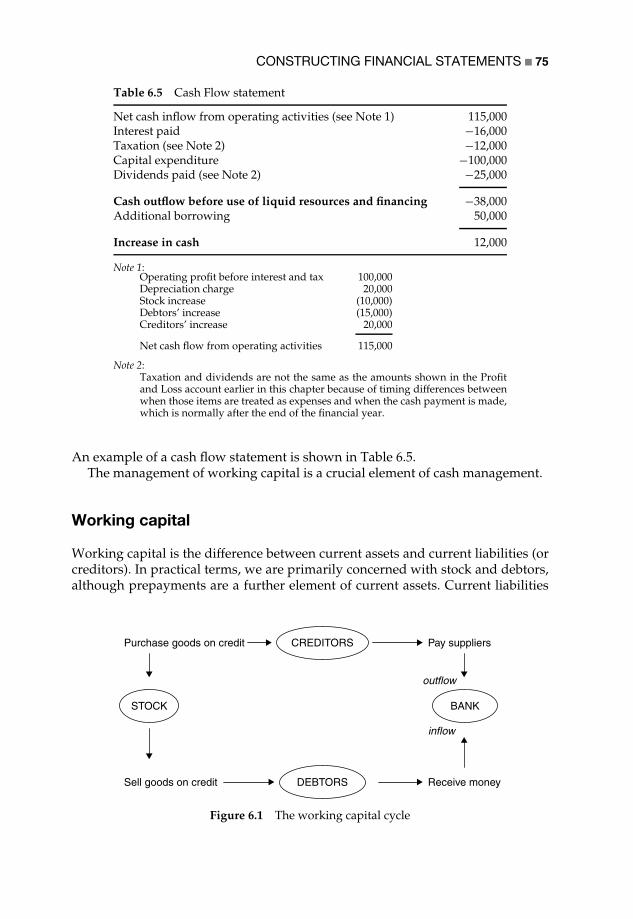
CONSTRUCTING FINANCIAL STATEMENTS 75
Table 6.5 Cash Flow statement
Net cash inflow from operating activities (see Note 1) 115,000Interest paid −16,000Taxation (see Note 2) −12,000Capital expenditure −100,000Dividends paid (see Note 2) −25,000
Cash outflow before use of liquid resources and financing −38,000Additional borrowing 50,000
Increase in cash 12,000
Note 1:Operating profit before interest and tax 100,000Depreciation charge 20,000Stock increase (10,000)Debtors’ increase (15,000)Creditors’ increase 20,000
Net cash flow from operating activities 115,000
Note 2:Taxation and dividends are not the same as the amounts shown in the Profitand Loss account earlier in this chapter because of timing differences betweenwhen those items are treated as expenses and when the cash payment is made,which is normally after the end of the financial year.
An example of a cash flow statement is shown in Table 6.5.The management of working capital is a crucial element of cash management.
Working capital
Working capital is the difference between current assets and current liabilities (orcreditors). In practical terms, we are primarily concerned with stock and debtors,although prepayments are a further element of current assets. Current liabilities
Purchase goods on credit CREDITORS Pay suppliers
outflow
STOCK BANK
inflow
Sell goods on credit DEBTORS Receive money
Figure 6.1 The working capital cycle
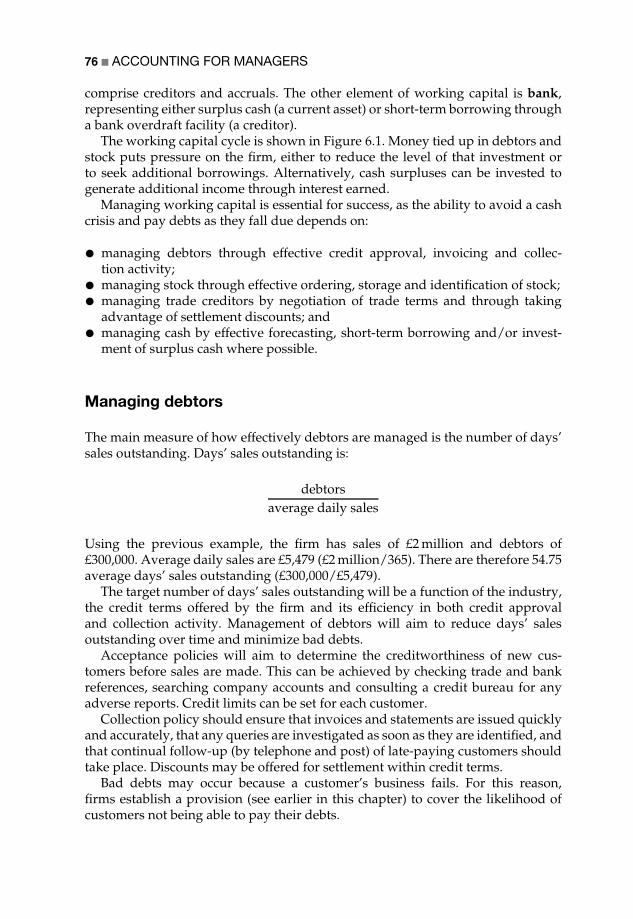
76 ACCOUNTING FOR MANAGERS
comprise creditors and accruals. The other element of working capital is bank,representing either surplus cash (a current asset) or short-term borrowing througha bank overdraft facility (a creditor).
The working capital cycle is shown in Figure 6.1. Money tied up in debtors andstock puts pressure on the firm, either to reduce the level of that investment orto seek additional borrowings. Alternatively, cash surpluses can be invested togenerate additional income through interest earned.
Managing working capital is essential for success, as the ability to avoid a cashcrisis and pay debts as they fall due depends on:
ž managing debtors through effective credit approval, invoicing and collec-tion activity;ž managing stock through effective ordering, storage and identification of stock;ž managing trade creditors by negotiation of trade terms and through takingadvantage of settlement discounts; andž managing cash by effective forecasting, short-term borrowing and/or invest-ment of surplus cash where possible.
Managing debtors
The main measure of how effectively debtors are managed is the number of days’sales outstanding. Days’ sales outstanding is:
debtorsaverage daily sales
Using the previous example, the firm has sales of £2 million and debtors of£300,000. Average daily sales are £5,479 (£2 million/365). There are therefore 54.75average days’ sales outstanding (£300,000/£5,479).
The target number of days’ sales outstanding will be a function of the industry,the credit terms offered by the firm and its efficiency in both credit approvaland collection activity. Management of debtors will aim to reduce days’ salesoutstanding over time and minimize bad debts.
Acceptance policies will aim to determine the creditworthiness of new cus-tomers before sales are made. This can be achieved by checking trade and bankreferences, searching company accounts and consulting a credit bureau for anyadverse reports. Credit limits can be set for each customer.
Collection policy should ensure that invoices and statements are issued quicklyand accurately, that any queries are investigated as soon as they are identified, andthat continual follow-up (by telephone and post) of late-paying customers shouldtake place. Discounts may be offered for settlement within credit terms.
Bad debts may occur because a customer’s business fails. For this reason,firms establish a provision (see earlier in this chapter) to cover the likelihood ofcustomers not being able to pay their debts.
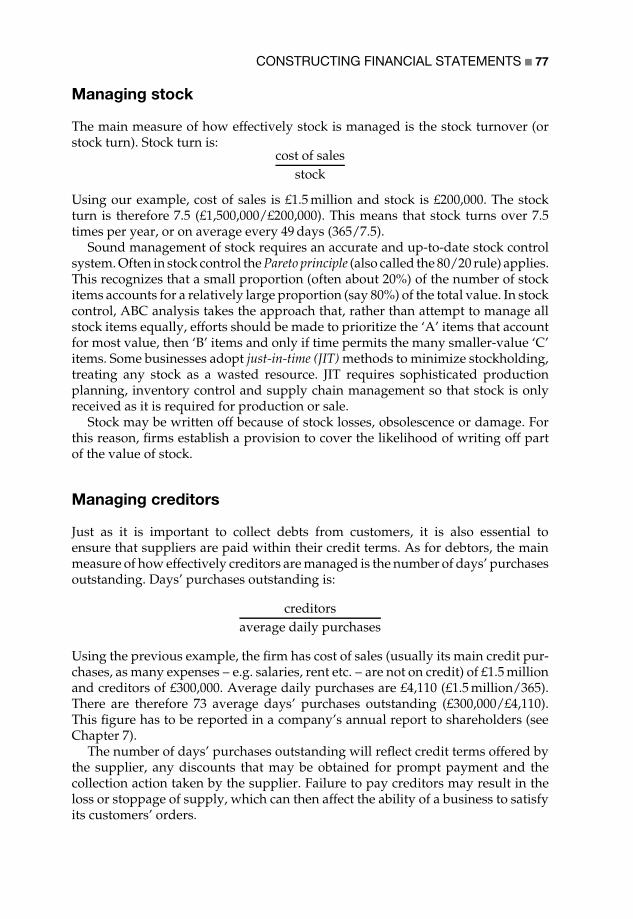
CONSTRUCTING FINANCIAL STATEMENTS 77
Managing stock
The main measure of how effectively stock is managed is the stock turnover (orstock turn). Stock turn is:
cost of salesstock
Using our example, cost of sales is £1.5 million and stock is £200,000. The stockturn is therefore 7.5 (£1,500,000/£200,000). This means that stock turns over 7.5times per year, or on average every 49 days (365/7.5).
Sound management of stock requires an accurate and up-to-date stock controlsystem. Often in stock control the Pareto principle (also called the 80/20 rule) applies.This recognizes that a small proportion (often about 20%) of the number of stockitems accounts for a relatively large proportion (say 80%) of the total value. In stockcontrol, ABC analysis takes the approach that, rather than attempt to manage allstock items equally, efforts should be made to prioritize the ‘A’ items that accountfor most value, then ‘B’ items and only if time permits the many smaller-value ‘C’items. Some businesses adopt just-in-time (JIT) methods to minimize stockholding,treating any stock as a wasted resource. JIT requires sophisticated productionplanning, inventory control and supply chain management so that stock is onlyreceived as it is required for production or sale.
Stock may be written off because of stock losses, obsolescence or damage. Forthis reason, firms establish a provision to cover the likelihood of writing off partof the value of stock.
Managing creditors
Just as it is important to collect debts from customers, it is also essential toensure that suppliers are paid within their credit terms. As for debtors, the mainmeasure of how effectively creditors are managed is the number of days’ purchasesoutstanding. Days’ purchases outstanding is:
creditorsaverage daily purchases
Using the previous example, the firm has cost of sales (usually its main credit pur-chases, as many expenses – e.g. salaries, rent etc. – are not on credit) of £1.5 millionand creditors of £300,000. Average daily purchases are £4,110 (£1.5 million/365).There are therefore 73 average days’ purchases outstanding (£300,000/£4,110).This figure has to be reported in a company’s annual report to shareholders (seeChapter 7).
The number of days’ purchases outstanding will reflect credit terms offered bythe supplier, any discounts that may be obtained for prompt payment and thecollection action taken by the supplier. Failure to pay creditors may result in theloss or stoppage of supply, which can then affect the ability of a business to satisfyits customers’ orders.

78 ACCOUNTING FOR MANAGERS
A theoretical perspective on financial statements
A necessary ingredient for shareholder value (see Chapter 2), given the separationof ownership from control in most large business organizations, is the controlof what managers actually do. Control is considered in the rational-economicparadigm (see Chapter 4) through the notion of contract, in which the role ofcontrol is to measure and reward performance such that there will be greater goalcongruence, i.e. that individuals pursuing their own self-interest will also pursuethe collective interest.
There are two main versions of contractual theory: agency theory and transac-tion cost economics. Agency theory sees the economy as a network of interlockingcontracts. The transaction cost approach sees the economy as a mixture of marketsand hierarchies (transaction cost economics is discussed further in Chapter 13).
Agency theory
Agency theory is concerned with contractual relationships within the firm, betweena principal and an agent, whose rights and duties are specified by a contract ofemployment. This model recognizes the behaviour of an agent (the manager),whose actions the management accounting and control system seeks to influenceand control. Both are assumed to be rational-economic persons motivated solelyby self-interest, although they may differ with respect to their preferences, beliefsand information.
The principal wishes to influence what the agent does, but delegates tasks to theagent in an uncertain environment. The agent expends effort in the performanceof these tasks. The outcome depends on both environmental factors and theeffort expended by the agent. Under the sharing rule, the agent usually receives areward, being a share of the outcome. The reward will depend on the informationsystem used to measure the outcome. Consequently, financial reports play animportant role in regulating the actions of agents. The assumption of agencytheory is that the agent obtains utility (a benefit) from the reward but disutilityfrom expending effort. Both principal and agent are assumed to be risk averse andutility maximizers.
The agency model involves seeking an employment contract that specifiesthe sharing rule and the information system. An accounting system can provideoutput measures from which an agent’s efforts can be inferred, but the measuresmay not accurately reflect the effort expended. This leads to uncertainty about therelationship between the accounting measure and the agent’s effort. If the principalcannot observe the agent’s effort, or infer it from measured output, the agent mayhave an incentive to act in a manner different to the employment contract – thisis called moral hazard. A principal who can observe the agent’s effort but does nothave access to all the information held by the agent does not know whether theeffort expended has been based on the agent’s information or whether the agenthas ‘shirked’. This is called adverse selection.
Moral hazard and adverse selection are a consequence of information asymmetry.This happens because principal and agent have different amounts of information. A

CONSTRUCTING FINANCIAL STATEMENTS 79
function of accounting under agency theory is to improve efficiency by minimizingthe losses caused through moral hazard and adverse selection.
Seal (1995) gives the example of renting a holiday home that is used by theowner only a few weeks of the year. The owner (the principal) may appoint a localagent to let out the home. The agency problem is how to motivate and monitorthe agent in return for the commission earned by the agent. The owner will expectregular accounts of income and expenditure. Agency theorists use this reasoningto explain the development of financial accounting and auditing in more complexagency relationships.
There are problems with agency theory, however. It ignores the effect of capitalmarkets by assuming a single owner rather than a group of owners. The modelfocuses on single-period behaviour; many individuals violate the assumptions ofrational self-interested behaviour and the agency perspective is narrow becausethere is no regard given to power, trust, ethical issues or equity, all of which mayaffect behaviour. We consider alternative theories in the next chapter.
Conclusion
This chapter has covered the main financial statements. It has introduced theregulations governing those statements and described the most important princi-ples underlying the construction of accounts. The chapter has also discussed themanagement of working capital. The chapter concluded with an introduction towhat has been historically one of the main theories underlying the constructionof financial statements, agency theory. In the next chapter, we introduce the toolsand techniques that are used to interpret financial statements and consider somealternative theoretical perspectives.
References
Blake, J. (1997). Accounting Standards. (6th edn). London: Financial Times/Pitman Publish-ing.
Seal, W. (1995). Economics and control. In A. J. Berry, J. Broadbent and D. Otley (eds),Management Control: Theories, Issues and Practices, London: Macmillan.

Part II
Using Accounting Informationfor Decision-Making, Planningand Control
Part II shows the reader how accounting information is used in decision-making,planning and control. The accounting tools and techniques are explained andillustrated by straightforward examples. Case studies, drawn mainly from realbusiness examples, help draw out the concepts. Theory is integrated with thetools and techniques, and the use of quotations from the original sources shouldencourage readers to access the accounting academic literature that they may findof interest.
Chapter 7 helps the reader to interpret the main financial statements. Chapters 8,9 and 10 consider the accounting techniques that are of value in marketing,operations and human resource decisions respectively. Chapters 8, 9 and 10do not take an approach to accounting that is common to other books. Thesechapters provide a practitioner- rather than an accounting-centred approach,demonstrating techniques that do not require any prior management accountingknowledge. The more traditional accounting focus is left to Chapter 11, by whichtime the reader should have little difficulty in understanding the more complexconcepts. Chapter 12 focuses on strategic decisions such as capital investment andChapter 13 on divisional performance measurement. Chapter 14 covers the subjectof budgeting and Chapter 15 discusses budgetary control.


7
Interpreting Financial Statementsand Alternative TheoreticalPerspectives
This chapter introduces the content of a company’s Annual Report and showshow ratio analysis can be used to interpret financial statements. This interpretationcovers profitability, liquidity (cash flow), gearing (borrowings), activity/efficiencyand shareholder return. A case study demonstrates how the use of ratios can look‘behind the numbers’ contained in an Annual Report. The chapter concludes withseveral alternative theoretical frameworks on financial reporting.
Interpreting financial statements
Financial statements are an important part of a company’s Annual Report, which isrequired for all companies listed on the Stock Exchange. For companies not listed,the Companies Act requires the preparation of financial statements. The process ofinterpreting financial statements begins with a consideration of the wider context:economic conditions; changes in the industry (e.g. regulation, technology); and thecompetitive advantage (e.g. marketing, operations, distribution etc.) held by thebusiness. Within this context, often gained through the financial press and tradeperiodicals, the Annual Report itself can be considered.
The Annual Report for a listed company typically contains:
1 A financial summary – the key financial information.2 The chairman’s or directors’ report. This provides a useful summary of the
key factors affecting the company’s performance over the past year and itsprospects for the future. It is important to read this information as it providesa background to the financial statements, in particular the company’s productsand major market segments. It is important to ‘read between the lines’ in thisreport, since the intention of the Annual Report is to paint a ‘glossy’ pictureof the business. However, as competitors will also read the Annual Report, thecompany takes care not to disclose more than is necessary.
3 The statutory reports (i.e. those required by the Companies Act) by the directorsand auditors. These will help to identify any key issues that may be found inthe accounts themselves.

84 ACCOUNTING FOR MANAGERS
4 The financial statements: Profit and Loss account, Balance Sheet and Cash Flowstatement. The consolidated figures should be used, as these are the total figuresfor the group of companies that comprise the whole business.
5 Notes to the accounts, which provide detailed figures and explanations to theaccounts. These often run to many pages.
6 A five-year summary of key financial information (a Stock Exchange Yellow Bookrequirement).
The Accounting Standards Board recommends that listed companies include anoperating and financial review that provides ‘a framework for the directors to discussand analyse the business’s performance and the factors underlying its resultsand financial position, in order to assist users to assess for themselves the futurepotential of the business’ (quoted in Blake, 1997). The operating and financialreview would replace much of the information contained in the chairman’s ordirectors’ reports (item 2 above).
The Profit and Loss account, Balance Sheet and Cash Flow statement can bestudied using ratios. Ratios are typically two numbers, with one being expressedas a percentage of the other. Ratio analysis can be used to help interpret trendsin performance year on year and by benchmarking to industry averages or to theperformance of individual competitors. Ratio analysis can be used to interpretperformance against five criteria:
ž the rate of profitability;ž liquidity, i.e. cash flow;ž gearing, i.e. the proportion of borrowings to shareholders’ investment;ž how efficiently assets are utilized; andž the returns to shareholders.
Ratio analysis
There are different definitions that can be used for each ratio. However, it isimportant that whatever ratios are used, they are meaningful to the business andapplied consistently. The most common ratios follow. The calculations refer tothe example Profit and Loss account and Balance Sheet provided in Tables 6.1,6.2 and 6.3 in Chapter 6. Ratios are nearly always expressed as a percentage (bymultiplying the answer by 100).
Profitability
Return on (shareholders’) investment (ROI)
net profit after taxshareholders’ funds
701000
= 7%

INTERPRETING FINANCIAL STATEMENTS 85
Return on capital employed (ROCE)
operating profit before interest and taxshareholders’ funds + long-term debt
1001,000 + 300
= 7.7%
Operating profit/sales
operating profit before interest and taxsales
1002,000
= 5%
Gross profit/sales
gross profitsales
5002,000
= 25%
Each of the profitability ratios provides a different method of interpretingprofitability. Satisfactory business performance requires an adequate return onshareholders’ funds and total capital employed in the business (the total of theinvestment by shareholders and lenders). Profit must also be achieved as a per-centage of sales, which must itself grow year on year. The operating profit andgross profit margins emphasize different elements of business performance.
Liquidity
Working capital
current assetscurrent liabilities
500350
= 143%
Acid test (or quick ratio)
current assets − inventorycurrent liabilities
500 − 200350
= 86%
A business that has an acid test of less than 100% may experience difficulty inpaying its debts as they fall due. On the other hand, a company with too high aworking capital ratio may not be utilizing its assets effectively.
Gearing
Gearing ratio
long-term debtshareholders’ funds + long-term debt
3001,000 + 300
= 23.1%

86 ACCOUNTING FOR MANAGERS
Table 7.1 Risk and return – effect of different debt/equity mix
100% equity 50% equity50% debt
10% equity90% debt
Capital employed 100,000 100,000 100,000
Equity 100,000 50,000 10,000Debt 0 50,000 90,000
Operating profit before interest and tax 20,000 20,000 20,000Interest at 10% on debt 0 5,000 9,000
Profit after interest 20,000 15,000 11,000Tax at 30% 6,000 4,500 3,300
Profit after tax 14,000 10,500 7,700
Return on investment 14% 21% 77%
Interest cover
profit before interest and taxinterest payable
10016
= 6.25 times
The higher the gearing, the higher the risk of repaying debt and interest. The lowerthe interest cover, the more pressure there is on profits to fund interest charges.
However, because external funds are being used, the rate of profit earned byshareholders is higher where external funds are used. The relationship betweenrisk and return is an important feature of interpreting business performance.Consider the example in Table 7.1 of risk and return for a business whose capitalemployed is derived from different mixes of debt and equity.
While in the above example the return on capital employed is a constant 20%(an operating profit of £20,000 on capital employed of £100,000), the return onshareholders’ funds increases as debt replaces equity. This improvement to thereturn to shareholders carries a risk, which increases as the proportion of profitstaken by the interest charge increases (and is reflected in the interest cover ratio).If profits turn down, there are substantially more risks carried by the highlygeared business.
Activity/efficiency
Asset turnover
salestotal assets
2,0001,150 + 500
= 121%
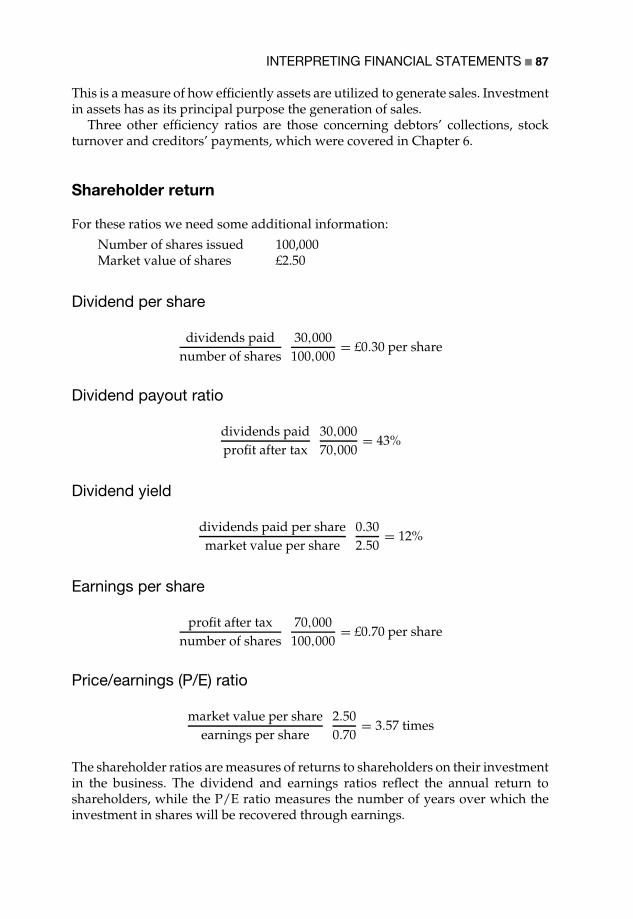
INTERPRETING FINANCIAL STATEMENTS 87
This is a measure of how efficiently assets are utilized to generate sales. Investmentin assets has as its principal purpose the generation of sales.
Three other efficiency ratios are those concerning debtors’ collections, stockturnover and creditors’ payments, which were covered in Chapter 6.
Shareholder return
For these ratios we need some additional information:
Number of shares issued 100,000Market value of shares £2.50
Dividend per share
dividends paidnumber of shares
30,000100,000
= £0.30 per share
Dividend payout ratio
dividends paidprofit after tax
30,00070,000
= 43%
Dividend yield
dividends paid per sharemarket value per share
0.302.50
= 12%
Earnings per share
profit after taxnumber of shares
70,000100,000
= £0.70 per share
Price/earnings (P/E) ratio
market value per shareearnings per share
2.500.70
= 3.57 times
The shareholder ratios are measures of returns to shareholders on their investmentin the business. The dividend and earnings ratios reflect the annual return toshareholders, while the P/E ratio measures the number of years over which theinvestment in shares will be recovered through earnings.

88 ACCOUNTING FOR MANAGERS
Interpreting financial information using ratios
The interpretation of any ratio depends on the industry. In particular, the rationeeds to be interpreted as a trend over time, or by comparison to industry averagesof competitor ratios. These comparisons help determine whether performance isimproving and where improvement may be necessary. Based on the understandingof the business context and competitive conditions, and the information providedby ratio analysis, users of financial statements can make judgements about thepattern of past performance and prospects for a company and its financial strength.
Broadly speaking, businesses seek:
ž increasing rates of profit on shareholders’ funds, capital employed and sales;ž adequate liquidity (a ratio of current assets to liabilities of not less than 100%)to ensure that debts can be paid as they fall due, but not an excessive rate tosuggest that funds are inefficiently used;ž a level of debt commensurate with the business risk taken;ž high efficiency as a result of maximizing sales from the business’s invest-ments; andž a satisfactory return on the investment made by shareholders.
When considering the movement in a ratio over two or more years, it is importantto look at possible causes for the movement. These can be gained by understandingthat either the numerator (top number in the ratio) or denominator (bottom numberin the ratio) or both can influence the change.
Some of the possible explanations behind changes in ratios are described below.
Profitability
Improvements in the returns on shareholders’ funds (ROI) and capital employed(ROCE) may either be because profits have increased and/or because the capitalused to generate those profits has altered. When businesses are taken over byothers, one way of improving ROI or ROCE is to increase profits by reducing costs(often as a result of economies of scale), but another is to maintain profits whilereducing assets and repaying debt.
Improvements in operating profitability as a proportion of sales (PBIT or EBIT)are the result of profitability growing at a faster rate than sales growth, a resulteither of a higher gross margin or lower expenses. Note that sales growth mayresult in a higher profit but not necessarily in a higher rate of profit as a percentageof sales.
Improvement in the rate of gross profit may be the result of higher sellingprices, lower cost of sales, or changes in the mix of product/services sold ordifferent market segments in which they are sold, which may reflect differentialprofitability.
Naturally, the opposite explanations hold true for deterioration in profitability.

INTERPRETING FINANCIAL STATEMENTS 89
Liquidity
Improvements in the working capital and acid test ratios are the result of changingthe balance between current assets and current liabilities. As the working capitalcycle in Figure 6.1 showed, money changes form between debtors, stock, bankand creditors. Borrowing over the long term in order to fund current assets willimprove this ratio, as will profits that generate cash flow. By contrast, using liquidfunds to repay long-term loans or incurring losses will reduce the working capitalused to repay creditors.
Gearing
The gearing ratio reflects the balance between long-term debt and shareholders’equity. It changes as a result of changes in either shareholders’ funds (more sharesmay be issued), raising new borrowings or repayments of debt. As debt increasesin proportion to shareholders’ funds, the gearing ratio will increase.
Interest cover may increase as a result of higher profits or lower borrowings(and reduce as a result of lower profits or higher borrowings), but even withconstant borrowings changes in the interest rate paid will also influence this ratio.
Activity/efficiency
Asset turnover improves either because sales increase or the total assets usedreduce, a similar situation to that described above for ROCE. The efficiency withwhich debtors are collected, inventory is managed and creditors paid is also animportant measure.
Shareholder return
Decisions made by directors influence both the dividend per share and thedividend payout ratio. Dividends are a decision made by directors on the basisof the proportion of profits they want to distribute and the capital needed to beretained in the business to fund growth. Often, shareholder value considerationswill dictate the level of dividends, which businesses do not like to reduce on a pershare basis. This is sometimes at the cost of retaining fewer profits and then havingto borrow additional funds to support growth strategies. However, the number ofshares issued also affects this ratio, as share issues will result in a lower dividendper share unless the total dividend is increased.
As companies have little influence over their share price, which is a result ofmarket expectations as much as past performance, dividend yield, while influencedby the dividend paid per share, is more readily influenced by changes in the marketprice of the shares.
Earnings per share is influenced, as for profitability, by the profit but also(like dividends) by the number of shares issued. As for the dividend yield, theprice/earnings (P/E) ratio is often more a result of changes in the share price thanin the profits reflected in the earnings per share.
Explanations for changes in ratios are illustrated in the following case study.

90 ACCOUNTING FOR MANAGERS
Case study: Ottakar’s – interpreting financial statements
Ottakar’s has 74 bookshops and 900 employees. It is the second largest specialistbookseller in the UK after Waterstone’s. The information in Tables 7.2 and 7.3 hasbeen extracted from the company’s annual report.
The number of shares issued was 20,121,000 in 2001 and 20,082,000 in 2000.Ratios for profitability are shown in Table 7.4.
There was a strong sales growth between 2000 and 2001. Despite this growth,the gross margin remained constant and operating profit to sales increased. Thisis because the proportion of sales consumed by overheads (selling, distributionand administration costs) reduced from 36.6% [(22,707 + 3,986)/72,922] to 34.8%[(26,219 + 3,797)/86,287]. Operating profit more than doubled (from £1,678 to£3,516) and profit after tax increased from £463 to £1,792 (all figures are in £’000).As shareholders’ funds increased by only 10% and capital employed by only 6%,the return on both measures of investment showed a strong improvement.
Ratios for liquidity are shown in Table 7.5. While the working capital ratio ishealthy, indicating that the company has adequate funds to pay its debts, theacid test reveals that after deducting inventory, the company has only about 22%of assets to cover its current liabilities. This means that it is dependent on salesof books in stock to pay suppliers for those books. The efficiency measures (seebelow) support this.
Table 7.2 Ottakar’s Profit and Loss account
in £’000 2001 2000
Turnover 86,287 72,922Cost of sales −52,755 −44,551
Gross profit 33,532 28,371Selling and distribution costs −26,219 −22,707Administration expenses −3,797 −3,968
Operating profit 3,516 1,678Profit/(loss) on disposal of fixed assets 4 −336
Profit before interest and taxation 3,520 1,342Other interest receivable and similar income 3 2Interest payable and similar charges −727 −562
Profit on ordinary activities before taxation 2,796 782Taxation on profit on ordinary activities −1,004 −319
Profit for the financial period 1,792 463Dividend and appropriations −503 −302
Retained profit for the period for equity shareholders 1,289 161
Earnings per share 8.91p 2.31p
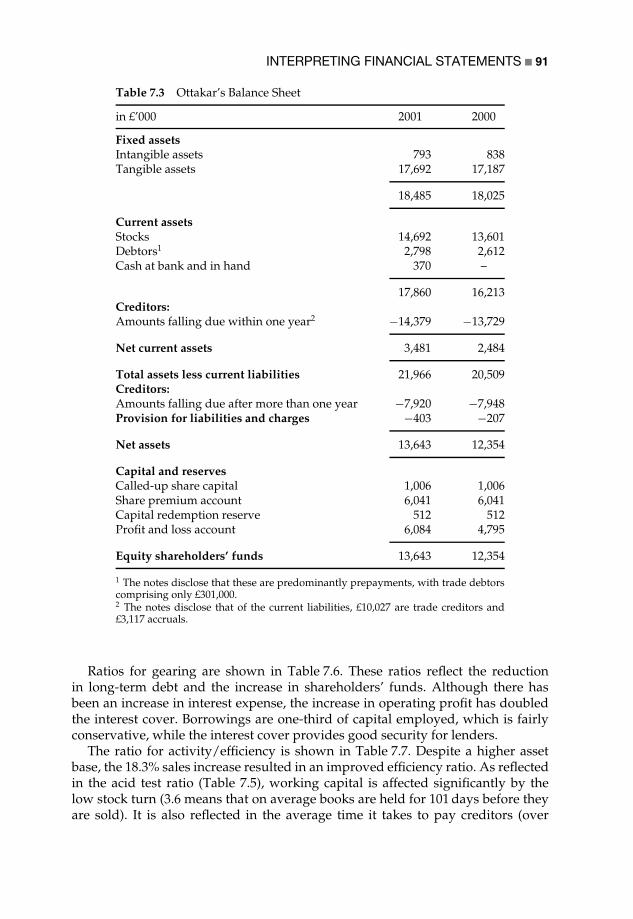
INTERPRETING FINANCIAL STATEMENTS 91
Table 7.3 Ottakar’s Balance Sheet
in £’000 2001 2000
Fixed assetsIntangible assets 793 838Tangible assets 17,692 17,187
18,485 18,025
Current assetsStocks 14,692 13,601Debtors1 2,798 2,612Cash at bank and in hand 370 –
17,860 16,213Creditors:Amounts falling due within one year2 −14,379 −13,729
Net current assets 3,481 2,484
Total assets less current liabilities 21,966 20,509Creditors:Amounts falling due after more than one year −7,920 −7,948Provision for liabilities and charges −403 −207
Net assets 13,643 12,354
Capital and reservesCalled-up share capital 1,006 1,006Share premium account 6,041 6,041Capital redemption reserve 512 512Profit and loss account 6,084 4,795
Equity shareholders’ funds 13,643 12,354
1 The notes disclose that these are predominantly prepayments, with trade debtorscomprising only £301,000.2 The notes disclose that of the current liabilities, £10,027 are trade creditors and£3,117 accruals.
Ratios for gearing are shown in Table 7.6. These ratios reflect the reductionin long-term debt and the increase in shareholders’ funds. Although there hasbeen an increase in interest expense, the increase in operating profit has doubledthe interest cover. Borrowings are one-third of capital employed, which is fairlyconservative, while the interest cover provides good security for lenders.
The ratio for activity/efficiency is shown in Table 7.7. Despite a higher assetbase, the 18.3% sales increase resulted in an improved efficiency ratio. As reflectedin the acid test ratio (Table 7.5), working capital is affected significantly by thelow stock turn (3.6 means that on average books are held for 101 days before theyare sold). It is also reflected in the average time it takes to pay creditors (over

92 ACCOUNTING FOR MANAGERS
Table 7.4 Ottakar’s profitability ratios
2001 2000
Return on shareholders’ funds 1,792 463
13,643 12,354=13.1% =3.7%
Return on capital employed 3,516 1,678
21,563 (13,643 + 7,920) 20,302 (12,354 + 7,948)=16.3% =8.3%
Operating profit/sales 3,516 1,678
86,287 72,922=4.1% =2.3%
Gross profit/sales 33,532 28,371
86,287 72,922=38.9% =38.9%
Sales growth 86,287 − 72,922
72,922=18.3%
Table 7.5 Ottakar’s liquidity ratios
2001 2000
Working capital 17,860 16,213
14,379 13,729=124.2% =118.1%
Acid test 3,168 (17,860 − 14,692) 2,612 (16,213 − 13,601)
14,379 13,729=22.0% =19.0%
two months). However, the ratios show a slight improvement between 2000 and2001 as current assets increased more than current liabilities, stock turn is higherand creditor payments quicker. Note that there are virtually no trade debtorsas the bookshops are a retail business, consequently the debtor days measure issomewhat meaningless.
The shareholder return ratios are shown in Table 7.8. The increase in profitsbetween 2000 and 2001 resulted in increased earnings per share and a higherdividend payout in cash terms, although the percentage of profits paid out individends reduced.
As was indicated earlier in this chapter, two years is too short a period to drawany meaningful conclusions and we would need to look at the ratios over five years

INTERPRETING FINANCIAL STATEMENTS 93
Table 7.6 Ottakar’s gearing ratios
2001 2000
Gearing 7,920 7,948
21,563 (13,643 + 7,920) 20,302 (7,948 + 12,354)=36.7% =39.1%
Interest cover 3,520 1,342
727 562=4.8 times =2.4 times
Table 7.7 Ottakar’s activity/efficiency ratio
2001 2000
Asset turnover 86,287 72,922
36,345 (18,485 + 17,860) 34,238 (18,025 + 16,213)=237% =213%
Stock turnover 52,755 44,551
14,692 13,601=3.6 turns =3.27 turns
=101 days (365/3.6) =112 days (365/3.27)Creditors days 10,027 8,695
145 (52,755/365) 122 (44,551/365)=69 days =71 days
Table 7.8 Ottakar’s shareholder return ratios
2001 2000
Dividend per share 503,000 302,000
20,121,000 20,082,000=2.5p per share =1.5p per share
Dividend payout ratio 503 302
1,792 463=28% =65%
Earnings per share (disclosed inProfit and Loss account)
8.91p 2.31p
to identify any trends properly. Table 7.9 shows some of the information fromthe five-year summary of performance in Ottakar’s annual report. These figuresshow the sales growth over the five years much more clearly than do the two-yearratios, although the increase in profits has been much lower. It also shows that the

94 ACCOUNTING FOR MANAGERS
Table 7.9 Ottakar’s five-year summary of performance
in £’000 1997 1998 1999 2000 2001
Turnover 23,710 38,649 57,316 72,922 86,287Gross profit 9,100 14,988 22,343 28,371 33,532Operating profit 1,276 2,619 3,312 1,678 3,516Earnings per share 7.78p 10.61p 12.36p 2.31p 8.91p
Table 7.10 Ottakar’s ratios based on five-year summary of performance
in £’000 1997 1998 1999 2000 2001
Sales growth +63% +48.3% +27.2% +18.3%Gross margin 38.4% 38.8% 39.0% 38.9% 38.9%Operating profit/sales 5.4% 6.8% 5.8% 2.3% 4.1%
2000 year experienced a fall in profits that was outside the trend. By calculatingthe ratios in Table 7.10 we can see this more clearly.
Although sales continue to increase, the rate of sales growth is slowing. Therate of gross profit to sales is very steady (an indication of the margin allowedby book publishers), while operating profits fluctuated (probably a reflection ofcosts incurred in opening new bookshops, since location, in common with mostretail businesses, is a key aspect of success). Ottakar’s annual report explains thatthe book market should experience an annual growth of 4–5%, but that the largerchains should gain market share at the expense of their weaker competitors.
It is important to remember that ratio analysis can be undertaken not only inrelation to the manager’s own organization, but also in relation to the financialstatements of competitors, customers and suppliers. This is an aspect of strategicmanagement accounting that was discussed in Chapter 4.
Alternative theoretical perspectives on financial statements
Chapter 6 described the traditional theoretical perspective that has informedfinancial statements, that is agency theory. We now consider some alternative per-spectives: social and environmental reporting, intellectual capital and institutionaltheory. We also introduce creative accounting and ethics.
Social and environmental reporting
The concern with stakeholders rather than shareholders (introduced in Chapter 2)began in the 1970s and is generally associated with the publication in 1975 of TheCorporate Report, a publication by the Accounting Standards Steering Committee.Accounting academics began to question profit as the sole measure of business

INTERPRETING FINANCIAL STATEMENTS 95
performance and suggested a wider social responsibility for business and socialaccounting. Concepts of corporate social accounting and socially responsible account-ing – most recently corporate social and environmental reporting (CSR) – attemptto highlight the impact of organizations on society.
Jones (1995) suggested three reasons for this:
1 A moral imperative that business organizations were insufficiently aware of thesocial consequences of their activities.
2 External pressure from government and pressure groups and the demand bysome institutional investors for ethical investments. This was linked to the roleof accounting in demonstrating how well organizations were fulfilling theirsocial contract, the implied contract between an organization and society.
3 Internal change taking place within organizations as a result of education etc.
However, there has been little support for broader social accounting becauseaccountants and managers have generally seen themselves as the agents of owners.Social reporting could be seen as undermining the power of shareholders and thefoundation of the capitalist economic system. There are also technical difficultiesassociated with social reporting, and a dominant belief among business leadersthat government and not business had the responsibility to determine whatwas reported.
During the 1980s and 1990s environmental accounting (see for example Grayet al., 1996) focused on responsibility for the natural environment and in particularon sustainability as a result of concerns about ozone depletion, the greenhouseeffect and global warming. These concerns were associated with the growth ofpressure groups such as Greenpeace and Friends of the Earth. Part of the appealof environmental accounting was that issues of energy efficiency, recycling andreductions in packaging had cost-saving potential and therefore profits and socialresponsibility came to be seen as not necessarily mutually exclusive.
Zadek (1998) argued that social and ethical accounting, auditing and reportingtogether provide one of the few practical mechanisms for companies to integratenew patterns of civil accountability and governance with a business success modelfocused on stakeholders and core non-financial as well as financial values. Sociallyresponsible businesses:
find the spaces in the pipeline between investors and consumers where somechoice in behaviour is possible . . . [and] a far more ambitious agenda ofshifting the basic boundaries by raising public awareness towards socialand environmental agendas, and supporting the emergence of new forms ofinvestors that take non-financial criteria into account. (p. 1439)
A further example of how the boundaries of accounting are set in arguablyinappropriate ways by the rational-economic paradigm is in the exclusion ofintellectual capital from financial statements.
96 ACCOUNTING FOR MANAGERS
Intellectual capital
Edvinsson and Malone (1997) defined intellectual capital as ‘the hidden dynamicfactors that underlie the visible company’ (p. 11). Stewart (1997) defined intellectualcapital as ‘formalized, captured and leveraged knowledge’ (p. 68).
Intellectual capital is of particular interest to accountants in increasinglyknowledge-based economies in which the limitations of traditional financialstatements erode their value as a tool supporting meaningful decision-making(Guthrie, 2001). Three dimensions of intellectual capital have been identified in theliterature: human (developing and leveraging individual knowledge and skills);organizational (internal structures, systems and procedures); and customer (loy-alty, brand, image etc.). The disclosure of information about intellectual capitalas an extension to financial reporting has been proposed by various accountingacademics. The most publicized example is the Skandia Navigator (see Edvinssonand Malone, 1997).
While most businesses espouse a commitment to employees and the value oftheir knowledge, as well as to some form of social or environmental responsibility,this is often merely rhetoric, a facade to appease the interest groups of stakeholders.The institutional setting of organizations provides another perspective from whichto view accounting and reporting.
Institutional theory
Institutional theory is valuable because it locates the organization within its his-torical and contextual setting. It is predicated on the need for legitimation andon isomorphic processes. Scott (1995) describes legitimation as the result of orga-nizations being dependent, to a greater or lesser extent, on support from theenvironment for their survival and continued operation. Organizations need thesupport of governmental institutions where their operations are regulated (andfew organizations are not regulated in some form or other). Organizations are alsodependent on the acquisition of resources (labour, finance, technology etc.) fortheir purposes. If an organization is not legitimated, it may incur sanctions of alegal, economic or social nature.
The second significant aspect of institutional power is the operation of isomor-phism, the tendency for different organizations to adopt similar characteristics.DiMaggio and Powell (1983) identified three forms of isomorphism: coercive, asa result of political influence and the need to gain legitimacy; mimetic, followingfrom standard responses to uncertainty; and normative, associated with profes-sionalization. They held that isomorphic tendencies between organizations werea result of wider belief systems and cultural frames of reference. Processes ofeducation, inter-organizational movement of personnel and professionalizationemphasize these belief systems and cultural values at an institutional level, andfacilitate the mimetic processes that result in organizations imitating each other.Isomorphic tendencies exist because ‘organizations compete not just for resources
INTERPRETING FINANCIAL STATEMENTS 97
and customers, but for political power and institutional legitimacy, for social aswell as economic fitness’ (DiMaggio and Powell, 1983, p. 150).
These legitimating and isomorphic processes become taken for granted byorganizations as they strive to satisfy the demands of external regulators, resourcesuppliers and professional groups. These taken-for-granted processes themselvesbecome institutionalized in the systems and processes – including accounting andreporting – adopted by organizations. Meyer (1994) argued that accounting arises‘in response to the demands made by powerful elements in the environment onwhich organizations are dependent’ (p. 122).
Each of these theoretical perspectives provides a different view of the role ofpreparers and the needs of users of financial statements. This perspective alsofollows through to the users of management accounting information.
However, as we have suggested earlier in this book, accounting is not withoutits limitations. A case study serves to highlight these limitations.
Case study: Carrington Printers – an accounting critique
Carrington Printers was a privately owned, 100-year-old printing companyemploying about 100 people and operating out of its own premises in a medium-sized town. Although the company was heavily indebted and had been operatingwith a small loss for the past three years, it had a fairly strong Balance Sheet and agood customer base spread over a wide geographic area. Carrington’s simplifiedBalance Sheet is shown in Table 7.11.
The nature of the printing industry at the time the accounts were preparedwas that there was excess production capacity and over the previous year a pricewar had been fought between competitors in order to retain existing customersand win new customers. The effect of this had been that selling prices (andconsequently profit margins) had fallen throughout the industry. Carrington’splant and equipment were, in the main, quite old and not suited to some ofthe work that it was winning. Consequently, some work was being producedinefficiently, with a detrimental impact on profit margins. Before the end ofthe year the sales director had left the company and had influenced many ofCarrington’s customers, with whom he had established a good relationship, tomove to his new employer. Over several months, Carrington’s sales began to dropsignificantly.
Lost sales and deteriorating margins on some of the business affected cash flow.Printing companies typically carry a large stock of paper in a range of weights,sizes and colours, while customers often take up to 60 days to pay their accounts.Because payment of taxes and employees takes priority, suppliers are often thelast group to be paid. The major suppliers are paper merchants, who stop supplieswhen their customers do not pay on time. The consequence of Carrington’s cashflow difficulties was that suppliers limited the supply of paper that Carringtonneeded to satisfy customer orders.
None of these events was reflected in the financial statements and the auditors,largely unaware of changing market conditions, had little understanding of the

98 ACCOUNTING FOR MANAGERS
Table 7.11 Carrington Printers’ Balance Sheet
Fixed assetsLand and buildings at cost less depreciation 1,000,000Plant and equipment at cost less depreciation 450,000
1,450,000
Current assetsDebtors 500,000Inventory 450,000
950,000
Less creditors due within one yearCreditors 850,000Bank overdraft 250,000
1,100,000Net current liabilities −150,000
Total assets less current liabilities 1,300,000Less creditors due after one year −750,000
Total net assets 550,000
Capital and reservesIssued capital 100,000Profit and loss account 450,000
Shareholders’ funds 550,000
gradual detrimental impact on Carrington that had taken place at the time of theaudit. Although aware of the cash flow tightening experienced by the company,the auditors signed the accounts, being satisfied that the business could be treatedas a going concern.
As a result of the problems identified above, Carrington approached its bankersfor additional loans. However, the bankers declined, believing that existing loanshad reached the maximum percentage of the asset values against which they wereprepared to lend. The company attempted a sale and leaseback of its land andbuildings (through which a purchaser pays a market price for the property, withCarrington becoming a tenant on a long-term lease). However, investors interestedin the property were not satisfied that Carrington was a viable tenant and theproperty was unable to be sold on that basis.
Cash flow pressures continued and the shareholders were approached tocontribute additional capital. They were unable to do so and six months afterthe Balance Sheet was produced the company collapsed, and was placed intoreceivership and subsequently liquidation by its bankers.

INTERPRETING FINANCIAL STATEMENTS 99
The liquidators found, as is common in failed companies, that the values in theBalance Sheet were substantially higher than what the assets could be sold for.In particular:
ž Land and buildings were sold for far less than an independent valuation hadsuggested, as the property would now be vacant.ž Plant and machinery were almost worthless given their age and condition andthe excess capacity in the industry at the time.ž Debtors were collected with substantial amounts being written off as bad debts.Customers often refuse to pay accounts giving spurious reasons and it is oftennot worthwhile for the liquidator to pursue collection action through the courts.ž Inventory was discovered to be largely worthless. Substantial stocks of paperwere found to have been held for long periods with little likelihood of everbeing used and other printers were unwilling to pay more than a fraction ofits cost.
As the bankers had security over most of Carrington’s assets, there were virtuallyno funds remaining after repaying bank loans to pay the unsecured creditors.
This case raises some important issues about the value of audited finan-cial statements:
1 The importance of understanding the context of the business, that is how itsmarket conditions and its mix of products or services are changing over time,and how well (or in this case badly) the business is able to adapt to these changes.
2 The preparation of financial statements assumes a going concern, but thecircumstances facing a business can change quickly and the Balance Sheet canbecome a meaningless document.
3 The auditors rely on information from the directors about significant risksaffecting the company. The directors did not intentionally deceive the auditors,but genuinely believed that the business could be turned around into profitthrough winning back customers. They also believed that the large inventorywould satisfy future customer orders. The directors also genuinely believed thatthe property could be sold in order to eliminate debt. This was unquestioned bythe auditors.
Creative accounting and ethics
Accounting choices, according to Francis, are moral choices:
Accounting is important precisely to the extent the accountant can transformthe world, can influence the lived experience of others in ways which causethat experience to differ from what it would be in the absence of accounting,or in the presence of an alternative kind of accounting. (quoted in Gowthorpeand Blake, 1998, p. 3)
Creative accounting practices have been justified by managers for reasons ofincome smoothing, to bring profits closer to forecasts; changing accounting policies

100 ACCOUNTING FOR MANAGERS
to distract attention from poor performance; or maintaining or boosting shareprices (Gowthorpe and Blake, 1998).
Despite the role of accounting standards and other regulations, creative account-ing has always played a part in the efforts made by a few companies to present theirperformance in a better light. Griffiths (1986) commented on the power of financialanalysts and investment advisers in the City (of London) and the aim of companydirectors to present the business as having steady growth in income and profits.This desire for a smoothing effect can be achieved by practices such as accruals,stock valuation, creating or reducing provisions, capitalizing or expensing costsand off-Balance Sheet financing (which was the main factor in Enron’s downfallin the United States). While creative accounting has been frowned on, earningsmanagement has not. Under earnings management, directors aim to satisfy themarket expectations influenced by stock analysts.
Smith (1992) described the techniques adopted by companies and claimed that‘much of the apparent growth in profits which had occurred in the 1980s was theresult of accounting sleight of hand rather than genuine economic growth’ (p. 4).However, although accounting standards continually improve, there are alwaysloopholes that accountants seem to find as quickly as standards are produced.
Richardson and Richardson (1998) emphasized the role of accountants inorganizations. They occupy special positions that privilege them to informationthat has the potential to reveal deviant top management behaviour, which can leadto social and emotional costs for innocent stakeholders and to corporate failures(such as those caused by Robert Maxwell and Polly Peck’s Asil Nadir). As theseconflicts are unlikely to be resolved internally, the authors argue for the ability to‘blow the whistle’. However, as things stand, it is more likely that the accountantwill simply leave the organization. The problem with whistleblowing, the authorscomment, is that to some it is an act of subversion, while to others it is an act ofcitizenship. To the organization, it is an act of disloyalty.
Conclusion
This chapter has provided the tools for analysing financial information. While ananalysis of the financial statements is useful, particularly for external interestedparties (shareholders, bankers and financiers, the government etc.), the informationis of limited use to the internal management of the business because:
ž it is aggregated to the corporate level, whereas managers require informationat the business unit level;ž it is aggregated to annual figures, whereas managers require timely information,at not less than monthly intervals;ž it is aggregated to headline figures, whereas managers require information inmuch greater detail;ž it does not provide a comparison of plan to actual figures to provide a gaugeon progress towards achieving business goals.
INTERPRETING FINANCIAL STATEMENTS 101
Consequently, the following chapters are concerned with the disaggregated (tobusiness unit level), more regular (usually monthly) and more detailed informationnecessary for management decision-making, planning and control.
This chapter and the previous chapter have set financial statements in the contextof alternative theoretical frameworks that can provide different perspectives onaccounting information. In the words of Bebbington et al. (2001), accountingpractice is the result of ‘habit, history, law and expedience, as well as social,political and economic choice’ (p. 8). These alternative perspectives continuethroughout the second part of this book.
References
Bebbington, J., Gray, R. and Laughlin, R. (2001). Financial Accounting: Practice and Principles.(3rd edn). London: Thomson Learning.
Blake, J. (1997). Accounting Standards. (6th edn). London: Financial Times/Pitman Publish-ing.
DiMaggio, P. J. and Powell, W. W. (1983). The iron cage revisited: Institutional isomorphismand collective rationality in organizational fields. American Sociological Review, 48, 147–60.
Edvinsson, L. and Malone, M. S. (1997). Intellectual Capital. London: Piatkus.Gowthorpe, C. and Blake, J. (eds) (1998). Ethical Issues in Accounting. London: Routledge.Gray, R. H., Owen, D. L. and Adams, C. (1996). Accounting and Accountability: Changes and
Challenges in Corporate Social and Environmental Reporting. London: Prentice Hall.Griffiths, I. (1986). Creative Accounting: How to Make Your Profits What You Want Them to Be.
London: Waterstone.Guthrie, J. (2001). The management, measurement and the reporting of intellectual capital.
Journal of Intellectual Capital, 2(1), 27–41.Jones, T. C. (1995). Accounting and the Enterprise: A Social Analysis. London: Routledge.Meyer, J. W. (1994). Social environments and organizational accounting. In W. R. Scott and
J. W. Meyer (eds), Institutional Environments and Organizations: Structural Complexity andIndividuality, Thousand Oaks, CA: Sage, Publications.
Richardson, S. and Richardson, B. (1998). The accountant as whistleblower. In C. Gowthorpeand J. Blake (eds), Ethical Issues in Accounting, London: Routledge.
Scott, W. R. (1995). Institutions and Organizations. Thousand Oaks, CA: Sage Publications.Smith, T. (1992). Accounting for Growth: Stripping the Camouflage from Company Accounts.
London: Century Business.Stewart, T. A. (1997). Intellectual Capital: The New Wealth of Organizations. London: Nicholas
Brealey Publishing.Zadek, S. (1998). Balancing performance, ethics, and accountability. Journal of Business Ethics,
17(13), 1421–41.


8
Marketing Decisions
This chapter considers the use of accounting information in making marketingdecisions. It begins with an overview of some of the key elements of marketingtheory and introduces cost behaviour: the distinction between fixed and variablecosts, average and marginal costs. Decisions involving the relationship betweenprice and volume are covered through the technique of cost–volume–profit (CVP)analysis. Different approaches to pricing are covered: cost-plus pricing; target rateof return; the optimum selling price; special pricing decisions; and transfer pricing.The chapter concludes with an introduction to segmental profitability.
Marketing strategy
Porter (1980) identified five forces that affect an industry: the threat of new entrants,the bargaining power of customers, the bargaining power of suppliers, and thethreat of substitute product/services. Against these four forces, the industry iscomposed of competitors, each of which develops strategies for success. In a laterbook, Porter (1985) identified three generic strategies that businesses can adopt inorder to achieve a sustainable competitive advantage. The alternative strategieswere to be a low-cost producer, a higher-cost producer that can differentiate itsproduct/services, or to focus on a market niche. Consequently, the notion of costis important in marketing decisions, particularly pricing decisions.
Marketing is the business function that aims to understand customer needs andsatisfy those needs more effectively than competitors. Marketing can be achievedthrough a focus on selling products and services or through building lastingrelationships with customers (customer relationship management). Marketingtexts emphasize the importance of adding value through marketing activity.Adding value differentiates product/services from competitors, and enables aprice to be charged that equates to the benefits obtained by the customer. However,for any business to achieve profitability, customers must be prepared to pay morefor the product/service benefit than the benefit costs to provide.
The price customers are willing to pay depends on what Doyle (1998) callsthe ‘factors which drive up the utility of an offer’, which he divides into fourgroups. Product drivers include performance, features, reliability, operating costsand serviceability. Services drivers include ease of credit availability, ordering,delivery, installation, training, after-sales service and guarantees. Personnel drivers
104 ACCOUNTING FOR MANAGERS
include the professionalism, courtesy, reliability and responsiveness of staff. Imagedrivers reflect the confidence of customers in the company or brand name, which isbuilt through the other three drivers and by advertising and promotional activity.Doyle (1998) recognized that each of these value drivers has cost drivers.
The sales mix is the mix of product/services offered by the business, each ofwhich may be aimed at satisfying different customer needs. Businesses developmarketing strategies to meet the needs of their customers in different marketsegments, each of which can be defined by its unique characteristics. These segmentsmay yield different prices and incur different costs as customers demand more orless of different product/services.
Pricing of product/services is crucial to business success, in terms of increas-ing the perceived value so as to maximize the margin between price and costand to increase volume and market share without eroding profits. Pricingstrategies may be aimed at penetration – achieving long-term market share – orskimming – maximizing short-term profits from a limited market.
A focus on customer relationship management entails taking a longer-termview than product/service profitability and emphasizes the profits that can bederived from a satisfied customer base. Doyle (1998) describes loyal customersas assets, quoting research that tried to measure the value of a loyal customer.Doyle says, ‘If managers know the cost of losing a customer, they can evaluatethe likely pay-off of investments designed to keep customers happy’ (pp. 51–2).Doyle explained that the cost of winning new customers is high, loyal customerstend to buy more regularly, spend more and are often willing to pay premiumprices. This is an element of the business goodwill, part of the ‘intellectual capital’that is not reported in financial statements (see Chapter 7).
A further element of marketing is the distribution channel to be used. Thismay range from the company’s own salesforce to retail outlets, direct marketingand the number of intermediaries between the product/service provider and theultimate customer.
Marketing texts typically introduce marketing strategy as a combination ofthe 4 Ps of product, price, place and promotion. The marketing strategy for abusiness will encompass decisions about product/service mix, customer mix,market segmentation, value and cost drivers, pricing and distribution channel.Each element of marketing strategy implies an understanding of accounting, whichcan help to answer questions such as:
ž What is the volume of product/services that we need to sell to maintainprofitability?ž What alternative approaches to pricing can we adopt?ž What is our customer, product/service and distribution channel profitability ineach of our market segments?
This chapter is concerned with answering these questions. Although informationon competitors, customers and suppliers is likely to be limited, strategic manage-ment accounting (see Chapter 4) can apply the same tools and techniques in thepursuit of competitive advantage.
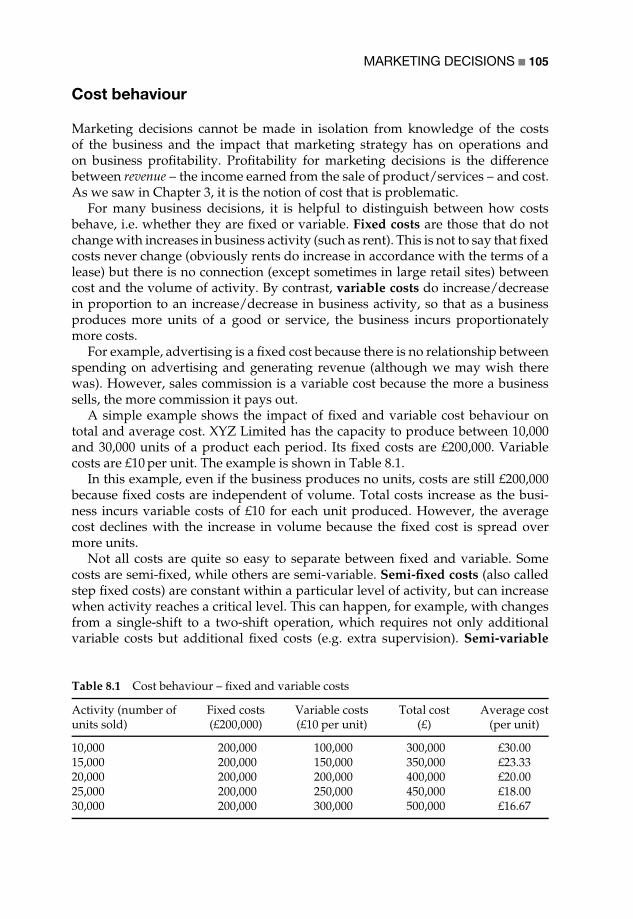
MARKETING DECISIONS 105
Cost behaviour
Marketing decisions cannot be made in isolation from knowledge of the costsof the business and the impact that marketing strategy has on operations andon business profitability. Profitability for marketing decisions is the differencebetween revenue – the income earned from the sale of product/services – and cost.As we saw in Chapter 3, it is the notion of cost that is problematic.
For many business decisions, it is helpful to distinguish between how costsbehave, i.e. whether they are fixed or variable. Fixed costs are those that do notchange with increases in business activity (such as rent). This is not to say that fixedcosts never change (obviously rents do increase in accordance with the terms of alease) but there is no connection (except sometimes in large retail sites) betweencost and the volume of activity. By contrast, variable costs do increase/decreasein proportion to an increase/decrease in business activity, so that as a businessproduces more units of a good or service, the business incurs proportionatelymore costs.
For example, advertising is a fixed cost because there is no relationship betweenspending on advertising and generating revenue (although we may wish therewas). However, sales commission is a variable cost because the more a businesssells, the more commission it pays out.
A simple example shows the impact of fixed and variable cost behaviour ontotal and average cost. XYZ Limited has the capacity to produce between 10,000and 30,000 units of a product each period. Its fixed costs are £200,000. Variablecosts are £10 per unit. The example is shown in Table 8.1.
In this example, even if the business produces no units, costs are still £200,000because fixed costs are independent of volume. Total costs increase as the busi-ness incurs variable costs of £10 for each unit produced. However, the averagecost declines with the increase in volume because the fixed cost is spread overmore units.
Not all costs are quite so easy to separate between fixed and variable. Somecosts are semi-fixed, while others are semi-variable. Semi-fixed costs (also calledstep fixed costs) are constant within a particular level of activity, but can increasewhen activity reaches a critical level. This can happen, for example, with changesfrom a single-shift to a two-shift operation, which requires not only additionalvariable costs but additional fixed costs (e.g. extra supervision). Semi-variable
Table 8.1 Cost behaviour – fixed and variable costs
Activity (number ofunits sold)
Fixed costs(£200,000)
Variable costs(£10 per unit)
Total cost(£)
Average cost(per unit)
10,000 200,000 100,000 300,000 £30.0015,000 200,000 150,000 350,000 £23.3320,000 200,000 200,000 400,000 £20.0025,000 200,000 250,000 450,000 £18.0030,000 200,000 300,000 500,000 £16.67

106 ACCOUNTING FOR MANAGERS
costs have both fixed and variable components. A simple example is a telephonebill, which will have a fixed component (rental) and a variable component (calls).Maintenance of motor vehicles can be both time based (the fixed component) andmileage based (the variable component).
This example introduces the notion of marginal cost. The marginal cost is thecost of producing one extra unit. In the above example, to increase volume from10,000 to 15,000 units incurs a marginal cost of £50,000 (which in this case is 5,000additional units at a variable cost of £10 each). However, marginal costs mayinclude a fixed-cost element (in the case of semi-fixed costs).
The notion of cost is therefore quite difficult. Is the cost in the above example theaverage cost or the marginal cost? If it is the average cost, what level of activity ischosen to determine that average, given fluctuating volumes of sales from periodto period?
Cost–volume–profit analysis
A method for understanding the relationship between revenue, cost and salesvolume is cost–volume–profit analysis, or CVP. CVP is concerned with under-standing the relationship between changes in activity (the number of units sold)and changes in selling prices and costs (both fixed and variable). Typical questionsthat CVP may help with are:
ž What is the likely effect on profits of changes in selling price or the volumeof activity?ž If we incur additional costs, what changes should we make to our selling priceor to the volume that we need to sell?
CVP is used by accountants in a relatively simplistic manner. While most busi-nesses will sell a wide range of product/services at many different prices (e.g.quantity discounts), accountants assume a constant product/service mix and aver-age selling prices per unit. The assumption is that these relationships are linear,rather than the curvilinear models preferred by economists that reflect economiesand diseconomies of scale. The accountant limits this problem by recognizing therelevant range. The relevant range is the volume of activity within which the busi-ness expects to be operating over the short-term planning horizon, typically thecurrent or next accounting period, and the business will usually have experienceof operating at this level of output. Within the relevant range, the accountant’smodel and the economist’s model are similar.
Profit can be shown as the difference between revenue and costs (both fixedand variable). This relationship can be shown in the following formula:
net profit = revenue − (fixed costs + variable costs)
net profit = (units sold × selling price) − [fixed costs + (units sold
× unit variable cost)]

MARKETING DECISIONS 107
In mathematical terms, this is:
N = Pu − (F + Bu)
where:
N = net profit
u = number of units sold
P = selling price per unit
F = total fixed costs
B = variable cost per unit
Using the example of XYZ Limited, a selling price of £25 for 20,000 units wouldyield a net profit of:
N = (£25 × 20,000) − [£200,000 + (£10 × 20,000)]
N = £500,000 − £400,000
N = £100,000
CVP permits sensitivity analysis. Sensitivity analysis is an approach to under-standing how changes in one variable (e.g. price) affect other variables (e.g.volume). This is important, because revenues and costs cannot be predicted withcertainty and there is always a range of possible outcomes, i.e. different mixes ofprice, volume and cost.
Using sensitivity analysis, a business may ask questions such as: What is theselling price (P) required for a profit (N) of £150,000 on sales of 25,000 units? Tocalculate this, we enter the data we know in the formula and solve for the missingfigure (in this case price):
£150,000 = £P × 25,000 − [£200,000 + (£10 × 25,000)]
£150,000 = £25,000P − £450,000
P = £600,00025,000
P = £24 per unit
The breakeven point is the point at which total costs equal total revenue, that iswhere there is neither a profit nor a loss. How many units have to be sold for thebusiness to break even? This question can be answered by using simple algebra

108 ACCOUNTING FOR MANAGERS
to solve the above equation for u (the number of units) where N (net profit) is 0,as follows:
0 = Pu − (F + Bu)
0 = 20u − (200,000 + 10u)
u = 200,00010
u = 20,000
However, a simpler formula for breakeven is:
breakeven sales (in units) = fixed costsselling price per unit − variable cost per unit
= £200,00020 − 10
= 20,000 units
Note that £10 is the unit contribution, i.e. the difference between the selling priceand the variable cost per unit. The unit contribution can also be expressed as apercentage of sales of 0.5 or 50% (£10/£20), which applies to any level of sales asthe ratio of contribution (£10) to selling price (£20) remains constant within therelevant range.
breakeven sales (in £s) = fixed costsunit contribution as a % of sales
= £200,0000.5
= £400,000
This is equivalent to the breakeven units of 20,000 at £20 selling price per unit.Businesses establish profit targets, and a variation on the above calculations is
to calculate the number of units that need to be sold to generate a target net profit.
sales (in units) for profit of £150,000 = fixed costs + target profitselling price per unit −variable cost per unit
= £200,000 + £150,00020 − 10
= 35,000 units
sales (in £s) for profit of £150,000 = fixed costs + target profitunit contribution as a % of sales
= £200,000 + £150,0000.5
= £700,000

MARKETING DECISIONS 109
This is equivalent to the sales in units of 35,000 at £20 selling price per unit.However, if the business has a maximum capacity of 25,000 units, the limit of itsrelevant range, this profitability may not be achievable and the cost structure ofthe business reflected in the CVP relationship would have to be revised.
CVP can be understood through a graphical representation. Using the samedata, the CVP graph is shown in Figure 8.1. In this CVP diagram, the verticalaxis represents money (both revenue and cost) and the horizontal axis representsvolume (the number of units sold). Fixed costs are seen to be constant, as increasesin volume do not influence total fixed cost within the relevant range. Variablecosts are nil at zero level of activity and increase in proportion to that activity.Total costs are the sum of variable and fixed costs. They begin above zero because,even with zero level of activity, fixed costs are still incurred. Total revenue startsat nil and increases with the volume sold.
As fixed costs remain constant, profit per unit will vary at different levels ofactivity. The point at which the total cost line intersects the total revenue line is thebreakeven point. The breakeven point is shown by the dotted line and can be readas the revenue required (£400,000) to sell a given volume (20,000 units) at a sellingprice of £20 per unit. The area of profit is found to the right of the breakeven point,between total revenue and total cost. The area of loss is found to the left of thebreakeven point, between total cost and total revenue. Note, however, that outsidethe relevant range (shown in the diagram as between 10,000 and 25,000 units) costbehaviour may be different and so the CVP diagram may have to be redrawn.
The breakeven chart shows the margin of safety. The margin of safety is a measureof the difference between the anticipated and breakeven levels of activity. It isexpressed as a percentage:
margin of safety (%) = expected sales − breakeven salesexpected sales
× 100
0
100,000
200,000
300,000
400,000
500,000
600,000
700,000
0 5,000 10,000 15,000 20,000 25,000 30,000
Units sold
£
Fixed costs
Variable costs
Total costs
Revenue
Relevant range
Breakeven point
Figure 8.1 Breakeven chart for XYZ Ltd

110 ACCOUNTING FOR MANAGERS
Using the same example, the margin of safety assuming anticipated sales of 25,000units is:
25,000 − 20,00025,000
× 100 = 20%
The lower the margin of safety, the higher the risk, as sales do not have to fallmuch before reaching the breakeven point. Conversely, there is less risk wherebusinesses operate with higher margins of safety.
Whereas the breakeven graph shows the breakeven point, the profit–volumegraph shows the profit or loss at different levels of activity. For the same example,the profit–volume graph is shown in Figure 8.2.
At any level of output the net profit (or loss) can be seen. This example shows thebreakeven point of 20,000 units and the small margin of safety to the anticipatedsales level of 25,000 units, compared with the risk of substantial loss followingfrom any level of activity below 20,000 units.
Despite the advantages presented by CVP analysis, there are some significantlimitations arising from the assumptions made:
ž Volume is the only factor that causes prices and variable costs to alter (in practice,production efficiencies, product/service mix, price levels etc. all influence costsand revenues).ž There is a single product/service or a product/service mix that remains con-stant (in practice, product/service mix can vary significantly and differentproduct/services may have different cost structures, prices and contributions).ž Costs can be accurately divided into fixed and variable elements (although inpractice many costs are semi-variable and semi-fixed).ž Fixed costs do not change (although in practice they vary with the range ofitems produced and with product complexity, as we will see in Chapter 11).ž Total costs and revenues are linear (while this is likely within the relevantrange, increases in volume may still lead to lower unit prices or economies ofscale and curvilinear costs and revenues may be more accurate).ž The CVP analysis applies only to the relevant range (although decisions maybe made in the current period to move outside this range).ž The analysis applies only to the short term and cannot reliably be used in thelonger term.
−250,000
−200,000
−150,000
−100,000
−50,000
0
50,000
100,000
150,000
05,
000
10,0
00
15,0
00
20,0
00
25,0
00
30,0
00 Net profit
Figure 8.2 Profit–volume graph for XYZ Ltd
MARKETING DECISIONS 111
Despite its limitations, CVP analysis is a useful tool in making decisions aboutpricing and volume, based on an understanding of the cost structure of thebusiness. How, then, do firms make decisions about what price to charge?
Alternative approaches to pricing
Accounting information can be used for pricing in various marketing strategies:
ž Cost-plus pricing.ž Target rate of return pricing.ž Optimum selling price.ž Special pricing decisions.ž Transfer pricing.
Cost-plus pricing
Accounting information may be used in pricing decisions, particularly where thefirm is a market leader or price-maker. In these cases, firms may adopt cost-pluspricing, in which a margin is added to the total product/service cost in orderto determine the selling price. In many organizations, however, prices are set bymarket leaders and competition requires that prices follow the market (i.e. thefirms are price-takers). Nevertheless, even in those cases an understanding of costhelps in making management decisions about what product/services to produce,how many to make and whether the price that exists in the market warrants thebusiness risk involved in any decision to sell in that market. An understanding ofthe firm’s marketing strategy is therefore essential in using cost information forpricing decisions.
In the long term, the prices that a business charges must cover all of itscosts. If it is unable to do so, it will make losses and may not survive. For everyproduct/service the full cost must be calculated, to which the desired profit marginis added. Full cost includes an allocation to each product/service of all the costsof the business, including producing and delivering a good or service, and all itsmarketing, selling, finance and administration costs. The calculation of full cost iscovered in Chapter 11, but it is taken as given for the purposes of this chapter.
Using the CVP example provided earlier in this chapter, the average cost was£20 assuming a level of activity of 20,000 units. The cost-plus pricing formula maybe applied as a mark-up on any element of cost. For example, a mark-up of 25%would result in a selling price of £25.
cost + mark-up on cost = selling price
£20 + (25% of £20) = £25
The profit margin is the profit as a percentage of the selling price. Using the sameexample, the profit margin of £5 is 20% of the selling price of £25. A mark-up is thepercentage added to cost for profit, whereas the margin is the percentage of theselling price that is represented by profit.

112 ACCOUNTING FOR MANAGERS
The actual mark-up used may be based on a ratio (see Chapter 7) such as returnon sales (as in the above example), which is likely to be arbitrary or as a targetreturn on investment.
Target rate of return pricing
Target rate of return pricing estimates the (fixed and working) capital investmentrequired for the business and the need to generate an adequate return on thatinvestment to satisfy shareholders.
For example, if the investment required is £1,000,000 and the company wantsa 12% return on investment, the desired profit is £120,000 (£1,000,000 @ 12%).Assuming a volume of 20,000 units, each unit would need to generate a profit of£6 (£120,000/20,000 units). If the total cost was £20, the selling price would be £26.This represents a 30% mark-up on cost and a 23.1% margin on selling price. Targetrate of return pricing is likely to lead to pricing decisions that are more closelylinked to shareholder value than adding an arbitrary margin to total cost.
Optimum selling price
While cost-plus pricing is useful, it ignores the relationship between price anddemand in a competitive business environment. The sensitivity of demand tochanges in price is reflected in the price elasticity of demand. Elastic demand existswhen a price increase leads to a fall in demand as customers place little valuein the product or switch to substitutes. Inelastic demand exists where small priceincreases/decreases cause only a small change in demand because customersvalue the product or because no substitute is available.
The optimum selling price is the point at which profit is maximized. Toascertain the optimum selling price, a business must understand cost behaviourin terms of variable or fixed and have some ability, via market research, to predictlikely changes in volume as prices increase or decrease.
Using the example earlier in this chapter, XYZ Limited is able to estimate thelikely increase in demand as the selling price falls. For each level of activity we cancalculate the revenue, variable costs and total contribution. The figures are shownin Table 8.2.
An approach that seeks to maximize sales revenue will result in a strategy thatseeks to sell 25,000 units at £25 each, with total revenue being £625,000. However,taking account of the price/volume relationship and costs (which were estimatedas £10 variable cost per unit) shows that the business will maximize its contributiontowards fixed costs and profit at £400,000 with an optimum selling price of £30.This is even though the number of units sold will be less at 25,000 with totalrevenue of £600,000.
The highest contribution will always be the highest profit as the fixed costs(£200,000) will be unchanged at each level of activity within the relevant range (note
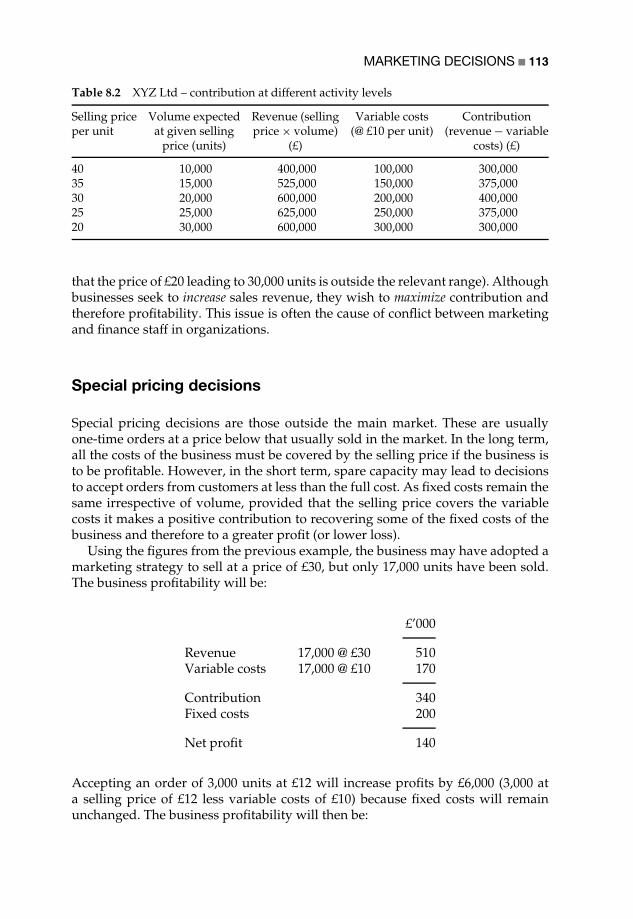
MARKETING DECISIONS 113
Table 8.2 XYZ Ltd – contribution at different activity levels
Selling priceper unit
Volume expectedat given selling
price (units)
Revenue (sellingprice × volume)
(£)
Variable costs(@ £10 per unit)
Contribution(revenue − variable
costs) (£)
40 10,000 400,000 100,000 300,00035 15,000 525,000 150,000 375,00030 20,000 600,000 200,000 400,00025 25,000 625,000 250,000 375,00020 30,000 600,000 300,000 300,000
that the price of £20 leading to 30,000 units is outside the relevant range). Althoughbusinesses seek to increase sales revenue, they wish to maximize contribution andtherefore profitability. This issue is often the cause of conflict between marketingand finance staff in organizations.
Special pricing decisions
Special pricing decisions are those outside the main market. These are usuallyone-time orders at a price below that usually sold in the market. In the long term,all the costs of the business must be covered by the selling price if the business isto be profitable. However, in the short term, spare capacity may lead to decisionsto accept orders from customers at less than the full cost. As fixed costs remain thesame irrespective of volume, provided that the selling price covers the variablecosts it makes a positive contribution to recovering some of the fixed costs of thebusiness and therefore to a greater profit (or lower loss).
Using the figures from the previous example, the business may have adopted amarketing strategy to sell at a price of £30, but only 17,000 units have been sold.The business profitability will be:
£’000
Revenue 17,000 @ £30 510Variable costs 17,000 @ £10 170
Contribution 340Fixed costs 200
Net profit 140
Accepting an order of 3,000 units at £12 will increase profits by £6,000 (3,000 ata selling price of £12 less variable costs of £10) because fixed costs will remainunchanged. The business profitability will then be:

114 ACCOUNTING FOR MANAGERS
£’000
Revenue 17,000 @ £30 5103,000 @ £12 36
546Variable costs 20,000 @ £10 200
Contribution 346Fixed costs 200
Net profit 146
Consequently, provided that the business can sell at a price that at least coversvariable costs, in the short term the business will be better off. This argument doesnot follow through into the long term, over which the business must cover all itscosts in order to be profitable. However, a business will also minimize its lossesby selling at a price that covers variable costs but not full costs. If in the aboveexample volume falls below the breakeven point:
£’000
Revenue 8,000 @ £30 240Variable costs 8,000 @ £10 80
Contribution 160Fixed costs 200
Net loss 40
If an order of 3,000 units at £12 is accepted, the loss will be reduced by £6,000:
£’000
Revenue 8,000 @ £30 2403,000 @ £12 36
276Variable costs 11,000 @ £10 110
Contribution 166Fixed costs 200
Net loss 34
However, consideration needs to be given to the long-term marketing implicationsof accepting orders at less than normal selling price:
MARKETING DECISIONS 115
1 The future selling price may be affected by accepting a special order, if competi-tors adopt similar pricing tactics.
2 Customers who receive or become aware of a special selling price may expect asimilar low price in the future.
3 Accepting this order may prevent the firm from accepting a more profitableorder at a higher price if one subsequently comes along.
4 It is assumed that the business has spare capacity that has no alternative use.5 It is assumed that fixed costs are unavoidable in the short term.
Transfer pricing
One special pricing decision is that concerned with the price at which goods orservices are sold between business units in the same company, rather than thearm’s-length price at which sales may be made to external customers. Transferprices may be based on:
ž the market price to external customers, including a normal profit margin;ž the market price to external customers, but including a lower profit margin;ž the total cost of producing the goods or services, including fixed and variablecosts but excluding any profit margin;ž the marginal cost of producing the goods or services, i.e. including only variablecosts, with or without a profit margin;ž a negotiated price.
An important issue in establishing a transfer price is the motivational effect thatthis may have on managers of both the buying and selling business units, who mayprefer to buy and sell on the open market. However, in the increasingly globalizedbusiness world, manufacturing, assembly and selling operations may take placein different countries. In these cases, transfer prices are often set to ensure thatreported profits are earned in countries where lower corporation tax is payable tomaximize the after-tax earnings of the multinational corporation. Transfer pricingis discussed in more detail in Chapter 13.
Segmental profitability
As well as being price-makers or price-takers, businesses also adopt market-skimming or market-penetration strategies at different phases of the product/servicelifecycle (see Chapter 9). A common marketing strategy is differential pricing, whereprices vary between each market segment.
Where products/services are sold in different market segments at differentprices, the price can be considered in different ways:
ž A minimum short-term price taking into account only marginal, i.e. usuallyvariable, costs.ž A minimum long-term price that covers the full product/service cost.ž A target long-term price that takes into account the return on investmentnecessary to increase shareholder value.
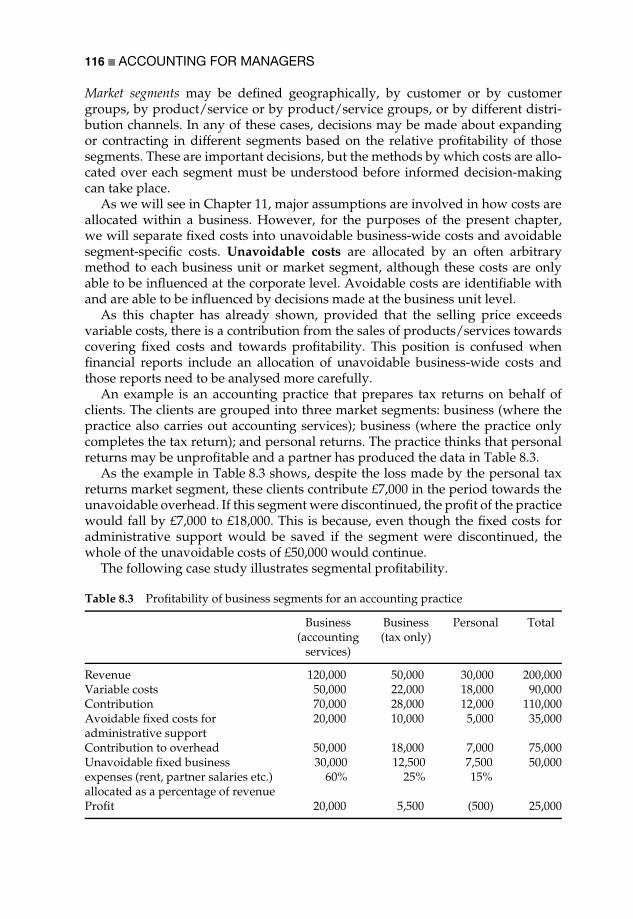
116 ACCOUNTING FOR MANAGERS
Market segments may be defined geographically, by customer or by customergroups, by product/service or by product/service groups, or by different distri-bution channels. In any of these cases, decisions may be made about expandingor contracting in different segments based on the relative profitability of thosesegments. These are important decisions, but the methods by which costs are allo-cated over each segment must be understood before informed decision-makingcan take place.
As we will see in Chapter 11, major assumptions are involved in how costs areallocated within a business. However, for the purposes of the present chapter,we will separate fixed costs into unavoidable business-wide costs and avoidablesegment-specific costs. Unavoidable costs are allocated by an often arbitrarymethod to each business unit or market segment, although these costs are onlyable to be influenced at the corporate level. Avoidable costs are identifiable withand are able to be influenced by decisions made at the business unit level.
As this chapter has already shown, provided that the selling price exceedsvariable costs, there is a contribution from the sales of products/services towardscovering fixed costs and towards profitability. This position is confused whenfinancial reports include an allocation of unavoidable business-wide costs andthose reports need to be analysed more carefully.
An example is an accounting practice that prepares tax returns on behalf ofclients. The clients are grouped into three market segments: business (where thepractice also carries out accounting services); business (where the practice onlycompletes the tax return); and personal returns. The practice thinks that personalreturns may be unprofitable and a partner has produced the data in Table 8.3.
As the example in Table 8.3 shows, despite the loss made by the personal taxreturns market segment, these clients contribute £7,000 in the period towards theunavoidable overhead. If this segment were discontinued, the profit of the practicewould fall by £7,000 to £18,000. This is because, even though the fixed costs foradministrative support would be saved if the segment were discontinued, thewhole of the unavoidable costs of £50,000 would continue.
The following case study illustrates segmental profitability.
Table 8.3 Profitability of business segments for an accounting practice
Business(accounting
services)
Business(tax only)
Personal Total
Revenue 120,000 50,000 30,000 200,000Variable costs 50,000 22,000 18,000 90,000Contribution 70,000 28,000 12,000 110,000Avoidable fixed costs foradministrative support
20,000 10,000 5,000 35,000
Contribution to overhead 50,000 18,000 7,000 75,000Unavoidable fixed businessexpenses (rent, partner salaries etc.)allocated as a percentage of revenue
30,00060%
12,50025%
7,50015%
50,000
Profit 20,000 5,500 (500) 25,000

MARKETING DECISIONS 117
Case study: Retail Stores PLC – the loss-making division
Retail Stores has three segments, producing the results in Table 8.4. The con-tribution as a percentage of sales, assuming a constant sales mix, is 70.6%(£600,000/£850,000). The company’s breakeven point in sales is calculated as:
fixed costsunit contribution as a % of sales
= 280,000 + 255,0000.706
= 535,0000.706
or £758,000.Current sales of £850,000 represent a margin of safety of:
expected sales − breakeven salesexpected sales
× 100 = £850,000 − £758,000£850,000
or 10.8%.Management is considering dropping the Toys segment due to its reported loss
after deducting avoidable segment-specific fixed costs and unavoidable business-wide costs, which are allocated as a percentage of sales revenue.
However, an understanding of cost behaviour helps to identify that eachsegment is making a positive contribution to business-wide costs after deductingthe segment-specific fixed costs, as the modification to the reported profits inTable 8.5 demonstrates.
Based on the figures in Table 8.5, despite the Toys segment making a loss,it makes a positive contribution of £30,000 to allocated business-wide costs.If the Toys segment was discontinued, total profit would fall by £30,000, asTable 8.6 shows.
This is because the loss of the contribution by the Toys segment to business-widecosts and profits amounts to £30,000 (after deducting avoidable segment-specificfixed costs). The business-wide costs of £255,000 are reallocated over the tworemaining business segments in proportion to sales revenue, which in turn makesthe Electrical segment appear only marginally profitable.
If the Toys division were discontinued, the impact would be to reducecosts by £60,000 and a new, higher contribution as a percentage of sales
Table 8.4 Retail Stores PLC – analysis of trading results
Clothing Electrical Toys Total
Sales 400,000 300,000 150,000 850,000Variable costs 25% 30% 40%
100,000 90,000 60,000 250,000
Contribution 300,000 210,000 90,000 600,000Segment-specific fixed costs 120,000 100,000 60,000 280,000Allocated business-wide costs (as a% of sales revenue)
120,000 90,000 45,000 255,000
Profit/(loss) 60,000 20,000 (15,000) 65,000

118 ACCOUNTING FOR MANAGERS
Table 8.5 Retail Stores PLC – contribution by business segment
Clothing Electrical Toys Total
Sales 400,000 300,000 150,000 850,000Variable costs 25% 30% 40%
100,000 90,000 60,000 250,000
Contribution 300,000 210,000 90,000 600,000Segment-specific fixed costs 120,000 100,000 60,000 280,000
Segment contribution tobusiness-wide costs and profits
180,000 110,000 30,000 320,000
Allocated business-wide costs (as a% of sales revenue)
120,000 90,000 45,000 255,000
Profit/(loss) 60,000 20,000 (15,000) 65,000
Table 8.6 Retail Stores PLC – effect of closure of business segment
Clothing Electrical Toys Total
Sales 400,000 300,000 700,000Variable costs 25% 30%
100,000 90,000 190,000
Contribution 300,000 210,000 510,000Segment-specificfixed costs
120,000 100,000 220,000
Segmentcontribution tobusiness-wide costsand profits
180,000 110,000 290,000
Allocatedbusiness-wide costs(as a % of salesrevenue)
146,000 109,000 255,000
Profit/(loss) 34,000 1,000 35,000
results (£510,000/£700,000 = 72.9%, up from 70.6%). Consequently, Retail Stores’breakeven point in sales can be revised to:
fixed costsunit contribution as a % of sales
= 220,000 + 255,0000.729
= 475,0000.729
or £652,000.Current sales of £700,000 represent a margin of safety of 6.8%, a fall of 4% from
the three-division breakeven calculation. This is calculated by:

MARKETING DECISIONS 119
expected sales − breakeven salesexpected sales
× 100 = £700,000 − £652,000£700,000
Segmental profitability is the result of avoidable variable costs and fixed costs thatare segment-specific and an allocation of unavoidable business-wide fixed costs.It is important to differentiate these costs in decision-making. We will return tothe cost allocation problem in Chapter 11.
The following case study shows how an understanding of financial informationcan assist more directly in carrying out the marketing function.
Case study: SuperTech – using accounting information to winsales
One of Global Enterprises’ target customers is SuperTech, a high-technologycompany involved in making semiconductors for advanced manufacturing capa-bilities. SuperTech has grown rapidly and its sales are £35 million per annum.Variable costs consume about 60% of sales and fixed selling, distribution andadministrative expenses are about £10 million, leaving a profit of £4 million. Thechallenge facing SuperTech is to continue to grow while maintaining profitability.It plans to achieve this by continuing to re-engineer its production processes toreduce the lead time between order and delivery and improve the yield from itsproduction by improving quality.
Global sees SuperTech as a major customer for its services. However, it operatesin a highly price-competitive industry. Global is unwilling to reduce its pricingbecause it has a premium brand image and believes that it should be able to use itscustomer knowledge, including published financial information, to increase salesand justify the prices being charged. Global believes that its services can contributeto SuperTech’s strategy of reducing lead time and improving yield.
Global has been able to ascertain the following information from the publishedaccounts of SuperTech:
ž Its cost of sales last year was £21 million and its inventory was £17.5 million.This is because the equipment made by SuperTech is highly technical andrequires long production lead times.ž Employment-related costs for the 250 employees were £8 million, 25% of thetotal business costs of £31 million.ž The company has borrowings of £14.5 million, its gearing being 90%, andinterest costs last year were £787,000.
We need to make a number of assumptions about the business, but these areacceptable in order to estimate the kind of savings that Global’s services mightobtain for SuperTech.
We can calculate that the company’s cost of production, assuming 240 workingdays per year, as £90,000 per day (£21.6 million/240). Given the low number ofemployees and the knowledge that many of these are employed in non-productionroles, the vast majority (over 80%) of production costs are believed to be materialcosts. Using the inventory days ratio (see Chapter 7), we can calculate that the
120 ACCOUNTING FOR MANAGERS
year-end inventory holding is 194 days (£17.5 million/£90,000), equivalent to 81%of working days (194/240).
Global’s services will increase the production costs because of its premiumpricing, and expects the price differential to be £250,000 per annum. However,Global’s services will generate savings for SuperTech. First, the service will reducethe lead time in manufacture by 10 days. The company’s interest cost of £787,000 is5.4% of its borrowings of £14.5 million. This is a very rough estimate as borrowingsincreased during the year and the company most likely had different interest ratesin operation. However, it is useful as a guide. If Global’s services can reduceSuperTech’s lead time by 10 days, that will reduce the level of inventory by£900,000 (£90,000 per day × 10), which can be used to reduce debt, resulting in aninterest saving of £48,600 (£900,000 @ 5.4%).
Second, Global also believes that its services will increase the yield from existingproduction because of the higher quality achieved. Global estimates that this yieldimprovement will lower the cost of sales from 60% to 59%. This 1% saving on salesof £35 million is equivalent to £350,000 per annum.
Global’s business proposal (which of course needs to demonstrate how thesegains can be achieved from a technical perspective) can contain the followingfinancial justification:
per annumSavings:Interest savings on reduced lead time £48,600Yield improvements £350,000
Total savings £398,600Additional cost of Global’s services £250,000
Net saving per annum £148,600
This is equivalent to an increase of 0.4% in the net profit (after interest)to SuperTech.
Conclusion
This chapter has introduced various cost concepts, including cost behaviour,cost–volume–profit analysis, alternative approaches to pricing and understandingsegmental profitability. While marketing is critical to business success, so isthe fulfilment of the promises made by marketing, which is the subject of thenext chapter.
ReferencesDoyle, P. (1998). Marketing Management and Strategy. (2nd edn). London: Prentice Hall
Europe.Porter, M. E. (1980). Competitive Strategy: Techniques for Analyzing Industries and Competitors.
New York, NY: Free Press.Porter, M. E. (1985). Competitive Advantage: Creating and Sustaining Superior Performance.
New York, NY: Free Press.

9
Operating Decisions
This chapter introduces the operations function through the value chain andcontrasts the different operating decisions faced by manufacturing and servicebusinesses. Operational decisions are considered, in particular capacity utiliza-tion, the cost of spare capacity and the product/service mix under capacityconstraints. Relevant costs are considered in relation to the make versus buydecision, equipment replacement and the relevant cost of materials. Other costingapproaches such as lifecycle, target and kaizen costing and the cost of quality arealso introduced.
The operations function
Operations is the function that produces the goods or services to satisfy demandfrom customers. This function, interpreted broadly, includes all aspects of pur-chasing, manufacturing, distribution and logistics, whatever those may be calledin particular industries. While purchasing and logistics may be common to allindustries, manufacturing will only be relevant to a manufacturing business. Therewill also be different emphases such as distribution for a retail business and theseparation of ‘front office’ (or customer-facing) functions from ‘back office’ (orsupport) functions for a financial institution.
Irrespective of whether the business is in manufacturing, retailing or services,we can consider operations as the all-encompassing processes that produce thegoods or services that satisfy customer demand. In simple terms, operations isconcerned with the conversion process between resources (materials, facilitiesand equipment, people etc.) and the products/services that are sold to customers.There are four aspects of the operations function: quality, speed, dependability andflexibility (Slack et al., 1995). Each of these has cost implications and the lower thecost of producing goods and services, the lower can be the price to the customer.Lower prices tend to increase volume, leading to economies of scale such thatprofits should increase (as we saw in Chapter 8).
A useful analytical tool for understanding the conversion process is the valuechain developed by Porter (1985) and shown in Figure 9.1. According to Porterevery business is:
a collection of activities that are performed to design, produce, market,deliver, and support its product . . . A firm’s value chain and the way it
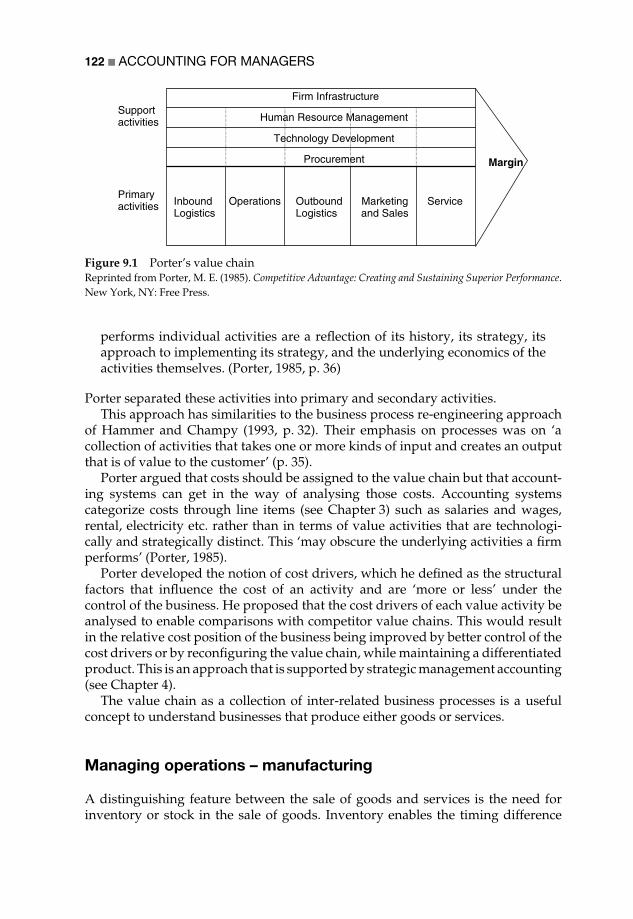
122 ACCOUNTING FOR MANAGERS
Firm Infrastructure
Human Resource Management
Technology Development
Procurement
InboundLogistics
Operations OutboundLogistics
Marketingand Sales
Service
Supportactivities
Margin
Primaryactivities
Figure 9.1 Porter’s value chainReprinted from Porter, M. E. (1985). Competitive Advantage: Creating and Sustaining Superior Performance.New York, NY: Free Press.
performs individual activities are a reflection of its history, its strategy, itsapproach to implementing its strategy, and the underlying economics of theactivities themselves. (Porter, 1985, p. 36)
Porter separated these activities into primary and secondary activities.This approach has similarities to the business process re-engineering approach
of Hammer and Champy (1993, p. 32). Their emphasis on processes was on ‘acollection of activities that takes one or more kinds of input and creates an outputthat is of value to the customer’ (p. 35).
Porter argued that costs should be assigned to the value chain but that account-ing systems can get in the way of analysing those costs. Accounting systemscategorize costs through line items (see Chapter 3) such as salaries and wages,rental, electricity etc. rather than in terms of value activities that are technologi-cally and strategically distinct. This ‘may obscure the underlying activities a firmperforms’ (Porter, 1985).
Porter developed the notion of cost drivers, which he defined as the structuralfactors that influence the cost of an activity and are ‘more or less’ under thecontrol of the business. He proposed that the cost drivers of each value activity beanalysed to enable comparisons with competitor value chains. This would resultin the relative cost position of the business being improved by better control of thecost drivers or by reconfiguring the value chain, while maintaining a differentiatedproduct. This is an approach that is supported by strategic management accounting(see Chapter 4).
The value chain as a collection of inter-related business processes is a usefulconcept to understand businesses that produce either goods or services.
Managing operations – manufacturing
A distinguishing feature between the sale of goods and services is the need forinventory or stock in the sale of goods. Inventory enables the timing difference

OPERATING DECISIONS 123
between production capacity and customer demand to be smoothed. This is ofcourse not possible in the supply of services.
Manufacturing firms purchase raw materials (unprocessed goods) and under-take the conversion process through the application of labour, machinery andknow-how to manufacture finished goods. The finished goods are then availableto be sold to customers. There are actually three types of inventory in this example:raw materials, finished goods and work-in-progress. Work-in-progress consistsof goods that have begun but have not yet completed the conversion process.
There are different types of manufacturing and it is important to differentiatethe production of the following:
ž Custom: Unique, custom products produced singly, e.g. a building.ž Batch: A quantity of the same goods produced at the same time (often called aproduction run), e.g. textbooks.ž Continuous: Products produced in a continuous production process, e.g. oiland chemicals.
For custom and batch manufacture, costs are collected through a job costingsystem that accumulates the cost of raw materials as they are issued to eachjob (either a custom product or a batch of products) and the cost of time spentby different categories of labour. In a manufacturing business the materials areidentified by a bill of materials, a list of all the components that go to make up thecompleted project, and a routing, a list of the labour or machine processing stepsand times for the conversion process. To each of these costs overhead is allocatedto cover the manufacturing costs that are not included in either the bill of materialsor the routing (this will be explained in Chapter 11).
The bill of materials and routing contain standard quantities of material andtime. Standard quantities are the expected quantities, based on past and cur-rent experience and planned improvements in product design, purchasing andmethods of production. Standard costs are the standard quantities multiplied bythe current and anticipated purchase prices for materials and the labour rates ofpay. The standard cost is therefore a budget cost for a product or batch. As actualcosts are not known for some time after the end of the accounting period, standardcosts are generally used for decision-making. Standard costs are usually expressedper unit.
The manufacturing process and its relationship to accounting can be seen inFigure 9.2. When a custom product is completed, the accumulated cost of materials,labour and overhead is the cost of that custom product. For a batch the total jobcost is divided by the number of units produced (e.g. the number of copies of thetextbook) to give a cost per unit (cost per textbook). The actual cost per unit canbe compared to the budget or standard cost per unit. Any variation needs to beinvestigated and corrective action taken (this is the feedback cycle described inChapter 4, to which we return in Chapter 15).
A simple example is the job cost for the printing of 5,000 copies of a textbook.The costing system shows:

124 ACCOUNTING FOR MANAGERS
INPUTS CONVERSION PROCESS OUTPUTS
CustomBatchContinuous
Raw materials Work-in-progress Finished goods+Labour
Equipment, facilities, space etc.
Bill of materialsComponents and quantities
Labour routingProcessing steps and times
which are priced to become
Standard costs
+
Figure 9.2 The manufacturing process and its relationship to accounting
Materials (paper, ink etc.) £12,000Labour for printing £20,000Overhead allocated £10,000
Total job cost £42,000
Cost per textbook (£42,000/5,000 copies) £8.40
For continuous manufacture a process costing system is used, under which costsare collected over a period of time, together with a measure of the volume ofproduction. At the end of the accounting period, the total costs are dividedby the volume produced to give a cost per unit of volume. For example, ifthe cost of producing a chemical in the month of November is £1,200,000 and400,000 litres have been produced in the same period, the cost per litre is £3.00(£1,200,000/400,000 litres). Again, there will be a comparison between the standardcost per unit and the actual cost per unit.
The distinction between custom and batch is not always clear. Some productsare produced on an assembly line as a batch of similar units but with somecustomization, since technology allows each unit to be unique. For example, motorvehicles are assembled as ‘batches of one’, since technology facilitates the sequenc-ing of different specifications for each vehicle along a common production line.Within the same model, different colours, transmissions (manual or automatic),steering (right-hand or left-hand drive) etc. can all be accommodated.
Any manufacturing operation involves a number of sequential activities thatneed to be scheduled so that materials arrive at the appropriate time at the correct
OPERATING DECISIONS 125
stage of production and labour is available to carry out the required process.Organizations that aim to have material arrive in production without holdingbuffer stocks are said to operate a just-in-time (or JIT) manufacturing system.
Most manufacturing processes require an element of set-up or make-ready time,during which equipment settings are made to meet the specifications of the nextproduction run (a custom product or batch). These settings may be made bymanual labour or by computer through CNC (computer numerical control) tech-nology. As Chapter 1 described, investments in computer and robotics technologyhave changed the shape of manufacturing industry. These investments involvesubstantial costs that need to be justified by an increased volume of production orby efficiencies that reduce production costs (we discuss this in Chapter 12).
Managing operations – services
Fitzgerald et al. (1991) emphasized the importance of the growing service sectorand identified four key differences between products and services: intangibility,heterogeneity, simultaneity and perishability. Services are intangible rather thanphysical and are often delivered in a ‘bundle’ such that customers may valuedifferent aspects of the service. Services involving high labour content are hetero-geneous, i.e. the consistency of the service may vary significantly. The productionand consumption of services are simultaneous so that services cannot be inspectedbefore they are delivered. Services are also perishable, so that unlike physical goods,there can be no stock of services that have been provided but remain unsold.
Fitzgerald et al. also identified three different service types. Professional servicesare ‘front office’, people based, involving discretion and the customization ofservices to meet customer needs in which the process is more important than theservice itself. Examples given by Fitzgerald et al. include professional firms suchas solicitors, auditors and management consultants. Mass services involve limitedcontact time by staff and little customization, with services equipment basedand product oriented with an emphasis on the ‘back office’ and little autonomy.Examples here are rail transport, airports and mass retailing. The third type ofservice is the service shop, a mixture of the other two extremes with emphasis onfront and back office, people and equipment and product and process. Examplesof service shops are banking and hotels.
Fitzgerald et al. emphasized how cost traceability differed between each ofthese service types. Their research found that many service companies did nottry to cost individual services accurately either for price-setting or profitabilityanalysis, except for the time-recording practices of professional service firms. Inmass services and service shops there were:
multiple, heterogeneous and joint, inseparable services, compounded by thefact that individual customers may consume different mixes of services andmay take different routes through the service process. (p. 24)
In these two categories of services, costs were controlled not by collecting the costsof each service but through responsibility centres (which is covered in more detailin Chapter 13).

126 ACCOUNTING FOR MANAGERS
Slack et al. (1995) contrasted types of service provision with types of manu-facturing and used a matrix of low volume/high variety and high volume/lowvariety to compare professional service with customized or batch manufacturing,mass service with continuous manufacture, and service shop with a batch-typeprocess. Slack et al. noted that this product–process matrix led to decisions aboutthe design of the operations function, while deviating from these broad groupshad implications for both flexibility and cost.
In describing operations, we will use the term production to refer to bothgoods and services and use manufacturing where raw materials are converted intofinished goods.
Accounting information has an important part to play in operational decisions.Typical questions that may arise include:
ž What is the cost of spare capacity?ž What product/service mix should be produced where there are capacity con-straints?ž What are the costs that are relevant for operational decisions?
Accounting for the cost of spare capacity
Production resources (material, facilities and equipment, and people) allocated tothe process of supplying goods and services provide a capacity. The utilizationof that capacity is a crucial performance driver for businesses, as the investmentin capacity often involves substantial outlays of funds that need to be recoveredby utilizing that capacity fully in the production of products/services. Capacitymay also be a limitation for the production and distribution of goods and serviceswhere market demand exceeds capacity.
A weakness of traditional accounting is that it equates the cost of using resourceswith the cost of supplying resources. Activity-based costing (which is describedfurther in Chapters 10 and 11) has as a central focus the identification andelimination of unused capacity. According to Kaplan and Cooper (1998), there aretwo ways in which unused capacity can be eliminated:
1 Reducing the supply of resources that perform an activity, i.e. spending reduc-tions that reduce capacity.
2 Increasing the quantity of activities for the resources, i.e. revenue increasesthrough greater utilization of existing capacity.
Activity-based costing identifies the difference between the cost of resourcessupplied and the cost of resources used as the cost of the unused capacity:
cost of resources supplied − cost of resources used = cost of unused capacity
An example illustrates this.Ten staff, each costing £30,000 per year, deliver banking services where the
cost driver (the cause of the activity) is the number of banking transactions.

OPERATING DECISIONS 127
Assuming that each member of staff can process 2,000 transactions per annum,the cost of resources supplied is £300,000 (10 × £30,000) and the capacity numberof transactions is 20,000 (10 × 2,000). The standard cost per transaction would be£15 (£300,000/20,000 transactions).
If in fact 18,000 transactions were carried out in the year, the cost of resourcesused would be £270,000 (18,000 @ £15) and the cost of unused capacity would be£30,000 (2,000 @ £15, or £300,000 resources supplied − £270,000 resources used).If the cost of resources used is equated with the cost of resources supplied,the actual transaction cost becomes £16.67 (£300,000/18,000 transactions) andthe cost of unused capacity is not identified. This is a weakness of traditionalaccounting systems.
Although there can be no carry forward of an ‘inventory’ of unused capacityin a service delivery function, management information is more meaningful ifthe standard cost is maintained at £15 and the cost of spare capacity is identifiedseparately. Management action can then be taken to reduce the cost of sparecapacity to zero, either by increasing the volume of business or reducing thecapacity (i.e. the number of staff).
Capacity utilization and product mix
Where demand exceeds the capacity of the business to produce goods or deliverservices as a result of scarce resources (whether that is space, equipment, materialsor staff), the scarce resource is the limiting factor. A business will want tomaximize its profitability by selecting the optimum product/service mix. Theproduct/service mix is the mix of products or services sold by the business, eachof which may have different selling prices and costs. It is therefore necessary,where demand exceeds capacity, to rank the products/services with the highestcontributions, per unit of the limiting factor (i.e. the scarce resource).
For example, Beaufort Accessories makes three parts (F, G and H) for a motorvehicle, each with different selling prices and variable costs and requiring adifferent number of machining hours. These are shown in Table 9.1. However,Beaufort has an overall capacity limitation of 10,000 machine hours.
Table 9.1 Beaufort accessories cost information
Part F Part G Part H
Selling price per unit £150 £200 £225Variable material cost per unit £50 £80 £40Variable labour cost per unit £50 £60 £125
Contribution per unit £50 £60 £60Machine hours per unit 2 4 5Estimated sales demand (units) 2,000 2,000 2,000Required machine hours basedon estimated demand
4,000 8,000 10,000

128 ACCOUNTING FOR MANAGERS
Table 9.2 Beaufort accessories – product ranking based oncontribution
Part F Part G Part H
Contribution per unit £50 £60 £60Machine hours per unit 2 4 5
Contribution per machine hour £25 £15 £12Ranking (preference) 1 2 3
The first step is to identify the ranking of the products by calculating thecontribution per unit of the limiting factor (machine hours in this case) for eachproduct. This is shown in Table 9.2.
Although both Part G and Part H have higher contributions per unit, thecontribution per machine hour (the unit of limited capacity) is higher for Part F.Profitability will be maximized by using the limited capacity to produce as manyPart Fs as can be sold, followed by Part Gs. Based on this ranking, the availableproduction capacity can be allocated as follows:
Production Contribution
2,000 of Part F @ 2 hours = 4,000 hours. 2,000 @ £50 per unit = £100,000Based on the capacity limitation of10,000 hours, there are 6,000 hoursremaining, so Beaufort can produce 3/4of the demand for Part G (6,000 hoursavailable/8,000 hours to meet demand)equivalent to 1,500 units of part G (3/4of 2,000 units).1,500 of Part G @ 4 hours = 6,000 hours 1,500 @ £60 per unit = £90,000
Maximum contribution £190,000There is no available capacity for Part H.
Theory of Constraints
A different approach to limited capacity was developed by Goldratt and Cox(1986), who focused on the existence of bottlenecks in production and the needto maximize volume through the bottleneck (throughput). Goldratt and Coxdeveloped the Theory of Constraints (ToC), under which only three aspectsof performance are important: throughput contribution, operating expense andinventory. Throughput contribution is defined as sales revenue less the costof materials:
throughput contribution = sales − cost of materials

OPERATING DECISIONS 129
Table 9.3 Beaufort accessories – product ranking based on throughput
Part F Part G Part H
Selling price per unit £150 £200 £225Variable material cost per unit £50 £80 £40Throughput contribution per unit £100 £120 £185Machine hours per unit 2 4 5Return per machine hour £50 £30 £37Ranking (preference) 1 3 2
Goldratt and Cox considered all other costs as fixed and independent of customersand products, so operating expenses included all costs except materials. Theyemphasized the importance of maximizing throughput while holding constantor reducing operating expenses and inventory. Goldratt and Cox also recognizedthat there is little point in maximizing non-bottleneck resources if this leads to aninability to produce at the bottlenecks.
Applying the Theory of Constraints to the Beaufort Accessories example andassuming that machine hours are the bottleneck resource, Table 9.3 shows thethroughput ranking. Under the Theory of Constraints, Part F retains the highestranking but Part H has a higher return per unit of the bottleneck resource than PartG after deducting only the variable cost of materials. This is a different rankingto the previous method, which used the contribution after deducting all variablecosts. The difference is due to the treatment of variable costs other than materials.
Strategic management accounting (see Chapter 4) can assist a business byapplying these concepts to competitors in order to gain a better understandingof how those competitors are utilizing their capacity. Understanding their irrel-ative strengths and weaknesses can result in gaining competitive advantage inthe market.
Operating decisions: relevant costs
Operating decisions imply an understanding of costs, but not necessarily thosecosts that are defined by accountants. We have already seen in Chapter 8 thedistinction between avoidable and unavoidable costs. This brings us to the notionof relevant costs. Relevant costs are those costs that are relevant to a particulardecision. Relevant costs are the future, incremental cash flows that result from adecision. Relevant costs specifically do not include sunk costs, i.e. costs that havebeen incurred in the past, as nothing we can do can change those earlier decisions.Relevant costs are avoidable costs because, by taking a particular decision, wecan avoid the cost. Unavoidable costs are not relevant because, irrespective ofwhat our decision is, we will still incur the cost. Relevant costs may, however, beopportunity costs. An opportunity cost is not a cost that is paid out in cash. It is theloss of a future cash flow that takes place as a result of making a particular decision.

130 ACCOUNTING FOR MANAGERS
Make versus buy?
A concern with subcontracting or outsourcing has dominated business in recentyears as the cost of providing goods and services in-house is increasingly comparedto the cost of purchasing goods on the open market. The make versus buy decisionshould be based on which alternative is less costly on a relevant cost basis, that istaking into account only future, incremental cash flows.
For example, the costs of in-house production of a computer processing servicethat averages 10,000 transactions per month are calculated as £25,000 per month.This comprises £0.50 per transaction for stationery and £2 per transaction forlabour. In addition, there is a £10,000 charge from head office as the share ofthe depreciation charge for equipment. An independent computer bureau hastendered a fixed price of £20,000 per month.
Based on this information, stationery and labour costs are variable costs that areboth avoidable if processing is outsourced. The depreciation charge is likely to bea fixed cost to the business irrespective of the outsourcing decision. It is thereforeunavoidable. The fixed outsourcing cost will only be incurred if outsourcingtakes place.
The relevant costs for each alternative can be compared as shown in Table 9.4.The £10,000 share of depreciation costs is not relevant as it is unavoidable. Therelevant costs for this decision are therefore those shown in Table 9.5.
Based on relevant costs, there would be a £5,000 per month saving by outsourc-ing the computer processing service.
Table 9.4 Relevant costs – make versus buy
Cost to make Cost to buy
Stationery 5,00010,000 @ £0.50Labour 20,00010,000 @ £2Share of depreciation costs 10,000 10,000Outsourcing cost 20,000Total relevant cost £35,000 £30,000
Table 9.5 Relevant costs – make versus buy, simplified
Relevant cost to make Relevant cost to buy
Stationery 5,00010,000 @ £0.50Labour 20,00010,000 @ £2Outsourcing cost 20,000Total relevant cost £25,000 £20,000
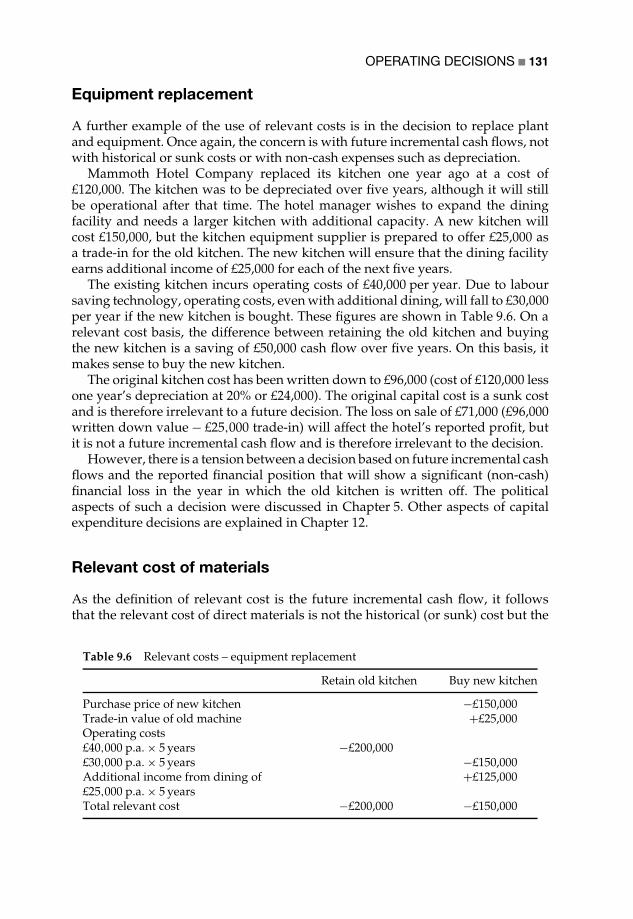
OPERATING DECISIONS 131
Equipment replacement
A further example of the use of relevant costs is in the decision to replace plantand equipment. Once again, the concern is with future incremental cash flows, notwith historical or sunk costs or with non-cash expenses such as depreciation.
Mammoth Hotel Company replaced its kitchen one year ago at a cost of£120,000. The kitchen was to be depreciated over five years, although it will stillbe operational after that time. The hotel manager wishes to expand the diningfacility and needs a larger kitchen with additional capacity. A new kitchen willcost £150,000, but the kitchen equipment supplier is prepared to offer £25,000 asa trade-in for the old kitchen. The new kitchen will ensure that the dining facilityearns additional income of £25,000 for each of the next five years.
The existing kitchen incurs operating costs of £40,000 per year. Due to laboursaving technology, operating costs, even with additional dining, will fall to £30,000per year if the new kitchen is bought. These figures are shown in Table 9.6. On arelevant cost basis, the difference between retaining the old kitchen and buyingthe new kitchen is a saving of £50,000 cash flow over five years. On this basis, itmakes sense to buy the new kitchen.
The original kitchen cost has been written down to £96,000 (cost of £120,000 lessone year’s depreciation at 20% or £24,000). The original capital cost is a sunk costand is therefore irrelevant to a future decision. The loss on sale of £71,000 (£96,000written down value − £25,000 trade-in) will affect the hotel’s reported profit, butit is not a future incremental cash flow and is therefore irrelevant to the decision.
However, there is a tension between a decision based on future incremental cashflows and the reported financial position that will show a significant (non-cash)financial loss in the year in which the old kitchen is written off. The politicalaspects of such a decision were discussed in Chapter 5. Other aspects of capitalexpenditure decisions are explained in Chapter 12.
Relevant cost of materials
As the definition of relevant cost is the future incremental cash flow, it followsthat the relevant cost of direct materials is not the historical (or sunk) cost but the
Table 9.6 Relevant costs – equipment replacement
Retain old kitchen Buy new kitchen
Purchase price of new kitchen −£150,000Trade-in value of old machine +£25,000Operating costs£40,000 p.a. × 5 years −£200,000£30,000 p.a. × 5 years −£150,000Additional income from dining of£25,000 p.a. × 5 years
+£125,000
Total relevant cost −£200,000 −£150,000

132 ACCOUNTING FOR MANAGERS
replacement price of the materials. Therefore it is irrelevant whether or not thosematerials are held in inventory, unless such materials have only scrap value oran alternative use, in which case the relevant cost is the opportunity cost of theforgone alternative. The cost of using materials can be summarized as follows:
ž If the material is purchased specifically the relevant cost is the purchase price.ž If the material is already in stock and is used regularly, the relevant cost is thepurchase price (i.e. the replacement price).ž If the material is already in stock but is surplus as a result of previousoverbuying, the relevant cost is the opportunity cost, which may be its scrapvalue or its value in any alternative use.
Stanford Potteries Ltd has been approached by a customer who wants to place aspecial order and is willing to pay £16,000. The order requires the materials shownin Table 9.7.
Material A would have to be purchased specifically for this order. Material B isused regularly and any inventory used for this order would have to be replaced.Material C is surplus to requirements and has no alternative use. Material Dis also surplus to requirements but can be used as a substitute for material E.Material E, although not required for this order, is in regular use and currentlycosts £8.00 per kg, but is not in stock. The relevant material costs are shown inTable 9.8.
As a result of the above, Stanford Potteries would accept the special orderbecause the additional income exceeds the relevant cost of materials. In the caseof A, the material is purchased at the current purchase price. For B, even thoughsome inventory is held at a lower cost price, it is used regularly and has to bereplaced at the current purchase price. For C, the 400 kg in inventory have noother value than scrap, which is the opportunity cost of using it in this order. The100 kg of C not in inventory have to be purchased at the current replacement price.For D, the opportunity cost is either the scrap value or the saving made by usingmaterial D as a substitute for material E. As the substitution value is higher, thisis what Stanford would do in the absence of this particular order. Therefore, theopportunity cost of D is the loss of the ability to substitute for material E.
Relevant costs are a useful tool in helping to make operational decisions.However, there are other approaches to costing that are also valuable.
Table 9.7 Material requirements
Material Total kgrequired
Kg in stock Originalpurchase price
per kg
Scrap valueper kg
Currentpurchase
price per kg
A 750 0 – – 6.00B 1,000 600 3.50 2.50 5.00C 500 400 3.00 2.50 4.00D 300 500 4.00 6.00 9.00

OPERATING DECISIONS 133
Table 9.8 Relevant cost of materials
Material Relevant cost
A 750 @ £6 (replacement price) 4,500B 1,000 @ £5 (replacement price) 5,000C 400 @ £2.50 (opportunity cost of scrap value) 1,000
100 @ £4 (replacement price) 400D 300 @ £6 (opportunity cost of scrap value) 1,800
or300 @ £8 (substitute for material E) 2,400
Total relevant material cost 13,300Proceeds of sale 16,000Incremental gain 2,700
Other costing approaches
Lifecycle costing
All products and services go through a typical lifecycle, from introduction, throughgrowth and maturity to decline. The lifecycle is represented in Figure 9.3.
Over time, sales volume increases, then plateaus and eventually declines.Management accounting has traditionally focused on the period after productdesign and development, when the product/service is in production for sale tocustomers. However, the product design phase involves substantial costs thatmay not be taken into account in product/service costing. These costs may havebeen capitalized (see Chapters 3 and 6) or treated as an expense in earlier years.Similarly, when products/services are discontinued, the costs of discontinuanceare rarely identified as part of the product/service cost.
Lifecycle costing estimates and accumulates the costs of a product/serviceover its entire lifecycle, from inception to abandonment. This helps to deter-mine whether the profits generated during the production phase cover all thelifecycle costs. This information helps managers make decisions about futureproduct/service development and the need for cost control during the develop-ment phase.
Salesvolume
Introduction Growth Maturity Decline
Figure 9.3 Typical product/service lifecycle

134 ACCOUNTING FOR MANAGERS
The design and development phase can determine up to 80% of costs in manyadvanced technology industries. This is because decisions about the productionprocess and the technology investment required to support production are madelong before the product/services are actually produced. This is shown in Figure 9.4.
Consequently, efforts to reduce costs during the production phase are unlikelyto be successful when the costs are committed or locked in as a result of technologyand process decisions made during the design phase.
Target costing
Target costing is concerned with managing whole-of-life costs during the designphase. It has four stages:
1 Determining the target price that customers will be prepared to pay for theproduct/service.
2 Deducting a target profit margin to determine the target cost, which becomesthe cost to which the product/service should be engineered.
3 Estimating the actual cost of the product/service based on the current design.4 Investigating ways of reducing the estimated cost to the target cost.
target price − target profit margin = target cost
The technique was developed in the Japanese automotive industry and is customeroriented. Its aim was to build a product at a cost that could be recovered over theproduct lifecycle through a price that customers would be willing to pay to obtainthe benefits (which in turn drive the product cost).
Target costing is equally applicable to a service. The design of an Internetbanking service involves substantial up-front investment, the benefits of whichmust be recoverable in the selling price over the expected lifecycle of the service.
Using a simple example, a new product is expected to achieve a desired volumeand market share at a price of £1,000, from which the manufacturer wants a 20%margin, leaving a target cost of £800. Current estimates suggest the cost as £900. Aninvestigation seeks to find which elements of design, manufacture or purchasingcontribute to the costs and how those costs can be reduced, or whether features
£ Capital investment
Design phase Launch Production phase
Figure 9.4 Investment decisions

OPERATING DECISIONS 135
can be eliminated that cannot be justified in the target price. This is an iterativeprocess, but an essential one if the lifecycle costs of the product/service are to bemanaged and recovered in the (target) selling price. Importantly, this process ofestimating costs over the product/service lifecycle and establishing a target sellingprice takes place before decisions are finalized about product/service design andthe production process to be used.
The investigation of cost reduction is a cost-to-function analysis that examinesthe relationship between how much cost is spent on the primary functions of theproduct/service compared with secondary functions. This is consistent with thevalue chain approach described earlier in this chapter. Such an investigation isusually a team effort involving designers, purchasing, production/manufacturing,marketing and costing staff. The target cost is rarely achieved from the beginningof the manufacturing phase. Japanese manufacturers tend to take a long-termperspective on business and aim to achieve the target cost during the lifecycle ofthe product.
Kaizen costingKaizen is a Japanese term – literally ‘tightening’ – for making continuous, incre-mental improvements to the production process. While target costing is appliedduring the design phase, kaizen costing is applied during the production phase ofthe lifecycle when large innovations may not be possible. Target costing focuses onthe product/service. Kaizen focuses on the production process, seeking efficienciesin production, purchasing and distribution.
Like target costing, kaizen establishes a desired cost-reduction target and relieson team work and employee empowerment to improve processes and reduce costs.This is because employees are assumed to have more expertise in the productionprocess than managers. Frequently, cost-reduction targets are set and producerswork collaboratively with suppliers who often have cost-reduction targets passedon to them.
Total quality management
One aspect of operational management that deserves particular attention is totalquality management and the cost of quality. Total quality management (TQM)encompasses design, purchasing, operations, distribution, marketing and admin-istration (see for example Slack et al. (1995) for a fuller description).
TQM involves comprehensive measurement systems, often developed fromstatistical process control (SPC). Continuous improvement is perhaps the latestform of total quality management. This is a systematic approach to qualitymanagement that focuses on customers, re-engineers business processes andensures that all employees are committed to quality. Standardization of processesensures consistency, which may be documented in a quality management systemsuch as ISO 9000. Continuous improvement goes beyond processes to encom-pass employee remuneration strategies, management information systems andbudgetary systems.
136 ACCOUNTING FOR MANAGERS
The Six Sigma approach, developed by Motorola, is a measure of standard devi-ation, that is how tightly clustered observations are around a mean (the average).Six Sigma aims to improve quality by removing defects and the causes of defects.Balanced Scorecard-type measures (see Chapter 4) are often used in Six Sigma,which is well developed as a management tool in high-technology manufactur-ing organizations. It is part of a larger performance measurement model calledDMAIC, an acronym for Define, Measure, Analyse, Improve and Control.
A holistic approach is taken by the Business Excellence model of the EuropeanFoundation for Quality Management (EFQM; see also Chapter 4). The EFQMmodel is a self-assessment tool to aid continuous improvement based on ninecriteria, five of which are enablers and four results. Each is scored in order todemonstrate improvement over time, although a criticism of the model is thesubjectivity of the scoring system (further information is available from the EFQMwebsite at www.efqm.org).
Not only is non-financial performance measurement crucial in TQM, butaccounting has a significant role to play because of its ability to record and reportthe cost of quality and how cost influences, and is influenced by, continuousimprovement in production processes.
Cost of quality
Recognizing the cost of quality is important in terms of continuous improvementprocesses. The Chartered Institute of Management Accountants define the costof quality as the difference between the actual costs of production, selling andafter-sales service and the costs that would be incurred if there were no failuresduring production or usage of product/services. There are two broad categoriesof the cost of quality: conformance costs and non-conformance costs.
Conformance costs are those costs incurred to achieve the specified standard ofquality and include prevention costs such as quality measurement and review,supplier review and quality training etc. (i.e. the procedures required by an ISO9000 quality management system). Costs of conformance also include the costsof inspection or testing to ensure that products or services actually meet thequality standard.
The costs of non-conformance include the cost of internal and external failure.Internal failure is where a fault is identified by the business before the prod-uct/service reaches the customer, typically evidenced by the cost of waste orrework. The cost of external failure is identified after the product/service is inthe hands of the customer. Typical costs are warranty claims, discounts andreplacement costs.
Identifying the cost of quality is important to the continuous improvementprocess, as substantial improvements to business performance can be achieved byinvesting in conformance and so avoiding the much larger costs usually associatedwith non-conformance.
Two case studies illustrate the main concepts identified in this chapter.
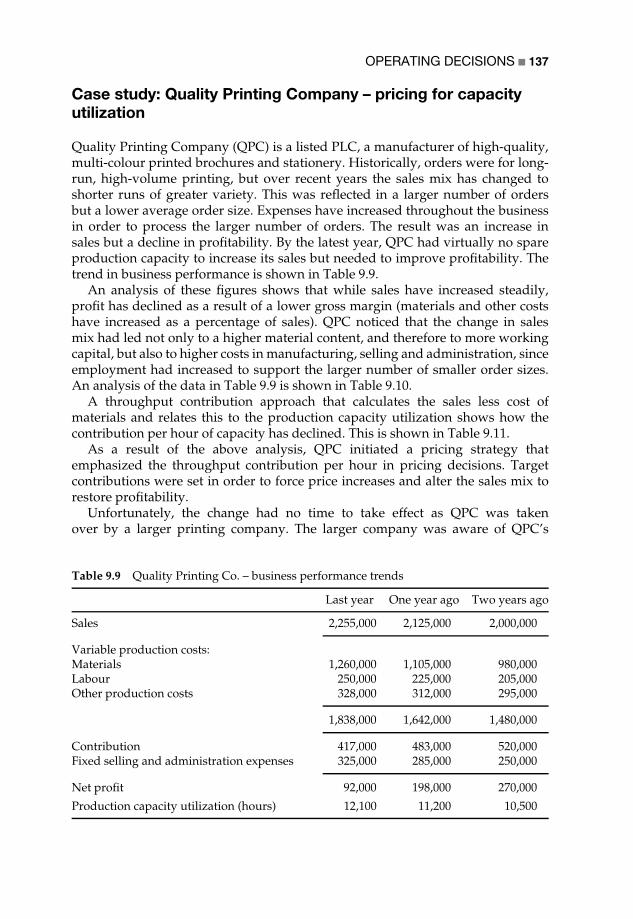
OPERATING DECISIONS 137
Case study: Quality Printing Company – pricing for capacityutilization
Quality Printing Company (QPC) is a listed PLC, a manufacturer of high-quality,multi-colour printed brochures and stationery. Historically, orders were for long-run, high-volume printing, but over recent years the sales mix has changed toshorter runs of greater variety. This was reflected in a larger number of ordersbut a lower average order size. Expenses have increased throughout the businessin order to process the larger number of orders. The result was an increase insales but a decline in profitability. By the latest year, QPC had virtually no spareproduction capacity to increase its sales but needed to improve profitability. Thetrend in business performance is shown in Table 9.9.
An analysis of these figures shows that while sales have increased steadily,profit has declined as a result of a lower gross margin (materials and other costshave increased as a percentage of sales). QPC noticed that the change in salesmix had led not only to a higher material content, and therefore to more workingcapital, but also to higher costs in manufacturing, selling and administration, sinceemployment had increased to support the larger number of smaller order sizes.An analysis of the data in Table 9.9 is shown in Table 9.10.
A throughput contribution approach that calculates the sales less cost ofmaterials and relates this to the production capacity utilization shows how thecontribution per hour of capacity has declined. This is shown in Table 9.11.
As a result of the above analysis, QPC initiated a pricing strategy thatemphasized the throughput contribution per hour in pricing decisions. Targetcontributions were set in order to force price increases and alter the sales mix torestore profitability.
Unfortunately, the change had no time to take effect as QPC was takenover by a larger printing company. The larger company was aware of QPC’s
Table 9.9 Quality Printing Co. – business performance trends
Last year One year ago Two years ago
Sales 2,255,000 2,125,000 2,000,000
Variable production costs:Materials 1,260,000 1,105,000 980,000Labour 250,000 225,000 205,000Other production costs 328,000 312,000 295,000
1,838,000 1,642,000 1,480,000
Contribution 417,000 483,000 520,000Fixed selling and administration expenses 325,000 285,000 250,000
Net profit 92,000 198,000 270,000
Production capacity utilization (hours) 12,100 11,200 10,500

138 ACCOUNTING FOR MANAGERS
Table 9.10 Quality Printing Co. – analysis of business performance
Last year One year ago Two years ago
Sales growth 6.1% 6.3%Net profit as a % of sales 4.1% 9.3% 13.5%Gross margin as a % of sales 18.5% 22.7% 26.0%Materials as a % of sales 55.9% 52.0% 49.0%Labour and other costs as a % of sales 25.6% 25.3% 25.0%Fixed selling and administration expenses asa % of sales
14.4% 13.4% 12.5%
Table 9.11 Quality Printing Co. – throughput contribution
Last year One year ago Two years ago
Throughput contribution 995,000 1,020,000 1,020,000No. production hours 12,100 11,200 10,500Throughput contribution per hour £82 £91 £97
situation, perhaps having applied strategic management accounting techniques toits knowledge of its smaller competitor.
Case study: Vehicle Parts Co. – the effect of equipmentreplacement on costs and prices
Vehicle Parts Co. (VPC) is a privately owned manufacturer of components anda Tier 1 supplier to several major motor vehicle assemblers. VPC has a longhistory and substantial machinery that was designed for long-run, high-volumeparts. The nature of the machinery meant that long set-up times were needed tomake the machines ready for the small production runs. The old equipment keptbreaking down and quality was poor. As a result of these problems, about 35%of VPC’s production was delivered late. Consequently, there was a gradual lossof production volume as customers sought more reliable suppliers. Demand wasunlikely to increase in the short term because of delivery performance. However,as the current machinery had been fully written off, the company incurred nodepreciation expense. As a result, its reported profits were quite high.
The market now demands more flexibility with more short runs of parts tomeet the assemblers’ just-in-time (JIT) requirements. New computer-numericallycontrolled (CNC) equipment was bought in order to satisfy customer demandand provide the ability to grow sales volume. While the new CNC equipmentsubstantially reduced set-up times, the significant depreciation charge increasedthe product cost and made the manufactured parts less profitable. The marketingmanager believed that the depreciation cost should be discounted as otherwisethe business would lose sales by retaining the existing mark-up on cost. VPC’s
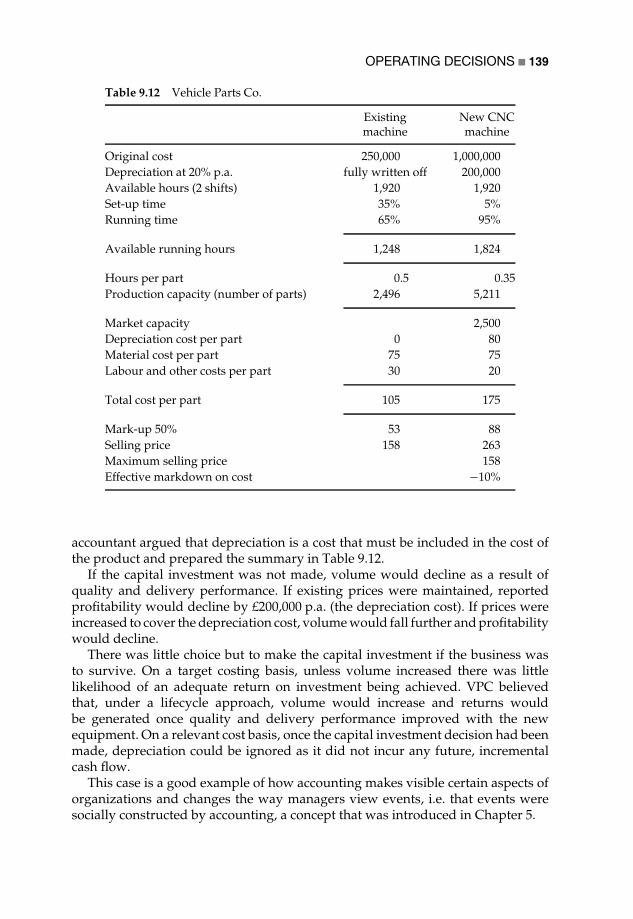
OPERATING DECISIONS 139
Table 9.12 Vehicle Parts Co.
Existingmachine
New CNCmachine
Original cost 250,000 1,000,000Depreciation at 20% p.a. fully written off 200,000Available hours (2 shifts) 1,920 1,920Set-up time 35% 5%Running time 65% 95%
Available running hours 1,248 1,824
Hours per part 0.5 0.35Production capacity (number of parts) 2,496 5,211
Market capacity 2,500Depreciation cost per part 0 80Material cost per part 75 75Labour and other costs per part 30 20
Total cost per part 105 175
Mark-up 50% 53 88Selling price 158 263Maximum selling price 158Effective markdown on cost −10%
accountant argued that depreciation is a cost that must be included in the cost ofthe product and prepared the summary in Table 9.12.
If the capital investment was not made, volume would decline as a result ofquality and delivery performance. If existing prices were maintained, reportedprofitability would decline by £200,000 p.a. (the depreciation cost). If prices wereincreased to cover the depreciation cost, volume would fall further and profitabilitywould decline.
There was little choice but to make the capital investment if the business wasto survive. On a target costing basis, unless volume increased there was littlelikelihood of an adequate return on investment being achieved. VPC believedthat, under a lifecycle approach, volume would increase and returns wouldbe generated once quality and delivery performance improved with the newequipment. On a relevant cost basis, once the capital investment decision had beenmade, depreciation could be ignored as it did not incur any future, incrementalcash flow.
This case is a good example of how accounting makes visible certain aspects oforganizations and changes the way managers view events, i.e. that events weresocially constructed by accounting, a concept that was introduced in Chapter 5.
140 ACCOUNTING FOR MANAGERS
Conclusion
Operations decisions are critical in satisfying customer demand. Optimizing pro-duction capacity for products or services using relevant costs for decision-makingand understanding the long-term impact of production design and continuousimprovement are both necessary to improve business performance. These tech-niques can be applied to other organizations in the value chain (suppliers andcustomers) and to competitors in order to improve competitive advantage.
References
Fitzgerald, L., Johnston, R., Brignall, S., Silvestro, R. and Voss, C. (1991). Performance Mea-surement in Service Businesses. London: Chartered Institute of Management Accountants.
Goldratt, E. M. and Cox, J. (1986). The Goal: A Process of Ongoing Improvement. (Revd. edn).Croton-on-Hudson, NY: North River Press.
Hammer, M. and Champy, J. (1993). Reengineering the Corporation: A Manifesto for BusinessRevolution. London: Nicholas Brealey Publishing.
Kaplan, R. S. and Cooper, R. (1998). Cost and Effect: Using Integrated Cost Systems to DriveProfitability and Performance. Boston, MA: Harvard Business School Press.
Porter, M. E. (1985). Competitive Advantage: Creating and Sustaining Superior Performance.New York, NY: Free Press.
Slack, N., Chambers, S., Harland, C., Harrison, A. and Johnston, R. (1995). Operations Man-agement. London: Pitman Publishing.
10
Human Resource Decisions
This chapter explains the components of labour costs and how those costs areapplied to the production of goods or services. The relevant cost of labour fordecision-making purposes is explained. This chapter also introduces the notion ofactivity-based costs.
According to Armstrong (1995a, p. 28), ‘personnel management is essentiallyabout the management of people in a way that improves organizational effec-tiveness’. Personnel management – or human resources as it is more commonlycalled – is a function concerned with job design; recruitment, training and motiva-tion; performance appraisal; industrial relations, employee participation and teamwork; remuneration; redundancy; health and safety; and employment policies andpractices. It is through human resources, that is people, that the production ofgoods and services takes place. Historically, as Chapter 1 suggested, employmentcosts were a large element of the cost of manufacture. Even with the shift toservice industries, people costs have tended to decline in proportion to total costs,a consequence of computer technology.
Armstrong (1995b) argued that the tighter grip of accountants on businessmanagement and the diffusion of management accounting techniques were forceswith which human resource managers had to contend. This was particularly thecase where the human resource (HR) function was being increasingly devolved todivisionalized business units under line management control. Line managementis in turn increasingly accountable for achieving corporate targets.
Many non-accounting readers ask why the balance sheet of a business doesnot show the value of its human assets (what the HR literature refers to ashuman resource accounting). The knowledge, skills and abilities of people are a keyresource in satisfying markets through the provision of goods and services. Butpeople are not owned by a business. They are recruited, trained and developed, thenmotivated to accomplish tasks for which they are appraised and rewarded. Peoplemay leave the business for personal reasons or be made redundant when there isa business downturn. The value of people to the business is in the application oftheir knowledge, skills and abilities towards the provision of goods and services.The limitations of accounting in relation to the organizational stock of knowledge,that is intellectual capital, was described in Chapter 7.
In accounting terms, people are treated as labour, a resource that is con-sumed – therefore an expense rather than an asset – either directly in producinggoods or services or indirectly as a business overhead. This distinction between

142 ACCOUNTING FOR MANAGERS
direct and indirect labour is an important concept that is considered in more detailin Chapter 11.
The cost of labour
The cost of labour can be considered either over the short term or long term. Inthe short term, the cost of labour is the total expense incurred in relation to thatresource, which may, for direct labour, also be calculated as the cost per unit ofproduction, for either goods or services. The cost of labour is the salary or wage costpaid through the payroll, plus the oncost. The labour oncost consists of the non-salary or wage costs that follow from the payment of salaries or wages. The mostobvious of these are National Insurance contributions and pension contributionsmade by the business. These oncosts can be expressed as a percentage of salary.The total employment cost may include other forms of remuneration such asbonuses, profit shares and non-cash remuneration such as share options, expenseallowances, business-provided motor vehicles and so on.
A less visible but important element of the cost of labour is the period duringwhich employees are paid but do not work, covering public holidays, annualleave, sick leave etc. A second element of the cost of labour is the time whenpeople are at work but are unproductive, such as when they are on refreshment ortoilet breaks, socializing, during equipment downtimes etc. These unproductivetimes all increase the cost of labour in relation to the volume of production. Theactual at-work and productive time is an important calculation in determining theproduction capacity of the business (see Chapter 9).
The following example shows how the total employment cost may be calculatedfor an individual:
£Salary 30,000Oncosts:National insurance 10% 3,000Pension contribution 4% 1,200 4,200
34,200Bonus paid as share options 1,000
Total salary cost 35,200Non-salary benefits:Cost of motor vehicle 4,000Expense allowance 500 4,500
Total employment cost 39,700
Assuming a five-day week and twenty days’ annual leave, five days’ sick leaveand eight public holidays per annum, the actual days at work (the production

HUMAN RESOURCE DECISIONS 143
capacity) can be calculated as:
Working days 52 × 5 260Less:Annual leave 20Sick leave 5Public holidays 8 33
Actual days at work 227
The total employment cost per working day for this employee is therefore £174.89(£39,700/227 days). Assuming that the employee works eight hours per day andthe employee is productive for 80% of the time at work, then the cost per hourworked is £27.33 (£174.89/(8 × 80%)).
The employee, taking home £30,000 for a 40-hour week, may consider their costas £14.42 per hour (£30,000/52/40). This example shows the total employment costand the effect of the paid but unproductive time on this cost, which almost doubles(what is £14.42 per hour to the employee is £27.33 per hour to the employer).The cost per unit of production can be expressed either as the (total employment)cost per (productive) hour worked, in this case a labour cost per hour of £27.33, oras a cost per unit of production. If an employee during their productive hourscompletes four units of a product, the direct labour cost per unit of production is£6.83 (£27.33/4). If a service employee processes five transactions per hour, thedirect labour cost per unit of production (a transaction is still a unit of production) is£5.47 (£27.33/5). An employee who is not involved in production but carries out asupport role is classified as an indirect labour cost. This is referred to as a businessoverhead (see Chapter 11).
The calculation of the cost of labour is shown in Table 10.1.In the longer term, a business may want to take a broader view of the total
cost of employment. As Chapter 9 showed in relation to the product developmentphase of the lifecycle, many costs are incurred before a product/service comes tomarket. The same is true of employees, who must be recruited and trained beforethey can be productive. A longer-term approach to the total cost of employmentmay include these costs as additional costs of employment. In relation to shortterm and long term, the issue arises as to whether the cost of labour is a fixed orvariable cost, following the distinction made in Chapter 8.
Table 10.1 The cost of labour
Cost Time
Salaries and wages + oncosts (pensions,National Insurance etc.) + non-salarybenefits (motor vehicles, expenses etc.) =total employment cost
Working days − annual leave, sick leave,public holidays, etc. = actual days at work× at work hours × productivity = actualhours worked
total employment costactual hours worked
= labour cost per hour

144 ACCOUNTING FOR MANAGERS
Accountants have historically considered labour that is consumed in producinggoods or services, i.e. direct labour, as a variable cost. This is because it isexpressed as a cost per unit of production, which, in total, increases or decreasesin line with business activity. However, changing legislation, the influence oftrade unions and business HR policies have meant that in the very short term,all labour takes on the appearance of a fixed cost. The consultation processfor redundancy takes time, and legislation such as Transfer of UndertakingsProtection of Employment (TUPE) secures the employment rights of labour that istransferred between organizations, a fairly common occurrence as a consequenceof outsourcing arrangements. Consequently, reflecting the underlying practicality,many businesses now account for direct labour as a fixed cost.
Relevant cost of labour
The distinction between fixed and variable costs is not sufficient for the purposeof making decisions about labour in the very short term as, in that short term,labour will still be paid irrespective of whether people are busy or occupied.Therefore, in the short term, a business bidding for a special order may only takeinto account the relevant costs. As was seen in Chapter 9, the relevant cost is thecost that will be affected by a particular decision to do (or not to do) something.As decision-making is not concerned with the past, historical (or sunk) costs areirrelevant. The relevant cost is the future, incremental cash flow that will resultfrom making a particular decision. This may be an additional cash payment oran opportunity cost, i.e. the loss from the opportunity forgone. For example, in thecase of full capacity, the relevant cost could be the additional labour costs (e.g.overtime) that may have to be incurred, or the opportunity cost following from theinability to sell products/services (e.g. both the loss of income from a particularorder and the wider potential loss of customer goodwill).
Costs that are the same irrespective of the alternative chosen are irrelevant forthe purposes of a particular decision, as there is no financial benefit or loss as aresult of either choice. The costs that are relevant may change over time and withchanging circumstances. This is particularly so with the cost of labour.
Where there is spare capacity, with surplus labour that will be paid whethera particular decision is taken or not, the labour cost is irrelevant to the decision.Where there is casual labour or use of overtime and the decision causes the cost toincrease (or decrease), the labour cost is relevant. Where labour is scarce and thereis full capacity, so that labour has to be diverted from alternative work involvingan opportunity cost, the opportunity loss is relevant.
For example, Brown & Co. is a small management consulting firm that has beenoffered a market research project for a client. The estimated workloads and labourcosts for the project are:
Hours Hourly labour costPartners 120 £60Managers 350 £45Support staff 150 £20

HUMAN RESOURCE DECISIONS 145
There is at present a shortage of work for partners, but this is a temporary situation.Managers are fully utilized and if they are used on this project, other clients willhave to be turned away, which will involve the loss of revenue of £100 per hour.Other staff can be hired and fired on a temporary basis. Fixed costs are £100,000per annum.
The relevant cost of labour to be used when considering this project can becalculated by considering the future, incremental cash flows:
Partners 120 hours – irrelevant as unavoidablesurplus labour
Nil
Managers 350 hours @ £100 – this is theopportunity cost of the lost revenuefrom clients who are turned away
£35,000
Support staff 150 hours @ £20 cost 3,000
Relevant cost of labour £38,000
The fixed/variable cost approach would have identified the cost of labour as:
Hours Hourly labour cost Total labour costPartners 120 £60 £7,200Managers 350 £45 £15,750Support staff 150 £20 £3,000
Variable cost of labour £25,950
The relevant cost approach identifies the future, incremental cash flows associatedwith acceptance of the order. This ignores the cost of partners as there is no future,incremental cash flow. The cost of managers is the opportunity cost – the lostrevenue from the work to be turned away. The support staff cost is due to the needto employ more temporary staff. Fixed costs are irrelevant as they are unaffectedby this project.
Chapter 9 introduced outsourcing as a business strategy that has been in favourto reduce the cost of labour and increase capacity utilization. The example givenfor the make versus buy decision in Chapter 9 related to an in-house computerprocessing service in which the relevant costs are shown in Table 10.2.
Table 10.2 Make versus buy – relevant costs
Relevant cost to make Relevant cost to buy
Stationery 10,000 @ £0.50 5,000Labour 10,000 @ £2 20,000Outsourcing cost 20,000
Total relevant cost £25,000 £20,000

146 ACCOUNTING FOR MANAGERS
Table 10.3 Make versus buy – relevant costs
Relevant cost to make Relevant cost to buy
Stationery 10,000 @ £0.50 5,000Outsourcing cost 20,000
Total relevant cost £5,000 £20,000
In the above example, it was implicit that TUPE required the cost of labour to betransferred to the external company, as labour ceased to be a relevant cost underthe outsourcing option. However, if the labour were not transferred to the externalcompany but retained in the organization, it could become a relevant cost and thefinancial calculation of the outsourcing decision may be different, depending onthe alternative use of the labour.
The relevant costs for each alternative would then be those shown in Table 10.3.Note in the example in Table 10.3 that labour is no longer a relevant cost, as it
is incurred irrespective of the decision to outsource. In this case it would be morecostly to outsource the service unless the underutilized labour could be directedat tasks that generated a contribution of at least £15,000. This example shows howit is important in any calculation of relevant costs to be sure about which costs areavoidable and which costs are unavoidable.
Unfortunately, one of the first business responses to a downturn in profits isto make staff redundant. Although the redundancy payments will be recognizedas a cost, there is a substantial social cost, not reflected in the financial reportsof a business. The social effects will be borne by the redundant employee, whilethe financial burden of unemployment benefits may be borne by the taxpayer(see Chapter 5 for a discussion). This short-term concern with reducing labourcost often ignores the potential for cost improvement that can arise from a betterunderstanding of business processes.
Business processes and activity-based costs
Activity-based costing (or ABC) was introduced in Chapter 9 in relation to the costof unused capacity. ABC developed from the work of Cooper and Kaplan (Cooperand Kaplan, 1988; Cooper, 1990; and Cooper and Kaplan, 1992), who arguedthat many resource demands are not proportional to volume but arise from thediversity and complexity of the product and customer mix. ABC systems estimatethe costs of resources used to perform activities for various outputs and directlylink the cost of performing activities to the products/services and customers forwhich those activities are performed.
ABC achieves this through the concept of the cost driver, which is the mostsignificant determinant of the cost of an activity. The cost driver seeks to determinecause-and-effect relationships for costs, and measures the demand for activities byeach product or service. ABC is described more fully in Kaplan and Cooper (1998)and is covered in more detail in Chapter 11.

HUMAN RESOURCE DECISIONS 147
A parallel concern has been with business process re-engineering (BPR), a termcoined by Hammer and Champy (1993) and which they defined as:
the fundamental rethinking and radical design of business processes toachieve dramatic improvements in critical, contemporary measures of per-formance, such as cost, quality, service, and speed. (p. 32)
The recognition by both ABC and BPR is that business processes flow throughthe organization (i.e. horizontally) and are not confined to hierarchical depart-ments (i.e. vertically). This is not a dissimilar concept to Porter’s value chain (seeChapter 9), where activities do not follow the route of the typical business organi-zation chart. However, accounting reports are typically structured in accordancewith the organizational chart, either on a functional basis (marketing, operations,finance etc.) or on a divisionalized basis (by product/service, geographic unit etc.,as described in Chapter 2). The lack of cost information in relation to businessprocesses is a limitation of traditional accounting systems.
Two examples, one from manufacturing and one from financial services, helpto understand the importance of BPR and ABC as tools that can aid in humanresource decision-making.
Example 1: manufacturing
Purchasing in a manufacturing business is a process that is not confined to acentralized purchasing department. The process begins with the identification ofthe need to order raw materials. A requisition may be raised in a productiondepartment, is approved and is submitted to a purchasing department that willhave an approved list of suppliers and negotiated prices. A purchase order willbe created and sent to the supplier. The process continues when the goods arereceived in the store, signed for and placed in a storage area. The paperwork is sentto the accounting department where the supplier’s delivery note, the purchaseorder and the goods receipt record are matched to await the supplier invoice. Theinvoice prices and quantities are checked and a cheque will be issued.
In this example, purchasing is a cross-functional process that affects the per-sonnel in many departments. However, a traditional accounting system arrangedaround hierarchical departments and line items (e.g. salaries) will not recognizethe total cost of the purchasing process. Building on the principles of BPR, an ABCaccounting system will collect and report the total process cost. This can lead toimproved management decisions.
In the motor vehicle industry, an understanding of cost drivers has led tothe recognition that the number of suppliers and the number of parts had to berationalized. It has also led to the adoption of designs that more frequently usecommon parts between different models (a recognition of the importance of theproduct design phase, see Chapter 9). This is a more sophisticated method ofdriving down purchasing costs than the conventional approach of reducing thepersonnel headcount while leaving business processes unchanged, resulting in anincreased workload for the remaining personnel.

148 ACCOUNTING FOR MANAGERS
Example 2: financial services
Serving customers in a bank involves many different personnel in many differentdepartments. A customer service employee may open an account and arrangecheque books and bank cards. The teller will process deposits. A loans officer willtake the details of loan applications. These are ‘front office’ or customer-facingpersonnel. In the ‘back office’, cheques will be processed by data-entry operators,the production of cheque books and bank cards will take place, customer fundswill be invested, statements printed and so on.
For most of these services (the exception is the loan, where a separate chargemay be made) a single bank charge covers the bank’s administration costs. Somebanks no longer charge fees to non-business customers as their costs are absorbedagainst the interest earned by the bank on their customers’ bank balances (lessany, usually smaller, interest payment to the customer).
Given this complexity, banks need to understand the profitability of differentbranch locations and different types of customers (market segments, see Chapter 8).In order to do this, an activity-based approach can be used. The cost drivers foreach major activity can be identified, e.g. the number of new customers (foraccount-opening costs); the number of cheque and deposit transactions (for theteller and data-entry costs); the number (or value) of loans (for loan-processingcosts); and the number of accounts (for account-maintenance costs). The numberof transactions for each branch and type of customer multiplied by the directlabour cost per transaction (see earlier in this chapter) can then be compared withthe income earned from bank charges and interest.
In banking, understanding these costs has led to the introduction of automaticteller machines (ATMs) to reduce the cost of front-office staff who previouslycashed cheques in the bank branch. ATMs increased bank profitability as manyemployees were made redundant, although more recently there has been anattempt (impeded by the competition authorities) to impose charges for the use ofATMs by customers.
The following case studies show the impact of an activity-based approach tolabour costs and capacity utilization.
Case study: The Database Management Company – labourcosts and unused capacity
The Database Management Company (DMC) is a call centre within a multi-national company that has built a sophisticated database to hold consumer buyingpreferences. DMC contracts with large retail organizations to provide informationon request and charges a fixed monthly fee plus a fee for each transaction (requestfor information). DMC estimates transaction volume based on past experience andrecruits employees accordingly, to ensure that it is able to satisfy its customers’demands without delay.
Employees are on a mix of permanent and temporary contracts. Labour costsare separated into variable (transaction-processing costs, which can be directly

HUMAN RESOURCE DECISIONS 149
attributable to specific contracts) and fixed elements (administration and supervi-sion). DMC also incurs fixed costs, the main items being for building occupancy (acharge made by the parent company based on floor area occupied) and the leaseof computer equipment. As these costs follow staffing levels that relate to specificcontracts, they can be allocated with a reasonable degree of accuracy.
DMC’s budget (based on anticipated activity levels and standard costs) is shownin Table 10.4. As a result of declining retail sales the demand for transactions hasfallen, but because of uncertainty in DMC about how long this downturn will last,it has only been able to reduce its variable labour cost by ending the contracts ofa small number of temporary staff. DMC’s actual results for the same period areshown in Table 10.5.
Table 10.4 DMC budget
(In £’000) Contract 1 Contract 2 Contract 3 Total
Budgeted number of transactions 10,000 15,000 25,000 50,000Fee per transaction £1.00 £0.85 £0.70Budgeted transaction income 10,000 12,750 17,500 40,250Fixed monthly fee 5,000 7,500 12,000 24,500
Total budgeted income 15,000 20,250 29,500 64,750Variable labour costs 4,000 6,000 9,000 19,000
Contribution 11,000 14,250 20,500 45,750Fixed labour costs 3,000 2,000 2,000 7,000Occupancy costs 5,000 6,000 12,000 23,000Computer costs 2,500 3,500 5,000 11,000
Budgeted net profit 500 2,750 1,500 4,750
Table 10.5 DMC actual results
(In £’000) Contract 1 Contract 2 Contract 3 Total
Actual number of transactions 9,000 10,500 22,000 41,500Fee per transaction £1.00 £0.85 £0.70Actual transaction income 9,000 8,925 15,400 33,325Fixed monthly fee 5,000 7,500 12,000 24,500
Actual income 14,000 16,425 27,400 57,825Variable labour costs 3,750 5,000 8,000 16,750
Contribution 10,250 11,425 19,400 41,075Fixed labour costs 3,000 2,000 2,000 7,000Occupancy costs 5,000 6,000 12,000 23,000Computer costs 2,500 3,500 5,000 11,000
Actual net profit/(-loss) −250 −75 400 75

150 ACCOUNTING FOR MANAGERS
How can the poor performance compared with budget beinterpreted?DMC’s income has fallen across the board because of the reduced number oftransactions on all its contracts. Because it has been unable to alter its variablelabour cost significantly in the short term, the contribution towards fixed costs andprofits has fallen. Therefore, although the business treats these costs as variable,in practice they are fixed costs, especially in the short term. The fixed salaryand non-salary costs are constant despite the fall in transaction volume and soprofitability has been eroded. DMC cannot alter its floor space allocation from theparent company or its computer lease costs despite having spare capacity.
What information can be provided to help in making a decisionabout cost reductions?Calculating the variance (or difference) between the budget and actual income andvariable costs shows how the difference between budget and actual profit of £4,675(£4,750 − £75) is represented by a fall in income of £6,925 offset by a reduction invariable labour costs of £2,250 (all figures are in £’000). This is shown in Table 10.6.
Calculating the cost of unused capacity identifies the profit decline more clearly,as can be seen in Table 10.7.
Table 10.6 DMC loss of contribution
Contract 1 Contract 2 Contract 3 Total
Income reduction from budget 1,000 3,825 2,100 6,925Variable labour costs reduction 250 1,000 1,000 2,250
Contribution reduction 750 2,825 1,100 4,675
Table 10.7 DMC cost of unused capacity
Contract 1 Contract 2 Contract 3 Total
Budgeted variable labour costs 4,000 6,000 9,000 19,000Budgeted number of transactions 10,000 15,000 25,000 50,000
Budgeted cost per transaction £0.40 £0.40 £0.36
Actual number of transactions 9,000 10,500 22,000 41,500Budgeted cost per transaction £0.40 £0.40 £0.36
Standard variable labour cost1 3,600 4,200 7,920 15,720
Cost of unused capacity (budget variablelabour cost less standard variable labourcost)
400 1,800 1,080 3,280
1 The actual number of transactions multiplied by the budgeted variable labour cost per transaction.

HUMAN RESOURCE DECISIONS 151
Table 10.8 DMC variable costs
Contract 1 Contract 2 Contract 3 Total
Actual variable labour costs 3,750 5,000 8,000 16,750Standard variable labour costs 3,600 4,200 7,920 15,720
Difference 150 800 80 1,030
Of the gap between budget and actual profit, £3,280 is accounted for by the costof unused capacity in variable labour. This gap has been offset to some extent bythe reduction in variable labour costs of £2,250. There remains the capability toreduce variable costs to meet the actual transaction volume, as Table 10.8 shows.
What conclusions can be drawn from this information?
It is clear that DMC has either to increase its income or reduce its costs in orderto reach its profitability targets. The company has a significant cost of unusedcapacity. However, it can only reduce this unused capacity based on soundmarket evidence or else it may be constraining its ability to provide services to itscustomers in future, which may in turn result in a greater loss of income. DMCneeds to renegotiate its prices and volumes with its customers.
Case study: Trojan Sales – the cost of losing a customer
Trojan Sales is a business employing a number of sales representatives, eachcosting the business £40,000 per annum, a figure that includes salary, oncosts andmotor vehicle running costs. Sales representatives also earn a commission of 1%on the orders placed by their customers. On average, each sales representativelooks after 100 customers (one driver of activity) and each year, customers placean average of five orders, with an average order size of £2,500. Therefore, eachrepresentative generates sales of:
100 × 5 × £2,500 = £1,250,000
and earns commission of 1%, amounting to £12,500.However, Trojan suffers from a loss to competitors of about 10% of its customer
base each year. Consequently, only about 70% of each sales representative’s time isspent with existing customers, the other 30% being spent on winning replacementcustomers, with each representative needing to find 10 new customers each year(a second driver of activity). The business wants to undertake a campaign toprevent the loss of customers and has asked for a calculation of the cost of eachlost customer.

152 ACCOUNTING FOR MANAGERS
A first step is to calculate the cost of the different functions carried out by eachsales representative:
employment cost of £40,000× 70% of time
100 existing customers= £280 per customer (account maintenance)
employment cost of £40,000× 30% of time
10 new customers= £1,200 per new customer
The cash cost of winning a new customer is £1,200. However, the opportunity costprovides a more meaningful cost. If there were no lost business and sales represen-tatives could spend all of their time with existing customers, each representativecould look after 142 customers (100 × 100/70) in the same time.
If each of the 142 customers placed the average five orders with an averageorder size of £2,500, each representative could generate income of £1,775,000 andearn commission of £17,750. The opportunity cost is the loss of the opportunityby the company to generate the extra income of £525,000 (£1,775,000 − £1,250,000)and the opportunity cost to the representative personally of £5,250 (commissionof £17,750 − £12,500).
Each customer lost costs Trojan £1,200 in time taken by sales representativesto find a replacement customer. However, on an opportunity cost basis, eachlost customer potentially costs the company £52,500 in lost sales and the salesrepresentative £525 in lost commission.
For this kind of reason, businesses sometimes adopt a strategy of splitting theirsalesforce into those representatives who are good at new account prospectingand those who are better at account maintenance.
Conclusion
This chapter has calculated the cost of labour and developed relevant costs toinclude labour. It has introduced the concept of activity-based costing as a methodby which the cost of business processes can be measured in order to improvebusiness decision-making.
References
Armstrong, M. (1995a). A Handbook of Personnel Management Practice. (5th edn). London:Kogan Page.
Armstrong, P. (1995b). Accountancy and HRM. In J. Storey (ed.), Human Resource Manage-ment: A Critical Text, London: International Thomson Business Press.
Cooper, R. (1990). Cost classifications in unit-based and activity-based manufacturing costsystems. Journal of Cost Management, Fall, 4–14.
Cooper, R. and Kaplan, R. S. (1988). Measure costs right: make the right decisions. HarvardBusiness Review, Sept–Oct, 96–103.

HUMAN RESOURCE DECISIONS 153
Cooper, R. and Kaplan, R. S. (1992). Activity-based systems: measuring the costs of resourceusage. Accounting Horizons, 6(3), 1–13.
Hammer, M. and Champy, J. (1993). Reengineering the Corporation: A Manifesto for BusinessRevolution. London: Nicholas Brealey Publishing.
Kaplan, R. S. and Cooper, R. (1998). Cost and Effect: Using Integrated Cost Systems to DriveProfitability and Performance. Boston, MA: Harvard Business School Press.


11
Accounting Decisions
This chapter explains how accountants classify costs and determine the costs ofproducts/services through differentiating product and period costs, and directand indirect costs. The chapter emphasizes the overhead allocation problem:how indirect costs are allocated over products/services. In doing so, it contrastsabsorption with activity-based costing. The chapter concludes with an overviewof contingency theory, Japanese approaches to management accounting and thebehavioural consequences of accounting choices.
Cost classification
Product and period costs
The first categorization of costs made by accountants is between period andproduct. Period costs relate to the accounting period (year, month). Product costsrelate to the cost of goods (or services) produced. This distinction is particularlyimportant to the link between management accounting and financial accounting,because the calculation of profit is based on the separation of product and periodcosts. However, the value given to inventory is based only on product costs, arequirement of accounting standards (see later in this chapter).
Although Chapters 8, 9 and 10 introduced the concept of the contribution (salesless variable costs), as we saw in Chapter 6 there are two types of profit: grossprofit and net profit:
gross profit = sales − cost of sales
The cost of sales is the product (or service) cost. It is either:
ž the cost of providing a service; orž the cost of buying goods sold by a retailer; orž the cost of raw materials and production costs for a product manufacturer.
net (or operating) profit = gross profit − expenses
Expenses are the period costs, as they relate more to a period of time thanto the production of product/services. These will include all the other (selling,

156 ACCOUNTING FOR MANAGERS
administration, finance etc.) costs of the business, i.e. those not directly concernedwith buying, making or providing goods or services, but supporting that activity.
To calculate the cost of sales, we need to take into account the change ininventory, to ensure that we match the income from the sale of goods with thecost of the goods sold. As we saw in Chapter 6, inventory (or stock) is the value ofgoods purchased or manufactured that have not yet been sold. Therefore:
cost of sales = opening stock + purchases − closing stock
for a retailer, or:
cost of sales = opening stock + cost of production − closing stock
for a manufacturer. For a service provider, there can be no inventory of servicesprovided but not sold, as the production and consumption of services take placesimultaneously, so:
cost of sales = cost of providing the services that are sold
Financial statements produced for external purposes, as we saw in Chapter 6,show merely the value of sales, cost of sales, gross profit, expenses and net profit.For management accounting purposes, however, a greater level of detail is shown.A simple example is:
Sales 1,000,000Less: cost of salesOpening stock 250,000Plus purchases (or cost of production) 300,000
Stock available for sale 550,000Less closing stock 200,000
Cost of sales 350,000
Gross profit 650,000Less period costs 400,000
Operating profit 250,000
Direct and indirect costs
Accounting systems typically record costs in terms of line items. As we sawin Chapter 3, line items reflect the structure of an accounting system aroundaccounts for each type of expense, such as materials, salaries, rent, advertisingetc. Production costs (the cost of producing goods or services) may be classed asdirect or indirect. Direct costs are readily traceable to particular product/services.Indirect costs are necessary to produce a product/service, but are not able to
ACCOUNTING DECISIONS 157
be readily traced to particular products/services. Indirect costs are often referredto as overheads. Any cost may be either direct or indirect, depending on itstraceability to particular products/services. Because of their traceability, directcosts are generally considered variable costs because costs increase or decreasewith the volume of production. However, as we saw in Chapter 10, direct labouris sometimes treated as a fixed cost. Indirect costs may be variable (e.g. electricity)or fixed (e.g. rent).
Direct materials are traceable to particular products through material issue docu-ments. For a manufacturer, direct material costs will include the materials boughtand used in the manufacture of each unit of product. They will clearly be identifi-able from a bill of materials: a detailed list of all the components used in production.There may be other materials of little value that are used in production, suchas screws, adhesives, cleaning materials etc., which do not appear on the bill ofmaterials because they have little value and the cost of recording their use wouldbe higher than the value achieved. These are still costs of production, but becausethey are not traced to particular products they are indirect material costs.
While the cost of materials will usually only apply to a retail or manufacturingbusiness, the cost of labour will apply across all business sectors. Direct labour istraceable to particular products or services via a time-recording system. It is thelabour directly involved in the conversion process of raw materials to finishedgoods (see Chapter 9). Direct labour will be clearly identifiable from an instructionlist or routing, a detailed list of all the steps required to produce a good or service.In a service business, direct labour will comprise those employees providing theservice that is sold. In a call centre, for example, the cost of those employeesmaking and receiving calls is a direct cost. Other labour costs will be incurredthat do not appear on the routing, such as supervision, quality control, health andsafety, cleaning, maintenance etc. These are still costs of production, but becausethey are not traced to particular products, they are indirect labour costs.
Other costs are incurred that may be direct or indirect. For example, in amanufacturing business, the depreciation of machines (a fixed cost) used to makeproducts may be a direct cost if each machine is used for a single product or anindirect cost if the machine is used to make many products. The electricity usedin production (a variable cost) may be a direct cost if it is metered to particularproducts or indirect if it applies to a range of products. A royalty paid per unitof a product/service produced or sold will be a direct cost. The cost of rental ofpremises, typically relating to the whole business, will be an indirect cost.
Prime cost is an umbrella term to refer to the total of all direct costs. Productionoverhead is the total of all indirect material and labour costs and other indirectcosts, i.e. all production costs other than direct costs. This distinction appliesequally to the production of goods and services.
However, not all costs in an organization are production costs. Some, as wehave seen, relate to the period rather than the product. These other costs (suchas marketing, sales, distribution, finance, administration etc.) are not included inproduction overhead. These other costs are classed generally as overheads, but inthe case of period costs they are non-production overheads.

158 ACCOUNTING FOR MANAGERS
Sales
Less cost of salesProduct costs− direct or prime costsIndirect costs− indirect costs or production overheadPlus/minus change in inventory
= Gross profit
Less selling, administrationand finance expenses
Period costsNon-production overhead
= Operating profit
Total costs= product costs + period costs
Figure 11.1 Cost classification
Distinguishing between production and non-production costs and betweenmaterials, labour and overhead costs as direct or indirect is contingent on the typeof product/service and the particular production process used in the organization.Contingency theory is described later in this chapter. There are no strict rules, asthe classification of costs depends on the circumstances of each business and thedecisions made by the accountants in that business. Consequently, unlike financialaccounting, there is far greater variety between businesses – even in the sameindustry – in how costs are treated for management accounting purposes.
Figure 11.1 shows the relationship between these different types of costs.
Calculating product/service costs
We saw in Chapter 8 the important distinction between fixed and variable costsand how the calculation of contribution (sales less variable costs) was importantfor short-term decision-making. However, we also saw that in the longer term,all the costs of a business must be recovered if it is to be profitable. To assistwith pricing and other decisions, accountants calculate the full or absorbed cost ofproduct/services.
As direct costs by definition are traceable, this element of product/service costis usually quite accurate. However indirect costs, which by their nature cannot betraced to products/services, must in some way be allocated over products/servicesin order to calculate the full cost. Overhead allocation is the process of spreadingproduction overhead (i.e. those overheads that cannot be traced directly to prod-ucts/services) equitably over the volume of production. The overhead allocationproblem can be seen in Figure 11.2.

ACCOUNTING DECISIONS 159
Direct costs Variable costs
Materials, labour etc. directly traceable to+
Electricity, consumables etc.
Indirect manufacturing costs Product costs
Fixed costs
Rent, depreciation etc. allocated to
+
Non-manufacturing costs Period costs
=
Total costs
Figure 11.2 The overhead allocation problem
The overhead allocation problem is a significant issue, as most businesses producea range of products/services using multiple production processes. The mostcommon form of overhead allocation employed by accountants has been to allocateoverhead costs to products/services in proportion to direct labour. However, thismay not accurately reflect the resources consumed in production. For example,some processes may be resource intensive in terms of space, machinery, peopleor working capital. Some processes may be labour intensive while others usediffering degrees of technology. The cost of labour, due to specialization andmarket forces, may also vary between different processes.
Further, the extent to which these processes consume the (production andnon-production) overheads of the firm can be quite different. The allocationproblem can lead to overheads being arbitrarily allocated across different prod-ucts/services, which can lead to misleading information about product/serviceprofitability. As production overheads are a component of the valuation of inven-tory (because they are part of the cost of sales), different methods of overheadallocation can also influence inventory valuation and hence reported profitability.An increase or decrease in inventory valuation will move profits between differentaccounting periods.
Shifts in management accounting thinking
In their book Relevance Lost: The Rise and Fall of Management Accounting, Johnson andKaplan (1987) emphasized the limitations of traditional management accountingsystems that failed to provide accurate product costs:

160 ACCOUNTING FOR MANAGERS
Costs are distributed to products by simplistic and arbitrary measures,usually direct-labor based, that do not represent the demands made by eachproduct on the firm’s resources . . . the methods systematically bias anddistort costs of individual products . . . [and] usually lead to enormous crosssubsidies across products. (p. 2)
Management accounting, according to Johnson and Kaplan (1987), failed to keeppace with new technology and became subservient to the needs of externalfinancial reporting, as costs were allocated by accountants between the valuationof inventory and the cost of goods sold. Johnson and Kaplan claimed that ‘[m]anyaccountants and managers have come to believe that inventory cost figures givean accurate guide to product costs, which they do not’ (p. 145). They argued that:
as product life cycles shorten and as more costs must be incurred beforeproduction begins . . . directly traceable product costs become a muchlower fraction of total costs, traditional financial measures such as peri-odic earnings and accounting ROI become less useful measures of corporateperformance. (p. 16)
Johnson and Kaplan claimed that the goal of a good product cost system:
should be to make more obvious, more transparent, how costs currentlyconsidered to be fixed or sunk actually do vary with decisions made aboutproduct output, product mix and product diversity. (p. 235)
Johnson and Kaplan also argued against the focus on short-term reported prof-its and instead for short-term non-financial performance measures that wereconsistent with the firm’s strategy and technologies (these were described inChapter 4).
In their latest book, Kaplan and Cooper (1998) describe how activity-based cost(ABC) systems:
emerged in the mid-1980s to meet the need for accurate information aboutthe cost of resource demands by individual products, services, customersand channels. ABC systems enabled indirect and support expenses to bedriven, first to activities and processes, and then to products, services, andcustomers. The systems gave managers a clearer picture of the economics oftheir operations. (p. 3)
ABC systems were introduced in Chapters 9 and 10 and are further developed inthe next section of this chapter.
Kaplan and Cooper (1998) argued that cost systems perform three primaryfunctions:
1 Valuation of inventory and measurement of the cost of goods sold for finan-cial reporting.
2 Estimation of the costs of activities, products, services and customers.3 Provision of feedback to managers about process efficiency.
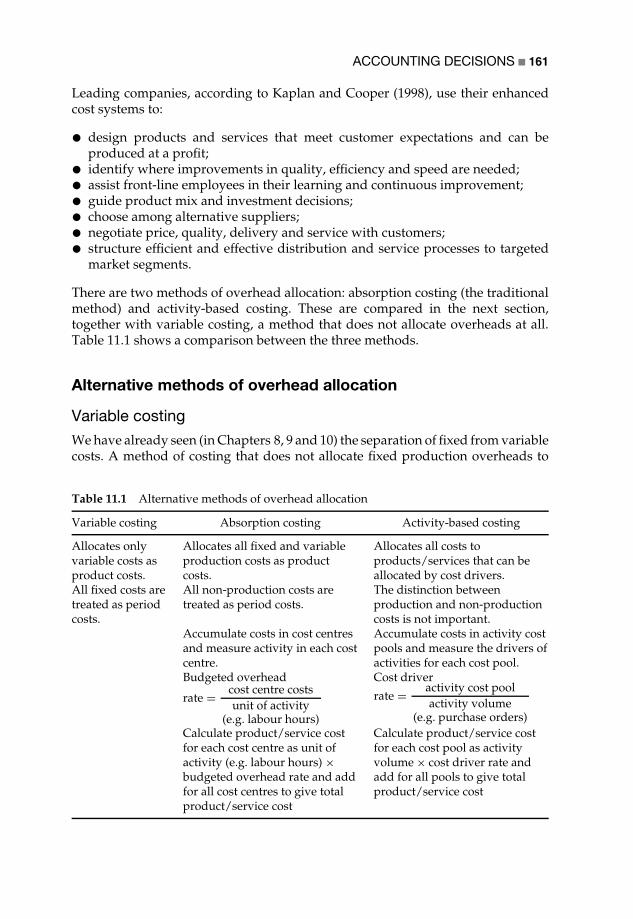
ACCOUNTING DECISIONS 161
Leading companies, according to Kaplan and Cooper (1998), use their enhancedcost systems to:
ž design products and services that meet customer expectations and can beproduced at a profit;ž identify where improvements in quality, efficiency and speed are needed;ž assist front-line employees in their learning and continuous improvement;ž guide product mix and investment decisions;ž choose among alternative suppliers;ž negotiate price, quality, delivery and service with customers;ž structure efficient and effective distribution and service processes to targetedmarket segments.
There are two methods of overhead allocation: absorption costing (the traditionalmethod) and activity-based costing. These are compared in the next section,together with variable costing, a method that does not allocate overheads at all.Table 11.1 shows a comparison between the three methods.
Alternative methods of overhead allocation
Variable costing
We have already seen (in Chapters 8, 9 and 10) the separation of fixed from variablecosts. A method of costing that does not allocate fixed production overheads to
Table 11.1 Alternative methods of overhead allocation
Variable costing Absorption costing Activity-based costing
Allocates onlyvariable costs asproduct costs.
Allocates all fixed and variableproduction costs as productcosts.
Allocates all costs toproducts/services that can beallocated by cost drivers.
All fixed costs aretreated as periodcosts.
All non-production costs aretreated as period costs.
The distinction betweenproduction and non-productioncosts is not important.
Accumulate costs in cost centresand measure activity in each costcentre.
Accumulate costs in activity costpools and measure the drivers ofactivities for each cost pool.
Budgeted overhead
rate = cost centre costsunit of activity
(e.g. labour hours)
Cost driver
rate = activity cost poolactivity volume
(e.g. purchase orders)Calculate product/service costfor each cost centre as unit ofactivity (e.g. labour hours) ×budgeted overhead rate and addfor all cost centres to give totalproduct/service cost
Calculate product/service costfor each cost pool as activityvolume × cost driver rate andadd for all pools to give totalproduct/service cost

162 ACCOUNTING FOR MANAGERS
products/services is variable (or marginal) costing. Under variable costing, theproduct cost only includes variable production costs. Fixed production costs aretreated as period costs and charged to the Profit and Loss account. This methodavoids much of the overhead allocation problem, as most production overheadstend to be fixed rather than variable in nature.
However, variable costing does not comply with SSAP9, the UK accountingprofession’s Statement of Standard Accounting Practice on Stocks. SSAP9 requiresthat the cost of stock should:
comprise that expenditure which has been incurred in the normal courseof business in bringing the product or service to its present location andcondition. Such costs will include all related production overheads.
The effect of SSAP9 is to require companies to account – for financial reportingpurposes – on an absorption costing basis, as ‘all related production overheads’include both fixed and variable production costs.
Absorption costing
Absorption costing is a system in which all (fixed and variable) productionoverhead costs are charged to product/services using an allocation base (a measureof activity or volume such as labour hours, machine hours, or the number of unitsproduced etc.). The allocation base used in absorption costing is often regardedas arbitrary.
Under absorption costing, a budgeted overhead rate can be calculated as either:
ž a business-wide rate, orž a cost centre overhead rate.
A business-wide budgeted overhead rate is calculated by dividing the productionoverheads for the total business by some measure of activity. Overhead rates canalso be calculated for each cost centre separately. A cost centre is a location withinthe organization to which costs are assigned (it may be a department or a group ofactivities within a department, see Chapter 2). A cost centre budgeted overhead rateis a result of determining the overheads that are charged to each cost centre andthe activity of that cost centre. It is preferable to calculate a separate overhead ratefor each cost centre, as the costs and activity of each may be quite different.
The overhead charged to each cost centre must then be recovered as a rate basedon the principal unit of activity within a cost centre, typically direct labour hours,machine hours or the number of units produced. We therefore calculate a directlabour hour rate or a machine hour rate or a rate per unit produced for each productioncost centre, or for the business as a whole.
Under both methods, the budgeted overhead rate is:
estimated overhead expenditure for the periodestimated activity for the period
ACCOUNTING DECISIONS 163
For example, a business with budgeted overhead expenditure of £100,000 and anactivity level of 4,000 direct labour hours would have a business-wide budgetedoverhead rate of £25 per hour (£100,000/4,000). Most businesses are able to identifytheir overhead costs and activity to individual cost centre levels and determinecost centre overhead rates. This can be achieved using a three-stage process:
1 Identify indirect costs with particular cost centres. In many cases, althoughcosts cannot be traced to products/services, they can be traced to particularcost centres. Accounting systems will separately record costs incurred by eachcost centre. For example, supervision costs may be traceable to each cost centre.Certain consumables may only be used in particular cost centres. Each costcentre may order goods and services and be charged for those goods andservices separately.
2 Analyse each line item of expenditure that cannot be traced to particular costcentres and determine a suitable method of allocating each cost across the costcentres. There are no rules for the methods of allocation, which are contingenton the circumstances of the business and the choices made by accountants.However, common methods of allocating indirect costs include:
Expense Allocation basisManagement salaries Number of employees in each cost
centrePremises cost Floor area occupied by each cost
centreElectricity Machine hours used in each cost
centreDepreciation on equipment Asset value in each cost centre
3 Identify those cost centres that are part of the production process and thoseservice cost centres that provide support to production cost centres. Allocate thetotal costs incurred by service cost centres to the production cost centres usinga reasonable method of allocation. Common methods of allocating service costcentres include:
Service cost centre Allocation basisMaintenance Timesheet allocation of hours spent in
each production cost centreCanteen Number of employees in each cost centreScheduling Number of production orders
An example of cost allocation between departments is shown below. Using theprevious example and the same overhead costs of £200,000, suitable methods ofallocation have been identified over five departments (stages 1 and 2) as follows:
Expense item Method of allocationIndirect wages From payrollFactory rental Floor areaDepreciation on equipment Asset valueElectricity Machine hours
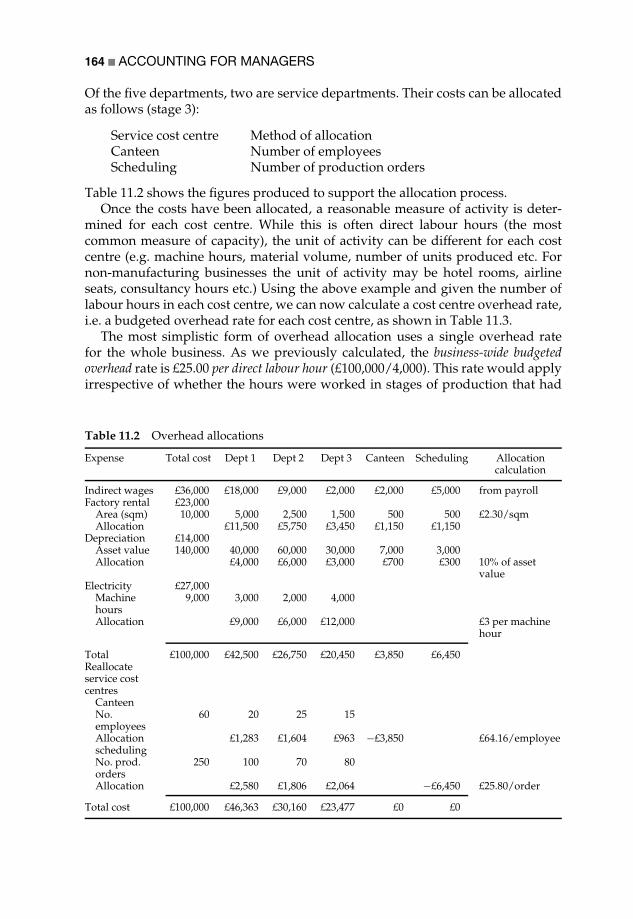
164 ACCOUNTING FOR MANAGERS
Of the five departments, two are service departments. Their costs can be allocatedas follows (stage 3):
Service cost centre Method of allocationCanteen Number of employeesScheduling Number of production orders
Table 11.2 shows the figures produced to support the allocation process.Once the costs have been allocated, a reasonable measure of activity is deter-
mined for each cost centre. While this is often direct labour hours (the mostcommon measure of capacity), the unit of activity can be different for each costcentre (e.g. machine hours, material volume, number of units produced etc. Fornon-manufacturing businesses the unit of activity may be hotel rooms, airlineseats, consultancy hours etc.) Using the above example and given the number oflabour hours in each cost centre, we can now calculate a cost centre overhead rate,i.e. a budgeted overhead rate for each cost centre, as shown in Table 11.3.
The most simplistic form of overhead allocation uses a single overhead ratefor the whole business. As we previously calculated, the business-wide budgetedoverhead rate is £25.00 per direct labour hour (£100,000/4,000). This rate would applyirrespective of whether the hours were worked in stages of production that had
Table 11.2 Overhead allocations
Expense Total cost Dept 1 Dept 2 Dept 3 Canteen Scheduling Allocationcalculation
Indirect wages £36,000 £18,000 £9,000 £2,000 £2,000 £5,000 from payrollFactory rental £23,000
Area (sqm) 10,000 5,000 2,500 1,500 500 500 £2.30/sqmAllocation £11,500 £5,750 £3,450 £1,150 £1,150
Depreciation £14,000Asset value 140,000 40,000 60,000 30,000 7,000 3,000Allocation £4,000 £6,000 £3,000 £700 £300 10% of asset
valueElectricity £27,000
Machine 9,000 3,000 2,000 4,000hoursAllocation £9,000 £6,000 £12,000 £3 per machine
hour
Total £100,000 £42,500 £26,750 £20,450 £3,850 £6,450Reallocateservice costcentres
CanteenNo. 60 20 25 15employeesAllocation £1,283 £1,604 £963 −£3,850 £64.16/employeeschedulingNo. prod. 250 100 70 80ordersAllocation £2,580 £1,806 £2,064 −£6,450 £25.80/order
Total cost £100,000 £46,363 £30,160 £23,477 £0 £0

ACCOUNTING DECISIONS 165
Table 11.3 Cost centre budget overhead rate
Total cost Dept 1 Dept 2 Dept 3
Total cost £100,000 £46,363 £30,160 £23,477Direct labour hours 4,000 2,000 750 1,250Hourly rate £25.00 £23.18 £40.21 £18.78
high or low machine utilization, different levels of skill, different pay rates orrequired different degrees of support.
Under the cost centre budgeted overhead rate, the rate per direct labour hour variesfrom a low of £18.78 for Dept 3 to a high of £40.21 for Dept 2. This reflects thedifferent cost structure and capacity of each cost centre.
Consider an example of two products, each requiring 10 machine hours. Theextent to which each product requires different labour hours in each of the threedepartments will lead to quite different overhead allocations.
Assume that product A requires 2 hours in Dept 1, 5 hours in Dept 2 and 3 hoursin Dept 3. The overhead allocation would be £303.77. If product B requires 5, 1and 4 hours respectively in each department, the overhead allocation would be£231.25, as Table 11.4 shows. By contrast, the overhead allocation to both products(each of which requires 10 hours of production time) using a business-wide ratewould be £250 (10 @ £25).
The total cost of a product comprises the prime cost (the total of direct costs)and the overhead allocation. Whether a business-wide or cost centre overheadallocation rate is used, the prime cost is unchanged. Assuming that the costs perunit for our two example products are:
Product A Product BDirect materials 110 150Direct labour 75 90
Prime cost 185 240
Table 11.4 Overhead allocation to products based on cost centre budget overhead rate
Total cost Dept 1 Dept 2 Dept 3
Hourly rate £25.00 £23.18 £40.21 £18.78Product A: direct labour hours 2 5 3
Overhead allocation £303.77 £46.36 £201.07 £56.34
Product B: direct labour hours 5 1 4
Overhead allocation £231.25 £115.91 £40.21 £75.13

166 ACCOUNTING FOR MANAGERS
The allocation of overhead based on cost centre rates (rounded to the nearest £)would be:
Overhead allocation 304 231
Full (or absorbed) cost 489 471
As can be seen in the above example, the overhead allocation as a percentage oftotal cost can be very high. This is not unusual in business, particularly in thoseorganizations that have invested heavily in technology or (except for professionalservices; see Chapter 9) in service businesses, where direct costs are a smallproportion of total business costs.
The cost centre rate is more accurate than the business-wide rate because itdoes attempt to differentiate between the different cost structures of cost centres.However, the three-stage method of allocating costs between cost centres andthen allocating those costs to products/services using a single activity measurecan be quite arbitrary. The absorption method of allocating overhead costs toproducts/services has received substantial criticism because of the arbitrary wayin which overheads are allocated. Most businesses use allocation bases such asdirect labour hours, machine hours or production units, because that data is readilyavailable. The implicit assumption of absorption costing is that the allocation basechosen is a reflection of why business overheads are incurred. For example, if theallocation base is direct labour or machine hours, the assumption of absorptioncosting is that overhead costs are incurred in proportion to direct labour or machinehours. This is unlikely to be the case in most businesses as many overheads arecaused by the range and complexity of product/services.
Activity-based costing
As we saw in Chapter 10, activity-based costing (or ABC) is an attempt to identifya more accurate method of allocating overheads to product/services. ABC usescost pools to accumulate the cost of significant business activities and then assignsthe costs from the cost pools to products based on cost drivers, which measure eachproduct’s demand for activities.
Cost pools accumulate the cost of business processes, irrespective of theorganizational structure of the business. The costs that correspond to the formalorganization structure may still be accumulated for financial reporting purposesthrough a number of cost centres, but this will not be the method used for productcosting. For example, the purchasing process can take place in many differentdepartments. A stores-person or computer operator may identify the need torestock a product. This will often lead to a purchase requisition, which mustbe approved by a manager before being passed to the purchasing department.Purchasing staff will have negotiated with suppliers in relation to quality, priceand delivery and will generally have approved suppliers and terms. A purchaseorder will be raised. The supplier will deliver the goods against the purchaseorder and the goods will be received into the store. The paperwork (a deliverynote from the supplier and a goods received note) will be passed to the accountingdepartment to be matched to the supplier invoice and a cheque will be produced

ACCOUNTING DECISIONS 167
and posted. This business process cuts across several departments. ABC collectsthe costs in all departments for the purchasing process in a cost pool.
A cost driver is then identified. The cost driver is the most significant cause ofthe activity. In the purchasing example, the causes of costs are often recognizedas the number of suppliers and/or the number of purchase orders. Cost driversenable the cost of activities to be assigned from cost pools to cost objects. Rates arecalculated for each cost driver and overhead costs are applied to product/serviceson the basis of the cost driver rates.
There are no rules about what cost pools and cost drivers should be used, asthis will be contingent on the circumstances of each business and the choices madeby its accountants. Examples of cost pools and drivers are:
Cost pool Cost driverPurchasing No. of purchase ordersMaterial handling No. of set-ups (i.e. batches)Scheduling No. of production ordersMachining Machine hours (i.e. not labour hours)
For example, a rate will be calculated for each cost driver (e.g. purchase order,set-up) and assigned to each product based on how many purchase orders and set-ups the product has consumed. The more purchase orders and set-ups a productrequires, the higher will be the overhead cost applied to it. ABC does not meanthat direct labour hours or machine hours or the number of units produced areignored. Where these are the significant cause of activities for particular cost pools,they are used as the cost drivers for those cost pools.
Using the same example as for absorption costing, assume for our two productsthat there are two cost pools: purchasing and scheduling. The driver for purchasingis the number of purchase orders and the driver for scheduling is the number ofproduction orders. Costs are collected by the accounting system into cost poolsand the measurement of cost drivers takes place, identifying how many activitiesare required for each product. The cost per activity is the cost pool divided by thecost drivers, as shown in Table 11.5.
Table 11.5 Overhead accumulated in cost pools and allocated by costdrivers
Cost pool and driver Total cost Product A Product B
Purchasing £40,000– no. of purchase orders 4,000 3,000 1,000
(£10 each) £30,000 £10,000Scheduling £60,000– no. of production orders 100 75 25
(£600 each) £45,000 £15,000
Total overhead £100,000 £75,000 £25,000

168 ACCOUNTING FOR MANAGERS
Table 11.6 Overhead per product based on ABC
Product A Product B
Total overhead £75,000 £25,000Quantity produced 150 250
Per product (/100) £500 £100
We can then calculate the overhead cost per product/service by dividing thetotal cost pool by the quantity of products/services produced. This is shown inTable 11.6.
The prime cost (the total of direct costs) is not affected by the method of overheadallocation. The total cost of each product using ABC for overhead allocation isshown in Table 11.7. Table 11.8 compares the cost of each product calculated usingabsorption costing with that using ABC.
Although this is an extreme example, significant differences can result from theadoption of an activity-based approach to overhead allocation. In this example,overheads allocated using direct labour hours under absorption costing do notreflect the actual causes for overheads being incurred. Product A not only usesmore purchasing and production order activity (the drivers of overheads), butalso has a lower volume. Reflecting the cause of overheads in overhead allocationsmore fairly represents the cost of each product. Under absorption costing, ProductB was subsidizing Product A. Cross-subsidization can be hidden where a businesssells a mixture of high-volume and low-volume products/services.
The distinction between fixed and variable costs and between productionoverhead and non-production overhead that applies to absorption costing is notso important under ABC. Costs under an ABC approach are identified as follows:
Table 11.7 Product costing under ABC
Directmaterials
Directlabour
Manufacturingoverhead
Total costper table
Product A £110 £75 £500 £685Product B £150 £50 £100 £300
Table 11.8 Comparison of product costs under absorption costingand activity-based costing
Product A Product B
Total cost using absorption costing £489 £471Total cost using activity-based costing £685 £300

ACCOUNTING DECISIONS 169
ž Unit-level activities: These are performed each time a unit is produced, e.g. directlabour, direct materials and variable manufacturing costs such as electricity.These activities consume resources in proportion to the number of units pro-duced. If we are producing books, then the cost of paper, ink and binding, andthe labour of printers, are unit-level activities. If we produce twice as manybooks, unit-level activities will be doubled.ž Batch-related activities: These are performed each time a batch of goods isproduced, e.g. a machine set-up. The cost of these activities varies with thenumber of batches, but is fixed irrespective of the number of units producedwithin the batch. Using our book example, the cost of making the printingmachines ready, e.g. washing up, changing the ink, changing the paper etc., isfixed irrespective of how many books are printed in that batch, but variable onthe number of batches that are printed.ž Product-sustaining activities: These enable the production and sale of multipleproducts/services, e.g. maintaining product specifications, after-sales support,product design and development. The cost of these activities increases withthe number of products, irrespective of the number of batches or the numberof units produced. For each differently titled book published, there is a costincurred in dealing with the author, obtaining copyright approval, typesettingthe text etc. However many batches of the book are printed, these costs arefixed. Nevertheless, the cost is variable depending on the number of booksthat are published. Similarly, customer-sustaining activities support individualcustomers or groups of customers, e.g. different costs may apply to supportingretail, that is end-user, customers compared with resellers. In the book example,particular costs are associated with promoting a textbook to academics in thehope that it will be set as required reading. Fiction books may be promotedthrough advertising and in-store displays.ž Facility-sustaining activities: These support the whole business and are commonto all products/services. Examples of these costs include senior managementand administrative staff, premises costs etc. Under ABC these costs are fixedand unavoidable and irrelevant for most business decisions, being unrelated tothe number of products, customers, batches or units produced.
Because costs are assigned to cost pools rather than cost centres under ABC, andas business processes cross through many cost centres, the distinction betweenproduction and non-production overhead also breaks down under ABC. While thedistinction is still important for stock valuation (as SSAP9 requires the inclusion ofproduction overheads), this distinction is not necessary for management decision-making. The more (production and non-production) overheads that are ableto be allocated accurately to product/services, the more accurate will be theinformation for decision-making about relevant costs, pricing and product/serviceprofitability.
The ABC method is preferred because the allocation of costs is based on cause-and-effect relationships, while the absorption costing system is based on an arbitraryallocation of overhead costs. However, ABC can be costly to implement becauseof the need to analyse business processes in detail, to collect costs in cost pools as
170 ACCOUNTING FOR MANAGERS
well as cost centres, and to identify cost drivers and measure the extent to whichindividual products/services consume resources.
Survey research by Drury and Tayles (2000) suggested that 27% of companiesreported using ABC, although this was affected by business size and sector, beingespecially evident in larger organizations and the financial and service sectors.However, the extent to which organizations use ABC for decision-making ratherthan stock valuation has not been fully explored.
Why, then, do different organizations adopt different methods of managementaccounting? One explanation is provided by contingency theory.
Contingency theory
The central argument of contingency theory is that there is no control system(which, as described in Chapter 4, includes accounting systems) that is appropriateto all organizations. Fisher (1995) contrasts contingency with situation-specificand universalist models. The situation-specific approach argues that each controlsystem is developed as a result of the unique characteristics of each organization.The universalist approach is that there is an optimal control system design thatapplies at least to some extent across different circumstances and organizations.The contingency approach is situated between these two extremes, in which theappropriateness of the control system depends on the particular circumstancesfaced by the business. However, generalizations in control systems design can bemade for different classes of business circumstances.
Fisher (1995) reviewed various contingency studies and found that the fol-lowing variables have been considered in research studies as affecting controlsystems design:
ž External environment: whether uncertain or certain; static or dynamic; simpleor complex.ž Competitive strategy: whether low cost or differentiated (e.g. Porter, see Chap-ter 8) and the stage of the product lifecycle (see Chapter 9).ž Technology: the type of production technology (see Chapter 9).ž Industry and business variables: size, diversification and structure (see Chap-ter 13).ž Knowledge and observability of outcomes and behaviour: the transformation processbetween inputs and outputs (see Chapter 4).
Otley (1980) argued that a simple linear explanation was inadequate. The linearexplanation assumed that contingent variables affected organizational design,which in turn determined the type of accounting/control system in use andled to organizational effectiveness. Otley emphasized the importance of othercontrols outside accounting, how many factors other than control system designinfluenced organizational performance and that organizational effectiveness isitself difficult to measure. He argued that the contingent variables were outsidethe control of the organization, and those that could be influenced were part ofa package of organizational controls including personnel selection, promotion and

ACCOUNTING DECISIONS 171
reward systems. Otley also argued that there were intervening variables that,together with the contingent variables, influenced organizational effectiveness,which was measured in relation to organizational objectives. Otley believed thatan organization ‘adapts to the contingencies it faces by arranging the factors itcan control into an appropriate configuration that it hopes will lead to effectiveperformance’ (p. 421).
In Chapters 1 and 2, the comment by Clark (1923) that there were ‘different costsfor different purposes’ can be seen as an early understanding of the application ofthe contingency approach. Clark further commented that ‘there is no one correctusage, usage being governed by the varying needs of varying business situationsand problems’. This reflected the need to use cost information in different waysdepending on the circumstances, which has been the focus of Chapters 8 to 10.
International comparisons
Alexander and Nobes (2001) described various approaches to categorizing inter-national differences in accounting, including:
ž legal systems;ž commercially driven, government-driven or professional regulation;ž strength of equity markets.
Alexander and Nobes argued that legal systems, tax systems and the strength of theaccountancy profession all influence the development of accounting, but the mainexplanation for the most important international differences in financial reportingis the financing system (such as the size and spread of corporate shareholding).
There have been efforts to harmonize financial reporting within the EuropeanUnion, although these have been slow. Through the International AccountingStandards Committee (IASC) there are moves towards harmonization, to a largeextent following US practices. This is likely to be a continuing trend given theglobalization of capital markets. Whether there will be any effect of harmonizationon management accounting practices is as yet unknown.
In understanding management accounting, practising managers and studentsof accounting receive little exposure to management accounting practices outsidethe UK and US. It is important to contrast the UK/US approach with otherpractices, particularly those in Japan. These practices are different because theyare predicated on different assumptions, particularly the different emphases onlong-term strategies for growth versus short-term strategies for shareholders.There are historical, cultural, political, legal and economic influences underlyingthe development of different management accounting techniques in that country,to take a single example.
Management accounting in Japan
Japan has a strong history of keiretsu, the interlocking shareholdings of industrialconglomerates and banks, with overlapping board memberships. This has, at

172 ACCOUNTING FOR MANAGERS
least in part, influenced long-term strategy because of the absence of strong stockmarket pressures for short-term performance, as is the case in the UK and US.
Demirag (1995) studied three Japanese multinationals with manufacturingsubsidiaries in the UK, two in consumer electronics and one in motor vehicles.The companies had strongly decentralized divisional profit responsibilities withautonomous plants focused on target results. A complex matrix structure resultedin reporting to general management in the UK as well as to functional and productmanagement in Japan. The company’s basic philosophy was that the design teamwas responsible for profit. Continuous processes were in place to monitor andreduce production costs.
According to Demirag (1995), Japanese companies exhibited a strategic planningstyle of management control rather than an emphasis on financial control. Thestrategic planning systems were bureaucratic, although business units gave topmanagement the information necessary to formulate and implement plans. AsJapanese managers move frequently between plants and divisions, they havea better understanding of communication and co-ordination than their Britishcounterparts. Japanese managers put the interest of the organization above theirown divisions. There is less attention to accounting and management control thanto smooth production and quality products. Performance targets were set in thecontext of strategy but were flexible, with results expected in the longer term.
Manufacturing and sales were independent of each other, each having itsown profit responsibility, the underlying principle being that each side of thebusiness drives the other to be more effective and efficient. Although traditionallymanufacturing had the greatest negotiating power, this did lead to a failure ofmarket information reaching top decision-makers in Japan. There was a top-downapproach to capital investment decisions, with managers taking a strategic andcompany-wide perspective that reduced the importance of financial decisions,with ROI not being seen as a particularly useful measure.
Pressures to meet short-term financial targets were not allowed to detract fromlong-term progress. In performance measurement, much more emphasis wasplaced on design, production and marketing than on financial control, althoughprofit was increasing in importance. Although fixed and variable costs were used,the main emphasis was on market-driven product costing, i.e. target costing, on theassumption that if market share increased the cost per unit would reduce, whichwould enable prices to be reduced and so prevent competition. Overhead allocationwas not important, but there was a focus on how the allocation techniques usedencouraged employees to reduce costs.
Hiromoto (1991) described Japanese management accounting practices andthe central principle that accounting policies should be subservient to corporatestrategy, not independent of it. Japanese companies use accounting systemsmore to motivate employees to act in accordance with long-term manufacturingstrategies. Japanese management accounting does not stress optimizing withinexisting constraints, but encourages employees to make continual improvementsby tightening operations.
Hiromoto describes the example of Hitachi, which used direct labour hours asthe overhead allocation base as this ‘creates the desired strong pro-automation

ACCOUNTING DECISIONS 173
incentives throughout the organization’ (p. 68). By contrast, another Hitachi factoryuses the number of parts as the allocation base in order to influence productengineering to drive reductions in the number of parts. Standard costs are notused in Japan as they are in the West. A market-driven target costing approach‘emphasizes doing what it takes to achieve a desired performance level undermarket conditions . . . how efficiently it must be able to build it for maximummarketplace success’ (Hiromoto, 1991, p. 70). Overall, Japanese accounting policiesare subservient to strategy.
Williams et al. (1995) reported similar findings to Demirag and, taking a criticalperspective, asserted:
In Japanese firms financial calculations are integrated into productive andmarket calculations; the result is a three-dimensional view which deniesthe universal representational privilege of financial numbers. Furthermorethe integration of different kinds of calculation broadens out the definitionof performance and identifies new points of intervention in a way whichundermines the privilege of financial guidance techniques; in Japanese firmsthe main practical emphasis is on productive and market intervention ratherthan orthodox financial control. (p. 228)
In Japan, production engineering knowledge has an equal or higher status toaccounting knowledge, with the result that, for example in Toyota, the ‘visiblebenefits’ of lower inventory in the financial statements was outweighed by theinvisible production benefits, ‘especially the ability to run mixed model lines in asmall batch factory’ (Williams et al., 1995, p. 233).
Currie (1995) undertook a comparative study of costing and investmentappraisal for the evaluation of advanced manufacturing technology (AMT).Research identified that Japanese managers were uninterested in new manage-ment accounting techniques such as activity-based costing, since knowledge thatsome products were more expensive to produce than others was not importantto product strategy decisions. On the contrary, expensive products were likely tohave strategic value to the company.
Japanese companies emphasize costing in the pre-manufacturing phase throughtarget and lifecycle costing (see Chapter 9). In investment decisions, Japanesemanagers stress the qualitative benefits of AMT such as quality control, scrap,rework, service costs, space saving etc. These are difficult to quantify. ROI measuresare considered unhelpful because the focus on short-term returns overestimatesthe cost of capital and results in discounted cash flow hurdles (see Chapter 12)being too high. Japanese companies did, however, use simple payback calculationswith targets of between two and five years.
Behavioural implications of management accounting
Hopper et al. (2001) traced the rise of behavioural and organizational accountingresearch from 1975. In the UK, a paradigm shift occurred that did not happen inthe US (where agency theory – see Chapter 6 – has been the dominant research
174 ACCOUNTING FOR MANAGERS
approach). In the UK, contingency theory and neo-human relations approacheswere abandoned for more sociological and political approaches that drew fromEuropean social theory and were influenced by Scandinavian case-based research.
Burchell et al. (1980) argued:
What is accounted for can shape organizational participants’ views of whatis important, with the categories of dominant economic discourse and orga-nizational functioning that are implicit within the accounting frameworkhelping to create a particular conception of organizational reality. (p. 5)
Similarly, Miller (1994) argued that accounting was a social and institutionalpractice. Accounting is not a neutral device that merely reports ‘facts’ but a setof practices that affects the type of world in which we live, the way in which weunderstand the choices able to be made by individuals and organizations, and theway in which we manage activities. Miller argued that ‘to calculate and record thecosts of an activity is to alter the way in which it can be thought about and actedupon’ (p. 2).
Cooper et al. (1981) reflected that accounting systems are a significant componentof power in organizations:
Internal accounting systems by what they measure, how they measure andwho they report to can effectively delimit the kind of issues addressed andthe ways in which they are addressed. (p. 182)
Various published research studies have adopted an interpretive or critical per-spective in understanding the link between accounting systems, organizationalchange and the behaviour of people in organizations as a result of culture andpower (see Chapter 5 for the theoretical framework of these subjects).
The interpretive perspective has provided a number of interesting studies. Thestudy of an area of the National Coal Board by Berry et al. (1985) emphasizeda dominant operational culture and the extent to which accounting reports were‘ignored, trivialised and/or misunderstood’ (p. 16). The accounting system was:
consistent with the values of the dominant managerial culture, and beingmalleable and ambiguous it reflected and helped coping with the uncertain-ties inherent with the physical task of coal extraction and its socioeconomicenvironment. (p. 22)
Dent (1991) carried out a longitudinal field study of accounting change in EuroRail(which is one of the readings in this book), in which organizations were portrayedas cultures, i.e. systems of knowledge, belief and values. Prior to the studythe dominant culture was engineering and production, in which accountingwas incidental. This was displaced by economic and accounting concerns thatconstructed the railway as a profit-seeking enterprise. New accounts:
were coupled to organizational activities to reconstitute interpretations oforganizational endeavour. Accounting actively shaped the dominant mean-ings given to organizational life . . . [in which a] new set of symbols, ritualsand language emerged. (p. 708)
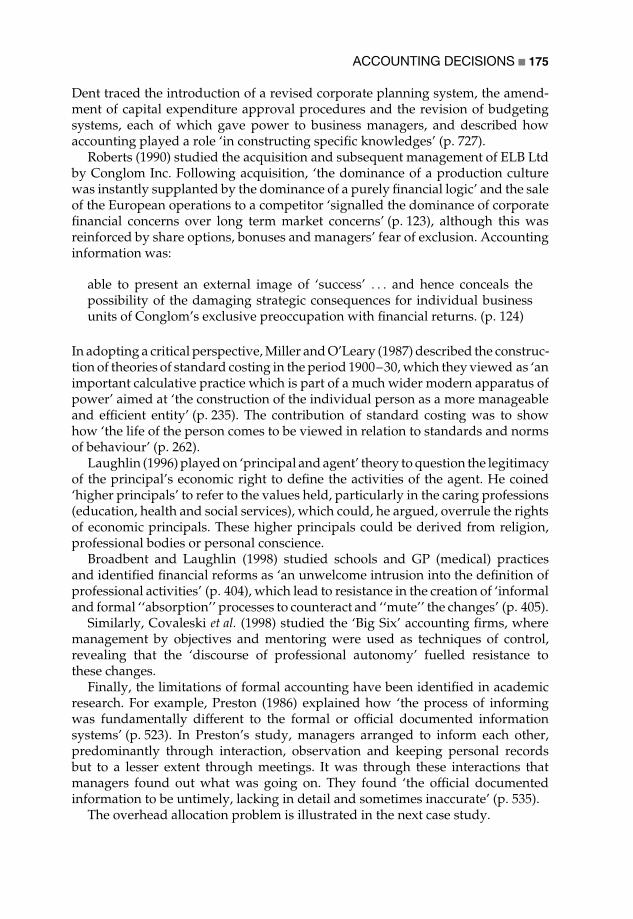
ACCOUNTING DECISIONS 175
Dent traced the introduction of a revised corporate planning system, the amend-ment of capital expenditure approval procedures and the revision of budgetingsystems, each of which gave power to business managers, and described howaccounting played a role ‘in constructing specific knowledges’ (p. 727).
Roberts (1990) studied the acquisition and subsequent management of ELB Ltdby Conglom Inc. Following acquisition, ‘the dominance of a production culturewas instantly supplanted by the dominance of a purely financial logic’ and the saleof the European operations to a competitor ‘signalled the dominance of corporatefinancial concerns over long term market concerns’ (p. 123), although this wasreinforced by share options, bonuses and managers’ fear of exclusion. Accountinginformation was:
able to present an external image of ‘success’ . . . and hence conceals thepossibility of the damaging strategic consequences for individual businessunits of Conglom’s exclusive preoccupation with financial returns. (p. 124)
In adopting a critical perspective, Miller and O’Leary (1987) described the construc-tion of theories of standard costing in the period 1900–30, which they viewed as ‘animportant calculative practice which is part of a much wider modern apparatus ofpower’ aimed at ‘the construction of the individual person as a more manageableand efficient entity’ (p. 235). The contribution of standard costing was to showhow ‘the life of the person comes to be viewed in relation to standards and normsof behaviour’ (p. 262).
Laughlin (1996) played on ‘principal and agent’ theory to question the legitimacyof the principal’s economic right to define the activities of the agent. He coined‘higher principals’ to refer to the values held, particularly in the caring professions(education, health and social services), which could, he argued, overrule the rightsof economic principals. These higher principals could be derived from religion,professional bodies or personal conscience.
Broadbent and Laughlin (1998) studied schools and GP (medical) practicesand identified financial reforms as ‘an unwelcome intrusion into the definition ofprofessional activities’ (p. 404), which lead to resistance in the creation of ‘informaland formal ‘‘absorption’’ processes to counteract and ‘‘mute’’ the changes’ (p. 405).
Similarly, Covaleski et al. (1998) studied the ‘Big Six’ accounting firms, wheremanagement by objectives and mentoring were used as techniques of control,revealing that the ‘discourse of professional autonomy’ fuelled resistance tothese changes.
Finally, the limitations of formal accounting have been identified in academicresearch. For example, Preston (1986) explained how ‘the process of informingwas fundamentally different to the formal or official documented informationsystems’ (p. 523). In Preston’s study, managers arranged to inform each other,predominantly through interaction, observation and keeping personal recordsbut to a lesser extent through meetings. It was through these interactions thatmanagers found out what was going on. They found ‘the official documentedinformation to be untimely, lacking in detail and sometimes inaccurate’ (p. 535).
The overhead allocation problem is illustrated in the next case study.
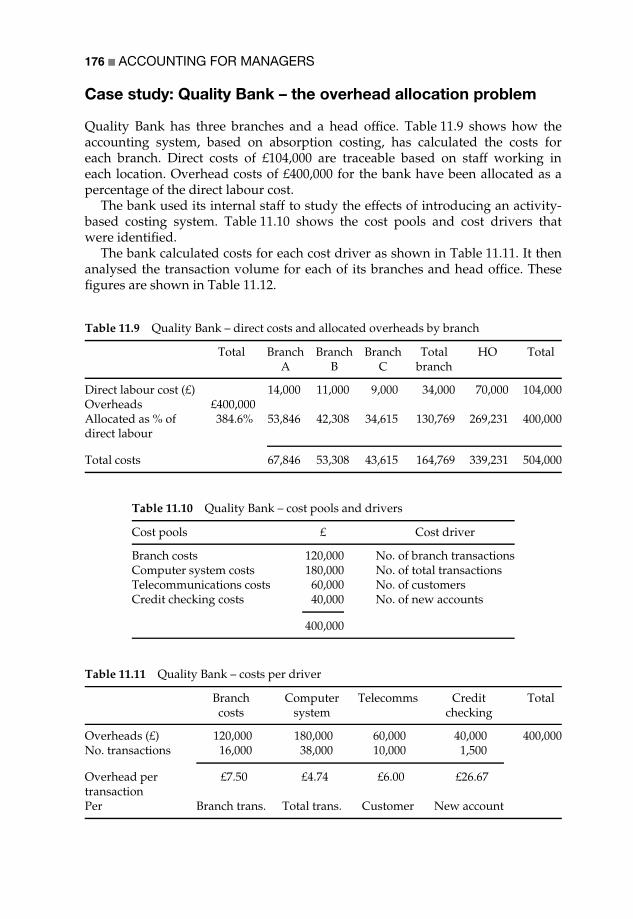
176 ACCOUNTING FOR MANAGERS
Case study: Quality Bank – the overhead allocation problem
Quality Bank has three branches and a head office. Table 11.9 shows how theaccounting system, based on absorption costing, has calculated the costs foreach branch. Direct costs of £104,000 are traceable based on staff working ineach location. Overhead costs of £400,000 for the bank have been allocated as apercentage of the direct labour cost.
The bank used its internal staff to study the effects of introducing an activity-based costing system. Table 11.10 shows the cost pools and cost drivers thatwere identified.
The bank calculated costs for each cost driver as shown in Table 11.11. It thenanalysed the transaction volume for each of its branches and head office. Thesefigures are shown in Table 11.12.
Table 11.9 Quality Bank – direct costs and allocated overheads by branch
Total BranchA
BranchB
BranchC
Totalbranch
HO Total
Direct labour cost (£) 14,000 11,000 9,000 34,000 70,000 104,000Overheads £400,000Allocated as % ofdirect labour
384.6% 53,846 42,308 34,615 130,769 269,231 400,000
Total costs 67,846 53,308 43,615 164,769 339,231 504,000
Table 11.10 Quality Bank – cost pools and drivers
Cost pools £ Cost driver
Branch costs 120,000 No. of branch transactionsComputer system costs 180,000 No. of total transactionsTelecommunications costs 60,000 No. of customersCredit checking costs 40,000 No. of new accounts
400,000
Table 11.11 Quality Bank – costs per driver
Branchcosts
Computersystem
Telecomms Creditchecking
Total
Overheads (£) 120,000 180,000 60,000 40,000 400,000No. transactions 16,000 38,000 10,000 1,500
Overhead pertransaction
£7.50 £4.74 £6.00 £26.67
Per Branch trans. Total trans. Customer New account
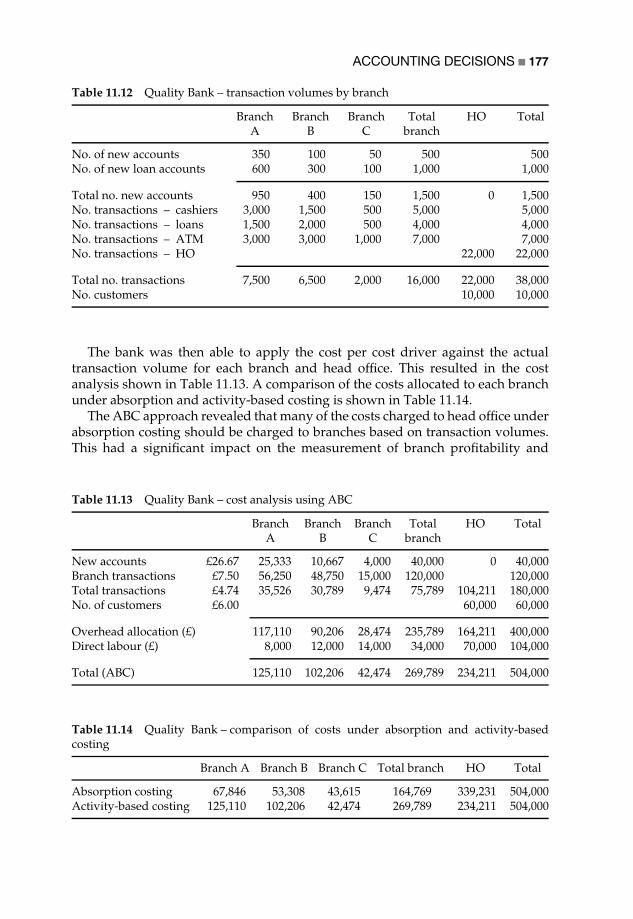
ACCOUNTING DECISIONS 177
Table 11.12 Quality Bank – transaction volumes by branch
BranchA
BranchB
BranchC
Totalbranch
HO Total
No. of new accounts 350 100 50 500 500No. of new loan accounts 600 300 100 1,000 1,000
Total no. new accounts 950 400 150 1,500 0 1,500No. transactions – cashiers 3,000 1,500 500 5,000 5,000No. transactions – loans 1,500 2,000 500 4,000 4,000No. transactions – ATM 3,000 3,000 1,000 7,000 7,000No. transactions – HO 22,000 22,000
Total no. transactions 7,500 6,500 2,000 16,000 22,000 38,000No. customers 10,000 10,000
The bank was then able to apply the cost per cost driver against the actualtransaction volume for each branch and head office. This resulted in the costanalysis shown in Table 11.13. A comparison of the costs allocated to each branchunder absorption and activity-based costing is shown in Table 11.14.
The ABC approach revealed that many of the costs charged to head office underabsorption costing should be charged to branches based on transaction volumes.This had a significant impact on the measurement of branch profitability and
Table 11.13 Quality Bank – cost analysis using ABC
BranchA
BranchB
BranchC
Totalbranch
HO Total
New accounts £26.67 25,333 10,667 4,000 40,000 0 40,000Branch transactions £7.50 56,250 48,750 15,000 120,000 120,000Total transactions £4.74 35,526 30,789 9,474 75,789 104,211 180,000No. of customers £6.00 60,000 60,000
Overhead allocation (£) 117,110 90,206 28,474 235,789 164,211 400,000Direct labour (£) 8,000 12,000 14,000 34,000 70,000 104,000
Total (ABC) 125,110 102,206 42,474 269,789 234,211 504,000
Table 11.14 Quality Bank – comparison of costs under absorption and activity-basedcosting
Branch A Branch B Branch C Total branch HO Total
Absorption costing 67,846 53,308 43,615 164,769 339,231 504,000Activity-based costing 125,110 102,206 42,474 269,789 234,211 504,000

178 ACCOUNTING FOR MANAGERS
the profitability of different business segments (e.g. new accounts, lending, ATMtransactions etc.).
Conclusion
In Chapters 8, 9 and 10, various accounting techniques were identified that canbe used by non-financial managers as part of the decision-making process. Withthe shift in most western economies to service industries and high-technologymanufacture, overheads have increased as a proportion of total business costs.This chapter has shown the importance to decision-making of the methods usedby accountants to allocate overheads to products/services. Understanding themethods used, and their limitations, is essential if informed decisions are to bemade by non-financial managers.
This chapter has also shown that we need to consider the underlying assump-tions behind the management accounting techniques that are in use. Othercountries adopt different approaches and we have something to learn fromthe success or failure of those practices. We also need to consider the behaviouralconsequences of the choices made in relation to accounting systems.
References
Alexander, D. and Nobes, C. (2001). Financial Accounting: An International Introduction.Harlow: Financial Times/Prentice Hall.
Berry, A. J., Capps, T., Cooper, D., Ferguson, P., Hopper, T. and Lowe, E. A. (1985). Man-agement control in an area of the NCB: Rationales of accounting practices in a publicenterprise. Accounting, Organizations and Society, 10(1), 3–28.
Broadbent, J. and Laughlin, R. (1998). Resisting the ‘new public management’: Absorptionand absorbing groups in schools and GP practices in the UK. Accounting, Auditing andAccountability Journal, 11(4), 403–35.
Burchell, S., Clubb, C., Hopwood, A. and Hughes, J. (1980). The roles of accounting inorganizations and society. Accounting, Organizations and Society, 5(1), 5–27.
Clark, J. M. (1923). Studies in the Economics of Overhead Costs. Chicago, IL: University ofChicago Press.
Cooper, D. J., Hayes, D. and Wolf, F. (1981). Accounting in organized anarchies: Under-standing and designing accounting systems in ambiguous situations. Accounting,Organizations and Society, 6(3), 175–91.
Covaleski, M. A., Dirsmith, M. W., Heian, J. B. and Samuel, S. (1998). The calculated and theavowed: Techniques of discipline and struggles over identity in big six public accountingfirms. Administrative Science Quarterly, 43, 293–327.
Currie, W. (1995). A comparative analysis of management accounting in Japan, USA/UKand west Germany. In D. Ashton, T. Hopper and R. W. Scapens (eds), Issues in Manage-ment Accounting (2nd edn), London: Prentice Hall.
Demirag, I. S. (1995). Management control systems of Japanese companies operating inthe united kingdom. In A. J. Berry, J. Broadbent and D. Otley (eds), Management Control:Theories, Issues and Practices, Basingstoke: Macmillan.
Dent, J. F. (1991). Accounting and organizational cultures: A field study of the emergenceof a new organizational reality. Accounting, Organizations and Society, 16(8), 705–32.
ACCOUNTING DECISIONS 179
Drury, C. and Tayles, M. (2000). Cost System Design and Profitability Analysis in UK Companies,London: Chartered Institute of Management Accountants.
Fisher, J. (1995). Contingency-based research on management control systems: Categoriza-tion by level of complexity. Journal of Accounting Literature, 14, 24–53.
Hiromoto, T. (1991). Another Hidden Edge – Japanese Management Accounting, GettingNumbers You Can Trust: The New Accounting. Boston, MA: Harvard Business ReviewPaperback.
Hopper, T., Otley, D. and Scapens, B. (2001). British management accounting research:Whence and whither: Opinions and recollections. British Accounting Review, 33, 263–91.
Johnson, H. T. and Kaplan, R. S. (1987). Relevance Lost: The Rise and Fall of ManagementAccounting. Boston, MA: Harvard Business School Press.
Kaplan, R. S. and Cooper, R. (1998). Cost and Effect: Using Integrated Cost Systems to DriveProfitability and Performance. Boston, MA: Harvard Business School Press.
Laughlin, R. (1996). Principals and higher principals: Accounting for accountability in thecaring professions. In R. Munro and J. Mouritsen (eds), Accountability: Power, Ethos andthe Technologies of Managing, London: International Thomson Business Press.
Miller, P. (1994). Accounting as social and institutional practice: An introduction. InA. G. Hopwood and P. Miller (eds), Accounting as Social and Institutional Practice, Cam-bridge: Cambridge University Press.
Miller, P. and O’Leary, T. (1987). Accounting and the construction of the governable person.Accounting, Organizations and Society, 12(3), 235–65.
Otley, D. (1980). The contingency theory of management accounting: Achievement andprognosis. Accounting, Organizations and Society, 5(4), 413–28.
Preston, A. (1986). Interactions and arrangements in the process of informing. Accounting,Organizations and Society, 11(6), 521–40.
Roberts, J. (1990). Strategy and accounting in a U.K. conglomerate. Accounting, Organizationsand Society, 15(1/2), 107–26.
Williams, K., Haslam, C., Williams, J., Abe, M., Aida, T. and Mitsui, I. (1995). Managementaccounting: The western problematic against the Japanese application. In A. J. Berry,J. Broadbent and D. Otley (eds), Management Control: Theories, Issues and Practices, Bas-ingstoke: Macmillan.


12
Strategic Investment Decisions
We introduced strategy in Chapter 2 to explain its link with achieving shareholdervalue. In this chapter we are more concerned with strategy implementationthrough capital investment decisions and the tools used to evaluate those decisions.
Strategy
Ansoff (1988) provided a typical description of strategy formulation: objectivesand goals were established; then an internal appraisal of strengths and weaknessesand an external appraisal of opportunities and threats led to strategic decisionssuch as diversification or the formulation of competitive strategy. He established ahierarchy of objectives that were centred on performance measures such as returnon investment (see Chapter 7, later in this chapter and Chapter 13).
A contrasting approach was developed by Quinn (1980), which he called logicalincrementalism. Quinn argued against formal planning systems, which he believedhad become ‘costly paper-shuffling exercises’, observing that ‘most major strategicdecisions seemed to be made outside the formal planning structure’ (p. 2). Quinnfurther argued that:
the real strategy tends to evolve as internal decisions and external eventsflow together to create a new, widely shared consensus for action among keymembers of the top management team. (p. 15)
Logical incrementalism is similar to work by Mintzberg and Waters (1985), whichdefined strategy as a pattern in a stream of decisions. Mintzberg and Watersseparated the intended from the realized strategy, arguing that deliberate strategiesprovided only a partial explanation, as some intended strategies were unable tobe realized while other strategies emerged over time.
The difficulty for businesses in the twenty-first century is that they mustcontinually adapt to technological and market change, making long-term strategyproblematic. However, to give the external appearance of being well managedthey need to develop strategies, even if only to legitimize what senior managers aredoing. Nevertheless, strategy can be crucial in enabling a business to be proactivein increasingly competitive and turbulent business conditions. The absence ofstrategy can lead to reactivity and a steady erosion of market share.

182 ACCOUNTING FOR MANAGERS
As we saw in Chapter 8, Porter (1980) developed his ‘five forces’ model foranalysing an industry. This focused on the effects of rivalry among existing firms,the threat of new entrants, the bargaining power of suppliers and customers,and the threat of substitute products and services. Porter also identified three‘generic strategies’ for competitive advantage: cost leadership, differentiation andfocus. Cost leadership requires efficiency, tight cost control and the avoidance ofunprofitable work, with low cost a defence against competition. Differentiationcan be achieved through, for example, brand image, technology or a uniquedistribution channel. These factors insulate against price competition becauseof brand loyalty and lower customer sensitivity to pricing differences. Focusemphasizes servicing a particular market segment (whether customer, territory orproduct/service) better than competitors who may be competing more broadly. Inhis second book, Porter (1985) introduced the ‘value chain’ as a tool to help createand sustain competitive advantage (see Chapter 9).
However, the formulation of strategy is frequently divorced from the annualbudgeting cycle (see Chapter 14), as organizations produce strategic planningdocuments separately from the annual budget based on last year plus or minusa percentage in order to achieve short-term financial targets. Consequently, theissue of translating strategy formulation into implementation is problematic unlessresource allocations follow strategy.
In their most recent addition to the strategy literature, Kaplan and Norton(2001) built on the success of their Balanced Scorecard approach (see Chapter 4)to emphasize the ‘strategy-focused organization’ that links financial performancewith non-financial measures. Non-financial measures in the Balanced Scorecardmeasure how well the organization is meeting the targets established in its strategy.Kaplan and Norton use ‘strategy maps’ to identify cause–effect relationships,although these should be modified over time as a result of experience gainedwithin organizations. They also argued that budgetary allocations and incentivesneed to be consistent with strategy, while reflecting the importance of continuallearning and improvement.
One of the most important elements of strategy implementation is capitalinvestment decision-making, because investment decisions provide the physicaland human infrastructure through which businesses produce and sell goods andservices. This is the topic of this chapter.
Investment appraisal
Capital investment or capital expenditure (often abbreviated as ‘cap ex’) meansspending money now in the hope of getting it back later through future cash flows.The process of evaluating or appraising potential investments is to:
ž generate ideas based on opportunities or identifying solutions to problems;ž research all relevant information;ž consider possible alternatives;ž evaluate the financial consequences of each alternative;
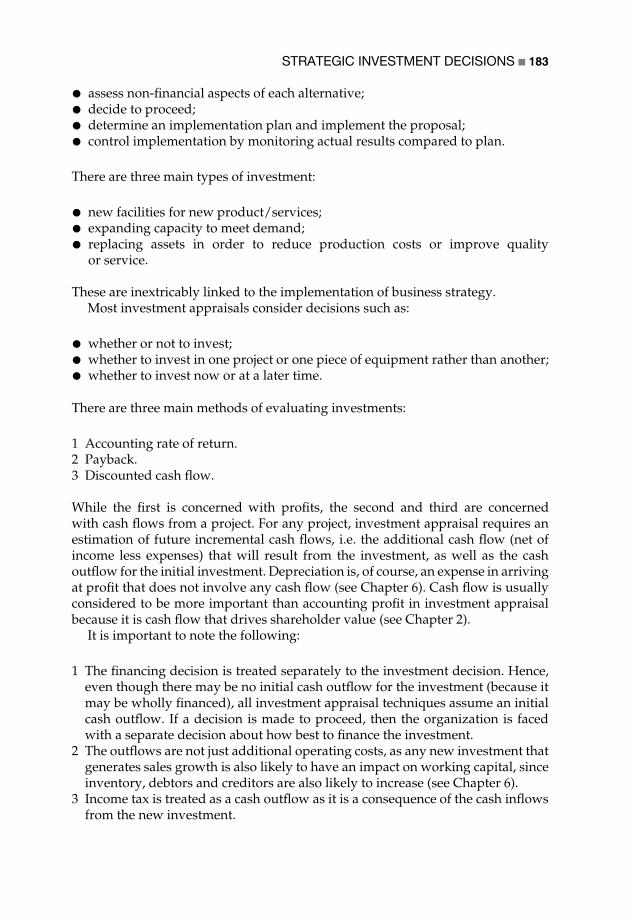
STRATEGIC INVESTMENT DECISIONS 183
ž assess non-financial aspects of each alternative;ž decide to proceed;ž determine an implementation plan and implement the proposal;ž control implementation by monitoring actual results compared to plan.
There are three main types of investment:
ž new facilities for new product/services;ž expanding capacity to meet demand;ž replacing assets in order to reduce production costs or improve qualityor service.
These are inextricably linked to the implementation of business strategy.Most investment appraisals consider decisions such as:
ž whether or not to invest;ž whether to invest in one project or one piece of equipment rather than another;ž whether to invest now or at a later time.
There are three main methods of evaluating investments:
1 Accounting rate of return.2 Payback.3 Discounted cash flow.
While the first is concerned with profits, the second and third are concernedwith cash flows from a project. For any project, investment appraisal requires anestimation of future incremental cash flows, i.e. the additional cash flow (net ofincome less expenses) that will result from the investment, as well as the cashoutflow for the initial investment. Depreciation is, of course, an expense in arrivingat profit that does not involve any cash flow (see Chapter 6). Cash flow is usuallyconsidered to be more important than accounting profit in investment appraisalbecause it is cash flow that drives shareholder value (see Chapter 2).
It is important to note the following:
1 The financing decision is treated separately to the investment decision. Hence,even though there may be no initial cash outflow for the investment (because itmay be wholly financed), all investment appraisal techniques assume an initialcash outflow. If a decision is made to proceed, then the organization is facedwith a separate decision about how best to finance the investment.
2 The outflows are not just additional operating costs, as any new investment thatgenerates sales growth is also likely to have an impact on working capital, sinceinventory, debtors and creditors are also likely to increase (see Chapter 6).
3 Income tax is treated as a cash outflow as it is a consequence of the cash inflowsfrom the new investment.

184 ACCOUNTING FOR MANAGERS
Table 12.1 Cash flows for investment alternatives
Year Project 1 Project 2 Project 3
0 initial investment −100,000 −125,000 −200,0001 inflows 25,000 35,000 60,0002 inflows 25,000 35,000 60,0003 inflows 25,000 35,000 80,0004 inflows 25,000 35,000 30,0005 inflows 25,000 35,000 30,000
As we consider each method, let us assume three alternative investments.Table 12.1 shows the estimated cash flows.
For simplicity, we assume that each of the cash flows occurs at the end of eachyear. Year 0 represents the beginning of the project when the initial funds arepaid out. If we add up the cash flows in the above example, Project 1 returns£125,000 (5 @ £25,000), Project 2 returns £175,000 (5 @ £35,000) and Project 3 returns£260,000 (2 @ £60,000 + £80,000 + 2 @ £30,000), although the initial investment ineach is different.
Accounting rate of return
The accounting rate of return (ARR) is the profit generated as a percentage ofthe investment. This is equivalent to the return on investment (ROI) that wasintroduced in Chapter 7. The investment value for ARR is the depreciated valueeach year. The depreciated value each year, assuming a life of five years with noresidual value at the end of that time, is shown in Table 12.2. The accounting rateof return varies annually, as Table 12.3 shows for Project 1.
For the whole investment period, the accounting rate of return is the averageannual return divided by the average investment. The average annual return isthe total profit divided by the number of years. As we assume that depreciation isspread equally throughout the life of the asset, the average investment is half theinitial investment, i.e. half-way through its life.
total profits/no. of yearsinitial investment/2
Table 12.2 Depreciated value of alternative investments
End of year Project 1 Project 2 Project 3
1 80,000 100,000 160,0002 60,000 75,000 120,0003 40,000 50,000 80,0004 20,000 25,000 40,0005 0 0 0
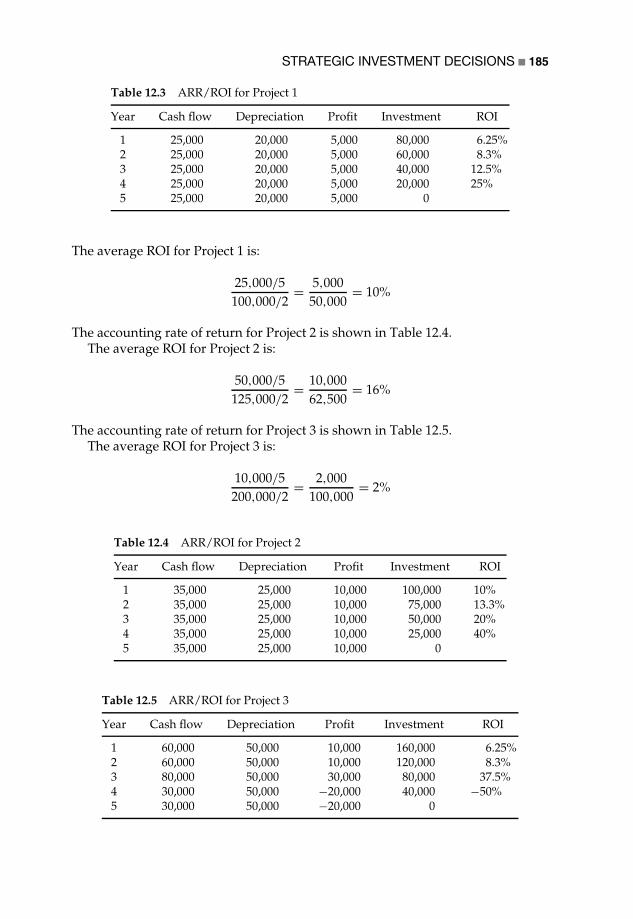
STRATEGIC INVESTMENT DECISIONS 185
Table 12.3 ARR/ROI for Project 1
Year Cash flow Depreciation Profit Investment ROI
1 25,000 20,000 5,000 80,000 6.25%2 25,000 20,000 5,000 60,000 8.3%3 25,000 20,000 5,000 40,000 12.5%4 25,000 20,000 5,000 20,000 25%5 25,000 20,000 5,000 0
The average ROI for Project 1 is:
25,000/5100,000/2
= 5,00050,000
= 10%
The accounting rate of return for Project 2 is shown in Table 12.4.The average ROI for Project 2 is:
50,000/5125,000/2
= 10,00062,500
= 16%
The accounting rate of return for Project 3 is shown in Table 12.5.The average ROI for Project 3 is:
10,000/5200,000/2
= 2,000100,000
= 2%
Table 12.4 ARR/ROI for Project 2
Year Cash flow Depreciation Profit Investment ROI
1 35,000 25,000 10,000 100,000 10%2 35,000 25,000 10,000 75,000 13.3%3 35,000 25,000 10,000 50,000 20%4 35,000 25,000 10,000 25,000 40%5 35,000 25,000 10,000 0
Table 12.5 ARR/ROI for Project 3
Year Cash flow Depreciation Profit Investment ROI
1 60,000 50,000 10,000 160,000 6.25%2 60,000 50,000 10,000 120,000 8.3%3 80,000 50,000 30,000 80,000 37.5%4 30,000 50,000 −20,000 40,000 −50%5 30,000 50,000 −20,000 0

186 ACCOUNTING FOR MANAGERS
Project 3 in particular has substantial fluctuations in ROI from year to year. Usingthis method, Project 2 shows the highest return. However, it does not take intoaccount either the scale of the investment required or the timing of the cash flows.
Payback
This second method calculates how many years it will take – in cash terms – torecover the initial investment, on the assumption that the shorter the paybackperiod, the better the investment. Based on the cash flows for each project:
ž Project 1 takes four years to recover its £100,000 investment (4 @ £25,000).ž Project 2 has recovered £105,000 by the end of the third year (3 @ £35,000)and will take less than seven months (20/35 = .57 of 12 months) to recover its£125,000 investment. The payback is therefore 3.57 years.ž Project 3 recovers its investment of £200,000 by the end of the third year(£60,000 + £60,000 + £80,000).
Based on the payback method, Project 3 is preferred (followed by Projects 2 and1) as it has the fastest payback. However, the payback method ignores the sizeof the investment and any cash flows that take place after the investment hasbeen recovered.
Neither the accounting rate of return nor the payback method considers the timevalue of money, i.e. that £100 is worth more now than in a year’s time, because it canbe invested now at a rate of interest that will increase its value. For example, £100invested today at 10% interest is equivalent to £110 in a year’s time. Conversely,receiving £100 in a year’s time is not worth £100 today. Assuming the same rate ofinterest it is worth only £91, because the £91, invested at 10%, will be equivalent to£100 in a year’s time.
The time value of money needs to be recognized in investment appraisals inorder to compare investment alternatives with different cash flows over differenttime periods. The third method of investment appraisal therefore involves dis-counted cash flow (DCF), i.e. it discounts the future cash flows to present valuesusing a discount rate (or interest rate) that is usually the firm’s cost of capital (therisk-adjusted cost of borrowing for the investment).
There are two discounted cash flow techniques: net present value and internalrate of return.
Net present value
The net present value (NPV) method discounts future cash flows to their presentvalue and compares the present value of future cash flows to the initial capi-tal investment.
present value (PV) of cash flows = cash flow × discount factor (based
on number of years in the future and the cost of capital)

STRATEGIC INVESTMENT DECISIONS 187
net present value (NPV) = present value of future cash
flows − initial capital investment
The discount rates to be applied are based on the company’s cost of capital.The cost of capital (see Chapter 2) represents the weighted average of the cost ofdebt and equity and takes into account the riskiness of a project. As the cost ofborrowing has been taken into account, an investment makes sense if the NPVis positive. The discount rate can be obtained from net present value tables (seeAppendix to this chapter for an example). More commonly, spreadsheet software(e.g. Excel or Lotus) is used as this contains an NPV function.
Using the same example, the NPV for Project 1 is shown in Table 12.6. As thenet present value is negative, Project 1 should not be accepted since the presentvalue of future cash flows does not cover the initial investment.
The NPV for Project 2 is shown in Table 12.7. Project 2 can be accepted becauseit has a positive net present value. However, we need to compare this with Project3 to see if that alternative yields a higher net present value. The NPV for Project 3is shown in Table 12.8.
Despite the faster payback for Project 3, the application of the net present valuetechnique to the timing of the cash flows reveals that the net present value ofProject 3 is lower than that for Project 2, and therefore Project 2 – which alsoshowed the highest accounting rate of return – is the recommended investment.However, using the NPV method it is difficult to determine how much betterProject 2 (with an NPV of £7,650) is than Project 3 (with an NPV of £3,300) becauseeach has a different initial investment.
One way of ranking projects with different NPVs is cash value added (CVA) orprofitability index, which is a ratio of the NPV to the initial capital investment:
cash value added = NPVinitial capital investment
In the above example, Project 2 returns a CVA of 6.12% (7,650/125,000) whileProject 3 returns a CVA of 1.165% (3,300/200,000). Companies may have a target
Table 12.6 NPV for Project 1
Year Project 1cash flows
Discount factor(10%)
Present value ofcash flows
1 25,000 .909 22,7252 25,000 .826 20,6503 25,000 .751 18,7754 25,000 .683 17,0755 25,000 .621 15,525
Total 94,750Less: Initial investment 100,000
Net present value −5,250
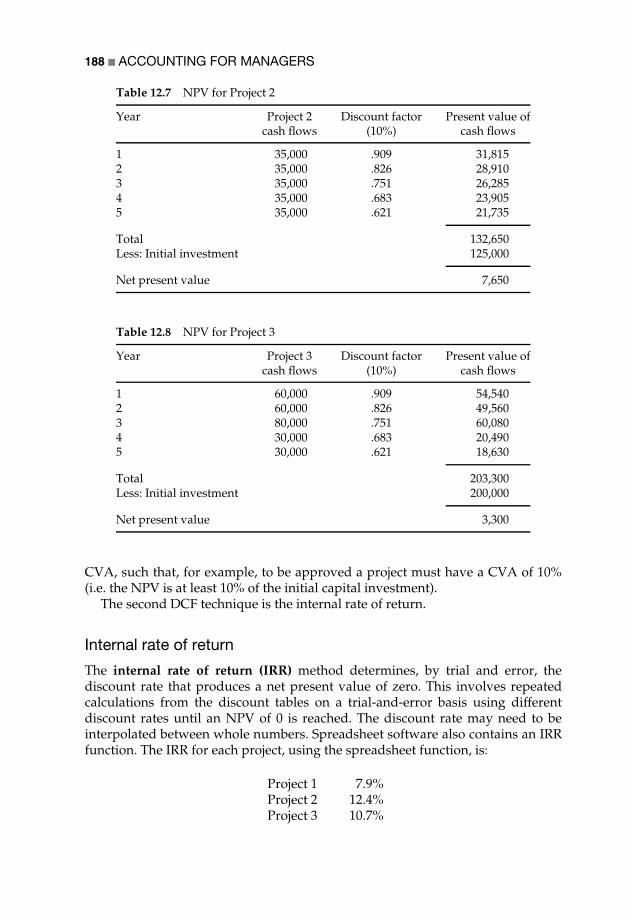
188 ACCOUNTING FOR MANAGERS
Table 12.7 NPV for Project 2
Year Project 2cash flows
Discount factor(10%)
Present value ofcash flows
1 35,000 .909 31,8152 35,000 .826 28,9103 35,000 .751 26,2854 35,000 .683 23,9055 35,000 .621 21,735
Total 132,650Less: Initial investment 125,000
Net present value 7,650
Table 12.8 NPV for Project 3
Year Project 3cash flows
Discount factor(10%)
Present value ofcash flows
1 60,000 .909 54,5402 60,000 .826 49,5603 80,000 .751 60,0804 30,000 .683 20,4905 30,000 .621 18,630
Total 203,300Less: Initial investment 200,000
Net present value 3,300
CVA, such that, for example, to be approved a project must have a CVA of 10%(i.e. the NPV is at least 10% of the initial capital investment).
The second DCF technique is the internal rate of return.
Internal rate of return
The internal rate of return (IRR) method determines, by trial and error, thediscount rate that produces a net present value of zero. This involves repeatedcalculations from the discount tables on a trial-and-error basis using differentdiscount rates until an NPV of 0 is reached. The discount rate may need to beinterpolated between whole numbers. Spreadsheet software also contains an IRRfunction. The IRR for each project, using the spreadsheet function, is:
Project 1 7.9%Project 2 12.4%Project 3 10.7%

STRATEGIC INVESTMENT DECISIONS 189
This is a more informative presentation of the comparison because it presents thecash flows as an effective interest rate. The project with the highest internal rate ofreturn would be preferred, provided that the rate exceeds the cost of capital (i.e.the borrowing cost).
Comparison of techniques
While the accounting rate of return method provides an average return oninvestment and a business may select the highest return, it ignores the timingof cash flows. Sometimes where there are high short-term ROIs, managers mayprefer those investments even though the longer-term impact is detrimental tothe organization. This is because managers may be evaluated and rewarded ontheir short-term performance (see Chapter 13). Payback measures the number ofyears it will take to recover the capital investment and while this takes timing intoaccount, it ignores cash flows after the payback period. Both methods ignore thetime value of money.
Discounted cash flow techniques take account of the time value of money anddiscount future cash flows to their present value. This is a more reliable method ofinvestment appraisal. Discounted cash flow is similar to the method of calculatingshareholder value proposed by Rappaport and described in Chapter 2.
However, for investment evaluation, while all projects with a positive netpresent value are beneficial, a business will usually select the project with thehighest net present value, or in other words the highest internal rate of return,sometimes using the initial cash investment (CVA) or the cost of capital (IRR) as abenchmark for the return.
Because of rapid change in markets and increased demands for shareholdervalue, the use of discounted cash flow techniques has declined in many businesses.Boards of directors typically set quite high ‘hurdle’ rates for investing in newassets. These are commonly in terms of payback periods of two to four years orROI rates of 25–50%. This approach reduces the importance of discounted cashflow techniques.
However, for larger investments where returns are expected over many years,discounted cash flow techniques are still important. Investments in buildings,major items of plant, mining exploration and so on etc. commonly use NPV andIRR as methods of capital investment appraisal.
The following case study provides an example of investment appraisal.
Case study: Goliath Co. – investment evaluation
Goliath Co. is considering investing in a project involving an initial cash outlay foran asset of £200,000. The asset is depreciated over five years at 20% p.a. Goliath’scost of capital is 10%. The cash flows from the project are expected to be as follows:
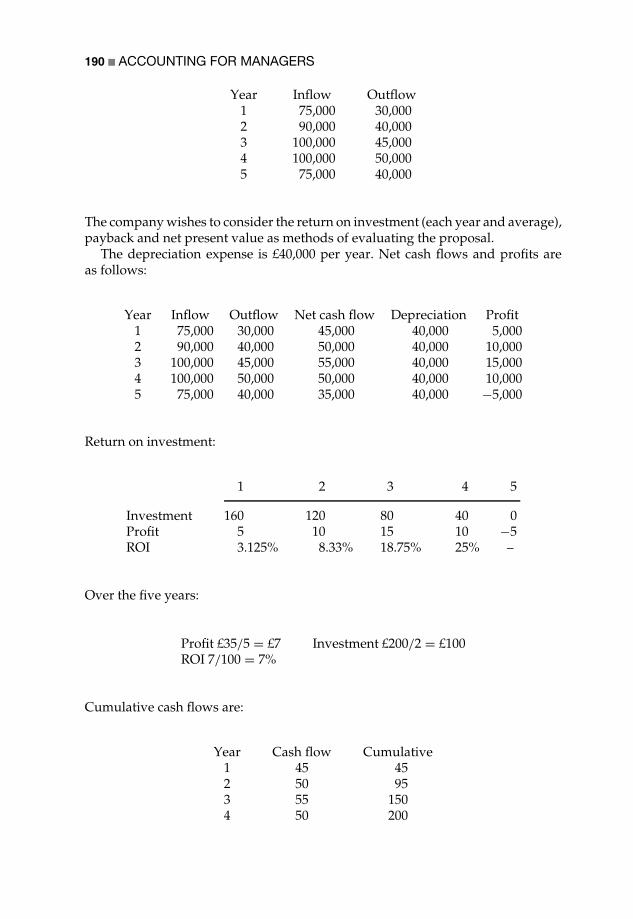
190 ACCOUNTING FOR MANAGERS
Year Inflow Outflow1 75,000 30,0002 90,000 40,0003 100,000 45,0004 100,000 50,0005 75,000 40,000
The company wishes to consider the return on investment (each year and average),payback and net present value as methods of evaluating the proposal.
The depreciation expense is £40,000 per year. Net cash flows and profits areas follows:
Year Inflow Outflow Net cash flow Depreciation Profit1 75,000 30,000 45,000 40,000 5,0002 90,000 40,000 50,000 40,000 10,0003 100,000 45,000 55,000 40,000 15,0004 100,000 50,000 50,000 40,000 10,0005 75,000 40,000 35,000 40,000 −5,000
Return on investment:
1 2 3 4 5
Investment 160 120 80 40 0Profit 5 10 15 10 −5ROI 3.125% 8.33% 18.75% 25% –
Over the five years:
Profit £35/5 = £7 Investment £200/2 = £100ROI 7/100 = 7%
Cumulative cash flows are:
Year Cash flow Cumulative1 45 452 50 953 55 1504 50 200

STRATEGIC INVESTMENT DECISIONS 191
Table 12.9 NPV for Goliath Co.
A BYear 0
CYear 1
DYear 2
EYear 3
FYear 4
GYear 5
Cash flows 45,000 50,000 55,000 50,000 35,000Present value 179,437
−200,000NPV −20,563
Initialinvestment
=+NPV (10%, C36:G36)
The payback period is the end of year 4 when £200,000 of cash flows hasbeen recovered.
Net present value of the cash flows:
Year Cash flow Factor Present value1 45,000 .9091 40,9102 50,000 .8264 41,3203 55,000 .7513 41,3214 50,000 .6830 34,1505 35,000 .6209 21,731
Present value of net cash flows 179,432Cash outflow −200,000
Net present value −20,568
Using the spreadsheet NPV function, the answer is calculated in Table 12.9 (thedifference is due to rounding).
Although the ROI is 7% and the payback is four years, the discounted cashflow shows that the net present value is negative. Therefore the project should berejected, as the returns are insufficient to recover the company’s cost of capital.
Conclusion: a critical perspective
In this chapter we have introduced strategy and the role of investment appraisal incapital investment decisions. In particular, we have described the main methodsof capital investment appraisal. Often, however, decisions are made subjectivelyand then justified after the event by the application of financial techniques. This isparticularly so for emergent strategy, described earlier in this chapter. Despite theusefulness of these techniques, the assumption has been that future cash flows canbe predicted with some accuracy. This is, however, one of the main difficulties inaccounting, as we will see in Chapter 14.
Shank (1996) used a case study to show how the conventional NPV approachwas limited in high-technology situations as it did not capture the ‘richness’of the investment evaluation problem. Shank saw NPV more as a constraint
192 ACCOUNTING FOR MANAGERS
than a decision tool because it was driven by how the investment proposal wasframed. Shank argued that a strategic cost management approach (see Chapter 4for a description of strategic management accounting) could apply value chainanalysis, cost driver analysis and competitive advantage analysis to achieve abetter fit between investment decisions and business strategy implementation.
References
Ansoff, H. I. (1988). The New Corporate Strategy. New York, NY: John Wiley & Sons.Kaplan, R. S. and Norton, D. P. (2001). The Strategy-Focused Organization: How Balanced
Scorecard Companies Thrive in the New Business Environment. Boston, MA: HarvardBusiness School Press.
Mintzberg, H. and Waters, J. A. (1985). Of strategies, deliberate and emergent. StrategicManagement Journal, 6, 257–72.
Porter, M. E. (1980). Competitive Strategy: Techniques for Analyzing Industries and Competitors.New York, NY: Free Press.
Porter, M. E. (1985). Competitive Advantage: Creating and Sustaining Superior Performance.New York, NY: Free Press.
Quinn, J. B. (1980). Strategies for Change: Logical Incrementalism. Homewood, IL: Irwin.Shank, J. K. (1996). Analysing technology investments – from NPV to strategic cost man-
agement (SCM). Management Accounting Research, 7, 185–97.

STRATEGIC INVESTMENT DECISIONS 193
Appendix: Present value factors
Table 12.10 gives the present value of a single payment received n years in thefuture discounted at an interest rate of x% per annum. For example, with a discountrate of 6% a single payment of £100 in five years’ time has a present value of £74.73(£100 × .7473).
Table 12.10 Present value factors
Years 1% 2% 3% 4% 5% 6% 7% 8% 9% 10%
1 0.9901 0.9804 0.9709 0.9615 0.9524 0.9434 0.9346 0.9259 0.9174 0.90912 0.9803 0.9612 0.9426 0.9426 0.9070 0.8900 0.8734 0.8573 0.8417 0.82643 0.9706 0.9423 0.9151 0.8890 0.8638 0.8396 0.8163 0.7938 0.7722 0.75134 0.9610 0.9238 0.8885 0.8548 0.8227 0.7921 0.7629 0.7350 0.7084 0.68305 0.9515 0.9057 0.8626 0.8219 0.7835 0.7473 0.7130 0.6806 0.6499 0.62096 0.9420 0.8880 0.8375 0.7903 0.7462 0.7050 0.6663 0.6302 0.5963 0.56457 0.9327 0.8706 0.8131 0.7599 0.7107 0.6651 0.6227 0.5835 0.5470 0.51328 0.9235 0.8535 0.7894 0.7307 0.6768 0.6274 0.5820 0.5403 0.5019 0.46659 0.9143 0.8368 0.7664 0.7026 0.6446 0.5919 0.5439 0.5002 0.4604 0.424110 0.9053 0.8203 0.7441 0.6756 0.6139 0.5584 0.5083 0.4632 0.4224 0.385511 0.8963 0.8043 0.7224 0.6496 0.5847 0.5268 0.4751 0.4289 0.3875 0.350512 0.8874 0.7885 0.7014 0.6246 0.5568 0.4970 0.4440 0.3971 0.3555 0.318613 0.8787 0.7730 0.6810 0.6006 0.5303 0.4688 0.4150 0.3677 0.3262 0.289714 0.8700 0.7579 0.6611 0.5775 0.5051 0.4423 0.3878 0.3405 0.2992 0.263315 0.8613 0.7430 0.6419 0.5553 0.4810 0.4173 0.3624 0.3152 0.2745 0.239416 0.8528 0.7284 0.6232 0.5339 0.4581 0.3936 0.3387 0.2919 0.2519 0.217617 0.8444 0.7142 0.6050 0.5134 0.4363 0.3714 0.3166 0.2703 0.2311 0.197818 0.8360 0.7002 0.5874 0.4936 0.4155 0.3503 0.2959 0.2502 0.2120 0.179919 0.8277 0.6864 0.5703 0.4746 0.3957 0.3305 0.2765 0.2317 0.1945 0.163520 0.8195 0.6730 0.5537 0.4564 0.3769 0.3118 0.2584 0.2145 0.1784 0.148621 0.8114 0.6598 0.5375 0.4388 0.3589 0.2942 0.2415 0.1987 0.1637 0.135122 0.8034 0.6468 0.5219 0.4220 0.3418 0.2775 0.2257 0.1839 0.1502 0.122823 0.7954 0.6342 0.5067 0.4057 0.3256 0.2618 0.2109 0.1703 0.1378 0.111724 0.7876 0.6217 0.4919 0.3901 0.3101 0.2470 0.1971 0.1577 0.1264 0.101525 0.7798 0.6095 0.4776 0.3751 0.2953 0.2330 0.1842 0.1460 0.1160 0.092326 0.7720 0.5976 0.4637 0.3607 0.2812 0.2198 0.1722 0.1352 0.1064 0.083927 0.7644 0.5859 0.4502 0.3468 0.2678 0.2074 0.1609 0.1252 0.0976 0.076328 0.7568 0.5744 0.4371 0.3335 0.2551 0.1956 0.1504 0.1159 0.0895 0.069329 0.7493 0.5631 0.4243 0.3207 0.2429 0.1846 0.1406 0.1073 0.0822 0.063030 0.7419 0.5521 0.4120 0.3083 0.2314 0.1741 0.1314 0.0094 0.0754 0.057335 0.7059 0.5000 0.3554 0.2534 0.1813 0.1301 0.0937 0.0676 0.0490 0.035640 0.6717 0.4529 0.3066 0.2083 0.1420 0.0972 0.0668 0.0460 0.0318 0.022145 0.6391 0.4102 0.2644 0.1712 0.1113 0.0727 0.0476 0.0313 0.0207 0.013750 0.6080 0.3715 0.2281 0.1407 0.0872 0.0543 0.0339 0.0213 0.0134 0.0085

13
Performance Evaluationof Business Units
This chapter describes the methods by which the performance of divisions and theirmanagers is evaluated. It builds on the foundation established in Chapter 2, whichexplained how divisionalized business structures have evolved to implementbusiness strategy. We also consider controllability and the transfer pricing problemand introduce the theory of transaction cost economics. This chapter suggests thatsome techniques may provide an appearance rather than the reality of ‘rational’decision-making.
The decentralized organization and divisional performancemeasurement
The evaluation of new capital expenditure proposals is a key element in allocatingresources by the whole organization (see Chapter 12). However, a further aspectof strategy implementation is improving and maintaining divisional performance.
Businesses may be organized in a centralized or decentralized manner. Thecentralized business is one in which most decisions are made at a head officelevel, even though the business may be spread over a number of market segmentsand geographically diverse locations. Decentralization implies the devolution ofauthority to make decisions. Divisionalization adds to decentralization the conceptof delegated profit responsibility (Solomons, 1965). We introduced the notion ofdivisional structures and responsibility centres in Chapter 2.
Divisionalization makes it easier for a company to diversify, while retainingoverall strategic direction and control. Performance improvement is encouragedby assigning individual responsibility for divisional performance, typically linkedto executive remuneration (bonuses, profit-sharing, share options etc.).
Shareholder value is the criterion for overall business success, but divisional per-formance is the criterion for divisional success. However, divisional performancemeasurement has also moved beyond financial measures to incorporate the driversof financial results, i.e. non-financial performance measures (see Chapter 4).
Solomons (1965) highlighted three purposes for financial reporting at a divi-sional level:

196 ACCOUNTING FOR MANAGERS
1 To guide divisional managers in making decisions.2 To guide top management in making decisions.3 To enable top management to appraise the performance of divisional manage-
ment.
The decentralization of businesses has removed the centrality of the head officewith its functional structure (marketing, operations, distribution, finance etc.).Instead, many support functions are now devolved to business units, which maybe called subsidiaries (if they are legally distinct entities), divisions, departmentsetc. For simplicity, we will use the term divisionalization although the sameprinciple applies to any business unit. This divisionalization allows managers tohave autonomy over certain aspects of the business, but those managers are thenaccountable for the performance of their business units. Divisionalized businessunits may be:
ž Cost centres – where managers are responsible for controlling costs withinbudget limits. Managers are evaluated on their performance compared tobudget by keeping costs within budget constraints.ž Profit centres – where managers are responsible for sales performance, achiev-ing gross margins and controlling expenses, i.e. for the ‘bottom-line’ profitperformance of the business unit. Managers are evaluated on their performancecompared to budget in achieving or exceeding their profit target.ž Investment centres – where managers have profit responsibility but also influencethe amount of capital invested in their business units. Managers are evaluatedbased on a measure of the return on investment made by the investment centre.
Budgets and performance against budget are the subjects of Chapters 14 and 15.Evaluating divisional performance in comparison to a strategic investment is thesubject of this chapter.
Solomons (1965) identified the difficulties involved in measuring managerialperformance. Absolute profit is not a good measure because it does not consider theinvestment in the business and how long-term profits can be affected by short-termdecisions such as reducing research, maintenance and advertising expenditure.These decisions will improve reported profits in the current year, but will usuallyhave a detrimental long-term impact. The performance of divisions and theirmanagers can be evaluated using two methods: either return on investment orresidual income.
Return on investment
The relative success of managers can be judged by the return on investment (orROI, which was introduced in Chapter 7). This is the rate of return achieved on thecapital employed and was a method developed by the DuPont Powder Companyearly in the twentieth century. Using ROI, managerial and divisional success isjudged according to the rate of return on the investment. However, a problem

PERFORMANCE EVALUATION OF BUSINESS UNITS 197
with this approach is whether a high rate of return on a small capital investmentis better or worse than a lower return on a larger capital. For example:
Div A Div BCapital invested £1,000,000 £2,000,000Operating profit £200,000 £300,000Return on investment 20% 15%
Division B makes a higher profit in absolute terms but a lower return on the capitalinvested in the business. Solomons (1965) also argued that a decision cannot bemade about relative performance unless we know the cost of capital.
Residual income
A different approach to evaluating performance is residual income, which takesinto account the cost of capital. Residual income (or RI) is the profit remainingafter deducting the notional cost of capital from the investment in the division. TheRI approach was developed by the General Electric Company and more recentlyhas been compared with Economic Value Added (EVA, see Chapter 2), as bothmethods deduct a notional cost of capital from the reported profit. Using theabove example:
Div A Div BCapital invested £1,000,000 £2,000,000Operating profit £200,000 £300,000less cost of capital at 17.5% £175,000 £350,000
Residual income £25,000 −£50,000
As the cost of capital is 17.5% in the above example, Division A makes a satisfactoryreturn but Division B does not. Division B is eroding shareholder value whileDivision A is creating it.
The aim of managers should be to maximize the residual income from thecapital investments in their divisions. However, Solomons (1965) emphasizesthat the RI approach assumes that managers have the power to influence theamount of capital investment. Solomons argued that an RI target is preferred to amaximization objective because it takes into account the differential investmentsin divisions, i.e. that a larger division will almost certainly produce – or shouldproduce – a higher residual income. Johnson and Kaplan (1987) believe that theresidual income approach:
overcame one of the dysfunctional aspects of the ROI measure in whichmanagers could increase their reported ROI by rejecting investments thatyielded returns in excess of their firm’s (or division’s) cost of capital, but thatwere below their current average ROI. (p. 165)

198 ACCOUNTING FOR MANAGERS
One of the main problems in evaluating divisional performance is the extent towhich managers can exercise control over investments and costs charged to theirresponsibility centres.
Controllability
The principle of controllability, according to Merchant (1987, p. 316), is that‘individuals should be held accountable only for results they can control’ (p. 336).
One of the limitations of operating profit as a measure of divisional performanceis the inclusion of costs over which the divisional manager has no control. Theneed for the company as a whole to make a profit demands that corporate costsbe allocated to divisions so that these costs can be recovered in the prices charged.The problem arises when a division’s profit is not sufficient to cover the head officecharge (we introduced this concept in relation to segmentation in Chapter 8).Solomons (1965) argued that so long as corporate expenses are independentof divisional activity, allocating corporate costs is irrelevant because a positivecontribution by divisions will cover at least some of those costs.
Solomons separated these components in the divisional profit report, a simpli-fied version of which is shown below:
Sales £££Less Variable cost of goods sold £££
Other variable expenses £££ £££Contribution margin £££Less Controllable divisional overhead £££Controllable profit £££Less Non-controllable overhead £££Operating profit £££
While the business as a whole may consider the operating profit to be the mostimportant figure, performance evaluation of the manager can only be carried outbased on the controllable profit. The controllable profit is the profit after deductingexpenses that can be controlled by the divisional manager, but ignoring thoseexpenses that are outside the divisional manager’s control. What is controllable ornon-controllable will depend on the circumstances of each organization. Solomonsargued that the most suitable figure for appraising divisional managers was thecontrollable residual income before taxes. Using this method, the controllable profit isreduced by the corporate cost of capital. For decisions in relation to a division’sperformance, the relevant figure is the net residual income after taxes.
One of the problems with both the ROI and RI measures of divisional perfor-mance is the calculation of the capital investment in the division: should it be total(i.e. capital employed) or net assets (allowing for gearing)? Should it include fixedor current assets, or both? Should assets be valued at cost or net book value? Shouldthe book value be at the beginning or end of the period? Solomons (1965) arguedthat it was the amount of capital put into the business, rather than what could be

PERFORMANCE EVALUATION OF BUSINESS UNITS 199
taken out, that was relevant. The investment value, according to Solomons, shouldbe total assets less controllable liabilities, with fixed assets valued at cost using thevalue at the beginning of the period. ROI calculations therefore relate controllableoperating profit as a percentage of controllable investment. An RI approach wouldmeasure net residual income plus actual interest expense (because the notionalcost of capital has been deducted in calculating RI) against the total investment inthe division.
The following case study provides an example of divisional performancemeasurement using ROI and RI techniques.
Case study: Majestic Services – divisional performancemeasurement
Majestic Services has two divisions, both of which have bid for £1 million forprojects that will generate significant cost savings. Majestic has a cost of capital of15% and can only invest in one of the projects.
The current performance of each division is as follows:
Division A Division BCurrent investment £4 million £20 millionProfit £1 million £2 million
Each division has estimated the additional controllable profit that will be generatedfrom the £1 million investment. A estimates £200,000 and B estimates £130,000.
Each division also has an asset of which they would like to dispose. A’s assetcurrently makes a return on investment (ROI) of 19%, while B’s asset makes anROI of 12%. The business wishes to use ROI and residual income techniques todetermine in which of the £1 million projects Majestic should invest, and whethereither of the division’s identified assets should be disposed of.
Using ROI, the two divisions can be compared as in Table 13.1. While DivisionB is the larger division and generates a higher profit in absolute terms, Division Aachieves a higher return on investment.
Again using ROI, the impact of the additional investment can be seen inTable 13.2. Using ROI, Division A may not want its project to be approved as theROI of 20% is less than the current ROI of 25%. The impact of the new investmentwould be to reduce the divisional ROI to 24% (£1.2 million/£5 million). However,Division B would want its project to be approved as the ROI of 13% is higher
Table 13.1 ROI on original investment
A B
Current investment £4 million £20 millionCurrent profit £1 million £2 millionROI 25% 10%
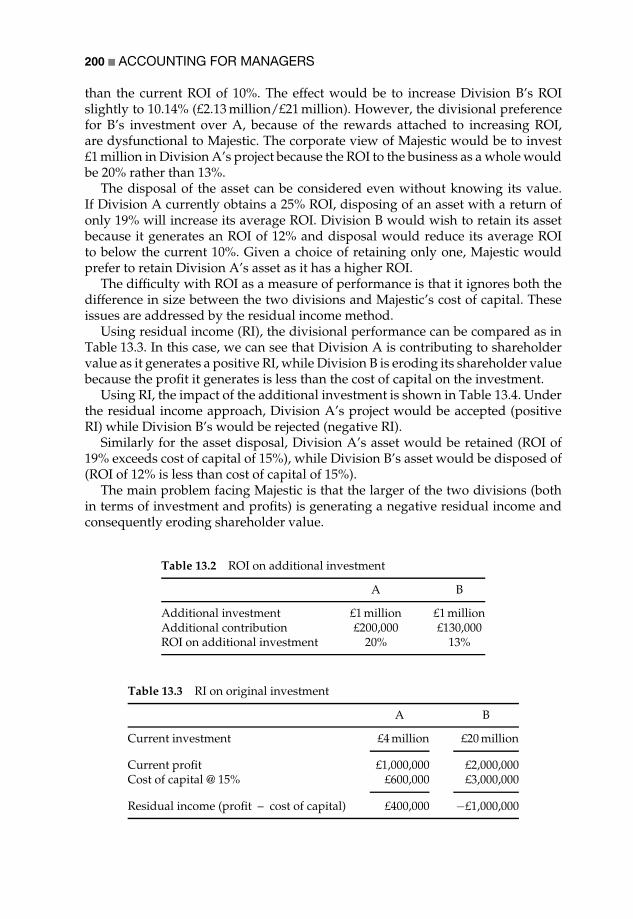
200 ACCOUNTING FOR MANAGERS
than the current ROI of 10%. The effect would be to increase Division B’s ROIslightly to 10.14% (£2.13 million/£21 million). However, the divisional preferencefor B’s investment over A, because of the rewards attached to increasing ROI,are dysfunctional to Majestic. The corporate view of Majestic would be to invest£1 million in Division A’s project because the ROI to the business as a whole wouldbe 20% rather than 13%.
The disposal of the asset can be considered even without knowing its value.If Division A currently obtains a 25% ROI, disposing of an asset with a return ofonly 19% will increase its average ROI. Division B would wish to retain its assetbecause it generates an ROI of 12% and disposal would reduce its average ROIto below the current 10%. Given a choice of retaining only one, Majestic wouldprefer to retain Division A’s asset as it has a higher ROI.
The difficulty with ROI as a measure of performance is that it ignores both thedifference in size between the two divisions and Majestic’s cost of capital. Theseissues are addressed by the residual income method.
Using residual income (RI), the divisional performance can be compared as inTable 13.3. In this case, we can see that Division A is contributing to shareholdervalue as it generates a positive RI, while Division B is eroding its shareholder valuebecause the profit it generates is less than the cost of capital on the investment.
Using RI, the impact of the additional investment is shown in Table 13.4. Underthe residual income approach, Division A’s project would be accepted (positiveRI) while Division B’s would be rejected (negative RI).
Similarly for the asset disposal, Division A’s asset would be retained (ROI of19% exceeds cost of capital of 15%), while Division B’s asset would be disposed of(ROI of 12% is less than cost of capital of 15%).
The main problem facing Majestic is that the larger of the two divisions (bothin terms of investment and profits) is generating a negative residual income andconsequently eroding shareholder value.
Table 13.2 ROI on additional investment
A B
Additional investment £1 million £1 millionAdditional contribution £200,000 £130,000ROI on additional investment 20% 13%
Table 13.3 RI on original investment
A B
Current investment £4 million £20 million
Current profit £1,000,000 £2,000,000Cost of capital @ 15% £600,000 £3,000,000
Residual income (profit – cost of capital) £400,000 −£1,000,000
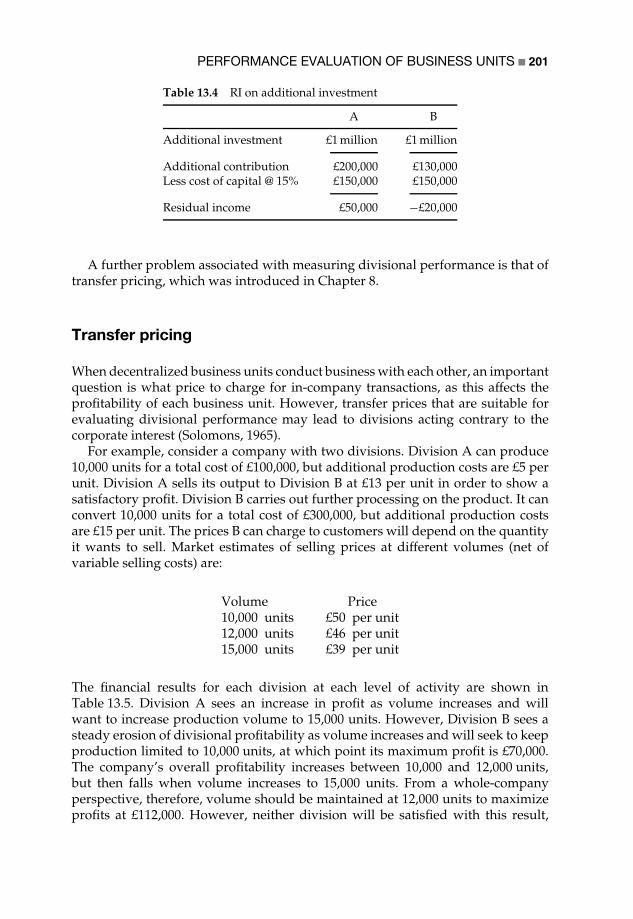
PERFORMANCE EVALUATION OF BUSINESS UNITS 201
Table 13.4 RI on additional investment
A B
Additional investment £1 million £1 million
Additional contribution £200,000 £130,000Less cost of capital @ 15% £150,000 £150,000
Residual income £50,000 −£20,000
A further problem associated with measuring divisional performance is that oftransfer pricing, which was introduced in Chapter 8.
Transfer pricing
When decentralized business units conduct business with each other, an importantquestion is what price to charge for in-company transactions, as this affects theprofitability of each business unit. However, transfer prices that are suitable forevaluating divisional performance may lead to divisions acting contrary to thecorporate interest (Solomons, 1965).
For example, consider a company with two divisions. Division A can produce10,000 units for a total cost of £100,000, but additional production costs are £5 perunit. Division A sells its output to Division B at £13 per unit in order to show asatisfactory profit. Division B carries out further processing on the product. It canconvert 10,000 units for a total cost of £300,000, but additional production costsare £15 per unit. The prices B can charge to customers will depend on the quantityit wants to sell. Market estimates of selling prices at different volumes (net ofvariable selling costs) are:
Volume Price10,000 units £50 per unit12,000 units £46 per unit15,000 units £39 per unit
The financial results for each division at each level of activity are shown inTable 13.5. Division A sees an increase in profit as volume increases and willwant to increase production volume to 15,000 units. However, Division B sees asteady erosion of divisional profitability as volume increases and will seek to keepproduction limited to 10,000 units, at which point its maximum profit is £70,000.The company’s overall profitability increases between 10,000 and 12,000 units,but then falls when volume increases to 15,000 units. From a whole-companyperspective, therefore, volume should be maintained at 12,000 units to maximizeprofits at £112,000. However, neither division will be satisfied with this result,

202 ACCOUNTING FOR MANAGERS
Table 13.5 Divisional financial results
Activity 10,000 12,000 15,000
Division A10,000 units 100,000 100,000 100,0002,000 units @ £5 10,0005,000 units @ £5 25,000
Total cost 100,000 110,000 125,000Transfer price @ £13 130,000 156,000 195,000
Division profit 30,000 46,000 70,000
Division BTransfer from Division A 130,000 156,000 195,000Conversion cost10,000 units 300,000 300,000 300,0002,000 units @ £15 30,0005,000 units @ £15 75,000
Total cost 430,000 486,000 570,000Selling price @ 50 46 39
Sales revenue 500,000 552,000 585,000
Division profit 70,000 66,000 15,000
CompanySales revenue 500,000 552,000 585,000Division A cost −100,000 −110,000 −125,000Division B cost −300,000 −330,000 −375,000Company profit 100,000 112,000 85,000
Table 13.6 Division A costs
10,000 12,000 15,000
Division A total costs 100,000 110,000 125,000Average per unit 10.00 9.17 8.33
as both will see it as disadvantaging them in terms of divisional profits, againstwhich divisional managers are evaluated.
For Division A, variable costs over 10,000 units are £5, but its transfer price is£13, so additional units contribute £8 each to divisional profitability. A’s averagecosts reduce as volume increases, as Table 13.6 shows.
However for Division B, its variable costs over 10,000 units are £28 (transferprice of £13 plus conversion costs of £15). The reduction in average costs of £2.50per unit is more than offset by the fall in selling price (net of variable selling costs),as Table 13.7 shows.

PERFORMANCE EVALUATION OF BUSINESS UNITS 203
Table 13.7 Division B costs
10,000 12,000 15,000
Division B total costs 430,000 486,000 570,000Average per unit 43.00 40.50 38.00Reduction in average cost per unit 2.50 2.50Reduction in selling price 4.00 7.00
There are several methods by which transfer prices between divisions can beestablished:
ž Market price: Where products/services can be sold on the outside market, themarket price is used. This is the easiest way to ensure that divisional decisionsare compatible with corporate profit maximization. However, if there is noexternal market, particularly for an intermediate product – i.e. one that requiresadditional processing before it can be sold – this method cannot be used.ž Marginal cost: The transfer price is the additional (variable) cost incurred. Inthe above example, the transfer price would be £5, but Division A wouldhave little motivation to produce additional volume if only incremental costswere covered.ž Full cost: This method would recover both fixed and variable costs. This has thesame overhead allocation problem as identified in Chapter 11 and would havethe same motivational problems as for the marginal cost transfer price.ž Cost-plus: This method provides a profit to each division, but has the problemidentified in this example of leading to different management decisions in eachdivision and at corporate level.ž Negotiated prices: This may take into account market conditions, marginalcosts and the need to motivate managers in each division. It tends to bethe most practical solution to align the interests of divisions with the wholeorganization and to share the profits equitably between each division. In usingthis method, care must be taken to consider differential capital investmentsbetween divisions, so that both are treated equitably in terms of ROI orRI criteria.
In practice, many organizations adopt negotiated prices in order to avoid demo-tivating effects on different business units. In some Japanese companies it iscommon to leave the profit with the manufacturing division, placing the onus onthe marketing division to achieve better market prices.
Transaction cost economics
A useful theoretical framework for understanding divisionalization and the trans-fer pricing problem is the transactions cost approach of Oliver Williamson (1975),which is concerned with the study of the economics of internal organization.Transaction cost economics seeks to explain why separate activities that require

204 ACCOUNTING FOR MANAGERS
co-ordination occur within the organization’s hierarchy (i.e. within the corporatestructure), while others take place through exchanges outside the organization inthe wider market (i.e. between arm’s-length buyers and sellers).
The work of business historians such as Chandler (1962) reflects a transactioncost approach in explanations of the growth of huge corporations such as GeneralMotors, in which hierarchies were developed as alternatives to market transactions.It is important to note that transactions take place within organizations, not justbetween them. For managers using accounting information, attention is focusedon the transaction costs associated with different resource-allocation decisions andwhether markets or hierarchies are more cost effective.
Transactions are more than exchanges of goods, services and money. Theyincur costs over and above the price for the commodity bought or sold, suchas costs associated with negotiation, monitoring, administration, insurance etc.They also involve time commitments and obligations, and are associated withlegal, moral and power conditions. Understanding these costs may reveal thatit is more economic to carry out an activity in-house than to accept a marketprice that appears less costly but may incur ‘transaction’ costs that are hidden inoverhead costs.
Under transaction cost economics, attention focuses on the transaction costsinvolved in allocating resources within the organization, and determining whenthe costs associated with one mode of organizing transactions (e.g. markets)would be reduced by shifting those transactions to an alternative arrangement(e.g. the internal hierarchy of an organization). The high costs of market-relatedtransactions can be avoided by specifying the rules for co-operative behaviourwithin the organization.
The markets and hierarchies perspective considers the vertical integrationof production and the decision about whether organizations should make orbuy. Both bounded rationality and opportunistic behaviour are assumed in thisperspective (see Chapter 6 for a discussion of this in relation to agency theory)and transaction costs are affected by asset specificity, when an investment is madefor a specific rather than a general purpose. Transaction costs are also affected byuncertainty and the frequency with which transactions take place.
Seal (1995) provided the example of a make versus buy decision for a component.In management accounting, a unit cost comparison would take place. (Relevantcosts for make versus buy decisions were described in Chapter 9.) A transactioncost approach would consider whether the production of the component requiredinvestment in specialized equipment or training, a problem of asset specificity.This approach raises the problem that an external contract may be difficult todraw up and enforce because the small number of organizations bargaining maybe hindered by opportunistic behaviour. It may therefore be cheaper to producein-house due to contractual problems.
Williamson (1975) argued that the desire to minimize transaction costs resultingfrom bounded rationality leads to transactions being kept within the organiza-tion, favouring the organizational hierarchy over markets. Markets are favouredwhere there are a large number of trading partners, which minimizes the risk ofopportunistic behaviour.

PERFORMANCE EVALUATION OF BUSINESS UNITS 205
Recurring, complex and uncertain exchanges that involve substantial invest-ment may be more efficiently undertaken when internal organization replacesmarket transactions. The efficiency of a transaction that takes place within theorganization depends on how the behaviour of managers is governed or con-strained, how economic activities are subdivided and how the managementaccounting system is structured.
However, decision-makers may themselves indulge in opportunistic behaviourthat causes the benefits of internal transactions to be reduced. Therefore, the man-agement accounting system can be used to ensure that these internal transactionsare conducted efficiently.
Rather than reflecting a concern with utility maximization (the assumption ofagency theory), the transaction cost framework is more concerned with boundedrationality. While an agency perspective ignores the power of owners and alsothat of employees, who can withdraw their labour, transaction cost theory givesrecognition to power in the hierarchy that is used to co-ordinate production.
Conclusion: a critical perspective
In this chapter we have described the divisionalized organization and howdivisional performance can be evaluated. We have discussed the controllabilityprinciple and the transfer pricing problem.
The divisional form is a preferred organizational structure because it allowsdevolved responsibility while linking performance to organizational goals throughmeasures such as ROI and RI that are meaningful at different organizationallevels, particularly when these support shareholder value methods such as thelink between RI and EVA.
However, research by Merchant (1987) concluded that the controllability prin-ciple was not found in practice and that managers should be evaluated ‘using allinformation that gives insight into their action choices’.
Managers are often critical that the corporate head office fails to distinguishadequately between controllable and non-controllable overhead. The point hasalready been made in Chapter 2 that determining a risk-adjusted cost of capitalcan be a subjective exercise.
Relationships between business units frequently cause friction, particularlyin some organizations where the number of business units has been increasedto a level that is difficult to manage. Transaction cost economics, a rationalmarkets/hierarchies approach like agency theory described in Chapter 6, providesa useful though limited perspective. For example, Child (1972) concluded:
When incorporating strategic choice in a theory of organization, one is rec-ognizing the operation of an essentially political process in which constraintsand opportunities are functions of the power exercised by decision-makersin the light of ideological values. (p. 16)
The political process inherent in transfer pricing between divisions is alsoevidenced in many multinational corporations, where transfer pricing is more

206 ACCOUNTING FOR MANAGERS
concerned with how to shift profits between countries so as to minimize incometaxes on profits and maximize after-tax profits to increase shareholder value. Whilethis is undoubtedly in the interests of individual companies and does need theapproval of taxation authorities, it still raises issues of the ethics of transfer pricingwhen multinationals minimize their profits and taxation in relatively high-taxcountries such as the UK.
References
Chandler, A. D. J. (1962). Strategy and Structure: Chapters in the History of the AmericanIndustrial Enterprise. Cambridge, MA: Harvard University Press.
Child, J. (1972). Organizational structure, environment and performance: The role of strate-gic choice. Sociology, 6, 1–22.
Johnson, H. T. and Kaplan, R. S. (1987). Relevance Lost: The Rise and Fall of ManagementAccounting. Boston, MA: Harvard Business School Press.
Merchant, K. A. (1987). How and why firms disregard the controllability principle. InW. J. Bruns and R. S. Kaplan (eds), Accounting and Management: Field Study Perspectives,Boston, MA: Harvard Business School Press.
Seal, W. (1995). Economics and control. In A. J. Berry, J. Broadbent and D. Otley (eds),Management Control: Theories, Issues and Practices, London: Macmillan.
Solomons, D. (1965). Divisional Performance: Measurement and Control. Homewood, IL:Richard D. Irwin.
Williamson, O. E. (1975). Markets and Hierarchies: Analysis and Antitrust Implications. A Studyin the Economics of Internal Organization. New York, NY: Free Press.
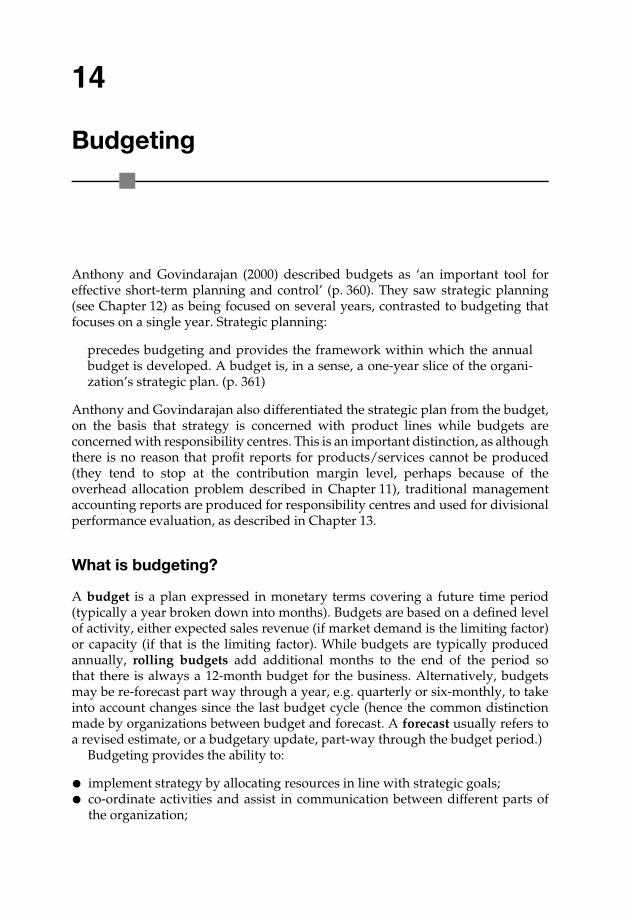
14
Budgeting
Anthony and Govindarajan (2000) described budgets as ‘an important tool foreffective short-term planning and control’ (p. 360). They saw strategic planning(see Chapter 12) as being focused on several years, contrasted to budgeting thatfocuses on a single year. Strategic planning:
precedes budgeting and provides the framework within which the annualbudget is developed. A budget is, in a sense, a one-year slice of the organi-zation’s strategic plan. (p. 361)
Anthony and Govindarajan also differentiated the strategic plan from the budget,on the basis that strategy is concerned with product lines while budgets areconcerned with responsibility centres. This is an important distinction, as althoughthere is no reason that profit reports for products/services cannot be produced(they tend to stop at the contribution margin level, perhaps because of theoverhead allocation problem described in Chapter 11), traditional managementaccounting reports are produced for responsibility centres and used for divisionalperformance evaluation, as described in Chapter 13.
What is budgeting?
A budget is a plan expressed in monetary terms covering a future time period(typically a year broken down into months). Budgets are based on a defined levelof activity, either expected sales revenue (if market demand is the limiting factor)or capacity (if that is the limiting factor). While budgets are typically producedannually, rolling budgets add additional months to the end of the period sothat there is always a 12-month budget for the business. Alternatively, budgetsmay be re-forecast part way through a year, e.g. quarterly or six-monthly, to takeinto account changes since the last budget cycle (hence the common distinctionmade by organizations between budget and forecast. A forecast usually refers toa revised estimate, or a budgetary update, part-way through the budget period.)
Budgeting provides the ability to:
ž implement strategy by allocating resources in line with strategic goals;ž co-ordinate activities and assist in communication between different parts ofthe organization;

208 ACCOUNTING FOR MANAGERS
ž motivate managers to achieve targets;ž provide a means to control activities; andž evaluate managerial performance.
In establishing the budget allocation to specific profit centres, cost centres ordepartments, there are four main methods of budgeting: incremental, prioritybased, zero based and activity based.
Incremental budgets take the previous year’s budget as a base and add (orsubtract) a percentage to give this year’s budget. The assumption is that thehistorical budget allocation reflected organizational priorities and was rooted insome meaningful justification developed in the past.
Priority-based budgets allocate funds in line with strategy. If priorities changein line with the organization’s strategic focus, then budget allocations would followthose priorities, irrespective of the historical allocation. A public-sector version ofthe priority-based budget is the planning, programming and budgeting system(PPBS) that was developed by the US space programme. Under PPBS, budgets areallocated to projects or programmes rather than to responsibility centres. Priority-based budgets may be responsibility centre based, but will typically be associatedwith particular projects or programmes. The intention of PPBS and priority-basedbudgeting systems is to compare costs more readily with benefits by identifyingthe resources used to obtain desired outcomes. An amalgam of incremental andpriority-based budgets is priority-based incremental budgeting. Here, the budget-holder is asked what incremental (or decremental) activities or results wouldfollow if budgets increased (or decreased). This method has the advantage ofcomparing changes in resources with the resulting costs and benefits.
Zero-based budgeting identifies the costs that are necessary to implementagreed strategies and achieve goals, as if the budget-holder were beginning with anew organizational unit, without any prior history. This method has the advantageof regularly reviewing all the activities that are carried out to see if they are stillrequired, but has the disadvantage of the cost and time needed for such reviews.It is also very difficult to develop a budget while ignoring current resourceallocations.
Activity-based budgeting is associated with activity-based costing (ABC, seeChapter 11). ABC identifies activities that consume resources and uses the conceptof cost drivers (essentially the cause of costs) to allocate costs to products or servicesaccording to how much of the resources of the firm they consume. Activity-basedbudgeting (ABB) follows the same process to develop budgets based on theexpected activities and cost drivers to meet sales (or capacity) projections.
Whichever method of budgeting is used, there are two approaches that can beapplied. Budgets may be top down or bottom up. Top-down budgets begin withthe sales forecast and, using the volume of sales, predict inventory levels, staffingand production times within capacity limitations. These are based on bills ofmaterials, labour routings and standard costs. For services, the top-down budgetis based largely on capacity utilization and staffing levels needed to meet expecteddemand. In both cases, senior management establishes spending limits withinwhich departments allocate costs to specific line items (salaries, travel, office

BUDGETING 209
expenses etc.). Senior managers set the revenue targets and spending limits thatthey believe are necessary to achieve profits that will satisfy shareholders. Bottom-up budgets are developed by the managers of each department based on currentspending and agreed plans, which are then aggregated to the corporate total.
Top-down budgets can ignore the problems experienced by operational man-agers. However, boards of directors often have a clear idea of the sales growth andprofit requirement that will satisfy stock market conditions. By contrast, the resultof the bottom-up budget may be inadequate in terms of ‘bottom-line’ profitabilityor unachievable as a result of either capacity limitations elsewhere in the businessor market demand. Therefore, the underlying factors may need to be modified.Consequently, most budgets are the result of a combination of top-down andbottom-up processes. By adopting both methods, budget-holders are given theopportunity to bid for resources (in competition with other budget-holders) withinthe constraints of the shareholder value focus of the business.
The budgeting process
Budgets are based on standard costs (see Chapter 9) for a defined level of salesdemand or production activity. The typical budget cycle – the period each yearover which budgets are prepared – will follow the sequence:
1 Identify business objectives.2 Forecast economic and industry conditions, including competition.3 Develop detailed sales budgets by market sectors, geographic territories, major
customers and product groups.4 Prepare production budgets (materials, labour and overhead) by responsibility
centre managers in order to produce the goods or services needed to satisfy thesales forecast and maintain agreed levels of inventory.
5 Prepare non-production budgets by cost centre.6 Prepare capital expenditure budgets.7 Prepare cash forecasts and identify financing requirements.8 Prepare master budget (profit and loss, balance sheet and cash flow).9 Obtain board approval of profitability and financing targets.
Good practice in budgeting at the level of each responsibility centre involveslooking at the causes of costs and the business processes in use. Bidding for fundsfor capital expenditure or to fund new initiatives or projects is an important partof budgeting because of the need to question past practice and continually seekimprovement. The process of budgeting is largely based on making informedjudgements about:
ž how business-wide strategies will affect the responsibility centre;ž the level of demand placed on the business unit and the expected level ofactivity to satisfy (internal or external) customers;ž the technology and processes used in the business unit to achieve desiredproductivity levels, based on past experience and anticipated improvements;

210 ACCOUNTING FOR MANAGERS
ž any new initiatives or projects that are planned and require resources;ž the headcount and historic spending by the business unit.
In preparing a budget it is important to carry out a thorough investigation ofcurrent performance, i.e. to get behind the numbers. For example, as many costs(particularly in service industries) follow headcount (as we saw in Chapter 10), itis essential that salary and related costs are accurately estimated, and the impact ofrecruitment, resignation and training is taken into account in cost and productivitycalculations.
The complexity of the budget will depend on a number of factors, such as:
ž knowledge of past performance;ž understanding of market trends, seasonal factors, competition etc.;ž whether the business is a price leader or price follower (see Chapter 8);ž understanding the drivers of business costs;ž the control that managers are able to exercise over expenses.
How well these factors can be understood and modelled using a spreadsheet willdepend on the knowledge, skills and time available to the business. Typically,budgets either at the corporate or responsibility centre level will contain a numberof subjective judgements of likely future events, customer demand and a num-ber of simplifying assumptions about product/service mix, average prices, costinflation etc.
Once the budget is agreed in total, the budget needs to be allocated over eachmonth. This is commonly based on working days or takes into account seasonalfluctuations etc. This is a process of profiling or time-phasing the budget. Profilingis important because the process of budgetary control (see Chapter 15) relieson an accurate estimation of when revenue will be earned and when costs willbe incurred.
Table 14.1 is a simplified example of a budget for a small hotel. It shows somestatistics that the Superior Hotel has used for its budget for next year. Both lastyear’s and the current year’s figures are shown. For ease of presentation, the budgetyear has been divided into four quarters and some simplifying assumptions havebeen made. The hotel capacity is limited to the number of rooms, but in commonwith the industry rarely achieves full occupancy, although there are substantialvariations both during the week and at peak times. The main income driver isthe number of rooms occupied, the price able to be charged (which can varysignificantly depending on the number of vacant rooms) and the average spendper head on dining, the bar and business services.
The statistical information, together with estimations of direct costs (food anddrink) and expenses, is based on historical experience and expected cost increases.The budget for the year for the Superior Hotel, based on these assumptions, isshown in Table 14.2.
A budget for a retailer will require an estimation, separate from the sales forecast,of the level of inventory to be held. This results in a purchasing budget. Similarly,a budget for a manufacturing business will involve developing a productionbudget (materials, labour and overhead) by cost centre in order to produce the

Tab
le14
.1Se
rvic
ebu
dge
texa
mpl
e:Su
peri
orH
otel
–bu
dge
tsta
tist
ics
Supe
rior
Hot
elB
UD
GE
TST
AT
IST
ICS
Exp
lana
tion
Las
tye
arC
urre
ntye
arQ
tr1
Jan
–Mar
Qtr
2A
pr–J
une
Qtr
3Ju
l–Se
pQ
tr4
Oct
–Dec
Nex
tye
ar
Num
ber
ofbe
dro
oms
8080
8080
8080
Day
spe
rye
ar(p
erqu
arte
r)36
536
590
9192
9236
5R
oom
sav
aila
ble
–36
5d
ays/
year
No.
day
s×
no.r
oom
s29
,200
29,2
007,
200
7,28
07,
360
7,36
029
,200
Ave
rage
occu
panc
yra
te(7
-day
basi
s)H
isto
rica
l50
%50
%40
%45
%55
%60
%
Ave
rage
no.r
oom
soc
cupi
edN
o.ro
oms×
occu
p.ra
te14
,600
14,6
002,
880
3,27
64,
048
4,41
614
,620
Ave
rage
room
rate
His
tori
cal/
plan
ned
£65.
00£7
0.00
£70.
00£7
2.00
£75.
00£7
5.00
Ave
rage
spen
don
din
ing
per
room
His
tori
cal/
plan
ned
£25.
00£2
5.00
£25.
00£2
5.00
£25.
00£2
5.00
Ave
rage
spen
don
bar
per
room
His
tori
cal/
plan
ned
£5.0
0£5
.00
£5.0
0£5
.00
£5.0
0£5
.00
Ave
rage
spen
don
busi
ness
serv
ices
per
room
His
tori
cal/
plan
ned
£2.0
0£2
.00
£2.0
0£2
.00
£2.0
0£2
.00

Tab
le14
.2Se
rvic
ebu
dge
t exa
mpl
e:Su
peri
orH
otel
bud
get
SUPE
RIO
RH
OT
EL
BU
DG
ET
INC
OM
EE
xpla
nati
onL
ast
year
Cur
rent
year
Qtr
1Ja
n–M
arQ
tr2
Apr
–Jun
eQ
tr3
Jul–
Sep
Qtr
4O
ct–D
ecN
ext
year
Roo
ms
No.
ofro
oms
×av
erag
esp
end
949,
000
1,02
2,00
020
1,60
023
5,87
230
3,60
033
1,20
01,
072,
272
Din
ing
No.
ofro
oms
×av
erag
esp
end
365,
000
365,
000
72,0
0081
,900
101,
200
110,
400
365,
500
Bar
No.
ofro
oms
×av
erag
esp
end
73,0
0073
,000
14,4
0016
,380
20,2
4022
,080
73,1
00B
usin
ess
serv
ices
No.
ofro
oms
×av
erag
esp
end
29,2
0029
,200
5,76
06,
552
8,09
68,
832
29,2
40
Tot
alIn
com
e1,
416,
200
1,48
9,20
029
3,76
034
0,70
443
3,13
647
2,51
21,
540,
112
EX
PEN
DIT
UR
ED
irec
tcos
tsFo
odco
stof
sale
s35
%of
din
ing
inco
me
127,
750
127,
750
25,2
0028
,665
35,4
2038
,640
127,
925
Liq
uor
cost
ofsa
les
40%
ofba
rin
com
e29
,200
29,2
005,
760
6,55
28,
096
8,83
229
,240
Tot
alco
stof
sale
s15
6,95
015
6,95
030
,960
35,2
1743
,516
47,4
7215
7,16
5Sa
lari
esan
dw
ages
Hot
elst
aff
incr
ease
s3%
p.a.
212,
000
218,
360
56,2
2856
,228
56,2
2856
,228
224,
911
Din
ing
staf
fin
crea
ses
3%p.
a.75
,000
77,2
5019
,892
19,8
9219
,892
19,8
9279
,568
Offi
cest
aff
incr
ease
s4%
p.a.
35,0
0036
,400
9,46
49,
464
9,46
49,
464
37,8
56M
anag
emen
tin
crea
ses
5%p.
a.50
,000
52,5
0013
,781
13,7
8113
,781
13,7
8155
,125
Fuel
,lig
htan
dw
ater
His
tori
cal/
esti
mat
e12
,000
14,0
004,
000
4,00
04,
000
4,00
016
,000
Lau
ndry
His
tori
cal/
esti
mat
e8,
000
9,00
02,
500
2,50
02,
500
2,50
010
,000
Cle
anin
gH
isto
rica
l/es
tim
ate
6,00
07,
000
2,00
02,
000
2,00
02,
000
8,00
0R
epai
rsan
dm
aint
enan
ceH
isto
rica
l/es
tim
ate
12,0
0020
,000
4,00
04,
000
4,00
04,
000
16,0
00A
dve
rtis
ing
and
prom
otio
nH
isto
rica
l/es
tim
ate
10,0
0012
,000
3,00
03,
000
3,00
03,
000
12,0
00T
elep
hone
sH
isto
rica
l/es
tim
ate
4,00
05,
000
1,50
01,
500
1,50
01,
500
6,00
0C
onsu
mab
les
His
tori
cal/
esti
mat
e5,
000
5,00
01,
500
1,50
01,
500
1,50
06,
000
Oth
erex
pens
esH
isto
rica
l/es
tim
ate
6,00
07,
000
2,00
02,
000
2,00
02,
000
8,00
0
Tot
alex
pend
itur
e59
1,95
062
0,46
015
0,82
515
5,08
216
3,38
116
7,33
763
6,62
4
Net
profi
tbef
ore
inte
rest
824,
250
868,
740
142,
935
185,
622
269,
755
305,
175
903,
488

BUDGETING 213
Table 14.3 Sports stores co-operative sales and expenses estimate
Jan Feb Mar Apr May Jun Total
Sales (in £’000) 75 80 85 70 65 90 465Average cost of sales 40% 30 32 34 28 26 36 186
Gross profit 45 48 51 42 39 54 279
Less: expensesSalaries 10 10 10 8 7 10 55Rent 15 15 15 15 15 15 90Insurance 1 1 1 1 1 1 6Depreciation on shop fittings 2 2 2 2 2 2 12Advertising and promotion 8 8 8 9 9 8 50Electricity, telephone etc. 5 5 5 5 5 5 30
Total expenses 41 41 41 40 39 41 243
Net profit 4 7 10 2 0 13 36
goods or services needed to satisfy the sales forecast and maintain agreed levelsof inventory.
The first problem to consider is stock, which is shown in the following example.
Retail budget example: Sports Stores Co-operative Ltd
Sports Stores Co-operative (SSC) is a large retail store selling a range of sportswear.Its anticipated sales levels and expenses for each of the next six months are shownin Table 14.3.
Although there are several hundred different items of stock and the productmix does fluctuate due to seasonal factors, SSC is only able to budget based on anaverage sales mix and applies an average cost of sales of 40%.
SSC carries six weeks’ inventory, i.e. sufficient stock to cover six weeks’ sales (atcost price). At the end of each month, therefore, the stock held by SSC will equalall of next month’s cost of sales, plus half of the following month’s cost of sales.This is shown in Table 14.4.
Table 14.4 Sports Stores Co-operative inventory calculation
In £’000s Jan Feb Mar Apr May Jun
Inventory required at end of month 49 48 41 44 54 53Inventory at beginning of month 45 49 48 41 44 54
Increase/-decrease in inventory 4 −1 −7 3 10 −1Sales during month (at cost) 30 32 34 28 26 36
Total purchases 34 31 27 31 36 35

214 ACCOUNTING FOR MANAGERS
In Table 14.4, for example, the inventory required at the end of February(£48,000) is the cost of sales for March (£34,000) plus half the cost of sales for April(£14,000). In order to budget for the inventory for May and June, SSC needs toestimate its sales for July and August. As this is the peak selling time, the salesare estimated at £90,000 and £85,000 respectively. The cost of sales (based on40%) is therefore £36,000 for July and £34,000 for August. Using these figures, theinventory required at the end of June (£53,000) is equal to the cost of sales for July(£36,000) and half the cost of sales for August (£17,000).
SSC also needs to know its inventory on 1 January, which is £45,000. Purchasescan be calculated as:
inventory required at end of month − inventory at beginning of month
= increase (or decrease) in inventory
plus the cost of sales for the current month (which need to be replaced)
Table 14.4 shows the calculation of total purchases. However, it can also be shownin the Profit and Loss report format introduced in previous chapters. This formatis shown in Table 14.5.
The second example is the construction of the production budget for a manu-facturing business.
Manufacturing budget example: Telcon Manufacturing
Telcon is a manufacturer. Its budget is shown in Table 14.6.Telcon estimates its sales for July and August as 1,400 units per month. Its
production budget is based on needing to maintain one month’s stock of finishedgoods, i.e. the cost of sales for the following month. Its finished goods inventoryat the beginning of January is 1,000 units. Table 14.7 shows that the productionrequired of £56,250 is greater than the cost of sales of £53,250 because of the needto produce an additional 400 units at a variable cost of £7.50, i.e. an increase ininventory of £3,000.
However, in order to produce the finished goods, Telcon must also ensurethat it has purchased sufficient raw materials. Once again, it wishes to have onemonth’s stock of raw materials (2 kg of the materials are required for each unit of
Table 14.5 Sports Stores Co-operative closing stock
Jan Feb Mar Apr May Jun
Opening stock 45 49 48 41 44 54Plus purchases 34 31 27 31 36 35Less cost of sales −30 −32 −34 −28 −26 −36
Closing stock 49 48 41 44 54 53
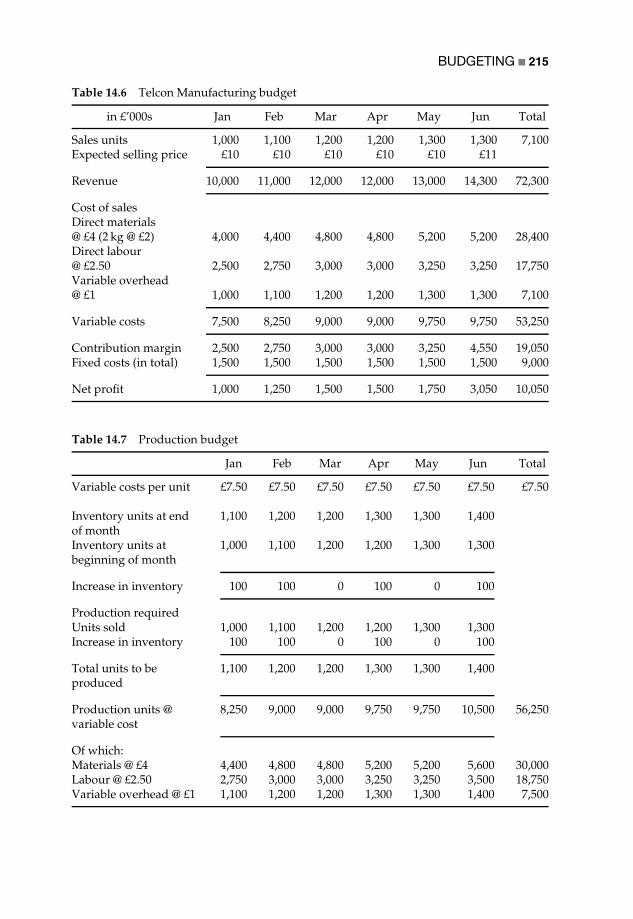
BUDGETING 215
Table 14.6 Telcon Manufacturing budget
in £’000s Jan Feb Mar Apr May Jun Total
Sales units 1,000 1,100 1,200 1,200 1,300 1,300 7,100Expected selling price £10 £10 £10 £10 £10 £11
Revenue 10,000 11,000 12,000 12,000 13,000 14,300 72,300
Cost of salesDirect materials@ £4 (2 kg @ £2) 4,000 4,400 4,800 4,800 5,200 5,200 28,400Direct labour@ £2.50 2,500 2,750 3,000 3,000 3,250 3,250 17,750Variable overhead@ £1 1,000 1,100 1,200 1,200 1,300 1,300 7,100
Variable costs 7,500 8,250 9,000 9,000 9,750 9,750 53,250
Contribution margin 2,500 2,750 3,000 3,000 3,250 4,550 19,050Fixed costs (in total) 1,500 1,500 1,500 1,500 1,500 1,500 9,000
Net profit 1,000 1,250 1,500 1,500 1,750 3,050 10,050
Table 14.7 Production budget
Jan Feb Mar Apr May Jun Total
Variable costs per unit £7.50 £7.50 £7.50 £7.50 £7.50 £7.50 £7.50
Inventory units at endof month
1,100 1,200 1,200 1,300 1,300 1,400
Inventory units atbeginning of month
1,000 1,100 1,200 1,200 1,300 1,300
Increase in inventory 100 100 0 100 0 100
Production requiredUnits sold 1,000 1,100 1,200 1,200 1,300 1,300Increase in inventory 100 100 0 100 0 100
Total units to beproduced
1,100 1,200 1,200 1,300 1,300 1,400
Production units @variable cost
8,250 9,000 9,000 9,750 9,750 10,500 56,250
Of which:Materials @ £4 4,400 4,800 4,800 5,200 5,200 5,600 30,000Labour @ £2.50 2,750 3,000 3,000 3,250 3,250 3,500 18,750Variable overhead @ £1 1,100 1,200 1,200 1,300 1,300 1,400 7,500

216 ACCOUNTING FOR MANAGERS
Table 14.8 Telcon Manufacturing materials budget
Jan Feb Mar Apr May Jun Total
Total units to be produced 1,100 1,200 1,200 1,300 1,300 1,400Total kg of materials (units × 2 kg) 2,200 2,400 2,400 2,600 2,600 2,800
Inventory units at end of month 2,400 2,400 2,600 2,600 2,800 2,800Inventory units at beginning of month 2,000 2,400 2,400 2,600 2,600 2,800
Increase in inventory 400 0 200 0 200 0
Materials requiredKg used in production 2,200 2,400 2,400 2,600 2,600 2,800Increase in inventory 400 0 200 0 200 0
Total kg to be purchased 2,600 2,400 2,600 2,600 2,800 2,800Purchase cost @ £2/kg 5,200 4,800 5,200 5,200 5,600 5,600 31,600
finished goods). There are 2,000 units of raw materials at the beginning of January.Table 14.8 shows the materials purchases budget.
The purchases budget of £31,600 is more than the materials usage of £30,000from the production budget because an additional 800 kg of materials is bought at£2 per kg (i.e. £1,600), due to the need to increase raw materials inventory.
Cash forecasting
Once a profit budget has been constructed, it is important to understand theimpact on cash flow. The purpose of the cash forecast is to ensure that sufficientcash is available to meet the level of activity planned by the sales and productionbudgets and to meet all the other cash inflows and outflows of the business.Cash surpluses and deficiencies need to be identified in advance to ensureeffective business financing decisions, e.g. raising short-term finance or investingshort-term surplus funds.
There is a substantial difference between profits and cash forecasts (for adetailed explanation see Chapter 6) because of:
ž the timing difference between when income is earned and when it is received(i.e. debtors);ž increases or decreases in inventory for both raw materials and finished goods;ž the timing difference between when expenses are incurred and when they arepaid (i.e. creditors);ž non-cash expenses (e.g. depreciation);ž capital expenditure;ž income tax;ž dividends;ž new loans and loan repayments.

BUDGETING 217
Cash forecasting example: Retail News Group
Retail News is a store selling newspapers, magazines, books, confectionery etc. Itsbudget for six months has been prepared and is shown in Table 14.9.
Retail News makes half of its sales in cash and half on credit to businesscustomers, who typically pay their account in the month following sale. Creditsales in December to customers who will pay during January amount to £3,500.Retail News’ sales receipts budget is shown in Table 14.10.
Retail New’s debtors have increased by £1,000 from £3,500 to £4,500, since 50%of the sales in June (£9,000) will not be received until July.
As in the previous examples, we also need to determine the purchases budgetfor Retail News, which needs stock equal to one month’s sales (at cost price) at theend of each month. The stock at the beginning of January is £4,500. The sales andcost of sales estimated for July are £12,000 and £4,800 respectively. The purchasesbudget is shown in Table 14.11.
Purchases are £27,900 compared with a cost of sales of £27,600, because inventoryhas increased by £300 (from £4,500 to £4,800). However, purchases are on credit
Table 14.9 Retail News Group budget
Jan Feb Mar Apr May Jun Total
Sales 10,000 12,000 15,000 12,000 11,000 9,000 69,000Cost of sales (40%) 4,000 4,800 6,000 4,800 4,400 3,600 27,600
Gross profit 6,000 7,200 9,000 7,200 6,600 5,400 41,400
Less expensesSalaries and wages 2,000 2,000 2,000 2,200 2,200 2,200 12,600Selling and distributionexpenses (7.5%)
750 900 1,125 900 825 675 5,175
Rent 1,000 1,000 1,000 1,000 1,000 1,000 6,000Electricity, telephone etc. 500 500 500 500 500 500 3,000Insurance 500 500 500 500 500 500 3,000Depreciation 500 500 500 500 500 500 3,000
Total expenses 5,250 5,400 5,625 5,600 5,525 5,375 32,775
Net profit 750 1,800 3,375 1,600 1,075 25 8,625
Table 14.10 Retail News Group sales receipts budget
Jan Feb Mar Apr May Jun Total
50% of sales received in cash 5,000 6,000 7,500 6,000 5,500 4,500 34,50050% of sales on credit – 30-day terms 3,500 5,000 6,000 7,500 6,000 5,500 33,500
Total receipts 8,500 11,000 13,500 13,500 11,500 10,000 68,000
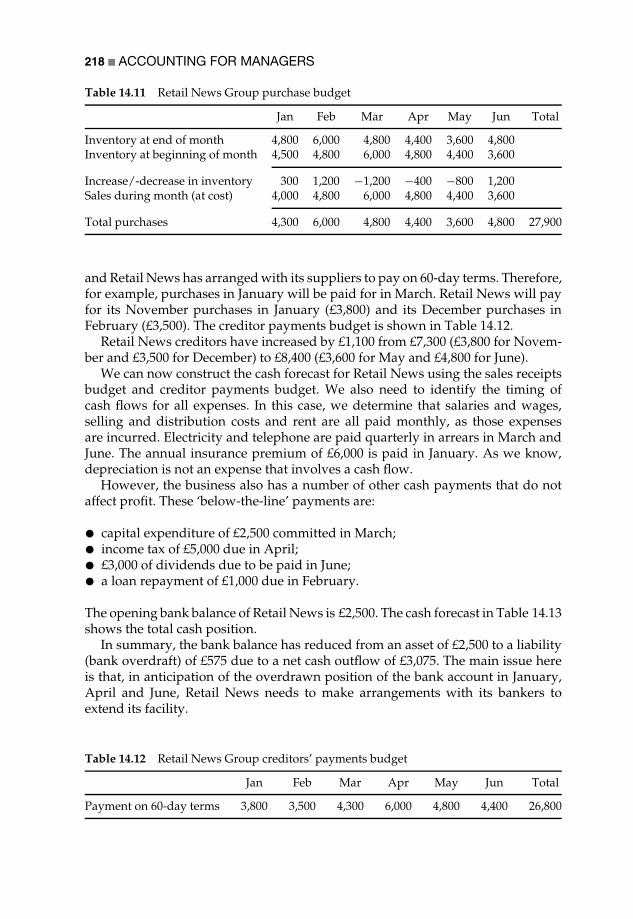
218 ACCOUNTING FOR MANAGERS
Table 14.11 Retail News Group purchase budget
Jan Feb Mar Apr May Jun Total
Inventory at end of month 4,800 6,000 4,800 4,400 3,600 4,800Inventory at beginning of month 4,500 4,800 6,000 4,800 4,400 3,600
Increase/-decrease in inventory 300 1,200 −1,200 −400 −800 1,200Sales during month (at cost) 4,000 4,800 6,000 4,800 4,400 3,600
Total purchases 4,300 6,000 4,800 4,400 3,600 4,800 27,900
and Retail News has arranged with its suppliers to pay on 60-day terms. Therefore,for example, purchases in January will be paid for in March. Retail News will payfor its November purchases in January (£3,800) and its December purchases inFebruary (£3,500). The creditor payments budget is shown in Table 14.12.
Retail News creditors have increased by £1,100 from £7,300 (£3,800 for Novem-ber and £3,500 for December) to £8,400 (£3,600 for May and £4,800 for June).
We can now construct the cash forecast for Retail News using the sales receiptsbudget and creditor payments budget. We also need to identify the timing ofcash flows for all expenses. In this case, we determine that salaries and wages,selling and distribution costs and rent are all paid monthly, as those expensesare incurred. Electricity and telephone are paid quarterly in arrears in March andJune. The annual insurance premium of £6,000 is paid in January. As we know,depreciation is not an expense that involves a cash flow.
However, the business also has a number of other cash payments that do notaffect profit. These ‘below-the-line’ payments are:
ž capital expenditure of £2,500 committed in March;ž income tax of £5,000 due in April;ž £3,000 of dividends due to be paid in June;ž a loan repayment of £1,000 due in February.
The opening bank balance of Retail News is £2,500. The cash forecast in Table 14.13shows the total cash position.
In summary, the bank balance has reduced from an asset of £2,500 to a liability(bank overdraft) of £575 due to a net cash outflow of £3,075. The main issue hereis that, in anticipation of the overdrawn position of the bank account in January,April and June, Retail News needs to make arrangements with its bankers toextend its facility.
Table 14.12 Retail News Group creditors’ payments budget
Jan Feb Mar Apr May Jun Total
Payment on 60-day terms 3,800 3,500 4,300 6,000 4,800 4,400 26,800
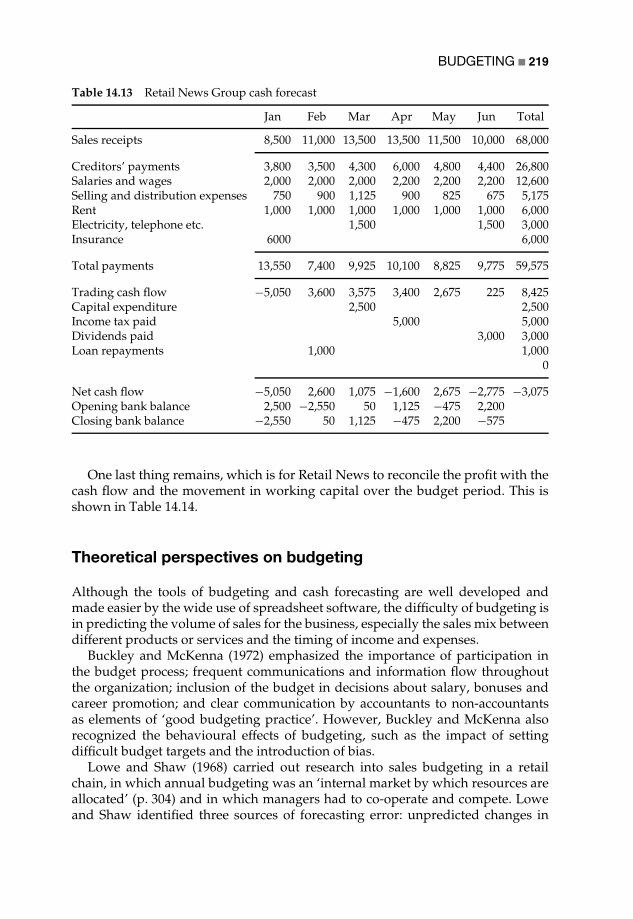
BUDGETING 219
Table 14.13 Retail News Group cash forecast
Jan Feb Mar Apr May Jun Total
Sales receipts 8,500 11,000 13,500 13,500 11,500 10,000 68,000
Creditors’ payments 3,800 3,500 4,300 6,000 4,800 4,400 26,800Salaries and wages 2,000 2,000 2,000 2,200 2,200 2,200 12,600Selling and distribution expenses 750 900 1,125 900 825 675 5,175Rent 1,000 1,000 1,000 1,000 1,000 1,000 6,000Electricity, telephone etc. 1,500 1,500 3,000Insurance 6000 6,000
Total payments 13,550 7,400 9,925 10,100 8,825 9,775 59,575
Trading cash flow −5,050 3,600 3,575 3,400 2,675 225 8,425Capital expenditure 2,500 2,500Income tax paid 5,000 5,000Dividends paid 3,000 3,000Loan repayments 1,000 1,000
0
Net cash flow −5,050 2,600 1,075 −1,600 2,675 −2,775 −3,075Opening bank balance 2,500 −2,550 50 1,125 −475 2,200Closing bank balance −2,550 50 1,125 −475 2,200 −575
One last thing remains, which is for Retail News to reconcile the profit with thecash flow and the movement in working capital over the budget period. This isshown in Table 14.14.
Theoretical perspectives on budgeting
Although the tools of budgeting and cash forecasting are well developed andmade easier by the wide use of spreadsheet software, the difficulty of budgeting isin predicting the volume of sales for the business, especially the sales mix betweendifferent products or services and the timing of income and expenses.
Buckley and McKenna (1972) emphasized the importance of participation inthe budget process; frequent communications and information flow throughoutthe organization; inclusion of the budget in decisions about salary, bonuses andcareer promotion; and clear communication by accountants to non-accountantsas elements of ‘good budgeting practice’. However, Buckley and McKenna alsorecognized the behavioural effects of budgeting, such as the impact of settingdifficult budget targets and the introduction of bias.
Lowe and Shaw (1968) carried out research into sales budgeting in a retailchain, in which annual budgeting was an ‘internal market by which resources areallocated’ (p. 304) and in which managers had to co-operate and compete. Loweand Shaw identified three sources of forecasting error: unpredicted changes in

220 ACCOUNTING FOR MANAGERS
Table 14.14 Retail News Group profit and cash flowreconciliation
Net profit £8,625Plus non-cash expense 3,000Depreciation
11,625Less increase in working capital –
Debtors 1,000Inventory 300Insurance prepayment 3, 000
4,300Less increase in creditors 1,100Net increase 3,200Net cash flow from operating activities 8,425Other outflows of cash –
Capital expenditure 2,500Income tax 5,000Dividend 3,000Loan repayment 1,000 11,500
Decrease in cash 3,075
the environment; inaccurate assessment of the effects of predicted changes; andforecasting bias.
Lowe and Shaw examined the sources of bias: the reward system; the influenceof recent practice and norms; and the insecurity of managers, arguing that bias maybe a common phenomenon as in ‘the desire to please superiors in a competitivemanagerial hierarchy’ (p. 312). They also explained counterbias as ‘the attempt byother managers to eliminate that part of a forecast which stems from the personalinterest of the forecaster’ (p. 312).
However, there are also problems with aggregation of divisional budgets intoa corporate budget. Berry and Otley (1975) explored the estimation of budgetfigures made by individuals at one hierarchical level in an organization, and thecoupling of these estimates to those made at a higher level to show the resultingbias in estimating that takes place. Otley and Berry (1979) argued that quitemild deviations from ‘expectation budgets’ at the unit level can produce severedistortions when budgets are aggregated to the organizational level.
An interpretive or critical perspective is appropriate for a study of budgeting, inparticular because budgets are one of the main sources of power in organizations,as a result of the influence of accountants over budgetary allocations. Czarniawska-Joerges and Jacobsson (1989) depicted budgets as:
a symbolic performance rather than a decision-making process; a means ofconversation rather than a means of control; and an expression of valuesrather than an instrument for action . . . Budgeting is seen as a ritual of reason;budgets are presented according to and conforming with prevailing normsof rationality. Budgeting is also a language of consensus; there are several

BUDGETING 221
mechanisms in budgetary processes for reducing the level and amount ofconflict. (pp. 29–30)
Covaleski and Dirsmith (1988) described the budgetary process between a stateuniversity and its state government and argued that budgeting systems help torepresent vested interests in political processes and maintain existing power rela-tionships. Other aspects of power relate to shifts in the dominant coalition withinorganizations. Covaleski et al. (1993) presented a case study of the introductionof diagnostic-related costing in hospitals in which case-mix accounting systems‘appear also to determine power by redistributing that power from physician toadministrator’ (p. 73).
In a UK university, Ezzamel (1994) studied the budgeting system and how itwas involved in power relations at two levels. First, it provided a vehicle throughwhich the proposed reallocation of funds was translated, communicated and giveninitial visibility. Second, it provided a basis for much of the discourse that tookplace between the various constituencies.
Preston et al. (1992) described the process of management budgeting in theUK hospital system, showing how budgeting was ‘fabricated’ – put togetherin a fragile manner – and, in the process of its design and implementation, newpossibilities for decision-making and definitions of responsibility emerged. Prestonet al. emphasized how people:
attempt to enmesh accounting innovations within the functioning of organi-zations and the processes by which new patterns of language, meaning andsignificance emerge through the fabrication of accounting and budgetingsystems. (p. 562)
They concluded:
[r]esistance and scepticism occurs from the outset and is a central elementin the fabrication process . . . resistance not only impedes and constrainsthe process, but also shapes it in specific ways designed to overcome thescepticism. (p. 589)
A final word in relation to budgeting concerns risk. Collier and Berry (2002)identified risk as being managed in four different domains: financial, operational,political and personal. These were the result of the unique circumstances, historyand technology in different organizations that had led to different ideas aboutrisk. These domains of risk revealed how participants in the budgeting processinfluenced the content of the budget through their unique perspectives.
The research distinguished the content of budgets from the process of budgeting.It contrasted three types of budget. In the risk-modelled process, there is an explicituse of formal probability models to assess the effect of different consequencesover a range of different assumptions. In the risk-considered process, informalsensitivity (or what-if) analysis is used to produce (for example) high, medium andlow consequences of different assumptions. The risk excluded budget managesrisk outside the budget process, and the budget relies on a single expectation of

222 ACCOUNTING FOR MANAGERS
performance. Collier and Berry found that little risk modelling may be used inpractice, and that the consideration of risk during the budgeting process influencedthe content of budgets that were largely risk excluded.
Case study: Svenska Handelsbanken – is budgetingnecessary?
Jan Wallander is an executive director of Handelsbanken. He was appointed tothe role when the bank, the largest commercial bank in Sweden, faced a crisis.Although at the time Swedish banks did not use budgets, Handelsbanken hadstarted to install a sophisticated budgeting system.
Wallander (1999) was very critical of budgeting. For example:
You can make forecasts very complicated by putting a lot of variables intothem and using sophisticated techniques for evaluating the time series youhave observed and used in your work. However, if you see through all thistechnical paraphernalia you will find that there are a few basic assumptionswhich determine the outcome of the forecast. (p. 408)
The accuracy of the budget therefore depends on how accurate the assumptionsare. Wallander argued that there are two reasons to abandon budgeting:
1 If there is economic stability and the business will continue as usual, we useprevious experience in order to budget. Wallander argued that we do not needan intricate budgeting system in this case, because people will continue workingas they presently are. Even when conditions are not normal, the expectation isthat they will return to normal.
2 If events arise that challenge economic stability then budgets will not reflectthis, because, Wallander says, ‘we have no ability to foresee something of whichwe have no previous experience’ (p. 411).
He concluded that traditional budgeting is ‘an outmoded way of controllingand steering a company. It is a cumbersome way of reaching conclusions whichare either commonplace or wrong’ (p. 419).
However, Wallander did not reject planning outright. He argued that it isimportant to have an ‘economic model’ that establishes the basic relationships inthe company, such as the ability to plan production. He commented, ‘This type ofplanning is something that is going on all the year round and has nothing to dowith the annual budget’ (p. 416).
Handelsbanken has an information system that is focused on the informationneeded to influence actual behaviour. It incorporates both financial and ‘BalancedScorecard’ measures at the profit centre level, and performance is benchmarkedexternally and internally. The bank rewards its staff through a profit-sharingscheme.

BUDGETING 223
Despite its abandonment of budgeting, Handelsbanken remains a very success-ful bank. Wallander concluded:
abandoning budgeting, which was an essential part of the changes, had noadverse effect on the performance of the bank compared to other banks,which all installed budgeting systems during the period. (p. 407)
Conclusion
In this chapter we have linked budgeting to the strategy process. We described var-ious approaches to budgeting and the mechanics of the budgeting cycle. Througha series of examples we explored budgeting for a service, retail and manufacturingorganization. We also introduced cash forecasting and the reconciliation betweenprofit and cash flow.
The chapter concluded with a snapshot of theoretical perspectives on budgetingthat contrast the rational-economic view of budgets with the subjectivity ofbudgets as a consequence of bias and aggregation, and the power that underliesthe budgeting process. We also questioned whether risk is really reflected in thecontent of the budget document and whether budgets have any value at all.
The assumptions behind the production of budgets are important for planningpurposes, but crucial when managers are held accountable for achieving budgettargets. This is the process of budgetary control, which is the subject of Chapter 15.
References
Anthony, R. N. and Govindarajan, V. (2000). Management Control Systems. (10th interna-tional edn). New York, NY: McGraw-Hill Irwin.
Berry, A. J. and Otley, D. T. (1975). The aggregation of estimates in hierarchical organiza-tions. Journal of Management Studies, May, 175–93.
Buckley, A. and McKenna, E. (1972). Budgetary control and business behaviour. Accountingand Business Research, Spring, 137–50.
Collier, P. M. and Berry, A. J. (2002). Risk in the process of budgeting. Management Account-ing Research, 13, 273–97.
Covaleski, M. A. and Dirsmith, M. W. (1988). The use of budgetary symbols in the politicalarena: an historically informed field study. Accounting, Organizations and Society, 13(1),1–24.
Covaleski, M. A., Dirsmith, M. W. and Michelman, J. E. (1993). An institutional theoryperspective on the DRG framework, case-mix accounting systems and health-careorganizations. Accounting, Organizations and Society, 18(1), 65–80.
Czarniawska-Joerges, B. and Jacobsson, B. (1989). Budget in a cold climate. Accounting,Organizations and Society, 14(1/2), 29–39.
Ezzamel, M. (1994). Organizational change and accounting: Understanding the budgetingsystem in its organizational context. Organization Studies, 15(2), 213–40.
Lowe, E. A. and Shaw, R. W. (1968). An analysis of managerial biasing: Evidence from acompany’s budgeting process. Journal of Management Studies, October, 304–15.
Otley, D. and Berry, A. (1979). Risk distribution in the budgetary process. Accounting andBusiness Research, 9(36), 325–7.

224 ACCOUNTING FOR MANAGERS
Preston, A. M., Cooper, D. J. and Coombs, R. W. (1992). Fabricating budgets: A study ofthe production of management budgeting in the National Health Service. Accounting,Organizations and Society, 17(6), 561–93.
Wallander, J. (1999). Budgeting – an unnecessary evil. Scandinavian Journal of Management,15, 405–21.
For a useful critique of budgeting, see the ‘Beyond Budgeting Round Table’ websiteat www.beyondbudgeting.org
15
Budgetary Control
In this chapter, we describe the budgetary control that takes place in organizationsthrough the techniques of flexible budgets and variance analysis. However, wecaution against variance analysis in circumstances where this could conflict withmore broadly based improvement strategies within the business. The chapter alsoconsiders how cost control can be exercised in practice.
What is budgetary control?
Budgetary control is concerned with ensuring that actual financial results arein line with targets. An important part of this feedback process (see Chapter 4) isinvestigating variations between actual results and budgeted results and takingappropriate corrective action.
Budgetary control provides a yardstick for comparison and isolates problemsby focusing on variances, which provide an early warning to managers. Buckleyand McKenna (1972) argued:
The sinews of the budgeting process . . . are the influencing of managementbehaviour by setting agreed performance standards, the evaluation of resultsand feedback to management in anticipation of corrective action wherenecessary. (p. 137)
Budgetary control is typically exercised at the level of each responsibility centre.Management reports show, for each line item, the budget expenditure, usually forboth the current accounting period and the year to date. The report will also showthe actual income and expenditure and a variance.
A typical actual versus budget financial report is shown in Table 15.1.There are two types of variance:
ž A favourable variance occurs where income exceeds budget and/or expensesare lower than budget.ž An adverse variance occurs where income is less than budget and/or expensesare greater than budget.
It is important to look both at the current period, which in the above exampleshows an underspend of £6,500 (budget of £80,000 less actual spending of £73,500),

226 ACCOUNTING FOR MANAGERS
Table 15.1 Actual v. budget financial report
Budget forthis period
Actual forthis period
Budget for theyear to date
Actual for theyear to date
Variance
Materials 40,000 45,000 100,000 96,000 4,000 FavLabour 21,000 19,000 30,000 32,000 2,000 AdvEnergy 9,000 7,000 40,000 38,000 2,000 FavOther costs 10,000 2,500 50,000 55,000 5,000 Adv
Total 80,000 73,500 220,000 221,000 1,000 Adv
and the year to date, which shows an overspend of £1,000. The weakness oftraditional management reports for budgetary control is that the business maynot be comparing like with like. For example, if the business volume is lowerthan budgeted, then it follows that any variable costs should (in total) be lowerthan budgeted. Conversely, if business volume is higher than budget, variablecosts should (in total) be higher than budget. In many management reports, thedistinction between variable and fixed costs (see Chapter 8) is not made and itbecomes very difficult to compare costs incurred at one level of activity withbudgeted costs at a different level of activity and to make judgements aboutmanagerial performance.
Flexible budgeting
Flexible budgets provide a better basis for investigating variances than the originalbudget, because the volume of production may differ from that planned. If theactual activity level is different to that budgeted, comparing revenue and/or costsat different (actual and budget) levels of activity will produce meaningless figures.A flexible budget is a budget that is flexed, that is standard costs per unit areapplied to the actual level of business activity. It makes little sense to comparethe budgeted costs of producing (say) 40,000 units with the costs incurred inproducing 35,000 units. Variance analysis is then carried out between the flexedbudget costs and actual costs.
Flexible budgets take into account variations in the volume of activity. Usingthe above example, costs are budgeted at £2 per unit for 40,000 units but actualcosts are £2.10 for 35,000 units. A standard actual versus budget report will show:
Budget Actual Variance£80,000 £73,500 £6,500 Favourable40,000 @ £2 35,000 @ £2.10
The favourable variance disguises the fact that fewer units were produced. Aflexible budget adjusts the original budget to the actual level of activity. The

BUDGETARY CONTROL 227
variance under a flexed budget would then show:
Original budget Flexed budget Actual Variance£80,000 £70,000 £73,500 £3,500 Adverse40,000 @ £2 35,000 @ £2 35,000 @ £2.10
This is a more meaningful comparison, because the manager responsible for costcontrol has spent more per unit and should not have this responsibility negatedby the effect of a reduced volume, which may have been outside that manager’scontrol. Separately, the adverse effect of the volume variance – the differencebetween the original and flexed budgets – is shown as 5,000 units @ £2 or £10,000.This may be controllable by a different manager. As can be seen by comparing thetwo styles of presentation, there is still a £6,500 favourable variance, but the flexedbudget identifies the two separate components of this variance:
ž £10,000 favourable variance (in terms of cost) because of the reduction in volumefrom 40,000 to 35,000 units at £2 each. This is offset byž £3,500 adverse variance because the 35,000 units produced each cost 10p morethan the standard cost.
Variance analysis
An important part of the feedback process (see Chapter 4) is variance analysis.Variance analysis involves comparing actual performance against plan, investi-gating the causes of the variance and taking corrective action to ensure that targetsare achieved. Variance analysis needs to be carried out for each responsibilitycentre, product/service and for each line item.
The steps involved in variance analysis are:
1 Ascertain the budget and phasing (see Chapter 14) for each period.2 Report the actual spending.3 Determine the variance between budget and actual (and determine whether it
is either favourable or adverse).4 Investigate why the variance occurred.5 Take corrective action.
Not only adverse variances need to be investigated. Favourable variances providea learning opportunity that can be repeated.
The questions that need to be asked as part of variance analysis are:
ž Is the variance significant?ž Is it early or late in the year?ž Is it likely to be repeated?ž Can it be explained (and understood)?ž Is it controllable?

228 ACCOUNTING FOR MANAGERS
Only significant variations need to be investigated. However, what is significantcan be interpreted differently by different people. Which is more significant, forexample, a 5% variation on £10,000 (£500) or a 25% variation on £1,000 (£250)? Thesignificance of the variation may be either an absolute amount or a percentage.
A variance later in the year will be more difficult to correct, so variances shouldbe detected for corrective action as soon as they occur. Similarly, a one-off variancerequires a single corrective action, but a variance that will continue requires moredrastic action. A variance that can be understood can be corrected, but if the causesof the variance are not understood or are outside the manager’s control, it may bedifficult to correct and control in the future.
Explanations need to be sought in relation to different types of variance:
ž sales variances: price and quantity of product/services sold;ž material variances: price and quantity of materials used;ž labour variances: wage rate and efficiency;ž overhead variances: spending and efficiency.
The following case study provides an example of variance analysis.
Variance analysis example: Wood’s Furniture Co.
Wood’s Furniture has produced a budget versus actual report, which is shownin Table 15.2. The difference between budget and actual is an adverse variance of£15,200. However, the firm’s accountant has produced a flexed budget to assist incarrying out a more meaningful variance analysis. This is shown in Table 15.3.
The flexed budget shows a favourable variance of £3,300 compared to theflexed budget. In order to undertake a detailed variance analysis, we need someadditional information, which the accountant has produced in Table 15.4.
Sales variance
The sales variance is used to evaluate the performance of the sales team. There aretwo sales variances for which the sales department is responsible:
ž The sales price variance is the difference between the actual price and thestandard price for the actual quantity sold.ž The sales quantity variance is the difference between the budget and actualquantity at the standard margin (i.e. the difference between the budget priceand the standard variable costs), because it would be inappropriate to holdsales managers accountable for production efficiencies and inefficiencies.
The sales price variance is the difference between the flexed budget and theactual sales revenue, i.e. £45,000. This is calculated in Table 15.5. The variance isfavourable because the business has sold 9,000 units at an additional £5 each.
The sales quantity variance is the difference between the original budget profitof £70,000 and the flexed budget profit of £50,500 – an unfavourable variance of

BUDGETARY CONTROL 229
Table 15.2 Budget v. actual report
Budget Actual Variance
Sales units 10,000 9,000Selling price
Revenue 1,700,000 1,575,000 125,000
Variable costsMaterials
Plastic 30,000 26,600 3,400Metal 20,000 20,000 0Wood 30,000 26,600 3,400
LabourSkilled 900,000 838,750 61,250Semi-skilled 225,000 195,000 30,000
Variable overhead 300,000 283,250 16,750
Total variable costs 1,505,000 1,390,200 114,800
Contribution 195,000 184,800 10,200Fixed costs 125,000 130,000 −5,000
Net profit 70,000 54,800 15,200
Table 15.3 Flexible budget
Originalbudget
Flexedbudget
Actual Variance
Sales units 10,000 9,000 9,000Selling price
Revenue 1,700,000 1,530,000 1,575,000 −45,000
Variable costsMaterials
Plastic 30,000 27,000 26,600 400Metal 20,000 18,000 21,000 −3,000Wood 30,000 27,000 26,600 400
LabourSkilled 900,000 810,000 838,750 −28,750Semi-skilled 225,000 202,500 195,000 7,500
Variable overhead 300,000 270,000 283,250 −13,250
Total variable costs 1,505,000 1,354,500 1,391,200 −36,700
Contribution 195,000 175,500 183,800 −8,300Fixed costs 125,000 125,000 130,000 −5,000
Net profit 70,000 50,500 53,800 −3,300

Tab
le15
.4V
aria
nce
repo
rt Std
cost
per
unit
Ori
gina
lbu
dge
tSt
dco
stpe
run
itFl
exed
bud
get
Usa
geqt
yA
ctco
stpe
run
itA
ctua
lV
aria
nce
Sale
sun
its
10,0
009,
000
9,00
0Se
lling
pric
e£1
70£1
70£1
75
Rev
enue
£1,7
00,0
00£1
,530
,000
£1,5
75,0
00−£
45,0
00
Var
iabl
eco
sts
Mat
eria
lsP
last
ic2
@£1
.50
30,0
002
@£1
.50
27,0
0019
,000
£1.4
026
,600
400
Met
al1
@£2
20,0
001
@£2
18,0
0010
,000
£2.1
021
,000
−3,0
00W
ood
4@
£0.7
530
,000
4@
£0.7
527
,000
38,0
00£0
.70
26,6
0040
0L
abou
rSk
illed
6@
£15
900,
000
6@
£15
810,
000
55,0
00£1
5.25
838,
750
−28,
750
Sem
i-sk
illed
3@
£7.5
022
5,00
03
@£7
.50
202,
500
26,0
00£7
.50
195,
000
7,50
0V
aria
ble
over
head
6@
£530
0,00
06
@£5
270,
000
55,0
00£5
.15
283,
250
−13,
250
Tot
alva
riab
leco
sts
£150
.50
1,50
5,00
0£1
50.5
01,
354,
500
£154
.58
1,39
1,20
0−3
6,70
0
Con
trib
utio
n£1
9.50
195,
000
£19.
5017
5,50
0£2
0.42
183,
800
−8,3
00Fi
xed
cost
s12
5,00
012
5,00
013
0,00
0−5
,000
Net
profi
t70
,000
50,5
0053
,800
−3,3
00

BUDGETARY CONTROL 231
Table 15.5 Sales price variance
Actual quantity 9,000@ actual price £175 £1,575,000
Actual quantity 9,000@ standard price £170 £1,530,000
Favourable price variance £45,000
Table 15.6 Sales quantity variance
Budget quantity 10,000–Actual quantity 9,000 1,000
@ standard margin £19.50Unfavourable quantity variance £19,500
£19,500. This is calculated in Table 15.6. The variance is unfavourable because1,000 units budgeted have not been sold and the standard margin for each of thoseunits was £19.50 (selling price of £170 less variable costs of £150.50), resulting in alost contribution of £19,500.
It is important to note that the sales mix can affect the quantity and pricevariances significantly. Therefore, a sales variance analysis should reflect thebudget and actual sales mix.
We have now accounted for the variance between the original budget and theflexed budget (i.e. due to volume of units sold) and between the revenue in theflexed budget and the actual (i.e. due to the difference in selling price). We nowhave to look at the variances between the costs in the flexed budget and the actualcosts incurred.
Cost variances
Each cost variance – for materials, labour and overhead – can be split into twotypes, a price variance and a usage variance. This is because each type of variancemay be the responsibility of a different manager. Price variances occur because thecost per unit of resources is higher or lower than the standard cost. Usage variancesoccur because the actual quantity of labour or materials used is higher or lowerthan the routing or bill of materials (these concepts were covered in Chapter 9).The relationship between price and usage variances is shown in Figure 15.1.
Materials variance
The total materials variance is £2,200 unfavourable, as shown in Table 15.7.However, we need to consider the price and usage variances for each type ofmaterial, because the reasons for the variance and the corrective action may bedifferent for each.

232 ACCOUNTING FOR MANAGERS
Standard quantity Actual quantity Actual quantity× × ×
Standard price Standard price Actual price
Usage variance Price variance
Total variance
Figure 15.1 Price and usage variances
Table 15.7 Materials variance
Std costper unit
Originalbudget
Std costper unit
Flexedbudget
Usageqty
Act costper unit
Actual Variance
2 @ £1.50 2 @ £1.50Plastic 30,000 27,000 19,000 1.4 26,600 400Metal 1 @ £2 20,000 1 @ £2 18,000 10,000 2.1 21,000 −3,000
4 @ £0.75 4 @ £0.75Wood 30,000 27,000 38,000 0.7 26,600 400
80,000 72,000 74,200 −2,200
Materials usage variance
Using the above formula we can calculate the usage variance for each of the threematerials. This is shown in Table 15.8. In each case, while holding the (standard)price constant, there has been a higher than expected usage of materials. This is anefficiency variance, which may be the result of:
ž poor productivity;ž out-of-date bill of materials;ž poor quality materials.
Materials price variance
Using the formula, the price variance for each of the three materials is shown inTable 15.9. While holding the (actual) quantity constant, we can see the effect ofprice fluctuations. Both plastic and wood have been bought below the standardprice, while metal has cost more than standard. These variances may be theresult of:
ž changes in supplier prices not yet reflected in the bill of materials;ž poor purchasing.
In total, the materials variance is £2,200. We can see that of the three materials,metal contributes the greatest variance – an adverse £3,000 (£2,000 usage and

BUDGETARY CONTROL 233
Table 15.8 Materials usage variance
PlasticStandard quantity 9,000 × 2Standard price @ £1.50 27,000
Actual quantity 19,000Standard price @ £1.50 28,500
Adverse variance −1,500
MetalStandard quantity 9,000 × 1Standard price @ £2.00 18,000
Actual quantity 10,000Standard price @ £2.00 20,000
Adverse variance −2,000
WoodStandard quantity 9,000 × 4Standard price @ £0.75 27,000
Actual quantity 38,000Standard price @ £0.75 28,500
Adverse variance −1,500Total usage variance – adverse −5,000
£1,000 price), which needs to be investigated as a matter of priority – while theremay be a trade-off between the price and usage variances for plastic and wood,as sometimes quality and price can conflict with each other. The total materialsvariance is shown in Table 15.10.
Similarly, we need to analyse the usage and price variances for both skilled andsemi-skilled labour.
Labour variance
The total labour variance is an unfavourable £21,250, as shown in Table 15.11.Similarly, we need to look at the usage variance (which is a productivity or
efficiency measure) and the price variance (which is a wage rate variance) for eachof the two types of labour.
Labour efficiency variance
Using the same formula, the efficiency variance for labour is shown in Table 15.12.The adverse variance is a result of 1,000 additional hours being worked for skilledlabour and 1,000 hours less being worked by unskilled labour. This may have beenthe result of:

234 ACCOUNTING FOR MANAGERS
Table 15.9 Materials price variance
PlasticActual quantity 19,000Standard price @ £1.50 28,500
Actual quantity 19,000Actual price @ £1.40 26,600
Favourable variance 1,900
MetalActual quantity 10,000Standard price @ £2.00 20,000
Actual quantity 10,000Actual price @ £2.10 21,000
Adverse variance −1,000
WoodActual quantity 38,000Standard price @ £0.75 28,500
Actual quantity 38,000Actual price @ £0.70 26,600
Favourable variance 1,900Total price variance – favourable 2,800
Table 15.10 Total materials variance
Usage – adverse −5,000Price – favourable 2,800
Total – adverse −2,200
Plastic 400Metal −3,000Wood 400
−2,200
ž poor-quality material that required greater skill to work;ž the lack of unskilled labour that was replaced by skilled labour;ž poor production planning.
Labour rate varianceThe labour rate variance is shown in Table 15.13. Skilled labour costs an additional25p for each hour worked, while unskilled labour was paid the standard rate. Thismay be the result of:

BUDGETARY CONTROL 235
Table 15.11 Labour variance
Std costper unit
Originalbudget
Std costper unit
Flexedbudget
Usageqty
Act costper unit
Actual Variance
Skilled 6 @ £15 900,000 6 @ £15 810,000 55,000 £15.25 838,750 −28,750Semi-skilled
3 @ £7.50 225,000 3 @ £7.50 202,500 26,000 £7.50 195,000 7,500
1,125,000 1,012,500 1,033,750 −21,250
Table 15.12 Labour efficiency variance
SkilledStandard quantity 9,000 × 6Standard price @ £15.00 810,000
Actual quantity 55,000Standard price @ £15.00 825,000
Adverse variance −15,000
UnskilledStandard quantity 9,000 × 3Standard price @ £7.50 202,500
Actual quantity 26,000Standard price @ £7.50 195,000
Favourable variance 7,500Total efficiency variance – adverse −7,500
ž unplanned overtime payments;ž a negotiated wage increase that has not been included in the labour routing.
The total labour variance is an unfavourable £21,250. This is a combination ofefficiency and rate variances, but it is all in relation to skilled labour. The totallabour variance is shown in Table 15.14.
Variable production costs also need to be analysed.
Variable overhead variance
The overhead variance is an adverse variation of £13,250, as shown in Table 15.15.There are two types of overhead variance, the efficiency variance and the
spending variance.The overhead efficiency variance is £5,000 adverse, as shown in Table 15.16.
The variance has occurred because an extra 1,000 hours have been worked. Theefficiency variance is typically related to production hours and often follows fromvariances in labour (see Chapter 11). The reason may be that as more hours have

236 ACCOUNTING FOR MANAGERS
Table 15.13 Labour rate variance
SkilledActual quantity 55,000Standard price @ £15.00 825,000
Actual quantity 55,000Actual price @ £15.25 838,750
Adverse variance −13,750
UnskilledActual quantity 26,000Standard price @ £7.50 195,000
Actual quantity 26,000Actual price @ £7.50 195,000
Favourable variance 0Total rate variance – adverse −13,750
Table 15.14 Total labour variance
Efficiency – adverse −7,500Rate – adverse −13,750
Total – adverse −21,250
Skilled −28,750Unskilled 7,500
−21,250
Table 15.15 Variable overhead variance
Std costper unit
Originalbudget
Std costper unit
Flexedbudget
Usageqty
Act costper unit
Actual Variance
Variableoverhead
6 @ £5 300,000 6 @ £5 270,000 55,000 5.15 283,250 −13,250
been worked this has consumed more variable costs, e.g. the more machinesrunning, the more electricity may be consumed.
The overhead spending variance is £8,250 adverse. This is shown in Table 15.17.This variance is due to extra spending for each hour worked. The reason for thisvariance may be a higher cost per hour, e.g. the rate per kilowatt used paid to theutility provider may have increased.

BUDGETARY CONTROL 237
Table 15.16 Overhead efficiency variance
Standard quantity 9,000 × 6Standard price @ £5.00 270,000
Actual quantity 55,000Standard price @ £5.00 275,000
Adverse efficiency variance −5,000
Table 15.17 Overhead spending variance
Actual quantity 55,000Standard price @ £5 275,000
Actual quantity 55,000Actual price @ £5.15 283,250
Adverse spending variance −8,250
Table 15.18 Total variable overhead variance
Efficiency – adverse −5,000Spending – adverse −8,250
Total – adverse −13,250
The total variable overhead variance is an adverse £13,250, which is a combina-tion of both efficiency and rate variances. The total variable overhead variance isshown in Table 15.18.
Fixed cost variance
The fixed cost variance is straightforward. As changes in quantity cannot influencefixed costs (which by definition are constant over different levels of production),the variation must be the result of a spending variance.
In this case the variance is an adverse £5,000, because costs of £130,000 exceedthe budget cost of £125,000.
Reconciling the variances
The difference between the original budget profit of £70,000 and the actual resultof £53,800 can now be reconciled, as in Table 15.19.
While the example used here is a manufacturing example, variance analysisis equally applicable to service businesses, although there will, of course, be no
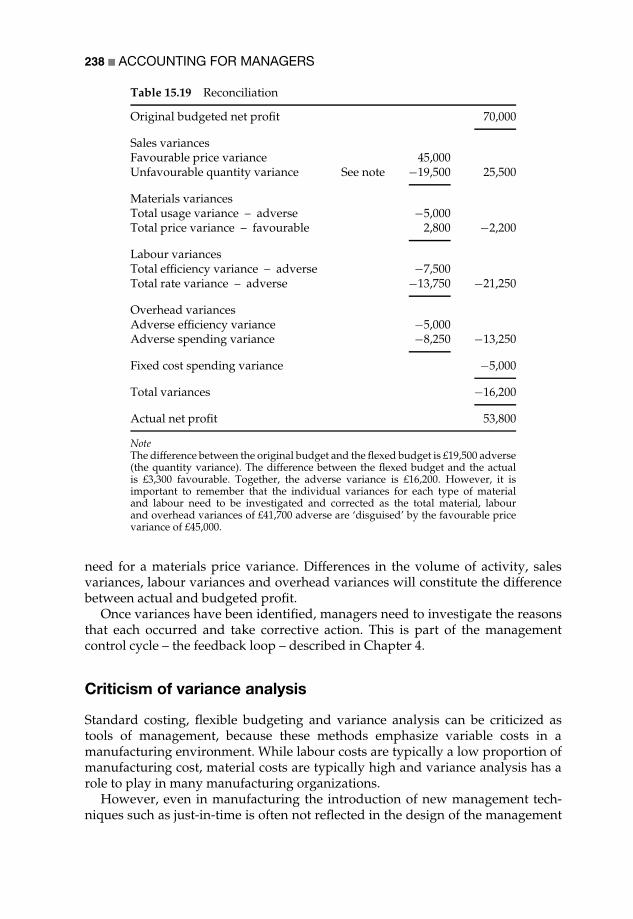
238 ACCOUNTING FOR MANAGERS
Table 15.19 Reconciliation
Original budgeted net profit 70,000
Sales variancesFavourable price variance 45,000Unfavourable quantity variance See note −19,500 25,500
Materials variancesTotal usage variance – adverse −5,000Total price variance – favourable 2,800 −2,200
Labour variancesTotal efficiency variance – adverse −7,500Total rate variance – adverse −13,750 −21,250
Overhead variancesAdverse efficiency variance −5,000Adverse spending variance −8,250 −13,250
Fixed cost spending variance −5,000
Total variances −16,200
Actual net profit 53,800
NoteThe difference between the original budget and the flexed budget is £19,500 adverse(the quantity variance). The difference between the flexed budget and the actualis £3,300 favourable. Together, the adverse variance is £16,200. However, it isimportant to remember that the individual variances for each type of materialand labour need to be investigated and corrected as the total material, labourand overhead variances of £41,700 adverse are ‘disguised’ by the favourable pricevariance of £45,000.
need for a materials price variance. Differences in the volume of activity, salesvariances, labour variances and overhead variances will constitute the differencebetween actual and budgeted profit.
Once variances have been identified, managers need to investigate the reasonsthat each occurred and take corrective action. This is part of the managementcontrol cycle – the feedback loop – described in Chapter 4.
Criticism of variance analysis
Standard costing, flexible budgeting and variance analysis can be criticized astools of management, because these methods emphasize variable costs in amanufacturing environment. While labour costs are typically a low proportion ofmanufacturing cost, material costs are typically high and variance analysis has arole to play in many manufacturing organizations.
However, even in manufacturing the introduction of new management tech-niques such as just-in-time is often not reflected in the design of the management
BUDGETARY CONTROL 239
accounting system. Just-in-time (JIT) aims to improve productivity and eliminatewaste by obtaining manufacturing components in the right quality, at the righttime and place to meet the demands of the manufacturing cycle. It requires closeco-operation within the supply chain and is generally associated with continuousmanufacturing processes with low inventory holdings, a result of eliminatingbuffer inventories – considered waste – between the different stages of manufac-ture. Many of these costs are hidden in a traditional cost accounting system.Variance analysis has less emphasis in a JIT environment because price varia-tions are only one component of total cost. Variance analysis does not account,for example, for higher or lower investments in inventory. Purchasing man-agers should therefore consider the total cost of ownership rather than the initialpurchase price.
In the non-manufacturing sector, overheads form the dominant part of the costof producing a service and so price and usage variance analysis has a limited roleto play. However, organizations can use variance analysis in a number of ways tosupport their business strategy, most commonly by investigating the reasons forvariations between budget and actual costs, even if those costs are independentof volume. These variations may identify poor budgeting practice, lack of costcontrol or variations in the usage or price of resources that may be outside amanager’s control.
We have already described approaches to total quality management (TQM)and continuous improvement in Chapter 9 and the implications of these processesfor cost management. It is important to recognize that reducing variances basedon standard costs can be an overly restrictive approach in a TQM or continu-ous improvement environment. This is because there will be a tendency to aimat the more obvious cost reductions (cheaper labour and materials) rather thanissues of quality, reliability, on-time delivery, flexibility etc. in purchased goodsand services. It will also tend to emphasize following standard work instruc-tions rather than encouraging employees to adopt an innovative approach tore-engineering processes.
Using a case study of the Portables division of Tektronix, Turney and Anderson(1989) found that accounting systems were obsolete, reporting information thatwas no longer used, but that the role of accounting changed ‘from being a watchdogto being a change facilitator’ (p. 41). They described how:
the accounting function has failed to adapt to a new competitive environmentthat requires continuous improvement in the design, manufacturing, andmarketing of a product. (p. 37)
The traditional focus for cost collection was labour, material and overhead for awork order, but shifted to the output of a production line based on standard costs.This moved improvement from individual worker performance to overall processeffectiveness. Variance reports were replaced by a system of stopping productionwhen a defect was found. Overhead was ‘bloated’ due to:
the enormous complexity of the production process . . . long production runstended to produce large inventories of the wrong product . . . [in which the]
240 ACCOUNTING FOR MANAGERS
additional cost of unique components was not fully reflected in the standardcost of the product. (p. 44)
and
the low-volume and tailored products consumed significantly more supportservices per unit than did the high-volume, mainline products. (p. 45)
Turney and Anderson described how Tektronix Portables introduced new mea-sures of continuous improvement and a new method of overhead allocation that‘shifts product cost from products with high-volume common parts to those withlow-volume unique parts’ (p. 46) that ‘has influenced product design decisions,encouraging a simpler product that is less costly and easier to manufacture’ (p. 47).
Variance analysis is therefore a tool that can be used in certain circumstances,but is not one that should be used without consideration of the wider impacton improvement strategies being implemented by the business. Nevertheless,neither accountants nor non-financial managers should overlook the importanceof cost control.
Cost control
Cost control is a process of either reducing costs while maintaining the samelevels of productivity, or maintaining costs while increasing levels of productivitythrough economies of scale or efficiencies in producing goods or services. Forthis reason cost control is more accurately considered as cost improvement. Costimprovement needs to be exercised by all budget holders in order to ensure thatlimited resources are effectively utilized and budgets are not over-spent. This isbest achieved by understanding the causes of costs – the cost drivers.
For example, the cost of purchasing as an activity can be traced to the numberof suppliers and the number of purchase orders that are required for differentactivities. The more suppliers and purchase orders (the drivers), the higher willbe the cost of purchasing. Cost control over the administration of purchasing canbe exercised by reducing the number of suppliers and/or reducing the number ofpurchase orders. This is an example of the application of activity-based costing,described in Chapter 11.
Cost control can also be exercised by undertaking a review of horizontalbusiness processes, i.e. crossing organizational boundaries, rather than within theconventional hierarchical structure displayed on an organization chart. Such areview aims to find out what activities people are carrying out, why they arecarrying out those activities, whether they need to be carried out at all, andwhether there is a more efficient method of achieving the desired output. This iscalled business process re-engineering (BPR, see Chapter 10).
Understanding cost drivers and reviewing business processes can be used astools to help in controlling costs such as:
ž projects: why are they being undertaken?ž salaries and overtime: what tasks are people performing, and why and how arethey performing those tasks?
BUDGETARY CONTROL 241
ž travel: what causes people to travel to other locations and by what methods?ž IT and telecommunication costs: what data is being processed and why?ž stationery: what is being used and why?
The questions that can be asked in relation to most costs are: What is being done?Why is it being done? When is it being done? Where is it being done? How is itbeing done?
We have already mentioned both activity-based costing (ABC, Chapter 11) andactivity-based budgeting (ABB, Chapter 14). Kaplan and Cooper (1998) definedactivity-based management (ABM) as:
the entire set of actions that can be taken, on a better informed basis, withactivity-based cost information. With ABM, the organization accomplishesits outcomes with fewer demands on organizational resources. (p. 137)
Kaplan and Cooper differentiated operational and strategic ABM. The former isconcerned with doing things right: increasing efficiency, lowering costs andenhancing asset utilization. Strategic ABM is about doing the right things, byattempting to alter the demand for activities to increase profitability.
Strategic ABM can be used in relation to product mix and pricing decisions.It works by shifting the mix of activities from unprofitable applications to prof-itable ones. The demand for activities is a result of decisions about products,services and customers. Costing was the first application of activity-based man-agement. It attempted to remove the distortions caused by traditional methodsof overhead allocation based on direct labour. ABC assigned overhead costs toproducts/services based on the cost drivers of activities and the resources con-sumed by those activities for individual products. Product-related actions canreduce the resources required to produce existing products/services. Pricing andproduct substitution decisions can shift the mix from difficult-to-produce itemsto simple-to-produce ones. Redesign, process improvement, focused productionfacilities and new technology can enable the same products or services to beproduced with fewer resources.
Strategic ABM extends the domain of analysis beyond production costs tomarketing, selling and administrative expenses, reflecting the belief that thedemand for resources arises not only from products/services but from customers,distribution and delivery channels. Cost information can be used to modify afirm’s relationships with its customers, transforming unprofitable customers intoprofitable ones through negotiations on price, product mix, delivery and paymentarrangements.
Similarly, strategic ABM can be pushed further back along the value chain(see Chapter 9) to suppliers, designers and developers. Managing supplier rela-tionships can lower the costs of purchased materials. ABM can also informproduct/service design and development decisions, which can result in a lower-ing of production costs for new products/services before they reach the productionstage.
242 ACCOUNTING FOR MANAGERS
Conclusion
In this chapter, we have described budgetary control through flexible budgets,variance analysis and cost control. There are, however, concerns about how wellthese techniques are able to contribute to organizational effectiveness in practice.
In his landmark study, Hopwood (1973) found that despite the sophistication ofmanagement accounting systems, they failed to contribute to achieving effectiveoperations. Although managers:
made extensive use of the accounting information, they did so in a rigidmanner, either attributing too much validity to the information or beingunaware of its intended purposes, with the result that again, despite thethought and consideration which went into the design and operation of thesystem, its final value was questionable. (p. 185)
Hopwood differentiated three styles of evaluation of budget information. Thebudget-constrained manager is evaluated based on the ability to meet the budgetcontinually on a short-term basis. The profit-conscious manager is evaluated onthe basis of the ability to increase the general effectiveness of operations to meetlong-term objectives. In the non-accounting style, accounting information playslittle part in the evaluation of a manager’s performance.
A manager who adopts a budget-constrained style takes budget informationat face value, has a short time horizon, considering each month’s variances inisolation rather than the trend or the long-term implications. An unfavourablebudget variance is an indicator of poor management performance, even thoughthe standards used by the accounting system may be faulty.
By contrast, managers adopting a profit-conscious style realize that accountinginformation is not a constraint, and that variances are a meaningful guide to action,even though they may be misleading. The profit-conscious manager is more likelyto experiment and innovate even though cost may exceed budget in the short term.
A survey by Armstrong et al. (1996) found that accounting controls were not asevident in business units and that ‘whether or not to use any or all of the apparatusof management accounting is a managerial choice largely devoid of consequences’(p. 20).
Samuelson (1986) argued that ‘senior management often articulate one role forthe budget but budgetees then perceive that another very different role may beintended’ (p. 35). Samuelson contrasted the ‘role articulated’ by management forbudgetary control (planning), which may be different to the ‘real role’ and the‘role intended’ by managers (responsibility).
References
Armstrong, P., Marginson, P., Edwards, P. and Purcell, J. (1996). Budgetary control and thelabour force: Findings from a survey of large British companies. Management AccountingResearch, 7(1), 1–24.

BUDGETARY CONTROL 243
Buckley, A. and McKenna, E. (1972). Budgetary control and business behaviour. Accountingand Business Research, 137–50.
Hopwood, A. G. (1973). An Accounting System and Managerial Behaviour. London: SaxonHouse.
Kaplan, R. S. and Cooper, R. (1998). Cost and Effect: Using Integrated Cost Systems to DriveProfitability and Performance. Boston, MA: Harvard Business School Press.
Samuelson, L. A. (1986). Discrepancies between the roles of budgeting. Accounting, Organi-zations and Society, 11(1), 35–45.
Turney, P. B. B. and Anderson, B. (1989). Accounting for continuous improvement. SloanManagement Review, Winter, 37–47.

Part III
Supporting Information
In Part III, Chapter 16 suggests an approach to research in accounting, providessome concluding comments and suggestions for further reading.
Four readings are included in Chapter 17 that cover the spectrum of the account-ing academic literature and support the most important concepts in the book.
Each reading has a series of questions that the reader is encouraged to thinkabout and discuss with others.
This part also contains an extensive glossary of the accounting terms used inthis book.

16
Research in Management Accounting,Conclusions and Further Reading
Research and theory in management accounting
Theory is an explanation of what is observed in practice. The development oftheory from practice is the result of a process of research. Practice informs theory,which in turn, via various forms of publication and education, can influence thespread of practice between organizations and countries.
Otley (2001) argued that management accounting research ‘has, in a numberof respects, lost touch with management accounting practices’ (p. 255), havingconcentrated too much on accounting and not enough on management. Otleyreinforced earlier arguments that management accounting had become ‘irrelevantto contemporary organizations, but worse that it was often actually counter-productive to good management decision-making’ (p. 243) and that we need to‘put the management back into management accounting’ (p. 259).
Hopper et al. (2001) argued that there have been few British scholars whohave achieved innovation in practice, either because of ‘the anti-intellectualism ofBritish managers and accountants . . . or the marginal role of academics in Britishpolicy making’ (p. 285).
Both issues are important, because an understanding of accounting tools andtechniques without an understanding of theory has the same problems as theoriesdivorced from business practice. An understanding of the underlying assumptionsof accounting and the limitations of the tools and techniques of accounting isessential. If we ignore those assumptions and limitations, we are likely to makedecisions on the basis of numbers that do not adequately reflect any underlyingbusiness reality.
Theory has been integrated with practical examples in this book to reflect theimportance of taking an interpretive and critical perspective on financial reports.Theory is not developed by academics in ivory towers divorced from practicalbusiness situations. It is developed from research, which typically takes one oftwo forms:
ž a quantitative study of a large number of business organizations that yields alarge database that can be analysed statistically in order to produce generaliza-tions about accounting practice;
248 ACCOUNTING FOR MANAGERS
ž a qualitative study of a single organization or a small number of organizationsthrough case studies comprising interviews, observation and documentaryresearch that aims to explain accounting practice in the context in which itis situated.
Both methods are valuable in helping to understand accounting practice. Thereader is encouraged to look at some of the literature referred to in the chap-ters throughout this book in order to understand the context of accounting inorganizations.
Hopper et al. (2001) traced the development of accounting research throughfour approaches:
ž conventional teaching emphasizing the needs of the professional account-ing bodies;ž the application of economics and management science;ž history and public-sector accounting;ž behavioural and organizational approaches.
The first approach is that traditionally taken by students of accounting. Thesecond approach relies heavily on econometric and mathematical models, whichare outside the scope of this book. This book has taken the view that managerswho use accounting information do not need as thorough an understanding ofhow to prepare accounting information, but rather that they should take a moreinterpretive and critical perspective. This implies a concern with the behaviouraland organizational approach, rooted in organizational history and the uniquecircumstance of each organization.
Power (1991) described his own experience of a professional accounting educa-tion and argued that ‘the lived reality of accounting education shows that it doesnot serve the functional ends that are claimed for it’ (p. 347). He described:
the institutionalization of a form of discourse in which critical and reflectivepractices are regarded as ‘waffle’ . . . of a cynicism and irony among studentstowards the entire examination process . . . and the public game that they arerequired to play. (p. 350)
Power (1991) concluded that this ‘may be dysfunctional for the profession itselfand for the goal of producing flexible and critical experts’ (p. 351).
Research in management accounting tends to fall into two distinct categories:
ž The normative view – what ought to happen – that there is one best way of doingaccounting, that accounting information is economically rational and serves aninstrumental purpose in making decisions in the pursuit of shareholder value.The normative view has been evident in this book through the presentation ofaccounting tools and techniques in each chapter.ž The interpretive and critical view – what does happen – the explanation of howaccounting systems develop and are used in particular organizational settings.This view recognizes that people do not necessarily make decisions based oneconomically rational reasons but have limited information, limited cognitive

RESEARCH IN MANAGEMENT ACCOUNTING 249
ability and are influenced by organizational structures and systems (including,but not limited to, accounting systems) and by organizational power andculture. The interpretive and critical view has been evident in the theories andcase studies presented in the book.
This second – interpretive and critical – view is descriptive or qualitative ratherthan statistical or quantitative. This is a necessary approach to explain the practiceof accounting in both its organizational setting and the wider social contextin which it exists. This second view has tended to be developed through casestudy research.
For example, Kaplan (1986) argued for empirical studies of managementaccounting systems in their organizational contexts, by ‘observing skilled prac-titioners in actual organizations’ (p. 441). Kaplan described empirical researchmethods, especially case or field studies that communicate the ‘deep, rich slices oforganizational life’ (p. 445) and are ‘the only mechanism by which managementaccounting can become a scientific field of inquiry’ (p. 448).
Spicer (1992) argued that case study research is appropriate when ‘why?’ or‘how?’ questions are asked about contemporary events. He classified two typesof case study research: descriptive and/or exploratory, and informing and/orexplanatory, arguing that:
the case method, when used for explanatory purposes, relies on analyticalnot statistical generalization. The objective of explanatory case research isnot to draw inferences to some larger population based on sample evidence,but rather to generalize back to theory. (p. 12)
Hopper et al. (2001) emphasized the rise of behavioural and organizationalaccounting research from 1975. In the UK, a paradigm shift occurred that did nothappen in the US (where agency theory remains the dominant research approach),as contingency theory and neo-human relations approaches were abandoned formore sociological and political approaches that drew from European social theoryand were influenced by Scandinavian case-based research. Under Thatcherism:
accounting data and the consulting arms of accounting firms had been centralto economic and policy debates, involving privatization, industrial restruc-turing, reform of the public sector, and worries about de-industrialization . . .
it appeared apparent that accounting had to be studied in its broader social,political and institutional context. (Hopper et al., 2001, p. 276)
Humphrey and Scapens (1996) argued for the capacity of explanatory case studies‘to move away from managerialist notions of accounting and to provide morechallenging reflections on the nature of accounting knowledge and practice’(p. 87) and to its ‘intricacies, complexities and inconsistencies’ (p. 90).
One problem that has arisen in academic research is the variety of theoriesused to explain practice, which Humphrey and Scapens (1996) believe excessivelydominate the analysis of case study evidence. Similarly, Hopper et al. (2001) arguedthat ‘the research thrust may lie in attempting to integrate and consolidate the

250 ACCOUNTING FOR MANAGERS
variety of theories and methodologies which have emerged in recent years, ratherthan seeking to add yet more’ (p. 283).
For example, case study researchers are:
becoming aware of the need to study accounting change from the perspectiveof global competition . . . there is a need to re-incorporate economics intosocial theory, and case study based research. (p. 284)
This book has attempted to integrate both views, i.e. to understand the tools andtechniques of accounting as though they were rational, while also introducingalternative ways of seeing accounting. It is hoped that it may also encouragereaders to undertake research into accounting, either in an academic environmentor in their own business organizations, in order to challenge conventional wisdomand better understand the context in which accounting is practised and theconsequences of the use of accounting information for decision-making.
In their introduction to a special issue of Management Accounting Researchdevoted to management accounting change, Burns and Vaivio (2001) noted thatmany firms have experienced significant change in their organizational design(structures and processes), competitive environment and information technolo-gies. There is a need for management accounting change, despite the relativelyrecent (in the last 20 years) introduction of activity-based costing and the BalancedScorecard. Information technology in particular is driving the routine financialaccounting functions into centralized head offices or is being outsourced. However,management accounting is increasingly decentralized to business units, where itbecomes the responsibility of functional and business unit managers. These oper-ating managers are more and more responsible for setting and achieving budgettargets. As the role of non-accounting managers is being extended to encompass(management) accounting functions, the role of the professional accountant is alsochanging to a business consultant, advisory or change management role, oftenwith responsibilities outside the traditional accounting one.
One of the reasons for this changed role for accountants is that they dounderstand the numbers, both financial and non-financial. The challenge for non-accounting managers is to understand the numbers sufficiently well to be able tocontribute to the formulation and implementation of business strategy. Those whodo not understand, or who do not want to understand, the numbers are likely tobe increasingly marginalized in their organizations.
Conclusion: revisiting the rationale
In the preface to this book, its rationale was described as being practitionercentric rather than accounting centric. In this, the subtitle of the book – Interpretingaccounting information for decision-making – identifies its aim as not only to describethe tools and techniques used by accountants, but to help managers understandthat these tools and techniques exist, to know when to apply them and toappreciate their underlying assumptions and limitations. It is more important forthe non-accounting manager to be able to use accounting than to be able to do

RESEARCH IN MANAGEMENT ACCOUNTING 251
accounting. Hence, in the Appendices to this book a number of questions and casestudies are provided to assist readers in testing themselves as to whether or notthey understand the concepts and can draw the appropriate interpretations andcritique. The concepts are also illustrated by four key readings from the accountingliterature in the next chapter.
The aim of the book has been to present both the tools and techniques andthe interpretive and critical perspective in an accessible language to the non-accountant. Every effort has been made to define terms clearly when they arefirst used and to cross-reference topics to the main chapters in which they arecovered. A glossary in this part describes all the terms used in one place, whilethe comprehensive index should make it easy for readers to find the informationthey need.
References
Burns, J. and Vaivio, J. (2001). Management accounting change. Management AccountingResearch, 12, 389–402.
Hopper, T., Otley, D. and Scapens, B. (2001). British management accounting research:Whence and whither: Opinions and recollections. British Accounting Review, 33, 263–91.
Humphrey, C. and Scapens, R. W. (1996). Theories and case studies of organizational andaccounting practices: Limitation or liberation? Accounting, Auditing and AccountabilityJournal, 9(4), 86–106.
Kaplan, R. S. (1986). The role for empirical research in management accounting. Accounting,Organizations and Society, 11(4/5), 429–52.
Otley, D. (2001). Extending the boundaries of management accounting research: Developingsystems for performance management. British Accounting Review, 33, 243–61.
Power, M. K. (1991). Educating accountants: Towards a critical ethnography. Accounting,Organizations and Society, 16(4), 333–53.
Spicer, B. H. (1992). The resurgence of cost and management accounting: A review ofsome recent developments in practice, theories and case research methods. ManagementAccounting Research, 3, 1–37.
Further reading
One of the aims of this book has been to encourage readers to access the research-based academic literature of accounting, in particular in relation to the broadersocial, historical and contextual influences on accounting; the organizational andbehavioural consequences of accounting information; and the assumptions andlimitations underlying the tools and techniques used by accountants.
For those who wish to read further, whether as part of their preparation foracademic research at postgraduate level or as part of their personal pursuit ofgreater knowledge, we identify some recommended additional reading.
BooksAlvesson, M. and Willmott, H. (eds) (1992). Critical Management Studies. London: SagePublications.

252 ACCOUNTING FOR MANAGERS
Ashton, D., Hopper, T. and Scapens, R. W. (eds) (1995). Issues in Management Accounting.(2nd edn). London: Prentice Hall.
Berry, A. J., Broadbent, J. and Otley, D. (eds) (1995). Management Control: Theories, Issues andPractices. London: Macmillan.
Emmanuel, C., Otley, D. and Merchant, K. (eds) (1992). Readings in Accounting for Manage-ment Control. London: Chapman & Hall.
Emmanuel, C., Otley, D. and Merchant, K. (1990). Accounting for Management Control. (2ndedn). London: Chapman & Hall.
Gowthorpe, C. and Blake, J. (eds) (1998). Ethical Issues in Accounting. London: Routledge.Hopwood, A. G. and Miller, P. (1994). Accounting as Social and Institutional Practice. Cam-
bridge: Cambridge University Press.Johnson, H. T. and Kaplan, R. S. (1987). Relevance Lost: The Rise and Fall of Management
Accounting. Boston, MA: Harvard Business School Press.Jones, T. C. (1995). Accounting and the Enterprise: A Social Analysis. London: Routledge.Kaplan, R. S. and Cooper, R. (1998). Cost and Effect: Using Integrated Cost Systems to Drive
Profitability and Performance. Boston, MA: Harvard Business School Press.Kaplan, R. S. and Norton, D. P. (2001). The Strategy-Focused Organization: How Balanced
Scorecard Companies Thrive in the New Business Environment. Boston, MA: HarvardBusiness School Press.
Macintosh, N. B. (1994). Management Accounting and Control Systems: An Organizational andBehavioral Approach. Chichester: John Wiley & Sons.
Munro, R. and Mouritsen, J. (eds) (1996). Accountability: Power, Ethos and the Technologies ofManaging. London: Internation Thomson Business Press.
Puxty, A. G. (1993). The Social and Organizational Context of Management Accounting. London:Academic Press.
Ryan, B., Scapens, R. W. and Theobald, M. (1992). Research Method and Methodology in Financeand Accounting. London: Academic Press.
Scapens, R. W. (1991). Management Accounting: A Review of Recent Developments. (2nd edn).London: Macmillan.
Scott, W. R. (1998). Organizations: Rational, Natural, and Open Systems. (4th edn). PrenticeHall International, Inc.
Articles published in the following journals
ž Accounting, Auditing and Accountability Journalž Accounting, Organizations and Societyž British Accounting Reviewž Critical Perspectives in Accountingž Financial Accountability and Management (public sector)ž Journal of Management Accounting Research (US)ž Management Accounting Research (UK)
These articles are generally available on-line for students through universitylibraries.

17
Introduction to the Readings
A rationale for this book was to provide a theoretical underpinning to accounting,drawn from accounting research, to assist in interpretation and critical questioning.This underpinning provides a critical perspective on the most common accountingtechniques and describes the social and organizational context in which accountingexists. This context influences accounting but is also influenced by accounting,as the way we see the world – even if only our small organizational part of theworld – is significantly influenced by the ways in which accounting portrays andrepresents that world.
In this part of the book, we reproduce four readings from the academicliterature to present four different yet complementary perspectives on accountingin organizations. Each reading has several questions that the reader should thinkabout and try to answer in order to help understand the concepts.
The article by Cooper and Kaplan is a classic, explaining clearly how traditionalmanagement accounting techniques have distorted management information andthe decisions made by managers. The authors criticize the distinction betweenvariable and fixed costs, the limitations of marginal costing and the arbitrarymethods by which overhead costs are allocated to products. The activity-basedapproach recommended by Cooper and Kaplan treats all costs as variable, althoughonly some vary with volume.
Covaleski, Dirsmith and Samuel’s paper describes the contribution of contin-gency theory, and interpretive perspectives using organizational and sociologicaltheories (including institutional theory) and critical perspectives. The authors callfor ‘paradigmatic pluralism’, not as competing perspectives but as ‘alternativeways of understanding the multiple roles played by management accounting inorganizations and society’ (p. 24).
Otley, Berry and Broadbent’s paper reviews the development of the manage-ment control literature in the context of organization theories and argues for theexpansion of management control beyond accounting. The authors use a frame-work of open/closed systems and rational/natural systems to contrast each ofthese four perspectives and give examples of research in each. They concludethat management control research needs to recognize the environment in whichorganizations exist. While the definition of management control is ‘managerialistin focus . . . this should not preclude a critical stance and thus a broader choice oftheoretical approaches’ (p. S42).

254 ACCOUNTING FOR MANAGERS
Dent’s case study of EuroRail is a highly regarded field study of accountingchange in which organizations are portrayed as cultures, i.e. systems of knowl-edge, belief and values. Prior to the study, the dominant culture in EuroRail wasengineering and production, but this culture was displaced by economic andaccounting concerns that constructed the railway as a profit-seeking enterprise.Dent traced the introduction of a revised corporate planning system, the amend-ment of capital expenditure approval procedures and the revision of budgetingsystems, each of which gave power to business managers. Dent describes howaccounting played a role ‘in constructing specific knowledges’ (p. 727).
Taken together, these readings provide a practical critique of traditional costingmethods, several theoretical perspectives from which accounting can be viewedand a field study of how accounting changed the reality in one organization.

Reading A
Cooper, R. and Kaplan, R. S. (1988). How cost accounting distorts product costs. ManagementAccounting (April), 20–27. Reproduced by permission of Copyright Clearance Center,Inc.
Questions
1 What are the criticisms that Cooper and Kaplan make about variable costs andwhy do they claim that marginal costing has failed?
2 Cooper and Kaplan argue that fixed cost allocations are faulty and that the ‘costof complexity’ requires a more comprehensive breakdown of costs. How dothey propose that such a breakdown takes place?
3 How can the product cost system proposed by Cooper and Kaplan be strategi-cally valuable to an organization that adopts it?
Further readingBrignall, S. (1997). A contingent rationale for cost system design in services. Management
Accounting Research, 8, 325–46.Kaplan, R. S. (1994). Management accounting (1984–1994): Development of new practice
and theory. Management Accounting Research, 5, 247–60.Kaplan, R. S. and Cooper, R. (1998). Cost and Effect: Using Integrated Cost Systems to Drive
Profitability and Performance. Boston, MA: Harvard Business School Press.Mitchell, F. (1994). A commentary on the applications of activity-based costing. Management
Accounting Research, 5, 261–77.Turney, P. B. B. and Anderson, B. (1989). Accounting for continuous improvement. Sloan
Management Review, Winter, 37–47.


How Cost Accounting Distorts ProductCosts
The traditional cost system that defines variable costs as varying in theshort-term with production will misclassify these costs as fixed.
by Robin Cooper and Robert S. Kaplan∗
In order to make sensible decisions concerning the products they market, managersneed to know what their products cost. Product design, new product introductiondecisions, and the amount of effort expended on trying to market a given productor product line will be influenced by the anticipated cost and profitability ofthe product. Conversely, if product profitability appears to drop, the question ofdiscontinuance will be raised. Product costs also can play an important role insetting prices, particularly for customized products with low sales volumes andwithout readily available market prices.
The cumulative effect of decisions on product design, introduction, support,discontinuance, and pricing helps define a firm’s strategy. If the product costinformation is distorted, the firm can follow an inappropriate and unprofitablestrategy. For example, the low-cost producer often achieves competitive advantageby servicing a broad range of customers. This strategy will be successful if theeconomies of scale exceed the additional costs, the diseconomies of scope, causedby producing and servicing a more diverse product line. If the cost system doesnot correctly attribute the additional costs to the products that cause them, then thefirm might end up competing in segments where the scope-related costs exceedthe benefits from larger scale production.
Similarly, a differentiated producer achieves competitive advantage by meetingspecialized customers’ needs with products whose costs of differentiation arelower than the price premiums charged for special features and services. If the costsystem fails to measure differentiation costs properly, then the firm might chooseto compete in segments that are actually unprofitable.
∗ From: R. Cooper and R. S. Kaplan, ‘‘How Cost Accounting Distorts Product Costs,’’ ManagementAccounting (April 1988): 20–27. Reprinted with permission.

258 ACCOUNTING FOR MANAGERS
Full vs. variable cost
Despite the importance of cost information, disagreement still exists about whetherproduct costs should be measured by full or by variable cost. In a full-cost system,fixed production costs are allocated to products so that reported product costsmeasure total manufacturing costs. In a variable cost system, the fixed costs arenot allocated and product costs reflect only the marginal cost of manufacturing.
Academic accountants, supported by economists, have argued strongly thatvariable costs are the relevant ones for product decisions. They have demonstrated,using increasingly complex models, that setting marginal revenues equal tomarginal costs will produce the highest profit. In contrast, accountants in practicecontinue to report full costs in their cost accounting systems.
The definition of variable cost used by academic accountants assumes thatproduct decisions have a short-time horizon, typically a month or a quarter.Costs are variable only if they vary directly with monthly or quarterly changes inproduction volume. Such a definition is appropriate if the volume of production ofall products can be changed at will and there is no way to change simultaneouslythe level of fixed costs.
In practice, managers reject this short-term perspective because the decisionto offer a product creates a long-term commitment to manufacture, market,and support that product. Given this perspective, short-term variable cost is aninadequate measure of product cost.
While full cost is meant to be a surrogate for long-run manufacturing costs,in nearly all of the companies we visited, management was not convinced thattheir full-cost systems were adequate for its product-related decisions. In partic-ular, management did not believe their systems accurately reflected the costs ofresources consumed to manufacture products. But they were also unwilling toadopt a variable-cost approach.
Of the more than 20 firms we visited and documented, Mayers Tap, Rockford,and Schrader Bellows provided particularly useful insights on how product costswere systematically distorted.1 These companies had several significant commoncharacteristics.
They all produced a large number of distinct products in a single facility. Theproducts formed several distinct product lines and were sold through diversemarketing channels. The range in demand volume for products within a productline was high, with sales of high-volume products between 100 and 1,000 timesgreater than sales of low-volume products. As a consequence, products weremanufactured and shipped in highly varied lot sizes. While our findings are basedupon these three companies, the same effects were observed at several other sites.
In all three companies, product costs played an important role in the deci-sions that surrounded the introduction, pricing, and discontinuance of products.Reported product costs also appeared to play a significant role in determininghow much effort should be assigned to marketing and selling products.
Typically, the individual responsible for introducing new products also wasresponsible for setting prices. Cost-plus pricing to achieve a desired level of grossmargin predominantly was used for the special products, though substantial
HOW COST ACCOUNTING DISTORTS PRODUCT COSTS 259
modifications to the resulting estimated prices occurred when direct competitionexisted. Such competition was common for high-volume products but rarelyoccurred for the low-volume items. Frequently, no obvious market prices existedfor low-volume products because they had been designed to meet a particularcustomer’s needs.
Accuracy of product costs
Managers in all three firms expressed serious concerns about the accuracy of theirproduct-costing systems.
For example, Rockford attempted to obtain much higher margins for its low-volume products to compensate, on an ad hoc basis, for the gross underestimates ofcosts that it believed the cost system produced for these products. But managementwas not able to justify its decisions on cutoff points to identify low-volume productsor the magnitude of the ad hoc margin increases. Further, Rockford’s managementbelieved that its faulty cost system explained the ability of small firms to competeeffectively against it for high-volume business. These small firms, with no apparenteconomic or technological advantage, were winning high-volume business withprices that were at or below Rockford’s reported costs. And the small firms seemedto be prospering at these prices.
At Schrader Bellows, production managers believed that certain productswere not earning their keep because they were so difficult to produce. But the costsystem reported that these products were among the most profitable in the line. Themanagers also were convinced that they could make certain products as efficientlyas anybody else. Yet competitors were consistently pricing comparable productsconsiderably lower. Management suspected that the cost system contributed tothis problem.
At Mayers Tap, the financial accounting profits were always much lower thanthose predicted by the cost system, but no one could explain the discrepancy. Also,the senior managers were concerned by their failure to predict which bids theywould win or lose. Mayers Tap often won bids that had been overpriced becauseit did not really want the business, and lost bids it had deliberately underpriced inorder to get the business.
Two-stage cost allocation system
The cost systems of all companies we visited had many common characteristics.Most important was the use of a two-stage cost allocation system: in the first stage,costs were assigned to cost pools (often called cost centers), and in the secondstage, costs were allocated from the cost pools to the products.
The companies used many different allocation bases in the first stage to allocatecosts from plant overhead accounts to cost centers. Despite the variation inallocation bases in the first stage, however, all companies used direct labor hoursin the second stage to allocate overhead from the cost pools to the products. Direct
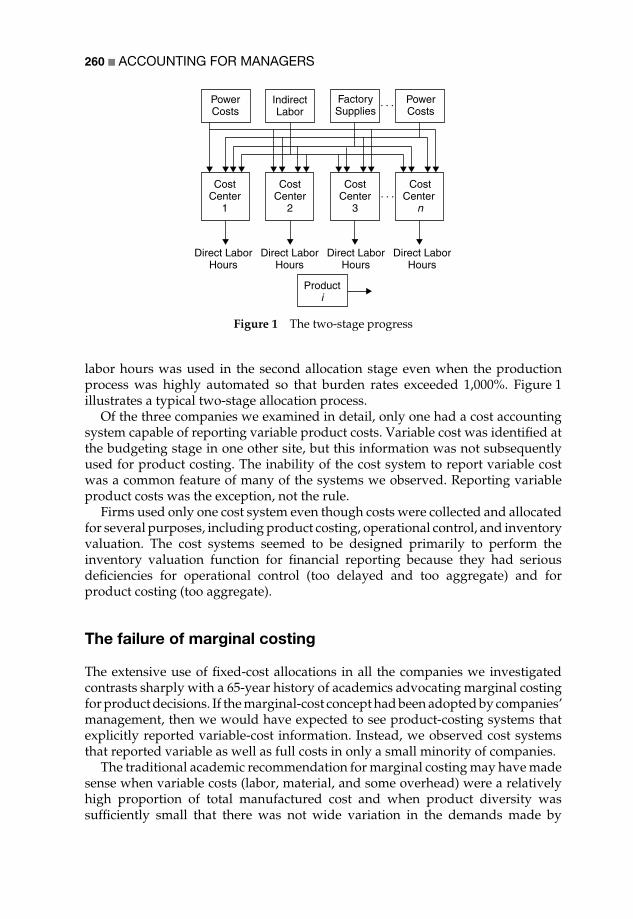
260 ACCOUNTING FOR MANAGERS
PowerCosts
IndirectLabor
FactorySupplies
. . . PowerCosts
CostCenter
1
CostCenter
2
CostCenter
3. . .
CostCenter
n
Direct LaborHours
Direct LaborHours
Direct LaborHours
Direct LaborHours
Producti
Figure 1 The two-stage progress
labor hours was used in the second allocation stage even when the productionprocess was highly automated so that burden rates exceeded 1,000%. Figure 1illustrates a typical two-stage allocation process.
Of the three companies we examined in detail, only one had a cost accountingsystem capable of reporting variable product costs. Variable cost was identified atthe budgeting stage in one other site, but this information was not subsequentlyused for product costing. The inability of the cost system to report variable costwas a common feature of many of the systems we observed. Reporting variableproduct costs was the exception, not the rule.
Firms used only one cost system even though costs were collected and allocatedfor several purposes, including product costing, operational control, and inventoryvaluation. The cost systems seemed to be designed primarily to perform theinventory valuation function for financial reporting because they had seriousdeficiencies for operational control (too delayed and too aggregate) and forproduct costing (too aggregate).
The failure of marginal costing
The extensive use of fixed-cost allocations in all the companies we investigatedcontrasts sharply with a 65-year history of academics advocating marginal costingfor product decisions. If the marginal-cost concept had been adopted by companies’management, then we would have expected to see product-costing systems thatexplicitly reported variable-cost information. Instead, we observed cost systemsthat reported variable as well as full costs in only a small minority of companies.
The traditional academic recommendation for marginal costing may have madesense when variable costs (labor, material, and some overhead) were a relativelyhigh proportion of total manufactured cost and when product diversity wassufficiently small that there was not wide variation in the demands made by

HOW COST ACCOUNTING DISTORTS PRODUCT COSTS 261
different products on the firm’s production and marketing resources. But theseconditions are no longer typical of many of today’s organizations. Increasingly,overhead (most of it considered ‘‘fixed’’) is becoming a larger share of totalmanufacturing costs. In addition, the plants we examined are being asked toproduce an increasing variety of products that make quite different demands onequipment and support departments. Thus, even if direct or marginal costing wereonce a useful recommendation to management, direct costing, even if correctlyimplemented, is not likely a solution – and may perhaps be a major problem – forproduct costing in the contemporary manufacturing environment.
The failure of fixed-cost allocations
While we consistently observed managers avoiding the use of variable or marginalcosts for their product-related decisions, we observed also their discomfort withthe full-cost allocations produced by their existing cost systems. We believe thatwe have identified the two major sources for the discomfort.
The first problem arises from the use of direct labor hours in the secondallocation stage to assign costs from cost centers to products. This proceduremay have been adequate many decades ago when direct labor was the principalvalue-adding activity in the material conversion process. But as firms introducemore automated machinery, direct labor is increasingly engaged in setup andsupervisory functions (rather than actually performing the work on the product)and no longer represents a reasonable surrogate for resource demands by product.
In many of the plants we visited, labor’s main tasks are to load the machines andto act as troubleshooters. Labor frequently works on several different productsat the same time so that it becomes impossible to assign labor hours intelligentlyto products. Some of the companies we visited had responded to this situationby beginning experiments using machine hours instead of labor hours to allocatecosts from cost pools to products (for the second stage of the allocation process).Other companies, particularly those adopting just-in-time or continuous-flowproduction processes, were moving to material dollars as the basis for distributingcosts from pools to products. Material dollars provide a less expensive method forcost allocation than machine hours because, as with labor hours, material dollarsare collected by the existing cost system, A move to a machine-hour basis wouldrequire the collection of new data for many of these companies.
Shifting from labor hours to machine hours or material dollars provides somerelief from the problem of using unrealistic bases for attributing costs to products.In fact, some companies have been experimenting with using all three allocationbases simultaneously: labor hours for those costs that vary with the number oflabor hours worked (e.g., supervision – if the amount of labor in a product ishigh, the amount of supervision related to that product also is likely to be high),machine hours for those costs that vary with the number of hours the machineis running (e.g., power – the longer the machine is running the more power thatis consumed by that product), and material dollars for those costs that vary withthe value of material in the product (e.g., material handling – the higher the value

262 ACCOUNTING FOR MANAGERS
of the material in the product, the greater the material-handling costs associatedwith those products are likely to be).
Using multiple allocation bases allows a finer attribution of costs to the productsresponsible for the incurrence of those costs. In particular, it allows for productdiversity where the direct labor, machine hours, and material dollars consumed inthe manufacture of different products are not directly proportional to each other.
For reported product costs to be correct, however, the allocation bases used mustbe capable of accounting for all aspects of product diversity. Such an accountingis not always possible even using all three volume-related allocation bases wedescribed. As the number of product items manufactured increases, so does thenumber of direct labor hours, machine hours, and material dollars consumed. Thedesigner of the cost system, in adopting these bases, assumes that all allocatedcosts have the same behavior; namely that they increase in direct relationship to thevolume of product items manufactured. But there are many costs that vary withthe diversity and complexity of products, not by the number of units produced.
The cost of complexity
The complexity costs of a full-line producer can be illustrated as follows. Considertwo identical plants. One plant produces 1,000,000 units of product A. The secondplant produces 100,000 units of product A and 900,000 units of 199 similar products.(The similar products have sales volumes that vary from 100 to 100,000 units.)
The first plant has a simple production environment and requires limitedmanufacturing-support facilities. Few setups, expediting, and scheduling activitiesare required.
The other plant presents a much more complex production-management envi-ronment. Its 200 products have to be scheduled through the plant, requiringfrequent setups, inventory movements, purchases, receipts, and inspections. Tohandle this complexity, the support departments must be larger and more sophis-ticated.
The traditional cost accounting system plays an important role in obfuscatingthe underlying relationship between the range of products produced and thesize of the support departments. First, the costs of most support departments areclassified as fixed, making it difficult to realize that these costs are systematicallyvarying. Second, the use of volume-related allocation bases makes it difficult torecognize how these support-department costs vary.
Support-department costs must vary with something because they have beenamong the fastest growing in the overall cost structure of manufactured products.As the example demonstrates, support-department costs vary not with the volumeof product items manufactured, rather they vary with the range of items produced(i.e., the complexity of the production process). The traditional definition ofvariable cost, with its monthly or quarterly perspective, views such costs as fixedbecause complexity-related costs do not vary significantly in such a short timeframe. Across an extended period of time, however, the increasing complexity ofthe production process places additional demands on support departments, andtheir costs eventually and inevitably rise.

HOW COST ACCOUNTING DISTORTS PRODUCT COSTS 263
The output of a support department consists of the activities its personnelperform. These include such activities as setups, inspections, material handling,and scheduling. The output of the departments can be represented by the numberof distinct activities that are performed or the number of transactions handled.Because most of the output of these departments consists of human activities, how-ever, output can increase quite significantly before an immediate deterioration inthe quality of service is detected. Eventually, the maximum output of the depart-ment is reached and additional personnel are requested. The request typicallycomes some time after the initial increase in diversity and output. Thus, supportdepartments, while varying with the diversity of the demanded output, growintermittently. The practice of annually budgeting the size of the departmentsfurther hides the underlying relationship between the mix and volume of demandand the size of the department. The support departments often are constrained togrow only when budgeted to do so.
Support-department costs are perhaps best described as ‘‘discretionary’’ becausethey are budgeted and authorized each year. The questions we must address are:What determines the level of these discretionary fixed costs? Why, if these costsare not affected by the quantity of production, are there eight people in a supportdepartment and not one? What generates the work, if not physical quantities ofinputs or outputs, that requires large support-department staffs? We believe theanswers to these questions on the origins of discretionary overhead costs (i.e.,what drives these costs) can be found by analyzing the activities or transactionsdemanded when producing a full and diverse line of products.
Transaction costing
Low-volume products create more transactions per unit manufactured than theirhigh-volume counterparts. The per unit share of these costs should, therefore,be higher for the low-volume products. But when volume-related bases are usedexclusively to allocate support-department costs, high-volume and low-volumeproducts receive similar transaction-related costs. When only volume-relatedbases are used for second-stage allocations, high-volume products receive anexcessively high fraction of support-department costs and, therefore, subsidize thelow-volume products.
As the range between low-volume and high-volume products increases, thedegree of cross-subsidization rises. Support departments expand to cope with theadditional complexity of more products, leading to increased overhead charges.The reported product cost of all products consequently increases. The high-volumeproducts appear more expensive to produce than previously, even though theyare not responsible for the additional costs. The costs triggered by the introductionof new, low-volume products are systematically shifted to high-volume productsthat may be placing relatively few demands on the plant’s support departments.
Many of the transactions that generate work for production-support depart-ments can be proxied by the number of setups. For example, the movement ofmaterial in the plant often occurs at the commencement or completion of a produc-tion run. Similarly, the majority of the time spent on parts inspection occurs just
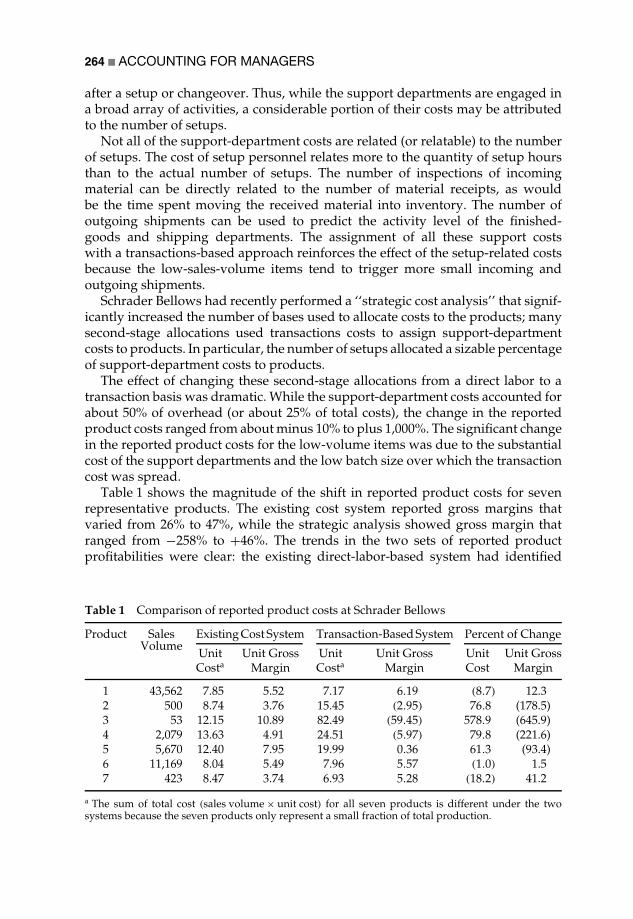
264 ACCOUNTING FOR MANAGERS
after a setup or changeover. Thus, while the support departments are engaged ina broad array of activities, a considerable portion of their costs may be attributedto the number of setups.
Not all of the support-department costs are related (or relatable) to the numberof setups. The cost of setup personnel relates more to the quantity of setup hoursthan to the actual number of setups. The number of inspections of incomingmaterial can be directly related to the number of material receipts, as wouldbe the time spent moving the received material into inventory. The number ofoutgoing shipments can be used to predict the activity level of the finished-goods and shipping departments. The assignment of all these support costswith a transactions-based approach reinforces the effect of the setup-related costsbecause the low-sales-volume items tend to trigger more small incoming andoutgoing shipments.
Schrader Bellows had recently performed a ‘‘strategic cost analysis’’ that signif-icantly increased the number of bases used to allocate costs to the products; manysecond-stage allocations used transactions costs to assign support-departmentcosts to products. In particular, the number of setups allocated a sizable percentageof support-department costs to products.
The effect of changing these second-stage allocations from a direct labor to atransaction basis was dramatic. While the support-department costs accounted forabout 50% of overhead (or about 25% of total costs), the change in the reportedproduct costs ranged from about minus 10% to plus 1,000%. The significant changein the reported product costs for the low-volume items was due to the substantialcost of the support departments and the low batch size over which the transactioncost was spread.
Table 1 shows the magnitude of the shift in reported product costs for sevenrepresentative products. The existing cost system reported gross margins thatvaried from 26% to 47%, while the strategic analysis showed gross margin thatranged from −258% to +46%. The trends in the two sets of reported productprofitabilities were clear: the existing direct-labor-based system had identified
Table 1 Comparison of reported product costs at Schrader Bellows
Product Sales Existing Cost System Transaction-Based System Percent of ChangeVolume
Unit Unit Gross Unit Unit Gross Unit Unit GrossCosta Margin Costa Margin Cost Margin
1 43,562 7.85 5.52 7.17 6.19 (8.7) 12.32 500 8.74 3.76 15.45 (2.95) 76.8 (178.5)3 53 12.15 10.89 82.49 (59.45) 578.9 (645.9)4 2,079 13.63 4.91 24.51 (5.97) 79.8 (221.6)5 5,670 12.40 7.95 19.99 0.36 61.3 (93.4)6 11,169 8.04 5.49 7.96 5.57 (1.0) 1.57 423 8.47 3.74 6.93 5.28 (18.2) 41.2
a The sum of total cost (sales volume × unit cost) for all seven products is different under the twosystems because the seven products only represent a small fraction of total production.

HOW COST ACCOUNTING DISTORTS PRODUCT COSTS 265
the low-volume products as the most profitable, while the strategic cost analysisindicated exactly the reverse.
There are three important messages in the table and in the company’s findingsin general.
ž Traditional systems that assign costs to products using a single volume-relatedbase seriously distort product costs.ž The distortion is systematic. Low-volume products are under-costed, andhigh-volume products are over-costed.ž Accurate product costs cannot, in general, be achieved by cost systems that relyonly on volume-related bases (even multiple bases such as machine hours andmaterial quantities) for second-stage allocations. A different type of allocationbase must be used for overhead costs that vary with the number of transactionsperformed, as opposed to the volume of product produced.
The shift to transaction-related allocation bases is a more fundamental changeto the philosophy of cost-systems design than is at first realized. In a traditionalcost system that uses volume-related bases, the costing element is always theproduct. It is the product that consumes direct labor hours, machine hours, ormaterial dollars. Therefore, it is the product that gets costed.
In a transaction-related system, costs are assigned to the units that caused thetransaction to be originated. For example, if the transaction is a setup, then thecosting element will be the production lot because each production lot requires asingle setup. The same is true for purchasing activities, inspections, scheduling,and material movements. The costing element is no longer the product but thoseelements the transaction affects.
In the transaction-related costing system, the unit cost of a product is determinedby dividing the cost of a transaction by the number of units in the costing element.For example, when the costing element is a production lot, the unit cost of aproduct is determined by dividing the production lot cost by the number of unitsin the production lot.
This change in the costing element is not trivial. In the Schrader Bellows strategiccost analysis (see Table 1), product seven appears to violate the strong inverserelationship between profits and production-lot size for the other six products.A more detailed analysis of the seven products, however, showed that productseven was assembled with components also used to produce two high-volumeproducts (numbers one and six) and that it was the production-lot size of thecomponents that was the dominant cost driver, not the assembly-lot size, or theshipping-lot size.
In a traditional cost system, the value of commonality of parts is hidden. Low-volume components appear to cost only slightly more than their high-volumecounterparts. There is no incentive to design products with common parts. Theshift to transaction-related costing identifies the much lower costs that derivefrom designing products with common (or fewer) parts and the much highercosts generated when large numbers of unique parts are specified for low-volumeproducts. In recognition of this phenomenon, more companies are experimenting

266 ACCOUNTING FOR MANAGERS
with assigning material-related overhead on the basis of the total number ofdifferent parts used, and not on the physical or dollar volume of materials used.
Long-term variable cost
The volume-unrelated support-department costs, unlike traditional variable costs,do not vary with short-term changes in activity levels. Traditional variable costsvary in the short run with production fluctuations because they represent costelements that require no managerial actions to change the level of expenditure.
In contrast, any amount of decrease in overhead costs associated with reducingdiversity and complexity in the factory will take many months to realize andwill require specific managerial actions. The number of personnel in supportdepartments will have to be reduced, machines may have to be sold off, and somesupervisors will become redundant. Actions to accomplish these overhead costreductions will lag, by months, the complexity-reducing actions in the productline and in the process technology. But this long-term cost response mirrors theway overhead costs were first built up in the factory – as more products withspecialized designs were added to the product line, the organization simplymuddled through with existing personnel. It was only over time that overworkedsupport departments requested and received additional personnel to handle theincreased number of transactions that had been thrust upon them.
The personnel in the support departments are often highly skilled and possessa high degree of firm-specific knowledge. Management is loathe to lay themoff when changes in market conditions temporarily reduce the level of produc-tion complexity. Consequently, when the workload of these departments drops,surplus capacity exists.
The long-term perspective management had adopted toward its products oftenmade it difficult to use the surplus capacity. When it was used, it was not to makeproducts never to be produced again, but rather to produce inventory of productsthat were known to disrupt production (typically the very low-volume items) orto produce, under short-term contract, products for other companies. We did notobserve or hear about a situation in which this capacity was used to introducea product that had only a short life expectancy. Some companies justified theacceptance of special orders or incremental business because they ‘‘knew’’ thatthe income from this business more than covered their variable or incrementalcosts. They failed to realize that the long-term consequence from accepting suchincremental business was a steady rise in the costs of their support departments.
When product costs are not known
The magnitude of the errors in reported product costs and the nature of their biasmake it difficult for full-line producers to enact sensible strategies. The existingcost systems clearly identify the low-volume products as the most profitable andthe high-volume ones as the least profitable. Focused competitors, on the other

HOW COST ACCOUNTING DISTORTS PRODUCT COSTS 267
hand, will not suffer from the same handicap. Their cost systems, while equallypoorly designed, will report more accurate product costs because they are notdistorted as much by lot-size diversity.
With access to more accurate product cost data, a focused competitor can sell thehigh-volume products at a lower price. The full-line producer is then apparentlyfaced with very low margins on these products and is naturally tempted to de-emphasize this business and concentrate on apparently higher-profit, low-volumespecialty business. This shift from high-volume to low-volume products, however,does not produce the anticipated higher profitability. The firm, believing in its costsystem, chases illusory profits.
The firm has been victimized by diseconomies of scope. In trying to obtain thebenefits of economy of scale by expanding its product offerings to better utilizeits fixed or capacity resources, the firm does not see the high diseconomies ithas introduced by creating a far more complex production environment. The costaccounting system fails to reveal this diseconomy of scope.
A comprehensive cost system
One message comes through overwhelmingly in our experiences with the threefirms, and with the many others we talked and worked with. Almost allproduct-related decisions – introduction, pricing, and discontinuance – are long-term. Management accounting thinking (and teaching) during the past half-centuryhas concentrated on information for making short-run incremental decisions basedon variable, incremental, or relevant costs. It has missed the most importantaspect of product decisions. Invariably, the time period for measuring ‘‘variable,’’‘‘incremental,’’ or ‘‘relevant’’ costs has been about a month (the time period cor-responding to the cycle of the firm’s internal financial reporting system). Whileacademics admonish that notions of fixed and variable are meaningful only withrespect to a particular time period, they immediately discard this warning andteach from the perspective of one-month decision horizons.
This short-term focus for product costing has led all the companies we visitedto view a large and growing proportion of their total manufacturing costs as‘‘fixed.’’ In fact, however, what they call ‘‘fixed’’ costs have been the most variableand rapidly increasing costs. This paradox has seemingly eluded most accountingpractitioners and scholars. Two fundamental changes in our thinking about costbehavior must be introduced.
First, the allocation of costs from the cost pools to the products should beachieved using bases that reflect cost drivers. Because many overhead costsare driven by the complexity of production, not the volume of production,nonvolume-related bases are required. Second, many of these overhead costs aresomewhat discretionary. While they vary with changes in the complexity of theproduction process, these changes are intermittent. A traditional cost system thatdefines variable costs as varying in the short term with production volume willmisclassify these costs as fixed.
The misclassification also arises from an inadequate understanding of the actualcost drivers for most overhead costs. Many overhead costs vary with transactions:

268 ACCOUNTING FOR MANAGERS
transactions to order, schedule, receive, inspect, and pay for shipments; to move,track, and count inventory; to schedule production work; to set up machines;to perform quality assurance; to implement engineering change orders; and toexpedite and ship orders. The cost of these transactions is largely independent ofthe size of the order being handled; the cost does not vary with the amount ofinputs or outputs. It does vary, however, with the need for the transaction itself.If the firm introduces more products, if it needs to expedite more orders, or if itneeds to inspect more components, then it will need larger overhead departmentsto perform these additional transactions.
Summary
Product costs are almost all variable costs. Some of the sources of variability relateto physical volume of items produced. These costs will vary with units produced,or in a varied, multiproduct environment, with surrogate measures such as laborhours, machine hours, material dollars and quantities, or elapsed time of produc-tion. Other costs, however, particularly those arising from overhead support andmarketing departments, vary with the diversity and complexity in the productline. The variability of these costs is best explained by the incidence of transactionsto initiate the next stage in the production, logistics, or distribution process.
A comprehensive product cost system, incorporating the long-term variablecosts of manufacturing and marketing each product or product line, shouldprovide a much better basis for managerial decisions on pricing, introducing,discontinuing, and reengineering product lines. The cost system may even becomestrategically important for running the business and creating sustainable compet-itive advantages for the firm.
The importance of field research
The accompanying article, coauthored with Robin Cooper, is excerpted fromAccounting & Management: Field Study Perspectives (Boston, Mass., Harvard BusinessSchool Press, 1987) William J. Bruns, Jr. and Robert S. Kaplan (eds.). The bookcontains 13 field studies on management accounting innovations presented at acolloquium at the Harvard Business School in June 1986 by leading academicresearchers from the U.S. and Western Europe. The colloquium represents thelargest single collection of field research studies on management accountingpractices in organizations.
The HBS colloquium had two principal objectives. First, the authors wereto understand and document the management accounting practices of actualorganizations. Some of the organizations would be captured in a process oftransition: attempting, and occasionally succeeding to modify their systems tomeasure, motivate and evaluate operating performance. Other organizations werestudied just to understand the system of measurement and control that hadevolved in their particular environment.
HOW COST ACCOUNTING DISTORTS PRODUCT COSTS 269
A second, and even more important, objective of the colloquium was to beginthe process by which field research methods in management accounting could beestablished as a legitimate method of inquiry. Academic researchers in accountinghave extensive experience with deductive, model-building, analytic research withthe design and analysis of controlled experiments, usually in a laboratory setting;and with the empirical analysis of large data bases. This experience has yieldedresearch guidance and criteria that, while not always explicit, nevertheless arewidely shared and permit research to be conducted and evaluated.
At a time when so many organizations are reexamining the adequacy of theirmanagement accounting systems it is especially important that university-basedresearchers spend more time working directly with innovating organizations. Weare pleased that MANAGEMENT ACCOUNTING, through publication of thisarticle, is helping to publicize the existence of the field studies performed to date.
The experiences described in the accompanying article, as well as in the otherpapers in the colloquium volume, indicate a very different role for manage-ment accounting systems in organizations than is currently taught in most ofour business schools and accounting departments. We believe that present andfuture field research and casewriting will lead to major changes in managementaccounting courses. To facilitate the needed changes in curriculum and research,however, requires extensive cooperation between university faculty and practicingmanagement accountants. As noted by observers at the Harvard colloquium:
There is a tremendous store of knowledge about management accounting practicesand ideas out there in real companies. Academicians as a whole are far too ignorant ofthat knowledge. When academics begin to see the relevance of this data base, perhapsgenerations of students will become more aware of its richness. Such awarenessmust precede any real progress on prescribing good management accounting for anygiven situation.
To observe is also to discover. The authors have observed interesting phenomena.We do not know how prevalent these phenomena are or under what conditions theyexist or do not exist. But the studies suggest possible relationships, causes, effects,and even dynamic process in the sense that Yogi Berra must have had in mind whenhe said, ‘‘Sometimes you can observe a lot just by watching.’’
With the research support and cooperation of the members of the NationalAssociation of Accountants, many university professors are looking forward towatching and also describing the changes now under way so that academics canbegin to develop theories, teach, and finally prescribe about the new opportunitiesfor management accounting.
Robert S. Kaplan
Endnotes
1 Mayers Tap (disguised name) is described in Harvard Business School, caseseries 9-185-111. Schrader-Bellows is described in HBS Case Series 9-186-272.

270 ACCOUNTING FOR MANAGERS
Robin Cooper is an associate professor of business administration at the Harvard BusinessSchool and a fellow of the Institute of Chartered Accountants in England and Wales.He writes a column, ‘‘Cost Management Principles and Concepts,’’ in the Journal ofCost Management and has produced research on activity- based costing for the CAM-1Cost Management System Project. Robert S. Kaplan is the Arthur Lowes DickinsonProfessor of Accounting at the Harvard Business School and a professor of industrialadministration at Carnegie-Mellon University. Currently, Professor Kaplan serves on theExecutive Committee of the CAM-1 Cost Management System Project, the ManufacturingStudies Board of the National Research Council, and the Financial Accounting StandardsAdvisory Committee.

Reading B
Otley, D. T., Broadbent, J. and Berry, A. J. (1995). Research in management control: Anoverview of its development. British Journal of Management, 6, Special Issue, S31–S44.John Wiley & Sons Limited. Reproduced with permission.
Questions
1 What is the distinction made by Otley et al. between management control andfinancial control?
2 What is the contribution of systems theory to an understanding of manage-ment control?
3 How does Scott’s distinction between open and closed, rational and naturalmodels help to categorize the accounting literature, and why is any suchcategorization important?
4 Why does an emphasis on accounting limit an understanding of the broaderimportance of management control? What contribution can non-financial perfor-mance management make to our understanding of management control withinorganizations?
Further readingBerry, A. J., Broadbent, J. and Otley, D. (eds). (1995). Management Control: Theories, Issues
and Practices. London: Macmillan.Fitzgerald, L., Johnston, R., Brignall, S., Silvestro, R. and Voss, C. (1991). Performance Mea-
surement in Service Businesses. London: Chartered Institute of Management Accountants.Hopper, T., Otley, D. and Scapens, B. (2001). British management accounting research:
Whence and whither: Opinions and recollections. British Accounting Review, 33, 263–91.Humphrey, C. and Scapens, R. W. (1996). Theories and case studies of organizational and
accounting practices: Limitation or liberation? Accounting, Auditing and AccountabilityJournal, 9(4), 86–106.
Kaplan, R. S. and Norton, D. P. (2001). The Strategy-Focused Organization: How BalancedScorecard Companies Thrive in the New Business Environment. Boston, MA: HarvardBusiness School Press.
Macintosh, N. B. (1994). Management Accounting and Control Systems: An Organizational andBehavioral Approach. Chichester: John Wiley & Sons.
Otley, D. (1999). Performance management: A framework for management control systemsresearch. Management Accounting Research, 10, 363–82.

272 ACCOUNTING FOR MANAGERS
Otley, D. (2001). Extending the boundaries of management accounting research: Developingsystems for performance management. British Accounting Review, 33, 243–61.
Scott, W. R. (1998). Organizations: Rational, Natural, and Open Systems. (4th edn). UpperSaddle River, NJ: Prentice Hall International, Inc.
Research in Management Control:An Overview of its Development
David Otley∗, Jane Broadbent† and Anthony Berry‡
∗Lancaster University Management School, †Department of Accounting and FinancialManagement, University of Essex and ‡Manchester Business School
Summary
This paper builds on a series of earlier reviews of the management control literature(Giglioni and Bedeian, 1974; Hofstede, 1968; Merchant and Simons, 1986; Parker,1986) and considers the development of the management control literature in thecontext of organizational theories. Early themes which have provided the roots forthe development of the subject area are explored as is more recent work whichhas evolved both as a continuation and a reaction against them, with Scott’s(1981) framework being used to organize this literature. It is argued that one ofthe unintended consequences of the influential work of Robert Anthony (1965) hasbeen a restriction of the subject to an accounting-based framework and that thisfocus needs to be broadened. The review points to the potential of the subject as aintegrating theme for the practice and research of management and some themesfor future research are suggested.
Introduction
This paper reviews the development of research in management control, buildingupon other reviews both to examine the roots of the subject from the turn of thecentury and to demonstrate the depth and breadth of the subject. Four previousreviews form the foundation for our overview.
Giglioni and Bedeian (1974) review the contribution of the general managementand organizational theory literature for the period 1900–1972, drawing out severaldifferent strands to conclude that
‘even though control theory has not achieved the level of sophistication ofsome other management functions, it has developed to a point that affordsthe executive ample opportunity to maintain the operations of his firm undercheck.’
Parker (1986) argues that accounting control developments lagged developmentsin the management literature, and criticizes accounting models for offering only

274 ACCOUNTING FOR MANAGERS
an imperfect reflection of management models of control. Hofstede (1968) offersan early survey of the behavioural approach to budgetary control. He exploreshow the role of budgets has been viewed in accounting theory, in motivationtheory, and from the perspective of systems theory. Finally, the brief overviewof research into control in complex organizations by Merchant and Simons (1986)takes a broad view of what constitutes control, as does the present paper. It differs,however, in also paying attention to agency theory literature and psychologistresearch both omitted from consideration here.1
It will be argued that one of the unintended consequences of Anthony’s (1965)seminal work is that management control has primarily been developed in anaccounting-based framework which has been unnecessarily restrictive. Althoughradical theorists have studied control processes more extensively, their attentionhas been focused much more on the exercise of power and its consequences thanon the role of control systems as a means of organizational survival. This is animportant area, but one which is outside the remit set for this review which is incloser alignment with Mills (1970) who argued for the place of management controlas a central management discipline. He suggested that it was a more appropriateintegrating discipline for general management courses than the tradition of usingbusiness policy or corporate strategy courses. ‘Control’ is itself a highly ambiguousterm as evidenced by the difficulty of translating it into many European languagesand the list of ‘57 varieties’ in its connotations given by Rathe (1960). Given thisdiversity some attention will be paid to matters of definition and the establishmentof appropriate boundaries for this review.
Anthony’s (1965) classic definition of management control was
‘the process by which managers assure that resources are obtained andused effectively and efficiently in the accomplishment of the organization’sobjectives.’
He saw management control as being sandwiched between the processes ofstrategic planning and operational control; these processes being super-imposedupon an organizational hierarchy to indicate the respective managerial levels atwhich they operate.
Strategic planning is concerned with setting goals and objectives for the wholeorganization over the long term. By contrast, operational control is concerned withthe activity of ensuring that immediate tasks are carried out. Management controlis the process that links the two. Global goals are broken down into sub-goals forparts of the organization; statements of future intent are given more substantivecontent; long-term goals are solidified into shorter term goals. The process ofmanagement control is designed to ensure that the day-to-day tasks performed byall participants in the organization come together in a coordinated set of actions
1 The authors recognize that this provides a narrow focus for the review, but space restraintspreclude the possibility of providing a more comprehensive survey. Our choice has been,therefore, to restrict the survey to one which focuses on the literature which sees managementcontrol as a practical activity of managers. See pages S32–S33 for a discussion of the boundariesof our survey.

RESEARCH IN MANAGEMENT CONTROL 275
which lead to overall goal specification and attainment. This can be seen primarilyas the planning and coordination function of management control. The other sideof the management control coin is its monitoring and feedback function. Regularobservations and reports on actual achievement are used to ensure that plannedactions are indeed achieving desired results.
It may be argued that Anthony’s approach is too restrictive in that it assumesaway important problems (see Lowe and Puxty, 1989 for further discussion ofthese issues). The first problem is concerned with problems of defining strategies,goals and objectives. Such procedures are typically complex and ill-defined, withstrategies being produced as much by accident as by design. It is clear thatAnthony was aware of the problems of ambiguity and uncertainty when helocated these issues in the domain of strategy, but he then avoided their furtherconsideration. The second problem concerns the methods used to control theproduction (or service delivery) processes, which are highly dependent upon thespecific technology in use and which are widely divergent. Anthony convenientlyrelegates these issues to the realm of operational control. Finally, his textbooksconcentrate upon planning and control through accounting rationales and containlittle or no discussion of social-psychological or behavioural issues, despite hishighlighting the importance of the latter. Anthony’s approach can, thus, be seenas a preliminary ground-clearing exercise, whereby he limits the extent of theproblem he sets out to study. In a complex field this was probably a very sensiblefirst step, however, it greatly narrowed the scope of the topic.
A broader view of management control is suggested by Lowe (1971) in a morecomprehensive definition:
‘A system of organizational information seeking and gathering, accountabil-ity and feedback designed to ensure that the enterprise adapts to changes inits substantive environment and that the work behaviour of its employees ismeasured by reference to a set of operational sub-goals (which conform withoverall objectives) so that the discrepancy between the two can be reconciledand corrected for.’
This stresses the role of a management control system (MCS) as a broad setof control mechanisms designed to assist organizations to regulate themselves,whereas Anthony’s definition is more specific and limited to a narrower sub-setof control activities. Machin (1983) continues this line of thought in his criticalreview of management control systems as a specialist subject of academic study.He explores each of the terms ‘management’, ‘control’ and ‘system’, defining aresearch focus:
‘Those formal, systematically developed, organization-wide, data-handlingsystems which are designed to facilitate management control which ‘‘isthe process by which managers assure that resources are obtained andused effectively and efficiently in the accomplishment of the organization’sobjectives.’’ ’
Machin notes that such a definition has the merit of leaving scope for academicsto disagree violently whilst still perceiving themselves to be studying the same

276 ACCOUNTING FOR MANAGERS
thing! Further, Machin argues that research in MCSs, led, as it was, by qualifiedaccountants, made the research questions
‘virtually immune from philosophical analysis’,
a critique also reflected in Hofstede’s (1978) criticism of the
‘poverty of management control philosophy’,
– the narrow, accounting focus which had become so prevalent.Such diverse opinions leave a number of issues to be clarified. First, is the
meaning of the term ‘control’. In this review we will include within the definitionof control both the ideas of informational feedback and the implementation ofcorrective actions. Equally, we explicitly exclude the exercise of power for its ownsake, restricting ourselves to those activities undertaken by managers which havethe intention of furthering organizational objectives (at least, insofar as perceivedby managers). We are, thus, primarily concerned with the exercise of legitimateauthority rather than power. This is no doubt a controversial position, but givesthe review a clear managerial focus.
There is also a distinction to be drawn between management control andfinancial control, which is of some importance given the accounting dominationof the subject in recent years. Financial control is clearly concerned with themanagement of the finance function within organizations. As such it is onebusiness function amongst many, and comprises but one facet of the widerpractice of management control. On the other hand, management control can bedefined as a general management function concerned with the achievement ofoverall organizational aims and objectives. Financial information is thus used inpractice to serve two interrelated functions. First, it is clearly used in a financialcontrol role, where its function is to monitor financial flows; that is, it is concernedwith looking after the money. Second, it is also often used as a surrogate measurefor other aspects of organizational performance. That is, management control isconcerned with looking after the overall business with money being used as aconvenient measure of a variety of other more complex dimensions, not as an endin itself.
Having set some boundaries, the next section of the paper will provide abrief account of the main themes that have formed the starting point for thedevelopment of the field. Whilst well known, these roots cannot be ignored astheir influence is reflected in work which continues today. There follows a reviewof the literature that has evolved over the last 20 years both as a continuation ofand as a reaction against those roots, using a heuristic map provided by Scott(1981). Finally, we will suggest possible themes for future development.
The starting points
The roots of management control issues lie in early managerial thought. Thesignificance of the work of Weber, Durkheim and Pareto upon the development

RESEARCH IN MANAGEMENT CONTROL 277
managerial thought is well rehearsed. Less well known, but providing an excel-lent example of the classical management theorists, is the contribution of MaryParker Follett, described by Parker (1986) as providing almost all of the ideasof modern control theory. Follett saw that the manager controlled not singleelements but complex interrelationships and argued that the basis for control layin self-regulating, self-directing individuals and groups who recognized commoninterests and objectives. It may be that Follett was an idealist in her search forunity in organizations for she sought a control that was
‘fact control’ not ‘man control’, and ‘correlated control’ rather than ‘super-imposed control’.
Further she saw coordination as the reciprocal relating of all factors in a settingthat involved direct contact of all people concerned. The application of these
‘fundamental principles of organisation’
was the control activity itself, for the whole point of her principles was to ensurepredictable performance for the organization.
Scientific management, another important root of management control, isfrequently associated with the work of F. W. Taylor (Miller and O’Leary, 1987),although there were earlier contributors to this movement. For example, Babbage(1832) was concerned with improving manufacture and systems and analysedoperations, the skills involved, the expense of each process and suggested pathsfor improvement. In 1874 Fink (see Wren, 1994) developed a cost accounting systemthat used information flows, classification of costs and statistical control devices;innovations which led directly to 20th century processes of management control.
What seems to characterize these theorists is an attention to real problems, ascientific approach which centred upon understanding and conceptual analysis,and a wish to solve problems. Their contribution to management control lay in theirattention to authority and accountability, an awareness of the need for analyticaland budgetary models for control, forging the link between cost and operationalactivities, and the separation of cost accounting from financial accounting, withthe former being a precursor of management accounting and control. However,these practical theorists may have pursued rationality of economic action and thesearch for universal solutions too far, although their ideas are still current andform the basis for much work in the field, many being echoed in the work of RobertAnthony. The ideas of the common purpose of social organizations along witha concern for the relationship between effectiveness and efficiency foreshadowthe concept of autopoeis (the view that systems can have a ‘life of their own’)developed by cyberneticians. These will be examined in the next section.
Evolution of the management control literature
As previously noted, Parker (1986) argued that developments in accounting controlhave followed and lagged developments in management theory. Developments

278 ACCOUNTING FOR MANAGERS
in management control seem to have followed a similar pattern, so we use theschema suggested by Scott (1981) for categorizing developments in organizationtheory as a framework for organizing this part of our review. We would argue thatsystems thinking has had an important influence on the development of MCSsand Scott’s schema is based on a systems approach, so it is to this we now turn.
Cybernetics and systems theory
Organizational theory in general and management control research in particularhave been influenced considerably by cybernetics (the science of communicationand control (Weiner, 1948). These insights have been extended in the holisticstandpoint taken by general systems theory and the ‘soft systems’ approach(Checkland, 1981). Its central contribution has been in the systemic approach itadopts, causing attention to be paid to the overall control of the organization, incontrast to the systematic approach dominant in accounting control, which hasoften assumed that the multiplication of ‘controls’ will lead inexorably to overall‘control’, a view roundly routed by Drucker (1964). Cybernetics and systemstheory have developed in such an interlinked manner that it is difficult to drawa meaningful dividing line between them (for a fuller survey see Otley, 1983),although a simple distinction would be to suggest that cybernetics is concernedwith closed systems, whereas systems theory specifically involves a more openperspective.
The major contribution of cybernetics has been in the study of systems in whichcomplexity is paramount (Ashby, 1956); it attempts to explain the behaviour ofcomplex systems primarily in terms of relatively simple feedback mechanisms(Wisdom, 1956). There have been a number of attempts to apply cyberneticconcepts to the issue of management control, but these have all been of a theoreticalnature, albeit based on general empirical observation. The process of generatingfeedback information is fundamental to management accounting on which muchmanagement control practice rests, although this is not usually elaborated in anyvery insightful manner. However, Otley and Berry (1980) developed Tocher’s(1970) control model and applied it to organizational control. They maintain thateffective control depends upon the existence of an adequate means of predicting theconsequences of alternative control actions. In most organizations such predictivemodels reside in the minds of line managers, rather than in any more formalform, and they argue that improvements in control practice need to focus onimproving such models. It is also argued that feedforward (anticipatory) controlsare likely to be of more importance than feedback (reactive) controls. This echoesprevious comments by authors such as Ashby (1956), who points to the biologicaladvantages in controlling not by error but by what gives rise to error, and Amey(1979) who stresses the importance of anticipatory control mechanisms in businessenterprises.
Arguably the most insightful use of cybernetic ideas applied to managementpractice is also one of the earliest. Vickers (1965, 1967) applied many cyberneticideas to management practice during the 1950s. Although developed in a primarilyclosed systems context, he also started to explore the issue of regulating institutions
RESEARCH IN MANAGEMENT CONTROL 279
from a societal perspective. This is also a major theme of Stafford Beer, mostcomprehensively in his 1972 book Brain of the Firm. Here he uses the human nervoussystem as an analogy for the control mechanisms that need to be adopted at variouslevels in the control of an organization. However, Beer’s major contribution liesin his attempt to tackle issues of the overall societal and political context withinwhich more detailed organizational forms and controls emerge. This is a themewhich is picked up, albeit in a very different form, by the radical theorists of the1980s and 1990s. The standard concepts of the cybernetic literature do not havesuch a straightforward application to the issue of organizational control as somepresentations of them tend to imply. However, they do provide a language inwhich any of the central issues of management control may be expressed.
Further progress comes from the use of general systems theory which stressesthe importance of emergent properties of systems, that is, properties which arecharacteristic of the level of complexity being studied and which do not havemeaning at lower levels; such properties are possessed by the system but not byits parts. Systems thinking is thus primarily a tool for dealing with high levelsof complexity, particularly with reference to systems which display adaptiveand apparently goal-seeking behaviour (Lilienfeld, 1978). Some useful conceptualdistinctions are drawn by Lowe and McInnes (1971) who attempt to apply asystems approach to the design of MCSs. An important extension to the realm ofso-called ‘soft’ systems (i.e. systems which include human beings, where objectivesare vague and ambiguous, decision-making processes ill-defined, and where, atbest, only qualitative measures of performance exist) has been made by theCheckland school at Lancaster (Checkland, 1981; Wilson, 1984).
One of the central issues with which the ‘soft’ systems methodology has tocope is the imputation of objectives to the system. In many ways this methodologyreflects the verstehen (or insight) tradition of thought in sociology, where great stressis laid upon the accuracy and honesty of observation, the sensitivity and perceptionof the observer, and on the imaginative interpretations of observations. Althoughthe soft systems approach has had considerable success in producing solutionsto real problems, it does not appear to have contributed to the development ofthe theory of control in the normal academic sense. It is very much an appliedproblem-solving methodology in its present form rather than a research methoddesigned to yield generalizable explanations, although it undoubtedly has furtherpotential in this area. This raises the issue of the nature and type of theories thatcan be expected in such a complex area of human and social behaviour.
A framework to map developments in managementcontrol research
Scott (1981) analysed the development of organization theory using two dimen-sions. First, he saw a transition from closed to open systems models of organization,reflecting the influence of systems ideas. Prior to 1960 most theorists tended toassume that organizations could be understood apart from their environments,and that most important processes and events were internal to the organization.
280 ACCOUNTING FOR MANAGERS
After that date it was increasingly recognized that organizations were highly inter-dependent with their environments, and that boundaries are both permeable andvariable. Second, he distinguished between rational and natural systems models.The rational systems model assumes that organizations are purposefully designedfor the pursuit of explicit objectives, whereas the natural systems model empha-sizes the importance of unplanned and spontaneous processes, with organicallyemerging informal structures supplementing or subduing rationally designedframeworks. The distinction between rational and natural systems is applicableto both sides of the closed-open system divide, resulting in the definition of thefour approaches.
We use these categories to summarize work in MCSs, although we recognizethat such categorization is not necessarily ‘neat’. Organizations can be viewedas being both rational and natural, (Thompson, 1967; Boland and Pondy, 1983);they are often intentionally designed to achieve specific purposes, yet also displayemergent properties. It can be argued that each successive theoretical devel-opment provides an additional perspective which is helpful in understandingorganizational processes, and which is likely to be additional and complementaryto those which have preceded it. However, it is also recognized that this is acontroversial statement that would not be accepted by some of those adopting apost-modernist viewpoint.
The Closed Rational Perspective This work is characterized by being bothuniversal in orientation and systematic in approach, scientific management beinga typical example. In the management control literature we find a continuingemphasis on rational solutions, implicitly assuming a closed systems model oforganization, which are universalistic in nature. Indeed, this can also be seen inmuch of the modern popular management literature, where a universal ‘how-to-do-it’ approach continues to find a ready market.
From a research point of view, there is much work which has sought to identifythe ‘one best way’ to operate a control system. An excellent example of thisapproach applied to budgetary control is that conducted by Hofstede (1968). Hesought to reconcile the US findings that budgets were extensively used in perfor-mance evaluation and control, but were associated with negative feelings on thepart of many managers and dysfunctional consequences to the organization, withthe European experience that budgets were seen positively but were little used.Multiple perspectives are brought to bear, including systems theory, although thisdraws primarily on cybernetics. His conclusions list several pages of recommen-dations as to how budgets could be used effectively without engendering negativeconsequences, and indicate an implicit universalistic orientation. Similarly, thewell known text co-authored by Anthony and a host of collaborators (see forexample, Anthony et al., 1984) also clearly falls into the closed rational mode withits heavy emphasis on accounting controls.
The Closed Natural Perspective The closed natural approach is centred aroundan increasing interest in the behavioural consequences of control systems opera-tion. This was perhaps first introduced to the control literature by Argyris (1952)

RESEARCH IN MANAGEMENT CONTROL 281
in his article entitled ‘The Impact of Budgets on People’, an emphasis reversedneatly almost 20 years later by Schiff and Lewin (1970) in their article ‘The Impactof People on Budgets’. Lowe and Shaw (1968) discussed the tendency of managersto bias budgetary estimates that were subsequently used for control purposes.Buckley and McKenna (1972) were able to publish a review article summarizingcurrent knowledge on the connection between budgetary control and managerialbehaviour in the early 1970s. Mintzberg followed his 1973 study of the natureof managerial activity with a 1975 study of the impediments to the use of man-agement information, which dealt with many of the behavioural issues in theoperation of control systems. There was thus a growing awareness of the humanconsequences of control systems use and operation beginning to emerge in theearly 1970s, perhaps lagging some 20 years behind the equivalent human relationsmovement in the organization theory literature.
A behavioural perspective on the theme of managerial performance evaluationalso began to emerge at this time. Hopwood (1972, 1974a) identified the differentstyles that managers could adopt in their use of accounting information andstudied their impact on individual behaviour and (implicitly) organizationalperformance. Rhaman and McCosh (1976) sought to explain why different uses ofaccounting control information were observed, and concluded that both individualcharacteristics and organizational climate were significant factors. A study byOtley (1978) yielded almost exactly contrary results to those of Hopwood (1972)because the research site had significant differences; the conflicting findings couldbe reconciled only by adopting a contingent approach, a task that was morethoroughly undertaken by Hirst (1981).
The idea that systems used to evaluate performance are affected by the infor-mation supplied by those being evaluated has led to the concept of informationinductance (Prakash and Rappaport, 1977; Dirsmith and Jablonsky, 1979). Thisgeneralized the observations of information bias and manipulation reported pre-viously as just one manifestation of a more general phenomenon. Such work wasextended by Birnberg et al. (1983) into a unified contingent framework, based onthe ideas of Thompson (1967), Perrow (1970) and Ouchi (1979).
Despite the categorization of organizational contingency theorists into the opensystems box by Scott (1981), the early contingent work in accounting-based controlsystems has a clear closed systems flavour. It was only in the late 1970s that theopen systems ideas in contingency theory, which followed primarily from the useof environment as a contingent variable, began to be reflected in the managementcontrol literature. This parallels developments in Organization Theory (OT), for itis arguable that early contingent work by writers such as Woodward (1958, 1965)concentrated on internal factors such as technology, and did not adopt an opensystems approach until later. Thus, texts in the management control area, such asEmmanuel et al. (1985, 1990), Merchant (1985), and Johnson and Gill (1993) whichrecognized the behavioural aspects of MCSs as well as adopting some tenets ofthe contingency framework, tend to lie along the boundary of the closed naturalcategory and the open rational approach.
The Open Rational Perspective As in OT, the emergence of an open systemsperspective was accompanied by a return to more rational approaches and a
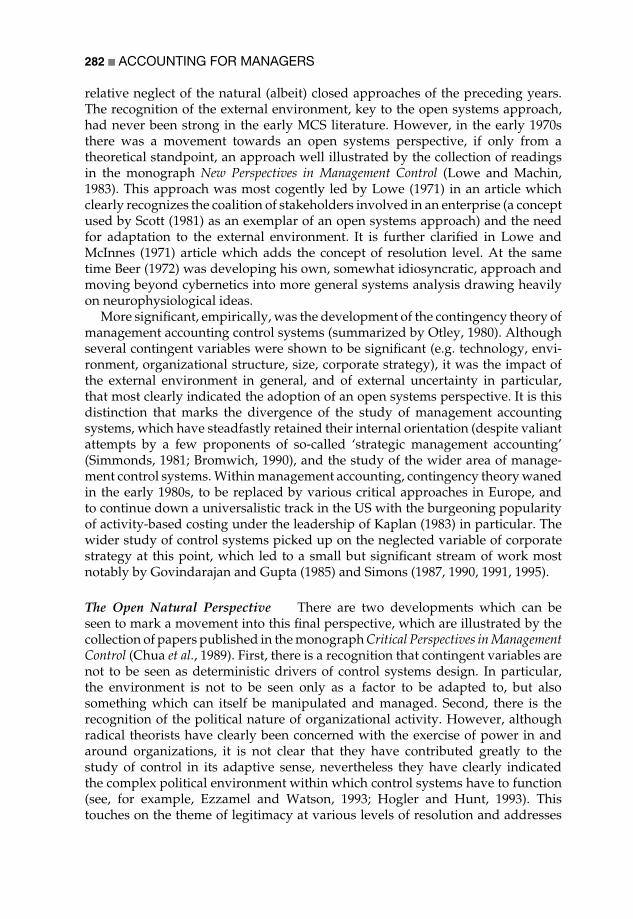
282 ACCOUNTING FOR MANAGERS
relative neglect of the natural (albeit) closed approaches of the preceding years.The recognition of the external environment, key to the open systems approach,had never been strong in the early MCS literature. However, in the early 1970sthere was a movement towards an open systems perspective, if only from atheoretical standpoint, an approach well illustrated by the collection of readingsin the monograph New Perspectives in Management Control (Lowe and Machin,1983). This approach was most cogently led by Lowe (1971) in an article whichclearly recognizes the coalition of stakeholders involved in an enterprise (a conceptused by Scott (1981) as an exemplar of an open systems approach) and the needfor adaptation to the external environment. It is further clarified in Lowe andMcInnes (1971) article which adds the concept of resolution level. At the sametime Beer (1972) was developing his own, somewhat idiosyncratic, approach andmoving beyond cybernetics into more general systems analysis drawing heavilyon neurophysiological ideas.
More significant, empirically, was the development of the contingency theory ofmanagement accounting control systems (summarized by Otley, 1980). Althoughseveral contingent variables were shown to be significant (e.g. technology, envi-ronment, organizational structure, size, corporate strategy), it was the impact ofthe external environment in general, and of external uncertainty in particular,that most clearly indicated the adoption of an open systems perspective. It is thisdistinction that marks the divergence of the study of management accountingsystems, which have steadfastly retained their internal orientation (despite valiantattempts by a few proponents of so-called ‘strategic management accounting’(Simmonds, 1981; Bromwich, 1990), and the study of the wider area of manage-ment control systems. Within management accounting, contingency theory wanedin the early 1980s, to be replaced by various critical approaches in Europe, andto continue down a universalistic track in the US with the burgeoning popularityof activity-based costing under the leadership of Kaplan (1983) in particular. Thewider study of control systems picked up on the neglected variable of corporatestrategy at this point, which led to a small but significant stream of work mostnotably by Govindarajan and Gupta (1985) and Simons (1987, 1990, 1991, 1995).
The Open Natural Perspective There are two developments which can beseen to mark a movement into this final perspective, which are illustrated by thecollection of papers published in the monograph Critical Perspectives in ManagementControl (Chua et al., 1989). First, there is a recognition that contingent variables arenot to be seen as deterministic drivers of control systems design. In particular,the environment is not to be seen only as a factor to be adapted to, but alsosomething which can itself be manipulated and managed. Second, there is therecognition of the political nature of organizational activity. However, althoughradical theorists have clearly been concerned with the exercise of power in andaround organizations, it is not clear that they have contributed greatly to thestudy of control in its adaptive sense, nevertheless they have clearly indicatedthe complex political environment within which control systems have to function(see, for example, Ezzamel and Watson, 1993; Hogler and Hunt, 1993). Thistouches on the theme of legitimacy at various levels of resolution and addresses

RESEARCH IN MANAGEMENT CONTROL 283
the question of how legitimacy becomes established and how it works throughto different hierarchical levels in organizations. Examples of such work includeresearch examining the reforms of the NHS using a post-modern perspective(Preston, 1992; Preston et al., 1992) and that, taking a critical theory approach, ofLaughlin and Broadbent (1993) who examined the impact of attempts to controlparticular organizations through the medium of the law. In a more general sensethe discontinuities of history and the diverse roots of control systems are broughtout by Miller and O’Leary (1987). Other work in this field has taken a moreinterpretive or anthropological approach, examining the role of values or culturein determining the extent to which it is possible to control organizational members.Ansari and Bell (1991) illustrate the effect of national culture; Broadbent (1992)and Dent (1991) focus in different ways on the impact of organizational cultures.
OverviewThis retrospective review of the roots of management control provides the oppor-tunity to reflect on its overall nature before moving forward to consider theprospects for the subject. It is clear that there is a wide range of research into thefunctioning of MCSs, even when its focus is narrowed to the more managerialistapproach which we have adopted. A rough categorization of MCSs research worksince 1965 set into this framework is given in Table 1 and allows some reflectionon the basic assumptions which underlie the work that has been undertaken.
As mentioned earlier, whilst the framework developed by Scott provides ameans by which to structure this review, it is important to note that everypaper reviewed does not fit tidily into such a sequence. Further, it is clear thatwhile practical theorists and scholars have developed ideas in new sectors ofthe diagram, this has not led to the abandonment of work in earlier sectors. Thescientific management tradition is alive and well in areas such as operationalresearch and in the consultancy world (e.g. in business process reengineering).The diversity of research approaches available is illustrated in the contents of thetext Managerial Control, Theories Issues and Practices (Berry et al., 1995) as well asthe special issue of the British Journal of Management on MCSs published in 1993
Table 1 Representative papers from four perspectives
Closed system models Open system models
Rational models Natural models Rational models Natural models
Classical management Behavioural Systems and contingent Radicaltheory approaches approaches perspectives
Classical theorists Argyris (1952) Ouchi (1979) Chua et al.Woodward (1958, Hopwood (1972, Beer (1972) (1989)1965, 1970) 1974a, 1974b) Lowe and Machin Ansari and BellBurns and Stalker Vickers (1965, (1983) (1991)(1961) 1967) Lowe and McInnes Dent (1991)Drucker (1964) Otley and Berry (1971) Laughlin andSimon et al. (1954) (1980) Otley (1980) Broadbent (1993)

284 ACCOUNTING FOR MANAGERS
(September, Vol. 4, No. 3). Both these publications (plus the edited collections byLowe and Machin, 1983 and Chua et al., 1989) have been spawned by the activitiesof the Management Control Association, a group of UK academics, which hassought for the past 20 years to promote wide-ranging research in the field. Thelatest review of nearly 20 research approaches is by Macintosh (1994), whichunusually develops the issues through a selection of methodological approaches.
The predominant ontological stance is realist, stemming from the originalconcentration of the practical theorists on what they saw as real problems inpractice. The primary epistemological stance of these control theorists is positivistand functionalist. Functionalist approaches have been severely criticized (e.g.Burrell and Morgan, 1979) as being part of the sociology (and perhaps theeconomy) of preservation, and thus antithetical to radical change. In the sense thatmanagement control is concerned with forms of stability this might be so, but thepursuit of efficiency has led to radical, and often unwelcome, change for manypeople, and control techniques have been used to promote quite radical socialchanges. Whilst some of the more radical theorists have examined this issue it,perhaps, remains somewhat under researched. Laughlin and Lowe (1990) usingthe framework of Burrell and Morgan (1979) along with Scott’s framework toreview accounting research and demonstrate the diversity of approaches availableargued that only the open systems approaches were beginning to move awayfrom the functionalist orientation. Given our argument as to the paucity of opensystems research, similar claims can be made for the need to extend the theoreticaland methodological boundaries of management control research.2
The review shows that accounting still acts as an important element of manage-ment control. Whilst there have been developments in control in associated areas(such as Management Information Systems (MIS), human relations, operationsresearch) these disciplines have been less inclined to see themselves as offeringthemselves as vehicles for integration of the diversity of organizational life thanhas accounting. Accounting is still seen as a pre-eminent technology by which tointegrate diverse activities from strategy to operations and with which to renderaccountability. There is a sense in which the reduction of values to accountingmeasurements can contribute to management control sliding into the merely tech-nical. Such a tendency is reinforced by the very constructs of the managementinformation system and of information management which accounting uses. Theubiquity of computers, data capture, high-speed software, electronic data inter-change and open access has changed the speed of data flow without yet havinghad great impact on either management control research or practice. Yet the topicof management control holds the promise of providing a powerful integratingidea to provide a very practical focus to concepts developed in other disciplinesif it is not wholly accounting focused. Mills (1970) thoughts about the role ofmanagement control as an integrative teaching device also appear to apply withsome force to its role as an integrative research framework for an important partof management studies. With this in mind we move to the final section.
2 Agency theory research, not included in this review, would not be immune from this comment.
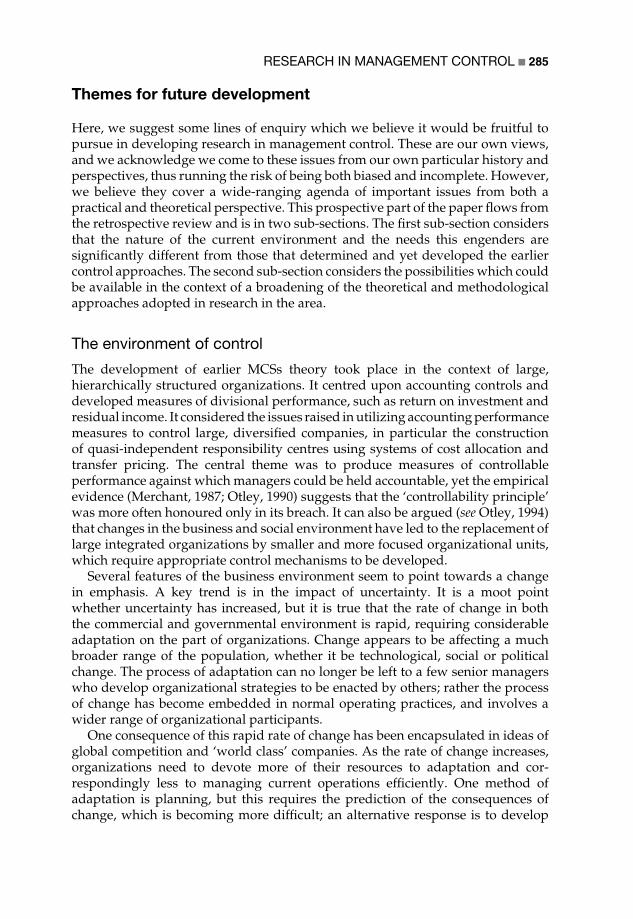
RESEARCH IN MANAGEMENT CONTROL 285
Themes for future development
Here, we suggest some lines of enquiry which we believe it would be fruitful topursue in developing research in management control. These are our own views,and we acknowledge we come to these issues from our own particular history andperspectives, thus running the risk of being both biased and incomplete. However,we believe they cover a wide-ranging agenda of important issues from both apractical and theoretical perspective. This prospective part of the paper flows fromthe retrospective review and is in two sub-sections. The first sub-section considersthat the nature of the current environment and the needs this engenders aresignificantly different from those that determined and yet developed the earliercontrol approaches. The second sub-section considers the possibilities which couldbe available in the context of a broadening of the theoretical and methodologicalapproaches adopted in research in the area.
The environment of control
The development of earlier MCSs theory took place in the context of large,hierarchically structured organizations. It centred upon accounting controls anddeveloped measures of divisional performance, such as return on investment andresidual income. It considered the issues raised in utilizing accounting performancemeasures to control large, diversified companies, in particular the constructionof quasi-independent responsibility centres using systems of cost allocation andtransfer pricing. The central theme was to produce measures of controllableperformance against which managers could be held accountable, yet the empiricalevidence (Merchant, 1987; Otley, 1990) suggests that the ‘controllability principle’was more often honoured only in its breach. It can also be argued (see Otley, 1994)that changes in the business and social environment have led to the replacement oflarge integrated organizations by smaller and more focused organizational units,which require appropriate control mechanisms to be developed.
Several features of the business environment seem to point towards a changein emphasis. A key trend is in the impact of uncertainty. It is a moot pointwhether uncertainty has increased, but it is true that the rate of change in boththe commercial and governmental environment is rapid, requiring considerableadaptation on the part of organizations. Change appears to be affecting a muchbroader range of the population, whether it be technological, social or politicalchange. The process of adaptation can no longer be left to a few senior managerswho develop organizational strategies to be enacted by others; rather the processof change has become embedded in normal operating practices, and involves awider range of organizational participants.
One consequence of this rapid rate of change has been encapsulated in ideas ofglobal competition and ‘world class’ companies. As the rate of change increases,organizations need to devote more of their resources to adaptation and cor-respondingly less to managing current operations efficiently. One method ofadaptation is planning, but this requires the prediction of the consequences ofchange, which is becoming more difficult; an alternative response is to develop

286 ACCOUNTING FOR MANAGERS
the flexibility to adapt to the consequences of change as they become apparent.The ‘management of change’ remains an important managerial skill, but it shouldno longer be seen as a discrete event bounded by periods of stability; rather weare concerned with management in a context of continual change. This requirescontinual adaptation, a note which is reflected in the current popular terminologyof ‘continuous improvement’.
A second feature has been a movement towards reducing the size of businessunits, certainly in terms of the number of people employed. In part, this hasbeen driven by technological change, but there has also often been a strategicchoice to encourage units to concentrate on their ‘core’ business and to avoidbeing distracted by irrelevant side issues. In turn, this has led to ‘non-core’activities being outsourced, a process which can be most reliably undertaken inthe context of long-term alliances. Such a trend is emphasized by just-in-timeproduction and the processes of ‘market testing’ which have been imposed uponthe public sector in the UK. The number of middle managers is being reducedand the range of responsibilities of those who remain is being increased. The splitbetween strategic planning, management control and operational control, whichwas always tendentious has now become untenable, and a much closer integrationbetween those functions has developed.
The boundaries of the organization and the boundaries of the control functionare not necessarily co-terminus. Within the organization, ideas of ‘business processre-engineering’ have reinforced the need to devise control mechanisms that arehorizontal (i.e. which follow the product or service through its production processuntil its delivery to the customer) rather than solely vertical (i.e. which followthe organizational hierarchy within organizational functions). As productionprocesses are increasingly spread across legal boundaries (and often across nationalboundaries) new processes for the control of such embedded operations are needed(Berry, 1994). That is, control systems need to be devised which coordinate thetotal production and delivery process regardless of whether these processes arecontained within a single (vertically integrated) organization or spread across aconsiderable number of (quasi-independent) organizations.
Traditional approaches to management control have been valuable in definingan important topic of study, but they have been predicated on a model of organi-zational functioning which has become increasingly outdated. This has resulted inthe study of control systems becoming over narrow by remaining focused primar-ily upon accounting control mechanisms which are vertical rather than horizontalin their orientation. Contemporary organizations display flexibility, adaptationand continuous learning, both within and across organizational boundaries, butsuch characteristics are not encouraged by traditional systems. There is consider-able anecdotal evidence to suggest that organizational practices are beginning toreflect these needs, so a key task for MCSs researchers is to observe and codifythese developments.
In this type of changing environment the logic of systems theory could beargued to be of some importance in emphasizing issues such as the importanceof environment and the holism of the organization. Although MCSs theory oftenmakes references to the concepts of cybernetics, and sometimes to those of general
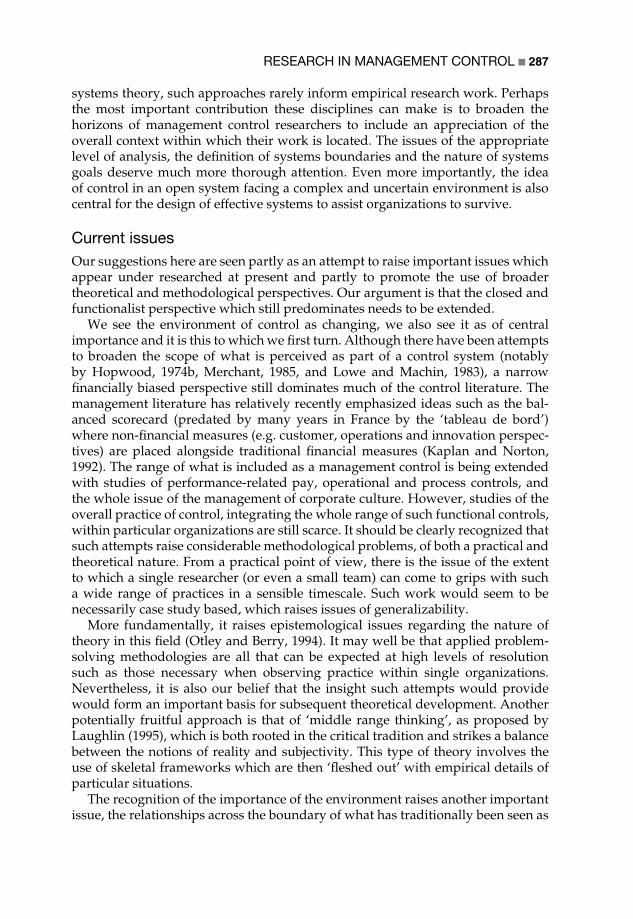
RESEARCH IN MANAGEMENT CONTROL 287
systems theory, such approaches rarely inform empirical research work. Perhapsthe most important contribution these disciplines can make is to broaden thehorizons of management control researchers to include an appreciation of theoverall context within which their work is located. The issues of the appropriatelevel of analysis, the definition of systems boundaries and the nature of systemsgoals deserve much more thorough attention. Even more importantly, the ideaof control in an open system facing a complex and uncertain environment is alsocentral for the design of effective systems to assist organizations to survive.
Current issuesOur suggestions here are seen partly as an attempt to raise important issues whichappear under researched at present and partly to promote the use of broadertheoretical and methodological perspectives. Our argument is that the closed andfunctionalist perspective which still predominates needs to be extended.
We see the environment of control as changing, we also see it as of centralimportance and it is this to which we first turn. Although there have been attemptsto broaden the scope of what is perceived as part of a control system (notablyby Hopwood, 1974b, Merchant, 1985, and Lowe and Machin, 1983), a narrowfinancially biased perspective still dominates much of the control literature. Themanagement literature has relatively recently emphasized ideas such as the bal-anced scorecard (predated by many years in France by the ‘tableau de bord’)where non-financial measures (e.g. customer, operations and innovation perspec-tives) are placed alongside traditional financial measures (Kaplan and Norton,1992). The range of what is included as a management control is being extendedwith studies of performance-related pay, operational and process controls, andthe whole issue of the management of corporate culture. However, studies of theoverall practice of control, integrating the whole range of such functional controls,within particular organizations are still scarce. It should be clearly recognized thatsuch attempts raise considerable methodological problems, of both a practical andtheoretical nature. From a practical point of view, there is the issue of the extentto which a single researcher (or even a small team) can come to grips with sucha wide range of practices in a sensible timescale. Such work would seem to benecessarily case study based, which raises issues of generalizability.
More fundamentally, it raises epistemological issues regarding the nature oftheory in this field (Otley and Berry, 1994). It may well be that applied problem-solving methodologies are all that can be expected at high levels of resolutionsuch as those necessary when observing practice within single organizations.Nevertheless, it is also our belief that the insight such attempts would providewould form an important basis for subsequent theoretical development. Anotherpotentially fruitful approach is that of ‘middle range thinking’, as proposed byLaughlin (1995), which is both rooted in the critical tradition and strikes a balancebetween the notions of reality and subjectivity. This type of theory involves theuse of skeletal frameworks which are then ‘fleshed out’ with empirical details ofparticular situations.
The recognition of the importance of the environment raises another importantissue, the relationships across the boundary of what has traditionally been seen as

288 ACCOUNTING FOR MANAGERS
the firm. Most of the management control literature has concentrated its attentionat the level of the firm (or sub-units within it). There has been comparatively littleexploration of control from a more macro or societal perspective. Although theseissues have been addressed to some extent by the radical theorists, the ‘micro’ andthe ‘macro’ have been seen as distinct areas. Despite the quite radical changes thathave occurred in the UK environment over the past 15 years (not least due to theThatcher government) the general issue has not been well explored in the control(as distinct from the economic) literature. In particular, the role of competition as acontrol mechanism is under researched: Further, such institutional arrangementsaffect the legitimacy of different methods of control within organizations, such asthe appropriate boundaries for managerial action and the role of consultation andparticipation amongst the workforce and these issues need fuller exploration.
This also raises the issue of what have been called embedded organizations.We have already alluded to the fact that control systems increasingly operateacross both the legal boundaries of firms and national boundaries. The needs ofmanaging business processes in an extended supply and distribution chain thatcrosses many organizational boundaries raise challenging control issues. Thesehave been explored to some extent in both the operations management andmanagement information systems literature, and have surfaced in the popularmanagement literature under the banner of ‘business process re-engineering’, buthave yet to receive proper attention from an overall control framework. The opensystems framework appears to be especially appropriate in this area.
We have also found very little research addressing the problems of controlin multinational and international organizations, in either the public or privatesector. This is an issue that seems to have been given much more attention in thefields of strategy and marketing, then in control. Undoubtedly a complex field,issues as disparate as the impact of differing legal and institutional structures,financial and exchange control constraints, and the varied impact of national andcorporate cultures all seem worthy of attention.
Wider fields also need to be addressed. The advent of environmental man-agement and the attention now paid to ‘green’ issues has yet to impact on thecontrol literature. However, the developing understanding of both human ecology(including issues of demography, population, ethnicity and religion) and physicalecology suggests that wider considerations need to be brought into the conceptu-alization of the problems of regulation and control of, and within, organizations.Clearly, these considerations raise new ethical issues for both control theorists andpractitioners.
Gender issues in management control have received scant attention, despitean emerging set of questions about the extent to which there are ‘feminine’ and‘masculine’ styles of managing. It may be that the language of management controlneeds reframing to encompass a wider range of possibilities. There is some supportin the popular management literature for styles associated with the femininegender stereotype, such as empowerment, group or mutual accountabilities andupward appraisal. The whole concept of the learning organization suggestsapproaches to management which are more supportive than directive in theirorientation. Numbers of women in the workforce continue to increase, although

RESEARCH IN MANAGEMENT CONTROL 289
the ‘glass ceiling’ still exists. The implications of these changes on MCSs remainsto be researched.
Conclusions
This paper extends previous reviews of the area of management control andprovides some suggestions for further research. Our suggestions stem from thebelief that the practice and researching of management control needs to recognizethe environment in which organizations exist and to loosen the boundariesaround the area of concern. We are also anxious to promote more critical research.Undoubtedly some of the narrowness of the research in the topic which we havehighlighted is the result of our choice of definition of management control whichremains rather managerialist in its focus. It is clear that the field of managementcontrol is of relevance to the practice of management but this should not precludea critical stance and thus a broader choice of theoretical approaches.
The area is also under researched, which might be explained by the nature of themethodologies required for its study and their unpopularity over the last 25 yearsespecially in the US. This indicates a significant opportunity for contributions,offering a broader set of methodological stances, to be made in an important anddeveloping field. In conclusion, we hope that this paper might play a small part indefining and developing management control as a coherent field of study withinthe management disciplines.
References
Amey, L. R. (1979). Budget Planning and Control Systems. Pitman, London.Ansari, S. and J. Bell (1991). ‘Symbolism, Collectivism and Rationality in Organizational
Control’, Accounting, Auditing and Accountability Journal, pp. 4–27.Anthony, R. N. (1965). Planning and Control Systems: A Framework for Analysis. Division
of Research, Harvard Business School, Boston.Anthony, R. N., J. Dearden and N. M. Bedford (1984). Management Control Systems. Irwin,
Homewood, IL.Argyris, C. (1952). The Impact of Budgets on People. The Controllership Foundation, Ithaca,
NY.Ashby, W. R. (1956). An Introduction to Cybernetics. Chapman and Hall, London.Babbage, C. (1832). On the Economy of Machinery and Manufacturers. Charles Knight, London.Beer, S. (1972). Brain of the Firm. Allen Lane, Harmondsworth, Middlesex.Berry, A. J. (1994). ‘Spanning Traditional Boundaries: Organization and Control of Embed-
ded Operations’, Leadership and Organisational Development Journal, pp. 4–10.Berry, A. J., J. Broadbent and D. T. Otley (eds) (1995). Managerial Control: Theories, Issues and
Practices. Macmillan, London.Birnberg, J. G., L. Turopolec and S. M. Young (1983). ‘The Organizational Context of
Accounting’, Accounting, Organizations and Society, pp. 111–129.Boland, R. J. Jnr. and L. R. Pondy (1983). ‘Accounting in Organizations: A Union of Rational
and Natural Perspectives’, Accounting, Organizations and Society, pp. 223–234.
290 ACCOUNTING FOR MANAGERS
Broadbent, J. (1992). ‘Change in Organisations: A Case Study of the Use of AccountingInformation in the NHS’, British Accounting Review, pp. 343–367.
Bromwich, M. (1990). ‘The Case for Strategic Management Accounting: The Role of Account-ing Information for Strategy in Competitive Markets’, Accounting, Organizations andSociety, pp. 27–46.
Buckley, A. and E. McKenna (1972). ‘Budgetary Control and Business Behaviour’, Account-ing and Business Research, pp. 137–150.
Burns, T. and G. M. Stalker (1961). The Management of Innovation. Tavistock, London.Burrell, G. and G. Morgan (1979). Sociological Paradigms and Organizational Analysis. Heine-
mann, London.Checkland, P. B. (1981). Systems Thinking, Systems Practice. Wiley, Chichester.Chua, W. F., T. Lowe and T. Puxty (1989). Critical Perspectives in Management Control.
Macmillan, London.Dent, J. F. (1991). ‘Accounting and Organizational Cultures: A Field Study of the Emergence
of a New Organizational Reality’, Accounting, Organizations and Society, pp. 705–732.Dirsmith, M. W. and S. F. Jablonsky (1979). ‘MBO, Political Rationality and Information
Inductance’, Accounting, Organizations and Society, pp. 39–52.Drucker, P. (1964). ‘Control, Controls and Management’. In: C. P. Bonini, R. K. Jaedieke
and H. M. Wagner, Management Controls: New Directions in Basic Research, McGraw-Hill,Maidenhead.
Emmanuel, C. R. and D. T. Otley (1985). Accounting for Management Control. Van NostrandReinhold, Wokingham.
Emmanuel, C. R., D. T. Otley and K. Merchant (1990). Accounting, for Management Control(2nd edition). Chapman and Hall, London.
Ezzamel, M. and R. Watson (1993). ‘Organizational Form, Ownership Structure and Cor-porate Performance: A Contextual Empirical Analysis of UK Companies’, British Journalof Management, pp. 161–176.
Giglioni, G. B. and A. B. Bedeian (1974). ‘A Conspectus of Management Control Theory:1900–1972’, Academy of Management Journal, pp. 292–305.
Govindarajan, V. and A. K. Gupta (1985). ‘Linking Control Systems to Business Unit Strat-egy: Impact on Performance’, Accounting, Organizations and Society, pp. 51–66.
Hirst, M. K. (1981). ‘Accounting Information and the Evaluation of Subordinate Perfor-mance: A Situational Approach’, Accounting Review, pp. 771–784.
Hofstede, G. H. (1968). The Game of Budget Control. Tavistock, London.Hofstede, G. H. (1978). ‘The Poverty of Management Control Philosophy’, Academy of
Management Review, July.Hogler, R. L. and H. G. Hunt (1993). ‘Accounting and Conceptions of Control in the Amer-
ican Corporation’, British Journal of Management pp. 177–190.Hopwood, A. G. (1972). ‘An Empirical Study of the Role of Accounting Data in Performance
Evaluation’, Supplement to Journal of Accounting Research, pp. 156–193.Hopwood, A. G. (1974a). ‘Leadership Climate and the Use of Accounting Data in Perfor-
mance Appraisal’, Accounting Review, pp. 485–495.Hopwood, A. G. (1974b). Accounting and Human Behaviour. Prentice-Hall.Johnson, P. and J. Gill (1993). Management Control and Organizational Behaviour. Paul Chap-
man, London.Kaplan, R. S. (1983). ‘Measuring Manufacturing Performance: A New Challenge for Man-
agement Accountants’, Accounting Review, LVIII, pp. 686–705.Kaplan, R. S. and D. P. Norton (1992). ‘The Balanced Scorecard – Measures that Drive
Performance’, Harvard Business Review, Jan/Feb, pp. 71–79.Laughlin, R. C. (1995). ‘Empirical Research in Accounting: A Case for Middle Range
Thinking’, Accounting, Auditing and Accountability, pp. 63–87.

RESEARCH IN MANAGEMENT CONTROL 291
Laughlin, R. C. and J. Broadbent (1993). ‘Accounting and Law: Partners in the Juridificationof the Public Sector in the UK?’ Critical Perspectives on Accounting, pp. 337–368.
Laughlin and Lowe (1990). ‘A Critical Analysis of Accounting Thought: Prognosis andProspects for Understanding and Changing Accounting Systems Design’. In: Cooper,D. J. and Hopper, T. M. (eds) Critical Accounts, Macmillan, London, pp. 15–43.
Lilienfeld, R. (1978). The Rise of Systems Theory: An Ideological Analysis. Wiley, New York.Lowe, E. A. (1971). ‘On the Idea of a Management Control System: Integrating Accounting
and Management Control’, Journal of Management Studies, pp. 1–12.Lowe, E. A. and J. L. J. Machin (eds) (1983). New Perspectives in Management Control. Macmil-
lan, London.Lowe, E. A. and J. M. Mclnnes (1971). ‘Control in Socio-Economic Organizations: A Ration-
ale for the Design of Management Control Systems (Section 1)’, Journal of ManagementStudies, pp. 213–227.
Lowe, E. A. and R. W. Shaw (1968). ‘An Analysis of Managerial Biasing: Evidence from aCompany’s Budgeting Process’, Journal of Management Studies, pp. 304–315.
Machin, J. L. J. (1983). ‘Management control systems: whence and whither?’ pp. 22–42. In:E. A. Lowe and J. L. J. Machin (eds), New Perspectives in Management Control. Macmillan,London.
Macintosh, N. B. (1994). Management Accounting and Control Systems, An Organizational andBehavioural Approach. John Wiley and Sons, Chichester.
Merchant, K. A. (1985). Control in Business Organizations. Pitman, Boston.Merchant, K. A. (1987). ‘How and Why Firms Disregard the Controllability Principle’. In:
W. J. Bruns and R. Kaplan (eds), Accounting and Management: Field Study Perspectives.Harvard Business School Press, Boston.
Merchant, K. A. and R. Simons (1986). ‘Research and Control in Complex Organizations:An Overview’, Journal of Accounting Literature, pp. 183–203.
Miller, P. and T. O’Leary (1987). ‘Accounting and the Construction of the GovernablePerson’, Accounting, Organizations and Society, pp. 235–266.
Mills, A. E. (1970). ‘Management Controls and Integration at the Conceptual Level’, Journalof Management Studies, pp. 364–375.
Mintzberg, H. (1973). The Nature of Managerial Work. Harper and Row, London.Mintzberg, H. (1975). ‘The Managers Job: Folklore and Fact’, Harvard Business Review, pp.
49–61.Otley, D. T. (1978). ‘Budget Use and Managerial Performance’, Journal of Accounting Research,
pp. 122–149.Otley, D. T. (1980). ‘The Contingency Theory of Management Accounting: Achievement
and Prognosis’, Accounting, Organizations and Society, pp. 413–428.Otley, D. T. (1983). ‘Concepts of Control: The Contribution of Cybernetics and Systems
Theory to Management Control’. In: E. A. Lowe and J. L. J. Machin (eds), New Perspectivesin Management Control. Macmillan, London.
Otley, D. T. (1990). ‘Issues in Accountability and Control: Some Observations from a Studyof Colliery Accountability in the British Coal Corporation’, Management AccountingResearch, pp. 91–165.
Otley, D. T. (1994). ‘Management Control in Contemporary Organizations: Towards AWider Framework’, Management Accounting Research, pp. 289–299.
Otley, D. T. and A. J. Berry (1980). ‘Control, Organization and Accounting’, Accounting,Organizations and Society, pp. 231–244.
Otley, D. T. and A. J. Berry (1994). ‘Case Study Research in Management Accounting andControl’, Management Accounting Research, pp. 45–65.
Ouchi, W. G. (1979). ‘A Conceptual Framework for the Design of Organizational ControlSystems’, Management Science, pp. 833–848.

292 ACCOUNTING FOR MANAGERS
Parker, L. D. (1986). Developing Control Concepts in the 20th Century. Garland, New York.Perrow, C. (1970). Organizational Analysis: A Sociological View. Wadsworth, Belmont, Cali-
fornia.Prakash, P. and A. Rappaport (1977). ‘Information Inductance and its Significance for
Accounting’, Accounting, Organizations and Society, pp. 29–38.Preston, A. M. (1992). ‘The Birth of Clinical Accounting: A Study of the Emergence and
Transformation of Discourses on Costs and Practices of Accounting in US Hospitals’,Accounting, Organizations and Society, pp. 63–100.
Preston, A. M., D. J. Cooper and R. W. Coombs (1992). ‘Fabricating Budgets: A Study ofthe Production of Management Budgeting in the NHS’, Accounting, Organizations andSociety, pp. 561–594.
Rathe, A. W. (1960). ‘Management Controls in Business’. In: D. G. Malcolm and A. J. Rowe,Management Control Systems, Wiley, New York.
Rhaman, M. and A. M. McCosh (1976). ‘The Influence of Organizational and PersonalFactors on the Use of Accounting Information: An Empirical Study’, Accounting, Organi-zations and Society, pp. 339–355.
Scott, W. R. (1981). ‘Developments in Organization Theory: 1960–1980’, American BehavioralScientist, pp. 407–422.
Simmonds, K. (1981). ‘Strategic Management Accounting’, Management Accounting, 59(4),pp. 26–29.
Simon, H. A., G. Kozmetsky, H. Guetzkow and G. Tyndall (1954). Centralization vs. Decen-tralization in the Controller’s Department. Reprinted by Scholar’s Book Co., Houston(1978).
Simons, R. (1987). ‘Accounting Control Systems and Business Strategy: An EmpiricalAnalysis’, Accounting, Organizations and Society, pp. 357–374.
Simons, R. (1990). ‘The Role of Management Control Systems in Creating CompetitiveAdvantage: New Perspectives’, Accounting, Organizations and Society, pp. 127–143.
Simons, R. (1991). ‘Strategic Orientation and Top Management Attention to Control Sys-tems’, Strategic Management Journal, pp. 49–62.
Simons, R. (1995). Levers of Control. Harvard Business School Press.Thompson, J. D. (1967). Organizations in Action. McGraw-Hill, Maidenhead.Tocher, K. D. (1970). ‘Control’, Operational Research Quarterly, pp. 159–180.Vickers, G. (1965). The Art of Judgement: A Study of Policy-Making. Chapman and Hall,
London.Vickers, G. (1967). Towards a Sociology of Management. Chapman and Hall, London.Weiner, N. (1948). Cybernetics. MIT Press. Cambridge, MA.Wilson, B. (1984). Systems: Concepts, Methodologies and Applications. Wiley, Chichester.Wisdom, J. O. (1956). ‘The Hypothesis of Cybernetics’, Yearbook for the Advancement of
General Systems Theory, Vol. 1.Woodward, J. (1958). Management and Technology. HMSO, London.Woodward, J. (1965). Industrial Organization: Theory and Practice. Oxford University Press,
London.Woodward, J. and J. Rackham (1970). Industrial Organization: Behaviour and Control. Oxford
University Press, London.Wren, P. A. (1994). The Evolution of Management Thought (4th edition). Wiley, Chichester.

Reading C
Covaleski, M. A., Dirsmith, M. W. and Samuel, S. (1996). Managerial accounting research:The contributions of organizational and sociological theories. Journal of ManagementAccounting Research, 8, 1–35. Reproduced by permission of American Accounting Asso-ciation.
Questions
1 Contrast contingency theory, interpretive and critical perspectives in terms ofhow each perspective can inform an understanding of management accounting.What are the strengths and weaknesses of each paradigm?
2 What is the advantage of the ‘paradigmatic pluralism’ that Covaleski et al.promote?
3 In undertaking management accounting research in an organizational setting,how would you determine the methods of enquiry that you would adopt?
Further readingBoland, J. R. J. and Pondy, L. R. (1983). Accounting in organizations: A union of natural and
rational perspectives. Accounting, Organizations and Society, 8(2/3), 223–34.Hopper, T. and Powell, A. (1985). Making sense of research into the organizational and
social aspects of management accounting: A review of its underlying assumptions.Journal of Management Studies, 22(5), 429–65.
Lowe, T. and Puxty, T. (1989). The problems of a paradigm: A critique of the prevailingorthodoxy in management control. In W. F. Chua, T. Lowe and T. Puxty (eds), CriticalPerspectives in Management Control, London: Macmillan.
Neimark, M. and Tinker, T. (1986). The social construction of management control systems.Accounting, Organizations and Society, 11(4/5), 369–95.
Otley, D. (1989). A strategy for the development of theories in management control. InW. F. Chua, T. Lowe and T. Puxty (eds), Critical Perspectives in Management Control,London: Macmillan.


Managerial Accounting Research:The Contributions of Organizational
and Sociological Theories
Mark A. CovaleskiUniversity of Wisconsin–Madison
Mark W. DirsmithPennsylvania State University
Sajay SamuelBucknell University
Abstract
Organizational and sociological theories explicitly recognize the centrality of issuesof social control and coordination in organizations, thus providing intellectualapproaches from which to study managerial accounting as important aspects ofthe manner in which organizations and society function. This paper examines var-ious organizational and sociological perspectives which have provided meaningfulcontributions to our understanding of managerial accounting. The credibility of boththe theoretical and methodological traditions which typically underpin these alter-native organizational and sociological perspectives is then discussed. Finally, thispaper considers the unique insights which organizational and sociological theoriesoffer in contrast to more traditional managerial accounting research perspectivesfor understanding the multiple roles of management accounting in contemporaryorganizations.
Managerial accounting research, which has adapted organizational or sociologicaltheories to examine the development, maintenance and change in managerialaccounting practices, explicitly recognizes the centrality of issues of social con-trol and coordination in organizations, thus providing intellectual approachesfrom which to study managerial accounting as problematic aspects of the orga-nizational and social context. The purpose of our paper is to provide a critique
We wish to thank Anthony Hopwood (Oxford University), John Meyer (Stanford University), MikeShields (University of Memphis), and S. Mark Young (University of Southern California) for their manyuseful suggestions.
296 ACCOUNTING FOR MANAGERS
of the organizational and sociological theoretical traditions which have beenused in managerial accounting research in order to facilitate understanding,and perhaps influence usage, by accounting scholars adopting more traditionalresearch perspectives. In our effort to provide a sweeping critique of organiza-tional and sociological perspectives, rather than a detailed and nuanced treatmentof this stream of management accounting research from these theoretical per-spectives, there are points of omission, under-representation, and compression ofthe multitude of views within these theoretical traditions. And yet, it is preciselythrough such a broad treatment that we hope to reveal the distinctiveness ofthese organizational and sociological research traditions which exhibit a clusterof tendencies that distinguish it from the more familiar research traditions whichdraw on neoclassical economics and contemporary social and organizationalpsychology.1
The paper is organized into four sections. The first section addresses the con-tributions which contingency theory has had in situating managerial accountingin the control processes and structures of organizations. Contingency theory(Thompson 1967; Perrow 1967; Lawrence and Lorsch 1969) represents a rich blendof organizational theory – i.e., it has roots in the organizational decision-makingperspectives of the 1950s (Simon 1957; March and Simon 1958) – and sociologicalfunctionalist perspectives of organizations – i.e., it has roots in the sociologicalconcerns about organizational structure of the 1960s (Burns and Stalker 1961;Woodward 1965; Aiken and Hage 1966; Hickson 1966). Contingency theory tookthe insights on such critical organizational processes as decision-making and con-trol as depicted in the literature on organizational decision-making and combinedthese with sociological functionalist concerns regarding the impact of such struc-tural factors as environment, size, technology, etc., on organizational behavior.Important to both the decision-making perspective of organizations and the soci-ological concerns for organizational structure are issues of organizational controland coordination. This explicit concern for issues of coordination and control, inturn, has provided important contributions to managerial accounting research inour understanding of such issues as the design of information and control systems,budgeting and strategic planning.
The second major section of this paper deals with the various organizationaland sociological theories which concern themselves with the social construction
1 Our focus on managerial accounting research motivated by organizational and sociologicaltheories precludes this paper from addressing managerial accounting research generated fromother theoretical traditions (economic, psychological, historical); nor does our paper addresssome excellent descriptive and applied work in managerial accounting. Here our approachcomplements such recent work as that of Young and Selto (1991) whose primary concern wasto review the managerial accounting literature by topic, i.e., strategic cost accounting, productlife cycle cost management, flexible manufacturing systems, etc., while embracing a varietyof theoretical and non-theoretical work, albeit with less of an explicit focus on critiquing thetheoretical traditions. McMann and Nanni (1996) took the same approach as Young and Selto(1991), however with a more specific focus on one topic – Japanese managerial accounting. Thisexplicit focus allowed them to provide more insight on such critical subtopics as continuousimprovement, quality, target costing, etc. – with the research once again cutting across theoreticaland non-theoretical traditions, as well as across research methods.
MANAGERIAL ACCOUNTING RESEARCH 297
and spread of rationality and, in turn, the manner in which this rationalityimpacts the power and politics in organizational functioning (Weber 1947). Theseorganizational and sociological theories – often referred to as interpretive perspec-tives – also draw from the organizational decision-making perspective (Simon1957; March and Simon 1958), thus sharing intellectual heritage with contingencytheory. We also see, however, the influence of more interpretive sociologicaltraditions beginning with the work of Weber (1947) and his concerns for the‘‘politics of rationality,’’ as well as the work of Berger and Luckmann (1967) (seealso Garfinkel 1967) and their work on the social construction (the developmentof cognitive processes) and the manner which subjective meaning becomes objec-tive facts. Specifically, we examine the relevance of interpretive perspectives byconsidering a number of organizational and social theories including institutionaltheory (Meyer and Rowan 1977; DiMaggio and Powell 1983), resource dependencytheories (Pfeffer 1981), political perspectives (Edelman 1977; Wildavsky 1964), andthe sociology of professions (Abbott 1988; Freidson 1986).
The third section of this paper examines the critical organizational and soci-ological perspectives which provide an even more direct explanation of powerand politics. Perhaps the most important attribute of critical perspectives is itsattention to issues of conflict, domination and power – an attention motivatedby a theoretical backdrop of capitalist social relations, and premised upon anirreducible conflict between capital and labor which ensures perpetual antago-nistic relations between the classes. Despite theoretical differences within criticalperspectives regarding the manner and form in which to conceptualize power, acommon attribute is that they eschew a consensus view of society. These criticalperspectives argue that functionalist and interpretive views of power stipulatethat individual interests mesh into a harmony at the societal level which contrastswith the critical perspectives’ focus on presumed perpetual antagonistic relationsbetween the classes. More specifically, whether through general equilibrium ineconomics (e.g., the functionalist concern for market value) or the public good inpolitics (the interpretive concerns for the negotiation and bargaining), the socialinterest is assumed to emerge from the interaction of individual interests. In sharpcontrast, critical perspectives deal explicitly with the role that accounting plays inrelation to issues of conflict, domination and power as defined by the presumedirreducible conflict between capital and labor (Cooper and Sherer 1984). Herewe will confine our attention to two major research strands of the many criticalperspectives that have illuminated our understanding of managerial accounting:labor process theory which is concerned with the extraction of surplus fromlaborers (e.g., Hopper et al. 1987; Hopper and Armstrong 1991), and the Fou-caultian perspective which is concerned with the methods by which the actionsof individuals are made visible and susceptible to discipline and control, therebyrendering the individual to be governed (e.g., Miller and O’Leary 1987; Walsh andStewart 1993).
The fourth section of the paper offers concluding remarks in which we con-sider the relationship among the three dominant organizational and sociologicalperspectives considered in this paper, as well as their relationship to moreorthodox, neoclassical, and social and organizational psychology perspectives of

298 ACCOUNTING FOR MANAGERS
managerial accounting with a focus on the issue as to whether these various per-spectives can be meaningfully blended, or whether a ‘‘champion’’ perspective mayemerge. This section also addresses issues pertaining to assessing the credibilityof the field-based research methods commonly (but not necessarily) utilized inthese alternative theoretical traditions.2 Finally, this section considers the uniquecontributions that the different organizational and sociological theories may makebeyond those offered by more traditional approaches.
Contingency theory
Contingency theory has provided considerable inspiration to managerial account-ing researchers through an elaboration of the basic theme that ‘‘tight’’ controlsystems should be used in centralized organizations faced with simple technol-ogy and stable task environments; ‘‘loose’’ control systems should be used indecentralized organizations, presumably faced with dynamic, complex task envi-ronments. Furthermore, a given means of control such as embedded in managerialaccounting information can only be understood through reference to other controlapproaches used in organizations as well as their organizational/task environmentcontext. For example, budgets may take on important meaning both for planningand control purposes for work processes or product lines which are more rou-tine, standardized and predictable. However, in situations where the processes orproduct lines are less routine, less standardized and less predictable, the budgetsmay be generated but are subject to much revision and are of little use as a controlbenchmark (Swieringa and Moncur 1975). Contingency theory is essentially a the-oretical perspective of organizational behavior that emphasizes how contingentfactors such as technology and the task environment affected the design and func-tioning of organizations. For example, Thompson’s (1967) Organizations in Actionattempted to link task environment and technological contingencies to variousorganizational arrangements, focusing particularly on the different mechanismsof coordination which were appropriate for more complex, dynamic technologiesand task environmental conditions. Perrow’s (1967) theory of technology focusedon the congruence between different types of technologies and organizationalarrangements, emphasizing that more flexible, loosely-structured arrangementswere more appropriate for organizations with non-routine technologies, whilejust the opposite type of organizational arrangements were more likely to fitroutine technologies. Lawrence and Lorsch’s (1969) Organizations and Environmentdeveloped, in a related manner the fit between organizational arrangements,
2 Our paper is primarily organized along theoretical traditions, thus cutting across method-ological approaches including fieldwork, surveys, lab experiments, etc., without a particularintent to critique the use of these various methods. In this sense, our paper complements therecent work of Keating (1995) who examined management accounting research in terms ofmethodology – focusing exclusively on case research in managerial accounting with the intent ofproviding an in-depth review of case research as a methodology – without a particular concernto critique the theoretical traditions which motivate these research studies.

MANAGERIAL ACCOUNTING RESEARCH 299
including mechanisms of social control and coordination, and environments oforganizations.
The sociological tradition embedded in contingency theory developed dur-ing the 1960s through various ‘‘structural’’ approaches to organizational studies(Woodward 1965; Aiken and Hage 1966; Hage and Aiken 1967; Blau 1970, 1973;Hickson 1966; Child 1972; Pugh et al. 1968). These studies suggested that orga-nizations’ structures are contingent upon contextual factors which have beenvariously defined to include technology (Woodward 1965), dimensions of taskenvironment (Burns and Stalker 1961), and organizational size (Pugh et al. 1969;Blau 1970). These contextual factors are hypothesized to influence dimensions ofstructure including the degree of formalization, specialization, differentiation andbureaucratization. Discussions of social control and coordination were sometimeselicited to explain some of the observed relationships among structural properties,but, by and large, were not of a central importance.
Not all functionalist theories of organizations developed during this periodpresented such static images of organizations. Contingency frameworks, forexample, drew directly from these sociological functionalist theories of orga-nization structure, while also using March and Simon’s (1958) organizationaldecision-making perspective. March and Simon (1958) developed a complexmacro-perspective of organizations that viewed them as flexible, loosely-coupledsystems in which human choice and voluntarism, and hence unpredictability,were major characteristics. The very essence of this decision-making perspectiveheld that decision-makers in organizations are unlikely in most circumstances tohave the information they need and want, and therefore, that many if not mostdecisions are made under conditions of uncertainty. In short, the primary con-cern of the organizational decision-making perspective is for the treatment of theproblematic ‘‘boundedly rational’’ person which, in turn, is the core legacy passedonto contingency theory as it seeks to provide insight as to this boundedly rationaldecision-maker in relation to the various contingent contextual factors (technology,environment, etc.) as suggested by the sociological structural perspectives.
March and Simon’s (1958) depiction of the organizational decision-maker undersuch conditions of uncertainty was influenced by an earlier organizational theorytradition: the ‘‘human relations’’ approach to organizational analysis as developedin the work of Mayo (1933) and more concretely articulated by Barnard’s (1938)seminal work, The Functions of the Executive. Perhaps the fundamental insight ofthis human relations approach in terms of its contribution to the organizationaldecision-making of March and Simon (1958), and eventually the contingencytheory perspective, was that social and psychological attitudes were significantfactors to be considered in the design of production processes and its related controlsystems. The human relations approach, in turn, extended the early scientific man-agement work of Frederick W. Taylor was concerned with the rationalization ofwork in order to maximize efficiency and productivity and, hence, profits. Scientificmanagement ushered in the monitoring of the individual worker, but ultimatelycontributed to the monitoring of work units within organizations as well. Thefascinating issue which the human relations perspective brought forth (as com-pared to earlier scientific management work) and pervades through contingency

300 ACCOUNTING FOR MANAGERS
theory was the depiction of corporations existing in a tentative equilibrium whichis inherently fragile, short lived and ever subject to a complex of personal, social,physical and biological destructive forces (Miller and O’Leary 1989). As Miller andO’Leary (1989) argued, it was axiomatic for the human relations perspective thatall organizations are founded on self-interest and a contractual principle; this isthe core reason that they are so fragile. This characterization of the organizationsfounded on self-interest and contractual principles becomes a major thrust of theorganizational decision-making perspective as articulated in the work of Marchand Simon (1958) but also in the related work of Simon (1957) and the later workof Cyert and March (1963) and March and Olsen (1976).
In summary, March and Simon (1958) and the organizational decision-makingperspective started with an image of human behavior and individual decision-making that was considerably more complex than the human relations perspectivethat had preceded them, but nonetheless, reflected a common concern for themanaging of the organization. In turn, contingency theory blended the insightson human behavior and individual decision-making as depicted in March andSimon’s (1958) organizational decision-making perspective with the sociologicalfunctionalist concerns regarding the impact of such structural factors as environ-ment, size, technology, etc., on organizational behavior. Important in this lineageof work were issues of organizational control and coordination which are sogermane to managerial accounting research.
Traditional management accounting research which has been based in thecontingency literature (as well as its predecessors – organizational decision-making, human relations and scientific management) suggests that managerialaccounting information should reflect and promote rationality in decision-making.Accordingly, management accounting information used by managers serves as aquantitative expressions of organizational goals and are used to support rationaldecision-making (Ijiri 1965). The prescriptive character of managerial accountinginformation espoused by this traditional school of thought is essentially internaland downward and also prescriptive in character (Anthony 1965), thus reflectingthe strong scientific management heritage, albeit later becoming more complexwhen sociological and psychological as well as structural factors are brought in.3
3 Caplan (1971, 13) identifies scientific management as providing the basis for the ‘‘TraditionalManagement Accounting of the Firm’’ where the accounting system is assumed to be neutral andrational as it serves as ‘‘. . . a control device which permits management to identify and correctundesirable performance.’’ In contrast, entitling the human relations tradition as ‘‘The ModernOrganizational Theory Model,’’ Caplan (1971, 43) defined management accounting issues comingfrom this perspective as being concerned with social and psychological factors as stated in histerms, the ‘‘. . . the interaction of the accounting technique of the individual to be controlled.’’Both of these functionalist perspectives are precursors to contingency theory and reflect work inmanagerial accounting research much earlier than contingency theory. For example, the humanrelations tradition is the intellectual basis for the classic work of Argyris (1952) who found thatbudgetee participation in the budgetary process tends to foster fuller and more robust control overbudgetees. He suggested that genuine participation in the budget process as a remedy to negativebudget attitudes at lower levels (also see Hopwood (1973) as to the importance of budgetaryparticipation in the behavioral attitudes of employees). Through this initial work of Argyris (1952)

MANAGERIAL ACCOUNTING RESEARCH 301
Among the earliest managerial accounting research which adopted a contin-gency perspective was Hofstede’s (1967) classic field work which found thateconomic, technological and sociological considerations have a significant impacton the way budgeting systems function, concluding that managers used budgetaryinformation in difficult economic environments to pressure workers; but in morelucrative environments, the budget was used more in a problem solving mode.Golembiewski (1964) was also among the earliest to explicitly examine variousaspects of organizational structure in relationship to the use of budgets. In this tra-dition, Hayes (1977) investigated the appropriateness of management accountingsystems for measuring the effectiveness of different departments in large industrialorganizations, finding that contingency factors proved to be the major predictorsof effectiveness for production departments. Extending this theme, Hirst (1981,1983) examined external control factors such as environmental uncertainty andtheir impact on the reliance on accounting measures of performance.
In applying contingency theories to control systems design, some researchershave sought to uncover direct relationships between these contextual factorsand organizations’ accounting and information systems (Khandwalla 1972). Tech-nology also was specifically introduced as a major explanatory variable of aneffective accounting information system by Daft and MacIntosh (1981). Othershave articulated more subtle relationships between contextual factors, structuralcharacteristics, and control system design (Gordon and Miller 1976; Waterhouseand Tiessen 1978). For example, Gordon and Miller (1976) hypothesized thataccounting information systems could be designed to cope with environmentaluncertainty by incorporating more nonfinancial data, increasing reporting fre-quency, and tailoring systems to local needs (see also MacIntosh 1981; Ansari1977). Dent’s (1987) focus was on the design of formal control systems in com-plex organizations, being concerned with the question of appropriate contingencyprinciples underlying the design of such systems.
accounting researchers have adapted this human relations approach and have been concernedwith modifying and assessing the effects of budgetary participation. This research traditionadvocated bringing managers into the budgetary process with the objective of exercising fullerand more robust control over them (Stedry 1960; Becker and Green 1962). Further extensions ofthis human relations research tradition which eventually led into contingency theory includedSchiff and Lewin’s (1970) analysis of the budget process, which identified the dysfunctionalaspects of participative budgeting in terms of using it to create organizational slack. Swieringaand Moncur’s (1975) study found self-assurance and assertiveness to be the most importantpredictors of how managers achieve their budget and how influential they are in the budgetingprocess. Otley (1978) studied the use of financial control systems in a coal mining firm andobserved that consideration on the part of the immediate superior may be a moderating factor.Otley’s (1978, 143) findings suggested that a non-considerate, non-supportive leadership stylecombined with high emphasis on budget performance, was primarily ‘‘punitive in its ethos andmay have a net result that is counterproductive.’’ Finally, Brownell (1981, 1982) also examinedthe influence of personality as a moderating factor in the budgetary participation process. Insummary of the human relations tradition, research pertaining to managerial accounting suggeststhat personality traits, participative budgeting patterns, and other psychological and sociologicalfactors are important issues to consider in the design of information systems (Milani 1975; Collins1978). This managerial accounting research tradition eventually included consideration of thestructural factors espoused in contingency theory.

302 ACCOUNTING FOR MANAGERS
More recently, accounting researchers have sought to extend contingencyarguments to embrace relationships between firms’ strategies and the designof their control systems (see Govindarajan and Gupta 1985; Merchant 1985;Simons 1987). For example, Kaplan (1983) reasoned that managerial accountinghas served business inadequately; it has become overly simplistic, structured andmisdirected. He urged a close scrutiny of organizational activity of successfulorganizations so that the managerial accounting systems adopted accuratelyreflect the complex conditions confronting contemporary organizations. Merchant(1981, 1984, 1985) found contingent relationships between corporate context (size,product diversity and extent of decentralization) and the uses of budgetinginformation. Govindarajan (1984, 1988) found environmental uncertainty to bea major explanatory variable regarding the appropriateness of accounting datain evaluating the performance of business units. Govindarajan and Gupta (1985)extended the concern for contingency relationships between organizational controlmechanisms and variables such as technology, environment and size, by exploringthe utility of relating these contingency relationships to strategy, where the utilityof a particular incentive bonus system is contingent upon the strategy of thefocal strategic bonus unit. The work of Shank (1989) and Simons (1987) alsoare important research efforts which mobilized contingency principles in theexamination of the use of managerial accounting systems and information in astrategic manner.
Reflecting concerns for the role of managerial accounting information in con-temporary organizations, the work of McNair and Mosconi (1988) and McNairet al. (1989) also reflects an implicit contingency tradition, finding that changes intechnologies are accompanied by changes in performance management systems.Furthermore, McNair’s group (McNair and Mosconi 1988; McNair et al. 1989)found that actual costs have begun to replace standards in JIT environmentsbecause of the ability to trace costs more easily and because of the more simplifiedmanufacturing process. On this point, Foster and Gupta (1990) provided a crosssectional comparison of manufacturing plants in an electronics firm, arguing thatcontingency variables (size and complexity of cost drivers) affect manufacturingoverhead. Patell’s (1987) longitudinal study of JIT implementation and changes incost accounting procedures also highlighted the importance of contingency struc-tural factors in the coordination problems of many new manufacturing operationswith regards to information for control and evaluation. The impact of structuralfactors is also apparent in the work of Banker et al. (1991) who found that firms thathave implemented JIT or other teamwork programs are more likely to providemanufacturing performance information to shop-floor workers. A contingencytheme underlies Young’s (1992) work which raises the intriguing issue that powershifting can occur within the organization as a result of the implementation ofJIT. Here it is argued that workers are given much more power under JIT thanmanagement may realize (i.e., a workers’ strike could cripple them) because of thetight coupling that takes place (see Wilkinson and Oliver 1989). Finally, Selto et al.(1995) provided a rather comprehensive contingency perspective of the adaptationof JIT manufacturing and a total quality control system (JIT/TQC system) whenthey considered JIT in relationship to classical contingency theory constructs,

MANAGERIAL ACCOUNTING RESEARCH 303
organizational structure, context and control to get some sense of the fit of theseorganizational variables and the JIT system. Drawing from Drazin and Van deVen’s (1985) review of the extensive contingency literature, Selto et al. (1995) foundcontingency theory to have intuitive appeal in understanding broad issues ofmanagement controls, but also argued that the extensive interaction of variablesas well as continuous changes in organizations would make it difficult to applycontingency theory.
The influence of contingency theory and its precursor theoretical traditions onmanagerial accounting research, however, have been criticized for presenting adeterministic, ahistorical view of organizations which provides limited insight as tothe mediating processes of organizations. Among the earlier critiques of the appli-cation of contingency theory in managerial accounting, Otley (1980) observed thatreliance tended to be placed on a relatively few number of very general variables,task environment and structure, which, in turn, were used to explain organizationstructure and design of managerial accounting systems. He argued that thesevariables tended to be ill-defined and measured, and were not comparable acrossearlier accounting studies, thus yielding fragmented results. Further, the proposalthat the link between accounting systems design and organizational effectivenesswas far from proven, Otley (1980) concluded that there remained a need to imbedaccounting systems in the overall package of organizational control approaches,to develop more nuanced expressions of organizational effectiveness, and in gen-eral to move to a more complex expression of the contingency framework. Also,he observed that many of the issues relating to the development of accountingsystems, and the relationships with the organization’s differentiated environment,were political as opposed to technical in nature, and urged the application of afield study approach to examine these issues.
Interpretive perspectives
By focusing on the management of complex relational networks and the exercise ofcoordination and control, contingency theory has adhered to the strong influenceof the classical sociological functionalist perspectives (Durkheim 1938) at thecost of neglecting alternative sociological theories such as expressed in the workof Weber (1947, 1958, 1964) whose primary concern was with the source offormal structure: the legitimacy of rationalized formal structures. In contingencytheory, legitimacy is given; assertions about bureaucratization such as the role ofmanagerial accounting practices and information systems rest on the assumptionsof norms of rationality. When such norms do play causal roles in theories ofbureaucratization, it is because they are thought to be built into modern societiesand organizations as very general values, which are thought to facilitate formalorganization. But norms of rationality are not simply general values. They existin much more specific and powerful ways in the rules, understandings andmeanings attached to institutionalized social structures. The causal importance ofsuch institutions has been neglected. According to Meyer and Rowan (1977, 343):
304 ACCOUNTING FOR MANAGERS
Formal structures are not only the result of their relational network in thesocial organization . . . [t]he elements of rationalized formal structure arealso deeply ingrained in, and reflect, widespread understandings of socialreality. . . . Such elements of formal structure are manifestations of powerfulinstitutional rules which function as highly rationalized myths that arebinding on particular organizations.
Strands of this Weberian sociological tradition are embedded in March andSimon’s (1958) organizational decision-making model which provides a key con-tribution in its focus on the routine, taken-for-granted aspects of organizational life.Traces of a cognitive orientation in Weber’s theory of bureaucracy – his emphasison the role of calculable rules in reducing uncertainty and rationalizing powerrelations – are apparent in the richness of March and Simon’s (1958) decision-making model where they urged a focus on understanding the initiation andpreservation of power relationships on two fronts: (1) the power to set premisesand define the norms and standards that shape and channel behavior; and (2) thepower to delimit appropriate models of bureaucratic structure and policy thatgo unquestioned for years. Weber’s concern was to understand the dominance oforganizations and their forms of rationality upon society’s technical, economic andpolitical forms of life. Weber reasoned that rationalization is concerned not onlywith the long-term process of social structure transformation, but simultaneouslyand more importantly, the perpetuation of existing power relations concealed inthe advancement of rational imperatives. Thus, the critical issue is the politics ofrationality itself.
This concern for the power and politics of rationality is inherent in otherinterpretive sociological work such as Berger and Luckmann’s (1967). The SocialConstruction of Reality, in which they reasoned that the central question forsociological theory is: How is it possible that subjective meanings become objectivefacts? Berger and Luckmann’s (1967) argument is that social order is basedfundamentally on a shared social reality which, in turn, is a human construction,being created in social interaction. The process by which actions become repeatedover time and are assigned similar meanings by self and others is definedas institutionalization. Further, Berger and Luckmann (1967) emphasized theimportance of employing an historical approach, arguing that it is impossible tounderstand an institution adequately without an understanding of the historicalprocesses in which it was produced. The result is the paradox ‘‘that man is capableof producing a world that he then experiences as something other than a humanproduct’’ (Berger and Luckmann 1967, 61). Similarly, Garfinkel (1967) developedan approach to social investigation, ethnomethodology, which shifted the imageof cognition from a rational, discursive, quasiscientific process to one that operateslargely beneath the level of consciousness, a routine and conventional practicalreason governed by rules that are recognized only when they are breached. Tothis he added a perspective on interaction that casts doubts on the importanceof normative or cognitive consensus. Here Garfinkel (1967) argued that action islargely scripted and justified, after the fact, by reference to a stock of culturallyavailable legitimating accounts.

MANAGERIAL ACCOUNTING RESEARCH 305
Interpretive perspectives, and their underlying concerns pertaining to the cog-nitive decision-making issues of the organizational decision-making model, theWeberian concern for the politics of rationality, and the ethnomethodologicalconcerns for the construction of social reality, have perhaps been most forcefullydeveloped within institutional theory. Following Selznick’s (1957, 17) definition‘‘. . . to institutionalize is to infuse with value beyond the technical requirementsof the task at hand,’’ the general theme of the institutional perspective is that anorganization’s survival requires it to conform to social norms of acceptable behav-ior as much as to achieve levels of production efficiency. Among the sociologistswhose work reflected the Weberian tradition, Selznick (1957) viewed organiza-tional structure as an adaptive vehicle shaped in reaction to the characteristicsand commitments of participants as well as to influences and constraints fromthe external environment. Institutionalization refers to this adaptive process: theprocesses by which societal expectations of appropriate organizational form andbehavior come to take on rule-like status in social thought and action. In particular,institutional theory extends beyond the focus of contingency theory on an orga-nization’s task environment, which has received much attention in managerialaccounting research, to instead focus on its institutional environment. Accordingto Scott (1987, 507):
Until the introduction of institutional conceptualizations, organizations wereviewed as being shaped largely by their technologies, their transactions, orthe power-dependency relations growing out of such interdependencies.Environments were conceived of as task environments . . . While such viewsare not wrong, they are clearly incomplete. Institutional theorists havedirected attention to the importance of symbolic aspects of organizations andtheir environments. They reflect and advance a growing awareness that noorganization is just a technical system and that many organizations are notprimarily technical systems. All social systems, hence all organizations, existin an institutional environment that defines and delimits social reality.
The general theme of the institutional perspective is that an organization’ssurvival requires it to conform to social norms of acceptable behavior as muchas to achieve high levels of production efficiency. Thus, many aspects of anorganization’s formal structure, policies and procedures serve to demonstrate aconformity with institutionalized rules, thereby legitimizing it, to assist in gainingsociety’s continued support (Meyer and Rowan 1977; Scott 1987; DiMaggio andPowell 1983, 1991). Meyer and Rowan (1977) proposed that such externallylegitimated, formal assessment criteria as managerial accounting information playa heightened though ritualistic role in a variety of settings as organizations gropeto find, conform to, and demonstrate for their internal and external constituentssome form of rationality in order to gain legitimacy. Thus, rather than merelyrepresenting some notion of an objective reality, managerial accounting mayserve as a ceremonial means for symbolically demonstrating an organization’scommitment to a rational course of action. Here accountants gain their power bythe responsible development and application of generally legitimated categories.Similarly, Zucker (1977) argued that the rationalization in formal control systems is

306 ACCOUNTING FOR MANAGERS
an important part of a network of political and power relations which are built intothe fabric of social life, a process of transforming the moral into the merely factual.
Covaleski and Dirsmith (1988a, 1988b) adopted an institutional perspectiveto examine the manner in which societal expectations of acceptable budgetarypractices are articulated, enforced and modified during a period of organizationaldecline. They examined a large university system’s budgeting process both throughextensive archival documents and through in-depth interview with budgetaryactors (see also Covaleski and Dirsmith 1983, 1986 for work pertaining to healthcare settings). Covaleski and Dirsmith (1988a, 1988b) followed a university budgetcategory through periods of ascent, transformation and decline, describing theprocess of how a university challenged and rejected a traditional institutionalizedbudgetary framework for allocating state funding when this framework becameinconsistent with the university’s goals and interests. Self-interest is foremost inthe minds of the various parties who propose, oppose, co-opt and contest thebudget category. Covaleski and Dirsmith (1988a, 1988b) show how conflictinginterests get couched in the common and legitimate language of budgeting, thusconcluding that the budgetary process is an important manner in which societalexpectations are reproduced.
Ansari and Euske (1987) also drew from institutional theory to examine therole of accounting information in the public sector, identifying this role in termsof documenting institutional compliance, i.e., seeking external legitimation ormasking underlying sociopolitical reality. Ansari and Euske (1987) examinedthe manner in which cost information is used in the Department of Defense,finding disparity between the formally stated objective of the system to improveorganization efficiency, and the lack of accounting system use for this purpose. Theauthors drew from an institutional perspective to explain the use of accountinginformation in the Department of Defense, in the light of this agency havingambiguous missions that foster rationalizing uses of accounting information.
Mezias (1990) examined the financial reporting practices of the Fortune 200and concluded that the institutional model adds significant explanatory powerover and above the models that currently dominate the applied economics lit-erature. Recognizing the institutional work that has been done pertaining to theaccounting practices of not-for-profit organizations, Mezias (1990) studied rela-tionships between institutional variables and the financial reporting practices usedby for-profit organizations. Mezias and Scarselletta (1994) extended this work byexamining the decision process of a public policy task force that plays a role inestablishing financial reporting standards to determine the affects of the kinds ofdecisions made. Drawing upon institutional theory, this study modeled the deci-sion process as an organized anarchy embedded in a larger institutional contextof accounting.
In summary, Carruthers (1995) argued that institutionalism views accountingpractices as one of a larger set of features that can legitimize organizations throughthe construction of an appearance of rationality and efficiency. As Carruthers (1995,326) stated, ‘‘Accounts are the quintessential rationalized myth, and it is surprisingthat new institutionalists have not devoted more time to studying them.’’ Perhapsthe single most important contribution of institutional theorists to the study of

MANAGERIAL ACCOUNTING RESEARCH 307
organizations is their reconceptualization of the environments of organizations.Earlier organizational and sociological models had emphasized technical facets.Meyer and Rowan’s (1977) work, however, called attention to a neglected facetof environments: institutional beliefs, rules and roles – symbolic elements capableof affecting organizational forms independent of resource flows and technicalrequirements. They emphasized (drawing from Berger and Luckmann 1967;Garfinkel 1967) that shared cognitive systems, although created in interactionby humans, come to be viewed as objectified and external structures definingsocial reality. This is an ethnomethodological view of human action as shaped byconventions, built up by participants in the course of interactions to the point thatmuch behavior takes on a taken-for-granted quality. The more institutionalizedthe cognitive categories and belief systems, the more human actions are definedby a widening sphere of taken-for-granted routines (Weber 1947).
Reflecting a theme similar to institutional theory, resource dependency theo-rists argue that organizations are limited by a variety of external pressures (Pfefferand Salancik 1978; Pfeffer 1981), that environments are collectivities and inter-connected, and that organizations must be responsive to external demands andexpectations in order to survive. Resource dependency theorists also suggest thatorganizations attempt to obtain stability and legitimacy, and that organizationalstability is achieved through the exercise of power or control for purposes ofachieving a predictable inflow of vital resources and reducing environmentaluncertainty (Oliver 1991). In this tradition, Weick (1976) stated that the chiefresponsibilities of organizational administrators are to provide a common lan-guage from which to reaffirm and solidify ties with outsiders through symbolmanagement, consistent articulation of a common vision, and interpretation ofdiverse actions in terms of common themes. In like manner, Burns (1986) observedthat such ‘‘rule systems’’ as formal control systems, rather than being neutral ormerely technical in nature, constitute power resources that actors use in advo-cating organizational structural forms which serve their own interests. On thistheme, Boland and Pondy’s (1983, 1986) accounting studies highlight the cere-monial, seemingly irrational, aspects of resource allocation activities where, forexample, they found that in a university case, the budget provided a context forstate agencies to exercise their legitimate authority in allocating funds to particularpriorities. At the same time the underlying flexibility was such that funds couldbe diverted from one program to another at will. In short, resource dependencytheorists also have placed a strong emphasis on the role of political language,particularly in budgeting processes.
Generally, the resource dependency tradition has recognized that budgeting isclosely linked with power, self-interest and political advocacy in contemporaryorganizations (Pfeffer and Salancik 1974, 1978; Salancik and Pfeffer 1974; Rose 1977;Pfeffer 1981; Schick 1985). More specifically, self-interest and internal power andpolitics, actively expressed, for example, through budgeting systems, have beenfound to play heightened roles during periods of organizational decline in termsof resource allocation decisions made within organizations, possibly so that theorganization maintains some semblance of subunit harmony (Hackman 1985; Hillsand Mahoney 1978; Gray and Ariss 1985). In addition, not only do organizations

308 ACCOUNTING FOR MANAGERS
appear to use budgeting in a political mode to allocate resources internally, butthe visibility of these internal budgetary allocations to external constituents alsoappears to influence the generation of resources (Hackman 1985). This dual roleof budgeting in generating and allocating resources suggests an expanded linkagebetween the values of external constituents and the internal resource needs anduses of an individual organization, most particularly in times of financial stress.
Cyert and March (1963) have defined budgets as both the substance and resultof political bargaining processes that are useful for legitimizing and maintainingsystems of power and control within organizations. Similarly, Pfeffer (1981) arguedthat a particularly effective way of influencing resource allocation decisions is todo it as unobtrusively as possible, such as through the apparently objectivemechanism of the budgetary process which tends to legitimate subjective andpolitical decision-making processes (see also Pfeffer and Salancik 1974, 1978).Here, according to Hopwood (1974), the trivial, dull, seemingly objective natureof accounting enables it to be used in taking the debatable out of the realm of opendebate and into the realm of calculation. Consequently, these theorists consideredmanagerial accounting information such as budgeting as a socially constructedphenomenon rather than a technically rational function driven by and serving theinternal operations of organizations. Moreover, these perspectives recognized thatonce implemented, what a budgeting system accounts for shapes organizationalmembers’ views of what is important and, more radically, what constitutes reality.Budgeting, then, has been implicated in the construction of social reality ratherthan being the passive mirror of a technical reality. On this point, Pfeffer (1981,184) concluded:
[t]he task of political language and symbolic activity is to rationalize andjustify decisions that are largely a result of power and influence, in order tomake these results acceptable and legitimate in the organization.
Regarding the political perspective of budgeting, Wildavsky (1964, 1975, 1979)long argued that budgeting systems achieve many purposes beyond control, thatthey are at once forms and sources of power, and that they serve both the guardiansof scarce resources and the advocates of budgetary units. Wildavsky also reasonedthat inherently conflictual organizations may use budgets in establishing andmaintaining existing power relations as opposed to serving decision-making andproblem solving directly in a technically rational manner. Instead, he argued,decision-making and problem solving are served by the sometimes asymmetricalpolitical confrontation between budgeters and budgetees. Wildavsky concludedthat the political nature of budgeting may well be inherent in complex organiza-tional life, and is not an aberrant defect in budgetary practice. Resource allocation,he suggests, is not the consequence of dispassionate analysis, but emerges througha subtle role of advocates and guardians. Building on Wildavsky’s analysis, Jons-son (1982) sought to capture some of the implicit political dynamics by followingthe way in which the budgetary process unfolded over three years in a Swedishmunicipality in a time of financial stringency.
Edelman’s (1977) broader political view and his concern for probing the consentof the governed in American politics also reflects concern for the significance
MANAGERIAL ACCOUNTING RESEARCH 309
of power and language. He argued that power relationships are seen as beingreflected in daily life through the use of language, myths and symbolic displaysdirected at maintaining the status quo. Viewed as a form of language, quantitativedata is selectively deployed by the state not to reflect underlying economicconditions, but to create public values, acquiescence and support. As Edelman(1977, 58) observed:
Language is always an intrinsic part of some particular social situation; itis never an independent instrument or simply a tool for description. Bynaively perceiving it as a tool, we mask its profound part in creating socialrelationships and in evoking the roles and the selves of those involved in therelationships.
Consent of the governed, then, comes about not from the conscious acceptanceof rules of procedure, but as acquiescence to and taking for granted an acceptedlanguage, thus at once creating and supporting a hierarchical relationship betweenthe governed and the state. Always cloaked in the appearance of objectivityand neutrality, this language is ultimately directed toward establishing andmaintaining hierarchies of authority and status (Clegg 1987). This acceptablediscourse, such as accounting information, is always an intrinsic part of someparticular social situation; it is never an independent instrument or simply a toolto be assessed for such attributes as its representational faithfulness. On this point,Scott (1987, 509) emphasized that:
Outcomes will . . . be strongly shaped by the agents’ differential ability tolay successful claim to the normative and cognitive facets of the politicalprocesses: those identified by such concepts as authority, legitimacy, andsovereignty.
Finally, Abbott’s (1988) work on professions can be meaningfully integratedinto the concern of interpretive perspectives. Here Abbott has observed both thatthe professions seek to legitimize themselves to society by attaching their expertiseto the widely held values of rationality, efficiency and science, and that a key char-acteristic lies in the use of power both externally to preserve an abstract system ofknowledge and, more importantly, internally in terms of hierarchical stratificationand differentiation (see also Sarfatti-Larson 1977). Joining Abbott in recognizingthe importance of power, Freidson (1986) alluded to a decoupling between theadministrative or formalized and structurally oriented component of professionalbureaucracies and the practitioner component comprised of those possessingand using internalized values and norms. Objectivity, having a close associationwith scientific endeavor, encodes expertise in an organizational structure andaway from individuals (Freidson 1986; Abbott 1988). Both authors pointed to thenecessity of conducting research at the micro-level of everyday practitioner expe-rience, where self-interest may come into play, in order to understand professionalendeavor. Abbott (1988) lamented that insufficient attention has been directed atstudying professionals, not as freestanding autonomous agents, but as members oforganizations, particularly for professions arising out of a commercial enterprise

310 ACCOUNTING FOR MANAGERS
such as accounting. Abbott’s (1988, 226–235) findings suggest that in the earlytwentieth century, U.S. engineers battled accountants for professional jurisdictionover the growing volume of quantitative work associated with corporations; abattle won by the accountants who won control and established a professionalmonopoly (Loft 1986; see also Armstrong 1985).
In summary, interpretive perspectives of managerial accounting and organi-zations take issue with the assumption of an objective reality, arguing that theimplementation of such apparently rational, bureaucratic mechanisms as manage-rial accounting systems is one manner in which the social world flows throughorganizations and changes them. These theorists have begun to see managerialaccounting practices and information as socially constructed phenomena withthe full implications of the power and politics of social construction rather thanas a technically rational function driven by and serving the internal opera-tions of organizations. Furthermore, these interpretive perspectives recognize thatonce managerial accounting practices and information are implemented, what itaccounts for shapes organizational members’ views of what is important and,more radically, what constitutes reality. Managerial accounting, then, is seen asbeing implicated in the social construction of reality rather than as being passivelyreflective of the reality as depicted in contingency theory and its predecessors.
Although the thrust of the interpretive perspectives in general and institutionaltheory in particular have received a growing amount of empirical support, a num-ber of useful criticisms of them have been offered. DiMaggio (1988), for example,suggested that an apparent paradox resides in the two senses in which theoristshave used the term ‘‘institutionalization.’’ Institutionalization as an outcome placessocietal expectations and organizational structures and practices beyond the reachof power and self-interest; expectations of acceptable practice merely exist and aretaken for granted (Perrow 1985; Powell 1985). By contrast, institutionalization asa process may be profoundly political and reflects the relative power of organizedinterests (see also Tolbert 1988; DiMaggio and Powell 1991). Within this concernfor institutionalization as a process, the major problem in institutionalized settingscan be defined in terms of finding some mechanism that can be mobilized byinterested actors to change an overly stable social system (DiMaggio 1988), orin terms of finding some process wherein social order is produced in a systemwhere organizations are constantly eroding (Zucker 1988). Regarding power andgroup interest, DiMaggio (1988) has observed that institutional and interest-basedexplanations of organizational practices are not necessarily antagonistic to oneanother, but combined, may yield a more comprehensive theoretical apparatusfor gaining insight into the social dynamics of organizations. He concluded thatallusions to power and group interests tend to be smuggled into the institutionalperspective rather than provide the focus of a sustained theoretical analysis.
Critical perspectives
Since the early 1980s an increasing number of researchers have begun to adoptdiverse critical perspectives to explore and investigate the roles of accounting

MANAGERIAL ACCOUNTING RESEARCH 311
practices in society. These critical perspectives in accounting research are markedby a great deal of intellectual ferment evident in the different theoretical approachesand methodologies deployed and the wide range of topics and issues addressed.Accordingly, in the light of such heterogeneity and the constraints of space, ourintent is to provide a flavor of these alternative accounting research agendaswithout claiming to be exhaustive.4
Classifying these heterogeneous theoretical stances as ‘‘critical perspectives,’’in contrast to the functionalist and interpretative traditions explored above, canbe justified by their singular attention to the interrelation between accountingand issues of conflict, domination and power. Despite the theoretical differenceswithin the different strands of the critical perspectives regarding the manner andform in which to conceptualize power, they all avoid a consensus view of societythat is the hallmark of both the functional and interpretive perspectives.
It may be argued that power, in both the functional and interpretive perspec-tives, is formulated as if it were a possession belonging to someone which heor she exercises for individual gain and further, that this power is diffused oversociety in a manner as to preclude the sustained and systematic negation of anyindividuals’ preferences (Alford and Friedland 1985). In sharp contrast, this indi-vidualist basis of power and ultimately consensus view of society is eschewed bythe critical perspectives which attempt to deal explicitly with conflict, dominationand power (Cooper and Sherer 1984). For example, rather than treating variousmanagerial accounting practices as a response to transaction costs considerationsas in Johnson and Kaplan (1987) or agency cost considerations as in Christensen(1983), they are treated as modes by which the extraction of labor from laborersis made possible (Hopper and Armstrong 1991) and as methods by which theactions of individuals are made visible and susceptible to greater discipline andcontrol (Hoskins and Macve 1988, Miller and O’Leary 1987). Accordingly, classconflict, the hegemony of elites, and the power of experts and professionals aresome of the elements that the critical perspectives systematically foreground (notall such analyses incorporate all of these emphases) in their attempt to understandaccounting practices.
Despite the theoretical richness within the critical perspectives, we will confineour attention to two major research strands that have illuminated our understand-ing of managerial accounting. First, we will consider the labor process perspectivewhich draws from the Marxist tradition and then we will examine the Foucaultianperspective which, as the name suggests, draws from the work of Michel Foucault.While both of these alternatives are critical in orientation, there are significant dif-ferences in the kinds of insights they offer and consequently, we will first describetheir relevant theoretical infrastructure and then, tease out from extant accountingstudies their implications for our understanding of managerial accounting.
4 For a more in-depth treatment of alternative research agendas in accounting, consult forexample, Critical Accounts by David Cooper and Trevor Hopper (1990), Sociological Perspectiveson Modern Accounting by Robin Rosenlender (1992), The Social and Organizational Context ofManagement Accounting by Anthony Puxty (1993), and Accounting as a Social and InstitutionalPractice by Anthony Hopwood and Peter Miller (1994).

312 ACCOUNTING FOR MANAGERS
The labor process perspectiveIt thus becomes essential for the capitalist that control over the labor processpass from the hands of the worker into his own. The transition presentsitself in history as the progressive alienation of the process of production fromthe worker; to the capitalist, it presents itself as the problem of management.(Braverman 1974, 58, emphasis in original)
Harry Braverman, in the much acclaimed Labor and Monopoly Capitalism: TheDegradation of Work in the Twentieth Century, offered a resounding critique ofconventional understandings of work processes in capitalist economic systems.Drawing from the pioneering work of Karl Marx, Braverman asserted the primacyof the social relations of production for any attempt to understand the manner andmodes in which goods and services are created in the capitalist economy. Specifi-cally, Braverman (1974, 52) following Marx, suggested that the differentia specifica ofcapitalist economies was ‘‘the purchase and sale of labor power.’’ Understandingthe historical novelty of this feature is crucial, for this defining aspect of moderneconomies which we take for granted is, as a general phenomenon, unknown toprior epochs of human history. Capitalist economies are accordingly differentiatedfrom prior epochs by the social relation embedded within the employment relation.Employment relations in contrast to, say, self-employment as the general form bywhich modern people earn their livelihood is an extremely recent phenomenon,and requires that workers sell their labor power to capitalists; for a wage. Thishistorical reduction of persons to hired hands deprive them of their connectednessto the production process. Treated as a commodity, labor consequently ‘‘has nomaterial interest in doing more that securing the highest wages and best conditionsfor the minimum of sacrifice’’ (Hopper et al. 1987, 445).5
Wage labor, or hired labor, is treated within capitalist economies as a costof production – as any other input factor of production – which need, from thecapitalist’s point of view, to be both minimized and optimized. The minimization oflabor costs is ‘‘rational’’ since it avoids the dependence on a factor of productionthat, unlike other factors, can rebel against its own use. Similarly, optimizing theuse of labor is ‘‘rational’’ since, as with any other factor of production, the efficientuse of resources is the precondition for profits. Consequently, and built into thecapitalist relations of production are the pressures to not only supplant labor bymachinery but also to control the labor process – how labor power is deployed, theactual mode of work – in all its aspects, in the interest of capital accumulation. Itis this pressure that motivates the capitalist to gain control over the labor process
5 According to Braverman (1974, 53) ‘‘In the United States, perhaps four-fifths of the populationwas self-employed in the early part of the nineteenth century . . . by 1970 only about one-tenth ofthe population was self-employed.’’ Laborers in having to sell their labor power as a commodity,are now alienated from the fruits of their labor. This is the significance of the labor theory of valuewhich asserts that the value of goods and services originate from and thus belong to those whomake them. Moreover, since workers can produce far more per unit time than is necessary tokeep them alive, this surplus value created is the source and object of capitalist strategies to makemore profits. Accordingly, profits come from extracting as much labor from the purchased laborpower, and then expropriating the surplus value so generated.

MANAGERIAL ACCOUNTING RESEARCH 313
and make the latter ‘‘the responsibility of the capitalist’’ (Braverman 1974, 57).However, treating human beings as just another factor of production sets the stagefor the exploitation and expropriation of labor by capital. Accordingly, there is anirreducible conflict between capital and labor ensuring perpetually antagonisticrelations between the classes. It is on this backdrop of capitalist social relationsthat the labor process perspective on cost and managerial accounting is fleshedout (see also Edwards 1979; Burawoy 1979; Noble 1977; Clawson 1980).
Hopper et al. (1987) introduced the labor process perspective to accounting bycontrasting this perspective from both functional and interpretative understand-ings of managerial accounting. Their central argument was that managementaccounting cannot be properly understood, except in the light of the social rela-tions of production. They argued that to view organizations as united by a commonpurpose is to fictionalize what is, in fact, a site of irreconcilable conflict. Such orga-nization goals as the maximization of the net present value of future cash flowstransforms what is the goal of one sectional interest into the overriding goal ofall, thus obscuring the class-based distributional conflicts inherent in all capitalistorganizations.
Accordingly, labor process theorists deny that management accounting is aneutral tool serving the general interests of efficiency and emphasize its rolein legitimizing partisan interests, in contributing to the control and dominationof labor, and in reinforcing the dominant mode of production, i.e., capitalistproduction, albeit in a contested terrain. Moreover, management accounting alsois capable of showing up the ambiguous position of managers within capitalistfirms. Where on the one hand, they are ‘‘materially privileged’’ agents of thecapitalists’ class and must accordingly serve the interests of the latter, they areon the other hand, wage labor and to that extent interested in ‘‘securing theirown employment, and in fighting for an improved share of available resources’’(Hopper et al. 1987, 450–451). Thus, managers are at once ‘‘both agents and victimsof control’’ such that phenomena such as budget games and divisional budgetingslack must not be seen as the consequence of some ‘‘individual pathology’’ butrather as the ‘‘deep effects of exploitative and oppressive social structures’’ thatare embedded and presupposed in the capitalist system of production.
While Hopper et al. (1987) offered a programmatic introduction to the laborprocess perspective and distinguish it from the more functionalist and interpretivetraditions, a later paper by Hopper and Armstrong (1991) presented a historicallyrooted reflection on the development of management and cost accounting sincethe middle of the nineteenth century, in part by challenging the very popularreading of the history of cost and managerial accounting given by Johnson andKaplan (1987) (see also Johnson 1972, 1981, 1983). Deploying a transactions-costapproach, Johnson and Kaplan (1987) argued for understanding the emergenceand prevalence of cost accounting as techniques which contributed to increasingoperational efficiencies, and for ROI and budgets as techniques which reduced thecosts of managing large vertically integrated bureaucracies as opposed to securingmarket-based coordination. In contrast, Hopper and Armstrong (1991) challengedthis interpretation by linking the presence and even subsequent absence of cost
314 ACCOUNTING FOR MANAGERS
and managerial accounting practices to the changing forms of control over thelabor process that are in turn linked to different phases of capitalism.
Accordingly, Hopper and Armstrong (1991) suggested that for the early factoryorganizations of the mid-nineteenth century (they especially consider LymanMills which was also the focus for Johnson and Kaplan (1987)), increases in profitswere secured primarily from extending the number of hours worked withoutsignificantly changing the wages and from applying a closer degree of controlover the labor process. Such ‘‘innovations’’ as the ‘‘stretch-out (an increase in thenumber of machines supervised by each operator), the speed-up (an increase in theoperating speed of machines),’’ and ‘‘a premium bonus system’’ for overseers toenforce productivity, were monitored and achieved by accounting records, whilesuch labor practices as firing workers for trade union activity and discipliningdormitory behavior of workers by the ‘‘moral police’’ ensured a relatively docilelabor force which was the precondition for managerial action that is based oncost accounting information (Hopper and Armstrong 1991, 414–415). Hence, theyargued that some of the accounting and cost information was not used for makingthe production process more efficient but rather used to intensify the extraction oflabor from the labor force.
Moreover, the decline of internal contracts (outsourcing products and skilledlabor) during the late nineteenth century was based on appropriating the profitsmade by subcontractors, though it involved increased costs for the companies(from replacing contractors with college trained executive who lacked knowledgeof production processes). Where previously ‘‘companies kept no records of thehours worked by the contractors’ employees, or of how much and on what basisthey were paid,’’ by paying workers directly, companies began to keep a hostof new records including ‘‘work records’’ (Hopper and Armstrong 1991, 416).Consequently, the creation of these new records, which also ‘‘laid the foundationfor the later development of standard costing systems’’ had ‘‘nothing to do withthe efficiency of the conversion process . . . but was a means of redistributing [the]profits . . . made by the contractors to the companies’’ (Hopper and Armstrong1991, 417). Furthermore, these records not only transferred ‘‘financial knowledgefrom the worker to the factor owner’’ but also fostered the ‘‘imposition of anadditional system of activity surveillance’’ (Hopper and Armstrong 1991, 417).Again, they argued that accounting records are hardly neutral but are deeplyintertwined with the expropriation of profits, the intensification of the laborprocess and the surveillance of worker activities.
Regarding the late nineteenth and the early twentieth century, Hopper andArmstrong (1991) said that such developments as standard costing, ROI measures,and budgets cannot be understood except in the context of the correlative destruc-tion of craft labor. Management accounting was one element in the developmentof a vast paper bureaucracy (measured by the increase in record-keeping andthe swelling ranks of white-collar employees) by which the production processshould be replicated, monitored and controlled. In the continual attempt to con-trol the labor process, owners, and by now also managers, sought to redesign,fragment and simplify the labor process ‘‘so that skill levels were reduced and

MANAGERIAL ACCOUNTING RESEARCH 315
the mental aspects of production incorporated into management’’ (Hopper andArmstrong 1991, 419).
The labor process perspective has illuminated not only historical issues butalso has been successfully applied to contemporary times. For example, Knightsand Collinson (1987) found that British workers in one factory were unable tocontest management’s accounting reports, even when these reports led to workerlayoffs. They suggested that accounting has inherent characteristics which makeit difficult for workers to challenge these numbers, thus accounting information isnot contested by labor on the grounds that its cultural values of ‘‘objectivity’’ and‘‘hard facts’’ mirror the ‘‘masculine values’’ on the shop floor. Similarly, Oakesand Covaleski (1994) examined organized labor’s involvement with accounting-based incentive plans, and the role this involvement played in labor-managementrelations. This study involved cases studies of profit-sharing plans implementedat three firms, Parker Pen, Kaiser Steel, and American Motors, in the 1950s andearly 1960s, suggesting that ‘‘accounting takes on characteristics or is constructedin ways that make it more or less likely that it will be contested at certain periodsof time’’ (Oakes and Covaleski 1994, 595). Bougen et al. (1990) (see also Bougen1989) documented the appearance and disappearance of accounting in British coalindustry labor debates. Their study showed the partisan nature of the disclosureof financial reports to trade unions, the contested and sometimes self-defeatingresults of such disclosures, and of the many alternative managerial mechanisms(joint consultations committees and profit-sharing schemes) that attempt to gaincooperation by persuasion and cooperation.
In summary, labor process theory is consistent with the other organizationalsociological perspectives such as contingency theory and interpretive work in thesense that it embeds management accounting in a wider context than more ortho-dox approaches. However, labor-process theory departs from these alternativeapproaches by focusing on the structural antagonism between classes inherentin capitalist societies. Also consistent with other organizational and sociologicalperspectives, labor-process theory offers a relatively non-technical understand-ing of management accounting in that management accounting appears withinthe context of a class-divided society to aid economic expropriation. Finally, thelabor-process perspective moves towards considering accounting as a social prac-tice rather than merely a technique, arguing that political events and ideologies,status, class, trust and technological changes impel people to act in certain ways,all potentially impinging on the roles served by management accounting.
The Foucaultian Perspective
Michel Foucault (1926–1984) was both a philosopher and historian who used his-tory to raise philosophical questions.6 A central motif that runs through his workand one which has also been productive for accounting scholarship is perhaps best
6 A solid entry into the work and thought of Michel Foucault is the Paul Rabinow, ed. (1984)Foucault Reader. The introductory essay is an especially good and clear statement while theselection of readings is representative.

316 ACCOUNTING FOR MANAGERS
described in his own words: ‘‘. . . the goal of my work during the last twenty years. . . has been to create a history of the different modes by which, in our culture,human beings are made subjects’’ (Foucault 1983, 208). To begin to unpack thisseemingly innocuous statement let us consider the key word here – ‘‘subject’’ – inboth the meanings that it admits: ‘‘subject to someone else by control and depen-dence, and tied to his own identity by a conscience or self-knowledge. Both mean-ings suggest a form of power which subjugates and makes subject to’’ (Foucault1983, 212). While the first meaning is a relatively familiar one (hierarchical employ-ment relations, prisoner-guard, parent-child etc.), the second hints at the radicaland innovative nature of Foucault’s thought. What is equally significant regardingthe exercise of this power, is the interrelation between power and knowledgewhich Foucault signifies by the slash in the term ‘‘Power/Knowledge.’’ Foucaultargued that to properly grasp the conditions for the emergence of the ‘‘humansciences’’ – all those ‘‘sciences’’ that are concerned with describing, explaining,understanding, predicting and controlling human behavior – one must under-stand its complicity with the historically unprecedented presence of a widespreadand general control of human beings. Foucault (1979, 191) argued that the ‘‘birth ofthe sciences of man’’ probably lies in the various written techniques (of notation,registration, columnar and tabular presentation, of measurement, classificationetc.) by which individuals are turned into a ‘‘case.’’ Transforming a human beinginto a ‘‘case’’ (patient, student, prisoner, worker) simultaneously homogenizes (byclassifying as one within a series) and individualizes (by measuring the individualdifferences). Implicit in such classification and measurement is the presence of nor-malizing judgments wherein the measurement of individual differences are madein regard to deviations from a norm (for example, students grades, standard cost,time and motion studies, budgets, benchmarks). According to Foucault, it was onlyby the late eighteenth century that this manner of describing, or more precisely,writing up individuals as cases became widespread and general. It furthermorerepresented a reversal of historic proportions, as stated by Foucault (1979, 191):
For a long time ordinary individuality – the everyday individuality ofeverybody – remained below the threshold of description. To be lookedat, observed, described in detail, followed from day to day by an uninter-rupted writing was a privilege. . . . The disciplinary methods reversed thisrelation, lowered the threshold of describable individuality and made of thisdescription a means of control and a method of domination.
Power, in this light, is not negative or repressive but rather positive andproductive, because ‘‘it produces reality; it produces domains of objects andrituals of truth. The individual and the knowledge gained of him belongs to thisproduction’’ (Foucault 1979, 194). Accordingly, for Foucault (1990, 98), power andknowledge are constitutive of, but not identical, to each other, since ‘‘betweentechniques of knowledge and strategies of power, there is no exteriority, even ifthey have specific roles and are linked together on the basis of their difference.’’The scientific disciplines which generate our knowledge of human beings is thusalso complicit in their disciplining, or as Foucault (1979, 222) suggested, ‘‘The‘Enlightenment,’ which discovered the liberties, also invented the disciplines.’’

MANAGERIAL ACCOUNTING RESEARCH 317
Foucault’s work has, as already been stated, sparked much attention in thecritical accounting tradition. In a recent paper, Walsh and Stewart (1993) exploredthe history of managerial accounting practices from a rigorously Foucaultianperspective. In comparing ‘‘two assemblages of people making things,’’ one fromthe 1700s and the other from the 1800s, they find support for one of Foucault’s mostprovocative theses. By asserting that ‘‘the individual’’ was the result of disciplinarymechanisms, Foucault also is implying that prior to the late eighteenth centuryindividuals could not be known and therefore controlled since they lay below thethreshold of description. Accordingly, what we consider axiomatic in managerialaccounting – namely the linking of accounting calculations and measures to thework of individuals and groups – must not have been prevalent prior to the lateeighteenth century. Indeed, this is precisely what Walsh and Stewart (1993) findwhen they compare the New Mills Woolen Manufactory (1681–1703) with theNew Lanark Cotton Factory (1800–1812). Some features which characterized themanufactory of the late seventeenth century include: master-servant relationshipsbetween the managers and workers; customary rather than market driven ratesof profit, calculations of selling prices and wages; use of the pillory and theprison as threats of retribution to workers for pilferage or shortages in piece work;bookkeeping as a ‘‘physical memory of the real proceedings of each day and eachweek to be certified by the masters’’ (Walsh and Stewart 1993, 786).
While Walsh and Stewart (1993) focused on the early days of the factory systemto provide some solid evidence and support for Foucault’s thesis, Miller andO’Leary (1994) studied another time period to examine the rising popularity ofstandard costing and budgetary practices in the U.S. during the turn of the century.Again, using a Foucaultian perspective, they illuminated dimensions of that muchstudied period that have hitherto escaped attention. Miller and O’Leary (1994, 99)argued that such accounting practices as standard costing and budgeting shouldbe understood ‘‘as a technology of government,’’ where the latter is understoodas ‘‘the ensemble of rationalities and technologies’’ by which ‘‘authorities attemptto act on the conduct of others, to shape their beliefs and behavior in directionsdeemed desirable.’’ Accordingly, the widespread emergence of standard costingand budgetary techniques by the 1930s in both the U.K. and the U.S. are seen asindicative of a new modality in the governance of economic life. This emergencewas linked not only to the scientific management movement associated withTaylor and the spread of industrial psychology but also to the concern withnational efficiency in the U.K. and the ‘‘efficiency craze’’ in the U.S. The termefficiency was deployed in a wide range of contexts from individual performanceon the factory floor to articulation the social responsibilities of the state in correctingthe ills of society, and subsumed under itself a host of financial and nonfinancialtechniques. Linkages were also forged between the scientific management ofindustrial enterprises and the rational and orderly planning of society as a whole.A host of such social sciences as public administration, engineering, and sociologyas well as a slew of such experts as accountants, urban planners and economistssought to ‘‘normalize and govern populations of individuals’’ (Miller and O’Leary1994, 111). It is this new modality of governing economic life that forms a context

318 ACCOUNTING FOR MANAGERS
that is both constitutive of and constituted by the standard costing and budgetarypractices of the early twentieth century.
To date, within accounting as well as organizational theory, a majority ofwork applying what has been termed Foucault’s archeological and genealogicalperspectives have had an historical perspective. However, the application ofFoucault’s insights into the functioning of modern societies is not limited to foraysinto the past. More pertinently, his work proves to be of continuing value as it isbeing profitably used to illuminate certain aspects of the contemporary uses andredefinitions of accounting. For example, Preston (1992, 64) studied the relativeemergence of Diagnostic Related Groups (DRGs) as an ‘‘accounting technologybased upon principles of cost control rather than cost reimbursement.’’ Using alongitudinal study Preston (1992, 97) showed how this practice of reimbursementcannot be exclusively related to a ‘‘a logic of economic incentives and rationaleconomic behavior.’’ Rather, a shifting complex of events, including Medicare andMedicaid, the private structure of American health care, the power of professionalassociations, changing public attitudes towards health care, is seen as being partof this transformation of accounting practices. Accordingly, Preston, followingFoucault, revealed the emergence of DRGs as being implicated in a wider andmore general transformation in the ‘‘politics of health’’ which involves not onlyeconomic factors but more decisively, social and cultural ones as well. On thissame issue of contemporary application of Foucault’s work, Rose (1991) arguedfor an interrelation between the mode of liberal democratic governance and thetechnology of quantification, numeracy and statistics. Rose (1991, 691) stated that‘‘numbers have an unmistakable power in modern political culture’’ evident fromopinion pools to the federal budget and the national income statistics. The role ofaccounting in this Foucaultian view, is that accounting, along with other variouscalculations, form the basis for democratic politics whose singular characteristic is‘‘arms-length’’ management from a distance.
Consistent with the underpinnings of critical perspectives, the Foucaultianview situates management accounting in a wider political and social context.Specifically, in the Foucaultian approach, management accounting is consideredas part of a larger historical trend through which people at large were subjected toa variety of disciplinary techniques. Whereas in labor-process theory, managementaccounting appears within the context of a class-divided society to aid economicexpropriation, the Foucaultian tradition reveals management accounting as anelement of a general historical process by which people are made calculable andgovernable. The Foucaultian view also considers management accounting as asocial practice rather than a technique by examining the intricacies and richnessin such social relations that are embedded in social patterns of interaction aslanguage, discipline and intimacy, all cultural norms and forces which potentiallyimpinge on the roles and nature of management accounting.
Closing discussion
It is important to note our interpretation of the relationship among the alternativemanagerial and sociological theories considered, as well as their relationship

MANAGERIAL ACCOUNTING RESEARCH 319
to more traditional perspectives of managerial accounting: can these variousperspectives be compared and contrasted or possibly blended, and a ‘‘champion’’paradigm isolated? In exploring the structure of more general scientific revolutions,Kuhn (1970) reasoned that because of fundamentally different philosophicalpresumptions, it is impossible to employ the tenets of one paradigm to assist thosesubscribing to a second paradigm to transition to understand the first paradigm.But rather, the ‘‘leap’’ from one paradigm to another must be based on faith inorder to fully appreciate what a particular paradigm may offer for understandingour existence. In this spirit, and more closely concerned with organizationalanalysis, Morgan (1980) (see also Burrell and Morgan 1979; in accounting seeDirsmith et al. 1985) theorized that different paradigms both address differentsorts of problems and, where paradigms address common problems, portray themin fundamentally different ways and thereby offer differing insights into theirnature. Thus, what is called for is not a blending of paradigms nor the isolation ofa particular paradigm as champion, but rather paradigmatic pluralism as a wayof enhancing our understanding of issues in the social sciences. Consequently,we offer the various paradigms not as competing perspectives but in some senseas alternative ways of understanding the multiple roles played by managementaccounting in organizations and society.
Extending this theme and drawing upon Churchman’s (1971) characterization ofinfluencing systems, Mitroff and Mason (1982) offered a useful way to understandthe properties of more orthodox research approaches and one which calls for aplurality of theories used in a dialectic fashion. The argument of Mitroff and Mason(1982) also highlights fundamental differences in the types of problems whichmay be addressed. Within the traditional approach to management accountingresearch, one seeks regularity, consistency or consensus by two means. In the first,one seeks patterns in specific sets of empirical data in a purely inductive mode.‘‘Consensus’’ of data is in essence a guarantor of faithfully representing a concretereality. Any lack of regularity or consensus in the data (e.g., low r2) serves toquestion the validity of the pattern isolated or theory used. One seeks improvedunderstanding by refining the model’s specification. In the second approach, oneseeks internal consistency in a postulational system wherein reality is the axiomaticstructure. In a deductively driven system, only the lack of internal consistency orconflict in the propositional network can cause one to abandon it in favor of acompeting network.
The rational frame of reference importantly assumes that the phenomena underinvestigation are either well specified and well known, or able to be well knownthrough some preliminary fieldwork (Keating 1995), or further refinement of themodel or propositional network, and hence, are eminently structurable. However,because of its reliance on a set of fixed concrete data or variables expressed ina fixed postulational structure, it is limited in its abilities to preserve or reflectanomalies and uniqueness in phenomena and to capture the essence of ill struc-tured problems. Its use is, therefore, relegated to examining well structured thoughperhaps technically complex problems. Paradoxically, because of their very com-prehensiveness, these traditional perspectives tend to suppress conflict, anomalyand uniqueness. By contrast, a more interpretive or critical view emphasizes

320 ACCOUNTING FOR MANAGERS
the use of multiple conceptual views of ill structured, anomalous phenomenaon the presumption that reality is too ill structured to be meaningfully repre-sented by any set of data or propositional network, no matter how comprehensivethey may appear.
The use of alternative research theories also has resulted in alternative researchmethods of forms of inquiry. The general literature which describes the useof qualitative, naturalistic methods in field research is growing in volume andstature. From this literature, it is possible to outline various criteria of ‘‘good’’research which are provisionally consistent with the knowledge claims advancedby its theoretical perspective discussed in the paper (Morgan (1983) sounds auseful warning note in such matters). However, we avoid detailed treatmentof such philosophical issues as epistemology, or such methodological issues asfalsification, or indeed of research methods. These and related matters have beenadequately dealt with in both the philosophy of science and accounting literatures.7
Denzin and Lincoln (1983) offer a useful discussion regarding criteria to con-sider for alternative methods of research inquiry. The first criteria is credibilitywhich relates to the believability of the observations and interpretations to boththe academic community and participants in the study. This criteria is addressedthrough such techniques as prolonged engagement at the organizational con-text studied which provides research scope, and persistent observations whichconcerns penetration into the context studied to identify relationships, forces,etc., which have salience in understanding the lived experiences of organizationalmembers. Representative adequacy also is important to credibility which entailshaving sufficient notes, transcripts, audio or video recordings enable differentresearchers to examine field observations and form similar though not necessarilyidentical interpretations.
The second criteria is transferability, or the ability of the interpretations of oneorganizational context to be transferred to another. Given the primary focus on thecontext or substantive domain and the lived experience of its members, interpretiveand critical field members would typically emphasize the importance of providingthick description in the research text, presenting vibrant, exact interview quotes,archival abstracts, etc., that provide both scope and depth in understanding thecontext. This thick description, in turn, influences theoretical perspectives beingprovisionally used to interpret the organizational context. It is this informedtheory, not the observations, that may be transferred to begin providing anotherorganizational context.
The third and fourth criteria are dependability and conformability. The formerconcerns developing reliable interpretations, but interpretations that simultane-ously recast the state of its organization studied (i.e., its stability) and the processby which the organization is changing (i.e., its instability); in turn the field workerconcedes instrumental unreliability, albeit a constructive unreliability. The latter
7 Notable in this regard was the paper by Tinker et al. (1982). Others addressing the philosophicalunderpinnings of different accounting research, include Christenson (1983), Chua (1986) andHopper and Powell (1985). For statements by philosophers on the philosophy of science, consultBernstein (1978), for those by organizational theorists see Burrell and Morgan (1979).

MANAGERIAL ACCOUNTING RESEARCH 321
criterion relates to the field observations themselves, can observations be corrob-orated by another investigator or another method? On this theme, Van Maanen(1995), has observed that the accounts rendered by field researchers employingqualitative, naturalistic methods may be described as ‘‘impressionist takes,’’ usingthe analogy of impressionist art wherein the viewer of a piece of art sees both thesubject being painted and the artist.
It is also important to note what may be gained by management accountingscholars beyond a more general appreciation of the technical, social and interest-based forces which may flow through and influence management accounting, andhow management accounting, by embodying and reproducing these forces, maycome to influence its own historical, socio-political context. Christenson (1983)argues that what may be derived is not the first-order concern of somehowmodifying management accounting as a set of somewhat disembodied practicesto somehow more faithfully represent an objective, albeit complex reality andthereby solve the technical problems of running an organization. But rather, whatcan be gained is a second-order focus of serving the problem solver, i.e., helpingthem recognize the multiple realities they confront and live, and the multiplemeanings attached to and served by management accounting.
One of the principle tendencies exhibited by alternative research theories andrelated methods which distinguish them from the more familiar approachesis that of embedding management accounting in a wider social context thanusual. Accounting research inspired by contemporary social and organizationalpsychology and neo-classical economics largely examines the roles and nature ofmanagement accounting from the perspective of the individual decision-maker orinformation processor within the organization. The alternative streams of researchdiscussed here, in contrast, typically approach the study of managerial accountingfrom an inter-organizational and sociological perspective.
To illustrate the broader orientation, Selto et al.’s (1995) field study of a Fortune500 firm examines the adaptation of JIT manufacturing and a total quality controlsystem (JIT/TQC system) in relationship to classical contingency theory con-structs – organizational structure, context and control – to ascertain the fit of theseorganizational variables and the JIT system. An interpretive perspective, such asinstitutional theory, might relate the adaption of the JIT/TQC system to evenlarger societal values of rationality while perhaps sacrificing on the robustness ofinsight provided by contingency theory regarding the impact of organizational-level variables. Here the theoretical and empirical focus would be more on probingthe firm’s broader field of relations, such as mimicking the structure of dominantfirms in the industry, or responding to the coercion of the government, or adaptingthe norms of professional associations, expressed in terms of a more widespreadJIT/TQC movement. Finally, critical perspectives would advance their theoreticalframe of reference by characterizing the JIT/TQC efforts in this firm as related tothe structural antagonism between classes inherent in capitalist societies (labor-process perspective), or as part of a larger historical trend through which peopleat large were subjected to a variety of disciplinary techniques rendering theminute details of their behavior more visible (the Foucaultian approach). Withthe critical perspective’s theoretical and empirical point of departure being at the

322 ACCOUNTING FOR MANAGERS
broadest social and historical level (i.e., parts of larger historical trends of struc-tural antagonism or disciplinary techniques) the more immediate organizationalinfluences (contingency theory) or organizational fields (interpretive perspectives)become more tangential to the research focus. In summary, despite the differencesbetween the theoretical points of departure and related demands for empiricalinquiry pertaining to the contingency, interpretive, and critical perspectives, theseapproaches to management accounting provide multiple understandings of man-agement accounting that are not offered by more narrowly focused analysis whichcenters around individual preference and cognitive functions.
A second aspect that distinguishes the management accounting research whichdraws on organizational and sociological traditions is its tendency to offer a rel-atively non-technical understanding of management accounting. For example, itis usual to suppose that management accounting is an information systems thatcan be designed to influence decisions and to so gain control over behavior. Here,accounting is a tool that not only signals certain states of the world, but also worksas an instrument by which certain outcomes are made more probable. This instru-mental and consequently asocial, ahistorical and apolitical view of accountingcontrasts with that gained from the various alternative research streams. Again,referring to the contributions of Selto et al.’s (1995) contingency perspective-drivenfield work, such management accounting practices as JIT/TQC systems are seento be invested with the social aspects of worker empowerment, workgroup perfor-mance, and relations within and between workgroups, operators and supervisors.By modifying the system, aided by management accounting, the fit may beenhanced and performance consequently improved. An interpretive perspectiveof management accounting would particularly probe the issue as to whetherJIT/TQC systems are as much a symbol demonstrating efficiency and rationalityto be displayed for external consumption as they are an instrument for achievingefficiencies, thus focusing their theoretical and empirical efforts to inform ourunderstanding of the symbolic nature of JIT/TQC. Critical perspectives, in turn,might mobilize their empirical efforts around their respective theoretical motiva-tions to examine JIT/TQC systems within the context of a class-divided society toaid economic expropriation of workers’ surplus, or, in the Foucaultian tradition, toexamine JIT/TQC systems as artifacts of a general historical mechanism by whichpeople are made calculable and manageable.
Accordingly, alternative streams of research, to varying degrees, move towardsconsidering accounting as a social practice rather than a technique. To treataccounting as a ‘‘practice’’ instead of a ‘‘technique’’ is to embed accountingwithin the web of human actions which are, in turn, constitutive of social rela-tions. The intricacies and richness of social relations that are suffused by suchaspects of sociality as symbols, myths, language, status, class, trust and intimacy,comprises the backdrop for the organizationally and sociologically informed stud-ies of accounting. More specifically, management accounting research rooted inthe contemporary social and organizational psychology and neo-classical eco-nomics usually examines management accounting procedures and techniqueswith the intent to improve its efficacy. In general, these traditional approachesare problem driven and directed towards improving and refining the instrument

MANAGERIAL ACCOUNTING RESEARCH 323
that is management accounting to better serve exogenously given organizationalgoals and thus somewhat narrow in focus. Designing better costing procedures,incentive contracts, information systems to account for processing biases, andso on, are examples of the problem-driven nature of mainstream managementaccounting research.
In contrast, the research drawing on organizational and sociological theories, todifferent degrees, situate management accounting practice within the context ofsocial life in general. The problem-driven focus is less apparent since, in part, thevery ways in which problems come to be defined as problems needing solutions,or indeed how particular calculative techniques come to be called ‘‘accounting,’’comprise the subject for analysis. From this perspective, managerial accountingpractices are not techniques that can be abstracted from the general milieu ofsocial life but rather one strand in the complex weave that makes up the socialfabric. Political events and ideologies, cultural norms and forces, social patternsof interaction and societal presuppositions, technological changes and subjectivemeanings that impel people to act in certain ways, all potentially impinge on theroles and nature of management accounting. It is in this manner that a differentlight is shed on the role and nature of management accounting practices by theresearch which draws from organizational and sociological theories.
References
Abbott, A. 1988. The System of Professions. Chicago: University of Chicago Press.Aiken, M., and J. Hage. 1966. Organizational alienation. American Sociological Review 31:
497–507.Alford, R., and R. Friedland. 1985. Powers of Theory. Cambridge: Cambridge University
Press.Ansari, S. L. 1977. An integrated approach to control systems design. Accounting, Organiza-
tions and Society 2: 101–112., and K. J. Euske. 1987. Rational, rationalizing and reifying uses of accounting data
in organizations. Accounting, Organizations and Society 12: 549–570.Anthony, R. 1965. Planning and Control Systems: A Framework for Analysis. Boston, MA:
Harvard University Press.Argyris, C. 1952. The Impact of Budgets on People. New York: Controllership Foundation.Armstrong, P. 1985. Changing management control strategies: the role of competition
between accountancy and other organizational professions. Accounting, Organizationsand Society 10: 129–148.
Banker, R. D., S. M. Datar, and L. Kemerer. 1991. A model to evaluate variables impactingthe productivity of software maintenance. Management Science: 1–18.
Barnard, C. 1938. The Functions of the Executive. Boston: Harvard University Press.Becker, S., and D. Green. 1962. Budgeting and employee behavior. Journal of Business
(October): 392–402.Berger, P. L., and T. Luckmann, 1967. The Social Construction of Reality. New York: Doubleday.Bernstein, R. 1978. The Restructuring of Social and Political Theory. Philadelphia: University
of Pennsylvania Press.Blau, P. M. 1970. A formal theory of differentiation in organizations. American Sociological
Review 35: 201–218.
324 ACCOUNTING FOR MANAGERS
. 1973. The Organization of Academic Work. New York: John Wiley.Boland, R. J., and L. R. Pondy. 1983. Accounting in organizations: A union of natural and
rational perspectives. Accounting, Organizations and Society 8: 223–234., and . 1986. The micro-dynamics of a budget cutting process: Modes,
models and structure. Accounting, Organizations and Society 11: 403–422.Bougen, P. D. 1989. The emergence, roles and consequences of an accounting-industrial
relations interaction. Accounting, Organizations and Society 14: 203–234., S. G. Ogden, and Q. Outram. 1990. The appearance and disappearance of account-
ing: wage determination in the U.K. Coal industry. Accounting, Organizations and Society15: 149–170.
Braverman, H. 1974. Labor and Monopoly Capital. New York: Monthly Review Press.Brownell, P. 1981. Participation in budgeting, locus of control and organizational effective-
ness. The Accounting Review 56: 844–860.. 1982. The role of accounting data in performance evaluation, budgetary partici-
pation, and organizational effectiveness. Journal of Accounting Research: 12–27.Burawoy, M. 1979. Manufacturing Consent. Chicago: University of Chicago Press.Burns, T. R. 1986. Actors, transactions and social structures. In Sociology: From Crisis to
Science? edited by V. Hemmelstrand, 8–37. London: Sage., and G. M. Stalker. 1961. The Management of Innovation. Tavistock.
Burrell, G., and G. Morgan. 1979. Sociological Paradigms and Organizational Analysis.Heinemann.
Caplan, E. H. 1971. Management Accounting and Behavioral Science. Reading, MA: Addison-Wesley.
Carruthers, B. G. 1995. Accounting, ambiguity, and the new institutionalism. Accounting,Organizations and Society 20: 313–328.
Child, J. 1972. Organization structure and strategies of control: A replication of the AshtonStudy. Administrative Science Quarterly 17: 163–177.
Christensen, J. 1983. The determination of performance standards and participation. Journalof Accounting Research 20: 589–603.
Christenson, C. 1983. The methodology of positive accounting. The Accounting Review 58(January): 1–22.
Chua, W. F. 1986. Radical developments in accounting thought. The Accounting Review 61(4):601–632.
Churchman, C. W. 1971. The Design of Inquiry Systems. New York: Basic Books.Clawson, D. 1980. Bureaucracy and the Labor Process: The Transformation of U.S. Industry,
1860–1920. New York: Monthly Review Press.Clegg, S. 1987. The language of power and the power of language. Organization Studies 8:
61–70.Collins, F. 1978. The interaction of budget characteristics and personality variables with
budgetary response attitudes. The Accounting Review 53: 324–335.Cooper, D., and T. Hopper. 1990. Critical studies in accounting. Accounting, Organizations
and Society 12: 407–414., and M. Sherer. 1984. The value of corporate accounting reports: Arguments for a
political economy of accounting. Accounting, Organizations and Society 9: 407–414.Covaleski, M. A., and M. W. Dirsmith. 1983. Budgeting as a means for control and loose
coupling. Accounting, Organizations and Society 8: 323–340., and . 1986. The budgetary process of power and politics. Accounting,
Organizations and Society 11: 193–214., and . 1988a. The use of budgetary symbols in the political arena: An
historically informed field study. Accounting, Organizations and Society 13: 1–24.

MANAGERIAL ACCOUNTING RESEARCH 325
, and . 1988b. An institutional perspective on the rise, social transfor-mation, and fall of a university budget category. Administrative Science Quarterly 33:562–587.
Cyert, R. N., and J. G. March. 1963. A Behavioral Theory of the Firm. Englewood Cliffs, NJ:Prentice Hall.
Daft, R. L., and N. B. MacIntosh. 1981. A tentative exploration into the amount and equiv-ocality of information processing in organizational work units. Administrative ScienceQuarterly 26: 207–224.
Dent, J. F. 1987. Tensions in the design of formal control systems: A field study in a computercompany. In Accounting and Management Field Study Perspectives, edited by W. J. Brunsand R. S. Kaplan, 119–145. Harvard.
Denzin, N., and Y. Lincoln. 1983. Beyond Method: Strategies for Social Research. London: Sage.DiMaggio, P. J. 1988. Interest and agency in institutional theory. In Institutional Patterns and
Organizations: Culture and Environment, edited by L. G. Zucker, 3–22. Cambridge, MA:Ballinger Publishing Company.
, and W. W. Powell. 1983. The iron cage revisited: institutional isomorphism andcollective rationality in organizational field. American Sociological Review 48: 147–160.
, and . 1991. Introduction to the new institutionalism in organizationalanalysis. In The New Institutionalism in Organizational Analysis, edited by W. W. Powelland P. J. DiMaggio, 1–38. Chicago: University of Chicago Press.
Dirsmith, M., M. Covaleski, and J. McAllister. 1985. Of paradigms and metaphors inauditing thought. Contemporary Accounting Research 2: 46–68.
Drazin, R., and A. Van de Ven. 1985. Alternative forms of fit in contingency theory.Administrative Science Quarterly 30: 514–539.
Durkheim, E. 1938. The Rules of Sociological Method. Glencoe, IL: Free Press.Edelman, J. M. 1977. Political Language: Words that Succeed and Policies that Fail. New York:
Academic Press.Edwards, R. 1979. Contested Terrain. New York: Basic Books.Foster, G., and M. Gupta. 1990. Manufacturing overhead cost driver analysis. Journal of
Accounting and Economics: 309–337.Foucault, M. 1979. Discipline and Punish: The Birth of the Prison. New York: Vintage Books.
. 1983. The subject and power. In Power/Knowledge: Selected Interviews and OtherWriting: 1972–1977, edited by C. Gordon, 78–108. New York: Pantheon Books.
. 1990. The History of Sexuality, Vol. 1: An Introduction, trans. by R. Hurley. NewYork: Vintage Books.
Freidson, E. 1986. Professional Powers: A Study of the Institutionalization of Formal Knowledge.Chicago: University of Chicago Press.
Garfinkel, H. 1967. Studies in Methodology. Prentice Hall.Golembiewski, R. T. 1964. Accountancy as a function of organization theory. The Accounting
Review 39: 333–341.Gordon, L. A., and D. Miller. 1976. A contingency framework for the design of accounting
information systems. Accounting, Organizations and Society 1: 59–70.Govindarajan, V. J. 1984. Appropriateness of accounting data in performance evaluation:
An empirical examination of environmental uncertainty as an intervening variable.Accounting, Organizations and Society 9: 125–136.
. 1988. A contingency approach to strategy implementation at the business level:Integrating administrative mechanisms with strategy. Academy of Management Journal:828–853.
, and A. K. Gupta. 1985. Linking control systems to business unit strategy: Impacton performance. Accounting, Organizations and Society 10: 51–66.

326 ACCOUNTING FOR MANAGERS
Gray, B., and S. S. Ariss. 1985. Politics and strategic change across organizational life.Academy of Management Review 10: 707–723.
Hackman, J. D. 1985. Power and centrality in the allocation of resources in colleges anduniversities. Administrative Science Quarterly 30: 61–77.
Hage, J., and M. Aiken. 1967. Relationship of centralization to other structural properties.Administrative Science Quarterly 12: 79–92.
Hayes, D. 1977. The contingency theory of management accounting. The Accounting Review52: 22–39.
Hickson, D. 1966. A convergence in organization theory. Administrative Science Quarterly 11:225–237.
Hills, F. S., and T. Mahoney. 1978. University budgets and organizational decision-making.Administrative Science Quarterly 23: 61–77.
Hirst, M. K. 1981. Accounting information and the evaluation of subordinate performance:A situational approach. The Accounting Review 56: 771–784.
. 1983. Reliance on accounting performance measures, task uncertainty, anddysfunctional behavior: some extensions. Journal of Accounting Research 20: 596–605.
Hofstede, G. 1967. The Game of Budget Control. London: Tavistock.Hopper, T., and P. Armstrong. 1991. Cost accounting, controlling labor and the rise of
conglomerates. Accounting, Organizations and Society 16: 408–438., and A. Powell. 1985. Making sense of research into the organizational and social
aspects of management accounting: A review of its underlying assumptions. Journal ofManagement Studies 22: 429–465.
, J. Storey, and H. Willmott. 1987. Accounting for accounting: Towards the devel-opment of a dialectical view. Accounting, Organizations and Society 12: 437–456.
Hopwood, A. 1973. An Accounting System and Managerial Behavior. Saxon House.. 1974. Accounting and Human Behavior. London: Haymarket., and P. Miller. 1994. Accounting as a Social and Institutional Practice. Cambridge:
Cambridge University Press.Hoskins, K., and R. Macve. 1988. The genesis of accountability: The West Point connections.
Accounting, Organizations and Society 13: 37–73.Ijiri, Y. 1965. Management Goals and Accounting for Control. New York: North Holland.Johnson, H. T. 1972. Early cost accounting for internal management control: Lyman Mills
in the late 1850s. Business History Review: 466–474.. 1981. Toward a new understanding of nineteenth century cost accounting. The
Accounting Review 56: 510–518.. 1983. The search for gain in markets and firms: A review of the historical
emergence of management accounting systems. Accounting, Organizations and Society 8:139–146.
, and R. S. Kaplan. 1987. Relevance Lost: The Rise and Fall of Management Accounting.Boston: Harvard Business School Press.
Jonsson, S. 1982. Budgetary behavior in local government – A case study over 3 years.Accounting, Organizations and Society 7: 287–304.
Kaplan, R. S. 1983. Measuring manufacturing performance: A new challenge for managerialaccounting research. The Accounting Review 58: 686–705.
Keating, P. J. 1995. A framework for classifying and evaluating the theoretical contributionof case research in management accounting. Journal of Management Accounting Research7: 66–86.
Khandwalla, P. 1972. The effect of different types of competition on the use of managementcontrols. Journal of Accounting Research 9: 276–295.

MANAGERIAL ACCOUNTING RESEARCH 327
Knights, D., and D. Collinson. 1987. Disciplining the shopfloor: A comparison of thedisciplinary effects of managerial psychology and financial accounting. Accounting,Organizations and Society 12: 457–477.
Kuhn, T. 1970. The Structure of Scientific Revolutions. Chicago: University of Chicago Press.Lawrence, P. R., and J. W. Lorsch. 1969. Organizations and Environment. Homewood, IL:
Irwin.Loft, A. 1986. Towards a critical understanding of accounting: A case of cost accounting in
the U.K., 1914–1925. Accounting, Organizations and Society 11: 137–169.MacIntosh, N. 1981. A contextual model for information systems. Accounting, Organizations
and Society 6: 39–52.March, J., and J. P. Olsen. 1976. Ambiguity and Choice in Organizations. Oslo: Universitiete
Forlaget., and H. A. Simon. 1958. Organizations. New York: Wiley.
Mayo, E. 1933. Human Problems of an Industrial Civilization. New York: Macmillan.McMann, P., and A. J. Nanni, Jr. 1996. Means versus ends: A review of the litera-
ture on Japanese management accounting. Journal of Management Accounting Research(forthcoming).
McNair, C. J. and W. Mosconi. 1989. Beyond the Bottom Line. New York: Dow Jones-Irwin., , and T. Norris. 1988. Meeting the Technology Challenge: Cost Accounting
in a JIT Environment. Montvale, NJ: National Association of Accountants.Merchant, K. A. 1981. The design of the corporate budgeting system: Influences on man-
agerial behavior and performance. The Accounting Review 56: 813–829.. 1984. Influences on departmental budgeting: An empirical examination of a
contingency model. Accounting, Organizations and Society 9: 291–307.. 1985. Organizational controls and discretionary program decision-making: A
field study. Accounting, Organizations and Society 10: 67–86.Meyer, J. W., and B. Rowan. 1977. Institutional organizations: Formal structures as myth
and ceremony. American Journal of Sociology 80: 340–363.Mezias, S. J. 1990. An institutional model of organizational practice: Financial reporting at
the Fortune 200. Administrative Science Quarterly 35: 431–457., and M. Scarselletta. 1994. Resolving financial reporting problems: An institutional
analysis of the process. Administrative Science Quarterly 39: 654–678.Milani, K. 1975. The relationship of participation in budget setting to industrial supervisor
performance and attitudes: A field study. The Accounting Review 50: 274–284.Miller, P. 1994. Governing the calculable person. In Accounting as a Social and Institutional
Practice, edited by A. Hopwood and P. Miller, 98–115. Cambridge: Cambridge UniversityPress.
, and T. O’Leary. 1987. Accounting and the construction of the governable person.Accounting, Organizations and Society 12: 235–265.
, and . 1989. Hierarchies and American ideals, 1900–1940. Academy ofManagement Review 14: 250–265.
Mitroff, I., and R. Mason. 1982. Business policy and metaphysics: some philosophicalconsiderations. Academy of Management Review 7: 361–371.
Morgan, G. 1980. Paradigms, metaphors and puzzle solving in organizational theory.Administrative Science Quarterly 25: 605–622.
. 1983. Beyond Method: Strategies for Social Research. London: Sage.Noble, D. 1977. American by Design. London: Oxford University Press.Oakes, L. S., and M. A. Covaleski. 1994. A historical examination of the use of accounting-
based incentive plans in the structuring of labor-management relations. Accounting,Organizations and Society 19: 579–599.
328 ACCOUNTING FOR MANAGERS
Oliver, C. 1991. Strategic responses to institutional processes. Academy of Management Review16: 145–179.
Otley, D. 1978. Budget use and managerial behavior. Journal of Accounting Research 15:122–149.
. 1980. The contingency theory of management accounting: Achievement andprognosis. Accounting, Organizations and Society 5: 413–428.
Patell, J. M. 1987. Cost accounting process controls and product design: A case study of theH-P personal office computer division. The Accounting Review 63: 808–839.
Perrow, C. 1967. A framework for comparative organizational analysis. American SociologicalReview 32: 194–208.
. 1985. Review essay: Overboard with myths and symbols. American Journal ofSociology 91: 194–208.
Pfeffer, J. 1981. Power in Organizations. Marshfield, MA: Pitman., and G. R. Salancik. 1974. Organizational decision-making as a political process:
The case of a university budget. Administrative Science Quarterly 19: 135–151., and . 1978. The External Control of Organizations: A Resource Dependence
Perspective. New York: Harper & Row.Powell, W. W. 1985. The institutionalization of rational organizations. Contemporary Sociol-
ogy 14: 151–155.Preston, A. 1992. The birth of clinical accounting: A study of the emergence and transfor-
mation of discourse on costs and practices of accounting in U.S. hospitals. Accounting,Organizations and Society 17: 63–100.
Pugh, D. S., D. J. Hickson, and C. R. Hinnings. 1969. The context of organization structures.Administrative Science Quarterly 14: 91–114.
, , , and C. Turner. 1968. Dimensions of organization structure.Administrative Science Quarterly 13: 65–105.
Puxty, A. 1993. The Social and Organizational Context of Managerial Accounting. New York:Academic Press.
Rabinow, P. 1984. The Foucault Reader. Pantheon Press.Rose, N. 1991. Governing by the numbers: Figuring out democracy. Accounting, Organiza-
tions and Society 16: 673–692.Rose, R. 1977. Implementation and cooperation: The record of MBO. Public Administrative
Review: 64–71.Rosenlender, R. 1992. Sociological Perspective in Modern Accounting. Englewood Cliffs, NJ:
Prentice Hall.Salancik, G. R., and J. Pfeffer. 1974. The base and use of power in organizational decision-
making: the case of a university. Administrative Science Quarterly 19: 453–473.Sarfatti-Larson, M. 1977. The Rise of Professionalism. Berkley: University of California Press.Schick, A. G. 1985. University budgeting: Administrative perspective, budget structure, and
budget process. Academy of Management Review 19: 794–802.Schiff, M., and A. Y. Lewin. 1970. The impact of people on budgets. The Accounting Review
45: 259–268.Scott, W. R. 1987. The adolescence of institutional theory. Administrative Science Quarterly
32: 493–511.Selto, F. H., C. J. Renner, and S. M. Young. 1995. Assessing the organizational fit of a just-
in-time manufacturing system: Testing selection, interaction and systems models ofcontingency theory. Accounting, Organizations and Society 20: 665–684.
Selznick, P. 1957. Foundations of the theory of organizations. American Sociological Review12: 25–35.
Shank, J. K. 1989. Strategic cost management: New wine, or just new bottles. Journal ofManagement Accounting Research 1: 47–65.

MANAGERIAL ACCOUNTING RESEARCH 329
Simon, H. A. 1957. Administrative Behavior. Glencoe, IL: The Free Press.Simons, R. 1987. Accounting control systems and business strategy. Accounting, Organiza-
tions and Society 12: 357–374.Stedry, A. 1960. Budget Control and Cost Behavior. Englewood Cliffs, NJ: Prentice Hall.Swieringa, R., and R. Moncur. 1975. Some Effects of Participative Budgeting on Managerial
Behavior. National Association of Accountants.Thompson, J. D. 1967. Organizations in Action. New York: McGraw-Hill.Tinker, A., B. Merino, and M. Neimark. 1982. The normative origins of positive theories:
Ideology and accounting thought. Accounting, Organizations and Society 7: 167–200.Tolbert, P. 1988. Institutional sources of organizational culture in major law firms. In
Institutional Patterns and Organizations: Culture and Environment, edited by L. Zucker,101–113. Cambridge, MA: Ballinger Publishing Company.
Van Maanen, J. 1995. The end of innocence: The ethnography of ethnography. In Represen-tation in Ethnography, edited by J. Van Maanen, 1–35. London: Sage.
Walsh, E., and R. Stewart. 1993. Accounting and the construction of institutions: The caseof a factory. Accounting, Organizations and Society 18: 783–800.
Waterhouse, J. H., and P. A. Tiessen. 1978. A contingency framework for managementaccounting systems research. Accounting, Organizations and Society 3: 65–76.
Weber, M. 1947. The Theory of Social and Economic Organizations. Glencoe, IL: Free Press.. 1958. From Max Weber. Glencoe, IL: Free Press.. 1964. Basic Concepts in Sociology. New York: Citidal Press.
Weick, K. 1976. Education organizations as loosely coupled systems. Administrative ScienceQuarterly 24: 1–19.
Wildavsky, A. B. 1964. The Politics of the Budgetary Process. Boston: Little Brown.. 1975. Budgeting: A Comparative Theory of Budgeting Processes. Boston, MA: Little
Brown.. 1979. Speaking Truth to Power: The Art and Craft of Policy Analysis. Boston, MA:
Little Brown.Wilkinson, B., and N. Oliver. 1989. Power, control and the Kanban. Journal of Management
Studies 26: 47–58.Woodward, J. 1965. Industrial Organizations: Theory and Practice. London: Oxford University
Press.Young, S. M. 1992. A framework for research on successful adoption and performance of
Japanese manufacturing practices in the United States. Academy of Management Review17: 677–700.
, and F. Selto. 1991. New manufacturing practices and cost management: A reviewof the literature and direction for research. Journal of Accounting Literature 10: 265–298.
Zucker, L. 1977. The role of institutionalization in cultural persistence. American SociologicalReview 42: 725–743.
. 1988. Where do institutional patterns come from? Organizational actors as socialsystems. In Institutional Patterns and Organizations: Culture and Environment, edited byL. Zucker, 23–52. Cambridge, MA: Ballinger Publishing Company.


Reading D
Reprinted from Accounting, Organizations and Society, Vol 16, No 8, J. F. Dent, Accountingand organizational cultures: A field study of the emergence of a new organizationalreality, pp 705–32, Copyright 1991, with permission from Elsevier Science.
Questions1 How does Dent define culture in his study of EuroRail?2 What was the research method used by Dent in this study? Why do you think
he chose this particular method?3 How does the transition from a ‘railway’ to a ‘business’ culture take place in
Dent’s study? What was the role of accounting in this transition? What meaningdid accounting have to each of the two cultures?
4 How does accounting help to construct a particular knowledge?
Further readingAllaire, Y. and Firsirotu, M. E. (1984). Theories of organizational culture. Organization
Studies, 5(3), 193–226.Atkinson, A. A. and Shaffir, W. (1998). Standards for field research in management account-
ing. Journal of Management Accounting Research, 10, 41–68.Deal, T. E. and Kennedy, A. A. (1982). Corporate Cultures. Reading, MA: Addison-Wesley.Humphrey, C. and Scapens, R. W. (1996). Theories and case studies of organizational and
accounting practices: Limitation or liberation? Accounting, Auditing and AccountabilityJournal, 9(4), 86–106.
Langfield-Smith, K. (1995). Organisational culture and control. In A. J. Berry, J. Broadbentand D. Otley (eds), Management Control: Theories, Issues and Practices, London: Macmillan.
Otley, D. T. and Berry, A. J. (1994). Case study research in management accounting andcontrol. Management Accounting Research, 5, 45–65.
Pettigrew, A. M. (1979). On studying organizational cultures. Administrative Science Quar-terly, 24, 570–81.
Scapens, R. W. (1990). Researching management accounting practice: The role of case studymethods. British Accounting Review, 22, 259–81.
Smircich, L. (1983). Concepts of culture and organizational analysis. Administrative ScienceQuarterly, 28, 339–58.
Smith, C., Whipp, R. and Willmott, H. (1988). Case-study research in accounting: Method-ological breakthrough or ideological weapon? Advances in Public Interest Accounting, 2,95–120.

Accounting and OrganizationalCultures: A Field Study of the
Emergence of a New OrganizationalReality∗
JEREMY F. DENTLondon School of Economics and Political Science
Abstract
Organizations have long been known to have cultural properties. A more recentinnovation is the study of organizations as cultures: systems of knowledge, beliefsand values in which action and artifact are vested with expressive qualities. We knowlittle about the way in which accounting is implicated in organizations’ cultures. Thispaper reports a longitudinal field study of organizational change, tracing out the wayin which new accounting practices were implicated in an emergent reconstruction ofthe organization’s culture.
The train arrived at Capital City Terminus at 12.10. It was on time despite a delay on theline. Walking up the platform, I saw the train driver leaning out of his cab. He must havedriven the train fast to recover the time: the windscreens were spattered with dead insects.He exchanged some words with men dressed in smart overalls. Muttering a few wordsinto ‘‘walkie-talkies’’, they jumped down onto the track to check the engine. Men drivingsmall electric trucks towing streams of trailers with logos on the side collected parcels andmail bags from the guard’s van. Others set about replenishing water and food supplies inthe train. At the barrier, a man wearing a smile and a dark uniform with red piping on theseams checked my ticket.
Moving on, the concourse was bright and airy, concealed lighting illuminating thewhite tiled floor. People were milling about. Soft music was playing on the tannoy. Largeelectronic screens indicated arrival and departure times. There were colourful boutiques
∗ This research was generously supported by the Chartered Institute of Management Accountants.Earlier versions of the paper were presented at the AAA Annual Convention, New York, 1986,the EAA Annual Congress, London, 1987, and the EIASM Workshop on Strategy, Accounting &Control, Venice, 1990. Ken Euske, Anthony Hopwood, Keith Hoskins, Kenneth Merchant, PeterMiller and two anonymous reviewers provided helpful comments.

334 ACCOUNTING FOR MANAGERS
displaying ties, handkerchiefs, socks and bags, and cafes where people were drinking coffeeand eating croissants. What a change, I thought, from just a short time ago, when thestation was dark and grimy, and a grumpy employee had greeted my question aboutdeparture times with a crude response.
At the new executive offices across the street I tangled with the revolving glass andstainless steel door. In the foyer, a manicured receptionist called upstairs to say I’d arrived.The security guard, at least I presumed he was a security guard (his appearance was quitelike a ticket inspector, but his commanding presence was more like a policeman), showedme to the lift. He deftly pressed the fourth floor button, removing himself before the doorsclosed. After a few moments the lift doors opened onto what appeared to be open-plan officespace, but in fact comprised zones of compartmentalized activity separated by cleverlypositioned shoulder-height cabinets and screens. A person came up to me: ‘‘Mr Charleswill be here in a minute’’, he said; ‘‘he’s at a retirement do’’. The man looked busy; histie was loose, the top button of his shirt was undone, he must have left his jacket on hischair. He was courteous: ‘‘his secretary just popped out for a few minutes, but she toldme to expect you. Why don’t you wait in his office?’’ Walking through the office space, Icould see over the cabinets. The arrangements were utilitarian. Some people were stabbingat computer keyboards, others were studying documents, others were writing or workingout sums on calculators. There were piles of print-out everywhere.
We entered Mr Charles’ office through his secretary’s room. From the large windowsthere was a fine view into, and over, the station. I could see trains arriving and leaving.I followed one right into the hills across the city. The office was softly furnished. At oneend, there was a large desk, at the other a couple of sofas; opposite the windows therewere bookshelves and a cabinet. The lighting was bright but unobtrusive. There wasn’ta computer in sight. My guide and I made small talk – incidental conversation aboutthe comforts of the new building and the air conditioning. Conscious that his work waspressing and not wishing to detain him, I told him not to worry about me. Eventually hemade to leave. ‘‘Ah! Mr General Manager’’, I heard him say before he had even left thesecretary’s office. ‘‘Your visitor has arrived’’. ‘‘Thanks John’’, came the reply. Mr Charles,the General Manager, entered the room. ‘‘Good to see you again, Mr Charles’’, I said tohim as we exchanged greetings.
Settling down in one of the sofas he said to me ‘‘I am glad you could come. I think youwill find this afternoon’s meeting interesting. We’re deeply embroiled in cost allocations.Intercity are holding Freight to ransom’’. After my query, he continued: ‘‘At night, wepush freight up the main line routes. Intercity don’t use them at night. You don’t want thespeed then; after all you can’t expect passengers to get off the train at 2 or 3 in the morning.Sleeper trains make their separate way on roundabout routes. Intercity say the wear andtear caused by freight trains, and they are very heavy, means they need to increase theengineering specification of the track. As it’s an Intercity track, they pick up the cost; andthey want Freight to pay. They’re holding them to ransom. Freight have responded byrunning their trains slower. This reduces the damage to the track. They don’t go very fastanyway, so I mean SLOW. Now Intercity say they can’t get back on the track when theywant it in the morning. They have threatened not to let Freight use the track unless theypay. Its going to be an interesting meeting. Would you like a drink before we have lunch?’’
Going to the cabinet, he poured two glasses of mineral water . . .

ACCOUNTING AND ORGANIZATIONAL CULTURES 335
Organizations have long been known to have distinct cultural properties (cf.Weber, 1947; Parsons, 1951). They create and sustain particular work customs.They establish norms for proper and improper behaviour and performance. Theypropagate stories and myths, and are replete with rituals (Van Maanen & Barley,1984; Martin et al., 1983). Communities in organizations have particular codesof communication: behaviour, language, dress, presentation, design, architecture,ceremony . . . The operation of work technologies in organizations is not a purelytechnical-rational affair. Rather it is embedded in a cultural system of ideas (beliefs,knowledges) and sentiments (values), in which actions and artifacts are vestedwith symbolic qualities of meaning. The appreciation of organizational dynamicsrequires a sensitivity to local frames of significance and interpretation.
Accounting practices are a common feature of most work organizations. Plan-ning and budgeting activities, systems of hierarchical accountability, performanceappraisal procedures, budgetary controls and remuneration arrangements, allrely to a greater or lesser extent on accounting practices. Inevitably, therefore,accounting is likely to be implicated in organizations’ cultural systems. But how,and in what way? Drawing on the insights of Meyer & Rowan (1977), Pfeffer &Salancik (1978), DiMaggio & Powell (1983), Scott (1987), Zucker (1988) and others,one theme in the literature appeals to accounting’s potential significance in thecontext of wider societal values and beliefs. Put crudely, organizations depend ona flow of resources for survival; society has beliefs in the efficacy of ‘‘rational’’management practices; organizations which adopt such practices are more likelyto be rewarded. Thus, recent empirically grounded studies (Berry et al., 1985;Ansari & Euske, 1987; Covaleski & Dirsmith, 1988) have cast accounting as a cul-turally expressive symbol of rationality, particularly oriented towards powerfulexternal constituencies, moderating environmental control. In this view, followingespecially Meyer & Rowan’s (1977) discussion, accounting is often seen to beneutral in its effects within the organization. It is kept at arm’s length, symbolicallyconstrued as necessary but irrelevant, and, as it were, not taken seriously. It ispurposefully uncoupled from organizations’ core technological activities.
All knowledges and practices can be reflexive, however. Accounting can reflectback on those institutions which adopt it. Hopwood (1987), Hines (1988), Miller &O’Leary (1987) and others have argued for its constitutive role in the constructionof organizational life. Finely crafted notions of costliness, efficiency, profitability,earnings-per-share and so forth, actively construct particular definitions of realitywhich privilege the financial and economic sphere. Rather than being kept at arm’slength, uncoupled from organizations’ core technological activities, these can per-meate into organizational settings, leading to the creation of particular agendas (inthe sense of objectives and priorities and the means for their achievement), stylizeddefinitions of success and failure, the characterization of heroic performance andthe mobilization of particular dynamics of change. This suggests the possibility ofa more intimate involvement of accounting in organizational cultures.
In fact, evidence in the field suggests that accounting practices are not uni-formly implicated in organizational activities (Goold & Campbell, 1987; Miles& Snow, 1978). In some organizations, accounting is centrally involved in workrituals: financial achievement is celebrated; budgets are massaged, pored over,

336 ACCOUNTING FOR MANAGERS
and matter. In others, accounting is incidental, perhaps existing as a practice, butwith no particular significance. Similarly, entrepreneurial risk taking is sometimesvalued for its own sake. Dynamic, decisive, action-oriented men and womenwho innovate are heroes, almost irrespective of the financial consequences. Inother organizations, risk taking is valued only if successful in financial terms.Arguably, the multi-faceted interplay of accounting with organizations’ culturaland technical systems is under-researched. More empirically grounded research isneeded to ascertain the way in which accounting is drawn upon by actors withinorganizations in the creation and maintenance of cultures.
Responding, with others, to appeals for field studies (e.g. Bruns & Kaplan, 1987)and for the study of accounting in its organizational and social context (e.g. Hop-wood, 1978, 1983; Dent, 1986), this paper reports a longitudinal study undertakenin one organization to research this issue. The organization is a railway company.The study focuses on its senior management elite: a group of approximately 120people including head office executives, senior line management and people insenior staff positions (i.e. finance and engineering). Prior to the study, the dominantculture within this management group was well established, and centred on engi-neering and production concerns. Accounting was incidental in this culture: it wasnecessary in the technical-rational sense of ensuring that revenues were accountedfor and suppliers were paid, but it was not incorporated into the culture amongthe senior management elite in any significant way. Rituals, symbols and languagecelebrated the primacy of the engineering and production orientation. During thecourse of the study, a new culture emerged. The previously dominant orientationwas displaced by a new preoccupation with economic and accounting concerns.New accounts were crafted. Gradually, through action and interaction, they werecoupled to organizational activities to reconstitute interpretations of organiza-tional endeavour. Accounting actively shaped the dominant meanings given toorganizational life, ultimately obtaining a remarkable significance in the seniormanagement culture. A new set of symbols, rituals and language emerged to cele-brate an economic rationale for organized activity. This paper carefully traces theevents and interactions through which accounting was endowed with significance.
The paper is written from a cultural perspective, but in a very real sensethe study is also concerned with power and influence in the organization. Anew culture can be a major source of power, particularly if it gains ascendancyto become dominant, for it effectively alters the legitimacy of accepted criteriafor action.
The next section of the paper outlines the cultural approach adopted in thesubsequent analysis. The following section explains the method employed in thestudy. Two sections then document the study itself. Thereafter, some implicationsfor accounting and culture are drawn out. Finally, there is a concluding comment.
Culture
In recent years, a prolific literature has emerged to offer a wide array of perceptual,symbolic and processual characterizations of organization (e.g. Hedberg et al.,1976; Jonsson & Lundin, 1977; Hedberg & Jonsson, 1978; Pondy, 1978; Weick, 1979;

ACCOUNTING AND ORGANIZATIONAL CULTURES 337
Ranson et al., 1980; Argyris & Schon, 1981; Pfeffer, 1981; Starbuck, 1982; Pondy et al.,1983; Brunsson, 1985; Greenwood & Hinings, 1988). As a result, we are now used toconceptualizing organizations as bodies of thought, variously described as myths,causal schema, theories-of-action, interpretive schemes, ideologies, paradigms andso forth. The concept of culture, drawn from anthropology and ethnography, hasentered the organizational literature as a framework for extending this ideationalunderstanding of organizations1 (Pettigrew, 1979; Smircich, 1983a; Allaire &Firsirotu, 1984; Van Maanen & Barley, 1984; Meek, 1988).
Culture is an elusive concept.2 Here, drawing on Geertz’ (1973, 1983) inter-pretive anthropology, it is defined to be the broad constellation of interpretivestructures through which action and events are rendered meaningful in a commu-nity. Balinese cockfights, a sheep raid in Morocco, funeral rites in Java – or nearerhome, the graduation ceremony, the distinguished lecture series, the publicationof papers in prestigious journals – all have singular meanings in their respectivecommunities (as does all social action). Culture is the ‘‘ordered clusters of sig-nificance’’ (Geertz, 1973, p. 363), the shared ‘‘webs of significance’’ (p. 5) throughwhich people appreciate the meaningfulness of their experience, and are guidedto action. Culture, as an ideational system, is produced and reproduced throughaction and interaction. But it is not just lodged in people’s minds. Culture is public,the product of minds, between minds. Culturally significant events give publicexpression to the ideational system.
The appreciation of organizations as cultures brings the interpretive, experi-ential aspects of their activities to the foreground of analysis, emphasizing theirexpressive qualities3 (Van Maanen, 1979, 1988; Feldman, 1986). Looking at therailway, for example, the train is not seen as cold technology; the concourse is notjust glass and marble; ‘‘Mr General Manager’’ is not an anybody; cost allocationsare not mere calculations: everything is expressive. Local knowledge, beliefs andvalues vest them with symbolic qualities of meaning. The train may be vestedwith a sacred quality (or not, as the case may be) quite beyond its technical
1 Cultural ideas are not new to organizational research. They surface in many classic descriptivestudies of organizational behaviour (e.g. Roethlisberger & Dickson, 1939; Whyte, 1948, [1943]1955; Selznick, 1949; Gouldner, 1954; Blau, 1955; Roy, 1954, 1960; Goffman, 1959; Hughes, 1958;Dalton, 1959; Buroway, 1979). Only in the late 1970s, however, did organizational culture emergeas an explicit theme.2 In cultural anthropology, culture is used in different ways. The broad idea of culture as a ‘‘totalway of life’’ of a community, developed by classical anthropologists (e.g. Radcliffe-Brown, 1952;Malinowski, 1922; Evans Pritchard, 1937, 1940), is continued by Harris (1979), among others.More commonly, culture is used to denote a system of ideas, a position associated in differentways with Goodenough (1971), Levi Strauss (1963, [1962] 1966) and Geertz (1973, 1983). Allaire& Firsirotu (1984) trace implications of these different perspectives on culture for organizationalresearch. Wuthnow & Witten (1988) discuss the use of culture in contemporary sociology, seealso Wuthnow et al. (1984).3 With Meek (1988), Feldman (1986) and others, I wish to distance myself from the currentvogue of ‘‘pop-culture’’ literature on the management of meaning, which is ill-informed in theanthropological tradition: e.g. Ouchi (1981), Peters & Waterman (1982), Deal & Kennedy (1982),Kilmann et al. (1985). No one has a monopoly of meanings (Smircich, 1983b). See Barley et al.(1988) for an interesting discussion of the contaminating effects of this literature.
338 ACCOUNTING FOR MANAGERS
properties; beliefs about the skills required to operate a railway and appropriateforms of organizing may endow the General Manager with special status andprivilege (or not). Cultural analysis attempts to uncover these meanings and totrace the underlying thematic relationships. The objective is interpretation and‘‘thick description’’: the production of rich contextually laden accounts conveyingthe symbolic content of social action.
Meaning systems may differ within organizations, of course. The train, theframing of the routing problem as a cost allocation issue and so on are likely to beinterpreted differently by different groups. Within the overarching concept of anorganization as a culture, it is sensible to recognize the possibility and likelihoodof distinct subcultures existing among managerial teams, occupational groups,members of different social classes and so on; many of which may transcend organi-zational boundaries (Van Maanen & Barley, 1984). As a limiting case, these subcul-tures may be isomorphic; more commonly, they may only partially overlap.4 Also,some may be dominant-cultures and others counter-cultures (Martin & Siehl, 1983),perhaps partially uncoupled from each other (Berry et al., 1985), or co-existing inan ‘‘uneasy symbiosis’’ (Martin & Siehl, 1983), or in contest with each other fordominance (Gregory, 1983; Riley, 1983; Pettigrew, 1985; Feldman, 1986). Moreover,cultures in organizations are not independent of their social context. They are inter-penetrated by wider systems of thought, interacting with other organizations andsocial institutions, both importing and exporting values, beliefs and knowledge.
Accounting is likely to be differentially implicated in these subcultures inorganizations. Accounting systems, and information systems more generally,inevitably offer highly stylized views of the world. Any representation is partial,an interpretation through a particular framing of reality, rendering some aspectsof events important and others unimportant; counter-interpretations are possible(Hedberg & Jonsson, 1978). Accounting systems embody particular assumptionsabout organization, rationality, authority, time and so forth. These may be moreor less consonant with local subcultures in organizations (cf. Markus & Pfeffer,1983). For example, to senior managers in some organizations accounting maysymbolize efficiency, calculative rationality, order and so forth: ‘‘the name of thegame is profit’’. This may motivate the development of sophisticated accountingsystems measuring economic performance this way and that. To others (nearerthe ground?), accounting may symbolize confusion or irrelevance: ‘‘no one under-stands the business’’; ‘‘when all else fails they resort to the numbers’’ (see Jones& Lakin, 1978, chapter 11, for a graphic example). Similarly, meanings may differ
4 Geertz’ (1973, pp. 407–408) analogy is relevant here: ‘‘Systems need not be exhaustivelyconnected . . . They may be densely interconnected or poorly . . . the problem of cultural analysisis as much a matter of determining independencies as interconnections, gulfs as well as bridges.The appropriate image . . . of cultural organisation, is . . . the octopus, whose tentacles are in largepart separately integrated, neurally quite poorly connected with one another and with what inan octopus passes for a brain, and yet who nonetheless manages to get around and to preservehimself, for a while anyway, as a viable if somewhat ungainly entity’’. He goes on: ‘‘Culturemoves like an octopus too – not all at once in a smoothly coordinated synergy of parts, a massivecoaction of the whole, but by disjointed movements of this part, then that, and now the otherwhich somehow cumulate to directional change’’.

ACCOUNTING AND ORGANIZATIONAL CULTURES 339
across occupational groups. Commercial managers may appreciate accountingrather differently to engineers, for example.
It is useful to think of societal cultures as emergent, unfolding through time5
(Geertz, 1973; Douglas, 1966), and similarly with organizational cultures (Petti-grew, 1985; Feldman, 1986). That is not to say that given cultures do not survivefor long periods, or that changes may be proactively managed: organizationalcultures probably have inertial tendencies (cf. Miller & Friesen, 1984), perhapssometimes not even incorporating changes in wider patterns of social thought6 (cf.Burns & Stalker’s, 1961, pathological responses in mechanistic firms). Rather, theimplication is that culture is not programmed or static. The processes of culturalchange in organizations are poorly understood, however. Perhaps cultural changeis a political process: subcultures competing with one another for legitimacy anddominance (Pettigrew, 1985). Perhaps cultural change is akin to the diffusion oforganizational forms, whole fields of organizations rapidly adopting knowledgeinnovations in leading firms (cf. Fligstein, 1990). Perhaps in a Kuhnian sense, cul-tural change is precipitated by crisis: the adoption of new cultural knowledge onlybeing possible when faith is undermined, for example by the failure of strategiesfor subsistence. Maybe new cultures are autonomously crafted in organizations(cf. ‘‘groping’’ towards ‘‘solutions-in-principle’’ and their subsequent elaboration:Mintzberg, 1978; Jonsson & Lundin, 1977); or perhaps they are already there,‘‘lying around’’ in counter-cultures, waiting to be discovered by others (cf. Cohenet al., 1972); alternatively, cultures may be imported from the environment throughnew actors (cf. Starbuck & Hedberg, 1977).
Clearly, there are multiple modes and possibilities for cultural change. However,the point of importance for this paper is the conceptualization of cultural changeas the uncoupling of organizational action from one culture and its recouplingto another (cf. Greenwood & Hinings, 1988; Hedberg, 1981). It is a process offundamental reinterpretation of organizational activities. Things cease to be whatthey were and become what they were not: a new reality, if you will. In the railway,for example, the sacred train could turn into cold steel, or the priest-like generalmanager could become an anybody. Moreover, this process of uncoupling andrecoupling is unlikely to be sudden, but emergent: the gradual disintegration ofone coupling and the crystallization of another. This crystallization may be aroundan idea not fully understood, a kind of ill-articulated new knowledge, perhapsimported from the environment. In the railway, this idea was a new accounting.
Research method
Arm’s length analysis is clearly inappropriate for cultural analysis of the kinddescribed here. Instead, it calls for closer engagement in the research setting and
5 Douglas (1966, p. 5) states: ‘‘. . . we think of ourselves as passively receiving our native language,and discount responsibility for shifts it undergoes in our life time. The anthropologist falls intothe same trap if he thinks of a culture he is studying as a long established pattern of values’’.6 There is a link here to the cultural adaptation literature (Harris, 1979), but it is not developed inthis paper; cf. Lawrence & Lorsch ([1967] 1969), Aldrich (1979).

340 ACCOUNTING FOR MANAGERS
‘‘interpretive’’ methodology (Geertz, 1973; Burrell & Morgan, 1979; Denzin, 1983).Necessarily, this precludes the imposition of exteriorized accounts, and radicalcritique. In part, the goal is ‘‘to grasp the native’s point of view, his relation to life,to realise his vision of his world’’ (Malinowski, 1922, p. 25); in part it is to reflecton the processes through which that vision comes to be and is sustained.7
This kind of research is necessarily qualitative. Data consist of descriptions andaccounts provided by participants in the research site, together with the researcher’sobservations on activities and interactions and the context in which they take place.Data must be collected over an extended period of time so that processes canbe recorded.
The researcher, in general, does not seek to test a prior hypothesis. Rather, heor she seeks to theorize through the data in an inductive manner. Analysis ofthe data is itself an emergent process. The researcher seeks gradually to developan empathy with the data, to understand what they tell of participants’ realitiesand the process through which they unfold. The researcher must constantlyconstruct alternative interpretations (‘‘readings’’: Levi Strauss, quoted in Turner,1983) until he or she is satisfied that the representation is a faithful account.Interpretations must be grounded in context and consistent with the chronologicalordering of events and interactions. Finally, research results must be presented insuch a way that the reader can independently judge their credibility, as far as ispossible.8
The study reported here was conducted over a period of two years, with followup visits one year and two years later. It involved ongoing iterations between datacollection and analysis. Access to the organization was gained through variouschannels and contacts. The researcher was given freedom to interview anyonehe wished. At no point in the data collection process did the researcher expressopinions, save where it was necessary to prompt interviewees.
Data were collected from staff within the organization in several ways. Thefirst source was a series of unstructured interviews. Approximately 30 managerswere interviewed, sometimes twice or more times at the researcher’s request.These included head office executives and their advisors or assistants, seniorline management and people in senior staff positions (finance and engineer-ing). Interviews averaged one and a half hours in length, and were spread overthe period of the research. They were tape-recorded and transcribed. Secondly,access was granted to various internal meetings. Debates were observed and
7 For Geertz (1983, p. 58): ‘‘The trick is not to get yourself into some inner correspondence ofspirit with your informants . . . The trick is to figure out what they think they are up to’’. Whileone may attempt to move towards an ‘‘experience near’’ understanding in the field, however,the presentation of an ethnography inevitably will recast these understandings through the‘‘experience far’’ theoretical categories of the reader. Crapanzano (1986) argues that this claimto ‘‘native view’’ interpretations is illusory: ‘‘There is only the constructed understanding of theconstructed native’s constructed point of view’’ (p. 74). See also Marcus & Fischer (1986) forcontemporary critique.8 The anthropological literature is brimming with reflexive discussion of ethnographic writingstyles. See Geertz (1988), Marcus & Cushman (1982), Clifford & Marcus (1986), also VanMaanen (1988).

ACCOUNTING AND ORGANIZATIONAL CULTURES 341
dialogue noted. Activities in these meetings were subsequently written up inabbreviated form. Thirdly, data were collected through casual conversations andby simply ‘‘being around’’.
As the project progressed, the data were repeatedly analysed. At first, itseemed that there was a real probability of drowning in the data. Transcripts andnotes were accumulating rapidly, and the material appeared to be incoherent.This is apparently a common feature of the initial stages of cultural research(Smircich, 1983b). But different ways of making sense of it all were explored andgradually a pattern began to emerge. At each stage emerging appreciations werechecked against the next round of data in an attempt to confirm the researcher’sunderstanding of the situation. This continued until such time as the subsequentdata became predictable.
It may be useful to indicate the precise way in which the data were found togive a coherent picture. Ultimately, the analysis hinged on three dimensions: role(function), and level of hierarchy of the subject, and time. Firstly, the data werecategorized according to content and underlying values. Opinions, sentiments,interpretations, confusions and so forth in each interview transcript were noted.This was done without reference to the identity of the person who had beeninterviewed. The data collected at any one time seemed to fall naturally intodistinct constellations or clusters (in the sense that groups of people expressedsimilar views). Attaching identity to the data, it transpired that these constellationscorresponded broadly to interviewees’ roles and positions in the hierarchy. Amongthose performing similar roles (functions) at a similar level in the hierarchy, therewas a marked similarity of perspective. Perspectives differed, however, acrossroles and at different levels of the hierarchy. These data were set up on atwo-dimensional space with role on one axis and hierarchy on the other.
This exercise was repeated on data collected at different times, and foundto give similar results, in the sense that the data again fell into role-hierarchyclusters. The specific content of the data differed over time, however. So, the two-dimensional spaces were set out in chronological order. In effect, a third dimensionwas added to the space, representing elapsed time. Studying the content of thedata as one moved through time, it transpired that the opinions, sentiments andinterpretations of each group were in fact evolving in a systematic way. In thisthree-dimensional space was a story of unfolding meanings in the organization.
This was indicative of the existence of different cultures in the organization, andsome systematic underlying trajectory in the emergence of those cultures. In fact,during the data collection process, it became clear that new interviewees’ viewswere predictable, given a knowledge of (a) the role (function) of the participant,(b) his or her position in the hierarchy, and (c) the time of the interview.
At this point, the data were analysed from a different perspective. Specifically,the level of analysis shifted from content to process. The data were re-examinedto see if the process through which the new meanings were emerging wasobservable. Some key turning points were obvious in the data. There was a seriesof events and interactions through which the emergence of the new meaningstructure could be traced. These are documented in following sections. Finally, the

342 ACCOUNTING FOR MANAGERS
findings of the research project were noted and informally discussed with variousparticipants.9
The organization: an overview
The research was undertaken in a major railway company. The company is referredto here as ER10 (‘‘Euro Rail’’). It is, and has been for some while, in public sectorownership. It is large by any standards, employing approximately 160,000 people.It has a distinguished history.
History and traditions
ER has its origins in the great private-sector railway companies set up in themiddle decades of the last century. These each built and operated a main line outof the capital city, i.e. radial routes and associated branch lines.11 The companiesare legendary. They raised capital to fund their projects on an unprecedented scale.Their railways were built by world-famous engineers who pioneered emergingindustrial technology, designing magnificent steam locomotives and tracks andbridges which the world admired. The railways were, and are, a visible celebrationof Victorian accomplishment.
These companies enjoyed a monopoly in the nation’s transport well into thiscentury. They had good relationships with successive governments. They paidconsistent dividends and their shares were blue-chip stocks. This monopolyposition and government patronage, coupled with a remarkable continuity inthe underlying nature of their operations, rendered them highly bureaucratic:rules and procedures were well defined, there were clear chains of commandand formalized systems for managing operations.12 Their managements wereconservative, cultivating a belief in the uniqueness of railway management andthe wisdom of practices built up over many decades.
9 There were several fascinating aspects of this last stage in the field. One was that many managershad simply forgotten what had happened, or at least had retrospectively reconstructed it. Inparticular, some seemed to forget how tentative their initiatives had been, the anguish andstress of trying to imagine a new future, the tense moments at the heights of political intrigueand the sheer uncertainty of the outcomes. They read the past through the present. Geertz’(1973, p. 19) notion, drawn from Ricoeur, of the ethnographer ‘‘. . . tracing the curve of socialdiscourse; fixing it in inspectable form . . . He turns it from a passing event which exists only inits own moment of occurrence, into an account, which . . . can be reconsulted’’, is particularlypertinent here. Secondly, my intervention at this stage actually constructed a past (and hence apresent) for participants; in other words, the theory developed here on the constitutive potentialof accounting may be a general theory of accounts.10 The company’s name has been disguised.11 This is an oversimplification, for in fact there were then a multitude of local regional railwaycompanies in addition. It was only in the 1920s that government inspired mergers led to theirconsolidation around the major routes.12 This was not unique to ER. See Chandler (1965), Crozier (1964) and Gourvish (1986).

ACCOUNTING AND ORGANIZATIONAL CULTURES 343
Importantly, though, while established as commercial concerns and earningtheir founders a handsome return,13 these companies also embraced a spirit ofpublic service, for the railway network provided a transport infrastructure muchneeded for the pursuit of trade and manufacturing, and for social mobility. Thisnotion of public service was significant in the managements’ interpretations of therailways: they took the rough with the smooth. They were run by ‘‘railway men’’:engineers and operators who took pride in the professional management of therailway and its public service.
The railway companies were nationalized in the late 1940s. In many respects,this was of limited significance. The nationalized railway consolidated the oldmanagement structure: it was organized by region, each representing one of theradial routes out of the capital city; and each still managed by a General Manager(the same title as before). An Executive Committee was established to overseepolicy decisions and to interface with government. This committee comprised theregional General Managers together with the Chief Executive of ER and variousengineering chiefs.14 Management practices of the former railways survived intact.Furthermore, nationalization reinforced the public service orientation, for this wasthe era of the Welfare State. Public-sector ownership established the railway asa social service. Its prime purpose was to provide a transport infrastructure.Profitability was secondary.
This interpretation of the railway remained dominant among senior managersfor thirty years or more. Post-nationalization governments, faced with deficits andhuge investment sums required for modernization, frequently sought to containthe costs of maintaining this infrastructure. Following a fundamental review inthe 1960s many branch lines were closed. Later, during the 1970s, the governmentimposed investment ceilings and set out expectations for the maximum level of itssupport. But, although now tempered with a concern for thrift and the avoidanceof waste, old traditions endured. Financial deficits continued. ER remained abureaucratic organization with a heritage of railway engineering and publicservice. The railways were still run for practical purposes by regional GeneralManagers, each one of these standing in a direct line of descent from a foundingpioneer. They occupied the same grand offices. There were portraits of previousincumbents on their walls. They were, very consciously, carrying on a tradition ofprofessional railway management.
13 In this connection, Bryer’s (1991) account of the differential returns to investors in Britain’srailways is interesting.14 Committee structures were continually revised and amended during the post-nationalizationperiod. My terminology anticipates the structure in place in the early 1980s, at the start ofthis research. Broadly speaking, this structure is not unrepresentative of early patterns, forthe representation of interests in railway management committees was constant throughoutthis period. The railway companies were also diversified into related businesses, however,e.g. engineering, shipping, harbours, property and hotels, which were also represented in themanagement structure. These other businesses are not discussed here. They only accountedfor about 25% of headcount and turnover, and the railway operations remained the dominantmanagerial concern. For the record, they were gradually privatized during and after the periodof this research.

344 ACCOUNTING FOR MANAGERS
This was the reality of the dominant ‘‘railway culture’’. The railway was a publicservice. The purpose of the railway was to run trains. In so doing profitabilitywas secondary. The accepted professional concerns were to do with railwayengineering and the logistical problems of operating trains. And although the‘‘golden age’’ of steam had passed, new electrical and electronic technologies stilloffered scope for railway people to further their engineering heritage.15
The emergence of the economic perspective
In a profound sense, nationalization thirty years before had created a relationshipof dependence for the railways, a dependence on government for sustenance.In the early 1980s the implications of this became clear. Government policybecame stringent. Social aims ceased to be a legitimate criterion for support.Government sought to impose harsh economic disciplines in all areas of publicand private endeavour. Declaring a determination to ‘‘take on’’ the public servicesin particular, it orchestrated a campaign challenging the competence of public-sector management. For the railway, government ‘‘expectations’’ were translatedinto more specific financial ‘‘objectives’’. These were progressively tightened.Investment funds were withheld. Reporting escalating losses, ER found itself in amalign, resource constrained environment.
We need, for a moment, to backtrack. Apparently, in the late 1970s, the ChiefExecutive of the railway had set up a strategy think-tank to improve long-termplanning.16 Embryonic ideas developed there, and subsequently nurtured by asmall group of executives, were now rolled out for more general consideration.Senior managers, by this time fully appreciative of the real hostility of governmentand the precarious position of the railway, fastened onto the ideas as a solutionto the current problems. The organization, through the Executive Committee,created new management positions. For the first time, ‘‘Business Managers’’ wereappointed. For analytical purposes (only), railway operations were broken downinto market sectors: for example, long distance passenger traffic, short distancepassenger traffic, freight, parcels and postal traffic. Business Managers wereassigned responsibility for developing strategies to enhance financial performancein each sector – in effect to manage the ‘‘bottom line(s)’’.
These people were appointed outside the main line-management hierarchyof the railway. They were long-range planning people in staff positions at theHead Office, with no formal control or authority over railway operations. In fact,their initial responsibilities were thought to be confined to the identification ofmarket-related initiatives. The Business Managers reported to the Chief Executive
15 A notorious example of this was the development of an advanced passenger train in the late1970s. Powered by a gas turbine, it employed a revolutionary suspension technology, the wholetrain tilting as it went round corners. In trials, the prototypes proved unreliable, and madepassengers sick. The project was shelved in the subsequent ‘‘business regime’’ of the 1980s. Aprototype was sent to a railway museum.16 I am indebted to independent archival research for this information. In the railway folklorethese events are shrouded in the mystery of (recent) time. This pattern of events is not unique:see Gourvish (1990) for comparable accounts.
ACCOUNTING AND ORGANIZATIONAL CULTURES 345
and joined the Executive Committee. But the regional management hierarchiesremained intact. Regional General Managers, carrying on the old traditions,continued to run the railway.
The appointment of Business Managers was to have far reaching consequences,however, for it introduced a new ‘‘business’’ culture, a counter-culture. Theybrought a different interpretation of reality. For them the railway was a business, itspurpose was to make profit. Engineering and logistical operations were essentiallya means for extracting revenues from customers. Professional management wasabout making the railway profitable.
Business Managers were appointed without staff or support at the marginsof the organization. But during the course of the study, they gained influenceat the expense of the regional General Managers. They persuaded many aroundthem of their idea of a business railway. Gradually, people converted to the‘‘business culture’’. Others left the organization. The nature of dialogue anddebate changed. Appeals to the old traditions of railway excellence and publicservice were repudiated. New kinds of policy decisions emerged, motivated bythe business logic. Operational activities out in the regions began to be informedby the new rationale.
Now, the old world view, the preoccupation with engineering and logistics,the belief in the railway as a social service, the railway culture, has been sub-stantially displaced by the business perspective, the belief that railways shouldbe instrumental in making profit and managed to that end. The counter-culturehas emerged to become the dominant-culture among the senior management.Traditions established over longer than a century were quickly overthrown.
Tracing the dynamics of change
The story is one of evolving interpretations, meanings and perceived possibilities.No one in the organization foresaw the outcome at the start, not even theBusiness Managers. At first, their ‘‘business culture’’ was vague and indistinct,a kind of abstract generality. But as events unfolded, it became more specific.Possibilities for coupling their business reality to organizational action wereperceived. Gradually, as people elaborated the new logic for organized activity,momentum was created. Capturing the emergent nature of these developments,one senior manager described the experience as ‘‘a voyage of discovery anddevelopment’’.
This section traces the dynamics of change. Firstly, it considers the contextsurrounding the appointment of Business Managers. Then it outlines the craftingof new accounting systems. Subsequently, it traces the process through whichthe new accounting was coupled to organizational activities and endowed withmeaning. Finally, it gives an account of the regional General Managers’ perspectivein these events. The section is interspersed with representative comments frommanagers in the organization.
346 ACCOUNTING FOR MANAGERS
People and contextThe context of the Business Managers’ appointments in ER is important inappreciating the trajectory of events. The railway was under acute threat. Thecompetence of public-sector management was openly under challenge. The railwaywas charged with being ‘‘old fashioned’’. Governmental pressures for profitabilitywere onerous, and sanctions were being applied.
These threats were clearly appreciated by senior management. The railway hasalways prided itself on being modern in its technological activities. The charge ofbeing ‘‘old-fashioned’’ in its management practice was deeply challenging. More-over, there was some recognition that the old traditions were not, in themselves,proving sufficient to manage the threats away, and needed to be supplementedin some way. The skills the Business Managers brought, marketing, long-termplanning, ‘‘bottom line’’ management, had an image of modernity, enabling therailway to throw off the charge of being ‘‘old-fashioned’’, and were thought to be auseful supplementation of the railway traditions. Moreover, they were thought tobe unintrusive, a ‘‘grafting-on’’ to the old traditions. The Business Managers hadno operational authority. They were ‘‘back office’’ planning people. Their roleswere defined through a remote accounting construct, the ‘‘bottom line’’, outsidethe prevailing mainstream understanding of railway activities. In bringing newknowledge to bear to cope with environmental pressures, they were not expected todisrupt the railway or existing patterns of authority. Senior managers commented:
Everything has its time. You’ve got to realize the environment of the (trans-port) industry. We’re now in the most competitive environment the railwayhas ever faced. And there were clear objectives emerging from the Govern-ment. These things made people think differently . . .. It’s all in the marketplace in the end, and how to exploit the market place. The traditional railwaywasn’t sensitive to the market place (Senior Executive).
We were weak in marketing and business issues generally. The governmenttargets were stiff. We needed those skills (General Manager).
Equally important are the personalities and backgrounds of the Business Man-agers. While they had all at some time worked in or with the railway, practicallyall had also worked outside. Thus, while they understood the railway culture andcould talk railway talk, they also appreciated what they saw as wider businesspractice: ‘‘managing for profit’’. Furthermore, these men became evangelists, hun-gry people with a mission. They developed a zeal to convert the railway from asocial service to a business enterprise.
In addition, the nature of their appointments was rather unusual (at least fora mechanistic organization). There were no briefs or manuals. Ultimate inten-tions were not articulated. Business Managers were just told to see what theycould do.
We introduced it in an evolutionary way. We said: ‘‘Let’s appoint BusinessManagers and then let it evolve. Be patient and let it evolve’’ (SeniorExecutive).

ACCOUNTING AND ORGANIZATIONAL CULTURES 347
When the Chief Executive introduced the Business Managers he didn’t haveany idea how to take the concept forward. I think he deliberately chosepeople who would win the day, and left them to get on with it. It was up toeach of us to build our influence. The regional General Managers had greatcentres of power: buildings and armies of people. They were the Gods onhigh, the last remnants of the Railway Companies. He wanted to stand backfrom it all, and see what would happen (Business Manager).
They had, at best, a vague job description, one which they could legitimatelyexpand.
Subsequent events were not independent of changes in the social and politicalclimate during the decade. It was one dominated by economic liberalism: dereg-ulation in many spheres of activity, privatization of state owned enterprises, anda sea change in attitudes towards the public services and the Welfare State. Thesesubstantive effects were to come later, but there was already a clear ‘‘idealiza-tion’’ by government of private sector management practices, and a belief thatthey could be introduced in the public sector. (Industrialists were rationalizing‘‘old fashioned’’ work routines in the Civil Service, for example.) There was alsoa stated political agenda to subject the public services to ‘‘market disciplines’’wherever possible.
Evolutionary change and organizational acclimatizationThe railway has long traditions and consensually accepted preoccupations. Atfirst, the Business Managers could only see limited opportunities for couplingtheir concept to day-to-day activities. But as events unfolded, tentative newpossibilities were perceived. Stage-by-stage, as if in episodes, their abstract notionof the business railway became more concrete.
The railway is a very formal organization. People in it describe the managementprocess in bureaucratic analogies, talking of ‘‘chains-of-command’’ and ‘‘goodold soldiers falling into line’’. In meetings, people are often referred to throughtheir official titles. There is much deference to authority. The Business Managersrecognized the significance of this formal management style in their quest toconvert the railway. In fact they worked through it. As their ideas evolved, in eachepisode they sought first to persuade the Chief Executive and his advisors. Thesepeople were likely to be the most sympathetic to their economic rhetoric, for theyinterfaced with government and felt the external pressures most immediately.Carefully negotiating in principle a course of action, often after much private andclosed debate, then, sure of their support, the Business Managers set out to converta wider group.
Each episode involved a fairly small incremental step. None, in isolation, wasespecially threatening or difficult to accommodate in the old railway culture.Indeed, at first, even those who ultimately stood to lose influence and statusappreciated the blending of the business perspective into the railway culture. Asthe organization became acclimatized to each change, however, as each episodehad a chance to ‘‘soak’’, so new possibilities were perceived. Repeatedly, newepisodes were enacted.

348 ACCOUNTING FOR MANAGERS
Commenting on the way in which they operated, a Business Manager reflected:
In the early days, there was nothing in writing, except that we had aresponsibility for improving the bottom line. There were no organizationcharts. This made life difficult. It was all about relationships. We had topersuade everyone around us . . . As we did so, our ideas evolved. Webecame increasingly aware of the potential of the Businesses.
Senior Executives recalled:
Our ideas were constrained because we were . . . well I was going to saytraditional railwaymen. We were coloured by the views of the complexityof running a railway. No one foresaw the present state as a possibility. Ourminds were opened.
It takes time to change an organization like the railways and to changeattitudes. There’s 150 years’ history. You don’t overturn that lightly. Norwould you want to, or the railways would cease to operate . . . The BusinessManagers recognized that. First, they convinced a small group, then graduallywidened that group until everyone was aboard . . .
They operated in stages . . . Incremental changes were easier to sell. It waseasier to build commitment and minimize opposition from those who stoodto lose . . . They took each stage to the limit.
Creating an alternative account
For the Business Managers the purpose of the railway was to make a profit. Thesignificance of customers was revenues; the significance of operations, that is,trains, infrastructure and staff, was cost. Upon their appointment, however, therewas no account of the railway’s activities in each market sector consistent withtheir reality. While profit or loss was measured for the organization as a whole, andwas used in dealings with government, no such measures existed for componentparts of the railway.17
In fact, during the 1970s, primarily for analytical purposes (rather than forresponsibility accounting), the railway had moved towards a system of contribu-tion accounting, matching directly traceable costs to revenues for various marketsegments.18 Common costs were not allocated to the segments. The railway is aremarkably integrated activity, with common staff, infrastructure and, to someextent, train-related activities, so these unallocated costs were very substantial.
17 Under existing systems, costs were accounted for by region, corresponding to the physicallocation of the operational activities concerned. The regions were thus essentially cost centres.Revenue responsibility was more diffuse, for passengers and freight were frequently transportedacross two or more regions. In fact it was not as simple as this, but in practical terms, the railwaynetwork alone was a huge profit centre.18 These did not precisely correspond to the present market sectors, but provided a basis onwhich to build the subsequent measures.

ACCOUNTING AND ORGANIZATIONAL CULTURES 349
Senior accounting executives had long argued, both privately and publicly, thatallocation was neither possible nor meaningful. Fundamental to the BusinessManagers’ appointments, however, was not just a profit-contribution responsi-bility, but a ‘‘bottom line’’ responsibility, and this called for the allocation ofcommon costs.
In a definite way, this ‘‘bottom line’’ responsibility had a normative symbol-ism – private sector managers were concerned with the ‘‘bottom line’’. But therewas a more practical logic: this was to ensure that one or other of the BusinessManagers would be responsible for all costs, and motivated, as events unfolded,to ask questions about the necessity and consequences of incurring cost. A SeniorExecutive commented:
You appoint a Business Manager and say: ‘‘We believe this is freight’’.The first thing he says is: ‘‘What’s mine? What are the boundaries of mybusiness?’’ Then he pursues questions such as: ‘‘How are costs being allocatedto me? I want to know more about it. Let me analyse and fillet all the costyou are suggesting is mine’’ . . . Then he asks: ‘‘How do these costs relate tomy revenues’’.
An individual within the accounting department was appointed to developprofit or loss measures by business sector. This person was in rather an invidiousposition. Given senior finance officials’ former public repudiation of the possibilityof developing these measures, he had to tread carefully. He later recalled:
At first I was not convinced that it was either sensible or feasible. There’s awhole history of avoiding cost allocations in the railway. But if the BusinessManagers were to take responsibility, they needed different ManagementAccounting. I was persuaded of this new way to run the railway. I wantedFinance to play a fundamental part in supporting it.
When I was appointed I spent several months bouncing ideas off walls – wallsnot people – because finance people didn’t believe you could or shoulddevelop the information they needed.
He became involved in intensive discussions with the Business Managers, andwith representatives of the Chief Executive’s office. Different ways of apportioningcosts were discussed, and a firm of accountants consulted. The guiding principlewas ‘‘cost exhaustion’’ – all costs incurred by the railway had somehow to beattributed to one or more of the businesses.
The precise details of the method of arriving at the profit or loss for eachbusiness are unimportant here. It suffices to say that it was founded on principlesreflecting the primacy of use of resources, and that the development of computersystems to operationalize the principle in full took some while. The significantpoint is that these measures were introduced, manually at first, and that they werefundamental to the emergence of the new culture.
Business Managers were appointed without any operational authority. Theirpositions were an abstract economic construct. They were made meaningful

350 ACCOUNTING FOR MANAGERS
through the new accounting constructs. Moreover, the accounting measures pro-vided a means through which they could later couple debate on operational andphysical concerns to an economic calculus. Reflecting on the penetration of thenew account of organizational activities, one Business Manager observed:
It’s my impression that the engineers, and after all we are an engineeringcompany, had no real understanding of what they were doing in termsof the ‘‘bottom line’’ . . . Now the engineers know what a ‘‘bottom line’’specification really is and they can respond to it.
One regional General Manager commented:
I always behaved with the ‘‘bottom line’’ in mind. But the Business Managerstook it further. They challenge to a much greater extent. Making the railwayprofitable is the real meaning of the Business.
And another:
I didn’t realize the extent to which budgets would be challenged, andchallenged so vehemently.
Coupling railway activities to the new account
At the head of the railway is the office of Chief Executive. Attached to this arevarious staff functions – Finance, Engineering Directorates and so forth. Reportingto the Chief Executive in a line-management relationship are the General Man-agers of the regions. Underneath these are the railway operations. Overlaid onthis management structure are formal planning and decision-making systems ofvarious kinds.
The Business Managers were appointed in staff positions outside the formal line-management structure of the railway organization. They wished to explore theirreality with others. But, there was, at first, no formal context for them to interactwith others. Neither did they have the formal status they perceived necessary toinfluence others. In a sequence of moves, they sought, first, to institutionalize theirstatus, and then to secure bases for participating in an increasing range of dialogueand debate.
Securing status. First they lobbied the Chief Executive and his advisors for achange in reporting relationships. If he was serious about the idea of marketing andbusiness planning in the railway, they argued, then they had to have comparablestatus to the regional General Managers. After some considerable debate, a newmanagement structure was introduced. The Chief Executive appointed two JointManaging Directors, one taking a responsibility for the regions – the operationsside of the railway, the regional General Managers; the other taking a responsibilityfor planning and marketing – in effect, the Business Managers. In a symbolicsense, although not at first in practice, this gave the Business Managers paritywith the regional General Managers. It also stood for the Chief Executive’sacknowledgement of the legitimacy of the ‘‘business’’ reality, the reality of the

ACCOUNTING AND ORGANIZATIONAL CULTURES 351
railways being managed for profit. Commenting on the significance of this, oneBusiness Manager observed:
The General Managers used to report directly to the Chief Executive. Thejoint Managing Directors gave us parity.
Creating contexts for interaction. Later, in subsequent episodes, they lobbied forsuccessive changes in the formal planning and decision-making systems. Changes,they argued at each juncture, were necessary to provide a balance to the over-bearing influence of the regional General Managers and engineers. Over theperiod of the study, three changes were forthcoming. Each change secured openedup possibilities for perceiving the potential of the next. Firstly, the corporateplanning system was revised. This dealt with longer-term matters. Formerly,regional General Managers prepared plans and presented them to the ExecutiveCommittee for ratification. The change gave Business Managers a formal inputinto the preparation of plans. In fact, the planning process became ‘‘business-led’’,with these managers setting financial and other objectives for the regions, theregions being required to identify actions to achieve those objectives. Next, capitalexpenditure approval procedures were amended. Formerly, regional GeneralManagers and engineering chiefs had significant autonomy in the approval ofcapital expenditures. The new system required expenditure proposals to beunderwritten by one or more Business Managers, and effectively gave them aright to veto if they thought the proposals were uneconomic. Finally, budgetingsystems were revised. Budgets emanating from each region were analysed bymarket sector. Business Managers became involved in their review.
The significance of these changes is that, in the context of ER’s formal man-agement style, formal systems and procedures imply rights to participate in andinfluence decisions and actions. The Business Managers’ participation in the oper-ation of these systems gave them a context to interact with others and question therationale underlying railway decisions. In meetings, they could be seen translatingoperational and engineering concerns into the new profit calculus, feeding theirfinancial vocabulary back into the stream of discourse. Appealing to the ‘‘ideal’’of the profit-conscious customer-oriented private sector manager, they challengedand sometimes ridiculed beliefs.
Thus, participation in the planning procedures enabled them to reinterpretlonger-run engineering and operational initiatives in business terms: what doesit mean for the customer? Will it improve journey times and punctuality? Whatimplications does it raise in terms of costs and revenues? Their sponsorship of cap-ital investments enabled them to ask: will it improve train reliability, eliminatingthe need for back up resources? Can the businesses afford it? What are the invest-ment options? The redesign of the budgeting system gave them opportunities tochallenge the cost effectiveness and profit implications of operational issues liketrain routing, train scheduling and the programming of maintenance.
Moving from the remote concerns of long-term planning, through capital invest-ments, to immediate issues of train scheduling and maintenance programming,they recast management debate into a language of the ‘‘bottom line’’. Others beganto take up their vocabulary. Railway matters gradually came to be discussed as

352 ACCOUNTING FOR MANAGERS
financial matters. Furthermore, planning and budgeting activities began to assumea new significance. Formerly, they were introverted acts of cost containment. Nowthey came to symbolize the search for profit-maximizing opportunities.
Commenting on the importance of these changes in formal systems, a BusinessManager observed:
We had responsibility for improving the profitability of the railway. Butit wasn’t clear who was in control – I think there was some diffidence inspelling that out with the utmost clarity. We lobbied to get control of theplanning process. Clarity has emerged, now that we have taken responsibilityfor planning and budgeting. That’s become our power base.
Over time, these changes cumulatively extended the opportunity for BusinessManagers to interact with engineers and operators far beyond their originalremit. Through this interaction, their ideas became more specific. But they werestill located in the Head Office. Accordingly, in a later episode, they set aboutextending their influence into the regional organizations. They appealed to theChief Executive for the appointment of individuals to represent their interestswithin the regions. These Regional Business Managers, once appointed, carried theeconomic perspective deep into the regional organizations, carving underneaththe regional General Managers and giving Business Managers a direct line ofinfluence to operational activities. One commented:
People in the regions are used to doing things without asking. They findthemselves subject to our scrutiny. I can take things up in a big way, ifnecessary, and howl for their blood.
And commenting on their influence, an operations manager in the regionsobserved:
Five years ago it would have been revolutionary to challenge what anengineer wanted to spend money on. Now it happens frequently.
Consolidating the emerging reality through symbolic events. Through interactionin meetings and elsewhere, many in the organization began to understand theBusiness Managers’ emerging reality. Most also found it appealing. The continualattacks on the competence of public sector managers had worn morale down. Tobe business-like was ‘‘good’’, it gave them pride, and made the railway modern.Increasingly people came to share the normative symbolism of the ‘‘bottom line’’.But to a large extent this was uncoupled from their concrete day-to-day activities.Meaningful symbols relating to everyday tasks, events and recollections throughwhich people could connect the business reality to their ongoing decisions andactions, were absent.
As the situation unfolded, this changed, however. In parallel with the formalchanges, a sequence of important events was enacted. The Business Managersstaged ‘‘contests’’ with the regional General Managers, forcing collisions betweenthe railway culture and the business culture. As before, they worked through the

ACCOUNTING AND ORGANIZATIONAL CULTURES 353
bureaucratic structure of the railway. Focusing, in each episode, on a specific issuedemonstrative of their concerns, they sought first to persuade the Chief Executiveand his advisors. Once sure of this group’s support they set out to convert a widergroup. Finally, they forced the issue for resolution. Again, each issue resolvedopened up the possibility of the next. Three events stand out. They are reportedin sequence.
The first concerned the disposition of locomotives and rolling stock. Over aperiod of time, one regional General Manager had been successful in acquiringresources to invest in high speed trains for passenger transport. These he zealouslyguarded against suggestions from other regional General Managers that theyshould be more widely dispersed on the railway network. The relevant BusinessManager’s analysis suggested that this situation was uneconomic. Profit could beimproved by relocating some of these train sets to other regions. This BusinessManager lobbied the Chief Executive and his advisors to have the location decisiondetermined by economic criteria. This was supported and the trains were moved.Commenting on this event, the relevant Business Manager observed:
Regional prejudices had stopped the movement of high speed trains to theareas where they could earn the most money. The General Managers werebarons. You just didn’t go into their territory. It was a sort of unwritten law.I got those trains moved early on, it was one of the first things I did.
A second event concerned capital investments. In this case, a major trackwas being upgraded to take faster trains. According to engineering precedent,it was usual to renew signalling equipment at the same time. The BusinessManager’s analysis indicated that this was neither necessary nor economic. Again,the Chief Executive was lobbied. The signalling was not renewed. As the BusinessManager observed:
The main line was being electrified at significant expense. When wires arebeing strung over the track, it is customary to renew signalling equipment atthe same time.
We can’t afford it. Anyway, the existing signalling will last another 15 years.All we needed to do was immunize the signals for electrification. TheGeneral Manager and his engineers were horrified. ‘‘This isn’t the way torun a railway’’, they said. ‘‘It’s a cash flow decision’’.
A third decision concerned the scheduling of trains. Note that this is gettingdown to operational and logistical detail, by any standards the province ofprofessional railway operators. Traditionally, train schedules had been set tomaximize operational convenience. For the sake of passenger convenience, aBusiness Manager wanted to alter the schedule on a route. This intervention wasbitterly resented by the regional General Managers. Even in this case, the BusinessManager’s judgement was supported by the Chief Executive.
Traditionally, timetables have been set for operational convenience. I wasdissatisfied and wanted to change the frequency of trains on the route.

354 ACCOUNTING FOR MANAGERS
The General Manager was determined not to have it. I took it to the ChiefExecutive. I said to the General Manager half an hour before the meeting:‘‘I’ve got to win, and will win, the writing’s on the wall whether you like ornot. I like you, why are you putting your head in a noose? Why don’t youback off?’’. But he didn’t (Business Manager).
All these events came to have a significance way beyond the decisions them-selves. Each stood for a whole class of decisions, signifying the primacy of thebusiness reality in relation to those kinds of decisions. The high speed train issueredefined all decisions concerning the location of locomotives and rolling stock aseconomic decisions. The signalling decision redefined all investment decisions aseconomic decisions. The scheduling decision established the economic nature ofdetailed operational issues.
These events coupled the business culture to concrete railway activities. Theywere widely celebrated in the organization, both in public documents and ininternal discussions, and are recalled in explanations of the emergence of thebusiness rationale for railway management. Cumulatively, they embrace almostall aspects of the railway. People used them to attribute a new meaning to theireveryday activities.
Not all decisions went in the Business Managers’ favour, though. Secure intheir conversion of the majority of the senior management elite, the BusinessManagers sought to explore their new reality with those within the organization.As already noted, representatives were appointed in regional offices: RegionalBusiness Managers. At first, these individuals reported formally to the regionalGeneral Managers, and were on their payroll. The Business Managers wanted topay their salaries from their own budgets to avoid them having divided loyalties.Regional General Managers found this unacceptable.
Apparently the Business Managers acted too soon; they lost. But the momentumthey had already established was too great and they came back to win supportsome weeks later. A Business Manager explained:
There was a famous breakfast meeting where I soundly lost. The organizationwas not ready. But of course, one rises again. Later, we were on firmer ground.I raised the matter again, and I won the votes of everyone.
In the regions, a similar process of change seems to be being enacted. These indi-viduals appear to be following a similar strategy, gaining contexts for interaction,persuading others of their views, and staging contests. The ‘‘bottom line’’ for eachbusiness is now decomposed into subsidiary ‘‘bottom line’’ accounts. In regionalmeetings, these managers reinterpret dialogue and debate through the subsidiaryaccounts. A sequence of new symbolic events is being enacted in each region.Commenting on his experiences, one Regional Business Manager observed:
At first we had to stand out there in front battling on our own. But now it’slike a tide coming in. Nobody can actually fight the tide. I’m coming in on asurfboard really.
The picture then, is one of sequencing, momentum and cumulation. TheBusiness Managers started on their mission with a vague concept of a business
ACCOUNTING AND ORGANIZATIONAL CULTURES 355
railway. They secured increasing contexts for interaction. Their ideas graduallybecame more concrete and they persuaded others around them. In an episodicmanner, moving from the general to the particular, they secured changes toreporting relationships and systems. Each episode was punctuated by a keyevent. These events became symbols of the business culture, endowing railwayactivities with a new meaning, and provided a basis for continual and cumulativereinterpretations of railway operations.
Of course, there was tension. These decisions challenged the status of theregional General Managers and others who still subscribed to old beliefs. Therewas resentment and hostility. But the Business Managers let each step ‘‘soak’’ sothe organization could acclimatize, before embarking on the next episode, and amajority of the senior management gradually converted to the ‘‘business culture’’.Appealing to another metaphor, a Senior Executive commented:
We’ve lit a bonfire and it’s burning like mad.
The Regional General Managers’ perspective
Regional General Managers were steeped in tradition. They were the descendantsof the railway pioneers, the bastions of the railway culture. The business culturestruck at their values and beliefs. When asked why and how they had let thesethings happen, they responded:
It wasn’t obvious at the time. The Business Managers were planners. Wedidn’t expect the railway operations to change (General Manager).
One quoted from a memo he had written to his staff immediately after theExecutive Committee meeting which had approved the principle of the BusinessManagers’ appointment:
The respective roles of Headquarters and the Regions will not change . . .
Policies, as now will evolve from discussions. The Regions will participate . . .
In fact, from the General Managers’ perspective, the story is one of initialseduction, followed by surprise and ambivalence, defection and resignation. Theywere aware of external pressures for financial performance. Some thought it wasa whim, and would pass. But most perceived a need for a business perspective,and supported the creation of the Business Managers’ positions in the ExecutiveCommittee. When the Business Managers were appointed, most welcomed theirinfluence. At an early stage, one General Manager commented:
This is good for us. I’m quite pleased at the way the culture is changing. Youtalk around now and nobody is in any doubt that the railway is business-led.
And another, commenting on the decision to relocate the high speed trains:
356 ACCOUNTING FOR MANAGERS
Why do we have fancy train sets? It’s not for General Managers to play trains.It’s to make the businesses more profitable.19
One joined the Senior Executives, representing the Business Managers. Accordingto his critics, he is reputed to have seen ‘‘which way the wind was blowing’’, buthe himself described it thus:
Initially I was opposed. But I saw the logic of the changes. I was converted.
Thus, most found the abstract normative symbolism of the ‘‘bottom line’’appealing. They thought it ‘‘good’’ to be more business-like. They aspired to‘‘private sector practice’’. Few perceived the underlying momentum of events ortheir potential significance. Acting out the new rationale, they thought they needhave no fear for the railway traditions. In fact, sitting in their grand offices withportraits and plaques around their walls and other symbols of former grandeur,it was inconceivable to them that the railway traditions could be underminedby anything.
As the significance of the economic reality emerged through subsequent events,however, the situation became less congenial for them. It threatened their prideas professional railway operators. Commenting on the resignalling decision notedearlier, a General Manager said:
We’ll have to do it all again in 15 years’ time. It’s not a sensible long-term decision.
Furthermore, the appointment of Regional Business Managers within their ownorganizations undermined their authority.
At this point, they protested vigorously. This prompted a report from thecentre discussing the relationship between Businesses and the Regions. The reportplacated them with the soothing idea of Business Managers and regional GeneralManagers as equals in a team-based organization. Nevertheless, the businessperspective continued to impinge on operational matters.
Many General Managers became unhappy. They thought the emerging deci-sions unprofessional, and feared for the quality of the railway. By this time,however, their appeals fell on deaf ears. Most others among the senior manage-ment elite had converted to the business culture. The General Managers werecharacterized as reactionary, protective and old-fashioned.
Towards the end of the study, most of them left the organization or took ‘‘earlyretirement’’. One stayed in office a while longer. Shortly before his retirement hehad this to say:
With the benefit of hindsight, I think the Chief Executive was right in allowingit through . . . But it’s gone too far . . .
While I’ve been in office, through good engineering management, I’vejust about managed to get rid of all the speed restrictions on the main
19 This General Manager claimed that he had repeatedly requested some of these train sets himself.

ACCOUNTING AND ORGANIZATIONAL CULTURES 357
line. Business Managers are taking a maintenance holiday [i.e. neglectingmaintenance]. In five years someone will be faced with exactly the situationI inherited.
Former regional General Managers have been replaced with sympathetic men.They repudiate the old traditions. They are proud to subscribe to the businessculture. A newly appointed General Manager had this to say:
I personally feel that this new approach is right. I support the businesses. Isee it as my job to influence my current staff to accept the business managers.
Far from being equals in a team, the regional General Managers are seen to besubservient to Business Managers. ‘‘Business managers set policy and standards;regions implement’’. Career patterns have changed. To become a regional GeneralManager was the ultimate aspiration for a railway-man; by the end of the fieldresearch it was to become a Business Manager. There was open discussion ofremoving the regional General Managers from Railway Executive.
Accounting and culture
Initially, there was a dominant ‘‘railway’’ culture. The Business Managers broughta counter ‘‘business’’ culture. This cascaded across the senior management eliteto become dominant. The Business Managers had an abstract idea of a businessrailway. New accounts were crafted representing the railway as a series ofbusinesses. The Business Managers gained contexts to interact with others. In thesecontexts, they recast dialogue and debate from a railway language of operationsand engineering to their business language of markets and profit. Gradually theidea of a business railway became more specific. Moving from remote concernsto immediate issues, they persuaded others of their interpretations. There werecontests over the definition of specific activities. The outcomes became symbolsthrough which people attributed new meaning to railway operations. Momentumbuilt up behind the business culture. People converted, others left. For seniormanagers, the abstract idea became a tangible, energizing reality, a source ofpride. Now the railway culture is repudiated.
A broad range of theories can be brought to bear to interpret the pattern ofthese events. Fundamental to this account is the notion of culture as a system ofideas: beliefs, knowledges and values in which action and artifacts are vested withexpressive qualities (Geertz, 1973, 1983); and the idea that organizations have dis-tinctive cultures (Pettigrew, 1979). This is exemplified in the contrasting ‘‘railway’’and ‘‘business’’ cultures described. Associated with this is the conceptualization oforganizational change as a process of uncoupling and recoupling (cf. Greenwood& Hinings, 1988): exemplified in the railway by the uncoupling of activities fromthe railway culture and their recoupling to the business culture.20 We can also see
20 This characterization, of course, emphasizes change; and there is also a sense in which there iscontinuity. The railway still runs trains, it still provides a transport infrastructure (of sorts), and

358 ACCOUNTING FOR MANAGERS
a theory of inertia in operation, change being precipitated by crisis (cf. Starbuck &Hedberg, 1977; Jonsson & Lundin, 1977; Mintzberg, 1978; Miller & Friesen, 1984).The railway culture was remarkably resilient over many previous decades, despiteseveral attacks; real threats only being perceived when the severity of the currentonslaught on the public services became apparent. There are also traces of the‘‘garbage can’’ (Cohen et al., 1972; March & Olsen, 1976): the Business Managementidea was developed independently of the crisis, only subsequently coupled to thethreats facing the organization.
Continuing, change was emergent (March & Olsen, 1976; Pettigrew, 1985). Thiswas not a controlled process, relying on plans and rational analyses engineeredby those standing outside, untainted as it were; the whole management groupwas bound up in the creation of the business culture. The process unfoldedthrough tentative initiatives, buffeted by the timing of events, the ambition and(relative) political skills of the ‘‘champions’’ (Kanter, 1983) and other actorsinvolved, and their failures and successes. Nor were the vagaries of chanceunimportant21 (Pettigrew, 1985). Moreover, we see changes in systems (planning,capital investment, budgeting) interpenetrating the emergence and elaboration ofthe business culture.
It also is possible to appeal to the insights of institutional theory (Meyer &Rowan, 1977; DiMaggio & Powell, 1983; Scott, 1987; Zucker, 1988). Government,the railway’s key environmental constituency, was intolerant of (what it saw as)managerial incompetence. The Business Management initiative could be inter-preted as a symbol of the railway becoming more modern and business-like: the‘‘bottom line’’ idea standing for the railway adopting private sector practices.Such solutions may have real and unintended internal consequences, however.One was the Business Managers amassing power and influence at the expenseof the General Managers. Although a theoretically impoverished theory in thiscontext, there is some link here with the strategic contingencies’ perspective ofintraorganizational power (Hickson et al., 1971; Hinings et al., 1974). Subsequentto the appointment of the Business Managers, the railway managed to persuadegovernment to make funds available, on a one-off basis, for a major electrificationproject (giving rise to the signalling controversy discussed earlier). Apparently,approval was forthcoming as a result of the ‘‘rigorous business case’’ orchestratedby the relevant Business Manager.
The purpose here is not to discuss these theories further, however. It is todevelop a cultural appreciation of accounting. The study shows that accountingwas implicated differently in the two cultures described. At this point, it isappropriate to explicate its linkages to underlying knowledge, values and beliefs.
it is still a very mechanistic bureaucracy. Nevertheless, managers in the organization currentlyemphasize change, and there is a sense in which linkages with the past have been ruptured, forthe railway, as I will explain, is interpreted quite differently.21 In ER, subsequent to the events described, there was an unfortunate accident in which onecrowded commuter train collided into the back of another. A formal inquiry found that basicsupervision of electrical rewiring in a signalling scheme had been neglected, attributing blame,in part, to ER’s pursuit of profit. It is interesting to speculate how outcomes might have differedhad this accident happened two years before.

ACCOUNTING AND ORGANIZATIONAL CULTURES 359
A cultural system incorporates, among other things, knowledge about envi-ronments, and strategies for extracting subsistence from them. This knowledge isquite different in the two cultures. In the railway culture it revolved around thepublic service idea, later coupled to notions of thrift. Essentially, the knowledgewas this: if the organization provided the nation with a transport infrastructure(without undue waste), then sustenance would be forthcoming from government.This knowledge is not unique to the railway culture. The expectation that low-cost,generally available services will be rewarded by the state is common to many pub-lic service organizations in Europe, for example the health and education services.Given this knowledge, accounting was incidental in the railway culture: it wasnecessary to ensure that revenues were accounted for and suppliers paid, andperhaps to contain waste, but that was the limit of its significance in the structuresof meaning. The purpose of the railway was to run trains; operating the railwaywould be rewarded by government. In this knowledge, the train, therefore, wasendowed with a special significance.
The business culture, revolving around the ‘‘bottom line’’, incorporates aquite different knowledge. Rather obviously, in view of events in ER, the bot-tom line constructs the notion of the railway as a profit-seeking enterprise. Thisis not just a matter of ‘‘cost efficiency’’, however, although that is important.More importantly, in ER it constructs the idea of looking to product markets,rather than to government, for sustenance. There is nothing somehow uniquely‘‘public service’’ about the railway network in this construction. Rail transportis a product (or service), to be bought and sold like any other; in fact it isa series of products: intercity travel, freight, suburban commuting, etc. Rev-enues from these products, rather than government support, must cover costs;and, critically, revenues are earned in the market place. Survival depends onextracting resources from these markets, perhaps in competition with other firms.Hence the new-found concern for competition with other means of transport(road, air, buses), expressed by railway managers early in the account above, aconcern which in the railway culture would have been probably inconsequen-tial.22 Given this knowledge, accounting activities become hugely significant. Thesearch for profit opportunities, and the elimination of non-profit-making activ-ities, is a quest for survival. It is now the customer, not the train, which hasspecial importance.
No culture is completely coherent, of course. Each has ambiguities andcontradictions. In ER, residues of the past create tensions. One is the partialincompatibility of the business culture with the restrictions placed on it by stateownership. ER is not allowed to borrow in financial markets to fund investment,for example, and as government funds are tight, this means investments necessaryfor competitive purposes cannot always be made. It also has statutory obligationsto keep certain branch lines open, even if they are unprofitable. Here it still
22 A Business Manager’s comment on market research is also interesting in this respect: ‘‘Thesingle most important question we ask is: ‘Are you more likely or less likely to travel on therailway as a result of your most recent journey?’ ’’ This question would have been substantiallyirrelevant in the railway culture.

360 ACCOUNTING FOR MANAGERS
looks to government for support (although a government conceptualized as acustomer). Nevertheless, the underlying knowledge systems are quite different,and constitute different realities.
This shift in knowledge which accounting helps to construct, the shift fromlooking to the state for subsistence to looking to markets, is fundamental, andit interpenetrates the operation and management of ER’s core technology withpervasive effects. For a start, it changes the appropriate form of organization. Inthe old knowledge, the prime task was the operation of trains. The meaningfulmanagement structure was one which facilitated operations. The physical facilitiesof the railway are geographically laid out along the radial routes of the old pre-nationalization companies. Thus the appropriate management organization wasaround these routes, i.e. the regional management structures. The regional GeneralManagers and engineers, because of their acknowledged expertise in operatingtrains, were afforded substantial status and influence.
Now, in the new knowledge, this is ‘‘mere’’ production, subservient to markets.The prime task is serving markets. The meaningful form of management organiza-tion is one which reflects and confronts markets. Since the long distance intercitytravel market is not confined to one main line, for example, or the freight marketconfined to one region, the regional and business forms of organization do not mapperfectly onto one another. Hence the reorientation of management structures andsystems around the Business Managers, and their subsequent elaboration throughthe Business Manager’s subordinates located in the regions. Of course, there isstill an operational task to be performed: trains, tracks, maintenance and so forth.But in this new knowledge it is Business Managers, with supposed expertise inmarkets and extracting resources from them, who attract status and influence.
The changing knowledge also redefines the appropriate form of action. In the oldknowledge, that of the celebration of the train, there were norms that made thingsintrinsically necessary. ‘‘Of course’’ professional railwaymen renewed signallingequipment when they electrified the track, for example; it was inconceivable notto do so. The train needs to be taken care of and nurtured. The interest in thrift, theavoidance of waste, also meant the elimination of activities not strictly necessaryfor the operation of trains: training staff to smile at customers, for example. Inthe new knowledge, activities are neither intrinsically necessary, nor intrinsicallywasteful. Rather they are judged for their consequences in the market. Throughthe ‘‘bottom line’’, activities become desirable to the extent that they add more‘‘value’’ than they cost. This is not simply cost minimization: the avoidance ofunnecessary gold-plating. The ‘‘bottom line engineering specification’’, mentionedearlier, means designing for the market, as it were: adding comfort, reliability,speed, customer service where its returns outweigh its cost. Attractive concoursedesign is not wasteful extravagance, it is reinterpreted as a ‘‘good’’ thing whichbrings in custom.
Action is also judged against a different concept of time. In the old knowledge,time was practically infinite. The railways were built to last for decades, forcenturies. The nation would always need a transport infrastructure. Professional

ACCOUNTING AND ORGANIZATIONAL CULTURES 361
standards were oriented towards doing a long-lasting thorough job. Govern-ment would reward the railway for maintaining the viability of the networkinto the future. In the new knowledge, the concept of time is much shorter.Survival is a day-to-day affair. Markets are ephemeral. Don’t spend moneynow on activities that you can put off until the future. Take ‘‘maintenanceholidays’’ where you can: deterioration of the infrastructure can be reme-died later.
The point being made here is that accounting can play a significant role inconstructing specific knowledges. Accounting systems embody particular assump-tions about rationality, organization, authority, time and so forth. If these permeateinto underlying values, knowledges and beliefs they can have very real conse-quences. Above we see accounting coming in to the organization to construct anew theory of subsistence, which in turn implies particular modes of organiz-ing, patterns of influence and authority, criteria for action and a new conceptof time.
The cultural knowledge described here was not discovered completely formed.Nor was it coupled to the railway’s management structures (or to action) in aninstant. Rather the meaning of the bottom line gradually crystallized around theinitial accounts, and the coupling had to be actively crafted. The business cultureunfolded in episodes: bursts of exhausting creativity, each building on what hadpreviously been accomplished, and punctuated by a concluding event; followedby a pause for consolidation, recovery and imagination before the next. Successiveepisodes moved from the abstract realm to the particular; from long-term issues toimmediate issues. In each, senior management struggled to reconceptualize a classof activities; then it was uncoupled, or perhaps one should say wrenched, fromthe railway culture and recoupled to the business culture. Again and again theseepisodes continued, until cumulatively practically all classes of railway activitywere redefined. Later, in the regions, a similar process of episodic uncoupling andrecoupling was enacted. In the process, linkages to the railway culture were onlybit-by-bit ruptured.
The general point arising is that organizations have different classes of activity.Cultural change is not simply uncoupling and recoupling, or even reconceptual-ization. Each class of activity may need to be separately uncoupled and recoupled.During the process, different classes of activity may be informed by differentrationales and knowledge. In ER, this led to a strange schizophrenia in the organi-zation (and difficulties in making sense of the data), in which some activities wererailway-culture issues, and some business-culture issues. It also led to strangedisjunctures between the interpretive schemes brought to bear in the head officeand in the regions. Only towards the end of the research did this schizophreniabegin to be resolved.
This process, however, needs to be enveloped in an awareness of the conditionsfor its possibility, conditions for the emergence of the particular culture described.In some ways, perhaps, the business culture in ER may be seen to be inevitable.

362 ACCOUNTING FOR MANAGERS
Today, the belief in markets (as an optimal form of organization) seems to befirmly entrenched in Anglo-American political cultures, and in those of somecontinental-European states. Governmental pressures, inevitably, in this view, ledto investment in financial calculation and the construction of the railway as abusiness enterprise. Support for this ‘‘theory of inevitability’’ might be sought byretrospective application of the present political determination to privatize ER, orat least some of its businesses.
As Fligstein (1990) notes, in a rather different critique, such an interpretationrelies on understandings of the present to construct appreciations of the past:interpreting the past through the present, rather than the present through the past.ER had a remarkably strong heritage which survived previous attacks. In the early1980s, its privatization was not just undiscussed, it was inconceivable. Arguably,the business culture in ER, the reconstruction of the railway through the ‘‘bottomline(s)’’ as a series of businesses, actually created preconditions for the discussionof privatization, not vice versa.
For sure, the early 1980s witnessed the beginnings of the sea change in atti-tudes towards the public services that swept across the political culture laterin the decade. Through influential right-wing think-tanks the idea of subject-ing public services to an entrepreneurial principle was then emerging, later tobe manifested in the ‘‘rolling back’’ of the public sector through the privati-zation of many public utilities and attempts to introduce market mechanismsin others. Associated with this was the emerging idea of the ‘‘dependence’’culture, and its repudiation; to be replaced by an ‘‘enterprise’’ culture. Indi-viduals, and organizations, were expected to take a responsibility for theirown destiny.
However, the initiative for business management in ER, conceived in thelate 1970s, preceded these political developments, and appears to have been asubstantially autonomous development in a separate arena: as one of the initiatorsin the senior management group explained, it was ‘‘the product of thinkingrailwaymen’’. Explicating this claim would require careful analysis of historicalmaterials beyond the scope of this paper. But such evidence as is available supportsthe view that the initiative was developed largely independently of political ideas,its private sector leanings probably owing more to the advice of a few businessconsultants than to any political agenda. Certainly it was not government-inspired;indeed government was initially sceptical, only later endorsing the ideas (andapplying them to its own ends).
That said, the initiative was congruent with the ideas emerging outside, and itssubsequent elaboration into the business culture undoubtedly owes much to theirdevelopment. Even here, though, due importance must be attached to the spe-cific circumstances within the organization. Public sector management was underchallenge, morale was low. Many in the senior management group were receptiveto the new ideas. Business Management was seen as a home-grown solution togovernmental attack. It expressed some kind of empowerment, a potential free-dom from the yoke of government restriction, and an opportunity for managersto show their entrepreneurial capabilities.
ACCOUNTING AND ORGANIZATIONAL CULTURES 363
Concluding comment
The purpose of this paper is to articulate a cultural analysis of accountingin organizations. The appreciation of organizations as cultures provides a richinsight into organizational life, drawing out the expressive qualities of action andartifact. Cultural knowledge in organizations vests organizational activities withsymbolic meanings; so also it vests accounting with symbolic meaning. A culturalanalysis of accounting seeks to uncover these particular meanings, and to locatethem in underlying local knowledges, values and beliefs.
The paper has sought to apply this cultural perspective in an empirical setting.Through a field study of organizational change, it showed how accounting can bevested with different meanings in local cultures. And it showed how accountingcan enter into organizational settings to constitute cultural knowledge in particularways, creating particular rationalities for organizational action; and in turn howthis can lead to new patterns of organization, of authority and influence, newconcepts of time and legitimate action. The study also traced the emergent, episodicprocess through which cultural knowledge was constituted in this organization,and coupled to organizational activities.
The study certainly flashes out the constitutive potential of accounting proposedby Hopwood (1987), Hines (1988) and others. However, the specific findings ofthe field study – the reorientation of a strategy for subsistence from government tomarkets, and its subsequent elaboration; and the process through which this real-ization was accomplished – are not offered as a general proposition on the culturalsignificance of accounting. Accounting systems are implicated in organizationalcultures in different, possibly unique ways. The cultural knowledge constructedin this organization is but one possibility; there are many others. In this, as in otherfields, ‘‘the road to the grand abstractions of science winds through a thicket ofsingular facts’’ (Geertz, 1973, p. 145).
Rather, the purpose of the field study is to explicate a mode of theorizinglinkages between accounting and culture. The mode of theorizing is interpretive,getting underneath surface descriptions to understand the significance of account-ing in local settings; and it is reflective, in the sense that the theorist reflectson that significance in the context of the underlying ideational system. Apply-ing this mode of analysis in different settings would contribute hugely to ouremergent appreciation of the way in which accounting is used in organizations,usefully supplementing the more quantitative approaches to research pursuedby contingency theorists, for example. It may be particularly valuable also in thedevelopment of comparative theories of the use of accounting in different socialcontexts. We know, for example, that accounting systems within organizationsin different countries are often not that dissimilar to Anglo-American designs; itseems, however, that they may be used quite differently. The mode of theorizingadvanced here would enable us to address this issue in a productive way.
Finally, while the paper has deliberately refrained from casting judgementson the developments described in the organization studied, it is probably worthacknowledging that there is widespread criticism of ‘‘bottom line’’ orientationssuch as those described here, particularly for their construction of time. Far from

364 ACCOUNTING FOR MANAGERS
creating an underlying competitiveness in organizations, the preoccupation withthe ‘‘bottom line’’ is seen to discourage technological innovation and investmentsin operational capability (e.g. Hayes & Abernathy, 1980; Johnson & Kaplan, 1987).ER, it seems, has adopted this vocabulary just as those organizations that have itare being exhorted to move towards longer-term, more strategic appreciations oftime. In the railway, assets have long lives and the lead-time on capital investmentis also long. To some extent the maintenance of the infrastructure is inevitablycompromised by its new culture. Quite possibly with innovations in transport,the railway network will be an irrelevance in 50 years’ time; on the other hand, itmay not be. The green lobby, in particular, might argue that it is sensible to keepoptions open in a way that at present may not be possible.
Postscript
The process of change in ER continues. The regional management structure is todaybeing dissolved. The operational side of the railway is currently being reorganizedand assimilated into the Businesses. The crafted accounts representing the railwayas a series of businesses have now permeated through management structuresand systems to operations on the ground. The railway quite literally has becomeits businesses. There are no longer any regional General Managers, no vestigesof the railway culture . . . or are there? High up on a building above one ofthe main-line termini, out of sight except to observant motorists on a nearbyflyover, there is a residue of the past: a large illuminated logo – the logo of apre-nationalization railway.
Bibliography
Aldrich, H. E., Organizations & Environments (Englewood Cliffs, NJ: Prentice-Hall, 1979).Allaire, Y. & Firsirotu, M. E., Theories of Organizational Culture, Organizational Studies
(1984) pp. 51–64.Ansari, S. & Euske, K. J., Rational, Rationalizing and Reifying Uses of Accounting Data in
Organizations, Accounting, Organizations and Society (1987) pp. 549–570.Argyris, C. & Schon, D. A., Organizational Learning (Reading, MA: Addison-Wesley, 1981).Barley, S. R., Meyer, G. W. & Gash, D. C., Cultures of Culture: Academics, Practitioners
and the Pragmatics of Normative Control, Administrative Science Quarterly (March 1988)pp. 24–60.
Berry, A., Capps, T., Cooper, D., Fergusson, P., Hopper, T. & Lowe, A., Management Con-trol in an Area of the National Coal Board, Accounting, Organizations and Society (1985)pp. 3–28.
Blau, P. M., The Dynamics of Bureaucracy: A Study of Interpersonal Relationships in TwoGovernment Agencies (Chicago, IL: University of Chicago Press, 1955).
Bruns, W. & Kaplan, R. S. (eds), Accounting and Management: A Field Study Perspective(Cambridge, MA: Harvard Business School Press, 1987).
Brunsson, N., The Irrational Organization (New York: Wiley, 1985).Bryer, R. A., Accounting for the Railway Mania of 1845 – A Great Railway Swindle?,
Accounting, Organizations and Society (1991) pp. 439–486.Burns, T. & Stalker, G. M., The Management of Innovation (London: Tavistock Press, 1961).

ACCOUNTING AND ORGANIZATIONAL CULTURES 365
Buroway, M., Manufacturing Consent (Chicago, IL: University of Chicago Press, 1979).Burrell, G. & Morgan, G., Sociological Paradigms and Organizational Analysis (London: Heine-
man, 1979).Chandler, A. D., The Railroads (New York: Harcourt, Brace & World, 1965).Clifford, J. & Marcus, G. E. (eds), Writing Culture (Berkeley, CA: University of California
Press, 1986).Cohen, M. D., March, J. G. & Olsen, J. P., A Garbage Can Model of Organizational Choice,
Administrative Science Quarterly (March 1972) pp. 1–25.Covaleski, M. & Dirsmith, M., The Use of Budgetary Symbols in the Political Arena: An
Historically Informed Field Study, Accounting, Organizations and Society (1988) pp. 1–24.Crapanzano, V., Hermes Dilemma: The Masking of Subversion in Ethnographic Descrip-
tion, in Clifford, J. & Marcus, G. E. (eds), Writing Culture (Berkeley, CA: University ofCalifornia Press, 1986) pp. 51–76.
Crozier, M., The Bureaucratic Phenomenon (London: Tavistock, 1964).Dalton, M., Men Who Manage (New York: Wiley, 1959).Deal, T. E. & Kennedy, A. A., Corporate Culture: The Rites and Rituals of Corporate Life
(Reading, MA: Addison-Wesley, 1982).Dent, J. F., Organizational Research in Accounting: Perspectives, Issues and a Commen-
tary, in Hopwood, A. G. & Bromwich, M., Research and Current Issues in ManagementAccounting (London: Pitman, 1986).
Denzin, N. K., Interpretive Interactionism, in Morgan, G. (ed), Beyond Method (Beverly Hills,CA: Sage, 1983) pp. 129–146.
DiMaggio, P. J. & Powell, W. W., The Iron Cage Revisited: Institutional Isomorphism andCollective Rationality in Organizational Fields, American Sociological Review (April 1983)pp. 147–160.
Douglas, M., Purity and Danger: An Analysis of Concepts of Pollution and Taboo (London:Routledge & Kegan Paul, 1966).
Evans Pritchard, E. E., Witchcraft, Oracles and Magic among the Azande (Oxford: OxfordUniversity Press, 1937).
Evans Pritchard, E. E., The Nuer (Oxford: Oxford University Press, 1940).Feldman, S. P., Management in Context: An Essay on the Relevance of Culture to the
Understanding of Organizational Change, Journal of Management Studies (November1986) pp. 587–607.
Fligstein, N., The Transformation of Corporate Control (Cambridge, MA: Harvard UniversityPress, 1990).
Geertz, C., The Interpretation of Cultures (New York: Basic Books, 1973).Geertz, C., Local Knowledge (New York: Basic Books, 1983).Geertz, C., Works and Lives: The Anthropologist as Author (Cambridge: Polity Press, 1988).Goffman, E., The Presentation of Self in Everyday Life (New York: Doubleday, 1959).Goodenough, W. H., Culture, Language and Society (Reading, MA: Addison-Wesley, 1971).Goold, M. & Campbell, A., Strategies and Styles (Oxford: Blackwell, 1987).Gouldner, A. W., Patterns of Industrial Bureaucracy (New York: Free Press, 1954).Gourvish, T. R., British Railways 1948–73: A Business History (Cambridge University Press,
1986).Gourvish, T. R., British Rail’s ‘‘Business Led’’ Organization, 1977–90: Government – Industry
Relations in Britain’s Public Sector, Business History Review (1990) pp. 109–149.Greenwood, R. & Hinings, C. R., Organization Design Types, Tracks and the Dynamics of
Strategic Change, Organization Studies (1988) pp. 293–316.Gregory, K. L., Native-View Paradigms: Multiple Cultures & Culture Conflicts in Organi-
zations, Administrative Science Quarterly (September 1983) pp. 359–377.

366 ACCOUNTING FOR MANAGERS
Harris, M., Cultural Materialism: the Struggle for a Science of Culture (New York: RandomHouse, 1979).
Hayes, R. & Abernathy, S. J., Managing Our Way to Economic Decline, Harvard BusinessReview (July–August 1980) pp. 67–77.
Hedberg, B. L. T., How Organizations Learn and Unlearn, in Nystrom, P. C. & Star-buck, W. H. (eds), Handbook of Organization Design: Volume 1 (Oxford: Oxford UniversityPress, 1981).
Hedberg, G. & Jonsson, S., Designing Semi-confusing Information Systems for Organiza-tions in Changing Environments, Accounting, Organizations and Society (1978) pp. 47–65.
Hedberg, B., Nystrom, P. C. & Starbuck, W. H., Camping on See Saws: Prescriptions for aSelf-Designing Organization, Administrative Science Quarterly (March 1976) pp. 41–65.
Hickson, D. J., Hinings, C. R., Lee, C. A., Schneck, R. E. & Pennings, J. M., A Strategic Con-tingencies’ Theory of Intra Organizational Power, Administrative Science Quarterly (June1971) pp. 216–229.
Hines, R., Financial Accounting: In Communicating Reality, We Construct Reality, Account-ing, Organizations and Society (1988) pp. 251–261.
Hinings, C. R., Hickson, D. J., Pennings, J. M. & Schneck, R. E., Structural Conditions ofIntra Organizational Power, Administrative Science Quarterly (March 1974) pp. 22–44.
Hopwood, A. G., Towards an Organizational Perspective for the Study of Accounting andInformation Systems, Accounting, Organizations and Society (1978) pp. 3–13.
Hopwood, A. G., On Trying to Study Accounting in the Contexts in which it Operates,Accounting, Organizations and Society (1983) pp. 287–305.
Hopwood, A. G., The Archaeology of Accounting Systems, Accounting, Organizations andSociety (1987) pp. 207–234.
Hughes, E. C., Men and their Work (Glencoe, IL: Free Press, 1958).Johnson, H. T. & Kaplan, R. S., Relevance Lost: The Rise and Fall of Management Accounting
(Cambridge, MA: Harvard, 1987).Jones, P. R. & Lakin, C., The Carpet Makers (Maidenhead: McGraw-Hill, 1978).Jonsson, S. & Lundin, R. A., Myths and Wishful Thinking as Management Tools, in Nys-
trom, P. C. & Starbuck, W. H. (eds), Prescriptive Models of Organization, pp. 157–170(Amsterdam: North-Holland, 1977).
Kanter, R., The Change Masters: Corporate Entrepreneurs at Work (New York: Simon & Schuster,1983).
Kilmann, R. H., Saxton, M. J. & Serpa, R. (eds), Gaining Control of the Corporate Culture (SanFrancisco: Jossey Bass, 1985).
Lawrence, P. R. & Lorsch, J. W., Organization and Environment: Managing Differentiation andIntegration (IL: Irwin, [1967] 1969).
Levi Strauss, C., Structural Anthropology (New York: Basic Books, 1963).Levi Strauss, C., The Savage Mind (Chicago, IL: University of Chicago Press, [1962] 1966).Malinowski, B., Argonauts of the Western Pacific (London: Routledge & Kegan Paul, 1922).March, J. G. & Olsen, J. P., Ambiguity and Choice in Organizations (Oslo: Universitetforlaget,
1976).Marcus, G. E. & Cushman, R., Ethnographies as Texts, Annual Review of Anthropology (1982)
pp. 25–69.Marcus, G. E. & Fischer, M. M. J., Anthropology as Cultural Critique (Chicago, IL: University
of Chicago Press, 1986).Markus, M. L. & Pfeffer, J., Power and the Design and Implementation of Accounting and
Control Systems, Accounting, Organizations and Society (1983) pp. 205–218.Martin, J., Fieldman, M. S., Hatch, M. J. & Sitkin, S. M., The Uniqueness Paradox in Organi-
zational Stories, Administrative Science Quarterly (September 1983) pp. 438–453.
ACCOUNTING AND ORGANIZATIONAL CULTURES 367
Martin, J. & Siehl, C., Organizational Culture and Counterculture: An Uneasy Symbiosis.Organizational Dynamics (Autumn 1983) pp. 52–64.
Meek, V. L., Organizational Culture: Origins and Weaknesses, Organization Studios (1988)pp. 453–473.
Meyer, J. W. & Rowan, B., Institutionalised Organizations: Formal Structure as Myth andCeremony, American Journal of Sociology (1977) pp. 340–363.
Miles, R. E. & Snow, C. C., Organizational Strategy, Structures and Process (New York:McGraw-Hill, 1978).
Miller, D. & Friesen, P. H., Organizations: A Quantum View (Englewood Cliffs, NJ: Prentice-Hall, 1984).
Miller, P. & O’Leary, T., The Construction of the Governable Person, Accounting, Organi-zaitons and Society (1987) pp. 235–265.
Mintzberg, H., Patterns in Strategy Formulation, Management Science (May 1978)pp. 934–948.
Ouchi, W., Theory Z: How American Business Can Meet the Japanese Challenge (Reading, MA:Addison-Wesley, 1981).
Parsons, T., The Social System (New York: Free Press, 1951).Peters, T. J. & Waterman, R. A., In Search of Excellence: Lessons from America’s Best Run
Companies (New York: Harper & Row, 1982).Pettigrew, A., On Studying Organizational Cultures, Administrative Science Quarterly
(December 1979) pp. 570–581.Pettigrew, A., The Awakening Giant, Continuity and Change in ICI (Oxford: Blackwell, 1985).Pfeffer, J., Management as Symbolic Action: The Creation and Maintenance of Organi-
zational Paradigms, in Cummings, I. L. & Staw, B. M. (eds), Research in OrganizationalBehavior, pp. 1–52 (Greenwich, CT: JAI Press, 1981).
Pfeffer, J. & Salancik, G. R., The External Control of Organizations (New York: Harper & Row,1978).
Pondy, L. R., Leadership is a Language Game, in McCall, M. W. & Lombardo, M. M. (eds),Leadership: Where Else Can We Go? (Durham, NC: Duke U.P., 1978).
Pondy, L. R., Frost, P. J., Morgan, G. & Dandridge, T. C. (eds), Organizational Symbolism(Greenwich, CT: JAI Press, 1983).
Radcliffe-Brown, A. R., Structure and Function in Primitive Society (Oxford: Oxford UniversityPress, 1952).
Ranson, S., Hinings, R. & Greenwood, R., The Structuring of Organizational Structures,Administrative Science Quarterly (March 1980) pp. 1–17.
Riley, P., A Structurationist Account of Political Culture, Administrative Science Quarterly(September 1983) pp. 414–437.
Roethlisberger, F. J. & Dickson, W. J., Management and the Worker (Cambridge, MA: HarvardUniversity Press, 1939).
Roy, D., Efficiency and ‘‘the Fix’’: Informal Intergroup Relations in a Piecework MachineShop, American Journal of Sociology (November 1954) pp. 255–266.
Roy, D., Banana Time: Job Satisfaction and Informal Interactions, Human Organization(Winter 1960) pp. 158–168.
Scott, W. R., The Adolescence of Institutional Theory, Administrative Science Quarterly(December 1987) pp. 493–511.
Selznick, P., TVA and the Grass Roots (Berkeley, CA: University of California Press, 1949).Smircich, L., Concepts of Culture and Organizational Analysis, Administrative Science Quar-
terly (September 1983a) pp. 339–358.Smircich, L., Studying Organizations as Cultures, in Morgan, G. (ed.), Beyond Method,
pp. 160–172 (Beverley Hills, CA: Sage, 1983b).

368 ACCOUNTING FOR MANAGERS
Starbuck, W. H., Congealing Oil: Inventing Ideologies to Justify Acting Ideologies Out,Journal of Management Studies (January 1982) pp. 3–27.
Starbuck, W. H. & Hedberg, B., Saving an Organization from a Stagnating Environment, inThorelli, H. B. (ed.), Strategy + Structure = Performance, pp. 249–258 (Bloomington, IN:Indiana University Press, 1977).
Turner, S., Studying Organization Through Levi Strauss’ Structuralism, in Morgan, G. (ed.),Beyond Method, pp. 189–201 (Beverley Hills, CA: Sage, 1983).
Van Maanen, J., The Fact of Fiction in Organizational Ethnography, Administrative ScienceQuarterly (December 1979) pp. 539–550.
Van Maanen, J., Tales of the Field (Chicago, IL: University of Chicago Press, 1988).Van Maanen, J. & Barley, S. R., Occupational Communities: Culture and Control in Orga-
nizations, in Cummings, L. L. & Staw, B. M. (eds), Research in Organizational Behavior,pp. 287–365 (Greenwich, CT: JAI Press, 1984).
Weber, M., The Theory of Social and Economic Organization (New York: Collier-Macmillan,1947).
Weick, K. E., The Social Psychology of Organizing, 2nd Edn (Reading, MA: Addison-Wesley,1979).
Whyte, W. F., Human Relations in the Restaurant Industry (New York: McGraw-Hill, 1948).Whyte, W. F., Street Corner Society (Chicago, IL: University of Chicago Press, [1943] 1955).Wuthnow, R., Hunter, J. D., Bergesen, A. & Kurzweil, E., Cultural Analysis (London: Rout-
ledge & Kegan Paul, 1984).Wuthnow, R. & Witten, M., New Directions in the Study of Culture, Annual Review of
Sociology (1988) pp. 49–67.Zucker, L. G. (ed.), Institutional Patterns and Organizations (Cambridge, MA: Ballinger, 1988).

Glossary of Accounting Terms
Absorption costing A method of costing in which all fixed andvariable production costs are charged toproducts or services using an allocation base.
Account An explanation or report in financial terms aboutthe transactions of an organization.
Accountability The process of satisfying stakeholders in theorganization that managers have acted in thebest interests of the stakeholders, a result of thestewardship function of managers, which takesplace through accounting.
Accounting A collection of systems and processes used torecord, report and interpret businesstransactions.
Accounting equation The representation of the double-entry system ofaccounting such that assets are equal to liabilitiesplus capital.
Accounting period The period of time for which financial statementsare produced – see also financial year.
Accounting rate of return(ARR)
A method of investment appraisal that measuresthe profit generated as a percentage of theinvestment – see return on investment.
Accounting system A set of accounts that summarize thetransactions of a business that have beenrecorded on source documents.
Accounts ‘Buckets’ within the ledger, part of theaccounting system. Each account containssimilar transactions (line items) that are used forthe production of financial statements. Orcommonly used as an abbreviation for financialstatements.
Accrual An expense for profit purposes even though nopayment has been made.

370 ACCOUNTING FOR MANAGERS
Accruals accounting A method of accounting in which profit iscalculated as the difference between incomewhen it is earned and expenses when they areincurred.
Activity-based budgeting A method of budgeting that develops budgetsbased on expected activities and costdrivers – see also activity-based costing.
Activity-based costing A method of costing that uses cost pools toaccumulate the cost of significant businessactivities and then assigns the costs from the costpools to products or services based on costdrivers.
Allocation base A measure of activity or volume such as labourhours, machine hours or volume of productionused to apportion overheads to products andservices.
Amortization See depreciation, but usually in relation to assetsattached to leased property.
Annual Report The report required by the Stock Exchange forall listed companies, containing the company’sfinancial statements.
Assets Things that the business owns.
Avoidable costs Costs that are identifiable with and able to beinfluenced by decisions made at the businessunit (e.g. division) level.
Balanced Scorecard A system of non-financial performancemeasurement that links innovation, customerand process measures to financial performance.
Balance Sheet A financial statement showing the financialposition of a business – its assets, liabilities andcapital – at the end of an accounting period.
Bank Money in a bank cheque account, the differencebetween receipts and payments.
Bank overdraft Money owed to the bank in a cheque accountwhere payments exceed receipts.
Batch A group of similar products produced together.
Bill of materials A listing of all the materials and quantities thatgo to make up a completed product.
Breakeven point The point at which total costs equal totalrevenue, i.e. where there is neither a profit nor aloss.

GLOSSARY OF ACCOUNTING TERMS 371
Budget A plan expressed in monetary terms covering afuture period of time and based on a definedlevel of activity.
Budget cycle The annual period over which budgets areprepared.
Budgetary control The process of ensuring that actual financialresults are in line with targets – see varianceanalysis.
Capacity The maximum volume of products or servicesthat can be produced given limitations of space,people, equipment or financial resources.
Capacity utilization The proportion of capacity that is able to beutilized to fulfil customer demand for productsor services.
Capital The shareholders’ investment in the business;the difference between the assets and liabilitiesof a business.
Capital employed The total of debt and equity, i.e. the total fundsin the business.
Capitalize To make a payment that might otherwise be anexpense (in the Profit and Loss account) an asset(in the Balance Sheet).
Capital market The market in which investors buy and sellshares of companies, normally associated with aStock Exchange.
Cash accounting A method of accounting in which profit iscalculated as the difference between incomewhen it is received and expenses when they are paid.
Cash cost The amount of cash expended.
Cash Flow statement A financial report that shows the movement incash for a business during an accounting period.
Cash value added (CVA) A method of investment appraisal that calculatesthe ratio of the net present value of aninvestment to the initial capital investment.
Contribution The difference between the selling price andvariable costs, which can be expressed either perunit or in total.
Controllable profit The profit made by a division after deductingonly those expenses that can be controlled by thedivisional manager and ignoring those expensesthat are outside the divisional manager’s control.
372 ACCOUNTING FOR MANAGERS
Cost A resource sacrificed or forgone to achieve aspecific objective (Horngren et al.), definedtypically in monetary terms.
Cost behaviour The idea that fixed costs and variable costs reactdifferently to changes in the volume ofproducts/services produced.
Cost centre A division or unit of an organization that isresponsible for controlling costs.
Cost control The process of either reducing costs whilemaintaining the same level of productivity ormaintaining costs while increasing productivity.
Cost driver The most significant cause of the cost of anactivity, a measure of the demand for an activityby each product/service enabling the cost ofactivities to be assigned from cost pools toproducts/services.
Cost object Anything for which a measurement of cost isrequired – inputs, processes, outputs orresponsibility centres.
Cost of capital The costs incurred by an organization to fund allits investments, comprising the risk-adjustedcost of equity and debt weighted by the mix ofequity and debt.
Cost of goods sold See cost of sales.Cost of manufacture The cost of goods manufactured for subsequent
sale.Cost of quality The difference between the actual costs of
production, selling and service and the costs thatwould be incurred if there were no failuresduring production or usage of products orservices.
Cost of sales The manufacture or purchase price of goods soldin a period or the cost of providing a service.
Cost-plus pricing A method of pricing in which a mark-up isadded to the total product/service cost.
Cost pool The costs of (cross-functional) businessprocesses, irrespective of the organizationalstructure of the business.
Cost–volume–profitanalysis (CVP)
A method for understanding the relationshipbetween revenue, cost and sales volume.
Credit Buying or selling goods or services now with theintention of payment following at some time inthe future (as opposed to buying or sellinggoods or services for cash).

GLOSSARY OF ACCOUNTING TERMS 373
Creditors Purchases of goods or services from suppliers oncredit to whom the debt is not yet paid. Or aterm used in the Balance Sheet to denote currentliabilities.
Current assets Amounts receivable by the business within aperiod of 12 months, including bank, debtors,inventory and prepayments.
Current liabilities Amounts due and payable by the businesswithin a period of 12 months, e.g. bankoverdraft, creditors and accruals.
Debt Borrowings from financiers.
Debtors Sales to customers who have bought goods orservices on credit but who have not yet paidtheir debt.
Depreciation An expense that spreads the cost of an asset overits useful life.
Direct costs Costs that are readily traceable to particularproducts or services.
Discounted cash flow(DCF)
A method of investment appraisal that discountsfuture cash flows to present value using adiscount rate, which is the risk-adjusted cost ofcapital.
Dividend The payment of after-tax profits to shareholdersas their share of the profits of the business for anaccounting period.
Double entry The system of recording business transactions intwo accounts.
Earnings before interestand taxes (EBIT)
The operating profit before deducting interestand tax.
Earnings before interest,taxes, depreciation andamortization (EBITDA)
The operating profit before deducting interest,tax, depreciation and amortization.
Economic Value Added(EVA)
Operating profit, adjusted to remove distortionscaused by certain accounting rules, less a chargeto cover the cost of capital invested in thebusiness.
Equity Funds raised from shareholders.
Expenses The costs incurred in buying, making orproducing goods and services.
Feedback The retrospective process of measuringperformance, comparing it with plan and takingcorrective action.
374 ACCOUNTING FOR MANAGERS
Feedforward The process of determining prospectivelywhether strategies are likely to achieve the targetresults that are consistent with organizationalgoals.
Financial accounting The production of financial statements,primarily for those interested parties who areexternal to the business.
Financial reports orstatements
The Profit and Loss account, Balance Sheet andCash Flow statement of a business.
Financial year The accounting period adopted by a business forthe production of its financial statements.
Finished goods Inventory that is ready for sale, either havingbeen purchased as such or the result of aconversion from raw materials through amanufacturing process.
Fixed assets Things that the business owns and are part of thebusiness infrastructure – fixed assets may betangible or intangible.
Fixed costs Costs that do not change with increases ordecreases in the volume of goods or servicesproduced, within the relevant range.
Flexible budget A method of budgetary control that flexes, i.e.adjusts the original budget by applying standardprices and costs per unit to the actual productionvolume.
Forecast A revised budget estimate or update, part-waythrough a budget period.
Full cost The cost of a product/service that includes anallocation of all the (production andnon-production) costs of the business.
Gearing A measure of the extent of long-term debt incomparison with shareholders’ funds.
Gross profit The difference between the price at which goodsor services are sold and the cost of sales.
Income The revenue generated from the sale of goods orservices.
Incremental budget A budget that takes the previous year as a baseand adds (or deducts) a percentage to arrive atthe budget for the current year.
Indirect costs Costs that are necessary to produce aproduct/service but are not readily traceable toparticular products or services – see overhead.
GLOSSARY OF ACCOUNTING TERMS 375
Intangible fixed assets Non-physical assets, e.g. customer goodwill orintellectual property (patents and trademarks).
Interest The cost of money, received on investments orpaid on borrowings.
Internal rate of return(IRR)
A discounted cash flow technique used forinvestment appraisal that calculates the effectivecost of capital that produces a net present valueof zero from a series of future cash flows and aninitial capital investment.
Inventory Goods bought or manufactured for resale but asyet unsold, comprising raw materials,work-in-progress and finished goods.
Investment centre A division or unit of an organization that isresponsible for achieving an adequate return onthe capital invested in the division or unit.
Job costing A method of accounting that accumulates thecosts of a product/service that is produced eithercustomized to meet a customer’s specification orin a batch of identical product/services.
Kaizen A method of costing that involves makingcontinual, incremental improvements to theproduction process during the manufacturingphase of the product/service lifecycle, typicallyinvolving setting targets for cost reduction.
Labour oncost The non-salary or wage costs that follow fromthe payment of salaries or wages, e.g. NationalInsurance and pension contributions.
Ledger A collection of all the different accounts of thebusiness that summarize the transactions of thebusiness.
Liabilities Debts that the business owns.
Lifecycle costing An approach to costing that estimates andaccumulates the costs of a product/service overits entire lifecycle, i.e. from inception toabandonment.
Limiting factor The production resource that, as a result ofscarce resources, limits the production of goodsor services, i.e. a bottleneck.
Line item Generic types of assets, liabilities, income orexpense that are common to all businesses andused as the basis of financial reporting, e.g. rent,salaries, advertising etc.

376 ACCOUNTING FOR MANAGERS
Liquidity A measure of the ability of a business to pay itsdebts as they fall due – see also working capital.
Long-term liabilities Amounts owing after more than one year.Make-ready See set-up.Management accounting The production of financial and non-financial
information used in planning for the future;making decisions about products, services,prices and what costs to incur; and ensuring thatplans are implemented and achieved.
Margin The amount added to a lower figure to reach ahigher figure, expressed as a percentage of thehigher figure, e.g. the margin that profitrepresents as a percentage of selling price.
Marginal cost The cost of producing one extra unit.Margin of safety A measure of the difference between the
anticipated and breakeven levels of activity.Mark-up The amount added to a lower figure to reach a
higher figure, expressed as a percentage of thelower figure, e.g. cost is marked up by apercentage to cover the desired profit todetermine a selling price.
Matching See accruals accounting.Net present value (NPV) A discounted cash flow technique used for
investment appraisal that calculates the presentvalue of future cash flows and deducts the initialcapital investment.
Net profit See operating profit.Non-production overhead A general term referring to period costs, such as
selling, administration and financial expenses.Operating profit The profit made by the business for an
accounting period, equal to gross profit lessselling, finance, administration etc. expenses, butbefore deducting interest or taxation.
Opportunity cost The lost opportunity of not doing something,which may be financial or non-financial, e.g.time.
Optimum selling price The price at which profit is maximized, whichtakes into account the cost behaviour of fixedand variable costs and the relationship betweenprice and demand for a product/service.
Overhead Any cost other than a direct cost – may refer toan indirect production cost and/or to anon-production expense.
GLOSSARY OF ACCOUNTING TERMS 377
Overhead allocation The process of spreading production overheadequitably over the volume of production ofgoods or services.
Overhead rate The rate (often expressed per hour) applied tothe time taken to produce a product/service,used to allocate production overheads toparticular products/services based on the timetaken. May be calculated on a business-wide orcost centre basis.
Payback A method of investment appraisal that calculatesthe number of years taken for the cash flowsfrom an investment to cover the initial capitaloutlay.
Period costs The costs that relate to a period of time.
Planning, programmingand budgeting system(PPBS)
A method of budgeting in which budgets areallocated to projects or programmes rather thanto responsibility centres.
Prepayment A payment made in advance of when it istreated as an expense for profit purposes.
Prime cost The total of all direct costs.
Priority-based budget A budget that allocates funds in line withstrategies.
Process costing A method of costing for continuous manufacturein which costs for an accounting compared arecompared with production for the same periodto determine a cost per unit produced.
Product cost The cost of goods or services produced.
Product market A business’s investment in technology, peopleand materials in order to make, buy and sellproducts or services to customers.
Product/service mix See sales mix.
Production overhead A general term referring to indirect costs.
Profiling A method of budgeting that takes into accountseasonal fluctuations and estimates of whenrevenues will be earned and costs will beincurred over each month in the budget period.
Profit The difference between income and expenses.
Profit and Loss account A financial statement measuring the profit orloss of a business – income less expenses – for anaccounting period.
Profit before interest andtaxes (PBIT)
See EBIT.

378 ACCOUNTING FOR MANAGERS
Profit centre A division or unit of an organization that isresponsible for achieving profit targets.
Profitability index See cash value added.Provision Estimates of possible future liabilities that may
arise.Ratio analysis A method of analysing financial reports to
interpret trends and make comparisons by usingratios – two numbers, with one generallyexpressed as a percentage of the other.
Raw materials Unprocessed goods bought for manufacture,part of inventory.
Relevant cost The cost that is relevant to a particulardecision – future, incremental cash flows.
Relevant range The upper and lower levels of activity withinwhich the business expects to be operatingwithin the short-term planning horizon (thebudget period).
Residual income (RI) The profit remaining after deducting from profita notional cost of capital on the investment in abusiness or division of a business.
Responsibility centre A division or unit of an organization for which amanager is held responsible – may be a costcentre, profit centre or investment centre.
Retained profits The amount of profit after deducting interest,taxation and dividends that is retained by thebusiness.
Return on capitalemployed (ROCE)
The operating profit before interest and tax as apercentage of the total shareholders’ funds plusthe long-term debt of the business.
Return on investment(ROI)
The net profit after tax as a percentage of theshareholders’ investment in the business.
Revenue Income earned from the sale of goods andservices.
Rolling budgets A method of budgeting in which as each monthpasses, an additional budget month is addedsuch that there is always a 12-month budget.
Routing A list of all the labour or machining processesand times required to convert raw materials intofinished goods or to deliver a service.
Sales mix The mix of product/services offered by thebusiness, each of which may be aimed atdifferent customers, with each product/servicehaving different prices and costs.

GLOSSARY OF ACCOUNTING TERMS 379
Semi-fixed costs Costs that are constant within a defined level ofactivity but that can increase or decrease whenactivity reaches upper and lower levels.
Semi-variable costs Costs that have both fixed and variablecomponents.
Sensitivity analysis An approach to understanding how changes inone variable of cost–volume–profit analysis areaffected by changes in the other variables.
Set-up The time required to make ready a machine orprocess for production, e.g. changing equipmentsettings.
Shareholders’ funds The capital invested in a business by theshareholders, including retained profits.
Shareholder value Increasing the value of the business to itsshareholders, achieved through a combination ofdividend and capital growth in the value of theshares.
Source document The document that records a transaction andforms the basis for recording in a business’saccounting system.
Standard costs A budget cost for materials and labour used fordecision-making, usually expressed as a per unitcost that is applied to standard quantities from abill of materials and to standard times from arouting.
Stock See inventory.Strategic managementaccounting
The provision and analysis of managementaccounting data about a business and itscompetitors, which is of use in the developmentand monitoring of strategy (Simmonds).
Sunk costs Costs that have been incurred in the past.Tangible fixed assets Physical assets that can be seen and touched, e.g.
buildings, machinery, vehicles, computers etc.Target costing A method of costing that is concerned with
managing whole-of-life costs of aproduct/service during the product designphase – the difference between target price (toachieve market share) and the target profitmargin.
Target rate of returnpricing
A method of pricing that estimates the desiredreturn on investment to be achieved from thefixed and working capital investment andincludes that return in the price of aproduct/service.

380 ACCOUNTING FOR MANAGERS
Throughput contribution Sales revenue less the cost of materials.Transaction The financial description of a business event.Transfer price The price at which goods or services are bought
and sold within divisions of the sameorganization, as opposed to an arm’s-lengthprice at which sales may be made to an externalcustomer.
Turnover The business income or sales of goods andservices.
Unavoidable cost A cost that cannot be influenced at the businessunit level but is controllable at the corporatelevel.
Value-based management A variety of approaches (see Chapter 2) thatemphasize increasing shareholder value as theprimary goal of every business.
Variable cost A cost that increases or decreases in proportionwith increases or decreases in the volume ofproduction of goods or services.
Variable costing A method of costing in which only variableproduction costs are treated as product costs andin which all fixed (production andnon-production) costs are treated as period costs.
Variance analysis A method of budgetary control that comparesactual performance against plan, investigates thecauses of the variance and takes corrective actionto ensure that targets are achieved.
Weighted average cost ofcapital
See cost of capital.
Working capital Current assets less current liabilities. Money thatrevolves in the business as part of the process ofbuying, making and selling goods and services,particularly in relation to debtors, creditors,inventory and bank.
Work-in-progress Goods or services that have commenced theproduction process but are incomplete andunable to be sold.
Zero-based budgeting A method of budgeting that ignores historicalbudgetary allocations and identifies the coststhat are necessary to implement agreedstrategies.

Appendices: Questions andCase Studies
Appendix 1: QuestionsAppendix 2: Solutions to QuestionsAppendix 3: Case StudiesAppendix 4: Solutions to Case Studies
One of the problems that most students of accounting face is being able to tacklecalculation problems. The ‘fear of numbers’ is quite common with postgraduatestudents and practising managers. Students often look back to find a similar ‘modelquestion’ and then try to repeat the calculation, simply replacing the numbers.This is not good practice as it does not help the student to think about theconcepts involved. Each problem is different, and this mirrors day-to-day businessdecisions. Solving these problems is about applying the underlying concepts.
The questions in the Appendices to this book require the reader to performcalculations. These are contained in Appendix 1 with the solutions in Appendix 2.This is a good way of learning about the techniques. In attempting to solve theseproblems, you need to think about
ž What the business problem is;ž The information that is provided to solve the problem;ž The most appropriate technique to apply to the problem; andž How to apply the technique to solve the problem.
The Case Studies in Appendix 3 already have calculations as these would mostlikely have already been produced by an accountant in business organizations.What is required to answer these questions is to apply your understanding of thetechniques employed by accountants and critically analyse the information given(some of which contains questionable assumptions) so that you can
ž Interpret the financial information;ž Identify the underlying assumptions used; and

382 ACCOUNTING FOR MANAGERS
ž Make suggestions to management to overcome any problems you haveidentified.
The case studies are also provided with suggested solutions (Appendix 4) so thatstudents can self-test themselves.
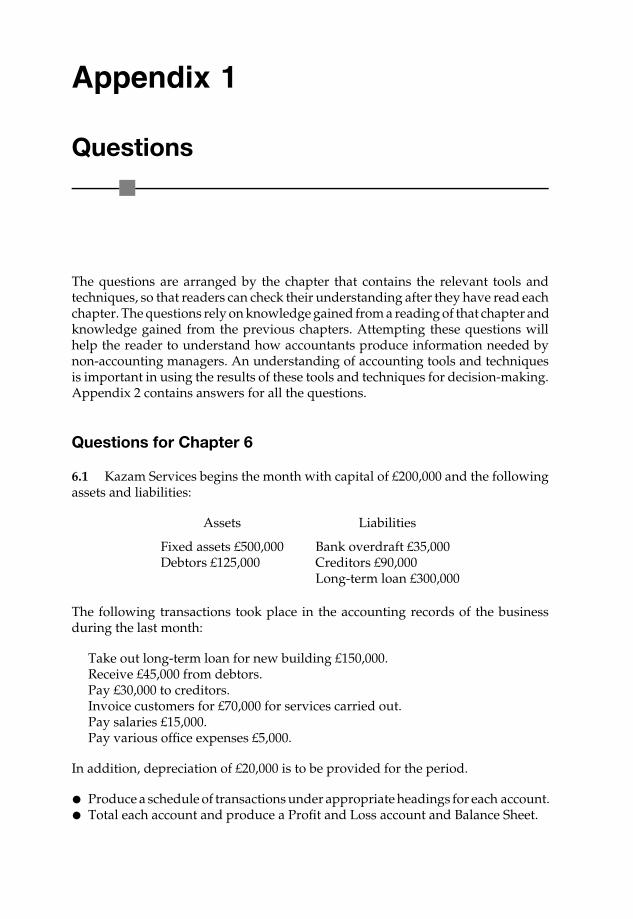
Appendix 1
Questions
The questions are arranged by the chapter that contains the relevant tools andtechniques, so that readers can check their understanding after they have read eachchapter. The questions rely on knowledge gained from a reading of that chapter andknowledge gained from the previous chapters. Attempting these questions willhelp the reader to understand how accountants produce information needed bynon-accounting managers. An understanding of accounting tools and techniquesis important in using the results of these tools and techniques for decision-making.Appendix 2 contains answers for all the questions.
Questions for Chapter 6
6.1 Kazam Services begins the month with capital of £200,000 and the followingassets and liabilities:
Assets Liabilities
Fixed assets £500,000 Bank overdraft £35,000Debtors £125,000 Creditors £90,000
Long-term loan £300,000
The following transactions took place in the accounting records of the businessduring the last month:
Take out long-term loan for new building £150,000.Receive £45,000 from debtors.Pay £30,000 to creditors.Invoice customers for £70,000 for services carried out.Pay salaries £15,000.Pay various office expenses £5,000.
In addition, depreciation of £20,000 is to be provided for the period.
ž Produce a schedule of transactions under appropriate headings for each account.ž Total each account and produce a Profit and Loss account and Balance Sheet.
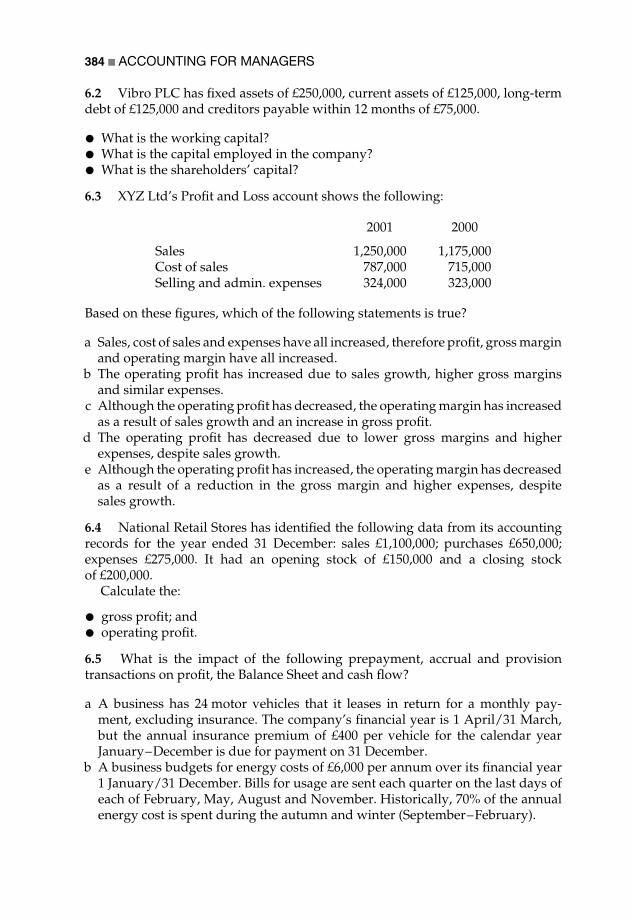
384 ACCOUNTING FOR MANAGERS
6.2 Vibro PLC has fixed assets of £250,000, current assets of £125,000, long-termdebt of £125,000 and creditors payable within 12 months of £75,000.
ž What is the working capital?ž What is the capital employed in the company?ž What is the shareholders’ capital?
6.3 XYZ Ltd’s Profit and Loss account shows the following:
2001 2000
Sales 1,250,000 1,175,000Cost of sales 787,000 715,000Selling and admin. expenses 324,000 323,000
Based on these figures, which of the following statements is true?
a Sales, cost of sales and expenses have all increased, therefore profit, gross marginand operating margin have all increased.
b The operating profit has increased due to sales growth, higher gross marginsand similar expenses.
c Although the operating profit has decreased, the operating margin has increasedas a result of sales growth and an increase in gross profit.
d The operating profit has decreased due to lower gross margins and higherexpenses, despite sales growth.
e Although the operating profit has increased, the operating margin has decreasedas a result of a reduction in the gross margin and higher expenses, despitesales growth.
6.4 National Retail Stores has identified the following data from its accountingrecords for the year ended 31 December: sales £1,100,000; purchases £650,000;expenses £275,000. It had an opening stock of £150,000 and a closing stockof £200,000.
Calculate the:
ž gross profit; andž operating profit.
6.5 What is the impact of the following prepayment, accrual and provisiontransactions on profit, the Balance Sheet and cash flow?
a A business has 24 motor vehicles that it leases in return for a monthly pay-ment, excluding insurance. The company’s financial year is 1 April/31 March,but the annual insurance premium of £400 per vehicle for the calendar yearJanuary–December is due for payment on 31 December.
b A business budgets for energy costs of £6,000 per annum over its financial year1 January/31 December. Bills for usage are sent each quarter on the last days ofeach of February, May, August and November. Historically, 70% of the annualenergy cost is spent during the autumn and winter (September–February).
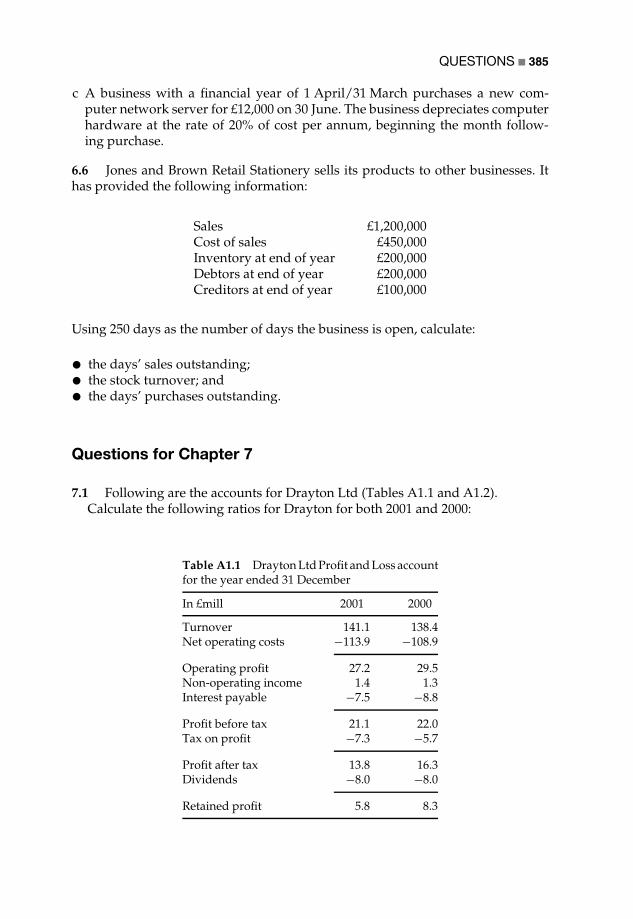
QUESTIONS 385
c A business with a financial year of 1 April/31 March purchases a new com-puter network server for £12,000 on 30 June. The business depreciates computerhardware at the rate of 20% of cost per annum, beginning the month follow-ing purchase.
6.6 Jones and Brown Retail Stationery sells its products to other businesses. Ithas provided the following information:
Sales £1,200,000Cost of sales £450,000Inventory at end of year £200,000Debtors at end of year £200,000Creditors at end of year £100,000
Using 250 days as the number of days the business is open, calculate:
ž the days’ sales outstanding;ž the stock turnover; andž the days’ purchases outstanding.
Questions for Chapter 7
7.1 Following are the accounts for Drayton Ltd (Tables A1.1 and A1.2).Calculate the following ratios for Drayton for both 2001 and 2000:
Table A1.1 Drayton Ltd Profit and Loss accountfor the year ended 31 December
In £mill 2001 2000
Turnover 141.1 138.4Net operating costs −113.9 −108.9
Operating profit 27.2 29.5Non-operating income 1.4 1.3Interest payable −7.5 −8.8
Profit before tax 21.1 22.0Tax on profit −7.3 −5.7
Profit after tax 13.8 16.3Dividends −8.0 −8.0
Retained profit 5.8 8.3

386 ACCOUNTING FOR MANAGERS
Table A1.2 Balance Sheet as at 31 December
In £mill 2001 2000
Fixed assetsTangible assets 266.7 265.3
Current assetsStock 5.3 5.8Trade debtors 15.7 20.9Other debtors and prepayments 2.4 2.0Bank 4.9 6.3
28.3 35.0Creditors falling due within one year −66.8 −27.6
Net current assets (-liabilities) −38.5 7.4
Total assets less current liabilities 228.2 272.7Creditors falling due after one year −96.7 −146.1
Net assets 131.5 126.6
Capital and reservesShare capital 81.9 82.8Profit and Loss account 49.6 43.8
Shareholders’ funds 131.5 126.6
ž Return on shareholders’ investment (ROI).ž Return on capital employed (ROCE).ž Operating profit/sales.ž Sales growth.ž Gearing.ž Asset turnover.
Draw some conclusions from the change in the ratios over the two years.
7.2 Jupiter Services has produced some financial ratios for the past two years.Use the ratios that have already been calculated to draw some conclusions aboutJupiter’s:
ž profitability;ž liquidity;ž gearing;ž efficiency.

QUESTIONS 387
Current year Previous year
Return on (shareholders’) investment (ROI)
net profit after taxshareholders’ funds
193.42,610.1
7.4%251.9
2,547.09.9%
Return on capital employed (ROCE)
net profit before interest and taxshareholders’ funds + long-term debt
367.32,610.1 + 1,770
8.4%394.7
2,547 + 1,537.79.7%
Net profit/sales
net profit before interest and taxsales
367.31,681.6
21.8%394.7
1,566.625.2%
Working capital
current assetscurrent liabilities
613.31,444
42.5%475.3
1,089.243.6%
Gearing ratio
long-term debtshareholders’ funds + long-term debt
1,7702,610.1 + 1,770
40.4%1,537.7
2,547 + 1,537.737.6%
Interest cover
profit before interest and taxinterest payable
367.3161.1
2.28394.7120.7
3.27
Debtors’ collections
debtorsaverage daily sales
414.71,681.6/365 = 4.607
90353.8
1,566.6/365 = 4.29282.4
Asset turnover
salestotal assets
1,681.65,304.5 + 613.3
28.4%1,566.6
4,794.6 + 475.329.7%
Questions for Chapter 8
8.1 Plastic Emoluments has a relevant range between 100,000 and 200,000 units,fixed costs are £645,000 and variable costs are £7 per unit. Calculate the averagecosts at a production volume of each of 100,000, 150,000 and 200,000 units.
8.2 Hilltop Solutions has a planned level of activity of 150,000 units, fixed costsare £300,000 and variable costs are £7 per unit. The actual production volume is140,000 units.
Identify the:
ž standard cost per unit;

388 ACCOUNTING FOR MANAGERS
ž actual cost per unit;ž marginal cost per unit.
8.3 Corporate Document Service incurs variable costs of £7 every time a docu-ment is processed. The business providing the service has fixed costs of £100,000per month. The selling price for each service is £25.
ž By how much does the average cost change between processing 10,000 and20,000 documents?ž Does the marginal cost change in the same way?ž Explain why the average cost changes.
8.4 The Cook Co. has two divisions, Eastern and Western. The divisions havethe following revenue and expenses:
Eastern Western£ £
Sales 550,000 500,000Variable costs 275,000 200,000Divisional fixed costs 180,000 150,000Allocated corporate costs 170,000 135,000
The management of Cook is considering the closure of the Eastern division salesoffice. If the Eastern division were closed, the fixed costs associated with thisdivision could be avoided but allocated corporate costs would continue.
Given this data:
ž Calculate the effect on Cook Co.’s operating profit before and after the closure.ž Should the Eastern division be closed?
8.5 Jacobean Creek PLC has provided the following data for last year:
Sales 5,000 unitsSales price £80 per unitVariable cost £55 per unitFixed cost £25,000
For the current year, Jacobean Creek believes that although sales volume willremain constant, the contribution margin per unit can be increased by 20% andtotal fixed cost can be reduced by 10%.
ž Calculate the operating profit for last year and the current year.ž What is the increase in profit between the two years?
8.6 Relay Co. makes batons. It can make 300,000 batons a year at a variable costof £750,000 and a fixed cost of £450,000. Relay predicts that next year it will sell240,000 batons at the normal price of £5 per baton. In addition, a special order hasbeen placed for 60,000 batons to be sold at a 40% discount. What will be Relay
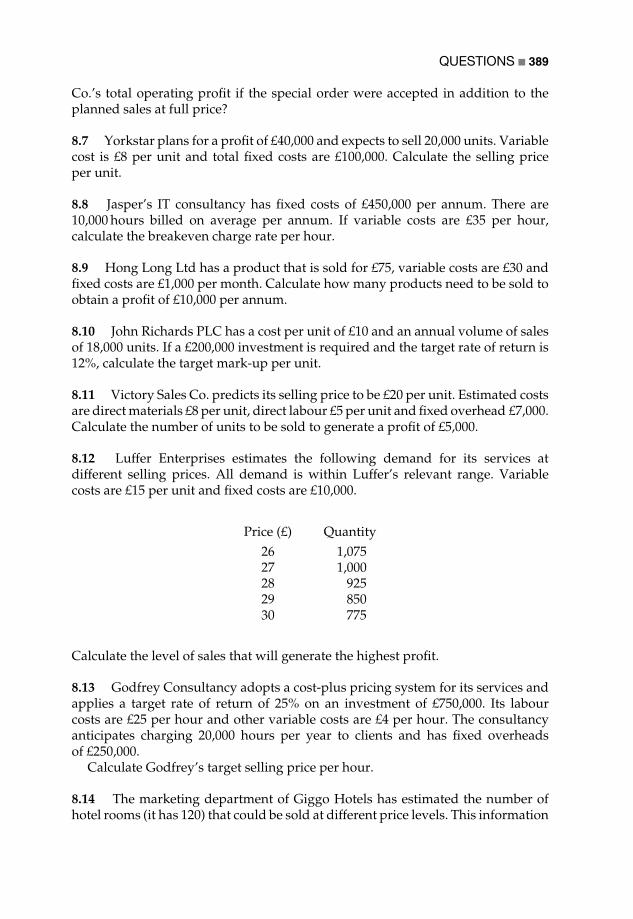
QUESTIONS 389
Co.’s total operating profit if the special order were accepted in addition to theplanned sales at full price?
8.7 Yorkstar plans for a profit of £40,000 and expects to sell 20,000 units. Variablecost is £8 per unit and total fixed costs are £100,000. Calculate the selling priceper unit.
8.8 Jasper’s IT consultancy has fixed costs of £450,000 per annum. There are10,000 hours billed on average per annum. If variable costs are £35 per hour,calculate the breakeven charge rate per hour.
8.9 Hong Long Ltd has a product that is sold for £75, variable costs are £30 andfixed costs are £1,000 per month. Calculate how many products need to be sold toobtain a profit of £10,000 per annum.
8.10 John Richards PLC has a cost per unit of £10 and an annual volume of salesof 18,000 units. If a £200,000 investment is required and the target rate of return is12%, calculate the target mark-up per unit.
8.11 Victory Sales Co. predicts its selling price to be £20 per unit. Estimated costsare direct materials £8 per unit, direct labour £5 per unit and fixed overhead £7,000.Calculate the number of units to be sold to generate a profit of £5,000.
8.12 Luffer Enterprises estimates the following demand for its services atdifferent selling prices. All demand is within Luffer’s relevant range. Variablecosts are £15 per unit and fixed costs are £10,000.
Price (£) Quantity26 1,07527 1,00028 92529 85030 775
Calculate the level of sales that will generate the highest profit.
8.13 Godfrey Consultancy adopts a cost-plus pricing system for its services andapplies a target rate of return of 25% on an investment of £750,000. Its labourcosts are £25 per hour and other variable costs are £4 per hour. The consultancyanticipates charging 20,000 hours per year to clients and has fixed overheadsof £250,000.
Calculate Godfrey’s target selling price per hour.
8.14 The marketing department of Giggo Hotels has estimated the number ofhotel rooms (it has 120) that could be sold at different price levels. This information
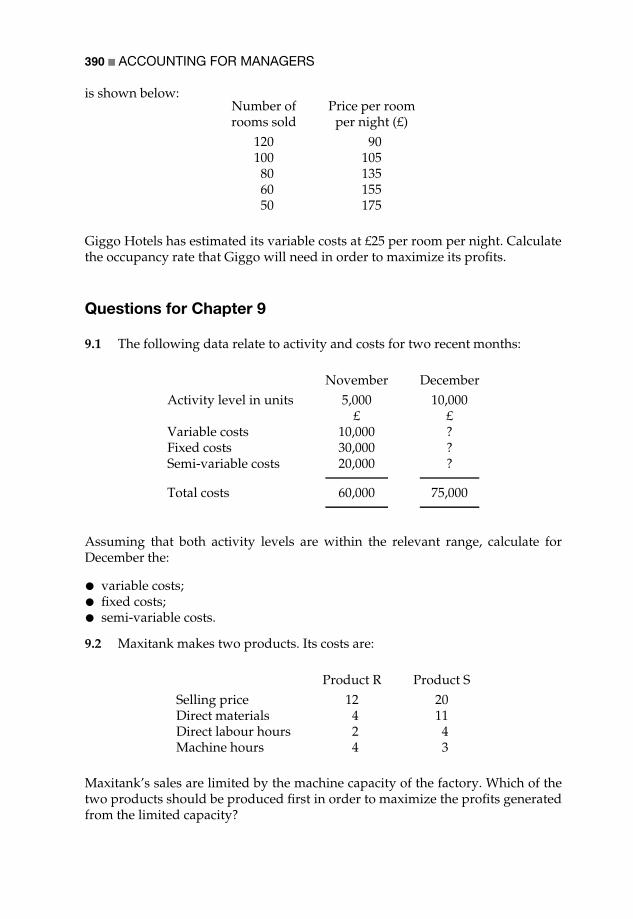
390 ACCOUNTING FOR MANAGERS
is shown below:Number of Price per roomrooms sold per night (£)
120 90100 10580 13560 15550 175
Giggo Hotels has estimated its variable costs at £25 per room per night. Calculatethe occupancy rate that Giggo will need in order to maximize its profits.
Questions for Chapter 9
9.1 The following data relate to activity and costs for two recent months:
November DecemberActivity level in units 5,000 10,000
£ £Variable costs 10,000 ?Fixed costs 30,000 ?Semi-variable costs 20,000 ?
Total costs 60,000 75,000
Assuming that both activity levels are within the relevant range, calculate forDecember the:
ž variable costs;ž fixed costs;ž semi-variable costs.
9.2 Maxitank makes two products. Its costs are:
Product R Product SSelling price 12 20Direct materials 4 11Direct labour hours 2 4Machine hours 4 3
Maxitank’s sales are limited by the machine capacity of the factory. Which of thetwo products should be produced first in order to maximize the profits generatedfrom the limited capacity?

QUESTIONS 391
9.3 Goldfish Enterprises’ costs for selling 15,000 hours of consultancy services are£345,000 and costs for 7,000 hours are £185,000. The company wishes to estimateits fixed and variable costs.
ž What are the fixed and variable costs for Goldfish?ž What is the principal assumption behind your calculation?
9.4 Midlands Refrigeration estimates the costs per unit of a product as:
Direct materials 40 kg @ £2.50 per kgDirect labour 7 hours machining @ £12 per hour
4 hours finishing @ £7 per hourVariable production overhead @ £5 per direct labour hourFixed production overhead of £1,000,000 based on a production volume of12,500 units.
Calculate the:
ž variable production cost;ž total production cost.
9.5 Harrison Products’ capacity is 20,000 units a year. A summary of operatingresults for last year is:
Sales (12,000 units @ £100) £1,200,000Variable costs 588,000
Contribution margin 612,000Fixed costs 245,000
Net operating income £ 367,000
A foreign distributor has offered to buy a guaranteed 8,000 units at £95 per unitnext year. Harrison expects its regular sales next year to be 15,000 units.
If Harrison accepts this offer and forgoes some of its expected sales to ensurethat it does not exceed capacity, what would be the total operating profit next yearassuming that total fixed costs increase by £100,000?
9.6 Global Conglomerates has a new product that requires 150 kg of materialY876, which is in constant use within the firm. There are 100 kg in stock that cost£11.00/kg. The replacement value is £12.50/kg and the scrap value is £2.00/kg.Calculate the relevant cost of the material to be used in the new product.
9.7 Magnificent Products makes three products, each requiring two machinehours per unit to produce. The following information has been provided by theSales Dept in relation to each product:
Macro Mezzo MicroBudgeted sales units 10,000 7,500 5,000Selling price per unit £12 £16 £18Variable costs per unit £6 £7 £4

392 ACCOUNTING FOR MANAGERS
If the company has a limited production capacity, preventing all its budgeted salesfrom being produced, how should Magnificent rank its products for manufacturein order to maximize profitability?
9.8 CarParts has a new automotive product that is in the final stages of design.Marketing expects to achieve the desired market share and volume at a price of £29per unit and the manufacturer expects a 25% margin on the selling price. Currentdesigns have been calculated to result in a production cost of £22.50 per unit.
Calculate the reduction required to meet the target cost per unit.
9.9 Buena Manufacturing has sales of £850,000. It used materials of £450,000,direct labour of £175,000 and incurred other variable manufacturing expenses of£30,000. The business also incurred fixed manufacturing expenses of £65,000 andselling and administrative expenses of £40,000. Its opening stock of finished goodswas £120,000 and its closing stock had reduced by £25,000.
Calculate each of the:
ž cost of production;ž cost of sales;ž contribution margin; andž operating profit.
Questions for Chapter 10
10.1 Grant & McKenzie is a firm of financial advisers that needs to calculate anhourly rate to charge customers for its services.
The average salary cost for its advisers is £40,000. National Insurance is11% and the firm pays a pension contribution of 6%. Each adviser has fourweeks’ annual holiday and there are 10 days per annum when the firm closes forbank holidays and Christmas. Each adviser is expected to do chargeable workfor clients of 25 hours per week, the remainder of the time being administra-tive work.
Calculate an hourly rate (to the nearest hour) to cover the cost of each finan-cial adviser.
10.2 Local Bank does not know how much of its cheque-processing costs arefixed and how much are variable. However, total costs have been estimated at£750,000 for processing of 1,000,000 transactions and £850,000 for processing of1,200,000 transactions.
ž What are the variable costs per transaction?ž What are the fixed costs?
10.3 Cardinal Co. needs 20,000 units of a certain part to use in one of its products.The following information is available.

QUESTIONS 393
Cost to Cardinal to make each part:
Direct materials £4Direct labour 16Variable manufacturing overhead 8Fixed manufacturing overhead 10
Total 38
The cost to buy the part from the Oriole Co. is £36. If Cardinal buys the partfrom Oriole instead of making it, Cardinal would have no use for the sparecapacity. Additionally, 60% of the fixed manufacturing overheads would continueregardless of what decision is made. Cardinal decides that direct labour is anavoidable cost for the purposes of this decision.
Decide whether to make or buy the 20,000 parts, by comparing the relevant costs.
10.4 Cirrus Company has calculated that the cost to make a component is madeup of direct materials £120, direct labour £60, variable overhead £30 and fixedoverhead of £25. Another company has offered to make the component for £140.
If the company has spare capacity and wishes to retain its skilled labour force,should it make or buy the component?
10.5 Bromide Partners provides three services: accounting, audit and tax. Thetotal business overheads of £650,000 have been divided into two cost pools. Thecost pools are:
Partners £200,000Juniors £450,000
Partner hours are a measure of complexity and junior hours define the duration ofthe work. The hours spent by each type of staff are:
Accounting Audit Tax TotalPartner hours 150 250 400 800Junior hours 1,200 2,800 1,000 5,000
Calculate the total activity-based cost of providing audit services.
10.6 Bendix Ltd is considering the alternatives of either purchasing componentVX-1 from an outside supplier or producing the component itself. Production coststo Bendix are estimated at:
Direct labour £200Direct materials 600Variable overheads 100Fixed overheads 300
Total £1,200

394 ACCOUNTING FOR MANAGERS
An outside supplier, Cosmo PLC, has quoted a price of £1,000 for each VX-1 foran order of 100 of these components. However, if Bendix accepts the quote fromCosmo, the company will need to give three months’ notice of redundancy to staff.
ž Calculate the relevant costs of the alternative choices (show your workings)and make a recommendation to management as to which choice to accept.ž How would your recommendation differ if Bendix employees were on tempo-rary contracts with no notice period?ž Explain the significance of a stock valuation of £1,300 for the VX-1 at the end ofthe last accounting period.
10.7 Victory Products Ltd manufactures high-technology products for the com-puter industry. Victory’s accountant has produced a profit report showing theprofitability of each of its three main customers for last year (Table A1.3).
Victory is operating at almost full capacity, but wishes to improve its profitabil-ity further. The accountant has reported that, based on the above figures, FranklinIndustries is the least profitable customer and has recommended that prices beincreased. If this is not possible, the accountant has suggested that Victory dis-continues selling to Franklin and seeks more profitable business from EngineeringPartners and Zeta.
Labour is the most significant limitation on capacity. It is highly specialized andis difficult to replace. Consequently, Victory does all it can to keep its workforceeven where there are seasonal downturns in business. The company charges£100 per hour for all labour, which is readily transferable between each of thecustomer products.
You have been asked to comment on the accountant’s recommendations.
Table A1.3 Victory products profit report
FranklinIndustries
EngineeringPartners
Zeta PLC Othercustomers
Total
Sales 1,000,000 1,500,000 2,000,000 1,500,000 6,000,000Cost of materials 250,000 600,000 750,000 750,000 2,350,000Cost of labour 300,000 200,000 300,000 75,000 875,000
Gross profit 450,000 700,000 950,000 675,000 2,775,000Corporate overheads:allocated as 30% of sales
300,000 450,000 600,000 450,000
Rental 250,000Depreciation 350,000Non-production salaries 600,000Selling expenses 350,000Administration 250,000
Operating profit 150,000 250,000 350,000 225,000 975,000

QUESTIONS 395
Questions for Chapter 11
11.1 Intelco, a professional services firm, has overheads of £500,000. It operatesthree divisions and an accountant’s estimate of the overhead allocation per divisionis 50% for Division 1, 30% for Division 2 and 20% for Division 3. The divisionsrespectively bill 4,000, 2,000 and 3,000 hours. Calculate the:
ž blanket (organization-wide) overhead recovery rate; and thež cost centre overhead recovery rate for each division.
11.2 BCF Ltd manufactures a product known as a Grunge. Direct material andlabour costs for each Grunge are £300 and £150 respectively. To produce a Grungerequires 20 hours, comprising 10 hours in machining, 7 hours in assembly and 3hours in finishing. Information for each department is:
Machining Assembly FinishingOverhead costs (£) 120,000 80,000 30,000Labour hours 20,000 10,000 10,000
Calculate the cost of producing a Grunge using a departmental overhead recov-ery rate.
11.3 Engineering Products PLC produces Product GH1, which incurs costs of£150 for direct materials and £75 for direct labour. The company has estimated itsproduction overhead and direct labour hours for a period as:
Dept A Dept B Dept COverheads £ 150,000 200,000 125,000Direct labour hours 5,000 10,000 5,000
Product GH1 is produced using 10 hours in Dept A, 12 hours in Dept B and 5hours in Dept C.
Calculate the total cost of each GH1 using:
ž a plant-wide overhead recovery rate; andž cost centre overhead recovery rates.
11.4 Haridan Co. uses activity-based costing. The company has two products,A and B. The annual production and sales of Product A are 8,000 units and ofproduct B 6,000 units. There are three activity cost pools, with estimated total costand expected activity as follows:
Activity Estimated Expected activityCost pool cost Product A Product B TotalActivity 1 £20,000 100 400 500Activity 2 £37,000 800 200 1,000Activity 3 £91,200 800 3,000 3,800

396 ACCOUNTING FOR MANAGERS
Calculate the cost per unit of Product A and Product B under activity-basedcosting.
11.5 Cooper’s Components uses an activity-based costing system for its productcosting. For the last quarter, the following data relates to costs, output volume andcost drivers:
Overhead Costs £Machinery 172,000Set-ups 66,000Materials handling 45,000
Total 283,000
Product A B CProduction and sales 4,000 units 3,000 units 2,000 unitsNumber of production runs 12 5 8Number of stores orders 12 6 4
per unit per unit per unitDirect costs £25 £35 £15Machine hours 5 2 3Direct labour hours 4 2 4
a If set-up costs are driven by the number of production runs, what is the set-upcost per unit traced to product A?
b If materials handling costs are driven by the number of stores orders, what isthe materials handling cost per unit traced to product B?
11.6 Elandem PLC produces 20,000 units of Product L and 20,000 units ofProduct M. Under activity-based costing, £120,000 of costs are purchasing related.If 240 purchase orders are produced each period, and the number of orders usedby each product is:
Product L Product MNo. of orders 80 160
ž Calculate the per-unit activity-based cost of purchasing for Products L and M.ž Calculate the overhead recovery for purchasing costs if those costs wererecovered over the number of units of the product produced.
11.7 Heated Tools Ltd uses activity-based costing. It has identified three costpools and their drivers as follows:
Purchasing Quality control DespatchCost pool £60,000 £40,000 £30,000Driver 12,000 4,000 2,000
Purchase orders Stores issues Deliveries
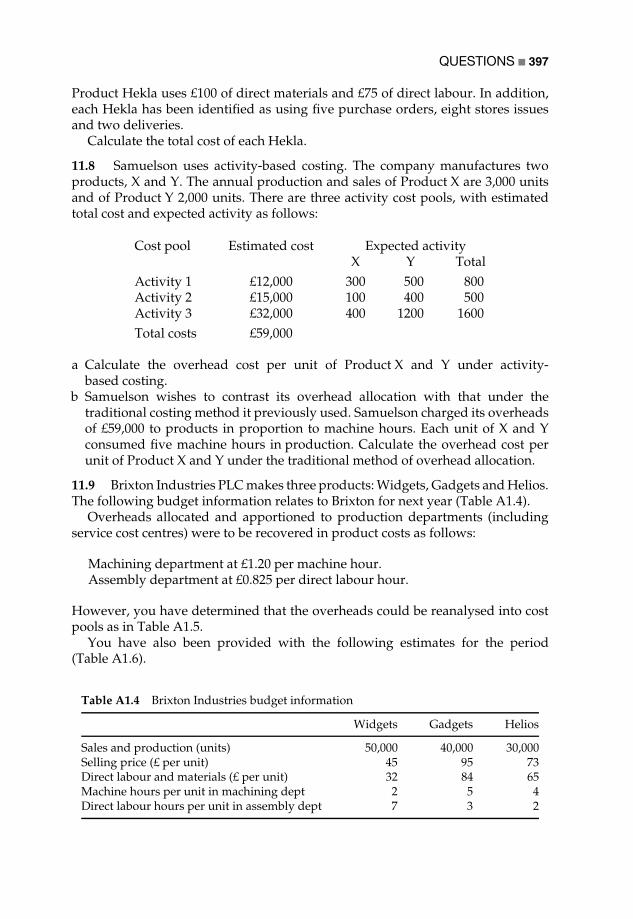
QUESTIONS 397
Product Hekla uses £100 of direct materials and £75 of direct labour. In addition,each Hekla has been identified as using five purchase orders, eight stores issuesand two deliveries.
Calculate the total cost of each Hekla.
11.8 Samuelson uses activity-based costing. The company manufactures twoproducts, X and Y. The annual production and sales of Product X are 3,000 unitsand of Product Y 2,000 units. There are three activity cost pools, with estimatedtotal cost and expected activity as follows:
Cost pool Estimated cost Expected activityX Y Total
Activity 1 £12,000 300 500 800Activity 2 £15,000 100 400 500Activity 3 £32,000 400 1200 1600Total costs £59,000
a Calculate the overhead cost per unit of Product X and Y under activity-based costing.
b Samuelson wishes to contrast its overhead allocation with that under thetraditional costing method it previously used. Samuelson charged its overheadsof £59,000 to products in proportion to machine hours. Each unit of X and Yconsumed five machine hours in production. Calculate the overhead cost perunit of Product X and Y under the traditional method of overhead allocation.
11.9 Brixton Industries PLC makes three products: Widgets, Gadgets and Helios.The following budget information relates to Brixton for next year (Table A1.4).
Overheads allocated and apportioned to production departments (includingservice cost centres) were to be recovered in product costs as follows:
Machining department at £1.20 per machine hour.Assembly department at £0.825 per direct labour hour.
However, you have determined that the overheads could be reanalysed into costpools as in Table A1.5.
You have also been provided with the following estimates for the period(Table A1.6).
Table A1.4 Brixton Industries budget information
Widgets Gadgets Helios
Sales and production (units) 50,000 40,000 30,000Selling price (£ per unit) 45 95 73Direct labour and materials (£ per unit) 32 84 65Machine hours per unit in machining dept 2 5 4Direct labour hours per unit in assembly dept 7 3 2

398 ACCOUNTING FOR MANAGERS
Table A1.5 Brixton Industries activity cost pools and drivers
Cost pool £ Cost Cost driver Quantity
Machining services 357,000 Machine hours 420,000Assembly services 318,000 Direct labour hours 530,000Set-up costs 26,000 Set-ups 520Order processing 156,000 Customer orders 32,000Purchasing 84,000 Supplier orders 11,200
Table A1.6 Brixton Industries estimates
Widgets Gadgets Helios
Number of set-ups 120 200 200Customer orders 8,000 8,000 16,000Supplier orders 3,000 4,000 4,200
ž Prepare and present a profit calculation showing the profitability of eachproduct using traditional absorption costing.ž Prepare and present a profit calculation showing the profitability of eachproduct using activity-based costing.ž Explain the differences between the product profitability using absorption andactivity-based costing.
11.10 Klingon Holdings has prepared a marketing study that shows the followingdemand and average price for each of its services for the following period:
A B CVolume 150,000 200,000 350,000Estimated selling price per unit £50 £35 £25The variable costs for each ofthese services is:
£20 £17 £14
Fixed expenses have been budgeted as £6,900,000.Using the above information:
ž Calculate the contribution per unit of volume (and in total) for each service.Which is the preferred service? Why? What should the business strategy be?ž Determine the absorption (full) cost per unit for the three services using threedifferent methods of allocating overheads.ž How do the results of these different methods compare?ž Assuming a constant mix of the services sold, calculate the breakeven point forthe business.
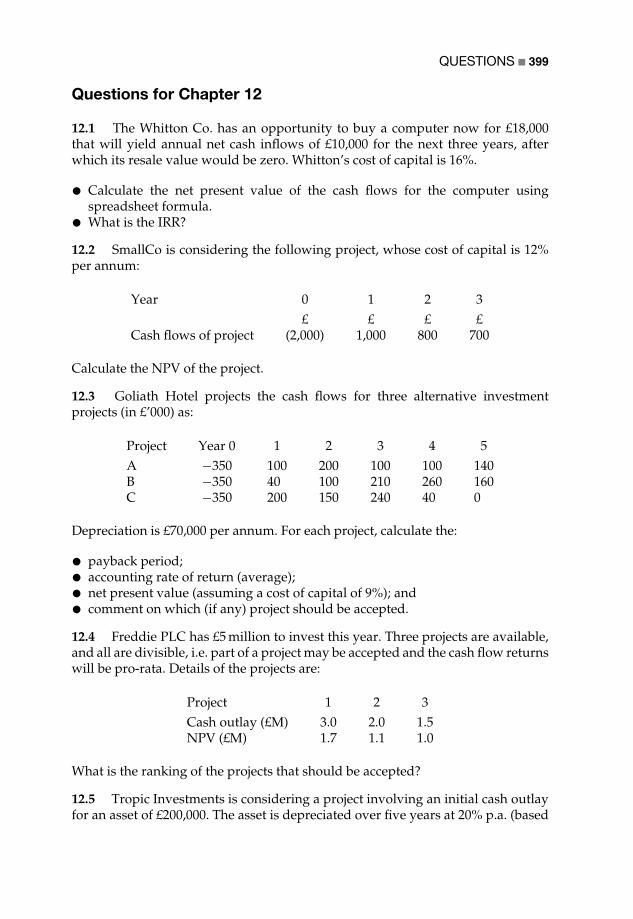
QUESTIONS 399
Questions for Chapter 12
12.1 The Whitton Co. has an opportunity to buy a computer now for £18,000that will yield annual net cash inflows of £10,000 for the next three years, afterwhich its resale value would be zero. Whitton’s cost of capital is 16%.
ž Calculate the net present value of the cash flows for the computer usingspreadsheet formula.ž What is the IRR?
12.2 SmallCo is considering the following project, whose cost of capital is 12%per annum:
Year 0 1 2 3£ £ £ £
Cash flows of project (2,000) 1,000 800 700
Calculate the NPV of the project.
12.3 Goliath Hotel projects the cash flows for three alternative investmentprojects (in £’000) as:
Project Year 0 1 2 3 4 5A −350 100 200 100 100 140B −350 40 100 210 260 160C −350 200 150 240 40 0
Depreciation is £70,000 per annum. For each project, calculate the:
ž payback period;ž accounting rate of return (average);ž net present value (assuming a cost of capital of 9%); andž comment on which (if any) project should be accepted.
12.4 Freddie PLC has £5 million to invest this year. Three projects are available,and all are divisible, i.e. part of a project may be accepted and the cash flow returnswill be pro-rata. Details of the projects are:
Project 1 2 3Cash outlay (£M) 3.0 2.0 1.5NPV (£M) 1.7 1.1 1.0
What is the ranking of the projects that should be accepted?
12.5 Tropic Investments is considering a project involving an initial cash outlayfor an asset of £200,000. The asset is depreciated over five years at 20% p.a. (based

400 ACCOUNTING FOR MANAGERS
on the value of the investment at the beginning of each year). The cash flows fromthe project are expected to be:
Inflow OutflowYear 1 75,000 30,000Year 2 90,000 40,000Year 3 100,000 45,000Year 4 100,000 50,000Year 5 75,000 40,000
ž What is the payback period?ž What is the return on investment (each year and average)?ž Assuming a cost of capital of 10% and ignoring inflation, what is the net presentvalue of the cash flows? (Use the tables rather than a spreadsheet to answerthis question.)ž Should the project be accepted?
Questions for Chapter 13
13.1 Jakobs Ladder has capital employed of £10 million and currently earns anROI of 15% per annum. It can make an additional investment of £2 million for afive-year life. The average net profit from this investment would be 14% of theoriginal investment. The division’s cost of capital is 12%.
Calculate the residual income before and after the investment.
13.2 China Group has a division with capital employed of £10 million thatcurrently earns an ROI of 15% per annum. It can make an additional investmentof £2 million for a five-year life with no scrap value. The average net profit fromthis investment would be £280,000 per annum after depreciation. The division’scost of capital is 9%.
Calculate the ROI and residual income for the:
ž original investment;ž additional investment; andž total new level of investment.
13.3 Brummy PLC consists of several investment centres. Green Division hasa controllable investment of £750,000 and profits are expected to be £150,000 thisyear. An investment opportunity is offered to Green that will yield a profit of£15,000 from an additional investment of £100,000. Brummy accepts projects if theROI exceeds the cost of capital, which is 12%.
ž Calculate Green’s ROI currently, for the additional investment and afterthe investment.ž How will Green and Brummy view this investment opportunity?ž Calculate the effect of the new investment opportunity on Green’s resid-ual income.

QUESTIONS 401
13.4 Anston Industries is the manufacturing division of a large multinational.The divisional general manager is about to purchase new equipment for themanufacture of a new product. He can buy either the Compax or the Newpaxequipment, each of which has the same capacity and an expected life of fouryears. Each type of equipment has different capital costs and expected cash flows,as follows:
Compax NewpaxInitial capital investment 6,400,000 5,200,000Net cash inflows (before tax)
Year 1 2,400,000 2,600,000Year 2 2,400,000 2,200,000Year 3 2,400,000 1,500,000Year 4 2,400,000 1,000,000
Net present value (@ 16% p.a.) £315,634 £189,615
The equipment will be installed and paid for at the end of the current year (Year 0)and the cash flows accrue at the end of each year. There is no scrap value for eitherpiece of equipment. In calculating divisional returns, divisional assets are valuedat net book value at the beginning of each year.
The multinational expects each division to achieve a minimum return beforetax of 16%. Anston is just managing to achieve that target. Anything less thana 16% return would make the divisional general manager ineligible for hisprofit-sharing bonus.
ž Prepare return on investment (ROI) and residual income (RI) calculations forthe Compax and the Newpax for each year.ž Suggest which equipment is preferred under each method.ž Compare this with the NPV calculation.
13.5 Magna Products PLC has three divisions, A, B and C. The current invest-ments in and net profits earned by each division are as follows:
Division AInvestment £1,000,000Net profit £75,000
Division BInvestment £1,500,000Net profit £90,000
Division CInvestment £2,000,000Net profit £150,000
Each division has put forward to the parent board a capital expenditure proposalfor £50,000. Each division expects to produce net profits of £40,000 from thatinvestment. Magna’s cost of capital is 7% p.a.

402 ACCOUNTING FOR MANAGERS
Use ROI and RI calculations to:
ž evaluate the current performance of each division; andž evaluate which proposal the board should approve if finance limits the decisionto a single proposal.
Questions for Chapter 14
14.1 April Co. receives payment from debtors for credit sales as follows:
ž 30% in the month of sale.ž 60% in the month following sale.ž 8% in the second month following the sale.ž 2% become bad debts and are never collected.
The following sales are expected:
January £100,000February £120,000March £110,000
ž Calculate how much will be received in March.ž What is the value of debtors at the end of March?
14.2 Creassos Ltd was formed in July 2000 with £20,000 of capital. £7,500 of thiswas used to purchase equipment. The owner budgeted for the following:
Sales Receipts Purchases Payments Wages Otherfrom debtors to creditors expenses
July 20,000 – 8,000 5,000 3,000 2,000Aug. 30,000 20,000 15,000 10,000 4,000 2,000Sept. 40,000 30,000 20,000 20,000 5,000 3,000
Wages and other expenses are paid in cash. In addition to the above, depreciationis £2,400 per annum. No inventory is held by the company.
ž Calculate the profit for each the three months from July to September andin total.ž Calculate the cash balance at the end of each month.ž Prepare a Balance Sheet at the end of September.
14.3 Highjinks Corporation’s sales department has estimated revenue of£2,250,000 for your division. 60% of this will be achieved in the first half yearand 40% in the remaining half year. Variable operating costs are typically 40% ofrevenue and fixed operating costs are expected to be £35,000 per month for thefirst six months and £40,000 per month thereafter.
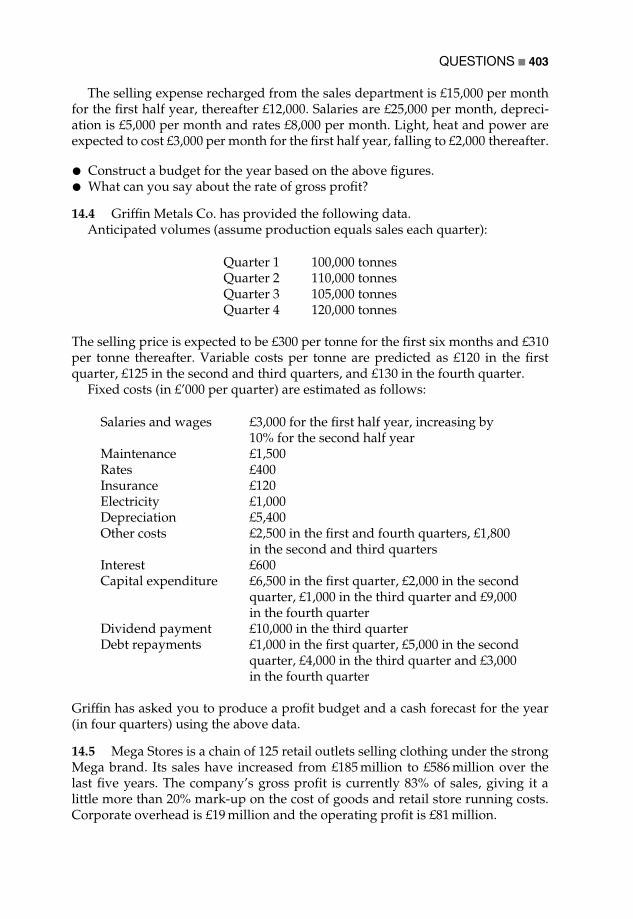
QUESTIONS 403
The selling expense recharged from the sales department is £15,000 per monthfor the first half year, thereafter £12,000. Salaries are £25,000 per month, depreci-ation is £5,000 per month and rates £8,000 per month. Light, heat and power areexpected to cost £3,000 per month for the first half year, falling to £2,000 thereafter.
ž Construct a budget for the year based on the above figures.ž What can you say about the rate of gross profit?
14.4 Griffin Metals Co. has provided the following data.Anticipated volumes (assume production equals sales each quarter):
Quarter 1 100,000 tonnesQuarter 2 110,000 tonnesQuarter 3 105,000 tonnesQuarter 4 120,000 tonnes
The selling price is expected to be £300 per tonne for the first six months and £310per tonne thereafter. Variable costs per tonne are predicted as £120 in the firstquarter, £125 in the second and third quarters, and £130 in the fourth quarter.
Fixed costs (in £’000 per quarter) are estimated as follows:
Salaries and wages £3,000 for the first half year, increasing by10% for the second half year
Maintenance £1,500Rates £400Insurance £120Electricity £1,000Depreciation £5,400Other costs £2,500 in the first and fourth quarters, £1,800
in the second and third quartersInterest £600Capital expenditure £6,500 in the first quarter, £2,000 in the second
quarter, £1,000 in the third quarter and £9,000in the fourth quarter
Dividend payment £10,000 in the third quarterDebt repayments £1,000 in the first quarter, £5,000 in the second
quarter, £4,000 in the third quarter and £3,000in the fourth quarter
Griffin has asked you to produce a profit budget and a cash forecast for the year(in four quarters) using the above data.
14.5 Mega Stores is a chain of 125 retail outlets selling clothing under the strongMega brand. Its sales have increased from £185 million to £586 million over thelast five years. The company’s gross profit is currently 83% of sales, giving it alittle more than 20% mark-up on the cost of goods and retail store running costs.Corporate overhead is £19 million and the operating profit is £81 million.

404 ACCOUNTING FOR MANAGERS
Mega Stores’ finance director has produced a budget, which has been approvedby the board of directors, to increase sales by 35% next year and to improveoperating profit margin to 15% of sales. Corporate overheads will be contained at£22 million.
The strategy determined by the marketing director is to continue expanding itssales by winning market share from competitors and by increasing the volume ofsales to existing customers. It aims to increase its direct mailing of catalogues tocustomers and its television advertising. The company also intends to open newstores to extend its geographic coverage.
Mega Stores also plans to improve its cost effectiveness by continuing itsinvestments in major regional warehouses and distribution facilities servicing itsnational network of stores, together with upgrading its information systems toreduce inventory and delivery lead times to its retail network.
You have been asked to produce a report for the senior management teamidentifying the financial information that is required to support the businessstrategy. You are also asked to identify any non-financial issues arising fromthe strategy.
Questions for Chapter 15
15.1 Conrad Corporation has a budget to produce 2,000 units at a variable costof £3 per unit, but actual production is 1,800 units with an actual cost of £3.20per unit.
Calculate the variance based on a flexible budget and determine whether it isfavourable or adverse.
15.2 Calculate the material price variance for Cracker Barrel based on thefollowing information:
Standard ActualQuantity purchased (units) 5,000 5,200Price per unit £3.10 £3.05
15.3 Gargantua PLC has produced the following budget and actual information(Table A1.7).
Table A1.7 Gargantua budget and actual
Budget Actual
Sales units 10,000 11,000Price per unit £37.10 £36Direct materials
Magna – per unit 4 kg @ £1.50/kg 46,500 kg – cost £67,425Carta – per unit 1 kg @ £5/kg 11,500 kg – cost £58,650
Labour – per unit 2.5 hours @ £7 26,400 – cost £187,440Fixed costs 75,000 68,000

QUESTIONS 405
a Prepare a traditional budget versus actual report using the above figures.b Prepare a flexible budget for Gargantua.c Calculate all sales and cost price and efficiency variances.d Reconcile the original budget and actual profit figures using the variance
analysis.


Appendix 2
Solutions to Questions
Solutions for Chapter 6
6.1Kazam Services’ accounting records are shown in Table A2.1.
Kazam Services
Profit and Loss account
Income 70,000Less expenses 40,000
Operating profit 30,000
Balance Sheet
Fixed assets 650,000Less depreciation 20,000 630,000
Debtors 150,000Less creditors:Bank overdraft 40,000Creditors 60,000 100,000
Net current assets 50,000
Total assets less current liabilities 680,000Long-term loans 450,000
Net assets 230,000

Tab
leA
2.1
Fixe
das
sets
Deb
tors
Ban
kC
red
itor
sL
ong-
term
loan
Cap
ital
Inco
me
Exp
ense
s
Ope
ning
bala
nce
+500
,000
+125
,000
−35,
000
+90,
000
+300
,000
+200
,000
Tak
esou
tloa
nfo
rne
wbu
ildin
g+1
50,0
00+1
50,0
00R
ecei
vefr
omd
ebto
rs−4
5,00
0+4
5,00
0Pa
yscr
edit
ors
−30,
000
−30,
000
Invo
ice
for
serv
ices
perf
orm
ed+7
0,00
0+7
0,00
0Pa
ysa
lari
es−1
5,00
0+1
5,00
0Pa
yof
fice
expe
nses
−5,0
00+5
,000
Dep
reci
atio
n−2
0,00
0+2
0,00
0
630,
000
150,
000
−40,
000
60,0
0045
0,00
020
0,00
070
,000
40,0
00
Profi
ttra
nsfe
rred
+30,
000
30,0
00
230,
000
Not
e:
+in
dic
ates
the
acco
unti
ncre
ases
.−
ind
icat
esth
eac
coun
tdec
reas
es.
The
bank
acco
unti
sa
liabi
lity
(wit
hdra
wal
sex
ceed
dep
osit
s)an
dis
show
nhe
reas
am
inus
tod
isti
ngui
shit
from
anas
set.

SOLUTIONS TO QUESTIONS 409
Capital 200,000Profit and Loss account 30,000
230,000
6.2See Table A2.2.
6.3Answer e: Although the operating profit has increased (from £137,000 to £139,000), theoperating margin has decreased (from 11.6% to 11.1%) as a result of a reduction in the grossmargin (from 39% to 37%) and higher expenses (from £323,000 to £324,000), despite salesgrowth (of 6.4%). See Table A2.3.
6.4See Table A2.4.
6.5a Prepayment
The annual payment is 24 × £400 = £9,600 (this is £800/mth). The prepayment at 31 Marchis 9/12 (Apr–Dec) @ £800 = £7,200.
Table A2.2
Fixed assets 250,000Current assets 125,000− Creditors −75,000
Working capital 50,000
Capital employed 300,000− Long-term debt −125,000
Shareholders’ capital 175,000
Table A2.3
2001 2000Sales 1,250,000 1,175,000Sales growth 6.4%Cost of sales 787,000 715,000
Gross profit 463,000 460,000Gross margin 37% 39%Selling and admin. expenses 324,000 323,000
Operating profit 139,000 137,000Operating margin 11.1% 11.6%

410 ACCOUNTING FOR MANAGERS
Table A2.4
Sales 1,100,000Less cost of salesOpening stock 150,000Purchases 650,000
800,000− Closing stock 200,000
Cost of sales 600,000
Gross profit 500,000− Expenses 275,000
Operating profit 225,000
Profit is reduced by £2,400 (expense: 3 mths @ £800).Asset in the Balance Sheet is increased by £7,200 (prepayment is an asset: 9 mths @ £800).Cash flow is reduced by £9,600 (payment 31 December).
NB: The effect of the prepayment of £7,200 is to carry forward the expense to the nextfinancial year.
b Accrual
The simple solution is to divide £6,000 by 12 months and charge £500/mth to profit.However, this ignores seasonal fluctuations and cash flow differences from quarter toquarter.
The quarterly bills have been paid during the year, but the last quarterly bill was inNovember. Therefore the business is missing one month’s expense (i.e. December). Todetermine the amount we need to calculate the seasonal charges:
£6,000 × 70% = £4,200 for September–February/6 = £700/mth.£6,000 × 30% = £1,800 for March–August/6 = £300/mth.Accrue for one month (December) = £700.
Profit reduced by £700 (expense).Balance Sheet reduced by £700 (accrual is a creditor).Cash flow has no impact (no money yet paid).
NB: The effect of the accrual is to reduce by £700 the expense impact of the expected billfor three months of £2,100, which will be received in February. This leaves £1,400 as theexpense (£700 for each of January and February).

SOLUTIONS TO QUESTIONS 411
c Depreciation
Depreciation is 20% of £12,000 = £2,400 p.a. or £200/mth. As depreciation is chargedfrom the next month, it needs to be provided for the period July–March. For that period,depreciation is £200 × 9 = £1,800.
Profit reduced by £1,800 (depreciation expense).Balance sheet increased by £12,000 (new asset) and reduced by £1,800 (depreciation),leaving a net value of £10,200.Cash flow reduced by £12,000 (payment for new system).
NB: The Balance Sheet value of the asset will be reduced by £2,400 p.a. until the asset iswritten down to a nil value, or sold or disposed of.
6.6Debtors/average daily sales
200,0001,200,000/250
= 200,0004,800
= 41.7 days’ sales outstanding
Stock turnover
Cost of sales/stock450,000200,000
= 2.25 times p.a.
or every 100 days (250/2.5).
Creditors/average daily purchases
100,000450,000/250
= 100,0001,800
= 55.5 days’ purchases outstanding
Solutions for Chapter 7
7.12001 2000
Return on (shareholders’) investment (ROI)net profit after tax
shareholders’ funds13.8131.5
= 10.5%16.3126.6
= 12.9%
Return on capital employed (ROCE)profit before
interest and taxshareholders’ funds+ long-term debt
27.2131.5 + 96.7
= 228.2
= 11.9%29.5
126.6 + 146.1= 272.7
= 10.8%
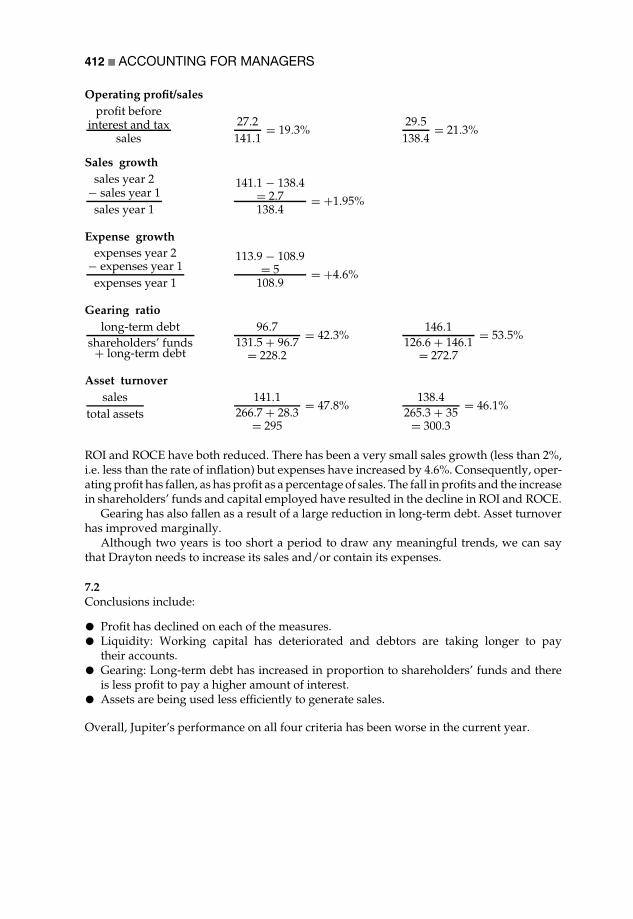
412 ACCOUNTING FOR MANAGERS
Operating profit/salesprofit before
interest and taxsales
27.2141.1
= 19.3%29.5138.4
= 21.3%
Sales growthsales year 2
− sales year 1sales year 1
141.1 − 138.4= 2.7138.4
= +1.95%
Expense growthexpenses year 2
− expenses year 1expenses year 1
113.9 − 108.9= 5
108.9= +4.6%
Gearing ratiolong-term debt
shareholders’ funds+ long-term debt
96.7131.5 + 96.7
= 228.2
= 42.3%146.1
126.6 + 146.1= 272.7
= 53.5%
Asset turnoversales
total assets141.1
266.7 + 28.3= 295
= 47.8%138.4
265.3 + 35= 300.3
= 46.1%
ROI and ROCE have both reduced. There has been a very small sales growth (less than 2%,i.e. less than the rate of inflation) but expenses have increased by 4.6%. Consequently, oper-ating profit has fallen, as has profit as a percentage of sales. The fall in profits and the increasein shareholders’ funds and capital employed have resulted in the decline in ROI and ROCE.
Gearing has also fallen as a result of a large reduction in long-term debt. Asset turnoverhas improved marginally.
Although two years is too short a period to draw any meaningful trends, we can saythat Drayton needs to increase its sales and/or contain its expenses.
7.2Conclusions include:
ž Profit has declined on each of the measures.ž Liquidity: Working capital has deteriorated and debtors are taking longer to paytheir accounts.ž Gearing: Long-term debt has increased in proportion to shareholders’ funds and thereis less profit to pay a higher amount of interest.ž Assets are being used less efficiently to generate sales.
Overall, Jupiter’s performance on all four criteria has been worse in the current year.

SOLUTIONS TO QUESTIONS 413
Solutions for Chapter 8
8.1See Table A2.5.
8.2
Volume Variable Fixed Total Standard Average Marginal
150,000 1,050 300 1,350 9.00 7.00140,000 980 300 1,280 9.14
The standard cost per unit is £9.00 at the budgeted level of activity.The actual cost per unit is £9.14 – this is the actual average production cost per unit.The marginal cost per unit is £7.00 – this is the variable cost per unit.
8.3Volume Variable Fixed Total Avg cost/unit
10,000 70,000 100,000 170,000 £1720,000 140,000 100,000 240,000 £12
The average cost reduces by £5 from £17 to £12. This is because the fixed costs of £100,000are spread over 20,000 documents (£5 per document) rather than 10,000 documents (£10per document).The marginal cost is £7, i.e. the variable cost. It does not change per unit irrespective ofvolume within the relevant range.The costs per unit at each activity level are:
10,000 20,000
Variable costs £7 £7Fixed costs £10 £5
Average cost £17 £12
Table A2.5
Units Fixed Variable @ £7 Total Average
100,000 645,000 700,000 1,345,000 £13.45150,000 645,000 1,050,000 1,695,000 £11.30200,000 645,000 1,400,000 2,045,000 £10.22

414 ACCOUNTING FOR MANAGERS
8.4Current position:
Eastern Western Total£ £ £
Sales 550,000 500,000 1,050,000
Variable costs 275,000 200,000 475,000Direct fixed costs 180,000 150,000 330,000
Contribution to corporate costs 95,000 150,000 245,000Allocated corporate costs 170,000 135,000 305,000
Operating profit (75,000) 15,000 (60,000)
After closure of Eastern division:
Eastern Western Total£ £ £
Sales – 500,000 1,050,000
Variable costs – 200,000 200,000Direct fixed costs – 150,000 150,000Allocated corporate costs – 305,000 305,000
Operating profit (155,000) (155,000)
The Eastern division should not be closed. It currently contributes £95,000 towards corporatecosts. If the division were closed, the corporate costs would remain unchanged and thecurrent loss of £60,000 would increase to £155,000.
8.5Last year Current year
Sales price 80Variable cost 55Contribution margin 25 +20% (£5) 30Units 5,000 5,000
Contribution 125,000 150,000−Fixed costs 25,000 −10% (£2,500) 22,500
Operating profit 100,000 127,500
Contribution margin is £25 (£80 − £55) + 20% = £5 × 5,000 units = +£25,000Fixed costs £25,000 × 10% = +£2,500
Increase in profit is £27,500

SOLUTIONS TO QUESTIONS 415
8.6Variable costs are £750,000/300,000 batons = £2.50/baton. As the selling price is £5/baton,the normal contribution/baton = £2.50 (£5 − £2.50).
If 240,000 batons are sold at the normal price:
Contribution = 240,000 @ £2.50 £600,000−Fixed costs 450,000
Operating profit £150,000
If 60,000 batons are sold at a 40% discount:
Sales = 60% of £5 = £3/baton, and contribution is 50p (£3 – variablecosts £2.50)Contribution = 60,000 @ 50p/baton £30,000Total operating profit £180,000
8.7Profit = selling price per unit × number of units − (VC/unit × no. units + fixed costs)therefore, £40,000 = SP × 20,000 − ((£8 × 20,000) + £100k)
Selling price = £40,000 + £160,000 + £100,00020,000 units
= £300,000/20,000 units = £15
8.8Breakeven is:
(10,000 × 35) + 450,000 + 010,000
= 800,00010,000
= £80
Or:
Profit = price × no. of units − (fixed costs + variable costs × no. of units)0 = 10,000P − (450,000 + 35 × 10,000)
0 = 10,000P − (450,000 + 350,000)
0 = 10,000P − 800,000800,000 = 10,000PP = 800,000/10,000 = 80
Proof10,000 × (80 − 35) = 10,000 × 45 = 450,000 − 450,000 = 0
8.9Contribution per unit is 75 − 30 = 45Fixed costs are 1,000 × 12 = 12,000
Breakeven = 12,000 + 10,00045
= 489 p.a.
8.10200,000 × 12%
18,000 units= £24,000
18,000= £1.33 per unit

416 ACCOUNTING FOR MANAGERS
8.11Selling price 20Direct materials 8Direct labour 5 13
Contribution margin 7
Breakeven = 7,000 + 5,0007
= 12,0007
= 1,714
8.12See Table A2.6.
The maximum contribution is at a selling price of £28. Note that this is not necessarilythe highest sales revenue. The highest contribution will also be the highest profit becausethe same amount of fixed costs are deducted from each level of activity (within therelevant range).
8.13Direct labour costs 25.00Variable costs 4.00Fixed costs £250,000/20,000 12.50Target return (750,000*25%)/20,000 9.38
Price 50.88
8.14See Table A2.7.
Contribution maximized at £135 (80 rooms). This is an occupancy rate of 67% (80/120).
Table A2.6
Price VC Contribution p.u. Quantity Total contribution
26 15 11 1,075 11,82527 15 12 1,000 12,00028 15 13 925 12,02529 15 14 850 11,90030 15 15 775 11,625
Table A2.7
Number ofrooms sold
Price per roomper night
Revenue Variable costs@ £25
Contribution
120 90 10,800 3,000 £7,800100 105 10,500 2,500 £8,00080 135 10,800 2,000 £8,80060 155 9,300 1,500 £7,80050 175 8,750 1,250 £7,500

SOLUTIONS TO QUESTIONS 417
Solutions for Chapter 9
9.1Variable costs are £2 per unit (£10,000/5,000), for December 10,000 @ £2 = £20,000.
Fixed costs do not change with activity, for December £30,000.As total costs are £75,000, semi-variable costs for December are £25,000 (£75,000 −
£20,000 − £30,000).
9.2Product R Product S
Selling price 12 20Direct materials 4 11Throughput contribution 8 9Machine hours 4 3Return per machine hour £2 £3Ranking 2 1
Product S generates more throughput contribution per machine hour (the limiting factor).Labour hours are irrelevant.
9.3Hours Cost £
15,000 345,0007,000 185,000
Increase 8,000 160,000
The increase in hours sold of 8,000 has generated a higher cost of £160,000. This cost mustbe a variable cost as, by definition, fixed costs do not vary with the volume of activity.Therefore variable costs are £160,000/8,000 or £20 per hour.
At the 15,000 level of activity, 15,000 @ £20 = £300,000. Therefore fixed costs are £45,000(£345,000 − £300,000).
At the 7,000 level of activity, 7,000 @ £20 = £140,000. Therefore fixed costs are £45,000(£185,000 − £140,000).
However, this only applies in the relevant range, as outside the relevant range the coststructure of fixed and variable costs may alter.
9.4Direct materials 40 @ 2.50 100Direct labour 7 @ £12 84
4 @ £7 28 112
11 212Variable overhead 11 @ £5 = 55
Variable production cost 267Fixed production overhead£1,000,000/12,500 80
Total production cost 347
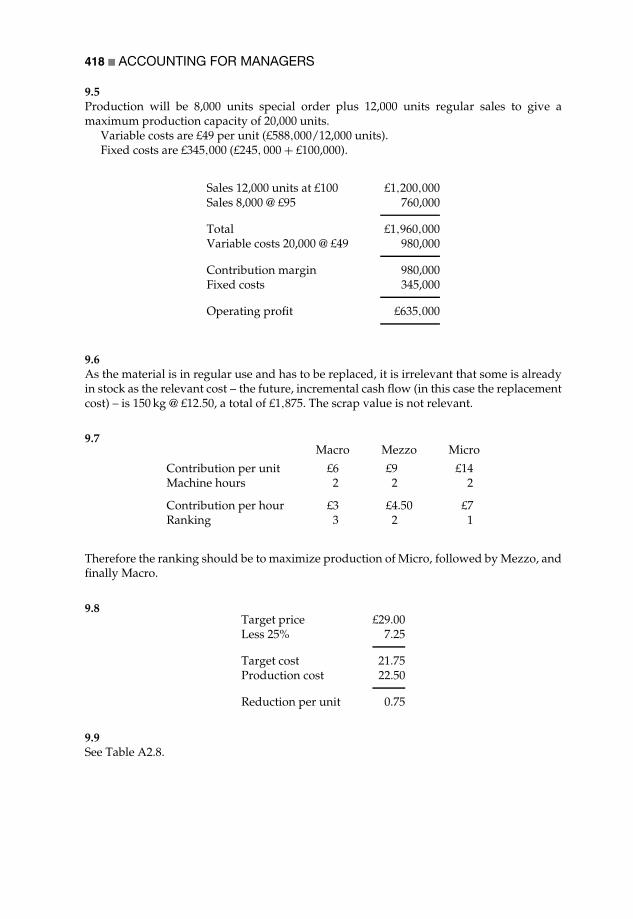
418 ACCOUNTING FOR MANAGERS
9.5Production will be 8,000 units special order plus 12,000 units regular sales to give amaximum production capacity of 20,000 units.
Variable costs are £49 per unit (£588,000/12,000 units).Fixed costs are £345,000 (£245, 000 + £100,000).
Sales 12,000 units at £100 £1,200,000Sales 8,000 @ £95 760,000
Total £1,960,000Variable costs 20,000 @ £49 980,000
Contribution margin 980,000Fixed costs 345,000
Operating profit £635,000
9.6As the material is in regular use and has to be replaced, it is irrelevant that some is alreadyin stock as the relevant cost – the future, incremental cash flow (in this case the replacementcost) – is 150 kg @ £12.50, a total of £1,875. The scrap value is not relevant.
9.7Macro Mezzo Micro
Contribution per unit £6 £9 £14Machine hours 2 2 2
Contribution per hour £3 £4.50 £7Ranking 3 2 1
Therefore the ranking should be to maximize production of Micro, followed by Mezzo, andfinally Macro.
9.8Target price £29.00Less 25% 7.25
Target cost 21.75Production cost 22.50
Reduction per unit 0.75
9.9See Table A2.8.

SOLUTIONS TO QUESTIONS 419
Table A2.8
Sales 850,000Less cost of productionMaterials 450,000Labour 175,000Variable manufacturing expense 30,000
Cost of production 655,000Opening stock 120,000
775,000− Closing stock 95,000
Cost of sales 680,000
Contribution margin 170,000
− Fixed manufacturing expenses 65,000− Selling and administrative expenses 40,000
Operating profit 65,000
Solutions for Chapter 10
10.1Salary 40,000National Insurance 11% 4,400Pension 6% 2,400
Total employment cost 46,800
Working weeks per person52 − 4 − 2 = 46
Cost per week 46,800/46 £1,017Chargeable hours per week 25Hourly rate (£1,017/25) £40.68 or £41 to the nearest hour
10.2Volume Cost
1,200,000 £850,0001,000,000 £750,000
Increase 200,000 £100,000
Variable cost = £100,000/200,000 = £0.501,200,000 @ .50 = £600,000. Therefore fixed costs are £250,000 (£850,000 − £600,000)

420 ACCOUNTING FOR MANAGERS
10.3Direct materials and variable costs are relevant costs as they are only incurred ifmanufacture takes place. Direct labour is avoidable, i.e. it will only be incurred if Car-dinal makes the part. As 60% of the fixed costs will continue regardless of the decision,only 40% of the fixed cost is relevant for the decision. Therefore, relevant costs of in-housemanufacture:
Direct material £4Direct labour 16Variable costs 8Fixed costs (40% of £10) 4
Total 32 × 20,000 units = £640,000
Relevant costs of outsourcing to Oriole are:
Purchase cost 36 × 20,000 units = £720,000
Consequently, based on relevant costs, it is cheaper to manufacture the part in-house.Note: the fixed manufacturing overhead of £10 per unit is an arithmetic calculation of
total fixed costs divided by the number of units produced. This does not mean that the costis a variable cost, just because it is expressed as a cost per unit.
10.4The manufactured cost is £235 (120 + 60 + 30 + 25). The relevant costs are direct mate-rials £120 and variable overhead £30, a total of £150. Direct labour and fixed costsare not relevant. Direct labour cannot be avoided as the business has spare capacityand wishes to retain its skilled employees. As the cost of purchasing the compo-nent is £140, on a relevant cost basis Cirrus should buy the component rather thanmake it.10.5
Partners’ cost £200,000Total hours 800 = £250 per hourJuniors’ cost £450,000Total hours 5,000 = £90 per hour
See Table A2.9.Audit services cost £314,500.
Table A2.9
Accounting Audit Tax Total
Partner hours 150 250 400 800@ £250 37,500 62,500 100,000 200,000Junior hours 1200 2800 1000 5,000@ £90 108,000 252,000 90,000 450,000
Total 145,500 314,500 190,000 650,000

SOLUTIONS TO QUESTIONS 421
10.6The comparison of costs under each alternative is shown in Table A2.10.
Direct labour and fixed overheads are irrelevant in making a choice between alternatives.Direct materials and variable overheads will not be incurred if the components arepurchased, and are therefore relevant costs.
Relevant costs are therefore as in Table A2.11.If employees were on a temporary contract, labour cost would be avoidable and therefore
the comparison of costs would be as in Table A2.12.Fixed overheads are irrelevant in making a choice between alternatives. Direct labour,
materials and variable overheads will not be incurred if the components are purchased,and are therefore relevant costs.
Relevant costs are therefore as in Table A2.13.Costs based on stock valuation are not relevant, as we are concerned with future
costs only.
Table A2.10
Manufacture 100 Purchase 100
Direct labour 100 @ £200 20,000 20,000Direct material 100 @ £600 60,000Variable overhead 100 @ £100 10,000Fixed overheads 100 @ £300 30,000 30,000Supplier price 100 @ £1,000 100,000
Total £120,000 £150,000
Table A2.11
Manufacture 100 Purchase 100
Direct material 60,000Variable overhead 10,000Supplier price 100,000
Total 70,000 100,000
Table A2.12
Manufacture 100 Purchase 100
Direct labour 100 @ £200 20,000Direct material 100 @ £600 60,000Variable overhead 100 @ £100 10,000Fixed overheads 100 @ £400 40,000 40,000Supplier price 100 @ £1,000 100,000
Total £130,000 £140,000

422 ACCOUNTING FOR MANAGERS
Table A2.13
Manufacture 100 Purchase 100
Direct labour 20,000Direct material 60,000Variable overhead 10,000Supplier price 100,000
Total 90,000 100,000
10.7An alternative format for these figures is as in Table A2.14.
This format shows the contribution, which based on the contribution after deductingmaterial is in fact highest for Franklin. However, calculating the contribution per labourhour (by dividing the contribution by the number of hours, i.e. labour cost divided by £100per hour) verifies the lower contribution by Franklin per unit of the limiting factor, i.e.labour capacity. This is reflected in the rate of gross profit being the lowest of the threemain customers.
The issues that arise from these figures are:
1 Labour is in effect a fixed cost given the circumstances of the business and its allocation todifferent products is questionable, other than in terms of determining the most profitableutilization of the limited capacity.
2 Can the high labour cost for Franklin be reduced by mechanization given that Franklincontributes almost 17% of total sales (£1,000,000/£6,000,000) with the highest contributionmargin of 75%?
3 While Engineering Partners and Zeta are the most profitable customers in the accountant’sreport, the revised format shows the highest contribution per labour hour from the ‘other’customer segment. Zeta, which on the accountant’s figures appears more profitable thanEngineering Partners, is using the revised format, less profitable per labour hour.
4 Do the corporate overheads, presently allocated arbitrarily in proportion to sales volume(30% of sales), accurately reflect the different cost structure of each segment of the businessin terms of space utilization (rent), capital investment in production processes (depreci-ation), non-production salaries, selling and administration expenses? An activity-basedapproach may lead to more meaningful allocation of costs and a different decision as tothe profitability of different business segments.
Table A2.14
FranklinIndustries
EngineeringPartners
Zeta PLC Othercustomers
Total(average)
Sales 1,000,000 1,500,000 2,000,000 1,500,000 6,000,000Cost of materials 250,000 600,000 750,000 750,000 2,350,000
Contribution 750,000 900,000 1,250,000 750,000 3,650,000% 75% 60% 62.5% 50% (60.8%)Cost of labour 300,000 200,000 300,000 75,000 875,000
Gross profit 450,000 700,000 950,000 675,000 2,775,000% 45% 46.7% 47.5% 45% (46.25%)No. of hours (labour/£100) 3,000 2,000 3,000 750 8,750Contribution per labour hour £250 £450 £417 £1,000 (£417)

SOLUTIONS TO QUESTIONS 423
Solutions for Chapter 11
11.1See Table A2.15.
11.2Machining Assembly Finishing Total
Overhead costs 120,000 80,000 30,000 230,000Labour hours 20,000 10,000 10,000 40,000Hourly rate £6 £8 £3 £5.75
Costing:Material 300Labour 150Overhead 10 @ £6 60
7 @ £8 563 @ £3 9 125
Total 575
11.3Dept A Dept B Dept C Total
Overheads £ 150,000 200,000 125,000 475,000Direct labour hours 5,000 10,000 5,000 20,000Overhead per hour £30 £20 £25 £23.75Hours for GH1 10 12 5 27Overhead 300 240 125 £641.25
Overhead using cost centre rate = £665 (£300 + £240 + £125)Using plant-wide rate:Direct materials £150Direct labour £75Overhead £641Total £866
Using cost centre rate:Direct materials £150Direct labour £75Overhead £665 (£300 + £240 + £125)Total £890
Table A2.15
Division 1 2 3 Total
Overheads 50% 30% 20%250,000 150,000 100,000 500,000
Hours 4,000 2,000 3,000 9,000Hourly rate £62.50 £75 £33.33 £55.55

424 ACCOUNTING FOR MANAGERS
11.4Cost pool Estimated Expected activity
cost Product A Product B Total Rate £/activity
Activity 1 £20,000 100 400 500 40.00Activity 2 £37,000 800 200 1,000 37.00Activity 3 £91,200 800 3,000 3,800 24.00
Product A:Total per unit (/8,000)
Activity 1: £40.00 × 100 £4,000 £0.50Activity 2: £37.00 × 800 £29,600 £3.70Activity 3: £24.00 × 800 £19,200 £2.40
£6.60
Product B:Total per unit (/6,000)
Activity 1: £40.00 × 400 £16,000 £2.67Activity 2: £37.00 × 200 £7,400 £1.23Activity 3: £24.00 × 3,000 £72,000 £12.00
£15.90
11.5
(a) Set-up costs £66,000Production runs 12 + 5 + 8 = 25Cost per set-up £66,000/25 = £2,640Product A has 12 runs @ £2,640 = £31,680And 4,000 units are producedCost per set-up per unit is £31,680/4,000 = £7.92
(b) Materials handling costs £45,000Stores orders 12 + 6 + 4 = 22Cost per store order £45,000/22 = £2,045Product B has 6 stores orders @ £2,045 = £12,270And 3,000 units are producedCost per stores order per unit is £12,270/3,000 = £4.09
11.6Purchasing cost £120,000No. purchase orders 240Cost per purchase order £500L uses 80 @ £500 £40,000For 20,000 units = £2 per unitM uses 160 @ £500 £80,000For 20,000 units = £4 per unit

SOLUTIONS TO QUESTIONS 425
If £120,000 of costs were recovered over the number of units produced (20,000 + 20,000 =40,000), the purchasing cost per unit would be £3 (£120,000/40,000 units) for both L and M.
11.7Purchasing Quality control Despatch
Total cost £60,000 £40,000 £30,000Driver 12,000 4,000 2,000Cost/driver £5 £10 £15Hekla uses 5 8 2Overhead £25 £80 £30
Total overhead £25 + 80 + 30 = £135Direct materials £100Direct labour £75Total cost £310
11.8
(a) Cost pool Estimated Expected activitycost X Y Total Cost/activity
Activity 1 £12,000 300 500 800 12,000/750 = £15Activity 2 £15,000 100 400 500 15,000/500 = £30Activity 3 £32,000 400 1,200 1,600 32,000/1,600 = £20
X 300 @ 15 = 4,500 Y 500 @ 15 = 7,500100 @ 30 = 3,000 400 @ 30 = 12,000400 @ 20 = 8,000 1,200 @ 20 = 24,000
15,500 43,500Units 3,000 2,000
Overhead cost per unit £5.17 £21.75
(b) X YUnits 3,000 2,000Machine hours 5 5Total machine hours 15,000 10,000 25,000Hourly rate £59,000/25,000 = £2.36 per hour
Overhead cost 5 @ 2.36 5 @ 2.36Overhead cost per unit £11.80 £11.80
11.9Traditional absorption costing
Machining overheads:Widgets 50,000 × 2 @ £1.20 120,000Gadgets 40,000 × 5 × £1.20 240,000Helios 30,000 × 4 @ £1.20 144,000
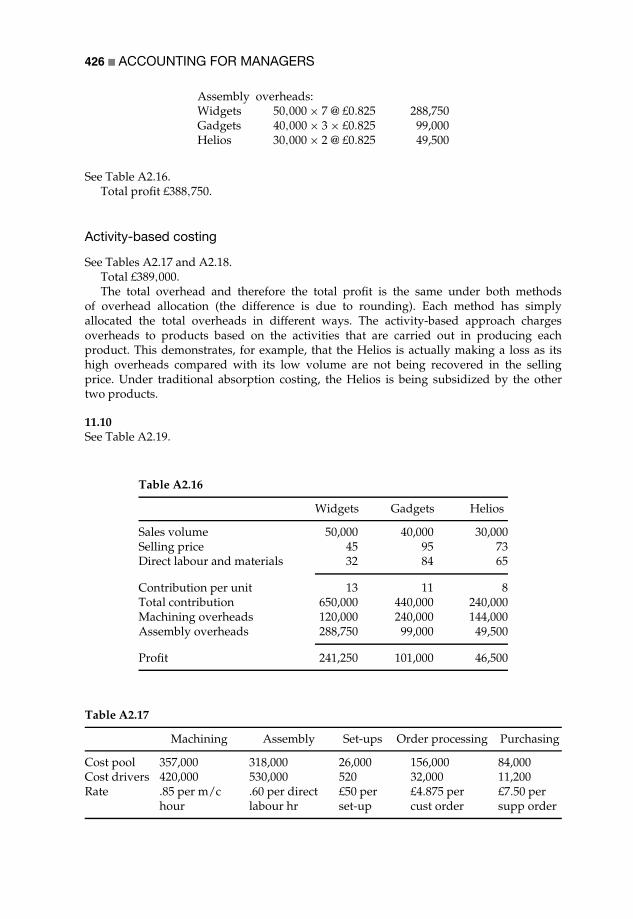
426 ACCOUNTING FOR MANAGERS
Assembly overheads:Widgets 50,000 × 7 @ £0.825 288,750Gadgets 40,000 × 3 × £0.825 99,000Helios 30,000 × 2 @ £0.825 49,500
See Table A2.16.Total profit £388,750.
Activity-based costing
See Tables A2.17 and A2.18.Total £389,000.The total overhead and therefore the total profit is the same under both methods
of overhead allocation (the difference is due to rounding). Each method has simplyallocated the total overheads in different ways. The activity-based approach chargesoverheads to products based on the activities that are carried out in producing eachproduct. This demonstrates, for example, that the Helios is actually making a loss as itshigh overheads compared with its low volume are not being recovered in the sellingprice. Under traditional absorption costing, the Helios is being subsidized by the othertwo products.
11.10See Table A2.19.
Table A2.16
Widgets Gadgets Helios
Sales volume 50,000 40,000 30,000Selling price 45 95 73Direct labour and materials 32 84 65
Contribution per unit 13 11 8Total contribution 650,000 440,000 240,000Machining overheads 120,000 240,000 144,000Assembly overheads 288,750 99,000 49,500
Profit 241,250 101,000 46,500
Table A2.17
Machining Assembly Set-ups Order processing Purchasing
Cost pool 357,000 318,000 26,000 156,000 84,000Cost drivers 420,000 530,000 520 32,000 11,200Rate .85 per m/c
hour.60 per directlabour hr
£50 perset-up
£4.875 percust order
£7.50 persupp order
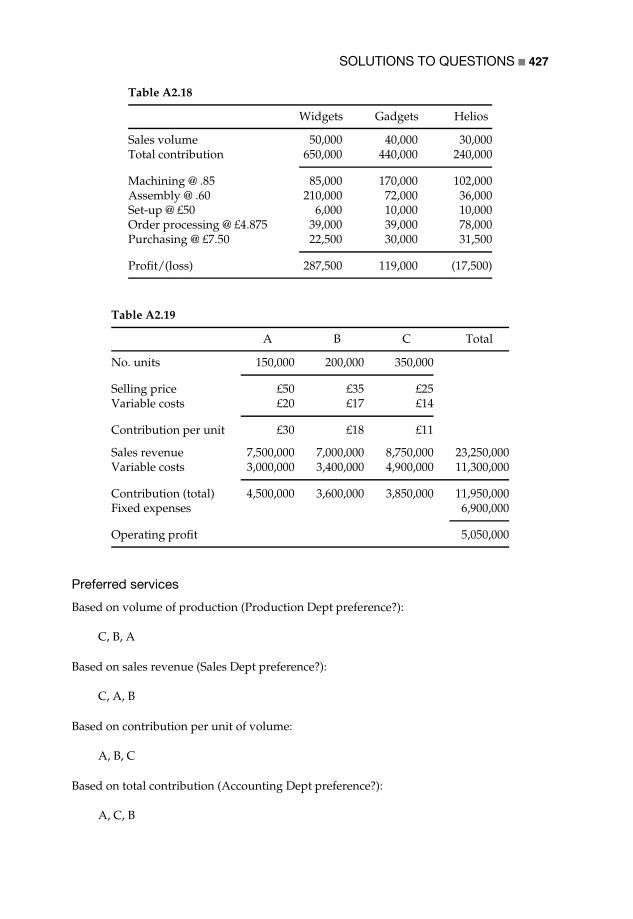
SOLUTIONS TO QUESTIONS 427
Table A2.18
Widgets Gadgets Helios
Sales volume 50,000 40,000 30,000Total contribution 650,000 440,000 240,000
Machining @ .85 85,000 170,000 102,000Assembly @ .60 210,000 72,000 36,000Set-up @ £50 6,000 10,000 10,000Order processing @ £4.875 39,000 39,000 78,000Purchasing @ £7.50 22,500 30,000 31,500
Profit/(loss) 287,500 119,000 (17,500)
Table A2.19
A B C Total
No. units 150,000 200,000 350,000
Selling price £50 £35 £25Variable costs £20 £17 £14
Contribution per unit £30 £18 £11
Sales revenue 7,500,000 7,000,000 8,750,000 23,250,000Variable costs 3,000,000 3,400,000 4,900,000 11,300,000
Contribution (total) 4,500,000 3,600,000 3,850,000 11,950,000Fixed expenses 6,900,000
Operating profit 5,050,000
Preferred services
Based on volume of production (Production Dept preference?):
C, B, A
Based on sales revenue (Sales Dept preference?):
C, A, B
Based on contribution per unit of volume:
A, B, C
Based on total contribution (Accounting Dept preference?):
A, C, B

428 ACCOUNTING FOR MANAGERS
Strategy should be to shift sales mix as far as possible to Product A (highest contributionper unit).
Absorption of overhead
See Table A2.20.While there is not much difference between using sales value and equal allocations for
overhead, the volume method leads to lower costs for Products A and B and higher costsfor Product C. The important point here is that different methods of overhead allocation (ofthe same value of overhead) can lead to different costs for products and services.
Breakeven
See Table A2.21.
Fixed costs £6,900,000 404,218 units of volume
Contribution per unit £17.07
Maintaining the same sales mix, the breakeven sales units of each product are:
86,619 of A
115,490 of B
202,109 of C
Table A2.20
A B C Total
Absorption costs based on sales value 7,500,000 7,000,000 8,750,000 23,250,00032.2% 30.1% 37.7%
Variable costs 3,000,000 3,400,000 4,900,000 11,300,000Fixed expenses 2,221,800 2,076,900 2,601,300 6,900,000
Total costs 5,221,800 5,476,900 7,501,300 18,200,000Cost per unit of volume £34.81 £27.38 £21.43
Absorption costs based on volume 150,000 200,000 350,000 700,00021.4% 28.6% 50%
Variable costs 3,000,000 3,400,000 4,900,000 11,300,000Fixed expenses 1,476,600 1,973,400 3,450,000 6,900,000
Total costs 4,476,600 5,373,400 8,350,000 18,200,000Cost per unit of volume £29.84 £26.87 £23.86
Absorption costs based on equalallocationVariable costs 3,000,000 3,400,000 4,900,000 11,300,000Fixed expenses 2,300,000 2,300,000 2,300,000 6,900,000
Total costs 5,300,000 5,700,000 7,200,000 18,200,000Cost per unit of volume £35.33 £28.50 £20.57

SOLUTIONS TO QUESTIONS 429
Table A2.21
A B C Total
No. units 150,000 200,000 350,000 700,000Sales revenue 7,500,000 7,000,000 8,750,000 23,250,000Variable costs 3,000,000 3,400,000 4,900,000 11,300,000
Contribution (total) 4,500,000 3,600,000 3,850,000 11,950,000Average contribution per unit of volume £17.07
Table A2.22
Col A Col BYear 0
Col CYear 1
Col DYear 2
Col EYear 3
Cash flows 10,000 10,000 10,000Present value 22,459Initial investment −18,000NPV 4,459
Solutions for Chapter 12
12.1Formula for present value = +NPV (16%, C3:E3). The cash flows are entered in columns C(Year 1) to E (Year 3). See Table A2.22.
To calculate IRR using the spreadsheet function, a negative figure (the initial cashinvestment) must be part of the range of values.
Formula for IRR = +IRR (B3:E3).
Year 0 Year 1 Year 2 Year 3
Cash flows −18,000 10,000 10,000 10,000IRR 31%
12.2See Table A2.23.
12.3Payback
Project A 2.5 years (100 + 200 + 1/2 × 50)
Project B 3 years (40 + 100 + 210)
Project C 2 years (200 + 150)
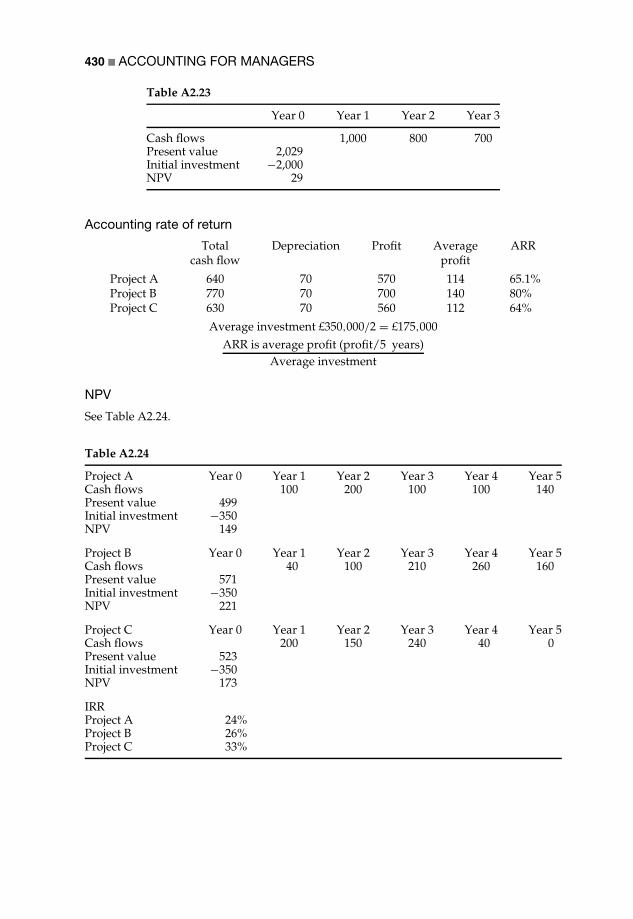
430 ACCOUNTING FOR MANAGERS
Table A2.23
Year 0 Year 1 Year 2 Year 3
Cash flows 1,000 800 700Present value 2,029Initial investment −2,000NPV 29
Accounting rate of return
Total Depreciation Profit Average ARRcash flow profit
Project A 640 70 570 114 65.1%Project B 770 70 700 140 80%Project C 630 70 560 112 64%
Average investment £350,000/2 = £175,000ARR is average profit (profit/5 years)
Average investment
NPV
See Table A2.24.
Table A2.24
Project A Year 0 Year 1 Year 2 Year 3 Year 4 Year 5Cash flows 100 200 100 100 140Present value 499Initial investment −350NPV 149
Project B Year 0 Year 1 Year 2 Year 3 Year 4 Year 5Cash flows 40 100 210 260 160Present value 571Initial investment −350NPV 221
Project C Year 0 Year 1 Year 2 Year 3 Year 4 Year 5Cash flows 200 150 240 40 0Present value 523Initial investment −350NPV 173
IRRProject A 24%Project B 26%Project C 33%

SOLUTIONS TO QUESTIONS 431
On a payback basis, the ranking of projects (with preference to the quickest payback)is C, then A then B. The accounting rate of return method favours B, then A then C.The NPV method ranks B followed by C then A. The IRR suggests that Project C hasthe highest return (as the cash flows are returned more quickly). No absolute prefer-ence is clear, although Project A is slightly less attractive. As the accounting profitsare likely to be important in terms of satisfying shareholders, this may be the opti-mum solution.
12.41 2 3
NPV 1.7 1.1 1.0Outlay 3.0 2.0 1.5PI .57 .55 .67
57% 55% 67%Ranking 2 3 1Select All Part All
Ranking 1 Project 3 requires £1.5 millionRanking 2 Project 1 requires £3 millionRanking 3 Project 2 £0.5 million available (25% of project)Total investment £5 million
12.5Payback period
End of year 4, i.e. £200,000.
Return on investment
1 2 3 4 5
Investment 200 160 120 80 40Cash flows 45 50 55 50 35−Depreciation 20% 40 40 40 40 40Profit 5 10 15 10 −5ROI 2.5% 6.25% 12.5% 12.5% −12.5%
Over the 5 years:
Profit £35/5 = £7 Investment £200/2 = £100
ROI 7/100 = 7%

432 ACCOUNTING FOR MANAGERS
NPV
Inflow Outflow Net Factor PV
Year 1 75,000 30,000 45,000 .9091 40,910Year 2 90,000 40,000 50,000 .8264 41,320Year 3 100,000 45,000 55,000 .7513 41,321Year 4 100,000 50,000 50,000 .6830 34,150Year 5 75,000 40,000 35,000 .6209 21,731
PV of net cash flows 179,432Cash outflow −200,000
NPV −20,568
Although the project has a payback of four years and an ROI of 7%, it should not beaccepted as the NPV is negative, i.e. the cash flows do not cover the cost of capital.
Solutions for Chapter 13
13.1Original Additional New
Investment 10,000 2,000 12,000ROI 15% 14% 14.8%Profit 1,500 280 1,780Cost of capital 12% 1,200 240 1,440
RI 300 40 340
13.2Original Additional New
Investment 10,000,000 2,000,000 12,000,000ROI 15% 14% (£280/£2000) 14.8% (1,780/12,000)
1,500,000 280,000 1,780,000Cost of capital 9% 900,000 180,000 1,080,000
Residual income 600,000 100,000 700,000
13.3Current Additional After
Controllable investment 750,000 100,000 850,000Profit 150,000 15,000 165,000ROI 20% 15% 19.4%
Green may not want to accept the investment as it decreases the divisional ROI, but forBrummy the project is better than the cost of capital (15% compared to 12%) and willincrease shareholder value.
Current Additional After
Controllable investment 750,000 100,000 850,000Profit 150,000 15,000 165,000Cost of capital 12% 90,000 12,000 102,000
RI 60,000 3,000 63,000

SOLUTIONS TO QUESTIONS 433
Using residual income, both Green and Brummy see an increase and will support theinvestment.
13.4Compax
1 2 3 4 Total
Cash flow 2.4 2.4 2.4 2.4 9.6Depreciation 1.6 1.6 1.6 1.6Profit 0.8 0.8 0.8 0.8 3.2Asset value
opening 6.4 4.8 3.2 1.6closing 4.8 3.2 1.6 0
Cost of capital16% of openingasset value 1.02 .77 .51 .26RI −.22 0.03 0.29 0.54 0.64ROI 12.5% 16.67% 25% 50%
Average ROIAverage profit 3.2/4 = 0.8
Average investment = 6.4/2 = 3.2
Average ROI = 0.8/3.2 = 25%
Newpax
1 2 3 4 Total
Cash flow 2.6 2.2 1.5 1.0 7.3Depreciation 1.3 1.3 1.3 1.3Profit 1.3 0.9 0.2 −0.3 2.1Asset value
opening 5.2 3.9 2.6 1.3closing 3.9 2.6 1.3 0
Cost of capital16% of openingasset value 0.83 .62 .42 .21RI .47 .28 −.22 −.51 .02ROI 25% 23% 7.7% −23%
Average ROIAverage profit 2.1/4 = 0.525
Average investment = 5.2/2 = 2.6
Average ROI = 0.525/2.6 = 20.2%
The NPV calculations show that Compax has a higher NPV at £315,634, giving a cash valueadded of 4.9% (315,634/6,400,000). Newpax has an NPV of £189,615 and a cash value addedof 3.6% (189,615/5,200,000).

434 ACCOUNTING FOR MANAGERS
Overall, Compax has a higher ROI, a higher RI and a higher cash value added basedon the NPV. This is the preferred investment. However, it is important to realize that thereturns for Compax are in the third and fourth years. Newpax looks more appealing inthe first two years, when both its ROI and RI are higher. This may make Newpax moreattractive from a divisional perspective or if Anston has a short-term focus.
13.5See Table A2.25.
Before the new investment, Divisions A and C have the highest ROI and Division C hasthe highest residual income. The additional investment achieves the same ROI and RI foreach division. After the new investment, Division A has the highest ROI and Division C thehighest RI. Division B has a negative RI before and after the new investment because thecurrent ROI of 6% is less than the cost of capital of 7%. The additional investment improvesthat position, but Division B still erodes shareholder value.
Solutions for Chapter 14
14.1Cash received in: Jan Feb Mar after neverSales made in: Jan 100 30 60 8 – 2
Feb 120 36 72 9.6 2.4Mar 110 33 74.8 2.2
330 30 96 113 84.4 6.6Cash received in March £113,000Debtors at end of March 84.4 + 6.6 = £91,000
Table A2.25
Division A Division B Division C
Original investment 1,000,000 1,500,000 2,000,000Original net profit 75,000 90,000 150,000Original ROI 7.5% 6.0% 7.5%Cost of capital 7% 70,000 105,000 140,000
Original RI 5,000 −15,000 10,000
Additional investment 500,000 500,000 500,000Additional profit 40,000 40,000 40,000Additional ROI 8.0% 8.0% 8.0%Cost of capital at 7% 35,000 35,000 35,000
Additional RI 5,000 5,000 5,000
New investment 1,500,000 2,000,000 2,500,000New profit 115,000 130,000 190,000New ROI 7.7% 6.5% 7.6%New cost of capital 105,000 140,000 175,000
New RI 10,000 −10,000 15,000

SOLUTIONS TO QUESTIONS 435
14.2Profit
See Table A2.26.Note: Depreciation is £2,400 p.a. or £200 per month.
Cash
See Table A2.27.Note: Depreciation does not involve any cash flow. The opening bank balance is the
capital of £20,000 less the equipment purchased of £7,500.
Balance Sheet
Fixed assets 7,500Less depreciation 600 6,900
Current assetsDebtors 40,000Bank 8,500 48,500
Less creditors 8,000
Net current assets 40,500
Total assets less currentLiabilities 47,400
Capital 20,000Plus profit for period 27,400
47,400
Note:Debtors 90,000 − 50,000 40,000Creditors 43,000 − 35,000 −8,000
Table A2.26
July August September Total
Sales 20,000 30,000 40,000 90,000Purchases 8,000 15,000 20,000 43,000Gross profit 12,000 15,000 20,000 47,000Wages 3,000 4,000 5,000 12,000Other expenses 2,000 2,000 3,000 7,000Depreciation 200 200 200 600Operating profit 6,800 8,800 11,800 27,400

436 ACCOUNTING FOR MANAGERS
Table A2.27
July August September Total
Receipts 20,000 30,000 50,000Payments to creditors −5,000 −10,000 −20,000 −35,000Wages −3,000 −4,000 −5,000 −12,000Other expenses −2,000 −2,000 −3,000 −7,000Net cash flow −10,000 4,000 2,000 −4,000Opening balance 12,500 2,500 6,500 12,500Closing bank balance 2,500 6,500 8,500 8,500
Table A2.28
Budgetin £’000 Apr May Jun Jul Aug Sep Oct Nov Dec Jan Feb Mar TotalRevenue 225 225 225 225 225 225 150 150 150 150 150 150 2,250
Variableoperating costs
68 68 68 68 68 68 45 45 45 45 45 45 675
Fixed operatingcosts
35 35 35 35 35 35 40 40 40 40 40 40 450
Total operatingcosts
103 103 103 103 103 103 85 85 85 85 85 85 1,125
Gross profit 123 123 123 123 123 123 65 65 65 65 65 65 1,125
OverheadsSales charge 15 15 15 15 15 15 12 12 12 12 12 12 162Salaries 25 25 25 25 25 25 25 25 25 25 25 25 300Depreciation 5 5 5 5 5 5 5 5 5 5 5 5 60Rates 8 8 8 8 8 8 8 8 8 8 8 8 96Heat, light andpower
3 3 3 3 3 3 2 2 2 2 2 2 30
Total overheads 56 56 56 56 56 56 52 52 52 52 52 52 648
Operating profit 67 67 67 67 67 67 13 13 13 13 13 13 477
14.3See Table A2.28.
The gross profit is 55% in the first half year and 43% in the second half year, because anincreased fixed cost is spread over a lower volume of sales.

SOLUTIONS TO QUESTIONS 437
14.4See Table A2.29.
14.5The known information is:
Current year Next year£ mill £ mill
Sales 586 791 + 35%Cost of sales 486
Gross profit 100 17%Overheads −19 22
Operating profit 81 13.8% 119 15%
Table A2.29
BudgetQtr 1 Qtr 2 Qtr 3 Qtr 4 Total
Volume (tonne) 100,000 110,000 105,000 120,000Selling price (per tonne) 300 300 310 310Variable costs (per tonne) 120 125 125 130
Budget in £’000Sales and production 30,000 33,000 32,550 37,200 132,750Variable costs (raw materials) 12,000 13,750 13,125 15,600 54,475
Contribution 18,000 19,250 19,425 21,600 78,275
Fixed costs:Salaries and wages 3,000 3,000 3,300 3,300 12,600Maintenance 1,500 1,500 1,500 1,500 6,000Rates 400 400 400 400 1,600Insurance 120 120 120 120 480Electricity 1,000 1,000 1,000 1,000 4,000Depreciation 5,400 5,400 5,400 5,400 21,600Other costs 2,500 1,800 1,800 2,500 8,600
Total fixed costs 13,920 13,220 13,520 14,220 54,880
Operating profit 4,080 6,030 5,905 7,380 23,395
Interest expense 600 600 600 600 2,400
Profit after interest 3,480 5,430 5,305 6,780 20,995
(continued overleaf )

438 ACCOUNTING FOR MANAGERS
Table A2.29 (continued)
BudgetCash flowProfit after interest 3,480 5,430 5,305 6,780 20,995Add back depreciation 5,400 5,400 5,400 5,400 21,600
8,880 10,830 10,705 12,180Less capital expenditure 6,500 2,000 1,000 9,000 18,500Less dividend 10,000 10,000Less debt repayments 1,000 5,000 4,000 3,000 13,000
Net cash flow 1,380 3,830 −4,295 180 1,095
Cumulative cash flow 1,380 5,210 915 1,095
Therefore, gross profit can be calculated as 141 or 17.8% of sales.
Sales 586 791 + 35%Cost of sales 486 650 (791 − 41)
Gross profit 100 17% 141 17.8% (119 + 22)Overheads −19 −22
Operating profit 81 13.8% 119 15%
The company plans to increase sales substantially and improve margins through better pur-chasing and/or higher prices, and will incur significant costs in store openings, warehousingand IT systems while maintaining only a 15% increase in corporate overheads.
A detailed budget projection would need to support these broad figures. The budgetshould identify, as a minimum:
ž The sales mix by whatever categories are relevant (products, geographic sales, type ofcustomer etc.).ž The margins on different categories of sales.ž The cost of materials, retail store salaries and property costs that are deducted to arriveat gross profit.ž The warehousing and distribution costs.ž Central overhead costs.
In terms of marketing, there are three distinct market strategies in existence:
ž Increasing sales to existing customers through direct mailing.ž Winning market share through television advertising.ž Increasing sales in new geographic areas through opening new stores.
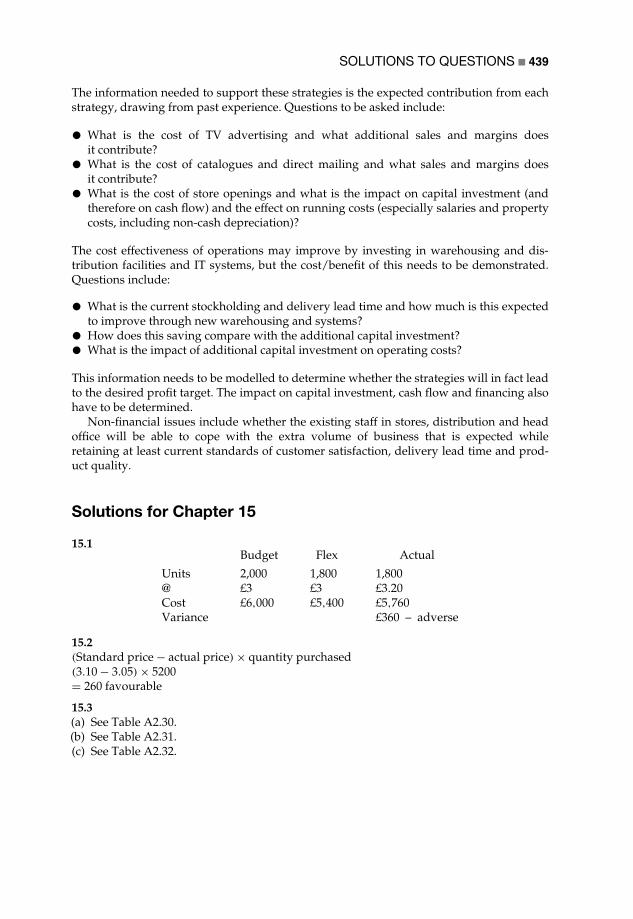
SOLUTIONS TO QUESTIONS 439
The information needed to support these strategies is the expected contribution from eachstrategy, drawing from past experience. Questions to be asked include:
ž What is the cost of TV advertising and what additional sales and margins doesit contribute?ž What is the cost of catalogues and direct mailing and what sales and margins doesit contribute?ž What is the cost of store openings and what is the impact on capital investment (andtherefore on cash flow) and the effect on running costs (especially salaries and propertycosts, including non-cash depreciation)?
The cost effectiveness of operations may improve by investing in warehousing and dis-tribution facilities and IT systems, but the cost/benefit of this needs to be demonstrated.Questions include:
ž What is the current stockholding and delivery lead time and how much is this expectedto improve through new warehousing and systems?ž How does this saving compare with the additional capital investment?ž What is the impact of additional capital investment on operating costs?
This information needs to be modelled to determine whether the strategies will in fact leadto the desired profit target. The impact on capital investment, cash flow and financing alsohave to be determined.
Non-financial issues include whether the existing staff in stores, distribution and headoffice will be able to cope with the extra volume of business that is expected whileretaining at least current standards of customer satisfaction, delivery lead time and prod-uct quality.
Solutions for Chapter 15
15.1Budget Flex Actual
Units 2,000 1,800 1,800@ £3 £3 £3.20Cost £6,000 £5,400 £5,760Variance £360 – adverse
15.2(Standard price − actual price) × quantity purchased(3.10 − 3.05) × 5200= 260 favourable
15.3(a) See Table A2.30.(b) See Table A2.31.(c) See Table A2.32.

440 ACCOUNTING FOR MANAGERS
(d) Budget 11,000VariancesSales price 12,100 ASales quantity 37,100 FMagna price 1,425 AMagna quantity 6,000 ACarta price 3,650 ACarta quantity 5,000 ALabour price 5,060 FLabour quantity 17,500 AFixed costs 7,000 F
3,485 F
Actual 14,485
Table A2.30
Budget Actual
Sales units 10,000 11,000Price per unit £37.10 £36
Sales revenue 371,000 396,000
Direct materialsMagna – per unit 40,000 kg @ £1.50/kg 46,500 kg @ £1.45
– total 60,000 67,425Carta – per unit 10,000 kg @ £5/kg 11,500 @ £5.10
– total 50,000 58,650Labour – per unit 25,000 hours @ £7 26,400 hrs @ £7.10
– total 175,000 187,440
Total direct costs 285,000 313,515
Contribution margin 86,000 82,485Fixed costs 75,000 68,000
Profit 11,000 14,485

SOLUTIONS TO QUESTIONS 441
Table A2.31
Budget Flexible budget Actual
Sales units 10,000 11,000 11,000Price per unit £37.10 £37.10 £36Sales revenue 371,000 408,100 396,000Direct materials
Magna – per unit 60,000 11,000 × 4 = 44,000 67,425– total @ £1.50 = 66,000
Carta – per unit 50,000 11,000 × 1 = 11,000 58,650– total @ £5 = 55,000
Labour – per unit 175,000 11,000 × 2.5 = 27,500 187,440– total @ £7 = 192,500
Total direct costs 285,000 313,500 313,515
Contribution margin 86,000 94,600 82,485Fixed costs 75,000 75,000 68,000
Profit 11,000 19,600 14,485
Table A2.32
Actual quantity×actual price
Actual quantity×standard price
Standard quantity×standard price
Sales 396 408.1 371Price 12.1 A Quantity 37.1 F
Magna 67,425 66,000 60,000Price 1,425 A Usage 6,000 A
Carta 58,650 55,000 50,000Price 3650 A Usage 5,000 A
Labour 187,440 192,500 175,000Price 5060 F Usage 17,500 A
Fixed costs 75,000 75,000 68,000Variance 7,000 F


Appendix 3
Case Studies
The case studies contained in this chapter provide the reader with the opportunityto interpret and analyse financial information produced by an accountant foruse by non-accounting managers in decision-making. Each case study is identifiedwith the chapter numbers that will aid in understanding, interpretation and criticalanalysis of the case.
Appendix 4 contains a suggested answer for each case, although the nature ofsuch cases is that there is rarely a single correct answer, as different approachesto the problem can highlight different aspects of the case and a range of possibleapproaches are possible.
Case study Title Chapters1 Paramount Services PLC 72 Swift Airlines 8 and 93 Holly Road Farm Produce Ltd 104 Call Centre Services PLC 9 and 105 Cryogene Corp. 116 Serendipity PLC 12 and 137 Carsons Stores Ltd 148 White Cold Equipment PLC 15
Case study 1: Paramount Services PLC
Paramount Services provides a range of business consultancy services. Its financialstatements for the last year are given in Table A3.1.
An analyst has produced the following ratio analysis (Table A3.2) and has askedyou to comment on any aspects that you think are important.
This question particularly relates to an understanding of Chapter 7.

444 ACCOUNTING FOR MANAGERS
Table A3.1 Paramount Services PLC
Profit and Loss accountin £’000 2002 2001
Income 34,000 29,000Less expenses 16,500 13,000
Operating profit before interest 17,500 16,000Less interest expense 4,000 2,700
Profit before tax 13,500 13,300Income tax expense 5,400 5,320
Net profit after tax 8,100 7,980Less dividends paid 4,000 3,750
Retained profits 4,100 4,230
Number of shares issued 10,000,000 10,000,000Earnings per share £0.81 £0.80Dividend per share £0.40 £0.38
Market price of shares £8.55 £10.20
Balance Sheetin £’000 2002 2001
Fixed assets 21,933 17,990
Current assetsDebtors 7,080 4,750Bank 377 1,250
7,457 6,000Less creditors due within one yearCreditors 4,300 3,750
Net current assets 3,157 2,250
Total assets less current liabilities 25,090 20,240Less creditors due after more thanone yearLong-term loans 2,750 2,000
Total net assets 22,340 18,240
Capital and reservesShareholders’ funds 10,000 10,000Retained profits 12,340 8,240
22,340 18,240
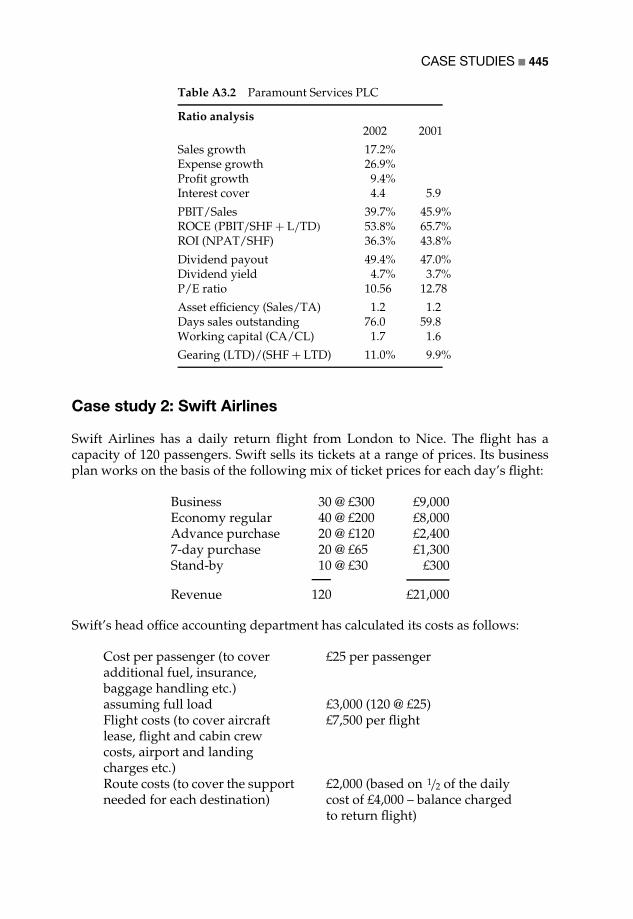
CASE STUDIES 445
Table A3.2 Paramount Services PLC
Ratio analysis2002 2001
Sales growth 17.2%Expense growth 26.9%Profit growth 9.4%Interest cover 4.4 5.9
PBIT/Sales 39.7% 45.9%ROCE (PBIT/SHF + L/TD) 53.8% 65.7%ROI (NPAT/SHF) 36.3% 43.8%
Dividend payout 49.4% 47.0%Dividend yield 4.7% 3.7%P/E ratio 10.56 12.78
Asset efficiency (Sales/TA) 1.2 1.2Days sales outstanding 76.0 59.8Working capital (CA/CL) 1.7 1.6
Gearing (LTD)/(SHF + LTD) 11.0% 9.9%
Case study 2: Swift Airlines
Swift Airlines has a daily return flight from London to Nice. The flight has acapacity of 120 passengers. Swift sells its tickets at a range of prices. Its businessplan works on the basis of the following mix of ticket prices for each day’s flight:
Business 30 @ £300 £9,000Economy regular 40 @ £200 £8,000Advance purchase 20 @ £120 £2,4007-day purchase 20 @ £65 £1,300Stand-by 10 @ £30 £300
Revenue 120 £21,000
Swift’s head office accounting department has calculated its costs as follows:
Cost per passenger (to coveradditional fuel, insurance,baggage handling etc.)
£25 per passenger
assuming full load £3,000 (120 @ £25)Flight costs (to cover aircraftlease, flight and cabin crewcosts, airport and landingcharges etc.)
£7,500 per flight
Route costs (to cover the supportneeded for each destination)
£2,000 (based on 1/2 of the dailycost of £4,000 – balance chargedto return flight)

446 ACCOUNTING FOR MANAGERS
Business overhead £3,000 (allocation of head officeoverhead)
Total £15,500
This results in a budgeted profit of £5,500 per flight, assuming that all seats aresold at the budgeted price. The head office accountant for European routes hasadvised the route manager for Nice that while the Nice–London inbound leg isbreaking even, losses are being made on the London–Nice outbound leg. If profitscannot be generated, the route may need to be closed, with the aircraft and crewbeing assigned to another route. The route manager for Nice has extracted recentsales figures, a typical flight having the following sales mix:
% ofticketssold
Business 60% 18 @ £300 £5,400Economy regular 70% 28 @ £200 £5,600Advance purchase 80% 16 @ £120 £1,9207-day purchase 75% 15 @ £65 £975Stand-by 100% 10 @ £30 £300
Revenue 87 £14,195
The route manager has calculated a loss on each outbound flight of £1,305. Shebelieves that there is a market for 48-hour ticket purchases if a new fare of £40 wasintroduced, as this would be £5 less than the price charged by a competitor for thesame ticket. She estimates that she could sell 15 seats per flight on this basis. Thiswould not affect either the 7-day purchase, which is used by business travellers,or stand-by fares, which are usually over-subscribed. The additional revenue of£600 (15 @ £40) would cover almost half the loss. The route manager has prepareda report for her manager asking that the new fare be approved and allowing herthree months to prove that the new tickets could be sold.
Comment on the route manager’s proposal.This question particularly relates to an understanding of Chapters 8 and 9.
Case study 3: Holly Road Farm Produce Ltd
Holly Road is a farm employing 100 people, 60 of whom are agricultural specialists,35 unskilled labourers and 5 clerical staff. The salary and related costs are shownin Table A3.3.
Due to a decline in business as a result of increases in sales of organic cropsby competitors, the company is going to make 40% of its employees redundant,reducing each grade of employee equally. Holly Road will use its remainingemployees over the next 12 months to change its production methods to be ableto compete with organic crops. Although none of the employees is unionized,
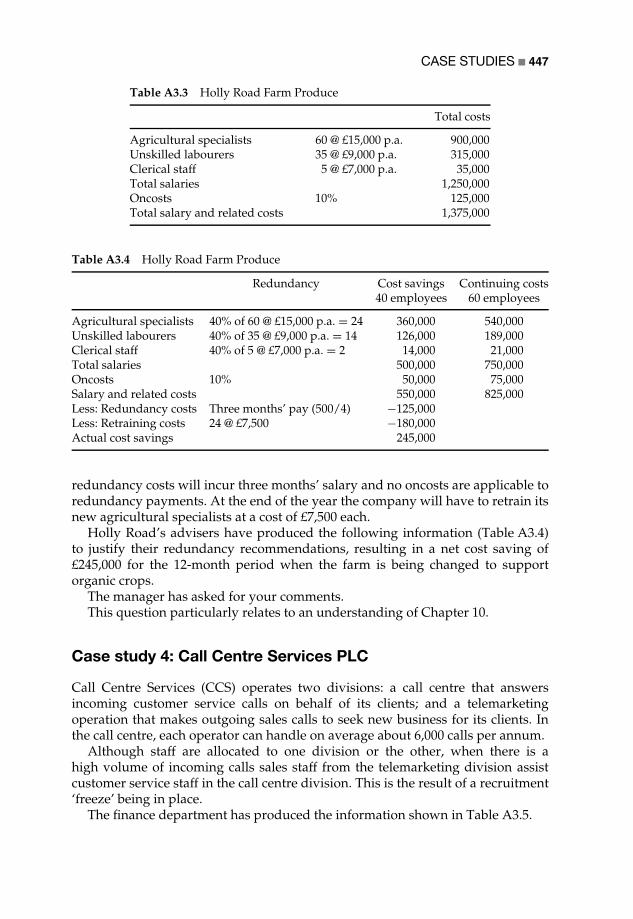
CASE STUDIES 447
Table A3.3 Holly Road Farm Produce
Total costs
Agricultural specialists 60 @ £15,000 p.a. 900,000Unskilled labourers 35 @ £9,000 p.a. 315,000Clerical staff 5 @ £7,000 p.a. 35,000Total salaries 1,250,000Oncosts 10% 125,000Total salary and related costs 1,375,000
Table A3.4 Holly Road Farm Produce
Redundancy Cost savings40 employees
Continuing costs60 employees
Agricultural specialists 40% of 60 @ £15,000 p.a. = 24 360,000 540,000Unskilled labourers 40% of 35 @ £9,000 p.a. = 14 126,000 189,000Clerical staff 40% of 5 @ £7,000 p.a. = 2 14,000 21,000Total salaries 500,000 750,000Oncosts 10% 50,000 75,000Salary and related costs 550,000 825,000Less: Redundancy costs Three months’ pay (500/4) −125,000Less: Retraining costs 24 @ £7,500 −180,000Actual cost savings 245,000
redundancy costs will incur three months’ salary and no oncosts are applicable toredundancy payments. At the end of the year the company will have to retrain itsnew agricultural specialists at a cost of £7,500 each.
Holly Road’s advisers have produced the following information (Table A3.4)to justify their redundancy recommendations, resulting in a net cost saving of£245,000 for the 12-month period when the farm is being changed to supportorganic crops.
The manager has asked for your comments.This question particularly relates to an understanding of Chapter 10.
Case study 4: Call Centre Services PLC
Call Centre Services (CCS) operates two divisions: a call centre that answersincoming customer service calls on behalf of its clients; and a telemarketingoperation that makes outgoing sales calls to seek new business for its clients. Inthe call centre, each operator can handle on average about 6,000 calls per annum.
Although staff are allocated to one division or the other, when there is ahigh volume of incoming calls sales staff from the telemarketing division assistcustomer service staff in the call centre division. This is the result of a recruitment‘freeze’ being in place.
The finance department has produced the information shown in Table A3.5.
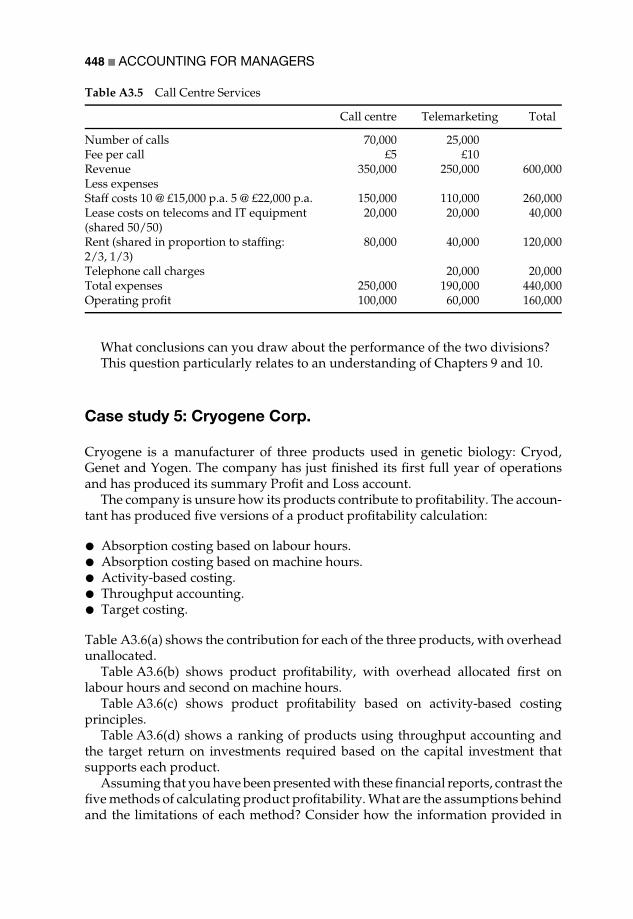
448 ACCOUNTING FOR MANAGERS
Table A3.5 Call Centre Services
Call centre Telemarketing Total
Number of calls 70,000 25,000Fee per call £5 £10Revenue 350,000 250,000 600,000Less expensesStaff costs 10 @ £15,000 p.a. 5 @ £22,000 p.a. 150,000 110,000 260,000Lease costs on telecoms and IT equipment(shared 50/50)
20,000 20,000 40,000
Rent (shared in proportion to staffing:2/3, 1/3)
80,000 40,000 120,000
Telephone call charges 20,000 20,000Total expenses 250,000 190,000 440,000Operating profit 100,000 60,000 160,000
What conclusions can you draw about the performance of the two divisions?This question particularly relates to an understanding of Chapters 9 and 10.
Case study 5: Cryogene Corp.
Cryogene is a manufacturer of three products used in genetic biology: Cryod,Genet and Yogen. The company has just finished its first full year of operationsand has produced its summary Profit and Loss account.
The company is unsure how its products contribute to profitability. The accoun-tant has produced five versions of a product profitability calculation:
ž Absorption costing based on labour hours.ž Absorption costing based on machine hours.ž Activity-based costing.ž Throughput accounting.ž Target costing.
Table A3.6(a) shows the contribution for each of the three products, with overheadunallocated.
Table A3.6(b) shows product profitability, with overhead allocated first onlabour hours and second on machine hours.
Table A3.6(c) shows product profitability based on activity-based costingprinciples.
Table A3.6(d) shows a ranking of products using throughput accounting andthe target return on investments required based on the capital investment thatsupports each product.
Assuming that you have been presented with these financial reports, contrast thefive methods of calculating product profitability. What are the assumptions behindand the limitations of each method? Consider how the information provided in

Tab
leA
3.6
Cry
ogen
eC
orp.
(a)
Cry
odG
enet
Yog
enT
otal
Sale
sun
its
3,00
02,
000
1,00
0Pr
ice
(£)
1,50
01,
150
2,50
0Sa
les
£’00
04,
500
2,30
02,
500
9,30
0U
nitc
osts
:D
irec
tmat
eria
ls45
060
090
0D
irec
tlab
our
Des
ign
@£1
050
2030
Man
ufac
ture
@£2
024
060
160
Ass
embl
y@
£15
6090
60
Tot
ald
irec
tlab
our
350
170
250
Prim
eco
sts
per
unit
800
770
1,15
0T
otal
vari
able
cost
s2,
400
1,54
01,
150
5,09
0C
ontr
ibut
ion
mar
gin
2,10
076
01,
350
4,21
0M
anuf
actu
ring
over
head
3,50
0G
ross
profi
t71
0L
ess
non-
mfg
over
head
600
Net
profi
t11
0(c
onti
nued
over
leaf
)
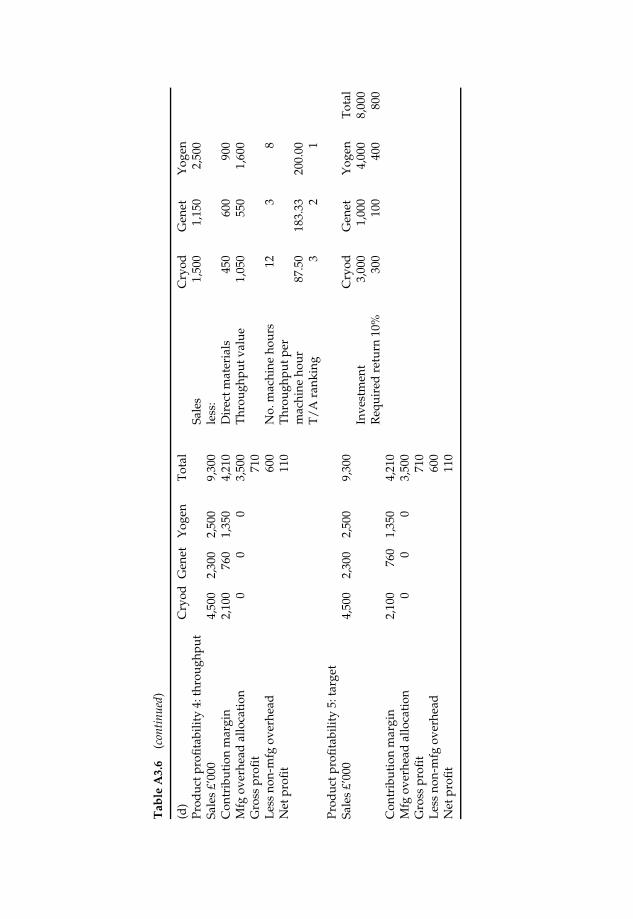
Tab
leA
3.6
(con
tinu
ed)
(d)
Prod
uctp
rofit
abili
ty4:
thro
ughp
utSa
les
£’00
0C
ontr
ibut
ion
mar
gin
Mfg
over
head
allo
cati
onG
ross
profi
tL
ess
non-
mfg
over
head
Net
profi
t
Cry
od
4,50
02,
100 0
Gen
et
2,30
076
0 0
Yog
en
2,50
01,
350 0
Tot
al
9,30
04,
210
3,50
071
060
011
0
Sale
sle
ss:
Dir
ectm
ater
ials
Thr
ough
putv
alue
No.
mac
hine
hour
sT
hrou
ghpu
tper
mac
hine
hour
T/
Ara
nkin
g
Cry
od1,
500
450
1,05
0 12
87.5
0 3
Gen
et1,
150
600
550 3
183.
33 2
Yog
en2,
500
900
1,60
0 8
200.
00 1
Prod
uctp
rofit
abili
ty5:
targ
etSa
les
£’00
04,
500
2,30
02,
500
9,30
0In
vest
men
tR
equi
red
retu
rn10
%
Cry
od3,
000
300
Gen
et1,
000
100
Yog
en4,
000
400
Tot
al8,
000
800
Con
trib
utio
nm
argi
nM
fgov
erhe
adal
loca
tion
Gro
sspr
ofit
Les
sno
n-m
fgov
erhe
adN
etpr
ofit
2,10
0 076
0 01,
350 0
4,21
03,
500
710
600
110
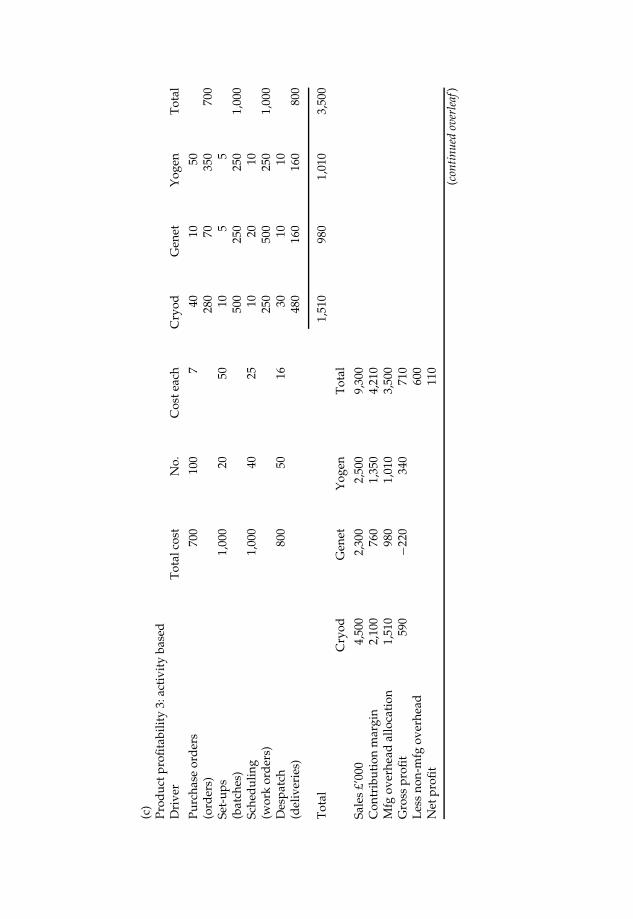
(c)
Prod
uct p
rofit
abili
ty3:
acti
vity
base
dD
rive
rT
otal
cost
No.
Cos
teac
hC
ryod
Gen
etY
ogen
Tot
al
Purc
hase
ord
ers
700
100
740
1050
(ord
ers)
280
7035
070
0Se
t-up
s1,
000
2050
105
5(b
atch
es)
500
250
250
1,00
0Sc
hed
ulin
g1,
000
4025
1020
10(w
ork
ord
ers)
250
500
250
1,00
0D
espa
tch
800
5016
3010
10(d
eliv
erie
s)48
016
016
080
0
Tot
al1,
510
980
1,01
03,
500
Cry
odG
enet
Yog
enT
otal
Sale
s£’
000
4,50
02,
300
2,50
09,
300
Con
trib
utio
nm
argi
n2,
100
760
1,35
04,
210
Mfg
over
head
allo
cati
on1,
510
980
1,01
03,
500
Gro
sspr
ofit
590
−220
340
710
Les
sno
n-m
fgov
erhe
ad60
0N
etpr
ofit
110
(con
tinu
edov
erle
af)
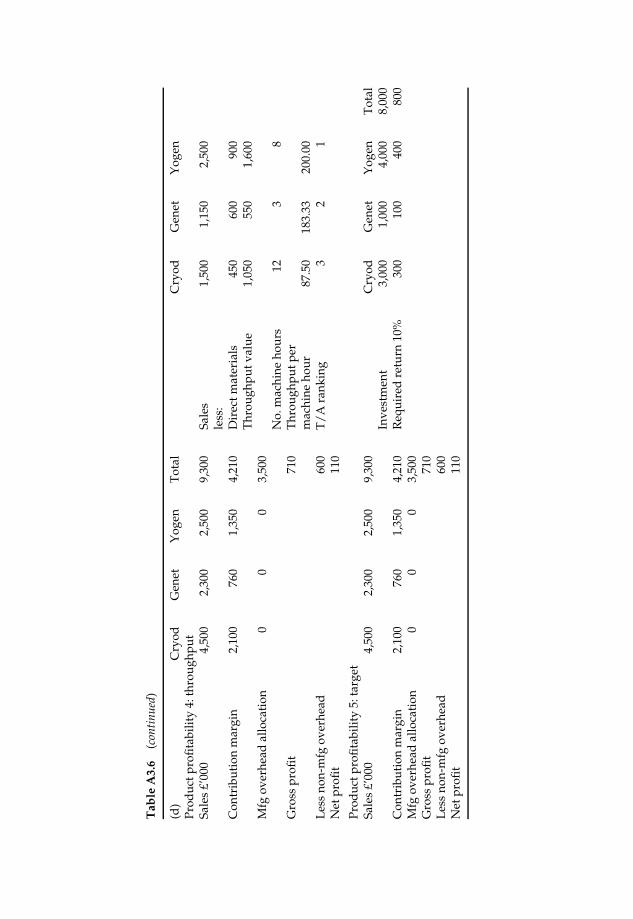
Tab
leA
3.6
(con
tinu
ed)
(d)
Cry
odG
enet
Yog
enT
otal
Cry
odG
enet
Yog
enPr
oduc
tpro
fitab
ility
4:th
roug
hput
Sale
s£’
000
4,50
02,
300
2,50
09,
300
Sale
s1,
500
1,15
02,
500
less
:C
ontr
ibut
ion
mar
gin
2,10
076
01,
350
4,21
0D
irec
tmat
eria
ls45
060
090
0T
hrou
ghpu
tval
ue1,
050
550
1,60
0M
fgov
erhe
adal
loca
tion
00
03,
500
No.
mac
hine
hour
s12
38
Gro
sspr
ofit
710
Thr
ough
putp
erm
achi
neho
ur87
.50
183.
3320
0.00
Les
sno
n-m
fgov
erhe
ad60
0T
/A
rank
ing
32
1N
etpr
ofit
110
Prod
uctp
rofit
abili
ty5:
targ
etSa
les
£’00
04,
500
2,30
02,
500
9,30
0C
ryod
Gen
etY
ogen
Tot
alIn
vest
men
t3,
000
1,00
04,
000
8,00
0C
ontr
ibut
ion
mar
gin
2,10
076
01,
350
4,21
0R
equi
red
retu
rn10
%30
010
040
080
0M
fgov
erhe
adal
loca
tion
00
03,
500
Gro
sspr
ofit
710
Les
sno
n-m
fgov
erhe
ad60
0N
etpr
ofit
110
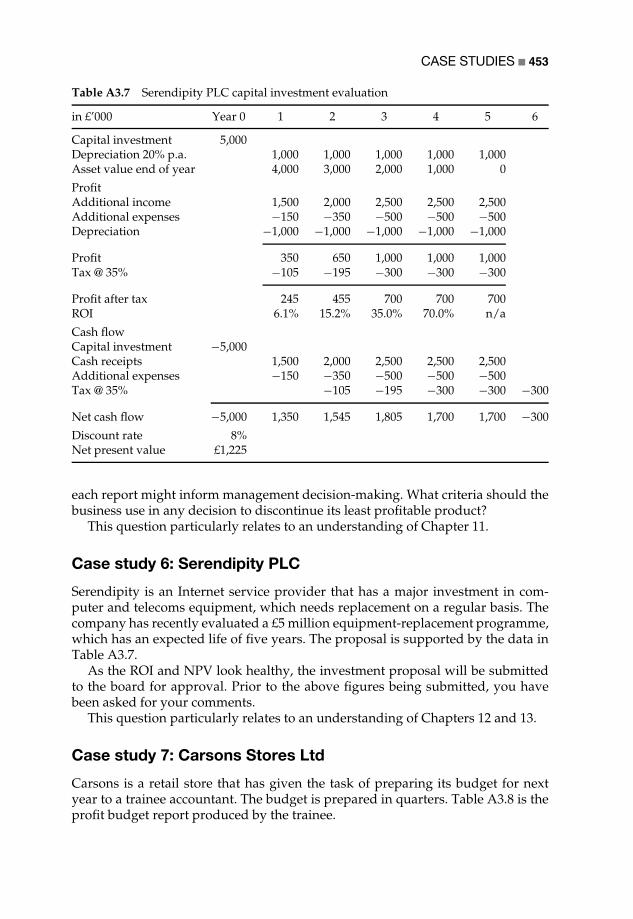
CASE STUDIES 453
Table A3.7 Serendipity PLC capital investment evaluation
in £’000 Year 0 1 2 3 4 5 6
Capital investment 5,000Depreciation 20% p.a. 1,000 1,000 1,000 1,000 1,000Asset value end of year 4,000 3,000 2,000 1,000 0
ProfitAdditional income 1,500 2,000 2,500 2,500 2,500Additional expenses −150 −350 −500 −500 −500Depreciation −1,000 −1,000 −1,000 −1,000 −1,000
Profit 350 650 1,000 1,000 1,000Tax @ 35% −105 −195 −300 −300 −300
Profit after tax 245 455 700 700 700ROI 6.1% 15.2% 35.0% 70.0% n/a
Cash flowCapital investment −5,000Cash receipts 1,500 2,000 2,500 2,500 2,500Additional expenses −150 −350 −500 −500 −500Tax @ 35% −105 −195 −300 −300 −300
Net cash flow −5,000 1,350 1,545 1,805 1,700 1,700 −300
Discount rate 8%Net present value £1,225
each report might inform management decision-making. What criteria should thebusiness use in any decision to discontinue its least profitable product?
This question particularly relates to an understanding of Chapter 11.
Case study 6: Serendipity PLC
Serendipity is an Internet service provider that has a major investment in com-puter and telecoms equipment, which needs replacement on a regular basis. Thecompany has recently evaluated a £5 million equipment-replacement programme,which has an expected life of five years. The proposal is supported by the data inTable A3.7.
As the ROI and NPV look healthy, the investment proposal will be submittedto the board for approval. Prior to the above figures being submitted, you havebeen asked for your comments.
This question particularly relates to an understanding of Chapters 12 and 13.
Case study 7: Carsons Stores Ltd
Carsons is a retail store that has given the task of preparing its budget for nextyear to a trainee accountant. The budget is prepared in quarters. Table A3.8 is theprofit budget report produced by the trainee.

454 ACCOUNTING FOR MANAGERS
Table A3.8 Carsons Stores Ltd
In £’000 Quarter 1 Quarter 2 Quarter 3 Quarter 4 Year total
Sales 100 110 110 120 440Cost of sales 40 44 44 48 176Gross profit 60 66 66 72 264Expenses:Salaries 10 10 10 10 40Rent 20 20 20 20 80Depreciation 5 5 5 5 20Promotional expenses 10 11 11 12 44Administration expenses 5 5 5 5 20Total expenses 50 51 51 52 204Net profit 10 15 15 20 60
Table A3.9 Carsons Stores Ltd
In £’000 Quarter 1 Quarter 2 Quarter 3 Quarter 4 Year total
Cash inflow from sales 100 110 110 120 440Purchases 40 44 44 128Expenses 50 51 51 52 204Capital expenditure 20 20Income tax 20 20Dividends 15 20 25 60Cash outflow 50 126 135 121 432Net cash flow 50 −16 −25 −1 8Cumulative cash flow 50 34 9 8
A cash forecast has also been prepared (see Table A3.9).What are the questions you would want to ask the trainee accountant in order
to satisfy yourself that the budget was realistic and achievable? Can you identifyany errors that have been made in the budget or cash forecast? If so, make anycorrections that you think are necessary and comment on any problems youhave identified.
This question particularly relates to an understanding of Chapter 14.
Case study 8: White Cold Equipment PLC
White Cold Equipment (WCE) makes refrigeration equipment for the domesticmarket. It sells all its production wholesale to a large retail chain. WCE’s budgetversus actual report for a recent month was as in Table A3.10.
Management was concerned about the significant shortfall in profits of £8,550and asked the finance director for more information. The finance director produceda revised report (Table A3.11) based on a flexible budget.
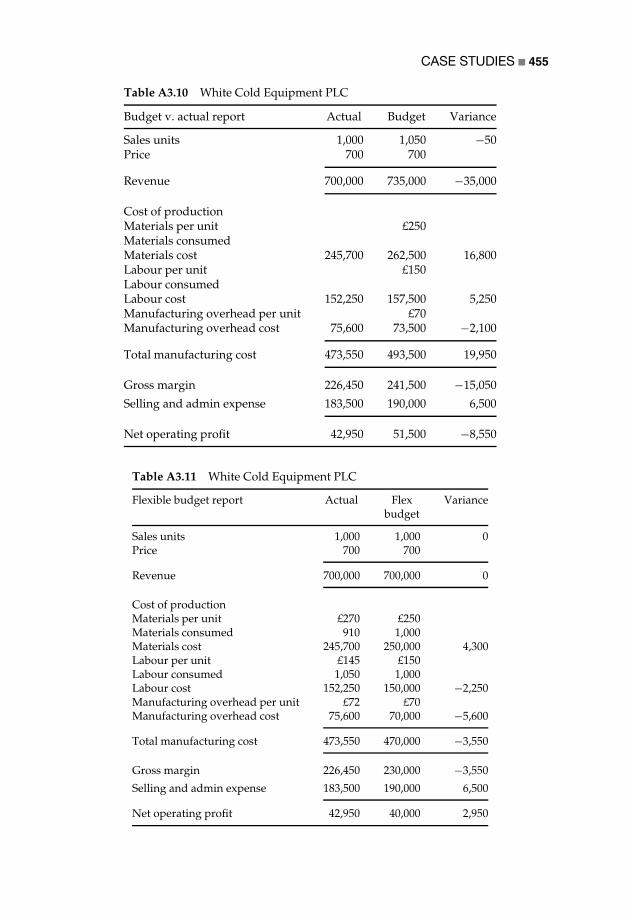
CASE STUDIES 455
Table A3.10 White Cold Equipment PLC
Budget v. actual report Actual Budget Variance
Sales units 1,000 1,050 −50Price 700 700
Revenue 700,000 735,000 −35,000
Cost of productionMaterials per unit £250Materials consumedMaterials cost 245,700 262,500 16,800Labour per unit £150Labour consumedLabour cost 152,250 157,500 5,250Manufacturing overhead per unit £70Manufacturing overhead cost 75,600 73,500 −2,100
Total manufacturing cost 473,550 493,500 19,950
Gross margin 226,450 241,500 −15,050
Selling and admin expense 183,500 190,000 6,500
Net operating profit 42,950 51,500 −8,550
Table A3.11 White Cold Equipment PLC
Flexible budget report Actual Flexbudget
Variance
Sales units 1,000 1,000 0Price 700 700
Revenue 700,000 700,000 0
Cost of productionMaterials per unit £270 £250Materials consumed 910 1,000Materials cost 245,700 250,000 4,300Labour per unit £145 £150Labour consumed 1,050 1,000Labour cost 152,250 150,000 −2,250Manufacturing overhead per unit £72 £70Manufacturing overhead cost 75,600 70,000 −5,600
Total manufacturing cost 473,550 470,000 −3,550
Gross margin 226,450 230,000 −3,550
Selling and admin expense 183,500 190,000 6,500
Net operating profit 42,950 40,000 2,950

456 ACCOUNTING FOR MANAGERS
Table A3.12 Variance analysis
Materials price variance £20Actual no. units 910
Adverse variance 18,200
Materials usage variance 90Standard cost £250
Favourable variance 22,500
Favourable materials variance 4,300
Labour rate variance £5Actual no. units 1,050
Favourable variance 5,250
Labour usage variance 50Standard cost £150
Adverse variance 7,500
Adverse labour variance −2,250
Overhead rate variance £2Actual no. units 1,050
Adverse variance 2,100
Overhead usage variance 50Standard cost £70
Adverse variance 3,500
Adverse overhead variance −5,600Total adverse manufacturing expense variance −3,550Favourable selling and admin variance 6,500
Variance based on actual production volume 2,950
The above report showed that by adjusting the budget to the actual volume ofproduction/sales, the profit was £2,950 higher than expected. The finance directoralso produced a variance analysis (Table A3.12).
This showed that the gross margin was lower than expected for the 1,000 unitsactually produced by £3,550, but that selling and administration expenses werebelow budget by £6,500. Therefore, profits were higher than expected for the 1,000units actually produced.
On receipt of the finance director’s report, comments were sought from theoperational executives.
This question particularly relates to an understanding of Chapter 15.
Appendix 4
Solutions to Case Studies
Case study 1: Paramount Services PLC
It is important to remember that ratio analysis is really only useful to identify trendsand comparisons. Trends require more than two years’ data, while comparisonsrequire either budget data or industry/competitor results that can be used as aperformance benchmark.
Nevertheless, although the two years’ data is limited, some conclusions can bedrawn from the ratios.
Sales growth is high (17.2%) but expense growth is greater (26.9%), suggestingthe need to control expenses. Consequently, profit growth (9.4%) has not beenmaintained at the same level as sales growth. Interest cost has increased due tohigher long-term borrowings and consequently the interest cover has fallen, aslightly more risky situation for lenders.
All profitability measures (PBIT/Sales, ROCE and ROI) have fallen, as a resultof the above-mentioned reasons. However, dividend payout has increased in total(and consequently per share for a constant number of shares) while the yield hasincreased, predominantly a result of the fall in the share price. For the same reason(a reduced share price) the price/earnings ratio has fallen.
Asset efficiency is constant at 1.2, although Paramount does appear to have avery high level of investment in fixed assets in relation to its income from services.Days’ sales outstanding have increased significantly from 60 days to 76 days, areflection of a credit control problem. Although creditors have also increased, theworking capital ratio has increased and is adequate at 1.7. Gearing has increased,but the level of long-term debt is quite low in comparison to the fixed assetinvestment, an indication that a substantial part of the capital and reserves hasbeen invested in fixed assets, possibly real estate.
Perhaps the major area of concern is whether the large fixed asset investmentcan be justified in terms of the business services that the company carries out.
Case study 2: Swift Airlines
By separating the controllable and non-controllable costs for the route, which theroute manager has not done, we can see the true position (Table A4.1).

458 ACCOUNTING FOR MANAGERS
Table A4.1 Swift Airlines
Outbound Inbound Total
Revenue 14,195 15,500 29,695Costs per passenger 87 @ £25 120 @ £25
2,175 3,000 5,175Costs per flight 7,500 7,500 15,000Costs per route 2,000 2,000 4,000Controllable costs 11,675 12,500 24,175Contribution to head office overhead 2,520 3,000 5,520Head office costs 3,000 3,000 6,000Profit/-loss −480 0 −480
Contrary to the route manager’s belief, the loss is £480, not £1,305. This isbecause she did not take account of the per passenger variable cost of £25. Thisreduces the costs by £825 per flight (120 − 87 = 33 @ £25).
While the additional revenue of £600 would help, the route manager has alsooverlooked the additional per passenger variable cost of £25. Each passengerwould therefore contribute £15 to profits (£40 − £25), a total of £225, although thisis only half the loss.
It is important to identify the relevant costs. On a per passenger basis, therelevant cost is £25 as that is the only extra cost to cover the additional fuel,insurance, baggage handling etc. The relevant costs for the Nice destination arethe flight costs of £7,500 (£15,000 for the outbound and inbound legs) and £4,000for the costs that support each route. If the route were discontinued, Swift wouldsave £11,500, particularly as it could reassign the aircraft and crew costs to anotherroute. The £3,000 allocation of business overhead (£6,000 for the return flight)are not relevant costs as those costs would not be saved, but would have to bereallocated to other routes.
Importantly, the route still makes a positive contribution to the recovery ofhead office overheads, which are allocated over each route. The route managerstill needs to address the capacity utilization problem and the average priceneeded to generate a profit on each flight. The average price based on SwiftAirlines’ model is £175 (£21,000/120). The average price being achieved on theoutbound route is £163.16 (£14,195/87). There is a likely trade-off between priceand volume (of passengers).
The breakeven per flight can be calculated based on fixed costs of £12,500(£7,500 + £2,000 + £3,000) and variable costs of £25 per passenger. A range ofbreakeven prices can be calculated.
The breakeven price for 120 passengers is:
12,500120 (P − 25)P = £129.17

SOLUTIONS TO CASE STUDIES 459
The breakeven price for 100 passengers is:
12,500100 (P − 25)P = £150
Using Swift’s business model average price of £175, the breakeven number ofpassengers is:
12,500(175 − 25)n
n = 83.3 or 84 passengers
Using a range of volume/price scenarios, the route manager should be able topresent a report to head office asking for additional time to reduce the losses,emphasizing the small size of the loss, the positive contribution to head office costsbeing made, and how flexibility in pricing and capacity utilization could overcomethe current problem.
Case study 3: Holly Road Farm Produce Ltd
The high cost of redundancy and retraining of skilled employees erode the costsavings. Given the salary differential between agricultural specialists and unskilledlabourers (£15,000 compared to £9,000), it would make more sense to make theunskilled labourers redundant and to use the agricultural specialists to do all thework necessary to convert the farm to organic crops. As unskilled labourers havelower salaries the redundancy payments would be less, and as all the agriculturalspecialists are retained there would be no retraining costs.
Table A4.2 shows the potential cost savings if this strategy were adopted. Thiswould of course require the agricultural specialists to undertake labouring work,
Table A4.2 Holly Road Farm Produce
Redundancy Cost savings37 employees
Continuing costs63 employees
Agricultural specialists 60 @ £15,000 p.a. 900,000Unskilled labourers 100% of 35 @ £9,000 p.a. = 35 315,000 0Clerical staff 40% of 5 @ £7,000 p.a. = 2 14,000 21,000Total salaries 329,000 921,000Oncosts 10% 32,900 92,100Salary and related costs 550,000 825,000Less: Redundancy costs Three months’ pay 329/4 −82,250Less: Retraining costs None 0Actual cost savings 467,500

460 ACCOUNTING FOR MANAGERS
but in the absence of unionization, their interest in retaining their jobs and on-the-job learning about crop changeover could have a motivational effect, which willalso benefit the business. The cost savings of £467,500 exceed the across-the-boardredundancy savings by £222,500. Some of this could be paid to the agriculturalspecialists as a bonus to cover their changed working conditions for the next12 months.
Case study 4: Call Centre Services PLC
The staffing level in the call centre provides a capacity of 60,000 calls (10 staff @6,000), but 70,000 calls have been taken. The telemarketing division has subsidizedthe operations of the call centre.
In the short term, all costs in CCS are fixed costs. The standard cost of a callis £250,000/60,000 calls = £4.17. The standard cost for 70,000 calls is £291,900.It could therefore be argued that a more accurate presentation of the divisionalperformance is as in Table A4.3.
Note: Telemarketing expenses have been calculated as total expenses (£440,000)less standard cost for 70,000 calls in the call centre (£291,900).
Table A4.3 Call Centre Services
Call centre Telemarketing Total
Number of calls 70,000 25,000Revenue 350,000 250,000 600,000@ standard cost (£4.17) 291,900 148,100 440,000Operating profit 58,100 101,900 160,000
Table A4.4 Call Centre Services
Call centre Telemarketing Total
Number of calls 70,000 25,000Fee per call £5 £10Revenue 350,000 250,000 600,000Less expensesStaff costs10 @ £15,000 p.a. 150,0002 @ £22,000 p.a. 44,0003 @ £22,000 p.a. 66,000 260,000Lease costs on telecoms andIT equipment (shared 50/50)
20,000 20,000 40,000
Rent (shared in proportion tostaffing: 4/5, 2/5
96,000 24,000 120,000
Telephone call charges 20,000 20,000Total expenses 310,000 130,000 440,000Operating profit 40,000 120,000 160,000

SOLUTIONS TO CASE STUDIES 461
This shows quite a different picture. However, the telemarketing manager islikely to point out that his staff are paid considerably more than call centre staff(£22,000 compared to £15,000) and that the standard cost is based on a salaryof £15,000.
The appropriate staffing for the call centre to handle 70,000 calls is 12 staff(70,000/6,000 = 11.7). Given the recruitment freeze, two of the telemarketing staffcosts should be transferred to the call centre. Rental costs are adjusted accordingly.It is arguable as to whether the lease costs should be allocated 50/50, but in theabsence of more information this is left unchanged. The revised profitability is asin Table A4.4.
Whether based on standard costs or a reallocation of expenses between thedivisions, the originally reported profit of £100,000 to the call centre and £60,000to telemarketing is distorted. As the standard cost and reallocation calculationsdemonstrate, the call centre is making a much smaller profit and telemarketing amuch larger profit than originally reported.
Case study 5: Cryogene Corp.
Table A3.6(a) reveals the contribution margins for each product. These are as inTable A4.5.
Yogen, which has little more than a quarter of total sales, has the highestcontribution, followed by Cryod and Genet.
Table A3.6(b) shows the gross profit after allocating the manufacturing overheadof £3,500,000 (which is very high at 83% of the contribution) based on labour hours.This suggests that Yogen is the only profitable product, with Cryod making a grossloss and Genet almost breaking even. Table A3.6(b) also shows the gross profitafter allocating manufacturing overhead based on machine hours. This suggeststhat both Yogen and Genet are profitable, but that Cryod is making a large loss.Looking at the information on the right-hand side of Table A3.6(b), we can seethat Cryod has the highest number of labour and machine hours, which is whythe overhead allocation results in that product appearing to be unprofitable. Ifthe high level of manufacturing overhead is a consequence of high labour and/ormachine hours, then that result is acceptable. However, if there are other driversof overheads, such a reported result may be misleading.
Table A3.6(c) shows the allocation of overhead based on activity costing prin-ciples, using four cost drivers: purchase orders, batches (set-ups), work orders
Table A4.5 Cryogene Corp.
Cryod Genet Yogen Total
Sales £’000 4,500 2,300 2,500 9,300% of total sales 48% 25% 27% 100%Contribution margin 2,100 760 1,350 4,210Contribution % 46.7% 33% 54% 45.3%
462 ACCOUNTING FOR MANAGERS
(scheduling) and deliveries. Contrary to the position in Table A3.6(b), Table A3.6(c)shows that Cryod makes the highest gross profit, followed by Yogen, whereasGenet makes a gross loss. Looking at the information in Table A3.6(c), we cansee that most of the overhead is allocated to the Cryod because, on a cost driverbasis, that product is consuming more of the four cost pools of overhead. Theactivity-based approach provides a more accurate allocation of overheads to prod-ucts because it looks at the causes of costs rather than allocating overheads on anarbitrary basis, such as labour or machine hours.
Table A3.6(d) adopts a throughput accounting perspective, which treats materi-als as the only variable cost and identifies the ‘value added’ per unit of the capacitythat limits the volume of production. Assuming that machine hours are the capac-ity limitation, throughput accounting suggests that the maximum contribution canbe achieved from the Yogen, followed by the Genet and the Cryod. It is importantto remember that while this information is useful, it does not take into account theoverheads that are needed to support each product. Throughput accounting is avaluable tool in making optimum use of capacity, but is not a substitute for theother methods, unless overheads are either relatively insignificant or difficult toallocate accurately to individual products.
Table A3.6(d) also shows the profitability using a target pricing approach.Target pricing takes into consideration the capital investment needed to supporteach product and the cost of capital of the business. Table A3.6(d) shows that themain investments are in the Yogen and the Cryod, which are expected to generatethe highest return.
Each presentation of information provides different information. Assuming thatactivity-based costing provides the most meaningful allocation of overhead costs,then we should maximize sales of Cryods and Yogens. Genets consume moreoverheads than they contribute. This requires investigation: either the selling priceis too low, or costs are too high to support that product. Continued sales of theGenet are likely to reduce the overall profitability of the business. This is despitethe low capital investment in the Genet.
The maximum throughput contribution comes from the Yogen and the leastfrom the Cryod. This suggests a need to look at the manufacturing methods forthe Cryod to see if productivity can be improved to reduce the number of machinehours needed to make this product.
In terms of target pricing, the gross profit made by the Cryod is almost twicethe required return of £300 (10% of £3,000), while the Yogen is a little belowtarget. However, in neither case have non-manufacturing overheads been takeninto consideration. This leads to the overall conclusion that overhead costs arevery high in the business, resulting in an overall contribution of 45.3% beingreduced to a net profit of 1.2% of sales (£110/£9,300). Overhead cost controlshould be the over-riding consideration of Cryogene Corp. Subject to this andto the above comment about the high number of hours required to producethe Cryod, Cryogene needs seriously to consider dropping the Genet if costscannot be restructured and increase its sales of the Cryod and the Yogen. It isimportant to note that if Cryogene used labour hours or machine hours to allocate

SOLUTIONS TO CASE STUDIES 463
overhead as the principal measure of profitability, it would be likely to discontinuethe Cryod!
Case study 6: Serendipity PLC
The first comment to be made is in relation to the accuracy of the expectedadditional cash inflows and outflows, which are notoriously difficult to assess. Theproposer of the capital investment will need to have some information to supportthe revenue growth projections and expected cost increases.
The ROI calculations are important, although as is common with ‘cap ex’proposals, the higher ROIs are in later years. A fuller picture may be seen bylooking at the average ROI over the life of the investment. Average profits are£560,000 (total profits/5) and average investment is £2.5 million (£5 million/2).The average ROI is therefore 22.4% (560/2,500).
Given a cost of capital of 8% used in the NPV calculation (which needs to beverified as the weighted average cost of capital for Serendipity), a residual incomeapproach may also present a fuller picture (Table A4.6).
The total RI over the project is £2 million.The NPV produces a positive £1.225 million at a cost of capital of 8%. Again, to
present a fuller picture, an internal rate of return calculation shows the discountrate that equates to a nil NPV. The IRR is 16.8%, which is double the cost of capital,a more meaningful figure than the NPV residual value.
Finally, a payback calculation shows that on a cash flow basis the investment ispaid back after three years and two months (Table A4.7).
Table A4.6 Serendipity
1 2 3 4 5
Residual incomeProfit after tax 245 455 700 700 700Cost of capital on asset value 8%Cost of capital on asset value 320 240 160 80 0
Residual income −75 215 540 620 700
Table A4.7 Serendipity
Year 0 1 2 3 4 5 6
PaybackNet cash flow −5,000 1,350 1,545 1,805 1,700 1,700 −300Cumulative −5,000 −3,650 −2,105 −300 1,400 3,100 2,800
300/1,700 = 176×12 = 2.1 months

464 ACCOUNTING FOR MANAGERS
Provided that payback, ROI, RI, NPV and IRR meet any board criteria, the invest-ment proposal appears to be sound, but inclusion of the additional informationshould assist in obtaining board approval.
Case study 7: Carsons Stores Ltd
The first set of questions to be asked is how the level of sales was arrived at.In particular, have the sales been broken down by department/product? Havemanagers been consulted to see if the budget sales figures are achievable? Isthe seasonal increase over the four quarters consistent with past trends, con-sumer spending patterns and market share? Does it reflect changing prices andcompetitive trends?
The second set of questions is in relation to the rate of gross profit (264/440 =60%). In particular, is this broken down by product or supplier? Is the cost ofsales consistent with previous trading? Does it reflect current negotiations withsuppliers? Does it reflect changing prices?
The third set of questions is in relation to expenses. Is the salary budget consistentwith the headcount and approved salary levels for each grade of staff? Has anallowance for across-the-board (i.e. inflation-adjusted) salaries been built in? Haveall the oncosts been included? Is the rental figure consistent with the propertylease? How has depreciation been calculated (e.g. the asset value and expectedlife)? Promotional expenses appear to be 10% of sales – is this consistent withpast experience and/or with marketing strategy? Are administration expensesconsistent with past experience and any changes that have been introduced in theadministration department?
The fourth set of questions is in relation to the cash flow. Are all sales forcash (because there is no assumption about delayed receipts for sales on credit)?Cost of sales appear to be on 30-day terms, but there is no payment showing forQuarter 1 – the payments for purchases made in Quarter 4 of the previous yearhave not been included. It also appears from the pattern of payments for purchasesthat there is no increase or decrease in stock – is this correct given the trend ofincreasing sales over the year? All expenses have been treated as cash expenses,i.e. no allowance has been made for creditors – is this correct? The inclusion ofdepreciation expense as a cash flow is incorrect. Have the assumptions as to thetiming and amount of capital expenditure, income tax and dividends been checkedwith the appropriate departments?
An adjusted cash forecast, taking into account the missing purchases figure(assume £40,000) and removing depreciation as a cash outflow, would be as inTable A4.8.
The previous cash flow of £8,000 has been increased by the non-cash deprecia-tion expense of £20,000 and reduced by the omission of the estimated Quarter 1purchases of £40,000. This results in a negative cash flow of £12,000. Importantly,this raises the question as to whether Carsons has an adequate overdraft facility tocover the negative cash flows in the third and fourth quarters. Due to the errors,this was not disclosed by the trainee accountant’s cash forecast.
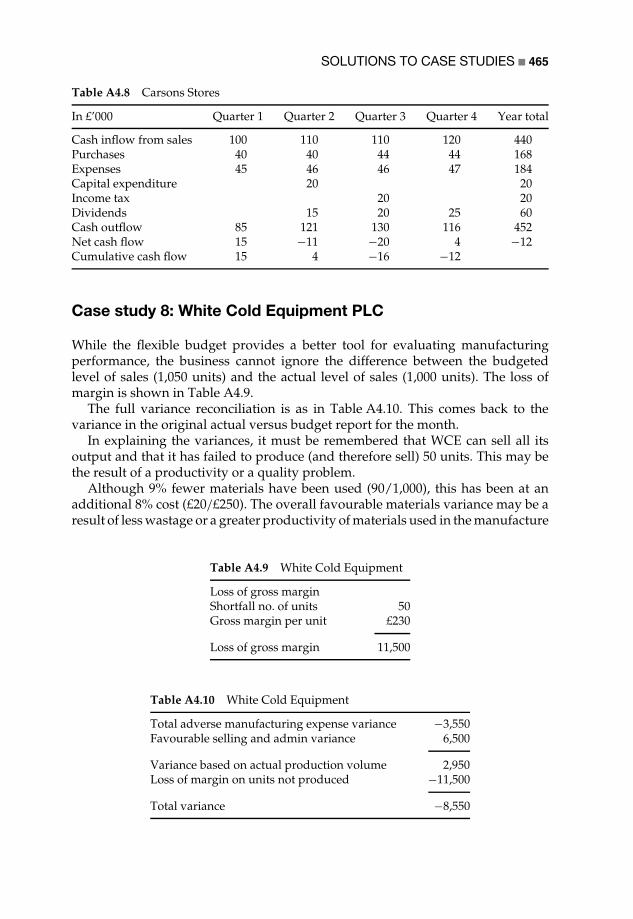
SOLUTIONS TO CASE STUDIES 465
Table A4.8 Carsons Stores
In £’000 Quarter 1 Quarter 2 Quarter 3 Quarter 4 Year total
Cash inflow from sales 100 110 110 120 440Purchases 40 40 44 44 168Expenses 45 46 46 47 184Capital expenditure 20 20Income tax 20 20Dividends 15 20 25 60Cash outflow 85 121 130 116 452Net cash flow 15 −11 −20 4 −12Cumulative cash flow 15 4 −16 −12
Case study 8: White Cold Equipment PLC
While the flexible budget provides a better tool for evaluating manufacturingperformance, the business cannot ignore the difference between the budgetedlevel of sales (1,050 units) and the actual level of sales (1,000 units). The loss ofmargin is shown in Table A4.9.
The full variance reconciliation is as in Table A4.10. This comes back to thevariance in the original actual versus budget report for the month.
In explaining the variances, it must be remembered that WCE can sell all itsoutput and that it has failed to produce (and therefore sell) 50 units. This may bethe result of a productivity or a quality problem.
Although 9% fewer materials have been used (90/1,000), this has been at anadditional 8% cost (£20/£250). The overall favourable materials variance may be aresult of less wastage or a greater productivity of materials used in the manufacture
Table A4.9 White Cold Equipment
Loss of gross marginShortfall no. of units 50Gross margin per unit £230
Loss of gross margin 11,500
Table A4.10 White Cold Equipment
Total adverse manufacturing expense variance −3,550Favourable selling and admin variance 6,500
Variance based on actual production volume 2,950Loss of margin on units not produced −11,500
Total variance −8,550

466 ACCOUNTING FOR MANAGERS
of the final product. However, the adverse labour and overhead variances cannotbe ignored.
Labour cost 3.3% less (£5/£150), which may be the result of lower-paid employ-ees or less overtime. However, 5% more labour units than expected have beenused (50/1,000). This may be linked to the lower materials usage, which may havecaused quality problems. The overhead rate is 2.85% higher (£2/£70) and, as usagefollows labour usage, this is also 5% higher (50/1,000).
Consequently, if the change in materials has caused excess labour to be worked,then the favourable materials variance of £4,300 may be more than offset by theadverse labour usage (£7,500) and adverse overhead usage (£3,500), resulting inan overall adverse variance of £6,700. This is offset by the favourable rate varianceon labour (£5,250) less the adverse rate variance on overhead (£2,100). The dangeris that the adverse usage variances persist while the rate variances are eliminated.These issues are particularly important if the effect of the variances has been toreduce the actual production volume from 1,050 to 1,000 units! The most importantquestions are therefore what usage and rates will persist in the future? And is therea quality problem caused by materials that is influencing labour productivity?
Of course, the actual production situation may be something different to whathas been described here. In a real business situation, managers would undertakean investigation into the causes of the material, labour and overhead rate andusage variances. In the absence of such an investigation, the above comments maybe reasonable conclusions to draw from the variance analysis.

Author Index
The author index contains a list of the first-named author only.
Alexander, D., 171Allaire, Y., 59American Accounting Association, 3Ansoff, H.I., 6, 181Anthony, R.N., 37, 40, 41, 207Armstrong, M., 141Armstrong, P., 11, 141, 242
Bebbington, J., 101Berry, A.J., 38, 41, 174, 220Blake, J., 68, 84Boland, R.J., 4, 58Bourne, M., 56Brignall, S., 47Broadbent, J., 62, 175Bromwich, M., 48Buckley, A., 219, 225Burchell, S., 174Burns, J., 250Burrell, G., 58, 61
Chandler, A.D.J., 6, 21, 203Chartered Institute of Management
Accountants, 46Child, J., 21, 63, 205Chua, W.F., 59Clarke, J.M., 8, 35, 171Collier, P.M., 221–2Cooper, R., 146Cooper, S., 15Cooper, D.J., 55–6, 63, 174Covaleski, M.A., 64, 175, 221Currie, W., 173Czarniawska-Joerges, B., 220–1
Daft, R.L., 42Deal, T.E., 60Demirag, I.S., 172Dent, J.F., 174
Dermer, J., 22DiMaggio, P.J., 96–7Dixon, R., 49Downs, A., 39Doyle, P., 103, 104Drury, C., 48, 170
Eccles, R.G., 44Edvinsson, L., 96Emmanuel, C., 21, 40, 41, 42, 63Ezzamel, M., 221
Fisher, J., 170Fitzgerald, L., 45, 125
Galbraith, J.R., 21Giddens, A., 63Goldratt, E.M., 128–9Gowthorpe, C., 99–100Grant, R.M., 19Gray, R.H., 95Griffiths, I., 100Guthrie, J., 96
Hammer, M., 122, 147Handy, C., 60Hiromoto, T., 172–3Hobsbawm, E., 10Hofstede, G., 40, 58, 61Hopper, T., 61, 62, 173, 247, 248, 249–50Hopwood, A.G., 59, 242Horngren, C.T., 34Hoskin, K., 4Humphrey, C., 249
Innes, J., 45
Johnson, G., 18Johnson H.T., 7–8, 43, 47, 51, 159–60, 197

468 ACCOUNTING FOR MANAGERS
Jones, T.C., 95
Kaplan, R.S., 43–4, 46, 51, 126, 146, 160–1,182, 241, 249
Langfield-Smith, K., 60–1Laughlin, R., 62, 175Lord, B.R., 48, 49Lowe, E.A., 219–20Lynch, R.L., 45
Macintosh, N.B., 49, 59March, J.G., 50, 55Markus, M.L., 61, 63Merchant, K.A., 198, 205Meyer, C., 44Meyer, J.W., 97Miller, P., 62, 174, 175Mintzberg, H., 22, 181Morgan, G., 62
Neely, A., 46Neimark, M., 61–2
Otley, D.T., 12, 37, 38, 39, 41, 42, 43, 47, 51,56, 63, 170–1, 220, 247
Ouchi, W.G., 38, 42, 60
Perrow, C., 62Pfeffer, J., 62Porter, M.E., 48–9, 103, 121–2, 182Power, M.K., 63–4, 248Preston, A., 59, 175, 221
Quinn, J.B., 181
Rappaport, A., 14, 16Richardson, S., 100Roberts, J., 11, 22, 175Roslender, R., 61, 63
Samuelson, L.A., 242Schein, E.H., 60Scott, W.R., 50, 56–7, 60, 96Seal, W., 79, 204Shank, J.K., 191–2Simons, R., 38Sinclair, D., 46Slack, N., 121, 126, 135Smircich, L., 60Smith, T., 100Solomons, D., 196, 197, 198, 201Spicer, B.H., 249Stewart, T.A., 96Stone, W.E., 5
Thompson, J., 56Tomkins, C., 48Turney, P.B.B., 239–40
Vatter, W.J., 8
Waggoner, D.B., 56Wallander, J., 222–3Williams, K., 173Williamson, O.E., 203, 204Wilson, R.M.S., 35, 48, 49
Zadek, S., 95

Subject Index
ABC analysis, 77Absorption costing, 161–6Acid test (ratio), 85, 89Account(s), 4, 26–7, 67Accounting,
and strategy 17–18critical (defined), 62defined, 3, 4entity, 31equation, 30, 72in action, 59period, 31principles, 31, 68, 72standards, 68, 100system, 25
Accounting rate of return (ARR), 183,184–6, 189
Accounting Standards Board, 68, 84Accountability, 4Accrual accounting, 72
accruals, 32, 72–3, 100Activity (ratios), 86–7, 89Activity-based budgeting, 208Activity-based costing, 126–7, 146–8,
160–1, 166–70, 173, 250Activity-based management, 9, 241Agency theory, 50, 78–9, 94, 173, 204, 249Agriculture, 19Allocation base, 162–6Amortization, 74Annual Report, 83–4Arthur Andersen, 33Assets, 26, 30, 70–1
asset turnover (ratio), 86Audit, 67Avoidable costs, 116
Bad debts, 76Balance Sheet, 26, 30, 67, 70–2, 84
Balanced Scorecard, 42, 43–5, 51, 182, 250Bank, 75Batch, 123–4, 169Behavioural implications, 173–5Benchmarking, 84Beyond Budgeting Round Table, 224Bill of materials, 123, 157Bottlenecks, 128–9Bounded rationality, 50, 55, 204Breakeven point, 107–8Budget, 42
bottom-up, 209budgetary control, 225–6budgeted overhead rate, 162–6budgeting, 182, 207–10, 219–22cycle, 209defined, 207top-down, 208
Business cycle, 32Business events, 25Business Excellence model, 45, 136Business Process Re-engineering (BPR), 9,
122, 147, 240
Capacity, 113, 126–9Capital, 26, 71–2
cost of, 14, 187, 189employed, 13market, 13, 15
Capital investment, 31, 112, 131, 182–3Capitalize, 31, 73, 100Carringtons Printers (case study), 97Cash, 27
accounting, 72cost, 34flow, 31, 183forecasting, 216–19
Cash Flow statement, 67, 74–5, 84Cash Value Added (CVA), 187–8, 189
470 ACCOUNTING FOR MANAGERS
Chartered Institute of ManagementAccountants (CIMA), 7, 46, 136
Chartermark, 46Closed system, 56Companies Act, 67, 83Conflict, 56Conservatism, 33Consistency, 33Contingency theory, 56–7, 158, 170–1, 174,
249Continuous improvement, 135Contract, 50, 78
social, 95Contribution, 108, 112, 198Control – see Management controlControllability, 198–9, 205Corporate finance, 14Corporate Report, 94Corporate Social and Environmental
Reporting (CSR) – see Social andenvironmental reporting
Cost, 26–7, 69accounting, 7behaviour, 105–6centre – see Cost centrecontrol, 240–1defined, 34direct – see Direct costdriver – see Cost driveremployment, 142–3environmental, 34fixed – see Fixed costsfull, 111human, 34improvement, 240indirect – see Indirect costmarginal, 106object, 34of capital – see Capital, cost ofof quality, 136of sales, 27, 69, 155–6per unit of production, 142–3pool, 166–7, 169prime, 157relevant – see Relevant costssemi-fixed, 105semi-variable, 105–6social, 34standard, 123systems, 160–1variable – see Variable costsvariances, 231
Cost centre, 20, 34, 162–6, 169, 196budgeted overhead rate, 162, 165service cost centre, 163–4
Cost driver, 122, 146, 166–7, 208, 240
Cost-plus pricing, 111–12, 203Cost-to-function analysis, 135Cost–Volume–Profit analysis (CVP),
106–11Creative accounting, 99–100Credit, 27
credit limits, 76credit terms, 77
Creditors, 27, 71, 75, 77Critical perspective (or paradigm), 10, 21,
58, 61–3, 191–2, 205–6, 247–50Culture, 59–61, 174–5Current assets, 71Current liabilities, 71Cybernetic control, 41, 56, 58
Database Management Company (casestudy), 148–51
Days’ purchases outstanding (ratio), 77Days’ sales outstanding (ratio), 76Debt, 13Debtors, 27, 71, 75
collection policy, 76see also Credit
Decentralization, 195, 250Depreciation, 73–4, 183Direct cost, 141–2, 156, 158
direct labour cost, 143, 157direct labour hour rate, 162direct materials, 157
Disclosure, 33, 68Discounted cash flow (DCF), 183, 186, 189
factors (table), 193Discount rate, 187Discourse, 62Dividend, 14, 70, 89
per share (ratio), 87payout (ratio), 87yield (ratio), 87
Divisionalization, 195–6divisional structure, 20–1
Double entry, 27, 30Doubtful debts, 73DuPont Company, 6, 196
Earnings before interest and taxes (EBIT),70, 88
Earnings before interest, taxes, depreciationand amortization (EBITDA), 74
Earnings management, 32, 100Earnings per share, 87, 89Economic paradigm – see Rational
paradigmEconomic Value Added (EVA), 17, 51,
197, 205

SUBJECT INDEX 471
Enron, 31, 33, 100Environmental accounting – see Social and
environmental reportingEquity, 13Ethics, 99–100European Foundation for Quality
Management – see BusinessExcellence model
EuroRail, 174–5Expenses, 26, 69, 155, 162–6
Facility-sustaining activities, 169Feedback, 39, 225Feedforward, 39Financial accounting, 4, 18Financial management, 14, 18Financial Reporting Review Panel, 68Financial Reporting Standards (FRS), 68, 72Financial reports, 26, 29, 67–75, 83–4, 156Financial statements – see Financial reportsFinished goods, 123Fixed assets, 70Fixed costs, 105, 109, 161–6
fixed cost variance, 237Flexible budgeting, 226–7Forecast, 207Free cash flow, 16Full cost, 111, 166, 203Functional paradigm, 58Functional structure, 19–20Future cost, 35
Garbage can theory, 55Gearing, 84, 86, 89
ratio, 85–6Generally Accepted Accounting Principles
(GAAP), 68General Electric Company, 197General Motors, 6, 204Goal congruence, 78Going concern, 33Goliath Co. (case study), 189–91Gross margin, 88Gross profit, 69, 88, 155
to sales (ratio), 85
Historic cost, 32, 35History of accounting, 5–6Hitachi, 172Human resources, 141
Income, 26, 69Income tax, 70, 183Incremental budget, 208Indirect cost, 141–2, 156, 158, 163
indirect labour cost, 143, 157indirect materials, 157
Industrial Revolution, 6, 10, 51Institutional theory, 58, 96–7Intangible fixed assets, 70Intellectual capital, 96, 104, 141Interest, 14, 70
interest cover (ratio), 86, 89Internal rate of return (IRR), 188–9International Accounting Standards Board
(or Committee), 68, 171International comparisons, 171Interpretive perspective (or paradigm), 58,
59–61, 247–50Inventory, 27, 69, 71, 73, 75, 77, 100, 122,
156, 162, 214Investment appraisal – see Capital
investmentInvestment centres, 20, 196Investors in People, 46ISO 9000, 46, 135Italy, 5
Japan, 171–3Job costing, 123Just-in-time (JIT), 9, 46, 77, 125, 238–9
Kaizen costing, 135Keiretsu, 171
Labour, 141–6cost, 143oncost, 142relevant cost, 144–6variances, 233–5
Labour process theory, 61Latin terms, 6Ledger, 27Liabilities, 26, 30, 71–2Lifecycle costing, 133–4, 160, 173Limited liability, 13Limiting factor, 127–8Line items, 31, 34Liquidity, 84, 85, 89Long-term liabilities, 71
Machine hour rate, 162Majestic Services (case study), 199Make-ready time, 125Make versus buy, 130, 145–6Management accounting, 5, 6, 18, 34, 42–3
limitations, 159–61Management Control Association, 53Management control, 37–43, 78, 170Manufacturing, 122–5, 126, 147
budget example, 214–16Margin, 111

472 ACCOUNTING FOR MANAGERS
Marginal cost, 106, 203Margin of safety, 109–10Market-to-book ratio, 32Market value added, 15Marketing, 103–4, 115
market segments, 104, 116Mark-up, 111Marxist, 61–2Matching principle, 32, 69, 72Materials, 123–4, 128–9, 131–3
materials variance, 231–3Microsoft, 33Monetary measurement, 32Motorola, 136
National Coal Board, 174Natural perspective, 56Net present value (NPV), 186–8
factors (table), 193Net profit, 70, 155Non-cybernetic, 58Non-financial performance
measurement – see Performancemeasurement
Non-production overhead, 157Non-rational, 55–6Normative view, 248Notes to the accounts, 84
Open system, 56Operating and financial review, 84Operating profit, 70
to sales (ratio), 85Operations, 121–2Opportunity cost, 35, 129, 144Optimum selling price, 112–13Ottakar’s (case study), 90Overhead, 143, 157
allocation, 158–9, 168–70, 172
Pacioli, 6Paradigm, defined 50
paradigmatic pluralism, 64paradigm shift, 249
Pareto principle, 77Payback, 183, 186, 189Performance measurement, 9, 18–19, 32,
43–7, 56, 160, 182Performance Measurement Association, 53Performance Prism, 46Performance Pyramid, 45Period costs, 155Planning, decision-making and control
defined, 5Planning, programming and budgeting
system (PPBS), 208
Political economy, 61Population ecology theory, 57–8Power, 62–3Predictive model, 41–2Prepayments, 72–3Present value – see Net present valuePrice, 27, 69, 203
pricing strategies, 104, 111–15Price/earnings ratio, 87, 89Prime cost, 157, 168Priority-based budget, 208Process costing, 124Product costs, 155Product market, 14, 15Product/service mix, 127Product-sustaining activities, 169Production, 122, 126
overhead, 157Profiling, 210Profit, 26–7, 69, 106–7
controllable, 198profit before interest and taxes (PBIT), 70,88
profit centres, 20, 196profit-volume graph, 110
Profit and Loss account, 26, 29, 67, 69–70, 84Profitability, 84–5, 88
profitability index, 187Provisions, 72–3, 100Purchasing, 121–2, 147, 239, 240
Quality – see Total quality managementQuality Bank (case study), 176–8Quality Printing Company (case study),
137–8
Radical paradigm, 58, 61–3Ranking, 128Ratio analysis, 84, 88Rational perspective (or paradigm), 50, 55,
56, 248Raw materials, 123Relevance Lost, 7, 9, 159–60Relevant costs, 129–33, 204
defined, 129equipment replacement, 131labour, 144–6make versus buy, 130materials, 131–3
Relevant range, 106Research, 247–50Residual income (RI), 197–9, 206Resource dependence theory, 58Responsibility centres, 20, 34, 125Results and Determinants Framework, 45

SUBJECT INDEX 473
Retail, budget example, 213–14, 217–19Retail Stores PLC (case study), 117–19Return on capital employed (ROCE), 14, 85,
88Return on investment (ROI), 6, 14, 84, 88,
160, 172, 173, 184, 189, 196–7,198–9, 205
Revenue, 26, 105Risk, 86, 221–2Rolling budget, 207Routing, 123, 157
Sales, 69growth, 88mix, 104variances, 228–31
Segmental profitability, 115–16Semi-fixed costs, 105Semi-variable costs, 105–6Sensitivity analysis, 107Services, 45, 125–16
budget example, 210–12financial services, 148
Set-up time, 125Shareholders, 13, 14
return, 87, 89Shareholder value, 14–18, 32, 78, 189, 195
shareholder value network, 16Shareholder value added, 16Six Sigma, 136Skandia Navigator, 96Social accounting – see Social and
environmental reportingSocial and environmental reporting, 22,
94–5Social construction, 59Source document, 25Special pricing decisions, 113–15Stakeholders, 4, 67
stakeholder theory, 21, 94–5Standard costs, 123, 173, 175, 231Statements of Standard Accounting
Practice (SSAP), 68, 72, 162, 169Stern Stewart & Co., 17, 51Stewardship, 4Stock – see InventoryStock Exchange, 6, 67, 83Stock turn, 77Strategic business unit (SBU), 20Strategic cost management, 49Strategic enterprise management, 47Strategic management accounting, 9,
47–9, 192
Strategy, 17–19, 37–9, 103–4, 181–2, 207Sunk cost, 129, 144SuperTech (case study), 119–20Svenska Handelsbanken (case study),
222–3
Tableaux de bord, 45Tangible fixed assets, 70Target costing, 134–5, 172, 173Target rate of return pricing, 112, 134Tektronix, 239–40Theory, 247–50Theory of Constraints (ToC), 128–9Throughput contribution, 128Time-recording system, 157Time value of money, 186Total quality management (TQM), 9, 46,
135–6, 239Total shareholder return, 15Toyota, 173Trade creditors – see CreditorsTransaction, 25–7Transaction cost economics, 50, 78, 203–5Transfer of Undertakings Protection of
Employment (TUPE), 144, 146Transfer pricing, 115, 201–3, 205–6Trojan Sales (case study), 151–2True and fair view, 67Turnover, 69
Unavoidable costs, 116Unit contribution, 108Unit-level activities, 169
Value-based management, 9, 14Value chain, 121–2Variable costs, 105, 109Variable costing, 161–2Variable overhead variance, 235–7Variance analysis, 227–8, 237–40Vehicle Parts Co. (case study), 138–9
Weighted average cost of capital – seeCapital, cost of
Work-in-progress, 123Working capital, 31, 74–5, 89
ratio, 85WorldCom, 32, 33
Yellow Book, 67, 84
Zero-based budgeting, 208