accounting aggregation: user preferences and decision making
TRANSCRIPT

Accounting, Organizations and Society. VoL 4, No. 3, pp. 187-210. 0361-3682/79/0701-018750200/0 © Pergamon Press Ltd, 1979. Printed in Great Britain.
A C C O U N T I N G A G G R E G A T I O N : U S E R P R E F E R E N C E S A N D D E C I S I O N M A K I N G
DAVID W. HARVEY
Tulane University
JOHN GRANT RHODE
University o f San Francisco
and
KENNETH A. MERCHANT
Harvard University
Abstract
This experiment tests the effects of alternative aggregations of accounting data in a simulated portfolio task. Certain entropy-based aggregation criteria were used to prepare differentially aggregated financial statements for use in the task. Subjects made allocations of initial endowments between hypothetical firms, disclosed confidence in their allocation decisions and reported on specific characteristics of the t'mancial statements. Differences in reported usefulness of statement sets furnished were found to be associated strongly with measured information content. The results also provide limited evidence that decisions and judgments of subjects were affected by the information content of the accounting aggregations provided.
The usefulness of the accounting product depends on the information content of particular data and how effectively that information is communicated to financial statement users. One important reporting decision, the extent of aggregation, involves summarization or condensation of data with resulting loss of detail. This decision is one of the factors affecting the usefulness of the accounting data. While information content may be lost by transmission of a reduced set of data, communication of the intended message may be enhanced by a beneficial clarification through summarization.
Several accounting researchers have recognized the relevance of aggregation decisions, and the result of their interest is a growing body of knowledge in the literature (Lev, 1968, 1969, 1970; Bare field, 1972; Abdel-khalik, 1974; Ronen & Falk, 1973). This study attempts to provide
evidence of the effects of information aggregation on user perceptions, preferences and financial decisions.
Earlier research on information was concerned with whether aggregation hindered or helped decision-making in a normative sense (Grilliches & Grunfeld, 1960; Orcutt, Watts & Edwards, 1968, 1969; Laub, 1972). In sum, these studies revealed that aggregation cannot provide more information than is present in the detailed data, and in many situations, information will be lost.
While attempting to quantify the amount of information lost by aggregation, Lev (1968, 1969, 1970) adapted the Entropy Law from scientific information theory and suggested measures as general purpose surrogates for the value of the information lost. The major criticism of Lev's work has come from those who feel that the information must be situation- and user-dependent
187

188 DAVID W. HARVEY, JOHN GRANT RHODE and KENNETH A. MERCHANT
(Bernhardt & Copeland, 1970; Hofstedt, 1970; Horowitz & Horowitz, 1976), and there is some limited empirical evidence that the entropy measure is not useful as a general-purpose surrogate (Ronen & Falk, 1973; Abdel-khalik, 1974). For example, Stallman (1970) provided evidence that certain disaggregated disclosures are not necessarily useful or valuable. In the Stallman experiment financial analysts perceived no differences in the value of securities due to receiving data on divisional operations for two companies. The entropy measure, however, may have use as an indicator of lost information in certain specific situations as yet unexplored.
EXPERIMENTAL PURPOSE AND DESIGN
This experiment was designed to test for relationships between the information content o f financial statements, as indicated by the Lev entropy measure, and decisions, judgments and preferences expressed by knowledgeable subjects in an investment situation. The independent variable in the study is information lost through aggregation based on maximum and minimum information financial statement aggregations.
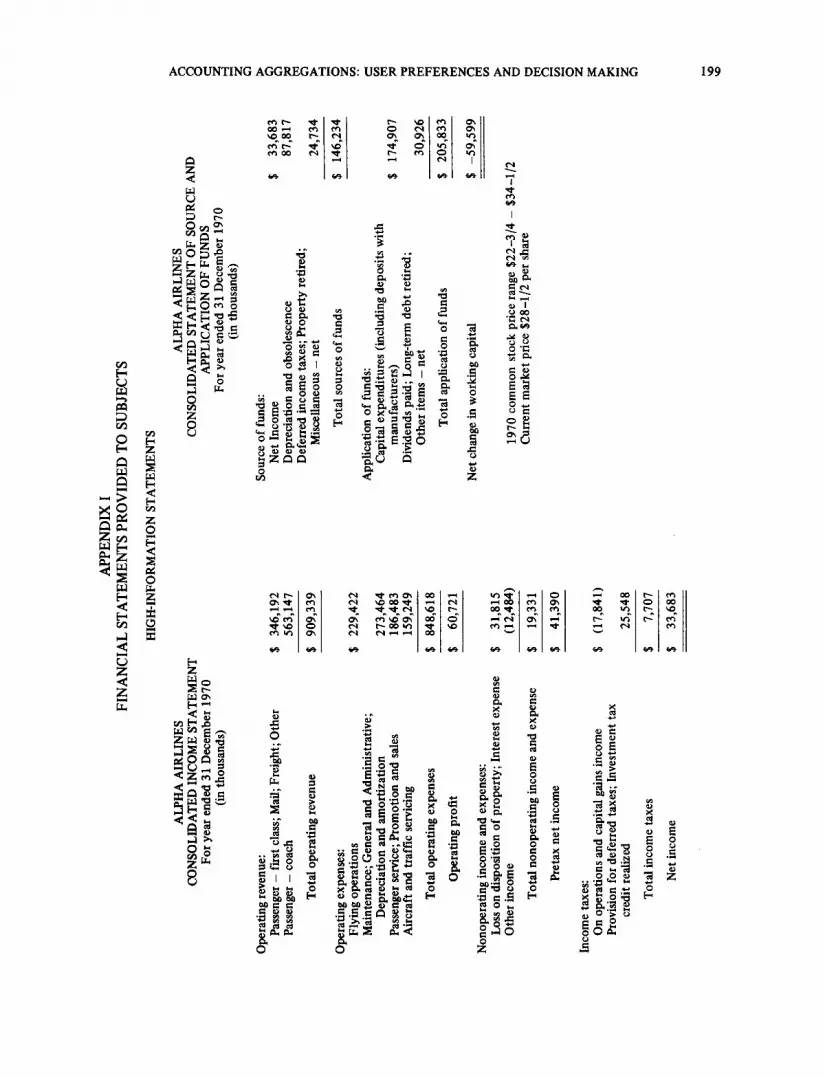
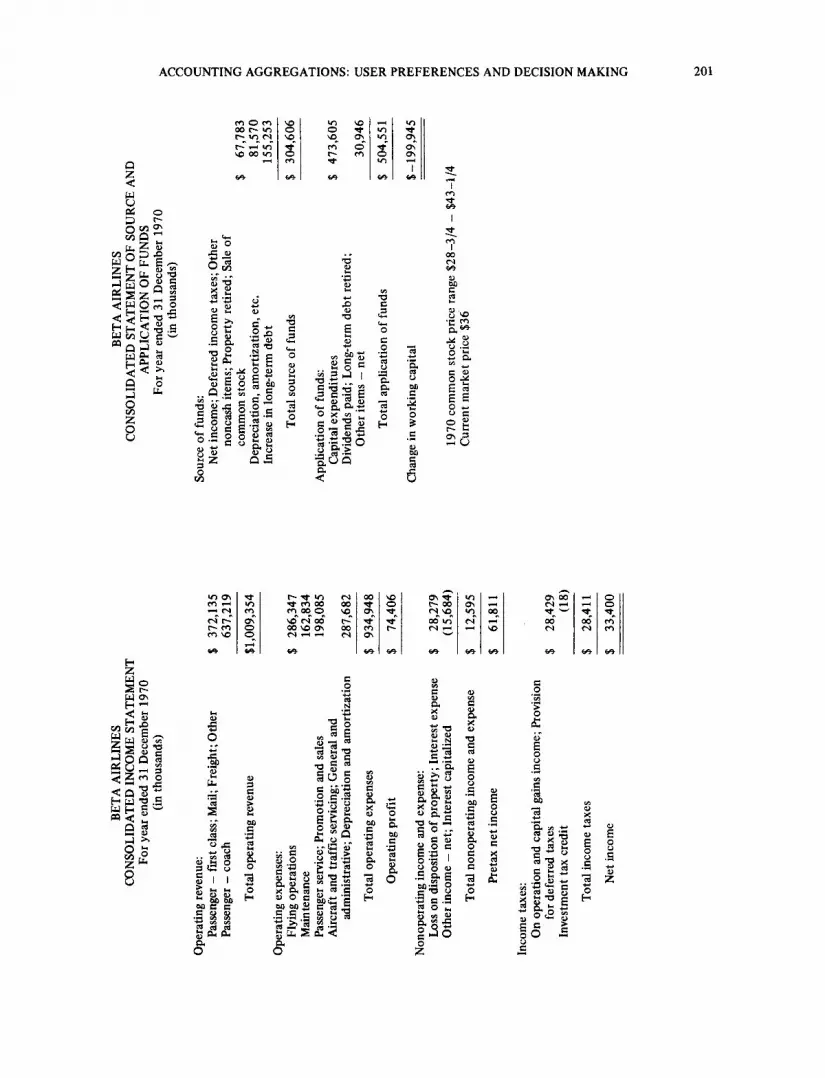
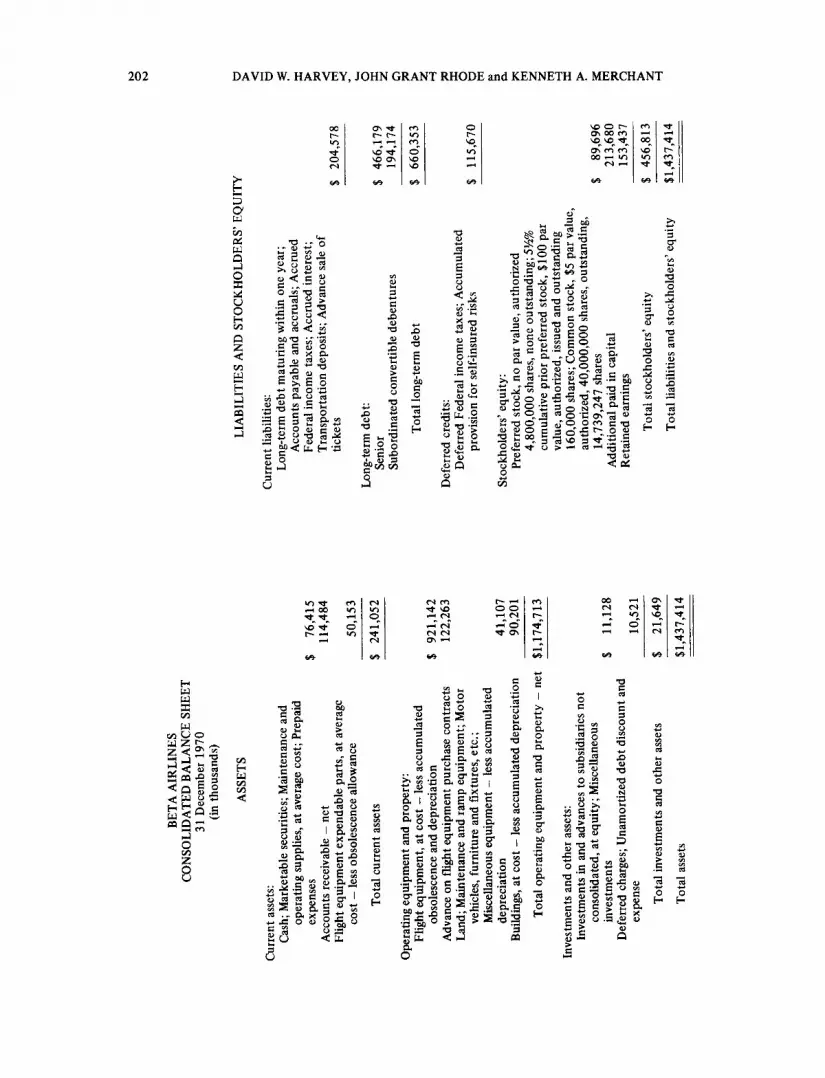
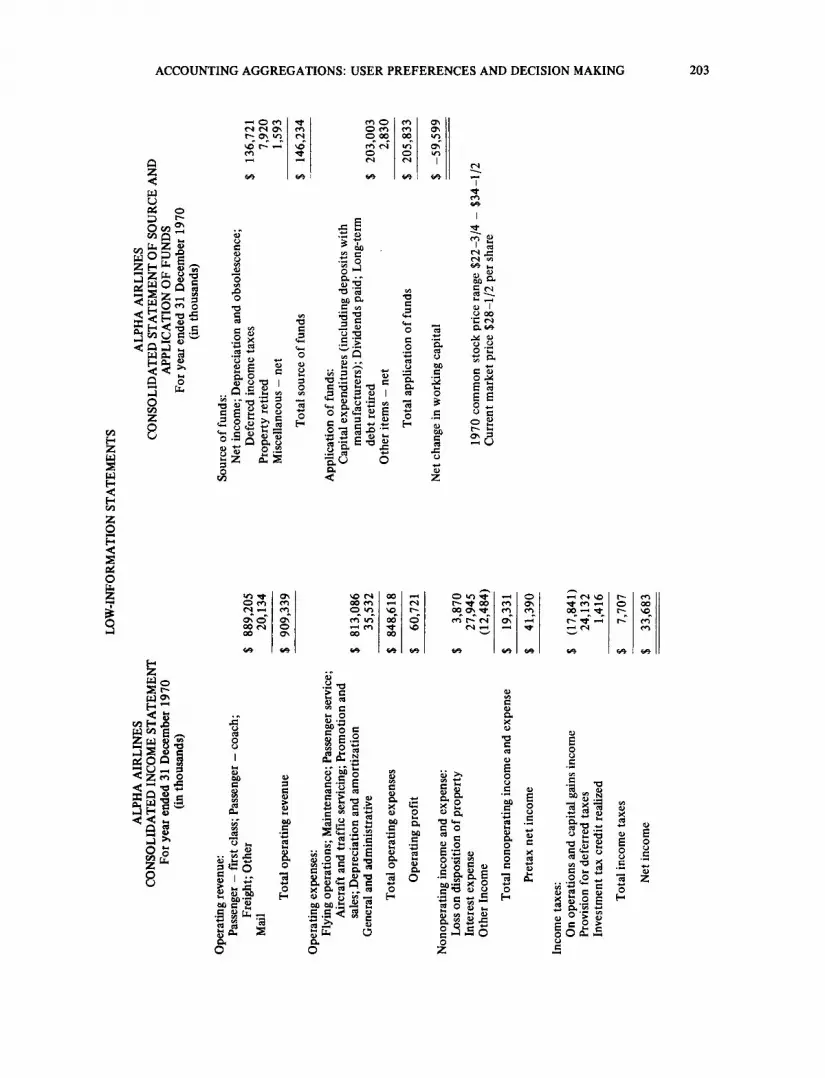
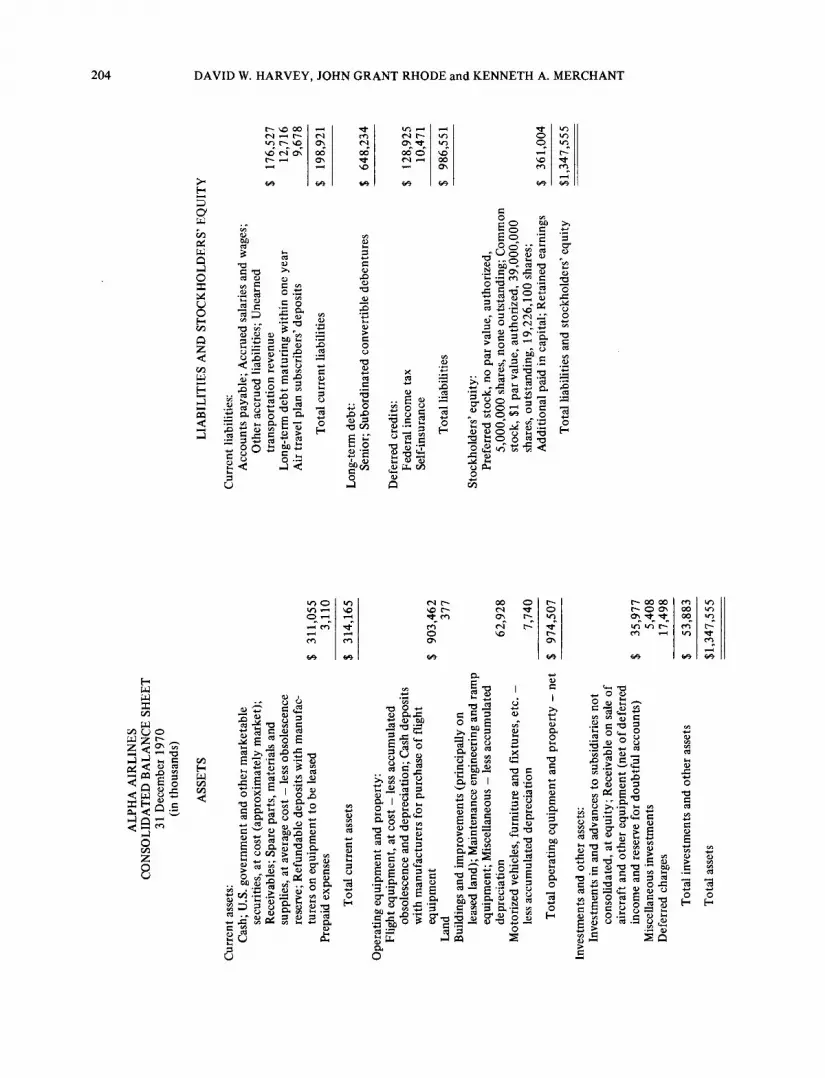
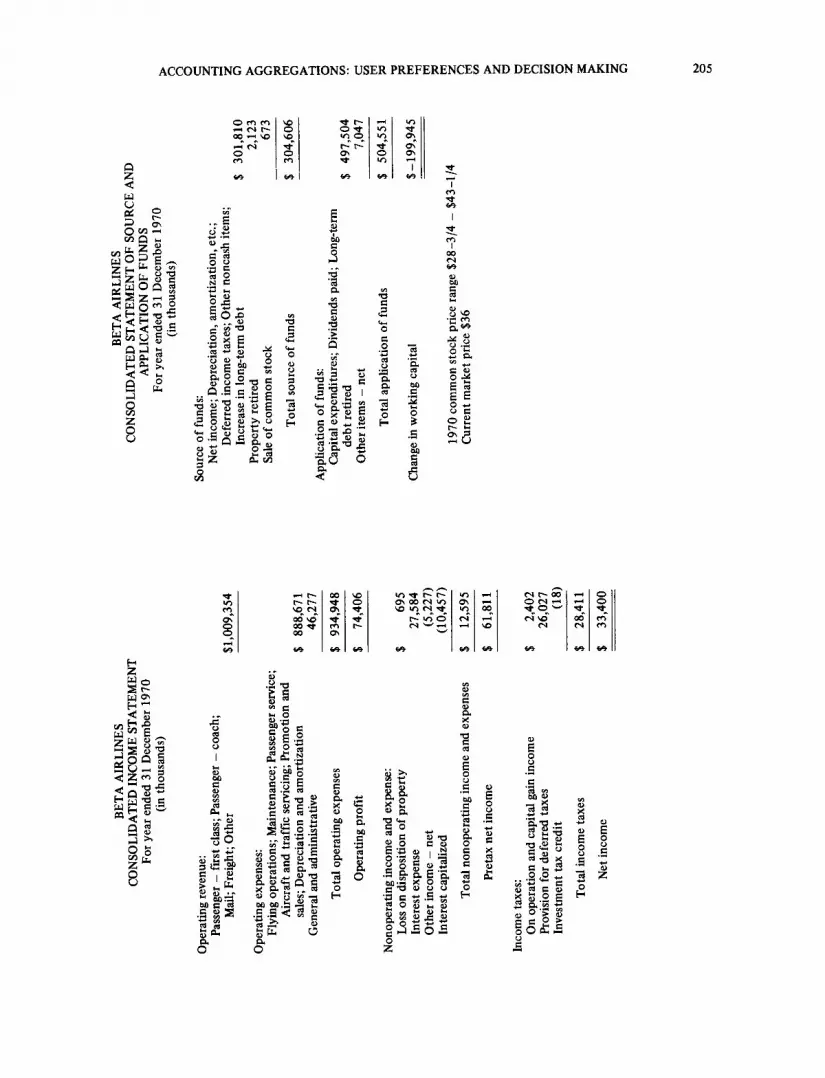
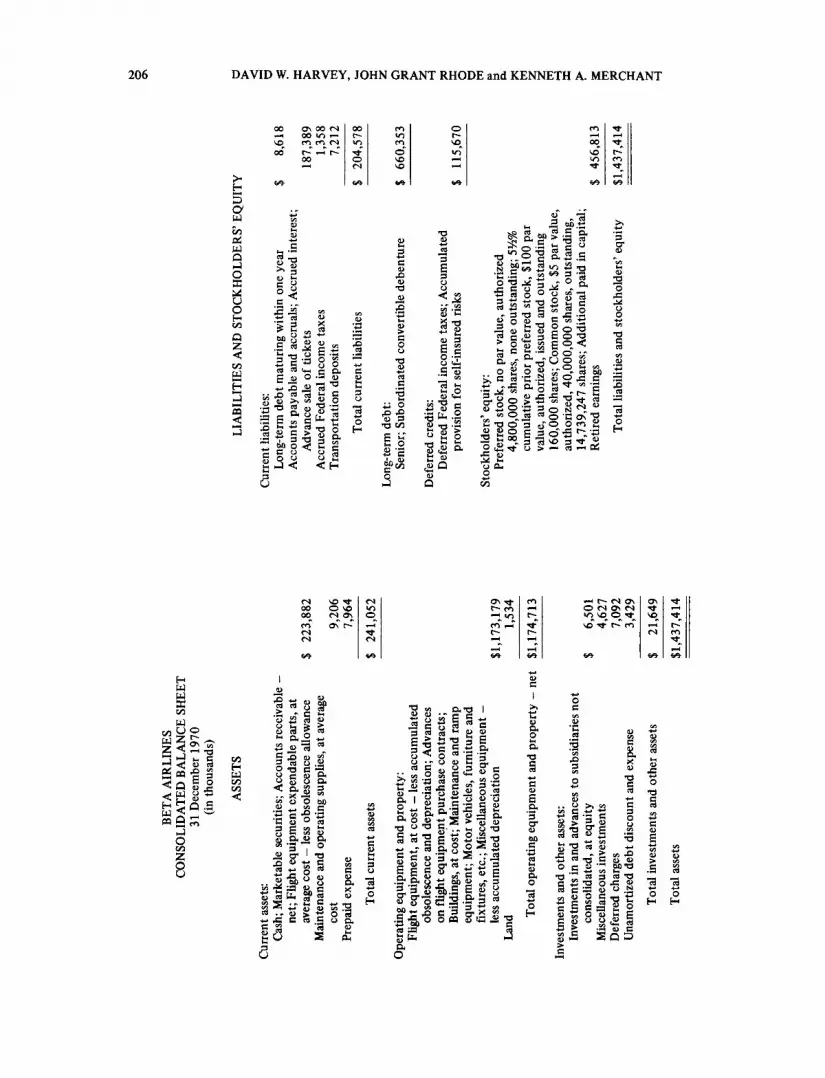
The experimental task required subjects to evaluate the investment quality o f common shares of two fictitious domestic airlines, allegedly traded on the New York Stock Exchange. Financial statements used in the task were aggregated from the basic financial statements of American and United Airlines. The statements were modified to display uniform account titles and numbers of accounts. Scalar adjustments were made to reduce the likelihood that the source airline would be recognized and the airlines were renamed Alpha
and Beta. Selected financial comparisons are presented in Table 1. See Appendix I for the sample financial statements used.
Financial statements were constructed from the basic data to yield low-information statements (LO) and high-information statements (HI) for each airline, a total of four different statements. The differences between the high and low information statements resulted from the choice o f data to aggregate, using Lev's entropy rules: (1) as the numerical inequality of two elements of a set increases, aggregating the elements becomes less undesirable and (2) as the total of the two elements decreases relative to the total of the related set, aggregating them becomes less undesirable (Lev, 1968). See Appendix II for a description of the entropy measurement procedure.
It has been demonstrated that quantity of data presented to decision makers may have substantial effects on the communication of the information content of the financial statements (Schroeder, Driver & Streufert, 1967; Miller, 1972; Dermer, 1973; San Miguel, 1976). To control for these effects, the number of line items presented in the aggregated financial statements in each of the treatments was equalized at approximately one- half that of the original presentations in the airlines' annual reports. The reduced number of presentations should make the instruments simple enough to avoid a state of information overload yet leave adequate information with which to make necessary judgments and decisions.
The aggregations were made to preserve a number of traditional financial statement categories such that the statements did not appear so foreign that subjects would reject them. Table 2 presents a summary of the entropy-measure
TABLE 1. Selected financial comparisons between Alpha and Beta
Alpha Beta
Yearly common share price range 22-3/4 - 34-1/2 Most recent common share price 28-1/2 Range as percentage of current price 40 Net income $33,638,000 Preferred dividend 0 Available for common $33,683,000 Common shares 19,226,100 Earnings per share $1.7519 Earnings yield - current price 0.061 Earnings yield - high yearly price 0.051 Earnings yield - low yearly price 0.077
28-3/4 - 43-1/4 36 40
$33,400,000 $ 880,000 $32,520,000
14,739,247 $2.2063 0.061 0.05t 0.077

ACCOUNTING AGGREGATIONS: USER PREFERENCES AND DECISION MAKING 189
information content of the statements. Subjects in the study were security analysts and
portfol io managers from a large midwestern metropoli tan area. All subjects received a package containing (1 ) in s t ruc t ions (see Appendix III), (2) a set of financial statements for each of the two test companies from one of four treatments described below, (3) a questionnaire of twelve items, ten for use in the first part of the study and two for use in the second (see Appendix IV), and (4) a sealed section containing another set of financial statements for one of the companies so that the subject would have both high information and low information statements from either Alpha
or Beta. This lat ter data set was used in the second part of the study, for questions 11 and 12 involving ascribed usefulness and preferences for different financial statements from the same company.
Since data for each of the two experimental companies were aggregated in two different ways, packages containing a set of two financial statements could be assigned in four ways, as shown in Table 3.
In addition, subjects could be provided with contrasting financial statements for either of the two companies in the second part of the study. Consequently, a total of eight possible treatment
TABLE 2. Information analysis
Information content of Alpha airline statements
Basic set Minimum-loss aggregation Maximum-loss aggregation
Information Information Loss through Information Loss through content content aggregation content aggregation
Balance sheet
Assets Liabilities O/E
Income statement
Revenue Expense & revenue reduction
Funds statements
Sources Uses
2.270300 2.101380 0.168920 1.398993 0.871307 2.863273 2.618695 0.244578 1.892695 0.970578
1.714779 1.163709 0.551070 0.382890 1.331889
2.907403 2.247677 0.657260 0.667762 2.239641
1.567691 1.362607 0.205084 0.389616 1.178075 0,814502 0.609839 0.204663 0.106273 0.708229
Information content of Beta airline statements
Basic set Minimum-loss aggregation Maximum-loss aggregation
Information Information Loss through Information Loss through content content aggregation content aggregation
Balance sheet
Assets Liabilities O/E
Income statement
Revenue Expenses & revenue reduction
Funds statements
Sources Uses
2.050736 1.904188 0.146548 0.875564 1.175172 2.879761 2.613353 0.266408 1.807894 1.071867
1.608390 1.047652 0.560708 0.126134 1.482226
2.845359 2.223848 0.621511 0.658506 2.186854
1.829491 1.487316 0.342175 0.080965 1.748526 0.423179 0.331401 0,091778 0.106273 0,316906
190 DAVID W. HARVEY, JOHN GRANT RHODE and KENNETH A. MERCHANT
combinations resulted•
HYPOTHESES
Two related general expectations test the applicability of the Lev theoretical entropy model to the specific decision-making situation con- structed in this experiment.
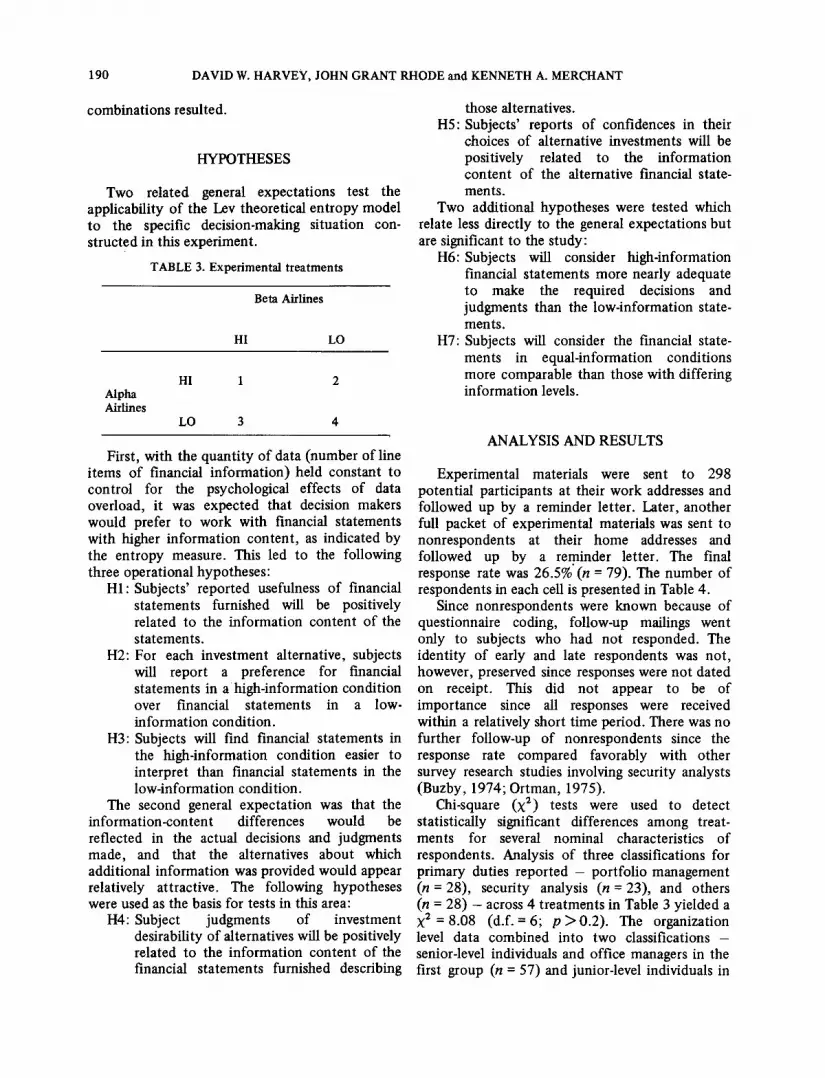
TABLE 3. Experimental treatments
Beta Airlines
HI LO
HI 1 2 Alpha Airlines
LO 3 4
First, with the quantity of data (number of line items of financial information) held constant to control for the psychological effects of data overload, it was expected that decision makers would prefer to work with financial statements with higher information content, as indicated by the entropy measure. This led to the following three operational hypotheses:
HI: Subjects' reported usefulness of financial statements furnished will be positively related to the information content of the statements.
H2: For each investment alternative, subjects will report a preference for financial statements in a high-information condition over financial statements in a low- information condition.
H3: Subjects will find financial statements in the high-information condition easier to interpret than financial statements in the low-information condition•
The second general expectation was that the information-content differences would be reflected in the actual decisions and judgments made, and that the alternatives about which additional information was provided would appear relatively attractive. The following hypotheses were used as the basis for tests in this area:
H4: Subject judgments of investment desirability of alternatives will be positively related to the information content of the financial statements furnished describing
those alternatives. H5: Subjects' reports of confidences in their
choices of alternative investments will be positively related to the information content of the alternative financial state- ments.
Two additional hypotheses were tested which relate less directly to the general expectations but are significant to the study:
H6: Subjects will consider high-information financial statements more nearly adequate to make the required decisions and judgments than the low-information state- ments.
H7: Subjects will consider the financial state- ments in equal-information conditions more comparable than those with differing information levels.
ANALYSIS AND RESULTS
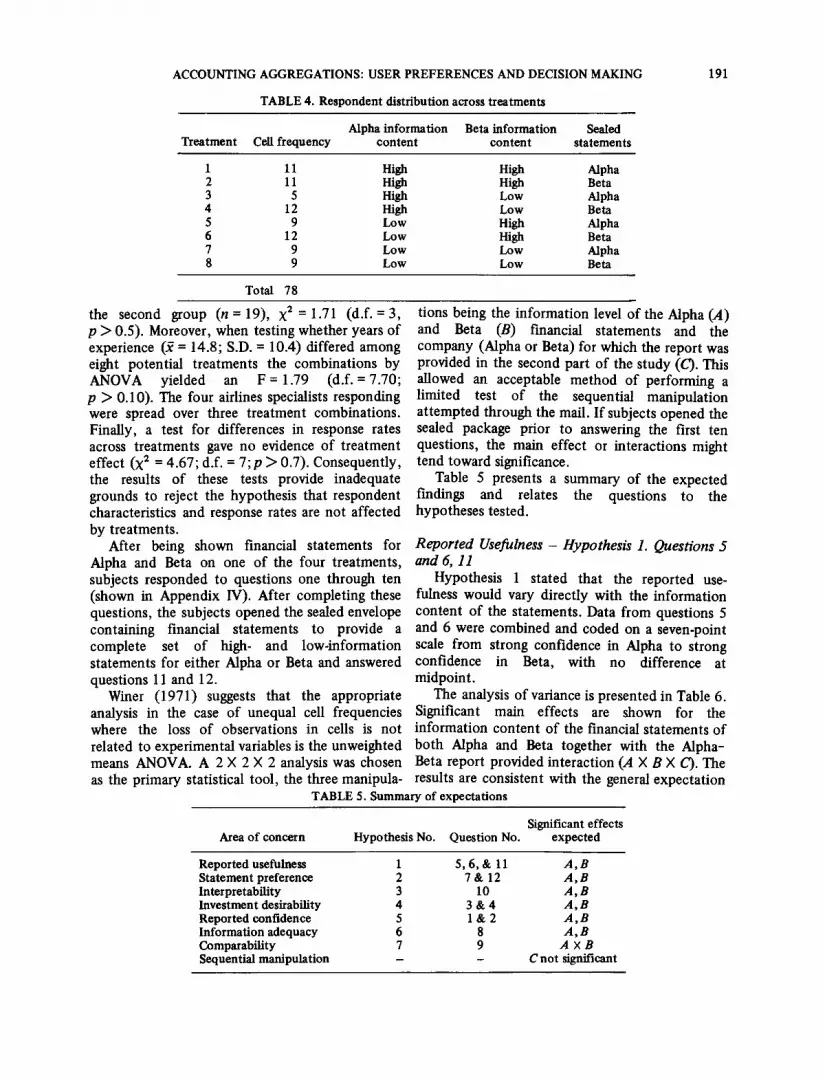
Experimental materials were sent to 298 potential participants at their work addresses and followed up by a reminder letter. Later, another full packet of experimental materials was sent to nonrespondents at their home addresses and followed up by a reminder letter. The final response rate was 26.5% (n --- 79). The number of respondents in each cell is presented in Table 4.
Since nonrespondents were known because of questionnaire coding, follow-up mailings went only to subjects who had not responded. The identity of early and late respondents was not, however, preserved since responses were not dated on receipt. This did not appear to be of importance since all responses were received within a relatively short time period. There was no further follow-up of nonrespondents since the response rate compared favorably with other survey research studies involving security analysts (Buzby, 1974; Ortman, 1975).
Chi-square (X 2) tests were used to detect statistically significant differences among treat- ments for several nominal characteristics of respondents. Analysis of three classifications for primary duties reported - portfolio management (n = 28), security analysis (n = 23), and others (n = 28) - across 4 treatments in Table 3 yielded a X 2 = 8.08 (d.f. = 6; p > 0.2). The organization level data combined into two classifications - senior-level individuals and office managers in the first group (n = 57) and junior-level individuals in
ACCOUNTING AGGREGATIONS: USER PREFERENCES AND DECISION MAKING 191
TABLE 4. Respondent distribution across treatments
Alpha information Beta information Sealed Treatment Cell frequency content content statements
1 11 High High Alpha 2 11 High High Beta 3 5 High Low Alpha 4 12 High Low Beta 5 9 Low High Alpha 6 12 Low High Beta 7 9 Low Low Alpha 8 9 Low Low Beta
Total 78
the second group (n = 19), × : = 1.71 (d . f .=3 , p > 0.5). Moreover, when testing whether years of experience (~ = 14.8; S.D. = 10.4) differed among eight potential treatments the combinations by ANOVA yielded an F = 1.79 (d.f. = 7.70; p > 0.10). The four airlines specialists responding were spread over three treatment combinations. Finally, a test for differences in response rates across treatments gave no evidence of treatment effect (X 2 = 4.67; d.f. = 7; p > 0.7). Consequently, the results of these tests provide inadequate grounds to reject the hypothesis that respondent characteristics and response rates are not affected by treatments.
After being shown financial statements for Alpha and Beta on one of the four treatments, subjects responded to questions one through ten (shown in Appendix IV). After completing these questions, the subjects opened the sealed envelope containing financial statements to provide a complete set of high- and low-information statements for either Alpha or Beta and answered questions 11 and 12.
Winer (1971) suggests that the appropriate analysis in the case of unequal cell frequencies where the loss of observations in cells is not related to experimental variables is the unweighted means ANOVA. A 2 X 2 X 2 analysis was chosen
tions being the information level of the Alpha (A) and Beta (B) t'mancial statements and the company (Alpha or Beta) for which the report was provided in the second part of the study (C). This allowed an acceptable method of performing a limited test of the sequential manipulation attempted through the mail. If subjects opened the sealed package prior to answering the first ten questions, the main effect or interactions might tend toward significance.
Table 5 presents a summary of the expected findings and relates the questions to the hypotheses tested.
Reported Usefulness - Hypothesis 1. Questions 5 and 6, 11
Hypothesis 1 stated that the reported use- fulness would vary directly with the information content of the statements. Data from questions 5 and 6 were combined and coded on a seven-point scale from strong confidence in Alpha to strong confidence in Beta, with no difference at midpoint.
The analysis of variance is presented in Table 6. Significant main effects are shown for the information content of the financial statements of both Alpha and Beta together with the Alpha- Beta report provided interaction (A X B X C). The
as the primary statistical tool, the three manipula- results are consistent with the general expectation TABLE 5. Summary of expectations
Significant effects Area of concern Hypothesis No. Question No. expected
Reported usefulness 1 5, 6, & 11 A, B Statement preference 2 7 & 12 A, B Interpretability 3 10 A, B Investment desirability 4 3 & 4 A, B Reported confidence 5 1 & 2 A , B Information adequacy 6 8 A, B Comparability 7 9 A × B Sequential manipulation - - C not significant

192 DAVID W. HARVEY, JOHN GRANT RHODE and KENNETH A. MERCHANT
and strong enough to reject the null hypothes is o f no difference in repor ted usefulness.
Quest ion 11 asked the subjects to indicate whe ther the high- or low- informat ion financial
Statement Preference - Hypothesis 2. Questions 7, 12
Similar to the repor ted usefulness hypothes is , it was expec ted that subjects would prefer to use the
TABLE 6. Usefulness ANOVA - hypothesis 1
Source of variation d.f. Mean square F
A : Alpha information level 1 39.5417 35.1335 B: Beta information level 1 20.3427 18.0748 C: Firm for second part 1 1.1898 1.0571 A X B 1 0.0119 0.0106 A × C 1 0.1856 0.1649 B × C 1 0.1856 0.1649 A × B X C 1 4.6173 4.1026
Within cell 70 1.1255
Total 77
F(0.01; 3, 60) = 4.13. F(0.025; 3, 60) = 3.46. F(0.05; 3, 60) = 2.76. F(0.10; 3, 60) = 2.18. F(0.25; 3, 60) = 1.41.
TABLE 7. Preference ANOVA - hypothesis 2
Source of variation d.f. Mean square F
A: Alpha information level 1 44.1416 19~4946 B: Beta information level 1 26.0005 11.4828 C: Firm for second part 1 0.4901 0.2164 A X B 1 4.1249 1.8217 A X C 1 0.1943 0.0858 B × C 1 0.0174 0.0077 A X B X C 1 2.2643
Within cell 68
Total 75
F(0.01; 3, 60) = 4.13. F(0.025; 3, 60) -- 3.46. F(0.05; 3, 60) = 2.76. F(0.10; 3, 60) = 2.18. F(0.25; 3, 60) = 1.14.
s ta tements o f the same company were perceived as more useful and it was expec ted that they would prefer the h igh- informat ion s ta tements . The normal approx ima t ion to the b inomial dis t r ibut ion was used to compu te a score cor rec ted for con t inu i ty to de termine the probabi l i ty o f each response f requency ou tcome . In every case, the F-statistic was significant at the 0.01 level, indicat ing that the h igh- informat ion s ta tements were perceived as more useful.
h igh- informat ion s ta tements . Table 7 presents the analysis o f variance wi th the responses to ques t ion 7 as the dependen t variable. The statist ically significant main effects for the Alpha and Beta s ta tements ' i n fo rma t ion level indicate a substantial preference for the high in fo rma t ion s ta tements . An F-test on the preferences expressed in ques t ion 12 when two sets o f s ta tements were available for the same f i rm also revealed a dif ference significant at the 0.01 level in favor o f the h igh- informat ion
ACCOUNTING AGGREGATIONS: USER PREFERENCES AND DECISION MAKING 193
s ta tements .
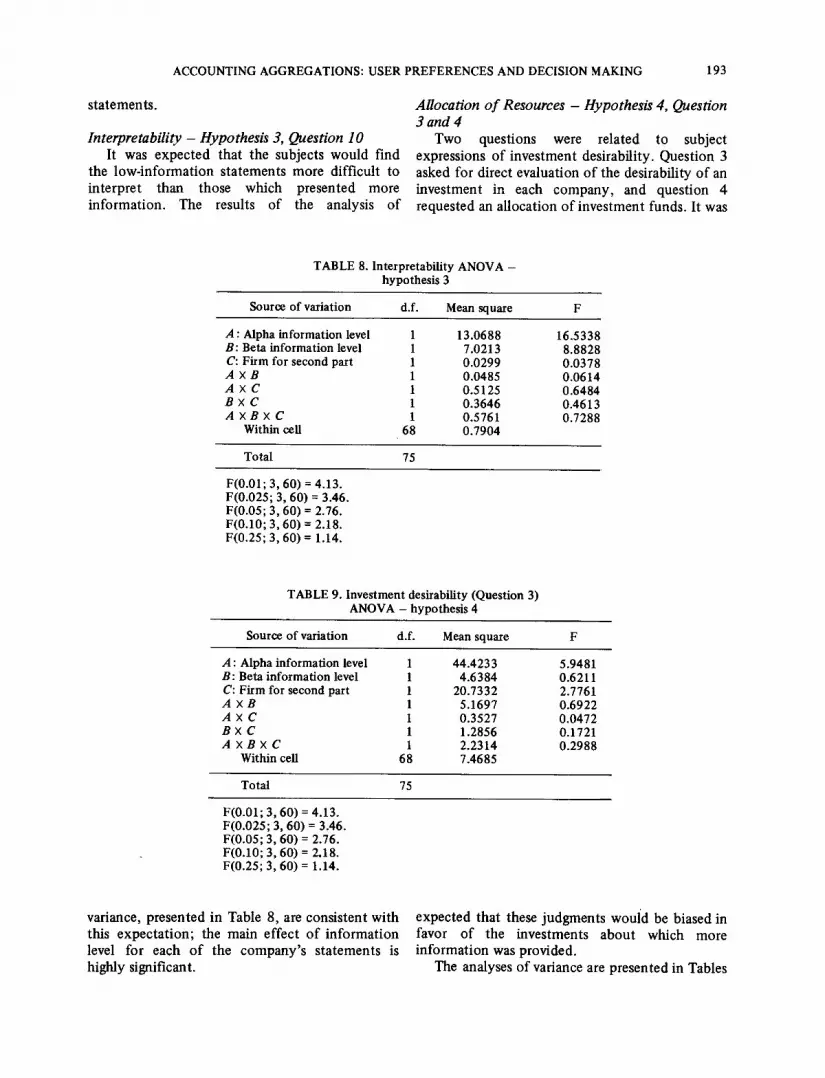
Interpretability - Hypothesis 3, Question 10 It was expec ted that the subjects would find
the low- informat ion s ta tements more diff icult to in terpre t than those which presented more informat ion . The results o f the analysis o f
Allocation o f Resources - Hypothesis 4, Question 3 and 4
Two questions were related to subject expressions o f inves tment desirabili ty. Quest ion 3 asked for direct evaluat ion o f the desirability o f an investment in each company , and quest ion 4 requested an a l locat ion o f inves tment funds. It was
TABLE 8. Interpretability ANOVA - hypothesis 3
Source of variation d.f. Mean square F
A : Alpha in formation level 1 13.0688 16.5338 B: Beta information level 1 7.0213 8.8828 C: Firm for second part 1 0.0299 0.0378 A X B 1 0.0485 0.0614 A X C 1 0.5125 0.6484 B X C 1 0.3646 0.4613 A X B X C 1 0.5761 0.7288
Within cell 68 0.7904
Total 75
F(0.01; 3, 60) = 4.13. F(0.025; 3, 60) = 3.46. F(0.05; 3, 60) = 2.76. F(0.10; 3, 60) = 2.18. F(0.25; 3, 60) = 1.14.
TABLE 9. Investment desirability (Question 3) ANOVA - hypothesis 4
Source of variation d.f. Mean square F
A: Alpha information level 1 44.4233 5.9481 B: Beta information level 1 4.6384 0.6211 C: Firm for second part 1 20.7332 2.7761 A X B 1 5.1697 0.6922 A X C 1 0.3527 0.0472 B × C 1 1.2856 0.1721 A X B X C 1 2.2314 0.2988
Within cell 68 7.4685
Total 75
F(0.01; 3, 60) = 4.13. F(0.025; 3, 60) = 3.46. F(0.05; 3, 60) = 2.76. F(0.10; 3, 60) = 2.18. F(0.25; 3, 60) = 1.14.
variance, presented in Table 8, are consistent wi th this expec ta t ion ; the main ef fec t o f in format ion level for each o f the company ' s s ta tements is highly significant.
expec ted that these judgments would be biased in favor o f the investments about which more in format ion was provided.
The analyses o f variance are presented in Tables
194 DAVID W. HARVEY, JOHN GRANT RHODE and KENNETH A. MERCHANT
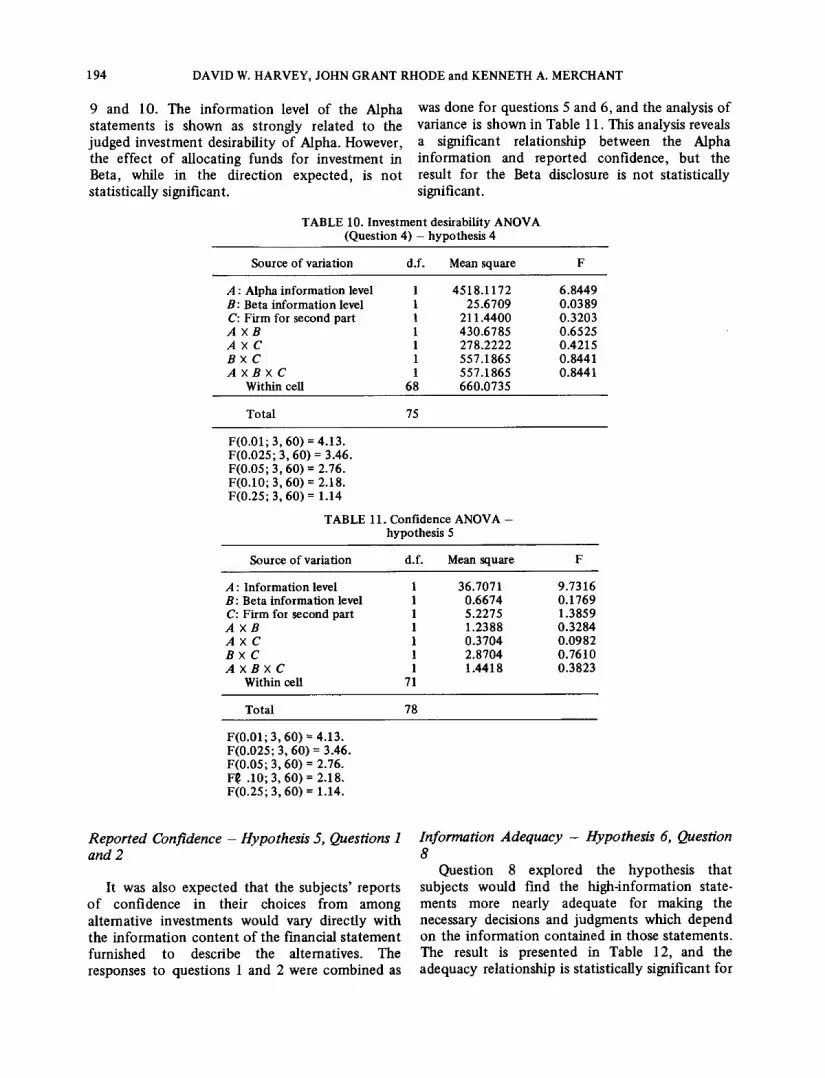
9 and 10. The in fo rmat ion level o f the Alpha s ta tements is shown as s t rongly related to the judged inves tment desirabili ty o f Alpha. However , the ef fec t o f al locat ing funds for inves tment in Beta, while in the di rect ion expec ted , is no t statist ically significant.
TABLE 10. Investment desirability ANOVA (Question 4) - hypothesis 4
was done for quest ions 5 and 6, and the analysis o f variance is shown in Table 11. This analysis reveals a significant relat ionship be tween the Alpha in fo rmat ion and repor ted conf idence , but the result for the Beta disclosure is no t statistically significant.
Source of variation d.f. Mean square F
A : Alpha information level 1 4518.1172 6.8449 B: Beta information level 1 25.6709 0.0389 C: Firm for second part 1 211.4400 0.3203 A X B 1 430.6785 0.6525 A X C 1 278.2222 0.4215 B X C 1 557.1865 0.8441 A X B X C 1 557.1865 0.8441
Within cell 68 660.0735
Total 75
F(0.01; 3, 60) = 4.13. F(0.025; 3, 60) = 3.46. F(0.05, 3, 60) = 2.76. F(0.10; 3, 60) = 2.18. F(0.25; 3, 60) = 1.14
TABLE 11. Confidence ANOVA - hypothesis 5
Source of variation d.f. Mean square F
A : Information level 1 36.7071 9.7316 B: Beta information level 1 0.6674 0.1769 C: Firm for second part 1 5.2275 1.3859 A X B 1 1.2388 0.3284 A X C 1 0.3704 0.0982 B X C 1 2.8704 0.7610 A X B X C 1 1.4418 0.3823
Within cell 71
Total 78
F(0.01; 3, 60) -- 4.13. F(0.025; 3, 60) = 3.46. F(0.05; 3, 60) = 2.76. FI~ .10; 3, 60) = 2.18. F(0.25; 3, 60) = 1.14.
Reported Confidence - Hypothesis 5, Questions 1 and 2
It was also expec ted that the subjects ' reports o f conf idence in their choices f rom among al ternative inves tments would vary direct ly wi th the in fo rmat ion con ten t o f the financial s t a tement furnished to describe the alternatives. The responses to quest ions 1 and 2 were combined as
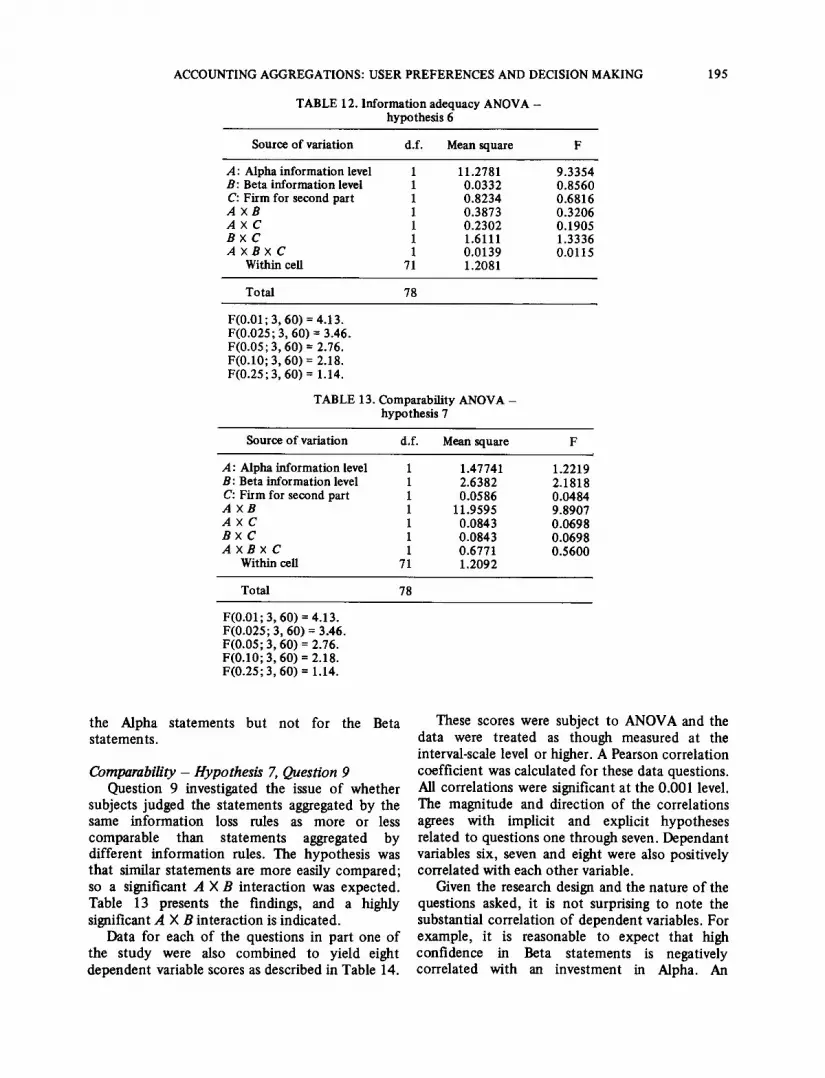
Information Adequacy - Hypothesis 6, Question 8
Quest ion 8 explored the hypothes is that subjects would find the h igh- informat ion state- ments more nearly adequate for making the necessary decisions and judgments which depend on the in fo rmat ion con ta ined in those s ta tements . The result is presented in Table 12, and the adequacy relat ionship is statistically significant for
ACCOUNTING AGGREGATIONS: USER PREFERENCES AND DECISION MAKING 195
TABLE 12. Information adequacy ANOVA - hypothesis 6
Source of variation d.f. Mean square F
A: Alpha information level 1 11.2781 9.3354 B: Beta information level 1 0.0332 0.8560 C: Firm for second part 1 0.8234 0.6816 A X B 1 0.3873 0.3206 A X C 1 0.2302 0.1905 B X C 1 1.6111 1.3336 A X B X C 1 0.0139 0.0115
Within cell 71 1.2081
Total 78
F(0.01; 3, 60) = 4.13. F(0.025; 3, 60) = 3.46. F(0.05; 3, 60) = 2.76. F(0.10; 3, 60) = 2.18. F(0.25; 3, 60) = 1.14.
TABLE 13. Comparability ANOVA - hypothesis 7
Source of variation d.f. Mean square F
A: Alpha informatmn level 1 1.47741 1.2219 B: Beta information level 1 2.6382 2.1818 C: Firm for second part 1 0.0586 0.0484 A x B 1 11.9595 9.8907 A x C 1 0.0843 0.0698 B x C I 0.0843 0.0698 A X B x C I 0.6771 0.5600
Within eeH 71 1.2092
Toml 78
F(0.01; 3, 60) = 4.13. F(0.025; 3, 60) = 3.46. F(0.05; 3, 60) = 2.76. F(0.10; 3, 60) = 2.18. F(0.25; 3, 60) = 1.14.
the Alpha statements but not for the Beta statements.
Comparability - Hypothesis 7, Question 9 Question 9 investigated the issue of whether
subjects judged the statements aggregated by the same information loss rules as more or less comparable than statements aggregated by different information rules. The hypothesis was that similar statements are more easily compared; so a significant A X B interaction was expected. Table 13 presents the findings, and a highly significant A X B interaction is indicated.
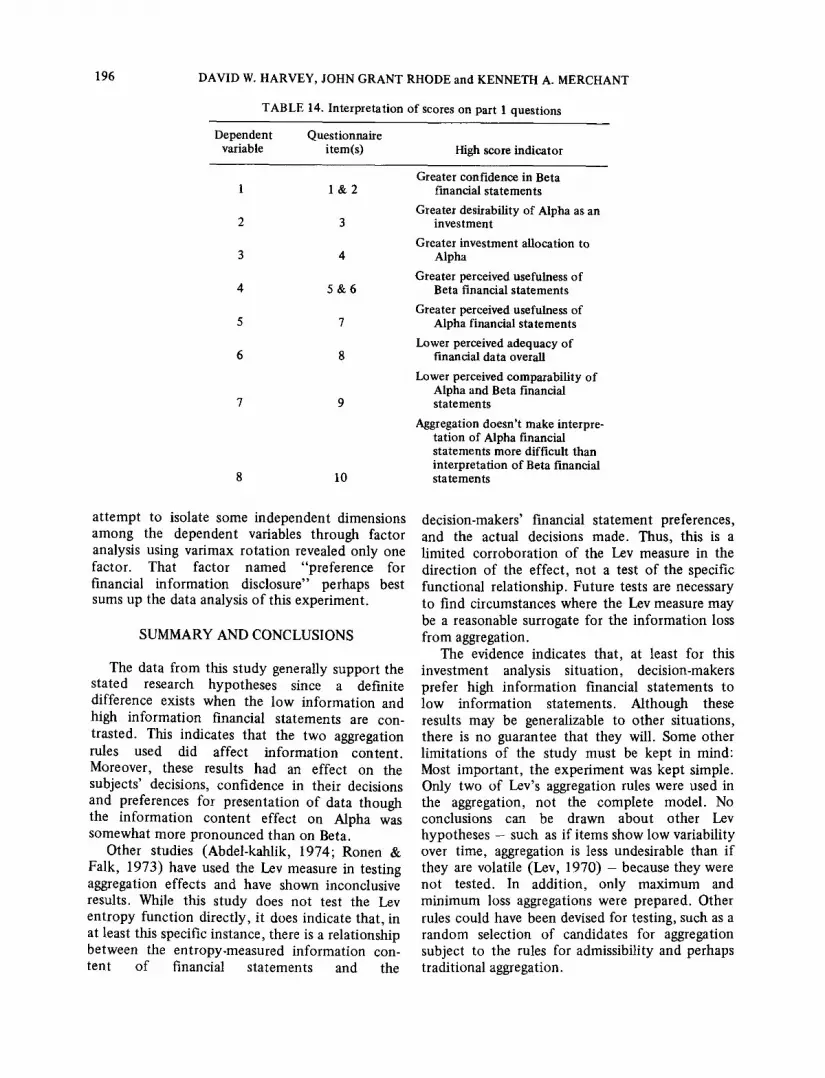
Data for each of the questions in part one of the study were also combined to yield eight dependent variable scores as described in Table 14.
These scores were subject to ANOVA and the data were treated as though measured at the interval-scale level or higher. A Pearson correlation coefficient was calculated for these data questions. All correlations were significant at the 0.001 level. The magnitude and direction of the correlations agrees with implicit and explicit hypotheses related to questions one through seven. Dependant variables six, seven and eight were also positively correlated with each other variable.
Given the research design and the nature of the questions asked, it is not surprising to note the substantial correlation of dependent variables. For example, it is reasonable to expect that high confidence in Beta statements is negatively correlated with an investment in Alpha. An
196 DAVID W. HARVEY, JOHN GRANT RHODE and KENNETH A. MERCHANT
TABLE 14. Interpretation of scores on part 1 questions
Dependent Questionnake variable item(s) High score indicator
1 l & 2
2 3
3 4
4 5 & 6
5 7
6 8
7 9
8 10
Greater confidence in Beta financial statements
Greater desirability of Alpha as an investment
Greater investment allocation to Alpha
Greater perceived usefulness of Beta financial statements
Greater perceived usefulness of Alpha financial statements
Lower perceived adequacy of financial data overall
Lower perceived comparability of Alpha and Beta financial statements
Aggregation doesn't make interpre- tation of Alpha financial statements more difficult than interpretation of Beta financial statements
a t tempt to isolate some independent dimensions among the dependent variables through factor analysis using varimax rotat ion revealed only one factor. That factor named "preference for financial information disclosure" perhaps best sums up the data analysis of this experiment.
SUMMARY AND CONCLUSIONS
The data from this s tudy generally support the stated research hypotheses since a definite difference exists when the low information and high information financial statements are con- trasted. This indicates that the two aggregation rules used did affect information content . Moreover, these results had an effect on the subjects' decisions, confidence in their decisions and preferences for presentation of data though the information content effect on Alpha was somewhat more pronounced than on Beta.
Other studies (Abdel-kahlik, 1974; Ronen & Falk, 1973) have used the Lev measure in testing aggregation effects and have shown inconclusive results. While this study does not test the Lev entropy function directly, it does indicate that, in at least this specific instance, there is a relationship between the entropy-measured information con- tent of financial statements and the
decision-makers' financial statement preferences, and the actual decisions made. Thus, this is a l imited corroborat ion of the Lev measure in the direction of the effect, not a test of the specific functional relationship. Future tests are necessary to find circumstances where the Lev measure may be a reasonable surrogate for the information loss from aggregation.
The evidence indicates that, at least for this investment analysis si tuation, decision-makers prefer high information financial statements to low information statements. Although these results may be generalizable to other situations, there is no guarantee that they will. Some other l imitations of the study must be kept in mind: Most important , the experiment was kept simple. Only two of Lev's aggregation rules were used in the aggregation, not the complete model. No conclusions can be drawn about other Lev hypotheses - such as if i tems show low variability over time, aggregation is less undesirable than if they are volatile (Lev, 1970) - because they were not tested. In addition, only maximum and minimum loss aggregations were prepared. Other rules could have been devised for testing, such as a random selection of candidates for aggregation subject to the rules for admissibility and perhaps tradit ional aggregation.

ACCOUNTING AGGREGATIONS: USER PREFERENCES AND DECISION MAKING 197
The volume of data provided here was probably not large enough to effect a data overload situation which could provide the substance for further experimentation.
Research results demonstrate that the volume of information processed is related to environ- mental load, one component of which is information complexity. In addition, mounting evidence suggests a more elaborate model relating preference for complex information to decision style (Driver & Mock, 1975).
Further research on aggregation is needed in many areas. The entropy measure is presently the only available quantitative measure of information in accounting. Evidence should be gathered about the usefulness of the measure, in what situations it is a useful surrogate for the expected information loss caused by aggregation and whether it is the most precise measure of information that can be found. I f the evidence looks promising, researchers may find ways to eliminate or reduce the mechanical problems of applying the measure.
Another difficulty lies in measuring the information content and effect of paragraph or context material which is often used instead of expanded financial statements. Failure to com- prehend these effects greatly limits the usefulness of a measure of information content or loss.
There is a wide range of behavioral variables which are potential ly relevant in a search for the
optimal aggregation strategy. Information can only be useful to the extent it is communicated. Presenting data in different categories and using different titles in future studies may yield some interesting results. Limits to human information processing ability (data overload) in accounting related situations also needs further clarification.
These suggested extensions have discussed only the effects of already prepared financial state- ments on users. It might also be valuable to examine the actual behavior of accountants as they prepare financial statements, to see, for example, to what extent they use a minimum information loss rule - or just what criteria they do use when aggregating accounting information.
Financial statement presentation is not the only aggregation problem-related area in accounting. Aggregation decisions must be made in areas such as installation of charts of accounts and design of management information systems.
Information can be lost in aggregation, and the accounting literature has just begun to yield limited insight into the nature of the aggregation- information loss relationships. A knowledge of these relationships may develop such that aggregation rules can be proposed to replace, at least in part, the traditional and more subjective guides to aggregation presently in use. This study is, hopefully, a step in that direction.
BIBLIOGRAPHY
Abdel-khalik, A. R., The Entropy Law, Accounting Data and Relevance to Decision-Making, The Accounting Review (April, 1974), pp. 271-283.
Barefield, R.M., The Effects of Aggregation on Decision Making Success: A Laboratory Study, Journal o f Accounting Research (Autumn, 1972), pp. 229-242.
Bernhardt, I. & Copeland, R. M., Some Problems in Applying an Information Theory Approach to Accounting Aggregation, Journal o f A ccounting Research (Spring, 1970), pp. 95 -98.
Buzby, S. L., Selected Items of Information and Their Disclosure in Annual Reports, The Accounting Review (July, 1974), pp. 423-435.
Dermer, J. D., Cognitive Characteristics and the Perceived Importance of Information, The Accounting Review (July, 1973), pp. 511-519.
Driver, M.J. & Mock, T. J., Human Information Processing, Decision Style Theory and Accounting Information Systems, The Accounting Review (July, 1975), pp. 490-508.
Grilliches, A. & Grunfeld, Y., Is Aggregation Necessarily Bad? Review o f Economics and Statistics (February, 1960), pp. 1-13.
Hofstedt, T. R., Some Behavioral Implications of Aggregation in Accounting Reports. Unpublished Ph.D. dissertation, Stanford University, 1970.
Horowitz, A. R. & Horowitz, I., The Real and Illusory Virtues of Entropy-Based Measures for Business and Economic Analysis, Decision Sciences (January, 1976), pp. 121-136.
Laub, P. M., Some Aspects of the Aggregation Problem in Dividend Earnings Relationships, Journal o f the American Statistical Association (September, 1972), pp. 557 -559.

198 DAVID W. HARVEY, JOHN GRANT RHODE and KENNETH A. MERCHANT
Lev, B., The Aggregation Problem in Financial Statements: An Informational Approach, Journal of Accounting Research (Autumn, 1968), pp. 247-261.
Lev, B., Accounting and Information Theory (Sarasota, Florida: American Accounting Association, 1969).
Lev, B., The Informational Approach to Aggregation in Financial Statements: Extensions, Journal of Accounting Research (Spring, 1970), pp. 78-94.
Miller, H., Environmental Complexity and Financial Reports, The Accounting Review (January, 1972), pp. 31-37.
Orcutt, G. H., Watts, H. W. & Edwards, J. B., Should Aggregation Prior to Aggregation Be the Rule? Review of Economics and Statistics (November, 1969), pp. 409-420.
Orcutt, G.H., Data Aggregation and Information Loss, American Economic Review (September, 1968), pp. 773-787.
Ortman, R. F., The Effects on Investment Analysis of Alternative Reporting Procedure for Diversified Firms, The Accounting Review (April, 1975), pp. 298-304.
San Miguel, J. G., Human Information Processing and lts Relevance to Accounting: A Laboratory Study, Accounting Organizations and Society (1976), pp. 357-373.
Schroeder, H. M., Driver, M. J. & Streufert, S., Human Information Processing (Ronald Press, 1971). Stallman, J.C., Toward Experimental Criteria for Judging Disclosure Improvement, Empirical
Research in Accounting." Selected Studies, 1969, Journal o f Accounting Research (Supplement to volume 7), 1970, pp. 29-43.
ACCOUNTING A G G R E G A T I O N S : USER P R E F E R E N C E S AND DECISION MAKING 199
~ 5
['- z
0 Z
o
~ z [.-, m ~ M =
Z
Z
r..)
= [..,,
M ~
o Z o r~
.~.~-~ ~ ~ ~
~ z ~ ' ~
,-,.i
~ , ~ m ~
g ~
"6 .~
z
"T
I
[-, z
~ o ~
z ~ ~ 8 o 8 i ~
g
~ = o Eo=~ ~ ~o~ ~ ~= ~
o ~ . . = ~ ° o ~ "~" o r ~ ~- ~ ~ ~ ~'~
= - - ~ ~ . ~
o z -~
i ; 0

200 DAVID W. HARVEY, JOHN G R A N T RHODE and KENNETH A. MERCHANT
o ~
0 ~ , . o o ~ .,9.
.~ ~ = ~ , ~ o ~ ~ ~ .- ~
u ~ e,
c.,I r-~ o c ~
0 ' ~ "~ ~ e ~
~ . . 0 0
~ ~ ~.~
0
M 0 r~ Z 0
<
.=~ ~ .~
e
6
O 0 ~-~ ~ "
0
~, ~.~ ~ ~ ~ -~
. ~ . ~ . - ~ ~ ~ ~ - ~
.=,,~,"~ = o '~ ~ ~ ~ ~ -~
e ~
0
oo
Oh
I
o
~'~oo o o ¢ ~
o .~ ~ .~,
~ . 8"'~ ~ ~ o = ~ =
ACCOUNTING AGGREGATIONS: USER P R E F E R E N C E S AND DECISION MAKING 201
Z <
¢o
g,
m ~ z ~ ~ 0 ~ , ~
<~z N ~[. . ,
[ . . ,~
Z 0
;2
8 0
7
i
b~ ~.~ '~ ~ ' ~
. . . . ~ o = = '~. ~ , o~o~_~ ~ ~ , ~ o~ ~ - -
~ ~.~ ~
0 ;~ ~ ' ~ 0 ~ ~
e.~
Z
M ~
8
i:i , - e ~ m ~
0 i$
..g=- • ,~ & ~ 8 o
. ~
0
0 ° ~
..=
~ o o =
'.=l .~ o o.~ ~
~:i, 0a
i
o,g" ¢',1 ~ o ~Slg
= ~ .g,
~a 0a
, . 0 ,.. ~ ~1~
o ' ~
~ o . . K ~ ~ ~" ~ a ~ o ~ ° ' ~
~o ~ 8 -= 0 ca
Z -=
8
Z
202 DAVID W. HARVEY, JOHN GRANT RHODE and KENNETH A. MERCHANT
0 cq
o ~ . ~ ~ ~ = ~ . ~ ,;o
< ~ - , . ~ ~ ~= ~: ~ . ~ : ~ , . . n o ~ ~ o o ~ , - . u o o ~ i~ '~ ~ ' ~ ' ~ ~ ' ~ ' ~
~ " 1~1 ' '~ ~
[..., ~a
r ~
~ Z z ~ ' ~
Z ©
[-,
.<
~:~ ~ - -
g
t"-t ¢-I
o
e..
L'~ ~ ~ . . ~ . ~ ' ~ i : :
©
O . ~ "0 0
"~ ~ ° ~ o
i
0
ACCOUNTING AGGREGATIONS: USER PREFERENCES AND DECISION MAKING 203
<
z o <
o
~ 0 ~ 1 i ~ 0
E~ z • < ?
o ~ ~ . . . ~
z ~ z . . °
~ ~ ~ ~ ~ ~ .~ • ~ ~ . . ~ ~ .-
o ~ . - . ~ ~ ~ . = 0: o ~ E
2 ~ z
I : o
o ~ ~,
[..
e a o o ~ o ~ M~ ~ o ~ ~ ~, "~ .-
, ' ' ~ E
~ ~ ~ ~ -
• . ~ = ~. ~ = " ~ a
• ~ . ~ ~ • ~ ~ ' - ~ ~
o o
o ~ "
e~
0 ' , ~
~.~ ~ 0 • = = ~_~ ~
0 z
8
o
. . . 0 ~0
aJ 0
¢~ o ' o ~
o .~
~z 0
204 DAVID W. HARVEY, JOHN GRANT RHODE and KENNETH A. MERCHANT
~y
o ~ ~ -~ ~: ~ o . .
0
g ° ,.-1
0 ~
o c t - - ~ o"
~ ~ 4~,~ ~ ~ ~.~,~,~ ~
~ ~ O ~ - q "~ o
0
[.-,
r ~
o z 8
r ~
< e ' ~ 0 ~
g
( 'q r-.~ o0 0 ~ -
0 ' ,o 0", o~
" ~ o ~ ~
~ , ~ , ~ . ~ = ~
'~o~ ~ ~ ~ ~ ~ ~
~ _ s ~ ~=~.~, ,~ ~
~ . . ~ ~ o
o~ o
o C: " ~
~ ~ 0 ~ ~ ~ ~ ~ 0 , ~
0 [...,
ACCOUNTING AGGREGATIONS: USER PREFERENCES AND DECISION MAKING 205
z .<
M
z e
7
~-~, ~ ~ ~ ~.~
' ~ , - ~ o ~ ~ : ~ . ~ ~ ~ o -
~ . = ~ , ' - .~ ~'~ o . 3 ~ o o
0
t-- r-- ~" ~4~1 C'I 0"I a s , ~
0~. O0 i N V")
Z ~
Q
. . o o ~ o ~ = . ~ . ~ - = = [ ' ~ o = ~, ° ' ~ - ~ ,
C)., ~ 0 o o
' 0
o o .~
.-=
0 ,1:3 0 ~
o T .
X
8 ..=
0
206 DAVID W. HARVEY, JOHN GRANT RHODE and KENNETH A. MERCHANT
o ~ .~- ~ ~'.~
' - ~=.~ ~ ~ < ~ "~ = . .
~ o ~ , ~ .~ ~ .~ '~
~ ,.., ~ ~i ~ . = ~ .-
~0
o.~ o ~ ~ ~ ~ "~ ~ ~ ~ ' 1 ~ . ~ ~ o , . ~ ~ " ~
o z 8
~ , ~ o , . ~ ,T-
I ~D
' ~ = ~
~ o ~
0~ =~.~ • ~ o
~.N,
• " ~ 0 ~ ~'~ ~ 0 0
o~ 0 ¢~ ,.~ ~ ~
o -=

ACCOUNTING AGGREGATIONS: USER PREFERENCES AND DECISION MAKING 207
APPENDIX II DESCRIPTION OF THE ENTROPY M E A S U R E M E N T P R O C E D U R E
To illustrate a simple entropy calculation, logarithms to any base may be used because, as monotonic transformations of each other, the calculations yield the same ranking of entropy losses. If base 2 is used, the units are called binary digits (bits). In this example, logarithms to base 10 are used.
The formula for entropy (H) is: H = ~; - p log p, where p is the proportion of a given account's dollar value compared to the total for the section being considered, in this ease, total assets. Note in this example that the Buildings are shown net of depreciation because logarithms cannot be taken of negative numbers.
Partial balance sheet
I tem Assets p - log p - p log p
Current assets: 1 Cash $ 10,000 0.10 1.0000 0.1000 2 Accounts receivable 40,000 0.40 0.3979 0.1592 3 Prepaid expenses 20,000 0.20 0.6990 0.1398
Fixed assets: 4 Land 15,000 0.15 0.8239 0.1236 5 Buildings - Net 15,000 0.15 0.8239 0.1236
Total assets $100,000 1.00
Total entropy 0.6462
Admissible pairs for aggregation are defined so that the subsections, Current Assets and Fixed Assets, are not violated. The entropy loss for the first admissible pair (Cash and Accounts Receivable) is calculated:
p - log p - p log p
Cash and accounts receivable $ 50,000 0.50 0.3010 0.1505
Since all other items stay the same, the entropy loss from this aggregation is the old entropy minus the new entropy (0.1000 + 0.1592 - 0.1505 = 0.1087). Since the entropy loss is 0.1087, the entropy for this section of the balance sheet with Cash and Accounts Receivable aggregated is 0.6462 - 0.1087 = 0.5375.
A table showing entropy loss for all admissible pairs is as follows:
Admissible pairs Entropy loss
1, 2 0.1087 1, 3 0.0829* 2, 3 0.1659 4, 5 0.1084
The first items to be aggregated under the minimum information loss criterion are (1, 3). If only one aggregation gave the desired volume of data, the procedure would stop here. If another aggregation was desired, the process would be repeated:
Admissible pairs Entropy loss
(1, 3), 2 0.2314 4, 5 0.0903*
The next items to be aggregated under the minimum information loss criterion are (4, 5).

208 DAVID W. HARVEY, JOHN GRANT RHODE and KENNETH A. MERCHANT
A P P E N D I X III
I N S T R U C T I O N S TO S U B J E C T S
This is a financial analysis task. Your job is to help an investor decide how to allocate $20,000 between the common stocks of two companies.
The investor, Mr. Robinson, is a single, professional man in his middle thirties. A confirmed bachelor, he has more than enough income from his practice to live comfortably and has as his primary investment objective long-term capital appreciation. Having decided to invest in the common stock of domestic airlines, he has narrowed the field to two companies, Alpha Airlines and Beta Airlines.
Financial statements for each company are available for the prior year only. Though financial statements are not available for earlier years, it is known that the airlines have had similar records of development, growth and profitability. Their route structures are comparable, with no route changes anticipated for either company in the near future. Neither airline is a likely merger candidate. Assume that general economic and industry factors effect each company in the same way.
Review the following financial statements of Alpha and Beta and answer the questions which come next. Examine the sealed material at the end only when directed to in the instructions.
• It is very important that you answer the questions in order.
• Make whatever notes and calculations are useful on the face of the financial statements.
• Feel free to separate the statements from the other material in this packet if it will aid your analysis.
A P P E N D I X IV
T W E L V E ITEM Q U E S T I O N N A I R E
1. Given the financial statements for the two companies, which would you feel more confident in recommending to the investor described earlier?
Alpha
Beta
No difference
2. Describe your preference. (Do not answer this question if you responded "No difference" in question 1 above.)
Strong
Moderate
Weak
3. In view of the given investment objective (capital appreciation), rate each company on its desirability as an investment by circling the number on the following scale best representing your evaluation.
Alpha
Beta
1 2 3 4 5 6 7 8 9 10 Lowest Highest
1 2 3 4 5 6 7 8 9 10
4. How should the investor allocate his $20,000 between Alpha and Beta?
Alpha % Beta _ _ %
5. The term "Usefulness" may be used to mean the quality of facilitating decision-making. Employing this definition, which firm's set of statements was more useful to you in your analysis.

ACCOUNTING AGGREGATIONS: USER PREFERENCES AND DECISION MAKING
Alpha's
Beta's
No difference
6. Describe the difference in usefulness. (Do not answer this question if you responded "No difference" in question 5 on the previous page.)
Large
Moderate
Small
7. In the context of this decision setting, rate each company's financial statements on its usefulness by circling the number on the following scale best representing your evaluation.
Alpha 1 2 3 4 5 6 7 8 9 10 Lowest Highest
Beta 1 2 3 4 5 6 7 8 9 10
8. I find the financial statement data adequate for me to answer question 1 through 7 above.
strongly strongly agree agree neutral disagree disagree
9. The statements of Alpha and Beta are comparable.
strongly agree agree neutral
strongly disagree disagree
10. The way data items are combined in the financial statements makes interpretation of Alpha statements more difficult than interpretation of Beta statements.
strongly agree
I (Second Phase of the study.)
strongly agree neutral disagree disagree
11. Defining "usefulness" as the quality of facilitating decision making, which set of Alpha statements would be more useful to you in the previous allocation decision if that task were to be repeated?
Set used in task
Set from sealed material
209

210 DAVID W. HARVEY, JOHN GRANT RHODE and KENNETH A. MERCHANT
12. Now consider Alpha's income statements, balance sheets, and funds statements separately. First compare the income statement from the task material with the income statement from the sealed material. Indicate which of these two statements you would prefer if that task were to be repeated. Next compare the balance sheets. Indicate which of these you would prefer. Compare the funds statements and state your preference.
Task Sealed
Income Statement
Balance Sheet
Funds Statement