interior post-tensioned slab-column connections subjected to cyclic lateral loading
TRANSCRIPT
Proceedings of the 8th U.S. National Conference on Earthquake Engineering April 18-22, 2006, San Francisco, California, USA
INTERIOR POST-TENSIONED SLAB-COLUMN CONNECTIONS SUBJECTED TO CYCLIC LATERAL LOADING
Thomas H.-K. Kang1, Seong-Hoon Kee2, Sang Whan Han3,
Li-Hyung Lee4, and John W. Wallace5
ABSTRACT In high seismic regions, post-tensioned (PT) slab-column frames are commonly
used to support gravity loads in conjunction with a lateral-force resisting system (LFRS; e.g., a core wall). The LFRS is designed to resist 100% of the design lateral forces as well as to limit lateral displacements to an acceptable level, whereas the slab-column frame must sustain the gravity loads under the expected (design) displacements. Given the relatively sparse data on the seismic performance of PT flat plate frames, cyclic tests of four interior PT slab-column connections were conducted. Primary test variables were the level of gravity shear at the slab-column connection and the slab tendon arrangement. Test results indicate that both the test variables strongly influence the cyclic behavior of the PT connections, and that the use of slab bottom reinforcement at the slab-column connection was effective in resisting positive moment developed under lateral loading as well as improving the hysteretic energy dissipation capacity.
Introduction Slab-column framing is popular because it offers distinct advantages such as low cost due to ease of construction (e.g., slip forms), low floor-to-floor height, and flexible use of space. In particular, post-tensioned (PT) flat plate slab systems are very efficient, since the PT flat plate slab systems provide improved crack and deflection control, and allow relatively large slab span-to-thickness ratios, on the order of 35 to 45. Slab-column frames are commonly used to resist gravity loads in high seismic regions (SDC-D or –E, IBC-03); however, they may be utilized as intermediate moment frames (ACI 318-05 Section 21.12.6) in areas with moderate seismic demands. Given the broad potential applications, a detailed understanding of slab-column frame behaviour subjected to lateral forces and/or displacements is important. According to the seismic provisions in ACI 318-05, structural systems are either designated to resist earthquake forces (i.e., be part of the LFRS) or they are referred to as “non-participating” systems or “gravity” force resisting systems (GFRS). In high seismic regions, post-tensioned slab-column frames are commonly used for GFRS, particularly for residential and office buildings where the LFRS consists of shear walls or moment resisting frames at the 1Faculty Fellow, Dept. of Civil Engineering, University of California (UCLA), Los Angeles, CA 90095 2Former Research Assistant, Division of Architectural Engineering, Hanyang University, Seoul, Korea 3Associate Professor, Division of Architectural Engineering, Hanyang University, Seoul, Korea 4Vice Chancellor and Professor, Division of Architectural Engineering, Hanyang University, Seoul, Korea 5Professor, Dept. of Civil Engineering, University of California (UCLA), Los Angeles, CA 90095
Paper No. 258
building perimeter. When subjected to earthquake ground motions, the LFRS undergoes lateral deformations, which are imposed on the GFRS through the floor diaphragms. The lateral displacements imposed on the slab-column frame are likely to introduce significant unbalanced moments on the slab-column connections, increasing the potential for punching failures. Prior to the introduction of ACI 318-05, no specific requirements existed to avoid punching failures at slab-column connections in GFRS due to the lateral displacement of the LFRS. However, the ability to maintain gravity loads after punching failure (i.e., post-punching resistance) could be justified due to the ACI 318 Chapter 7 requirement for integrity reinforcement (continuous bottom reinforcement through the column cage). Available seismic provisions for the flat plate systems (e.g., ACI 318-05 S21.11) focus on conventional non-prestressed slab-column connections, similar provisions for prestressed post-tensioned slab-column connections do not exist. In particular, very limited testing has been conducted on the PT interior connections subjected to reversed cyclic loads (Qaisrani, Pimanmas et al.). For PT flat plate systems with shear reinforcement, existing data are limited to the shake table tests of an approximately one-third scale, two story, post-tensioned flat plate frame (Kang and Wallace 2005). Therefore, seismic performance of the PT connections, which tend to have relatively high gravity shear ratios due to the substantial spans, have not been adequately studied. As well, the impact of the tendon arrangement, which typically involves the use of banded tendons in one direction and distributed tendons in the other direction, has not been systematically assessed, and the influence of bonded bottom reinforcement on the behavior of PT flat plate systems subjected to moment reversal has not been addressed.
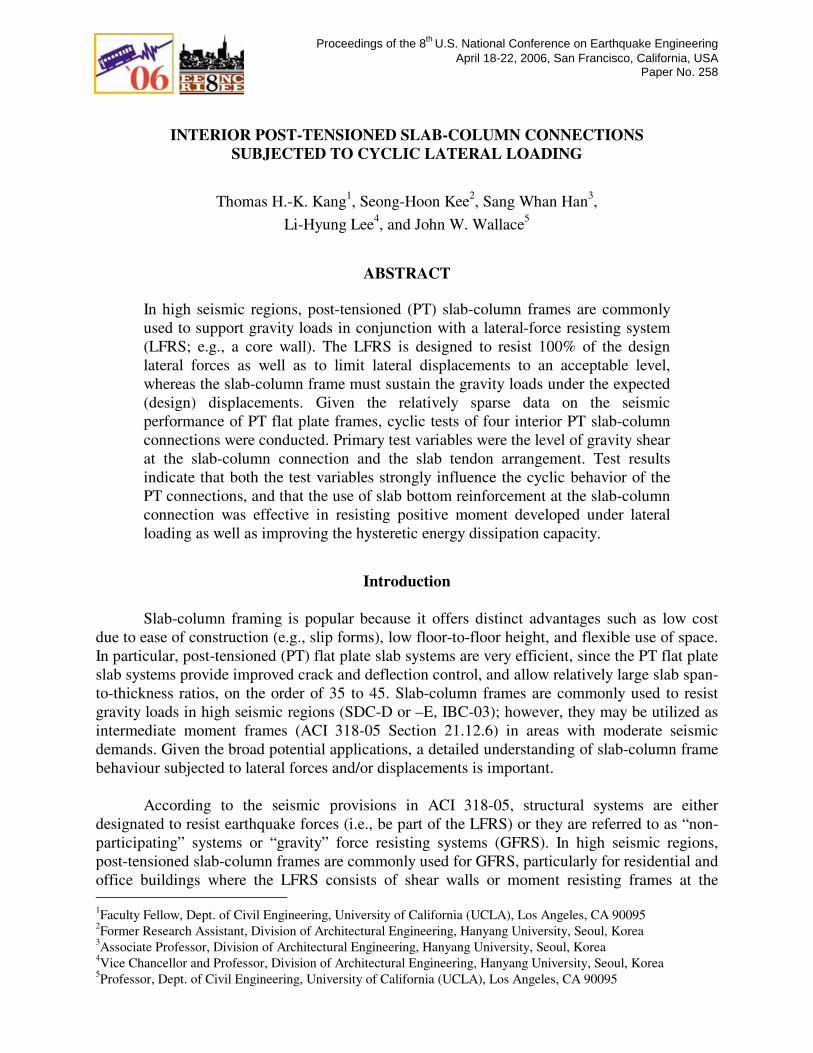
Test Programs Prototype and Specimen Design Figure 1 depicts the prototype building selected to assist in the determination of specimen proportions and details. The prototype building is a ten-story, post-tensioned flat plate slab system with 3.5 m story heights with special reinforced concrete (RC) shear walls (R = 6) designed according to IBC-03 and ACI 318-05 requirements for Seismic Design Category E (SDC-E, high seismic risk). A slab thickness of 220 mm and a span length of 8 m were selected for the prototype building, resulting in a span-to-thickness ratio of 36, which is within the range of 35 to 45 typically used for PT flat plate construction. The shear walls were designed to resist the lateral forces, whereas the PT flat plate systems were proportioned to support gravity forces.
Given that the prototype building is used for typical residential/office construction, the unit weight of the building is estimated as 23.5 kN/m3. Additional dead loads of 0.5 kPa and live loads of 2 kPa were chosen based on recommendations in IBC-03. Slab moments and shear forces due to factored gravity loads were determined based on the results of an elastic analysis.
The specimens were approximately two-thirds scale representations of a typical interior slab-column connection within the prototype building (Figure 1). For substantial lateral loads, inflection points were assumed to occur near slab midspan, resulting in a span length of 4.6 m for the loading direction. A slightly shorter span length of 3.6 m was used in the transverse direction. A 300 x 300 mm column cross section and a 130 mm slab thickness were selected
based on the two-thirds scale factor.
10 @
3.5m
8.08.08.0 8.0 8.0
8.0
8.0
8.0
8.0
8.0
3.5
8.08.08.0 8.0 8.0
(b) Plan(a) Elevation
8.0
8.0
Unit: m
Figure 1. Prototype building.
100
820
900
90013
90
150
1800
40
c2+
3h
4600
1390
4-S
WP
C7B
@12
0
4-SWPC7B@700
4-D
10@
100
4-SWPC7B@700 150100
Loading DirectionE W
TC 8 TC 7 TC 6 TC 5
TC
1T
C 2TC
3
TC
4
Top
Unit: mm
rebars
c2+
4h
TC 4
Unit: mm
100 150150
4-SWPC7B@120
4-D
10@
100
40
1800
900
900
c+
3h
Loading Direction
3-S
WP
C7B
@70
010
035
03-
SW
PC
7B@
700
350
4600
2
WE
Toprebars
TC
1T
C 2
TC
3
TC 5
TC 7
TC 6
c+
8h
2
(a) PI-B50 and PI-B30 (b) PI-D50 and PI-D30
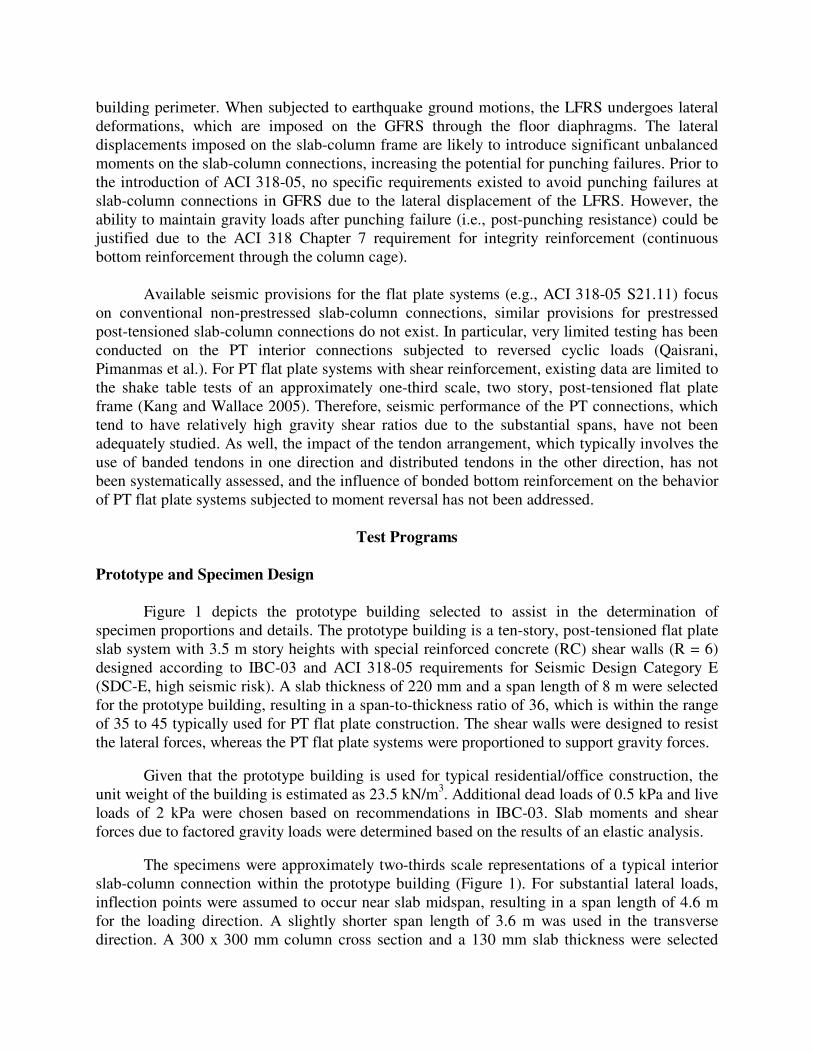
Figure 2. Details of unbonded tendons and bonded top rebars of specimens.
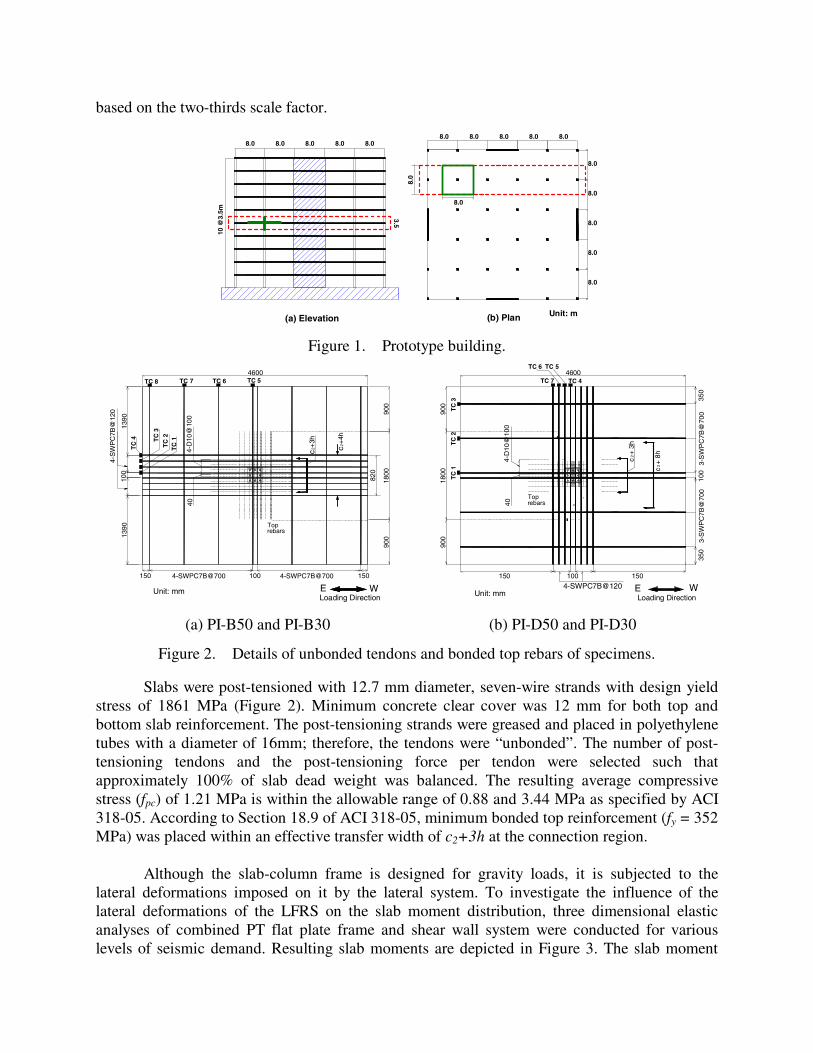
Slabs were post-tensioned with 12.7 mm diameter, seven-wire strands with design yield stress of 1861 MPa (Figure 2). Minimum concrete clear cover was 12 mm for both top and bottom slab reinforcement. The post-tensioning strands were greased and placed in polyethylene tubes with a diameter of 16mm; therefore, the tendons were “unbonded”. The number of post-tensioning tendons and the post-tensioning force per tendon were selected such that approximately 100% of slab dead weight was balanced. The resulting average compressive stress (fpc) of 1.21 MPa is within the allowable range of 0.88 and 3.44 MPa as specified by ACI 318-05. According to Section 18.9 of ACI 318-05, minimum bonded top reinforcement (fy = 352 MPa) was placed within an effective transfer width of c2+3h at the connection region. Although the slab-column frame is designed for gravity loads, it is subjected to the lateral deformations imposed on it by the lateral system. To investigate the influence of the lateral deformations of the LFRS on the slab moment distribution, three dimensional elastic analyses of combined PT flat plate frame and shear wall system were conducted for various levels of seismic demand. Resulting slab moments are depicted in Figure 3. The slab moment
diagrams indicate that the positive slab moment eventually develops on one side of the slab-column connection as the seismic demand is increased; therefore, sufficient bottom reinforcement should be provided to avoid the formation of large cracks. Requirements for minimum bonded bottom reinforcement for the post-tensioned connections do not exist; therefore, it is common to provide structural integrity reinforcement per ACI 318-05 Section 7.13.2.5. This provision was developed primarily based on common practice for RC slab-column frames, which typically have slab span-to-thickness ratios closer to 20. Due to the larger spans of typical PT construction, bottom reinforcement satisfying ACI 352.1R-89 was provided:
1 20.5
u
smy
l lA
f
ωφ
= (1)
where ωu is the uniformly distributed design load, l1 and l2 are the center to center span in orthogonal directions, φ = 0.9, and fy is the yield stress of steel. Accordingly, five D10 (db = 10 mm) bottom bars were placed within a column width of c2 for both directions, whereas no bottom reinforcement was provided outside of c2.
- 600
- 400
- 200
0
200
400
600
0 2 4 6 8 10 12 14 16
1.0D+0.25L+E (SDC- B)
1.0D+0.25L+E (SDC- C)
1.0D+0.25L+E (SDC- D)
1.0D+0.25L+E (SDC- E)
Distance from A1 [m]
Mom
ent [
kN-m
]
A1 B1 C1
A1 B1 C1
Figure 3. Slab moment distribution for both gravity and lateral loads.
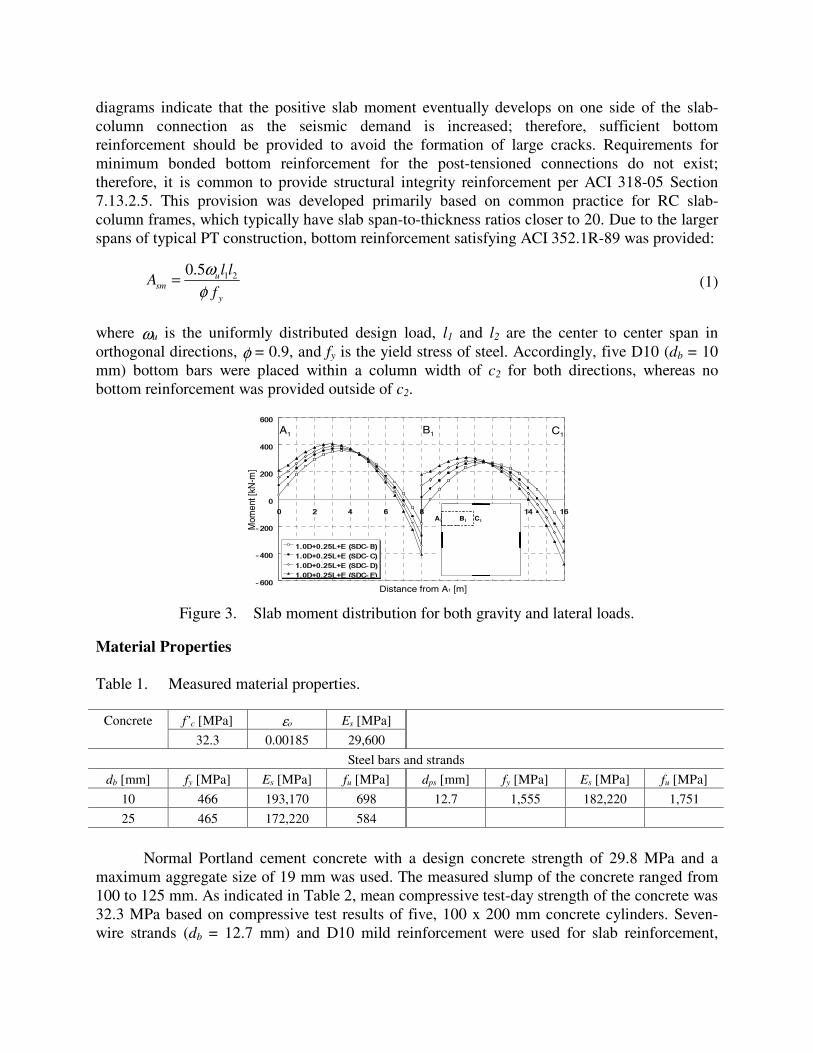
Material Properties Table 1. Measured material properties.
f’c [MPa] εo Es [MPa] Concrete
32.3 0.00185 29,600
Steel bars and strands
db [mm] fy [MPa] Es [MPa] fu [MPa] dps [mm] fy [MPa] Es [MPa] fu [MPa]
10 466 193,170 698 12.7 1,555 182,220 1,751
25 465 172,220 584
Normal Portland cement concrete with a design concrete strength of 29.8 MPa and a maximum aggregate size of 19 mm was used. The measured slump of the concrete ranged from 100 to 125 mm. As indicated in Table 2, mean compressive test-day strength of the concrete was 32.3 MPa based on compressive test results of five, 100 x 200 mm concrete cylinders. Seven-wire strands (db = 12.7 mm) and D10 mild reinforcement were used for slab reinforcement,
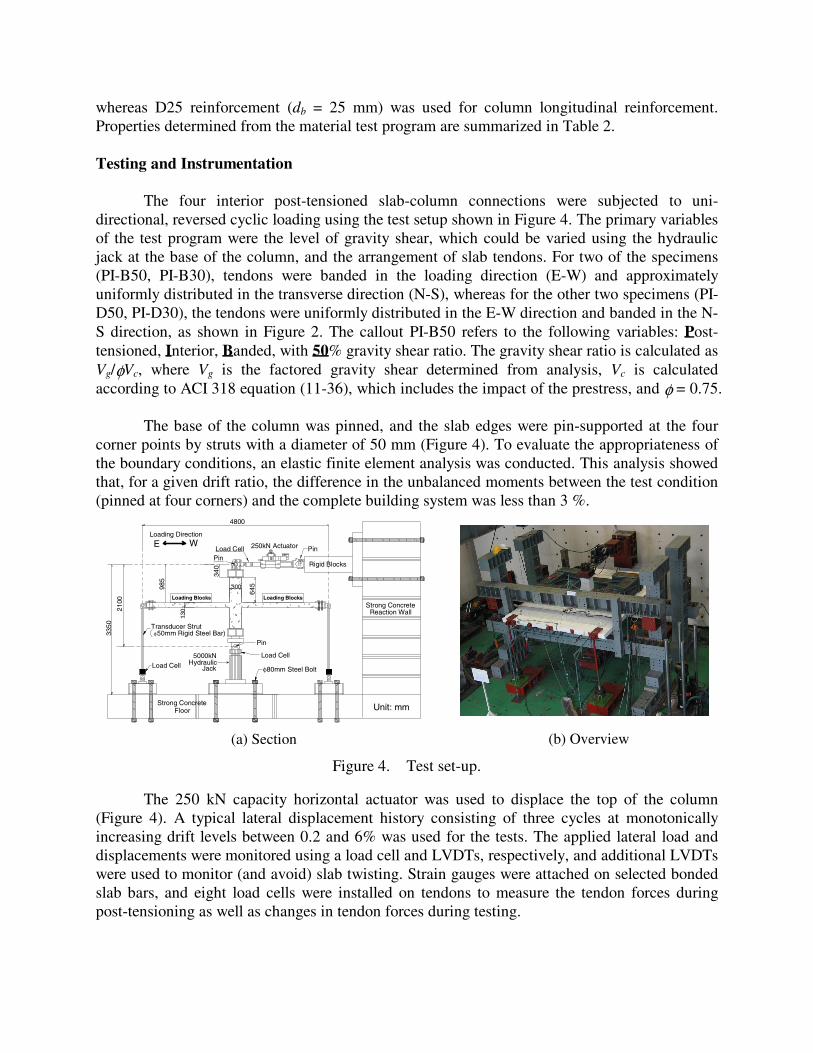
whereas D25 reinforcement (db = 25 mm) was used for column longitudinal reinforcement. Properties determined from the material test program are summarized in Table 2. Testing and Instrumentation The four interior post-tensioned slab-column connections were subjected to uni-directional, reversed cyclic loading using the test setup shown in Figure 4. The primary variables of the test program were the level of gravity shear, which could be varied using the hydraulic jack at the base of the column, and the arrangement of slab tendons. For two of the specimens (PI-B50, PI-B30), tendons were banded in the loading direction (E-W) and approximately uniformly distributed in the transverse direction (N-S), whereas for the other two specimens (PI-D50, PI-D30), the tendons were uniformly distributed in the E-W direction and banded in the N-S direction, as shown in Figure 2. The callout PI-B50 refers to the following variables: Post-tensioned, Interior, Banded, with 50% gravity shear ratio. The gravity shear ratio is calculated as Vg/φVc, where Vg is the factored gravity shear determined from analysis, Vc is calculated according to ACI 318 equation (11-36), which includes the impact of the prestress, and φ = 0.75. The base of the column was pinned, and the slab edges were pin-supported at the four corner points by struts with a diameter of 50 mm (Figure 4). To evaluate the appropriateness of the boundary conditions, an elastic finite element analysis was conducted. This analysis showed that, for a given drift ratio, the difference in the unbalanced moments between the test condition (pinned at four corners) and the complete building system was less than 3 %.
985
3350
Strong Concrete
130
Load Cell
Transducer Strutφ50mm Rigid Steel Bar)
φ80mm Steel Bolt
Rigid Blocks
300
4800
250kN Actuator
5000kN
Strong Concrete
Pin
340
645
Reaction Wall
Hydraulic
Floor
2100
Loading Blocks
PinLoad Cell Pin
Unit: mm
Loading Blocks
WELoading Direction
Load Cell
Jack
(a) Section (b) Overview
Figure 4. Test set-up.
The 250 kN capacity horizontal actuator was used to displace the top of the column (Figure 4). A typical lateral displacement history consisting of three cycles at monotonically increasing drift levels between 0.2 and 6% was used for the tests. The applied lateral load and displacements were monitored using a load cell and LVDTs, respectively, and additional LVDTs were used to monitor (and avoid) slab twisting. Strain gauges were attached on selected bonded slab bars, and eight load cells were installed on tendons to measure the tendon forces during post-tensioning as well as changes in tendon forces during testing.
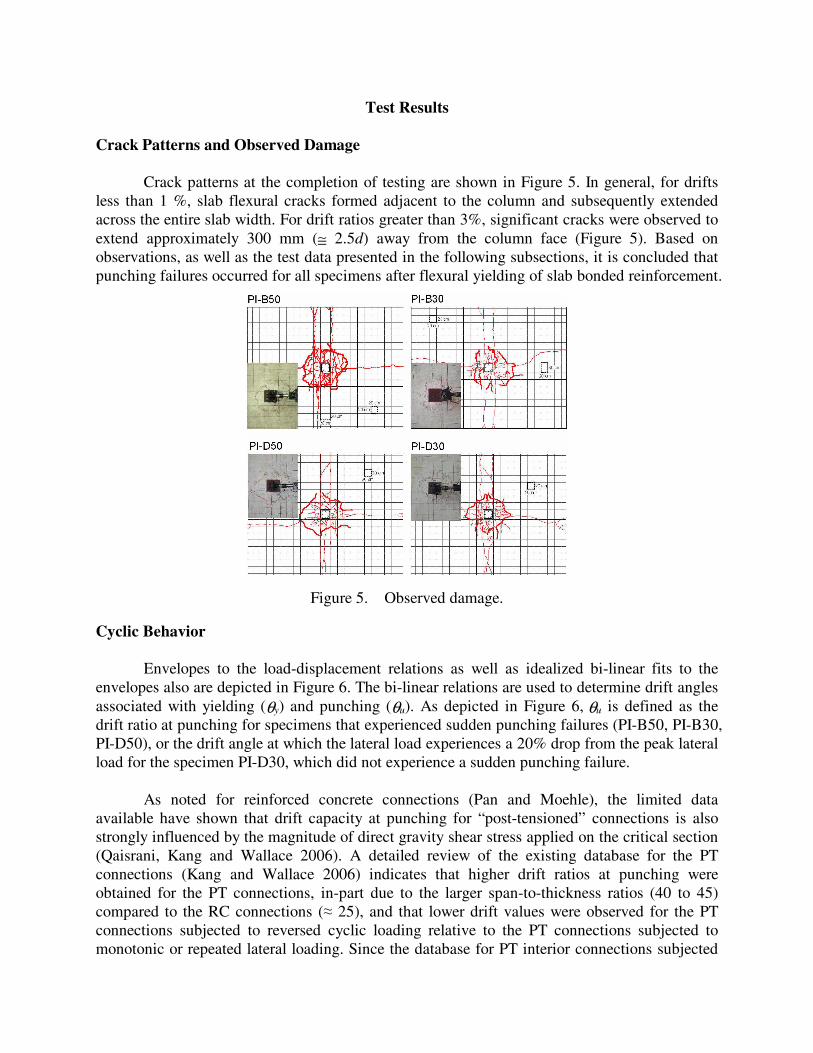
Test Results Crack Patterns and Observed Damage Crack patterns at the completion of testing are shown in Figure 5. In general, for drifts less than 1 %, slab flexural cracks formed adjacent to the column and subsequently extended across the entire slab width. For drift ratios greater than 3%, significant cracks were observed to extend approximately 300 mm (≅ 2.5d) away from the column face (Figure 5). Based on observations, as well as the test data presented in the following subsections, it is concluded that punching failures occurred for all specimens after flexural yielding of slab bonded reinforcement.
Figure 5. Observed damage.
Cyclic Behavior Envelopes to the load-displacement relations as well as idealized bi-linear fits to the envelopes also are depicted in Figure 6. The bi-linear relations are used to determine drift angles associated with yielding (θy) and punching (θu). As depicted in Figure 6, θu is defined as the drift ratio at punching for specimens that experienced sudden punching failures (PI-B50, PI-B30, PI-D50), or the drift angle at which the lateral load experiences a 20% drop from the peak lateral load for the specimen PI-D30, which did not experience a sudden punching failure. As noted for reinforced concrete connections (Pan and Moehle), the limited data available have shown that drift capacity at punching for “post-tensioned” connections is also strongly influenced by the magnitude of direct gravity shear stress applied on the critical section (Qaisrani, Kang and Wallace 2006). A detailed review of the existing database for the PT connections (Kang and Wallace 2006) indicates that higher drift ratios at punching were obtained for the PT connections, in-part due to the larger span-to-thickness ratios (40 to 45) compared to the RC connections (≈ 25), and that lower drift values were observed for the PT connections subjected to reversed cyclic loading relative to the PT connections subjected to monotonic or repeated lateral loading. Since the database for PT interior connections subjected
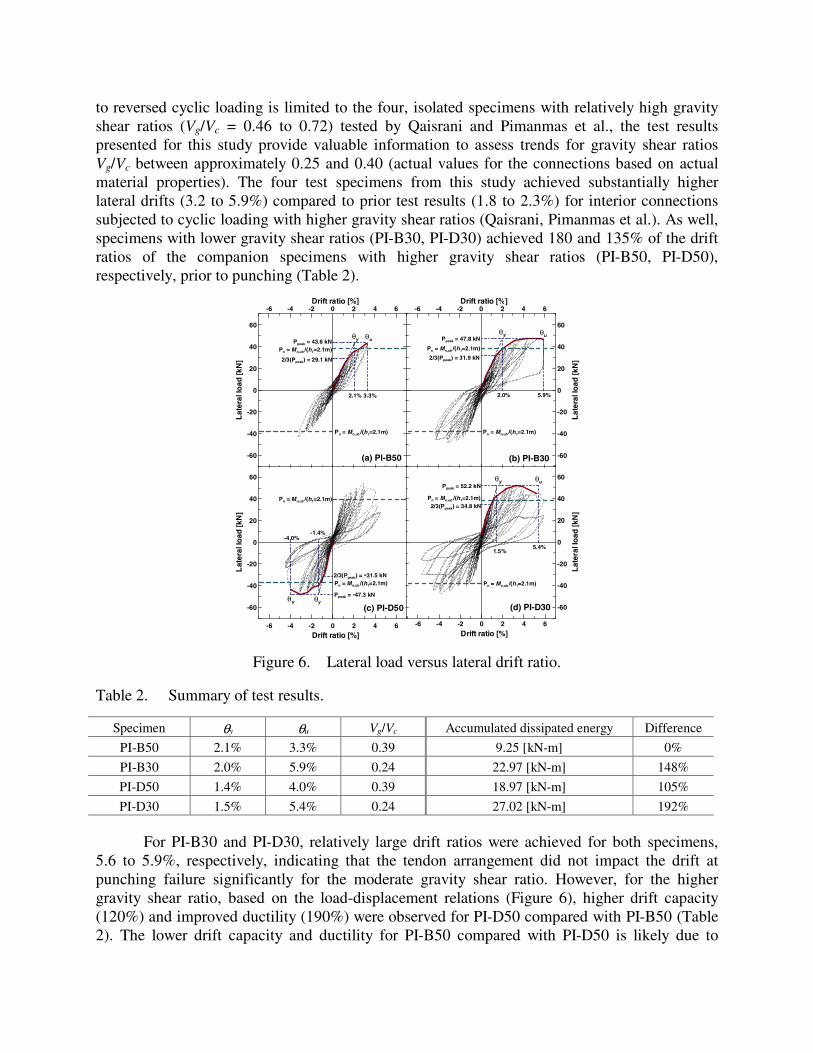
to reversed cyclic loading is limited to the four, isolated specimens with relatively high gravity shear ratios (Vg/Vc = 0.46 to 0.72) tested by Qaisrani and Pimanmas et al., the test results presented for this study provide valuable information to assess trends for gravity shear ratios Vg/Vc between approximately 0.25 and 0.40 (actual values for the connections based on actual material properties). The four test specimens from this study achieved substantially higher lateral drifts (3.2 to 5.9%) compared to prior test results (1.8 to 2.3%) for interior connections subjected to cyclic loading with higher gravity shear ratios (Qaisrani, Pimanmas et al.). As well, specimens with lower gravity shear ratios (PI-B30, PI-D30) achieved 180 and 135% of the drift ratios of the companion specimens with higher gravity shear ratios (PI-B50, PI-D50), respectively, prior to punching (Table 2).
-6 -4 -2 0 2 4 6 Drift ratio [%]
-60
-40
-20
0
20
40
60
Lat
eral
load
[kN
]
(a) PI-B50
-6 -4 -2 0 2 4 6 Drift ratio [%]
-60
-40
-20
0
20
40
60
Lat
eral
load
[kN
]
(b) PI-B30
-60
-40
-20
0
20
40
60
Lat
eral
load
[kN
]
-6 -4 -2 0 2 4 6
Drift ratio [%]
-60
-40
-20
0
20
40
60
Lat
eral
load
[kN
]
-6 -4 -2 0 2 4 6 Drift ratio [%]
(d) PI-D30(c) PI-D50
Ppeak = 43.6 kN
2.1% 3.3%
θy θu Ppeak = 47.8 kNθy θu
2.0% 5.9%
Ppeak = 52.2 kNθy θu
1.5%5.4%
Ppeak = -47.3 kNθyθu
-1.4%-4.0%
2/3(Ppeak) = 29.1 kN 2/3(Ppeak) = 31.9 kN
2/3(Ppeak) = -31.5 kN
2/3(Ppeak) = 34.8 kN
Pn = Mn,ub /(h1=2.1m)
Pn = Mn,ub /(h1=2.1m)
Pn = Mn,ub /(h1=2.1m)
Pn = Mn,ub /(h1=2.1m) Pn = Mn,ub /(h1=2.1m)
Pn = Mn,ub /(h1=2.1m)
Pn = Mn,ub /(h1=2.1m)
Pn = Mn,ub /(h1=2.1m)
Figure 6. Lateral load versus lateral drift ratio.
Table 2. Summary of test results.
Specimen θy θu Vg/Vc Accumulated dissipated energy Difference
PI-B50 2.1% 3.3% 0.39 9.25 [kN-m] 0%
PI-B30 2.0% 5.9% 0.24 22.97 [kN-m] 148%
PI-D50 1.4% 4.0% 0.39 18.97 [kN-m] 105%
PI-D30 1.5% 5.4% 0.24 27.02 [kN-m] 192%
For PI-B30 and PI-D30, relatively large drift ratios were achieved for both specimens, 5.6 to 5.9%, respectively, indicating that the tendon arrangement did not impact the drift at punching failure significantly for the moderate gravity shear ratio. However, for the higher gravity shear ratio, based on the load-displacement relations (Figure 6), higher drift capacity (120%) and improved ductility (190%) were observed for PI-D50 compared with PI-B50 (Table 2). The lower drift capacity and ductility for PI-B50 compared with PI-D50 is likely due to
larger precompression within the connection region. In both cases of gravity shear ratios, larger drift ratio at punching was achieved for the case with distributed tendons. Current practice, which typically bands tendons in one direction, may result in connections that have less drift capacity for loads parallel to the banded direction. Bonded Slab Reinforcement
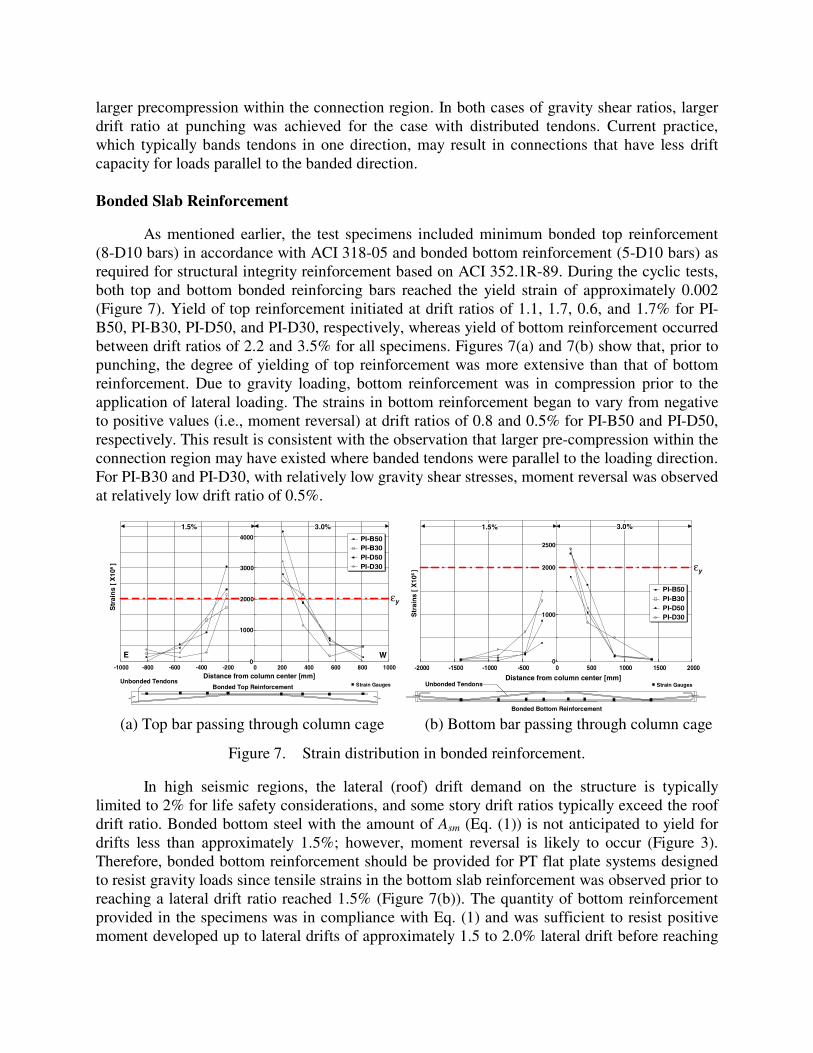
As mentioned earlier, the test specimens included minimum bonded top reinforcement (8-D10 bars) in accordance with ACI 318-05 and bonded bottom reinforcement (5-D10 bars) as required for structural integrity reinforcement based on ACI 352.1R-89. During the cyclic tests, both top and bottom bonded reinforcing bars reached the yield strain of approximately 0.002 (Figure 7). Yield of top reinforcement initiated at drift ratios of 1.1, 1.7, 0.6, and 1.7% for PI-B50, PI-B30, PI-D50, and PI-D30, respectively, whereas yield of bottom reinforcement occurred between drift ratios of 2.2 and 3.5% for all specimens. Figures 7(a) and 7(b) show that, prior to punching, the degree of yielding of top reinforcement was more extensive than that of bottom reinforcement. Due to gravity loading, bottom reinforcement was in compression prior to the application of lateral loading. The strains in bottom reinforcement began to vary from negative to positive values (i.e., moment reversal) at drift ratios of 0.8 and 0.5% for PI-B50 and PI-D50, respectively. This result is consistent with the observation that larger pre-compression within the connection region may have existed where banded tendons were parallel to the loading direction. For PI-B30 and PI-D30, with relatively low gravity shear stresses, moment reversal was observed at relatively low drift ratio of 0.5%.
Distance from column center [mm]Strain GaugesBonded Top Reinforcement
Unbonded Tendons
Str
ain
s [
X10
6 ]
-1000 -800 -600 -400 -200 0 200 400 600 800 1000
PI-B50PI-B30PI-D50PI-D30
E W
1.5%4000
εy
3.0%
3000
1000
0
Strain GaugesDistance from column center [mm]
Unbonded Tendons
-2000 -1500 -1000 -500 0 500 1000 1500 2000
Bonded Bottom Reinforcement
PI-B50PI-B30PI-D50PI-D30
1.5% 3.0%
εy
2500
2000
1000
0
Str
ain
s [
X10
6 ]
2000
(a) Top bar passing through column cage (b) Bottom bar passing through column cage
Figure 7. Strain distribution in bonded reinforcement.
In high seismic regions, the lateral (roof) drift demand on the structure is typically limited to 2% for life safety considerations, and some story drift ratios typically exceed the roof drift ratio. Bonded bottom steel with the amount of Asm (Eq. (1)) is not anticipated to yield for drifts less than approximately 1.5%; however, moment reversal is likely to occur (Figure 3). Therefore, bonded bottom reinforcement should be provided for PT flat plate systems designed to resist gravity loads since tensile strains in the bottom slab reinforcement was observed prior to reaching a lateral drift ratio reached 1.5% (Figure 7(b)). The quantity of bottom reinforcement provided in the specimens was in compliance with Eq. (1) and was sufficient to resist positive moment developed up to lateral drifts of approximately 1.5 to 2.0% lateral drift before reaching
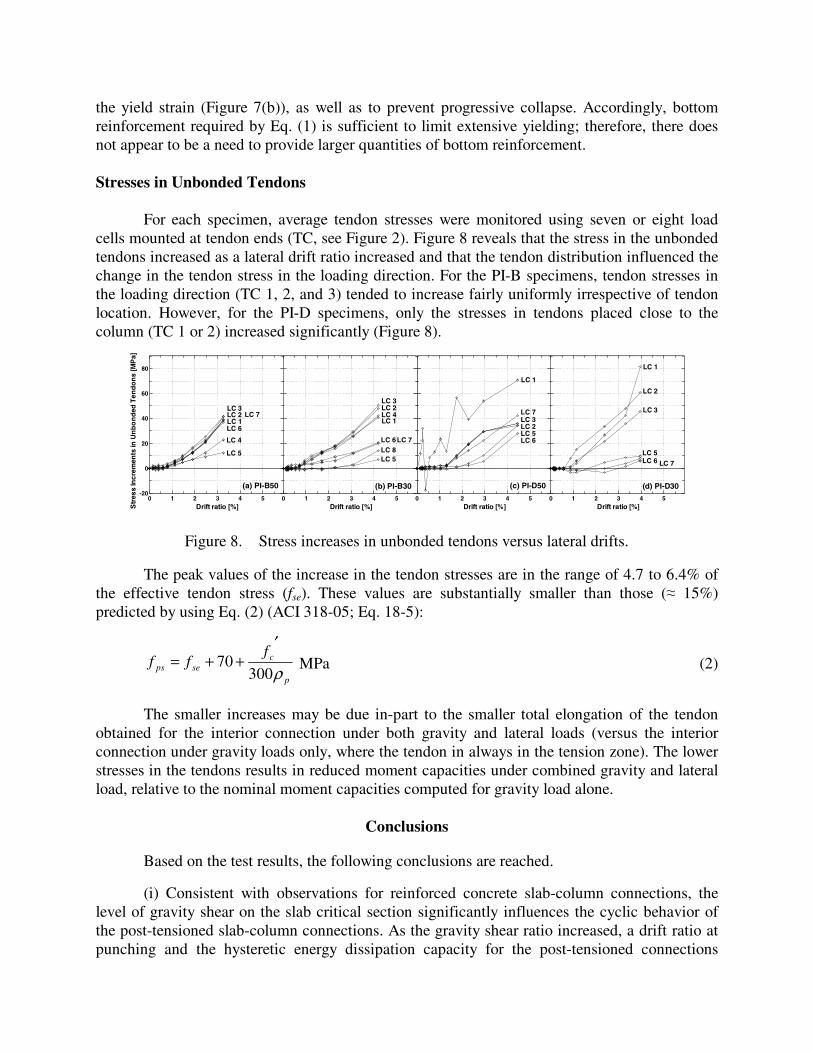
the yield strain (Figure 7(b)), as well as to prevent progressive collapse. Accordingly, bottom reinforcement required by Eq. (1) is sufficient to limit extensive yielding; therefore, there does not appear to be a need to provide larger quantities of bottom reinforcement. Stresses in Unbonded Tendons For each specimen, average tendon stresses were monitored using seven or eight load cells mounted at tendon ends (TC, see Figure 2). Figure 8 reveals that the stress in the unbonded tendons increased as a lateral drift ratio increased and that the tendon distribution influenced the change in the tendon stress in the loading direction. For the PI-B specimens, tendon stresses in the loading direction (TC 1, 2, and 3) tended to increase fairly uniformly irrespective of tendon location. However, for the PI-D specimens, only the stresses in tendons placed close to the column (TC 1 or 2) increased significantly (Figure 8).
-20
0
20
40
60
80
Str
ess
Incr
emen
ts in
Un
bo
nd
ed T
end
on
s [M
Pa]
0 1 2 3 4 5 Drift ratio [%]
(a) PI-B50 (b) PI-B30
0 1 2 3 4 5 Drift ratio [%]
0 1 2 3 4 5 Drift ratio [%]
(c) PI-D50 (d) PI-D30
0 1 2 3 4 5 Drift ratio [%]
LC 1 LC 1
LC 1
LC 1
LC 2LC 3
LC 4
LC 5
LC 6
LC 7LC 2LC 3
LC 4
LC 5
LC 6LC 7
LC 2LC 3
LC 8
LC 5LC 6
LC 7
LC 2
LC 3
LC 5LC 6 LC 7
Figure 8. Stress increases in unbonded tendons versus lateral drifts.
The peak values of the increase in the tendon stresses are in the range of 4.7 to 6.4% of the effective tendon stress (fse). These values are substantially smaller than those (≈ 15%) predicted by using Eq. (2) (ACI 318-05; Eq. 18-5):
p
cseps
fff
ρ30070
′++= MPa (2)
The smaller increases may be due in-part to the smaller total elongation of the tendon obtained for the interior connection under both gravity and lateral loads (versus the interior connection under gravity loads only, where the tendon in always in the tension zone). The lower stresses in the tendons results in reduced moment capacities under combined gravity and lateral load, relative to the nominal moment capacities computed for gravity load alone.
Conclusions Based on the test results, the following conclusions are reached.
(i) Consistent with observations for reinforced concrete slab-column connections, the level of gravity shear on the slab critical section significantly influences the cyclic behavior of the post-tensioned slab-column connections. As the gravity shear ratio increased, a drift ratio at punching and the hysteretic energy dissipation capacity for the post-tensioned connections
decreased. The improved performance for the connections with lower gravity shear (PI-B30 and PI-D30) was due to more extensive yielding of bonded reinforcement prior to punching failure.
(ii) Results indicate that seismic performance of the post-tensioned flat plate slab systems is impacted by the tendon distribution. For the higher gravity shear ratio (40%), higher drift capacity and improved ductility were observed for PI-D50 compared to PI-B50. For these cases, limited yielding of both top and bottom slab reinforcement was noted and the use of banded tendons appears to create larger precompression within the connection region.
(iii) Moment reversal (change from negative slab moment due to gravity load to positive slab moment under lateral load on one side of a connection) occurred between lateral drifts of 0.5 to 0.8%. In turn, bonded bottom reinforcement, which was placed according to ACI 352.1R-89, reached yield at lateral drifts between 2.2 to 3.5%. Based on these results, it is concluded that bonded bottom reinforcement should be provided for the post-tensioned flat plate slab systems; however, integrity reinforcement required by ACI 352.1R-89 appears sufficient to limit rebar yielding. In addition, the bottom reinforcement improves the hysteretic energy dissipation capacity of the PT interior connections.
(iv) Test results indicate that tendon stresses for combined gravity and lateral loading were approximately 35 to 60% of the values predicted by ACI 318-05 provisions. The reduced tendon stress should be considered for flexural design of the post-tensioned flat plate slab systems in high seismic regions, as moment reversal is anticipated.
References
ACI 318 Committee, 2005. Building Code Requirements for Structural Concrete and Commentary (ACI
318-05), Farmington Hills. International Code Council, 2003. International Building Code (IBC-03), Whittier. Joint ACI-ASCE Committee 352, 1989. Recommendation for Design of Slab-Column Connections in
Monolithic Reinforced Concrete Structures (ACI 352.1R-89), Farmington Hills. Kang, T. H.-K., and J. W. Wallace, 2005. Dynamic responses of flat plate systems with shear
reinforcement, ACI Structural Journal, 102 (5), 763-773. Kang, T. H.-K., and J. W. Wallace, 2006. Punching of reinforced and post-tensioned concrete slab-column
connections, ACI Structural Journal, in-press. Pan, A. D., and J. P. Moehle, 1989. Lateral displacement ductility of reinforced concrete flat plates, ACI
Structural Journal, 86 (3), 250-258. Pimanmas, A., Warnitchai, P., and S. Pongpornsup, 2004. Seismic performance of 3/5 scaled post-
tensioned interior flat slab-column connections, Proceedings, ACEE 2004, Manilla, Philippines. Qaisrani, A. N., 1993. Interior post-tensioned flat-plate connections subjected to vertical and biaxial
loading, Ph.D. Thesis, University of California, Berkeley.