interferon and biologic signatures in dermatomyositis skin: specificity and heterogeneity across...
TRANSCRIPT

Seediscussions,stats,andauthorprofilesforthispublicationat:https://www.researchgate.net/publication/221738598
WongD,KeaB,PesichRetal.Interferonandbiologicsignaturesindermatomyositisskin:specificityandheterogeneityacrossdiseases.PLoSONE7:e29161
ARTICLEinPLOSONE·JANUARY2012
ImpactFactor:3.23·DOI:10.1371/journal.pone.0029161·Source:PubMed
CITATIONS
26
READS
30
8AUTHORS,INCLUDING:
BoryKea
OregonHealthandScienceUniversity
14PUBLICATIONS95CITATIONS
SEEPROFILE
RobertPesich
StanfordUniversity
13PUBLICATIONS5,810CITATIONS
SEEPROFILE
WeiZhu
UniversityofIllinois,Urbana-Champaign
248PUBLICATIONS3,236CITATIONS
SEEPROFILE
PatrickO'ReillyBrown
StanfordUniversity
159PUBLICATIONS81,728CITATIONS
SEEPROFILE
Availablefrom:PatrickO'ReillyBrown
Retrievedon:03February2016
Interferon and Biologic Signatures in DermatomyositisSkin: Specificity and Heterogeneity across DiseasesDavid Wong1, Bory Kea1, Rob Pesich2, Brandon W. Higgs3, Wei Zhu3, Patrick Brown2, Yihong Yao3, David
Fiorentino1*
1 Department of Dermatology, Stanford University School of Medicine, Stanford, California, United States of America, 2 Department of Biochemistry, Stanford University
School of Medicine, Stanford, California, United States of America, 3 MedImmune, Translational Sciences, One MedImmune Way, Gaithersburg, Maryland, United States of
America
Abstract
Background: Dermatomyositis (DM) is an autoimmune disease that mainly affects the skin, muscle, and lung. Thepathogenesis of skin inflammation in DM is not well understood.
Methodology and Findings: We analyzed genome-wide expression data in DM skin and compared them to those fromhealthy controls. We observed a robust upregulation of interferon (IFN)-inducible genes in DM skin, as well as several othergene modules pertaining to inflammation, complement activation, and epidermal activation and differentiation. Theinterferon (IFN)-inducible genes within the DM signature were present not only in DM and lupus, but also cutaneous herpessimplex-2 infection and to a lesser degree, psoriasis. This IFN signature was absent or weakly present in atopic dermatitis,allergic contact dermatitis, acne vulgaris, systemic sclerosis, and localized scleroderma/morphea. We observed that the IFNsignature in DM skin appears to be more closely related to type I than type II IFN based on in vitro IFN stimulationexpression signatures. However, quantitation of IFN mRNAs in DM skin shows that the majority of known type I IFNs, as wellas IFN g, are overexpressed in DM skin. In addition, both IFN-beta and IFN-gamma (but not other type I IFN) transcript levelswere highly correlated with the degree of the in vivo IFN transcriptional response in DM skin.
Conclusions and Significance: As in the blood and muscle, DM skin is characterized by an overwhelming presence of an IFNsignature, although it is difficult to conclusively define this response as type I or type II. Understanding the significance ofthe IFN signature in this wide array of inflammatory diseases will be furthered by identification of the nature of the cells thatboth produce and respond to IFN, as well as which IFN subtype is biologically active in each diseased tissue.
Citation: Wong D, Kea B, Pesich R, Higgs BW, Zhu W, et al. (2012) Interferon and Biologic Signatures in Dermatomyositis Skin: Specificity and Heterogeneityacross Diseases. PLoS ONE 7(1): e29161. doi:10.1371/journal.pone.0029161
Editor: Serge Nataf, University of Lyon, France
Received June 15, 2011; Accepted November 22, 2011; Published January 3, 2012
Copyright: � 2012 Wong et al. This is an open-access article distributed under the terms of the Creative Commons Attribution License, which permitsunrestricted use, distribution, and reproduction in any medium, provided the original author and source are credited.
Funding: The authors have no support or funding to report.
Competing Interests: The authors have declared that no competing interests exist.
* E-mail: [email protected]
Introduction
Dermatomyositis (DM) is a chronic inflammatory disorder that
can affect the skin, muscle, and other organs and is associated with
significant morbidity and mortality. The prevalence of DM is not
well-defined, as it is historically grouped together with polymyositis
(PM) and inclusion body myositis (IBM) in most epidemiologic
studies. The estimated incidence of DM is approximately 1 per
100,000 per year [1]. There are two forms of DM, juvenile and
adult, that have overlapping but some distinct clinical features [1].
DM is considered an autoimmune disease, as it is associated with
specific autoantibodies, and its prevalence is associated with
particular HLA alleles [2].
Currently classified as an idiopathic inflammatory myopathy
(IIM), much of the work in understanding DM has been focused
on the muscle pathology that accompanies this disorder. Some
authors have suggested that the muscle disease is due to an
immune-mediated vasculopathy, with resultant ischemic damage
to the muscle fibers resulting in myocyte death and muscle atrophy
[3]. However, the precise mechanism of either endothelial cell or
myocyte damage is unclear [3]. Inflamed muscle shows infiltration
with B lymphocytes, T lymphocytes, and dendritic cells, and the
contribution of each to the disease is not well understood [4,5].
Cytokines and chemokines are also postulated to be important in
disease pathogenesis [6]. DM muscle expresses large amounts of
type I interferon (IFN)-inducible genes [7]. It is possible that these
gene products might themselves be causing the vascular and
parenchymal cellular damage [7]. In addition, an IFN signature
that correlates with overall disease activity is observed in
peripheral blood of most DM patients, including patients with
juvenile DM [8,9,10]. Thus, much as with other autoimmune
diseases such as Systemic Lupus Erythematosus and Sjogren’s
syndrome, DM is emerging as a potentially type I IFN-driven
autoimmune disease.
The pathogenesis of skin inflammation in DM is not well-
studied and its pathologic mechanisms may or may not overlap
with those causing DM muscle disease. The typical cutaneous
histopathologic changes in DM include pathologic apoptosis/
necrosis of keratinocytes, perivascular and lichenoid inflammation,
increased dermal mucin deposition, endothelial cell damage with
PLoS ONE | www.plosone.org 1 January 2012 | Volume 7 | Issue 1 | e29161

loss of capillaries, and vascular dilatation [11,12]. Similarities to
muscle disease exist in the skin: first, vasculopathy and vascular
deposition of complement components can be detected in
cutaneous DM skin [13,14]; second, there is damage to the
parenchymal cells (e.g. keratinocytes) [11]; third, DM skin appears
to be characterized by increased abundance of several gene
products that are known to be upregulated by IFN [15,16] as well
as by increased numbers of plasmacytoid dendritic cells [17,18]. It
has been proposed that some of these gene products, such as
CXCL9/10/11, act as chemoattractrants for CXCR3-bearing T
lymphocytes which can then perpetuate inflammation and
keratinocyte necrosis [16]. In addition, there appears to be a
topographical relationship between the site of cell injury,
inflammation, and the basement membrane that is shared by
both skin and muscle disease in DM [19]. However, there are
certain differences between muscle and skin disease in DM
patients: clinically, the course of skin and muscle disease is often
discordant between patients [20], suggesting different mechanisms
of disease pathogenesis; in addition, there are important
histopathologic differences between skin and muscle—for exam-
ple, B lymphocytes are rarely found in the skin disease [21], in
contrast to their common perivascular location in DM muscle.
Current therapies for DM skin disease include immunosuppressive
medications, which are not uniformly efficacious and can be
associated with significant morbidity [20]. A better understanding
of molecular pathogenesis of DM could potentially unveil better
molecular markers for this disease and more effective targets for
therapy.
In this study, we performed global gene expression analysis of
skin from DM patients and healthy controls. Our results reveal a
gene expression signature that is unique to skin inflammation in
both DM and lupus, but distinct from other inflammatory skin
diseases. Within this signature, we also identify a characteristic
IFN-driven expression pattern in DM and lupus that partially
overlaps with the pattern seen in other lichenoid dermatoses as
well as psoriasis.
Results
Defining expression signature in skin of individuals withDM
In order to understand the molecular characteristics of DM, we
hybridized RNA from skin biopsies from patients with active DM
(n = 16) and healthy patients (n = 10) (total of 32 independent
biopsies, with 12 technical replicates for total of 44 arrays) to
HEEBO oligonucleotide arrays. The baseline characteristics of
these patients are listed in Table S1. Using significance analysis of
microarrays (FDR,0.05), we identified 946 unique genes that
were differentially regulated at least 2-fold in DM skin relative to
healthy skin: we term this the ‘‘DM gene module’’ (Table S2).
Over two-thirds (646 of 946) of the genes identified were up-
regulated and 300 were down-regulated in DM skin relative to
healthy skin. Two-dimensional hierarchical clustering using these
946 genes segregated all healthy controls and DM patients into 2
distinct clusters (Fig. 1A). The 3 DM patients (4 samples) that
segregated with the healthy controls formed a separate sub-cluster
unto themselves. There was no apparent clustering with regards to
age, gender, or site of biopsy (not shown). When patients with
inactive skin disease were included in the cluster analysis, we found
that 6 of 7 of the inactive DM patients clustered with the healthy
controls (Fig. S1).
We noted that the DM gene module contained groups of
genes that are known to function in several distinct biological
pathways (Figs. 1A and S2). For example, a group of 13 genes
associated with keratinocyte/epidermal activation (S100A7/8/
9, SERPINB3/4, and FABP5) was upregulated in DM (yellow
bar, Figs. 1A and S2). In addition, genes involved in epidermal
differentiation, including IVL, TGM, SPRR2A/B/E/G, SER-
PINB7/8, are induced in DM (red bar, Figs. 1A and S2), which
have also been shown to be elevated in other inflammatory skin
diseases, such as psoriasis and atopic dermatitis [22,23]. A large
cluster of genes upregulated in DM are involved in T cell
(IL2RB, CD2, TRAC, CD3D, CTLA4), cytotoxic/NK cell
(NKG7), macrophage (CD68), and dendritic cell (CD83)
function (green bar, Figs. 1A and Fig. S2), which is consistent
with previous observations regarding T cell and macrophage
infiltration in DM skin [21]. The overexpression of the cell
surface marker CD83 is consistent with previous studies that
showed with immunostaining that mature dendritic cells are
present in DM skin (either myeloid or plasmacytoid) [16,18]. In
addition, skin from patients with DM had induction of markers
of endothelial cell activation (VCAM1, SEL-L). A subset of the
DM samples showed elevated immunoglobulin expression,
indicative of infiltrating mature B lymphocytes and/or plasma
cells, the former of which have been shown to be present in low
and variable amounts in DM skin (lavender bar, Figs. 1A and
S2) [21].
A striking observation in DM skin was the over expression of
genes that were induced by IFN (light blue bar, Figs. 1A and S2).
In fact, 21 of the top 25 most upregulated genes are known or
presumed to be upregulated by IFN [24,25,26] (Table S3). These
genes included CXCL10, IFIH1, ISG15/UBE2L6, C1S/R, IRF7,
IDO1, MXB and CHN1. Notably this cluster of IFN genes was
generally not overexpressed in the skin of DM patients with
inactive skin disease (Fig. S1), suggesting that they are induced
preferentially in active skin lesions.
Of the downregulated genes in DM, many were involved in
either ribosomal synthesis (brown bar, Figs. 1A and S2) or lipid
metabolism (dark purple bar, Figs. 1A and S2). The latter group of
genes included MVD, MGST1, GCS1, FADS1/2 and GAL.
Many of the genes involved in lipid metabolism have been
previously reported to be downregulated in other inflammatory
skin disorders such as psoriasis and atopic dermatitis [22,27].
To validate our findings from these microarrays, we performed
TaqMan quantitative real-time reverse-transcriptase PCR-(QRT-
PCR-) based assays on several genes from two of the enriched
gene modules, the IFN and lipid gene modules (Fig. 1B). As
suggested by the arrays, TaqMan QRT-PCR confirmed that two
IFN-induced genes (IFIT3 and OAS2) were upregulated, and two
genes involved in lipid metabolism (FADS, HMGCS1) were
downregulated in the skin of DM patients. Across patient
samples, there was a good correlation between microarray and
QRT-PCR values for each of the four genes (Spearman r= 0.76
to 0.88).
In order to systematically investigate the biological processes
that are altered in DM skin, we constructed a gene module map
(p,0.05, FDR,0.05) to look for enrichment of gene sets
associated with various biologic pathways and/or functions, based
on either Gene Ontology (GO) and KEGG pathway annotations
and on data derived from publicly available gene expression
studies (Figs. 2 and S3). Biologic functions and pathways found to
be enriched in the upregulated genes in DM skin included antigen
processing, complement activation, MHC I/II receptor activity, T
cell function, chemokine activity, antiviral and immune responses
and epidermal differentiation (Fig. 2). Besides the IFN signaling
pathway, TNF-alpha, IL-1, IL6, IL17 and VEGF pathway
activation was also observed in the skin of DM patients (Fig.
S3). Downregulated processes in DM skin included fatty acid
Type I Interferon Signature in DM
PLoS ONE | www.plosone.org 2 January 2012 | Volume 7 | Issue 1 | e29161

metabolism, lipid biosynthesis and metabolism, mitochondrial
function (electron transport and pyruvate metabolism), peroxisome
and ribosomal function.
Mapping the DM gene module across different skindiseases
We next sought to study the specificity of these gene expression
changes across various inflammatory skin diseases. With the
exception of the cutaneous lupus samples (which were internally
collected and processed along with the DM samples), we used
publicly available gene expression sets, and all disease data were
normalized to internal healthy controls within each study. We
examined the expression of genes in the DM gene module across
the different diseases (Fig. 3; see also Fig. S4 for a full pairwise
correlation matrix). Due to the use of different array platforms in
this analysis, only 490 genes of the original 946 genes of the DM
module were contained in all of the experimental datasets
analyzed and could thus be used for the analysis. Although the
data were generated by different investigators on different
microarray platforms, diseases for which more than one dataset
existed (psoriasis and atopic dermatitis) showed remarkably similar
expression patterns between datasets (Spearman r= 0.77 to 0.82).
A similar correlation analysis between DM samples analyzed using
HEEBO arrays and an independent set of DM samples analyzed
using Affymetrix arrays demonstrated high correlation (Spearman
r = 0.76) (Fig. 3). This suggests that the differences observed
between diseases were primarily driven by biological disease-
specific characteristics rather than platform or laboratory
differences.
The gene expression profiles in DM and lupus skin samples
were remarkably similar (Spearman r = 0.87; Fig. 3), suggesting
that skin from individuals with DM and lupus, which are both
autoimmune interface dermatitis processes, have a common
pathophysiology. Interestingly, the upregulated genes in the
DM gene module were similarly induced in the muscle of DM
patients (Spearman r = 0.56; Fig. 3). DM skin also showed
similarity to samples from (herpes simplex-2) HSV-2 infection
(Spearman r = 0.64; Fig. 3). The rest of the inflammatory skin
diseases appeared to have a small subset of similarly regulated
genes as in DM, but overall the pattern was quite different. The
epidermal activation genes, such as S100 and SERPIN genes
appear to be generally upregulated across most of the skin
diseases except for localized and systemic scleroderma (yellow
bar, Fig. 3). In addition, many of the inflammatory genes were
variably expressed across different diseases, with the highest
expression observed in cutaneous lupus and HSV-2, moder-
ately high expression in DM skin and muscle, and modest
increase in expression in other diseases (green bar, Fig. 3).
Genes involved in the complement cascade (C1S, C1R, C1QB,
and C2) were only upregulated in DM skin/muscle, cutaneous
lupus, and HSV-2 skin (not shown). IFN-inducible genes were
very highly overexpressed in DM skin/muscle, lupus skin, and
HSV-2 skin; and to a lesser degree in psoriasis, and the blood of
DM and lupus patients (light blue bar, Fig. 3). Genes of lipid
metabolism were generally repressed not only in cutaneous DM
and lupus but also psoriasis, atopic dermatitis, and morphea,
and to a variable extent in other inflammatory skin diseases
(dark purple bar, Fig. 3). Of note, this repression of lipid
metabolism genes is not found in DM muscle, DM blood, or
Figure 1. Visualization and validation of DM gene expressionon HEEBO oligonucleotide arrays. RNA was prepared from skinbiopsies as detailed in Methods, and the same source was used for bothgene expression array (A) and QRT-PCR experiments (B). A. Experi-mental hierarchical clustering dendrogram. Two-dimensional hierarchi-cal clustering was performed on gene expression data from active DMskin lesions and skin from healthy controls. A set of 946 genes whoseaverage expression significantly differed between DM and healthycontrols (the ‘‘DM module) was used to group sample expression data;646 genes were upregulated (red bar on left) and 300 genes weredownregulated (green bar on left) in DM patients relative to controlbiopsies. All values are in log2 space and are mean-centered across eachgene. Colored bars on right indicate gene clusters evident ondendrogram: yellow bar—epidermal activation; green bar—leukocytefunction; light blue bar—IFN signature; red bar—epidermal differenti-ation; lavender bar—immunoglobulin; brown bar—ribosome; darkpurple bar-lipid metabolism. A larger view of the dendrogram andmore complete lists of genes in these clusters can be found inSupplementary Figure S2. B. Validation of array data using TaqManQRT-PCR of selected transcripts. QRT-PCR was performed (see Methods)on 9 DM skin RNA samples and 8 control skin RNA samples for fourselected transcripts that were either found to be upregulated (OAS2,IFIT3) or downregulated (FADS1, HMGCS1) in DM skin. Shown are themean values (with SEM) for each transcript in DM skin relative to the
mean value in control skin. Relative transcript values for each of the 4genes across the 9 DM samples showed a high correlation (Pearson’sr = 0.71 to 0.86) between the HEEBO array and QRT-PCR.doi:10.1371/journal.pone.0029161.g001
Type I Interferon Signature in DM
PLoS ONE | www.plosone.org 3 January 2012 | Volume 7 | Issue 1 | e29161
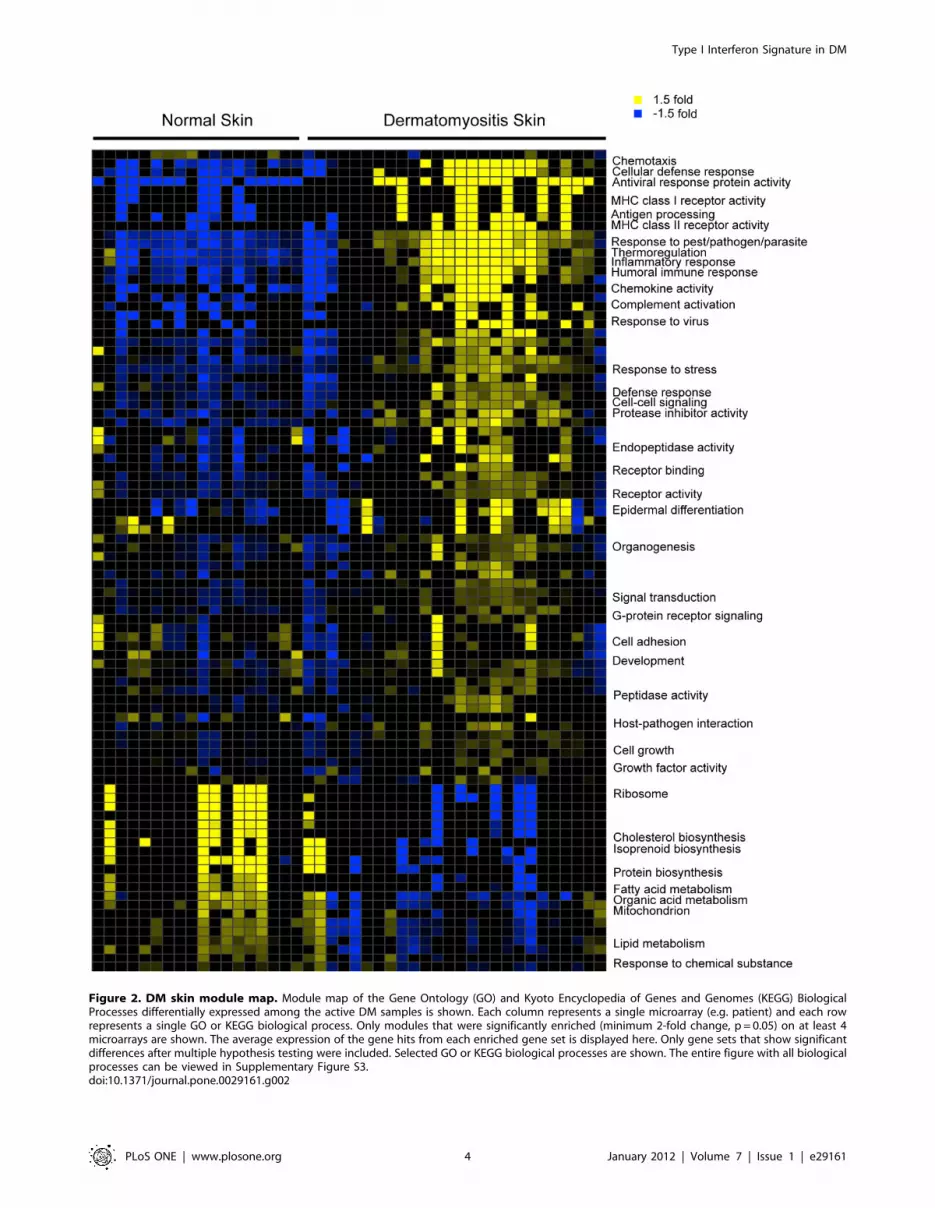
Figure 2. DM skin module map. Module map of the Gene Ontology (GO) and Kyoto Encyclopedia of Genes and Genomes (KEGG) BiologicalProcesses differentially expressed among the active DM samples is shown. Each column represents a single microarray (e.g. patient) and each rowrepresents a single GO or KEGG biological process. Only modules that were significantly enriched (minimum 2-fold change, p = 0.05) on at least 4microarrays are shown. The average expression of the gene hits from each enriched gene set is displayed here. Only gene sets that show significantdifferences after multiple hypothesis testing were included. Selected GO or KEGG biological processes are shown. The entire figure with all biologicalprocesses can be viewed in Supplementary Figure S3.doi:10.1371/journal.pone.0029161.g002
Type I Interferon Signature in DM
PLoS ONE | www.plosone.org 4 January 2012 | Volume 7 | Issue 1 | e29161
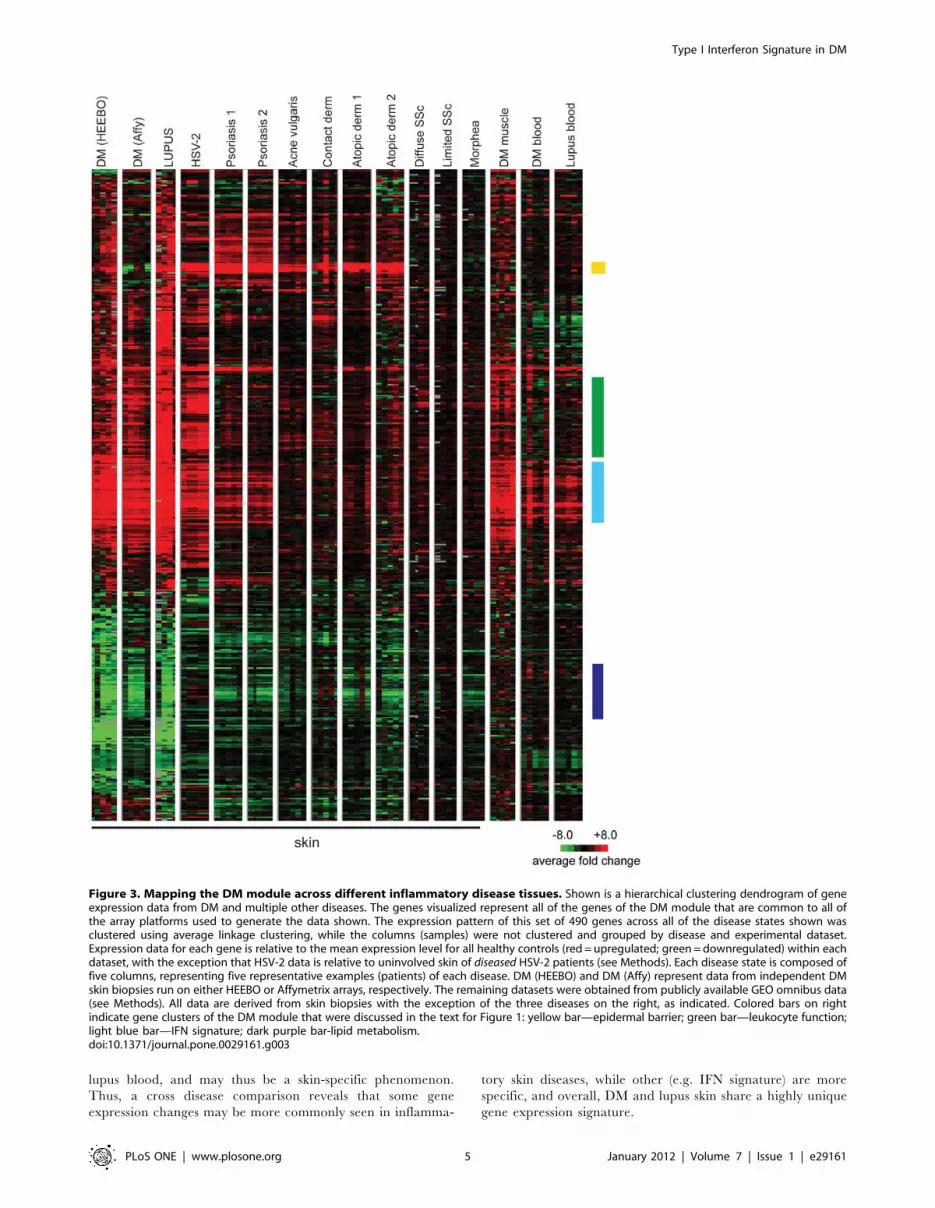
lupus blood, and may thus be a skin-specific phenomenon.
Thus, a cross disease comparison reveals that some gene
expression changes may be more commonly seen in inflamma-
tory skin diseases, while other (e.g. IFN signature) are more
specific, and overall, DM and lupus skin share a highly unique
gene expression signature.
Figure 3. Mapping the DM module across different inflammatory disease tissues. Shown is a hierarchical clustering dendrogram of geneexpression data from DM and multiple other diseases. The genes visualized represent all of the genes of the DM module that are common to all ofthe array platforms used to generate the data shown. The expression pattern of this set of 490 genes across all of the disease states shown wasclustered using average linkage clustering, while the columns (samples) were not clustered and grouped by disease and experimental dataset.Expression data for each gene is relative to the mean expression level for all healthy controls (red = upregulated; green = downregulated) within eachdataset, with the exception that HSV-2 data is relative to uninvolved skin of diseased HSV-2 patients (see Methods). Each disease state is composed offive columns, representing five representative examples (patients) of each disease. DM (HEEBO) and DM (Affy) represent data from independent DMskin biopsies run on either HEEBO or Affymetrix arrays, respectively. The remaining datasets were obtained from publicly available GEO omnibus data(see Methods). All data are derived from skin biopsies with the exception of the three diseases on the right, as indicated. Colored bars on rightindicate gene clusters of the DM module that were discussed in the text for Figure 1: yellow bar—epidermal barrier; green bar—leukocyte function;light blue bar—IFN signature; dark purple bar-lipid metabolism.doi:10.1371/journal.pone.0029161.g003
Type I Interferon Signature in DM
PLoS ONE | www.plosone.org 5 January 2012 | Volume 7 | Issue 1 | e29161
Measuring the IFN signature across different skindiseases
Although many IFN-inducible genes were upregulated in our
DM module, we wished to determine in more detail how
expression of a pre-defined module of IFN-inducible genes was
regulated in DM and several other inflammatory skin diseases. A
consensus list of 117 IFN-stimulated genes (Table S4) was derived
by using publicly available data from in vitro stimulations of
various cell types with either type I or II IFNs (see Methods). The
expression pattern of these IFN-inducible genes was then surveyed
across both the in vitro IFN stimulation data as well as diseased skin
expression data. Some variation exists in the in vitro response upon
IFN stimulation, depending on the cell type, IFN type, and the
independent labs that generated the data (Fig. 4A, left panel).
Again it appeared that DM skin and muscle, lupus skin, and HSV-
2 skin infection had the most robust overexpression of IFN-
inducible genes (Fig. 4B, right panel; also see Fig. S5 for a full
pairwise correlation matrix). As was the case for the entire DM
module, the expression patterns of IFN-inducible genes in skin of
DM and lupus patients appeared almost indistinguishable, and
similar to those in DM muscle and HSV-2. DM blood and lupus
blood had a weaker induction of IFN genes, which is likely due to
the fact that the IFN module was constructed using data from cell
types present in skin and not blood. Interestingly, psoriasis
demonstrated induction of a subset of IFN-inducible genes. In
contrast, most of the skin samples of acne vulgaris, contact
dermatitis, atopic dermatitis, allergic contact dermatitis, systemic
sclerosis, and morphea did not appear to show significant
induction of IFN-driven genes.
We next quantified the strength of the IFN-signature across
different disease states. Similar to previous studies, we selected the
top 25 most highly IFN-inducible genes from our ‘‘core IFN
signature’’, based on the in vitro studies that were used to define this
signature (Table S4) [28]. We found that the scores calculated
these 25 genes versus the full 117 gene module display a high
correlation (Spearman’s r = 0.96; not shown). We then calculated
the median expression value (relative to healthy controls) of these
25 genes for each sample, which constituted the ‘‘IFN score’’
(Fig. 4B) [28]. DM and lupus skin had the highest average median
IFN scores of 20 and 44, respectively. DM muscle and HSV-2 skin
had high IFN scores (9.5 and 8.1, respectively), while the two
psoriasis datasets yielded mean scores of 2.5 and 2.8. In contrast,
all other skin diseases had scores of 1.7 or less.
In addition to the differences in overall IFN score, we were
intrigued with the different patterns of IFN-induced genes in the
various skin inflammatory diseases (Fig. 4A). These different
patterns of IFN signature could be due to multiple factors,
including: 1) a difference in cell types responding to IFN
stimulation, 2) a difference in IFN subtypes (e.g. type I or II)
that are present among the diseases, or 3) the presence of other
cytokines that may induce a subset of genes in our ‘‘core IFN set’’.
To further investigate the differences in these patterns, we
performed principal components analysis of the various disease
samples as well as the samples obtained using in vitro IFN
stimulations (Fig. 4A) using the in vitro-defined core IFN signature
genes (Fig. 5A). We observed that the horizontal component tends
to correlate with the strength of IFN signature, specifically in the
skin (Figs. 4B and 5). Thus, DM muscle, DM and lupus skin, and
HSV-2 are furthest to the right, while psoriasis, DM and lupus
blood, and selected systemic sclerosis and atopic dermatitis
samples all are modestly displaced to the right from all other skin
diseases that are clustered together on the left—this is in general
agreement with our IFN scoring data (Fig. 4B). On the other hand,
the vertical component (component 2) appears to at least partially
distinguish type I versus type II IFN (see in vitro stimulation data
towards the right of Fig. 5). Additionally, the disease samples tend
to be more positively positioned along this component, suggesting
that DM, lupus and psoriasis all have signatures more consistent
with type I IFN than with type II IFN.
IFN gene expression in DM skinIn order to further characterize the IFN response in DM skin,
we performed QRT-PCR analysis of the selected IFNs, including
IFN-alpha (subtypes 1,2,4,6,8,14 and 21), IFN-beta, IFN-kappa,
IFN-omega, and IFN-gamma. Due to unavailability of RNA from
samples in our original dataset, these data were derived from skin
biopsy samples from an independent cohort of 39 DM patients (see
Methods). Importantly, these samples showed similar gene
expression patterns to our original dataset (Fig. 4A and S5). We
found that expression levels of all IFN transcripts, with the
exception of IFN-a4, were elevated in DM skin compared to
healthy controls, although there was considerable variation
between patients (Fig. 6A). Noting this variation, we next wished
to clarify if any of the IFN transcripts were coordinately regulated
by performing average linkage hierarchical clustering of the QRT-
PCR data for the IFN transcripts across the 39 samples. The IFN-
alpha transcripts (with the possible exception of IFN-a21 and IFN-
a4) as well as the IFN-omega transcripts were coordinately
regulated (Fig. 6B). IFN-beta and IFN-gamma were more closely
correlated with one another than any of the other transcripts,
while IFN-kappa had the most distinct pattern of expression across
the samples.
Our previous data suggested that the IFN signature in DM skin
was more similar to the pattern seen with type I rather than type II
IFN (Fig. 5). We reasoned that another independent method of
identifying the dominant IFN subtype(s) generating the in vivo IFN
signature in DM skin was to perform a correlation analysis
between the level of each particular IFN family transcript and the
IFN score for all of the available samples. Strikingly, IFN-beta
transcript level was very highly correlated with IFN signature
strength in the skin (Spearman r = 0.82; p,0.0001) (Fig. 6C).
Interestingly, IFN-gamma also demonstrated a high correlation
with IFN signature score (Spearman r = 0.72; p,0.0001), while
none of the IFN-alpha subtypes (as well as IFN-omega) were
significantly correlated with the strength of the IFN signature
(Fig. 6C; data not shown).
Discussion
This is the first study of global gene expression in the skin of DM
patients. We demonstrate an expression signature (the ‘‘DM
module’’) in the skin of 16 DM patients relative to skin from 10
normal, unaffected individuals using whole genome HEEBO
oligonucleotide arrays. This DM signature was validated in an
independent set of DM skin samples on a different microarray
platform (Affymetrix). In addition, examination of this signature
across multiple different inflammatory skin diseases demonstrated
that this signature is unique to DM and lupus, suggesting that
cutaneous DM and cutaneous lupus have a similar underlying
pathogenetic mechanism. This signature was characterized by up-
regulation of genes involved in antigen processing, complement
activation, MHC I/II receptor activity, T cell function, chemokine
activity, antiviral and immune responses and epidermal differen-
tiation, and down-regulation of genes involved in fatty acid
metabolism, lipid biosynthesis and metabolism, mitochondrial
function, and ribosomal function.
One might argue that these gene expression changes are simply
a function of increased immune cell infiltration in DM skin. Thus,
Type I Interferon Signature in DM
PLoS ONE | www.plosone.org 6 January 2012 | Volume 7 | Issue 1 | e29161
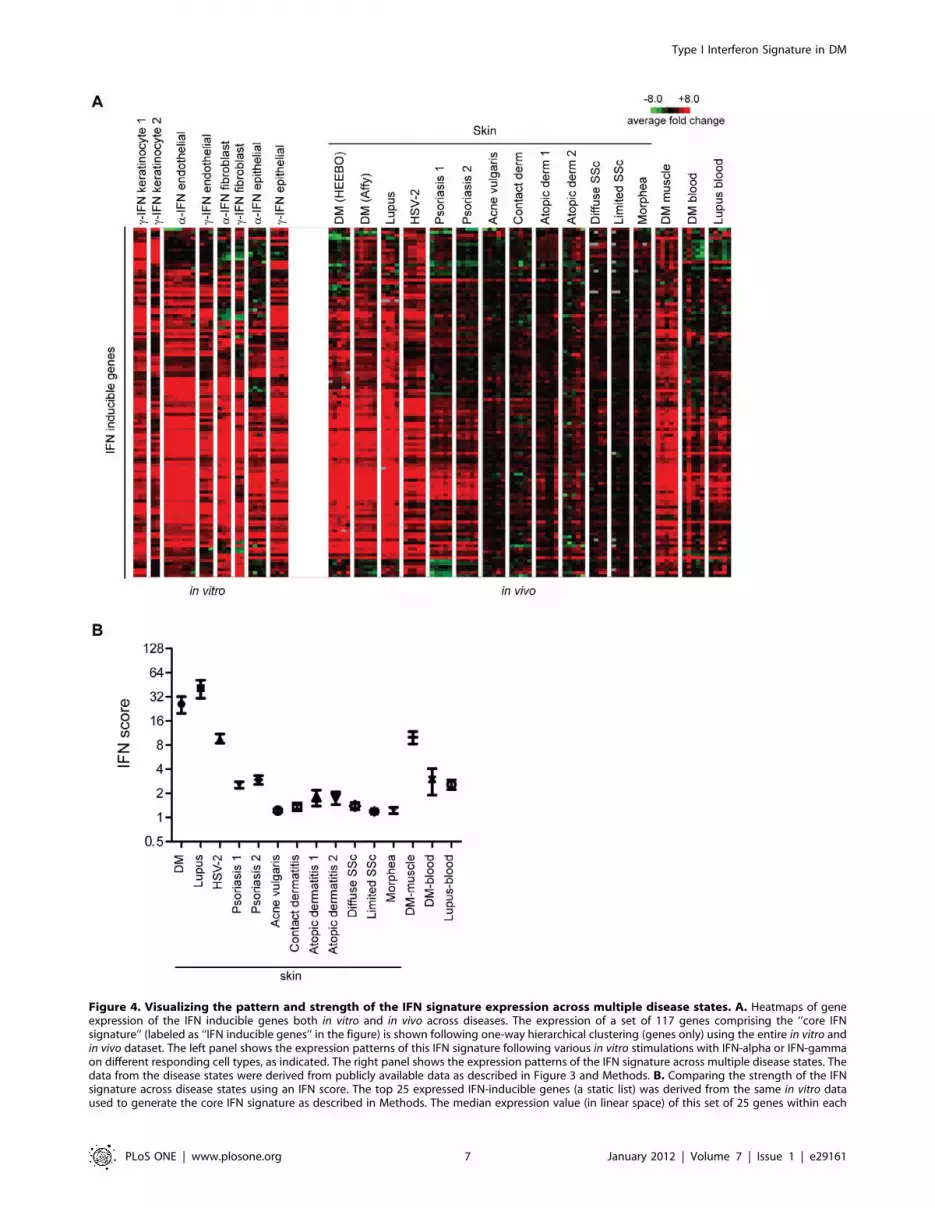
Figure 4. Visualizing the pattern and strength of the IFN signature expression across multiple disease states. A. Heatmaps of geneexpression of the IFN inducible genes both in vitro and in vivo across diseases. The expression of a set of 117 genes comprising the ‘‘core IFNsignature’’ (labeled as ‘‘IFN inducible genes’’ in the figure) is shown following one-way hierarchical clustering (genes only) using the entire in vitro andin vivo dataset. The left panel shows the expression patterns of this IFN signature following various in vitro stimulations with IFN-alpha or IFN-gammaon different responding cell types, as indicated. The right panel shows the expression patterns of the IFN signature across multiple disease states. Thedata from the disease states were derived from publicly available data as described in Figure 3 and Methods. B. Comparing the strength of the IFNsignature across disease states using an IFN score. The top 25 expressed IFN-inducible genes (a static list) was derived from the same in vitro dataused to generate the core IFN signature as described in Methods. The median expression value (in linear space) of this set of 25 genes within each
Type I Interferon Signature in DM
PLoS ONE | www.plosone.org 7 January 2012 | Volume 7 | Issue 1 | e29161

we performed a study across multiple inflammatory skin diseases
to address the specificity of the altered transcriptional modules
seen in DM skin. This cross-disease comparison suggests that,
while several gene expression patterns are shared more commonly
across inflammatory skin diseases, many of the gene expression
patterns are not found uniformly across inflammatory skin
diseases. For example, upregulation of genes typically associated
with epidermal activation was seen in all skin diseases except
scleroderma. In addition, we observed downregulation of a large
number of genes involved in lipid metabolism across most of the
skin diseases we studied. The only disease in which this was not
apparent was HSV-2, and this may actually reflect the fact that
this dataset used non-lesional skin from patients (rather than skin
from healthy volunteers) as a control—downregulation of lipid
genes has been seen in non-lesional skin of psoriasis patients [27]
and we have also seen this in the uninvolved skin from DM
patients (data not shown). Downregulation of genes involved in
lipid metabolism has been previously reported in psoriasis and
atopic dermatitis [22,27,29], but our data suggest that it is a more
general feature of many inflammatory skin diseases. It is unclear
what cell types are being affected to cause these observed changes,
although this lipid regulation could indicate the presence of a
defective epidermal barrier, as suggested previously [22]. Howev-
er, we found other signatures, notably the interferon signature as
well as others, that appear to be more characteristic of only
selected inflammatory skin diseases, despite the fact that many
conditions lacking these signatures (e.g. atopic dermatitis, acne
vulgaris) are known to be characterized by inflammatory infiltrates
in the skin. Of course, it is still possible that the transcriptional
changes seen in DM skin are a direct result of a unique type(s) of
infiltrating cell. For the interferon signature, one possible cell type
would be the plasmacytoid dendritic cell, and experiments to
correlate the strength of various transcriptional responses with
infiltrating cell types would be important to perform in the future.
Our data show conclusively that a genuine IFN signature is seen
in DM skin, similar to that found in the blood and muscle of DM
patients [9,10,30,31]. It is important to look at a complete set of
IFN-inducible genes and not simply one gene product, as this can
lead to erroneous conclusions of an IFN signature being present.
For example, focusing only at MxA, a protein classically
characterized as type I IFN-specific, would have led to the
conclusion that both atopic dermatitis datasets showed an average
of 2.9-fold overexpression relatively to healthy controls (data not
shown); this could be misconstrued as evidence of type I IFN
activation in the skin of atopic dermatitis, which is clearly not the
case. Thus, our results confirm and extend previous reports that
demonstrated upregulation of a few selected, IFN-inducible
proteins (MxA, CXCL9, CXCL10) in DM skin [15,16]. This
signature was found in all patients in which active skin disease was
biopsied, but was found at low or absent levels in biopsies from
disease sample was defined as the IFN score for that sample. Shown is the mean and SEM for IFN scores calculated for each disease datasetrepresented in panel A.doi:10.1371/journal.pone.0029161.g004
Figure 5. Distinguishing between type I and II IFN expression patterns across disease states. Two-dimensional PCA plot is shown usingexpression data derived from our data (DM, lupus) and publicly available datasets across the 117 gene ‘‘core IFN gene set’’ as described in Methods.Approximately 60% of the total data variation is summarized in these first two principal components.doi:10.1371/journal.pone.0029161.g005
Type I Interferon Signature in DM
PLoS ONE | www.plosone.org 8 January 2012 | Volume 7 | Issue 1 | e29161

Figure 6. Expression of IFN transcripts in DM skin and correlation with downstream response. A. Upregulation of most IFN transcripts inDM skin. QRT-PCR analysis of different IFN transcripts in DM skin samples. TaqMan PCR was performed (see Methods) on 39 DM skin RNA samples and4 control skin RNA samples for selected IFN transcripts. Shown are the mean values (with SEM) for each transcript in DM skin relative to the meanvalue in control skin. B. IFN transcripts are not co-regulated across DM skin samples. Hierarchical clustering dendrogram is shown for relative IFNtranscript expression levels (using QRT-PCR) across 39 DM samples. Average linkage clustering was performed using correlation (uncentered)similarity metric. Similarity branches (length is inversely correlated with similarity of expression patterns) for IFN-a and IFN-v are shown in red, IFN-beta in light blue, IFN-gamma in dark purple, and IFN-k in green. C. IFN-beta and IFN-gammacorrelate most closely with the IFN score in DM skin. Foreach RNA sample made from 39 independent DM skin biopsies, an IFN score was calculated based on transcript levels of downstream IFN-induciblegenes from array data (as described in Figure 4B and Methods) as well as a relative transcript level (using QRT-PCR) for several IFN transcripts (seepanel A). Shown are correlation plots (for each of the 39 samples) of the IFN score and IFN transcript levels for IFN-a1, IFN-beta, IFN-gamma, and IFN-kappa.doi:10.1371/journal.pone.0029161.g006
Type I Interferon Signature in DM
PLoS ONE | www.plosone.org 9 January 2012 | Volume 7 | Issue 1 | e29161

patients with inactive skin disease, despite the presence of active
myositis in the latter group. Thus, the IFN signature in the skin
might serve as a useful marker for cutaneous disease activity in
DM.
This study also provides information regarding the specificity
of the IFN signature across many inflammatory skin diseases. We
found that DM, lupus, and HSV-2 skin, and to a lesser degree,
psoriasis, had moderate-to-robust IFN signatures, whereas atopic
dermatitis, contact dermatitis, systemic sclerosis, and acne
vulgaris had relatively weak or absent IFN signatures. Psoriasis
was characterized by induction of a large subset of the IFN
‘‘core’’ genes whose expression pattern appeared to correlate with
a type I IFN response, in agreement with prior observations [32].
The subtle differences between the IFN signatures of DM and
lupus compared with psoriasis may be due to a different source of
IFN in the two diseases, different population of responding cells,
or modulating cytokines. It is curious that psoriasis appears to
have an IFN signature, as all other skin diseases that we found to
have this signature are characterized by a predominance of
keratinocyte injury and/or death. Indeed, it has been suggested
that the IFN signature is characteristic of the lichenoid skin
reaction [33], but, given the fact that keratinocyte death is not
associated with psoriasis, it is clear that the significance of an IFN
signature in skin disease may be more complicated. However, it
should be noted that the IFN score was much lower in psoriasis
skin than in the other lichenoid disorders, and thus may not reach
a threshold required to initiate pathways involved in keratinocyte
death.
Our data have highlighted the difficulty in assigning an IFN
signature as being ‘‘type I’’ or ‘‘type II’’, especially in tissue that
contains multiple cell types and cannot be easily modeled in vitro.
Although a type I IFN signature has been suggested to be present
in multiple inflammatory skin diseases, this has yet to be shown
conclusively [32,33,34]. Many genes thought to be specifically
induced by type I IFN can also be induced by type II IFN, and
this relationship is highly dependent on responding cell type and
IFN dose. We have employed two methodologies to address this
question in DM skin. First, we used various methods of
comparing patterns of IFN-inducible gene expression with those
obtained from various in vitro stimulations using recombinant type
I or type II IFN. Although these comparisons suggest that DM
skin is more characteristic of Type I IFN rather than type II IFN
activity (see Fig. 5), it is difficult to draw firm conclusions from
these data. One weakness of this approach is that it is difficult to
compare patterns of gene expression obtained under in vitro
conditions in cell lines and that which occurs in a dynamic tissue
with multiple responding cell types and unknown concentrations
of various IFN proteins. Our data certainly could be consistent
with activation of either the type I or II IFN pathways in DM
skin.
We also performed a correlation analysis between specific IFN
transcript levels and a composite measurement of IFN-activity,
namely the IFN gene score. We found that IFN-beta and IFN-
gamma levels most closely correlate with activation of IFN-
induced genes (see Fig. 6C), also suggesting that either type I or II
IFNs could be driving the IFN response. Although we did not find
a correlation between the IFN-alpha (and other type I) transcripts
we measured, this does not rule out a role for these interferons in
DM skin disease. It is possible that a threshold level of IFN-alpha is
required for the IFN response, which may then be modulated by
varying levels of other interferons. The involvement of specific
interferons in disease activity will only be conclusively answered by
treating patients with specific IFN inhibitors. An alternative
interpretation of these data is that IFN-betaand IFN-gamma) are
regulated in the same manner as the other IFN-induced transcripts
in DM skin, although this is unlikely given the striking difference in
abundance of IFN-beta mRNA versus the other IFN-induced
transcripts in DM skin (data not shown). One weakness of this
approach is that it assumes that IFN transcript level faithfully
reflects the level of active IFN protein in the skin biopsies—
however, this assumption would only serve to weaken any positive
correlation, and thus the high correlation coefficients we observed
are likely of significance.
The fact that many biopsies have high levels of other type I IFN
transcripts (which share the same receptor as IFN-beta) in the
absence of an IFN signature (Fig. 6C) suggests that other
considerations are critical for the strong induction of IFN-induced
genes seen in the skin of DM patients—these may include
translation of IFN transcripts, localization of IFN production and/
or presence of a responder cell population that is sensitive signaling
via the IFN receptor. Thus, our data do not rule out an essential
role for other type I or II IFNs in the pathogenesis of DM skin
disease. They also point out the important fact that elevation of a
particular IFN transcript does not provide proof of its activity in
vivo.
One limitation of our study is that our data are derived from
whole skin biopsies, and thus it is unclear what cell(s) constitute the
source of IFN, as well as what cell(s) are responsible for producing
such high levels of IFN-induced mRNA transcripts. Previous data
suggest that keratinocytes as well as inflammatory cells are
included in the latter ‘‘responding’’ population in DM skin [16].
However, it is clear that the pattern of expression of IFN-inducible
proteins depends on the protein examined [15,16,33]. In addition,
it will be important to detect the source of different IFN transcripts
and proteins in DM skin, which can be technically demanding.
Without detailed understanding of these issues, the role of IFN in
DM skin disease will remain unclear.
Another potential weakness of our study is that many of our
analyses compared data generated by different investigators,
using different methodologies, across different microarray
platforms. We attempted to mitigate this problem by only using
datasets in which a control group was included, so that all data
could be expressed relative to healthy patient skin. In addition,
where possible, we used identical methodologies for normalizing
array data. Despite this, we realize that this can always be a
concern when analyzing microarray data, and thus we were more
interested in the patterns of gene expression rather than absolute
levels of selected genes. We believe our methodology had internal
validation in that, for a given disease, independent patient
samples run by independent investigators across disparate
microarray platforms showed astonishingly similar patterns of
gene expression over the gene modules that we were interested in
studying (see Figure 3).
Our study defines patterns of gene expression that readily
distinguish normal from DM skin. Many of these genes may prove
to be useful as specific molecular markers that correlate with
disease progression and prognosis. Our analysis provides further
insight into the underlying pathogenesis of DM, including
characterization of a specific IFN response in DM that may
provide more effective targets for therapy.
Methods
Ethics StatementThe Stanford Panel on Medical Human Subjects approved
human subjects involvement in this research project (last renewal
on 04/18/2011). All subjects entered in this study signed an
Informed Consent document before donating tissue.
Type I Interferon Signature in DM
PLoS ONE | www.plosone.org 10 January 2012 | Volume 7 | Issue 1 | e29161

PatientsAll patients were seen in the adult Stanford Dermatology Clinics
between August 2004 and March 2006 and agreed to sign an
Informed Consent before participating in the study. All patients
were diagnosed with DM based upon diagnostic cutaneous
findings suggested previously [35] and all patients had a skin
biopsy consistent with DM. Exclusion criteria included: (1) age less
than 18 years old, and/or (2) evidence of medication-induced DM
or mixed-connective tissue disease or other overlap syndromes.
There were no restrictions on concomitant medications. We
analyzed skin biopsies from 23 DM patients (16 active and 7
inactive) and 10 healthy controls (Table S1). All biopsies were
taken from an area that was considered to be representative of
active disease. In patients considered to have inactive skin disease
(but active myositis), biopsies were taken from areas of telangiec-
tasia and/or pigmentary alteration consistent with prior active
DM skin disease. Because skin disease localization in DM patients
can be variable, many of these biopsies are from different
anatomic sites, although the majority of biopsies were from the
arm or neck/upper back (Table S1). 23 DM patients provided a
total of 25 biopsies, with 9 technical replicates for a total of 34
samples. 10 healthy controls provided a total of 15 biopsies, with 3
technical replicates, for a total of 18 samples. The DM patients
were significantly older than the healthy control patients (mean
age 53.1 vs 38.2, p = .019) and had a mean disease duration of 6.0
years. Four of the patients (17%) had cancer-associated DM. 8 of
the patients (35%) had skin predominant disease–5 of them with a
past history of myositis, and 3 never experiencing myositis
(amyopathic). We also included skin biopsies from 4 patients with
cutaneous lupus erythematosus (2 with acute cutaneous lupus and
2 with discoid lupus lesions).
Skin biopsy Processing and Microarray AnalysisPoly-adenylated RNA was extracted from snap-frozen skin
biopsy specimens (DM and lupus) using a two step method. First,
total RNA was extracted with phenol-guanidine thiocyaniate
extraction (RNAbee, Tel-Test, Friendswood TX). Next, poly-
adenylated RNA was purified using RNeasy Kit (Quiagen,
Chatsworth, CA) according to the manufacturer’s instructions.
Sample RNA and reference mRNA (Stratagene) were amplified
using an Amino Allyl MessageAmp II aRNA kit (Ambion, Austin,
TX). Amplified skin RNA (labeled with Cy5) and amplified
Human Universal Reference RNA (labeled with Cy3) (Stratagene,
La Jolla, CA) were competitively hybridized to HEEBO (human
exon evidence-based oligonucleotide) microarrays as described
(http://www.microarray.org/sfgf/heebo.do).
Array data were filtered based on fluorescent hybridization
signal $1.5-fold over local background in either the Cy5 or the
Cy3 channel and if the data were technically adequate in $80% of
experiments. Array data underwent LOWESS normalization, and
the data were displayed as a log2 ratio of LOWESS-normalized
Cy5/Cy3 ratio (span parameter = 0.4). These array data are
publicly available at Gene Expression Omnibus (GEO), accession
number GSE32245.
For experiments assessing the platform independence of our
DM array findings (Fig. 3) and for quantifying IFN expression in
DM skin (Fig. 6), several independent DM (n = 39) and healthy
control (n = 18) biopsies were obtained in the exact manner as
described above. These biopsies were processed and hybridized to
Affymetrix Human Genome U133 Plus 2.0 GeneChip arrays as
described [32]. These array data were normalized using Robust
Multichip Averaging (RMA) using Genespring (www.agilent.com/
chem/genespring).
For all datasets, after filtering and normalization, expression
data of each sample for all probes mapping to the same
UnigeneID were averaged in linear space before any analysis
was performed. Genes which showed significantly different
expression between DM and controls were identified using
Significance Analysis of Microarrays, with a false discovery rate
(FDR),0.043 and a minimum average expression of 2-fold greater
or less than controls.
Average linkage hierarchical clustering was performed using
GeneCluster ver3.0 software (http://bonsai.ims.u-tokyo.ac.jp/
,mdehoon/software/cluster/software.htm). Clustered trees and
gene expression heat maps were viewed using Java TreeView
Software (http://jtreeview.sourceforge.net/).
Module MapsGene module map was done as described with the program
Genomica (http://genomica.weizmann.ac.il/) using gene sets
derived from Gene Ontology and KEGG Pathway annotations
and the gene expression profiles of skin from patients with
dermatomyositis and normal controls.
Briefly, given this collection of precompiled gene sets and this
compendium of expression arrays, the method identifies the gene
sets that are induced or repressed significantly in the set of arrays
(p#0.05, hypergeometric distribution).
Comparisons with publicly available microarray dataPublicly available gene expression data was obtained for
psoriasis (GSE13355, GSE14905), atopic dermatitis (GSE5667,
GSE6012), acne vulgaris (GSE6475), allergic contact dermatitis
(GSE6281), HSV-2 infection (GSE18527), systemic sclerosis and
morphea (GSE9285), DM muscle (GSE1551, GSE5370), DM
blood (courtesy S. Greenberg, Brigham and Women’s Hospital),
and systemic lupus (GSE8650). The following array platforms
were used for these studies: Affymetrix U133A (GSE5667,
GSE6012, GSE1551, GSE5370, GSE8650) Affymetrix U133A
2.0 (GSE6475, 5667); Affymetrix U133 plus 2.0 (GSE6281,
GSE13355, GSE14905); Agilent Whole Human Genome Oligo
Microarray G4112A (GSE9285); Illumina humanref-8 v. 2.0
(GSE18527). Only scleroderma samples that classified as ‘‘inflam-
matory subgroup’’ were used for comparisons [36], given that we
wished to enrich these data for samples that might express an IFN
signature. For Affymetrix data, all array data was normalized
using Robust Multichip Averaging (RMA) using Genespring
(www.agilent.com/chem/genespring).
In order to compare data from different experiments, all
expression data were first mapped to a common EntrezGene
number. A set of 7783 unique EntrezGene IDs that were common
to all platforms was used in these comparisons (‘‘comparison
matrix’’). Probes that matched to multiple genes were not used.
For instances in which multiple probes mapped to the same
EntrezGene, these data were averaged by calculating the mean
value in linear space to give a single value for each EntrezGene ID.
Next, data for each gene in a given disease sample were
normalized to the mean expression value of all control samples
for that gene. Control samples were always skin biopsies from
healthy donors, with the exception of the data from the HSV-2
patients (GSE18527), as the only control data available were
derived from patient skin from uninvolved sites. Thus, each
experiment was normalized to its own internal control samples, in
order to facilitate comparison across experiment sets.
RT PCR analysis of individual transcriptsThe expression level of several microarray target genes was
assessed in patient tissue using Taqman quantitative one-step RT-
Type I Interferon Signature in DM
PLoS ONE | www.plosone.org 11 January 2012 | Volume 7 | Issue 1 | e29161

PCR (Applied Biosystems, Foster City, California, United States).
Fifty nanograms of total RNA was used in each assay. Assay on
demand primers for fatty acid desaturase 1 (Assay ID:
Hs00203685_m1), IFN-b1 (Assay ID: Hs00277188_s1), 3-hy-
droxy-3-methylglutaryl-Coenzyme A synthase 1 (Assay ID:
Hs00266810_m1), IFN a 2 (Assay ID: Hs02621172_s1), IFN-a1
(Assay ID: Hs00256882_s1), IFN-induced protein with tetratrico-
peptide repeats 3 (Assay ID: Hs00155468_m1) and IFN-alpha-
inducible protein 6 (Assay ID: Hs00242571_m1) were normalized
to GAPDH (Assay ID: Hs99999905_m1) levels and relative
abundance was calculated using delta-delta threshold analysis. All
assays were conducted on a Stratagene MX3000P thermocycler
(La Jolla, CA). RT-PCR analysis of IFN mRNA transcripts was
performed as described previously [32].
Mapping the DM module across disease statesDue to differences across array platforms, we first determined
that 490 of the 946 genes from the DM module were present
across all samples in the ‘‘comparison matrix’’ (defined above).
One-way hierarchical clustering was performed (genes only) and
the data were viewed as described above, with 5 representative
examples from each inflammatory disease used for comparison.
Method for defining genes comprising core IFN signatureWe reasoned that the skin has keratinocytes, fibroblasts,
endothelial cells, and leukocytes, among other cells that could
potentially respond differently to IFN. Thus we generated our list of
IFN-stimulated genes from all publicly available expression data
pertaining to in vitro stimulation with either IFN-gamma, -alpha,
-beta, or other IFN preparations—these included data derived from
the use of keratinocytes, lung epithelial cells, macrophages,
endothelial cells, and fibroblasts as responder cells. These specific
datasets used had the following GEO identifiers: GSE1132,
GSE7216, GSE5542, GSE3920, GSE1925, GSE1740. The time
of stimulation and concentration of IFN varied between studies. For
each study, pre- and post-stimulation data were placed in log2 space
and mean-centered for each gene. All data were then combined and
evaluated using Statistical Analysis of Microarrays using a two-class
analysis (pre vs post-treatment). From this analysis, 749 genes were
identified as significantly regulated by IFN. From this set, we
selected only genes that were regulated by an average of two-fold or
greater, leaving a final set of 161 genes. Of these 161 genes, 117
were contained in the set of 7783 comprised in the ‘‘comparison
matrix’’ gene list discussed above, and thus this set was used as the
final ‘‘core IFN signature’’ (Table S4).
Correlation matrices and principal components analysisSpearman’s rank correlations were calculated between individ-
ual arrays for various disease/specimen sources and various in vitro
stimulations with IFN-alpha or IFN-gamma on different respond-
ing cell types using the DM module gene set (490 genes) as well as
the IFN signature (as described above). The same expression data
of the 117 core IFN signature were further utilized to calculate
principal components analysis (PCA). Both the correlations and
PCA were conducted using the R statistical computing environ-
ment (http://r-project.org). The missing values in the data matrix
were imputed by the method svdImpute (from the R package
‘‘pcaMethods’’) and the principal components were calculated
with the function prcomp.
Supporting Information
Figure S1 Inactive DM skin samples cluster withhealthy controls and not active DM skin samples. Shown
is a hierarchical clustering dendrogram using two-dimensional
clustering of gene expression data from active DM skin (gold
branches), skin from patients with inactive skin disease (green
branches), and healthy controls (light blue branches). The 946
gene ‘‘DM module’’ was used to cluster the skin samples. The red
bar to the right of the dendrogram indicates the cluster of IFN-
induced genes.
(TIF)
Figure S2 Detailed view of heat map of expression ofDM module across skin samples. Two-dimensional hierar-
chical clustering was performed on gene expression data from
active DM skin lesions and skin from healthy controls. A set of 946
genes whose average expression significantly differed between DM
and healthy controls (the ‘‘DM module) was used to group sample
expression data and is shown on the thumbnail diagram at the left.
Major clusters of genes are shown with the colored bars and
labeled with letters A-G. Shown at the panel on the right are
enlarged details of expression data for the labeled clusters, with
selected groups of genes labeled at the right. Clusters of genes are:
A—epidermal activation; B—leukocyte function; C-IFN signature;
D-epidermal differentiation; E—immunoglobulin expression; G—
lipid metabolism.
(TIF)
Figure S3 DM skin module map (detailed). Module map of
the Gene Ontology (GO), Kyoto Encyclopedia of Genes and Genomes
(KEGG), and selected other Biological Processes differentially
expressed among the active DM samples is shown. Each column
represents a single microarray (e.g. patient) and each row represents a
single biological process. Only modules that were significantly enriched
(minimum 2-fold change, p = 0.05) on at least 4 micoarrays are shown.
The average expression of the gene hits from each enriched gene set is
displayed here. Only gene sets that show significant differences after
multiple hypothesis testing were included. Selected GO or KEGG
biological processes are shown. The entire figure with all biological
processes can be viewed in Supplementary Figure S3.
(TIF)
Figure S4 Spearman’s rank coefficient matrix using theDM module across different inflammatory diseasetissues. Correlation correlation similarity matrix for 16 cohorts
of disease/specimen source groups with 4–5 replicates per each
cohort using the 490 genes in the DM module. DM (HEEBO) and
DM (Affy) represent data from independent DM skin biopsies run
on either HEEBO or Affymetrix arrays, respectively. The
remaining datasets were obtained from publicly available GEO
omnibus data (see Methods). All data are derived from skin
biopsies with the exception of the three diseases on the rightmost
region of the x-axis, as indicated. The color legend at the bottom
indicates the range of Spearman p values, with general degrees of
correlation indicated at each threshold (e.g. low, no (no
correlation), mod (moderate), high, or identity). This figure
represents the individual array comparisons from the data
presented in Figure 3.
(TIF)
Figure S5 Spearman’s rank coefficient matrix using 117IFN inducible genes both in vitro and in vivo acrossdiseases. Correlation correlation similarity matrix for 16 cohorts
of disease/specimen source groups as well as various in vitro
stimulations with IFN-alpha or IFN-gamma on different respond-
ing cell types with 2–7 replicates per each cohort using 117 IFN
inducible genes. Similar to the information presented in Figure 4A,
the leftmost columns on the x-axis shows the correlation patterns
of this IFN signature following various in vitro stimulations with
Type I Interferon Signature in DM
PLoS ONE | www.plosone.org 12 January 2012 | Volume 7 | Issue 1 | e29161
IFN-alpha or IFN-gamma on different responding cell types, as
indicated. The rightmost columns on the x-axis show the
expression patterns of the IFN signature across multiple disease
states. The data from the disease states were derived from publicly
available data as described in Figure 3 and Methods. The color
legend at the bottom indicates the range of Spearman p values,
with general degrees of correlation indicated at each threshold (e.g.
low, no (no correlation), mod (moderate), high, or identity). This
figure represents the individual array comparisons from the data
presented in Figure 4A.
(TIF)
Table S1 Patients in this study. 1Limited to immunomod-
ulatory medications. 2Skin disease graded as active or inactive.
Active disease considered based on erythema, induration and/or
pruritus. Inactive disease based on absence of erythema with
pigmentary alteration and/or telangiectasia. 3Defined if any of the
following were found: proximal muscle weakness, eleveated muscle
enzymes (CPK, aldolase), EMG findings consistent with inflam-
matory myopathy, muscle biopsy consistent with DM. Abbrevi-
ations. DM = DM; NT = not tested; Pred = prednisone (daily dose
in mg); MTX = methotrexate; AZA = azathioprine; CSA = cyclos-
porine; MMF = mycophenolate moefitil; HCQ = hydroxychloro-
quine; Doxy = doxycycline; homo = homogeneous; unk = un-
known; Ca = cancer; ILD = interstitial lung disease.
(DOCX)
Table S2 List of genes significantly dysregulated in DMskin. Genes significantly dysregulated in DM skin (compared to
skin from healthy donors) were determined using SAM analysis as
described in Methods. ‘‘Average fold change’’ refers to the ratio of
the mean of the average expression in DM samples divided by the
mean of the average expression in control (healthy) samples.
(XLS)
Table S3 Top 25 upregulated genes in DM skin. The top
25 upregulated genes from Table S2 are ordered (highest to lowest
expression values relative to healthy controls). Genes previously
identified to be induced by IFN are bolded.
(XLS)
Table S4 Core IFN gene list. The 117 genes comprising the
‘‘core IFN gene list’’ are listed (highest to lowest expression values
relative to unstimulated cells). The list was derived as described in
Methods.
(XLS)
Author Contributions
Conceived and designed the experiments: DW BK DF. Performed the
experiments: DW BK RP BH WZ DF. Analyzed the data: DW BK BH YY
PB DF. Contributed reagents/materials/analysis tools: DW BK WZ YY
PB DF. Wrote the paper: DW BK DF.
References
1. Mammen AL (2010) Dermatomyositis and polymyositis: Clinical presentation,
autoantibodies, and pathogenesis. Ann N Y Acad Sci 1184: 134–153.
2. O’Hanlon TP, Miller FW (2009) Genetic risk and protective factors for the
idiopathic inflammatory myopathies. Curr Rheumatol Rep 11: 287–294.
3. Greenberg SA, Amato AA (2004) Uncertainties in the pathogenesis of adult
dermatomyositis. Curr Opin Neurol 17: 359–364.
4. Arahata K, Engel AG (1984) Monoclonal antibody analysis of mononuclear cellsin myopathies. I: Quantitation of subsets according to diagnosis and sites of
accumulation and demonstration and counts of muscle fibers invaded by T cells.
Ann Neurol 16: 193–208.
5. Page G, Chevrel G, Miossec P (2004) Anatomic localization of immature andmature dendritic cell subsets in dermatomyositis and polymyositis: Interaction
with chemokines and Th1 cytokine-producing cells. Arthritis Rheum 50:
199–208.
6. De Paepe B, Creus KK, De Bleecker JL (2009) Role of cytokines andchemokines in idiopathic inflammatory myopathies. Curr Opin Rheumatol 21:
610–616.
7. Greenberg SA (2010) Dermatomyositis and type 1 interferons. Curr Rheumatol
Rep 12: 198–203.
8. Niewold TB, Kariuki SN, Morgan GA, Shrestha S, Pachman LM (2009)
Elevated serum interferon-alpha activity in juvenile dermatomyositis: associa-tions with disease activity at diagnosis and after thirty-six months of therapy.
Arthritis Rheum 60: 1815–1824.
9. Baechler EC, Bauer JW, Slattery CA, Ortmann WA, Espe KJ, et al. (2007) An
interferon signature in the peripheral blood of dermatomyositis patients isassociated with disease activity. Mol Med 13: 59–68.
10. Walsh RJ, Kong SW, Yao Y, Jallal B, Kiener PA, et al. (2007) Type I interferon-
inducible gene expression in blood is present and reflects disease activity in
dermatomyositis and polymyositis. Arthritis Rheum 56: 3784–3792.
11. Krathen MS, Fiorentino D, Werth VP (2008) Dermatomyositis. Curr DirAutoimmun 10: 313–332.
12. Crowson AN, Magro CM (1996) The role of microvascular injury in thepathogenesis of cutaneous lesions of dermatomyositis. Hum Pathol 27: 15–19.
13. Mascaro JM, Jr., Hausmann G, Herrero C, Grau JM, Cid MC, et al. (1995)
Membrane attack complex deposits in cutaneous lesions of dermatomyositis.
Arch Dermatol 131: 1386–1392.
14. Magro CM, Crowson AN (1997) The immunofluorescent profile of dermato-myositis: a comparative study with lupus erythematosus. J Cutan Pathol 24:
543–552.
15. Wenzel J, Scheler M, Bieber T, Tuting T (2005) Evidence for a role of type I
interferons in the pathogenesis of dermatomyositis. Br J Dermatol 153: 462–463;author reply 463–464.
16. Wenzel J, Schmidt R, Proelss J, Zahn S, Bieber T, et al. (2006) Type Iinterferon-associated skin recruitment of CXCR3+ lymphocytes in dermatomy-
ositis. Clin Exp Dermatol 31: 576–582.
17. Shrestha S, Wershil B, Sarwark JF, Niewold TB, Philipp T, et al. (2010) Lesional
and nonlesional skin from patients with untreated juvenile dermatomyositis
displays increased numbers of mast cells and mature plasmacytoid dendritic
cells. Arthritis Rheum 62: 2813–2822.
18. McNiff JM, Kaplan DH (2008) Plasmacytoid dendritic cells are present in
cutaneous dermatomyositis lesions in a pattern distinct from lupus erythema-tosus. J Cutan Pathol 35: 452–456.
19. Greenberg SA, Fiorentino D (2009) Similar topology of injury to keratinocytesand myofibres in dermatomyositis skin and muscle. Br J Dermatol 160: 464–465.
20. Callen JP, Wortmann RL (2006) Dermatomyositis. Clin Dermatol 24: 363–373.
21. Caproni M, Torchia D, Cardinali C, Volpi W, Del Bianco E, et al. (2004)Infiltrating cells, related cytokines and chemokine receptors in lesional skin of
patients with dermatomyositis. Br J Dermatol 151: 784–791.
22. Saaf AM, Tengvall-Linder M, Chang HY, Adler AS, Wahlgren CF, et al. (2008)
Global expression profiling in atopic eczema reveals reciprocal expression ofinflammatory and lipid genes. PLoS One 3: e4017.
23. Gudjonsson JE, Ding J, Johnston A, Tejasvi T, Guzman AM, et al. (2010)
Assessment of the psoriatic transcriptome in a large sample: additional regulated
genes and comparisons with in vitro models. J Invest Dermatol 130: 1829–1840.
24. Der SD, Zhou A, Williams BR, Silverman RH (1998) Identification of genesdifferentially regulated by interferon alpha, beta, or gamma using oligonucle-
otide arrays. Proc Natl Acad Sci U S A 95: 15623–15628.
25. Sanda C, Weitzel P, Tsukahara T, Schaley J, Edenberg HJ, et al. (2006)
Differential gene induction by type I and type II interferons and theircombination. J Interferon Cytokine Res 26: 462–472.
26. Indraccolo S, Pfeffer U, Minuzzo S, Esposito G, Roni V, et al. (2007)Identification of genes selectively regulated by IFNs in endothelial cells.
J Immunol 178: 1122–1135.
27. Gudjonsson JE, Ding J, Li X, Nair RP, Tejasvi T, et al. (2009) Global gene
expression analysis reveals evidence for decreased lipid biosynthesis and increasedinnate immunity in uninvolved psoriatic skin. J Invest Dermatol 129: 2795–2804.
28. Yao Y, Richman L, Higgs BW, Morehouse CA, de los Reyes M, et al. (2009)
Neutralization of interferon-alpha/beta-inducible genes and downstream effect
in a phase I trial of an anti-interferon-alpha monoclonal antibody in systemiclupus erythematosus. Arthritis Rheum 60: 1785–1796.
29. Plager DA, Leontovich AA, Henke SA, Davis MD, McEvoy MT, et al. (2007)
Early cutaneous gene transcription changes in adult atopic dermatitis and
potential clinical implications. Exp Dermatol 16: 28–36.
30. Greenberg SA, Pinkus JL, Pinkus GS, Burleson T, Sanoudou D, et al. (2005)Interferon-alpha/beta-mediated innate immune mechanisms in dermatomyosi-
tis. Ann Neurol 57: 664–678.
31. Tezak Z, Hoffman EP, Lutz JL, Fedczyna TO, Stephan D, et al. (2002) Gene
expression profiling in DQA1*0501+ children with untreated dermatomyositis: anovel model of pathogenesis. J Immunol 168: 4154–4163.
32. Yao Y, Richman L, Morehouse C, de los Reyes M, Higgs BW, et al. (2008) TypeI interferon: potential therapeutic target for psoriasis? PLoS One 3: e2737.
33. Wenzel J, Tuting T (2008) An IFN-associated cytotoxic cellular immune
response against viral, self-, or tumor antigens is a common pathogenetic feature
in ‘‘interface dermatitis’’. J Invest Dermatol 128: 2392–2402.
Type I Interferon Signature in DM
PLoS ONE | www.plosone.org 13 January 2012 | Volume 7 | Issue 1 | e29161

34. Ghoreishi M, Martinka M, Dutz JP (2010) Type 1 interferon signature in the
scalp lesions of alopecia areata. Br J Dermatol 163: 57–62.35. Sontheimer RD (2002) Dermatomyositis: an overview of recent progress with
emphasis on dermatologic aspects. Dermatol Clin 20: 387–408.
36. Milano A, Pendergrass SA, Sargent JL, George LK, McCalmont TH, et al.
(2008) Molecular subsets in the gene expression signatures of scleroderma skin.
PLoS One 3: e2696.
Type I Interferon Signature in DM
PLoS ONE | www.plosone.org 14 January 2012 | Volume 7 | Issue 1 | e29161