interaction of robot swarms using the honeybee-inspired control algorithm beeclust
TRANSCRIPT

This article was downloaded by: [K F Univ Graz], [Michael Bodi]On: 12 September 2011, At: 07:39Publisher: Taylor & FrancisInforma Ltd Registered in England and Wales Registered Number: 1072954 Registeredoffice: Mortimer House, 37-41 Mortimer Street, London W1T 3JH, UK
Mathematical and Computer Modellingof Dynamical SystemsPublication details, including instructions for authors andsubscription information:http://www.tandfonline.com/loi/nmcm20
Interaction of robot swarms using thehoneybee-inspired control algorithmBEECLUSTMichael Bodi a , Ronald Thenius a , Martina Szopek a , ThomasSchmickl a & Karl Crailsheim aa Department of Zoology, Karl-Franzens Universitäät Graz,Universitäätsplatz 2, A-8010, Graz, Austria
Available online: 01 Aug 2011
To cite this article: Michael Bodi, Ronald Thenius, Martina Szopek, Thomas Schmickl &Karl Crailsheim (2011): Interaction of robot swarms using the honeybee-inspired controlalgorithm BEECLUST, Mathematical and Computer Modelling of Dynamical Systems,DOI:10.1080/13873954.2011.601420
To link to this article: http://dx.doi.org/10.1080/13873954.2011.601420
PLEASE SCROLL DOWN FOR ARTICLE
Full terms and conditions of use: http://www.tandfonline.com/page/terms-and-conditions
This article may be used for research, teaching and private study purposes. Anysubstantial or systematic reproduction, re-distribution, re-selling, loan, sub-licensing,systematic supply or distribution in any form to anyone is expressly forbidden.
The publisher does not give any warranty express or implied or make any representationthat the contents will be complete or accurate or up to date. The accuracy of anyinstructions, formulae and drug doses should be independently verified with primarysources. The publisher shall not be liable for any loss, actions, claims, proceedings,demand or costs or damages whatsoever or howsoever caused arising directly orindirectly in connection with or arising out of the use of this material.

Mathematical and Computer Modelling of Dynamical SystemsiFirst, 2011, 1–14
Interaction of robot swarms using the honeybee-inspired controlalgorithm BEECLUST
Michael Bodi*, Ronald Thenius, Martina Szopek, Thomas Schmickland Karl Crailsheim
Department of Zoology, Karl-Franzens Universität Graz, Universitätsplatz 2, A-8010 Graz, Austria
(Received 29 April 2011; final version received 11 May 2011)
In this work we investigated how robust a robot swarm acts against disturbances causedby another robot swarm, both using the BEECLUST algorithm, which is inspired byhoneybee behaviour. For our investigation we simulated an environment with an ambi-ent illuminance, a light spot and a shadow spot. In such an environment we tested twodifferent castes of Jasmine III robots whereas each caste had to perform a differenttask. One swarm aggregates at places of high illuminance (light spot) and the otherone at places of low illuminance (shadow spot). We show that small swarm populationscan benefit from the presence of another robot swarm. Medium populated swarms areaffected neither positively nor negatively. Large swarm populations act robust againstdisturbances caused by other robot swarms as long as no jamming effects occur. Inthis article we show that the BEECLUST algorithm provides all features for makingcollective decisions. Furthermore we show that the robustness of the BEECLUST algo-rithm allows us to control a heterogeneous robot swarm in environments which demanddiffering controller strategies and swarm intelligent behaviour.
Keywords: swarm robotics; collective decision; swarm intelligent
1. Introduction
Swarms of autonomous entities (animals, robots) show interesting features: huge numbersof agents act and interact in high densities and often perform their tasks in separated spe-cialized cohorts [1]. The regulation of the agents’ behaviours is often self-organized andswarm intelligent [2–4], features that are mainly achieved by various interlinked feedbackloops within the swarm system. A prime example for such self-organized and swarm-intelligent systems would be the nectar source selection by honeybees or the trail formationin ants [5].
The requirements for identifying a system as swarm intelligent were defined byMillonas [6] and in other terms also by Sahin [7]:
(1) Proximity principle: The swarm should be able to do elementary space andtime computation whereas in this case computation is understood as a directbehavioural reaction on a given environmental stimulus.
*Corresponding author. Email: [email protected]
ISSN 1387-3954 print/ISSN 1744-5051 online© 2011 Taylor & FrancisDOI: 10.1080/13873954.2011.601420http://www.informaworld.com
Dow
nloa
ded
by [
K F
Uni
v G
raz]
, [M
icha
el B
odi]
at 0
7:39
12
Sept
embe
r 20
11

2 M. Bodi et al.
(2) Quality principle: The swarm should be able to determine and react to the qualityof an environmental stimulus.
(3) Principle of diverse response: The swarm should not narrow down its exploita-tion of a certain resource to much as an insurance against sudden changes in theenvironment.
(4) Principle of stability: The swarm should not shift its behaviour on every smallenvironmental change.
(5) Principle of adaptability: On the other hand, the swarm should be able to changeits behaviour to clear environmental changes. So an optimal solution for theswarm would be a good mixture of principles 4 and 5.
When creating artificial (e.g. robotic) swarm systems, the feedback networks which deter-mine self-organized behaviour can quickly get rather complex and swarm behaviours canbecome hard to predict. This generates the demand for finding simple behavioural rulesfor individuals and also simple rules of interactions. Such rules can often be found innatural swarm systems [8–10]. This allows extraction of such regulation mechanisms andtranslation of these feedbacks to artificial swarm systems, which in turn show compara-ble behaviour like the natural sources of inspiration [11–13]. We recently demonstratedsuch a translation of natural algorithms to a swarm robotic algorithm by developing theBEECLUST [14–17].
Young honeybees prefer an ambient temperature of 36 ◦C which corresponds to thetemperature of the brood nest in the beehive [18,19]. Recent experiments with young hon-eybees in a temperature gradient have shown that a single bee moves almost randomlythrough an arena (see Figure 1(a)) [15,20]. Some bees exhibit a slight bias towards thewarm area during its random walk but it hardly ever stays there. In contrast, groups of bees(Figure 1(b)) show aggregation behaviour in or close to the warm spot. The bees still movealmost randomly but the clusters which are accidentally formed in warm areas last longerthan clusters formed in cooler areas. At the end of the experiment, almost all bees cluster inthe warm area [15,20] (see Figure 1(c)). This interesting behaviour inspired us to developthe BEECLUST algorithm which is described in detail in Section 1.1.
Such bio-inspired algorithms are frequently investigated in the field of autonomousrobotics in the recent years and are developed using a big variety of techniques: Halloy
(a) (b) (c)
Figure 1. Aggregation behaviour of young honeybees. The ambient temperature in the arena is30 ◦C. On the left side is a temperature optimum with 36 ◦C (marked with a black line in (b) and (c)).(a) Trajectory of a single bee. The single bee does not show a clear preference to the temperatureoptimum. (b) A group of bees are released in the centre of the arena (t = 0 min). (c) At the end ofthe experiment, most of the bees are clustered in the temperature optimum (t = 30 min).
Dow
nloa
ded
by [
K F
Uni
v G
raz]
, [M
icha
el B
odi]
at 0
7:39
12
Sept
embe
r 20
11

Mathematical and Computer Modelling of Dynamical Systems 3
et al. [21] experimented with robots which were able to integrate in insect societies. Thefield of bio-inspired control algorithms for large populated robot swarms has also beeninvestigated intensively: In the I-Swarm project [22], techniques for controlling a swarmof 1000 microrobots were investigated. The Swarm-Bot project [23,24] investigated theself-organizing abilities of a robot swarm, consisting of simpler, insect-like robots. In theSymbrion project [25], the concept of a swarm of reconfigurable robots is investigated.The Replicator project [26] plans to develop an autonomous robot swarm for industrialpurposes.
Compared to single robot systems, such robot swarms have the advantage to workrobustly, because the removal or malfunction of single individuals affects the behaviour ofthe whole swarm only slightly. Robot swarms are also able to act ‘swarm intelligent’ whichpermits a group of individuals to make decisions to reach a common goal in a decentral-ized manner. In the following, we demonstrate how the BEECLUST algorithm scales withswarm sizes and how cooperation can emerge (without being pre-programmed) betweenseveral interacting robot swarms.
1.1. The BEECLUST algorithm
In recent works it has been shown that a swarm of Jasmine III robots using the BEECLUSTalgorithm are able to find locations of maximum illumination using a few simple rules [15](see Figure 2):
(1) The robots move straight through the arena. Whenever a robot detects an obstacle,it stops and checks whether the obstacle is another robot or a wall by watching foremitted IR signals.
(2) If the detected obstacle does not emit IR signals it is a wall. The robot turnsrandomly and continues with Step 1.
(3) If the detected obstacle does emit IR signals it is another robot. The robotmeasures the local illuminance.
No
No
No
Yes
Yes
YesCollision?
Move
forwardTurn
WaitWaiting time
over?
Measure
illuminance
&
calculate
waiting time
*
Collision
with robot?
Figure 2. Finite-state machine of the BEECLUST controller. Boxes represent the differentbehavioural states of a robot. Asterisk indicates the starting state of the algorithm. Diamondsrepresent control structures (if–else decisions).
Dow
nloa
ded
by [
K F
Uni
v G
raz]
, [M
icha
el B
odi]
at 0
7:39
12
Sept
embe
r 20
11

4 M. Bodi et al.
(a) (b)
Dimmed light
Bright light
Figure 3. (a) A single Jasmine III robot. (b) A swarm of Jasmine III robots in a real-life experiment.Most of the robots are aggregated in the bright area of the arena. Reprinted from [15].
(4) Depending on the local illuminance, the robot calculates a waiting time: thehigher the local illuminance, the longer the waiting time. After the waiting timeis over, the robot turns randomly and continues with Step 1.
Our recent studies showed that the BEECLUST algorithm allows a robot swarm to aggre-gate collectively at a light spot (see Figure 3(b)) [15]. This collective ability is achievedby robots that move purely random, and which have only one illuminance sensor that doesnot allow a directed gradient exploitation. Also no memory of past illuminance values isinvolved in the algorithm. The measurements of the environment occur rarely, only afterrobot-to-robot collisions. Although the individual ‘intelligence’ of single robots is keptquite low, the swarm as a total was found to act very intelligently, even in dynamic envi-ronments. The reasons for this emergent ability are the feedback loops that arise within therobot swarm, as it is explained in detail in [12,27]. Based on the work of [15], we investi-gated how the robustness of the BEECLUST algorithm is affected by the swarm populationand how it is influenced by a second group of robots in the arena performing a differenttask at the same time.
2. Methods
The experiments in this work were performed with simulated Jasmine III robots. TheJasmine III robot (Figure 3(a)) has a size of about 30 × 30 × 25 mm (L × W × H). Ithas two wheels as actuators which can be turned in both directions. For distance measure-ment and for collision avoidance the Jasmine III has six IR sensors. The sensors rangeis approximately 60 mm. For light measurement the Jasmine III has two light sensors ontop. A detailed description of the robot hardware can be found in [15,16] and buildinginstructions are given in [24].
For our experiments we used SMARS (Small Robot Simulator), a simulation envi-ronment programmed in NetLogo [28], which was built for performing experiments withsimulated Jasmine III robots (see Figure 4). In this simulation environment we simulatedtwo different ‘castes’ of Jasmine III robots which were implemented with the physicalproperties of the real robots. The only difference between the two castes is that one castewaits longer at places of high illuminance (light finders) and the other one at places of lowilluminance (shadow finders). All other properties of the robots are equal.
We generated a virtual arena with the dimension of 49 × 29 spatial units. These spatialunits are called patches and have a base area of 3 × 3 cm2, which is equal to the base
Dow
nloa
ded
by [
K F
Uni
v G
raz]
, [M
icha
el B
odi]
at 0
7:39
12
Sept
embe
r 20
11

Mathematical and Computer Modelling of Dynamical Systems 5
Figure 4. Screenshot of two robot swarms acting in the simulation environment SMARS. The whitespot is the optimum for the ‘light finders’ with 1000 lux and the black spot is the optimum for the‘shadow finders’ with 0 lux. The ambient illuminance is 500 lux. Robots are represented by boxeswhich indicate their caste: dark boxes are ‘light finders’ and bright boxes are ‘shadow finders’. Theline shows a trajectory of a randomly chosen robot for demonstration purposes.Note: SMARS, Small Robot Simulator.
area of a Jasmine III robot. In this arena we implemented an environment with an ambientilluminance of 500 lux. We added a light spot with 1000 lux and a shadow spot with 0 lux(see Figure 5).
2.1. The simulation
In our simulation each infrared sensor s is modelled as a set of two values:
s = {α,d}, (1)
whereby α is the perception angle of the sensor and d its range. The sensors areimplemented as a list of sensors S
S = {s1, . . . , s6}. (2)
For each sensor s of S, an object O and an object R are generated; O is the closest object(including other robots) and R is the closest robot. When robots detect an obstacle they emitan infrared signal and switch to a perception mode in which they wait for other infraredsignals. (In this way a robot discriminates an obstacle from another robot because obsta-cles reflect IR light but do not emit IR light by themselves.) First we calculate whether arobot in the sensor cone could possibly be occluded by another object (expressed by i) bydetermining the distance of the robot cR and the distance to the occluding object cO:
i ={
true, if cO < cR
false, else. (3)
In a next step we calculate whether a robot is visible behind an obstacle (expressed by j).Therefore the angles βO and βR are defined for each O and each R in the sensor cone.
j =⎧⎨⎩
true, if |βR − βO| < arctanaO2
cO
false, else, (4)
Dow
nloa
ded
by [
K F
Uni
v G
raz]
, [M
icha
el B
odi]
at 0
7:39
12
Sept
embe
r 20
11

6 M. Bodi et al.
Arena length
x-Coordinate (arena length)
Sensor
valu
e θ
Are
na w
idth
–200
50
100
150
200
–10 0 10 20
(a)
(b)
Figure 5. (a) Overhead screenshot of the arena in SMARS. The bright area indicates the light spotand the dark area indicates the shadow spot. Arena length = 49 patches, arena width = 29 patches.(b) Sensor values detected by the robots. Samples are taken from patches with y = 0, which is thevertical centre of the arena.
whereby a is the diameter of the seen object.There is a direct proportion between the illuminance and the sensor value whereby
the maximal sensor value (180) is reached at 1000 lux and above. In our model sensorvalues of the light sensors are a linear function of local illuminance, as it is explained byEquation (5):
ex,y ={ Ex,yθ , if ex,y ≤ Emax
emax, else, (5)
whereby ex,y represents the sensor value of the robot’s light sensor at the position x, y in thearena and emax the maximum sensor value of a robot. Ex,y is modelled as the illuminanceat the position x, y and Emax as the maximal perceived light value. θ refers to the transla-tion coefficient which converts measured light values to sensor values. For simulating theturning behaviour of a robot, the turnangle γ and the turnradius r have to be calculated:
γ = 360p
2rπ, (6)
Dow
nloa
ded
by [
K F
Uni
v G
raz]
, [M
icha
el B
odi]
at 0
7:39
12
Sept
embe
r 20
11

Mathematical and Computer Modelling of Dynamical Systems 7
r = rR
1 − pq
, (7)
whereby p is the distance which is covered by the outer actuator and q is the distance whichis covered by the inner actuator. rR represents the diameter of a robot. The turning of a robottakes place in three steps: first the robot turns γ /2, then the robot moves forward. In thelast step the robot turns γ /2 again.
2.2. The controller
As mentioned above, each robot which meets another robot calculates its waiting timeindividually, depending on the local illuminance but regardless of the other robots’ caste.The waiting time of the ‘light finders’ is modelled as
wLx,y = wmax
1 + exp−(ex,y+o)σ, (8)
and for ‘shadow finders’ it is modelled as
wSx,y = wmax
1 + exp−(emax+ex,y+o)σ, (9)
whereby wLx,y refers to the waiting time at the position x, y for ‘light finders’ and wS
x,yfor ‘shadow finders’. wmax is modelled as the maximum waiting time, ex,y is the robot’sactual sensor value, emax is the maximum sensor value, o is the vertical offset and σ is thesteepness. Equations (8) and (9) are both illustrated in Figure 6. The given values for theconstants can be seen in Table 1.
2.3. The experiments
To find the optimal density of a Jasmine III swarm, we first tested groups of differingpopulation sizes only consisting of ‘light finders’. We defined a target zone for the ‘lightfinder’ caste consisting of all patches having a light value between 600 and 1000 lux (this is40% of the maximum light value in the arena). For each swarm population, we repeated theexperiment six times for 4 simulated minutes. We defined two different measurable criteria
0102030405060
0 200 400 600 800 1000
Wai
ting
time
(s)
Illuminance (lux)
Light findersShadow finders
Figure 6. Illustration of the dependence between the local illuminance ex,y and the waiting timewx,y. The solid drawn function was implemented in the ‘light finders’, and the dashed drawn functionwas implemented in the ‘shadow finders’.
Dow
nloa
ded
by [
K F
Uni
v G
raz]
, [M
icha
el B
odi]
at 0
7:39
12
Sept
embe
r 20
11

8 M. Bodi et al.
Table 1. Constants and their values used in Equations(1)–(3) in our simulation runs.
Constants Values Dimensions
wmax 60 semax 180 DimensionlessEmax 1000 luxθ 0.18 Dimensionlesso 147 Dimensionlessσ 0.5 DimensionlessrR 30 mm
for aggregation success: aggregation quality and aggregation speed. To get an overview ofthe aggregation quality of our robot swarm, we monitored the ‘light finders’ in the state‘wait’ located in the target zone within the last minute of every repetition. To analysethe aggregation speed, we monitored the point of time when 50% of the ‘light finder’population aggregated within the target zone (A50). To test the robustness of a robot swarmagainst disturbances caused by another swarm performing another task, we added groupsof variable numbers of ‘shadow finders’ and observed how they affect the aggregationbehaviour of the ‘light finders’.
3. Results
Our results show that there is an optimal density of the tested robot swarm for the usedenvironmental conditions. This optimal density was found at a swarm population of 9individuals (see Figure 7). A swarm consisting of 9 individuals is able to aggregate, onaverage, 80% of its individuals in the target zone.
0
0.2
0.4
0.6
0.8
1
1 10 100 1000
AL(N
L)
NL
Quartile 1–3Median
MinMax
Figure 7. Fraction of aggregated ‘light finders’ AL(NL) in target zone over the last minute of obser-vation. The optimal swarm population for the given environment was found at 9 robots. The testedswarm populations were 2, 3, 6, 9, 12, 18, 24, 33, 42, 60, 100 and 120 individuals; n = 6 repetitionsper experiment.
Dow
nloa
ded
by [
K F
Uni
v G
raz]
, [M
icha
el B
odi]
at 0
7:39
12
Sept
embe
r 20
11
Mathematical and Computer Modelling of Dynamical Systems 9
NL = 2 NL = 3 NL = 6
(NS) NL = 9
AL(N
L)
AL(N
L)
(NS) NL = 18 (NS) NL = 33
NS NS NS
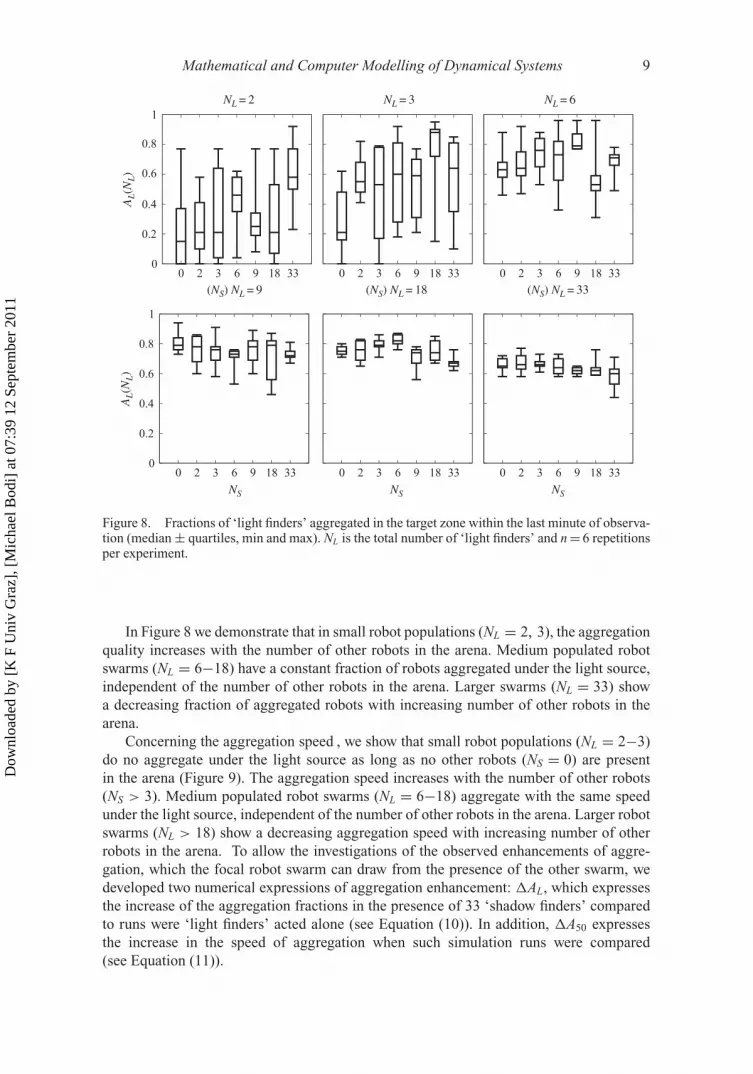
Figure 8. Fractions of ‘light finders’ aggregated in the target zone within the last minute of observa-tion (median ± quartiles, min and max). NL is the total number of ‘light finders’ and n = 6 repetitionsper experiment.
In Figure 8 we demonstrate that in small robot populations (NL = 2, 3), the aggregationquality increases with the number of other robots in the arena. Medium populated robotswarms (NL = 6−18) have a constant fraction of robots aggregated under the light source,independent of the number of other robots in the arena. Larger swarms (NL = 33) showa decreasing fraction of aggregated robots with increasing number of other robots in thearena.
Concerning the aggregation speed , we show that small robot populations (NL = 2−3)do no aggregate under the light source as long as no other robots (NS = 0) are presentin the arena (Figure 9). The aggregation speed increases with the number of other robots(NS > 3). Medium populated robot swarms (NL = 6−18) aggregate with the same speedunder the light source, independent of the number of other robots in the arena. Larger robotswarms (NL > 18) show a decreasing aggregation speed with increasing number of otherrobots in the arena. To allow the investigations of the observed enhancements of aggre-gation, which the focal robot swarm can draw from the presence of the other swarm, wedeveloped two numerical expressions of aggregation enhancement: �AL, which expressesthe increase of the aggregation fractions in the presence of 33 ‘shadow finders’ comparedto runs were ‘light finders’ acted alone (see Equation (10)). In addition, �A50 expressesthe increase in the speed of aggregation when such simulation runs were compared(see Equation (11)).
Dow
nloa
ded
by [
K F
Uni
v G
raz]
, [M
icha
el B
odi]
at 0
7:39
12
Sept
embe
r 20
11

10 M. Bodi et al.
NL = 2A
50(N
L)
(s)
A50
(NL)
(s)
NL = 3 NL = 6
(NS) NL = 9 (NS) NL = 18 (NS) NL = 33
NS NS NS
Figure 9. Time in which 50% of the ‘light finder’ swarm aggregated in the target zone (A50NL) atdifferent population sizes of ‘shadow finders’ NS (median quartiles, min and max). NL is the numberof ‘light finders’ and n = 6 repetitions per experiment.
�AL(NL) = AL(NS = 33) − AL(NS = 0). (10)
Figure 10, where �AL(NL) was evaluated for different swarm sizes of ‘light finders’, showsthat small populations show an enhancement of their ability to aggregate by increasingnumber of other robots, whereas larger populations are not affected, whereby �AL(NL) rep-resents the difference between the fraction of ‘light finders’ in the target zone at a ‘shadowfinder’ population of 33 AL(NS = 33) and a ‘shadow finder’ population of 0 AL(NS = 0).
To investigate also the advancements in aggregation speed, which are caused bythe presence of other robot swarm, we defined an aggregation enhancement �A50
according to
�A50(NL) = A50(NS = 0) − A50(NS = 33), (11)
whereby A50(NS = 0) is the point of time when 50% of the ‘light finders’ aggregate underthe light source by a population of 0 ‘shadow finders’ and A50(NS = 33) a population of 33‘shadow finders’. In Figure 11 we show that small populations of ‘light finders’ aggregatefaster by increasing number of ‘shadow finders’. Medium populated swarms only take
Dow
nloa
ded
by [
K F
Uni
v G
raz]
, [M
icha
el B
odi]
at 0
7:39
12
Sept
embe
r 20
11

Mathematical and Computer Modelling of Dynamical Systems 11
1
0.5
0
–0.5
–12 3
NL
6 9 18 33ΔA
L(N
L)
Figure 10. The enhancement of aggregation �AL(NL) which is the difference of fraction betweenNS = 0 and NS = 33, for NL = 2–33, is shown. For details on the formulation of �AL(NL), seeEquation (10).
200150100500
–50–100
–150–200
ΔA50
(NL)
2 3
NL
6 9 18 33
Figure 11. The acceleration of aggregation A50(NL) in seconds which is the difference of TA50
between NS = 0 and NS = 33, for NL = 2–33, is shown. For details on the formulation of A50(NL),see Equation (11).
small disadvantage by an increasing number of ‘shadow finders’ and large ‘light finder’populations take strong disadvantage.
4. Discussion
As shown in Figure 7, a robot swarm using the BEECLUST algorithm is predicted byour model to have an optimal swarm population of nine individuals for the tested arenasize and illuminance patterns. Below this value there is a steep increase in the aggregationperformance. This could be caused by positive feedback loops, which are typical for swarmbehaviour: the more individuals, the better is the performance of the whole swarm. At aswarm population above the optimum of nine individuals, the aggregation performancedecreases again. On the one hand , the robots block each other because the robot densitygets too high for the arena size; on the other hand, the light spot gets saturated. We expect adifferent finding in a differently dimensioned environment because the optimal populationsize is dependent on the robot density.
Concerning the robustness of the swarm, we found that small ‘light finder’ popula-tions gain benefit from increasing numbers of ‘shadow finders’ in aggregation quality as
Dow
nloa
ded
by [
K F
Uni
v G
raz]
, [M
icha
el B
odi]
at 0
7:39
12
Sept
embe
r 20
11

12 M. Bodi et al.
well as in their aggregation speed. This results from a higher total number of robots in thearena; more collisions happen and lead to an increasing frequency of light measurements.Medium populated swarms act robust in the presence of another robot swarm concern-ing their ability to aggregate as well as concerning their aggregation speed. Both of theseobservables are affected only slightly. The advantage of more measurements and the dis-advantage of jamming cancel each other out. Large swarms take disadvantage from anincreasing number of other robots, because the robot density gets too high and jammingeffects occur. The appearance of advantages in aggregation caused by other robots in thearena is caused by the increase of robot collisions which go along with a higher robotdensity in the arena. This leads to an increasing number of light measurements due to anincreasing number of robot collisions. But if the density of robots in the arena is too high,jamming effects occur. This leads to a lower quantity of aggregation (Figures 8 and 10) andlower aggregation speed (Figures 9 and 11).
With the work at hand we show that the BEECLUST algorithm is not only capableof working robustly in a homogeneous robot swarm, but also suitable in heterogeneousrobot groups with differing controller strategies, even without discrimination of caste affil-iation of other robots. Those gained benefits allow us to use the BEECLUST algorithm inenvironments which may demand heterogeneous controller strategies, for example, load-ing energy: Robots with low energy aggregate at the fuelling station, whereas robots withenough energy accomplish their mission.
The topic of aggregation of swarms of agents is a common benchmark in the fieldof swarm robotics: Dorigo et al. [23] used an evolving neural network consisting of 12neurons for robot aggregation. Compared to this work the BEECLUST algorithm is quitesimple, because it gets along with just a few basic rules and therefore it needs less pro-cessing power and memory. Other experiments with cockroach-like robots have beenperformed in simulations as well as in real world [29,30]. The main difference to ourwork presented here is the ability of cockroach-like robots to measure the number of othernearby robots. This requires a unique ID and communication between the individuals. Ourrobots, which use the BEECLUST algorithm, neither need to discriminate between dif-ferent individuals within the swarm nor need to know how many individuals are locatedin a nearby aggregation spot. Furthermore, the ‘cockroach-derived algorithm’ is aimed toemulate cockroach behaviour as closely as possible while the BEECLUST is aimed to col-lectively choose an optimal aggregation site. Therefore, the ‘cockroach-derived algorithm’is more complex than the BEECLUST.
In summary, the BEECLUST algorithm is simple and therefore it has little require-ments. It does not require any communication in a biological sense. The robots are ableto distinguish other robots from obstacles in the environment via their physical propertiesand characteristics, but they do not need to know ‘which’ and how many other robots arearound. Above all, our study presented here shows how robust the BEECLUST algorithmworks and how versatile its applicability is despite its simplicity.
In future we will investigate how the distribution of light in the arena (gradient ordiscrete) influences the aggregation behaviour. Furthermore, we will investigate how thedistance between the two optima influences the aggregation behaviour.
AcknowledgementsWe thank Sibylle Hahshold and Gerald Radspieler for providing us with the data of honeybeeexperiments and for building the honeybee temperature arena. This work was supported by EU-IST-FET project SYMBRION, no. 216342; EU-ICT project ‘REPLICATOR’, no. 216240; and AustrianScience Fund (FWF) research grants P15961-B06 and P19478-B16.
Dow
nloa
ded
by [
K F
Uni
v G
raz]
, [M
icha
el B
odi]
at 0
7:39
12
Sept
embe
r 20
11

Mathematical and Computer Modelling of Dynamical Systems 13
References[1] B.R. Johnson, Organization of work in the honeybee: A compromise between division of labour
and behavioural flexibility, Proc. R. Soc. Lond. B 270 (2003), pp. 147–152.[2] G. Beni, From swarm intelligence to swarm robotics, in Proceedings of the First International
Workshop on Swarm Robotics, E. Sahin and W.M. Spears, eds., LNCS, Santa Monica, CA,2005, pp. 1–9.
[3] E. Bonabeau, M. Dorigo, and G. Theraulaz, Swarm Intelligence: From Natural to ArtificialSystems, Oxford University Press, Oxford, 1999.
[4] J. Kennedy and R.C. Eberhart, Swarm Intelligence, Morgan Kaufmann Series in EvolutionaryComputation, Morgan Kaufmann, San Francisco, CA, 2001.
[5] S. Camazine, J.L. Deneubourg, N.R. Franks, J. Sneyd, G. Theraulaz, and E. Bonabeau, Self-Organization in Biological Systems, Princeton University Press, Princeton, NJ, 2001.
[6] M.M. Millonas, Swarms, phase transitions, and collective intelligence, in Artificial Life, C.G.Langton III, ed., Addison-Wesley, Reading, MA, 1994, pp. 417–445.
[7] E. Sahin, Swarm robotics: From sources of inspiration to domains of application, in SwarmRobotics: State-of-the-Art Survey, E. Sahin and W.M. Spears, eds., LNCS 3342, Springer-Verlag, Berlin, 2005, pp. 10–20.
[8] T.D. Seeley, S. Camazine, and J. Sneyd, Collective decision-making in honey bees: Howcolonies choose among nectar sources, Behav. Ecol. Sociobiol. 28 (1991), pp. 277–290.
[9] T. Schmickl and K. Crailsheim, Costs of environmental fluctuations and benefits of dynamicdecentralized foraging decisions in honey bees, Adapt. Behav. Anim. Anim., Software AgentsRob. Adapt. Syst. 12 (2004), pp. 263–277.
[10] R. Jeanson, C. Rivault, J.L. Deneubourg, S. Blanco, R. Fournier, C. Jost, and G. Theraulaz,Self-organized aggregation in cockroaches, Anim. Behav. 69 (2005), pp. 169–180.
[11] G. Theraulaz, E. Bonabeau, S.C. Nicolis, R.V. Sole, V. Fourcassie, S. Blanco, R. Fournier, J.L.Joly, P. Fernandez, A. Grimal, P. Dalle, and J.-L. Deneubourg, Spatial patterns in ant colonies,Proc. Natl. Acad. Sci. U.S.A. 99 (2002), pp. 9645–9649.
[12] T. Schmickl, H. Hamann, H. Wörn, and K. Crailsheim, Two different approaches to amacroscopic model of a bio-inspired robotic swarm, Rob. Auton. Syst. 57 (2009), pp. 913–921.
[13] C.W. Reynolds, Flocks, herds, and schools, Comput. Graph. 21 (1987), pp. 25–34.[14] T. Schmickl and H. Hamann, BEECLUST: A swarm algorithm derived from honeybees, in
Bioinspired Computing and Communication Networks, Y. Xiao and F. Hu, eds., Routledge,New York, 2011, pp. 95–137.
[15] T. Schmickl, R. Thenius, C. Möslinger, G. Radspieler, S. Kernbach, and K. Crailsheim, Getin touch: Cooperative decision making based on robot-to-robot collisions, Auton. Agent MultiAgent Syst. 18 (2008), pp. 133–155.
[16] S. Kernbach, R. Thenius, O. Kornienko, and T. Schmickl, Re-embodiment of honeybeeaggregation behavior in an artificial micro-robotic swarm, Adapt. Behav. 17 (2009), pp.237–259.
[17] H. Hamann, T. Schmickl, H. Wörn, and K. Crailsheim, Analysis of emergent symmetry breakingin collective decision making, Neural Comput. Appl. (2011), pp. 1–12.
[18] H. Heran, Untersuchungen über den Termperatursinn der Honigbiene (Apis mellifica) unterbesonderer Berücksichtigung der Wahrnehmung strahlender Wärme, Z. vgl. Physiol. 34 (1952),pp. 179–206.
[19] T. Ohtani, Spatial distribution and age-specific thermal reaction of worker honeybees, Hum.Nature 1 (1992), pp. 11–26.
[20] M. Szopek, G. Radspieler, R. Thenius, T. Schmickl, and K. Crailsheim, Cooperative thermo-taxis in honeybees: Group decisions in a complex temperature gradient, Apidologie 40 (2009),p. 663.
[21] J. Halloy, G. Sempo, G. Caprari, C. Rivault, and J.L. Deneubourg, Social integration ofrobots into groups of cockroaches to control self-organized choices, Science 318 (2007),pp. 1155–1158.
[22] P. Valdastri, P. Corradi, A. Menciassi, T. Schmickl, K. Crailsheim, J. Seyfried, and P. Dario,Micromanipulation, communication and swarm intelligence issues in a swarm microroboticplatform, Rob. Auton. Syst. 54 (2006), pp. 789–804.
[23] M. Dorigo, V. Trianni, E. Sahin, R. Groß, T.H. Labella, G. Baldassarre, S. Nolfi, J.-L.Deneubourg, F. Mondada, D. Floreano, and L.M. Gambardella, Evolving self-organizingbehaviors for a swarm-bot, Auton. Rob. 17 (2004), pp. 223–245.
[24] U. Stuttgart, Available at http://www.swarmrobot.org (Accessed 15 April 2011).
Dow
nloa
ded
by [
K F
Uni
v G
raz]
, [M
icha
el B
odi]
at 0
7:39
12
Sept
embe
r 20
11

14 M. Bodi et al.
[25] SYMBRION, Project Website. Available at http://www.symbrion.eu (Accessed 15 April 2011).[26] REPLICATOR, Project Website. Available at http://www.replicators.eu (Accessed 15 April
2011).[27] H. Hamann, H. Wörn, K. Crailsheim, and T. Schmickl, Spatial macroscopic models of a bio-
inspired robotic swarm algorithm, IEEE/RSJ 2008 International Conference on IntelligentRobots and Systems (IROS’08), IEEE Press, Los Alamitos, CA, 2008, pp. 1415–1420.
[28] U. Wilensky, NetLogo, Center for Connected Learning and Computer-Based Modeling,Northwestern University, Evanston, IL, 1999.
[29] S. Garnier, C. Jost, R. Jeanson, J. Gautrais, M. Asadpour, G. Caprari, and G. Theraulaz,Collective decision-making by a group of cockroach-like robots, Proceedings of the 2nd IEEESwarm Intelligence Symposium (SIS), IEEE, Los Alamitos, CA, 2005, pp. 233–240.
[30] S. Garnier, F. Tache, M. Combe, A. Grimal, and G. Theraulaz, Alice in pheromone land: Anexperimental setup for the study of ant-like robots, Swarm Intelligence Symposium (SIS 2007),IEEE Press, Los Alamitos, CA, 2007, pp. 37–44.
Dow
nloa
ded
by [
K F
Uni
v G
raz]
, [M
icha
el B
odi]
at 0
7:39
12
Sept
embe
r 20
11