community inspired - swift
TRANSCRIPT

Community Inspired Annual Report 2007

1
SWIFT Annual Report 2007
Community InspiredSWIFT is a community-inspired co-operative, founded by and for the financial services industry. We work globally with more than 8,300 organisations including banks, market infrastructures, securities institutions, corporations, network providers, business partners and technology companies to ensure the financial world can carry out its business operations with certainty. Our role is two-fold. We provide the platform, products and services that allow our customers to connect and exchange financial information securely and reliably. We also act as the catalyst that brings the financial community together to work collaboratively to shape market practice, define standards and consider solutions to issues of mutual concern and interest.
Contents04 — 07A broader, stronger community A few words from our Chairman
08 — 11 A smarter, simpler SWIFT Perspectives from the CEO
12 — 15 Getting closer Accessible, involving, in touch
16 — 19 Ensuring relevance Smarter, simpler solutions built around the customer
20 — 23 Strengthening resilience Increased capacity, robust systems
24 — 25Enabling change, growing opportunities Smoothing the path through major industry change
26 — 29Facts and figures
30 — 31Leadership Council Individual contribution, shared responsibility, collective accountability
32 — 33Board of Directors Experienced industry practitioners, pro-active governors and advisors
34 — 35Governance at SWIFT
36Oversight of SWIFT
37 Financial performance and key figures
38 Report of the independent financial auditors
39 Consolidated statement of income and recognised income and expense ('SoRIE')
40 Consolidated balance sheet
41 Consolidated statement of cash flows
42—68 Notes to the consolidated financial statements
69 SWIFT business offices
70 SWIFT Partners
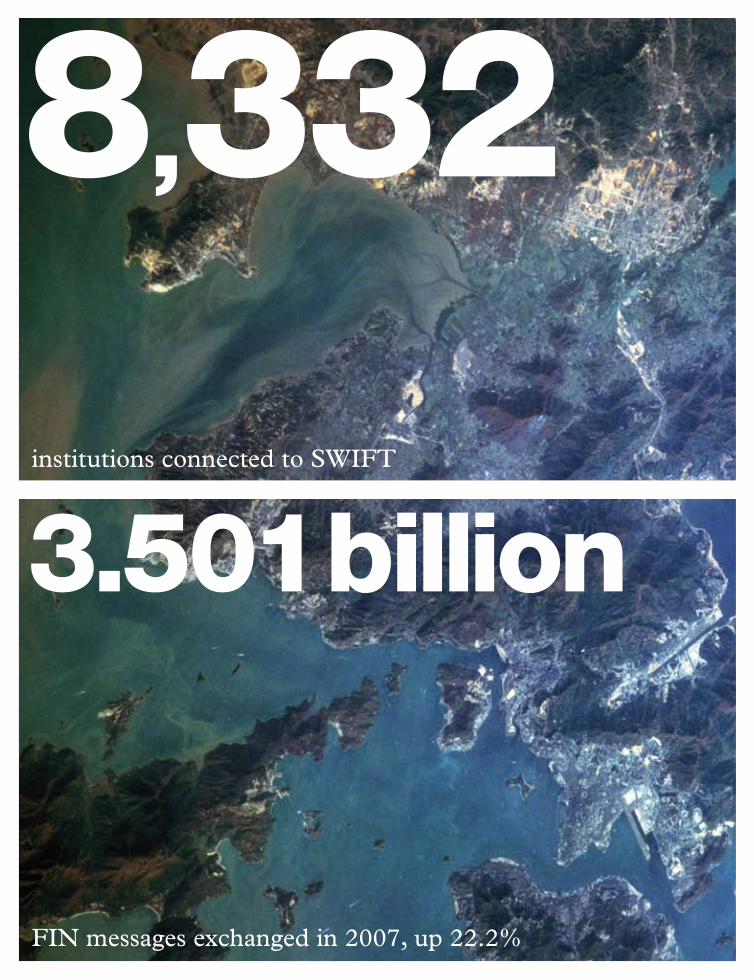
8,332
3.501 billioninstitutions connected to SWIFT
FIN messages exchanged in 2007, up 22.2%
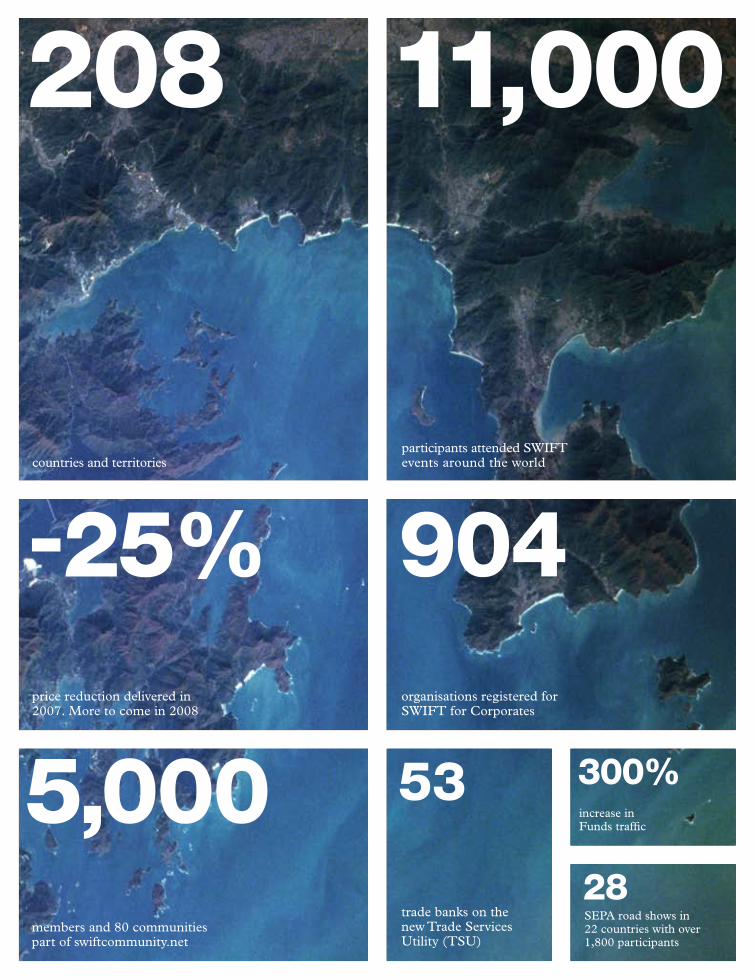
208 1 1,000
countries and territoriesparticipants attended SWIFT events around the world
-25%
53
28
904price reduction delivered in 2007. More to come in 2008
members and 80 communities part of swiftcommunity.net
increase in Funds traffic
SEPA road shows in 22 countries with over 1,800 participants
organisations registered for SWIFT for Corporates
trade banks on the new Trade Services Utility (TSU)
300%5,000
4
SWIFT Annual Report 2007
A broader, stronger community— A few words from our Chairman
As I write, the financial markets continue to experience unprecedented volatility, continuing the trend set in 2007. As industry practitioners, all of our institutions have worked hard to process record trading and payments volumes; meet the need for rapid, accurate information; and keep costs down in a particularly harsh investment environment.
With this backdrop, the past year has been remarkably successful for the SWIFT co-operative under the leadership of CEO, Lázaro Campos, who took over from Leonard Schrank in April, and his management team.
Record resultsAs a result of this market volatility SWIFT experienced record messaging volumes. Revenues were substantially higher than projected across all areas of the business. Taken in combination with an already solid financial position, the co-operative reduced our prices by 10 percent, granted a 15 percent rebate on all messaging traffic at the end of the year, and committed to a further 5 percent price reduction in January 2008.
The high-volume trends extended into 2008. In January, SWIFT recorded two peak traffic days – a first. SWIFT has also
continued to grow as a global community. In June we welcomed Financial Market Regulators as a new category of participants. More and more corporates are benefiting from access to SWIFT and I am confident we will see similar progress with investment managers.
As part of a renewed commitment to engage with the worldwide community and encourage dialogue, SWIFT was increasingly present around the globe with regional conferences, business forums and, of course, Sibos. Sibos in Boston was our largest ever with over 7,000 attendees, and above all great networking and business opportunities.
During the course of the year, the Board also approved a recommendation to invest in a strategic Distributed Architecture Programme that will allow SWIFT to accommodate future business growth.
Data protectionAt the beginning of 2007, SWIFT was in the midst of working out compliance and data protection issues, and I am happy to say that these are now mostly behind us. By the end of the third quarter, Safe Harbor status had been achieved, and relevant policies had been revised and published in order to provide SWIFT Members with more contractual transparency. In parallel, the EU and US authorities reached an agreement that takes SWIFT out of the middle and provides it with legal certainty. A benefit of the Distributed Architecture Programme
is that in the future intra-European messages will remain in Europe, thereby allaying concerns over data protection.
Ensuring SWIFT’s relevanceFor many of us, SWIFT is the provider of choice for secure, global financial messaging services. As a co-operative, it has always been open and public. Standards developed by SWIFT are available to all. This openness makes SWIFT easier to compete with and competitive threats must be taken more seriously than in the past. As a co-operative, we must look out for the interests of our members, customers and users – for their benefit and for the benefit of their end users.
I believe that SWIFT needs to work harder and more aggressively to become the de facto ‘shared services’ provider and set the standard for the industry as a whole. This will happen if we continue to reduce prices, make it easier to connect and encourage more institutions to join. The more counter-parties we can reach through SWIFT, the more value its services bring to its customers. As a community, we should encourage the co-operative to explore other business areas and opportunities.
A strong governance structureWe have a unique governance structure at SWIFT and we have a solid record of success in growing with the industry and meeting the needs and wishes of our members and customers. But we can do more by taking governance on the
5
SWIFT Annual Report 2007
offensive. We have a diverse and talented Board representing the global financial services industry. We have specialised standing committees. Task Forces and Advisory Groups are formed with appropriate experts to address specific issues. By leveraging this depth of talent, governance can support change instead of being a process-centred obstacle to progress. This makes SWIFT more nimble, gives it an edge, allows it to be more aggressive and ensures that it does not take competition lightly. SWIFT will always focus on doing what its customers want and need.
A strategic infrastructureFinancial regulators and our customers’ CEOs see SWIFT as a strategic infrastructure, essential to the global economy. This is a responsibility we take very seriously. Because of the huge value of messages exchanged over the network each day, SWIFT cannot be allowed to fail operationally.
Over the years SWIFT has made significant investments with its Four Pillars programme, resilience, and now the new distributed architecture. SWIFT makes it its business to prevent failure. We ensure that we have no single points of failure. We work closely with the financial services community on an individual and community basis and with the SWIFT Crisis Coordination and Communication Group. We conduct regular exercises with the community to test our resilience. We work with key market infrastructures to ensure that we understand and meet their requirements.
The governance process has supported and enabled this. And beyond the governance process there is an oversight group led by central banks that treat our co-operative as a precious asset for the industry – which it is. I would like to
extend my thanks to Lázaro Campos, his Leadership Council and the entire SWIFT team. Lázaro’s transition into the CEO role has been smooth and rapid and the organisation is responding quickly to the challenges he has laid out. The Leadership Council has been instrumental in nurturing a customer-centric culture. As both a practitioner and Chairman I welcome and encourage this move.
I would like to thank my fellow Board members for all of their hard work over the course of the past year. They had much to do – in governing the company’s implementation of SWIFT2010; in contributing to shaping the Distributed Architecture Programme; in overseeing SWIFT’s response to data protection issues. They are a great asset to the company, combining their experience as market practitioners with their expertise in offering pro-active governance and guidance.
SWIFT has always relied on the dedication of its members and of its member groups around the world. Keeping our members involved – and increasing that involvement – is one of my highest priorities. I am working with my fellow Board members and with the Leadership Council to make sure that we make it as easy as possible for all of our members and customers to contribute opinions and views. Your commitment and engagement are keystones of SWIFT’s success.
Thank you.
Yawar ShahChairmanApril 2008
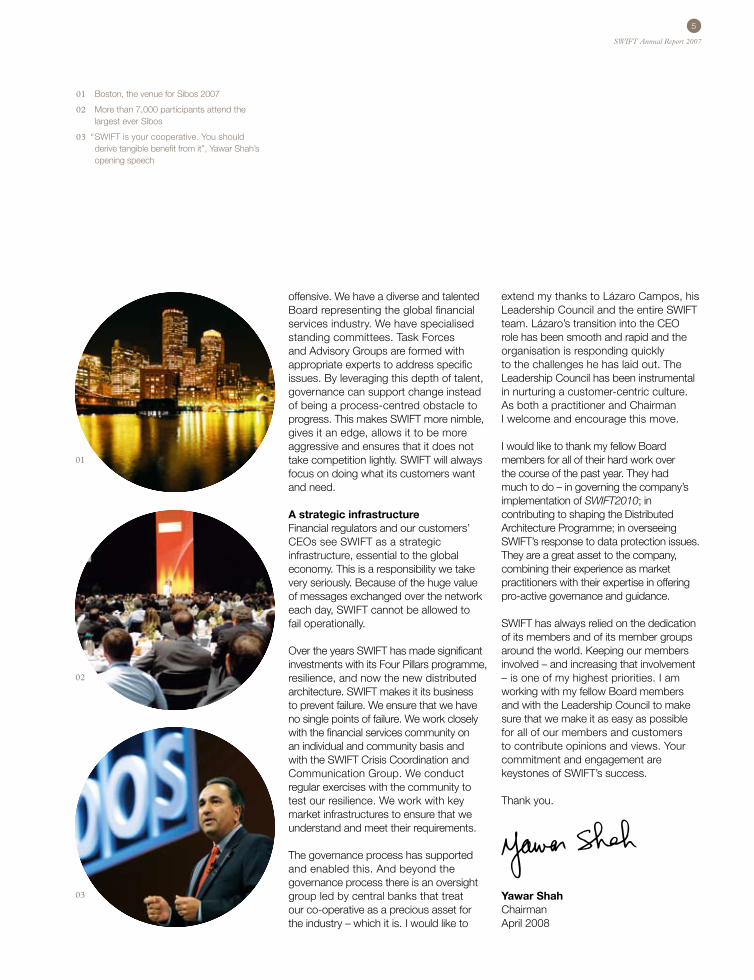
01 Boston, the venue for Sibos 2007
02 More than 7,000 participants attend the largest ever Sibos
03 “ SWIFT is your cooperative. You should derive tangible benefit from it”, Yawar Shah’s opening speech
03
01
02
“ The pace of change in the securities industry is unprecedented and presents an ongoing strategic challenge. The Securities Steering Committee takes advantage of industry experts and practitioners to help evolve SWIFT’s strategic approach to the market so that it stays relevant for the industry in the coming years.”
Jacques-Philippe Marson, Chairman of the Securities Steering Committee of the Board
“ Standards are at the heart of SWIFT’s value proposition. At the Standards Board Committee, we strive to achieve the best balance between global, regional and sector-specific requirements; and between what is optimal technically and achievable operationally. SWIFT’s leadership in financial messaging standards is built on decades of success made possible through the active participation of the entire community.”
Alan Goldstein, Chairman of the Standards Committee of the Board
“ Maintaining the trust of the industry is essential to our cooperative. The Audit and Finance Committee is determined to maintain SWIFT’s high standards of rigorous governance, working with the other members of the Board and the executive team.”
Eli Sinyak, Chairman of the Audit and Finance Committee of the Board
“ The most important decision of any Board is the appointment of a new CEO. We are proud of our decision to appoint Lázaro Campos, congratulate him on his achievement and look forward to working with him and his leadership team.”
Stephan Zimmermann, Chairman of the Human Resources Committee of the Board and Deputy Chairman of the Board
“ As financial services become more integrated, the demands on SWIFT grow: low-value payments, commercial trade services and globalisation place competing demands on the cooperative. The Banking and Payments Committee works with the executive team to evolve a strategy that meets the needs of all players.”
Finn Otto Hansen, Chairman of the Banking and Payments Committee of the Board
“ Working closely with the CIO, the Technology and Production Committee makes sure that SWIFT’s most valuable assets – its reliable and secure infrastructure, and the services it delivers – will remain relevant for the industry for years to come. We have seen the benefits of this partnership through the support of the entire industry for the launch of the distributed architecture project.”
Wolfgang Gaertner, Chairman of the Technology and Production Committee of the Board
8
SWIFT Annual Report 2007
It is with great pleasure that I write to you in the Annual Report for the first time as SWIFT’s CEO. And what a first year it has been!
Performance in 2007 exceeded expectations at all levels. Traffic growth was well above projected levels: 3.5 billion FIN messages compared to the 3 billion forecast in our SWIFT2010 strategy. Total operating revenue before rebate rose by 6.3 percent, while FIN traffic volumes soared at a staggering 22.2 percent over the previous year.
Operationally, we achieved 99.9 percent availability, although we did suffer a significant power outage in March. And all of this while obtaining clean financial and security audit opinions.
None of this would have been possible if we had not had a solid foundation on which to build. I would like to thank Leonard Schrank for leaving the company in such good shape – and with no debt.
Much of my initial effort on becoming CEO was devoted to assuring our customers that they are at the core of all our activities going forward. Our commercial success in 2007 has helped underpin that message as we began an ambitious programme of reform and innovation.
Lifting barriersMarket volatility boosted our financial performance. It also presented many challenges for the community and put further emphasis on the importance of cost management and cost predictability for our customers. As a result, an early focus for reform was our pricing model. In addition to the 25 percent price reduction highlighted by Yawar in his Chairman’s statement, we introduced a new strategic pricing option for high-volume users, based on a three-year fixed fee. Those who sign up can increase messaging usage by up to 50 percent over the term of the contract at no extra cost.
At the time of writing, 27 customers have taken advantage of the new price plan, representing almost half of our FIN traffic. We expect more to follow during the course of this year. This fixed-fee option is a clear ‘win-win’: it limits customers’ costs and protects SWIFT’s revenues. We have not forgotten the smaller customer. In 2007, we reduced overall FIN prices by 10 percent, and in December the Board agreed a 15 percent rebate on all messaging services. The SWIFTNet Kits that we introduced in April were a first step to make it cheaper and easier for smaller customers to connect to SWIFT.
Our user base has continued to expand in recent years and now includes thousands of institutions whose messaging needs are relatively light. Some 1,800 of our users send less than 150 messages a day, whilst we estimate that on average our top 50 users exchange messages with over 4,500 end points every quarter. Recognising the growing importance of capillarity to the membership, we began work in 2007 on a
new web-based connectivity option for very low-volume users. This new product will be launched in 2008.
Listening to customersTo ensure that our understanding of customer requirements is in touch with reality, we conducted a customer survey in October and November 2007. The overall rating was 8.33 out of 10 for the total SWIFT customer experience. The results of this survey confirmed that you continue to place significant value on the core strengths of SWIFT – security, reliability and resilience – and that SWIFT continues to deliver to your high expectations in these areas. Some 64 percent of survey respondents, for example, cited security as SWIFT’s most valued attribute and gave us a rating of 9.1 out of 10.
Of course, the survey also suggested aspects of performance where there is room for improvement. We are committed to making SWIFT easier, more flexible and cheaper. In our SWIFT2010 strategy, we have set ourselves clear targets in all three areas and are well on the way to implementation. Providing simpler pricing and easier connectivity is just a start.
A customer-centric organisationTo help us deliver on our promises, we reorganised the company in 2007. The details are provided elsewhere in the Annual Report, but, in a nutshell, our guiding principle was to ensure that every member of the SWIFT team has a line of sight to our customers and that our own decision-making processes are as close to theirs as possible. We have therefore moved many key commercial and support functions into three regions with regional
A smarter, simpler SWIFT— Perspectives from the CEO
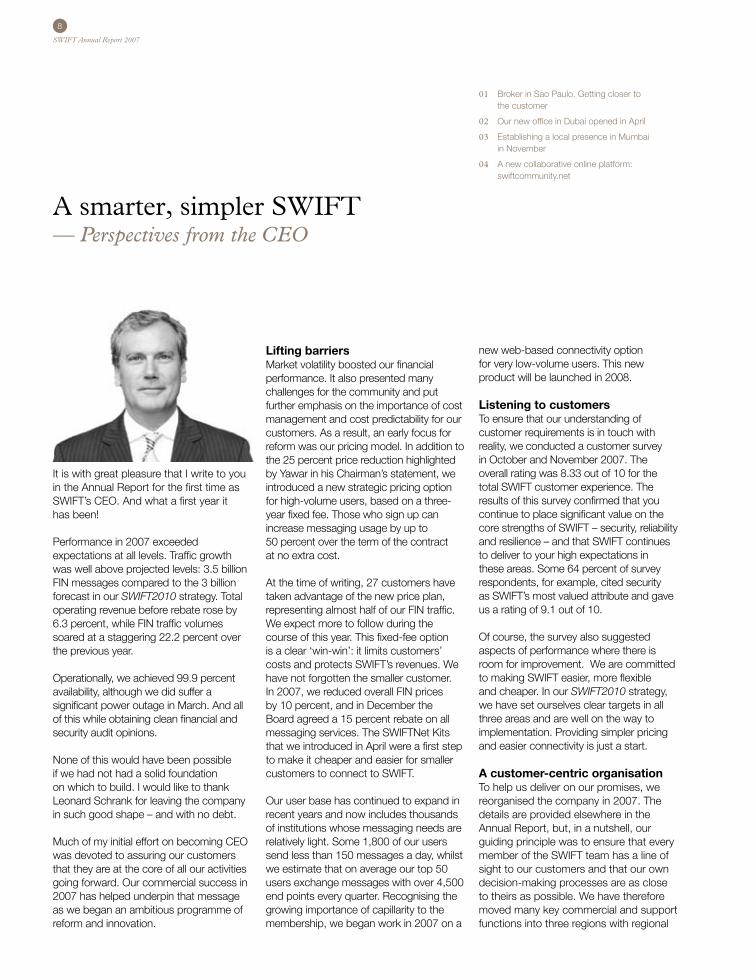
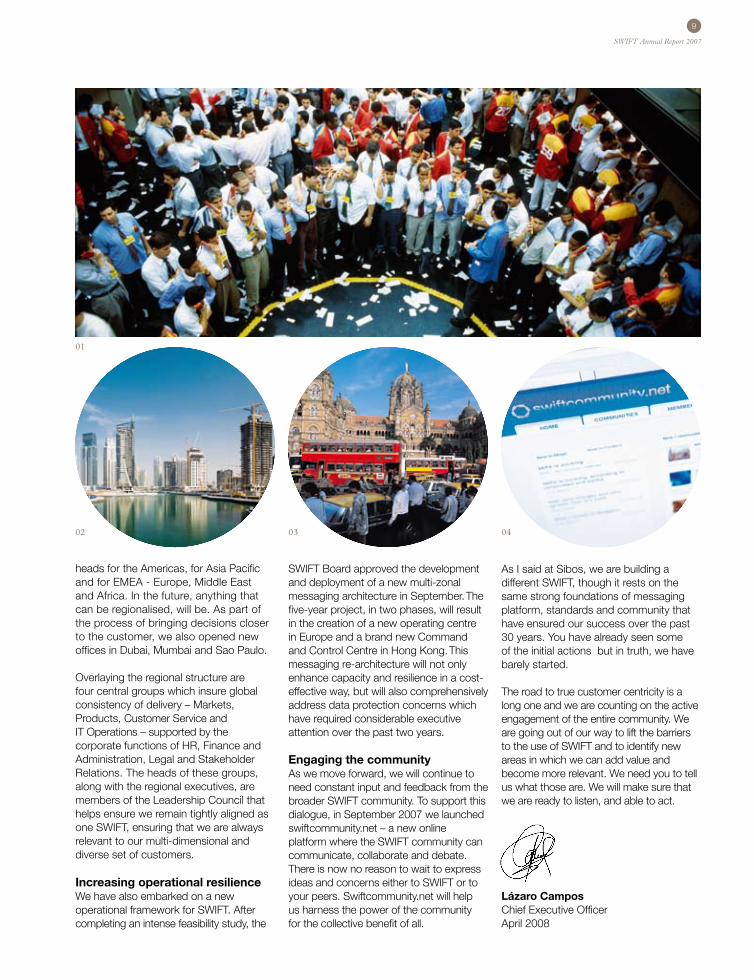
01 Broker in Sao Paulo. Getting closer to the customer
02 Our new office in Dubai opened in April
03 Establishing a local presence in Mumbai in November
04 A new collaborative online platform: swiftcommunity.net
9
SWIFT Annual Report 2007
heads for the Americas, for Asia Pacific and for EMEA - Europe, Middle East and Africa. In the future, anything that can be regionalised, will be. As part of the process of bringing decisions closer to the customer, we also opened new offices in Dubai, Mumbai and Sao Paulo.
Overlaying the regional structure are four central groups which insure global consistency of delivery – Markets, Products, Customer Service and IT Operations – supported by the corporate functions of HR, Finance and Administration, Legal and Stakeholder Relations. The heads of these groups, along with the regional executives, are members of the Leadership Council that helps ensure we remain tightly aligned as one SWIFT, ensuring that we are always relevant to our multi-dimensional and diverse set of customers.
Increasing operational resilienceWe have also embarked on a new operational framework for SWIFT. After completing an intense feasibility study, the
SWIFT Board approved the development and deployment of a new multi-zonal messaging architecture in September. The five-year project, in two phases, will result in the creation of a new operating centre in Europe and a brand new Command and Control Centre in Hong Kong. This messaging re-architecture will not only enhance capacity and resilience in a cost-effective way, but will also comprehensively address data protection concerns which have required considerable executive attention over the past two years.
Engaging the communityAs we move forward, we will continue to need constant input and feedback from the broader SWIFT community. To support this dialogue, in September 2007 we launched swiftcommunity.net – a new online platform where the SWIFT community can communicate, collaborate and debate. There is now no reason to wait to express ideas and concerns either to SWIFT or to your peers. Swiftcommunity.net will help us harness the power of the community for the collective benefit of all.
As I said at Sibos, we are building a different SWIFT, though it rests on the same strong foundations of messaging platform, standards and community that have ensured our success over the past 30 years. You have already seen some of the initial actions but in truth, we have barely started.
The road to true customer centricity is a long one and we are counting on the active engagement of the entire community. We are going out of our way to lift the barriers to the use of SWIFT and to identify new areas in which we can add value and become more relevant. We need you to tell us what those are. We will make sure that we are ready to listen, and able to act.
Lázaro CamposChief Executive OfficerApril 2008
0402 03
01
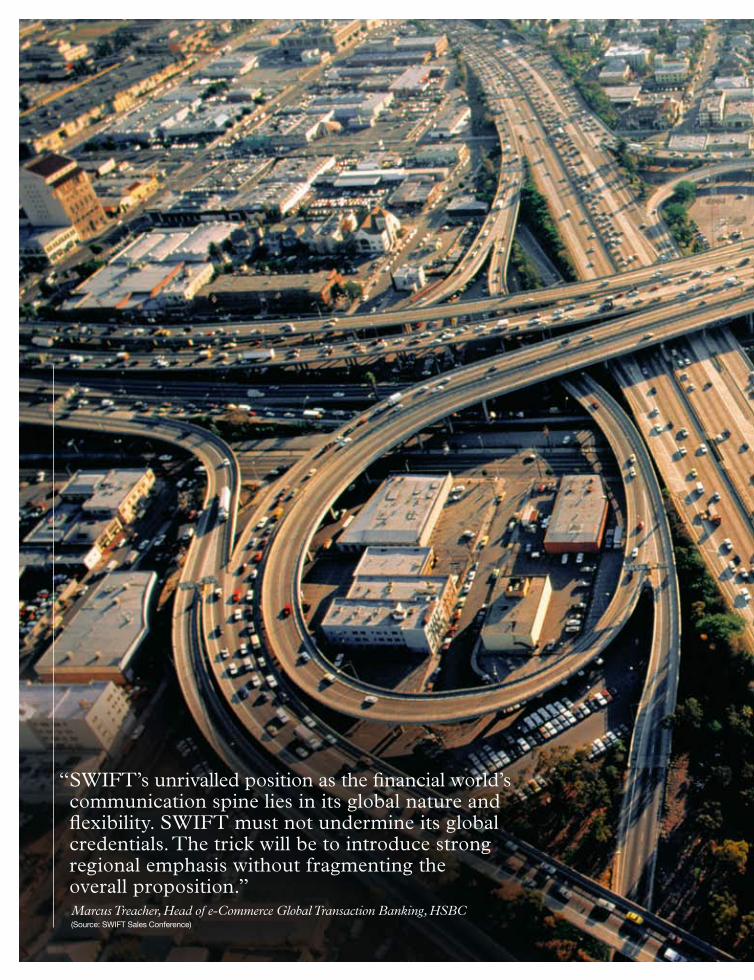
“ SWIFT’s unrivalled position as the financial world’s communication spine lies in its global nature and flexibility. SWIFT must not undermine its global credentials. The trick will be to introduce strong regional emphasis without fragmenting the overall proposition.”
Marcus Treacher, Head of e-Commerce Global Transaction Banking, HSBC (Source: SWIFT Sales Conference)

12
SWIFT Annual Report 2007
Getting closer— Accessible, involving, in touch
We have taken action to:
— Improve our accessibility and responsiveness with a reorganisation designed around our customers geographically and by market;
— Build on our past strengths by involving the community even more in testing new products and services;
— Nurture community dialogue and discussions through a full programme of events and a new online collaborative platform.
Organised for understanding and responsivenessIn September, we made major changes to our organisational structure to put us more in touch with the needs of our different geographical markets, while still maintaining the global scale that is fundamental to what we do. The driving principle is to make us much more nimble and responsive.
We are organised around three regions – Americas, Asia Pacific, and Europe, Middle East and Africa – giving each the power they need to bring decision making closer to customers. Each of the regional teams includes relationship managers, market and product managers, standards specialists and communications and support experts.
The Markets Group is sharpening our focus on individual market segments worldwide, looking at specific services and standards tailored to meet those needs. Our Products group and Customer Service group work together to make sure that our products will meet the requirements of individual customers, and will be simple and easy to use. Once a product has been installed, these groups are committed to providing world-class support.
Our IT Operations group has a single-minded focus on ensuring the absolute reliability and resilience of our messaging services. It is also responsible for the delivery of the distributed architecture programme and the additional control centre in Asia Pacific – key to our continued success.
Corporate functions have been organised into Finance and Administration, which includes pricing in its responsibilities, Legal, Human Resources and Stakeholder Relations.
Close at handWe became a local presence for more customers in 2007 with the opening of three new offices in key developing markets. First to open was São Paolo in February, followed by Dubai in April and Mumbai in December. The largest emerging markets have been significantly under-represented in their use of SWIFT. The new presence, in line with our 2010 strategy, will help us increase penetration in local financial institutions, build good relations with central banks and regulators to contribute to regional and local market infrastructures.
Engaging the communityIt is the involvement of our customers as part of a dynamic community that gives SWIFT its unique strength. In 2007, we continued to involve customers in all our major initiatives from the earliest stages and to give them the support and training that they require to reap the full benefits of what we deliver. In Europe, this included getting ready for the Single Euro Payments Area (SEPA). More than 28 road shows in 22 countries were organised to help customers in their preparations.We know the importance of getting people together to network and debate, to give their frank views on how we are doing and to set constructive challenges for the future. Our extensive 2007
Achieving operational excellence has been our driving force over the past few years. The challenge for 2007 has been to translate this into long-term business value for our customers by getting closer to them, better understanding their needs and having a more open dialogue about their future priorities.
13
SWIFT Annual Report 2007
“ Coming together is a beginning, keeping together is progress, working together is a success.”
Ruth Baitshepi, Senior System Analyst, Bank of Botswana, quoting Henry Ford (Source: swiftcommunity.net)
programme of events and conferences allowed our customers to do just that and acted as the hub of the community.
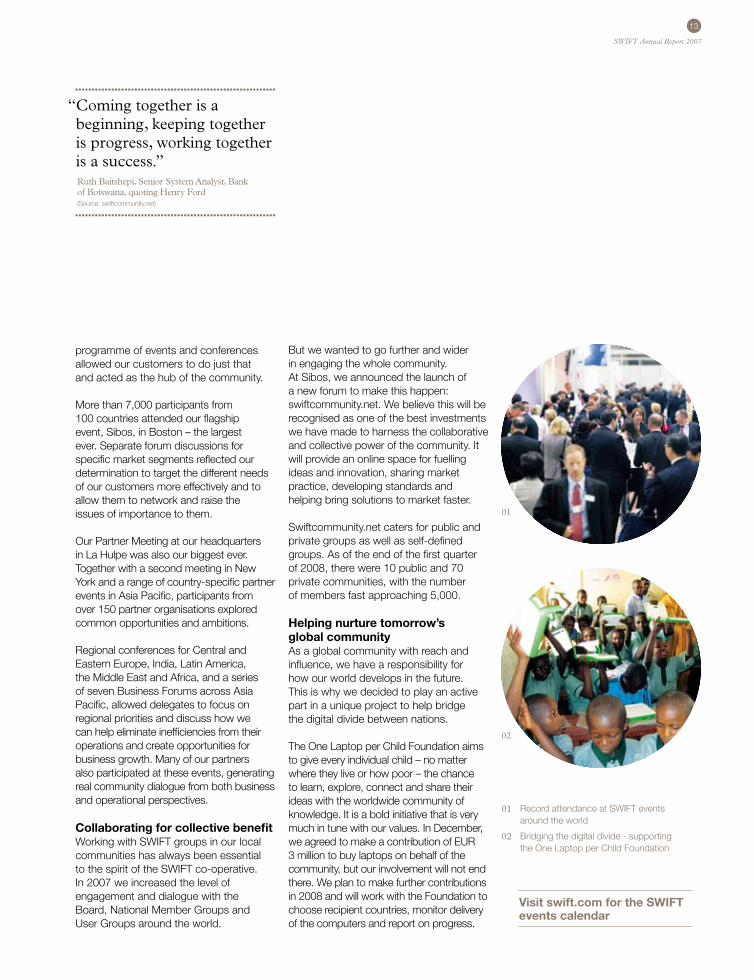
More than 7,000 participants from 100 countries attended our flagship event, Sibos, in Boston – the largest ever. Separate forum discussions for specific market segments reflected our determination to target the different needs of our customers more effectively and to allow them to network and raise the issues of importance to them.
Our Partner Meeting at our headquarters in La Hulpe was also our biggest ever. Together with a second meeting in New York and a range of country-specific partner events in Asia Pacific, participants from over 150 partner organisations explored common opportunities and ambitions.
Regional conferences for Central and Eastern Europe, India, Latin America, the Middle East and Africa, and a series of seven Business Forums across Asia Pacific, allowed delegates to focus on regional priorities and discuss how we can help eliminate inefficiencies from their operations and create opportunities for business growth. Many of our partners also participated at these events, generating real community dialogue from both business and operational perspectives.
Collaborating for collective benefitWorking with SWIFT groups in our local communities has always been essential to the spirit of the SWIFT co-operative. In 2007 we increased the level of engagement and dialogue with the Board, National Member Groups and User Groups around the world.
But we wanted to go further and wider in engaging the whole community. At Sibos, we announced the launch of a new forum to make this happen: swiftcommunity.net. We believe this will be recognised as one of the best investments we have made to harness the collaborative and collective power of the community. It will provide an online space for fuelling ideas and innovation, sharing market practice, developing standards and helping bring solutions to market faster.
Swiftcommunity.net caters for public and private groups as well as self-defined groups. As of the end of the first quarter of 2008, there were 10 public and 70 private communities, with the number of members fast approaching 5,000.
Helping nurture tomorrow’s global communityAs a global community with reach and influence, we have a responsibility for how our world develops in the future. This is why we decided to play an active part in a unique project to help bridge the digital divide between nations.
The One Laptop per Child Foundation aims to give every individual child – no matter where they live or how poor – the chance to learn, explore, connect and share their ideas with the worldwide community of knowledge. It is a bold initiative that is very much in tune with our values. In December, we agreed to make a contribution of EUR 3 million to buy laptops on behalf of the community, but our involvement will not end there. We plan to make further contributions in 2008 and will work with the Foundation to choose recipient countries, monitor delivery of the computers and report on progress.
Visit swift.com for the SWIFT events calendar
01 Record attendance at SWIFT events around the world
02 Bridging the digital divide - supporting the One Laptop per Child Foundation
02
01

“ There is more to do in the next five years than we have done in the previous 20, as well for the cash as for the securities industry. We look to SWIFT to simplify the lives of its users through the introduction of a lighter interface in an increasingly complex and demanding environment.”
Alain Pochet, Head of Banking Services, BNP Paribas Securities Services (Source: SWIFT Operations Forum)

16
SWIFT Annual Report 2007
Our aim has been threefold:
— Provide easy access to SWIFT for a broader range of customers;
— Create more straightforward pricing;
— Focus on what is really important to our different customer groups with a clear offering that delivers efficiencies for their business and allows them to serve their customers better.
Easy accessIn 2007 we started to lift the barriers to using SWIFT by introducing a range of connectivity services that allow customers to choose the right package to suit their needs based on their volume of transactions and type of connection.
We also announced our commitment to launch a new and simple connectivity option for users with very low messaging requirements. This new secure web-based service will bring the benefits of standardisation and reduced risk to many more institutions within the financial services community at the right cost and in a way that makes sense for their business.
Straightforward pricingWe know customers want both value and a straightforward approach to pricing and we have announced changes to improve both. Our approach to lowering prices has been a continuing story, but in 2007 we took the bold step of introducing cuts up front, as well as giving a rebate at year end.
We reduced prices cumulatively by 25 percent in 2007, with a combination of reduced prices and a rebate on all messaging traffic. We also announced a further 5 percent price reduction from January 2008.
At the same time, we made a commitment that high-volume customers would be able to opt for a fixed fee pricing scheme – and 27 customers have already done so, representing almost half of our FIN traffic. The new scheme will offer significant cost savings and meet customer demand for predictability.
Customer-centric servicesCustomer centricity is at the heart of our strategy. Some demands are common to everyone and are real drivers for what we offer – lower costs, smarter automation and reduced risk. But for 2007, and beyond, our goal has been to gain a much deeper understanding of the requirements of specific segments of our customer base. We will innovate and improve our services based on these insights.
We will help global banks, regional banks and payment market infrastructures to extend their reach, improve service and deliver value through new and enhanced payment and trade solutions. In 2007, this included putting in place smarter Cash Reporting, enabling customers to use the service more practically across different time zones. This is being rolled out in 2008. In addition, our Exceptions and Investigations solution is being extended for Corporate-to-Bank use.
The Trade Services Utility (TSU) was launched in April, helping banks meet the supply chain challenge – 53 trade banks around the globe were early adopters.The first commercial interbank end-to-end transaction was between JPMorgan in London and BNP Paribas in Hong Kong, following close collaboration with members of our banking community. In a pilot for the new service, Bank of Tokyo-Mitsubishi UFJ in partnership with Japanese holding company Seven and I,
Ensuring relevance— Smarter, simpler solutions built around the customer
The world in which our customers operate is becoming ever more complex. We want to do all we can to make life simple, with smart solutions aimed at the specific needs of our different customer segments.
17
SWIFT Annual Report 2007
used TSU to cut trade settlement times from 12 days to just two, helping halve delivery times for imports. Bank of China launched its own new services, based on TSU, to extend the open account supply chain financing it provides to corporate customers, improving services in order financing and invoice discounting. The next release is planned for late 2008.
Plans are also under way for new services that will facilitate workers’ remittances.
Our offering for investment managers and broker-dealers has been led by their need to be more responsive to their clients and to communicate with the many different players involved during a transaction lifecycle. Our Funds solution has been a key component of our offering to this customer group and in 2007 traffic almost tripled, from 400,000 messages in 2006 to 1.2 million messages in 2007.
With corporate governance becoming ever more important, we have created a Proxy Voting solution for investment managers and their custodians. This will increase efficiency and make it easier to trace and follow up on voting instructions.
We also developed an enhanced Giovannini-compliant solution that helps securities market infrastructures meet
the challenge of regulatory changes. For corporate customers, the priority was to meet the demand for increased control, more efficiency, and greater funds visibility.
In January 2007, our Corporate-to-Bank access service, SWIFT for Corporates, went live commercially. SWIFT for Corporates allows corporates to communicate with their banks through SWIFT, offering greater efficiency and control, stronger standardisation and freeing them of the complexities of managing technical connections with different banks. The initial focus is on cash management and treasury, but work on additional bank services, including exceptions and investigations, commercial trade and financial investment services is under way.
By year end, 282 corporates and 622 financial institutions had registered for SWIFT for Corporates. Early adopters have recorded a return on investment of between 120 and 400 percent.
Simple to useAcross-the-board service improvements that benefit all our customers included: — Major enhancements to the Bank
Identifier Code (BIC), including a move to monthly updates, the launch of two directories supporting the Single
Euro Payments Area (SEPA), and the addition of SEPA and US ABA codes to the BICPlusIBAN Directory:
— A major simplification of the usage restrictions for our solutions as well as further progress towards a simplification of the user categories;
— A successful SWIFTNet Phase 2 migration, which, thanks to the engagement of our customers, met all its major milestone targets;
— A new e-ordering service, offering easier navigation, layout and usability;
— Upgrades to the online billing service to allow customers easier access to invoices, credit notes and the status of an account;
— Translation of SWIFT documentation into more and more languages – and the launch of a Japanese language website within swift.com.
We know that we still have more to do in cutting out complexity and making it easy to work with us. 2007 saw solid progress, but our commitment to making SWIFT simple and totally customer centric will continue in 2008 with a programme of improvements to our messaging services, connectivity and customer service.
01 02
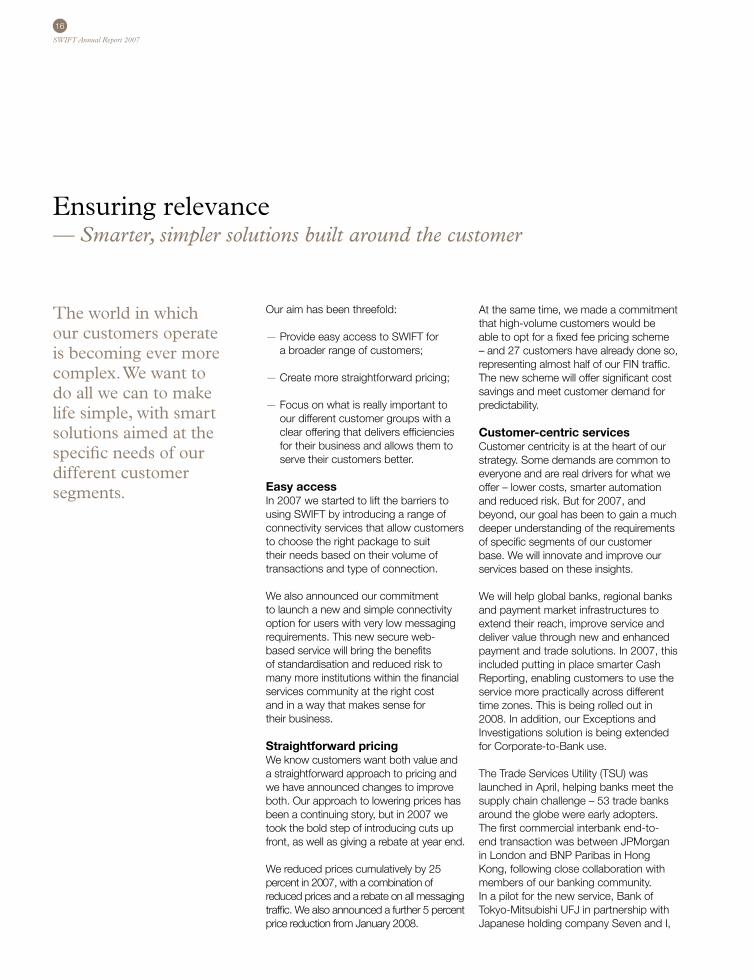
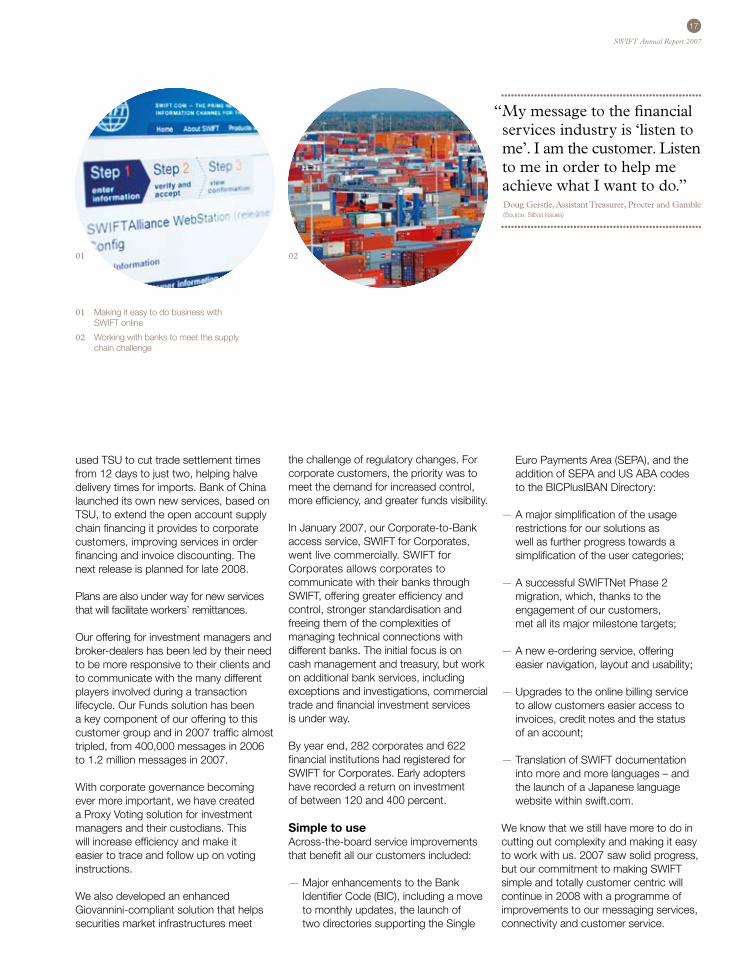
01 Making it easy to do business with SWIFT online
02 Working with banks to meet the supply chain challenge
“ My message to the financial services industry is ‘listen to me’. I am the customer. Listen to me in order to help me achieve what I want to do.”
Doug Gerstle, Assistant Treasurer, Procter and Gamble (Source: Sibos Issues)

“ We never know what the next disruption will look like or how broad or deep it will be. So when it comes to hardening our systems, building in redundancies, planning for contingencies, we can never rest.”
Kenneth D. Lewis, Chairman and CEO, Bank of America (Source: Sibos 2007 speech)

20
SWIFT Annual Report 2007
This success is evidence of our continuing resolve to make our strong resilience proposition even better. This year has seen major developments:
— Approval of plans for a new distributed messaging architecture, which will not only improve resilience but also increase capacity and address data protection concerns;
— Strong business continuity planning and training for our customers and our own people.
Distributed architectureDuring 2007, we took speedy and decisive action to move to a multi-zonal messaging architecture – a crucial step in strengthening our position as the leader in secure global financial messaging.
Once the Board approved the concept in December 2006, a dedicated task force of Board members and executives was set up. It mapped out the framework for a proposal in principle by June.
We then developed a formal proposal for a distributed architecture, which the Board approved in September. We began implementation activities immediately after the Board decision.
The new architecture will allow us to meet customer requirements for increased processing capacity, improved resilience and continued cost efficiency. It represents an investment of EUR 150 million and will create new jobs in Europe and Asia Pacific.
Full implementation will take five years. The first parts of the programme include:
— An enhanced core platform that will allow us to run messaging services in multiple zones by the end of 2009;
— A new operating centre in Europe that is expected to be up and running by the end of 2009. This second European operating centre will ensure that intra-European messages remain in Europe, addressing data protection concerns. The additional centre also increases capacity and improves resilience;
— A new command and control centre in Asia Pacific, which complements our existing control centres in the US and Europe. This will allow us to rotate global operational control between Asia Pacific, Europe and the US in a true ‘follow the sun’ model.
Stronger contingency planningAs the world in which we operate has become more interconnected as well as more uncertain, we have responded by strengthening our business continuity planning. In 2007, we carried out two major contingency planning exercises involving our largest customers, including key market infrastructures. In addition, we carried out over 200 internal exercises to check our processes and procedures.
The strength of our contingency planning was put to the test in March when the power supply failed at a SWIFT operating
Strengthening resilience— Increased capacity, robust systems
Above all, what our customers have come to expect from us is resilience. Creating a ‘no fail’ culture has been an almost single-minded operational obsession for us for the past few years and it has paid off. In 2007, we achieved over 99.9 percent uptime for our messaging services.
21
SWIFT Annual Report 2007
centre and messaging services were unavailable to customers for 45 minutes. We took prompt action to recover and traffic was processed through an alternative operating centre.
No loss of service to customers is ever acceptable, but we were able to minimise downtime, and learn
lessons. We then launched an improvement plan, incorporating the results of a full external review of the power infrastructure.
Maintaining financial strengthAs one of their most important suppliers, we recognise that the financial resilience of SWIFT is important to all members of
the community. We remain debt free and our positive cash flow has enabled us to continue to invest in improvements for our customers without compromising our resilience. We expect to fund the investments in the new distributed architecture from existing reserves and operating cashflows, maintaining our strong balance sheet structure.
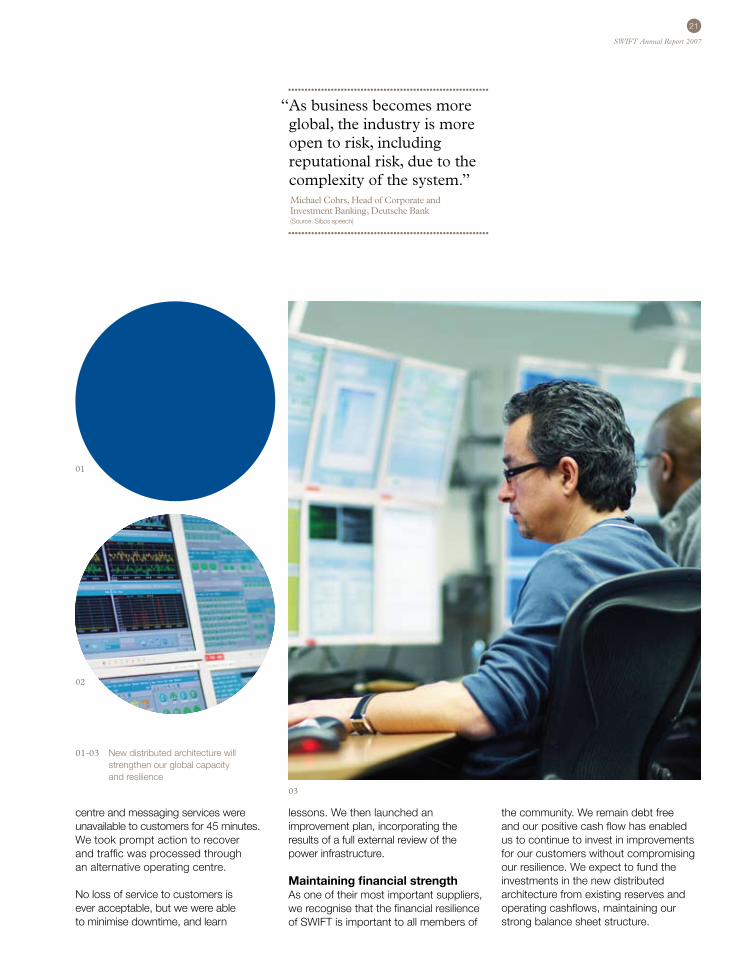
“ As business becomes more global, the industry is more open to risk, including reputational risk, due to the complexity of the system.”
Michael Cohrs, Head of Corporate and Investment Banking, Deutsche Bank (Source: Sibos speech)
01-03 New distributed architecture will strengthen our global capacity and resilience
01
02
03


“ SWIFT is uniquely positioned to act as a catalyst in the region to support a stronger market infrastructure and more standardised practices.”
Stephen Street, Director, Global Clearing, Standard Chartered Bank (Source: Singapore Business Forum)
24
SWIFT Annual Report 2007
Enabling change, growing opportunities— Smoothing the path through major industry change
Change is a constant in the financial services industry. By drawing on our collective knowledge and experience, we help to provide the services that the community needs to do business. There were major changes for market infrastructures in 2007. Although they offer opportunities – greater harmonisation, efficiency and reduced risk – they present major challenges, too.
As we welcomed financial market regulators into the SWIFT community, we have worked together to:
— Facilitate, support and smooth any changes required by market infrastructures;
— Make sure the right standards are in place;
— Help individual customers understand the implications and grasp the opportunities.
Supporting European integrationOne of the major developments in the clearing and settlement markets has been the effort to remove the Giovannini Barriers. Their removal will be a major step forward in delivering more efficiency, cost effectiveness and lower risks across the industry. We have done everything possible to support our customers as they gear up for the change. Our final report on the high level gaps in ISO messaging was published in June after a year of extensive consultation.
November saw the implementation of one of the most important pieces of legislation in the creation of a single European market in financial services, the Markets in Financial Instruments Directive (MiFID). We have been working for the past two years to support investment firm customers and ease the complexities of compliance. New ISO transaction reporting messages have been introduced to give firms a secure channel to report their transaction activity to market regulators.
Also in November, a new harmonised high-value payment system in the Eurozone went live. TARGET2, the new Real-Time Gross Settlement (RTGS) system for the euro, replaced the existing
decentralised system with a single technical platform. It offers more reliability, higher security and real-time information.
This has been a collective effort. The European Central Bank and three of the Eurosystem central banks – Banca d’Italia, Banque de France and Deutsche Bundesbank – took a leading role. SWIFT has worked closely with all parties to support their requirements. There is now discussion about developing a similar system for the securities industry, TARGET2 for Securities (T2S), and we are keeping in close touch with developments.
January 2008, saw the introduction of SEPA. For bank customers, this means that making payments will now be simpler and more predictable. The preparation for the change was challenging for all players. As the common messaging and standards denominator among competing clearing and settlement mechanisms, we gave banks, clearing and settlement organisations and corporates the tools, information and a comprehensive programme of support to enable them to test their readiness.
In June, Euroclear, one of our largest customers, chose SWIFT to provide secure messaging services for its Common Communication Interface. The CCI brings together all of the various systems used by clients to
“ The world of securities post-trade is changing and everyone has to face that now with a much greater sense of urgency.” Joël Mérère, Chairman of European Central Securities Depository Association (Source: Dialogue Q3 2007)
25
SWIFT Annual Report 2007
communicate with each of the Euroclear international and national central securities depositories. The interface will conform to all of the major European harmonisation initiatives. Clients will be able to make significant back-office savings while still benefiting from the highest levels of security and client service.
Market infrastructure harmonisation in Asia PacificIn Hong Kong, preparations have been under way for the replacement of the existing system for real-time gross settlement of high-value payments. The SWIFT team has been working closely with the Hong Kong Monetary Authority, Hong Kong Interbank Clearing Limited, and partners to prepare and support the migration of more than 140 licensed banks in 2009. In Japan, JASDEC – the Japan Securities Depository Centre
– needed to make sure that global financial messaging standards met the needs of Japanese market practice and regulations. We signed a memorandum of understanding with them at the beginning of October to achieve this.
Structural and standards initiatives in the AmericasIn the Americas region, we made progress with groups working on cross-border securities projects, linking central securities depositories in Mexico, Brazil, Columbia and Chile.
In the US, we have worked with the Depository Trust & Clearing Corporation (DTCC) on a number of important projects and on a new service linking the DTCC to CLS and the new EuroCCP. The Clearing House (TCH) in New York also accepted SWIFT as an alternative
messaging platform for its CHIPS payments system and in 2007 we saw the first banks move to live operations over SWIFT.
We have also worked with the US community in the area of OTC derivatives. The US accounted for nine out of the ten initial participants in a Closed User Group that was set up to exchange trade notifications using FpML standards – the standard of choice in the business – over SWIFT. The focus was on interest rate, equity and credit derivatives.
The project was developed in cooperation with the International Swaps and Derivatives Association (ISDA). A collaborative approach enabled SWIFT to deliver an important industry solution to the market in a very short time, reflecting our ambition to be more agile, customer focused and creative.
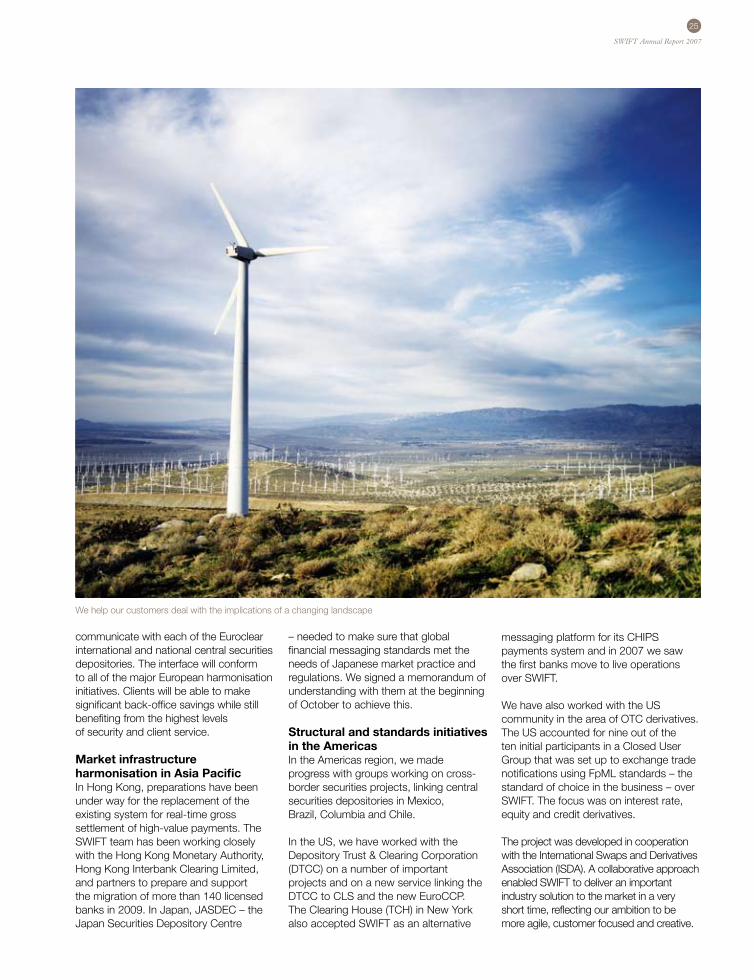
We help our customers deal with the implications of a changing landscape
26
SWIFT Annual Report 2007
Facts and figures
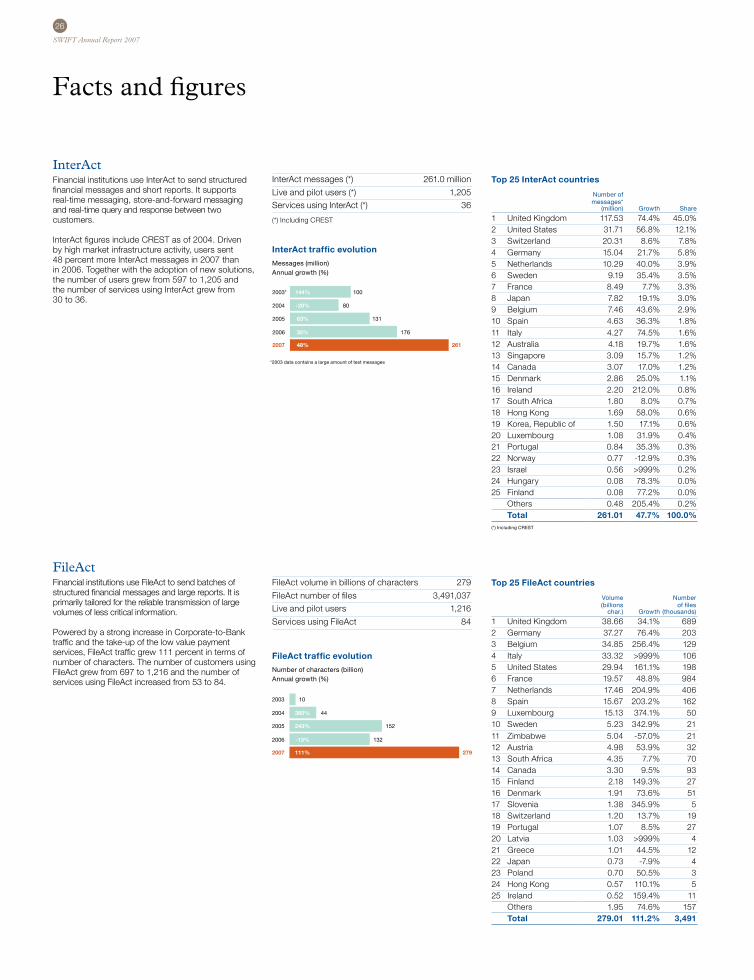
InterActFinancial institutions use InterAct to send structured financial messages and short reports. It supports real-time messaging, store-and-forward messaging and real-time query and response between two customers.
InterAct figures include CREST as of 2004. Driven by high market infrastructure activity, users sent 48 percent more InterAct messages in 2007 than in 2006. Together with the adoption of new solutions, the number of users grew from 597 to 1,205 and the number of services using InterAct grew from 30 to 36.
FileActFinancial institutions use FileAct to send batches of structured financial messages and large reports. It is primarily tailored for the reliable transmission of large volumes of less critical information.
Powered by a strong increase in Corporate-to-Bank traffic and the take-up of the low value payment services, FileAct traffic grew 111 percent in terms of number of characters. The number of customers using FileAct grew from 697 to 1,216 and the number of services using FileAct increased from 53 to 84.
2003* 1A.
1B.
2004
2005
2006
2007
144%
-20%
63%
35%
48%
100
80
131
176
261
2003
2004
2005
2006
2007
360%
243%
-13%
111%
10
44
152
132
279
2C.
2B.
2A.
2D.
2E.
2F.
2G.
2003
2004
2005
2006
2007
12.2%
9.5%
6.5%
9.3%
16.1%
1,208
1,355
1,422
1,577
1,830
2003
2004
2005
2006
2007
12.3%
12.7%
9.5%
13.7%
22.2%
2,048
2,299
2,518
2,865
3,501
2003
2004
2005
2006
2007
14.8%
17.9%
8.2%
12.8%
24.6%
129
148
160
180
225
2003
2004
2005
2006
2007
12.2%
18.6%
16.4%
22.1%
32.2%
657
737
858
1,048
1,386
2003
2004
2005
2006
2007
6.2%
2.6%
-2.6%
2.6%
1.9%
44
47
46
47
48
2003
2004
2005
2006
2007
8.8%
18.3%
1.6%
6.2%
12.5%
169
184
187
198
223
52.3%39.6%
6.4%
1.4% 0.4%
InterAct traffic evolution
Messages (million)Annual growth (%)
*2003 data contains a large amount of test messages
2003* 1A.
1B.
2004
2005
2006
2007
144%
-20%
63%
35%
48%
100
80
131
176
261
2003
2004
2005
2006
2007
360%
243%
-13%
111%
10
44
152
132
279
2C.
2B.
2A.
2D.
2E.
2F.
2G.
2003
2004
2005
2006
2007
12.2%
9.5%
6.5%
9.3%
16.1%
1,208
1,355
1,422
1,577
1,830
2003
2004
2005
2006
2007
12.3%
12.7%
9.5%
13.7%
22.2%
2,048
2,299
2,518
2,865
3,501
2003
2004
2005
2006
2007
14.8%
17.9%
8.2%
12.8%
24.6%
129
148
160
180
225
2003
2004
2005
2006
2007
12.2%
18.6%
16.4%
22.1%
32.2%
657
737
858
1,048
1,386
2003
2004
2005
2006
2007
6.2%
2.6%
-2.6%
2.6%
1.9%
44
47
46
47
48
2003
2004
2005
2006
2007
8.8%
18.3%
1.6%
6.2%
12.5%
169
184
187
198
223
52.3%39.6%
6.4%
1.4% 0.4%
FileAct traffic evolution
Number of characters (billion)Annual growth (%)
InterAct messages (*) 261.0 million
Live and pilot users (*) 1,205
Services using InterAct (*) 36
(*) Including CREST
FileAct volume in billions of characters 279
FileAct number of files 3,491,037
Live and pilot users 1,216
Services using FileAct 84
Top 25 InterAct countries
Number ofmessages*
(million) Growth Share
1 United Kingdom 117.53 74.4% 45.0%2 United States 31.71 56.8% 12.1%3 Switzerland 20.31 8.6% 7.8%4 Germany 15.04 21.7% 5.8%5 Netherlands 10.29 40.0% 3.9%6 Sweden 9.19 35.4% 3.5%7 France 8.49 7.7% 3.3%8 Japan 7.82 19.1% 3.0%9 Belgium 7.46 43.6% 2.9%10 Spain 4.63 36.3% 1.8%11 Italy 4.27 74.5% 1.6%12 Australia 4.18 19.7% 1.6%13 Singapore 3.09 15.7% 1.2%14 Canada 3.07 17.0% 1.2%15 Denmark 2.86 25.0% 1.1%16 Ireland 2.20 212.0% 0.8%17 South Africa 1.80 8.0% 0.7%18 Hong Kong 1.69 58.0% 0.6%19 Korea, Republic of 1.50 17.1% 0.6%20 Luxembourg 1.08 31.9% 0.4%21 Portugal 0.84 35.3% 0.3%22 Norway 0.77 -12.9% 0.3%23 Israel 0.56 >999% 0.2%24 Hungary 0.08 78.3% 0.0%25 Finland 0.08 77.2% 0.0%
Others 0.48 205.4% 0.2%Total 261.01 47.7% 100.0%
(*) Including CREST
Top 25 FileAct countries
Volume Number (billions of files
char.) Growth (thousands)
1 United Kingdom 38.66 34.1% 689 2 Germany 37.27 76.4% 203 3 Belgium 34.85 256.4% 129 4 Italy 33.32 >999% 106 5 United States 29.94 161.1% 198 6 France 19.57 48.8% 984 7 Netherlands 17.46 204.9% 406 8 Spain 15.67 203.2% 162 9 Luxembourg 15.13 374.1% 50 10 Sweden 5.23 342.9% 21 11 Zimbabwe 5.04 -57.0% 21 12 Austria 4.98 53.9% 32 13 South Africa 4.35 7.7% 70 14 Canada 3.30 9.5% 93 15 Finland 2.18 149.3% 27 16 Denmark 1.91 73.6% 51 17 Slovenia 1.38 345.9% 5 18 Switzerland 1.20 13.7% 19 19 Portugal 1.07 8.5% 27 20 Latvia 1.03 >999% 4 21 Greece 1.01 44.5% 12 22 Japan 0.73 -7.9% 4 23 Poland 0.70 50.5% 3 24 Hong Kong 0.57 110.1% 5 25 Ireland 0.52 159.4% 11
Others 1.95 74.6% 157 Total 279.01 111.2% 3,491
27
SWIFT Annual Report 2007
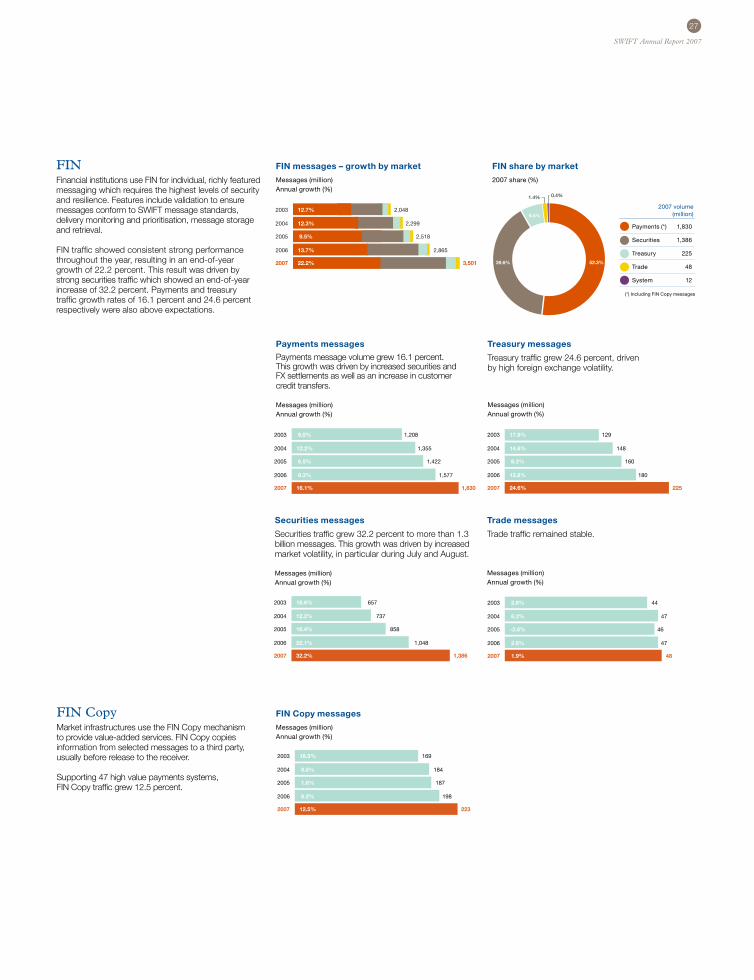
Payments (*) 1,830
Securities 1,386
Treasury 225
Trade 48
System 12
(*) Including FIN Copy messages
FINFinancial institutions use FIN for individual, richly featured messaging which requires the highest levels of security and resilience. Features include validation to ensure messages conform to SWIFT message standards, delivery monitoring and prioritisation, message storage and retrieval.
FIN traffic showed consistent strong performance throughout the year, resulting in an end-of-year growth of 22.2 percent. This result was driven by strong securities traffic which showed an end-of-year increase of 32.2 percent. Payments and treasury traffic growth rates of 16.1 percent and 24.6 percent respectively were also above expectations.
FIN CopyMarket infrastructures use the FIN Copy mechanism to provide value-added services. FIN Copy copies information from selected messages to a third party, usually before release to the receiver.
Supporting 47 high value payments systems, FIN Copy traffic grew 12.5 percent.
Payments messages
Payments message volume grew 16.1 percent. This growth was driven by increased securities and FX settlements as well as an increase in customer credit transfers.
Messages (million)Annual growth (%)
2003* 1A.
1B.
2004
2005
2006
2007
144%
-20%
63%
35%
48%
100
80
131
176
261
2003
2004
2005
2006
2007
360%
243%
-13%
111%
10
44
152
132
279
2C.
2B.
2A.
2D.
2E.
2F.
2G.
2003
2004
2005
2006
2007
12.2%
9.5%
6.5%
9.3%
16.1%
1,208
1,355
1,422
1,577
1,830
2003
2004
2005
2006
2007
12.3%
12.7%
9.5%
13.7%
22.2%
2,048
2,299
2,518
2,865
3,501
2003
2004
2005
2006
2007
14.8%
17.9%
8.2%
12.8%
24.6%
129
148
160
180
225
2003
2004
2005
2006
2007
12.2%
18.6%
16.4%
22.1%
32.2%
657
737
858
1,048
1,386
2003
2004
2005
2006
2007
6.2%
2.6%
-2.6%
2.6%
1.9%
44
47
46
47
48
2003
2004
2005
2006
2007
8.8%
18.3%
1.6%
6.2%
12.5%
169
184
187
198
223
52.3%39.6%
6.4%
1.4% 0.4%
Treasury messages
Treasury traffic grew 24.6 percent, driven by high foreign exchange volatility.
Messages (million)Annual growth (%)
2003* 1A.
1B.
2004
2005
2006
2007
144%
-20%
63%
35%
48%
100
80
131
176
261
2003
2004
2005
2006
2007
360%
243%
-13%
111%
10
44
152
132
279
2C.
2B.
2A.
2D.
2E.
2F.
2G.
2003
2004
2005
2006
2007
12.2%
9.5%
6.5%
9.3%
16.1%
1,208
1,355
1,422
1,577
1,830
2003
2004
2005
2006
2007
12.3%
12.7%
9.5%
13.7%
22.2%
2,048
2,299
2,518
2,865
3,501
2003
2004
2005
2006
2007
14.8%
17.9%
8.2%
12.8%
24.6%
129
148
160
180
225
2003
2004
2005
2006
2007
12.2%
18.6%
16.4%
22.1%
32.2%
657
737
858
1,048
1,386
2003
2004
2005
2006
2007
6.2%
2.6%
-2.6%
2.6%
1.9%
44
47
46
47
48
2003
2004
2005
2006
2007
8.8%
18.3%
1.6%
6.2%
12.5%
169
184
187
198
223
52.3%39.6%
6.4%
1.4% 0.4%
Securities messages
Securities traffic grew 32.2 percent to more than 1.3 billion messages. This growth was driven by increased market volatility, in particular during July and August.
Messages (million) Annual growth (%)
2003* 1A.
1B.
2004
2005
2006
2007
144%
-20%
63%
35%
48%
100
80
131
176
261
2003
2004
2005
2006
2007
360%
243%
-13%
111%
10
44
152
132
279
2C.
2B.
2A.
2D.
2E.
2F.
2G.
2003
2004
2005
2006
2007
12.2%
9.5%
6.5%
9.3%
16.1%
1,208
1,355
1,422
1,577
1,830
2003
2004
2005
2006
2007
12.3%
12.7%
9.5%
13.7%
22.2%
2,048
2,299
2,518
2,865
3,501
2003
2004
2005
2006
2007
14.8%
17.9%
8.2%
12.8%
24.6%
129
148
160
180
225
2003
2004
2005
2006
2007
12.2%
18.6%
16.4%
22.1%
32.2%
657
737
858
1,048
1,386
2003
2004
2005
2006
2007
6.2%
2.6%
-2.6%
2.6%
1.9%
44
47
46
47
48
2003
2004
2005
2006
2007
8.8%
18.3%
1.6%
6.2%
12.5%
169
184
187
198
223
52.3%39.6%
6.4%
1.4% 0.4%
Trade messages
Trade traffic remained stable.
Messages (million)Annual growth (%)
2003* 1A.
1B.
2004
2005
2006
2007
144%
-20%
63%
35%
48%
100
80
131
176
261
2003
2004
2005
2006
2007
360%
243%
-13%
111%
10
44
152
132
279
2C.
2B.
2A.
2D.
2E.
2F.
2G.
2003
2004
2005
2006
2007
12.2%
9.5%
6.5%
9.3%
16.1%
1,208
1,355
1,422
1,577
1,830
2003
2004
2005
2006
2007
12.3%
12.7%
9.5%
13.7%
22.2%
2,048
2,299
2,518
2,865
3,501
2003
2004
2005
2006
2007
14.8%
17.9%
8.2%
12.8%
24.6%
129
148
160
180
225
2003
2004
2005
2006
2007
12.2%
18.6%
16.4%
22.1%
32.2%
657
737
858
1,048
1,386
2003
2004
2005
2006
2007
6.2%
2.6%
-2.6%
2.6%
1.9%
44
47
46
47
48
2003
2004
2005
2006
2007
8.8%
18.3%
1.6%
6.2%
12.5%
169
184
187
198
223
52.3%39.6%
6.4%
1.4% 0.4%
FIN Copy messages
Messages (million)Annual growth (%)
2003* 1A.
1B.
2004
2005
2006
2007
144%
-20%
63%
35%
48%
100
80
131
176
261
2003
2004
2005
2006
2007
360%
243%
-13%
111%
10
44
152
132
279
2C.
2B.
2A.
2D.
2E.
2F.
2G.
2003
2004
2005
2006
2007
12.2%
9.5%
6.5%
9.3%
16.1%
1,208
1,355
1,422
1,577
1,830
2003
2004
2005
2006
2007
12.3%
12.7%
9.5%
13.7%
22.2%
2,048
2,299
2,518
2,865
3,501
2003
2004
2005
2006
2007
14.8%
17.9%
8.2%
12.8%
24.6%
129
148
160
180
225
2003
2004
2005
2006
2007
12.2%
18.6%
16.4%
22.1%
32.2%
657
737
858
1,048
1,386
2003
2004
2005
2006
2007
6.2%
2.6%
-2.6%
2.6%
1.9%
44
47
46
47
48
2003
2004
2005
2006
2007
8.8%
18.3%
1.6%
6.2%
12.5%
169
184
187
198
223
52.3%39.6%
6.4%
1.4% 0.4%
FIN messages – growth by market
Messages (million)Annual growth (%)
FIN share by market
2007 share (%)
2003* 1A.
1B.
2004
2005
2006
2007
144%
-20%
63%
35%
48%
100
80
131
176
261
2003
2004
2005
2006
2007
360%
243%
-13%
111%
10
44
152
132
279
2C.
2B.
2A.
2D.
2E.
2F.
2G.
2003
2004
2005
2006
2007
12.2%
9.5%
6.5%
9.3%
16.1%
1,208
1,355
1,422
1,577
1,830
2003
2004
2005
2006
2007
12.3%
12.7%
9.5%
13.7%
22.2%
2,048
2,299
2,518
2,865
3,501
2003
2004
2005
2006
2007
14.8%
17.9%
8.2%
12.8%
24.6%
129
148
160
180
225
2003
2004
2005
2006
2007
12.2%
18.6%
16.4%
22.1%
32.2%
657
737
858
1,048
1,386
2003
2004
2005
2006
2007
6.2%
2.6%
-2.6%
2.6%
1.9%
44
47
46
47
48
2003
2004
2005
2006
2007
8.8%
18.3%
1.6%
6.2%
12.5%
169
184
187
198
223
52.3%39.6%
6.4%
1.4% 0.4%
2007 volume (million)
28
SWIFT Annual Report 2007
Facts and figures (continued)
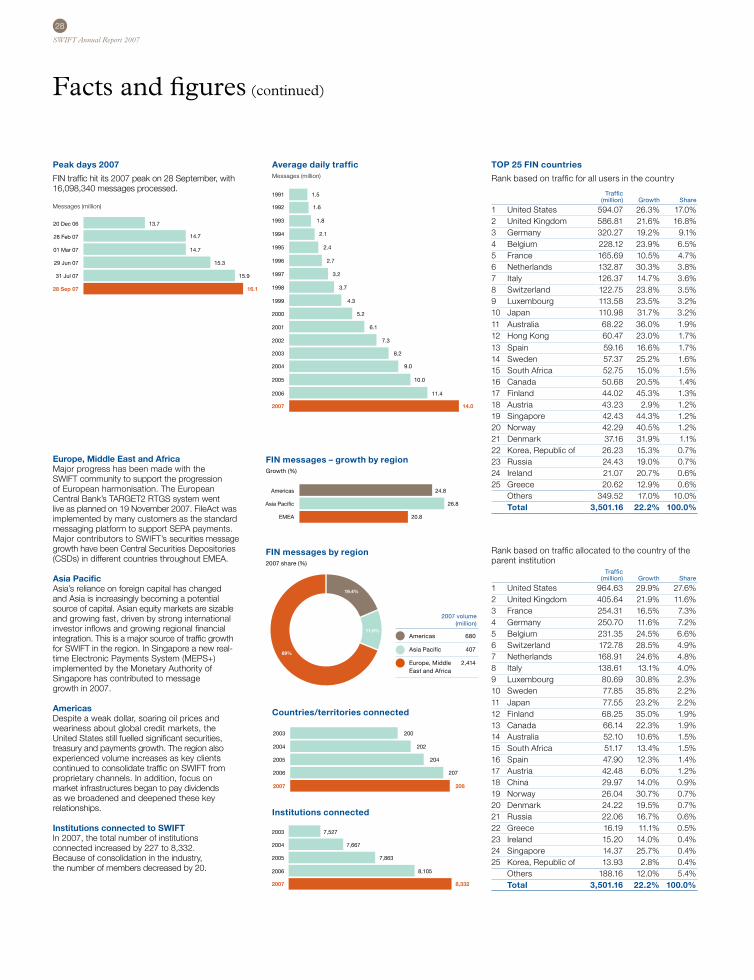
TOP 25 FIN countries
Rank based on traffic for all users in the country
Traffic(million) Growth Share
1 United States 594.07 26.3% 17.0%2 United Kingdom 586.81 21.6% 16.8%3 Germany 320.27 19.2% 9.1%4 Belgium 228.12 23.9% 6.5%5 France 165.69 10.5% 4.7%6 Netherlands 132.87 30.3% 3.8%7 Italy 126.37 14.7% 3.6%8 Switzerland 122.75 23.8% 3.5%9 Luxembourg 113.58 23.5% 3.2%10 Japan 110.98 31.7% 3.2%11 Australia 68.22 36.0% 1.9%12 Hong Kong 60.47 23.0% 1.7%13 Spain 59.16 16.6% 1.7%14 Sweden 57.37 25.2% 1.6%15 South Africa 52.75 15.0% 1.5%16 Canada 50.68 20.5% 1.4%17 Finland 44.02 45.3% 1.3%18 Austria 43.23 2.9% 1.2%19 Singapore 42.43 44.3% 1.2%20 Norway 42.29 40.5% 1.2%21 Denmark 37.16 31.9% 1.1%22 Korea, Republic of 26.23 15.3% 0.7%23 Russia 24.43 19.0% 0.7%24 Ireland 21.07 20.7% 0.6%25 Greece 20.62 12.9% 0.6%
Others 349.52 17.0% 10.0%Total 3,501.16 22.2% 100.0%
Rank based on traffic allocated to the country of the parent institution
Traffic(million) Growth Share
1 United States 964.63 29.9% 27.6%2 United Kingdom 405.64 21.9% 11.6%3 France 254.31 16.5% 7.3%4 Germany 250.70 11.6% 7.2%5 Belgium 231.35 24.5% 6.6%6 Switzerland 172.78 28.5% 4.9%7 Netherlands 168.91 24.6% 4.8%8 Italy 138.61 13.1% 4.0%9 Luxembourg 80.69 30.8% 2.3%10 Sweden 77.85 35.8% 2.2%11 Japan 77.55 23.2% 2.2%12 Finland 68.25 35.0% 1.9%13 Canada 66.14 22.3% 1.9%14 Australia 52.10 10.6% 1.5%15 South Africa 51.17 13.4% 1.5%16 Spain 47.90 12.3% 1.4%17 Austria 42.48 6.0% 1.2%18 China 29.97 14.0% 0.9%19 Norway 26.04 30.7% 0.7%20 Denmark 24.22 19.5% 0.7%21 Russia 22.06 16.7% 0.6%22 Greece 16.19 11.1% 0.5%23 Ireland 15.20 14.0% 0.4%24 Singapore 14.37 25.7% 0.4%25 Korea, Republic of 13.93 2.8% 0.4%
Others 188.16 12.0% 5.4%Total 3,501.16 22.2% 100.0%
Peak days 2007
FIN traffic hit its 2007 peak on 28 September, with 16,098,340 messages processed.
Messages (million)
Average daily traffic Messages (million)
2003
2004
2005
2006
2007
200
202
204
207
208
2003
2007 8,332
2006 8,105
2005 7,863
2004 7,667
7,527
1991
1992
1993
1994
1995
1996
1997
1998
1999
2000
2001
2002
2003
2004
2005
2006
2007
1.5
1.6
1.8
2.1
2.4
2.7
3.2
3.7
4.3
5.2
6.1
7.3
8.2
9.0
10.0
11.4
14.0
28 Feb 07
20 Dec 06
01 Mar 07
29 Jun 07
31 Jul 07
28 Sep 07
13.7
14.7
14.7
15.3
15.9
16.1
Americas
Asia Pacific
EMEA
24.8
26.8
20.8
11.6%
19.4%
69%
2003
2004
2005
2006
2007
200
202
204
207
208
2003
2007 8,332
2006 8,105
2005 7,863
2004 7,667
7,527
1991
1992
1993
1994
1995
1996
1997
1998
1999
2000
2001
2002
2003
2004
2005
2006
2007
1.5
1.6
1.8
2.1
2.4
2.7
3.2
3.7
4.3
5.2
6.1
7.3
8.2
9.0
10.0
11.4
14.0
28 Feb 07
20 Dec 06
01 Mar 07
29 Jun 07
31 Jul 07
28 Sep 07
13.7
14.7
14.7
15.3
15.9
16.1
Americas
Asia Pacific
EMEA
24.8
26.8
20.8
11.6%
19.4%
69%
Europe, Middle East and AfricaMajor progress has been made with the SWIFT community to support the progression of European harmonisation. The European Central Bank’s TARGET2 RTGS system went live as planned on 19 November 2007. FileAct was implemented by many customers as the standard messaging platform to support SEPA payments. Major contributors to SWIFT’s securities message growth have been Central Securities Depositories (CSDs) in different countries throughout EMEA. Asia PacificAsia’s reliance on foreign capital has changed and Asia is increasingly becoming a potential source of capital. Asian equity markets are sizable and growing fast, driven by strong international investor inflows and growing regional financial integration. This is a major source of traffic growth for SWIFT in the region. In Singapore a new real- time Electronic Payments System (MEPS+) implemented by the Monetary Authority of Singapore has contributed to message growth in 2007.
AmericasDespite a weak dollar, soaring oil prices and weariness about global credit markets, the United States still fuelled significant securities, treasury and payments growth. The region also experienced volume increases as key clients continued to consolidate traffic on SWIFT from proprietary channels. In addition, focus on market infrastructures began to pay dividends as we broadened and deepened these key relationships.
Institutions connected to SWIFTIn 2007, the total number of institutions connected increased by 227 to 8,332. Because of consolidation in the industry, the number of members decreased by 20.
Countries/territories connected
Institutions connected
FIN messages – growth by regionGrowth (%)
FIN messages by region2007 share (%)
2007 volume (million)
Americas 680
Asia Pacific 407
Europe, Middle 2,414 East and Africa
2003
2004
2005
2006
2007
200
202
204
207
208
2003
2007 8,332
2006 8,105
2005 7,863
2004 7,667
7,527
1991
1992
1993
1994
1995
1996
1997
1998
1999
2000
2001
2002
2003
2004
2005
2006
2007
1.5
1.6
1.8
2.1
2.4
2.7
3.2
3.7
4.3
5.2
6.1
7.3
8.2
9.0
10.0
11.4
14.0
28 Feb 07
20 Dec 06
01 Mar 07
29 Jun 07
31 Jul 07
28 Sep 07
13.7
14.7
14.7
15.3
15.9
16.1
Americas
Asia Pacific
EMEA
24.8
26.8
20.8
11.6%
19.4%
69%
2003
2004
2005
2006
2007
200
202
204
207
208
2003
2007 8,332
2006 8,105
2005 7,863
2004 7,667
7,527
1991
1992
1993
1994
1995
1996
1997
1998
1999
2000
2001
2002
2003
2004
2005
2006
2007
1.5
1.6
1.8
2.1
2.4
2.7
3.2
3.7
4.3
5.2
6.1
7.3
8.2
9.0
10.0
11.4
14.0
28 Feb 07
20 Dec 06
01 Mar 07
29 Jun 07
31 Jul 07
28 Sep 07
13.7
14.7
14.7
15.3
15.9
16.1
Americas
Asia Pacific
EMEA
24.8
26.8
20.8
11.6%
19.4%
69%
29
SWIFT Annual Report 2007
29
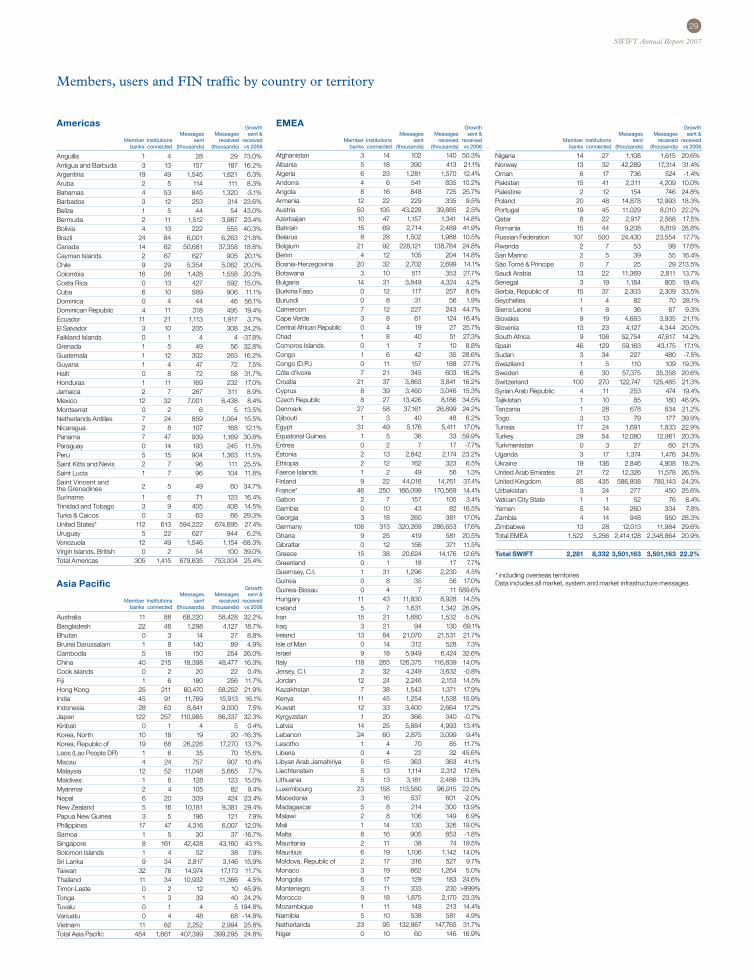
Members, users and FIN traffic by country or territory
Anguilla 1 4 28 29 73.0%Antigua and Barbuda 3 13 157 187 16.2%Argentina 19 49 1,545 1,821 6.3%Aruba 2 5 114 111 8.3%Bahamas 4 53 845 1,320 -3.1%Barbados 3 12 253 314 23.6%Belize 1 5 44 54 43.0%Bermuda 2 11 1,512 3,987 23.4%Bolivia 4 13 222 555 40.3%Brazil 24 84 6,001 6,263 21.8%Canada 14 62 50,681 37,358 18.8%Cayman Islands 2 67 627 905 20.1%Chile 9 29 5,354 5,062 20.0%Colombia 16 26 1,428 1,558 20.3%Costa Rica 0 13 427 592 15.0%Cuba 6 10 569 906 11.1%Dominica 0 4 44 46 56.1%Dominican Republic 4 11 318 495 19.4%Ecuador 11 21 1,113 1,917 3.7%El Salvador 3 10 205 308 24.2%Falkland Islands 0 1 4 4 -37.8%Grenada 1 5 49 56 32.8%Guatemala 1 12 302 263 16.2%Guyana 1 4 47 72 7.5%Haiti 0 8 72 58 31.7%Honduras 1 11 169 232 17.0%Jamaica 2 7 267 311 8.9%Mexico 12 32 7,001 6,438 8.4%Montserrat 0 2 6 5 13.5%Netherlands Antilles 7 24 859 1,064 15.5%Nicaragua 2 8 107 168 12.1%Panama 7 47 939 1,169 30.8%Paraguay 0 14 193 245 11.5%Peru 5 15 904 1,363 11.5%Saint Kitts and Nevis 2 7 96 111 25.5%Saint Lucia 1 7 96 104 11.8%Saint Vincent and the Grenadines 2 5 49 60 34.7%
Suriname 1 6 71 123 16.4%Trinidad and Tobago 3 9 405 408 14.5%Turks & Caicos 0 3 63 66 29.3%United States* 112 613 594,222 674,695 27.4%Uruguay 5 22 627 944 6.2%Venezuela 12 49 1,546 1,154 -68.3%Virgin Islands, British 0 2 54 100 39.0%Total Americas 305 1,415 679,635 753,004 25.4%
Australia 11 88 68,220 58,428 32.2%Bangladesh 22 46 1,298 4,127 18.7%Bhutan 0 3 14 27 8.8%Brunei Darussalam 1 8 140 89 4.9%Cambodia 5 18 150 254 26.0%China 40 215 18,398 48,477 16.3%Cook islands 0 2 20 22 0.4%Fiji 1 6 180 256 11.7%Hong Kong 25 211 60,470 58,252 21.9%India 45 91 11,769 15,913 16.1%Indonesia 28 63 8,841 9,000 7.5%Japan 122 257 110,985 86,337 32.3%Kiribati 0 1 4 5 0.4%Korea, North 10 18 19 20 -16.3%Korea, Republic of 19 68 26,226 17,270 13.7%Laos (Lao People DR) 1 6 35 70 15.6%Macau 4 24 757 907 10.4%Malaysia 12 52 11,048 5,665 7.7%Maldives 1 6 128 123 15.0%Myanmar 2 4 105 82 9.4%Nepal 6 20 309 424 23.4%New Zealand 5 16 10,181 9,381 29.4%Papua New Guinea 3 5 196 121 7.9%Philippines 17 47 4,316 6,007 12.0%Samoa 1 5 30 37 -16.7%Singapore 8 161 42,428 43,160 43.1%Solomon Islands 1 4 52 38 7.9%Sri Lanka 9 34 2,817 3,146 15.9%Taiwan 32 76 14,974 17,173 11.7%Thailand 11 34 10,932 11,366 4.5%Timor-Leste 0 2 12 10 45.9%Tonga 1 3 39 40 24.2%Tuvalu 0 1 4 5 194.8%Vanuatu 0 4 48 68 -14.8%Vietnam 11 62 2,252 2,994 25.8%Total Asia Pacific 454 1,661 407,399 399,295 24.8%
GrowthMessages Messages sent &
Member Institutions sent received receivedbanks connected (thousands) (thousands) vs 2006
GrowthMessages Messages sent &
Member Institutions sent received receivedbanks connected (thousands) (thousands) vs 2006
GrowthMessages Messages sent &
Member Institutions sent received receivedbanks connected (thousands) (thousands) vs 2006
GrowthMessages Messages sent &
Member Institutions sent received receivedbanks connected (thousands) (thousands) vs 2006
Afghanistan 3 14 102 140 50.3%Albania 5 18 390 413 21.1%Algeria 6 23 1,281 1,570 12.4%Andorra 4 6 541 835 10.2%Angola 8 16 848 725 25.7%Armenia 12 22 229 335 9.5%Austria 50 105 43,228 39,885 2.5%Azerbaijan 10 47 1,157 1,341 14.8%Bahrain 15 69 2,714 2,489 41.9%Belarus 8 28 1,502 1,988 10.5%Belgium 21 92 228,121 138,764 24.8%Benin 4 12 105 204 14.8%Bosnia-Herzegovina 20 32 2,702 2,699 14.1%Botswana 3 10 511 353 27.7%Bulgaria 14 31 3,849 4,324 4.2%Burkina Faso 0 12 117 257 8.6%Burundi 0 8 31 56 1.9%Cameroon 7 12 227 243 44.7%Cape Verde 3 8 61 124 16.4%Central African Republic 0 4 19 27 25.7%Chad 1 8 40 51 27.3%Comoros Islands 0 1 7 10 8.8%Congo 1 6 42 35 28.6%Congo (D.R.) 0 11 157 188 27.7%Côte d'Ivoire 7 21 345 603 16.2%Croatia 21 37 3,863 3,841 16.2%Cyprus 8 39 3,460 3,046 15.3%Czech Republic 8 27 13,426 8,186 34.5%Denmark 27 58 37,161 26,899 24.2%Djibouti 1 3 40 48 6.2%Egypt 31 49 5,176 5,411 17.0%Equatorial Guinea 1 5 36 33 59.9%Eritrea 0 2 7 17 -7.7%Estonia 2 13 2,842 2,174 23.2%Ethiopia 2 12 162 323 6.5%Faeroe Islands 1 2 49 56 1.3%Finland 9 22 44,016 14,761 37.4%France* 46 250 166,099 170,569 14.4%Gabon 2 7 157 105 3.4%Gambia 0 10 43 82 16.5%Georgia 3 18 260 381 17.0%Germany 106 313 320,269 286,653 17.6%Ghana 9 25 419 581 20.5%Gibraltar 0 12 156 371 11.5%Greece 15 38 20,624 14,176 12.6%Greenland 0 1 18 17 7.7%Guernsey, C.I. 1 31 1,296 2,230 4.5%Guinea 0 8 35 56 17.0%Guinea-Bissau 0 4 7 11 589.6%Hungary 11 43 11,830 8,928 14.5%Iceland 5 7 1,631 1,342 26.9%Iran 15 21 1,680 1,532 -5.0%Iraq 3 21 94 130 69.1%Ireland 13 84 21,070 21,531 21.7%Isle of Man 0 14 312 528 7.3%Israel 9 18 5,949 6,424 32.6%Italy 118 265 126,375 116,839 14.0%Jersey, C.I. 2 32 4,249 3,632 -0.8%Jordan 12 24 2,246 2,153 14.5%Kazakhstan 7 38 1,543 1,371 17.9%Kenya 11 45 1,254 1,538 15.9%Kuwait 12 33 3,400 2,664 17.2%Kyrgyzstan 1 20 366 340 -0.7%Latvia 14 25 5,884 4,993 13.4%Lebanon 24 60 2,875 3,099 9.4%Lesotho 1 4 70 85 11.7%Liberia 0 4 22 32 45.6%Libyan Arab Jamahiriya 5 15 363 363 41.1%Liechtenstein 5 13 1,114 2,312 17.6%Lithuania 5 13 3,181 2,486 13.3%Luxembourg 23 158 113,580 96,915 22.0%Macedonia 3 16 537 601 -2.0%Madagascar 5 8 214 300 13.9%Malawi 2 8 106 149 6.9%Mali 1 14 130 326 19.0%Malta 8 16 905 853 -1.8%Mauritania 2 11 38 74 19.5%Mauritius 6 19 1,106 1,142 14.0%Moldova, Republic of 2 17 316 527 9.7%Monaco 3 19 662 1,264 5.0%Mongolia 6 17 129 183 24.6%Montenegro 3 11 333 230 >999%Morocco 9 18 1,875 2,170 23.3%Mozambique 1 11 148 213 14.4%Namibia 5 10 538 581 4.9%Netherlands 23 95 132,867 147,765 31.7%Niger 0 10 60 146 16.9%
Nigeria 14 27 1,108 1,615 20.6%Norway 13 32 42,289 17,314 31.4%Oman 6 17 736 524 -1.4%Pakistan 15 41 2,311 4,209 10.0%Palestine 2 12 154 746 24.8%Poland 20 48 14,878 12,993 18.3%Portugal 19 45 11,029 8,010 22.2%Qatar 8 22 2,917 2,568 17.5%Romania 15 44 9,208 8,819 28.8%Russian Federation 107 500 24,430 23,554 17.7%Rwanda 2 7 53 99 17.6%San Marino 2 5 39 55 16.4%São Tomé & Principe 0 7 25 29 213.5%Saudi Arabia 13 22 11,369 2,811 13.7%Senegal 3 19 1,184 805 19.4%Serbia, Republic of 15 37 2,303 2,309 33.5%Seychelles 1 4 82 70 28.1%Sierra Leone 1 8 36 67 9.3%Slovakia 9 19 4,683 3,935 21.1%Slovenia 13 23 4,127 4,344 -20.0%South Africa 9 106 52,754 47,617 14.2%Spain 46 129 59,163 43,175 17.1%Sudan 3 34 227 480 -7.5%Swaziland 1 5 110 109 19.3%Sweden 6 30 57,375 35,358 20.6%Switzerland 100 270 122,747 125,485 21.3%Syrian Arab Republic 4 11 253 474 19.4%Tajikistan 1 10 85 180 46.9%Tanzania 1 28 678 834 21.2%Togo 3 13 79 177 39.9%Tunisia 17 24 1,691 1,833 22.9%Turkey 29 54 12,080 12,961 20.3%Turkmenistan 0 3 27 60 21.3%Uganda 3 17 1,374 1,476 34.5%Ukraine 19 136 2,846 4,808 18.2%United Arab Emirates 21 72 12,326 11,578 26.5%United Kingdom 85 435 586,808 780,143 24.3%Uzbekistan 3 24 277 450 25.6%Vatican City State 1 1 52 76 8.4%Yemen 5 14 260 334 7.8%Zambia 4 14 948 950 28.3%Zimbabwe 13 28 12,013 11,984 29.6%Total EMEA 1,522 5,256 2,414,128 2,348,864 20.9%
Total SWIFT 2,281 8,332 3,501,163 3,501,163 22.2%
* including overseas territoriesData includes all market, system and market infrastructure messages
Americas
Asia Pacific
EMEA
30
SWIFT Annual Report 2007
Leadership Council— Individual contribution, shared responsibility, collective accountability
01 Lázaro CamposChief Executive OfficerNationality: SpanishLázaro took over as CEO in April 2007 with a commitment to making the organisation truly customer-centric. He has more than 20 years' international banking and telecommunications experience behind him. He has seen SWIFT both from the customer perspective, during his early career with international division of Banc Agricol, and as a leading player within SWIFT. Before becoming CEO, he was Head of the Banking Industry Division and worked previously as Head of Marketing, Director of Treasury Markets and Director of Market Infrastructure Projects.
02 Mark WallerHead of Human ResourcesNationality: British Mark joined SWIFT in April 2001 from Alcatel Lucent. He has had many years' international experience in senior HR roles in the UK and continental Europe.
03 Blanche PetreGeneral Counsel and Board SecretaryNationality: BelgianBlanche became General Counsel in 1998 and Board Secretary in 2000. She has more than 25 years' experience with the SWIFT community, joining as legal counsel in 1980 after practising law at the Brussels Bar.
04 Francis VanbeverChief Financial OfficerNationality: BelgianFrancis has been SWIFT’s CFO for 10 years and with the organisation for almost 20. He previously worked in finance for the Belgian and European operations of Exxon Chemical.
05 Rosie HalfheadHead of Stakeholder RelationsNationality: BritishRosie took over as Head of Stakeholder Relations in 2007 with a remit to help SWIFT get closer both to its community and to wider audiences. It was a return to SWIFT for Rosie who originally joined the organisation in 1987. She came back to take on the new challenge after working for ACNielsen and running her own brand communications consultancy.
06 Alain RaesHead of EMEANationality: BelgianAlain also took up his role in September. He was previously Director of Continental Europe, covering securities and banking activities. He joined SWIFT in 1990. Prior to joining SWIFT Alain used SWIFT as a customer working at Citibank in Belgium and Fortis Bank in Singapore.
07 David Pryce Head of Americas (acting)Nationality: BritishDavid became acting Head of Americas in September. He was previously Director, Commercial Channels and Developing Markets, covering securities and banking commercial activities, and has been with SWIFT since 1985. His previous experience was in the international division of Burroughs (now Unisys) where he handled customer sales, support and education.
08 Gottfried LeibbrandtHead of MarketsNationality: DutchGottfried is responsible for SWIFT’s offering to customers including both standards and solutions. Gottfried was previously Head of Standards. Before joining SWIFT in 2005, he worked for McKinsey & Co for 18 years.
09 Jean SonnevilleHead of Investment Management Services Nationality: BelgianJean is responsible for strategy, product development and value propositions for investment management services, asset servicing and securities market infrastructures. He joined SWIFT in 2007 from ING Group, bringing with him 20 years' experience in investment management, custody and wealth management.
10 Ian JohnstonHead of Asia PacificNationality: AustralianIan became Head of the Asia Pacific region after serving as interim Head of the Banking Industry Division for the same region. He joined SWIFT in 1993, bringing with him 20 years' broad experience in banking operations, international business, trade, treasury and communications.
11 Didier VerstichelDeputy Chief Information OfficerNationality: BelgianDidier has been Director of the Enterprise Security and Architecture department at SWIFT for two years. Before joining SWIFT in 1994, Didier worked with Europay (now Mastercard Europe) in ICT.
12 Michael FishChief Information OfficerNationality: AmericanMike has been CIO since 2006 and oversees the teams that build, maintain and operate the company’s core platform and messaging services. Mike has eight years' experience with SWIFT, joining from Ameritech where he held senior positions in IT.
13 Brian HaughanHead of ProductsNationality: IrishBrian has long standing experience with the SWIFT community. He joined SWIFT in 1988 from technology solutions company, Logica, where he worked on SWIFT-related applications. Brian was previously Head of Customer Operations.
14 Kosta PericHead of Product InnovationNationality: BelgianKosta was appointed Head of Product Innovation in 2007. Before taking his current role, Kosta was responsible for negotiating and bringing on board key strategic programmes such as Euroclear CCI. He was also the chief architect for SWIFTNet, SWIFT’s IP based communication platform. He previously worked for Solvay & Cie, Control Data Corporation and the Université Libre de Bruxelles.
15 Amanda WestwoodHead of Customer ServiceNationality: BritishAmanda’s priority is to enhance our customers’ SWIFT experience. Her responsibilities include partner management, customer training, and integration and support services. Prior to joining SWIFT in 2003, Amanda worked for IONA technologies as VP of Services & Business Development and held a variety of senior management positions at Compaq and Digital Equipment Corporation.
Resignations from the executive teamOn 2 April, Jim Donovan resigned from SWIFT. Coming to SWIFT from Citibank, Jim developed the Securities Industry strategy and put in place an organisation more aligned with our key securities industry segments.
On 30 September, Johan Kestens resigned from SWIFT. Joining us from Almanij, one of Belgium’s leading financial holding companies, Johan helped drive improvements in our product portfolio and our partner management programme. He spearheaded our drive to bring corporates onto SWIFT.
“ There are clear and strong benefits to having a large and broad group of experienced and senior people working together to lead the company. It allows more voices and opinions to be heard; it is more representative of the diversity of the SWIFT organisation.”
Lázaro Campos, CEO
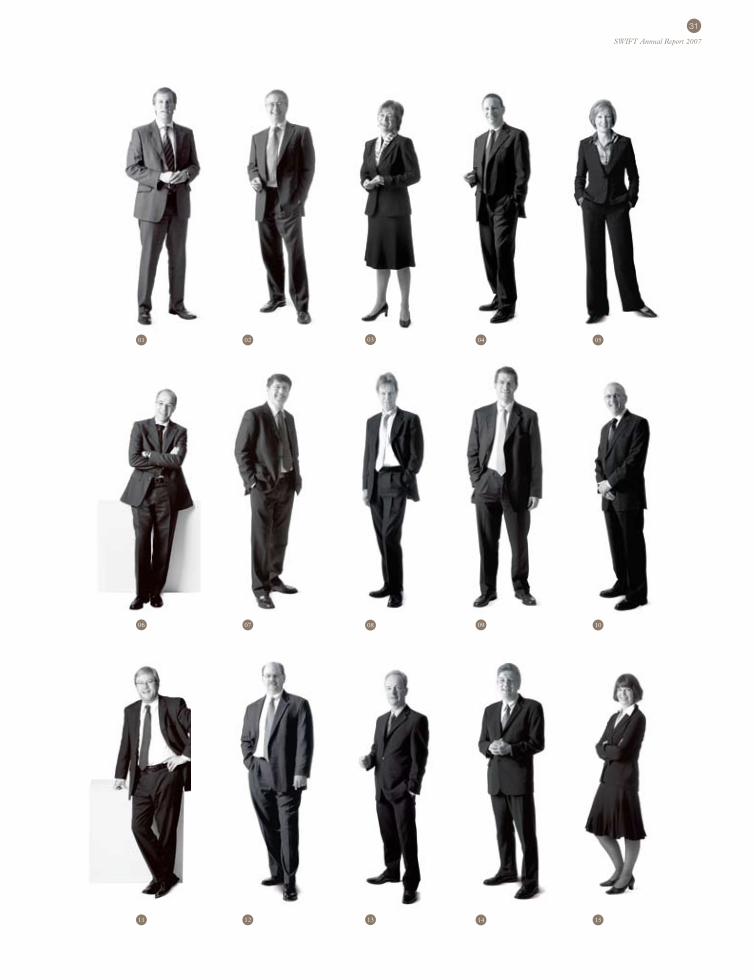
31
SWIFT Annual Report 2007
01 02 03 04 05
06 07 08 09 10
11 12 13 14 15
32
SWIFT Annual Report 2007
Board of Directors— Experienced industry practitioners, pro-active governors and advisors
01 Yawar ShahChief Operations Officer, Shared Services, Citi, and Chairman of the Board of Directors, SWIFTYawar Shah has been a SWIFT Director since 1995, Deputy Chairman of the Board since 1996, and Chairman since June 2006. He is the Chief Operations Officer for Citi Shared Services globally and is Chair of the Citi Operations Council. Prior to this, Mr. Shah was at JPMorgan for over 20 years. Positions there have included Global Operations Executive for Worldwide Securities Services, Retail Service and Operations Executive, Chief Operating Officer of the Global Private Bank, and General Manager of the Treasury Management Services business.
02 Stephan ZimmermannDeputy Chairman, COO, Global Wealth Management and Business Banking and Member of the Group Managing Board, UBS AG, SwitzerlandSWIFT Director since 1998 and Chairman of the Human Resources Committee of the Board. Vice Chairman SFMS, Swiss Financial Market Services, Switzerland.
03 Udo BraunHead Zentraler Servicebereich, Transaction Banking Markets, Commerzbank, GermanySWIFT Director since 2007. Mr. Braun joined Commerzbank in 1988. He is currently responsible for all operations services for Financial Market Instruments of the Commerzbank Group. He previously held several managerial functions in information technology, securities and capital markets at Commerzbank in Europe and the US.
04 Ignace CombesDeputy Chief Executive Officer, Euroclear SA/NV, BelgiumSWIFT Director since 2006. Deputy Chief Executive Officer, Vice Chairman of the Management Committee and member of the Executive Committee of Euroclear SA/NV. Chairman of the Board of Directors of Euroclear France, Euroclear Nederland and Euroclear Belgium and Member of the Board of Directors of Euroclear Bank. He is Chairman of TransConstellation a.s.b.l./v.z.w. and is also a Board Member of Febelfin and Partena. Previously held several managerial positions with JPMorgan in Brussels and New York.
05 Arthur CousinsDirector Strategy and Product Development, The Standard Bank of South Africa, South Africa SWIFT Director since 2003. Joined Standard Bank in 1969. Currently responsible for strategy and product development at Corporate and Investment Banking Division. Previously Head of Treasury Operations, International Banking Operations including Trade Finance, and Custody. CLS Board Member. Previous Board Member of STRATE (national CSD). Member of the JSE Securities Exchange Advisory Committee for Clearing and Settlement. Chairman of Back Office Forum of South Africa. Chairman of national ISO TC68 Standards Committee and a Member of the Global Payments Forum Steering Committee.
06 Erik DralansChief Executive Officer of ING South West Europe and Member of the Retail Committee of ING BankSWIFT Director since 2003. Started his career with Bank Brussels Lambert in 1972 and gained extensive international experience while working in Tokyo, Northeast Asia, Singapore and New York. Between 1997 and 2007 responsible for the processing of global operations and the related IT applications and platforms for ING Bank. Vice-Chairman of the Board of Equens, Chairman of the European Debit Advisory Committee of MasterCard.
07 John EllingtonDirector, Payment Operations, The Royal Bank of Scotland, United Kingdom SWIFT Director since 2005. Joined The Royal Bank of Scotland (previously NatWest) in 1985 and held several managerial positions in international payment and trade operations. Currently responsible for all non-card payment processing operations and associated customer service functions within the UK, including domestic and international electronic payments, trade services, cheque clearing, cash handling, ATM network and electronic banking support. Director, SWIFT (UK), and Director, Vocalink.
08 Wolfgang GaertnerCIO, Deutsche Bank AG, GermanySWIFT Director since 2001 and Chairman of the Technology and Production Committee of the Board. Joined Deutsche Bank in 1998 and serves as Chief Information Officer. His group provides IT solutions and operations services to the Global Banking, Private & Business Clients and Private Wealth Management divisions. Previous functions included management of Deutsche Bank’s cash business for financial institutions, as well as managerial positions in IT at Commerzbank. Holds a degree in economics and technology from the University of Karlsruhe.
09 Günther Gall Executive Vice President, Division Head of Transactions Services, Raiffeisen Zentralbank, AustriaSWIFT Director since 2001. Joined the Genossenschaftliche Zentralbank, Vienna (formerly Raiffeisen Zentralbank) in 1969. Currently Divisional Head of Transaction Services, which comprises cash management, custody, cards and infrastructure. Represents the Raiffeisen Banking Group on the Supervisory Board of STUZZA, the Austrian platform for non-competitive cooperation in payments, at the management committee of APC (Austrian Payments Council), of the Supervisory Board of Paylife, the Austrian Card Acquiring and Issuing company, and A-TRUST, the accredited Austrian Certification Authority. Internationally, he is Member of the EBA Association Board and the European Payment Council Plenary.
10 Jean-Yves GarnierDeputy Manager, Natixis, FranceSWIFT Director since 2002. Joined Natixis (formerly Natexis Banques Populaires) in 1988 and was appointed Head of Interbank Relationships for Payments in 2000. Previously supervised the back offices for card and payment systems and the project management team. Previously held functions at Banque Internationale pour l’Afrique Occidentale and Société Générale.
11 Alan GoldsteinManaging Director & Chief Information Officer, BNY Mellon Asset Management, United StatesSWIFT Director since 2006 and Chairman of the Standards Committee of the Board. Joined The Bank of New York in 1997 as a Division Manager for Software Development and his responsibilities at the company have included Technology Risk Management and Architecture. He currently heads technology for BNY Mellon Asset Management. Mr Goldstein previously held management and technical positions with a number of firms in the US and Europe.
12 Finn Otto HansenHead, Clearing and Settlement Strategies, DnB NOR Bank ASA, NorwaySWIFT Director since 2004 and Chairman of the Banking and Payments Committee of the Board. Joined DnB NOR in 1974. Held various positions in Credit, Payments and Cash Management. Currently heads the department for Clearing and Settlement Strategies. Has represented his institution and Norwegian banks on various national committees over the last two decades, including the SWIFT National Member Group. Representative of DnB NOR to EBA Clearing.
13 Takashi Kimori General Manager of Transaction Services Division, The Bank of Tokyo-Mitsubishi UFJ Ltd, Japan SWIFT Director since 2005. Joined The Bank of Tokyo Ltd. in 1978. Responsible for Yen-denominated interbank payment and clearing business and local custody operations, as well as implementing and managing new settlement business and managing industry-wide issues, such as developing various insourcing businesses in DVP settlements for Japanese Securities. Held various managerial positions in Foreign Exchange and Treasury in Tokyo Head Office, European Treasury Office in London and Brussels and Paris. Holds a degree in Economics from the University of Kyoto.
01 02 03 04 05 06
1307 08 09 10 11 12
33
SWIFT Annual Report 2007
14 Yves Maas Head International Operations, Managing Director, Credit Suisse, SwitzerlandSWIFT Director since 2003. Started his career with Credit Suisse in 1999 (Credit Suisse Private Banking). Held positions in Securities, Treasury, IT, Operations as well as managerial positions at Cedelbank in Luxembourg. Member of the Board of Credit Suisse Private Advisors and representative of Credit Suisse at the G30 Clearing and Settlement Monitoring Committee.
15 Jacques-Philippe MarsonPresident and Chief Executive Officer, BNP Paribas Securities Services, FranceSWIFT Director since 2001 and Chairman of the Securities Steering Committee of the Board. Joined Paribas in 1998 as Head of Global Securities Services and Member of the Investment Bank Management Board. Formerly Executive Vice President of State Street. Held managerial positions at Cedel, SWIFT and JPMorgan. Member of the Board of Trustees of the International Charter School of New England, Member of the SICOVAM Holding Board, Member of the Board of Omgeo, Member of the ISSA Board, Member of the EURO CCP Board and Member of various BNP Paribas subsidiary boards.
16 Lynn MathewsChairman of the Australian National Member Group and Asia Pacific and Latin American Representative of CLS Services, AustraliaSWIFT Director since 1998. Formerly, Head of Payments, Products and Industry Policy and Strategy in the Global Transaction Services Group at Westpac Banking Corporation and General Manager of the Corporate and Investor Services Group at Citibank in Australia. Former Deputy Chairman of Austraclear Ltd.
17 Maurizio MisturaInterbank Relations Director, SIA-SSB SpA, ItalySWIFT Director since 2000. Joined Banca Commerciale Italiana (now Intesa Sanpaolo SpA) in 1967. He has held various domestic and international responsibilities. Joined SIA-SSB in 2003.
18 Alfredo Rodríguez PinillaChief Executive Officer, OP PLUS, Operaciones y Servicios (BBVA Group), SpainSWIFT Director since 2003. Formerly Head of Operations at Banco Bilbao Vizcaya Argentaria (BBVA) London from 1995 until end 2002. Board Member at EBA Clearing, Member of the European Payments Council (EPC).
19 Eli I Sinyak Chief Information Officer, The Hongkong and Shanghai Banking Corporation Limited, Asia Pacific, Hong KongSWIFT Director since 2006 and Chairman of the Audit and Finance Committee of the Board. Joined HSBC Asia Pacific region in 2005 as Chief Information Officer and responsible for HSBC Information Technology in the region. Additionally, he is responsible for the CMB Customer Group Technology globally. Member of the Executive Committee of HSBC Hong Kong. Previously Chief Executive Officer of HSBC.com, Vice President, Distribution Systems, HSBC North America, and held other managerial positions in information technology.
20 Per-Eric SkotthagSenior Advisor and Head of Transition Office, Nordea Bank AB (publ), SwedenSWIFT Director since 2006. Joined Nordea Bank AB after senior positions as Deputy Regional Manager at SEB, and Deputy Chief Executive Officer and Chief Executive Officer of Postgirot Bank. Member of a number of Credit, Executive and other committees at SEB, the Swedish Post, Postgirot Bank, Nordea and Swedish Central Bank.
21 Marilyn H. SpearingManaging Director, Global Head of Trade Finance & Cash Management Corporates, Deutsche Bank AG, United KingdomSWIFT Director since 2005. Marilyn H. Spearing is the Global Head of Trade Finance and Cash Management Corporates for Deutsche’s Global Transaction Banking (GTB) area, since August 15, 2006. GTB covers Deutsche Bank’s cash management, trade finance and trust & securities services including domestic custody. Prior to Deutsche Bank, Marilyn was in HSBC’s global transaction bank, where she was responsible for the global payments and cash management business and, most recently, global head of sales.
22 Jeffrey TesslerChairman Clearstream Bank AG, Member of the Board of Directors, Clearstream International S.A., Luxembourg SWIFT Director since 2006. Chief Executive Officer of Clearstream International S.A., President and Chairman of the Group Executive Management of Clearstream International S.A., Member of the Executive Board of Deutsche Börse AG, Chief Executive Officer of Clearstream Banking S.A., Chairman of the Group Executive Management of Clearstream Banking S.A. Chairman of Edmond Israel Foundation. Previously held several managerial positions at Bank of New York, and BNY Securities Group in New York.
23 Dirk VanderschrickMember of the Management Board and COO, Dexia Bank, BelgiumResponsible for Operations, IT, Facility Management and Organisation. Head of Payments of Dexia Group. Board Member of Dexia Technology Services and Quest for Growth (Private Equity fund quoted on the Brussels Stock Exchange).
24 Ingrid VersnelHead, Payments & Trade – Global Technology & Operations, Royal Bank of Canada, CanadaCurrently leads the RBC’s Payments and Trade transaction processing. Includes after-sales support for retail and wholesale payments products including cheques clearing, cash and electronic payment products for all wholesale and retail clients. Senior bank’s representative on industry forums including the Board of the Canadian Payments Association, Canadian Bankers’ Association Interbank Operations Committee. Previously was Managing Director, Global Capital Markets – Operations and Administration. At the RBC Financial Group held various positions in Money Markets, Foreign Exchange, Derivatives, and Financial Engineering operations.
25 Jee Hong Yee-TangTechnology Advisor to ABS, SingaporeSWIFT Director since 1999. Currently Technology Advisor to the Association of Banks in Singapore and Member of Computerisation Steering Committee of National Health Care Group, Singapore and Singapore Pools Pte Ltd. Previously Managing Director and Head of IT at DBS Bank. As EVP (Corporate Services) had responsibility for risk management and various operational departments, including Finance, Human Resources, Trade Finance, Credit Administration and Settlements. Was Board Member of DBS Asset Management and DBS Card Centre Pte Ltd.
Directors leaving the Board in 2007During the course of 2007, three Directors left the Board.
Roland Boeff, Chief Executive Officer SECB Swiss Euro Clearing Bank in Germany, left in December 2007, having joined the Board in 1999. He served as Chairman of the Standards Committee and of the Pricing Board Task Force. He was replaced by Mr. Braun.
Pascal Deman, Chief Executive Officer Fin-Force, Belgium, left the Board in June 2007. He joined the Board in 2002. He was replaced by Mr. Vanderschrick.
Martin Read, Assistant General Manager, Bank of Nova Scotia, Canada, left the Board in June 2007. A member of the Board since 1990, he served as Chairman of the Audit and Finance Committee. He was replaced by Mrs. Versnel.
14 15 16 17 18
20 21 22 23 24 25
19
34
SWIFT Annual Report 2007
Governance at SWIFT
SWIFT is a co-operative society under Belgian law, which its shareholders own and control. The shareholders elect a Board of 25 independent Directors, which governs the Company and oversees the Leadership Council. The Leadership Council is a group of full-time employees headed by a Chief Executive Officer.
ElectionsThe Directors are elected by the Annual General Meeting of shareholders for a term of three years. They are eligible for re-election. The Board elects a Chairman and a Deputy Chairman from among its members. It meets at least four times a year.
Board CommitteesThe Board has six committees:
— The Audit and Finance Committee (AFC) is the oversight body for the audit process of SWIFT’s operations and related internal controls. It commits to applying best practice for Audit Committees to ensure best governance and oversight in the following areas:
- Accounting;
- Financial reporting and control;
- Regulatory oversight;
- Budget, finance and financial long-term planning;
- Responsibility and liability;
- Audit oversight.
The AFC meets four or five times per annum with management, the CFO, SWIFT’s Chief Auditor and external auditors.
— The Human Resources Committee oversees executive compensation. It assesses Company performance and decides on the remuneration package for members of the Leadership Council and other key executives. It monitors employee compensation and benefits programmes, including the provisioning and funding of the pension plans. It also approves appointments to the Leadership Council and assists in the development of the organisation,
including succession planning. The Board Chairman and Deputy Chairman are members of the Committee and meet four to five times per year with the CEO, the Head of Human Resources, and the CFO on financial and performance measures. The Human Resources Committee has delegated powers from the Board in these matters. The Committee also meets without the SWIFT executives several times a year;
— Two Business Committees: Banking and Payments and Securities;
— Two Technical Committees: Standards and Technology and Production.
The Committees provide strategic guidance to the Board and the Leadership Council, and review project progress in their respective areas.
Remuneration of Directors The members of the Board do not receive any remuneration from the Company. They are reimbursed for the travel costs incurred to perform their mandate. SWIFT reimburses the employer of the Chairman of the Board for the share of the Chairman’s payroll and related costs representing the portion of the time dedicated by the Chairman to SWIFT.
Remuneration of executivesThe remuneration of the executives is designed to:
— Attract and retain high-calibre talent, for which SWIFT competes in the international marketplace;
— Reward achievement of both demanding operational targets and medium-term strategic objectives;
— Recognise both strong individual contribution and solid team performance.
35
SWIFT Annual Report 2007
The composition and the aggregate Company cost of the reward packages of the CEO and the Executive for 2007 and 2006 are included in the Related Party Disclosures section of the Annual Report 2007 (see Note 28 in the Accounts Section of the Financial review). The main components of the short-term employee benefits are the base salary and the annual bonus. The annual bonus is linked to the achievement of operational targets. The main benefit in the post-employment benefits is pension plans in the various countries in which the executives are employed (Australia, Belgium, Hong Kong and the US).
The majority of the executives are employed in Belgium and this plan is a defined benefit pension plan. This plan provides for a pension calculated on the ‘final pensionable salary’, which excludes variable compensation. The long-term incentive awards make up the most important element of the benefits reported under long-term benefits. The pay-out under this scheme is determined by SWIFT’s performance against a number of key performance indicators which are aligned with the Company’s strategic plan. In the aggregate amount of base salary, annual bonus and long-term incentives, the fixed component (base salary) represents 35 percent and the variable components (annual bonus and long-term incentives) represent 65 percent.
It is the opinion of the Human Resources Board Committee that the compensation packages provided to the SWIFT executives are in line with the market and represent fair and appropriate recognition and remuneration for the individuals involved.
Audit processSWIFT’s Chief Auditor has a dual reporting line with a direct functional reporting line to the Chair of the Audit and Finance Committee (AFC), and a direct solid administrative reporting line to the CEO. Given the sensitivity to external auditors performing consultancy work for management, the AFC also annually reviews the respective spending and trends. To ensure objectivity, the mandates of the external auditors, as well as their remuneration, are approved by the AFC. SWIFT has two mandates for external audit:
— Ernst & Young, Brussels, has held the Financial Audit mandate since June 2000. Their mandate was renewed in June 2006, and runs to June 2009. Their financial audit statement is on page 38 of the Annual Report 2007;
— PriceWaterhouseCoopers has held the Security Audit mandate since September 2003. It runs to June 2008.
Oversight SWIFT maintains an open and constructive dialogue with oversight authorities. Under an arrangement with the central banks of the G-10 countries, the National Bank of Belgium, the central bank of the country in which SWIFT’s headquarters are located, acts as lead overseer of SWIFT. The issues discussed can include all topics related to systemic risk, confidentiality, integrity, availability and company strategy. SWIFT is overseen because of its importance to the smooth functioning of the worldwide financial system in its role of provider of messaging services.
User representation National Member Groups and National User Groups help ensure a coherent global focus by ensuring a timely and accurate two-way flow of information between SWIFT and its users.
— The National Member Group comprises all of a nation’s SWIFT shareholders, and proposes candidates for election to the SWIFT Board of Directors. It serves in an advisory capacity to the Board of Directors and SWIFT management, and serves the interests of the shareholders by coordinating their views. The National Member Group is chaired by a Chairperson elected by the SWIFT shareholders of the nation;
— The National User Group comprises all SWIFT users within a nation and acts as a forum for planning and coordinating operational activities. The user group is chaired by the User Group Chairperson who is a prime line of communication between the national user community and SWIFT.
Board nominations A nation can propose a Board Director depending on its ranking, which is determined by the total number of shares owned by the nation’s shareholders:
a. The shareholders from each of the first six nations ranked by number of shares may collectively propose two Directors for election.
b. The shareholders from each of the ten following nations ranked by number of shares may collectively propose one Director for election.
c. The shareholders of a nation which does not qualify under a) or b) may join with the shareholders of one or more other nations to propose a Director for election. The number of Directors proposed in this way shall not exceed three.
The Directors are elected by the Annual General Meeting of shareholders for a term of three years. They are eligible for re-election. The total number of Directors cannot exceed 25.
36
SWIFT Annual Report 2007
While SWIFT is neither a payment nor a settlement system and, as such, is not regulated by central banks or bank supervisors, a large and growing number of systemically important payment systems have become dependent on SWIFT, which has thus acquired a systemic character.
Because of this, the central banks of the Group of Ten countries (G-10) agreed that SWIFT should be subject to co-operative oversight by central banks. The oversight of SWIFT in its current form dates from 1998, and the most recent strengthening of the practical arrangements took place in 2004.
An open and constructive dialogue SWIFT is committed to an open and constructive dialogue with oversight authorities. The National Bank of Belgium acts as the lead overseer, supported by the G-10 central banks. The oversight focuses primarily on ensuring that SWIFT has effective controls and processes to avoid posing a risk to the financial stability and the soundness of financial infrastructures.
The National Bank of Belgium (NBB) is lead overseer, as SWIFT is incorporated in Belgium. Other central banks also have a legitimate interest in, or responsibility for, the oversight of SWIFT, given SWIFT’s role in their domestic systems.
As is generally the case in payments systems oversight, the major instrument for the oversight of SWIFT is moral suasion. Overseers place great importance on the constructive and open dialogues conducted on a basis of mutual trust with the SWIFT Board
and senior management. During these dialogues, overseers formulate their recommendations to SWIFT.A protocol signed between the NBB and SWIFT lays down the common understanding of overseers and SWIFT about the oversight objectives, and the activities that will be undertaken to achieve those objectives. It can be revised periodically to reflect evolving oversight arrangements.
Objectives, areas of interest and limitations The objectives of oversight of SWIFT centre on the security, operational reliability, business continuity and resilience of the SWIFT infrastructure. To review whether SWIFT is pursuing these objectives, overseers want to obtain comfort that SWIFT has put in place appropriate governance arrangements, structures, processes, risk management procedures and controls that enable it to effectively manage the potential risks to financial stability and to the soundness of financial infrastructures.
Overseers review SWIFT’s identification and mitigation of operational risks, and may also review legal risks, transparency of arrangements and customer access policies. SWIFT’s strategic direction may also be discussed with the Board and senior management.
This list of oversight fields is indicative and not exhaustive. In short, overseers will undertake those activities that provide them comfort that SWIFT is paying proper attention to the objectives described above. Nevertheless, SWIFT continues to bear the responsibility for the security and reliability of its systems, products and services. It should be understood that the oversight of SWIFT does not grant SWIFT any certification, approval or authorisation.
International co-operative oversight As lead overseer, the NBB conducts the oversight of SWIFT in cooperation with the other G-10 central banks, that is Bank of Canada, Deutsche Bundesbank, European Central Bank,
Banque de France, Banca d’Italia, Bank of Japan, De Nederlandsche Bank, Sveriges Riksbank, Swiss National Bank, Bank of England and the Federal Reserve System (USA), represented by the Federal Reserve Bank of New York and the Board of Governors of the Federal Reserve System.
Oversight structure — oversight meetings The NBB monitors SWIFT on an ongoing basis. It identifies relevant issues through the analysis of documents provided by SWIFT and through discussions with management. It maintains a continuous relationship with SWIFT, with ad hoc meetings on a regular basis, and serves as the G-10 central banks’ entry point for the co-operative oversight of SWIFT. In that capacity, the NBB chairs the senior policy and technical groups that facilitate the co-operative oversight, provide the secretariat and monitor the follow up of the decisions taken.
Access to informationIn order to achieve their oversight objectives, the overseers need timely access to all information they judge relevant for the purpose of the oversight. Typical sources of information are SWIFT Board papers, security audit reports, incident reports and incident review reports.
Another important channel for gathering information is through presentations by SWIFT staff and management. Finally, SWIFT assists overseers in identifying internal SWIFT documents that might be relevant to address specific oversight questions. Provisions on the confidential treatment of non-public information are included both in the protocol between the NBB and SWIFT, and in the bilateral Memorandums of Understanding between the NBB and each of the other co-operative central banks. The official description of the NBB’s oversight role can be found in Financial Stability Review 2007, published by the National Bank of Belgium and available on its web site www.nbb.be.
Oversight of SWIFT
Central banks generally have the explicit objective of fostering financial stability and promoting the soundness of payment and settlement systems.
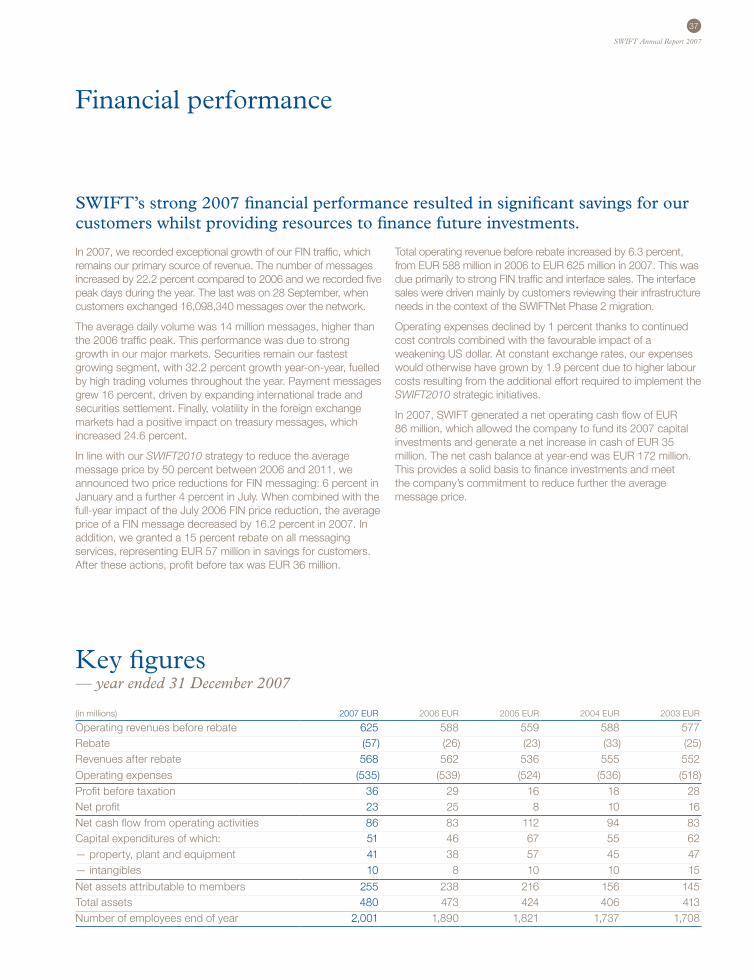
37
SWIFT Annual Report 2007
Financial performance
(in millions) 2007 EUR 2006 EUR 2005 EUR 2004 EUR 2003 EUR
Operating revenues before rebate 625 588 559 588 577 Rebate (57) (26) (23) (33) (25)Revenues after rebate 568 562 536 555 552 Operating expenses (535) (539) (524) (536) (518)Profit before taxation 36 29 16 18 28 Net profit 23 25 8 10 16 Net cash flow from operating activities 86 83 112 94 83 Capital expenditures of which: 51 46 67 55 62 — property, plant and equipment 41 38 57 45 47 — intangibles 10 8 10 10 15
Net assets attributable to members 255 238 216 156 145 Total assets 480 473 424 406 413 Number of employees end of year 2,001 1,890 1,821 1,737 1,708
Key figures— year ended 31 December 2007
SWIFT’s strong 2007 financial performance resulted in significant savings for our customers whilst providing resources to finance future investments.
In 2007, we recorded exceptional growth of our FIN traffic, which remains our primary source of revenue. The number of messages increased by 22.2 percent compared to 2006 and we recorded five peak days during the year. The last was on 28 September, when customers exchanged 16,098,340 messages over the network.
The average daily volume was 14 million messages, higher than the 2006 traffic peak. This performance was due to strong growth in our major markets. Securities remain our fastest growing segment, with 32.2 percent growth year-on-year, fuelled by high trading volumes throughout the year. Payment messages grew 16 percent, driven by expanding international trade and securities settlement. Finally, volatility in the foreign exchange markets had a positive impact on treasury messages, which increased 24.6 percent.
In line with our SWIFT2010 strategy to reduce the average message price by 50 percent between 2006 and 2011, we announced two price reductions for FIN messaging: 6 percent in January and a further 4 percent in July. When combined with the full-year impact of the July 2006 FIN price reduction, the average price of a FIN message decreased by 16.2 percent in 2007. In addition, we granted a 15 percent rebate on all messaging services, representing EUR 57 million in savings for customers. After these actions, profit before tax was EUR 36 million.
Total operating revenue before rebate increased by 6.3 percent, from EUR 588 million in 2006 to EUR 625 million in 2007. This was due primarily to strong FIN traffic and interface sales. The interface sales were driven mainly by customers reviewing their infrastructure needs in the context of the SWIFTNet Phase 2 migration.
Operating expenses declined by 1 percent thanks to continued cost controls combined with the favourable impact of a weakening US dollar. At constant exchange rates, our expenses would otherwise have grown by 1.9 percent due to higher labour costs resulting from the additional effort required to implement the SWIFT2010 strategic initiatives.
In 2007, SWIFT generated a net operating cash flow of EUR 86 million, which allowed the company to fund its 2007 capital investments and generate a net increase in cash of EUR 35 million. The net cash balance at year-end was EUR 172 million. This provides a solid basis to finance investments and meet the company’s commitment to reduce further the average message price.
38
SWIFT Annual Report 2007
To the shareholders of S.W.I.F.T. SCRL
We have audited the accompanying financial statements of S.W.I.F.T. SCRL, which comprise the balance sheet as at 31 December 2007, and the income statement, statement of recognised income and expense and cash flow statement for the year then ended, and a summary of significant accounting policies and other explanatory notes.
Management’s responsibility for the financial statementsManagement is responsible for the preparation and fair presentation of these financial statements in accordance with International Financial Reporting Standards. This responsibility includes: designing, implementing and maintaining internal control relevant to the preparation and fair presentation of financial statements that are free from material misstatement, whether due to fraud or error; selecting and applying appropriate accounting policies; and making accounting estimates that are reasonable in the circumstances.
Auditor’s responsibilityOur responsibility is to express an opinion on these financial statements based on our audit. We conducted our audit in accordance with International Standards on Auditing. Those standards require that we comply with ethical requirements and plan and perform the audit to obtain reasonable assurance whether the financial statements are free from material misstatement.
An audit involves performing procedures to obtain audit evidence about the amounts and disclosures in the financial statements. The procedures selected depend on the auditor’s judgment, including the assessment of the risks of material misstatement of the financial statements, whether due to fraud or error. In making those risk assessments, the auditor considers internal control relevant to the entity’s preparation and fair presentation of the financial statements in order to design audit procedures that are appropriate in the circumstances, but not for the purpose of expressing an opinion on the effectiveness of the entity’s internal control. An audit also includes evaluating the appropriateness of accounting policies used and the reasonableness of accounting estimates made by management, as well as evaluating the overall presentation of the financial statements.
We believe that the audit evidence we have obtained is sufficient and appropriate to provide a basis for our audit opinion.
OpinionIn our opinion, the financial statements give a true and fair view of the financial position of S.W.I.F.T. SCRL as of 31 December 2007, and of its financial performance and its cash flows for the year then ended in accordance with International Financial Reporting Standards.
Ernst & Young Reviseurs d’Entreprises SCCRL
Represented by
Marc Van SteenvoortPartner Brussels, 7 March 2008
Report of the independent financial auditors
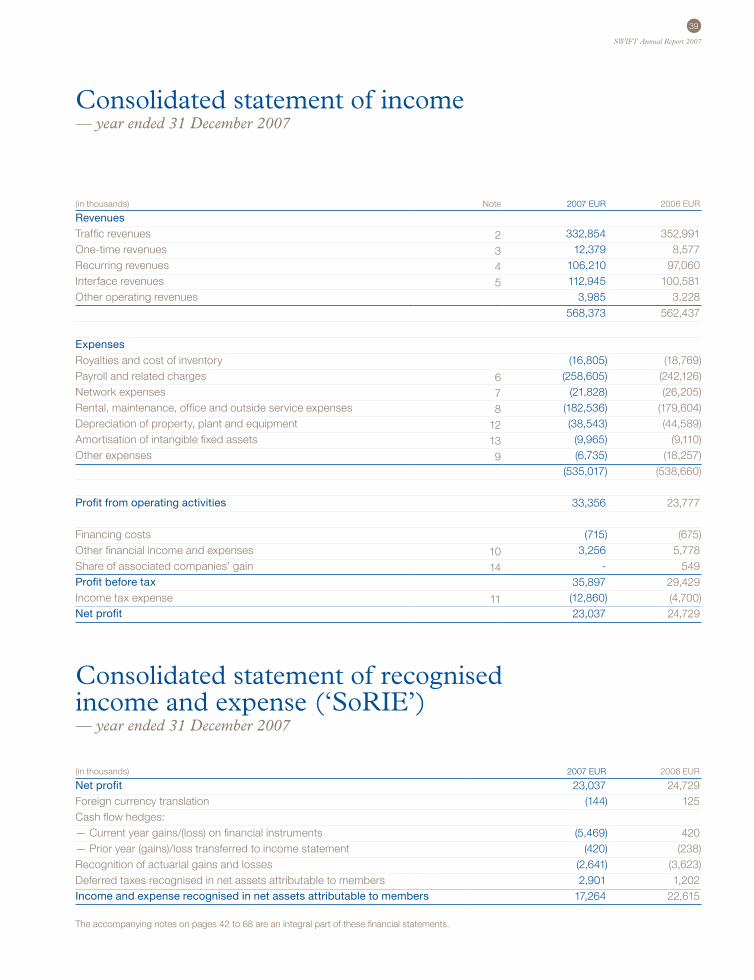
39
SWIFT Annual Report 2007
(in thousands) Note 2007 EUR 2006 EUR
RevenuesTraffic revenues 2 332,854 352,991 One-time revenues 3 12,379 8,577 Recurring revenues 4 106,210 97,060 Interface revenues 5 112,945 100,581 Other operating revenues 3,985 3,228
568,373 562,437
Expenses
Royalties and cost of inventory (16,805) (18,769)Payroll and related charges 6 (258,605) (242,126)Network expenses 7 (21,828) (26,205)Rental, maintenance, office and outside service expenses 8 (182,536) (179,604)Depreciation of property, plant and equipment 12 (38,543) (44,589)Amortisation of intangible fixed assets 13 (9,965) (9,110)Other expenses 9 (6,735) (18,257)
(535,017) (538,660)
Profit from operating activities 33,356 23,777
Financing costs (715) (675)Other financial income and expenses 10 3,256 5,778 Share of associated companies’ gain 14 - 549 Profit before tax 35,897 29,429 Income tax expense 11 (12,860) (4,700)Net profit 23,037 24,729
Consolidated statement of recognised income and expense (‘SoRIE’) — year ended 31 December 2007
(in thousands) 2007 EUR 2006 EUR
Net profit 23,037 24,729 Foreign currency translation (144) 125 Cash flow hedges:— Current year gains/(loss) on financial instruments (5,469) 420 — Prior year (gains)/loss transferred to income statement (420) (238)Recognition of actuarial gains and losses (2,641) (3,623)Deferred taxes recognised in net assets attributable to members 2,901 1,202 Income and expense recognised in net assets attributable to members 17,264 22,615
Consolidated statement of income — year ended 31 December 2007
The accompanying notes on pages 42 to 68 are an integral part of these financial statements.
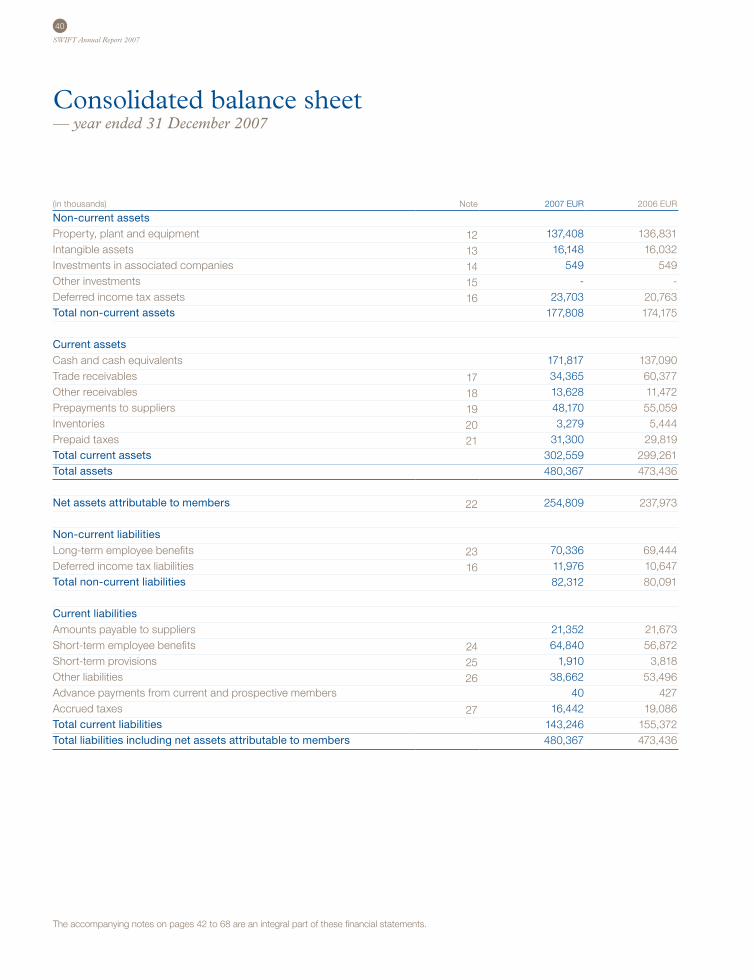
40
SWIFT Annual Report 2007
(in thousands) Note 2007 EUR 2006 EUR
Non-current assetsProperty, plant and equipment 12 137,408 136,831 Intangible assets 13 16,148 16,032 Investments in associated companies 14 549 549 Other investments 15 - - Deferred income tax assets 16 23,703 20,763 Total non-current assets 177,808 174,175
Current assets
Cash and cash equivalents 171,817 137,090 Trade receivables 17 34,365 60,377 Other receivables 18 13,628 11,472 Prepayments to suppliers 19 48,170 55,059 Inventories 20 3,279 5,444 Prepaid taxes 21 31,300 29,819 Total current assets 302,559 299,261 Total assets 480,367 473,436
Net assets attributable to members 22 254,809 237,973
Non-current liabilities
Long-term employee benefits 23 70,336 69,444Deferred income tax liabilities 16 11,976 10,647Total non-current liabilities 82,312 80,091
Current liabilities
Amounts payable to suppliers 21,352 21,673Short-term employee benefits 24 64,840 56,872Short-term provisions 25 1,910 3,818Other liabilities 26 38,662 53,496Advance payments from current and prospective members 40 427Accrued taxes 27 16,442 19,086Total current liabilities 143,246 155,372Total liabilities including net assets attributable to members 480,367 473,436
Consolidated balance sheet — year ended 31 December 2007
The accompanying notes on pages 42 to 68 are an integral part of these financial statements.
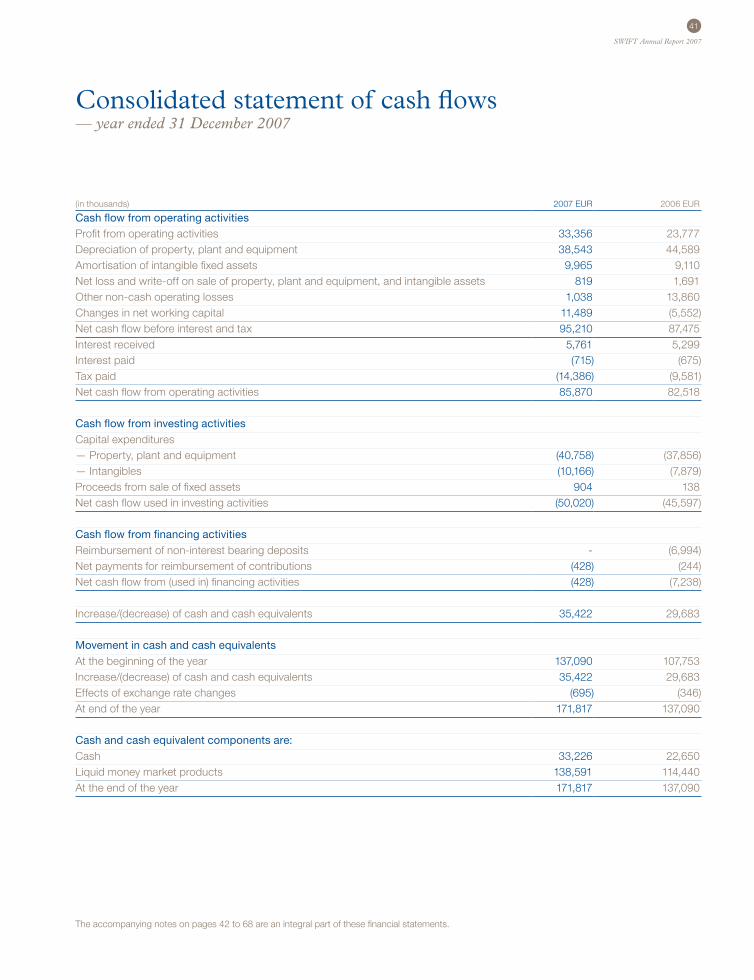
41
SWIFT Annual Report 2007
(in thousands) 2007 EUR 2006 EUR
Cash flow from operating activitiesProfit from operating activities 33,356 23,777 Depreciation of property, plant and equipment 38,543 44,589 Amortisation of intangible fixed assets 9,965 9,110 Net loss and write-off on sale of property, plant and equipment, and intangible assets 819 1,691 Other non-cash operating losses 1,038 13,860 Changes in net working capital 11,489 (5,552)Net cash flow before interest and tax 95,210 87,475 Interest received 5,761 5,299 Interest paid (715) (675)Tax paid (14,386) (9,581)Net cash flow from operating activities 85,870 82,518
Cash flow from investing activities
Capital expenditures— Property, plant and equipment (40,758) (37,856)— Intangibles (10,166) (7,879)Proceeds from sale of fixed assets 904 138 Net cash flow used in investing activities (50,020) (45,597)
Cash flow from financing activities
Reimbursement of non-interest bearing deposits - (6,994)Net payments for reimbursement of contributions (428) (244)Net cash flow from (used in) financing activities (428) (7,238)
Increase/(decrease) of cash and cash equivalents 35,422 29,683
Movement in cash and cash equivalents
At the beginning of the year 137,090 107,753 Increase/(decrease) of cash and cash equivalents 35,422 29,683 Effects of exchange rate changes (695) (346)At end of the year 171,817 137,090
Cash and cash equivalent components are:
Cash 33,226 22,650 Liquid money market products 138,591 114,440 At the end of the year 171,817 137,090
Consolidated statement of cash flows — year ended 31 December 2007
The accompanying notes on pages 42 to 68 are an integral part of these financial statements.
42
SWIFT Annual Report 2007
01 Corporate informationThe consolidated financial statements of the Society for Worldwide Interbank Financial Telecommunication SCRL (in abbreviation S.W.I.F.T. SCRL or SWIFT) for the year ended 31 December 2007, were authorised for issuance in accordance with a resolution of the Board of Directors on 6 March 2008 and will be proposed for approval at the Annual General Meeting of 11 June 2008.
The registered office of S.W.I.F.T. SCRL is located at Avenue Adele 1, B-1310 La Hulpe, Belgium.
S.W.I.F.T. SCRL is the financial industry-owned co-operative supplying secure, standardised messaging services and interface software to more than 8,300 financial institutions. SWIFT’s worldwide community includes banks, broker-dealers and investment managers, as well as their market infrastructures in payments, securities, treasury and trade.
S.W.I.F.T. SCRL operates in 208 countries and employed 2,001 employees as of 31 December 2007.
Summary of significant accounting policies:
Basis of preparationThe consolidated financial statements of S.W.I.F.T. SCRL have been prepared in accordance with International Financial Reporting Standards (IFRSs) and are presented in thousands of euro. The financial statements have been prepared on a historical cost basis, except for the measurement at fair value of derivatives and available-for-sale investment securities as required by IFRSs. The significant accounting policies used in the preparation of these financial statements are set out below.
Use of estimatesThe preparation of financial statements in conformity with IFRSs requires management to make estimates and assumptions that affect the reported amounts of assets and liabilities, the disclosures of contingent assets and liabilities at the date of the financial statements and the reported amounts of revenues and expenses during the reporting period. Actual amounts could differ from those estimates.
Changes in accounting standardsCertain new or modified IFRSs became effective for financial statements covering periods beginning on or after 1 January 2007. It was concluded that these have no significant impact on the financial statements of the Company.
The Company adopted IFRS 7 - Financial Instruments: Disclosures, during the year. Adoption of this standard did not have any effect on the financial performance or position of the Company. It did however give rise to additional disclosures.
New Standards and Interpretations, that have been issued but are not yet effective, have not been applied as they are still under investigation. The impact of initial application of these Standards and Interpretations has not yet been determined in detail and is not likely to have significant impact on the financial position or the results of the Company.
1/ IFRS 8 - Operating segments
2/ IAS 32 - Presentation and IAS 1 presentation of financial statements - Revised
3/ IAS 23 - Borrowing costs - Revised
4/ IFRIC 11 - IFRS 2 - Group and treasury share transactions
5/ IFRIC 12 - Service concession arrangements
6/ IFRIC 13 - Customer loyalty programmes
7/ IFRIC 14 - IAS 19 - The limit on a defined benefit asset, minimum funding requirements and their interaction.
Notes to the consolidated financial statements
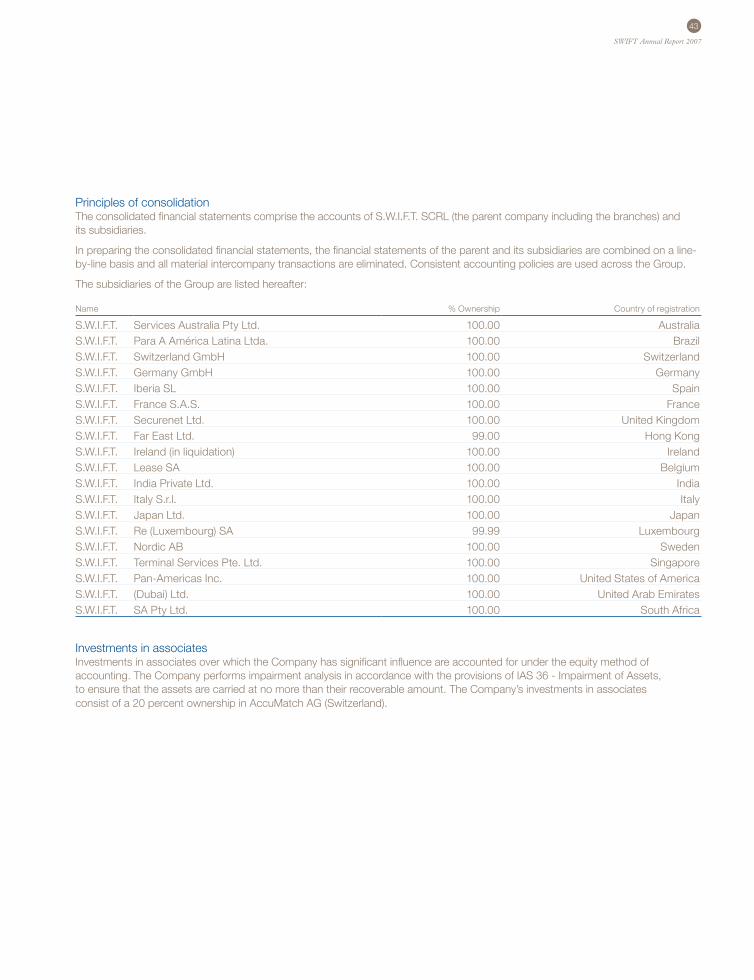
43
SWIFT Annual Report 2007
Principles of consolidationThe consolidated financial statements comprise the accounts of S.W.I.F.T. SCRL (the parent company including the branches) and its subsidiaries.
In preparing the consolidated financial statements, the financial statements of the parent and its subsidiaries are combined on a line-by-line basis and all material intercompany transactions are eliminated. Consistent accounting policies are used across the Group.
The subsidiaries of the Group are listed hereafter:
Name % Ownership Country of registration
S.W.I.F.T. Services Australia Pty Ltd. 100.00 AustraliaS.W.I.F.T. Para A América Latina Ltda. 100.00 BrazilS.W.I.F.T. Switzerland GmbH 100.00 SwitzerlandS.W.I.F.T. Germany GmbH 100.00 GermanyS.W.I.F.T. Iberia SL 100.00 SpainS.W.I.F.T. France S.A.S. 100.00 FranceS.W.I.F.T. Securenet Ltd. 100.00 United KingdomS.W.I.F.T. Far East Ltd. 99.00 Hong KongS.W.I.F.T. Ireland (in liquidation) 100.00 IrelandS.W.I.F.T. Lease SA 100.00 BelgiumS.W.I.F.T. India Private Ltd. 100.00 IndiaS.W.I.F.T. Italy S.r.l. 100.00 ItalyS.W.I.F.T. Japan Ltd. 100.00 JapanS.W.I.F.T. Re (Luxembourg) SA 99.99 LuxembourgS.W.I.F.T. Nordic AB 100.00 SwedenS.W.I.F.T. Terminal Services Pte. Ltd. 100.00 SingaporeS.W.I.F.T. Pan-Americas Inc. 100.00 United States of AmericaS.W.I.F.T. (Dubai) Ltd. 100.00 United Arab EmiratesS.W.I.F.T. SA Pty Ltd. 100.00 South Africa
Investments in associatesInvestments in associates over which the Company has significant influence are accounted for under the equity method of accounting. The Company performs impairment analysis in accordance with the provisions of IAS 36 - Impairment of Assets, to ensure that the assets are carried at no more than their recoverable amount. The Company’s investments in associates consist of a 20 percent ownership in AccuMatch AG (Switzerland).
44
SWIFT Annual Report 2007
Property, plant and equipmentLand and buildings, plant and equipment, leasehold improvements and office furniture and equipment are carried at cost less accumulated depreciation. The rates of depreciation used are described in Note 12.
Leasehold improvements are depreciated over the term of the leases, using the straight-line method commencing in the month of actual use of the asset for the operations of the Company. Government capital grants are deducted from the related fixed assets to arrive at the carrying amount of the asset. The net cost is depreciated using the straight-line method and recognised in the income statement over the useful life of the related assets. Government interest subsidies are recognised in the income statement over the same period as the related interest charges.
Impairment tests are performed when there is an indication that the asset could be impaired. Further, the carrying amounts are reviewed at each balance sheet date to assess whether or not they are in excess of their recoverable amounts. Where carrying amounts exceed these estimated recoverable amounts, assets are written down to their recoverable amounts.
Intangible assetsIntangible assets include acquired software licences and capitalised development costs. Intangible assets are amortised using the straight-line method commencing when the asset is available for its intended use for the operations of the Company. Depreciation rates are detailed in Note 13.
Research and Development costs are accounted for in accordance with IAS 38 - Intangibles. Expenditures on research or on the research phase of an internal project are recognised as an expense when incurred. The intangible assets arising from the development phase of an internal project are recognised if the conditions as outlined in IAS 38 are complied with. This implies that the technical feasibility of completing the intangible asset for it to be available for sale or use can be demonstrated and that the intangible asset will generate probable future economic benefits. The intangible assets arising from development are amortised over the useful economic lives. At each balance sheet date, the Company assesses whether there is any indication of impairment in accordance with IAS 36 - Impairment of Assets. If any such indication exists, assets are written down to recoverable amount.
ProvisionsProvisions are recognised in accordance with IAS 37 when the Company has a present legal or constructive obligation as a result of a past event and when it is probable that an outflow of resources will be required to settle the obligation and a reliable estimate of the amount can be made.
Income taxesCurrent income taxes are based on the results of the parent company and its subsidiaries and are calculated according to local tax rules.
Deferred income tax assets and liabilities are determined, using the liability method, for all temporary differences arising between the tax basis of the assets and liabilities and their carrying values for financial reporting purposes. Deferred income tax assets and liabilities are measured at the tax rates that apply for the period when the asset will be realised or the liability will be settled based on tax rates and tax laws that have been enacted or substantially enacted at the balance sheet date.
Deferred income tax assets are recognised on all temporary differences to the extent that it is probable that future taxable profit will be available against which the deductible temporary differences can be utilised.
No provision is made for taxes which may be withheld on possible future distribution of earnings retained by subsidiaries, as there is no current intention to distribute retained earnings to the parent company.
45
SWIFT Annual Report 2007
Derivatives and hedge accountingThe Company uses derivative financial instruments such as foreign exchange forward and option contracts to hedge its risks associated with foreign currency fluctuations. It is the Company’s policy to use financial instruments only to protect against market rate fluctuations and never for speculative or trading purposes. Details of the Company’s financial risk management objectives and policies are set out in Note 30.
The derivative financial instruments are recognised at fair value on the balance sheet. Economic hedges, which mitigate foreign currency risk but that do not meet the strict IAS 39 hedge accounting rules, are measured at fair value through profit and loss. This is mainly applicable for exotic and vanilla options.
For the purposes of hedge accounting, hedges are classified into two categories:
(a) cash flow hedges to hedge exposure to variability in cash flows that is attributable to a particular risk associated with forecasted transactions;
(b) fair value hedges to hedge exposure to changes in the fair value of a recognised asset or liability.
In the case of cash flow hedges, any gain or loss from re-measuring the hedging instrument at fair value is recognised immediately in the statement of recognised income and expense (SoRIE) under the line item cash flow hedges. Qualitative and quantitative tests are used to assess hedge effectiveness.
When the hedged transaction relates to a non-financial asset or liability, then at the time the asset or liability is recognised, the associated gains or losses that have previously been recognised in the SoRIE are included in the initial measurement of the acquisition cost or other carrying amount of the asset or liability. For all other cash flow hedges, the gains or losses which are recognised in the SoRIE are transferred to the financial profit and loss accounts in the same period in which the hedged firm commitment or forecasted transaction affects the profit and loss accounts.
In the case of fair value hedges, fair market value changes of the hedged item and the hedging instrument are recognised in the profit and loss accounts.
Cash and cash equivalentsCash and cash equivalents consist of cash on hand and balances with banks as well as investments in liquid money market products. These are carried at market value and revalued through the income statement in financial results.
The money market products are classified as available for sale. The revaluation of these products is entirely made up of interest recognised in the profit and loss accounts.
InventoriesInventories mainly comprise software licences and encryption and security devices for resale to end customers.
Inventories are stated at cost or net realisable value, whichever is lower. Cost is determined on a weighted average basis. Net realisable value is the amount that can be realised from the sale of the inventories in the normal course of business after allowing for the costs of realisation.
Trade receivablesTrade receivables, which generally have 40-90 days payment terms, are recognised and carried at original invoice amount. An impairment loss is recognised for any difference between carrying amount and recoverable amount. Receivables from related parties are recognised and carried at nominal value.
46
SWIFT Annual Report 2007
Pension schemesS.W.I.F.T. SCRL operates a number of defined benefit pension plans covering primarily its Belgian, US and Dutch employees. Plan benefits are based on years of service and the employee’s salary during the final years of employment. The funds are valued by a professional actuary on an annual basis.
In 2006, the Company decided to report all actuarial gains and losses in the SoRIE, as allowed under IAS 19 (revised 2004).
In addition to the defined benefit plans described above, S.W.I.F.T. SCRL makes contributions to defined contribution plans covering primarily employees in other locations.
Details on the annual pension costs and the funded status for the defined benefit pension plans are disclosed in Note 23.
RevenuesTraffic revenues include:
— The amounts billed for messaging services such as: financial data exchange, structured message exchange, file exchange, and browser based messaging;
— Amounts billed for business solutions such as: payment and cash management, treasury and derivatives, securities pre-trade/trade, pre-settlement, clearing and settlement, custody services, and reporting;
— Amounts billed to a specific group of customers for matching services;
— Discounts and rebates on messaging services granted to customers.
One-time revenues consist mainly of connection and security product fees.
Recurring revenues consist of fees charged for the provision of services and equipment other than direct message transmission, and revenues from conferences and training courses.
Interface revenues consist of fees charged for the sale of software needed for customers to communicate with their counterparties, which are recognised in income when delivered, as well as software maintenance charges which are recognised in revenues on a pro rata basis over the period of the agreement.
Other operating revenues comprise mainly the recovery of charges incurred on behalf of members, capital gains on the sale of fixed assets, and other non recurring items.
Foreign exchange differencesThe Company’s financial statements are presented in euro. The euro is also the functional currency for all subsidiaries and branches of the Group except for Securenet Ltd. which has the British pound as functional currency.
Transactions in foreign currencies are initially translated to the functional currency at the exchange rate applicable at the date of the transaction. Monetary assets and liabilities denominated in foreign currencies are translated to the functional currency at the exchange rate which applies at the balance sheet date. All differences are taken to profit or loss. Non-monetary assets and liabilities denominated in foreign currencies are translated using the exchange rates which were applied at the dates of the initial transactions.
The assets and liabilities of Securenet Ltd. (monetary and non-monetary) are translated from its functional currency, the British pound, into the presentation currency of the Company, the euro, at the exchange rate applicable at the balance sheet date. Its income statement is translated at the weighted average exchange rates for the year. The exchange differences arising from this translation are recorded directly in the SoRIE.
Net assets attributable to membersIFRIC interpretation 2 - members’ shares in co-operative entities and similar instruments, requires the Company’s member shares, share premium, and retained earnings to be presented as net assets attributable to members.
47
SWIFT Annual Report 2007
02 Traffic revenuesThe decrease in traffic revenues from EUR 353.0 million in 2006 to EUR 332.9 million in 2007 is primarily explained by continued message price reductions amounting to 16.2 percent compared to 2006, and a rebate on traffic revenues amounting to EUR 57.2 million versus EUR 26.1 million in 2006. This decrease is partly offset by FIN traffic volume growth, which amounted to 22.2 percent in 2007.
The reduction in message prices results from the full-year impact of the 2006 price reductions, and the decision of the Board of Directors to further lower overall pricing in 2007.
03 One-time revenuesThe increase in one-time revenues from EUR 8.6 million in 2006 to EUR 12.4 million in 2007 is mainly explained by increased revenues from the sale of security certificates and the development of specific customer solutions, which are partially offset by the decision to no longer charge membership admission fees as of July 2007.
04 Recurring revenues
(in thousands) 2007 EUR 2006 EUR
Recurring connectivity revenues 34,922 33,812 Recurring service revenues 31,042 28,802 Documentation and directory services 15,705 15,844 Conferences 16,339 12,667 Education 8,202 5,935
106,210 97,060
The increase in conference revenues is mainly explained by the attendance to Sibos 2007 in Boston, which was the largest Sibos to date.
The increase in education revenue results mainly from additional training courses given within the context of the SWIFTNet Phase 2 migration.
05 Interface revenuesThe increase in interface revenues from EUR 100.6 million last year to EUR 112.9 million in 2007 is driven by the increase in the number of new interfaces and security systems sold, mainly due to customers reviewing their infrastructure needs in the context of the SWIFTNet Phase 2 migration. This is partially offset by the weakening of the US dollar compared to 2006, as interfaces pricing is denominated in US dollar.
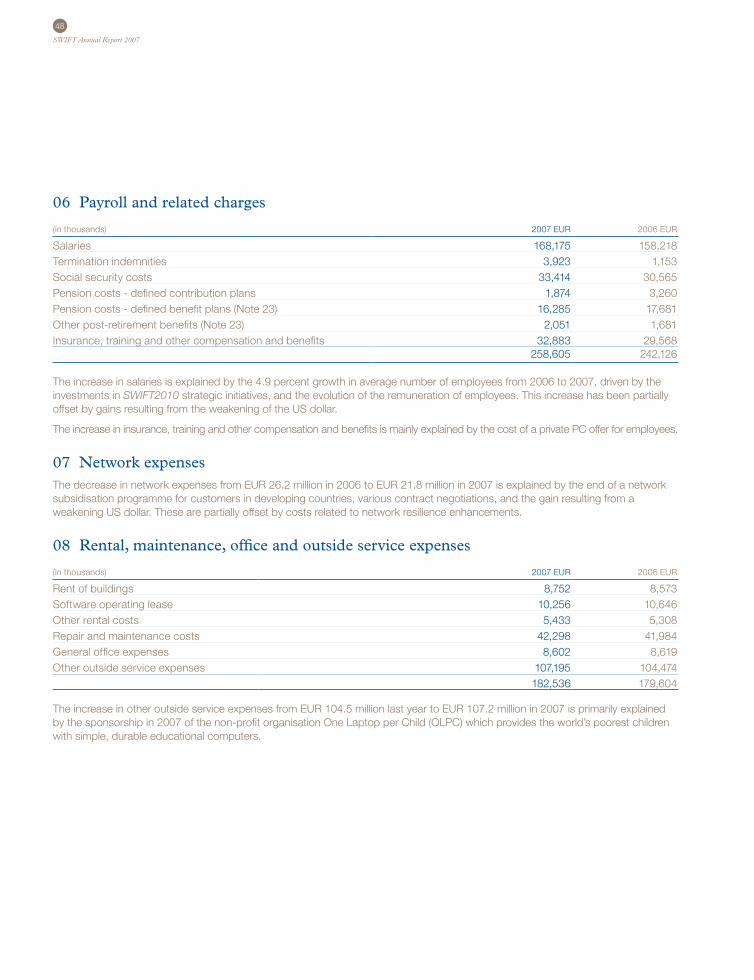
48
SWIFT Annual Report 2007
06 Payroll and related charges
(in thousands) 2007 EUR 2006 EUR
Salaries 168,175 158,218 Termination indemnities 3,923 1,153 Social security costs 33,414 30,565 Pension costs - defined contribution plans 1,874 3,260 Pension costs - defined benefit plans (Note 23) 16,285 17,681 Other post-retirement benefits (Note 23) 2,051 1,681 Insurance, training and other compensation and benefits 32,883 29,568
258,605 242,126
The increase in salaries is explained by the 4.9 percent growth in average number of employees from 2006 to 2007, driven by the investments in SWIFT2010 strategic initiatives, and the evolution of the remuneration of employees. This increase has been partially offset by gains resulting from the weakening of the US dollar.
The increase in insurance, training and other compensation and benefits is mainly explained by the cost of a private PC offer for employees.
07 Network expensesThe decrease in network expenses from EUR 26.2 million in 2006 to EUR 21.8 million in 2007 is explained by the end of a network subsidisation programme for customers in developing countries, various contract negotiations, and the gain resulting from a weakening US dollar. These are partially offset by costs related to network resilience enhancements.
08 Rental, maintenance, office and outside service expenses
(in thousands) 2007 EUR 2006 EUR
Rent of buildings 8,752 8,573 Software operating lease 10,256 10,646 Other rental costs 5,433 5,308 Repair and maintenance costs 42,298 41,984 General office expenses 8,602 8,619 Other outside service expenses 107,195 104,474
182,536 179,604
The increase in other outside service expenses from EUR 104.5 million last year to EUR 107.2 million in 2007 is primarily explained by the sponsorship in 2007 of the non-profit organisation One Laptop per Child (OLPC) which provides the world’s poorest children with simple, durable educational computers.
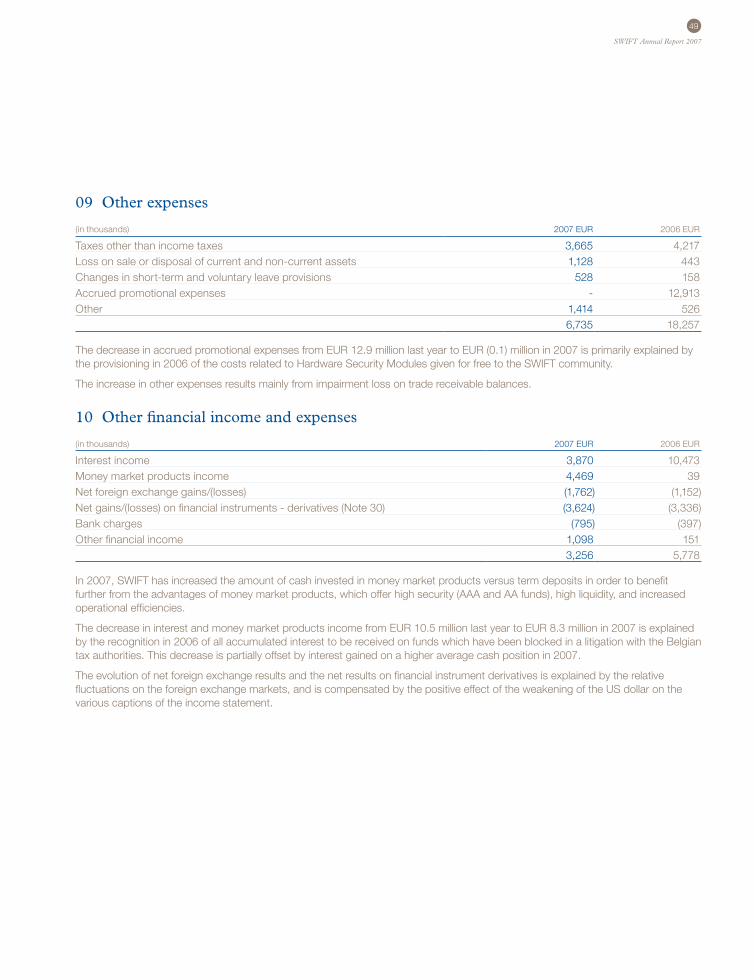
49
SWIFT Annual Report 2007
09 Other expenses
(in thousands) 2007 EUR 2006 EUR
Taxes other than income taxes 3,665 4,217 Loss on sale or disposal of current and non-current assets 1,128 443 Changes in short-term and voluntary leave provisions 528 158 Accrued promotional expenses - 12,913 Other 1,414 526
6,735 18,257
The decrease in accrued promotional expenses from EUR 12.9 million last year to EUR (0.1) million in 2007 is primarily explained by the provisioning in 2006 of the costs related to Hardware Security Modules given for free to the SWIFT community.
The increase in other expenses results mainly from impairment loss on trade receivable balances.
10 Other financial income and expenses
(in thousands) 2007 EUR 2006 EUR
Interest income 3,870 10,473 Money market products income 4,469 39 Net foreign exchange gains/(losses) (1,762) (1,152)Net gains/(losses) on financial instruments - derivatives (Note 30) (3,624) (3,336)Bank charges (795) (397)Other financial income 1,098 151
3,256 5,778
In 2007, SWIFT has increased the amount of cash invested in money market products versus term deposits in order to benefit further from the advantages of money market products, which offer high security (AAA and AA funds), high liquidity, and increased operational efficiencies.
The decrease in interest and money market products income from EUR 10.5 million last year to EUR 8.3 million in 2007 is explained by the recognition in 2006 of all accumulated interest to be received on funds which have been blocked in a litigation with the Belgian tax authorities. This decrease is partially offset by interest gained on a higher average cash position in 2007.
The evolution of net foreign exchange results and the net results on financial instrument derivatives is explained by the relative fluctuations on the foreign exchange markets, and is compensated by the positive effect of the weakening of the US dollar on the various captions of the income statement.
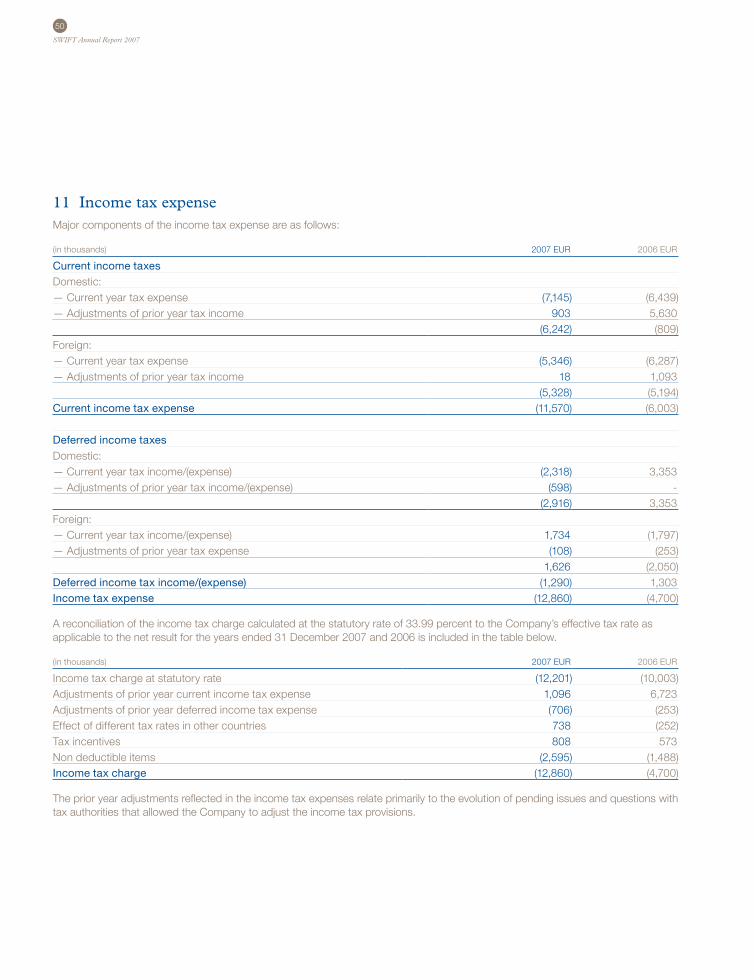
50
SWIFT Annual Report 2007
11 Income tax expenseMajor components of the income tax expense are as follows:
(in thousands) 2007 EUR 2006 EUR
Current income taxesDomestic:— Current year tax expense (7,145) (6,439)— Adjustments of prior year tax income 903 5,630
(6,242) (809)Foreign:— Current year tax expense (5,346) (6,287)— Adjustments of prior year tax income 18 1,093
(5,328) (5,194)Current income tax expense (11,570) (6,003)
Deferred income taxesDomestic:— Current year tax income/(expense) (2,318) 3,353 — Adjustments of prior year tax income/(expense) (598) -
(2,916) 3,353 Foreign:— Current year tax income/(expense) 1,734 (1,797)— Adjustments of prior year tax expense (108) (253)
1,626 (2,050)Deferred income tax income/(expense) (1,290) 1,303 Income tax expense (12,860) (4,700)
A reconciliation of the income tax charge calculated at the statutory rate of 33.99 percent to the Company’s effective tax rate as applicable to the net result for the years ended 31 December 2007 and 2006 is included in the table below.
(in thousands) 2007 EUR 2006 EUR
Income tax charge at statutory rate (12,201) (10,003)Adjustments of prior year current income tax expense 1,096 6,723 Adjustments of prior year deferred income tax expense (706) (253)Effect of different tax rates in other countries 738 (252)Tax incentives 808 573 Non deductible items (2,595) (1,488)Income tax charge (12,860) (4,700)
The prior year adjustments reflected in the income tax expenses relate primarily to the evolution of pending issues and questions with tax authorities that allowed the Company to adjust the income tax provisions.
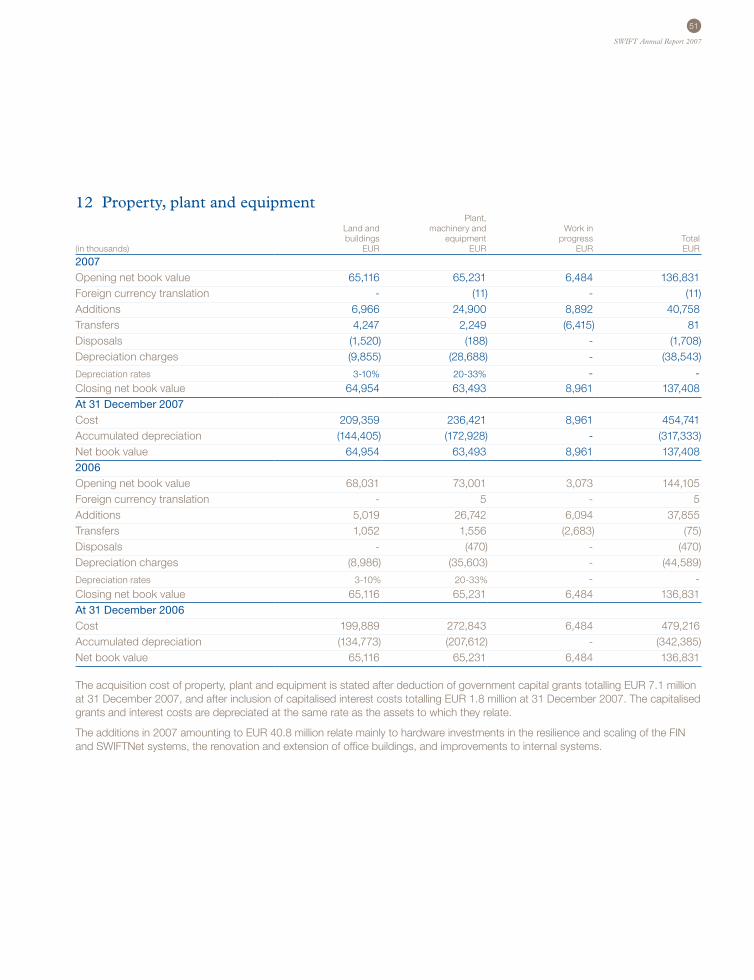
51
SWIFT Annual Report 2007
12 Property, plant and equipmentPlant,
Land and machinery and Work inbuildings equipment progress Total
(in thousands) EUR EUR EUR EUR
2007 Opening net book value 65,116 65,231 6,484 136,831 Foreign currency translation - (11) - (11)Additions 6,966 24,900 8,892 40,758 Transfers 4,247 2,249 (6,415) 81 Disposals (1,520) (188) - (1,708)Depreciation charges (9,855) (28,688) - (38,543)
Depreciation rates 3-10% 20-33% - - Closing net book value 64,954 63,493 8,961 137,408 At 31 December 2007Cost 209,359 236,421 8,961 454,741 Accumulated depreciation (144,405) (172,928) - (317,333)Net book value 64,954 63,493 8,961 137,408 2006 Opening net book value 68,031 73,001 3,073 144,105 Foreign currency translation - 5 - 5 Additions 5,019 26,742 6,094 37,855 Transfers 1,052 1,556 (2,683) (75)Disposals - (470) - (470)Depreciation charges (8,986) (35,603) - (44,589)
Depreciation rates 3-10% 20-33% - - Closing net book value 65,116 65,231 6,484 136,831 At 31 December 2006Cost 199,889 272,843 6,484 479,216 Accumulated depreciation (134,773) (207,612) - (342,385)Net book value 65,116 65,231 6,484 136,831
The acquisition cost of property, plant and equipment is stated after deduction of government capital grants totalling EUR 7.1 million at 31 December 2007, and after inclusion of capitalised interest costs totalling EUR 1.8 million at 31 December 2007. The capitalised grants and interest costs are depreciated at the same rate as the assets to which they relate.
The additions in 2007 amounting to EUR 40.8 million relate mainly to hardware investments in the resilience and scaling of the FIN and SWIFTNet systems, the renovation and extension of office buildings, and improvements to internal systems.
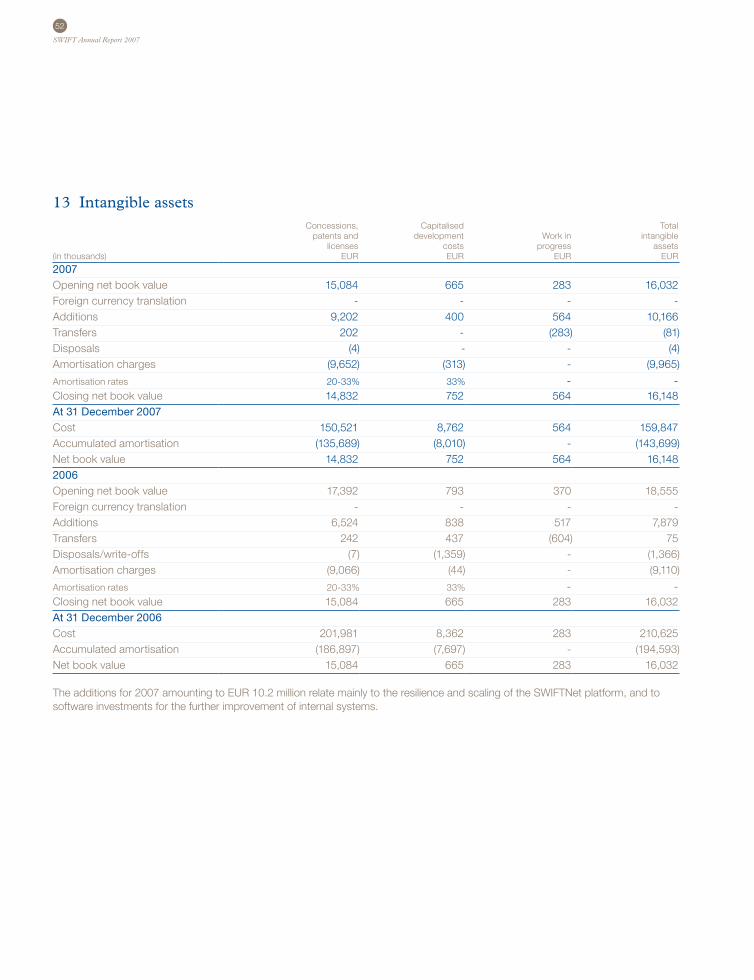
52
SWIFT Annual Report 2007
13 Intangible assetsConcessions, Capitalised Total
patents and development Work in intangiblelicenses costs progress assets
(in thousands) EUR EUR EUR EUR
2007 Opening net book value 15,084 665 283 16,032 Foreign currency translation - - - - Additions 9,202 400 564 10,166 Transfers 202 - (283) (81)Disposals (4) - - (4)Amortisation charges (9,652) (313) - (9,965)
Amortisation rates 20-33% 33% - - Closing net book value 14,832 752 564 16,148 At 31 December 2007Cost 150,521 8,762 564 159,847 Accumulated amortisation (135,689) (8,010) - (143,699)Net book value 14,832 752 564 16,148 2006 Opening net book value 17,392 793 370 18,555 Foreign currency translation - - - - Additions 6,524 838 517 7,879 Transfers 242 437 (604) 75 Disposals/write-offs (7) (1,359) - (1,366)Amortisation charges (9,066) (44) - (9,110)
Amortisation rates 20-33% 33% - - Closing net book value 15,084 665 283 16,032 At 31 December 2006Cost 201,981 8,362 283 210,625 Accumulated amortisation (186,897) (7,697) - (194,593)Net book value 15,084 665 283 16,032
The additions for 2007 amounting to EUR 10.2 million relate mainly to the resilience and scaling of the SWIFTNet platform, and to software investments for the further improvement of internal systems.
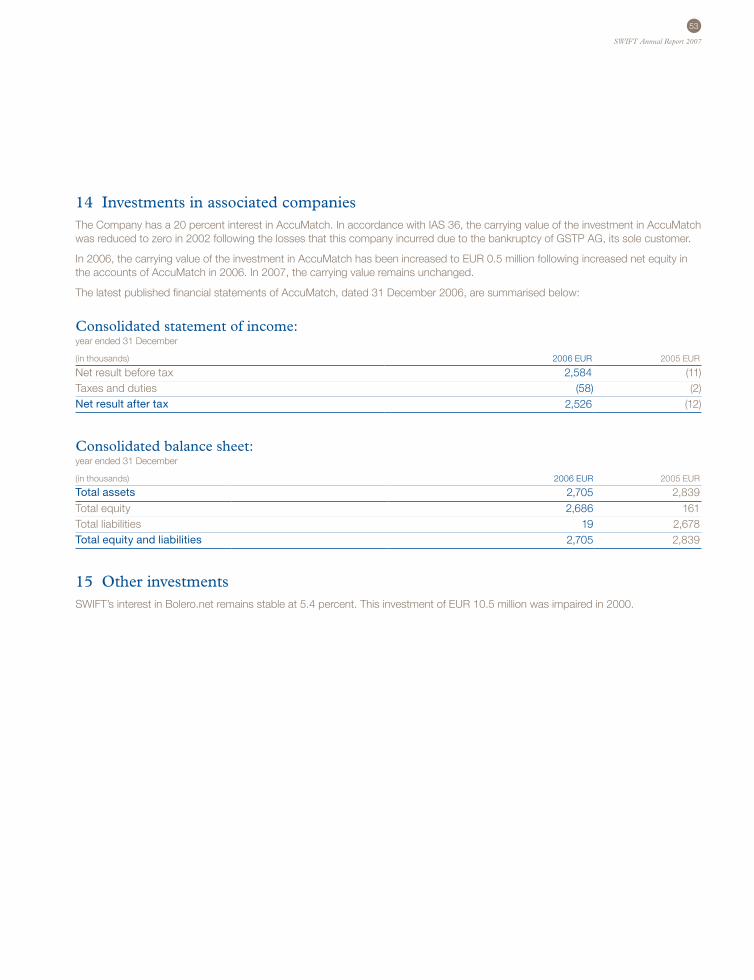
53
SWIFT Annual Report 2007
14 Investments in associated companiesThe Company has a 20 percent interest in AccuMatch. In accordance with IAS 36, the carrying value of the investment in AccuMatch was reduced to zero in 2002 following the losses that this company incurred due to the bankruptcy of GSTP AG, its sole customer.
In 2006, the carrying value of the investment in AccuMatch has been increased to EUR 0.5 million following increased net equity in the accounts of AccuMatch in 2006. In 2007, the carrying value remains unchanged.
The latest published financial statements of AccuMatch, dated 31 December 2006, are summarised below:
Consolidated statement of income:year ended 31 December
(in thousands) 2006 EUR 2005 EUR
Net result before tax 2,584 (11)Taxes and duties (58) (2)Net result after tax 2,526 (12)
Consolidated balance sheet:year ended 31 December
(in thousands) 2006 EUR 2005 EUR
Total assets 2,705 2,839 Total equity 2,686 161 Total liabilities 19 2,678 Total equity and liabilities 2,705 2,839
15 Other investments SWIFT’s interest in Bolero.net remains stable at 5.4 percent. This investment of EUR 10.5 million was impaired in 2000.
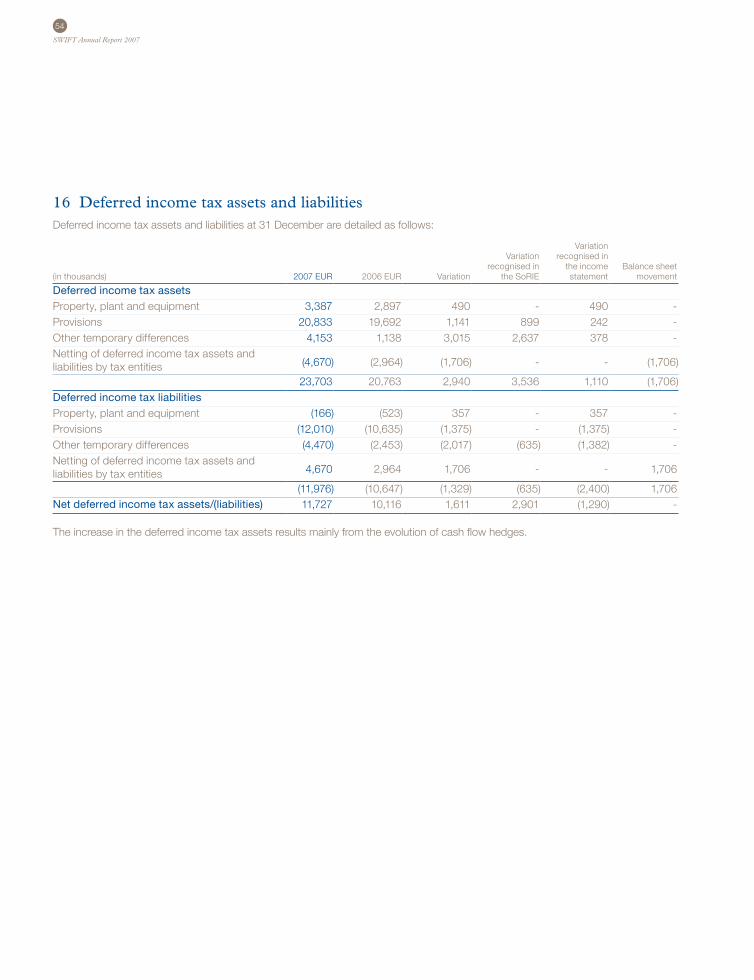
54
SWIFT Annual Report 2007
16 Deferred income tax assets and liabilitiesDeferred income tax assets and liabilities at 31 December are detailed as follows:
VariationVariation recognised in
recognised in the income Balance sheet(in thousands) 2007 EUR 2006 EUR Variation the SoRIE statement movement
Deferred income tax assetsProperty, plant and equipment 3,387 2,897 490 - 490 - Provisions 20,833 19,692 1,141 899 242 - Other temporary differences 4,153 1,138 3,015 2,637 378 - Netting of deferred income tax assets and liabilities by tax entities (4,670) (2,964) (1,706) - - (1,706)
23,703 20,763 2,940 3,536 1,110 (1,706)Deferred income tax liabilitiesProperty, plant and equipment (166) (523) 357 - 357 - Provisions (12,010) (10,635) (1,375) - (1,375) - Other temporary differences (4,470) (2,453) (2,017) (635) (1,382) - Netting of deferred income tax assets and liabilities by tax entities 4,670 2,964 1,706 - - 1,706
(11,976) (10,647) (1,329) (635) (2,400) 1,706 Net deferred income tax assets/(liabilities) 11,727 10,116 1,611 2,901 (1,290) -
The increase in the deferred income tax assets results mainly from the evolution of cash flow hedges.
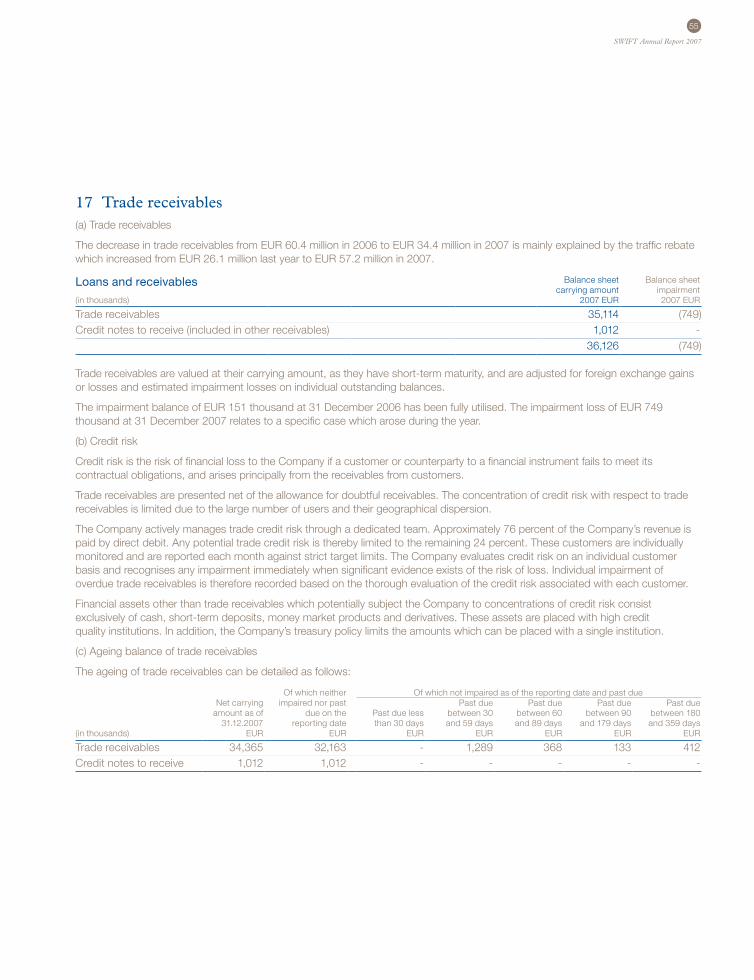
55
SWIFT Annual Report 2007
17 Trade receivables(a) Trade receivables
The decrease in trade receivables from EUR 60.4 million in 2006 to EUR 34.4 million in 2007 is mainly explained by the traffic rebate which increased from EUR 26.1 million last year to EUR 57.2 million in 2007.
Loans and receivables Balance sheet Balance sheetcarrying amount impairment
(in thousands) 2007 EUR 2007 EUR
Trade receivables 35,114 (749)Credit notes to receive (included in other receivables) 1,012 -
36,126 (749)
Trade receivables are valued at their carrying amount, as they have short-term maturity, and are adjusted for foreign exchange gains or losses and estimated impairment losses on individual outstanding balances.
The impairment balance of EUR 151 thousand at 31 December 2006 has been fully utilised. The impairment loss of EUR 749 thousand at 31 December 2007 relates to a specific case which arose during the year.
(b) Credit risk
Credit risk is the risk of financial loss to the Company if a customer or counterparty to a financial instrument fails to meet its contractual obligations, and arises principally from the receivables from customers.
Trade receivables are presented net of the allowance for doubtful receivables. The concentration of credit risk with respect to trade receivables is limited due to the large number of users and their geographical dispersion.
The Company actively manages trade credit risk through a dedicated team. Approximately 76 percent of the Company’s revenue is paid by direct debit. Any potential trade credit risk is thereby limited to the remaining 24 percent. These customers are individually monitored and are reported each month against strict target limits. The Company evaluates credit risk on an individual customer basis and recognises any impairment immediately when significant evidence exists of the risk of loss. Individual impairment of overdue trade receivables is therefore recorded based on the thorough evaluation of the credit risk associated with each customer.
Financial assets other than trade receivables which potentially subject the Company to concentrations of credit risk consist exclusively of cash, short-term deposits, money market products and derivatives. These assets are placed with high credit quality institutions. In addition, the Company’s treasury policy limits the amounts which can be placed with a single institution.
(c) Ageing balance of trade receivables
The ageing of trade receivables can be detailed as follows:
Of which neither Of which not impaired as of the reporting date and past due Net carrying impaired nor past Past due Past due Past due Past due
amount as of due on the Past due less between 30 between 60 between 90 between 18031.12.2007 reporting date than 30 days and 59 days and 89 days and 179 days and 359 days
(in thousands) EUR EUR EUR EUR EUR EUR EUR
Trade receivables 34,365 32,163 - 1,289 368 133 412 Credit notes to receive 1,012 1,012 - - - - -
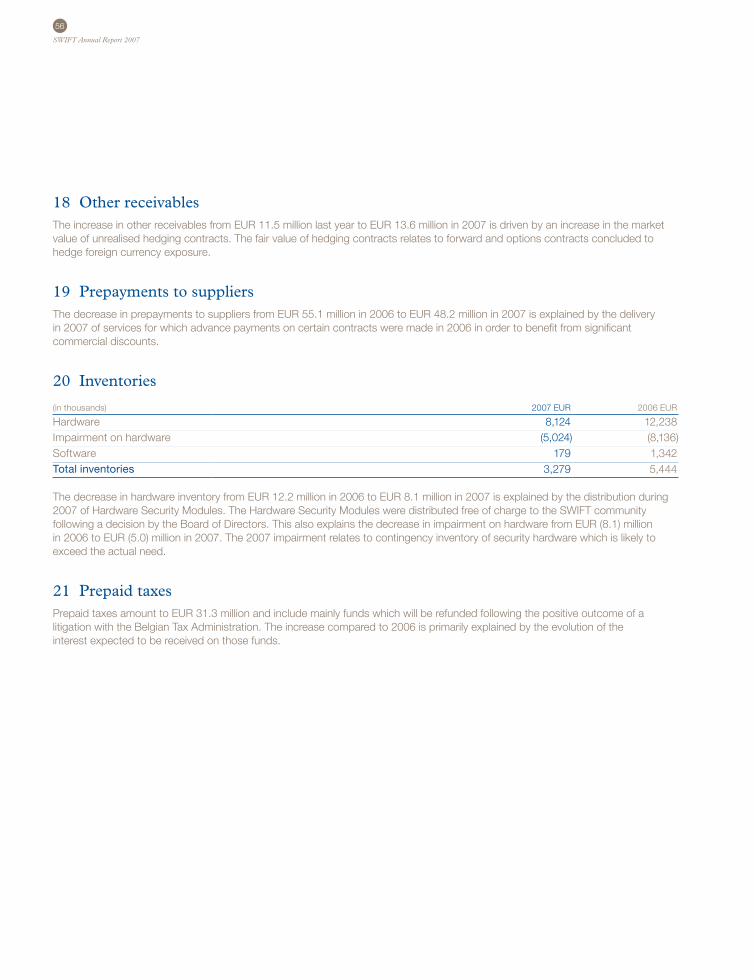
56
SWIFT Annual Report 2007
18 Other receivablesThe increase in other receivables from EUR 11.5 million last year to EUR 13.6 million in 2007 is driven by an increase in the market value of unrealised hedging contracts. The fair value of hedging contracts relates to forward and options contracts concluded to hedge foreign currency exposure.
19 Prepayments to suppliersThe decrease in prepayments to suppliers from EUR 55.1 million in 2006 to EUR 48.2 million in 2007 is explained by the delivery in 2007 of services for which advance payments on certain contracts were made in 2006 in order to benefit from significant commercial discounts.
20 Inventories
(in thousands) 2007 EUR 2006 EUR
Hardware 8,124 12,238 Impairment on hardware (5,024) (8,136)Software 179 1,342 Total inventories 3,279 5,444
The decrease in hardware inventory from EUR 12.2 million in 2006 to EUR 8.1 million in 2007 is explained by the distribution during 2007 of Hardware Security Modules. The Hardware Security Modules were distributed free of charge to the SWIFT community following a decision by the Board of Directors. This also explains the decrease in impairment on hardware from EUR (8.1) million in 2006 to EUR (5.0) million in 2007. The 2007 impairment relates to contingency inventory of security hardware which is likely to exceed the actual need.
21 Prepaid taxesPrepaid taxes amount to EUR 31.3 million and include mainly funds which will be refunded following the positive outcome of a litigation with the Belgian Tax Administration. The increase compared to 2006 is primarily explained by the evolution of the interest expected to be received on those funds.
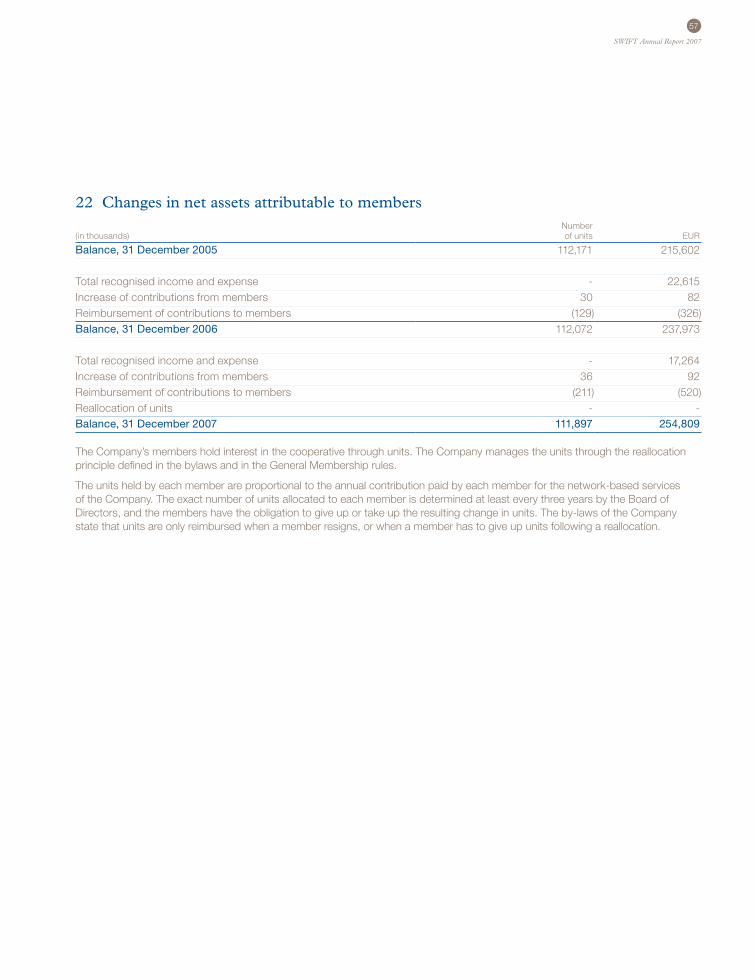
57
SWIFT Annual Report 2007
22 Changes in net assets attributable to membersNumber
(in thousands) of units EUR
Balance, 31 December 2005 112,171 215,602
Total recognised income and expense - 22,615 Increase of contributions from members 30 82 Reimbursement of contributions to members (129) (326)Balance, 31 December 2006 112,072 237,973
Total recognised income and expense - 17,264 Increase of contributions from members 36 92 Reimbursement of contributions to members (211) (520)Reallocation of units - - Balance, 31 December 2007 111,897 254,809
The Company’s members hold interest in the cooperative through units. The Company manages the units through the reallocation principle defined in the bylaws and in the General Membership rules.
The units held by each member are proportional to the annual contribution paid by each member for the network-based services of the Company. The exact number of units allocated to each member is determined at least every three years by the Board of Directors, and the members have the obligation to give up or take up the resulting change in units. The by-laws of the Company state that units are only reimbursed when a member resigns, or when a member has to give up units following a reallocation.
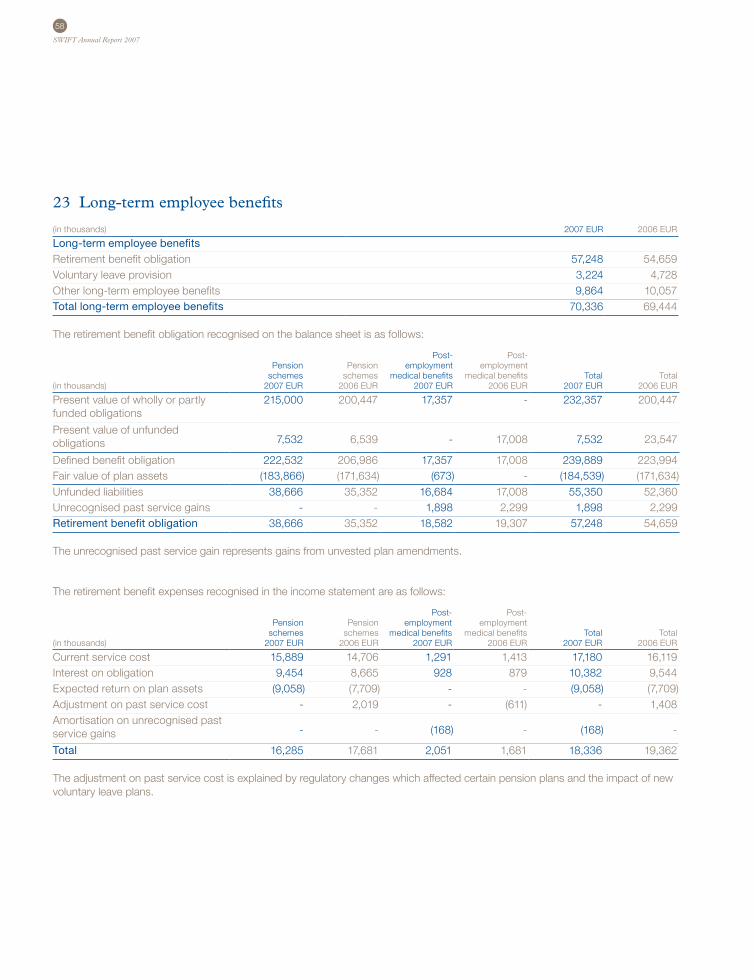
58
SWIFT Annual Report 2007
23 Long-term employee benefits
(in thousands) 2007 EUR 2006 EUR
Long-term employee benefitsRetirement benefit obligation 57,248 54,659 Voluntary leave provision 3,224 4,728 Other long-term employee benefits 9,864 10,057 Total long-term employee benefits 70,336 69,444
The retirement benefit obligation recognised on the balance sheet is as follows:
Post- Post-Pension Pension employment employment
schemes schemes medical benefits medical benefits Total Total(in thousands) 2007 EUR 2006 EUR 2007 EUR 2006 EUR 2007 EUR 2006 EUR
Present value of wholly or partly funded obligations
215,000 200,447 17,357 - 232,357 200,447
Present value of unfunded obligations 7,532 6,539 - 17,008 7,532 23,547
Defined benefit obligation 222,532 206,986 17,357 17,008 239,889 223,994 Fair value of plan assets (183,866) (171,634) (673) - (184,539) (171,634)Unfunded liabilities 38,666 35,352 16,684 17,008 55,350 52,360 Unrecognised past service gains - - 1,898 2,299 1,898 2,299 Retirement benefit obligation 38,666 35,352 18,582 19,307 57,248 54,659
The unrecognised past service gain represents gains from unvested plan amendments.
The retirement benefit expenses recognised in the income statement are as follows:
Post- Post-Pension Pension employment employment
schemes schemes medical benefits medical benefits Total Total(in thousands) 2007 EUR 2006 EUR 2007 EUR 2006 EUR 2007 EUR 2006 EUR
Current service cost 15,889 14,706 1,291 1,413 17,180 16,119 Interest on obligation 9,454 8,665 928 879 10,382 9,544 Expected return on plan assets (9,058) (7,709) - - (9,058) (7,709)Adjustment on past service cost - 2,019 - (611) - 1,408 Amortisation on unrecognised past service gains - - (168) - (168) -
Total 16,285 17,681 2,051 1,681 18,336 19,362
The adjustment on past service cost is explained by regulatory changes which affected certain pension plans and the impact of new voluntary leave plans.
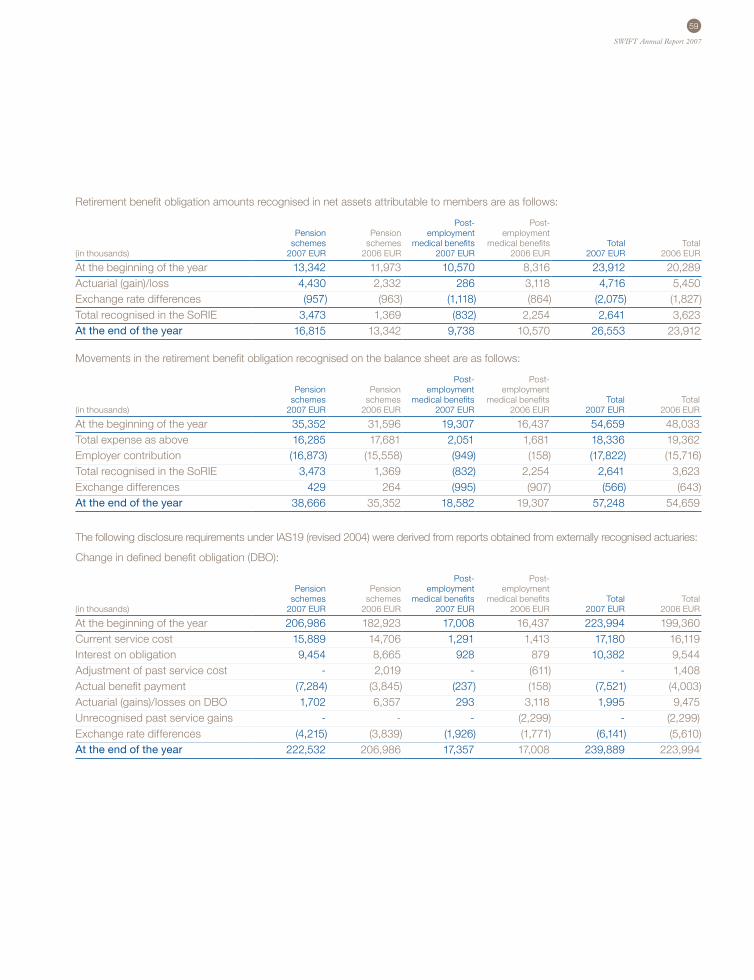
59
SWIFT Annual Report 2007
Retirement benefit obligation amounts recognised in net assets attributable to members are as follows:
Post- Post-Pension Pension employment employment
schemes schemes medical benefits medical benefits Total Total(in thousands) 2007 EUR 2006 EUR 2007 EUR 2006 EUR 2007 EUR 2006 EUR
At the beginning of the year 13,342 11,973 10,570 8,316 23,912 20,289 Actuarial (gain)/loss 4,430 2,332 286 3,118 4,716 5,450 Exchange rate differences (957) (963) (1,118) (864) (2,075) (1,827)Total recognised in the SoRIE 3,473 1,369 (832) 2,254 2,641 3,623 At the end of the year 16,815 13,342 9,738 10,570 26,553 23,912
Movements in the retirement benefit obligation recognised on the balance sheet are as follows:
Post- Post-Pension Pension employment employment
schemes schemes medical benefits medical benefits Total Total(in thousands) 2007 EUR 2006 EUR 2007 EUR 2006 EUR 2007 EUR 2006 EUR
At the beginning of the year 35,352 31,596 19,307 16,437 54,659 48,033 Total expense as above 16,285 17,681 2,051 1,681 18,336 19,362 Employer contribution (16,873) (15,558) (949) (158) (17,822) (15,716)Total recognised in the SoRIE 3,473 1,369 (832) 2,254 2,641 3,623 Exchange differences 429 264 (995) (907) (566) (643)At the end of the year 38,666 35,352 18,582 19,307 57,248 54,659
The following disclosure requirements under IAS19 (revised 2004) were derived from reports obtained from externally recognised actuaries:
Change in defined benefit obligation (DBO):
Post- Post-Pension Pension employment employment
schemes schemes medical benefits medical benefits Total Total(in thousands) 2007 EUR 2006 EUR 2007 EUR 2006 EUR 2007 EUR 2006 EUR
At the beginning of the year 206,986 182,923 17,008 16,437 223,994 199,360 Current service cost 15,889 14,706 1,291 1,413 17,180 16,119 Interest on obligation 9,454 8,665 928 879 10,382 9,544 Adjustment of past service cost - 2,019 - (611) - 1,408 Actual benefit payment (7,284) (3,845) (237) (158) (7,521) (4,003)Actuarial (gains)/losses on DBO 1,702 6,357 293 3,118 1,995 9,475 Unrecognised past service gains - - - (2,299) - (2,299)Exchange rate differences (4,215) (3,839) (1,926) (1,771) (6,141) (5,610)At the end of the year 222,532 206,986 17,357 17,008 239,889 223,994
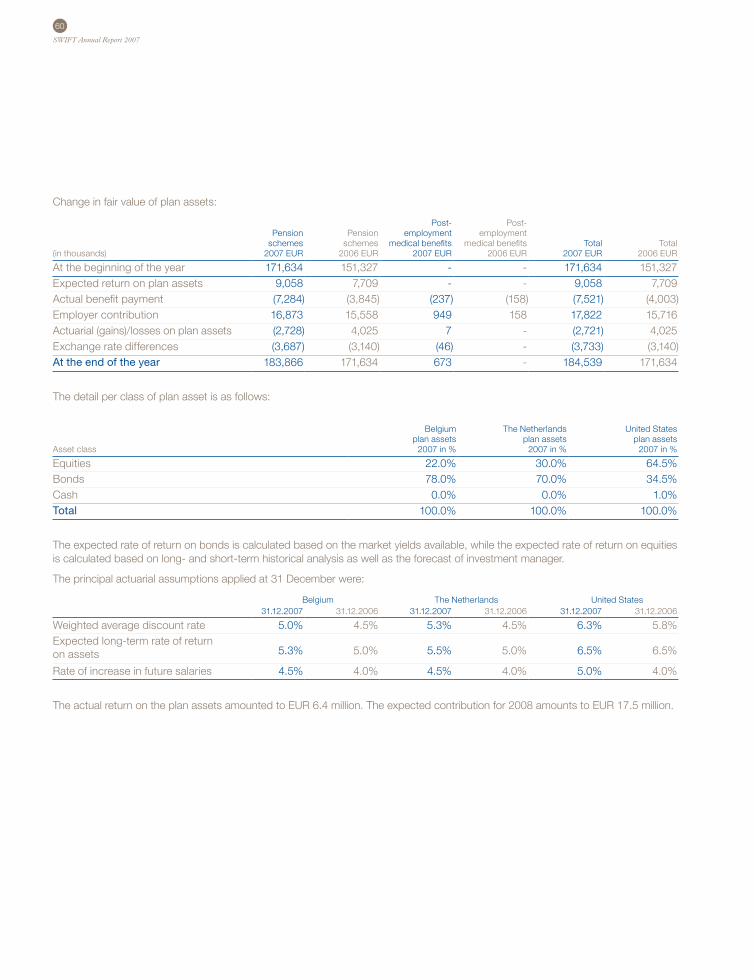
60
SWIFT Annual Report 2007
Change in fair value of plan assets:
Post- Post-Pension Pension employment employment
schemes schemes medical benefits medical benefits Total Total(in thousands) 2007 EUR 2006 EUR 2007 EUR 2006 EUR 2007 EUR 2006 EUR
At the beginning of the year 171,634 151,327 - - 171,634 151,327 Expected return on plan assets 9,058 7,709 - - 9,058 7,709 Actual benefit payment (7,284) (3,845) (237) (158) (7,521) (4,003)Employer contribution 16,873 15,558 949 158 17,822 15,716 Actuarial (gains)/losses on plan assets (2,728) 4,025 7 - (2,721) 4,025 Exchange rate differences (3,687) (3,140) (46) - (3,733) (3,140)At the end of the year 183,866 171,634 673 - 184,539 171,634
The detail per class of plan asset is as follows:
Belgium The Netherlands United Statesplan assets plan assets plan assets
Asset class 2007 in % 2007 in % 2007 in %
Equities 22.0% 30.0% 64.5%Bonds 78.0% 70.0% 34.5%Cash 0.0% 0.0% 1.0%Total 100.0% 100.0% 100.0%
The expected rate of return on bonds is calculated based on the market yields available, while the expected rate of return on equities is calculated based on long- and short-term historical analysis as well as the forecast of investment manager.
The principal actuarial assumptions applied at 31 December were:
Belgium The Netherlands United States31.12.2007 31.12.2006 31.12.2007 31.12.2006 31.12.2007 31.12.2006
Weighted average discount rate 5.0% 4.5% 5.3% 4.5% 6.3% 5.8%Expected long-term rate of return on assets 5.3% 5.0% 5.5% 5.0% 6.5% 6.5%
Rate of increase in future salaries 4.5% 4.0% 4.5% 4.0% 5.0% 4.0%
The actual return on the plan assets amounted to EUR 6.4 million. The expected contribution for 2008 amounts to EUR 17.5 million.
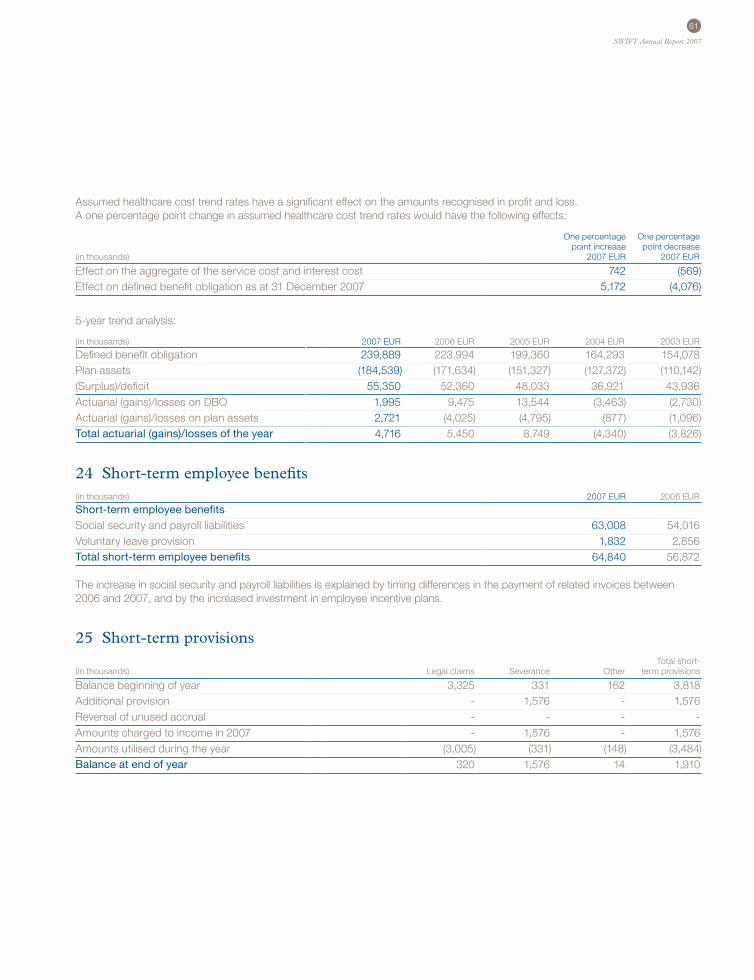
61
SWIFT Annual Report 2007
Assumed healthcare cost trend rates have a significant effect on the amounts recognised in profit and loss. A one percentage point change in assumed healthcare cost trend rates would have the following effects:
One percentage One percentagepoint increase point decrease
(in thousands) 2007 EUR 2007 EUR
Effect on the aggregate of the service cost and interest cost 742 (569)Effect on defined benefit obligation as at 31 December 2007 5,172 (4,076)
5-year trend analysis:
(in thousands) 2007 EUR 2006 EUR 2005 EUR 2004 EUR 2003 EUR
Defined benefit obligation 239,889 223,994 199,360 164,293 154,078 Plan assets (184,539) (171,634) (151,327) (127,372) (110,142)(Surplus)/deficit 55,350 52,360 48,033 36,921 43,936 Actuarial (gains)/losses on DBO 1,995 9,475 13,544 (3,463) (2,730)Actuarial (gains)/losses on plan assets 2,721 (4,025) (4,795) (877) (1,096)Total actuarial (gains)/losses of the year 4,716 5,450 8,749 (4,340) (3,826)
24 Short-term employee benefits(in thousands) 2007 EUR 2006 EUR
Short-term employee benefitsSocial security and payroll liabilities 63,008 54,016 Voluntary leave provision 1,832 2,856 Total short-term employee benefits 64,840 56,872
The increase in social security and payroll liabilities is explained by timing differences in the payment of related invoices between 2006 and 2007, and by the increased investment in employee incentive plans.
25 Short-term provisionsTotal short-
(in thousands) Legal claims Severance Other term provisions
Balance beginning of year 3,325 331 162 3,818 Additional provision - 1,576 - 1,576 Reversal of unused accrual - - - - Amounts charged to income in 2007 - 1,576 - 1,576 Amounts utilised during the year (3,005) (331) (148) (3,484)Balance at end of year 320 1,576 14 1,910
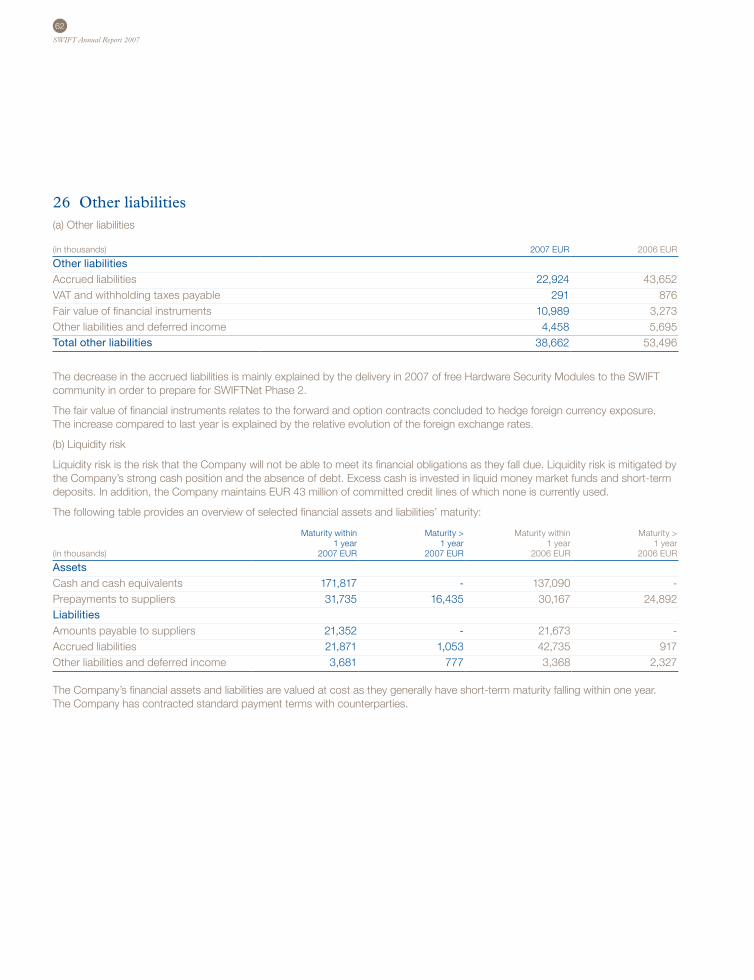
62
SWIFT Annual Report 2007
26 Other liabilities(a) Other liabilities
(in thousands) 2007 EUR 2006 EUR
Other liabilitiesAccrued liabilities 22,924 43,652VAT and withholding taxes payable 291 876Fair value of financial instruments 10,989 3,273Other liabilities and deferred income 4,458 5,695Total other liabilities 38,662 53,496
The decrease in the accrued liabilities is mainly explained by the delivery in 2007 of free Hardware Security Modules to the SWIFT community in order to prepare for SWIFTNet Phase 2.
The fair value of financial instruments relates to the forward and option contracts concluded to hedge foreign currency exposure. The increase compared to last year is explained by the relative evolution of the foreign exchange rates.
(b) Liquidity risk
Liquidity risk is the risk that the Company will not be able to meet its financial obligations as they fall due. Liquidity risk is mitigated by the Company’s strong cash position and the absence of debt. Excess cash is invested in liquid money market funds and short-term deposits. In addition, the Company maintains EUR 43 million of committed credit lines of which none is currently used.
The following table provides an overview of selected financial assets and liabilities’ maturity:
Maturity within Maturity > Maturity within Maturity >1 year 1 year 1 year 1 year
(in thousands) 2007 EUR 2007 EUR 2006 EUR 2006 EUR
AssetsCash and cash equivalents 171,817 - 137,090 - Prepayments to suppliers 31,735 16,435 30,167 24,892 Liabilities
Amounts payable to suppliers 21,352 - 21,673 - Accrued liabilities 21,871 1,053 42,735 917 Other liabilities and deferred income 3,681 777 3,368 2,327
The Company’s financial assets and liabilities are valued at cost as they generally have short-term maturity falling within one year. The Company has contracted standard payment terms with counterparties.
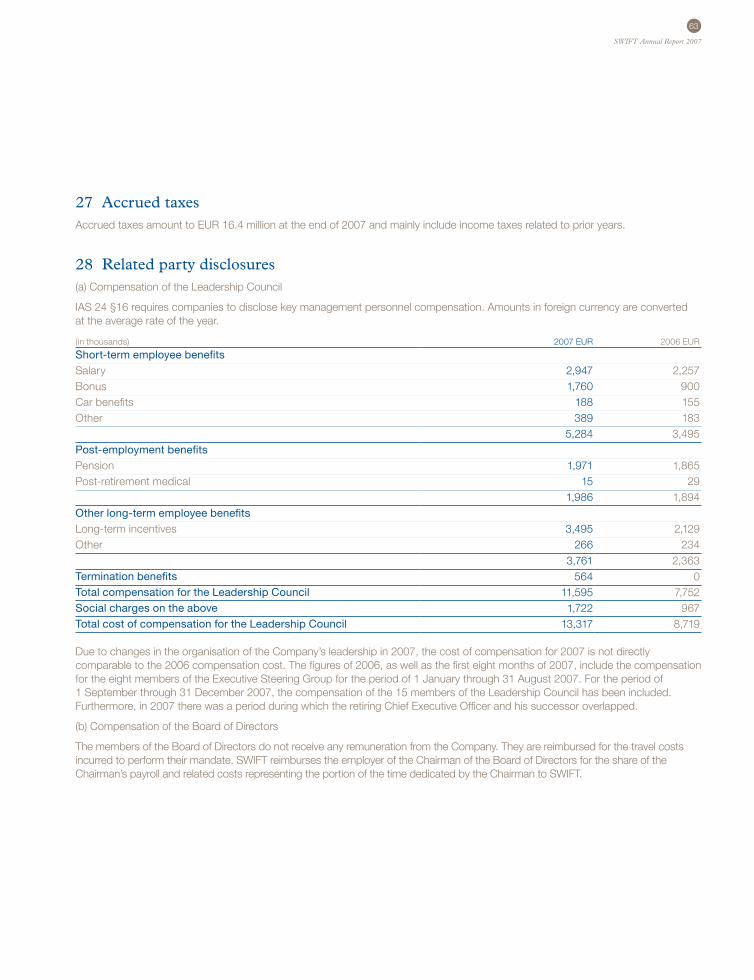
63
SWIFT Annual Report 2007
27 Accrued taxesAccrued taxes amount to EUR 16.4 million at the end of 2007 and mainly include income taxes related to prior years.
28 Related party disclosures(a) Compensation of the Leadership Council
IAS 24 §16 requires companies to disclose key management personnel compensation. Amounts in foreign currency are converted at the average rate of the year.
(in thousands) 2007 EUR 2006 EUR
Short-term employee benefitsSalary 2,947 2,257 Bonus 1,760 900 Car benefits 188 155 Other 389 183
5,284 3,495 Post-employment benefitsPension 1,971 1,865 Post-retirement medical 15 29
1,986 1,894 Other long-term employee benefitsLong-term incentives 3,495 2,129 Other 266 234
3,761 2,363 Termination benefits 564 0 Total compensation for the Leadership Council 11,595 7,752 Social charges on the above 1,722 967 Total cost of compensation for the Leadership Council 13,317 8,719
Due to changes in the organisation of the Company’s leadership in 2007, the cost of compensation for 2007 is not directly comparable to the 2006 compensation cost. The figures of 2006, as well as the first eight months of 2007, include the compensation for the eight members of the Executive Steering Group for the period of 1 January through 31 August 2007. For the period of 1 September through 31 December 2007, the compensation of the 15 members of the Leadership Council has been included. Furthermore, in 2007 there was a period during which the retiring Chief Executive Officer and his successor overlapped.
(b) Compensation of the Board of Directors
The members of the Board of Directors do not receive any remuneration from the Company. They are reimbursed for the travel costs incurred to perform their mandate. SWIFT reimburses the employer of the Chairman of the Board of Directors for the share of the Chairman’s payroll and related costs representing the portion of the time dedicated by the Chairman to SWIFT.
64
SWIFT Annual Report 2007
29 Commitments and contingent liabilities(a) Capital expenditure commitments
The Company had commitments for capital expenditure at 31 December 2007 amounting to EUR 8.6 million primarily related to the renovation of office buildings and machinery and equipment.
(b) Contractual obligations and operating leases
The Company has entered into contractual obligations and operating leases covering certain equipment and rental space. These commitments total EUR 182 million at 31 December 2007, and are estimated to be payable in the following years:
Year EUR (millions)
2008 94 2009 33 2010 24 2011 9 2012 and beyond 23 Total commitments 183
(c) Contingent liabilities
SWIFT has contractual commitments to reimburse its users up to a maximum amount for specific losses resulting from certain failures of the SWIFT system. SWIFT is insured against these losses. No material claims arose during 2007 or in 2006.
As indicated in the prior year annual report, the Company has been involved in litigations with tax authorities related to the income tax charges for the financial years 1988 through 2000, and with employees. Both of these litigations were closed in 2007.
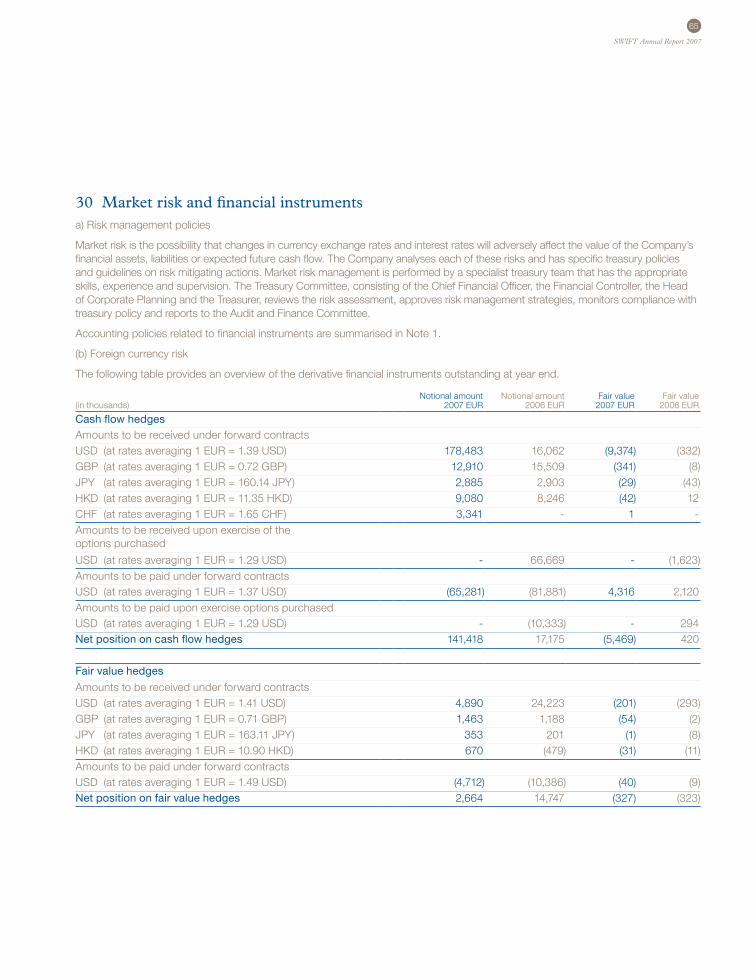
65
SWIFT Annual Report 2007
30 Market risk and financial instrumentsa) Risk management policies
Market risk is the possibility that changes in currency exchange rates and interest rates will adversely affect the value of the Company’s financial assets, liabilities or expected future cash flow. The Company analyses each of these risks and has specific treasury policies and guidelines on risk mitigating actions. Market risk management is performed by a specialist treasury team that has the appropriate skills, experience and supervision. The Treasury Committee, consisting of the Chief Financial Officer, the Financial Controller, the Head of Corporate Planning and the Treasurer, reviews the risk assessment, approves risk management strategies, monitors compliance with treasury policy and reports to the Audit and Finance Committee.
Accounting policies related to financial instruments are summarised in Note 1.
(b) Foreign currency risk
The following table provides an overview of the derivative financial instruments outstanding at year end.
Notional amount Notional amount Fair value Fair value(in thousands) 2007 EUR 2006 EUR 2007 EUR 2006 EUR
Cash flow hedgesAmounts to be received under forward contracts USD (at rates averaging 1 EUR = 1.39 USD) 178,483 16,062 (9,374) (332)GBP (at rates averaging 1 EUR = 0.72 GBP) 12,910 15,509 (341) (8)JPY (at rates averaging 1 EUR = 160.14 JPY) 2,885 2,903 (29) (43)HKD (at rates averaging 1 EUR = 11.35 HKD) 9,080 8,246 (42) 12 CHF (at rates averaging 1 EUR = 1.65 CHF) 3,341 - 1 - Amounts to be received upon exercise of the options purchased
USD (at rates averaging 1 EUR = 1.29 USD) - 66,669 - (1,623)Amounts to be paid under forward contractsUSD (at rates averaging 1 EUR = 1.37 USD) (65,281) (81,881) 4,316 2,120 Amounts to be paid upon exercise options purchasedUSD (at rates averaging 1 EUR = 1.29 USD) - (10,333) - 294 Net position on cash flow hedges 141,418 17,175 (5,469) 420
Fair value hedges
Amounts to be received under forward contractsUSD (at rates averaging 1 EUR = 1.41 USD) 4,890 24,223 (201) (293)GBP (at rates averaging 1 EUR = 0.71 GBP) 1,463 1,188 (54) (2)JPY (at rates averaging 1 EUR = 163.11 JPY) 353 201 (1) (8)HKD (at rates averaging 1 EUR = 10.90 HKD) 670 (479) (31) (11)Amounts to be paid under forward contractsUSD (at rates averaging 1 EUR = 1.49 USD) (4,712) (10,386) (40) (9)Net position on fair value hedges 2,664 14,747 (327) (323)
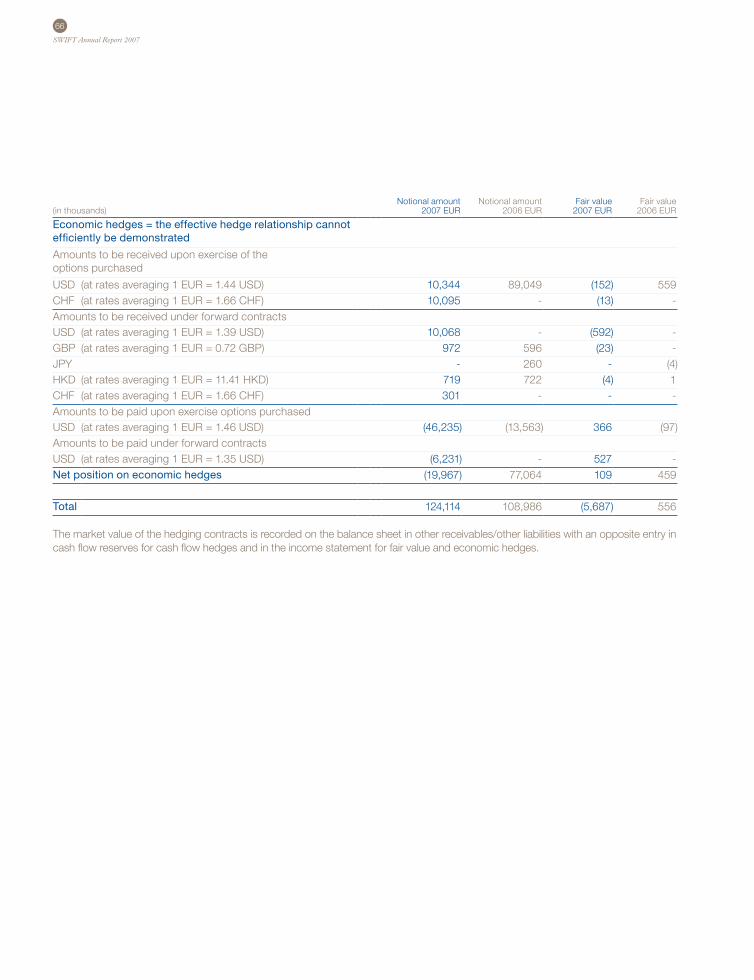
66
SWIFT Annual Report 2007
Notional amount Notional amount Fair value Fair value(in thousands) 2007 EUR 2006 EUR 2007 EUR 2006 EUR
Economic hedges = the effective hedge relationship cannot efficiently be demonstrated
Amounts to be received upon exercise of the options purchased
USD (at rates averaging 1 EUR = 1.44 USD) 10,344 89,049 (152) 559 CHF (at rates averaging 1 EUR = 1.66 CHF) 10,095 - (13) - Amounts to be received under forward contractsUSD (at rates averaging 1 EUR = 1.39 USD) 10,068 - (592) - GBP (at rates averaging 1 EUR = 0.72 GBP) 972 596 (23) - JPY - 260 - (4)HKD (at rates averaging 1 EUR = 11.41 HKD) 719 722 (4) 1 CHF (at rates averaging 1 EUR = 1.66 CHF) 301 - - - Amounts to be paid upon exercise options purchasedUSD (at rates averaging 1 EUR = 1.46 USD) (46,235) (13,563) 366 (97)Amounts to be paid under forward contractsUSD (at rates averaging 1 EUR = 1.35 USD) (6,231) - 527 - Net position on economic hedges (19,967) 77,064 109 459
Total 124,114 108,986 (5,687) 556
The market value of the hedging contracts is recorded on the balance sheet in other receivables/other liabilities with an opposite entry in cash flow reserves for cash flow hedges and in the income statement for fair value and economic hedges.
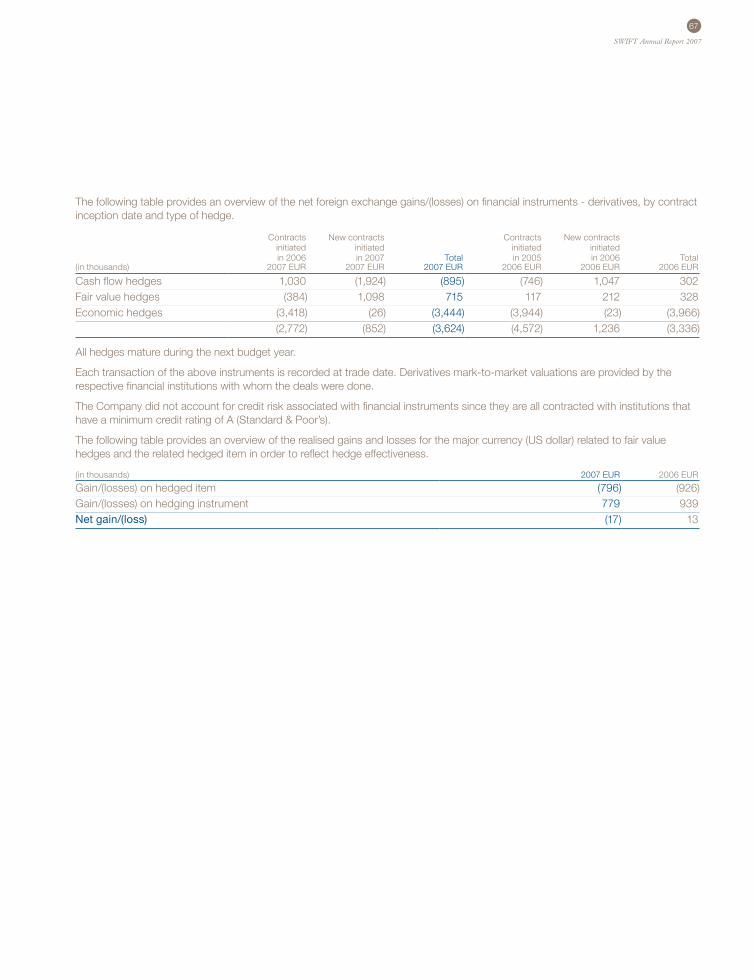
67
SWIFT Annual Report 2007
The following table provides an overview of the net foreign exchange gains/(losses) on financial instruments - derivatives, by contract inception date and type of hedge.
Contracts New contracts Contracts New contracts initiated initiated initiated initiated in 2006 in 2007 Total in 2005 in 2006 Total
(in thousands) 2007 EUR 2007 EUR 2007 EUR 2006 EUR 2006 EUR 2006 EUR
Cash flow hedges 1,030 (1,924) (895) (746) 1,047 302 Fair value hedges (384) 1,098 715 117 212 328 Economic hedges (3,418) (26) (3,444) (3,944) (23) (3,966)
(2,772) (852) (3,624) (4,572) 1,236 (3,336)
All hedges mature during the next budget year.
Each transaction of the above instruments is recorded at trade date. Derivatives mark-to-market valuations are provided by the respective financial institutions with whom the deals were done.
The Company did not account for credit risk associated with financial instruments since they are all contracted with institutions that have a minimum credit rating of A (Standard & Poor’s).
The following table provides an overview of the realised gains and losses for the major currency (US dollar) related to fair value hedges and the related hedged item in order to reflect hedge effectiveness.
(in thousands) 2007 EUR 2006 EUR
Gain/(losses) on hedged item (796) (926)Gain/(losses) on hedging instrument 779 939 Net gain/(loss) (17) 13
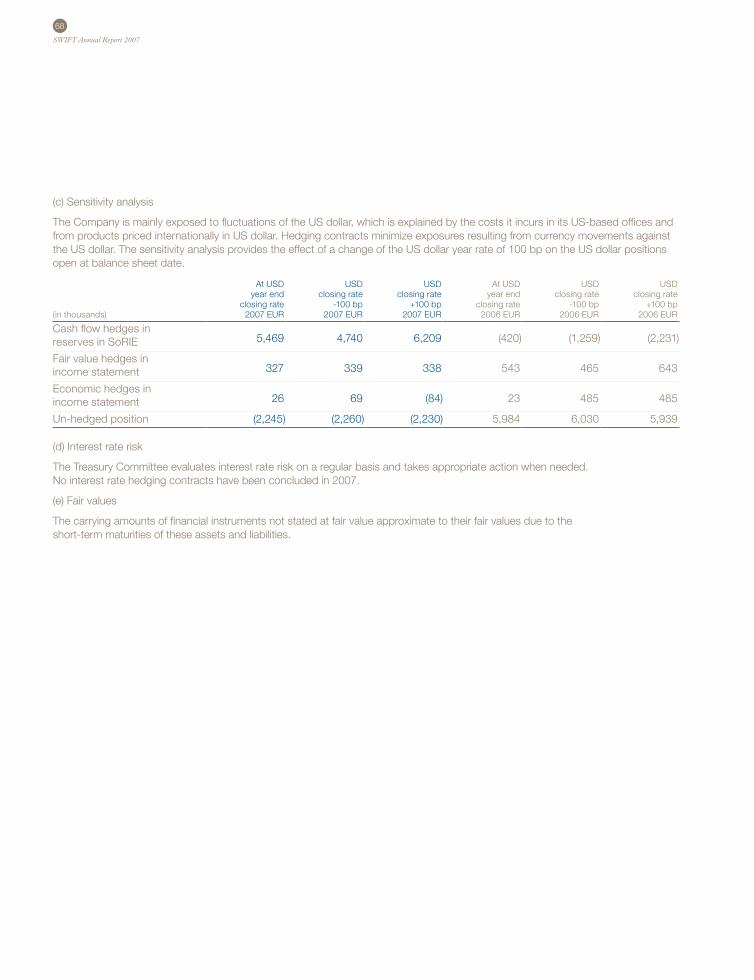
68
SWIFT Annual Report 2007
(c) Sensitivity analysis
The Company is mainly exposed to fluctuations of the US dollar, which is explained by the costs it incurs in its US-based offices and from products priced internationally in US dollar. Hedging contracts minimize exposures resulting from currency movements against the US dollar. The sensitivity analysis provides the effect of a change of the US dollar year rate of 100 bp on the US dollar positions open at balance sheet date.
At USD USD USD At USD USD USD year end closing rate closing rate year end closing rate closing rate
closing rate -100 bp +100 bp closing rate -100 bp +100 bp(in thousands) 2007 EUR 2007 EUR 2007 EUR 2006 EUR 2006 EUR 2006 EUR
Cash flow hedges in reserves in SoRIE 5,469 4,740 6,209 (420) (1,259) (2,231)
Fair value hedges in income statement 327 339 338 543 465 643
Economic hedges in income statement 26 69 (84) 23 485 485
Un-hedged position (2,245) (2,260) (2,230) 5,984 6,030 5,939
(d) Interest rate risk
The Treasury Committee evaluates interest rate risk on a regular basis and takes appropriate action when needed. No interest rate hedging contracts have been concluded in 2007.
(e) Fair values
The carrying amounts of financial instruments not stated at fair value approximate to their fair values due to the short-term maturities of these assets and liabilities.
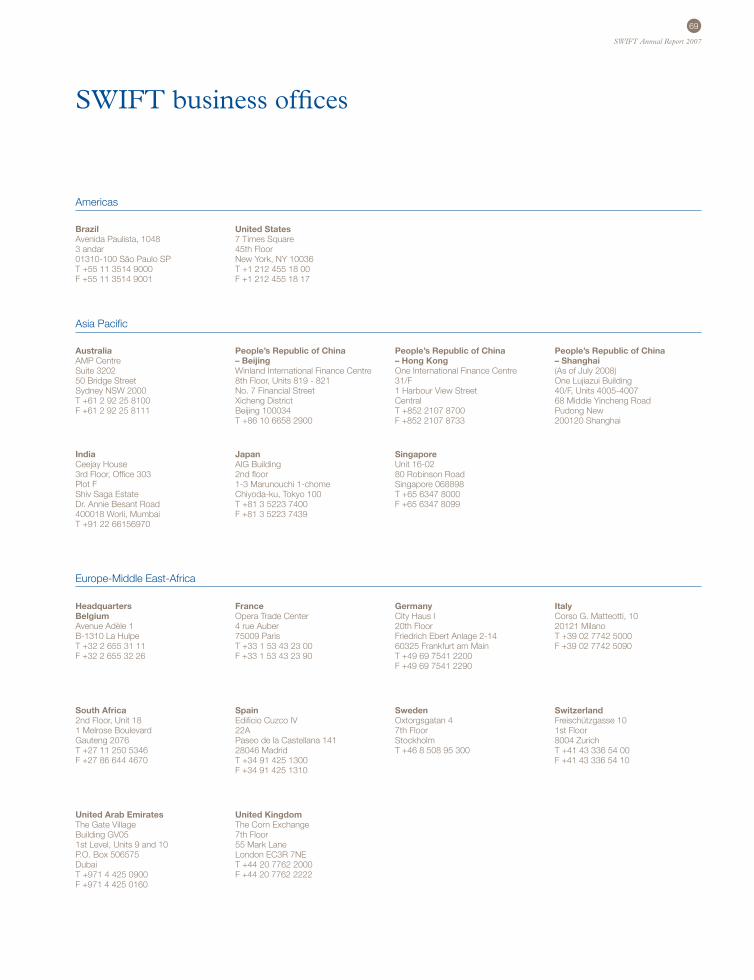
69
SWIFT Annual Report 2007
BrazilAvenida Paulista, 10483 andar 01310-100 São Paulo SPT +55 11 3514 9000F +55 11 3514 9001
United States7 Times Square45th FloorNew York, NY 10036T +1 212 455 18 00F +1 212 455 18 17
AustraliaAMP Centre Suite 320250 Bridge Street Sydney NSW 2000 T +61 2 92 25 8100F +61 2 92 25 8111
People’s Republic of China – BeijingWinland International Finance Centre 8th Floor, Units 819 - 821No. 7 Financial StreetXicheng DistrictBeijing 100034T +86 10 6658 2900
People’s Republic of China – Hong Kong One International Finance Centre31/F1 Harbour View StreetCentralT +852 2107 8700F +852 2107 8733
People’s Republic of China – Shanghai(As of July 2008)One Lujiazui Building40/F, Units 4005-400768 Middle Yincheng RoadPudong New200120 Shanghai
IndiaCeejay House3rd Floor, Office 303Plot FShiv Saga EstateDr. Annie Besant Road400018 Worli, MumbaiT +91 22 66156970
Japan AIG Building 2nd floor1-3 Marunouchi 1-chomeChiyoda-ku, Tokyo 100T +81 3 5223 7400F +81 3 5223 7439
SingaporeUnit 16-0280 Robinson RoadSingapore 068898T +65 6347 8000F +65 6347 8099
Headquarters Belgium Avenue Adèle 1 B-1310 La Hulpe T +32 2 655 31 11 F +32 2 655 32 26
FranceOpera Trade Center4 rue Auber75009 ParisT +33 1 53 43 23 00F +33 1 53 43 23 90
GermanyCity Haus I20th FloorFriedrich Ebert Anlage 2-1460325 Frankfurt am MainT +49 69 7541 2200F +49 69 7541 2290
ItalyCorso G. Matteotti, 1020121 Milano T +39 02 7742 5000F +39 02 7742 5090
South Africa 2nd Floor, Unit 181 Melrose BoulevardGauteng 2076 T +27 11 250 5346F +27 86 644 4670
SpainEdificio Cuzco IV22APaseo de la Castellana 141 28046 MadridT +34 91 425 1300F +34 91 425 1310
SwedenOxtorgsgatan 47th FloorStockholm T +46 8 508 95 300
SwitzerlandFreischützgasse 101st Floor8004 Zurich T +41 43 336 54 00 F +41 43 336 54 10
United Arab Emirates The Gate VillageBuilding GV051st Level, Units 9 and 10P.O. Box 506575 DubaiT +971 4 425 0900F +971 4 425 0160
United KingdomThe Corn Exchange7th Floor55 Mark LaneLondon EC3R 7NET +44 20 7762 2000F +44 20 7762 2222
SWIFT business offices
Americas
Asia Pacific
Europe -Middle East-Africa
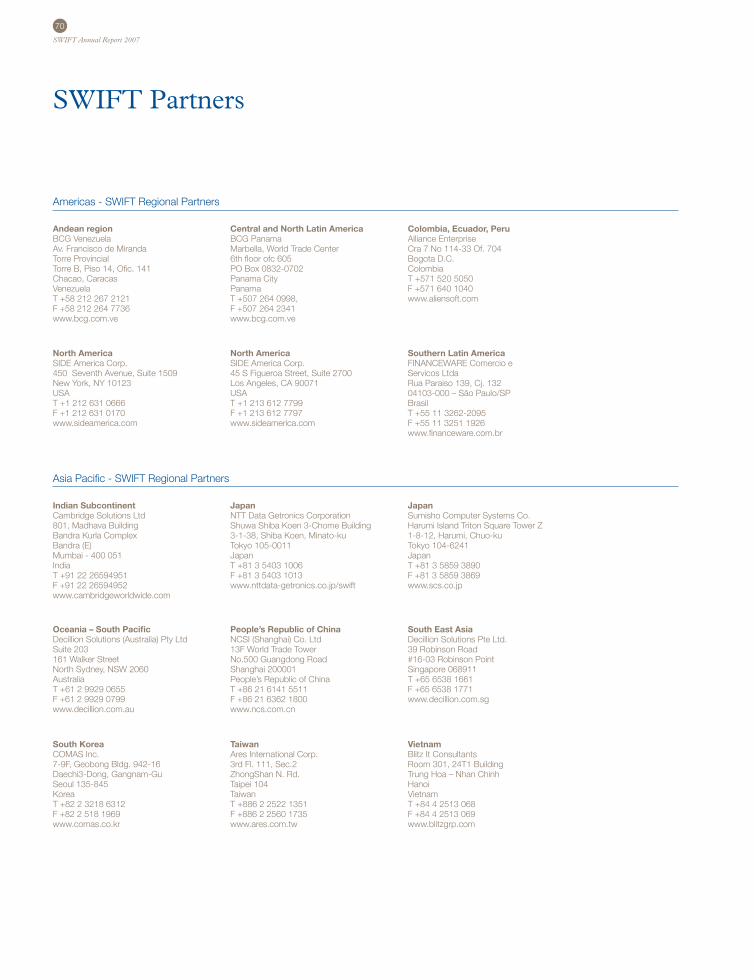
70
SWIFT Annual Report 2007
Andean regionBCG VenezuelaAv. Francisco de MirandaTorre ProvincialTorre B, Piso 14, Ofic. 141Chacao, Caracas VenezuelaT +58 212 267 2121F +58 212 264 7736www.bcg.com.ve
Central and North Latin America BCG PanamaMarbella, World Trade Center 6th floor ofc 605 PO Box 0832-0702Panama CityPanamaT +507 264 0998, F +507 264 2341www.bcg.com.ve
Colombia, Ecuador, PeruAlliance EnterpriseCra 7 No 114-33 Of. 704Bogota D.C.ColombiaT +571 520 5050F +571 640 1040www.aliensoft.com
North AmericaSIDE America Corp.450 Seventh Avenue, Suite 1509New York, NY 10123USAT +1 212 631 0666F +1 212 631 0170www.sideamerica.com
North AmericaSIDE America Corp.45 S Figueroa Street, Suite 2700Los Angeles, CA 90071USAT +1 213 612 7799F +1 213 612 7797www.sideamerica.com
Southern Latin America FINANCEWARE Comercio e Servicos LtdaRua Paraiso 139, Cj. 13204103-000 – São Paulo/SPBrasilT +55 11 3262-2095F +55 11 3251 1926www.financeware.com.br
Indian SubcontinentCambridge Solutions Ltd 801, Madhava BuildingBandra Kurla ComplexBandra (E)Mumbai - 400 051IndiaT +91 22 26594951 F +91 22 26594952 www.cambridgeworldwide.com
JapanNTT Data Getronics CorporationShuwa Shiba Koen 3-Chome Building3-1-38, Shiba Koen, Minato-kuTokyo 105-0011JapanT +81 3 5403 1006F +81 3 5403 1013www.nttdata-getronics.co.jp/swift
JapanSumisho Computer Systems Co.Harumi Island Triton Square Tower Z1-8-12, Harumi, Chuo-kuTokyo 104-6241JapanT +81 3 5859 3890 F +81 3 5859 3869www.scs.co.jp
South KoreaCOMAS Inc.7-9F, Geobong Bldg. 942-16Daechi3-Dong, Gangnam-GuSeoul 135-845 KoreaT +82 2 3218 6312F +82 2 518 1969www.comas.co.kr
TaiwanAres International Corp.3rd Fl. 111, Sec.2ZhongShan N. Rd.Taipei 104Taiwan T +886 2 2522 1351F +886 2 2560 1735www.ares.com.tw
VietnamBlitz It ConsultantsRoom 301, 24T1 Building Trung Hoa – Nhan ChinhHanoi VietnamT +84 4 2513 068F +84 4 2513 069www.blitzgrp.com
Oceania – South Pacific Decillion Solutions (Australia) Pty LtdSuite 203161 Walker StreetNorth Sydney, NSW 2060AustraliaT +61 2 9929 0655F +61 2 9929 0799www.decillion.com.au
People’s Republic of China NCSI (Shanghai) Co. Ltd13F World Trade TowerNo.500 Guangdong RoadShanghai 200001People’s Republic of ChinaT +86 21 6141 5511F +86 21 6362 1800www.ncs.com.cn
South East AsiaDecillion Solutions Pte Ltd.39 Robinson Road#16-03 Robinson PointSingapore 068911T +65 6538 1661F +65 6538 1771www.decillion.com.sg
SWIFT Partners
Americas - SWIFT Regional Partners
Asia Pacific - SWIFT Regional Partners
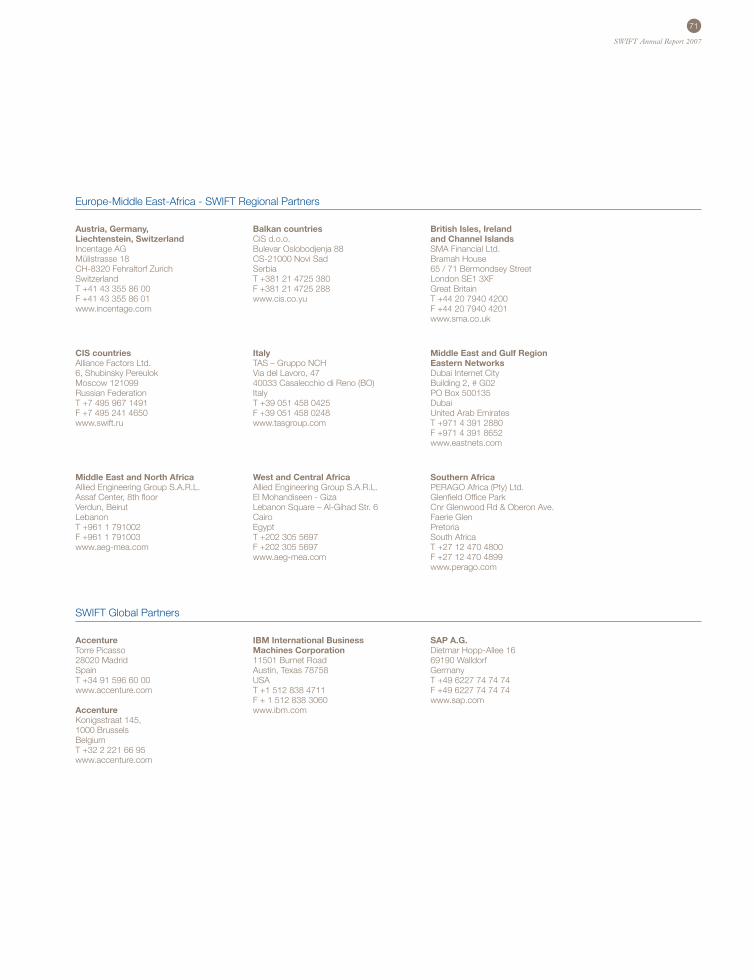
71
SWIFT Annual Report 2007
Middle East and North AfricaAllied Engineering Group S.A.R.L.Assaf Center, 8th floorVerdun, BeirutLebanonT +961 1 791002F +961 1 791003www.aeg-mea.com
West and Central AfricaAllied Engineering Group S.A.R.L.El Mohandiseen - GizaLebanon Square – Al-Gihad Str. 6 CairoEgyptT +202 305 5697F +202 305 5697www.aeg-mea.com
Southern AfricaPERAGO Africa (Pty) Ltd.Glenfield Office ParkCnr Glenwood Rd & Oberon Ave.Faerie GlenPretoriaSouth AfricaT +27 12 470 4800F +27 12 470 4899www.perago.com
Austria, Germany, Liechtenstein, SwitzerlandIncentage AGMülistrasse 18CH-8320 Fehraltorf ZurichSwitzerlandT +41 43 355 86 00F +41 43 355 86 01www.incentage.com
Balkan countriesCiS d.o.o.Bulevar Oslobodjenja 88CS-21000 Novi SadSerbia T +381 21 4725 380F +381 21 4725 288www.cis.co.yu
British Isles, Ireland and Channel IslandsSMA Financial Ltd.Bramah House65 / 71 Bermondsey StreetLondon SE1 3XFGreat BritainT +44 20 7940 4200F +44 20 7940 4201www.sma.co.uk
AccentureTorre Picasso 28020 Madrid Spain T +34 91 596 60 00 www.accenture.com
Accenture Konigsstraat 145, 1000 Brussels Belgium T +32 2 221 66 95 www.accenture.com
IBM International Business Machines Corporation11501 Burnet RoadAustin, Texas 78758 USAT +1 512 838 4711F + 1 512 838 3060www.ibm.com
SAP A.G.Dietmar Hopp-Allee 1669190 Walldorf GermanyT +49 6227 74 74 74 F +49 6227 74 74 74www.sap.com
CIS countriesAlliance Factors Ltd.6, Shubinsky PereulokMoscow 121099Russian FederationT +7 495 967 1491F +7 495 241 4650www.swift.ru
ItalyTAS – Gruppo NCHVia del Lavoro, 4740033 Casalecchio di Reno (BO) ItalyT +39 051 458 0425F +39 051 458 0248www.tasgroup.com
Middle East and Gulf RegionEastern NetworksDubai Internet CityBuilding 2, # G02PO Box 500135DubaiUnited Arab EmiratesT +971 4 391 2880 F +971 4 391 8652www.eastnets.com
Europe-Middle East-Africa - SWIFT Regional Partners
SWIFT Global Partners

72
SWIFT Annual Report 2007

For more information about SWIFT, visit swift.comTo join the community debate, visit swiftcommunity.net
Designed by Dragon, dragonbrands.com
© SWIFT 2008