integrating technology into educational organizations: the role of human resource development
TRANSCRIPT

DOCUMENT RESUME
ED 376 569 EA 026 264
AUTHOR Nash, John B.TITLE Integrating Technology into Educational
Organizations: The Role of Human ResourceDevelopment.
PUB DATE Apr 94NOTE 39p.; Paper presented at the Annual Meeting of the
American Educational Research Association (NewOrleans, LA, April 4-8, 1994).
PUB TYPE Speeches/Conference Papers (150) -- ReportsResearch /Technical (143)
EDRS PRICE MF01/PCO2 Plus Postage.DESCRIPTORS Computer Assisted Instruction; *Computer Uses in
Education; *Educational Technology; ElementarySecondary Education; *Faculty Development;Instructional Improvement; *Microcomputers;*Professional Development; Program Effectiveness;Public Schools
ABSTRACT
The relationship between staff development and theintegration of microcomputing into instructional practice isexamined. Data were obtained from a survey of all public schooldistricts in a midwestern state (N=427). The questionnaire elicitedinformation about the districts' integration of microcomputers intoinstruction an4 the extent/scope of staff development related tomicrocomputers. The analysis is based on Joyce and Showers' model(1988) that identifies the following components of an effectivestaff-development program: (1) information or theory about thetraining topic; (2) live and mediated demonstration; (3)
opportunities for practice in the training setting and work place;(4) feedback on performance; and (5) peer coaching. Findings tendedto support Joyce and Showers' theory of staff development in thethree ways. First, if greater student contact with microcomputers isa goal of public schools, then good staff development is related tothat success. Second, good staff development may occur more readilyin districts that have a lower pupil-to-computer ratio. And third,quality staff development is key in bringing about greater use ofinnovative technologies in instruction Five recommendations forpractice are offered. Twenty-two tables are included. Contains 31references. (LMI)
***********************************************************************
Reproductions supplied by EDRS are the best that can be madefrom the original document. *
***********************************************************************

Curricular Microcomputing
1
Integrating Technology into Educational Organizations:
The Role of Human Resource Development
John B. Nash
University of Texas at El Paso
Paper presented at the Annual Meeting of the
American Educational Research Association
April 7, 1994, New Orleans, Louisiana
U S DEPARTMENT OF EDUCATION, 1w. J t aeaNPF, and imppvemenl
F PUrSTIONAI. RESOURCES INFORMATIONCCNTER IERICI
11/./,,s rxw ,,,ner,$ has been rePFOduced eswp,s1:1 cmwson ra, ryegAnrs.,,
^11,,{JOS P`11(14.
Jo,ig 'wt ' A
PERMISSION TO REPRODUCE THISMATERIAL HAS BEEN GRANTED BY
;14.4-11//
TO THE EDUCATIONAL RESOURCESNFORMATION CENTER (ERIC1'
Running Head: CURRICULAR MICROCOMPUTING
BEST COPY AVAILABLE

Curricular Microcomputing
2
Abstract
The purpose of this study was to examine the relationship between staff
development and the integration of microcomputing into instructional practice. The
questions addressed in the study were: To what extent have microcomputers been
integrated into instructional practice in public schools; what is the nature andextent (type
and scope) of staff development related to microcomputing in public schools; what is the
relation between curricular integration of microcomputers and microcomputer staff
development; and is there a relationship between comprehensiveness of microcomputer
integration into instruction, staff development and demographic variables.
Results indicate that students continue to engage the microcomputer regularly as
part of their instructional day. Results also suggest that the pupil to computer ratio is
falling but that school size is not related to the pupil to computer ratio. Greater use of
microcomputers does not necessitate increased use of emerging technologies. Further,
there appears to be some positive relation with five key aspects of staff development and
certain facets of curricular microcomputer use. Specifically, a relationship exists between
the percentage of students with regular contact with microcomputers and key elements of
staff development. Also, greater emphasis occurs in settings where there are fewer
students per computer. Staff development is an important link in creating successful
change, yet it is undervalued in many settings. In the conclusion, recommendations for
practice are put forth.

Curricular Microcomputing
3
Introduction
Many instructional methods, from the chalkboard to the television, resulted from
new technologies (Cuban, 1986). Invariably some individuals, who as targeted end-users
of a given technology, resist using it. Among pedagogues, this reaction is not new. Plato
once described the invention of writing as a catastrophe in human history, killing the oral
tradition and killing mental training in remembering (Bork, 1980). In spite of Plato's
contention however, few today would argue that writing is not vital to communication and
learning. But Plato's dissent still illustrates the inevitable reaction by some intended users
of any new technology that affects the way people do things (Cuban, 1986).
Microcomputers in schools met with similar resistance.
Microcomputers proliferated in elementary and secondary education in recent years.
Congress estimates that American schools obtained nearly 2 million computers in the
1980s, and as of 1988 there were over 10,000 educational software products on the market
for use in school or at home (U.S. Congress, 1988). A report in 1989 showed that 76,395
of the 79,963 public schools in the United States (over 95%) had two or more
microcomputers (Ely, 1989).
In schools the movement to embrace computing has emanated from both "top-
down" and "bottom-up" sources (Cuban, 1986). The move to embrace microcomputing in
elementary and secondary schools was propelled by cultural forces in the late 1970s. In his
analysis of the use of machines by teachers in the twentieth century, Cuban describes how
the following factors contributed to the adoption of microcomputers in schools:
corporate and legislative mandates for improved education on the heels of the report "A
Nation at Risk." released in 1983 (Education, 1983);
parental involvement ranging from urging school boards to purchase microcomputers to
donating the machines themselves;

Curricular Microcomputing
4
administrators and teachers at the building level championing the virtues of computing and
lobbying central office for resources to build a computing program.
As computers became more commonplace in public education settings, the tasks for
which they are put to use continued to grow. For example, microcomputers initially
introduced to improve instruction have been used by educational administrators for a
variety of tasks, such as planning, budgeting, filing, student reports, and word processing
(Rees, 1987).
The tasks assigned to microcomputers increased mainly because of the broad
capabilities of the machines. Since 1975 the machines have become smaller, faster, more
powerful, and less expensive. A study by the Ohio State Department of Education notes
that, "for a few hundred dollars, one can obtain modern computer circuitry that provides
computing power obtainable only through an investment of millions of dollars in the
1950s. This computing power is packaged in a unit whose physical size has shrunk by a
factor of 10,000 while the speed of the equipment has increased 50,000 fold" (Ohio, 1987,
p. 2).
In the future, microcomputers will continue to find new uses in elementary and
secondary education. A report by the Commission on Schools for the 21st Century
(Wisconsin, 1990) recommends that by the year 2000 "compptors shall be readily
accessible to teachers for daily use in their planning, teaching and managing of their
classrooms (p. 8.,)," and every Wisconsin school district "shall have a minimum of an
electronic on-line catalog, circulation system, CD-ROM and/or other emerging technology
for each school library media center (coupled with) a microcomputer, printer, fax machine,
dedicated phone line, and modem with software to access electronic mail (and) on-line
databases..."(p. 84).
The above "wish list" includes a great deal of competence-destroying hardware.
Whether school personnel make effective use of these new technologies, depends on their
Curricular Microcomputing
5
attitude toward innovation and the evolution of the implementor (administration) and the
user (teacher) relationships (Lay & Ruttenberg, 1982; Rice & Aydin, 1991). Some new
uses atfect the curriculum. The next section discusses aspects of microcomputer use in
instruction.
Microcomputer Use in Instruction
For the most part, microcomputers are used by students in industrial countries for
four main purposes (Hawkridge, 1990):
to become aware of the uses and limitations of computers;
to learn computer programming;
to learn application programs for word processing, spreadsheets, and graphics;
to learn topics across the school curriculum with the computer complementing or
replacing the teacher.
The tutor, tool, tutee framework for microcomputer use in instruction, advocated by
Taylor (Taylor, 1980), views all computer use within one of the three modes. To function
as a tutor in some subject, Taylor notes that "the computer presents some subject material,
the student responds, the computer evaluates the response, and, from the results of the
evaluation, determines what to present next" (p. 3). As a tool, the computer has some
useful function that it is programmed to do. Tasks that humans find laborious or tedious
are well suited to the computer's tool mode. In schools this may include editing text,
calculating math problems, or plotting a curve to a set of data. Taylor notes, yet, that
"neither tutor nor tool mode confers upon the user much of the general educational benefit
associated with using the computer in the third mode, as tutee" (p. 4).
When the computer is in the tutee mode, the learner tutors the computer. Taylor
and others (Papert, 1980) have suggested that when students engage the computer in the
tutee mode, "the focus of education in the classroom (changes) from end product to

Curricular Microcomputing
6
process, from acquiring facts to manipulating them and understanding them" (Taylor,
1980, p. 4).
Seymour Papert's (Papert, 1980) programming language Logo is an example of the
student engaging the computer in the tutee mode. Papert suggested that problem solving,
project management, and the ability to utilize errors to one's benefit could be enhanced by
engaging in simple programming projects. Children would have to express ideas in a
simple, formal language (ie Logo), and rely on their skills to correct and debug the
programs in order to have them run as intended. Cathcart's (Cathcart, 1990) study of fifth
graders exposed to Logo programming suggested that Logo may have some positive effect
on cognitive style, namely divergent thinking and field independence. Others have noted
positive effects on students' creativity and reflectivity after their exposure to Logo
(Clements & Gullo, 1984).
This is not to say that engaging in the tutor mode will bring about thegreatest gains
in student achievement for all subjects. In reading, for instance, tutorial applications
achieved higher effects than other types in a meta-analysis of 84 studies related to computer
assisted instruction (Roblyer, Castine, & King, 1988). Likewise, the same analysis
suggested that word processing, a tool, was best suited to increasing quality of writing
when computers were used for writing instruction.
Despite the mode employed, the microcomputer's use in instruction represents
curricular transformation in schools. The next section addresses how its introduction into
curricular practice relates to issues of innovation and change.
Microcomputer Staff Development in Schools
Methods of instruction have been the target of technological innovations in the
twentieth century. Coupled with the introduction of an innovation is a change in the way
tasks are carried out, and often times users will resist the change (Cuban, 1986).

Curricular Microcomputing
7
Overcoming resistance involves providing users with a profound understanding of
why the change is important (Fullan, 1982). This profound understanding can be
accomplished through high quality staff development programs. Thorough staff
development programs are a vital part of successful implementation of an innovation
(Fullan, 1982, 1991; Loucks-Horsley, Harding, Arbuckle, Murray, Dubea, & Williams,
1987;.Pink, 1989; Stallings, 1989). Unfortunately, staff development programs often fail
to deliver the change that is critical to compel an innovation stay in place. Table 1 lists
reasons why most professional development programs fail.
Table 1
REASONS WHY PROFESSIONAL DEVELOPMENT PROGRAMS FAIL
1. An inadequate theory of implementation, resulting in too little time for teachersand school leaders to plan for and learn new skills and practices.2. District tendencies toward faddism and quick-fix solutions.3. Lack of sustained central office support and follow-through.4. Underfunding the project, or trying to do too much with too little support.5. Attempting to manage the projects from the central office instead of developingschool leadership and capacity.6. Lack of technical assistance and other forms of intensive staff development.7. Lack of awareness of the limitations of teacher and school administratorknowledge about how to implement the project.8. The turnover of teachers in the school.9. Too many competing demands or overload.10. Failure to address the incompatibility between project requirements andexisting organizational policies and structure.11. Failure to understand and take into account site-specific differences amongschools.12. Failure to clarify and negotiate the role relationships and partnershipsinvolving the district and the local university (Pink, 1989, p. 21-22)
The listings above seem dismal given that "there is no single strategy that can
contribute more to meaning and improvement than ongoing professional development"
(Fullan, 1991, p. 318).

Curricular Microcomputing
8
The importance of staff development in microcomputing has not gone unnoticed by
researchers and policy makers. Priorities cited by educational computing pioneer Arthrur
Luehrmann in 1979 (Luehrmann, 1980) are strikingly similar to the priorities called for by
educational policy makers for the year 2000. Luehrmann called for r basic computer skills
curricula in schools; in- service training of teachers, with specialized subject matter training
to apply computer skills to all topics; and curriculum development centers to foster greater
understanding of student use of computers in all academic fields.
In 1990, the Wisconsin Commission on Schools for the 21st Century, a panel
reporting to the Governor, recommended that "all Wisconsin school districts shall develop
a district-wide plan for the integration of computers and related technologies into the
curriculum."; "an on-going staff development plan shall be developed and budgeted
annually by all districts for continuing in-service of new and emerging computer and related
technologies and to integrate these technologies into curriculum"; and there should be
"regional technology centers to insure educator competence in the use of instructional
computer and related technologies" (Wisconsin, 1990, p. 83).
Unfortunately, staff development is often overlooked, taken for granted, or
undervalued sometimes, especially in implementing microcomputing in schools. The U.S.
Office of Technology Assessment (OTA) noted in a large study that despite the presence of
microcomputers in almost every elementary and secondary school in the United States,
only half the Nation's teachers report that they have used computers in instruction. Many
cite fears of using the technology and a lack of understanding of the computer's value in
serving the curriculum (U.S. Congress, 1988). Further, the study's findings note that
preservice technology training only serves as an introduction to microcomputing; teachers
need continuing training as the technology changes.
In reviewing the implementation of an integrated instructional system (11S), a
computer based instructional tool where most of the learning is done on the computer,

Curricular Microcomputing
9
Sherry (Sherry, 1990) found that to maximize the effectiveness of an IIS, teachers must be
given the time and training necessary to take advantage of the system. He noted that poorly
trained teachers felt that the IIS was nothing more than a nuisance. Further, staff training
had been neglected in that most of the training consisted of "little more than allowing
teachers to preview some of the software Compounding the lack of general training in the
use of the system was the fact that almost none of the teachers had been advised on how to
integrate the IIS into their regular classroom activities" (p. 119-120).
A Promising Framework for Practice
Joyce and Showers (Joyce, & Showers, 1988) model of staff development is built
upon a large body of research related to change implementation (Fullan, 1982, 1977),
learning theory, and teacher behavior (Lortie, 1975). Their model is based on five
assumptions regarding human resource development in schools:
1. comprehensive resource-development systems for education personnel should be
developed;
2. student learning can be greatly increased through human resource programs;
3. virtually all teachers can learn the most powerful and complex teaching strategies if
staff development is designed properly;
4. when staff development is implemented properly, the energy of the workplace
increases considerably;
5. staff development that is embedded into practice will have a great effect on the
beliefs and behavior of teachers.
Joyce and Showers' (Joyce, et al., 1988) model holds that a staff development
program that includes the presentation of information or theory about the topic of the
training, live and mediated demonstration or modeling of new skills and teaching models,
opportunities for practice of new skills and strategies in the training setting as well as in the

Curricular Microcomputing
10
workplace, feedback on performance in practice trials, and peer coaching of new skills and
strategies will increase teacher knowledge, teacher skill, and transfer of learning to new
settings over °the1 programs that employ fewer components.
Staff development programs that employ only some components listed in the above
model do not provide as great an amount of increase in knowledge or skill acquisition as do
programs enlisting the theory, demonstration, practice, feedback, coaching model.
Joyce and Showers (Joyce, et al., 1988) model suggests that schools would have
greater curricular integration of microcomputing if they embraced the notion of theory,
demonstration, feedback, practice, coaching in their inservice programs related to
microcomputer integration. I suggest that schools that use components of training
encompassing introductory ideas or theory accompanied by only demonstrations may
produce staff with knowledge and skills related to operation of the machines, but not the
transfer of training needed to carry out the practice of curricular integration of the machines.
Research Questions
The following research questions, guided by the literature review and Joyce and
Showers model of staff development are posed for this study:
1. To what extent have microcomputers been integrated into instructional practice
in public schools?
2. What is the nature and extent (type and scope) of staff development related to
microcomputing in public schools?
3. What is the relation between the dependent variable of curricular integration of
microcomputers and the independent variables of curricular microcomputer staff
development, comprised of theory, demonstration, practice, feedback, and coaching?
1l

Curricular Microcomputing
11
4. Is there a relationship between comprehensiveness of microcomputer integration
into instruction, staff development and demographic variables consisting of school size,
school region (urban, suburban, rural) and by district expenditure per pupil?
Method
A survey was designed to gather data regarding school districts' integration of
microcomputers into instruction and the extent and scope of staff development related to
microcomputers.
Sample
The population of this study consisted of all public school districts in a midwestern
state. The sample of the survey contained the entire population (ie: all 427 school districts
in the state).
Instrumentation
A seventeen item questionnaire was developed based upon a questionnaire written
by Lohr (Lohr, 1990), Petruk (Petruk, 1985), and the South Carolina State Department of
Education (South Carolina, 1984). The questionnaire was also based upon Joyce and
Shower's (Joyce, et al., 1988) model of staff development, Taylor's model of
microcomputer use in education, and interviews with experts in educational
microcomputing and staff development related to microcomputing.
The questionnaire covered five major content areas: demographics, microcomputer
use, types of computers and software in use, and staff development related to
microcomputing. Dilman's total design method (Dilman, 1978) provided a framework for
the format and wording of the survey.
Data analysis occured as follows:

If Curricular Microcomputing
12
Question 1
To what extent have microcomputers been integrated into instructional practice in
schools? Microcomputer integration was measured in fourways. First, respondents were
asked to estimate the approximate number of students in their district who have direct
contact with microcomputers as a part of their instructional program (at least fifteen minutes
per week) (Item 6). Second, a variable was created representing the number of pupils per
computer.
Third, respondents were asked to estimate the percentage of how much computers
are used in all of three modes, tutor, tool, or tutee across subject areas math, language arts,
science, and social studies (Item 8). To compute the use of the microcomputer for a given
mode across the elementary and secondary setting, raw scores were converted to
standardized z scores. The scores for the subject areas for each mode were added together
to yield a total mode score for elementary and secondary schools and elementary/secondary
combined, with higher scores indicating greater use for that mode. Fourth, respondents
estimated to what extent CD-ROM, interactive videodisc, and hypermedia have been
integrated into math, language arts, science, and social studies.
A grade-level use variable was created from the raw data to analyze the use of
emerging technologies. Scores reflecting use in specific subject areas were summed within
grade levels (elementary level and secondary level) to indicate the extent of CD-ROM,
interactive video, and hypermedia use. Higher scores indicated more frequent use of the
technology.
Question 2
What is the nature and extent (type and scope) of staff development related to
microcomputing in schools? Staff development was measured in three ways. First,
respondents rated the current emphasis placed on twelve aspects of microcomputer related
inservice activities within their district. Further, the respondents indicated the amount of

Curricular Microcoinputing
13
emphasis that should be placed on the same twelve aspects of microcomputer related
inservice activities. Included within the twelve probes were five discrete probes examining
presence and need for theory, demonstration, practice, feedback, and coaching (Item 13).
Second, the respondents indicated the title of the primary staff person responsible for
microcomputer training and awareness (Item 14). Third, a new variable was created from
this data indicating whether microcomputer training and awareness was facilitated within
the district, outside the district, or both. The twelve aspects of staff development rated
were:
I. District provides informational inservice for staff on basic instructional integration
of microcomputers;
2. Inservices describe theories related to general instructional integration of
microcomputers;
3. Inservices describe theories related to content specific integration of
microcomputers (ie: mathematics, reading, writing, spelling, business, music, etc.);
4. Inservices provide demonstrations of hardware or software to be integrated into
instruction;
5. Training allows participants to practice using the hardware or software in a setting
similar to where the technology will be instructionally integrated;
6. Inservice trainers provide feedback to trainees; and trainees provide feedback to
each other after practicing use of software or hardware;
7. Training provides skills or capabilities for staff to engage in peer coaching after
integrating the hardware or software into instruction;
8. Inservices are provided for staff on specific application software (ie: word
processing, database, spreadsheet. telecomputing, graphics);
9. Inservices instruct staff in areas of software and hardware evaluation;
10. District provides ongoing inservice on software and hardware upgrades;

Curricular Microcomputing
14
11. District provides ongoing inservices on related emerging technologies (CD-ROM,
interactive video, telecomputing, networking);
12. District provides ongoing inservice on curricular development and revision for
microcomputer integration.
The scale for the ratings was as follows: 1 = No emphasis; 2 = Minimal emphasis;
3 = Some emphasis; 4 = Great emphasis. This question was answered using descriptive
statistics, correlation, and analysis of variance.
Question 3
Research question three was "What is the relation between the dependent variable of
curricular integration of microcomputers and the independent variables of curricular
microcomputer staff development, comprised of theory, demonstration, practice, feedback,
and coaching?" This relationship was measured by correlating the mean ratings of five
aspects (those specifically related to the theoretical framework, items 3-7 listed above) of
Item 13 on staff development with data related to microcomputer use in instruction
(percentage of students with regular contact, pupils per computer, mode of use, and use of
emerging technologies).
Validity and Reliability
The instrument was submitted to a panel of experts who reviewed it for content
validity. The panel consisted of a microcomputer consultant with a state Department of
Public Instruction, and professors educational administration in a major midwestem
university.
Reliability was measured during the study using Cronbach's (1951) Alpha test for
reliability. The reliability of questions 8 and 9 on the survey instrument about curricular
microcomputer use in elementary and secondary grades were tested (comprising a major

Curricular Microcomputing
15
part of the dependent variable). Additionally, question 13 on emphasis placed on inservice
activities was tested (a major independent variable).
On questions 8 and 9, respondents were asked to estimate the percentage of
computer use devoted to each of three modes, tutor, tool or tutee, in a given curricular area.
The Cronbach's Alpha coefficients (displayed in table 2.1) ofreliability for tutor, tool, and
tutee use in elementary settings were .8591, .8288 and .6952, respectively. The
Cronbach's Alpha coefficients of reliability for tutor, tool, and tutee use in secondary
settings were .7469, .7515 and .4879, respectively. The Cronbach's Alpha coefficients of
reliability for tutor, tool, and tutee use in both elementary and secondary settings combined
were .8328, .8202 and .6545, respectively.
On question 13, respondents stated the emphasis placed on twelve aspects of
microcomputer related inservice in their school district and then showed where they believe
the emphasis should be placed for those same twelve aspects. The Cronbach's Alpha
coefficient of reliability for perceived current emphasis on twelve aspects of microcomputer
inservice was .9349. The Cronbach's Alpha coefficient of reliability for where emphasis
should be placed on twelve aspects of microcomputer inservice was .8922. Thus, it was
believed that the reliability and the validity of the instrument were properly established for
this study.
Results
Demographic Profile of Respondent Districts
A total of 429 surveys was delivered to the school districts. Of these, 267 were
returned for a response rate of 62.24 percent. A total of 255 surveys were suitable for
analysis, yielding a 59 percent usable return rate. Twelve surveys were dismissed for one
of three reasons: 1) the respondent returned the survey indicating they refused to
participate; 2) the respondent only partially completed a survey; and 3) a survey arrived
after analysis had taken place. Table 2 contains descriptive information on the demographic
C

Curricular Microcomputing
16
characteristics of the respondent districts, including average daily membership (ADM),
grade levels served, per pupil expenditure, and area type (urban, suburban, rural).
TABLE 2
DEMOGRAPHIC VARIABLES PERTAINING TO DISTRICTS
Variable Mean Frequency PercentRural 193 78Suburban 47 OwUrban 0 3Serves K-12 213 83Serves K-8 34 14Serves 9-12 7 3Elementary ADM 1079Middle ADM 486Higi3chool ADM 627Per Pupil Expenditure 5313
Seventy-eight percent of the sample were rural school districts. Nineteen percent
were suburban, and three percent were urban. The mean number of elementary students
per district was 1079. The mean number of middle school students per district was 486.
The mean number of high school students per district was 627. The average per pupil
expenditure per district was $5313.00.
Research Questions
Research Question 1
Research question 1 was "To what extent have microcomputers been integrated into
instructional practice in schools?" This question was answered by examining direct student
contact with microcomputers, pupils per computer, mode of computer use, and use of
emerging technologies.
Direct t__$vith Microcomputers
Overall, a majority of students have regular contact with microcomputers as a part
of their instructional program (table 3). The greatest percentage of students with regular
17

Curricular Microcomputing
17
microcomputer contact as a group (defined as at least fifteen minutes per week) are in
elementary school, with seventy-four percent. They are followed by middle and high
school with seventy-two and sixty-six percent respectively.
Suburban districts tend to have more students receiving regular contact with
microcomputers than rural or urban districts, with 85 percent of the students having regular
contact. Only at the high school level do urban districts have a greater percentage of
students receiving regular contact (72 percent versus 70 percent for suburban and 65
percent for rural). Rural schools report the least percentage of students engaging
microcomputers regularly for the elementary and high school level (70 and 65 percent
respectively), but not the middle level (68 percent). For middle schools, urban districts
show the smallest percentage of students engaging computers regularly (65 percent).
In terms of average daily membership (table 4), districts in the third quartile (921-
1,877) have 68 percent of their students engaging the computer regularly, followed by
quartiles one (72 percent), two (73 percent), and four (78 percent). That is, school size has
no bearing on student engagement with computers. In terms of per pupil expenditure (table
5), districts in the second and third quartiles have 67 and 68 percent of their students
engaging the computer, respectively. Districts in quartile one and four display regular
contact at 72 and 80 percent, respectively. Therefore, per pupil expenditure has no bearing
on students' contact with the microcomputers.
18
L

Curricular Microcomputing
18
TABLE 3
PERCENTAGE OF STUDENTS WITHREGULAR MICROCOMPUTER CONTACT
BY GRADE LEVEL AND DISTRICT LOCATION
Level Aggregate Rural Suburban Urban
All levels 72 68.14 80.74 70.04Elementary 74 70.i-6 85.44 71.87Middle 72- 68.35 g5:00 .65.-
Scnool 66 65.IT 70.18 72.41
TABLE 4
PERCENTAGE OF STUDENTS WITHREGULAR MICROCOMPUTER CONTACT
BY AVERAGE DAILY MEMBERSHIP (ADM)
ADM Category 1 0- Category 2 Category 3 Category 4535 536-920 921-1877 >1877
Percent with 71.63 73.21 64.31 78.28regular contact
TABLES
PERCENTAGE OF STUDEN'TS WITHREGULAR MICROCOMPUTER CONTACT
BY PER PUPIL EXPENDITURE (PPE)
PPE Category 1 0- Category 2 Category 3 Category 44787 4788-5200 5201-5718 >5718
Percent with 72.23 67.07 68.68 80.25regular contact

Curricular Microcomputing
19
pupils Per Comp=
There are between six and thirteen pupils per computer in the sample public
schools. Table 6 displays the number of pupils per microcomputer. Middle school
students must share more computers (thirteen to one), compared to high school students
(seven to one). The differences across rural-urban lines are less (urban students - nine to
one; suburban and rural students at ten to one). Average daily membership is not
significantly related to the student to computer ratio. However, per pupil expenditure is. A
significant negative correlation indicates that as per pupil expenditure goes up, the student
to computer ratio goes down (table 7).
TABLE 6
PUPILS PER COMPUTER
Level
Elementary_
High SchoolRuralSuburbanUrban
Pupils per computer
10.513
6.g84o.708
ir.1§1"5:481'
TABLE 7
CORRELATION OF AVERAGE DAILY MEMBERSHIP (ADM) AND PER PUPILEXPENDITURE (PPE) WITH PUPILS PER COMPUTER (PK')
Variable Coefficient
ADM & PPC .055PPE & PPC -.250** Significant at p < .0l

Curricular Microcomputing
20
Computer Use
Table 8 shows which mode is used most, either tutor, tool, or tutee, across math,
language arts, science, and social studies. To function as a tutor in some subject the
computer presents material, awaits a student response, and then evaluates the response.
From the results of the evaluation, the computer determines what to present next. As a
tool, the computer has lome lci-d of programmed function. When the computer is in the
tutee mode, the learner tut.. , or programs the computer in some fashion.
At the elementary level, the microcomputer tends to be used most as a tutor in
mathematics (64%), science (57%), and social studies (54%), and as a tool in language arts
(51%). At the secondary level the microcomputer is used as a tutor mostly in math (39%)
(with tool use second at 34%), and as a tool in language arts (72%), science (46%) and
social studies (49%). The greatest amount of tutee use is found in mathematics in both the
elementary and secondary level with six percent and seventeen percent respectively.TABLE 8
MEAN PERCENTAGE OF STUDENT COMPUTER USEBY SUBJECT AND MODE
Subject Tutor Mode Tool Mode Tutee Mode
Elementary Math 64.55 27.82" 6.13Elementary Language Arts 4196 5 LW 2-.6Elementary Science 37.15 28.15Elem. Social Studies 54.29 24.43 2.08Secondary Math P.21. T7:117 17.g2Secondary Language Arts 18.62 7T.42 4.DSecon Science 39.48 46.18 6.13Secondary Social Studies 31.12 49.31 2.52
To examine the use of the microcomputer across rural, suburban, and urban
settings, an analysis of variance was performed (table 9). In elementary settings, tutor use
primarily occurs in rural settings. Tool use occurs most often in urban settings, and tutee
use occurs most in suburban settings. At the secondary level, again, tutor use occurs most

Curricular Microcomputing
21
in rural settings. Tool use occurs most in urban settings, as in the elementary schools.
However, at the secondary level, tutee use occurs most often in urban settings, although
the analysis was not significantly different. Combined use scores reflected the differences
found at the elementary level, again with the variance on tutee use not significant.
TABLE 9
ANALYSIS OF VARIANCE ON INSTRUCTIONALCOMPUTER USE BY GRADE LEVEL AND SETTING
Variable Ruraln n
Urbann
Elementary 170 .247 11 -.731 9 -1.629 2.69 .070Tutor UseElementary 171 -.268 41 .811 0 1.907 5.44 .005Tool UseElementary 171 -.262 41 1.179 9 -.564 4.14 .014Tutee UseSecondary 147 .249 39 -.345 9 -.1996 2.72 .068Tutor UseSecondary 147 -.344 39 .817 9 1.485 3.45 .034Tool UseSecondary 148 -.062 39 -.025 9 1.710 0.86 .427Tutee Use
Average daily membership is negatively correlated with the use of the computer as a
tool in elementary, secondary, and combined settings, indicating that smaller schools
emphasize tutor use of the microcomputer in instruction. Conversely, the use of the
computer as a tool increases with enrollment in elementary, secondary, and combined
settings (table 10)

Curricular Microcomputiag
22
TABLE 10
CORRELATION OF AVERAGE DAILY MEMBERSHIP AND STANDARDIZED USE-MODE SCORES
Elem. Elem. Elem. Sec. Sec. Sec. Comb. Comb. Comb.Tutor Tool Tutee Tutor Tool Tutee Tutor Tool TuteeUse Use Use Use Use Use Use Use Use
ADM -.162 .186 .024 -.117 .151 .012 -.176 .218 .023
*significant at .01t significance at .05
A correlation of per-pupil expenditure and computer mode was performed.
Significant coefficients appeared with tutee use at the elementary and combined level,
suggesting that as per pupil expenditure rises, one may find more students engaging the
microcomputer in the tutee mode (table 11).
TABLE 11
CORRELATION OF PER PUPIL EXPENDITURE AND STANDARDIZED USE-MODESCORES
Elem. Elem. Elem. Sec. Sec. Sec. Comb. Comb. Comb.Tutor Tool Tutee Tutor Tool Tutee Tutor Tool Tutee
Use Use Use Use Use Use Use Use Use
PPE -.113 .116 t.152 -.084 .046 .126 -.104 .064 t.175
tsignificant at .05
Emerging Technology
Tables 12-14 show the amount of emerging technology (CD-ROM, interactive
video, and hypermedia) used in instruction. Overall, the majority of districts report no use
of any emerging technologies. Fifty to ninety-four percent of the districts report no use of

Curricular Microcomputing
23
any emerging technology in any subject. The most frequent use of CD-ROM in a subject
area is in secondary language arts (4.9 percent of respondents reporting daily use).
Interactive video and hypermedia appear to be used most in the secondary science area with
3.2 and 1.8 percent of the respondents, respectively, using it daily.
TABLE 12
PERCENTAGE OF DISTRICTS REPORTING USE OFCD-ROM BY SUBJECT
Subject No Use Once perquarter
Once permonth
Once perweek
Daily use
Elementary Math 90.5 5.3 1.6 1.6 .8Elementary Language Arts 77.8 5.1 A. I 6.1 2.4Elementarigcience 12.8 6. 4.5 5.3 .8Elem. Social Studies 79.9 5.7 7.3 5.3 1.6Secondary Math 80.9 0.0 5.8 3.1 .9Secondary Language Arts 58.0 14.4 11.7 9.9 4.9
Science 63.2 16.3 11.1 6.1 2.7_SeconSecon Ty ocial Studies 61.1" 17.7 .1 8:T 4.0
TABLE 13
PERCENTAGE OF DISTRICTS REPORTING USE OFINTERACTIVE VIDEO BY SUBJECT
Subject No UseOnce perquarter
Once per Once permonth week Daily use
Elementari Math 94.6 4.1 1.2 -Elementary Language Arts 9-0:4 I:1 5.4 .40Elementarx Science .-86.8 4.5 7.0 1.2 .4Elem. Social Studies 87.5 4.0 6.2 1.2Secondar1 Math 88.0 6.4 4.5 .40 .40Secon Language Arts 81.4 8.7 4.5 1.2Secondary Science 64./ 11.4 13.7-----1-2----- 1:2-Secondary Social Studies 77.5 10.0 4.6 2.2 .4

Curricular Microcomputing
24
TABLE 14
PERCENTAGE OF DISTRICTS REPORTING USE OFHYPERMEDIA BY SUBJECT
Subject No Use Once peruarter
Once per Once permonth week
Daily use
Elementary MathElementary Language Arts 88.7
.90748.7 1.6 .il
Erementary_Science -7.0- 1-./ LT--89.6 6.2 -2-74.-----T.-C----Elem. Social Studies
Secondary Math 83-.0- 10.0' -3.6 LI 13-Secondary Lame Arts 81.6 11.9 3.6 23 -Secon Science 80.7 9.6 5.0 2.7 1.8
econ Social Studies i2.5 11.9 '372 1. F
In the use of emerging technologies, area type elicited significant differences in all
technologies. Across all use, urban areas used emerging technologies most and rural areas
used them least. At the secondary level, use of the technologies tends to increase
somewhat across the spectrum, regardless of the geographical setting (table 15).
TABLE 15
ANALYSIS OF VARIANCE OF USEOF EMERGING TECHNOLOGY BY AREA TYPE
Variable Ruraln
X Suburbann
7 Urbann
X
Elementary 186 5.199 44 6.045 9 8.22 .005CD ROMElementary 187 4.676 44 4.8-86 6-.33 .DF6--IVDElementary 184 4.413 44 5.295 9 6.00 .000HypermediaSecondary 165 6.40 41 7.208 0 9.444 .014Tutor UseSecondary 162 4.809 41 5.829 q 7.667IVDSecondary 165 5.158 41 6.160 9 7.111 .427Hypermedia

Curricular Microcomputing
25
Regarding use of emerging technologies, average daily membership is significantly
conelateu with elementary level interactive video and hypermedia use, and with high school
interactive video use, suggesting that as average daily membership rises, so does the use of
interactive video at the elementary and secondary level, and hypermedia use at the
elementary level (table 16). A correlation of per-pupil expenditure and emerging
technologies does not yield any significant relationships (table 17).
TABLE 16
CORRELATION OF AVERAGE DAILY MEMBERSHIP AND EMERGINGTECHNOLOGY USE
Elem. Elem. Elem. Sec. Sec. Sec.CD IVD Hyper CD IVD Hyper
media media
ADM .128 .164* .290* .090 .237* .134
* significant at .01* significant at .05
TABLE 17
CORRELATION OF PER PUPIL EXPENDITURE ANDEMERGING TECHNOLOGY USE
Elem. Elem. Elem. Sec. Sec. Sec.CD IVD Hyper CD IVD Hyper
media media
PPE -.082 -.026 -.027 -.027 .031 .064

Curricular Microcomputing
26
none significant
Research Question 2
Research question two was "What is the nature and extent (type and scope) of staff
development related to microcomputing in public schools?" To answer the question,
variables related to current inservice emphasis and need, sources of staff development, and
staff responsible for training were examined.
Inservice Emphasis
Figure 1 and table 18 display the mean emphasis ratings for twelve aspects of
microcomputer-related inservices or activities. Overall, respondents were dissatisfied with
the emphasis placed on all aspects of staff development. Further, all respondents
expressed a significantly higher desire for emphasis on all aspects of staff development. In
rating the current state of staff development related to microcomputing, fewer than nineteen
percent of the respondents indicated that "great emphasis" is given to any of the twelve
aspects of staff development. Further, the range of mean scores spanned from 1.92 to
2.48, surrounding the "/. inimal emphasis" selecjon. Inservices that provide
demonstrations of hardware or software to be integrated into instruction receive the most
emphasis, while ongoing inservices related to emerging technologies receive the least
attention.
In contrast, thirty to fifty-seven percent of the districts felt that "great emphasis"
was needed on all aspects of staff development. The range of mean scores for desired
inservice emphasis spanned from 2.99 to 3.54, surrounding the "some emphasis" needed,
leaning towards "great emphasis." Basic instructional integration of microcomputers was
deemed most important by the most respondents (57.66 percent).
Of the five aspects of staff development related to theory, demonstration, feedback,
and coaching, respondents rated demonstration highest in terms of current inservice
emphasis (mean score of 2.48). Coaching was given least emphasis in current practice
9

Curricular Microcomputing
27
(mean score of 2.06). As noted above, desired emphasis was high for all aspects of staff
development. The range of scores for theory, demonstration, practice, feedback, and
coaching was 3.27 to 3.49, with highest desired emphasis on the practice aspect.
4
3.5
3
2.5
Mean2
Emphasis
1.5
1
0.5
0
FIGURE 1
lnservice Emphasis: Current vs. Desired
1 2 3 4 5 6 7 8 9 10 11 12
Inservice Aspects
(#347: Theory, demonstration, practice, feedback, coaching)
28

Curricular Microcomputing
28
TABLE 18ANALYSIS OF VARIANCE OF CURRENT VS.
DESIRED INSERVICE ,SMPHASES
Inservice Current Current Desired Desired F pAspect Emphasis Emphasis Emphasis Emphasis
n 7 n 71 252 2.45 248 3.54 261.40 0.002
.-3
251 2.00 246--7:11-146
3.07 104.33 0.00-252 -115 304.0
4- -----231- -2748- -248 S.43- 160.5 0.6V-5 250 2.43 247 3.49 204.93 0.006 250 2.14 248 3.27 224.49 0.007 252 2.06 250 3.29 300.62 0.008 152 2.45 250 147 193.46 10.069 252 1.82 250 2.00 269.70 0.0010 252 1.96 250 3.07 208.44 0.-6011 252 1.92 249 3.24 303.82 0.0012 24-9 2.00 249 3.29 304.90 0.00
Research Question 3
Research question 3 was "What is the relation between the dependent variable of
curricular integration of microcomputers and the independent variables of curricular
microcomputer staff development, comprised of theory, demonstration, practice, feedback,
and coaching?" This question was answered by examining student contact, mode of use,
use of emerging technologies, and pupils per computer in relation to five aspects of staff
development.
Student Contact
Table 19 shows that the five aspects of staff development related to theory,
demonstration, feedback, practice, and coaching are significantly related to the number of
students with regular contact with microcomputers as part of their instructional program. It
appears that as emphasis on key components of training increases, so to does the number
of students engaging the computer.

Curricular Microcomputing
29
TABLE 19
CORRELATION OF THEORY, DEMONSTRATION, PRACTICE, FEEDBACK,COACHING WITH PERCENTAGE OF STUDENTS WITH REGULAR CONTACTWITH MICROCOMPUTERS AS PART OF THEIR INSTRUCTIONAL PROGRAM
Setting Theory Demon-stration
Practice Feedback Coaching
Elementary .194* .263* .304* .248* .245*MiddleHighSchool
.103.1564
.135t
.265*.143t.113*
.206*
.22"6*.181*.112*
* significant at .01t significant at .05
Mode of Use
Table 20 displays correlations of the standardized use-mode scores with five
aspects of staff development, theory, demonstration, practice, feedback, coaching.
Significant relationships arise with demonstration and practice where the computer is used
as a tool, both in the secondary setting and as a combined variable across both elementary
and secondary levels. Demonstration and practice appear to be two aspects of training that
are stressed in settings where the computer is used as a tool, both in secondary programs
and in overall district use. The aspect of feedback is significantly related to programs that
use the computer as a tool and as tutee, specifically at the aggregated district level.

Curricular Microcomputing
30
TABLE 20
CORRELATION OF STANDARDIZED USE-MODE SCORES WITH THEORY,DEMONSTRATION, PRACTICE, FEEDBACK, COACHING
Mode Theory Demon-stration
Practice Feedback Coaching
Elementary -.004 0.022 -.034 -.057 .086Tutor Use
-Elementary .040 .055 .076 .090 -.030Tool UseElementaryTutee Use
.(1TT- .114 .611 .-1(I
Secondary .072 .023 .008 -.041 -.016Tutor UseSecondary .108 .197* .158t .121 .110Tool UseSecondary .010 .067 -.006 .121 .014Tutee UseCombined .039 -.004 -.042 -.079 .030Tutor UseCombined .098 .200* .1714 .141t .071Tool UseCombined .026 .117 .017 .145* .023Tutee Use
* significant at .01significant at .05
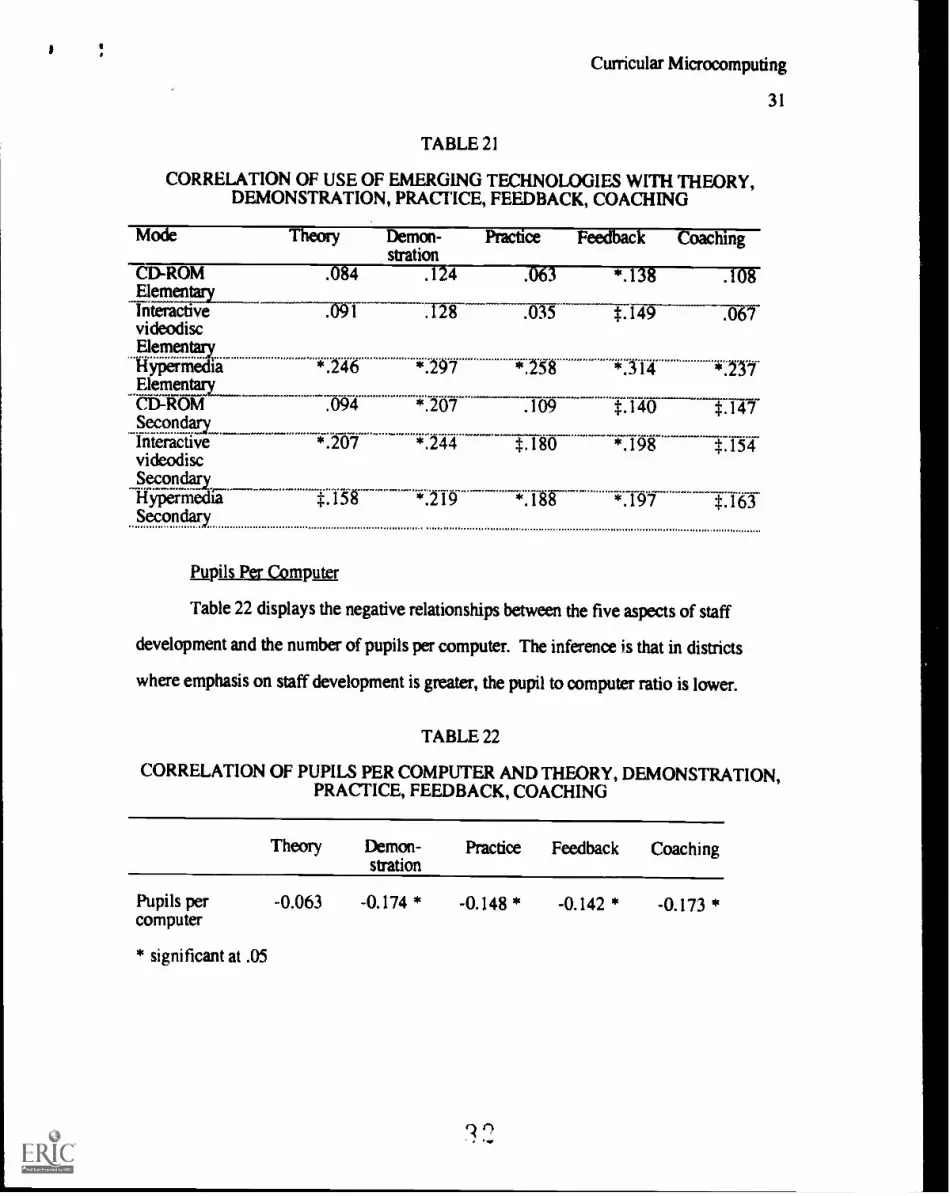
Use of Emerging Technologies
Theory, demonstration, practice, feedback, and coaching appear to be significantly
related to emerging technology use in three ways (table 21). First, the use of feedback in
training is significantly related to the use of emerging technologies in all settings. Second,
all five aspects of staff development (theory, demonstration, practice, feedback, and
coaching) are significantly related to the use of hypermedia in both elementary and
secondary settings. Third, staff development is significantly related to the use of more
types of emerging technologies in secondary settings than it is in elementary grades. This
is not surprising given that there is greater use of emerging technologies in secondary
settings, as noted in the section responding to question one.
Curricular Microcomputing
31
TABLE 21
CORRELATION OF USE OF EMERGING TECHNOLOGIES WITH THEORY,DEMONSTRATION, PRACTICE, FEEDBACK, COACHING
Mode Theory Demon- Practice Feedback Coachingstration
CD-ROM .084 .124-7M.
ElementaryInteractivevideodisc
Ti .128 .-013 t.149 T67ElementaryHypermedia *.246 *.297 *.258 *.1l4 *.237ElementaryCID -ROM .094 *.207 .109 t.140 t.147SecondagInteractivevideodisc
*.207 *.244 t.180 *.198 t.154
SecondaryHypermedia $.15 *.219 *.lgr *.197 4:363Secondary
rupi 1 s Per Computer
Table 22 displays the negative relationships between the five aspects of staff
development and the number of pupils per computer. The inference is that in districts
where emphasis on staff development is greater, the pupil to computer ratio is lower.
TABLE 22
CORRELATION OF PUPILS PER COMPUTER AND THEORY, DEMONSTRATION,PRACTICE, FEEDBACK, COACHING
Theory Demon- Practice Feedback Coachingstration
Pupils per -0.063 -0.174 * -0.148 * -0.142 * -0.173 *computer
* significant at .05

Curricular Microcomputing
32
Discussion
Joyce and Showers' (Joyce, et al., 1988) model holds that a staff development
program that includes the presentation of information or theory about the topic of the
training, live and mediated demonstration or modeling of new skills and teaching models,
opportunities for practice of new skills and strategies in the training setting as well as in the
workplace, feedback on performance in practice trials, and peer coaching of new skills and
strategies will increase teacher knowledge, teacher skill, and transfer of learning to new
settings over other programs that employ fewer components.
The data from this study indicate that few if any key elements of staff development
are emphasized to the degree that other elements are. Elements not as strongly linked to
successful practice are rated higher. When the five key elements of Joyce and Showers
(1988) theory are emphasized, the percentage of students engaging the computer regularly
as part of their instructional program increases and the ratio of pupils to computer
decreases. Therefore, if one of the objectives of instructional technology is to increase
student contact with computers, then strong emphasis on key components of staff
development may be one route to achieving this goal. Good staff development takes place
where the pupil to computer ratio is lower.
Emphasis on demonstration and practice were shown to be related to the use of the
computer as a tool in secondary and combined elementary/secondary settings. Tool use
involves application use as a means to some instructional end. This may include word
processing for writing, or using a graphics program for a drafting project, for example.
These results are consistent with previous findings in this study that, overall, emphasis in
current staff development seems to stress demonstration in training, and inservices on
specific application packages.

Curricular Microcomputing
33
The results of this study suggest that when the key elements of Joyce and Showers'
(1988) training model were emphasized, there was greater use of hypermedia in elementary
and secondary settings, and of interactive videodisc in secondary settings. Emphasis on
the aspects of demonstration and trainer/trainee feedback correlated most positively with
emerging technology use. Since these are new technologies, their use has not achieved the
relative mainstream status that the stand-alone microcomputer has. This may explain why
all five aspects of Joyce and Showers' (1988) theory are significantly related to emerging
technology use and not to general computer use. Schools may not see the need to explain
the theory behind the reasons teachers should use computers, or allow time for feedback
and post-inservice coaching, da the Everest Syndrome (Maddux, 1988). Schools that
succumb to the Everest Syndrome believe that:
microcomputers should be brought into an educational setting simply because they are
there;
mere exposure to microcomputers will be beneficial to students; and
if schools can obtain a sufficient quantity of hardware and software, quality will take care
of itself.
However, the newer technologies, hypermedia in particular (which is often the kind
of software that drives CD-ROM's and interactive videodisc players) represents an
important breakthrough in making computers more compatible with human cognition, in
that their storage of information is nonlinear. This conceptual leap may dictate the need for
initial emphasis on all five aspects of Joyce and Showers' (1988) model.
In sum, this study tends to support Joyce and Showers' theory of staff
development in the following ways:
Assuming greater student contact with microcomputers is a goal of public schools, then
good staff development is related to that success.

Curricular Microcomputing
34
Good staff development may occur more readily in districts that have a lower pupil to
computer ratio.
For new, novel, or emerging technologies, quality staff development is key in bringing
about greater use in instruction.
Implications for practice
The recommendations by state commissions, like the Commission on Schools for
the 21st Century (Wisconsin, 1990), include implementng on-line cataloging, CD-ROM
capabilities, acquisition of educational hardware, software, and peripherals, as well as
development of ongoing staff development programs for the integration of such
technologies. The finer analyses of mode of use across subject and grade (ie : tutor, tool,
tutee) can assist policy makers and administrators understand where limited resources may
need to be allocated for program support. The results of this study can inform school
leaders where further study should be made to carry out these goals.
The Wisconsin State Department of Public Instruction (DPI) has acknowledged the
need for coherent staff development programs in integrating microcomputers into
instructional practice (Lohr, 1990). This need, coupled with the historical speed at which
changes take place in microcomputing technology, suggests the need to map the current
status of instructional microcomputing and staff development in public schools. As
microcomputers become more capable, so too must the staff that operate and integrate them
into instructional practice.
Based on the findings of this study, the following recommendations for practice are
put forth:
1) The data indicates that the majority of students are engaging the computer in
instruction. Future policies need to insure equitable student access to microcomputers and
emerging technologies continues across grade, geographic size, and funding levels.

..,
Curricular Microcomputing
35
2) Educators must insure that the microcomputer's mode of use is the most
appropriate possible within the given subject it is used.
3) Given that rural schools tend to emphasize the use of the computer as a tutor
more than any other setting, and districts with high per pupil expenditure utilize tutee mode
more than any other group, educators must insure that mode of use is not a function of
demography or financial exigency.
4) Emphasis on quality inservice must be placed high on the priority of goals if
quality microcomputer integration is to occur in instruction.
5) Given the recommendations of the Commission on Schools for the 21st Century
(Wisconsin, 1990) regarding integration of microcomputer technologies, implementation of
a staff development model designed to improve staff and student performance, such as
Joyce and Showers (1988), may lead to increased integration of microcomputers and
emerging technologies within instruction.

0Curricular Microcomputing
36
Bibliography
Bork, A. (1980). Interactive Learning. In R. Talyor (Ed.), The Computer in the School:
Tutor. Tool. Tutee New York: Teachers College Press.
Cathcart, W. G. (1990). Effects of LOGO instruction on cognitive style. Journal of
Educational Computing Research 6(2), 231-242
Clements, D. H., & Gullo, D. F. (1984). Effects of computer programming on young
children's cognition. Journal of Educational Psychology 76(6), 1051-1058
Cronbach, L. J. (1951). Coefficient alpha and the internal structure of tests.
Esychometrika, 16, 297-334
Cuban, L. (1986). Teachers and machines . New York: Teachers College Press.
Dilman, D. A. (1978). Mail and Telephone Surveys: The total design method . New York:
John Wiley & Sons.
Education, National Commission on Excellence in. (1983). A Nation at Risk . U.S.
Department of Education.
Ely, D. P. (1989). Trends and Issues in Educational Technology 1989. ERIC
Clearinghouse on Information Resources.
Fullan, M. (1982). The Meaning of Educational Change . New York: Teachers College
Press.
Fullan, M. (1991). The New Meaning of Educational Change (Second ed.). New York:
Teachers College Press.
Hawkridge, D. (1990). Who needs computers in schools, and why? Computers Education
15(103), 1-6
Joyce, B., & Showers, B. (1988). Student achievement through staff development . White
Plains, NY: Longman, Inc.

Curricular Microcomputing
37
Lay, I., & Ruttenberg, S. (1982). The human side of technological innovation: Labor's
view. In S. Lundstedt (Ed.), Managing Innovation: The social dimensions of
creativity New York: Pergamon Press.
Lohr, N. (1990). Computer Integration/Staff Development. Specialist in Educational
Administration, University of Wisconsin - Madison,
Lortie, D. (1975). Schoolteacher . Chicago: The University of Chicago Press.
Loucks-Horsley, S., Harding, C., Arbuckle, M., Murray, L., Dubea, C., & Williams, M.
(1987). Continuing to learn: A guidebook for teacher development . Andover, MA:
Regional Laboratory for Educational Improvement of the Northeast and Islands and
National Staff Development Council.
Luehrmann, A. (1980). Technology in Science Education. In R. Taylor (Ed.), The
Computer in the School: Tutor. Tool. Tutee New York: Teachers College Press.
Maddux, C. D. (1984). Breaking the Everest Syndrome in educational' microcomputing:
An interview with Gregory Jackson and Judah L. Schwartz. Computers in the
Schools 1(2), 37-48
Ohio, State of (1987). Integrating Technology into the Curriculum . Ohio Department of
Education.
Papert, S. (1980). Mindstorms: Children. Computers. and Powerful Ideas . New York:
Basic Books.
Petruk, M. W. (1985). Microcomputers in Alberta Schools--1985. A Final Report on the
Results of a Resource SurveyDIAILeruSclwi 1 s (ERIC Document 265 834).
Alberta University, Edmonton. Faculty of Education.
Pink, W. T. (1989). Effective staff development for urban school improvement.
Rees, R. (1987). The Applicaion of Computer Technology to Educational Administration-
A Pilot Study . Queen's Univ., Kingston (Ontario). Faculty of Education.

Curricular Microcomputing
38
Rice, R., & Aydin, C. (1991). Attitudes toward new organizational technology: Network
proximity as a mechanism for social information processing. Administrative
Science Quarterly 35, 219-244
Roblyer, M. D., Castine, W. H., & King, F. J. (1988). Assessing the impact of computer-
based instruction. Computers in the Schools N3I4), 1-149
Sherry, M. (1990). Implementing an Integrated Instructional System: Critical Issues. Phi
Delta Kappan , 118-120 October
South Carolina, State of. (1984). 1983-1984 Statewide Computer Survey. Final Report
(ERIC Document 263 907). South Carolina State Dept. of Education, Columbia.
Stallings, J. A. (1989). School achievement effects and staff development: Whatare some
critical factors?
Taylor, R. P. (1980). The Computer in Education: Tutor. Tool. Tutee. New York:
Teachers College Press, 274.
U.S. Congress, Office of Technology and Assessment. (1988). Power On! New Tools for
Teaching and Learning (OTA-SET-379). U.S. Government Printing Office.
Wisconsin, State of. (1990). A New Design for Education in Wisconsin: Schools Capable
of Continuous Improvement . Commission on Schools for the 21st Century.