public confidence in organizations
TRANSCRIPT

Current Research Journal of Social Sciences 2(3): 155-173, 2010
ISSN: 2041-3246
© Maxwell Scientific Organization, 2010
Submitted Date: February 26, 2010 Accepted Date: March 22, 2010 Published Date: June 15, 2010
155
Public Confidence in Organizations
Paul A. Bourne
Department of Community Health and Psychiatry, Faculty of Medical Sciences,
University of the West Indies, Mona, Kingston, Jamaica
Abstract: The aim of this study is two-fold within the broader context of organizational trust. Firstly, to build
an organizational trust model for socio-political institutions in Jamaica (using confidence in 22-sociopolitical
institutions in the society) as well as to examine the top five and the lower five institutions in regard to people’s
confidence in them. Secondly, from the model ascertain what is the explanatory power of the final model, and
from the identify model examine the explanation of each of the significant factors as well as ascertain whether
the model is a predictive one. The findings of this study were obtained from a nationally representative
descriptive cross-sectional observational survey data of some 1,338 Jamaicans, with a sampling error of ± 3%:
95% confidence level. The observational data was stored and retrieved using the Statistical Package for the
Social Sciences version 17.0. Logistic regression was used to establish the predictive model for organizational
trust, with factor analysis used to establish the variable referred to as trust in organization. Cronbach alpha was
used to test the validity of the following variables-political participation and subjective psychosocial wellbeing.
While we do not claim to provide all the answers with this single static study, it will be used assist future
research in the area, as nothing exists on the topic at the moment.
Key words: Confidence in socio-political institution, distrust, organizational trust, trust
INTRODUCTION
People’s behaviour is essentially influenced by their
perception of what they believe reality is, not by reality
itself. Despite the many anti-corruption measures, which
have been implemented over the years, generally
speaking, the critical findings of this CaPRI Taking
Responsibility Survey revealed that there exists a broad
consensus among many Jamaicans that corruption is still
prevalent and persistent in all government institutions.
(Waller et al., 2007).
[Corruption] violates the public trust [i.e. confidence]
and corrodes social capital (World Bank, 1997).
Traditionally, there is a perception that corruption
was widespread and rampant in Jamaica, and scholars
have found that this has remained the same in 2007
(Boxill et al. 2007; W aller et al., 2007). In Waller et al.
(2007) monograph titled ‘A landscape assessment of
political corruption in Jamaica’, using sample survey
research of some 1,140 Jamaica by way of probability
sampling technique, find that 85% of the respondents
report that it was easy to corrupt public officials. Based
on current public perception, Jamaicans have a low level
of trust in socio-political institutions (in particular
government, police, customs) Powell et al. (2007) trust in
government 8%; trust in police 46.7%; political parties
30.3%; local government 40.3%) and that this is due to
perception of corruption, past pe rformance of
organizations, unmet expectations, injustices and
inequitable distribution of economic resources and the
lack of transparency within the global context of
increased accountability, credibility and transparency. The
issues of unaccountability and low transparency are
characteristics that led to violation of public trust
(Uslaner, 2005), and that this breeds corruption, which
erodes the public’s confidence in socio-political
institutions as well as the depletion of social capital.
Uslaner (2005) argues that there is a strong reciprocal
relation between corruption and trust. He added that
countries with high levels of corruption have a low degree
of trust and the opposite is true (Uslaner, 2005), and
further offered that this affects gross domestic product
(economic growth). In examining distrust, Uslaner (2005)
finds that this is statistically association with tax evasion,
and bureaucracy. Tax evasion is a clear case of
corruption, and dishonesty; but how critical is it in a
society?
A low social capital country is not only likely to have
small, weak, and inefficient companies; it will also suffer
from pervasive corruption of its public officials and
ineffective public administration (Fukuyama, 1995).
In March 2006, in her inaugural address [to the
nation], the Most Honourable Portia Lucretia Simpson-
Miller, Jamaica’s first female Prime Minister, made the
following oath [that] “I want to pledge to the Jamaican
people to work tirelessly to eradicate corruption and
extortion. I am committed to their eradication” (Jamaica
Information Service, 2003; Waller et al., 2007).

Curr. Res. J. Soc. Sci., 2(3): 155-173, 2010
156
The issue of corruption is no longer a perception, it is
a reality; and the former Prime Minister of Jamaica
admitted this in her inaugural address to the nation.
Recently Jamaica has seen an unprecedented number of
arrests of police officers for corruption, and a number of
key public officials have been defamed due to - (1)
falsification of academic qualifications (“Dr.” Omer
Thomas), (2) misuse of public funds (former Junior
Minister in the Ministry of Energy – Kern Spencer; JAG
Smith), (3) alleged ‘wife beatings’, and (4) confession of
the falsification of statement (Detective police constable,
Corey Lyn Sue) – and these have further reduce the
public’s trust in particular sociopolitical institutions as
well as they are increased interpersonal distrust (or
confidence). Those issues are not specialized to the
geopolitical space of the Jamaica as they extend to the
Caribbean, United States, Europe, Asia, Africa and the
Oceania. Jamaica, Haiti, Iraq, Grenada, Dominica, and
Guyana to name of few nations have continuously had to
interface with crime and violence, and high distrust in
sociopoli t ical organizations. Anthony Harriott,
Christopher Charles, Don Robotham, Dillon Alleyne and
Ian Boxill, Mark Figueroa and Amand Sives, Farley
Brathwaite, and Scot W ortley have all contributed various
scholarships on crime, criminal justice (or injustice), and
victimization from a Caribbean perspective (Boxill et al.,
2007), but dearth of literature exists on organization trust
despite the seemingly correlation between crime and
different typologies of distrust. Hence, this study bridges
the gap by examining organization trust (confidence),
using sample survey research. The sample was a
stratified random sample of some 1,338 Jamaicans, which
was a nationally representative cross-sectional research.
The aim of this study is two-fold. Firstly, to build an
organizational trust model for socio-political institutions
in Jamaica (using confidence in 22-socio-political
institutions in the society) as well as to examine the top
five and the lower five institutions based on particular
demographic characteristics. Secondly, to ascertain what
are some of the factors of organizational trust along with
explanatory power of the final institutional trust model.
Conceptual framework: Perception is sometimes
different from reality, and the truth is difficult to establish
when there is the absence of knowledge, information and
the cosmology of what is hidden from people, which
means that the yardstick for interpreting what we see is
skewed because the premise upon which knowledge is
derived is deceptive and fallacious. But how do the
perception of corruption, dishonesty, intent, capability,
past performance and motives influence trust in an
organization? And, how does trust influence organization
productivity, profitability and success?
Diener (1984; 2000) began the discussion that
subjective assessment of events is still a ‘good’
measurement as an objective assessment. Although
Diener’s (1984; 2000) monologues have been specialized
to wellbeing, he showed that there is a strong relation
between subjective assessment of wellbeing and objective
assessment of wellbeing. Using sample survey research
observational data established a clear linkage between
subjective and objective wellbeing. Other scholars have
concurred with Diener and Suh (1997) and even some
economists have now ventured into the discourse. Stutzer
and Frey (2003), who are economists, studied wellbeing
from the perspective of happiness (subjective assessment),
which Edward Diener has been arguing for years that
happiness (subjective assessment) of wellbeing is a better
judge of quality of life compared to income, economic
resources or per capita income. Another economist (Sen,
1982; 1998) argued that the use of Gross Domestic
product per capita (economic resources) to evaluate
wellbeing is focusing on the end and not the means. The
author cites that using the means approach is
multidimensional as it incorporates both economic as well
as non-economic resources in the assessment of
wellbeing.
Happiness, according to Easterlin (2003) is
associated with w ellbeing, and so does ill-being (for
example, depression, anxiety, and dissatisfaction).
Easterlin (2003) argued that material resources have the
capacity to improve one’s choices, comfort level, state of
happiness and leisure, which mitigates against static
wellbeing. Within the context that developing countries
and developed countries had at some point accepted the
economic theory that economic wellbeing should be
measured by per capita Gross Domestic Product (GDP) –
(total money value of goods and services produced within
an economy over a stated period per person). Sen (1998),
who is an economist, writes that plethora of literature
exist that show that life expectancy is positively related to
Gross National Product (GNP) per capita (Anand and
Ravallion, 1993; Sen, 1998). Such a perspective implies
that mortality is lower whenever economic boom exists
within the society and that this is believed to have the
potential to increase development, and by extension
standard of living.
Sen (1998), however, was quick to offer a rebuttal
that data analyzed have shown that some countries (i.e.
Sri Lanka, China and Costa Rica) have had reduced
mortality without a corresponding increase in economic
growth (Sen, 1998), and that this was attained through
other non-income factors such as education, nutrition
immunization, expenditure on public health and poverty
removal. The latter factors, undoubtedly, require income
resources and so this is clear that income is unavoidable
a critical component in welfare and wellbeing. Some
scholars believe it that economic growth and/or
development is a measure of welfare (Becker et al.,
2004).

Curr. Res. J. Soc. Sci., 2(3): 155-173, 2010
157
People's moods and emotions reflect on-line reactions
to events happening to them. Each individual also makes
broader judgments about his or her life as a whole, as well
as about domains such as marriage and work. Thus, there
are a number of separable components of SWB
[subjective well-being]: life satisfaction (global judgments
of one's life), sa tisfaction with important domains (e.g.,
work satisfaction), positive affect (experiencing many
pleasant emotions and moods), and low levels of negative
affect (experiencing few unpleasant emotions and moods).
In the early research on SWB, researchers studying the
facets of happiness usually relied on only a single self-
report item to measure each construct (Diener, 2000).
The discourse on perception in the measurement of
wellbeing is current and real as human wanting oxygen
for survival. Using the works of Sen, Diener, Easterlin,
Diener and Suh and others, the debate is continuous and
will continue in the further as there is no panacea for this
disagreement nor is there a simple consensus. W e would
like to note here that the discussion of objective and
subjective goes beyond wellbeing as there are some
critical issues that formulate the crux of the matter in this
reasoning. In a reading titled ‘Objective measures of
wellbeing and the cooperation production problem’,
Gaspart (1998) provided arguments that support the
rationale behind the objectification. His premise for
objective quality of life is embedded within the difficulty
as it relates to consistency of measurement when
subjectivity is the construct of operationalization.
This approach takes precedence because an objective
measurement of concept is of exactness as non-
objectification; therefore, the former receives priority over
any subjective preferences. He claimed that for wellbeing
to be comparable across individuals, population and
communities, there is a need for empiricism. Ringen
(1995) in a paper titled ‘Wellbeing, measurement, and
Preferences’ argued that non-welfarist approaches to
measuring wellbeing are possible despite its subjectivity.
The direct approach for w ellbeing computation through
the utility function according to R ingen (1995) is not a
better quantification as against the indirect method (i.e.
using social indicators). The stance taken was purely from
the vantage point that utility is a function, ‘not of goods
and preferences’, but of products and ‘taste’. The
constitution of wellbeing is based on choices. Choices are
a function of individual assets and options. With this
premise, Ringen (1995) forwarded arguments, which
show that people’s choices are sometimes ‘irrational’,
which is the make for the departure from empiricism.
The foundation has already been established that
subjective (i.e. perception) in the assessment of issues,
yields the same degree of realism as empiricism (or the
objectification of events). The issues that we forwarded
earlier go beyond wellbeing as it relates to trust. Using
the traditional (classical school of economists’
perspective), events must be investigated and thereby
interpreted from a quantitative perspective, which is
empiricism. This discourse commenced as prior to the 20th
century, when Max W eber purported that social
phenomena could be studied from a subjective
(qualitative) perspective without scientificness. Follow ing
Weber’s work, research is now done using quantitative
techniques, qualitative methodologies, and mixed
methodologies Weber’s perspective with that of Kuhn
(1996) have laid the premise for that Social Science
(arguable a soft science) can be studied with the same
degree of scientific rigours as the Natural (or hard)
Sciences. It follows that trust can be studied from a
subjective perspective, and that this does not reduce the
validity or reliability of the results.
Fukuyama (1995) outlines in his text “Trust” that
trust social capita (Boxill et al., 2007), development,
productivity, profitability, cooperation and democracy
(Blind, 2007) as w ell as civil and harmonious
relationship, which are need for the effective function of
modern societies. Many scholarships have concurred with
Fukuyama (1995) that trust is dependent on confidence,
cooperation, and a particular expectation (Deutsch, 1958,
1962; Gambetta, 1988) as well as conflict resolution
(Deutsch, 1973; Lewicki, and Stevenson, 1998).
Throughout Fukuyama’s (1995) work, he did not
distinguish between the different typologies of trust, but
it was obvious from that text published in 1995 that trust
is interpersonal, organizational, governmental, and that
the crux of trust is confidence in an event, object or
person.
Like Blind (2007) believes that democracy requires
cooperation, which is the crux of the matter therein. Both
scholars argue that without cooperation in a society it
disintegrates into anarchy. Blind (2007) cannot be aptly
summarized and produce the same meaning, as he does so
well in this regard and so we use his own words to
emphasize the crucible ingredient in a society, when he
says that “Trust, in this regard, emerges as one of the most
important ingredients upon which the legitimacy and
sustainability of political systems are built”. Even though
it is sometimes over by some of us in our daily
functioning in society, we continuously, having to rely on
others, (in addition to some degree of cooperation is
present) allow for the building of all types of relations.
Using sample survey research, Almond and Verba (1963)
collected data on political attitude of people who dwell in
UK, US, Italy, Mexico and Germany that interpersonal
trust is directly associated with democracy (Seligson,
2002; Putnam, 1993). The argument that was forwarded
for this association was simply that interpersonal trust
fosters cooperation between people, groups and
organizations which is a central pillow upon which a
stable democracy rest. Inglehart (1999) clarifies the
association when he found that the relation between trust

Curr. Res. J. Soc. Sci., 2(3): 155-173, 2010
158
and democracy was a very strong one. This means that
democracy is fostered by adherence to laws, principles,
structures and a particular system of governance. Thus,
democracy requires consensus from a personal, civic, and
societal level.
Despite the complexities of litigations in the
contemporary societies, people will only oblige the
system if they are cooperative. It has happened before in
our annals that people have demonstrated against
decisions handed down by the legislators and judiciaries.
In some instances, these demonstrations have escalated
into civil disobedience and civil protests against the state.
Nevertheless, like Fukuyama (1995) we believe that
litigations foster cooperation, which does not necessarily
produce trust – example soldiers following the dictates of
this superior, and this does not necessarily means that
he/she trust the commander; the paying taxes (property,
consumption or indirect taxes and even direct taxes).
Embedded in this discourse is not only cooperation but
tolerance. It is because people decide to cooperation that
they become tolerant of others behaviour (Morgan, 2005;
Zak and Knack, 2001).
People’s confidence in sociopolitical institutions
(proxy for trust) is build based on past performance, the
intent, motives, and credibility of the trustor (the person
carrying out the action) as well as based on the
expectations of the trustee (person receiving the actions).
Hence, some scholarships show that distrust emerged
whenever the expectations of the trustee are not met
(Covey and Merrill, 2006; Lewicki et al., 2006;
Fukuyama, 1995), which is referred to as negative
expectations. Some intelligentsia believe that distrust
occur when confidence is low (Mark`czy, 2003). Simply
put, distrust is the opposite of trust. This speaks to the
unidimensional approach to the study of trust (Blind,
2007; Lewicki et al., 2006). Hence, if someone’s
expectation is low, then it is not surprising when the
individual’s trust in low for the next person, organization
or thing based on credibility issues with the trustor. Low
expectations are not fashioned on a single occurrence.
Although this is possible on the single visit because
people formulate their opinion of someone or something
from the first interaction, but this is likely to be modified
with more interactions. As such, when a concrete position
is taken because of repeated interactions, low expectations
will emerge, and that this implies low confidence
(or distrust). Credibility denotes keeping ones works
(Blinder, 2000). And when credibility is questioned by the
trustee, he/she is questioning trust, and distrust is usually
ensured to replace confidence in the trustor. The United
Nations (2007) in explaining social trust, states that it is
people’s confidence in other member of the community,
which we believe covers socio-political institutions.
There are scholarships that have identified factors
that influence trust. The examples here range from
studies in China (Tang, 2005, United States and England
(Torney-Purta et al., 2004) and the Caribbean in particular
Jamaica (Boxill et al., 2007; Bourne et al., 2010). In a
sample survey research that was conducted in China in
2004, Tang (2005) find the following – people reported
the highest level of trust for family and relatives followed
by friends, neighbours, schoolmates and people who
dwell in the same geographic area; and that age was
positively related to organizational trust; gender was not
statistical related to local government trust, education was
not a factor of trust (p>0.05), civic trust is statistically
associated with interpersonal trust, trust is inversely
related to problem solving by violence as it encourages
civic solutions, but ones party involvement increases ones
level of trust (adjusted R2 = 4.6%). Further examination of
R-square revealed that they were very low. The R2 for
United States was 10.8%, England (7.9%,), Bulgaria (5%)
and Chile (7.1% ). How ever, the R2 in the study conducted
by Bourne (2010) was 23.5%, with none given for
Boxill et al. (2007) work.
Measuring organizational trust: Before we continue any
discourse on the issue of organizational trust, we must
define trust. The question is therefore, does confidence
captures trust? Fukuyama (1995), in wanting people to
understand the essence of this text on trust, he defined it
as “the expectation that arises within a community of
regular, honest and cooperative behaviour based on
commonly shared norms on the part of other members of
that society”. Fukuyama (1995) stops short of saying that
trust goes hand in hand with tolerance, cooperation,
intent, honesty, and expectation. In addition to the
aforementioned issues, although he did not refer to
confidence, it is embedded in tolerance, cooperation,
honesty and societal expectation. Unlike Fukuyama
(1995), other scholars unequivocally stated that
confidence in entities is an indicator of trust
manifestation. (Dogan, 2002; O’Neill, 2002).
Trust is categorized into two main areas, (1)
interpersonal trust, and (2) organizational trust (or
political trust) (Kramer and Taylor, 1995; Duck, 1997;
Blind, 2007). The latter refers to citizenry’s trust (or
distrust) in politicians and/or politics due to satisfaction or
dissatisfaction with credibility of the various agents and
their policies (Miller, 1974). Organizational trust is
people’s belief in political actors (prime ministers, party
presidents or leaders and public officials) and political
institutions (such as parliament, judiciary, political
parties, army, civil service) to provide policies and
programmes that will benefit them and protect their rights
Organizational trust (political trust) is at the nexus of
cooperation and a relationship between citizenry and
those who represent them, whereas interpersonal trust (or
social trust) speaks to the confidence, cooperation, and
that is shared between or among people (Putnam, 1993;

Curr. Res. J. Soc. Sci., 2(3): 155-173, 2010
159
1995). ‘Thy word is thy bond’ is a critical property upon
which social and political trust is based within various
societies. There is another side to this discourse, as some
degree of distrust stimulates fewer persons participating
in socio-political institutions.
Scholars like Powell et al. (2007) measure
interpersonal trust, as well as trust in government by way
of ascertaining people’s perspective on generalized trust.
Hence, they asked “Generally speaking, would say that
most people are essentially good and can be trusted, or
that most people are not essentially good and cannot be
trusted”. Powell et al. (2007) question to collect data on
generalized trust differs marginally from that of James
and Sykuta (2004) - "Generally speaking, do you believe
that most people can be trusted or that you can't be too
careful in dealing with people?" Prior to Powell et al.,
(2007), a similar approach was used by other academics
like Hardin (1993) and Baier (1986). The operational
definition of trust could be said to have begun with
Almond and Verba (1963) and the World Values Survey
in 1959 – “Generally speaking, would you say that most
people can be trusted or that you need to be very careful
in dealing with people?” Two choices were given, “most
people can be trust” (coded 1) and “”need to be very
careful” (coded 0). This is similar to how trust in
government was operationalized, by way of the
generalized approach. Furthermore, in the same nationally
representative sample survey research of some 1,338
Jamaicans, Powell et al. (2007) used a likert scale items
to garner data on the degree of confidence of residents.
The researchers asked 22 different questions on particular
sociopolitical institution, in an attempt to ascertain
people’s confidence (trust) in these institutions (Nye,
1997).
MATERIALS AND METHODS
This study utilizes primary observational data
collected by the Centre of Leadership and Governance,
Department of Government, the University of the West
Indies at Mona, Kingston, Jamaica between July-August,
2006. The purpose of the survey was to collect
observational data on Jamaican’s political culture, which
included pertinent information of basic orientation of
leadership, governance and democracy, perception
wellbeing, trust and confidence in sociopolitical
institutions, political participation and civic engagement,
electoral preferences and leadership. The observational
data were collected by way of a 166-item questionnaire.
It was a stratified nationally representative sample of
some 1,338 Jamaicans (18 years and older), from the 14
parishes with a sampling error of ±3%: 95% Confidence
level. The questionnaire constitutes questions on civic
culture and orientation to democracy, generalized trust
which constitutes core variables such as - interpersonal
trust, institutional trust, confidence, perception of
wellbeing, crime and corruption, and political
participation as well as the standard demographic
variables. The observational data were collected and
stored using the Statistical Packages for the Social
Sciences for Widows version 17.0 (SPSS Inc; Chicago,
IL, USA). Dummy variables were created from some
demographic and some other variables – sex, race,
religiosity, area of residence, generalized trust,
unemployed person, perceived social class and justice.
Wellbeing and political participation were computed from
a number of scale questions. Descriptive statistics were
done to provide background information on the sample;
tests were done for Cronbach alpha to examine the
validity of the construct - i.e. wellbeing and political
participation. Then, logistic regression was used to build
a model. A goodness of fit statistics was done for the
model.
Using data from the literature and the scope of thedataset, Equation (1) was tested with the available data:
TS-P =ƒ (R i, E i RA i, PPIi, S i, C i, O i, X i, W i, A i, J i, AR i TG , T I ) (1)
Where:TS-P = Organizational Trust of person iR i = religiosity of person iEi = Education of individual iRA i = Denotes race of individualPPIi = Means political participation index of individual iX i = Sex of individual iS i = Represents self-reported social class of individual
iW i = Wellbeing of person iA i = Age of person iJi = This is justice of person iAR i = Area of residence of person iTG = Trust in governmentT I = Interpersonal trustC i = Perceived corruption in Jamaica of individual iO i. = Occupation of person i
Of the 14 predisposed variables that were chosen tobe used in this model, from the observational data of thePowell et al. (2007), 9 of them were statisticallysignificant ones (-2 Log likelihood = 885.024, P2 (26) =119.438, p<0.05). The 9 variables explain 19.2% (i.e.Nagelkerke r square) of the variance in organizationaltrust. Hence, the final model is shown in Eq. (2).
TS-P =ƒ (R i, PPIi, C i, S i, O i, Ji, AR i ,TG, T I) ( 2 )
Measure: Subjective Psychological Wellbeing Index,‘W’. W = EQ i / Ef; where Qi is the selected value fromeach ladder of Maslow’s Hierarchy of Need, and ‘f’ beingthe frequency of the event. The Cronbach " = 0.762 forthe 5-item variables, which are used to constitute thisindex.

Curr. Res. J. Soc. Sci., 2(3): 155-173, 2010
160
Political Participation Index, ‘PPI’. Based on Trevor
Munroe’s work, ‘political participation’ “...the extent to
which citizens use their rights, such as the right to protest,
the right of free speech, the right to vote, to influence or
to get involved in political activity” (Munroe, 2002), We
use the construct forwarded by Munroe to formulate a PPI
= Eb i, b i $ 0. The bi represents each response to a
question on political behaviour, such as voting,
involvement in protest and 0#PPI#19 with a Cronbach
Ø for the five-item scale is 0.76. The interpretation of the
scores are as follows – (1) low is between 0 and 7, (2)
moderate ranges from 8 to 13, and (3) high means a score
from 14 to 19.
Organizational Trust (using confidence in
sociopolitical institutions), TO. The TO = E fi.ci, where f i
indicates the frequency of the occurrence of the event, and
c i denotes the event. F i ranges from 1 = no confidence,
2 = a little confidence, 3 = some confidence, and 4 = a lot
of confidence or extended listing of the ci). Confidence
index = summation of 22 items, with each question being
weighted equally; and 0# confidence index#88, with a
Cronbach " for the 22-item scale being 0.896. The higher
the scores, the more people have confidence in
sociopolitical institutions within the society. Thus, the
confidence index is interpreted as from 0 to 34 represents
very little confidence; 35 to 61 is low confidence; 62 to 78
is moderate confidence and 79 to 88 is most confidence.
Area of Residence, ‘AR’. This variable is the parish
in which the individual lives while the study was being
conducted.
Sex, ‘X’. Sex is a binary measure, where 1 = male
and 0 = female.
Trust in Government, TG, is a dummy variable which
is based on the 1 = trust in government and 0 is otherwise.
Subjective Social Class, ‘S’. This is people’s
perception of their social and economic position in life,
based on social stratification.
Class1: 1 = Middle class, 0 = Other
Class2: 1 = Upper class, 0 = Other
The reference group is ‘Lower Classes
Educational Level, ‘E’.
Edu_level1: 1 = Primary/Preparatory, 0=Other
Edu_level2: 1 = All age, secondary and vocat ional
skills, 0=other
Edu_level3: 1 = University, and professional training,
0=other
The reference group is ‘No formal’ education.
Justice, ‘J’. This variable is a non-metric variable,
which speaks to people’s perception of the ‘fairness’ (or
‘fairness, for that matter as it relates to system favouring
Table 1: Demographic characteristics of the sampled population
Va riable N %
Political participation index 4.02 ± 3.73, rang e = 1 7: from 0 to 17 max.
Gender:
M ale 574 44 .3
Fem ale 723 55 .7
Age group
Yo uth 445 33 .3
Other 810 60 .5
Elderly 83 6.2
Orga nizational Tru st
Low 903 67 .9
M ode rate 396 29 .8
High 31 2.3
Subjective So cial Class
Lower 766 59 .0
M iddle 476 36 .6
Upper 57 4.4
Eth nicity
African, Black 1088 82 .0
Indian 32 2.4
Chinese 4 0.3
European, Caucasian 10 0.8
Mixed, Brown 189 14 .2
Other 4 0.3
a few rich people within the society) as in relation to the
governance of the country. The construct will be dummy
coded as 1 = Yes, and 0 = No.
Governance of the country, G, is defined as people’s
perception of administration of the society by the elected
officials. This is a dummy variable, where 1 denotes in
favour of a few powerful interest groups or the affluent,
0 is otherwise
Political Party Preference, this variable is measured
based on an individual’s response to the question
–“Thinking back to the times you’ve voted in the
past… would you say that you always vote for the PNP
candidate, or do you usually vote for the PNP and
sometimes for the JLP, or do you usually vote for the JLP
candidate, or do you always vote for the JLP”
(Powell et al., 2007)
RESULTS
Demographic characteristics of sample: Of the sampled
respondents (N = 1,338), the response rate for the gender
question was 96.9% (N = 1,297). Of the valid
respondents, 55.7% were females compared to 44.3%
males (Table 1). Of the number of males (N = 574), 7.7%
were elderly, 62.0% were other adults, compared to
30.3% youth. On the other hand, of the females
respondents (N = 723), 5.1% elderly, 59.3% other adults,
and 35.5% youth. Based on the findings in Table 2,
67.9% of Jamaicans distrust (i.e., low) sociopolitical
institutions in the nations (Organizational distrust), with
only 2.3% of the sample indicated a high organizational
trust compared to 29.8% a moderate organizational trust.
Disaggregating the organizational trust (or distrust) by

Curr. Res. J. Soc. Sci., 2(3): 155-173, 2010
161
Tab le 2: Bivaria te analysis between trus t in sociopolitical institution
and age group of respondents, N = 1,330
Ag e gro up o f resp ond ents
---------------------------------------
Organizational trust Yo uth Oth er adults Elderly
Very low to low 72 .2 66 .2 61 .4
Middle 26 .7 30 .8 36 .1
High 1.1 3.0 2.4
Count 442 805 83
P2 (4) = 9.054, p = 0.060>0.05
Tab le 3: Bivariate analysis between o rganizational trust and age group
of respondents, N = 1,289
Sex of res pon den ts
---------------------------------------------------
Org anization al trust: Fem ale M ale
Very low to low 66 .0 69 .5
Middle 31 .2 28 .6
High 2.8 1.9
Count 568 721
P2 (2) = 2.325, p = 0.313>0.05
gender revealed the following results that 69.5% of
females indicated distrust in sociopolitical institutions
compared to 66.0% males. On the other hand, with
respect to a high trust in organizations, 2.8% reported yes
compared to 1.9% females.
Of the sampled population who indicated a subjective
state of social class (N = 1,299, 97.1%), most of them
were in the lower class (59.0%) compared to 4.4% in the
upper class (Table 1). Disaggregating these figures by
gender revealed that 54.9% of the working class (i.e.
lower) was females, with 56.7% of the middle class, with
only 50.9% of the upper class being females. With
respect to political participation, of the total population of
1,338, 1,289 people were use to evaluate this question
with a mean participation in Jamaica is 4.02±3.73 (i.e.,
range 17: min 0 to maximum 17). Hence, average political
participation is very low (i.e., 4 out of 17). Further
examination of political participation controlled for
gender revealed that on an average males have a higher
participation (mean = 4.56±3.9) compared to their female
counterparts (mean = 3.60±3.5). It should be noted here
that females’ political participation is lower than the
national average of 4.56.
Hypothesis 1: There is a statistical relation between
Organizational Trust (i.e. Organizational Trust) and age
group of respondents.
We found that there is no statistical association
between Organizational Trust and age group of
respondents - P2 (4) = 9.054, p = 0.060>0.05 (Table 2).
Hence, this denotes that Jamaicans trust in organization is
not determine (or a factor) by age group of respondents,
which suggested that irrespective of the sampled
respondents age, their trust in organization is the same.
Hypothesis 2: There is a statistical association between
Organization Trust and sex of respondents.
We tested the aforementioned hypothesis
(hypothesis 2), and no statistical relation was found
between the two variables - P2 (2) = 2.325, P= 0.313 >
0.05 (Table 3). Thus, sex is not a factor in perception of
trust (or distrust) in Jamaican organizations.
Hypothesis 3: There is a statistical association between
Organizational Trust and Educational Level of
respondents
From Table 4 (testing hypothesis 3), the results show
that there was no statistical association between
Organizational Trust and educational level of
respondents - P2 (8) = 11.070, P = 0.198>0.05. Thus,
there is no statistical difference between the educational
level of Jamaicans and how they trust Organizations.
Hypothesis 4a: There is a statistical association between
Organizational Trust and Political Party Preference (i.e.
PNP or JLP)
Using hypothesis 4a, from Table 5, the results show
that there is statistical relation between Organizational
Trust and political party preference - P2 (8) = 33.280, P =
0.001<0.05, with a very w eak association (i.e. cc =
20.6%). From Table 5, Jamaicans who revealed that they
have ‘always voted for the People’s National Party [PNP]’
have a low degree of distrust (very low trust of 50.6%)
compared to someone who declared that they have
‘always voted for the Jamaica Labour Party [JLP]- 2.6%.
Thus, it follows that the former group of respondents are
approximately twice (1.7 times) as trust at the highest
degree compared to the latter group of people. Further, the
cross-tabulation revealed that people both have no
political party preference indicated a higher level of
organizational trust compared to those who had reported
a preference for the JLP.
Hypothesis 4b: There is a statistical relation between
Organizational Trust and Political Party one voted for in
2002 general elections (i.e. PNP, JLP or Other).
The cross-tabulation between organizational trust and
who one voted for the 2002 general election revealed a
statistical relation between the 2 aforementioned
variables - P2 (4) = 34.844, P = 0.001<0.05 (Table 6).
Approximately 44% (N = 587) of the observational data
(1,338) were used for the analysis of the bivariate analysis
between organizational trust and political party voted for
in 2002 general elections, with a weak positive relation
(contingency coefficient being 23.7%). We observed from
Table 6 that those who voted for the Jamaica Labour
Party (i.e. JLP) was more distrusting of sociopolitical
institutions in the nation (i.e. 76.4%) compared to those
who voted for the People’s National Party (i.e. PNP) –
51.7%, but these were lower than those who voted other
(77.8%).

Curr. Res. J. Soc. Sci., 2(3): 155-173, 2010
162
Table 4: Bivariate analysis between organizational trust and age group of respondents, N = 1,283
Educa tiona l leve l
----------------------------------------------------------------------------------------------------------------------------------------
Org anization al trust: No form al Primary Seco ndary Post-sec ond ary Tertiary
Very low to low 75 .0 62 .0 67 .6 66 .4 72 .0
Middle 25 .0 33 .9 30 .0 31 .5 25 .7
High 0.0 4.1 1.6 2.1 2.4
Count 20 242 447 235 339
P2 (8) = 11.070, p = 0.198>0.05
Table 5: Cross-tabulation between organizational trust and Political Party Preference (i.e. PNP or JLP), N = 817
Party P reference (PN P or JL P)
----------------------------------------------------------------------------------------------------------------------------------------
Org anization al trust: Always PNP Always JLP Bo th Usua lly PNP Usually JLP
Very low to low 50 .6 73 .3 65 .3 65 .2 72 .8
Middle 45 .1 24 .1 31 .3 31 .9 22 .2
High 4.3 2.6 3.5 2.8 0.0
Count 326 116 144 90 141
P2 (8) = 36.280, p = 0.001<0.05, cc = 0.206
Table 6: Bivariate betw een o rganiza tional trust and political party
voted for, N = 587
Political party voted in 2002 general election
-----------------------------------------------------------
Organizational trust PNP JLP OTHER
Very low to low 51 .7 76 .4 77 .8
Middle 44 .3 22 .2 22 .2
High 4.0 1.5 0.0
Count 375 203 9
P2 (4) = 34.844, p = 0.001<0.05, cc = 0.237
Tab le 7: Assoc iation between organizational trust and enu merated to
vote, N = 1,195
Enum erated to vo te
-----------------------------------------------
Organizational trust No Yes
Very low to low 74 .0 64 .7
Middle 24 .7 32 .5
High 1.4 2.8
Count 361 834
P2 (2) = 10.334, p = 0.006<0.05
Tab le 8: Cross-tabulation between organizational trust and enumerated
to vote controlled by sex, N = 1,157
Enumerated to vote
--------------------------------------------------------
Male* Female**
------------------------ ----------------------------
Org anization al trust: No Yes No Yes
Very low to low 74 .8 62 .0 73 .3 67 .4
Middle 23 .0 35 .4 25 .7 29 .8
High 2.2 2.6 1.0 2.8
Count 139 379 206 43
*: P2 (2) = 7.474, p = 0.024<0.05, cc = 0.119
**: P2 (2) = 3.567, p = 0.168>0.05
Hypothesis 5: People who are enumerated to vote aremore likely to trust sociopolitical institutions than thosewho are not enumerated to vote.
We tested the aforementioned hypothesis(hypothesis 5), and found that there is a statistical relationbetween organizational trust and being enumerated tovote - P2 (2) = 10.334, p = 0.006<0.05. However, theassociation was a very weak one - cc = 0.093 - i.e. theassociation between the two variables is 9.3%. Thegeneral level of distrust in organizations in Jamaica was68.1%, but the level of distrust of those who indicated thatthey were enumerated to vote is less than the general
Tab le 9: Cross-tabulation between organizational trust and voted in the
last general elections, N = 981
Voted in last general elections (i.e. 2002)*
----------------------------------------------------
Organizational trust No Yes
Very low to low 74 .0 60 .9
Middle 24 .0 36 .3
High 2.0 2.9
Count 350 631
P2 (2) = 17.237, P = 0.001<0.05, cc = 0.131
*: The rationale for the ‘voted in last general elections (i.e 2002), even
though the last one was in 200 7 is bec ause th e observation al data w ere
collected in July to A ugu st of 20 06 in p reparation for understanding
voting behaviour and wanting to forecast the 2007 general election – See
Bourne (2007a, 2007b)
distrust (i.e., 64.7% , Table 7). W ith respect to those who
were not enumerated to vote, 74% of them revealed that
they have a low trust (i.e., distrust) in sociopolitical
organizations in the country. In addition to the distrust,
those who are enumerated to vote are 2 times likely to
reveal a high degree of organizational trust compared to
those who were not enumerated to vote.
Hypothesis 6: People who are enumerated to vote are
more likely to trust sociopolitical institutions than those
who are not enumerated to vote controlled for sex.
Further examination of organizational trust and
enumerated to vote controlled for sex revealed that the
relation between organization trust and enumerated to
vote is explained by male (i.e. P2 (2) = 7.474, p =
0.024<0.05, cc = 0.119) and not being female (i.e., P2
(2) = 3.567, p = 0.168>0.05, Table 8).
Hypothesis 7: Those who participate in general elections
(i.e., voted in 2002 general elections) are more likely to
trust sociopolitical institutions than those who did not
participate.
A cross-tabulation between organizational trust and
those who voted in the 2002 general election found that
there is a statistical relation between two aforementioned
variables - P2 (2) = 17.237, p = 0.001<0.05 (Table 9).
How ever, the association was a very weak one -

Curr. Res. J. Soc. Sci., 2(3): 155-173, 2010
163
cc = 0.131 - i.e. the association between the two variables
is 13.1%. The general level of distrust in organizations in
Jamaica was 68.1%, but the level of distrust of those who
indicated that they had voted in the 2002 general elections
was less than for those who did not vote (i.e., 60.9 and
74.0% respectively, Table 9). With respect to those who
reported that they had not voted in 2002 general elections,
74% of them revealed that they had a low trust (i.e.,
distrust) in sociopolitical organizations in the country,
compared to 60.9% of those who voted.
Hypothesis 8: People who are enumerated to vote are
more likely to trust sociopolitical institutions than those
who are not enumerated to vote controlled for sex.
An examination of organizational trust by those who
voted in the last general election (i.e., 2002) controlled for
sex revealed that the relation between organization trust
and enumerated to vote is explained by both male (i.e., P2
(2) = 14.183, p = 0.001<0.05) and female (i.e., P2 (2) =
7.143, p = 0.028<0.05, Table 10). In regard to the strength
of the statistical relation, we found that it was higher for
males (17.8%) compared to females (11.6%). The
rationale behind the 13.1% (Table 9) is low because the
relationship is weaker for female than male. An analysis
of Table 9 showed that men who voted in the 2002
general reported are 4.2% less likely to distrust
sociopolitical institutions (i.e. 58.6%) compared to their
female counterparts (62.8% ).
Hypothesis 9: Cross-tabulation between organizational
trust and perception of corruption There is a statistical
relation between Organizational Trust and people’s
perception as to whether or not there is corruption within
the nation - P2(2) = 6.442, p = 0.040<0.05 (Table 11),
with a very weak statistical association between the two
Tab le 10: Cross-tabulation between organizational tru st and vote d in last
general elections controlled by sex, N = 953
Voted in last general elections (i.e. 2002)
----------------------------------------------------------
Male* Female**
------------------------ ----------------------------
Org anization al Tru st: No Yes No Yes
Very low to low 75 .9 58 .6 73 .5 62 .8
Middle 20 .6 38 .7 25 .5 34 .4
High 3.5 2.7 1.0 2.8
Count 141 292 200 320
*: P2 (2) = 14.183, p = 0.001<0.05, cc = 0.178, N = 433
**: P2 (2) = 7.143, p = 0.028< 0.05, cc = 0.116, N = 520
Tab le 11: Bivariate analysis between organizational trust and perception
of corruption, N = 1,290
Perception of corruption in the nation
-----------------------------------------------------
Organizational trust No Yes
Very low to low 65 .7 73 .5
Middle 31 .7 25 .1
High 2.6 1.4
Count 1007 283
P2 (2) = 6.442, p = 0.040>0.05, cc = 0.070
Table 12: Cros s-tabula tion between O rganizational Trust and
Perception of Corruption, N = 1,290
Perception of corruption in nation
------------------------------------------------------------
Male* Female**
----------------------- ----------------------------
Organizational trust No Yes No Yes
Very low to low 62 .1 74 .7 68 .0 74 .2
Middle 34 .9 23 .3 29 .7 25 .0
High 3.0 2.1 2.3 0.8
Count 401 146 575 128
*: P2 (2) = 7.471, p = 0.024< 0.05, cc = 0.16, N = 547
**: P2 (2) = 2.551, p = 0.279>0.05, N = 703
aforementioned variables (i.e. 7.0%). Of the number of
respondents who indicated that corruption does exist
within the nation (n = 283), approximately 8% more of
them distrust organizations (low to very low trust in
sociopolitical institutions) compared those who reported
that there is no corruption in Jamaica. Approximately
twice the number of respondents who indicated that
corruption does not exist in Jamaica had a high
organizational trust compared to those who reported that
they believed that corruption was present in the nation
(Table 11).
Hypothesis 10: There is a statistical association betweenorganizational trust and people’s perception as to whetheror not corruption exists in the society.
Further examination of organizational trust andperception of corruption controlled for sex revealed thatthe relation between organization trust and perception ofcorruption is explained by male (i.e. P2 (2) = 7.471,p = 0.024<0.05, Table 12) and not being female(i.e. P2 (2) = 2.55, P = 0.279>0.05). The findings, inTable 3, revealed that 12.6% more males who indicatedthat corruption existed in Jamaica distrust sociopoliticalinstitutions (using very low to low trust as a proxy fordistrust) compared to those who said that it did not exist.
The findings displayed in Fig. 1 (i.e. hypothesis 1.11,below) revealed that a statistical relation existed betweenOrganizational Trust and Parish of Residence of therespondents - P2 (26) = 191.776, p = 0.001. The relationbetween two aforementioned variables was a statisticallyweak one (i.e. contingency coefficient = 0.356 or 35 .6%),with a 1% change in parish of residence explaining a12.7% change in organizational trust. Further perusal ofFig. 1 showed that people who resided in St. James andClarendon reported the greatest degree of distrust (83.9%and 83.3% low organizational trust respectively), withthose dwelling in Kingston reporting the highest level oftrust for sociopolitical institutions in the nation (i.e.54.9%) followed by those who lived in Westmoreland(51%) then by those who resided in St. Mary (48.5%).Approximately 57% of the those people who resided inthe various parishes reported a distrust that was in excessof 70% (low degree of organizational trust) – in additionto St. James and Clarendon, they were Manchester(76.8%), Portland (73.5% ), St. Andrew (72.3%), St. Ann

Curr. Res. J. Soc. Sci., 2(3): 155-173, 2010
164
Fig. 1: Organizational trust by parish of residence
Table 13: The 10- most distrusting socio-p olitical Institutions in
Jamaica, N = 1,338
Institutions Count Percentage
Private sector 534 41 .3
Large corporations 593 46 .0
Armed forces 598 46 .1
Trade unions 606 49 .8
Police 702 53 .3
Jud iciary, cour ts 716 55 .4
Government 734 56 .2
Peo ple’s natio nal p arty 757 59 .1
Local gove rnm ent coun cil 771 59 .7
Parliament 803 62 .2
Political parties 910 69 .7
Jam aica labou r party 894 70.0*
Co mp iled b y Pa ul B ourne fro m d atase t of P ow ell et al. (2007)
*: Jama ica Lab our Party level of distrust was significantly more than
that of the People’s National Party, and the observation al data w ere
collected during when the People’s National Party was in government
(July-August, 2006)
(77.7%), St. Catherine (72.8%), and St. Elizabeth
(74.8%), (Fig. 1). It should be noted here that although
Kingston is bordered by St. Thomas, St. Andrew and St.
Catherine, it shares a low trust in sociopolitical
institutions like St. Thomas (57.5%) unlike St. Catherine
and St. Andrew that had high distrust, with those who
lived in St. Catherine and St. Andrew sharing a relatively
high distrust (or a high trust) in organizations in the nation
(Fig. 1).
Hypothesis 11: There is a statistical relation between
organizational trust and parish of residence
The 10 most distrusting socio-political institutions in
Jamaica (using low trust) in ascending are listed below in
Table 13. The study found that Jamaicans level of
confidence in the judiciary is very low, which is even
lower for Central Government, Local Government,
Parliament, and Political Parties.
In Jamaica, the level of organizational distrust is very
high (67.9%). However, there are particular institutions in
Table 14: The 6-least distrusting socio politic al institu tions in Jamaica,
N = 1,338
Institutions Count Percentage
Families 95 7.2
Sch ools 107 8.1
Universities 127 9.8
Churches 227 17 .1
Banks 368 27 .9
Prime Minister 507 40.0*
Co mp iled b y Pa ul B ourne fro m d atase t of P ow ell et al. (2007)
*: Th is response was during the time when the P eop le’s nation al Pa rty
was in power and M rs. Po rtia Simpson-Miller was the prime minister of
Jamaica - July-August, 2006.
families, schools, universities and colleges, churches, andthe least being the prime minister. Findings from Table 14reveal that Jamaicans have the greatest confidence (trust)in families (i.e. 92.3%), with trust in schools being 91.9%,universities and colleges (90.2%), banks (72.1%)compared to the prime minister (60% trust).
Hypothesis 12: Organizational trust (i.e. Sociopolitical
Trust) by ethnicity of the 6-most trusting sociopolitical
organizations in Jamaica, the sample population trusts the
prime minister the least (Fig. 2). Jamaicans of ‘Other’
ethnicities reported the highest level of trust in
organizations, with the least reported being in the Prime
Minister (i.e. 75% at the time Mrs. Portia Simpson-Miller
was prime minister), and banks (75%).
Hypothesis 13: Organizational trust (Sociopolitical Trust)
by education attainment.
Generally, when we examined trust in selected (6-
most trusting) organizational institutions by educational
attainment (Fig. 3), we found that irrespective of
educational attainment of the individual the most trusted
socio-political institution was the family followed by
schools, and the institution that was the least trusted was
the Prime Minister. Interestingly, tertiary level educated
respondents trusted the Prime Minister the least (55.7%).

Curr. Res. J. Soc. Sci., 2(3): 155-173, 2010
165
Fig. 2: The 6-most trusting institutions by Ethnicity
Fig. 3: Trusting of selected organizations by educational attainment

Curr. Res. J. Soc. Sci., 2(3): 155-173, 2010
166
Table 15: Bivariate analysis between trust in families and gend er of
respondents, N = 1,277
Ge nde r of re spo nde nts
------------------------------------------------------------
Trust in families: M ale Fem ale
Trust 92 .9 92 .4
Distrust 7.1 7.6
Count 562 715
P2 (1) = 0.087, p = 0.427>0.05
Tab le 16: B ivaria te analysis between trust in families and age groups of
respondents, N = 1,318
Ag e gro up o f resp ond ents
---------------------------------------------------------
Trust in families Yo uth Oth er adults Elderly
Trust 92 .0 93 .0 95 .1
Distrust 8.0 7.0 4.9
Count 438 799 81
P2 (2) = 1.073, p = 0.585>0.05
Table 17: Bivariate analysis between trust in schools and gender of
respondents, N = 1,280
Ge nde r of re spo nde nts
---------------------------------------------------------
Trust in schools: M ale Fem ale
Trust 91 .8 91 .8
Distrust 8.2 8.2
Count 562 715
P2 (1) = 0.087, p = 0.427>0.05
Hypothesis 14: There is a statistical difference between
the gender of respondents and trust in family.
We have found that there is no statistical relation
between bivariate analysis between trust in families and
gender of respondents - P2 (1) = 0.087, p = 0.427>0.05.
(Table 15).
Hypothesis 15: There is a statistical difference between
the age group of respondents and trust in family. The
findings revealed that there is no statistical relation
between bivariate analysis between trust in families and
age group of respondents - P2 (2) = 1.073, p = 0.585>
0.05. (Table 16).
Hypothesis 16: There is a statistical difference between
the gender of respondents and trust in school.
A cross-tabulation between trust in schools and
gender of respondents reveal that there is no statistical
association between the two aforementioned variables -
P2 (1) = 0.001, P = 0.970>0.05 (Table 17).
Hypothesis 17: There is a statistical difference between
age group of respondents and trust in family.
An examination of the cross-tabulation between trust
in schools and age group of respondents show that there
is no statistical relations between trust in schools and age
group of people in the sampled population (N = 1,321) -
P2 (2) = 3.469, P = 0.176>0.05. (Table 18).
Hypothesis 18: There is a statistical difference between
the gender of respondents and trust in church.
Tab le 18: Bivariate analysis between trust in families and age groups of
respondents, N = 1,321
Ag e gro up o f resp ond ents
---------------------------------------------------------
Trust in families: Yo uth Oth er adults Elderly
Trust 92 .7 91 .0 96 .3
Distrust 7.3 9.0 3.7
Count 440 799 82
P2 (2) = 03.469, p = 0.176>0.05
Tab le 19: Bivariate analysis between trust in churches and gender of
respondents, N = 1,282
Ge nde r of re spo nde nts
------------------------------------------------------
Trust in Chu rches: M ale Fem ale
Trust 78 .7 85 .8
Distrust 21 .3 14 .2
Count 562 715
P2 (1) = 11.029, p = 0.001<0.05
Tab le 20: B ivaria te analysis between trust in churches and age groups
of respondents, N = 1,323
Ag e gro up o f resp ond ents
---------------------------------------------------------
Trust in churches Yo uth Oth er adults Elderly
Trust 84 .7 81 .3 88 .0
Distrust 15 .3 18 .7 12 .0
Count 438 802 83
P2 (2) = 3.939, p = 0.140>0.05
Based on Table 19, we found a statistical relation
between trust in churches (i.e. confidence in) and gender
of respondents - P2 (1) = 11.029, p = 0.001<0.05.
Approximately 7% more males distrust the church
compared to 14.2% females. This means that 78.7% of
males had a high confidence in the church compared to
85.8% of females.
Hypothesis 19: There is a statistical difference between
age group of respondents and trust in church.
The cross-tabulation between trust in churches and
age group of respondents show that there is no statistical
relations between the two aforementioned variables
(N=1,323) - P2 (2) = 3.939, p = 0.140>0.05 (Table 20).
Based on Table 20, there is no statistical difference
between the various age groups and the sampled
respondents’ perception of trusts or distrust in churches.
Hypothesis 20: There is a statistical relation between
trusting the government and trust in sociopolitical
organizations (i.e. organizational trust).
An examination of organizational trust and trust in
government reveal that there is a statistical relation
between the two aforementioned variables - P2 (3) =
58.51, p = 0.014<0.05. The statistical association is a
very weak one (contingency coefficient = 21.3% ).
Further inquiry of Table 21 reveals, that of the 8% of
those who reported that they trust the government,
approximately 44% of them have a low trust in
organization, with only 12.1% having a high trust in
organization. Some 8 times more of those who trust
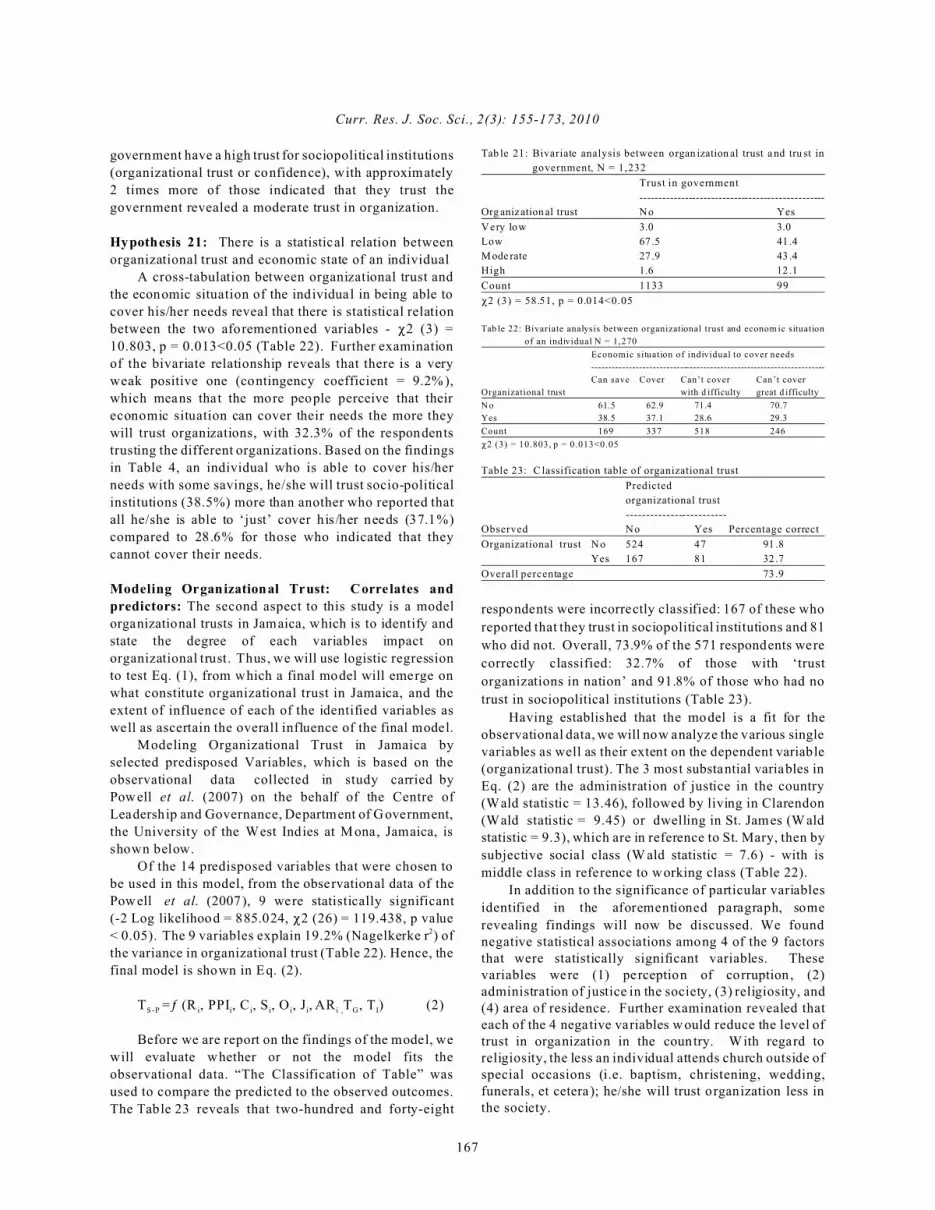
Curr. Res. J. Soc. Sci., 2(3): 155-173, 2010
167
government have a high trust for sociopolitical institutions
(organizational trust or confidence), with approximately
2 times more of those indicated that they trust the
government revealed a moderate trust in organization.
Hypothesis 21: There is a statistical relation between
organizational trust and economic state of an individual
A cross-tabulation between organizational trust and
the economic situation of the individual in being able to
cover his/her needs reveal that there is statistical relation
between the two aforementioned variables - P2 (3) =
10.803, p = 0.013<0.05 (Table 22). Further examination
of the bivariate relationship reveals that there is a very
weak positive one (contingency coefficient = 9.2% ),
which means that the more people perceive that their
economic situation can cover their needs the more they
will trust organizations, with 32.3% of the respondents
trusting the different organizations. Based on the findings
in Table 4, an individual who is able to cover his/her
needs with some savings, he/she will trust socio-political
institutions (38.5%) more than another who reported that
all he/she is able to ‘just’ cover his/her needs (37.1%)
compared to 28.6% for those who indicated that they
cannot cover their needs.
Modeling Organizational Trust: Correlates and
predictors: The second aspect to this study is a model
organizational trusts in Jamaica, which is to identify and
state the degree of each variables impact on
organizational trust. Thus, we will use logistic regression
to test Eq. (1), from which a final model will emerge on
what constitute organizational trust in Jamaica, and the
extent of influence of each of the identified variables as
well as ascertain the overall influence of the final model.
Modeling Organizational Trust in Jamaica by
selected predisposed Variables, which is based on the
observational data collected in study carried by
Powell et al. (2007) on the behalf of the Centre of
Leadership and Governance, Department of Government,
the University of the West Indies at Mona, Jamaica, is
shown below.
Of the 14 predisposed variables that were chosen to
be used in this model, from the observational data of the
Powell et al. (2007), 9 were statistically significant
(-2 Log likelihood = 885.024, P2 (26) = 119.438, p value
< 0.05). The 9 variables explain 19.2% (Nagelkerke r2) of
the variance in organizational trust (Table 22). Hence, the
final model is shown in Eq. (2).
TS-P =ƒ (R i, PPIi, C i, S i, O i, Ji, AR i ,TG, T I) (2)
Before we are report on the findings of the model, we
will evaluate whether or not the model fits the
observational data. “The Classification of Table” was
used to compare the predicted to the observed outcomes.
The Table 23 reveals that two-hundred and forty-eight
Tab le 21: Bivariate analysis between organ ization al trust a nd tru st in
government, N = 1,232
Trust in government
-------------------------------------------------
Org anization al trust No Yes
Very low 3.0 3.0
Low 67 .5 41 .4
M ode rate 27 .9 43 .4
High 1.6 12 .1
Count 1133 99
P2 (3) = 58.51, p = 0.014<0.05
Tab le 22: Bivariate analysis between organizational trust and econom ic situation
of an individual N = 1,270
Economic situation of individual to cover needs
---------------------------------------------------------------------
Can save Cover Can’t cover Can’t cover
Organizational trust with d ifficulty great d ifficulty
No 61.5 62.9 71.4 70.7
Yes 38.5 37.1 28.6 29.3
Count 169 337 518 246
P2 (3) = 10.803, p = 0.013<0.05
Table 23: C lassification table of organizational trust
Predicted
organizational trust
-------------------------
Observed No Yes Percentage correct
Organizational trust No 524 47 91 .8
Yes 167 81 32 .7
Overall percentage 73 .9
respondents were incorrectly classified: 167 of these who
reported that they trust in sociopolitical institutions and 81
who did not. Overall, 73.9% of the 571 respondents were
correctly classified: 32.7% of those with ‘trust
organizations in nation’ and 91.8% of those who had no
trust in sociopolitical institutions (Table 23).
Having established that the model is a fit for theobservational data, we will now analyze the various singlevariables as well as their extent on the dependent variable(organizational trust). The 3 most substantial variables inEq. (2) are the administration of justice in the country(Wald statistic = 13.46), followed by living in Clarendon(Wald statistic = 9.45) or dwelling in St. James (W aldstatistic = 9.3), which are in reference to St. Mary, then by
subjective social class (W ald statistic = 7.6) - with is
middle class in reference to working class (Table 22).
In addition to the significance of particular variables
identified in the aforementioned paragraph, some
revealing findings will now be discussed. We foundnegative statistical associations among 4 of the 9 factorsthat were statistically significant variables. Thesevariables were (1) perception of corruption, (2)administration of justice in the society, (3) religiosity, and(4) area of residence. Further examination revealed thateach of the 4 negative variables w ould reduce the level oftrust in organization in the country. With regard toreligiosity, the less an individual attends church outside ofspecial occasions (i.e. baptism, christening, wedding,funerals, et cetera); he/she will trust organization less inthe society.

Curr. Res. J. Soc. Sci., 2(3): 155-173, 2010
168
On the other hand, 5 of the 9 factors do positively
influence organization trust (Table 9) and these are as
follows-trust in government, interpersonal trust,
occupation, political participation, and social class. W e
found that an individual who trust the government in
reference to those who do not are 2 times more likely to
trust organizational institutions in the society (OD = 2.1,
95% CI: 1.2 to 3.7). Furthermore, a person who classify
him/herself as in the lower professions is 1.5 times
(OD = 1.5, 95% CI: 1.03 to 2.20) more likely to trust
sociopolitical organization in referent to those in the high
professions – for example managers, medicine, teaching
et cetera. Interpersonal trust was the same as occupation
(OR = 1.5, 95% CI: 1.06 to 2.13).
In addition to aforementioned positive factor is
subjective social class. W e found that those in the middle
class with referent to lower class is 1.7 times (OR = 1.7,
95% CI: 1.16 to 2.36) more likely to trust organizational
institutions in nation (Table 24).
Is the model identified in Eq. (2) a predictive one?
We will use the log formula to establish whether or not
our model in Eq. (2) is a predictive one.
TS-P =ƒ (R i, PPIi, C i, S i, O i, Ji, AR i TG , T I,) (2)
Prob (event) = 1 / (1 + e-z) (3)
Z = B0 + B1X1 + B2X2 + B3X3 + B4X4 + …+ B pX p (4)
where B0 is the value for the constant and B1 to Bp are
the coefficients estimated from the data, X is the
independent variable and Z is a component within the
probability of the event occurring. W e will now illustrate
the use of Z below as follows – let us replace each X with
the variable that is statistically significant from the model
in along with the constant and the estimators (Table 25):
Z = -1.075 + 0.745(TG) + 0.409 (O i) + 0.056(PPIi) –
0.456(C i) + 0.404(T I) – 0.700 (J i) – 0.103 (R i) +
0.503(S i) + $ (ARi) (5)
Z= - 0.747 (Table 25)
We will use the log formula in Eq. (5):
Prob (event) = 1 / (1 + e-z) (3)
As the formula that will test the predictive power of the
predisposed factors
Option 1: In each cases, 1 denotes that the individual
trust the government as well as other people, lower
occupation, corruption, administration of justice that
benefits all equally, middle class with referent to lower
class and the area of residence that will be used
is Portland because it has the least impact on the
Tab le 24 : Logi st ic Regress ion : Publ ic confidence in o rgan izat ions by some
demographic, and political variables
C I ( 95 % )
--------------------------
Political variables Coefficient p-value Odds ratio Low er Upper
Tru st (gov ’t) 0.745 0.009 2.11 1.20 3.70
Race1 0.390 0.631 1.48 0.30 7.28
Race2 - 0.111 0.881 0.90 0.21 3.80
Occupation 0.409 0.035 1.51 1.03 2.20
Political participation 0.056 0.030 1.06 1.01 1.11
Sex 0.200 0.243 1.22 0.87 1.71
Perceived corruption - 0.456 0.030 0.63 0.42 0.96
Wellbeing 0.079 0.146 1.08 0.97 1.20
Interpersonal Trust 0.404 0.023 1.50 1.06 2.13
Justice - 0.700 0.000 0.50 0.34 0.72
Religio sity - 0.103 0.012 0.90 0.83 0.98
socialcl1 0.503 0.006 1.65 1.16 2.36
socialcl2 0.732 0.069 2.08 0.94 4.58
Age 0.007 0.309 1.01 0.99 1.02
Clarendon - 1.449 0.002 0.24 0.09 0.59
Hanover - 0.102 0.784 0.90 0.44 1.87
Kingston 0.244 0.565 1.28 0.56 2.94
Manchester - 1.048 0.009 0.35 0.16 0.77
Portland - 0.969 0.010 0.38 0.18 0.80
St Andrew - 1.096 0.010 0.33 0.15 0.77
St Ann - 0.444 0.291 0.64 0.28 1.46
St Catherine - 0.634 0.105 0.53 0.25 1.14
St E lizabeth - 1.039 0.006 0.35 0.17 0.74
St James - 1.320 0.002 0.27 0.11 0.63
St Thom as 0.014 0.968 1.01 0.51 2.00
Trelawny - 0.143 0.745 0.87 0.37 2.05
Constant - 1.075 0.257 0.34
-2 Log Likelihood = 885.024
N ag elk er ke R s qu ar e = 0.1 92 (o r 1 9.2 % )
Ch i-squ are ( 26) = 1 19.4 38, p -value = 0.00 1,
N = 819, 61.2%
Table 25:
Va riable Option 1 Option 2
TG: 0.745 0
O i: 0.409 0
PPIi 0.392
C i: - 0.456 0
T I: 0.404 0
J i: - 0.700 0
S i: 0.503 0
AR i: - 0.969 - 1.449
Constant - 1.075 - 1.075
Z = - 0.747 - 2.524
organizational trust, 7 is used for political participation
because it indicates the highest value for the lowest
degree of political participation, and
Option 1(Table 3):
Prob (event) = 1 / (1 + e-0 .747)
= 1/ (1 + 0.47378578)
= 1/1. 47378578 = 0.678 (# 0.7) (for option 1)
hence, the model is a predictive one for option 1
(Table 25).
Option 2: In each cases, 0 denotes that the person does
not trust government or other persons, upper occupation,
believe that there is no corruption, administration of
justice that does not benefits all equally, the individual is
in lower class and the area of residence that will be used
is Clarendon because it has the least impact on the
organizational trust, 7 is used for political participation
because it indicates the highest value for the lowest
degree of political participation and O ption 2 (Table 3):

Curr. Res. J. Soc. Sci., 2(3): 155-173, 2010
169
Option 2(Table 3):
Prob (event) = 1 / (1 + e-2 .524)
= 1/ (1 + 0.080138411)
= 1/1. 080138411 = 0.925 (for option 2)
Hence, the model is a predictive one for option 2.
We can now conclude that TS-P =ƒ (R i, PPIi, C i, S i, O i,
Ji, AR i TG , T I,) is a predictive model for organization trust
and more than more factors.
Limitation of the model: The initial Model [TS-P =ƒ (R i,
PPIi, C i, S i , O i, Ji, AR i TG , T I,)] assumes that trust is
continuous over time, which is furthest from the reality as
organization trust is continually change based on people’s
perception of the various sociopolitical organization at a
static ‘snapshot’ time. But the dataset from which the
Model is derived is at a static ‘snapshot’ moment in time
and this does not take into consideration different time
intervals. Trust is fluid; and therefore, any measure of
this construct must include the fact that trust is
continuously changing over ones lifetime based on the
perception of trustor (the decision maker) or trustee
(receiver of the trust) and this may even change over short
periods of time. Hence, we must make a modification to
the initial model to include time intervals, t, as an
important factor:
TS-P =ƒ (R i, PPIi, C i, S i , O i, Ji, AR i TG , T I, t)
DISCUSSION
The aim of this study was two-fold within the broader
context of organizational trust. Firstly, to build an
organizational trust model for socio-political institutions
in Jamaica (using confidence in 22-socio-political
institutions in the society) as well as to examine the top
five and the lower five institutions in regard to public
confidence (trust) in them. Secondly, from the model
ascertain what is the explanatory power of the final
model, and from the identify model examine the
explanation of each of the significant factors as well as
ascertain whether the model is a predictive one. In
summary, the literature has shown perception is a ‘good’
evaluation of reality as people are best able to determine
what affects them. Hence, using Jamaicans’ perception,
this paper has modeled trust in organizations. We have
found that 9-factor influence organizational trust, with an
explanation of 19.2% - Nagelkerke R2 = 19%.
One of the delimitation of a snapshot study is that
information is specialized to the time period and that trust
is not static, hence we have included time, t, as an
additional variable to address the issue of continuity. Why
did we choose to use only the number of predisposed
variables in this study and not more? The answer to this
question is primarily because the observational data
gathered; and so, we do not claim to provide all the
answers to the organizational trust discourse but this
model provides a premise for which we can understand
the debate. It should be noted here that in this study, the
model only explain 19.2% of the variance in
organizational trust compared to Tang’s work (2005) that
identified 13 variables and that they explain 4.6% of the
model (adjusted R2). In a five country study on trust in
government and related institutions among adolescents,
Torney-Purta et al. (2004) found that each of the model
had a low R-square - Bulgaria (0.05); Chile (0.071);
Colombia (0.054); England (0.071) and the United States
(0.108). Thus our model is a very good one. Furthermore,
the factors identified in this research are predictive in
nature .
In recent times, there is a widespread perception that
corruption is rampant in Jamaica, and with the
unprecedented number of police officers that have been
charged for corruption coupled with upsurge of crime and
violence in nation is making people highly suspicious
(distrusting) of organization, and other persons in the
society. For some time now, people have been arguing
that corruption does not influence trust; the findings of
this research have disproved this notion as perception of
corruption does affect organization trust. The finding in
this research concurs with Uslaner’s work (2005) that
corruption is inversely related to trust. Unlike Uslaner, we
found that the relation between the two aforementioned
variables to be a weak negative one (single correlation
coefficient, phi = - 0.069). Furthermore, he forwards the
perspective that there is no evidence to support that a
change in corruption will result in changes in trust. This
study is offering some clarification as we have found that
the more people believe that corruption exist in the
society, the less they w ill trust organizations (B = -0.456,
Exp (B) = 0.634, 95% CI-0.420 to 0.958, p = 0.030<0.05).
Corruption destroys integrity and credibility. People
do not trust blindly forever, and so they will modify their
trust in times based on past performance, integrity and
credibility of the trustor. If people have come to expect
dis ingenuous behaviour, unfulfi l led promises,
misappropriate of funds, inequality and injustices, graft,
dishonesty, kleptocracy, cronyism, poor, bride, deception
and collusion, and management practices, one thing that
this will change is people’s trust in others and in
organizations. Thus, Jamaicans high probability of
evading taxes is a by-product of low trust society
(Uslaner, 2005). Although it appears difficult for some
people to comprehend ‘tax evasion’, this is coming from
people’s perception of the injustices, dishonesty, the
‘broken’ promises and inequalities within the society.
People do not void themselves of their sociopolitical
milieu in how they act, and this helps to fashion their
behaviour. And this should inform human resource
practitioners, publicists and others that people w ill reduce

Curr. Res. J. Soc. Sci., 2(3): 155-173, 2010
170
their confidence in an organization, if they believe that
corruption exists therein.
This study has found that general organization trust
(i.e. confidence in sociopolitical institutions) is very low -
that is, 7 out of 10 persons do not trust organizations in
the nations - however, there a particular institution in
which people still reported great trust. These
organizations are like (1) family (9 out of 10); (2) Church
(8 out of 10); (3) schools (9 out of 10); universities (9 out
of 10); banks (7 out of 10). Nevertheless, some
institutions do not seem to be resonating with the public
as they distrust these organizations. The examples here
are political parties; parliament, local government, and
central government (Table 10). Those findings are not
unique as the literature shows that the family is the most
trusting in organization, followed the schools and the least
trusting being local government and political parties. We
would like to forward here that although general
organizational is very low in Jamaica. we need to
contextualize this finding. Using the European Values
Survey, the average interpersonal trust in Europe is 30.7%
(i.e. 3 out of 10 persons trust each other), compared to
that in Belarus (41.9% or 4 out of 10 person), Ukraine
(27.2%, that is, 3 out of 10), L ithuania (23.7% or 2 out of
10), Russia (23 .7%, 2 out of 10) and that in Poland
(18.9%, or 2 out of 10 persons). Even though this is not
organizational trust, people will not trust institutions more
than how they trust themselves or others. Hence, using
interpersonal trust in Europe we now know that the level
of organizational trust in Jamaica, despite it being low, is
highly comparable with like in the rest of the world.
It is, therefore, not surprising that there is a
credibility issue for the distrusting organizations, and the
difficulty with which they must execute their tasks
coupled with the uncooperative atmosphere between
themselves and people. Organization trust is not a simple
phenomenon as it builds cooperation, tolerance,
productivity, production, lower unit and transactional cost
and strengthens harmonious relationship (Fukuyama,
1995). With the high levels of distrust in Jamaica, the
high degree of crime and violence are also fostering and
deepening this distrust. People are not tolerant of each
other. And people believe that the intentions, motives and
purpose of others is to do them harm. Hence, at the first
act of another they will retaliation in self - defense and
preservation. A factor that this study identified within the
model is justice (or injustice), and the fact that there is an
inverse association between the administration of justice
favouring the rich and organizational distrust, which
further our claim of self defense instead of through the
courts or by the police. Pow ell et al. (2007) study, find
that the police are the third least trusting institution in
Jamaica, with the judiciary being the fifth least trusting
organization. With this reality, self-protection, crime and
violence are preferred alternatives to (1) reporting a
matter to the police, (2) taking an issue to court, (3)
adhering to the dictates of judiciary, (4) ‘buying’ into a
vision of change and socioeconomic advancement from
political parties as there is a credibility issue from past
performance, (5) seeing institutions as having ‘good’
intents or motives, and (6) interpreting actions from
organizations are equally beneficial to all.
The researcher recommend, within what obtains, that
a study be done on ‘trust development in Jamaica’ as it
holds the answer for many of the current sociopolitical
dilemmas in the society. Like the literature outlined, we
believe that organizational trust (or distrust) explains the
crux of the matter on social cooperation and the low
social capital in the society. Hence, the restoration of
trust is pivotal to the establishment tolerance, cooperation,
democracy, civility, credibility, confidence, and
forgiveness. Embedded in organizational trust, here, is
the personal aspect to this. A personal variable that we
found did not relation to organizational trust was
wellbeing (p>0.05). It means here that Jamaicans will not
trust organizations because of a change in their personal
wellbeing, but it will be based on other conditions.
Self-trust (or interpersonal trust) is positively
associated with organizational trust. As such, when people
have a low personal trust, interpersonal trust is low and so
does organizational trust. The implications are extensive
as people interpret other people’s motives, and intents and
credibility based on their self-trust. It goes beyond
interpretations to actions of others. A number of
companies’ executives continuously have to transact
business with other companies’ executives in different
transactions, and the process becomes highly complex
when there is no self-test and this is even intensive when
there is an issue of credibility. The process is expanded
when there is no trust; and this increases transactional
costs (Fukuyama, 1995), lower production, and increases
frustration. Hence, this explains why high trust companies
outperform low trust organization. Companies that are in
a high trust milieu create a ‘good’ working environment,
which encourages friendly competitions. Then, in this
discussion so far we have not addresses the restoring trust
when it has been lost. We will avoid examining this
aspect because there is no study within our geographic
space that has investigated trust development and
building.
The findings of this research concur with the
literature that there is a high distrust for political parties.
In the study carried out by Tang (2005), the researcher
identified that a positive statistical relation exists between
political party involvement and trust, which was
concurred on by this study. In this study we found that an
individual is 1.1 times more likely to trust an
organization, if he/she becomes more involved in political
activities. Based on the findings of this research, we have
found that no statistical association exists between trust

Curr. Res. J. Soc. Sci., 2(3): 155-173, 2010
171
and gender, trust and age group. However, this was not
the case in the literature (in particular China). W e will
note here for Boxill et al. (2007) study, they found a
statistical relation between interpersonal trust and age, but
this was not the case for this study as the dependent
variable was organizational trust and not interpersonal
trust. However, in this study we disagreed with Tang
(2005) that interpersonal trust is associated with corporate
(or organizational trust). Here, we found that not only a
positive relation between the two aforementioned
variables but that organizational trust will increase by
approximately by 1.5 times, if an individual reported that
he/she trust other persons. Furthermore, we examine
whether trust in government is associated with corporate
(or organizational) trust and we found that a person who
trust the government is 2 times more trusting in an
organization. On the issue of trust and area of residence,
Boxill et al. (2007) study revealed that a statistical
association exists between parish of residence and trust in
particular interpersonal trust, we our findings noted that
this is also the case for organizational trust.
CONCLUSION
In concluding, companies’ executives are stewards,
which are not only assessed based on profitability but on
transparency and accountability, thereby fostering
resourcefulness, and creating dividends for sustainability.
These are accomplished whenever people trust an
organization. This becomes even stronger when there is
transparency, as it is a byproduct of reputation. Trust
fosters heightened loyalty for the company’s and its
brands, and any perceive question of credibility due to
corruption or disingenuousness means reduced trusting of
the institution. On the other hand, if people are able to
trust the organization and its product, it (the company) is
able to build partnership, deepens collaborations, increase
sales, productivity and profitability (Fukuyama, 1995).
This improved collaboration is attained through
cooperation. As we have found that credibility, which can
be measured by way of corruption and perception of
justice influence organizational trusted, distrust
disconnects the people from the institution.
High trusting companies are able to execute their
policies than low trusting companies because people will
allow them to do so. As people will be supportive of the
policies and programmes of institutions that have a strong
reputation, transparency, honesty, credibility, delivers
services and product on times based on their promises,
clarify their ex pecta tions, responsibil i ty and
accountability. A human resource personnel needs to
understand that an organization is a family, and families
are organizations. People will adhere and follow
organizational objectives and mandate because they are
confident with their credibility, past performance and
intent of the institutions, which is the collective
conscience of commitment. Embedded in high trust
organizations are easy with which we share information,
allow others to make mistakes, high loyalty, transparency
and accountability are important, people are authentic and
people feel a sense of positive expectation for each other.
An organization that holds everything together is
using trust as the company’s experience goes beyond the
operational apparatuses, tutelage and mission statement.
Achieving an organizational goal and mission are carried
out by civic commitment of employers, customers, and
external publics. It should be noted that what holds all of
this together is the ‘social glue’ called trust. Trust,
therefore, is the core of human relationships, and like
human relationships, the organization is a likened to a
family with different individuals, systems and structures
that must come together as a single unit for the holistic
nature of the common good. This can only be attained
through cooperation, civic engagement, confidence,
positive expectation, which are all within the purview of
trust. Once gains, while we do not claim to provide all
the answer with this single static study, it will be used
assist future research in the area as nothing exists on the
topic at the moment.
Human resource practitioners, policy makers and
general public need to be cognizant that interpersonal
distrust, distrust in government and related institutions
dates back as earlier as to slavery, and that any
cooperation between the publics and organizations must
be done within the context of trust as the level of distrust
is increasing and it is not expected to be lowered in any
time soon. Many factors affect trust in socio-political
institutions, and so trust building must be driven by our
current knowledge of trust (or d istrust). W ith the low
organizational confidence (which is used as a synonym
for trust throughout this work) that the nation is now
undergoing, this explains why some company are faced
with lawsuits, sabotage, grievances, militant stakeholders,
unhealthy working environment, unhappy working
environment, intense socio-political environment,
excessive time wasted due to bureaucracy and defending
positions and decisions, slow approvals of issues, and
unnecessary hierarchy as many companies seek to protect
themselves against distrusting employees, the public and
other stakeholders. The costs of dishonesty, fraud,
corruption and deception are enormous; and further add to
the cost of doing business in a society (in terms of
profit/bottom-line). While companies must surv ive within
these milieus, institutions need to understand that they
need to aid people, employees and stakeholders through
these challenging times as they can generate trust by their
actions throughout the society. Organizations are,
therefore, built on trust and not on force. As a result, it is
imperative that their intent reflects motives, mission and
principles that w ill build trust.

Curr. Res. J. Soc. Sci., 2(3): 155-173, 2010
172
REFERENCES
Almond, G.A. and S. Verba, 1963. The civic culture:
Political attitudes and democracy in five nations.
Princeton University Press, Princeton.
Anand, S. and M. Ravallion, 1993. Human development
in poor countries: On the role of private incomes
and public services. J. Econ. Perspect., 7: 133-150.
Baier, A., 1986. Trust and a antitrust. Ethics, 96: 231-260.
Becker, G.S., T.J. Philipson and R.R. Soares, 2004. The
quantity and quality of life and the evolution of
world inequality. Retrieved from: http://www.spc.
uchicago.edu/prc/pdfs/becker05.pdf. (Accessed date:
August 22, 2009).
Blind, P.K., 2007. Building trust in government in the
twenty-first century: Review of literature and
emerging issues. Symposium Conducted at the
Meeting of the 7th Global Forum on Reinventing
Government Building Trust in Government, Vienna,
Austria.
Blinder, A.S., 2000. Central Bank credibility: Why do we
care? How do we build it? Am. Econ. Rev., 90(5):
1421-1431.
Bourne, P.A., O.W. Beckford and N.C. Duncan, 2010.
Generalized trust in an english-speaking caribbean
nation. Curr. Res. J. Soc. Sci., 2(1): 24-36.
Bourne, P.A., 2010. Crime, tourism and trust in Jamaica.
Curr. Res. J. Soc. Sci., 2(2): 69-83.
Boxill, I., B. Lewis, R. Rusell, A. Bailey, L. W aller,
C. James, P. M artin and L. Gibbs, 2007. Political
culture of democracy in Jamaica. The United States
Agency for International Development, United
States.
Covey, S.M.R. and R.R. Merrill, 2006. The Speed of
Trust: The one Thing that Changes Everything. Free
Press, New York.
Deutsch, M., 1958. Trust and suspicion. J. Conflict
Resolut., 2: 265-279.
Deutsch, M., 1962. Cooperation and Trust: Some
Theoretical Notes. In: Marshall R.J. (Ed.), Nebraska
Symposium on Motivation, pp: 275-320.
Deutsch, M., 1973. The resolution of conflict. Yale
University Press, New Haven, CT.
Diener, E., 2000. Subjective wellbeing: The science ofhappiness and a proposal for a national index. Am.Psychol. Assoc., 55: 34-43.
Diener, E., 1984. Subjective wellbeing. Psychol. Bull.,95(3): 542-575.
Diener, E. and E. Suh, 1997. Measuring quality of life:Economic, social subjective indicators. Soc. Indic.Res., 40: 189-216.
Dogan, M., 2002. Dissatisfaction and distrust in WestEuropean democracies. Eur. Rev., 10: 91-114.
Duck, S., 1997. The Handbook of Personal Relationships:Theory, Research and Interventions. W iley, NewYork.
Easterlin, R.A., 2003. Building a better theory of
wellbeing. Prepared for presentation at the
Conference “Paradoxes of Happiness in Economics.
University of Milano-Bicocca, March 21-23, 2003.
Retrieved from: http://www-rcf.usc.edu/~easterl/
papers/BetterTheory.pdf. (Accessed date: August 26.
2006).
Fukuyama, F., 1995. Trust. The Social Virtues and the
Creation of Prosperity. Free Press, New York.
Gambetta, D., 1988. Can we Trust? In: Gambetta, D.,
(Ed.), Trust: Making and Breaking Cooperative
Relationships. Basil Blackwell, Cambridge, UK, pp:
213-237.
Gaspart, F., 1998. Objective measures of wellbeing and
the cooperation production problem. Soc. Choice
Welfare, 15(1): 95-112.
Hardin, T., 1993. The street-level epistemology of trust.
Polit. Soc., 21: 505-529.
Inglehart, R., 1999. Trust, Wellbeing and Democracy. In:
Mark, E.W ., (Ed.), Democracy and Trust. Cambridge
University Press, Cambridge.
Jamaica Information Service (JIS), 2003. Inaugural
Address by the Hon. Portia Lucretia Simpson-Miller,
MP, Prime Minister of Jamaica. In: Waller, L.,
P. Bourne, I. Minto and J. Rapley, 2007. A
Landscape Assessment of Political Corruption in
Jamaica. CAPRI Taking Responsibility, Kingston.
Retrieved from: http://www.jis.gov.jm/PMspeeches/
html/20060331T120000. (Accessed date: October 01,
2006).
James, H.S.Jr. and M.E. Sykuta, 2004. Generalized and
particularized trust in organization. Symposium
Conducted at the Meeting of the International Society
for New Institutional Economics Meetings in Tucsan,
Arizona, USA , October.
Kramer, R.M . and T.R. Taylor, 1995. Trust in
Organizations: Frontiers of Theory and Research.
Thousand Oaks, Calif., Sage.
Kuhn, T.S., 1996. The Structure of Scientific Revolution.
3nd Edn., University of Chicago, Chicago.
Lewicki, R.J., E.C. Tomlinson and N. Gillespie, 2006.
Models of interpersonal trust development:
Theoretical approaches, empirical evidence, and
future directions. J. Manage., 32: 991-1022.
Lewicki, R.J. and M.A. Stevenson, 1998. Trust
development in negotiation: Proposed actions and a
research agenda. J. Bus. Prof. Ethic., 16(1-3):
99-132.
Mark`czy, L., 2003. Trust but Verify: Distinguishing
Distrust from V igilanc e. Re trieved from:
http://www.goldmark.org/livia/papers/socint/socint.
pdf, (Accessed: April 22, 2008)
Miller, A.H., 1974. Political issues and trust in
government, 1964-1970. Am. Polit. Sci. Rev., 68(3):
951-972.

Curr. Res. J. Soc. Sci., 2(3): 155-173, 2010
173
Morgan, B., 2005. Trust, education and development inJamaica, 1950-2000. Unpublished Ph.D. Thesis, CaseWestern Reserve University.
Nye, J., 1997. Introduction: The Decline of confidence inGovernment. In: Nye, J., S. Joseph, P.D. Zelikowand D.C. King, (Eds.), Why People Don’t TrustGovernment? Harvard University Press, Cambridge.
O’Neill, O., 2002. A question of trust. CambridgeUniversity Press. Retrieved from: http://assets.cambridge.org/97805215/29969/sample/9780521529969ws.pdf, (Accessed: March 2, 2008)
Powell, L.A., P. Bourne and L. Waller, 2007. ProbingJamaica’s Political culture, Volume 1: Main trendsin the July-August 2006 Leadership and GovernanceSurvey. Centre for Leadership and Governance,Kingston, Jamaica, pp: 1-117.
Putnam, R.D., 1993. Making D emocracy Work: CivicTraditions in Modern Italy. Princeton UniversityPress, Princeton.
Putnam, R.D., 1995. Bowling alone: America’s decliningsocial capital. J. Democr., 6: 65-78.
Ringen, S., 1995. Wellbeing, measurement, andpreferences. Scand. Sociol. Assoc., 38(1): 3-15.
Seligson, M., 2002. The renaissance of political culture orthe renaissance of the ecological fallacy. Comp.Polit., 34: 273-292.
Sen, A., 1982. Choice, W elfare and M easurement. BasilBlackwell, Oxford.
Sen, A., 1998. Mortality as an indicator of economicsuccess and failure. Econ. J., 108: 1-25.
Stutzer, A. and B.S. Frey, 2003. Reported subjective
wellbeing: A challenge for economic theory and
economic policy. Retrieved from: http://www.crema-
research.ch/papers/2003-07.pdf, (Accessed: August
31, 2006)
Tang, W., 2005. Public opinion and political change in
China. Standard University Press, Los Angeles.
Torney-Purta, J., K.W. Richardson and C.H. Barber,
2004. Trust in government-related institutions and
civic engagement among adolescents: Analysis of
Five Countries from the IEA Civic Education Study.
Circle Working Paper, the Centre of Information and
Research on Civic Engagement, August.
Uslaner, E.M., 2005. Trust and Corruption. Global
Corruption Report, 2005 Transparency International,
London, pp: 262-264
United Nations, 2007. Building Trust through Civic
Engagement. New York, Retrieved from: http://
unpan1.un.org/intradoc/groups/public/documents/U
N/UNPA N028357.pdf.
Waller, L., P. Bourne, I. Minto and J. Rapley, 2007. A
landscape assessment of political corruption in
Jamaica. CAPRI Taking Responsibility, Kingston.
World Bank, 1997. World Development Report. Oxford
University Press, New York, pp: 102-104.
Zak, P.J. and S. Knack, 2001. Trust and growth. Econ. J.,
111: 295-321.