integrating spectral, spatial, and terrain variables for forest ecosystem classification. photogramm...
TRANSCRIPT

Integrating Spectral, Spatial, and Terrain Variables for Forest Ecosystem Classification
Paul Treltz and Philip Howarth
Abstract Sets of spectral, spectral-spatial, textural, and geomor- phometric variables derived fram high spatial resolution Compact Airborne Spectrographic Imager (CASI) and elevation data are tested to determine their ability to discriminate landscape-scale forest ecosystem classes for a study area in northern Ontario, Canada. First, linear discriminant analysis for various spectral and spectral-spatial variables indicated that a spatial resolution of approximately 6 m was optimal for discriminating six landscape-scale forest ecosystem classes. Second, texture features, using second-order spatial statistics, significantly improved discrimination of the classes over the original reflectance data. Finally, addition of terrain descriptors improved discrimination of the six forest ecosystem classes. It has been demonstrated that, in a low- to moderate-relief boreal environment, addition of textural and terrain variables to high- resolution CASI reflectance data provides improved discrim- ination of forest ecosystem classes.
Introduction In an ecosystem approach to land classification, coherent ter- rain units may be defined by a complex of factors including vegetation, landforms, and drainage. Because forest ecosystems in northwestern Ontario, Canada are defined, in part, by physi- ography, it seems logical that incorporation of terrain variables with remote sensing data would improve mapping of forest ecosystems at landscape scales. It has been demonstrated that geomorphometric variables (e.g., elevation, gradient) provide additional information for discriminating land-cover classes in combination with satellite remote sensing data in high-relief environments (e.g., Frank, 1988; Peddle and Franklin, 1991; Franklin et al., 1994; Michaelsen et al., 1994; Florinsky and Kuryakova, 1996; Gong et al., 1996; Ekstrand, 1996; Florinsky, 1998; Vogelman et al., 1998). However, it is not clear whether these terrain variables contribute additional information for discriminating forest ecosystem classes in a low- to moderate- relief boreal environment when combined with high-resolu- tion remote sensing data.
The Forest Ecosystem Classification (FEC) for northwestern Ontario represents an ecologically based classification which incorporates physiographic and biotic elements of the forest ecosystem [Sims et al., 1989). The FTC framework incorporates
P. Treitz was with the Department of Geography, Faculty of Arts, and Faculty of Environmental Studies, York University, 4700 Keele Street, North York, Ontario M3J 1P3, Canada. He is presently with the Department of Geography, Faculty of Arts and Science, Queen's University, Kingston, Ontario K7L 3N6, Canada ([email protected]]. P. Howarth is with the Department of Geography, Faculty of Environmental Studies, University of Waterloo, Waterloo, Ontario N2L 3G1, Canada (howarth~atleo.uwaterloo.ca).
those components of forest site that contribute to forest devel- opment (i.e., canopy and understory vegetation, soils, land- form, general climatic regime, and regional physiography) (Sims and Uhlig, 1992). FECs were developed for stand-level (i.e., < 10 hectares) application to provide information regard- ing vegetation, soil, and site conditions. However, this detailed ecosystem classification is difficult to implement for large tracts of boreal forest that are characteristic of much of north- western Ontario, Canada. Because the FEC framework is some- what hierarchical, field-level units can be aggregated to create coarser resolution ecosystem units based on moisture and nutrient regimes (Racey et al., 1989). Essentially, arange of for- est ecosystem classes can be derived that account for a range of scales of application, thereby creating an ecosystem classifica- tion that is "mappable" using spectral and terrain variables, also acquired at arange of scales. Thus, integration of appropri- ately "scaled" and spatially processed georeferenced remote sensing data and spatially geocoded terrain information offers potential for assisting in the analysis of large areas of forest for identification of relevant landscape-scale ecosystem classes, particularly within the context of a hierarchical classification scheme.
In digital image classification of remote sensing data, deci- sion rules based on spectral reflectance or radiance of land- scape elements are applied to image data to define ecological units. It may be appropriate to incorporate terrain attributes (e.g., elevation, gradient, local reliefl into the statistical deci- sion rules to classify ecological units using remote sensing data (Moore et al., 19911. At landscape scales, the primary causes which determine the differences between ecosystem units are topographic position, parent material, and slope, aspect, and inclination with controlling factors being moisture regime, soil fertility, microclimate, and snow depth (Hills and Pierpoint, 1960). At the stand level, these causes and controlling factors are important along with disturbance history (Damman, 1979). It therefore seems reasonable to expect digital terrain descrip- tors (e.g., elevation, gradient, aspect) to assist in the discrimina- tion of landscape-scale forest ecosystem classes when inte- grated with spectral data (Florinsky and Kuryakova, 1996; Flo- rinsky, 1998).
Texture, or the intrinsic spatial variability of tone, is recog- nized as an important interpretive tool for discriminating dif- ferent land-cover and land-use types and is a function of spatial resolution or scale. This concept is dependent on three vari- ables: (I) size of the area being investigated/processed, (2) the relative sizes of the discrete tonal features, and (3) spatial dis- tribution of discrete tonal features (Baraldi and Parmiggiani,
Photogrammetric Engineering & Remote Sensing VO~. 66, NO. 3, March 2000, pp. 305-317.
0099-1112/00/6603-305$3.00/0 O 2000 American Society for Photogrammetry
and Remote Sensing
PHOTOGRAMMETRIC ENGINEERING & REMOTE SENSING

1995). A texture field within an image is described as homoge- neous if the spatial arrangement of pixel values are more homo- geneous (as a unit) within than between texture fields (Barber et al., 1993). It has been demonstrated that texture transforms have a role in image analysis for forestry by improving the accuracy of the interpretation of forest types and conditions (Wilson, 1996; Cain et al., 1997; Wulder et al., 1998). For instance, stand structural characteristics (e.g., diameter at breast height (dbh), crown diameter, density, basal area, and age) have been found to be highly correlated with texture images generated from SPOT panchromatic data (Cohen and Spies, 1992). Texture also appears to be more evident at high spatial resolutions (e.g., < lo m) as stand structural characteris- tics tend to, at these levels, dominate the scene (Yuan et al., 1991; Franklin and McDermid, 1993). Ecologists are also examining these texture measures for development as "pattern indices" for ecological data sets (Musick and Grover, 1990; Cain et al., 1997). In this study, the gray-level co-occurrence matrix (GLCM) statistical method is used to generate texture fea- tures from Compact Airborne Spectographic Imager (CASI) data.
It has been proposed that landscape-scale site classifica- tion can provide the basis for detailed applications and plan- ning, especially when spatial analysis and modeling tech- niques are applied using remote sensing and other spatial data in conjunction with field-oriented classifications (Sims et al., 1994). It is recognized that many ecological and timber resources cannot be directly sensed using remotely sensed data, but must be modeled or derived from other sources of pri- mary data. This is a natural conclusion based on a holistic eco- system concept. The approach taken in this study is to collect high-resolution remote sensing data, derive appropriately scaled and processed images for different forest ecosystems, and integrate these features with terrain descriptors derived for landscape-scale analysis. It is suggested that, by deriving opti- mal spectral, textural, and terrain descriptors of the vegetation and landscape, discrimination of landscape-scale forest ecosys- tems can be optimized.
The objective of this study is to determine the extent to which texture and terrain variables can improve forest ecosys- tem mapping within the boreal forest of northwestern Ontario. An integrated dataset is developed to model forest ecosystems that incorporates multi-spatial resolution remote sensing data, texture variables, and terrain variables. High-resolution CASI data are spatially averaged to generate "optimally" and vari- ously scaled remote sensing data. CASI spectral and spatial variables are used in combination with texture variables (mean, contrast, and correlation) and geomorphometric variables (ele- vation, local relief, gradient) to test the discriminability of for- est ecosystems at a landscape scale (1:20,000).
Study Area Description The study site is located approximately 100 km north of Thun- der Bay, Ontario within the Central Plateau section of the Boreal Forest Region (Rowe, 1972). The area consists of a diverse mosaic of forest-stand types with various soil and land- form conditions, primarily of glacial origin. Trembling aspen (Populus tremuloides Michx.) and black spruce (Picea mari- ana (Mill.) BSP.) are dominant with jack pine (Pinus banksiana Lamb.), white spruce (Picea glauca (Moench) A. Voss), balsam fir (Abies balsamea (L.) Mill.), white birch (Betula papyrifera Marsh.), white cedar (Thuja occidentalis L.), and tamarack (Lnrixlaricina (Du Roi) K. Koch) occurring in various mixtures. Forest-stand overstories are monospecific or mixed, and understories range from shrub- and/or herb-rich to poor (Walsh et al., 1994). The FEC applicable to the study area is the North- western Ontario FEC (Sims et al., 1989). The ecosystem units derived from the Nwo FEC for the Rinker Lake area and used in this study are listed in Table 1.
The physiography of the study site is bedrock-controlled
TABLE 1. R C VEGETATION TYPES (V-TYPES) FOR THE RINKER LAKE STUDY AREA
V-Type* FEC Description
Aspen-Dominated Hardwood and Mixedwood V5 Aspen Hardwood V6 Trembling Aspen (White Birch)-Balsam Fir/
Mountain Maple V7 Trembling Aspen-Balsam FirIBalsam Fir
Shrub V8 Trembling Aspen (White Birch)/Mountain
Maple V9 Trembling Aspen Mixedwood V10 Trembling Aspen-Black Spruce-Jack
PineILow Shrub
White SprucelBalsam Fir Conifer and Mixedwood V14 Balsam Fir Mixedwood V15 White Spruce Mixedwood V16 Balsam Fir-White Spruce Mixedwoodl
Feathermoss V24 White Spruce-Balsam FirIShrub Rich V25 White Spruce-Balsam FirIFeathermoss
Cedar Mixedwood V2 2 Cedar (inc. Mixedwood)/Speckled Alder1
Sphagnum
Upland Black SpruceIJack Pine V31 Black spruce-Jack PineITall Shrub1
Feathermoss V32 Jack Pine-Black SpruceIEricaceous Shrub1
Feathermoss V3 3 Black SpruceIFeathermoss
Lowland Black Spruce V34 Black SpruceILabrador Tea/Feathermoss
(Sphagnum) V35 Black SpruceISpeckled AlderISphagnum V36 Black SprucelBunchberrylSphagnum
[Feathermoss) V3 7 Black Spruce/Ericaceous ShrubISphagnum
Wetland Black Spruce V38 Black Spruce/Leatherleaf/Sphagnum
with elevations ranging from 430 m to 530 m. The study site lies within the Severn Upland physiographic unit, in the James Bay Region of the Precambrian Shield (Mollard and Mollard, 1981). The glacial deposits in the area originate from the Wis- consinan glaciation. The predominant ice flow was from the northeast to southwest. Glacial drift is generally less than 3 m with till being the oldest and most widespread sediment in the area. This till consists of a predominantly sand to silty-sand matrix with a coarse fragment content ranging from less than 5 percent to greater than 30 percent (by volume) (Walsh et a]., 1994). The glaciofluvial deposits of eskers, crevasse fills, kames, and kame terraces have moderately well- to well-sorted sand and gravelly sand textures. Mineral soils in the area are moderately deep (60 to 100 cm) to deep (>I00 cm), with signifi- cant amounts of coarse fragments, while very thin soils (< 20 cm), exposed bedrock, and organic soils occur to a lesser extent throughout the study area (Walsh et al., 1994).
Data Description Ground Data Collection Ground data were collected using a methodology devised by Forestry Canada for characterizingvegetation Types (V-Types) within a forest stand (McLean and Uhlig, 1987). FEC plots are 10- by 10-m quadrats where V-Types are determined based on the presence and abundance of canopy and secondary trees; high, low, and dwarf shrubs; broadleaf herbs; and mosses and
306 March 2000 PHOTOGRAMMETRIC ENGINEERING & REMOTE SENSING
lichens. Here, detailed FEC plot data were collected for 71 for- ested sites within the study area during the periods 2 1 June to 15 July 1993 and 04 to 15 July 1994. Data collected for each 10- by 10-m sample plot included (1) differential Global Positioning System (GPS) data, (2) vegetation data (species and percent cover for tree, shrub, and herb layers), (3) mensuration data (age, height, density, diameter breast height (dbh)), and (4) can- opy data (visual estimates of mean maximum crown diameter (MMCD)). Percent cover for each species was determined by visual estimation of (1) dominant, main canopy, and secondary trees; (2) high, low, and dwarf shrubs; (3) broadleaf herbs; and (4) mosses and lichens. In total, plot data were collected for 25 of the 38 V-Types within the NWO FEC. Of the 13 V-Types not sampled, six of these were characteristics of the Great Lakes - St. Lawrence forest to the south of the study site, four were too small in extent to be sampled effectively, and three did not occur within the study site (Kalnins et al., 1994). In 1994 and 1995, a series of transects was traversed through selected forest stands in order to collect additional V-Type data. These sam- ples of V-Type characterization only, occurred at fixed inter- vals of 50 m along predetermined transects.
Compact Airborne Spectmgraphic Imager (Reflectance) Data The CASI is a visiblelnear-infrared pushbroom imaging spectro- graph with a reflection grating and a two-dimensional CCD solid-state array measuring 512 by 288 pixels. The specifica- tions of the CASI are outlined in Table 2.
CASI data were acquired from a Piper Navajo Chieftan air- craft on 30 July 1993 at an altitude of 2630 m above ground level (AGL) (Kalnins et al., 1994). To minimize bidirectional reflectance (BRF) and effectively cover the study area, flight lines were oriented parallel to the solar azimuth (i.e., away from the sun], restricting data collection to a two-hour time window (10:30 a.m. to 12:30 p. m. local time). Flight lines were flown over the study site at a ground speed of 149 knots (76.7 meters1 second) heading 300 degrees true with the sensor pointing at nadir. This provided an integration time of 70 milliseconds. The CASI data were collected in nine spectral bands (Table 3) and possessed a spatial resolution of 3.18 m in the cross-track direction and 5.36 m in the along-track direction.
CASI data were converted to radiance using software devel- oped at the Center for Research in Earth and Space Technolo- gies (c~ESTech) and the algorithms of Baby and Soffer (1992). This conversion was applied in order to eliminate artifacts pres- ent in the imagery and to convert digital numbers from arbitrary values to physical units of radiance (Shepherd, 1994). The data were then converted to reflectance to eliminate atmospheric
TABLE 2. DESCRIPTION OF THE COMPACT AIRBORNE SPECTROGRAPHIC IMAGER (CASI) (ADAPTED FROM GOWER ETAL. (1992)).
Parameter Description
Spectral Coverage 418 nm to 926 nm using 288 detectors; sam- pling interval 1.8 nm; spectral resolution 2.9 nm
Spectral Mode 39 spectra of the full 418 nm to 926 nm range are recorded, with 2.9 nm resolution, £rom 39 different directions across the swath; a full-resolution image at a prede- termined wavelength is also recorded to assist in track recovery
Spatial Coverage 35.5"swath, with standard lens; single camera gives 612 pixels; sampling interval 1.2 mrad; spatial resolution 1.6 mrad
spectral pixels are grouped to form up to 15 bands (512 pixels wide); band width and spectral position are under software control; the number of bands governs the integra- tion time
Spatial Mode
TABLE 3. CASl IMAGING MODE WAVELENGTHS
Feature Number Center
Wavelength (nm) Bandwidth
(nm)
31.18 20.80 20.88 20.94 15.60 10.22
6.62 10.24 28.44
Band Range (nm)
434.72-465.90 539.07-559.87 580.06-600.94 623.01-643.95 662.50-678.10 734.61-744.83 743.64-750.26 785.26-795.50 859.63-888.07
effects and compensate for changes in solar illumination dur- ing image acquisition. Calibration to reflectance provides a basis for comparison of reflectance values between adjacent flight lines and between different altitudes. A hybrid model was used to perform this calibration using pseudoinvariant features (PIFS) and an on-board downwelling irradiance sensor (Incident Light Probe (ILP)) (Shepherd, 1994; Shepherd et al., 1995). The CASI data are calibrated to reflectance (%'-bit real numbers) but stored as 16-bit integers for more efficient storage and data processing. The relationship between CAsI digital number (DN] and reflectance is Reflectance (R) = (CASI DN)IO-~.
Digital Elevation Data The DEM for the study area was produced by the Department of Natural Resources-Forestry Canada. This DEM was generated at a 20-mgrid spacing using the ANLJDEM procedure (Hutchinson, 1989; Mackey eta]., 1994) based on digital topographic data (contours and streamline data) from the 1:20,000-scale Ontario Basic Mapping (OBM) Series.
Georeferencing of CASl Data A georeferenced database for the study area was developed incorporating spectral, spectral-spatial, texture, and terrain variables. A common spatial resolution of 4 m by 4 m was selected for this database, incorporating CASI data as well as the 20-m DEM. ~~slref lectance data were registered to a Landsat TM scene that was resampled to 4 m and georeferenced to the Universal Transverse Mercator (UTM) projection at a 4-m pixel spacing. To register the CASI data to a 4-m pixel within the georeferenced dataset, a fourth- or fifth-order polynomial was applied to each flight line to model the distortions inherent in each flight line. Using such high-order polynomials is neces- sary for correcting distortions caused by aircraft movement and orientation. At the same time, it is understood that using polynomials of such high order can also generate significant distortions in some parts of the image. To minimize this poten- tial, care was taken to select a large number of control points that were well distributed throughout each flight line. The data were then resampled using a nearest-neighbor algorithm. Al- though the CASI data had been corrected for aircraft roll, regis- tration errors persisted (e.g., mean residuals in the x and y direction of 3 and 7 pixels, respectively). In all, five USI flight lines were georeferenced and combined with Landsat TM data to form a mosaic covering the entire study area (Figure 1).
CASl Spectral Feature Selection Band l(435 to 466 nm) was eliminated from analysis due to noise and poor dynamic range. Also, it was observed that Bands 8 (785 to 795 nm) and 9 (860 to 888 nm) suffered from poor focus and, therefore, were omitted from this analysis. To reduce the data dimensionality of the remaining six features of
PHOTOGRAMMETRIC ENGINEERING & REMOTE SENSING March 2000 307

I Figure 1. c ~ s l and Landsat TM mosaic for the Rinker Lake study site (pixel size = 4 m). I
CASI data, the Jeffries-Matusita (J-M) distance, a statistical sepa- rability measure, was used to evaluate candidate feature sub- sets. J-M distance is a measure of the average difference between the two-class density functions and ranges between 0 and 2 (Swain and Davis, 1978). J-M distance was selected because it, along with transformed divergence, produced superior separa- bility results for image classification over Bhattacharyya dis- tance and simple divergence (Mausel et al., 1990).
Feature selection was applied to the original CASI data because spectral-spatial and texture features would be gener- ated from these original CASI data. In order to keep the number of derived variables to a minimum (i.e., spectral-spatial and tex- ture features), the dimensionality of the original dataset was re- duced. Also, because linear discriminant analysis is affected by the number of variables, it was desirable to maintain a mini- mum number of variables.
cASI features were selected using the following procedure to collect reflectance data for the six landscape-scale ecosys- tem classes (Treitz et al., 1996):
(1) FEC plots were located on the georeferenced imagery using GPS coordinates. For each landscape-scale forest ecosystem class,
ten calibration sites (consisting of 25 pixels each) were used to calculate the mean and covariance for each class.
(2) The number of CASI features was selected from one to six. (3) Feature subsets of the specified number of C A ~ I features (i.e.,
1,2,3,4,5, or 6) were determined. For each candidate feature subset, the average J-M distance was calculated for each land- scape-scale class pair.
(4) This process was repeated for each possible combination of the specified number of CASI features identified in Step 2, and the average J-M distance for each feature subset was tracked.
(5) The maximum of the average J-M distance was used to select the best feature subset for the given number of features desired.
(6) Steps 2 to 5 were repeated for different numbers of fea- tures. These results are reported in Table 4.
J-M distances greater than 1.9 for a two-class density func- tion indicate good separability between those two classes. Val- ues ranging from 1.0 to 1.9 indicate the classes (or subset of classes) are separable to some extent. The J-M distances pre- sented in Table 4 indicate the maximum average pairwise J-M
308 March 2000 PHOTOGRAMMETRIC ENGINEERING 81 REMOTE SENSING

TABLE 4. FEATURE SELECTION BASED ON JEFFRIES-MATUSITA (J-M) DISTANCE
Features Maximum Number of J-M Distance Features 2 3 4 5 6 7 Average*
1 J 0.591 2 J J 0.877 3 J J J 0.987 4 J J J J 1.081 5 J J J J J 1.136 6 J J J J J J 1.165
distances for the specified number of CASI features and six forest ecosystem classes. Based on this analysis, CASI spectral features (variables) 3,5, and 7 were selected for spatial averaging to "optimal" spatial resolutions/scales, texture analysis, and inte- gration with terrain variables. Although all six features pro- vided the greatest J-M distance (Table 4), it was decided that the three features providing the highest J-M distance would be selected, in order to maximize J- distance while maintaining a relatively small number of variables (i.e., for linear discrimi- nant analysis). Each of these features represent important "spectral regions" of the reflectance curve (green peak reflect- ance, chlorophyll well, and infrared reflectance). It was antici- pated that features representative of these regions would also provide the best features for scaling, texture analysis, and inte- gration with terrain features.
SpectraCSpatial Features Specific spatial resolutions for visible and near-infrared reflectance data were identified for the six landscape-scale ecosystem classes based on semivariogram analysis of sample CASI data collected at 0.70- by 5.36-m spatial resolution (600 m AGL) (Treitz, 1997) (Table 5). Based on the semivariogram analysis of the sample data, a series of spectral-spatial fea- tures were derived from the 4-m CASI data (features 3,5, and 7) using a technique of non-overlapping spatial averaging. With this technique, the mean reflectance within a non-over- lapping square window is calculated and assigned to an out- put image. The input window is then moved a distance equivalent to the window size and a new mean reflectance value is calculated. This process is repeated over the entire image. The 4-m data approximate the lower limits of "opti- mal" spatial resolutions estimated for specific forest ecosys- tem classes. For example, the spatial resolution of the CASI
Landscape ~ e v e l Ecosystem Classes*
CASI Spectral Variable Spatial Resolution 1 2 3 4 5 6
CASI (580-601 nm) 4 meters 5 meters
J J
6 meters J J
CASI (663-678 nm) 4 meters J J
5 meters J J
6 meters J J
CASI (744-750 nm) 5 meters 6 meters
J J
7 meters J J
J J *1. Aspen-Dominated Hardwood and Mixedwood; 2. White Spruce1 Balsam Fir Conifer and Mixedwood; 3. Cedar Mixedwood; 4. Upland Black SpruceIJack Pine; 5. Lowland Black Spruce; and 6. Wetland Black Spruce
data used in this analysis (i.e., 3.18 m by 5.36 m or 17 m2 and subsequently resampled to 4 m by 4 m or 16 m2 during geore- ferencing) approximates the "optimal" spatial resolution esti- mated from CASI data collected at 600 m AGL (i.e., 0.7 m by 5.36 m or 16 m2) for LowlandIWetland Black Spruce using semivariogram analysis. "Optimal" spatial resolutions often differed between landscape-scale ecosystem classes and between visible and near infrared wavelengths.
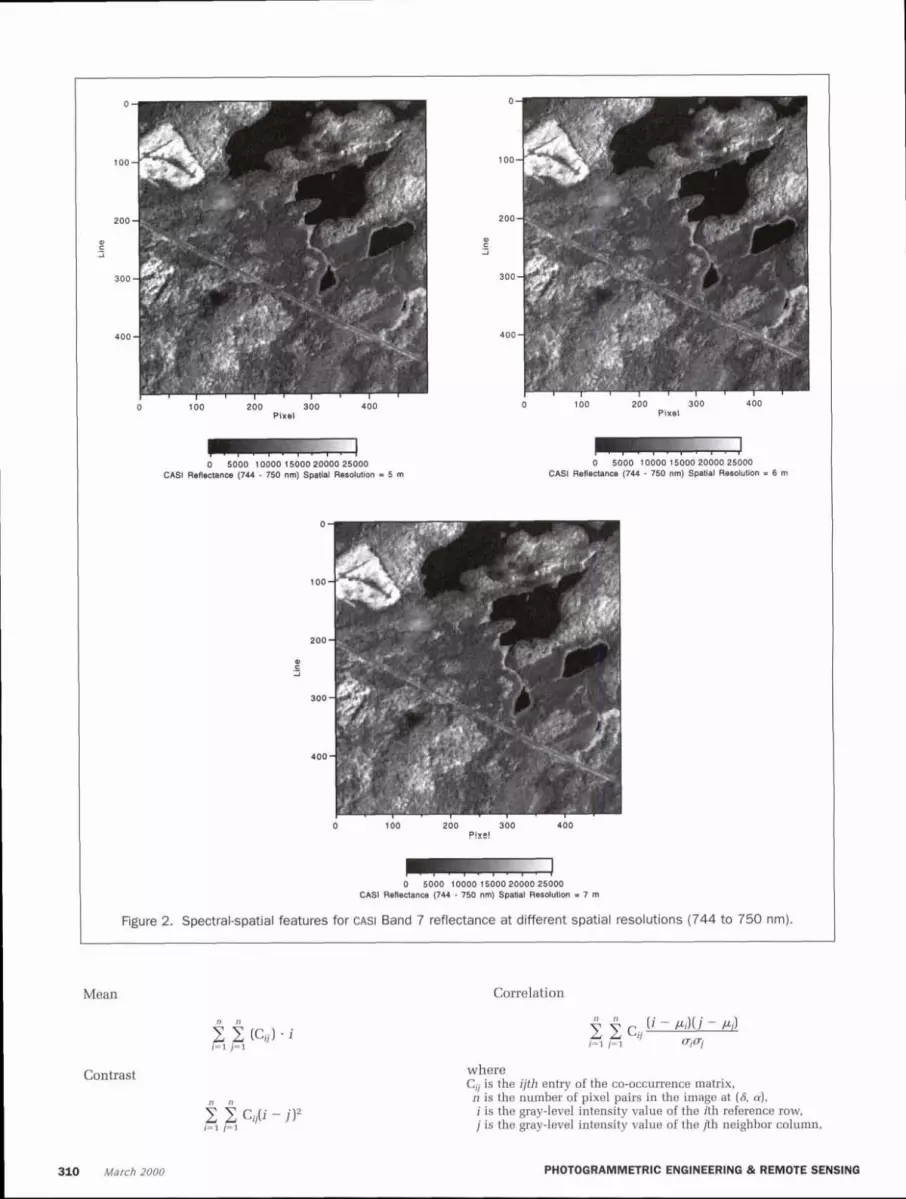
To simulate datasets at 5,6, and 7 meters spatial resolution, a one-meter database was developed from the original CASI data, meaning that the original database of 4-m spatial resolu- tion (3500 pixels by 3000 lines) was written to a database of 14,000 pixels by 12,000 lines. C ~ s ~ B a n d s 3 and 5 were then spa- tially averaged to 5 m and 6 m while CASI Band 7 was averaged to 5-, 6-, and 7-m spatial resolutions. These spatial resolutions reflect the results of the semivariogram analysis, with the opti- mal resolutions being larger for the near-infrared data than for the visible (Treitz, 1997).
Although it is unclear how closely spatial averaging simu- lates multi-spatial resolution remote sensing data, it has been demonstrated to be superior to algorithms such as cubic convo- lution and bilinear interpolation for upscaling spectral signals (Hay et al., 1997). Non-overlapping spatial averaging assumes that smaller-scale systems behave similarly to the average of larger-scale systems. However, differing structural patterns occur within the landscape at various scales and do not neces- sarily interact in a linear fashion. The 5-, 6-, and 7-m CASI data- sets were then georeferenced to the 4-m dataset using a first- order polynomial and nearest-neighbor resampling algorithm. Sub-areas representing spatially averaged features for Band 7 (744 to 750 nm) are presented in Figure 2.
Texture Features Here, texture analysis is examined as an important contributor to scene information extraction. Texture may contain impor- tant information about the structural arrangement of surfaces and their relationships to the surrounding environment (Hara- lick et al., 1973). It has been shown that classification accura- cies are improved when texture features are incorporated into image classification (Peddle and Franklin, 1991; Barber et al., 1993; Rotumo eta]., 1996). In this study, the gray-level co- occurrence matrix (GLCM) statistical method is used to generate texture features from the CAsI data.
The GLCM method can be defined as a matrix of relative fre- quencies in which two neighboring pixels, separated by dis- tance Sand having an angular relationship a; occur on the image, one withgray tone i, and the other with gray tone j (Har- alick et al., 1973). The power of the GLCM approach is that it characterizes the spatial interrelationships of the gray tones in a textural pattern and can do so in a way that is invariant under monotonic gray-tone transformations. On the other hand, it does not capture the shape aspects of the tonal primitives and, there- fore, is not well-suited for textures composed of large-area primitives (Haralick 1979). Hence, this technique is suited to the CASI data analyzed in this study (i.e., L-resolution data as defined by Strahler et al., 1986). The objective of these statisti- cal approaches is to translate visual properties into quantita- tive descriptors in a manner that they can be used to discrimi- nate relevant land features using additional image processing techniques.
GLCM analysis was performed on a 6-bit linear transforma- tion of the original 16-bit CASI data using measures of contrast, mean, and correlation. Quantization-level scaling is performed to increase computational efficiency during matrix calcula- tions. These analyses were performed on visible (580 to 601 nm) and near-infrared (744 to 750 nm) data. Texture features (mean, contrast, and correlation) (Figure 3) based on GLCMs were generated using EASIIPACE software (PCI, 1997): i.e.,
PHOTOGRAMMETRIC ENGINEERING & REMOTE SENSING Varch 2000 309
0 5000 10000 150002000025000 CASl Reflectance (744 - 750 nm) Spatlal Resolution = 6 m
0 50b0 10000 15000 20000 25000 CASl ReReclance (744 - 750 nm) Spatid Resolution - 5 m
CASl ReHectancs (744 - 750 nm) Spatla1 Resolullon - 7 m
Figure 2. Spectral-spatial features for CASI Band 7 reflectance at different spatial resolutions (744 to 750 nm).
Mean Correlation
Contrast where Cij is the ijth entry of the co-occurrence matrix, n is the number of pixel pairs in the image at (6, 4, i is the gray-level intensity value of the ith reference row, j is the gray-level intensity value of the jth neighbor column,
PHOTOGRAMMETRIC ENGINEERING & REMOTE SENSING 310 March 2000

0 100 200 300 400 Pixel
0 500 1000 1500 2000 2500 CASl (744 - 750 nm) Mean Texture Feature
0 100 200 300 400 Pixel
0 500 1000 1500 2000 2500 CASl (744 - 750 nm) Contrast Textum Feature
0 100 200 300 400 Pixel
- 5 0 0 2000 4500 7000 CASl (744 - 750 nm) Conelation Textum Feature
Figure 3. Mean, contrast, and correlation texture features for CASI Band 7 (744 to 750 nm).
pi is the mean of row i, pj is the mean of column j, q is the standard deviation of row i, and o;. is the standard deviation of column j.
image (Haralick et al., 1973; Ulaby et al., 1986; Pultz and Brown, 1987). Contrast is a measure that is associated with the average gray-level difference between neighboring pixels and is sensitive to standard deviation but not mean [Barber. 19891. A
~ l t h ~ ~ ~ h these features measure the same characteristics low-contrast image results in a concentration of entries around of the data (i.e., texture), they are interpreted differently. The the diagonal of the GLCM and* consequently* alowvalue for the mean texture statistic incorporates both tone and texture infor- computed contrast statistic (Baraldi and Parmiggiani, 1995). mation. This is achieved by incorporating the gray level of the The correlation statistic is analogous to Pearson's product ith line of the matrix in the texture calculation. The contrast sta- moment correlation and is sensitive to the correlation between tistic is a measure of the amount of local variation present in an gray values and the probability density functions at each of the
PHOTOGRAMMETRIC ENGINEERING 81 REMOTE SENSING March 2000 311
gray-level pairs. The correlation texture statistic is sensitive to both mean and standard deviation (Barber, 1989).
In generating each of these texture features, three parame- ters must be selected. These include (1) window size for which the co-occurrence matrix will be generated, (2) interpixel sam- pling distance, and (3) direction for pixel co-occurrence within the sampling window. For feature generation, an appropriate window size is one that is large enough so that a meaningful joint distribution of gray tones can be computed to characterize specific land covers, yet is small enough to minimize the tran- sitional effects of the texture calculation at boundaries between adjacent classes. Because the "optimal" spatial resolutions determined for the visible and near-infrared data were different (Treitz, 1997), a 5- by 5-pixel window was used for generating the GLCM for the visible data (580 to 601 nm) and a 7- by 7-pixel window for the near-infrared data (744 to 750 nm). These win- dow sizes were selected for application to the 2630-m AGL CASI data to account for the differences between the visible and near-infrared data and to generate a meaningful joint distribu- tion of gray tones. However, it must be noted that optimal tex- tural window operators were based on semivariogram analysis of CASI data collected at 600 m AGL, thereby possessing a spatial resolution of 0.73 m by 5.36 m (Treitz, 1997). These estimates portray smaller spatial dimensions than are used here for the 2630-m AGL CASI data. It is accepted that the relationship between reflectances of the 600-m and 2630-m AGL CASI data is not likely to be linear. In this respect, based on semivariogram analysis of the 600-m AGL CASI data, the texture processing of the 2630-m AGL data addresses texture at a smaller scale than was observed in the 600-m AGL CASI data.
The inter-pixel sampling distance (8) is selected based on the coarseness or fineness of the textures present in the image. For example, for fine-texture features, a short inter-pixel sarn- pling distance would be suitable, whereas a greater distance would be appropriate for coarse-textured images. However, because there are generally a variety of degrees of fineness and coarseness within an image, an inter-pixel sampling distance of one (8 = 1) is valid to characterize different degrees of texture.
Haralick et al. (1973) proposed calculating second-order statistics for the co-occurrence matrix in four directions (a = O", 45", 90°, 135"). If the objective is to create invariant features after rotation, this method is appropriate (Vickers and Mod- estino, 1982). However, in a study by Franklin and Peddle (1989), it was observed that individual texture orientations produced higher class accuracies than did average texture mea- sures using the four orientations. In this study, one directional measure was used (i.e., a = 0). Here, the evaluation of the GLCM technique is based on the discrimination of the six landscape- scale forest ecosystem classes from these texture features. Tex- ture features generated from the GLCM are classified individu- ally and in combination using a linear discriminant function.
Geomorphometrlc Processing %O first-order derivatives of altitude (gradient and local relief) were derived from the elevation model. A gradient image por- trays the rate of maximum change in elevation between neigh- boring cells (0 to 90'). Degree gradient for any given cell in the matrix is calculated as the gradient of a plane formed by the vec- tors connecting the neighboring cells in a 3- by 3-cell window, where each cell contains an elevation value. The gradient image was derived using the algorithms implemented in ARC/ INFO (ESRI, 1996). To quantify the local variability in elevation and gradient, a map of local relief was generated by calculating the range of altitude within a 5- by 5-pixel moving window. This feature effectively portrays the maximum change in alti- tude within a 100- by 100-m (1-ha) area and represents a first- order statistical derivative of elevation. A sub-area depicting the three terrain features-elevation, gradient, and local relief-is presented in Figure 4.
Forest Ecosystem Reflectance Data Collection For this study, detailed V-?lpes were aggregated to six land- scape-scale ecosystem classes that were present in the Rinker Lake Study Area (Table 1). Here, detailed V-Types were aggre- gated to coarser ecological units based on (1) "Treatment Units" (Racey et al., 1989) which are groupings determined by similar soil moisture and nutrient regimes and (2) observed vegetation associations in the field. Forest ecosystem plot data were then aggregated into the six landscape-scale forest eco- system classes. Based on this grouping, sites were located in the C A ~ I image data. Only sites that could be accurately located, and fell within a relatively large homogeneous area, were selected for analysis. A sample consisting of 1500 calibration pixels and 1500 validation pixels (250 calibration and valida- tion pixels per sample for each of the six classes) was collected.
Forest ecosystem plots were located on the georeferenced imagery using GPS coordinates. Due to the error observed in the registration process, these positions were checked against 1:8,000-scale color-infrared photographs and distance and direction measurements used in the field. For each landscape- scale forest ecosystem class, 20 sites were located for a total of 120 sites. For each site, a 20-by 20-m area, corresponding to 25 pixels, was extracted from the CASI image dataset and used in the calculation of mean and covariance for each class.
In cases where there were only a few forest stands of a par- ticular landscape-scale forest ecosystem class (i.e., cedar mixedwood and wetland black spruce), attempts were made to collect calibration and validation data from separate stands or from the same stand on different flight lines. When this was not possible, samples were taken from different locations within the stand.
Unear Dlscrlmlnant Analysls (LDA) Linear discriminant analysis (LDA) procedures were applied within SYSTAT~" (SYSTAT Inc., 1992) to explore the relative discriminatory power of the (1) spectral-spatial, (2) texture, (3) terrain, and (4) combinations of spectral-spatial, texture, and terrain variables. According to Duda and Hart (1973), LDA does not have a rigorous requirement for an underlying statistical model. In this sense, LDA is not seriously affected by limited deviations from normality or limited inequality of variances (Davis, 1986). In this analysis, Fisher's method, which is based on a single within-groups covariance matrix derived from cali- bration data, is applied (SYSTAT Inc., 1992). This method first derives a transform that minimizes the ratio of the difference between group multivariate means and their within-group mul- tivariate variance. This transform is used to find a discriminant function as the orientation that optimizes the separability of classes while at the same time minimizing the internal spread of each individual class distribution (Tom and Miller, 1984). An input pixel is then assigned to a particular class based on its location along the discriminant function axis. Discriminant analysis as a classification technique has been shown to be less sensitive to the number of variables and deviations from the normal (Gaussian) distribution as opposed to other methods such as maximum likelihood (Tom and Miller, 1984).
The variable sets used in this analysis are defined in Table 6. The minimum number of variables for any trial was one, the maximum, nine. For each set of variables, calibration data were used to generate a discriminant function, which was then applied to the validation data to obtain individual and mean class accuracies. The Kappa coefficient ( K ) was calculated for the validation accuracies of each classification. The Kappa coefficient is a measure of agreement between the ground sam- ple classes and those derived through classification of spectral, spatial, texture, andlor terrain features. This measure accounts for all elements of the confusion matrix and excludes the agree- ments that occur by chance (Rosenfield and Fitzpatrick-Lins, 1986). Difference-of-proportions tests (Freund and Simon,
312 March 2000 PHOTOGRAMMETRIC ENGINEERING & REMOTE SENSING

' 1 ' 1 ' 1 ' 440 480 480 500 520
Elevation (m)
0 - 0
100
200 20c
0
3 e 3
300
400
' 1 ' 1 ' 300 400 0 100 200 300 400
Pixel Pixel
SLOPE (degrees)
3 100 200 300 400 Pixel
0 10 20 30 40 SO 80 Local Ralial (m)
Figure 4. Elevation, gradient, and local relief terrain variables for a sub-area of the Rinker Lake study site (pixel size = 4 m).
1992) were performed to determine the significance of the dif- ferences between classification accuracies for the various com- binations of input variables.
Results The CASI 6-m dataset (SPAC) provided the highest accuracies among the spectral-spatial variables and were significantly greater than the 4-m data set (SPEB) (z = 3.88). The 6-m data (SPAC) also provided greater discrimination of the six land- scape-scale classes than did the "optimal" spatial resolution
dataset (SPAA), the 5-m dataset (SPAB), and the 6-m and 7-m data- set (SPAD) (Table 7).
Among the texture datasets, TEXF provides the highest clas- sification accuracy, significantly greater than TEXA (z = 3.47) and TEXC (z = 2-64), as well as all spectral-spatial and terrain feature datasets (Table 7). The texture dataset, TEXF, which incorporates six texture features, does not provide significant improvement in classification accuracy over TEXB, a three-tex- ture feature dataset (z = 0.87). Of the three-texture features tested, the mean-texture feature provides the greatest discrimi- nation, followed by contrast and correlation.
March 2000 313 PHOTOGRAMMETRIC ENGINEERING & REMOTE SENSING
Variable Set Description
Spectral SPEA
Spectral-Spatial SPAA
SPAB
SPAC
SPAD Texture
TEXA TEXB
TEXC
TEXD
TEXE
TEXF
Terrain DEM REL
GRAD TERA TERB
Integrated INTA INTB INTC
CASI Bands 3, 5, 7
Optimal Spatial Resolutions by class (4m, 5m, 6m and 7m) for CASI Bands 3, 5 and 7
CASI Bands 3, 5, and 7 at 5 meter spatial resolution
CASI Bands 3, 5, and 7 at 6 meter spatial resolution
CASI Bands 3, 5 (6m) and Band 7 (7m)
Texture Statistics: Mean-Bands 3 and 7 Texture Statistics: Mean-Bands 3 and 7; Con-
trast-Band 7 Texture Statistics: Mean-Bands 3 and 7; Cor-
relation-Band 7 Texture Statistics: Mean-Bands 3 and 7; Con-
trast and Correlation-Band 7 Texture Statistics: Mean, Contrast-Bands 3
and 7; Correlation-Band 7 Texture Statistics: Mean, Contrast, Correla-
tion-Bands 3 and 7
Digital Elevation Model (DEM) Local Relief Elevation (range within lOOm x
loom window) Gradient Local Relief and DEM Local Relief. DEM and Gradient
SPAC and TEXB SPAC and TERB SPAC, TERB and TEXB
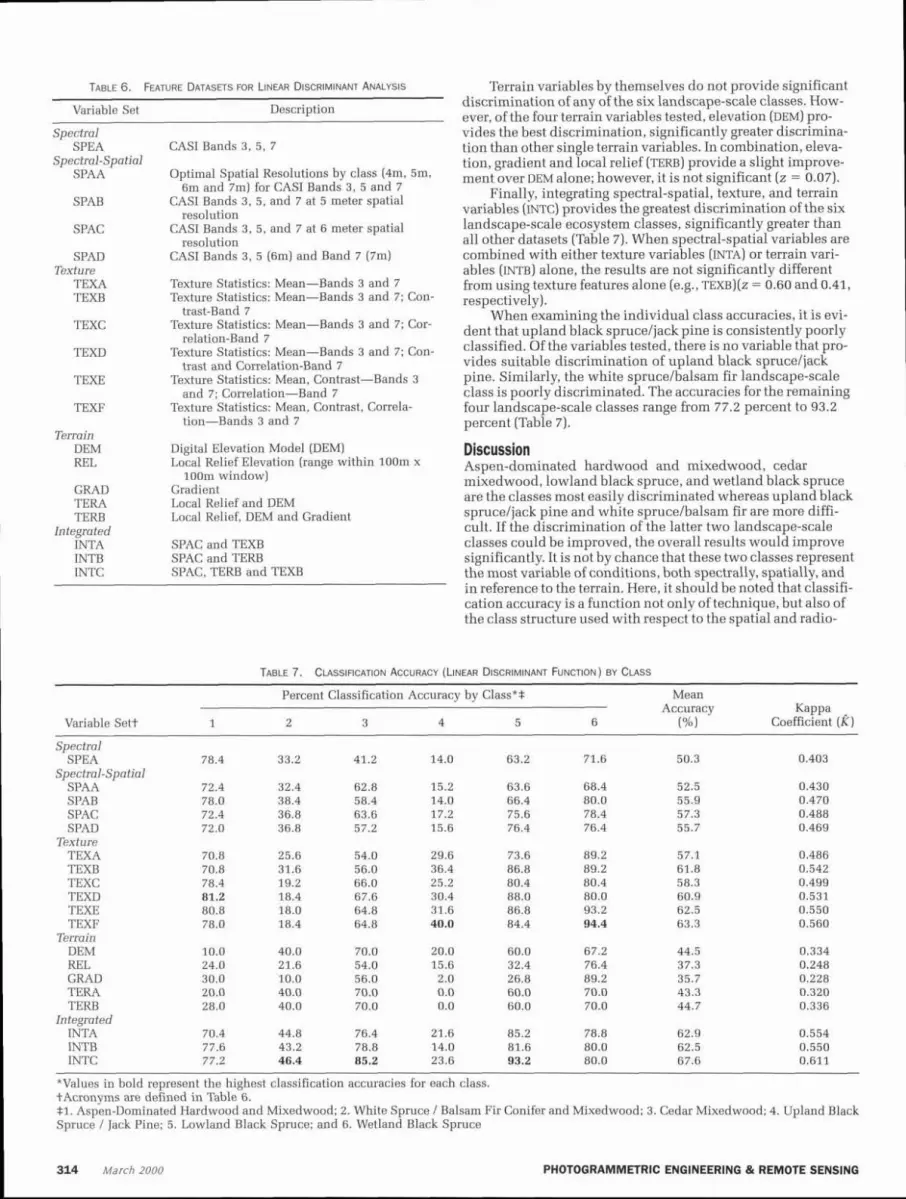
Terrain variables by themselves do not provide significant discrimination of any of the six landscape-scale classes. How- ever, of the four terrain variables tested, elevation (DEM) pro- vides the best discrimination, significantly greater discrimina- tion than other single terrain variables. In combination, eleva- tion, gradient and local relief (TERB) provide a slight improve- ment over DEM alone; however, it is not significant (z = 0.07).
Finally, integrating spectral-spatial, texture, and terrain variables (INTC) provides the greatest discrimination of the six landscape-scale ecosystem classes, significantly greater than all other datasets (Table 7). When spectral-spatial variables are combined with either texture variables (INTA) or terrain vari- ables (INTB) alone, the results are not significantly different from using texture features alone (e.g., TEXB)(Z = 0.60 and 0.41, respectively).
When examining the individual class accuracies, it is evi- dent that upland black spruceljack pine is consistently poorly classified. Of the variables tested, there is no variable that pro- vides suitable discrimination of upland black spruceljack pine. Similarly, the white sprucelbalsam fir landscape-scale class is poorly discriminated. The accuracies for the remaining four landscape-scale classes range from 77.2 percent to 93.2 percent (Table 7).
Discussion Aspen-dominated hardwood and mixedwood, cedar mixedwood, lowland black spruce, and wetland black spruce are the classes most easily discriminated whereas upland black spruceljack pine and white spruce/balsam fir are more diffi- cult. If the discrimination of the latter two landscape-scale classes could be improved, the overall results would improve significantly. It is not by chance that these two classes represent the most variable of conditions, both spectrally, spatially, and in reference to the terrain. Here, it should be noted that classifi- cation accuracy is a function not only of technique, but also of the class structure used with respect to the spatial and radio-
TABLE 7. CLASSIFICATION ACCURACY (LINEAR DISCRIMINANT FUNCTION) BY CLASS
Percent Classification Accuracy by Class** Mean Accuracy Kappa
Variable Sett 1 2 3 4 5 6 (%I Coefficient (2) Spectral
SPEA 78.4 33.2 41.2 14.0 63.2 71.6 50.3 0.403 Spectral-Spatial
SPAA 72.4 32.4 62.8 15.2 63.6 68.4 52.5 0.430 SPAB 78.0 38.4 58.4 14.0 66.4 80.0 55.9 0.470 SPAC 72.4 36.8 63.6 17.2 75.6 78.4 57.3 0.488 SPAD 72.0 36.8 57.2 15.6 76.4 76.4 55.7 0.469
Texture TEXA 70.8 25.6 54.0 29.6 73.6 89.2 57.1 0.486 TEXB 70.8 31.6 56.0 36.4 86.8 89.2 61.8 0.542 TEXC 78.4 19.2 66.0 25.2 80.4 80.4 58.3 0.499 TEXD 81.2 18.4 67.6 30.4 88.0 80.0 60.9 0.531 TEXE 80.8 18.0 64.8 31.6 86.8 93.2 62.5 0.550 TEXF 78.0 18.4 64.8 40.0 84.4 94.4 63.3 0.560
Terrain DEM 10.0 40.0 70.0 20.0 60.0 67.2 44.5 0.334 REL 24.0 21.6 54.0 15.6 32.4 76.4 37.3 0.248 GRAD 30.0 10.0 56.0 2.0 26.8 89.2 35.7 0.228 TERA 20.0 40.0 70.0 0.0 60.0 70.0 43.3 0.320 TERB 28.0 40.0 70.0 0.0 60.0 70.0 44.7 0.336
Integrated INTA 70.4 44.8 76.4 21.6 85.2 78.8 62.9 0.554 INTB 77.6 43.2 78.8 14.0 81.6 80.0 62.5 0.550 INTC 77.2 46.4 85.2 23.6 93.2 80.0 67.6 0.611
*Values in bold represent the highest classification accuracies for each class. tAcronyms are defined in Table 6. $1. Aspen-Dominated Hardwood and Mixedwood; 2. White Spruce / Balsam Fir Conifer and Mixedwood; 3. Cedar Mixedwood; 4. Upland Black Spruce / Jack Pine; 5. Lowland Black Spruce; and 6. Wetland Black Spruce
314 March 2000 PHOTOGRAMMETRIC ENGINEERING & REMOTE SENSING
metric precision of the data (Hutchinson, 1982). These two classes in particular require close examination as to the condi- tions under which they may be uniquely characterized, either spectrally, spatially, or with reference to more specific terrain characteristics. It is likely that examination of these two classes from a class perspective is required, in that they may require further segregation or aggregation in order to consider them as mappable units or classes. The remaining four classes appear to be discriminable at appropriate levels, although these may also require reorganization to improve discriminability while maintaining ecological significance.
In terms of the spectral-spatial variables used to map the six landscape-scale classes, the dataset consisting of three c~s r spectral bands at a spatial resolution of 6-m (SPAC) provided the best discrimination when compared to other spectral-spatial variables. The differences were not great, but were statistically significant. The dataset combining 6-m and 7-m data had a slightly lower LDA classification accuracy than did the 6-m dataset, suggesting that the optimal resolution was exceeded. On the other hand, the dataset that combined 4-, 5-, 6-, and 7-m data, did not produce the best results among the spectral-spa- tial variables. This may be linked to the fact that the estimates derived from the semivariogram analysis represent the mean sizes of support for a number of transects taken from each of the six landscape-scale classes. Possibly it would be more prudent to over-estimate the size of support based on the experimental variograms in order to optimally regularize the variability within the six landscape-scale classes. There may be some rela- tionship between the mean size of support and maximum size of support observed from a sample of experimental variograms to optimally determine the spatial resolution per class. This estimate then may best account for the spatial variability within the class. The estimate may not necessarily have the same rela- tionship to the mean for each class, but may vary based on the level of variability of each class. Regardless, it seems apparent that selecting an optimal spatial resolution for spectral data col- lection alone does not provide sufficient discriminatory power for classifying and mapping the six landscape-scale classes studied here. With the spatial resolutions examined, there is still significant within-class variability to contribute to poor between-class separability.
Texture variables provide accuracies equal to, or greater than, any of the spectral-spatial variables. This supports the assertion that texture information is present within these L-res- olution reflectance data and is characterized to some degree by second-order texture transforms to assist in the discrimination of these landscape-scale classes. In addition, the mean texture feature provided the greatest discrimination among the classes because it not only characterizes texture, but it contains tonal (spectral) information as well. Mean texture features combined with the contrast texture feature for CASIBand 7 (744 nrn to 750 nm) contributes additional textural information to provide additional discrimination for the forest ecosystem classes using three texture variables. It is suggested that these texture variables not only capture the tonal differences between gen- eral ecosystem classes, but that, within general ecosystem classes, they capture forest stand density differences. For example, texture variables improve the discrimination between lowland black spruce and lowlandtwetland black spruce. This may be attributed to the contrasting stem densities of 1700 stemstha and 900 stemstha for lowland black spruce and lowlandtwetland black spruce, respectively. Aspen-domi- nated stands, which possess the lowest stand densities (<700 stemstha), are also well discriminated using textural features. This would suggest that texture variables may be extremely useful in characterizing forest stand structure (e.g., stem den- sity, canopy closure) at spatial resolutions where individual objects are not resolvable.
It is evident that the terrain features tested here (i.e., eleva-
tion, local relief, and gradient) do not provide great discrimina- tory power for the six landscape-scale classes examined. How- ever, it does appear that, within a small region, local elevation and gradient can be used to assist in the discrimination of for- est ecosystem classes when combined with other descriptors. It must be emphasized that, for a low- to moderate-relief boreal environment, these variables, particularly elevation, would have to be used within a relatively small local area, emphasiz- ing the local variation between ecosystem types. Gradient, on the other hand, may have potential for use at more regional scales.
Based on the analyses presented, the integration of spectral data collected at appropriate resolutions with terrain informa- tion and texturally processed features offers promise for dis- criminating and classifying forest ecosystem classes. When the three types of variables were combined (INTC), a mean classifi- cation accuracy of 67.6 percent ( K = 0.611) was achieved using LDA. Although this does not approach operational levels, it indicates that spectral, spatial, and terrain variables, in combi- nation, offer potential for discriminating forest ecosystems classes in low- to moderate-relief boreal environments. How- ever, it appears that, in this boreal environment, application of geomorphometric variables derived from 1:20,000-scale map data with a 5-m contour interval does not provide sufficient dis- crimination for the forest ecosystems examined. Based on field observations, elevation differences as small as a meter in this bedrock controlled environment could produce contrasting moisture regimes and, hence, vegetation patterns at close prox- imity to each other. Given that the root-mean-square error of DEMs derived from contours is approximately one-third to one- fifth of the contour interval, the difficulty in associating terrain variables with vegetation associations in a low- to moderate- relief boreal environment such as this is problematic. The reader is referred to numerous articles detailing the accuracy of digital elevationtterrain models (e.g., Chang and Tsai, 1991; Robinson, 1994; Giles and Franklin, 1996; Florinsky, 1998).
Further refinements in spectral-spatial, textural, and ter- rain variables may provide the necessary discrimination required for operational classification and mapping of large areas of northern boreal forest. Specifically, improvement in discriminating certain ecosystem types such as upland black spruceljack pine and white sprucehalsam fir conifer and mixedwood would increase significantly the potential for clas- sification and mapping. It is suggested that more detailed terrain data modeling soil nutrient and moisture regimes are necessary for incorporation with reflectance and textural data for dis- criminating forest ecosystems. Additional potential lies with estimating structural variables from spectral-spatial and tex- tural features.
Conclusions Given the relationship between forest and site, it was hypothe- sized that combining appropriately scaled remote sensing data with terrain descriptors/variables should improve the discrim- inability of landscape-scale forest ecosystem classes for the boreal forest of northwestern Ontario, Canada. Although not completely encouraging in terms of absolute classification accuracies, various conclusions can be made regarding (1) opti- mal scales of remote sensing data, (2) texture processing, and (3) the integration of terrain variables with reflectance data for discriminating forest ecosystem classes in a low- to moderate- relief boreal environment. These include
Careful consideration must be given to the relationships between the forest classes of interest and the appropriate remote sensing spatial resolutions at which to sample those classes. To maximize discriminability of forest ecosystem classes, a spatial resolution that minimizes (regularizes) within- class variability, but maximizes between-class discrimination is required. Here it was demonstrated that 6-m reflectance data
PHOTOGRAMMETRIC ENGINEERING & REMOTE SENSING March 2000 315

provided the best discrimination of the landscape-scale forest Referenc- ecosystem classes studied. This spatial resolution or scale pro- vided greater discrimination than the following spectral-spatial Babey, s., and R. Soffer, 1992. Radiometric calibration of the compact datasets: 111 a 5-m dataset; (2) a combined dataset of 6- and Airborne Spectrographic Imager (CASI), Canadian Journal of 7-m data;'&d (3) an "optimal" dataset (by class) of 4-, 5-, 6-, Remote Sensing, 18(4):233-242. and 7-m data. However, multiple spatial resolutio~S~~cales of Bard&, A., and F. P-iggiani, 1995. An investigation of the textural remote sensing reflectance data may be required, depending on characteristics associated with gray level co-occurrence matrix the nature of the classes to be discriminated and their structure, statistical parameters, IEEE nansactions on Geoscience and as well as their characteristic visible and near-infrared Remote Sensine, 33(2):293-304. reflectance. Texture features derived from L-resolution CASI reflectance data provide significant information for discrimination of land- scape-scale forest ecosystem classes. Here, texture variables pro- vide accuracies equal to, or greater than, any of the spectral- spatial variables. It is clear that texture information is present within these L-resolution reflectance data and is characterized to some degree by GLcM texture transforms to assist in the dis- crimination of these landscape-scale forest ecosystem classes. Terrain variables alone provide weak discrimination of forest ecosystem classes. However, when used in combination with spectral-spatial variables, they improve the discrimination of landscape-scale forest ecosystem classes. It must be empha- sized that for a low- to moderate-relief boreal environment, these variables, particularly elevation, would have to be used within a relatively small local area, emphasizing the local variation between ecosystem types. Slope, on the other hand, may have potential for use at more regional scales. It is postulated that more precise descriptors or models of terrain are required for integration with appropriate spectral-spatial reflectance fea- tures in a low- to moderate-relief boreal environment. These features must be derived from geomorphometric and soils data to model soil texture classes and moisture and nutrient regimes. The integration of spectral data coNected at appropriate resolu- tions with termin information and texturally processed features offrs promise for discriminating and classifying forest ecosys- tem classes. A mean classification accuracy of 67.6 percent (K = 0.611) was achieved when combining spectral-spatial, tex- tural, and terrain variables. This represents a significant im- provement over using spectral-spatial, texture, or terrain variables alone or in combinations of two variable types. This level of accuracy is not sufficient for operational classification and mapping, but it does indicate that appropriately scaled spectral, textural, and terrain variables provide a basis for classi- fication and mapping of large forest regions based on ecologi- cal criteria.
It has been demonstrated that in a low-relief boreal envi- ronment, addition of textural and geomorphometric variables to high-resolution airborne remote sensing reflectance data pro- vides improved discrimination of forest ecosystem classes. Although these improvements are statistically significant, the absolute classification accuracies are not yet at levels suitable for operational classification and mapping. Further refine- ments, particularly of forest ecosystem class structure and ter- rain descriptors, are required for operational mapping of forest ecosystem classes.
Acknowledgments Funding for this research has been provided through the North- ern Ontario Development Agreement, Northern Forestry Pro- gram. Several agencies contributed to the success of the field program, including Canadian Forest Service-Natural Resources Canada; Northwest Region Science and Technology Unit-Ontario Ministry of Natural Resources; Earth-Observa- tions Laboratory-Centre for Research in Earth and Space Technologies (CREST~C~); and the Provincial Remote Sensing Office-Ontario Ministry of Natural Resources. Additional financial support was provided through the University of Waterloo (scholarships and teaching assistantships), the Natu- ral Sciences and Engineering Research Council of Canada (NSERC)-Research Grants awarded to Philip Howarth and Paul Treitz, and the Undergraduate Student Research Awards pro- gram, and the Environmental Youth Corps program funded by the Ontario Ministry of Natural Resources.
- - - Barber, D., 1989. Texture Measures for SAR Sea Ice Discrimination:
An Evaluation of Univariate Statistical Distributions, Earth- Observations Laboratory, Institute for Space and Terrestrial Sci- ence Technical Report, ISTS-EOL-TR89-005, Department of Geog- raphy, University of Waterloo, Ontario, Canada, 56 p.
Barber, D.G., M.E. Shokr, R.A. Fernandes, E.D. Soulis, D.G. Flett, and E.F. LeDrew, 1993. Comparison of second-order classifiers for SAR sea ice discrimination, Photogrammetric Engineering & Remote Sensing, 59(9):1397-1408.
Cain, D.H., K. Ritters, and K. Orvis, 1997. A multi-scale analysis of landscape statistics, Landscape Ecology, 12:199-212.
Chang, K.-t., and B.-w. Tsai, 1991. The effect of DEM resolution on slope and aspect mapping, Cartography and Geographic Informa- tion Systems, 18(1):69-77.
Cohen, W.B., and T.A. Spies, 1992. Estimating structural attributes of Douglas-FirIWestern Hemlock forest stands from Landsat and SPOT imagery, Remote Sensing of Environment, 41:l-17.
Damman, A.W.H., 1979. The role of vegetation analysis in land classifi- cation, Forestry Chronicle, 55(5):175-182.
Davis, J.C., 1986. Statistics and Data Analysis in Geology, Second Edition, John Wiley and Sons, New York, N.Y., 646 p.
Duda, R.O., and P.E. Hart, 1973. Pattern Classification and SceneAnal- ysis, John Wiley and Sons, New York, 482 p.
Ekstrand, S., 1996. Landsat TM-based forest damage assessment: Cor- rection for topographic effects, Photogrammetric Engineering 6 Remote Sensing, 62(2):151-161.
ESRI Inc., 1996. ArcInfo Users Manual, Version 7, Environmental Sys- tems Research Institute Inc., 380 New York Street, Redlands, Cali- fornia, variously paged.
Florinsky, I.V., 1998. Combined analysis of digital terrain models and remotely sensed data in landscape investigations, Progress in Physical Geography, 22[1):33-60.
Florinsky, I.v, and G.A. Kuryakova, 1996. Influence of topography on some vegetation cover properties, Catena, 27:123-141.
Frank, T.D., 1988. Mapping dominant vegetation communities in the Colorado Rocky Mountain Front Range with Landsat Thematic Mapper and digital terrain data, Photogrammetric Engineering b Remote Sensing, 54:1727-1734.
Franklin, S.E., and D.R. Peddle, 1989. Spectral texture for improved class discrimination in complex terrain, International Journal of Remote Sensing, 10(8):1437-1443.
Franklin, S.E., and G.J. McDermid, 1993. Empirical relations between digital SPOT HRV and CASI spectral response and lodgepole pine (Pinus contortal forest stand uarameters. International Iournal of kemote sensini, 14(12):233112348. .
Franklin, S.E., D.R. Connery, and J.A. Williams, 1994. Classification of alpine vegetation using Landsat Thematic Mapper, SPOT HRV and DEM data, Canadian Journal of Remote Sensing, 20[1):49-56.
Freund, J.E., and G.A. Simon, 1992. Modern Elementary Statistics, Eighth Edition, Prentice-Hall, Englewood Cliffs, New Jersey, 578 p.
Giles, P.J., and S.E. Franklin, 1996. Comparison of derivative topo- graphic surfaces of a DEM generated from stereoscopic SPOT images with field measurements, Photogrammetric Engineering 6. Remote Sensing, 62(10):1165-1171.
Gong, P., R. Pu, and J. Chen, 1996. Mapping ecological land systems and classification uncertainties from digital elevation and forest- cover data using neural networks, Photogrammetric Engineering 6. Remote Sensing, 62:1249-1260.
Gower, J.F.R., G.A. Borstad, C.D. Anger, and H.R. Edel, 1992. CCD- based imaging spectrometry for remote sensing: The FLI and CASI programs, Canadian Journal of Remote Sensing, 18[4):199-208,
316 March 2000 PHOTOGRAMMETRlC ENGINEERING 81 REMOTE SENSING

Haralick, R.M., 1979. Statistical and structural approaches to texture, Proceedings of the IEEE, 67[5):786-804.
Haralick, R.M., K. Shanmugam, and I. Dinstein, 1973. Texture features for image classification, IEEE Transactions on Systems, Man, and Cybernetics, 3(6):610-621.
Hay, G.J., K.O. Niemann, and D.G. Goodenough, 1997. Spatial thresh- olds, image-objects, and upscaling: A multiscale evaluation, Remote Sensing of Environment, 621-19.
Hills, G.A., and G. Pierpoint, 1960. Forest Site Evaluation in Ontario, Research Report, No. 42, Ontario Department of Lands and For- ests, Toronto, Ontario, 63 p.
Hutchinson, C., 1982. Techniques for combining Landsat and ancillary data for digital classification improvement, Photogrammetric Engineering b Remote Sensing, 48(1):123-130.
Hutchinson, M.F., 1989. A new procedure for gridding elevation and stream line data with automatic removal of pits, Journal of Hydml- om, 106:211-232.
Kalnins, V.J., P.M. Treitz, and P.J. Howarth, 1994. Rinker Lake Data Report 1993-1994, Technical Report ISTS-EOL-TR94-002, Earth- Observations Laboratory, Waterloo, Ontario, variously paged.
Mackey, B.G., R.A. Sims, K.A. Baldwin, and I.D. Moore, 1996. Spatial analysis of boreal forest ecosystems: Results from the Rinker Lake case study, GIS and Environmental Modeling: Progress and Research Issues (M.F. Goodchild, L.T. Steyaert, B.O. Parks, C. Johnston, D. Maidment, M. Crane, and S. Glendinning, editors), GIs World Jnc., Fort Collins, Colorado, pp. 187-190.
Mausel, P.W., W.J. Kamber, and J.K. Lee, 1990. Optimal band selection for supervised classification of multispectral data, Photogrammet- ric Engineering 6. Remote Sensing, 56(1):5 5-60.
McLean, N.H., and P.W. Uhlig, 1987. Field Methods Training Manual for the Northwest Region FEC, Ontario Ministry of Natural Resources (OMNR), Toronto, Canada, unpublished report, 28 p. plus three appendices.
Michaelsen, J., D.S. Schimel, M.A. Friedl, F.W. Davis, and R.C. Dubayah, 1994. Regression tree analysis of satellite and terrain data to guide vegetation sampling and surveys, Journal of Vegeta- tion Science, 5:673-686.
Mollard, D.G., and J.D. Mollard, 1981. Heaven Lake Area (NTS 52H/ SW), District of Thunder Bay; Ontario Geological Survey, Northern Ontario Engineering Geology Terrain Study 41 (accompanied by Map 5051, Scale 1:100,000), Ministry of Natural Resources, Toronto, Canada, 26 p.
Moore, I.D., R.B. Grayson, and A.R. Ladson, 1991. Digital terrainmodel- ing: a review of hydrological, geomorphological and biological applications, Hydrological Processes, 5:3-30.
Musick, H.B., and H.D. Grover, 1990. Image textural measures as indi- ces of landscape pattern, Quantitative Methods in Landscape Ecology, The enaiysis and interpretation of Landscape ~ e t i r o ~ e - neitv, IM. G. Turner and R.H. Gardner. editors). Ecoloeical Studies ~erces; Vol 82, Springer-Verlag, New York, 77-1c3.
PC1 Inc., 1997. EASI/PACE Image Analysis System Manual, Version 6.0, PC1 Inc., Toronto, Ontario, Canada, variously paged.
Peddle, D.R., and S.E. Franklin, 1991. Image texture processing and data integration for surface pattern discrimination, Photogmm- metric Engineering 6. Remote Sensing, 57(4):413-420.
Pultz, T.J., and R.J. Brown, 1987. SAR image classification of agricul- tural targets using first- and second-order statistics, Canadian Journal of Remote Sensing, 13(2):85-91.
Racey, G.D., T.S. Whitfield, and R.A. Sims, 1989. Northwestern Ontario Forest Ecosystem Interpretations, NWOFTDU Technical Report No. 46, Ontario Ministry of Natural Resources, Thunder Bay, Ontario, Canada, 160 p.
Robinson, G.J., 1994. The accuracy of digital elevation models derived from digitised contour data, Photogrammetric Record, 14(83):805-814.
Rosenfield, G.H., and K. Fitzpatrick-Lins, 1986. A coefficient of agree- ment as a measure of thematic classification accuracy, Photogram- metric Engineering b Remote Sensing, 52(2):223-227.
Rotunno, O.C., P.M. Treitz, E.D. Soulis, P.J. Howarth, and N. Kouwen, 1996. Texture processing of synthetic aperture radar data using
second-order spatial statistics, Computers and Geosciences, 22(1):27-34.
Rowe, J.S., 1972. Forest Regions of Canada, Publication No. 1300, Canadian Forestry Service, Department of the Environment, Ottawa, Ontario, Canada, 172 p.
Shepherd, P.R., 1994. Airborne remote Sensing Data, Rinker Lake Data Report - 1993-1994, (V. J. Kalnins, P.M. 'Ikeitz, and P. J. Howarth, editors), Technical Report ISTS-EOL-TR94-002, Earth-Observa- tions Laboratory, Waterloo, Ontario, pp. 3-19-3-48.
Shepherd P.R., J.R. Freemantle, S. McArdle, and J.R. Miller, 1995. A comparison of different operational reflectance generation meth- ods applied to airborne CASI imagery, 17th Canadian Symposium on Remote Sensing: Radar Remote Sensing: A Tool for Real-Time Land Cover Monitoring and GIs Integration, 13-15 June, Saska- toon, Saskatchewan, pp. 268-273.
Sims, R.A., W.D. Towill, K.A. Baldwin, and G.M. Wickware, 1989. Field Guide to the Forest Ecosystem Classification for Northwestern Ontario. Ontario Ministry of Natural Resources, Toronto, Ontario, 191 p.
Sims, R.A., and P. Uhlig, 1992. The current status of forest site classifi- cation in Ontario, Forestry Chronicle, 68(1):64-77.
Sims, R.A., B.G. Mackey, and K.A. Baldwin, 1995. Stand and landscape level applications of a forest ecosystem classification for north- western Ontario, Canada, Annales des Sciences Forestiere, 52:573-588.
Strahler, A.H., C.E. Woodcock, and J.A. Smith, 1986. On the nature of models in remote sensing, Remote Sensing of Environment, 20:121-139.
Swain, P.H., and S.M. Davis, 1978. Remote Sensing: The Quantitative Approach, McGraw Hill, Inc., Toronto, Ontario, 396 p.
SYSTAT Inc., 1992. SYSTAT User's Guide - Statistics, SYSTAT Inc., Evanston, Illinois, 724 p.
Tom, C.H., and L.D. Miller, 1984. An automated land-use mapping comparison of the Bayesian maximum likelihood and linear dis- criminant analysis algorithms, Photogrammetric Engineering b Remote Sensing, 50(2):193-207.
Treitz, P.M., 1997. Boreal Forest Ecosystem Characterization at Site and Landscape Scales using Multispatial Resolution Remote Sensing Data, PhD thesis, Department of Geography, University of Waterloo, Waterloo, Ontario, Canada, 297 p.
Treitz, P.M., P.R. Shepherd, P.J. Howarth, and J.R. Miller, 1996. Integ- rating remote sensing data and terrain variables to discriminate forest ecosystems in northwestern Ontario, 26th International Symposium on Remote Sensing of Environment / 18th Canadian Symposium on Remote Sensing, Vancouver, B.C., 25-29 March, pp. 515-518.
Ulaby, F.T., F. Kouyate, B. Brisco, and T.H.L. Williams, 1986. Textural information in SAR images, IEEE Transactions on Geoscience and Remote Sensing, 24(2):235-245.
Vickers, A.L., and J.W. Modestino, 1982. A maximum likelihood approach to texture classification, IEEE i'kansactions on Pattern Analysis and Machine Intelligence, 4(1):61-68.
Vogelmann, J.E., T. Sohl, and S.M. Howard, 1998. Regional character- ization of land cover using multiple sources of data, Photogram- metric Engineering P Remote Sensing, 64(1):45-57.
Walsh, S.A., R. Sims, and J. Ford, 1994. General description of the Rinker Lake Research Area, Rinker Lake Data Report - 1993, (V.J. Kalnins, P.M. lkeitz, and P.J. Howarth, editors), Technical Report ISTS-EOL-TR94-002, Earth-Observations Laboratory, Waterloo, Ontario, pp. 2-5-2-14.
Wilson, B.A., 1996. Estimating coniferous forest structure using SAR texture and tone, Canadian Journal of Remote Sensing, 22(4):382-389.
Wulder, M.A., E.F. LeDrew, S. Franklin, and M. Lavigne, 1998. Aerial image texture information in the estimation of northern deciduous and mixed wood forest leaf area index (LAI), Remote Sensing of Environment, 64:64-76.
Yuan, X., D. King, and J. Vlcek, 1991. Sugar Maple decline assessment based on spectral and textural analysis of multispectral aerial videography, Remote Sensing of Environment, 37:47-54.
(Received 25 August 1998; revised and accepted 26 March 1999)
PHOTOGRAMMETRIC ENGINEERING & REMOTE SENSING darch 2000 317