integrating information technology and operational research in the management of milk collection
TRANSCRIPT
1
Integrating Information Technology and Operational Research in the
Management of Milk Collection
Martin Butler1, Pat Herlihy2, Peter B. Keenan1*
1 Department of Management Information Systems, UCD Business Schools, University
College Dublin, Belfield, Dublin 4, Ireland.2 UDS Software, Unit 2, Garville Drive, Rathgar, Dublin 6, Ireland.
* Corresponding author: email [email protected] Tel +353 1 7164727 Fax +353 1
7164783
Abstract
The Dairy industry is an important part of the food sector and milk collection is a
challenging logistics problem that had long been of interest to operational researchers.
Advances in information technology (IT) greatly facilitate data collection, manipulation
and presentation and these advances facilitate the building of Decision Support Systems
(DSS) to support logistics management in the milk collection sector. This paper
discusses how a Geographic Information System (GIS) based DSS allows a scheduler
interact with optimisation algorithms to plan milk collection routes. The paper goes on
to discuss how such a DSS can be integrated with automatic data capture devices and
database management systems to provide effective management of milk collection
operations.
Milk Collection
Background to Milk Collection
Transportation costs are always a significant component of total cost for a company where the
movement of raw material or product is required. Major components of this cost include the
labour cost of the drivers, the cost of fuel, and the cost of the trucks. These costs are
especially important where perishable products are being transported and specialised handing
2
is required. These conditions frequently arise in the transport of agricultural products, and
especially in the handling of dairy products. Significant transportation problems arise both in
the collection of milk from farmers and the distribution of finished products to shops. The
cost of delivery of these products is a key issue (Adenso-Diaz, González, & García, 1998)
(Tarantilis & Kiranoudis, 2001) which has something in common with other delivery
applications. On the other hand, bulk milk collection is a distinctive logistics application and
one where major transport costs are incurred.
In most countries milk is a scarce commodity, and within a region dairy companies attempt to
attract as many farms as possible to supply them with milk. The most attractive inducement
that a dairy can offer a farmer is a competitive price per litre for the farm's milk output. Rival
dairy companies regularly attempt to “poach” farmers from other dairy companies through
much publicised increases in price per litre. The history of the dairy industry contains many
examples of so called “Milk Wars”. Marketplace competition for dairy products, and similar
levels of efficiency in modern milk processing plants, ensure that the dairies cannot profitably
operate if the cost of a litre of milk arriving at the processing plant is out of line with others in
the industry.
The cost of milk has two components: first, the cost of transport, and second, the cost of
paying the farmer for the milk. Given that the dairy has little scope for allowing the total cost
to increase, then any increase in the price per litre paid to the farmer must be compensated by
a reduction in the cost per litre of collecting the milk. An efficient transport operation can
allow a higher milk price to farmers, in turn attracting higher volumes that can lead to further
economies of scale in milk collection. Because a reduction in transport cost can improve the
price per litre that a dairy can offer its farmers, dairy companies have consistently attempted
to adopt cost reducing initiatives. These have included introducing larger capacity collection
vehicles and longer working days for the drivers. In dairies, schedulers control milk collection
3
operations, by selecting which vehicle is to visit which customer. Dairies have always been
interested in the ability of schedulers to design a cost efficient set of routes, which allocate
farmers to trucks in a way that minimises the total cost of milk collection.
In most dairies, the scheduler responsible for allocating farmers to trucks and drivers is
someone promoted from the organisation’s cohort of drivers. The scheduler, once in the
position, finds it difficult to reconcile the conflicting demands of management, drivers and
farmers. The demand from management is for a milk collection system that they believe to be
the most efficient and cheapest possible. On the other hand, drivers are usually paid
employees and typically resist changes that impact on their working conditions. Dairy farmers
develop a routine that includes the daily arrival of the milk tanker, and respond in a negative
fashion if changes in this routine are suggested.
Schedulers must operate in the context of these conflicting demands from the various interest
groups involved. Traditionally, milk collection routes evolve organically over time. Given the
complexity of the problem, the scheduler has a limited capacity to make drastic changes to a
route structure. The management of the dairy is primarily concerned with cost factors and the
perceived reluctance of the scheduler to make changes has led to the perception that transport
costs in milk collection are higher than they should be.
Operational Research in Milk Collection
In the 1970’s energy and labour costs increased dramatically, with a consequent impact on
transport costs, this led to interest in the use of Operational Research (OR) techniques for cost
reduction. In this period, computer technology became sufficiently powerful to be capable of
solving simple OR problems of reasonable size. OR techniques were subsequently
incorporated into a series of computer packages that purported to provide optimal solutions to
route optimisation problems. This software incorporated a simplified view of the routing
4
problem, largely concentrating on distance minimisation to the exclusion of other issues of
concern to schedulers. This early software was difficult to use and lacked the type of
interactive interface that later facilitated software use in business.
Initially, these packages were applied to transport problems involving the distribution of
product in response to changing customer orders. These problems were characterised by route
patterns that differed from day to day. The scheduling on such routes was extremely difficult,
as the scheduler frequently had only a few hours between receiving the customer orders and
preparing the delivery routes. For this type of problem any computational assistance from
software, however inadequate, was very welcome. Given the once off nature of the routes, the
schedulers were prepared to overlook the limitations in the solutions generated, as there was
insufficient time to prepare superior solutions in any case.
Fisher, a prominent researcher in vehicle routing, noted that the overall procedures used in
early routing software were sub-optimal, as the routing problem was modelled inexactly to
achieve tractability (Fisher, 1995). He suggested that these routing algorithms performed well
in some situations, but delivered unreasonable results in other cases with slightly different
data. Fisher suggested that a number of strategies could be used to improve algorithm
robustness. These included using better road network data, this has been facilitated by the
introduction of Geographic Information Systems (GIS) based techniques discussed below.
Fisher suggested that manual intervention might improve the usefulness of algorithms, this is
the approach embodied in Decision Support Systems (DSS) that form the basis of this paper.
He also suggested that faster computers would allow optimal results be achieved for more
complex problems. Computer technology continues to improve, but many routing problems
remain difficult to solve optimally.
The milk collection sector demonstrates the trends discussed by Fisher. Milk collection
problems differ greatly from many other routing problems in that the routes are static in
5
nature and vary only marginally on a day-to-day basis. Customers, drivers and other interest
groups expect that milk collection routes will meet their needs, as these routes will be used
with little change for a long period. These distinct features meant that software developed to
meet the needs of other routing applications was unlikely to succeed in the diary industry.
Nevertheless, the management of dairy companies saw these routing packages as a solution to
the scheduling problem in their distinct environment. They hoped to replace the scheduler
with software that would produce an optimal solution to minimise transport costs without any
of the political reluctance of the scheduler. This software had usually been developed with a
different industry in mind, and was not able to adequately model the complexity of the milk
collection process. Time window constraints, constraints arising from problems of access to a
farm by large trucks, and even driver constraints where by the driver for social reasons wished
to collect farms in a certain sequence, were not fully catered for by the “Black Box”. This
meant that the solution provided by the “Black Box” ignored various fundamental constraints,
making the solution unusable as a working schedule. The additional constraints relating to
milk collection could not be added into the models used without increasing the execution time
excessively. Consequently, the use of the “Black Box” approach was discontinued and the
unfortunate outcome of these unsuccessful attempts to use these packages was a deep
scepticism towards OR within management of dairy firms.
The lesson from the above is that milk collection is complex and distinct from other routing
applications. Consequently, what is really required is technology that supports the scheduler,
rather than technology that attempts to replace the scheduler. This supportive approach and
associated technology started to emerge in the milk collection sector in the 1990’s with the
development of DSS.
The DSS approach to scheduling
6
Decision Support Systems (DSS)
The limitations of OR algorithms alone to fully meet the needs of business decision-makers
became obvious in a number of fields. This led to the development of the concept of a DSS in
the 1970’s (Gorry & Scott-Morton, 1971; Little, 1971). A DSS, as the name suggests, is
designed to support rather than replace a decision-maker. A DSS will include computational
techniques, but in contrast to the traditional approach these operate under the control of the
decision-maker through a user-friendly interface. Barbosa and Hirko (1980) put forward a
succinct set of guidelines for the design of OR/MS based DSS. These guidelines focus on user
control, flexibility and system feedback through a user-friendly interface.
Routing has been identified as one of the major areas of application of DSS (Eom & Lee,
1990; Eom, Lee, & Kim, 1993). The Geodata Analysis and Display System (GADS) was an
early system, with relatively sophisticated graphics, that illustrated the potential of routing
DSS (Grace, 1977). In a review of the vehicle routing field, Bott and Ballou (1986) argued for
the use of graphically based interactive techniques combined with appropriate algorithms.
Another review of the routing field (Ronen, 1988), reached a similar conclusion about the
importance of interactive software working with experienced schedulers. A review of
software for milk collection argued for flexible, user-friendly, interactive and inexpensive
software with less need for improvement of the optimisation procedures (Bocxe & Tilanus,
1985). Software in that period did not generally provide that flexibility, a review of PC based
routing software (Golden, Bodin, & Goodwin, 1986), found that only one-third of the
packages reviewed had extensive graphic facilities.
Early DSS
Consequently, the need for interactivity became widely recognised and software could only
meet this need by providing an improved interface. The introduction of personal computers
with reasonable graphics facilitated the development of DSS generally, and this is especially
true for routing DSS. Traditionally a scheduler used a map of their region with farms
7
identified by coloured pins. The colour associated with a pin reflects the milk collection route
that is used to service the particular farm. Early DSS applications provided simple graphics
and the system was designed to reduce the need for the geographic map and the coloured pins.
Early systems were unable to replace maps completely because of the limited amount of
information displayed on the screen.
By means of this first generation DSS a scheduler could get a coloured display of the milk
collection operation, and could see the consequence of moving one farm from one route to
another route. This functionality was useful when the total milk from a route approached or
exceeded the volume capacity of a truck. When this happened, the scheduler would have to
move one farm from one route to another. What farm to move, and onto what route to move
that farm, could be determined by the scheduler by simply viewing the computer screen. The
DSS did not attempt to suggest a solution; it supported the decision-making by re-calculating
the volume collected and distance travelled on each route as a result of a suggestion by the
scheduler.
Unlike the “Black Box” systems, this reactive system received the support of the scheduler.
The decision remained with the scheduler, while all that was expected of the technology was
to provide calculation support. No attempt was made to replace the scheduler; the DSS was
designed to work in a supportive role to the scheduler.
Second Generation DSS
Technology limitations meant that early DSS applications had a sparse interface that provided
only some of the information of interest to the decision-maker. As computer systems
improved, the objective of DSS development was to provide a richer information environment
for decision-makers. This required the provision of more contextual information, in the milk
routing example this included more geographic information and more information on the
customers and their volumes, time windows, etc. During the 1990’s various generations of
8
DSS have been introduced. All these have the same philosophy, what has changed is the
quality of geographic map, and the level of information available to the scheduler about each
customer. In the first generation, the coloured symbol used to represent a customer only
contained information on the route and volume. Later generations incorporated an interface
linked to a comprehensive database and this enabled a whole variety of information relevant
to milk collection to be associated with a symbol.
This richer environment can be achieved by customised programming or by using an
appropriate software tool. In the 1990s a number of routing DSS systems were developed
using the graphical programming facilities in modern programming languages, for example
the road sweeping system in England by Eglese and Murdock (1991) or the milk collection
Fleetmanager system in New Zealand (Basnet, Foulds, & Igbaria, 1996). The availability of
PC based geographic information systems (GIS) has made an important contribution to
routing DSS. These systems allow the storage and manipulation of geographic information.
GIS can be seen as a generator for building a routing DSS, with the addition of specific data
and calculations to support the routing function (Keenan, 1996). Modern GIS software such
as ArcGIS or MapInfo provides an effective DSS interface, a powerful macro language and
the ability to interact with external programs. Consequently, a second generation DSS can be
built with a much richer interface and GIS technology forms the basis of many modern
routing systems (Keenan, 1998). GIS based systems have been used for a variety of routing
applications, from urban product delivery (Tarantilis & Kiranoudis, 2002) (Ioannou, Kritikos,
& Prastacos, 2002), to hazardous waste transportation (Frank, Thill, & Batta, 2000) and
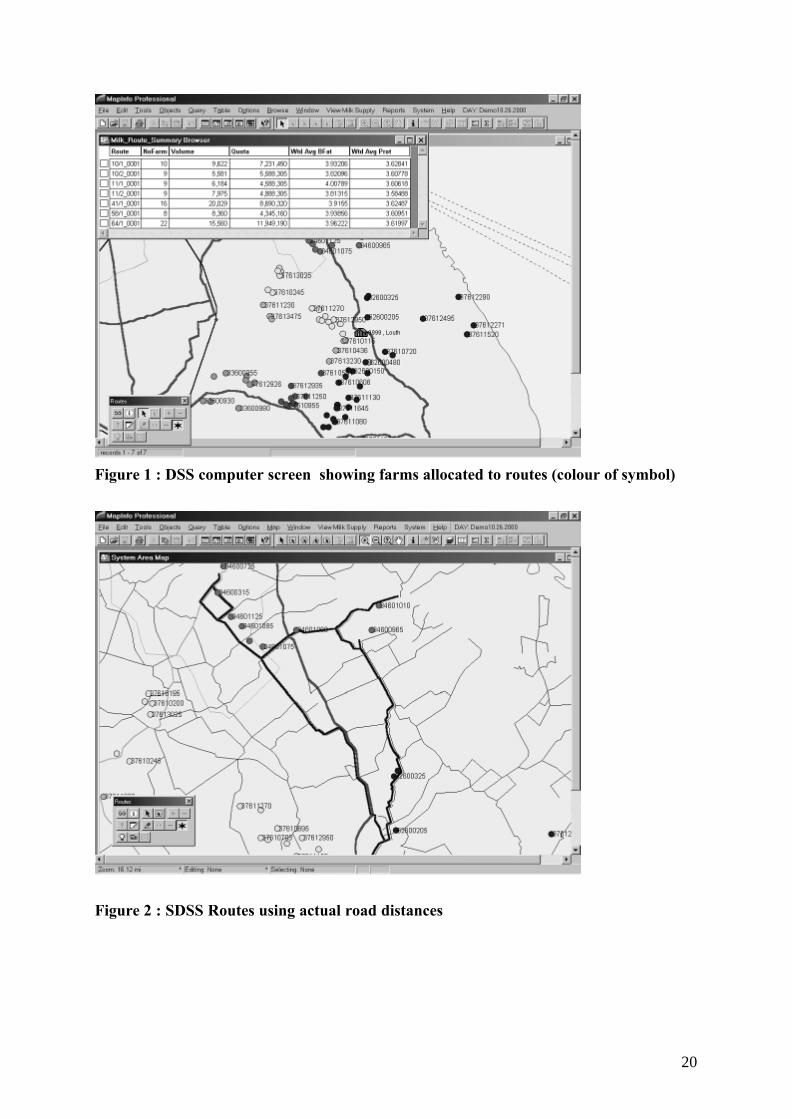
ambulance dispatching (Derekenaris et al., 2001). Figure 1 shows a typical routing interface
for a routing DSS developed with the MapInfo GIS.
FIGURE 1 about HERE
9
In Figure 1, the colour suggests the route on which a farm is collected. In addition, the DSS
also uses the size of the symbol to represent the milk volume output from the farm. This size
variation also a scheduler some hint as to which farm to move and the consequence to a route
of moving that farm.
The information that could be associated with a symbol included:
Supplier name
Telephone number
Supplier code
Volume collected at most recent collection
Temperature of most recent collection
Butterfat for most recent test
Protein for most recent test
Lactose for most recent test
Total Bacterial Count (TBC) for most recent test
Somatic Cell Count (SCC) for most recent test
Total supplies to date
Quota
Reference butterfat
Butterfat adjusted quota position( % of quota used)
Memories of expensive past failures with “Black Box” systems have made management of
dairy companies reluctant to invest in computer systems. However, through the support of
schedulers, realistic expectation management by marketers, and some very successful
implementations, DSS is slowly becoming a feature of how progressive dairies manage their
milk collection operations.
Case Study of DSS success
10
UDS Software is a Dublin based software company specialising in developing management
and logistical software for the milk sector. UDS Software has been a pioneer in the
development of successful DSS implementations. UDS Software uses MapInfo as its
development environment, and has over 10 years of experience of applying DSS to both Irish
and UK dairies. One example of the value of a DSS driven application occurred when an Irish
dairy decided to radically change its milk collection system.
Traditionally, the dairy had used drivers who were their direct employees to collect the milk.
These employees were unionised, and over the years many work practices had developed that
were responsible for a higher than acceptable cost of milk collection. These work practices
covered such issues as: length of day, meal breaks, maximum truck size, a limit on the
number of farms on a route, and holiday rosters.
The approach favoured by management was to make redundant all of the drivers, and to
replace them by several small collection companies. It was assumed that each collection
company would be built around an existing driver. Each company would be allocated a cluster
of farms with the company paid a fixed price per litre to collect the milk. It was expected that
two routes per day would collect the milk from a cluster during the period for peak milk
production, and one route per day during the off-peak period.
The issues for negotiations between management and workers were:
1. The optimal size of a cluster. Assuming that each cluster would be allocated to a
company owned and worked by an existing employee, then how much could a driver
collect during a day at peak, and during a day at off-peak? These maximums would
dictate how much milk, and how many farms, management should allocate to a
cluster. It was assumed that each company/cluster had a main driver, but, in addition,
that driver would have call on additional drivers to cover holidays, rest days etc. The
management of these relief drivers would be the responsibility of the main driver. The
11
dairy’s only responsibility would be to allocate milk to a company/cluster. The detail
of the required routes to service the cluster would be the responsibility of the
company, managed by the main driver.
2. The allocation of farms to a cluster. Negotiations from the first phase suggested that 9
million litres per annum, with a certain peak to off-peak ratio, would be the target. The
second issue was how to partition the total milk pool of the dairy into coherent clusters
of appropriate size. This is where the transparency of the DSS became an invaluable
tool. The approach used was to create a DSS containing relevant data on all of the
farms serviced by the dairy, approximately 800 farms in this example. These 800
farms were located on the DSS map by coloured symbols, and the data behind each
symbol was the annual milk output from the farm, the peak daily output from the
farm, and the off-peak daily output. Management used the DSS to form feasible
clusters from their perspective. In this process, the scheduler was able to cluster the
farms manually, by looking at the visual display of all the farms on the DSS. The DSS
calculated the three volumes, annual total, peak daily, and off peak daily, for each
cluster. The scheduler moved farms from cluster to cluster using the DSS until a set of
feasible clusters was obtained.
3. Ownership of the collecting companies. The dairy aimed to allocate to a days work to
a transport company owned by an existing driver, who would be responsible for all
aspects of its operations. The dairy would allocate each collecting company a cluster
of farms, and dairy would pay an agreed price per litre to the company to collect the
milk from the farms within its cluster. It was agreed that the dairy would issue a five-
year contract to each collecting company.
Discussions took place between management and drivers as to who would be offered
the ownership of the collecting companies. In total the dairy employed 80 drivers, and
12
first estimates suggested that 32 clusters would be required. This suggested that 32 of
the 80 existing drivers would be offered clusters, while the remaining 48 would be
offered redundancy. Partially due to the age profile of the drivers, and the generosity
of the redundancy scheme, the management had little difficulty finding the 48 drivers
to volunteer for redundancy.
Negotiations now could start with the 32 remaining drivers as to the final composition
of the clusters. In the boardroom of the dairy, and through the use of a large television
screen, the DSS was used to display the proposed clusters. Using the local knowledge
of the drivers, together with a collective feeling of equity, the final clusters were
agreed. The author suggests that the DSS provided an invaluable ability to view and
change the solution, in a way transparent to all parties. Without this technology,
agreement would have been much harder to achieve.
4. Price per litre to collect the milk. By now the dairy had an agreement to replace its
existing drivers by independent collecting companies. It had also agreed the size and
composition of the 32 clusters. It has also agreed which driver would be allocated each
cluster. The final stage was to agree the collection payment schedule.
Each company/cluster would have annual revenue derived from the number of litres
collected from the cluster multiplied by the fixed price per litre agreed with the dairy.
Costs to the company would be the full cost of collecting the milk from the cluster.
These included truck costs, fuel costs, additional driver costs, and provision for
pension costs. It was assumed that the profit of the collecting company would be the
payment to the main driver in lieu of salary.
By agreeing expected company profit, by estimating all of the expected costs,
management could agree the annual revenue required by each cluster. This annual
revenue figure, divided by the annual milk volume in a cluster, is the price per litre for
13
a cluster. This price per litre, together with an agreed inflation increase, would form
part of the collection contracts.
Management completed all negotiations with its drivers in 1998, and the new system of
collecting companies started in September 1998. The dairy estimates that this change has
reduced its annual cost of milk collection by approximately IR£500 000 (€635 000).
Management of the dairy also suggested that the DSS was a vital tool in the negotiations
because it allowed management and drivers to actively engage in the clustering process, and it
ensured that drivers could take ownership of any decisions reached.
The above process received significant coverage in the dairy sector, and has to a certain extent
restored management’s confidence in Operational Research, and the ability of technology to
play a significant role in optimising milk collection costs.
DSS Enhancements
Geographic Data
The use of GIS also requires the availability of suitable geographic data. This has been
facilitated by technical developments in data capture. Initially digital mapping data was not
widely available and customised data collection from maps was achieved by digitisation using
a hand-held device, an error prone and time consuming process. In Ireland, data has been
historically quite expensive and of poor quality because of inadequate updating of maps. The
situation has now greatly improved, with general mapping information now available, at a
price, in digital form. The widespread availability of accurate road network data allows
calculation of accurate travel times using the actual road distances used rather than estimation
using co-ordinate distance. This is especially important in milk collection as the rural road
network is quite sparse and the road distance between two points may be much further than
14
the co-ordinate distance. Modern GIS software contains network analysis tools to exploit this
road network data (Figure 2).
FIGURE 2 about HERE
Other technical developments such as Global Positioning Systems (GPS) have greatly
facilitated the collection of geographic data in general. GPS is seen as an important
development in data collection for routing (Imielinski & Navas, 1999). GPS allows the
collection of point and time data, either as single data points or as a stream of data. A GPS
installed in a moving vehicle can collect continuous data on the vehicle location and the time
that it reached those locations. This is valuable both for data collection in advance of route
optimisation and for validation of the routes produced. GPS has an important role to play in
agricultural applications as the exact location of farms and their milk storage facilities may
not be recorded on maps, these locations can be easily identified by a GPS on an existing
vehicle that visits these facilities.
Customer Data
While GPS provides location data, a successful DSS also requires non-spatial (attribute) data
about customers. This can be facilitated by using several different data capture strategies and
by the use of a database to organise the data collected. UDS Software has developed, in
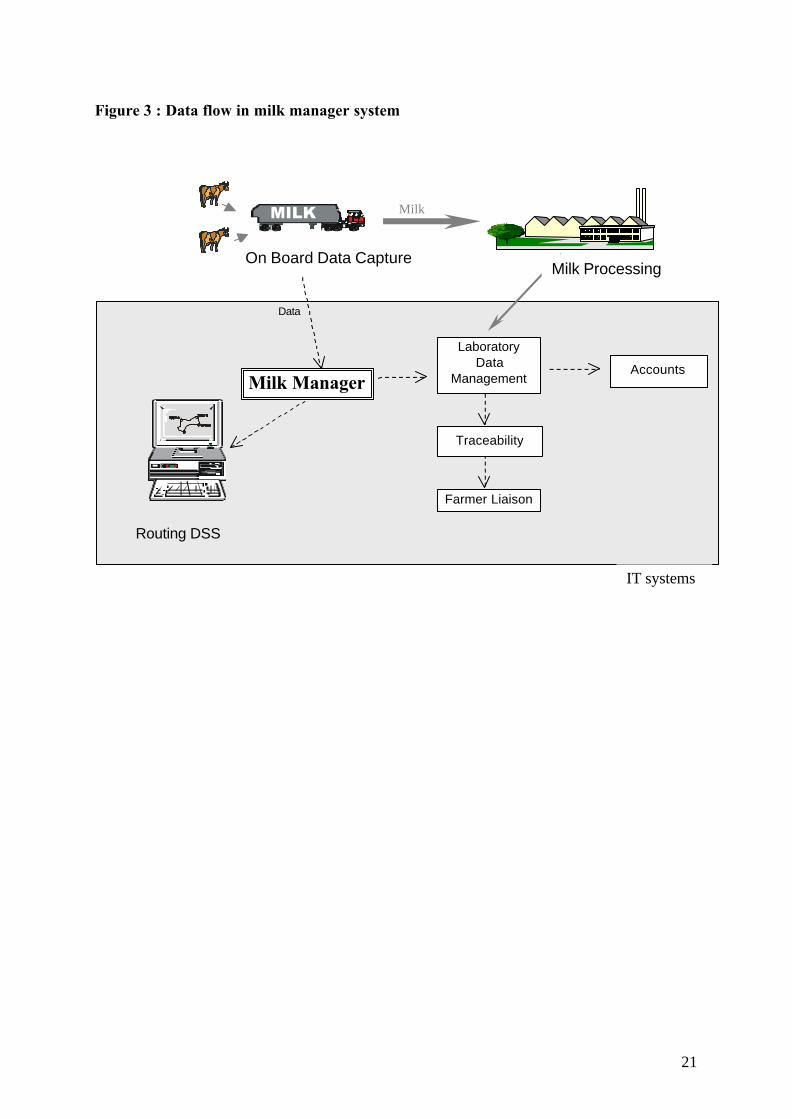
parallel with their DSS, a Milk Procurement Management System. The management of the
dairy uses this system to plan and control all aspects of the milk collection operation. The
system includes modules to reconcile the load of each milk collection tanker against a
weighbridge, modules to monitor the milk quota position of each farm, and modules to assess
payment farmers for milk supplied. The milk payment process is complicated, as the amounts
paid to a farmer at the end of each month depend not only on the volume of milk supplied, but
also on the quality and composition of that milk. The quality and composition of milk is
15
calculated based on a daily milk sample taken at each farm. These samples are laboratory
tested, and the data is fed back electronically to the Milk Procurement software (Figure 3)
FIGURE 3 about HERE.
The use of software to store data relating to all aspects of a farms milk operation, and the
linking of the DSS to this database, allows management use a range of data to underpin the
DSS. For example, management might be interested in viewing all farms that are approaching
the limit of their annual quota; the DSS together with an interface to the Quota Module allows
this. A second example might involve milk output that is less than acceptable. Here,
management might wish to visit all farms whose milk is below a given standard. The DSS
would allow management display a geographic plot showing all such farms and, possibly
using an optimisation tool, management can determine an efficient route that to visit each
farm.
The key to the milk collection process is the accurate recording of the volume of milk
collected at each farm. In addition, data on milk temperature and time of collection is needed
for effective management of the process. Normally, the milk collected from a farm should
have been cooled to 4C, quality issues can arise if the milk collected is in excess of this
temperature. Traditionally, a driver would record manually at each farm; the volume of milk,
its temperature, and time of collection. This data would then be manually inputted into a
computer system when the vehicle returned to the dairy. Management has always been
concerned about the accuracy of this data. The volume data can be reconciled against a total
route volume as by passing the truck across a weighbridge. Historically, the verification of
temperature and time of collection is not as easy, although the introduction of on-tanker
computers in the 1990’s has greatly improved the situation. This data capture equipment,
together with volume and temperature probes, allows a range of relevant data be collected and
stored electronically during a route. At the end of a route this data can be downloaded into
16
suitable software for reporting (see Figure 3). By integrating this data into the DSS, further
aspects of the milk collection process can be managed and controlled.
Optimisation
Successful DSS implementations, like the one described in the previous section, have greatly
restored management’s confidence in technology. With this restored confidence has come the
willingness of companies to invest in DSS systems. This confidence in these DSS
implementations arose because they supported the decision-maker. However, the support
provided was usually confined to a graphical representation of the problem and simple
computational support, without the extensive use of OR techniques. Gradually, as schedulers
became more relaxed with the DSS, they became more willing to delegate progressively more
intelligence to the DSS. This could allow use, under the control of the scheduler, of
techniques for clustering and routing, for example Travelling Salesman (TSP) algorithms.
In the dairy example above, the first request from the scheduler was for the DSS to provide a
“hint” as to which farm they should move from one cluster to another. The “hint” concept
allowed the scheduler to accept or reject a suggestion from the DSS. Observation of the use of
the DSS revealed that the scheduler would more and more often accept the “hint”. When the
scheduler rejected a “hint”, analysis would be initiated as to why the “hint” was rejected. By
incorporating, where possible, the result of this analysis into the techniques behind the “hint”,
the usefulness of the computational algorithms could be increased.
As this increase in confidence evolved, not only was the “hint” being used more and more, the
schedulers were also requesting an increase in the scope and number of “hints”. Initially, the
“hints” only looked at the volume implications of a swap. Soon it became obvious that
schedulers were also interested in the routing implications of either adding or deleting a farm
from a cluster. As the algorithm is operating on the points selected by the scheduler, it has
been found the standard 3-opt TSP procedure, using accurate road network data, performs
17
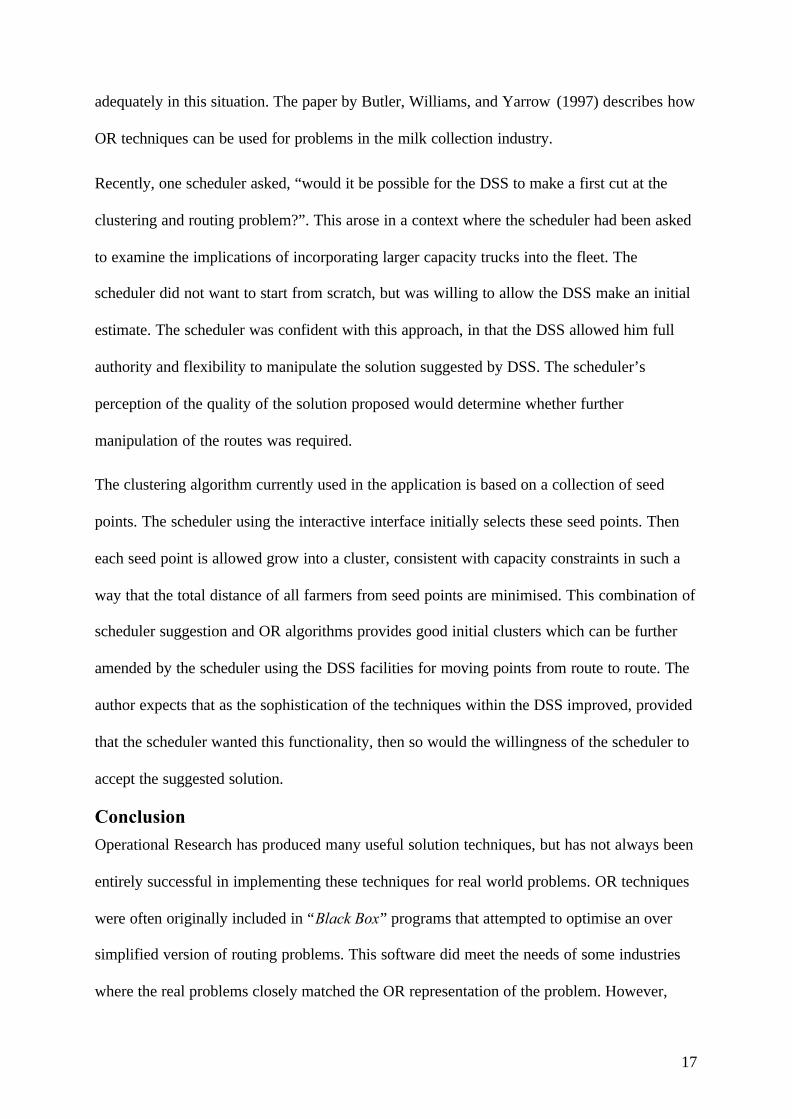
adequately in this situation. The paper by Butler, Williams, and Yarrow (1997) describes how
OR techniques can be used for problems in the milk collection industry.
Recently, one scheduler asked, “would it be possible for the DSS to make a first cut at the
clustering and routing problem?”. This arose in a context where the scheduler had been asked
to examine the implications of incorporating larger capacity trucks into the fleet. The
scheduler did not want to start from scratch, but was willing to allow the DSS make an initial
estimate. The scheduler was confident with this approach, in that the DSS allowed him full
authority and flexibility to manipulate the solution suggested by DSS. The scheduler’s
perception of the quality of the solution proposed would determine whether further
manipulation of the routes was required.
The clustering algorithm currently used in the application is based on a collection of seed
points. The scheduler using the interactive interface initially selects these seed points. Then
each seed point is allowed grow into a cluster, consistent with capacity constraints in such a
way that the total distance of all farmers from seed points are minimised. This combination of
scheduler suggestion and OR algorithms provides good initial clusters which can be further
amended by the scheduler using the DSS facilities for moving points from route to route. The
author expects that as the sophistication of the techniques within the DSS improved, provided
that the scheduler wanted this functionality, then so would the willingness of the scheduler to
accept the suggested solution.
ConclusionOperational Research has produced many useful solution techniques, but has not always been
entirely successful in implementing these techniques for real world problems. OR techniques
were often originally included in “Black Box” programs that attempted to optimise an over
simplified version of routing problems. This software did meet the needs of some industries
where the real problems closely matched the OR representation of the problem. However,
18
where these simplified problems differed from real world ones, efforts were sometimes made
to simplify the problem to fit the software. This approach proved largely unsuccessful in the
milk collection sector. Researchers realised that systems were needed to support rather than
replace the decision-maker; this insight inspired the DSS field. Routing has become one of the
areas where the DSS approach is most appropriate.
As schedulers gained created confidence in using user-friendly systems, what has happened is
that the optimisation techniques and the DSS have met. To provide enhanced support, the
DSS needs the sophisticated modelling techniques that drove the “Black Box”. In reality, the
current generation of DSS is basically the original “Black Box” with a user-friendly interface.
However, from the user acceptance perspective they differ fundamentally. The “Black Box”
was marketed and perceived as a threat to the scheduler. It is not surprising that this approach
failed. The way forward lay in decision support systems with interactive graphics and tools
customised to the problem. DSS is presented as a supportive tool that complements rather
than replaces the scheduler. This can achieve wider user acceptance and has the potential to
greatly contribute to the management of milk collection.
19
ReferencesAdenso-Diaz, B., González, M., & García, E. (1998). A hierarchical approach to managing dairy routing.Interfaces, 28(2), 21-31.
Barbosa, L. C., & Hirko, R. G. (1980). Integration of Algorithmic Aids Into Decision Support Systems. MISQuarterly, 4(1), 1-12.
Basnet, C., Foulds, L., & Igbaria, M. (1996). FleetManager: a microcomputer-based decision support system forvehicle routing. Decision Support Systems, 16(3), 195-207.
Bocxe , M. A. G., & Tilanus, C. B. (1985). Testing vehicle scheduling programs for milk collection. EuropeanJournal of Operational Research, 20(1), 25-33.
Bott, K., & Ballou, R. (1986). Research Persepectives in Vehicle Routing and Scheduling. TransportationResearch Part A, 20A(3), 239-243.
Butler, M., Williams, H. P., & Yarrow, L. A. (1997). The two-period travelling salesman problem applied tomilk collection in Ireland. Computational Optimization and Applications, 7(3), 291-306.
Derekenaris , G., Garofalakis , J., Makris , C., Prentzas, J., Sioutas, S., & Tsakalidis , A. (2001). Integrating GIS,GPS and GSM technologies for the effective management of ambulances. Computers, Environment and UrbanSystems, 25(3), 267-278.
Eglese, R., & Murdock, H. (1991). Routeing Road Sweepers in a Rural Area. Journal of the OperationalResearch Society, 42(4), 281-288.
Eom, H., & Lee, S. (1990). Decision support systems applications research: A bibliography (1971-1988).European Journal of Operational Research, 46(3), 333-342.
Eom, S., Lee, S., & Kim, J. (1993). The intellectual structure of Decision Support Systems (1971-1989).Decision Support Systems, 10(1), 19-35.
Fisher, M. (1995). Vehicle Routing. In M. O. Ball, T. Magnanti, C. Monma, & G. Nemhauser (Eds.), Handbooksin OR & MS (Vol. 8, pp. 1-33). Amsterdam: North-Holland, Elsevier.
Frank, W. C., Thill, J.-C., & Batta, R. (2000). Spatial decision support system for hazardous material truckrouting. Transportation Research Part C, 8(1-6), 337-359.
Golden, B. L., Bodin, L., & Goodwin, T. (1986). Microcomputer-Based Vehicle Routing and SchedulingSoftware. Computers and Operations Research, 13(2), 277-285.
Gorry, A., & Scott-Morton, M. (1971). A Framework for Information Systems. Sloan Management Review,13(1), 56-79.
Grace, B. F. (1977). Training Users of a prototype DSS. Data Base, 8(3), 30-36.
Imielinski, T., & Navas, J. C. (1999). GPS-based geographic addressing, routing, and resource discovery.Communications of the ACM, 42(4), 86-92.
Ioannou, G., Kritikos, M. N., & Prastacos, G. P. (2002). Map-Route: a GIS-based decision support system forintra-city vehicle routing with time windows. Journal of the Operational Research Society, 53(8), 842-854.
Keenan, P. (1996). Using a GIS as a DSS Generator. In J. Darzentas, J. S. Darzentas, & T. Spyrou (Eds.),Perspectives on DSS (pp. 33-40): University of the Aegean, Greece.
Keenan, P. B. (1998). Spatial Decision Support Systems for Vehicle Routing. Decision Support Systems, 22(1),65-71.
Little, J. D. C. (1971). Models and managers: the concept of a decision calculus. Management Science, 16(8),466-485.
Ronen, D. (1988). Perspectives on practical aspects of truck routing and scheduling. European Journal ofOperational Research, 35(2), 137-145.
Tarantilis , C. D., & Kiranoudis , C. T. (2002). Using a spatial decision support system for solving the vehiclerouting problem. Information & Management, 39(5), 359-375.
20
Figure 1 : DSS computer screen showing farms allocated to routes (colour of symbol)
Figure 2 : SDSS Routes using actual road distances
21
Figure 3 : Data flow in milk manager system
LaboratoryData
ManagementMilk Manager
Data
Routing DSS
MILK Milk
Milk Processing
Farmer Liaison
Traceability
Accounts
On Board Data Capture
IT systems