integrated report - distell
TRANSCRIPT
INTEGRATED REPORT
T W E N T Y E I G H T E E N
www.distell.co.za
INTEGRATED REPORT
W E L C O M E T O O U R 2 0 1 8
This integrated report reflects our performance for the year ended 30 June 2018 and prospects for the future.
Distell Group Holdings Limited (Distell or the Group) is a leading producer and marketer of wines, spirits, ciders and ready-to-drinks (RTDs). Most of our products are produced in South Africa and sold in more than 100 countries. Distell has an extensive worldwide distribution network which is supported by local production capability in Scotland, Angola and Kenya as well as joint venture and associate partnerships in countries that include Tanzania and Zimbabwe. Most of the Group’s revenue (74,5%) is generated in South Africa.
ALL PRODUCTS MENTIONED IN THIS INTEGRATED REPORT ARE NOT FOR SALE TO PERSONS UNDER THE AGE OF 18 YEARS. AS ALWAYS, WE APPEAL TO CONSUMERS WHO HAVE CHOSEN TO DRINK ALCOHOL TO ENJOY OUR PRODUCTS RESPONSIBLY.
Leading practice starts at Distell, where many of our employees are exposed to alcohol in the workplace. Guided by a strict company-wide alcohol policy, we encourage exemplary and responsible behaviour from our employees. This responsibility extends beyond our doors and into the communities where our products are consumed. To help combat the social and economic impact of alcohol abuse, we invest in harm reduction initiatives (including responsible advertising) and ensure we expand our portfolio to offer consumers greater choice.
Read more in our sustainability report online.
SUSTAINABILITY FACT
APPROVAL OF THE INTEGRATED REPORTThe board of directors has reviewed the report and collectively believes it fairly represents the material performance aspects of the Group. The audit committee, which has oversight responsibility for integrated reporting, recommended the report for approval by the board. The board approved the 2018 integrated report in Stellenbosch on 23 August 2018 for release to shareholders on 19 September 2018.
Jannie DurandChairman
Richard RushtonGroup chief executive officer
Catharina Sevillano-BarredoChairperson of the audit committee
FEEDBACKYour feedback is important to us and we welcome your input to enhance our reporting content and processes. Please send your comments to: [email protected] or call +27 21 809 7000.
FOLLOW US ON:
Facebook LinkedIn Twitter
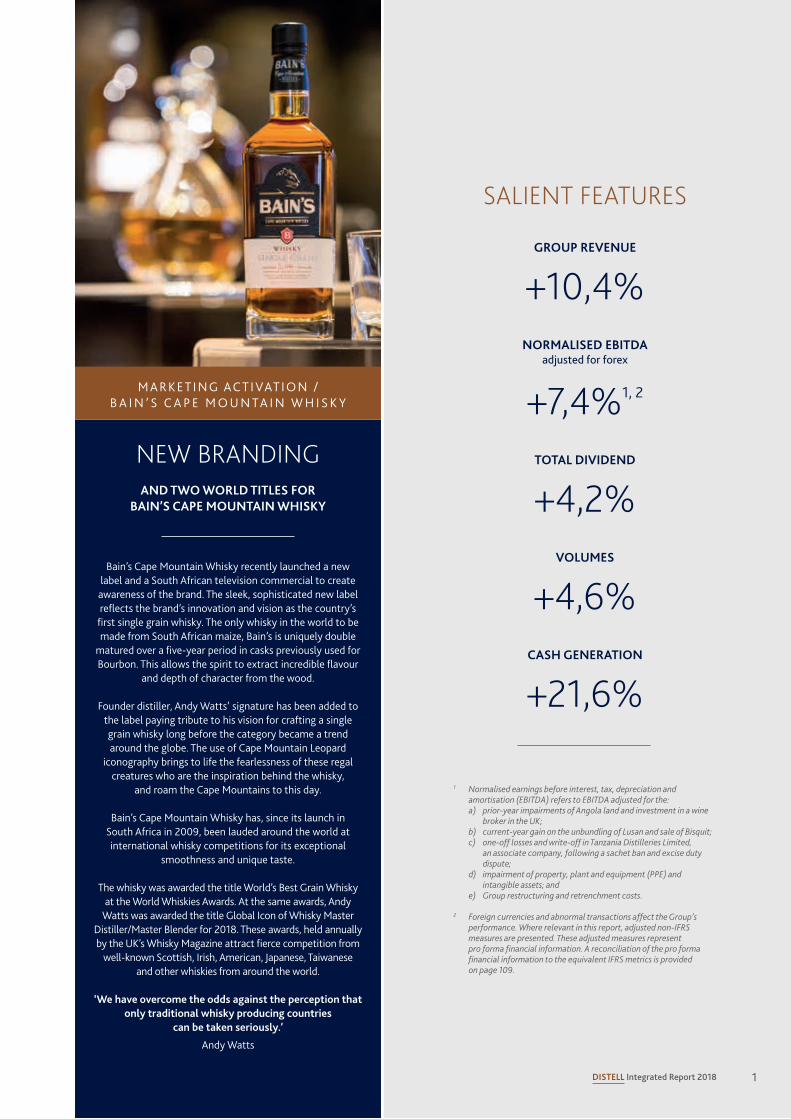
NEW BRANDING AND TWO WORLD TITLES FOR
BAIN’S CAPE MOUNTAIN WHISKY
Bain’s Cape Mountain Whisky recently launched a new label and a South African television commercial to create awareness of the brand. The sleek, sophisticated new label reflects the brand’s innovation and vision as the country’s
first single grain whisky. The only whisky in the world to be made from South African maize, Bain’s is uniquely double
matured over a five-year period in casks previously used for Bourbon. This allows the spirit to extract incredible flavour
and depth of character from the wood.
Founder distiller, Andy Watts’ signature has been added to the label paying tribute to his vision for crafting a single grain whisky long before the category became a trend around the globe. The use of Cape Mountain Leopard
iconography brings to life the fearlessness of these regal creatures who are the inspiration behind the whisky,
and roam the Cape Mountains to this day.
Bain’s Cape Mountain Whisky has, since its launch in South Africa in 2009, been lauded around the world at international whisky competitions for its exceptional
smoothness and unique taste.
The whisky was awarded the title World’s Best Grain Whisky at the World Whiskies Awards. At the same awards, Andy
Watts was awarded the title Global Icon of Whisky Master Distiller/Master Blender for 2018. These awards, held annually by the UK’s Whisky Magazine attract fierce competition from
well-known Scottish, Irish, American, Japanese, Taiwanese and other whiskies from around the world.
‘We have overcome the odds against the perception that only traditional whisky producing countries
can be taken seriously.’
Andy Watts
M A R K E T I N G AC T I VAT I O N / B A I N ’ S C A P E M O U N TA I N W H I S K Y
1DISTELL Integrated Report 2018
SALIENT FEATURES
+10,4%GROUP REVENUE
+7,4%1, 2
NORMALISED EBITDA adjusted for forex
+4,2%TOTAL DIVIDEND
+4,6%VOLUMES
+21,6%CASH GENERATION
1 Normalised earnings before interest, tax, depreciation and amortisation (EBITDA) refers to EBITDA adjusted for the: a) prior-year impairments of Angola land and investment in a wine
broker in the UK; b) current-year gain on the unbundling of Lusan and sale of Bisquit; c) one-off losses and write-off in Tanzania Distilleries Limited,
an associate company, following a sachet ban and excise duty dispute;
d) impairment of property, plant and equipment (PPE) and intangible assets; and
e) Group restructuring and retrenchment costs.
2 Foreign currencies and abnormal transactions affect the Group’s performance. Where relevant in this report, adjusted non-IFRS measures are presented. These adjusted measures represent pro forma financial information. A reconciliation of the pro forma financial information to the equivalent IFRS metrics is provided on page 109.
2 www.distell.co.za
DISTELL Integrated Report 2018 3
CREATING AND SHARING VALUE / 10
FROM OUR GROUP CEO / 34
FROM OUR GROUP CFO / 42
OUR REGIONAL PERFORMANCE / 54
CONTENTS
FROM OUR CHAIRMAN / 6
OUR INVESTMENT CASE/ 4
CORPORATE GOVERNANCE / 62
GROUP ANNUAL FINANCIAL STATEMENTS / 104
SUPPLEMENTARY INFORMATION / 204
Our resources and trade-offs / 12Our business activities / 14 Our Group strategic framework / 14 Our strategic risks and opportunities / 16Our brands / 20How we create value for our stakeholders / 26
South Africa / 54Africa / 56International / 60
Board of directors / 62Executive management / 66Corporate governance report / 70Remuneration report / 81Risk report / 98Social and ethics committee report / 102
4 www.distell.co.za
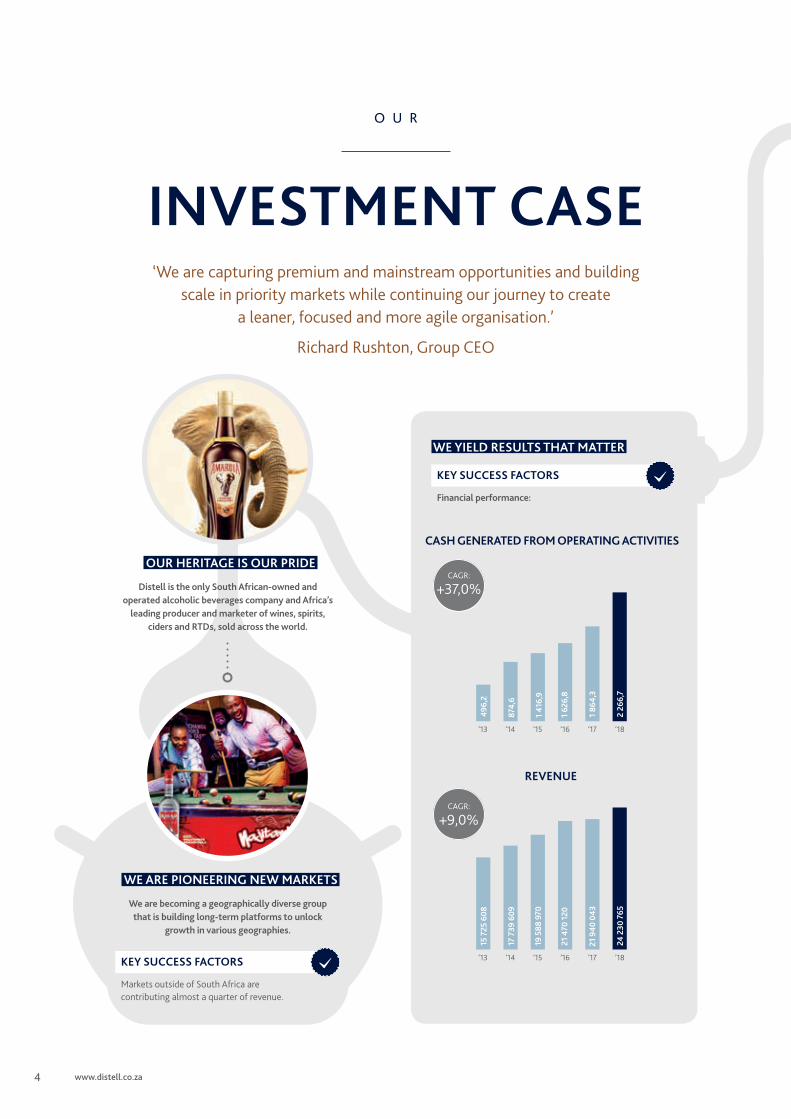
Distell is the only South African-owned and operated alcoholic beverages company and Africa’s
leading producer and marketer of wines, spirits, ciders and RTDs, sold across the world.
We are becoming a geographically diverse group that is building long-term platforms to unlock
growth in various geographies.
WE ARE PIONEERING NEW MARKETS
OUR HERITAGE IS OUR PRIDE
KEY SUCCESS FACTORS
Markets outside of South Africa are contributing almost a quarter of revenue.
WE YIELD RESULTS THAT MATTER
KEY SUCCESS FACTORS
Financial performance:
CASH GENERATED FROM OPERATING ACTIVITIES
’13 ’14 ’15 ’16 ’17 ’18
496,
2
874,
6
1 41
6,9
1 62
6,8
1 86
4,3
2 26
6,7
’13 ’14 ’15 ’16 ’17 ’18
17 7
39 6
09
15 7
25 6
08
19 5
88 9
70
21 4
70 1
20
21 9
40 0
43
24 2
30 7
65
REVENUE
+9,0%CAGR:
+37,0%CAGR:
CASH GENERATED FROM OPERATING ACTIVITIES
’13 ’14 ’15 ’16 ’17 ’18
496,
2
874,
6
1 41
6,9
1 62
6,8
1 86
4,3
2 26
6,7
’13 ’14 ’15 ’16 ’17 ’18
17 7
39 6
09
15 7
25 6
08
19 5
88 9
70
21 4
70 1
20
21 9
40 0
43
24 2
30 7
65
REVENUE
+9,0%CAGR:
+37,0%CAGR:
INVESTMENT CASE
O U R
‘We are capturing premium and mainstream opportunities and building scale in priority markets while continuing our journey to create
a leaner, focused and more agile organisation.’
Richard Rushton, Group CEO
5DISTELL Integrated Report 2018
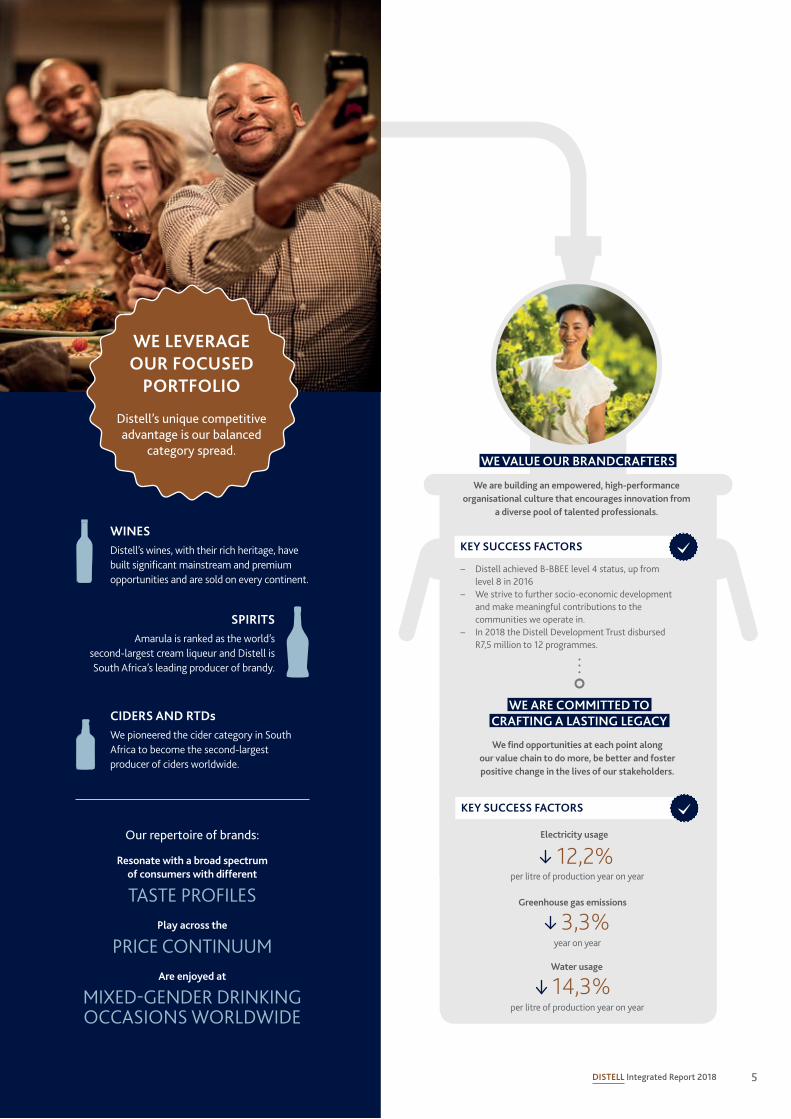
WE LEVERAGE OUR FOCUSED
PORTFOLIO
Distell’s unique competitive advantage is our balanced
category spread.
Our repertoire of brands:
Resonate with a broad spectrum of consumers with different
TASTE PROFILESPlay across the
PRICE CONTINUUMAre enjoyed at
MIXED-GENDER DRINKING OCCASIONS WORLDWIDE
KEY SUCCESS FACTORS
− Distell achieved B-BBEE level 4 status, up from level 8 in 2016
− We strive to further socio-economic development and make meaningful contributions to the communities we operate in.
− In 2018 the Distell Development Trust disbursed R7,5 million to 12 programmes.
We find opportunities at each point along our value chain to do more, be better and foster positive change in the lives of our stakeholders.
KEY SUCCESS FACTORS
WE ARE COMMITTED TO CRAFTING A LASTING LEGACY
We are building an empowered, high-performance organisational culture that encourages innovation from
a diverse pool of talented professionals.
WE VALUE OUR BRANDCRAFTERS
INVESTMENT CASE
O U R
WINES Distell’s wines, with their rich heritage, have built significant mainstream and premium opportunities and are sold on every continent.
CIDERS AND RTDsWe pioneered the cider category in South Africa to become the second-largest producer of ciders worldwide.
SPIRITSAmarula is ranked as the world’s
second-largest cream liqueur and Distell is South Africa’s leading producer of brandy.
Electricity usage
12,2% per litre of production year on year
Water usage
14,3% per litre of production year on year
3,3%Greenhouse gas emissions
year on year
6 www.distell.co.za
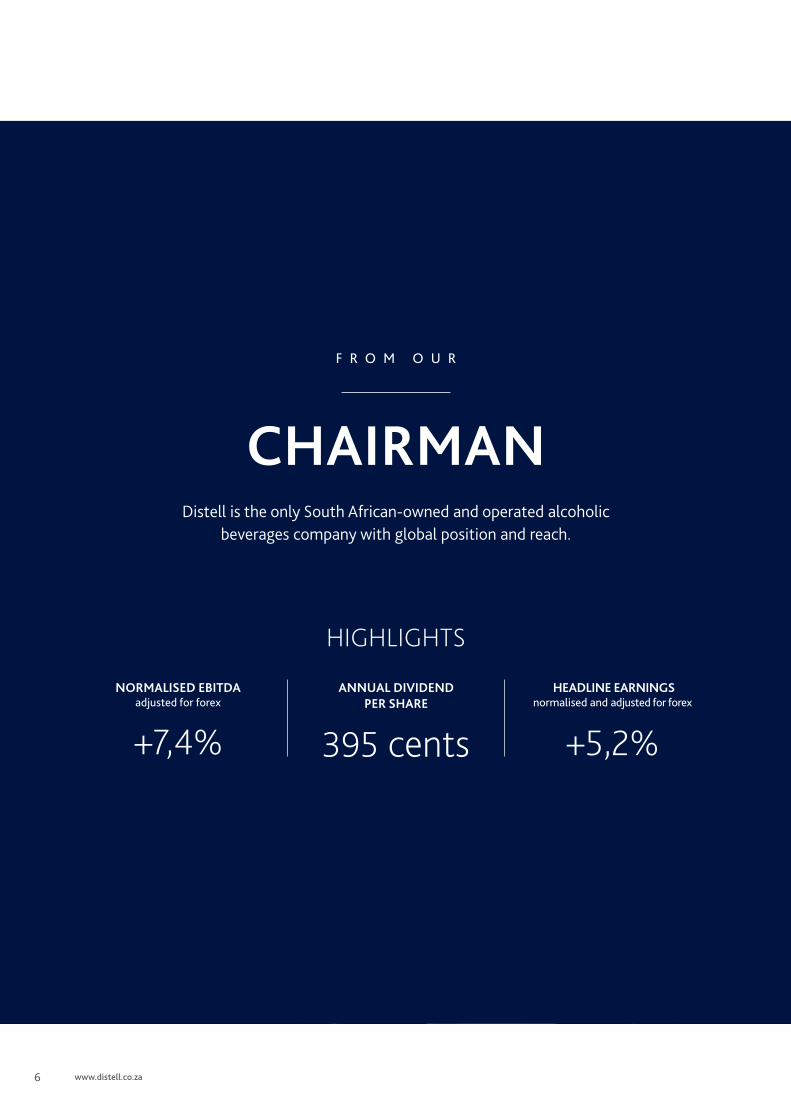
CHAIRMAN
F R O M O U R
Distell is the only South African-owned and operated alcoholic beverages company with global position and reach.
HIGHLIGHTS
NORMALISED EBITDA adjusted for forex
+7,4%
ANNUAL DIVIDEND PER SHARE
395 cents
HEADLINE EARNINGS normalised and adjusted for forex
+5,2%
7DISTELL Integrated Report 2018
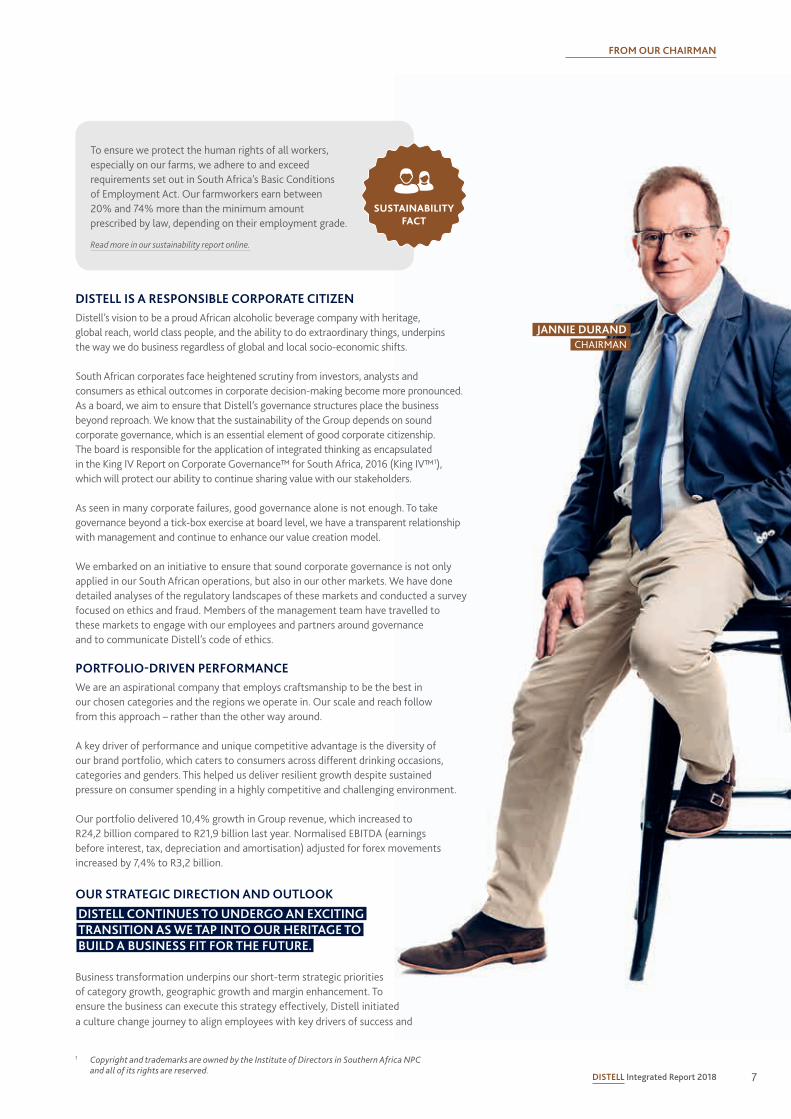
JANNIE DURANDCHAIRMAN
FROM OUR CHAIRMAN
DISTELL IS A RESPONSIBLE CORPORATE CITIZENDistell’s vision to be a proud African alcoholic beverage company with heritage, global reach, world class people, and the ability to do extraordinary things, underpins the way we do business regardless of global and local socio-economic shifts.
South African corporates face heightened scrutiny from investors, analysts and consumers as ethical outcomes in corporate decision-making become more pronounced. As a board, we aim to ensure that Distell’s governance structures place the business beyond reproach. We know that the sustainability of the Group depends on sound corporate governance, which is an essential element of good corporate citizenship. The board is responsible for the application of integrated thinking as encapsulated in the King IV Report on Corporate Governance™ for South Africa, 2016 (King IV™1), which will protect our ability to continue sharing value with our stakeholders.
As seen in many corporate failures, good governance alone is not enough. To take governance beyond a tick-box exercise at board level, we have a transparent relationship with management and continue to enhance our value creation model.
We embarked on an initiative to ensure that sound corporate governance is not only applied in our South African operations, but also in our other markets. We have done detailed analyses of the regulatory landscapes of these markets and conducted a survey focused on ethics and fraud. Members of the management team have travelled to these markets to engage with our employees and partners around governance and to communicate Distell’s code of ethics.
PORTFOLIO-DRIVEN PERFORMANCEWe are an aspirational company that employs craftsmanship to be the best in our chosen categories and the regions we operate in. Our scale and reach follow from this approach – rather than the other way around.
A key driver of performance and unique competitive advantage is the diversity of our brand portfolio, which caters to consumers across different drinking occasions, categories and genders. This helped us deliver resilient growth despite sustained pressure on consumer spending in a highly competitive and challenging environment.
Our portfolio delivered 10,4% growth in Group revenue, which increased to R24,2 billion compared to R21,9 billion last year. Normalised EBITDA (earnings before interest, tax, depreciation and amortisation) adjusted for forex movements increased by 7,4% to R3,2 billion.
OUR STRATEGIC DIRECTION AND OUTLOOK DISTELL CONTINUES TO UNDERGO AN EXCITING TRANSITION AS WE TAP INTO OUR HERITAGE TO BUILD A BUSINESS FIT FOR THE FUTURE.
Business transformation underpins our short-term strategic priorities of category growth, geographic growth and margin enhancement. To ensure the business can execute this strategy effectively, Distell initiated a culture change journey to align employees with key drivers of success and
To ensure we protect the human rights of all workers, especially on our farms, we adhere to and exceed requirements set out in South Africa’s Basic Conditions of Employment Act. Our farmworkers earn between 20% and 74% more than the minimum amount prescribed by law, depending on their employment grade.
Read more in our sustainability report online.
SUSTAINABILITY FACT
CHAIRMAN
1 Copyright and trademarks are owned by the Institute of Directors in Southern Africa NPC and all of its rights are reserved.
8 www.distell.co.za
encourage innovation and creativity. This journey is driven by management and focuses on four aspects to positively shift behaviour within the Group:
− Transform: We will lead change by challenging the status quo and collaborating across boundaries to scale and invest in new ideas
− Mobilise: We will engage, inspire and mobilise our people to put our customers first, thereby shaping a resilient future for the Group
− Be agile: We will create an ownership mind-set and foster sustained energy by setting a clear purpose with the flexibility to change
− Execute: We will translate strategy into execution by strengthening our organisational capability with talented and diverse teams
Distell is the only South African-owned and operated alcoholic beverages company with a global position and reach. This puts us in a unique position to foster the momentum created in South Africa and align our business with the priorities of our country and customers. As a substantial contributor to tax, an employer of 4 828 people and a significant consumer in the agricultural sector, Distell can play a meaningful role in the transformation and prosperity of South Africa.
A focus looking forward is growth into key African markets. Distell takes a long-term view on Africa: our investments here are for the benefit of the next generation and are paced accordingly. We are forging partnerships and putting the operational building blocks in place to ensure profitable and sustainable growth in Africa.
As pioneers and entrepreneurs this journey entails strategic choices and trade-offs which have not always delivered the desired results.
We are now in a position where we are confident in our discipline and processes for the allocation of capital, as well as our ability to shape and optimise our asset portfolio to meet future demand.
The board has resolved to declare a final gross cash dividend of 230,0 cents per share, bringing the total dividend for the year ended 30 June 2018 to 395,0 cents per share (2017: 379,0 cents per share).
APPRECIATIONIn a business with such a rich heritage as Distell, it takes a special breed of employees to embrace change. During a year of dynamic shifts, Distell’s team of Brandcrafters once again showed courage, resilience and innovation in their execution of our strategy.
I would like to thank the board for sharing Distell’s vision and recognising the need for change. As a board we also appreciate the executive and management teams for their support and delivering a strong performance in an unpredictable world.
The board, the management teams and I extend our thanks to our shareholders, partners, customers and suppliers for their ongoing support.
Jannie DurandChairman
Stellenbosch 23 August 2018
THE REDISTRIBUTION OF DISTELL’S OWNERSHIP STRUCTURE In our previous multi-tiered ownership structure, Remgro and Capevin held a material interest in Distell via Remgro-Capevin Investments Proprietary Limited (RCI). Remgro and Capevin each held 50% of the shares in RCI, and RCI held 52,8% of the Distell shares. Remgro also held 19% of the Capevin shares. The long-standing Capevin structure impeded our liquidity and prevented us from raising capital for value-enhancing acquisitions.
The board proposed flattening the Group structure, thus creating more liquidity in the shares and enabling streamlined business decision-making. An increased free float of shares enhanced Distell’s weighting in stock market indices, both on the JSE and internationally, and is likely to improve our investment appeal to foreign and local investors. In addition, it improves our ability to raise capital, should we need to do so to support Distell’s long-term growth strategy.
A key benefit of the transaction is the stability and continuity as a result of the Remgro Group remaining a significant and credible shareholder of reference alongside key institutions such as the PIC and other major domestic and foreign institutional shareholders. This ensures credibility in the current challenging corporate climate. The proposed restructuring was first announced in mid-2017, but finalisation of the deal was delayed by the need for approval by the relevant competition authorities in a few jurisdictions.
As of 1 June 2018, the elimination of the multi-tiered ownership structure left a single entry point to investing in Distell: Distell Group Holdings Limited (DGHL), an investment holding company, holding shares in Distell, directly and indirectly via Capevin and RCI.
The transaction did not entail the raising of any capital and effectively amounted to an exchange of Distell shares and Capevin shares for DGHL ordinary shares.
CHANGES TO THE BOARD − Louisa Mojela and Ben Van der Ross retired as non-
executive directors from the board on 27 October 2017. The board thanks them for their contribution to the Group and wishes them well.
− Mark Bowman was appointed as non-executive director with effect from 27 October 2017. However, he was obliged to resign with effect from 26 July 2018, given a potential conflict of interest. We thank him for his contribution during his short tenure and wish him well.
FROM OUR CHAIRMAN
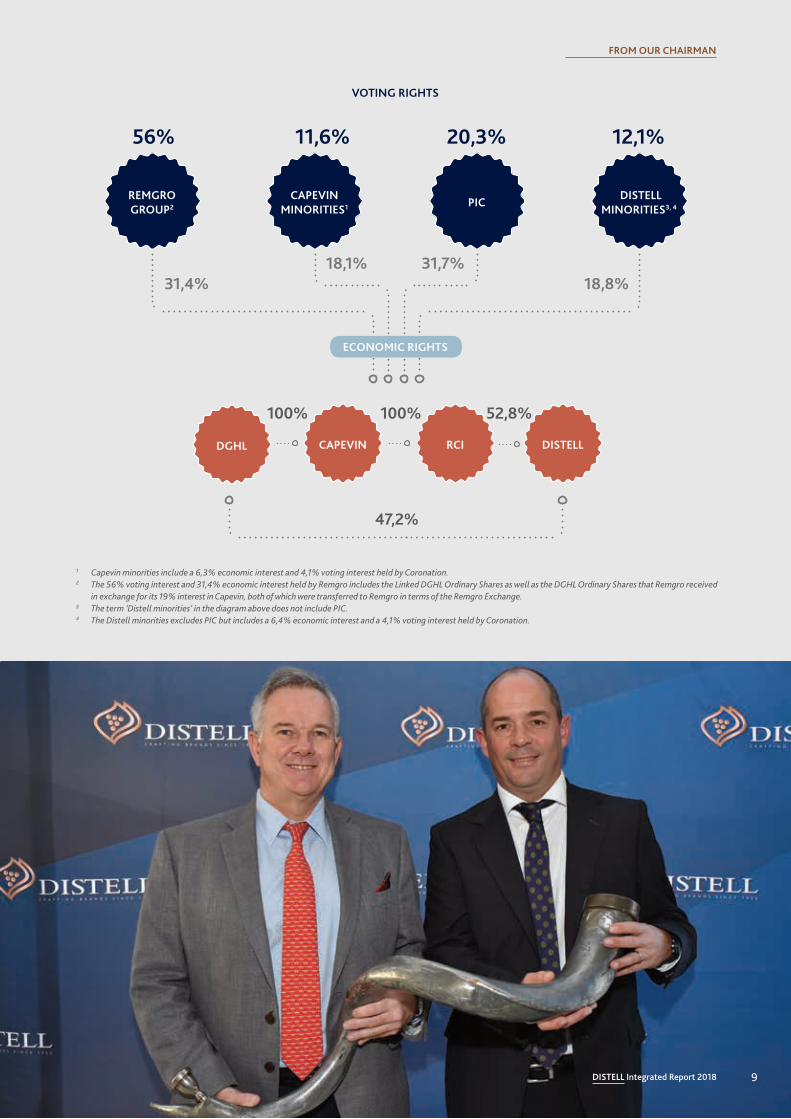
56% 11,6% 20,3% 12,1%
VOTING RIGHTS
1 Capevin minorities include a 6,3% economic interest and 4,1% voting interest held by Coronation.2 The 56% voting interest and 31,4% economic interest held by Remgro includes the Linked DGHL Ordinary Shares as well as the DGHL Ordinary Shares that Remgro received
in exchange for its 19% interest in Capevin, both of which were transferred to Remgro in terms of the Remgro Exchange. 3 The term ‘Distell minorities’ in the diagram above does not include PIC.4 The Distell minorities excludes PIC but includes a 6,4% economic interest and a 4,1% voting interest held by Coronation.
18,1% 31,7%
47,2%
DGHL CAPEVIN RCI DISTELL
100%100% 52,8%
DISTELL MINORITIES3, 4 '
REMGRO GROUP2
CAPEVIN MINORITIES1 PIC
18,8%31,4%
ECONOMIC RIGHTS
9DISTELL Integrated Report 2018
SHARING VALUE
C R E A T I N G A N D
Distell is Africa’s leading producer and marketer of wines, spirits, ciders and RTDs, sold across the world. Distell was created in 2001
through the merger of Distillers Corporation (SA) Limited and Stellenbosch Farmers Winery Group Limited.
WHO WE AREWe create value by crafting inspiring experiences that provide stakeholders with distinctive brands they can trust to be made with quality. Our stakeholders want to be able to select from a range of clearly differentiated brands in a world of increasing choice, while being assured that the company from which these brands originate demonstrates quality, trust and integrity in everything that they do.
10 www.distell.co.za
With a diverse portfolio of brands with rich provenance and authenticity, our products are positioned across the pricing continuum, catering for different taste profiles and are enjoyed at mixed-gender occasions. Distell enjoys a growing global reach and we continue to build the presence of our brands in select priority markets.
Read more about our brand portfolio on page 20.
CREATING AND SHARING VALUE
11DISTELL Integrated Report 2018
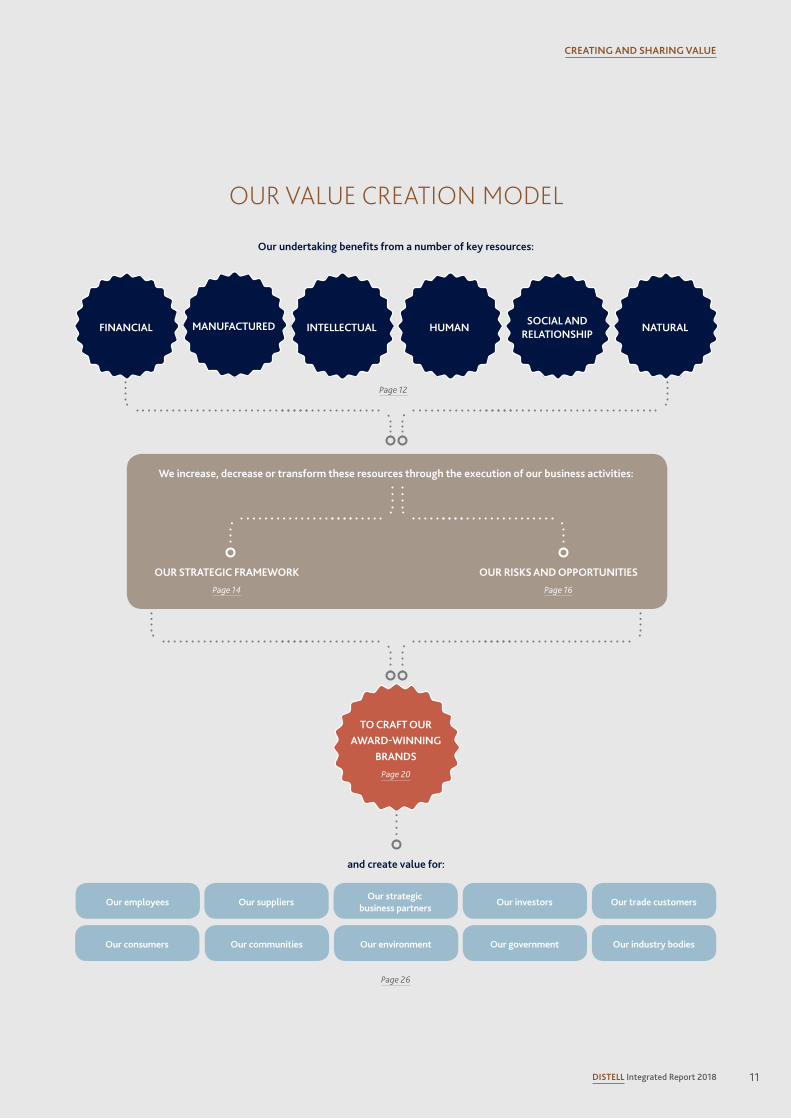
Our undertaking benefits from a number of key resources:
and create value for:
Page 26
OUR VALUE CREATION MODEL
Our suppliersOur employees Our trade customersOur strategic
business partners
Our consumers Our environment
Our investors
Our communities Our government Our industry bodies
We increase, decrease or transform these resources through the execution of our business activities:
HUMANSOCIAL AND
RELATIONSHIPNATURALFINANCIAL MANUFACTURED INTELLECTUAL
TO CRAFT OUR AWARD-WINNING
BRANDS
Page 20
OUR STRATEGIC FRAMEWORK
Page 14
OUR RISKS AND OPPORTUNITIES
Page 16
Page 12
12 www.distell.co.za
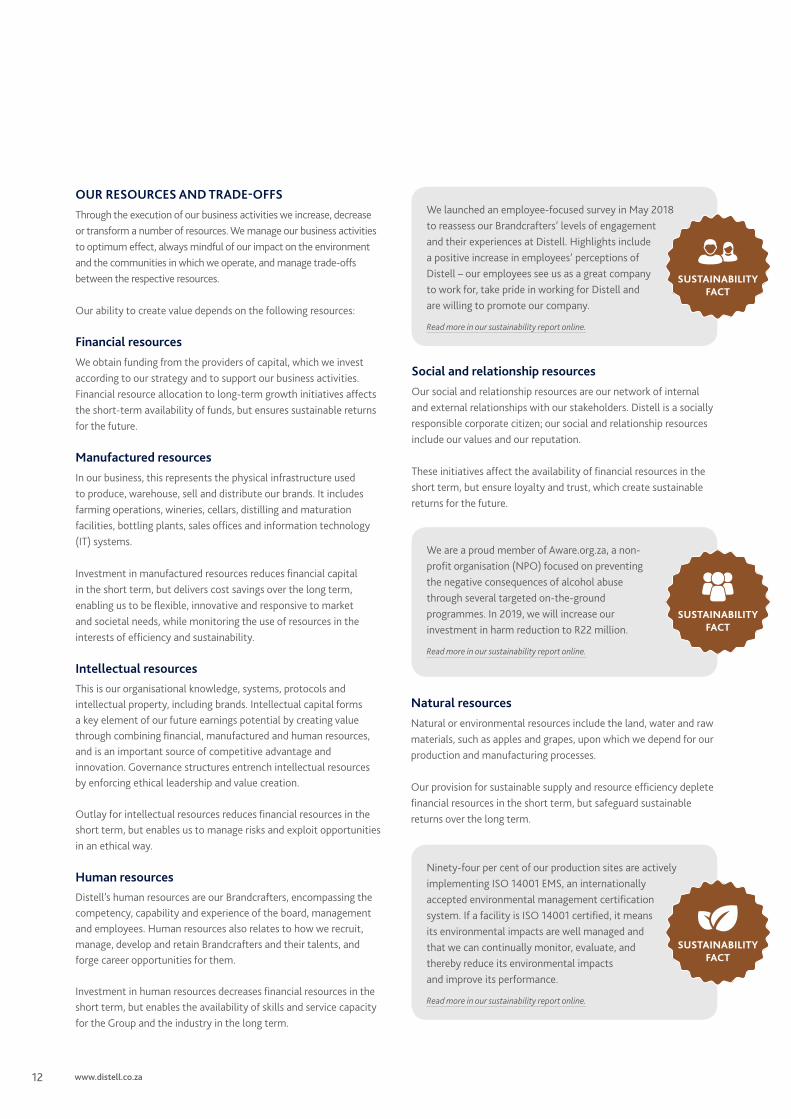
OUR RESOURCES AND TRADE-OFFSThrough the execution of our business activities we increase, decrease or transform a number of resources. We manage our business activities to optimum effect, always mindful of our impact on the environment and the communities in which we operate, and manage trade-offs between the respective resources.
Our ability to create value depends on the following resources:
Financial resourcesWe obtain funding from the providers of capital, which we invest according to our strategy and to support our business activities. Financial resource allocation to long-term growth initiatives affects the short-term availability of funds, but ensures sustainable returns for the future.
Manufactured resourcesIn our business, this represents the physical infrastructure used to produce, warehouse, sell and distribute our brands. It includes farming operations, wineries, cellars, distilling and maturation facilities, bottling plants, sales offices and information technology (IT) systems.
Investment in manufactured resources reduces financial capital in the short term, but delivers cost savings over the long term, enabling us to be flexible, innovative and responsive to market and societal needs, while monitoring the use of resources in the interests of efficiency and sustainability.
Intellectual resourcesThis is our organisational knowledge, systems, protocols and intellectual property, including brands. Intellectual capital forms a key element of our future earnings potential by creating value through combining financial, manufactured and human resources, and is an important source of competitive advantage and innovation. Governance structures entrench intellectual resources by enforcing ethical leadership and value creation.
Outlay for intellectual resources reduces financial resources in the short term, but enables us to manage risks and exploit opportunities in an ethical way.
Human resourcesDistell’s human resources are our Brandcrafters, encompassing the competency, capability and experience of the board, management and employees. Human resources also relates to how we recruit, manage, develop and retain Brandcrafters and their talents, and forge career opportunities for them.
Investment in human resources decreases financial resources in the short term, but enables the availability of skills and service capacity for the Group and the industry in the long term.
Social and relationship resourcesOur social and relationship resources are our network of internal and external relationships with our stakeholders. Distell is a socially responsible corporate citizen; our social and relationship resources include our values and our reputation.
These initiatives affect the availability of financial resources in the short term, but ensure loyalty and trust, which create sustainable returns for the future.
We launched an employee-focused survey in May 2018 to reassess our Brandcrafters’ levels of engagement and their experiences at Distell. Highlights include a positive increase in employees’ perceptions of Distell – our employees see us as a great company to work for, take pride in working for Distell and are willing to promote our company.
Read more in our sustainability report online.
We are a proud member of Aware.org.za, a non- profit organisation (NPO) focused on preventing the negative consequences of alcohol abuse through several targeted on-the-ground programmes. In 2019, we will increase our investment in harm reduction to R22 million.
Read more in our sustainability report online.
Ninety-four per cent of our production sites are actively implementing ISO 14001 EMS, an internationally accepted environmental management certification system. If a facility is ISO 14001 certified, it means its environmental impacts are well managed and that we can continually monitor, evaluate, and thereby reduce its environmental impacts and improve its performance.
Read more in our sustainability report online.
Natural resourcesNatural or environmental resources include the land, water and raw materials, such as apples and grapes, upon which we depend for our production and manufacturing processes.
Our provision for sustainable supply and resource efficiency deplete financial resources in the short term, but safeguard sustainable returns over the long term.
SUSTAINABILITY FACT
SUSTAINABILITY FACT
SUSTAINABILITY FACT

13DISTELL Integrated Report 2018
CREATING AND SHARING VALUE
14 www.distell.co.za
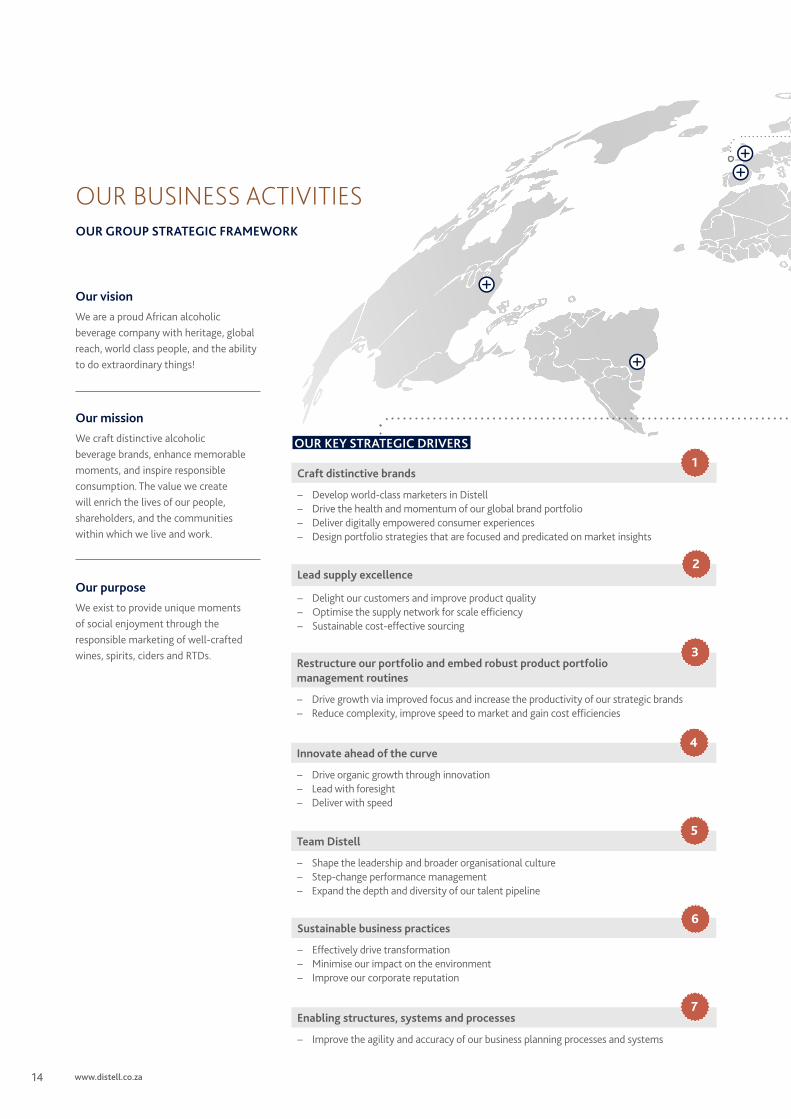
OUR KEY STRATEGIC DRIVERS
Our vision We are a proud African alcoholic beverage company with heritage, global reach, world class people, and the ability to do extraordinary things!
Our missionWe craft distinctive alcoholic beverage brands, enhance memorable moments, and inspire responsible consumption. The value we create will enrich the lives of our people, shareholders, and the communities within which we live and work.
Our purposeWe exist to provide unique moments of social enjoyment through the responsible marketing of well-crafted wines, spirits, ciders and RTDs.
Lead supply excellence
− Delight our customers and improve product quality − Optimise the supply network for scale efficiency − Sustainable cost-effective sourcing
2
Innovate ahead of the curve
− Drive organic growth through innovation − Lead with foresight − Deliver with speed
4
Restructure our portfolio and embed robust product portfolio management routines
− Drive growth via improved focus and increase the productivity of our strategic brands − Reduce complexity, improve speed to market and gain cost efficiencies
3
Craft distinctive brands
− Develop world-class marketers in Distell − Drive the health and momentum of our global brand portfolio − Deliver digitally empowered consumer experiences − Design portfolio strategies that are focused and predicated on market insights
1
Enabling structures, systems and processes
− Improve the agility and accuracy of our business planning processes and systems
7
Sustainable business practices
− Effectively drive transformation − Minimise our impact on the environment − Improve our corporate reputation
6
Team Distell
− Shape the leadership and broader organisational culture − Step-change performance management − Expand the depth and diversity of our talent pipeline
5
OUR BUSINESS ACTIVITIESOUR GROUP STRATEGIC FRAMEWORK
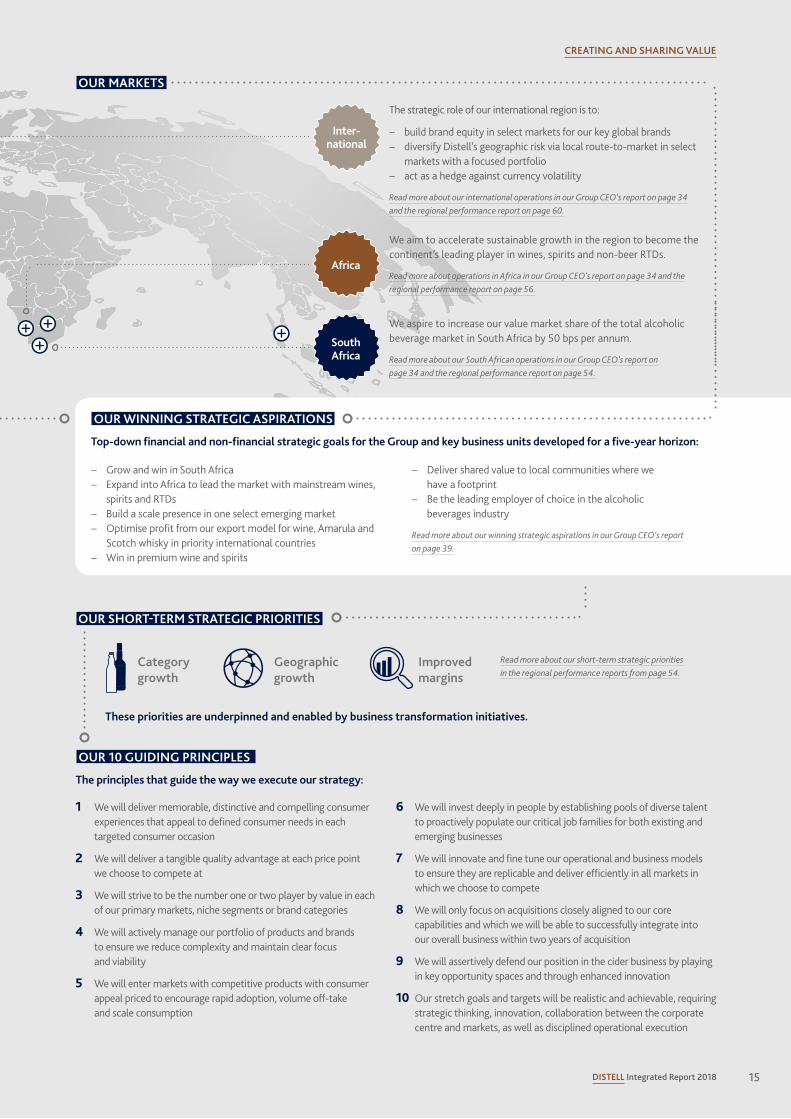
OUR MARKETS
OUR SHORT-TERM STRATEGIC PRIORITIES
OUR 10 GUIDING PRINCIPLES:
The principles that guide the way we execute our strategy:
15DISTELL Integrated Report 2018
Read more about our short-term strategic priorities in the regional performance reports from page 54.
Improved margins
Geographic growth
Category growth
1 We will deliver memorable, distinctive and compelling consumer experiences that appeal to defined consumer needs in each targeted consumer occasion
2 We will deliver a tangible quality advantage at each price point we choose to compete at
3 We will strive to be the number one or two player by value in each of our primary markets, niche segments or brand categories
4 We will actively manage our portfolio of products and brands to ensure we reduce complexity and maintain clear focus and viability
5 We will enter markets with competitive products with consumer appeal priced to encourage rapid adoption, volume off-take and scale consumption
6 We will invest deeply in people by establishing pools of diverse talent to proactively populate our critical job families for both existing and emerging businesses
7 We will innovate and fine tune our operational and business models to ensure they are replicable and deliver efficiently in all markets in which we choose to compete
8 We will only focus on acquisitions closely aligned to our core capabilities and which we will be able to successfully integrate into our overall business within two years of acquisition
9 We will assertively defend our position in the cider business by playing in key opportunity spaces and through enhanced innovation
10 Our stretch goals and targets will be realistic and achievable, requiring strategic thinking, innovation, collaboration between the corporate centre and markets, as well as disciplined operational execution
We aspire to increase our value market share of the total alcoholic beverage market in South Africa by 50 bps per annum.
Read more about our South African operations in our Group CEO’s report on page 34 and the regional performance report on page 54.
The strategic role of our international region is to:
− build brand equity in select markets for our key global brands − diversify Distell’s geographic risk via local route-to-market in select
markets with a focused portfolio − act as a hedge against currency volatility
Read more about our international operations in our Group CEO’s report on page 34 and the regional performance report on page 60.
We aim to accelerate sustainable growth in the region to become the continent’s leading player in wines, spirits and non-beer RTDs.
Read more about operations in Africa in our Group CEO’s report on page 34 and the regional performance report on page 56.
Africa
Inter-national
− Grow and win in South Africa − Expand into Africa to lead the market with mainstream wines,
spirits and RTDs − Build a scale presence in one select emerging market − Optimise profit from our export model for wine, Amarula and
Scotch whisky in priority international countries − Win in premium wine and spirits
− Deliver shared value to local communities where we have a footprint
− Be the leading employer of choice in the alcoholic beverages industry
Read more about our winning strategic aspirations in our Group CEO’s report on page 39.
These priorities are underpinned and enabled by business transformation initiatives.
SouthAfrica
CREATING AND SHARING VALUE
OUR WINNING STRATEGIC ASPIRATIONS
Top-down financial and non-financial strategic goals for the Group and key business units developed for a five-year horizon:
16 www.distell.co.za
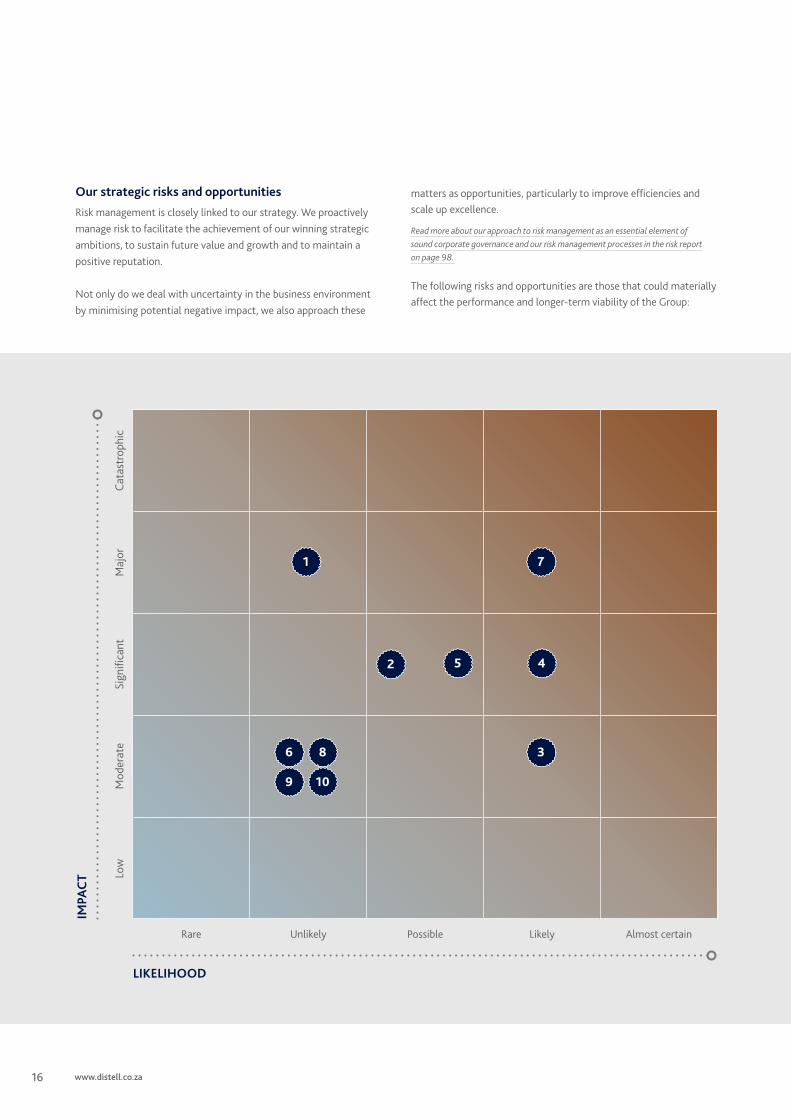
Our strategic risks and opportunities
Risk management is closely linked to our strategy. We proactively manage risk to facilitate the achievement of our winning strategic ambitions, to sustain future value and growth and to maintain a positive reputation.
Not only do we deal with uncertainty in the business environment by minimising potential negative impact, we also approach these
matters as opportunities, particularly to improve efficiencies and scale up excellence.
Read more about our approach to risk management as an essential element of sound corporate governance and our risk management processes in the risk report on page 98.
The following risks and opportunities are those that could materially affect the performance and longer-term viability of the Group:
Low
Mod
erat
eSi
gnifi
cant
Maj
orCa
tast
roph
ic
Rare Unlikely Possible Likely Almost certain
LIKELIHOOD
IMPA
CT
1
3
9
6
10
8
2 45
7
17DISTELL Integrated Report 2018
CREATING AND SHARING VALUE
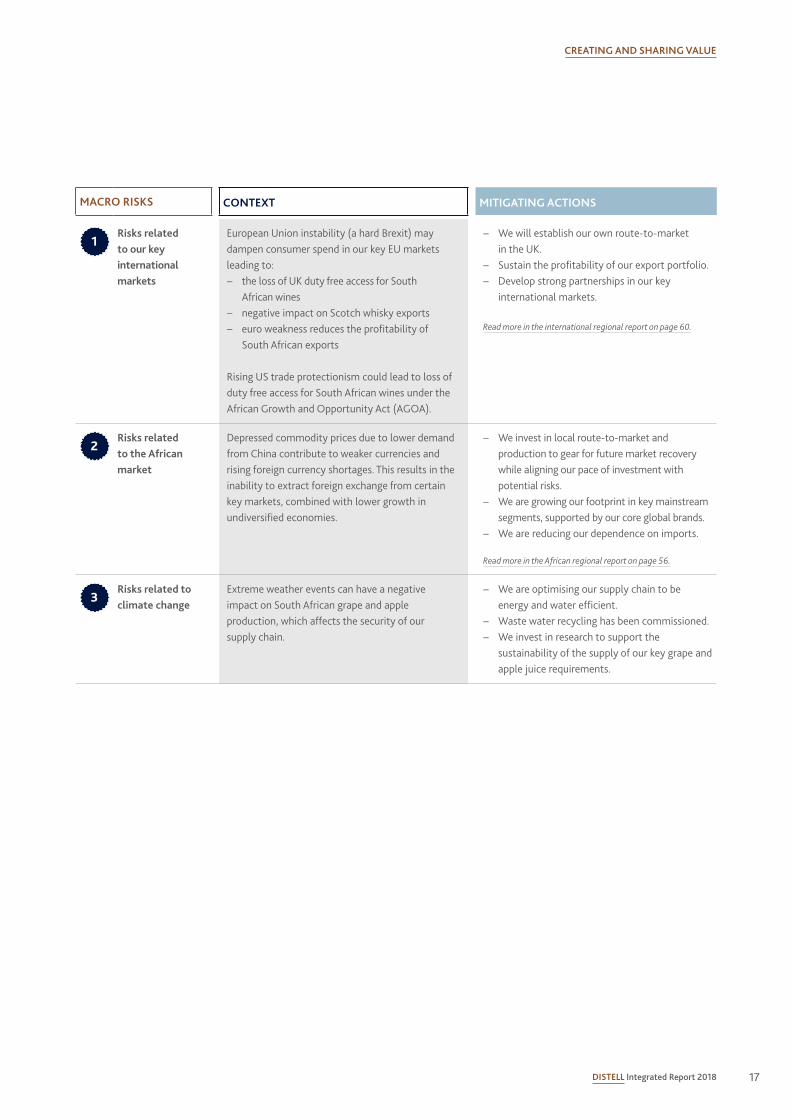
MACRO RISKS CONTEXT MITIGATING ACTIONS
1 Risks related to our key international markets
European Union instability (a hard Brexit) may dampen consumer spend in our key EU markets leading to:
− the loss of UK duty free access for South African wines
− negative impact on Scotch whisky exports − euro weakness reduces the profitability of
South African exports
Rising US trade protectionism could lead to loss of duty free access for South African wines under the African Growth and Opportunity Act (AGOA).
− We will establish our own route-to-market in the UK.
− Sustain the profitability of our export portfolio. − Develop strong partnerships in our key
international markets.
Read more in the international regional report on page 60.
2 Risks related to the African market
Depressed commodity prices due to lower demand from China contribute to weaker currencies and rising foreign currency shortages. This results in the inability to extract foreign exchange from certain key markets, combined with lower growth in undiversified economies.
− We invest in local route-to-market and production to gear for future market recovery while aligning our pace of investment with potential risks.
− We are growing our footprint in key mainstream segments, supported by our core global brands.
− We are reducing our dependence on imports.
Read more in the African regional report on page 56.
3Risks related to climate change
Extreme weather events can have a negative impact on South African grape and apple production, which affects the security of our supply chain.
− We are optimising our supply chain to be energy and water efficient.
− Waste water recycling has been commissioned. − We invest in research to support the
sustainability of the supply of our key grape and apple juice requirements.
18 www.distell.co.za
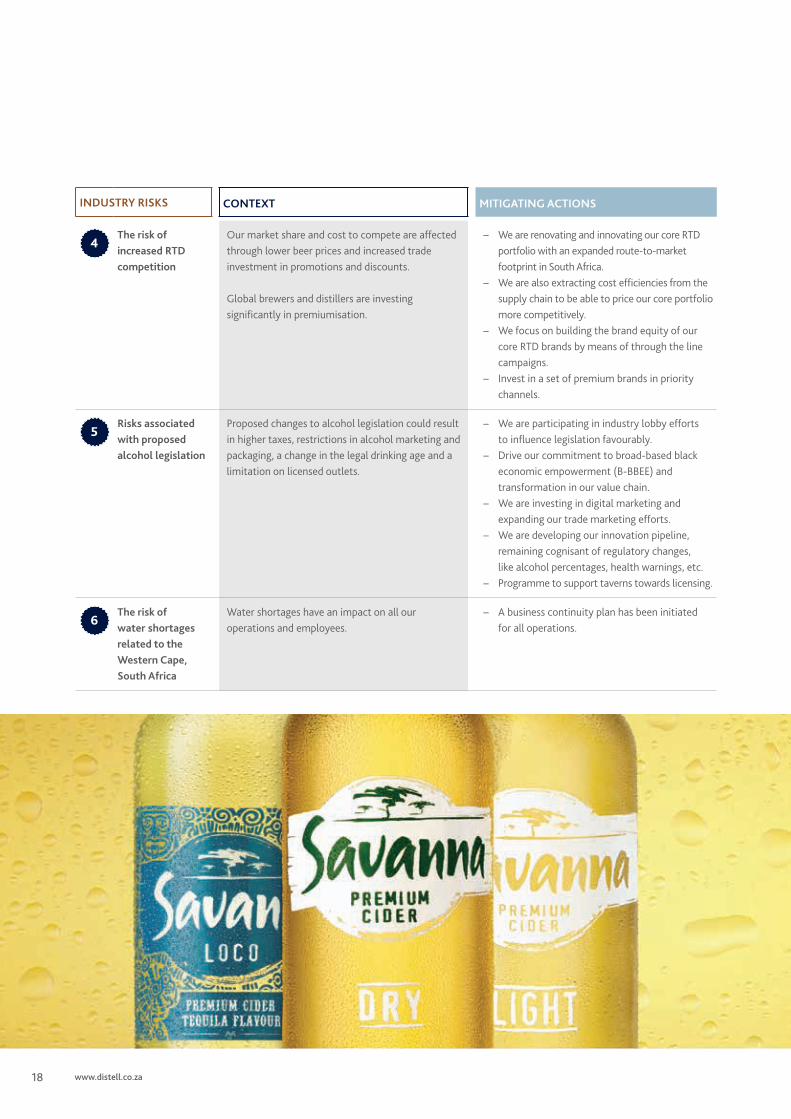
INDUSTRY RISKS CONTEXT MITIGATING ACTIONS
4 The risk of increased RTD competition
Our market share and cost to compete are affected through lower beer prices and increased trade investment in promotions and discounts.
Global brewers and distillers are investing significantly in premiumisation.
− We are renovating and innovating our core RTD portfolio with an expanded route-to-market footprint in South Africa.
− We are also extracting cost efficiencies from the supply chain to be able to price our core portfolio more competitively.
− We focus on building the brand equity of our core RTD brands by means of through the line campaigns.
− Invest in a set of premium brands in priority channels.
5 Risks associated with proposed alcohol legislation
Proposed changes to alcohol legislation could result in higher taxes, restrictions in alcohol marketing and packaging, a change in the legal drinking age and a limitation on licensed outlets.
− We are participating in industry lobby efforts to influence legislation favourably.
− Drive our commitment to broad-based black economic empowerment (B-BBEE) and transformation in our value chain.
− We are investing in digital marketing and expanding our trade marketing efforts.
− We are developing our innovation pipeline, remaining cognisant of regulatory changes, like alcohol percentages, health warnings, etc.
− Programme to support taverns towards licensing.
6 The risk of water shortages related to the Western Cape, South Africa
Water shortages have an impact on all our operations and employees.
− A business continuity plan has been initiated for all operations.
19DISTELL Integrated Report 2018
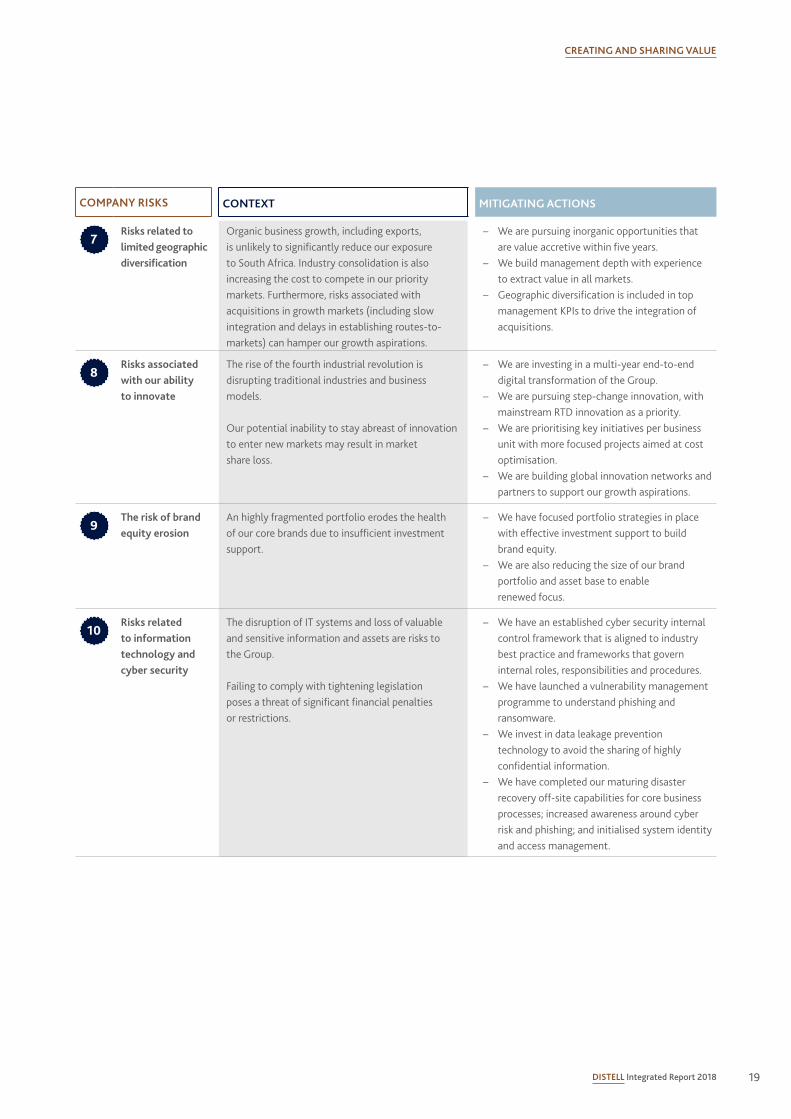
COMPANY RISKS CONTEXT MITIGATING ACTIONS
7 Risks related to limited geographic diversification
Organic business growth, including exports, is unlikely to significantly reduce our exposure to South Africa. Industry consolidation is also increasing the cost to compete in our priority markets. Furthermore, risks associated with acquisitions in growth markets (including slow integration and delays in establishing routes-to-markets) can hamper our growth aspirations.
− We are pursuing inorganic opportunities that are value accretive within five years.
− We build management depth with experience to extract value in all markets.
− Geographic diversification is included in top management KPIs to drive the integration of acquisitions.
8 Risks associated with our ability to innovate
The rise of the fourth industrial revolution is disrupting traditional industries and business models.
Our potential inability to stay abreast of innovation to enter new markets may result in market share loss.
− We are investing in a multi-year end-to-end digital transformation of the Group.
− We are pursuing step-change innovation, with mainstream RTD innovation as a priority.
− We are prioritising key initiatives per business unit with more focused projects aimed at cost optimisation.
− We are building global innovation networks and partners to support our growth aspirations.
9 The risk of brand equity erosion
An highly fragmented portfolio erodes the health of our core brands due to insufficient investment support.
− We have focused portfolio strategies in place with effective investment support to build brand equity.
− We are also reducing the size of our brand portfolio and asset base to enable renewed focus.
10 Risks related to information technology and cyber security
The disruption of IT systems and loss of valuable and sensitive information and assets are risks to the Group.
Failing to comply with tightening legislation poses a threat of significant financial penalties or restrictions.
− We have an established cyber security internal control framework that is aligned to industry best practice and frameworks that govern internal roles, responsibilities and procedures.
− We have launched a vulnerability management programme to understand phishing and ransomware.
− We invest in data leakage prevention technology to avoid the sharing of highly confidential information.
− We have completed our maturing disaster recovery off-site capabilities for core business processes; increased awareness around cyber risk and phishing; and initialised system identity and access management.
CREATING AND SHARING VALUE

Our brand portfolio holds a diverse range of much-loved brands, not only in South Africa, but around the world. Many of our brands are household names
to consumers in Africa and select international markets.
www.distell.co.za20
OUR BRANDSOur brands are our heritage. They are also our future.
4th Street RichelieuGordon’s Gin
Amarula SavannaHunter’s
Bernini Three Ships WhiskyNederburg
Autumn Harvest Crackling Scottish LeaderKlipdrift
Drostdy-Hof ViceroyOriginal Paarl Perlé
For a complete list of our brands, see page 205.
TOP 15 DISTELL BRANDS
21DISTELL Integrated Report 2018
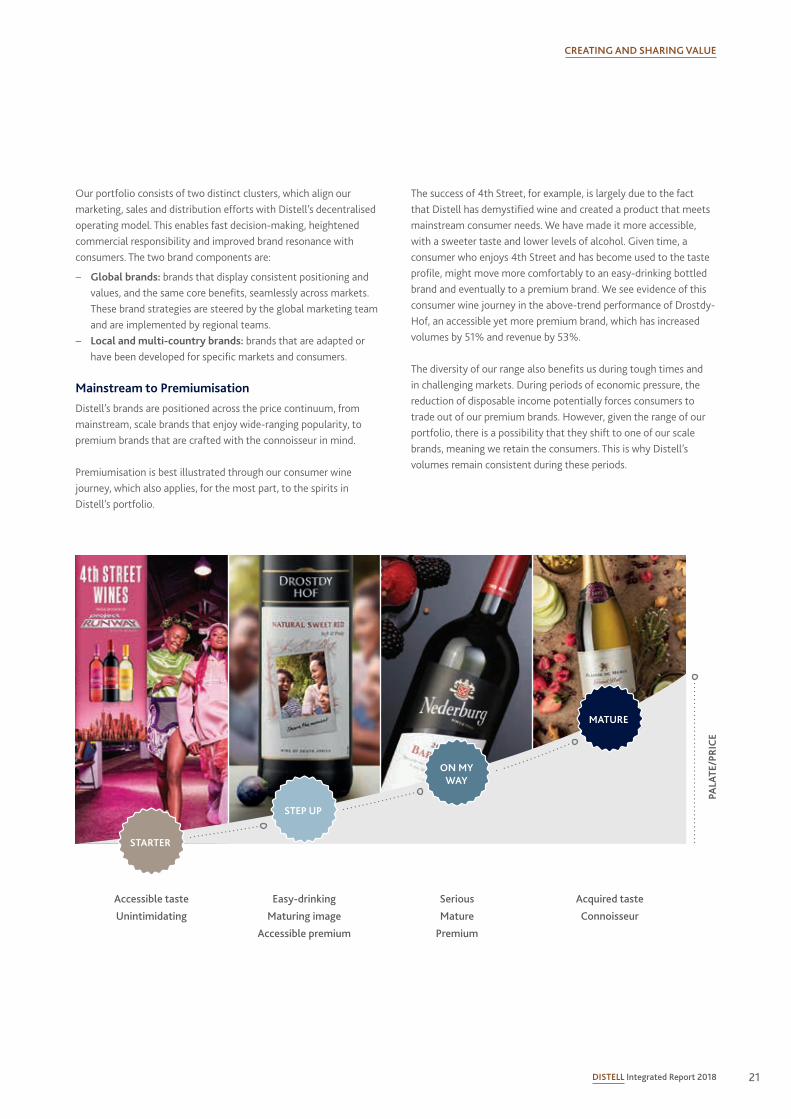
Our portfolio consists of two distinct clusters, which align our marketing, sales and distribution efforts with Distell’s decentralised operating model. This enables fast decision-making, heightened commercial responsibility and improved brand resonance with consumers. The two brand components are:
− Global brands: brands that display consistent positioning and values, and the same core benefits, seamlessly across markets. These brand strategies are steered by the global marketing team and are implemented by regional teams.
− Local and multi-country brands: brands that are adapted or have been developed for specific markets and consumers.
Mainstream to PremiumisationDistell’s brands are positioned across the price continuum, from mainstream, scale brands that enjoy wide-ranging popularity, to premium brands that are crafted with the connoisseur in mind.
Premiumisation is best illustrated through our consumer wine journey, which also applies, for the most part, to the spirits in Distell’s portfolio.
The success of 4th Street, for example, is largely due to the fact that Distell has demystified wine and created a product that meets mainstream consumer needs. We have made it more accessible, with a sweeter taste and lower levels of alcohol. Given time, a consumer who enjoys 4th Street and has become used to the taste profile, might move more comfortably to an easy-drinking bottled brand and eventually to a premium brand. We see evidence of this consumer wine journey in the above-trend performance of Drostdy-Hof, an accessible yet more premium brand, which has increased volumes by 51% and revenue by 53%.
The diversity of our range also benefits us during tough times and in challenging markets. During periods of economic pressure, the reduction of disposable income potentially forces consumers to trade out of our premium brands. However, given the range of our portfolio, there is a possibility that they shift to one of our scale brands, meaning we retain the consumers. This is why Distell’s volumes remain consistent during these periods.
CREATING AND SHARING VALUE
Treat your palate to the smooth, suave and self-assured notes of
Nederburg Baronne, the iconic South African red blend. Full-bodied with ripe, succulent flavours, soft tannins and gentle oak this noble wine has a
rich heritage steeped in history. The perfect companion
for any occasion.
nederburg.com
There’s alwaysa story in
STARTER
STEP UP
MATURE
ON MY WAY
PALA
TE/P
RIC
E
Accessible taste
Unintimidating
Easy-drinking
Maturing image
Accessible premium
Serious
Mature
Premium
Acquired taste
Connoisseur
22 www.distell.co.za
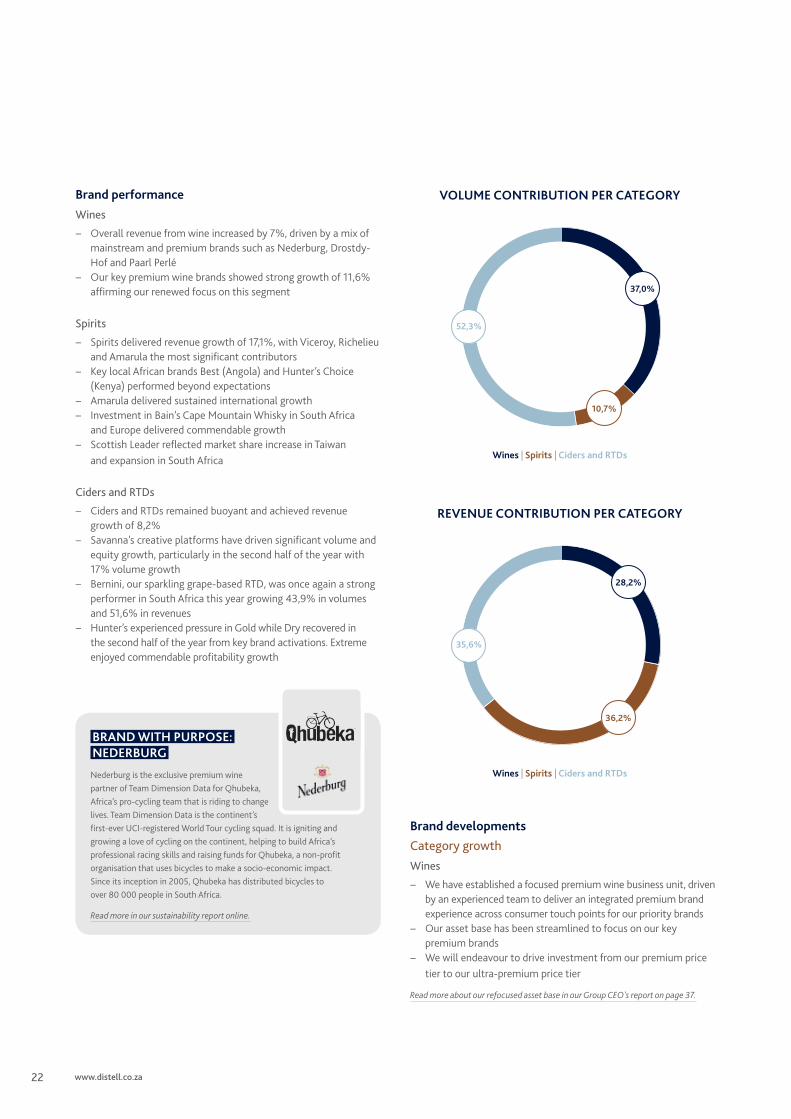
REVENUE CONTRIBUTION PER CATEGORY
28,2%
35,6%
36,2%
Wines | Spirits | Ciders and RTDs
VOLUME CONTRIBUTION PER CATEGORY
Wines | Spirits | Ciders and RTDs
37,0%
52,3%
10,7%
Brand developments Category growthWines
− We have established a focused premium wine business unit, driven by an experienced team to deliver an integrated premium brand experience across consumer touch points for our priority brands
− Our asset base has been streamlined to focus on our key premium brands
− We will endeavour to drive investment from our premium price tier to our ultra-premium price tier
Read more about our refocused asset base in our Group CEO's report on page 37.
BRAND WITH PURPOSE: NEDERBURG
Nederburg is the exclusive premium wine partner of Team Dimension Data for Qhubeka, Africa’s pro-cycling team that is riding to change lives. Team Dimension Data is the continent’s first-ever UCI-registered World Tour cycling squad. It is igniting and growing a love of cycling on the continent, helping to build Africa’s professional racing skills and raising funds for Qhubeka, a non-profit organisation that uses bicycles to make a socio-economic impact. Since its inception in 2005, Qhubeka has distributed bicycles to over 80 000 people in South Africa.
Read more in our sustainability report online.
Brand performance Wines
− Overall revenue from wine increased by 7%, driven by a mix of mainstream and premium brands such as Nederburg, Drostdy-Hof and Paarl Perlé
− Our key premium wine brands showed strong growth of 11,6% affirming our renewed focus on this segment
Spirits
− Spirits delivered revenue growth of 17,1%, with Viceroy, Richelieu and Amarula the most significant contributors
− Key local African brands Best (Angola) and Hunter’s Choice (Kenya) performed beyond expectations
− Amarula delivered sustained international growth − Investment in Bain’s Cape Mountain Whisky in South Africa
and Europe delivered commendable growth − Scottish Leader reflected market share increase in Taiwan
and expansion in South Africa
Ciders and RTDs
− Ciders and RTDs remained buoyant and achieved revenue growth of 8,2%
− Savanna’s creative platforms have driven significant volume and equity growth, particularly in the second half of the year with 17% volume growth
− Bernini, our sparkling grape-based RTD, was once again a strong performer in South Africa this year growing 43,9% in volumes and 51,6% in revenues
− Hunter’s experienced pressure in Gold while Dry recovered in the second half of the year from key brand activations. Extreme enjoyed commendable profitability growth
23DISTELL Integrated Report 2018
CREATING AND SHARING VALUE
Spirits
− Distell’s rejuvenated whisky strategy has delivered growth through strong global brands. The diversity of our whisky portfolio has served us well with malt whisky trending upward and blended whisky showing some decline
− We have seen returns from our investments in distilleries, with our malts performing beyond expectation and we will continue to invest in our whisky asset base to improve production efficiency
Ciders and RTDs
− Savanna Premium Cider’s sustained growth will be underpinned by establishing a global platform, a consistent visual identity and a focused innovation pipeline
− Hunter’s EDGE has reinvented the hop from the traditional world of beer into the refreshing world of cider
− A new campaign, to be launched in October 2018, will draw on the brand equity of Hunter’s to market an innovation pipeline driven by refreshment
Geographic growthWines
− Our wines are sold on every continent − We are pushing premiumisation in all our markets, and in
Europe we are actively working to change the perception of South African wines
Read more in the international regional report on page 60.
Spirits
− Apart from our own South African-conceived and produced brands, our portfolio includes a selection of international specialty spirits brands which are performing above expectations
− Best Global Brands (BGB) has significant expansion potential and it offers a platform to build a scale pan-African business
− Amarula is South Africa’s most widely distributed international alcoholic beverage brand and is ranked as the world’s second-largest cream liqueur
− We will grow Amarula globally by shifting away from African curio souvenir branding and establishing it as a global premium spirit brand. This will be achieved by:• Refreshing the ‘Made from Africa’ communication platform
to address the next generation of consumers, thus rejuvenating our authentic African positioning
• Expanding the brand’s occasion portfolio through brand extensions and product innovations
• Reducing underperforming stock keeping units • Entrenching our purpose through conservation initiatives
− The whisky category has grown in Taiwan
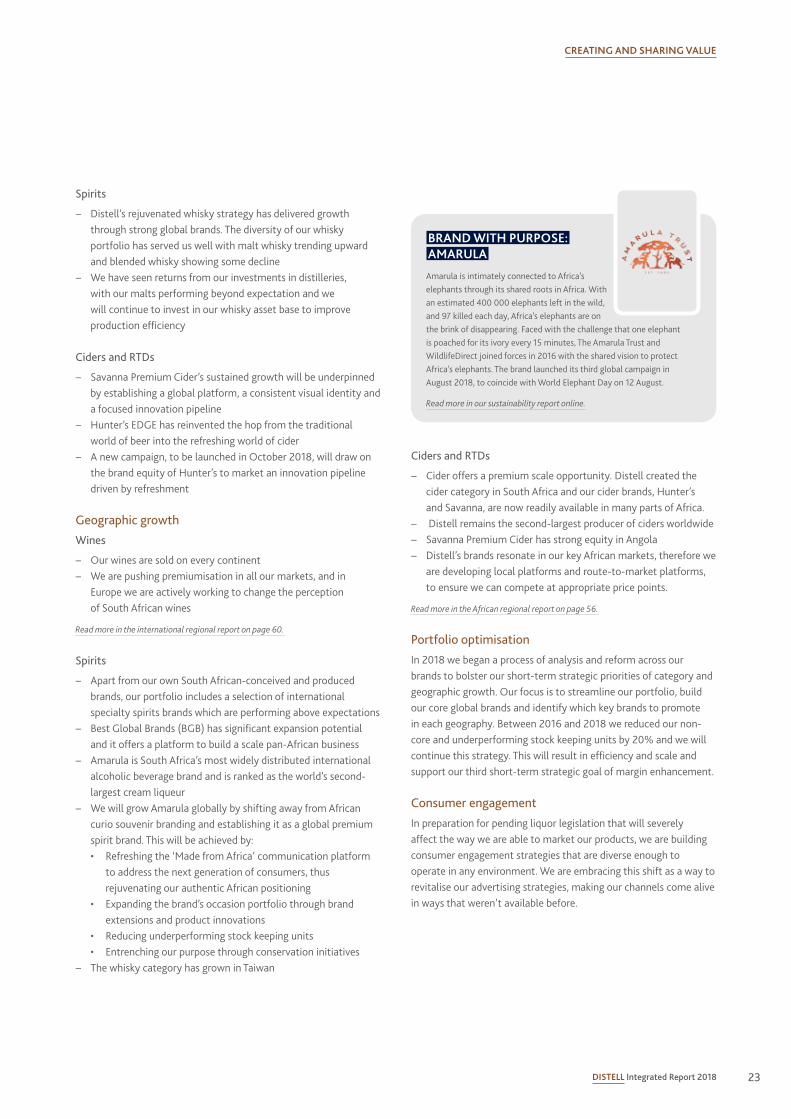
BRAND WITH PURPOSE: AMARULA
Amarula is intimately connected to Africa’s elephants through its shared roots in Africa. With an estimated 400 000 elephants left in the wild, and 97 killed each day, Africa’s elephants are on the brink of disappearing. Faced with the challenge that one elephant is poached for its ivory every 15 minutes, The Amarula Trust and WildlifeDirect joined forces in 2016 with the shared vision to protect Africa’s elephants. The brand launched its third global campaign in August 2018, to coincide with World Elephant Day on 12 August.
Read more in our sustainability report online.
Ciders and RTDs
− Cider offers a premium scale opportunity. Distell created the cider category in South Africa and our cider brands, Hunter’s and Savanna, are now readily available in many parts of Africa.
− Distell remains the second-largest producer of ciders worldwide − Savanna Premium Cider has strong equity in Angola − Distell’s brands resonate in our key African markets, therefore we
are developing local platforms and route-to-market platforms, to ensure we can compete at appropriate price points.
Read more in the African regional report on page 56.
Portfolio optimisationIn 2018 we began a process of analysis and reform across our brands to bolster our short-term strategic priorities of category and geographic growth. Our focus is to streamline our portfolio, build our core global brands and identify which key brands to promote in each geography. Between 2016 and 2018 we reduced our non-core and underperforming stock keeping units by 20% and we will continue this strategy. This will result in efficiency and scale and support our third short-term strategic goal of margin enhancement.
Consumer engagement In preparation for pending liquor legislation that will severely affect the way we are able to market our products, we are building consumer engagement strategies that are diverse enough to operate in any environment. We are embracing this shift as a way to revitalise our advertising strategies, making our channels come alive in ways that weren’t available before.
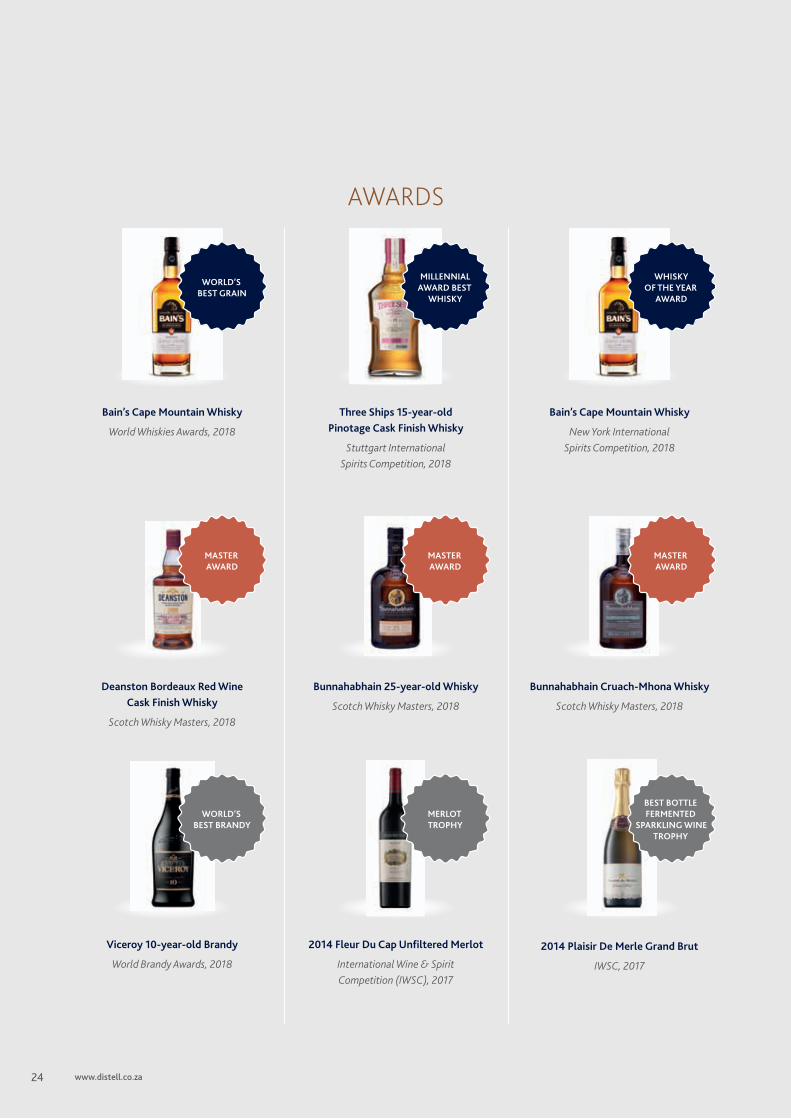
AWARDS
www.distell.co.za24
Bain’s Cape Mountain Whisky
World Whiskies Awards, 2018
Deanston Bordeaux Red Wine Cask Finish Whisky
Scotch Whisky Masters, 2018
Viceroy 10-year-old Brandy
World Brandy Awards, 2018
Three Ships 15-year-old Pinotage Cask Finish Whisky
Stuttgart International Spirits Competition, 2018
Bunnahabhain 25-year-old Whisky
Scotch Whisky Masters, 2018
2014 Fleur Du Cap Unfiltered Merlot
International Wine & Spirit Competition (IWSC), 2017
Bain’s Cape Mountain Whisky
New York International Spirits Competition, 2018
Bunnahabhain Cruach-Mhona Whisky
Scotch Whisky Masters, 2018
2014 Plaisir De Merle Grand Brut
IWSC, 2017
WORLD’S BEST GRAIN
MASTER AWARD
WORLD’S BEST BRANDY
MILLENNIAL AWARD BEST
WHISKY
MASTER AWARD
MERLOT TROPHY
WHISKY OF THE YEAR
AWARD
MASTER AWARD
BEST BOTTLE FERMENTED
SPARKLING WINE TROPHY
CREATING AND SHARING VALUE
25DISTELL Integrated Report 2018
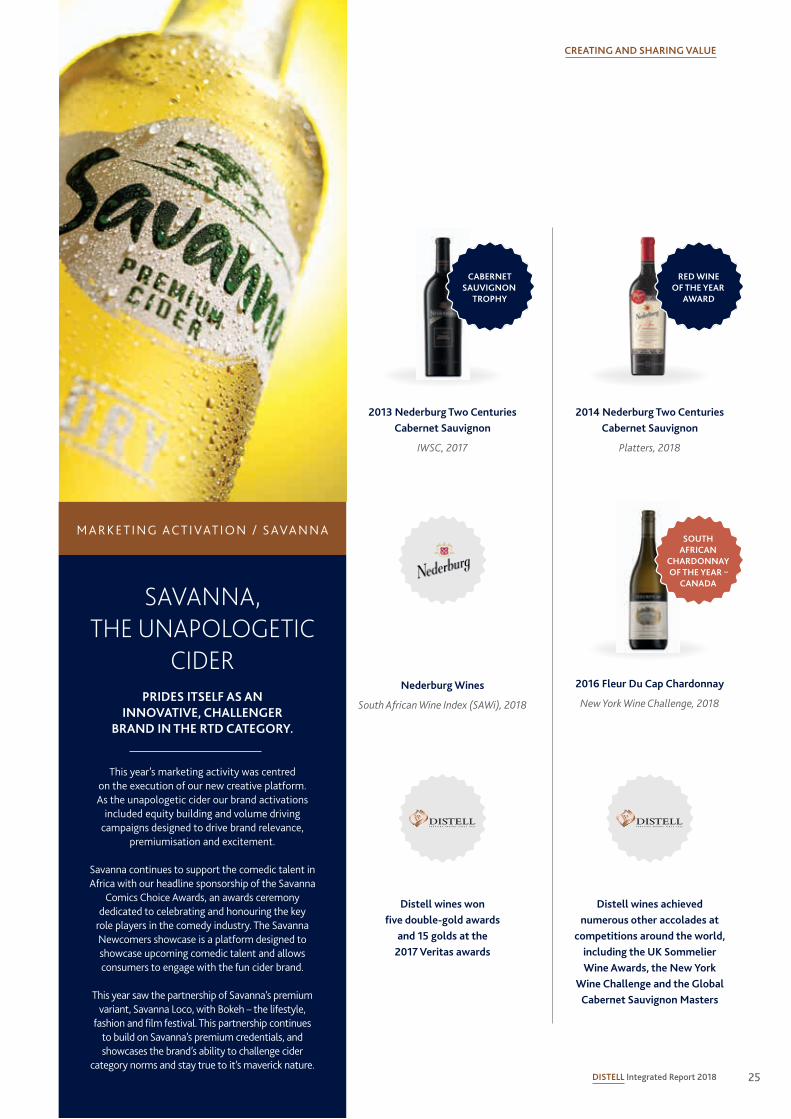
2013 Nederburg Two Centuries Cabernet Sauvignon
IWSC, 2017
Nederburg Wines
South African Wine Index (SAWi), 2018
Distell wines won five double-gold awards
and 15 golds at the 2017 Veritas awards
CABERNET SAUVIGNON
TROPHY
2014 Nederburg Two Centuries Cabernet Sauvignon
Platters, 2018
2016 Fleur Du Cap Chardonnay
New York Wine Challenge, 2018
Distell wines achieved numerous other accolades at
competitions around the world, including the UK Sommelier Wine Awards, the New York
Wine Challenge and the Global Cabernet Sauvignon Masters
SOUTH AFRICAN
CHARDONNAY OF THE YEAR –
CANADA
RED WINE OF THE YEAR
AWARD
SAVANNA, THE UNAPOLOGETIC
CIDER PRIDES ITSELF AS AN
INNOVATIVE, CHALLENGER BRAND IN THE RTD CATEGORY.
This year’s marketing activity was centred on the execution of our new creative platform. As the unapologetic cider our brand activations
included equity building and volume driving campaigns designed to drive brand relevance,
premiumisation and excitement.
Savanna continues to support the comedic talent in Africa with our headline sponsorship of the Savanna
Comics Choice Awards, an awards ceremony dedicated to celebrating and honouring the key
role players in the comedy industry. The Savanna Newcomers showcase is a platform designed to showcase upcoming comedic talent and allows consumers to engage with the fun cider brand.
This year saw the partnership of Savanna’s premium variant, Savanna Loco, with Bokeh – the lifestyle,
fashion and film festival. This partnership continues to build on Savanna’s premium credentials, and showcases the brand’s ability to challenge cider
category norms and stay true to it’s maverick nature.
M A R K E T I N G AC T I VAT I O N / S AVA N N A
To maintain legitimacy, consistency and relevance, we take into account stakeholder expectations, needs, concerns and opportunities.
Maintaining sound, transparent relationships with all our stakeholders is a priority. Engagement and communication does not only happen at corporate level, but also at touch points across the business. Our decentralised model aids effective communication at business unit level, particularly with customers and consumers.
The social and ethics committee, which functions according to regulation 43 of the Companies Regulations, 2011, is responsible for the Group Stakeholder Management framework that outlines our philosophy for relationships with stakeholders.
26 www.distell.co.za
HOW WE CREATE VALUE FOR OUR STAKEHOLDERSWe believe effective communication with all our
stakeholders is the basis for good corporate governance and is directly correlated with our success.
During the year, the committee oversaw the integration of existing sources of stakeholder information into a stakeholder engagement framework to improve our engagement capability.
We have formalised our approach to stakeholder engagement to ensure effective measurement and reporting continues within the appropriate frameworks. In 2019, the committee will continue to monitor progress against aligning our stakeholder engagement framework with the principles and objectives outlined in King IV™ to include measurable reporting on stakeholder engagement.
Below is a high-level summary of our stakeholder engagement approach:
STAKEHOLDER GROUP: OUR EMPLOYEESOur employees are our biggest asset. All employees are actively involved in our cultural evolution to become a more agile and focused company through ongoing communication and engagement on progress, successes, failures and challenges.
Our value propositionIn order to retain talent, we want to ensure employees remain committed and passionate about their work and the company and take pride in Distell as an employer of choice.
How we engage − Our employee value proposition and employee-focused
surveys to measure engagement and employee satisfaction − Daily interaction and monthly internal communications − Training and development programmes − Ongoing formal performance evaluations − Ongoing engagement with labour unions
How we measure value creation − Survey results − Training and development spend − Employee turnover and retention − B-BBEE level
One key initiativeWe are committed to growing Distell’s future leaders and we invest in training programmes, including internships, learnerships, skills programmes, apprenticeships and adult basic education.
Read more in our sustainability report online.
Future focus − Understand and foster management actions to improve
employee retention, develop the business’ next generation of leaders, and inspire employees to keep growing with the company.
− Enhanced employee communications. − Employees as engaged brand ambassadors.
27DISTELL Integrated Report 2018
HOW WE CREATE VALUE FOR OUR STAKEHOLDERSWe believe effective communication with all our
stakeholders is the basis for good corporate governance and is directly correlated with our success.
CREATING AND SHARING VALUE
STAKEHOLDER GROUP: OUR SUPPLIERSSuppliers provide services and raw materials that are essential to our ability to produce and market our products.
Our value propositionWe work with suppliers to support continuous innovation that yields solutions to optimise our costs, build partnerships and achieve our business objectives.
How we engage − Supplier visits and audits − Our dedicated local enterprise and supplier development
programme: the E+Scalator programme − Collaboration with suppliers on B-BBEE and preferential
procurement requirements − Supplier conferences and workshops − Supplier engagement sessions on key issues – for example,
transformation, the drought and land reform
How we measure value creation − Joint targets − Sustainable sourcing programme − Preferential procurement − Supplier feedback
One key initiativeThe Distell E+Scalator programme was established to empower and escalate small- and medium-sized enterprises (SMEs) within our value chain, thereby ensuring their long-term viability.
Read more in our sustainability report online.
Future focusFull integration of suppliers into strategic planning making suppliers a key part of the business.
STAKEHOLDER GROUP: OUR STRATEGIC BUSINESS PARTNERSWe support various strategic partnerships along our value chain. Strategic partners play an important role in the growth and sustainability of our business, particularly in markets outside of South Africa where we rely on their experience and expertise.
Our value propositionOur geographic growth strategy relies on opportunities for mutually beneficial relationships that are long term in nature and respectful in character.
How we engage − Regular forum and one-on-one meetings − Roadshows − Conferences
How we measure value creation − Co-creation of programmes
Future focusProactive engagement of key strategic partners to jointly address issues of interest and concern to achieve mutual benefit in the short and long term.
28 www.distell.co.za
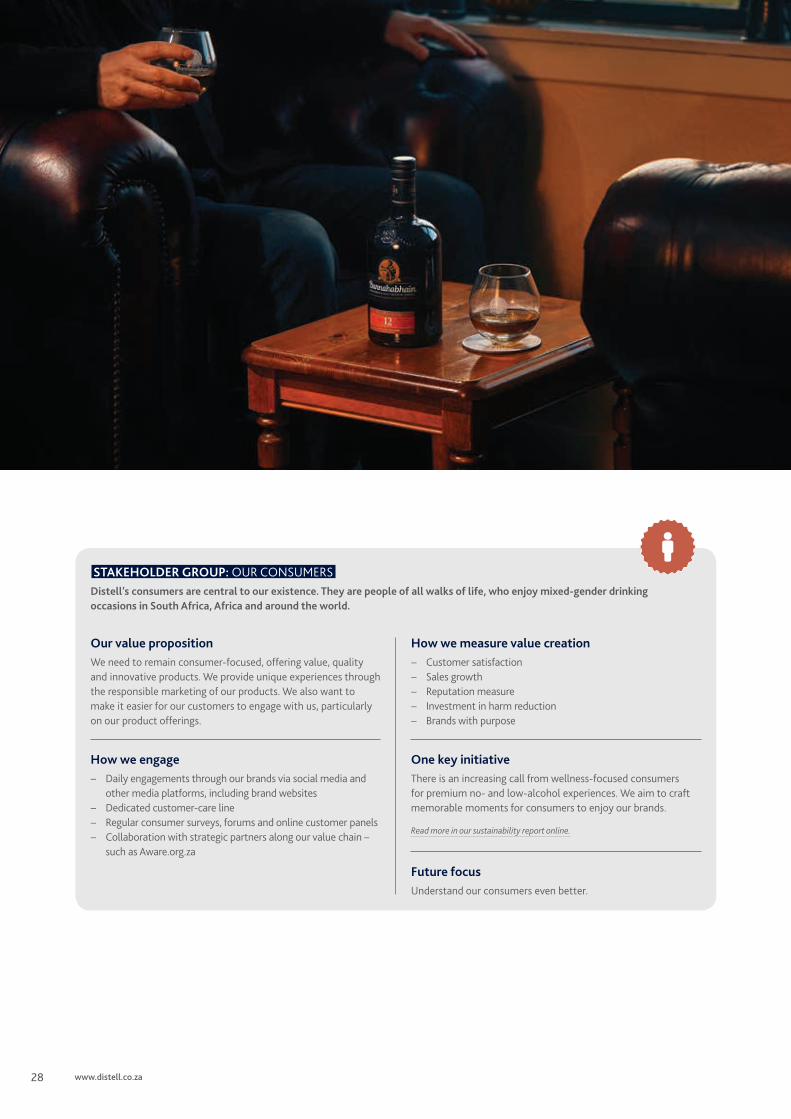
STAKEHOLDER GROUP: OUR CONSUMERSDistell’s consumers are central to our existence. They are people of all walks of life, who enjoy mixed-gender drinking occasions in South Africa, Africa and around the world.
Our value propositionWe need to remain consumer-focused, offering value, quality and innovative products. We provide unique experiences through the responsible marketing of our products. We also want to make it easier for our customers to engage with us, particularly on our product offerings.
How we engage − Daily engagements through our brands via social media and
other media platforms, including brand websites − Dedicated customer-care line − Regular consumer surveys, forums and online customer panels − Collaboration with strategic partners along our value chain –
such as Aware.org.za
How we measure value creation − Customer satisfaction − Sales growth − Reputation measure − Investment in harm reduction − Brands with purpose
One key initiativeThere is an increasing call from wellness-focused consumers for premium no- and low-alcohol experiences. We aim to craft memorable moments for consumers to enjoy our brands.
Read more in our sustainability report online.
Future focusUnderstand our consumers even better.
29DISTELL Integrated Report 2018
CREATING AND SHARING VALUE
STAKEHOLDER GROUP: OUR TRADE CUSTOMERSOur trade customers are the interface between the business and our consumers.
Our value propositionOur engagement with trade customers facilitates a thorough understanding of our business and brand portfolio.
How we engage − Regular site and facility visits − One-on-one meetings and joint business planning meetings − Trade customer conferences
How we measure value creation − Surveys − Top-to-top feedback
One key initiativeOne example of how we support our trade customers is by playing an important role in managing and coordinating industry initiatives to combat the illicit trade in alcohol through the South African Liquor Brand owners Association (SALBA).
Read more in our sustainability report online.
Future focusConsider all insights about how we can improve our customer experience to drive business growth and higher customer satisfaction.
STAKEHOLDER GROUP: OUR COMMUNITIESThe communities in which we do business are impacted by our operations.
Our value propositionWe aim to foster transparency and openness in our engagement with communities, and facilitate positive dialogue which discusses and resolves issues of mutual interest, such as employment and economic development.
How we engage − Collaboration with strategic partners along our value chain –
such as The Chrysalis Academy, Bergzicht Training and others − Brands with purpose − Collaboration with the Distell Development Trust
How we measure value creation − Social return on investment − CSI spend − Investment in communities
One key initiativeThe Distell Development Trust contributes to our integrated B-BBEE strategy. During the year, the Trust disbursed R7,5 million to 12 programmes.
Read more in our sustainability report online.
Future focus − Partnering with non-governmental organisations,
communities and global advocacy organisations. − Respond to and address key challenges facing the
communities we operate in. − Build relationships with key NGOs so that we can share our
challenges with them and work on co-creating solutions.
30 www.distell.co.za
STAKEHOLDER GROUP: OUR GOVERNMENTWe engage with all levels and spheres of government, including national and regional governments as well as government agencies such as regulators.
Our value propositionStrong relations between government and the private sector are good for South Africa and society as a whole. We create value through enabling legislation, and partnering on community development and empowerment issues and maintaining our licence to operate.
How we engage − Ongoing and regular engagement – either directly or through
relevant industry bodies
How we measure value creation − Feedback
One key initiativeWe have engaged all tiers of government on key business enablers and challenges – both macro and external.
Future focusMitigate risk by identifying issues and opportunities to maintain a social licence to thrive.
Enter into public-private sector partnerships to foster an enabling business environment.
To engage government on the mandate of the respective departments, to assist them with building an appreciation of how the different mandates either hamper our ability as a business or help us better deliver on government priorities.
STAKEHOLDER GROUP: OUR ENVIRONMENTWe understand that our long-term sustainability is intrinsically linked to the natural resources on which we depend, from farm to consumer and back again. We must therefore nurture, preserve and protect the planet.
Our value propositionOur resource efficiency targets for 2020 (relate to the usage of water, electricity and fossil fuel-based energy in our production processes) will enable us to actively drive annual improvements in performance to ensure we reach our long-term goals.
How we engage − Strategic partners along our value chain – such as
The Stellenbosch River Collaborative − Through our dedicated email address:
[email protected] − Regular engagement and interaction with relevant
environmental regulatory bodies and local authorities (either directly or through industry bodies)
− Collaboration with leading industry players on matters of social and environmental compliance – such as the Wine and Agricultural Ethical Trade Association (WIETA)
How we measure value creation − Water usage − Electricity usage − Greenhouse gas emissions − Reduction in effluent discharged
One key initiativeWe achieved our 2018 target and even exceeded our 2020 target to reduce water usage by 15% by increasing water recycling at our Adam Tas and Green Park sites and installing a closed loop cooling system at our Wellington distillery.
Read more about our performance against our environmental targets in our sustainability report online.
Future focusWe are committed to responsible water stewardship that takes into consideration our communities, consumers and the environment we operate in. In the upcoming year, we will collaborate with various like-minded stakeholders to mobilise highly effective interventions that will achieve sustainable outcomes for preserving freshwater life.
We remain committed to tracking our environmental performance to ensure self-improvement on our environmental targets.
31DISTELL Integrated Report 2018
CREATING AND SHARING VALUE
STAKEHOLDER GROUP: OUR INVESTORSOur investors are at the heart of our business and we place significant emphasis on relationship development and investor communication.
STAKEHOLDER GROUP: OUR INDUSTRY BODIESDistell engages with various industry bodies on matters relating to, among others, promoting responsible drinking, supplier and enterprise development, industry regulation, social compliance and matters of environmental concern.
Our value propositionInvestors have a vested interest in Distell as providers of capital and we want to keep them informed about our financial performance and sustainability. We build investor confidence by demonstrating that we adhere to the highest standards of corporate governance and that Distell is a company that creates value and return on investment for all its stakeholders.
Our value propositionIndustry bodies can endorse a collective view to government and other stakeholders on behalf of members.
How we engage − Investor presentations, meetings and roadshows − Annual general meeting (AGM)
How we engage − Regular meetings − Task teams (issue dependent)
How we measure value creation − Total return to shareholders − Annual dividend
How we measure value creation − Feedback
One key initiativeThe year under review saw renewed focus on investor relations with the appointment of a dedicated investor relations manager. The collapse of the Distell shareholder structure was a material event for our investors. Since the announcement of the collapse late in 2017, until its completion in June, we engaged with investors individually as well as at the Group AGM. Distell received 99% investor support for the restructure, mainly owing to the benefits of broader index inclusion and an increase in free float and liquidity.
One key initiativeIndustry engagement on the drought, wine strategy, and transformation (through organisations such as, for example, VinPro, WIETA, Wines of South Africa and SALBA).
Future focusImplement a corporate governance strategy that demonstrates corporate citizenship, transparency and trust. Investor understanding of the Distell strategy.
Future focusWe remain committed to reinforcing our industry partnerships.
32 www.distell.co.za
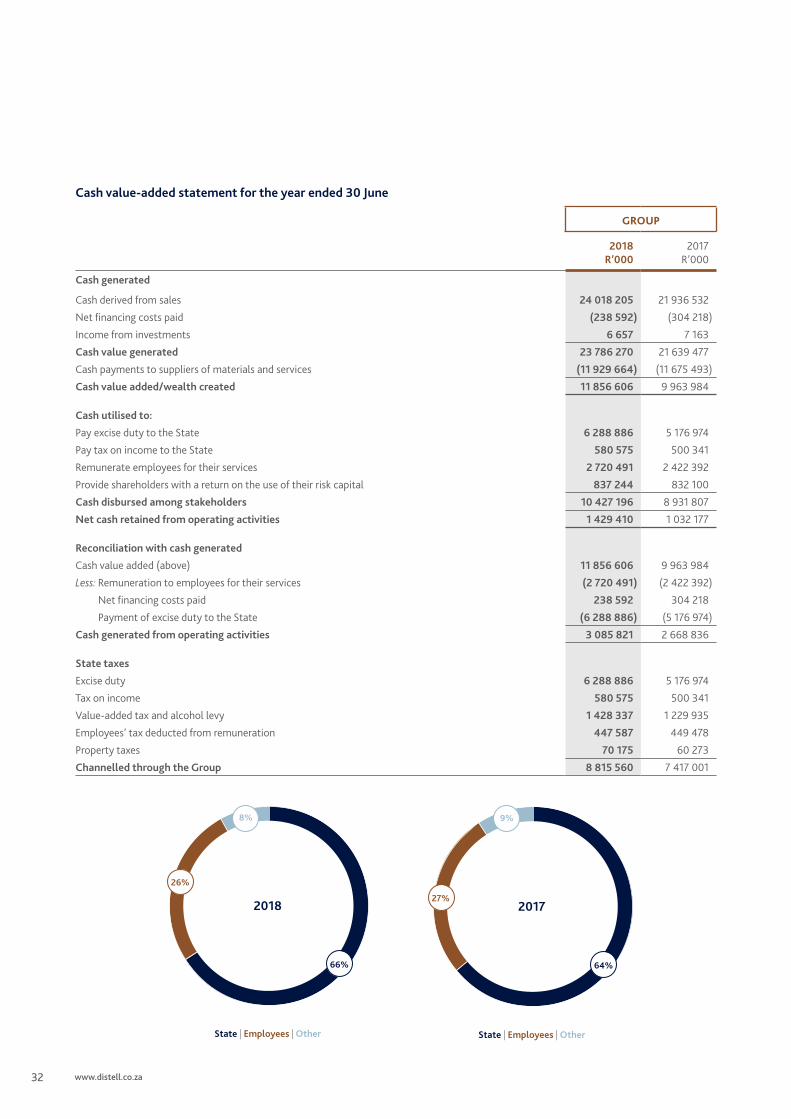
64%
9%
27%
State | Employees | Other
2017
Cash value-added statement for the year ended 30 June
GROUP
2018R’000
2017R’000
Cash generated
Cash derived from sales 24 018 205 21 936 532
Net financing costs paid (238 592) (304 218)
Income from investments 6 657 7 163
Cash value generated 23 786 270 21 639 477
Cash payments to suppliers of materials and services (11 929 664) (11 675 493)
Cash value added/wealth created 11 856 606 9 963 984
Cash utilised to:
Pay excise duty to the State 6 288 886 5 176 974
Pay tax on income to the State 580 575 500 341
Remunerate employees for their services 2 720 491 2 422 392
Provide shareholders with a return on the use of their risk capital 837 244 832 100
Cash disbursed among stakeholders 10 427 196 8 931 807
Net cash retained from operating activities 1 429 410 1 032 177
Reconciliation with cash generated
Cash value added (above) 11 856 606 9 963 984
Less: Remuneration to employees for their services (2 720 491) (2 422 392)
Net financing costs paid 238 592 304 218
Payment of excise duty to the State (6 288 886) (5 176 974)
Cash generated from operating activities 3 085 821 2 668 836
State taxes
Excise duty 6 288 886 5 176 974
Tax on income 580 575 500 341
Value-added tax and alcohol levy 1 428 337 1 229 935
Employees’ tax deducted from remuneration 447 587 449 478
Property taxes 70 175 60 273
Channelled through the Group 8 815 560 7 417 001
State | Employees | Other
2018
66%
8%
26%

33DISTELL Integrated Report 2018
CREATING AND SHARING VALUE
34 www.distell.co.za
GROUP CEO
F R O M O U R
Our three main operating regions, namely South Africa, the rest of Africa and international, delivered
robust results in a tough trading year.
HIGHLIGHTS
NORMALISED EBITDAadjusted for forex
+7,4%
RETURN ON INVESTED CAPITAL UP 40 BPS AT
13,1%
NORMALISED HEPS adjusted for forex
+5,1%
35DISTELL Integrated Report 2018
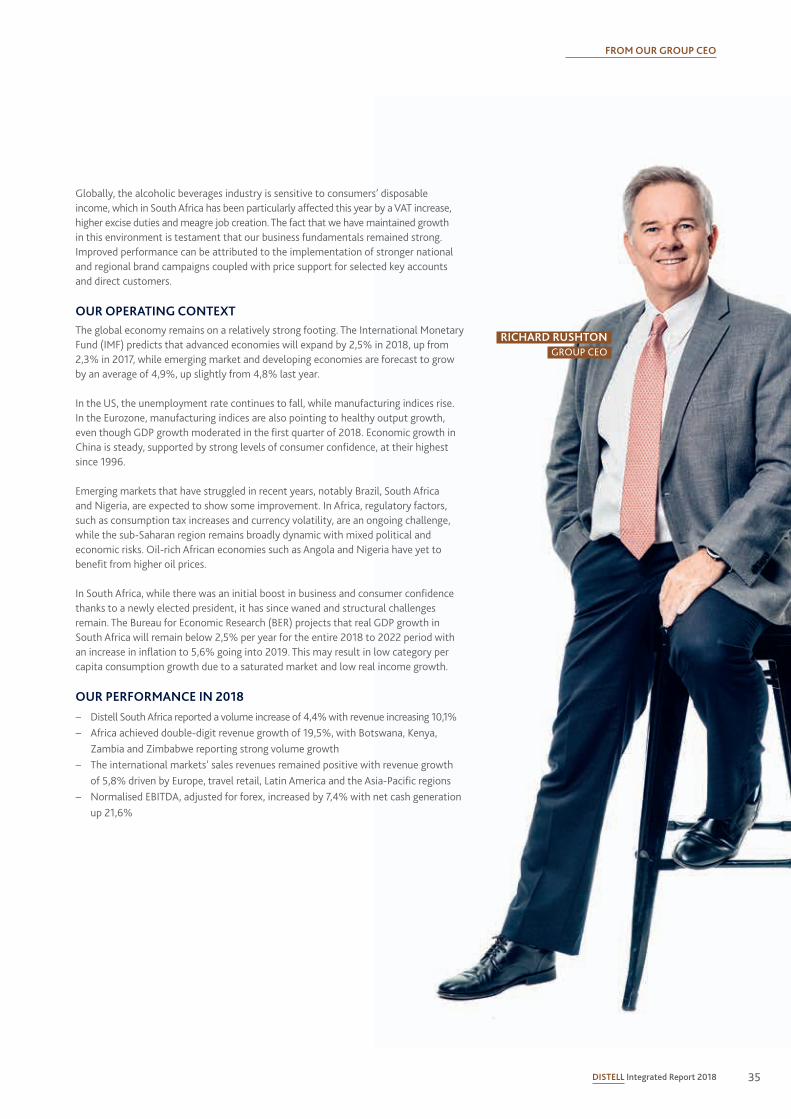
RICHARD RUSHTONGROUP CEO
Globally, the alcoholic beverages industry is sensitive to consumers’ disposable income, which in South Africa has been particularly affected this year by a VAT increase, higher excise duties and meagre job creation. The fact that we have maintained growth in this environment is testament that our business fundamentals remained strong. Improved performance can be attributed to the implementation of stronger national and regional brand campaigns coupled with price support for selected key accounts and direct customers.
OUR OPERATING CONTEXTThe global economy remains on a relatively strong footing. The International Monetary Fund (IMF) predicts that advanced economies will expand by 2,5% in 2018, up from 2,3% in 2017, while emerging market and developing economies are forecast to grow by an average of 4,9%, up slightly from 4,8% last year.
In the US, the unemployment rate continues to fall, while manufacturing indices rise. In the Eurozone, manufacturing indices are also pointing to healthy output growth, even though GDP growth moderated in the first quarter of 2018. Economic growth in China is steady, supported by strong levels of consumer confidence, at their highest since 1996.
Emerging markets that have struggled in recent years, notably Brazil, South Africa and Nigeria, are expected to show some improvement. In Africa, regulatory factors, such as consumption tax increases and currency volatility, are an ongoing challenge, while the sub-Saharan region remains broadly dynamic with mixed political and economic risks. Oil-rich African economies such as Angola and Nigeria have yet to benefit from higher oil prices.
In South Africa, while there was an initial boost in business and consumer confidence thanks to a newly elected president, it has since waned and structural challenges remain. The Bureau for Economic Research (BER) projects that real GDP growth in South Africa will remain below 2,5% per year for the entire 2018 to 2022 period with an increase in inflation to 5,6% going into 2019. This may result in low category per capita consumption growth due to a saturated market and low real income growth.
OUR PERFORMANCE IN 2018 − Distell South Africa reported a volume increase of 4,4% with revenue increasing 10,1% − Africa achieved double-digit revenue growth of 19,5%, with Botswana, Kenya,
Zambia and Zimbabwe reporting strong volume growth − The international markets’ sales revenues remained positive with revenue growth
of 5,8% driven by Europe, travel retail, Latin America and the Asia-Pacific regions − Normalised EBITDA, adjusted for forex, increased by 7,4% with net cash generation
up 21,6%
FROM OUR GROUP CEO
GROUP CEO
36 www.distell.co.za
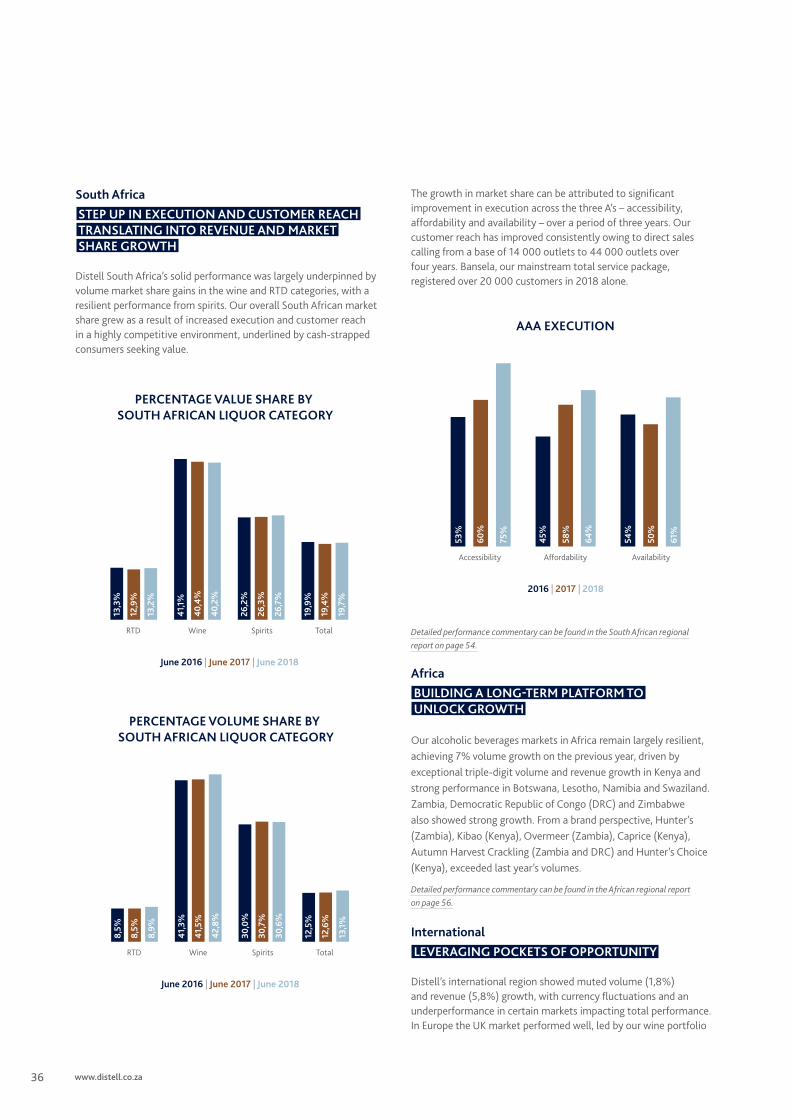
South AfricaSTEP UP IN EXECUTION AND CUSTOMER REACH TRANSLATING INTO REVENUE AND MARKET SHARE GROWTH
Distell South Africa’s solid performance was largely underpinned by volume market share gains in the wine and RTD categories, with a resilient performance from spirits. Our overall South African market share grew as a result of increased execution and customer reach in a highly competitive environment, underlined by cash-strapped consumers seeking value.
PERCENTAGE VALUE SHARE BY SOUTH AFRICAN LIQUOR CATEGORY
RTD Wine Spirits Total
June 2016 | June 2017 | June 2018
13,3
%
12,9
%
13,2
%
41,1%
40,4
%
40,2
%
26,2
%
26,3
%
26,7
%
19,9
%
19,4
%
19,7
%AAA EXECUTION
Accessibility Affordability Availability
2016 | 2017 | 2018
53%
60%
75%
45%
58%
64%
54%
50%
61%
PERCENTAGE VOLUME SHARE BY SOUTH AFRICAN LIQUOR CATEGORY
RTD Wine Spirits Total
June 2016 | June 2017 | June 2018
8,5%
8,5%
8,9%
41,3
%
41,5
%
42,8
%
30,0
%
30,7
%
30,6
%
12,5
%
12,6
%
13,1%
The growth in market share can be attributed to significant improvement in execution across the three A’s – accessibility, affordability and availability – over a period of three years. Our customer reach has improved consistently owing to direct sales calling from a base of 14 000 outlets to 44 000 outlets over four years. Bansela, our mainstream total service package, registered over 20 000 customers in 2018 alone.
Detailed performance commentary can be found in the South African regional report on page 54.
AfricaBUILDING A LONG-TERM PLATFORM TO UNLOCK GROWTH
Our alcoholic beverages markets in Africa remain largely resilient, achieving 7% volume growth on the previous year, driven by exceptional triple-digit volume and revenue growth in Kenya and strong performance in Botswana, Lesotho, Namibia and Swaziland. Zambia, Democratic Republic of Congo (DRC) and Zimbabwe also showed strong growth. From a brand perspective, Hunter’s (Zambia), Kibao (Kenya), Overmeer (Zambia), Caprice (Kenya), Autumn Harvest Crackling (Zambia and DRC) and Hunter’s Choice (Kenya), exceeded last year’s volumes.
Detailed performance commentary can be found in the African regional report on page 56.
InternationalLEVERAGING POCKETS OF OPPORTUNITY
Distell’s international region showed muted volume (1,8%) and revenue (5,8%) growth, with currency fluctuations and an underperformance in certain markets impacting total performance. In Europe the UK market performed well, led by our wine portfolio
FROM OUR GROUP CEO
in retail and wholesale channels. The Taiwan market showed stronger than expected results, despite the lower overall growth of the market. Even while total whiskey volumes declined, Scottish Leader managed to grow market share. Our focused portfolio and streamlined management of the travel retail channel delivered results that support our intention of profiling, showcasing and building brands.
Detailed performance commentary can be found in the international regionalreport on page 60.
THE ALLOCATION OF CAPITALWe allocate capital according to our strategic initiatives with a focus on economic value added (EVA) and return on invested capital (ROIC). Distell is fairly intensive in terms of capital usage, so we direct significant investment to maintain our assets, and enhance and scale them in Africa.
Changing consumer preferences, evolving market trends, growing disposable income in the millennial category and product innovation require that we continuously optimise our brand and asset portfolios – to ensure a sustainable long-term business. Our growth aspirations further guide us towards investing in a select portfolio of core brand assets and markets. As a result, we disposed of a number of non-core assets this year, significantly improving our balance sheet ratios:
− We dissolved the historic Lusan joint venture − We disposed of our French cognac subsidiary, Bisquit, preferring
to accelerate our growth in other categories
Investments during the year focused mainly on the optimisation of our business networks, as well as increased capacity at our Springs and Worcester production facilities, which are our largest cider and brandy production sites respectively. Our Springs facility is a model site for sustainable savings and efficiencies, featuring a range of green technology innovations.
The construction of the new waste water treatment facility at our Springs production plant is expected to be completed early in the new financial year, and the full pilot plant evaluation for a new anaerobic waste water treatment facility at our Worcester facility was completed. The absolute volume of waste water and effluent from our sites decreased by 17,1% to 1 351 721 ℓ (2017: 1 640 266 ℓ).
Read more in our sustainability report online.
SUSTAINABILITY FACT
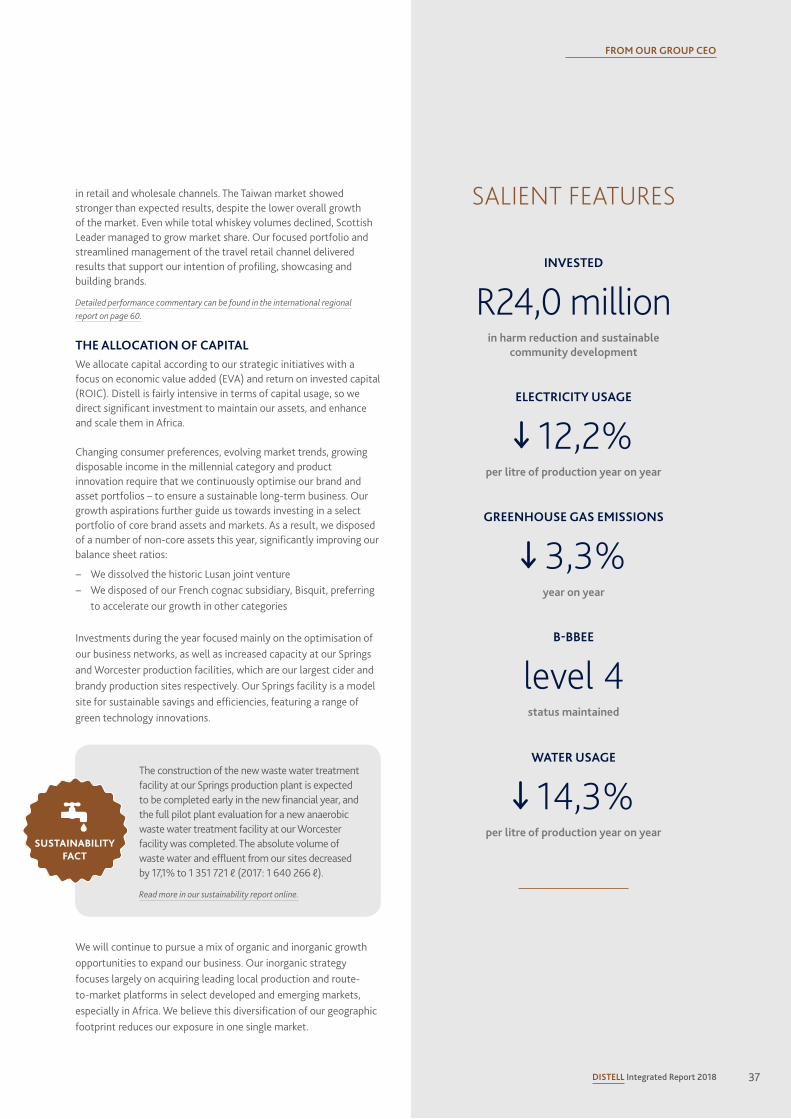
in harm reduction and sustainable community development
R24,0 millionINVESTED
per litre of production year on year
12,2%ELECTRICITY USAGE
3,3%GREENHOUSE GAS EMISSIONS
status maintained
level 4B-BBEE
per litre of production year on year
14,3%WATER USAGE
37DISTELL Integrated Report 2018
SALIENT FEATURES
We will continue to pursue a mix of organic and inorganic growth opportunities to expand our business. Our inorganic strategy focuses largely on acquiring leading local production and route-to-market platforms in select developed and emerging markets, especially in Africa. We believe this diversification of our geographic footprint reduces our exposure in one single market.
year on year
38 www.distell.co.za
Our criteria for mergers and acquisitions, in Africa as well as other markets, are as follows:
− We are prudent and considered when it comes to investments − We perform proper empirical due diligence and build our own
value case for each transaction − We invest in markets with good growth potential − We require end-to-end route-to-market platforms that
are sustainable
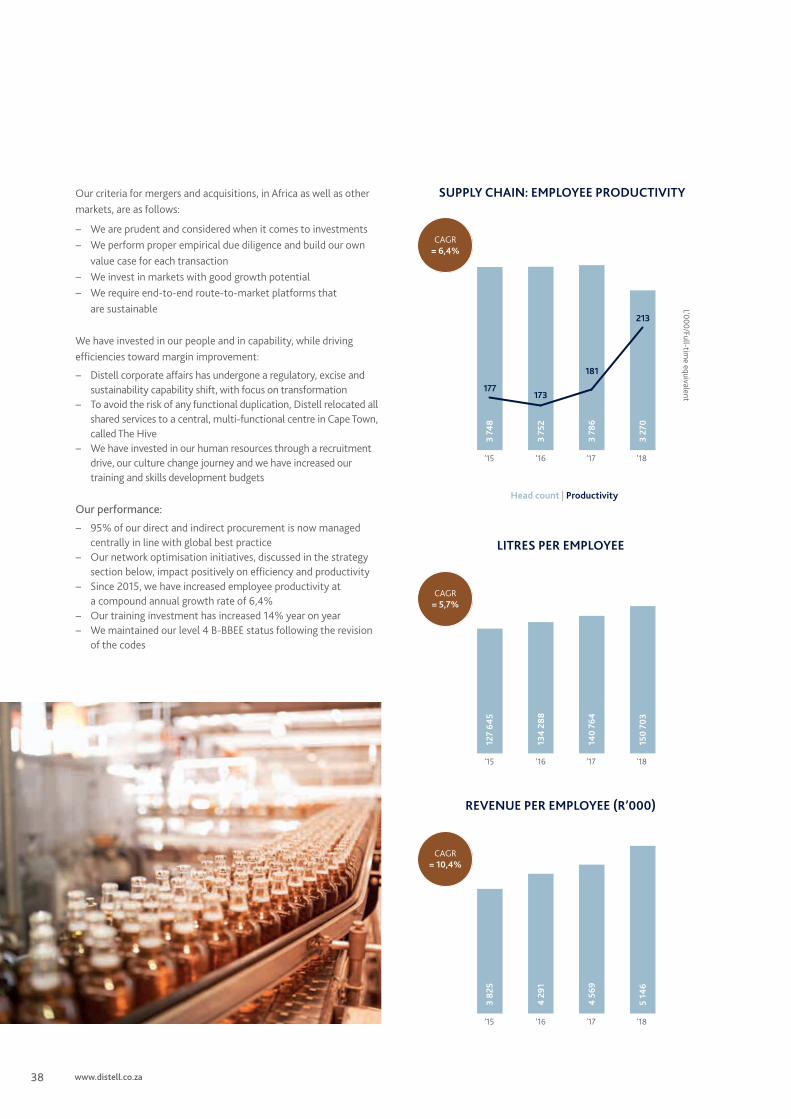
We have invested in our people and in capability, while driving efficiencies toward margin improvement:
− Distell corporate affairs has undergone a regulatory, excise and sustainability capability shift, with focus on transformation
− To avoid the risk of any functional duplication, Distell relocated all shared services to a central, multi-functional centre in Cape Town, called The Hive
− We have invested in our human resources through a recruitment drive, our culture change journey and we have increased our training and skills development budgets
Our performance:
− 95% of our direct and indirect procurement is now managed centrally in line with global best practice
− Our network optimisation initiatives, discussed in the strategy section below, impact positively on efficiency and productivity
− Since 2015, we have increased employee productivity at a compound annual growth rate of 6,4%
− Our training investment has increased 14% year on year − We maintained our level 4 B-BBEE status following the revision
of the codes
SUPPLY CHAIN: EMPLOYEE PRODUCTIVITY
Head count | Productivity
’15 ’16 ’17 ’18
3 74
8
3 75
2
3 78
6
L’000/Full-time equivalent
3 27
0
177173
181
213
CAGR= 6,4%
LITRES PER EMPLOYEE
’15 ’16 ’17 ’18
127
645
134
288
140
764
150
703
CAGR = 5,7%
REVENUE PER EMPLOYEE (R’000)
’15 ’16 ’17 ’18
3 82
5
4 29
1
4 56
9
5 14
6
CAGR = 10,4%
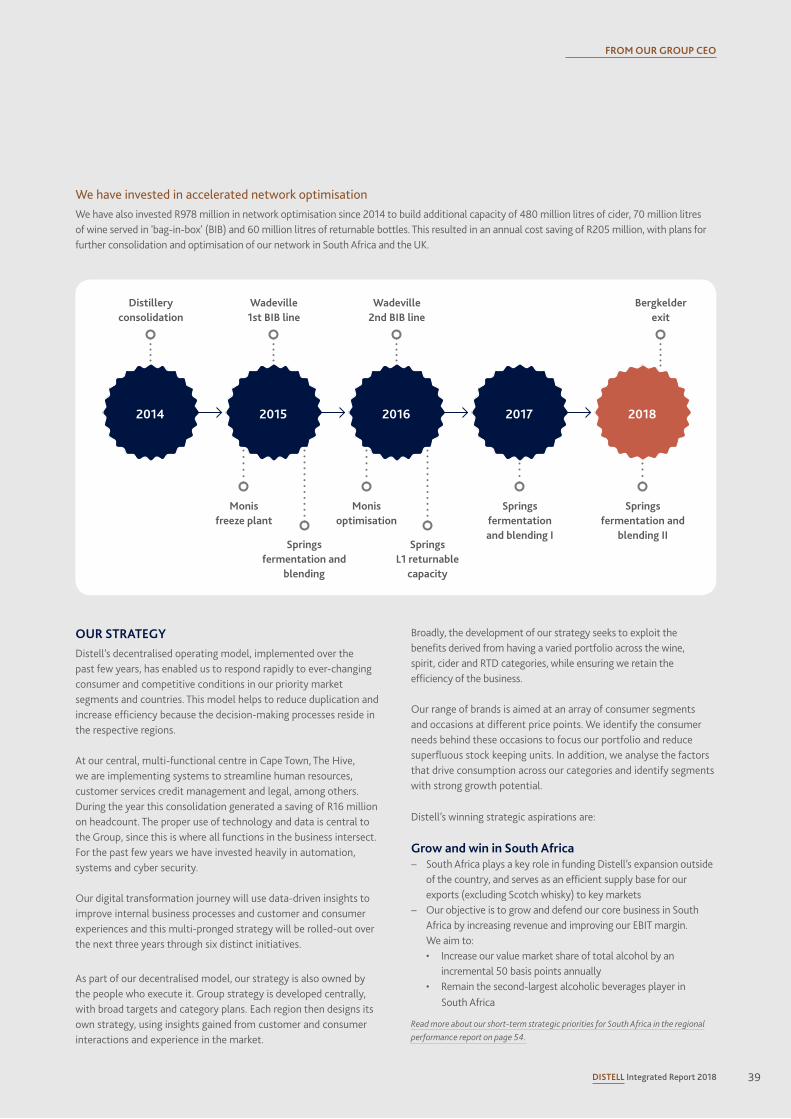
We have invested in accelerated network optimisationWe have also invested R978 million in network optimisation since 2014 to build additional capacity of 480 million litres of cider, 70 million litres of wine served in 'bag-in-box' (BIB) and 60 million litres of returnable bottles. This resulted in an annual cost saving of R205 million, with plans for further consolidation and optimisation of our network in South Africa and the UK.
FROM OUR GROUP CEO
39DISTELL Integrated Report 2018
OUR STRATEGYDistell’s decentralised operating model, implemented over the past few years, has enabled us to respond rapidly to ever-changing consumer and competitive conditions in our priority market segments and countries. This model helps to reduce duplication and increase efficiency because the decision-making processes reside in the respective regions.
At our central, multi-functional centre in Cape Town, The Hive, we are implementing systems to streamline human resources, customer services credit management and legal, among others. During the year this consolidation generated a saving of R16 million on headcount. The proper use of technology and data is central to the Group, since this is where all functions in the business intersect. For the past few years we have invested heavily in automation, systems and cyber security.
Our digital transformation journey will use data-driven insights to improve internal business processes and customer and consumer experiences and this multi-pronged strategy will be rolled-out over the next three years through six distinct initiatives.
As part of our decentralised model, our strategy is also owned by the people who execute it. Group strategy is developed centrally, with broad targets and category plans. Each region then designs its own strategy, using insights gained from customer and consumer interactions and experience in the market.
Broadly, the development of our strategy seeks to exploit the benefits derived from having a varied portfolio across the wine, spirit, cider and RTD categories, while ensuring we retain the efficiency of the business.
Our range of brands is aimed at an array of consumer segments and occasions at different price points. We identify the consumer needs behind these occasions to focus our portfolio and reduce superfluous stock keeping units. In addition, we analyse the factors that drive consumption across our categories and identify segments with strong growth potential.
Distell’s winning strategic aspirations are:
Grow and win in South Africa − South Africa plays a key role in funding Distell’s expansion outside
of the country, and serves as an efficient supply base for our exports (excluding Scotch whisky) to key markets
− Our objective is to grow and defend our core business in South Africa by increasing revenue and improving our EBIT margin. We aim to:• Increase our value market share of total alcohol by an
incremental 50 basis points annually • Remain the second-largest alcoholic beverages player in
South Africa
Read more about our short-term strategic priorities for South Africa in the regional performance report on page 54.
2014 2015 2016 2017 2018
Distillery consolidation
Springs fermentation and
blending II
Monis freeze plant
Monis optimisation
Springs fermentation and
blending
Springs L1 returnable
capacity
Wadeville1st BIB line
Wadeville2nd BIB line
Springs fermentation and blending I
Bergkelder exit
40 www.distell.co.za
Expand into Africa to lead the market with mainstream wines, spirits and RTDs
− Africa offers untapped potential and will be a key driver of growth, particularly in the scale market segment in the medium to long term
− The continent has rapidly expanding markets for alcoholic beverages, with opportunities for the formalisation of the alcoholic beverages market
− The priority markets for development of local route-to-market platforms in Africa include Angola, Nigeria, Ghana, Kenya, Tanzania, Mozambique, Zimbabwe and Zambia
− We will endeavour to use South Africa as an efficient production hub for supply to markets within close proximity, based on the principle that it is more scale-efficient
Read more about our short-term strategic priorities for Africa in the regional performance report on page 56.
Build a scale presence in one other selected emerging market
− Through acquisitions, we will invest in developing an end-to-end production, marketing and sales capability in one leading emerging market outside of Africa
Optimise profit from our export model for wine, Amarula and Scotch whisky in priority international countries
− The international region will grow revenue and improve its EBIT margin
− It will also optimise profit and channel presence from our traditional export wine base
Read more about our short-term strategic priorities for the international regions in the regional performance report on page 60.
Win in premium wine and spirits − We will lead the premiumisation of South African wines in key
target markets, with the aim to triple Distell’s premium wine volumes within the next decade
− We will profitably grow our South African and Scotch whisky business
Deliver shared value to local communities where we have a footprint
− Our commercial activities will be environmentally sustainable and supportive of responsible alcohol consumption
− We will strive to empower local communities by creating jobs and formalising liquor in our priority African markets via local sourcing and production supported by favourable taxation
Read more in our sustainability report online.
Be the leading employer of choice in the alcoholic beverages industry
− Our employee value proposition will be competitively positioned to attract and retain top talent
− We will develop a high-performance culture which rewards innovation
SUSTAINABILITYAT DISTELL, SUCCESS IN SUSTAINABILITY AND BEING A LEADER IN RESPONSIBLE CORPORATE CITIZENSHIP CAN NO LONGER BE DEFINED BY HOW MUCH WE SPEND. INSTEAD WE ARE FOCUSED ON INNOVATION AND BUILDING LASTING PARTNERSHIPS THAT DELIVER A POSITIVE IMPACT ALONG OUR VALUE CHAIN.
We view sustainability as an opportunity, not only to grow our brands, our revenue and our sales, but also to make a real difference in society and in the communities we operate in.
We recognise the responsibility that comes with being a leading player in the global alcoholic beverage industry and South Africa’s last remaining locally owned global beverage company. Our actions and the decisions we make have the potential to impact the economy, the environment and our stakeholders. We recognise that our success can only be achieved if we fully embrace sustainable business practices.
I am pleased to report that in the past year we continued to make good progress in key areas such as promoting responsible drinking, transformation, supply chain management, sustaining our communities and managing our supply chain sustainably:
− We refined our sustainability framework, bringing together what we believe are the essential tenets for maintaining success as a company and responsiveness to socio-economic drivers in our local communities.
− Working with our key partner organisations, we identified and defined areas along our value chain where we believe we can make the biggest impact – and make positive and lasting change.
− The fact that we maintained our level 4 B-BBEE status confirms our commitment to promoting greater economic participation, localisation and building inclusive partnerships along our value chain.
− Our E+Scalator programme has been widely recognised as one of the best supplier development programmes in South Africa.
− As part of the successful management of our environmental footprint, we were able to continue to operate during the prolonged drought in the Western Cape – without placing additional strain on this critical resource.
− Our governance processes have been bolstered by the establishment of a Sustainability Council, which provides management with oversight of our company-wide sustainability agenda. This ensures alignment between our strategy and our sustainability efforts.
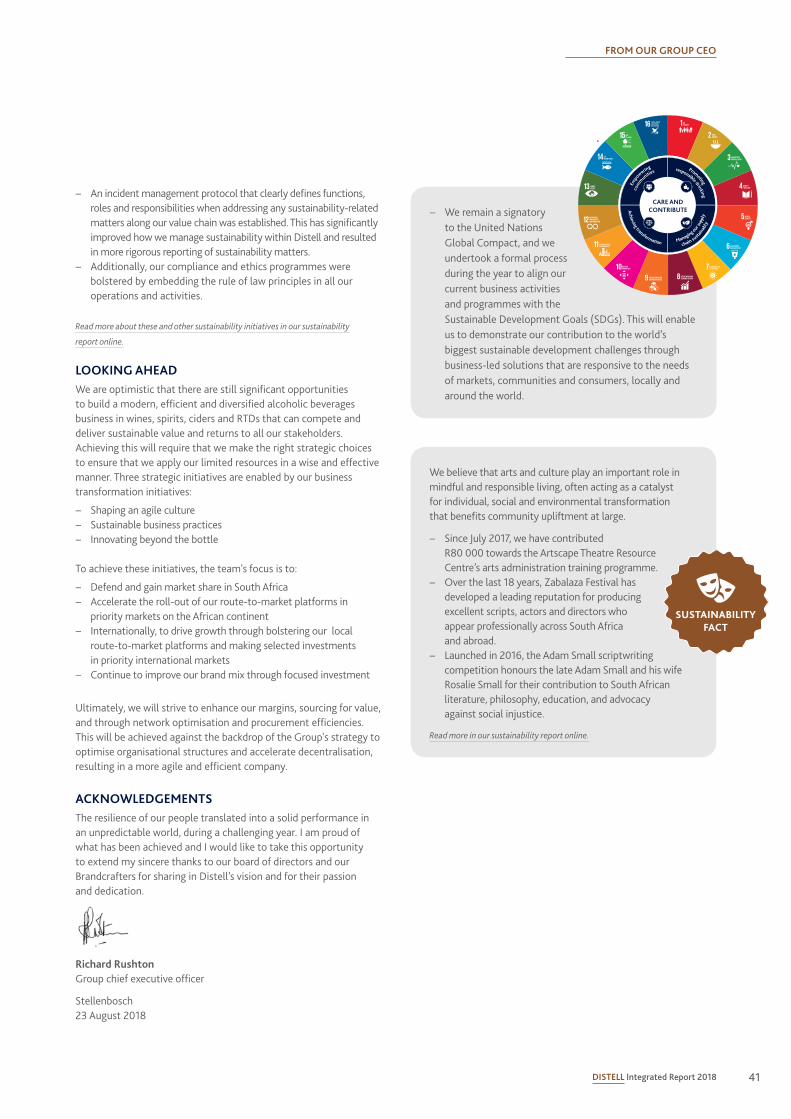
41DISTELL Integrated Report 2018
− An incident management protocol that clearly defines functions, roles and responsibilities when addressing any sustainability-related matters along our value chain was established. This has significantly improved how we manage sustainability within Distell and resulted in more rigorous reporting of sustainability matters.
− Additionally, our compliance and ethics programmes were bolstered by embedding the rule of law principles in all our operations and activities.
Read more about these and other sustainability initiatives in our sustainability
report online.
LOOKING AHEADWe are optimistic that there are still significant opportunities to build a modern, efficient and diversified alcoholic beverages business in wines, spirits, ciders and RTDs that can compete and deliver sustainable value and returns to all our stakeholders. Achieving this will require that we make the right strategic choices to ensure that we apply our limited resources in a wise and effective manner. Three strategic initiatives are enabled by our business transformation initiatives:
− Shaping an agile culture − Sustainable business practices − Innovating beyond the bottle
To achieve these initiatives, the team's focus is to:
− Defend and gain market share in South Africa − Accelerate the roll-out of our route-to-market platforms in
priority markets on the African continent − Internationally, to drive growth through bolstering our local
route-to-market platforms and making selected investments in priority international markets
− Continue to improve our brand mix through focused investment
Ultimately, we will strive to enhance our margins, sourcing for value, and through network optimisation and procurement efficiencies. This will be achieved against the backdrop of the Group's strategy to optimise organisational structures and accelerate decentralisation, resulting in a more agile and efficient company.
ACKNOWLEDGEMENTSThe resilience of our people translated into a solid performance in an unpredictable world, during a challenging year. I am proud of what has been achieved and I would like to take this opportunity to extend my sincere thanks to our board of directors and our Brandcrafters for sharing in Distell’s vision and for their passion and dedication.
Richard RushtonGroup chief executive officer
Stellenbosch 23 August 2018
We believe that arts and culture play an important role in mindful and responsible living, often acting as a catalyst for individual, social and environmental transformation that benefits community upliftment at large.
− Since July 2017, we have contributed R80 000 towards the Artscape Theatre Resource Centre’s arts administration training programme.
− Over the last 18 years, Zabalaza Festival has developed a leading reputation for producing excellent scripts, actors and directors who appear professionally across South Africa and abroad.
− Launched in 2016, the Adam Small scriptwriting competition honours the late Adam Small and his wife Rosalie Small for their contribution to South African literature, philosophy, education, and advocacy against social injustice.
Read more in our sustainability report online.
SUSTAINABILITY FACT
FROM OUR GROUP CEO
− We remain a signatory to the United Nations Global Compact, and we undertook a formal process during the year to align our current business activities and programmes with the Sustainable Development Goals (SDGs). This will enable us to demonstrate our contribution to the world’s biggest sustainable development challenges through business-led solutions that are responsive to the needs of markets, communities and consumers, locally and around the world.
Achieving transformation
Empo
wering
CARE AND CONTRIBUTE
com
m
unities
chain sustain
ably
Managing our sup
ply
Promoting
responsible drinking
42 www.distell.co.za
GROUP CFO
F R O M O U R
Distell delivered a resilient set of results in a turbulent year. Overall, our performance shows that underlying
business fundamentals remain strong.
HIGHLIGHTS
REVENUE
+10,4%
HEADLINE EARNINGSadjusted for forex
+5,2%
NET CASH GENERATION
+21,6%
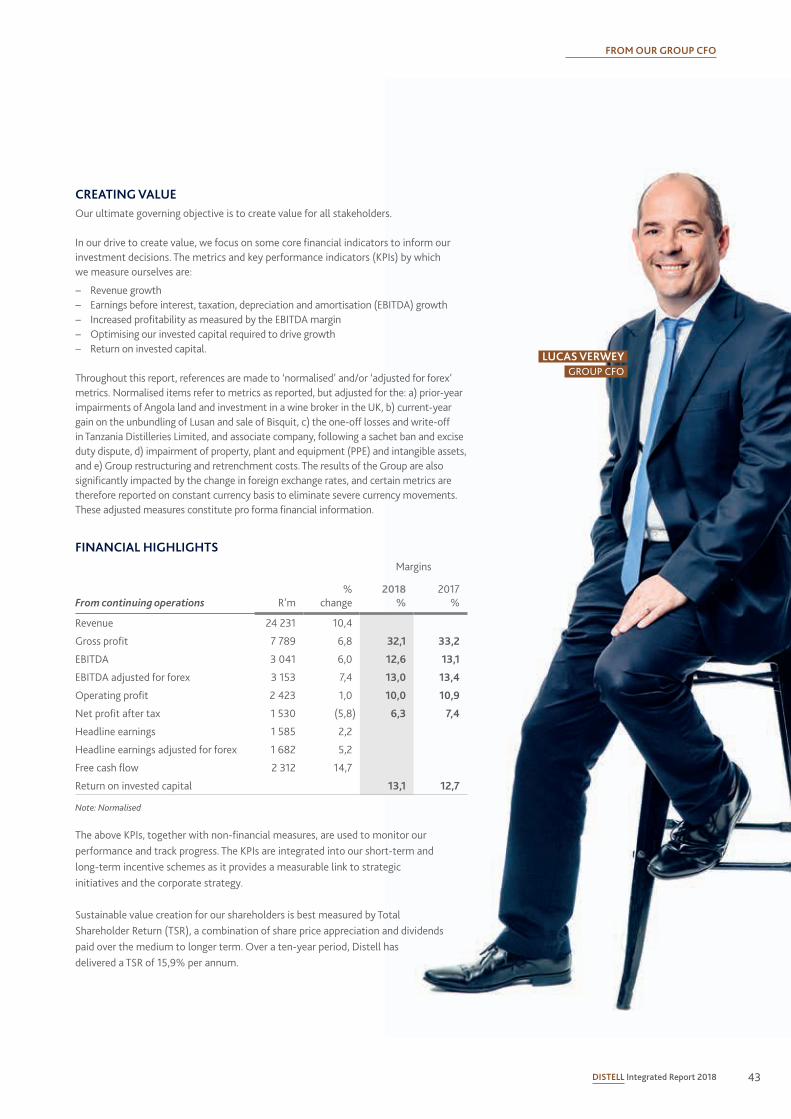
43DISTELL Integrated Report 2018
LUCAS VERWEYGROUP CFO
FROM OUR GROUP CFO
GROUP CFO
CREATING VALUEOur ultimate governing objective is to create value for all stakeholders.
In our drive to create value, we focus on some core financial indicators to inform our investment decisions. The metrics and key performance indicators (KPIs) by which we measure ourselves are:
− Revenue growth − Earnings before interest, taxation, depreciation and amortisation (EBITDA) growth − Increased profitability as measured by the EBITDA margin − Optimising our invested capital required to drive growth − Return on invested capital.
Throughout this report, references are made to ‘normalised’ and/or ‘adjusted for forex’ metrics. Normalised items refer to metrics as reported, but adjusted for the: a) prior-year impairments of Angola land and investment in a wine broker in the UK, b) current-year gain on the unbundling of Lusan and sale of Bisquit, c) the one-off losses and write-off in Tanzania Distilleries Limited, and associate company, following a sachet ban and excise duty dispute, d) impairment of property, plant and equipment (PPE) and intangible assets, and e) Group restructuring and retrenchment costs. The results of the Group are also significantly impacted by the change in foreign exchange rates, and certain metrics are therefore reported on constant currency basis to eliminate severe currency movements. These adjusted measures constitute pro forma financial information.
FINANCIAL HIGHLIGHTSMargins
From continuing operations R’m%
change 2018
%2017
%
Revenue 24 231 10,4
Gross profit 7 789 6,8 32,1 33,2
EBITDA 3 041 6,0 12,6 13,1
EBITDA adjusted for forex 3 153 7,4 13,0 13,4
Operating profit 2 423 1,0 10,0 10,9
Net profit after tax 1 530 (5,8) 6,3 7,4
Headline earnings 1 585 2,2
Headline earnings adjusted for forex 1 682 5,2
Free cash flow 2 312 14,7
Return on invested capital 13,1 12,7
Note: Normalised
The above KPIs, together with non-financial measures, are used to monitor our performance and track progress. The KPIs are integrated into our short-term and long-term incentive schemes as it provides a measurable link to strategic initiatives and the corporate strategy.
Sustainable value creation for our shareholders is best measured by Total Shareholder Return (TSR), a combination of share price appreciation and dividends paid over the medium to longer term. Over a ten-year period, Distell has delivered a TSR of 15,9% per annum.
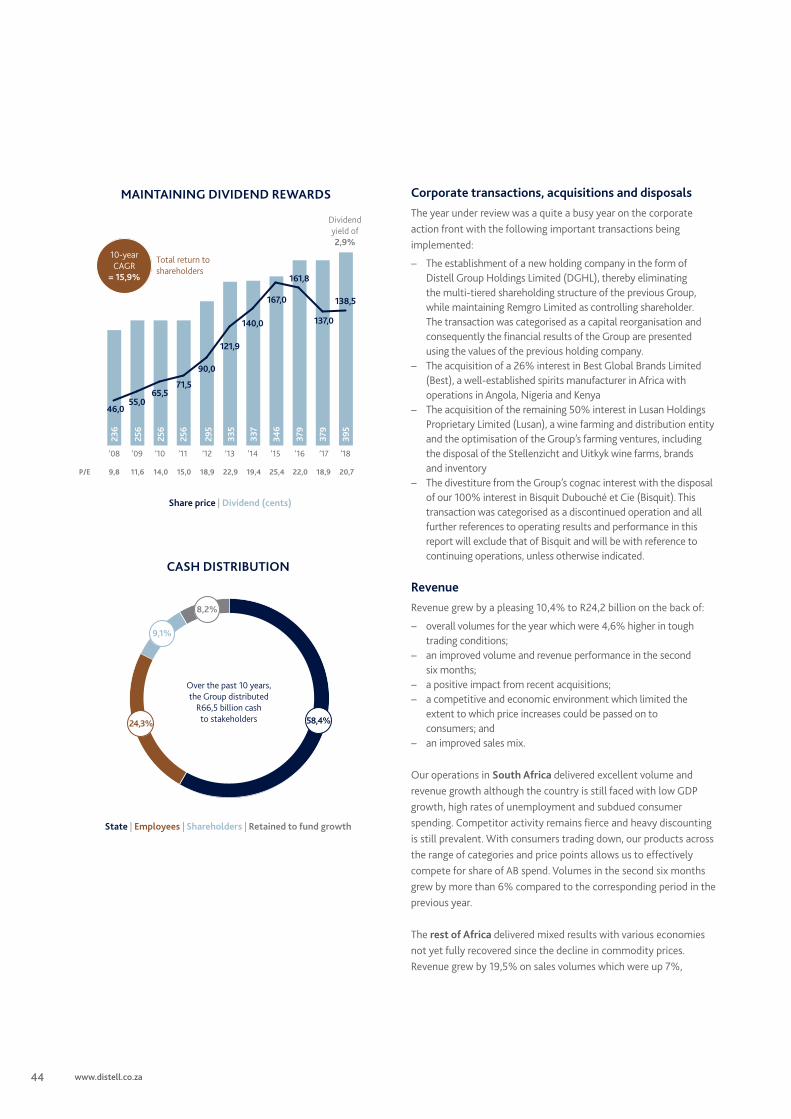
44 www.distell.co.za
Corporate transactions, acquisitions and disposalsThe year under review was a quite a busy year on the corporate action front with the following important transactions being implemented:
− The establishment of a new holding company in the form of Distell Group Holdings Limited (DGHL), thereby eliminating the multi-tiered shareholding structure of the previous Group, while maintaining Remgro Limited as controlling shareholder. The transaction was categorised as a capital reorganisation and consequently the financial results of the Group are presented using the values of the previous holding company.
− The acquisition of a 26% interest in Best Global Brands Limited (Best), a well-established spirits manufacturer in Africa with operations in Angola, Nigeria and Kenya
− The acquisition of the remaining 50% interest in Lusan Holdings Proprietary Limited (Lusan), a wine farming and distribution entity and the optimisation of the Group’s farming ventures, including the disposal of the Stellenzicht and Uitkyk wine farms, brands and inventory
− The divestiture from the Group’s cognac interest with the disposal of our 100% interest in Bisquit Dubouché et Cie (Bisquit). This transaction was categorised as a discontinued operation and all further references to operating results and performance in this report will exclude that of Bisquit and will be with reference to continuing operations, unless otherwise indicated.
RevenueRevenue grew by a pleasing 10,4% to R24,2 billion on the back of:
− overall volumes for the year which were 4,6% higher in tough trading conditions;
− an improved volume and revenue performance in the second six months;
− a positive impact from recent acquisitions; − a competitive and economic environment which limited the
extent to which price increases could be passed on to consumers; and
− an improved sales mix.
Our operations in South Africa delivered excellent volume and revenue growth although the country is still faced with low GDP growth, high rates of unemployment and subdued consumer spending. Competitor activity remains fierce and heavy discounting is still prevalent. With consumers trading down, our products across the range of categories and price points allows us to effectively compete for share of AB spend. Volumes in the second six months grew by more than 6% compared to the corresponding period in the previous year.
The rest of Africa delivered mixed results with various economies not yet fully recovered since the decline in commodity prices. Revenue grew by 19,5% on sales volumes which were up 7%,
CASH DISTRIBUTION
58,4%
9,1%
24,3%
8,2%
State | Employees | Shareholders | Retained to fund growth
Over the past 10 years, the Group distributed
R66,5 billion cash to stakeholders
MAINTAINING DIVIDEND REWARDS
46,0
10-year CAGR
= 15,9%
Dividend yield of2,9%
’08 ’09 ’10 ’11 ’12 ’13 ’14 ’15 ’16 ’17 ’18
9,8P/E 11,6 14,0 15,0 18,9 22,9 19,4 25,4 22,0 18,9 20,7
Share price | Dividend (cents)
55,065,5
71,5
90,0
121,9
140,0
167,0
161,8
137,0
256
236
256
256
295
335
337
346
379
379
395
Total return to shareholders
138,5
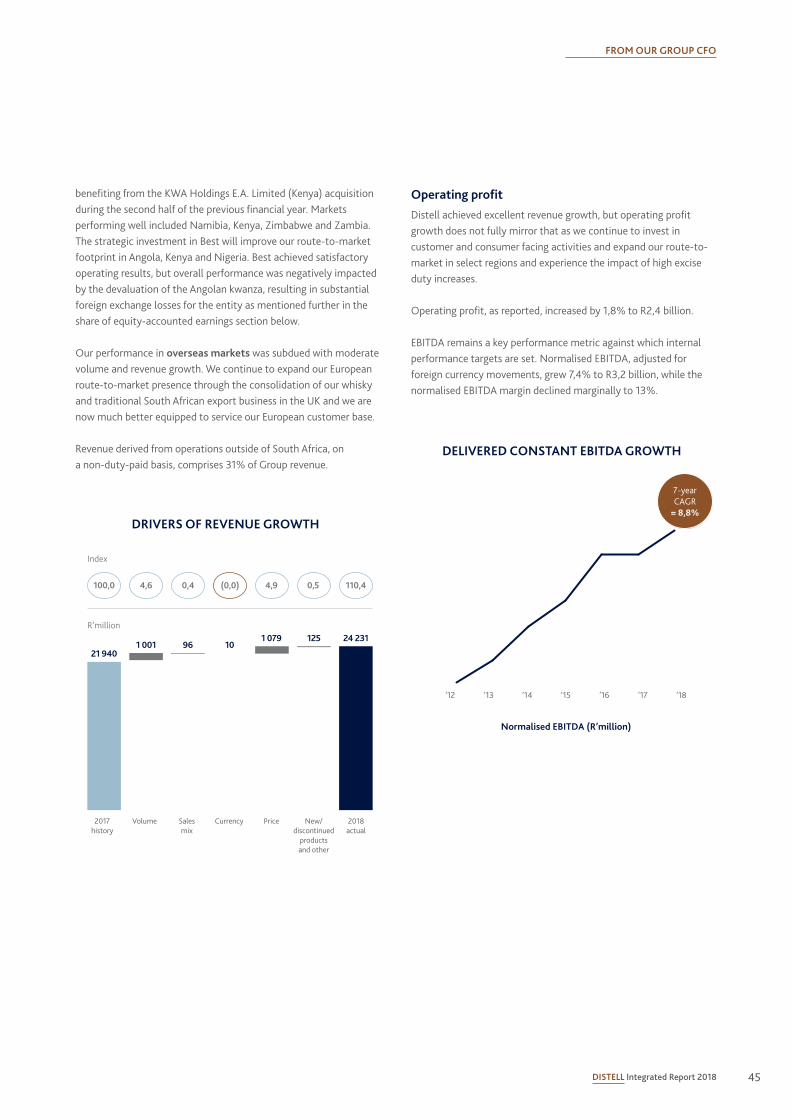
45DISTELL Integrated Report 2018
DELIVERED CONSTANT EBITDA GROWTH
7-year CAGR
= 8,8%
’12 ’13 ’14 ’15 ’16 ’17 ’18
Normalised EBITDA (R’million)
FROM OUR GROUP CFO
benefiting from the KWA Holdings E.A. Limited (Kenya) acquisition during the second half of the previous financial year. Markets performing well included Namibia, Kenya, Zimbabwe and Zambia. The strategic investment in Best will improve our route-to-market footprint in Angola, Kenya and Nigeria. Best achieved satisfactory operating results, but overall performance was negatively impacted by the devaluation of the Angolan kwanza, resulting in substantial foreign exchange losses for the entity as mentioned further in the share of equity-accounted earnings section below.
Our performance in overseas markets was subdued with moderate volume and revenue growth. We continue to expand our European route-to-market presence through the consolidation of our whisky and traditional South African export business in the UK and we are now much better equipped to service our European customer base.
Revenue derived from operations outside of South Africa, on a non-duty-paid basis, comprises 31% of Group revenue.
Operating profitDistell achieved excellent revenue growth, but operating profit growth does not fully mirror that as we continue to invest in customer and consumer facing activities and expand our route-to-market in select regions and experience the impact of high excise duty increases.
Operating profit, as reported, increased by 1,8% to R2,4 billion.
EBITDA remains a key performance metric against which internal performance targets are set. Normalised EBITDA, adjusted for foreign currency movements, grew 7,4% to R3,2 billion, while the normalised EBITDA margin declined marginally to 13%.
DRIVERS OF REVENUE GROWTH
2017history
Volume Salesmix
Currency Price New/discontinued
products and other
2018actual
21 940
100,0 4,6 0,4 (0,0) 4,9 0,5 110,4
1 001 96 101 079 125 24 231
R’million
Index
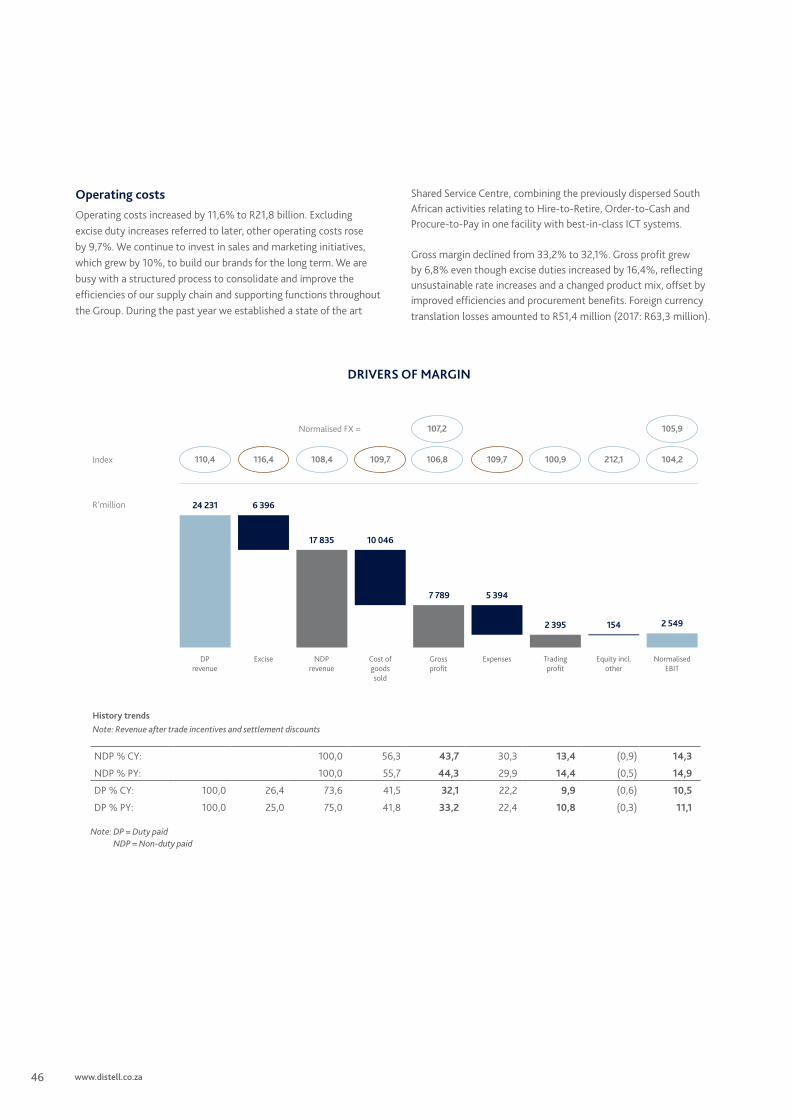
46 www.distell.co.za
Operating costsOperating costs increased by 11,6% to R21,8 billion. Excluding excise duty increases referred to later, other operating costs rose by 9,7%. We continue to invest in sales and marketing initiatives, which grew by 10%, to build our brands for the long term. We are busy with a structured process to consolidate and improve the efficiencies of our supply chain and supporting functions throughout the Group. During the past year we established a state of the art
Shared Service Centre, combining the previously dispersed South African activities relating to Hire-to-Retire, Order-to-Cash and Procure-to-Pay in one facility with best-in-class ICT systems.
Gross margin declined from 33,2% to 32,1%. Gross profit grew by 6,8% even though excise duties increased by 16,4%, reflecting unsustainable rate increases and a changed product mix, offset by improved efficiencies and procurement benefits. Foreign currency translation losses amounted to R51,4 million (2017: R63,3 million).
DRIVERS OF MARGIN
DP revenue
Excise NDP revenue
Cost of goods sold
Gross profit
Expenses Trading profit
Equity incl. other
Normalised EBIT
24 231 6 396
17 835 10 046
7 789 5 394
2 395 154 2 549
110,4 116,4 108,4 109,7 106,8
107,2
109,7 100,9 212,1 104,2
105,9
R’million
Index
Normalised FX =
Note: Revenue after trade incentives and settlement discountsHistory trends
NDP % CY: 100,0 56,3 43,7 30,3 13,4 (0,9) 14,3
NDP % PY: 100,0 55,7 44,3 29,9 14,4 (0,5) 14,9
DP % CY: 100,0 26,4 73,6 41,5 32,1 22,2 9,9 (0,6) 10,5
DP % PY: 100,0 25,0 75,0 41,8 33,2 22,4 10,8 (0,3) 11,1
Note: DP = Duty paid NDP = Non-duty paid
47DISTELL Integrated Report 2018
Other gains and lossesIncluded in ‘other gains and losses’ in the income statement are a gain of R37,8 million on the Group’s previously held equity interest when Lusan was acquired, as well as impairments of R78,7 million for intangible assets and property, plant and equipment, mainly relating to our Asian operations and a whisky trademark.
Share of equity-accounted earningsThe Group’s share of equity-accounted earnings comprises its share of the after-tax profits of associated companies and joint ventures.
AssociatesOur investment in associated companies includes a 35% share in Tanzania Distilleries Limited (TDL), as well as 26% interests in Best and the Mauritian company Grays Inc. Limited. Distell’s share of after-tax losses from associated companies was R7,7 million (2017: R18,2 million profit). The decline was mainly because of the unfavourable impact of a sachet ban imposed in Tanzania which impacted the TDL performance. Best contributed a net profit of R29,8 million after the severe devaluation of the Angolan kwanza resulted in a foreign exchange loss of about R81,0 million.
Joint venturesOur share of profits from joint ventures was marginally lower at R39,1 million (2017: R41,2 million).
Finance costs and cash flowTotal interest-bearing borrowings, net of cash and cash equivalents, decreased from R3,7 billion to R3,5 billion.
Net cash generated from operations, after working capital movements, increased 15,7% to R3,1 billion. Investment in working capital resulted in a cash outflow of R173,2 million (2017: R315,5 million), as we continue to carefully manage our working capital.
Finance costs and taxation paid increased marginally to R819,2 million (2017: R804,6 million).
Cash outflow from investment activities was R1,14 billion. This included fixed capital investment spent to maintain and expand operations amounting to R1,17 billion (2017: R805,6 million), and for the purchase consideration of R783,4 million for the interests in Best and Lusan. Proceeds from the disposal of subsidiaries, mainly Bisquit, amounted to R757,1 million.
Cash inflow before financing activities grew to R1,12 billion (2017: R914,6 million). Dividends paid to shareholders amounted to R837,2 million (2017: R832,1 million).
The R284,8 million surplus was used to reduce interest-bearing borrowings.
FROM OUR GROUP CFO
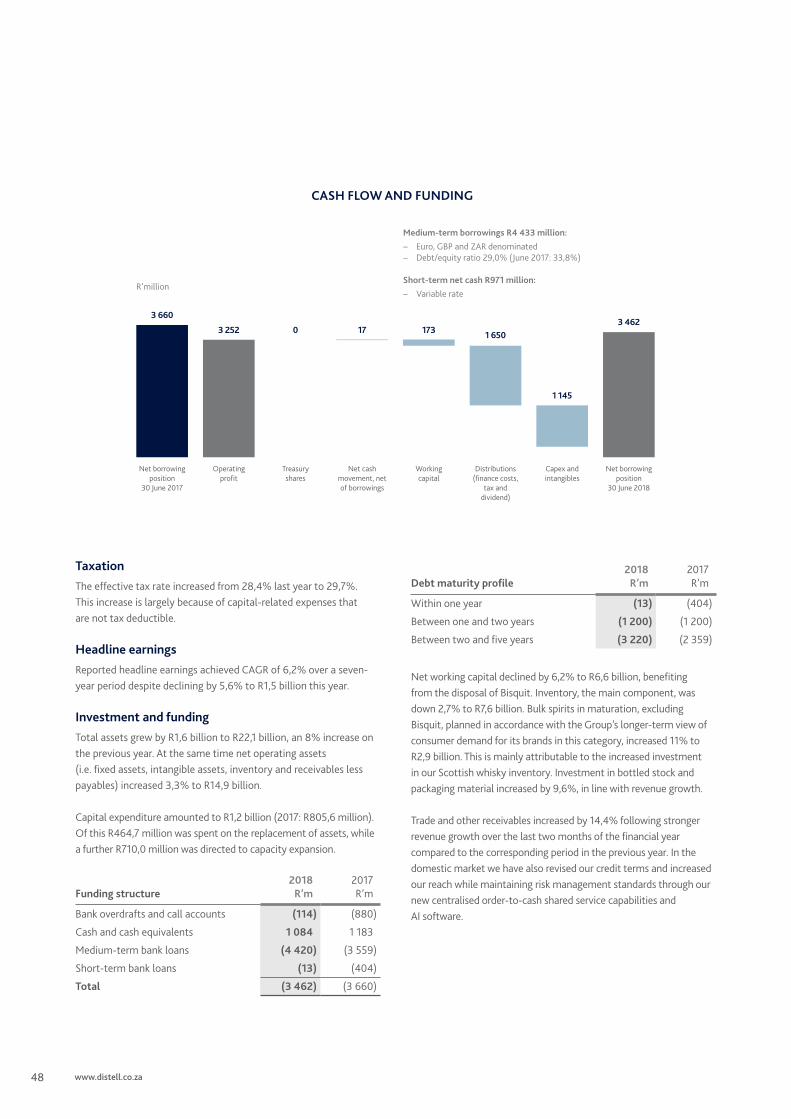
48 www.distell.co.za
TaxationThe effective tax rate increased from 28,4% last year to 29,7%. This increase is largely because of capital-related expenses that are not tax deductible.
Headline earningsReported headline earnings achieved CAGR of 6,2% over a seven-year period despite declining by 5,6% to R1,5 billion this year.
Investment and fundingTotal assets grew by R1,6 billion to R22,1 billion, an 8% increase on the previous year. At the same time net operating assets (i.e. fixed assets, intangible assets, inventory and receivables less payables) increased 3,3% to R14,9 billion.
Capital expenditure amounted to R1,2 billion (2017: R805,6 million). Of this R464,7 million was spent on the replacement of assets, while a further R710,0 million was directed to capacity expansion.
Funding structure2018
R’m2017R’m
Bank overdrafts and call accounts (114) (880)
Cash and cash equivalents 1 084 1 183
Medium-term bank loans (4 420) (3 559)
Short-term bank loans (13) (404)
Total (3 462) (3 660)
CASH FLOW AND FUNDING
Net borrowing position
30 June 2017
Operating profit
Treasury shares
Net cash movement, net of borrowings
Working capital
Distributions (finance costs,
tax and dividend)
Capex and intangibles
Net borrowing position
30 June 2018
3 660
3 252 0 17 173 1 650
1 145
3 462
R’million
Medium-term borrowings R4 433 million:− Euro, GBP and ZAR denominated− Debt/equity ratio 29,0% (June 2017: 33,8%)
Short-term net cash R971 million:− Variable rate
Debt maturity profile2018
R’m2017R’m
Within one year (13) (404)
Between one and two years (1 200) (1 200)
Between two and five years (3 220) (2 359)
Net working capital declined by 6,2% to R6,6 billion, benefiting from the disposal of Bisquit. Inventory, the main component, was down 2,7% to R7,6 billion. Bulk spirits in maturation, excluding Bisquit, planned in accordance with the Group’s longer-term view of consumer demand for its brands in this category, increased 11% to R2,9 billion. This is mainly attributable to the increased investment in our Scottish whisky inventory. Investment in bottled stock and packaging material increased by 9,6%, in line with revenue growth.
Trade and other receivables increased by 14,4% following stronger revenue growth over the last two months of the financial year compared to the corresponding period in the previous year. In the domestic market we have also revised our credit terms and increased our reach while maintaining risk management standards through our new centralised order-to-cash shared service capabilities and AI software.
49DISTELL Integrated Report 2018
We continue to be a strong cash-generative business with net cash generated from operating activities increasing by 21,6% and we were able to reduce net debt by R197,9 million. Our debt mainly consists of medium-term loans and we further utilise short-term bank credit facilities to manage the cyclical nature of our cash flows during the year. We further match funding requirements with the currency of the underlying operations or assets to be financed when deemed cost-effective and to obtain natural currency hedges. Most of our interest-bearing debt is fully secured by fixed properties, trade receivables and inventory.
The Group has access to R2,3 billion of general banking facilities, of which R2,2 billion remains unutilised at year-end. We have borrowing capacity available which will allow us to seek new investment opportunities and service our ongoing funding and liquidity requirements. Our revised shareholding structure provides us with some flexibility to pursue new investments should they arise.
The Group’s interest-bearing debt, net of cash and cash equivalents, was R3,5 billion (2017: R3,7 billion), and with a debt-to-debt-plus-equity ratio of 22,5%, it places us in a strong position to pursue our strategic priorities.
Return on invested capital and economic profitReturn on invested capital and economic profit are measures applied by management to assess the return obtained from the Group’s asset base and are determined to evaluate the overall performance of the business and underlying business units.
Return on invested capitalThe profit used in assessing the return on total invested capital reflects the operating performance of the business, stated before exceptional items and finance charges, and after applying the tax rate before exceptional items for the year. Average total invested capital is calculated using the average derived from the consolidated statements of financial position at the beginning, middle and end of the year. Average capital employed/average total invested capital comprises average net assets for the year (excluding post-retirement employment net liabilities/assets) and average net borrowings.
Economic profitEconomic profit is determined to assess the Group’s returns from its asset base, compared to a standard cost of capital charge. It is calculated as the difference between the standard capital charge on the average total invested assets and the actual returns achieved by
the Group on these assets. Currently, the standard capital charge applied to the average total invested capital is 10,8% (2017: 10,7%). Calculations for return on average total invested capital and economic profit are as follows:
Economic profit2018
R’m2017R’m
Trend(%)
Normalised headline earnings adjusted for currency movements 1 682,4 1 599,4 5,2
Interest (after tax) 213,1 157,3 35,5
Actual returns achieved 1 895,5 1 756,7 7,9
Capital charge at 10,8% (June 2017: 10,7%) 1 569,8 1 478,0 6,2
Economic profit 325,8 278,7 16,9
Average total invested capital 14 504,8 13 813,2 5,0
Return on average total invested capital 13,1% 12,7%
The Group remains focused on creating shareholder value by improving its operating margin, while driving revenue growth and the efficient use of assets.
DividendReported headline earnings declined by 5,6% to R1,5 billion. Normalised headline earnings adjusted for currency movements increased by 5,2% to R1,7 billion and by 5,1% per share to 766,7 cents.
The directors have resolved to declare a gross cash dividend, number 1, of 230,0 cents (2017: 214,0 cents) per share for the year ended 30 June 2018. This represents a total dividend of 395,0 cents (2017: 379,0 cents) for the year and a dividend cover of 1,9 times (2017: 1,9 times) by normalised headline earnings.
Our guideline is to achieve a dividend cover of between 2,0 and 2,5 times normalised headline earnings.
Lucas VerweyGroup chief financial officer
Stellenbosch23 August 2018
FROM OUR GROUP CFO
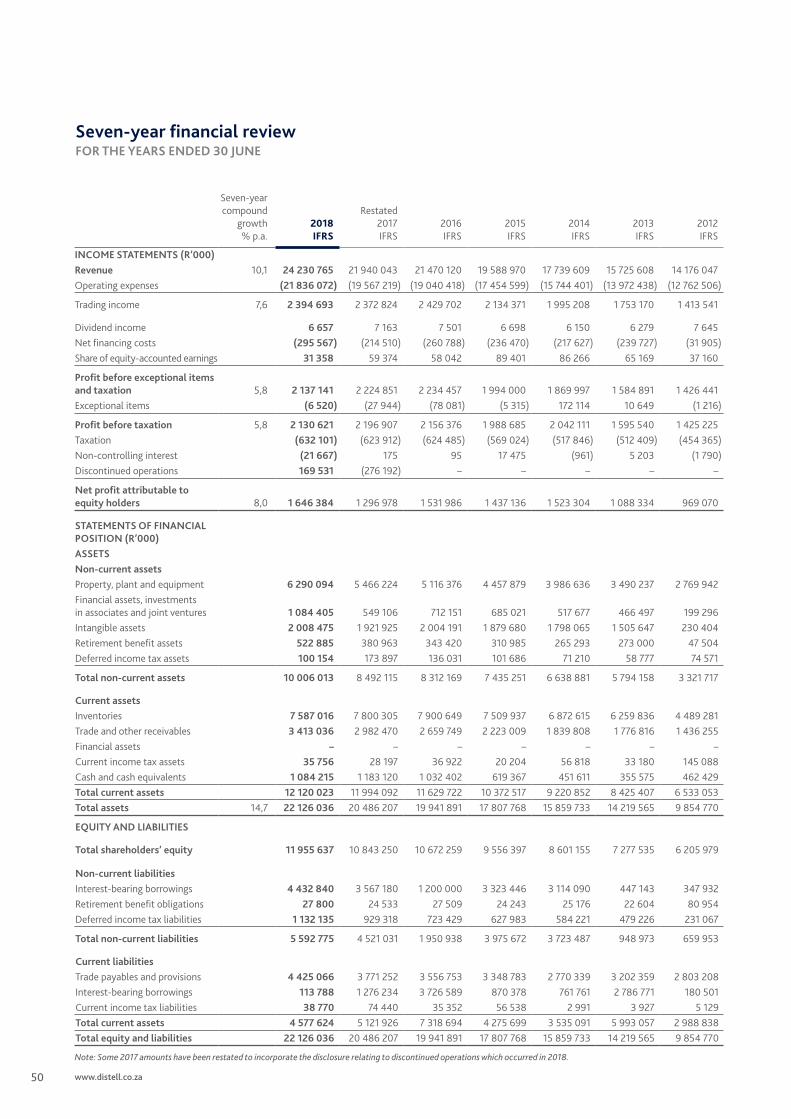
50 www.distell.co.za
Seven-year financial reviewFOR THE YEARS ENDED 30 JUNE
Seven-yearcompound
growth % p.a.
2018IFRS
Restated 2017 IFRS
2016 IFRS
2015 IFRS
2014 IFRS
2013 IFRS
2012 IFRS
INCOME STATEMENTS (R’000)Revenue 10,1 24 230 765 21 940 043 21 470 120 19 588 970 17 739 609 15 725 608 14 176 047Operating expenses (21 836 072) (19 567 219) (19 040 418) (17 454 599) (15 744 401) (13 972 438) (12 762 506)
Trading income 7,6 2 394 693 2 372 824 2 429 702 2 134 371 1 995 208 1 753 170 1 413 541
Dividend income 6 657 7 163 7 501 6 698 6 150 6 279 7 645Net financing costs (295 567) (214 510) (260 788) (236 470) (217 627) (239 727) (31 905)Share of equity-accounted earnings 31 358 59 374 58 042 89 401 86 266 65 169 37 160
Profit before exceptional items and taxation 5,8 2 137 141 2 224 851 2 234 457 1 994 000 1 869 997 1 584 891 1 426 441Exceptional items (6 520) (27 944) (78 081) (5 315) 172 114 10 649 (1 216)
Profit before taxation 5,8 2 130 621 2 196 907 2 156 376 1 988 685 2 042 111 1 595 540 1 425 225Taxation (632 101) (623 912) (624 485) (569 024) (517 846) (512 409) (454 365)Non-controlling interest (21 667) 175 95 17 475 (961) 5 203 (1 790)Discontinued operations 169 531 (276 192) – – – – –
Net profit attributable to equity holders 8,0 1 646 384 1 296 978 1 531 986 1 437 136 1 523 304 1 088 334 969 070
STATEMENTS OF FINANCIAL POSITION (R’000) ASSETSNon-current assetsProperty, plant and equipment 6 290 094 5 466 224 5 116 376 4 457 879 3 986 636 3 490 237 2 769 942Financial assets, investments in associates and joint ventures 1 084 405 549 106 712 151 685 021 517 677 466 497 199 296Intangible assets 2 008 475 1 921 925 2 004 191 1 879 680 1 798 065 1 505 647 230 404Retirement benefit assets 522 885 380 963 343 420 310 985 265 293 273 000 47 504Deferred income tax assets 100 154 173 897 136 031 101 686 71 210 58 777 74 571
Total non-current assets 10 006 013 8 492 115 8 312 169 7 435 251 6 638 881 5 794 158 3 321 717
Current assetsInventories 7 587 016 7 800 305 7 900 649 7 509 937 6 872 615 6 259 836 4 489 281Trade and other receivables 3 413 036 2 982 470 2 659 749 2 223 009 1 839 808 1 776 816 1 436 255Financial assets – – – – – – –Current income tax assets 35 756 28 197 36 922 20 204 56 818 33 180 145 088Cash and cash equivalents 1 084 215 1 183 120 1 032 402 619 367 451 611 355 575 462 429Total current assets 12 120 023 11 994 092 11 629 722 10 372 517 9 220 852 8 425 407 6 533 053Total assets 14,7 22 126 036 20 486 207 19 941 891 17 807 768 15 859 733 14 219 565 9 854 770
EQUITY AND LIABILITIES
Total shareholders’ equity 11 955 637 10 843 250 10 672 259 9 556 397 8 601 155 7 277 535 6 205 979
Non-current liabilitiesInterest-bearing borrowings 4 432 840 3 567 180 1 200 000 3 323 446 3 114 090 447 143 347 932Retirement benefit obligations 27 800 24 533 27 509 24 243 25 176 22 604 80 954Deferred income tax liabilities 1 132 135 929 318 723 429 627 983 584 221 479 226 231 067
Total non-current liabilities 5 592 775 4 521 031 1 950 938 3 975 672 3 723 487 948 973 659 953
Current liabilitiesTrade payables and provisions 4 425 066 3 771 252 3 556 753 3 348 783 2 770 339 3 202 359 2 803 208Interest-bearing borrowings 113 788 1 276 234 3 726 589 870 378 761 761 2 786 771 180 501Current income tax liabilities 38 770 74 440 35 352 56 538 2 991 3 927 5 129Total current assets 4 577 624 5 121 926 7 318 694 4 275 699 3 535 091 5 993 057 2 988 838Total equity and liabilities 22 126 036 20 486 207 19 941 891 17 807 768 15 859 733 14 219 565 9 854 770
Note: Some 2017 amounts have been restated to incorporate the disclosure relating to discontinued operations which occurred in 2018.
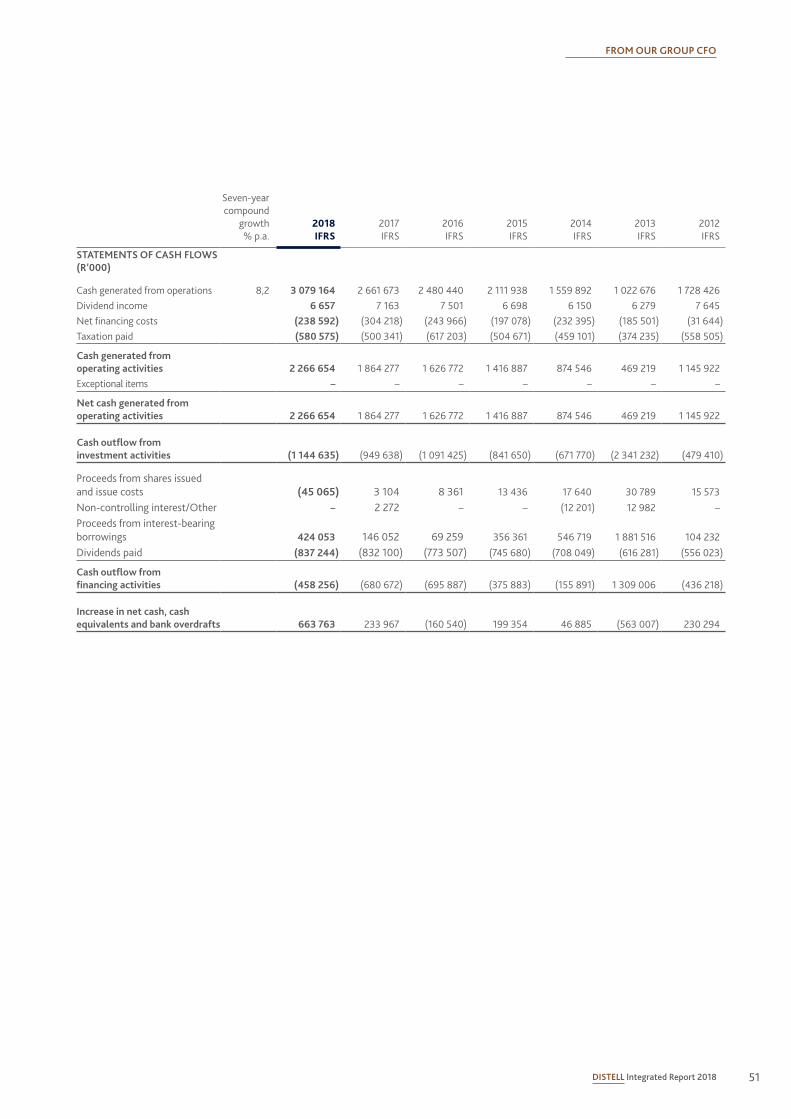
51DISTELL Integrated Report 2018
Seven-yearcompound
growth % p.a.
2018IFRS
2017 IFRS
2016 IFRS
2015 IFRS
2014 IFRS
2013 IFRS
2012 IFRS
STATEMENTS OF CASH FLOWS (R’000)
Cash generated from operations 8,2 3 079 164 2 661 673 2 480 440 2 111 938 1 559 892 1 022 676 1 728 426Dividend income 6 657 7 163 7 501 6 698 6 150 6 279 7 645Net financing costs (238 592) (304 218) (243 966) (197 078) (232 395) (185 501) (31 644)Taxation paid (580 575) (500 341) (617 203) (504 671) (459 101) (374 235) (558 505)
Cash generated from operating activities 2 266 654 1 864 277 1 626 772 1 416 887 874 546 469 219 1 145 922Exceptional items – – – – – – –
Net cash generated from operating activities 2 266 654 1 864 277 1 626 772 1 416 887 874 546 469 219 1 145 922
Cash outflow from investment activities (1 144 635) (949 638) (1 091 425) (841 650) (671 770) (2 341 232) (479 410)
Proceeds from shares issued and issue costs (45 065) 3 104 8 361 13 436 17 640 30 789 15 573Non-controlling interest/Other – 2 272 – – (12 201) 12 982 –Proceeds from interest-bearing borrowings 424 053 146 052 69 259 356 361 546 719 1 881 516 104 232Dividends paid (837 244) (832 100) (773 507) (745 680) (708 049) (616 281) (556 023)
Cash outflow from financing activities (458 256) (680 672) (695 887) (375 883) (155 891) 1 309 006 (436 218)
Increase in net cash, cash equivalents and bank overdrafts 663 763 233 967 (160 540) 199 354 46 885 (563 007) 230 294
FROM OUR GROUP CFO
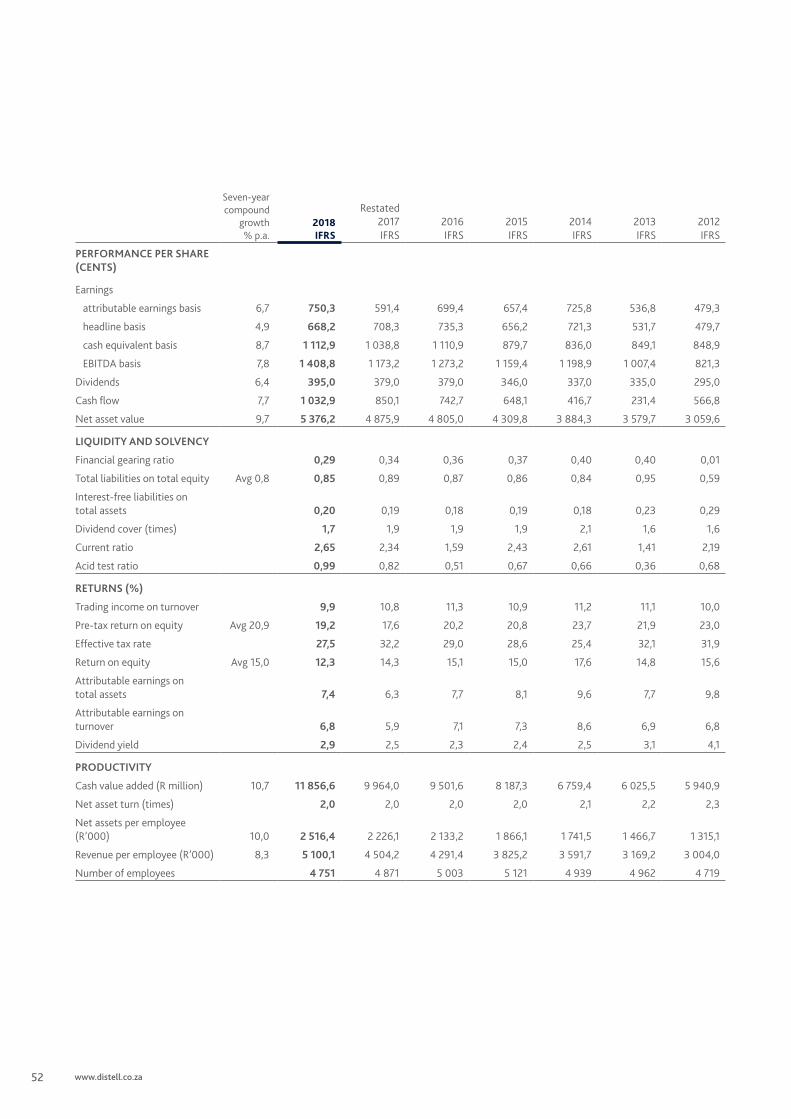
52 www.distell.co.za
Seven-yearcompound
growth % p.a.
2018IFRS
Restated2017IFRS
2016IFRS
2015IFRS
2014IFRS
2013IFRS
2012IFRS
PERFORMANCE PER SHARE (CENTS)
Earnings
attributable earnings basis 6,7 750,3 591,4 699,4 657,4 725,8 536,8 479,3
headline basis 4,9 668,2 708,3 735,3 656,2 721,3 531,7 479,7
cash equivalent basis 8,7 1 112,9 1 038,8 1 110,9 879,7 836,0 849,1 848,9
EBITDA basis 7,8 1 408,8 1 173,2 1 273,2 1 159,4 1 198,9 1 007,4 821,3
Dividends 6,4 395,0 379,0 379,0 346,0 337,0 335,0 295,0
Cash flow 7,7 1 032,9 850,1 742,7 648,1 416,7 231,4 566,8
Net asset value 9,7 5 376,2 4 875,9 4 805,0 4 309,8 3 884,3 3 579,7 3 059,6
LIQUIDITY AND SOLVENCY
Financial gearing ratio 0,29 0,34 0,36 0,37 0,40 0,40 0,01
Total liabilities on total equity Avg 0,8 0,85 0,89 0,87 0,86 0,84 0,95 0,59
Interest-free liabilities on total assets 0,20 0,19 0,18 0,19 0,18 0,23 0,29
Dividend cover (times) 1,7 1,9 1,9 1,9 2,1 1,6 1,6
Current ratio 2,65 2,34 1,59 2,43 2,61 1,41 2,19
Acid test ratio 0,99 0,82 0,51 0,67 0,66 0,36 0,68
RETURNS (%)
Trading income on turnover 9,9 10,8 11,3 10,9 11,2 11,1 10,0
Pre-tax return on equity Avg 20,9 19,2 17,6 20,2 20,8 23,7 21,9 23,0
Effective tax rate 27,5 32,2 29,0 28,6 25,4 32,1 31,9
Return on equity Avg 15,0 12,3 14,3 15,1 15,0 17,6 14,8 15,6
Attributable earnings on total assets 7,4 6,3 7,7 8,1 9,6 7,7 9,8
Attributable earnings on turnover 6,8 5,9 7,1 7,3 8,6 6,9 6,8
Dividend yield 2,9 2,5 2,3 2,4 2,5 3,1 4,1
PRODUCTIVITY
Cash value added (R million) 10,7 11 856,6 9 964,0 9 501,6 8 187,3 6 759,4 6 025,5 5 940,9
Net asset turn (times) 2,0 2,0 2,0 2,0 2,1 2,2 2,3
Net assets per employee (R’000) 10,0 2 516,4 2 226,1 2 133,2 1 866,1 1 741,5 1 466,7 1 315,1
Revenue per employee (R’000) 8,3 5 100,1 4 504,2 4 291,4 3 825,2 3 591,7 3 169,2 3 004,0
Number of employees 4 751 4 871 5 003 5 121 4 939 4 962 4 719
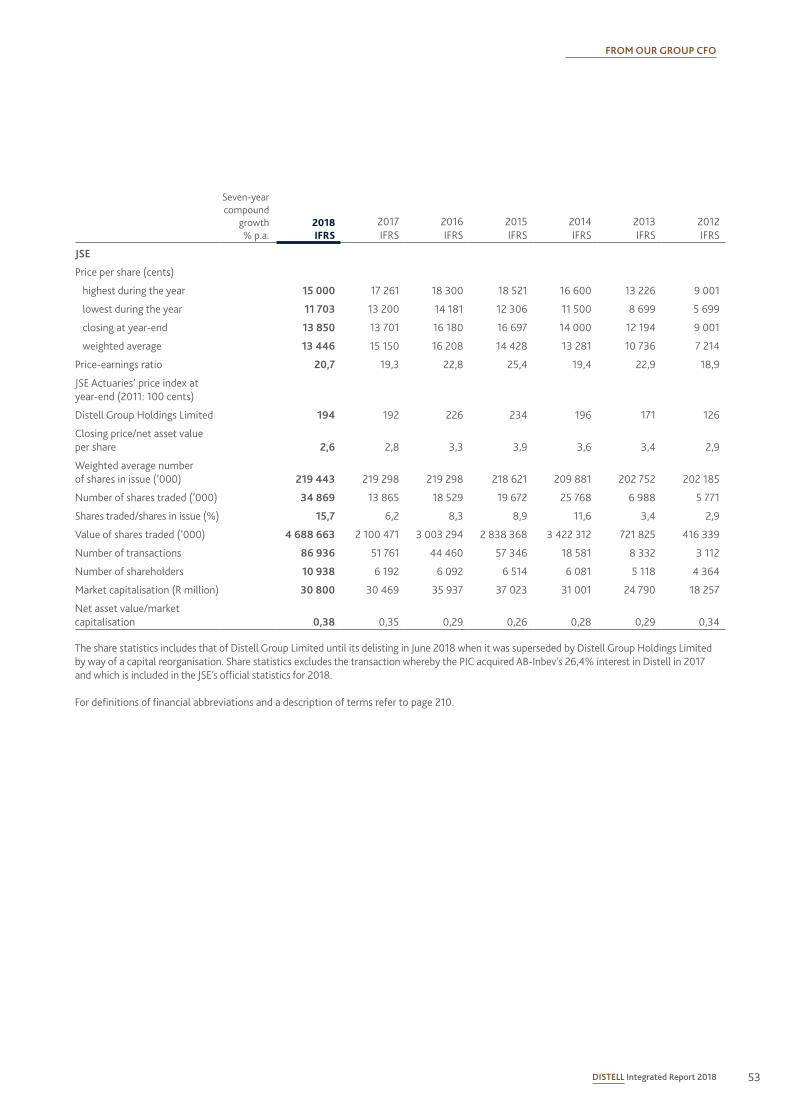
53DISTELL Integrated Report 2018
FROM OUR GROUP CFO
Seven-yearcompound
growth % p.a.
2018IFRS
2017IFRS
2016IFRS
2015IFRS
2014IFRS
2013IFRS
2012IFRS
JSE
Price per share (cents)
highest during the year 15 000 17 261 18 300 18 521 16 600 13 226 9 001
lowest during the year 11 703 13 200 14 181 12 306 11 500 8 699 5 699
closing at year-end 13 850 13 701 16 180 16 697 14 000 12 194 9 001
weighted average 13 446 15 150 16 208 14 428 13 281 10 736 7 214
Price-earnings ratio 20,7 19,3 22,8 25,4 19,4 22,9 18,9
JSE Actuaries’ price index at year-end (2011: 100 cents)
Distell Group Holdings Limited 194 192 226 234 196 171 126
Closing price/net asset value per share 2,6 2,8 3,3 3,9 3,6 3,4 2,9
Weighted average number of shares in issue (’000) 219 443 219 298 219 298 218 621 209 881 202 752 202 185
Number of shares traded (’000) 34 869 13 865 18 529 19 672 25 768 6 988 5 771
Shares traded/shares in issue (%) 15,7 6,2 8,3 8,9 11,6 3,4 2,9
Value of shares traded (’000) 4 688 663 2 100 471 3 003 294 2 838 368 3 422 312 721 825 416 339
Number of transactions 86 936 51 761 44 460 57 346 18 581 8 332 3 112
Number of shareholders 10 938 6 192 6 092 6 514 6 081 5 118 4 364
Market capitalisation (R million) 30 800 30 469 35 937 37 023 31 001 24 790 18 257
Net asset value/market capitalisation 0,38 0,35 0,29 0,26 0,28 0,29 0,34
The share statistics includes that of Distell Group Limited until its delisting in June 2018 when it was superseded by Distell Group Holdings Limited by way of a capital reorganisation. Share statistics excludes the transaction whereby the PIC acquired AB-Inbev’s 26,4% interest in Distell in 2017 and which is included in the JSE’s official statistics for 2018.
For definitions of financial abbreviations and a description of terms refer to page 210.
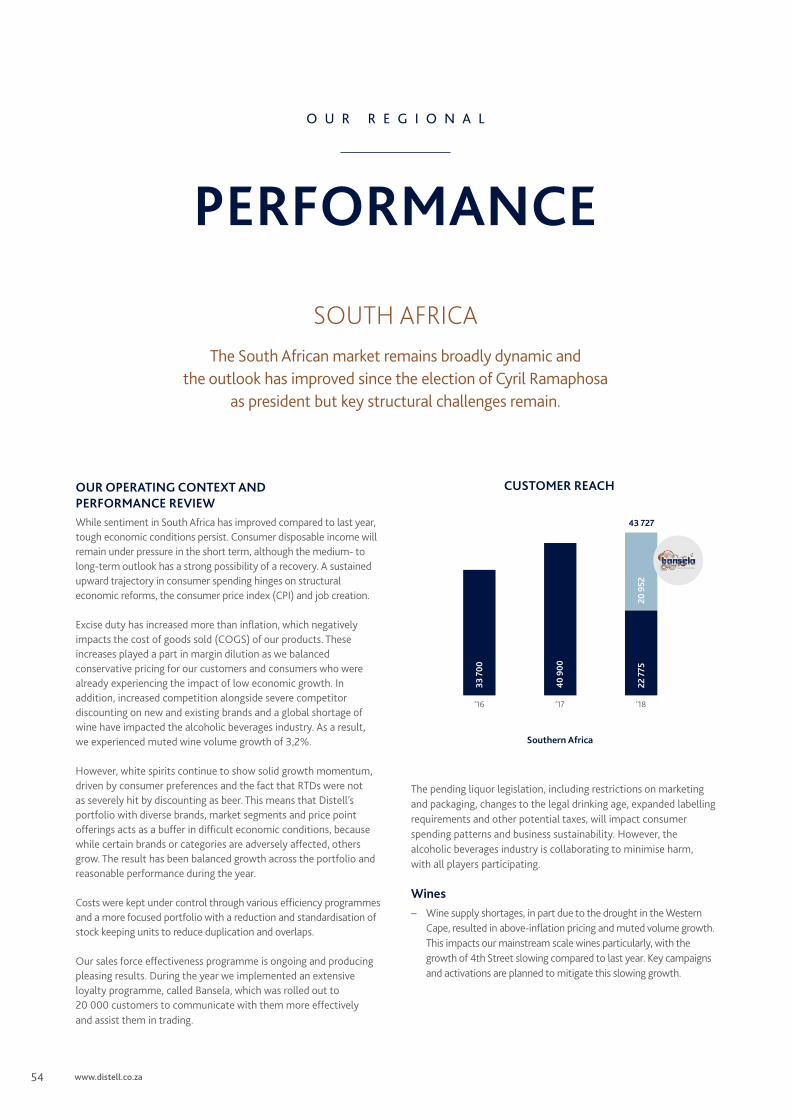
54 www.distell.co.za
PERFORMANCE
O U R R E G I O N A L
OUR OPERATING CONTEXT AND PERFORMANCE REVIEWWhile sentiment in South Africa has improved compared to last year, tough economic conditions persist. Consumer disposable income will remain under pressure in the short term, although the medium- to long-term outlook has a strong possibility of a recovery. A sustained upward trajectory in consumer spending hinges on structural economic reforms, the consumer price index (CPI) and job creation.
Excise duty has increased more than inflation, which negatively impacts the cost of goods sold (COGS) of our products. These increases played a part in margin dilution as we balanced conservative pricing for our customers and consumers who were already experiencing the impact of low economic growth. In addition, increased competition alongside severe competitor discounting on new and existing brands and a global shortage of wine have impacted the alcoholic beverages industry. As a result, we experienced muted wine volume growth of 3,2%.
However, white spirits continue to show solid growth momentum, driven by consumer preferences and the fact that RTDs were not as severely hit by discounting as beer. This means that Distell’s portfolio with diverse brands, market segments and price point offerings acts as a buffer in difficult economic conditions, because while certain brands or categories are adversely affected, others grow. The result has been balanced growth across the portfolio and reasonable performance during the year.
Costs were kept under control through various efficiency programmes and a more focused portfolio with a reduction and standardisation of stock keeping units to reduce duplication and overlaps.
Our sales force effectiveness programme is ongoing and producing pleasing results. During the year we implemented an extensive loyalty programme, called Bansela, which was rolled out to 20 000 customers to communicate with them more effectively and assist them in trading.
SOUTH AFRICAThe South African market remains broadly dynamic and
the outlook has improved since the election of Cyril Ramaphosa as president but key structural challenges remain.
The pending liquor legislation, including restrictions on marketing and packaging, changes to the legal drinking age, expanded labelling requirements and other potential taxes, will impact consumer spending patterns and business sustainability. However, the alcoholic beverages industry is collaborating to minimise harm, with all players participating.
Wines − Wine supply shortages, in part due to the drought in the Western
Cape, resulted in above-inflation pricing and muted volume growth. This impacts our mainstream scale wines particularly, with the growth of 4th Street slowing compared to last year. Key campaigns and activations are planned to mitigate this slowing growth.
CUSTOMER REACH
’16 ’17 ’18
8 050
15 298
33 700
33 7
00
40 9
00
22 7
7520
952
43 727
Southern Africa
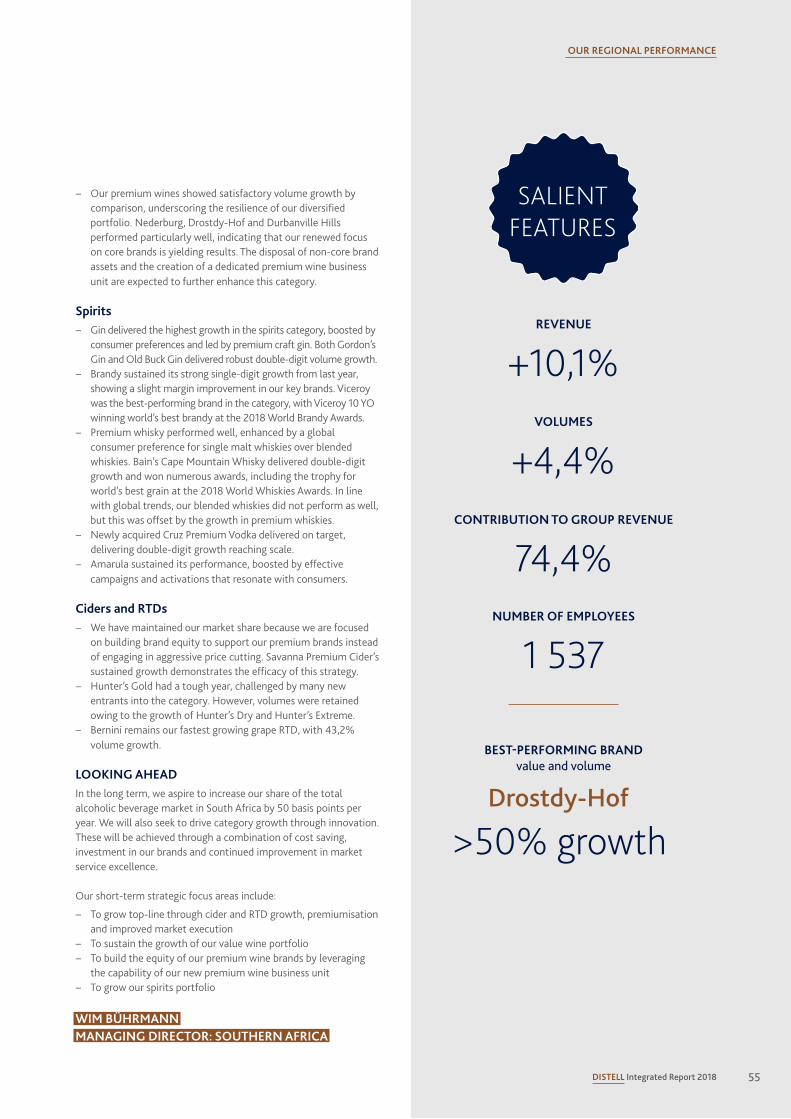
OUR REGIONAL PERFORMANCE
− Our premium wines showed satisfactory volume growth by comparison, underscoring the resilience of our diversified portfolio. Nederburg, Drostdy-Hof and Durbanville Hills performed particularly well, indicating that our renewed focus on core brands is yielding results. The disposal of non-core brand assets and the creation of a dedicated premium wine business unit are expected to further enhance this category.
Spirits − Gin delivered the highest growth in the spirits category, boosted by
consumer preferences and led by premium craft gin. Both Gordon’s Gin and Old Buck Gin delivered robust double-digit volume growth.
− Brandy sustained its strong single-digit growth from last year, showing a slight margin improvement in our key brands. Viceroy was the best-performing brand in the category, with Viceroy 10 YO winning world’s best brandy at the 2018 World Brandy Awards.
− Premium whisky performed well, enhanced by a global consumer preference for single malt whiskies over blended whiskies. Bain’s Cape Mountain Whisky delivered double-digit growth and won numerous awards, including the trophy for world’s best grain at the 2018 World Whiskies Awards. In line with global trends, our blended whiskies did not perform as well, but this was offset by the growth in premium whiskies.
− Newly acquired Cruz Premium Vodka delivered on target, delivering double-digit growth reaching scale.
− Amarula sustained its performance, boosted by effective campaigns and activations that resonate with consumers.
Ciders and RTDs − We have maintained our market share because we are focused
on building brand equity to support our premium brands instead of engaging in aggressive price cutting. Savanna Premium Cider’s sustained growth demonstrates the efficacy of this strategy.
− Hunter’s Gold had a tough year, challenged by many new entrants into the category. However, volumes were retained owing to the growth of Hunter’s Dry and Hunter’s Extreme.
− Bernini remains our fastest growing grape RTD, with 43,2% volume growth.
LOOKING AHEADIn the long term, we aspire to increase our share of the total alcoholic beverage market in South Africa by 50 basis points per year. We will also seek to drive category growth through innovation. These will be achieved through a combination of cost saving, investment in our brands and continued improvement in market service excellence.
Our short-term strategic focus areas include:
− To grow top-line through cider and RTD growth, premiumisation and improved market execution
− To sustain the growth of our value wine portfolio − To build the equity of our premium wine brands by leveraging
the capability of our new premium wine business unit − To grow our spirits portfolio
WIM BÜHRMANNMANAGING DIRECTOR: SOUTHERN AFRICA
55DISTELL Integrated Report 2018
+10,1%REVENUE
+4,4%VOLUMES
74,4%CONTRIBUTION TO GROUP REVENUE
1 537NUMBER OF EMPLOYEES
>50% growthDrostdy-Hof
BEST-PERFORMING BRAND value and volume
SALIENT FEATURES
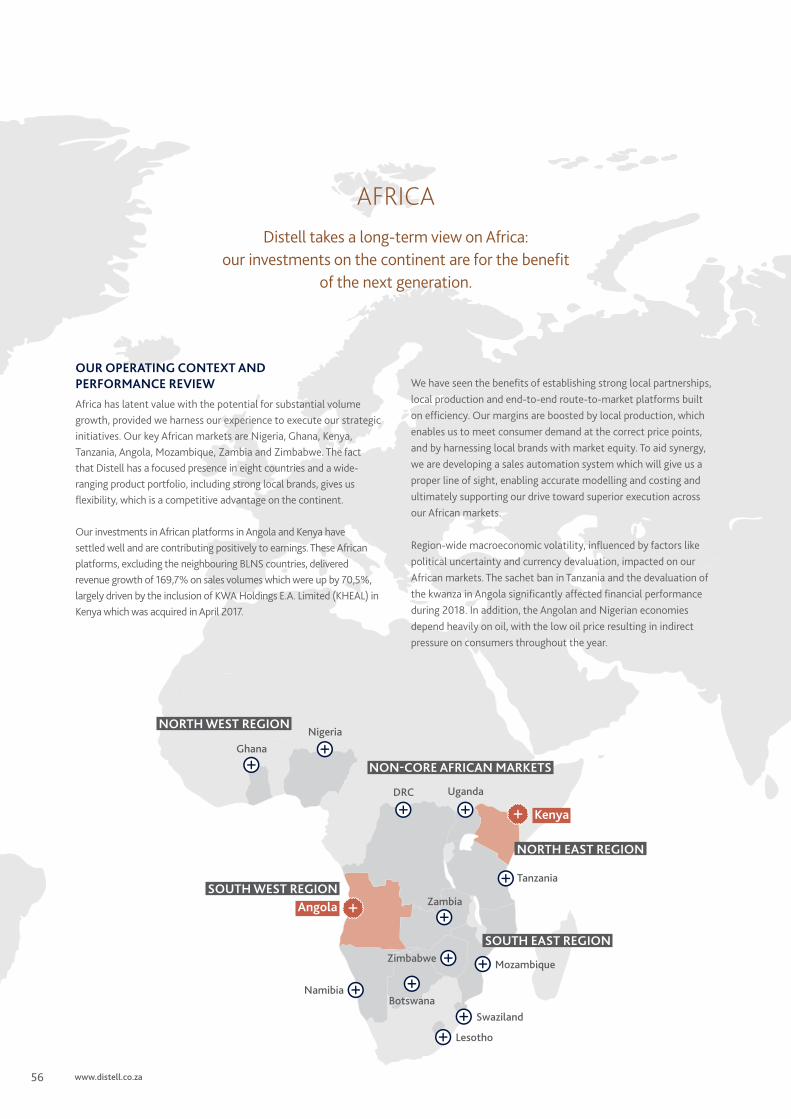
56 www.distell.co.za
NORTH WEST REGION
NORTH EAST REGION
NON-CORE AFRICAN MARKETS
Kenya
Angola
SOUTH EAST REGION
Uganda
Nigeria
Tanzania
Zambia
DRC
MozambiqueZimbabwe
BotswanaNamibia
Lesotho
Swaziland
Ghana
SOUTH WEST REGION
AFRICADistell takes a long-term view on Africa:
our investments on the continent are for the benefit of the next generation.
OUR OPERATING CONTEXT AND PERFORMANCE REVIEWAfrica has latent value with the potential for substantial volume growth, provided we harness our experience to execute our strategic initiatives. Our key African markets are Nigeria, Ghana, Kenya, Tanzania, Angola, Mozambique, Zambia and Zimbabwe. The fact that Distell has a focused presence in eight countries and a wide-ranging product portfolio, including strong local brands, gives us flexibility, which is a competitive advantage on the continent.
Our investments in African platforms in Angola and Kenya have settled well and are contributing positively to earnings. These African platforms, excluding the neighbouring BLNS countries, delivered revenue growth of 169,7% on sales volumes which were up by 70,5%, largely driven by the inclusion of KWA Holdings E.A. Limited (KHEAL) in Kenya which was acquired in April 2017.
We have seen the benefits of establishing strong local partnerships, local production and end-to-end route-to-market platforms built on efficiency. Our margins are boosted by local production, which enables us to meet consumer demand at the correct price points, and by harnessing local brands with market equity. To aid synergy, we are developing a sales automation system which will give us a proper line of sight, enabling accurate modelling and costing and ultimately supporting our drive toward superior execution across our African markets.
Region-wide macroeconomic volatility, influenced by factors like political uncertainty and currency devaluation, impacted on our African markets. The sachet ban in Tanzania and the devaluation of the kwanza in Angola significantly affected financial performance during 2018. In addition, the Angolan and Nigerian economies depend heavily on oil, with the low oil price resulting in indirect pressure on consumers throughout the year.
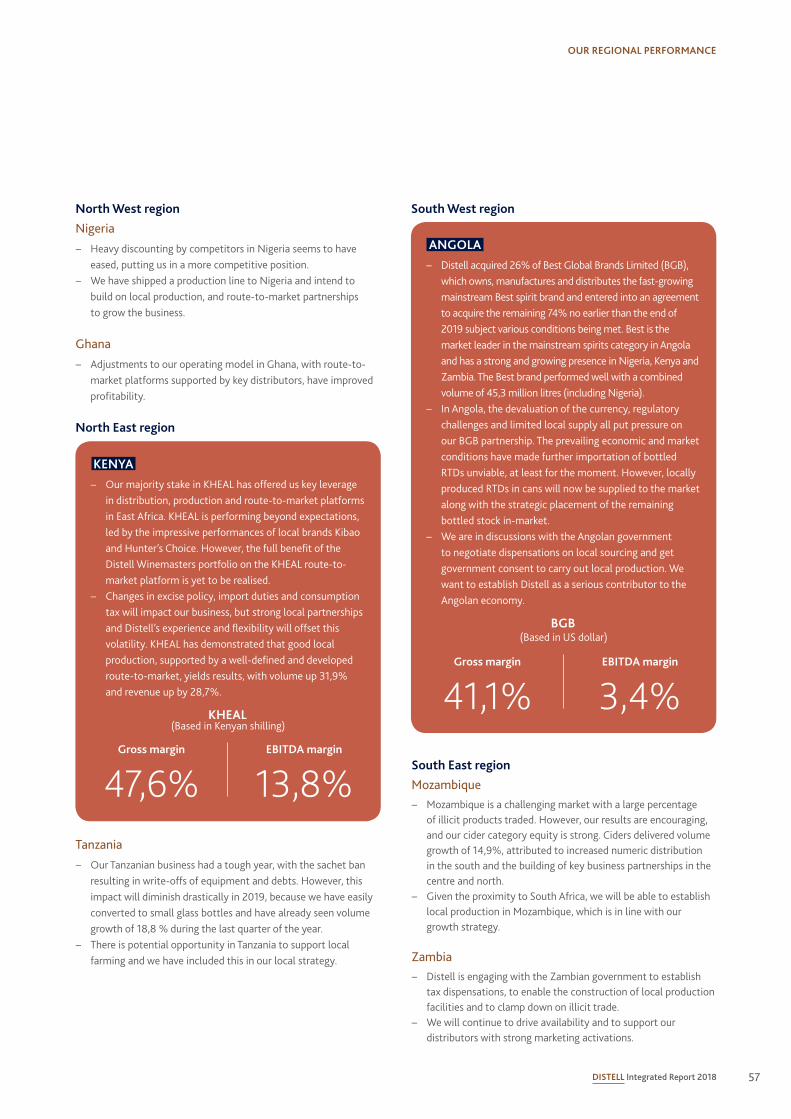
OUR REGIONAL PERFORMANCE
North West regionNigeria
− Heavy discounting by competitors in Nigeria seems to have eased, putting us in a more competitive position.
− We have shipped a production line to Nigeria and intend to build on local production, and route-to-market partnerships to grow the business.
Ghana − Adjustments to our operating model in Ghana, with route-to-
market platforms supported by key distributors, have improved profitability.
North East region
57DISTELL Integrated Report 2018
South West region
KENYA − Our majority stake in KHEAL has offered us key leverage
in distribution, production and route-to-market platforms in East Africa. KHEAL is performing beyond expectations, led by the impressive performances of local brands Kibao and Hunter’s Choice. However, the full benefit of the Distell Winemasters portfolio on the KHEAL route-to-market platform is yet to be realised.
− Changes in excise policy, import duties and consumption tax will impact our business, but strong local partnerships and Distell’s experience and flexibility will offset this volatility. KHEAL has demonstrated that good local production, supported by a well-defined and developed route-to-market, yields results, with volume up 31,9% and revenue up by 28,7%.
KHEAL
Gross margin
47,6%EBITDA margin
13,8%Tanzania
− Our Tanzanian business had a tough year, with the sachet ban resulting in write-offs of equipment and debts. However, this impact will diminish drastically in 2019, because we have easily converted to small glass bottles and have already seen volume growth of 18,8 % during the last quarter of the year.
− There is potential opportunity in Tanzania to support local farming and we have included this in our local strategy.
South East regionMozambique
− Mozambique is a challenging market with a large percentage of illicit products traded. However, our results are encouraging, and our cider category equity is strong. Ciders delivered volume growth of 14,9%, attributed to increased numeric distribution in the south and the building of key business partnerships in the centre and north.
− Given the proximity to South Africa, we will be able to establish local production in Mozambique, which is in line with our growth strategy.
Zambia − Distell is engaging with the Zambian government to establish
tax dispensations, to enable the construction of local production facilities and to clamp down on illicit trade.
− We will continue to drive availability and to support our distributors with strong marketing activations.
ANGOLA − Distell acquired 26% of Best Global Brands Limited (BGB),
which owns, manufactures and distributes the fast-growing mainstream Best spirit brand and entered into an agreement to acquire the remaining 74% no earlier than the end of 2019 subject various conditions being met. Best is the market leader in the mainstream spirits category in Angola and has a strong and growing presence in Nigeria, Kenya and Zambia. The Best brand performed well with a combined volume of 45,3 million litres (including Nigeria).
− In Angola, the devaluation of the currency, regulatory challenges and limited local supply all put pressure on our BGB partnership. The prevailing economic and market conditions have made further importation of bottled RTDs unviable, at least for the moment. However, locally produced RTDs in cans will now be supplied to the market along with the strategic placement of the remaining bottled stock in-market.
− We are in discussions with the Angolan government to negotiate dispensations on local sourcing and get government consent to carry out local production. We want to establish Distell as a serious contributor to the Angolan economy.
BGB
Gross margin
41,1%EBITDA margin
3,4%(Based in Kenyan shilling)
(Based in US dollar)
Zimbabwe − Zimbabwe is showing strong double-digit volume growth of
25,5%, driven by the availability of locally produced ciders.
Non-core African marketsDRC
− Although the DRC is not one of Distell’s eight focus markets on the continent, our business there exceeded targets this year. While we don’t have local production facilities, we have two in-country distribution partners. This model has produced growth across our portfolio in a volatile market, again emphasising the benefits of local partnerships.
Uganda − We have launched a pilot partnership with Coca-Cola Beverages
Africa (CCBA) to establish a route-to-market platform in Uganda, which will enable local production. This is already showing results and has the potential to be rolled out to other countries in the region.
Across the remainder of the continent (Botswana, Lesotho, Namibia, Swaziland and Mauritius), mixed results were achieved, with Mauritius delivering excellent volume growth of 61,6%.
www.distell.co.za58
LOOKING AHEADOUR STRATEGIC ASPIRATION FOR AFRICA IS TO ACCELERATE SUSTAINABLE GROWTH IN THE REGION TO BECOME THE CONTINENT’S LEADING PLAYER IN WINES, SPIRITS AND NON-BEER RTDS.
While continually striving to improve our margins, our short-term strategic goals are:
− To roll out local route-to-market in priority countries, with control over distribution and local sales and marketing capability
− To partner with strong local businesses that share our values and strategic commercial objectives
− To leverage the scale efficiency, where possible, of our South African supply network for supply to countries within close proximity
LEN VOLSCHENKMANAGING DIRECTOR: AFRICA
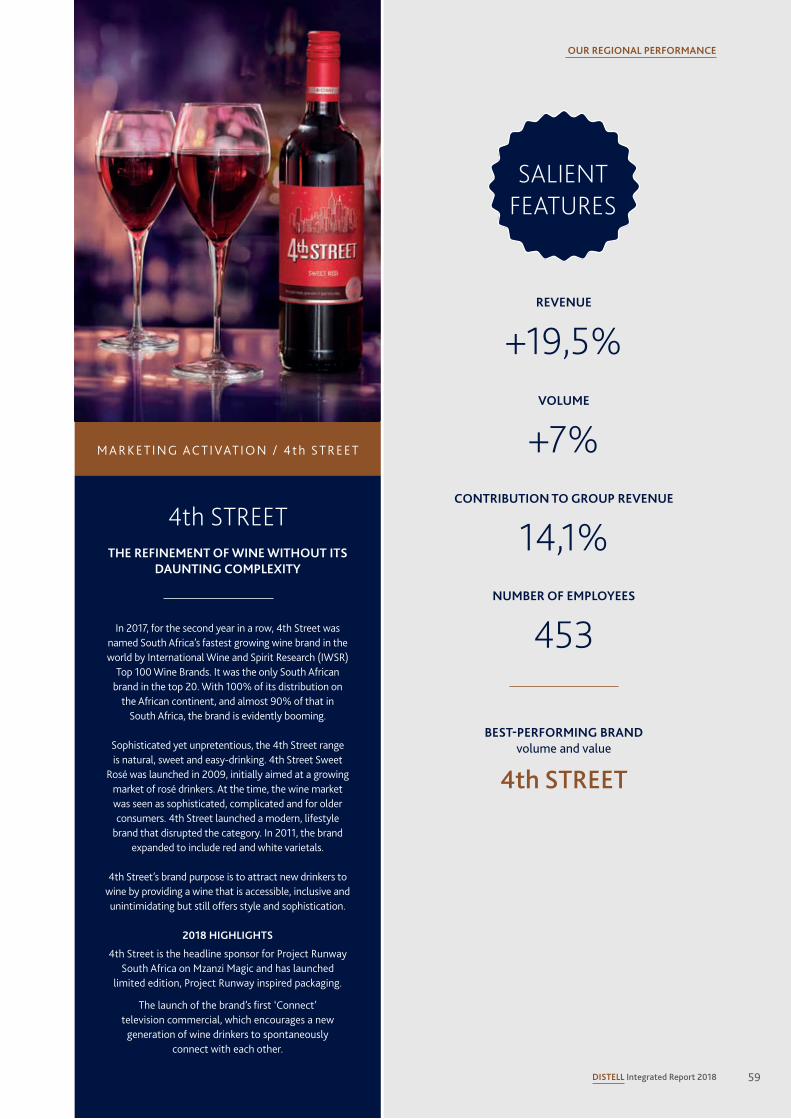
+19,5%REVENUE
+7%VOLUME
14,1%CONTRIBUTION TO GROUP REVENUE
453NUMBER OF EMPLOYEES
4th STREET
BEST-PERFORMING BRAND volume and value
SALIENT FEATURES
59DISTELL Integrated Report 2018
OUR REGIONAL PERFORMANCE
4th STREET THE REFINEMENT OF WINE WITHOUT ITS
DAUNTING COMPLEXITY
In 2017, for the second year in a row, 4th Street was named South Africa’s fastest growing wine brand in the world by International Wine and Spirit Research (IWSR)
Top 100 Wine Brands. It was the only South African brand in the top 20. With 100% of its distribution on
the African continent, and almost 90% of that in South Africa, the brand is evidently booming.
Sophisticated yet unpretentious, the 4th Street range is natural, sweet and easy-drinking. 4th Street Sweet
Rosé was launched in 2009, initially aimed at a growing market of rosé drinkers. At the time, the wine market was seen as sophisticated, complicated and for older consumers. 4th Street launched a modern, lifestyle
brand that disrupted the category. In 2011, the brand expanded to include red and white varietals.
4th Street’s brand purpose is to attract new drinkers to wine by providing a wine that is accessible, inclusive and unintimidating but still offers style and sophistication.
2018 HIGHLIGHTS
4th Street is the headline sponsor for Project Runway South Africa on Mzanzi Magic and has launched
limited edition, Project Runway inspired packaging.
The launch of the brand’s first ‘Connect’ television commercial, which encourages a new
generation of wine drinkers to spontaneously connect with each other.
M A R K E T I N G AC T I VAT I O N / 4 t h S T R E E T
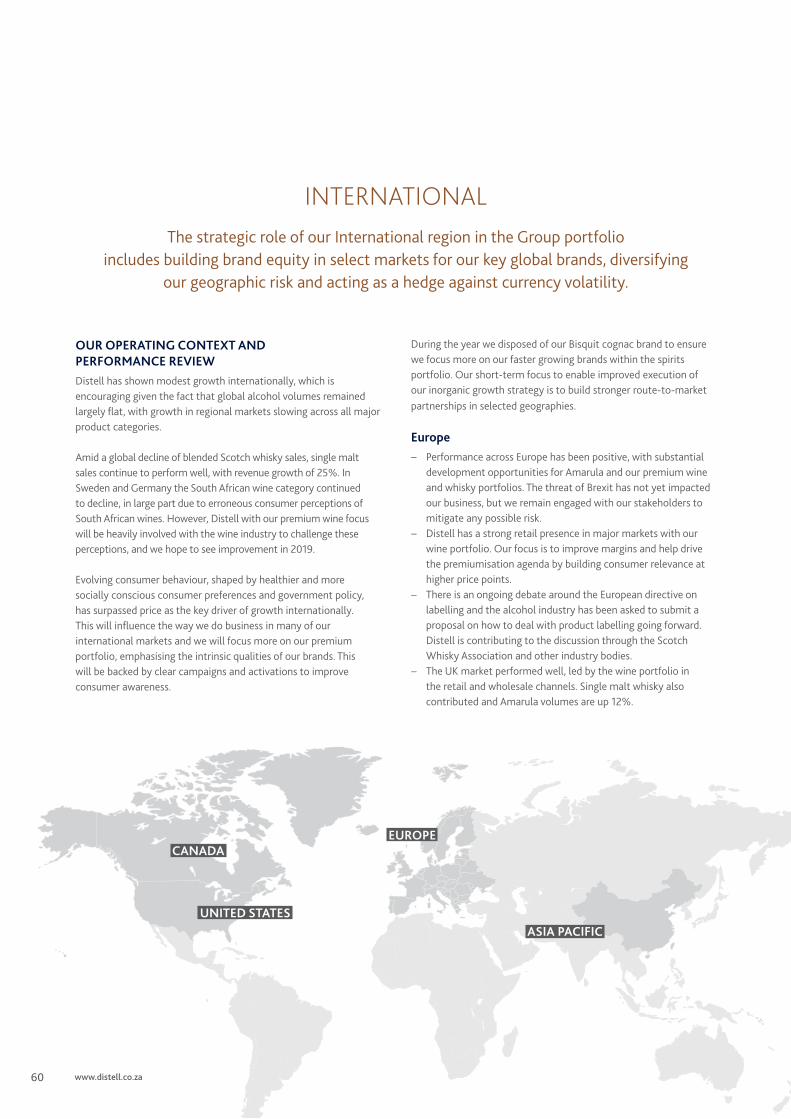
60 www.distell.co.za
CANADA
UNITED STATESASIA PACIFIC
EUROPE
OUR OPERATING CONTEXT AND PERFORMANCE REVIEWDistell has shown modest growth internationally, which is encouraging given the fact that global alcohol volumes remained largely flat, with growth in regional markets slowing across all major product categories.
Amid a global decline of blended Scotch whisky sales, single malt sales continue to perform well, with revenue growth of 25%. In Sweden and Germany the South African wine category continued to decline, in large part due to erroneous consumer perceptions of South African wines. However, Distell with our premium wine focus will be heavily involved with the wine industry to challenge these perceptions, and we hope to see improvement in 2019.
Evolving consumer behaviour, shaped by healthier and more socially conscious consumer preferences and government policy, has surpassed price as the key driver of growth internationally. This will influence the way we do business in many of our international markets and we will focus more on our premium portfolio, emphasising the intrinsic qualities of our brands. This will be backed by clear campaigns and activations to improve consumer awareness.
INTERNATIONALThe strategic role of our International region in the Group portfolio
includes building brand equity in select markets for our key global brands, diversifying our geographic risk and acting as a hedge against currency volatility.
During the year we disposed of our Bisquit cognac brand to ensure we focus more on our faster growing brands within the spirits portfolio. Our short-term focus to enable improved execution of our inorganic growth strategy is to build stronger route-to-market partnerships in selected geographies.
Europe − Performance across Europe has been positive, with substantial
development opportunities for Amarula and our premium wine and whisky portfolios. The threat of Brexit has not yet impacted our business, but we remain engaged with our stakeholders to mitigate any possible risk.
− Distell has a strong retail presence in major markets with our wine portfolio. Our focus is to improve margins and help drive the premiumisation agenda by building consumer relevance at higher price points.
− There is an ongoing debate around the European directive on labelling and the alcohol industry has been asked to submit a proposal on how to deal with product labelling going forward. Distell is contributing to the discussion through the Scotch Whisky Association and other industry bodies.
− The UK market performed well, led by the wine portfolio in the retail and wholesale channels. Single malt whisky also contributed and Amarula volumes are up 12%.
+5,8%REVENUE
+1,8%VOLUME
11,5%CONTRIBUTION TO GROUP REVENUE
329NUMBER OF EMPLOYEES
Scottish Leader
BEST-PERFORMING BRAND value
Nederburg
BEST-PERFORMING BRAND volume
SALIENT FEATURESAsia Pacific
− The region’s economies remain fairly robust and Distell has seen growth in select Asia Pacific markets. Economic activity levels are steady, supported by strong levels of consumer confidence and we expect growth to continue.
− Bernini continued its encouraging progress in South Korea and our wine and whisky portfolios continue to gain traction in the region.
− In Taiwan Scottish Leader grew market share, despite a blended Scotch category decline in the market.
North AmericaUnited States
− Terlato Distell Artisan Spirits, (TDAS) our joint venture business in the market, is building the presence of our spirits portfolio in a receptive market. We have aligned our route-to-market partners in key states.
Canada − Our Canadian market is dominated by Two Oceans, which is
delivering encouraging sales activity after a pack upgrade during the year. We have consolidated our route-to-market through one primary Canadian agent, of which Distell owns a 10% shareholding. This should improve focus going forward.
Latin America − Amarula volumes in the Brazilian domestic market have been
recovering, but tax policy reforms, exchange rate fluctuations and reduced consumer spending power hampered growth.
− The border regions, particularly Paraguay, continue to perform well, and compensated for losses in the Brazilian domestic market.
− Amarula’s volume growth for the Latin American region was 12%.
Travel retail − Global travel retail delivered exceptional performance with
double-digit volume growth. Single malt whisky continued to perform strongly in this market, with an overwhelming response to the Bunnahabhain exclusive range.
LOOKING AHEADThe strategic role of our international region in the Group portfolio includes building brand equity in select markets for our key global brands, diversifying our geographic risk and acting as a hedge against currency volatility.
In the short term, we will:
− Lead the growth of our premium wine and spirits categories in select markets
− Drive our focused growth strategy for travel retail − Optimise and build a self-sufficient supply chain − Pursue complementary inorganic growth opportunities.
FRASER THORNTONMANAGING DIRECTOR: INTERNATIONAL
61DISTELL Integrated Report 2018
OUR REGIONAL PERFORMANCE

62 www.distell.co.za
GOVERNANCE
C O R P O R A T E
BOARD OF DIRECTORS
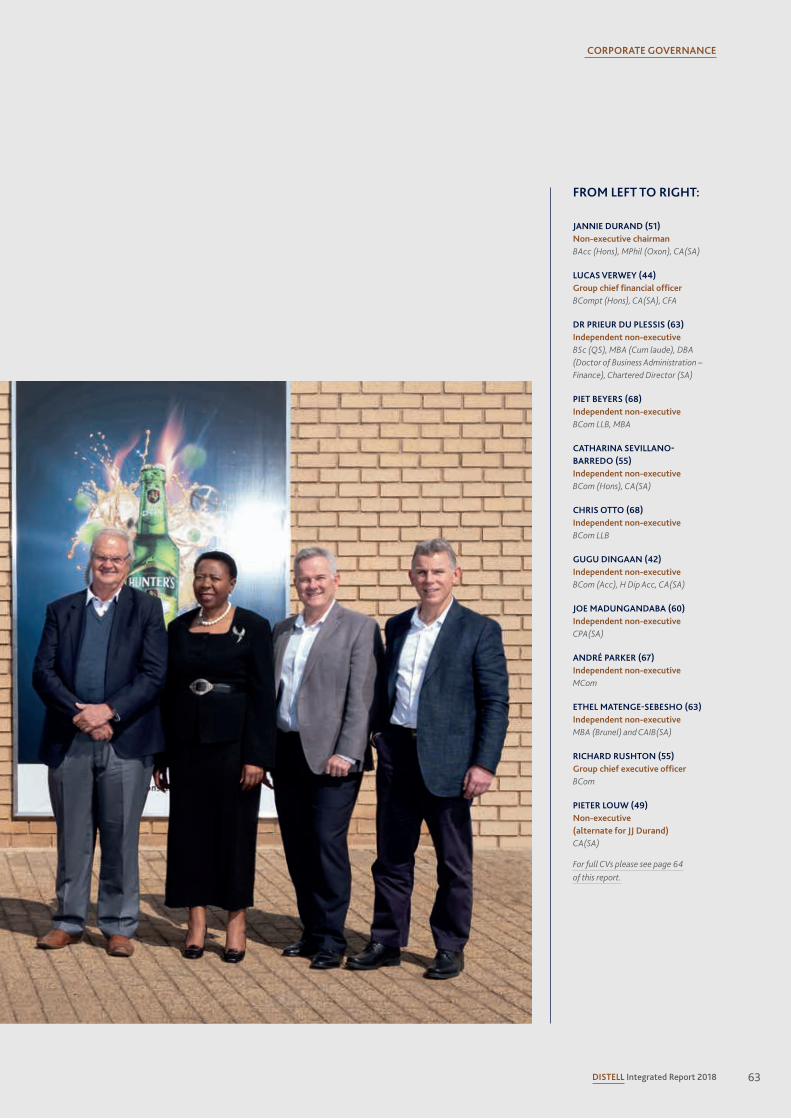
JANNIE DURAND (51)Non-executive chairmanBAcc (Hons), MPhil (Oxon), CA(SA)
LUCAS VERWEY (44)Group chief financial officerBCompt (Hons), CA(SA), CFA
DR PRIEUR DU PLESSIS (63)Independent non-executiveBSc (QS), MBA (Cum laude), DBA (Doctor of Business Administration – Finance), Chartered Director (SA)
PIET BEYERS (68)Independent non-executiveBCom LLB, MBA
CATHARINA SEVILLANO- BARREDO (55) Independent non-executiveBCom (Hons), CA(SA)
CHRIS OTTO (68)Independent non-executiveBCom LLB
GUGU DINGAAN (42)Independent non-executive BCom (Acc), H Dip Acc, CA(SA)
JOE MADUNGANDABA (60)Independent non-executiveCPA(SA)
ANDRÉ PARKER (67)Independent non-executiveMCom
ETHEL MATENGE-SEBESHO (63)Independent non-executiveMBA (Brunel) and CAIB(SA)
RICHARD RUSHTON (55)Group chief executive officerBCom
PIETER LOUW (49)Non-executive (alternate for JJ Durand)CA(SA)
For full CVs please see page 64 of this report.
FROM LEFT TO RIGHT:
63DISTELL Integrated Report 2018
GOVERNANCE
CORPORATE GOVERNANCE
64 www.distell.co.za
Jannie Durand (51)
BAcc (Hons), MPhil (Oxon), CA(SA)Non-executive chairmanGender: Male
Tenure and committees: Appointed to the board, remuneration committee and the nomination committee in 2012 and as a member of the investment subcommittee in 2015. Appointed as chairperson of the board in 2016 and as chairperson of the investment subcommittee in 2015
Expertise: Financial markets and investments, international business, general business, mergers and acquisitions, marketing, fast-moving consumer goods, manufacturing, legal and governance
Other: Chief executive officer of Remgro and a director of, inter alia, RCL Foods, RMI Holdings Limited and Mediclinic International PLC
Lucas Verwey (44)
BCompt (Hons), CA(SA), CFAGroup chief financial officerGender: Male
Tenure: Lucas joined Distell in 2014 from Remgro where he was an investment executive overseeing a specific portfolio of investments since 2008. Lucas was appointed to his current position in September 2015. He is responsible for financial planning and control, information technology and statutory reporting.
Expertise: Financial markets and investments, general business, mergers and acquisitions, risk management and governance
Dr Prieur du Plessis (63)
BSc (QS), MBA (Cum laude), DBA (Doctor of Business Administration – Finance), Chartered Director (SA)Independent non-executiveGender: Male
Tenure and committees: Appointed to the board in November 2015, as member of the audit committee in 2016, as chairman of the risk and compliance committee in 2016 and as a member of the social and ethics committee in 2016
Expertise: Financial markets and investments, international business, general business, governance, mergers and acquisitions, and risk management
Other: Chairperson of Plexus Holdings, an investment management business he founded in 1995. He also serves as chairperson of the Institute of Directors in Southern Africa and Bridge Fund Managers, and as director of PPS Insurance Company. He is a member of the advisory board of the University of Stellenbosch Business School (USB), chairperson of the audit and risk committee and a member of the investment committee of Stellenbosch University.
Additionally, he is professor extraordinaire at the USB, Honorary Consul General of Slovenia for South Africa and Deputy Dean of the Consular Corps of Cape Town.
Piet Beyers (68)
BCom LLB, MBAIndependent non-executiveGender: Male
Tenure and committees: Appointed to the board in 2000 and as a member of the investment subcommittee in 2015
Expertise: International business, marketing and fast-moving consumer goods
Other: Formerly a director of, inter alia, Remgro, Richemont Société Anonyme and British American Tobacco
Catharina Sevillano-Barredo (55)
BCom (Hons), CA(SA)Independent non-executiveGender: Female
Tenure and committees: Appointed to the board in 2008, as chairperson of the audit committee in 2009, as member of the risk and compliance committee in 2016 and investment subcommittee in 2015
Expertise: Financial markets and investments, international business, general business, mergers and acquisitions, transformation, risk management and governance
Other: Founder, director and chief financial officer of the Universal Healthcare group of companies and formerly a director of WIPHOLD and Concor. She was also a member of WIPHOLD’s audit committee and chaired the Concor audit committee.
Chris Otto (68)
BCom LLBIndependent non-executive*Gender: Male
Tenure and committees: Appointed to the board in 2011 and as a member of the investment subcommittee in 2015
Expertise: Financial markets and investments, international business, general business, mergers and acquisitions, retail operations, marketing, manufacturing, risk management, legal, human resources, sustainability and governance
Other: Founder director of PSG Group, Capitec Bank Holdings and Zeder Investments. He is also non-executive director of Kaap Agri Investments and serves on selected audit and remuneration committees
* Independent (as at 30 June 2018) following the collapse of Distell’s shareholder
structure and resignation from the board of Capevin.
65DISTELL Integrated Report 2018
CORPORATE GOVERNANCE
Gugu Dingaan (42)
BCom (Acc), H Dip Acc, CA(SA)Independent non-executive Gender: Female
Tenure and committees: Appointed to the board in 2005, as a member of the audit committee in 2006, as chairperson of the social and ethics committee in 2012, as a member of the risk and compliance committee in 2016 as a member of the investment subcommittee in 2015 and as a member of the remuneration committee and the nomination committee in 2017
Expertise: Financial markets and investments, general business, mergers and acquisitions, transformation, risk management and governance
Other: Investment executive at WIPHOLD, and non-executive board member and audit committee member of Landis+Gyr, SA Corporate Real Estate Limited. She is also a non-executive board member of Adcorp Holdings Limited and Sasfin Holdings Limited
Joe Madungandaba (60)
CPA(SA)Independent non-executiveGender: Male
Tenure and committees: Appointed to the Distell board in 2000
Expertise: Financial markets and investments, international and general business
Other: Group chief executive officer of Community Investment Holdings Group, non-executive chairperson of Schneider Electric, non-executive deputy chairperson of Jasco Electronics Holdings and non-executive director of Air Liquide Healthcare and of Afrocentric Limited
André Parker (67)
MComIndependent non-executiveGender: Male
Tenure and committees: Appointed to the board in 2008 and as lead independent director in 2016. He was appointed as chairperson of the remuneration committee in 2013 and as chairperson of the nomination committee in 2017. He has been a member of the investment subcommittee since 2015
Expertise: International business, general business, mergers and acquisitions, marketing and fast-moving consumer goods
Other: Retired managing director of SABMiller Africa and Asia, where he served on several boards of SABMiller subsidiaries, and was also an executive committee member of SABMiller PLC. He is also a director of Standard Bank.
Ethel Matenge-Sebesho (63)
MBA (Brunel) and CAIB(SA)Independent non-executive*Gender: Female
Tenure and committees: Appointed to the board in 2015 and as member of the risk and compliance committee in 2016
Expertise: Financial markets and investments, international business, general business, marketing, risk management and governance
Other: Director on the boards of FirstRand and FinMark Trust
Richard Rushton (55)
BComGroup chief executive officerGender: Male
Tenure: Richard was appointed to the board in 2013 following various leadership roles with SABMiller in Africa, Asia and Latin America since 1997. Richard initially held leadership positions at Barclays and Adcock Ingram before joining SABMiller. Richard’s role is to ensure the company delivers on its key strategic objectives and to build a high-performance culture within the company.
Expertise: International business, mergers and acquisitions, marketing and fast-moving consumer goods
Pieter Louw (49)
CA(SA)Non-executive (alternate for JJ Durand)Gender: Male
Tenure and committees: Appointed to the board, as alternate director for JJ Durand, in 2014, to the investment subcommittee in 2015 and to the risk and compliance committee in 2016. He attends the audit, remuneration and nomination committee meetings as an invitee
Expertise: Financial markets and investments, general business, mergers and acquisitions, risk management and governance
Other: Board member of RCL Foods Limited.
He is currently Head of Corporate Finance at Remgro.
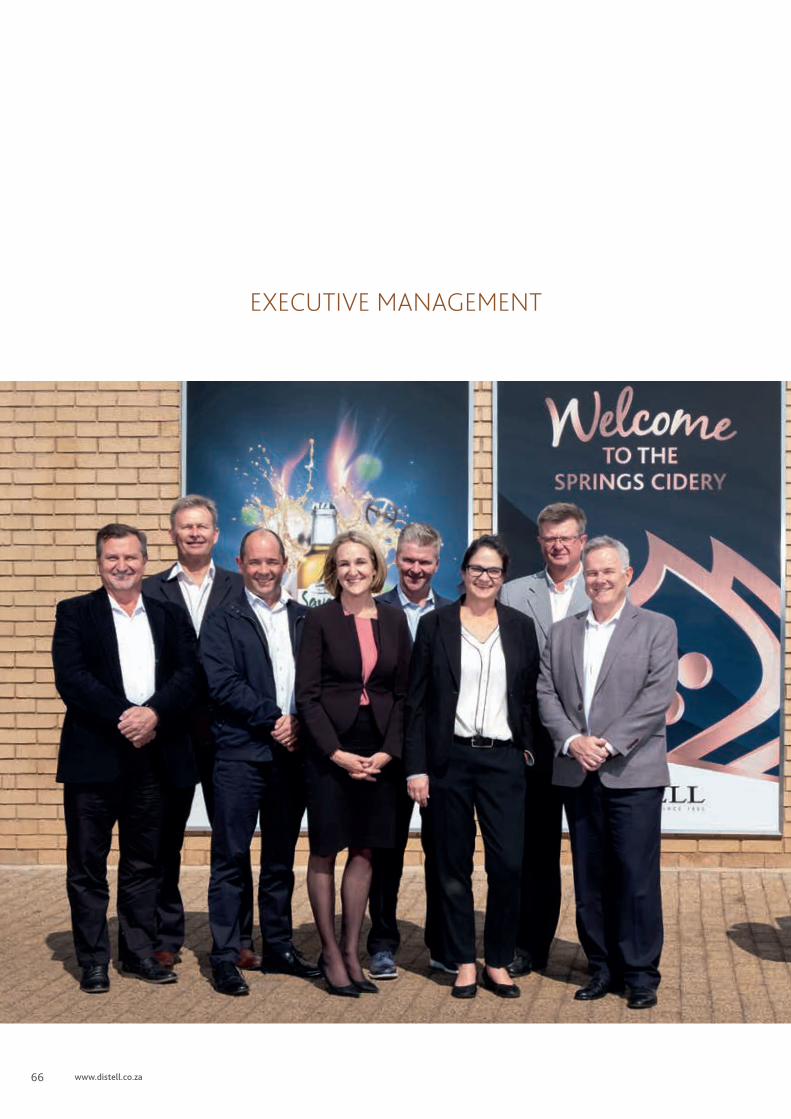
66 www.distell.co.za
EXECUTIVE MANAGEMENT
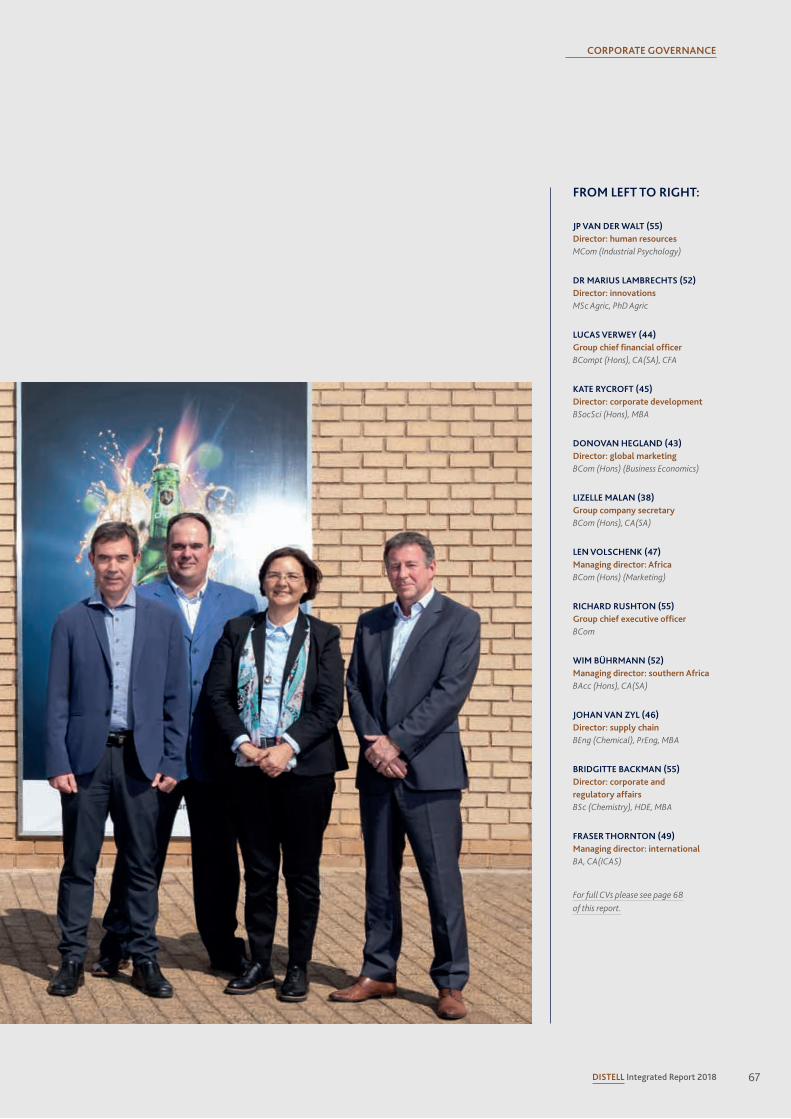
JP VAN DER WALT (55)Director: human resourcesMCom (Industrial Psychology)
DR MARIUS LAMBRECHTS (52) Director: innovationsMSc Agric, PhD Agric
LUCAS VERWEY (44) Group chief financial officerBCompt (Hons), CA(SA), CFA
KATE RYCROFT (45) Director: corporate developmentBSocSci (Hons), MBA
DONOVAN HEGLAND (43) Director: global marketingBCom (Hons) (Business Economics)
LIZELLE MALAN (38)Group company secretaryBCom (Hons), CA(SA)
LEN VOLSCHENK (47)Managing director: AfricaBCom (Hons) (Marketing)
RICHARD RUSHTON (55)Group chief executive officerBCom
WIM BÜHRMANN (52) Managing director: southern AfricaBAcc (Hons), CA(SA)
JOHAN VAN ZYL (46)Director: supply chainBEng (Chemical), PrEng, MBA
BRIDGITTE BACKMAN (55) Director: corporate and regulatory affairsBSc (Chemistry), HDE, MBA
FRASER THORNTON (49) Managing director: internationalBA, CA(ICAS)
For full CVs please see page 68 of this report.
FROM LEFT TO RIGHT:
CORPORATE GOVERNANCE
67DISTELL Integrated Report 2018
68 www.distell.co.za
JP van der Walt (55)
MCom (Industrial Psychology)Director: human resourcesGender: Male
Tenure: JP joined Distell in 2014 after a long career at British American Tobacco South Africa (BAT SA). He is responsible for the full spectrum of human resources activities across Distell Group.
Expertise: Human resources
Dr Marius Lambrechts (52)
MSc Agric, PhD AgricDirector: innovationsGender: Male
Tenure: Marius joined Distell in 2001 as research manager and was appointed as quality management and research (QM&R) director in August 2009. In July 2014 he was appointed as director: innovations.
Expertise: Fast-moving consumer goods, manufacturing and sustainability
Kate Rycroft (45)
BSocSci (Hons), MBADirector: corporate developmentGender: Female
Tenure: Kate joined Distell in 2003 shortly after the merger of SFW and Distillers into a newly created function to integrate the two entities. Her role evolved into overseeing the strategy and mergers and acquisitions functions over time and took up her present position in August 2014. She is responsible for corporate strategy, mergers and acquisitions. Her role is to step-change Distell’s growth through inorganic expansion and to deliver a clear and integrated corporate strategy. Before Distell, Kate worked with ABN Amro in London on project and change management initiatives before joining leisure and hospitality group CC Africa. Kate completed her MBA at UCT Graduate school of Business in 2002.
Expertise: Business management, mergers and acquisitions, business transformation, deal integration and deal origination
Donovan Hegland (43)
BCom (Hons) (Business Economics)Director: global marketingGender: Male
Tenure: Donovan joined Distell as marketing director: southern Africa in 2010 post various leadership roles at BAT SA. In 2015 he moved on to head up the Africa business, setting the transition strategy for the business unit focusing on the portfolio, local production and route-to-market platforms in key markets. Donovan took over the global marketing function at the end of 2017 and is focused on the health and profitability of the brand portfolio, innovation, digital transformation and marketing capability development.
Expertise: Africa and general business, marketing and sales, fast-moving consumer goods, transformation, human resources, agile leadership
Lizelle Malan (38)
BCom (Hons), CA(SA)Group company secretaryGender: Female
Tenure: Lizelle joined Distell in 2012. She performs all statutory company secretarial functions and is also responsible for the company’s forensic compliance, risk management and legal divisions.
Expertise: Retail operations, fast-moving consumer goods, manufacturing, risk management, legal and governance
Len Volschenk (47)
BCom (Hons) (Marketing) Managing director: AfricaGender: Male
Tenure: Len joined Distell as head sales and operations in March 2017 before moving on to his current role as managing director for Africa in May 2018. Before joining Distell Len held various leadership roles within SABMiller of which the latest was managing director for Namibia.
Expertise: General business, mergers and acquisitions, wholesale and retail operations, trade marketing and marketing, sales and operational, people and team capability building, commercial and business acumen
Wim Bührmann (52)
BAcc (Hons), CA(SA)Managing director: southern AfricaGender: Male
Tenure: Wim joined the Group in 1994, was appointed head of new business development in 2007 and took up his present position in July 2010. He is responsible for our business functions in South Africa and BNLS countries, including sales, distribution and marketing operations.
Expertise: General business, mergers and acquisitions, and manufacturing
69DISTELL Integrated Report 2018
Johan van Zyl (46)
BEng (Chemical), PrEng, MBADirector: supply chainGender: Male
Tenure: Johan joined Distell in 2016 as the head of manufacturing and was appointed as director: supply chain in 2017. He is responsible for optimising Group supply chain operations across procurement, planning, manufacturing, warehousing, logistics and technical centres of excellence (intrinsics, engineering, capital projects and safety, health, environment, risk and quality). Johan has multi-industry experience at operational, business and executive level. Johan began his career at Anglo American before moving on to AECI where he held various roles implementing key projects over his tenure. He then joined SAB where he held manufacturing and general manager regional roles before moving to Cadbury/Kraft Foods overseeing their supply chain for sub-Saharan Africa, then moving on to AVI and Distell.
Expertise: General business, fast-moving consumer goods, integrated supply chains, manufacturing and operations
Bridgitte Backman (55)
BSc (Chemistry), HDE, MBADirector: corporate and regulatory affairsGender: Female
Tenure: Bridgitte joined Distell in 2016 and is responsible for the overall reputation management, stakeholder and corporate citizenship strategy of the company. She has multi-industry experience in different functional, business and executive roles.
Expertise: General business, fast-moving consumer goods, manufacturing, transformation, risk management and sustainability
Fraser Thornton (49)
BA, CA(ICAS) Managing director: international Gender: Male
Fraser joined Distell in 2013 following the acquisition of Burn Stewart Distillers where he was the managing director. During his 23 years in the spirits Industry he has held senior commercial roles covering North America, Asia and Europe with Burn Stewart Distillers. In addition he served as a director of Angostura Holdings PLC for seven years and served as the managing director of J. Wray & Nephew for two years. He previously spent seven years with PwC in audit and corporate finance.
Expertise: international business development, marketing, spirits cross category
CORPORATE GOVERNANCE
70 www.distell.co.za
In striving towards this objective, we believe best practice in corporate governance contributes towards an ethical culture that stretches beyond compliance with regulation and across the principles of true accountability, transparency and fairness.
Governance requirements continually evolve and present new challenges, especially with our growing global footprint. The board of directors (the board) is committed to complying with the requirements of the Companies Act, No. 71 of 2008, as amended (the
Companies Act), the JSE Listings Requirements and the King IV Report on Corporate Governance™ for South Africa, 2016 (King IV™).
Compliance is achieved through processes and frameworks that ensure the ongoing sustainability of the business and maximise value for shareholders and other key stakeholders, while contributing to national prosperity. This report sets out how Distell adopted and applied King IV™.
LEADERSHIP, ETHICS AND CORPORATE CITIZENSHIP
Principle 1 Leadership – the board should lead ethically and effectively. Page 73,
paragraph 3
Principle 2 Organisational ethics – the board should govern the ethics of the organisation in a way that supports the establishment of an ethical culture.
Page 73,
paragraph 3
Principle 3 Responsible corporate citizenship – the board should ensure that the organisation is and is seen to be a responsible corporate citizen.
Page 73,
paragraph 3
STRATEGY, PERFORMANCE AND REPORTING
Principle 4 Strategy and performance – the board should appreciate that the organisation’s core purpose, its risks and opportunities, strategy, business model, performance and sustainable development are all inseparable elements of the value creation process.
Page 71,
paragraph 2
Principle 5 Reporting – the board should ensure that reports issued by the organisation enable stakeholders to make informed assessments of the organisation’s performance, and its short-, medium- and long-term prospects.
Page 74,
paragraph 1
GOVERNING STRUCTURES AND DELEGATION
Principle 6 Primary role and responsibilities of the board – the board should serve as the focal point and custodian of corporate governance in the organisation.
Page 73,
paragraph 1
Principle 7 Composition of the board – the board should comprise the appropriate balance of knowledge, skills, experience, diversity and independence for it to discharge its governance role and responsibilities objectively and effectively.
Page 72,
paragraph 10
Principle 8 Committees of the board – the board should ensure that its arrangements for delegation within its own structures promote independent judgement, and assist with balance of power and the effective discharge of its duties.
Page 71,
paragraph 4
Principle 9 Evaluations of the performance of the board – the board should ensure that the evaluation of its own performance and that of its committees, its chair and its individual members, support continued improvement in its performance and effectiveness.
Page 73,
paragraph 3
Principle 10 Appointment and delegation to management – the board should ensure that the appointment of, and delegation to, management contribute to role clarity and the effective exercise of authority and responsibilities.
Page 73,
paragraph 2
REPORT
C O R P O R A T E G O V E R N A N C E
The governing objective of the Group is sustained value creation for our stakeholders over the long term.
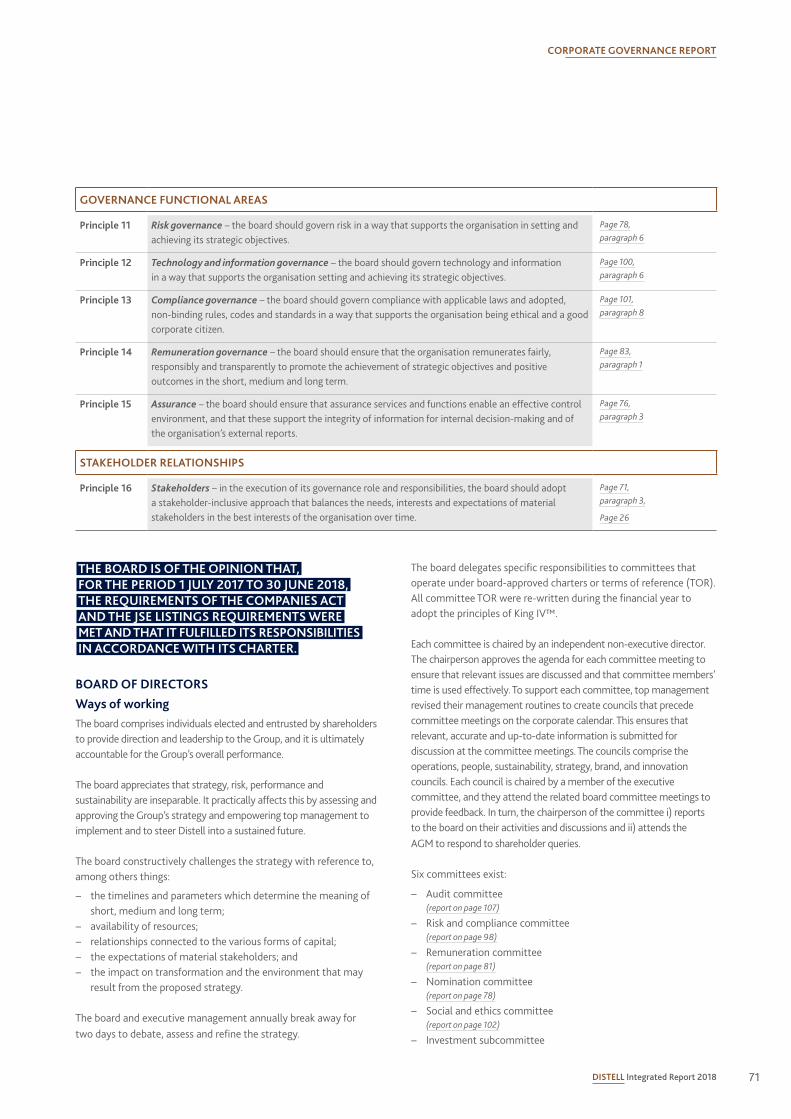
71DISTELL Integrated Report 2018
GOVERNANCE FUNCTIONAL AREAS
Principle 11 Risk governance – the board should govern risk in a way that supports the organisation in setting and achieving its strategic objectives.
Page 78, paragraph 6
Principle 12 Technology and information governance – the board should govern technology and information in a way that supports the organisation setting and achieving its strategic objectives.
Page 100, paragraph 6
Principle 13 Compliance governance – the board should govern compliance with applicable laws and adopted, non-binding rules, codes and standards in a way that supports the organisation being ethical and a good corporate citizen.
Page 101, paragraph 8
Principle 14 Remuneration governance – the board should ensure that the organisation remunerates fairly, responsibly and transparently to promote the achievement of strategic objectives and positive outcomes in the short, medium and long term.
Page 83, paragraph 1
Principle 15 Assurance – the board should ensure that assurance services and functions enable an effective control environment, and that these support the integrity of information for internal decision-making and of the organisation’s external reports.
Page 76, paragraph 3
STAKEHOLDER RELATIONSHIPS
Principle 16 Stakeholders – in the execution of its governance role and responsibilities, the board should adopt a stakeholder-inclusive approach that balances the needs, interests and expectations of material stakeholders in the best interests of the organisation over time.
Page 71, paragraph 3,
Page 26
THE BOARD IS OF THE OPINION THAT, FOR THE PERIOD 1 JULY 2017 TO 30 JUNE 2018, THE REQUIREMENTS OF THE COMPANIES ACT AND THE JSE LISTINGS REQUIREMENTS WEREMET AND THAT IT FULFILLED ITS RESPONSIBILITIESIN ACCORDANCE WITH ITS CHARTER.
BOARD OF DIRECTORS Ways of workingThe board comprises individuals elected and entrusted by shareholders to provide direction and leadership to the Group, and it is ultimately accountable for the Group’s overall performance.
The board appreciates that strategy, risk, performance and sustainability are inseparable. It practically affects this by assessing and approving the Group’s strategy and empowering top management to implement and to steer Distell into a sustained future.
The board constructively challenges the strategy with reference to, among others things:
− the timelines and parameters which determine the meaning of short, medium and long term;
− availability of resources; − relationships connected to the various forms of capital; − the expectations of material stakeholders; and − the impact on transformation and the environment that may
result from the proposed strategy.
The board and executive management annually break away for two days to debate, assess and refine the strategy.
The board delegates specific responsibilities to committees that operate under board-approved charters or terms of reference (TOR). All committee TOR were re-written during the financial year to adopt the principles of King IV™.
Each committee is chaired by an independent non-executive director. The chairperson approves the agenda for each committee meeting to ensure that relevant issues are discussed and that committee members’ time is used effectively. To support each committee, top management revised their management routines to create councils that precede committee meetings on the corporate calendar. This ensures that relevant, accurate and up-to-date information is submitted for discussion at the committee meetings. The councils comprise the operations, people, sustainability, strategy, brand, and innovation councils. Each council is chaired by a member of the executive committee, and they attend the related board committee meetings to provide feedback. In turn, the chairperson of the committee i) reports to the board on their activities and discussions and ii) attends the AGM to respond to shareholder queries.
Six committees exist:
− Audit committee (report on page 107)
− Risk and compliance committee (report on page 98)
− Remuneration committee (report on page 81)
− Nomination committee (report on page 78)
− Social and ethics committee (report on page 102)
− Investment subcommittee
CORPORATE GOVERNANCE REPORT
REPORT
72 www.distell.co.za
Composition, appointment and rotationBoard members are appointed transparently and with the full board’s consideration. When identifying individuals to become board members, the nomination committee considers skills gaps that should be filled to deliver on the Group’s strategic initiatives, bearing in mind South Africa’s demographics and our voluntary targets stipulated in our policies on the Promotion of Gender and Race Diversity. The nomination committee uses reputable recruitment firms to source suitable candidates.
The board currently comprises 11 directors, nine of whom are non-executive members and eight of whom are independent. The executive directors are Richard Rushton (Group CEO) and Lucas Verwey (Group CFO).
During the year under review, Louisa Mojela and Ben van der Ross retired at the AGM after serving on the board for 12 and nine years respectively. Louisa Mojela served Distell with distinction in a number of capacities, including being a member of the remuneration and nomination committees. She was instrumental in Distell’s B-BBEE transaction, considered to be one of the most successful B-BBEE transactions. Ben served with great success. Through his wide-ranging business insights and his passion for the Group, he has made an enduring contribution over many years and provided significant strategic contribution to the evolution of the Group. The board wishes them well in their future endeavours. In addition, Mark Bowman was appointed as independent non-executive director at the AGM, but was obliged to resign effective from 26 July 2018, due to a potentially conflicting personal investment in a Western Cape-based drinks operation.
Our policy on the Promotion of Gender Diversity sought to achieve a voluntary target of 40% female representation at board level by the end of 2020. At the end of the current financial year, female representation accounted for 25% of board membership, a decrease of 4% since the previous year.
The nomination committee also adopted a Promotion of Race Diversity policy. Although formal targets are not set, the nomination committee pursues all opportunities to enhance race diversity of the board.
The controlling shareholder’s representation on the board is Jannie Durand who is not an independent non-executive director. Jannie Durand is CEO of Remgro Limited (Remgro). Remgro is Distell’s shareholder of reference and owns a 31,4% economic interest with a 56% voting interest. This provides assurance to all shareholders that the board and management are held accountable to key principles of capital allocation and that they invest alongside minority shareholders. Given Jannie’s knowledge of the business and his extensive commercial experience, the board deemed this arrangement not only appropriate but also essential to achieving Distell’s business objectives. Distell is undergoing significant transformation and has ambitious expansion plans.
Therefore, his leadership is deemed vital in this phase of the Group’s evolution. The chairman is elected on an annual basis.
The board ensures that an appropriate balance of power and authority exists so that no individual, or block of individuals, has unfettered decision-making powers or undue influence on the board.
In compliance with King IV™ and the JSE Listings Requirements, and to guard against any perceived conflict of interest, the board annually elects a lead independent director (LID). The current LID is André Parker. The main function of the LID is, inter alia, to lead and advise the board, without detracting from the authority of the chairman, when the chairman has a conflict of interest.
While there is no maximum term for appointment, the retirement age for non-executive directors is 70 years. All non-executive directors retire by rotation in terms of the Group’s Memorandum of Incorporation (MOI). At the AGM, one-third of the directors retire and may make themselves available for re-election. The directors who retire are those longest in office since their last election.
The nomination committee makes recommendations regarding the re-election of the retiring directors considering performance, meeting conduct, etc. The independence and performance of non-executive directors who have served on the board for more than nine years are subjected to a rigorous review.
The board is satisfied that all directors have the required qualifications and relevant experience to actively contribute to the success of Distell and that its composition reflects the appropriate mix of knowledge, skills, experience and independence.
Refer to pages 62 and 64 for the directors in office as at 30 June 2018 as well as their biographical details.
Board meetings and attendance The board meets at least four times per year to review a formal schedule of matters, of which its members are fully briefed in advance. The board holds ad hoc meetings, if required.
A majority of the directors in office counts as a quorum for any directors’ meeting. Decisions taken at board meetings are confirmed by a majority of votes, with each director having one vote per matter. A majority vote is considered approval of a resolution. In the case of a tied vote, the chairman may not cast a deciding vote, and such resolution shall fail. A round robin resolution shall be as valid and effectual as if it had been passed at a board meeting duly called and constituted, provided that such resolution is adopted by way of written consent by all board members.
Effective chairing and a formal agenda with supporting documentation ensure all issues requiring attention are raised and addressed. Supporting documentation is distributed a week before meetings. This enables directors to discharge their fiduciary responsibilities.
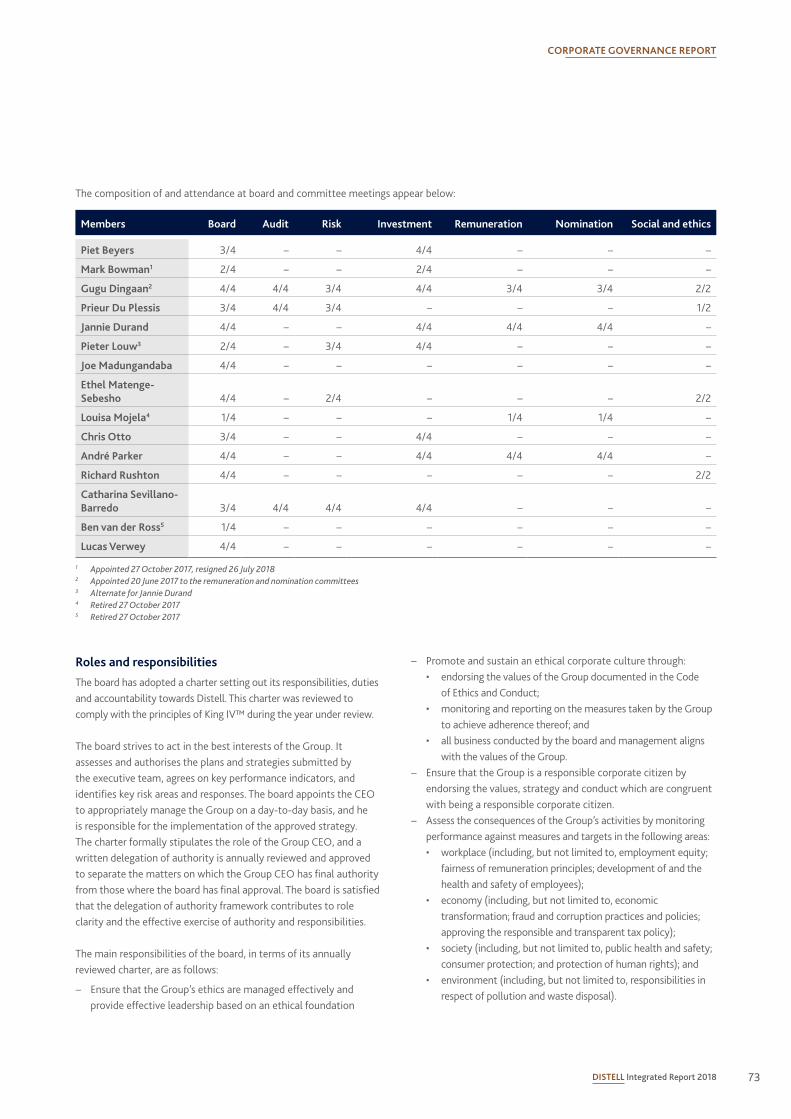
73DISTELL Integrated Report 2018
The composition of and attendance at board and committee meetings appear below:
Members Board Audit Risk Investment Remuneration Nomination Social and ethics
Piet Beyers 3/4 – – 4/4 – – –
Mark Bowman1 2/4 – – 2/4 – – –
Gugu Dingaan2 4/4 4/4 3/4 4/4 3/4 3/4 2/2
Prieur Du Plessis 3/4 4/4 3/4 – – – 1/2
Jannie Durand 4/4 – – 4/4 4/4 4/4 –
Pieter Louw3 2/4 – 3/4 4/4 – – –
Joe Madungandaba 4/4 – – – – – –
Ethel Matenge-Sebesho 4/4 – 2/4 – – – 2/2
Louisa Mojela4 1/4 – – – 1/4 1/4 –
Chris Otto 3/4 – – 4/4 – – –
André Parker 4/4 – – 4/4 4/4 4/4 –
Richard Rushton 4/4 – – – – – 2/2
Catharina Sevillano-Barredo 3/4 4/4 4/4 4/4 – – –
Ben van der Ross5 1/4 – – – – – –
Lucas Verwey 4/4 – – – – – –
1 Appointed 27 October 2017, resigned 26 July 20182 Appointed 20 June 2017 to the remuneration and nomination committees3 Alternate for Jannie Durand4 Retired 27 October 20175 Retired 27 October 2017
Roles and responsibilities The board has adopted a charter setting out its responsibilities, duties and accountability towards Distell. This charter was reviewed to comply with the principles of King IV™ during the year under review.
The board strives to act in the best interests of the Group. It assesses and authorises the plans and strategies submitted by the executive team, agrees on key performance indicators, and identifies key risk areas and responses. The board appoints the CEO to appropriately manage the Group on a day-to-day basis, and he is responsible for the implementation of the approved strategy. The charter formally stipulates the role of the Group CEO, and a written delegation of authority is annually reviewed and approved to separate the matters on which the Group CEO has final authority from those where the board has final approval. The board is satisfied that the delegation of authority framework contributes to role clarity and the effective exercise of authority and responsibilities.
The main responsibilities of the board, in terms of its annually reviewed charter, are as follows:
− Ensure that the Group’s ethics are managed effectively and provide effective leadership based on an ethical foundation
CORPORATE GOVERNANCE REPORT
− Promote and sustain an ethical corporate culture through:• endorsing the values of the Group documented in the Code
of Ethics and Conduct;• monitoring and reporting on the measures taken by the Group
to achieve adherence thereof; and• all business conducted by the board and management aligns
with the values of the Group. − Ensure that the Group is a responsible corporate citizen by
endorsing the values, strategy and conduct which are congruent with being a responsible corporate citizen.
− Assess the consequences of the Group’s activities by monitoring performance against measures and targets in the following areas:• workplace (including, but not limited to, employment equity;
fairness of remuneration principles; development of and the health and safety of employees);
• economy (including, but not limited to, economic transformation; fraud and corruption practices and policies; approving the responsible and transparent tax policy);
• society (including, but not limited to, public health and safety; consumer protection; and protection of human rights); and
• environment (including, but not limited to, responsibilities in respect of pollution and waste disposal).
74 www.distell.co.za
− Provide strategic direction and review the execution of strategic initiatives
− Consider and approve Distell’s annual business plan and budget, as submitted by management, including sustainability initiatives
− Establish committees to assist it in discharging its responsibilities and duties (please refer to the separate sections for more detail on the roles these committees fulfil on behalf of the board)
− Set the direction for how risk should be approached and addressed in the Group and oversee the governance of information technology
− Evaluate and approve the integrated report, annual financial statements, interim financial statements and dividend to shareholders, based on the recommendations of the audit committee
− Advise on and review transformation and empowerment − Consider significant financial matters such as investment
proposals − Oversee that the implementation and execution of the
Reward Policy achieve the set objectives − Evaluate the performance and effectiveness of individual
directors, the board as a whole and its committees − Appoint new directors, including the chairman of the board,
the LID chairpersons of committees and the Group CEO, based on the recommendations of the nomination committee
− Ensure that relevant and accurate information is timeously communicated to stakeholders
− Evaluate the viability of the Group as a going concern
Orientation and development All new directors undergo a formal induction programme. Upon their appointment, new directors receive an induction pack including agendas and minutes of the previous board and board committee meetings, the latest integrated report, relevant insurance information, strategic documents, and relevant policies and charters and TOR. These directors are informed of their fiduciary duties in terms of the Companies Act and JSE Listings Requirements. They also visit various production sites and distribution centres and have meetings with executive directors.
Board and director evaluation The board and its chairman, individual members, and committees are each subject to a formal evaluation. The process happens at least every two years and is either a self-evaluation or an externally facilitated one. The LID facilitates the chairman’s evaluation.
The results of the evaluations are discussed with the board as a whole, and suggested changes and comments are minuted and actioned by the board. All recommendations from the previous evaluation were implemented with success and included digitalisation of all board packs and communication.
No evaluation was done during the 2018 financial year. The nomination committee has indicated that a formal evaluation will be done during the 2019 financial year.
Share trading Management has adopted a Price-sensitive Information policy to prevent the abuse of inside information. The policy prohibits directors, senior management, and other employees from trading in the Group’s shares during price-sensitive or closed periods.
In terms of the policy, closed periods commence a week before the end of the interim (December) and annual (June) financial periods, and end at the close of the day after the financial results are disclosed on SENS. The company secretary informs all employees of the closed periods.
Additional restrictions on trading may apply where unpublished, price-sensitive information exists in relation to the Group’s shares in terms of the policy.
Before dealing in Distell shares:
− Executive directors and the company secretary are required to advise the chairman and obtain his clearance.
− Executive management and directors of major subsidiary companies are required to advise the Group CEO or the company secretary and obtain clearance.
− Other senior employees require the approval and clearance of the company secretary.
Conflict of interest The directors are required by the Companies Act to disclose annually their personal financial interests in material contracts or other matters, including interest by related persons to them. This process is facilitated by the company secretary around year-end. Where a potential conflict of interest exists, directors must recuse themselves from relevant discussions and decisions.
All directors are required to comply with the Code of Ethics and Conduct, the Financial Markets Act, 19 of 2012, and the requirements of the JSE Limited regarding inside information, dealings in securities and the disclosure of such dealings.
Company secretary’s role and responsibilities The company secretary is responsible to the board and facilitates adherence to proper corporate governance principles that are outlined in the board charter; compliance with relevant legislation; and preparing meeting agendas and recording minutes. The company secretary also assists with director induction and ongoing training as necessary.
All directors have unlimited access to the advice and services of the company secretary, and they may seek independent professional advice at the Group’s expense, when appropriate.
To comply with the King IV™ principle of having an arm’s-length relationship, the company secretary is not a member of the board and is suitably independent. The board confirms that Lizelle Malan, who is a chartered accountant, has an arm’s-length relationship
75DISTELL Integrated Report 2018
with the board, suitably fulfils the role, and possesses the requisite competence and knowledge to carry out the duties of a secretary of a public company.
BOARD COMMITTEESThe audit committeeThe committee comprises three independent non-executive directors, nominated by the nomination committee and the board, and confirmed by the shareholders.
Please refer to pages 64 for biographical details of the members.
The committee’s purpose, role, composition, authority and responsibilities are formalised in its terms of reference, approved by the board, and is informed by the following legislation, regulation and guidance:
− Companies Act − JSE Listings Requirements − King IV™
The committee meets at least four times per year and the Group CEO, the Group CFO, external auditors, chief audit executive and selected senior management are invited to attend the meetings.
The purpose and role of the audit committee is to assist the board with discharging its responsibility to:
− Safeguard the Group’s assets − Operate adequate and effective systems of internal control,
risk management and governance − Prepare materially accurate financial reporting information
and statements in compliance with all applicable legal and regulatory requirements and accounting standards
− Monitor compliance with laws and regulations and the business code of conduct
− Provide oversight of the external and internal audit functions and appointments
The committee has an independent role with accountability to both the board and shareholders. It operates as an overseer and makes recommendations to the board for its consideration and final approval.
Please refer to page 73 for the attendance at audit committee meetings.
During the year under review the committee discharged its responsibilities in terms of its charter by performing the following activities:
Internal financial control − Reviewed the adequacy and effectiveness of the financial
reporting process and the system of internal control and satisfied itself that the internal financial controls form a sound basis for the preparation of reliable financial statements
− Reviewed and approved Distell’s integrated report, annual financial statements, interim reports and other financial media releases, and recommended final approval to the board
− Reviewed and confirmed, during interim and year-end reporting, the Group’s current financial position, budgets and cash flow projections and decided whether, to the best of its judgement, there were adequate resources to continue with operations in the foreseeable future
− Ensured compliance of published information with relevant legislation, reporting standards and good governance
− Considered any significant legal and tax matters that could have had a material impact on the financial statements
− Reviewed the external auditor’s report and authorised management to sign the representation letter
− Met separately with management, external audit and internal audit to discuss matters the respective parties believed should be discussed privately for the committee’s consideration in satisfying itself that no material control weakness existed
− Reviewed the following items in relation to the financial statement, which required significant judgement during the year:• Provision for bad debts• Impairment provisions• Discontinued operations• Corporate transactions
− Satisfied itself that the Group does not have an interest in any off-balance sheet structures and that related-party transactions are arm's-length transactions conducted in the normal course of business
External audit − Satisfied itself that PricewaterhouseCoopers Inc. (PwC) is
independent of the Group even though they have been the auditor of Distell for 30 years. In addition, PwC and their predecessor firms have been the auditor of the Group as a result of its business transacted through Stellenbosch Farmers Winery Group Limited and Distillers Corporation SA Limited, for 73 years. In reaching this conclusion, the committee considered:• the current designated partner, Nicolaas Hendrik Döman, was
assigned to the Distell audit in 2016, • the extent of non-audit services is continuously monitored
with no material or excessive engagements noted,• the appointment of the CEO in 2013 and the CFO in 2015
assists to mitigate the risk of familiarity between the auditor and senior management,
• PwC has delivered a high quality of external audit considering the calibre of the audit team assigned to the audit, the standard of the execution of engagements, scope of activities performed, PwC’s independence, its relationship with stakeholders, and understanding of the business and the extent of non-audit services provided, and
• the requirements of mandatory audit firm rotation as prescribed by IRBA effective 1st April 2023. PwC’s tenure was discussed in light of these changes. The committee agreed to rotate external auditors from the 2021 financial year to align with the rotation of the current audit partner. However, this timing may be influenced by the main shareholder, Remgro’s decision around appointing auditors for the Remgro Group. A final decision will be made in due course.
CORPORATE GOVERNANCE REPORT
76 www.distell.co.za
− Nominated to the shareholders for re-appointment of PwC as the external auditor, and Rika Maré Labuschaigne as the designated auditor. She will replace Nicolaas Hendrik Döman as the designated auditor, who will retire from the Distell audit in June 2019. The audit committee confirms that it has discharged its duty per paragraph 22.15(h) of the Listings Requirements in making this decision. The committee ensured this appointment complied with all legal and regulatory requirements
− Approved the audit fees of the external auditors as well as non-audit services, which had been preapproved by the chairperson of the audit committee (fees paid to the auditors are detailed in note 18.3 of the annual financial statements)
− Reviewed and approved the annual audit plan, the effectiveness of the external auditor and its independence
Internal audit − Oversaw the internal audit function and approved the annual
internal audit plan and budget − Approved the terms of references for both internal audit and the
audit committee − Evaluated the independence, resources, performance and
effectiveness of the chief audit executive and the internal audit function
− Reviewed the co-operation and co-ordination between the internal and external audit functions to avoid unnecessary duplication of work
− Reviewed and considered the significant findings raised by internal audit as well as the adequacy of management’s corrective actions
− Met separately with the chief audit executive to discuss matters the committee or internal audit believed should be discussed privately
− Received assurance on the adequacy of internal controls − Based on the above, formed an opinion that there was no material
breakdown in internal controls, including financial controls
Combined assurance − Approved the combined assurance model and arrangements;
however, its full implementation is still in progress. − Satisfied itself that the combined assurance plan
implementation was adequate and reviewed the progress of the combined assurance methodology and plan to achieve the objective of an effective, integrated approach across the activities of the five levels of assurance.
Expertise of the chief financial officer and the finance function
− As required by the JSE Listings Requirements, the committee considered the experience and expertise of Distell’s Group CFO, Lucas Verwey (his biographical details are detailed on page 64), and is satisfied that it is appropriate.
− The committee also reviewed and satisfied itself that the composition, experience and skills of the finance function were able to meet the Group’s requirements.
Discharge of responsibilities − The committee has determined that it discharged both its legal
and general responsibilities in terms of its terms of reference and the Companies Act during the review period. The board is in agreement with this and has approved the interim and year-end financial statements as well as the integrated report.
Internal controls The board of directors assumes ultimate accountability to ensure the Group maintains adequate systems of controls across the broad spectrum of financial, operational, information and technology, and compliance controls.
Management is tasked with implementing the internal controls to mitigate risks in pursuit of the company’s objectives and targets.
The systems of internal controls are generally not expected to eliminate risk entirely or guarantee absolute assurance against misstatement or loss; however, they are designed to manage risks within appetite and tolerance levels to reasonably assure that the Group’s:
− Assets are safeguarded − Objectives will be achieved − Operations are efficient and effective − Financial information is reliable − Compliance with applicable laws and regulations is adequate
The implementation of effective systems of controls involves the following:
− An appropriate control environment is established that demonstrates commitment to high integrity and ethical values; provides the appropriate level of oversight and operating structures; and ensures placement of suitably qualified employees, segregation of duties and clearly defined lines of authority and accountability
− Business objectives are clearly outlined and formal processes are in place to identify and analyse risks related to the achievement of the objectives
− Control activities are developed to address the identified risks and, where applicable, formalised policies and procedures are implemented
− Relevant and accurate information is identified and used in decision-making and adequate controls for communication processes and activities are in place for internal and external communication
− Controls are evaluated on an ongoing basis and deficiencies are addressed promptly and effectively
The board and management, in particular, place great emphasis on financial controls and policies. Specifically, Distell’s capital expenditure, investment, and exposure to interest rate, liquidity and currency risks are closely monitored. Treasury functions and decisions are guided by written policies and procedures, as well as
77DISTELL Integrated Report 2018
by clearly defined levels of authority and permitted risk assumption. While non-leveraged derivatives are purchased periodically to hedge specific interest rate or currency exposures, treasury functions do not undertake speculative financial transactions.
The board has adopted a combined assurance model that is designed to assist in highlighting gaps in assurance coverage of key business risk areas and in identifying opportunities for optimisation. The model distinguishes the five levels of assurance across the various risk and control owners, internal and independent assurance providers, i.e.:
− Line functions that own and manage risks: This includes a comprehensive monthly management control self-assessment checklist covering operational and financial controls at all operations, plants, sites, depots, distribution centres and a number of head office corporate functions. The control self-assessment processes are being implemented at sites in the newly integrated Africa and International regions
− Specialist internal functions that oversee and facilitate risk management and compliance, e.g. risk management, corporate and regulatory affairs, and legal and compliance, etc.
− Internal auditors, internal forensic fraud examiners and auditors, safety and process assessors, and statutory actuaries
− Independent external assurance service providers such as external auditors (PwC), other external assurance providers such as sustainability and environmental auditors, external actuaries, and external forensic fraud examiners and auditors
− Regulatory inspectors such as Department of Labour inspectors
For the period under review, audit reviews and other assurance obtained did not indicate any material breakdowns in the functioning of internal controls. Where compliance issues were identified, they were reported and timeously rectified. Except where identified issues are being addressed by management, the audit committee and the board are satisfied that control systems and procedures were suitably implemented, maintained and monitored by qualified personnel, with appropriate segregation of authority, duties and reporting lines.
Internal audit Distell Internal audit (DIA) is a significant contributor to the Group’s defence systems that assist to safeguard assets; ensure the reliability and integrity of significant financial, managerial and operational information; identify and protect against factors and behaviour that diminishes value; and is the primary assurance provider to the board on the efficiency and effectiveness of governance, risk management and control systems, structures and processes.
DIA is a centralised global function with regionally based teams to optimise localised focus on risks and controls and provide a greater level of support to management. It operates under terms set out in a formal mandate approved by the board, conforming to the Institute of Internal Auditor’s (IIA) International Professional Practices Framework (IPPF) for internal audit. This framework includes a Code of Ethics with which team members annually
confirm compliance. In addition to the IIA IPPF, the principles outlined in the following leading frameworks are embedded in the overarching internal audit practices, approach and methodologies:
− King IV™ – governance, risk and controls principles − COSO – global internal control and risk management framework − COBIT 5.1 – information and technology general controls
framework
The DIA resources have an average of more than ten years’ experience and all employees have either a relevant qualification or extensive industry and technical skills. The resourcing includes trainee chartered accountants participating in the South African Institute of Chartered Accountants (SAICA) trainee programme offered by Distell, as an accredited Training Office. This is a three-year programme with internal audit as an elected focus area of training. During the programme, trainees also rotate to other business functions to gain the necessary competencies as prescribed by SAICA. Lizelle Malan, the Group company secretary, is the training officer.
Internal audit provides assurance that the key strategic, financial, information and technology, compliance and operational risks are understood, identified, and effectively managed and mitigated. This is achieved through the execution of an annual risk-based audit plan aligned to the Group’s goals and objectives. The audit plan, resources and budget are formally approved by the audit committee prior to each financial year.
When required, specialist information and technology skills are co-sourced.
Independence and authority The appropriate organisational positioning of DIA is enabled by reporting functionally to the audit committee and administratively to the Group CFO, to maintain its independence. The chief audit executive and the audit committee formally consider the independence of internal audit annually. Furthermore, internal audit has free and unrestricted access to the board, executive management, information and all areas within the Group.
Scope of work Internal audit assurance can only be reasonable and not absolute and does not supersede the board’s and management’s responsibility for the ownership, design, implementation, monitoring and reporting of governance, risk management and internal controls.
For the financial year ending 30 June 2018, DIA confirms that sufficient and appropriate audit procedures have been conducted through the completion of the approved risk-based audit plan and evidence gathered to support the audit opinions and conclusions.
There were no undue scope limitations or impairments to independence.
CORPORATE GOVERNANCE REPORT
78 www.distell.co.za
The nomination committee The nomination committee comprises André Parker (chairperson), Jannie Durand and Gugu Dingaan whom are all non-executive directors. Their attendance of meetings appears on page 73. The Group CEO and other executives may attend the meetings by invitation but do not vote.
The primary responsibilities of the nomination committee are as follows:
− Review and recommend to the board the size and composition of the board and the criteria for board membership
− Assist the board in i) identifying the necessary and desirable competencies of board members and ii) maintaining an appropriate mix of skills, experience, expertise and diversity on the board
− Assist the board in identifying appropriate individuals as potential candidates for board membership and re-election (key focus area during the reporting period)
− Craft succession plans for executive and non-executive directors (key focus area during the reporting period)
− Develop a process to evaluate the performance and independence of the board, its committees and individual directors (including executive, non-executive and independent non-executive directors and the company secretary) and implement a process to identify, assess and enhance the skill set of directors
The authority to appoint directors remains with the full board. Appointees are nominated at the next AGM for election by the shareholders.
During the past financial year, the committee ensured that succession plans are in place for the Group CEO and other key positions, and oversaw the talent management programme.
The committee is satisfied that it has fulfilled its responsibilities in accordance with its terms of reference, which are available on https://www.distell.co.za/corporate-governance/, for the reporting period.
RISK MANAGEMENT The company secretary serves as the chief risk officer for the Group and attends all audit and risk and compliance committee meetings. Senior management, supported by the internal audit function, is responsible for identifying, managing and mitigating risks.
Refer to pages 98 to 101 for the report on risk management.
INVESTOR RELATIONS Our investors are an integral stakeholder group, and we place significant emphasis on transparency, access to management and proactive communication. We anticipated that our shareholder structure will collapse and that we will have larger free float for
trading. We have accordingly appointed Frank Ford as Group general manager: investor relations to proactively and regularly engage the investment community. He will do this in person; by email; at our interim and annual results presentations; and through market updates, conference calls, site visits, investor conferences, and one-on-one meetings
We engage in a transparent manner, in compliance with JSE Listings Requirements, as Distell is listed on the JSE.
Some of these engagement sessions are attended by the Group’s senior management to give investors wider access to management teams and a deeper understanding of Distell’s investment proposition. Over and above these engagements, investors have access to our dedicated investor website which provides mandatory information about the Group.
We believe that open and transparent engagement can enhance the valuation of our Group, thereby improving our access to capital.
We always report on our operational and financial performance; progress in delivering on our strategic objectives; and material matters that may impact our performance, such as regulatory and political risk, corporate activity by way of acquisitions or disposals, other corporate transactions, drought, and community matters.
Investors are encouraged to attend and actively participate in the AGM in October. They can do this by submitting questions either during or prior to the AGM. The chairpersons of the Group’s audit, risk, social and ethics, remuneration and nomination committees are always present to respond to questions from shareholders.
ORGANISATIONAL ETHICSThe board ensures that Distell’s ethics are managed effectively and provides effective leadership based on an ethical foundation.
An ethical corporate culture is promoted and sustained by:
− endorsing the values of the Group documented in the Code of Ethics and Conduct, which is published on the website and incorporated by reference in employee contracts;
− endorsing internal policies, specifically around anti-bribery and corruption, gifts and entertainment and whistle-blowing to tackle practices inimical to ethical conduct more efficiently;
− monitoring and reporting on the measures taken by the Group to adhere to the Code of Ethics and Conduct (through the social and ethics and audit committees); and
− ensuring all business conducted by the board and management aligns with the values of the Group.
79DISTELL Integrated Report 2018
The implementation and execution of the Code of Ethics and Conduct and related policies are delegated to management.
The key area of focus for organisational ethics was to create awareness around conflict of interest. The policy was reviewed, updated and communicated through an awareness campaign. Employees were asked to declare all actual and potential conflicts and any other business relationships. All managerial level employees are required to complete an annual declaration.
Anti-bribery and corruptionDistell is committed to protecting its revenue, expenditure, assets and reputation from any attempt by any person or Group to gain financial or other benefit in an unlawful, dishonest or unethical manner. Fraud, corruption, theft, maladministration or any other dishonest activities of a similar nature are not tolerated. Incidents and suspicions are investigated and treated with the application of the full extent of the law. Furthermore, Distell strictly adheres to both the letter and the spirit of the Companies Act, the Prevention and Combating of Corrupt Activities Act, No. 12 of 2004 (the PCCA), and other relevant laws.
Gifts and entertainmentWe believe in fostering healthy, mutually beneficial relationships with our suppliers, business partners and customers. While giving and receiving gifts can play a role in building such relationships, doing so should never impose improper influences or obligations. Our policy therefore limits the type, nature, extent and value of gifts and entertainment that may be given or accepted.
Ethics hotlineDistell is committed to doing business in an ethical and sound manner and to fully comply with local and global anti-bribery and corruption laws.
We offer the Distell Ethics Line, independently managed by Deloitte’s Tip-offs Anonymous division to combat fraud, theft, corruption and unethical behaviour. In upholding the Group’s values, we encourage all employees to use the Ethics Line, which offers a selection of communication channels and is available 24 hours a day and 365 days a year.
The Ethics Line has been expanded and is now also available to employees in Europe, Asia and the rest of Africa. This expansion was combined with a global awareness campaign, which consisted of the distribution of awareness materials, as well as awareness training sessions presented to Distell International, Distell Namibia, Distell Asia Pacific and Middle East and Distell Africa.
A global fraud perception survey conducted during 2018 provided invaluable information for focusing our resources on specific areas to ensure a practical and sustainable approach to fraud risk management across the business. Awareness training sessions presented during 2019 will focus on identified high-risk sites and will include training on the Code of Ethics and Conduct, the Conflict of Interest Policy, anti-bribery training, as well as the Distell Ethics Line.
The social and ethics committee continues to govern over the workings of the Distell Ethics Line and ensures appropriate action is taken on reported matters. Management has established a quarterly ethics committee that reviews all reported matters in detail and to ensure appropriate action were taken. Feedback on this forum is submitted to the social and ethics committee for consideration. Additionally a year-to-date report is discussed at each social and ethics committee meeting and the members will ask questions on steps taken by management and, if required, additional reporting on certain matters.
CORPORATE GOVERNANCE REPORT
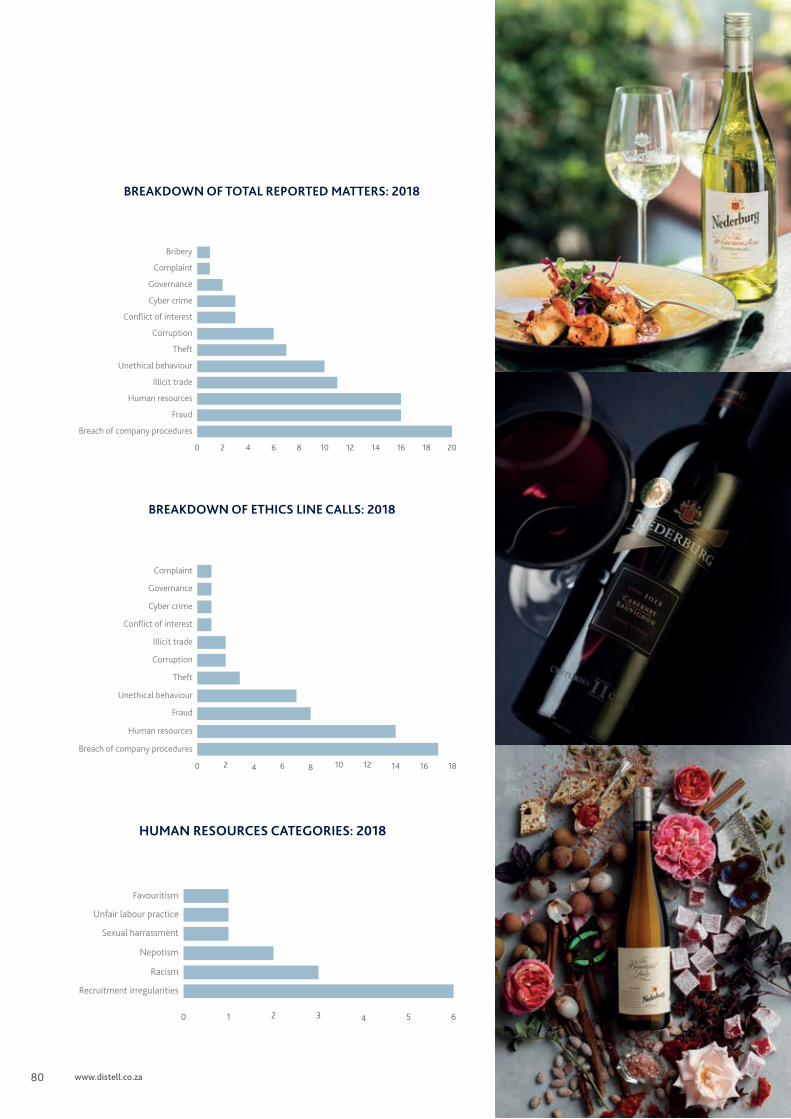
BREAKDOWN OF TOTAL REPORTED MATTERS: 2018
Bribery
0 2 4 6 8 10 12 14 16 18 20
Complaint
Governance
Cyber crime
Conflict of interest
Corruption
Theft
Unethical behaviour
Illicit trade
Human resources
Fraud
Breach of company procedures
80 www.distell.co.za
BREAKDOWN OF ETHICS LINE CALLS: 2018
0 2 4 6 8 10 12 14 16 18
Complaint
Governance
Cyber crime
Conflict of interest
Illicit trade
Corruption
Theft
Unethical behaviour
Fraud
Human resources
Breach of company procedures
HUMAN RESOURCES CATEGORIES: 2018
0 1 2 3 4 5 6
Favouritism
Unfair labour practice
Sexual harrassment
Nepotism
Racism
Recruitment irregularities
REPORT
81DISTELL Integrated Report 2018
Dear Shareholders,
I am pleased to present the Distell Group’s remuneration report for the 2017/18 financial year. This report will among others, focus on the guaranteed and variable elements of executive remuneration, the fees paid to non-executive directors (NEDs), and an overview of our remuneration policy, practices and governance.
The 2017/18 financial year delivered moderate results when measured against our stated key performance indicators and aspirations. The extent to which the stated financial performance goals and other strategic success factors were achieved has influenced variable remuneration outcomes for the year. It has been a busy year for the remuneration committee; including thorough reviews of our salaries and benefit-offering, the Short-Term Incentive Scheme (STI), the Long-Term Incentive Scheme (LTI), and various other reward initiatives.
I firmly believe that we have step-changed the way we manage and govern total reward within Distell by ensuring that the remuneration committee has an overview of reward across all employee groups, including that of our farm and factory workers. In considering the various benchmarking and comparator group information at our disposal, we can proudly confirm that we are making good progress in transforming Distell into a better workplace for all our employees, not only from a reward perspective, but also in terms of programmes and initiatives specifically focused on employees at the lower levels.
As the remuneration committee, we believe Distell’s remuneration policy has achieved its stated objectives during the 2017/18 financial year. Key activities of the remuneration committee executed during the year to ensure alignment with the objectives, include the following:
− Significant changes were made to the design of our LTI scheme to better align to its main purpose of driving the organisation’s performance, while also serving as a retention mechanism for key personnel. More details of the LTI scheme can be found on page 87 of this report.
− With regards to our STI scheme, we have conducted various alignment exercises to ensure that the key performance indicators in the corporate scorecard, as well as the various functional scorecards, support the company’s goals and aspirations, and that proper line-of-sight is maintained throughout the organisation.
REMUNERATION REPORT
− We enhanced the use of our Employee Performance Management System (EPMS), ensuring that a rigorous process was followed, which resulted in better alignment between individual performance and salary increases at all levels, except for the bargaining unit, where salaries are negotiated collectively.
− We strive towards making Distell an Employer of Choice for current and prospective employees, and rely on our Employee Value Proposition (EVP), among other mechanisms to achieve and maintain this status. During the year under review, we have conducted several employee engagement sessions where our reward offering is comprehensively explained to our employees.
At the 2017 AGM, we received 97,98% support for our remuneration policy. In line with King IV™, at the 2018 AGM, we will be putting the remuneration policy and implementation report to separate non-binding votes. The remuneration committee looks forward to your continued support.
During the 2018/19 financial year, the remuneration committee will focus on embedding the EPMS to bolster alignment between individual performance and salary increases, including the roll-out of core benefits (i.e. retirement, risk and medical aid) to geographies outside of South Africa. We will also focus on global alignment of our reward practices and related communication thereof.
We are proud of our role as a responsible corporate citizen that conducts business fairly and with integrity. The remuneration committee is the guardian tasked with the implementation and maintenance of sustainable and equitable remuneration practices. Although much progress has been made in this regard, we are aware that more needs to be done in order to remain abreast of the ever-evolving requirements that define best-practice in this arena. My thanks to each member of the remuneration committee and subject-matter experts for their contribution towards achieving this goal.
André ParkerChairman of the remuneration committee
Stellenbosch 23 August 2018
REPORT
R E M U N E R A T I O N
PART 1: BACKGROUND STATEMENT
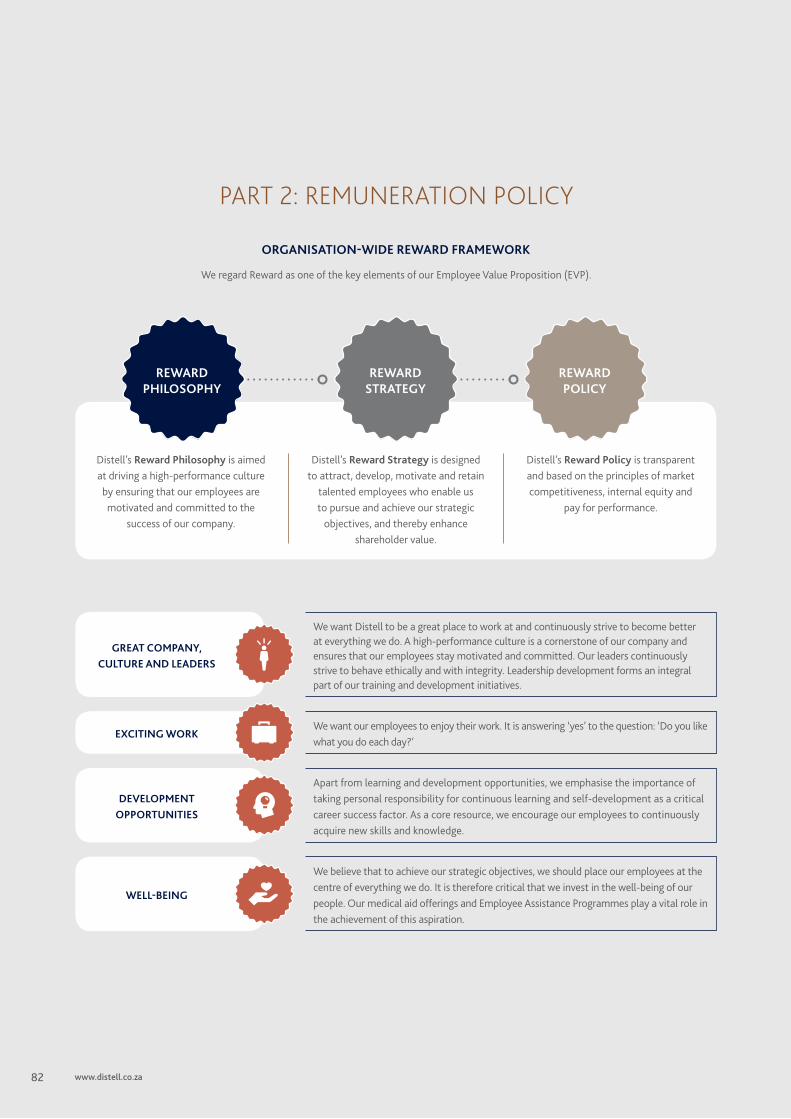
ORGANISATION-WIDE REWARD FRAMEWORK
We regard Reward as one of the key elements of our Employee Value Proposition (EVP).
Distell’s Reward Philosophy is aimed at driving a high-performance culture by ensuring that our employees are motivated and committed to the
success of our company.
Distell’s Reward Strategy is designed to attract, develop, motivate and retain
talented employees who enable us to pursue and achieve our strategic
objectives, and thereby enhance shareholder value.
Distell’s Reward Policy is transparent and based on the principles of market competitiveness, internal equity and
pay for performance.
REWARD STRATEGY
REWARD POLICY
REWARD PHILOSOPHY
www.distell.co.za82
PART 2: REMUNERATION POLICY
We want Distell to be a great place to work at and continuously strive to become better at everything we do. A high-performance culture is a cornerstone of our company and ensures that our employees stay motivated and committed. Our leaders continuously strive to behave ethically and with integrity. Leadership development forms an integral part of our training and development initiatives.
We want our employees to enjoy their work. It is answering ‘yes’ to the question: ‘Do you like what you do each day?’
Apart from learning and development opportunities, we emphasise the importance of taking personal responsibility for continuous learning and self-development as a critical career success factor. As a core resource, we encourage our employees to continuously acquire new skills and knowledge.
We believe that to achieve our strategic objectives, we should place our employees at the centre of everything we do. It is therefore critical that we invest in the well-being of our people. Our medical aid offerings and Employee Assistance Programmes play a vital role in the achievement of this aspiration.
GREAT COMPANY, CULTURE AND LEADERS
EXCITING WORK
DEVELOPMENT OPPORTUNITIES
WELL-BEING
83DISTELL Integrated Report 2018
Remuneration governanceThe remuneration committee primarily consists of non-executive directors who review and oversee remuneration policy (as part of the overall reward policy) of Distell. The Group chief executive officer (CEO) and other executives may attend remuneration committee meetings by invitation, but do not vote, and are not present when their own remuneration is discussed.
The remuneration committee had four meetings during the year and the committee composition and attendance is reflected on page 73.
The terms of reference of the remuneration committee is reviewed annually and include, among others, the following responsibilities:
− Ensuring that an appropriate comparator group is selected when comparing remuneration levels.
− Reviewing and approving short- and long-term incentive plans, including the hurdle-rate of the long-term incentive and targets of the annual incentive plan.
− Satisfying itself with regards to the accuracy of recorded performance measures that govern the vesting of shares or other incentives.
− Considering and recommending material changes to contracts of employment, as well as retention and termination policies and procedures.
− Reviewing and approving the individual remuneration levels of the CEO, and other executives who report directly to the CEO.
− Reviewing and recommending to the board the fees for the non-executive directors (NEDs), including independent NEDs, for shareholder approval at the AGM.
The remuneration committee’s full terms of reference are available on: https://www.distell.co.za/corporate-governance/.
During the year the remuneration committee received advice from PwC on remuneration matters, including benchmarking and remuneration reporting. The committee is satisfied that PwC’s work was conducted objectively and independently.
REMUNERATION REPORT
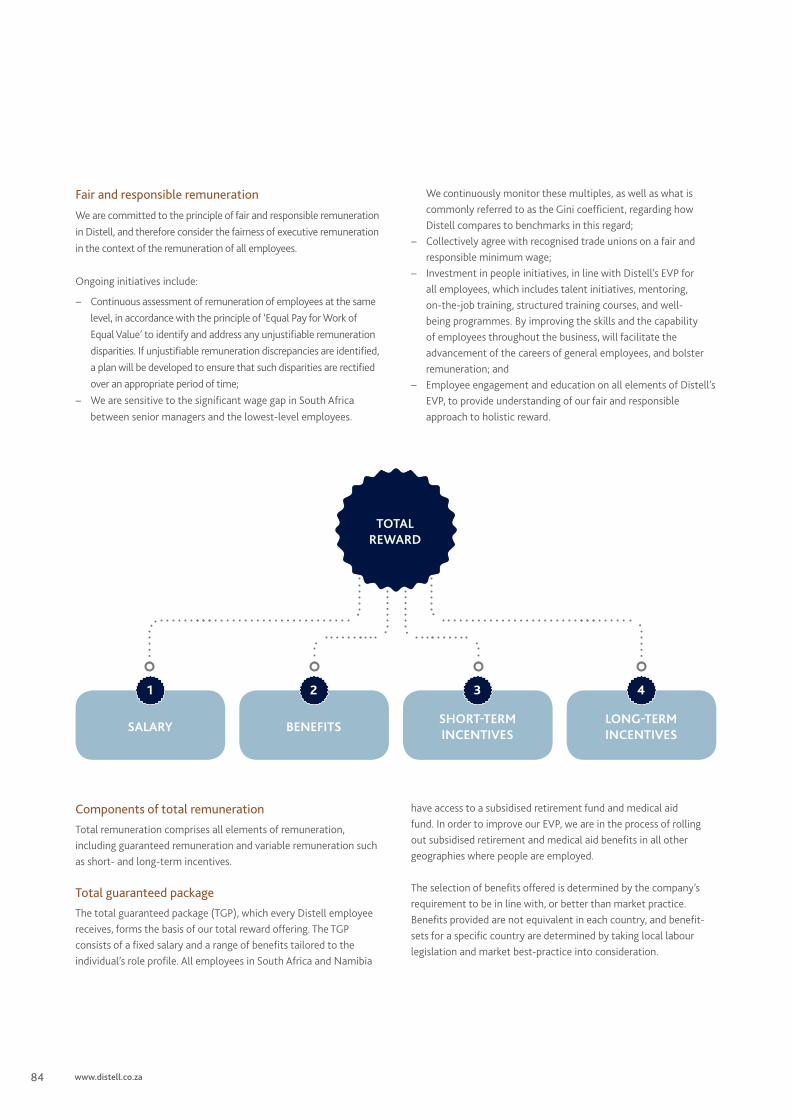
84 www.distell.co.za
Fair and responsible remuneration
We are committed to the principle of fair and responsible remuneration in Distell, and therefore consider the fairness of executive remuneration in the context of the remuneration of all employees.
Ongoing initiatives include:
− Continuous assessment of remuneration of employees at the same level, in accordance with the principle of ‘Equal Pay for Work of Equal Value’ to identify and address any unjustifiable remuneration disparities. If unjustifiable remuneration discrepancies are identified, a plan will be developed to ensure that such disparities are rectified over an appropriate period of time;
− We are sensitive to the significant wage gap in South Africa between senior managers and the lowest-level employees.
We continuously monitor these multiples, as well as what is commonly referred to as the Gini coefficient, regarding how Distell compares to benchmarks in this regard;
− Collectively agree with recognised trade unions on a fair and responsible minimum wage;
− Investment in people initiatives, in line with Distell’s EVP for all employees, which includes talent initiatives, mentoring, on-the-job training, structured training courses, and well-being programmes. By improving the skills and the capability of employees throughout the business, will facilitate the advancement of the careers of general employees, and bolster remuneration; and
− Employee engagement and education on all elements of Distell’s EVP, to provide understanding of our fair and responsible approach to holistic reward.
Components of total remunerationTotal remuneration comprises all elements of remuneration, including guaranteed remuneration and variable remuneration such as short- and long-term incentives.
Total guaranteed package The total guaranteed package (TGP), which every Distell employee receives, forms the basis of our total reward offering. The TGP consists of a fixed salary and a range of benefits tailored to the individual’s role profile. All employees in South Africa and Namibia
SALARYSHORT-TERM INCENTIVES
BENEFITSLONG-TERM INCENTIVES
1 2 3 4
TOTAL REWARD
have access to a subsidised retirement fund and medical aid fund. In order to improve our EVP, we are in the process of rolling out subsidised retirement and medical aid benefits in all other geographies where people are employed.
The selection of benefits offered is determined by the company’s requirement to be in line with, or better than market practice. Benefits provided are not equivalent in each country, and benefit-sets for a specific country are determined by taking local labour legislation and market best-practice into consideration.
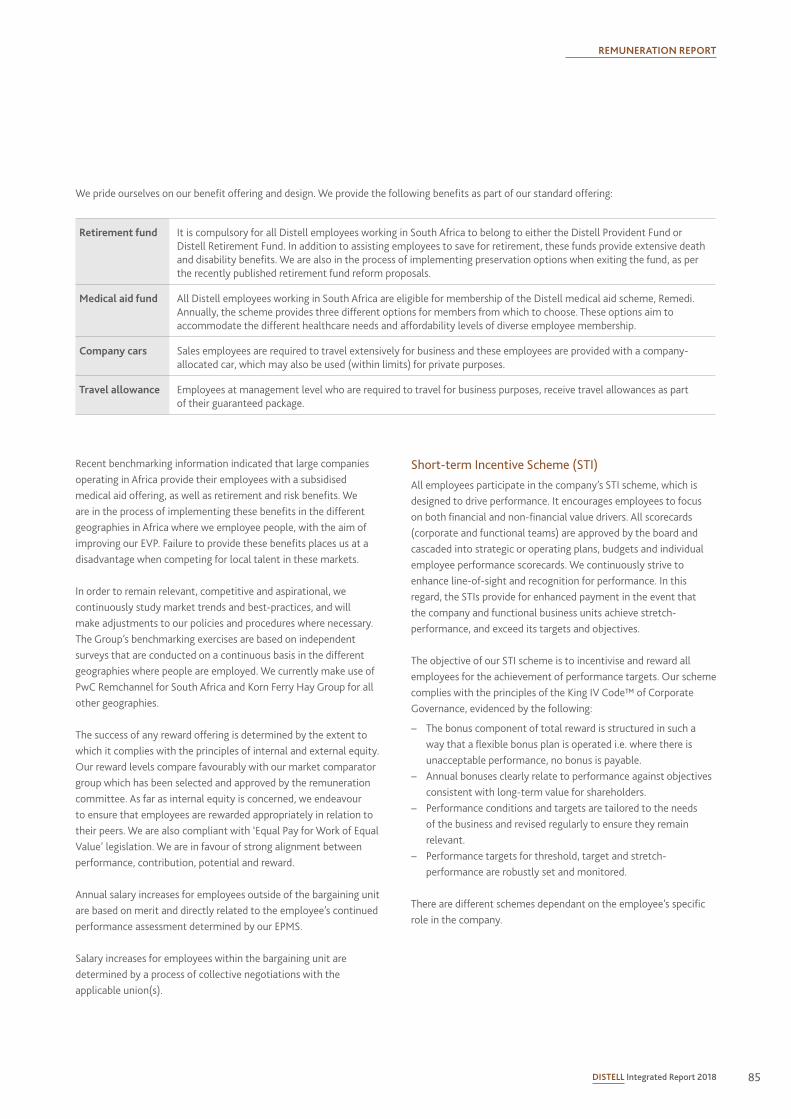
85DISTELL Integrated Report 2018
We pride ourselves on our benefit offering and design. We provide the following benefits as part of our standard offering:
Retirement fund It is compulsory for all Distell employees working in South Africa to belong to either the Distell Provident Fund or Distell Retirement Fund. In addition to assisting employees to save for retirement, these funds provide extensive death and disability benefits. We are also in the process of implementing preservation options when exiting the fund, as per the recently published retirement fund reform proposals.
Medical aid fund All Distell employees working in South Africa are eligible for membership of the Distell medical aid scheme, Remedi. Annually, the scheme provides three different options for members from which to choose. These options aim to accommodate the different healthcare needs and affordability levels of diverse employee membership.
Company cars Sales employees are required to travel extensively for business and these employees are provided with a company-allocated car, which may also be used (within limits) for private purposes.
Travel allowance Employees at management level who are required to travel for business purposes, receive travel allowances as part of their guaranteed package.
Recent benchmarking information indicated that large companies operating in Africa provide their employees with a subsidised medical aid offering, as well as retirement and risk benefits. We are in the process of implementing these benefits in the different geographies in Africa where we employee people, with the aim of improving our EVP. Failure to provide these benefits places us at a disadvantage when competing for local talent in these markets.
In order to remain relevant, competitive and aspirational, we continuously study market trends and best-practices, and will make adjustments to our policies and procedures where necessary. The Group’s benchmarking exercises are based on independent surveys that are conducted on a continuous basis in the different geographies where people are employed. We currently make use of PwC Remchannel for South Africa and Korn Ferry Hay Group for all other geographies.
The success of any reward offering is determined by the extent to which it complies with the principles of internal and external equity. Our reward levels compare favourably with our market comparator group which has been selected and approved by the remuneration committee. As far as internal equity is concerned, we endeavour to ensure that employees are rewarded appropriately in relation to their peers. We are also compliant with ‘Equal Pay for Work of Equal Value’ legislation. We are in favour of strong alignment between performance, contribution, potential and reward.
Annual salary increases for employees outside of the bargaining unit are based on merit and directly related to the employee’s continued performance assessment determined by our EPMS.
Salary increases for employees within the bargaining unit are determined by a process of collective negotiations with the applicable union(s).
Short-term Incentive Scheme (STI)All employees participate in the company’s STI scheme, which is designed to drive performance. It encourages employees to focus on both financial and non-financial value drivers. All scorecards (corporate and functional teams) are approved by the board and cascaded into strategic or operating plans, budgets and individual employee performance scorecards. We continuously strive to enhance line-of-sight and recognition for performance. In this regard, the STIs provide for enhanced payment in the event that the company and functional business units achieve stretch- performance, and exceed its targets and objectives.
The objective of our STI scheme is to incentivise and reward all employees for the achievement of performance targets. Our scheme complies with the principles of the King IV Code™ of Corporate Governance, evidenced by the following:
− The bonus component of total reward is structured in such a way that a flexible bonus plan is operated i.e. where there is unacceptable performance, no bonus is payable.
− Annual bonuses clearly relate to performance against objectives consistent with long-term value for shareholders.
− Performance conditions and targets are tailored to the needs of the business and revised regularly to ensure they remain relevant.
− Performance targets for threshold, target and stretch-performance are robustly set and monitored.
There are different schemes dependant on the employee’s specific role in the company.
REMUNERATION REPORT
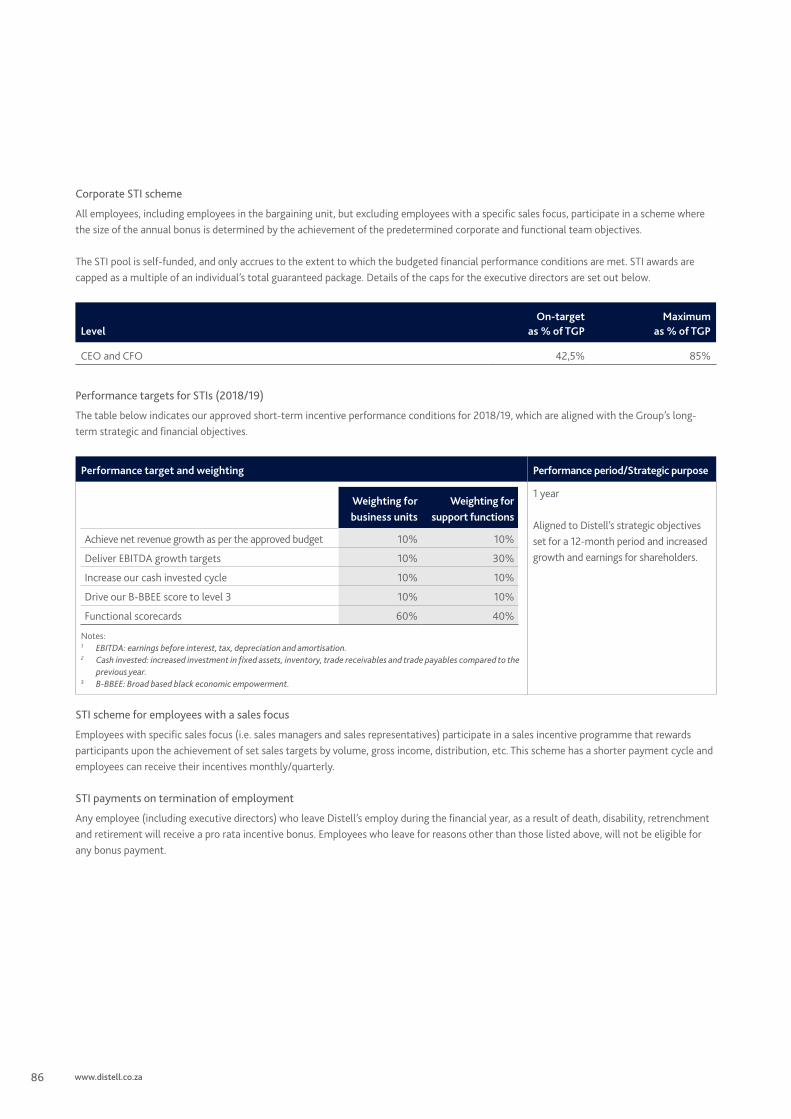
86 www.distell.co.za
Corporate STI scheme
All employees, including employees in the bargaining unit, but excluding employees with a specific sales focus, participate in a scheme where the size of the annual bonus is determined by the achievement of the predetermined corporate and functional team objectives.
The STI pool is self-funded, and only accrues to the extent to which the budgeted financial performance conditions are met. STI awards are capped as a multiple of an individual’s total guaranteed package. Details of the caps for the executive directors are set out below.
LevelOn-target
as % of TGPMaximum
as % of TGP
CEO and CFO 42,5% 85%
Performance targets for STIs (2018/19)
The table below indicates our approved short-term incentive performance conditions for 2018/19, which are aligned with the Group’s long-term strategic and financial objectives.
Performance target and weighting Performance period/Strategic purpose
Weighting for business units
Weighting for support functions
Achieve net revenue growth as per the approved budget 10% 10%
Deliver EBITDA growth targets 10% 30%
Increase our cash invested cycle 10% 10%
Drive our B-BBEE score to level 3 10% 10%
Functional scorecards 60% 40%
Notes:1 EBITDA: earnings before interest, tax, depreciation and amortisation.2 Cash invested: increased investment in fixed assets, inventory, trade receivables and trade payables compared to the
previous year.3 B-BBEE: Broad based black economic empowerment.
1 year
Aligned to Distell’s strategic objectives set for a 12-month period and increased growth and earnings for shareholders.
STI scheme for employees with a sales focus
Employees with specific sales focus (i.e. sales managers and sales representatives) participate in a sales incentive programme that rewards participants upon the achievement of set sales targets by volume, gross income, distribution, etc. This scheme has a shorter payment cycle and employees can receive their incentives monthly/quarterly.
STI payments on termination of employment
Any employee (including executive directors) who leave Distell’s employ during the financial year, as a result of death, disability, retrenchment and retirement will receive a pro rata incentive bonus. Employees who leave for reasons other than those listed above, will not be eligible for any bonus payment.
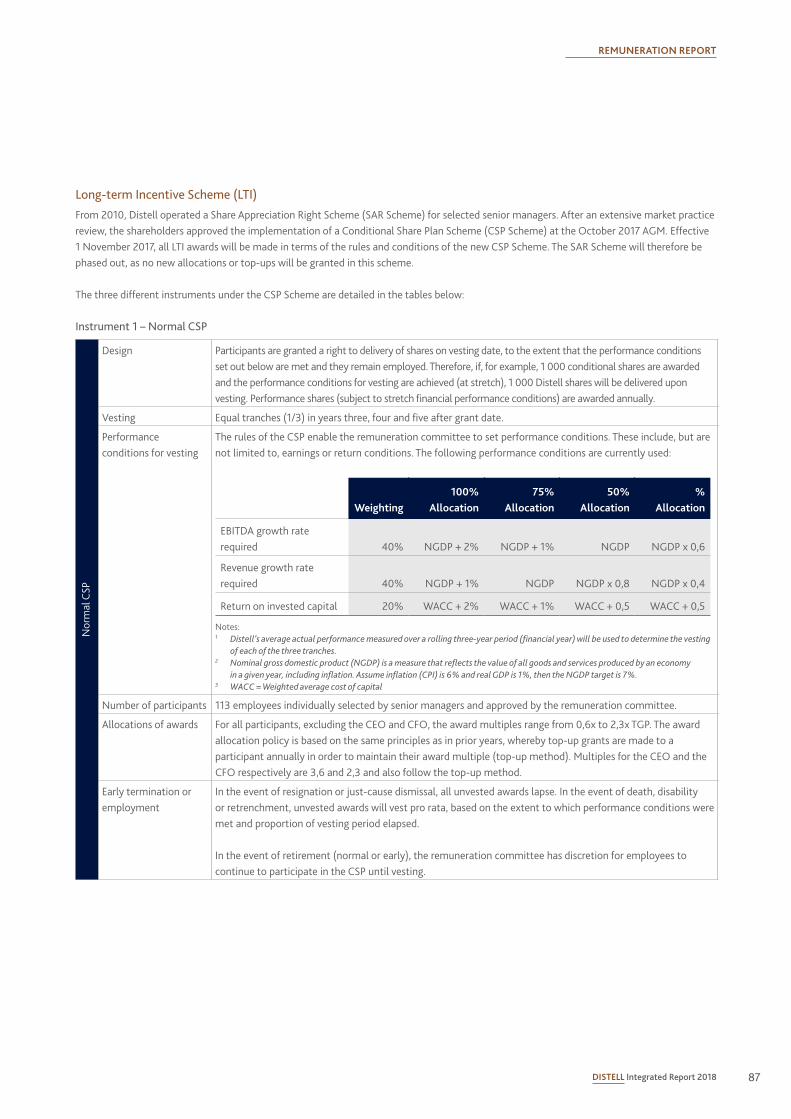
87DISTELL Integrated Report 2018
Long-term Incentive Scheme (LTI)From 2010, Distell operated a Share Appreciation Right Scheme (SAR Scheme) for selected senior managers. After an extensive market practice review, the shareholders approved the implementation of a Conditional Share Plan Scheme (CSP Scheme) at the October 2017 AGM. Effective 1 November 2017, all LTI awards will be made in terms of the rules and conditions of the new CSP Scheme. The SAR Scheme will therefore be phased out, as no new allocations or top-ups will be granted in this scheme.
The three different instruments under the CSP Scheme are detailed in the tables below:
Instrument 1 – Normal CSP
Nor
mal
CSP
Design Participants are granted a right to delivery of shares on vesting date, to the extent that the performance conditions set out below are met and they remain employed. Therefore, if, for example, 1 000 conditional shares are awarded and the performance conditions for vesting are achieved (at stretch), 1 000 Distell shares will be delivered upon vesting. Performance shares (subject to stretch financial performance conditions) are awarded annually.
Vesting Equal tranches (1/3) in years three, four and five after grant date.
Performance conditions for vesting
The rules of the CSP enable the remuneration committee to set performance conditions. These include, but are not limited to, earnings or return conditions. The following performance conditions are currently used:
Weighting100%
Allocation75%
Allocation50%
Allocation%
Allocation
EBITDA growth rate required 40% NGDP + 2% NGDP + 1% NGDP NGDP x 0,6
Revenue growth rate required 40% NGDP + 1% NGDP NGDP x 0,8 NGDP x 0,4
Return on invested capital 20% WACC + 2% WACC + 1% WACC + 0,5 WACC + 0,5
Notes:1 Distell’s average actual performance measured over a rolling three-year period (financial year) will be used to determine the vesting
of each of the three tranches.2 Nominal gross domestic product (NGDP) is a measure that reflects the value of all goods and services produced by an economy
in a given year, including inflation. Assume inflation (CPI) is 6% and real GDP is 1%, then the NGDP target is 7%.3 WACC = Weighted average cost of capital
Number of participants 113 employees individually selected by senior managers and approved by the remuneration committee.
Allocations of awards For all participants, excluding the CEO and CFO, the award multiples range from 0,6x to 2,3x TGP. The award allocation policy is based on the same principles as in prior years, whereby top-up grants are made to a participant annually in order to maintain their award multiple (top-up method). Multiples for the CEO and the CFO respectively are 3,6 and 2,3 and also follow the top-up method.
Early termination or employment
In the event of resignation or just-cause dismissal, all unvested awards lapse. In the event of death, disability or retrenchment, unvested awards will vest pro rata, based on the extent to which performance conditions were met and proportion of vesting period elapsed.
In the event of retirement (normal or early), the remuneration committee has discretion for employees to continue to participate in the CSP until vesting.
REMUNERATION REPORT
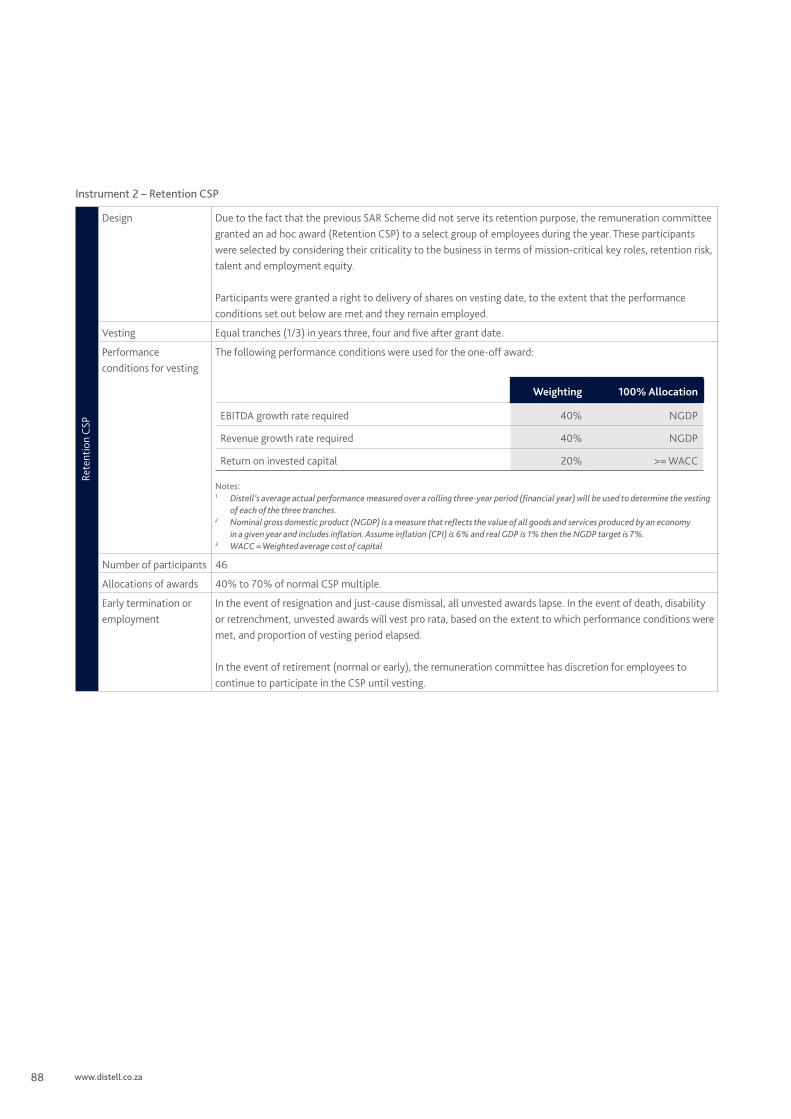
88 www.distell.co.za
Instrument 2 – Retention CSP
Rete
ntio
n CS
P
Design Due to the fact that the previous SAR Scheme did not serve its retention purpose, the remuneration committee granted an ad hoc award (Retention CSP) to a select group of employees during the year. These participants were selected by considering their criticality to the business in terms of mission-critical key roles, retention risk, talent and employment equity.
Participants were granted a right to delivery of shares on vesting date, to the extent that the performance conditions set out below are met and they remain employed.
Vesting Equal tranches (1/3) in years three, four and five after grant date.
Performance conditions for vesting
The following performance conditions were used for the one-off award:
Weighting 100% Allocation
EBITDA growth rate required 40% NGDP
Revenue growth rate required 40% NGDP
Return on invested capital 20% >= WACC
Notes: 1 Distell’s average actual performance measured over a rolling three-year period (financial year) will be used to determine the vesting
of each of the three tranches. 2 Nominal gross domestic product (NGDP) is a measure that reflects the value of all goods and services produced by an economy
in a given year and includes inflation. Assume inflation (CPI) is 6% and real GDP is 1% then the NGDP target is 7%.3 WACC = Weighted average cost of capital
Number of participants 46
Allocations of awards 40% to 70% of normal CSP multiple.
Early termination or employment
In the event of resignation and just-cause dismissal, all unvested awards lapse. In the event of death, disability or retrenchment, unvested awards will vest pro rata, based on the extent to which performance conditions were met, and proportion of vesting period elapsed.
In the event of retirement (normal or early), the remuneration committee has discretion for employees to continue to participate in the CSP until vesting.
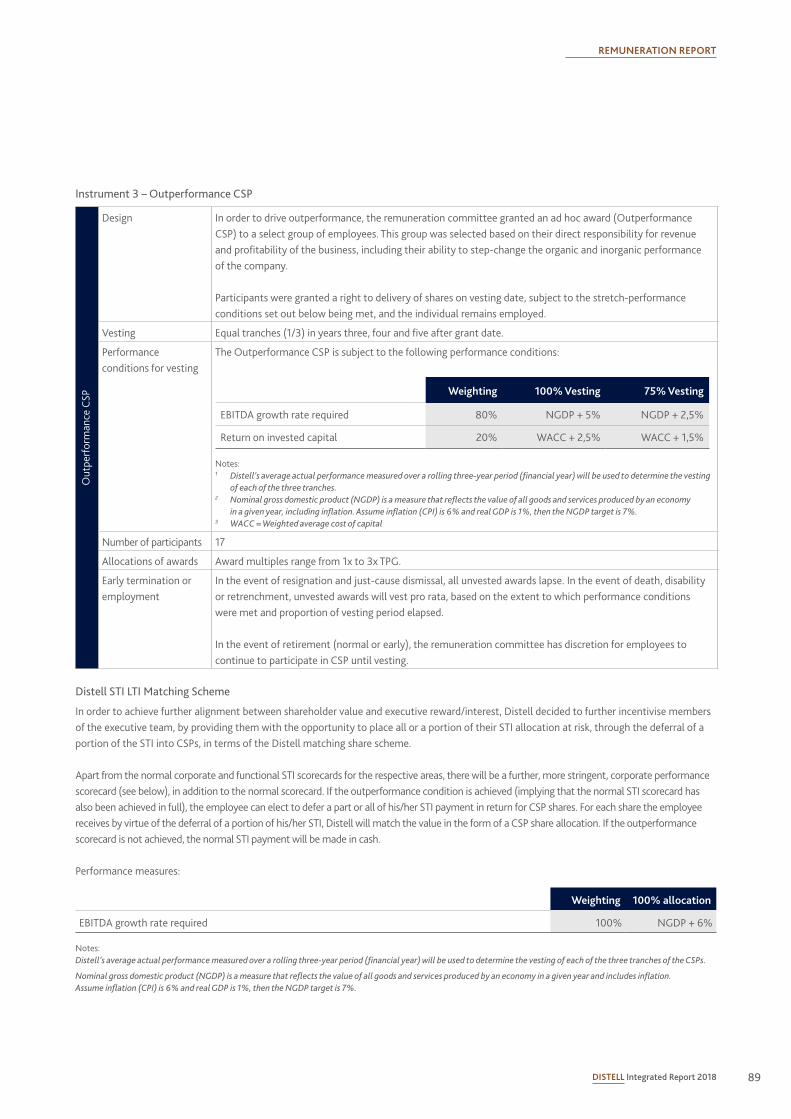
89DISTELL Integrated Report 2018
Instrument 3 – Outperformance CSP
Out
perf
orm
ance
CSP
Design In order to drive outperformance, the remuneration committee granted an ad hoc award (Outperformance CSP) to a select group of employees. This group was selected based on their direct responsibility for revenue and profitability of the business, including their ability to step-change the organic and inorganic performance of the company.
Participants were granted a right to delivery of shares on vesting date, subject to the stretch-performance conditions set out below being met, and the individual remains employed.
Vesting Equal tranches (1/3) in years three, four and five after grant date.
Performance conditions for vesting
The Outperformance CSP is subject to the following performance conditions:
Weighting 100% Vesting 75% Vesting
EBITDA growth rate required 80% NGDP + 5% NGDP + 2,5%
Return on invested capital 20% WACC + 2,5% WACC + 1,5%
Notes: 1 Distell’s average actual performance measured over a rolling three-year period (financial year) will be used to determine the vesting
of each of the three tranches. 2 Nominal gross domestic product (NGDP) is a measure that reflects the value of all goods and services produced by an economy
in a given year, including inflation. Assume inflation (CPI) is 6% and real GDP is 1%, then the NGDP target is 7%.3 WACC = Weighted average cost of capital
Number of participants 17
Allocations of awards Award multiples range from 1x to 3x TPG.
Early termination or employment
In the event of resignation and just-cause dismissal, all unvested awards lapse. In the event of death, disability or retrenchment, unvested awards will vest pro rata, based on the extent to which performance conditions were met and proportion of vesting period elapsed.
In the event of retirement (normal or early), the remuneration committee has discretion for employees to continue to participate in CSP until vesting.
Distell STI LTI Matching Scheme
In order to achieve further alignment between shareholder value and executive reward/interest, Distell decided to further incentivise members of the executive team, by providing them with the opportunity to place all or a portion of their STI allocation at risk, through the deferral of a portion of the STI into CSPs, in terms of the Distell matching share scheme.
Apart from the normal corporate and functional STI scorecards for the respective areas, there will be a further, more stringent, corporate performance scorecard (see below), in addition to the normal scorecard. If the outperformance condition is achieved (implying that the normal STI scorecard has also been achieved in full), the employee can elect to defer a part or all of his/her STI payment in return for CSP shares. For each share the employee receives by virtue of the deferral of a portion of his/her STI, Distell will match the value in the form of a CSP share allocation. If the outperformance scorecard is not achieved, the normal STI payment will be made in cash.
Performance measures:
Weighting 100% allocation
EBITDA growth rate required 100% NGDP + 6%
Notes:Distell’s average actual performance measured over a rolling three-year period (financial year) will be used to determine the vesting of each of the three tranches of the CSPs.
Nominal gross domestic product (NGDP) is a measure that reflects the value of all goods and services produced by an economy in a given year and includes inflation. Assume inflation (CPI) is 6% and real GDP is 1%, then the NGDP target is 7%.
REMUNERATION REPORT
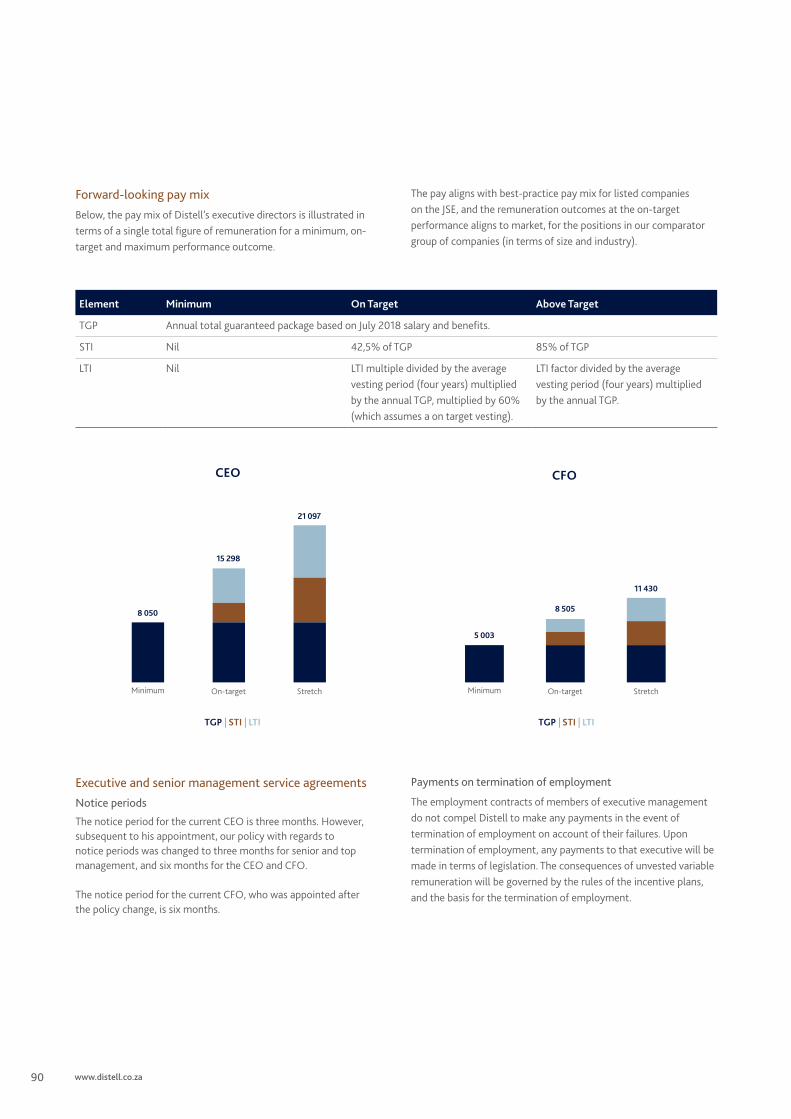
90 www.distell.co.za
CEO
TGP | STI | LTI
Minimum On-target Stretch
8 050
15 298
21 097
CFO
TGP | STI | LTI
Minimum On-target Stretch
5 003
8 505
11 430
Forward-looking pay mixBelow, the pay mix of Distell’s executive directors is illustrated in terms of a single total figure of remuneration for a minimum, on-target and maximum performance outcome.
Executive and senior management service agreementsNotice periods
The notice period for the current CEO is three months. However, subsequent to his appointment, our policy with regards to notice periods was changed to three months for senior and top management, and six months for the CEO and CFO.
The notice period for the current CFO, who was appointed after the policy change, is six months.
Payments on termination of employment
The employment contracts of members of executive management do not compel Distell to make any payments in the event of termination of employment on account of their failures. Upon termination of employment, any payments to that executive will be made in terms of legislation. The consequences of unvested variable remuneration will be governed by the rules of the incentive plans, and the basis for the termination of employment.
The pay aligns with best-practice pay mix for listed companies on the JSE, and the remuneration outcomes at the on-target performance aligns to market, for the positions in our comparator group of companies (in terms of size and industry).
Element Minimum On Target Above Target
TGP Annual total guaranteed package based on July 2018 salary and benefits.
STI Nil 42,5% of TGP 85% of TGP
LTI Nil LTI multiple divided by the average vesting period (four years) multiplied by the annual TGP, multiplied by 60% (which assumes a on target vesting).
LTI factor divided by the average vesting period (four years) multiplied by the annual TGP.
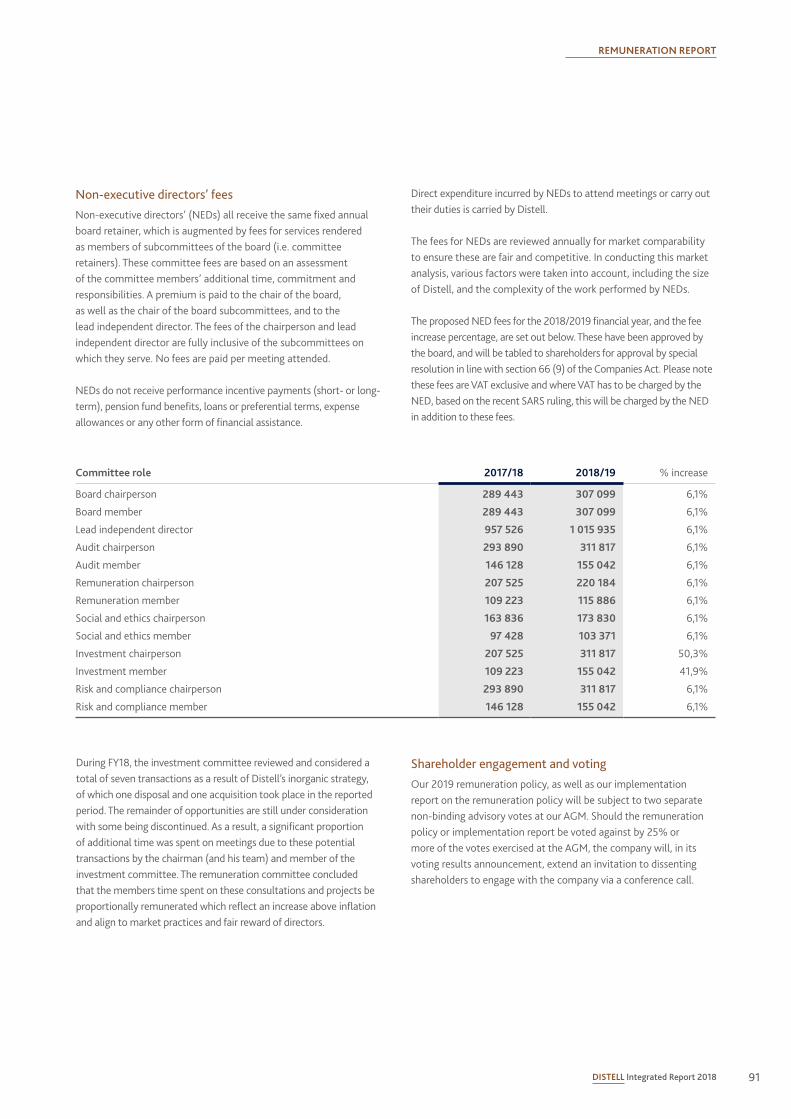
91DISTELL Integrated Report 2018
Non-executive directors’ feesNon-executive directors’ (NEDs) all receive the same fixed annual board retainer, which is augmented by fees for services rendered as members of subcommittees of the board (i.e. committee retainers). These committee fees are based on an assessment of the committee members’ additional time, commitment and responsibilities. A premium is paid to the chair of the board, as well as the chair of the board subcommittees, and to the lead independent director. The fees of the chairperson and lead independent director are fully inclusive of the subcommittees on which they serve. No fees are paid per meeting attended.
NEDs do not receive performance incentive payments (short- or long-term), pension fund benefits, loans or preferential terms, expense allowances or any other form of financial assistance.
Direct expenditure incurred by NEDs to attend meetings or carry out their duties is carried by Distell.
The fees for NEDs are reviewed annually for market comparability to ensure these are fair and competitive. In conducting this market analysis, various factors were taken into account, including the size of Distell, and the complexity of the work performed by NEDs.
The proposed NED fees for the 2018/2019 financial year, and the fee increase percentage, are set out below. These have been approved by the board, and will be tabled to shareholders for approval by special resolution in line with section 66 (9) of the Companies Act. Please note these fees are VAT exclusive and where VAT has to be charged by the NED, based on the recent SARS ruling, this will be charged by the NED in addition to these fees.
Committee role 2017/18 2018/19 % increase
Board chairperson 289 443 307 099 6,1%
Board member 289 443 307 099 6,1%
Lead independent director 957 526 1 015 935 6,1%
Audit chairperson 293 890 311 817 6,1%
Audit member 146 128 155 042 6,1%
Remuneration chairperson 207 525 220 184 6,1%
Remuneration member 109 223 115 886 6,1%
Social and ethics chairperson 163 836 173 830 6,1%
Social and ethics member 97 428 103 371 6,1%
Investment chairperson 207 525 311 817 50,3%
Investment member 109 223 155 042 41,9%
Risk and compliance chairperson 293 890 311 817 6,1%
Risk and compliance member 146 128 155 042 6,1%
During FY18, the investment committee reviewed and considered a total of seven transactions as a result of Distell’s inorganic strategy, of which one disposal and one acquisition took place in the reported period. The remainder of opportunities are still under consideration with some being discontinued. As a result, a significant proportion of additional time was spent on meetings due to these potential transactions by the chairman (and his team) and member of the investment committee. The remuneration committee concluded that the members time spent on these consultations and projects be proportionally remunerated which reflect an increase above inflation and align to market practices and fair reward of directors.
Shareholder engagement and votingOur 2019 remuneration policy, as well as our implementation report on the remuneration policy will be subject to two separate non-binding advisory votes at our AGM. Should the remuneration policy or implementation report be voted against by 25% or more of the votes exercised at the AGM, the company will, in its voting results announcement, extend an invitation to dissenting shareholders to engage with the company via a conference call.
REMUNERATION REPORT
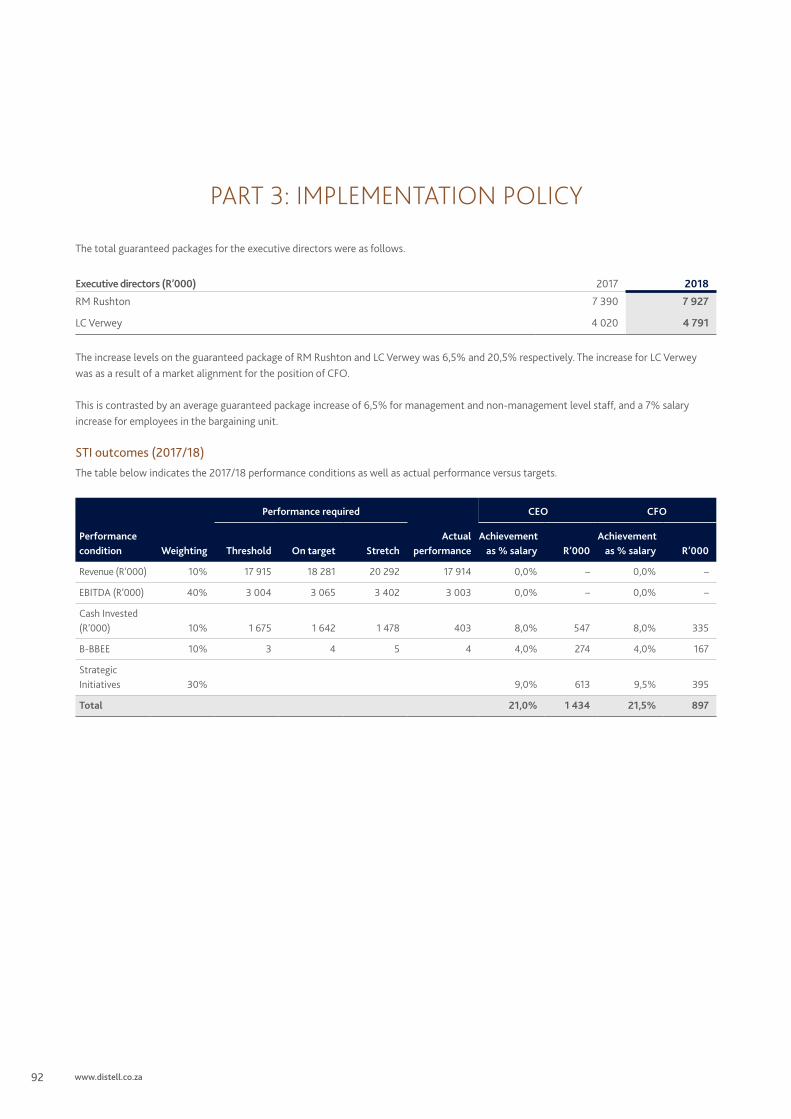
92 www.distell.co.za
The total guaranteed packages for the executive directors were as follows.
Executive directors (R’000) 2017 2018
RM Rushton 7 390 7 927
LC Verwey 4 020 4 791
The increase levels on the guaranteed package of RM Rushton and LC Verwey was 6,5% and 20,5% respectively. The increase for LC Verwey was as a result of a market alignment for the position of CFO.
This is contrasted by an average guaranteed package increase of 6,5% for management and non-management level staff, and a 7% salary increase for employees in the bargaining unit.
STI outcomes (2017/18)The table below indicates the 2017/18 performance conditions as well as actual performance versus targets.
Performance condition Weighting
Performance required CEO CFO
Threshold On target StretchActual
performanceAchievement
as % salary R’000Achievement
as % salary R’000
Revenue (R’000) 10% 17 915 18 281 20 292 17 914 0,0% – 0,0% –
EBITDA (R’000) 40% 3 004 3 065 3 402 3 003 0,0% – 0,0% –
Cash Invested (R’000) 10% 1 675 1 642 1 478 403 8,0% 547 8,0% 335
B-BBEE 10% 3 4 5 4 4,0% 274 4,0% 167
Strategic Initiatives 30% 9,0% 613 9,5% 395
Total 21,0% 1 434 21,5% 897
PART 3: IMPLEMENTATION POLICY
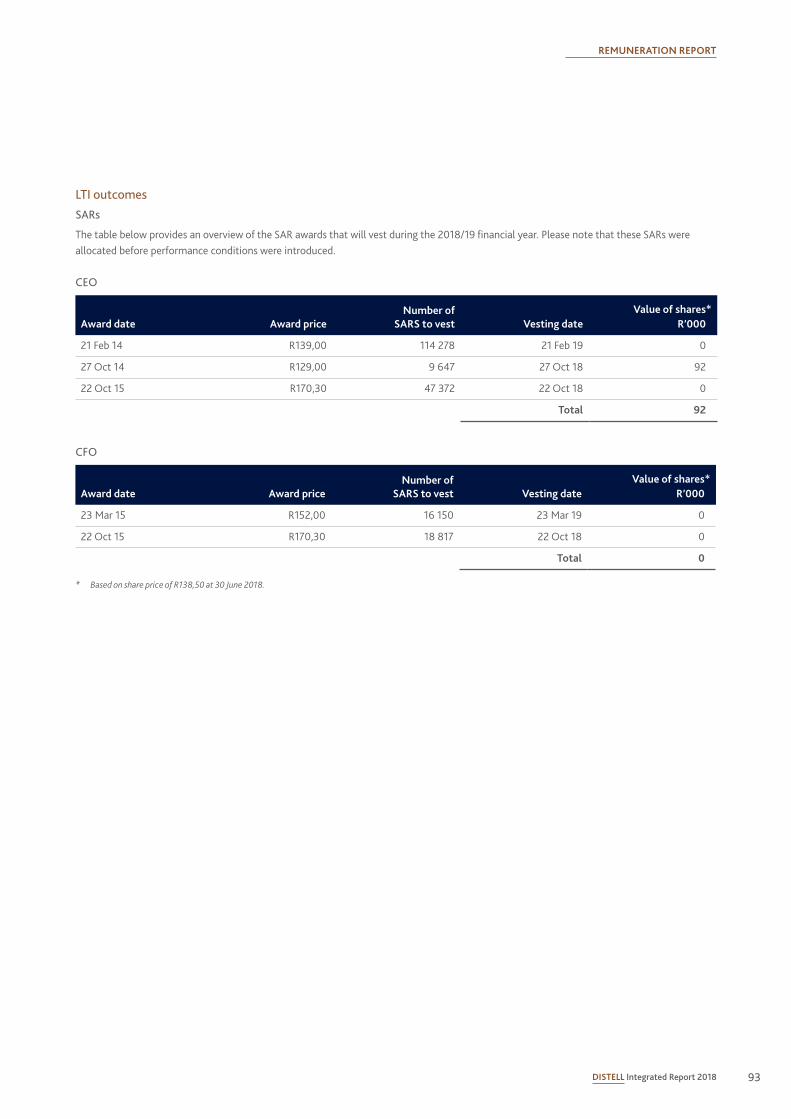
93DISTELL Integrated Report 2018
LTI outcomesSARs
The table below provides an overview of the SAR awards that will vest during the 2018/19 financial year. Please note that these SARs were allocated before performance conditions were introduced.
CEO
Award date Award priceNumber of
SARS to vest Vesting dateValue of shares*
R’000
21 Feb 14 R139,00 114 278 21 Feb 19 0
27 Oct 14 R129,00 9 647 27 Oct 18 92
22 Oct 15 R170,30 47 372 22 Oct 18 0
Total 92
CFO
Award date Award priceNumber of
SARS to vest Vesting dateValue of shares*
R’000
23 Mar 15 R152,00 16 150 23 Mar 19 0
22 Oct 15 R170,30 18 817 22 Oct 18 0
Total 0
* Based on share price of R138,50 at 30 June 2018.
REMUNERATION REPORT
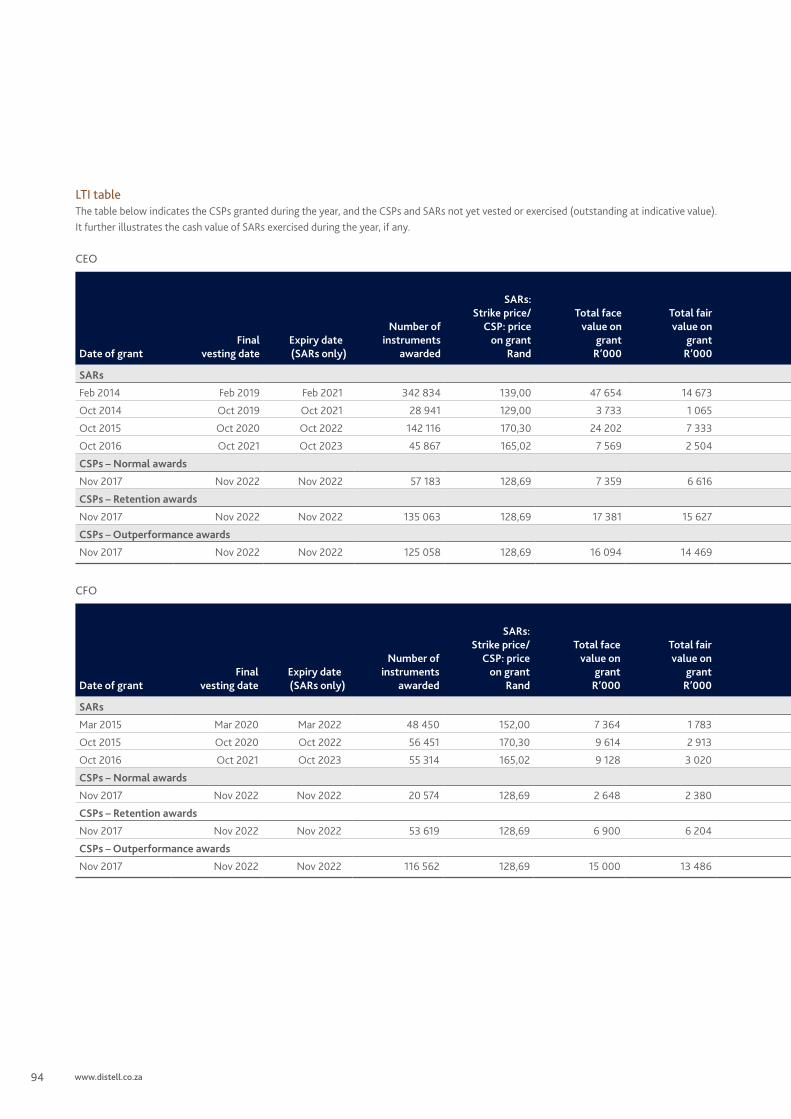
94 www.distell.co.za
LTI tableThe table below indicates the CSPs granted during the year, and the CSPs and SARs not yet vested or exercised (outstanding at indicative value). It further illustrates the cash value of SARs exercised during the year, if any.
CEO
Date of grantFinal
vesting dateExpiry date (SARs only)
Number of instruments
awarded
SARs: Strike price/
CSP: price on grant
Rand
Total face value on
grantR’000
Total fair value on
grantR’000
Number of instruments vested and/
or vested and exercised
Number of instruments
lapsed
Closing number of unvested
and/or vested but unexercised
instruments
Indicative fair value of
unvested and/or unexercised instruments
R’000
Number of awards
exercised/settled in year
Share price on date of
exercise/settlement
Cash value of instruments
exercised/settled in year
SARs
Feb 2014 Feb 2019 Feb 2021 342 834 139,00 47 654 14 673 – – 342 834 7 777 – –
Oct 2014 Oct 2019 Oct 2021 28 941 129,00 3 733 1 065 – – 28 941 510 – –
Oct 2015 Oct 2020 Oct 2022 142 116 170,30 24 202 7 333 – – 142 116 1 875 – –
Oct 2016 Oct 2021 Oct 2023 45 867 165,02 7 569 2 504 – – 45 867 890 – –
CSPs – Normal awards
Nov 2017 Nov 2022 Nov 2022 57 183 128,69 7 359 6 616 – – 57 183 4 631 – –
CSPs – Retention awards
Nov 2017 Nov 2022 Nov 2022 135 063 128,69 17 381 15 627 – – 135 063 12 501 – –
CSPs – Outperformance awards
Nov 2017 Nov 2022 Nov 2022 125 058 128,69 16 094 14 469 – – 125 058 8 682 – –
CFO
Date of grantFinal
vesting dateExpiry date (SARs only)
Number of instruments
awarded
SARs: Strike price/
CSP: price on grant
Rand
Total facevalue on
grantR’000
Total fairvalue on
grantR’000
Number ofinstrumentsvested and/
or vested and exercised
Number ofinstruments
lapsed
Closing number of unvested
and/or vested but unexercised
instruments
Indicativefair value of
unvested and/or unexercised instruments
R’000
Number ofawards
exercised/ settled in year
Share priceon date of
exercise/settlement
Cash valueof instruments
exercised/settled in year
SARs
Mar 2015 Mar 2020 Mar 2022 48 450 152,00 7 364 1 783 – – 48 450 1 154 – –
Oct 2015 Oct 2020 Oct 2022 56 451 170,30 9 614 2 913 – – 56 451 745 – –
Oct 2016 Oct 2021 Oct 2023 55 314 165,02 9 128 3 020 – – 55 314 1 073 – –
CSPs – Normal awards
Nov 2017 Nov 2022 Nov 2022 20 574 128,69 2 648 2 380 – – 20 574 1 666 – –
CSPs – Retention awards
Nov 2017 Nov 2022 Nov 2022 53 619 128,69 6 900 6 204 – – 53 619 4 963 – –
CSPs – Outperformance awards
Nov 2017 Nov 2022 Nov 2022 116 562 128,69 15 000 13 486 – – 116 562 8 092 – –
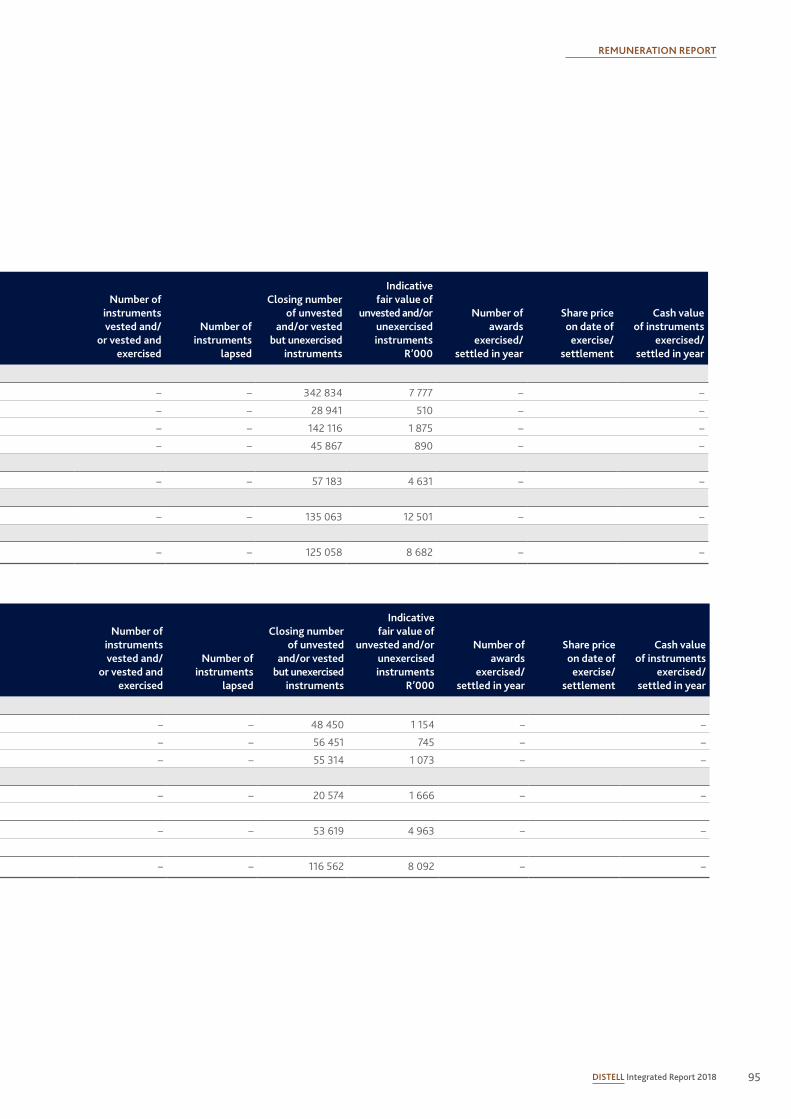
95DISTELL Integrated Report 2018
LTI tableThe table below indicates the CSPs granted during the year, and the CSPs and SARs not yet vested or exercised (outstanding at indicative value). It further illustrates the cash value of SARs exercised during the year, if any.
CEO
Date of grantFinal
vesting dateExpiry date (SARs only)
Number of instruments
awarded
SARs: Strike price/
CSP: price on grant
Rand
Total face value on
grantR’000
Total fair value on
grantR’000
Number of instruments vested and/
or vested and exercised
Number of instruments
lapsed
Closing number of unvested
and/or vested but unexercised
instruments
Indicative fair value of
unvested and/or unexercised instruments
R’000
Number of awards
exercised/settled in year
Share price on date of
exercise/settlement
Cash value of instruments
exercised/settled in year
SARs
Feb 2014 Feb 2019 Feb 2021 342 834 139,00 47 654 14 673 – – 342 834 7 777 – –
Oct 2014 Oct 2019 Oct 2021 28 941 129,00 3 733 1 065 – – 28 941 510 – –
Oct 2015 Oct 2020 Oct 2022 142 116 170,30 24 202 7 333 – – 142 116 1 875 – –
Oct 2016 Oct 2021 Oct 2023 45 867 165,02 7 569 2 504 – – 45 867 890 – –
CSPs – Normal awards
Nov 2017 Nov 2022 Nov 2022 57 183 128,69 7 359 6 616 – – 57 183 4 631 – –
CSPs – Retention awards
Nov 2017 Nov 2022 Nov 2022 135 063 128,69 17 381 15 627 – – 135 063 12 501 – –
CSPs – Outperformance awards
Nov 2017 Nov 2022 Nov 2022 125 058 128,69 16 094 14 469 – – 125 058 8 682 – –
CFO
Date of grantFinal
vesting dateExpiry date (SARs only)
Number of instruments
awarded
SARs: Strike price/
CSP: price on grant
Rand
Total facevalue on
grantR’000
Total fairvalue on
grantR’000
Number ofinstrumentsvested and/
or vested and exercised
Number ofinstruments
lapsed
Closing number of unvested
and/or vested but unexercised
instruments
Indicativefair value of
unvested and/or unexercised instruments
R’000
Number ofawards
exercised/ settled in year
Share priceon date of
exercise/settlement
Cash valueof instruments
exercised/settled in year
SARs
Mar 2015 Mar 2020 Mar 2022 48 450 152,00 7 364 1 783 – – 48 450 1 154 – –
Oct 2015 Oct 2020 Oct 2022 56 451 170,30 9 614 2 913 – – 56 451 745 – –
Oct 2016 Oct 2021 Oct 2023 55 314 165,02 9 128 3 020 – – 55 314 1 073 – –
CSPs – Normal awards
Nov 2017 Nov 2022 Nov 2022 20 574 128,69 2 648 2 380 – – 20 574 1 666 – –
CSPs – Retention awards
Nov 2017 Nov 2022 Nov 2022 53 619 128,69 6 900 6 204 – – 53 619 4 963 – –
CSPs – Outperformance awards
Nov 2017 Nov 2022 Nov 2022 116 562 128,69 15 000 13 486 – – 116 562 8 092 – –
REMUNERATION REPORT
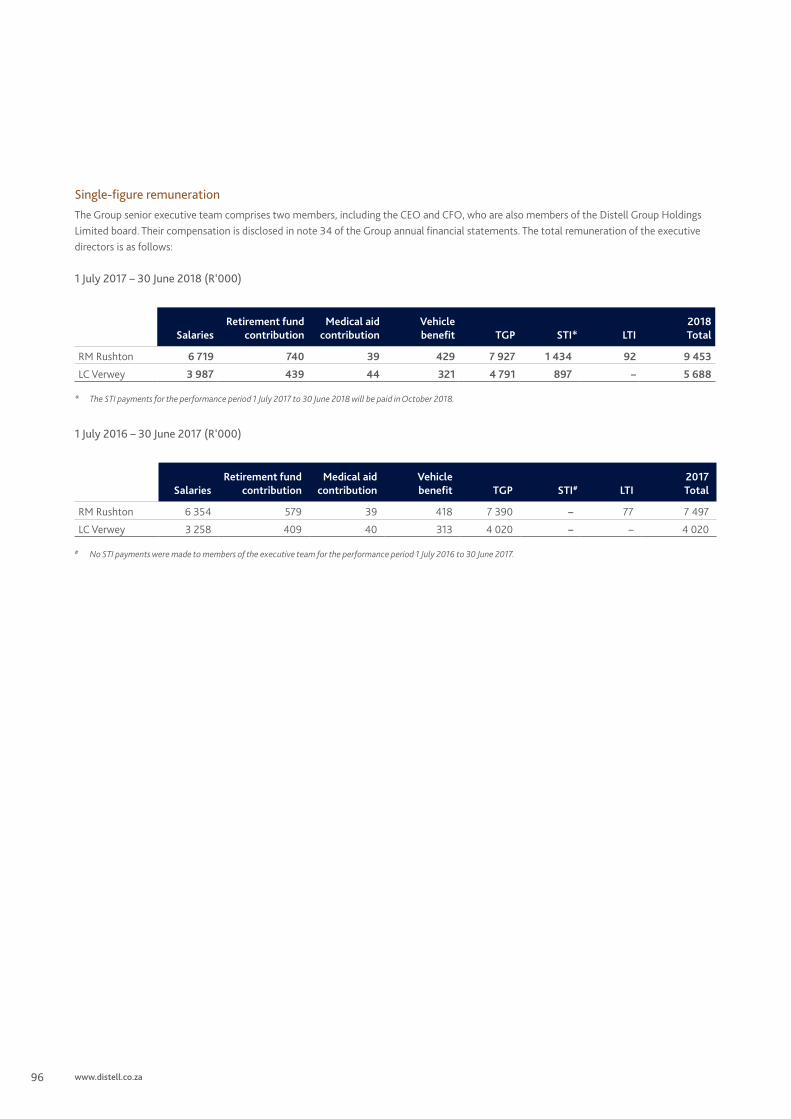
96 www.distell.co.za
Single-figure remunerationThe Group senior executive team comprises two members, including the CEO and CFO, who are also members of the Distell Group Holdings Limited board. Their compensation is disclosed in note 34 of the Group annual financial statements. The total remuneration of the executive directors is as follows:
1 July 2017 – 30 June 2018 (R‘000)
SalariesRetirement fund
contribution Medical aid
contributionVehiclebenefit TGP STI* LTI
2018Total
RM Rushton 6 719 740 39 429 7 927 1 434 92 9 453
LC Verwey 3 987 439 44 321 4 791 897 – 5 688
* The STI payments for the performance period 1 July 2017 to 30 June 2018 will be paid in October 2018.
1 July 2016 – 30 June 2017 (R‘000)
SalariesRetirement fund
contribution Medical aid
contributionVehiclebenefit TGP STI# LTI
2017Total
RM Rushton 6 354 579 39 418 7 390 – 77 7 497
LC Verwey 3 258 409 40 313 4 020 – – 4 020
# No STI payments were made to members of the executive team for the performance period 1 July 2016 to 30 June 2017.

97DISTELL Integrated Report 2018
REMUNERATION REPORT
98 www.distell.co.za
REPORT
R I S K
PROACTIVELY MANAGING RISK The board of directors is ultimately accountable for the risk management process, which includes a comprehensive risk management system that incorporates continual risk assessment, evaluation and embedding of internal controls. The risk and compliance committee provides oversight of Distell’s risk management processes as well as information technology governance, legal and other regulatory compliance.
The board appreciates that the Group is exposed to certain risks as it operates in the fast-moving consumer goods industry across the African continent and 77 other countries. Risk management involves achieving an appropriate balance between realising opportunities for gains and minimising adverse impacts. Enterprise Risk Management (ERM) is a key tool in optimising enterprise value and protecting stakeholder interests.
The committee is chaired by an independent, non-executive director and it operates under a board-approved charter, which was reviewed during the year for compliance with King IV™. The committee comprises five non-executive directors, four of whom are independent. The CEO and Bridgitte Backman, who is responsible for corporate and regulatory affairs on the executive committee, are members. The chairperson of the audit committee is also a member of this committee. Other executives as well as experts may attend the meetings by invitation. The chief risk officer is separate from the chief audit executive. The committee meets once every quarter.
For full details of the members’ qualifications and experience, please refer to their CVs on pages 64 and 68 and to page 73 for meeting attendance.
OUR FRAMEWORK The responsibility and accountability for implementation of risk management rest with all levels of management and employees. Our ERM policy and framework provide a basis for management to deal effectively with the uncertainty of associated risks and opportunities, thereby enhancing its capacity to build value. The risk management activities in the framework are based on the principles of King IV™ and ISO 31000.
RISK MANAGEMENT PRINCIPLES Risk appetite and risk tolerance levelsRisk appetite can be defined as the amount and type of risk an organisation is willing to take to meet its strategic objectives. Risk tolerance is the willingness of an organisation to accept or avoid risk.
Distell’s risk appetite and tolerance levels are reviewed annually and submitted to the board for approval. The board approves specific risk tolerance and appetite levels for each category of risk. These categories include revenue growth, earnings sustainability, brand protection, corporate reputation, environmental sustainability and protection, and health and safety, among others.All significant business decisions are risk based, with formal consideration of the implications for the organisation’s risk profile.
The annual work plan The risk management plan includes a ‘risk calendar’ or ‘work plan’ that documents the year’s scheduled risk activities and initiatives to mature the risk management process. This work plan is approved by the committee and forms part of its charter.
Functional risk registers Each function and business unit within the Group is responsible for creating, updating and mitigating its risk register. Each unit assigns an owner to the register and each risk has an owner and action owner. The risk-rating matrix is used to determine the severity of the risk. This matrix has detailed descriptions of likelihood and impact criteria and serves as a basis for each unit to conduct its annual review of the risk register.
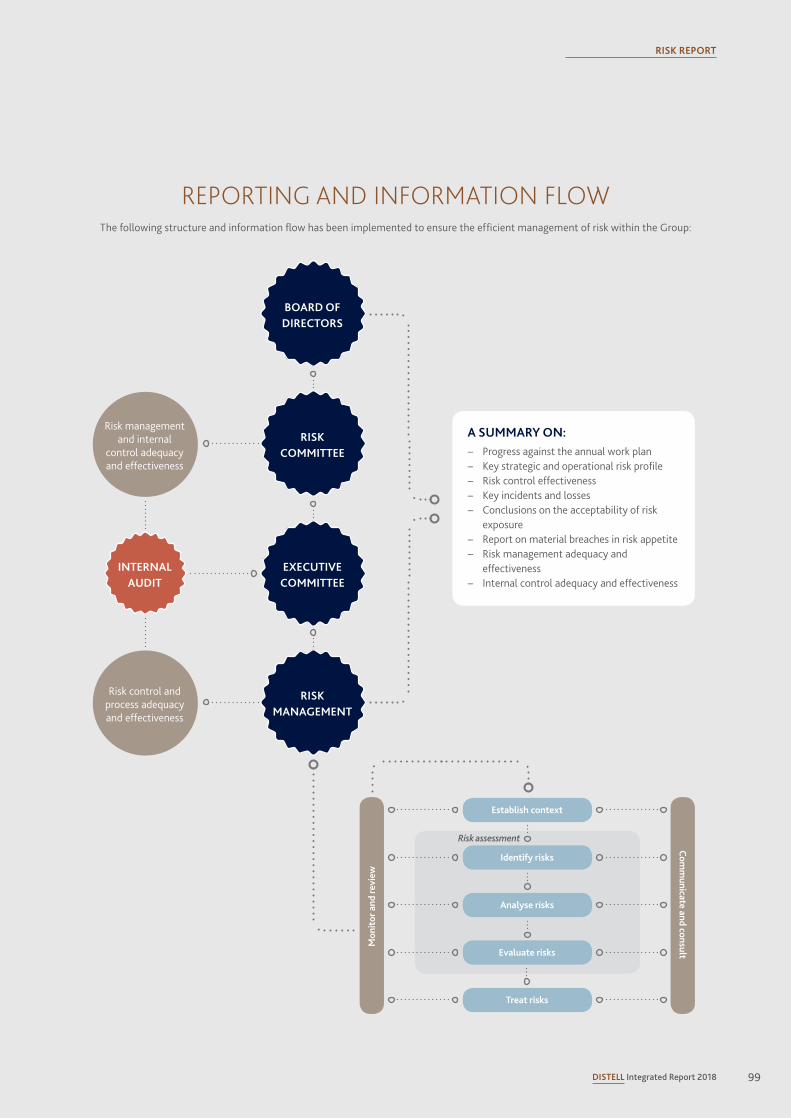
REPORT REPORTING AND INFORMATION FLOWThe following structure and information flow has been implemented to ensure the efficient management of risk within the Group:
RISK REPORT
99DISTELL Integrated Report 2018
Establish context
A SUMMARY ON: − Progress against the annual work plan − Key strategic and operational risk profile − Risk control effectiveness − Key incidents and losses − Conclusions on the acceptability of risk
exposure − Report on material breaches in risk appetite − Risk management adequacy and
effectiveness − Internal control adequacy and effectiveness
Identify risks
Analyse risks
Evaluate risks
Treat risks
Mon
itor
and
revi
ew
Com
municate and consult
Risk assessment
BOARD OF DIRECTORS
RISK COMMITTEE
INTERNAL AUDIT
EXECUTIVE COMMITTEE
RISK MANAGEMENT
Risk managementand internal
control adequacyand effectiveness
Risk control andprocess adequacyand effectiveness
100 www.distell.co.za
ROLE, COMMITMENT AND RESPONSIBILITIESThe role of the committee is to assist the board to ensure the company has implemented a risk management infrastructure, effective frameworks, policies and plans for enterprise risk management, ICT governance and legislative compliance, and adequate enterprise risk management processes and activities. The role of the committee is also to see that the disclosure regarding risk is comprehensive, timely and relevant.
The commitments of the committee include:
− Application of necessary resources and transparent reporting; − Governance of our activities in a manner that is commensurate
with the overarching corporate governance principles of fairness, accountability, responsibility and transparency; and
− Embedding of risk management objectives in the measurable functions of all employees.
The committee has responsibilities towards risk governance and risk management, ICT governance and compliance, and the main focus areas include:
− Helping to set the tone and developing a culture pertaining to risk of the company, specifically by promoting open discussion regarding risk and ensuring the integration of risk management into the company’s objectives and goals;
− Defining management’s risk review activities regarding decisions (e.g. acquisitions), initiatives (e.g. new products), transactions and exposures (e.g. by amount) and prioritising them prior to being sent for the board’s attention;
− Ensuring management performs continual risk assessments and risk monitoring;
− Evaluating the adequacy of communication about escalating risk and the company’s crisis preparedness, disaster recovery and business continuity processes and plans;
− Continually obtaining reasonable assurance from management that all known and emerging risks have been identified and mitigated or managed, and the risk management plan is integrated in the daily activities of the company;
− Reviewing and assessing the company’s risk maturity, i.e. the effectiveness of the company’s enterprise-wide risk assessment processes and risk management, and recommending improvements, and reviewing and addressing, as appropriate, management’s corrective actions for identified deficiencies that arise with respect to the effectiveness of such programmes;
− Liaising closely with the audit committee to exchange information relevant to risk;
− In collaboration with the audit committee, understanding how the company’s internal audit work plan is aligned with the risks that have been identified and with risk governance information needs;
− Assessing any significant risk control findings or weaknesses identified and their potential impact, and ensuring appropriate action has been taken;
− Reviewing the adequacy of insurance coverage; − Approving and ensuring implementation of an ICT charter,
ICT principles, policies, procedures and standards; − Ensuring the ICT strategy is aligned with the performance and
sustainability objectives of the company, including making sure the ICT strategy is integrated with the company’s strategic and business processes;
− Monitoring and evaluating significant ICT investments and expenditure;
− Ensuring information assets are managed effectively; − Obtaining assurance from management on the ICT governance
and controls supporting significant ICT processes; − Obtaining independent assurance on the effectiveness of the
ICT governance, internal controls and controls supporting outsourced ICT services;
− Ensuring the promotion of an ethical legislative compliance culture; − Reviewing and approving a legal compliance framework and
policy and ensuring it is implemented by management; − Monitoring the company’s compliance with applicable laws,
rules, codes and standards and considering adherence to instances where it is non-binding;
− Reviewing the effectiveness of the system for monitoring compliance with laws and regulations and the results of management’s investigation and follow-up of any instances of non-compliance; and
− Ensuring details of material or often repeated instances of non-compliance by either the company or its directors in their capacity as such are included in the annual integrated report.
PRACTICAL APPLICATIONThe committee’s most recent activities include the following:
− Discussed the top business risks* debated at strategic planning sessions and reviewed quarterly by the risk and compliance committee and executive management;
− Reviewed operational and functional risks (on rotation per quarterly meeting) and how they were mitigated;
− Regularly asked management for the Group’s plans to mitigate the water crisis in the Western Cape, South Africa; and
− Discussed recent corporate governance failures in South Africa and their implications for director responsibilities in the oversight of management.
* Top business risks are generally described as risks with high impact or the
likelihood thereof. These risks are managed in the context of the Group’s risk appetite. Controls and treatment plans are implemented to reduce risk exposures to acceptable residual risk levels, and records are kept of the execution of the risk management function that satisfies independent audit criteria. Please refer to pages 16 to 19 for the corporate strategic risk table.
TECHNOLOGY AND INFORMATION GOVERNANCE Due to the growing dependency on IT systems for process automation, business growth and e-commerce, IT-related risk has become a significant factor in doing business. As a result, the
101DISTELL Integrated Report 2018
board, through the Distell risk and compliance committee, has been assigned the responsibility of maintaining oversight of and providing direction for all IT-related risks.
The governance of information and related technology is a broad and ever-evolving discipline, and for this reason international guidelines such as Control Objectives for IT (COBIT), the IT infrastructure library (ITIL) and ISO standards have been created to evaluate and monitor the progress of IT controls implementation over time, with the goal of reducing risk. Distell ICT has adopted these as guidelines, and is reporting to the committee on progress made.
The mitigation against cyber risk was a key focus area of the committee during the reporting period as this is the fastest-growing IT-related risk for Distell in 2018, which included ransomware attacks with examples of the ‘WannaCry’ attack that affected 300 000 computers across 150 countries and ‘NotPetya’, which caused quarterly losses of approximately $300 million in some cases. Phishing attacks proved to be a looming threat.
Meanwhile, data protection laws such as General Data Protection Regulation (GDPR) in the EU and The Protection of Personal Information Act (PoPIA) in South Africa are putting added pressure on businesses to mature data protection practices, including the establishment of data breach reporting procedures. The net effect of cyber risk proves that awareness of the dangers of this elusive risk cannot remain only within IT, which is why cyber risk is a standing item on the Distell risk committee’s agenda.
Key ICT risk projects for the 2018 financial year included:
− Maturing disaster recovery off-site capabilities for core business processes
− Cyber risk awareness and phishing self-assessments − Initialising system identity and access management − Establishing an ICT vulnerability management programme − Optimising computing endpoint security and hardening
Looking towards the 2019 financial year, the ICT risk landscape for Distell includes inter alia advanced stealthy hacking and compliance with data protection laws, as well as recovering successfully from disasters affecting core business information systems. To reduce our risk exposure, we will be focusing on cyber incident monitoring and response and confidential data leakage prevention, as well as improving compliance with GDPR and PoPIA.
Future IT-related risksAdvancements in technology are changing the risk landscape irrevocably, presenting opportunities and distinctive challenges for businesses. Examples of these are autonomous machines, artificial intelligence (AI), smart factories and digitalised supply chains. It is anticipated that increasing interconnections between buildings, factories and devices as well as better utilisation of data and analytics will enable greater productivity and more tailored
customer offerings. This in turn opens doors for more complicated cyber threats that leverage these advancements, creating ongoing challenges for doing business in a digitally driven era.
COMPLIANCE WITH LAWS AND REGULATIONS The Group company secretary and Group legal counsel are responsible for guiding the board in discharging its regulatory responsibilities. The Group company secretary regularly reports to the risk and compliance committee on the processes implemented by management to ensure legal compliance.
A key focus area during the period under review included the legal department embarking on a process to fully scope the Group’s regulatory universe. An external service provider was appointed to determine which laws are applicable to the Group in the countries where Distell operates. The regulatory universe was reviewed and each applicable law was classified as high, medium or low based on the Group’s exposure and the responsible department identified. Monitoring of compliance is done through self-evaluation, internal audit validation or external verification.
Distell has maintained its focus on other legislative compliance. Embedding of anti-bribery compliance continues, while the Group has also established an illicit trade forum. Employees and business partners are regularly trained either face to face or via e-learning modules. Future focus includes specific training on the Group’s Code of Ethics and Conduct. Training on anti-bribery legislation, ethics, fraud, the free-call line and conflict of interest will continue. Sales staff are regularly updated on the Consumer Protection Act and the Competition Act.
The regulations of the Companies Act require the Group’s social and ethics committee to monitor the implementation of a series of good corporate governance obligations, including the Organisation for Economic Cooperation and Development (OECD) recommendations on reducing corruption, as well as the UN Global Compact Principles. Distell had no instances of major non-compliance with legislation and no material fines were incurred.
THE EFFECTIVENESS OF THE RISK MANAGEMENT PROCESS The board, via the committee, has considered the process of ERM, the policies and the procedures and is satisfied that the risk management process implemented in the Group was effective during the reporting period and that it fulfilled its responsibilities in accordance with its terms of reference.
Dr Prieur du Plessis Chairman of the risk and compliance committee
Stellenbosch 23 August 2018
RISK REPORT
102 www.distell.co.za
COMMITTEE REPORT
S O C I A L A N D E T H I C S
MEMBERS OF THE COMMITTEEIn accordance with its mandate, the SEC met twice during the year under review: on 28 August 2017 and on 13 February 2018. The SEC considered detailed reports on the matters listed below. Overall, it was satisfied that Distell is fulfilling its social and ethical obligations as a good corporate citizen.
For further information please refer to the sustainability report online.
GUIDANCEThe SEC takes a principles-based approach guided by regulation 43 of the Companies Regulations, 2011 and the 10 principles of the UN Global Compact.
SUSTAINABILITY: MANAGEMENT APPROACH We embarked on a journey to fully integrate sustainability into our strategy and management routines. A Sustainability Council was established during the year under review and forms part of Distell’s new operating model. It provides strategic thought leadership and oversight, and reports Distell’s sustainability performance to the SEC. Council membership comprises senior management, including the Group CEO, and is headed by Bridgitte Backmann. This high level of membership attests to the importance of the Council in driving Distell’s strategy. The Council monitors Distell’s action plans and performance against set metrics relating to:
− SHERQ (safety, health, environment, risk and quality) − Public policy (industry- and geography-related) and
regulatory affairs − B-BBEE − Corporate social investment − Enterprise and supplier development
The Council meets quarterly.
B-BBEE Distell retained its level 4 status in 2018. This was thanks to a leader-led strategy implementation, as well as business units and functions taking ownership of the various scorecard elements.
OWNERSHIPThe Distell Development Trust is an important contributor to our B-BBEE score. As the Trust is required to operate as a B-BOS (Broad-based Ownership Scheme), it contributes toward the ownership element. The B-BBEE points are awarded provided the Trust fulfils its mandate. This is assessed independently by an Independent Competent Person’s Report.
Through the course of the year, members of the committee engaged the B-BBEE commission to proactively gauge the commissioners’ thinking and share ideas into broad-based ownership to ensure alignment for the Group.
The management of additional risks and opportunities will remain an area of focus in the new financial year.
PREFERENTIAL PROCUREMENTProcurement is tracked and monitored on a monthly basis. This includes a breakdown of preferential procurement spend per business unit and service function to identify opportunities for the development of new and existing empowered suppliers across the Group.
SKILLS DEVELOPMENT High-potential employees are supported to fast-track and accelerate their career development through various training and development interventions. Highlights for 2017:
− Of the 14 candidates who participated in our Accelerated Development Programme during the year, 13 were African, Coloured and Indian (ACI) candidates
− 86% and 55% of candidates who participated in our Supervisory Development and Middle Management Programmes respectively were ACI candidates
− 96% of all learnerships, 100% of all disability learnerships and 100% of all internships were awarded to ACI candidates
In addition to the above, 30 high-potential ACI candidates were identified by the business and specific focus is being placed on their career development within Distell. The purpose of this is to create an internal pipeline of management talent within the Group.
103DISTELL Integrated Report 2018
SOCIAL AND ETHICS COMMITTEE REPORT
COMMITTEE REPORT SuccessFactors Learning was launched in 2018. This module enables eLearning across the organisation and provides a comprehensive, centralised learning and development platform for our employees.
EMPLOYMENT EQUITY New employment equity targets were set for the next five-year period from 1 July 2017 – 30 June 2022 as part of Distell’s revised five-year National Employment Equity Plan 2017 – 2022. The Plan was discussed by the SEC, including the actions to be taken to accelerate the appointment and promotion of previously disadvantaged individuals within Distell.
Following a review of the actual performance against set targets for the past year, the assessment showed that planned targets were achieved. The new targets for 2022 are set per business unit and service function, providing the SEC and management with performance oversight across the Group. This will enable a focused plan to address areas where urgent intervention is required. The oversight of targets and performance against targets for top management will remain an area of focus in the new financial year.
CONSUMER HEALTH AND SAFETY Distell aims to achieve zero quality incidents. Any incidents relating to the bottling process are monitored closely and receive focused attention by management. Distell’s current quality control technology includes base and neck inspection of bottles to detect any foreign particles or chips. New technology is being tested at Springs that will enable Distell to conduct a side inspection of bottles and increase quality control during the bottling process. Distell is furthermore investigating establishing a more visible customer care line in support of a new quality alert procedure. This will be launched early in the new financial year.
COMPLIANCE The SEC requested management to consider appointing an independent service provider to conduct interviews and focus groups with employees that address racism and sexual harassment in the workplace. This includes conducting an awareness programmes that will offer workshops and presentations to employees.
ENVIRONMENT The severe drought affecting the Western and Eastern Cape provinces was a matter of significant concern during the year under review. The SEC considered management’s business continuity plan to address short- and long-term risk of water availability. This includes the risks and mitigating actions to be undertaken by management as required. Key elements of the water continuity plan include:
− The initiation of an integrated water savings and behavioural change programme at all manufacturing, distribution and office facilities across both provinces
− Significant investment in water recycling and recovery technology to reduce dependence on the municipal supply
− Contingency plans and alternative water supply solutions for affected operations – this includes an assessment of major suppliers for water risk and mitigating actions
Long-term planning includes the implementation of grey water solutions at all sites nationally to reduce dependence on municipal water. This will be initiated during the new financial year.
STAKEHOLDER ENGAGEMENT In the new financial year, the SEC will monitor progress against aligning Distell’s stakeholder engagement framework with the principles and objectives outlined in King IV™. This is assisted and tracked via a stakeholder engagement landscape report and analysis.
Gugu DingaanChairperson of the social and ethics committee
Stellenbosch 23 August 2018
CONTENTS
CURRENCY OF FINANCIAL STATEMENTS / 105
AUDIT COMMITTEE REPORT / 107 STATEMENTS OF CASH FLOWS / 124
REPORT OF THE BOARD OF DIRECTORS / 108
INDEPENDENT AUDITOR’S REPORT / 112
STATEMENTS OF FINANCIAL POSITION / 118
CERTIFICATE BY THE COMPANY SECRETARY / 106
DIRECTORS’ RESPONSIBILITIES FOR FINANCIAL REPORTING/ 106
STATEMENTS OF COMPREHENSIVE INCOME / 120
INCOME STATEMENTS / 119
STATEMENTS OF CHANGES IN EQUITY / 121
NOTES TO THE ANNUAL FINANCIAL STATEMENTS / 125
FINANCIAL STATEMENTS
G R O U P A N N U A L
www.distell.co.za104
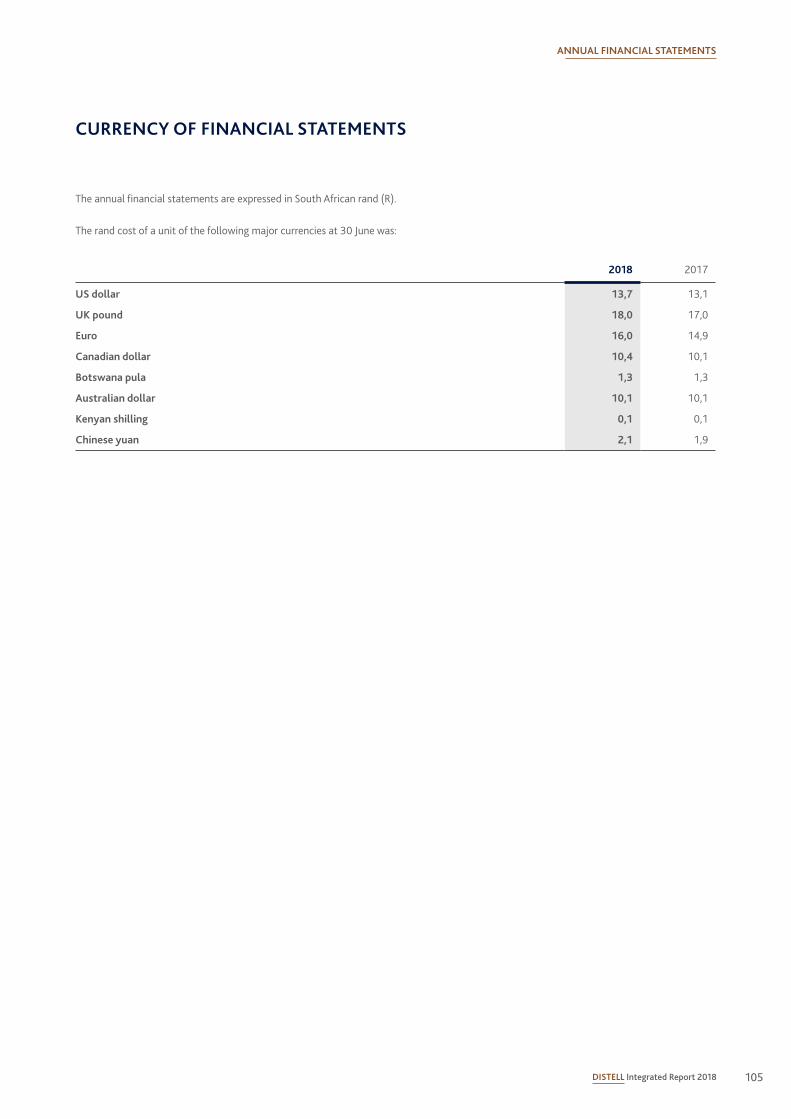
CURRENCY OF FINANCIAL STATEMENTS
The annual financial statements are expressed in South African rand (R).
The rand cost of a unit of the following major currencies at 30 June was:
2018 2017
US dollar 13,7 13,1
UK pound 18,0 17,0
Euro 16,0 14,9
Canadian dollar 10,4 10,1
Botswana pula 1,3 1,3
Australian dollar 10,1 10,1
Kenyan shilling 0,1 0,1
Chinese yuan 2,1 1,9
FINANCIAL STATEMENTS
G R O U P A N N U A L
105DISTELL Integrated Report 2018
ANNUAL FINANCIAL STATEMENTS
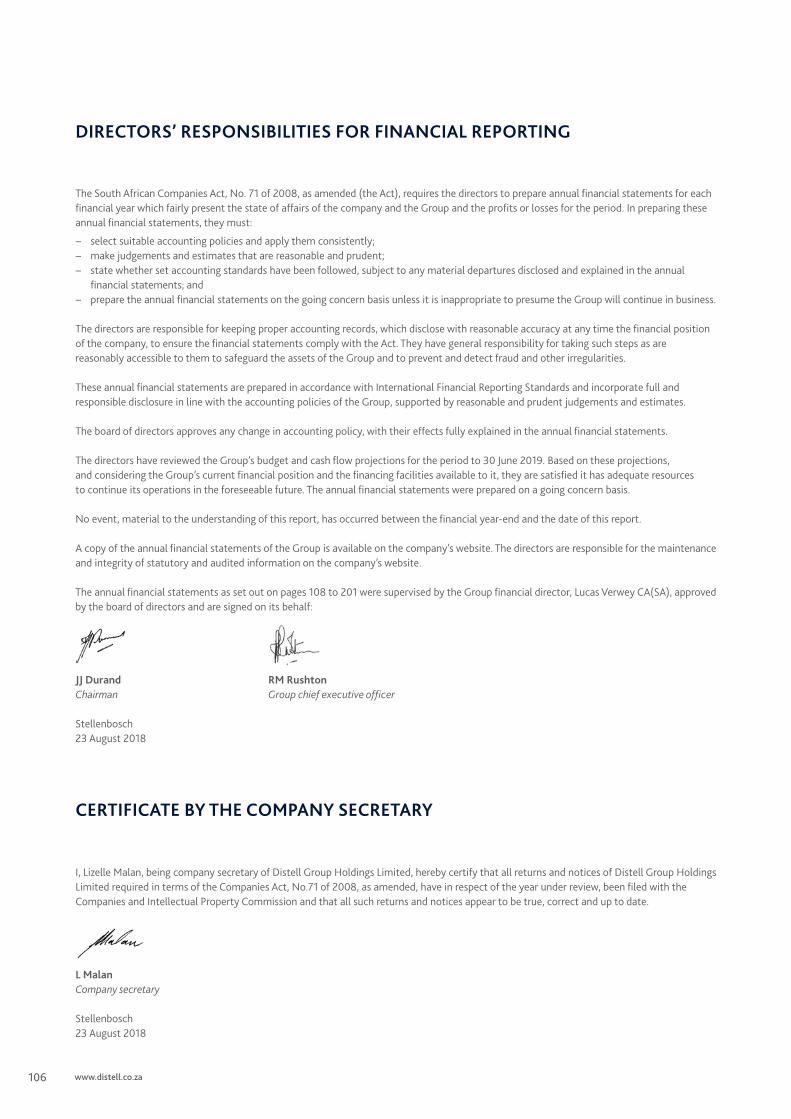
DIRECTORS’ RESPONSIBILITIES FOR FINANCIAL REPORTING
The South African Companies Act, No. 71 of 2008, as amended (the Act), requires the directors to prepare annual financial statements for each financial year which fairly present the state of affairs of the company and the Group and the profits or losses for the period. In preparing these annual financial statements, they must:
− select suitable accounting policies and apply them consistently; − make judgements and estimates that are reasonable and prudent; − state whether set accounting standards have been followed, subject to any material departures disclosed and explained in the annual
financial statements; and − prepare the annual financial statements on the going concern basis unless it is inappropriate to presume the Group will continue in business.
The directors are responsible for keeping proper accounting records, which disclose with reasonable accuracy at any time the financial position of the company, to ensure the financial statements comply with the Act. They have general responsibility for taking such steps as are reasonably accessible to them to safeguard the assets of the Group and to prevent and detect fraud and other irregularities.
These annual financial statements are prepared in accordance with International Financial Reporting Standards and incorporate full and responsible disclosure in line with the accounting policies of the Group, supported by reasonable and prudent judgements and estimates.
The board of directors approves any change in accounting policy, with their effects fully explained in the annual financial statements.
The directors have reviewed the Group’s budget and cash flow projections for the period to 30 June 2019. Based on these projections, and considering the Group’s current financial position and the financing facilities available to it, they are satisfied it has adequate resources to continue its operations in the foreseeable future. The annual financial statements were prepared on a going concern basis.
No event, material to the understanding of this report, has occurred between the financial year-end and the date of this report.
A copy of the annual financial statements of the Group is available on the company’s website. The directors are responsible for the maintenance and integrity of statutory and audited information on the company’s website.
The annual financial statements as set out on pages 108 to 201 were supervised by the Group financial director, Lucas Verwey CA(SA), approved by the board of directors and are signed on its behalf:
JJ Durand RM RushtonChairman Group chief executive officer
Stellenbosch23 August 2018
CERTIFICATE BY THE COMPANY SECRETARY
I, Lizelle Malan, being company secretary of Distell Group Holdings Limited, hereby certify that all returns and notices of Distell Group Holdings Limited required in terms of the Companies Act, No.71 of 2008, as amended, have in respect of the year under review, been filed with the Companies and Intellectual Property Commission and that all such returns and notices appear to be true, correct and up to date.
L MalanCompany secretary
Stellenbosch23 August 2018
106 www.distell.co.za
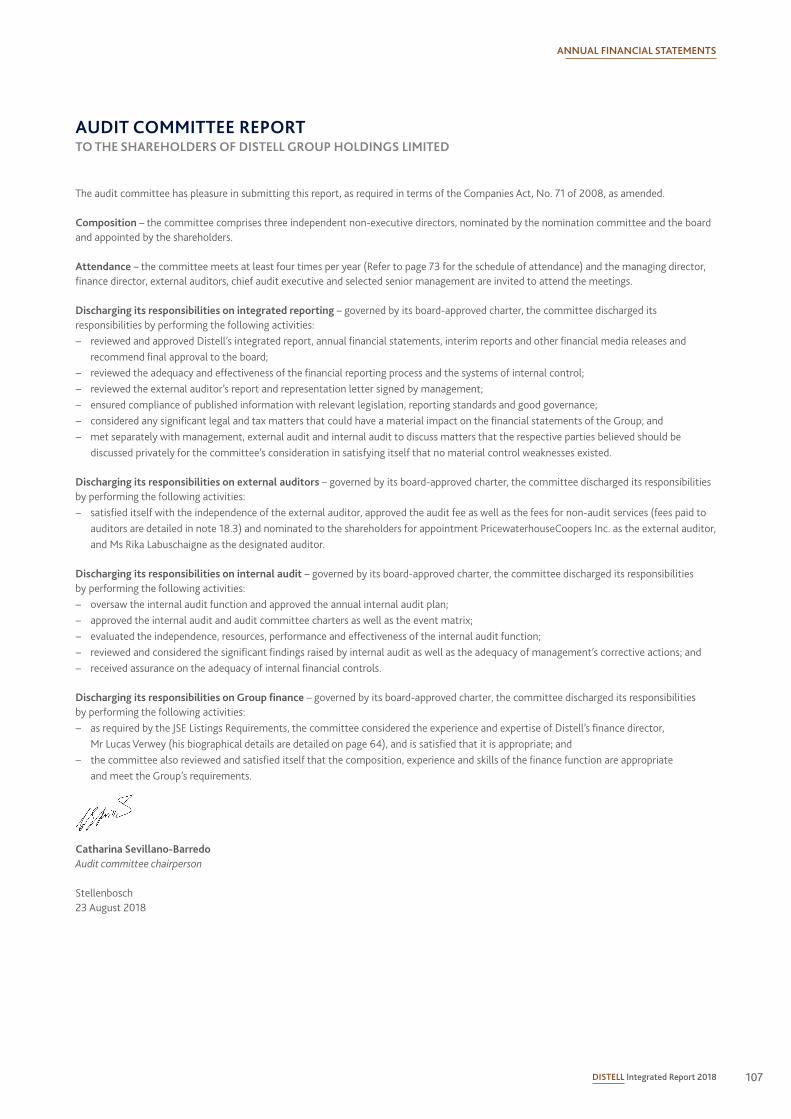
AUDIT COMMITTEE REPORTTO THE SHAREHOLDERS OF DISTELL GROUP HOLDINGS LIMITED
The audit committee has pleasure in submitting this report, as required in terms of the Companies Act, No. 71 of 2008, as amended.
Composition – the committee comprises three independent non-executive directors, nominated by the nomination committee and the board and appointed by the shareholders.
Attendance – the committee meets at least four times per year (Refer to page 73 for the schedule of attendance) and the managing director, finance director, external auditors, chief audit executive and selected senior management are invited to attend the meetings.
Discharging its responsibilities on integrated reporting – governed by its board-approved charter, the committee discharged its responsibilities by performing the following activities:
− reviewed and approved Distell’s integrated report, annual financial statements, interim reports and other financial media releases and recommend final approval to the board;
− reviewed the adequacy and effectiveness of the financial reporting process and the systems of internal control; − reviewed the external auditor’s report and representation letter signed by management; − ensured compliance of published information with relevant legislation, reporting standards and good governance; − considered any significant legal and tax matters that could have a material impact on the financial statements of the Group; and − met separately with management, external audit and internal audit to discuss matters that the respective parties believed should be
discussed privately for the committee’s consideration in satisfying itself that no material control weaknesses existed.
Discharging its responsibilities on external auditors – governed by its board-approved charter, the committee discharged its responsibilities by performing the following activities:
− satisfied itself with the independence of the external auditor, approved the audit fee as well as the fees for non-audit services (fees paid to auditors are detailed in note 18.3) and nominated to the shareholders for appointment PricewaterhouseCoopers Inc. as the external auditor, and Ms Rika Labuschaigne as the designated auditor.
Discharging its responsibilities on internal audit – governed by its board-approved charter, the committee discharged its responsibilities by performing the following activities:
− oversaw the internal audit function and approved the annual internal audit plan; − approved the internal audit and audit committee charters as well as the event matrix; − evaluated the independence, resources, performance and effectiveness of the internal audit function; − reviewed and considered the significant findings raised by internal audit as well as the adequacy of management’s corrective actions; and − received assurance on the adequacy of internal financial controls.
Discharging its responsibilities on Group finance – governed by its board-approved charter, the committee discharged its responsibilities by performing the following activities:
− as required by the JSE Listings Requirements, the committee considered the experience and expertise of Distell’s finance director, Mr Lucas Verwey (his biographical details are detailed on page 64), and is satisfied that it is appropriate; and
− the committee also reviewed and satisfied itself that the composition, experience and skills of the finance function are appropriate and meet the Group’s requirements.
Catharina Sevillano-BarredoAudit committee chairperson
Stellenbosch23 August 2018
ANNUAL FINANCIAL STATEMENTS
107DISTELL Integrated Report 2018
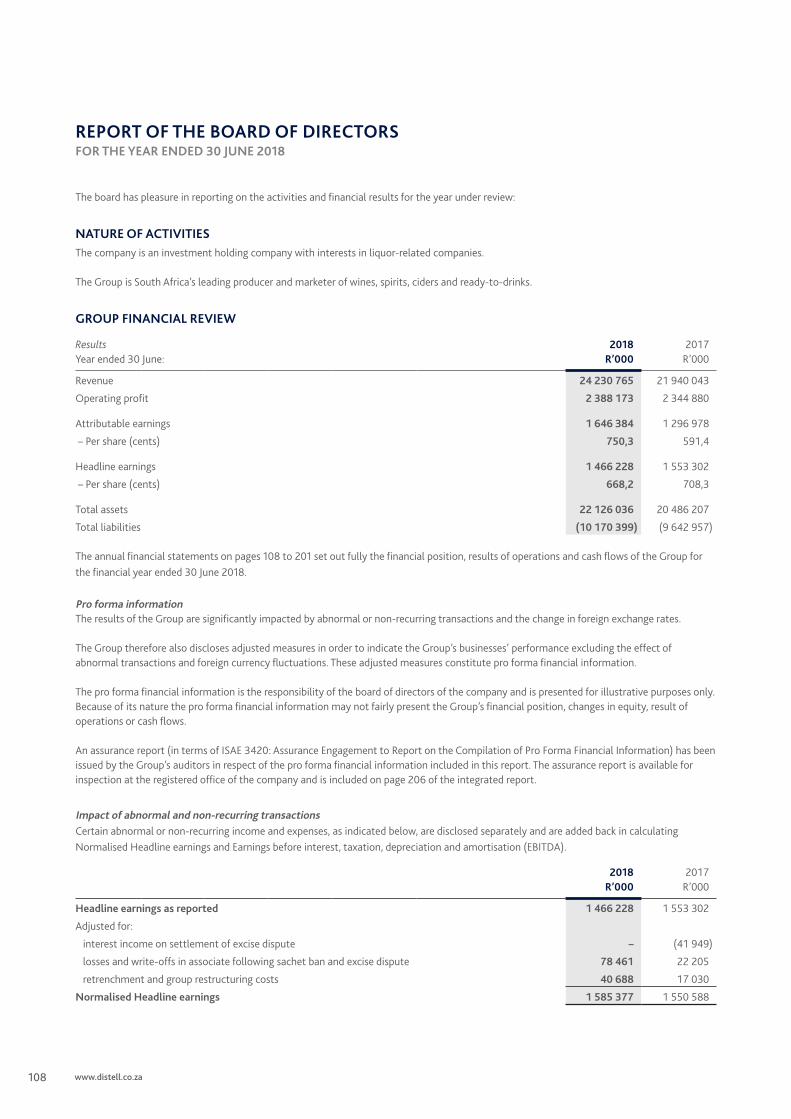
REPORT OF THE BOARD OF DIRECTORSFOR THE YEAR ENDED 30 JUNE 2018
The board has pleasure in reporting on the activities and financial results for the year under review:
NATURE OF ACTIVITIESThe company is an investment holding company with interests in liquor-related companies.
The Group is South Africa’s leading producer and marketer of wines, spirits, ciders and ready-to-drinks.
GROUP FINANCIAL REVIEW
Results Year ended 30 June:
2018R’000
2017R’000
Revenue 24 230 765 21 940 043
Operating profit 2 388 173 2 344 880
Attributable earnings 1 646 384 1 296 978
– Per share (cents) 750,3 591,4
Headline earnings 1 466 228 1 553 302
– Per share (cents) 668,2 708,3
Total assets 22 126 036 20 486 207
Total liabilities (10 170 399) (9 642 957)
The annual financial statements on pages 108 to 201 set out fully the financial position, results of operations and cash flows of the Group for the financial year ended 30 June 2018.
Pro forma informationThe results of the Group are significantly impacted by abnormal or non-recurring transactions and the change in foreign exchange rates.
The Group therefore also discloses adjusted measures in order to indicate the Group’s businesses’ performance excluding the effect of abnormal transactions and foreign currency fluctuations. These adjusted measures constitute pro forma financial information.
The pro forma financial information is the responsibility of the board of directors of the company and is presented for illustrative purposes only. Because of its nature the pro forma financial information may not fairly present the Group’s financial position, changes in equity, result of operations or cash flows.
An assurance report (in terms of ISAE 3420: Assurance Engagement to Report on the Compilation of Pro Forma Financial Information) has been issued by the Group’s auditors in respect of the pro forma financial information included in this report. The assurance report is available for inspection at the registered office of the company and is included on page 206 of the integrated report.
Impact of abnormal and non-recurring transactionsCertain abnormal or non-recurring income and expenses, as indicated below, are disclosed separately and are added back in calculating Normalised Headline earnings and Earnings before interest, taxation, depreciation and amortisation (EBITDA).
2018R’000
2017R’000
Headline earnings as reported 1 466 228 1 553 302
Adjusted for:
interest income on settlement of excise dispute – (41 949)
losses and write-offs in associate following sachet ban and excise dispute 78 461 22 205
retrenchment and group restructuring costs 40 688 17 030
Normalised Headline earnings 1 585 377 1 550 588
108 www.distell.co.za
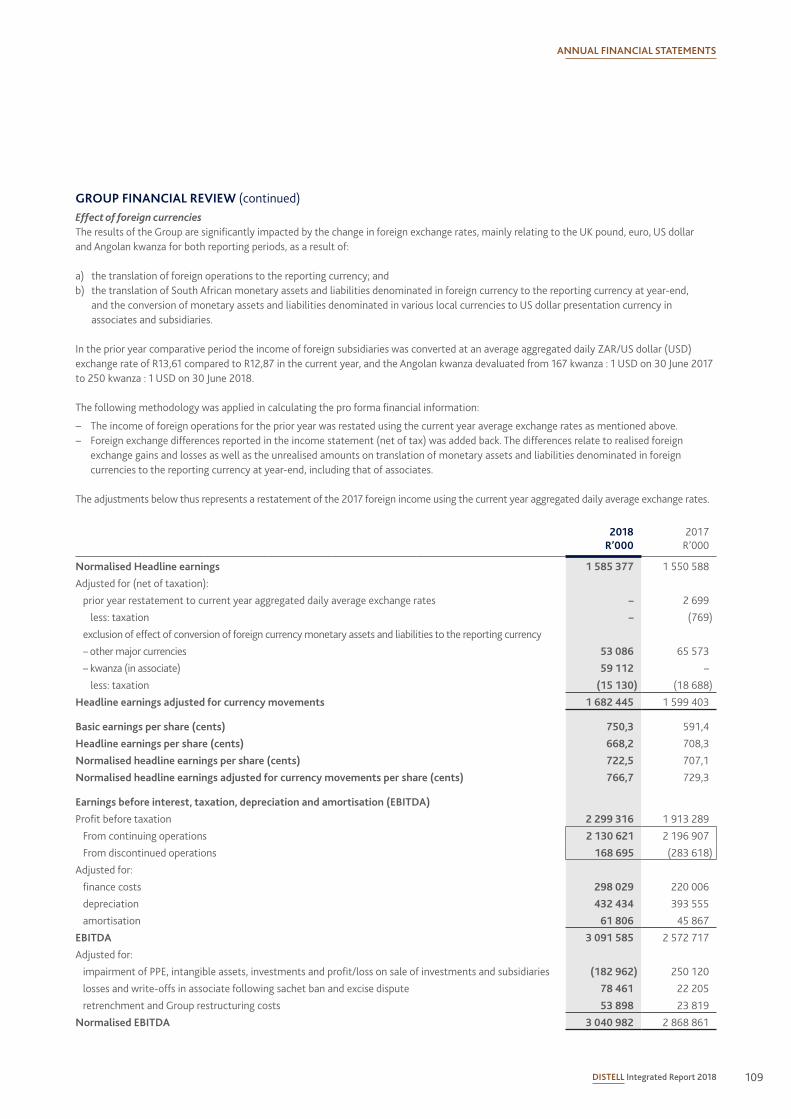
GROUP FINANCIAL REVIEW (continued)Effect of foreign currenciesThe results of the Group are significantly impacted by the change in foreign exchange rates, mainly relating to the UK pound, euro, US dollar and Angolan kwanza for both reporting periods, as a result of:
a) the translation of foreign operations to the reporting currency; andb) the translation of South African monetary assets and liabilities denominated in foreign currency to the reporting currency at year-end,
and the conversion of monetary assets and liabilities denominated in various local currencies to US dollar presentation currency in associates and subsidiaries.
In the prior year comparative period the income of foreign subsidiaries was converted at an average aggregated daily ZAR/US dollar (USD) exchange rate of R13,61 compared to R12,87 in the current year, and the Angolan kwanza devaluated from 167 kwanza : 1 USD on 30 June 2017 to 250 kwanza : 1 USD on 30 June 2018.
The following methodology was applied in calculating the pro forma financial information:
− The income of foreign operations for the prior year was restated using the current year average exchange rates as mentioned above. − Foreign exchange differences reported in the income statement (net of tax) was added back. The differences relate to realised foreign
exchange gains and losses as well as the unrealised amounts on translation of monetary assets and liabilities denominated in foreign currencies to the reporting currency at year-end, including that of associates.
The adjustments below thus represents a restatement of the 2017 foreign income using the current year aggregated daily average exchange rates.
2018R’000
2017R’000
Normalised Headline earnings 1 585 377 1 550 588
Adjusted for (net of taxation):
prior year restatement to current year aggregated daily average exchange rates – 2 699
less: taxation – (769)
exclusion of effect of conversion of foreign currency monetary assets and liabilities to the reporting currency
– other major currencies 53 086 65 573
– kwanza (in associate) 59 112 –
less: taxation (15 130) (18 688)
Headline earnings adjusted for currency movements 1 682 445 1 599 403
Basic earnings per share (cents) 750,3 591,4
Headline earnings per share (cents) 668,2 708,3
Normalised headline earnings per share (cents) 722,5 707,1
Normalised headline earnings adjusted for currency movements per share (cents) 766,7 729,3
Earnings before interest, taxation, depreciation and amortisation (EBITDA)
Profit before taxation 2 299 316 1 913 289
From continuing operations 2 130 621 2 196 907
From discontinued operations 168 695 (283 618)
Adjusted for:
finance costs 298 029 220 006
depreciation 432 434 393 555
amortisation 61 806 45 867
EBITDA 3 091 585 2 572 717
Adjusted for:
impairment of PPE, intangible assets, investments and profit/loss on sale of investments and subsidiaries (182 962) 250 120
losses and write-offs in associate following sachet ban and excise dispute 78 461 22 205
retrenchment and Group restructuring costs 53 898 23 819
Normalised EBITDA 3 040 982 2 868 861
ANNUAL FINANCIAL STATEMENTS
109DISTELL Integrated Report 2018
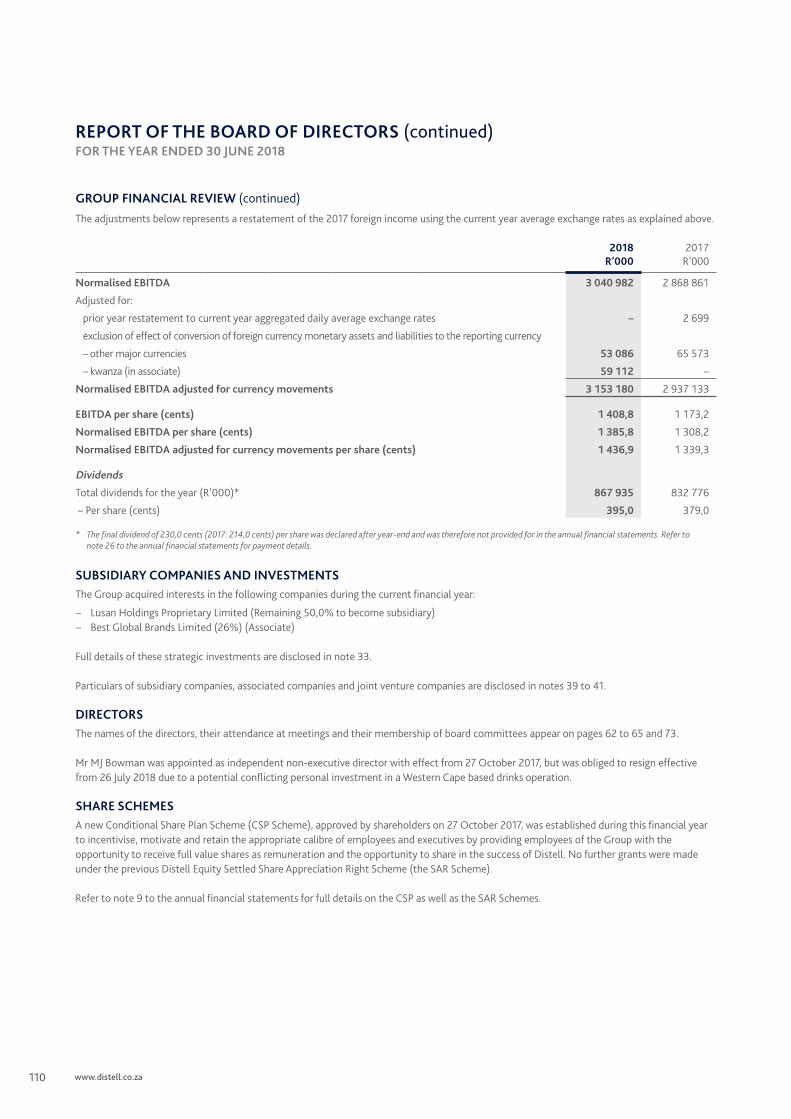
GROUP FINANCIAL REVIEW (continued)The adjustments below represents a restatement of the 2017 foreign income using the current year average exchange rates as explained above.
2018R’000
2017R’000
Normalised EBITDA 3 040 982 2 868 861
Adjusted for:
prior year restatement to current year aggregated daily average exchange rates – 2 699
exclusion of effect of conversion of foreign currency monetary assets and liabilities to the reporting currency
– other major currencies 53 086 65 573
– kwanza (in associate) 59 112 –
Normalised EBITDA adjusted for currency movements 3 153 180 2 937 133
EBITDA per share (cents) 1 408,8 1 173,2
Normalised EBITDA per share (cents) 1 385,8 1 308,2
Normalised EBITDA adjusted for currency movements per share (cents) 1 436,9 1 339,3
Dividends
Total dividends for the year (R’000)* 867 935 832 776
– Per share (cents) 395,0 379,0
* The final dividend of 230,0 cents (2017: 214,0 cents) per share was declared after year-end and was therefore not provided for in the annual financial statements. Refer to note 26 to the annual financial statements for payment details.
SUBSIDIARY COMPANIES AND INVESTMENTSThe Group acquired interests in the following companies during the current financial year:
− Lusan Holdings Proprietary Limited (Remaining 50,0% to become subsidiary) − Best Global Brands Limited (26%) (Associate)
Full details of these strategic investments are disclosed in note 33.
Particulars of subsidiary companies, associated companies and joint venture companies are disclosed in notes 39 to 41.
DIRECTORSThe names of the directors, their attendance at meetings and their membership of board committees appear on pages 62 to 65 and 73.
Mr MJ Bowman was appointed as independent non-executive director with effect from 27 October 2017, but was obliged to resign effective from 26 July 2018 due to a potential conflicting personal investment in a Western Cape based drinks operation.
SHARE SCHEMESA new Conditional Share Plan Scheme (CSP Scheme), approved by shareholders on 27 October 2017, was established during this financial year to incentivise, motivate and retain the appropriate calibre of employees and executives by providing employees of the Group with the opportunity to receive full value shares as remuneration and the opportunity to share in the success of Distell. No further grants were made under the previous Distell Equity Settled Share Appreciation Right Scheme (the SAR Scheme).
Refer to note 9 to the annual financial statements for full details on the CSP as well as the SAR Schemes.
REPORT OF THE BOARD OF DIRECTORS (continued)FOR THE YEAR ENDED 30 JUNE 2018
110 www.distell.co.za
DIRECTORS’ INTERESTS AND EMOLUMENTSParticulars of the emoluments of directors and their interests in the issued share capital of the company and in contracts are disclosed in notes 34 to 36 to the annual financial statements.
RESTRUCTURING OF THE SHAREHOLDING STRUCTURE OF DISTELLDuring May and June 2018, the Distell Group Limited group was restructured under schemes of arrangement, approved by shareholders on 27 October 2017, whereby shareholders of Distell Group Limited became shareholders of Distell Group Holdings Limited, a newly incorporated entity registered in South Africa. This transaction was accounted for as a capital reorganisation of the existing group and did not change the substance of the reporting entity.
The consolidated financial statements of Distell Group Holdings Limited are therefore presented using the values from the consolidated financial statements of the previous holding company.
More details are provided in note 38 to the financial statements.
EVENTS SUBSEQUENT TO STATEMENT OF FINANCIAL POSITION DATEThe directors are not aware of any matter or circumstance arising since the end of the financial year that would significantly affect the operations of the Group or the results of its operations.
HOLDING COMPANYThe holding company of the Group is Remgro Limited.
The Group structure appears on page 204.
SECRETARYThe name and address of the company secretary appears on the inside back cover.
APPROVALThe annual financial statements set out on pages 108 to 201 have been approved by the board.
Signed on behalf of the board of directors:
JJ Durand RM RushtonChairman Group chief executive officer
Stellenbosch23 August 2018
ANNUAL FINANCIAL STATEMENTS
111DISTELL Integrated Report 2018
INDEPENDENT AUDITOR’S REPORTTO THE SHAREHOLDERS OF DISTELL GROUP HOLDINGS LIMITED
REPORT ON THE AUDIT OF THE CONSOLIDATED AND SEPARATE FINANCIAL STATEMENTS Our opinionIn our opinion, the consolidated and separate financial statements present fairly, in all material respects, the consolidated and separate financial position of Distell Group Holdings Limited (the company) and its subsidiaries (together the Group) as at 30 June 2018, and its consolidated and separate financial performance and its consolidated and separate cash flows for the year then ended in accordance with International Financial Reporting Standards and the requirements of the Companies Act of South Africa.
What we have auditedDistell Group Holdings Limited’s consolidated and separate financial statements set out on pages 118 to 201 comprise:
− the consolidated and separate statements of financial position as at 30 June 2018; − the consolidated and separate income statements for the year then ended; − the consolidated and separate statements of comprehensive income for the year then ended; − the consolidated and separate statements of changes in equity for the year then ended; − the consolidated and separate statements of cash flows for the year then ended; and − the notes to the financial statements, which include a summary of significant accounting policies.
Basis for opinionWe conducted our audit in accordance with International Standards on Auditing (ISAs). Our responsibilities under those standards are further described in the Auditor’s responsibilities for the audit of the consolidated and separate financial statements section of our report.
We believe that the audit evidence we have obtained is sufficient and appropriate to provide a basis for our opinion.
IndependenceWe are independent of the Group in accordance with the Independent Regulatory Board for Auditors Code of Professional Conduct for Registered Auditors (IRBA Code) and other independence requirements applicable to performing audits of financial statements in South Africa. We have fulfilled our other ethical responsibilities in accordance with the IRBA Code and in accordance with other ethical requirements applicable to performing audits in South Africa. The IRBA Code is consistent with the International Ethics Standards Board for Accountants Code of Ethics for Professional Accountants (Parts A and B).
Our audit approachOverview
Keyaudit
matters
Groupscoping
Materiality
Overall Group materiality − R106,5 million, which represents 5,0% of the consolidated profit before taxation from continuing
operations.
Group audit scope − Full scope audits were performed at all financially significant components and further audit and
analytical review procedures were performed over the remaining balances and the consolidation process in order to gain sufficient and appropriate evidence over the consolidated numbers.
Key audit matters − Acquisition of Best Global Brands Limited (BGB); − Impairment of goodwill and indefinite life intangible assets of Distell International Limited (DI); and − Capital reorganisation and simplification of the shareholder structure by the Group.
As part of designing our audit, we determined materiality and assessed the risks of material misstatement in the consolidated and separate financial statements. In particular, we considered where the directors made subjective judgements; for example, in respect of significant accounting estimates that involved making assumptions and considering future events that are inherently uncertain. As in all of our audits, we also addressed the risk of management override of internal controls, including among other matters, consideration of whether there was evidence of bias that represented a risk of material misstatement due to fraud.
112 www.distell.co.za
MaterialityThe scope of our audit was influenced by our application of materiality. An audit is designed to obtain reasonable assurance whether the financial statements are free from material misstatement. Misstatements may arise due to fraud or error. They are considered material if individually or in aggregate, they could reasonably be expected to influence the economic decisions of users taken on the basis of the consolidated financial statements.
Based on our professional judgement, we determined certain quantitative thresholds for materiality, including the overall group materiality for the consolidated financial statements as a whole as set out in the table below. These, together with qualitative considerations, helped us to determine the scope of our audit and the nature, timing and extent of our audit procedures and to evaluate the effect of misstatements, both individually and in aggregate on the financial statements as a whole.
Overall Group materiality R106,5 million
How we determined it 5,0% of consolidated profit before tax from continuing operations
Rationale for the materiality benchmark applied
We chose consolidated profit before taxation from continuing operations as the benchmark because, in our view, it is the benchmark against which the performance of the Group is most commonly measured by users, and is a generally accepted benchmark. We chose 5,0% which is consistent with quantitative materiality thresholds used for profit-oriented companies.
How we tailored our Group audit scope We tailored the scope of our audit in order to perform sufficient work to enable us to provide an opinion on the consolidated financial statements as a whole, taking into account the structure of the Group, the accounting processes and controls, and the industry in which the Group operates.
Distell Limited, the company in which most of the South African trading operations take place, is the only financially significant component in the Group. All other components are considered financially insignificant. In order to ensure that sufficient work was performed over material line items in the financial statements, we have also scoped in Distell International Limited, the company that operates the Group’s whisky business, for a full scope audit, together with four smaller entities for which statutory audits are being performed. The Group engagement team further performed analytical review procedures over the remaining balances and audited the consolidation process in order to gain sufficient evidence over the consolidated numbers.
In establishing the approach to the Group audit, we determined the extent of the work that needed to be performed by us, as the Group engagement team, or by component auditors from other PwC network firms or other auditors operating under our instruction, in order to issue our audit opinion on the consolidated financial statements of the Group. Detailed Group audit instructions were communicated to all component audit teams in scope. Throughout the audit, various calls, and discussions were held with the component audit teams. Where the work was performed by component auditors, we determined the level of involvement necessary in the audit work at those components to be able to conclude whether sufficient appropriate audit evidence has been obtained as the basis for our opinion on the consolidated financial statements as a whole.
Key audit mattersKey audit matters are those matters that, in our professional judgement, were of most significance in our audit of the consolidated and separate financial statements of the current period. These matters were addressed in the context of our audit of the consolidated and separate financial statements as a whole, and in forming our opinion thereon, and we do not provide a separate opinion on these matters.
ANNUAL FINANCIAL STATEMENTS
113DISTELL Integrated Report 2018
Key audit matter How our audit addressed the key audit matter
Acquisition of Best Global Brands Limited (BGB)
In July 2017, the Group acquired 26% of BGB for USD54,6 million (R726,5 million). The Group has also entered into an agreement to acquire the remaining 74,0% of the shares, which will become effective once certain operating hurdles are achieved and conditions precedent are either fulfilled or waived.
This transaction was a matter of most significance to the audit due to the judgement involved in a number of areas, directing our attention in particular at the following areas:
− The investment in BGB has been equity accounted as a result of the Group’s judgement that it is able to exert significant influence over the financial and operating policy decisions of BGB, but do not control it. The existence of options and approval rights in the shareholder arrangements, do not indicate power to direct the relevant activities of that investee.
− The agreement to acquire the remaining 74,0% of the shares in BGB involved option agreements that qualify as derivatives. Management have assessed the derivatives at fair value not to be material and have not recognised and measured these financial instruments in the financial statements of the Group.
Further detail relating to the transaction is included in note 33.2 to the annual financial statements.
This key audit matter only relates to the consolidated financial statements.
We obtained the signed agreements relating to the BGB acquisition and read significant contract terms relevant to the accounting and disclosures in the financial statements.
We assessed management’s classification of the investment as an associate with reference to the Group’s percentage shareholding in the investee and participation on BGB’s board of directors, concluding that the Group does have significant influence over BGB. By analysing the relevant clauses in the shareholders agreement, we assessed whether the rights of Distell in terms of the contract give them the current ability to direct the relevant activities of BGB, and concurred with management’s assessment that Distell does not have control over BGB.
We held discussions with management regarding the current status of the conditions precedent in closing the option to acquire the additional shares in BGB. We also critically assessed the likelihood of the hurdles being achieved by comparing the actual financial results of the entity to the hurdle conditions and evaluating the current position of non-financial targets. As a result of our work, we identified no information that disagrees with management’s assessment and that there is a significant degree of uncertainty at this point in time with regards to reaching the hurdles. As a result any value attributed to the derivative agreements, would be immaterial.
Key audit matter How our audit addressed the key audit matter
Impairment of goodwill and indefinite life intangible assets of Distell International Limited (DI)
The Group has R2,0 billion of intangible assets of which R1,2 billion relates to DI, its Scotch whisky operations acquired in 2013. The R1,4 billion indefinite intangible asset consists of goodwill of R942 million and trademarks of R509 million of which the trademark, Scottish Leader, is R271 million, as disclosed in note 5 to the financial statements.
All trademarks were classified as indefinite life intangible assets at the time of the acquisition and the Group carries out annual impairment tests based on value-in-use calculations to assess the recoverability of the carrying value of those assets. Management recognised no impairment with regards to goodwill and an impairment of the Black Bottle trademark of R18 million for the current financial year.
We deem this to be a matter of most significance to our audit due to the impairment reviews carried out by the Group that involves a number of significant judgements and estimates including growth rates and discount rates. Changes in these assumptions might lead to a significant change in the carrying values of the related assets.
This key audit matter only relates to the consolidated financial statements.
Using our valuation expertise, we evaluated the valuation methodologies used by management in determining the recoverable amount of cash-generating unit (CGU) and evaluated the reasonableness of management’s discount rate by performing a recalculation thereof and benchmarking the cost of capital of the CGU against industry-specific market information available for similar companies as well as considering territory-specific factors. We also assessed the reasonableness of the long-term growth rates applied by comparing them to the industry average long-term growth rates.
We assessed the projected future cash flows, operating margins and working capital requirements used in the models by understanding the process followed by management to determine these forecasts and agreeing the forecasted information to approved budgets and business plans. In order to test the robustness of management’s projections and estimates, we compared the actual results for FY2018 to the FY2018 forecasts in the prior year budget and ensured that the forecasts are adjusted for any variances.
In addition, we performed our own independent sensitivity calculation on the impairment assessments, to determine the degree by which the key assumptions (the discount rates and growth rates) needed to change in order to trigger an impairment charge. We discussed these with management and considered the likelihood of such changes occurring, and accepted management’s conclusions that the key assumptions applied in the models were reasonable.
INDEPENDENT AUDITOR’S REPORTTO THE SHAREHOLDERS OF DISTELL GROUP HOLDINGS LIMITED (CONTINUED)
114 www.distell.co.za
Key audit matter How our audit addressed the key audit matter
Capital reorganisation and simplification of the shareholder structure by the Group
During May 2018, the Group completed a capital reorganisation transaction through which it simplified the shareholding structure of its previous listed holding company, Distell Group Limited (DGL).
The reorganisation was effected through schemes of arrangement that resulted in the formation of a new holding company, Distell Group Holdings Limited (DGHL), which then effectively acquired all shareholders’ direct and indirect interests in DGL in exchange for shares directly in DGHL.
This transaction was a matter of most significance to the audit of the Group and company due to the complexity of the associated accounting and disclosures:
− The presentation and disclosure of the transaction in the financial statements is reflective of a capital reorganisation rather than a business combination. The comparative numbers in the consolidated financial statements relate to that of the legacy Distell Group, whereas the shareholding relates to DGHL; and
− The acquisition of DGHL was effected through a scheme of arrangement approved by the shareholders and was preceded by a number of internal restructuring steps.
Further detail is included in note 38 and 41 to the annual financial statements.
This key audit matter relates to both the consolidated and separate financial statements.
Using our IFRS specialists, we evaluated management’s assessment that the transaction should be treated as a capital reorganisation and not a business combination on the basis that Distell is the only entity in the Group that was a business as defined by IFRS 3, DGHL is essentially an extension of the pre-existing Distell Group and the non-controlling interest is now merely consolidated at one level within the Group; and before and after the transaction the same group of shareholders hold the exact same economic interest in Distell.
Accordingly, the transaction was treated as a capital reorganisation and no fair value uplift or goodwill was recognised.
We obtained the signed agreements relating to the transaction and read significant contract terms relevant to the accounting and disclosures in the financial statements. We substantively tested journal entries and supporting workings and evidence relating to the accounting for the exchange of shares, and internal restructuring steps, agreeing them to the contracts and to the terms of the scheme of arrangement.
We considered guidance in IFRS pertaining to restructuring transactions in which a parent reorganises the structure of its group by establishing a new entity as its parent and subsequently obtains control of the original parent by issuing shares in exchange for shares in the original parent. We recalculated the cost of the investment in the separate financial statements in line with the above-mentioned requirements.
We evaluated the capital and equity movements of DGHL for accuracy by comparison to the terms of the scheme of arrangement and whether the Group’s disclosures in respect of the reorganisation meet the requirement of IFRS 3 and reflected the transaction terms.
Other informationThe directors are responsible for the other information. The other information comprises the information included in the Distell Group Holdings annual financial statements for the year ended 30 June 2018, which includes the report of the board of directors, the audit committee report and the certificate by the company secretary as required by the Companies Act of South Africa, which we obtained prior to the date of this auditor’s report, and the Distell Group Holdings Limited Integrated Report 2018 which is expected to be made available to us after that date. Other information does not include the consolidated and separate financial statements and our auditor’s report thereon.
Our opinion on the consolidated and separate financial statements does not cover the other information and we do not express an audit opinion or any form of assurance conclusion thereon.
In connection with our audit of the consolidated and separate financial statements, our responsibility is to read the other information identified above and, in doing so, consider whether the other information is materially inconsistent with the consolidated and separate financial statements or our knowledge obtained in the audit, or otherwise appears to be materially misstated.
If, based on the work we have performed, we conclude that there is a material misstatement of this other information, we are required to report that fact. We have nothing to report in this regard.
ANNUAL FINANCIAL STATEMENTS
115DISTELL Integrated Report 2018
Responsibilities of the directors for the consolidated and separate financial statementsThe directors are responsible for the preparation and fair presentation of the consolidated and separate financial statements in accordance with International Financial Reporting Standards and the requirements of the Companies Act of South Africa, and for such internal control as the directors determine is necessary to enable the preparation of consolidated and separate financial statements that are free from material misstatement, whether due to fraud or error.
In preparing the consolidated and separate financial statements, the directors are responsible for assessing the Group and the company’s ability to continue as a going concern, disclosing, as applicable, matters related to going concern and using the going concern basis of accounting unless the directors either intend to liquidate the Group and/or the company or to cease operations, or have no realistic alternative but to do so.
Auditor’s responsibilities for the audit of the consolidated and separate financial statementsOur objectives are to obtain reasonable assurance about whether the consolidated and separate financial statements as a whole are free from material misstatement, whether due to fraud or error, and to issue an auditor’s report that includes our opinion. Reasonable assurance is a high level of assurance, but is not a guarantee that an audit conducted in accordance with ISAs will always detect a material misstatement when it exists. Misstatements can arise from fraud or error and are considered material if, individually or in the aggregate, they could reasonably be expected to influence the economic decisions of users taken on the basis of these consolidated and separate financial statements.
As part of an audit in accordance with ISAs, we exercise professional judgement and maintain professional scepticism throughout the audit. We also:
− Identify and assess the risks of material misstatement of the consolidated and separate financial statements, whether due to fraud or error, design and perform audit procedures responsive to those risks, and obtain audit evidence that is sufficient and appropriate to provide a basis for our opinion. The risk of not detecting a material misstatement resulting from fraud is higher than for one resulting from error, as fraud may involve collusion, forgery, intentional omissions, misrepresentations, or the override of internal control.
− Obtain an understanding of internal control relevant to the audit in order to design audit procedures that are appropriate in the circumstances, but not for the purpose of expressing an opinion on the effectiveness of the Group’s and the company’s internal control.
− Evaluate the appropriateness of accounting policies used and the reasonableness of accounting estimates and related disclosures made by the directors.
− Conclude on the appropriateness of the directors’ use of the going concern basis of accounting and, based on the audit evidence obtained, whether a material uncertainty exists related to events or conditions that may cast significant doubt on the Group’s and the company’s ability to continue as a going concern. If we conclude that a material uncertainty exists, we are required to draw attention in our auditor’s report to the related disclosures in the consolidated and separate financial statements or, if such disclosures are inadequate, to modify our opinion. Our conclusions are based on the audit evidence obtained up to the date of our auditor’s report. However, future events or conditions may cause the Group and/or company to cease to continue as a going concern.
− Evaluate the overall presentation, structure and content of the consolidated and separate financial statements, including the disclosures, and whether the consolidated and separate financial statements represent the underlying transactions and events in a manner that achieves fair presentation.
− Obtain sufficient appropriate audit evidence regarding the financial information of the entities or business activities within the Group to express an opinion on the consolidated financial statements. We are responsible for the direction, supervision and performance of the Group audit. We remain solely responsible for our audit opinion.
INDEPENDENT AUDITOR’S REPORTTO THE SHAREHOLDERS OF DISTELL GROUP HOLDINGS LIMITED (CONTINUED)
116 www.distell.co.za
We communicate with the directors regarding, among other matters, the planned scope and timing of the audit and significant audit findings, including any significant deficiencies in internal control that we identify during our audit.
We also provide the directors with a statement that we have complied with relevant ethical requirements regarding independence, and to communicate with them all relationships and other matters that may reasonably be thought to bear on our independence, and where applicable, related safeguards.
From the matters communicated with the directors, we determine those matters that were of most significance in the audit of the consolidated and separate financial statements of the current period and are therefore the key audit matters. We describe these matters in our auditor’s report unless law or regulation precludes public disclosure about the matter or when, in extremely rare circumstances, we determine that a matter should not be communicated in our report because the adverse consequences of doing so would reasonably be expected to outweigh the public interest benefits of such communication.
Report on other legal and regulatory requirements In terms of the IRBA Rule published in Government Gazette Number 39475 dated 4 December 2015, we report that PricewaterhouseCoopers Inc. and its predecessor firms have been the auditor of Distell Group Holdings Limited and predecessor companies for 73 years.
PricewaterhouseCoopers Inc. Director: NH DömanRegistered Auditor
Stellenbosch23 August 2018
ANNUAL FINANCIAL STATEMENTS
117DISTELL Integrated Report 2018
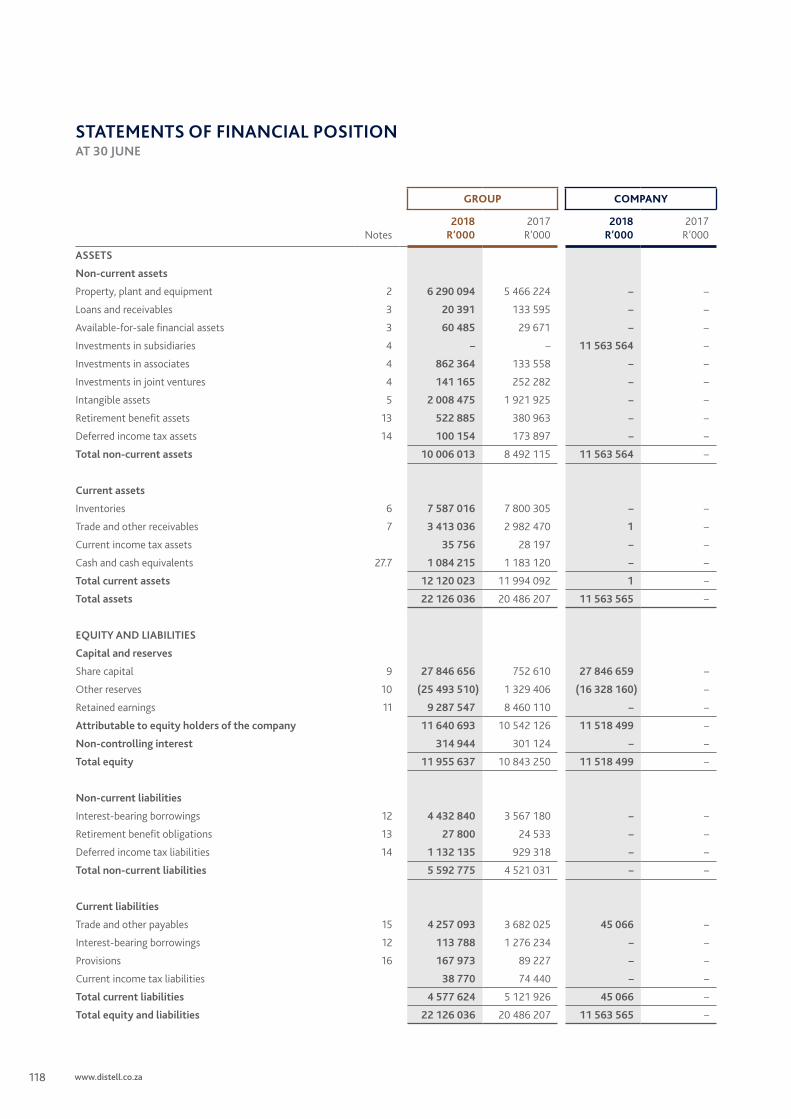
STATEMENTS OF FINANCIAL POSITIONAT 30 JUNE
GROUP COMPANY
Notes2018
R’0002017
R’0002018
R’0002017
R’000
ASSETS
Non-current assets
Property, plant and equipment 2 6 290 094 5 466 224 – –
Loans and receivables 3 20 391 133 595 – –
Available-for-sale financial assets 3 60 485 29 671 – –
Investments in subsidiaries 4 – – 11 563 564 –
Investments in associates 4 862 364 133 558 – –
Investments in joint ventures 4 141 165 252 282 – –
Intangible assets 5 2 008 475 1 921 925 – –
Retirement benefit assets 13 522 885 380 963 – –
Deferred income tax assets 14 100 154 173 897 – –
Total non-current assets 10 006 013 8 492 115 11 563 564 –
Current assets
Inventories 6 7 587 016 7 800 305 – –
Trade and other receivables 7 3 413 036 2 982 470 1 –
Current income tax assets 35 756 28 197 – –
Cash and cash equivalents 27.7 1 084 215 1 183 120 – –
Total current assets 12 120 023 11 994 092 1 –
Total assets 22 126 036 20 486 207 11 563 565 –
EQUITY AND LIABILITIES
Capital and reserves
Share capital 9 27 846 656 752 610 27 846 659 –
Other reserves 10 (25 493 510) 1 329 406 (16 328 160) –
Retained earnings 11 9 287 547 8 460 110 – –
Attributable to equity holders of the company 11 640 693 10 542 126 11 518 499 –
Non-controlling interest 314 944 301 124 – –
Total equity 11 955 637 10 843 250 11 518 499 –
Non-current liabilities
Interest-bearing borrowings 12 4 432 840 3 567 180 – –
Retirement benefit obligations 13 27 800 24 533 – –
Deferred income tax liabilities 14 1 132 135 929 318 – –
Total non-current liabilities 5 592 775 4 521 031 – –
Current liabilities
Trade and other payables 15 4 257 093 3 682 025 45 066 –
Interest-bearing borrowings 12 113 788 1 276 234 – –
Provisions 16 167 973 89 227 – –
Current income tax liabilities 38 770 74 440 – –
Total current liabilities 4 577 624 5 121 926 45 066 –
Total equity and liabilities 22 126 036 20 486 207 11 563 565 –
118 www.distell.co.za
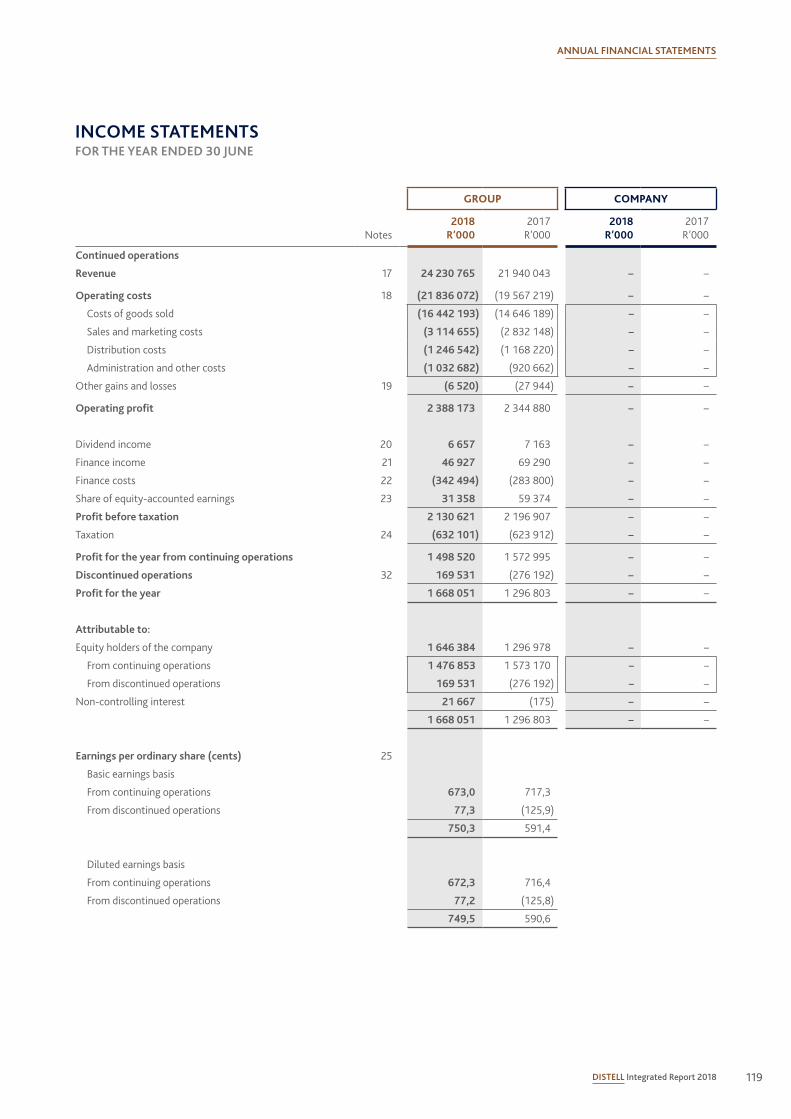
INCOME STATEMENTSFOR THE YEAR ENDED 30 JUNE
GROUP COMPANY
Notes2018
R’0002017
R’0002018
R’0002017
R’000
Continued operations
Revenue 17 24 230 765 21 940 043 – –
Operating costs 18 (21 836 072) (19 567 219) – –
Costs of goods sold (16 442 193) (14 646 189) – –
Sales and marketing costs (3 114 655) (2 832 148) – –
Distribution costs (1 246 542) (1 168 220) – –
Administration and other costs (1 032 682) (920 662) – –
Other gains and losses 19 (6 520) (27 944) – –
Operating profit 2 388 173 2 344 880 – –
Dividend income 20 6 657 7 163 – –
Finance income 21 46 927 69 290 – –
Finance costs 22 (342 494) (283 800) – –
Share of equity-accounted earnings 23 31 358 59 374 – –
Profit before taxation 2 130 621 2 196 907 – –
Taxation 24 (632 101) (623 912) – –
Profit for the year from continuing operations 1 498 520 1 572 995 – –
Discontinued operations 32 169 531 (276 192) – –
Profit for the year 1 668 051 1 296 803 – –
Attributable to:
Equity holders of the company 1 646 384 1 296 978 – –
From continuing operations 1 476 853 1 573 170 – –
From discontinued operations 169 531 (276 192) – –
Non-controlling interest 21 667 (175) – –
1 668 051 1 296 803 – –
Earnings per ordinary share (cents) 25
Basic earnings basis
From continuing operations 673,0 717,3
From discontinued operations 77,3 (125,9)
750,3 591,4
Diluted earnings basis
From continuing operations 672,3 716,4
From discontinued operations 77,2 (125,8)
749,5 590,6
ANNUAL FINANCIAL STATEMENTS
119DISTELL Integrated Report 2018
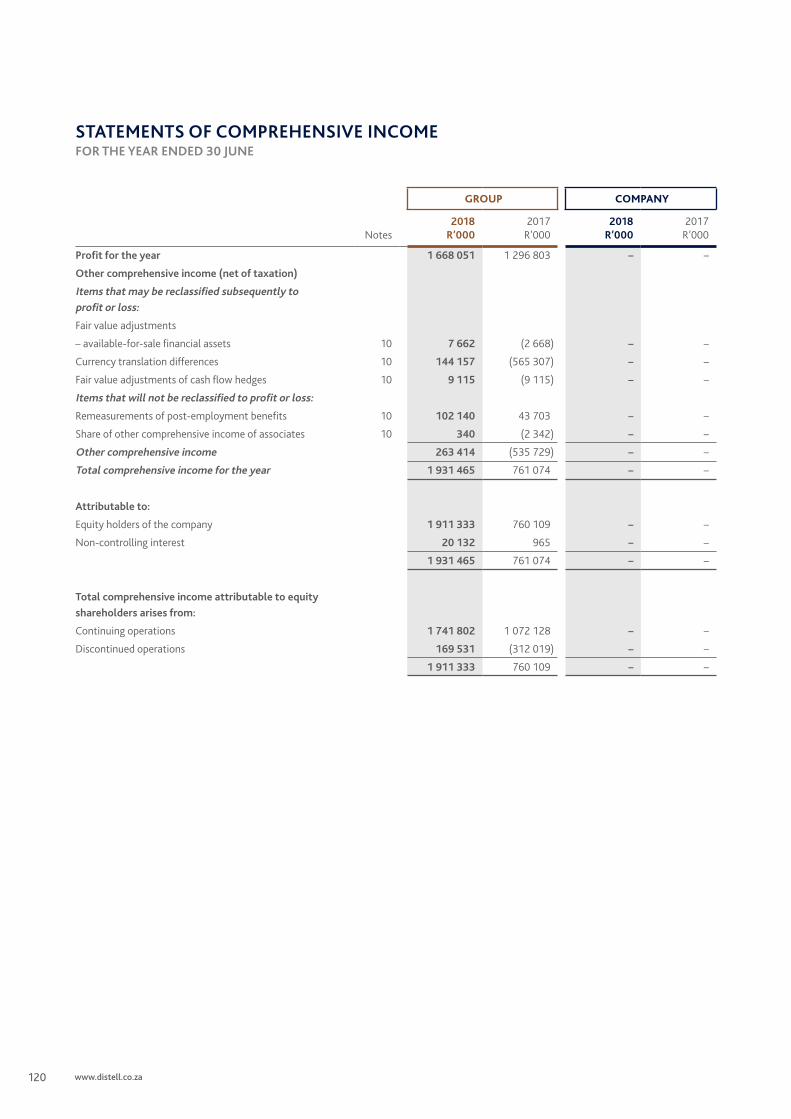
STATEMENTS OF COMPREHENSIVE INCOMEFOR THE YEAR ENDED 30 JUNE
GROUP COMPANY
Notes2018
R’0002017
R’0002018
R’0002017
R’000
Profit for the year 1 668 051 1 296 803 – –
Other comprehensive income (net of taxation)
Items that may be reclassified subsequently to profit or loss:
Fair value adjustments
– available-for-sale financial assets 10 7 662 (2 668) – –
Currency translation differences 10 144 157 (565 307) – –
Fair value adjustments of cash flow hedges 10 9 115 (9 115) – –
Items that will not be reclassified to profit or loss:
Remeasurements of post-employment benefits 10 102 140 43 703 – –
Share of other comprehensive income of associates 10 340 (2 342) – –
Other comprehensive income 263 414 (535 729) – –
Total comprehensive income for the year 1 931 465 761 074 – –
Attributable to:
Equity holders of the company 1 911 333 760 109 – –
Non-controlling interest 20 132 965 – –
1 931 465 761 074 – –
Total comprehensive income attributable to equity shareholders arises from:
Continuing operations 1 741 802 1 072 128 – –
Discontinued operations 169 531 (312 019) – –
1 911 333 760 109 – –
120 www.distell.co.za
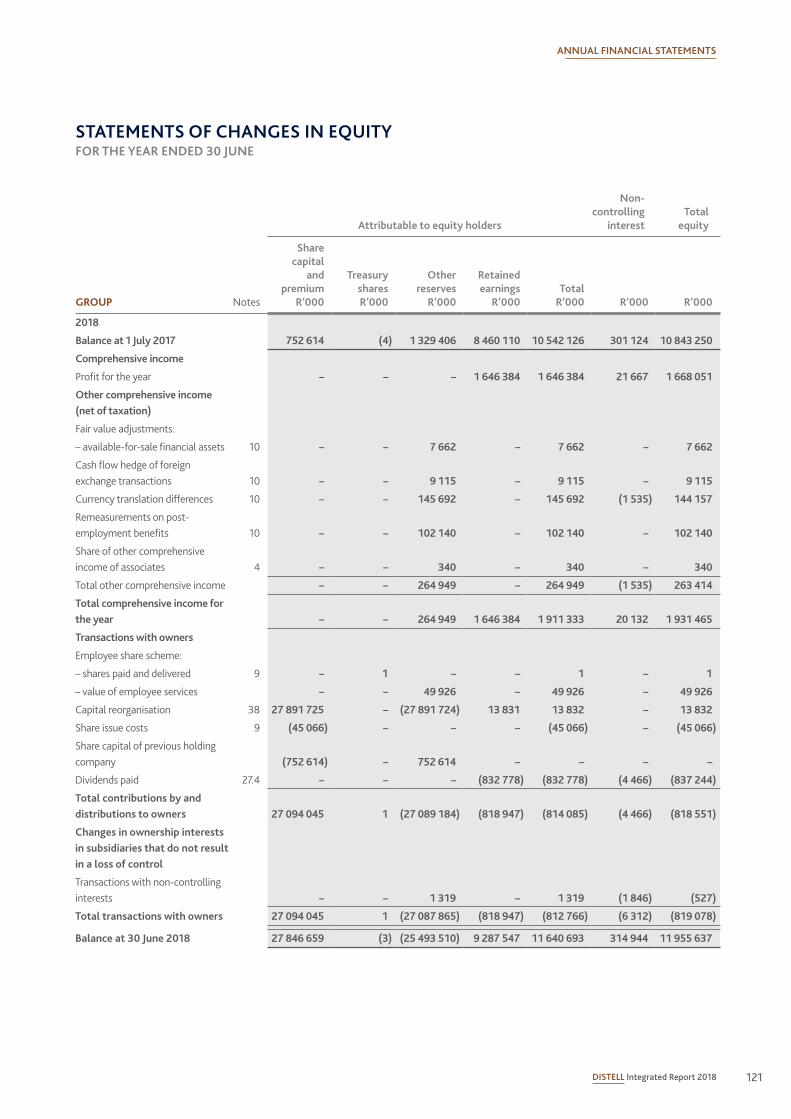
STATEMENTS OF CHANGES IN EQUITYFOR THE YEAR ENDED 30 JUNE
Attributable to equity holders
Non-controlling
interestTotal
equity
GROUP Notes
Share capital
and premium
R’000
TreasurysharesR’000
Otherreserves
R’000
Retainedearnings
R’000Total
R’000 R’000 R’000
2018
Balance at 1 July 2017 752 614 (4) 1 329 406 8 460 110 10 542 126 301 124 10 843 250
Comprehensive income
Profit for the year – – – 1 646 384 1 646 384 21 667 1 668 051
Other comprehensive income (net of taxation)
Fair value adjustments:
– available-for-sale financial assets 10 – – 7 662 – 7 662 – 7 662
Cash flow hedge of foreign exchange transactions 10 – – 9 115 – 9 115 – 9 115
Currency translation differences 10 – – 145 692 – 145 692 (1 535) 144 157
Remeasurements on post-employment benefits 10 – – 102 140 – 102 140 – 102 140
Share of other comprehensive income of associates 4 – – 340 – 340 – 340
Total other comprehensive income – – 264 949 – 264 949 (1 535) 263 414
Total comprehensive income for the year – – 264 949 1 646 384 1 911 333 20 132 1 931 465
Transactions with owners
Employee share scheme:
– shares paid and delivered 9 – 1 – – 1 – 1
– value of employee services – – 49 926 – 49 926 – 49 926
Capital reorganisation 38 27 891 725 – (27 891 724) 13 831 13 832 – 13 832
Share issue costs 9 (45 066) – – – (45 066) – (45 066)
Share capital of previous holding company (752 614) – 752 614 – – – –
Dividends paid 27.4 – – – (832 778) (832 778) (4 466) (837 244)
Total contributions by and distributions to owners 27 094 045 1 (27 089 184) (818 947) (814 085) (4 466) (818 551)
Changes in ownership interests in subsidiaries that do not result in a loss of control
Transactions with non-controlling interests – – 1 319 – 1 319 (1 846) (527)
Total transactions with owners 27 094 045 1 (27 087 865) (818 947) (812 766) (6 312) (819 078)
Balance at 30 June 2018 27 846 659 (3) (25 493 510) 9 287 547 11 640 693 314 944 11 955 637
ANNUAL FINANCIAL STATEMENTS
121DISTELL Integrated Report 2018
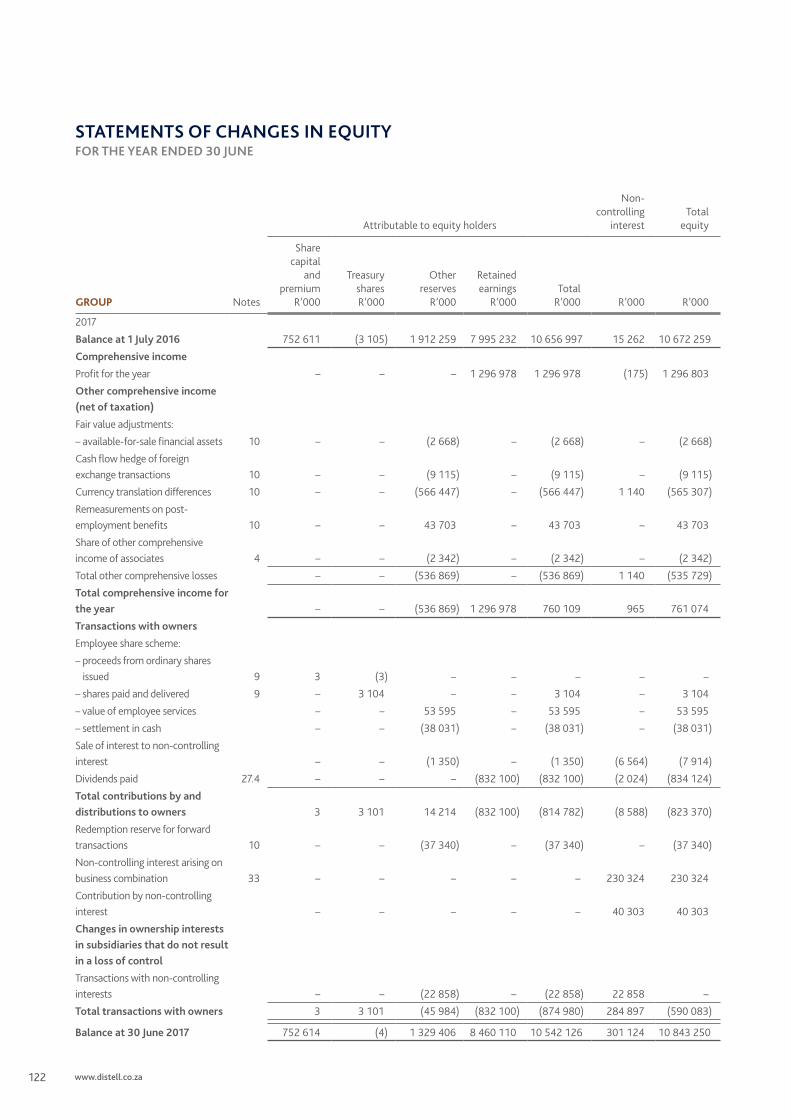
STATEMENTS OF CHANGES IN EQUITYFOR THE YEAR ENDED 30 JUNE
Attributable to equity holders
Non-controlling
interestTotal
equity
GROUP Notes
Share capital
and premium
R’000
TreasurysharesR’000
Otherreserves
R’000
Retainedearnings
R’000Total
R’000 R’000 R’000
2017
Balance at 1 July 2016 752 611 (3 105) 1 912 259 7 995 232 10 656 997 15 262 10 672 259
Comprehensive income
Profit for the year – – – 1 296 978 1 296 978 (175) 1 296 803
Other comprehensive income (net of taxation)
Fair value adjustments:
– available-for-sale financial assets 10 – – (2 668) – (2 668) – (2 668)
Cash flow hedge of foreign exchange transactions 10 – – (9 115) – (9 115) – (9 115)
Currency translation differences 10 – – (566 447) – (566 447) 1 140 (565 307)
Remeasurements on post-employment benefits 10 – – 43 703 – 43 703 – 43 703
Share of other comprehensive income of associates 4 – – (2 342) – (2 342) – (2 342)
Total other comprehensive losses – – (536 869) – (536 869) 1 140 (535 729)
Total comprehensive income for the year – – (536 869) 1 296 978 760 109 965 761 074
Transactions with owners
Employee share scheme:
– proceeds from ordinary shares issued 9 3 (3) – – – – –
– shares paid and delivered 9 – 3 104 – – 3 104 – 3 104
– value of employee services – – 53 595 – 53 595 – 53 595
– settlement in cash – – (38 031) – (38 031) – (38 031)
Sale of interest to non-controlling interest – – (1 350) – (1 350) (6 564) (7 914)
Dividends paid 27.4 – – – (832 100) (832 100) (2 024) (834 124)
Total contributions by and distributions to owners 3 3 101 14 214 (832 100) (814 782) (8 588) (823 370)
Redemption reserve for forward transactions 10 – – (37 340) – (37 340) – (37 340)
Non-controlling interest arising on business combination 33 – – – – – 230 324 230 324
Contribution by non-controlling interest – – – – – 40 303 40 303
Changes in ownership interests in subsidiaries that do not result in a loss of control
Transactions with non-controlling interests – – (22 858) – (22 858) 22 858 –
Total transactions with owners 3 3 101 (45 984) (832 100) (874 980) 284 897 (590 083)
Balance at 30 June 2017 752 614 (4) 1 329 406 8 460 110 10 542 126 301 124 10 843 250
122 www.distell.co.za
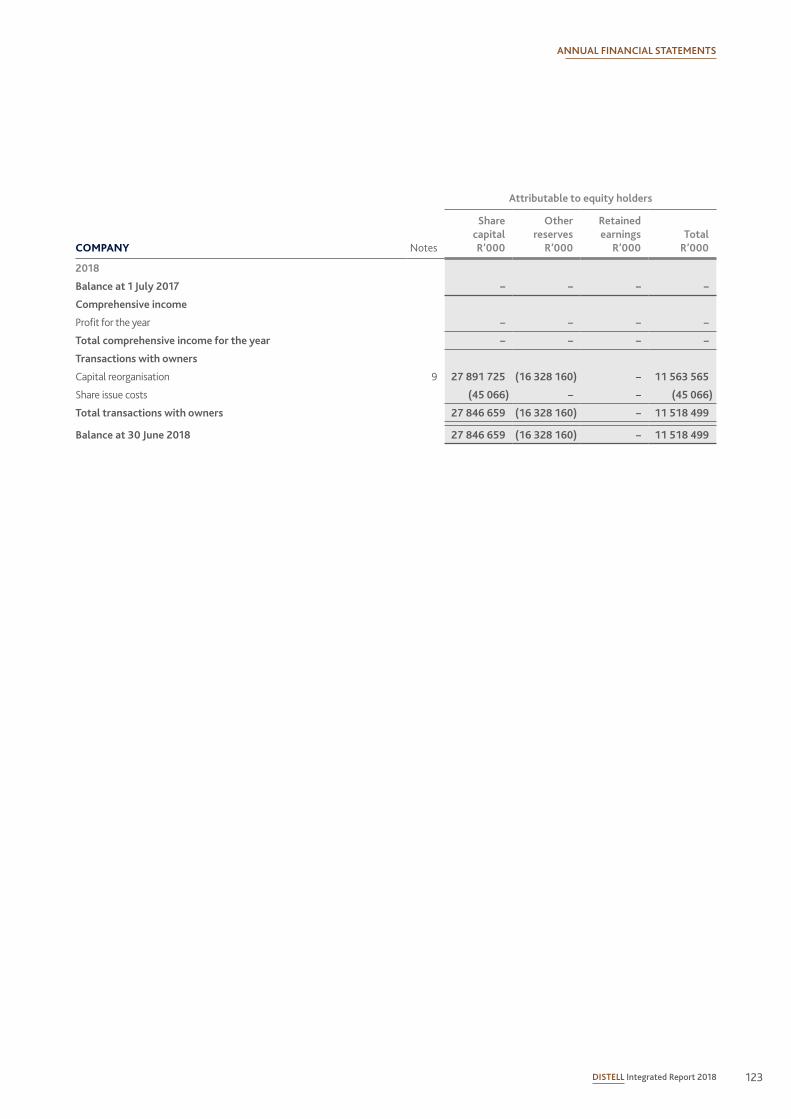
Attributable to equity holders
COMPANY Notes
Share capital
R’000
Other reserves
R’000
Retained earnings
R’000Total
R’000
2018
Balance at 1 July 2017 – – – –
Comprehensive income
Profit for the year – – – –
Total comprehensive income for the year – – – –
Transactions with owners
Capital reorganisation 9 27 891 725 (16 328 160) – 11 563 565
Share issue costs (45 066) – – (45 066)
Total transactions with owners 27 846 659 (16 328 160) – 11 518 499
Balance at 30 June 2018 27 846 659 (16 328 160) – 11 518 499
ANNUAL FINANCIAL STATEMENTS
123DISTELL Integrated Report 2018
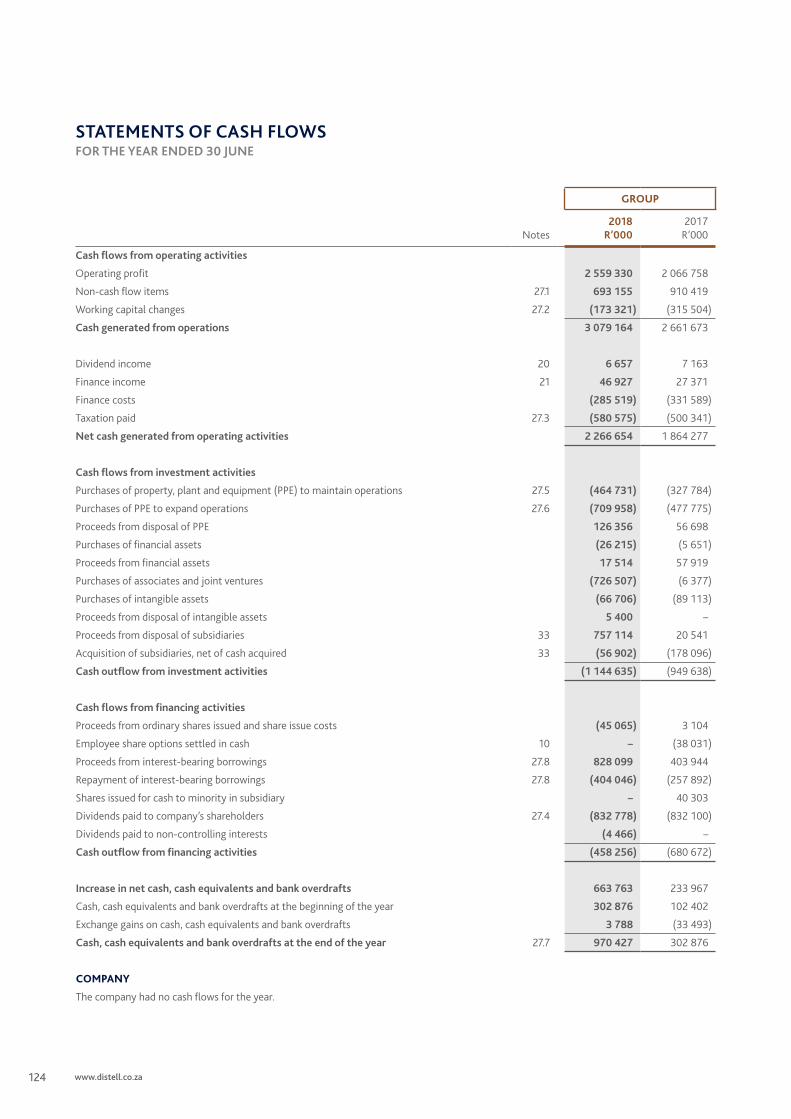
GROUP
Notes2018
R’0002017
R’000
Cash flows from operating activities
Operating profit 2 559 330 2 066 758
Non-cash flow items 27.1 693 155 910 419
Working capital changes 27.2 (173 321) (315 504)
Cash generated from operations 3 079 164 2 661 673
Dividend income 20 6 657 7 163
Finance income 21 46 927 27 371
Finance costs (285 519) (331 589)
Taxation paid 27.3 (580 575) (500 341)
Net cash generated from operating activities 2 266 654 1 864 277
Cash flows from investment activities
Purchases of property, plant and equipment (PPE) to maintain operations 27.5 (464 731) (327 784)
Purchases of PPE to expand operations 27.6 (709 958) (477 775)
Proceeds from disposal of PPE 126 356 56 698
Purchases of financial assets (26 215) (5 651)
Proceeds from financial assets 17 514 57 919
Purchases of associates and joint ventures (726 507) (6 377)
Purchases of intangible assets (66 706) (89 113)
Proceeds from disposal of intangible assets 5 400 –
Proceeds from disposal of subsidiaries 33 757 114 20 541
Acquisition of subsidiaries, net of cash acquired 33 (56 902) (178 096)
Cash outflow from investment activities (1 144 635) (949 638)
Cash flows from financing activities
Proceeds from ordinary shares issued and share issue costs (45 065) 3 104
Employee share options settled in cash 10 – (38 031)
Proceeds from interest-bearing borrowings 27.8 828 099 403 944
Repayment of interest-bearing borrowings 27.8 (404 046) (257 892)
Shares issued for cash to minority in subsidiary – 40 303
Dividends paid to company’s shareholders 27.4 (832 778) (832 100)
Dividends paid to non-controlling interests (4 466) –
Cash outflow from financing activities (458 256) (680 672)
Increase in net cash, cash equivalents and bank overdrafts 663 763 233 967
Cash, cash equivalents and bank overdrafts at the beginning of the year 302 876 102 402
Exchange gains on cash, cash equivalents and bank overdrafts 3 788 (33 493)
Cash, cash equivalents and bank overdrafts at the end of the year 27.7 970 427 302 876
COMPANY
The company had no cash flows for the year.
STATEMENTS OF CASH FLOWSFOR THE YEAR ENDED 30 JUNE
124 www.distell.co.za
NOTES TO THE ANNUAL FINANCIAL STATEMENTSFOR THE YEAR ENDED 30 JUNE 2018
1. SIGNIFICANT ACCOUNTING POLICIES1.1 Basis of preparation The reorganisation of Distell Group Limited to Distell Group Holdings Limited has been accounted for in accordance with the principles
of reorganisation accounting as applicable to group reorganisations. The consolidated financial statements are, therefore, presented as if Distell Group Holdings Limited had been the parent company of the Group throughout the periods presented.
The annual consolidated and separate financial statements of Distell Group Holdings Limited are prepared in accordance with and comply with International Financial Reporting Standards (IFRS) and the IFRS Interpretations Committee (IFRS IC), and the SAICA Financial Reporting Guides as issued by the Accounting Practices Committee (APC) and Financial Pronouncements as issued by the Financial Reporting Standards Council and the requirements of the Companies Act, No. 71 of 2008, as amended. The annual financial statements are prepared on the historical cost convention, as modified by the revaluation of certain financial instruments.
Standards and amendments applicable to the Group effective for the first time: − Amendments to IAS 12: Income taxes – issued to clarify the requirements for recognising deferred tax assets on unrealised losses
(effective 1 January 2017) − Amendments to IAS 7: Statement of Cash Flows – introducing an additional disclosure to evaluate changes in liabilities arising from
financing activities (effective 1 January 2017) − Annual improvements 2014 – 2016 cycle – IFRS 12: Disclosure of Interests in Other Entities (effective 1 January 2018)
Standards, interpretations and amendments to published standards that are not yet effective Management considered all new accounting standards, interpretations and amendments to IFRS that were issued prior to 30 June 2018,
but not yet effective on that date. Management is in the process of assessing the impact of these standards, interpretations and amendments on the reported results of the Group.
The standards that are applicable to the Group, but that were not implemented early, are the following: − Amendments to IFRS 2: Share-based Payments – Clarifying how to account for certain types of share-based payment transactions
(effective 1 January 2018) − Amendments to IAS 28: Investments in Associates and Joint Ventures – long-term interests in associates and joint ventures
(effective 1 January 2019) − Amendments to IFRS 10: Consolidated Financial Statements and IAS 28 Investments in Associates and Joint Ventures – on sale
or contribution of assets (effective date postponed) − IFRIC 22: Foreign Currency Transactions and Advance Consideration (effective 1 January 2018) − IFRIC 23: Uncertainty over Income Tax Treatments (effective 1 January 2019) − Annual Improvements 2014 – 2016 cycle (effective 1 January 2018) − Annual Improvements 2015 – 2017 cycle (effective 1 January 2019) − IFRS 16: Leases (effective 1 January 2019)
The new standard for leases, IFRS 16, requires a lessee to recognise a right-of-use asset and corresponding lease liability on the balance sheet for almost all lease contracts. Currently operating lease expenses are charged to the income statement on a straight- line basis over the term of the lease. The Group leases farming land, and various warehouses, machinery, equipment and vehicles under operating lease agreements. Note 18.5 sets out details of operating lease expenses paid during the year. Management still has to perform a detailed analysis of all lease contracts on an individual basis, but it is expected that as a minimum the Group will have to capitalise right-of-use assets of about R300 million, this being the net present value of future minimum lease payments under non-cancellable leases as set out in note 29 to the financial statements. The remainder of the lease expenses relates to short-term leases and low-value assets. Apart from the right-of-use asset and lease liability being recognised on the statement of financial position, the effect of the change in the standard would be a reduction in the operating lease expenses in the income statement, and an increase in depreciation charges (on the right-of-use asset) and finance cost (interest expense of the lease liability). The impact of these cannot be quantified at this stage.
ANNUAL FINANCIAL STATEMENTS
125DISTELL Integrated Report 2018
1. SIGNIFICANT ACCOUNTING POLICIES (continued)1.1 Basis of preparation (continued)
− IFRS 15: Revenue from Contracts with Customers (effective 1 January 2018) Under IFRS 15, Revenue needs to be recognised at a point in time or over time depending, on the performance obligations linked to separate elements of the contract with the customer. The Group’s revenue consists mostly of sales of liquor products delivered to customers at the point of sale and does not have multiple element arrangements included in it. Therefore, it is expected that the timing and measurement of the Group’s revenue will not change as a result of the implementation of IFRS 15. Management, however, still has to perform a detailed analysis of all revenue contracts to assess each individually.
− IFRS 9: Financial Instruments – on financial liabilities, derecognition of financial instruments, financial assets and general hedge accounting (effective 1 January 2018) Although IFRS 9 changes the classification of certain financial instruments, the measurement of the Group’s financial assets and liabilities is expected to be unchanged under the new principles. Trade receivables, loans and other receivables are all held to collect principal and interest only and will continue to be measured at amortised cost in future. Similarly, borrowings and trade and other payables will continue to be measured at amortised cost. The Group has only a small amount of available-for-sale equity instruments – currently measured at fair value through other comprehensive income – and the intention is to also choose the fair value through other comprehensive income option under IFRS 9. Derivatives will remain at fair value through profit or loss. The Group does not expect that the new expected credit loss impairment model would significantly change the provision for impairment of trade receivables since the amounts are not material to the Group.
1.2 Critical accounting estimates and assumptions The Group makes estimates and assumptions concerning the future and these accounting estimates are an integral part of the
preparation of financial statements. The resulting accounting estimates will, by definition, seldom equal the related actual results. The estimates and assumptions that have a significant risk of causing a material adjustment to the carrying amounts of assets and liabilities within the next financial year are as follows:
a) Estimated impairment of goodwill and intangible assets The Group tests annually whether goodwill and the intangible assets with indefinite useful lives have suffered any impairments,
in accordance with the accounting policy stated in note 1.8. The recoverable amounts of cash-generating units are determined as being the higher of the value-in-use or fair value less costs to sell. Calculation of these amounts requires the use of estimates. Further details are provided in note 5.
b) Income taxes The Group is subject to income taxes in numerous jurisdictions. Significant judgement is required in determining the provision for
income taxes. There are many transactions and calculations for which the ultimate tax determination is uncertain. The Group recognises liabilities for anticipated tax audit issues based on estimates of whether additional taxes will be due. Where the final tax outcome of these matters is different from the amounts that were initially recorded, such differences will impact the current tax and deferred tax assets and liabilities in the period in which such determination is made.
c) Retirement benefits The present value of the pension obligation depends on a number of factors that are determined on an actuarial basis using
a number of assumptions. The assumptions used in determining the net cost/(income) for pension include the discount rate. Any changes in these assumptions will impact the carrying amount of pension obligations.
The Group determines the appropriate discount rate at the end of each year. This is the interest rate that should be used to determine the present value of estimated future cash flows expected to be required to settle the pension obligations. In determining the appropriate discount rate, the Group considers the interest rates of high-quality corporate bonds that are denominated in the currency in which the benefits will be paid and that have terms to maturity approximating the terms of the related pension obligation.
Other key assumptions for pension obligations are based, in part, on current market conditions. Further details are provided in note 13.
NOTES TO THE ANNUAL FINANCIAL STATEMENTSFOR THE YEAR ENDED 30 JUNE 2018
126 www.distell.co.za
1. SIGNIFICANT ACCOUNTING POLICIES (continued)1.2 Critical accounting estimates and assumptions (continued) d) Impairment of available-for-sale financial assets The Group follows the guidance of IAS 39 to determine when an available-for-sale financial asset is impaired. This determination
requires significant judgement. In making this judgement the Group evaluates, among factors, the duration and extent to which the fair value of an investment is less than its cost; and the financial health of and short-term business outlook for the investee, including factors such as industry and sector performance, and operational and financing cash flow.
e) Business combinations Where the Group acquires control of another business, the consideration transferred has to be allocated to the identifiable assets
acquired, the liabilities assumed and any non-controlling interest in the acquired business, with any residual recorded as goodwill. This process involves management making an assessment of the fair value of these items. Management’s judgement is particularly involved in the recognition and measurement of the following items:
− Intellectual property, which includes patents, licences, trademarks and similar rights for currently marketed products. − Contingencies such as legal and environmental matters. − Accumulated tax losses, particularly the recoverability of any previously incurred by the acquired company.
In all cases management makes an assessment based on the underlying economic substance of the items concerned, and not only on the contractual terms, in order to fairly present these items.
f) Property, plant and equipment It is necessary for the Group to make use of judgement when determining the useful life of the property, plant and equipment.
Further details are provided in note 2.
g) Consolidation of entities where the Group holds less than 50% shareholding The Group is one of the two largest shareholders in Mirma Products Proprietary Limited with a 45% equity interest. The Group
buys more than 98% of the total product produced by Mirma Products. There is no history of other shareholders forming a group to exercise their votes collectively. Based on the absolute size of the Group’s shareholding, as well as the business model of Mirma Products Proprietary Limited, management has concluded that the Group has sufficiently dominant interest to have the power to direct the relevant activities of the entity. Refer to note 39.
1.3 Basis of consolidation Subsidiaries Subsidiaries are all entities (including structured entities) that are, directly or indirectly, controlled by the Group. Control is established
where the Group is exposed, or has rights, to variable returns from its involvement with the entity and has the ability to affect those returns through its power over the entity. Subsidiaries are fully consolidated from the date on which effective control is transferred to the Group. They are deconsolidated from the date that control ceases.
The Group applies the acquisition method of accounting to account for business combinations. The consideration transferred for the acquisition of a subsidiary is the fair values of the assets transferred, the liabilities incurred and the equity interests issued by the Group. The consideration transferred includes the fair value of any asset or liability resulting from a contingent consideration arrangement. Acquisition-related costs are expensed as incurred. Identifiable assets acquired and liabilities and contingent liabilities assumed in a business combination are measured initially at their fair values at the acquisition date. On an acquisition-by-acquisition basis the Group recognises any non-controlling interest in the acquiree, either at fair value or at the non-controlling interest’s proportionate share of the recognised amounts of the acquiree’s identifiable net assets.
If the business combination is achieved in stages, the acquisition date carrying value of the acquirer’s previously held equity interest in the acquiree is remeasured to fair value at the acquisition date. Any gains or losses arising from such remeasurement are recognised in profit or loss.
ANNUAL FINANCIAL STATEMENTS
127DISTELL Integrated Report 2018
1. SIGNIFICANT ACCOUNTING POLICIES (continued)1.3 Basis of consolidation (continued) Subsidiaries (continued) Any contingent consideration to be transferred by the Group is recognised at fair value at the acquisition date. Subsequent changes to
the fair value of the contingent consideration that is deemed to be an asset or liability is recognised in accordance with IAS 39 either in profit or loss, or as a change to other comprehensive income. Contingent consideration that is classified as equity is not remeasured and its subsequent settlement is accounted for within equity.
The excess of the consideration transferred, the amount of any non-controlling interest in the acquiree and the acquisition date fair value of any previous equity interest in the acquiree over the fair value of the Group’s share of the identifiable net assets acquired is recorded as goodwill. If this is less than the fair value of the net assets of the subsidiary acquired in the case of a bargain purchase, the difference is recognised directly in the income statement. Transactions with owners are recognised in equity only when control is not lost.
Intercompany transactions, balances, income and expenses on transactions between Group companies are eliminated. Unrealised gains and losses resulting from intercompany transactions that are recognised in assets are also eliminated. Accounting policies of subsidiaries have been changed where necessary to ensure consistency with the policies adopted by the Group.
The investments of Distell Group Holdings Limited in the ordinary shares of its subsidiaries, Distell Group Limited and Capevin Holdings Limited, are carried at cost less impairment losses in the separate financial statements.
Changes in ownership interests in subsidiaries without change of control Transactions with non-controlling interests that do not result in loss of control are accounted for as equity transactions – that is,
as transactions with the owners in their capacity as owners. The difference between fair value of any consideration paid and the relevant share acquired of the carrying value of net assets of the subsidiary is recorded in equity. Gains or losses on disposals to non-controlling interests are also recorded in equity.
Disposal of subsidiaries When the Group ceases to have control, any retained interest in the entity is remeasured to its fair value at the date when control is lost,
with the change in carrying amount recognised in profit or loss. The fair value is the initial carrying amount for the purposes of subsequently accounting for the retained interest as an associate, joint venture or financial asset. In addition, any amounts previously recognised in other comprehensive income in respect of that entity are accounted for as if the Group had directly disposed of the related assets or liabilities. This may mean that amounts previously recognised in other comprehensive income are reclassified to profit or loss.
Associates Associates are all entities over which the Group has and exercises significant influence, generally accompanying a shareholding of between
20% and 50% of the voting rights, but which it does not control. Investments in associates are accounted for using the equity method of accounting and are initially recognised at cost, and the carrying amount is increased or decreased to recognise the investor’s share of the profit or loss of the investee after the date of acquisition. The Group’s investment in associates includes goodwill identified on acquisition.
If the ownership interest in an associate is reduced, but significant influence is retained, only a proportionate share of the amounts previously recognised in other comprehensive income is reclassified to profit or loss where appropriate.
The Group’s share of post-acquisition profit or loss is recognised in the income statement and its share of post-acquisition movements in other comprehensive income is recognised in other comprehensive income, with a corresponding adjustment to the carrying amount of the investment. When the Group’s share of losses in an associate equals or exceeds its interest in the associate, including any other unsecured receivables, the Group does not recognise further losses, unless it has incurred legal or constructive obligations or made payments on behalf of the associate.
The Group determines, at each reporting date, whether there is any objective evidence that the investment in the associate is impaired. If this is the case, the Group calculates the amount of impairment as the difference between the recoverable amount of the associate and its carrying value and recognises the amount adjacent to ‘share of equity-accounted earnings of an associate’ in the income statement.
NOTES TO THE ANNUAL FINANCIAL STATEMENTSFOR THE YEAR ENDED 30 JUNE 2018
128 www.distell.co.za
1. SIGNIFICANT ACCOUNTING POLICIES (continued)1.3 Basis of consolidation (continued) Associates (continued) Unrealised gains and losses resulting from intercompany transactions between the Group and its associate are recognised in the Group’s
financial statements only to the extent of unrelated investor’s interest in the associate. Unrealised losses are also eliminated unless the transaction provides evidence of an impairment of the asset transferred. Accounting policies of associates have been changed where necessary to ensure consistency with the policies adopted by the Group.
Dilution gains and losses arising on investment in associates are recognised in the income statement.
Joint ventures The Group applies IFRS 11 to all joint arrangements. Under IFRS 11, investments in joint arrangements are classified as either joint operations
or joint ventures, depending on the contractual rights and obligations of each investor. The Group has assessed the nature of its joint arrangements and determined them to be joint ventures. Joint ventures are accounted for using the equity method.
Under the equity method of accounting, interests in joint ventures are initially recognised at cost and adjusted thereafter to recognise the Group’s share of the post-acquisition profits or losses and movements in other comprehensive income. When the Group’s share of losses in a joint venture equals or exceeds its interests in the joint ventures, the Group does not recognise further losses, unless it has incurred obligations or made payments on behalf of the joint ventures.
Unrealised gains on transactions between the Group and its joint ventures are eliminated to the extent of the Group’s interest in the joint ventures. Unrealised losses are also eliminated unless the transaction provides evidence of an impairment of the asset transferred. Accounting policies of the joint ventures have been changed, where necessary, to ensure consistency with the policies adopted by the Group.
1.4 Foreign currency translation Functional and presentation currency Items included in the financial statements of each of the Group’s entities are measured using the currency of the primary economic
environment in which the entity operates (the functional currency). The consolidated financial statements are prepared in South African rand (R), which is the company’s functional and the Group’s presentation currency.
Foreign Group entities The results and the financial position of all Group entities that have a functional currency that is different from the presentation currency
of the Group are translated into the presentation currency as follows:
− Assets and liabilities for each statement of financial position presented are translated at the closing rate at the date of that statement of financial position.
− Income and expenses for each income statement presented are translated at the average exchange rates (unless this average is not a reasonable approximation of the cumulative effect of the rates prevailing on the transaction dates, in which case income and expenses are translated at the rate on the dates of the transactions).
− All resulting exchange differences are recognised in other comprehensive income as part of a foreign currency translation reserve (FCTR). − On consolidation, exchange rate differences arising from the translation of the net investment in foreign operations, and of borrowings
and other currency instruments designated as hedges of such investments, if applicable, are also taken to the FCTR. When a foreign operation is sold, all related exchange rate differences that were recorded in the FCTR are recognised in the income statement as part of the profit or loss on sale. When a partial disposal takes place, the FCTR is proportionately reattributed to the non-controlling shareholders in terms of IAS 21. The Group’s net investment in a subsidiary or joint venture is equal to the equity investment plus all monetary items that are receivable from or payable to the subsidiary or joint venture, for which settlement is neither planned nor likely to occur in the foreseeable future.
− Goodwill and fair value adjustments arising on the acquisition of a foreign entity are treated as assets and liabilities of the foreign entity and are translated at the closing rate.
ANNUAL FINANCIAL STATEMENTS
129DISTELL Integrated Report 2018
1. SIGNIFICANT ACCOUNTING POLICIES (continued)1.4 Foreign currency translation (continued) Transactions and balances Foreign currency transactions are translated into the functional currency using the exchange rates prevailing at the dates of the transactions
or valuation where items are remeasured. Foreign exchange gains and losses resulting from the settlement of such transactions and from the translation at year-end exchange rates of monetary assets and liabilities denominated in foreign currencies are recognised in profit or loss.
Foreign exchange gains and losses that relate to borrowings and cash and cash equivalents are presented in the income statement within ‘finance income or costs’. All other foreign exchange gains and losses are presented in the income statement within ‘other gains and losses’.
Changes in the fair value of monetary securities denominated in foreign currency classified as available-for-sale are analysed between translation differences resulting from changes in the amortised cost of the security, and other changes in the carrying amount of the security. Translation differences related to changes in amortised cost are recognised in profit or loss, and other changes in the carrying amount are recognised in other comprehensive income.
Translation differences on non-monetary financial assets and liabilities such as equities held at fair value through profit or loss, are recognised in profit or loss as part of the fair value gain or loss. Translation differences on non-monetary financial assets such as equities classified as available-for-sale are recorded in other comprehensive income.
1.5 Segment reporting Operating segments are reported in a manner consistent with the internal reporting provided to the chief operating decision-maker
(executive management team). Operating segments are individual components of an entity that engage in business activities from which it may earn revenues and incur expenses, and whose operating results are regularly reviewed by the entity’s chief operating decision-maker and for which discrete financial information is available. Operating segments which display similar economic characteristics are aggregated for reporting purposes.
1.6 Property, plant, equipment and grapevines Property, plant, equipment and grapevines are tangible assets held by the Group for use in the manufacturing and distribution of its
products and are expected to be used during more than one period. All property, plant, equipment and grapevines are stated at historical costs less subsequent depreciation and accumulated impairment. The historical cost includes all expenditure that is directly attributable to the acquisition of the property, plant, equipment and grapevines, and the costs of dismantling and preparing the site for grapevines, and is depreciated on a straight-line basis, from the date that assets are available for use, at rates appropriate to the various classes of assets involved, taking into account the estimated useful life and residual values of the individual items. Grapevines are measured at accumulated costs until maturity, similar to the accounting for a self-constructed item of property, plant and equipment. Land is not depreciated as it is deemed to have an unlimited useful life. Improvements to leasehold properties are recognised as property, plant and equipment when it is probable that future economic benefits will flow to the Group. Improvements to leasehold properties are shown at cost and written off over the remaining period of the lease. Assets under construction are defined as assets still in the construction phase and not yet available for use. These assets are carried at initial cost and are not depreciated. Depreciation on these assets commences when they become available for use and depreciation periods are based on management’s assessment of their useful lives.
Management determines the estimated useful lives and the related depreciation charges at acquisition.
Useful lives:Buildings 5 – 60 yearsStainless steel tanks 3 – 45 yearsOther machinery and barrels 2 – 45 yearsEquipment and vehicles 2 – 33 yearsGrapevines 20 yearsCapitalised finance lease vehicles 4 years
The assets’ residual values and useful lives are reviewed, and adjusted if appropriate, at the end of each reporting period.
NOTES TO THE ANNUAL FINANCIAL STATEMENTSFOR THE YEAR ENDED 30 JUNE 2018
130 www.distell.co.za
1. SIGNIFICANT ACCOUNTING POLICIES (continued)1.6 Property, plant, equipment and grapevines (continued) Subsequent costs are included in the asset’s carrying amount or recognised as a separate asset, as appropriate, to the extent that it is
probable that future economic benefits associated with the item will flow to the Group and the cost of the item can be measured reliably. The carrying amount of the replaced part is derecognised. All other repairs and maintenance is charged to the income statement during the financial period in which they are incurred.
An asset’s carrying amount is written down immediately to its recoverable amount if the asset’s carrying amount is greater than its estimated recoverable amount. The recoverable amount is calculated as the higher of the asset’s fair value less cost to sell and the value-in-use. Also refer to note 1.9 for impairment of non-financial assets.
Gains and losses on disposal or scrapping of property, plant and equipment, this being the difference between the net proceeds on disposals or scrappings and the carrying amount, are recognised in the income statement within ‘other gains and losses’.
1.7 Biological assets Grapes harvested from the Group’s grapevines are measured at its fair value less cost to sell at the point of harvest. Such measurement is the
cost at that date when transferring the harvest produce to inventory.
1.8 Intangible assets Goodwill Goodwill arises on the acquisition of subsidiaries and represents the excess of the consideration transferred over the Group’s interest in the fair
value of the net identifiable assets of the acquired subsidiaries at the date of acquisition. Goodwill on acquisition of subsidiaries is included in ‘intangible assets’. Goodwill on acquisition of associates and joint ventures is included in ‘investments in associates’ or ‘investments in joint ventures’ and is tested for impairment as part of the overall balance. Goodwill denominated in a foreign currency is translated at closing rates.
Trademarks Separately acquired trademarks are shown at historical cost. Trademarks that have a finite useful life are carried at cost less accumulated
amortisation. Amortisation is calculated using the straight-line method to allocate the cost of trademarks over their estimated useful lives. Trademarks are deemed as having an indefinite useful life when there is no foreseeable limit on the time the trademarks are expected to provide future cash flows. Trademarks that are deemed to have an indefinite useful life are carried at cost less accumulated impairment losses and tested annually for impairment.
Industrial property rights Industrial property rights are intangible assets held by the Group for use in the manufacturing and distribution of its products and are
expected to be used during more than one period. All industrial property rights are stated at historical costs less subsequent amortisation and accumulated impairment. The historical cost includes all expenditure that is directly attributable to the acquisition of the industrial property rights and is depreciated on a straight-line basis, from the date that assets are available for use, over 60 years, taking into account the residual values.
Computer software Acquired computer software (which is not an integral part of computer hardware) and software licences and the direct costs associated
with the development and installation thereof are capitalised.
Costs associated with developing or maintaining software are recognised as an expense when incurred. Development costs that are directly attributable to the design and testing of identifiable and unique software products controlled by the Group are recognised as intangible assets when the following criteria are met:
− it is technically feasible to complete the software product so that it will be available for use; − management intends to complete the software product and use it or sell it; − there is an ability to use or sell the software product; − it can be demonstrated how the software product will generate probable future economic benefits; − adequate technical, financial and other resources to complete the development; and − the expenditure attributable to the software product during its development can be reliably measured.
Directly attributable costs that are capitalised as part of the software product include the software development employee cost and an appropriate portion of relevant overheads.
Computer software is depreciated on the straight-line method over its estimated useful life (three to five years) when available for use.
ANNUAL FINANCIAL STATEMENTS
131DISTELL Integrated Report 2018
1. SIGNIFICANT ACCOUNTING POLICIES (continued)1.9 Impairment of non-financial assets Assets that have an indefinite useful life – or intangible assets not ready for use – are not subject to amortisation and are tested for
impairment annually. Assets that are subject to amortisation are reviewed for impairment whenever events or changes in circumstances indicate that the full carrying amount may not be recoverable. An impairment loss is recognised for the amount by which the asset’s carrying amount exceeds its recoverable amount. The recoverable amount is the higher of an asset’s fair value less costs to sell and value-in-use. For the purpose of assessing impairment, assets are grouped at the lowest level for which there are separately identifiable cash flows (cash-generating units (CGUs)). Non-financial assets, other than goodwill, that suffered impairment are reviewed for possible reversal of impairment at each reporting date.
For the purpose of impairment testing, goodwill acquired in a business combination is allocated to each of the CGUs, or groups of CGUs, that is expected to benefit from the synergies of the combination. Each unit or group of units to which the goodwill is allocated represents the lowest level within the entity at which the goodwill is monitored for internal management purposes. Goodwill is monitored at the operating segment level.
Goodwill impairment reviews are undertaken annually, or more frequently if events or changes in circumstances indicate a potential impairment. The carrying value of goodwill is compared to the recoverable amount, which is the higher of value-in-use and the fair value less costs of disposal. Any impairment is recognised immediately as an expense and is not subsequently reversed.
1.10 Financial assets Classification The Group classifies its financial assets in the following categories:
− Financial assets at fair value through profit and loss − Loans and receivables − Available-for-sale financial assets
The classification is dependent on the purpose for which the financial asset was acquired. Management determines the classification of its financial assets at initial recognition.
Financial assets at fair value through profit and loss Financial assets at fair value through profit and loss are financial assets held for trading. A financial asset is classified in this category if
acquired principally for the purpose of selling in the short term. Derivatives are also categorised as held-for-trading unless they are designated as hedges. Assets in this category are classified as current assets if expected to be settled within 12 months of the end of the reporting period.
Loans and receivables Loans and receivables are non-derivative financial assets with fixed or determinable payments that are not quoted in an active market.
They are included in current assets, except for maturities greater than 12 months after the end of the reporting period. These are classified as non-current assets.
Available-for-sale financial assets Available-for-sale financial assets are non-derivatives that are either designated in this category or not classified in any of the other
categories. They are included in non-current assets unless management intends to dispose of the investment within 12 months of the end of the reporting period.
NOTES TO THE ANNUAL FINANCIAL STATEMENTSFOR THE YEAR ENDED 30 JUNE 2018
132 www.distell.co.za
1. SIGNIFICANT ACCOUNTING POLICIES (continued)1.10 Financial assets (continued) Recognition and measurement Regular purchases and sales of investments are recognised on trade date – the date on which the Group commits to purchase or sell the
asset. Investments are initially recognised at fair value plus transaction costs for all financial assets not carried at fair value through profit or loss. Financial assets carried at fair value through profit or loss are initially recognised at fair value and transaction costs are expensed in the income statement. Financial assets are derecognised when the rights to receive cash flows from the investments have expired or have been transferred and the Group has transferred substantially all risks and rewards of ownership. Available-for-sale investments and financial assets at fair value through profit or loss are subsequently carried at fair value. Loans and receivables and held-to-maturity investments are carried at amortised cost using the effective interest rate method.
Gains or losses arising from changes in the fair value of the ‘financial assets at fair value through profit or loss’ category are presented in the income statement within ‘other gains and losses’ in the period in which they arise. Dividend income from financial assets at fair value through profit or loss is recognised in the income statement as part of dividend income when the Group’s right to receive payments is established.
Changes in the fair value of monetary securities denominated in a foreign currency and classified as available-for-sale are analysed between translation differences resulting from changes in amortised cost of the security and other changes in the carrying amount of the security. The translation differences in monetary securities are recognised in profit or loss, and translation differences on non-monetary securities are recognised in other comprehensive income. Changes in the fair value of monetary securities classified as available-for-sale and non-monetary securities classified as available-for-sale are recognised in other comprehensive income. When securities classified as available-for-sale are sold or impaired, the accumulated fair value adjustments recognised in equity are included in the income statement as ‘other gains and losses’. Interest on available-for-sale securities calculated using the effective interest rate method is recognised in the income statement within ‘finance income’. Dividends on available-for-sale equity instruments are recognised in the income statement when the Group’s right to receive payments is established.
Offsetting financial instruments Financial assets and liabilities are offset and the net amount reported in the statement of financial position when there is a legally
enforceable right to offset the recognised amounts and there is an intention to settle on a net basis or realise the asset and settle the liability simultaneously. The legally enforceable right must not be contingent on future events and must be enforceable in the normal course of business and in the event of default, insolvency or bankruptcy of the company or the counterparty.
Impairment of financial assets Assets carried at amortised cost The Group assesses at the end of each reporting period whether there is objective evidence that a financial asset or group of financial
assets is impaired. A financial asset or a group of financial assets is impaired and impairment losses are incurred only if there is objective evidence of impairment as a result of one or more events that occurred after the initial recognition of the asset (a ‘loss event’) and that loss event (or events) has an impact on the estimated future cash flows of the financial asset or group of financial assets that can be reliably estimated.
Evidence of impairment may include indications that the debtors or a group of debtors is experiencing significant financial difficulty, default or delinquency in interest or principal payments; it is probable that they will enter bankruptcy or other financial reorganisation; and where observable data indicate that there is a measurable decrease in the estimated future cash flows, such as changes in arrears or economic conditions that correlate with defaults.
The Group first assesses whether objective evidence of impairment exists.
ANNUAL FINANCIAL STATEMENTS
133DISTELL Integrated Report 2018
1. SIGNIFICANT ACCOUNTING POLICIES (continued)1.10 Financial assets (continued) Impairment of financial assets (continued) For the loans and receivables category, the amount of the loss is measured as the difference between the asset’s carrying amount and
the present value of estimated future cash flows (excluding future credit losses that have not been incurred) discounted at the financial asset’s original effective interest rate. The carrying amount of the asset is reduced and the amount of the loss is recognised in the income statement. If a loan has a variable interest rate, the discount rate for measuring any impairment loss is the current effective interest rate determined under the contract. As a practical expedient, the Group may measure impairment on the basis of an instrument’s fair value using an observable market price.
If, in a subsequent period, the amount of the impairment loss decreases and the decrease can be related objectively to an event occurring after the impairment was recognised (such as an improvement in the debtor’s credit rating), the reversal of the previously recognised impairment loss is recognised in the consolidated income statement.
Assets classified as available-for-sale The Group assesses, at the end of each reporting period, whether there is objective evidence that a financial asset or a group of
financial assets is impaired. For debt securities, the Group uses the criteria referred to in ‘Assets carried at amortised cost’ above. In the case of equity investments classified as available-for-sale, a significant or prolonged decline in the fair value of the security below its cost is also evidence that the assets are impaired. If any such evidence exists for available-for-sale financial assets, the cumulative loss – measured as the difference between the acquisition cost and the current fair value, less any impairment loss on that financial asset previously recognised in profit or loss – is removed from equity and recognised in the income statement. Impairment losses recognised in the income statement on equity instruments are not reversed through the income statement. If, in a subsequent period, the fair value of a debt instrument classified as available-for-sale increases and the increase can be objectively related to an event occurring after the impairment loss was recognised in profit or loss, the impairment loss is reversed through the income statement.
Impairment testing of trade receivables is described in note 1.16.
1.11 Derivative financial instruments and hedging activities The Group is party to financial instruments that reduce exposure to fluctuations in foreign currency exchange and interest rates.
These instruments mainly comprise forward foreign exchange contracts. The purpose of these instruments is to reduce risk.
Derivatives are initially recognised at fair value on the date a derivative contract is entered into and are subsequently remeasured at their fair value. The method of recognising the resulting gain or loss depends on whether the derivative is designated as a hedging instrument and, if so, the nature of the item being hedged.
Interest rate swaps are taken out to hedge variable rate bank borrowings and are accounted for as cash flow hedges. The gain or loss relating to the effective portion of these interest rate swaps are recognised in the income statement within ‘Finance costs’.
1.12 Financial guarantees Financial guarantee contracts are recognised initially at fair value and subsequently at the higher of the amount in accordance with
IAS 37 and the amount initially recorded, less appropriate cumulative amortisation recognised in accordance with IAS 18.
NOTES TO THE ANNUAL FINANCIAL STATEMENTSFOR THE YEAR ENDED 30 JUNE 2018
134 www.distell.co.za
1. SIGNIFICANT ACCOUNTING POLICIES (continued)1.13 Current and deferred income tax The tax expense for the period comprises current and deferred tax. Tax is recognised in the income statement, except to the extent that
it relates to items recognised in other comprehensive income or directly in equity. In this case the tax is also recognised in other comprehensive income or directly in equity, respectively.
Current income tax The current income tax charge is calculated on the basis of the tax laws enacted or substantively enacted at the statement of financial
position date in the countries where the company’s subsidiaries, joint ventures and associates operate and generate taxable income. Management periodically evaluates positions taken in tax returns with respect to situations in which applicable tax regulation is subject to interpretation and establishes provisions, where appropriate, on the basis of amounts expected to be paid to the tax authorities.
Deferred income tax Deferred income tax is provided in full at currently enacted or substantially enacted tax rates using the liability method. Provision
is made for all temporary differences arising between the taxation bases of assets and liabilities and their statement of financial position carrying values.
No deferred income tax is accounted for if it arises from initial recognition of an asset or liability in a transaction other than a business combination that, at the time of the transaction, affects neither accounting nor taxable profit or loss. Deferred tax liabilities are not recognised if they arise from the initial recognition of goodwill. Deferred income tax is determined using tax rates (and laws) that have been enacted or substantially enacted by the statement of financial position date and are expected to apply when the related deferred income tax asset is realised or the deferred income tax liability is settled.
Deferred income tax assets are recognised to the extent that it is probable that future taxable profit will be available against which the temporary differences can be utilised. Management applies judgement to determine whether sufficient future taxable profit will be available after considering, amongst others, factors such as profit history, forecasted cash flows and budgets.
Deferred income tax is provided on temporary differences arising on investments in subsidiaries, associates and joint ventures, except where the timing of the reversal of the temporary difference can be controlled by the Group and it is probable that it will not reverse in the foreseeable future. Generally the Group is unable to control the reversal of the temporary differences for associates.
Deferred income tax assets and liabilities are offset when there is a legally enforceable right to off-set current tax assets against current tax liabilities and when the deferred income tax assets and liabilities relate to income taxes levied by the same taxation authority on either the taxable entity or different taxable entities where there is an intention to settle the balances on a net basis.
Taxation rates The normal South African company tax rate used for the year ending 30 June 2018 is 28% (2017: 28%). Deferred tax assets and
liabilities for South African entities at 30 June 2018 have been calculated using the 28% (2017: 28%) rate, this being the rate that the Group expects to apply to the periods when the assets are realised or the liabilities are settled. Capital gains tax is calculated as 80% (2017: 80%) of the company tax rate. International tax rates vary from jurisdiction to jurisdiction.
Dividend withholding tax (DWT) Shareholders are subject to DWT on dividends received, unless they are exempt in terms of the amended tax law. DWT is levied at 20%
(2017: 20%) of the dividend received. The DWT is categorised as a withholding tax as the tax is withheld and paid to tax authorities by the company paying the dividend or by a regulated intermediary and not the beneficial owner of the dividend.
ANNUAL FINANCIAL STATEMENTS
135DISTELL Integrated Report 2018
NOTES TO THE ANNUAL FINANCIAL STATEMENTSFOR THE YEAR ENDED 30 JUNE 2018
1. SIGNIFICANT ACCOUNTING POLICIES (continued)1.14 Leases The Group leases certain property, plant and equipment. Capitalised leased assets are assets leased in terms of finance lease agreements
where the Group has, substantially, all the risks and rewards of ownership. Finance leases are capitalised at the lease’s commencement at the lower of the fair value of the leased item or the present value of the minimum lease payments. Depreciation is provided on the straight-line method over the shorter of the lease term and its estimated useful life. Each lease payment is allocated between the liability and finance charges so as to achieve a constant rate on the finance balance outstanding. The corresponding rental obligations, net of finance charges, are included in other long-term payables. The interest element of the finance cost is charged to the income statement over the lease period so as to produce a constant periodic rate of interest on the remaining balance of the liability for each period.
Leases of assets in terms of which all the risks and benefits of ownership are effectively retained by the lessor are classified as operating leases. Payments made under operating leases (net of any incentives received from the lessor) are charged to the income statement on a straight-line basis over the lease term.
1.15 Inventories Inventories are stated at the lower of cost and net realisable value. Cost is determined by the first-in first-out (FIFO) method. The cost
of finished goods and work in progress comprises raw materials, direct labour, other direct costs and related production overheads (based on normal operating capacity), but excludes borrowing cost.
Net realisable value is the estimated selling price in the ordinary course of business, less the applicable costs of completion and selling expenses.
1.16 Trade and other receivables Trade and other receivables are initially recognised at fair value and subsequently measured at amortised cost using the effective
interest rate method, less provision for impairment. Fair value is determined as the estimated future cash flows discounted at a market-related interest rate.
A provision for impairment of trade receivables is established when there is objective evidence that the Group will not be able to collect all amounts due according to the original terms of the receivables. Significant financial difficulties of the debtor, probability that the debtor will enter bankruptcy or financial reorganisation and default or delinquency in payments are considered indicators that the trade receivable is impaired. The amount of the provision is the difference between the carrying amount and the recoverable amount, this being the present value of the expected cash flows, discounted at the original effective interest rate.
The carrying amount of the asset is reduced through the use of an allowance account and the amount of the loss is recognised in the income statement within ‘operating costs’. When a trade receivable is uncollectable, it is written off against the allowance account for trade receivables. Subsequent recoveries of amounts previously written off are credited against ‘operating costs’ in the income statement.
1.17 Cash and cash equivalents Cash and cash equivalents comprise cash on hand, deposits held at call with banks, other short-term highly liquid investments with
original maturities of three months or less and bank overdrafts. Bank overdrafts are included in current interest-bearing borrowings in the statement of financial position.
1.18 Share capital Ordinary shares are classified as equity. Incremental costs directly attributable to the issue of new shares or options are shown in
equity as a deduction from proceeds, net of taxation.
Where entities controlled by the Group purchase the company’s shares, the consideration paid, including attributable transaction costs net of income taxes, is deducted from total shareholders’ equity as treasury shares until they are sold or cancelled. Where such shares are subsequently sold, any consideration received, net of any directly attributable incremental transaction costs and the related income tax effects, is included in equity attributable to the company’s equity holders. Dividends received on treasury shares are eliminated on consolidation.
136 www.distell.co.za
1. SIGNIFICANT ACCOUNTING POLICIES (continued)1.19 Trade and other payables Trade payables are obligations to pay for goods or services that have been acquired in the ordinary course of business from suppliers.
Accounts payable are classified as current liabilities if payment is due within one year or less (or in the normal operating cycle of the business if longer). If not, they are presented as non-current liabilities.
Trade and other payables are recognised initially at fair value and subsequently measured at amortised cost using the effective interest rate method.
1.20 Borrowings Borrowings are recognised initially at fair value, net of transaction costs incurred. Borrowings are subsequently stated at amortised cost.
Any difference between the proceeds (net of transaction costs) and the redemption value is recognised in the income statement over the period of the borrowings using the effective interest rate method. Borrowings are classified as current liabilities unless the Group has the unconditional right to defer settlement of the liability for at least 12 months after the statement of financial position date.
Fees paid on the establishment of loan facilities are recognised as transaction costs of the loan to the extent that it is probable that some or all of the facility will be drawn down. In this case the fee is deferred until the drawdown occurs. To the extent there is no evidence that it is probable that some or all of the facility will be drawn down, the fee is capitalised as a prepayment for liquidity services and amortised over the period of the facility to which it relates.
Borrowing costs Borrowing costs that are directly attributable to the acquisition, construction or production of a qualifying asset are capitalised as part
of the cost of that asset until such time as the asset is ready for its intended use. When funds are borrowed specifically for the purpose of obtaining a qualifying asset, the amount to be capitalised is the actual borrowing costs less any temporary investment income on those borrowings. General borrowing costs are capitalised by calculating the weighted average expenditure on the qualifying asset and applying a weighted average borrowing rate to the expenditure.
The borrowing costs capitalised do not exceed the total borrowing costs incurred. The capitalisation of borrowing costs commences when expenditures for the asset have occurred, borrowing costs have been incurred or when activities that are necessary to prepare the asset for its intended use or sale are in progress. Capitalisation is suspended during extended periods in which active development is interrupted. Capitalisation ceases when, substantially, all the activities necessary to prepare the qualifying asset for its intended use or sale are complete.
All other borrowing costs are recognised as an expense in profit or loss in the period in which they are incurred.
1.21 Provisions Provisions are recognised when the Group has a present legal or constructive obligation, as a result of past events, and it is probable
that an outflow of resources embodying economic benefits will be required to settle the obligation, and a reliable estimate of the amount of the obligation can be made. Provisions are measured at the present value of the expenditures expected to be required to settle the obligation using a pre-tax rate that reflects current market assessments of the time value of money and the risks specific to the obligation. The increase in the provision due to the passage of time is recognised as interest expense. Provisions are not recognised for future operating losses.
ANNUAL FINANCIAL STATEMENTS
137DISTELL Integrated Report 2018
NOTES TO THE ANNUAL FINANCIAL STATEMENTSFOR THE YEAR ENDED 30 JUNE 2018
1. SIGNIFICANT ACCOUNTING POLICIES (continued)1.22 Employee benefits Retirement funds The Group provides pension, retirement or provident fund benefits to all permanent employees.
The schemes are generally funded through payments to insurance companies or trustee-administered funds, which are determined by periodic actuarial calculations. The Group has both defined-contribution and defined-benefit plans.
A defined-contribution plan is a plan under which the Group pays fixed contributions to a separate entity. The Group has no legal or constructive obligations to pay further contributions if the fund does not hold sufficient assets to pay all employees the benefits relating to employee service in the current and prior periods.
The Group’s contributions to defined-contribution plans, in respect of services rendered in a particular period are recognised as an expense in that period. Additional contributions are recognised as an expense in the period during which the associated services are rendered by employees.
A defined-benefit plan is a plan that is not a defined-contribution plan. This plan defines an amount of pension benefit an employee will receive on retirement, dependent on one or more factors such as age, years of service and compensation.
The liability recognised in the statement of financial position in respect of defined-benefit pension plans is the present value of the defined-benefit obligation at the end of the reporting period less the fair value of plan assets. The defined-benefit obligation is actuarially valued every three years and reviewed every year by independent actuaries using the projected unit credit method. The present value of the defined-benefit obligation is determined by discounting the estimated future cash outflows using interest rates of government bonds that are denominated in the currency in which the benefits will be paid and that have terms to maturity approximating the terms of the related pension obligation.
Current service costs are recognised immediately in the income statement.
Actuarial gains and losses arising from experience adjustments and changes in actuarial assumptions are charged or credited to equity in other comprehensive income in the period in which they arise.
Past service costs are recognised immediately in the income statement.
Post-retirement medical benefits The Group makes provision for actuarially determined future medical benefits of employees who remained in service up to retirement
age and completed a minimum service period. The expected costs of these benefits are accrued over the period of employment based on past services. This post-retirement medical benefit obligation is measured as the present value of the estimated future cash outflows based on a number of assumptions. These assumptions include, amongst others, healthcare cost inflation, discount rates, salary inflation and promotions and experience increases, expected retirement age and continuation at retirement. Valuations of this obligation are carried out every year by independent qualified actuaries, in respect of past service liabilities and actuarial gains or losses arising from experience adjustments and changes in actuarial assumptions, we are charged or credited to equity in other comprehensive income in the period in which they arise. The projected unit credit method is used to determine the present value of the post-retirement medical benefit obligation.
Share-based compensation The Group grants conditional shares and share appreciation rights (SARs) to its employees under equity-settled share incentive
schemes through the Distell Group Holdings Limited Conditional Share Plan Scheme (CSP), as well as an equity-settled share appreciation rights scheme (SAR Scheme).
A CSP or SAR Scheme share is considered equity settled when it is settled by an issue of a Distell Group Holdings Limited share. The CSP and the SAR rules, as appropriate, indicates whether it is to be settled by the issue of Distell Group Holdings shares or not.
138 www.distell.co.za
1. SIGNIFICANT ACCOUNTING POLICIES (continued)1.22 Employee benefits (continued) Share-based compensation (continued) The fair value of the employee services received in exchange for the grant of the CSP shares/SARs is recognised as an expense
over the vesting period. The fair value is determined at grant date with reference to the fair value of the CSP shares/SARs granted, including any market performance conditions and excluding the impact of any service and non-market performance vesting conditions (for example, profitability, sales growth targets and remaining an employee of the entity over a specified time period), as well as including the impact of any non-vesting conditions (for example, the requirement for employees to save). Non-market vesting conditions are included in assumptions about the number of CSP shares/SARs that are expected to vest. At each statement of financial position date, the entity revises its estimates of the number of CSP shares/SARs that are expected to vest. It recognises the impact of the revision of original estimates, if any, in the income statement and a corresponding adjustment to equity over the remaining vesting period. The proceeds received net of any directly attributable transaction costs are credited to share capital (nominal value) when the CSP shares/SARs are exercised.
The grant by the company of CSP shares/SARs relating to its equity instruments to the employees of subsidiary undertakings in the Group is treated as a capital contribution. The fair value of employee services received, measured with reference to the grant date fair value, is recognised over the vesting period as an increase to investment in subsidiary undertakings, with a corresponding credit to equity in the parent’s accounts.
Long-service awards Long-service awards are provided to employees who achieve certain predetermined milestones of service within the Group. The
Group’s obligation is valued by independent qualified professionals at year-end and the corresponding liability is raised. Costs incurred are set off against the liability. Movements in the liability, resulting from the valuation, including notional interest, are charged against the income statement upon valuation. The projected unit credit method is used to determine the present value of the long-service awards obligation.
Bonus plans The Group recognises a liability and an expense for bonuses and profit-sharing, based on a formula that takes into consideration the
profit attributable to the company’s shareholders after certain adjustments. The Group recognises a provision where contractually obliged or where there is a past practice that has created a constructive obligation.
1.23 Revenue recognition Revenue comprises the fair value of the consideration received or receivable for the sale of goods and services in the ordinary course
of the Group’s activities, including excise duty, but net of value added tax (VAT), general sales taxes (GST), rebates and discounts, and after eliminating sales within the Group. The Group recognises revenue when the amount of revenue can be reliably measured and when it is probable that the future economic benefits will flow to the entity.
Excise duty is not directly related to sales, unlike VAT. It is not recognised as a separate item on invoices. Increases in excise duty are not always directly passed on to customers and the Group cannot reclaim the excise duty where customers do not pay for products received. The Group considers excise duty as a cost to the Group and reflects it in ‘cost of goods sold’ and consequently any excise duty that is recovered in the sales price is included in revenue.
Revenue is recognised as follows:
− Cash sales of goods are recognised upon delivery of products and customer acceptance and collectability of the related receivable is reasonably assured.
− Sales of services are recognised in the accounting period in which the services are rendered, with reference to completion of the specific transaction assessed on the basis of the actual service provided as a proportion of the total services to be provided.
− Interest income is recognised on a time-proportion basis using the effective interest rate method. When a receivable is impaired, the Group reduces the carrying amount to its recoverable amount, this being the estimated future cash flow discounted at the original effective interest rate of the instrument, and continues unwinding the discount as interest income. Interest income on impaired loans is recognised using the original effective interest rate.
− Dividend income is recognised when the shareholder has an irrevocable right to receive payment.
ANNUAL FINANCIAL STATEMENTS
139DISTELL Integrated Report 2018
1. SIGNIFICANT ACCOUNTING POLICIES (continued)1.24 Earnings per share Earnings and headline earnings per share are calculated by dividing the net profit attributable to shareholders by the weighted average
number of ordinary shares in issue during the year, excluding the ordinary shares held by the Group as treasury shares.
For the diluted earnings per share, the weighted average number of ordinary shares in issue is adjusted to assume conversion of all ordinary shares with dilutive potential. CSP shares and SARs have dilutive potential. For the CSP/SARs a calculation is done to determine the number of shares that could have been acquired, at the closing market price, based on the monetary value of subscription rights attached to outstanding CSP shares/SARs in order to determine the ‘bonus’ element. The ‘bonus’ shares are added to the ordinary shares in issue. No adjustment is made to net profit, as the CSP shares/SARs have no income statement effect.
1.25 Dividend distribution Dividend distribution to the company’s shareholders is recognised as a liability in the Group’s financial statements in the period
in which the dividends are approved by the company’s shareholders.
1.26 Non-current assets held for sale Non-current assets held for sale are classified as assets held for sale and are stated at the lower of the carrying amount and fair value,
less costs to sell if their carrying amount is recovered principally through a sale transaction rather than through continued use.
1.27 Related parties Individuals or entities are related parties if one party has the ability, directly or indirectly, to control or jointly control the other party
or exercise significant influence over the other party in making financial and/or operating decisions. Key management personnel are defined as members of the executive committee of Distell Limited – the main operating company of the Group.
NOTES TO THE ANNUAL FINANCIAL STATEMENTSFOR THE YEAR ENDED 30 JUNE 2018
140 www.distell.co.za
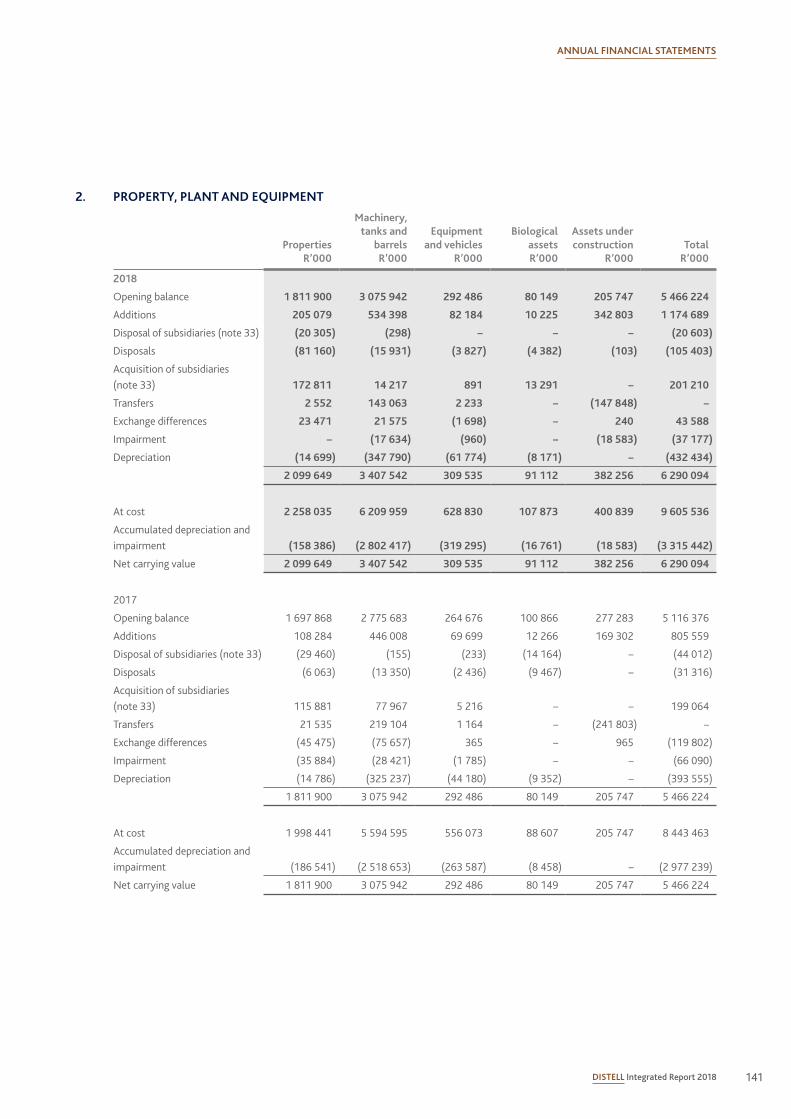
2. PROPERTY, PLANT AND EQUIPMENT
PropertiesR’000
Machinery,tanks and
barrelsR’000
Equipment and vehicles
R’000
BiologicalassetsR’000
Assets underconstruction
R’000Total
R’000
2018
Opening balance 1 811 900 3 075 942 292 486 80 149 205 747 5 466 224
Additions 205 079 534 398 82 184 10 225 342 803 1 174 689
Disposal of subsidiaries (note 33) (20 305) (298) – – – (20 603)
Disposals (81 160) (15 931) (3 827) (4 382) (103) (105 403)
Acquisition of subsidiaries (note 33) 172 811 14 217 891 13 291 – 201 210
Transfers 2 552 143 063 2 233 – (147 848) –
Exchange differences 23 471 21 575 (1 698) – 240 43 588
Impairment – (17 634) (960) – (18 583) (37 177)
Depreciation (14 699) (347 790) (61 774) (8 171) – (432 434)
2 099 649 3 407 542 309 535 91 112 382 256 6 290 094
At cost 2 258 035 6 209 959 628 830 107 873 400 839 9 605 536
Accumulated depreciation and impairment (158 386) (2 802 417) (319 295) (16 761) (18 583) (3 315 442)
Net carrying value 2 099 649 3 407 542 309 535 91 112 382 256 6 290 094
2017
Opening balance 1 697 868 2 775 683 264 676 100 866 277 283 5 116 376
Additions 108 284 446 008 69 699 12 266 169 302 805 559
Disposal of subsidiaries (note 33) (29 460) (155) (233) (14 164) – (44 012)
Disposals (6 063) (13 350) (2 436) (9 467) – (31 316)
Acquisition of subsidiaries (note 33) 115 881 77 967 5 216 – – 199 064
Transfers 21 535 219 104 1 164 – (241 803) –
Exchange differences (45 475) (75 657) 365 – 965 (119 802)
Impairment (35 884) (28 421) (1 785) – – (66 090)
Depreciation (14 786) (325 237) (44 180) (9 352) – (393 555)
1 811 900 3 075 942 292 486 80 149 205 747 5 466 224
At cost 1 998 441 5 594 595 556 073 88 607 205 747 8 443 463
Accumulated depreciation and impairment (186 541) (2 518 653) (263 587) (8 458) – (2 977 239)
Net carrying value 1 811 900 3 075 942 292 486 80 149 205 747 5 466 224
ANNUAL FINANCIAL STATEMENTS
141DISTELL Integrated Report 2018
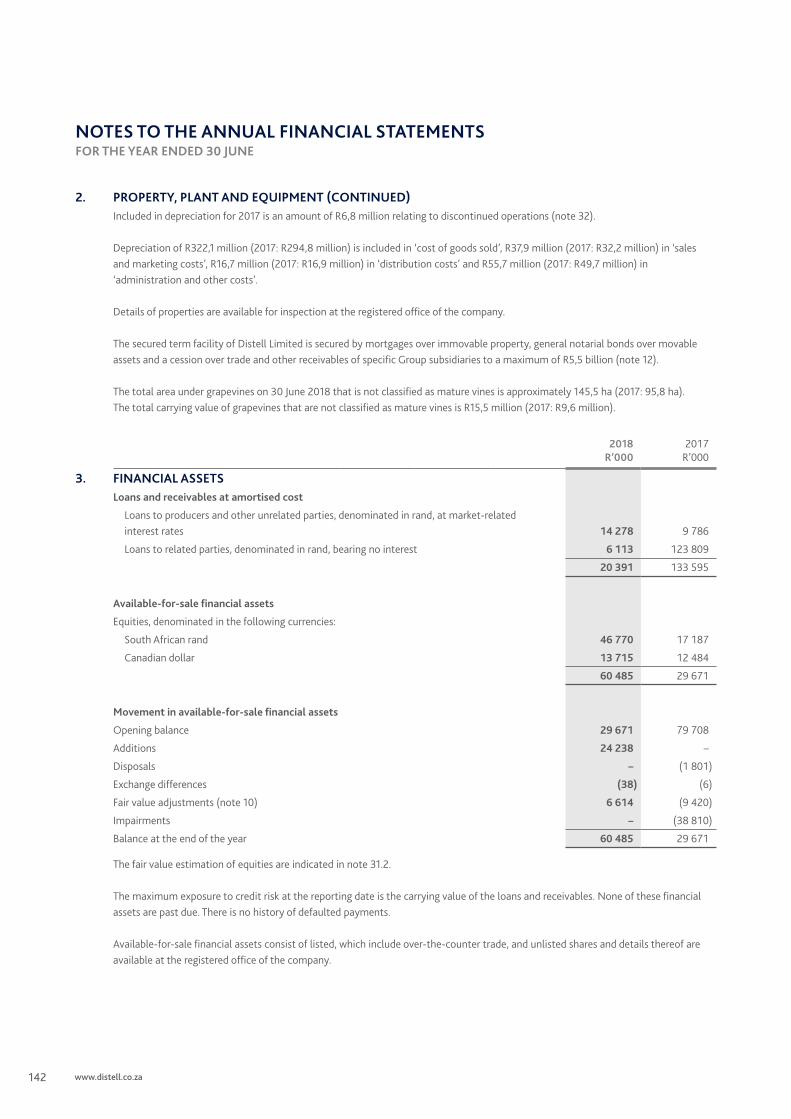
NOTES TO THE ANNUAL FINANCIAL STATEMENTSFOR THE YEAR ENDED 30 JUNE
2. PROPERTY, PLANT AND EQUIPMENT (CONTINUED)Included in depreciation for 2017 is an amount of R6,8 million relating to discontinued operations (note 32).
Depreciation of R322,1 million (2017: R294,8 million) is included in ‘cost of goods sold’, R37,9 million (2017: R32,2 million) in ‘sales and marketing costs’, R16,7 million (2017: R16,9 million) in ‘distribution costs’ and R55,7 million (2017: R49,7 million) in ‘administration and other costs’.
Details of properties are available for inspection at the registered office of the company.
The secured term facility of Distell Limited is secured by mortgages over immovable property, general notarial bonds over movable assets and a cession over trade and other receivables of specific Group subsidiaries to a maximum of R5,5 billion (note 12).
The total area under grapevines on 30 June 2018 that is not classified as mature vines is approximately 145,5 ha (2017: 95,8 ha).The total carrying value of grapevines that are not classified as mature vines is R15,5 million (2017: R9,6 million).
2018R’000
2017R’000
3. FINANCIAL ASSETSLoans and receivables at amortised cost
Loans to producers and other unrelated parties, denominated in rand, at market-related interest rates 14 278 9 786
Loans to related parties, denominated in rand, bearing no interest 6 113 123 809
20 391 133 595
Available-for-sale financial assets
Equities, denominated in the following currencies:
South African rand 46 770 17 187
Canadian dollar 13 715 12 484
60 485 29 671
Movement in available-for-sale financial assets
Opening balance 29 671 79 708
Additions 24 238 –
Disposals – (1 801)
Exchange differences (38) (6)
Fair value adjustments (note 10) 6 614 (9 420)
Impairments – (38 810)
Balance at the end of the year 60 485 29 671
The fair value estimation of equities are indicated in note 31.2.
The maximum exposure to credit risk at the reporting date is the carrying value of the loans and receivables. None of these financial assets are past due. There is no history of defaulted payments.
Available-for-sale financial assets consist of listed, which include over-the-counter trade, and unlisted shares and details thereof are available at the registered office of the company.
142 www.distell.co.za
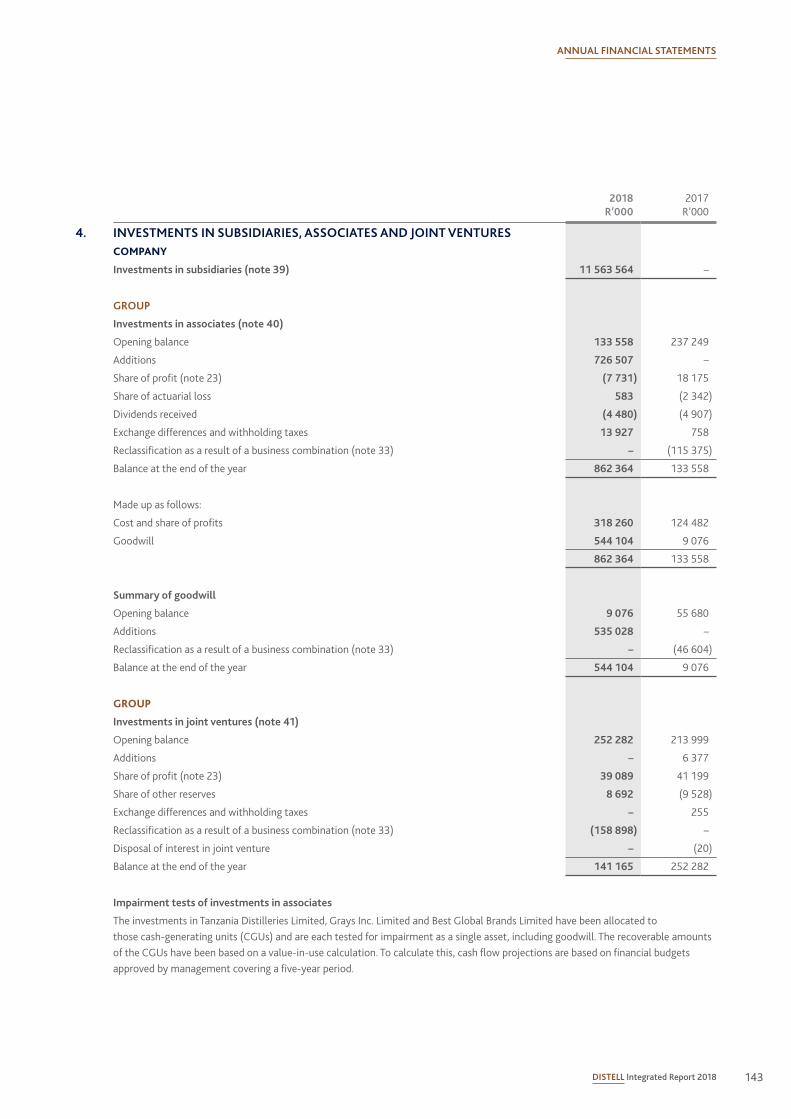
2018R’000
2017R’000
4. INVESTMENTS IN SUBSIDIARIES, ASSOCIATES AND JOINT VENTURESCOMPANY
Investments in subsidiaries (note 39) 11 563 564 –
GROUP
Investments in associates (note 40)
Opening balance 133 558 237 249
Additions 726 507 –
Share of profit (note 23) (7 731) 18 175
Share of actuarial loss 583 (2 342)
Dividends received (4 480) (4 907)
Exchange differences and withholding taxes 13 927 758
Reclassification as a result of a business combination (note 33) – (115 375)
Balance at the end of the year 862 364 133 558
Made up as follows:
Cost and share of profits 318 260 124 482
Goodwill 544 104 9 076
862 364 133 558
Summary of goodwill
Opening balance 9 076 55 680
Additions 535 028 –
Reclassification as a result of a business combination (note 33) – (46 604)
Balance at the end of the year 544 104 9 076
GROUP
Investments in joint ventures (note 41)
Opening balance 252 282 213 999
Additions – 6 377
Share of profit (note 23) 39 089 41 199
Share of other reserves 8 692 (9 528)
Exchange differences and withholding taxes – 255
Reclassification as a result of a business combination (note 33) (158 898) –
Disposal of interest in joint venture – (20)
Balance at the end of the year 141 165 252 282
Impairment tests of investments in associates
The investments in Tanzania Distilleries Limited, Grays Inc. Limited and Best Global Brands Limited have been allocated to those cash-generating units (CGUs) and are each tested for impairment as a single asset, including goodwill. The recoverable amounts of the CGUs have been based on a value-in-use calculation. To calculate this, cash flow projections are based on financial budgets approved by management covering a five-year period.
ANNUAL FINANCIAL STATEMENTS
143DISTELL Integrated Report 2018
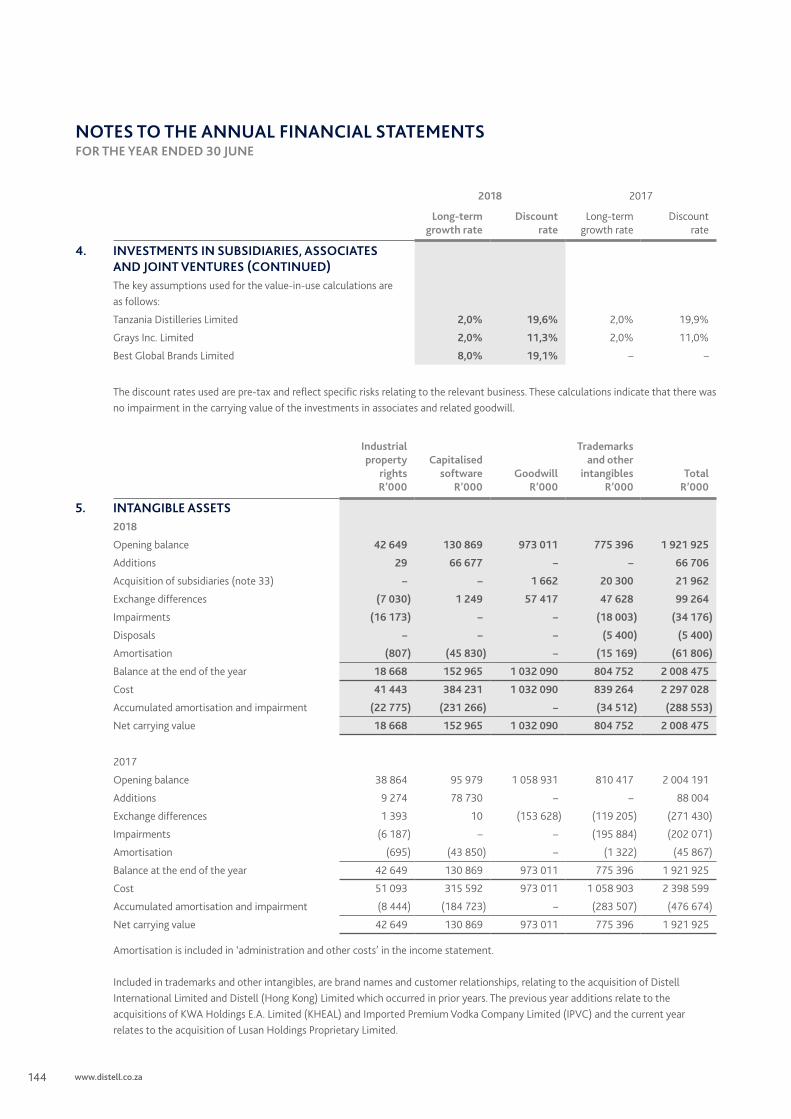
NOTES TO THE ANNUAL FINANCIAL STATEMENTSFOR THE YEAR ENDED 30 JUNE
2018 2017
Long-termgrowth rate
Discount rate
Long-termgrowth rate
Discount rate
4. INVESTMENTS IN SUBSIDIARIES, ASSOCIATES AND JOINT VENTURES (CONTINUED)The key assumptions used for the value-in-use calculations are as follows:
Tanzania Distilleries Limited 2,0% 19,6% 2,0% 19,9%
Grays Inc. Limited 2,0% 11,3% 2,0% 11,0%
Best Global Brands Limited 8,0% 19,1% – –
The discount rates used are pre-tax and reflect specific risks relating to the relevant business. These calculations indicate that there was no impairment in the carrying value of the investments in associates and related goodwill.
Industrial property
rightsR’000
Capitalisedsoftware
R’000 Goodwill
R’000
Trademarksand other
intangibles R’000
Total R’000
5. INTANGIBLE ASSETS2018
Opening balance 42 649 130 869 973 011 775 396 1 921 925
Additions 29 66 677 – – 66 706
Acquisition of subsidiaries (note 33) – – 1 662 20 300 21 962
Exchange differences (7 030) 1 249 57 417 47 628 99 264
Impairments (16 173) – – (18 003) (34 176)
Disposals – – – (5 400) (5 400)
Amortisation (807) (45 830) – (15 169) (61 806)
Balance at the end of the year 18 668 152 965 1 032 090 804 752 2 008 475
Cost 41 443 384 231 1 032 090 839 264 2 297 028
Accumulated amortisation and impairment (22 775) (231 266) – (34 512) (288 553)
Net carrying value 18 668 152 965 1 032 090 804 752 2 008 475
2017
Opening balance 38 864 95 979 1 058 931 810 417 2 004 191
Additions 9 274 78 730 – – 88 004
Exchange differences 1 393 10 (153 628) (119 205) (271 430)
Impairments (6 187) – – (195 884) (202 071)
Amortisation (695) (43 850) – (1 322) (45 867)
Balance at the end of the year 42 649 130 869 973 011 775 396 1 921 925
Cost 51 093 315 592 973 011 1 058 903 2 398 599
Accumulated amortisation and impairment (8 444) (184 723) – (283 507) (476 674)
Net carrying value 42 649 130 869 973 011 775 396 1 921 925
Amortisation is included in ‘administration and other costs’ in the income statement.
Included in trademarks and other intangibles, are brand names and customer relationships, relating to the acquisition of Distell International Limited and Distell (Hong Kong) Limited which occurred in prior years. The previous year additions relate to the acquisitions of KWA Holdings E.A. Limited (KHEAL) and Imported Premium Vodka Company Limited (IPVC) and the current year relates to the acquisition of Lusan Holdings Proprietary Limited.
144 www.distell.co.za
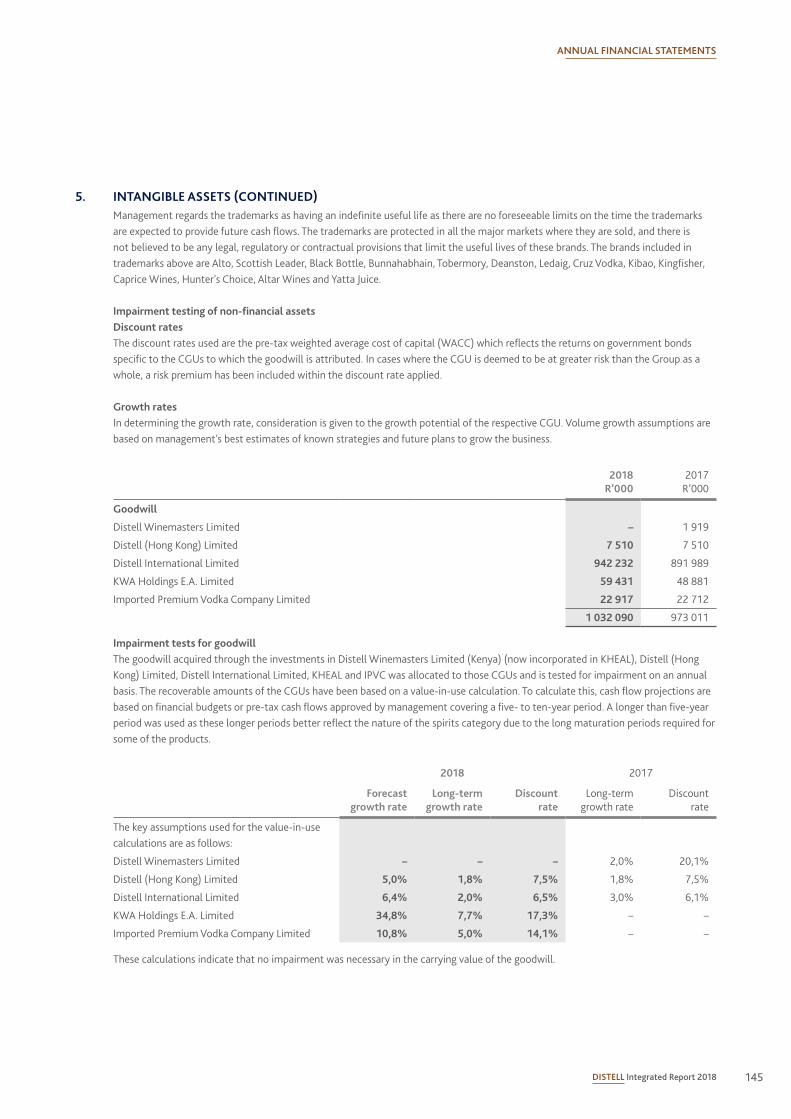
5. INTANGIBLE ASSETS (CONTINUED)Management regards the trademarks as having an indefinite useful life as there are no foreseeable limits on the time the trademarks are expected to provide future cash flows. The trademarks are protected in all the major markets where they are sold, and there is not believed to be any legal, regulatory or contractual provisions that limit the useful lives of these brands. The brands included in trademarks above are Alto, Scottish Leader, Black Bottle, Bunnahabhain, Tobermory, Deanston, Ledaig, Cruz Vodka, Kibao, Kingfisher, Caprice Wines, Hunter's Choice, Altar Wines and Yatta Juice.
Impairment testing of non-financial assetsDiscount ratesThe discount rates used are the pre-tax weighted average cost of capital (WACC) which reflects the returns on government bonds specific to the CGUs to which the goodwill is attributed. In cases where the CGU is deemed to be at greater risk than the Group as a whole, a risk premium has been included within the discount rate applied.
Growth ratesIn determining the growth rate, consideration is given to the growth potential of the respective CGU. Volume growth assumptions are based on management’s best estimates of known strategies and future plans to grow the business.
2018R’000
2017R’000
Goodwill
Distell Winemasters Limited – 1 919
Distell (Hong Kong) Limited 7 510 7 510
Distell International Limited 942 232 891 989
KWA Holdings E.A. Limited 59 431 48 881
Imported Premium Vodka Company Limited 22 917 22 712
1 032 090 973 011
Impairment tests for goodwillThe goodwill acquired through the investments in Distell Winemasters Limited (Kenya) (now incorporated in KHEAL), Distell (Hong Kong) Limited, Distell International Limited, KHEAL and IPVC was allocated to those CGUs and is tested for impairment on an annual basis. The recoverable amounts of the CGUs have been based on a value-in-use calculation. To calculate this, cash flow projections are based on financial budgets or pre-tax cash flows approved by management covering a five- to ten-year period. A longer than five-year period was used as these longer periods better reflect the nature of the spirits category due to the long maturation periods required for some of the products.
2018 2017
Forecastgrowth rate
Long-termgrowth rate
Discount rate
Long-termgrowth rate
Discount rate
The key assumptions used for the value-in-use calculations are as follows:
Distell Winemasters Limited – – – 2,0% 20,1%
Distell (Hong Kong) Limited 5,0% 1,8% 7,5% 1,8% 7,5%
Distell International Limited 6,4% 2,0% 6,5% 3,0% 6,1%
KWA Holdings E.A. Limited 34,8% 7,7% 17,3% – –
Imported Premium Vodka Company Limited 10,8% 5,0% 14,1% – –
These calculations indicate that no impairment was necessary in the carrying value of the goodwill.
ANNUAL FINANCIAL STATEMENTS
145DISTELL Integrated Report 2018
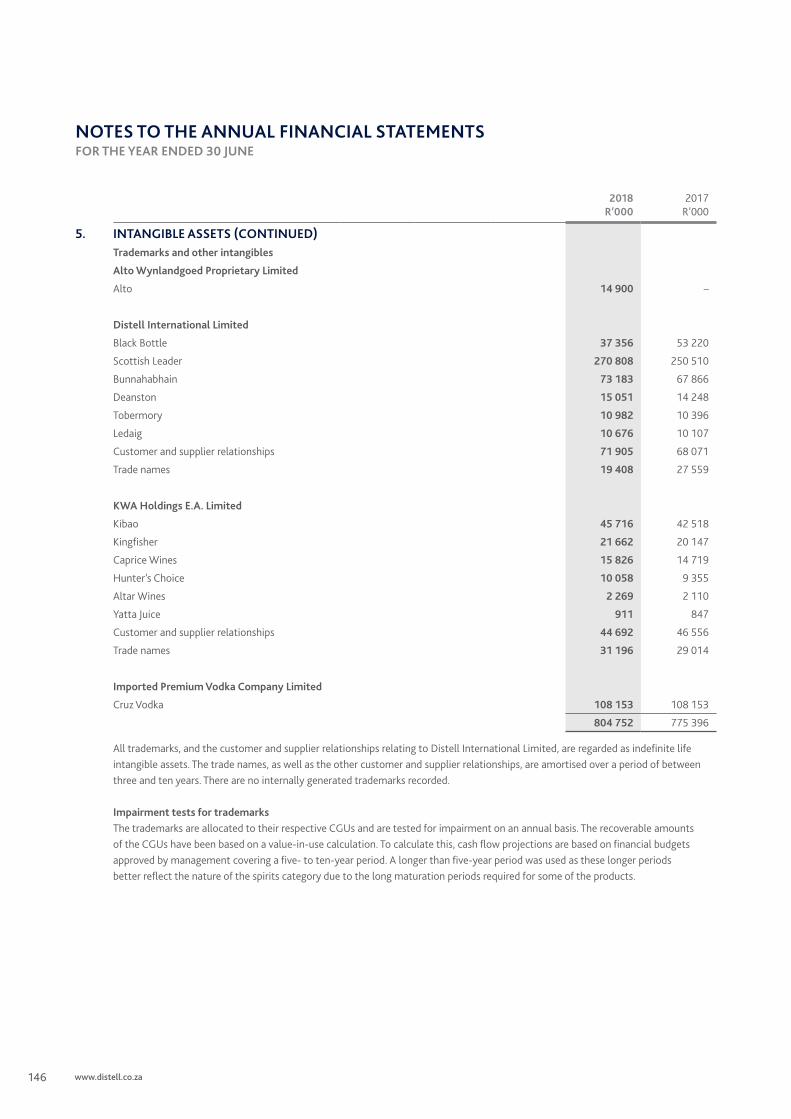
NOTES TO THE ANNUAL FINANCIAL STATEMENTSFOR THE YEAR ENDED 30 JUNE
2018R’000
2017R’000
5. INTANGIBLE ASSETS (CONTINUED)Trademarks and other intangibles
Alto Wynlandgoed Proprietary Limited
Alto 14 900 –
Distell International Limited
Black Bottle 37 356 53 220
Scottish Leader 270 808 250 510
Bunnahabhain 73 183 67 866
Deanston 15 051 14 248
Tobermory 10 982 10 396
Ledaig 10 676 10 107
Customer and supplier relationships 71 905 68 071
Trade names 19 408 27 559
KWA Holdings E.A. Limited
Kibao 45 716 42 518
Kingfisher 21 662 20 147
Caprice Wines 15 826 14 719
Hunter’s Choice 10 058 9 355
Altar Wines 2 269 2 110
Yatta Juice 911 847
Customer and supplier relationships 44 692 46 556
Trade names 31 196 29 014
Imported Premium Vodka Company Limited
Cruz Vodka 108 153 108 153
804 752 775 396
All trademarks, and the customer and supplier relationships relating to Distell International Limited, are regarded as indefinite life intangible assets. The trade names, as well as the other customer and supplier relationships, are amortised over a period of between three and ten years. There are no internally generated trademarks recorded.
Impairment tests for trademarksThe trademarks are allocated to their respective CGUs and are tested for impairment on an annual basis. The recoverable amounts of the CGUs have been based on a value-in-use calculation. To calculate this, cash flow projections are based on financial budgets approved by management covering a five- to ten-year period. A longer than five-year period was used as these longer periods better reflect the nature of the spirits category due to the long maturation periods required for some of the products.
146 www.distell.co.za
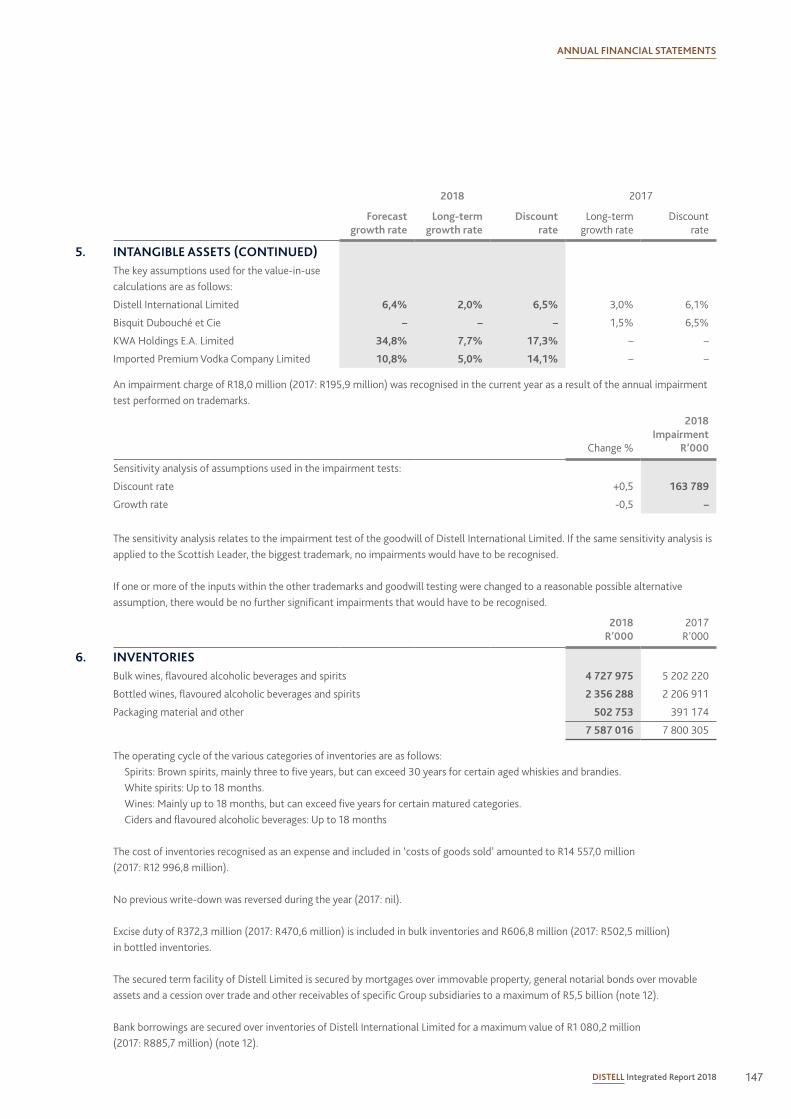
2018 2017
Forecastgrowth rate
Long-termgrowth rate
Discount rate
Long-termgrowth rate
Discount rate
5. INTANGIBLE ASSETS (CONTINUED)The key assumptions used for the value-in-use calculations are as follows:
Distell International Limited 6,4% 2,0% 6,5% 3,0% 6,1%
Bisquit Dubouché et Cie – – – 1,5% 6,5%
KWA Holdings E.A. Limited 34,8% 7,7% 17,3% – –
Imported Premium Vodka Company Limited 10,8% 5,0% 14,1% – –
An impairment charge of R18,0 million (2017: R195,9 million) was recognised in the current year as a result of the annual impairment test performed on trademarks.
Change %
2018 Impairment
R’000
Sensitivity analysis of assumptions used in the impairment tests:
Discount rate +0,5 163 789
Growth rate -0,5 –
The sensitivity analysis relates to the impairment test of the goodwill of Distell International Limited. If the same sensitivity analysis is applied to the Scottish Leader, the biggest trademark, no impairments would have to be recognised.
If one or more of the inputs within the other trademarks and goodwill testing were changed to a reasonable possible alternative assumption, there would be no further significant impairments that would have to be recognised.
2018R’000
2017R’000
6. INVENTORIESBulk wines, flavoured alcoholic beverages and spirits 4 727 975 5 202 220
Bottled wines, flavoured alcoholic beverages and spirits 2 356 288 2 206 911
Packaging material and other 502 753 391 174
7 587 016 7 800 305
The operating cycle of the various categories of inventories are as follows:Spirits: Brown spirits, mainly three to five years, but can exceed 30 years for certain aged whiskies and brandies. White spirits: Up to 18 months.Wines: Mainly up to 18 months, but can exceed five years for certain matured categories.Ciders and flavoured alcoholic beverages: Up to 18 months
The cost of inventories recognised as an expense and included in ‘costs of goods sold’ amounted to R14 557,0 million (2017: R12 996,8 million).
No previous write-down was reversed during the year (2017: nil).
Excise duty of R372,3 million (2017: R470,6 million) is included in bulk inventories and R606,8 million (2017: R502,5 million) in bottled inventories.
The secured term facility of Distell Limited is secured by mortgages over immovable property, general notarial bonds over movable assets and a cession over trade and other receivables of specific Group subsidiaries to a maximum of R5,5 billion (note 12).
Bank borrowings are secured over inventories of Distell International Limited for a maximum value of R1 080,2 million (2017: R885,7 million) (note 12).
ANNUAL FINANCIAL STATEMENTS
147DISTELL Integrated Report 2018
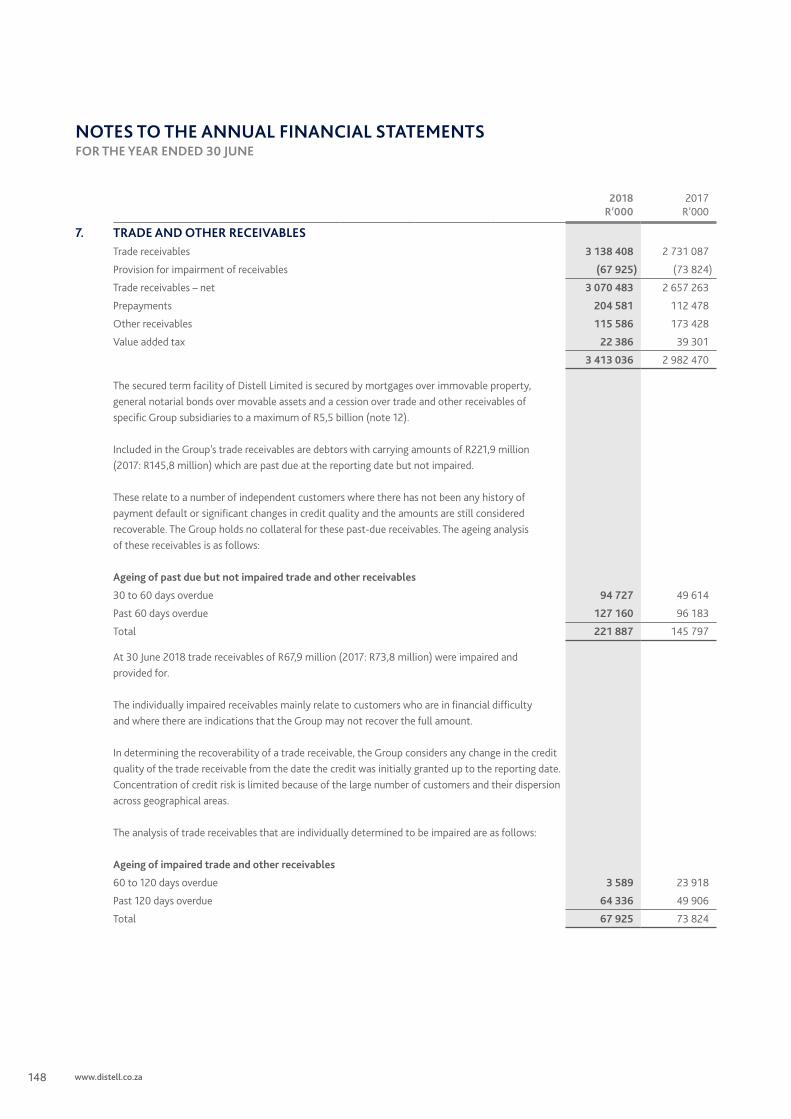
NOTES TO THE ANNUAL FINANCIAL STATEMENTSFOR THE YEAR ENDED 30 JUNE
2018R’000
2017R’000
7. TRADE AND OTHER RECEIVABLESTrade receivables 3 138 408 2 731 087
Provision for impairment of receivables (67 925) (73 824)
Trade receivables – net 3 070 483 2 657 263
Prepayments 204 581 112 478
Other receivables 115 586 173 428
Value added tax 22 386 39 301
3 413 036 2 982 470
The secured term facility of Distell Limited is secured by mortgages over immovable property, general notarial bonds over movable assets and a cession over trade and other receivables of specific Group subsidiaries to a maximum of R5,5 billion (note 12).
Included in the Group’s trade receivables are debtors with carrying amounts of R221,9 million (2017: R145,8 million) which are past due at the reporting date but not impaired.
These relate to a number of independent customers where there has not been any history of payment default or significant changes in credit quality and the amounts are still considered recoverable. The Group holds no collateral for these past-due receivables. The ageing analysis of these receivables is as follows:
Ageing of past due but not impaired trade and other receivables
30 to 60 days overdue 94 727 49 614
Past 60 days overdue 127 160 96 183
Total 221 887 145 797
At 30 June 2018 trade receivables of R67,9 million (2017: R73,8 million) were impaired and provided for.
The individually impaired receivables mainly relate to customers who are in financial difficulty and where there are indications that the Group may not recover the full amount.
In determining the recoverability of a trade receivable, the Group considers any change in the credit quality of the trade receivable from the date the credit was initially granted up to the reporting date. Concentration of credit risk is limited because of the large number of customers and their dispersion across geographical areas.
The analysis of trade receivables that are individually determined to be impaired are as follows:
Ageing of impaired trade and other receivables
60 to 120 days overdue 3 589 23 918
Past 120 days overdue 64 336 49 906
Total 67 925 73 824
148 www.distell.co.za
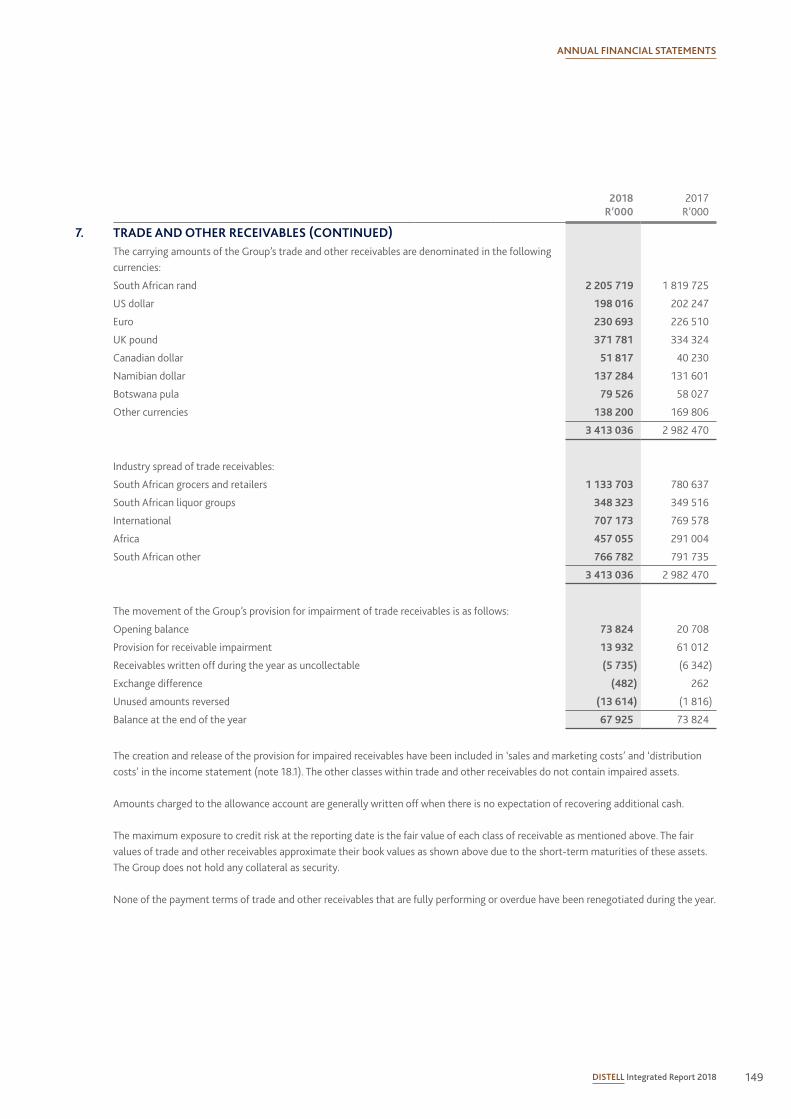
2018R’000
2017R’000
7. TRADE AND OTHER RECEIVABLES (CONTINUED)The carrying amounts of the Group’s trade and other receivables are denominated in the following currencies:
South African rand 2 205 719 1 819 725
US dollar 198 016 202 247
Euro 230 693 226 510
UK pound 371 781 334 324
Canadian dollar 51 817 40 230
Namibian dollar 137 284 131 601
Botswana pula 79 526 58 027
Other currencies 138 200 169 806
3 413 036 2 982 470
Industry spread of trade receivables:
South African grocers and retailers 1 133 703 780 637
South African liquor groups 348 323 349 516
International 707 173 769 578
Africa 457 055 291 004
South African other 766 782 791 735
3 413 036 2 982 470
The movement of the Group’s provision for impairment of trade receivables is as follows:
Opening balance 73 824 20 708
Provision for receivable impairment 13 932 61 012
Receivables written off during the year as uncollectable (5 735) (6 342)
Exchange difference (482) 262
Unused amounts reversed (13 614) (1 816)
Balance at the end of the year 67 925 73 824
The creation and release of the provision for impaired receivables have been included in ‘sales and marketing costs’ and ‘distribution costs’ in the income statement (note 18.1). The other classes within trade and other receivables do not contain impaired assets.
Amounts charged to the allowance account are generally written off when there is no expectation of recovering additional cash.
The maximum exposure to credit risk at the reporting date is the fair value of each class of receivable as mentioned above. The fair values of trade and other receivables approximate their book values as shown above due to the short-term maturities of these assets. The Group does not hold any collateral as security.
None of the payment terms of trade and other receivables that are fully performing or overdue have been renegotiated during the year.
ANNUAL FINANCIAL STATEMENTS
149DISTELL Integrated Report 2018
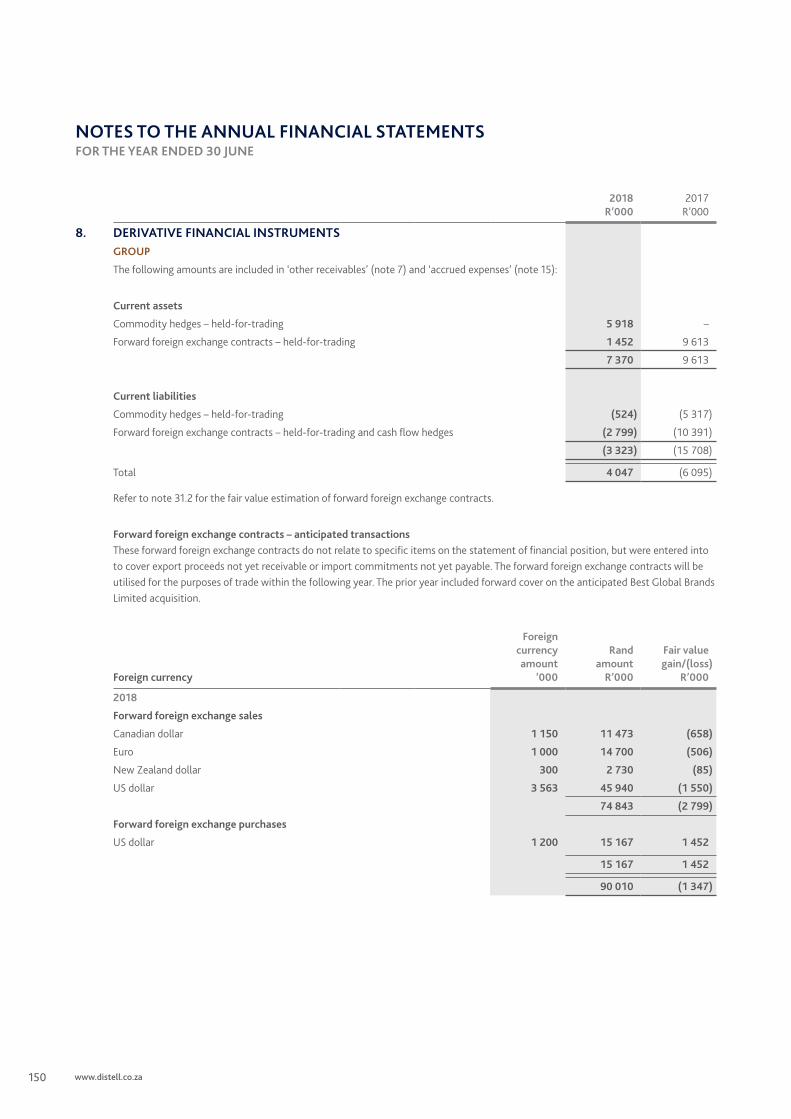
NOTES TO THE ANNUAL FINANCIAL STATEMENTSFOR THE YEAR ENDED 30 JUNE
2018R’000
2017R’000
8. DERIVATIVE FINANCIAL INSTRUMENTSGROUP
The following amounts are included in ‘other receivables’ (note 7) and ‘accrued expenses’ (note 15):
Current assets
Commodity hedges – held-for-trading 5 918 –
Forward foreign exchange contracts – held-for-trading 1 452 9 613
7 370 9 613
Current liabilities
Commodity hedges – held-for-trading (524) (5 317)
Forward foreign exchange contracts – held-for-trading and cash flow hedges (2 799) (10 391)
(3 323) (15 708)
Total 4 047 (6 095)
Refer to note 31.2 for the fair value estimation of forward foreign exchange contracts.
Forward foreign exchange contracts – anticipated transactionsThese forward foreign exchange contracts do not relate to specific items on the statement of financial position, but were entered into to cover export proceeds not yet receivable or import commitments not yet payable. The forward foreign exchange contracts will be utilised for the purposes of trade within the following year. The prior year included forward cover on the anticipated Best Global Brands Limited acquisition.
Foreign currency
Foreign currencyamount
’000
Rand amount
R’000
Fair value gain/(loss)
R’000
2018
Forward foreign exchange sales
Canadian dollar 1 150 11 473 (658)
Euro 1 000 14 700 (506)
New Zealand dollar 300 2 730 (85)
US dollar 3 563 45 940 (1 550)
74 843 (2 799)
Forward foreign exchange purchases
US dollar 1 200 15 167 1 452
15 167 1 452
90 010 (1 347)
150 www.distell.co.za
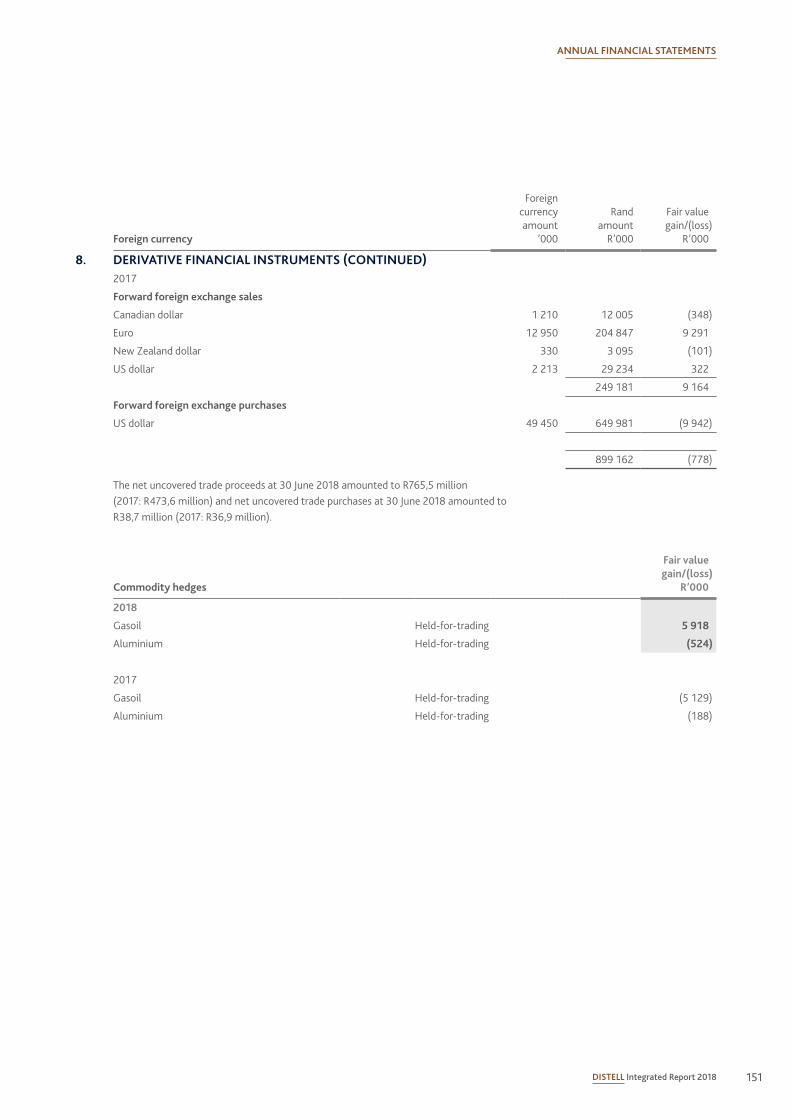
Foreign currency
Foreign currencyamount
’000
Rand amount
R’000
Fair value gain/(loss)
R’000
8. DERIVATIVE FINANCIAL INSTRUMENTS (CONTINUED)2017
Forward foreign exchange sales
Canadian dollar 1 210 12 005 (348)
Euro 12 950 204 847 9 291
New Zealand dollar 330 3 095 (101)
US dollar 2 213 29 234 322
249 181 9 164
Forward foreign exchange purchases
US dollar 49 450 649 981 (9 942)
899 162 (778)
The net uncovered trade proceeds at 30 June 2018 amounted to R765,5 million (2017: R473,6 million) and net uncovered trade purchases at 30 June 2018 amounted to R38,7 million (2017: R36,9 million).
Commodity hedges
Fair valuegain/(loss)
R’000
2018
Gasoil Held-for-trading 5 918
Aluminium Held-for-trading (524)
2017
Gasoil Held-for-trading (5 129)
Aluminium Held-for-trading (188)
ANNUAL FINANCIAL STATEMENTS
151DISTELL Integrated Report 2018
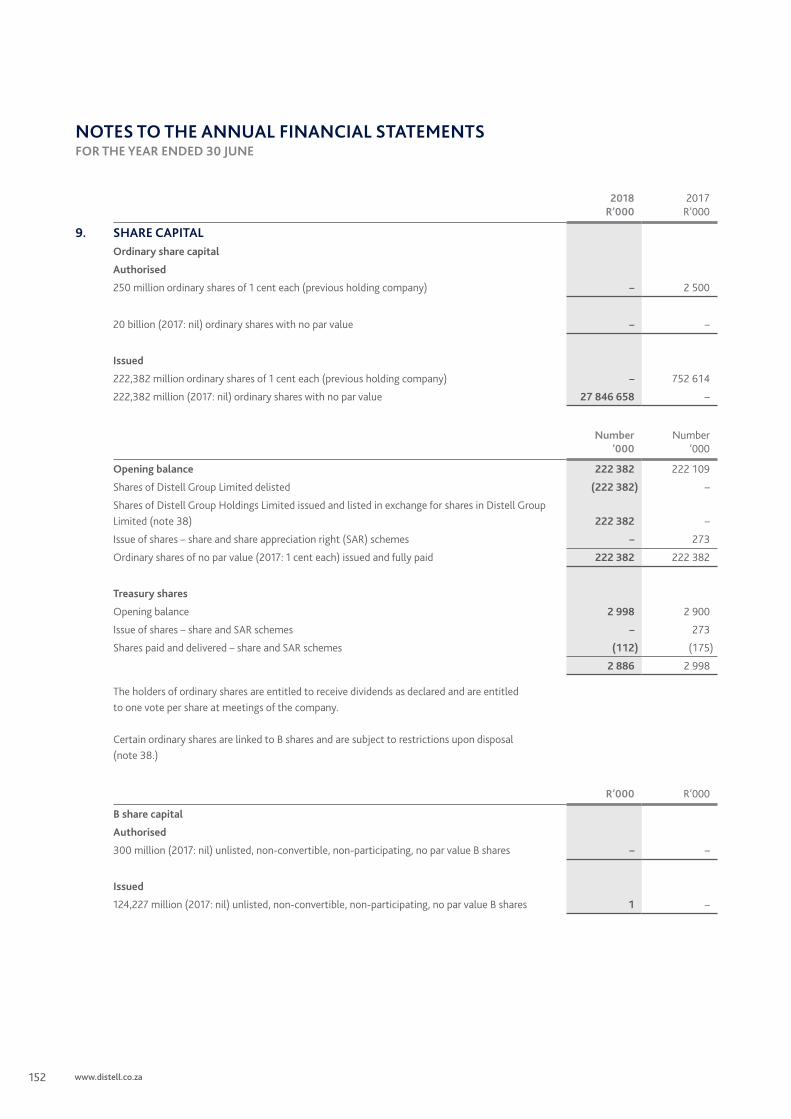
NOTES TO THE ANNUAL FINANCIAL STATEMENTSFOR THE YEAR ENDED 30 JUNE
2018 R’000
2017 R’000
9. SHARE CAPITALOrdinary share capital
Authorised
250 million ordinary shares of 1 cent each (previous holding company) – 2 500
20 billion (2017: nil) ordinary shares with no par value – –
Issued
222,382 million ordinary shares of 1 cent each (previous holding company) – 752 614
222,382 million (2017: nil) ordinary shares with no par value 27 846 658 –
Number ’000
Number ’000
Opening balance 222 382 222 109
Shares of Distell Group Limited delisted (222 382) –
Shares of Distell Group Holdings Limited issued and listed in exchange for shares in Distell Group Limited (note 38) 222 382 –
Issue of shares – share and share appreciation right (SAR) schemes – 273
Ordinary shares of no par value (2017: 1 cent each) issued and fully paid 222 382 222 382
Treasury shares
Opening balance 2 998 2 900
Issue of shares – share and SAR schemes – 273
Shares paid and delivered – share and SAR schemes (112) (175)
2 886 2 998
The holders of ordinary shares are entitled to receive dividends as declared and are entitled to one vote per share at meetings of the company.
Certain ordinary shares are linked to B shares and are subject to restrictions upon disposal (note 38.)
R’000 R’000
B share capital
Authorised
300 million (2017: nil) unlisted, non-convertible, non-participating, no par value B shares – –
Issued
124,227 million (2017: nil) unlisted, non-convertible, non-participating, no par value B shares 1 –
152 www.distell.co.za
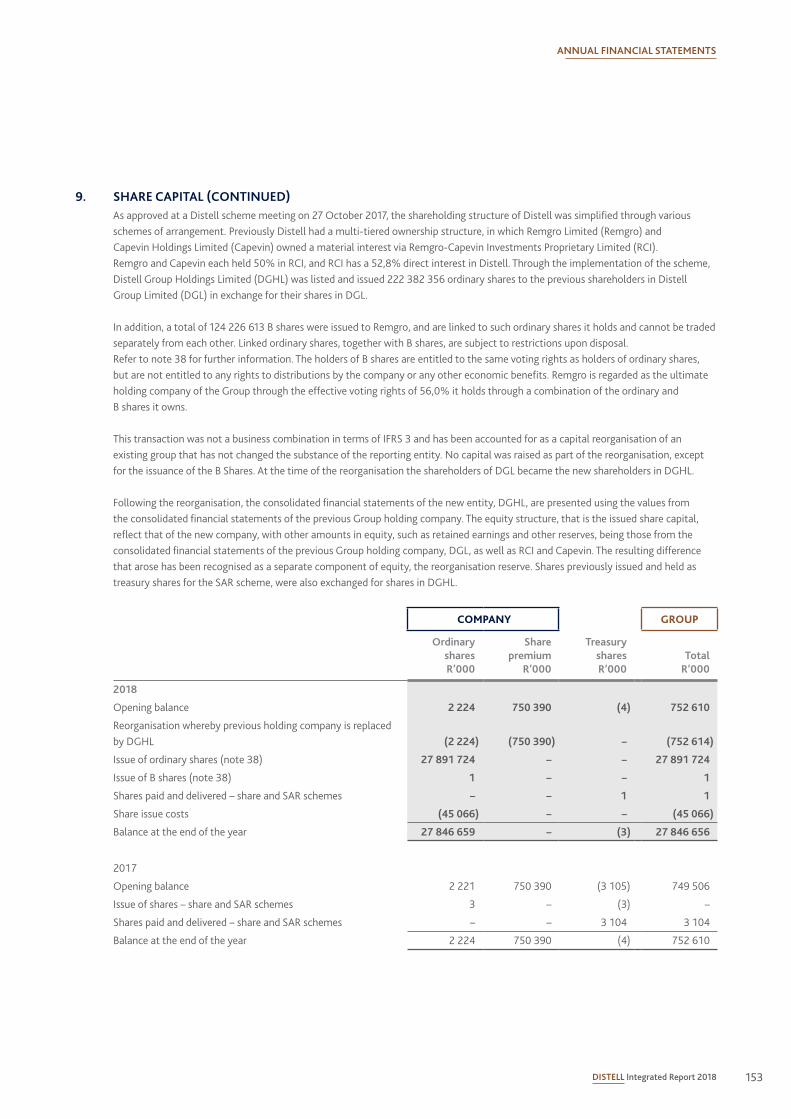
9. SHARE CAPITAL (CONTINUED)As approved at a Distell scheme meeting on 27 October 2017, the shareholding structure of Distell was simplified through various schemes of arrangement. Previously Distell had a multi-tiered ownership structure, in which Remgro Limited (Remgro) and Capevin Holdings Limited (Capevin) owned a material interest via Remgro-Capevin Investments Proprietary Limited (RCI). Remgro and Capevin each held 50% in RCI, and RCI has a 52,8% direct interest in Distell. Through the implementation of the scheme, Distell Group Holdings Limited (DGHL) was listed and issued 222 382 356 ordinary shares to the previous shareholders in Distell Group Limited (DGL) in exchange for their shares in DGL.
In addition, a total of 124 226 613 B shares were issued to Remgro, and are linked to such ordinary shares it holds and cannot be traded separately from each other. Linked ordinary shares, together with B shares, are subject to restrictions upon disposal. Refer to note 38 for further information. The holders of B shares are entitled to the same voting rights as holders of ordinary shares, but are not entitled to any rights to distributions by the company or any other economic benefits. Remgro is regarded as the ultimate holding company of the Group through the effective voting rights of 56,0% it holds through a combination of the ordinary and B shares it owns.
This transaction was not a business combination in terms of IFRS 3 and has been accounted for as a capital reorganisation of an existing group that has not changed the substance of the reporting entity. No capital was raised as part of the reorganisation, except for the issuance of the B Shares. At the time of the reorganisation the shareholders of DGL became the new shareholders in DGHL.
Following the reorganisation, the consolidated financial statements of the new entity, DGHL, are presented using the values from the consolidated financial statements of the previous Group holding company. The equity structure, that is the issued share capital, reflect that of the new company, with other amounts in equity, such as retained earnings and other reserves, being those from the consolidated financial statements of the previous Group holding company, DGL, as well as RCI and Capevin. The resulting difference that arose has been recognised as a separate component of equity, the reorganisation reserve. Shares previously issued and held as treasury shares for the SAR scheme, were also exchanged for shares in DGHL.
COMPANY GROUP
Ordinary shares R’000
Share premium
R’000
Treasury shares R’000
Total R’000
2018
Opening balance 2 224 750 390 (4) 752 610
Reorganisation whereby previous holding company is replaced by DGHL (2 224) (750 390) – (752 614)
Issue of ordinary shares (note 38) 27 891 724 – – 27 891 724
Issue of B shares (note 38) 1 – – 1
Shares paid and delivered – share and SAR schemes – – 1 1
Share issue costs (45 066) – – (45 066)
Balance at the end of the year 27 846 659 – (3) 27 846 656
2017
Opening balance 2 221 750 390 (3 105) 749 506
Issue of shares – share and SAR schemes 3 – (3) –
Shares paid and delivered – share and SAR schemes – – 3 104 3 104
Balance at the end of the year 2 224 750 390 (4) 752 610
ANNUAL FINANCIAL STATEMENTS
153DISTELL Integrated Report 2018
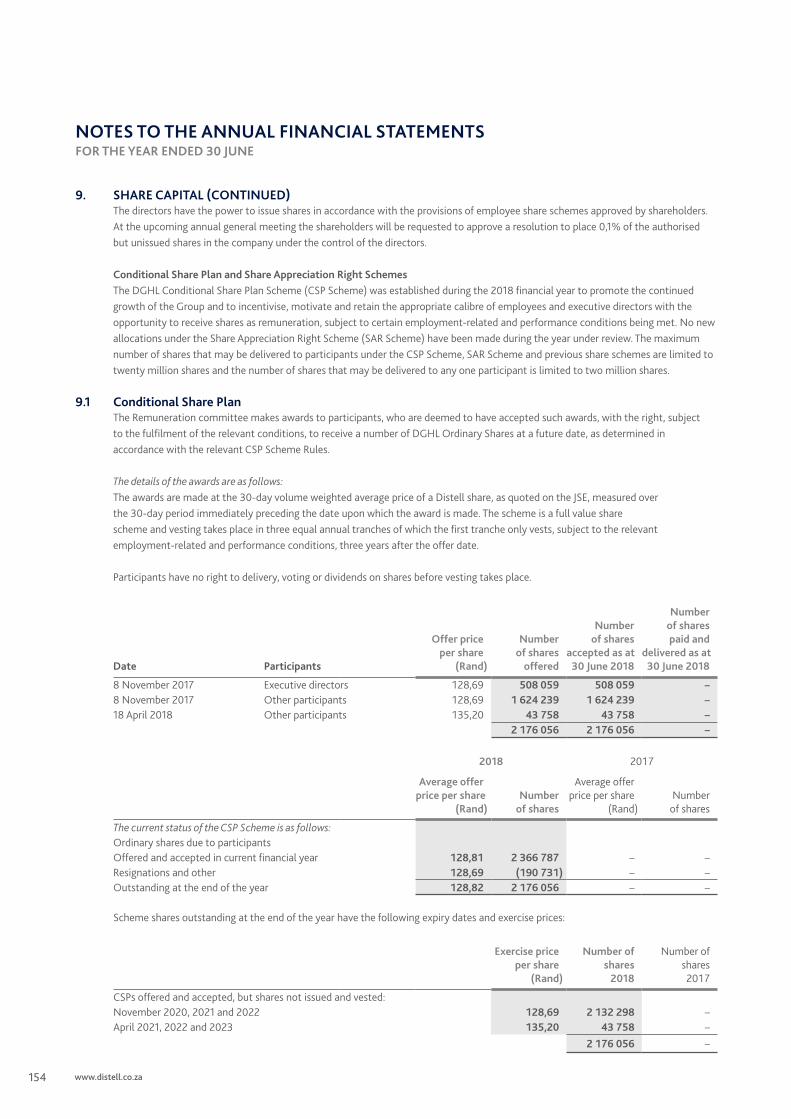
NOTES TO THE ANNUAL FINANCIAL STATEMENTSFOR THE YEAR ENDED 30 JUNE
9. SHARE CAPITAL (CONTINUED)The directors have the power to issue shares in accordance with the provisions of employee share schemes approved by shareholders. At the upcoming annual general meeting the shareholders will be requested to approve a resolution to place 0,1% of the authorised but unissued shares in the company under the control of the directors.
Conditional Share Plan and Share Appreciation Right SchemesThe DGHL Conditional Share Plan Scheme (CSP Scheme) was established during the 2018 financial year to promote the continued growth of the Group and to incentivise, motivate and retain the appropriate calibre of employees and executive directors with the opportunity to receive shares as remuneration, subject to certain employment-related and performance conditions being met. No new allocations under the Share Appreciation Right Scheme (SAR Scheme) have been made during the year under review. The maximum number of shares that may be delivered to participants under the CSP Scheme, SAR Scheme and previous share schemes are limited to twenty million shares and the number of shares that may be delivered to any one participant is limited to two million shares.
9.1 Conditional Share PlanThe Remuneration committee makes awards to participants, who are deemed to have accepted such awards, with the right, subject to the fulfilment of the relevant conditions, to receive a number of DGHL Ordinary Shares at a future date, as determined in accordance with the relevant CSP Scheme Rules.
The details of the awards are as follows:The awards are made at the 30-day volume weighted average price of a Distell share, as quoted on the JSE, measured over the 30-day period immediately preceding the date upon which the award is made. The scheme is a full value share scheme and vesting takes place in three equal annual tranches of which the first tranche only vests, subject to the relevant employment-related and performance conditions, three years after the offer date.
Participants have no right to delivery, voting or dividends on shares before vesting takes place.
Date Participants
Offer price per share
(Rand)
Number of shares
offered
Numberof shares
accepted as at30 June 2018
Number of shares paid and
delivered as at30 June 2018
8 November 2017 Executive directors 128,69 508 059 508 059 – 8 November 2017 Other participants 128,69 1 624 239 1 624 239 – 18 April 2018 Other participants 135,20 43 758 43 758 –
2 176 056 2 176 056 –
2018 2017
Average offerprice per share
(Rand) Number of shares
Average offerprice per share
(Rand) Number of shares
The current status of the CSP Scheme is as follows:Ordinary shares due to participantsOffered and accepted in current financial year 128,81 2 366 787 – – Resignations and other 128,69 (190 731) – – Outstanding at the end of the year 128,82 2 176 056 – –
Scheme shares outstanding at the end of the year have the following expiry dates and exercise prices:
Exercise priceper share
(Rand)
Number ofshares
2018
Number ofshares 2017
CSPs offered and accepted, but shares not issued and vested:November 2020, 2021 and 2022 128,69 2 132 298 – April 2021, 2022 and 2023 135,20 43 758 –
2 176 056 –
154 www.distell.co.za
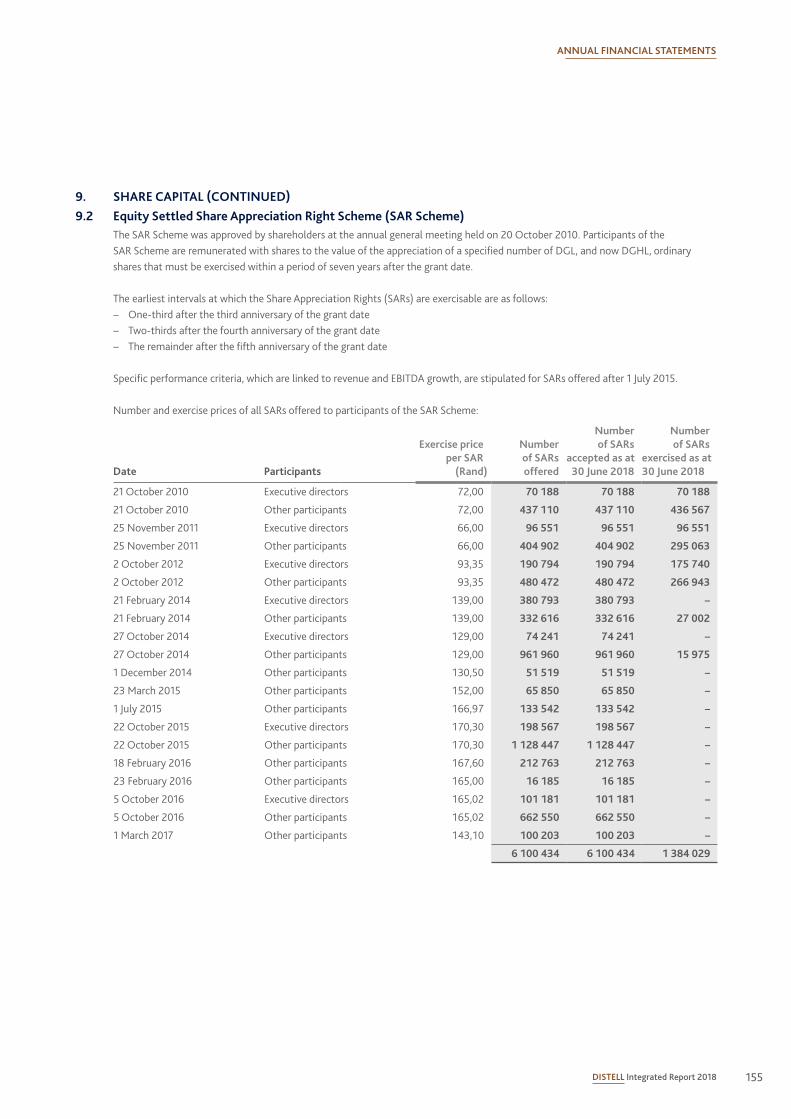
9. SHARE CAPITAL (CONTINUED)9.2 Equity Settled Share Appreciation Right Scheme (SAR Scheme)
The SAR Scheme was approved by shareholders at the annual general meeting held on 20 October 2010. Participants of the SAR Scheme are remunerated with shares to the value of the appreciation of a specified number of DGL, and now DGHL, ordinary shares that must be exercised within a period of seven years after the grant date.
The earliest intervals at which the Share Appreciation Rights (SARs) are exercisable are as follows: − One-third after the third anniversary of the grant date − Two-thirds after the fourth anniversary of the grant date − The remainder after the fifth anniversary of the grant date
Specific performance criteria, which are linked to revenue and EBITDA growth, are stipulated for SARs offered after 1 July 2015.
Number and exercise prices of all SARs offered to participants of the SAR Scheme:
Date Participants
Exercise price per SAR
(Rand)
Number of SARs offered
Number of SARs
accepted as at30 June 2018
Number of SARs
exercised as at 30 June 2018
21 October 2010 Executive directors 72,00 70 188 70 188 70 188
21 October 2010 Other participants 72,00 437 110 437 110 436 567
25 November 2011 Executive directors 66,00 96 551 96 551 96 551
25 November 2011 Other participants 66,00 404 902 404 902 295 063
2 October 2012 Executive directors 93,35 190 794 190 794 175 740
2 October 2012 Other participants 93,35 480 472 480 472 266 943
21 February 2014 Executive directors 139,00 380 793 380 793 –
21 February 2014 Other participants 139,00 332 616 332 616 27 002
27 October 2014 Executive directors 129,00 74 241 74 241 –
27 October 2014 Other participants 129,00 961 960 961 960 15 975
1 December 2014 Other participants 130,50 51 519 51 519 –
23 March 2015 Other participants 152,00 65 850 65 850 –
1 July 2015 Other participants 166,97 133 542 133 542 –
22 October 2015 Executive directors 170,30 198 567 198 567 –
22 October 2015 Other participants 170,30 1 128 447 1 128 447 –
18 February 2016 Other participants 167,60 212 763 212 763 –
23 February 2016 Other participants 165,00 16 185 16 185 –
5 October 2016 Executive directors 165,02 101 181 101 181 –
5 October 2016 Other participants 165,02 662 550 662 550 –
1 March 2017 Other participants 143,10 100 203 100 203 –
6 100 434 6 100 434 1 384 029
ANNUAL FINANCIAL STATEMENTS
155DISTELL Integrated Report 2018
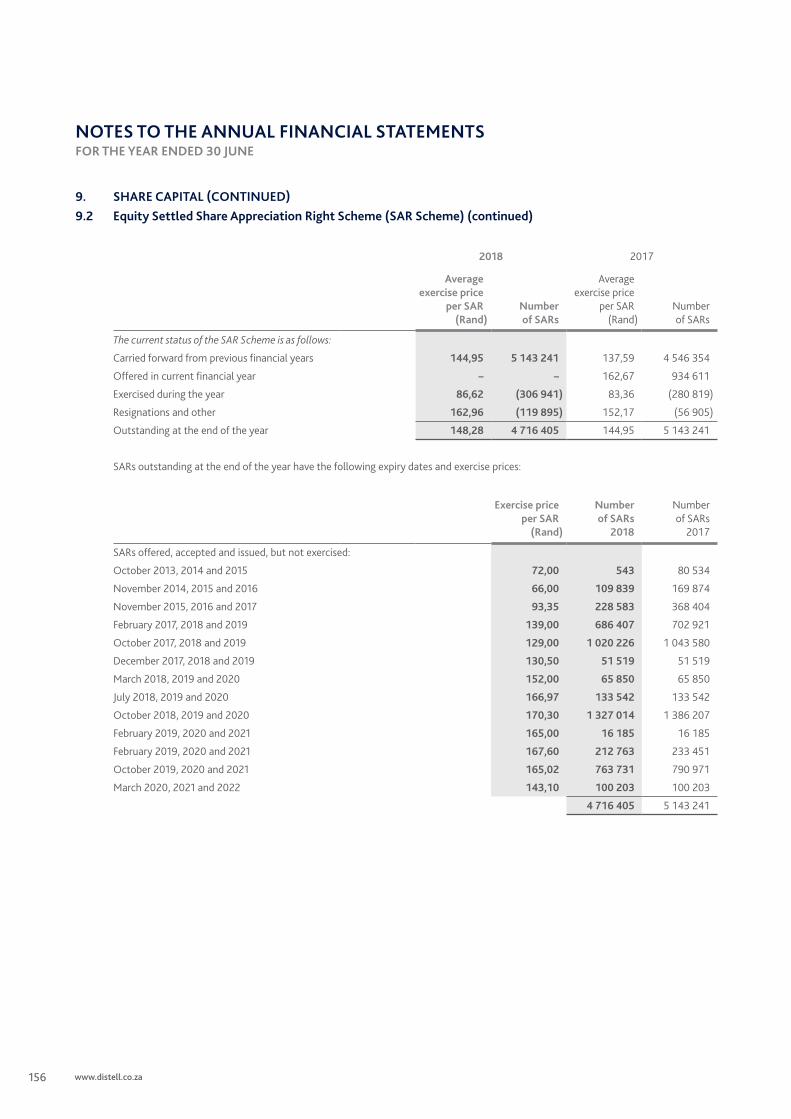
NOTES TO THE ANNUAL FINANCIAL STATEMENTSFOR THE YEAR ENDED 30 JUNE
9. SHARE CAPITAL (CONTINUED)9.2 Equity Settled Share Appreciation Right Scheme (SAR Scheme) (continued)
2018 2017
Averageexercise price
per SAR (Rand)
Number of SARs
Averageexercise price
per SAR (Rand)
Number of SARs
The current status of the SAR Scheme is as follows:
Carried forward from previous financial years 144,95 5 143 241 137,59 4 546 354
Offered in current financial year – – 162,67 934 611
Exercised during the year 86,62 (306 941) 83,36 (280 819)
Resignations and other 162,96 (119 895) 152,17 (56 905)
Outstanding at the end of the year 148,28 4 716 405 144,95 5 143 241
SARs outstanding at the end of the year have the following expiry dates and exercise prices:
Exercise priceper SAR
(Rand)
Number of SARs
2018
Number of SARs
2017
SARs offered, accepted and issued, but not exercised:
October 2013, 2014 and 2015 72,00 543 80 534
November 2014, 2015 and 2016 66,00 109 839 169 874
November 2015, 2016 and 2017 93,35 228 583 368 404
February 2017, 2018 and 2019 139,00 686 407 702 921
October 2017, 2018 and 2019 129,00 1 020 226 1 043 580
December 2017, 2018 and 2019 130,50 51 519 51 519
March 2018, 2019 and 2020 152,00 65 850 65 850
July 2018, 2019 and 2020 166,97 133 542 133 542
October 2018, 2019 and 2020 170,30 1 327 014 1 386 207
February 2019, 2020 and 2021 165,00 16 185 16 185
February 2019, 2020 and 2021 167,60 212 763 233 451
October 2019, 2020 and 2021 165,02 763 731 790 971
March 2020, 2021 and 2022 143,10 100 203 100 203
4 716 405 5 143 241
156 www.distell.co.za
9. SHARE CAPITAL (CONTINUED)9.3 Valuation methodology and assumptions
The fair value of the CSP shares and SARs granted after 7 November 2002 was valued at each grant date by using an actuarial binomial option pricing model. The model is an extension of the binomial model, incorporating employee behaviour.
The significant inputs into the model were:
share price at the grant date R14,60 to R170,30
exercise price shown above
expected volatility 19,85% to 35,90%
dividend yield 2,29% to 6,34%
option life shown above
annual risk-free interest rate 5,67% to 10,43%
The expected lifetime of each grant is estimated by considering separately each of the tranches within that grant. The risk-free rate was estimated by using the implied yield on a South African zero-coupon government bond and the yield curve over the expected contract lifetimes of three, five, six and seven years from the offer date.
Share price volatility of ordinary shares in DGL and now DGHL was determined with reference to movements in the share price on the JSE taking into consideration the expected lifetimes of each tranche of all grants over the vesting period.
Dividend yield was calculated using the two-year moving average dividend yield at each offer date.
The total expense recognised in the income statement in ‘employee benefit expense’ (note 18.4) relating to the above equity-settled share-based payments was R49,7 million (2017: R52,8 million).
ANNUAL FINANCIAL STATEMENTS
157DISTELL Integrated Report 2018
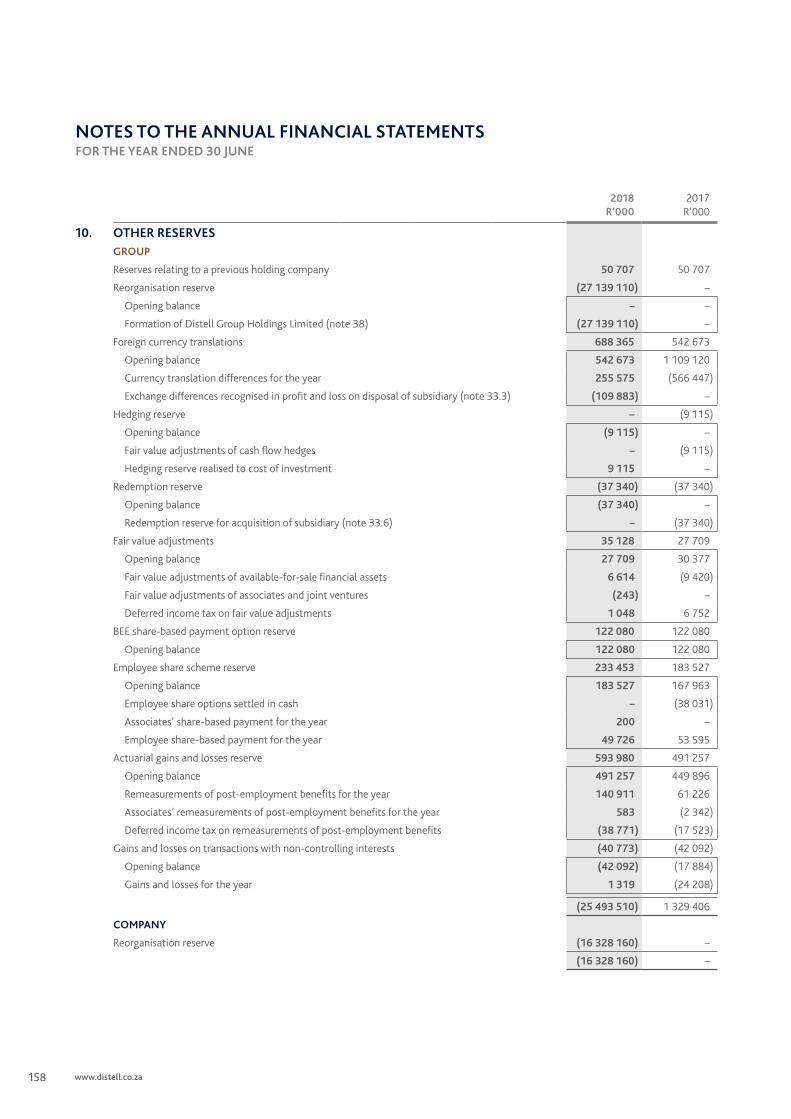
NOTES TO THE ANNUAL FINANCIAL STATEMENTSFOR THE YEAR ENDED 30 JUNE
2018R’000
2017R’000
10. OTHER RESERVESGROUP
Reserves relating to a previous holding company 50 707 50 707
Reorganisation reserve (27 139 110) –
Opening balance – –
Formation of Distell Group Holdings Limited (note 38) (27 139 110) –
Foreign currency translations 688 365 542 673
Opening balance 542 673 1 109 120
Currency translation differences for the year 255 575 (566 447)
Exchange differences recognised in profit and loss on disposal of subsidiary (note 33.3) (109 883) –
Hedging reserve – (9 115)
Opening balance (9 115) –
Fair value adjustments of cash flow hedges – (9 115)
Hedging reserve realised to cost of investment 9 115 –
Redemption reserve (37 340) (37 340)
Opening balance (37 340) –
Redemption reserve for acquisition of subsidiary (note 33.6) – (37 340)
Fair value adjustments 35 128 27 709
Opening balance 27 709 30 377
Fair value adjustments of available-for-sale financial assets 6 614 (9 420)
Fair value adjustments of associates and joint ventures (243) –
Deferred income tax on fair value adjustments 1 048 6 752
BEE share-based payment option reserve 122 080 122 080
Opening balance 122 080 122 080
Employee share scheme reserve 233 453 183 527
Opening balance 183 527 167 963
Employee share options settled in cash – (38 031)
Associates’ share-based payment for the year 200 –
Employee share-based payment for the year 49 726 53 595
Actuarial gains and losses reserve 593 980 491 257
Opening balance 491 257 449 896
Remeasurements of post-employment benefits for the year 140 911 61 226
Associates’ remeasurements of post-employment benefits for the year 583 (2 342)
Deferred income tax on remeasurements of post-employment benefits (38 771) (17 523)
Gains and losses on transactions with non-controlling interests (40 773) (42 092)
Opening balance (42 092) (17 884)
Gains and losses for the year 1 319 (24 208)
(25 493 510) 1 329 406
COMPANY
Reorganisation reserve (16 328 160) –
(16 328 160) –
158 www.distell.co.za
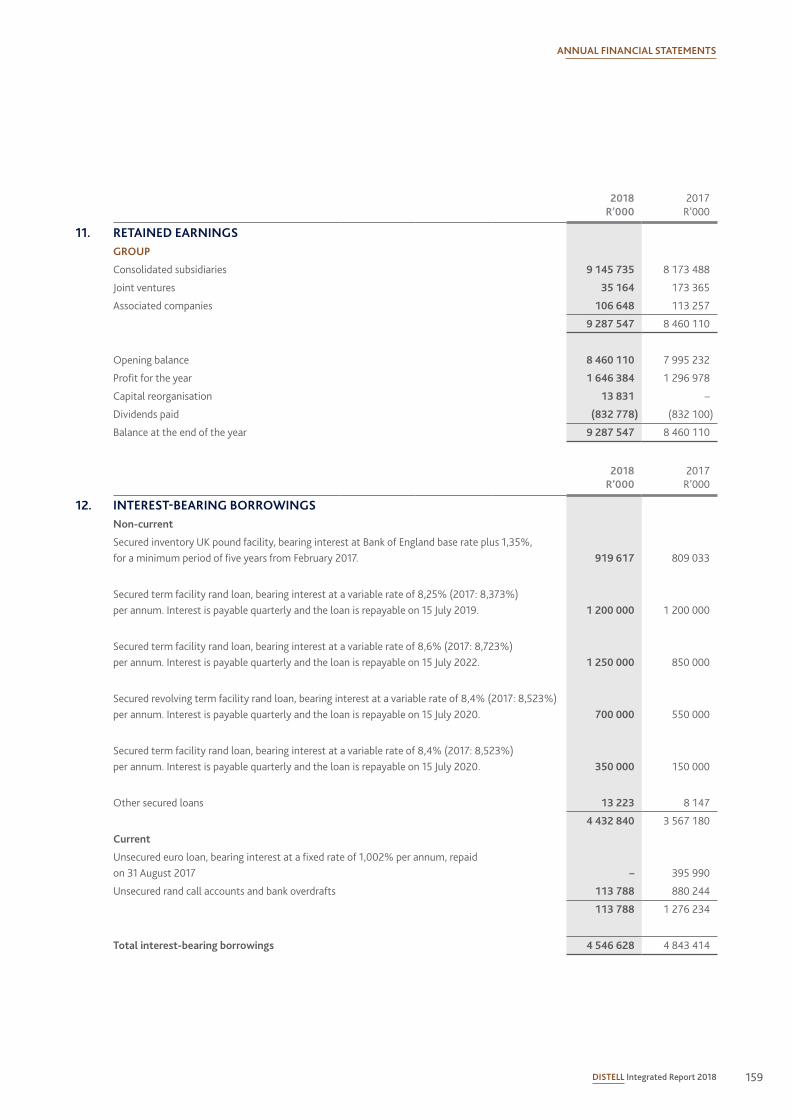
2018 R’000
2017 R’000
11. RETAINED EARNINGSGROUP
Consolidated subsidiaries 9 145 735 8 173 488
Joint ventures 35 164 173 365
Associated companies 106 648 113 257
9 287 547 8 460 110
Opening balance 8 460 110 7 995 232
Profit for the year 1 646 384 1 296 978
Capital reorganisation 13 831 –
Dividends paid (832 778) (832 100)
Balance at the end of the year 9 287 547 8 460 110
2018 R’000
2017 R’000
12. INTEREST-BEARING BORROWINGSNon-current
Secured inventory UK pound facility, bearing interest at Bank of England base rate plus 1,35%, for a minimum period of five years from February 2017. 919 617 809 033
Secured term facility rand loan, bearing interest at a variable rate of 8,25% (2017: 8,373%) per annum. Interest is payable quarterly and the loan is repayable on 15 July 2019. 1 200 000 1 200 000
Secured term facility rand loan, bearing interest at a variable rate of 8,6% (2017: 8,723%) per annum. Interest is payable quarterly and the loan is repayable on 15 July 2022. 1 250 000 850 000
Secured revolving term facility rand loan, bearing interest at a variable rate of 8,4% (2017: 8,523%) per annum. Interest is payable quarterly and the loan is repayable on 15 July 2020. 700 000 550 000
Secured term facility rand loan, bearing interest at a variable rate of 8,4% (2017: 8,523%) per annum. Interest is payable quarterly and the loan is repayable on 15 July 2020. 350 000 150 000
Other secured loans 13 223 8 147
4 432 840 3 567 180
Current
Unsecured euro loan, bearing interest at a fixed rate of 1,002% per annum, repaid on 31 August 2017 – 395 990
Unsecured rand call accounts and bank overdrafts 113 788 880 244
113 788 1 276 234
Total interest-bearing borrowings 4 546 628 4 843 414
ANNUAL FINANCIAL STATEMENTS
159DISTELL Integrated Report 2018
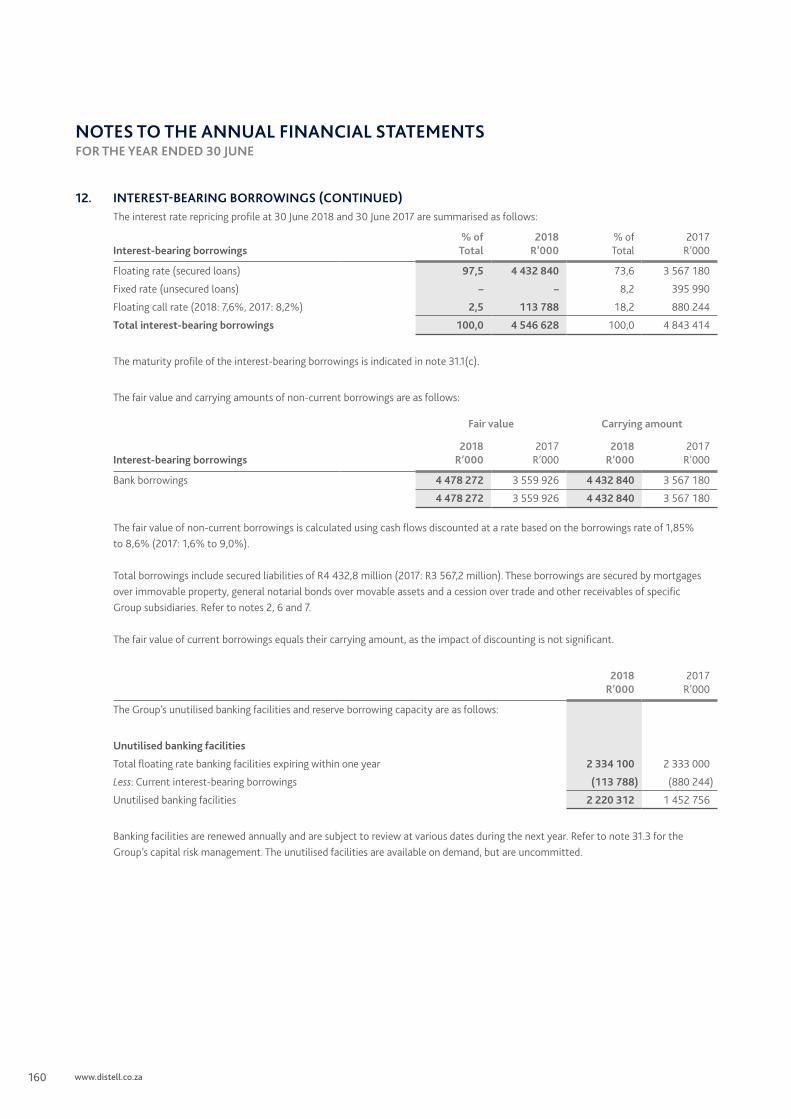
NOTES TO THE ANNUAL FINANCIAL STATEMENTSFOR THE YEAR ENDED 30 JUNE
12. INTEREST-BEARING BORROWINGS (CONTINUED)The interest rate repricing profile at 30 June 2018 and 30 June 2017 are summarised as follows:
Interest-bearing borrowings% of
Total2018
R’000 % of Total
2017 R’000
Floating rate (secured loans) 97,5 4 432 840 73,6 3 567 180
Fixed rate (unsecured loans) – – 8,2 395 990
Floating call rate (2018: 7,6%, 2017: 8,2%) 2,5 113 788 18,2 880 244
Total interest-bearing borrowings 100,0 4 546 628 100,0 4 843 414
The maturity profile of the interest-bearing borrowings is indicated in note 31.1(c).
The fair value and carrying amounts of non-current borrowings are as follows:
Interest-bearing borrowings
Fair value Carrying amount
2018 R’000
2017 R’000
2018 R’000
2017 R’000
Bank borrowings 4 478 272 3 559 926 4 432 840 3 567 180
4 478 272 3 559 926 4 432 840 3 567 180
The fair value of non-current borrowings is calculated using cash flows discounted at a rate based on the borrowings rate of 1,85% to 8,6% (2017: 1,6% to 9,0%).
Total borrowings include secured liabilities of R4 432,8 million (2017: R3 567,2 million). These borrowings are secured by mortgages over immovable property, general notarial bonds over movable assets and a cession over trade and other receivables of specific Group subsidiaries. Refer to notes 2, 6 and 7.
The fair value of current borrowings equals their carrying amount, as the impact of discounting is not significant.
2018 R’000
2017 R’000
The Group’s unutilised banking facilities and reserve borrowing capacity are as follows:
Unutilised banking facilities
Total floating rate banking facilities expiring within one year 2 334 100 2 333 000
Less: Current interest-bearing borrowings (113 788) (880 244)
Unutilised banking facilities 2 220 312 1 452 756
Banking facilities are renewed annually and are subject to review at various dates during the next year. Refer to note 31.3 for the Group’s capital risk management. The unutilised facilities are available on demand, but are uncommitted.
160 www.distell.co.za
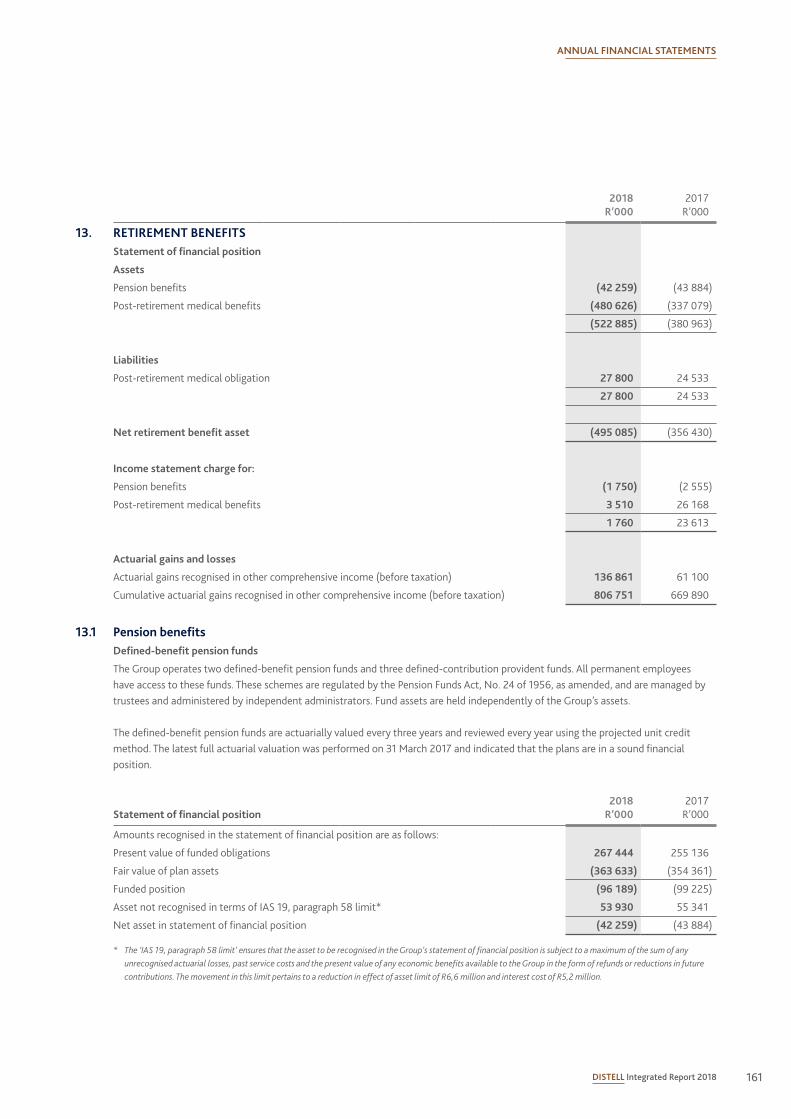
2018R’000
2017R’000
13. RETIREMENT BENEFITSStatement of financial position
Assets
Pension benefits (42 259) (43 884)
Post-retirement medical benefits (480 626) (337 079)
(522 885) (380 963)
Liabilities
Post-retirement medical obligation 27 800 24 533
27 800 24 533
Net retirement benefit asset (495 085) (356 430)
Income statement charge for:
Pension benefits (1 750) (2 555)
Post-retirement medical benefits 3 510 26 168
1 760 23 613
Actuarial gains and losses
Actuarial gains recognised in other comprehensive income (before taxation) 136 861 61 100
Cumulative actuarial gains recognised in other comprehensive income (before taxation) 806 751 669 890
13.1 Pension benefitsDefined-benefit pension funds
The Group operates two defined-benefit pension funds and three defined-contribution provident funds. All permanent employees have access to these funds. These schemes are regulated by the Pension Funds Act, No. 24 of 1956, as amended, and are managed by trustees and administered by independent administrators. Fund assets are held independently of the Group’s assets.
The defined-benefit pension funds are actuarially valued every three years and reviewed every year using the projected unit credit method. The latest full actuarial valuation was performed on 31 March 2017 and indicated that the plans are in a sound financial position.
Statement of financial position2018
R’0002017
R’000
Amounts recognised in the statement of financial position are as follows:
Present value of funded obligations 267 444 255 136
Fair value of plan assets (363 633) (354 361)
Funded position (96 189) (99 225)
Asset not recognised in terms of IAS 19, paragraph 58 limit* 53 930 55 341
Net asset in statement of financial position (42 259) (43 884)
* The ‘IAS 19, paragraph 58 limit’ ensures that the asset to be recognised in the Group’s statement of financial position is subject to a maximum of the sum of any unrecognised actuarial losses, past service costs and the present value of any economic benefits available to the Group in the form of refunds or reductions in future contributions. The movement in this limit pertains to a reduction in effect of asset limit of R6,6 million and interest cost of R5,2 million.
ANNUAL FINANCIAL STATEMENTS
161DISTELL Integrated Report 2018
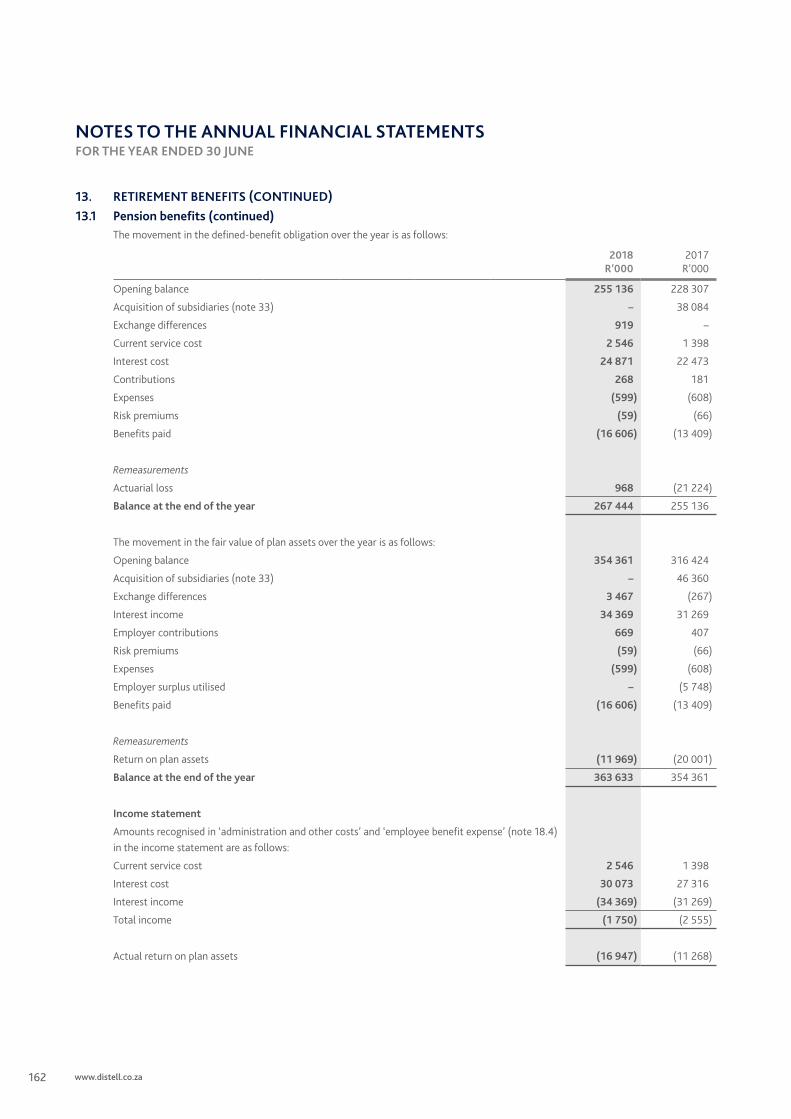
NOTES TO THE ANNUAL FINANCIAL STATEMENTSFOR THE YEAR ENDED 30 JUNE
13. RETIREMENT BENEFITS (CONTINUED)13.1 Pension benefits (continued)
The movement in the defined-benefit obligation over the year is as follows:
2018 R’000
2017 R’000
Opening balance 255 136 228 307
Acquisition of subsidiaries (note 33) – 38 084
Exchange differences 919 –
Current service cost 2 546 1 398
Interest cost 24 871 22 473
Contributions 268 181
Expenses (599) (608)
Risk premiums (59) (66)
Benefits paid (16 606) (13 409)
Remeasurements
Actuarial loss 968 (21 224)
Balance at the end of the year 267 444 255 136
The movement in the fair value of plan assets over the year is as follows:
Opening balance 354 361 316 424
Acquisition of subsidiaries (note 33) – 46 360
Exchange differences 3 467 (267)
Interest income 34 369 31 269
Employer contributions 669 407
Risk premiums (59) (66)
Expenses (599) (608)
Employer surplus utilised – (5 748)
Benefits paid (16 606) (13 409)
Remeasurements
Return on plan assets (11 969) (20 001)
Balance at the end of the year 363 633 354 361
Income statement
Amounts recognised in ‘administration and other costs’ and ‘employee benefit expense’ (note 18.4) in the income statement are as follows:
Current service cost 2 546 1 398
Interest cost 30 073 27 316
Interest income (34 369) (31 269)
Total income (1 750) (2 555)
Actual return on plan assets (16 947) (11 268)
162 www.distell.co.za
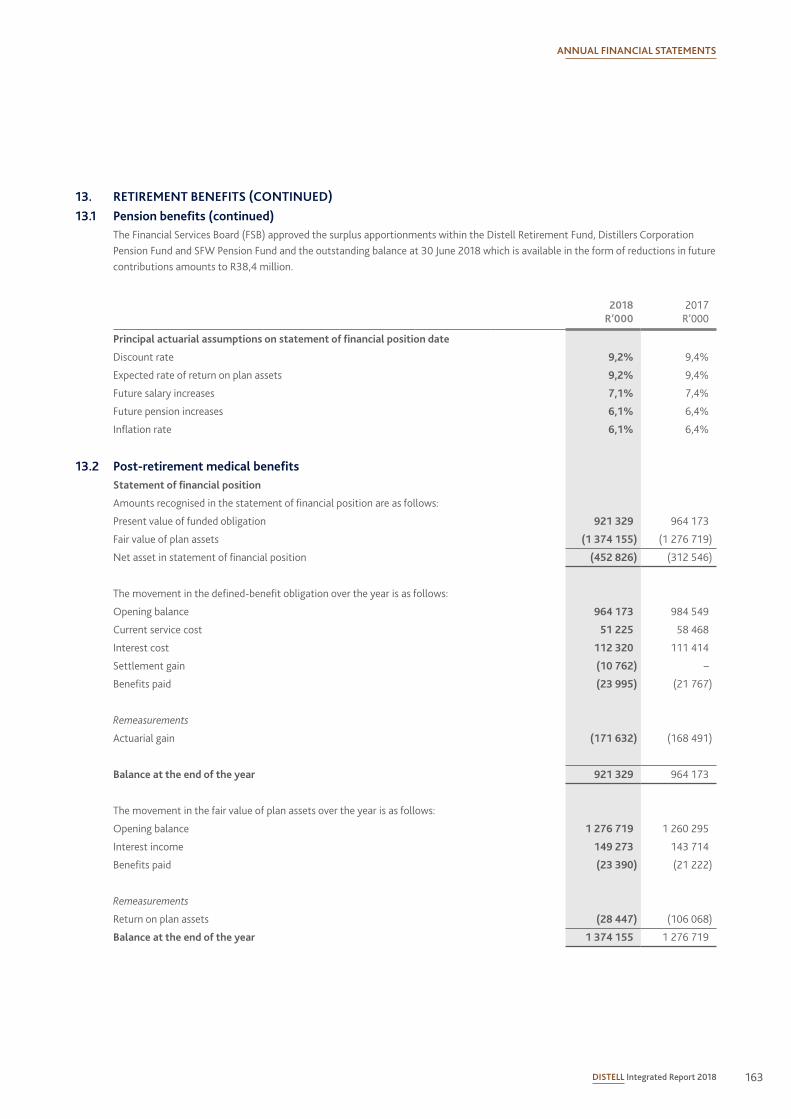
13. RETIREMENT BENEFITS (CONTINUED)13.1 Pension benefits (continued)
The Financial Services Board (FSB) approved the surplus apportionments within the Distell Retirement Fund, Distillers Corporation Pension Fund and SFW Pension Fund and the outstanding balance at 30 June 2018 which is available in the form of reductions in future contributions amounts to R38,4 million.
2018 R’000
2017 R’000
Principal actuarial assumptions on statement of financial position date
Discount rate 9,2% 9,4%
Expected rate of return on plan assets 9,2% 9,4%
Future salary increases 7,1% 7,4%
Future pension increases 6,1% 6,4%
Inflation rate 6,1% 6,4%
13.2 Post-retirement medical benefitsStatement of financial position
Amounts recognised in the statement of financial position are as follows:
Present value of funded obligation 921 329 964 173
Fair value of plan assets (1 374 155) (1 276 719)
Net asset in statement of financial position (452 826) (312 546)
The movement in the defined-benefit obligation over the year is as follows:
Opening balance 964 173 984 549
Current service cost 51 225 58 468
Interest cost 112 320 111 414
Settlement gain (10 762) –
Benefits paid (23 995) (21 767)
Remeasurements
Actuarial gain (171 632) (168 491)
Balance at the end of the year 921 329 964 173
The movement in the fair value of plan assets over the year is as follows:
Opening balance 1 276 719 1 260 295
Interest income 149 273 143 714
Benefits paid (23 390) (21 222)
Remeasurements
Return on plan assets (28 447) (106 068)
Balance at the end of the year 1 374 155 1 276 719
ANNUAL FINANCIAL STATEMENTS
163DISTELL Integrated Report 2018
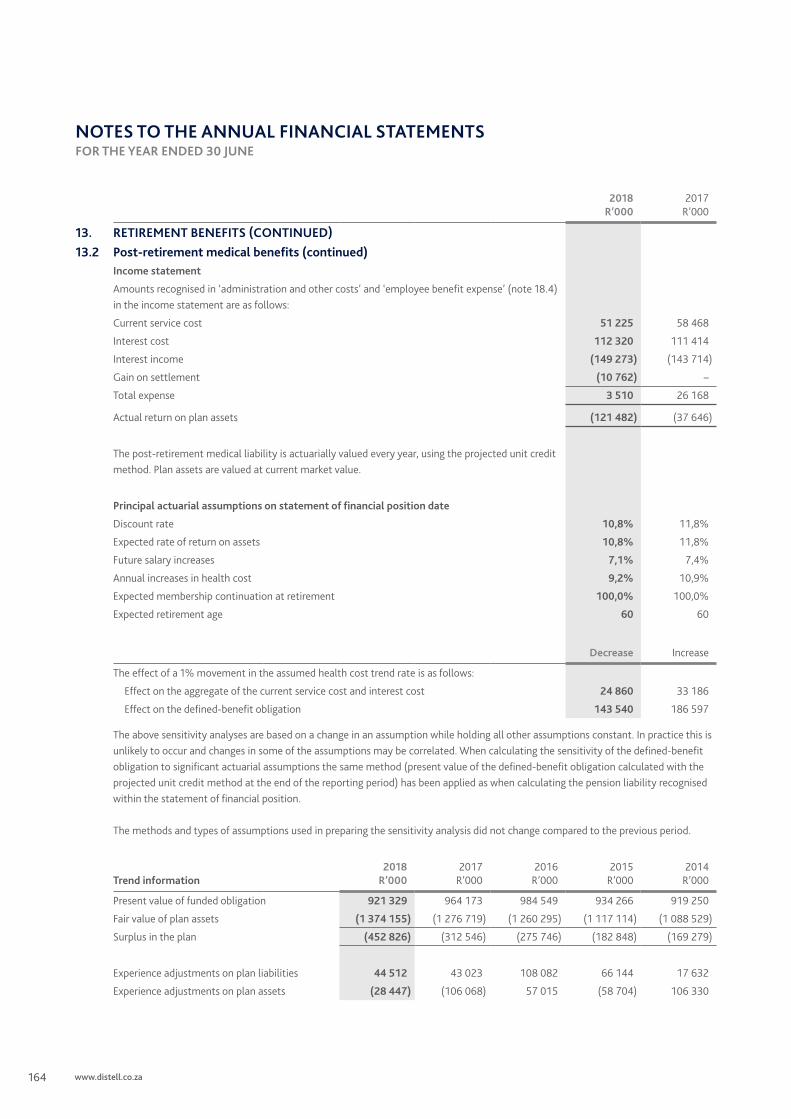
NOTES TO THE ANNUAL FINANCIAL STATEMENTSFOR THE YEAR ENDED 30 JUNE
2018 R’000
2017 R’000
13. RETIREMENT BENEFITS (CONTINUED)13.2 Post-retirement medical benefits (continued)
Income statement
Amounts recognised in ‘administration and other costs’ and ‘employee benefit expense’ (note 18.4) in the income statement are as follows:
Current service cost 51 225 58 468
Interest cost 112 320 111 414
Interest income (149 273) (143 714)
Gain on settlement (10 762) –
Total expense 3 510 26 168
Actual return on plan assets (121 482) (37 646)
The post-retirement medical liability is actuarially valued every year, using the projected unit credit method. Plan assets are valued at current market value.
Principal actuarial assumptions on statement of financial position date
Discount rate 10,8% 11,8%
Expected rate of return on assets 10,8% 11,8%
Future salary increases 7,1% 7,4%
Annual increases in health cost 9,2% 10,9%
Expected membership continuation at retirement 100,0% 100,0%
Expected retirement age 60 60
Decrease Increase
The effect of a 1% movement in the assumed health cost trend rate is as follows:
Effect on the aggregate of the current service cost and interest cost 24 860 33 186
Effect on the defined-benefit obligation 143 540 186 597
The above sensitivity analyses are based on a change in an assumption while holding all other assumptions constant. In practice this is unlikely to occur and changes in some of the assumptions may be correlated. When calculating the sensitivity of the defined-benefit obligation to significant actuarial assumptions the same method (present value of the defined-benefit obligation calculated with the projected unit credit method at the end of the reporting period) has been applied as when calculating the pension liability recognised within the statement of financial position.
The methods and types of assumptions used in preparing the sensitivity analysis did not change compared to the previous period.
Trend information2018
R’0002017
R’0002016
R’0002015
R’0002014
R’000
Present value of funded obligation 921 329 964 173 984 549 934 266 919 250
Fair value of plan assets (1 374 155) (1 276 719) (1 260 295) (1 117 114) (1 088 529)
Surplus in the plan (452 826) (312 546) (275 746) (182 848) (169 279)
Experience adjustments on plan liabilities 44 512 43 023 108 082 66 144 17 632
Experience adjustments on plan assets (28 447) (106 068) 57 015 (58 704) 106 330
164 www.distell.co.za
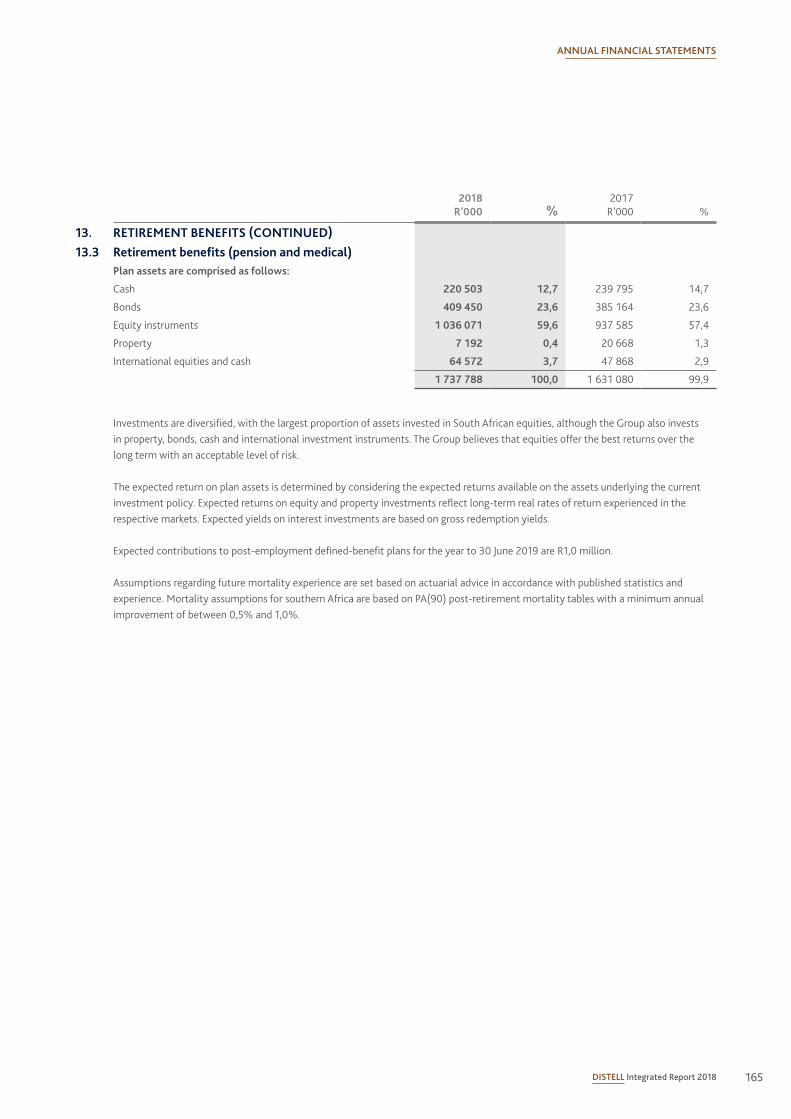
2018R’000 %
2017R’000 %
13. RETIREMENT BENEFITS (CONTINUED)13.3 Retirement benefits (pension and medical)
Plan assets are comprised as follows:
Cash 220 503 12,7 239 795 14,7
Bonds 409 450 23,6 385 164 23,6
Equity instruments 1 036 071 59,6 937 585 57,4
Property 7 192 0,4 20 668 1,3
International equities and cash 64 572 3,7 47 868 2,9
1 737 788 100,0 1 631 080 99,9
Investments are diversified, with the largest proportion of assets invested in South African equities, although the Group also invests in property, bonds, cash and international investment instruments. The Group believes that equities offer the best returns over the long term with an acceptable level of risk.
The expected return on plan assets is determined by considering the expected returns available on the assets underlying the current investment policy. Expected returns on equity and property investments reflect long-term real rates of return experienced in the respective markets. Expected yields on interest investments are based on gross redemption yields.
Expected contributions to post-employment defined-benefit plans for the year to 30 June 2019 are R1,0 million.
Assumptions regarding future mortality experience are set based on actuarial advice in accordance with published statistics and experience. Mortality assumptions for southern Africa are based on PA(90) post-retirement mortality tables with a minimum annual improvement of between 0,5% and 1,0%.
ANNUAL FINANCIAL STATEMENTS
165DISTELL Integrated Report 2018
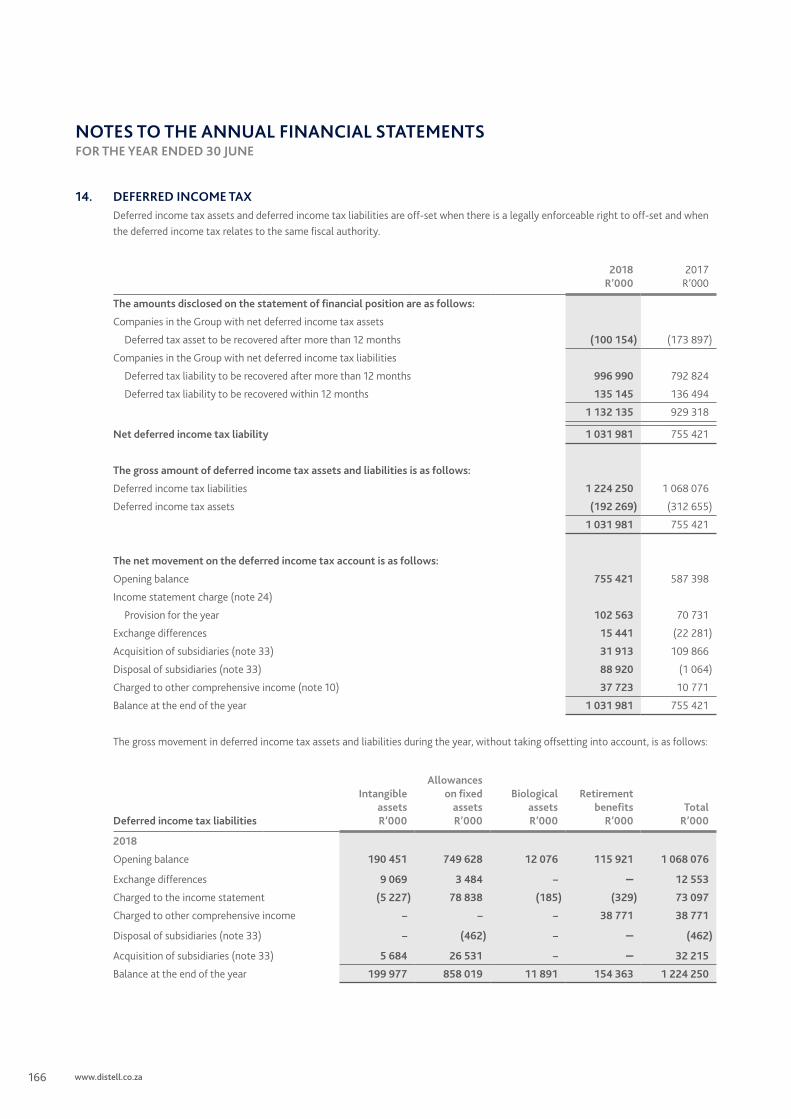
NOTES TO THE ANNUAL FINANCIAL STATEMENTSFOR THE YEAR ENDED 30 JUNE
14. DEFERRED INCOME TAXDeferred income tax assets and deferred income tax liabilities are off-set when there is a legally enforceable right to off-set and when the deferred income tax relates to the same fiscal authority.
2018R’000
2017R’000
The amounts disclosed on the statement of financial position are as follows:
Companies in the Group with net deferred income tax assets
Deferred tax asset to be recovered after more than 12 months (100 154) (173 897)
Companies in the Group with net deferred income tax liabilities
Deferred tax liability to be recovered after more than 12 months 996 990 792 824
Deferred tax liability to be recovered within 12 months 135 145 136 494
1 132 135 929 318
Net deferred income tax liability 1 031 981 755 421
The gross amount of deferred income tax assets and liabilities is as follows:
Deferred income tax liabilities 1 224 250 1 068 076
Deferred income tax assets (192 269) (312 655)
1 031 981 755 421
The net movement on the deferred income tax account is as follows:
Opening balance 755 421 587 398
Income statement charge (note 24)
Provision for the year 102 563 70 731
Exchange differences 15 441 (22 281)
Acquisition of subsidiaries (note 33) 31 913 109 866
Disposal of subsidiaries (note 33) 88 920 (1 064)
Charged to other comprehensive income (note 10) 37 723 10 771
Balance at the end of the year 1 031 981 755 421
The gross movement in deferred income tax assets and liabilities during the year, without taking offsetting into account, is as follows:
Deferred income tax liabilities
IntangibleassetsR’000
Allowances on fixed
assetsR’000
BiologicalassetsR’000
Retirementbenefits
R’000 Total R’000
2018
Opening balance 190 451 749 628 12 076 115 921 1 068 076
Exchange differences 9 069 3 484 – – 12 553
Charged to the income statement (5 227) 78 838 (185) (329) 73 097
Charged to other comprehensive income – – – 38 771 38 771
Disposal of subsidiaries (note 33) – (462) – – (462)
Acquisition of subsidiaries (note 33) 5 684 26 531 – – 32 215
Balance at the end of the year 199 977 858 019 11 891 154 363 1 224 250
166 www.distell.co.za
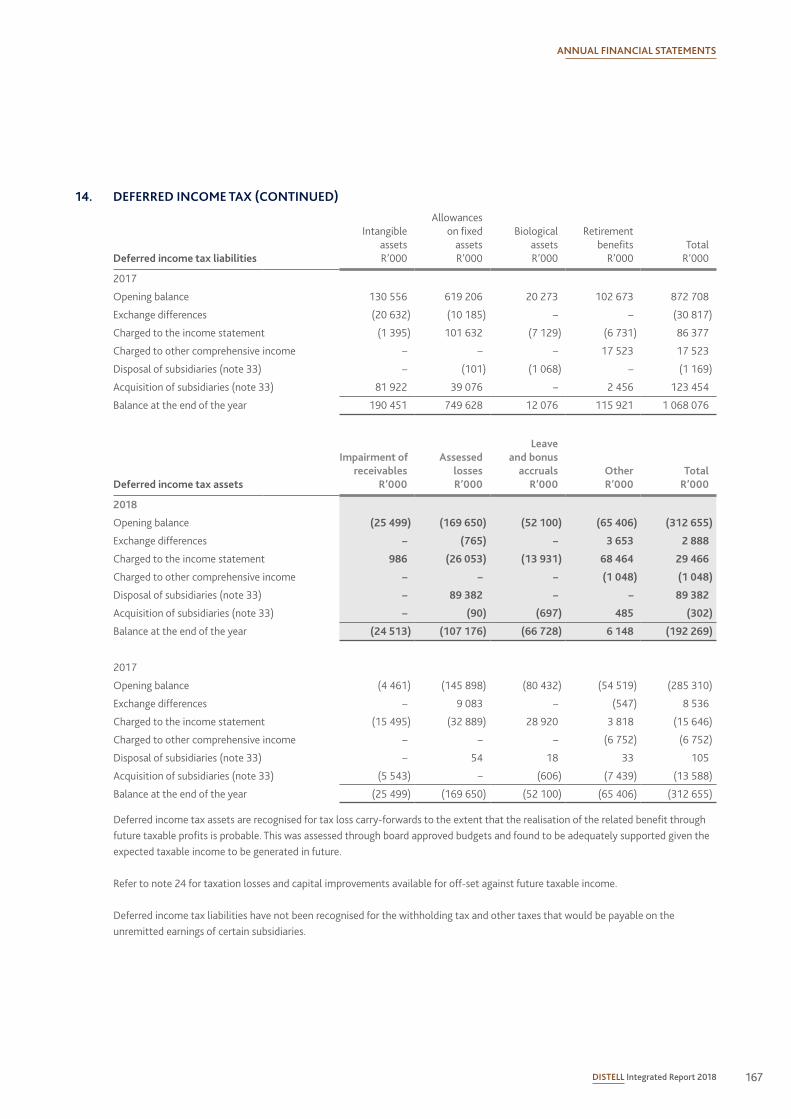
14. DEFERRED INCOME TAX (CONTINUED)
Deferred income tax liabilities
IntangibleassetsR’000
Allowances on fixed
assetsR’000
BiologicalassetsR’000
Retirementbenefits
R’000 Total R’000
2017
Opening balance 130 556 619 206 20 273 102 673 872 708
Exchange differences (20 632) (10 185) – – (30 817)
Charged to the income statement (1 395) 101 632 (7 129) (6 731) 86 377
Charged to other comprehensive income – – – 17 523 17 523
Disposal of subsidiaries (note 33) – (101) (1 068) – (1 169)
Acquisition of subsidiaries (note 33) 81 922 39 076 – 2 456 123 454
Balance at the end of the year 190 451 749 628 12 076 115 921 1 068 076
Deferred income tax assets
Impairment ofreceivables
R’000
Assessed lossesR’000
Leave and bonus
accrualsR’000
OtherR’000
Total R’000
2018
Opening balance (25 499) (169 650) (52 100) (65 406) (312 655)
Exchange differences – (765) – 3 653 2 888
Charged to the income statement 986 (26 053) (13 931) 68 464 29 466
Charged to other comprehensive income – – – (1 048) (1 048)
Disposal of subsidiaries (note 33) – 89 382 – – 89 382
Acquisition of subsidiaries (note 33) – (90) (697) 485 (302)
Balance at the end of the year (24 513) (107 176) (66 728) 6 148 (192 269)
2017
Opening balance (4 461) (145 898) (80 432) (54 519) (285 310)
Exchange differences – 9 083 – (547) 8 536
Charged to the income statement (15 495) (32 889) 28 920 3 818 (15 646)
Charged to other comprehensive income – – – (6 752) (6 752)
Disposal of subsidiaries (note 33) – 54 18 33 105
Acquisition of subsidiaries (note 33) (5 543) – (606) (7 439) (13 588)
Balance at the end of the year (25 499) (169 650) (52 100) (65 406) (312 655)
Deferred income tax assets are recognised for tax loss carry-forwards to the extent that the realisation of the related benefit through future taxable profits is probable. This was assessed through board approved budgets and found to be adequately supported given the expected taxable income to be generated in future.
Refer to note 24 for taxation losses and capital improvements available for off-set against future taxable income.
Deferred income tax liabilities have not been recognised for the withholding tax and other taxes that would be payable on the unremitted earnings of certain subsidiaries.
ANNUAL FINANCIAL STATEMENTS
167DISTELL Integrated Report 2018
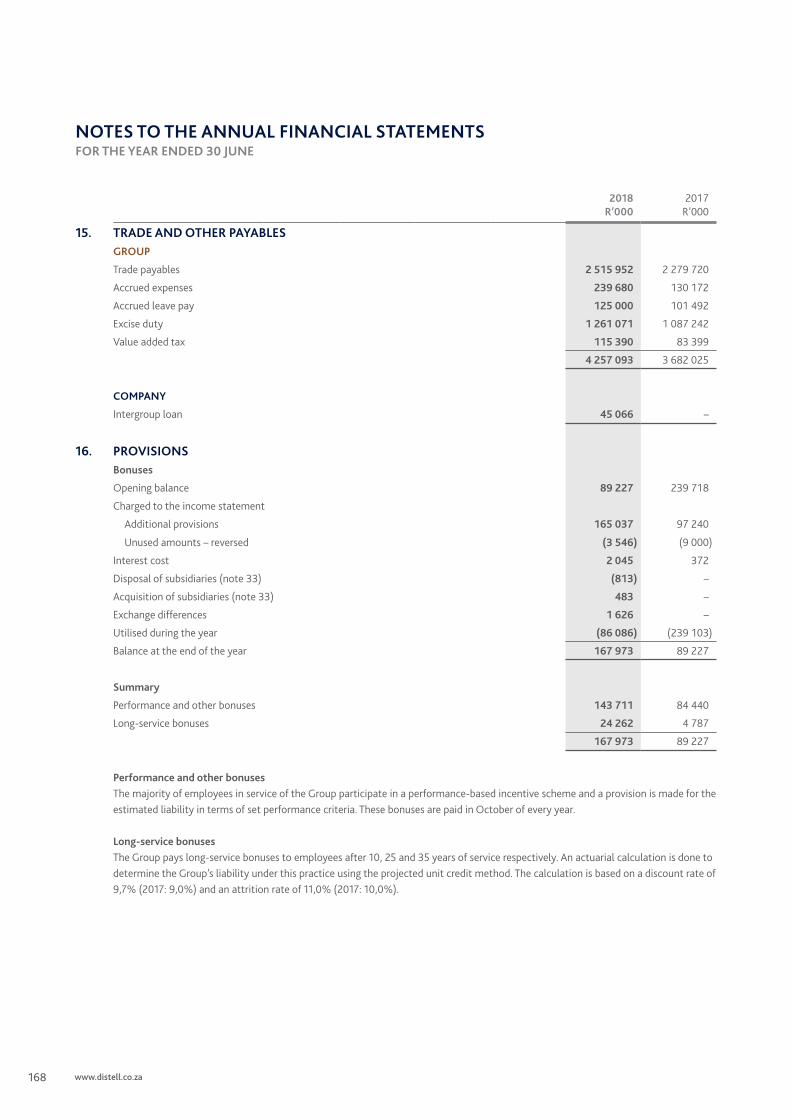
NOTES TO THE ANNUAL FINANCIAL STATEMENTSFOR THE YEAR ENDED 30 JUNE
2018R’000
2017R’000
15. TRADE AND OTHER PAYABLESGROUP
Trade payables 2 515 952 2 279 720
Accrued expenses 239 680 130 172
Accrued leave pay 125 000 101 492
Excise duty 1 261 071 1 087 242
Value added tax 115 390 83 399
4 257 093 3 682 025
COMPANY
Intergroup loan 45 066 –
16. PROVISIONSBonuses
Opening balance 89 227 239 718
Charged to the income statement
Additional provisions 165 037 97 240
Unused amounts – reversed (3 546) (9 000)
Interest cost 2 045 372
Disposal of subsidiaries (note 33) (813) –
Acquisition of subsidiaries (note 33) 483 –
Exchange differences 1 626 –
Utilised during the year (86 086) (239 103)
Balance at the end of the year 167 973 89 227
Summary
Performance and other bonuses 143 711 84 440
Long-service bonuses 24 262 4 787
167 973 89 227
Performance and other bonusesThe majority of employees in service of the Group participate in a performance-based incentive scheme and a provision is made for the estimated liability in terms of set performance criteria. These bonuses are paid in October of every year.
Long-service bonusesThe Group pays long-service bonuses to employees after 10, 25 and 35 years of service respectively. An actuarial calculation is done to determine the Group’s liability under this practice using the projected unit credit method. The calculation is based on a discount rate of 9,7% (2017: 9,0%) and an attrition rate of 11,0% (2017: 10,0%).
168 www.distell.co.za
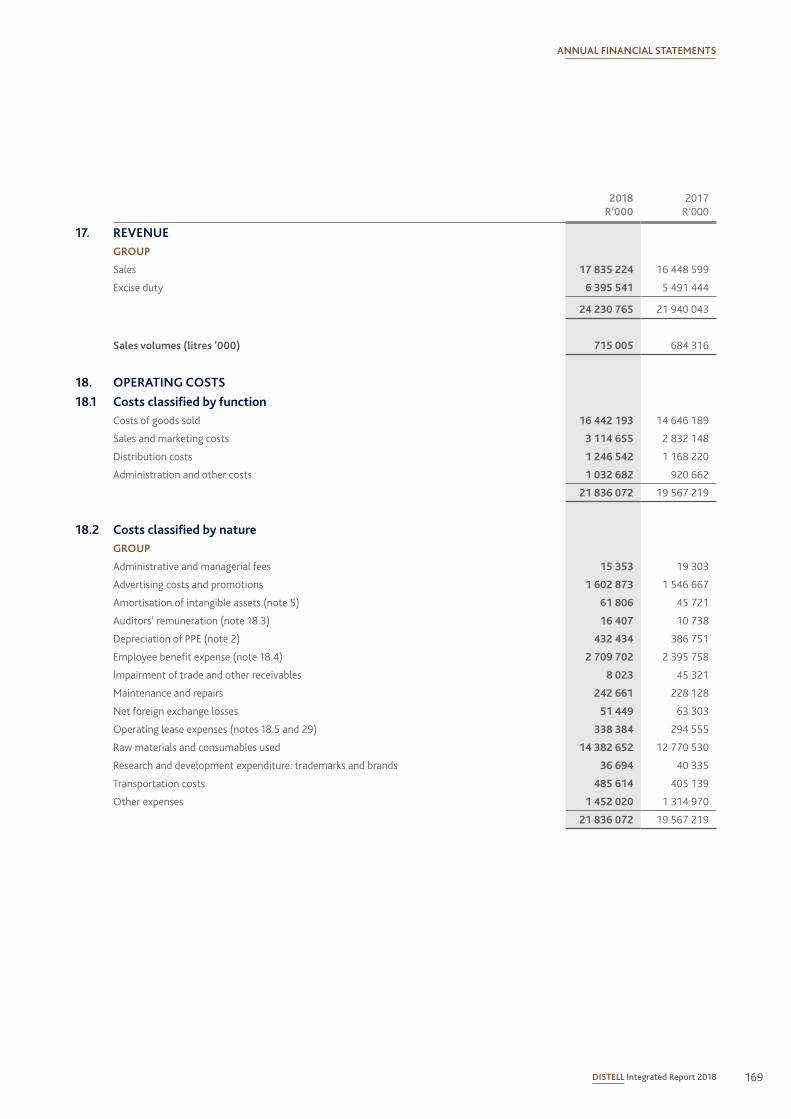
2018R’000
2017R’000
17. REVENUEGROUP
Sales 17 835 224 16 448 599
Excise duty 6 395 541 5 491 444
24 230 765 21 940 043
Sales volumes (litres ’000) 715 005 684 316
18. OPERATING COSTS18.1 Costs classified by function
Costs of goods sold 16 442 193 14 646 189
Sales and marketing costs 3 114 655 2 832 148
Distribution costs 1 246 542 1 168 220
Administration and other costs 1 032 682 920 662
21 836 072 19 567 219
18.2 Costs classified by natureGROUP
Administrative and managerial fees 15 353 19 303
Advertising costs and promotions 1 602 873 1 546 667
Amortisation of intangible assets (note 5) 61 806 45 721
Auditors’ remuneration (note 18.3) 16 407 10 738
Depreciation of PPE (note 2) 432 434 386 751
Employee benefit expense (note 18.4) 2 709 702 2 395 758
Impairment of trade and other receivables 8 023 45 321
Maintenance and repairs 242 661 228 128
Net foreign exchange losses 51 449 63 303
Operating lease expenses (notes 18.5 and 29) 338 384 294 555
Raw materials and consumables used 14 382 652 12 770 530
Research and development expenditure: trademarks and brands 36 694 40 335
Transportation costs 485 614 405 139
Other expenses 1 452 020 1 314 970
21 836 072 19 567 219
ANNUAL FINANCIAL STATEMENTS
169DISTELL Integrated Report 2018
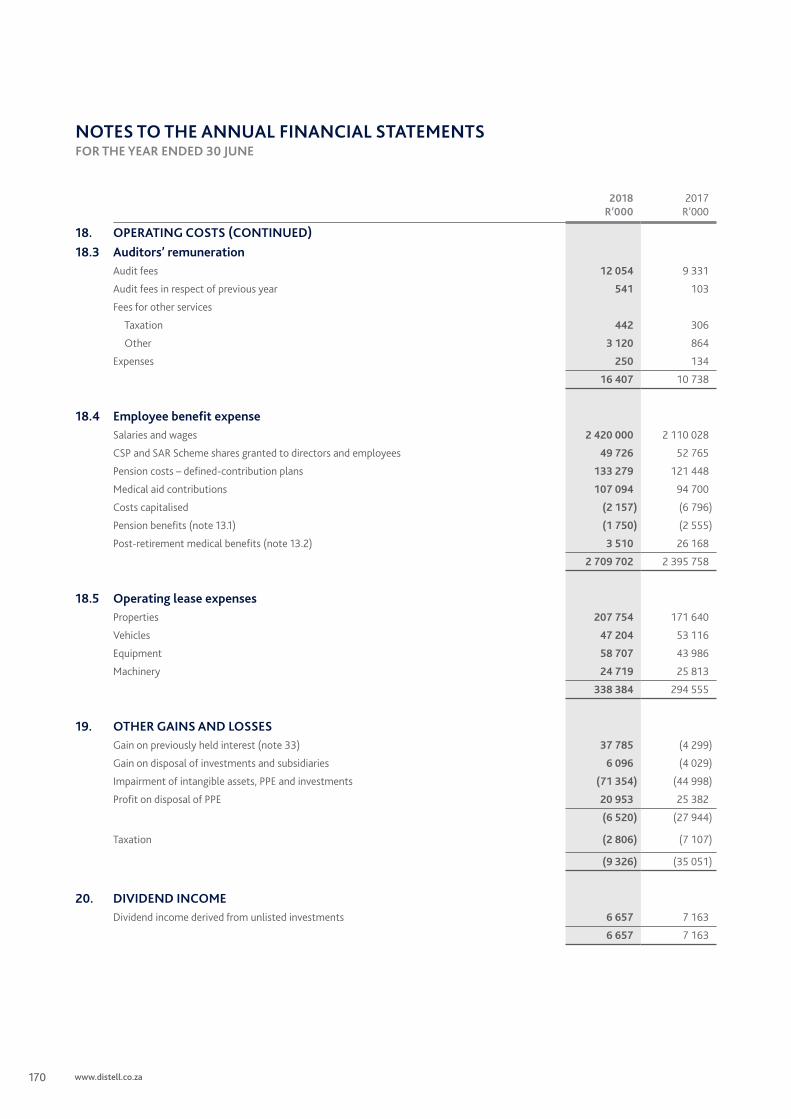
NOTES TO THE ANNUAL FINANCIAL STATEMENTSFOR THE YEAR ENDED 30 JUNE
2018R’000
2017R’000
18. OPERATING COSTS (CONTINUED)18.3 Auditors’ remuneration
Audit fees 12 054 9 331
Audit fees in respect of previous year 541 103
Fees for other services
Taxation 442 306
Other 3 120 864
Expenses 250 134
16 407 10 738
18.4 Employee benefit expenseSalaries and wages 2 420 000 2 110 028
CSP and SAR Scheme shares granted to directors and employees 49 726 52 765
Pension costs – defined-contribution plans 133 279 121 448
Medical aid contributions 107 094 94 700
Costs capitalised (2 157) (6 796)
Pension benefits (note 13.1) (1 750) (2 555)
Post-retirement medical benefits (note 13.2) 3 510 26 168
2 709 702 2 395 758
18.5 Operating lease expensesProperties 207 754 171 640
Vehicles 47 204 53 116
Equipment 58 707 43 986
Machinery 24 719 25 813
338 384 294 555
19. OTHER GAINS AND LOSSESGain on previously held interest (note 33) 37 785 (4 299)
Gain on disposal of investments and subsidiaries 6 096 (4 029)
Impairment of intangible assets, PPE and investments (71 354) (44 998)
Profit on disposal of PPE 20 953 25 382
(6 520) (27 944)
Taxation (2 806) (7 107)
(9 326) (35 051)
20. DIVIDEND INCOMEDividend income derived from unlisted investments 6 657 7 163
6 657 7 163
170 www.distell.co.za
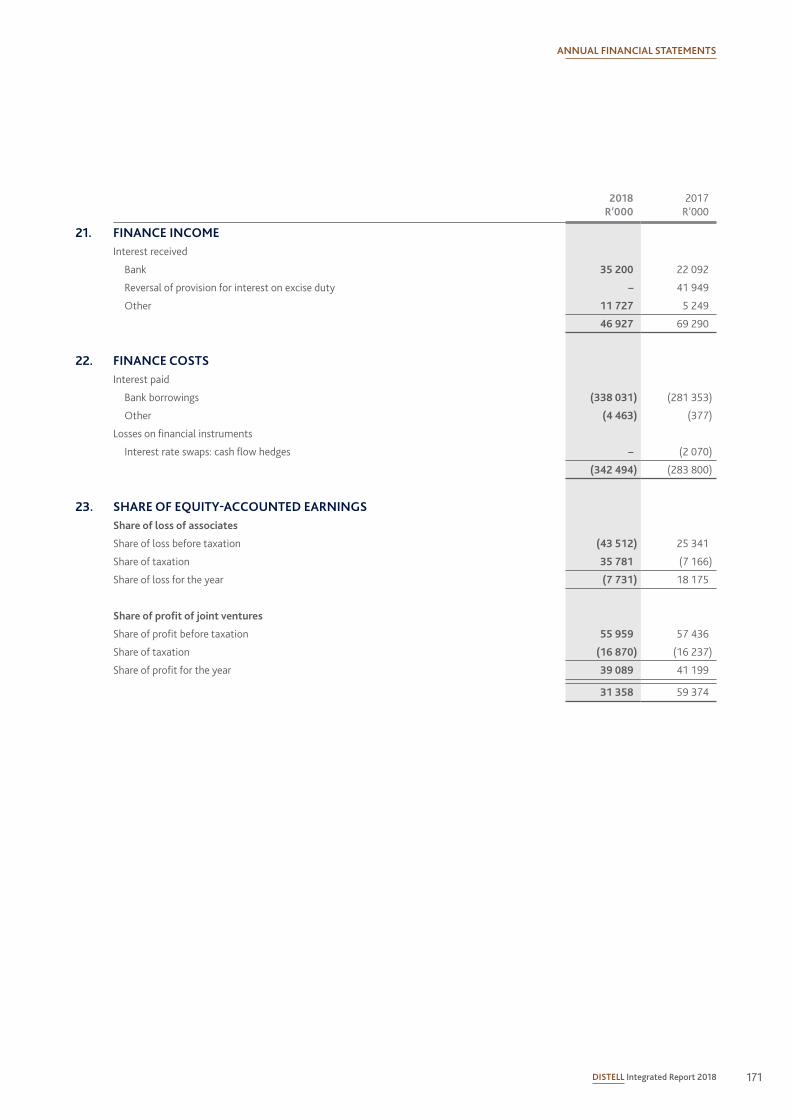
2018R’000
2017R’000
21. FINANCE INCOMEInterest received
Bank 35 200 22 092
Reversal of provision for interest on excise duty – 41 949
Other 11 727 5 249
46 927 69 290
22. FINANCE COSTSInterest paid
Bank borrowings (338 031) (281 353)
Other (4 463) (377)
Losses on financial instruments
Interest rate swaps: cash flow hedges – (2 070)
(342 494) (283 800)
23. SHARE OF EQUITY-ACCOUNTED EARNINGSShare of loss of associates
Share of loss before taxation (43 512) 25 341
Share of taxation 35 781 (7 166)
Share of loss for the year (7 731) 18 175
Share of profit of joint ventures
Share of profit before taxation 55 959 57 436
Share of taxation (16 870) (16 237)
Share of profit for the year 39 089 41 199
31 358 59 374
ANNUAL FINANCIAL STATEMENTS
171DISTELL Integrated Report 2018
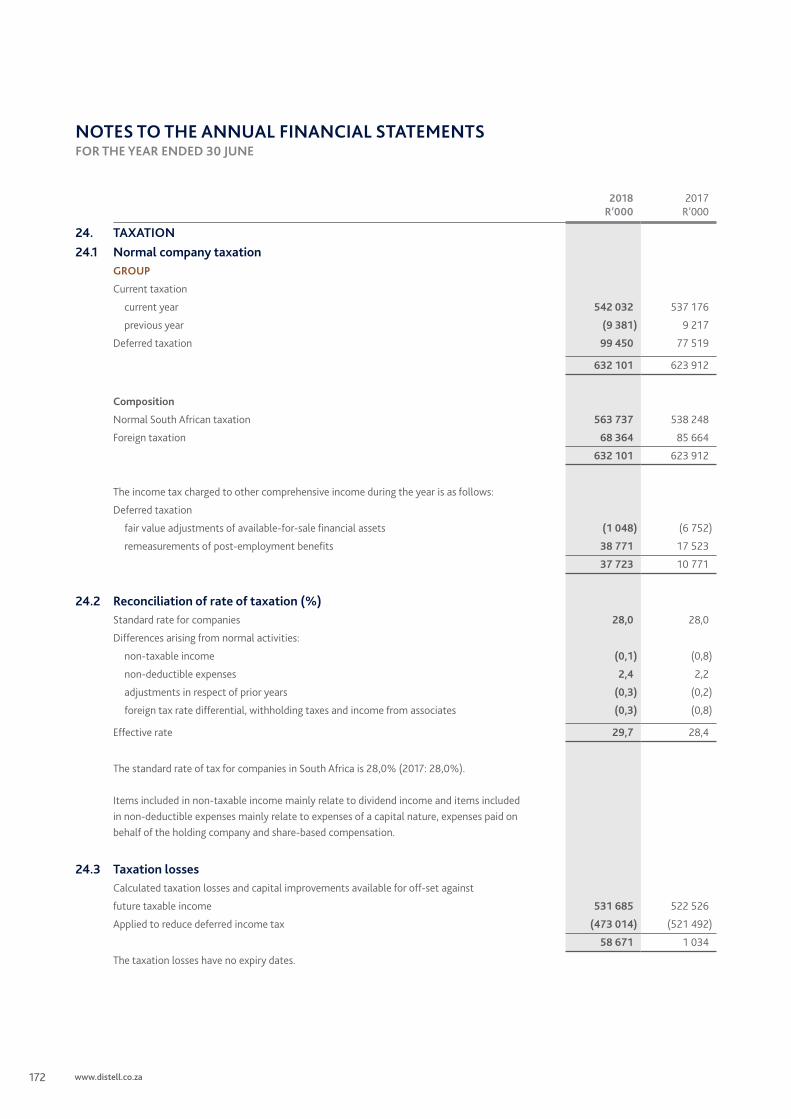
NOTES TO THE ANNUAL FINANCIAL STATEMENTSFOR THE YEAR ENDED 30 JUNE
2018R’000
2017R’000
24. TAXATION24.1 Normal company taxation
GROUP
Current taxation
current year 542 032 537 176
previous year (9 381) 9 217
Deferred taxation 99 450 77 519
632 101 623 912
Composition
Normal South African taxation 563 737 538 248
Foreign taxation 68 364 85 664
632 101 623 912
The income tax charged to other comprehensive income during the year is as follows:
Deferred taxation
fair value adjustments of available-for-sale financial assets (1 048) (6 752)
remeasurements of post-employment benefits 38 771 17 523
37 723 10 771
24.2 Reconciliation of rate of taxation (%)Standard rate for companies 28,0 28,0
Differences arising from normal activities:
non-taxable income (0,1) (0,8)
non-deductible expenses 2,4 2,2
adjustments in respect of prior years (0,3) (0,2)
foreign tax rate differential, withholding taxes and income from associates (0,3) (0,8)
Effective rate 29,7 28,4
The standard rate of tax for companies in South Africa is 28,0% (2017: 28,0%).
Items included in non-taxable income mainly relate to dividend income and items included in non-deductible expenses mainly relate to expenses of a capital nature, expenses paid on behalf of the holding company and share-based compensation.
24.3 Taxation lossesCalculated taxation losses and capital improvements available for off-set against
future taxable income 531 685 522 526
Applied to reduce deferred income tax (473 014) (521 492)
58 671 1 034
The taxation losses have no expiry dates.
172 www.distell.co.za
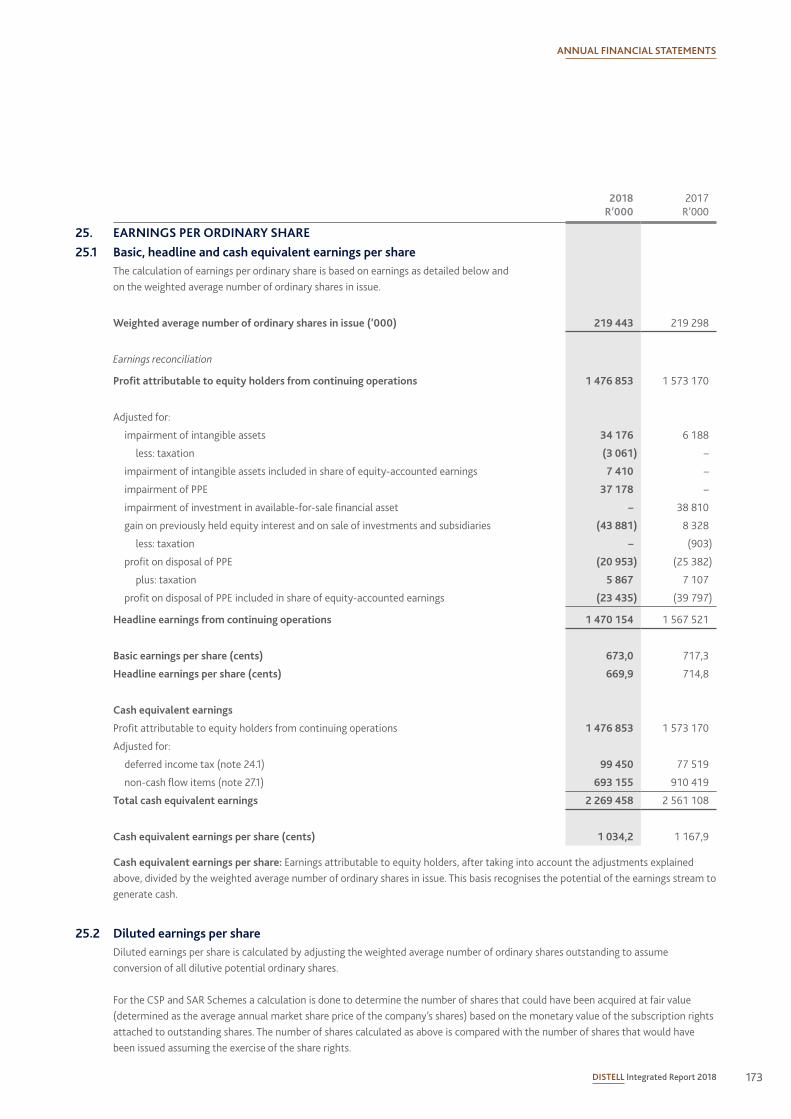
2018R’000
2017R’000
25. EARNINGS PER ORDINARY SHARE25.1 Basic, headline and cash equivalent earnings per share
The calculation of earnings per ordinary share is based on earnings as detailed below and on the weighted average number of ordinary shares in issue.
Weighted average number of ordinary shares in issue (’000) 219 443 219 298
Earnings reconciliation
Profit attributable to equity holders from continuing operations 1 476 853 1 573 170
Adjusted for:
impairment of intangible assets 34 176 6 188
less: taxation (3 061) –
impairment of intangible assets included in share of equity-accounted earnings 7 410 –
impairment of PPE 37 178 –
impairment of investment in available-for-sale financial asset – 38 810
gain on previously held equity interest and on sale of investments and subsidiaries (43 881) 8 328
less: taxation – (903)
profit on disposal of PPE (20 953) (25 382)
plus: taxation 5 867 7 107
profit on disposal of PPE included in share of equity-accounted earnings (23 435) (39 797)
Headline earnings from continuing operations 1 470 154 1 567 521
Basic earnings per share (cents) 673,0 717,3
Headline earnings per share (cents) 669,9 714,8
Cash equivalent earnings
Profit attributable to equity holders from continuing operations 1 476 853 1 573 170
Adjusted for:
deferred income tax (note 24.1) 99 450 77 519
non-cash flow items (note 27.1) 693 155 910 419
Total cash equivalent earnings 2 269 458 2 561 108
Cash equivalent earnings per share (cents) 1 034,2 1 167,9
Cash equivalent earnings per share: Earnings attributable to equity holders, after taking into account the adjustments explained above, divided by the weighted average number of ordinary shares in issue. This basis recognises the potential of the earnings stream to generate cash.
25.2 Diluted earnings per shareDiluted earnings per share is calculated by adjusting the weighted average number of ordinary shares outstanding to assume conversion of all dilutive potential ordinary shares.
For the CSP and SAR Schemes a calculation is done to determine the number of shares that could have been acquired at fair value (determined as the average annual market share price of the company’s shares) based on the monetary value of the subscription rights attached to outstanding shares. The number of shares calculated as above is compared with the number of shares that would have been issued assuming the exercise of the share rights.
ANNUAL FINANCIAL STATEMENTS
173DISTELL Integrated Report 2018
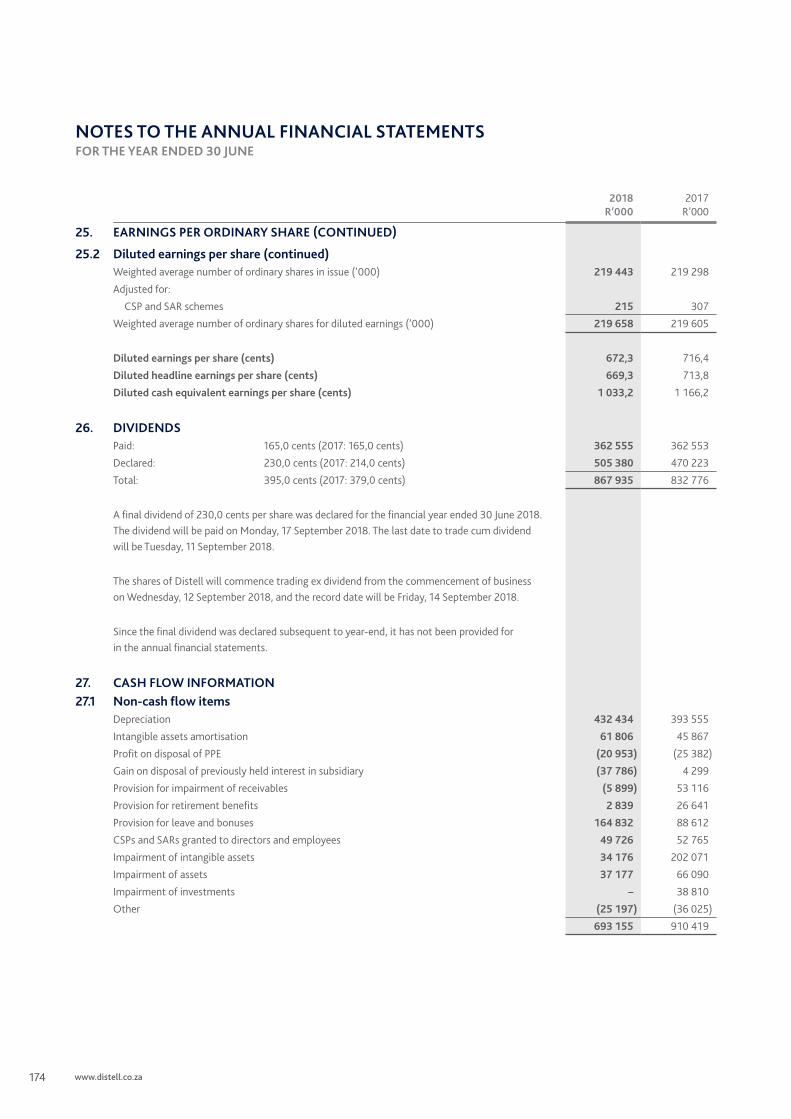
NOTES TO THE ANNUAL FINANCIAL STATEMENTSFOR THE YEAR ENDED 30 JUNE
2018R’000
2017R’000
25. EARNINGS PER ORDINARY SHARE (CONTINUED)
25.2 Diluted earnings per share (continued)Weighted average number of ordinary shares in issue (’000) 219 443 219 298
Adjusted for:
CSP and SAR schemes 215 307
Weighted average number of ordinary shares for diluted earnings (’000) 219 658 219 605
Diluted earnings per share (cents) 672,3 716,4
Diluted headline earnings per share (cents) 669,3 713,8
Diluted cash equivalent earnings per share (cents) 1 033,2 1 166,2
26. DIVIDENDSPaid: 165,0 cents (2017: 165,0 cents) 362 555 362 553
Declared: 230,0 cents (2017: 214,0 cents) 505 380 470 223
Total: 395,0 cents (2017: 379,0 cents) 867 935 832 776
A final dividend of 230,0 cents per share was declared for the financial year ended 30 June 2018. The dividend will be paid on Monday, 17 September 2018. The last date to trade cum dividend will be Tuesday, 11 September 2018.
The shares of Distell will commence trading ex dividend from the commencement of business on Wednesday, 12 September 2018, and the record date will be Friday, 14 September 2018.
Since the final dividend was declared subsequent to year-end, it has not been provided for in the annual financial statements.
27. CASH FLOW INFORMATION27.1 Non-cash flow items
Depreciation 432 434 393 555
Intangible assets amortisation 61 806 45 867
Profit on disposal of PPE (20 953) (25 382)
Gain on disposal of previously held interest in subsidiary (37 786) 4 299
Provision for impairment of receivables (5 899) 53 116
Provision for retirement benefits 2 839 26 641
Provision for leave and bonuses 164 832 88 612
CSPs and SARs granted to directors and employees 49 726 52 765
Impairment of intangible assets 34 176 202 071
Impairment of assets 37 177 66 090
Impairment of investments – 38 810
Other (25 197) (36 025)
693 155 910 419
174 www.distell.co.za
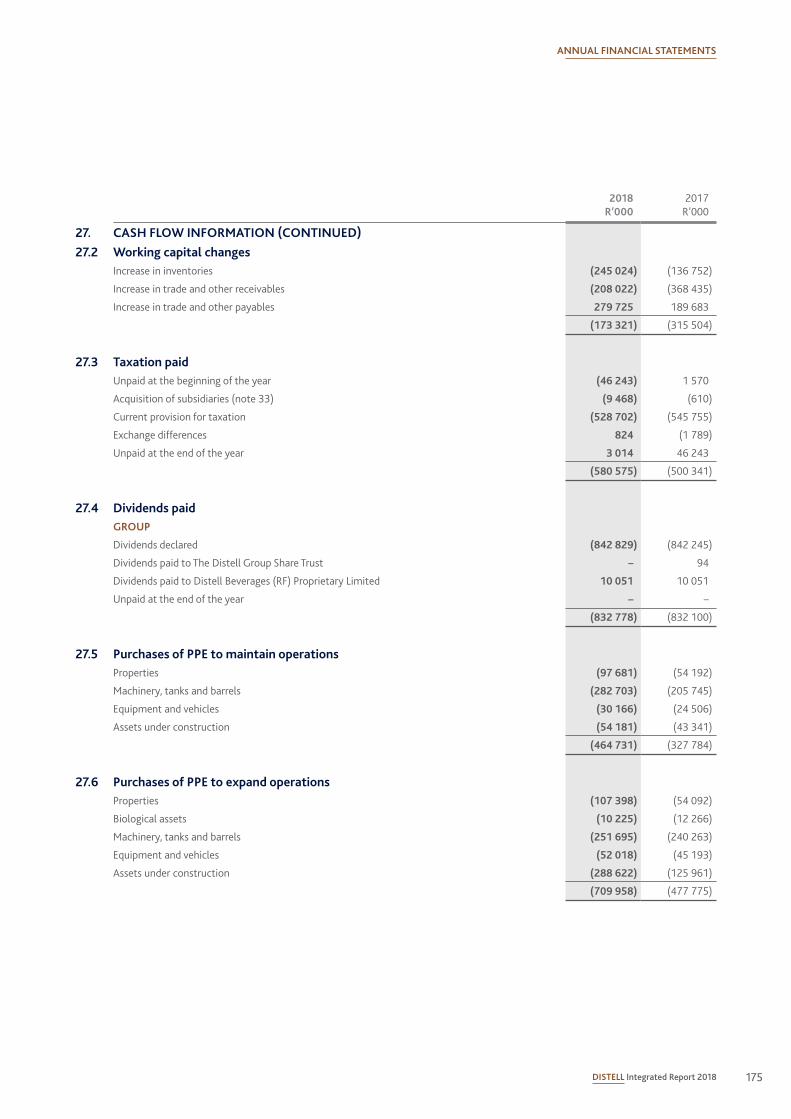
2018R’000
2017R’000
27. CASH FLOW INFORMATION (CONTINUED)27.2 Working capital changes
Increase in inventories (245 024) (136 752)
Increase in trade and other receivables (208 022) (368 435)
Increase in trade and other payables 279 725 189 683
(173 321) (315 504)
27.3 Taxation paidUnpaid at the beginning of the year (46 243) 1 570
Acquisition of subsidiaries (note 33) (9 468) (610)
Current provision for taxation (528 702) (545 755)
Exchange differences 824 (1 789)
Unpaid at the end of the year 3 014 46 243
(580 575) (500 341)
27.4 Dividends paidGROUP
Dividends declared (842 829) (842 245)
Dividends paid to The Distell Group Share Trust – 94
Dividends paid to Distell Beverages (RF) Proprietary Limited 10 051 10 051
Unpaid at the end of the year – –
(832 778) (832 100)
27.5 Purchases of PPE to maintain operationsProperties (97 681) (54 192)
Machinery, tanks and barrels (282 703) (205 745)
Equipment and vehicles (30 166) (24 506)
Assets under construction (54 181) (43 341)
(464 731) (327 784)
27.6 Purchases of PPE to expand operationsProperties (107 398) (54 092)
Biological assets (10 225) (12 266)
Machinery, tanks and barrels (251 695) (240 263)
Equipment and vehicles (52 018) (45 193)
Assets under construction (288 622) (125 961)
(709 958) (477 775)
ANNUAL FINANCIAL STATEMENTS
175DISTELL Integrated Report 2018
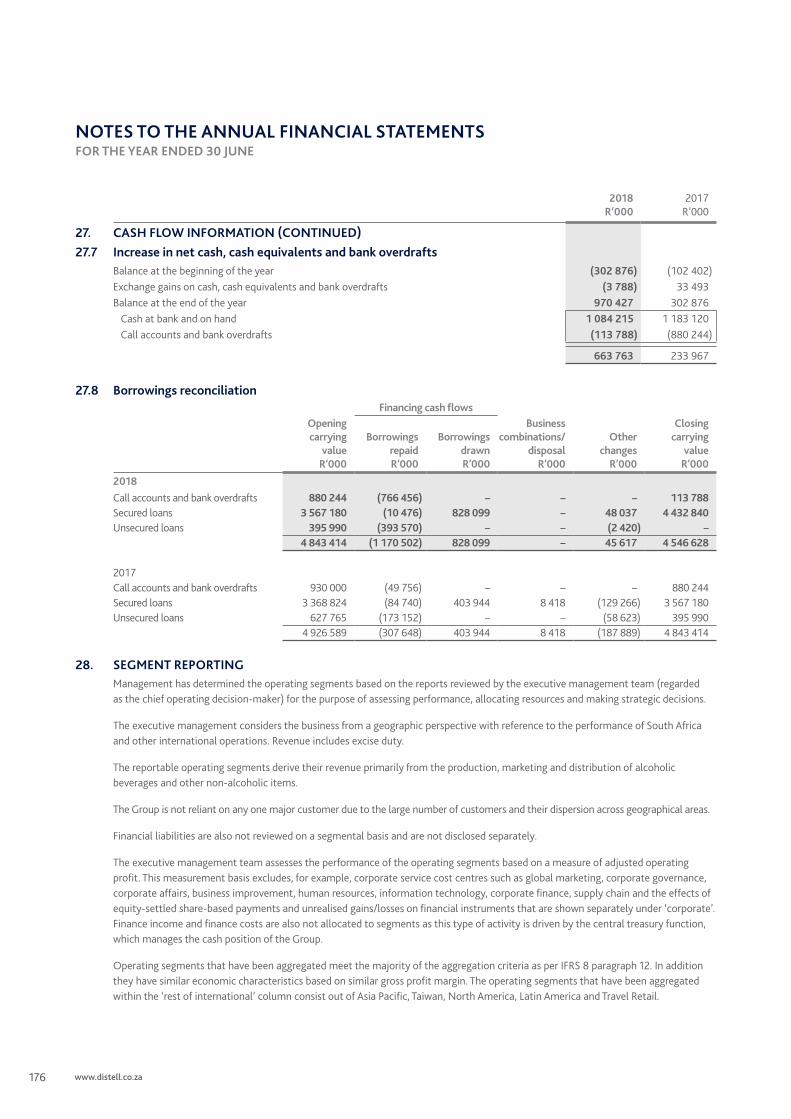
NOTES TO THE ANNUAL FINANCIAL STATEMENTSFOR THE YEAR ENDED 30 JUNE
2018R’000
2017R’000
27. CASH FLOW INFORMATION (CONTINUED)27.7 Increase in net cash, cash equivalents and bank overdrafts
Balance at the beginning of the year (302 876) (102 402)Exchange gains on cash, cash equivalents and bank overdrafts (3 788) 33 493 Balance at the end of the year 970 427 302 876
Cash at bank and on hand 1 084 215 1 183 120 Call accounts and bank overdrafts (113 788) (880 244)
663 763 233 967
27.8 Borrowings reconciliationFinancing cash flows
Opening carrying
valueR’000
Borrowings repaidR’000
Borrowings drawnR’000
Business combinations/
disposalR’000
Other changes
R’000
Closing carrying
valueR’000
2018Call accounts and bank overdrafts 880 244 (766 456) – – – 113 788 Secured loans 3 567 180 (10 476) 828 099 – 48 037 4 432 840 Unsecured loans 395 990 (393 570) – – (2 420) –
4 843 414 (1 170 502) 828 099 – 45 617 4 546 628
2017Call accounts and bank overdrafts 930 000 (49 756) – – – 880 244 Secured loans 3 368 824 (84 740) 403 944 8 418 (129 266) 3 567 180 Unsecured loans 627 765 (173 152) – – (58 623) 395 990
4 926 589 (307 648) 403 944 8 418 (187 889) 4 843 414
28. SEGMENT REPORTINGManagement has determined the operating segments based on the reports reviewed by the executive management team (regarded as the chief operating decision-maker) for the purpose of assessing performance, allocating resources and making strategic decisions.
The executive management considers the business from a geographic perspective with reference to the performance of South Africa and other international operations. Revenue includes excise duty.
The reportable operating segments derive their revenue primarily from the production, marketing and distribution of alcoholic beverages and other non-alcoholic items.
The Group is not reliant on any one major customer due to the large number of customers and their dispersion across geographical areas.
Financial liabilities are also not reviewed on a segmental basis and are not disclosed separately.
The executive management team assesses the performance of the operating segments based on a measure of adjusted operating profit. This measurement basis excludes, for example, corporate service cost centres such as global marketing, corporate governance, corporate affairs, business improvement, human resources, information technology, corporate finance, supply chain and the effects of equity-settled share-based payments and unrealised gains/losses on financial instruments that are shown separately under ‘corporate’. Finance income and finance costs are also not allocated to segments as this type of activity is driven by the central treasury function, which manages the cash position of the Group.
Operating segments that have been aggregated meet the majority of the aggregation criteria as per IFRS 8 paragraph 12. In addition they have similar economic characteristics based on similar gross profit margin. The operating segments that have been aggregated within the ‘rest of international’ column consist out of Asia Pacific, Taiwan, North America, Latin America and Travel Retail.
176 www.distell.co.za
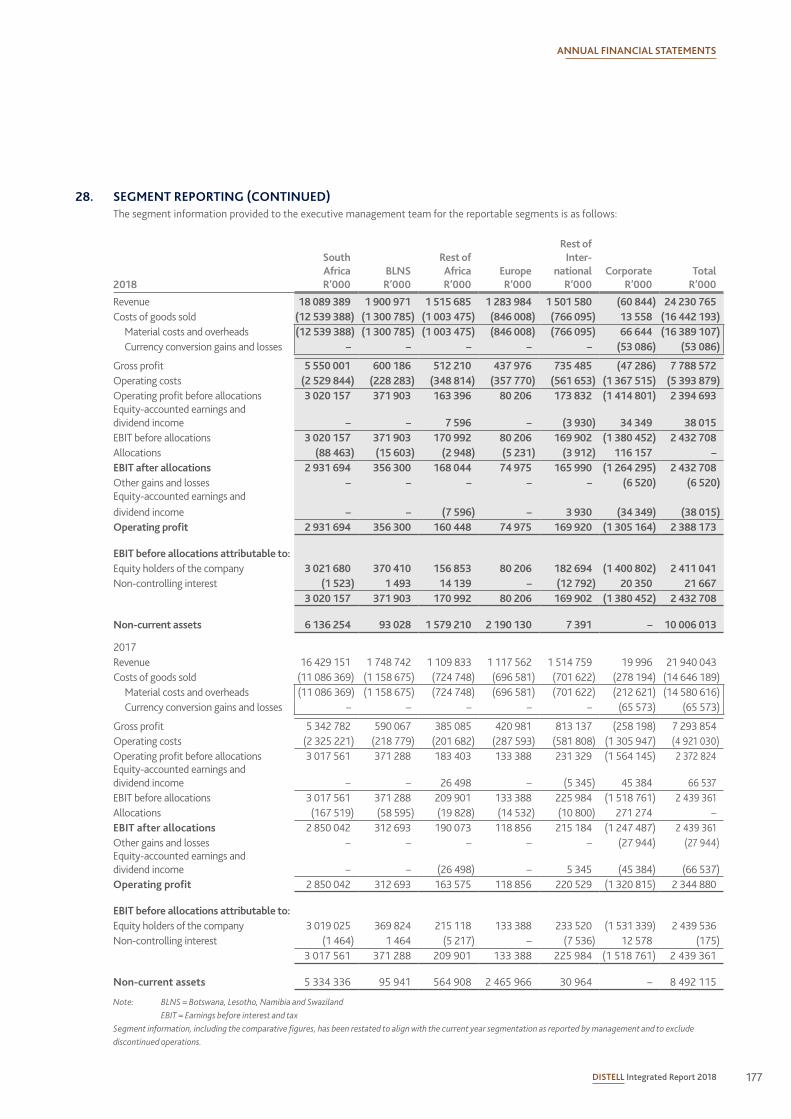
28. SEGMENT REPORTING (CONTINUED)The segment information provided to the executive management team for the reportable segments is as follows:
2018
South AfricaR’000
BLNSR’000
Rest of AfricaR’000
EuropeR’000
Rest ofInter-
nationalR’000
CorporateR’000
TotalR’000
Revenue 18 089 389 1 900 971 1 515 685 1 283 984 1 501 580 (60 844) 24 230 765 Costs of goods sold (12 539 388) (1 300 785) (1 003 475) (846 008) (766 095) 13 558 (16 442 193)
Material costs and overheads (12 539 388) (1 300 785) (1 003 475) (846 008) (766 095) 66 644 (16 389 107)Currency conversion gains and losses – – – – – (53 086) (53 086)
Gross profit 5 550 001 600 186 512 210 437 976 735 485 (47 286) 7 788 572 Operating costs (2 529 844) (228 283) (348 814) (357 770) (561 653) (1 367 515) (5 393 879)Operating profit before allocations 3 020 157 371 903 163 396 80 206 173 832 (1 414 801) 2 394 693 Equity-accounted earnings and dividend income – – 7 596 – (3 930) 34 349 38 015 EBIT before allocations 3 020 157 371 903 170 992 80 206 169 902 (1 380 452) 2 432 708 Allocations (88 463) (15 603) (2 948) (5 231) (3 912) 116 157 – EBIT after allocations 2 931 694 356 300 168 044 74 975 165 990 (1 264 295) 2 432 708 Other gains and losses – – – – – (6 520) (6 520)Equity-accounted earnings and dividend income – – (7 596) – 3 930 (34 349) (38 015)Operating profit 2 931 694 356 300 160 448 74 975 169 920 (1 305 164) 2 388 173
EBIT before allocations attributable to:Equity holders of the company 3 021 680 370 410 156 853 80 206 182 694 (1 400 802) 2 411 041 Non-controlling interest (1 523) 1 493 14 139 – (12 792) 20 350 21 667
3 020 157 371 903 170 992 80 206 169 902 (1 380 452) 2 432 708
Non-current assets 6 136 254 93 028 1 579 210 2 190 130 7 391 – 10 006 013
2017Revenue 16 429 151 1 748 742 1 109 833 1 117 562 1 514 759 19 996 21 940 043 Costs of goods sold (11 086 369) (1 158 675) (724 748) (696 581) (701 622) (278 194) (14 646 189)
Material costs and overheads (11 086 369) (1 158 675) (724 748) (696 581) (701 622) (212 621) (14 580 616)Currency conversion gains and losses – – – – – (65 573) (65 573)
Gross profit 5 342 782 590 067 385 085 420 981 813 137 (258 198) 7 293 854 Operating costs (2 325 221) (218 779) (201 682) (287 593) (581 808) (1 305 947) (4 921 030)Operating profit before allocations 3 017 561 371 288 183 403 133 388 231 329 (1 564 145) 2 372 824Equity-accounted earnings and dividend income – – 26 498 – (5 345) 45 384 66 537EBIT before allocations 3 017 561 371 288 209 901 133 388 225 984 (1 518 761) 2 439 361 Allocations (167 519) (58 595) (19 828) (14 532) (10 800) 271 274 – EBIT after allocations 2 850 042 312 693 190 073 118 856 215 184 (1 247 487) 2 439 361 Other gains and losses – – – – – (27 944) (27 944)Equity-accounted earnings and dividend income – – (26 498) – 5 345 (45 384) (66 537)Operating profit 2 850 042 312 693 163 575 118 856 220 529 (1 320 815) 2 344 880
EBIT before allocations attributable to:Equity holders of the company 3 019 025 369 824 215 118 133 388 233 520 (1 531 339) 2 439 536 Non-controlling interest (1 464) 1 464 (5 217) – (7 536) 12 578 (175)
3 017 561 371 288 209 901 133 388 225 984 (1 518 761) 2 439 361
Non-current assets 5 334 336 95 941 564 908 2 465 966 30 964 – 8 492 115
Note: BLNS = Botswana, Lesotho, Namibia and Swaziland EBIT = Earnings before interest and taxSegment information, including the comparative figures, has been restated to align with the current year segmentation as reported by management and to exclude discontinued operations.
ANNUAL FINANCIAL STATEMENTS
177DISTELL Integrated Report 2018
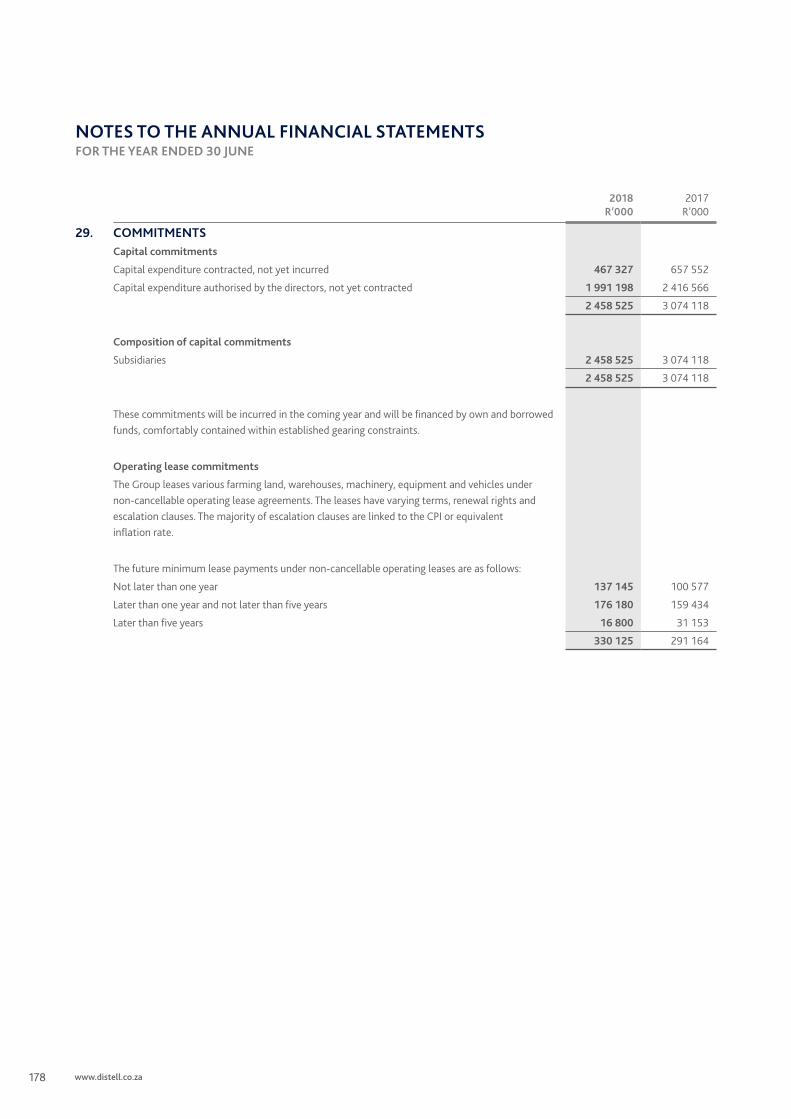
NOTES TO THE ANNUAL FINANCIAL STATEMENTSFOR THE YEAR ENDED 30 JUNE
2018R’000
2017R’000
29. COMMITMENTSCapital commitments
Capital expenditure contracted, not yet incurred 467 327 657 552
Capital expenditure authorised by the directors, not yet contracted 1 991 198 2 416 566
2 458 525 3 074 118
Composition of capital commitments
Subsidiaries 2 458 525 3 074 118
2 458 525 3 074 118
These commitments will be incurred in the coming year and will be financed by own and borrowed funds, comfortably contained within established gearing constraints.
Operating lease commitments
The Group leases various farming land, warehouses, machinery, equipment and vehicles under non-cancellable operating lease agreements. The leases have varying terms, renewal rights and escalation clauses. The majority of escalation clauses are linked to the CPI or equivalent inflation rate.
The future minimum lease payments under non-cancellable operating leases are as follows:
Not later than one year 137 145 100 577
Later than one year and not later than five years 176 180 159 434
Later than five years 16 800 31 153
330 125 291 164
178 www.distell.co.za
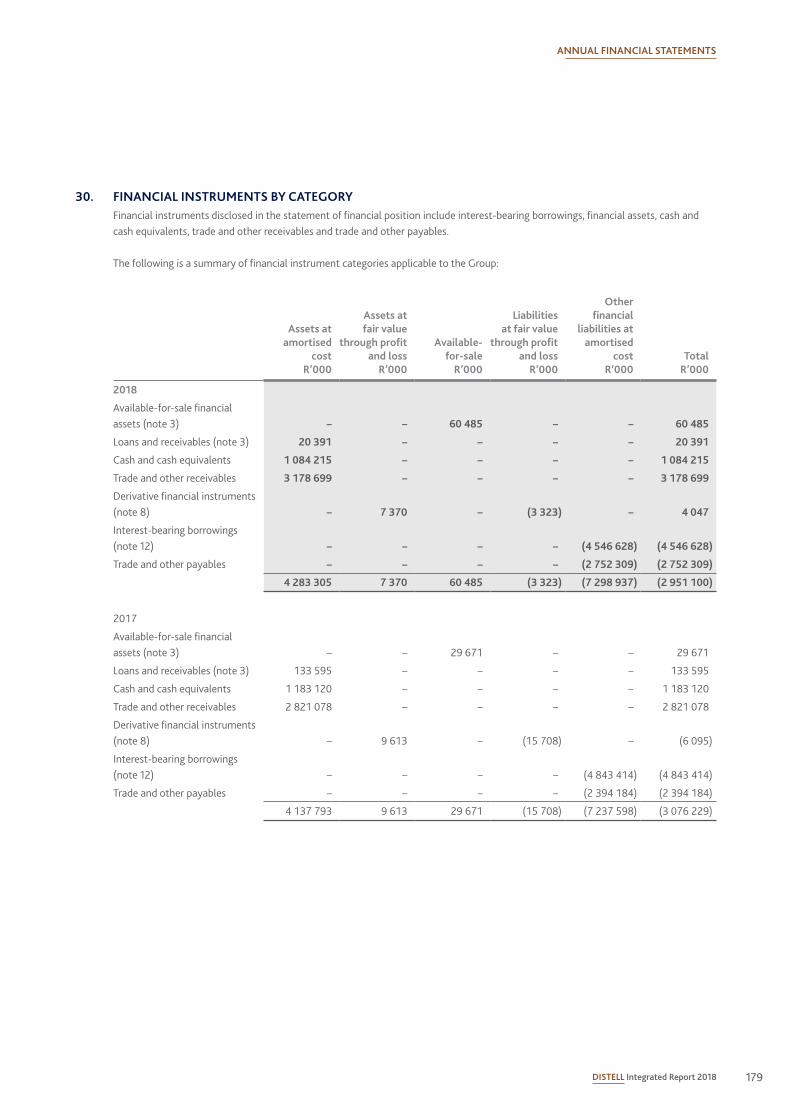
30. FINANCIAL INSTRUMENTS BY CATEGORYFinancial instruments disclosed in the statement of financial position include interest-bearing borrowings, financial assets, cash and cash equivalents, trade and other receivables and trade and other payables.
The following is a summary of financial instrument categories applicable to the Group:
Assets atamortised
costR’000
Assets at fair value
through profit and loss
R’000
Available-for-sale
R’000
Liabilitiesat fair value
through profitand loss
R’000
Other financial
liabilities atamortised
costR’000
TotalR’000
2018
Available-for-sale financial assets (note 3) – – 60 485 – – 60 485
Loans and receivables (note 3) 20 391 – – – – 20 391
Cash and cash equivalents 1 084 215 – – – – 1 084 215
Trade and other receivables 3 178 699 – – – – 3 178 699
Derivative financial instruments (note 8) – 7 370 – (3 323) – 4 047
Interest-bearing borrowings (note 12) – – – – (4 546 628) (4 546 628)
Trade and other payables – – – – (2 752 309) (2 752 309)
4 283 305 7 370 60 485 (3 323) (7 298 937) (2 951 100)
2017
Available-for-sale financial assets (note 3) – – 29 671 – – 29 671
Loans and receivables (note 3) 133 595 – – – – 133 595
Cash and cash equivalents 1 183 120 – – – – 1 183 120
Trade and other receivables 2 821 078 – – – – 2 821 078
Derivative financial instruments (note 8) – 9 613 – (15 708) – (6 095)
Interest-bearing borrowings (note 12) – – – – (4 843 414) (4 843 414)
Trade and other payables – – – – (2 394 184) (2 394 184)
4 137 793 9 613 29 671 (15 708) (7 237 598) (3 076 229)
ANNUAL FINANCIAL STATEMENTS
179DISTELL Integrated Report 2018
NOTES TO THE ANNUAL FINANCIAL STATEMENTSFOR THE YEAR ENDED 30 JUNE
31. FINANCIAL RISK MANAGEMENT31.1 Financial risk factors
The board of directors oversees the adequacy and functioning of the entire system of risk management and internal control, assisted by management. Group internal audit provides independent assurance on the entire risk management and internal control system. Regional and subsidiary company management are responsible for managing performance, underlying risks and effectiveness of operations, within the rules set by the board, supported and supervised by Group departments. The audit and risk committees review the internal control environment and risk management systems within the Group and report their activities to the board. The board members receive reports on treasury activities, including confirmation of compliance with treasury risk management policies.
The Group’s activities expose it to a variety of financial risks: market risk (including interest rate risk and foreign currency risk), credit risk and liquidity risk. The board approves prudent treasury policies for managing each of the risks summarised below.
The Group’s corporate treasury department is responsible for controlling and reducing exposure to interest rate, liquidity and currency transaction risks. Senior executives and advisers meet on a regular basis to analyse currency and interest rate exposures and re-evaluate treasury management strategies against revised economic forecasts. Group policies, covering specific areas such as foreign exchange risk, interest rate risk, credit risks, use of derivative financial instruments and non-derivative financial instruments, and investment of excess liquidity, are reviewed annually by the board. The Group, through its training and management standards and procedures, aims to develop a disciplined and constructive control environment in which all employees understand their roles and responsibilities. The Group treasury department does not undertake speculative financial transactions.
31.1(a) Market riskThe Group’s activities expose it primarily to the financial risks of changes in foreign currency exchange rates and interest rates. The Group is not materially exposed to equity price risk on investments held and classified in the consolidated statement of financial position as available-for-sale.
(i) Foreign currency risk managementThe Group operates internationally and has transactional currency exposures, which principally arise from commercial transactions, recognised assets and liabilities and investment in foreign operations. In order to manage this risk the Group may enter into transactions in terms of approved policies and limits which make use of financial instruments that include forward foreign exchange contracts. Foreign subsidiaries do not have material transactional currency exposures as they mainly operate in their functional currencies.
The Group does not speculate or engage in the trading of financial instruments.
The Group is primarily exposed to the currencies of the US dollar, euro and UK pound. If the rand had weakened/strengthened by 10% against the USD on 30 June 2018, with all other variables remaining constant, the post-tax profit for the year would have been R16,8 million (2017: R17,8 million) lower/higher, mainly as a result of translating outstanding foreign currency denominated monetary items.
Had the rand at 30 June 2018 weakened/strengthened by 10% against the euro, with all other variables remaining constant, the post-tax profit for the year would have been R12,1 million (2017: R29,4 million) lower/higher.
Similarly, had the rand at 30 June 2018 weakened/strengthened by 10% against the UK pound, with all other variables remaining constant, the post-tax profit for the year would have been R9,3 million (2017: R1,2 million) lower/higher.
180 www.distell.co.za
31. FINANCIAL RISK MANAGEMENT (CONTINUED)31.1 Financial risk factors (continued)31.1(a) Market risk (continued)
(ii) Price risk management The Group is exposed to equity securities price risk because of investments held by the Group and classified as available-for-sale in the consolidated statement of financial position. The Group is not materially exposed to commodity price risk. To manage the price risk the Group diversifies its portfolio.
(iii) Interest rate risk managementThe Group’s interest rate risk arises from long-term borrowings and cash. Borrowings at variable interest rates expose the Group to cash flow interest rate risk, while fixed rate borrowings expose the Group to fair value interest rate risk.
The Group is exposed to interest rate risk arising from the repricing of forward cover and floating rate debt as well as incremental funding/new borrowings and the rollover of maturing debt/refinancing of existing borrowings.
The management of the actual debt and investment portfolios is done by adjusting the repricing and maturity profiles of the debt and/or investment portfolios from time to time, relative to that of the benchmark portfolios as well as using derivative instruments to alter the repricing profiles of the actual portfolios relative to the benchmark portfolios.
As at 30 June 2018, if the floating interest rates had been 100 basis points higher/lower and all other variables held constant, the Group’s post-tax profit for the year would have increased/decreased as a result of interest received/paid on cash and cash equivalents and borrowings by R32,0 million (2017: R26,9 million).
The other financial instruments in the Group’s statement of financial position are not exposed to interest rate risk.
31.1(b) Credit risk managementPotential concentrations of credit risk principally exist for trade and other receivables, cash and cash equivalents and derivative financial instruments. The Group only deposits cash with banks with high credit ratings. Trade receivables comprise a large, widespread customer base and the Group performs ongoing credit evaluations of the financial strength of these customers. The type of customers range from wholesalers and distributors to smaller retailers. The granting of credit is controlled by means of a robust application process and the credit limits assigned to each individual customer are reviewed and updated on an ongoing basis taking into consideration its financial position, past experience and other factors. The Group does not have any significant credit risk exposure to any single counterparty or any group of counterparties having similar characteristics.
At year-end the Group’s cash was invested with financial institutions that have been awarded the following Moody’s short-term credit rating:
2018R’000
2017R’000
P-1 1 082 981 1 181 639
P-2 – 246
Cash 1 234 1 235
1 084 215 1 183 120
ANNUAL FINANCIAL STATEMENTS
181DISTELL Integrated Report 2018
NOTES TO THE ANNUAL FINANCIAL STATEMENTSFOR THE YEAR ENDED 30 JUNE
31. FINANCIAL RISK MANAGEMENT (CONTINUED)31.1 Financial risk factors (continued)31.1(b) Credit risk management (continued)
The Group is exposed to credit-related losses in the event of non-performance by counterparties relating to derivative financial instruments. The counterparties to these contracts are major financial institutions. The Group continually monitors its positions and the credit ratings of its counterparties and limits the extent to which it enters into contracts with any one party.
The carrying amount of the financial assets recorded in the financial statements, which is net of impaired losses, represents the Group’s maximum exposure to credit risk.
The Group is also exposed to credit-related losses in the event of non-performance by counterparties to financial guarantee contracts relating to vineyard development loans to certain farmers of R31,8 million (2017: R29,4 million) and staff housing loans of R3,8 million (2017: R2,5 million). The guarantees relating to vineyard development loans are secured by mortgage bonds over farming property with a market value in excess of the loan obligations. The Group continually monitors its positions and limits its exposure with any one party.
At 30 June 2018 the Group did not consider there to be a significant concentration of credit risk which had not been adequately provided for.
31.1(c) Liquidity risk managementThe Group manages liquidity risk through the compilation and monitoring of cash flow forecasts, as well as ensuring that adequate borrowing facilities are maintained. Refer to note 12 regarding the Group’s unutilised banking facilities and reserve borrowing capacities. Banking facilities are renewed annually and are subject to review at various dates during the next year.
The table below analyses the Group’s financial liabilities and derivative financial instruments which will be settled on a gross basis into relevant maturity groupings based on the remaining period at the statement of financial position date to contract maturity date. The amounts disclosed in the table are the contracted undiscounted cash flows. Balances due within 12 months equal their carrying balances as the impact of discounting is not significant.
0 – 12 months
R’000
1 – 2years
R’000
3 – 5years
R’000
Beyond 5 years
R’000
2018Total
R’000
2017Total
R’000
Financial liabilities
Forward exchange contracts held for trading
– Outflow 91 357 – – – 91 357 899 940
– Inflow 90 010 – – – 90 010 899 162
Trade and other payables 2 752 833 – – – 2 752 833 2 399 501
Financial guarantees 35 573 – – – 35 573 31 909
Interest-bearing borrowings 425 499 1 417 362 3 470 886 – 5 313 747 5 684 785
182 www.distell.co.za
31. FINANCIAL RISK MANAGEMENT (CONTINUED)31.2 Fair value estimation
The table below analyses assets and liabilities carried at fair value, by valuation method. The different levels have been defined as follows:
Level 1: Quoted prices (unadjusted) in active markets for identical assets or liabilities
Level 2: Inputs other than quoted prices included within level 1 that are observable for the asset or liability, either directly (that is, as prices) or indirectly (that is, derived from prices) Level 3: Inputs for the asset or liability that are not based on observable market data (that is, unobservable inputs)
Specific valuation techniques used to value these assets and liabilities include:Cash and cash equivalents, trade and other receivables and loans: The carrying amounts reported in the statement of financial position approximate fair values due to the short-term maturities of these amounts.
Available-for-sale financial assets: The fair value is based on quoted bid prices at the statement of financial position date. The fair value of financial instruments that are not trading in an active market is determined by using various valuation techniques. These valuation techniques maximise the use of observable market data where it is available and rely as little as possible on entity-specific estimates. If all significant inputs required to fair value an instrument are observable, the instrument is included in level 2. If one or more of the significant inputs is not based on observable market data, the instrument would be included in level 3. Several valuation techniques are used including discounted cash flow analysis for level 2 and 3 financial assets.
Forward foreign exchange contracts: Forward foreign exchange contracts are entered into to cover import orders and export proceeds, and fair values are determined using foreign exchange bid or offer rates at year-end as the significant inputs in the valuation.
If one or more of the significant inputs is not based on observable market data, the instrument is included in level 3.
The following table presents the Group’s assets and liabilities that are measured at fair value at 30 June:
Level 1 R’000
Level 2R’000
Level 3R’000
TotalR’000
2018
Available-for-sale financial assets 3 741 16 212 40 532 60 485
Derivative financial assets – 7 370 – 7 370
Derivative financial liabilities – (3 323) – (3 323)
3 741 20 259 40 532 64 532
2017
Available-for-sale financial assets 3 667 11 891 14 113 29 671
Derivative financial assets – 9 613 – 9 613
Derivative financial liabilities – (15 708) – (15 708)
3 667 5 796 14 113 23 576
There were no transfers between level 1 and level 2 during the year.
ANNUAL FINANCIAL STATEMENTS
183DISTELL Integrated Report 2018
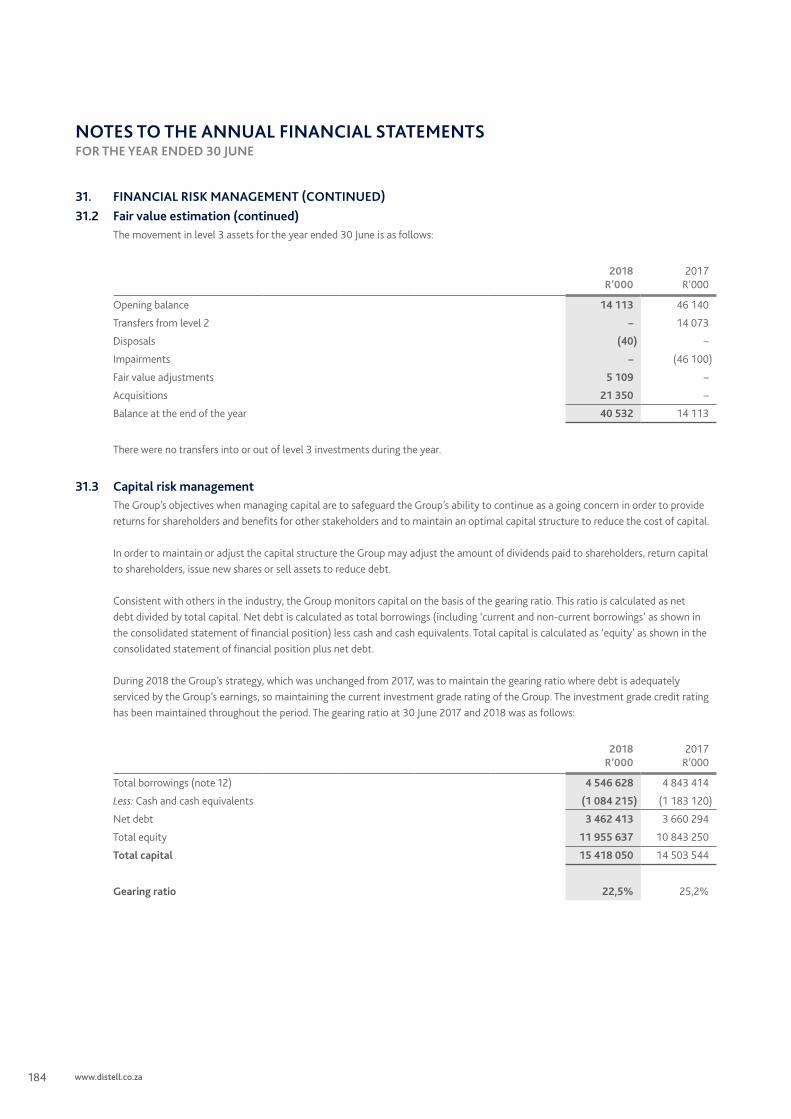
NOTES TO THE ANNUAL FINANCIAL STATEMENTSFOR THE YEAR ENDED 30 JUNE
31. FINANCIAL RISK MANAGEMENT (CONTINUED)31.2 Fair value estimation (continued)
The movement in level 3 assets for the year ended 30 June is as follows:
2018R’000
2017R’000
Opening balance 14 113 46 140
Transfers from level 2 – 14 073
Disposals (40) –
Impairments – (46 100)
Fair value adjustments 5 109 –
Acquisitions 21 350 –
Balance at the end of the year 40 532 14 113
There were no transfers into or out of level 3 investments during the year.
31.3 Capital risk managementThe Group’s objectives when managing capital are to safeguard the Group’s ability to continue as a going concern in order to provide returns for shareholders and benefits for other stakeholders and to maintain an optimal capital structure to reduce the cost of capital.
In order to maintain or adjust the capital structure the Group may adjust the amount of dividends paid to shareholders, return capital to shareholders, issue new shares or sell assets to reduce debt.
Consistent with others in the industry, the Group monitors capital on the basis of the gearing ratio. This ratio is calculated as net debt divided by total capital. Net debt is calculated as total borrowings (including ‘current and non-current borrowings’ as shown in the consolidated statement of financial position) less cash and cash equivalents. Total capital is calculated as ‘equity’ as shown in the consolidated statement of financial position plus net debt.
During 2018 the Group’s strategy, which was unchanged from 2017, was to maintain the gearing ratio where debt is adequately serviced by the Group’s earnings, so maintaining the current investment grade rating of the Group. The investment grade credit rating has been maintained throughout the period. The gearing ratio at 30 June 2017 and 2018 was as follows:
2018R’000
2017R’000
Total borrowings (note 12) 4 546 628 4 843 414
Less: Cash and cash equivalents (1 084 215) (1 183 120)
Net debt 3 462 413 3 660 294
Total equity 11 955 637 10 843 250
Total capital 15 418 050 14 503 544
Gearing ratio 22,5% 25,2%
184 www.distell.co.za
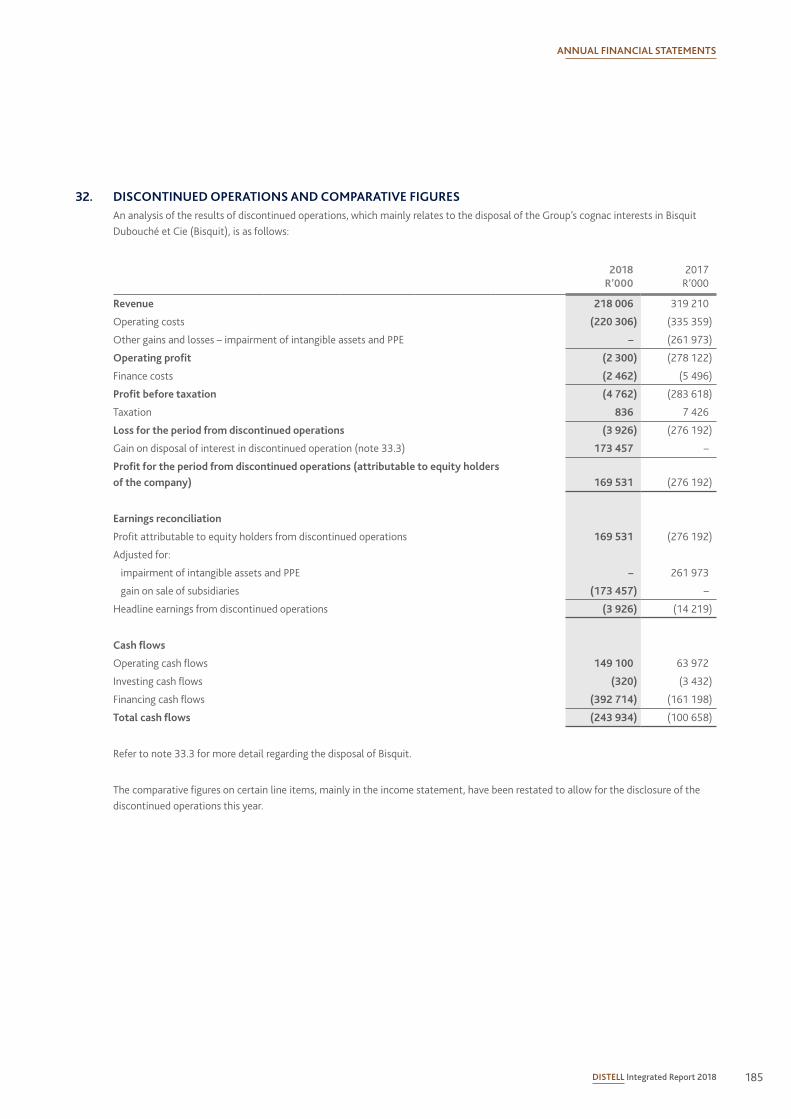
32. DISCONTINUED OPERATIONS AND COMPARATIVE FIGURESAn analysis of the results of discontinued operations, which mainly relates to the disposal of the Group’s cognac interests in Bisquit Dubouché et Cie (Bisquit), is as follows:
2018R’000
2017R’000
Revenue 218 006 319 210
Operating costs (220 306) (335 359)
Other gains and losses – impairment of intangible assets and PPE – (261 973)
Operating profit (2 300) (278 122)
Finance costs (2 462) (5 496)
Profit before taxation (4 762) (283 618)
Taxation 836 7 426
Loss for the period from discontinued operations (3 926) (276 192)
Gain on disposal of interest in discontinued operation (note 33.3) 173 457 –
Profit for the period from discontinued operations (attributable to equity holders of the company) 169 531 (276 192)
Earnings reconciliation
Profit attributable to equity holders from discontinued operations 169 531 (276 192)
Adjusted for:
impairment of intangible assets and PPE – 261 973
gain on sale of subsidiaries (173 457) –
Headline earnings from discontinued operations (3 926) (14 219)
Cash flows
Operating cash flows 149 100 63 972
Investing cash flows (320) (3 432)
Financing cash flows (392 714) (161 198)
Total cash flows (243 934) (100 658)
Refer to note 33.3 for more detail regarding the disposal of Bisquit.
The comparative figures on certain line items, mainly in the income statement, have been restated to allow for the disclosure of the discontinued operations this year.
ANNUAL FINANCIAL STATEMENTS
185DISTELL Integrated Report 2018
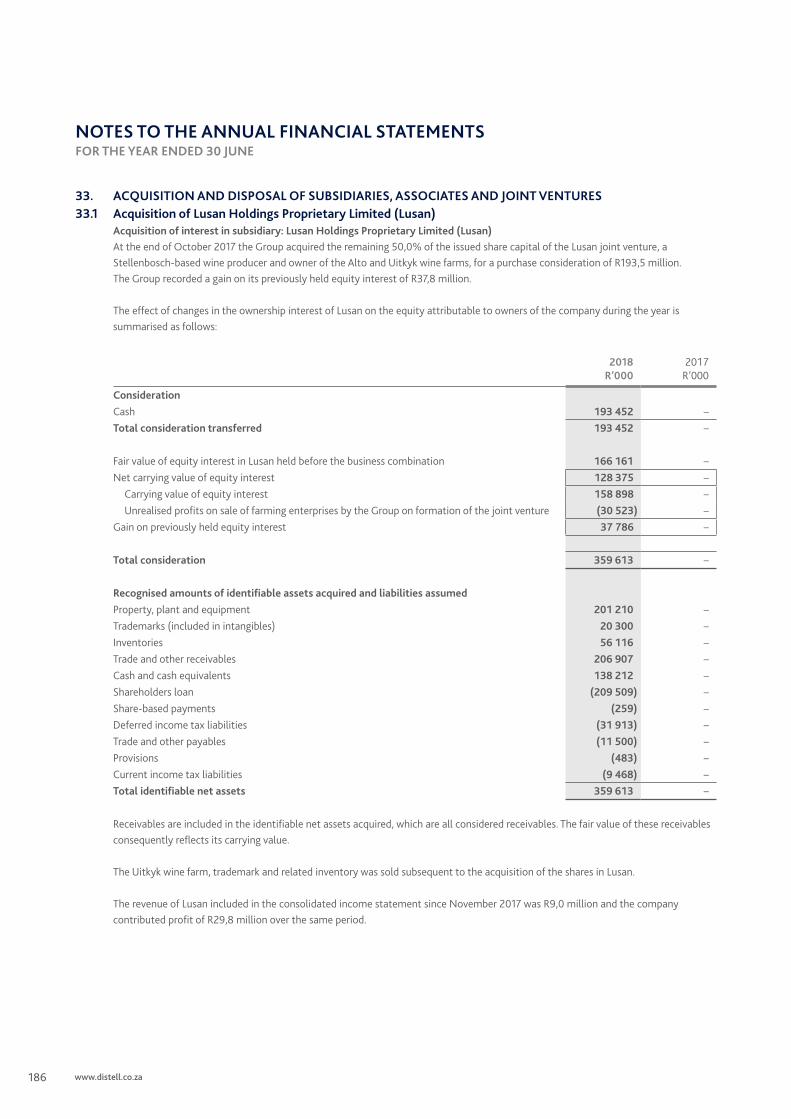
NOTES TO THE ANNUAL FINANCIAL STATEMENTSFOR THE YEAR ENDED 30 JUNE
33. ACQUISITION AND DISPOSAL OF SUBSIDIARIES, ASSOCIATES AND JOINT VENTURES33.1 Acquisition of Lusan Holdings Proprietary Limited (Lusan)
Acquisition of interest in subsidiary: Lusan Holdings Proprietary Limited (Lusan)At the end of October 2017 the Group acquired the remaining 50,0% of the issued share capital of the Lusan joint venture, a Stellenbosch-based wine producer and owner of the Alto and Uitkyk wine farms, for a purchase consideration of R193,5 million. The Group recorded a gain on its previously held equity interest of R37,8 million.
The effect of changes in the ownership interest of Lusan on the equity attributable to owners of the company during the year is summarised as follows:
2018R’000
2017R’000
ConsiderationCash 193 452 – Total consideration transferred 193 452 –
Fair value of equity interest in Lusan held before the business combination 166 161 – Net carrying value of equity interest 128 375 –
Carrying value of equity interest 158 898 –Unrealised profits on sale of farming enterprises by the Group on formation of the joint venture (30 523) –
Gain on previously held equity interest 37 786 –
Total consideration 359 613 –
Recognised amounts of identifiable assets acquired and liabilities assumedProperty, plant and equipment 201 210 – Trademarks (included in intangibles) 20 300 – Inventories 56 116 – Trade and other receivables 206 907 – Cash and cash equivalents 138 212 – Shareholders loan (209 509) – Share-based payments (259) – Deferred income tax liabilities (31 913) – Trade and other payables (11 500) – Provisions (483) –Current income tax liabilities (9 468) – Total identifiable net assets 359 613 –
Receivables are included in the identifiable net assets acquired, which are all considered receivables. The fair value of these receivables consequently reflects its carrying value.
The Uitkyk wine farm, trademark and related inventory was sold subsequent to the acquisition of the shares in Lusan.
The revenue of Lusan included in the consolidated income statement since November 2017 was R9,0 million and the company contributed profit of R29,8 million over the same period.
186 www.distell.co.za
33. ACQUISITION AND DISPOSAL OF SUBSIDIARIES, ASSOCIATES AND JOINT VENTURES (CONTINUED)33.2 Acquisition of 26% interest in Best Global Brands Limited (BGB)
Acquisition of 26% interest in associate: Best Global Brands Limited (BGB)In July 2017 the Group acquired 26% of the ordinary shares for USD54,6 million. The payment of the upfront purchase consideration is subject to a clawback or top-up once closing accounts have been finalised and the net debt and working capital of BGB at closing have been confirmed. A further deferred purchase consideration payment of USD15,2 million is due should BGB’s Angolan operations obtain an import duty waiver on the importation of raw materials into Angola within a period of 12 months from closing.
The Group has also entered into an agreement to acquire the remaining 74,0% of the ordinary shares of BGB, which will become effective no earlier than the end of 2019 once certain operating hurdles are achieved and conditions precedent to closing are fulfilled or waived. The purchase consideration will be determined based on a 9,3x multiple of BGB’s last 12 months’ after-tax operating performance. The operating hurdles will be measured every six months from 30 June 2019 to 30 June 2022 against agreed upon criteria in relation to inter alia i) volumes delivered by the Angola operations ii) externalisation of cash remittances from the Angola operations to other Group companies and iii) minimum Group profitability margins being achieved. The hurdles have been put in place for the benefit of both Distell and the sellers to ensure that the business is operating on a normalised and sustainable basis when the additional 74,0% is acquired. Distell has not attributed any value to the derivative to acquire the remaining 74,0% of BGB as the current currency restrictions and impact of a devaluing and volatile Angolan currency negatively impacts the achievement of the operating hurdles.
BGB is the holding company of a group of companies which own, manufacture and distribute the fast-growing mainstream ‘Best’ spirit brand in countries throughout Africa. The Best brand achieved volumes of nearly 30 million litres for the reporting period ending 30 June 2018 with Best whisky and Best cream comprising the largest proportion of those volumes. Best is the market leader in the mainstream spirits category in Angola and has a strong and growing presence in Nigeria, Kenya and Zambia.
BGB is a newly established group following a restructuring of the business. BGB’s profit after tax for the period ended 30 June 2018 was USD8,9 million, with the results materially impacted by foreign exchange losses incurred in its Angolan operations following the devaluation of the Angolan kwanza. BGB’s net asset value at closing was about USD18,9 million, it being noted that tangible and intangible assets were not fair valued when BGB was constituted.
The acquisition of the strategic interest in BGB will enable Distell to advance its strategy of becoming the leading wine, spirits and RTD company across Africa.
− BGB is a well-established pan-African brand founded in 1998 and is the leading mainstream spirits brand in both whisky and cream in Angola and is the leading mainstream cream spirits brand in Nigeria. The brand is experiencing strong growth in various other African countries most notably Kenya and Zambia.
− BGB’s market leading positions in Angola and Nigeria are underpinned by strong and established route-to-market capabilities in these countries.
− BGB operates modern state of the art production facilities in Angola and Nigeria which provide a competitive advantage in both cost of production and speed to market.
− BGB is a profitable and cash-generative group and the acquisition will step-change Distell’s African division by providing scale and efficiency in the spirits category.
BGB and Distell expect the transaction to generate significant synergies in the short to medium term, especially in procurement, route-to-market and production, which will unlock further value for both parties.
The acquisition is expected to be accretive to Distell’s headline earnings per share over the medium term.
ANNUAL FINANCIAL STATEMENTS
187DISTELL Integrated Report 2018
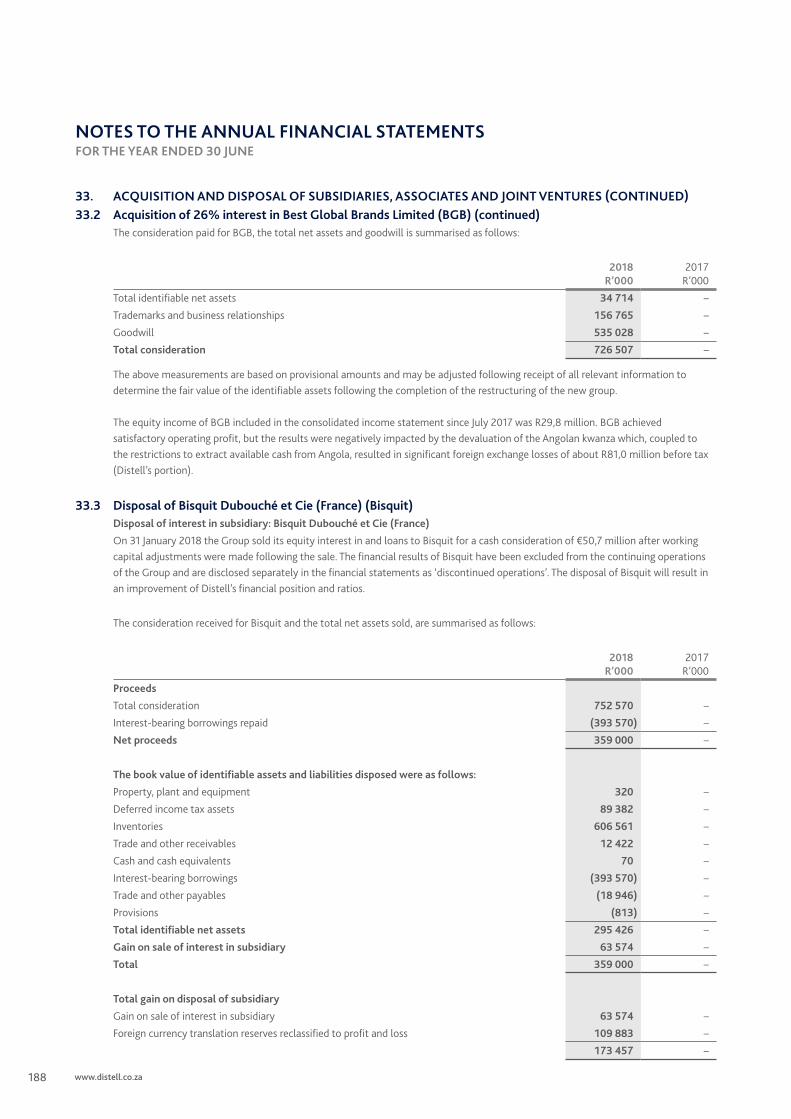
NOTES TO THE ANNUAL FINANCIAL STATEMENTSFOR THE YEAR ENDED 30 JUNE
33. ACQUISITION AND DISPOSAL OF SUBSIDIARIES, ASSOCIATES AND JOINT VENTURES (CONTINUED)33.2 Acquisition of 26% interest in Best Global Brands Limited (BGB) (continued)
The consideration paid for BGB, the total net assets and goodwill is summarised as follows:
2018R’000
2017R’000
Total identifiable net assets 34 714 –
Trademarks and business relationships 156 765 –
Goodwill 535 028 –
Total consideration 726 507 –
The above measurements are based on provisional amounts and may be adjusted following receipt of all relevant information to determine the fair value of the identifiable assets following the completion of the restructuring of the new group.
The equity income of BGB included in the consolidated income statement since July 2017 was R29,8 million. BGB achieved satisfactory operating profit, but the results were negatively impacted by the devaluation of the Angolan kwanza which, coupled to the restrictions to extract available cash from Angola, resulted in significant foreign exchange losses of about R81,0 million before tax (Distell’s portion).
33.3 Disposal of Bisquit Dubouché et Cie (France) (Bisquit)Disposal of interest in subsidiary: Bisquit Dubouché et Cie (France)
On 31 January 2018 the Group sold its equity interest in and loans to Bisquit for a cash consideration of €50,7 million after working capital adjustments were made following the sale. The financial results of Bisquit have been excluded from the continuing operations of the Group and are disclosed separately in the financial statements as ‘discontinued operations’. The disposal of Bisquit will result in an improvement of Distell’s financial position and ratios.
The consideration received for Bisquit and the total net assets sold, are summarised as follows:
2018R’000
2017R’000
Proceeds
Total consideration 752 570 –
Interest-bearing borrowings repaid (393 570) –
Net proceeds 359 000 –
The book value of identifiable assets and liabilities disposed were as follows:
Property, plant and equipment 320 –
Deferred income tax assets 89 382 –
Inventories 606 561 –
Trade and other receivables 12 422 –
Cash and cash equivalents 70 –
Interest-bearing borrowings (393 570) –
Trade and other payables (18 946) –
Provisions (813) –
Total identifiable net assets 295 426 –
Gain on sale of interest in subsidiary 63 574 –
Total 359 000 –
Total gain on disposal of subsidiary
Gain on sale of interest in subsidiary 63 574 –
Foreign currency translation reserves reclassified to profit and loss 109 883 –
173 457 –
188 www.distell.co.za
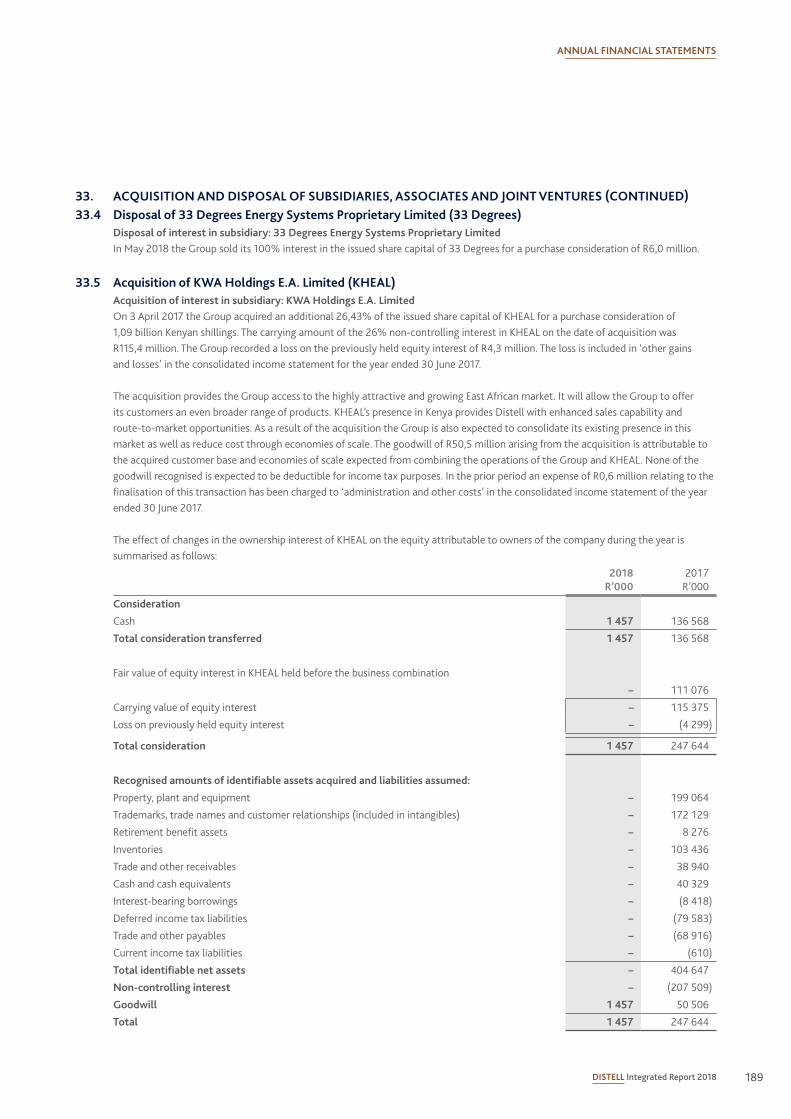
33. ACQUISITION AND DISPOSAL OF SUBSIDIARIES, ASSOCIATES AND JOINT VENTURES (CONTINUED)33.4 Disposal of 33 Degrees Energy Systems Proprietary Limited (33 Degrees)
Disposal of interest in subsidiary: 33 Degrees Energy Systems Proprietary LimitedIn May 2018 the Group sold its 100% interest in the issued share capital of 33 Degrees for a purchase consideration of R6,0 million.
33.5 Acquisition of KWA Holdings E.A. Limited (KHEAL)Acquisition of interest in subsidiary: KWA Holdings E.A. LimitedOn 3 April 2017 the Group acquired an additional 26,43% of the issued share capital of KHEAL for a purchase consideration of 1,09 billion Kenyan shillings. The carrying amount of the 26% non-controlling interest in KHEAL on the date of acquisition was R115,4 million. The Group recorded a loss on the previously held equity interest of R4,3 million. The loss is included in ‘other gains and losses’ in the consolidated income statement for the year ended 30 June 2017.
The acquisition provides the Group access to the highly attractive and growing East African market. It will allow the Group to offer its customers an even broader range of products. KHEAL’s presence in Kenya provides Distell with enhanced sales capability and route-to-market opportunities. As a result of the acquisition the Group is also expected to consolidate its existing presence in this market as well as reduce cost through economies of scale. The goodwill of R50,5 million arising from the acquisition is attributable to the acquired customer base and economies of scale expected from combining the operations of the Group and KHEAL. None of the goodwill recognised is expected to be deductible for income tax purposes. In the prior period an expense of R0,6 million relating to the finalisation of this transaction has been charged to ‘administration and other costs’ in the consolidated income statement of the year ended 30 June 2017.
The effect of changes in the ownership interest of KHEAL on the equity attributable to owners of the company during the year is summarised as follows:
2018R’000
2017R’000
Consideration
Cash 1 457 136 568
Total consideration transferred 1 457 136 568
Fair value of equity interest in KHEAL held before the business combination
– 111 076
Carrying value of equity interest – 115 375
Loss on previously held equity interest – (4 299)
Total consideration 1 457 247 644
Recognised amounts of identifiable assets acquired and liabilities assumed:
Property, plant and equipment – 199 064
Trademarks, trade names and customer relationships (included in intangibles) – 172 129
Retirement benefit assets – 8 276
Inventories – 103 436
Trade and other receivables – 38 940
Cash and cash equivalents – 40 329
Interest-bearing borrowings – (8 418)
Deferred income tax liabilities – (79 583)
Trade and other payables – (68 916)
Current income tax liabilities – (610)
Total identifiable net assets – 404 647
Non-controlling interest – (207 509)
Goodwill 1 457 50 506
Total 1 457 247 644
ANNUAL FINANCIAL STATEMENTS
189DISTELL Integrated Report 2018
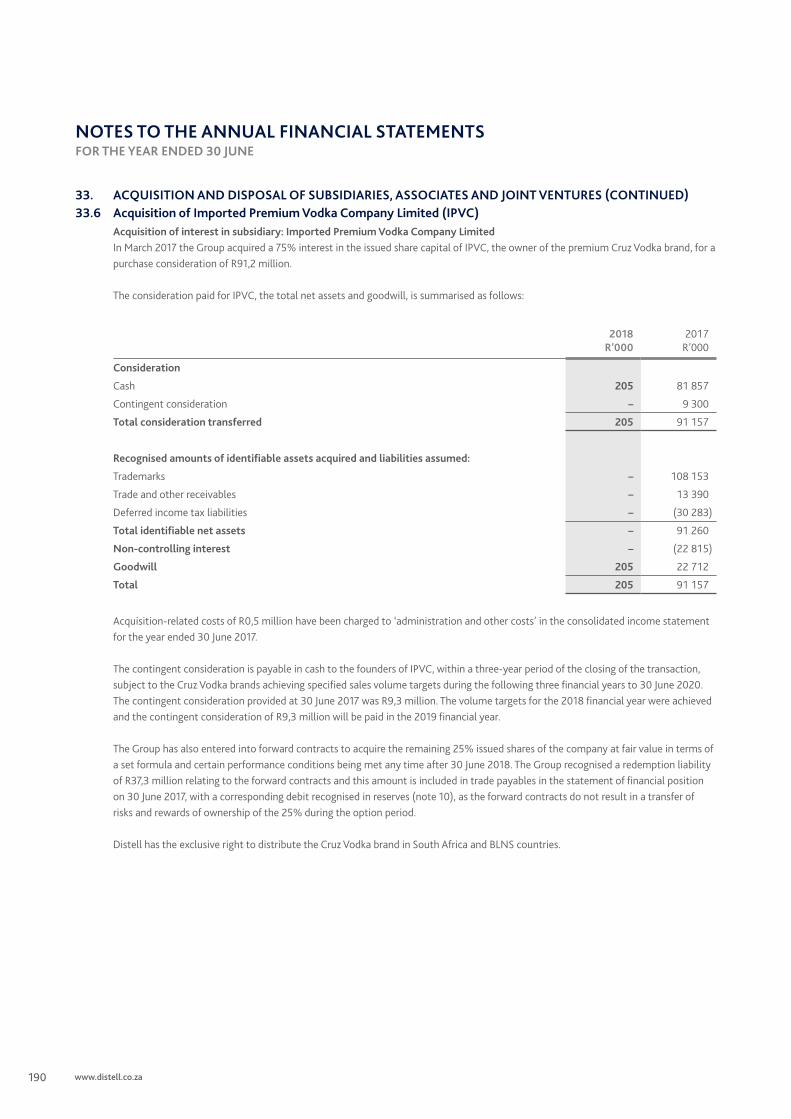
NOTES TO THE ANNUAL FINANCIAL STATEMENTSFOR THE YEAR ENDED 30 JUNE
33. ACQUISITION AND DISPOSAL OF SUBSIDIARIES, ASSOCIATES AND JOINT VENTURES (CONTINUED)33.6 Acquisition of Imported Premium Vodka Company Limited (IPVC)
Acquisition of interest in subsidiary: Imported Premium Vodka Company LimitedIn March 2017 the Group acquired a 75% interest in the issued share capital of IPVC, the owner of the premium Cruz Vodka brand, for a purchase consideration of R91,2 million.
The consideration paid for IPVC, the total net assets and goodwill, is summarised as follows:
2018R’000
2017R’000
Consideration
Cash 205 81 857
Contingent consideration – 9 300
Total consideration transferred 205 91 157
Recognised amounts of identifiable assets acquired and liabilities assumed:
Trademarks – 108 153
Trade and other receivables – 13 390
Deferred income tax liabilities – (30 283)
Total identifiable net assets – 91 260
Non-controlling interest – (22 815)
Goodwill 205 22 712
Total 205 91 157
Acquisition-related costs of R0,5 million have been charged to ‘administration and other costs’ in the consolidated income statement for the year ended 30 June 2017.
The contingent consideration is payable in cash to the founders of IPVC, within a three-year period of the closing of the transaction, subject to the Cruz Vodka brands achieving specified sales volume targets during the following three financial years to 30 June 2020. The contingent consideration provided at 30 June 2017 was R9,3 million. The volume targets for the 2018 financial year were achieved and the contingent consideration of R9,3 million will be paid in the 2019 financial year.
The Group has also entered into forward contracts to acquire the remaining 25% issued shares of the company at fair value in terms of a set formula and certain performance conditions being met any time after 30 June 2018. The Group recognised a redemption liability of R37,3 million relating to the forward contracts and this amount is included in trade payables in the statement of financial position on 30 June 2017, with a corresponding debit recognised in reserves (note 10), as the forward contracts do not result in a transfer of risks and rewards of ownership of the 25% during the option period.
Distell has the exclusive right to distribute the Cruz Vodka brand in South Africa and BLNS countries.
190 www.distell.co.za
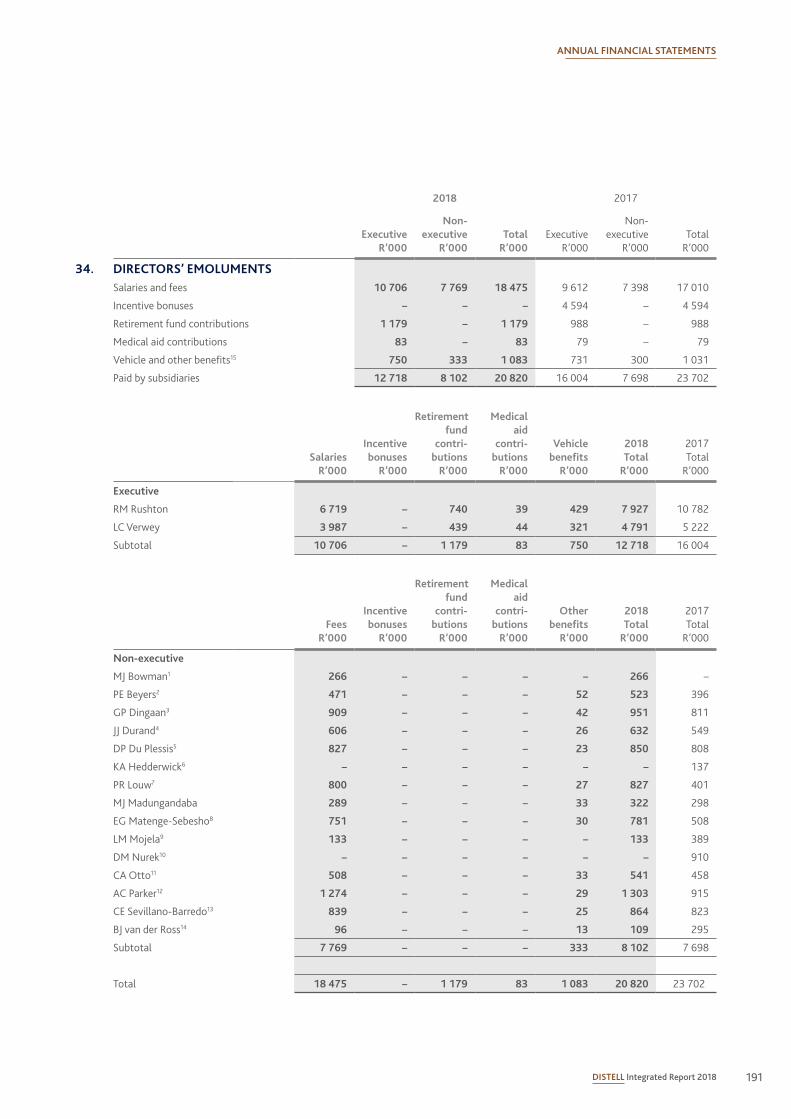
2018 2017
ExecutiveR’000
Non-executive
R’000Total
R’000Executive
R’000
Non-executive
R’000Total
R’000
34. DIRECTORS’ EMOLUMENTSSalaries and fees 10 706 7 769 18 475 9 612 7 398 17 010
Incentive bonuses – – – 4 594 – 4 594
Retirement fund contributions 1 179 – 1 179 988 – 988
Medical aid contributions 83 – 83 79 – 79
Vehicle and other benefits15 750 333 1 083 731 300 1 031
Paid by subsidiaries 12 718 8 102 20 820 16 004 7 698 23 702
SalariesR’000
Incentivebonuses
R’000
Retirementfund
contri-butions
R’000
Medical aid
contri-butions
R’000
Vehiclebenefits
R’000
2018Total
R’000
2017Total
R’000
Executive
RM Rushton 6 719 – 740 39 429 7 927 10 782
LC Verwey 3 987 – 439 44 321 4 791 5 222
Subtotal 10 706 – 1 179 83 750 12 718 16 004
FeesR’000
Incentivebonuses
R’000
Retirementfund
contri-butions
R’000
Medical aid
contri-butions
R’000
Otherbenefits
R’000
2018Total
R’000
2017Total
R’000
Non-executive
MJ Bowman1 266 – – – – 266 –
PE Beyers2 471 – – – 52 523 396
GP Dingaan3 909 – – – 42 951 811
JJ Durand4 606 – – – 26 632 549
DP Du Plessis5 827 – – – 23 850 808
KA Hedderwick6 – – – – – – 137
PR Louw7 800 – – – 27 827 401
MJ Madungandaba 289 – – – 33 322 298
EG Matenge-Sebesho8 751 – – – 30 781 508
LM Mojela9 133 – – – – 133 389
DM Nurek10 – – – – – – 910
CA Otto11 508 – – – 33 541 458
AC Parker12 1 274 – – – 29 1 303 915
CE Sevillano-Barredo13 839 – – – 25 864 823
BJ van der Ross14 96 – – – 13 109 295
Subtotal 7 769 – – – 333 8 102 7 698
Total 18 475 – 1 179 83 1 083 20 820 23 702
ANNUAL FINANCIAL STATEMENTS
191DISTELL Integrated Report 2018
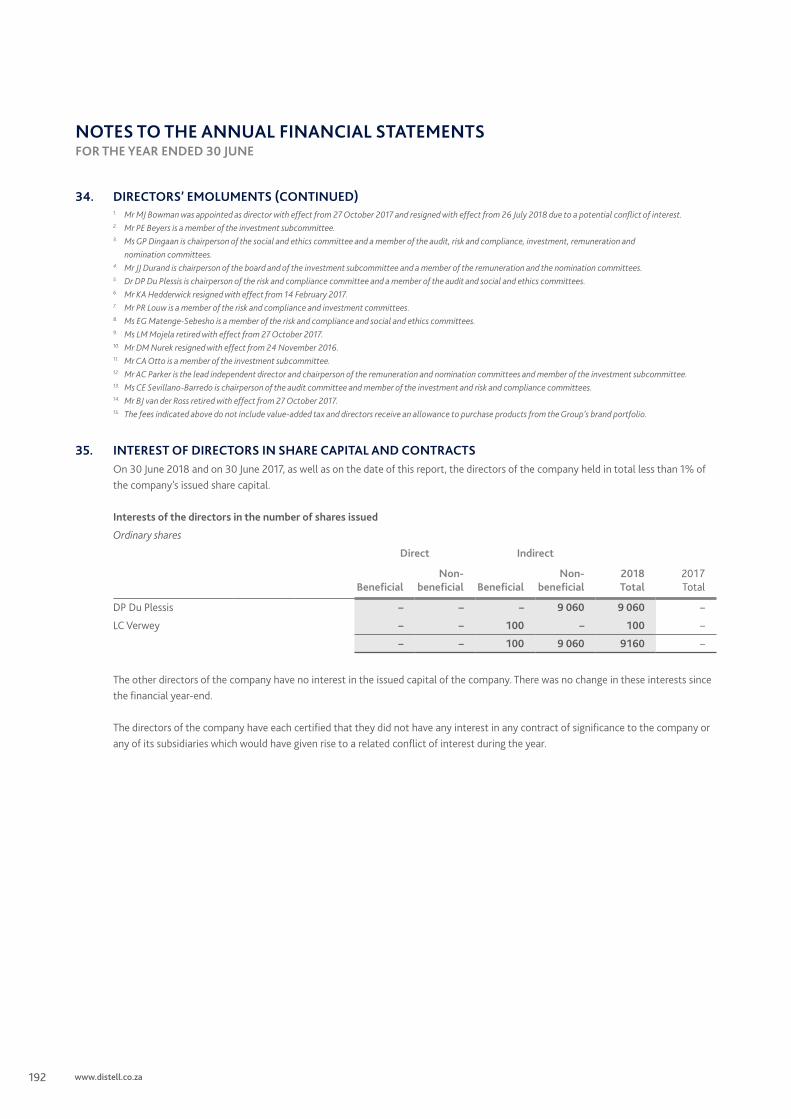
NOTES TO THE ANNUAL FINANCIAL STATEMENTSFOR THE YEAR ENDED 30 JUNE
34. DIRECTORS’ EMOLUMENTS (CONTINUED)1. Mr MJ Bowman was appointed as director with effect from 27 October 2017 and resigned with effect from 26 July 2018 due to a potential conflict of interest.2. Mr PE Beyers is a member of the investment subcommittee.3. Ms GP Dingaan is chairperson of the social and ethics committee and a member of the audit, risk and compliance, investment, remuneration and
nomination committees.4. Mr JJ Durand is chairperson of the board and of the investment subcommittee and a member of the remuneration and the nomination committees.5. Dr DP Du Plessis is chairperson of the risk and compliance committee and a member of the audit and social and ethics committees.6. Mr KA Hedderwick resigned with effect from 14 February 2017.7. Mr PR Louw is a member of the risk and compliance and investment committees.8. Ms EG Matenge-Sebesho is a member of the risk and compliance and social and ethics committees.9. Ms LM Mojela retired with effect from 27 October 2017.10. Mr DM Nurek resigned with effect from 24 November 2016.11. Mr CA Otto is a member of the investment subcommittee.12. Mr AC Parker is the lead independent director and chairperson of the remuneration and nomination committees and member of the investment subcommittee.13. Ms CE Sevillano-Barredo is chairperson of the audit committee and member of the investment and risk and compliance committees.14. Mr BJ van der Ross retired with effect from 27 October 2017.15. The fees indicated above do not include value-added tax and directors receive an allowance to purchase products from the Group’s brand portfolio.
35. INTEREST OF DIRECTORS IN SHARE CAPITAL AND CONTRACTSOn 30 June 2018 and on 30 June 2017, as well as on the date of this report, the directors of the company held in total less than 1% of the company’s issued share capital.
Interests of the directors in the number of shares issued
Ordinary shares
Direct Indirect
BeneficialNon-
beneficial BeneficialNon-
beneficial2018Total
2017Total
DP Du Plessis – – – 9 060 9 060 –
LC Verwey – – 100 – 100 –
– – 100 9 060 9160 –
The other directors of the company have no interest in the issued capital of the company. There was no change in these interests since the financial year-end.
The directors of the company have each certified that they did not have any interest in any contract of significance to the company or any of its subsidiaries which would have given rise to a related conflict of interest during the year.
192 www.distell.co.za
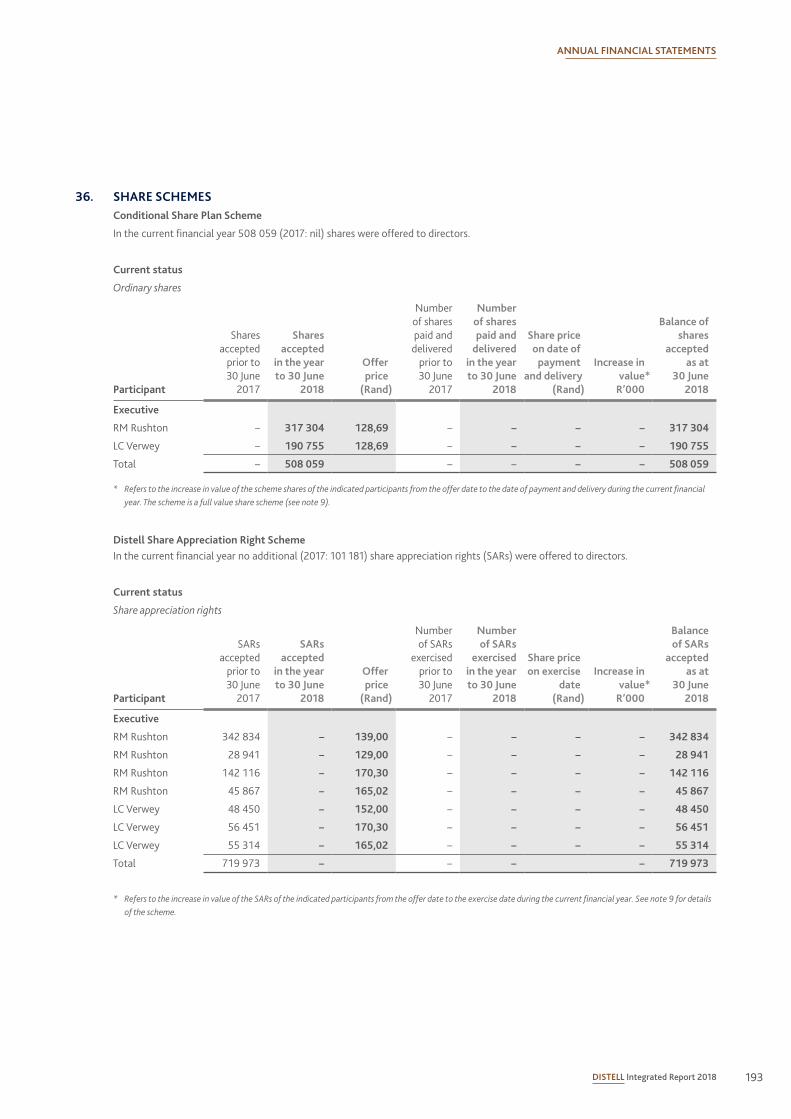
36. SHARE SCHEMESConditional Share Plan Scheme
In the current financial year 508 059 (2017: nil) shares were offered to directors.
Current status
Ordinary shares
Participant
Sharesaccepted
prior to 30 June
2017
Sharesaccepted
in the year to 30 June
2018
Offer price
(Rand)
Number of sharespaid anddelivered
prior to 30 June
2017
Number of sharespaid and
delivered in the year to 30 June
2018
Share priceon date of
payment and delivery
(Rand)
Increase invalue*
R’000
Balance ofshares
accepted as at
30 June2018
Executive
RM Rushton – 317 304 128,69 – – – – 317 304
LC Verwey – 190 755 128,69 – – – – 190 755
Total – 508 059 – – – – 508 059
* Refers to the increase in value of the scheme shares of the indicated participants from the offer date to the date of payment and delivery during the current financial year. The scheme is a full value share scheme (see note 9).
Distell Share Appreciation Right SchemeIn the current financial year no additional (2017: 101 181) share appreciation rights (SARs) were offered to directors.
Current status
Share appreciation rights
Participant
SARsaccepted
prior to 30 June
2017
SARsaccepted
in the year to 30 June
2018
Offer price
(Rand)
Number of SARs
exercised prior to 30 June
2017
Number of SARs
exercised in the year to 30 June
2018
Share price on exercise
date(Rand)
Increase invalue*
R’000
Balance of SARs
accepted as at
30 June 2018
Executive
RM Rushton 342 834 – 139,00 – – – – 342 834
RM Rushton 28 941 – 129,00 – – – – 28 941
RM Rushton 142 116 – 170,30 – – – – 142 116
RM Rushton 45 867 – 165,02 – – – – 45 867
LC Verwey 48 450 – 152,00 – – – – 48 450
LC Verwey 56 451 – 170,30 – – – – 56 451
LC Verwey 55 314 – 165,02 – – – – 55 314
Total 719 973 – – – – 719 973
* Refers to the increase in value of the SARs of the indicated participants from the offer date to the exercise date during the current financial year. See note 9 for details of the scheme.
ANNUAL FINANCIAL STATEMENTS
193DISTELL Integrated Report 2018
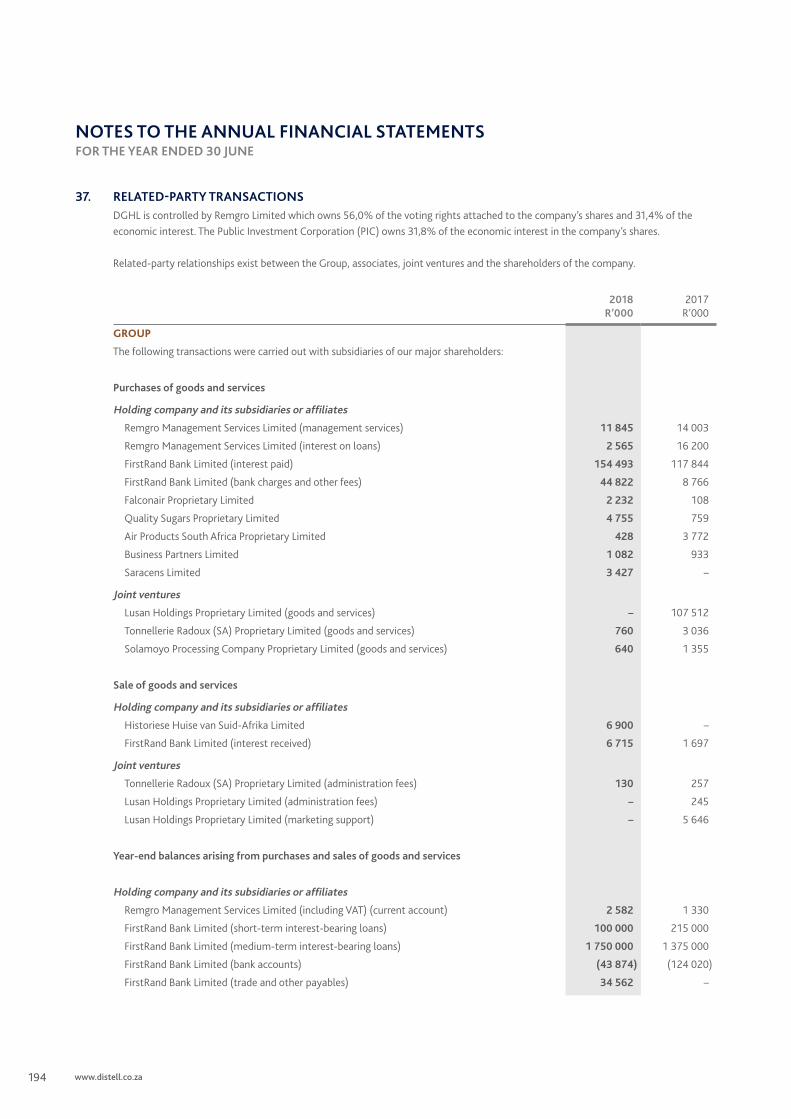
NOTES TO THE ANNUAL FINANCIAL STATEMENTSFOR THE YEAR ENDED 30 JUNE
37. RELATED-PARTY TRANSACTIONSDGHL is controlled by Remgro Limited which owns 56,0% of the voting rights attached to the company’s shares and 31,4% of the economic interest. The Public Investment Corporation (PIC) owns 31,8% of the economic interest in the company’s shares.
Related-party relationships exist between the Group, associates, joint ventures and the shareholders of the company.
2018R’000
2017R’000
GROUP
The following transactions were carried out with subsidiaries of our major shareholders:
Purchases of goods and services
Holding company and its subsidiaries or affiliates
Remgro Management Services Limited (management services) 11 845 14 003
Remgro Management Services Limited (interest on loans) 2 565 16 200
FirstRand Bank Limited (interest paid) 154 493 117 844
FirstRand Bank Limited (bank charges and other fees) 44 822 8 766
Falconair Proprietary Limited 2 232 108
Quality Sugars Proprietary Limited 4 755 759
Air Products South Africa Proprietary Limited 428 3 772
Business Partners Limited 1 082 933
Saracens Limited 3 427 –
Joint ventures
Lusan Holdings Proprietary Limited (goods and services) – 107 512
Tonnellerie Radoux (SA) Proprietary Limited (goods and services) 760 3 036
Solamoyo Processing Company Proprietary Limited (goods and services) 640 1 355
Sale of goods and services
Holding company and its subsidiaries or affiliates
Historiese Huise van Suid-Afrika Limited 6 900 –
FirstRand Bank Limited (interest received) 6 715 1 697
Joint ventures
Tonnellerie Radoux (SA) Proprietary Limited (administration fees) 130 257
Lusan Holdings Proprietary Limited (administration fees) – 245
Lusan Holdings Proprietary Limited (marketing support) – 5 646
Year-end balances arising from purchases and sales of goods and services
Holding company and its subsidiaries or affiliates
Remgro Management Services Limited (including VAT) (current account) 2 582 1 330
FirstRand Bank Limited (short-term interest-bearing loans) 100 000 215 000
FirstRand Bank Limited (medium-term interest-bearing loans) 1 750 000 1 375 000
FirstRand Bank Limited (bank accounts) (43 874) (124 020)
FirstRand Bank Limited (trade and other payables) 34 562 –
194 www.distell.co.za
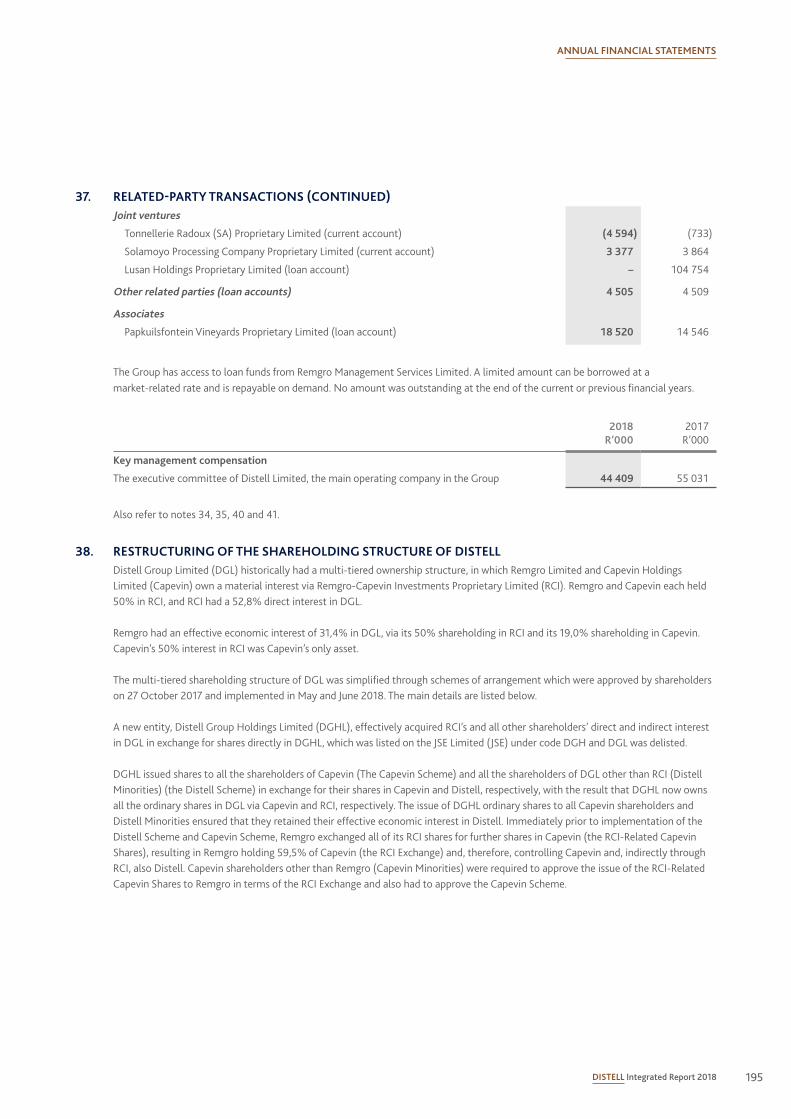
37. RELATED-PARTY TRANSACTIONS (CONTINUED)Joint ventures
Tonnellerie Radoux (SA) Proprietary Limited (current account) (4 594) (733)
Solamoyo Processing Company Proprietary Limited (current account) 3 377 3 864
Lusan Holdings Proprietary Limited (loan account) – 104 754
Other related parties (loan accounts) 4 505 4 509
Associates
Papkuilsfontein Vineyards Proprietary Limited (loan account) 18 520 14 546
The Group has access to loan funds from Remgro Management Services Limited. A limited amount can be borrowed at a market-related rate and is repayable on demand. No amount was outstanding at the end of the current or previous financial years.
2018R’000
2017R’000
Key management compensation
The executive committee of Distell Limited, the main operating company in the Group 44 409 55 031
Also refer to notes 34, 35, 40 and 41.
38. RESTRUCTURING OF THE SHAREHOLDING STRUCTURE OF DISTELLDistell Group Limited (DGL) historically had a multi-tiered ownership structure, in which Remgro Limited and Capevin Holdings Limited (Capevin) own a material interest via Remgro-Capevin Investments Proprietary Limited (RCI). Remgro and Capevin each held 50% in RCI, and RCI had a 52,8% direct interest in DGL.
Remgro had an effective economic interest of 31,4% in DGL, via its 50% shareholding in RCI and its 19,0% shareholding in Capevin. Capevin’s 50% interest in RCI was Capevin’s only asset.
The multi-tiered shareholding structure of DGL was simplified through schemes of arrangement which were approved by shareholders on 27 October 2017 and implemented in May and June 2018. The main details are listed below.
A new entity, Distell Group Holdings Limited (DGHL), effectively acquired RCI’s and all other shareholders’ direct and indirect interest in DGL in exchange for shares directly in DGHL, which was listed on the JSE Limited (JSE) under code DGH and DGL was delisted.
DGHL issued shares to all the shareholders of Capevin (The Capevin Scheme) and all the shareholders of DGL other than RCI (Distell Minorities) (the Distell Scheme) in exchange for their shares in Capevin and Distell, respectively, with the result that DGHL now owns all the ordinary shares in DGL via Capevin and RCI, respectively. The issue of DGHL ordinary shares to all Capevin shareholders and Distell Minorities ensured that they retained their effective economic interest in Distell. Immediately prior to implementation of the Distell Scheme and Capevin Scheme, Remgro exchanged all of its RCI shares for further shares in Capevin (the RCI-Related Capevin Shares), resulting in Remgro holding 59,5% of Capevin (the RCI Exchange) and, therefore, controlling Capevin and, indirectly through RCI, also Distell. Capevin shareholders other than Remgro (Capevin Minorities) were required to approve the issue of the RCI-Related Capevin Shares to Remgro in terms of the RCI Exchange and also had to approve the Capevin Scheme.
ANNUAL FINANCIAL STATEMENTS
195DISTELL Integrated Report 2018
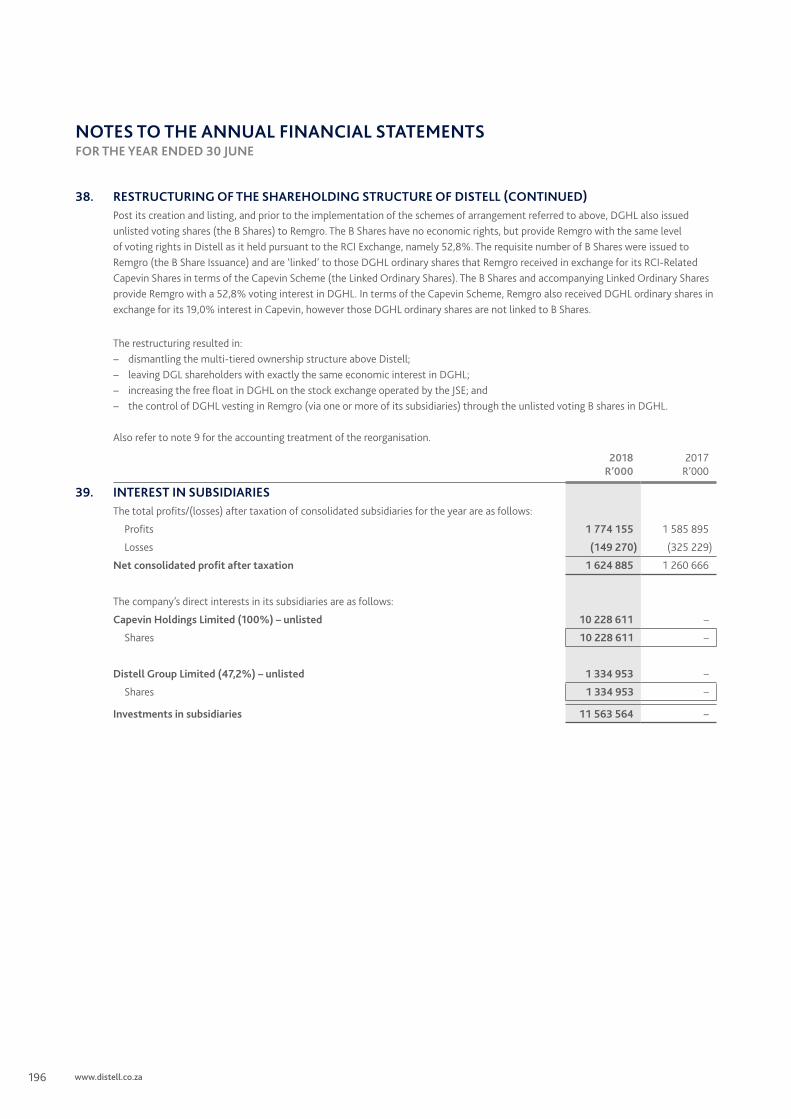
NOTES TO THE ANNUAL FINANCIAL STATEMENTSFOR THE YEAR ENDED 30 JUNE
38. RESTRUCTURING OF THE SHAREHOLDING STRUCTURE OF DISTELL (CONTINUED)Post its creation and listing, and prior to the implementation of the schemes of arrangement referred to above, DGHL also issued unlisted voting shares (the B Shares) to Remgro. The B Shares have no economic rights, but provide Remgro with the same level of voting rights in Distell as it held pursuant to the RCI Exchange, namely 52,8%. The requisite number of B Shares were issued to Remgro (the B Share Issuance) and are ‘linked’ to those DGHL ordinary shares that Remgro received in exchange for its RCI-Related Capevin Shares in terms of the Capevin Scheme (the Linked Ordinary Shares). The B Shares and accompanying Linked Ordinary Shares provide Remgro with a 52,8% voting interest in DGHL. In terms of the Capevin Scheme, Remgro also received DGHL ordinary shares in exchange for its 19,0% interest in Capevin, however those DGHL ordinary shares are not linked to B Shares.
The restructuring resulted in: − dismantling the multi-tiered ownership structure above Distell; − leaving DGL shareholders with exactly the same economic interest in DGHL; − increasing the free float in DGHL on the stock exchange operated by the JSE; and − the control of DGHL vesting in Remgro (via one or more of its subsidiaries) through the unlisted voting B shares in DGHL.
Also refer to note 9 for the accounting treatment of the reorganisation.
2018R’000
2017R’000
39. INTEREST IN SUBSIDIARIESThe total profits/(losses) after taxation of consolidated subsidiaries for the year are as follows:
Profits 1 774 155 1 585 895
Losses (149 270) (325 229)
Net consolidated profit after taxation 1 624 885 1 260 666
The company’s direct interests in its subsidiaries are as follows:
Capevin Holdings Limited (100%) – unlisted 10 228 611 –
Shares 10 228 611 –
Distell Group Limited (47,2%) – unlisted 1 334 953 –
Shares 1 334 953 –
Investments in subsidiaries 11 563 564 –
196 www.distell.co.za
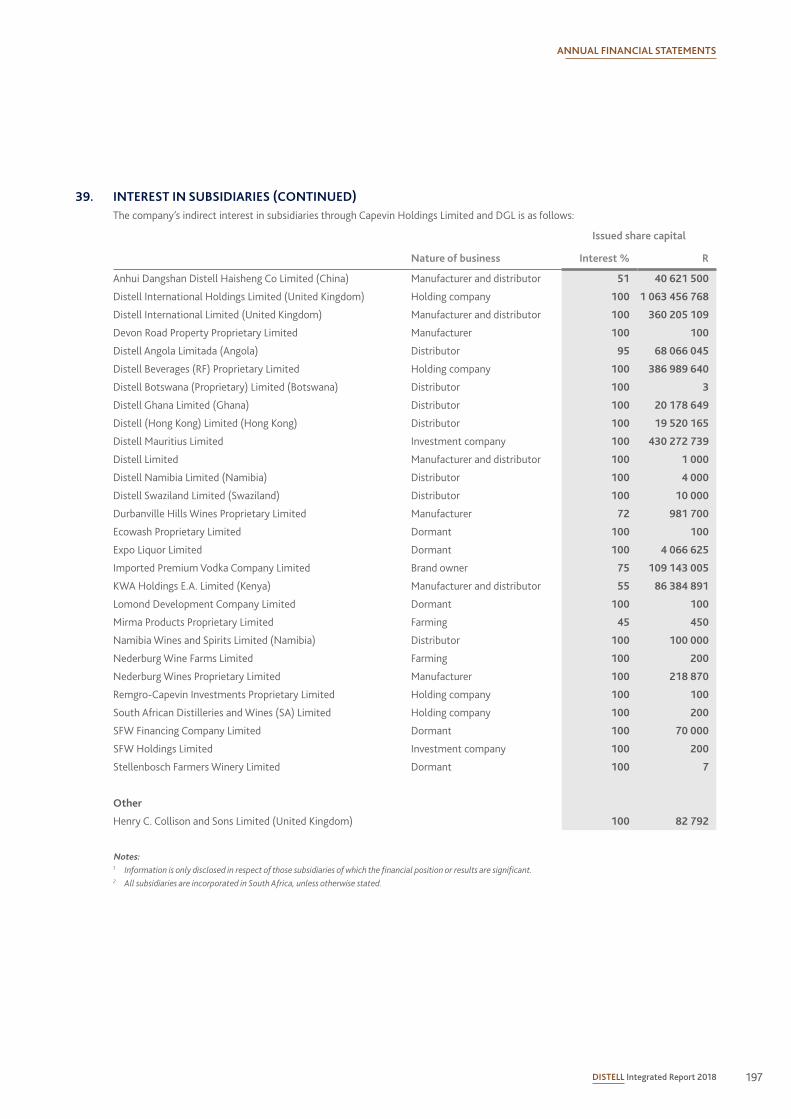
39. INTEREST IN SUBSIDIARIES (CONTINUED)The company’s indirect interest in subsidiaries through Capevin Holdings Limited and DGL is as follows:
Issued share capital
Nature of business Interest % R
Anhui Dangshan Distell Haisheng Co Limited (China) Manufacturer and distributor 51 40 621 500
Distell International Holdings Limited (United Kingdom) Holding company 100 1 063 456 768
Distell International Limited (United Kingdom) Manufacturer and distributor 100 360 205 109
Devon Road Property Proprietary Limited Manufacturer 100 100
Distell Angola Limitada (Angola) Distributor 95 68 066 045
Distell Beverages (RF) Proprietary Limited Holding company 100 386 989 640
Distell Botswana (Proprietary) Limited (Botswana) Distributor 100 3
Distell Ghana Limited (Ghana) Distributor 100 20 178 649
Distell (Hong Kong) Limited (Hong Kong) Distributor 100 19 520 165
Distell Mauritius Limited Investment company 100 430 272 739
Distell Limited Manufacturer and distributor 100 1 000
Distell Namibia Limited (Namibia) Distributor 100 4 000
Distell Swaziland Limited (Swaziland) Distributor 100 10 000
Durbanville Hills Wines Proprietary Limited Manufacturer 72 981 700
Ecowash Proprietary Limited Dormant 100 100
Expo Liquor Limited Dormant 100 4 066 625
Imported Premium Vodka Company Limited Brand owner 75 109 143 005
KWA Holdings E.A. Limited (Kenya) Manufacturer and distributor 55 86 384 891
Lomond Development Company Limited Dormant 100 100
Mirma Products Proprietary Limited Farming 45 450
Namibia Wines and Spirits Limited (Namibia) Distributor 100 100 000
Nederburg Wine Farms Limited Farming 100 200
Nederburg Wines Proprietary Limited Manufacturer 100 218 870
Remgro-Capevin Investments Proprietary Limited Holding company 100 100
South African Distilleries and Wines (SA) Limited Holding company 100 200
SFW Financing Company Limited Dormant 100 70 000
SFW Holdings Limited Investment company 100 200
Stellenbosch Farmers Winery Limited Dormant 100 7
Other
Henry C. Collison and Sons Limited (United Kingdom) 100 82 792
Notes:1 Information is only disclosed in respect of those subsidiaries of which the financial position or results are significant.2 All subsidiaries are incorporated in South Africa, unless otherwise stated.
ANNUAL FINANCIAL STATEMENTS
197DISTELL Integrated Report 2018
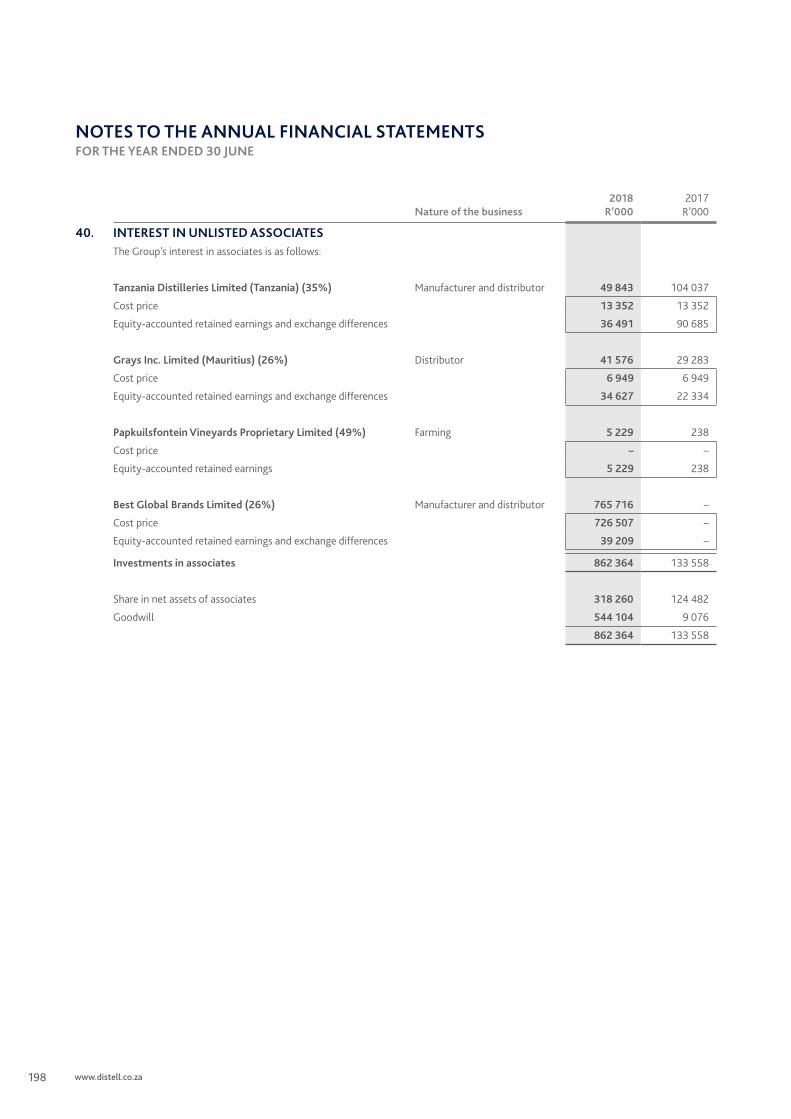
NOTES TO THE ANNUAL FINANCIAL STATEMENTSFOR THE YEAR ENDED 30 JUNE
Nature of the business2018
R’0002017
R’000
40. INTEREST IN UNLISTED ASSOCIATESThe Group’s interest in associates is as follows:
Tanzania Distilleries Limited (Tanzania) (35%) Manufacturer and distributor 49 843 104 037
Cost price 13 352 13 352
Equity-accounted retained earnings and exchange differences 36 491 90 685
Grays Inc. Limited (Mauritius) (26%) Distributor 41 576 29 283
Cost price 6 949 6 949
Equity-accounted retained earnings and exchange differences 34 627 22 334
Papkuilsfontein Vineyards Proprietary Limited (49%) Farming 5 229 238
Cost price – –
Equity-accounted retained earnings 5 229 238
Best Global Brands Limited (26%) Manufacturer and distributor 765 716 –
Cost price 726 507 –
Equity-accounted retained earnings and exchange differences 39 209 –
Investments in associates 862 364 133 558
Share in net assets of associates 318 260 124 482
Goodwill 544 104 9 076
862 364 133 558
198 www.distell.co.za
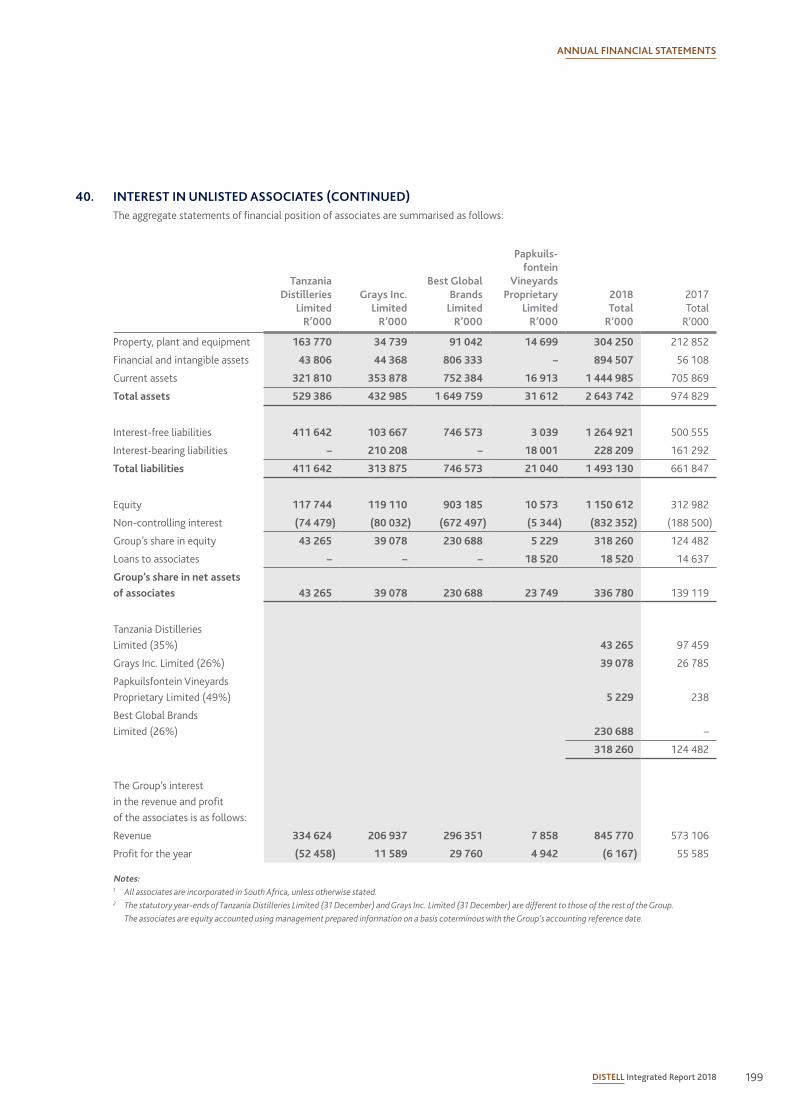
40. INTEREST IN UNLISTED ASSOCIATES (CONTINUED)The aggregate statements of financial position of associates are summarised as follows:
TanzaniaDistilleries
LimitedR’000
Grays Inc. Limited
R’000
Best Global Brands
LimitedR’000
Papkuils-fontein
VineyardsProprietary
LimitedR’000
2018Total
R’000
2017Total
R’000
Property, plant and equipment 163 770 34 739 91 042 14 699 304 250 212 852
Financial and intangible assets 43 806 44 368 806 333 – 894 507 56 108
Current assets 321 810 353 878 752 384 16 913 1 444 985 705 869
Total assets 529 386 432 985 1 649 759 31 612 2 643 742 974 829
Interest-free liabilities 411 642 103 667 746 573 3 039 1 264 921 500 555
Interest-bearing liabilities – 210 208 – 18 001 228 209 161 292
Total liabilities 411 642 313 875 746 573 21 040 1 493 130 661 847
Equity 117 744 119 110 903 185 10 573 1 150 612 312 982
Non-controlling interest (74 479) (80 032) (672 497) (5 344) (832 352) (188 500)
Group’s share in equity 43 265 39 078 230 688 5 229 318 260 124 482
Loans to associates – – – 18 520 18 520 14 637
Group’s share in net assets of associates 43 265 39 078 230 688 23 749 336 780 139 119
Tanzania Distilleries Limited (35%) 43 265 97 459
Grays Inc. Limited (26%) 39 078 26 785
Papkuilsfontein Vineyards Proprietary Limited (49%) 5 229 238
Best Global Brands Limited (26%) 230 688 –
318 260 124 482
The Group’s interest in the revenue and profit of the associates is as follows:
Revenue 334 624 206 937 296 351 7 858 845 770 573 106
Profit for the year (52 458) 11 589 29 760 4 942 (6 167) 55 585
Notes:1 All associates are incorporated in South Africa, unless otherwise stated.2 The statutory year-ends of Tanzania Distilleries Limited (31 December) and Grays Inc. Limited (31 December) are different to those of the rest of the Group.
The associates are equity accounted using management prepared information on a basis coterminous with the Group’s accounting reference date.
ANNUAL FINANCIAL STATEMENTS
199DISTELL Integrated Report 2018
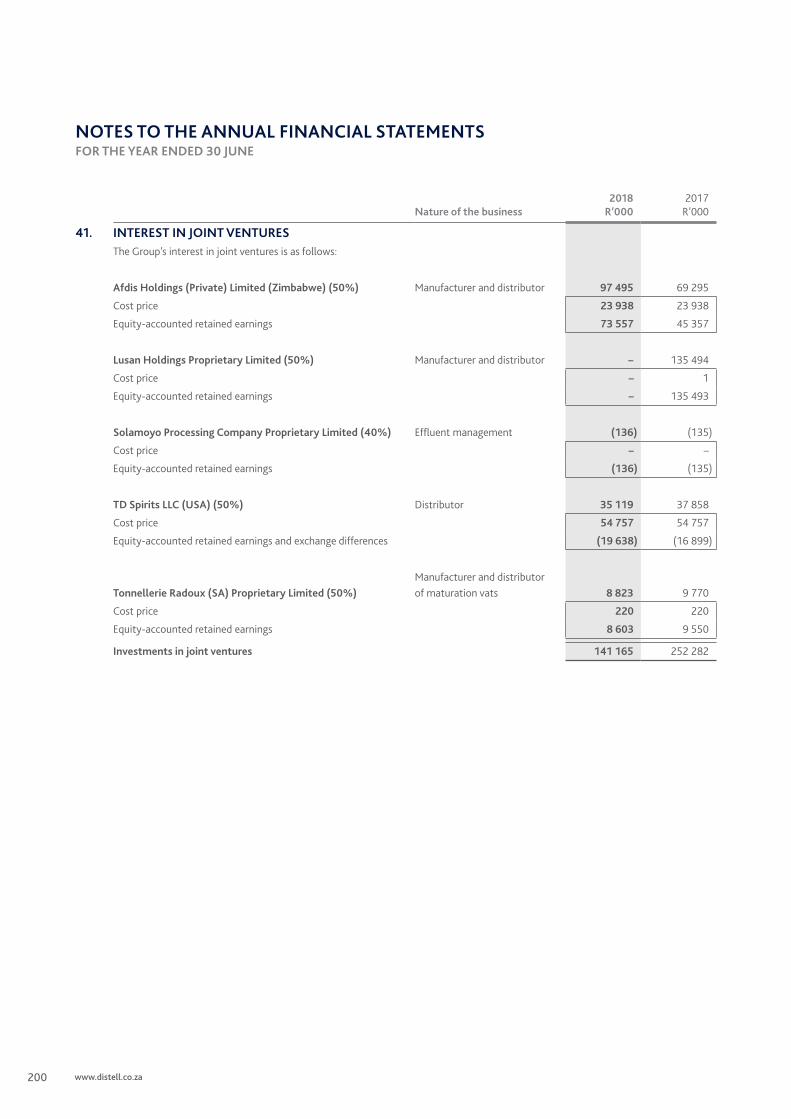
NOTES TO THE ANNUAL FINANCIAL STATEMENTSFOR THE YEAR ENDED 30 JUNE
Nature of the business2018
R’0002017
R’000
41. INTEREST IN JOINT VENTURESThe Group’s interest in joint ventures is as follows:
Afdis Holdings (Private) Limited (Zimbabwe) (50%) Manufacturer and distributor 97 495 69 295
Cost price 23 938 23 938
Equity-accounted retained earnings 73 557 45 357
Lusan Holdings Proprietary Limited (50%) Manufacturer and distributor – 135 494
Cost price – 1
Equity-accounted retained earnings – 135 493
Solamoyo Processing Company Proprietary Limited (40%) Effluent management (136) (135)
Cost price – –
Equity-accounted retained earnings (136) (135)
TD Spirits LLC (USA) (50%) Distributor 35 119 37 858
Cost price 54 757 54 757
Equity-accounted retained earnings and exchange differences (19 638) (16 899)
Tonnellerie Radoux (SA) Proprietary Limited (50%)Manufacturer and distributor of maturation vats 8 823 9 770
Cost price 220 220
Equity-accounted retained earnings 8 603 9 550
Investments in joint ventures 141 165 252 282
200 www.distell.co.za
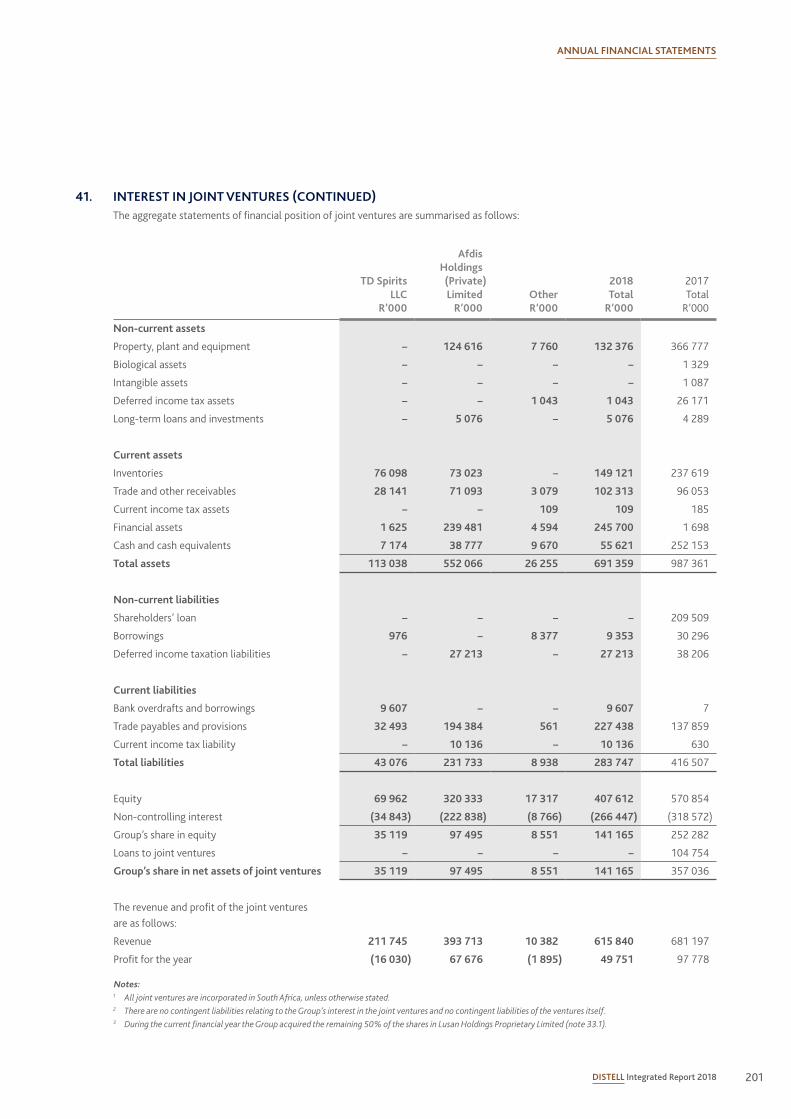
41. INTEREST IN JOINT VENTURES (CONTINUED)The aggregate statements of financial position of joint ventures are summarised as follows:
TD Spirits LLC
R’000
Afdis Holdings
(Private)Limited
R’000OtherR’000
2018Total
R’000
2017Total
R’000
Non-current assets
Property, plant and equipment – 124 616 7 760 132 376 366 777
Biological assets – – – – 1 329
Intangible assets – – – – 1 087
Deferred income tax assets – – 1 043 1 043 26 171
Long-term loans and investments – 5 076 – 5 076 4 289
Current assets
Inventories 76 098 73 023 – 149 121 237 619
Trade and other receivables 28 141 71 093 3 079 102 313 96 053
Current income tax assets – – 109 109 185
Financial assets 1 625 239 481 4 594 245 700 1 698
Cash and cash equivalents 7 174 38 777 9 670 55 621 252 153
Total assets 113 038 552 066 26 255 691 359 987 361
Non-current liabilities
Shareholders’ loan – – – – 209 509
Borrowings 976 – 8 377 9 353 30 296
Deferred income taxation liabilities – 27 213 – 27 213 38 206
Current liabilities
Bank overdrafts and borrowings 9 607 – – 9 607 7
Trade payables and provisions 32 493 194 384 561 227 438 137 859
Current income tax liability – 10 136 – 10 136 630
Total liabilities 43 076 231 733 8 938 283 747 416 507
Equity 69 962 320 333 17 317 407 612 570 854
Non-controlling interest (34 843) (222 838) (8 766) (266 447) (318 572)
Group’s share in equity 35 119 97 495 8 551 141 165 252 282
Loans to joint ventures – – – – 104 754
Group’s share in net assets of joint ventures 35 119 97 495 8 551 141 165 357 036
The revenue and profit of the joint ventures are as follows:
Revenue 211 745 393 713 10 382 615 840 681 197
Profit for the year (16 030) 67 676 (1 895) 49 751 97 778
Notes:1 All joint ventures are incorporated in South Africa, unless otherwise stated.2 There are no contingent liabilities relating to the Group’s interest in the joint ventures and no contingent liabilities of the ventures itself.3 During the current financial year the Group acquired the remaining 50% of the shares in Lusan Holdings Proprietary Limited (note 33.1).
ANNUAL FINANCIAL STATEMENTS
201DISTELL Integrated Report 2018

202 www.distell.co.za

203DISTELL Integrated Report 2018
ANNUAL FINANCIAL STATEMENTS
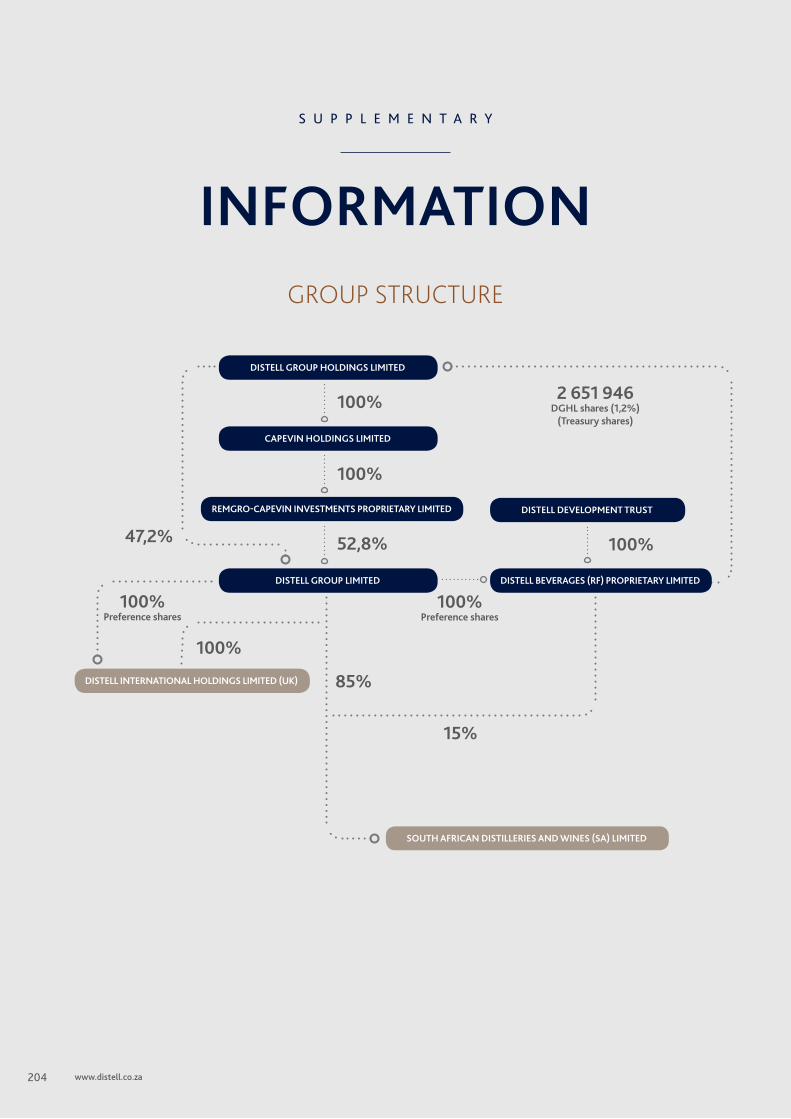
STATEMENTS OF FINANCIAL POSITIONAS AT 30 JUNE 2018
INFORMATION
S U P P L E M E N T A R Y
GROUP STRUCTURE
100%Preference shares
52,8%
100% Preference shares
47,2%
2 651 946 DGHL shares (1,2%)
(Treasury shares)
DISTELL BEVERAGES (RF) PROPRIETARY LIMITEDDISTELL GROUP LIMITED
REMGRO-CAPEVIN INVESTMENTS PROPRIETARY LIMITED
DISTELL GROUP HOLDINGS LIMITED
CAPEVIN HOLDINGS LIMITED
DISTELL INTERNATIONAL HOLDINGS LIMITED (UK)
SOUTH AFRICAN DISTILLERIES AND WINES (SA) LIMITED
DISTELL DEVELOPMENT TRUST
100%
100%
15%
85%
100%
100%
204 www.distell.co.za
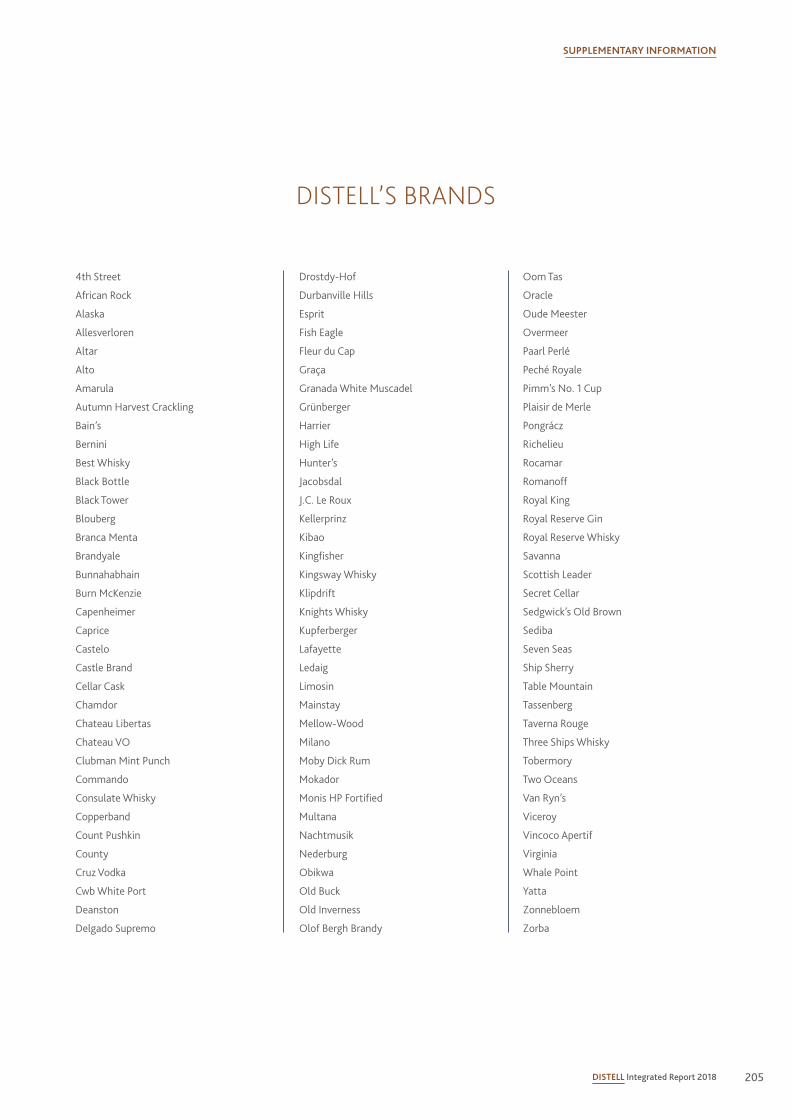
DISTELL’S BRANDS
4th Street
African Rock
Alaska
Allesverloren
Altar
Alto
Amarula
Autumn Harvest Crackling
Bain’s
Bernini
Best Whisky
Black Bottle
Black Tower
Blouberg
Branca Menta
Brandyale
Bunnahabhain
Burn McKenzie
Capenheimer
Caprice
Castelo
Castle Brand
Cellar Cask
Chamdor
Chateau Libertas
Chateau VO
Clubman Mint Punch
Commando
Consulate Whisky
Copperband
Count Pushkin
County
Cruz Vodka
Cwb White Port
Deanston
Delgado Supremo
Drostdy-Hof
Durbanville Hills
Esprit
Fish Eagle
Fleur du Cap
Graça
Granada White Muscadel
Grünberger
Harrier
High Life
Hunter’s
Jacobsdal
J.C. Le Roux
Kellerprinz
Kibao
Kingfisher
Kingsway Whisky
Klipdrift
Knights Whisky
Kupferberger
Lafayette
Ledaig
Limosin
Mainstay
Mellow-Wood
Milano
Moby Dick Rum
Mokador
Monis HP Fortified
Multana
Nachtmusik
Nederburg
Obikwa
Old Buck
Old Inverness
Olof Bergh Brandy
Oom Tas
Oracle
Oude Meester
Overmeer
Paarl Perlé
Peché Royale
Pimm’s No. 1 Cup
Plaisir de Merle
Pongrácz
Richelieu
Rocamar
Romanoff
Royal King
Royal Reserve Gin
Royal Reserve Whisky
Savanna
Scottish Leader
Secret Cellar
Sedgwick’s Old Brown
Sediba
Seven Seas
Ship Sherry
Table Mountain
Tassenberg
Taverna Rouge
Three Ships Whisky
Tobermory
Two Oceans
Van Ryn’s
Viceroy
Vincoco Apertif
Virginia
Whale Point
Yatta
Zonnebloem
Zorba
205DISTELL Integrated Report 2018
SUPPLEMENTARY INFORMATION
INDEPENDENT AUDITOR’S REPORT
To the Directors of Distell Group Holdings Limited
ASSURANCE ENGAGEMENT REPORT ON THE COMPILATION OF PRO FORMA FINANCIAL INFORMATION BY DISTELL GROUP HOLDINGS LIMITED FOR THE YEAR ENDED 30 JUNE 2018IntroductionDistell Group Holdings Limited (the “Company” or the “Group”) is presenting adjusted earnings measures to indicate the impact on the financial results of abnormal and non-recurring transactions, as well as the effect of changes in foreign exchange rates.
These adjusted measures consist of: − Normalised headline earnings; − Normalised headline earnings adjusted for currency movements; − Normalised Earnings before interest, tax, depreciation and amortisation (EBITDA); and − Normalised EBITDA adjusted for currency movements, collectively the “pro forma financial information”.
The pro forma financial information is presented in the SENS announcement, Summarised Financial Statements and the Report of the Board of Directors contained in the Integrated Report for the year ended 30 June 2018 (the “2018 Financial Reports”), and related notes thereto.
At your request, we have completed our assurance engagement to report on the compilation of the pro forma financial information of the Group. The pro forma financial information has been compiled by the directors on the basis of the applicable criteria specified in the JSE Limited (JSE) Listings Requirements and described in the 2018 Financial Reports. As part of this process, information about the Group’s financial position and financial performance has been extracted by the directors from the Group’s financial statements for the year ended 30 June 2018, on which an audit report has been published.
Directors’ responsibilityThe directors of the Company are responsible for compilation, contents and presentation of the pro forma financial information on the basis of the applicable criteria specified in the JSE Listings Requirements and described in the 2018 Financial Reports. The directors of the Company are also responsible for the financial statements from which it has been derived.
Our independence and quality controlWe have complied with the independence and other ethical requirements of the Code of Professional Conduct for Registered Auditors issued by the Independent Regulatory Board for Auditors (IRBA Code), which is founded on fundamental principles of integrity, objectivity, professional competence and due care, confidentiality and professional behaviour. The IRBA Code is consistent with the International Ethics Standards Board for Accountants Code of Ethics for Professional Accountants (Part A and B).
The firm applies International Standard on Quality Control 1 and, accordingly, maintains a comprehensive system of quality control including documented policies and procedures regarding compliance with ethical requirements, professional standards and applicable legal and regulatory requirements. Reporting accountant’s responsibilityOur responsibility is to express an opinion about whether the pro forma financial information has been compiled, in all material respects, by the directors on the basis of the applicable criteria specified in the JSE Listings Requirements and described in the 2018 Financial Reports based on our procedures performed.
We conducted our engagement in accordance with the International Standard on Assurance Engagements (ISAE) 3420, Assurance Engagements to Report on the Compilation of Pro Forma Financial Information Included in a Prospectus issued by the International Auditing and Assurance Standards Board. This standard requires that we plan and perform our procedures to obtain reasonable assurance about whether the pro forma financial information has been compiled, in all material respects, on the basis specified in the JSE Listings Requirements and described in the 2018 Financial Reports.
For purposes of this engagement, we are not responsible for updating or reissuing any reports or opinions on any historical financial information used in compiling the pro forma financial information, nor have we, in the course of this engagement, performed an audit or review of the financial information used in compiling the pro forma financial information.
206 www.distell.co.za
The purpose of pro forma financial information is solely to illustrate the impact on the financial results of abnormal and non-recurring transactions, as well as the effect of changes in foreign exchange rates. Accordingly, we do not provide any assurance that the actual outcome of events or transactions pertaining to these adjustments, would have been as presented.
A reasonable assurance engagement to report on whether the pro forma financial information has been compiled, in all material respects, on the basis of the applicable criteria involves performing procedures to assess whether the applicable criteria used by the directors in the compilation of the pro forma financial information provide a reasonable basis for presenting the adjusted earnings measures, and to obtain sufficient appropriate evidence about whether:
− The related pro forma adjustments give appropriate effect to those criteria; and − The pro forma financial information reflects the proper application of those adjustments to the unadjusted financial information.
The procedures selected depend on our judgment, having regard to our understanding of the nature of the Group, the event or transaction in respect of which the pro forma financial information has been compiled, and other relevant engagement circumstances.
Our engagement also involves evaluating the overall presentation of the pro forma financial information.
We believe that the evidence we have obtained is sufficient and appropriate to provide a basis for our opinion.
OpinionIn our opinion, the pro forma financial information has been compiled, in all material respects, on the basis of the applicable criteria specified by the JSE Listings Requirements and described in the 2018 Financial Reports.
PricewaterhouseCoopers Inc. Director: NH DömanRegistered Auditor
Stellenbosch23 August 2018
207DISTELL Integrated Report 2018
SUPPLEMENTARY INFORMATION
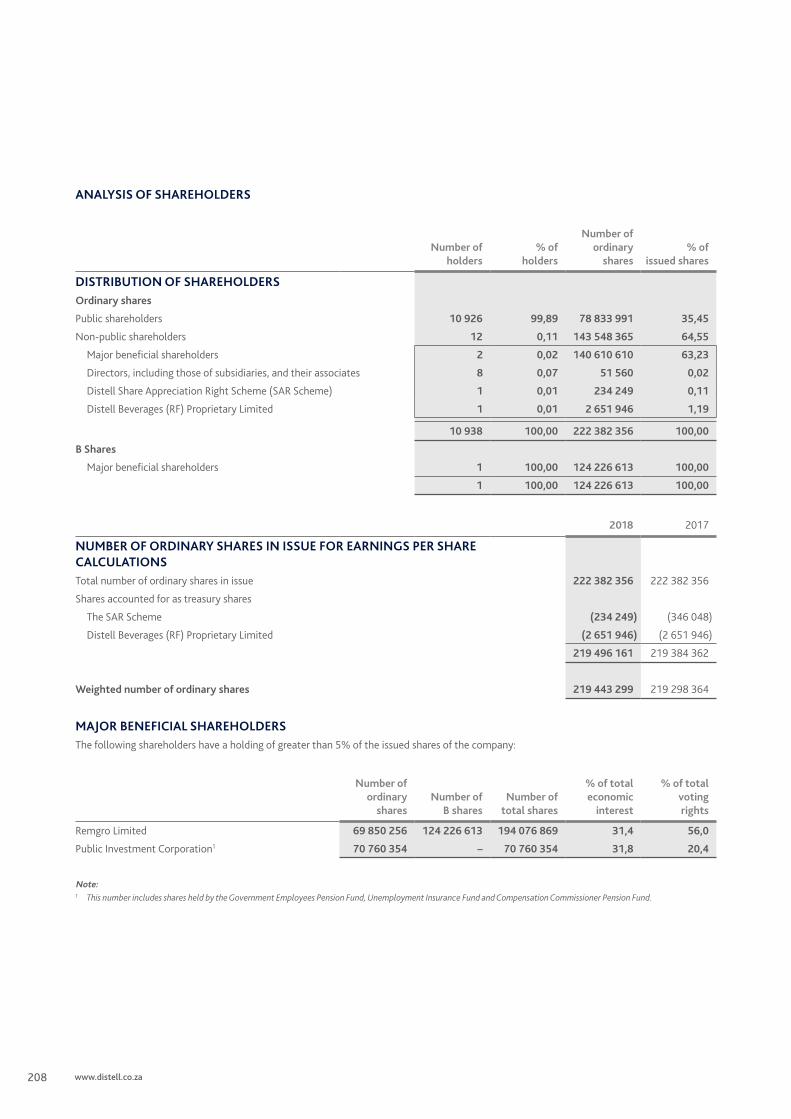
ANALYSIS OF SHAREHOLDERS
Number ofholders
% of holders
Number ofordinary
shares% of
issued shares
DISTRIBUTION OF SHAREHOLDERSOrdinary shares
Public shareholders 10 926 99,89 78 833 991 35,45
Non-public shareholders 12 0,11 143 548 365 64,55
Major beneficial shareholders 2 0,02 140 610 610 63,23
Directors, including those of subsidiaries, and their associates 8 0,07 51 560 0,02
Distell Share Appreciation Right Scheme (SAR Scheme) 1 0,01 234 249 0,11
Distell Beverages (RF) Proprietary Limited 1 0,01 2 651 946 1,19
10 938 100,00 222 382 356 100,00
B Shares
Major beneficial shareholders 1 100,00 124 226 613 100,00
1 100,00 124 226 613 100,00
2018 2017
NUMBER OF ORDINARY SHARES IN ISSUE FOR EARNINGS PER SHARE CALCULATIONSTotal number of ordinary shares in issue 222 382 356 222 382 356
Shares accounted for as treasury shares
The SAR Scheme (234 249) (346 048)
Distell Beverages (RF) Proprietary Limited (2 651 946) (2 651 946)
219 496 161 219 384 362
Weighted number of ordinary shares 219 443 299 219 298 364
MAJOR BENEFICIAL SHAREHOLDERSThe following shareholders have a holding of greater than 5% of the issued shares of the company:
Number of ordinary
sharesNumber of
B sharesNumber of
total shares
% of totaleconomic
interest
% of total votingrights
Remgro Limited 69 850 256 124 226 613 194 076 869 31,4 56,0
Public Investment Corporation1 70 760 354 – 70 760 354 31,8 20,4
Note:1 This number includes shares held by the Government Employees Pension Fund, Unemployment Insurance Fund and Compensation Commissioner Pension Fund.
208 www.distell.co.za
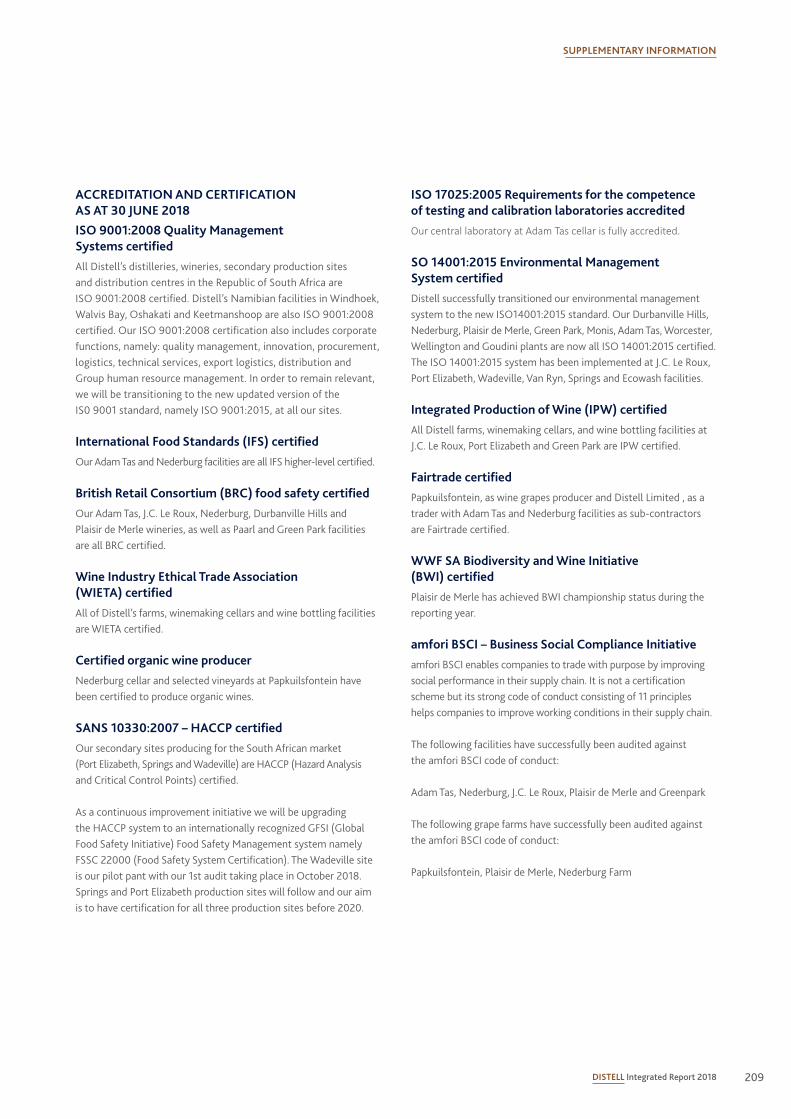
ACCREDITATION AND CERTIFICATION AS AT 30 JUNE 2018ISO 9001:2008 Quality Management Systems certifiedAll Distell’s distilleries, wineries, secondary production sites and distribution centres in the Republic of South Africa are ISO 9001:2008 certified. Distell’s Namibian facilities in Windhoek, Walvis Bay, Oshakati and Keetmanshoop are also ISO 9001:2008 certified. Our ISO 9001:2008 certification also includes corporate functions, namely: quality management, innovation, procurement, logistics, technical services, export logistics, distribution and Group human resource management. In order to remain relevant, we will be transitioning to the new updated version of the IS0 9001 standard, namely ISO 9001:2015, at all our sites.
International Food Standards (IFS) certifiedOur Adam Tas and Nederburg facilities are all IFS higher-level certified.
British Retail Consortium (BRC) food safety certifiedOur Adam Tas, J.C. Le Roux, Nederburg, Durbanville Hills and Plaisir de Merle wineries, as well as Paarl and Green Park facilities are all BRC certified.
Wine Industry Ethical Trade Association (WIETA) certifiedAll of Distell’s farms, winemaking cellars and wine bottling facilities are WIETA certified.
Certified organic wine producerNederburg cellar and selected vineyards at Papkuilsfontein have been certified to produce organic wines.
SANS 10330:2007 – HACCP certifiedOur secondary sites producing for the South African market (Port Elizabeth, Springs and Wadeville) are HACCP (Hazard Analysis and Critical Control Points) certified.
As a continuous improvement initiative we will be upgrading the HACCP system to an internationally recognized GFSI (Global Food Safety Initiative) Food Safety Management system namely FSSC 22000 (Food Safety System Certification). The Wadeville site is our pilot pant with our 1st audit taking place in October 2018. Springs and Port Elizabeth production sites will follow and our aim is to have certification for all three production sites before 2020.
ISO 17025:2005 Requirements for the competence of testing and calibration laboratories accreditedOur central laboratory at Adam Tas cellar is fully accredited.
SO 14001:2015 Environmental Management System certifiedDistell successfully transitioned our environmental management system to the new ISO14001:2015 standard. Our Durbanville Hills, Nederburg, Plaisir de Merle, Green Park, Monis, Adam Tas, Worcester, Wellington and Goudini plants are now all ISO 14001:2015 certified. The ISO 14001:2015 system has been implemented at J.C. Le Roux, Port Elizabeth, Wadeville, Van Ryn, Springs and Ecowash facilities.
Integrated Production of Wine (IPW) certifiedAll Distell farms, winemaking cellars, and wine bottling facilities at J.C. Le Roux, Port Elizabeth and Green Park are IPW certified.
Fairtrade certifiedPapkuilsfontein, as wine grapes producer and Distell Limited , as a trader with Adam Tas and Nederburg facilities as sub-contractors are Fairtrade certified.
WWF SA Biodiversity and Wine Initiative (BWI) certifiedPlaisir de Merle has achieved BWI championship status during the reporting year.
amfori BSCI – Business Social Compliance Initiativeamfori BSCI enables companies to trade with purpose by improving social performance in their supply chain. It is not a certification scheme but its strong code of conduct consisting of 11 principles helps companies to improve working conditions in their supply chain.
The following facilities have successfully been audited against the amfori BSCI code of conduct:
Adam Tas, Nederburg, J.C. Le Roux, Plaisir de Merle and Greenpark
The following grape farms have successfully been audited against the amfori BSCI code of conduct:
Papkuilsfontein, Plaisir de Merle, Nederburg Farm
209DISTELL Integrated Report 2018
SUPPLEMENTARY INFORMATION
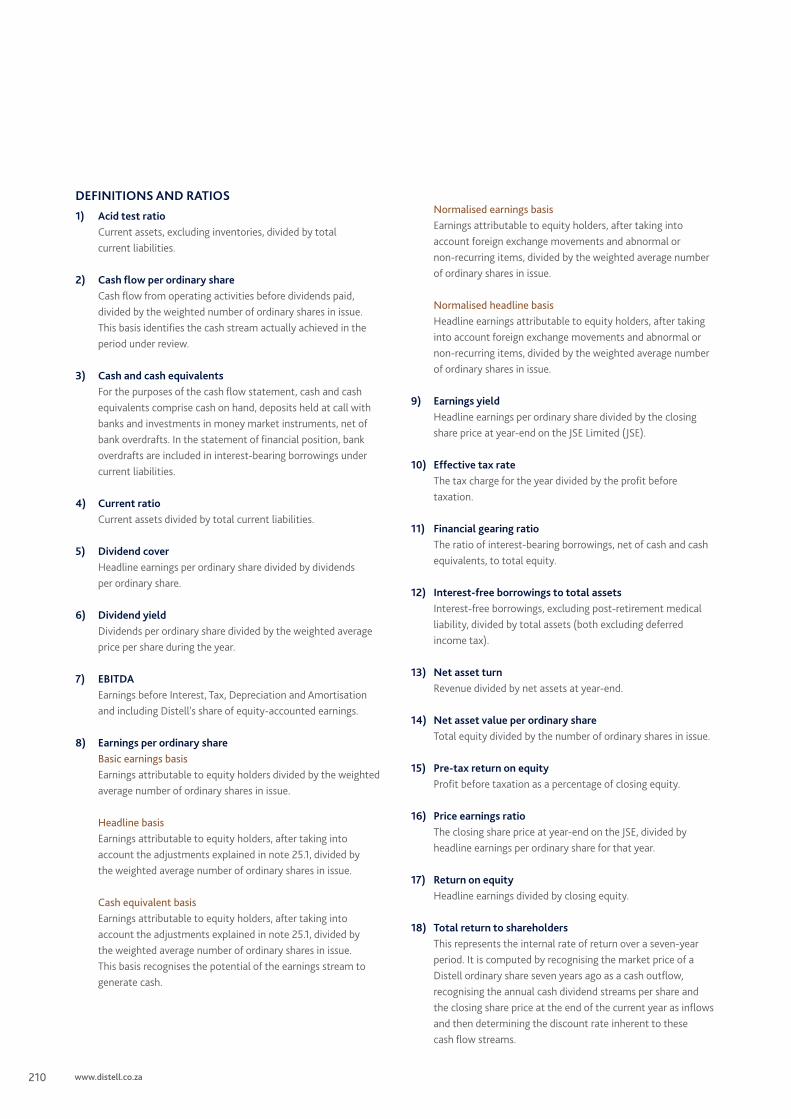
DEFINITIONS AND RATIOS1) Acid test ratio
Current assets, excluding inventories, divided by total current liabilities.
2) Cash flow per ordinary shareCash flow from operating activities before dividends paid, divided by the weighted number of ordinary shares in issue. This basis identifies the cash stream actually achieved in the period under review.
3) Cash and cash equivalentsFor the purposes of the cash flow statement, cash and cash equivalents comprise cash on hand, deposits held at call with banks and investments in money market instruments, net of bank overdrafts. In the statement of financial position, bank overdrafts are included in interest-bearing borrowings under current liabilities.
4) Current ratioCurrent assets divided by total current liabilities.
5) Dividend coverHeadline earnings per ordinary share divided by dividends per ordinary share.
6) Dividend yieldDividends per ordinary share divided by the weighted average price per share during the year.
7) EBITDAEarnings before Interest, Tax, Depreciation and Amortisation and including Distell's share of equity-accounted earnings.
8) Earnings per ordinary shareBasic earnings basisEarnings attributable to equity holders divided by the weighted average number of ordinary shares in issue.
Headline basisEarnings attributable to equity holders, after taking into account the adjustments explained in note 25.1, divided by the weighted average number of ordinary shares in issue.
Cash equivalent basisEarnings attributable to equity holders, after taking into account the adjustments explained in note 25.1, divided by the weighted average number of ordinary shares in issue. This basis recognises the potential of the earnings stream to generate cash.
Normalised earnings basisEarnings attributable to equity holders, after taking into account foreign exchange movements and abnormal or non-recurring items, divided by the weighted average number of ordinary shares in issue.
Normalised headline basisHeadline earnings attributable to equity holders, after taking into account foreign exchange movements and abnormal or non-recurring items, divided by the weighted average number of ordinary shares in issue.
9) Earnings yieldHeadline earnings per ordinary share divided by the closing share price at year-end on the JSE Limited (JSE).
10) Effective tax rateThe tax charge for the year divided by the profit before taxation.
11) Financial gearing ratioThe ratio of interest-bearing borrowings, net of cash and cash equivalents, to total equity.
12) Interest-free borrowings to total assetsInterest-free borrowings, excluding post-retirement medical liability, divided by total assets (both excluding deferred income tax).
13) Net asset turnRevenue divided by net assets at year-end.
14) Net asset value per ordinary shareTotal equity divided by the number of ordinary shares in issue.
15) Pre-tax return on equityProfit before taxation as a percentage of closing equity.
16) Price earnings ratioThe closing share price at year-end on the JSE, divided by headline earnings per ordinary share for that year.
17) Return on equityHeadline earnings divided by closing equity.
18) Total return to shareholdersThis represents the internal rate of return over a seven-year period. It is computed by recognising the market price of a Distell ordinary share seven years ago as a cash outflow, recognising the annual cash dividend streams per share and the closing share price at the end of the current year as inflows and then determining the discount rate inherent to these cash flow streams.
210 www.distell.co.za
OUR APPROACH TO REPORTINGScope of the reportThe report covers the integrated performance of the Distell Group for the year ended 30 June 2018.
The report is aimed primarily at our shareholders and the local and offshore investment community – the providers of financial capital. While Distell interacts with a range of other stakeholders who influence the business, their needs are addressed through other forms of focused communication.
There has been no change from last year in the scope and boundary of the report. A number of minor restatements of past statistical data have been made. These are clearly marked and explained in this report.
More detailed non-financial information is available online in the full sustainability report. Additional information relating to presentations, events and results can be found in the investor centre section of our website.
Content guidanceWe consider, use and apply a range of content guidance documents in the preparation of our reporting elements:
− The integrated report considers the requirements of the International Integrated Reporting Council’s (IIRC) Integrated Reporting (<IR>) Framework.
− The annual financial statements presented in this report are prepared in accordance with: • International Financial Reporting Standards (IFRS);• the reporting guides provided by the South African Institute
of Chartered Accountants (SAICA) and the Accounting Practices Committee (APC), where applicable,
• the South African Companies Act, No. 71 of 2008, as amended (the Companies Act); and
• the JSE Listings Requirements. − We have applied the principles outlined in the King IV Report on
Corporate Governance™ for South Africa 2016 (King IV™).
Independent assuranceThe content of the report has been reviewed by the board of directors and management, but has not been externally assured. While the Group has not sought third-party assurance with respect to its non-financial data, broad-based black economic empowerment (B-BBEE) performance has been independently assessed and verified. Other non-financial disclosures and performance data have been audited and validated through an internal auditing process.
Assurance of the annual financial statements has been provided by the external auditors, PricewaterhouseCoopers Inc., and an unqualified opinion has been issued thereon.
Our report is assessed by management each year to ensure that we continue to meet the reporting and disclosure needs of local and international investors.
Forward-looking statementsDue to the future-orientated principle of integrated reporting, many of the statements in this report constitute forward-looking statements. These are not guarantees or predictions of future performance. As discussed in the report, the business faces risks, opportunities and other factors outside its control. These or other uncertainties may cause our actual future results to be materially different from those expressed in this report. Readers are therefore advised not to place undue reliance on forward-looking statements as we do not undertake to update these.
211DISTELL Integrated Report 2018
SUPPLEMENTARY INFORMATION
DATES OF IMPORTANCE TO SHAREHOLDERSAnnual general meeting 24 October 2018
Financial reportInterim report February 2019Preliminary announcement of annual results August 2019
Annual financial statements 19 September 2018
Ordinary dividendsInterim dividends
− declaration February 2019 − payable March 2019
Final dividends − declaration August 2019 − payable September 2019
ADMINISTRATIONDistell Group Holdings LimitedIncorporated in the Republic of South Africa(Registration number: 2016/394974/06)JSE share code: DGHISIN: ZAE000248811
Company secretaryL Malan
Registered officeAan-de-Wagenweg, Stellenbosch 7600PO Box 184, Stellenbosch 7599Telephone: 021 809 7000Facsimile: 021 886 4611E-mail: [email protected]
Transfer secretariesComputershare Investor Services Proprietary LimitedRosebank Towers, 15 Biermann Avenue, Rosebank 2196PO Box 61051, Marshalltown 2107Telephone: 011 370 7700Facsimile: 011 688 5238
AuditorsPricewaterhouseCoopers Inc.Stellenbosch
ListingJSE LimitedSector: Consumer Goods – Food and Beverage – Beverages
SponsorRand Merchant Bank (a division of FirstRand Bank Limited)
Websitewww.distell.co.za
212 www.distell.co.za

GREYMATTER & FINCH # 12545
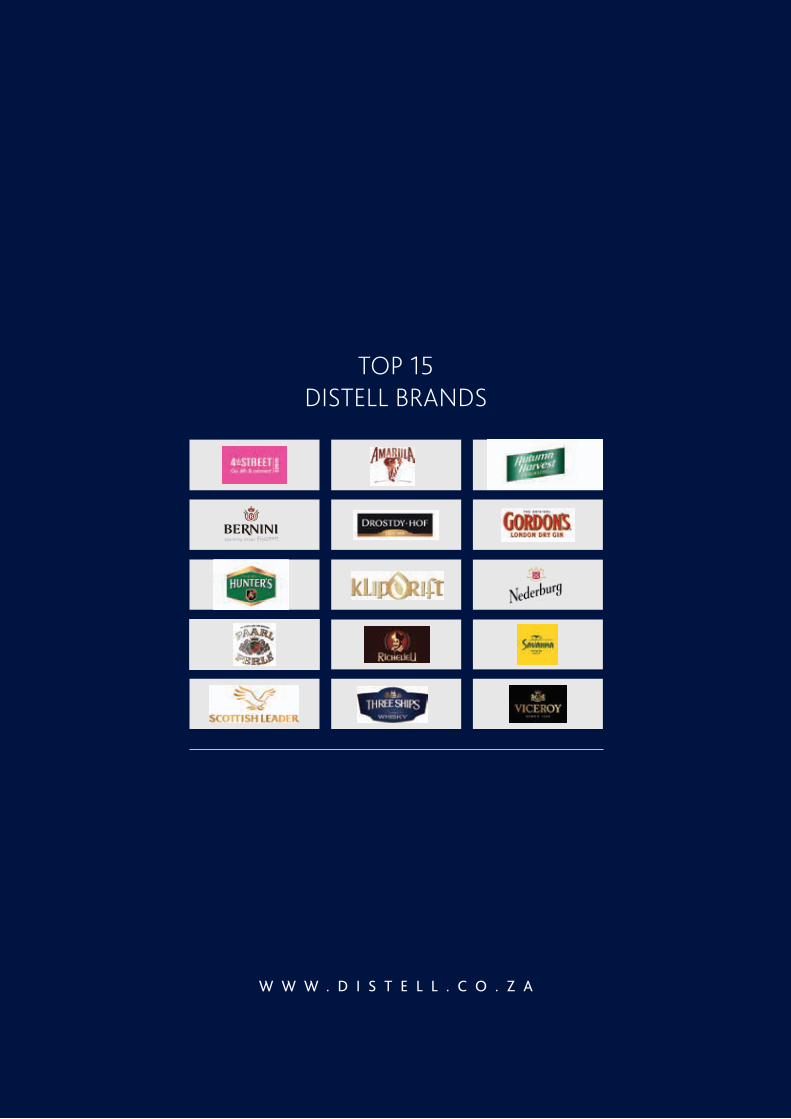
W W W . D I S T E L L . C O . Z A
TOP 15 DISTELL BRANDS