int j envi sci tech
TRANSCRIPT
ORIGINAL PAPER
Response surface methodology mediated optimizationof Remazol Orange decolorization in plain distilled waterby Pseudomonas aeruginosa BCH
S. B. Jadhav • S. N. Surwase • S. S. Phugare •
J. P. Jadhav
Received: 20 January 2012 / Accepted: 16 June 2012 / Published online: 20 July 2012
� CEERS, IAU 2012
Abstract The bacterium Pseudomonas aeruginosa BCH
decolorized and degraded the sulphonated azo dye
Remazol Orange in plain distilled water. The effects of
different parameters, i.e. pH, temperature and cell mass
concentration on the biodegradation of dye in aqueous
phase was evaluated using response surface methodology.
Optimization was carried out using three-level Box–
Behnken design. Predicted values were found to be in good
agreement with experimental values (R2 0.9997 and pred
R2 0.9984), which indicated suitability of the employed
model and the success of response surface methodology.
Optimum dye decolorization was maximized and the
favourable conditions were pH 7.43, temperature 29.39 �C
and cell mass concentration 2.88 g l-1, which resulted in
96.01 % decolorization within 5 h. It was validated from
the predicted response (97.37 %). According to the anal-
ysis of variance results, the proposed model can be used to
navigate the design space. 3D plot analysis disclosed the
significant interaction between all three tested factors on
decolorization process. The combinations of the three
variables predicted during response surface methodology
were confirmed through confirmatory experiments. Obser-
vations indicated that higher cell mass accelerated the
decolorization process. Degradation of the dye was verified
through high performance liquid chromatography analysis.
Phytotoxicity studies carried out with dye and dye metab-
olites using Phaseolus mungo, Triticum aestivum and
Sorghum vulgare indicated the detoxification of dye.
Keywords Biodegradation � Box–Behnken design �High performance liquid chromatography � Phytotoxicity
Introduction
Azo dyes are the most widely and diversely used textile dyes.
Besides their negative aesthetic effects, these substances may
show toxicity to aquatic life, can be responsible for allergenic
effects and are often potentially carcinogenic or mutagenic
to humans (Brown and Hamburger 1987). Generally, it is
assumed that the first step in the biodegradation of azo
compounds is the reduction to the corresponding amines, a
reaction catalyzed by azoreductase. Then, the resultant
aromatic amines are further degraded aerobically (Sandhya
et al. 2005). Moreover, conventional aerobic wastewater
treatment processes, such as activated sludge, cannot usually
efficiently remove the colour of azo dyes, since these com-
pounds are often recalcitrant aerobically (Chang et al. 2001).
So, the need to develop a novel biological process leading to
a more effective cleanup of azo dye contamination and
degradation of azo dyes by microorganisms with a high
metabolizing capacity is greatly desirable.
Biodegradation of azo dyes has been extensively studied
in the last decades. Various microbial species, individually
or in consortium, have been demonstrated for their activity to
degrade azo dyes (Asad et al. 2007; Fang et al. 2004; Gou
et al. 2009; Patil et al. 2010). Even mutant strains also have
been constructed to increase the efficiency for azo dye deg-
radation (Gopinath et al. 2009). However, degradation of azo
S. B. Jadhav � S. S. Phugare � J. P. Jadhav
Department of Biochemistry, Shivaji University,
Kolhapur 416004, India
S. N. Surwase
Department of Microbiology, Shivaji University,
Kolhapur 416004, India
J. P. Jadhav (&)
Department of Biotechnology, Shivaji University,
Kolhapur 416004, India
e-mail: [email protected]
123
Int. J. Environ. Sci. Technol. (2013) 10:181–190
DOI 10.1007/s13762-012-0088-9
dye in plain distilled water has been reported only for yeast
species Saccharomyces cerevisiae (Jadhav et al. 2007).
A number of statistically designed experimental models
have been applied to optimize the culture parameters in
biological research. Response surface methodology (RSM)
is an experimental approach to identify the optimum con-
ditions for a multivariable system. This methodology has
been successfully applied in optimization of the enzyme
production, dye and other pollutants degradation, media
optimization for dye decolorization and other pollutants
degradation (Bae and Shoda 2005; Fan et al. 2004;
Nyanhongo et al. 2002; Singh et al. 2010; Trupkin et al.
2003; Wang et al. 2004; Zhou et al. 2011). However, herein
we applied RSM for textile dye degradation in plain dis-
tilled water. There is no such report on the decolorization
of textile dye in the absence of any kind of nutrients by a
bacterial species. In this study, a three-level Box–Behnken
design was employed to optimize and maximize the
decolorization and degradation of textile azo dye Remazol
Orange (RmO) by Pseudomonas aeruginosa BCH. Further
dye degradation and detoxification was assessed with high
performance liquid chromatography (HPLC) and phyto-
toxicity studies, respectively.
Materials and methods
Dye and chemicals
Azo dye RmO used in this study was obtained from textiles
industries, Ichalkaranji, Maharashtra, India. Medium com-
ponents for bacterial growth, o-tolidine, veratryl alcohol
and L-ascorbic acid were purchased from Hi-Media Pvt.
Ltd. India. Catechol was obtained from Thomas-Baker.
Solvents, ethyl acetate and dichloromethane were bought
from Merck, India and HPLC grade methanol and water
was from Sigma-Aldrich, India.
Bacterial strain and culture conditions
Bacterial strain P. aeruginosa BCH used in this study was
previously isolated in our laboratory from dye contami-
nated soil (Jadhav et al. 2010). The pure culture was
maintained at 4 �C on yeast extract agar medium having
composition (g l-1): yeast extract 5, NaCl 5 and agar 25.
The medium for bacterial growth was composed of (g l-1):
yeast extract 2, NaCl 5.
Biodegradation assay
A single colony of bacterium was inoculated in 250 ml
Erlenmeyer flasks containing 100 ml growth medium and
grown for 8 h at 30 �C at shaking condition (120 rpm).
From this inoculum (log phase), 1 ml of culture was then
inoculated in the 100 ml fresh medium and grown for 24 h as
mentioned above. Cells were harvested by centrifugation at
6,000 rpm for 10 min at 4 �C (dry cells weight was
30 ± 2 mg). Centrifuged cells were washed twice with
sterile distilled water and re-suspended in distilled water at a
required concentration (1.0 or 2.0 or 3.0 g l-1 dry weight).
Dye was added at a concentration of 50 mg l-l from the
stock solution prepared in sterile distilled water. Adjustment
of the pH was done with 0.1 M NaOH and 0.1 M HCl prior to
re-suspension of the cells in water. For studies under various
temperatures, flasks with cell suspension in water were
incubated at respective temperatures for 15 min. (to attain
the temperature) prior to dye addition. Then after dye addi-
tion, incubation was continued at respective temperatures.
Aliquots of 1 ml from this decolorization assay sample were
withdrawn immediately after dye addition (zero time) and,
after dye decolorization, centrifuged at 5,500 rpm for
15 min at room temperature and supernatants were analyzed
at 495 nm on spectrophotometer (Shimadzu, UV-1800). The
decolorization activity was calculated by using the formula:
Decolorization %ð Þ
¼ Initial absorbanceð Þ � Observed absorbanceð Þ½ �Initial absorbanceð Þ � 100
ð1Þ
All experiments were performed in triplicates in aseptic
conditions.
Response surface methodology (RSM)
RSM is an empirical modelling technique used to assess
the correlation between a set of controllable experimental
factors and observed results. This optimization technique
involves three major steps: (i) performing statistically
designed experiments, (ii) estimating the coefficients in a
mathematical model and (iii) predicting the response and
checking the adequacy of the model (Box and Behnken
1960). The Box and Behnken design was applied using
Design-Expert (Stat-Ease) software trial version 8.0.6.1 to
our study with three variables at three levels. The three
parameters of pH, temperature and cell mass concentration
were chosen based on the results from the preliminary
experiments. These parameters were chosen as the critical
variables to maximize dye decolorization and designated as
A, B, and C and the boundary conditions for each parameter
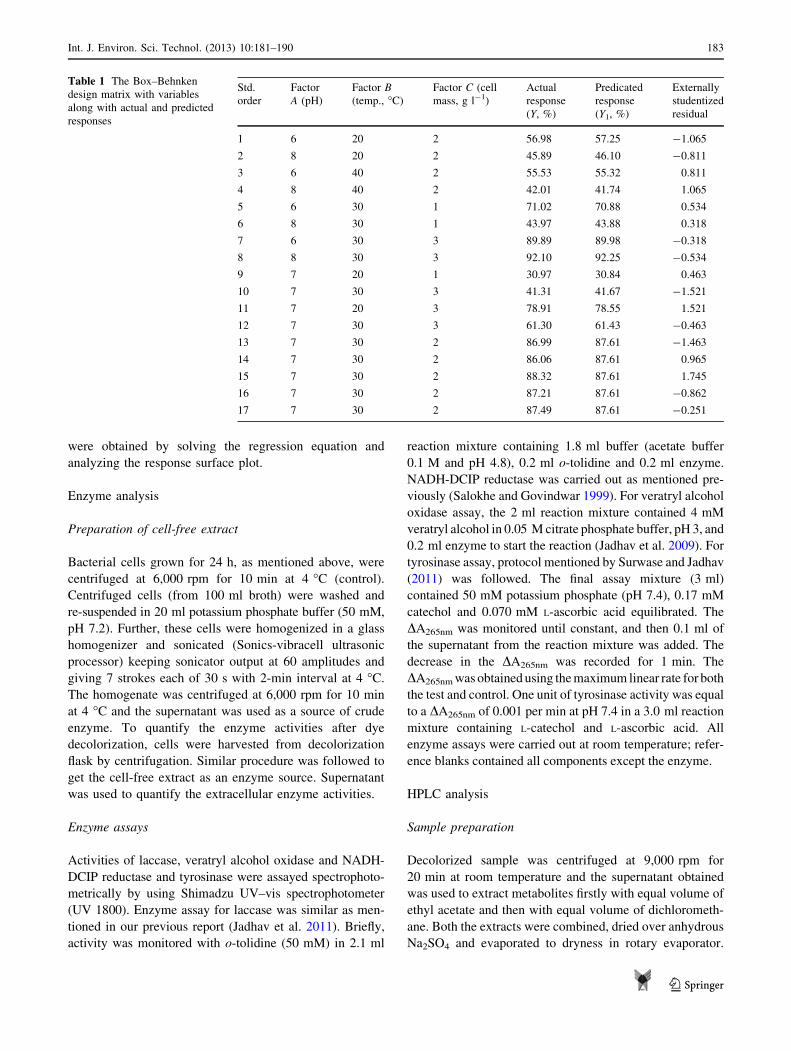
with actual design are depicted in Table 1. The significance
of the model equation and model terms was evaluated by
F test. The quality of the quadratic model equation was
expressed by the determination coefficient R2 and adjusted
R2. Analysis of variance (ANOVA) was applied to evaluate
the statistical significance of the model. The optimal values
182 Int. J. Environ. Sci. Technol. (2013) 10:181–190
123
were obtained by solving the regression equation and
analyzing the response surface plot.
Enzyme analysis
Preparation of cell-free extract
Bacterial cells grown for 24 h, as mentioned above, were
centrifuged at 6,000 rpm for 10 min at 4 �C (control).
Centrifuged cells (from 100 ml broth) were washed and
re-suspended in 20 ml potassium phosphate buffer (50 mM,
pH 7.2). Further, these cells were homogenized in a glass
homogenizer and sonicated (Sonics-vibracell ultrasonic
processor) keeping sonicator output at 60 amplitudes and
giving 7 strokes each of 30 s with 2-min interval at 4 �C.
The homogenate was centrifuged at 6,000 rpm for 10 min
at 4 �C and the supernatant was used as a source of crude
enzyme. To quantify the enzyme activities after dye
decolorization, cells were harvested from decolorization
flask by centrifugation. Similar procedure was followed to
get the cell-free extract as an enzyme source. Supernatant
was used to quantify the extracellular enzyme activities.
Enzyme assays
Activities of laccase, veratryl alcohol oxidase and NADH-
DCIP reductase and tyrosinase were assayed spectrophoto-
metrically by using Shimadzu UV–vis spectrophotometer
(UV 1800). Enzyme assay for laccase was similar as men-
tioned in our previous report (Jadhav et al. 2011). Briefly,
activity was monitored with o-tolidine (50 mM) in 2.1 ml
reaction mixture containing 1.8 ml buffer (acetate buffer
0.1 M and pH 4.8), 0.2 ml o-tolidine and 0.2 ml enzyme.
NADH-DCIP reductase was carried out as mentioned pre-
viously (Salokhe and Govindwar 1999). For veratryl alcohol
oxidase assay, the 2 ml reaction mixture contained 4 mM
veratryl alcohol in 0.05 M citrate phosphate buffer, pH 3, and
0.2 ml enzyme to start the reaction (Jadhav et al. 2009). For
tyrosinase assay, protocol mentioned by Surwase and Jadhav
(2011) was followed. The final assay mixture (3 ml)
contained 50 mM potassium phosphate (pH 7.4), 0.17 mM
catechol and 0.070 mM L-ascorbic acid equilibrated. The
DA265nm was monitored until constant, and then 0.1 ml of
the supernatant from the reaction mixture was added. The
decrease in the DA265nm was recorded for 1 min. The
DA265nm was obtained using the maximum linear rate for both
the test and control. One unit of tyrosinase activity was equal
to a DA265nm of 0.001 per min at pH 7.4 in a 3.0 ml reaction
mixture containing L-catechol and L-ascorbic acid. All
enzyme assays were carried out at room temperature; refer-
ence blanks contained all components except the enzyme.
HPLC analysis
Sample preparation
Decolorized sample was centrifuged at 9,000 rpm for
20 min at room temperature and the supernatant obtained
was used to extract metabolites firstly with equal volume of
ethyl acetate and then with equal volume of dichlorometh-
ane. Both the extracts were combined, dried over anhydrous
Na2SO4 and evaporated to dryness in rotary evaporator.
Table 1 The Box–Behnken
design matrix with variables
along with actual and predicted
responses
Std.
order
Factor
A (pH)
Factor B(temp., �C)
Factor C (cell
mass, g l-1)
Actual
response
(Y, %)
Predicated
response
(Y1, %)
Externally
studentized
residual
1 6 20 2 56.98 57.25 -1.065
2 8 20 2 45.89 46.10 -0.811
3 6 40 2 55.53 55.32 0.811
4 8 40 2 42.01 41.74 1.065
5 6 30 1 71.02 70.88 0.534
6 8 30 1 43.97 43.88 0.318
7 6 30 3 89.89 89.98 -0.318
8 8 30 3 92.10 92.25 -0.534
9 7 20 1 30.97 30.84 0.463
10 7 30 3 41.31 41.67 -1.521
11 7 20 3 78.91 78.55 1.521
12 7 30 3 61.30 61.43 -0.463
13 7 30 2 86.99 87.61 -1.463
14 7 30 2 86.06 87.61 0.965
15 7 30 2 88.32 87.61 1.745
16 7 30 2 87.21 87.61 -0.862
17 7 30 2 87.49 87.61 -0.251
Int. J. Environ. Sci. Technol. (2013) 10:181–190 183
123
This dried residue was redissolved in small volume of HPLC
grade methanol and used for HPLC analysis.
Analytical method
High performance liquid chromatography analysis was per-
formed in an isocratic Waters 2690 system equipped with
dual absorbance detector. Column specifications were—C18
column with symmetry 4.6 mm 9 250 mm. HPLC grade
methanol:water (80:20) was used as mobile phase with flow
rate 1 ml min-1 and HPLC run was carried out for 10 min.
Phytotoxicity
The biodegradation metabolites of RmO extracted in sol-
vents were dried and dissolved in water to form the final
concentration of 500 ppm for phytotoxicity studies. Phy-
totoxicity of the dye (500 ppm) and its extracted degra-
dation products was carried out using Sorghum vulgare,
Phaseolus mungo and Triticum aestivum (10 seeds of each)
by watering separately 10 ml sample of dyes and its deg-
radation products per day. Control set was carried out using
water at the same time. Germination (%) and the length of
the plumule and radical were recorded after 8 days.
Results and discussion
Dye decolorization
Pseudomonas aeruginosa BCH was found to have the
potential for the decolorization of textile azo dye RmO in
plain distilled water. There is no such report on bacterial
dye decolorization in plain distilled water. However, yeast
species S. cerevisiae MTCC 463 was shown to degrade
triphenylmethane dyes in plain distilled water (Jadhav and
Govindwar 2006). In that study, the decolorization of the
dye was occurred through both biosorption and biotrans-
formation. In order to check whether bacterium P. aeru-
ginosa BCH in the present study followed similar
mechanism, heat-killed cell suspension was checked for the
decolorization activity. No dye biosorption was observed
visually as well as in solvent desorption experiments with
various solvents (Phugare et al. 2010). Dye desorption
experiments were also carried out with live cell culture
after dye decolorization, and no dye adsorption was
observed. However, dye adsorption was observed only
initially. It was also important to check the stability of dye
over various pH ranges. We carried out UV–vis spectral
analysis of dye at different pHs. It was observed that there
was no shift or change in the absorbance maxima of the
dye, when scanned in visible range, at different pHs (figure
not shown). It indicates that dye was stable at various pHs
and also signify that the decolorization was mediated by
bacterial activity only. In order to optimize this bacterial
decolorization performance in plain distilled water, we
employed RSM technique.
Experimental design, significance analysis
and adequacy of the model
RSM with Box–Behnken design was applied to optimize the
decolorization performance of the bacterium. During pre-
liminary dye decolorization studies system, variables and
their levels were identified. To accomplish a more realistic
model, prior knowledge gained from previous studies for
understanding the process and the process variables under
investigation is necessary for the RSM optimization method
(Sharma et al. 2009a). Each run was performed in triplicate
and mean values for % decolorization was putted in the
software. The design matrix of the variables in actual units is
given in Table 1 along with the predicted and experimental
values of response. By applying multiple regression analysis
methods, the predicted response, Y (% decolorization) for can
be obtained and given in terms of coded factors as:
Y ¼ þ87:61� 6:18� A� 1:57� Bþ 16:87� C � 0:61
� A� Bþ 7:32� A� C � 6:99� B
� C � 8:19� A2 � 29:32� B2 � 5:17� C2 ð2aÞ
or in terms of actual factors as:
% Decolorization ¼ �548:97500þ 88:41925� pH
þ 19:95420 � Temperatureþ 35:34150� Cell mass
� 0:060750 � pH � Temperatureþ 14:63000� pH
� Cell mass� 1:39750� Temperature � Cell mass
� 8:19450� pH2 � 0:29317� Temperature2
� 20:69800 � Cell mass2 ð2bÞ
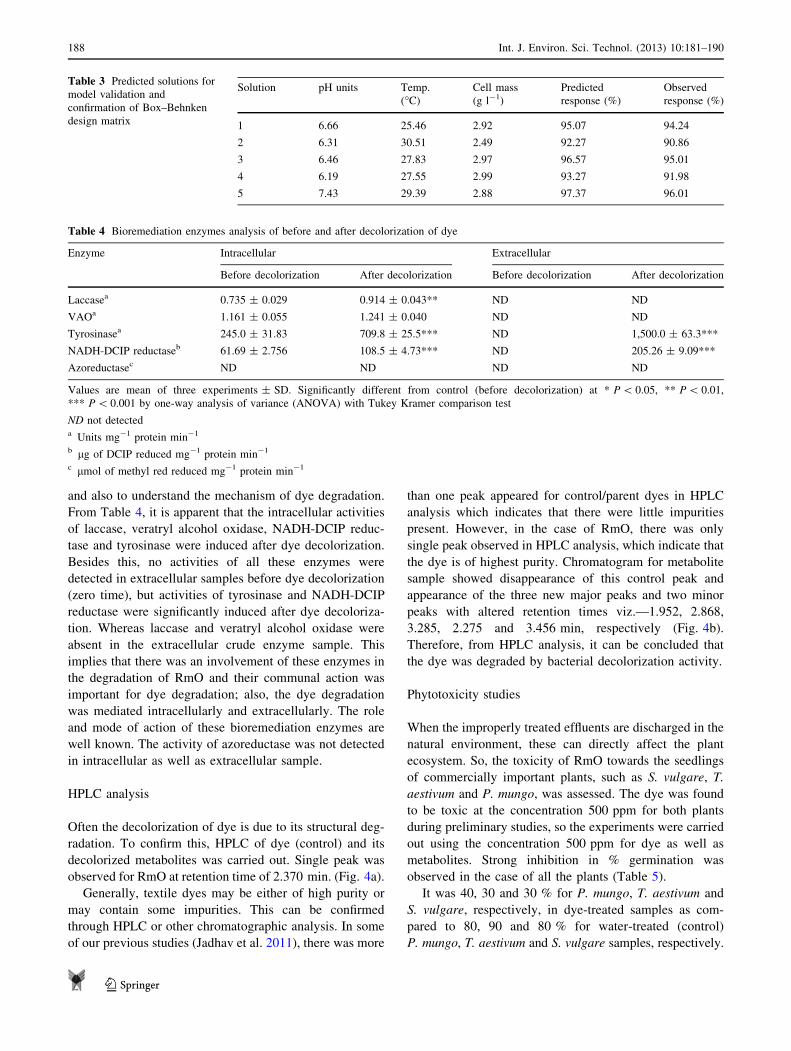
The statistical significance of model was evaluated by
F test and the ANOVA for response surface quadratic
model is summarized in Table 2.
ANOVA of regression model demonstrates that the
model is highly significant, as it is evident from the Fish-
er’s F test with a very low probability value [(Pmod-
el [ F) = 0.0001]. The lack-of-fit test measures the failure
of the model to represent data in the experimental domain
at points, which are not included in the regression. This test
is desired to be non-significant to signify the model
(Sharma et al. 2009b). In this study, the non-significant
value of lack of fit (F value 0.62) exposed that the qua-
dratic model is statistically significant for the response, and
therefore it can be used for further analysis.
In general, it is imperative to substantiate the fitted model
to make sure that it gives sufficient approximation to the
actual test. Model should represent a satisfactory fit,
184 Int. J. Environ. Sci. Technol. (2013) 10:181–190
123
otherwise proceeding with investigation and optimization
of the fitted response surface is likely to give poor or mis-
leading results (Murugesan et al. 2007). Generally multiple
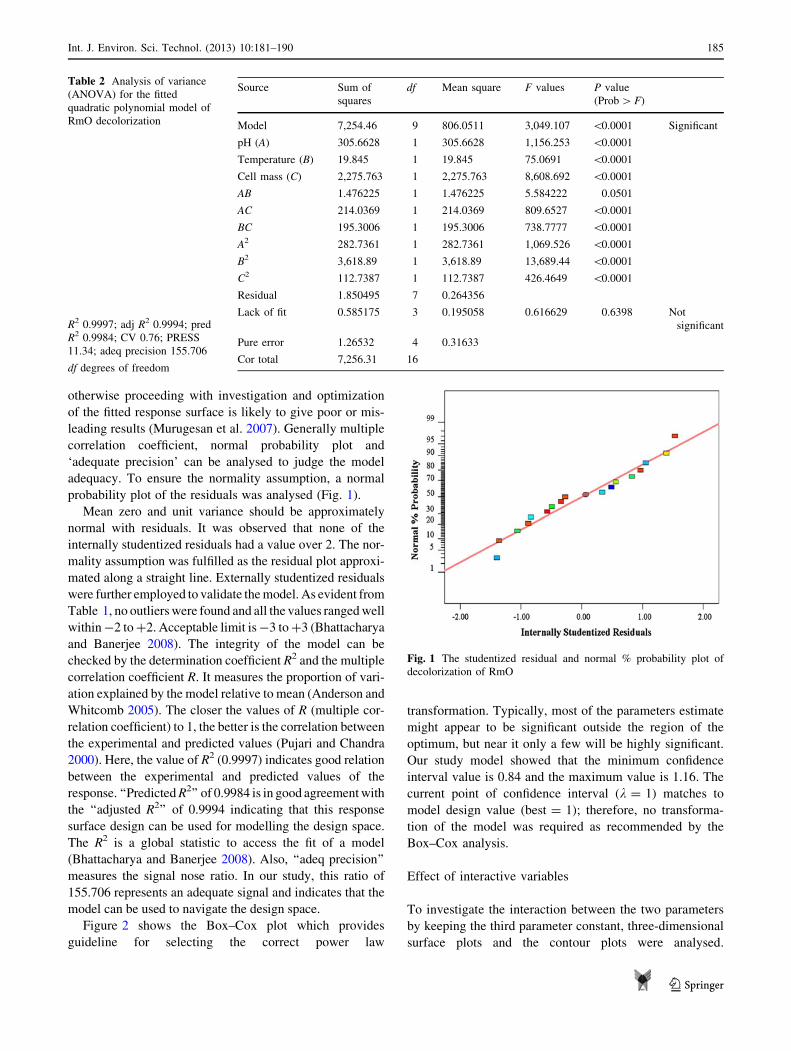
correlation coefficient, normal probability plot and
‘adequate precision’ can be analysed to judge the model
adequacy. To ensure the normality assumption, a normal
probability plot of the residuals was analysed (Fig. 1).
Mean zero and unit variance should be approximately
normal with residuals. It was observed that none of the
internally studentized residuals had a value over 2. The nor-
mality assumption was fulfilled as the residual plot approxi-
mated along a straight line. Externally studentized residuals
were further employed to validate the model. As evident from
Table 1, no outliers were found and all the values ranged well
within -2 to ?2. Acceptable limit is -3 to ?3 (Bhattacharya
and Banerjee 2008). The integrity of the model can be
checked by the determination coefficient R2 and the multiple
correlation coefficient R. It measures the proportion of vari-
ation explained by the model relative to mean (Anderson and
Whitcomb 2005). The closer the values of R (multiple cor-
relation coefficient) to 1, the better is the correlation between
the experimental and predicted values (Pujari and Chandra
2000). Here, the value of R2 (0.9997) indicates good relation
between the experimental and predicted values of the
response. ‘‘Predicted R2’’ of 0.9984 is in good agreement with
the ‘‘adjusted R2’’ of 0.9994 indicating that this response
surface design can be used for modelling the design space.
The R2 is a global statistic to access the fit of a model
(Bhattacharya and Banerjee 2008). Also, ‘‘adeq precision’’
measures the signal nose ratio. In our study, this ratio of
155.706 represents an adequate signal and indicates that the
model can be used to navigate the design space.
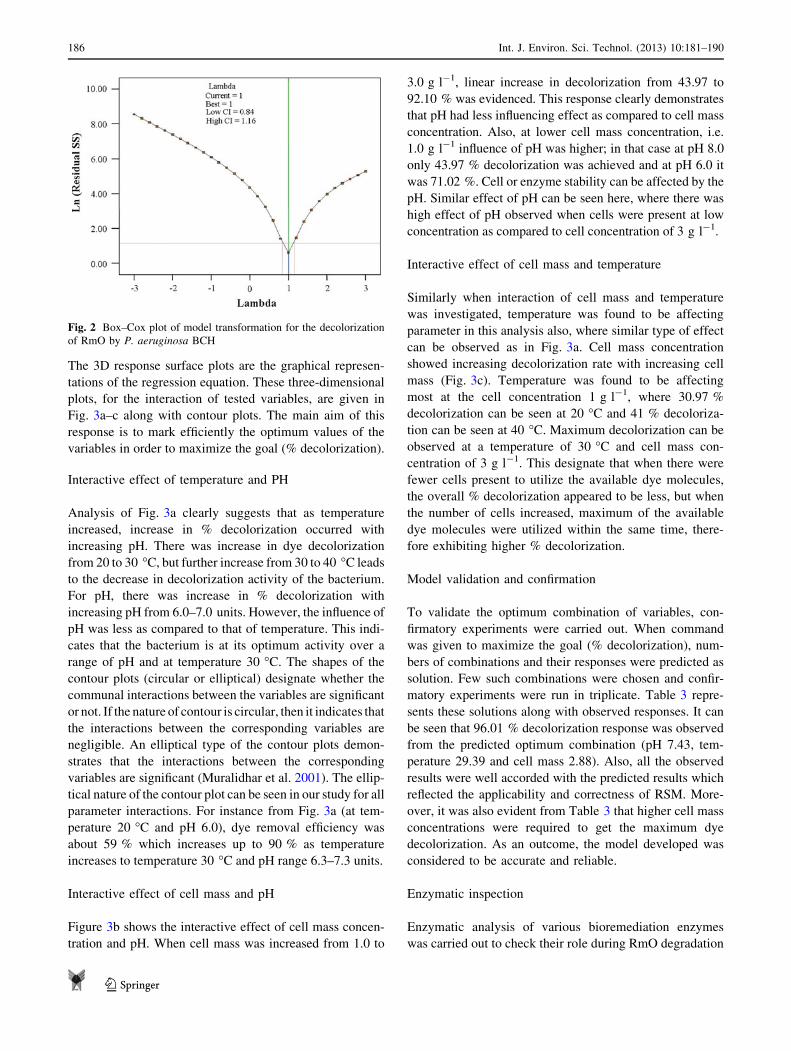
Figure 2 shows the Box–Cox plot which provides
guideline for selecting the correct power law
transformation. Typically, most of the parameters estimate
might appear to be significant outside the region of the
optimum, but near it only a few will be highly significant.
Our study model showed that the minimum confidence
interval value is 0.84 and the maximum value is 1.16. The
current point of confidence interval (k = 1) matches to
model design value (best = 1); therefore, no transforma-
tion of the model was required as recommended by the
Box–Cox analysis.
Effect of interactive variables
To investigate the interaction between the two parameters
by keeping the third parameter constant, three-dimensional
surface plots and the contour plots were analysed.
Fig. 1 The studentized residual and normal % probability plot of
decolorization of RmO
Table 2 Analysis of variance
(ANOVA) for the fitted
quadratic polynomial model of
RmO decolorization
R2 0.9997; adj R2 0.9994; pred
R2 0.9984; CV 0.76; PRESS
11.34; adeq precision 155.706
df degrees of freedom
Source Sum of
squares
df Mean square F values P value
(Prob [ F)
Model 7,254.46 9 806.0511 3,049.107 \0.0001 Significant
pH (A) 305.6628 1 305.6628 1,156.253 \0.0001
Temperature (B) 19.845 1 19.845 75.0691 \0.0001
Cell mass (C) 2,275.763 1 2,275.763 8,608.692 \0.0001
AB 1.476225 1 1.476225 5.584222 0.0501
AC 214.0369 1 214.0369 809.6527 \0.0001
BC 195.3006 1 195.3006 738.7777 \0.0001
A2 282.7361 1 282.7361 1,069.526 \0.0001
B2 3,618.89 1 3,618.89 13,689.44 \0.0001
C2 112.7387 1 112.7387 426.4649 \0.0001
Residual 1.850495 7 0.264356
Lack of fit 0.585175 3 0.195058 0.616629 0.6398 Not
significant
Pure error 1.26532 4 0.31633
Cor total 7,256.31 16
Int. J. Environ. Sci. Technol. (2013) 10:181–190 185
123
The 3D response surface plots are the graphical represen-
tations of the regression equation. These three-dimensional
plots, for the interaction of tested variables, are given in
Fig. 3a–c along with contour plots. The main aim of this
response is to mark efficiently the optimum values of the
variables in order to maximize the goal (% decolorization).
Interactive effect of temperature and PH
Analysis of Fig. 3a clearly suggests that as temperature
increased, increase in % decolorization occurred with
increasing pH. There was increase in dye decolorization
from 20 to 30 �C, but further increase from 30 to 40 �C leads
to the decrease in decolorization activity of the bacterium.
For pH, there was increase in % decolorization with
increasing pH from 6.0–7.0 units. However, the influence of
pH was less as compared to that of temperature. This indi-
cates that the bacterium is at its optimum activity over a
range of pH and at temperature 30 �C. The shapes of the
contour plots (circular or elliptical) designate whether the
communal interactions between the variables are significant
or not. If the nature of contour is circular, then it indicates that
the interactions between the corresponding variables are
negligible. An elliptical type of the contour plots demon-
strates that the interactions between the corresponding
variables are significant (Muralidhar et al. 2001). The ellip-
tical nature of the contour plot can be seen in our study for all
parameter interactions. For instance from Fig. 3a (at tem-
perature 20 �C and pH 6.0), dye removal efficiency was
about 59 % which increases up to 90 % as temperature
increases to temperature 30 �C and pH range 6.3–7.3 units.
Interactive effect of cell mass and pH
Figure 3b shows the interactive effect of cell mass concen-
tration and pH. When cell mass was increased from 1.0 to
3.0 g l-1, linear increase in decolorization from 43.97 to
92.10 % was evidenced. This response clearly demonstrates
that pH had less influencing effect as compared to cell mass
concentration. Also, at lower cell mass concentration, i.e.
1.0 g l-1 influence of pH was higher; in that case at pH 8.0
only 43.97 % decolorization was achieved and at pH 6.0 it
was 71.02 %. Cell or enzyme stability can be affected by the
pH. Similar effect of pH can be seen here, where there was
high effect of pH observed when cells were present at low
concentration as compared to cell concentration of 3 g l-1.
Interactive effect of cell mass and temperature
Similarly when interaction of cell mass and temperature
was investigated, temperature was found to be affecting
parameter in this analysis also, where similar type of effect
can be observed as in Fig. 3a. Cell mass concentration
showed increasing decolorization rate with increasing cell
mass (Fig. 3c). Temperature was found to be affecting
most at the cell concentration 1 g l-1, where 30.97 %
decolorization can be seen at 20 �C and 41 % decoloriza-
tion can be seen at 40 �C. Maximum decolorization can be
observed at a temperature of 30 �C and cell mass con-
centration of 3 g l-1. This designate that when there were
fewer cells present to utilize the available dye molecules,
the overall % decolorization appeared to be less, but when
the number of cells increased, maximum of the available
dye molecules were utilized within the same time, there-
fore exhibiting higher % decolorization.
Model validation and confirmation
To validate the optimum combination of variables, con-
firmatory experiments were carried out. When command
was given to maximize the goal (% decolorization), num-
bers of combinations and their responses were predicted as
solution. Few such combinations were chosen and confir-
matory experiments were run in triplicate. Table 3 repre-
sents these solutions along with observed responses. It can
be seen that 96.01 % decolorization response was observed
from the predicted optimum combination (pH 7.43, tem-
perature 29.39 and cell mass 2.88). Also, all the observed
results were well accorded with the predicted results which
reflected the applicability and correctness of RSM. More-
over, it was also evident from Table 3 that higher cell mass
concentrations were required to get the maximum dye
decolorization. As an outcome, the model developed was
considered to be accurate and reliable.
Enzymatic inspection
Enzymatic analysis of various bioremediation enzymes
was carried out to check their role during RmO degradation
Fig. 2 Box–Cox plot of model transformation for the decolorization
of RmO by P. aeruginosa BCH
186 Int. J. Environ. Sci. Technol. (2013) 10:181–190
123
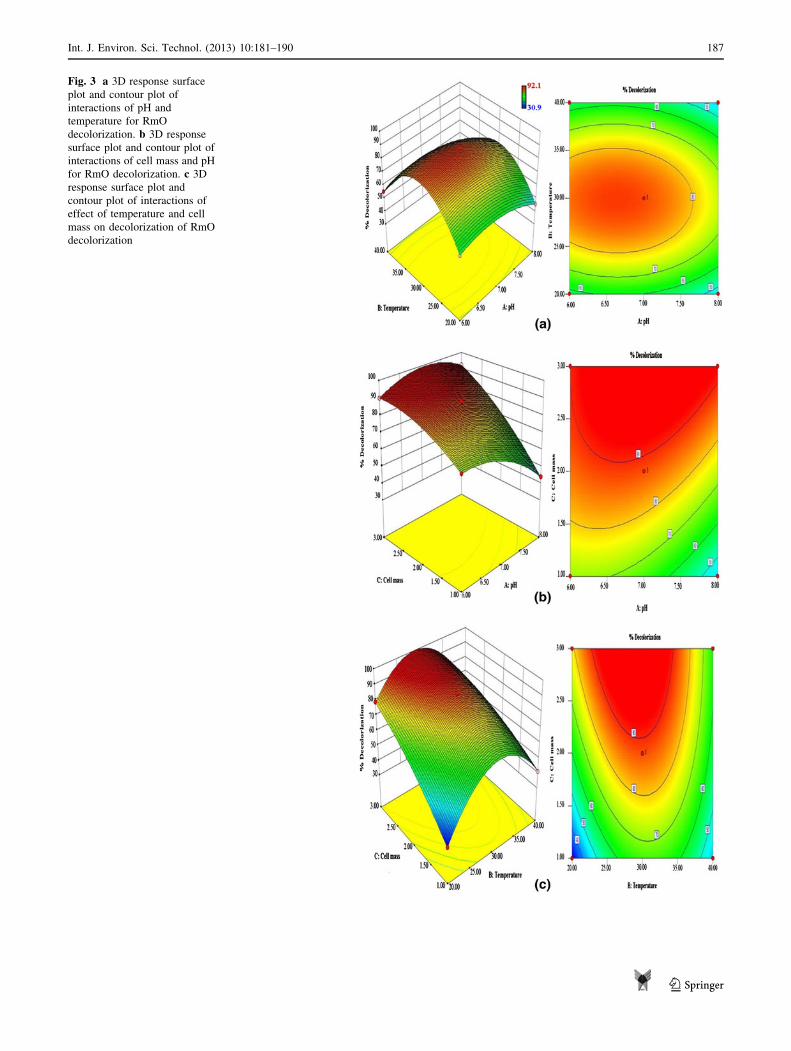
Fig. 3 a 3D response surface
plot and contour plot of
interactions of pH and
temperature for RmO
decolorization. b 3D response
surface plot and contour plot of
interactions of cell mass and pH
for RmO decolorization. c 3D
response surface plot and
contour plot of interactions of
effect of temperature and cell
mass on decolorization of RmO
decolorization
Int. J. Environ. Sci. Technol. (2013) 10:181–190 187
123
and also to understand the mechanism of dye degradation.
From Table 4, it is apparent that the intracellular activities
of laccase, veratryl alcohol oxidase, NADH-DCIP reduc-
tase and tyrosinase were induced after dye decolorization.
Besides this, no activities of all these enzymes were
detected in extracellular samples before dye decolorization
(zero time), but activities of tyrosinase and NADH-DCIP
reductase were significantly induced after dye decoloriza-
tion. Whereas laccase and veratryl alcohol oxidase were
absent in the extracellular crude enzyme sample. This
implies that there was an involvement of these enzymes in
the degradation of RmO and their communal action was
important for dye degradation; also, the dye degradation
was mediated intracellularly and extracellularly. The role
and mode of action of these bioremediation enzymes are
well known. The activity of azoreductase was not detected
in intracellular as well as extracellular sample.
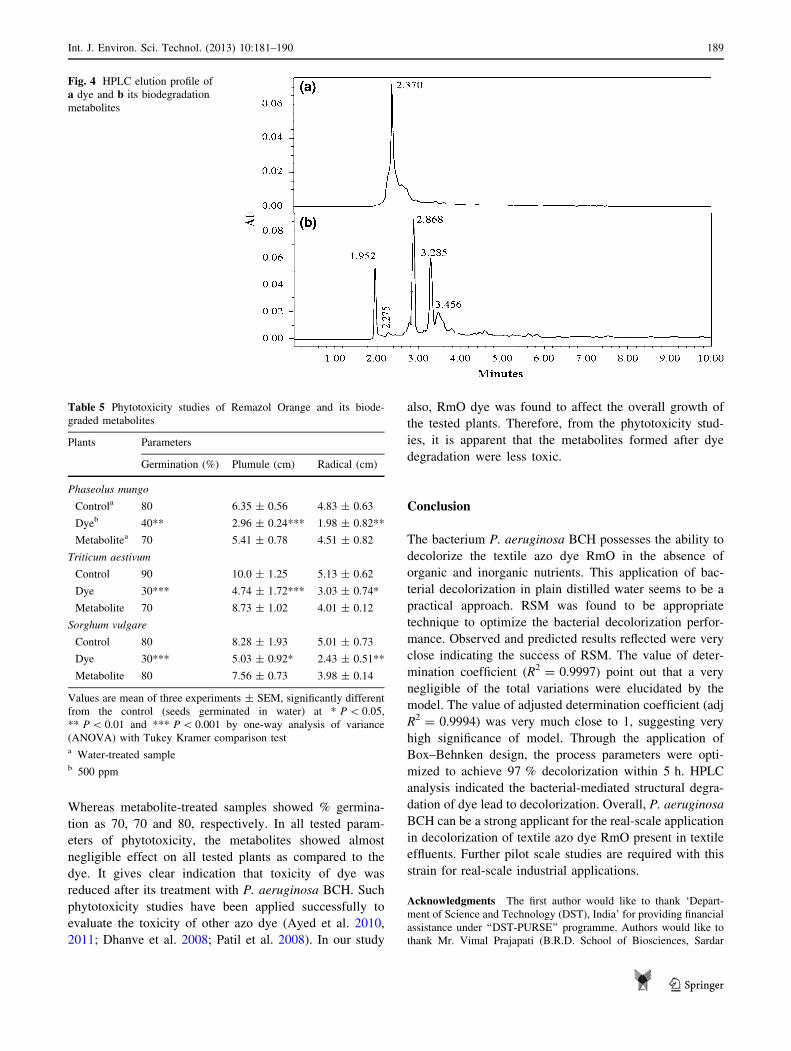
HPLC analysis
Often the decolorization of dye is due to its structural deg-
radation. To confirm this, HPLC of dye (control) and its
decolorized metabolites was carried out. Single peak was
observed for RmO at retention time of 2.370 min. (Fig. 4a).
Generally, textile dyes may be either of high purity or
may contain some impurities. This can be confirmed
through HPLC or other chromatographic analysis. In some
of our previous studies (Jadhav et al. 2011), there was more
than one peak appeared for control/parent dyes in HPLC
analysis which indicates that there were little impurities
present. However, in the case of RmO, there was only
single peak observed in HPLC analysis, which indicate that
the dye is of highest purity. Chromatogram for metabolite
sample showed disappearance of this control peak and
appearance of the three new major peaks and two minor
peaks with altered retention times viz.—1.952, 2.868,
3.285, 2.275 and 3.456 min, respectively (Fig. 4b).
Therefore, from HPLC analysis, it can be concluded that
the dye was degraded by bacterial decolorization activity.
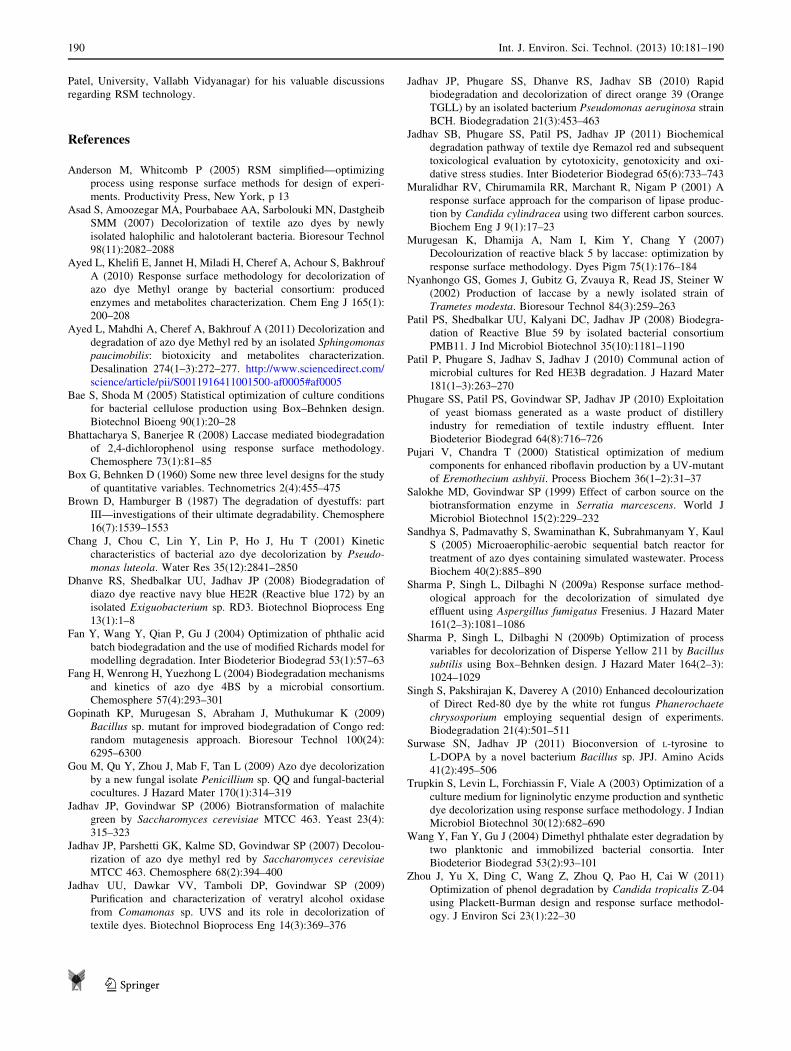
Phytotoxicity studies
When the improperly treated effluents are discharged in the
natural environment, these can directly affect the plant
ecosystem. So, the toxicity of RmO towards the seedlings
of commercially important plants, such as S. vulgare, T.
aestivum and P. mungo, was assessed. The dye was found
to be toxic at the concentration 500 ppm for both plants
during preliminary studies, so the experiments were carried
out using the concentration 500 ppm for dye as well as
metabolites. Strong inhibition in % germination was
observed in the case of all the plants (Table 5).
It was 40, 30 and 30 % for P. mungo, T. aestivum and
S. vulgare, respectively, in dye-treated samples as com-
pared to 80, 90 and 80 % for water-treated (control)
P. mungo, T. aestivum and S. vulgare samples, respectively.
Table 3 Predicted solutions for
model validation and
confirmation of Box–Behnken
design matrix
Solution pH units Temp.
(�C)
Cell mass
(g l-1)
Predicted
response (%)
Observed
response (%)
1 6.66 25.46 2.92 95.07 94.24
2 6.31 30.51 2.49 92.27 90.86
3 6.46 27.83 2.97 96.57 95.01
4 6.19 27.55 2.99 93.27 91.98
5 7.43 29.39 2.88 97.37 96.01
Table 4 Bioremediation enzymes analysis of before and after decolorization of dye
Enzyme Intracellular Extracellular
Before decolorization After decolorization Before decolorization After decolorization
Laccasea 0.735 ± 0.029 0.914 ± 0.043** ND ND
VAOa 1.161 ± 0.055 1.241 ± 0.040 ND ND
Tyrosinasea 245.0 ± 31.83 709.8 ± 25.5*** ND 1,500.0 ± 63.3***
NADH-DCIP reductaseb 61.69 ± 2.756 108.5 ± 4.73*** ND 205.26 ± 9.09***
Azoreductasec ND ND ND ND
Values are mean of three experiments ± SD. Significantly different from control (before decolorization) at * P \ 0.05, ** P \ 0.01,
*** P \ 0.001 by one-way analysis of variance (ANOVA) with Tukey Kramer comparison test
ND not detecteda Units mg-1 protein min-1
b lg of DCIP reduced mg-1 protein min-1
c lmol of methyl red reduced mg-1 protein min-1
188 Int. J. Environ. Sci. Technol. (2013) 10:181–190
123
Whereas metabolite-treated samples showed % germina-
tion as 70, 70 and 80, respectively. In all tested param-
eters of phytotoxicity, the metabolites showed almost
negligible effect on all tested plants as compared to the
dye. It gives clear indication that toxicity of dye was
reduced after its treatment with P. aeruginosa BCH. Such
phytotoxicity studies have been applied successfully to
evaluate the toxicity of other azo dye (Ayed et al. 2010,
2011; Dhanve et al. 2008; Patil et al. 2008). In our study
also, RmO dye was found to affect the overall growth of
the tested plants. Therefore, from the phytotoxicity stud-
ies, it is apparent that the metabolites formed after dye
degradation were less toxic.
Conclusion
The bacterium P. aeruginosa BCH possesses the ability to
decolorize the textile azo dye RmO in the absence of
organic and inorganic nutrients. This application of bac-
terial decolorization in plain distilled water seems to be a
practical approach. RSM was found to be appropriate
technique to optimize the bacterial decolorization perfor-
mance. Observed and predicted results reflected were very
close indicating the success of RSM. The value of deter-
mination coefficient (R2 = 0.9997) point out that a very
negligible of the total variations were elucidated by the
model. The value of adjusted determination coefficient (adj
R2 = 0.9994) was very much close to 1, suggesting very
high significance of model. Through the application of
Box–Behnken design, the process parameters were opti-
mized to achieve 97 % decolorization within 5 h. HPLC
analysis indicated the bacterial-mediated structural degra-
dation of dye lead to decolorization. Overall, P. aeruginosa
BCH can be a strong applicant for the real-scale application
in decolorization of textile azo dye RmO present in textile
effluents. Further pilot scale studies are required with this
strain for real-scale industrial applications.
Acknowledgments The first author would like to thank ‘Depart-
ment of Science and Technology (DST), India’ for providing financial
assistance under ‘‘DST-PURSE’’ programme. Authors would like to
thank Mr. Vimal Prajapati (B.R.D. School of Biosciences, Sardar
Fig. 4 HPLC elution profile of
a dye and b its biodegradation
metabolites
Table 5 Phytotoxicity studies of Remazol Orange and its biode-
graded metabolites
Plants Parameters
Germination (%) Plumule (cm) Radical (cm)
Phaseolus mungo
Controla 80 6.35 ± 0.56 4.83 ± 0.63
Dyeb 40** 2.96 ± 0.24*** 1.98 ± 0.82**
Metabolitea 70 5.41 ± 0.78 4.51 ± 0.82
Triticum aestivum
Control 90 10.0 ± 1.25 5.13 ± 0.62
Dye 30*** 4.74 ± 1.72*** 3.03 ± 0.74*
Metabolite 70 8.73 ± 1.02 4.01 ± 0.12
Sorghum vulgare
Control 80 8.28 ± 1.93 5.01 ± 0.73
Dye 30*** 5.03 ± 0.92* 2.43 ± 0.51**
Metabolite 80 7.56 ± 0.73 3.98 ± 0.14
Values are mean of three experiments ± SEM, significantly different
from the control (seeds germinated in water) at * P \ 0.05,
** P \ 0.01 and *** P \ 0.001 by one-way analysis of variance
(ANOVA) with Tukey Kramer comparison testa Water-treated sampleb 500 ppm
Int. J. Environ. Sci. Technol. (2013) 10:181–190 189
123
Patel, University, Vallabh Vidyanagar) for his valuable discussions
regarding RSM technology.
References
Anderson M, Whitcomb P (2005) RSM simplified—optimizing
process using response surface methods for design of experi-
ments. Productivity Press, New York, p 13
Asad S, Amoozegar MA, Pourbabaee AA, Sarbolouki MN, Dastgheib
SMM (2007) Decolorization of textile azo dyes by newly
isolated halophilic and halotolerant bacteria. Bioresour Technol
98(11):2082–2088
Ayed L, Khelifi E, Jannet H, Miladi H, Cheref A, Achour S, Bakhrouf
A (2010) Response surface methodology for decolorization of
azo dye Methyl orange by bacterial consortium: produced
enzymes and metabolites characterization. Chem Eng J 165(1):
200–208
Ayed L, Mahdhi A, Cheref A, Bakhrouf A (2011) Decolorization and
degradation of azo dye Methyl red by an isolated Sphingomonaspaucimobilis: biotoxicity and metabolites characterization.
Desalination 274(1–3):272–277. http://www.sciencedirect.com/
science/article/pii/S0011916411001500-af0005#af0005
Bae S, Shoda M (2005) Statistical optimization of culture conditions
for bacterial cellulose production using Box–Behnken design.
Biotechnol Bioeng 90(1):20–28
Bhattacharya S, Banerjee R (2008) Laccase mediated biodegradation
of 2,4-dichlorophenol using response surface methodology.
Chemosphere 73(1):81–85
Box G, Behnken D (1960) Some new three level designs for the study
of quantitative variables. Technometrics 2(4):455–475
Brown D, Hamburger B (1987) The degradation of dyestuffs: part
III—investigations of their ultimate degradability. Chemosphere
16(7):1539–1553
Chang J, Chou C, Lin Y, Lin P, Ho J, Hu T (2001) Kinetic
characteristics of bacterial azo dye decolorization by Pseudo-monas luteola. Water Res 35(12):2841–2850
Dhanve RS, Shedbalkar UU, Jadhav JP (2008) Biodegradation of
diazo dye reactive navy blue HE2R (Reactive blue 172) by an
isolated Exiguobacterium sp. RD3. Biotechnol Bioprocess Eng
13(1):1–8
Fan Y, Wang Y, Qian P, Gu J (2004) Optimization of phthalic acid
batch biodegradation and the use of modified Richards model for
modelling degradation. Inter Biodeterior Biodegrad 53(1):57–63
Fang H, Wenrong H, Yuezhong L (2004) Biodegradation mechanisms
and kinetics of azo dye 4BS by a microbial consortium.
Chemosphere 57(4):293–301
Gopinath KP, Murugesan S, Abraham J, Muthukumar K (2009)
Bacillus sp. mutant for improved biodegradation of Congo red:
random mutagenesis approach. Bioresour Technol 100(24):
6295–6300
Gou M, Qu Y, Zhou J, Mab F, Tan L (2009) Azo dye decolorization
by a new fungal isolate Penicillium sp. QQ and fungal-bacterial
cocultures. J Hazard Mater 170(1):314–319
Jadhav JP, Govindwar SP (2006) Biotransformation of malachite
green by Saccharomyces cerevisiae MTCC 463. Yeast 23(4):
315–323
Jadhav JP, Parshetti GK, Kalme SD, Govindwar SP (2007) Decolou-
rization of azo dye methyl red by Saccharomyces cerevisiaeMTCC 463. Chemosphere 68(2):394–400
Jadhav UU, Dawkar VV, Tamboli DP, Govindwar SP (2009)
Purification and characterization of veratryl alcohol oxidase
from Comamonas sp. UVS and its role in decolorization of
textile dyes. Biotechnol Bioprocess Eng 14(3):369–376
Jadhav JP, Phugare SS, Dhanve RS, Jadhav SB (2010) Rapid
biodegradation and decolorization of direct orange 39 (Orange
TGLL) by an isolated bacterium Pseudomonas aeruginosa strain
BCH. Biodegradation 21(3):453–463
Jadhav SB, Phugare SS, Patil PS, Jadhav JP (2011) Biochemical
degradation pathway of textile dye Remazol red and subsequent
toxicological evaluation by cytotoxicity, genotoxicity and oxi-
dative stress studies. Inter Biodeterior Biodegrad 65(6):733–743
Muralidhar RV, Chirumamila RR, Marchant R, Nigam P (2001) A
response surface approach for the comparison of lipase produc-
tion by Candida cylindracea using two different carbon sources.
Biochem Eng J 9(1):17–23
Murugesan K, Dhamija A, Nam I, Kim Y, Chang Y (2007)
Decolourization of reactive black 5 by laccase: optimization by
response surface methodology. Dyes Pigm 75(1):176–184
Nyanhongo GS, Gomes J, Gubitz G, Zvauya R, Read JS, Steiner W
(2002) Production of laccase by a newly isolated strain of
Trametes modesta. Bioresour Technol 84(3):259–263
Patil PS, Shedbalkar UU, Kalyani DC, Jadhav JP (2008) Biodegra-
dation of Reactive Blue 59 by isolated bacterial consortium
PMB11. J Ind Microbiol Biotechnol 35(10):1181–1190
Patil P, Phugare S, Jadhav S, Jadhav J (2010) Communal action of
microbial cultures for Red HE3B degradation. J Hazard Mater
181(1–3):263–270
Phugare SS, Patil PS, Govindwar SP, Jadhav JP (2010) Exploitation
of yeast biomass generated as a waste product of distillery
industry for remediation of textile industry effluent. Inter
Biodeterior Biodegrad 64(8):716–726
Pujari V, Chandra T (2000) Statistical optimization of medium
components for enhanced riboflavin production by a UV-mutant
of Eremothecium ashbyii. Process Biochem 36(1–2):31–37
Salokhe MD, Govindwar SP (1999) Effect of carbon source on the
biotransformation enzyme in Serratia marcescens. World J
Microbiol Biotechnol 15(2):229–232
Sandhya S, Padmavathy S, Swaminathan K, Subrahmanyam Y, Kaul
S (2005) Microaerophilic-aerobic sequential batch reactor for
treatment of azo dyes containing simulated wastewater. Process
Biochem 40(2):885–890
Sharma P, Singh L, Dilbaghi N (2009a) Response surface method-
ological approach for the decolorization of simulated dye
effluent using Aspergillus fumigatus Fresenius. J Hazard Mater
161(2–3):1081–1086
Sharma P, Singh L, Dilbaghi N (2009b) Optimization of process
variables for decolorization of Disperse Yellow 211 by Bacillussubtilis using Box–Behnken design. J Hazard Mater 164(2–3):
1024–1029
Singh S, Pakshirajan K, Daverey A (2010) Enhanced decolourization
of Direct Red-80 dye by the white rot fungus Phanerochaetechrysosporium employing sequential design of experiments.
Biodegradation 21(4):501–511
Surwase SN, Jadhav JP (2011) Bioconversion of L-tyrosine to
L-DOPA by a novel bacterium Bacillus sp. JPJ. Amino Acids
41(2):495–506
Trupkin S, Levin L, Forchiassin F, Viale A (2003) Optimization of a
culture medium for ligninolytic enzyme production and synthetic
dye decolorization using response surface methodology. J Indian
Microbiol Biotechnol 30(12):682–690
Wang Y, Fan Y, Gu J (2004) Dimethyl phthalate ester degradation by
two planktonic and immobilized bacterial consortia. Inter
Biodeterior Biodegrad 53(2):93–101
Zhou J, Yu X, Ding C, Wang Z, Zhou Q, Pao H, Cai W (2011)
Optimization of phenol degradation by Candida tropicalis Z-04
using Plackett-Burman design and response surface methodol-
ogy. J Environ Sci 23(1):22–30
190 Int. J. Environ. Sci. Technol. (2013) 10:181–190
123