innovation and internationalization of latin american services
TRANSCRIPT
Innovation and internationalization of Latin American
services
René A. HernándezAlfredo HualdeNanno MulderPierre Sauvé
Editors

The views expressed in this document are those of the authors and do not necessarily reflect the views of the Organization.
LC/L.4177 • S.15-01357ISBN: 978-607-479-207-2
© United Nations, 2016
© Colegio de la Frontera Norte A. C., 2016
All rights reservedPrinted at United Nations, Santiago
Contents
Introduction ................................................................................................................. 9
Part IThe role of services in manufacturing and other global value chains................. 37
Chapter IGlobal structural change and value chains in services: a reappraisalMaria Savona .............................................................................................................. 39
Summary .............................................................................................................. 39Introduction ......................................................................................................... 40A. A brief overview of GVCs in trade theory .................................................. 42B. GVCs in business services: a third globalization unbundling? ................ 45C. When Linder meets Hirschman: a complementary view
of service GVCs ............................................................................................. 52D. Concluding remarks ..................................................................................... 57Bibliography ........................................................................................................ 59
Chapter IIThe contribution of services to manufacturing competitiveness in BrazilJorge Arbache ............................................................................................................... 65
Summary .............................................................................................................. 65Introduction ......................................................................................................... 66A. Theoretical and empirical issues ................................................................. 67B. Methodology ................................................................................................. 78
E C L A C / C O L E F
4
C. Brazil: already a service economy ............................................................... 80D. Contribution of services to manufacturing ................................................ 85E. Large share, poor contribution .................................................................... 90F. Conclusions ................................................................................................... 96Bibliography ........................................................................................................ 98
Chapter IIIInternationalization, integration, and innovation in multinational enterprises in services versus manufacturing: evidence for MexicoRedi Gomis, Jorge Carrillo ........................................................................................... 99
Summary .............................................................................................................. 99Introduction ....................................................................................................... 100A. Theoretical and conceptual insights .......................................................... 101B. Nature of data: analysis and sample unit ................................................. 104C. Methodological strategy ............................................................................. 106D. Analyses of results ...................................................................................... 108E. Conclusion ....................................................................................................114Bibliography .......................................................................................................116
Part IIInnovation and internationalization policies ........................................................119
Chapter IVEvaluation of public policies on production: the Chilean Global Services ClusterDorotea López Giral, Felipe Muñoz Navia ................................................................ 121
Summary ............................................................................................................ 121Introduction ....................................................................................................... 122A. The role of the State in economic development strategies ..................... 123B. Conceptual framework for public policy analysis .................................. 125C. The Chilean Global Services Cluster ......................................................... 132D. Analysis of the global services cluster ...................................................... 138E. Conclusions ................................................................................................. 141Bibliography ...................................................................................................... 142
Chapter VInnovation in services and the internationalization of services SMEs: challenges and the policy spheres in which they can be overcomeLuisa Rodriguez ......................................................................................................... 145
Summary ............................................................................................................ 145Introduction ....................................................................................................... 146A. Innovation .................................................................................................... 147B. The internationalization of services SMEs ............................................... 161C. Concluding remarks ................................................................................... 172Bibliography ...................................................................................................... 173
Innovation and internationalization of Latin American services
5
Part IIICase studies on services innovation and internationalization ........................... 175
Chapter VIThe evolution of call centres and the implications for service quality and workforce management in MexicoAlfredo Hualde, Jordy Micheli ................................................................................... 177
Summary ............................................................................................................ 177Introduction ....................................................................................................... 178A. Employment growth at call centres in Mexico ......................................... 179B. Employment characteristics in Mexico ..................................................... 181C. The socio-technical system and metrics.................................................... 185D. The dispute over quality measurement at Mexican call centres ............ 190E. Conclusions ................................................................................................. 191Bibliography ...................................................................................................... 192
Chapter VIIRevealing the spillover effects of foreign direct investment on offshore services in Costa RicaYoshimichi Murakami, René A. Hernández ............................................................... 195
Summary ............................................................................................................ 195Introduction ....................................................................................................... 196A. Literature review and conceptual framework ......................................... 197B. Offshore services in Costa Rica ................................................................. 210C. Concluding remarks ................................................................................... 218Bibliography ...................................................................................................... 220
Chapter VIIIThe role of quality certifications in exports of Chilean information technology servicesMarcela Gómez, Nanno Mulder ................................................................................ 223
Summary ............................................................................................................ 223Introduction ....................................................................................................... 224A. Quality certifications and their use in Chile
and neighbouring countries ....................................................................... 225B. Theories and evidence on the role of QCs in exporting .......................... 228C. The questionnaire and results .................................................................... 233D. Final considerations .................................................................................... 239Bibliography ...................................................................................................... 241Annex VIII.A1.................................................................................................... 242
Chapter IXValue creation, configuration and appropriation: a case study on a knowledge-intensive service firm in BrazilFabio Morganti, Dimária Silva e Meirelles ................................................................ 247
Summary ............................................................................................................ 247Introduction ....................................................................................................... 248
E C L A C / C O L E F
6
A. The theoretical background ....................................................................... 249B. Methodology ............................................................................................... 256C. Results and discussion ............................................................................... 257D. Business Model Canvas .............................................................................. 262E. Conclusions and limitations ...................................................................... 264Bibliography ...................................................................................................... 265
Author profiles ........................................................................................................ 267
Tables, figures, diagrams, boxes and mapsTable 1 World and regions: sectoral GDP shares, 2000 and 2014 .......... 12Table 2 Selected Latin American and other countries: innovation
inputs, around 2012 ...................................................................... 18Table 3 Selected Latin American and other countries: innovation
outputs, around 2012 ................................................................... 20Table II.1 Commercial services as a share of gross manufacturing
output, 2005 ................................................................................... 75Table II.2 Main databases used and time coverage ................................... 78Table II.3 Average characteristics of firms in the services sector ............. 83Table II.4 Intermediate consumption of services in industry ................... 86Table II.5 Position of Brazil in the ranking of competitiveness
indicators, 2013 ............................................................................. 91Table III.1 Variables, indicators, and values .............................................. 107Table III.2 Multinomial logistic regression (employment status)
parameter estimates (SPSS program) ....................................... 109Table III.3 Multinomial logistic regression (activity sector)
parameter estimates (SPSS program) ........................................113Table III.4 Labour and employment status in MNEs, by main
activity sector ...............................................................................114Table IV.1 Global Services Cluster strategic agenda ................................. 136Table IV.2 Main activities of the Global Services Cluster, 2008-2009 ...... 137Table IV.3 Budget clusters programme ...................................................... 138Table IV.4 Global Services Cluster budget ................................................. 139Table V.1 Sectors analysed in UNCTAD Services Policy Reviews
in the Latin American region .................................................... 147Table VI.1 Types of call centre ..................................................................... 181Table VI.2 Geographical distribution of call centres in Mexico ............... 182Table VI.3 Characteristics of business process outsourcing workers,
circa 2007-2008 ............................................................................ 183Table VI.4 Summary of metrics used at call centres .................................. 187Table VI.5 The three economic phases and technologies employed
at call centres ............................................................................... 189Table VII.1 Determinants of GVC governance ............................................ 205Table VII.2 Costa Rica: average monthly wages in free economic
zones, by sector, 2008-2012 ........................................................ 213Table VII.3 Costa Rica: sectoral FDI inflows, 2000-2013............................. 214
Innovation and internationalization of Latin American services
7
Table VII.4 Costa Rica: sectoral shares of FDI inflows, 2000-2013 ............ 214Table VII.5 Costa Rica: employment in free economic zones,
by sector, 2006-2010 .................................................................... 215Table VII.6 Costa Rica: employment shares in economic free zones,
by sector, 2006-2010 .................................................................... 215Table VIII.1 Comparison of three standards: CMMI, ISO 9001 and ITIL ..... 227Table VIII.2 Sales by companies answering the questionnaire, 2012 ......... 234Table IX.1 Business model elements ........................................................... 250Table IX.2 Graphical representation of the Business Model Canvas ....... 251Table IX.3 Generic value configuration models ........................................ 254Table IX.4 Analysis of value creation sources according to Amit
and Zott’s (2001) model ............................................................. 258Table IX.5 Value configuration analysis ..................................................... 259Table IX.6 PDC Business Model Canvas .................................................... 263Figure 1 World and selected regions: employment in services,
1995 to 2010 ................................................................................... 13Figure 2 Latin America and the Caribbean (selected countries):
employment in services ............................................................... 13Figure 3 World (selected countries and regions): service exports
as a share of services GDP, 1990-2013 ......................................... 14Figure 4 Latin America (selected countries): service exports
as a percentage of services GDP, 1995 and 2013 ........................ 15Figure 5 Latin America and the Caribbean: share of services
in total inward FDI, 1995-2014 .................................................... 16Figure 6 Latin America (selected countries): share of services
in total inward FDI, 1995 to 2014 ................................................ 17Figure 7 Latin America (selected countries): share of innovating
firms in manufacturing and services .......................................... 22Figure I.1 Factory North America: United States, Canada
and Mexico, re-imports and re-exports, 2009 ............................ 47Figure I.2 Factory Europe: Germany, Poland and the Czech
Republic, re-imports and re-exports, 2009 ................................. 48Figure II.1 Industry-Space: the dynamics of industrial development ....... 69Figure II.2 Smiling curve in manufacturing ................................................. 72Figure II.3 Industrial density and commercial services, 2011..................... 74Figure II.4 Industry-Space, 2011 .................................................................... 76Figure II.5 Business services, manufacturing and industrial density
in Brazil and Turkey, 2011 ............................................................ 77Figure II.6 Per capita income and participation of services
in GDP, 2011 .................................................................................. 80Figure II.7 Sectoral participation in GDP...................................................... 81Figure II.8 Breakdown of services output..................................................... 82Figure II.9 Labour productivity ..................................................................... 84Figure II.10 Labour productivity index .......................................................... 84Figure II.11 Intermediate consumption of services in manufacturing,
2005 or closest year ....................................................................... 85
E C L A C / C O L E F
8
Figure II.12 Intermediate consumption of services in manufacturing gross output, 2011 ......................................................................... 87
Figure II.13 Intermediate consumption of services in manufacturing gross output: growth rate between 1996-1998 and 2009-2011 ............ 88
Figure II.14 Breakdown of service demand by industry ............................... 88Figure II.15 Breakdown of services required by manufacturing, 2011 ........ 89Figure II.16 Selected industries: breakdown of services consumed, 2011 ... 90Figure II.17 Services inflation rate ................................................................... 92Figure II.18 Productivity ratio in relation to manufacturing ........................ 93Figure II.19 Ranking of industries with the highest ratio of services
input to manufacturing gross output, 2011 ............................... 94Figure II.20 Ranking of industries with the highest ratio of value added
services input to manufacturing gross output, 2011 ................. 95Figure II.21 Ratio of services input to manufacturing gross output
by technology intensity ................................................................ 96Figure VIII.1 Chilean IT services firms: destination countries
for IT exports, 2012 ..................................................................... 235Figure VIII.2 Chilean IT companies: QC adoption rate, 2012 ....................... 236Figure VIII.3 Benefits attributed to QC ........................................................... 238Figure VIII.4 Main obstacles to beginning a certification process................ 238Diagram 1 Determinants that strengthen the links between
innovation and internationalization ........................................... 23Diagram IV.1 Analysis perspectives ................................................................. 126Diagram IV.2 Considerations for policy analysis ........................................... 127Diagram IV.3 Global services cluster workgroups ......................................... 135Diagram VII.1 Costa Rica: upgrading paths for offshore services ................. 217Diagram VIII.1 Theoretical relationships between Capability Maturity
Model (CMM), average costs and exports ............................... 230Diagram VIII.2 Theoretical links between standards, trade,
wealth and welfare ..................................................................... 233Diagram IX.1 The value construct .................................................................... 252Diagram IX.2 The relationship between use value, firm activities
and value creation ...................................................................... 252Diagram IX.3 Drivers of value creation in e-business .................................... 253Box V.1 The importance of interaction among actors
for innovation ............................................................................. 150Box V.2 Policy spheres that have an impact on innovation ................. 151Box V.3 Policy and regulatory frameworks for overcoming
the infrastructure deficit ............................................................ 158Box V.4 Jamaica: a successful case of infrastructure development
to increase the value of services exports .................................. 159Box V.5 Entrepreneurship curricula: developing the skills
required for entrepreneurialism ............................................... 167Box V.6 Market access conditions for Jamaican providers
of entertainment services to the European Union .................. 171Map I.1 World map of service offshoring, 2008 ....................................... 50
Introduct ion
René A. Hernández Alfredo Hualde Nanno Mulder
Pierre Sauvé
The services sector consists of a highly diverse group of industries and related labour tasks. Before the advent of the digital revolution, services were typically defined as immaterial products consumed and produced simultaneously and consequently as non-storable (Gadrey, 2000). Services were also long considered to be predominantly non-traded activities that offered scant productivity growth potential. Most employment in services was seen as concentrated in low-technology intensive activities for low-skilled workers, with limited innovative capabilities (Guerrieri and Meliciani, 2005). In this context, the so-called “Baumol disease” hypothesis (1967) suggested that productivity growth in services was almost zero and that the sector thus represented a drag on overall economic growth. Unlike manufacturing, little technological progress was deemed to occur in services, thereby limiting the prospects of productivity growth. One major policy implication was that structural change within economies towards a more service-centric growth and development path was mostly to be avoided or delayed.
The far-reaching spread of information and communication technologies (ICTs) since the 1980s has resulted in an almost complete policy U-turn. ICTs facilitate the storage, transportability and remote supply of an ever-increasing range of services —effectively collapsing time and space. Nowadays, many
E C L A C / C O L E F
10
services can be produced in one geographical location and consumed in others (Miozzo and Soete, 2001). The resulting international tradability of services has led to the global reorganization of manufacturing sectors and to rising production fragmentation in service industries themselves. ICTs have added complexity to the world of services and facilitated the increasing bundling of manufacturing and services within regional and global production networks. Not surprisingly, services have ceased to be considered non-tradable and offshoring to other countries has expanded at a brisk pace, mainly from developed to developing countries. Expressed as they should be in value added terms, services have in fact come to occupy a dominant share of global trade, whether on their own or (even more so) embedded in other goods and services. ICT applications have also significantly boosted the innovative potential of services. As a result, services are no longer seen as largely ancillary to manufacturing but have become a centrally important source of value creation in their own right (Montgomery and Porter, 1991).
The tradability of services has increased most of all in business services, which are increasingly being offshored. Over the past two decades, firms have lowered costs and improved efficiency by tapping new sources of human capital and technical efficiency across international borders. The rise of business services as a globally dynamic sector has been facilitated by unprecedented reductions in trade costs and supported by continuous trade and investment liberation, whether unilaterally decreed or resulting from concerted attempts at negotiated market opening (Wirtz, Tuzovic and Ehret, 2015). The increased internationalization of services explains part of the dramatic recent growth of global (and regional) value chains (GVCs), which are now the predominant form of organization of international production and trade (Guerrieri and Meliciani, 2005). Business services are often referred to as the glue that holds GVCs together, playing an intricate role in the coordination of production and distribution of goods and services across the globe (Elms and Low, 2013).
Business service offshoring initially began with information technology outsourcing (ITO), whereby maintenance, basic software programming and hosting functions were offshored to overseas suppliers. Gradually, business process outsourcing (BPO) evolved to include enterprise resource planning (ERP), human resource management (HRM) and customer relationship management (CRM) services. The most recent, if less frequently offshored, services relate to knowledge process outsourcing (KPO), which is a

Innovation and internationalization of Latin American services
11
knowledge sector offering higher value added activities, including legal services, market intelligence and business analytics (Fernandez-Stark, Bamber and Gereffi, 2011).
The increasing fragmentation of value chain activities offshored to foreign locations around the world by developed and, to a lesser (but increasing) extent, developing countries has resulted in a significant increase of domestic and international market contestability (Park, 2014). In this new globalized world, it is essential for firms to maintain their competitiveness by combining two strategies that have long tended to be viewed separately: innovation and internationalization. Both strategies have been recognized as the key driving forces behind the tectonic transformation and productivity growth of services over the last three decades (Miozzo and Soete, 2001).
Innovation in services can be defined as the process of overcoming new and existing challenges to facilitate greater efficiency and value creation in the provision of services. Innovation in services is important because it adds value, shapes and builds new industries and sectors, creates new business models and contributes to improved competitiveness within global value chains. Unlike innovation in manufacturing, which is heavily reliant on research and development, innovation in services occurs through the improvement of one or more aspects of service production – so-called “process” innovation (including IT adoption, increased knowledge and skills, improved organization and management, marketing or the development of new service products (Gallouj, 2002). The internationalization of services relates to the search for market opportunities abroad, greater participation in international investment and trade, and opportunities to gain advanced knowledge from external sources of demand (Kyläheiko and others, 2011).
Knowledge is the epicentre of services innovation and one of the main determinants of international competitiveness. Drawing on existing knowledge to create new types of services or seeking new knowledge from external sources contributes to continuous innovation (Park, 2014). Service firms operating in foreign countries require continuous innovation, as they are required to adapt to new, and often complex, legal systems and regulatory environments, overcome cultural barriers, and adopt international quality standards or tailor product offerings to local market conditions. Moreover, operating in foreign markets often exposes firms to higher levels of competition, which may also increase the pressure to innovate (Castro-Lucas and others, 2012). Not surprisingly, there is much empirical evidence suggesting that innovative firms have a greater export potential than non-innovative firms,

E C L A C / C O L E F
12
and exporting firms are more likely to innovate than non-exporting ones (Ganotakis and Love, 2011).
The nexus between innovation and internationalization in services offers firms scope for new growth strategies. As offshoring service activities increase along with the expansion of GVCs, successful firms seem to use innovation and internationalization as a basis for building and maintaining their competitive advantages. Innovation is driven by the perpetual requirement for knowledge that enables firms to improve efficiency, productivity and quality. Moreover, firms are increasingly internationalizing to gain access to specialized knowledge in foreign locations, as well as seeking new markets. However, firms wishing to internationalize must typically innovate first in order to meet the strict requirements of conducting business in the international arena (Park, 2014).
Innovation and internationalization in services are key drivers of productivity growth and the overall economic performance of countries, as this sector predominates in most economies of the world. The share of services in world GDP rose from 67% in 2000 to 70% in 2014. Simultaneously, the GDP shares of agriculture and manufacturing declined during the same period (see table 1). Services represent an even higher share of GDP in developed countries relative to middle- and lower-income countries. Moreover, high-income economies have recently moved further away from manufacturing and concentrated more on the services sector, managing to earn relatively high incomes from innovation and internationalization (Wirtz, Tuzovic and Ehret, 2015). In Latin America and the Caribbean, services represented almost two thirds of GDP in 2014.
Table 1 World and regions: sectoral GDP shares, 2000 and 2014
(Percentages)
Agriculture Manufacturing Services
2000 2014 2000 2014 2000 2014
World 4.0 3.0 18.7 15.8 66.9 70.5
Low income 35.7 32.3 9.6 9.0 45.0 46.2
Middle income 13.2 9.8 22.3 21.0 50.4 55.5
Latin America and the Caribbean 5.4 5.2 18.2 14.3 61.8 64.9
High income 1.9 2.0 18.0 14.8 70.5 73.8
Source: Prepared by the authors on the basis of World Bank, World Development Indicators 2015 and Organization for Economic Cooperation and Development (OECD), National Accounts.
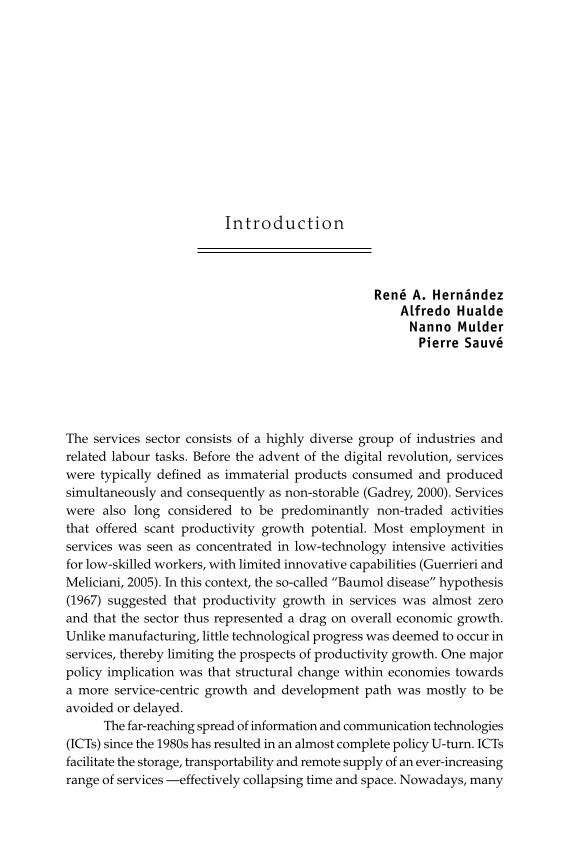
Services also account for the largest proportion of employment in most countries of the world (Pascal and Soete, 2001). Worldwide, workers in services accounted for half of total employment in 2010 (see figure 1). In
Innovation and internationalization of Latin American services
13
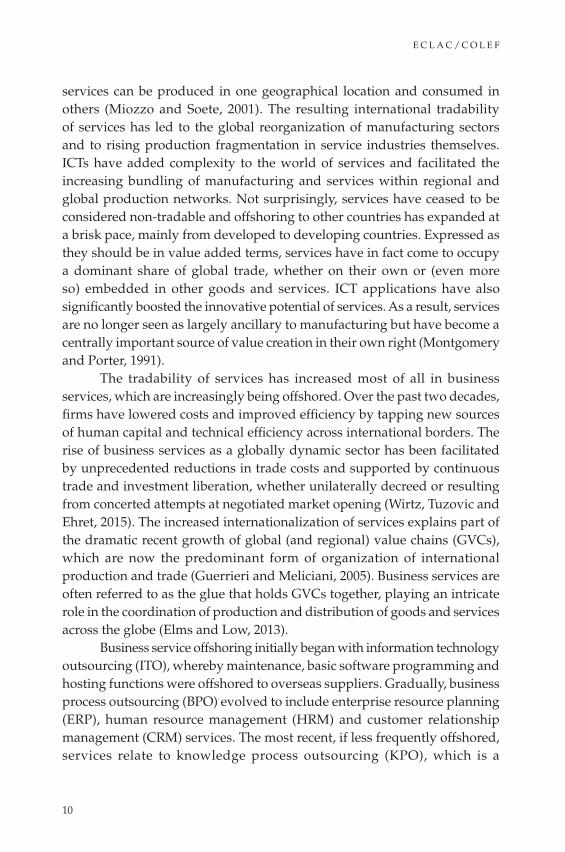
developed economies, services employ two thirds or more of the labour force, such as in Canada and the United States (80%) and the European Union (66%) in 2010. In all three cases, the share of highly skilled and educated workers in services has grown over time, whereas the share of lower skilled activities has fallen (Evangelista and Savona, 2003). In most countries of Latin America and the Caribbean, the share of services in total employment also increased between 1995 and 2010 (see figure 2).
Figure 1 World and selected regions: employment in services, 1995 to 2010
(Percentages)
0
10
20
30
40
50
60
70
80
90
North America European Union Latin America and the Caribbean
Europe andCentral Asia
World
1995 2000 2005 2010
Source: Prepared by the authors on the basis of World Bank, World Development Indicators 2015.
Figure 2 Latin America and the Caribbean (selected countries): employment in services
(Percentages)
0
10
20
30
40
50
60
70
80
P
eru
Arg
entin
a E
cuad
or
Bol
ivia
(P
lur.
Sta
te o
f) U
rugu
ay
Col
ombi
a Ve
nezu
ela
(Bol
. Rep
. of)
Dom
inic
an
Rep
. P
anam
a C
hile
B
razi
l M
exic
o C
osta
Ric
a E
l Sal
vado
r
Par
agua
y N
icar
agua
Hon
dura
s
1995 2010
Source: Prepared by the authors on the basis of World Bank, World Development Indicators 2015.

E C L A C / C O L E F
14
While Latin America is a relative latecomer to services exports, the region has several strategic assets for increasing them in the future. These include its relatively competitive labour costs and favourable geographical location, particularly as it shares time zones with the United States. Moreover, several Latin American countries have invested heavily in ICT infrastructure and the development of specific related skills. As a result, many countries in the region are now considered strategic locations for offshoring services operations. This is suggested by the presence of eight Latin American countries in the 2014 A.T. Kearney Global Services Location Index, which lists the world’s 50 most attractive countries in this regard. These eight countries have become significant players in the global offshore services sector (Hernández, Martínez-Piva and Mulder, 2014). However, despite such advances, the share of service exports in Latin America’s GDP remains lower than that of India, the Philippines and the world average (see figure 3).
Figure 3 World (selected countries and regions): service exports as a share
of services GDP, 1990-2013 (Percentages)
0
2
4
6
8
10
12
14
16
18
1990
1991
1992
1993
1994
1995
1996
1997
1998
1999
2000
2001
2002
2003
2004
2005
2006
2007
2008
2009
2010
2011
2012
2013
Latin America and the Caribbean China Philippines India World
Source: Prepared by the authors on the basis of World Bank, World Development Indicators 2015.
India offers a well-documented success story in terms of service exports. The country’s digital revolution began with ITO exports in the early 1990s. Since then, the country has continued to upgrade into both the BPO and KPO service sectors —which explains the rapid rise in both
Innovation and internationalization of Latin American services
15
the volume and value added of the country’s services exports (Fernandez-Stark, Bamber and Gereffi, 2011).
China’s declining share of service exports in aggregate output GDP contrasts with the growing importance of services in the economy and exports. China (not including Hong Kong Special Administrative Region) exported almost 50% more services than India in 2014 in value terms. Moreover, China exports a significantly more diverse range of services than India, precisely because of the strength of its manufacturing growth (which requires a broad range of service inputs). Many of these services are incorporated into the value of exported manufacturing goods and are therefore not measured in balance-of-payments accounting. China’s recent shift towards a consumption-based growth model will mean an even greater dependence on service production and exports in the future.
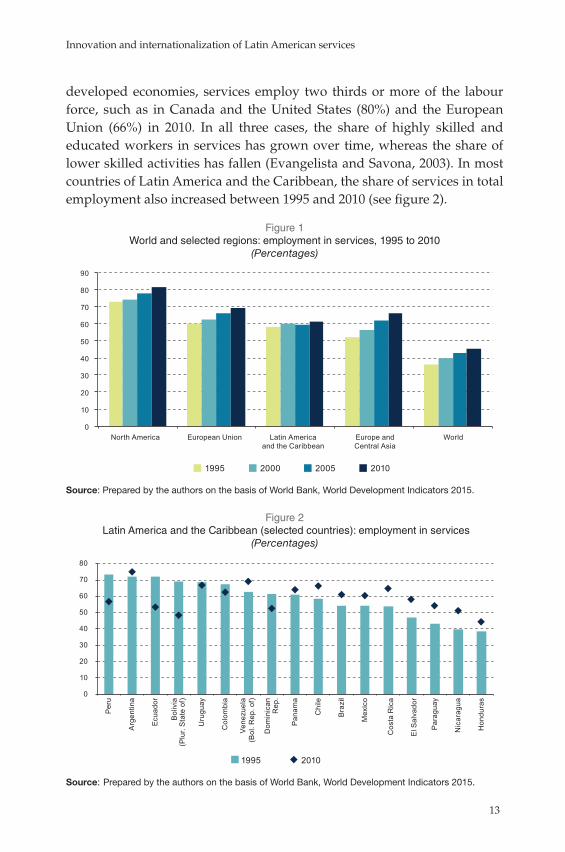
More than half of the Latin American countries in the sample show an increase in service exports as a share of services GDP from 1995 to 2015 (see figure 4). The countries with the largest export gains during this period were Central American countries (Panama, Guatemala, Nicaragua, El Salvador and Costa Rica). The countries with the largest percentage-point drops were Paraguay and the Dominican Republic.
Figure 4 Latin America (selected countries): service exports as a percentage
of services GDP, 1995 and 2013 (Percentages)
0
5
10
15
20
25
30
35
Pan
ama
Cos
ta R
ica
Dom
inic
an
Rep
.
Nic
arag
ua
Hon
dura
s
El S
alva
dor
Uru
guay
Gua
tem
ala
Chi
le
Bol
ivia
(P
lur.
Sta
te o
f)
Par
agua
y
Ecu
ador
Arg
entin
a
Col
ombi
a
Mex
ico
Bra
zil
Vene
zuel
a (B
ol. R
ep. o
f)
1995 2013
Source: Prepared by the authors on the basis of official data from the Economic Commission for Latin America and the Caribbean (ECLAC).
E C L A C / C O L E F
16
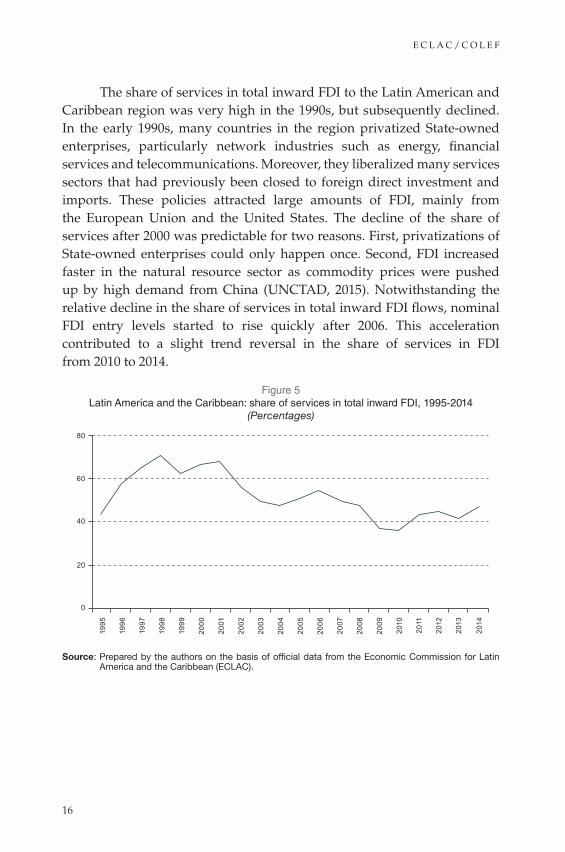
The share of services in total inward FDI to the Latin American and Caribbean region was very high in the 1990s, but subsequently declined. In the early 1990s, many countries in the region privatized State-owned enterprises, particularly network industries such as energy, financial services and telecommunications. Moreover, they liberalized many services sectors that had previously been closed to foreign direct investment and imports. These policies attracted large amounts of FDI, mainly from the European Union and the United States. The decline of the share of services after 2000 was predictable for two reasons. First, privatizations of State-owned enterprises could only happen once. Second, FDI increased faster in the natural resource sector as commodity prices were pushed up by high demand from China (UNCTAD, 2015). Notwithstanding the relative decline in the share of services in total inward FDI flows, nominal FDI entry levels started to rise quickly after 2006. This acceleration contributed to a slight trend reversal in the share of services in FDI from 2010 to 2014.
Figure 5 Latin America and the Caribbean: share of services in total inward FDI, 1995-2014
(Percentages)
1995
1996
1997
1998
1999
2000
2001
2002
2003
2004
2005
2006
2007
2008
2009
2010
2011
2012
2013
2014
80
60
40
20
0
Source: Prepared by the authors on the basis of official data from the Economic Commission for Latin America and the Caribbean (ECLAC).

Innovation and internationalization of Latin American services
17
The decline of the services sector in regional inward FDI from 2006-2014 compared to 1995-2005 was observed in over half of the sample countries. However, six countries from the region experienced an increase in the service sector’s share in inward FDI: Costa Rica, El Salvador, Guyana, Jamaica, Trinidad and Tobago and Uruguay (see figure 6 below).
Figure 6 Latin America (selected countries): share of services in total inward FDI, 1995 to 2014
(Percentages)
0
10
20
30
40
50
60
70
80
90
100
Pan
ama
El S
alva
dor
Par
agua
y
Cos
ta R
ica
Uru
guay
Jam
aica
Arg
entin
a
Hon
dura
s
Dom
inic
an
Rep
.
Gua
tem
ala
Nic
arag
ua
Chi
le
Mex
ico
Guy
ana
Bra
zil
Ecu
ador
Col
ombi
a
Trin
idad
and
To
bago
Bol
ivia
(P
lur.
Sta
te o
f)
1995-2005 2006-2014
Source: Prepared by the authors on the basis of official data from the Economic Commission for Latin America and the Caribbean (ECLAC).
Although empirical evidence on innovation efforts in services in Latin America is only available for a few countries, more information can be obtained on some of the main determinants of innovation for a larger sample of economies. These data on innovation metrics in index form with country rankings are included in The Global Innovation Index 2015 edited by Cornell University, INSEAD and the World Intellectual Property Organization (WIPO) (see table 2). To put the region’s performance into perspective, table 2 also includes two high-income economies (Japan and the United States) and three emerging economies that compete with Latin American and Caribbean suppliers in the provision of services (China, India and the Philippines).

E C L A C / C O L E F
18
Tabl
e 2
Sel
ecte
d La
tin A
mer
ican
and
oth
er c
ount
ries:
inno
vatio
n in
puts
, aro
und
2012
(S
core
s fr
om
1 t
o 10
0, w
ith a
hig
her
sco
re in
dic
atin
g a
bet
ter
per
form
ance
)
F
ull t
ime
rese
arch
ers
per
1
mill
ion
popu
latio
n
Kno
wle
dge
wor
kers
Em
ploy
men
t in
kno
wle
dge
- in
tens
ive
serv
ices
Gro
ss e
xpen
ditu
re o
n R
&D
as
perc
enta
ge
of G
DP
Use
of I
nter
net
and
mob
ile
phon
es
Logi
stic
s pe
rfor
man
ce
Spe
ndin
g on
com
pute
r so
ftw
are
Arg
entin
a15
40.
9 4
0.9
13.6
34.
242
.110
.7B
oliv
ia (
Plu
rinat
iona
l Sta
te o
f)1.
9 2
4.9
24.9
3.4
18.6
16.3
16.2
Bra
zil
8.5
34.
4 3
4.8
29.2
40.
13
9.9
20.2
Chi
le4.
6 4
0.5
40.
58.
44
0.8
55.8
20.7
Col
ombi
a1.
9 2
7.6
27.6
5.1
30.
724
.416
Cub
a...
…
......
......
...C
osta
Ric
a15
.4 4
1.6
41.6
114
4.8
27.5
20.2
Dom
inic
an R
epub
lic...
28.
2 28
.2...
26.5
35.
7...
Ecu
ador
2.1
23.
3 23
.38.
128
.828
.115
.7E
l Sal
vad
or...
19.
5 19
.50.
412
.74
0.8
...G
uate
mal
a0.
3 1
7.3
17.3
0.8
9.6
32.5
...H
ondu
ras
... 2
0.7
20.7
0.7
10.3
22.8
19.6
Mex
ico
4.6
31.
5 31
.511
.624
.549
.314
Nic
arag
ua...
24.
1 24
.1...
6.8
25.1
...P
anam
a1.
3 4
0.5
40.
54
2752
.716
.6P
arag
uay
1.9
31.
1 31
.11.
815
31.6
...P
eru
... 2
4.4
24.4
3.5
16.9
34.
717
.4U
rugu
ay6.
3 3
8.4
38.
45.
44
5.6
26.4
16.7
Ven
ezue
la (
Bol
ivar
ian
Rep
ublic
of)
3.4
31.
6 31
.6...
23.6
33
14.6
Japa
n62
.3 4
0.4
40.
482
.978
89.
422
.3U
nite
d S
tate
s47
.7 6
3.9
63.
96
6.4
758
9.6
100
Chi
na12
.8 1
1.4
11.4
49.4
29.9
69.
931
.2In
dia
1.9
…
...18
.96.
84
6.9
14.7
Phi
lippi
nes
0.9
39.
4 3
9.4
2.3
22.8
43
19
So
urce
: P
rep
ared
by
the
auth
ors
on th
e b
asis
of C
orne
ll U
nive
rsity
/IN
SE
AD
/Wor
ld In
telle
ctua
l Pro
per
ty O
rgan
izat
ion
(WIP
O),
The
Glo
bal
Inno
vatio
n In
dex
201
5: E
ffec
tive
Inno
vatio
n P
olic
ies
for
Dev
elo
pm
ent,
Gen
eva,
201
5.
Innovation and internationalization of Latin American services
19
According to these data, Latin America records an average to low performance in terms of services R&D determinants. The region has a low level of research intensity when compared to the advanced economies and China, as may be inferred from indicators measuring the number of researchers and R&D spending as a percentage of GDP. Only Argentina and Costa Rica have a proportion of researchers comparable to that of China. Interestingly, the region performs better than India and the Philippines overall. However, the latter two countries have created special niche service export hubs that compete globally and significantly outperform the rest of the economy. Compared to the previous two indicators, various Latin American and Caribbean countries present a better performance in Internet and mobile phone use, logistics, knowledge workers and employment in knowledge-intensive business services. Most notable in this regard are Uruguay and Costa Rica in Internet and mobile phone use; Chile and Panama in logistics; and Costa Rica, Argentina, Chile and Panama in respect of employment in knowledge-intensive business services. Most countries in Latin America also record low scores in terms of spending on computer software, including in comparison with China.
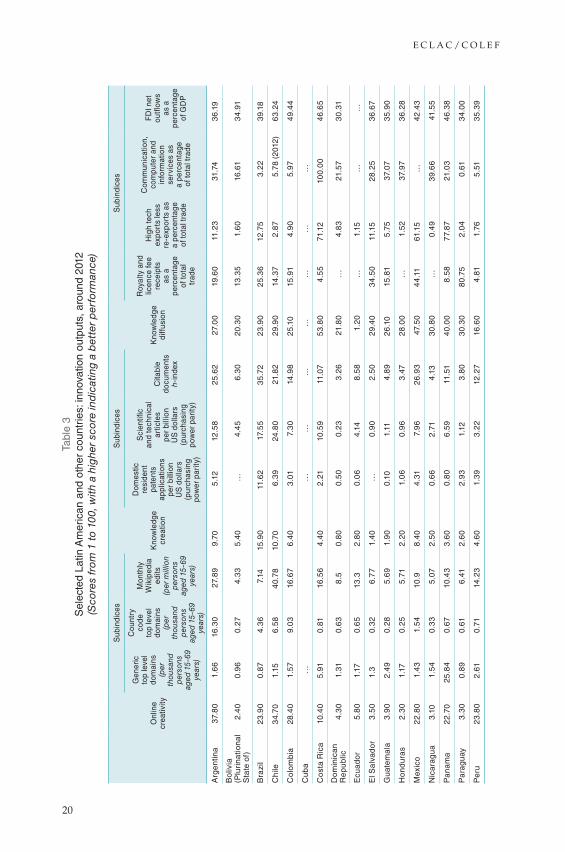
In a context where innovation inputs are comparatively scarce, it is no surprise that Latin American countries also underperform in terms of innovation outputs as expressed by online creativity, knowledge creation and knowledge diffusion (table 3). Online creativity refers to the creation of Internet content. It is approximated by four subindices, only three of which are shown in the table, as few of the region’s countries report data on the fourth indicator (video uploads to YouTube). The three indicators are the number of generic (biz, info, org, net, and com) and country-code top level domains, and the number of average monthly edits to Wikipedia, all in respect of the population aged between 15 and 69 years. Argentina and Chile are the best-performing countries in the region in these areas, in particular when it comes to Wikipedia edits.
A second group of indicators concern knowledge creation, including the number of patent applications filed by residents at the national patent office and the number of scientific and technical journal articles. Both indices are expressed per billion GDP measured in purchasing power parity (PPP) dollars. A third indicator is the h-index, which reflects the number of articles published by the country to have received at least h citations during the period 1996-2013. The Latin American countries present very low scores on patent applications, but do somewhat better in terms of scientific publications. This is particularly true of Argentina, Brazil and Chile.
E C L A C / C O L E F
20
Tabl
e 3
Sel
ecte
d La
tin A
mer
ican
and
oth
er c
ount
ries:
inno
vatio
n ou
tput
s, a
roun
d 20
12
(Sco
res
fro
m 1
to
100,
with
a h
ighe
r sc
ore
ind
icat
ing
a b
ette
r p
erfo
rman
ce)
O
nlin
e cr
eativ
ity
Sub
indi
ces
Kno
wle
dge
crea
tion
Sub
indi
ces
Kno
wle
dge
diff
usio
n
Sub
indi
ces
Gen
eric
to
p le
vel
dom
ains
(per
th
ousa
nd
per
sons
ag
ed 1
5-69
ye
ars)
Cou
ntry
co
de
top
leve
l do
mai
ns(p
er
thou
sand
p
erso
ns
aged
15-
69
year
s)
Mon
thly
W
ikip
edia
ed
its(p
er m
illio
n p
erso
ns
aged
15-
69
year
s)
Dom
estic
re
side
nt
pate
nts
appl
icat
ions
per
billi
on
US
dol
lars
(p
urch
asin
g po
wer
par
ity)
Sci
entifi
c an
d te
chni
cal
artic
les
per
billi
on
US
dol
lars
(p
urch
asin
g po
wer
par
ity)
Cita
ble
docu
men
ts
h-in
dex
Roy
alty
and
lic
ence
fee
rece
ipts
as
a
perc
enta
ge
of to
tal
trad
e
Hig
h te
ch
expo
rts
less
re
-exp
orts
as
a pe
rcen
tage
of
tota
l tra
de
Com
mun
icat
ion,
co
mpu
ter
and
info
rmat
ion
serv
ices
as
a
perc
enta
ge
of to
tal t
rade
FD
I net
ou
tflow
s as
a
perc
enta
ge
of G
DP
Arg
entin
a37
.80
1.6
616
.30
27.8
99.
705.
1212
.58
25.6
227
.00
19.6
011
.23
31.7
43
6.19
Bo
livia
(P
luri
natio
nal
Sta
te o
f)2.
40
0.9
60.
274.
33
5.4
0…
4.4
56.
30
20.3
013
.35
1.6
016
.61
34.
91
Bra
zil
23.9
00.
874.
36
7.14
15.9
011
.62
17.5
53
5.72
23.9
025
.36
12.7
53.
22
39.
18
Chi
le3
4.70
1.15
6.5
84
0.78
10.7
06.
39
24.8
021
.82
29.9
014
.37
2.87
5.78
(20
12)
63.
24
Co
lom
bia
28.4
01.
579.
03
16.6
76.
40
3.01
7.3
014
.98
25.1
015
.91
4.9
05.
974
9.4
4
Cu
ba…
……
……
……
…
Co
sta
Ric
a10
.40
5.91
0.81
16.5
64.
40
2.21
10.5
911
.07
53.
80
4.5
571
.12
100.
00
46.
65
Do
min
ican
R
epu
blic
4.3
01.
310.
63
8.5
0.8
00.
50
0.23
3.26
21.8
0…
4.8
321
.57
30.
31
Ecu
ador
5.8
01.
170.
65
13.3
2.8
00.
06
4.14
8.5
81.
20…
1.15
……
El S
alva
dor
3.50
1.3
0.3
26.
77
1.4
0…
0.9
02.
50
29.4
03
4.5
011
.15
28.2
53
6.67
Gu
atem
ala
3.9
02.
49
0.28
5.6
91.
90
0.10
1.11
4.8
926
.10
15.8
15.
7537
.07
35.
90
Ho
nd
ura
s2.
30
1.17
0.25
5.71
2.20
1.0
60.
96
3.47
28.0
0…
1.52
37.9
73
6.28
Mex
ico
22.
80
1.4
31.
54
10.9
8.4
04.
317.
96
26.9
347
.50
44.
1161
.15
…42
.43
Nic
arag
ua
3.10
1.5
40.
33
5.07
2.5
00.
66
2.71
4.13
30.
80
…0.
49
39.
66
41.5
5
Pan
ama
22.
7025
.84
0.67
10.4
33.
60
0.8
06.
5911
.51
40.
00
8.5
87
7.87
21.0
34
6.3
8
Par
agu
ay3.
30
0.8
90.
616.
412.
60
2.9
31.
123.
80
30.
30
80.
752.
04
0.61
34.
00
Per
u23
.80
2.61
0.71
14.2
34.
60
1.3
93.
22
12.2
716
.60
4.81
1.76
5.51
35.
39

Innovation and internationalization of Latin American services
21
O
nlin
e cr
eativ
ity
Sub
indi
ces
Kno
wle
dge
crea
tion
Sub
indi
ces
Kno
wle
dge
diff
usio
n
Sub
indi
ces
Gen
eric
to
p le
vel
dom
ains
(per
th
ousa
nd
per
sons
ag
ed 1
5-69
ye
ars)
Cou
ntry
co
de
top
leve
l do
mai
ns(p
er
thou
sand
p
erso
ns
aged
15-
69
year
s)
Mon
thly
W
ikip
edia
ed
its(p
er m
illio
n p
erso
ns
aged
15-
69
year
s)
Dom
estic
re
side
nt
pate
nts
appl
icat
ions
per
billi
on
US
dol
lars
(p
urch
asin
g po
wer
par
ity)
Sci
entifi
c an
d te
chni
cal
artic
les
per
billi
on
US
dol
lars
(p
urch
asin
g po
wer
par
ity)
Cita
ble
docu
men
ts
h-in
dex
Roy
alty
and
lic
ence
fee
rece
ipts
as
a
perc
enta
ge
of to
tal
trad
e
Hig
h te
ch
expo
rts
less
re
-exp
orts
as
a pe
rcen
tage
of
tota
l tra
de
Com
mun
icat
ion,
co
mpu
ter
and
info
rmat
ion
serv
ices
as
a
perc
enta
ge
of to
tal t
rade
FD
I net
ou
tflow
s as
a
perc
enta
ge
of G
DP
Uru
gu
ay21
.60
3.4
45.
45
44.
33
10.2
02.
50
18.8
210
.97
20.3
00.
675.
84
24.7
35.
15
Ven
ezue
la
(Bo
livar
ian
Re
pub
lic o
f)6.
60
1.0
82.
3111
.97
5.4
00.
34
1.8
413
.90
25.7
0…
…1.
9137
.62
Japa
n3
3.10
8.5
32.
85
24.3
05
6.3
010
023
.39
73.9
45
0.0
08
3.8
252
.58
4.0
85
4.8
5
Uni
ted
Sta
tes
60.
30
100
1.3
83
8.0
36
8.5
010
03
0.9
010
0.0
04
9.5
09
2.3
628
.74
21.3
352
.41
Chi
na2.
60
1.0
51.
89
1.07
64.
1010
020
.85
45.
93
42.8
07.
58
100.
00
11.4
447
.58
Ind
ia10
.30
0.5
30.
32
1.9
215
.20
11.8
410
.92
35.
614
0.10
14.5
014
.78
100
35.
58
Phi
lipp
ine
s18
.60
0.6
30.
209.
56
9.10
2.4
51.
94
12.8
141
.70
0.91
…75
.96
44.
98
So
urce
: Pre
par
ed b
y th
e au
thor
s on
the
bas
is o
f Cor
nell
Uni
vers
ity/I
NS
EA
D/W
orld
Inte
llect
ual P
rop
erty
Org
aniz
atio
n (W
IPO
), T
he G
lob
al In
nova
tion
Ind
ex 2
015:
Eff
ectiv
e In
nova
tion
Po
licie
s fo
r D
evel
op
men
t, G
enev
a, 2
015.
Tab
le 3
(co
nclu
ded
)

E C L A C / C O L E F
22
The third group of output measures relate to knowledge diffusion. Several Latin American countries record a comparatively better performance in this area, in particular with regard to exports of communication, computer and information services (especially Costa Rica) and net outflows of foreign direct investment (mainly Chile). Costa Rica and Mexico stand out in the region in terms of high-tech manufacturing exports.
Regular innovation surveys on manufacturing and services are another instrument that can be used to measure countries’ innovation efforts. These surveys are carried out in only five countries in the region on a regular basis and show that technological innovation is consistently more common in manufacturing than in services (see figure 7). Other survey results show that innovation in manufacturing takes place mostly through formal R&D, whereas service innovation is concentrated in other activities such as disembodied technology, engineering, training of workers and marketing (Crespi, Tacsir and Vargas, 2014). Within services, knowledge-intensive business services (KIBS) are the most innovative activities, due to the high levels of knowledge involved in performing them (Tacsir, 2011).
Figure 7 Latin America (selected countries): share of innovating firms in manufacturing and services
(Percentages)
13
33
32
38
27
5
18
28
31
41
0 10 20 30 40 50
Mexico
Peru
Chile
Uruguay
Colombia
Services Manufacturing
B. Non-technological innovationA. Technological innovation
25.8
20.4
28.0
9.2
46.0
23.2
24.4
27.8
27.9
48.4
0 10 20 30 40 50
Peru
Uruguay
Chile
Colombia
Mexico
Source: G. Crespi, E. Tacsir and F. Vargas, “Innovation and productivity in services: Empirical evidence from Latin America”, Technical Note, No. IDB-TN 690, Washington, D.C., Inter-American Development Bank (IDB), 2014.
Note: The data are from innovation surveys conducted in each country between 2005 and 2010.
This book’s nine chapters explore the frontiers between internationalization and innovation of the services sector in Latin America. The book posits that, in order for Latin American countries and firms to
Innovation and internationalization of Latin American services
23
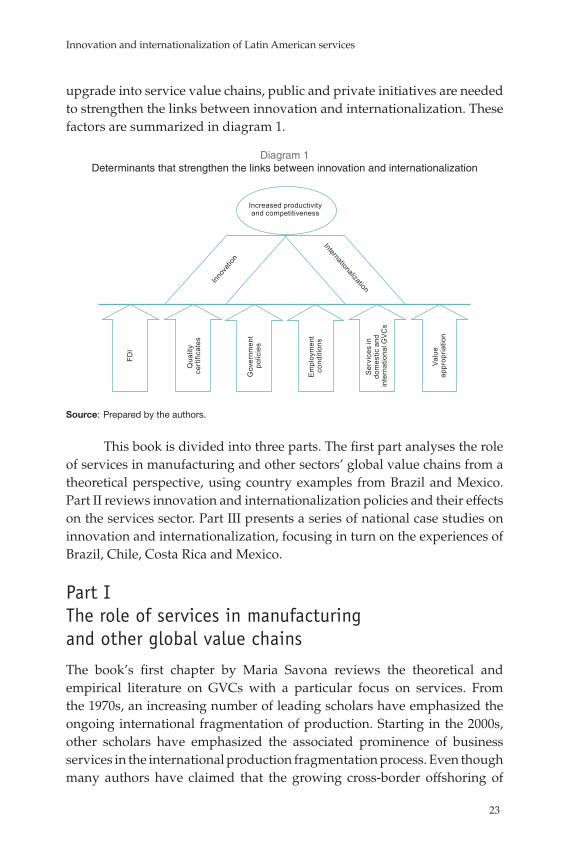
upgrade into service value chains, public and private initiatives are needed to strengthen the links between innovation and internationalization. These factors are summarized in diagram 1.
Diagram 1 Determinants that strengthen the links between innovation and internationalization
FDI
Qua
lity
cert
ifica
tes
Gov
ernm
ent
polic
ies
Em
ploy
men
t co
nditi
ons
Valu
e ap
prop
riatio
n
Ser
vice
s in
do
mes
tic a
nd
inte
rnat
iona
l GV
Cs
Innov
ation
InternationalizationIncreased productivity and competitiveness
Source: Prepared by the authors.
This book is divided into three parts. The first part analyses the role of services in manufacturing and other sectors’ global value chains from a theoretical perspective, using country examples from Brazil and Mexico. Part II reviews innovation and internationalization policies and their effects on the services sector. Part III presents a series of national case studies on innovation and internationalization, focusing in turn on the experiences of Brazil, Chile, Costa Rica and Mexico.
Part I The role of services in manufacturing and other global value chains
The book’s first chapter by Maria Savona reviews the theoretical and empirical literature on GVCs with a particular focus on services. From the 1970s, an increasing number of leading scholars have emphasized the ongoing international fragmentation of production. Starting in the 2000s, other scholars have emphasized the associated prominence of business services in the international production fragmentation process. Even though many authors have claimed that the growing cross-border offshoring of
E C L A C / C O L E F
24
services could be an engine of development for developing countries, the author questions this premise. This is because many developing countries find it difficult to upgrade within GVCs and often get stuck in low value added activities. Savona bases her assertion on a theoretical framework that combines the findings of Linder and Hirschman showing that strong domestic intermediate demand is a necessary condition for engaging in business service GVCs. Her framework suggests that countries need to develop a critical mass of domestic manufacturing and other sectors that are intensive in high value added services prior to joining a GVC, so as to ensure greater progression once established.
The study of GVCs is still in its early stages, which means that there is a lack of empirical evidence (apart from a limited number of industry-specific studies). Services are the next-generation engine of growth and form part of what has been called the “third unbundling” of globalization (Baldwin, 2008). However, the chapter by Savona challenges the idea that developing countries can easily or automatically migrate towards higher value added services and challenges the assumption that most business services can easily be exported across national borders. The author finds that the significant knowledge and skills required for non-routine tasks counteract the effect of falling transport and communication costs. Savona also suggests that the GVC literature and trade-in-task framework can fruitfully explain the phenomenon of service offshoring. Without the construction of a critical mass of domestic capabilities linked to business services, it is unlikely that a developing country could construct its own GVC or join an existing one and easily upgrade from low value added services.
Reviewing recent trade theory contributions on trade in tasks, the author proposes an alternative approach to the emergence of GVCs in services. Despite the underlying optimism on the benefits of this trend, the trade-in-tasks framework helps to explain why falling transport and communication costs would mainly favour the fragmentation and offshoring of ‘routine’ tasks, usually performed by lower-skilled workers. Developing countries would therefore become preferred destinations of those elements of service offshoring that mainly compete on price rather than knowledge, skills and talent. In a few cases, however, Latin American countries have managed to join the higher value added segments of service GVCs.
Chapter II by Jorge Arbache examines the contribution of services to manufacturing value chains in Brazil. Using various data sets, Arbache compares the service sector’s linkages with manufacturing in Brazil and several other advanced and emerging countries. His work reveals that the

Innovation and internationalization of Latin American services
25
relationship between industry and services in advanced economies differs from that observed in developing countries. This is due to differences in access to technology, credit and human skills. Unsurprisingly, developing countries are typically found to participate in low(er) value added activities while developed countries concentrate on high(er) value added market segments. Moreover, this division of labour between developed and developing countries only increases the gap between the two, thereby reinforcing prevailing asymmetries as a greater number of developing nations seek to join service GVCs. The author suggests that developing countries need strategies to strengthen the provision of services that increase industrial value added, contribute to the upgrading of GVCs and increase their participation in international markets.
In Brazil, services have assumed a prominent role in the economy, outpacing both agriculture and manufacturing. The service sector’s share of GDP stood at 70% in 2014. This share is comparable to that of countries with much higher levels of per capita income. Except for South Africa, the share of services in GDP in other emerging economies is much lower, especially in Asia. For example, in the Republic of Korea, the service sector’s share stood at 58% in 2014, and at 44% in China.
The main intermediate services purchased by Brazil’s manufacturing sector are financial, industrial and maintenance services provided by third parties as well as freight and truck fleets. Together, they account for over 60% of total purchased intermediate services. However, industries that are more technology-intensive consume proportionately more sophisticated services, such as royalties, technical assistance and marketing. In contrast, low-technology industries consume proportionately more financial, transport and other services provided by third parties.
The author’s findings confirm the important link between industry and services in Brazil. Over time, the share of purchased intermediate services in total output has reached levels similar to those found in advanced economies. However, the quality of services in Brazil remains low and their cost too high, which hinders the international competitiveness of Brazilian manufacturers. To break the low growth path the country has experienced since the 1980s, Brazil needs to increase the value added and services content of its manufacturing products. The country needs to nurture higher value added services that contribute to product differentiation in manufacturing products. The size of the domestic market and the potential for industrialization are clear advantages for the country. However, a greater international integration strategy will only work if it forms part of a more ambitious development strategy to increase industrial value added. For this to happen, Brazil needs to

E C L A C / C O L E F
26
invest in human capital, science and technology and innovation. It also needs to place high value added services at the heart of the country’s industrial, technological, trade and investment policies.
Chapter III by Jorge Carrillo and Redi Gomis compares working conditions among Mexico’s manufacturing and service multinational enterprises (MNEs) in global value chains. MNEs have undoubtedly driven the globalization process over the past two decades. Several studies have revealed significant differences between service and manufacturing MNEs in terms of their impact on host countries. Compared to the former, the latter seem more competitive, innovative, export-oriented and attractive in terms of working conditions. In particular, the authors explore the links between the “three I’s” (internationalization, integration and innovation) and working conditions between the two sectors on the basis of face-to-face interviews with human resource (HR) managers. The “three I’s” are indicators for corporations within an economic space characterized by globalization.
The authors’ initial hypothesis was that Mexico’s manufacturing multinationals pursue an export-driven efficiency-seeking strategy, while service MNEs predominantly follow market-seeking strategies. The paper posits that, compared with more domestically-oriented services MNEs, manufacturing companies are likely to secure a better position within a global value chain and generate more favourable employment conditions thanks to their international networks.
The evidence emerging from the author interviews provides little support for the hypothesis in terms of substantive differences between manufacturing and services MNEs. The chapter finds no significant correlation between the quality of employment and the degree of firm innovation and integration in value chains. Employment quality is measured by the share of college graduates, employment dynamics and wages. Somewhat counter-intuitively, however, those MNEs with higher levels of internationalization are found to have a lower quality of employment.
Part II Innovation and internationalization policies
The various contributions in Part II take up the key role of government policies in upgrading domestic service providers for enhanced insertion into higher value-adding GVCs. Examples of such policies include the development of ICT infrastructure, a specialized labour pool, access to finance, the attraction (and retention) of FDI and the promotion of exports.
Innovation and internationalization of Latin American services
27
The two chapters discuss government policies aimed at promoting the upgrading of service firms in a number of Latin American countries.
Chapter IV, by Dorotea López Giral and Felipe Muñoz Navia, reviews the policies of two successive governments in Chile towards the country’s offshore business services cluster between 2006 and 2014. Looking at the experience of several countries, the chapter presents a theoretical framework on successful industrial policy strategies to diversify and upgrade production and export matrices. In recent decades, many countries developed successfully through the application of selective development policies, often including the temporary protection of emerging industries. Particularly in developing countries where the private sector may be unable or unwilling to invest in new strategic sectors, public policies have often proven necessary and effective in diversifying production and export structures. Several countries that have pursued active government policies —such as Malaysia, Singapore and the Republic of Korea— succeeded in transforming their production structures from primary and low-tech manufactures towards medium- and high-technology goods and services.
Using this framework, the chapter reviews the offshore business service promotion policies of two successive governments in Chile: that of President Michelle Bachelet (2006-2010), followed by the administration of President Sebastián Piñera (2010-2014). The first government introduced active policies to promote five different clusters, including offshore business services. Through its national clusters programme, the government implemented a number of policy initiatives in the areas of FDI attraction, domestic industry development, human capital upgrading, international marketing and regulatory reforms. These initiatives, which were carried out in close collaboration with the private sector and universities, were largely successful. By 2010, the cluster had grown to more than 60 global service firms employing over 20,000 workers. From 2006 to 2010, exports grew by 300%. Under the following, more conservative, government, the cluster programme was terminated as the emphasis shifted to reliance on neutral and non-selective support to the private sector (for example through strengthened intellectual property rights enforcement and facilitating business start-ups). The end of the cluster programme, combined with a less dynamic global economy, contributed to the stagnation of Chile’s offshore business services sector from 2010 onwards.
The authors conclude that the cluster programme for offshore business services was technically well designed but lacked broad political support. Its structure, financing, operation and the involvement of the private sector and academia were all relevant and appropriate. However, because the
E C L A C / C O L E F
28
programme lacked political support, it became a casualty of President Piñera administration’s more ideological approach of neutral private sector support and a rejection of selecting or assisting potential “winning” export sectors. In short, selective policies were eliminated on the basis of political considerations rather than on a technical evaluation of the programme’s objectives and achievements under the previous government.
Chapter V by Luisa Rodriguez identifies a number of challenges in designing policies that promote innovation and the internationalization of service sector SMEs in selected Latin American countries. It is based on the United Nations Conference on Trade and Development (UNCTAD) Services Policy Reviews (SPR) of Nicaragua, Paraguay and Peru, and on more general analyses of the service sector policies of Colombia and Jamaica. The national case studies reviewed document the innovation- and export-related difficulties faced by SMEs in more knowledge-intensive service sectors, as well as the challenges governments face in designing, implementing and monitoring policies that promote such goals. To overcome such obstacles, other, complementary, policies are necessary, such as upgrading ICT infrastructures, improving education and labour training, expanding access to finance, promoting knowledge sharing and patent protection and SME capacity-building through associative schemes and certifications.
The chapter’s case studies reveal the need for a large skilled and educated domestic labour pool that can help firms upgrade. The government and the private sector need to work together to ensure that a sufficiently large number of professionals entering the job market can cope with the increasing demand for skills in key service sectors. Equally crucial is that the institutional framework for improving quality in education results in high standards being enforced. The analysis conducted by UNCTAD through its Services Policy Reviews reveals the importance of targeted promotion policies for SMEs and of generating stronger linkages with and between service SMEs. This group of firms has the potential to generate employment in the formal economy and avoid the emergence of “service enclaves” with limited linkages and spillover effects with the rest of the economy.
Another key policy area concerns internationalization strategies, which are needed to improve export opportunities for domestic service providers. The cases analysed in UNCTAD SPRs show that service SMEs often lack knowledge of service demand characteristics and consumer expectations in foreign markets. Such information asymmetries can affect the way in which SMEs evaluate costs and risks when deciding whether to internationalize their business. Overcoming these challenges requires strategies to adapt the

Innovation and internationalization of Latin American services
29
supply of services by SMEs to external demand conditions. This suggests the usefulness of supporting SMEs with adequate market intelligence and commercial (export) promotion (branding and marketing) to facilitate their entry into international markets and of increasing SME awareness of export opportunities.
Part III Case studies on services innovation and internationalization
Part III of the book reports the findings of four case studies, from Brazil, Chile, Costa Rica and Mexico. These case studies illustrate how service providers in Latin America participate in service GVCs and what innovation and internationalization strategies they follow with a view to upgrading their service offerings.
Chapter VI by Alfredo Hualde and Jordy Micheli reviews the changes in technology and employment conditions within the Mexican call centre industry. The partial transformation observed from call to contact centres was shaped in part by changes in the technologies of the information society, namely the new generation of communication tools in the form of social networks and the individualization of consumer patterns. These changes also affect worker perceptions of the tension between quantitative and qualitative metrics and the procedures to measure quality, and fair compensation in terms of job quality and remuneration.
Latin America is an emerging player in service offshoring, specifically through the expansion of call centres. Many Latin American countries have attempted to attract FDI through the provision of call centre services, which offer a number of cost-cutting advantages to multinational firms. The use of the Spanish language has favoured inflows of FDI from firms from countries or companies associated with the United States that need to serve a fast-growing Spanish-speaking market. The near-shoring opportunities existing between Mexico and the United States have led to an increase in this type of FDI activity. Mexican call centres are heavily concentrated in the country’s three main cities (Mexico City, Guadalajara and Monterrey) as well as in some border cities such as Tijuana.
In recent years, working conditions and organizational methods in this industry have reinforced labour tensions. On the one hand, the measurement of labour productivity is being standardized according to predefined metrics. On the other hand, prevailing production systems require workers to deliver “quality”, which means flexibility and non-standardized problem solving.
E C L A C / C O L E F
30
The evolution of technology and labour-related practices is progressively transforming call centres into contact centres. These use the tools of the information age for their interactions with people, in conjunction with more traditional functions based on telephone contact. In this context, the authors hypothesize that increasing professionalization might open up new career paths. The result is a more complex and varied industry integrating an ever-increasing range of services into the information society.
Chapter VII by Yoshimichi Murakami and René A. Hernández explores the spillover effects of Costa Rica’s FDI on the upgrading trajectories of offshore services using a GVC analytical framework. The impacts of offshore service industries on Costa Rica are, to some extent, predictable from theories that analyse the impact of FDI on recipient countries. This is so, among other reasons, because captive offshoring —the main form found in the country— requires FDI by definition. The chapter reviews the theoretical literature on the impact of FDI, GVCs and offshore service industries on recipient countries. The authors place particular emphasis on the connections between the above three factors, all of which relate to the fragmentation or “unbundling” of global production sharing at the global or regional levels.
The case study shows that Costa Rica has successfully diversified its export basket towards high-technology manufacturing goods, such as electronics and medical devices, but also towards offshore services. The offshore services industry in Costa Rica saw its share in GDP grow from 4.6% in 2008 to 5.8% in 2013. A salient feature of the country’s successful diversification trajectory relates to its ability to attract and retain FDI in high-end manufacturing goods and offshore services. The chapter’s findings suggest that FDI in Costa Rica has gradually shifted from manufacturing to services since 2000. During this period of structural change, the country’s service sector created the most jobs in absolute terms and produced the highest wages of all sectors operating in the country’s free economic zones (where average wages are substantially higher in comparison with the rest of the country). Furthermore, increasing levels of FDI have compensated for the country’s low rate of domestic investment and now account for a substantial (and increasing) share of the country’s gross fixed capital formation. The chapter’s analysis suggests that FDI has had clearly positive impacts on the country’s level of fixed investment, human capital and employment.
Meanwhile, the upgrading trajectories of offshore services in Costa Rica show that, while the country entered the offshore services business through the low-end BPO segment (such as call centres or shared service centres), upgrading actually started within the BPO segment and swiftly

Innovation and internationalization of Latin American services
31
diversified into higher-value ITO market segments. Most recently (i.e. since 2012), Costa Rica has attempted to advance further towards a range of KPO services, including niches such as digital technologies and engineering and design services. In the upgrading process, low-value segments such as call centres have been progressively outsourced to third party providers as well as to other low-cost (neighbouring) developing countries. However, the presence of Costa Rican suppliers of KPO services remains limited to specific niche activities.
The chapter concludes by noting that the positive impacts of FDI on offshore services in terms of enhanced technological capabilities and human capital are partially concentrated on the country’s innovation, learning and knowledge systems, which are in turn attributable to sustained improvements in the educational programmes of universities and technical colleges on the back of financial, technical and curriculum assistance from transnational corporations (TNCs) such as Intel (so-called “supplier development programmes”). In this sense, the chapter makes clear that FDI was a major catalyst for qualitative upgrading.
However, the chapter also notes the development of local technological capabilities and investment in Costa Rica’s labour pool to improve the country’s absorptive capacity. It is thus vital that steps be taken to supply more skilled workers and enhance local capabilities to attract further TNC investment. Such efforts have to form part of a more comprehensive development strategy sustained by a “renewed industrial policy”, which will eventually enable Costa Rica and its workforce to engage in ever-more diversified and knowledge-intensive service activities.
The chapter warns, however, that disciplines on trade and investment policy stemming from Costa Rica’s membership of the World Trade Organization (WTO) and from numerous latest generation preferential trade agreements may well restrict the “policy space” needed to enact industrial policies. In a similar vein, globalization also impacts on Costa Rica’s policy space through the reality of global supply chains that are controlled by large transnational corporations and buyer-led networks. In a world of global production networks, “vertical specialization” or trade in intermediate goods has become more significant and has led TNCs to establish quality standards that firms in developing countries need to comply with if they are to upgrade into such supply chains on a sustainable basis.
Chapter VIII by Marcela Gómez and Nanno Mulder tests the hypothesis that the rapid export growth of the Chilean IT sector is linked to the adoption of international quality certifications (QCs). Information technology (IT)
E C L A C / C O L E F
32
services have been one of the fastest growing sectors of the Chilean economy over the past decade. From 2001 to 2012, sales of IT-related services grew by 12% a year on average, with exports amounting to US$ 206 million in 2012. Within the same period, 887 new firms entered the market, increasing employment in the industry by over 50%. In 2012, Chile issued 230 ISO 9001 certificates per 1 million population, placing the country ahead of Uruguay, Colombia, Argentina, Brazil and Mexico.
Quality certifications reduce information asymmetries between sellers and (foreign) buyers. Firms use QCs to enhance their competitiveness in an ever-increasing global market by guaranteeing that their production meets internationally recognized standards verified by an independent entity. Certifications increase the value added share of exports and offer better quality services. This in turn strengthens supplier-consumers relationships. Gómez and Mulder refer to signalling theory, process efficiency theory and institutional theory, all of which help explain the benefits of a firm adopting QCs. An alternative hypothesis is that firms adopt QCs to streamline procedures and cut costs without directly impacting exports. Owing to a lack of detailed data on Chilean IT firms, the authors note that it is not possible to perform robust econometric analyses testing both hypotheses. Instead, a tailor-made survey designed for the purpose of the chapter was sent to the 110 members of Chile’s largest association of IT service producers (Association of Information Technology Companies (ACTI)). The responses received to the questionnaire, which was answered by 38% of the members, suggest that Chilean firms are generally unaware of the type of QC that is most essential in their target export countries. This may be explained by the fact that the domestic market is proportionally more important than exports for Chilean firms. The answers also seem to reject the hypothesis that the main reason for adopting a QC was to increase exports. Just under half of all respondents stated that they obtained QCs in order to streamline and improve their production processes. The remaining respondents obtained QCs in order to increase their participation in either local or overseas markets. Therefore, the findings suggest that the primary motivation for seeking QCs is to make firms’ production processes more cost effective and efficient.
Chapter IX by Fabio Morganti and Dimária Silva e Meirelles analyses the processes of value creation, configuration and appropriation of a medium-sized multinational knowledge-intensive service firm in Brazil. In particular, the authors look into how a service company manages to appropriate value to maintain a competitive edge over its competitors. Firms are frequently unable to collect meaningful returns from their innovations. This is particularly

Innovation and internationalization of Latin American services
33
so in business services, where many innovations are difficult to protect through patents.
The chapter uses the theoretical Business Model Canvas proposed by Osterwalder and Pigneur (2010). This model uses nine blocks to show how an organization creates, delivers and captures value. The case study focuses on the Process Development Corporation (PDC) from the United States, a midsize multinational company providing technical services. PDC was founded in 1988 and has offices in Brazil, Canada, China, Europe and Mexico. For the case study, data were collected through a semi-structured qualitative interview targeting the processes of value creation, configuration and appropriation adopted by the company.
The analysis shows that the firm creates value by working with its service attributes, along with its image and business relations. These elements enable it to create positive customer value, which represents the difference between the end-user and initial values. It was also found that PDC creates value by adopting Amit and Zott’s (2001) drivers of novelty (new transaction structures; new content); efficiency (low search costs; symmetric information); complementarity (full service provider from design to implementation and support); and lock-in (trust-based relationship, increasing exchange costs).
The research also found that the PDC process of value appropriation operates mainly through complementary assets such as reputation, upper management capacity and differentiated information systems, since the appropriation regime is considered weak by the company due to ineffective systems and mechanisms.
The Business Model Canvas analysis also confirms the importance of reputation and distinctive relationships with clients in the value creation process. It emphasizes how the company uses its upper management capacity and proprietary information systems to configure the value proposition offered to clients. Even though the company uses labour intensively, its labour force is not considered as a competitive advantage for the company. Rather, such competitive advantages result from the way the company’s operations are configured and the way it appropriates value.
Final remarks
The chapters of this book shed new light on the innovation and internationalization processes of service firms in Latin America as a means of improving their productivity and competitiveness, as well as on the policies that best promote such goals. Although services dominate economic activity and employment in all of the region’s countries, their share in exports
E C L A C / C O L E F
34
is still low. One of the underlying reasons for this observed trend is that inadequate innovation takes place in the sector, notwithstanding notable exceptions. Limited exports also do little to stimulate innovation. The low internationalization and innovation intensity of most services in the region partly explains their poor productivity growth. Policies in these areas are also underdeveloped, in part because government policies have tended to focus primarily on manufacturing and the natural resource sector. This reality contrasts with some emerging economies in Asia and with high-income economies, where services now generate the most productivity growth thanks to high and rising innovation and internationalization intensities.
The book’s various chapters have also highlighted the continued dearth of data with which to study the issues of innovation and internationalization in Latin America’s service economy in greater depth. National accounts in most countries provide very little industry detail on the services sector, as few surveys are carried out to collect data on services (with the notable exception of Mexico). Also, few countries collect data on innovation in services compared with the manufacturing sector. Moreover, limited data are available on the origins of imports and destinations of exports, as well as by category of services. One notable exception in this regard is Brazil, whose national statistical agency has since 2014 broken down its bilateral trade in services into almost 1,000 categories for all of its trading partners. The service trade statistics of most other Latin American and Caribbean countries show 40 service categories at most. Furthermore, no country in the region yet publishes data on sales by subsidiaries of firms in foreign markets (so-called “Mode 3 trade in services”), which is an essential dimension of firms’ internationalization processes.
One issue that warrants further study is the way in which business services firms’ participation in manufacturers’ production networks impacts their innovation and internationalization performance. A growing proportion of goods and services are today jointly produced within global value chains. This complicates attempts to conduct separate analyses of innovation and internationalization processes of goods and service producers.
Innovation and internationalization of Latin American services
35
BibliographyAmit, R. and C. Zott (2001), “Value creation in e-business”, Strategic Management
Journal, vol. 22.
Baldwin, R. (2008), “Globalisation as the great unbundling(s): What should governments do?”, VOX, 4 September [online] http://www.voxeu.org/article/making-globalisation-work-skills-families-unions-and-welfare-state.
Baumol, W. J. (1967), “Macroeconomics of unbalanced growth: the anatomy of urban crisis”, The American Economic Review, vol. 57, No. 3.
Castro-Lucas, C. and others (2012), “International performance and innovation in services: preliminary findings from logistical and engineering consultancy services”, International Business Research, vol. 6, No. 2.
Cornell University/INSEAD/WIPO (World Intellectual Property Organization) (2015), The Global Innovation Index 2015: Effective Innovation Policies for Development, Geneva.
Crespi, G., E. Tacsir and F.Vargas (2014), “Innovation and productivity in services: Empirical evidence from Latin America”, Technical Note, No. IDB-TN 690, Washington, D.C., Inter-American Development Bank (IDB).
Elms, D. and P. Low (2013), Global Value Chains in a Changing World, Geneva, World Trade Organization (WTO).
Evangelista, R. and M. Savona (2003), “Innovation, employment and skills in services. Firm and sectoral evidence”, Technology and the Economy, vol. 14, No. 4.
Fernandez-Stark, K., P. Bamber and G. Gereffi (2011), “The offshore services value chain: Upgrading trajectories in developing countries”, International Journal of Technological and Development, vol. 4, No.1-3.
Gadrey, J. (2000), “The characterization of goods and services: an alternative approach”, Review of Income and Wealth, Series 46, No. 3, September.
Ganotakis, P. and J. Love (2011), “R&D, product innovation, and exporting: evidence from UK new technology based firms”, Oxford Economic Papers, vol. 63.
Gallouj, F. (2002), Innovation in Services: The New Wealth of Nations, Cheltenham, Edward Elgar.
Guerrieri, P. and V. Meliciani (2005), “Technology and international competitiveness: the interdependence between manufacturing and producer services”, Structural Change and Economic Dynamics, vol. 16, No. 4.
Hernández, R.A., J.M. Martínez-Piva and N. Mulder (2014), Global Value Chains and World Trade: Prospects and Challenges for Latin America, ECLAC Books, No. 127, Economic Commission for Latin America and the Caribbean (ECLAC).
Kyläheiko, K. and others (2011), “Innovation and internationalization as growth strategies: The role of technological capabilities and appropriability”, International Business Review, vol. 20, No. 5, October.
E C L A C / C O L E F
36
Miozzo, M. and L. Soete (2001), “Internationalization of services: a technological perspective”, Technology Policy and Innovation in the Globalized Learning Society, vol. 67, No. 2–3, June 7.
Montgomery, C. and M. Porter (1991), Strategy: Seeking and Securing Competitive Advantage, Harvard Business Press.
Osterwalder, A. and Y. Pigneur (2010), Business Model Generation, New Jersey, John Wiley & Sons.
Park, E. (2014), “How does the global relocation of business activities affect firm innovation? An empirical analysis of the impact of offshoring on innovation in Danish firms” [online] http://druid8.sit.aau.dk/acc_papers/91onbc7m4bdjtgx9koxtlx7ryl6y.pdf.
Pascal, P. and L. Soete (2001), Technology and the Future of European Employment, Cheltenham, Edward Elgar Publishing Limited.
Tacsir, Ezequiel (2011), “Innovación en los servicios: el difícil caso de América Latina y el Caribe”, Washington, D.C., Inter-American Development Bank (IDB) [online] https://publications.iadb.org/handle/11319/5094?locale-attribute=en.
UNCTAD (United Nations Conference on Trade and Development) (2015), World Investment Report 2015. Reforming International Investment Governance, Geneva.
Wirtz, J., S. Tuzovic and M. Ehret (2015), “Global business services: Increasing specialization and integration of the world economy as drivers of economic growth”, Journal of Service Management, vol. 26, No. 4.
Part I
The role of services in manufacturing and other global value chains

Chapter I
Global structural change and value chains in services: a reappraisal
Maria Savona
Summary
The literature on global value chains (GVCs) has recently begun to recognize the increasing importance of fragmentation of production that involves service —in particular business service—1 GVCs (Blinder, 2006; Gereffi and Fernandez-Stark, 2010a; Ventura-Dias, 2012). Participation in business service GVCs might be considered a sort of third unbundling of the internationalization of production, which has been argued to open up new opportunities for catching up in developing countries (Gereffi and Fernandez-Stark, 2010b). What are the theoretical and empirical bases for such a claim? This chapter selectively systematizes the traditional and emerging literature on GVCs
1 Business services include ICT-related services (ISIC code 72), research & development (73) and all intermediate services such as engineering, technical consultancy, legal aid and other business services (74).

E C L A C / C O L E F
40
in services and argues that developing domestic and local specialization, including backward linkages à la Hirschman, is an important prerequisite for joining service GVCs as a catching-up strategy.
Introduction
International trade scholars are increasingly aware that the unit of analysis of traditional trade theory is changing, from final products to tasks (Grossman and Rossi-Hansberg, 2006, 2008 and 2012; Costinot, Vogel and Wang, 2013; Baldwin and Robert-Nicoud, 2014). Both the volume and geographical spread of traded tasks are also increasing. International fragmentation of production, which implies that countries specialize in portions of the value chain and trade other portions of it, is a relatively recent phenomenon, involving offshoring and the globalization of value chains.2 As described by Baldwin (2011), this process has led to a second unbundling of globalization, transformed the terms of international competition and shifted the barycentre of the world’s global headquarters and peripheries (see also Baldwin and López-Gonzalez, 2014).
Academic interest in a new phenomenon often sparks fierce debates on its determinants and effects. Analysis of the emergence of global value chains (GVCs) within the landscape of international trade theory is no exception. Scholars have analysed the conditions that favour countries joining GVCs (Costinot, Vogel and Wang, 2013); the effects on labour markets and wages in participating countries (Feenstra and Hanson, 1999; Grossman and Rossi-Hansberg, 2006; Antras, Garicano and Rossi-Hansberg, 2006; Timmer and others, 2013; Acemoglu, Gancia and Zilibotti, 2014); and the implications in terms of GVC governance asymmetries between developed and developing countries (Kaplinsky, 2000 and 2013; Schmitz and Strambach, 2009). This literature often includes opposing stances, for instance, with regard to the presence and the quality of the contribution of GVCs to catch-up and development processes.
These debates have so far overlooked the increasing importance of fragmentation of production that involves service offshoring. The new developments in trade theory based on the trade-in-task framework have not yet been able to incorporate service GVCs. The core assumption of the trade-in-task framework is related to falling transport and communication
2 For recent reviews, see Kaplinsky (2013); OECD (2013); and Timmer and others (2013).
Innovation and internationalization of Latin American services
41
costs, which are claimed to have caused two different waves of unbundling of globalization (Baldwin, 2011; Baldwin and López-Gonzalez, 2014). Adoption of the task approach originally put forward by Autor, Levy and Murnane (2003), as in Baldwin and Robert-Nicoud (2014), might, in principle, provide a generalized framework that encompasses the international fragmentation of production of intangible activities such as services.3
The empirical evidence on service GVCs is so far mainly based on industry cases (Gereffi and Fernández-Stark, 2010a and 2010b; see also Massini and Miozzo, 2012). To paraphrase Baldwin (2011), the growth of and the first-time participation of developing countries in service GVCs might be considered a third unbundling of globalization. Indeed, developing countries, especially in East Asia and Latin America, are increasingly becoming a destination for offshore services, particularly business services. Participation in business service GVCs is therefore thought to open up new opportunities for developing countries to catch up (Blinder, 2006; Gereffi and Fernandez-Stark, 2010a; Lema, Quadros and Schmitz, 2012; Ventura-Dias, 2012; Hernández and others, 2014).
This chapter aims to reappraise the debate on service GVCs from two perspectives. First, following a review of the literature on GVCs in general and service GVCs in particular, I introduce two alternative voices that are often neglected in these circles, namely, Hirschman (1958) and Linder (1961). Specifically, I combine Hirschman’s theoretical framework and (a modified version of) the Linder thesis to explain the propensity to participate in service GVCs, as a complementary explanation with respect to the traditional determinants of cost and factor endowments. This conjecture is broadly based on the empirical evidence shown in my prior work (Meliciani and Savona, 2014; López-Gonzalez, Meliciani and Savona, 2014) and takes into account the literature on the economics of services. I then argue that the higher the domestic specialization in industries with backward linkages to business services, (that is, sectors with the highest intermediate demand for business services), the higher the propensity to participate in business service GVCs directly and indirectly, in line with Linder’s claim that the composition of final domestic demand favours trade in similar sectors.
Second, I suggest that in the absence of a strong domestic share of manufacturing industries with backward linkages to business services,
3 Although I do not attempt to develop this argument here, it might represent an interesting avenue that a research agenda on service GVCs should include.

E C L A C / C O L E F
42
it is unlikely that a (developing) country would be able to build the capabilities to join a GVC in these sectors or to upgrade existing low value added services into high value added business services to join the upstream segments of GVCs serving international markets. I then offer preliminary reflections on the policy implications of these arguments and suggest using caution when considering unconditional participation in service GVCs as a new pathway for sectoral and technological upgrading in developing countries.
In venturing into the above reflections, I also consider the competing view that joining GVCs presents new opportunities for industrialization in developing countries without the need for “building their own from scratch” (Baldwin, 2012; Baldwin and López-Gonzalez, 2014, p. 4). This view implies that backward linkages à la Hirschman may increasingly arise across national boundaries and therefore lead to participation in business service GVCs as a result of proximity to so-called headquarter nations, regardless of the domestic sectoral structure. Reappraising these alternative views is important given their implications for industrial policy.
The remainder of the chapter is organized as follows. The next section briefly and selectively reviews the trade theory literature on GVCs. Section B focuses on business service GVCs in the empirical literature. Section C outlines the Hirschman-Linder hypothesis as a possible explanation of the emergence of service GVCs and describes the implications of industrial policy for development. Section D summarizes and concludes.
A. A brief overview of GVCs in trade theory
Trade theory has dealt with comparative advantage in and trade of final products for over a century. However, the fragmentation of production, let alone the international spatial disaggregation of productive activities, was not really acknowledged until the 1970s, when the concept of commodity chain was first introduced (Bair, 2005; de Backer and Miroudot, 2013). The concept then evolved to encompass the international geographical spread of production and the increasing interconnectedness of countries in productive processes, termed “offshoring and global commodity chains” (Gereffi, 1994). In the 2000s, Grossman and Rossi-Hansberg (2006) declared the end of trade in “wine for cloth,” referring to Ricardo’s seminal example, and the start of fragmentation in the production of manufactured products across countries. Comparative advantage has now to be accounted for in terms of portions of

Innovation and internationalization of Latin American services
43
value added: the term “global value chain” finally enters the debate (Gereffi, Humphrey and Sturgeon, 2005; Gereffi, Fernandez-Stark and Psilos, 2011; Kaplinsky, 2013).
According to trade scholars, a key determinant of the emergence of GVCs is the dramatic decrease in transportation and communication costs. This has radically changed the opportunity cost of specializing in sectors and activities that once required spatial concentration, thereby undermining the role of agglomeration economies to such an extent that scholars have forecast the “death of distance” and a “flat world” (Friedman, 2005; Leamer, 2007). With transport and communication costs virtually converging to zero, the locational advantages of economic activities should become increasingly meaningless, favouring their migration to destinations where factor endowments and wage competition, at least for low-skilled or routinized activities, make the key difference (Autor, Levy and Murnane, 2003; Autor and Dorn, 2013; Baldwin, 2011).
Building on the task approach put forward by Autor, Levy and Murnane (2003), trade theory has moved towards a trade-in-task framework. This new framework embodies the emergence of GVCs and focuses on their effects on domestic and international labour markets and wages (see Grossman and Rossi-Hansberg, 2008; Antras, Garicano and Rossi-Hansberg, 2006; Costinot, Vogel and Wang, 2013; Baldwin and Robert-Nicoud, 2014). The appeal of a task approach to explain the international fragmentation of production within trade theory lies in a certain degree of determinism. The starting point is a straightforward (assumed) association between the incentives to offshore and the degree of routinization, where routinized tasks are usually (but not exclusively) performed by low-skilled labour and non-routinized tasks are usually (but not exclusively) performed by high-skilled labour. Firms would be more prone to offshore routinized rather than non-routinized tasks, because non-routinized tasks depend on tacit knowledge and are more costly to offshore (Autor, Levy and Murnane, 2003; Vona and Consoli 2014).4
4 Consoli, Rentocchini and Vona (2015) build on the task-based approach developed by Autor, Levy and Murnane, (2003) and empirically test competing explanations of the demand for non-routinized skills over the past decade. They find that technology —in particular, information and communication technology— is less of a driver of the demand for non-routinized skills now than it was in the 1990s. Trade, the enlargement of access to low-skilled markets and import competition have led to an increased demand for higher skills domestically and a greater polarization of skills at the extremes of the skills distribution.
E C L A C / C O L E F
44
Trade-in-task models, common to most of this literature, show that the benefits of offshoring for the domestic labour markets in both developed and developing economies are similar to those arising from factor-augmenting technical progress (Jones and Kierzkowski, 1990 and 2005; Grossman and Rossi-Hansberg, 2006). The productivity impact on offshoring firms generates positive spillovers and increases the domestic wages for tasks that are performed by similarly skilled labour.
From a theoretical perspective, the trade-in-task framework might well lend itself to encompass service GVCs, as the notion of task rather than product is intuitively more appropriate for describing both the sequence of intermediate inputs composing the service and the (intangible) output itself. Often, sectors such as business services include activities that Autor, Levy and Murnane, (2003) would refer to as non-routinized tasks performed by high-skilled workers. However, the applicability of the trade-in-task framework to services is not entirely clear, given that no explicit attempt has yet been made to conceptualize the differences between an intermediate service input, a task and a service output.5
While most of the literature based on the trade-in-task framework consists of models,6 the collection of empirical evidence on tasks remains a challenge. So far efforts are mainly confined to the United States, where task data have been derived by matching the Current Population Survey with the Dictionary of Occupational Titles (Autor, Levy and Murnane, 2003; Autor and Dorn, 2013; Consoli, Rentocchini and Vona, 2015). Similar data in Europe have only recently been collected.7 To the best of my knowledge, there has not yet been such an attempt in developing countries.
Key organizations are moving forward on the collection of homogenized data on trade in value added. The database on Trade in Value Added (TiVA), a joint initiative by the Organization for Economic Cooperation and Development (OECD) and the World Trade Organization (WTO), and the World Input Output Database (WIOD), originally funded by the European Commission, were first released in 2013 and 2012, respectively. These databases trace the
5 While this is clearly out of the scope of this work, it would be an interesting challenge for both trade and service economics scholars (see Consoli and Rentocchini, 2014, for an interesting attempt).
6 See Baldwin and Robert-Nicoud (2014) for a recent review.7 See European Commission, “European Skills, Competences, Qualifications and
Occupations” [online] (https://ec.europa.eu/esco/home).
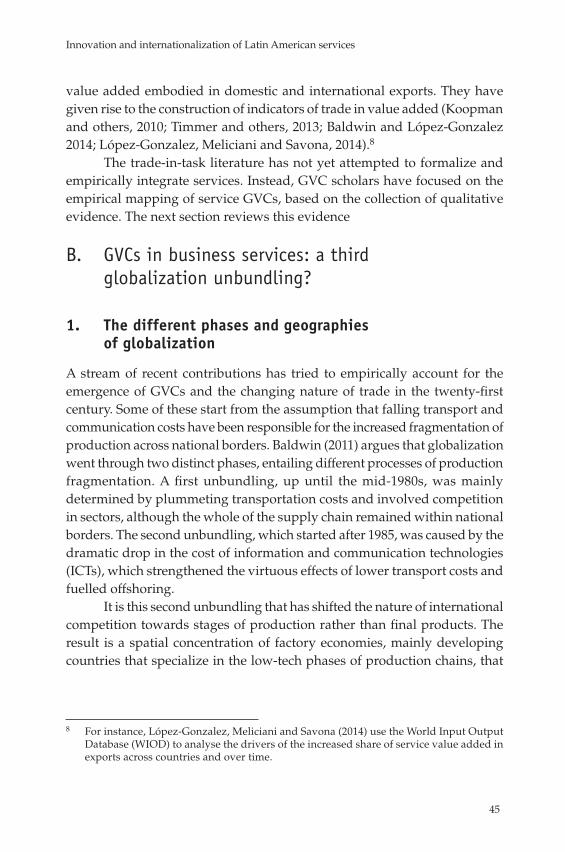
Innovation and internationalization of Latin American services
45
value added embodied in domestic and international exports. They have given rise to the construction of indicators of trade in value added (Koopman and others, 2010; Timmer and others, 2013; Baldwin and López-Gonzalez 2014; López-Gonzalez, Meliciani and Savona, 2014).8
The trade-in-task literature has not yet attempted to formalize and empirically integrate services. Instead, GVC scholars have focused on the empirical mapping of service GVCs, based on the collection of qualitative evidence. The next section reviews this evidence
B. GVCs in business services: a third globalization unbundling?
1. The different phases and geographies of globalization
A stream of recent contributions has tried to empirically account for the emergence of GVCs and the changing nature of trade in the twenty-first century. Some of these start from the assumption that falling transport and communication costs have been responsible for the increased fragmentation of production across national borders. Baldwin (2011) argues that globalization went through two distinct phases, entailing different processes of production fragmentation. A first unbundling, up until the mid-1980s, was mainly determined by plummeting transportation costs and involved competition in sectors, although the whole of the supply chain remained within national borders. The second unbundling, which started after 1985, was caused by the dramatic drop in the cost of information and communication technologies (ICTs), which strengthened the virtuous effects of lower transport costs and fuelled offshoring.
It is this second unbundling that has shifted the nature of international competition towards stages of production rather than final products. The result is a spatial concentration of factory economies, mainly developing countries that specialize in the low-tech phases of production chains, that
8 For instance, López-Gonzalez, Meliciani and Savona (2014) use the World Input Output Database (WIOD) to analyse the drivers of the increased share of service value added in exports across countries and over time.

E C L A C / C O L E F
46
produce inputs for headquarter economies, mainly industrialized countries such as the United States, Japan and Germany. Falling costs have thus mattered in different ways, first for the disagglomeration of production and value chains within national borders and then for the international fragmentation of production and value chains across countries. A key factor in the latter process was a developing country’s closeness to headquarters, for industrialization in the form of participation in existing GVCs, as opposed to “building [GVCs] from scratch” (Baldwin and López-Gonzalez 2014).
According to Baldwin and López-Gonzalez (2014), developing countries start to function as neighbouring factory economies, specializing in the lower-skilled (manufactured) portion of the value chain, while the higher-skilled segments remain within the boundaries of the headquarter country. The process of joining an existing value chain is claimed to have provided a unique opportunity for many countries, which managed to industrialize at a fraction of the time that today’s developed countries took. For instance, countries such as Mexico (close to the United States), China (close to Japan) and Poland and Turkey (close to Germany) have all increased their participation in GVCs thanks to their closeness to headquarters. Baldwin and López-Gonzalez (2014) show that in what has become termed “Factory North America”, the United States sources intermediate goods from a variety of countries, whereas neighbouring Mexico predominantly buys from the United States. Thus, the pattern of specialization driven by GVCs is that Mexico buys intermediate goods from the United States, assembles them into final products and then exports them to American consumers (see figure I.1). The same pattern is found in Factory Europe, with Germany leading the GVC comprising factory economies such as Poland and the Czech Republic (see figure I.2).
Baldwin (2011, p. 33) sums up as follows: “The second unbundling made industrialization less meaningful. Before the second unbundling a nation had to have a deep and wide industrial base before it could export, for example, car engines. Exporting engines was a sign of victory. Now it is a sign that the nation is located in a particular segment of an international value chain.”
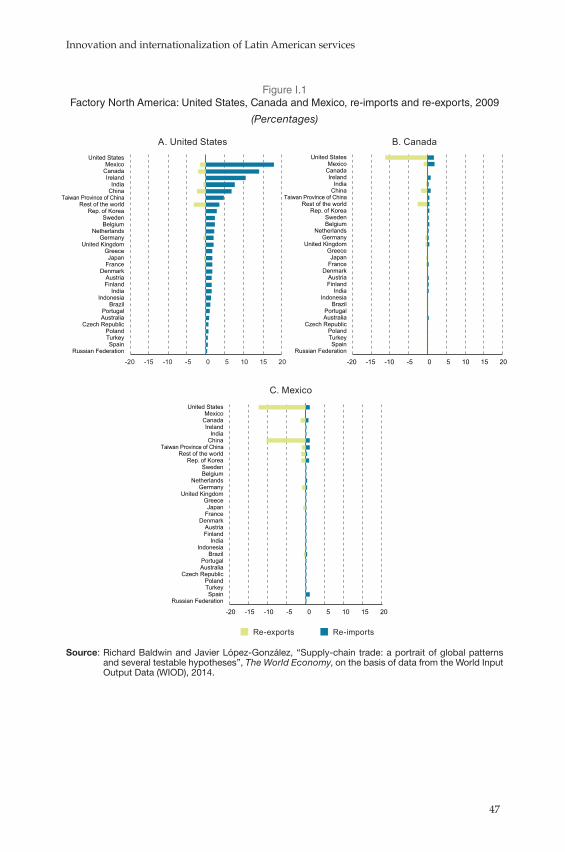
Innovation and internationalization of Latin American services
47
Figure I.1 Factory North America: United States, Canada and Mexico, re-imports and re-exports, 2009
(Percentages)
-20 -15 -10 -5 0 5 10 15 20
Russian Federation Spain
Turkey Poland
Czech Republic Australia Portugal
Brazil Indonesia
India Finland Austria
Denmark France Japan
Greece United Kingdom
Germany Netherlands
Belgium Sweden
Rep. of Korea Rest of the world
Taiwan Province of China China India
Ireland Canada Mexico
United States
A. United States
-20 -15 -10 -5 0 5 10 15 20
Russian Federation Spain
Turkey Poland
Czech Republic Australia Portugal
Brazil Indonesia
India Finland Austria
Denmark France Japan
Greece United Kingdom
Germany Netherlands
Belgium Sweden
Rep. of Korea Rest of the world
Taiwan Province of China China India
Ireland Canada Mexico
United States
B. Canada
Re-exports Re-imports
-20 -15 -10 -5 0 5 10 15 20
Russian Federation Spain
Turkey Poland
Czech Republic Australia Portugal
Brazil Indonesia
India Finland Austria
Denmark France Japan
Greece United Kingdom
Germany Netherlands
Belgium Sweden
Rep. of Korea Rest of the world
Taiwan Province of China China India
Ireland Canada Mexico
United States
C. Mexico
Source: Richard Baldwin and Javier López-González, “Supply-chain trade: a portrait of global patterns and several testable hypotheses”, The World Economy, on the basis of data from the World Input Output Data (WIOD), 2014.
E C L A C / C O L E F
48
Figure I.2 Factory Europe: Germany, Poland and the Czech Republic, re-imports and re-exports, 2009
(Percentages)
Re-exports Re-imports
-20 -10 0 10 20
A. Germany
Australia United States
Canada Japan
Russian Federation Greece
Brazil Indonesia
India Mexico
Taiwan Province of China China
Rest of world Rep. of Korea
Turkey United Kingdom
Italy Portugal
Spain Finland
Sweden Denmark
France Ireland
Netherlands Belgium Poland Austria
Czech Republic Germany
-20 -10 0 10 20
Australia United States
Canada Japan
Russian Federation Greece
Brazil Indonesia
India Mexico
Taiwan Province of China China
Rest of world Rep. of Korea
Turkey United Kingdom
Italy Portugal
Spain Finland
Sweden Denmark
France Ireland
Netherlands Belgium Poland Austria
Czech Republic Germany
B. Poland
-20 -10 0 10 20 Australia
United States Canada
Japan Russian Federation
Greece Brazil
Indonesia India
Mexico Taiwan Province of China
China Rest of world Rep. of Korea
Turkey United Kingdom
Italy Portugal
Spain Finland
Sweden Denmark
France Ireland
Netherlands Belgium Poland Austria
Czech Republic Germany
C. Czech Republic
Source: Richard Baldwin and Javier López-González, “Supply-chain trade: a portrait of global patterns and several testable hypotheses”, The World Economy, on the basis of data from the World Input Output Data (WIOD), 2014.
This evidence has raised concerns within a different stream of literature, interested in the distribution of benefits along the value chain and the income polarization effects observed as a consequence of value chain globalization. Kaplinsky (2000), for instance, points to the sources of inequality linked to the spatial distribution of production activities between headquarter and factory economies. Kaplinsky argues that while being left out of GVCs
Innovation and internationalization of Latin American services
49
is a losing proposition, the countries that are most likely to lose from the globalization process are those that keep joining and participating in GVCs at costly conditions. Many of the cross-country asymmetries in the distribution of the gains deriving from a GVC are attributable to issues of governance (Kaplinsky, 2000; Gereffi, Humphrey and Sturgeon, 2005) that entail “the role of coordination and the complementary role of identifying dynamic rent opportunities and apportioning roles to key players” (Kaplinsky, 2000).
One of the questions that remain open is whether factory economies can upgrade their specialization to higher value added segments of the value chains and, if so, under what conditions. Systematically joining existing GVCs rather than building new ones (Baldwin, 2011) —even assuming that such a clear-cut difference exists and is meaningful— might hamper a process of domestic capacity building and upgrading, thereby resulting in a specialization trap. If technological and economic upgrading from low to higher value added activities is difficult, it is important to understand the conditions (or the specific policy actions) that facilitate this process.
More generally, attention needs to be paid to the nexus between positioning in a particular segment of a global value chain; the opportunities to move to higher value-added segments and transform the structure of domestic specialization; the dynamics of rent appropriation along these different segments; and the power structure asymmetries characterizing the actors involved. It is in the dynamics of this nexus that different development scenarios might arise for developing countries. The chances to “kick away the ladder” (Chang, 2002) are most likely linked to the opportunities for technological, economic and social upgrading along phases of the value chain, with an associated redistribution of rents (Kaplinsky, 2000; Schmitz and Strambach, 2009; Kaplinsky and Morris, 2015).
2. A third globalization unbundling: service GVCs
Both the first and second unbundling of globalization refer to manufacturing value chains. However, the recent literature emphasizes the emerging phenomenon of the servicification of manufacturing, and the increase in the service content of exports (Gereffi and Fernandez-Stark, 2010a; Hernández, Martínez-Piva and Mulder, 2014; Hernández and others, 2014; Lanz and Maurer, 2015). For example, the European Union’s value added that is used by China to produce exports is mainly in the service sectors, where China is basically engaged in the manufacturing elements of the value chain, particularly in lower-skilled activities. The evidence on service GVCs further shows that the concentration of trade in business services is mainly among
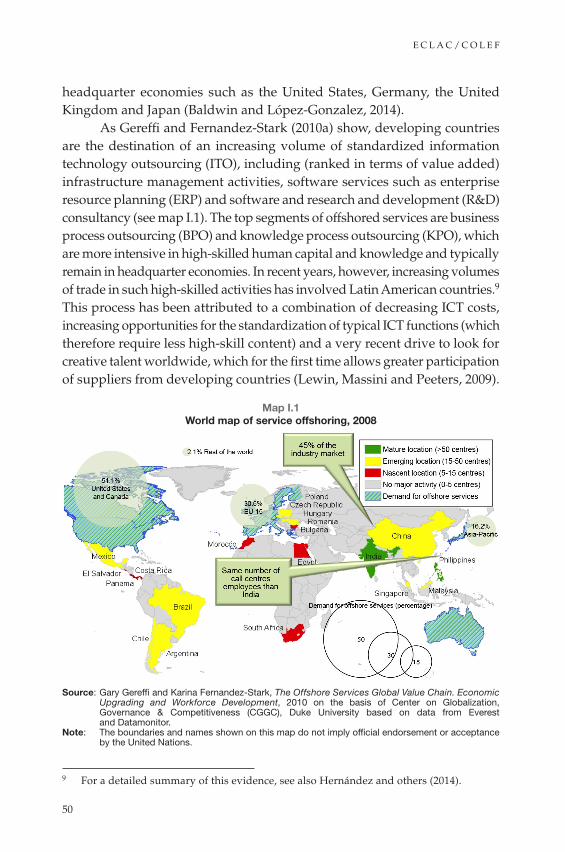
E C L A C / C O L E F
50
headquarter economies such as the United States, Germany, the United Kingdom and Japan (Baldwin and López-Gonzalez, 2014).
As Gereffi and Fernandez-Stark (2010a) show, developing countries are the destination of an increasing volume of standardized information technology outsourcing (ITO), including (ranked in terms of value added) infrastructure management activities, software services such as enterprise resource planning (ERP) and software and research and development (R&D) consultancy (see map I.1). The top segments of offshored services are business process outsourcing (BPO) and knowledge process outsourcing (KPO), which are more intensive in high-skilled human capital and knowledge and typically remain in headquarter economies. In recent years, however, increasing volumes of trade in such high-skilled activities has involved Latin American countries.9 This process has been attributed to a combination of decreasing ICT costs, increasing opportunities for the standardization of typical ICT functions (which therefore require less high-skill content) and a very recent drive to look for creative talent worldwide, which for the first time allows greater participation of suppliers from developing countries (Lewin, Massini and Peeters, 2009).
Map I.1 World map of service offshoring, 2008
Source: Gary Gereffi and Karina Fernandez-Stark, The Offshore Services Global Value Chain. Economic Upgrading and Workforce Development, 2010 on the basis of Center on Globalization, Governance & Competitiveness (CGGC), Duke University based on data from Everest and Datamonitor.
Note: The boundaries and names shown on this map do not imply official endorsement or acceptance by the United Nations.
9 For a detailed summary of this evidence, see also Hernández and others (2014).

Innovation and internationalization of Latin American services
51
Overall, the emerging discourse is prone to present a rosy picture of the developmental opportunities for peripheral countries to join service GVCs and the role of industrial policy in nurturing this process (Gereffi and Fernandez-Stark, 2010b). However, the literature on service GVCs is still at an embryonic stage, with much empirical evidence still limited to single-industry cases, which, albeit highly informative, lack generalizability. Moreover, the determinants of participation in service GVCs might differ from those that have been identified to matter in the case of manufacturing GVCs. This calls for some degree of caution and certainly for further research to support this view.
3. Global sectoral structural change and service GVCs
The economics of services as a discipline has developed in parallel with the evolving theory of value and been characterized by shifting concerns. Concern about the intangibility of services and the erosion of capital accumulation leading to the threat of de-industrialization in most advanced countries has subsequently mutated into optimism over the scope for knowledge accumulation and leveraging for the rest of the economy that are intrinsic to some business services.10 More recently, this has fed into the debate around the so-called knowledge economy (Marrano, Haskel and Wallis, 2009). The latter is often associated with an increasing share of knowledge-intensive business services (KIBS) in developed economies and the widespread diffusion of ICTs, which has not only dramatically reduced input costs, but also allowed the standardization and codification of numerous service activities. The empirical evidence on the emergence of KIBS is often coupled with this rhetoric (Ciarli, Meliciani and Savona, 2012; Meliciani and Savona, 2014).11 This view is affecting the evolution of the theoretical and empirical debate within trade theory and the GVC literature. In particular, it has been suggested that joining business service GVCs would facilitate desirable diversification and upgrading opportunities in a number of developing countries (Ventura-Dias 2012; Crespi, Tacsir, and Vargas 2014).
10 A seminal contribution on the topic remains Kaldor (1966), followed by Baumol (1967) and Fuchs 1968). Classical contributions from the opposite perspective —that is, optimism regarding progress and the third industrial revolution— are Fourastie (1949) and Bell (2008). For a review, see Gallouj and Savona (2008); Ciarli, Meliciani and Savona (2012).
11 As mentioned earlier, concerns with tertiarization have been cyclical. Further evidence of this is the very recent reassessment of the benefits of industry —most likely due to the second public outrage following the latest global financial crisis— as reported in European Commission (2014).
E C L A C / C O L E F
52
As argued above, the international fragmentation of production involving services represents a third unbundling of globalization, with potential beneficial effects. Further exploration of the conceptual and empirical bases supporting this view requires a research agenda on service GVCs that ideally would bridge trade theory, the GVC literature and the economics of services. Four issues seem especially pertinent:
• Are the determinants of participation in manufacturing GVCs —particularly the proximity to large headquarters economies— also crucial in explaining participation in business service GVCs?
• Related to the first question, to what extent does domestic industrial structure —particularly in the form of specialization in sectors that are high users of business services— explain participation in business service GVCs?
• What development prospects would ensue from participation in service —particularly business service GVCs— compared, for instance, with those that emerged from manufacturing GVCs?
• What are the implications in terms of industrial policy? The remainder of the chapter addresses the first two issues by advancing
an interpretation of the phenomenon of service GVCs that complements the existing theories and evidence. However, as I discuss in the conclusion, further research is needed to disentangle crucial issues such as the quality of development that might ensue from participation in business service GVCs and, most importantly, the implications for alternative approaches to industrial policy.
C. When Linder meets Hirschman: a complementary view of service GVCs
As mentioned above, it has been argued that the increasing standardization and transferability of knowledge following the spread of ICTs have been the most important drivers behind the increased outsourcing and offshoring of (some) business services. Most likely the business services that have most gained from increased standardization are also those that are the most routinized (Autor, Levy and Murnane, 2003) and that appear at the low end of map I.1 (Gary Gereffi and Fernandez-Stark, 2010a).
Meliciani and Savona (2014) study a small, higher-end set of business services (R&D, ICT-related services, engineering, technical consultancy and legal services) in Europe. They find that business services tend to spatially agglomerate and localize close to the industries that are highly intensive in
Innovation and internationalization of Latin American services
53
business services, typically high-technology manufacturing industries. In line with other contributions (Rodriguez-Pose and Crescenzi, 2008), this evidence empirically challenges the view of an increasingly flat world (Friedman, 2005; Leamer, 2007), by showing that despite falling ICT costs, less routinized and standardized business services (mostly intensive in high-level skills) do not easily cross national and regional boundaries.
Bahar, Hausmann, and Hidalgo (2014) support these conclusions. They look at the dynamics of countries’ comparative advantages by modelling the cross-country diffusion of knowledge on the basis of national export baskets.12 They assume that “controlling for product-specific shifts in global demand, firms in a country will be able to incorporate a new good into their export basket only after they have become productive enough to compete in global markets” (p. 111). Their results —contrary to what mainstream trade theory and gravity models predict— support the view that non-codified knowledge, which is most likely required to carry out non-routinized tasks in Autor, Levy and Murane’s (2003) terms, does not cross national borders very easily. Even when it does, it might tend to concentrate in neighbouring countries. It follows that a country’s evolving comparative advantage, embodied in its export basket, is very much shaped by the knowledge accumulated domestically and in that of its closest trading partners.13
Business services are carriers of much tacit, non-reproducible knowledge, and they are generally intensive in high-skilled human capital. Consequently, they are not easily offshored. These sectors thus tend to be characterized by geographical proximity to their (typically intermediate) demand. Falling transportation and communication costs and ICT-enabled standardization of tasks, which were responsible for the first two globalization unbundlings, might not act as a strong driver for KPO and BPO offshoring, whereas it has most likely played an important role in ITO offshoring to developing countries. Overall, the potential for the standardization of service activities opened up by ICTs has, to date, primarily affected only a share of service activities, namely, those at the lower-end of value chains (Blinder, 2006).
These factors need to be taken into account when reappraising the theory discussed in section A, and particularly the main assumptions behind it, to determine whether it applies to service GVCs. The stickiness of knowledge
12 Bahar, Hausmann, and Hidalgo (2014) still use a trade-in-goods framework, rather than the task approach of most of the trade literature reviewed in section A.
13 Knowledge stickiness across firms, sectors and countries was first identified by evolutionary economists and technology historians several years ago (Cowan, 2000; Foray , 2006; Mokyr, 2002).
E C L A C / C O L E F
54
and the spatial distribution of the skills necessary for performing tasks that are typically non-routinized are likely to counterbalance the effects of falling transport and communication costs, as shown at the regional level by Meliciani and Savona (2014) and at the national level by Bahar, Hausmann and Hidalgo (2014).
Further core assumptions of both trade theory and the GVC literature also seem to be ill-suited to account for the observed rise in service GVCs. One of these is the disagglomeration between production and consumption (Blinder, 2006). For most service activities, it is difficult to conceptually and empirically separate their provision and consumption, in line with what is called co-terminality in service economics (Gallouj and Savona, 2008). Consequently, many of the effects of falling costs that have indeed favoured the disagglomeration of production of manufactured goods might simply not affect services, or affect them to a much lesser extent.
The services that are most likely to be offshored are either the low segments of the value chains, due to the separability of standardized and codified knowledge between the supplier and the recipient (Gereffi and Fernandez-Stark, 2010a), or services that are highly intensive in non-standardized and tacit knowledge, which have thus far mostly been confined to headquarter countries (Kowalski and others, 2015). The increasing involvement of services in GVCs is therefore the result of more complex processes that, in my view, are unlikely to be exclusively attributed to the same historical processes of falling costs that characterized the first two globalization unbundlings. Explaining participation in service GVCs thus requires a complementary framework.
1. When Linder meets Hirschman
In the absence of a strong domestic presence of industries with backward linkages to (high-end) services, such as most business services, it appears unlikely that a developing country would construct its own business service GVC or join an existing one, let alone upgrade from existing low value added service GVCs and develop competitive business services. To articulate this intuition, I revive two seminal classical contributions to the theory of international trade and economic development, namely, the works of Staffan Burenstam Linder and Albert Hirschman. While I do not formalize anything here, I hope that this might stimulate further reflection and research.
Both Hirschman (1958) and Linder (1961) represent alternative voices to the mainstream trade and development thinking at their time (Lundahl 2005). Hirschman (1958) identified the structure of intermediate sectoral

Innovation and internationalization of Latin American services
55
linkages within regional economies as the main determinant of specialization and growth polarization. According to Hirschman, there are different types of externalities, depending on whether activities are related to one another by forward or backward linkages, that is, whether certain sectors concentrate where their clients are located or migrate where new or emerging supplier sectors are located.14 This was a remarkably original position with respect to the mainstream growth theory based on factor endowments. Sectoral specialization and structural change had hitherto rarely been considered relevant for explaining growth polarization across local and national economies.15 The role of linkages in Hirschman’s work is to create new sectors by way of a scalable intermediate demand. This provides a useful device for explaining structural change in the sectoral composition of economies, although Hirschman’s work remained relatively silent on the conditions and specific mechanisms through which intermediate demand translates into the creation of new supplier sectors and the upgrading of existing ones.16 It is worth noting that the role of structural change is increasingly being brought back into the development debate (Lin 2012; Stiglitz, Lin, and Monga 2013).
Linder (1961) also emerged as a radical voice against mainstream trade theory. Most analysts at the time followed the Heckscher-Ohlin-Samuelson model, which explains foreign trade on the basis of cross-country differences in factor endowments: capital-endowed countries will export capital-intensive goods and reach higher incomes per capita, while relatively more labour-endowed countries will specialize in labour-intensive goods. Linder put forward what it is now known as the Linder thesis, his main contribution to the theory of international trade. According to Linder (1961), the Heckscher-Ohlin model is able to explain trade in raw materials, but not trade in manufactured goods, which depends on whether a country has reached a certain level of domestic representative demand in a particular manufactured good. This benchmark level of domestic demand provides necessary feedback from purchasers to producers, which eventually allows producers to face competition in foreign markets. Therefore, countries with
14 “The input-provision, derived demand, or backward linkage effects, i.e. every non primary economic activity, will induce attempts to supply through domestic production the inputs needed in that activity. The output-utilization or forward linkage effects, i.e., every activity that does not by its nature cater exclusively to final demands, will induce attempts to utilize its outputs as inputs in some new activities” (Hirschman, 1958).
15 These intuitions have occasionally been operationalized in the literature (Jones, 1976; Hausmann, Klinger and Lawrence, 2008), although it is out of the scope of this paper to discuss these works in depth.
16 I thank Martin Bell for reflections on structural change in Hirschman’s work.

E C L A C / C O L E F
56
a similar structure of final demand —owing, for instance, to similar levels of per capita income— tend to have similar structures of trade specialization.
A joint Hirschman-Linder hypothesis introduces the importance of linkages into the Linder thesis and describes domestic intermediate rather than final demand, so as to explain the propensity to join service GVCs. As argued above, the traditional determinants of cost and factor endowments cannot fully explain the recent processes of global structural change involving service GVCs. Rather, the structure of domestic intermediate demand for business services and the specialization in industries with backward linkages to business services —that is, the domestic representative intermediate demand— determine the propensity and capacity to engage in international business service value chains, in line with what Linder claimed for final domestic demand.
In a related work, López-Gonzalez, Meliciani and Savona (2014) empirically test the above conjecture using the World Input-Output Database (WIOD) and the annual Inter-Country Input-Output (ICIO) tables. These data sources cover forty economies (including all 27 European Union countries, as well as Australia, Brazil, Canada, China, India, Indonesia, Japan, Korea, Mexico, the Russian Federation, Chinese Taipei, Turkey and the United States) and a rest-of-world grouping across 35 sectors (20 service, 11 manufacturing and four primary sectors) over a period of 15 years (yearly from 1995 to 2009). The ICIO data allow tracking not just the direct linkages within and between countries and sectors, but also those that arise indirectly through the growing interconnectedness in trade. The database therefore lends itself to the creation of indicators that capture the extent and nature of GVC participation across different sectors (see also Koopman and others, 2010; Erumban and others, 2011). The results show that a joint Hirschman-Linder hypothesis holds for the full WIOD sample of countries and also for emerging countries only. The intermediate demand coming from close trade partners has a displacement effect on the likelihood that developing countries will participate in service GVCs. This seems to be at odds with the idea that countries can enter global value chains by mainly relying on global demand and regardless of their own specialization.
There is, of course, opposing evidence to these findings, albeit based on specific country cases. For instance, both Lema, Quadros and Schmitz (2012) and Gereffi and Fernandez-Stark (2010a) look at the Indian offshore service industries. They find that despite the absence of a strong backward-linked industry, the country has massively upgraded from an initial specialization in mature segments (IT and BPO) to higher value added segments such as KPO
Innovation and internationalization of Latin American services
57
and R&D. It would be interesting to find more evidence that corroborates long-term upgrading processes led exclusively by foreign demand.
D. Concluding remarks
This chapter has proposed a brief and selected reappraisal of the theoretical and empirical literature on GVCs with a particular focus on service GVCs, which have recently emerged as the latest path of international fragmentation of production. My aim was two-fold. First, I reviewed the new developments in trade theory based on the trade-in-task framework and critically assessed whether they can explain service, and particularly business service, GVCs. Based on the literature on service economics and on empirical evidence on the spatial concentration of these activities, I proposed a complementary view on the emergence of service GVCs. Second, I pointed out the need for further research on the opportunity to favour participation in service GVCs as a development strategy, which the GVC scholarship seems to be increasingly suggesting.
I briefly reviewed the trade-in-task framework and emphasized that its core assumption relates to falling transport and communication costs, which are claimed to have caused two different phases of unbundling in the globalization process (Baldwin, 2011 and 2012; Baldwin and López-Gonzalez, 2014). I acknowledged that the adoption of the task approach put forward by Autor, Levy and Murnane (2003) and Baldwin and Robert-Nicoud (2014) might, in principle, provide a generalized framework that encompasses the international fragmentation of production of intangible activities such as services. I have not attempted this here as it is outside the scope of this chapter, but research in trade theory might fruitfully pursue this direction of investigation.
Rather, I reviewed the empirical evidence on GVCs in services, which so far is mainly based on industry cases (Gereffi and Fernandez-Stark, 2010a; Lema, Quadros and Schmitz 2012) and asked whether the first-time participation of developing countries in service GVCs might be considered a third unbundling of globalization, to paraphrase Baldwin (2011). Developing countries, especially in East Asia and Latin America, are increasingly becoming a destination for service offshoring. Despite underlying optimism on the benefits of such trends, the trade-in-task framework suggests that falling transport and communication costs would mainly favour the fragmentation and offshoring of routinized tasks, usually involving lower-skilled jobs. Some developing countries might therefore become favourite destinations

E C L A C / C O L E F
58
for segments of service GVCs that mainly compete on price rather than skills and talent. Only in a few cases have countries such as India (and a few Latin American economies) managed to join higher value added segments of service GVCs (Lema, Quadros and Schmitz 2012; Hernández and others, 2014).
I argued that —due to the specificity and heterogeneity of the industry, especially within business services— there is a potentially complementary explanation of the emergence of GVCs and the choice of certain countries as offshoring destinations. Taking stock of the literature on service economics and drawing on the existing empirical evidence in developed countries, I have put forward a Hirschman-Linder hypothesis. Business services tend to emerge and spatially concentrate where a critical mass of sectors with backward linkages to business services builds up to a representative domestic intermediate demand, following Linder (1961). In the case of developed countries, this is mainly represented by manufacturing sectors that are intensive users of business services (Meliciani and Savona, 2014). This evidence seems to hold in the case of developing countries (López-Gonzalez, Meliciani and Savona, 2014), although much more research is needed to support this evidence.
Linder proposed the notion of representative domestic demand; Hirschman highlighted the importance of intermediate demand and backward linkages for structural change. The Hirschman-Linder hypothesis emphasizes the importance for countries —particularly developing countries— to develop internal industrial capacity in sectors with backward links to business services, in order to spur a critical demand for high value added services before attempting to join service GVCs. Cases such as India, the Philippines and Uruguay offer counter-evidence to this view, whereby trade specialization and participation in service GVCs has mainly been driven by external demand. These are indeed interesting cases to observe over the coming decades, to assess their long-term development paths compared to other developing countries which different domestic sectoral and trade specialization.
The rationale behind the Hirschman-Linder view might be considered similar to the infant-industry argument. Despite being criticized by mainstream trade economists, infant-industry policies successfully spurred rapid catching-up processes in most European countries during their initial phases of industrialization, as well as South Korea and many other economies later on (see Chang, 2002). In today’s globalized economy, a modern infant-industry policy would have to take into account the internationally fragmented production system. Would it have the same potential for production, technology and export upgrading that was implicit in its original argument?
Innovation and internationalization of Latin American services
59
One of the challenges of industrial policy in this context is to minimize the risk of freezing a country’s specialization pattern at the lower end of value chains, with little opportunities and scope for subsequent technological upgrading and structural change, before venturing into international value chains. It is a matter of directing domestic structural change in terms of both quality and timing. It might be detrimental for industrial policy whereby to promote participation in GVCs that have little scope for upgrading or to fast-track participation without giving the economy time to build the necessary domestic capabilities. Additional theoretical and empirical GVC research is needed to address whether joining service GVCs represents a sustainable policy when it is decoupled from local/domestic accumulation of capabilities in highly developmental Hirschman-linked sectors.
BibliographyAcemoglu, Daron, Gino Gancia y Fabrizio Zilibotti (2014), “Offshoring and Directed
Technical Change” [online] http://crei.cat/people/gancia/Acemoglu_Gancia_Zilibotti_June24_2014.pdf.
Antras, Pol, Luis Garicano and Esteban Rossi-Hansberg (2006), “Offshoring in a knowledge economy”, The Quarterly Journal of Economics, February.
Autor, David H. and David Dorn (2013), “The growth of low-skill service jobs and the polarization of the US labor market”, American Economic Review, vol. 103, No. 5, American Economic Association.
Autor, David H., Frank Levy and Richard J. Murnane (2003), “The skill content of recent technological change: an empirical exploration”, The Quarterly Journal of Economics, vol. 118, No. 4, MIT Press.
Bahar, Dany, Ricardo Hausmann and Cesar Hidalgo (2014), “Neighbors and the evolution of the comparative advantage of nations: evidence of international knowledge diffusion?”, Journal of International Economics, vol. 92, No.1, Elsevier B.V.
Bair, Jennifer (2005), “Global capitalism and commodity chains: looking back, going forward”, Competition & Change, vol. 9, No. 2, Maney Publishing.
Baldwin, Richard (2012), “Global supply chains: why they emerged, why they matter and where they are going”, CTEI Working Papers, Geneva, Centre for Trade and Economic Integration.
(2011), “Trade and industrialization after globalization’s 2nd unbundling: how building and joining a supply chain are different and why it matters”, NBER Working Paper, No. 17716, October.
Baldwin, Richard and Frederic Robert-Nicoud (2014), “Trade-in-goods and trade-in-tasks: an integrating framework”, Journal of International Economics, vol. 92, No. 1, Elsevier.
E C L A C / C O L E F
60
Baldwin, Richard and Javier López-González (2014), “Supply-chain trade: a portrait of global patterns and several testable hypotheses”, The World Economy.
Baumol, William J. (1967), “Macroeconomics of unbalanced growth: the anatomy of urban crisis”, The American Economic Review, vol. 57, No. 36.
Bell, Daniel (2008), The Coming of Post-Industrial Society: A Venture in Social Forecasting, Basic Books.
Blinder, Alan S. (2006), “Offshoring: the next industrial revolution?”, Foreign Affairs, vol. 85, No. 2.
Burenstam Linder, S. (1961), An Essay on Trade and Transformation, Stockholm, Almqvist & Wicksell.
Chang, Ha-Joon (2002), Kicking Away the Ladder: Development Strategy in Historical Perspective, Anthem Press.
Ciarli, Tommaso, Valentina Meliciani and Maria Savona (2012), “Knowledge dynamics, structural change and the geography of business services”, Journal of Economic Surveys, vol. 26, No. 3.
Consoli, Davide and Francesco Rentocchini (2014), “A taxonomy of multi-industry labour force skill”, Research Policy, December.
Consoli, Davide, Francesco Rentocchini and Francesco Vona (2015), “That was then, this is now. Skills and routinization in the 2000s”, Industrial and Corporate Change, forthcoming.
Costinot, Arnaud, Jonathan Vogel and Su Wang (2013), “An elementary theory of global supply chains”, Review of Economic Studies, vol. 80, No. 1.
Cowan, R. (2000), “The explicit economics of knowledge codification and tacitness”, Industrial and Corporate Change, vol. 9, No. 2.
Crespi, Gustavo, Ezequiel Tacsir and Fernando Vargas (2014), “Innovation and productivity in services: empirical evidence from Latin America”, Technical Note, No. 690, Inter-American Development Bank (IDB), August.
De Backer, Koen and Stephane Miroudot (2013), “Mapping Global Value Chains”, OECD Trade Policy Papers, No. 159.
Erumban, A. and others (2011), “The World Input-Output Database (WIOD): construction, challenges and applications”, paper prepared for the World Bank Workshop “The Fragmentation of Global Production and Trade in Value Added”.
European Comission (2014), European Competitiveness Report 2013. Towards Knowledge Driven Re-Industrialisation [online] http://ec.europa.eu/growth/tools-databases/newsroom/cf/itemdetail.cfm?item_id=7507&lang=en&title=European-Competitiveness-report-2013.
Feenstra, R. and G. Hanson (1999), “The impact of outsourcing and high-technology capital on wages: estimates for the US, 1972-1990”, Quarterly Journal of Economics, vol. 114, No. 3.
Foray, Dominique (2006), The Economics of Knowledge, The MIT Press [online] https://mitpress.mit.edu/books/economics-knowledge.
Innovation and internationalization of Latin American services
61
Fourastie, Jean (1949), Le grand espoir du XXe siecle progres technique, progres economique, progres social, Paris, Presses Universitaires de France.
Friedman, T. (2005), The World is Flat: a Brief History of the Twenty-First Century, New York, Farrar, Straus and Giroux.
Fuchs, Victor R. (1968), “The growing importance of service employment”, National Bureau of Economic Research (NBER) [online] http://ideas.repec.org/h/nbr/nberch/1156.html.
Gallouj, Faïz and Maria Savona (2008), “Innovation in services: a review of the debate and a research agenda”, Journal of Evolutionary Economics, vol. 19, No. 2.
Gereffi, Gary (1994), “The organization of buyer-driven global commodity chains: how us retailers shape overseas production networks”, Commodity Chains and Global Capitalism, G. Gereffi and M. Korzeniewicz (eds.), Praeger Publishers.
Gereffi, Gary and Karina Fernandez-Stark (2010a), The Offshore Services Global Value Chain. Economic Upgrading and Workforce Development [online] http://www.cggc.duke.edu/pdfs/2011-11-11_CGGC_Offshore-Services-Global-Value-Chain.pdf.
(2010b), “The offshore services value chain: developing countries and the crisis”, Global Value Chains in a Postcrisis World. A Development Perspective, O. Cattaneo, G. Gereffi and C. Staritz (eds.),Washington, D.C., World Bank.
Gereffi, Gary, Karina Fernandez-Stark and Phil Psilos (2011), Skills for Upgrading: Workforce Development and Global Value Chains in Developing Countries, Durham, North Carolina, Center on Globalization, Governance & Competitiveness, Duke University.
Gereffi, Gary, John Humphrey and Timothy Sturgeon (2005), “The Governance of Global Value Chains.” Review of International Political Economy 12 (1). Taylor & Francis Group.
Grossman, G. and E. Rossi-Hansberg (2012), “Trade tasks between similar countries”, Econometrica, vol. 80, No. 2.
(2008), “Trading tasks: a simple theory of off-shoring”, American Economic Review, vol. 98.
(2006), “The rise of offshoring: it is not wine for cloth any more”, The New Economic Geography: Effects and Policy Implications, Jackson Hole Conference Volume, University of Sussex
Hausmann, Ricardo, Bailey Klinger and Robert Lawrence (2008), “Examining beneficiation”, Centre for International Development Working Paper, No. 162 [online] http://www.hks.harvard.edu/content/download/69081/1249134/version/1/file/162.pdf.
Hernández, R.A., J.M. Martínez-Piva and N. Mulder (2014), Global Value Chains and World Trade: Prospects and Challenges for Latin America, ECLAC Books, No. 127, R.A. Hernandez, J.M. Martínez-Piva and N. Mulder, Economic Commission for Latin America and the Caribbean (ECLAC).
E C L A C / C O L E F
62
Hernández, R. and others (2014), “Latin America’s emergence in global services. A new driver of structural change in the region?”, Economic Commission for Latin America and the Caribbean (ECLAC), unpublished.
Hirschman, Albert O. (1958), Strategy of Economic Development, New Haven, London, Yale University Press.
Jones, Leroy P. (1976), “The measurement of Hirschmanian linkages”, The Quarterly Journal of Economics, vol. 90, No. 2.
Jones, Ronald W. and Henryk Kierzkowski (2005), “International fragmentation and the new economic geography”, The North American Journal of Economics and Finance, vol. 16, No. 1.
(1990), “The role of services in production and international trade”, The Political Economy of International Trade, R. Jones and A. Krueger (eds.), Oxford, Basic Blackwell.
Kaldor, Nicholas (1966), Causes of the Slow Rate of Economic Growth of the United Kingdom: An Inaugural Lecture, Cambridge University Press [online] http://books.google.co.uk/books/about/Causes_of_the_slow_rate_of_economic_grow.html?id=Mi87AAAAMAAJ&pgis=1.
Kaplinsky, R. (2013), “Global value chain, where they came from, where they are going and why this is important”, Handbook on Industrial Development, Duke University.
(2000), “Globalisation and unequalisation: what can be learned from value chain analysis?”, The Journal of Development Studies, vol. 37, No. 2.
Kaplinsky, Raphael and Mike Morris (2015), “Thinning and thickening: productive sector policies in the era of global value chains”, European Journal of Development Research, Nature Publishing Group.
Koopman, R. and others (2010), “Give credit where credit is due: tracing value added in global production chains”, NBER Working Paper, No. 16426.
Kowalski, Przemyslaw and others (2015), “Participation of developing countries in global value chains: implications for trade and trade-related policies”, OECD Trade Policy Papers, No. 179, Paris, OECD Publishing.
Lanz, Rainer and Andreas Maurer (2015), “Services and Global Value Chains: Servicification of Manufacturing and Services Networks.” Journal of International Commerce, Economics and Policy 06 (03).
Leamer, E. (2007), “A flat world, a level playing field, a small world after all, or none of the above? A review of Thomas L. Friedman’s The World Is Flat”, Journal of Economic Literature, vol. 45, No. 1.
Lema, Rasmus, Ruy Quadros and Hubert Schmitz (2012), “Shifts in innovation power to Brazil and India: insights from the auto and software industries”, IDS Research Report, No. 73.
Lewin, Arie Y, Silvia Massini and Carine Peeters (2009), “Why are companies offshoring innovation? the emerging global race for talent”, Journal of International Business Studies, vol. 40, No. 8.
Innovation and internationalization of Latin American services
63
Lin, Justin Yifu (2012), New Structural Economics. A Framework for Rethinking Development and Policy, World Bank [online] http://siteresources.worldbank.org/DEC/Resources/84797-1104785060319/598886-1104951889260/NSE-Book.pdf.
López-Gonzalez, Javier, Valentina Meliciani and Maria Savona (2014), “When Linder meets Hirschman. inter-industry linkages and GVCs in services”, paper presented at the RESER Conference, Helsinki, September, and at the REDLAS Conference, Montevideo, May 2015.
Lundahl, Mats (2005), “To be an independent thinker: an intellectual portrait of Staffan Burenstam Linder”, The European Journal of the History of Economic Thought, vol. 12, No. 4.
Marrano, Mauro Giorgio, Jonathan Haskel and Gavin Wallis (2009), “What happened to the knowledge economy? ICT, intangible investment, and Britain’s productivity record revisited”, Review of Income and Wealth, vol. 55, No. 3.
Massini, Silvia and Marcela Miozzo (2012), “Outsourcing and offshoring of business services: challenges to theory, management and geography of innovation”, Regional Studies, vol. 46, No. 9.
Meliciani, V. and M. Savona (2014), “The determinants of regional specialisation in business services. agglomeration economies, vertical linkages and innovation”, The Journal of Economic Geography, January.
Mokyr, Joel (2002), The Gifts of Athena, Princeton University Press.
OECD (Organisation for Economic Cooperation and Development) (2013), Interconnected Economies: Benefiting from Global Value Chains, Paris, OECD Publishing.
Rodriguez-Pose, A. and R. Crescenzi (2008), “Mountains in a flat world: why proximity still matters for the location of economic activity”, Cambridge Journal of Regions, Economy and Society, vol. 1, No. 3.
Schmitz, Hubert and Simone Strambach (2009), “The organisational decomposition of innovation and global distribution of innovative activities: insights and research agenda”, International Journal of Technological Learning, Innovation and Development, vol. 2, No. 4.
Stiglitz, Joseph E., Justin Yifu Lin and Celestin Monga (2013), “The rejuvenation of industrial policy”, Policy Research Working Paper, No. 6628.
Timmer, Marcel and others (2013), “Fragmentations, income and jobs: an analysis of European competitiveness”, Economic Policy, vol. 20, October.
(2012), “Slicing up global value chains”, paper presented at Latin America’s Prospects for Upgrading in Global Value Chain, Mexico City.
Ventura-Dias, Vivianne (2012), “Service offshoring: notes on patterns, determinants and policy implications for Latin America”, [online] http://www.cepal.org/comercio/tpl/contenidos/Services_Offshoring_patterns_LAC_Ventura_Dias.pdf.
Vona, F., and D. Consoli (2014), “Innovation and skill dynamics: a life-cycle approach”, Industrial and Corporate Change, October.

Chapter I I
The contribution of services to manufacturing competitiveness in Brazil
Jorge Arbache1
Summary
With services generating 70% of its GDP and employing 73% of its labour force, Brazil is a service economy. Low productivity and poor productivity growth over the past few decades represent the two main challenges facing the Brazilian services sector. In addition, the prices of many services are high and their quality is low by international standards. This chapter aims to investigate whether and how the services sector can help explain manufacturing’s declining competitiveness and the intensity and nature of Brazil’s participation in global value chains. The evidence presented here suggests that the various service sectors have been an important factor in the manufacturing sector’s disappointing productivity growth and export performance. To counter this
1 This chapter also benefited from valuable comments and suggestions by Nanno Mulder. Any mistakes and omissions are the author’s own.
E C L A C / C O L E F
66
effect, the services sector should be better integrated into investment, human capital formation, and industrial, technology and trade policies.
Introduction
With considerable effort and sacrifice, Brazil has built a dynamic and integrated industry that helped it become one of the world’s largest economies. More recently, however, the industry has shown signs of losing steam. Basic indicators, such as output, employment and exports, suggest that the manufacturing sector is growing slowly and losing ground in the economy.
There are explanations for such a pattern, including high production costs, a heavy tax burden, bureaucracy, an overvalued exchange rate and regulatory and macroeconomic uncertainties. However, there may be other factors to explain the recent performance of Brazilian manufacturing. One such factor relates to changes in the nature of manufactured goods. In an increasingly synergistic and symbiotic relationship, goods and services have been combined to form a third product that is not a traditional industrial good or a conventional service.
Because of the relationship that unites manufacturing and the service sector, services have become an increasingly crucial component of industrial competitiveness and countries’ integration into the global economy. The growing complementarity between industry and services requires both sectors to be competitive enough to benefit from one another.
What is the relationship like between industry and services in Brazil? Have services contributed to increasing the competitiveness of the industry? The purpose of this chapter is to answer these questions and compare Brazil to other countries. The starting point will be the performance of the service sector in Brazil, based on an analysis of national accounts. Data from the Annual Industrial Survey and Annual Survey of Services from the Brazilian Geographical and Statistical Institute (IBGE) are then used to investigate the relationship between manufacturing and services. Finally, there is an international comparative analysis using input-output matrices from the Organization for Economic Cooperation and Development (OECD).
The main empirical findings of the chapter are as follows. First, services are already major components of industrial production with similar levels to those of industrialized countries. Second, services are expensive and of poor quality, which helps to explain the loss of competitiveness of the industry. Third, the industry’s performance and Brazil’s integration into global value chains demand greater levels of competitiveness within the service sector.
Innovation and internationalization of Latin American services
67
Within this chapter, the next section discusses the theoretical and empirical issues of the relationship between services and industrial competitiveness. The third section deals with methodological aspects, as well as the databases used in the study. The fourth section outlines the development of the productive structure in Brazil and highlights the growing proportion of output accounted for by services. The fifth section investigates the contribution of services in relation to industrial production. The sixth section examines the impact of services on industrial competitiveness. The final section suggests policies for the public and private sectors.
A. Theoretical and empirical issues2
The increase in the share of services within output is a stylized fact from economic literature. This increase is due to various factors relating to people, firms, technology and trade. The economic structure of a typical developing country is well known: agriculture is the main source of value added and employment, while manufacturing and services represent small portions of gross domestic product (GDP). However, increasing urbanization and per capita income means that agriculture loses ground to industry and services. The use of more advanced agricultural techniques in farms allows the transition to take place smoothly.3
As income continues to rise and the economy becomes more complex, people and companies begin to demand more services such as education, health, transport, financial intermediation and professional services. However, the growth rate of labour productivity in services does not increase as quickly as in agriculture and industry, given that most services are not easy to standardize and are less capital intensive.
The expansion of GDP per capita and continued urbanization are followed by the increase in income elasticity of demand for services, a phenomenon known as Engel’s Law. This relationship is not linear: as income rises, so does demand for services and goods with higher services content. The ageing population (which is already a reality in some emerging countries such as Brazil, China and the Russian Federation) tends to be accompanied by increased consumption of services such as education, healthcare, welfare and recreation.
2 In this text, commercial and business services are synonymous, and manufacturing and the industrial sector are also used interchangeably.
3 For more details on structural transformation, see Chenery (1982) and Syrquin and Chenery (1989).
E C L A C / C O L E F
68
The change in consumer preferences and the shorter life cycle of goods associated with globalization also contribute to higher demand for services. However, the increase in service output is also connected to productive and technological factors behind the growing share of services in supply chains and the value added of goods. The development and massification of information and communications technologies (ICT) and transport and logistics services have popularized the organizational and production technologies that lead firms to focus on core activities while outsourcing other functions.
The rise of China and other Asian countries as a world centre for manufactured goods (known as “Factory Asia”) is both result and cause of such a phenomenon. Indeed, the low prices of Chinese manufactured goods have forced competitors to adopt organizational and productive technologies that are increasingly service intensive.
As consumption and production patterns have become global, distribution networks, marketing, after-sales support, industrial design and research and development (R&D) activities are gaining importance as determining factors of industrial competitiveness.4
1. Industrial development path
Analysing industrial development is useful for examining the growth and dynamics of the service sector and its relationship with manufacturing (Arbache, 2012). The “Industry-Space” shown in figure II.1 reflects a three-dimensional chart that describes the trajectory of industrial development. On the horizontal axis (dimension D1) is the share of manufacturing in GDP. On the vertical axis to the left (D2) is industrial density, and to the right is the share of commercial services in GDP (D3).5
4 The growing importance of global value chains is followed by a deepening internationalization at the level of activities and tasks. Consequences include the increasing trade of inputs, both of goods and services (which already account for at least 60% of the total), and the growing importance of services in foreign direct investment (FDI). According to UNCTAD (2013), 67% of the world stock of FDI is associated with services. According to OECD, services account for 22% of world trade in gross terms, but in value added terms they account 54%. By 2025, this is expected to reach 75%.
5 The industrial density of a country is calculated as the value added of manufacturing divided by the country’s total population. The industrial density reflects the availability of resources and factors that contribute to add value, including human capital, science, technology and market-friendly institutions and infrastructure. It captures the good will of a society to provide resources needed to promote industrial development (Arbache, 2012). As discussed below, commercial services typically refer to production inputs such as machinery rental, financial intermediation, research and development, professional services and information technology services.
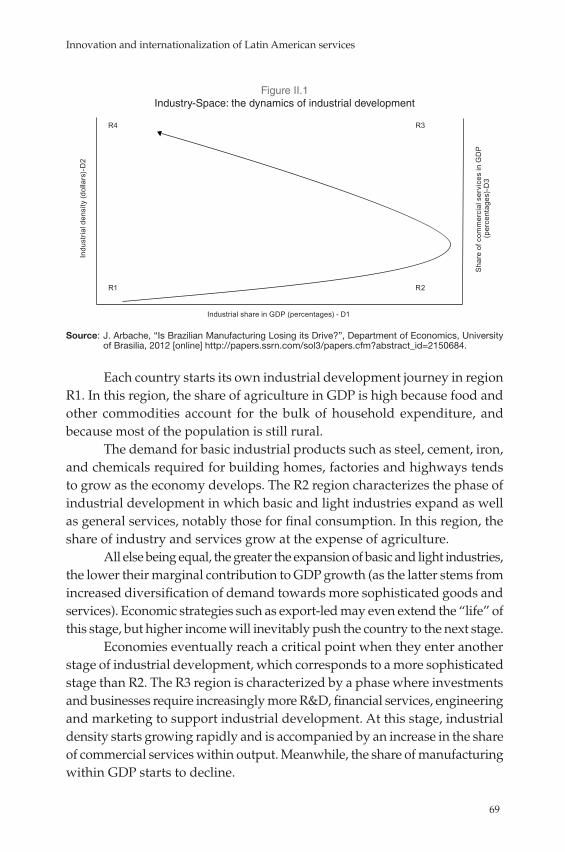
Innovation and internationalization of Latin American services
69
Figure II.1 Industry-Space: the dynamics of industrial development
R4 R3
R1 R2
Industrial share in GDP (percentages) - D1
Indu
stria
l den
sity
(dol
lars
)-D
2
Sha
re o
f com
mer
cial
ser
vice
s in
GD
P
(per
cent
ages
)-D
3
Source: J. Arbache, “Is Brazilian Manufacturing Losing its Drive?”, Department of Economics, University of Brasilia, 2012 [online] http://papers.ssrn.com/sol3/papers.cfm?abstract_id=2150684.
Each country starts its own industrial development journey in region R1. In this region, the share of agriculture in GDP is high because food and other commodities account for the bulk of household expenditure, and because most of the population is still rural.
The demand for basic industrial products such as steel, cement, iron, and chemicals required for building homes, factories and highways tends to grow as the economy develops. The R2 region characterizes the phase of industrial development in which basic and light industries expand as well as general services, notably those for final consumption. In this region, the share of industry and services grow at the expense of agriculture.
All else being equal, the greater the expansion of basic and light industries, the lower their marginal contribution to GDP growth (as the latter stems from increased diversification of demand towards more sophisticated goods and services). Economic strategies such as export-led may even extend the “life” of this stage, but higher income will inevitably push the country to the next stage.
Economies eventually reach a critical point when they enter another stage of industrial development, which corresponds to a more sophisticated stage than R2. The R3 region is characterized by a phase where investments and businesses require increasingly more R&D, financial services, engineering and marketing to support industrial development. At this stage, industrial density starts growing rapidly and is accompanied by an increase in the share of commercial services within output. Meanwhile, the share of manufacturing within GDP starts to decline.

E C L A C / C O L E F
70
The transition from R2 to R3 is usually the escape from the middle-income trap. At this stage of industrial development, the demand of families for more sophisticated health services, education, social security, leisure, urban mobility, security and connectivity with the world also begins to grow more rapidly.
The R4 region is characterized by the most advanced stage of industrial development. Industrial density continues to expand in proportion with the demand for business services, while the share of manufacturing within output continues to decline. This stage is also characterized by high demand and the participation of manufacturing in the financing and development of sophisticated services to add value and differentiate industrial products (Helper, Krueger and Wial, 2012).
The decline of the manufacturing sector’s share within GDP does not necessarily mean that industry becomes irrelevant. In fact, increasing industrial density features a more sophisticated and influential stage of manufacturing, which is marked by the changing nature of goods and the way they are produced. The manufacturing sector acts as a catalyst for R&D and other advanced services, as well as creating wealth and good jobs in a more complex way.
The R3 and R4 regions are characterized by a symbiotic and synergistic relationship between manufacturing and services that creates value. Indeed, manufacturing value added increases when combined with services to form a third product that is not in itself an industrial good or a conventional service. These are goods with a high content of services such as smartphones; products that rely heavily on marketing, branding and/or design; and products sold in packages such as mainframe computers or aircraft jet engines. The marketing of engines, for example, includes leasing services, insurance, training, engineering, maintenance and other after-sales and business-to-business (B2B) services.
The case of the Nokia N95 smartphone is an example of the modern relationship between goods and services. Cost breakdown shows that no less than 81.4% of the final price relates to value added by services such as licenses, software, marketing, branding and distribution, while only 18.6% relates to parts, components and assembly functions.6
The changing relationship between manufacturing and services is perhaps one of the main elements of the so-called “Third Industrial Revolution”. The
6 See Ali-Yrkkö and others (2011). For the case of the iPhone, see Xing and Detert (2010).
Innovation and internationalization of Latin American services
71
changing nature of products suggests that the definition and classification of goods in the national accounts based on sectors and activities are obsolete.
2. Services related to production costs and services related to value added
Services are associated with manufacturing activities through two sets of functions. The first set relates to production costs. They include transport and logistics, infrastructure services in general, storage, repairs and maintenance, outsourcing services, general information technology, credit and financial services, travel, accommodation, food and distribution services.
The second set relates to adding value, differentiating and customizing products to increase their market price. They include R&D, design, engineering and architecture projects, consulting, professional technical services, sophisticated information technology services, branding, marketing and sales.
At first, the longer the value chain of a good, the greater the importance of services related to production costs (such as logistics) for its competitiveness. Such services may also be relevant to commodities such as corn and soybean, iron ore and oil, but also for budget cars and cheap clothes in general. On the other hand, the more sophisticated and unique a good, the greater the importance of services that add value. However, several goods require increasing portions of both sets of services, such as premium vehicles.
There is not, however, a simple and direct correspondence between types of goods and sets of services. Consider the case of pre-salt oil in Brazil, with production requiring highly sophisticated and advanced scientific and technological services in geology, engineering, physics and chemistry for the identification and development of fields, equipment development, extraction, logistics systems and mitigation of environmental risks. Despite all the sophistication and skilled personnel involved, those services do not add value because oil is a commodity.7
The smiling curve shows a typical industrial value chain in terms of value added (see figure II.2). High value added service activities —such as innovation, R&D, design, and branding— are at the two edges, while services related to production costs (such as logistics and assembly lines adding little value) are at the centre.
7 Correspondence between goods and services should be analysed on a case-by- case basis.
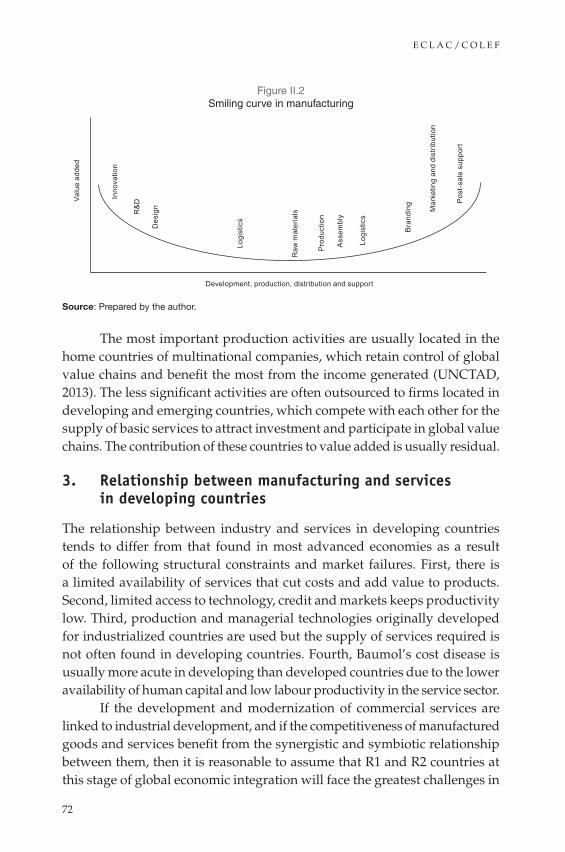
E C L A C / C O L E F
72
Figure II.2 Smiling curve in manufacturing
Development, production, distribution and support
Valu
e ad
ded
Inno
vatio
n
R&
D
Des
ign
Pro
duct
ion
Ass
embl
y
Logi
stic
s
Mar
ketin
g an
d di
strib
utio
n
Bra
ndin
g Pos
t-sa
le s
uppo
rt
Logi
stic
s
Raw
mat
eria
ls
Source: Prepared by the author.
The most important production activities are usually located in the home countries of multinational companies, which retain control of global value chains and benefit the most from the income generated (UNCTAD, 2013). The less significant activities are often outsourced to firms located in developing and emerging countries, which compete with each other for the supply of basic services to attract investment and participate in global value chains. The contribution of these countries to value added is usually residual.
3. Relationship between manufacturing and services in developing countries
The relationship between industry and services in developing countries tends to differ from that found in most advanced economies as a result of the following structural constraints and market failures. First, there is a limited availability of services that cut costs and add value to products. Second, limited access to technology, credit and markets keeps productivity low. Third, production and managerial technologies originally developed for industrialized countries are used but the supply of services required is not often found in developing countries. Fourth, Baumol’s cost disease is usually more acute in developing than developed countries due to the lower availability of human capital and low labour productivity in the service sector.
If the development and modernization of commercial services are linked to industrial development, and if the competitiveness of manufactured goods and services benefit from the synergistic and symbiotic relationship between them, then it is reasonable to assume that R1 and R2 countries at this stage of global economic integration will face the greatest challenges in
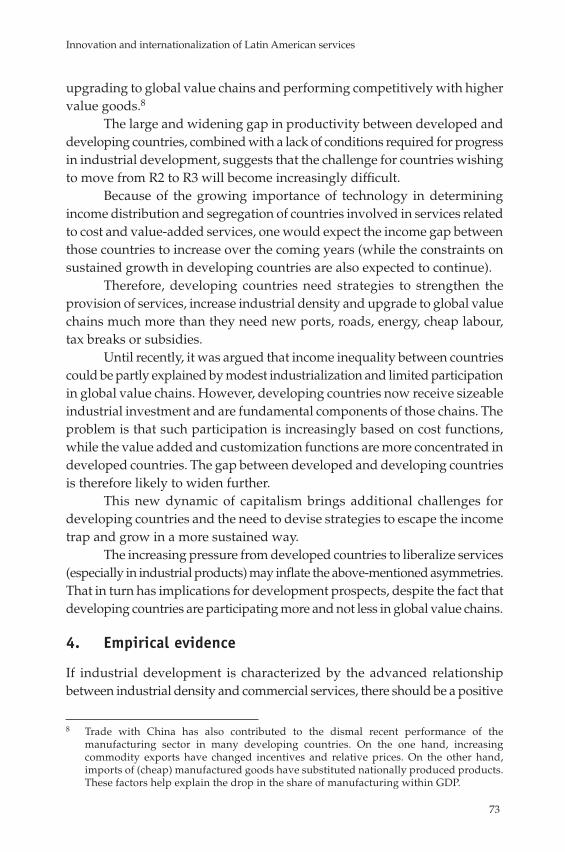
Innovation and internationalization of Latin American services
73
upgrading to global value chains and performing competitively with higher value goods.8
The large and widening gap in productivity between developed and developing countries, combined with a lack of conditions required for progress in industrial development, suggests that the challenge for countries wishing to move from R2 to R3 will become increasingly difficult.
Because of the growing importance of technology in determining income distribution and segregation of countries involved in services related to cost and value-added services, one would expect the income gap between those countries to increase over the coming years (while the constraints on sustained growth in developing countries are also expected to continue).
Therefore, developing countries need strategies to strengthen the provision of services, increase industrial density and upgrade to global value chains much more than they need new ports, roads, energy, cheap labour, tax breaks or subsidies.
Until recently, it was argued that income inequality between countries could be partly explained by modest industrialization and limited participation in global value chains. However, developing countries now receive sizeable industrial investment and are fundamental components of those chains. The problem is that such participation is increasingly based on cost functions, while the value added and customization functions are more concentrated in developed countries. The gap between developed and developing countries is therefore likely to widen further.
This new dynamic of capitalism brings additional challenges for developing countries and the need to devise strategies to escape the income trap and grow in a more sustained way.
The increasing pressure from developed countries to liberalize services (especially in industrial products) may inflate the above-mentioned asymmetries. That in turn has implications for development prospects, despite the fact that developing countries are participating more and not less in global value chains.
4. Empirical evidence
If industrial development is characterized by the advanced relationship between industrial density and commercial services, there should be a positive
8 Trade with China has also contributed to the dismal recent performance of the manufacturing sector in many developing countries. On the one hand, increasing commodity exports have changed incentives and relative prices. On the other hand, imports of (cheap) manufactured goods have substituted nationally produced products. These factors help explain the drop in the share of manufacturing within GDP.

E C L A C / C O L E F
74
relationship between these indicators. Figure II.3 supports this hypothesis. Exercises involving cross-section data and data from first differences identify a positive and statistically significant relationship between the indicators. Countries at the top right are those found in R3 and R4, while countries at the bottom left are in R1 and R2.9
Figure II.3 Industrial density and commercial services, 2011
BRA
GBR
USA
CHN IND IDN
KOR
MEX THA
TUR ZAF
SWE
NOR NLD
JPN
FRA
DEU
DNK
CAN
0
1 000
2 000
3 000
4 000
5 000
6 000
7 000
8 000
0 0.1 0.1 0.2 0.2 0.3 0.3 0.4
Indu
stria
l den
sity
(con
stan
t dol
lars
at 2
005
pric
es)
Business services (percentage of GDP)
Source: Prepared by the author on the basis of data from World Bank, World Development Indicators (WDI) and Organization for Economic Cooperation and Development (OECD), Input-output dataset.
Note: The industrial density is the value added of manufacturing divided by the country’s total population. Commercial services are the following sectors of the International Standard Industrial Classification of All Economic Activities (ISIC Rev. 3): post and telecommunications (I64), financial intermediation (J), commercial real estate, machinery leasing and equipment, IT and related activities, R&D and other business activities (K).
Table II.1 shows the share of commercial services in gross output in advanced and emerging economies. First, the table shows that the share of commercial services increases with technological intensity. The aerospace industry, computers, electrical equipment and communication —which are high-technology intensive sectors— have a greater share of commercial services than food, beverages, tobacco, textiles, clothing and wood products, which are low technology intensive industries. Second, the share of commercial services in gross output in advanced countries is higher than in emerging ones.
9 The countries in the sample are: Austria, Australia, Brazil, Denmark, Finland, France, Germany, Hungary, India, Indonesia, Italy, Japan, Mexico, Netherlands, Poland, Portugal, Republic of Korea, Sweden, Turkey, United Kingdom and United States. The inclusion of countries in the sample was based on data availability in the OECD input-output matrices and on WDI.
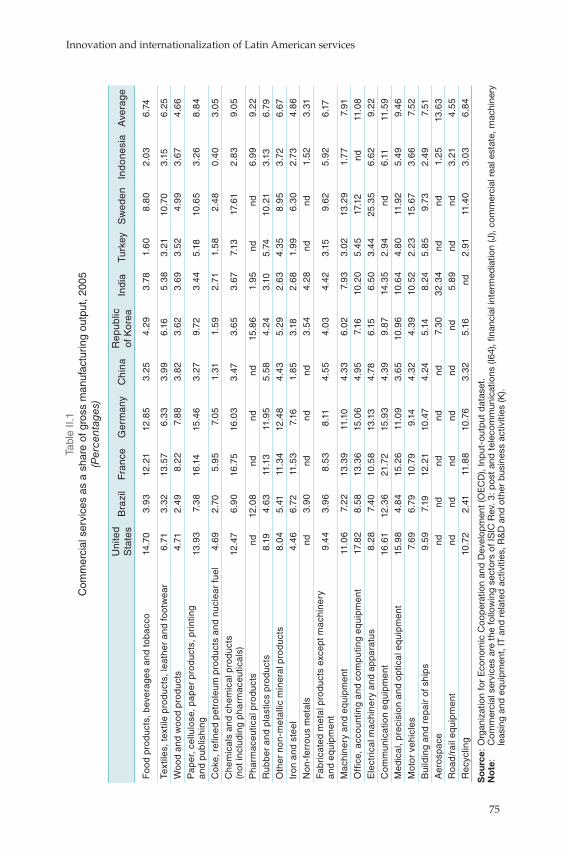
Innovation and internationalization of Latin American services
75
Tabl
e II.
1 C
omm
erci
al s
ervi
ces
as a
sha
re o
f gro
ss m
anuf
actu
ring
outp
ut, 2
005
(Per
cent
ages
)
Uni
ted
Sta
tes
Bra
zil
Fra
nce
Ger
man
yC
hina
Rep
ublic
of
Kor
eaIn
dia
Turk
eyS
wed
enIn
done
sia
Ave
rage
Foo
d pr
odu
cts,
bev
erag
es a
nd to
bacc
o14
.70
3.93
12.2
112
.85
3.25
4.29
3.78
1.6
08.
80
2.0
36.
74
Text
iles,
text
ile p
rodu
cts,
leat
her
and
foot
wea
r6.
713.
3213
.57
6.3
33.
99
6.16
5.3
83.
2110
.70
3.15
6.25
Woo
d an
d w
ood
pro
duct
s4.
712.
498.
227.
88
3.82
3.62
3.6
93.
524.
99
3.67
4.6
6
Pap
er, c
ellu
lose
, pap
er p
rodu
cts,
pri
ntin
g
and
publ
ishi
ng13
.93
7.3
816
.14
15.4
63.
279.
723.
44
5.18
10.6
53.
268.
84
Cok
e, r
efine
d pe
trol
eum
pro
duct
s an
d nu
clea
r fu
el4.
69
2.70
5.9
57.
05
1.31
1.59
2.71
1.58
2.4
80.
40
3.0
5
Che
mic
als
and
chem
ical
pro
duct
s
(not
incl
udin
g ph
arm
aceu
tical
s)12
.47
6.9
016
.75
16.0
33.
473.
65
3.67
7.13
17.6
12.
83
9.0
5
Pha
rmac
eutic
al p
rodu
cts
nd12
.08
ndnd
nd15
.86
1.9
5nd
nd6.
99
9.22
Rub
ber
and
plas
tics
pro
duct
s8.
194.
63
11.1
311
.95
5.58
4.24
3.10
5.74
10.2
13.
136.
79
Oth
er n
on-m
etal
lic m
iner
al p
rodu
cts
8.0
45.
4111
.34
12.4
84.
43
5.29
2.6
34.
35
8.9
53.
726.
67
Iron
and
ste
el4.
46
6.72
11.5
37.
161.
85
3.18
2.6
81.
99
6.3
02.
734.
86
Non
-fer
rous
met
als
nd3.
90
ndnd
nd3.
54
4.28
ndnd
1.52
3.31
Fab
rica
ted
met
al p
rodu
cts
exce
pt m
achi
nery
an
d eq
uipm
ent
9.4
43.
96
8.53
8.11
4.55
4.0
34.
423.
159.
625.
926.
17
Mac
hine
ry a
nd e
quip
men
t11
.06
7.22
13.3
911
.10
4.3
36.
02
7.93
3.0
213
.29
1.7
77.
91
Off
ice,
acc
ount
ing
and
com
putin
g eq
uipm
ent
17.8
28.
5813
.36
15.0
64.
95
7.16
10.2
05.
45
17.1
2nd
11.0
8
Ele
ctri
cal m
achi
nery
and
ap
para
tus
8.28
7.4
010
.58
13.1
34.
786.
156.
503.
44
25.3
56.
629.
22
Com
mun
icat
ion
equi
pmen
t16
.61
12.3
621
.72
15.9
34.
39
9.87
14.3
52.
94
nd6.
1111
.59
Med
ical
, pre
cisi
on a
nd o
ptic
al e
quip
men
t15
.98
4.8
415
.26
11.0
93.
65
10.9
610
.64
4.8
011
.92
5.49
9.4
6
Mot
or v
ehic
les
7.6
96.
7910
.79
9.14
4.32
4.3
910
.52
2.23
15.6
73.
66
7.52
Bui
ldin
g an
d re
pair
of s
hips
9.59
7.19
12.2
110
.47
4.24
5.14
8.24
5.8
59.
732.
497.
51
Aer
ospa
cend
ndnd
ndnd
7.3
032
.34
ndnd
1.25
13.6
3
Roa
d/r
ail e
quip
men
tnd
ndnd
ndnd
nd5.
89
ndnd
3.21
4.55
Re
cycl
ing
10.7
22.
4111
.88
10.7
63.
325.
16nd
2.91
11.4
03.
03
6.8
4
So
urce
: O
rgan
izat
ion
for
Eco
nom
ic C
oop
erat
ion
and
Dev
elop
men
t (O
EC
D),
Inp
ut-o
utp
ut d
atas
et.
No
te:
Com
mer
cial
ser
vice
s ar
e th
e fo
llow
ing
sect
ors
of IS
IC R
ev. 3
: pos
t an
d t
elec
omm
unic
atio
ns (I
64),
finan
cial
inte
rmed
iatio
n (J
), co
mm
erci
al r
eal e
stat
e, m
achi
nery
le
asin
g an
d e
qui
pm
ent,
IT a
nd r
elat
ed a
ctiv
ities
, R&
D a
nd o
ther
bus
ines
s ac
tiviti
es (K
).
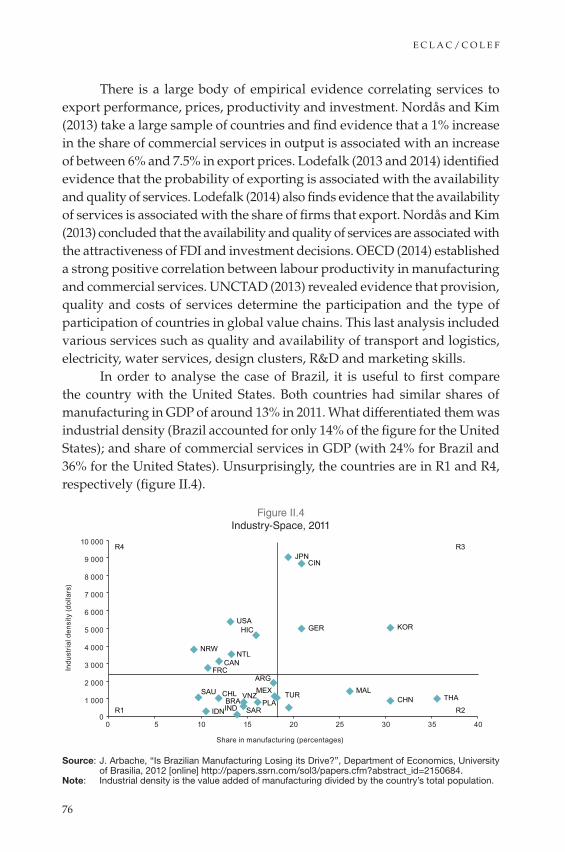
E C L A C / C O L E F
76
There is a large body of empirical evidence correlating services to export performance, prices, productivity and investment. Nordås and Kim (2013) take a large sample of countries and find evidence that a 1% increase in the share of commercial services in output is associated with an increase of between 6% and 7.5% in export prices. Lodefalk (2013 and 2014) identified evidence that the probability of exporting is associated with the availability and quality of services. Lodefalk (2014) also finds evidence that the availability of services is associated with the share of firms that export. Nordås and Kim (2013) concluded that the availability and quality of services are associated with the attractiveness of FDI and investment decisions. OECD (2014) established a strong positive correlation between labour productivity in manufacturing and commercial services. UNCTAD (2013) revealed evidence that provision, quality and costs of services determine the participation and the type of participation of countries in global value chains. This last analysis included various services such as quality and availability of transport and logistics, electricity, water services, design clusters, R&D and marketing skills.
In order to analyse the case of Brazil, it is useful to first compare the country with the United States. Both countries had similar shares of manufacturing in GDP of around 13% in 2011. What differentiated them was industrial density (Brazil accounted for only 14% of the figure for the United States); and share of commercial services in GDP (with 24% for Brazil and 36% for the United States). Unsurprisingly, the countries are in R1 and R4, respectively (figure II.4).
Figure II.4 Industry-Space, 2011
BRA
ARG
CHL CHN
FRC
GER HIC
IND IDN
JPN
KOR
PLA
MAL MEX
NTL NRW
SAU
CIN
SAR
TUR
USA
VNZ THA
CAN
0
1 000
2 000
3 000
4 000
5 000
6 000
7 000
8 000
9 000
10 000
0 5 10 15 20 25 30 35 40
Indu
stria
l den
sity
(dol
lars
)
Share in manufacturing (percentages)
R3
R2
R4
R1
Source: J. Arbache, “Is Brazilian Manufacturing Losing its Drive?”, Department of Economics, University of Brasilia, 2012 [online] http://papers.ssrn.com/sol3/papers.cfm?abstract_id=2150684.
Note: Industrial density is the value added of manufacturing divided by the country’s total population.
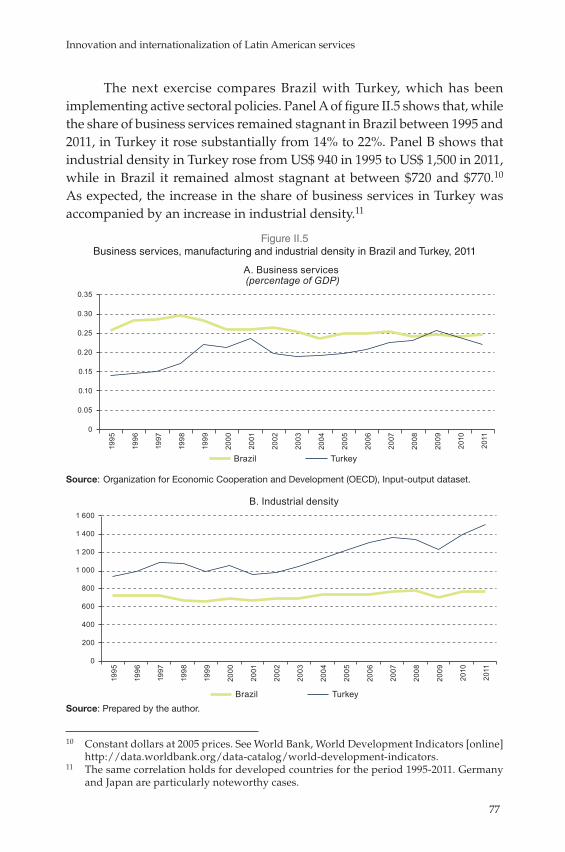
Innovation and internationalization of Latin American services
77
The next exercise compares Brazil with Turkey, which has been implementing active sectoral policies. Panel A of figure II.5 shows that, while the share of business services remained stagnant in Brazil between 1995 and 2011, in Turkey it rose substantially from 14% to 22%. Panel B shows that industrial density in Turkey rose from US$ 940 in 1995 to US$ 1,500 in 2011, while in Brazil it remained almost stagnant at between $720 and $770.10 As expected, the increase in the share of business services in Turkey was accompanied by an increase in industrial density.11
Figure II.5 Business services, manufacturing and industrial density in Brazil and Turkey, 2011
0
0.05
0.10
0.15
0.20
0.25
0.30
0.35
1995
1996
1997
1998
1999
2000
2001
2002
2003
2004
2005
2006
2007
2008
2009
2010
2011
Brazil Turkey
A. Business services (percentage of GDP)
Source: Organization for Economic Cooperation and Development (OECD), Input-output dataset.
Brazil
B. Industrial density
Turkey
0
200
400
600
800
1 000
1 200
1 400
1 600
1995
1996
1997
1998
1999
2000
2001
2002
2003
2004
2005
2006
2007
2008
2009
2010
2011
Source: Prepared by the author.
10 Constant dollars at 2005 prices. See World Bank, World Development Indicators [online] http://data.worldbank.org/data-catalog/world-development-indicators.
11 The same correlation holds for developed countries for the period 1995-2011. Germany and Japan are particularly noteworthy cases.
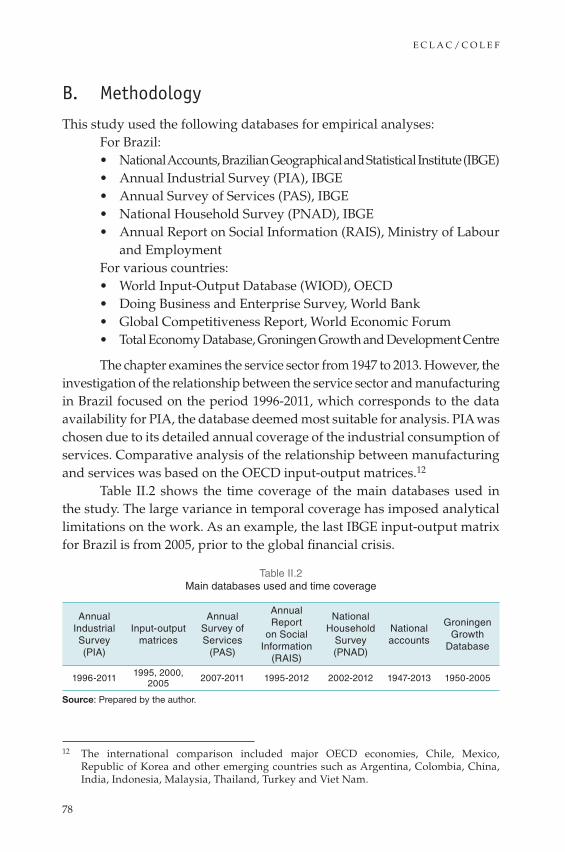
E C L A C / C O L E F
78
B. Methodology
This study used the following databases for empirical analyses:For Brazil:• National Accounts, Brazilian Geographical and Statistical Institute (IBGE)• Annual Industrial Survey (PIA), IBGE• Annual Survey of Services (PAS), IBGE• National Household Survey (PNAD), IBGE• Annual Report on Social Information (RAIS), Ministry of Labour
and EmploymentFor various countries:• World Input-Output Database (WIOD), OECD• Doing Business and Enterprise Survey, World Bank• Global Competitiveness Report, World Economic Forum• Total Economy Database, Groningen Growth and Development Centre
The chapter examines the service sector from 1947 to 2013. However, the investigation of the relationship between the service sector and manufacturing in Brazil focused on the period 1996-2011, which corresponds to the data availability for PIA, the database deemed most suitable for analysis. PIA was chosen due to its detailed annual coverage of the industrial consumption of services. Comparative analysis of the relationship between manufacturing and services was based on the OECD input-output matrices.12
Table II.2 shows the time coverage of the main databases used in the study. The large variance in temporal coverage has imposed analytical limitations on the work. As an example, the last IBGE input-output matrix for Brazil is from 2005, prior to the global financial crisis.
Table II.2 Main databases used and time coverage
Annual Industrial Survey (PIA)
Input-output matrices
Annual Survey of Services
(PAS)
Annual Report
on Social Information
(RAIS)
National Household
Survey (PNAD)
National accounts
Groningen Growth
Database
1996-2011 1995, 2000, 2005 2007-2011 1995-2012 2002-2012 1947-2013 1950-2005
Source: Prepared by the author.
12 The international comparison included major OECD economies, Chile, Mexico, Republic of Korea and other emerging countries such as Argentina, Colombia, China, India, Indonesia, Malaysia, Thailand, Turkey and Viet Nam.
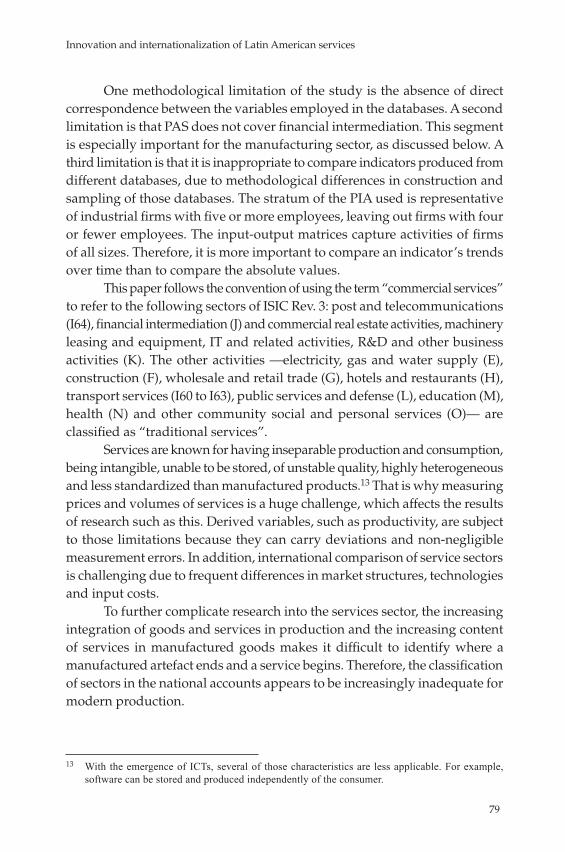
Innovation and internationalization of Latin American services
79
One methodological limitation of the study is the absence of direct correspondence between the variables employed in the databases. A second limitation is that PAS does not cover financial intermediation. This segment is especially important for the manufacturing sector, as discussed below. A third limitation is that it is inappropriate to compare indicators produced from different databases, due to methodological differences in construction and sampling of those databases. The stratum of the PIA used is representative of industrial firms with five or more employees, leaving out firms with four or fewer employees. The input-output matrices capture activities of firms of all sizes. Therefore, it is more important to compare an indicator’s trends over time than to compare the absolute values.
This paper follows the convention of using the term “commercial services” to refer to the following sectors of ISIC Rev. 3: post and telecommunications (I64), financial intermediation (J) and commercial real estate activities, machinery leasing and equipment, IT and related activities, R&D and other business activities (K). The other activities —electricity, gas and water supply (E), construction (F), wholesale and retail trade (G), hotels and restaurants (H), transport services (I60 to I63), public services and defense (L), education (M), health (N) and other community social and personal services (O)— are classified as “traditional services”.
Services are known for having inseparable production and consumption, being intangible, unable to be stored, of unstable quality, highly heterogeneous and less standardized than manufactured products.13 That is why measuring prices and volumes of services is a huge challenge, which affects the results of research such as this. Derived variables, such as productivity, are subject to those limitations because they can carry deviations and non-negligible measurement errors. In addition, international comparison of service sectors is challenging due to frequent differences in market structures, technologies and input costs.
To further complicate research into the services sector, the increasing integration of goods and services in production and the increasing content of services in manufactured goods makes it difficult to identify where a manufactured artefact ends and a service begins. Therefore, the classification of sectors in the national accounts appears to be increasingly inadequate for modern production.
13 With the emergence of ICTs, several of those characteristics are less applicable. For example, software can be stored and produced independently of the consumer.
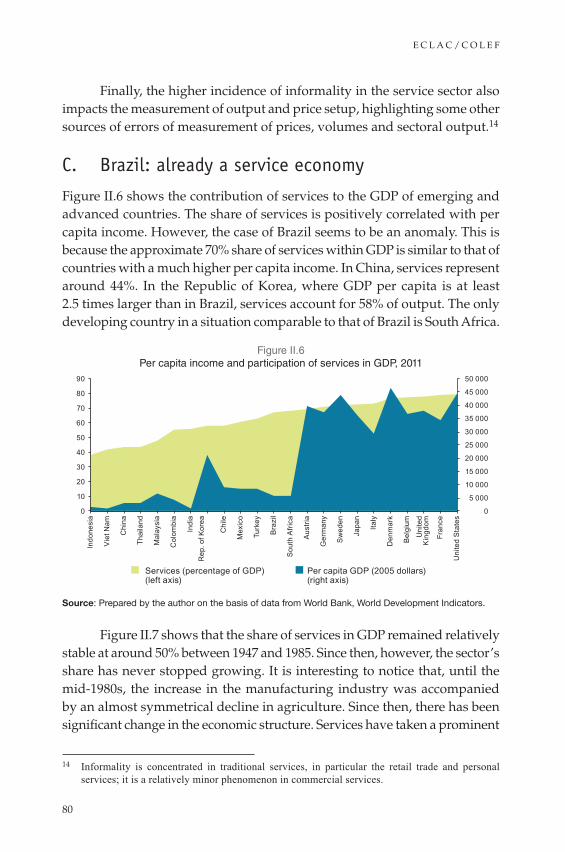
E C L A C / C O L E F
80
Finally, the higher incidence of informality in the service sector also impacts the measurement of output and price setup, highlighting some other sources of errors of measurement of prices, volumes and sectoral output.14
C. Brazil: already a service economy
Figure II.6 shows the contribution of services to the GDP of emerging and advanced countries. The share of services is positively correlated with per capita income. However, the case of Brazil seems to be an anomaly. This is because the approximate 70% share of services within GDP is similar to that of countries with a much higher per capita income. In China, services represent around 44%. In the Republic of Korea, where GDP per capita is at least 2.5 times larger than in Brazil, services account for 58% of output. The only developing country in a situation comparable to that of Brazil is South Africa.
Figure II.6 Per capita income and participation of services in GDP, 2011
0
5 000
10 000
15 000
20 000
25 000
30 000
35 000
40 000
45 000
50 000
0
10
20
30
40
50
60
70
80
90
Indo
nesi
a
Vie
t Nam
Chi
na
Thai
land
Mal
aysi
a
Col
ombi
a
Indi
a R
ep. o
f Kor
ea
Chi
le
Mex
ico
Turk
ey
Bra
zil
Bra
zil
Sou
th A
frica
Aus
tria
Ger
man
y
Sw
eden
Japa
n
Italy
Den
mar
k
Bel
gium
Uni
ted
Kin
gdom
Fran
ce
Uni
ted
Sta
tes
Services (percentage of GDP)(left axis)
Per capita GDP (2005 dollars)(right axis)
Source: Prepared by the author on the basis of data from World Bank, World Development Indicators.
Figure II.7 shows that the share of services in GDP remained relatively stable at around 50% between 1947 and 1985. Since then, however, the sector’s share has never stopped growing. It is interesting to notice that, until the mid-1980s, the increase in the manufacturing industry was accompanied by an almost symmetrical decline in agriculture. Since then, there has been significant change in the economic structure. Services have taken a prominent
14 Informality is concentrated in traditional services, in particular the retail trade and personal services; it is a relatively minor phenomenon in commercial services.
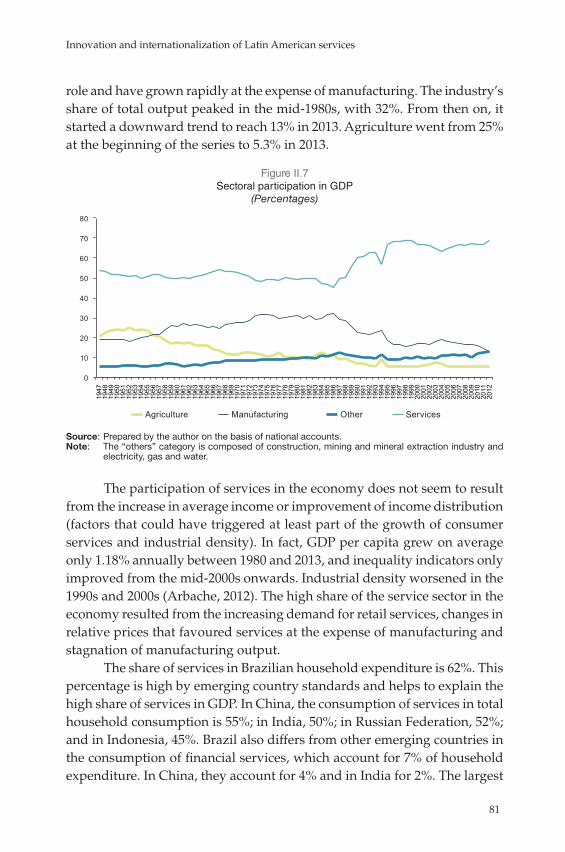
Innovation and internationalization of Latin American services
81
role and have grown rapidly at the expense of manufacturing. The industry’s share of total output peaked in the mid-1980s, with 32%. From then on, it started a downward trend to reach 13% in 2013. Agriculture went from 25% at the beginning of the series to 5.3% in 2013.
Figure II.7 Sectoral participation in GDP
(Percentages)
0
10
20
30
40
50
60
70
80
1947
19
48
1949
19
50
1951
19
52
1953
19
54
1955
19
56
1957
19
58
1959
19
60
1961
19
62
1963
19
64
1965
19
66
1967
19
68
1969
19
70
1971
19
72
1973
19
74
1975
19
76
1977
19
78
1979
19
80
1981
19
82
1983
19
84
1985
19
86
1987
19
88
1989
19
90
1991
19
92
1993
19
94
1995
19
96
1997
19
98
1999
20
00
2001
20
02
2003
20
04
2005
20
06
2007
20
08
2009
20
10
2011
20
12
Agriculture Manufacturing Other Services
Source: Prepared by the author on the basis of national accounts.Note: The “others” category is composed of construction, mining and mineral extraction industry and
electricity, gas and water.
The participation of services in the economy does not seem to result from the increase in average income or improvement of income distribution (factors that could have triggered at least part of the growth of consumer services and industrial density). In fact, GDP per capita grew on average only 1.18% annually between 1980 and 2013, and inequality indicators only improved from the mid-2000s onwards. Industrial density worsened in the 1990s and 2000s (Arbache, 2012). The high share of the service sector in the economy resulted from the increasing demand for retail services, changes in relative prices that favoured services at the expense of manufacturing and stagnation of manufacturing output.
The share of services in Brazilian household expenditure is 62%. This percentage is high by emerging country standards and helps to explain the high share of services in GDP. In China, the consumption of services in total household consumption is 55%; in India, 50%; in Russian Federation, 52%; and in Indonesia, 45%. Brazil also differs from other emerging countries in the consumption of financial services, which account for 7% of household expenditure. In China, they account for 4% and in India for 2%. The largest

E C L A C / C O L E F
82
share of services in the consumption basket are wholesale, retail trade, restaurants, education, health and renting.15
Figure II.8 shows the composition of services over time. First, the share of public services such as health and education grew significantly.16 Second, while the contribution of retail remains high, the sector has lost some of its share. Third, other services increased their participation. Fourth, information services showed significant growth. Fifth, the share of financial intermediation recorded growth from the early 1970s to around the mid-1990s, which probably reflects the effects of the national financial system reform in the late 1960s and the benefits of the inflation tax for the sector.
Figure II.8 Breakdown of services output
(Percentages)
0
10
20
30
40
50
60
70
80
90
100
1996 1997 1998 1999 2000 2001 2002 2003 2004 2005 2006 2007 2008 2009 2010 2011 2012 2013
Transportation, storage and post Others Financial intermediation Information servicesTrade Real estate activities and renting Administration, public health and education
Source: Prepared by the author on the basis of data from national accounts.Note: The “others” category is composed of construction, mining and mineral extraction industry and
electricity, gas and water.
The service sector is by far the one that employs the most formal and informal workers. In 2012, it accounted for no less than 72.3% of total formal workers. On the other hand, the manufacturing sector went from 20.8% in 1995 to 17.1% in 2012. With such participation in employment, the services sector virtually dictates the contours of the Brazilian labour market and whatever happens in this sector is likely to spill over into the rest of the economy.
15 The high share of financial services in Brazil is partly due to high inflation and high banking market concentration, together with high interest rates.
16 The tax burden in Brazil is much higher than in countries with similar per capita income. This allows Brazil to employ a relatively high number of teachers, doctors, nurses and civil servants.

Innovation and internationalization of Latin American services
83
In recent years, 8.3 of every 10 new formal jobs created originated in the services sector. The CAGED dataset, from the Ministry of Labour and Employment, shows that the turnover in the service sector is about four times higher than in the rest of the economy. The high turnover discourages investment in human capital by employees and employers, which is a powerful source of low productivity.
Table II.3 presents the characteristics of service sector firms. First, it shows that the value added per month per firm is R$ 45,600. Second, the value added per worker per month is R$ 4,326. Third, firms are relatively small (employing 10 workers).17 Fourth, wages are relatively high for the value added per worker. Fifth, real wages rose more than value added per worker. It seems reasonable to infer that wages are influenced by factors other than just the market. Two possible factors are the minimum wage, which has grown significantly more than inflation, and the slower growth of the working age population combined with the stagnation of labour force participation, which could limit the pool of workers seeking employment.18
Table II.3 Average characteristics of firms in the services sector
(Constant reais)
2011Growth rate, 2007-2011
(percentages)Monthly value added by firm 45 600 10.79Monthly value added by worker 4 326 11.53Size (number of workers) 10.5 -0.7Monthly wage 1 368 13.04
Source: Annual Survey of Services (PAS), Brazilian Geographical and Statistical Institute (IBGE).
PAS data show a high diversity of characteristics between the service segments. Firms providing business services had, on average, twice as many workers as those providing services to families. The data also confirm that the service sector is probably the most diverse in the economy. Very high- and very low-tech firms co-exist in the same segment and market, as do high- and low-skilled workers and high- and low-productivity firms. Distinctions remain in terms of geographic regions and states. Because of this feature, the formulation of effective policies for the service sector is a major challenge for the government and the private sector alike.
17 OECD (2014) found evidence that in Brazil and other countries, smaller firms have lower total factor productivity. The PAS sample in this chapter considered firms with five or more workers. The average number of workers per firm in the original sample of PAS was 5.26.
18 For a detailed study of the service sector’s productivity in Brazil, see Arbache (2015).

E C L A C / C O L E F
84
Figure II.9 shows that service sector productivity is particularly low in terms of comparative and long-term perspectives. However, the popularization of technology-intensive services, such as IT and telecommunications, is likely to push up the average rate of productivity growth in the service sector over the coming years.
Figure II.9 Labour productivity
(Constant reais)
0
20
40
60
80
100
120
1950
1952
1954
1956
1958
1960
1962
1964
1966
1968
1970
1972
1974
1976
1978
1980
1982
1984
1986
1988
1990
1992
1994
1996
1998
2000
2002
2004
Agriculture Mining Manufacturing Services
Source: Prepared by the author, on the basis of data from the Groningen Growth and Development Centre.
Figure II.10 shows the growth rate of labour productivity over time. The growth rate of services is not only low, but has decreased since the beginning of the 1980s. Considering the sector size and its importance for employment, it seems reasonable to claim that the service sector is the single most important factor behind the stagnation of productivity in Brazil.
Figure II.10 Labour productivity index
(1950=100)
Agriculture Mining Manufacturing Services
0
500
1 000
1 500
2 000
2 500
1950
1952
1954
1956
1958
1960
1962
1964
1966
1968
1970
1972
1974
1976
1978
1980
1982
1984
1986
1988
1990
1992
1994
1996
1998
2000
2002
2004
Source: Prepared by the author, on the basis of data from the Groningen Growth and Development Centre.
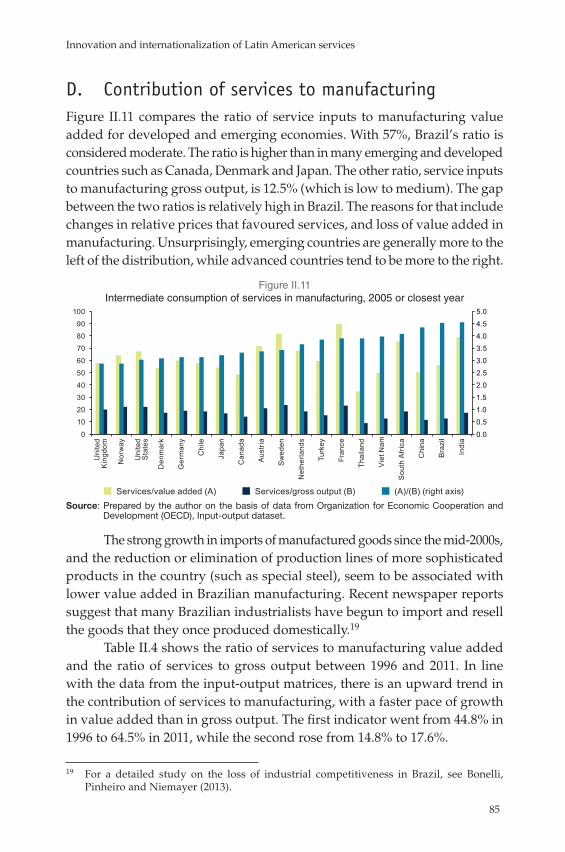
Innovation and internationalization of Latin American services
85
D. Contribution of services to manufacturingFigure II.11 compares the ratio of service inputs to manufacturing value added for developed and emerging economies. With 57%, Brazil’s ratio is considered moderate. The ratio is higher than in many emerging and developed countries such as Canada, Denmark and Japan. The other ratio, service inputs to manufacturing gross output, is 12.5% (which is low to medium). The gap between the two ratios is relatively high in Brazil. The reasons for that include changes in relative prices that favoured services, and loss of value added in manufacturing. Unsurprisingly, emerging countries are generally more to the left of the distribution, while advanced countries tend to be more to the right.
Figure II.11 Intermediate consumption of services in manufacturing, 2005 or closest year
0.0
0.5
1.0
1.5
2.0
2.5
3.0
3.5
4.0
4.5
5.0
0
10
20
30
40
50
60
70
80
90
100
Uni
ted
Kin
gdom
Nor
way
Uni
ted
Sta
tes
Den
mar
k
Ger
man
y
Chi
le
Japa
n
Can
ada
Aus
tria
Sw
eden
Net
herla
nds
Turk
ey
Fran
ce
Thai
land
Vie
t Nam
Sou
th A
fric
a
Chi
na
Bra
zil
Indi
a
Services/value added (A) Services/gross output (B) (A)/(B) (right axis)
Source: Prepared by the author on the basis of data from Organization for Economic Cooperation and Development (OECD), Input-output dataset.
The strong growth in imports of manufactured goods since the mid-2000s, and the reduction or elimination of production lines of more sophisticated products in the country (such as special steel), seem to be associated with lower value added in Brazilian manufacturing. Recent newspaper reports suggest that many Brazilian industrialists have begun to import and resell the goods that they once produced domestically.19
Table II.4 shows the ratio of services to manufacturing value added and the ratio of services to gross output between 1996 and 2011. In line with the data from the input-output matrices, there is an upward trend in the contribution of services to manufacturing, with a faster pace of growth in value added than in gross output. The first indicator went from 44.8% in 1996 to 64.5% in 2011, while the second rose from 14.8% to 17.6%.
19 For a detailed study on the loss of industrial competitiveness in Brazil, see Bonelli, Pinheiro and Niemayer (2013).
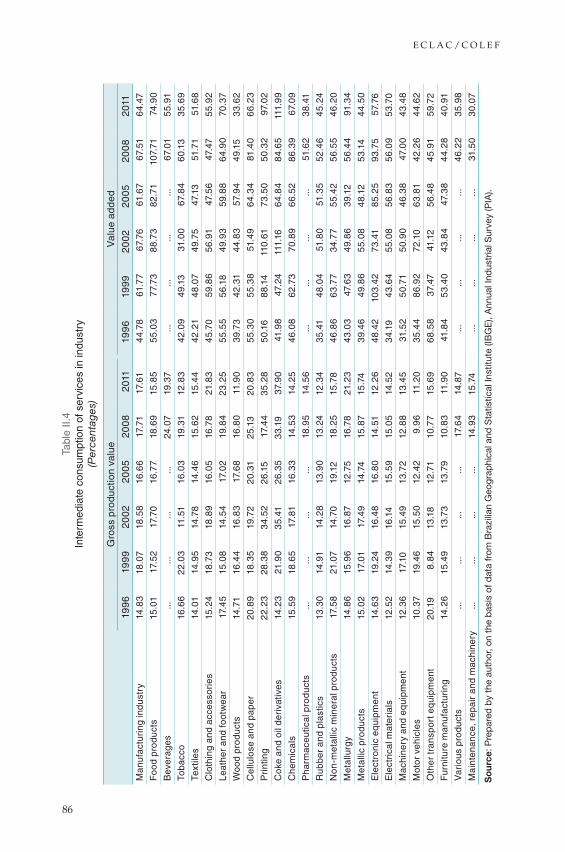
E C L A C / C O L E F
86
Tabl
e II.
4 In
term
edia
te c
onsu
mpt
ion
of s
ervi
ces
in in
dust
ry(P
erce
ntag
es)
Gro
ss p
rodu
ctio
n va
lue
Val
ue a
dde
d
199
619
99
2002
200
520
08
2011
199
619
9920
0220
05
200
820
11M
anuf
actu
ring
indu
stry
14.8
318
.07
18.5
816
.66
17.7
117
.61
44.
7861
.77
67.7
661
.67
67.5
16
4.47
Foo
d pr
odu
cts
15.0
117
.52
17.7
016
.77
18.6
915
.85
55.0
37
7.73
88.
7382
.71
107.
7174
.90
Bev
erag
es...
......
...24
.07
19.3
7...
......
...67
.01
55.9
1
Toba
cco
16.6
622
.03
11.5
116
.03
19.3
112
.83
42.0
949
.13
31.0
067
.84
60.
133
5.6
9
Text
iles
14.0
114
.95
14.7
814
.46
15.6
215
.44
42.2
14
8.07
49.7
547
.13
51.7
151
.68
Clo
thin
g an
d ac
cess
orie
s15
.24
18.7
318
.89
16.0
516
.78
21.8
34
5.70
59.8
656
.91
47.5
647
.47
55.9
2
Leat
her
and
foot
wea
r17
.45
15.0
814
.54
17.0
219
.84
23.2
555
.55
56.1
849
.93
59.8
86
4.9
070
.37
Woo
d pr
odu
cts
14.7
116
.44
16.8
317
.68
16.8
011
.90
39.
7342
.31
44.
83
57.9
449
.15
33.
62
Cel
lulo
se a
nd p
aper
20.8
918
.35
19.7
220
.31
25.1
320
.83
55.3
055
.38
51.4
96
4.3
481
.40
66.
23
Pri
ntin
g22
.23
28.3
83
4.52
26.1
517
.44
35.
2850
.16
88.
1411
0.61
73.5
050
.32
97.0
2
Cok
e an
d oi
l der
ivat
ives
14.2
321
.90
35.
4126
.35
33.
1937
.90
41.9
847
.24
111.
166
4.8
48
4.6
511
1.9
9
Che
mic
als
15.5
918
.65
17.8
116
.33
14.5
314
.25
46.
08
62.7
370
.89
66.
528
6.3
967
.09
Pha
rmac
eutic
al p
rodu
cts
......
......
18.9
514
.56
......
......
51.6
23
8.41
Rub
ber
and
plas
tics
13.3
014
.91
14.2
813
.90
13.2
412
.34
35.
414
8.0
451
.80
51.3
552
.46
45.
24
Non
-met
allic
min
eral
pro
duct
s17
.58
21.0
714
.70
19.1
218
.25
15.7
84
6.8
66
3.7
73
4.7
755
.42
56.5
54
6.20
Met
allu
rgy
14.8
615
.96
16.8
712
.75
16.7
821
.23
43.
03
47.6
349
.86
39.
1256
.44
91.3
4
Met
allic
pro
duct
s15
.02
17.0
117
.49
14.7
415
.87
15.7
43
9.4
649
.86
55.0
84
8.12
53.1
44
4.50
Ele
ctro
nic
equi
pmen
t14
.63
19.2
416
.48
16.8
014
.51
12.2
64
8.42
103.
4273
.41
85.
2593
.75
57.7
6
Ele
ctri
cal m
ater
ials
12.5
214
.39
16.1
415
.59
15.0
514
.52
34.
194
3.6
455
.08
56.8
356
.09
53.7
0
Mac
hine
ry a
nd e
quip
men
t12
.36
17.1
015
.49
13.7
212
.88
13.4
531
.52
50.7
150
.90
46.
38
47.0
04
3.4
8
Mot
or v
ehic
les
10.3
719
.46
15.5
012
.42
9.9
611
.20
35.
44
86.
9272
.10
63.
8142
.26
44.
62
Oth
er tr
ansp
ort e
quip
men
t20
.19
8.8
413
.18
12.7
110
.77
15.6
96
8.58
37.4
741
.12
56.4
84
5.91
59.7
2
Fur
nitu
re m
anuf
actu
ring
14.2
615
.49
13.7
313
.79
10.8
311
.90
41.8
453
.40
43.
84
47.3
84
4.28
40.
91
Var
ious
pro
duct
s...
......
...17
.64
14.8
7...
......
...4
6.22
35.
98
Mai
nten
ance
, rep
air
and
mac
hine
ry...
......
...14
.93
15.7
4...
......
...31
.50
30.
07
So
urce
: Pre
par
ed b
y th
e au
thor
, on
the
bas
is o
f dat
a fr
om B
razi
lian
Geo
grap
hica
l and
Sta
tistic
al In
stitu
te (I
BG
E),
Ann
ual I
ndus
tria
l Sur
vey
(PIA
).

Innovation and internationalization of Latin American services
87
In spite of the general upward trend in the share of services within manufacturing, there is significant variation among industries (as shown in figure II.12). While the contribution of services to motor vehicle output was 11%, for the oil and gas industry it was 38%.
Figure II.12 Intermediate consumption of services in manufacturing gross output, 2011
(Percentages)
0 5 10 15 20 25 30 35 40 Vehicles
Furniture manufacturing Wood products
Electronic equipment Rubber and plastics
Tobacco Equipment and machinery
Chemicals Electrial material Pharmaceuticals
Other products Textiles
Other transport equipment Metal products
Maintenance, repair and machinery Food prod.
Transformation industry Beverages
Pulp and paper Metallurgy
Clothing and accessories Leather and footwear
Printing Coke and oil products
Source: Prepared by the author, on the basis of data from Brazilian Geographical and Statistical Institute (IBGE), Annual Industrial Survey (PIA).
Figure II.13 shows the growth rates in the contribution of services to manufacturing gross output. There is no uniformity in direction, with a decrease in the consumption of services in some industries (such as transportation equipment, furniture and clothes) and a substantial increase in others such as oil and gas, metallurgy and chemistry. The different rates may reflect, inter alia, a change in relative prices, production technologies, organization of production, management and market structure.
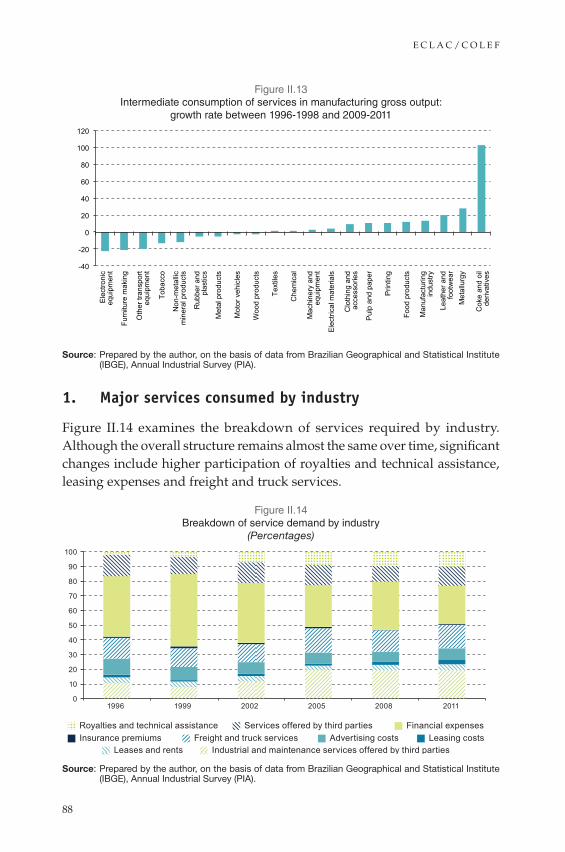
E C L A C / C O L E F
88
Figure II.13 Intermediate consumption of services in manufacturing gross output:
growth rate between 1996-1998 and 2009-2011
-40
-20
0
20
40
60
80
100
120
Ele
ctro
nic
equi
pmen
t
Furn
iture
mak
ing
Oth
er tr
ansp
ort
equi
pmen
t
Toba
cco
Non
-met
allic
m
iner
al p
rodu
cts
Rub
ber a
nd
plas
tics
Met
al p
rodu
cts
Mot
or v
ehic
les
Woo
d pr
oduc
ts
Text
iles
Che
mic
al
Mac
hine
ry a
nd
equi
pmen
t
Ele
ctric
al m
ater
ials
Clo
thin
g an
d ac
cess
orie
s
Pul
p an
d pa
per
Prin
ting
Food
pro
duct
s
Man
ufac
turin
g in
dust
ry
Leat
her a
nd
foot
wea
r M
etal
lurg
y
Cok
e an
d oi
l de
rivat
ives
Source: Prepared by the author, on the basis of data from Brazilian Geographical and Statistical Institute (IBGE), Annual Industrial Survey (PIA).
1. Major services consumed by industry
Figure II.14 examines the breakdown of services required by industry. Although the overall structure remains almost the same over time, significant changes include higher participation of royalties and technical assistance, leasing expenses and freight and truck services.
Figure II.14 Breakdown of service demand by industry
(Percentages)
0
10
20
30
40
50
60
70
80
90
100
1996 1999 2002 2005 2008 2011
Royalties and technical assistance Services offered by third parties Financial expenses Insurance premiums Freight and truck services Advertising costs Leasing costs
Leases and rents Industrial and maintenance services offered by third parties
Source: Prepared by the author, on the basis of data from Brazilian Geographical and Statistical Institute (IBGE), Annual Industrial Survey (PIA).
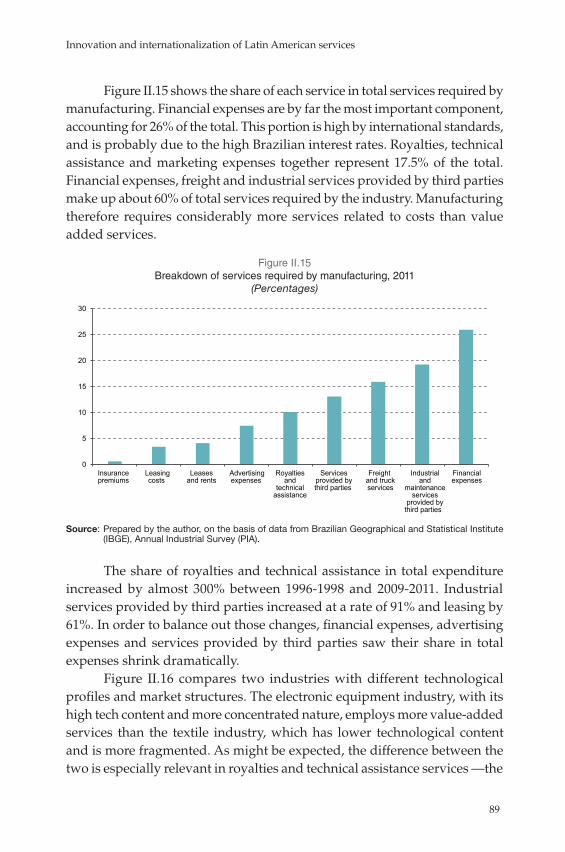
Innovation and internationalization of Latin American services
89
Figure II.15 shows the share of each service in total services required by manufacturing. Financial expenses are by far the most important component, accounting for 26% of the total. This portion is high by international standards, and is probably due to the high Brazilian interest rates. Royalties, technical assistance and marketing expenses together represent 17.5% of the total. Financial expenses, freight and industrial services provided by third parties make up about 60% of total services required by the industry. Manufacturing therefore requires considerably more services related to costs than value added services.
Figure II.15 Breakdown of services required by manufacturing, 2011
(Percentages)
0
5
10
15
20
25
30
Insurance premiums
Leasing costs
Leases and rents
Advertisingexpenses
Royaltiesand
technicalassistance
Servicesprovided bythird parties
Freight and truckservices
Industrialand
maintenanceservices
provided bythird parties
Financial expenses
Source: Prepared by the author, on the basis of data from Brazilian Geographical and Statistical Institute (IBGE), Annual Industrial Survey (PIA).
The share of royalties and technical assistance in total expenditure increased by almost 300% between 1996-1998 and 2009-2011. Industrial services provided by third parties increased at a rate of 91% and leasing by 61%. In order to balance out those changes, financial expenses, advertising expenses and services provided by third parties saw their share in total expenses shrink dramatically.
Figure II.16 compares two industries with different technological profiles and market structures. The electronic equipment industry, with its high tech content and more concentrated nature, employs more value-added services than the textile industry, which has lower technological content and is more fragmented. As might be expected, the difference between the two is especially relevant in royalties and technical assistance services —the
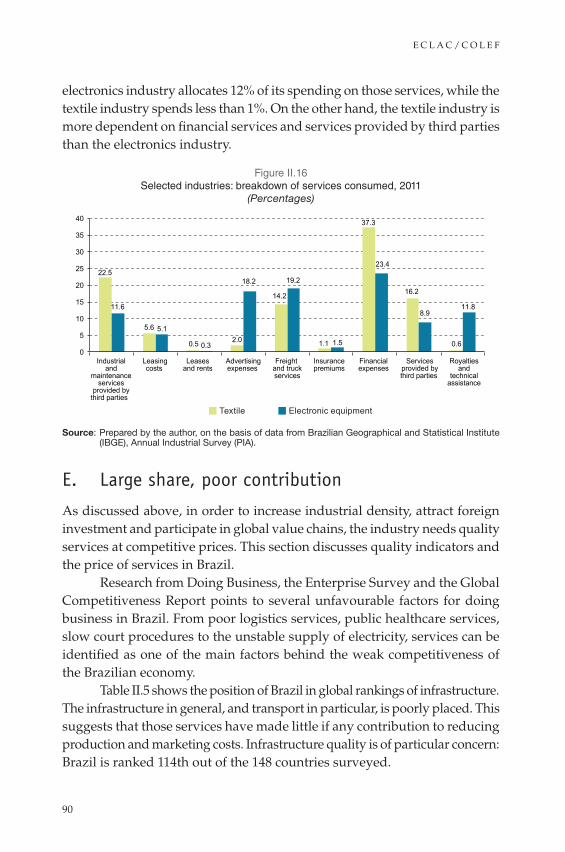
E C L A C / C O L E F
90
electronics industry allocates 12% of its spending on those services, while the textile industry spends less than 1%. On the other hand, the textile industry is more dependent on financial services and services provided by third parties than the electronics industry.
Figure II.16 Selected industries: breakdown of services consumed, 2011
(Percentages)
Insurance premiums
Leasing costs
Leases and rents
Advertisingexpenses
Royaltiesand
technicalassistance
Servicesprovided bythird parties
Freight and truckservices
Industrialand
maintenanceservices
provided bythird parties
Financial expenses
22.5
5.6
0.5 2.0
14.2
1.1
37.3
16.2
0.6
11.6
5.1
0.3
18.2 19.2
1.5
23.4
8.9 11.8
0
5
10
15
20
25
30
35
40
Textile Electronic equipment
Source: Prepared by the author, on the basis of data from Brazilian Geographical and Statistical Institute (IBGE), Annual Industrial Survey (PIA).
E. Large share, poor contribution
As discussed above, in order to increase industrial density, attract foreign investment and participate in global value chains, the industry needs quality services at competitive prices. This section discusses quality indicators and the price of services in Brazil.
Research from Doing Business, the Enterprise Survey and the Global Competitiveness Report points to several unfavourable factors for doing business in Brazil. From poor logistics services, public healthcare services, slow court procedures to the unstable supply of electricity, services can be identified as one of the main factors behind the weak competitiveness of the Brazilian economy.
Table II.5 shows the position of Brazil in global rankings of infrastructure. The infrastructure in general, and transport in particular, is poorly placed. This suggests that those services have made little if any contribution to reducing production and marketing costs. Infrastructure quality is of particular concern: Brazil is ranked 114th out of the 148 countries surveyed.
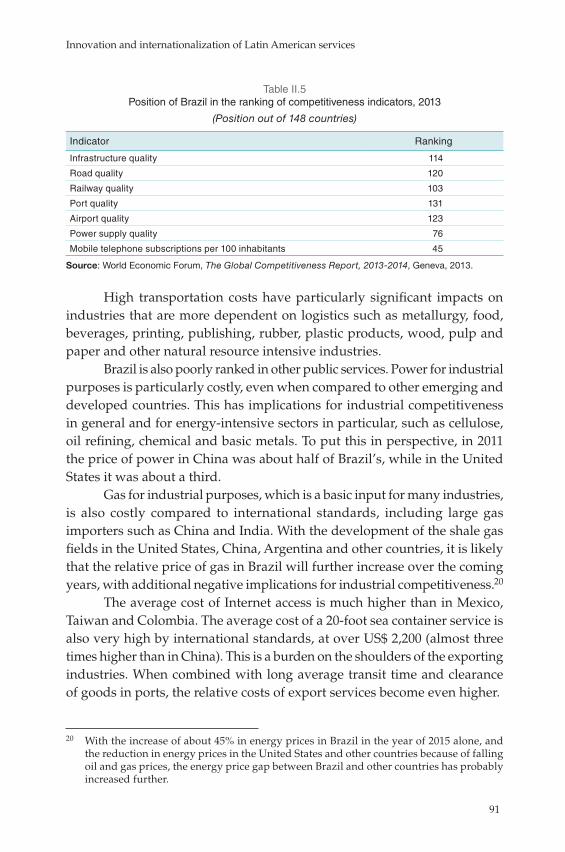
Innovation and internationalization of Latin American services
91
Table II.5 Position of Brazil in the ranking of competitiveness indicators, 2013
(Position out of 148 countries)
Indicator Ranking
Infrastructure quality 114
Road quality 120
Railway quality 103
Port quality 131
Airport quality 123
Power supply quality 76
Mobile telephone subscriptions per 100 inhabitants 45
Source: World Economic Forum, The Global Competitiveness Report, 2013-2014, Geneva, 2013.
High transportation costs have particularly significant impacts on industries that are more dependent on logistics such as metallurgy, food, beverages, printing, publishing, rubber, plastic products, wood, pulp and paper and other natural resource intensive industries.
Brazil is also poorly ranked in other public services. Power for industrial purposes is particularly costly, even when compared to other emerging and developed countries. This has implications for industrial competitiveness in general and for energy-intensive sectors in particular, such as cellulose, oil refining, chemical and basic metals. To put this in perspective, in 2011 the price of power in China was about half of Brazil’s, while in the United States it was about a third.
Gas for industrial purposes, which is a basic input for many industries, is also costly compared to international standards, including large gas importers such as China and India. With the development of the shale gas fields in the United States, China, Argentina and other countries, it is likely that the relative price of gas in Brazil will further increase over the coming years, with additional negative implications for industrial competitiveness.20
The average cost of Internet access is much higher than in Mexico, Taiwan and Colombia. The average cost of a 20-foot sea container service is also very high by international standards, at over US$ 2,200 (almost three times higher than in China). This is a burden on the shoulders of the exporting industries. When combined with long average transit time and clearance of goods in ports, the relative costs of export services become even higher.
20 With the increase of about 45% in energy prices in Brazil in the year of 2015 alone, and the reduction in energy prices in the United States and other countries because of falling oil and gas prices, the energy price gap between Brazil and other countries has probably increased further.
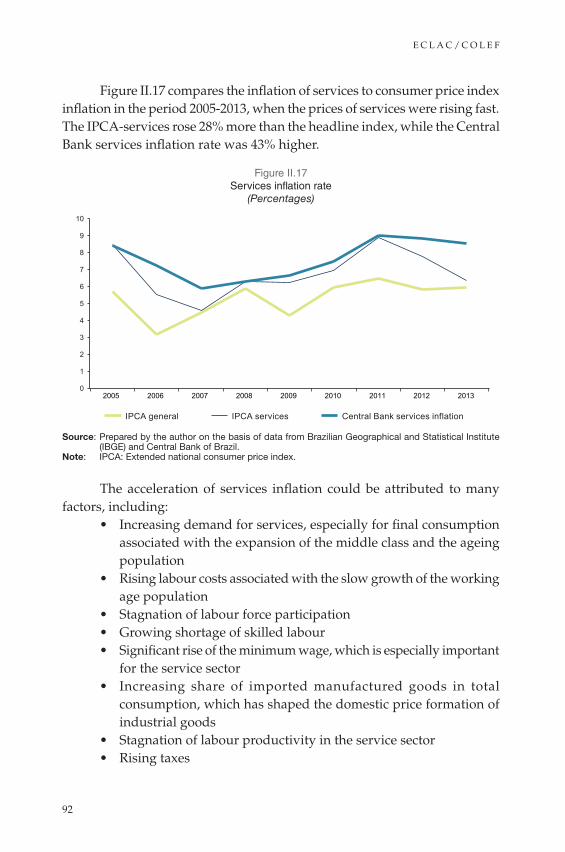
E C L A C / C O L E F
92
Figure II.17 compares the inflation of services to consumer price index inflation in the period 2005-2013, when the prices of services were rising fast. The IPCA-services rose 28% more than the headline index, while the Central Bank services inflation rate was 43% higher.
Figure II.17 Services inflation rate
(Percentages)
0
1
2
3
4
5
6
7
8
9
10
2005 2006 2007 2008 2009 2010 2011 2012 2013
IPCA general IPCA services Central Bank services inflation
Source: Prepared by the author on the basis of data from Brazilian Geographical and Statistical Institute (IBGE) and Central Bank of Brazil.
Note: IPCA: Extended national consumer price index.
The acceleration of services inflation could be attributed to many factors, including:
• Increasing demand for services, especially for final consumption associated with the expansion of the middle class and the ageing population
• Rising labour costs associated with the slow growth of the working age population
• Stagnation of labour force participation• Growing shortage of skilled labour• Significant rise of the minimum wage, which is especially important
for the service sector• Increasing share of imported manufactured goods in total
consumption, which has shaped the domestic price formation of industrial goods
• Stagnation of labour productivity in the service sector • Rising taxes

Innovation and internationalization of Latin American services
93
According to CNS (2013), the tax burden on services is heavier than in other sectors. In 2013, non-financial private services collected 24% of total revenue, which consisted mainly of taxes on income and property. Also according to CNS, while average value added tax (VAT) on goods and services is 19.4%, it is 16.9% in healthcare services, 18.6% in education, 20.1% in accommodation and food services, 23.5% in transport, storage and postal services, 23.6% in business services, 27.3% in IT services and 30.4% in electricity.21
Therefore, high inflation in services seems to result from demand factors combined with institutional factors, demographic changes and Baumol’s cost disease.
Figure II.18 shows the ratio of productivity in agriculture, mining and services to the productivity in manufacturing. The ratio fell over most of the period, suggesting that services have indeed constrained industry competitiveness.
Figure II.18 Productivity ratio in relation to manufacturing
0
0.5
1.0
1.5
2.0
2.5
3.0
3.5
4.0
4.5
1950
1952
1954
1956
1958
1960
1962
1964
1966
1968
1970
1972
1974
1976
1978
1980
1982
1984
1986
1988
1990
1992
1994
1996
1998
2000
2002
2004
Agriculture Mining Services
Source: Prepared by the author, on the basis of data from the Groningen Growth and Development Centre.
1. What are the most critical services for industry competitiveness?
There is no single answer to this question because, as shown above, the composition of services varies widely across industries and over time. The most critical services to manufacturing seem to be those that are most used,
21 For a detailed study on taxes on imported services, see CNI (2013).
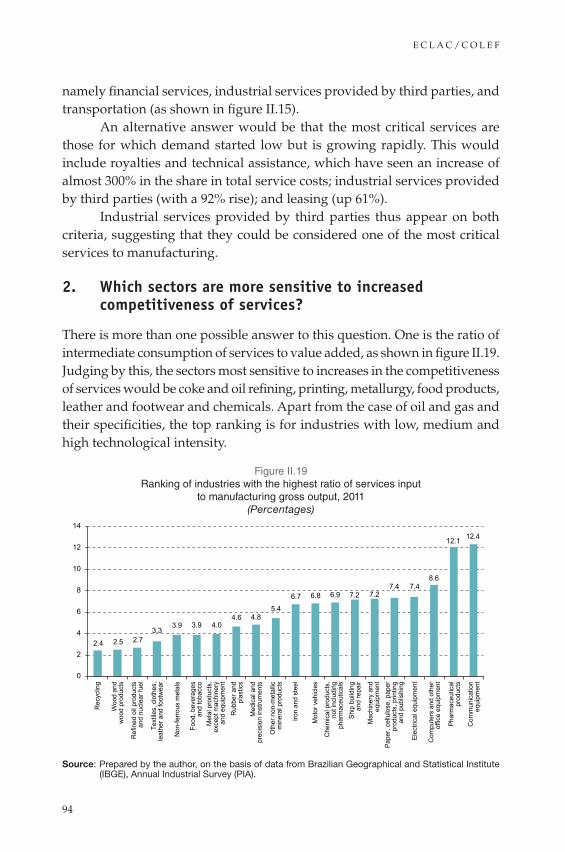
E C L A C / C O L E F
94
namely financial services, industrial services provided by third parties, and transportation (as shown in figure II.15).
An alternative answer would be that the most critical services are those for which demand started low but is growing rapidly. This would include royalties and technical assistance, which have seen an increase of almost 300% in the share in total service costs; industrial services provided by third parties (with a 92% rise); and leasing (up 61%).
Industrial services provided by third parties thus appear on both criteria, suggesting that they could be considered one of the most critical services to manufacturing.
2. Which sectors are more sensitive to increased competitiveness of services?
There is more than one possible answer to this question. One is the ratio of intermediate consumption of services to value added, as shown in figure II.19. Judging by this, the sectors most sensitive to increases in the competitiveness of services would be coke and oil refining, printing, metallurgy, food products, leather and footwear and chemicals. Apart from the case of oil and gas and their specificities, the top ranking is for industries with low, medium and high technological intensity.
Figure II.19 Ranking of industries with the highest ratio of services input
to manufacturing gross output, 2011(Percentages)
2.4 2.5 2.7 3.3
3.9 3.9 4.0 4.6 4.8
5.4
6.7 6.8 6.9 7.2 7.2 7.4 7.4
8.6
12.1 12.4
0
2
4
6
8
10
12
14
Rec
yclin
g
Woo
d an
d w
ood
prod
ucts
Ref
ined
oil
prod
ucts
an
d nu
clea
r fue
l
Text
iles,
clo
thes
, le
athe
r and
foot
wea
r
Non
-ferro
us m
etal
s
Food
, bev
erag
es
and
toba
cco
Met
al p
rodu
cts,
ex
cept
mac
hine
ry
and
equi
pmen
t
Rub
ber a
nd
plas
tics
Med
ical
and
pr
ecis
ion
inst
rum
ents
Oth
er n
on-m
etal
lic
min
eral
pro
duct
s
Iron
and
stee
l
Mot
or v
ehic
les
Che
mic
al p
rodu
cts,
no
t inc
ludi
ng
phar
mac
eutic
als
Ship
bui
ldin
g an
d re
pair
Mac
hine
ry a
nd
equi
pmen
t Pa
per,
cellu
lose
, pap
er
prod
ucts
, prin
ting
and
publ
ishi
ng
Elec
trica
l equ
ipm
ent
Com
pute
rs a
nd o
ther
of
fice
equi
pmen
t
Phar
mac
eutic
al
prod
ucts
Com
mun
icat
ion
equi
pmen
t
Source: Prepared by the author, on the basis of data from Brazilian Geographical and Statistical Institute (IBGE), Annual Industrial Survey (PIA).

Innovation and internationalization of Latin American services
95
A second answer relates to the sectors with the greatest sensitivity to value-added services, which would point to more promising areas of investment returns. According to figure II.20, this would include sectors such as communications equipment, pharmaceuticals, computers and electrical equipment, which are all industries with high technological content.
Figure II.20 Ranking of industries with the highest ratio of value added services input
to manufacturing gross output, 2011(Percentages)
2.4
5.6 5.8
7.1 7.3 7.4 7.6 7.6 7.8 7.8 7.8
8.5 8.7 9.2 9.3
10.3 10.9 10.9 11.1 11.2
0
2
4
6
8
10
12
Rec
yclin
g
Woo
d an
d w
ood
prod
ucts
Ref
ined
oil
prod
ucts
an
d nu
clea
r fue
ls
Text
ile, c
loth
ing,
le
athe
r and
foot
wea
r
Non
-ferr
ous
met
als
Food
, bev
erag
es
and
toba
cco
Met
al p
rodu
cts,
ex
cept
for m
achi
nery
an
d eq
uipm
ent
Rub
ber a
nd
plas
tics
Med
ical
and
pr
ecis
ion
inst
rum
ents
Oth
er n
on-m
etal
lic
min
eral
pro
duct
s
Iron
and
stee
l
Mot
or v
ehic
les
Che
mic
al p
rodu
cts,
ex
cept
for
pham
aceu
tical
s B
uild
ing
and
ship
repa
ir
Mac
hine
ry a
nd
equi
pmen
t P
aper
, pul
p, p
aper
pr
oduc
ts, p
rintin
g an
d ed
ition
Ele
ctric
al e
quip
men
t
Com
pute
rs a
nd o
ther
of
fice
mac
hine
s
Pha
rmac
eutic
als
Com
mun
icat
ion
equi
pmen
t
Source: Prepared by the author, on the basis of data from Brazilian Geographical and Statistical Institute (IBGE), Annual Industrial Survey (PIA).
Lastly, figure II.21 shows the ratio of services input to manufacturing gross output according to technology intensity. Industries with medium-to-low and low technology levels seem to be more sensitive to changes in the service sector.
These indicators suggest that improvement in the quality and prices of services can increase competitiveness, especially in industries where the country has comparative advantages, such as natural resource intensive industries.
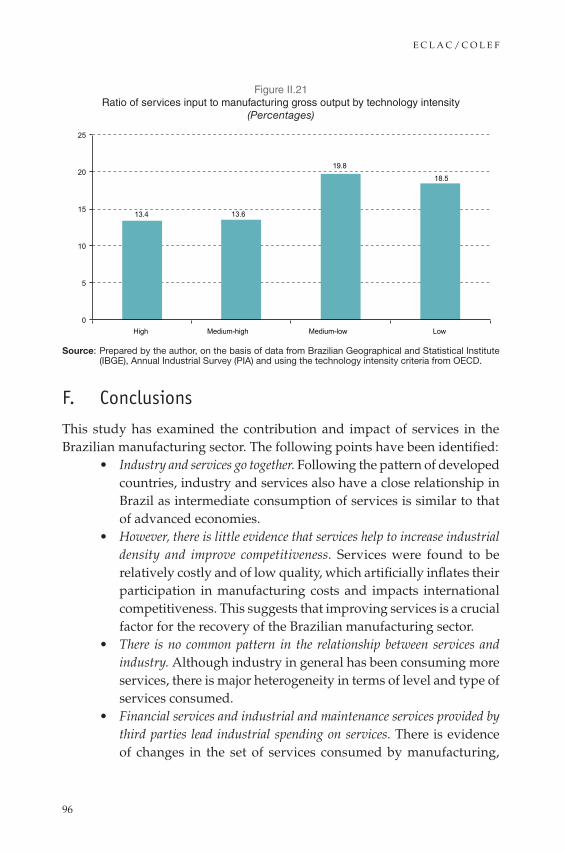
E C L A C / C O L E F
96
Figure II.21 Ratio of services input to manufacturing gross output by technology intensity
(Percentages)
13.4 13.6
19.8
18.5
0
5
10
15
20
25
High Medium-high Medium-low Low
Source: Prepared by the author, on the basis of data from Brazilian Geographical and Statistical Institute (IBGE), Annual Industrial Survey (PIA) and using the technology intensity criteria from OECD.
F. Conclusions
This study has examined the contribution and impact of services in the Brazilian manufacturing sector. The following points have been identified:
• Industry and services go together. Following the pattern of developed countries, industry and services also have a close relationship in Brazil as intermediate consumption of services is similar to that of advanced economies.
• However, there is little evidence that services help to increase industrial density and improve competitiveness. Services were found to be relatively costly and of low quality, which artificially inflates their participation in manufacturing costs and impacts international competitiveness. This suggests that improving services is a crucial factor for the recovery of the Brazilian manufacturing sector.
• There is no common pattern in the relationship between services and industry. Although industry in general has been consuming more services, there is major heterogeneity in terms of level and type of services consumed.
• Financial services and industrial and maintenance services provided by third parties lead industrial spending on services. There is evidence of changes in the set of services consumed by manufacturing,

Innovation and internationalization of Latin American services
97
which can be explained by changes in technological and consumer preferences. The services most in demand from the industry are financial expenses, industrial and maintenance services provided by third parties and freight and truck services, together accounting for over 60% of total service costs. However, the services whose share has grown the most are royalties and technical assistance.
• Consumption of services is associated with the technological profile of the industry. Technology-intensive industries consume more sophisticated services such as royalties, technical assistance and marketing. Natural resource intensive industries consume more financial and transport services and services provided by third parties.
For Brazil to escape the low-growth trap, raise industrial density and access the world economy through the “front door”, it must invest more in commercial services and in value-added services in particular.
However, it is important to recognize that —given the science and technology gaps in between Brazil and advanced countries and the current rules governing trade, investment, services and intellectual property— Brazil is likely to face additional challenges in pursuing the conventional trajectory of industrial development (R1 -> R2 -> R3 -> R4). At this point, it seems that this trajectory is not as attainable as it was, as illustrated by some Asian countries. Moreover, considering the current stage of market globalization, technological changes and Brazil’s need to resume growth and respond to growing social demands, the country will probably have to seek a “shortcut” between R1 and R3.
A promising path for Brazil is to integrate more into the world economy, so that it can benefit from the many opportunities including access to technologies, knowledge, investment and markets. The size of the domestic market and the potential for industrialization of comparative advantages are also in Brazil’s favour. However, greater integration will only succeed if it is part of a more ambitious development strategy that aims to increase industrial density.
Investing in human capital, improving conditions for scientific and technological development, shortening the gap between universities and industries, fostering competition and integrating services to the nuclei of industrial, technological, trade and investment policies will be important steps if services are to make more of a contribution to economic and social development.

E C L A C / C O L E F
98
BibliographyAli-Yrkkö, J. and others (2011), “Who captures value in global supply chains?”,
Discussion Paper, No. 1240, The Research Institute of the Finnish Economy (ETLA).
Arbache, J. (2015), “Produtividade no setor de serviços”, Produtividade no Brasil: desempenho e determinantes, F. De Negri and R. Cavalcanti (orgs.), Brasilia, Institute of Applied Economic Research (IPEA).
(2012), “Is Brazilian Manufacturing Losing its Drive?”, Department of Economics, University of Brasilia [online] http://papers.ssrn.com/sol3/papers.cfm?abstract_id=2150684.
Bonelli, R., A.C. Pinheiro and L. Niemayer (2013), “O fraco desempenho da indústria é culpa da crise?”, Ensaios IBRE de economia brasileira - I, A.C. Pinheiro and R. Bonelli (orgs.), Rio de Janeiro, Editora FGV.
Chenery, H.B. (1982), “Industrialization and growth. The experience of large countries”, World Bank Staff Working Papers, No. 539, Washington, D.C., World Bank.
CNI (National Confederation of Industry) (2013), Tributação sobre importação de serviços: impactos, casos e recomendações de políticas, Brasilia.
CNS (Confederação Nacional de Serviços) (2013), Os serviços no Brasil 2013, Brasilia.
Griliches, Z. (1957), “Hybrid corn: an exploration in the economics of technological change”, Econometrica, vol. 25, No. 4, New York, Econometric Society.
Helper, S., T. Krueger and H. Wial (2012), Why Does Manufacturing Matter? Which Manufacturing Matters? A Policy Framework, Washington, D.C., Brookings.
Lodefalk, M. (2014), “The role of services for manufacturing firm exports”, Review of World Economics, vol. 150, No. 1, Springer.
(2013), “Servicification of manufacturing: evidence from Sweden”, International Journal of Economics and Business Research, vol. 6, No. 1.
Nordås, H.K. and Y. Kim (2013), “The role of services for competitiveness in manufacturing”, OECD Trade Policy Papers, No. 148.
OECD (Organization for Economic Cooperation and Development) (2014), OECD Perspectives on Global Development 2014: Boosting Productivity to Meet the Middle-Income Challenge, Paris.
Syrquin, M. and H.B. Chenery (1989), “Patterns of development 1950-1983”, World Bank Discussion Papers, No. 41, Washington, D.C., World Bank.
UNCTAD (United Nations Conference on Trade and Development) (2013), World Investment Report 2013. Global Value Chains: Investment and Trade for Development, Geneva.
Xing, Y. and N. Detert (2010), “How iPhone widens the US trade deficits with the PRC”, GRIPS Discussion Paper, No. 10-12, National Graduate Institute for Policy Studies.
Chapter I I I
Internationalization, integration, and innovation in multinational enterprises in services versus
manufacturing: evidence for Mexico
Redi Gomis Jorge Carrillo
Summary
Studies of multinational corporations and their impact on host country development have revealed a significant difference between services and manufacturing. Greater integration is occurring in both sectors, revealing the increasing importance of vertical linkages and inter-sectoral knowledge exchanges between these interrelated branches of the economy.
This paper documents the type of participation in global value chains by manufacturing and service MNEs (multinational enterprises) in Mexico. We compare the “Three I’s” (internationalization, integration and innovation) in the two sectors based on face-to-face interviews with human resource (HR) managers. The survey is statistically representative of MNEs located in Mexico.
The paper’s hypothesis is that, in Mexico, manufacturing multinationals have specialized in an export-driven efficiency-seeking strategy, while services focus predominantly on pursuing market-seeking strategies. The paper posits

E C L A C / C O L E F
100
that manufacturing companies are likely to secure a better position within the global value chain and generate more favourable impacts on employment due to their global networks (compared with more domestically oriented services MNEs). The empirical findings suggest that the above trajectories are more nuanced than originally expected.
Introduction
One could ask whether the most internationalized companies —those more innovative and those integrated1 into their respective value chains— offer better working conditions to their employees. In other words, are global enterprises the most socially inclusive? Based on what much of the available literature suggests, one might be inclined to assume that this is the case, especially regarding manufacturing companies that are presumed to be more innovative and inclusive than their services counterparts. In reality, however, this is more an intuitive judgement than an evidenced-based one. The empirical evidence is ambiguous enough to prevent definitive conclusions from being drawn. This paper seeks to contribute to this ongoing debate.
The paper has two main objectives. First, it explores the relationship between economic and social progress. To this end, the behaviour of labour relations and the human resource performance of MNEs in Mexico is analysed on the basis of different levels of internationalization, integration into global value chains and innovation. These three “I’s” are undoubtedly excellent indicators of the corporations’ strength of projection into the economic space of globalization. The paper is based on a 2008-2009 survey of MNEs operating in Mexico conducted by El Colegio de la Frontera Norte (COLEF).
Exporting firms, particularly global ones, are commonly assumed to be more innovative and competitive. They are in turn presumed to offer better job prospects to their employees. Many multinational companies operating in manufacturing are considered as falling into this category, as opposed to service MNEs, which traditionally focus on sales in the domestic market. Therefore, considering the variables of internationalization, integration into global value chains, and innovation, there is usually a tendency to attribute high scores in these three dimensions to manufacturing MNEs
1 There are several types of integration, which refers to the bonds that create a union or conjunction between elements. The study’s references to MNEs’ “respective value chains” relate to the integration of MNEs in Mexico with other actors within the same transnational chain, including vertical corporate ties and horizontal linkages with units of production or service worldwide.

Innovation and internationalization of Latin American services
101
(partly composed of world-class maquiladoras). In contrast, the tendency is to associate service companies with the lowest levels of outcomes in those three categories —precisely because of their domestic market orientation. This alleged relationship will be explored through a comparative analysis of companies in these sectors, in order to examine if service MNEs do perform in such a manner.2 That is the second objective of the work.
The structure of this paper is as follows. After presenting the paper’s key objectives in the introduction, the paper covers four main topics: a discussion of the literature about the impacts of globalization on the labour characteristics of MNEs; a discussion of methodological issues related to the analysis to be conducted, especially those associated with the nature of the data, as well as the analytical strategies to be followed; analysis of the data from the results of HR interviews conducted; and, finally, some tentative policy conclusions.
A. Theoretical and conceptual insights
The importance of multinational enterprises in today’s global economy cannot be ignored, be it in developed or developing country settings. Dickens (1998) and Sklair (2001) argue that multinational enterprises are the institutions that have influenced the globalization process more than any other forces for several decades.
The principal vector through which such influence has been felt has been the rapid expansion of foreign direct investment (FDI) flows to developing countries, a process largely led by the worldwide fragmentation of production networks (and this has involved mainly MNEs). In Mexico, for example, FDI has flowed steadily and in significant volumes, averaging about US$ 23 billion per year over the decade to 2011 (ECLAC, 2013).
It is perhaps for this reason that, in recent years, these transformations have been accompanied by a debate on the role played by FDI through MNEs in the economic, social, and political dynamics of host countries. This has been a heated ideological and political debate. The same controversy has also raged in academia, pitting those who emphasize the benefits of multinational companies against those who point out their potential downsides. Both
2 There is a small minority of service companies that exhibit a high propensity to internationalization, while there are also manufacturing ones that show low levels in the same dimension. One might wonder if highly internationalized service firms behave like internationalized manufacturing companies, and vice versa. This would relate more to the first objective.
E C L A C / C O L E F
102
stances were masterfully summarized by Moran (2000) in his taxonomy of rival models —”benign” and “malign”— of FDI impact on development.
One of the effects of FDI is what Lee (2013) calls “the middle-income trap.” This occurs when developing countries face an economic slowdown that leaves them with low value-added exports and a generally low level of technological sophistication, both of which hold back their ability to compete with developed country firms. This has prompted Rodrik (2008) to suggest that it may be better to maintain economic growth in tandem with technological upgrading than to engage in economic growth without commensurate increases in a country’s technological capabilities.
To avoid falling into the above trap —or to escape from it— Lee and Lim (2001) put forward three proposals: new market entrants should emphasize research and development (R&D) activities using already established companies as examples; if applicable, each company should skip certain stages in the R&D pathway that do not benefit them; and long-established companies should explore their own path to technological development.
There is a certain consensus among specialists about the role that MNEs can play in the transfer of knowledge, the dissemination of best practices, the establishment of standards and, particularly, the building of technological capacity (Lee, 2013; Nelson, 2008; Lundvall, 2004). The central interest of this paper relates to the impact of MNE activities on labour market performance because, as Dunning and Lundan (2008) point out, “almost all actions by MNEs or their affiliates are likely to directly or indirectly impinge on the level, quality, growth, stability, and motivation of the labor force” (p. 414). This becomes important in developing countries because, historically, technological transformation has taken place in the core countries of the world system and in the leading multinational enterprises from the different productive sectors (Pérez, 2008).
Perhaps the most important idea that can be deduced from the above debates about the impact of MNEs on developing countries —from an academic, not policy perspective—, is that there is as much evidence supporting one stance as the other. In reality, the impact of multinational enterprises on host country performance is varied, owing to the diversity of situations in which MNEs operate; and the fact that MNEs, rather than being undifferentiated entities, are themselves highly heterogeneous.
One issue that has attracted greater analytical scrutiny in this context is the relationship between export specialization and job creation, where the debate has recently focused on whether exporting firms are more productive and create more and better employment opportunities and wages. Several
Innovation and internationalization of Latin American services
103
empirical studies have found that companies that develop internationalization processes have higher levels of productivity than companies that only produce for the domestic market (Tumini, 2011). This author initially refers to the pioneering research of Bernard and Jensen (1995), who analyse the differences between exporting and non-exporting firms. Their purpose was to understand the role that exports play in the structure and dynamics of productivity, employment and wages. Both authors found that exporting companies show better performance characteristics than non-exporting companies, and present higher levels of productivity, higher growth rates and higher wages. Although, in general, the evidence shows a positive relationship between exports and employment, the differentials found regarding the enterprises geared toward the domestic market are not as clear or homogeneous.
A similar debate has emerged regarding innovation, an element to which enterprises, academia and governments attach great importance as a development factor. While authors such as Kristensen and Zeitlin (2005) consider multinationals as a world laboratory for innovation, the reality is that this process is not detached from the regional context. Laursen, Masciarelli, and Prencipe (2012) found that social capital that is geographically connected affects the innovative capacity of enterprises. Regional social interaction helps build innovation through the interaction of regional actors and through the effects of support from trusteeships. In other words, innovation ecosystems are important. Therefore, companies that are located in regions characterized by a high level of structural social capital show a higher propensity to innovate. Institutions that serve as local learning centres, universities, research centres and laboratories, as well as access to foreign knowledge bases (mainly represented by MNEs), are recognized as critical success factors in increasing technological capabilities (Lee, 2013).
Since companies do not innovate in isolation but within innovation ecosystems, we would expect positive social multiplier effects on regions derived from internal innovation practices. However, innovation does not seem as strongly associated with social inclusion as could be expected. Empirical evidence does not show binding actions between these two concepts, but it does in relation to employment. Although the relationship between innovation and employment is highly complex (Pianta, 2006), current empirical evidence shows that innovations have an overall positive impact on employment (Tumini, 2011). This means that the most innovative firms —not only in products but also in processes— tend to be the fastest growing and the ones that expand their employment by a greater degree.
E C L A C / C O L E F
104
While not objecting to this idea, García, Rodríguez and Jaumandreu (2002) present a more complex relationship between innovation and employment. According to these authors, innovation (in processes) could displace employment and cause it to decrease. However, that same innovation could be conducive to offsetting such displacement. The significant reduction in marginal costs from innovation processes could easily be transferred to the price of the product. This would expand its demand and generate a compensatory effect on employment as a result of innovation. At the same time, however, these authors emphasize that the role of compensatory mechanisms may be blocked (García, Rodríguez and Jaumandreu, 2002). That would directly hurt employment, not wages themselves. In any event, any negative effects would be temporary and would turn positive in the long run.
In summary, it is clear that the general interest of this work relates to the impact of indigenous activity of MNEs. In an era characterized by pressing demands from both governments and domestic and international organisms to ensure that benefits of development are more widespread, it is understandable that the main concern of the study is pointing more particularly to the impacts of MNE as important vehicles for the distribution of such benefits —in social progress and social inclusion (ECLAC, 2014).
In the light of global production networks, this study aims to discover the link between innovation and social inclusion. The MNEs that are the most innovative and well integrated into global networks are expected to be the most efficient, profitable and engaged in activities with higher added value. The goal is to establish whether these companies are also those that do better in social terms.
B. Nature of data: analysis and sample unit
The nature of the data establishes limits and possibilities for exploration and analysis. Knowing the characteristics of the information gives a clearer picture of its limitations.
The information that will serve as a primary source for this work originated in a survey of a sample of 171 multinational firms in Mexico (out of a total of 922) carried out between late 2008 and early 2009. The survey took place within the framework of a research project developed in COLEF, with the objective of studying the organizational structure, innovation and employment practices of MNEs in Mexico. This project, in turn, closely followed the guidelines established by the Investigation of Transnational Employment Practices: An International Database

Innovation and internationalization of Latin American services
105
(INTREPID)3 —an international network of independent researchers that seeks to consolidate a reliable and relatively homogeneous database that produces comparable high-quality analyses of employment policies and practices of multinational enterprises around the world.
The target population of the research is based on the operational definition adopted by mutual agreement by the INTREPID group participants. According to this definition, the firms considered multinational are those that participate in the economy of at least one other country besides Mexico, and have at least 500 total employees, but a minimum of 100 employees in the country where the survey originates.4
Due to its methodological implications, one additional restriction should be more specifically defined. It derives from the adopted operational definition, according to which the firm is considered as the sole and total analysis unit. This means that all survey questions are addressed to the head of the organization in human resources, not to subordinate or lower-level business units. The notion of firm, in this case, refers to the enterprise’s corporate structure in Mexico. Thus, for example, while a multinational corporation may have several plants or production units within Mexican territory —with intense activity and dependencies on each other, or relatively isolated and disconnected from each other— only the main one would be part of the sample. The information collected would correspond to the conglomerate as a whole and not to each of the separate units that would shape it.
A specification such as this one logically has advantages and disadvantages. The most important advantages —besides ensuring comparability within the INTREPID global database— include: (i) preventing duplication, since the information of each firm is collected only once, ultimately providing more consistent conclusions about the processes and phenomena to be analysed; (ii) allowing the incorporation of Mexican companies, which are often excluded from studies of multinationals (by wrongly considering the latter as only those subject to foreign investment); and (iii) not completely excluding relatively smaller MNEs, as the minimum 500 employees globally and 100 for Mexico is much more inclusive than
3 This network’s participants are researchers from nine countries: Argentina, Australia, Canada, Finland, Ireland, Mexico, Norway, Spain and United Kingdom. Its members meet about once a year to exchange information and outline long-term research strategies based on comparative studies.
4 This means that to be considered multinational, a company must meet both numeric requirements. Although this limits the concept’s field of meaning, it was necessary to standardize operationalization criteria for comparative purposes inside the INTREPID network.
E C L A C / C O L E F
106
sources such as Expansión magazine, which includes only the 500 largest such companies.5
There are three main disadvantages to this specification: (i) smaller multinationals will be missed if they are under the threshold for minimum number of employees at the global or national level; (ii) the difficulties of finding corporations from the many with foreign capital registered in Mexico as seemingly independent and autonomous company names; and (iii) the loss of the significant heterogeneity that exists within many firms, particularly those that have a more complex organization and multiple units.
Identifying corporations —using the conceptual approach and appropriate sample selection criteria— was arduous and rigorous. Several strategies were followed.6 Achieving the stated goal implied involved great efforts and major investment of time. The result was satisfactory, as it provided a robust and reliable database of multinational enterprises.
Nonetheless, there are limitations related to the information that was collected and stored in the database. While attempts were made to ensure a random selection of representative cases, there were difficulties with the response rate of the enterprises, and this gradually modified these initial selections both quantitatively and qualitatively. The reluctance of MNEs to agree to answer the questionnaire was due to three factors: the global economic crisis that started in 2008 and worsened in 2009; growing public insecurity in several states of the Mexican Republic; and the epidemic of the A-H1N1 influenza virus. Another limitation is that not one multinational company from the primary sector could be interviewed, so its representation was missing from the database. It is difficult to determine how these limitations may affect the validity of the conclusions, but it can be presumed that they will somehow diminish their strength and power of generalization.
C. Methodological strategy
In the first exercise to be developed, “the labour and employment conditions or status” will be considered a dependent variable. The behaviour of this variable would be assumed to be subject to the influence of the remaining aspects of the company considered earlier in this paper that, in turn, are
5 Expansión is a biweekly Mexican publication that focuses on economic, financial and business issues. It is owned by Time Warner. It issues an annual special edition of the 500 most important enterprises in Mexico (CNNMéxico, 2014).
6 In an earlier study, published by the Frontera Norte journal, we detailed some of the intricacies of the process followed. (Carrillo and Gomis, 2011).
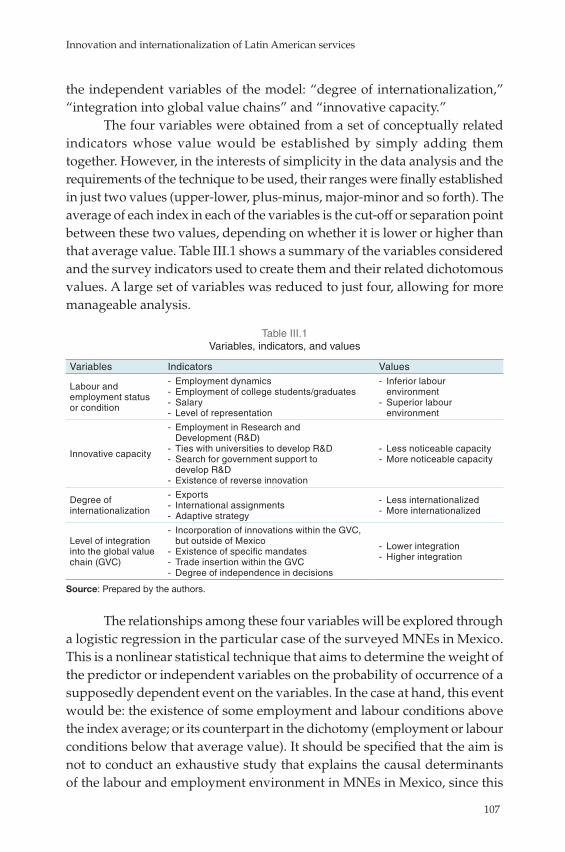
Innovation and internationalization of Latin American services
107
the independent variables of the model: “degree of internationalization,” “integration into global value chains” and “innovative capacity.”
The four variables were obtained from a set of conceptually related indicators whose value would be established by simply adding them together. However, in the interests of simplicity in the data analysis and the requirements of the technique to be used, their ranges were finally established in just two values (upper-lower, plus-minus, major-minor and so forth). The average of each index in each of the variables is the cut-off or separation point between these two values, depending on whether it is lower or higher than that average value. Table III.1 shows a summary of the variables considered and the survey indicators used to create them and their related dichotomous values. A large set of variables was reduced to just four, allowing for more manageable analysis.
Table III.1 Variables, indicators, and values
Variables Indicators Values
Labour and employment status or condition
- Employment dynamics - Employment of college students/graduates - Salary - Level of representation
- Inferior labour environment
- Superior labour environment
Innovative capacity
- Employment in Research and Development (R&D)
- Ties with universities to develop R&D - Search for government support to develop R&D
- Existence of reverse innovation
- Less noticeable capacity - More noticeable capacity
Degree of internationalization
- Exports - International assignments - Adaptive strategy
- Less internationalized - More internationalized
Level of integration into the global value chain (GVC)
- Incorporation of innovations within the GVC, but outside of Mexico
- Existence of specific mandates - Trade insertion within the GVC - Degree of independence in decisions
- Lower integration - Higher integration
Source: Prepared by the authors.
The relationships among these four variables will be explored through a logistic regression in the particular case of the surveyed MNEs in Mexico. This is a nonlinear statistical technique that aims to determine the weight of the predictor or independent variables on the probability of occurrence of a supposedly dependent event on the variables. In the case at hand, this event would be: the existence of some employment and labour conditions above the index average; or its counterpart in the dichotomy (employment or labour conditions below that average value). It should be specified that the aim is not to conduct an exhaustive study that explains the causal determinants of the labour and employment environment in MNEs in Mexico, since this

E C L A C / C O L E F
108
would far exceed the scope of this work. Rather, it is to estimate with greater precision the degree of influence that other factors examined have on the occurrence of the resulting events.
The relationships that are to be explored could also be described through other simpler procedures, such as the analysis of contingency tables. However, although it is more complex, there are two advantages of logistic regression that make it superior to others and thus more suitable for purposes of the research. One is that the analyses are less biased, to the extent that the effect of each variable is isolated and controlled in the process by the remaining variables that are part of the model. This makes the results more reliable. The other advantage is that the odds ratios provide the weight with which each of the variables considered affects the outcome; this allows them to be ranked according to the strength of their effect. Of course, all models are only approximations, as expressed by George Box: “Essentially, all models are wrong, but some are useful” (Box and Draper, 1987).
The comparison between sectors followed a similar path. Likewise, a logistic regression was applied, considering the same independent variables as in the previous model, but with the sector as a dependent variable. The idea is to see how different the manufacturing and services sectors are with regard to this group of factors. Once this point is clarified, one can detect any differences in the employment and labour status.
D. Analyses of results
In accordance with the two objectives presented and the methodological strategy, the empirical results of the data used will be analysed in this section. In order to place these results in context, it is important to state that 67.8% of the 922 MNEs interviewed, belong to the manufacturing sector, while 32.2% belong to the service sector.
1. Employment dynamics: internationalization, integration, and innovation
Table III.2 shows the logistic regression results related to employment status in MNEs in Mexico (shown in SPSS statistical program output format). As this table shows, the “superior employment and labour status” value of the dependent variable was chosen as the reference value. This means that the model compares the probability of the other outcome —”inferior employment and labour status”— in relation to the reference one. It is therefore known as
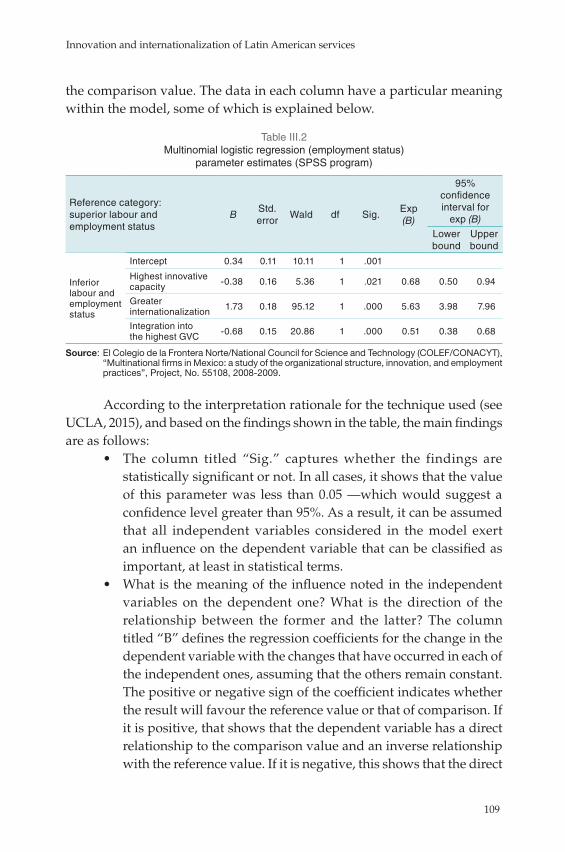
Innovation and internationalization of Latin American services
109
the comparison value. The data in each column have a particular meaning within the model, some of which is explained below.
Table III.2 Multinomial logistic regression (employment status)
parameter estimates (SPSS program)
Reference category: superior labour and employment status
BStd. error
Wald df Sig.Exp (B)
95% confidence interval for
exp (B)
Lower bound
Upper bound
Inferior labour and employment status
Intercept 0.34 0.11 10.11 1 .001
Highest innovative capacity -0.38 0.16 5.36 1 .021 0.68 0.50 0.94
Greater internationalization 1.73 0.18 95.12 1 .000 5.63 3.98 7.96
Integration into the highest GVC -0.68 0.15 20.86 1 .000 0.51 0.38 0.68
Source: El Colegio de la Frontera Norte/National Council for Science and Technology (COLEF/CONACYT), “Multinational firms in Mexico: a study of the organizational structure, innovation, and employment practices”, Project, No. 55108, 2008-2009.
According to the interpretation rationale for the technique used (see UCLA, 2015), and based on the findings shown in the table, the main findings are as follows:
• The column titled “Sig.” captures whether the findings are statistically significant or not. In all cases, it shows that the value of this parameter was less than 0.05 —which would suggest a confidence level greater than 95%. As a result, it can be assumed that all independent variables considered in the model exert an influence on the dependent variable that can be classified as important, at least in statistical terms.
• What is the meaning of the influence noted in the independent variables on the dependent one? What is the direction of the relationship between the former and the latter? The column titled “B” defines the regression coefficients for the change in the dependent variable with the changes that have occurred in each of the independent ones, assuming that the others remain constant. The positive or negative sign of the coefficient indicates whether the result will favour the reference value or that of comparison. If it is positive, that shows that the dependent variable has a direct relationship to the comparison value and an inverse relationship with the reference value. If it is negative, this shows that the direct

E C L A C / C O L E F
110
relationship is with the reference value and the inverse relationship with the comparison value. Since the intercept is positive, the probability that enterprises have inferior labour and employment status is higher than the probability of their having superior labour and employment status. The same applies specifically to the “degree of internationalization” independent variable. In this case, the regression coefficient is also positive, indicating that when the internationalization of the company is greater, its labour and employment status is lower. Exactly the opposite occurs in relation to the “innovative capacity” and “integration into the global value chain” independent variables and the direction of relationship. When the value of the regression coefficient is negative in both cases (when the innovative capacity of the company and the degree of integration into their respective chains are higher), the company is more likely to have a superior labour and employment status.
• What is the strength of each of these relationships? Which variables have a stronger or weaker influence on the outcome? The odds ratios of the coefficients —shown in the column titled “Exp (B)”— help to clarify these questions. If the regression coefficients indicated in which group —comparison or reference— it is more likely to fall, the odds ratios reveal the scope and strength of that probability. Of the three independent variables, the “degree of internationalization” is the one that most powerfully influences the dependent variable. Translating the table results, it is 5.63 times more likely that —as the degree of internationalization of the company increases— working conditions and employment status will worsen rather than improve. While the other two independent variables were also statistically significant, their impact on the result is not as intense as in the case of the previous variable. Given that there is an inverse relationship between them —keeping in mind that B is a negative sign— and based on the odds ratios, as innovative capacity and integration into the global value chain increase, working conditions and employment status in the company are 0.68 and 0.51 times more likely, respectively, to improve rather than worsen.
In summary, the scale and quality of employment, as well as other working conditions, are partly dependent on processes related to innovation, internationalization and integration of enterprises into global value chains. However, while the innovative capacity and the integration processes into the chains favour the improvement of those aspects related to employment,
Innovation and internationalization of Latin American services
111
the strength of their influence is not as intense. Conversely, the weight of internationalization is more noticeable but in the opposite direction, as this factor contributes more to the deterioration of conditions related to employment.
2. The sector in action: manufacturing versus services
As characteristics particular to enterprises, processes of internationalization, integration into value chains and innovative developments continue to be attributed more to manufacturing than to services. This is quite a widespread idea due to the following factors: first, products have usually been the main reference when one thinks about innovation. Product innovation, for example, was the dominant factor in the early stages of the concept of innovation; second, because many services traditionally required direct interaction with the end user, which would demand the presence of the company that provides the services in the consumer market (Álvarez and González, 2009). It has even been suggested that the objective of direct foreign investment in the area of services has historically been the search for markets (UNCTAD, 2004); third, many services are intangible, indivisible and cannot be divided into separate phases. In many cases, this leads to independent subsidiaries aimed at conquering local markets and, therefore, less integrated into international value chains (UNCTAD, 2004). Moreover, as manufacturing technology in certain sectors progressed considerably (such as Fordism and lean production), services had lower levels of technological development. This changed radically with the arrival of the Internet, information technology and telecommunications and the development of semiconductors.
How accurate are these three considerations? It is highly restrictive to see innovation (an economic function described by Schumpeter (1934)) as a result relative only to the product. It is widely accepted that, in addition to the product, innovations can also aim at different business processes (in the form of service companies and legitimate carriers of innovations). Moreover, the most innovative companies are currently service based. Suffice to say that, although Steve Jobs did not invent the telephone, Howard Schultz did not create coffee and Mark Zuckerberg did not found the Internet or online databases, they were able to find new ways to use the phone, serve coffee and use social networks. In other words, “they transformed their markets” (CNNMéxico, 2014).
It is not so simple, however, to neutralize factors related to two other considerations: the alleged barrier to services of becoming international because of the need for face-to-face interaction with the end user, and the
E C L A C / C O L E F
112
alleged indivisibility of service activities. Recent decades have seen rapid internationalization and fragmentation of services led by the extraordinary advances in information technology and communications. However, there remain barriers limiting the global expansion of all or some services.
With the development of new technologies, much content has been digitized to be stored and/or sent anywhere in the world within seconds. Books, songs and movies are examples of these recent innovations. This has two direct consequences. One is that services have been given the ability to be marketable across borders. The other important consequence is that production of many services could be fragmented, thereby giving rise to various forms of outsourcing services internationally. The term “offshoring” that came into vogue a few years ago clearly outlines this phenomenon. In some cases, it presumes outsourcing to be part of the service, such as the diagnosis of a medical examination or review of a book. In others, the full service is international, including customer service through call centres or remote monitoring of facilities through electronic means. The speed and depth with which these changes occurred resulted in some considering this as a revolution in transit (UNCTAD, 2004; Blinder, 2006).
Not all services, however, have the necessary characteristics to participate fully in these processes. Legal services, which require local knowledge of specific codes, are one such example. There may also be technological and idiosyncratic limitations. At least some service MNEs in Mexico should theoretically be prevented from developing internationalization strategies and integrating naturally into international value chains.
This leads to the crux of this section. One would expect manufacturing MNEs operating in Mexico to have more developed processes of internationalization and integration into respective chains than services MNEs. However, is this really the case? How different are the companies that belong to the two sectors in these and other related aspects? Does one or the other truly “produce” different labour and employment conditions?
Another logistic regression was performed to explore these issues. The same independent variables were used as in the previous model, but with the sector as the dependent variable. The intention was to assess how deeply manufacturing MNEs are related to service MNEs. In other words, which of the two sectors is more likely to develop processes of internationalization and integration into productive chains, and which has a higher innovative capacity. Table III.3 shows the results for this new regression. The “services” value of the “activity sector” dependent variable was taken as a category or reference value, while “manufacturing” is the comparison value.

Innovation and internationalization of Latin American services
113
Table III.3 Multinomial logistic regression (activity sector) parameter estimates (SPSS program)
Reference category: activity sector: services
BStd. error
Wald df Sig.Exp (B)
95% confidence interval for
exp (B)
Lower bound
Upper bound
Activity sector: manufacturing
Intercept 0.02 0.11 0.03 1 .087
Highest innovative capacity 0.50 0.18 7.51 1 0.01 1.65 1.15 2.37
Greater internationalization 2.35 0.24 94.00 1 0.00 10.48 6.52 16.85
Integration into the highest GVC 0.19 0.16 1.46 1 0.23 1.21 0.89 1.65
Source: El Colegio de la Frontera Norte/National Council for Science and Technology (COLEF/CONACYT), “Multinational firms in Mexico: a study of the organizational structure, innovation, and employment practices”, Project, No. 55108, 2008-2009.
Following similar analysis patterns, the main ideas can be listed as follows:
• The most obvious idea is given by the intercept. The low value of the regression coefficient (0.02) and the Wald test statistic (0.03), together with a p-value (0.87) much higher than 0.05, indicate that the two sectors are very similar in terms of the variables examined —although not completely homogeneous. There are differences, but they are not extreme.
• Of the independent variables, not all were statistically significant in this model. The p-value of the “degree of integration into the chain” variable is 0.23 (see column titled Sig), a value above 0.5. This rules out the hypothesis that they are statistically and importantly interlinked, so it will no longer be considered in the following points. The other two independent variables, “degree of internationalization” and “innovative capacity”, were significant.
• These two significant variables have a straightforward relationship with the comparison value (manufacturing), since all coefficients are positive (column titled “B”). This means that, if internationalization and innovative capacity were to grow, it is more likely to be within a manufacturing company than a service one.
• The strength of this probability is unequal, being much more intense in the “degree of internationalization” variable than in the “innovative capacity” one. If the first is increased, it is 10.48 times
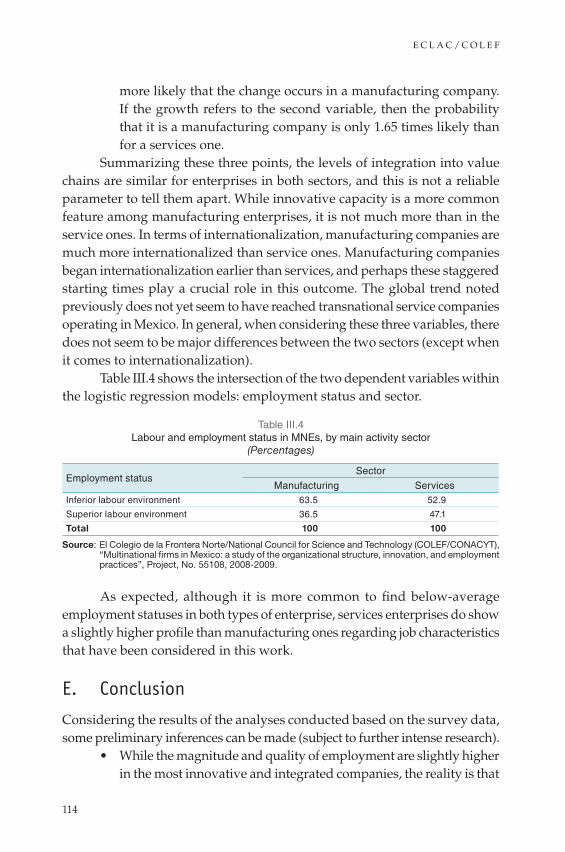
E C L A C / C O L E F
114
more likely that the change occurs in a manufacturing company. If the growth refers to the second variable, then the probability that it is a manufacturing company is only 1.65 times likely than for a services one.
Summarizing these three points, the levels of integration into value chains are similar for enterprises in both sectors, and this is not a reliable parameter to tell them apart. While innovative capacity is a more common feature among manufacturing enterprises, it is not much more than in the service ones. In terms of internationalization, manufacturing companies are much more internationalized than service ones. Manufacturing companies began internationalization earlier than services, and perhaps these staggered starting times play a crucial role in this outcome. The global trend noted previously does not yet seem to have reached transnational service companies operating in Mexico. In general, when considering these three variables, there does not seem to be major differences between the two sectors (except when it comes to internationalization).
Table III.4 shows the intersection of the two dependent variables within the logistic regression models: employment status and sector.
Table III.4 Labour and employment status in MNEs, by main activity sector
(Percentages)
Employment statusSector
Manufacturing ServicesInferior labour environment 63.5 52.9
Superior labour environment 36.5 47.1
Total 100 100
Source: El Colegio de la Frontera Norte/National Council for Science and Technology (COLEF/CONACYT), “Multinational firms in Mexico: a study of the organizational structure, innovation, and employment practices”, Project, No. 55108, 2008-2009.
As expected, although it is more common to find below-average employment statuses in both types of enterprise, services enterprises do show a slightly higher profile than manufacturing ones regarding job characteristics that have been considered in this work.
E. Conclusion
Considering the results of the analyses conducted based on the survey data, some preliminary inferences can be made (subject to further intense research).
• While the magnitude and quality of employment are slightly higher in the most innovative and integrated companies, the reality is that
Innovation and internationalization of Latin American services
115
neither the strength of the innovative capacity nor the degree of consistency of integration into chains seems to have a transcendent effect on the considered dimensions of employment (bearing in mind the low statistical significance of the relationship between these variables).
• This is not the case, however, for the degree of internationalization. This was a particularly influential element, although with an impact that could be considered negative. The job performance tended to be lower among MNEs with higher levels of internationalization.
• Internationalization was the main factor of distinction. In terms of innovative capacity and degree of integration, manufacturing and services do not differ categorically. In terms of degree of internationalization, however, manufacturing MNEs leading service MNEs in this dimension. The degree of internationalization is the key factor in explaining why employment status is slightly higher in service MNEs than in manufacturing MNEs. The word “slightly” should be emphasized because no substantive differences are noted between the sectors regarding the magnitude and quality of employment.
Some of these ideas do not reflect existing general representations regarding the relationships among these variables. When it comes to establishing differences in terms of job characteristics, it does not matter much if the company is more or less innovative, let alone how integrated it is into global value chains. Nor does it seem to matter whether the MNE conducts its economic activity in manufacturing or services. What is most common is that employment status is below average in all these cases. In terms of other ideas, not only do the findings not show any support for the notion that export capacity —and the degree of internationalization— favours employment conditions, but the results contradict this principle.
Are the MNEs located in Mexico so different in these aspects from those operating in other countries? This is the conclusion that —at least to some extent— seems to be suggested by the discrepancies between these results and those in the existing literature. However, such differences are more at the level of conjecture than conclusion. Issues relating to the data and the analysis themselves could be contributing to limiting the scope of the conclusions. Nonetheless, the results are sufficiently suggestive to stimulate debate on the subject and encourage more in-depth research on these same issues in future studies.
E C L A C / C O L E F
116
BibliographyÁlvarez González, J.A. and O. González Morales (2009), La internacionalización de las
empresas de servicios en España: los factores explicativos, Tenerife, Universidad de La Laguna [online] http://www.pe.uma.es/Arethuse/16p.pdf.
Bernard, A.B. and J.B. Jensen (1995), “Exporters, jobs and wages in the U.S. manufacturing: 1976-1987”, Brooking Papers on Economic Activity.
Blinder, Alan S. (2006), “Offshoring: the next industrial revolution?”, Foreign Affairs, vol. 85, No. 2, New York, Council on Foreign Relations, March-April [online] http://www.internationaltraderelations.com/Blinder.Offshoring %20(Foreign%20Affairs,%20March-April%202006).pdf.
Box, George E. P. and Norman R. Draper (1987), Empirical Model-Building and Response Surfaces, Oxford, John Wiley & Sons.
Carrillo Jorge and Redi Gomis (2011), “A study of employment practices in multinational firms in México: a first mapping”, Frontera Norte, vol. 23, No. 46, July-December.
Castellacci, Fluvio (2008), “Technological paradigms, regimes and trajectories: manufacturing and service industries in a new taxonomy of sectoral patterns of innovation”, Research Policy, vol. 37.
Caves, Richard E. (2007), Multinational Enterprise and Economic Analysis, Cambridge, Cambridge University Press.
CNNMéxico (2014), Expansión, March [online] http://www.cnnexpansion.com/rankings/2014/super-empresas-2014.
Dickens, Peter (1998), Global Shift: Transforming the World Economy, London, Paul Chapman Publishing.
Dunning, John H. (1974), Economic Analysis and the Multinational Enterprise, Sydney, Allen &Unwin.
Dunning, John H. and Sarianna M. Lundan (2008), Multinational Enterprises and the Global Economy, Cheltenham, Edward Elgar Publishing.
ECLAC (Economic Commission for Latin America and the Caribbean) (2014), Regional integration: Towards a strategy for inclusive value chain (LC/G.2594 (SES.35/11)), Santiago.
(2013), Foreign Direct Investment in Latin America and the Caribbean, 2012 (LC/G.2571-P), Santiago.
García, A. J. Jaumandreu and C. Rodríguez (2002), Innovation and Jobs: Evidence from Manufacturing Firms, Univesidad Carlos III de Madrid [online] http://www.eco.uc3m.es/IEFF [date of reference: Jun, 2014].
Kosakoff, Bernardo and Andrés López (2008), “América Latina y las cadenas globales de valor: debilidades y potencialidades”, GCG: Revista de Globalización, Competitividad y Gobernabilidad, Georgetown University/Universia, vol. 2, No. 1 [online] http://gcg.universia.net/pdfs_revistas/articulo_78_1206609687202.pdf [date of reference: May, 2014].

Innovation and internationalization of Latin American services
117
Kristensen, Peer H. and Jonathan Zeitlin (2005), Local Players in Global Games: The Strategic Constitution of a Multinational Corporation, Oxford, Oxford University Press.
Laursen, K., F. Masciarelli and A. Prencipe (2012), “Regions matter: how localized social capital affects external knowledge acquisition and innovation”, Organization Science, vol. 23, No.1.
Lee, Keun (2013), Schumpeterian Analysis of Economic Catch-up: Knowledge, Path-Creation, and the Middle-Income-Trap, Cambridge, Cambridge University Press.
Lee, K. and C. Kim (2001), “Technological regimes, catching-up and leapfrogging: findings from the Korean industries”, Research Policy, No. 30.
Lundvall, Bengt-Ake (2004), “The economics of knowledge and learning”, Research on Technological Innovation, Management and Policy, vol. 8, Emerald Group Publishing Limited.
Moran, Theodore H. (2000), Inversión extranjera directa y desarrollo: nueva agenda política para países en vías de desarrollo y economías en transición, Oxford, Oxford University Press.
Nelson, Richard (2008), “What enables rapid economic progress: what are the needed institutions?”, Research Policy, vol. 37, No.1, February.
OECD (Organization for Economic Cooperation and Development) (2011), OECD Benchmark Definition of Foreign Direct Investment - 4th Edition, Paris, OCDE Publishing.
Pérez, T. (2008), “Multinational enterprises and technological spillovers: an evolutionary model“, Multinational Enterprises and Host Economies; vol. 1, Cheltenham, Elgar.
Pianta, Mario (2006), “Innovation and employment”, The Oxford Handbook of Innovation, Jan Fagerberg, David C. Mowery and Richard R. Nelson (eds.), Oxford, Oxford University Press.
Rodrik, D. (2008), “The real exchange rate and economic growth”, Brooking Papers on Economic Activity, No. 2.
Schumpeter, Joseph (1934), The Theory of Economic Development: An Inquiry Into Profits, Capital, Credit, Interest, and the Business Cycle, New Brunswick, Transaction Publishers.
Sklair, Leslie (2001), The Transnational Capitalist Class, Oxford, Wiley-Blackwell Publishing.
Tumini, Lucía (2011), “Empresas exportadoras industriales, dinámica de empleo de calidad e ingresos. Un análisis del caso argentino en el período 1998-2008”, master thesis, Master’s Programme in economy and industrial development with specialization in SMEs, Universidad Nacional de General Sarmiento/Universidad Nacional de Mar del Plata, Buenos Aires [online] http://www.ungs.edu.ar/ms_ungs/wp-content/uploads/2012/09/Tesis_Tumini_Luc%C3%ADa_compl_012012.pdf [date of reference: April, 2014].

E C L A C / C O L E F
118
UCLA (University of California) (2015), Annotated SPSS Output: Multinomial Logistic Regression, Institute for Digital Research and Education [online] http://www.ats.ucla.edu/stat/spss/output/mlogit.htm.
UNCTAD (United Nations Conference on Trade and Development) (2004), World Investment Report, 2004. The Shift towards Services (UNCTAD/WIR/2004), New York.
(1996), Companies without borders: transnational corporations in the 1990s, London, International Thomson Business Press.
Part I I
Innovation and internationalization policies


Chapter IV
Evaluation of public policies on production: the Chilean Global
Services Cluster
Dorotea López Giral Felipe Muñoz Navia
Summary
There is consensus that, in order to achieve development, countries’ production structure should be oriented towards activities that provide more value added and maintain a diversified production matrix (particularly in relation to the export basket). The objectives of economic policy aimed at diversifying and increasing the value of exports, particularly services, provide insight into the role of the State in development, and the significance of building new tools and strategies to streamline the processes of economic orientation. This paper uses a multidisciplinary approach to propose and assess an analytical framework for productive development policies. The case of the Global Services Cluster (GSC) in Chile is used to consider this approach. The first section reviews the discussion on the role of the State in terms of industrial and trade policies. The second section presents a conceptual framework based on the literature and case studies. Following a description of the GSC in Chile, the programme’s failure is analysed using the aforementioned

E C L A C / C O L E F
122
conceptual framework. Finally, some remarks are presented on strategies for diversification and value added for service exports.
Introduction
There is general consensus that, in order to scale the ladder of development, countries should route their economies in a way that implements strategies to add more value and maintain a diversified production matrix (particularly in the export basket). Considering the objectives of economic policy aimed at diversifying and increasing the value of exports (particularly services), a relevant discussion relates to two aspects: the role that the State should play in development, and the importance of building new policy instruments (including trade policy that streamlines the processes of economic orientation).
The nature of public policy, as well as its applications and impact, requires a multidisciplinary approach as any other kind of public policy analysis could lead to biased results. The traditional approach has been to conduct this kind of analysis from a single discipline perspective. This paper presents a conceptual framework for understanding factors in relevant to the success of policies on productive development. The objective is to assess a comprehensive and multidimensional conceptual framework. There must be interdisciplinary dialogue and multidisciplinary analysis of public policy, particularly concerning the promotion of services. In this paper, a literature review of successful cases of industrial policy strategies aimed at diversifying the production and export matrix is used as a basis for six categories within a theoretical approach that is then tested in the cluster policy in Chile.
During the government of President Michelle Bachelet (2006-2010), a programme of clusters was implemented to encourage the country’s production and export development. One of these was the Global Services Cluster (GSC), aimed at turning Chile into an offshoring services exporter. This policy was a turnaround from the traditional market orientation and non-intervention reigning in Chilean economic policy. The change of administration in 2010 to President Sebastián Piñera (2010-2014) ended this policy, returning to economic policy neutrality. This case allows us to study a policy of service export promotion to draw lessons for policy analysis.
The first section reviews the discussion on the role of the State in terms of industrial and trade policies. The second section presents a conceptual framework for the analysis of public policy, with six considerations from the literature and case studies (in the form of development strategies designed to add value and increase diversification). Following the description of the
Innovation and internationalization of Latin American services
123
GSC implemented in Chile, the conceptual framework developed in the second section is used to analyse the programme’s failure. Lastly, the paper concludes with further thoughts on strategies for diversification and value added in service exports.
A. The role of the State in economic development strategies
Discussion surrounding the State’s involvement in the economy through development policies has been constant but never fully conclusive. It seemed to be that the debate on the role of the State is not so much a debate but the case of two paradigms talking without listening to each other (Devlin and Moguillansky, 2010). The question relates to issues such as the scale and type of involvement that the State should have when intervening in markets to promote, encourage or attract new production and trade capacities —or whether the State should have any such role at all.
The recent decade has seen new evidence for the limitations of the neoliberal model, particularly with regard to the resulting socio-productive structures in national economies. This has occurred due to the persistence of high poverty rates and the pervasive effects of social inequality. In contrast, Asian countries like the Republic of Korea and Singapore with State-active models have consolidated their economies and successfully integrated into the world economy during the same period. Both facts have reinforced the arguments in favour of State intervention in development strategies.
Mainstream State theory is built fundamentally on the assertion that markets function inadequately, particularly in developing countries. State intervention is therefore only accepted in the presence of externalities and market failures. Criticism of the neoliberal model has emerged in most disciplines because, despite its theoretical consistency and modelling elegance, in practice it has failed to identify and activate the determinants of economic and social development of a peripheral economy (Katz, 2008). Current heterodox and neo-structuralist literature revolves around the question of whether governments can drive the market towards improved industrial performance more effectively than a free market —even in the absence of a neoclassical market failure.
Space for an intervening State is opening up, especially in developing economies, as there are strategic sectors in which the private sector either does not want to participate due to the risk involved or because it does not have the financial capabilities. It is also assumed that States have a strategic
E C L A C / C O L E F
124
role beyond the assurance of property rights, enforcement of contracts and macroeconomic stability. Some authors described the Economic Commission for Latin America and the Caribbean (ECLAC) as being in a “neo-structuralist” phase in the 1990s, and the Commission promoted cautious reforms aimed at liberalization (which may have positive impacts but only under adequate leadership). That was a recognition of the need for a set of public policies to support development, diversification and the benefits of value added. This same “ECLAC-thinking” was enhanced between 1998 and 2008 with its proposed policy agenda covering the four key analytical areas of ECLAC: macroeconomics and finance, international trade and productive development, social development and environmental sustainability (Bielschowsky, 2009). These proposals promote the need for industrialization policies to overcome underdevelopment and poverty, and to implement stimulus measures and export diversification.
Evidence suggests that those countries that have managed to develop are those that have diversified through State intervention and have become aware that primary or secondary products with low technological intensity do not generate the same employment quality as services (particularly knowledge or professional services) (McMillan and Rodrik, 2011). That is the limitation of development based on primary activities and the never-ending quest for value added. Trade policy alone cannot change production structures defined by low value added and job insecurity.
While crises or challenges to neoliberalism suggest a return of the State, Crouch (2011) suggests that the 2008 crisis has led States to cut government spending even more aggressively. In addition, despite criticisms, neoliberalism has returned to define and minimize State involvement. This leads us to review approaches to development productive policies whose main purpose is to accelerate the process of structural change towards more complex activities (Rodrik, 1993).
One way to consider the role of the State in development strategies is to focus on industrial policies (which are now referred to as productive development policies) (IDB, 2014). These policies have a long history, and many studies have examined their effects on development. There is research by supporters and critics of the public sector’s role in the economy, which means that the evidence is inconclusive.
The literature on modern industrial policy includes many case studies from Asia, as successful countries have gave the State active an active role in overseeing global integration in intensive production structures based on skilled employment (Devlin and Moguillansky, 2010). Although development
Innovation and internationalization of Latin American services
125
in countries like Japan, Republic of Korea and Taiwan (compared with Latin America) shows the limits of trade policy as a guarantee of competitiveness, it does point to the need of a strong boost from the State in terms of innovation and education as driving forces in the economy. In the last few centuries, countries have become rich through a period of development productive policies, particularly by protecting emerging industries before becoming a liberal economy (Bairoch, 1995; Chang, 2003; Reinert, 1999).
The neoclassical school argues that countries like Brazil and Mexico (with intervention but no significant success) prove the need for governments to reduce their size and eliminate many of their market interventions. However, in these countries public influence has been lower than in most successful cases in Asia. The most common criticism of industrial policy is the difficulty that States have in choosing and directing their limited resources. In this regard, Rodrik argues that what matters is not picking winning productive sectors, but the ability to leave the losers alone. Another frequent criticism is that industrial policy has substantial scope for corruption and personal interests. These observations are challenged by findings that most national interventions take the form of trade facilitation, promotion of foreign investment or trade agreements —which are just different names for industrial policy strategies. It is therefore essential for the discussion to focus on the sort of implementation and the design of strategies.
While the importance of policies for economic development is recognized, the theoretical and political discourse has not matched up with the strategies and programmes implemented. The resistance to a stronger role for the State underlying the Chilean neoliberal model will reduce possibilities for action in the economy. The possible advantages or disadvantages of the production matrix form a discussion about the extent to which the State should intervene in economic development. The importance of implementing public policies to support development and diversification differs according to the role of State policy within liberal or neoliberal thinking. The theoretical issue of State neutrality is that it is seen as a problematic practice determined by economic needs and considerations that are not based on the logic of private actors, but rather grounded in the vested interests of public or social agents.
B. Conceptual framework for public policy analysis
Nowadays, governments intervene through policies in various fields including public transport planning, prevention of infectious diseases, provision of
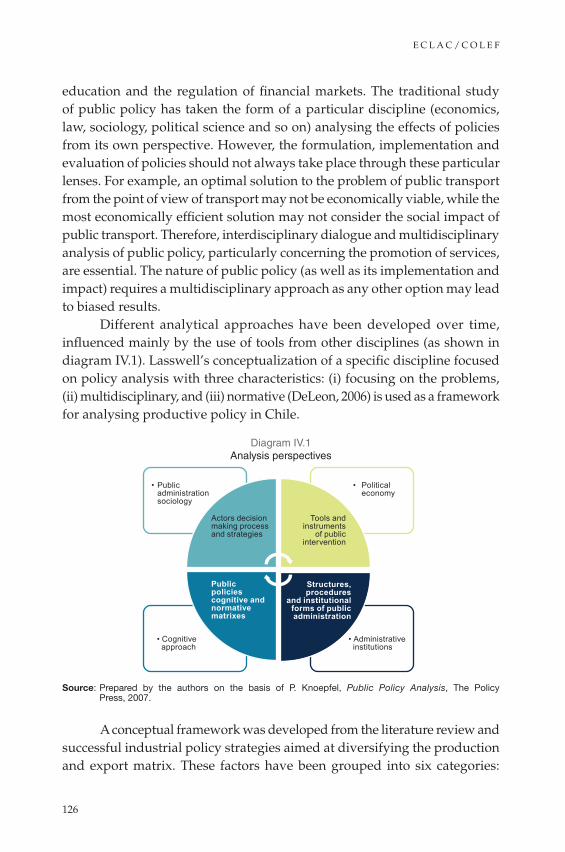
E C L A C / C O L E F
126
education and the regulation of financial markets. The traditional study of public policy has taken the form of a particular discipline (economics, law, sociology, political science and so on) analysing the effects of policies from its own perspective. However, the formulation, implementation and evaluation of policies should not always take place through these particular lenses. For example, an optimal solution to the problem of public transport from the point of view of transport may not be economically viable, while the most economically efficient solution may not consider the social impact of public transport. Therefore, interdisciplinary dialogue and multidisciplinary analysis of public policy, particularly concerning the promotion of services, are essential. The nature of public policy (as well as its implementation and impact) requires a multidisciplinary approach as any other option may lead to biased results.
Different analytical approaches have been developed over time, influenced mainly by the use of tools from other disciplines (as shown in diagram IV.1). Lasswell’s conceptualization of a specific discipline focused on policy analysis with three characteristics: (i) focusing on the problems, (ii) multidisciplinary, and (iii) normative (DeLeon, 2006) is used as a framework for analysing productive policy in Chile.
Diagram IV.1 Analysis perspectives
• Administrative institutions
• Cognitive approach
• Politicaleconomy
•
Actors decisionmaking process and strategies
Structures,procedures
and institutionalforms of publicadministration
Tools andinstruments
of publicintervention
Publicpoliciescognitive andnormativematrixes
Publicadministrationsociology
Source: Prepared by the authors on the basis of P. Knoepfel, Public Policy Analysis, The Policy Press, 2007.
A conceptual framework was developed from the literature review and successful industrial policy strategies aimed at diversifying the production and export matrix. These factors have been grouped into six categories:
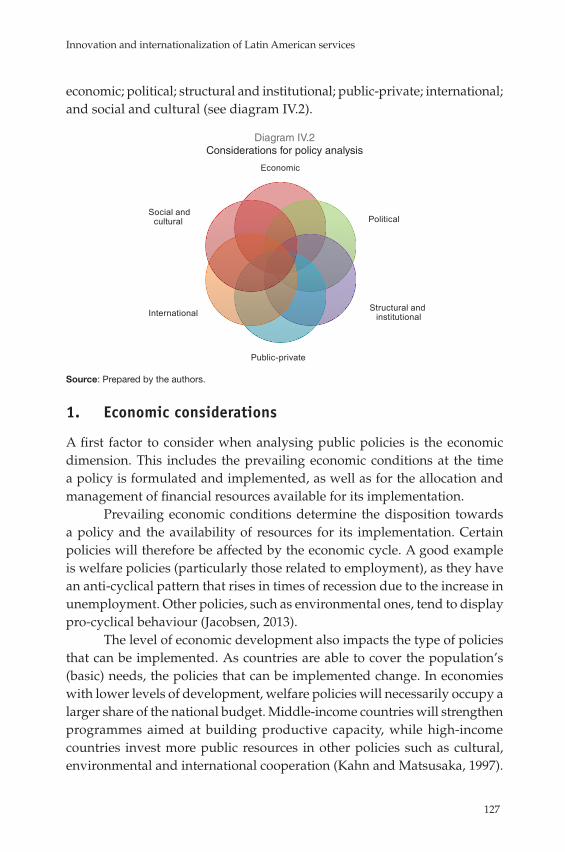
Innovation and internationalization of Latin American services
127
economic; political; structural and institutional; public-private; international; and social and cultural (see diagram IV.2).
Diagram IV.2 Considerations for policy analysis
Economic
Political
Structural and institutional
Public-private
International
Social and cultural
Source: Prepared by the authors.
1. Economic considerations
A first factor to consider when analysing public policies is the economic dimension. This includes the prevailing economic conditions at the time a policy is formulated and implemented, as well as for the allocation and management of financial resources available for its implementation.
Prevailing economic conditions determine the disposition towards a policy and the availability of resources for its implementation. Certain policies will therefore be affected by the economic cycle. A good example is welfare policies (particularly those related to employment), as they have an anti-cyclical pattern that rises in times of recession due to the increase in unemployment. Other policies, such as environmental ones, tend to display pro-cyclical behaviour (Jacobsen, 2013).
The level of economic development also impacts the type of policies that can be implemented. As countries are able to cover the population’s (basic) needs, the policies that can be implemented change. In economies with lower levels of development, welfare policies will necessarily occupy a larger share of the national budget. Middle-income countries will strengthen programmes aimed at building productive capacity, while high-income countries invest more public resources in other policies such as cultural, environmental and international cooperation (Kahn and Matsusaka, 1997).
E C L A C / C O L E F
128
Any analysis of policies, programmes and actions should consider their economic and financial structure. For the successful implementation of a programme, the intended budget should be consistent with the efforts needed to achieve the objectives. However, not only are the disbursements important for a policy, but the flexibility with which these funds can be used for new situations and the sustainability of resources over time are also key to evaluating a policy.
2. Political considerations
As noted by Lahera (2004), excellent public policies consider the political aspect and frame themselves in a participatory process.
Successful programmes depend on political leadership at the highest level, and a coordinating body to design, implement and monitor industrial policies (Rodrik, 2004). This type of leadership is essential for avoiding policy volatility as a result of governments’ changing political platforms and the resulting vulnerability to political cycles (Devlin and Moguillansky, 2010). It is vital for leadership to be comprised of specialized authorities in charge of sectors and activities.
National strategies and their components must overlap with sub-national strategies, including various degrees of linkages (Devlin and Moguillansky, 2010). With regard to the political and technical aspects, coordination is clearly desirable. Clear and consistent public policy formulation, high technical and political quality with maximum political support should ensure the most efficient and effective management. The political environment that makes up parties, social groups and individuals should be internalized in relation to public policy analysis (Lahera, 2004).
3. Structural and institutional considerations
These considerations are closely linked, as institutional aspects are related to the structure used in formulating and implementing industrial policies. The implementation period will be critical in the success of a diversification and value added policy. The foundation of the policy should be comprehensive (so that it is part of a larger goal) (Lahera, 2004).
Industrial policy strategies must be considered and designed as medium- and long-term strategies, so they should therefore be flexible and dynamic over time to be able to respond to changing internal and external conditions by gathering feedback and replacing strategies as new scenarios arise (Devlin and Moguillansky, 2010). When possible sub-sectors and companies
Innovation and internationalization of Latin American services
129
are identified to implement policies, their size, potential and market share should be considered.
These policies should develop mechanisms for transparency and ongoing evaluation. Governments need to know whether they want a neutral or sectoral approach (Rodrik, 2004), and they need to be supported by fiscal policies that create space for proactive public policy (Devlin and Moguillansky, 2010; Reinert, 1999; Rodrik, 2004).
The economic literature agrees that institutions are key elements in growth (Calderón and Fuentes, 2005) with a particular need for strong institutions as trade liberalization processes benefit the economy (Bolaky and Freund, 2004). Acemoglu and Robinson (2012) claimed that the type, design, quality and performance of institutions are all key.
The definitions of institutions include political, financial, government and judicial institutions (as well as the institutional and organizational structures of a country). It is clear, however, that it is difficult to identify appropriate institutional requirements to ensure the effectiveness of development assistance (Rodrik and Subramanian, 2003).
Coase (1937) incorporates transaction costs, which allow modifications in the neoclassical frameworks by rejecting the assumptions that individuals have perfect information and unlimited rationality, and that transactions are free and immediate.
The purpose of institutions is to reduce these transaction costs in the economy, which can be defined as “the costs of measuring what is being exchanged and enforcing agreements. In the larger context of societal evolution they are all the costs involved in human interaction over time” (North, 1990). The mandatory implementation of rules and contracts is essential for the proper functioning of markets. Institutions that are not respected by society as a whole will perform poorly in reducing transaction costs. It is therefore essential to have mechanisms to ensure compliance and enforcement of the various formal and informal institutions.
A major advance in the study of the institutional conditions for an efficient use of trade liberalization may be found in Rodrik (2000), who identifies five “non-economic” institutions without which the markets would not work properly: property rights, regulatory institutions, institutions for macroeconomic stabilization, social security institutions and institutions for conflict management.
Some of the key elements identified in the implementation of diversification and aggregation strategies can be understood as the need for associated institutions associated to have the following characteristics:
E C L A C / C O L E F
130
• Organization: for some authors, the State’s failed role in economic development is closely associated with institutional weaknesses —particularly those of political institutions (Rodrik, 2003). There must be a degree of synchronization between the institutions and government policies. The actions of firms depend not only on “market forces” sensu lato, but also on political and institutional facts that are often unrelated to strictly “market” issues (Katz, 2008).
• Coordination and implementation team: the number of organizations involved should strike an appropriate balance between autonomy and involvement of public servants —which seems to be more important than the instruments themselves (Rodrik, 1993). Internal coordination, particularly with regard to non-duplication of tasks, must ensure that efforts are combined.
• Adaptability: it is important to understand how and when institutional diversity is accommodated within national economies, as national institutions determine the application of science and technology (Crouch, 2011). This characteristic also allows institutions to respond to changing external and domestic dynamics.
• Laws, norms and regulations: at the national and international levels, there needs to be an element of regulatory coherence and flexibility in legislation to strengthen and implement processes.
4. Public-private considerations
State action cannot be fully understood without considering the context of cooperation with the private sector. As in classic relationship building, development strategies are designed and produced from a joint effort with private actors. In that sense, we are not faced with an entrepreneurial or subsidiary State, but an engaging one.
Public-private partnerships link a private sector that provides valuable market information and identifies certain market failures related to information, coordination, technologies, capabilities, among others with a public sector that suffers from failures and incomplete information, but can encourage and lead a national long-term strategic vision and provide coordination support, access to information, skills, incentives and so forth (Devlin and Moguillansky, 2010). In other words, this relationship strengthens mutual learning, knowledge sharing and collaboration for social development.
Innovation and internationalization of Latin American services
131
Other questions arise over the interaction dynamics between the State and business. The first question concerns those systems of public and private action that were established and their results. The second question relates to how private actors perceive these partnerships with the State, as well as how the State perceives its own potential for intervention. Under certain conditions, public-private partnerships are central to the success of modern strategies, particularly those relating to the diversification of production (Hoekman & Matoo, 2008; Haussmann, 2011; Prieto, 2004).
Owing to the difference between social and private benefits, cost considerations must be taken into account by both sectors with the appropriate timing (Rodrik, 2009). Similarly, governments and private companies can work together but regulation is essential, because markets cannot self-regulate. The interplay between the State and the private sector should not converge to co-opt one to achieve the other (Chang, 2002).
For Cañeque (2007), public-private partnerships combining strategic objectives of public administration with specific interests of private companies have been a key factor in global economic growth.
5. International considerations
In the case of economic policies, particularly those related to the promotion of exports, the international context in which they are formulated and implemented becomes critical. International agreements provide frameworks for economies to operate and make adjustments.
WTO, regional, pluri- or bilateral agreements limit the scope of States. Countries with large international commitments should discuss building their strategies with that in mind. It is the depth of the commitments made, rather than the number of agreements, that will have an impact on policy development. Furthermore, preferential market access may strengthen policies related to export development. It is also necessary for internationalization policies to consider whether there is a favourable international environment for development. Support for and interaction with international organizations that directly impact the sector are also vital.
6. Social and cultural considerations
Experience shows the successful formulation and implementation of public policies require data on the society as a whole (or the part to be transformed) in terms of cultural, social, economic religious, political and institutional patterns.
E C L A C / C O L E F
132
Devising, implementing and assessing policies must all involve society. For Rodrik (2004), industrial policy is a “mental state” in which the internal coordination of society is essential (rather than a list of measures).
A well-ordered society has social arrangements based on an agreement that everyone would adopt given the opportunity. This was described by Rawls (Lahera, 2004). At the civil society level, individuals cannot be expected to form large voluntary associations to promote issues of public interest unless the conditions are right. Actors should know the policy context, and those directly involved should participate in its design and implementation.
The social and cultural setting in which policies develop should not be seen separately from policy analysis, since the success of a policy is largely dependent on its ability to adapt to prevailing conditions.
Education becomes a critical factor. Successful countries implementing such policies have simultaneously strengthened primary, secondary and higher education (Devlin and Moguillansky, 2010). Raising educational coverage should not be the only objective. The quality and type of education must also be considered. Today, it is essential to expand digital literacy and provide equal access to education and the Internet, to avoid any skewing or inhibition of social discussion. Also, the media have emerged as a fundamental policy space in which citizens’ opinions and decisions are formed (Lahera, 2004).
C. The Chilean Global Services Cluster
For the purposes of this paper, the State policy evaluated is the National Clusters Programme implemented in Chile between 2007 and 2010 —particularly the Global Services Cluster. Cluster policy arose in response to the need to improve the quality of Chile’s integration into the global economy and its ability to progress on the international stage. Diversifying exports was therefore prioritized as a government strategy, with the development of a non-traditional export-based industry using on highly rated human resources (the global services industry).
Global services, also known as offshoring, represent a new model of outsourcing and reallocation of business processes, services, information technology and research and development in a constant state of flux and expansion. Chile was identified as a prominent location for the operation
Innovation and internationalization of Latin American services
133
of global centres, mainly as a result of the advantages that its geographical location provides with the main consumer market —United States— due to its proximity and time zones as potential factors for competitiveness with major service providers (including India and Ireland). The global services industry is not only a highly dynamic sector of the Chilean economy, its development is also a prerequisite for foreign investment, transfer of new technologies and applications, introduction of new business models and increased competitiveness in global markets (Castillo, 2008).
The challenge of implementing of a global services cluster was to strengthen Chile’s position as an attractive and competitive location for offshoring to take advantage of the new trends in economic globalization based on the application of information technology, the internationalization of labour markets and new business models. Scaling up service exports from Chile to the world and upgrading professional skills and infrastructure for the installation of world-class services facilities in the country were just some of the goals that the public, private and academic sector had to work towards under the mandate of the national policy of clusters, to promote the development of the country. For a better understanding of the global services cluster and its analysis, it is important to identify the milestones that marked its operation from creation to the end of the selective competitiveness policy.
In 2006, at the beginning of Michelle Bachelet’s presidency, the National Council for Competitiveness Innovation (CNIC) defined a national innovation strategy for competitiveness to double GDP per capita by 2020. Based on the above and the recommendations from the Boston Consulting Group’s 2007 based on its “Study on Competitiveness Clusters of the Chilean Economy”, five clusters were defined with sectors having greater medium- and long-term growth potential: food, mining, specialist tourism, aquaculture and global services (offshoring).
In late 2007, the Clusters were set up through Strategic Councils, Executive Secretaries and specific agendas. In order to coordinate all public agencies and establish responsibilities for carrying out the new innovation for competitiveness strategy, the government established the Ministers Innovation Committee, which gave the Chilean Economic Development Agency (CORFO) the mandate to implement the Clusters Programme through methodological, financial and operational support to the Executive Secretaries of the public-private Clusters Strategic Councils.
E C L A C / C O L E F
134
The Global Services Public-Private Strategic Council was established in November 2007. Nevertheless, the mixed collaboration on the development of this industry dates back to the launching of CORFO’s Technology Investment Attraction programme (2000) and the public-private missions to Silicon Valley, India and New York organized by the Innovation Forum (2006 and 2007). This Council was chaired by the Executive Vice-President of CORFO and included representatives from business, trade associations, higher education institutions and the public sector. The functions defined for the Strategic Council were:
• Validate the action guidelines of the cluster’s strategic agenda• Articulate, coordinate and strengthen the cluster’s public-private
environment and institutional conditions• Serve as permanent communication channel with the cluster’s sector• Guide the cluster’s Executive Secretariat’s actions for the implementation
of the strategic agenda and programme monitoringThe strategic agenda of the GSC was based on the action guidelines
based on the gaps identified in the study of the Boston Consulting Group (BCG, 2007):
• To address the low number of professionals trained to provide offshoring services and their technical capabilities and linguistic deficit, it proposed an action line focused on the development of human capital
• To change the negative perception of Chile and make it an attractive destination for non-offshore suppliers’ customers
• To maximize the positive effects of agglomeration in the cluster • To overcome the problems faced by transnational corporations
based in Chile• To boost local firms’ production capacity for international markets• To compensate for the absence of specific clustering of the
offshoring sector, it developed a clustering action plan• To align regulatory and legal frameworks to help the sector
development, such as acknowledging difficulties in service exports, the negative impact of the tax framework on enterprise development and the lack of effective protection mechanisms for the information and intellectual property of services providers
During the implementation of the National Clusters Programme, activities were developed through the promotion of collaborative work

Innovation and internationalization of Latin American services
135
between agglomerate actors based on working groups for each action line (see diagram IV.3).
Diagram IV.3 Global services cluster workgroups
• PUC (Group leader)• MINEDUC• ACTI• Synopsis• Evalueserve• CORFO• INACAP
• Innovation Forum (Group leader)• ProChile• ACTI• Evalueserve• Synopsis• Oracle• Amcham• CORFO
• ACTI (Group leader)• Teleperformance• CORFO• Economics Ministry• ProChile
• Economics Ministry• Amcham• Innovation Forum• CORFO• ACTI
Human capital
Infraestructureand regulation
Local industrydevelopment
Internationalmarketing
Source: Prepared by the authors on the basis of M. Castillo, “La industria global de servicios: oportunidades para Chile”, Globalización económica: oportunidades y desafíos para Chile, vol. 21, 2008; Chilean Economic Development Agency (CORFO), Informe para la Comisión Especial Mixta de Presupuestos, Santiago, Subdivision of Agencies and Clusters Programme, 2012; “Cluster de Servicios Globales (Offshoring) El nacimiento de una nueva industria”, Santiago, Executive Secretary, Global Services Cluster, 2010.
The goals from the industry diagnosis made by the BCG in 2007 and validated by the Cluster Strategic Council were to achieve at least US$ 1 billion in service exports by 2010 and generate at least 35,000 new jobs for new companies based in Chile. With that in mind, a Strategic Agenda was drawn up in each of the fields of the cluster. Table IV.1 lists the main actions.
Between 2008 and 2009 —the peak years of the cluster (table IV.2)— a total of US$ 14,290,256 was invested to develop the initiatives (CORFO, 2010), Chile took the lead in Latin America as one of the emerging locations for outsourcing and became an important reference for offshoring issues, as shown by studies carried out by international consultants: AT Kearney Global Services, Global Services, Black Book of Outsourcing, KPMG and Gartner.
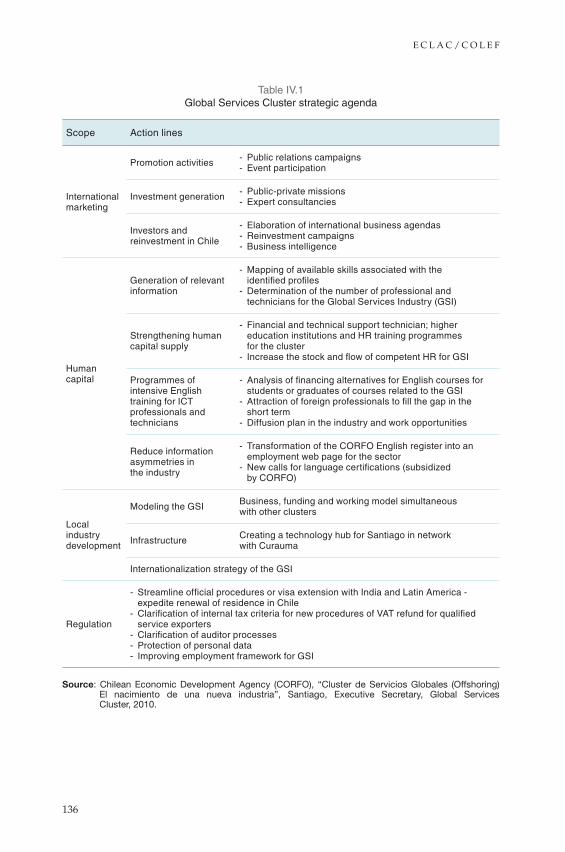
E C L A C / C O L E F
136
Table IV.1 Global Services Cluster strategic agenda
Scope Action lines
International marketing
Promotion activities - Public relations campaigns - Event participation
Investment generation - Public-private missions - Expert consultancies
Investors and reinvestment in Chile
- Elaboration of international business agendas - Reinvestment campaigns - Business intelligence
Human capital
Generation of relevant information
- Mapping of available skills associated with the identified profiles
- Determination of the number of professional and technicians for the Global Services Industry (GSI)
Strengthening human capital supply
- Financial and technical support technician; higher education institutions and HR training programmes for the cluster
- Increase the stock and flow of competent HR for GSI
Programmes of intensive English training for ICT professionals and technicians
- Analysis of financing alternatives for English courses for students or graduates of courses related to the GSI
- Attraction of foreign professionals to fill the gap in the short term
- Diffusion plan in the industry and work opportunities
Reduce information asymmetries in the industry
- Transformation of the CORFO English register into an employment web page for the sector
- New calls for language certifications (subsidized by CORFO)
Local industry development
Modeling the GSI Business, funding and working model simultaneous with other clusters
Infrastructure Creating a technology hub for Santiago in network with Curauma
Internationalization strategy of the GSI
Regulation
- Streamline official procedures or visa extension with India and Latin America - expedite renewal of residence in Chile
- Clarification of internal tax criteria for new procedures of VAT refund for qualified service exporters
- Clarification of auditor processes - Protection of personal data - Improving employment framework for GSI
Source: Chilean Economic Development Agency (CORFO), “Cluster de Servicios Globales (Offshoring) El nacimiento de una nueva industria”, Santiago, Executive Secretary, Global Services Cluster, 2010.
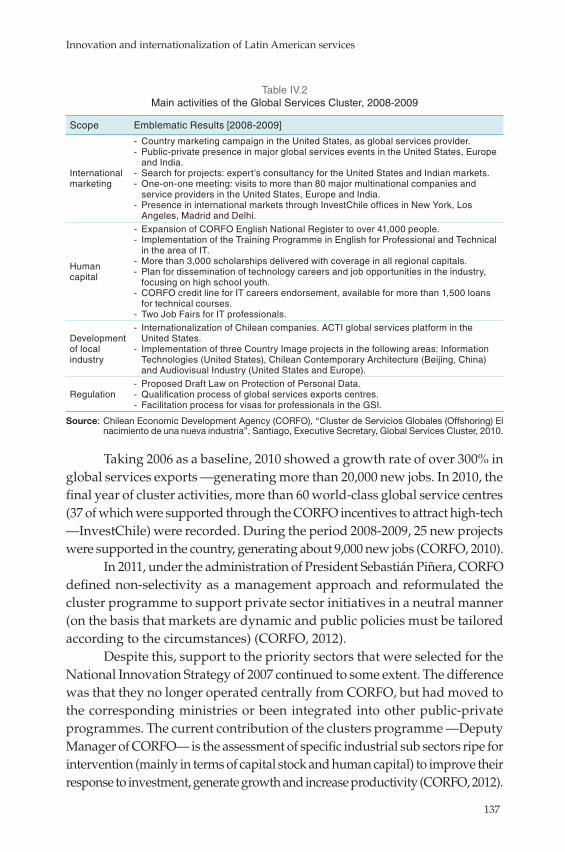
Innovation and internationalization of Latin American services
137
Table IV.2 Main activities of the Global Services Cluster, 2008-2009
Scope Emblematic Results [2008-2009]
International marketing
- Country marketing campaign in the United States, as global services provider. - Public-private presence in major global services events in the United States, Europe and India.
- Search for projects: expert’s consultancy for the United States and Indian markets. - One-on-one meeting: visits to more than 80 major multinational companies and service providers in the United States, Europe and India.
- Presence in international markets through InvestChile offices in New York, Los Angeles, Madrid and Delhi.
Human capital
- Expansion of CORFO English National Register to over 41,000 people. - Implementation of the Training Programme in English for Professional and Technical in the area of IT.
- More than 3,000 scholarships delivered with coverage in all regional capitals. - Plan for dissemination of technology careers and job opportunities in the industry, focusing on high school youth.
- CORFO credit line for IT careers endorsement, available for more than 1,500 loans for technical courses.
- Two Job Fairs for IT professionals.
Development of local industry
- Internationalization of Chilean companies. ACTI global services platform in the United States.
- Implementation of three Country Image projects in the following areas: Information Technologies (United States), Chilean Contemporary Architecture (Beijing, China) and Audiovisual Industry (United States and Europe).
Regulation - Proposed Draft Law on Protection of Personal Data. - Qualification process of global services exports centres. - Facilitation process for visas for professionals in the GSI.
Source: Chilean Economic Development Agency (CORFO), “Cluster de Servicios Globales (Offshoring) El nacimiento de una nueva industria”, Santiago, Executive Secretary, Global Services Cluster, 2010.
Taking 2006 as a baseline, 2010 showed a growth rate of over 300% in global services exports —generating more than 20,000 new jobs. In 2010, the final year of cluster activities, more than 60 world-class global service centres (37 of which were supported through the CORFO incentives to attract high-tech —InvestChile) were recorded. During the period 2008-2009, 25 new projects were supported in the country, generating about 9,000 new jobs (CORFO, 2010).
In 2011, under the administration of President Sebastián Piñera, CORFO defined non-selectivity as a management approach and reformulated the cluster programme to support private sector initiatives in a neutral manner (on the basis that markets are dynamic and public policies must be tailored according to the circumstances) (CORFO, 2012).
Despite this, support to the priority sectors that were selected for the National Innovation Strategy of 2007 continued to some extent. The difference was that they no longer operated centrally from CORFO, but had moved to the corresponding ministries or been integrated into other public-private programmes. The current contribution of the clusters programme —Deputy Manager of CORFO— is the assessment of specific industrial sub sectors ripe for intervention (mainly in terms of capital stock and human capital) to improve their response to investment, generate growth and increase productivity (CORFO, 2012).

E C L A C / C O L E F
138
D. Analysis of the global services cluster
Although the global services industry represented one of the clusters with the highest growth potential (according to CNIC), the targets set were consistent with the trend of the international technology services market, the export of global services quadrupled in the first year of activity of the cluster (CORFO, 2010) and new challenges in the short and medium term were identified, the clusters strategy was ultimately discontinued when the government of Sebastián Piñera switched back to a development model based on non-selectivity. Using the conceptual framework developed above, it is now possible to analyse the reasons that led to the end of the GSC.
1. Economic considerations
The first analysis in the GSC economic considerations is to review the structure of its budget. It should first be noted that there was a budget for the clusters programme in general, which was intended to finance staff programme administration, as well as the inputs required to support the measures being implemented. This budget tripled during three years of the programme as part of the implementation process and in response to the need for more and better qualified staff (see table IV.3). The budget came from recently established mining royalties, thus ensuring the sustainability of resources.
Table IV.3 Budget clusters programme
(Chilean pesos)
2008 2009 2010
Budget Executed Budget Executed Budget ExecutedGoods and services
4 541 677(US$ 8 704)
4 534 941(US$ 8 691)
120 114 968(US$ 214 617)
118 188 173(US$ 211 174)
83 601 000(US$ 163 708)
49 531 726(US$ 97 048)
Staff81 181 157
(US$ 155 582)78 402 422
(US$ 150 256)207 803 000
(US$ 371 295)197 834 238
(US$ 353 483)319 874 000
(US$ 626 736)236 568 817
(US$ 459 596)
Source: Prepared by the authors on the basis of information from the Chilean Economic Development Agency (CORFO).
Regarding the specific GSC budget, it averaged US$ 100,000 with a strong swing in its three years of operation. This was attributable to the gradual implementation, initial exploration of projects and concrete actions towards the end. The amounts allocated were not large, but the documentation stated that the sums would grow as new actions and projects were implemented (table IV.4).
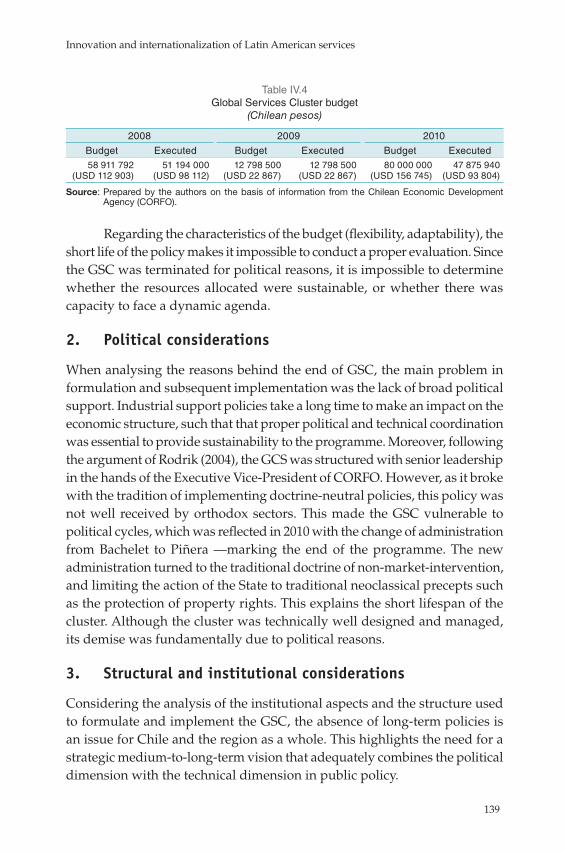
Innovation and internationalization of Latin American services
139
Table IV.4 Global Services Cluster budget
(Chilean pesos)
2008 2009 2010
Budget Executed Budget Executed Budget Executed58 911 792
(USD 112 903)51 194 000
(USD 98 112)12 798 500
(USD 22 867)12 798 500
(USD 22 867)80 000 000
(USD 156 745)47 875 940
(USD 93 804)
Source: Prepared by the authors on the basis of information from the Chilean Economic Development Agency (CORFO).
Regarding the characteristics of the budget (flexibility, adaptability), the short life of the policy makes it impossible to conduct a proper evaluation. Since the GSC was terminated for political reasons, it is impossible to determine whether the resources allocated were sustainable, or whether there was capacity to face a dynamic agenda.
2. Political considerations
When analysing the reasons behind the end of GSC, the main problem in formulation and subsequent implementation was the lack of broad political support. Industrial support policies take a long time to make an impact on the economic structure, such that that proper political and technical coordination was essential to provide sustainability to the programme. Moreover, following the argument of Rodrik (2004), the GCS was structured with senior leadership in the hands of the Executive Vice-President of CORFO. However, as it broke with the tradition of implementing doctrine-neutral policies, this policy was not well received by orthodox sectors. This made the GSC vulnerable to political cycles, which was reflected in 2010 with the change of administration from Bachelet to Piñera —marking the end of the programme. The new administration turned to the traditional doctrine of non-market-intervention, and limiting the action of the State to traditional neoclassical precepts such as the protection of property rights. This explains the short lifespan of the cluster. Although the cluster was technically well designed and managed, its demise was fundamentally due to political reasons.
3. Structural and institutional considerations
Considering the analysis of the institutional aspects and the structure used to formulate and implement the GSC, the absence of long-term policies is an issue for Chile and the region as a whole. This highlights the need for a strategic medium-to-long-term vision that adequately combines the political dimension with the technical dimension in public policy.
E C L A C / C O L E F
140
Chile has succeeded in establishing an environment conducive to the development and use of an institutional framework for trade openness. While the national development strategy should not intervene in markets, this does not mean that the State is absent. Following Rodrik (2000), various governments have sought to strengthen the “non-economic” factors necessary for the proper functioning of markets institutions. Laws and regulations are therefore respected, and the country has a relatively efficient public system compared with other developing countries.
At the institutional level, many agencies were involved in implementation but not at the design stage. This skewed the necessary balance between the expertise of the agencies involved and the coordination required to achieve the objectives.
The GSC was conceived as a long-term public policy, since the achievement of its main objectives was not possible in the short term (due to technical aspects of politics). However, implementing long-term public policies in democracies requires a broad political agreement that was lacking in this instance (see political considerations).
4. Public-private considerations
The public-private coalition that was formed to shape the cluster was successful in terms of establishing a common vision and defining ambitious goals to develop the sector, such that the cooperation dynamics between stakeholders and the cluster leadership led to strategic partnerships and the mobilization of resources for a high-impact action plan. Overlaps between sectors were at an early stage.
5. International considerations
There was a favourable development within the cluster, which boosted domestic industry through increased demand for services and preferential access to major markets as a result of preferential trade liberalization. While it is often noted that such a policy would limit other policy options, it was appropriate for achieving the objectives of the cluster and allowing the implementation of policies and programmes necessary for its success.
6. Social and cultural considerations
The incorporation of Chile into the international scene and its long history in discussing integration issues promoted a consideration of social and cultural

Innovation and internationalization of Latin American services
141
issues. In the light of deficiencies, a plan to improve English language and information technology skills was implemented, as well as strategies for social involvement and the advancement of digital infrastructure with the Ministry of Economy.
E. Conclusions
A conceptual framework is useful for an overall understanding of productive development policies aimed at diversifying national productive and export matrices. This structure is still under construction and, despite the GSC ending due to change of government, it has proved useful to understand the process.
The cluster policy and the GCS were technically well designed but had weaknesses in the general sense. The structure, financing, operation and involvement of the private sector and academia were relevant and appropriate, while international and domestic conditions facilitated achievement of the objectives. However, there was no overall political design. The traditional view of economic policy in Chile is that strategy should be neutral rather than about picking winning sectors. This spelled failure for the cluster. The new government put an end to the policy based on a political rather than a technical evaluation of its objectives and results.
The Chilean experience in the promotion of service exports provides several lessons for public policy. First, it highlights the relevance of industrial policy in the design of economic policy. According to Hausmann (2012), countries that have managed to maintain growth and development are not necessarily those in which the State has been active through direct investment in the productive system, but those that have knowingly operated the entire system to support the efficient operation of complex activities and the right conditions for industrial development. In Chile, horizontal policy (particularly trade in services) has meant that the State has failed to intervene and fulfill its responsibilities to promote competitiveness.
Policies should be formulated on the basis of factors that influence the success of a programme. This includes traditional aspects such as policy structure or financing, as well as interaction with different actors involved and their degree of participation and political and international considerations (which reflect the conditions that may affect the implementation process). This is the only way to formulate and implement policies that meet requirements and that have a minimum guarantee of success.

E C L A C / C O L E F
142
BibliographyAcemoglu, D. and J. Robinson (2012), Why Nations Fail: the Origins of Power,
Crown Business.
Bairoch, P. (1995), Economics and World History: Myths and Paradoxes, University of Chicago Press.
BCG (Boston Consulting Group) (2007), Estudios de competitividad en clusters de la economía chilena. Informe final 31 de 2007, Santiago, October.
Bielschowsky, R. (2009), “Sixty years of ECLAC: structuralism and neo-structuralism”, CEPAL Review, No. 97 (LC/G.2400-P), Santiago, Economic Commission for Latin America and the Caribbean (ECLAC), April.
Bolaky, B. and C. L. Freund (2004), Trade, Regulations, and Growth, vol. 3255, World Bank Publications.
Calderón, C. and R. Fuentes (2005), “Cuánto explican las reformas y la calidad de las instituciones el crecimiento chileno? Una comparación internacional”, Documento de Trabajo, No. 314. Central Bank of Chile.
Cañeque, F. C. (2007), “Alianzas público-privadas para el desarrollo”, Documentos de Trabajo Fundación Carolina, vol. 9, No. 1.
Castillo, M. (2008), “La industria global de servicios: oportunidades para Chile”, Globalización económica: oportunidades y desafíos para Chile, vol. 21.
Chang, H.J. (2003), Rethinking Development Economics, Anthem Press.
(2002), Kicking Away the Ladder: Development Strategy in Historical Perspective, Anthem Press.
Coase, R. H. (1937), “The nature of the firm”, Economica, vol. 4, No. 16.
CORFO (Chilean Economic Development Agency) (2012), Informe para la Comisión Especial Mixta de Presupuestos, Santiago, Subdivision of Agencies and Clusters Programme.
(2010), “Cluster de Servicios Globales (Offshoring) El nacimiento de una nueva industria”, Santiago, Executive Secretary, Global Services Cluster.Crouch, C. (2011), The Strange Non-Death of Neo-Liberalism, Polity.
DeLeon, P. (2006), “The historical roots of the field”, The Oxford Handbook of Public Policy, Oxford.
Devlin, Robert and Graciela Moguillansky (2010), Alianzas público-privadas para una nueva visión estratégica del desarrollo, ECLAC Books, No. 108 (LC/G.2426-P), Santiago, Economic Commission for Latin America and the Caribbean (ECLAC).
Hausmann, R. (2012), “El Estado chileno renunció a cumplir sus funciones”, El Mercurio, Santiago, 31 de enero.
Hoekman, B. and Mattoo, A. (2008). Services trade and growth. World Bank Policy Research Working Paper Series.
IDB (Inter-American Development Bank) (2014), ¿Cómo repensar el desarrollo productivo? Políticas e instituciones sólidas para la transformación económica, Manuel Agosin and others, Washington, D.C.

Innovation and internationalization of Latin American services
143
Jacobsen, G. D. (2013), “Do economic conditions influence environmental policy? Evidence from the US Senate”, Economics Letters, vol. 120, No. 2.
Kahn, M. E. and J.G. Matsusaka (1997), “Demand for environmental goods: evidence from voting patterns on California initiatives”, Journal of Law and Economics, vol. 40, No. 1.
Katz, J. (2008), “Una nueva visita a la teoría del desarrollo económico”, Project Documents, No. 167 (LC/W.167), Santiago, Economic Commission for Latin America and the Caribbean (ECLAC).
Knoepfel, P. (2007), Public Policy Analysis, The Policy Press.
Lahera, E. (2004), “Política y políticas públicas”, Políticas sociales series, No. 95 (LC/L.2176-P), Santiago, Economic Commission for Latin America and the Caribbean (ECLAC).
McMillan, M. S. and D. Rodrik (2011), “Globalization, structural change and productivity growth”, NBER Working Paper, No. 17143.
North, D.C. (1990), Institutions, Institutional Change and Economic Performance, Cambridge University Press.
Prieto, F. (2004). Fomento y diversificación de las exportaciones de servicios: United Nations Publications.
Reinert, E. S. (1999), “The role of the State in economic growth”, Journal of Economic Studies, vol. 26, No. 4/5.
Rodrik, D. (2009), “Growth after the crisis”, CEPR Discussion Paper, No. DP7480, Centre for Economic Policy Research (CEPR).
(2004), “Industrial Policy for the Twenty-First Century” [online] https://www.sss.ias.edu/files/pdfs/Rodrik/Research/industrial-policy-twenty-first-century.pdf.
(2003), “Institutions, integration, and geography: In search of the deep determinants of economic growth”, In Search of Prosperity: Analytic Country Studies on Growth, Princeton, Princeton University Press.
(2000), “Trade Policy Reform as Institutional Reform”, Inter-American Development Bank (IDB).
(1993), “Taking trade policy seriously: export subsidization as a case study in policy effectiveness”, NBER Working Paper, No. 4567.
Rodrik, D. and A. Subramanian (2003), “The primacy of institutions”, Finance and Development, vol. 40, No. 2.

Chapter V
Innovation in services and the internationalization of services SMEs:
challenges and the policy spheres in which they can be overcome
Luisa Rodriguez
Summary
This chapter identifies challenges involved in designing policies to promote innovation in services and the internationalization of services SMEs.1
The countries analysed have had difficulty innovating in knowledge-intensive services and in processes associated with the design, monitoring and implementation of services policies. Overcoming these challenges requires action to be taken at other policy levels, including education, capacity-building through partnership schemes and certification, access to finance and access to key infrastructure and ICT inputs, technology transfer and protection for innovation.
Weaknesses affecting the internationalization of services enterprises, and particularly SMEs, have had to do with: (i) supply capacity, (ii) burdensome
1 It is based on the United Nations Conference on Trade and Development (UNCTAD) Services Policy Reviews (SPRs) of Peru, Nicaragua and Paraguay and on analysis of Jamaica’s and Colombia’s services policies.
E C L A C / C O L E F
146
procedures and bureaucratic barriers and (iii) commercial intelligence. Overcoming these weaknesses will require the design of appropriate incentives and support schemes to enhance the competitiveness of SMEs, strategies aimed at developing demand in international markets, and measures to identify and address trade barriers.
Introduction
The service sector is playing an increasingly important role in the global economy, as well as in the growth and development of countries. Services are becoming crucial to any country’s development, including its prospects of achieving Millennium Development Goals such as those for poverty reduction and access to basic services, including education and health services.
For several years now, UNCTAD has been implementing a comprehensive work programme for services with a view to assisting developing countries in strengthening their service sectors, increasing their participation in trade in services and realizing development benefits. This work has combined research, intergovernmental debates and capacity-building in three distinct areas:
(i) Emerging service-sector trends and challenges in developing countries;(ii) The contribution of services to trade and development;(iii) Regulatory, policy and institutional frameworks for services reform. This chapter identifies the challenges involved in designing policies to
promote innovation in services and the internationalization of services SMEs. It is based on some of the findings yielded by UNCTAD work on services, particularly the recent Services Policy Reviews (SPRs) of Peru, Nicaragua and Paraguay and the analysis conducted on Jamaica’s and Colombia’s services policies. SPR analysis does no more than touch on the topics of this chapter, considering them in a broader policy context and only to the extent to which stakeholders prioritize them during SPR-related discussions. This chapter seeks to explore them individually, linking challenges with the policy spheres where they can be overcome if actions are needed.
SPRs are systematic reviews of the economic, trade policy, regulatory and institutional frameworks characterizing service sectors, and are carried out so that the development benefits of the service sector and of international trade in services can be better harnessed. The methodology of SPR analysis encompasses policy analysis and research as well as multi-stakeholder meetings at the national level for fact-finding, awareness-raising and consensus-building. SPRs, once completed, offer recommendations for the
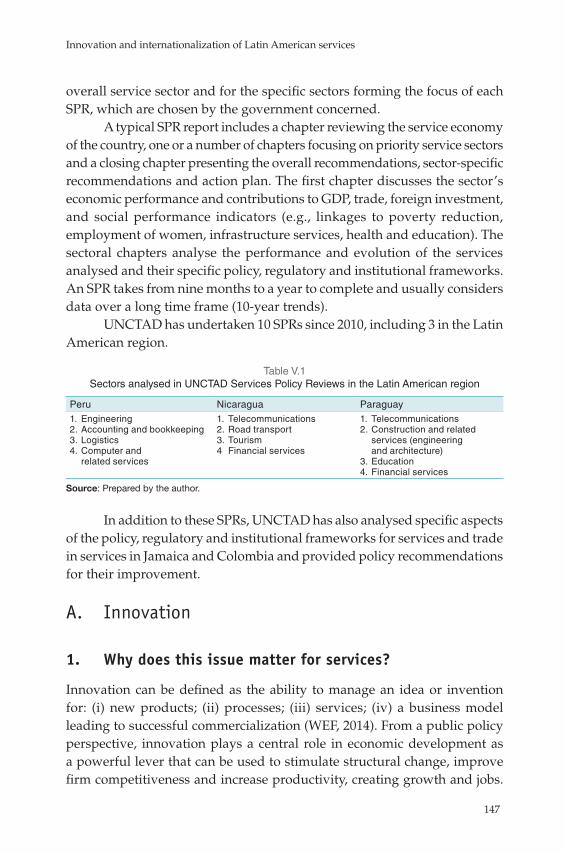
Innovation and internationalization of Latin American services
147
overall service sector and for the specific sectors forming the focus of each SPR, which are chosen by the government concerned.
A typical SPR report includes a chapter reviewing the service economy of the country, one or a number of chapters focusing on priority service sectors and a closing chapter presenting the overall recommendations, sector-specific recommendations and action plan. The first chapter discusses the sector’s economic performance and contributions to GDP, trade, foreign investment, and social performance indicators (e.g., linkages to poverty reduction, employment of women, infrastructure services, health and education). The sectoral chapters analyse the performance and evolution of the services analysed and their specific policy, regulatory and institutional frameworks. An SPR takes from nine months to a year to complete and usually considers data over a long time frame (10-year trends).
UNCTAD has undertaken 10 SPRs since 2010, including 3 in the Latin American region.
Table V.1 Sectors analysed in UNCTAD Services Policy Reviews in the Latin American region
Peru Nicaragua Paraguay1. Engineering 2. Accounting and bookkeeping3. Logistics4. Computer and
related services
1. Telecommunications2. Road transport3. Tourism4 Financial services
1. Telecommunications2. Construction and related
services (engineering and architecture)
3. Education4. Financial services
Source: Prepared by the author.
In addition to these SPRs, UNCTAD has also analysed specific aspects of the policy, regulatory and institutional frameworks for services and trade in services in Jamaica and Colombia and provided policy recommendations for their improvement.
A. Innovation
1. Why does this issue matter for services?
Innovation can be defined as the ability to manage an idea or invention for: (i) new products; (ii) processes; (iii) services; (iv) a business model leading to successful commercialization (WEF, 2014). From a public policy perspective, innovation plays a central role in economic development as a powerful lever that can be used to stimulate structural change, improve firm competitiveness and increase productivity, creating growth and jobs.
E C L A C / C O L E F
148
Innovation can stem from science-based technological progress or from the acquisition, adaptation and diffusion of existing technological knowledge. It can also result from entrepreneurial activity leading to new, more efficient combinations of productive resources (UNCTAD, 2011b).
The phenomenon known as “servicification of products” describes how traditional boundaries between manufacturing and services have become blurred. Today, the success of manufacturing depends on innovative services like design, marketing and logistics as well as on product-related aftersales services. Services innovation is thus important as a way to add value, shape new industries and sectors, restructure, create new business models and gain competitiveness in global value chains which include both goods and services. Despite the heterogeneity characterizing service sectors, innovation in services appears to differ from innovation in manufacturing in that it (i) relies more on skills2 and (ii) encompasses other sources of innovation3 aside from technological or scientific innovation4 (Mattoo, Iacovone and Zahler, 2013).
2. Challenges related to services innovation
The goal of promoting innovation is present in the broader development strategies of Colombia, Jamaica, Nicaragua and Peru. In Jamaica and Peru, innovation is also important for the pursuit of export promotion goals; promoting exports of computer-related services in the case of Peru, for example, and services associated with creative industries in the case of Jamaica.
In spite of this, the analysis revealed that these countries faced difficulties innovating in knowledge-intensive services and in processes associated with the delivery of services. It also highlighted the need for innovation in the institutional mechanisms associated with the design, monitoring and implementation of services policies.
(a) Thedifficultiesofinnovatinginknowledge-intensiveservicesThe analysis of computer-related services in Peru illustrates the
difficulties of innovating in knowledge-intensive services. This sector has witnessed strikingly positive developments in recent years in terms of
2 I.e., intangible assets associated with tacit knowledge, embedded in firms’ skilled staff and researchers.
3 Such as marketing or organizational innovation, which refers to product design and organizational management in a firm’s production activities, work environment or management structure.
4 By this is meant the introduction of new products or processes in the market and related expenditure on research and development (R&D), physical equipment acquisition and training.
Innovation and internationalization of Latin American services
149
increased domestic and foreign sales, as a result of support provided by the Peru Export and Tourism Promotion Board (PROMPERU). Notwithstanding, further growth and innovation in this service sector are being held back by:
• Factors in the overall environment for innovation, including insufficient research and development (R&D) investment for scientific, technological and innovative activities, a lack of innovation incentives for the information technology (IT) industry, IT infrastructure deficiencies and low levels of consumer and business adoption of IT and telecommunications. The institutional environment for innovation is marred by duplication of organizations and functions (UNCTAD, 2011a).
• An inadequate supply of engineers with the qualifications required for complex IT programming. Some industry leaders interviewed in the course of the SPR study were of the view that academic curricula in systems engineering courses were not designed in the way needed to create innovative professionals, but lengthened the learning curve involved in creating programs and solutions and thus production costs for software companies. In addition, leading industry representatives stated that it was very difficult to retain talent in domestic companies, given the attractive opportunities offered by global companies.
• Poor English capabilities were also considered a major obstacle to further growth in the specific case of computer services in Peru. Proficiency in English is a requirement in this industry, since most of the specialized literature is in that language.
(b) ThedifficultiesofinnovatinginprocessesassociatedwiththedeliveryofaserviceoraproductDifficulties in innovating by adding value through services (particularly
computer-related or telecommunication services) and in enhancing the customer experience and increasing efficiency were revealed in the course of the analysis. Some examples that could be cited are:
• Financial services in Nicaragua. In this case, the underuse of information and communication technology (ICT) infrastructure to process banking operations and the lack of expedient credit assessment processes were found to be correlated with the relative lack of financial depth in the economy.
E C L A C / C O L E F
150
• Accounting services in Peru. The lack of resources for developing IT solutions was found to be hindering technological innovation in the sector, and this in turn was considered to be a factor affecting further development of accounting services exports via offshoring. It also affected the potential for entering new markets and increasing productive efficiency and was seen as a major obstacle to achieving credibility in developed-country markets.
(c) Theneedforinnovationininstitutionalmechanismsassociatedwiththedesign,monitoringandimplementation ofservicespolicies
Box V.1 The importance of interaction among actors for innovation
The differences observed in the innovation performance of economies are mainly due to differences in the systems of interacting actors (firms, universities, research centres and public agencies) involved in the production, diffusion and use of science and technology as well as the environment in which these actors operate.
Source: United Nations Conference on Trade and Development (UNCTAD), A Framework for Science, Technology and Innovation Policy Review. Helping countries leverage knowledge and innovation for development (UNCTAD/DTL/STICT/2011/7), Geneva, 2011.
Given the nature of services markets and the multiplicity of actors involved, policymaking in this area is rather complex. Ensuring coherence between different policy spheres is an important factor in efforts to maximize development gains from service-sector reforms and trade in services. Such policy spheres include, for instance:
• Development goals and strategies, sectoral strategies and trade strategies
• Policies aimed at improving supply-side and export capacity and trade promotion strategies
• Multilateral, regional and bilateral trade and cooperation frameworksThe analysis also revealed the need for innovation in institutional
mechanisms associated with the design, monitoring and implementation of services policies. An interesting example of institutional arrangements aimed at promoting comprehensive policymaking and consistency is the collaborative engagement entered into by a number of stakeholders in the tourism sector in Nicaragua. This involves wide consultation between different levels of government, including municipalities, and service providers, who periodically meet to decide on joint work agendas and actions. This

Innovation and internationalization of Latin American services
151
collaborative interaction has also involved foreign financing partners to help ensure the sustainability of financing for the development of key tourism infrastructure.
3. Policy interlinkages: policy spheres with an impact on innovation
Box V.2 Policy spheres that have an impact on innovation
Science, technology and innovation (STI) policy is complex and demanding to design, implement and monitor. It is not only concerned with strengthening the “supply side” of knowledge and technology, but also needs to encompass management of the “demand side” (the use that firms, farms and public-sector entities make of knowledge and technology in the production of goods and services), as well as the interactions between the two sides and the need to develop enabling framework conditions. This will require the coordinated management of an extensive arsenal of explicit and implicit policy instruments. Examples of the first group include education policies at all levels, the development of STI infrastructure, technological support services and policies dealing with the transfer of technology through foreign direct investment, trade and other market-based mechanisms. Implicit STI policy instruments encompass the likes of general trade policies, public procurement, taxation, infrastructure (electricity supply, roads, and telecommunications) and direct and indirect financial support to enterprises. Adding to the complexity of the policy challenge is the need to organize policies that address both market and systemic failures, to combine horizontal policies (education and training, access to finance and knowledge dissemination) with vertical ones (support for specific sectors or technologies, or both) and to incentivize collaborative interactions between firms, universities and research centres.
Source: United Nations Conference on Trade and Development (UNCTAD), A Framework for Science, Technology and Innovation Policy Review. Helping countries leverage knowledge and innovation for development (UNCTAD/DTL/STICT/2011/7), Geneva, 2011.
In the context of policy analysis relating to services in Latin American and Caribbean countries, policymakers seeking to promote innovation in services were confronted with both domestic and external challenges. The following sections summarize these.
(a) ThedomesticagendaKey domestic challenges included human capital development, the
availability of finance to promote research and development, and access to key infrastructure.
(i) Education Increasing value added in services is a function of innovation which,
in turn, is a function of human capital. The concern crystallized by analysis of service frameworks was about whether educational performance was adequate to promote labour transformation and enhanced levels of human
E C L A C / C O L E F
152
capacity, and thereby support the growth of service sectors. In this context, understanding the skills gaps and barriers limiting innovation and technology adoption in specific service sectors is the key to overcoming them.
In the case of Jamaica, for example, ensuring that the education system and institutions were producing a large enough pool of people with adequate skills was considered an important part of the effort to promote the development of the ICT sector and the IT-enabled service sector. The skills needed were those required to provide services in the areas of finance, accounting, human resources, legal services, R&D and software development and testing.
In some cases, developing a specific subset of skills was deemed important. The Colombian example offers an interesting perspective on policies pursued to enhance innovation in the service sector. Colombia is seeking to develop skills considered critical for innovation in services that are not sector-specific. These include skills associated with organizational innovation such as creation and experimentation, business models, platforms and modules, consumer-supplier interaction and process analysis.
In Peru, the development of “soft skills” was also discussed as a means to improve the preparation of professionals, in accordance with the current needs of service industries. These soft skills included: problem-solving, customer service orientation, teamwork and research for innovation. One of the recommendations consisted in developing targeted training programmes for graduates with private-sector-designed curricula (also known as finishing schools) that covered these skills as well as technical aspects.
Other recommendations sought to encourage the development of other skills, including, in the case of Peru, the ability to use English, as this is the language of the core literature where trends in the computer service sector are presented. Specific proposals included creating further incentives to promote English learning among students on IT-related courses, for example by instilling the idea that proficiency in English was crucial for accessing higher-paid jobs.
In other cases, the shortcoming lay in a lack of professionals entering the job market. In Peru, for example, this was because there was an insufficient number of scientists and engineers, particularly electrical engineers and those needed for the production activities that had been expanding in recent years, i.e., the oil and petrochemical industries. A decline in the take-up of engineering courses was observed. Another reason for the inadequate supply of engineers was a further challenge, that of retaining human resources in companies and in the country, particularly in the field of systems engineering.

Innovation and internationalization of Latin American services
153
Education quality was also found to be correlated with the capacity to innovate in services. In Peru, for example, interviews with businesses revealed problems with the qualifications of engineering graduates. Some industry leaders interviewed in the course of this study were of the opinion that academic curricula in systems engineering courses were not designed in the way needed to create innovative professionals. Discussions with stakeholders suggested weaknesses in the institutional frameworks for ensuring the quality of education programmes in the engineering profession, particularly at private universities. Professional boards, for example, should be more proactive in developing the supply of courses, ensuring their quality and certifying professional skills in the sector.
In the case of Paraguay, the concern about education quality was also articulated in connection with secondary education. The inadequate supply of engineers in Paraguay was correlated with deficiencies in the quality of secondary school mathematics and science that meant candidates were unable to attain the average required for admission to university-level engineering courses.
One conclusion was that the institutional quality assurance framework for education programmes needed to be strengthened. In the case of the engineering profession in Peru, for example, the study found that a lack of quality control over the academic courses on offer, particularly at private universities, was correlated with the perceived deterioration in the quality of qualifications that in turn had resulted in there being an inadequate number of qualified professionals in this sector.
It was therefore recommended that the institutional quality assurance framework for engineering syllabuses should be strengthened. To this end, the mandate and capabilities of boards of engineers should be enhanced to broaden their field of action beyond their current procedural (registration) role. They should be more proactive in developing academic offerings, ensuring their quality and certifying professional skills in the sector.
The following actions could be considered by the engineering (professional) boards to achieve this:
• Taking a proactive role in efforts to encourage local universities to improve their syllabuses and obtain international certification and appropriate accreditation
• Certifying the experience and skills of young engineers• Improving collaboration with universities that have engineering
syllabuses to raise awareness of market opportunities for highly qualified graduates with postgraduate studies and foreign language skills
E C L A C / C O L E F
154
In the case of computer services, recommendations for improving the quality of education included designing a targeted strategy to improve the institutions that source technicians and professionals for the IT services industry and promoting partnerships with foreign universities with a view to academic exchanges being undertaken at master’s degree level.
(ii) Other capacity-building measuresImproving linkages between businesses and public and other
institutions, including professional associations and universities, can promote scientific and productive skills as well as innovation and technological upgrading in services. Indeed, good links ensure the needs of the private sector are understood and aligned with policy incentives and educational offerings.
In the case of Colombia, for example, improving collaboration and synergies between the private and public sectors was deemed important for the design and implementation of a strategic agenda that would prioritize innovation goals, facilitating Colombian exports of higher value added professional services.
The analysis of Peru included the following recommendations in connection with this issue:
• Including the policy objective of more effective linkages with employers through private sector-academia collaborations in an overall strategy aimed at developing both the service sector and trade-related opportunities
• Strengthening the links between the academic sector, businesses and policymaking bodies as a means to develop skills relevant to the provision of higher value added computer services
• Expanding interaction with academia, public entities and other institutions, while also collaborating with centres abroad that are similar to Peru’s Technological Innovation Centre for Software (CITE Software) and promoting integration in international networks of similar organizations
Clusters and incubators can also play an important role in promoting these linkages and fostering innovation. Clusters are organized collaborations between a variety of public- and private-sector actors such as firms, government agencies and academic institutions, undertaken with a view to improving the competitiveness of one or a number of business sectors. Clusters are an important element supporting service sector innovation. They create favourable ecosystems for service providers, suppliers, external experts and associations to interact in and a favourable business environment
Innovation and internationalization of Latin American services
155
for service innovation by supporting a steady flow of new ideas and their implementation, fostering knowledge transfers and spillovers.
Cluster development policies are already being implemented in Peru. At the stakeholder workshops held as part of the SPR project in Lima, PROMPERU explained how companies that invested in the ZOFRATACNA free trade zone in the southern city of Tacna and the Ilo Export, Transformation, Industry, Commercialization and Services Centre (CETICOS) in the Moquegua Region were successfully supplying services to the mining industry. PROMPERU has also made efforts to create software and IT services clusters.
Incubators are schemes whereby SMEs operating in strategic sectors receive direct services from government. ICT incubators are specially designed to extend networks, facilitate the sharing of ideas, information and knowledge and assist with management and technological development. Incubators can invigorate the relationship between universities and businesses.
The Peru study identified limited cooperation between academic, public and other institutions (including professional associations) and business sectors as one of the main obstacles affecting the further growth of service provision in Peru. In the computer services sector in particular, the link between academia, businesses and policymaking bodies was found to be weak. Strengthening it was deemed important for the development of skills and the promotion of innovation to overcome problems with the quality of professionals in the sector. Providing venture capital to support start-ups and incubators and expanding the number of technology parks were suggested as plausible actions that Peru could consider to support and encourage cluster promotion efforts.
Promoting certification and compliance with international standards can play an important role in strengthening service quality and building up an image of reliability for service providers abroad. Peru’s policies offer an interesting example in the area of computer services. PROMPERU and the Peruvian Association of Software Producers (APESOFT) have encouraged and helped firms in the sector to obtain relevant certification such as the Capability Maturity Model Integration (CMMI) certification (CMMI-3 is an important international standard) administered by the European Software Institute (ESI). CMMI certification validates the capacity, maturity and quality of the processes used to produce software, certifying that the best practices are being applied in its development. In addition, most companies listed in the PROMPERU Software Portfolio 2011 have also obtained ISO 9001 and are certified partners of Microsoft, Oracle, SAP, IBM or other world-class software developers.
E C L A C / C O L E F
156
According to leading local providers, the granting of CMMI-3 was a landmark in the history of the Peruvian IT business, helping firms to enhance product and service quality and broaden the range of services provided to the local corporate market while competing with the BRIC countries (Brazil, Russia, India and China) on quality but with lower costs. Nevertheless, the CMMI scale goes up to 5, so the score obtained by Peru (3) is middling, indicating that the process has been implemented but not yet optimized.
The creation of CITE Software was another major effort by the Peruvian government to promote the development of the country’s computer services industry. This initiative was undertaken by the Ministry of Production (PRODUCE) with the aim of providing the services needed to strengthen the competitiveness of software companies. Administered by APESOFT, CITE Software has worked intensively to supply laboratory and accreditation services, provide training in quality certification systems, promote the use of quality standards and hold seminars on technological solutions for micro and small enterprises.
(iii) Access to financeEnsuring access to finance is a key part of promoting innovation.
This is because innovation and R&D are associated with risk. The riskiness of innovation is correlated with investment needs, particularly in capital-intensive industries and when knowledge generated by innovation can be appropriated without the needful intellectual property protection. The challenge of ensuring access to finance is also affected by the functioning of financial markets, which are traditionally risk-averse. In addition, small markets are inadequately integrated in most developing countries and economies of scale therefore lacking.
The Latin American region in particular has a low rate of investment in innovation compared to other regions. Average investment in Latin America was 0.67% of GDP in 2007, with Brazil and Chile leading the region at 1.1% and 0.6% respectively (IDB, 2010).
The SPRs undertaken by UNCTAD have identified access to finance as an important challenge when it comes to promoting innovation. The Peru SPR describes the specific situation of Peru in this regard. Peru has scarcely invested in STI, spending barely 0.15% of GDP on R&D in 2007, according to the Fund for Innovation, Science and Technology (FINCyT). This was acknowledged in Peru’s 2012-2013 Competitiveness Agenda, which identified improved access to finance as a critical area for overcoming some of the bottlenecks constraining further growth in services exports. The SPR identified the need to promote investment in education, capacity-
Innovation and internationalization of Latin American services
157
building and research in order to improve production processes through technological innovation.
Another interesting angle when it comes to analysing access to finance for innovation is the origins and proportions of financing for innovation and R&D. The Latin American region contrasts in this respect with the Organization for Economic Cooperation and Development (OECD) countries, where the proportions average 65% from the private sector, 11% from government and 17% from academic institutions. In Latin America, by contrast, 40% comes from governments, 41% from companies and 38% from academic institutions. Although analysis by the Inter-American Development Bank (IDB) shows that innovation financing from the public sector can have a lower impact on competitiveness and production activities than financing from the private sector, they note a positive impact on innovation at enterprises with access to this type of support (IDB, 2010). This is confirmed by the experience of Colombia with the Administrative Department of Science, Technology and Innovation (COLCIENCIAS) programme. The Colombian government found that labour productivity improved by 23% to 26% in service companies benefiting from specific projects aimed at promoting innovation.
Several countries in the region are currently providing financing to promote innovation. They are doing so as part of policy instruments aimed at boosting demand for innovation or linking strategies better. Examples of the former include technology and competitiveness funds, venture capital and other financial funds for businesses, fiscal incentives for R&D, and financing to promote technology and knowledge transfer (technology extension services). Examples of the latter include sector-specific funds, funding for priority areas and funding for clusters and incubators.
Peru, for example, has implemented the Programme to Support the Competitiveness of the Software Industry (PACIS), with US$ 5 million budgeted over 7 years (2007-2013) for technology-related projects. The positive experience of a company that was able to develop a major software solution for the mining sector with a loan from this programme illustrates how financing programmes can help to generate opportunities for services SMEs.
To overcome challenges in this area, Colombia changed its regulatory framework for royalties in 2012 so that a Science and Technology Fund could be created. As result, annual investment in research, development and innovation is expected to triple in Colombia in the coming years.
(iv) Access to key infrastructure and ICT inputsThe ability of emerging economies to move up the innovation ladder and
improve their competitiveness on this basis depends to a large extent on how
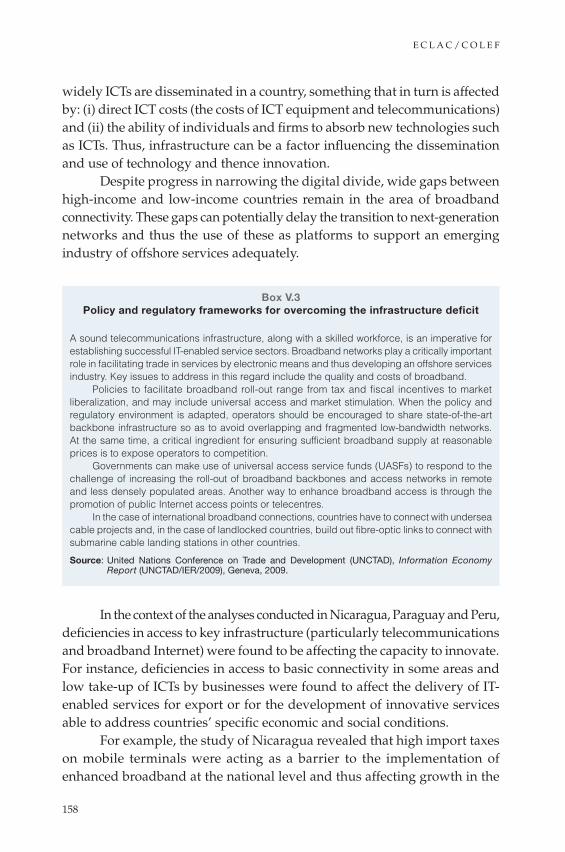
E C L A C / C O L E F
158
widely ICTs are disseminated in a country, something that in turn is affected by: (i) direct ICT costs (the costs of ICT equipment and telecommunications) and (ii) the ability of individuals and firms to absorb new technologies such as ICTs. Thus, infrastructure can be a factor influencing the dissemination and use of technology and thence innovation.
Despite progress in narrowing the digital divide, wide gaps between high-income and low-income countries remain in the area of broadband connectivity. These gaps can potentially delay the transition to next-generation networks and thus the use of these as platforms to support an emerging industry of offshore services adequately.
Box V.3 Policy and regulatory frameworks for overcoming the infrastructure deficit
A sound telecommunications infrastructure, along with a skilled workforce, is an imperative for establishing successful IT-enabled service sectors. Broadband networks play a critically important role in facilitating trade in services by electronic means and thus developing an offshore services industry. Key issues to address in this regard include the quality and costs of broadband.
Policies to facilitate broadband roll-out range from tax and fiscal incentives to market liberalization, and may include universal access and market stimulation. When the policy and regulatory environment is adapted, operators should be encouraged to share state-of-the-art backbone infrastructure so as to avoid overlapping and fragmented low-bandwidth networks. At the same time, a critical ingredient for ensuring sufficient broadband supply at reasonable prices is to expose operators to competition.
Governments can make use of universal access service funds (UASFs) to respond to the challenge of increasing the roll-out of broadband backbones and access networks in remote and less densely populated areas. Another way to enhance broadband access is through the promotion of public Internet access points or telecentres.
In the case of international broadband connections, countries have to connect with undersea cable projects and, in the case of landlocked countries, build out fibre-optic links to connect with submarine cable landing stations in other countries.
Source: United Nations Conference on Trade and Development (UNCTAD), Information Economy Report (UNCTAD/IER/2009), Geneva, 2009.
In the context of the analyses conducted in Nicaragua, Paraguay and Peru, deficiencies in access to key infrastructure (particularly telecommunications and broadband Internet) were found to be affecting the capacity to innovate. For instance, deficiencies in access to basic connectivity in some areas and low take-up of ICTs by businesses were found to affect the delivery of IT-enabled services for export or for the development of innovative services able to address countries’ specific economic and social conditions.
For example, the study of Nicaragua revealed that high import taxes on mobile terminals were acting as a barrier to the implementation of enhanced broadband at the national level and thus affecting growth in the

Innovation and internationalization of Latin American services
159
sector, particularly of data services and the potential use by developers of telecommunications to design applications and value-enhancing content. Specific recommendations in the case of Nicaragua included reviewing regulation and tax systems affecting these goods.
Box V.4 Jamaica: a successful case of infrastructure development to increase
the value of services exports
Jamaica has been increasingly recognized as a regional leader in ICT-enabled services, allowing the country to tap into the large United States market and move towards providing value added services such as finance and accounting, human resources outsourcing, legal process outsourcing, R&D and software development and testing. Infrastructure improvements have greatly contributed to this success.
Jamaica has improved its ICT infrastructure since the 1990s. As of 2013, its telecommunications infrastructure included a fully digital telecommunications network, a submarine fibre optic transmission ring around the island, international submarine cable links through the Cayman-Jamaica fibre system, the Columbus Communications FibraLink connection to the Dominican Republic and the spur to the Florida-Colombia cable, among others. As a result of these infrastructure improvements, Jamaica enjoys seamless connectivity to North America, Latin America and the Caribbean via three parallel fibre routes.
To achieve these objectives, Jamaica adopted strategies aimed at ensuring a favourable business environment and support framework for ICT investment and operations. It promoted collaborative efforts between the public and private sectors, liberalized telecommunications and developed technology parks.a These measures led to positive results and to considerable FDI inflows going to the ICT industry during 2001-2005.
Source: Prepared by the author.a Technology parks provide well-developed technological support and infrastructure to a subset of
service sectors and have proved useful in increasing the country’s attractiveness as a services hub for offshoring.
(b) TheexternalagendaTwo main challenges were identified in connection with the external
agenda: (i) ensuring that the establishment of foreign companies in the local market led to technology and knowledge transfer and (ii) ensuring that innovations by services companies were adequately protected.
For example, the study of Paraguay highlighted a concern regarding the first challenge mentioned above. A recently approved law on construction services sought to promote joint ventures between foreign and local companies in public-private partnerships (PPPs) in order to increase domestic production and operating capacities and experience in public tendering processes. However, the subcontracting practices prevailing in the sector neither led to the transfer of know-how nor added value or improved local companies. Accordingly, the private sector was concerned that the law would not improve
E C L A C / C O L E F
160
the quality of domestic service providers or lead to technology transfer, and that local construction companies would participate mainly as subcontractors or minority partners.
To improve matters as regarded the transfer of know-how from foreign companies through consortiums with local companies, the engagement with stakeholders that formed part of the SPR process led to a recommendation for the current legal framework to be adapted to incorporate additional requirements relating to the terms and conditions for hiring local personnel for public tenders, training and the procurement of construction inputs.
Ensuring that innovation generated by companies has adequate intellectual property protection is important for Colombia from the perspective of enhanced competitiveness, productivity and the creation of innovative services that can compete successfully in foreign markets. Colombia’s policy framework5 identifies this need to promote trade in creative services, cultural services and entertainment services. Colombia also views intellectual property protection as a cornerstone of its marketing and promotion strategies, as the use of trademarks can associate a service provider with a high level of expected quality, for instance in the case of tourism. Colombia is also seeking to promote intellectual property protection for business models in the service sector. A challenge faced by Colombia as it seeks to achieve these goals is the lack of interlinkages between actors in the Intellectual Property System6
and between this system and users of intellectual property (companies and research institutions).
The following actions could help to overcome this challenge in the case of Colombia:
• Increased awareness of legal provisions concerning protection and use of intellectual property rights, particularly among services SMEs
• Access to finance to ensure intellectual property rights are available and enforceable at reasonable cost for SMEs
• Creation of an intellectual property management centre for SMEs which could support the creation of incubators, innovation networks and clusters, among other things
• Enactment of modern trade secret laws
5 National Council for Economic and Social Policy (CONPES) document No. 3533, “Bases de un Plan de Acción para la Adecuación del sistema de propiedad intelectual a la competitividad y productividad nacional 2008-2010” (2008) and CONPES document No. 3527, “Política Nacional de Competitividad y Productividad” (2008).
6 This encompasses different government bodies involved in the administration, exploitation and enforcement of these rights.
Innovation and internationalization of Latin American services
161
B. The internationalization of services SMEs
Internationalization can be defined as a process whereby a firm moves from operating only in its home market to operating internationally (Etemad-Sajadi, 2008).
1. Why does this issue matter for services and for SME service providers in particular?
From a public policy perspective, internationalization strategies are important as a way of improving prospects and trade opportunities for domestic services providers. From this viewpoint, it is worth noting that the SPRs identified different motivations and rationales for the internationalization of Peruvian and Paraguayan firms.
In the case of Paraguay, internationalization was perceived as a way to overcome the small size of the market. In the case of Peru, it was often seen as a strategy to cope with increasing competition from the multinationals and foreign companies (particularly engineering consulting and accounting companies) that are increasingly participating in the Peruvian market. Internationalization was thus viewed as a survival strategy to avoid being pushed towards less attractive segments of the market.
The analysis conducted by UNCTAD through its SPRs has revealed the importance of prioritizing support targeted at SMEs, particularly with a view to generating solid linkages with and between services SMEs. This is because of their potential to generate employment, overcome informality and avoid forming “services enclaves of excellence” that create limited linkages and spillover effects for the rest of the economy.
SMEs represented a high proportion of domestic service providers in the markets analysed in the SPRs. In these contexts, the market structure was such that many micro and small enterprises existed alongside and competed against a few large (and sometimes vertically integrated) firms, the result being asymmetric competition. The following examples are taken from the Peru and Nicaragua SPRs:
• SMEs represented 85% of domestic service providers in the tourism sector in Nicaragua in 2009. Tourism SMEs generated direct employment for 37,461 persons and indirect employment for 140,000 persons between 2007 and 2011 in Nicaragua.
• 96% of services accounting firms in Peru were SMEs, with turnover of less than 517,000 nuevos soles and fewer than 10 employees. In contrast, four big companies with turnover of more than 10 million
E C L A C / C O L E F
162
soles and over 200 employees accounted for 56% of total market turnover in the country in 2010.
• The market structure of the software industry in Peru in 2008 was as follows: 63% of firms were microenterprises, 27% were small, 6% were medium-sized and 4% were large. In contrast, large companies made 46% of total sales in 2007, while medium-sized ones accounted for 12% of sales, small ones 20% and microenterprises 21%.
The following sections summarize challenges identified by the SPRs as affecting the internationalization of services SMEs.
2. Challenges affecting the internationalization of services SMEs
The SPR findings revealed that limited production capacity, burdensome procedures and bureaucratic barriers, and marketing weaknesses were all challenges to the internationalization of services SMEs.
(a) LimitedSMEproductioncapacityIn the analysis undertaken by UNCTAD, specific policy frameworks
to support service-oriented SMEs and their internationalization were lacking or were narrowly defined in the context of a specific services subsector.
Designing appropriate incentives and support schemes to enhance the productivity and competitiveness of services SMEs can be challenging. In Peru, for example, although the current policy framework supported the development of services and sought to promote exports of them, contradictory views were held by different institutions within the Peruvian government regarding the policies and measures necessary to promote this sector.
Disagreements related to the use of fiscal incentives (or other industrial policy measures) to promote services exports. For some stakeholders, such measures would be tantamount to artificially supporting sectors that were not competitive and would run counter to the philosophy of allowing the competitiveness of each sector to be determined by its competitive advantages. The implementation of specific measures also came up against operational difficulties relating to the definition of services exports, the traceability and monitoring of services rendered for fiscal purposes and the issue of whether value added tax (VAT) exemptions should apply to intermediate inputs (goods or services) incorporated into final services not subject to VAT.
International standards and quality certification is another challenging dimension associated with efforts to enhance the production capacity of SMEs and thence promote their internationalization. Compliance with
Innovation and internationalization of Latin American services
163
international standards is important for accessing international markets in many service sectors because these benchmark a service provider’s quality and delivery capacity.
In the case of the service sectors examined in the SPRs, such standards were highly relevant for exports of computer- and IT-enabled services from Nepal and Peru, tourism in Nicaragua and Rwanda, and offshoring-related professional services (accounting and bookkeeping) and engineering consulting services in Peru.
Meeting international quality standards is a challenge for many local suppliers in developing countries and particularly for SMEs, given their cost implications. In addition, the relevant standard may be different in different target markets, this being the case, for example, with some computer services. Countries seeking to enter global value chains through exports of offshored services face another challenge in this respect, as they have to improve their local capacity while at the same time adopting what in some service industries are demanding standards.
Weak (or non-existent) associations can also be seen as a challenge to the internationalization of SMEs. Associations can play an important role in supporting sectoral and particularly SME development by providing advisory and capacity-building services in the areas of certification and branding, by lobbying governments for support strategies and measures, and by promoting business partnerships to improve the performance, productivity and efficiency of all participants. In the SPRs conducted, several services associations also played a vital role in the collection of key statistics at the disaggregated level.
The Peruvian Association of Software Producers (APESOFT) offers a positive example in this respect. APESOFT played an important role by facilitating training and capacity-building for software firms, encouraging the adoption of CMMI certification, creating a trademark (“CREA, Software Perú”) to publicize Peruvian products internationally and helping to forge partnerships with Brazilian companies to serve the Peruvian and foreign markets.
By contrast, also in Peru, institutional weaknesses were observed in the role played by professional associations in the accounting services sector. These affected the sector’s ability to align the interests of businesses and professionals. Public accountants’ associations were not actively promoting the profession, and no specific efforts to promote exports of accounting services could be identified.
Technical and management weaknesses are also affecting the ability of SMEs to internationalize. These weaknesses may stem, for instance, from
E C L A C / C O L E F
164
a lack of business skills in the areas of marketing and financial management. Together with information asymmetries, resource constraints and a lack of the kind of support networks of local industry participants that provide complementary services in most developing countries, this situation affects the competitiveness, sustainability and internationalization of SMEs.
The case of tourism SMEs in Nicaragua illustrates the problem. For example, interaction with stakeholders during the preparation of the SPR report and at the workshops revealed that many tourism accommodation facilities did not comply with minimum safety requirements and that this was due to lack of technical assistance prior to business operations starting, such as architects’ advice on design and construction criteria to guide investment decisions and ensure quality.
This situation, together with a lack of knowledge about the business and sectoral realities and technical deficiencies in operation planning and management by SME service providers, was directly correlated with shortcomings affecting consumers’ perception of quality. Examples highlighted concerned hygiene management for food and beverage services and cleaning services in accommodation facilities.
These weaknesses stem from a combination of factors, including lack of financial support. They constitute major barriers to growth in this sector in Nicaragua and explain why the estimated lifespan of tourism SMEs is five years.
(b) BurdensomeproceduresandbureaucraticbarriersBurdensome procedures and bureaucratic barriers are often cited in
SPRs as an impediment to entrepreneurship and to the internationalization of SMEs.
They were found to affect Nicaraguan tourism and road transport services. In the case of tourism, there was evidence of SME providers of accommodation services preferring to undertake their operations informally to avoid the lengthy procedures involved in starting and running a business.
(c) WeaknessesincommercialintelligenceCommercial intelligence can be defined as information on business
environments and competitors. The cases analysed in SPRs showed that services SMEs lacked knowledge about demand, e.g., the expectations of those consuming services and other markets. In this context, establishing a branch or subsidiary abroad was seen as a costly and risky way to obtain this information. The lack of such information affected the way SMEs
Innovation and internationalization of Latin American services
165
evaluated costs and risks when considering whether to internationalize. This situation was identified in SPRs and in the analysis of some services policies.
For example, the Peru study revealed different situations in different service sectors regarding the data and market intelligence needs of service providers looking to participate in foreign markets. In the case of bookkeeping and accounting services, these needs arose in the effort to prepare the ground for future internationalization by increasing awareness of export opportunities among SMEs. In other services, like engineering, timely access was needed to the information required to participate in tenders operated in other countries and by international organizations, and in temporary financing schemes that could be made available to those participating in these tenders.
Notwithstanding these sectoral differences, this study revealed a general perception that service providers, and particularly SMEs, lacked some key information needed to internationalize in areas such as:
• Fiscal regimes and taxes applying to services activities• Any restrictions on the activities of foreign suppliers and
regulatory barriers• Successful experiences in other countries with policies to support
the development of sectors of interest and to promote export opportunities, as an input for PROMPERU and the Ministry of Foreign Trade and Tourism (MINCETUR) to consider their implementation in Peru
• Competition conditions for trade in services of priority interest to Peru
Similarly, the case of Nicaragua highlighted how little tourism SMEs knew about consumer preferences in target markets.7 This shortcoming affected the ability of SMEs to deliver services that met quality expectations and to achieve the policy goals of increasing and diversifying tourism demand and encouraging higher tourist spending and longer stays.
In the case of Colombia, improving access to export-relevant information was identified as one of the paths towards maximizing the export potential of services. The Colombian private sector has identified weaknesses when it comes to accessing information on requirements and regulations affecting
7 The markets were Europe (France, Germany, Spain and the United Kingdom), North America (Canada and the United States), South and Central America (Argentina, Brazil and neighbouring countries) and the BRICs.

E C L A C / C O L E F
166
services exports, fiscal incentives and measures to avoid double taxation, services export financing instruments and prerequisites for accessing these, and target markets (i.e., business opportunities and market access requirements such as technical standards and tax regulations).
3. Policy interlinkages: policy spheres that have an impact on internationalization
At the domestic level, overcoming the challenges identified in the previous section means designing appropriate incentives and support schemes to enhance SME competitiveness, while where the external agenda is concerned, it means promoting trade and identifying and dealing with trade barriers.
(a) Thedomesticagenda(i) Designing appropriate incentives and support schemes to enhance
the competitiveness of SMEsThe prevalence of services SMEs underlines the need for policymakers
to address size-related constraints in order to enhance their development impact. Trade impediments and regulatory obstacles may be particularly problematic for SMEs, which are often less well equipped to deal with them than large companies.
Addressing such constraints may mean developing cross-cutting policies to support services SMEs and policy frameworks to maintain meaningful and effective support for SMEs in specific service sectors, while strengthening the institutional framework to support small and micro businesses. Specific policy measures could include facilitating access to finance, for instance by providing venture capital to support start-ups and incubators.
Such recommendations were reflected, for example, in the SPRs of Nicaragua and Peru. In the case of Nicaragua, the recommendations for improving the export prospects of tourism SMEs encompassed: (i) measures to strengthen the institutional framework of the State bank in relation to SME service activities and (ii) capacity-building activities aimed at meeting consumer expectations and market demand, for instance by putting quality-enhancing incentives in place and improving business planning and management.
In the case of Peru, the recommendations included: (i) strengthening financing programmes and actively involving APESOFT in the search for ways of better targeting small and micro enterprises in support programmes and (ii) ensuring financing made available under FINCyT and under the Fund for Research and Development for Competitiveness (FIDECOM) reached micro and small enterprises, to make research and development projects feasible.

Innovation and internationalization of Latin American services
167
(ii) Capacity-building (enterprise development support)As illustrated in the case of Peruvian software companies, services
SMEs require technical and administrative support and entrepreneurial skills to manage their business and stay competitive. Entrepreneurship education is usually not an explicit part of the curriculum of educational institutions at any level in most countries. Instead, hard and soft entrepreneurship skills are taught as part of basic subjects or through teaching methods (UNCTAD, 2012).
Box V.5 Entrepreneurship curricula: developing the skills required
for entrepreneurialism
• Personal competencies, including: ability to work in a team, self-confidence, self-awareness, calculated risk-taking, problem-solving, creativity, thinking as employers rather than as employees and dealing with uncertainty in an entrepreneurial way.
• Core operational skills: numeracy, accounting, communication, ICTs and rudimentary knowledge of local commercial law and governance principles. These represent the fundamentals for operating effectively in a working environment, and also help to improve personal and family budgets and management.
• Business and management skills: competitive advantage analysis, market research, business plan development, marketing, financial management, sales and human resources. Curricula should include case studies and exercises in setting up and running a company and should develop the know-how to identify and exploit business opportunities for solving social and/or environmental issues.
• Financial and human resource management skills that are necessary for the formation and survival of a new enterprise.
Source: United Nations Conference on Trade and Development (UNCTAD), Entrepreneurship Policy Framework and Implementation Guidance, Geneva, 2012.
Enterprise development support in the form of hand-holding or coaching schemes to prepare companies to export can also prove useful. In the Nicaraguan SPR, for example, the Nicaraguan Micro, Small and Medium-sized Enterprise Tourism Chamber expressed its preference for coaching or hand-holding schemes over training, given their practical and customized approach to business development. Companies felt freer to ask questions that might reveal business information in this context than in a training setting in the presence of potential competitors.
Capacity-building programmes to increase the ability of SMEs to adopt ICTs were also deemed relevant. In the case of Jamaica, initiatives aimed at increasing ICT use by SMEs were correlated with more efficient resource management. In the case of Peru’s accounting SMEs, these types of capacity-building initiatives were considered important for maximizing opportunities from offshoring and the scope for moving up to the provision of higher value added services.
E C L A C / C O L E F
168
(iii) Developing local capacities with international standardsStrengthening trade support institutions and inter-firm cooperation can
lead to local capacities developing to international standards. Associations can ensure improved coordination of the trade interests of SMEs. They can also contribute to business development and supply-side capacity-building by (i) aggregating the services offerings of SMEs, (ii) strengthening SMEs by engaging them in production clusters and (iii) generating opportunities to link up to bigger national, regional and foreign companies. These links will generate exposure to and learning from the business experience of other companies and foreign service providers.
Some specific recommendations in the SPR of Peru in this respect include:
• Maximizing the participation of micro and small enterprises in the computer service sector in clusters promoted by PROMPERU to facilitate cooperation efforts aimed at upgrading their capacity as business partners.
• Improving the resources of APESOFT and its ability to help SMEs in the computer service sector seek out business partnerships to improve the competitiveness of local software designers.
• Designing a support strategy aimed at promoting partnerships between local SME accounting firms and bigger accounting firms, for example through matchmaking between SMEs or with (bigger) local companies, as this would enable SMEs to capture greater outsourcing opportunities in the local market, first in lower value added activities (such as bookkeeping functions) then higher up the value chain as capabilities develop.
(iv) Overcoming burdensome procedures and bureaucratic barriersReducing bureaucracy and simplifying and streamlining administrative
procedures generally can promote trade and investment and are particularly relevant for SMEs. Actions in this direction can include, for example, facilitating export and commercial contract law procedures and establishing single window facilities for handling administrative aspects associated with company registration and procedures.
In the case of Nicaragua, burdensome requirements were found to be correlated with informality among SME service providers in some service sectors. To overcome burdensome procedures and bureaucratic barriers, the study included recommendations such as:
• Reforming the Commercial Code to enable the use of electronic signatures.

Innovation and internationalization of Latin American services
169
• Creating a single window for all procedures required for tourism businesses to start operating; in a first stage, this one-stop shop could centralize the procedures considered most burdensome, such as those needing to be undertaken with municipalities, the health ministry (permits relating to food and beverages), the police and the tax administration, while less burdensome procedures, such as those relating to fire prevention (carried out with fire brigades) and operating licences (carried out with the Nicaragua Institute for Tourism), could be centralized in a second stage.
(b) TheexternalagendaInformation gaps and a lack of understanding of the functioning of
international markets affect SME decision-making about whether to embrace internationalization. Overcoming these constraints requires strategies aimed at developing demand. These strategies consist of supporting SMEs with market intelligence and commercial promotion (i.e., branding and marketing) aimed at facilitating their entry into international markets and increasing their awareness of export opportunities.
Peru’s experience in the software sector is a good example of commercial promotion and brand image promotion. PROMPERU, with the assistance of MINCETUR, has undertaken efforts to introduce current and potential exporters to other markets in several ways, such as:
• Providing commercial intelligence to help companies identify export opportunities; in recent years, PROMPERU has conducted market studies in several countries of the region, including Chile and Ecuador (software market profile), Argentina (software and computer services market profile) and Spain (video games market analysis), among others, with these studies containing evaluations of software, computer services and even video game markets.
• Leading on the design and publication of the Software Portfolio, a document that describes the Peruvian software industry, its representative suppliers and its offerings, providing some general statistics on the sector.
• Promoting the sector’s participation in a variety of trade missions and in domestic and international fairs to make Peruvian offerings known to potential clients in target markets.
For Peru, some suggestions were made for PROMPERU to further develop export promotion efforts, such as:

E C L A C / C O L E F
170
• Strengthening trade associations to enable them to provide advisory services regarding certification, branding and matchmaking.
• Capacity-building initiatives aimed at enhancing the ability of commercial attachés abroad to compile key information in order to promote the internationalization of companies in markets of interest and to facilitate competitive access to such markets, for example: (i) the fiscal regime and taxes applying to service activities; (ii) any regulatory barriers and restrictions on the activities of foreign providers; (iii) successful experiences in other countries with policies to support the development of sectors of interest and to promote export opportunities, as an input for PROMPERU and MINCETUR to consider their implementation in Peru; (iv) competition conditions for trade in services of priority interest to Peru.
• In the specific case of computer services, it was recommended that additional operative market plans should be developed for this sector, including interlinkages with services that are growing and require computer services (e.g., retail services), with a view to identifying further opportunities for the sector.
The analysis suggested that requirements relating to visas, licences and nationality and non-equivalence of qualifications were major trade barriers affecting services exports, in particular by hindering the movement of natural persons (mode 4). To take the case of Peru, such barriers were found to make it difficult, for example, for Peruvians to provide professional accounting services abroad. In the case of Colombia, the problem was that standards for legal, accounting, engineering, architecture and health services were higher in countries with which Colombia had signed free trade agreements than in Colombia itself. Box V.6 illustrates the specific case of cumulative conditions affecting access to the European Union (EU) market for Jamaican providers of entertainment services.
Ensuring that the skills and qualifications of both individual service suppliers and legal persons offering professional services are recognized by trading partners was identified as an important measure for overcoming regulatory barriers affecting trade in professional services. To achieve this, importance was given in the Peru SPR, for example, to promoting mutual recognition agreements in accounting services with existing free trade agreement partners and prioritizing key markets of interest to Peru (i.e., Latin American trade partners). Including clauses on temporary licensing schemes in ongoing and future trade negotiations was also deemed worth considering in this case.
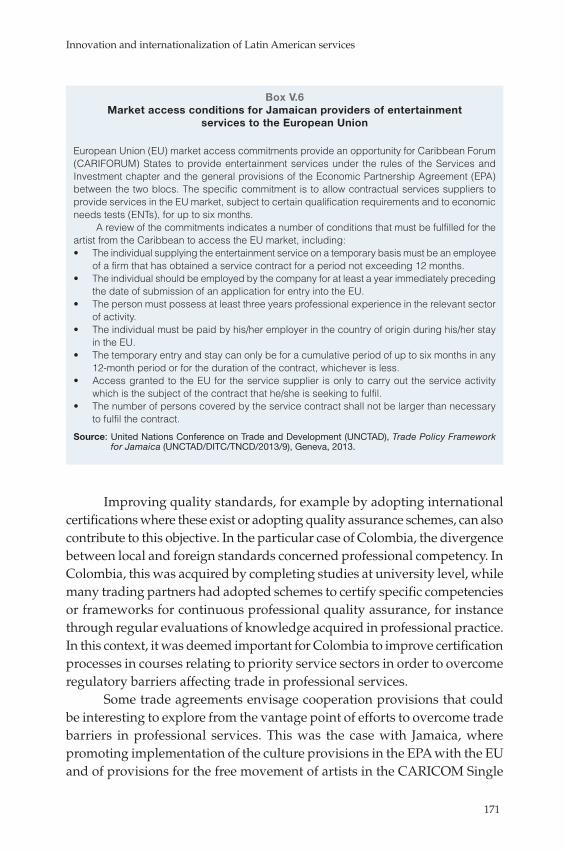
Innovation and internationalization of Latin American services
171
Box V.6 Market access conditions for Jamaican providers of entertainment
services to the European Union
European Union (EU) market access commitments provide an opportunity for Caribbean Forum (CARIFORUM) States to provide entertainment services under the rules of the Services and Investment chapter and the general provisions of the Economic Partnership Agreement (EPA) between the two blocs. The specific commitment is to allow contractual services suppliers to provide services in the EU market, subject to certain qualification requirements and to economic needs tests (ENTs), for up to six months.
A review of the commitments indicates a number of conditions that must be fulfilled for the artist from the Caribbean to access the EU market, including:• The individual supplying the entertainment service on a temporary basis must be an employee
of a firm that has obtained a service contract for a period not exceeding 12 months.• The individual should be employed by the company for at least a year immediately preceding
the date of submission of an application for entry into the EU.• The person must possess at least three years professional experience in the relevant sector
of activity.• The individual must be paid by his/her employer in the country of origin during his/her stay
in the EU.• The temporary entry and stay can only be for a cumulative period of up to six months in any
12-month period or for the duration of the contract, whichever is less.• Access granted to the EU for the service supplier is only to carry out the service activity
which is the subject of the contract that he/she is seeking to fulfil.• The number of persons covered by the service contract shall not be larger than necessary
to fulfil the contract.
Source: United Nations Conference on Trade and Development (UNCTAD), Trade Policy Framework for Jamaica (UNCTAD/DITC/TNCD/2013/9), Geneva, 2013.
Improving quality standards, for example by adopting international certifications where these exist or adopting quality assurance schemes, can also contribute to this objective. In the particular case of Colombia, the divergence between local and foreign standards concerned professional competency. In Colombia, this was acquired by completing studies at university level, while many trading partners had adopted schemes to certify specific competencies or frameworks for continuous professional quality assurance, for instance through regular evaluations of knowledge acquired in professional practice. In this context, it was deemed important for Colombia to improve certification processes in courses relating to priority service sectors in order to overcome regulatory barriers affecting trade in professional services.
Some trade agreements envisage cooperation provisions that could be interesting to explore from the vantage point of efforts to overcome trade barriers in professional services. This was the case with Jamaica, where promoting implementation of the culture provisions in the EPA with the EU and of provisions for the free movement of artists in the CARICOM Single
E C L A C / C O L E F
172
Market and Economy (CSME) were considered a potentially valuable way of promoting trade in entertainment services.
C. Concluding remarks
Innovation in services is important because it adds value, shapes new industries and sectors, restructures, creates new business models and contributes to improved competitiveness in global value chains. The countries analysed have experienced difficulties innovating in knowledge-intensive services and in processes associated with the design, monitoring and implementation of services policies. Overcoming these challenges requires action at other policy levels, including education, capacity-building through partnership schemes and certification, access to finance and to key infrastructure and ICT inputs, technology transfer and protection for innovation.
From a public policy perspective, internationalization strategies are important as a way of improving prospects and trade opportunities for domestic services providers. The analysis conducted by UNCTAD through SPRs has revealed the importance of prioritizing support targeted at SMEs, particularly with the aim of generating solid linkages with and between services SMEs.
Weaknesses affecting the internationalization of services enterprises, and particularly SMEs, related to (i) supply capacity (ii) burdensome procedures and bureaucratic barriers and (iii) commercial intelligence. Overcoming these weaknesses will require the design of appropriate incentives and support schemes to enhance the competitiveness of SMEs, strategies aimed at developing demand in international markets, and measures to identify and address trade barriers.
Innovation and internationalization of Latin American services
173
BibliographyCONPES/DNP (Colombia’s National Council for Economic and Social Policy/
National Planning Department) (2013), “Proyecto de documento CONPES sobre el fortalecimiento de la exportación de servicios”, Bogota.
Etemad-Sajadi, Reza (2008), “Internationalization of services firms: the case of computer related services”, PHD thesis in Management, University of Neuchatel.
European Commission (2012), The Smart Guide to Service Innovation, Brussels.
IDB (Inter-American Development Bank) (2010), Science, Technology, and Innovation in Latin America and the Caribbean: A Statistical Compendium of Indicators [online] https://publications.iadb.org/handle/11319/3393?locale-attribute=en#sthash.BovGOqgo.dpuf.
Mattoo, Aaditya, Leonardo Iacovone and Andrés Zahler (2013), “Trade and innovation in services. Evidence from a Developing Economy”, The World Economy, vol. 37, No.7.
UNCTAD (United Nations Conference on Trade and Development) (2013a), Services Policy Review of Peru (UNCTAD/DITC/TNCD/2013/11), Geneva.
(2013b), Services Policy Review of Nicaragua (UNCTAD/DITC/TNCD/2013/13), Geneva.
(2013c), Trade Policy Framework for Jamaica (UNCTAD/DITC/TNCD/2013/9), Geneva.
(2012), Entrepreneurship Policy Framework and Implementation Guidance, Geneva.
(2011a), Science, Technology and Innovation Policy Review of Peru (UNCTAD/DTL/STICT/2010/2), Geneva.
(2011b), A Framework for Science, Technology and Innovation Policy Review. Helping countries leverage knowledge and innovation for development (UNCTAD/DTL/STICT/2011/7), Geneva.
Uppenberg, Christian and Hubert Strauss (2010), Innovation and Productivity Growth in EU Services Sector, European Investment Bank.
WEF (World Economic Forum) (2014), Enhancing Europe’s Competitiveness: Fostering Innovation-driven Entrepreneurship in Europe.


Part I I I
Case studies on services innovation and internationalization

Chapter VI
The evolution of call centres and the implications for service quality and workforce management in Mexico
Alfredo Hualde Jordy Micheli
Summary
The advent and consolidation of the strategic role of call centres during the second half of the twentieth century was one of the socio-technical innovations that strengthened mass production based on new digital technologies in the service economy. The evolution and diversity of call centres since their inception in the 1960s has been marked by the pace of technological innovation and the adaptation of human functions.
In line with the above considerations, this paper presents the technological, organizational and occupational characteristics of call centres from an evolutionary perspective. The central element brought in to explain the limitations and potential of call centres is the metrics system, which sums up many of the current tensions between a standardized service economy, customers’ individual needs and the potential for satisfying these through new forms of organization, technological tools and professionalization
E C L A C / C O L E F
178
processes. The empirical work is based on industry data and an essentially qualitative research project funded by the National Council for Science and Technology (CONACYT) of Mexico.
Introduction
The advent and consolidation of the strategic role of call centres during the second half of the twentieth century was one of the socio-technical innovations that strengthened mass production based on new digital technologies in the service economy. The evolution and diversity of call centres since their inception in the 1960s has been marked by the pace of technological innovation and the adaptation of human functions. There were basically two milestones in the technological development of call centres in the early stages: computer-controlled call distribution (in the early 1970s) and the integration of the computer with the telephone (1990). The former allows calls to be answered in a steady flow, creating a form of mass production, while the latter permits the generation of individual information on the customer and selective service orientation (Micheli, 2006; Cossalter and Venco, 2006). The systems used in a third phase, currently under way, are intensifying this ability to pinpoint callers’ modes of consumption and making use of social networking technologies and digital traceability, as a result of which call centres are evolving to become contact centres.
The convergence between this industry and digital production media in work processes has meant that call centres are now also considered part of the emerging industry of business process outsourcing (BPO), a new industrial category of the information society that includes information and communications technologies (ICTs) in its value chain. Information technology development has thus made it possible to provide real-time services, accumulate large databases and increase overall business productivity (Messenger and Ghosheh, 2010).
Most definitions of a call centre have common elements revolving around communication, technologies and the purposes of the communication. One definition giving an idea of this characterizes a call centre as “a specialized office where agents remotely provide information, deliver services, and/or conduct sales, using some combination of integrated telephone and information technologies, typically with an aim to enhancing customer service while reducing organizational costs” (McPhail, 2002).
In line with the above considerations, this paper presents the technological, organizational and occupational characteristics of call centres
Innovation and internationalization of Latin American services
179
from an evolutionary perspective. The central element brought in to explain the limitations and potential of call centres is the metrics system, which sums up many of the current tensions between a standardized service economy, customers’ individual needs and the potential for satisfying these through new forms of organization, technological tools and professionalization processes. The empirical work is based on industry data and an essentially qualitative research project funded by the National Council for Science and Technology (CONACYT) of Mexico.1
To this end, the first section presents the main features of call centres as described by international studies, which underline the tension between service standardization and the need for quality. The second section provides an overview of the geography of call centres in Mexico and the characteristics of the workforce employed. The third section describes the characteristics of the metrics and their evolution. The fourth section includes some significant testimonials by workers regarding implementation of the metrics and their assessment of these. The paper ends with the conclusions of the study.
A. Employment growth at call centres in Mexico
The largest worldwide study on call centres (Holman, Batt and Holtgrewe, 2007), covering almost 2,500 call centres in 17 countries, mentions a set of general features that shed light on some of the characteristics of the sector during the first decade of the twenty-first century.2 They are establishments with an average age of eight years that mainly service national, regional or local (86%) markets, with international markets in the minority. The vast majority operate solely as voice centres rather than using multiple channels, although this trend has probably been changing. Call centres employ an average of 49 workers, although most agents (75%) work in establishments with 230 or more employees; managers make up only 12% of the total workforce, and 71% of the workers are female.
The report distinguishes two types of call centre: those targeting a mass market (mass market centres or MMCs), accounting for approximately 75%, and the remainder, designed to provide services for companies (business-to-
1 In the course of the research, undertaken to assess job insecurity and instability in three occupations from a diachronic perspective, a survey of 85 call centre workers (including some supervisors and trainers) was undertaken in three Mexican cities, while in-depth interviews were conducted with 35 workers (Guadarrama, Hualde and López, 2014).
2 The report covered almost 2,500 centres in 17 countries, with a total of 475,000 employees between them (Holman, Batt and Holtgrewe, 2007).
E C L A C / C O L E F
180
business centres). The results of this study indicate that working conditions are more favourable for workers in the second type of call centre. They offer a more specialized service, which permits greater employee discretion. Moreover, contracts and collective forms of action translate into clearer benefits for the workers employed (Weinkopf, 2009).
Although outsourcing is a characteristic attributed to call centres, two thirds of the establishments surveyed in the report are in-house operations or internal call centres. Once again, working conditions are less favourable when there is outsourcing. Lastly, the report distinguishes between private-sector and public-sector call centres.3
This tension between service quantity (which produces cost-based benefits) and quality is also mentioned in many other studies. Taylor and Bain (2005) distinguish three models of call centres: Taylorized ones, oriented towards mass production; others predominantly concerned with professional service provision; and a hybrid form of mass services in which there is also a concern to meet customers’ needs. According to Taylor and Bain (2005), there are subspecies of call centres. For their part, Kinnie and Purcel (2000, cited by Taylor and Bain, 2005) establish a contrast between call centres with a predominance of repetitive tasks and strict control, and others characterized by “relational” work whereby a negotiated interaction is established with customers. Some authors characterize call centres as hybrid systems: “The system is characterized by the coexistence of (mainly quantitative) bureaucratic-style controls originating in the information technology equipment and a set of (more qualitative) professional standards originating in the service objective” (Lanciano-Morandat and others, 2009).
Empirical evidence has made it possible to move forward with the identification of different types of tasks and remote work in which the relative importance assigned to quantitative and qualitative criteria in setting goals and evaluating results reveals activities with different characteristics.
3 As noted by Van Den Broek (2008), public health centres such as those studied by this author in Australia have particular features. Since the employees are nurses, it is more difficult to establish sharp differences between routine work and professionalized work. The study shows that the nurses continue using professional criteria based on their expertise in their field despite the rationalization of operations, which organizes work into disease protocols translated into algorithms to be used for diagnosis. In this case, however, the staff’s previous work experience is a more decisive factor than the nature of the call centre.

Innovation and internationalization of Latin American services
181
Table VI.1 Types of call centre
ClassificationBy market(Holman, Batt and Holtgrewe, 2007)
Mass market-oriented Business-to-business
By organizational type(Taylor and Bain, 2005)
Taylorized Professional services Mixed: Taylorized and customer service
By contract type In-house Outsourcing
By call type a Call centre inbound Call centre outbound
Source: Prepared by the authors.a Some centres combine both.
Research conducted internationally and in Mexico indicates that the forms of work organization and employment systems adopted by outsourcing call centres often lead to routine employment practices constrained by increasingly strict metrics. Particularly in outsourcing centres, which have been studied the most, there is a computerized neo-Taylorism where job insecurity and instability predominate. In everyday work, researchers have documented the rigidity and tight control businesses attempt to exert over users through the use of screens, metrics and other computerized procedures to assess quality and control time. However, the organization of call centres is not without paradoxes. On the one hand, employees’ educational attainment in industrializing countries like Mexico is usually high by the standards of local labour markets, suggesting that employees probably have the potential to perform more complex tasks and contribute to the development of innovations within the company. On the other, the standardization of service protocols conflicts with the need for customized and personalized treatment of customers (see below).
Nonetheless, this is an extremely attractive form of work for one sector of young people because schedules are flexible, allowing them to combine work and study. Some women with sick children or single mothers value the access to social security it provides, while certain adults over 50 regard it as a haven in a labour market with few opportunities (Hualde, Jurado and Tolentino, 2014).
B. Employment characteristics in Mexico
Calculating employment at call centres in Mexico is complicated since agents do not fit into a specific category in official statistics. The International Labour Organization (ILO), quoting the Mexican Institute of Teleservices (IMT), estimates that the number of jobs in Mexico around 2013 was 575,000, more

E C L A C / C O L E F
182
than India, which had 439,500 jobs, and slightly less than the Philippines, with 586,000 employees.4
As in other countries, the financial and telecommunications sectors are the ones that tend to use this type of service, although public agencies in the education sector, the Secretariat of Foreign Affairs and services assisting victims of crime are increasingly employing call centres to improve their services. The whole of Latin America, from Mexico to South America, is a key destination for investment in call centres, and increasing investments have recently been made in call centres in Colombia and Peru (IMT, 2015b).
In countries with emerging information societies, the call centre industry is an urban phenomenon (Micheli, 2012). In Mexico, it is mainly concentrated in the metropolitan area of Mexico City, Guadalajara, Monterrey and Tijuana, as shown in table VI.2, according to a survey by IMT of 230 call and contact centres.
Table VI.2 Geographical distribution of call centres in Mexicoa
State ExecutivesShare of all
executives in Mexico(percentages)
Number of contact centres
Mexico City Metropolitan Area 52 766 49 115
Nuevo León (Monterrey Metropolitan Area) 17 257 15 29
Baja California Norte (Mexicali and Tijuana) 7 852 7 12
Jalisco (Guadalajara Metropolitan Area) 7 537 6 15
Sonora (Hermosillo) 4 189 4 9
Puebla 4 674 4 7
Durango 3 100 3 3
Querétaro 2 459 2 8
Aguascalientes 2 600 2 4
Tlaxcala 1 000 1 1
Other 9 853 7 26
Total 118 323 100 210
Source: Mexican Institute of Teleservices (IMT), Contact Forum, No. 62, Mexico City, January-February 2015 [online] http://imt.com.mx/revistaCF/2015/01Enero/#8.
a Survey of 230 call and contact centres.
4 According to ILO several obstacles stand in the way of an accurate estimation of call centre jobs: “When industry bodies make estimates, they tend to combine voice-services employees with those in non -customer-facing back office activities, under Business Process Outsourcing (BPO), or Information Technology Enabled Services (ITES), as opposed to IT or software employment. Another statistical difficulty is that “in house” contact centre activity can be invisible within organizational structures and is often not externalized to a distinct site (ILO, 2015).
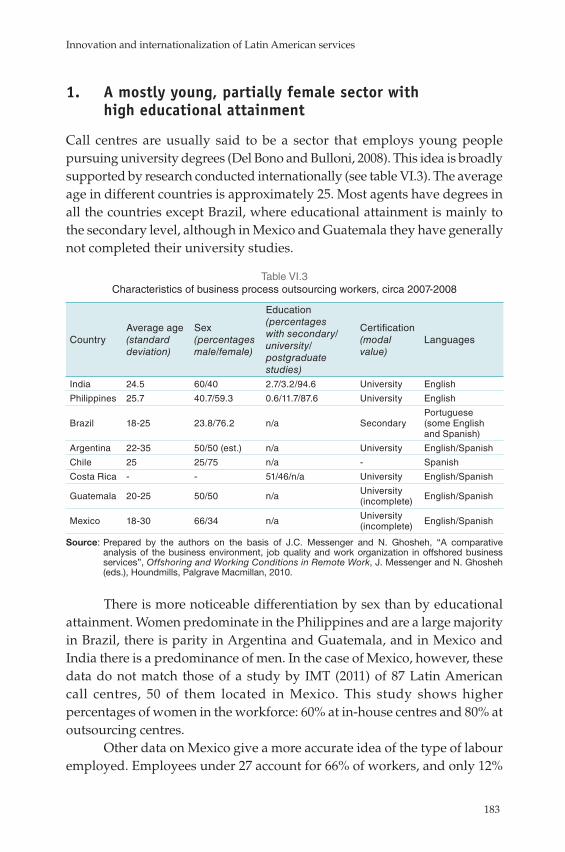
Innovation and internationalization of Latin American services
183
1. A mostly young, partially female sector with high educational attainment
Call centres are usually said to be a sector that employs young people pursuing university degrees (Del Bono and Bulloni, 2008). This idea is broadly supported by research conducted internationally (see table VI.3). The average age in different countries is approximately 25. Most agents have degrees in all the countries except Brazil, where educational attainment is mainly to the secondary level, although in Mexico and Guatemala they have generally not completed their university studies.
Table VI.3 Characteristics of business process outsourcing workers, circa 2007-2008
CountryAverage age(standard deviation)
Sex(percentages male/female)
Education(percentages with secondary/university/ postgraduate studies)
Certification (modal value)
Languages
India 24.5 60/40 2.7/3.2/94.6 University English
Philippines 25.7 40.7/59.3 0.6/11.7/87.6 University English
Brazil 18-25 23.8/76.2 n/a SecondaryPortuguese (some English and Spanish)
Argentina 22-35 50/50 (est.) n/a University English/Spanish
Chile 25 25/75 n/a - Spanish
Costa Rica - - 51/46/n/a University English/Spanish
Guatemala 20-25 50/50 n/a University (incomplete) English/Spanish
Mexico 18-30 66/34 n/a University (incomplete) English/Spanish
Source: Prepared by the authors on the basis of J.C. Messenger and N. Ghosheh, “A comparative analysis of the business environment, job quality and work organization in offshored business services”, Offshoring and Working Conditions in Remote Work, J. Messenger and N. Ghosheh (eds.), Houndmills, Palgrave Macmillan, 2010.
There is more noticeable differentiation by sex than by educational attainment. Women predominate in the Philippines and are a large majority in Brazil, there is parity in Argentina and Guatemala, and in Mexico and India there is a predominance of men. In the case of Mexico, however, these data do not match those of a study by IMT (2011) of 87 Latin American call centres, 50 of them located in Mexico. This study shows higher percentages of women in the workforce: 60% at in-house centres and 80% at outsourcing centres.
Other data on Mexico give a more accurate idea of the type of labour employed. Employees under 27 account for 66% of workers, and only 12%
E C L A C / C O L E F
184
are over 35.5 As for educational attainment, 54% are studying at university or have completed their university degrees and 44% have at least finished secondary school. In other words, virtually all call centre agents (98%) have completed at least upper secondary school, even though the percentage of the Mexican population with that level of educational attainment is only 27%. Other studies indicate a higher percentage of university students at call centres that are in-house departments or divisions of companies than at outsourcing centres, which is probably because career plans exist for employees at in-house call centres.
2. Stability and turnover
The predominance of young people who study at least part of the time is a conditioning (although not decisive) factor in labour relations because youth is a phase of instability and change in people’s lives. When this combines with the interests and objectives of transnational companies seeking flexibility and low labour costs, it results in high turnover, particularly among younger workers (IMT, 2011). As for the length of time spent in jobs in these sectors, it has been estimated that Indian BPO employees remain on average for less than half a year, with similar rates being recorded for Filipinos. The figure increases to two and a half years in Brazil, although 44% of Brazilian BPO employees had been in their jobs for less than a year (Messenger and Ghosheh, 2010). A survey of 19 call centres in Mexico estimated that annual turnover was 129.85% in outsourced call centres; turnover at in-house centres, by contrast, was estimated at 49.72% (IMT, 2015a).
The IMT study on human resources, in which Mexican call centres are strongly represented, yields different data for in-house and outsourcing call centres: 45% of agents at outsourcing centres had been working there for between 7 and 12 months and 32% for between 13 and 18 months, whereas at in-house call centres over half had been employed for over 18 months. This is therefore a sector characterized in both Mexico and similar countries by a relatively young workforce with high turnover. Employees of this kind are part of a socio-technical system whose characteristics are depicted below.
5 According to the IMT human resources study, agents are younger at outsourcing than at in-house centres.
Innovation and internationalization of Latin American services
185
C. The socio-technical system and metrics
1. The technological dimension
In the 1980s, the liberalization of industries such as telecommunications and the increasing emergence of financial product offerings that could be negotiated by telephone were important drivers of the call centre industry, and it became an essential part of the new service economy. Even in the 1990s, however, interactions continued to be by telephone, in convergence with evolving automatic call distributor (ACD) technology and the development of computer-to-telephony integration (CTI).6 This was also the period when customer relationship management (CRM) technology developed to provide an increased ability to maintain stable, lasting ties with customers, something that was becoming a priority owing to the development of the diverse markets served by call centres (Micheli, 2006 and 2012).
Since the beginning of the twenty-first century, CTI technology has facilitated the entry of call centres into social networks, and with the workforce constantly adapting to the various core technologies, agents tend to become real-time experts on issues that have even more immediacy than those traditionally dealt with by telephone or chat communications. The result could be the development of new social and professional skills among agents and a line of business management called social media management. Nevertheless, this is a trend and not yet a widespread practice: companies generally lack vision regarding the use of social technologies and it is widely recognized that this is a field that has yet to be analysed and rationalized (Micheli, 2014).
2. Metrics systems
Call centres are organizations that produce mass services. Their modus operandi therefore contains a productive rationality: they must generate
6 This trend is based on the central innovation of the technology, originally called voice over Internet protocol (VoIP) and also known as IP telephony, consisting of voice transmission over the Internet. This technology found an immediate application in call centres, basically because of new management capabilities allowing digital technology to be integrated into a firm’s operations, with these being reported on a centralized basis. Each teleoperator is monitored more efficiently and it is possible to integrate the teleoperator’s work process and information management, an aspect whose importance increases as information is required to feed into the data used for competition strategy.
E C L A C / C O L E F
186
effective contacts in a way that is time- and/or worker-efficient. That is their core business. Contacts lead to other economic activities on which the economic sustainability of the company using the call centre service depends. The evolution of these organizations revolves around this rationality, expressed in the metrics used. We can therefore understand this evolution by observing how the concern for efficiency is managed. Metrics link technological and work aspects (Hauser and Katz, 1998).
The evolution of call centres has grown from a simple core of links constituting the relationship between the labour force and communications technology via the telephone to encompass other key dimensions such as quality of service, the generation of information from the internal life of the organization and the markets served by the call centre, and of course the company’s economic management.
The technological leap that made it possible to rationalize personal contact was automatic call distribution, which introduced a costs and outcomes metrics. Call centres were therefore transformed into organizations that operated under what might be called a classic Taylorist scheme, designed to achieve faster production, standardization and cost reduction.
Call centres nowadays combine several operational functions aimed at the workforce: quality, technology, information management and reports, and economic and financial management (NAQC, 2010; callcentrehelper.com, 2012). The general metrics of a call centre within this organizational context will now be set out.
In the work-technology core, the goal is to measure the amount of work done and the economic result of this work. These are the efficiency indicators of a call centre. The agent’s basic work process depends on the variation in the number of contacts made in a context that must be taken into account: during a working day, the number of contacts has peaks and troughs. This variation is at the heart of the call centre’s labour and technological rationalization: the ways of managing the workforce and technological innovations must address these variations in making contacts while handling them efficiently with a minimum of time and maximum results.
The basic metric is an agent’s amount of working time spent making telephone contact and registering the activity, something that must be done immediately afterwards. This is a measure of the total time the agent works compared with the total time for which he or she is employed (the difference being the equivalent of downtime in traditional production), which makes it possible to determine whether the number of people hired was actually the number required. This accurately determines the labour cost factor, meaning
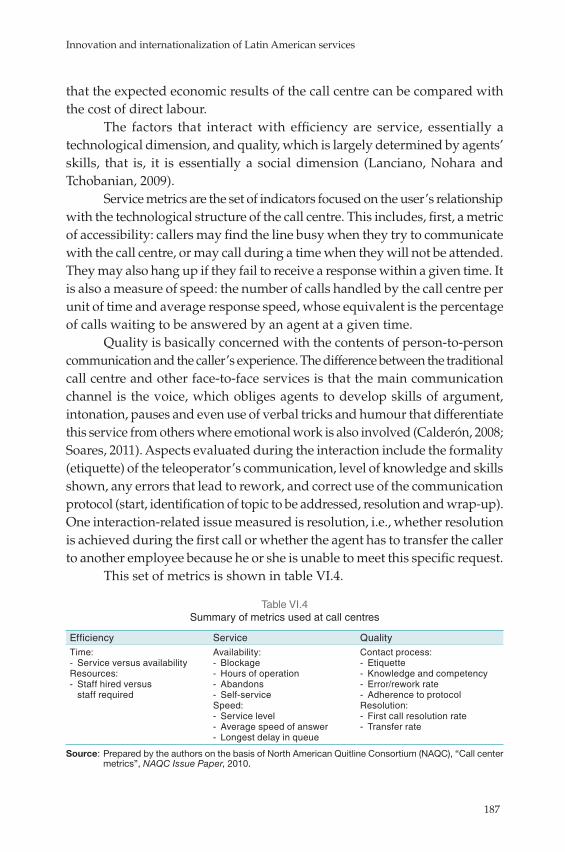
Innovation and internationalization of Latin American services
187
that the expected economic results of the call centre can be compared with the cost of direct labour.
The factors that interact with efficiency are service, essentially a technological dimension, and quality, which is largely determined by agents’ skills, that is, it is essentially a social dimension (Lanciano, Nohara and Tchobanian, 2009).
Service metrics are the set of indicators focused on the user’s relationship with the technological structure of the call centre. This includes, first, a metric of accessibility: callers may find the line busy when they try to communicate with the call centre, or may call during a time when they will not be attended. They may also hang up if they fail to receive a response within a given time. It is also a measure of speed: the number of calls handled by the call centre per unit of time and average response speed, whose equivalent is the percentage of calls waiting to be answered by an agent at a given time.
Quality is basically concerned with the contents of person-to-person communication and the caller’s experience. The difference between the traditional call centre and other face-to-face services is that the main communication channel is the voice, which obliges agents to develop skills of argument, intonation, pauses and even use of verbal tricks and humour that differentiate this service from others where emotional work is also involved (Calderón, 2008; Soares, 2011). Aspects evaluated during the interaction include the formality (etiquette) of the teleoperator’s communication, level of knowledge and skills shown, any errors that lead to rework, and correct use of the communication protocol (start, identification of topic to be addressed, resolution and wrap-up). One interaction-related issue measured is resolution, i.e., whether resolution is achieved during the first call or whether the agent has to transfer the caller to another employee because he or she is unable to meet this specific request.
This set of metrics is shown in table VI.4.
Table VI.4 Summary of metrics used at call centres
Efficiency Service QualityTime: - Service versus availability
Resources: - Staff hired versus staff required
Availability: - Blockage - Hours of operation - Abandons - Self-service
Speed: - Service level - Average speed of answer - Longest delay in queue
Contact process: - Etiquette - Knowledge and competency - Error/rework rate - Adherence to protocol
Resolution: - First call resolution rate - Transfer rate
Source: Prepared by the authors on the basis of North American Quitline Consortium (NAQC), “Call center metrics”, NAQC Issue Paper, 2010.
E C L A C / C O L E F
188
3. How are metrics related to the evolution of call centres?
Analytically, we can distinguish three phases in the development of call centres. One is linked to the expansion of the mass economy, with few restrictions on the growth of various markets, so that call centres should expand according to the market’s needs. The basic indicators are therefore those involving efficiency and, to a lesser extent, service.
In the second stage, service indicators become important because the level of social use of call centres is already significant and technology must cope with the growing demands of users. Obviously efficiency remains crucial. At the same time, the mass economy faces market saturation and creates a differentiation strategy (“customization”), and customer loyalty and retention become important. Call centres must perform an important function: individualizing the customer/user in a mass economy context. At this point, quality metrics and CRM technology emerge. The call centre can evaluate service and create customer information, while evaluating agents for efficiency and quality.
There is a third phase, the current one, in which the three areas of metrics remain valid in a context where information and communications technologies are developed and customers report their experience through channels such as chat rooms and social networks. As soon as an opportunity arises to expand the service with new communication channels and metrics, the call centre should use web analytics and new programs for tracking and retrieving network users’ digital footprints.
For call centres with contact activity in social networks, often called contact centres on the basis of this operating premise, the metrics that are beginning to emerge pose challenges. The indicators will now be looked at.
The recovery indicator is used when a negative post about the firm is detected and followed up until the caller is contacted and a relationship is established, making it possible to subsequently generate a neutral or positive post. The point is not to create a positive opinion but rather for the client to know that the firm is listening to him or her. If the client recognizes this situation, it is considered a recovery.
The tweet indicator assesses the number of tweets produced by the caller and the company, the aim being to achieve recovery by transferring communication to a channel where communication is more explicit, less conflictive and more manageable by the company, the preferred one obviously being the telephone.

Innovation and internationalization of Latin American services
189
Another indicator, first contact resolution in social networks, is based on the same principle as first call resolution in telephone communication, but two different types of customers must be attended to: those who only communicate via social networks, and those who come to them because they have exhausted all other possibilities.
Trends in the performance metrics of call centres are shown in table VI.5.
Table VI.5 The three economic phases and technologies employed at call centres
Economic stage
Expanding markets, Fordism
Market saturation, customization, customer-centred strategies
Information society, advanced services based on ICTs
Technologies ACD, analog telephony
ACD, CRM, VoIP, ACD, CRM, VoIP, data surveillance, web analytics, text analysis
Objectives of metrics
Direct management of workforce to reduce time and costs
Control of customer experience instruments
Management and control of customer comments and activity in social networks
Source: J. Micheli, “Call Centers: the Dynamic Relationship between ICT and Information Society”, 2014 [online] http://papers.ssrn.com/sol3/papers.cfm?abstract_id=2462546.
By adopting information and communications technologies and entering cyberspace, call centre operations became fully formed socio-technical systems of the information society. As part of this process, one of the functions they began to acquire through their quality and customization strategies became important: creating information on callers/customers and tracking them in cyberspace through their digital footprints.
In this paper, we treat metrics as a core analytical tool that explains many of the dynamics of the call centres established in Mexico. The study highlights the stresses caused by the implementation of “phase one” metrics and the way agents intuitively perceive and implement the practice of spontaneous customization or individualization by bending rigid protocols and personalizing their dealings with customers. At the same time, classifying calls as valid or invalid depending on their quality affects two aspects: the financial aspect, since bonuses largely depend on quality and organizational aspects, and the organizational aspect itself, because disputes over quality are a source of conflict between supervisors and agents in a context where employment practices and working conditions have good and bad points, as will be explained in the following section.

E C L A C / C O L E F
190
D. The dispute over quality measurement at Mexican call centres7
The process of calculating the income of call centre agents has a number of peculiarities. For one thing, schedules vary from company to company, from campaign to campaign and even from week to week. The second factor to consider is bonuses, which largely depend on quality and may account for 20% to 30% of an agent’s total income. Losing the bonus may lead the agent to resign.
According to a unrepresentative survey (part of the research mentioned in the Introduction) conducted in 2010 among 85 employees in three Mexican cities, namely Mexico City, Monterrey and Tijuana, average pay, including supervisors and trainers, totalled approximately US$ 500 a month. The Mexican Association of Teleservices estimated that the fixed wage at outsourcing centres was US$ 350 a month and the variable portion $150. At in-house centres, it was estimated at US$ 450 and US$ 250, respectively.
Bonuses are calculated by applying metrics and are one of the aspects that cause disputes between supervisors and agents. In some cases, the bonus is measured purely quantitatively by the number of calls answered. The person with the most calls is paid the full bonus, and this is followed by progressively smaller amounts, while the person who has produced least has a certain amount deducted from their salary.
When metrics, especially qualitative ones, are strictly applied, workers perceive that their performance has been judged to be substandard, and their dissatisfaction with the evaluations increases, as they consider these metrics to be too rigid. According to a worker interviewed, 25% to 30% of the evaluations carried out are not clearly described in the manual and are based on personal criteria. This makes him very uncomfortable and he regards it as manipulative (Jorge, interview, 2010). The respondent still loves his work and tries to provide a good service, but metrics, he says, are the main obstacle “to giving my best”.
This respondent’s opinion summarizes much of the tension that permeates call centres’ work and organization. The need to meet quantitative
7 This section is based on the qualitative occupational research undertaken. It shows the importance agents attach to bonuses in deciding whether or not to remain at a call centre. The tension between call quality, rigid protocols and the consequences for the payment of bonuses was mentioned by several employees. This result tallies with the findings of the international literature, which is why we consider it an important focus of analysis.
Innovation and internationalization of Latin American services
191
targets may conflict with the obligation agents are or should be under to give customers a high-quality service. Routine, standardized work may come into conflict with the personalized work needed to meet a customer’s specific needs. There is a tension between the provisions in protocols and the real situations that arise in the management of the product or the service being sold or consumed.
This dissatisfaction leads to suspicion and even accusations against supervisors, in this case over what the company calls “abandons”, a collective failure to answer all the calls coming into the call centre. The method involves creating teams of 20 agents who are jointly responsible for answering a number of calls and rewarded or punished on the basis of the group’s results. An agent from Tijuana who was dismissed from a call centre says that quality was the pretext for her dismissal, although this was impossible to prove.
Quality is always the field defined by metrics, and the way they are used and the link between metrics and pay is a source of tension in any organization. In call centres, it is palpable. Although the views quoted here only represent those of teleoperators, they are indicative of labour relations where conflicts with supervisors are fairly common despite managers’ attempts to improve the situation.
E. Conclusions
Our study of call centres has focused on evolution and diversity in the socio-technical systems that characterize the service economy and their convergence with the information society. We have reviewed the major stages in the evolution of these production systems, observing the waves of technological change and the various roles played by call centres, with the subsequent professional adaptation of their workforce.
A key aspect we have tried to show is the evolution of the metrics used in call centres as a codified system of labour rationalization and a basic tool for evaluating job performance from the standpoint of expected “quality”. This system of rationalization is synthesized in the evolution of technological and occupational aspects whose successive stages indicate the importance and functionality of call centres in the economy since the last century.
Our review of the labour situation in the industry in Mexico over recent years allows us to examine the contentious issues involved in metrics and the construction of “quality” in these production systems, and suggests a complex professional life that is far removed from simplistic interpretations of it as routine work for young people during a short period in their lives.
E C L A C / C O L E F
192
Lastly, in the light of the evolution of both technological and occupational aspects, we point to the formation of a new model for call centres, increasingly referred to as contact centres, which use the tools of the information society to interact with people, in conjunction with more traditional functions based on telephone contact. Given this development, it is possible to hypothesize that professionalization could lead to new career paths. What emerges is a more complex and varied industry of socio-technical systems of calls and contacts whereby the production of certain services is integrated into the information society.
BibliographyCalderón, J.A. (2008), “Trabajo, subjetividad y cambio social: rastreando el trabajo
emocional de las Teleoperadoras, Cuadernos de Relaciones Laborales, vol. 26, No. 2, Madrid, Complutense University of Madrid.
Callcentrehelper.com (2012), “The Top 10 Most Important Call Centre Metrics” [online] http://www.callcentrehelper.com/the-top-10-most-important-contact-centre-metrics-30432.htm.
Cossalter, C. and S. Venco (2006), “Les centres d’appels dans les banques en France et au Brésil”, Travail et Emploi, No. 105.
Del Bono, A. and M.N. Bulloni (2008), “Experiencias laborales juveniles: los agentes telefónicos de call centers offshore en Argentina”, Trabajo y Sociedad, vol. 9, No. 10.
Guadarrama, R., A. Hualde and S. López (2014), La precariedad laboral en México. Dimensiones, dinámicas y significados, Tijuana, El Colegio de la Frontera Norte/Universidad Nacional Autónoma Metropolitana-Unidad Cuajimalpa.
Hauser, John R. and Gerald M. Katz, 1998, “Metrics: You are what you Measure!” [online] http://web.mit.edu/~hauser/www/Papers/Hauser-Katz%20Measure%2004-98.pdf
Holman, D., R. Batt and U. Holtgrewe (2007), The Global Call Center Report: International Perspectives on Management and Employment (Executive Summary) [online] http://digitalcommons.ilr.cornell.edu/cgi/viewcontent.cgi?article=1011&context=reports.
Hualde, A., M. Jurado and H. Tolentino (2014), “Los significados del trabajo y su relación con los call center”, La precariedad laboral en México. Dimensiones, dinámicas y significados, Tijuana, El Colegio de la Frontera Norte/Universidad Nacional Autónoma Metropolitana-Unidad Cuajimalpa.
Innovation and internationalization of Latin American services
193
ILO, (2015) Employment relationships in telecommunications services and in the call centre industry. Issues paper for discussion at the Global Dialogue Forum on the Employment Relationships in Telecommunications Services and in the Call Centre Industry, Geneva, 27 28 October 2015 .Sectoral Policies Department. International Labour Office, Geneva [online], http: //http://www.ilo.org/wcmsp5/groups/public/---ed_dialogue/---sector/documents/publication/wcms_409415.pdf.
IMT (Mexican Institute of Teleservices) (2014), “Censo Nacional de Agencias de Servicios de Contact Center y BPO” [online] http://www.imt.com.mx/revistaCF/2014/01Enero/files/assets/common/downloads/publication.pdf.
(2011), “Censo Nacional de Agencias, IMT Research” [online] www.imt.com.mx/pdf/estudios/IMTC-NA2011.pdf.
(2015a), “Sueldos y compensaciones en centros de contacto”, IMT Research [online] http: //http://www.imt.com.mx/pdf/estudios/Sueldos Comp2015.pdf.
(2015b), Contact Forum, No. 62, Mexico City, January-February.
Jorge [interview] (2010) by Edward Jensen García, [fieldwork], “Heterogeneidad ocupacional, precariedad laboral y diferencias de género en México”, Tijuana, El Colegio de la Frontera Norte.
Kinnie, N., S. Hutchinson and J. Purcell (2000), “Fun and surveillance”: the paradox of high commitment management in call centers”, The International Journal of Human Resources Management, vol. 11, No. 5, Taylor & Francis.
Lanciano-Morandat, C., H. Nohara and R. Tchobanian (2009), “Les centres d’appel en France: mobilisation et mobilité des salariés face à un système hybride de travail”, Économies et Sociétés. Série Socio-économie du Travail, vol. 43, No. 9.
McPhail, B. (2002), “What is “On the Line” in Call Centre Studies? A Review of Key Issues in the Academic Literature”, University of Toronto [online] http://citeseerx.ist.psu.edu/viewdoc/download?doi=10.1.1.95.840&rep=rep 1&type=pdf.
Messenger, J. and N. Ghosheh (2010), “A comparative analysis of the business environment, job quality and work organization in offshored business services”, Offshoring and Working Conditions in Remote Work, J. Messenger and N. Ghosheh (eds.), Houndmills, Palgrave Macmillan.
Micheli, J. (2014), “Call Centers: the Dynamic Relationship between ICT and Information Society” [online] http://papers.ssrn.com/sol3/papers.cfm?abstract_id=2462546.
(2012), “El sector de call centers: estructura y tendencias. Apuntes sobre la situación de México”, Frontera Norte, vol. 24, No. 47 [online] http://www.colef.mx/fronteranorte/articulos/FN47/6-f47.pdf.
E C L A C / C O L E F
194
(2006), “El trabajo en la sociedad de la información. El caso ilustrativo del telemercadeo”, Estudios Sociológicos, vol. 24, No. 70.
NAQC (North American Quitline Consortium) (2010), “Call center metrics”, NAQC Issue Paper [online] http://c.ymcdn.com/sites/www.naquitline.org/resource/resmgr/issue_papers/callcentermetricspaperbestpr.pdf.
Soares, A. (2011), “Tao longe, tao perto. O trabalho no sector do servicios”, Revista Latino-Americana de Estudos do Trabalho, year 16, No. 26.
Taylor, P. and P. Bain (2005), “India calling to the far away towns: the call centre labour process and globalization”, Work, Employment & Society, vol. 19, No. 2, SAGE.
Van Den Broek, D. (2008), “´Doing things right’, or ‘doing the right things’? Call centre migrations and dimensions of knowledge”, Work, Employment & Society, vol. 22, No. 4, SAGE.
Weinkopf, C. (2009), “Job quality in call centres in Germany”, International Labour Review, vol. 128, No. 4.
Chapter VII
Revealing the spillover effects of foreign direct investment on offshore services
in Costa Rica
Yoshimichi Murakami René A. Hernández1
Summary
This paper uses the global value chain (GVC) approach to explore upgrading paths in the offshore services industry for Costa Rica. It seeks to identify the spillover effects of Costa Rica’s inward foreign direct investment (FDI) on domestic firms, analysing the country’s absorptive capacity, the development of technological capabilities and the existence of backward and forward linkages. The main findings suggest that the positive impacts of FDI and offshoring in terms of human capital, technological capabilities, employment
1 The authors are deeply grateful to Mikio Kuwayama, Jorge Mario Martínez and Pierre Sauvé for their insightful comments and constructive suggestions, and to two anonymous external evaluators. They are also grateful to Jean Carlo Calderón for providing data from the Foreign Trade Corporation of Costa Rica (PROCOMER) and to Natalia Morales for providing data from the National Household Survey (ENAHO). The opinions expressed in this paper are the sole responsibility of the authors and do not necessarily reflect those of the United Nations. Any remaining errors are their own.
E C L A C / C O L E F
196
and productivity depend on whether a recipient country has an innovation and knowledge system in place to foster backward linkages and induce technological spillovers across the entire economy. The chapter concludes by suggesting a renewed industrial policy and arguing that FDI may well be an important source of upgrading.
Introduction
Attracting foreign direct investment (FDI) has been one of the key ingredients of the export-led model and trade liberalization policies adopted in the last three decades in the developing countries of Latin America and the Caribbean. FDI and the consequent integration of the region into global value chains (GVCs) and global production networks (GPNs) were initially favoured by the fragmentation or “unbundling” of the production process at the global level, and in particular by the existence of export processing zones (EPZs) and maquila (assembly for re-export) regimes, particularly in Mexico and Central America. In recent years, some of these regimes have been updated and modified in conformity with World Trade Organization (WTO) agreements.
This chapter uses the global value chain (GVC) approach to explore upgrading paths in Costa Rica’s offshore services industry. It also looks at high-end manufacturing GVCs in electronics, medical devices, the automotive industry, aeronautics and aerospace, and film broadcasting devices. It then goes on to identify the spillover effects of inward FDI on Costa Rica’s domestic firms and development strategy, analysing the country’s absorptive capacity, the development of technological capabilities and the existence of backward and forward linkages in the production matrix.
Offshore services in Latin America are becoming one of the main drivers of structural change and include information technology outsourcing (ITO), business process outsourcing (BPO) and knowledge process outsourcing (KPO), as well as industry-specific services (Hernández and others, 2014).
Offshoring refers to the international fragmentation of services production, something that has been proceeding apace in many developing countries, notably India but also Latin American and Caribbean countries since the 2000s. This chapter argues that offshore services can be a new driver of structural change and an alternative to specialization in natural

Innovation and internationalization of Latin American services
197
resources, especially for countries in South America. Some countries, such as Chile, Costa Rica and Uruguay, produce well-educated workers who can engage in many of the tasks required in knowledge- or skill-intensive service industries. The region’s location advantages, such as time zones matching those of the United States, relatively low transportation costs and growing political stability of late, all provide great opportunities for the development of this sector.
Costa Rica, whose main product basket was limited to a number of commodities such as coffee and bananas two decades ago, has succeeded in diversifying its exports: the number of goods exported by the country increased from 2,907 in 1996 to 4,473 in 2013 (ECLAC, 2014). The major new export products include electronics, medical devices and business services. An important feature of Costa Rica is that the principal driver of this transformation was the selective policies introduced to attract FDI, with FDI inflows increasing by 13% a year from 1990 to 2012 (ECLAC, 2014). Moreover, FDI destination sectors have tended to be highly export-oriented, with a correlation of 0.858 between export values and FDI inflow values during 1980-2010 (Martínez and Hernández, 2012). The figures suggest that FDI recipient sectors have succeeded in engaging in higher value-added activities, including offshore services.
The chapter is organized as follows. After this Introduction, section A reviews the existing literature on FDI, GVC analysis and offshore services. Section B pinpoints the determinants of FDI and offshoring, the impacts thereof and the upgrading paths of offshore services in Costa Rica. Section C presents the conclusions and a set of policy recommendations.
A. Literature review and conceptual framework
1. Determinants of FDI
GVCs for offshore services are determined to some extent by the dynamics and paths of FDI in developing countries. In general, the literature defines offshoring as the shifting of production activities abroad. This can occur through two channels. Firstly, offshoring of goods or services can be achieved by relocating production from a parent company to its foreign affiliates (“captive offshoring”). Secondly, it can be achieved by outsourcing provision of services, including manufacturing services, to local suppliers or third-party
E C L A C / C O L E F
198
providers (“foreign outsourcing”) (UNCTAD, 2004). Thus, the first type of offshoring requires FDI by the outsourcing firms.2
The determinants of FDI can be analysed from the viewpoint of firms’ strategies or of investment typologies. According to the well-known analytical framework proposed by Dunning (1979), a firm will engage in FDI if three conditions are in place, namely ownership-specific advantages, location-specific advantages and internalization advantages. Ownership-specific advantages largely take the form of the possession of intangible assets such as knowledge, technology and management or research and development (R&D) capacity that are, at least for a period of time, exclusive or specific to the firm possessing them and thus can be a source of competitiveness.3
Second, location-specific advantages relate to immobile, natural or man-made endowments outside a firm’s home country (e.g. the spatial distribution of inputs and markets, input prices, labour quality and productivity, energy, materials and components, transport and communications costs, tariffs and non-tariff barriers, the investment climate and infrastructure) which make the specific foreign country attractive for FDI. Internalization advantages concern variables which make it more beneficial for firms to internalize their activities because they can thereby avoid market failures (e.g. transaction and negotiating costs and buyer uncertainty). Otherwise, they will externalize their activities through licensing and similar contracts with third-party providers and so not require FDI, as discussed above.4
In sum, there are three major determinants of FDI as defined in this chapter: whether a firm possesses net ownership advantages vis-à-vis firms of other nationalities, whether it is more beneficial for the firm possessing these advantages to use them for itself, and whether utilizing these advantages in conjunction with the advantages of recipient countries is in fact profitable.
2 Outsourcing refers to an organization contracting out activities in the production process to another company, while offshoring refers to it externalizing activities in a different country, usually to attain cost advantages. It is possible to outsource work but not offshore it, for example by hiring an outside firm to review contracts instead of maintaining an in-house human resources staff. It is also possible to offshore work but not outsource it; for example, Toshiba may use a customer service centre in India to serve customers in Latin America. It is likewise possible to offshore outsourcing, this being the practice of hiring a firm to do the work offshore, usually in order to lower costs and take advantage of the firm’s expertise, economies of scale and large and scalable labour pool.
3 Markusen (2002) calls intangible assets “knowledge capital”.4 This is the case with the second type of offshoring (foreign outsourcing).
Innovation and internationalization of Latin American services
199
2. FDI impacts
The literature identifies possible FDI impacts on the following variables in recipient countries: growth, human capital and employment, international trade, inflation, real exchange rates, financial flows, and the balance of payments. This section will discuss three major channels through which FDI impacts growth, namely fixed investment, human capital formation and employment, and total factor productivity (TFP) (Cubero, 2006; Martínez and Hernández, 2012).
(a) Fixed investmentFDI affects gross capital formation in recipient countries through two
channels. The first is the direct impact from fixed investment by foreign firms. Although such investment is treated as synonymous with FDI, the actual flows of FDI are different from fixed investment in any given country and period. FDI can be used not only for fixed investment but also to finance current expenditures and acquire existing assets, as in the case of mergers and acquisitions (M&A). Moreover, the foreign firm can finance its capital formation through sources other than FDI, such as reinvested earnings or bank borrowing. Therefore, FDI flows may be higher or lower than fixed investment. The data available show that FDI inflows going to United States affiliates are larger than their fixed investment, except for those going to African countries during 1999-2001 (Cubero, 2006).
The second channel is the impact FDI has on capital expenditure by domestic firms. The relationship between FDI and domestic firms’ fixed investment may be complementary or substitutive depending on the characteristics of the operations of foreign affiliates, the efficiency of local firms and the characteristics of factor markets in recipient countries (Cubero, 2006). FDI might have positive impacts on domestic investment (i.e. the relationship could be complementary) through the following channels. First, if FDI entails increasing demand or a requirement for higher-quality intermediate goods, foreign firms may stimulate investment by local providers (backward linkages). Second, if foreign firms provide better and cheaper inputs for the development of new products, they may induce investment among their purchasers (forward linkages). Third, competition with foreign firms could entice domestic firms to invest in order to increase their productivity (horizontal linkages). Finally, if FDI drives national output and income growth, it may also have dynamic indirect effects on investment through its impact on aggregate demand (multiplier effects) (Cubero, 2006).
E C L A C / C O L E F
200
On the other hand, FDI might have negative impacts on domestic investment (i.e. the relationship could be substitutive). First, if foreign firms have productivity advantages or receive fiscal incentives from host governments, competing against them in the product market could reduce the real and expected profits of local companies and thence their capital expenditures.5 Second, FDI may crowd out domestic investment by reducing marginal returns to capital and exerting upward pressure on wages or, alternatively, by absorbing scarce resources (e.g. minerals, skilled workers and access to credit). These negative effects of FDI on capital expenditures by domestic firms could also be worsened if the backward linkages of domestic firms are replaced by imports from foreign firms (Cubero, 2006).
(b) Human capital and employmentFDI affects human capital in the recipient country. First, foreign
firms provide training to their affiliates’ employees. This training is usually associated with the introduction of new knowledge or equipment and new processes. There is considerable evidence that foreign firms provide training especially to senior managers at their local firms, and knowledge transfer occurs through labour turnover or productive linkages (Cubero, 2006). Second, foreign firms sometimes provide financial, technical and curricular assistance to universities and technical colleges in the recipient countries. Intel in Costa Rica is an example of this. Intel has not only invested heavily in the training of its own workforce but has also supported educational programmes at public universities. As a result of this collaboration, there have been improvements in curriculums and teacher training in technical subjects and a significant increase in enrolment in technical fields at public universities (Rodríguez-Clare, 2001). Third, FDI also has an impact on human capital formation on the demand side. Foreign firms increase demand for specific skilled workers and send signals about the need and opportunities for specific skills in educational markets (Blömstrom and Kokko, 2002).
The impact of FDI on employment and wages derives from other transmission mechanisms associated with its effects on growth, especially those relating to capital formation, because the expansion of capital stock leads to an increase in employment and higher wages, irrespective of ownership. However, FDI has more of a positive impact on wages than domestic investment, for the following two reasons. First, existing evidence shows that
5 This occurred in the Bolivarian Republic of Venezuela during 1976-1989, for example (Aitken and Harrison 1999).
Innovation and internationalization of Latin American services
201
foreign firms tend to have higher productivity and thus pay higher wages than domestic firms, after controlling for firms’ observable characteristics, industrial organization and worker skills. Second, this increase in wages forces domestic firms to increase pay in order to retain and recruit workers (Cubero, 2006).
(c) Total factor productivityFDI can also contribute to economic growth through an increase in
total factor productivity (TFP). As a general rule, foreign firms have higher productivity than domestic firms, because they own specific advantages and can tap a specific set of technological capabilities in order to compete with the latter, as discussed in the previous section. Therefore, FDI has potential externalities. These are of two types. First, there are pecuniary externalities, which are transmitted by market mechanisms (i.e. prices and quantities), through either market competition or purchases and sales of inputs (Cubero, 2006). Positive pecuniary externalities arise from backward linkages between foreign and domestic firms as intermediate inputs are purchased from domestic firms (Cubero, 2006). On the other hand, negative pecuniary externalities derive from a decline in the output of domestic firms as a result of the intensified competition with foreign firms, as discussed in the section on the impacts of FDI on domestic investment (Aitken and Harisson, 1999). The second type are pure externality effects (spillover effects) in the form of the diffusion of knowledge or technology that is not exclusive to foreign firms by the nature of the goods but can be freely applied by domestic firms (Cubero, 2006). Such diffusion may occur simply as a result of demonstration effects where there are foreign firms nearby. More directly, it may occur because staff from foreign firms move to domestic firms, or the former provide on-the-job training for the latter (Aitken and Harisson, 1999).
3. The global value chain (GVC) approach
Baldwin (2011) argues that globalization driven by lower information and communications technology (ICT) costs is fundamentally different from globalization driven by lower trade costs. Although pre-1980s globalization was mostly attributable to falling trade costs, high coordination costs persisted during the period. This was because coordinating production processes requires complex exchanges of goods at different stages, technology, people, training, investment and information (Baldwin, 2012). However, the post-1985 ICT revolution radically reduced such coordination costs and thus enabled firms located in different geographical areas or countries to be engaged in the
E C L A C / C O L E F
202
same production process.6 Moreover, the wage gaps between developed and developing countries made separating off some segments of the production process from the former to the latter sufficiently profitable (Baldwin, 2012). Therefore, the reduced coordination costs resulting from the ICT revolution and continued wage gaps allowed for the possibility of production sharing or “vertical specialization” at all stages across countries. Such trends explain the recent intensification of production fragmentation and the international dispersion of tasks in a globalized world.
(a) The fragmentation of production processes and the emergence of GVCsThe fragmentation of production processes has also led to the emergence
of borderless production systems. They can be sequential chains or complex networks that are functionally coordinated by leading transnational corporations (TNCs) (UNCTAD, 2013). GVCs are defined by “fragmented supply chains, with internationally dispersed tasks and activities coordinated by a lead firm (TNC)” (UNCTAD, 2013). The value chain concept encompasses “the full range of activities which are required to bring a product or service from conception, through the intermediary phases of production (involving a combination of physical transformation and the input of various producer services), delivery to final consumers, and final disposal after use” (Kaplinsky, 2000). Thus, GVCs are configured around a specific product to which all value added activities, from the initial stage of design through to sale or disposal, are linked (UNIDO, 2004). This means that one specific GVC can consist of different companies participating in the production process.
The activities of companies are also internationally dispersed and functionally organized by a flagship firm; some knowledge-intensive activities of GVCs, such as R&D, design and marketing, are separated from the value chain as a whole and often performed by global production networks (GPNs) that consist of the flagship firm and local suppliers (UNIDO, 2004). From the viewpoint of a particular firm, a GPN brings many of the same activities as GVCs; GPNs are configured around a specific flagship firm and local firms which participate in a variety of GVCs. For example, Solectron, a flagship firm which is the world’s largest electronics service company, together with 53 local suppliers in the Americas, Asia-Pacific and Europe, participates in various GVCs which produce electronic products such as
6 Baldwin (2011 and 2012) calls the globalization attributable mainly to trade costs the “first unbundling” and the globalization driven by the ICT revolution the “second unbundling”.
Innovation and internationalization of Latin American services
203
automotive, communications, computing and storage, consumer, industrial and medical products (UNIDO, 2004). The activities of GVCs and GPNs are thus intertwined; a product-specific GVC consists of various segments of GPNs, while a firm-specific GPN consists of various segments of GVCs.
(b) GVC governance The governance of GVCs, that is, the relationship between a TNC
and local suppliers in the value chain, depends on (i) the complexity of inter-firm transactions, (ii) the ability to codify transactions (i.e. the degree to which this complexity can be mitigated through codification) and (iii) the capabilities of local suppliers. According to whether the values for these three determinants are high or low, the following five types of GVC governance are currently found (Gereffi, Humphrey and Sturgeon, 2005; UNIDO, 2004) (see table VII.1) .
(i) Market-based relationships arise when transactions are easily codified, product specifications are relatively simple and local suppliers can provide their products with few inputs from the TNC (Gereffi, Humphrey and Sturgeon, 2005). In this case, TNCs need not internalize their activities within their affiliates, and market prices are the central governance mechanism. This type of governance is seen in the incorporation of primary commodities such as coffee and bananas into GVCs (UNIDO, 2004). Accordingly, transactions do not involve FDI, and the positive spillover effects of FDI cannot be expected to be associated with such activities.
(ii) Modular relationships arise when product manufacturing is compartmentalized in order to comply with technological standards, the ability to codify specifications extends to complex products, and local suppliers have the competence to supply full packages and modules (Gereffi, Humphrey and Sturgeon, 2005; UNIDO, 2004). In this case, since codified knowledge is transferred from a TNC to local suppliers, complex information can be exchanged with little explicit coordination, and thus switching customers and suppliers involves relatively low costs (Gereffi, Humphrey and Sturgeon, 2005).
(iii) Relational value chains arise when transactions are complex and local capabilities are strong, but product specifications cannot be codified. This mutually dependent relationship is managed through reputation, social and spatial proximity and family and ethnic ties between a TNC and local suppliers (Gereffi, Humphrey and

E C L A C / C O L E F
204
Sturgeon, 2005; UNIDO, 2004). This type of governance is seen in technological collaboration which requires complementary skills among different producers (e.g. joint assemblers in the electronics and automobile industries) (UNIDO, 2004). In this case, since the sharing of complex information is mainly accomplished by face-to-face interaction and requires high levels of explicit coordination, switching customers and suppliers involves relatively high costs (Gereffi, Humphrey and Sturgeon, 2005).
(iv) Captive value chains arise when the ability to codify transactions and the complexity of product specifications are both high, but the capabilities of local suppliers are low. In this case, TNCs outsource their activities to local suppliers but tightly monitor and control lower-quality suppliers. The relationship becomes captive because TNCs try to prevent others from reaping the benefits without incurring the monitoring costs. This type of governance is typically seen in basic assembly processes which depend on TNCs for complementary activities such as design, logistics, component purchasing and process technology upgrading (Gereffi, Humphrey and Sturgeon, 2005; UNIDO, 2004).7
(v) Vertically integrated hierarchies arise when products are complex, product specifications cannot be codified and the capabilities of local suppliers are low. In this case, TNCs internalize activities within their affiliates and the relationship requires direct control of wholly-owned foreign affiliates by the head offices of the TNC (Gereffi, Humphrey and Sturgeon, 2005; UNIDO, 2004). Therefore, this type of governance involves FDI by definition, as discussed in section A.1.
The typologies of GVC governance set out above (i.e. market, modular, relational, captive and hierarchical) are shown in table VII.1. Such governance may involve anything from high to low levels of explicit coordination (i.e. non-market forms of coordination of economic activity) and power asymmetries (i.e. dependence of local suppliers on TNCs). Gereffi, Humphrey and Sturgeon (2005) show that current GVC governance paths are not unique, but depend on information complexity, tension between codification and innovation within industries, and supplier competence.
7 Although we use the term “captive”, the type of offshoring involving captive value chains is not “captive offshoring” but “foreign outsourcing”, as discussed in section A.1. The term thus needs to be interpreted with caution.
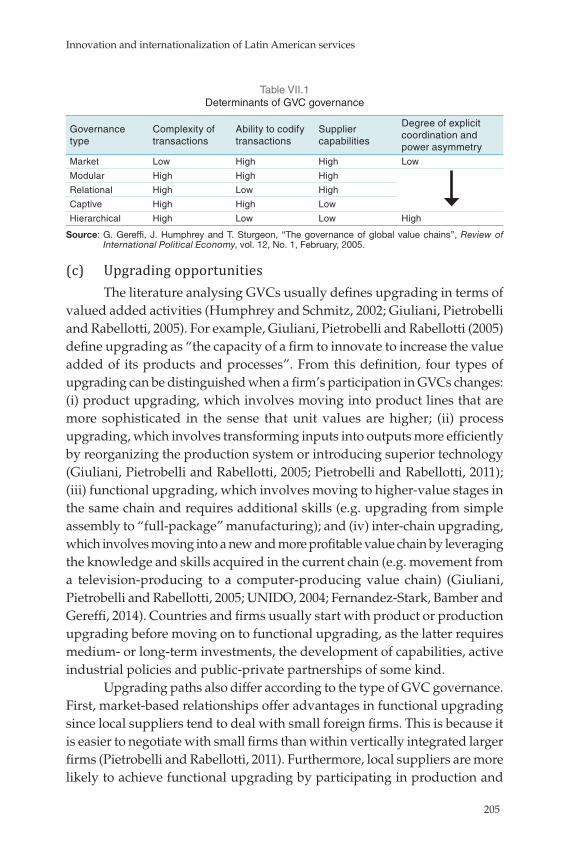
Innovation and internationalization of Latin American services
205
Table VII.1 Determinants of GVC governance
Governance type
Complexity of transactions
Ability to codify transactions
Supplier capabilities
Degree of explicit coordination and power asymmetry
Market Low High High Low
Modular High High High
Relational High Low High
Captive High High Low
Hierarchical High Low Low High
Source: G. Gereffi, J. Humphrey and T. Sturgeon, “The governance of global value chains”, Review of International Political Economy, vol. 12, No. 1, February, 2005.
(c) Upgrading opportunitiesThe literature analysing GVCs usually defines upgrading in terms of
valued added activities (Humphrey and Schmitz, 2002; Giuliani, Pietrobelli and Rabellotti, 2005). For example, Giuliani, Pietrobelli and Rabellotti (2005) define upgrading as “the capacity of a firm to innovate to increase the value added of its products and processes”. From this definition, four types of upgrading can be distinguished when a firm’s participation in GVCs changes: (i) product upgrading, which involves moving into product lines that are more sophisticated in the sense that unit values are higher; (ii) process upgrading, which involves transforming inputs into outputs more efficiently by reorganizing the production system or introducing superior technology (Giuliani, Pietrobelli and Rabellotti, 2005; Pietrobelli and Rabellotti, 2011); (iii) functional upgrading, which involves moving to higher-value stages in the same chain and requires additional skills (e.g. upgrading from simple assembly to “full-package” manufacturing); and (iv) inter-chain upgrading, which involves moving into a new and more profitable value chain by leveraging the knowledge and skills acquired in the current chain (e.g. movement from a television-producing to a computer-producing value chain) (Giuliani, Pietrobelli and Rabellotti, 2005; UNIDO, 2004; Fernandez-Stark, Bamber and Gereffi, 2014). Countries and firms usually start with product or production upgrading before moving on to functional upgrading, as the latter requires medium- or long-term investments, the development of capabilities, active industrial policies and public-private partnerships of some kind.
Upgrading paths also differ according to the type of GVC governance. First, market-based relationships offer advantages in functional upgrading since local suppliers tend to deal with small foreign firms. This is because it is easier to negotiate with small firms than within vertically integrated larger firms (Pietrobelli and Rabellotti, 2011). Furthermore, local suppliers are more likely to achieve functional upgrading by participating in production and
E C L A C / C O L E F
206
marketing networks coordinated by small foreign firms (Humphrey and Schmitz, 2000). Second, captive value chains (i.e. quasi-hierarchical value chains) offer favourable conditions for process and product upgrading but may prevent functional upgrading (Humphrey and Schmitz, 2002).8 This is because local suppliers in GVCs are usually confined to simple assembly, as discussed above, and discouraged from engaging in higher-value stages such as design, branding, marketing and sales (Pietrobelli and Rabellotti, 2011). Third, vertically-integrated hierarchies can be expected to improve the human technical skills derived from FDI, as discussed in sections A.1 and A.2 (Pietrobelli and Rabellotti, 2011).
Increasing value added is a necessary but not sufficient condition for upgrading. This is because increasing value added while losing market share or decreasing value added while raising market share can be considered ambiguous results; thus, higher value added with an increasing market share is the necessary and sufficient condition for upgrading (ECLAC, 2008).9 For example, those export products that saw their market share increase in the Latin America and Caribbean region between 1990 and 2002 have not been involved in the generation of higher value added, which means that the number of upgrading products has been smaller than the number of downgrading products in most Latin American and Caribbean countries, the exceptions being Brazil and Mexico.
For upgrading to be accomplished, the absorptive capacity of the recipient country, involving its national innovation system (NIS), technological capabilities and productivity, needs to be durably strengthened.10 First, Pietrobelli and Rabellotti (2011) discuss how NISs and GVCs interact and how this interaction is likely to affect upgrading paths. They conclude that a well-structured and efficient NIS would help to reduce transaction costs and the complexity of transactions, promoting a transition from captive or hierarchical to market-based GVC governance and thereby increasing the probability of local innovation, functional upgrading and domestic firm-led value chains. Second, Fagerberg and Srholec (2008) find positive relationships
8 Although Humphrey and Schmitz (2002) use the term “quasi-hierarchical value chains”, it is equivalent to “captive value chains” (see Gereffi, Humphrey and Sturgeon, 2005).
9 Conversely, decreasing value added and declining market share can be regarded as “downgrading”.
10 The concept of the “national innovation system” or “national system of innovation” was originally introduced by Freeman (1974) and elaborated by Lundvall (1992). It was used in the 1980s to explain differences in the innovation performance of industrialized countries (ECLAC, 2011). ECLAC (2011) provides an analytical framework for national innovation systems based on a large body of literature.
Innovation and internationalization of Latin American services
207
between technological capability and governance indicators and per capita GDP levels in cross-country analyses.11 Third, Crespi and Zuñiga (2010) conclude from firm-level analyses in six Latin American and Caribbean countries that technical innovation as measured by per worker expenditures on innovation activities positively correlates with labour productivity after controlling for selection bias and endogeneity. The findings of the above studies suggest that NISs, technological capabilities and productivity interact in such a way as to eventually affect productivity and bring about economic growth.
GVC analysis is also frequently used in the analysis of economic development, with two key channels being identified. The first application is for new actors, with the analysis mapping out the role played by each individual economic actor in the global economy (Fernandez-Stark, Bamber and Gereffi, 2014). GVC analysis also allows the actor to distinguish between the external and internal constraints it faces in the upgrading process (Farfan, 2005). Through this methodology, every new actor, including SMEs and firms from developing countries, are able to compete at the global level to find new business opportunities and overcome difficulties and constraints. The second application of GVC analysis is for countries which already participate in global industries, as it is also a good way to segment the global industry in these cases. Therefore, those countries which are already in the GVC framework can further strengthen their position in the global market by finding their own niche within the industry (Fernandez-Stark, Bamber and Gereffi, 2014). This methodology is particularly useful for policymakers.
4. The offshore services industry
Traditionally, most services were deemed non-tradable because they required simultaneous production and consumption. However, the progress of ICTs has allowed services tasks to be codified, standardized and digitalized and has thus in part resolved the problem of transportability (UNCTAD, 2004). Moreover, developments in the telecommunications industry in many developing countries, as well as increased transportability of services and considerable wage differentials in similar occupations between one developing country and another and between developed and developing countries (e.g.
11 Each indicator is constructed by factor analysis. Patenting, scientific publications, ICT infrastructure, international standards and access to finance are dominant factors in technological capabilities. Adherence to property rights, a well-functioning judicial system, little corruption and a favourable environment for business are dominant factors of governance.

E C L A C / C O L E F
208
between India and the United States) have facilitated service provision from developing countries, such as information provided through call centres and data entry via software programming. Therefore, services have also become internationally fragmented between providers, with consumers taking advantage of differences in labour costs as well as in labour quality and productivity and market scales, as happens with FDI (GAO, 2004; UNCTAD, 2004). Offshoring is defined as “the provision of services from a location outside the country where the customer is located” (ECLAC, 2009). Offshore services include a broad range of activities such as information technology outsourcing (ITO), business process outsourcing (BPO), knowledge process outsourcing (KPO) and other industry-specific services (ECLAC, 2009).12
The development of offshore services has differed with the type of lead firm (foreign affiliates or third-party providers). First, there are the captive operations of the foreign affiliates of United States and European TNCs such as Citibank, General Electric and Unilever, developed in the early 1990s (ECLAC, 2009; Fernandez-Stark, Bamber and Gereffi, 2011). Second, third-party providers from developed countries, such as Accenture (United States), CapGemini (France), EDS (now HP enterprises, United States), IBM (United States) and Teleperformance (France), which were sold off by the affiliates of other TNCs pursuing cost reductions, started to operate in India in the mid-1990s; they were also established in Eastern and Central Europe and the Philippines in the early 2000s and have grown rapidly in the Latin America and Caribbean region since the mid-2000s. For example, Latin America and the Caribbean accounts for 23% of Teleperformance’s total payroll (Fernandez-Stark, Bamber and Gereffi, 2014). Third, third-party providers from India such as Infosys, Tata Consultancy Services (TCS) and Wipro began to grow rapidly in the late 1990s, aiming at United States markets where many Indian firms had established connections with TNCs. TNCs also began to outsource activities of this type in Latin America and the Caribbean during the 2000s, with Infosys establishing operations in Mexico, TCS in Argentina, Brazil, Chile, Colombia, Mexico and Uruguay, and Wipro in Brazil (Fernandez-Stark, Bamber and Gereffi, 2011 and 2014). Fourth, local providers from developing countries also started to export IT-related services in the early 2000s, targeting Latin American and Caribbean markets. Although they still have low capabilities compared to other third-party providers from developed countries and India, a few firms have emerged as large and sophisticated providers, such as CPM Braxis and Politec of Brazil,
12 See ECLAC (2009, p. 84) for further details.

Innovation and internationalization of Latin American services
209
Softtek and Neoris of Mexico and Sonda of Chile (Fernandez-Stark, Bamber and Gereffi, 2011).
Offshore services grew rapidly in Latin America and the Caribbean during the 2000s, providing decent jobs in the region. The crucial determinants when it comes to attracting offshore services have been location-specific advantages such as the availability of well-educated workers at relatively low cost and the recent growth of political stability, along with incentives to promote FDI implemented by the region’s governments and the cost reduction strategies of TNCs (Fernandez-Stark, Bamber and Gereffi, 2014). Offshore services have become important economic sectors in the Latin America and Caribbean region, especially for small countries, representing 4.6% of GDP in Costa Rica and 2.6% in Uruguay, and absorbing 1.3% of the total labour force in both Costa Rica and Uruguay in 2008, much as in India and the Philippines (Fernandez-Stark, Bamber and Gereffi, 2014).
The GVC framework is useful for identifying how firms and countries participate in offshore services and where they can perform value added activities. The process whereby firms, countries or regions move to higher-value activities in GVCs is called upgrading, as discussed above (Fernandez-Stark, Bamber and Gereffi, 2014). Upgrading paths in offshore services can take two forms, horizontal and vertical. Horizontal upgrading describes a move to higher value added activities in GVCs across all industries. Vertical upgrading describes a shift to more industry-specific activities.
The horizontal services (i.e. general business services) that are provided across all industries are classified into three segments according to the upgrading level. The first is ITO, which is found across the spectrum from low to high value chains and includes infrastructure, software, IT consulting and software R&D. The second is BPO, which involves low and middle segments of value chains and includes enterprise resource management (ERM), consisting of content and document management, procurement, logistics and supply chain management, and finance and accounting; human resource management (HRM), consisting of recruiting, payroll, talent management and training; and customer relationship management (CRM), consisting of contact centres and call centres, and marketing and sales. The third is KPO, which involves the highest-value segment of value chains and includes business consulting, business analytics, market intelligence and legal services (Gereffi and Fernandez-Stark, 2010; Fernandez-Stark, Bamber and Gereffi, 2011 and 2014).
Vertical services include a variety of activities that are not linked to general business services and require industry-specific knowledge of
E C L A C / C O L E F
210
limited applicability to other services. These services range from low to high value added activities. Examples include pharmaceutical R&D, industrial engineering and medical transcription (Gereffi and Fernandez-Stark, 2010; Fernandez-Stark, Bamber and Gereffi, 2011).
Five main upgrading paths for offshore services can be identified. The first is entering the value chain, which is usually done by establishing call centre operations. The second is upgrading within the BPO segment, for example by moving from call centre operations into higher value added services such as finance and accounting (ERM), training (HRM) and customer relationship management (CRM) or specific niche industries. The third is offering full package services, which means specializing in a range of activities that include some BPO services. The fourth is expanding from ITO into KPO, which means extending IT services to include KPO activities such as business consulting performed by IT firms. Lastly, the fifth is specializing in vertical industries, which involves a group of activities focused on specific industries in order to develop expertise, with the firms concerned developing ties to leading production industries and specific niche areas in the recipient countries (Fernandez-Stark, Bamber and Gereffi, 2011 and 2014).
Although workforce developments and new technological capabilities (e.g. the creation of new skills through education and training) contribute to country-level upgrading, the operations of TNCs that provide higher value added products or services can also lead to country-level upgrading in a specific country (Fernandez-Stark, Bamber and Gereffi, 2011). In other words, FDI may well be an important source of upgrading. Setting out from this, we can link FDI and offshore services by introducing value chain analysis, with the interaction between agents, institutions and policies determining upgrading paths in GVCs within this framework.
B. Offshore services in Costa Rica
This section will review the development of offshore service industries in Costa Rica before going on to discuss the determinants of FDI and offshoring, FDI impacts, and upgrading paths for offshore services, using the conceptual framework set out in section A.
The offshore services industry in Costa Rica is growing in importance as an economic sector, representing 4.6% of GDP in 2008 and 5.8% in 201313
13 For the purposes of these data, the offshore services industry consists of communications services, computer and information services, and other business services. The figures are authors’ calculations based on data from WTO (2015).
Innovation and internationalization of Latin American services
211
and absorbing 1.3% of the total labour force in 2011 (Fernandez-Stark, Bamber and Gereffi, 2013). These figures are quite high by comparison with India and the Philippines, the two leading countries in offshore services, where the industry represents 4.0% and 3.6% of GDP and absorbs 0.47% and 1.22% of the total labour force, respectively.
According to the Costa Rican Investment Promotion Agency (CINDE), Costa Rica is one of the most suitable locations for offshoring and outsourcing services in the region, with more than 100 multinational companies currently operating in the country. The Global Competitiveness Report 2014-2015 identifies Costa Rica as the country with the greatest potential for innovation and sophistication factors in the Latin America and Caribbean region (WEF, 2014). The 2014 Global Retail Development Index ranked Costa Rica among the top seven global services locations in the Latin America and Caribbean region, while in 2013 fDi Intelligence, a division of the Financial Times, ranked the country’s capital, San José, among the top seven cities for future inward FDI in the Latin America and Caribbean region, and Tholons ranked San José as the region’s top outsourcing city in the Top 100 Outsourcing Destinations ranking for 2015.
1. FDI impacts and trends
(a) The determinants and impacts of FDIIn the case of Costa Rica, FDI inflows are basically driven by location-
specific and efficiency-seeking advantages rather than natural resource- or market-seeking ones. Labour costs (i.e. input prices of labour) are another fundamental determinant of inward FDI (Martínez and Hernández, 2012). On the other hand, market size and natural resources (i.e. the spatial distribution of inputs and markets) do not determine or explain the investments of TNCs in Costa Rica because the domestic market is too small and Costa Rica is not abundantly endowed with natural resources compared with other countries in the Latin America and Caribbean region.
With regard to other pull factors, we do not consider internalization advantages because we do not find clear evidence of this type of motivation for FDI in the case of Costa Rica. In sum, Costa Rica has attracted cost-optimizing or efficiency-seeking FDI in offshore services. Moreover, the Costa Rican offshore services industry primarily involves foreign affiliates —in other words, FDI. For example, 61% of back office services, currently the main segment of BPO services, involve captive centres (Fernandez-Stark,

E C L A C / C O L E F
212
Bamber and Gereffi, 2013). Thus, the determinants of offshore services are also explained to some extent by those of FDI. In fact, it is also the cost reduction motive that fundamentally attracts offshore services to the country, whose economic and political stability, well-educated workforce (including, for example, workers who are bilingual in English and Spanish) and close proximity to the United States Central Time Zone have all likewise helped to enhance its attractiveness for offshore service industries (Fernandez-Stark, Bamber and Gereffi, 2013).
As the analysis in section A.2 suggests, the following FDI-derived effects can be observed. First, rising FDI has compensated for the country’s low rate of investment, contributing an estimated 15% to 35% of gross fixed capital formation (an average of 24.0%) during 2000-2012 (ECLAC, 2013; Central Bank of Costa Rica, 2014a). The ratio of FDI flows to gross fixed capital formation is relatively high in Mexico and the Central American countries, because countries where FDI focuses on export-oriented manufacturing and services tend to have much lower ratios than small commodity-dependent South American countries such as Chile and the Plurinational State of Bolivia (ECLAC, 2011). Second, FDI has created a skilled labour force and higher-paid jobs. Despite the cost-optimizing strategies of TNCs investing in Costa Rica, average wages in free economic zones are higher than the average wages of technical and professional workers in the country. Workers in these zones earned US$ 1,287.1 per month on average in 2012 (see table VII.2), while the country’s technical and professional workers earned US$ 1,118.4 per month on average in 2013, so that the former enjoyed a 15.1% earnings premium in comparison with the highest-paid occupational category in the country.14 Moreover, average wages in the country’s free economic zones are highest in service sectors, where workers were paid an average of US$ 1,554.9 per month in 2012 (see table VII.2). Therefore, average wages in the free economic zones are substantially higher than those of technical and professional workers in the country as a whole and highest of all in the service sectors in these zones.
14 Wages by occupational category are calculated from the National Household Survey (ENAHO), while the figures for wages in the free economic zones are provided by the Foreign Trade Corporation of Costa Rica (PROCOMER). The exchange-rate data are from the Central Bank of Chile [online] http://www.bccr.fi.cr/indicadores_economicos_/Tipos_cambio.html, accessed on August 29, 2014.
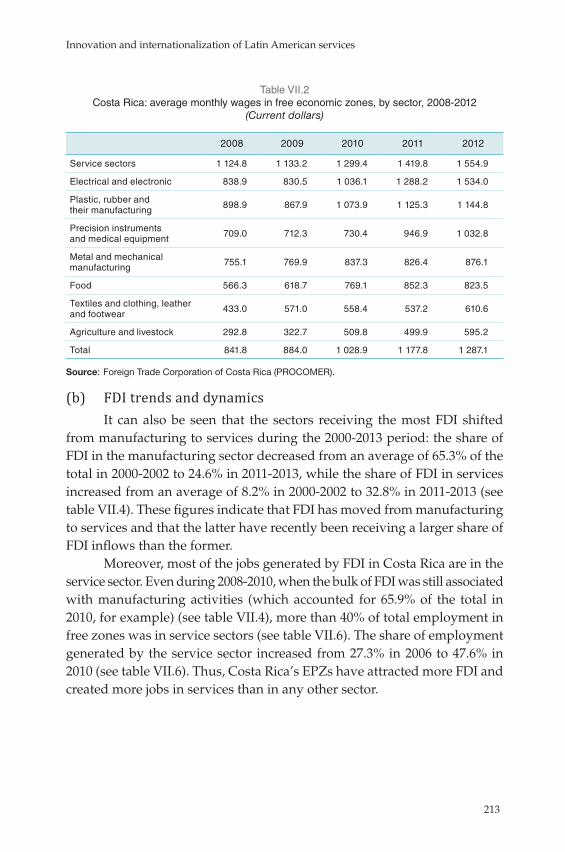
Innovation and internationalization of Latin American services
213
Table VII.2 Costa Rica: average monthly wages in free economic zones, by sector, 2008-2012
(Current dollars)
2008 2009 2010 2011 2012
Service sectors 1 124.8 1 133.2 1 299.4 1 419.8 1 554.9
Electrical and electronic 838.9 830.5 1 036.1 1 288.2 1 534.0
Plastic, rubber and their manufacturing 898.9 867.9 1 073.9 1 125.3 1 144.8
Precision instruments and medical equipment 709.0 712.3 730.4 946.9 1 032.8
Metal and mechanical manufacturing 755.1 769.9 837.3 826.4 876.1
Food 566.3 618.7 769.1 852.3 823.5
Textiles and clothing, leather and footwear 433.0 571.0 558.4 537.2 610.6
Agriculture and livestock 292.8 322.7 509.8 499.9 595.2
Total 841.8 884.0 1 028.9 1 177.8 1 287.1
Source: Foreign Trade Corporation of Costa Rica (PROCOMER).
(b) FDI trends and dynamicsIt can also be seen that the sectors receiving the most FDI shifted
from manufacturing to services during the 2000-2013 period: the share of FDI in the manufacturing sector decreased from an average of 65.3% of the total in 2000-2002 to 24.6% in 2011-2013, while the share of FDI in services increased from an average of 8.2% in 2000-2002 to 32.8% in 2011-2013 (see table VII.4). These figures indicate that FDI has moved from manufacturing to services and that the latter have recently been receiving a larger share of FDI inflows than the former.
Moreover, most of the jobs generated by FDI in Costa Rica are in the service sector. Even during 2008-2010, when the bulk of FDI was still associated with manufacturing activities (which accounted for 65.9% of the total in 2010, for example) (see table VII.4), more than 40% of total employment in free zones was in service sectors (see table VII.6). The share of employment generated by the service sector increased from 27.3% in 2006 to 47.6% in 2010 (see table VII.6). Thus, Costa Rica’s EPZs have attracted more FDI and created more jobs in services than in any other sector.
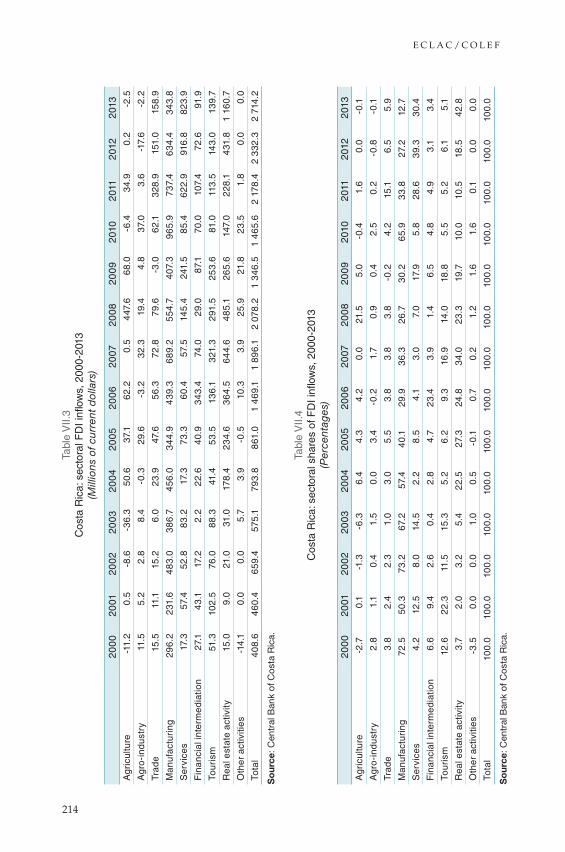
E C L A C / C O L E F
214
Tabl
e V
II.3
Cos
ta R
ica:
sec
tora
l FD
I infl
ows,
200
0-20
13(M
illio
ns o
f cur
rent
do
llars
)
20
00
2001
2002
2003
200
420
05
200
620
0720
08
200
920
1020
1120
1220
13A
gric
ultu
re-1
1.2
0.5
-8.6
-36.
350
.637
.162
.20.
54
47.6
68.
0-6
.43
4.9
0.2
-2.5
Agr
o-i
ndus
try
11.5
5.2
2.8
8.4
-0.3
29.6
-3.2
32.3
19.4
4.8
37.0
3.6
-17.
6-2
.2
Trad
e15
.511
.115
.26.
023
.947
.656
.372
.879
.6-3
.062
.132
8.9
151.
015
8.9
Man
ufac
turi
ng29
6.2
231.
64
83.
03
86.
74
56.0
34
4.9
43
9.3
68
9.2
554.
74
07.3
96
5.9
737.
46
34.
43
43.
8
Ser
vice
s17
.357
.452
.88
3.2
17.3
73.3
60.
457
.514
5.4
241.
58
5.4
622.
991
6.8
823.
9
Fin
anci
al in
term
edia
tion
27.1
43.
117
.22.
222
.64
0.9
34
3.4
74.0
29.0
87.1
70.0
107.
472
.691
.9
Tour
ism
51.3
102.
576
.08
8.3
41.4
53.5
136.
132
1.3
291.
525
3.6
81.0
113.
514
3.0
139.
7
Rea
l est
ate
activ
ity
15.0
9.0
21.0
31.0
178.
423
4.6
36
4.5
64
4.6
48
5.1
265.
614
7.0
228.
14
31.8
1 16
0.7
Oth
er a
ctiv
ities
-14.
10.
00.
05.
73.
9-0
.510
.33.
925
.921
.823
.51.
80.
00.
0
Tota
l4
08.
64
60.
46
59.4
575.
179
3.8
861
.01
46
9.1
1 8
96.
12
078.
21
34
6.5
1 4
65.
62
178.
42
332
.32
714.
2
So
urce
: Cen
tral
Ban
k of
Cos
ta R
ica.
Tabl
e V
II.4
Cos
ta R
ica:
sec
tora
l sha
res
of F
DI i
nflow
s, 2
000-
2013
(Per
cent
ages
)
20
00
2001
2002
2003
200
420
05
200
620
0720
08
200
920
1020
1120
1220
13A
gric
ultu
re-2
.70.
1-1
.3-6
.36.
44.
34.
20.
021
.55.
0-0
.41.
60.
0-0
.1
Agr
o-i
ndus
try
2.8
1.1
0.4
1.5
0.0
3.4
-0.2
1.7
0.9
0.4
2.5
0.2
-0.8
-0.1
Trad
e3.
82.
42.
31.
03.
05.
53.
83.
83.
8-0
.24.
215
.16.
55.
9
Man
ufac
turi
ng72
.550
.373
.267
.257
.44
0.1
29.9
36.
326
.73
0.2
65.
93
3.8
27.2
12.7
Ser
vice
s4.
212
.58.
014
.52.
28.
54.
13.
07.
017
.95.
828
.63
9.3
30.
4
Fin
anci
al in
term
edia
tion
6.6
9.4
2.6
0.4
2.8
4.7
23.4
3.9
1.4
6.5
4.8
4.9
3.1
3.4
Tour
ism
12.6
22.3
11.5
15.3
5.2
6.2
9.3
16.9
14.0
18.8
5.5
5.2
6.1
5.1
Rea
l est
ate
activ
ity
3.7
2.0
3.2
5.4
22.5
27.3
24.8
34.
023
.319
.710
.010
.518
.542
.8
Oth
er a
ctiv
ities
-3.5
0.0
0.0
1.0
0.5
-0.1
0.7
0.2
1.2
1.6
1.6
0.1
0.0
0.0
Tota
l10
0.0
100.
010
0.0
100.
010
0.0
100.
010
0.0
100.
010
0.0
100.
010
0.0
100.
010
0.0
100.
0
So
urce
: Cen
tral
Ban
k of
Cos
ta R
ica.
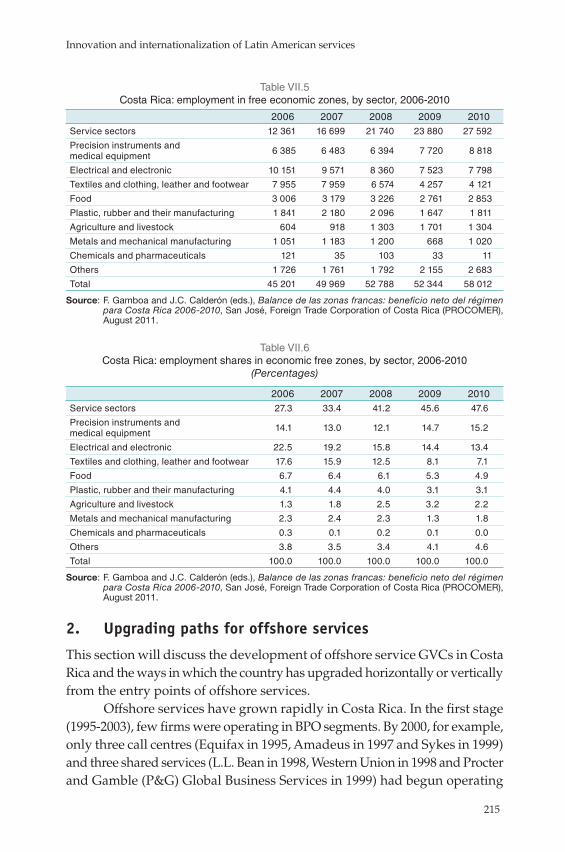
Innovation and internationalization of Latin American services
215
Table VII.5 Costa Rica: employment in free economic zones, by sector, 2006-2010
2006 2007 2008 2009 2010Service sectors 12 361 16 699 21 740 23 880 27 592
Precision instruments and medical equipment 6 385 6 483 6 394 7 720 8 818
Electrical and electronic 10 151 9 571 8 360 7 523 7 798
Textiles and clothing, leather and footwear 7 955 7 959 6 574 4 257 4 121
Food 3 006 3 179 3 226 2 761 2 853
Plastic, rubber and their manufacturing 1 841 2 180 2 096 1 647 1 811
Agriculture and livestock 604 918 1 303 1 701 1 304
Metals and mechanical manufacturing 1 051 1 183 1 200 668 1 020
Chemicals and pharmaceuticals 121 35 103 33 11
Others 1 726 1 761 1 792 2 155 2 683
Total 45 201 49 969 52 788 52 344 58 012
Source: F. Gamboa and J.C. Calderón (eds.), Balance de las zonas francas: beneficio neto del régimen para Costa Rica 2006-2010, San José, Foreign Trade Corporation of Costa Rica (PROCOMER), August 2011.
Table VII.6 Costa Rica: employment shares in economic free zones, by sector, 2006-2010
(Percentages)
2006 2007 2008 2009 2010Service sectors 27.3 33.4 41.2 45.6 47.6
Precision instruments and medical equipment 14.1 13.0 12.1 14.7 15.2
Electrical and electronic 22.5 19.2 15.8 14.4 13.4
Textiles and clothing, leather and footwear 17.6 15.9 12.5 8.1 7.1
Food 6.7 6.4 6.1 5.3 4.9
Plastic, rubber and their manufacturing 4.1 4.4 4.0 3.1 3.1
Agriculture and livestock 1.3 1.8 2.5 3.2 2.2
Metals and mechanical manufacturing 2.3 2.4 2.3 1.3 1.8
Chemicals and pharmaceuticals 0.3 0.1 0.2 0.1 0.0
Others 3.8 3.5 3.4 4.1 4.6
Total 100.0 100.0 100.0 100.0 100.0
Source: F. Gamboa and J.C. Calderón (eds.), Balance de las zonas francas: beneficio neto del régimen para Costa Rica 2006-2010, San José, Foreign Trade Corporation of Costa Rica (PROCOMER), August 2011.
2. Upgrading paths for offshore services
This section will discuss the development of offshore service GVCs in Costa Rica and the ways in which the country has upgraded horizontally or vertically from the entry points of offshore services.
Offshore services have grown rapidly in Costa Rica. In the first stage (1995-2003), few firms were operating in BPO segments. By 2000, for example, only three call centres (Equifax in 1995, Amadeus in 1997 and Sykes in 1999) and three shared services (L.L. Bean in 1998, Western Union in 1998 and Procter and Gamble (P&G) Global Business Services in 1999) had begun operating
E C L A C / C O L E F
216
in the country (ECLAC, 2014; Fernandez-Stark, Bamber and Gereffi, 2013). Thus, the entry point of Costa Rica was largely call centres, the lowest value adding component of the BPO market segment, and shared services, which are a higher-value BPO segment.
Offshore services grew rapidly in the second stage (2004-2011), and the majority of enterprises currently operating were established in this period (Fernandez-Stark, Bamber and Gereffi, 2013). In addition to L.L. Bean, Western Union and P&G, the following enterprises established shared service centres: Baxter Americas in 2004, Dole SS in 2005, Oracle in 2007, DHL in 2007 and Hellman Logistic in 2007.15 Some higher-value BPO activities such as ERM (e.g. back office operations) started in the following enterprises: Amba Research in 2006, Access Personnel in 2004 and Experian Marketing Services in 2008 (ECLAC, 2009). Most of the upgrading within the BPO segment was therefore implemented during this period. Moreover, most of the enterprises currently engaged in the ITO segment started operations during this period as well: Intertec in 2002, Avionyx in 2004, Fiserv in 2004 and Softtek in 2010. In addition, some enterprises such as Hewlett-Packard (HP) upgraded within the ITO segment to higher-value niche segments (Fernandez-Stark, Bamber and Gereffi, 2013).
In the third stage (2012 to the present), there have been some very specific instances of progress in terms of KPO activities, although the most common types of service operations are still chiefly in ITO and BPO services. Upgrading towards KPO activities has been gathering momentum. There are two Costa Rican firms providing KPO services: Amba Research and Citi Business Services, with 800 employees between them in 2012 (ECLAC, 2014).16 Upgrading from BPO to KPO has thus occurred in very specific niche activities. Entering KPO segments remains difficult, however, as it requires an entirely new set of skills from the labour market pool (Fernandez-Stark, Bamber and Gereffi, 2013). Other upgrading paths can be seen in other industry-specific activities, such as digital technologies and engineering and design (ECLAC, 2014). Although Costa Rica adopted a non-discriminatory approach to attracting FDI at the first (BPO) level of offshoring services, efforts at attracting investment focused more on higher-end technological activities in the second stage, while efforts to attract FDI in specific niche industries have been made in the current third stage (ECLAC, 2014).
15 Although shared services may fall into the ITO segment as well as the BPO segment, we assume them to involve the provision of HRM services such as personnel administration, training and development services.
16 Amba Research and Citi Business Services were previously engaged in back office operations and shared service operations, respectively (ECLAC, 2008, p. 96).
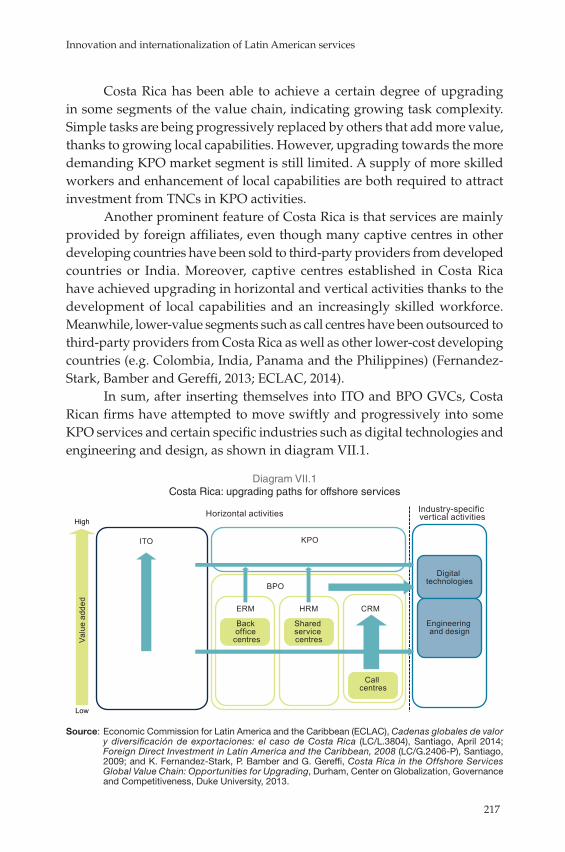
Innovation and internationalization of Latin American services
217
Costa Rica has been able to achieve a certain degree of upgrading in some segments of the value chain, indicating growing task complexity. Simple tasks are being progressively replaced by others that add more value, thanks to growing local capabilities. However, upgrading towards the more demanding KPO market segment is still limited. A supply of more skilled workers and enhancement of local capabilities are both required to attract investment from TNCs in KPO activities.
Another prominent feature of Costa Rica is that services are mainly provided by foreign affiliates, even though many captive centres in other developing countries have been sold to third-party providers from developed countries or India. Moreover, captive centres established in Costa Rica have achieved upgrading in horizontal and vertical activities thanks to the development of local capabilities and an increasingly skilled workforce. Meanwhile, lower-value segments such as call centres have been outsourced to third-party providers from Costa Rica as well as other lower-cost developing countries (e.g. Colombia, India, Panama and the Philippines) (Fernandez-Stark, Bamber and Gereffi, 2013; ECLAC, 2014).
In sum, after inserting themselves into ITO and BPO GVCs, Costa Rican firms have attempted to move swiftly and progressively into some KPO services and certain specific industries such as digital technologies and engineering and design, as shown in diagram VII.1.
Diagram VII.1 Costa Rica: upgrading paths for offshore services
Back office
centres
Shared service centres
ITO
BPO
ERM HRM CRM
KPO
Horizontal activities
Digital technologies
Engineering and design
Valu
e ad
ded
Low
High
Industry-specific vertical activities
Call centres
Source: Economic Commission for Latin America and the Caribbean (ECLAC), Cadenas globales de valor y diversificación de exportaciones: el caso de Costa Rica (LC/L.3804), Santiago, April 2014; Foreign Direct Investment in Latin America and the Caribbean, 2008 (LC/G.2406-P), Santiago, 2009; and K. Fernandez-Stark, P. Bamber and G. Gereffi, Costa Rica in the Offshore Services Global Value Chain: Opportunities for Upgrading, Durham, Center on Globalization, Governance and Competitiveness, Duke University, 2013.

E C L A C / C O L E F
218
C. Concluding remarks
This chapter has set out to show the causal links between FDI and offshore services in Costa Rica by using the GVC approach to briefly describe the main upgrading paths taken by the offshore services industry.
The findings of this chapter suggest that, since 2000, FDI in Costa Rica has gradually shifted from manufacturing (electronics, medical devices, vehicle-making, aeronautics and aerospace, film broadcasting devices) to service sectors (call centres, back office, entertainment and media, shared services, digital technologies, engineering and design, headquarters operations). During this process of structural change, service sectors have created the most jobs in absolute terms and paid the highest wages of any industrial sector in the country’s free economic zones, with average pay substantially higher there than for technical and professional workers in the country as a whole. Furthermore, rising FDI has compensated for the country’s low rate of investment, contributing a substantial portion of its gross fixed capital formation. This chapter therefore suggests that FDI has had positive impacts on fixed investment, human capital and employment in Costa Rica.
The upgrading paths of offshore services in Costa Rica show that while the country entered the offshore services business through the low-end BPO segment with call centres and shared service centres, upgrading actually started within the BPO segment and swiftly diversified into higher-value ITO market segments. More recently (since 2012), Costa Rica has attempted to climb up further towards some KPO services, including certain specific industries such as digital technologies and engineering and design. In the upgrading process, low-value segments such as call centres have been outsourced to third-party providers and to other low-cost developing countries. However, entry into KPO segments in Costa Rica remains limited to specific niche activities.
This chapter concludes that the positive impacts of offshore services FDI in terms of enhanced technological capabilities and human capital investments are explained to some extent by the country’s innovation, learning and knowledge system, largely thanks to improvements in the educational curriculums of universities and technical colleges due to financial, technical and curricular support from TNCs such as Intel. Accordingly, our contention is that FDI may well be an important source of upgrading. The country’s absorptive capacity is directly related to its ability to imitate, adapt, learn and improve on the practices and know-how of TNCs in order to innovate and add value within GVCs.
Innovation and internationalization of Latin American services
219
The FDI spillover effects found in offshore service industries in Costa Rica may also be explicable within the framework of standard macroeconomic growth theory, and the findings suggest that FDI has had positive impacts on fixed investment in the country because of the crowding-in effects of FDI on domestic investment, contributing to an increase in TFP; that the increased productivity of skilled workers has led to wages and employment increasing for them, especially in service businesses located in EPZs; and that the accumulation of human capital, explained to some extent by TNC-driven improvements in education and training, has enhanced technological capabilities and thereby contributed to the upgrading of offshore services within GVCs. However, microdata analyses of the impact of FDI on local firms in terms of improvements in productivity, wages and employment could not be undertaken because of data availability problems.
This chapter has also argued that the development of local technological capabilities and investment in people in Costa Rica to improve absorptive capacity has been inadequate and that a supply of more skilled workers and enhancement of local capabilities are required to attract further investment from TNCs. The contention, then, is that the development of local technological capabilities and investment in Costa Rican human capital have to be part of a more comprehensive development strategy sustained by a renewed class of industrial policies, including programmes to assist industries with a “latent comparative advantage” by increasing the supply of skilled workers and encouraging technology adoption (Harrison and Rodriguez-Clare, 2010).
This new class of industrial policy is a departure from what is propounded in the extensive literature justifying the use of industrial policy involving government interventions in the face of market failures. Additional considerations and dynamic factors beyond the market failure argument are considered, suggesting that this new class of industrial policy should foster structural change through innovation, the enhancement of technological capabilities and the diversification of production activities needed to rise up through the global production hierarchy.
This renewal of industrial policy also highlights the fact that governance mechanisms for international trade and investment structured by the World Trade Organization (WTO) and related multilateral and bilateral agreements may well restrict the “policy space” of governments when it comes to following industrial policies. Similarly, globalization also impacts on Costa Rica’s policy space through global supply chains, now controlled by large transnational corporations and buyer-led networks. In this new system of global production networks and global value chains, “vertical specialization”
E C L A C / C O L E F
220
or trade in intermediate goods has become more significant and has led TNCs to set quality standards which firms in developing countries will need to catch up with if they wish to upgrade to these supply chains.
The renewed industrial policy suggested here is less ideological and more neutral. It is essentially systemic, working in alignment with other policy instruments (social and environmental instruments and those relating to trade, science, technology and innovation, intellectual property rights, FDI, SME, productive linkages and infant industries) and affecting the structure of the economy as a whole and not only the manufacturing sector or firms operating in the EPZs. Accordingly, externalities and spillovers (particularly in the provision of knowledge) can justify State intervention. The challenge for Costa Rica is to craft an institutional framework (tying together State and non-State actors and market and non-market institutions) that creates the rewards and incentives needed to upgrade the country’s comparative advantage and eventually enable it and its workforce to engage in more diversified and knowledge-intensive service activities.
BibliographyAitken, B. and A.E. Harrison (1999), “Do domestic firms benefit from direct foreign
investment? Evidence from Venezuela”, American Economic Review, vol. 89, No. 3, June.
Baldwin, Richard (2012), “Global supply chains: why they emerged, why they matter, and where they are going”, Working Paper, No. FGI-2012-1, July.
(2011), “Trade and industrialization after globalization’s 2nd unbundling: How building and joining a supply chain are different and why it matters”, NBER Working Paper, No. 17716, December.
Blömstrom, M. and A. Kokko (2002), “FDI and human capital: a research agenda”, OECD Development Centre Working Papers, No. 195, August.
Central Bank of Costa Rica (2014a), “Foreign Sector” [online] http://www.bccr.fi.cr/bccr_ home_page/economic_indicators/foreign_sector.html [date of reference: 19 July].
(2014b), “Exchange Rates” [online] http://www.bccr.fi.cr/bccr_home_page/economic_indicators/exchange_rates.html [date of reference: 29 August].
Crespi, G. and P. Zuñiga (2010), “Innovation and productivity: evidence from six Latin American countries”, IDB Working Paper Series, No. IDB-WP-218, Washington, D.C., Inter-American Development Bank (IDB).
Cubero, R. (2006), “Determinantes y efectos económicos de la IED: teoría y evidencia internacional”, Inversión extranjera en Centroamérica, C.G. López and C.E. Umaña, San José, Academia de Centroamérica.
Dunning, J.H. (1979), “Explaining changing patterns of international production: in defence of the eclectic theory”, Oxford Bulletin of Economics and Statistics, vol. 41, No. 4.
Innovation and internationalization of Latin American services
221
ECLAC (Economic Commission for Latin America and the Caribbean) (2014), Cadenas globales de valor y diversificación de exportaciones: el caso de Costa Rica (LC/L.3804), Santiago, April.
(2013), Statistical Yearbook for Latin America and the Caribbean, 2013 (LC/G.2582-P), Santiago.
(2011), Foreign Direct Investment in Latin America and the Caribbean, 2010 (LC/G.2494-P), Santiago.
(2009), Foreign Direct Investment in Latin America and the Caribbean, 2008 (LC/G.2406-P), Santiago.
(2008), Structural Change and Productivity Growth - 20 Years Later. Old problems, new opportunities (LC/G.2367(SES.32/3)), Santiago.
Fagerberg, J. and M. Srholec (2008), “National innovation systems, capabilities and economic development”, Research Policy, vol. 37, No. 9.
Farfan, O.H. (2005), Understanding and Escaping Commodity-Dependency: a Global Value Chain Perspective. Prepared for the Investment Climate Unit International Finance Corporation, The World Bank Group, October [online] http://www.cggc.duke.edu/pdfs/093005_Farfan_Commodity_Dependency_Uma_WB.pdf.
Fernandez-Stark, K., P. Bamber and G. Gereffi (2014), “Global value chains in Latin America: A development perspective for upgrading”, Global Value Chains and World Trade: Prospects and Challenges for Latin America, ECLAC Books, No. 127, R.A. Hernandez, J.M. Martínez-Piva and N. Mulder, Economic Commission for Latin America and the Caribbean (ECLAC).
(2013), Costa Rica in the Offshore Services Global Value Chain: Opportunities for Upgrading, Durham, Center on Globalization, Governance and Competitiveness, Duke University.
(2011), The Offshore Services Industry: Upgrading Through Workforce Development, Durham, North Carolina, Center on Globalization, Governance & Competitiveness.
Fernandez-Stark, K. and others (2014), “Introduction”, Latin America’s emergence in global services: A new driver of structural change in the region?, R. Hernández and others (eds.), ECLAC Books, No. 121 (LC/G.2599-P), Santiago, Economic Commission for Latin America and the Caribbean (ECLAC).
Freeman, C. (1974), The Economics of Industrial Innovation, Harmondsworth, Penguin Books.
Gamboa, F. and J.C. Calderón (eds.) (2011), Balance de las zonas francas: beneficio neto del régimen para Costa Rica 2006 – 2010, San José, Foreign Trade Corporation of Costa Rica (PROCOMER), August.
GAO (United States Government Accountability Office) (2004), International Trade: Current Government Data Provide Limited Insight into Offshoring of Services, September.
Gereffi, G., J. Humphrey and T. Sturgeon (2005), “The governance of global value chains”, Review of International Political Economy, vol. 12, No. 1, February.
E C L A C / C O L E F
222
Gereffi, G. and K. Fernandez-Stark (2010), The Offshore Services Global Value Chain, Durham, Center on Globalization, Governance and Competitiveness, Duke University, March.
Giuliani, E., C. Pietrobelli and R. Rabellotti (2005), “Upgrading in global value chains: lessons from Latin American clusters”, World Development, vol. 33, No. 4.
Harrison, A. and A. Rodríguez-Clare (2010), “Trade, foreign investment, and industrial policy for developing countries”, Handbook of Development Economics, D. Rodrik and M. Rosenzweig (eds.), vol. 5, North-Holland.
Hernández, R. and others (eds.) (2014), Latin America’s emergence in global services: A new driver of structural change in the region?, ECLAC Books, No. 121 (LC/G.2599-P), Santiago, Economic Commission for Latin America and the Caribbean (ECLAC).
Humphrey, J. and H. Schmitz (2002), “How does insertion in global value chains affect upgrading in industrial clusters?”, Regional Studies, vol. 36, No. 9.
(2000), “Governance and upgrading: linking industrial cluster and global value chain research”, IDS Working Paper, No.120.
Kaplinsky, R. (2000), “Globalisation and unequalisation: what can be learned from value chain analysis?”, The Journal of Development Studies, vol. 37, No. 2, December.
Lundvall, B.A. (1992), National Systems of Innovation: Towards a Theory of Innovation and Interactive Learning, London, Pinter.
Markusen, J.R. (2002), Multinational Firms and the Theory of International Trade, Boston, MIT Press.
Martínez, J. and R. Hernández (2012), “La inversión extranjera directa en Costa Rica: factores determinantes y efectos en el desarrollo nacional y regional”, Serie Aportes para el Análisis del Desarrollo Humano Sostenible, 11 May, San José, Programa Estado de la Nación.
Pietrobelli, C. and R. Rabellotti (2011), “Global value chains meet innovation systems. Are there learning opportunities for developing countries?”, World Development, vol. 39, No. 7.
Rodríguez-Clare, A. (2001), “Costa Rica’s development strategy based on human capital and technology: how it got there, the impact of Intel, and lessons for other countries”, Journal of Human Development, vol. 2, No. 2.
UNCTAD (United Nations Conference on Trade and Development) (2013), World Investment Report 2013. Global Value Chains: Investment and Trade for Development (UNCTAD/WIR/2013), Geneva.
(2004), World Investment Report, 2004. The Shift towards Services (UNCTAD/WIR/2004), New York.
UNIDO (United Nations Industrial Development Organization) (2004), Inserting Local Industries into Global Value Chains and Global Production Networks. Opportunities and Challenges for Upgrading. With a focus on Asia, Vienna.
WEF (World Economic Forum) (2014), Global Competitiveness Report 2014-2015, Davos.
WTO (World Trade Organization) (2015), “Statistics database” [online] http://stat.wto.org [date of reference: 4 March].
Chapter VIII
The role of quality certifications in exports of Chilean information
technology services
Marcela Gómez Nanno Mulder1
Summary
Information technology (IT) services have been a fast-growing category of Chilean exports over the past decade. A parallel trend has been the spread of different types of quality certifications (QCs). This chapter explores the hypothesis that the export performance of firms is linked to their acquisition of QCs as signalling devices, since these demonstrate their capabilities to foreign clients. An alternative hypothesis is that acquisition of QCs is mainly motivated by the desire to achieve efficiency improvements. These hypotheses were explored using a semi-structured questionnaire which was sent to all 110 member firms of the Chilean Association of Information
1 The authors are grateful to the Chilean Association of Information Technology Companies (ACTI) and its members for their collaboration in this survey, to Gordana Stojkovic for her guidance, to Gustavo Zanabria and Andrew Barry for their support with the translation from Spanish, and to Sebastián Herreros for his comments.
E C L A C / C O L E F
224
Technology Companies (ACTI). With a return rate of 38%, the results seem to suggest that most firms adopted QCs to cut costs rather than to improve their standing with foreign buyers.
Introduction
Information technology (IT) services have been one the fastest-growing sectors of the Chilean economy over the past decade.2 From 2001 to 2012, the value of sales grew by 12% a year on average. According to the annual structural survey of services conducted by the Chilean National Institute of Statistics (INE), the number of firms almost tripled during the same period, from 580 to 1,467, as did employment, from 16,700 to 43,200 workers. Exports grew at an average annual rate of 18.3% during this period, reaching US$ 206 million in 2012.
Several factors may explain the rapid expansion of Chile’s IT sector. First, there has been high demand for IT services in the economy as firms have sought to increase productivity and competitiveness. One manifestation of this was Chile’s IT investment rate in 2012, which at 2.1% of GDP was among the highest in Latin America, according to International Data Corporation (2013). Second, the country has introduced several public-private initiatives encompassing government institutions, business organizations and academia. These are aimed at modernizing the public sector, using IT to narrow the productivity gap between small and large enterprises and increasing the attractiveness of Chile as a provider of offshore IT services for the rest of Latin America. A third factor has been the rapid spread of broadband in the country (Rivera von Hagen, Marinao and Mulder, 2014).
A parallel trend in Chile has been the rapid adoption of different types of quality certifications (QCs). Within the sector, the most common QCs are Capability Maturity Model Integration (CMMI), ISO 9001 (a multisectoral standard) and Information Technology Infrastructure Library (ITIL). Although there is an abundance of literature on the contribution that standards make to trade in goods, evidence for their impact on trade in IT services is scant, being mostly limited to a few Indian case studies.
This chapter explores the hypothesis that the recent rapid expansion of Chilean exports in the IT sector is linked to the adoption of international
2 IT services include computer equipment consulting, computer program editing, computer program consulting, computer program supply, data processing, maintenance and repair work for office machinery, accounting and information, and activities related to databases and the online distribution of electronic contents (IMF, Balance of Payments Manual, fifth edition).
Innovation and internationalization of Latin American services
225
quality certifications (QCs), which serve to reduce information asymmetries between sellers and foreign buyers. This signalling effect should directly boost exports. An alternative hypothesis is that firms adopt QCs to streamline procedures and cut costs, with no direct impact on exports if selling prices are maintained. Due to a lack of detailed data on Chilean IT firms, it is not possible to perform robust econometric analyses to test the two hypotheses. Instead, a tailor-made survey was designed for the purpose of this study and sent to the 110 members of the Chilean Association of Information Technology Companies (ACTI), the country’s largest such organization.
The survey results provide a number of preliminary answers regarding the use of QCs by Chilean IT producers and their reasons for obtaining them. It turns out that the majority of the firms answering the questionnaire have engaged in some kind of certification process in order to reduce costs, with the remaining firms incorporating QCs chiefly with a view to improving their standing with foreign clients. These results may reflect the fact that most Chilean exports of IT services go to other Latin American countries, where there are few requirements for QCs.
The structure of this chapter is as follows. Section A presents the main types of quality certifications and some aggregate data on their adoption in Chile and other countries of the region. Section B reviews the theoretical arguments and some empirical evidence on how standards may contribute to international trade in IT services. Section C explores the role of standards in the Chilean IT sector by considering the responses to a semi-structured questionnaire sent to all 110 members of ACTI. The final section concludes and provides suggestions for future research.
A. Quality certifications and their use in Chile and neighbouring countries
There are different types of QCs that IT producers can obtain to signal the quality of their services and products. Standardization and certification were first developed in manufacturing and agriculture, but have spread to the IT services industry over the past two decades. Standardization refers to a process whereby service features are reflected in a document known as a “standard”. Certification is the result of a process in which an independent certification body examines the conformity of a service with the requirements of a standard. Approval means that the IT services production process and final product meet a minimum quality level (Castagnino, 2006).
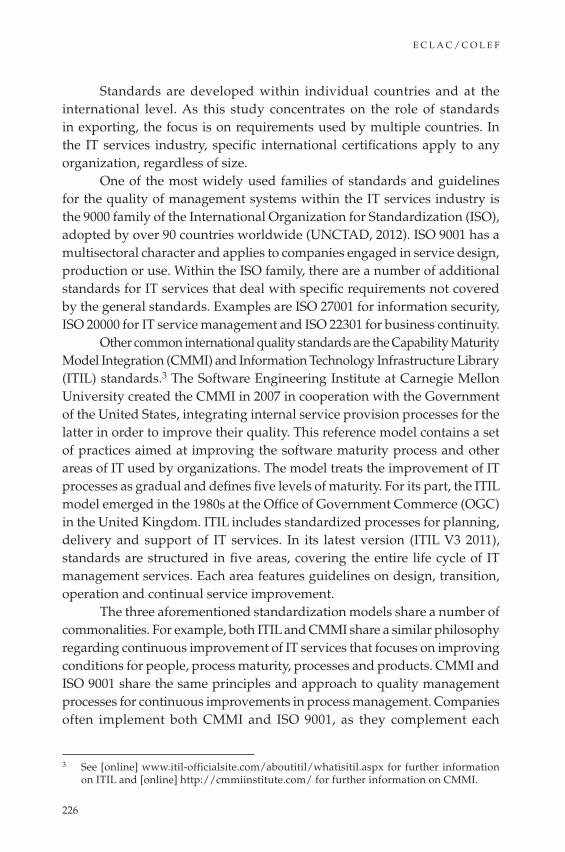
E C L A C / C O L E F
226
Standards are developed within individual countries and at the international level. As this study concentrates on the role of standards in exporting, the focus is on requirements used by multiple countries. In the IT services industry, specific international certifications apply to any organization, regardless of size.
One of the most widely used families of standards and guidelines for the quality of management systems within the IT services industry is the 9000 family of the International Organization for Standardization (ISO), adopted by over 90 countries worldwide (UNCTAD, 2012). ISO 9001 has a multisectoral character and applies to companies engaged in service design, production or use. Within the ISO family, there are a number of additional standards for IT services that deal with specific requirements not covered by the general standards. Examples are ISO 27001 for information security, ISO 20000 for IT service management and ISO 22301 for business continuity.
Other common international quality standards are the Capability Maturity Model Integration (CMMI) and Information Technology Infrastructure Library (ITIL) standards.3 The Software Engineering Institute at Carnegie Mellon University created the CMMI in 2007 in cooperation with the Government of the United States, integrating internal service provision processes for the latter in order to improve their quality. This reference model contains a set of practices aimed at improving the software maturity process and other areas of IT used by organizations. The model treats the improvement of IT processes as gradual and defines five levels of maturity. For its part, the ITIL model emerged in the 1980s at the Office of Government Commerce (OGC) in the United Kingdom. ITIL includes standardized processes for planning, delivery and support of IT services. In its latest version (ITIL V3 2011), standards are structured in five areas, covering the entire life cycle of IT management services. Each area features guidelines on design, transition, operation and continual service improvement.
The three aforementioned standardization models share a number of commonalities. For example, both ITIL and CMMI share a similar philosophy regarding continuous improvement of IT services that focuses on improving conditions for people, process maturity, processes and products. CMMI and ISO 9001 share the same principles and approach to quality management processes for continuous improvements in process management. Companies often implement both CMMI and ISO 9001, as they complement each
3 See [online] www.itil-officialsite.com/aboutitil/whatisitil.aspx for further information on ITIL and [online] http://cmmiinstitute.com/ for further information on CMMI.
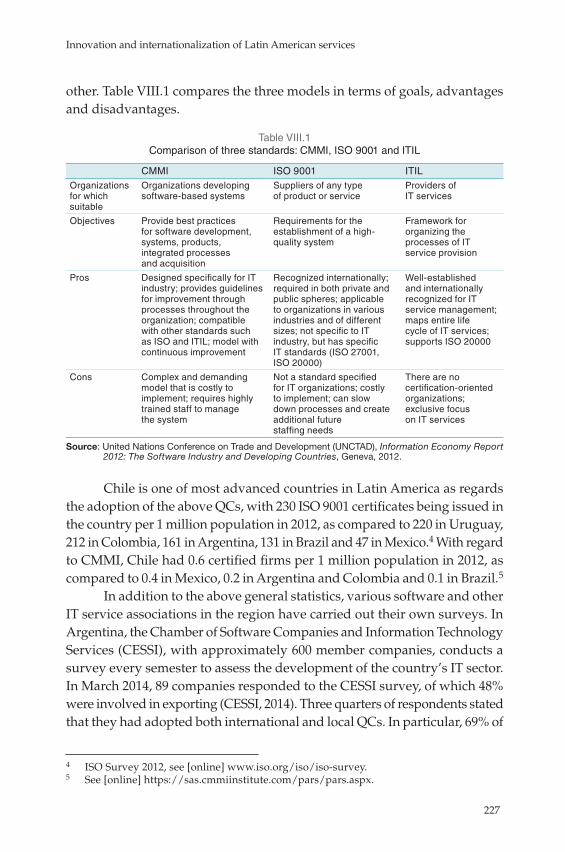
Innovation and internationalization of Latin American services
227
other. Table VIII.1 compares the three models in terms of goals, advantages and disadvantages.
Table VIII.1 Comparison of three standards: CMMI, ISO 9001 and ITIL
CMMI ISO 9001 ITILOrganizations for which suitable
Organizations developing software-based systems
Suppliers of any type of product or service
Providers of IT services
Objectives Provide best practices for software development, systems, products, integrated processes and acquisition
Requirements for the establishment of a high-quality system
Framework for organizing the processes of IT service provision
Pros Designed specifically for IT industry; provides guidelines for improvement through processes throughout the organization; compatible with other standards such as ISO and ITIL; model with continuous improvement
Recognized internationally; required in both private and public spheres; applicable to organizations in various industries and of different sizes; not specific to IT industry, but has specific IT standards (ISO 27001, ISO 20000)
Well-established and internationally recognized for IT service management; maps entire life cycle of IT services; supports ISO 20000
Cons Complex and demanding model that is costly to implement; requires highly trained staff to manage the system
Not a standard specified for IT organizations; costly to implement; can slow down processes and create additional future staffing needs
There are no certification-oriented organizations; exclusive focus on IT services
Source: United Nations Conference on Trade and Development (UNCTAD), Information Economy Report 2012: The Software Industry and Developing Countries, Geneva, 2012.
Chile is one of most advanced countries in Latin America as regards the adoption of the above QCs, with 230 ISO 9001 certificates being issued in the country per 1 million population in 2012, as compared to 220 in Uruguay, 212 in Colombia, 161 in Argentina, 131 in Brazil and 47 in Mexico.4 With regard to CMMI, Chile had 0.6 certified firms per 1 million population in 2012, as compared to 0.4 in Mexico, 0.2 in Argentina and Colombia and 0.1 in Brazil.5
In addition to the above general statistics, various software and other IT service associations in the region have carried out their own surveys. In Argentina, the Chamber of Software Companies and Information Technology Services (CESSI), with approximately 600 member companies, conducts a survey every semester to assess the development of the country’s IT sector. In March 2014, 89 companies responded to the CESSI survey, of which 48% were involved in exporting (CESSI, 2014). Three quarters of respondents stated that they had adopted both international and local QCs. In particular, 69% of
4 ISO Survey 2012, see [online] www.iso.org/iso/iso-survey.5 See [online] https://sas.cmmiinstitute.com/pars/pars.aspx.

E C L A C / C O L E F
228
respondents had adopted ISO 9001, 13% had ISO 90003, 9% had CMMI, 3% had ISO 27000 and several firms had adopted multiple QCs. Their adoption has been promoted by an Argentine software law which provides tax benefits to certified companies. A European Union programme for small and medium-sized enterprises (SMEs) called AL-INVEST has provided another stimulus to micro, small and medium-sized enterprises in the Greater Buenos Aires region. The National Institute of Industrial Technology (INTI) also promotes the adoption of national QCs.
In Colombia, the Federation for the Software Industry and Information Technology conducted an evaluation on its IT sector in 2012 (FEDESOFT, 2012). A questionnaire was sent to 5,512 enterprises, eliciting 1,120 responses. Of all the companies surveyed, 162 had some type of certification. Half of these had ISO 9001 certification and 12% CMMI certification.
In Uruguay, the 2009 annual survey of the Uruguayan Chamber of Information Technologies (CUTI), with 300 member companies, showed that 20% of companies had some type of certification or were in the process of obtaining it. Of those with certification, 52% had ISO 9001, 19% had CMMI, 8% had ITIL and the remaining 21% had other certifications. Of those companies that were in the process of obtaining certification, 52% were preparing to meet the requirements of ISO 9001, 7% those of CMMI and the remaining 41% those of other QCs. The Inter-American Development Bank (IDB) has supported Uruguayan SMEs with export potential in their efforts to secure QCs.
B. Theories and evidence on the role of QCs in exporting
Many studies have assessed how QCs may enhance the performance and exports of goods producers, but those targeting the IT service industry are mostly limited to India. This section reviews both the theoretical arguments and the empirical evidence on this issue.
The causal relationship between QCs on the one hand and company performance and exports on the other runs both ways. Three theories have been put forward to explain this reciprocal relationship: signalling theory, process efficiency theory and institutional theory (Gopal and Gao, 2009). All three help explain why a firm may want to obtain a QC and what potential benefits it can derive from it. In particular, they all show how a firm’s performance, approximated by its average costs and exports, influences its decision to adopt QCs, and how the adoption of QCs may in turn affect average costs and exports.
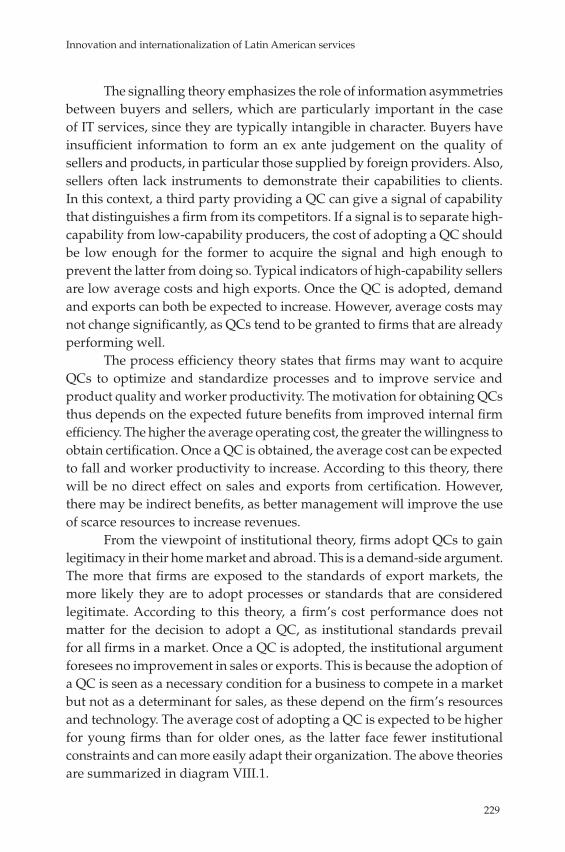
Innovation and internationalization of Latin American services
229
The signalling theory emphasizes the role of information asymmetries between buyers and sellers, which are particularly important in the case of IT services, since they are typically intangible in character. Buyers have insufficient information to form an ex ante judgement on the quality of sellers and products, in particular those supplied by foreign providers. Also, sellers often lack instruments to demonstrate their capabilities to clients. In this context, a third party providing a QC can give a signal of capability that distinguishes a firm from its competitors. If a signal is to separate high-capability from low-capability producers, the cost of adopting a QC should be low enough for the former to acquire the signal and high enough to prevent the latter from doing so. Typical indicators of high-capability sellers are low average costs and high exports. Once the QC is adopted, demand and exports can both be expected to increase. However, average costs may not change significantly, as QCs tend to be granted to firms that are already performing well.
The process efficiency theory states that firms may want to acquire QCs to optimize and standardize processes and to improve service and product quality and worker productivity. The motivation for obtaining QCs thus depends on the expected future benefits from improved internal firm efficiency. The higher the average operating cost, the greater the willingness to obtain certification. Once a QC is obtained, the average cost can be expected to fall and worker productivity to increase. According to this theory, there will be no direct effect on sales and exports from certification. However, there may be indirect benefits, as better management will improve the use of scarce resources to increase revenues.
From the viewpoint of institutional theory, firms adopt QCs to gain legitimacy in their home market and abroad. This is a demand-side argument. The more that firms are exposed to the standards of export markets, the more likely they are to adopt processes or standards that are considered legitimate. According to this theory, a firm’s cost performance does not matter for the decision to adopt a QC, as institutional standards prevail for all firms in a market. Once a QC is adopted, the institutional argument foresees no improvement in sales or exports. This is because the adoption of a QC is seen as a necessary condition for a business to compete in a market but not as a determinant for sales, as these depend on the firm’s resources and technology. The average cost of adopting a QC is expected to be higher for young firms than for older ones, as the latter face fewer institutional constraints and can more easily adapt their organization. The above theories are summarized in diagram VIII.1.
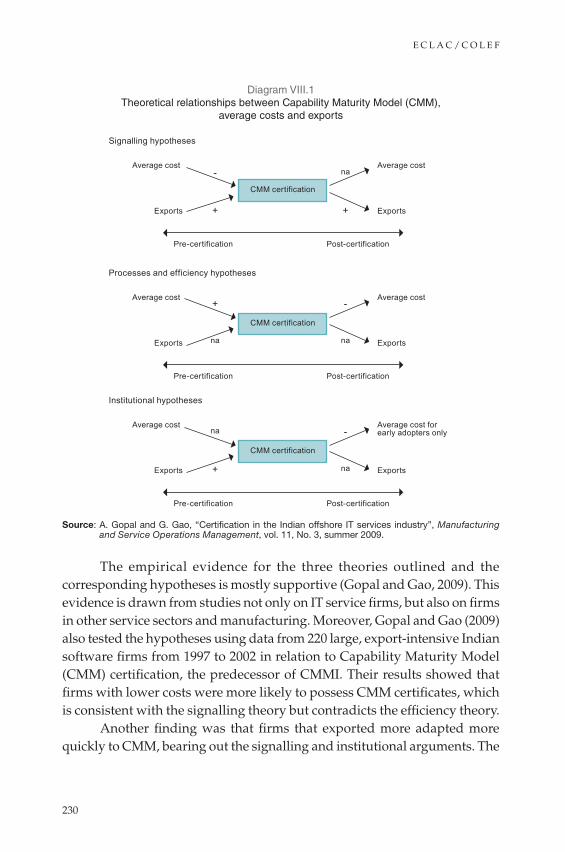
E C L A C / C O L E F
230
Diagram VIII.1 Theoretical relationships between Capability Maturity Model (CMM),
average costs and exports
Signalling hypotheses
Average cost
Pre-certification Post-certification
CMM certification
CMM certification
CMM certification
Average cost
ExportsExports
Processes and efficiency hypotheses
Average cost
Pre-certification Post-certification
Average cost
ExportsExports
Institutional hypotheses
Average cost
Pre-certification Post-certification
Average cost forearly adopters only
ExportsExports
-
+
na
+
+
na
-
na
na
+
-
na
Source: A. Gopal and G. Gao, “Certification in the Indian offshore IT services industry”, Manufacturing and Service Operations Management, vol. 11, No. 3, summer 2009.
The empirical evidence for the three theories outlined and the corresponding hypotheses is mostly supportive (Gopal and Gao, 2009). This evidence is drawn from studies not only on IT service firms, but also on firms in other service sectors and manufacturing. Moreover, Gopal and Gao (2009) also tested the hypotheses using data from 220 large, export-intensive Indian software firms from 1997 to 2002 in relation to Capability Maturity Model (CMM) certification, the predecessor of CMMI. Their results showed that firms with lower costs were more likely to possess CMM certificates, which is consistent with the signalling theory but contradicts the efficiency theory.
Another finding was that firms that exported more adapted more quickly to CMM, bearing out the signalling and institutional arguments. The
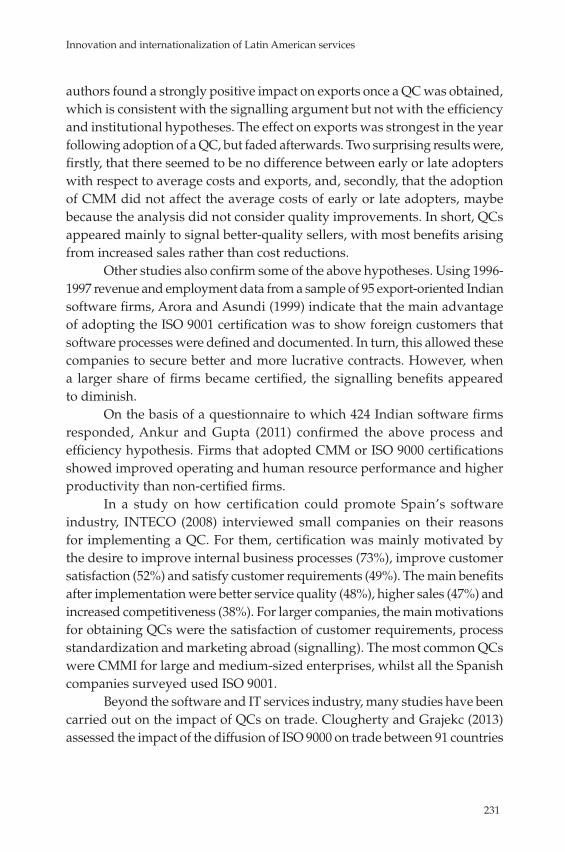
Innovation and internationalization of Latin American services
231
authors found a strongly positive impact on exports once a QC was obtained, which is consistent with the signalling argument but not with the efficiency and institutional hypotheses. The effect on exports was strongest in the year following adoption of a QC, but faded afterwards. Two surprising results were, firstly, that there seemed to be no difference between early or late adopters with respect to average costs and exports, and, secondly, that the adoption of CMM did not affect the average costs of early or late adopters, maybe because the analysis did not consider quality improvements. In short, QCs appeared mainly to signal better-quality sellers, with most benefits arising from increased sales rather than cost reductions.
Other studies also confirm some of the above hypotheses. Using 1996-1997 revenue and employment data from a sample of 95 export-oriented Indian software firms, Arora and Asundi (1999) indicate that the main advantage of adopting the ISO 9001 certification was to show foreign customers that software processes were defined and documented. In turn, this allowed these companies to secure better and more lucrative contracts. However, when a larger share of firms became certified, the signalling benefits appeared to diminish.
On the basis of a questionnaire to which 424 Indian software firms responded, Ankur and Gupta (2011) confirmed the above process and efficiency hypothesis. Firms that adopted CMM or ISO 9000 certifications showed improved operating and human resource performance and higher productivity than non-certified firms.
In a study on how certification could promote Spain’s software industry, INTECO (2008) interviewed small companies on their reasons for implementing a QC. For them, certification was mainly motivated by the desire to improve internal business processes (73%), improve customer satisfaction (52%) and satisfy customer requirements (49%). The main benefits after implementation were better service quality (48%), higher sales (47%) and increased competitiveness (38%). For larger companies, the main motivations for obtaining QCs were the satisfaction of customer requirements, process standardization and marketing abroad (signalling). The most common QCs were CMMI for large and medium-sized enterprises, whilst all the Spanish companies surveyed used ISO 9001.
Beyond the software and IT services industry, many studies have been carried out on the impact of QCs on trade. Clougherty and Grajekc (2013) assessed the impact of the diffusion of ISO 9000 on trade between 91 countries

E C L A C / C O L E F
232
from 1999 to 2005. Their evidence supports the signalling hypothesis, as high certification levels in trading partner countries reduced information asymmetries and allowed for better organization of vertical relations in bilateral trade relationships. Also, export competitiveness improved with the adoption of ISO 9000. Another interesting finding is that exporters from developing nations lag in adopting QCs, compared to developed countries, where QCs are widespread.
In a review of the literature on standards and goods trade, Swann (2010) showed eight linkages between the two (see diagram VIII.2). First, standards reduce the variety of goods being traded, which in turn helps to reduce transaction costs. Examples are pallets and container sizes. Second, standards reduce transaction costs and promote the division of labour, outsourcing and offshoring. Third, standards are a carrier of codified knowledge, which is similar to the signalling argument above. The examples relate to the use of ISO 9000, which is the most commonly adopted standard worldwide. Fourth, good institutions (good in terms of low corruption, good bureaucratic quality and good protection of property rights, for example) can promote trade, as they have greater information and compliance capacities. Fifth, standards promote network effects and innovation, as is the case, for example, in information and communications technologies. Sixth, standards may promote more accurate measurement of intermediate inputs and other products, which in turn also favours innovation. Seventh, standards may raise the quality of products, but may also increase the cost of compliance and therefore constitute a trade barrier. Finally, standards promote trust and can therefore reduce transaction costs and promote trade.
Swann (2010) also reviewed the empirical evidence on the links between standards and trade. Most of the econometric results reviewed show a positive relationship between international standards, exports and imports. However, studies have revealed both positive and negative relationships, documenting how national standards may constitute trade barriers.
To sum up, certification is a tool to enhance a firm’s competitiveness in the global market. QCs provide a guarantee from an internationally recognized and independent entity, with quality requirements defined in its parameters. Such certification makes it possible to develop exports with higher value added and high-quality service. This is likely to raise customer satisfaction levels and enhance longer-term buyer-seller relationships.

Innovation and internationalization of Latin American services
233
Diagram VIII.2 Theoretical links between standards, trade, wealth and welfare
Scale economies
Competencies
Network effects
Trust and risk
Precision
Transaction costs
Barriers to entry
Measurement
Quality and safety
CompatibilityStandards
Codified knowledge
Variety reduction
Division of labour
Prices
Entry/Competition
Market failure
Productivity
Innovation
Outsourcing
Trade
Wealth and welfare
Source: G.P. Swann, “International standards and trade: A review of the empirical literature”, OECD Trade Policy Working Papers, No. 97, Paris, OECD Publishing, 2010.
Note: “Competencies” encompass institutions, innovation- and productivity-relevant knowledge, and vision; “barriers to entry” include compliance costs; and “precision” includes uniformity and consistency.
C. The questionnaire and results
Since detailed data on QC adoption and performance measurements of IT service producers are lacking in Chile, performing an econometric assessment is not feasible. Instead, a tailor-made survey was designed for the purposes of this chapter. The survey’s aim was to obtain information on the prevalence of QCs among Chilean IT service providers and identify their motivation for obtaining these, as well their potential impacts.
1. Design of the questionnaire and target group
A sample list of questions was prepared in the light of the literature survey. These were sent to two companies and two academics to assess their analytical relevance and clarity.
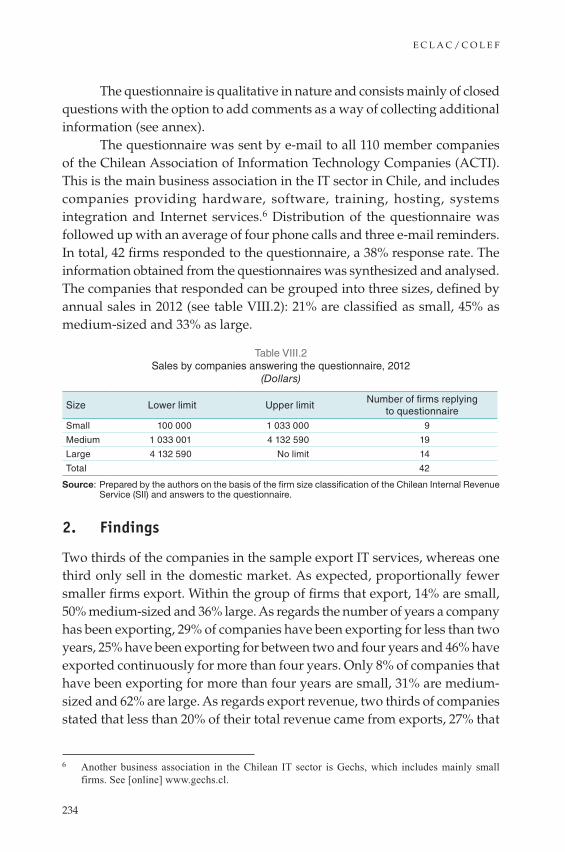
E C L A C / C O L E F
234
The questionnaire is qualitative in nature and consists mainly of closed questions with the option to add comments as a way of collecting additional information (see annex).
The questionnaire was sent by e-mail to all 110 member companies of the Chilean Association of Information Technology Companies (ACTI). This is the main business association in the IT sector in Chile, and includes companies providing hardware, software, training, hosting, systems integration and Internet services.6 Distribution of the questionnaire was followed up with an average of four phone calls and three e-mail reminders. In total, 42 firms responded to the questionnaire, a 38% response rate. The information obtained from the questionnaires was synthesized and analysed. The companies that responded can be grouped into three sizes, defined by annual sales in 2012 (see table VIII.2): 21% are classified as small, 45% as medium-sized and 33% as large.
Table VIII.2 Sales by companies answering the questionnaire, 2012
(Dollars)
Size Lower limit Upper limitNumber of firms replying
to questionnaireSmall 100 000 1 033 000 9
Medium 1 033 001 4 132 590 19
Large 4 132 590 No limit 14
Total 42
Source: Prepared by the authors on the basis of the firm size classification of the Chilean Internal Revenue Service (SII) and answers to the questionnaire.
2. Findings
Two thirds of the companies in the sample export IT services, whereas one third only sell in the domestic market. As expected, proportionally fewer smaller firms export. Within the group of firms that export, 14% are small, 50% medium-sized and 36% large. As regards the number of years a company has been exporting, 29% of companies have been exporting for less than two years, 25% have been exporting for between two and four years and 46% have exported continuously for more than four years. Only 8% of companies that have been exporting for more than four years are small, 31% are medium-sized and 62% are large. As regards export revenue, two thirds of companies stated that less than 20% of their total revenue came from exports, 27% that
6 Another business association in the Chilean IT sector is Gechs, which includes mainly small firms. See [online] www.gechs.cl.
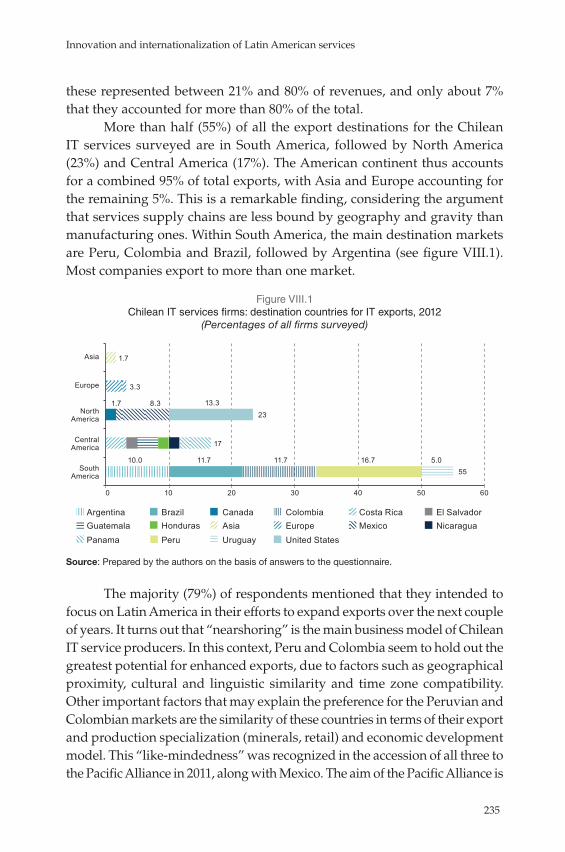
Innovation and internationalization of Latin American services
235
these represented between 21% and 80% of revenues, and only about 7% that they accounted for more than 80% of the total.
More than half (55%) of all the export destinations for the Chilean IT services surveyed are in South America, followed by North America (23%) and Central America (17%). The American continent thus accounts for a combined 95% of total exports, with Asia and Europe accounting for the remaining 5%. This is a remarkable finding, considering the argument that services supply chains are less bound by geography and gravity than manufacturing ones. Within South America, the main destination markets are Peru, Colombia and Brazil, followed by Argentina (see figure VIII.1). Most companies export to more than one market.
Figure VIII.1 Chilean IT services firms: destination countries for IT exports, 2012
(Percentages of all firms surveyed)
11.7 10.0
1.7
11.7
8.3
16.7 5.0
13.3
0 10 20 30 40 50 60
South America
Central America
North America
Europe
Asia
Argentina Brazil Canada Colombia Costa Rica El Salvador Guatemala Honduras Asia Europe Mexico Nicaragua Panama Peru Uruguay United States
55
1.7
3.3
23
17
Source: Prepared by the authors on the basis of answers to the questionnaire.
The majority (79%) of respondents mentioned that they intended to focus on Latin America in their efforts to expand exports over the next couple of years. It turns out that “nearshoring” is the main business model of Chilean IT service producers. In this context, Peru and Colombia seem to hold out the greatest potential for enhanced exports, due to factors such as geographical proximity, cultural and linguistic similarity and time zone compatibility. Other important factors that may explain the preference for the Peruvian and Colombian markets are the similarity of these countries in terms of their export and production specialization (minerals, retail) and economic development model. This “like-mindedness” was recognized in the accession of all three to the Pacific Alliance in 2011, along with Mexico. The aim of the Pacific Alliance is
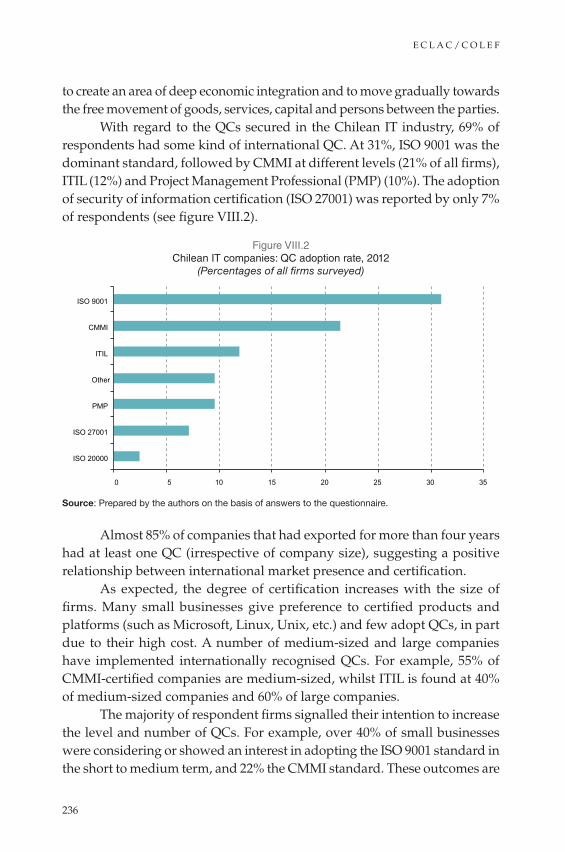
E C L A C / C O L E F
236
to create an area of deep economic integration and to move gradually towards the free movement of goods, services, capital and persons between the parties.
With regard to the QCs secured in the Chilean IT industry, 69% of respondents had some kind of international QC. At 31%, ISO 9001 was the dominant standard, followed by CMMI at different levels (21% of all firms), ITIL (12%) and Project Management Professional (PMP) (10%). The adoption of security of information certification (ISO 27001) was reported by only 7% of respondents (see figure VIII.2).
Figure VIII.2 Chilean IT companies: QC adoption rate, 2012
(Percentages of all firms surveyed)
0 5 10 15 20 25 30 35
ISO 20000
ISO 27001
PMP
Other
ITIL
CMMI
ISO 9001
Source: Prepared by the authors on the basis of answers to the questionnaire.
Almost 85% of companies that had exported for more than four years had at least one QC (irrespective of company size), suggesting a positive relationship between international market presence and certification.
As expected, the degree of certification increases with the size of firms. Many small businesses give preference to certified products and platforms (such as Microsoft, Linux, Unix, etc.) and few adopt QCs, in part due to their high cost. A number of medium-sized and large companies have implemented internationally recognised QCs. For example, 55% of CMMI-certified companies are medium-sized, whilst ITIL is found at 40% of medium-sized companies and 60% of large companies.
The majority of respondent firms signalled their intention to increase the level and number of QCs. For example, over 40% of small businesses were considering or showed an interest in adopting the ISO 9001 standard in the short to medium term, and 22% the CMMI standard. These outcomes are
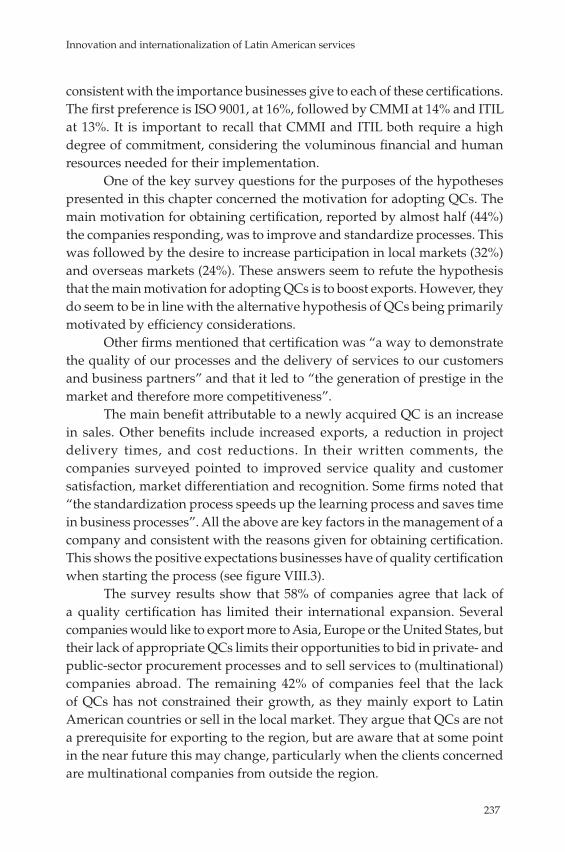
Innovation and internationalization of Latin American services
237
consistent with the importance businesses give to each of these certifications. The first preference is ISO 9001, at 16%, followed by CMMI at 14% and ITIL at 13%. It is important to recall that CMMI and ITIL both require a high degree of commitment, considering the voluminous financial and human resources needed for their implementation.
One of the key survey questions for the purposes of the hypotheses presented in this chapter concerned the motivation for adopting QCs. The main motivation for obtaining certification, reported by almost half (44%) the companies responding, was to improve and standardize processes. This was followed by the desire to increase participation in local markets (32%) and overseas markets (24%). These answers seem to refute the hypothesis that the main motivation for adopting QCs is to boost exports. However, they do seem to be in line with the alternative hypothesis of QCs being primarily motivated by efficiency considerations.
Other firms mentioned that certification was “a way to demonstrate the quality of our processes and the delivery of services to our customers and business partners” and that it led to “the generation of prestige in the market and therefore more competitiveness”.
The main benefit attributable to a newly acquired QC is an increase in sales. Other benefits include increased exports, a reduction in project delivery times, and cost reductions. In their written comments, the companies surveyed pointed to improved service quality and customer satisfaction, market differentiation and recognition. Some firms noted that “the standardization process speeds up the learning process and saves time in business processes”. All the above are key factors in the management of a company and consistent with the reasons given for obtaining certification. This shows the positive expectations businesses have of quality certification when starting the process (see figure VIII.3).
The survey results show that 58% of companies agree that lack of a quality certification has limited their international expansion. Several companies would like to export more to Asia, Europe or the United States, but their lack of appropriate QCs limits their opportunities to bid in private- and public-sector procurement processes and to sell services to (multinational) companies abroad. The remaining 42% of companies feel that the lack of QCs has not constrained their growth, as they mainly export to Latin American countries or sell in the local market. They argue that QCs are not a prerequisite for exporting to the region, but are aware that at some point in the near future this may change, particularly when the clients concerned are multinational companies from outside the region.
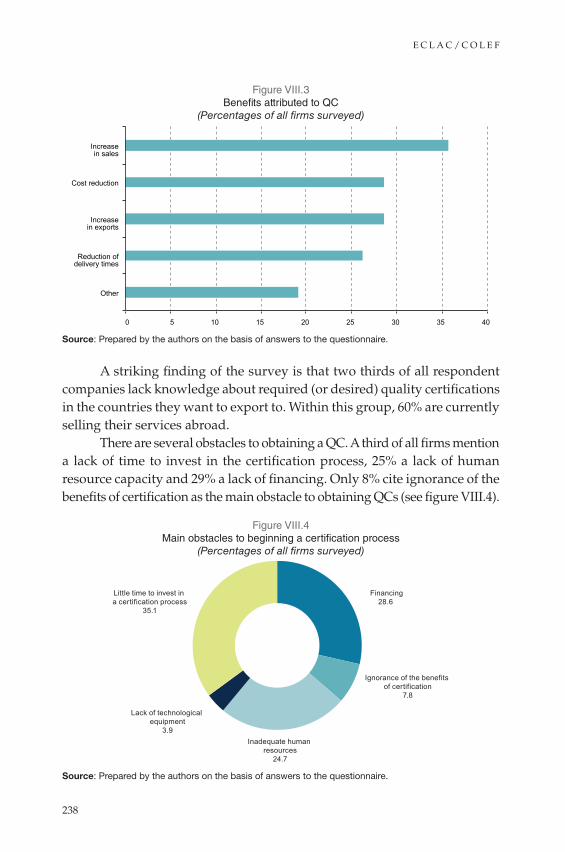
E C L A C / C O L E F
238
Figure VIII.3 Benefits attributed to QC
(Percentages of all firms surveyed)
0 5 10 15 20 25 30 35 40
Other
Reduction of delivery times
Increase in exports
Cost reduction
Increase in sales
Source: Prepared by the authors on the basis of answers to the questionnaire.
A striking finding of the survey is that two thirds of all respondent companies lack knowledge about required (or desired) quality certifications in the countries they want to export to. Within this group, 60% are currently selling their services abroad.
There are several obstacles to obtaining a QC. A third of all firms mention a lack of time to invest in the certification process, 25% a lack of human resource capacity and 29% a lack of financing. Only 8% cite ignorance of the benefits of certification as the main obstacle to obtaining QCs (see figure VIII.4).
Figure VIII.4 Main obstacles to beginning a certification process
(Percentages of all firms surveyed)
Financing28.6
Ignorance of the benefits of certification
7.8
Inadequate human resources
24.7
Lack of technological equipment
3.9
Little time to invest in a certification process
35.1
Source: Prepared by the authors on the basis of answers to the questionnaire.

Innovation and internationalization of Latin American services
239
Public-sector support for efforts to obtain QCs is very low. Almost 80% of companies reported that they had received no governmental support or incentives for certification. The remainder (21%) acknowledged receiving some kind of support, mostly in the form of co-financing. In 2003, for example, Chile’s Production Development Corporation (CORFO), a public-sector agency responsible for promoting entrepreneurship, innovation and growth, subsidized the efforts of 25 companies to obtain ISO 9001 and CMMI certifications through its Partnership Development Project (PROFO) programme. The initiative was repeated in 2012 in collaboration with ACTI.
D. Final considerations
The results of the survey carried out as part of this study seem to suggest that more than two thirds (69%) of Chilean IT service producers and exporters have adopted some kind of QC. The most common standard is ISO 9001, in large measure because the cost, human resource implications and time required for the implementation of other QCs are all significantly greater. Another finding is that the type of certification likely to be implemented depends on the IT service being sold. For example, firms that develop software tend to implement CMMI, while companies that concentrate on the implementation of IT projects focus on ISO 9001. In the case of small Chilean IT companies, the scarcity of QCs is chiefly due to their prohibitive cost. The survey did not include a variable indicating foreign or local ownership of the firm, which may affect the propensity to seek certification.
The responses to the questionnaire designed for this study would appear to disprove the hypothesis that the principal motivation for acquiring a QC is to increase exports. Almost half (44%) of all companies cited process improvement and standardization as one of the main motivations for obtaining certifications, followed by a desire to increase their participation in local (32%) and foreign (24%) markets. In sum, the results seem to be in line with the alternative hypothesis of QCs being primarily motivated by efficiency (i.e. cost) considerations.
Another factor that appears to support rejection of the first hypothesis is that Chilean companies generally display limited knowledge about which quality certifications are the most important in the countries targeted for increased exports. Furthermore, it was observed that the share of export revenue relative to overall sales revenue was low at many of the companies.
The survey results suggest that the majority (79%) of respondents concentrate their exports on Latin America and will continue to do so in the
E C L A C / C O L E F
240
next couple of years. This indicates that “nearshoring” is the main business model of Chilean IT service providers. In this context, Peru and Colombia seem to have the greatest potential, due to factors such as geographical proximity, cultural and linguistic similarity and time zones. Other important factors that may explain the preference for the Peruvian and Colombian markets is the similarity of these countries in terms of export and production specialization (minerals, retail) and economic development models. As most Latin American markets do not seem to demand much in the way of QCs, lack of these does not seem to be an obstacle to the export efforts of the enterprises surveyed.
Regarding the benefits that companies derive from QCs, most businesses seem to confirm that they help to boost sales. Other benefits include a reduction in service delivery times, process improvement and standardization, and project cost reduction. Overall, firms seem to be satisfied with the returns from investing in QCs.
On the basis of this chapter’s literature review and the survey results, the following recommendations can be made for future analysis and policymaking in the area of QCs for the IT services sector. These findings are intended to help firms and policymakers in Chile and other developing countries better understand the benefits and obstacles of using QCs to boost IT service exports and to identify the types of support measures best able to promote such objectives:
• Incorporate questions on the use of QCs in the annual services survey of the Chilean National Institute of Statistics (INE) or surveys on innovation.
• Use firm-level data to conduct econometric studies on the links between QCs, exports and company performance, in collaboration with IT services organizations.
• Investigate the reasons for the professed lack of awareness among IT service producers of the importance of QCs in export markets, and implement policies that may support the adoption of market-relevant QCs. One example is a tax rebate for costs incurred to implement certain QCs, as in Argentina and Brazil.
• Develop a user-friendly business guide on the requirements and steps involved in the certification process.
• Promote partnerships between IT services companies that are already certified and those wishing to become certified.
• Mandate the Export Promotion Bureau of Chile (PROCHILE), the country’s trade promotion agency, to establish a publicly available database with information on the most appropriate or valued certifications for different export markets.
Innovation and internationalization of Latin American services
241
BibliographyAnkur, J. and S.L Gupta (2011), “Significance of quality certification towards business
excellence: Case of Indian software industry”, International Journal of Innovation, Management and Technology, vol. 2, No. 3, June.
Arora, A. and J. Asundi (1999), “Quality certification and the economics of contract software development: A study of the Indian software industry”, NBER Working Paper series, No. 7260, Cambridge, MA, National Bureau of Economic Research (NBER).
Barletta, F. and others (2013), “Argentina: recent dynamics in the software and IT services industry”, CEPAL Review, No. 110 (LC/G.2572-P), Santiago, Economic Commission for Latin America and the Caribbean (ECLAC), August.
Castagnino, T. (2006), “Estándares internacionales de calidad y desempeño exportador: evidencia a nivel de firma”, Revista del CEI, Buenos Aires, International Economics Centre (CEI).
CESSI (Chamber of Software Companies and Information Technology Services of Argentina) (2014), “Reporte semestral sobre el sector de software y servicios informáticos de la República de Argentina”, Buenos Aires.
Clougherty, J.A. and M. Grajekc (2013), “International standards and international trade: Empirical evidence from ISO 9000 diffusion”, International Journal of Industrial Organization, August.
CUTI (Uruguayan Chamber of Information Technologies) (2010), Análisis del equipo de fortalecimiento institucional de la cámara uruguaya de TI, Montevideo, ALES.
FEDESOFT (Colombian Federation for the Software Industry and Information Technology) (2012), “Estudio de la caracterización de productos y servicios de la industria de software y servicios asociados”, Bogota, Ministry of Information and Communications Technologies.
Gopal, A. and G. Gao (2009), “Certification in the Indian offshore IT services industry”, Manufacturing and Service Operations Management, vol. 11, No. 3, Summer.
INTECO (The National Institute of Information Technology) (2008), “Estudio sobre la certificación de la calidad como medio para impulsar la industria del desarrollo del software en España”, Madrid, Ministry of Industry, Tourism and Commerce.
International Data Corporation (2013), IDC Worldwide Black Book Q4 2013, Framingham, Massachusetts.
Rivera von Hagen, F., O. Marinao and N. Mulder (2014), “Information technology enabled services in Chile: A new export niche?”, Latin America’s emergence in global services: A new driver of structural change in the region?, R. Hernández and others (eds.), ECLAC Books, No. 121 (LC/G.2599-P), Santiago, Economic Commission for Latin America and the Caribbean (ECLAC).
Swann, G. P. (2010), “International standards and trade: A review of the empirical literature”, OECD Trade Policy Working Papers, No. 97, Paris, Organization for Economic Cooperation and Development (OECD).
UNCTAD (United Nations Conference on Trade and Development) (2012), Information Economy Report: The Software Industry and Developing Countries, Geneva.

E C L A C / C O L E F
242
Annex VIII.A1
Questionnaire for information technology service producers in Chile
This confidential survey is addressed to Chilean information technology companies. Its purpose is to determine the role of quality certifications in exports. The findings will be presented to public bodies and associations, along with recommendations. We would like to thank you for your support. We will e-mail you the results of this survey as soon as it is complete. Your answers to this survey are very valuable to us. Thank you very much.Mark an X in the box, or write your answers as appropriate.
1. Name of company (optional): ___________________________________
2. Number of employees at company (optional): _____________________
3. Contact e-mail address (optional): _______________________________
1. In order to identify your company’s size, what is its total annual turnover in development units (UF)?
• 2,401-10,000 • 10,001-25,000 • 25,001-50,000 • 50,001-75,000 • 75,001-100,000
2. Does your company export information technology services? • Yes • No
If not, does it wish to do so? ____________________________________
3. If your company exports information technology services, how long has it been doing so?
• 0-2 years • 2-4 years • 4 years or more
Have there been any periods over the past 10 years when your company has not participated in the export market? If the answer is yes, please say when and for how long: ____________________________________ _____________________________________________________________
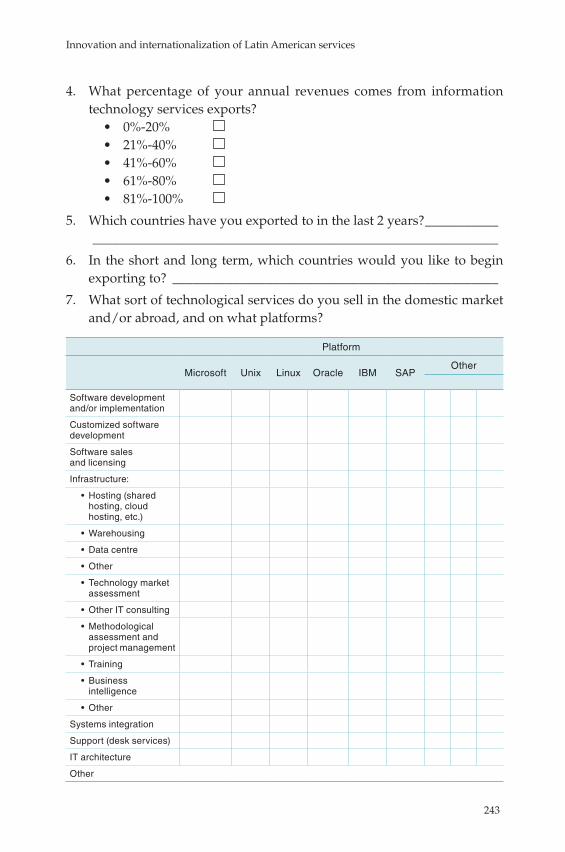
Innovation and internationalization of Latin American services
243
4. What percentage of your annual revenues comes from information technology services exports?
• 0%-20% • 21%-40% • 41%-60% • 61%-80% • 81%-100%
5. Which countries have you exported to in the last 2 years? ___________ _____________________________________________________________
6. In the short and long term, which countries would you like to begin exporting to? _________________________________________________
7. What sort of technological services do you sell in the domestic market and/or abroad, and on what platforms?
Platform
Microsoft Unix Linux Oracle IBM SAPOther
Software development and/or implementation
Customized software development
Software sales and licensing
Infrastructure:
• Hosting (shared hosting, cloud hosting, etc.)
• Warehousing
• Data centre
• Other
• Technology market assessment
• Other IT consulting
• Methodological assessment and project management
• Training
• Business intelligence
• Other
Systems integration
Support (desk services)
IT architecture
Other

E C L A C / C O L E F
244
8. What type of quality certificates does your company hold, and at what level? Whether or not you currently have quality certification, which would you like to obtain?
Obtained
Pending Desired / Planned certificationYear
Level of certification
CMMI
ITIL
PMP
ISO 20000
ISO 27001
ISO 22301
ISO 9001
Other
9. What are your company’s main reasons for wanting certification?
Yes No
Higher local market share
Higher foreign market share
Improvement and standardization of your processes
Other (please specify):
10. How important do you consider the following quality certifications to be for your business (whether or not you actually hold them)?
Very important
Important NeutralNot very important
Not at all important
Don’t know
CMMI
ITIL
PMP
ISO 20000
ISO 27001
ISO 22301
ISO 9001
Other

Innovation and internationalization of Latin American services
245
11. Are you clearly aware of which quality certifications are important in the countries you export to?
• Yes • No
If the answer is yes, please indicate:
Latin AmericaCanada and the
United StatesEurope Asia-Pacific Other
CMMI
ITIL
PMP
ISO 20000
ISO 27001
ISO 22301
ISO 9001
Other
12. If your company has obtained a quality certification, what consequences would you say this has had?
Yes No No information
Increased sales
Increased exports
Reduced project delivery times
Reduced costs
Other (please specify):
13. If your company has never obtained any quality certification, do you believe this has limited its development?
• Yes • No
If the answer is yes, please explain why: __________________________ _____________________________________________________________

E C L A C / C O L E F
246
14. What are the main obstacles preventing you from entering a quality certification process? More than one may be specified.
Yes No No information
Financing
Lack of knowledge of the benefits of certification
Inadequate human resources
Lack of technological equipment
Not enough time to invest in this process
Other (please specify):
15. Has the public sector in any way supported you in a certification process?• Yes • No
If the answer is yes, which programmes or institutions supported you? _____________________________________________________________ _____________________________________________________________
16. Is there anything you wish to add?
Thank you very much!
Chapter IX
Value creation, configuration and appropriation: a case study on a
knowledge-intensive service firm in Brazil
Fabio Morganti Dimária Silva e Meirelles
Summary
Innovation plays a fundamental role in economic growth, but innovative firms often do not reap the returns on their technological leadership. In light of this, the present study analyses the processes of value creation, configuration and appropriation for a knowledge-intensive medium-sized multinational service firm in Brazil. This is done using both the Business Model Canvas (Osterwalder and Pigneur, 2010) and the Profiting from Innovation framework (Teece, 1986). Our case study shows that the firm appropriates value mainly through the use of complementary assets such as reputation, upper management capacity and differentiated information systems, owing to difficulties in appropriating the gains from innovation. The Business Model Canvas analysis confirms the importance of reputation and relationships in the value creation process. It also emphasizes that competitive advantage depends on a firm’s business model being configured to exploit its complementary assets so that value is appropriated.
E C L A C / C O L E F
248
Introduction
Information and knowledge play a much larger role in value creation now than a few decades ago. Over time, the volume of information has grown at exponential rates. At the beginning of the twentieth century, for example, the volume of global information took around 30 years to double. This period had fallen to seven years by the 1970s (Bontis, 2002a), and by 2011 an IDC report shows world data doubling every 13 months (Gantz and Reinsel, 2011). Growing volumes of information and knowledge allow customers to demand better products while making it possible to improve delivery and quality conditions, adapt products to their needs, achieve better cost-benefit ratios and reduce the life cycle of products and services (Cobenhagen, 2000).
In this context, firms need to update their product portfolios frequently to obtain or keep a competitive advantage over their rivals. The ability to innovate and knowledge itself have become the main competitive resources available to firms. A number of authors have pointed to innovation as a key determinant of a firm’s performance (Porter, 1998a and 1998b; Tidd, 2001; Chaney and Devinney, 1992; Freeman, 1994). Chaney and Devinney (1992), for example, state that innovation is responsible for corporate success, while Freeman (1994) reaffirms the consensus among most economists about the contribution of innovation to long-term economic growth.
However, it is well documented in the economics and business administration literature that innovative companies often do not reap the returns on their technological leadership. Technological progress does not guarantee commercial success. For example, EMI introduced the computerized axial tomography (CAT) scanner in 1974 but was unable to appropriate the returns on its technical leadership, allowing General Electric (GE) and Technicare to reap the economic fruits of this invention and become market leaders (Teece, 1986).
In short, new knowledge and innovation are fundamental drivers of company performance, but innovation per se does not guarantee economic returns (Bontis, 2002a, 2002b; Porter, 1998a and 1998b; Freeman, 1994). To better grasp the links between the two, it is necessary to understand the strategies and processes adopted by companies to create, configure and appropriate the value generated by their innovations (Winter, 2006).
Our view is that many value creation, configuration and appropriation challenges can be solved by the correct business model. However, the business model literature has yet to present a clear foundation for this relationship. The aim of this exploratory and descriptive study, therefore, is to shed light on the
Innovation and internationalization of Latin American services
249
links between business models and the value creation process. In particular, it looks at how a service company can succeed in appropriating a portion of the value created and thus keep a competitive edge over its competitors. We focus on a business model adopted by a knowledge-intensive medium-sized technical services firm in Brazil.
In this chapter, we have adopted the Business Model Canvas proposed by Osterwalder and Pigneur (2010). As the business model literature has yet to present a clear foundation for the relationship between innovation and value generation, we adopt three types of models for (i) value creation (Ito and others, 2012; Amit and Zott, 2001), (ii) value configuration (Stabell and Fjeldstad, 1998) and (iii) value appropriation, using Teece’s (1986) Profiting From Innovation (PFI) framework.
A. The theoretical background
1. Business models
There are many definitions of the term “business model” (Osterwalder, Pigneur and Tucci, 2005). Some provide a general description of how firms do business, while others present detailed accounts of business model elements and their interrelations. Osterwalder, Pigneur and Tucci (2005) unite existing business model conceptions in the following definition:
“A business model is a conceptual tool containing a set of objects, concepts and their relationships with the objective to express the business logic of a specific firm. Therefore we must consider which concepts and relationships allow a simplified description and representation of what value is provided to customers, how this is done and with which financial consequences.”The same authors show that the term “business model” started to
appear in the body text of academic literature in the early 1990s. Its occurrence began to increase exponentially once the Internet emerged as a commercially viable means of communicating and sharing information in the mid-1990s. At this point, the term also started to appear in keywords, abstracts and even article titles. Osterwalder, Pigneur and Tucci (2005) also argue that “a lot of the fuzziness and confusion about business models stems from the fact that when different authors write about business models they do not necessarily mean the same thing”.
Osterwalder, Pigneur and Tucci (2005) separate the conception of business models from their application. They split the conception into four
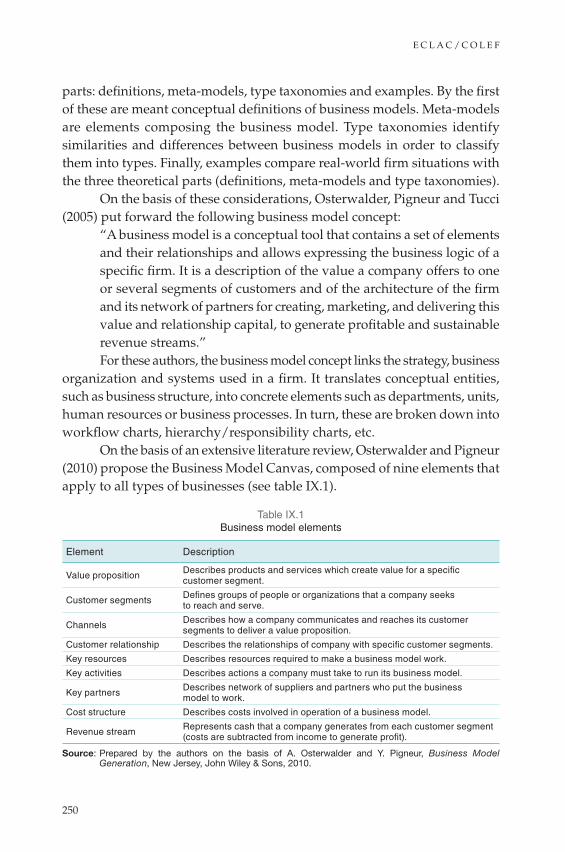
E C L A C / C O L E F
250
parts: definitions, meta-models, type taxonomies and examples. By the first of these are meant conceptual definitions of business models. Meta-models are elements composing the business model. Type taxonomies identify similarities and differences between business models in order to classify them into types. Finally, examples compare real-world firm situations with the three theoretical parts (definitions, meta-models and type taxonomies).
On the basis of these considerations, Osterwalder, Pigneur and Tucci (2005) put forward the following business model concept:
“A business model is a conceptual tool that contains a set of elements and their relationships and allows expressing the business logic of a specific firm. It is a description of the value a company offers to one or several segments of customers and of the architecture of the firm and its network of partners for creating, marketing, and delivering this value and relationship capital, to generate profitable and sustainable revenue streams.”For these authors, the business model concept links the strategy, business
organization and systems used in a firm. It translates conceptual entities, such as business structure, into concrete elements such as departments, units, human resources or business processes. In turn, these are broken down into workflow charts, hierarchy/responsibility charts, etc.
On the basis of an extensive literature review, Osterwalder and Pigneur (2010) propose the Business Model Canvas, composed of nine elements that apply to all types of businesses (see table IX.1).
Table IX.1 Business model elements
Element Description
Value proposition Describes products and services which create value for a specific customer segment.
Customer segments Defines groups of people or organizations that a company seeks to reach and serve.
Channels Describes how a company communicates and reaches its customer segments to deliver a value proposition.
Customer relationship Describes the relationships of company with specific customer segments.
Key resources Describes resources required to make a business model work.
Key activities Describes actions a company must take to run its business model.
Key partners Describes network of suppliers and partners who put the business model to work.
Cost structure Describes costs involved in operation of a business model.
Revenue stream Represents cash that a company generates from each customer segment (costs are subtracted from income to generate profit).
Source: Prepared by the authors on the basis of A. Osterwalder and Y. Pigneur, Business Model Generation, New Jersey, John Wiley & Sons, 2010.

Innovation and internationalization of Latin American services
251
The same authors also provide a graphical representation of the Business Model Canvas (table IX.2) to help towards an understanding of how business model elements interact. The table provides a standardized analysis of any business model together with its main components. The combination of nine blocks defines how “an organization creates, delivers and captures value” (Osterwalder and Pigneur, 2010). In this study, we have adopted the Business Model Canvas to analyse the triangle of value creation, configuration and appropriation.
Table IX.2 Graphical representation of the Business Model Canvas
Key partners Key activities Value proposition Customer relationships
Customer segments
Key resources Channels
Cost structure Revenue streams
Source: A. Osterwalder and Y. Pigneur, Business Model Generation, New Jersey, John Wiley & Sons, 2010.
2. Value creation
To deal with the processes of value creation, configuration and appropriation, it is necessary to define what value is. In the business literature, there are several definitions of value which apply to different contexts. For Porter (1998a), value in the context of firm competitiveness is “the amount that buyers are prone to pay for what is offered by the firm. Value is thus measured by the total income, which, at its turn, is a reflex of the price practiced by a firm and the number of units that this company may sell at such price […]. Creating Value for the buyers that exceed the direct cost is the target of any generic strategy.”
For Ito and others (2012), value in the context of Resource-Based Theory (RBT) is an attribute of a firm’s resources. These resources contribute to the development and implementation of strategies that improve efficiency, increase profits or reduce costs while maintaining quality levels. The authors also stress the lack of consensus on the definition of value, even within the field of organizational strategy. They suggest that the concept of value related to competitive advantages is usually bound up with the question of the imitability of distinctive resources. Moreover, they link the definition of value with the customer’s ability to pay a given price or the effort to obtain economic returns.
Kaplan and Norton (1996) present an operational concept based on the components of the value construct:
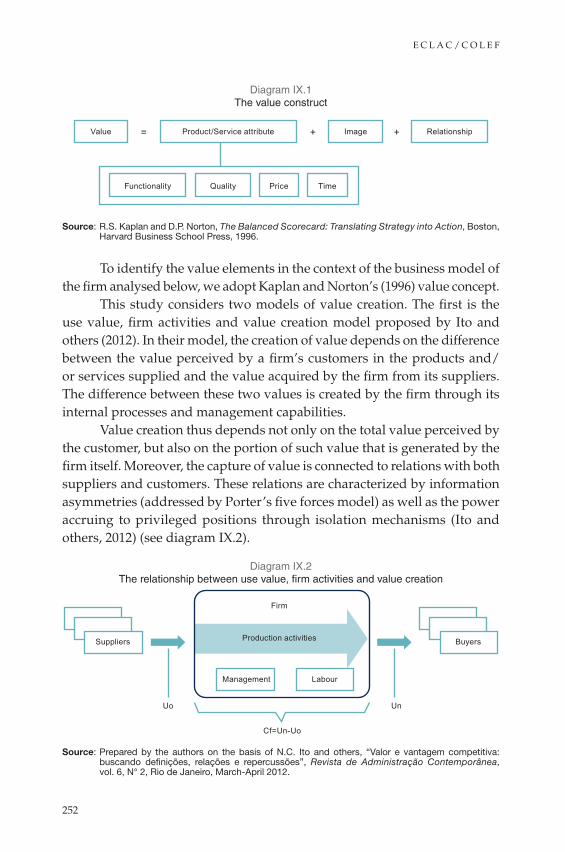
E C L A C / C O L E F
252
Diagram IX.1 The value construct
Value
Functionality Quality Price Time
= + +Image RelationshipProduct/Service attribute
Source: R.S. Kaplan and D.P. Norton, The Balanced Scorecard: Translating Strategy into Action, Boston, Harvard Business School Press, 1996.
To identify the value elements in the context of the business model of the firm analysed below, we adopt Kaplan and Norton’s (1996) value concept.
This study considers two models of value creation. The first is the use value, firm activities and value creation model proposed by Ito and others (2012). In their model, the creation of value depends on the difference between the value perceived by a firm’s customers in the products and/or services supplied and the value acquired by the firm from its suppliers. The difference between these two values is created by the firm through its internal processes and management capabilities.
Value creation thus depends not only on the total value perceived by the customer, but also on the portion of such value that is generated by the firm itself. Moreover, the capture of value is connected to relations with both suppliers and customers. These relations are characterized by information asymmetries (addressed by Porter’s five forces model) as well as the power accruing to privileged positions through isolation mechanisms (Ito and others, 2012) (see diagram IX.2).
Diagram IX.2 The relationship between use value, firm activities and value creation
Suppliers Production activities
Cf=Un-Uo
Uo Un
Buyers
Firm
Management Labour
Source: Prepared by the authors on the basis of N.C. Ito and others, “Valor e vantagem competitiva: buscando definições, relações e repercussões”, Revista de Administração Contemporânea, vol. 6, N° 2, Rio de Janeiro, March-April 2012.
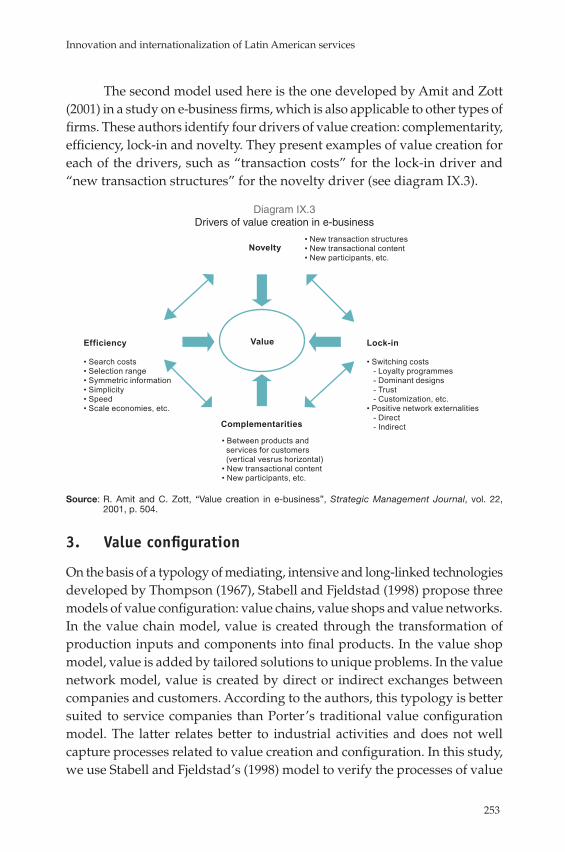
Innovation and internationalization of Latin American services
253
The second model used here is the one developed by Amit and Zott (2001) in a study on e-business firms, which is also applicable to other types of firms. These authors identify four drivers of value creation: complementarity, efficiency, lock-in and novelty. They present examples of value creation for each of the drivers, such as “transaction costs” for the lock-in driver and “new transaction structures” for the novelty driver (see diagram IX.3).
Diagram IX.3 Drivers of value creation in e-business
• New transaction structures• New transactional content• New participants, etc.
Lock-in
• Switching costs - Loyalty programmes - Dominant designs - Trust - Customization, etc.• Positive network externalities - Direct - Indirect
• Between products and services for customers (vertical vesrus horizontal)• New transactional content• New participants, etc.
Efficiency
• Search costs• Selection range• Symmetric information• Simplicity• Speed• Scale economies, etc.
Value
Novelty
Complementarities
Source: R. Amit and C. Zott, “Value creation in e-business”, Strategic Management Journal, vol. 22, 2001, p. 504.
3. Value configuration
On the basis of a typology of mediating, intensive and long-linked technologies developed by Thompson (1967), Stabell and Fjeldstad (1998) propose three models of value configuration: value chains, value shops and value networks. In the value chain model, value is created through the transformation of production inputs and components into final products. In the value shop model, value is added by tailored solutions to unique problems. In the value network model, value is created by direct or indirect exchanges between companies and customers. According to the authors, this typology is better suited to service companies than Porter’s traditional value configuration model. The latter relates better to industrial activities and does not well capture processes related to value creation and configuration. In this study, we use Stabell and Fjeldstad’s (1998) model to verify the processes of value
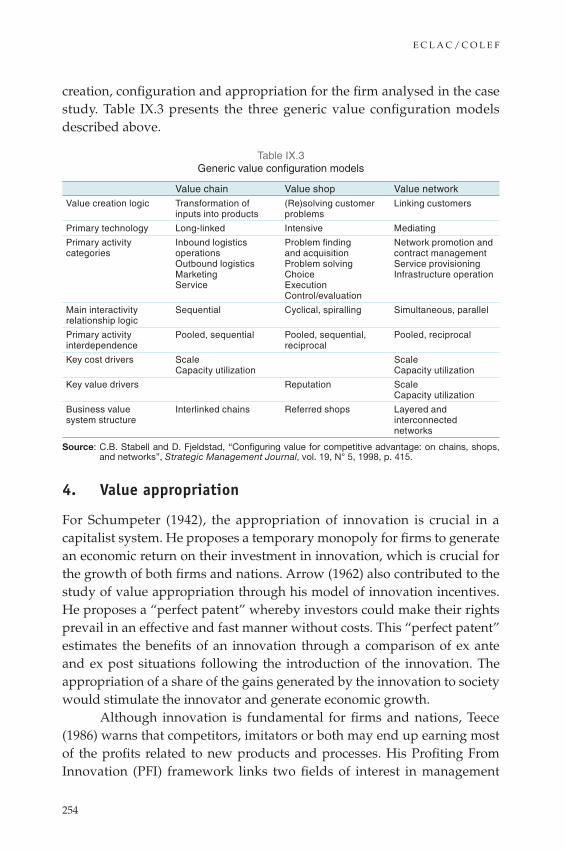
E C L A C / C O L E F
254
creation, configuration and appropriation for the firm analysed in the case study. Table IX.3 presents the three generic value configuration models described above.
Table IX.3 Generic value configuration models
Value chain Value shop Value networkValue creation logic Transformation of
inputs into products(Re)solving customer problems
Linking customers
Primary technology Long-linked Intensive Mediating
Primary activity categories
Inbound logistics operationsOutbound logisticsMarketing Service
Problem finding and acquisition Problem solving Choice Execution Control/evaluation
Network promotion and contract management Service provisioning Infrastructure operation
Main interactivity relationship logic
Sequential Cyclical, spiralling Simultaneous, parallel
Primary activity interdependence
Pooled, sequential Pooled, sequential, reciprocal
Pooled, reciprocal
Key cost drivers Scale Capacity utilization
Scale Capacity utilization
Key value drivers Reputation Scale Capacity utilization
Business value system structure
Interlinked chains Referred shops Layered and interconnected networks
Source: C.B. Stabell and D. Fjeldstad, “Configuring value for competitive advantage: on chains, shops, and networks”, Strategic Management Journal, vol. 19, N° 5, 1998, p. 415.
4. Value appropriation
For Schumpeter (1942), the appropriation of innovation is crucial in a capitalist system. He proposes a temporary monopoly for firms to generate an economic return on their investment in innovation, which is crucial for the growth of both firms and nations. Arrow (1962) also contributed to the study of value appropriation through his model of innovation incentives. He proposes a “perfect patent” whereby investors could make their rights prevail in an effective and fast manner without costs. This “perfect patent” estimates the benefits of an innovation through a comparison of ex ante and ex post situations following the introduction of the innovation. The appropriation of a share of the gains generated by the innovation to society would stimulate the innovator and generate economic growth.
Although innovation is fundamental for firms and nations, Teece (1986) warns that competitors, imitators or both may end up earning most of the profits related to new products and processes. His Profiting From Innovation (PFI) framework links two fields of interest in management
Innovation and internationalization of Latin American services
255
studies, namely innovation and strategy. The PFI framework shows that the results of innovation depend on three factors: the appropriability regime, complementary assets and the dominant design paradigm (Teece, 1986).
The appropriability regime refers to external factors, excluding firm and market structures, which affect an innovator’s ability to capture the profits generated by an innovation. Two dimensions are important for the definition of an appropriability regime: the nature of the technology and the efficacy of appropriability mechanisms.
The nature of a technology in Teece’s PFI framework is related to the degree to which it (and related knowledge) may be easily imitated by competitors. Tacit knowledge, for example, is hard to copy. Technologies with a high degree of tacitness may be protected as industrial secrets. The nature of a technology also impacts the efficacy of legal appropriability mechanisms (Levin and others, 1987). Different rates of adoption of these mechanisms from one industry to another can be explained in part by the fact that their efficacy is highly variable across sectors.
The combination of the nature of a technology and the efficacy of appropriability mechanisms forms a continuum (Teece, 1986). At one end of this continuum is a strong appropriability regime able to protect intellectual property rights. At the other end is a weak appropriability regime where the legal system is unfavourable to the innovative firm, which is thus unable to protect its intellectual property rights.
The development of a dominant design may present risks to the innovator in cases where the technology is easily imitable and the imitator improves the invention with small design changes (Teece, 1986). When such imitations occur in the phase where a dominant design is being defined, leadership may well end up with the imitator, to the detriment of the original innovator. This also applies to the ease of imitability addressed in the appropriability regime. Thus, the question relating to the dominant design is one more element to be considered by the innovator.
Since many innovators struggle to make returns on their innovations, the successful commercialization of an innovation requires the technology or know-how represented by it to be used in conjunction with other assets or capabilities. These can be referred to as complementary assets (Teece, 1986). Examples of complementary assets are found in various “services”, including marketing, sales and aftersales support. When innovation is a component of a complex system, we may consider other parts of the system as complementary assets, since innovators cannot commercialize their inventions as stand-alone products. But even in the case of innovations that are independent of other

E C L A C / C O L E F
256
products, some complementary assets and capabilities will be needed for them to reach the market.
Complementary assets may be generic, specialized and co-specialized. Generic assets are those that are in common use and not related (i.e., not adapted) to a specific innovation. Assets are specialized when there is unilateral dependence between the innovation and the asset, and co-specialized when the dependence is bilateral. An example of the latter is the introduction of the Mazda rotary engine. This engine required a new service and repair network because it is fundamentally different from the standard engine. Assets like this service and repair network are co-specialized complementary assets, since there is a mutual dependence between the innovation and the network (Teece, 1986).
B. Methodology
The aim of this chapter is to analyse the processes of value creation, configuration and appropriation adopted by a knowledge-intensive service firm and their relationship with the firm’s business model by means of an exploratory case study. This methodology allows the concepts described to be empirically verified and is especially suitable when the boundaries between the phenomenon and its context are unknown (Yin, 2006). It allows general information about the phenomenon to be obtained from the point of view of the informant. The aim is not to generalize the findings statistically, but rather to compare the empirical findings with the theory outlined above (Triviños, 1987).
Data were collected through a semi-structured in-depth qualitative interview conducted in May 2013 with the South America General Director of the company being researched. Secondary data such as presentations on the company and information from its website were also used.
The case study is on Process Development Corporation (PDC) of the United States. It is a medium-sized multinational company providing technical services. It was founded in 1988 and has offices in Brazil, Canada, China, Europe and Mexico. PDC offers services and consultancy in the areas of manufacturing, supply chain management, engineering, quality systems, logistics, warehousing and material handling, and information systems. Its services include controlled shipping, label error proofing, inspections, quality workshops, lean manufacturing consulting, cost reduction programmes, tooling tracking, global sourcing programmes, quality system basics, representation for foreign suppliers, sub-assemblies, teams of quality engineers, supplier development, tooling inventory and operations management.
Innovation and internationalization of Latin American services
257
C. Results and discussion
1. Value creation
According to the respondent, PDC seeks to create value for its customers through the supply of higher-quality services than those offered by its competitors. Also, it aims to be at the cutting edge of technological developments as the main driver of high-quality services. Examples of these were evident in the interview (emphasis added):
“Look, what is the most effective is you perform the service with quality.” “We have an engineering team in the business centre. During the start-up phase of projects, they provide strong technical support which allows clients to see that PDC has control over the information, and knows exactly what the project needs are.”“In the United States, for example, there is great know-how in information technology, management systems, quality monitoring systems, and systems that communicate with the key functional areas of the customers such as logistics, purchasing.”“Our goal is to actually perform technical and supportive service, which distinguishes our work from smaller competitors.”Another service management priority for PDC was communication,
both between PDC and its clients and between the senior management of PDC and mid-level leadership (emphasis added):
“Inspection, for example, is a commodity.”“In relatively simple projects subject to intense competition, we try to differentiate ourselves from other companies by the quality of management and information passed on to the customer.”“We maintain constant communication through the Internet and direct contact with our key leaders [referring to PDC project leaders, i.e., mid-level management personnel] in all regions of Brazil and outside the country.”“We use all necessary resources to guarantee the quality of our service through instant communication using smartphones and a special communication tool for our personnel to be online with customers. Every time we receive a message, the project leaders receive this information and take the necessary actions. We do not wait until the professional returns to the office by the end of the day. He or she has a computer to prepare a specific report if needed and to reply to the client’s inquiries.”

E C L A C / C O L E F
258
The importance of image and reputation is another dimension of PDC’s value proposition that emerged during the content analysis. This is important to reduce risk perception among (potential) clients and for marketing the firm’s services (emphasis added).
“We prefer to refuse a project instead of running the risk of delivering a service with low quality.”“The service has to match the customer’s needs [...]. If you deliver a good service, the client will remember you.”“The cost of a multinational company is always higher than a domestic company. This is because we comply with all tax and other laws. Instead many local and smaller companies do not pay all taxes, incurring a certain risk not only for themselves but also their clients.”“Some clients prefer cheaper service providers which often deliver lower-quality services. As a consequence, they may incur additional costs and losses, which causes them to incur additional unexpected costs.”The interview suggests that the researched firm puts in great effort
to deliver a differentiated service based on attributes (quality, technological expertise and communication), reputation and a differentiated relationship with clients grounded in value and a long-term vision. These findings match the value definition of Kaplan and Norton (1996), who stress that value can be based on precisely these dimensions (attributes, image and relationship).
In relation to the value model of Ito and others (2012), in which value is created through use value and the firm’s activities, we found that PDC tried to do exactly this. This value added is the difference between inputs (mostly personnel costs) and the final use value provided by PDC. It can be understood as the value created by PDC activities and processes. On the one hand, the interviewee considered one of its services to be a “commodity”, whereas on the other he pointed out that PDC did not seek to compete on price, but differentiated its services through other benefits (risk reduction, quality, and competence in service design). Finally, we also note that PDC has elements of the value creation posited in Amit and Zott’s (2001) model (see table IX.4).
Table IX.4 Analysis of value creation sources according to Amit and Zott’s (2001) model
Value creation source Activity PDC exampleNovelty New transaction
structuresUse of web for communication and client monitoring
Efficiency Information symmetry
Real-time communication between upper management and mid-level leaders
Lock-in Transaction cost Risk reduction with high quality-assured serviceComplementarity Inter activities Global and local support structures
Full service provider (design, execution)
Source: Prepared by the authors.
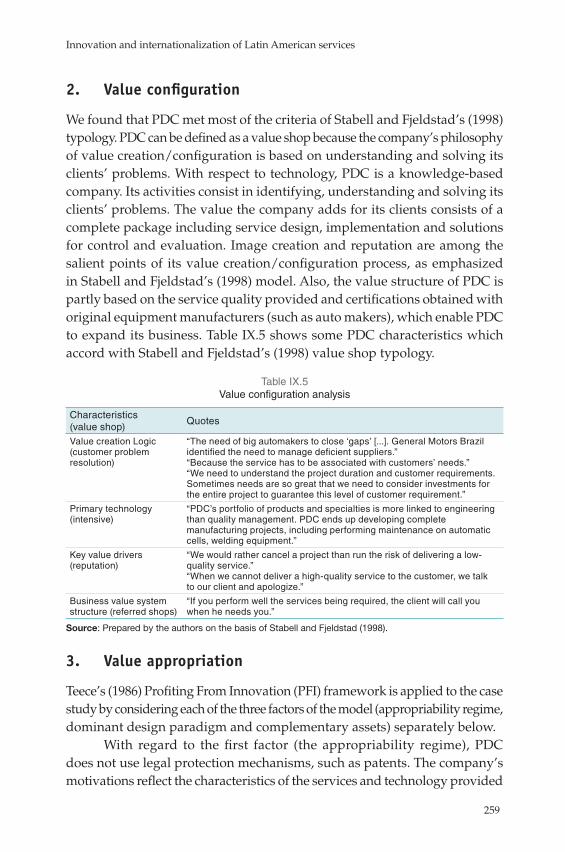
Innovation and internationalization of Latin American services
259
2. Value configuration
We found that PDC met most of the criteria of Stabell and Fjeldstad’s (1998) typology. PDC can be defined as a value shop because the company’s philosophy of value creation/configuration is based on understanding and solving its clients’ problems. With respect to technology, PDC is a knowledge-based company. Its activities consist in identifying, understanding and solving its clients’ problems. The value the company adds for its clients consists of a complete package including service design, implementation and solutions for control and evaluation. Image creation and reputation are among the salient points of its value creation/configuration process, as emphasized in Stabell and Fjeldstad’s (1998) model. Also, the value structure of PDC is partly based on the service quality provided and certifications obtained with original equipment manufacturers (such as auto makers), which enable PDC to expand its business. Table IX.5 shows some PDC characteristics which accord with Stabell and Fjeldstad’s (1998) value shop typology.
Table IX.5 Value configuration analysis
Characteristics (value shop)
Quotes
Value creation Logic (customer problem resolution)
“The need of big automakers to close ‘gaps’ [...]. General Motors Brazil identified the need to manage deficient suppliers.” “Because the service has to be associated with customers’ needs.” “We need to understand the project duration and customer requirements. Sometimes needs are so great that we need to consider investments for the entire project to guarantee this level of customer requirement.”
Primary technology (intensive)
“PDC’s portfolio of products and specialties is more linked to engineering than quality management. PDC ends up developing complete manufacturing projects, including performing maintenance on automatic cells, welding equipment.”
Key value drivers (reputation)
“We would rather cancel a project than run the risk of delivering a low-quality service.” “When we cannot deliver a high-quality service to the customer, we talk to our client and apologize.”
Business value system structure (referred shops)
“If you perform well the services being required, the client will call you when he needs you.”
Source: Prepared by the authors on the basis of Stabell and Fjeldstad (1998).
3. Value appropriation
Teece’s (1986) Profiting From Innovation (PFI) framework is applied to the case study by considering each of the three factors of the model (appropriability regime, dominant design paradigm and complementary assets) separately below.
With regard to the first factor (the appropriability regime), PDC does not use legal protection mechanisms, such as patents. The company’s motivations reflect the characteristics of the services and technology provided
E C L A C / C O L E F
260
by PDC, which reduce the effectiveness of legal appropriation mechanisms (Levin and others, 1987). Nonetheless, PDC uses contractual mechanisms to protect service projects presented to potential clients. But even in this case, the respondent claims these mechanisms are not very effective, as in the past some competitors have appropriated service projects presented by PDC. These points are highlighted below (emphasis added):
“We adopt confidentiality agreements in our projects. Within our service activities [...] there is nothing to be patented or registered. As our engineering services are public activities [referring to the fact that activities are open and accessible to other companies and that engineering knowledge itself is not proprietary] based on a knowledge chain, there are no technical secrets. We always have [...] a confidentiality of information clause in our contracts, because we have access to sensitive information of our clients’. Examples are quality problems with parts or documentation on production processes.”In part due to the weak appropriability regime, the company has
identified several losses. Indeed, the interviewee cited cases in which service project designs in PDC commercial proposals were used by the client to define the scope of services for PDC’s competitors (emphasis added):
“Sometimes the business ethics is broken when our proposals are open to competitors, who in turn prepare similar offers for a lower price but with the same technical format [...]. This is particularly true for smaller firms, which often have little idea on how to present proposals. Sometimes they win the bids [...].” Contractual arrangements are ineffective, according to the interviewee,
in part because of the difficulty of assembling evidence. This is why PDC does not seek enforcement of its intellectual property rights through the legal system (emphasis added):
“No, we never undertake legal actions. This is because we cannot prove a breach of contract. However, we observe that the service format used by some competitors is the same as the one offered by us.”Another appropriability-related challenge identified by the interviewee
was competition from former PDC employees, especially those at higher technical and leadership levels. These former employees had access to confidential information and internal PDC processes. This competition arises from the fact that services are highly dependent on and intensive in qualified personnel. Former PDC employees may favour competitors when they make use in their new job of this confidential information or of established contacts made during their time at PDC. The respondent again expressed scepticism
Innovation and internationalization of Latin American services
261
regarding the legal protection provided by non-compete agreements and Brazilian labour law (emphasis added):
“Under Brazilian law [...] any signed labour contract can be easily ignored when the employee says he or she is performing his or her job to survive or that he or she is unemployed [...]. In those cases we learned the contract is totally ineffective. Labour contracts stipulate for example that an employee cannot set up a new company to compete with you in the two years after the dismissal [...]. However, we have seen our former employees set up a business before this term expires. Brazilian laws and legal system cannot really do something about this.”According to the second PFI factor (the dominant design paradigm), the
risk of imitation is especially critical for firms facing technological paradigm shifts (Teece, 1986). This is the case with the firm under study. When it develops new methods and processes, its competitors try to quickly match the leader’s innovation. This happens in particular in the context of the weak appropriability regime in Brazil. This situation may prevent the company from adding an innovative service to its portfolio. As a consequence, PDC offers a more limited service portfolio in Brazil than in the country where its headquarters are based.
Another concern for PDC is the cyclical nature of its project-based activities or value shop (Stabell and Fjeldstad, 1998). For each project, one type of service design may prove more effective than others. On the one hand, this favours the company with the best technological expertise. On the other hand, competitors can take advantage of the weak appropriability regime and copy a new concept introduced by PDC on each occasion.
As for the third PFI factor (complementary assets), lastly, the interview showed that the strength of PDC in terms of value appropriation depended precisely on its complementary assets. In line with Teece’s (1986) arguments, the successful marketing of PDC services requires a combination of its technology and know-how embodied in services and other assets or capabilities. These latter include its image and reputation, (upper) management capabilities, presence in other countries’ markets and use of a web-based control system. The following quotes illustrate the importance of complementary assets in PDC’s value creation and appropriation processes, which are difficult for competitors to imitate (emphasis added):
• On top management capabilities: “We try to differentiate our company on the basis of the quality of management and information provided to clients.”

E C L A C / C O L E F
262
• On communication and web-based control: “The constant updating of our communication channels through the Internet and direct contact with our key leaders [referring to PDC project leaders, i.e., mid-level management personnel], keeping contacts communication updated in all regions of Brazil and outside Brazil, is the ‘differential’ [...].”
• On reputation (image): “We prefer to cancel a project instead of running the risk of delivering a low-quality service. If you impress your client with a well-performed service, he will remember you.”
• On the importance of the multinational structure: “We control exported materials to Mexico and the United States. In these countries, we deliver the same service as we do in Brazil. Our clients are reassured that throughout the process of sending materials abroad, we can give support inside and outside of Brazil.”
In sum, the interview illustrates that value appropriation by the firm analysed depends mostly on its complementary assets. This is because the appropriability regime is weak and the type of service provided by PDC is project-based and cyclical. This facilitates imitation by competitors and increases the potential for PDC to lose income. Nevertheless, the distinctive complementary assets of PDC allow it to appropriate a portion of the created value.
D. Business Model Canvas
We use the Business Model Canvas framework to analyse the nine elements that make up the PDC business model. This analysis confirms the previous diagnosis of the PDC value system. Moreover, it adds new elements to the discussion of its value system.
The PDC business model suggests that operational workers are not the predominant resource for value creation and appropriation. The interviewee considers multiple services performed by PDC to be commodities. These services are delivered by blue-collar workers and are easily imitated. This finding reinforces the previously signalled challenges posed by weak legal protection and labour laws. Highly mobile workers are therefore not a key resource for the PDC value appropriation process.
Within the canvas model, PDC considers its upper management capabilities to be a unique asset for the process of value creation and appropriation. This asset differentiates the company from its competitors. Among its distinctive features are its ability to provide fast responses to clients’ needs and to monitor its service performance closely. Operational

Innovation and internationalization of Latin American services
263
workers are managed in such a way that they provide the value proposition desired by the company.
Reputation and image are other assets in the PDC business model, and support two value propositions: reliability and risk reduction for the client. Moreover, reputation also supports the trust-based relationship, which shows up in the “customer relationship” element of the PDC business model.
Interestingly, the respondent did not regard legal protection granted to trademarks as an element of value appropriation. This is surprising for two reasons. First, PDC regularly registers trademarks with the Brazilian patent and trademark office. Second, these trademarks should be key elements of appropriability, as the protection of reputation and image are important complementary assets in the PDC business model.
Other key resources in the PDC business model are the firm’s “multinational structure” and “web-based control system”. The first resource supports the value proposition “local and global support”, whereby PDC seeks to maintain a value-based relationship with its clients. The second not only supports the value propositions “reliability” and “risk reduction for clients”, but also reinforces the “customer relationships” element. These and the remaining elements of the PDC Business Model Canvas can be seen in table IX.6.
Table IX.6 PDC Business Model Canvas
Key partners Key activitiesValue proposition
Customer relationships
Customer segments
- International suppliers representation)
- Relationship management - Human capital management - Service design - Web-based service management - Trained management on service site
- High technical capability - Risk reduction for client - Service design capability - Local and global support - Reliability
- Long-term relationship - Trust-based relationship - Value-based relationship
- Technical and commercial representation - Automotive (original equipment manufacturers) - Automotive (suppliers) - Co-work (business centre)
Key resources Channels - Upper management capability - Multinational structure - Web-based control system - Reputation
- Personal commercial contact - Web-based control systems - On-site servicing
Cost structure Revenue streams
- Labour (operational) - Management support structure - Compliance costs
- Quality services (80% of total) - Engineering services - Business centre (co-work)
Source: Prepared by the authors on the basis of A. Osterwalder and Y. Pigneur, Business Model Generation, New Jersey, John Wiley & Sons, 2010.

E C L A C / C O L E F
264
E. Conclusions and limitations
This study has analysed the processes of value creation, configuration and appropriation of a multinational medium-sized service company in Brazil which provides engineering and technical quality services. This firm is known in its sector for its investment in innovative business processes. The main theoretical frameworks used here are the Business Model Canvas (Osterwalder and Pigneur, 2010) and the Profiting from Innovation (PFI) framework (Teece, 1986).
The firm selected for the case study in this chapter was chosen for its relevance to an understanding of the process of value creation, configuration and appropriation and its relationship with the business model. The use of a single case study and data from one single interviewee are important limitations of the study. However, the main reason for the choice of a single case study was that the difference between PDC and its competitors is meaningful, since those competitors in Brazil are not innovative firms and can generally be considered imitators or followers. In any event, since little information on the subject is available (Casadesus-Masanel and Ricart, 2010; Teece, 1986), we consider that the information in this case study represents a step forward, even though generalizations cannot be made.
The data collected on the firm analysed show that it creates value by working with its service attributes, along with its image and its business relationships (Kaplan and Norton, 1996). The work performed by the firm using these elements enables it to create positive customer value, which equals the difference between the end-use and initial values (Ito and others, 2012). It was also found that PDC creates value by adopting Amit and Zott’s (2001) drivers of novelty (new transaction structures; new content), efficiency (low search costs; symmetric information), complementarity (full service provider from design to implementation and support) and lock-in (trust-based relationship, increasing exchange costs).
Regarding the value configuration process, consideration of Stabell and Fjeldstad’s (1998) model led us to conclude that the firm’s value configuration was that of a value shop. It is based on the logic of problem-solving, with the firm’s knowledge and reputation being important for its activities.
The study has also shown that the value appropriation process of the firm analysed is primarily aimed at appropriation through complementary assets, since the appropriability regime is considered weak by the company, due to both service characteristics and the inefficacy of the legal mechanisms available to protect its activities. Although this was not cited by the firm,
Innovation and internationalization of Latin American services
265
legal trademark protection is critical for maintaining the value of one of its complementary assets, namely reputation. Other important complementary assets identified for the firm’s value appropriation process were its managerial capabilities (upper management), its web-based control system and a multinational structure that allows it to support clients both locally and globally. All of these assets are relevant in the firm’s appropriation process because they are distinctive, allow value to be created and are difficult to imitate (Teece, 1986).
The Business Model Canvas analysis (Osterwalder and Pigneur, 2010) confirmed the importance of the elements discussed in the analyses of value creation, configuration and appropriation processes. It provided a better understanding of how these elements fitted into the business model logic of the firm analysed. It also illustrated how they were interrelated with the firm’s resources and key activities, as well the as value propositions, channels and customer relationship elements of this business model. The model also made it easier to visualize how these elements related to the firm’s sources of funds and costs.
Although PDC is a labour-intensive firm, this production factor is not its main value creation resource. Instead, it creates most value through its complementary assets. These include reputation, control systems and a multinational structure. Since this is an exploratory study, more empirical analysis is needed on the relationships between value creation, configuration and appropriation and business models in other sectors, with firms of different sizes and different sources of capital.
BibliographyAmit, R. and C. Zott (2001), “Value creation in e-business”, Strategic Management
Journal, vol. 22.
Arrow, K.J. (1962), “Economic welfare and the allocation of re-sources for invention”, The Rate and Direction of Inventive Activity, R.R. Nelson (ed.), New York, Princeton University Press.
Bontis, N. (2002a), “Managing organizational knowledge by diagnosing intellectual capital”, The Strategic Management of Intellectual Capital and Organizational Knowledge, Chun Wei Choo and Nick Bontis, New York, Oxford University Press.
(2002b), “Intellectual capital”, The Strategic Management of Intellectual Capital and Organizational Knowledge, Chun Wei Choo and Nick Bontis, New York, Oxford University Press.
Casadesus-Masanell, R. and J.E. Ricart (2010), “From strategy to business model and to tactics”, Long Range Planning, vol. 43.

E C L A C / C O L E F
266
Chaney, P. K. and T.M. Devinney (1992), “New product innovation and stock price performance”, Journal of Business Finance and Accounting, vol. 19, No. 5.
Cobbenhagen, J. (2000), Successful Innovation, Cheltenham, Edward Elgar Publishing.
Demil, B. y X. Lecocq (2010), “Business model evolution: In search of dynamic consistency”, Long Range Planning, vol. 43.
Freeman, C. (1994), “Innovation and growth”, The Handbook of Industrial Innovation, Roy Rothwell and Mark Dodgson (eds.), Cheltenham, Edward Elgar Publishing.
Gantz, J. and D. Reinsel (2011), “Extracting Value From Chaos. IDC Report (sponsored by EMC)” [online] http://www.emc.com/collateral/analyst-reports/idc-extracting-value-from-chaos-ar.pdf [date of reference: 30 April 30 2015].
Ito, N.C. and others (2012), “Valor e vantagem competitiva: buscando definições, relações e repercussões”, Revista de Administração Contemporânea, vol.6, No. 2, Rio de Janeiro, March-April.
Kaplan, R. S. and D.P. Norton (1996), The Balanced Scorecard: Translating Strategy into Action, Boston, Harvard Business School Press.
Levin, R. and others (1987), “Appropriating the returns from industrial R&D”, Brookings Papers on Economic Activity, vol. 18, No. 3.
Osterwalder, A. and Y. Pigneur (2010), Business Model Generation, New Jersey, John Wiley & Sons.
Osterwalder A., Y. Pigneur and C.L. Tucci (2005), “Clarifying business models: Origins, present, and future of the concept”, Communications of the Association for Information Systems (AIS), vol. 15.
Porter, M. (1998a), Competitive Strategy: Techniques for Analyzing Industries and Competitors, New York, Free Press.
Porter, M. (1998b). Competitive Advantage: Creating and Sustaining Superior Performance, New York, Free Press.
Schumpeter, J.A. (1942), Capitalism, Socialism and Democracy, New York, Harper and Row.
Stabell, C. B. and D. Fjeldstad (1998), “Configuring value for competitive advantage: on chains, shops, and networks”, Strategic Management Journal, vol. 19, No. 5.
Teece, D. (1986), “Profiting from technological innovation: Implications for integration, collaboration, licensing and public policy”, Research Policy, No. 15.
(2010), “Business models, business strategy and innovation”, Long Range Planning, vol. 43.
Thompson, J. (1967), Organizations in Action, New York, McGraw-Hill.
Tidd, J. (2001), “Innovation management in context: environment, organization and performance”, International Journal of Management Reviews, vol. 3, No. 3.
Triviños, A. N. S (1987), Introdução à pesquisa em ciências sociais: a pesquisa qualitativa em educação, São Paulo, Atlas.
Winter, S (2006). “The logic of appropriability: from Schumpeter to Arrow to Teece”, Research Policy, No. 35.
Yin, R. K (2006), Estudo de Caso, São Paulo, Ed. Bookman.

Innovation and internationalization of Latin American services
267
Author profiles
Jorge Arbache is the chief economist at the Brazilian Ministry of Planning, and he also maintains a position as a professor of economics at the University of Brasilia. His previous appointments include senior economic adviser to the President of the Brazilian National Bank for Economic and Social Development (BNDES), and senior economist with the World Bank in Washington, D.C. He has authored four books, published over 80 papers in academic journals and books, and runs a blog on the economics of the services sector (www.economiadeservicos.com). Mr. Arbache holds a Ph.D in economics and Bachelor’s degrees in economics and law. His current research interests are sectoral competitiveness, investment, productivity, technology and trade.
Jorge Carrillo has been the director of the Social Studies Department at El Colegio de la Frontera Norte (COLEF) in Tijuana, Mexico since 1982. He is a member of the National System of Researchers and the Mexican Academy of Sciences, and has a Ph.D. in sociology from El Colegio de México. He has held visiting research fellowships in France, Japan, Spain, the United Kingdom and the United States. Mr. Carillo has authored seven books, served as editor for a further 20, and has contributed 122 book chapters and 68 academic journal articles. He has participated in 57 research projects and is an editorial committee member for journals in Mexico and other countries. He is very active in international academic networks (Interuniversity Research Centre on Globalization and Work (CRIMT) of Canada, Réseau international de l’automobile (GERPISA) of France, Japan Multinational Enterprise Study Group (JMNESG), Latin American Association of Labour Studies (ALAST), and the global INTREPID network). He is a specialist in industrial and labour sociology and has been studying the maquila industry and the automotive and electronic sector in Mexico for several years. His current area of research is employment, innovation and global value chains in multinational corporations in Mexico. His website is www.jorgecarrillo.info.
Marcela Gómez is an industrial engineer who received her Master’s degree in international strategy and trade policy from the University of Chile in 2013. Her area of research is trade in services, with a focus on the role of quality certification for Chilean information technology services exports. From 2005 to 2011, Ms. Gómez worked on information and telecommunications projects as a consultant for multinational management consulting and technology services companies such as Accenture and Adepcon. She also has SAP

E C L A C / C O L E F
268
certification (enterprise resource planning (ERP)), with a specialization in procurement processes.
René A. Hernández is an economic affairs officer with the Latin American and Caribbean Institute for Economic and Social Planning (ILPES) of the Economic Commission for Latin America and the Caribbean (ECLAC). His current research interests include international economics, global value chains, development economics and industrial organization. He is one of the editors of Latin America’s emergence in global services: A new driver of structural change in the region? (2014) and Global Value Chains and World Trade: Prospects and Challenges for Latin America (2014). Mr. Hernández has lectured widely at universities in Europe, Latin America and the United States. He completed his postgraduate studies in economics at Vanderbilt University in the United States and the University of Warwick in the United Kingdom.
Dorotea López Giral is a graduate in economics of the Autonomous Technological Institute of Mexico (ITAM). She was awarded a Ford-National Council for Science and Technology (Conacyt) scholarship to undertake postgraduate work at the University of Cambridge in the United Kingdom, where she obtained an M. Phil. in Economics. She has worked in the operations directorate of the Mexican central bank, where she was in charge of the balance-of-payments division, and at Mexico’s Secretariat of Economy as Organization for Economic Cooperation and Development (OECD) area director, responsible for coordinating Mexico’s participation in that organization’s activities. In Chile, she has worked for the Chilean Ministry of Foreign Affairs as an official trade negotiator in the area of trade in services and investment with regard to the World Trade Organization (WTO) and free trade agreements. She is currently a professor at the University of Chile’s Institute of International Studies and WTO Chair for the WTO Chairs Programme.
Fabio Morganti has Bachelor’s degrees in both industrial mechanical engineering and business administration, and holds an Executive MBA in marketing from Fundação Getúlio Vargas in São Paulo and a Master’s degree in administration from Mackenzie Presbyterian University, also in São Paulo. From 1995 to 1998, he taught marketing at Santa Cecília University and at Mackenzie Presbyterian University. He is currently a Ph.D. candidate in administration at Mackenzie Presbyterian University and is also an independent consultant specializing in intellectual property and brand protection.

Innovation and internationalization of Latin American services
269
Nanno Mulder heads the International Trade Unit of the Division of International Trade and Integration at the Economic Commission for Latin America and the Caribbean (ECLAC). His main research areas are value chains and production networks, with a focus on the role of services. He is also interested in the links between trade, productivity and the internationalization of small firms. Before joining ECLAC in 2006, he worked for the Latin America Desk of the Economics Department at the Organization for Economic Cooperation and Development (OECD) from 2002 to 2005, and for the French Centre for International Prospective Studies and Information (CEPII) from 1996 to 2002. He is the current chair of the Latin American Network for Research on Services (REDLAS). Mr. Mulder holds a Master’s degree and a Ph.D. in economics from the University of Groningen in the Netherlands.
Felipe Muñoz Navia has a Bachelor’s degree in economics and a Master’s degree in international studies from the University of Chile. He is currently an assistant professor at the Institute of International Studies of the University of Chile, where he works on international economics and trade policy issues. He lectures on postgraduate programmes and is a member of the Institute’s WTO Chair team.
Yoshimichi Murakami has been an assistant professor at the Research Institute for Economics and Business Administration of Kobe University, Japan, since 2015, where he obtained his Ph.D. in Economics in 2013. Previously, he was an associate expert at the Latin American and Caribbean Institute for Economic and Social Planning (ILPES) of the Economic Commission for Latin America and the Caribbean (ECLAC). He has published articles on trade liberalization and wage inequality in Chile and on Latin American and East Asian regional integration in comparative perspective, including Trade Liberalization and Skill Premium in Chile (México y la Cuenca del Pacífico, 2014) and Strategy for Trans-Pacific Integration from Japanese Perspective, co-authored with Nobuaki Hamaguchi (Trade Relations between Latin America and Asia Pacific: Challenges and Opportunities, 2014).
Luisa Antonia Rodriguez has 16 years’ experience in trade issues, nine of which were devoted to providing research and training for developing country government officials. For the past five years, she has worked for the United Nations Conference on Trade and Development (UNCTAD), performing research and training on behalf of developing country government officials on (i) emerging trends in the international trading system, trade

E C L A C / C O L E F
270
agreements and trade negotiations; and (ii) policy, regulatory and institutional frameworks for services reform. She holds an MBA in international trade, a management certificate in international trade and a Bachelor›s degree in international relations. Prior to joining UNCTAD, she worked for the South Centre, the Permanent Mission of the Bolivarian Republic of Venezuela to the World Trade Organization (WTO), and the Ministry of Foreign Affairs of the Bolivarian Republic of Venezuela.
Maria Savona is a professor at the Science Policy Research Unit (SPRU) at the University of Sussex in the United Kingdom. She has been an honorary research fellow at the University of Cambridge’s Judge Business School in the United Kingdom, and an associate professor of economics at the University of Lille 1, France. She is an economist and holds a Ph.D. in science and technology studies from SPRU. Her main research interests are the economics and policy of innovation in services; structural change and development; and the spatial distribution of innovation and production activities. She also works on the theory and micro-econometrics of innovation, particularly on the effect of barriers to innovation and growth. She has published widely on these areas in international, peer-reviewed journals and handbooks. Ms. Savona has produced commissioned reports for the Organization for Economic Cooperation and Development (OECD), the Bank for International Settlements (BIS) and the Department for Business, Innovation and Skills of the United Kingdom, among others, and has been involved in several European Framework Programme projects. She is a member of the council of the European Association for Research on Services (RESER) and the Latin American Network for Research on Services (REDLAS).
Redi Gomis holds a degree in psychology from the University of Havana, Cuba, and a Ph.D. in social science from El Colegio de la Frontera Norte (COLEF) in Tijuana, Mexico. Since 1992, he has been a research professor in the Social Studies Department at COLEF, where he studies business networks, especially those of technology and multinational companies. He is a member of the National System of Researchers, and has published several articles in journals and specialized books. Some of his most recent papers are “Empresas multinacionales en México: innovación con inclusion social?”, “El empleo femenino en multinacionales maquiladoras y no maquiladoras de México”, “Patrones de discriminación y exclusión vigentes en Tijuana” and “Principales estrategias de las corporaciones multinacionales en México”.

Innovation and internationalization of Latin American services
271
Jordy Micheli is a professor and researcher in the Department of Economics of the Autonomous Metropolitan University (UAM) in Mexico City. He is also in charge of the university’s virtual learning centre. His main areas of interest are innovation, territory and development, and manufacturing and services industries, in particular the automotive sector, telecommunications, call centres, video surveillance, virtual learning, and gas and water utilities. His latest books on services are Telemetrópolis: Explorando la ciudad y su producción inmaterial (Barcelona, Gedisa, 2014) and, as editor, Educación virtual y universidad, un modelo de evolución (UAM, 2015). He is an engineer and holds a Master’s degree in economics and a Ph.D. in urban studies. He is also a member of the National System of Researchers.
Alfredo Hualde has been a professor and researcher at El Colegio de la Frontera Norte in Mexico since 1990. His main research interests are occupational and professional skills and knowledge, labour markets, and industrial development in regional spaces. He has written extensively on the development of maquiladoras along the northern border of Mexico, and on other sectors such as the software and aerospace industries. Recently, his work has focused on labour conditions in the call centre industry through a diachronic perspective on worker trajectories. His work has been published in journals and books in several countries including Brazil, the Bolivarian Republic of Venezuela, France, Mexico, the Netherlands and Spain. His most recent book, co-edited with Guadarrama Rocío and Silvia López and published in 2014, is La precariedad laboral en México. Dimensiones, dinámicas y significados. He is part of the Research Committee of Sociology of Work of the International Sociological Association and an active member of several international networks.
Dimária Silva e Meirelles holds a Bachelor’s degree in economics from the Uberlândia Federal University in Brazil and a Master’s degree and Ph.D. in industry and technology economics from Rio de Janeiro’s Federal University. She is currently an assistant professor at Mackenzie Presbyterian University in Brazil, working in particular on the Graduate Programme in Business Administration. She has taught several subjects at both undergraduate and graduate levels. Ms. Silva e Mereilles also coordinates the research group GETCOS (Management, Technology and Competencies in Services). Her current research interests include (but are not limited to): evolutionary dynamics of the service sector; service company population life cycles; technological

E C L A C / C O L E F
272
competencies and dynamic capabilities in services; and innovation and business models in service organizations. She was previously a researcher at Energy Economy Group at Rio de Janeiro’s Federal University, a professor at Moacyr Sreder Bastos University, and a senior market planning analyst at Elektro, a major Brazilian electrical energy company. She has authored more than 15 articles published in peer-reviewed journals, as well as two book chapters, and was editor of the book Formação e evolução da grande empresa brasileira: estudos de caso embasados nas teorias da firma (Mackenzie Presbyterian University, 2011).
Pierre Sauvé is Director of External Programmes and Academic Partnerships and faculty member at the World Trade Institute (WTI), University of Bern, Switzerland. He also serves as an academic adviser and as a faculty member for the University of Barcelona’s LLM programme in international economic law and policy (IELPO) and is a Visiting Professor at the College of Europe in Bruges, Belgium.

Innovation and internationalization in services are key drivers of structural transformation, productivity growth and overall economic performance in Latin America. The services sector accounts for two thirds of the region’s GDP and provides over 60% of its employment. These shares are higher than in other developing regions, but still lower than in countries with higher levels of per capita income.
The spread of information and communication technologies in Latin America over the past three decades has vastly enhanced both the tradability of services and the sector’s propensity to innovate. Long considered unrelated processes, both internationalization and innovation are today widely recognized as key and complementary sources of firm-level competitiveness and human capital enhancement. The advent of many novel types of business and consumer services is furthermore a key factor in the rising insertion of Latin American firms in regional and global value chains and transnational production networks, which are now the predominant form of organization of international production and trade.
This volume explores three different levels of interaction between internationalization and innovation in the services sector in Latin America. Part I analyses the role of services in manufacturing and other sectors’ global value chains from a theoretical perspective, drawing on the experiences of Brazil and Mexico. Part II reviews innovation and internationalization policies and their effects on the performance of the services sector. Part III presents a series of case studies on innovation and internationalization linkages in Brazil, Chile, Costa Rica and Mexico. The book concludes that, in order for Latin American countries and firms to upgrade into services value chains, public and private initiatives must generate a host of regional public goods —enhanced investment climates, supply of skills, greater access to finance, improved protection of intellectual property, better value appropriation, enhanced efforts at standardization and quality certification— to strengthen the links between innovation and internationalization.