income inequality, the psychosocial environment and health comparisons of wealthy nations
TRANSCRIPT
Luxembourg Income Study Working Paper No. 269
INCOME INEQUALITY, THE PSYCHO-SOCIAL ENVIRONMENTAND HEALTH COMPARISONS OF WEALTHY NATIONS
John LynchGeorge Davey SmithMarianne Hillemeier
Mary ShawTrivellore Raghunathan
George Kaplan
January 2001
Draft Version – Do not cite or quote - To be published in Lancet (2001)
1
Income Inequality, the Psycho-social Environment and Health: Comparisons of Wealthy Nations
John Lynch, PhD 1
George Davey Smith, MD 2
Marianne Hillemeier, PhD 3
Mary Shaw, PhD 4
Trivellore Raghunathan, PhD 5
George Kaplan, PhD 1
Revised 29th January, 2001
1. Department of Epidemiology, School of Public Health, and Institute for Social Research, University of Michigan, USA.
2. Department of Social Medicine, University of Bristol, UK. 3. Department of Epidemiology, School of Public Health, University of Michigan, USA. 4. Department of Geographical Sciences, University of Bristol, UK. 5. Department of Biostatistics, School of Public Health, and Institute for Social Research,
University of Michigan, USA.
Word Count: 4,000 Tables: 2 Figures: 2
Requests for Reprints: John Lynch Department of Epidemiology School of Public Health University of Michigan 109 Observatory Street Ann Arbor, MI 48109-2029 USA Phone: (734) 647-9548 Fax: (734) 764-3192 Email: [email protected]
Draft Version – Do not cite or quote - To be published in Lancet (2001)
2
Summary Background. The theory that income inequality and characteristics of the psycho-social
environment - indexed by such things as social capital and sense of control over life’s
circumstances - are key determinants of health, and may account for health differences between
countries has become influential in health inequalities research and for population health policy.
Methods. We examined cross-sectional associations between income inequality and low birth
weight, life expectancy, self-rated health, and age- and cause-specific mortality among countries
providing data in Wave III (circa 1989-92) of the Luxembourg Income Study. We used data from
the 1990-91 wave of the World Values Survey (WVS) on distrust, belonging to organizations,
volunteering, control, trade union membership and the proportion of women elected to national
government from the UN Human Development Report. Life expectancy, mortality and low birth
weight data were taken from the WHO Statistical Information System. Self-rated poor health was
taken from the WVS.
Findings. Among the countries studied, higher income inequality was strongly associated with
greater infant mortality (r=0.69, p=0.004 for females; r=0.74, p=0.002 for males). Associations
between income inequality and mortality declined with age at death, and then reversed among
those aged 65 and older. Income inequality exhibited inconsistent associations with specific
causes of death and was not associated with CHD, breast or prostate cancer, cirrhosis or diabetes.
Variations between countries in belonging to organizations, distrust and perceived control were
unrelated to country differences in mortality at any age. However, countries that had greater
trade union membership and political representation by women had better child mortality
Draft Version – Do not cite or quote - To be published in Lancet (2001)
3
profiles. Differences between countries in levels of social capital showed generally weak and
somewhat inconsistent associations with cause-specific mortality. For instance, greater distrust
was associated with lower CHD mortality among both females (r=-0.61, p=0.03) and males (r=-
0.63, p=0.02).
Interpretation. Income inequality and characteristics of the psycho-social environment like
trust, control and organizational membership do not appear to be key factors in understanding
health differences between these wealthy countries. The associations that do exist are largely
limited to child health outcomes and cirrhosis. Explanations for between-country differences in
health will likely require an appreciation of the complex interactions of history, culture, politics,
economics, and the status of women and minorities.
Keywords:
inequality, socioeconomic factors, social capital, population health
Draft Version – Do not cite or quote - To be published in Lancet (2001)
4
Introduction
There has been great interest in understanding links between income inequality and health.1-5
Some studies have examined income inequality in regard to between-country health differences,
6,7 while others have analyzed associations of income inequality and health within countries.8-10
Two distinct questions have been raised regarding associations between income inequality and
health. First, for a given level of average income, is the extent of inequality in the distribution of
income associated with differences in average levels of population health between countries or
between regions (e.g., states) within a country? As an extension of this question, it has been
proposed that the quality of the psycho-social environment - characterized by such things as
social capital and sense of control over life - is the main explanatory mechanism for such
associations.1,7,11 While there is evidence at the individual level that psycho-social factors, like
distrust,12 control13 and the quality of inter-personal relationships14 affect health, there is little
known about whether population-level analogs of these psycho-social factors explain health
differences between countries. A recent study showed that such psycho-social indicators were
not important in understanding between-country differences in self-rated health.15 The second
question is that if an association does exist between income inequality and health at the
population level, to what extent is that association the mathematical result of the underlying
association between income and health at the individual level.16,17 Several within-US studies
have investigated aspects of this.17-20
Our analyses investigate the first question. Is the extent of income inequality associated
with average population health differences between wealthy countries? And, are between-
country variations in indicators of the psychosocial environment associated with between-
country health differences? The theory that income inequality, and its potential influence on
Draft Version – Do not cite or quote - To be published in Lancet (2001)
5
aspects of the psycho-social environment, can account for international health differences has
become influential for interpreting health inequalities and in a number of countries has been
embraced in policy documents focussed on strategies to improve population health.3 Interest in
the health effects of unequal income distribution was generated by the observation that income
inequality was strongly associated with life expectancy among 9 OECD nations.6 These data
from the late 1970s and early 1980s showed that more unequal countries like the US and UK had
lower life expectancy than more egalitarian Nordic countries. After publication of this
provocative idea, concerns were raised about accuracy of the income data, contrary findings
were published,21 questioned,22 and subsequently more studies published.23-26 Despite the fact
that these studies produced inconsistent findings, the theory that income inequality and its
psychosocial effects are critical determinants of population health continues to be generally
accepted and widely promoted.27-30
Important questions remain concerning the underlying empirical evidence to support
claims that countries with higher levels of income inequality and poorer psycho-social
environment have worse population health. Previous research has been based on small numbers
of countries and limited health indicators, such as life expectancy - a synthetic, overall measure
of population health which can mask differences in the age- and cause-of-death structure
between countries. Across Europe, between-country differences in the cause-of-death structure
have been shown to be important in interpreting differences in the extent of within-country
health inequalities.31-33
We carried out the most complete international examination to date of associations
between income inequality and low birth weight, life expectancy, self-rated health, and age- and
cause-specific mortality among countries providing data in Wave III of the Luxembourg Income
Draft Version – Do not cite or quote - To be published in Lancet (2001)
6
Study (LIS). The LIS is widely regarded as the premier study of income distribution in the
world.34 We have also examined how aspects of the psycho-social environment such as distrust,
belonging to organizations, volunteering (all proposed as measures of social capital)35 and
perceived control over one’s life circumstances were associated with between-country variations
in health. We also included data on belonging to trade unions and the proportion of women
elected to national government, as indicators of class relations within the labour market and
broader socio-political participation of women.36
Draft Version – Do not cite or quote - To be published in Lancet (2001)
7
Methods
Country Selection
Wave III (1989-1992) of the LIS provides the most recent, complete income inequality data
available and includes 23 countries – Taiwan, Czech Republic, Hungary, Israel, Poland, Russia,
Slovak Republic, Australia, Belgium, Canada, Denmark, Finland, France, Germany, Italy,
Luxembourg, Netherlands, Norway, Spain, Sweden, Switzerland, United Kingdom, and United
States. Taiwan was excluded because health data were not available. We first examined income
inequality and life expectancy among the remaining 22 countries. However, all subsequent
analyses were limited to 16 countries after excluding Russia, Poland, Hungary, Slovak and
Czech Republics and Israel. We limited the sample because the period under study witnessed the
break-up of the Soviet Union, collapse of other eastern block governments, and the continuing
struggles in Israel. Such social instability may directly affect both income inequality and
measures of the psycho-social environment thus making comparisons with countries having
more stable political, economic and social institutions difficult to interpret.
There is clearly much to be learned from studying population health in the transition
economies of eastern Europe. It is not that the population health experiences in these ex-Soviet
countries are not informative – it is that they may not be directly comparable to countries with
relatively stable economies, governments and social institutions. We were interested in
understanding how income inequality and the psycho-social environment affected population
health in a subset of countries variously characterized in the literature as being wealthy,
democratic, market-based economies. If the goal was to generalize to transition economies or
countries undergoing civil strife, economic, political or institutional turmoil then inclusion of
other countries may be appropriate. In this case, these countries were excluded because they are
Draft Version – Do not cite or quote - To be published in Lancet (2001)
8
not in the target population to which both theoretical and policy-relevant generalizations have
been and continue to be made. There is no doubt that understanding the population health effects
of civil strife or transition from one kind of political economy to another is of great importance,
but it is another question what implications that might have for the population health effects of
income inequality and the psycho-social environment as it currently exists in stable, western
democracies.
Assessment of Income Inequality
We used the Gini coefficient, based on equivalized household disposable income, as our measure
of income inequality. This is a standard measure providing an overall estimate of inequality that
ranges from 0 to 1 – higher values mean greater inequality. We also examined the ratios of the
90th and 50th income percentiles to the 10th as indicators of inequality but using these did not
substantively alter results.
Assessment of the Psycho-social Environment
We used data from the 1990-91 wave of the World Values Survey (WVS)37 to generate measures
of the quality of the psycho-social environment. The WVS was conducted through face-to-face
interviews of nationally representative samples in 43 countries and collected data on beliefs
toward political, cultural, economic, civic and other aspects of life. All measures were weighted
to generate valid national estimates. “Distrust” was measured by the question “Generally
speaking, would you say that most people can be trusted or that you can't be too careful in
dealing with people.” “Belonging to Organizations” and “Volunteering” was the mean number of
organizations to which respondents reported belonging and doing unpaid work. Both these
question were asked in regard to a variety of organizations - social welfare, religious,
Draft Version – Do not cite or quote - To be published in Lancet (2001)
9
education/cultural, political, local community, third world development/human rights,
conservation/environment, professional, youth, recreation, women's groups, peace, animal rights,
health-related, or other groups. Mean perceptions of “Control” were calculated from a question
concerning how much “freedom of choice and control you feel you have over the way your life
turns out”. "Belonging to a Trade Union" was the percent of respondents reporting trade union
membership. We a priori distinguished “belonging to trade unions” from belonging to other
types of organizations, because of the specific role trade unions play in affecting socioeconomic
policies and in mediating social class relations. We also included an additional social indicator
from the UN Human Development Report – “Females in Government” - which represents the
percent of elected seats in national government held by women.38
Assessment of Health Outcomes
Life expectancy at birth (1991-1993) was taken from the World Health Organization's Statistical
Information System (http://www.who.int/whosis/). Mortality rates were calculated from age- and
sex-specific numbers of deaths and population counts from the WHO Mortality Data Base
(http://www.who.int/whosis/mort/download.htm#). All-cause death rates were standardized in
five-year age groups using the new European Standard populations for males and females.39
Rates were calculated for all ages combined and age groups <1, 1-14, 15-44, 45-64, and 65 plus.
Standardized mortality rates were also computed for the following causes of death: coronary
heart disease (ICD-9 Basic Tabulation List code=27), stroke (29), lung cancer (101), breast
cancer (113), prostate cancer (124), diabetes (181), infectious (01-07), chronic obstructive
pulmonary disease (323, 324, and 325), cirrhosis (347), unintended injury (E47 through E53),
suicide plus deaths undetermined whether accidental or suicide (E54 and E560), and homicide
Draft Version – Do not cite or quote - To be published in Lancet (2001)
10
(E55). We calculated age-specific rates of unintentional injury mortality because of the
heterogeneity in the underlying causes of these deaths. Infant unintentional deaths may include
suffocation or burns while unintentional deaths among older groups are dominated by motor
vehicle accidents. The WHO Mortality Data Base contains ICD-9 cause of death coding for all
countries except Denmark and Switzerland. Cause-specific rates for these countries were
calculated from the corresponding ICD-8 "A" list codes. Mortality rates were computed for
1989-92 for all countries except Germany, where only 1990-92 data were available. Rates of
low birth weight (< 2,500gm) were obtained from WHOSIS and were available for 1991-93 for
all study countries except Canada and the U.S., for which 1989-90 rates were used. Low birth
weight data were not available for the Netherlands. Self-rated poor health was taken from the
WVS, and represents the percent of the population reporting their health to be “fair, poor, or very
poor”. All outcomes were calculated from pooled rates for the years described above, except for
self-rated health which was based on point prevalence for 1990-91 round of the WVS survey.
Statistical Analyses
Pearson correlation coefficients were calculated for associations between income inequality,
social capital and health outcomes. All analyses were weighted by population size and adjusted
for gross domestic product (GDP/capita), using the Penn World Tables purchasing power parity.
(http://www.datacentre.chass.utoronto.ca/pwt/).
Results
We first examined data on income inequality and life expectancy for 22 countries in the Wave III
LIS database. As we have argued elsewhere, when data points are few, the selection of countries
Draft Version – Do not cite or quote - To be published in Lancet (2001)
11
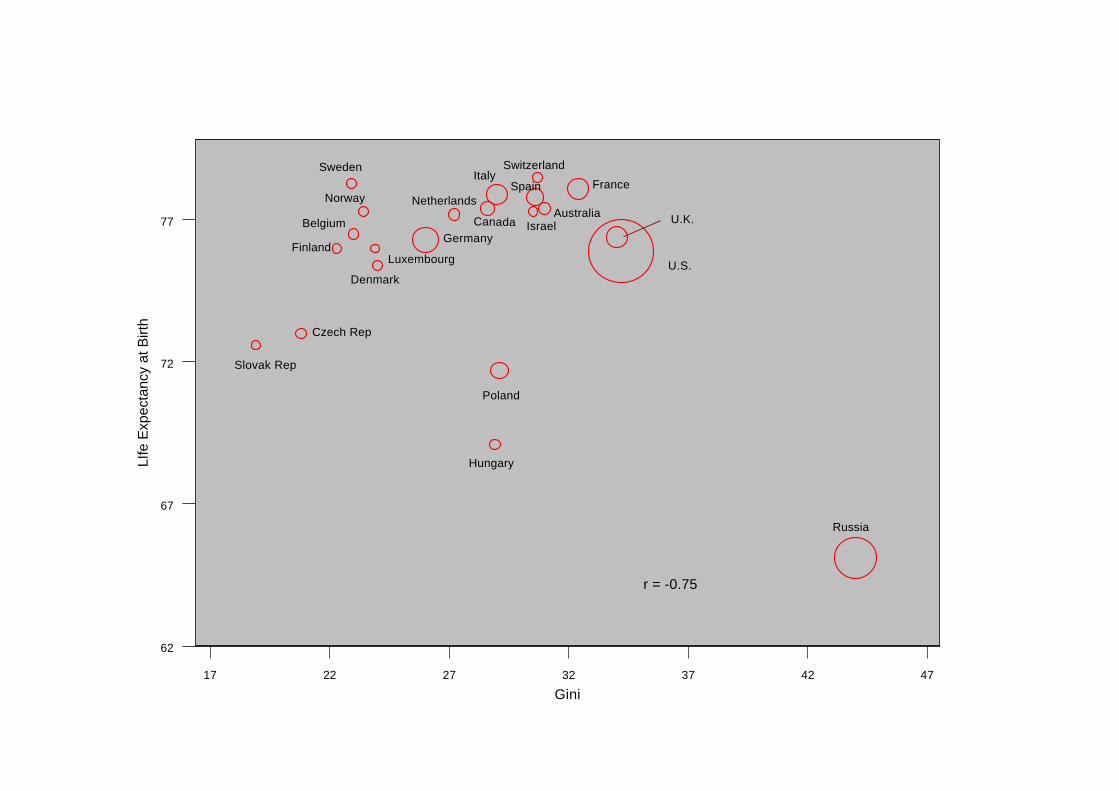
can be crucial to interpretation of results.40 Thus, we have presented data from all available
countries in Figure 1, which shows that income inequality was strongly and negatively associated
with life expectancy (r=-0.75, p=0.0001). Inspecting the plot revealed that this association was
largely induced by the data point for Russia, where the level of income inequality vastly
exceeded even the US. For the reasons explained above, we excluded Israel, Russia, Poland,
Hungary, Czech and Slovak Republics. Thus, all subsequent analyses were limited to the
remaining 16 countries.
Income Inequality and Age-specific Mortality
Table 1 shows sex-specific associations of income inequality with mortality by age and cause,
and with life expectancy for 16 countries. Low birth weight and poor self-rated health were only
available for both sexes combined. Table 1 shows that higher income inequality was strongly
associated with greater mortality among infants (r=0.69, p=0.004 for females; r=0.74, p=0.002
for males), and more moderately associated with mortality among those aged 1-14 in both sexes.
Associations between income inequality and mortality declined with age at death, and then
reversed, so that among those aged 65 or older, higher income inequality was moderately, but not
significantly, associated with lower all-cause mortality. In analyses not shown, exclusion of the
US substantially diminished the associations between income inequality and child mortality. For
instance, the correlation between inequality and female infant mortality dropped from r=0.69 to
r=0.26 (p=0.37).
Draft Version – Do not cite or quote - To be published in Lancet (2001)
12
Income Inequality and Cause-specific Mortality
Income inequality exhibited inconsistent associations with specific causes of death. Among
women, higher inequality was at least moderately associated with higher rates of homicide, lung
cancer, COPD, infectious disease, and unintentional deaths under age 1. However, it was also
moderately but not significantly associated with lower stroke and suicide rates among women.
For men, higher inequality was associated with higher rates of homicide, infectious and
unintentional death from ages 0-14, but it was also associated with lower stroke mortality.
Income inequality was not associated with CHD, breast or prostate cancer, cirrhosis or diabetes.
Exclusion of the US removed associations between income inequality and deaths from
unintentional injury, infectious disease and homicide (data not shown). For instance, the
correlation between inequality and female homicide mortality dropped from r=0.66 and actually
reversed sign to r=-0.14 (p=0.63).
Income Inequality, Life Expectancy, Low Birth Weight, and Poor Self-rated Health
Higher income inequality was strongly associated with a greater proportion of low birth weight
infants (r=0.79, p=0.001). This association was reduced to r=0.53 (p=0.06) with exclusion of the
US. Income inequality was not related to life expectancy differences across these 16 countries
and was only moderately associated with poorer self-rated health.
Psycho-social Environment, Trade Union Membership, Female Political Representation and
Age-specific All-Cause Mortality
Table 2 shows that belonging to organizations, distrust and control were unrelated to mortality at
any age. However, countries that had greater trade union membership and political representation
Draft Version – Do not cite or quote - To be published in Lancet (2001)
13
by women had better child mortality profiles. For instance, lower male infant mortality was
associated with greater trade union membership (r=-0.58, p=0.04) and female political
representation (r=-0.73, p=0.002). Similar but weaker patterns emerged for mortality between
ages 1-14. No social indicators were strongly related to mortality at higher ages, except
volunteering which was related to lower mortality among the elderly.
Psycho-social Environment, Trade Union Membership, Female Political Representation and
Cause-specific Mortality
Measures of the quality of the psycho-social environment showed generally weak and somewhat
inconsistent associations with cause-specific mortality. Greater distrust was associated with
lower CHD mortality among both females (r=-0.61, p=0.03) and males (r=-0.63, p=0.02). As
distrust and control were strongly negatively correlated (r=-0.62, p=0.02), higher levels of
perceived control were also significantly correlated with higher CHD mortality in both men and
women. Distrust was also moderately associated with greater cirrhosis and unintentional deaths
under 1 and above 65. Belonging to organizations was associated with lower cirrhosis among
men and women. The amount of volunteering was negatively associated with stroke and
cirrhosis. Associations with measures of social capital were unchanged by excluding the US.
Greater trade union membership and having more females in government were both moderately
associated with lower unintentional death, especially among the young.
Draft Version – Do not cite or quote - To be published in Lancet (2001)
14
Psycho-social Environment, Trade Union Membership, Female Political Representation Life
Expectancy, Low Birth Weight, and Poor Self-rated Health
None of the psycho-social indicators were associated with female or male life expectancy. Only
trade union membership and females in government were associated with reduced rates of low
birth weight. Poor self-rated health was only associated with volunteering (r=-0.80, p=0.003).
Discussion
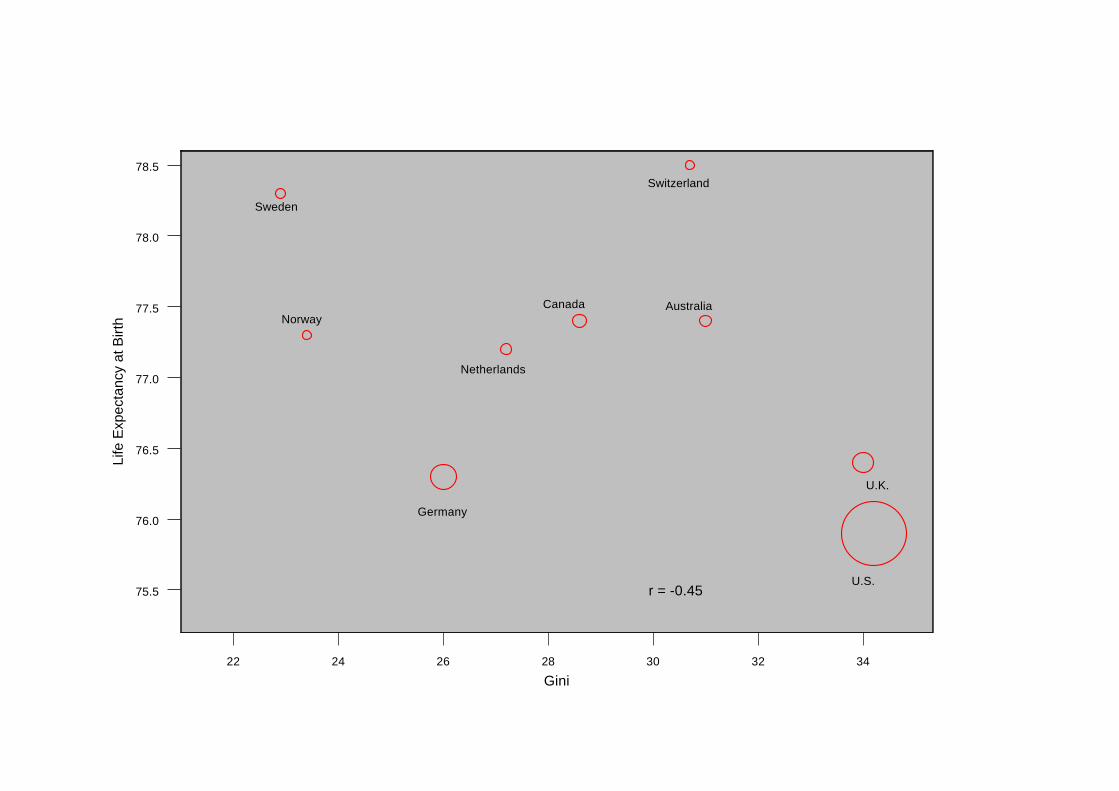
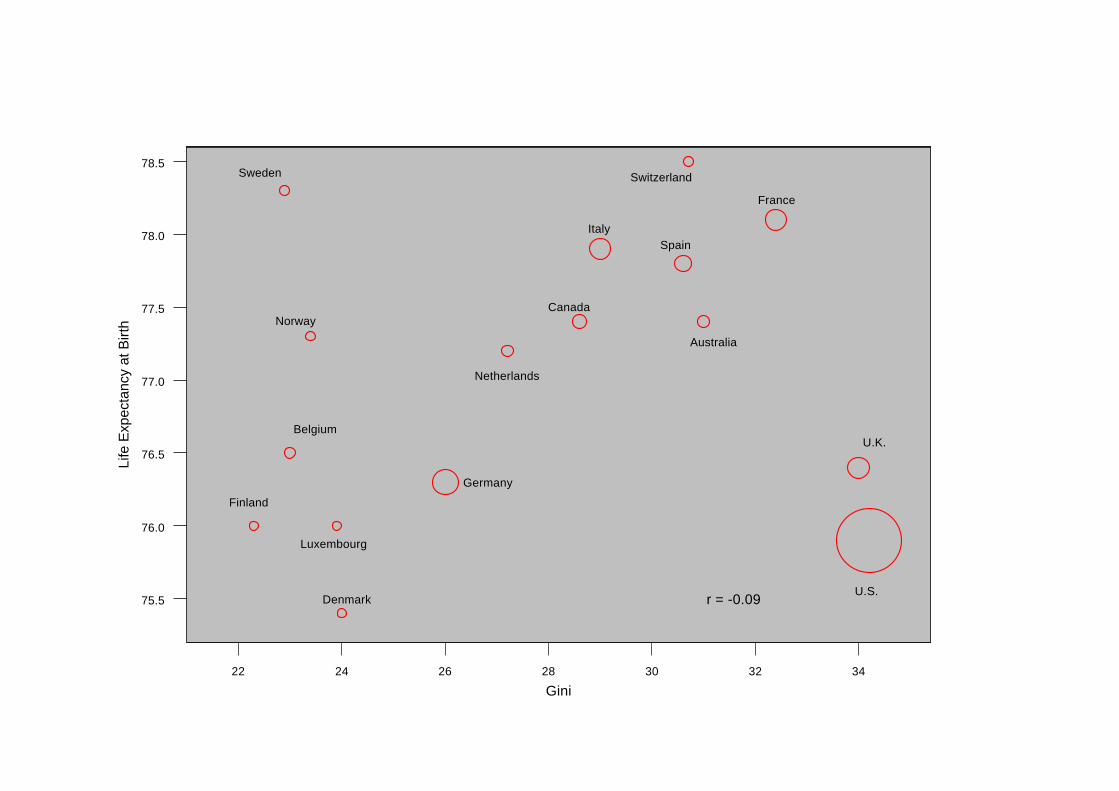
What should we conclude from these analyses? First, we should recognize the inherent
limitations of interpreting associations based on sixteen, or fewer observations. To illustrate this
point, in Panel (a) of Figure 2 we have selected the 9 countries that were used in the important
1992 analysis that sparked so much interest in this topic.6 That study reported a correlation of
r=0.86 between more equal income distribution and life expectancy using data for the late 1970s
and early 1980s. Panel (a) shows that when we used these same 9 countries, but analyzed data
for 1989-92, higher income inequality was associated with lower life expectancy albeit more
weakly (r=-0.45). However, now that data have become available for Italy, Spain, France,
Belgium, Finland, Luxembourg and Denmark, Panel (b) of Figure 2 shows that when these
countries were added to the analysis, there was no longer an association between income
inequality and life expectancy (r=-0.09, p=0.75). Thus, the discrepancy between our results and
the previous study,6 is simply that we had the advantage of being able to include more countries
as data became available.
Adding these particular countries highlights the complexity of attempting to come up with
universal theories for what explains variations in population health among rich nations. While
Draft Version – Do not cite or quote - To be published in Lancet (2001)
15
not directly comparable to the current analyses because they were based on within-country
differences, Mackenbach31 and Kunst,32 clearly show how deciphering variation in the extent of
within-country socioeconomic health inequalities across Europe is complicated by between-
country differences in the cause-of-death structure, particularly the north-south differences in
CHD.33 Three of the countries we added in Panel (b) - Spain, Italy and France are typical of the
pattern in southern Europe - higher life expectancy due largely to lower CHD. The countries
added from northern Europe - like Denmark and Finland - have lower inequality, but higher
CHD rates and lower life expectancy. Assuming that these north-south CHD and life expectancy
differences did not emerge between the 1970s and 1990s, and if the data had been available, it
seems likely that earlier studies6 would also have found little association between income
inequality and life expectancy for this expanded set of countries.
Income Inequality and Health
Cognizant of the dangers of over-interpretation, what can we reasonably conclude from these
patterns of findings? It appears there is a relatively strong and consistent pattern of associations
between income inequality and child health outcomes. Higher income inequality was associated
with higher infant mortality, low birth weight and mortality aged 1-14 in both sexes. For a
country of such vast wealth, the United States has appalling levels of both income inequality and
child health. Associations with infant and early-life mortality largely disappeared when the US
was excluded from analyses (data not shown), but an association with low birth weight remained
(r=0.53, p=0.06) due to high levels of both income inequality and low birth weight in the UK.
Associations with mortality above age 65 were the opposite of that predicted by the theory that
higher income inequality is automatically bad for health. These negative associations were
Draft Version – Do not cite or quote - To be published in Lancet (2001)
16
largely driven by the fact that higher inequality countries like the US and France have relatively
low mortality above age 65, especially for CHD, compared to countries like Finland, Denmark,
Luxembourg and Germany. The age-specific pattern of associations between income inequality
and mortality may be consistent with time lags. It is widely recognized that income inequality
within many of these countries generally narrowed after WWII, but increased markedly since the
1970’s and so it is possible that the associations observed with child health outcomes may be
reflected in differences in adult health at some future point in time, as populations exposed to
this period of increasing inequality age. Longer-term data on changes in inequality and health are
needed to explore this hypothesis.
Some of the strongest arguments in support of the theory that greater income inequality produces
worse population health have come from analyses of homicide. In some ways, homicide has been
the quintessential example of a cause-of-death that is plausibly affected by the extent of income
inequality,41 the breakdown of social cohesion and the negative emotions of distrust and
hostility, it is theorized to engender in individuals.1 While income inequality was reasonably
strongly correlated with homicide, these associations were almost entirely induced by the US
data point. For instance, excluding the US changed the correlation between income inequality
and homicide from r=0.65 (p=0.01) to r=-0.15.
According to the psycho-social environment theory, income inequality is associated with health
through two main pathways – behaviour and stress.42 Income inequality was associated with lung
cancer, but only among women. On the other hand, it was not associated with cirrhosis – an
outcome with a clearly identifiable behavioural component. Nor was income inequality
Draft Version – Do not cite or quote - To be published in Lancet (2001)
17
associated with CHD or diabetes – outcomes linked to both behaviour and psycho-neuro-
endocrine stress mediation.
Quality of the Psycho-social Environment and Health
The most important piece of empirical evidence in support of the idea that social capital is an
important determinant of population health came from a study of 38 US states.10 That cross-
sectional study showed that levels of distrust and the extent of organizational membership
mediated the within-country association between income inequality and mortality. While we
used almost identical indicators of social capital to those used in the US study, we failed to find
any consistent associations with between-country differences in age- or cause-specific mortality.
In fact, one of the stronger correlations observed in these data was the association between
higher distrust and lower CHD among both men (r=-0.63, p=0.02) and women (r=-0.61, p=0.03).
This finding is the exact opposite of what the current income inequality-psychosocial
environment theory would predict and is inconsistent with findings of a small within-country
study of 10 US cities.43 An examination of the data plots revealed that people in France, Italy and
Spain (lower CHD countries) reported the highest levels of distrust, while those in Finland,
Sweden and Norway (higher CHD countries) reported the lowest distrust. One could speculate
over the reasons for these international differences in the tendency to report distrust, but they are
likely the product of quite particular historical, social and cultural forces. It is also possible that
the general practice of aggregating individual responses to characterize the psycho-social
environment of a place may be inappropriate for between-country comparisons because of their
cultural specificity. Additionally, the individual-level correlates of distrust may vary across
countries.
Draft Version – Do not cite or quote - To be published in Lancet (2001)
18
These results do not offer much support for a psycho-social environment theory as a general
explanation for health differences between rich countries. Higher perceived control over life
circumstances was actually significantly associated with higher CHD – the opposite of what
would be predicted by the psycho-social environment theory and the opposite of what would be
inferred from individual-level studies. Social capital indicators were associated with cirrhosis,
but not lung cancer, diabetes or homicide as might be specifically predicted by the theory.
Belonging to organizations was not strongly associated with any health outcomes, except
cirrhosis, while volunteering was also associated with lower stroke mortality and better self-rated
health. In contrast, belonging to one specific type of organization - trade unions - appeared more
strongly and broadly associated with better health, especially for children. It is noteworthy that
some of the strongest associations observed in these data were between greater female political
participation and better child health.
Conclusions
It seems difficult to sustain the theory that income inequality and indicators of the quality of the
psycho-social environment explain between-country health differences among these stable,
wealthy nations. What theoretically consistent associations do exist are largely limited to child
health outcomes and cirrhosis. Does this mean we think economic inequality is not an important
determinant of health? No – clearly there is abundant evidence that within countries, lower
income is a powerful determinant of poorer health. In addition, the extent of unequal income
distribution has been associated with health within some countries.8-10,25,44 Does it mean we think
that psycho-social factors are not important in understanding health? No – there is certainly
Draft Version – Do not cite or quote - To be published in Lancet (2001)
19
evidence that within populations, psycho-social factors are associated with poorer health. Our
results show that neither an income inequality nor psycho-social environment theory of health is
universally applicable to understanding why some countries have better population health than
others.45,46
Our findings appear consistent with a previous study that compared the US and Canada.47 While
the extent of inequality was strongly related to health differences between US metropolitan areas,
there was no association between income inequality and mortality across such areas in Canada.
Evidence comparing states and cities within the US has been used extensively to support the
income inequality-psychosocial environment theory of population health. It seems likely that the
US is the exception, not the rule, and it is possible that evidence drawn from studies within the
US has less direct applicability to other wealthy nations. Higher income inequality within the US
is overwhelmingly associated with more unequal distribution of many powerful determinants of
health. This may not be the case in other wealthy countries where there has been more
widespread and more evenly distributed social investments in public health relevant goods and
services. As we have argued elsewhere,3 there is no necessary association between income
inequality and population health – it may depend on the distribution of other health-relevant
resources and exposures that exist within a country. For example, low CHD in southern Europe
may be related to high prevalence and low social inequality in healthy diets, while the relatively
low life expectancy of Danish women is likely related to the high prevalence and low social
inequality in smoking.48 Understanding how different countries generate particular patterns and
trends in population health is likely to be historically and culturally contextualized.45,49
Draft Version – Do not cite or quote - To be published in Lancet (2001)
20
It may not be income inequality per se, or the quality of the psycho-social environment that drive
population health. Rather, what may be most important is the current and historical links between
income inequality and the distribution of health-relevant resources and exposures, and how these
links have played out over the lifecourse of different birth cohorts.50 Levels of health within a
country are the product of complex interactions of history, culture, politics, economics, and the
status of women and minorities. These complex interactions may not be adequately described by
current levels of income inequality or aggregate indicators of the psycho-social environment.
Contributers
John Lynch and George Davey Smith contributed to the idea, design, analysis and interpretation
of the data. Marianne Hillemeier, Mary Shaw, and Trivellore Raghunathan contributed to the
design, analysis and interpretation of the data. All authors contributed to the writing of the
manuscript.
This research was partly supported by the University of Michigan Center for Social Epidemiology and Population Health, University of Michigan Initiative on Inequalities in Health and University of Michigan Inter-disciplinary Center on Social Inequalities in Mind and Body.
Draft Version – Do not cite or quote - To be published in Lancet (2001)
21
References
1. Wilkinson RG. Unhealthy Societies The Afflictions of Inequality. London: Routledge, 1996.
2. Davey Smith G. Income inequality and mortality: why are they related? Income inequality
goes hand in hand with underinvestment in human resources. BMJ 1996;312:987-8.
3. Lynch JW, Davey Smith G, Kaplan GA, House J. Income inequality and mortality:
importance to health of individual income, psychosocial environment, or material conditions.
BMJ 2000;320:1200-4.
4. Kawachi I. Income inequality and health. In: Berkman LF, Kawachi I, editors. Social
Epidemiology. New York: Oxford University Press, 2000. p.76-94.
5. Wagstaff A, va Doorslaer E. Income inequality and health: what does the literature tell us?
Annu Rev Public Health 2000;21:543-67.
6. Wilkinson RG. Income distribution and life expectancy. BMJ 1992;304:165-8.
7. Marmot MG. Bobek M. International comparators and poverty and health in Europe. BMJ
2000;321:1124-8.
8. Kaplan GA, Pamuk ER, Lynch JW, Cohen RD, Balfour JL. Inequality in income and
mortality in the United States: analysis of mortality and potential pathways. BMJ
1996;312:999-1003.
9. Kennedy BP, Kawachi I, Prothrow-Stith D. Income distribution and mortality: cross-
sectional ecological study of the Robin Hood index in the United States. BMJ
1996;312:1004-7.
10. Lynch JW, Kaplan GA, Pamuk E, Cohen RD, Heck K, Balfour JL, Yen IH. Income inequality
and mortality in metropolitan areas of the United States. Am J Public Health 1998;88:1074-80.
Draft Version – Do not cite or quote - To be published in Lancet (2001)
22
11. Kawachi I, Kennedy BP, Lochner K, Prothrow-Stith D. Social capital, income inequality, and
mortality. Am J Public Health 1997;87:1491-9.
12. Everson SA, Kauhanen J, Kaplan GA, Goldberg DE, Julkunen J, Tuomilehto J, Salonen JT.
Hostility and increased risk of mortality and acute myocardial infarction: The mediating role
of behavioral risk factors. Am J Epidemiol 1997;146:142-52.
13. Marmot MG, Bosma H, Hemingway H, Brunner E, Stansfeld S. Contribution of job control
and other risk factors to social variations in coronary heart disease incidence. Lancet
1997;350,235-9.
14. Kaplan GA, Wilson TW, Cohen RD, Kauhanen J, Wu M, Salonen JT. Social functioning and
overall mortality: prospective evidence from the Kuopio Ischemic Heart Disease Risk Factor
Study. Epidemiology 1994;5:495-500.
15. Ellison G. Income inequality, social trust, and self-reported health status in high-income
countries. Ann New York Academy Sci 1999;896:325-8.
16. Gravelle H. How much of the relation between population mortality and unequal distribution of
income is a statistical artifact? BMJ 1998; 316: 382-5.
17. Wolfson M, Kaplan GA, Lynch JW, Ross N, Backlund E. The relationship between income
inequality and mortality is not a statistical artefact. BMJ 1999; 319:953-957.
18. Fiscella K, Franks P. Poverty or income inequality as predictor of mortality: longitudinal cohort
study. BMJ 1997;314:1724-7.
19. Kennedy BP, Kawachi I, Glass R, Prothrow-Stith D. Income distribution, socioeconomic
status, and self-rated health in the United States: multilevel analysis. BMJ 1998; 317:917-21.
20. Blakely TA, Kennedy BP, Lochner K, Glass R, Kawachi I. Metropolitan area income
inequality and self-rated health – a multi-level study. Soc Sci Med 2001; in press.
Draft Version – Do not cite or quote - To be published in Lancet (2001)
23
21. Judge K. Income distribution and life expectancy: a critical appraisal. BMJ 1995;311:1282-5.
22. Wilkinson RG. Commentary: A reply to Ken Judge: mistaken criticisms ignore
overwhelming evidence. BMJ 1995;311:1285-7.
23. McIsaac S, Wilkinson RG. Income distribution and cause-specific mortality. Euro J Public
Health 1997;7:45-53.
24. Judge K, Mulligan J, Benzeval M. Income inequality and population health. Soc Sci Med
1998;46:567-79.
25. Hales S, Howden-Chapman P, Salmond C, Woodward A, Mackenback J. National infant
mortality rates in relation to gross domestic product and distribution of income. Lancet
1999;354:2047.
26. Lobmayer P, Wilkinson RG. Income, inequality and mortality in 14 developed countries.
Sociol Health Illness 2000;22:401-14.
27. Lomas J. Social capital and health: implications for public health and epidemiology. Soc Sci
Med 1997;47:1181-8.
28. Marmot MG. Improvement of social environment to improve health. Lancet 1998;351:57-60.
29. Wilkinson RG. The culture of inequality. In: Kawachi I, Kennedy BP, Wilkinson RG. (eds.) The
Society and Population Health Reader-Income Inequality and Health. New York: The New
Press, 1999, 492-8.
30. Baum F. Social Capital: Is it good for your health? Issues for a public health agenda. J
Epidemiol Community Health 1999;53:195-6.
31. Mackenbach JP, Kunst AE, Cavelaars AEJM, et al. Socioeconomic inequalities in morbidity
and mortality in western Europe. Lancet 1997;349:1655-9.
Draft Version – Do not cite or quote - To be published in Lancet (2001)
24
32. Kunst AE, Groenhof F, Mackenbach JP, et al. Occupational class and cause specific
mortality in middle aged men in 11 European countries: comparison of population based
studies. BMJ 1998;316, 1636-42.
33. Leon D. Commentary: Unequal inequalities across Europe. BMJ 1998;316:1642.
34. Atkinson AB, Rainwater L, Smeeding TM. Income Distribution in OECD Countries:
Evidence from the Luxembourg Income Study. Paris: OECD, 1995. (http://www.lis.ceps.lu/)
35. Putnam R. Bowling Alone. New York: Simon and Schuster, 2000.
36. United Nations. Women in Politics and Decision-Making in the Late Twentieth Century.
Dordrecht: Martinus Nijhoff, 1992.
37. Inglehart R. Modernization and Postmodernization. New Jersey: Princeton University Press,
1997.
38. United Nations Development Programme. Human Development Report 1993. New York:
Oxford University Press, 1993.
39. World Health Organization. World Health Statistics Annual, 1992. Geneva: WHO, 1993.
40. Lynch JW, Due P, Muntaner C, Davey Smith G. Social capital: Is it a good investment
strategy for public health? J Epidemiol Community Health 2000; 54:404-8.
41. Kennedy BP, Kawachi I, Prothrow-Stith D, Lochner K, Gupta V, Social capital, income
inequality, and firearm violent crime Soc Sci Med 1998;47:7-17.
42. Wilkinson RG. Health inequalities: relative or absolute material standards. BMJ
1997;314:591-5.
43. Williams RB, Feaganes J, Barefoot JC. Hostility and death rates in ten US cities. Psychom
Med 1995;57:96. (abstract)
Draft Version – Do not cite or quote - To be published in Lancet (2001)
25
44. Szwarcwald CL, Bastos FI, Viacava F, de Andrade CL. Income inequality and homicide rates in
Rio de Janeiro, Brazil. Am J Public Health 1999;89:845-80.
45. Lynch JW. Income inequality and health: Expanding the debate. Soc Sci Med 2000; 51:1000-
5.
46. Davey Smith G, Egger M. Commentary: Understanding it all-health, meta-theories, and
mortality trends. BMJ 1996;313:1584-5.
47. Ross NA, Wolfson MC, Dunn JR, Berthelot J-M, Kaplan GA, Lynch JW. Income inequality
and mortality in Canada and the United States: A cross-sectional assessment using Census
data and vital statistics. BMJ 2000; 320:898-902.
48. Cavelaars AEJM, Kunst AE, Geurts JJM, et al. Educational differences in smoking:
international comparison. BMJ 2000; 320: 1102-7.
49. Kunitz S. Disease and Social Diversity. New York: Oxford University Press, 1994..
50. Davey Smith G, Gunnell D, Ben-Shlomo Y. Lifecourse approaches to socioeconomic
differentials in cause-specific adult mortality. In: Leon D, Walt G. (editors) Poverty,
Inequality and Health. Oxford: Oxford University Press, 2000, 88-124.
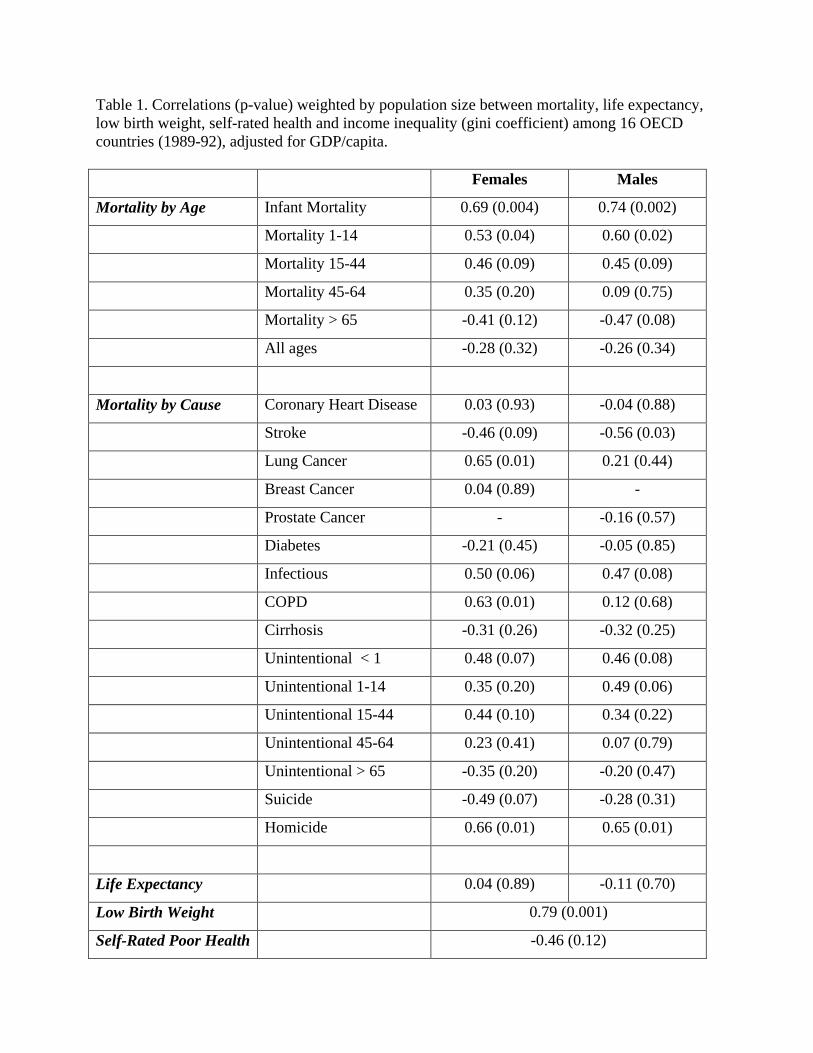
Table 1. Correlations (p-value) weighted by population size between mortality, life expectancy, low birth weight, self-rated health and income inequality (gini coefficient) among 16 OECD countries (1989-92), adjusted for GDP/capita. Females Males
Mortality by Age Infant Mortality 0.69 (0.004) 0.74 (0.002)
Mortality 1-14 0.53 (0.04) 0.60 (0.02)
Mortality 15-44 0.46 (0.09) 0.45 (0.09)
Mortality 45-64 0.35 (0.20) 0.09 (0.75)
Mortality > 65 -0.41 (0.12) -0.47 (0.08)
All ages -0.28 (0.32) -0.26 (0.34)
Mortality by Cause Coronary Heart Disease 0.03 (0.93) -0.04 (0.88)
Stroke -0.46 (0.09) -0.56 (0.03)
Lung Cancer 0.65 (0.01) 0.21 (0.44)
Breast Cancer 0.04 (0.89) -
Prostate Cancer - -0.16 (0.57)
Diabetes -0.21 (0.45) -0.05 (0.85)
Infectious 0.50 (0.06) 0.47 (0.08)
COPD 0.63 (0.01) 0.12 (0.68)
Cirrhosis -0.31 (0.26) -0.32 (0.25)
Unintentional < 1 0.48 (0.07) 0.46 (0.08)
Unintentional 1-14 0.35 (0.20) 0.49 (0.06)
Unintentional 15-44 0.44 (0.10) 0.34 (0.22)
Unintentional 45-64 0.23 (0.41) 0.07 (0.79)
Unintentional > 65 -0.35 (0.20) -0.20 (0.47)
Suicide -0.49 (0.07) -0.28 (0.31)
Homicide 0.66 (0.01) 0.65 (0.01)
Life Expectancy 0.04 (0.89) -0.11 (0.70)
Low Birth Weight 0.79 (0.001)
Self-Rated Poor Health -0.46 (0.12)
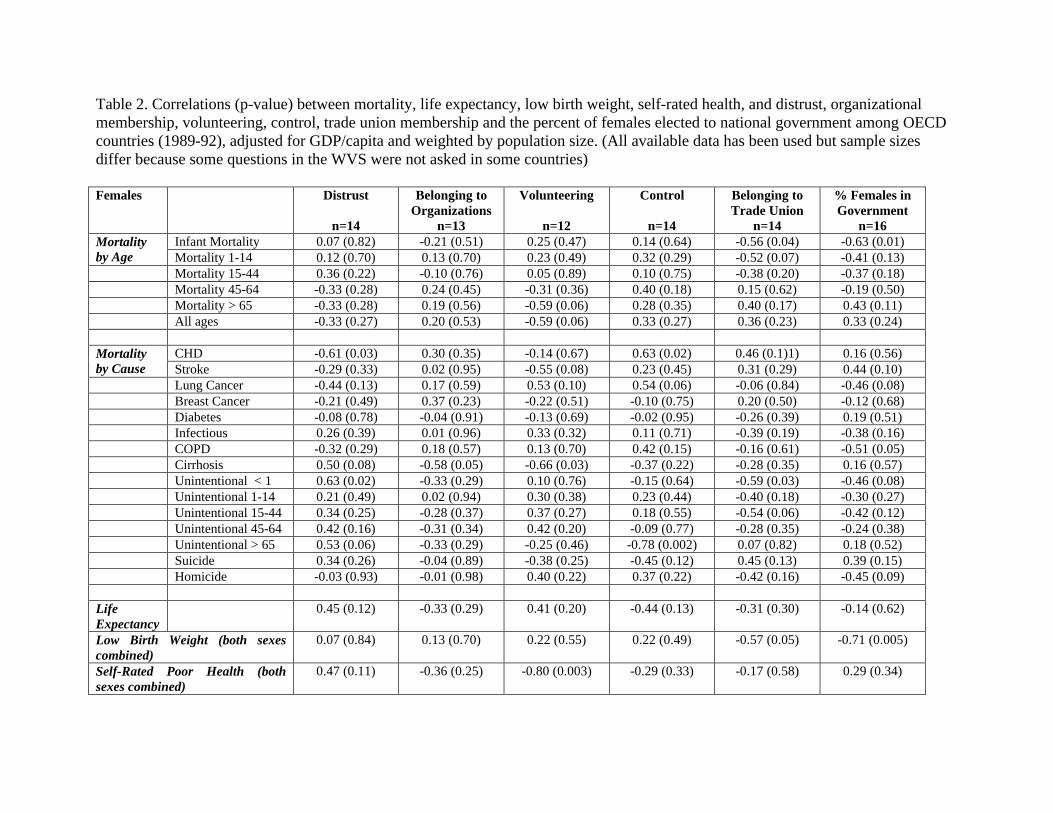
Table 2. Correlations (p-value) between mortality, life expectancy, low birth weight, self-rated health, and distrust, organizational membership, volunteering, control, trade union membership and the percent of females elected to national government among OECD countries (1989-92), adjusted for GDP/capita and weighted by population size. (All available data has been used but sample sizes differ because some questions in the WVS were not asked in some countries) Females
Distrust
n=14
Belonging to Organizations
n=13
Volunteering
n=12
Control
n=14
Belonging to Trade Union
n=14
% Females in Government
n=16 Infant Mortality 0.07 (0.82) -0.21 (0.51) 0.25 (0.47) 0.14 (0.64) -0.56 (0.04) -0.63 (0.01) Mortality
by Age Mortality 1-14 0.12 (0.70) 0.13 (0.70) 0.23 (0.49) 0.32 (0.29) -0.52 (0.07) -0.41 (0.13) Mortality 15-44 0.36 (0.22) -0.10 (0.76) 0.05 (0.89) 0.10 (0.75) -0.38 (0.20) -0.37 (0.18) Mortality 45-64 -0.33 (0.28) 0.24 (0.45) -0.31 (0.36) 0.40 (0.18) 0.15 (0.62) -0.19 (0.50) Mortality > 65 -0.33 (0.28) 0.19 (0.56) -0.59 (0.06) 0.28 (0.35) 0.40 (0.17) 0.43 (0.11) All ages -0.33 (0.27) 0.20 (0.53) -0.59 (0.06) 0.33 (0.27) 0.36 (0.23) 0.33 (0.24)
CHD -0.61 (0.03) 0.30 (0.35) -0.14 (0.67) 0.63 (0.02) 0.46 (0.1)1) 0.16 (0.56) Mortality by Cause Stroke -0.29 (0.33) 0.02 (0.95) -0.55 (0.08) 0.23 (0.45) 0.31 (0.29) 0.44 (0.10) Lung Cancer -0.44 (0.13) 0.17 (0.59) 0.53 (0.10) 0.54 (0.06) -0.06 (0.84) -0.46 (0.08) Breast Cancer -0.21 (0.49) 0.37 (0.23) -0.22 (0.51) -0.10 (0.75) 0.20 (0.50) -0.12 (0.68) Diabetes -0.08 (0.78) -0.04 (0.91) -0.13 (0.69) -0.02 (0.95) -0.26 (0.39) 0.19 (0.51) Infectious 0.26 (0.39) 0.01 (0.96) 0.33 (0.32) 0.11 (0.71) -0.39 (0.19) -0.38 (0.16) COPD -0.32 (0.29) 0.18 (0.57) 0.13 (0.70) 0.42 (0.15) -0.16 (0.61) -0.51 (0.05) Cirrhosis 0.50 (0.08) -0.58 (0.05) -0.66 (0.03) -0.37 (0.22) -0.28 (0.35) 0.16 (0.57) Unintentional < 1 0.63 (0.02) -0.33 (0.29) 0.10 (0.76) -0.15 (0.64) -0.59 (0.03) -0.46 (0.08) Unintentional 1-14 0.21 (0.49) 0.02 (0.94) 0.30 (0.38) 0.23 (0.44) -0.40 (0.18) -0.30 (0.27) Unintentional 15-44 0.34 (0.25) -0.28 (0.37) 0.37 (0.27) 0.18 (0.55) -0.54 (0.06) -0.42 (0.12) Unintentional 45-64 0.42 (0.16) -0.31 (0.34) 0.42 (0.20) -0.09 (0.77) -0.28 (0.35) -0.24 (0.38) Unintentional > 65 0.53 (0.06) -0.33 (0.29) -0.25 (0.46) -0.78 (0.002) 0.07 (0.82) 0.18 (0.52) Suicide 0.34 (0.26) -0.04 (0.89) -0.38 (0.25) -0.45 (0.12) 0.45 (0.13) 0.39 (0.15) Homicide -0.03 (0.93) -0.01 (0.98) 0.40 (0.22) 0.37 (0.22) -0.42 (0.16) -0.45 (0.09) Life Expectancy
0.45 (0.12) -0.33 (0.29) 0.41 (0.20) -0.44 (0.13) -0.31 (0.30) -0.14 (0.62)
Low Birth Weight (both sexes combined)
0.07 (0.84) 0.13 (0.70) 0.22 (0.55) 0.22 (0.49) -0.57 (0.05) -0.71 (0.005)
Self-Rated Poor Health (both sexes combined)
0.47 (0.11) -0.36 (0.25) -0.80 (0.003) -0.29 (0.33) -0.17 (0.58) 0.29 (0.34)
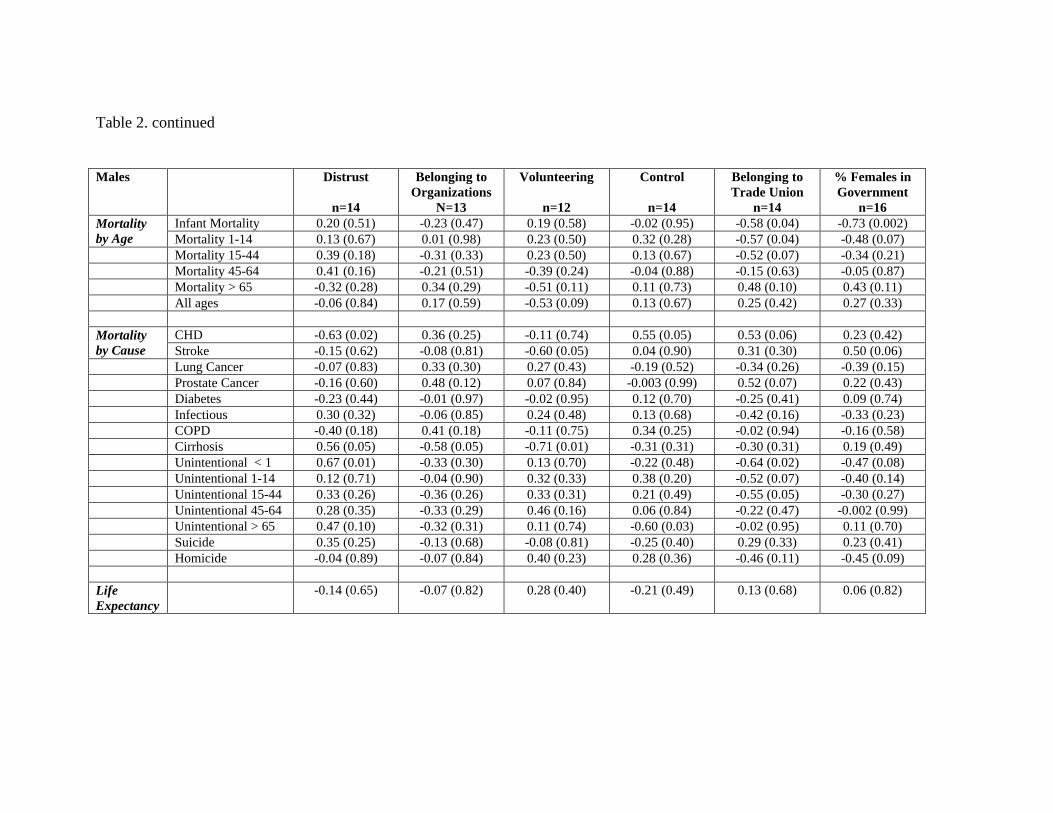
Table 2. continued Males
Distrust
n=14
Belonging to Organizations
N=13
Volunteering
n=12
Control
n=14
Belonging to Trade Union
n=14
% Females in Government
n=16 Infant Mortality 0.20 (0.51) -0.23 (0.47) 0.19 (0.58) -0.02 (0.95) -0.58 (0.04) -0.73 (0.002) Mortality
by Age Mortality 1-14 0.13 (0.67) 0.01 (0.98) 0.23 (0.50) 0.32 (0.28) -0.57 (0.04) -0.48 (0.07) Mortality 15-44 0.39 (0.18) -0.31 (0.33) 0.23 (0.50) 0.13 (0.67) -0.52 (0.07) -0.34 (0.21) Mortality 45-64 0.41 (0.16) -0.21 (0.51) -0.39 (0.24) -0.04 (0.88) -0.15 (0.63) -0.05 (0.87) Mortality > 65 -0.32 (0.28) 0.34 (0.29) -0.51 (0.11) 0.11 (0.73) 0.48 (0.10) 0.43 (0.11) All ages -0.06 (0.84) 0.17 (0.59) -0.53 (0.09) 0.13 (0.67) 0.25 (0.42) 0.27 (0.33)
CHD -0.63 (0.02) 0.36 (0.25) -0.11 (0.74) 0.55 (0.05) 0.53 (0.06) 0.23 (0.42) Mortality by Cause Stroke -0.15 (0.62) -0.08 (0.81) -0.60 (0.05) 0.04 (0.90) 0.31 (0.30) 0.50 (0.06) Lung Cancer -0.07 (0.83) 0.33 (0.30) 0.27 (0.43) -0.19 (0.52) -0.34 (0.26) -0.39 (0.15) Prostate Cancer -0.16 (0.60) 0.48 (0.12) 0.07 (0.84) -0.003 (0.99) 0.52 (0.07) 0.22 (0.43) Diabetes -0.23 (0.44) -0.01 (0.97) -0.02 (0.95) 0.12 (0.70) -0.25 (0.41) 0.09 (0.74) Infectious 0.30 (0.32) -0.06 (0.85) 0.24 (0.48) 0.13 (0.68) -0.42 (0.16) -0.33 (0.23) COPD -0.40 (0.18) 0.41 (0.18) -0.11 (0.75) 0.34 (0.25) -0.02 (0.94) -0.16 (0.58) Cirrhosis 0.56 (0.05) -0.58 (0.05) -0.71 (0.01) -0.31 (0.31) -0.30 (0.31) 0.19 (0.49) Unintentional < 1 0.67 (0.01) -0.33 (0.30) 0.13 (0.70) -0.22 (0.48) -0.64 (0.02) -0.47 (0.08) Unintentional 1-14 0.12 (0.71) -0.04 (0.90) 0.32 (0.33) 0.38 (0.20) -0.52 (0.07) -0.40 (0.14) Unintentional 15-44 0.33 (0.26) -0.36 (0.26) 0.33 (0.31) 0.21 (0.49) -0.55 (0.05) -0.30 (0.27) Unintentional 45-64 0.28 (0.35) -0.33 (0.29) 0.46 (0.16) 0.06 (0.84) -0.22 (0.47) -0.002 (0.99) Unintentional > 65 0.47 (0.10) -0.32 (0.31) 0.11 (0.74) -0.60 (0.03) -0.02 (0.95) 0.11 (0.70) Suicide 0.35 (0.25) -0.13 (0.68) -0.08 (0.81) -0.25 (0.40) 0.29 (0.33) 0.23 (0.41) Homicide -0.04 (0.89) -0.07 (0.84) 0.40 (0.23) 0.28 (0.36) -0.46 (0.11) -0.45 (0.09) Life Expectancy
-0.14 (0.65) -0.07 (0.82) 0.28 (0.40) -0.21 (0.49) 0.13 (0.68) 0.06 (0.82)
Draft Version – Do not cite or quote - To be published in Lancet (2001)
26
Figure Legends
Figure 1. Income inequality (gini coefficient) and life expectancy for all 22 countries reporting to
the Luxembourg Income Study, for the period 1989-1991. *Circles represent country population
size.
Figure 2.
Panel A – Income inequality (gini coefficient) and life expectancy for the same 9 countries
reported by Wilkinson (1992),11 but with information updated to 1989-1991.
Panel B – Income inequality and life expectancy after adding the other 7 countries for which
income inequality data is now available in the Luxembourg Income Study, for the period 1989-
1991. *Circles represent country population size
17 22 27 32 37 42 47
Gini
62
67
72
77
LIfe
Exp
ecta
ncy
at B
irth
r = -0.75
U.S.
Russia
Hungary
Poland
Slovak Rep
Czech Rep
Sweden
Norway
Belgium
FinlandLuxembourg
Denmark
Germany
Netherlands
Canada
Italy
IsraelAustralia
France
Switzerland
U.K.
Spain
22 24 26 28 30 32 34
Gini
75.5
76.0
76.5
77.0
77.5
78.0
78.5
Life
Exp
ecta
ncy
at B
irth
U.S.
U.K.
Germany
Norway
Sweden
Switzerland
Netherlands
Canada Australia
r = -0.45
22 24 26 28 30 32 34
Gini
75.5
76.0
76.5
77.0
77.5
78.0
78.5
Life
Exp
ecta
ncy
at B
irth
r = -0.09U.S.
U.K.
Germany
Denmark
Luxembourg
Finland
Belgium
Norway
Sweden
Netherlands
Canada
Italy
Australia
Spain
Switzerland
France