comparisons between ambient and forced
TRANSCRIPT
EARTHQUAKE ENGINEERING AND STRUCTURAL DYNAMICS, VOL. 1, 133-150 (1972)
COMPARISONS BETWEEN AMBIENT AND FORCEDVIBRATION EXPERIMENTS
MIHAILO D. TRIFUNAC*
Earthquake Engineering Research Laboratory, California Institute of Technology, Pasadena
and
Lamont-Doherty Geological Observatory, Columbia University, New York
SUMMARY
The ambient and forced vibration techniques for testing full-scale structures are critically compared. Both methods,based on small level excitation, may be used to determine many mode shapes and frequencies of vibration and thecorresponding damping values, with adequate accuracy for most purposes. The two techniques give mutuallyconsistent results.
The mode amplitudes determined by ambient and forced vibration tests show systematic departure for highmodes and near the top levels of buildings tested. This phenomenon is attributed to the participation of all modeshapes and is a consequence of excitation by a concentrated force near the top of a building and at a frequencydiffering by only a few per cent from a natural frequency of vibrations.
A new way of showing the effect of unwanted modes on the response near resonance of the mode being soughtis developed. It is particularly useful for the analysis of steady, forced vibration tests of structures using eccentricmass vibration generators.
INTRODUCTION
In recent years a method for testing structures based on wind- and microtremor-induced vibrations has beendeveloped. Although the method has been in use for almost 40 years by the United States Coast and GeodeticSurvey' to measure fundamental periods of buildings, it was not until recently that this approach wasextended to higher modes.2-7
Another important approach to dynamic testing of structures is based on forced vibration tests. Duringthese tests the structure is excited in a steady-state vibration with one or more shakers having accurate speedcontrol.8 These shakers have been used successfully to test many different structures, including dams,9,10a reservoir intake tower," atomic reactors12 and many different buildings and special structures.'3-27
A common objective of the above-mentioned methods is to explore the dynamic properties of full-scalestructures. These properties include frequencies and modes of vibration and the amount of energy dissipatedby the structure. Knowledge of these properties is essential to understand and interpret structural responseduring strong earthquake ground motion, during wind excitation and to compare observations withtheoretical results.
The amplitudes of structural motion in the case of ambient vibrations depend mainly on wind speed,since wind is usually a more effective exciting source than ground microtremors or sources in the structure.Although the displacements detected in both ambient and vibration generator tests are very small, thevibrator-induced motions may be several orders of magnitude greater than the ambient vibrations. Therefore,there is a possibility that the above-mentioned methods might lead to different results if the structure behavesdifferently at various levels of excitation. It is the objective of this paper to explore this important point bycomparing results from ambient and forced vibration tests performed on the same structures.
A comparison of the ambient and forced vibration tests is made for two structures. One is a twenty-twostorey steel frame building of the San Diego Gas and Electric Company in San Diego, California. It wastested during the summer of 1969, and the results of the forced vibration experiment were reported by
* Assistant Professor of Applied Science.
© 1972 by John Wiley & Sons, Ltd.
Received 14 January 1972
133
134 MIHAILO D. TRIFUNAC
Jennings and co-workers.27,34 The ambient vibration tests and a preliminary comparison with the forced
vibration tests were described by Trifunac.6 The ambient vibration tests were performed immediately afterthe forced vibration tests. There were no major earthquakes in the area during or between the two tests, soit may be assumed that the structure and its foundation characteristics remained the same.
The second structure described in this paper is a nine-storey reinforced concrete building, the RobertMillikan Library on the campus of the California Institute of Technology in Pasadena, California. The forcedvibration experiment of this building was described by Kuroiwa28 and briefly summarized by Jennings andKuroiwa.23 Several ambient vibration tests of this structure were performed since its completion in 1967and the reports are now being prepared. The test used for comparison in this paper, performed in early1967, was described by Blanford and co-workers.4 Again, there were no major earthquakes in the areabetween or during the time the tests were conducted, so the structure-soil system may be consideredunchanged.
Many modern dynamic studies, although aimed at acquiring information that would assist in the designof earthquake resistant structures, are still based on the infinitesimal, linear theory of elasticity. Hence, theresults of small-amplitude vibrations can be used to check and improve various assumptions involved inconstructing dynamical mathematical models of structures.
Theoretical studies of earthquake-resistant structures will, in the future, tend to be increasingly moreconcerned with calculations based on elasto-plastic and other non-linear force-deflection relationships.During these large, partially damaging motions, modes and natural periods of the structure will be differentfrom those determined by the linear theory or by experiments based either on low-level forced vibrations oron wind- and microtremor-induced vibrations. However, even then the small-amplitude experimental deter-minations of structural properties will be invaluable, since they can serve as reference points for morecomplete calculations.
Only a small number of buildings has so far been tested by the ambient vibration measurement method,and many more tests are needed. Tests using vibration generators have been performed on various types ofstructures, as was noted above. Before our knowledge of structural dynamics can be based on sound founda-tions, however, many more structures will have to be tested, employing existing and developing new techniquesof measurement.
Although two case studies are not sufficient to justify general conclusions, the results summarized in thispaper strongly suggest that, in the linear range of excitation, tests based on microtremor- and wind-inducedvibrations give essentially the same results as would be obtained from the forced vibration experiments.
TWO CASE STUDIES
Twenty-two storey steel frame building
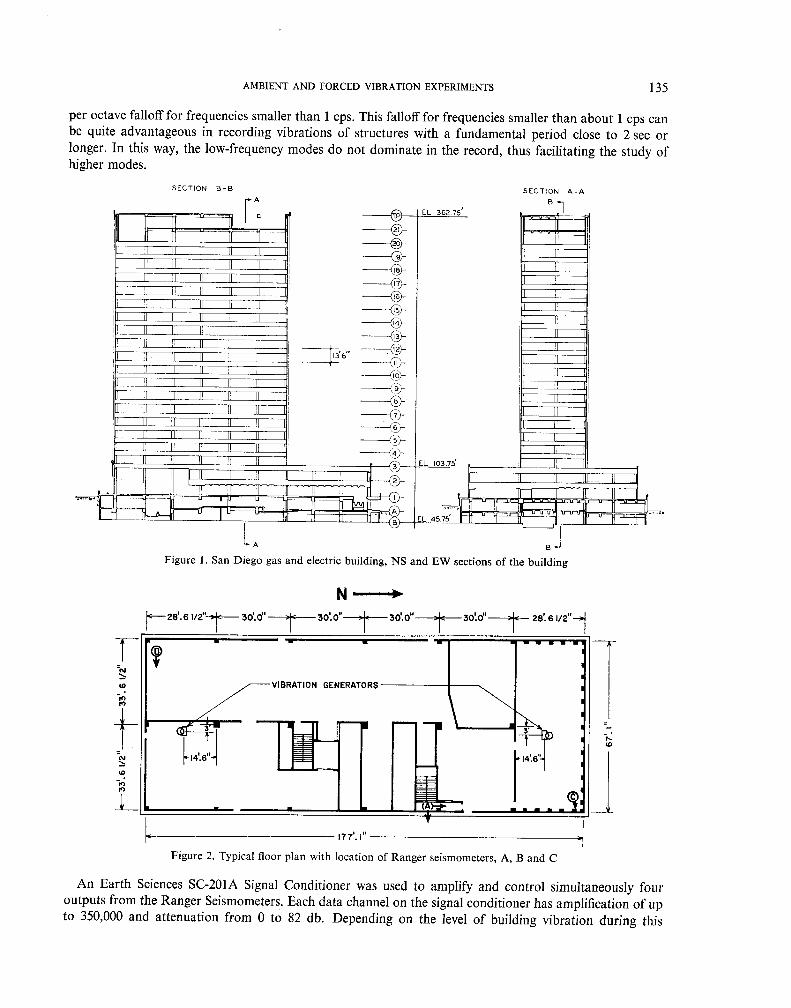
Description of the building. The San Diego Gas and Electric Building is located in the block betweenFirst and Second and Ash and A Streets in San Diego. It has a 180 ft by 70 ft tower, six bays by two baysin plan dimension, extending from the fourth floor to the top (Figures 1 and 2). A typical floor plan is givenin Figure 2; a typical storey height is 13.5 ft.
The building is separated by a seismic joint into the `Low Building,' which is a U-shaped structure about180 ft wide and 250 ft long, and the twenty-two storey `Tower'. The structure for the lower two storeys ofthe `Low Building' is a reinforced concrete frame. Two upper stories consist of a steel frame and concreteshear walls (Figure 1). The tower, which is enclosed by the `Low Building' is a ductile, moment-resisting,steel space frame. The typical floor structure consists of a cellular steel deck with concrete topping. Becauseof the favourable soil conditions, conventional reinforced concrete spread footings are employed. The buildingwas designed for earthquake loads according to the specifications for zone 3 of the Uniform Building Code.
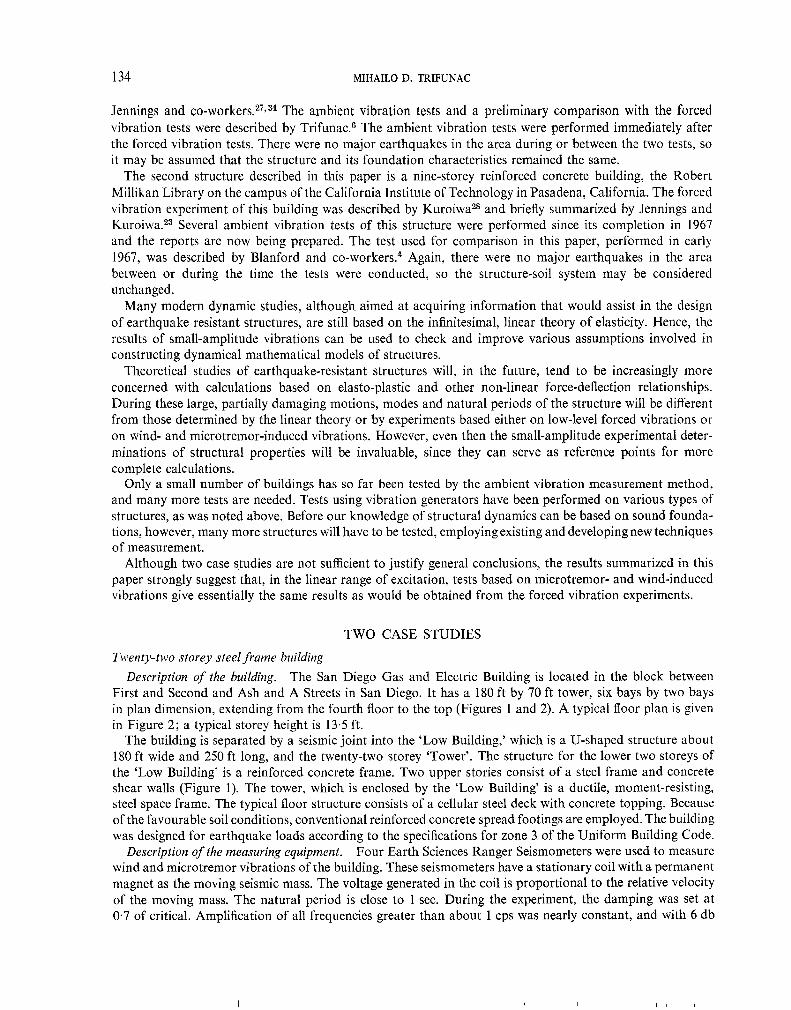
Description of the measuring equipment. Four Earth Sciences Ranger Seismometers were used to measurewind and microtremor vibrations of the building. These seismometers have a stationary coil with a permanentmagnet as the moving seismic mass. The voltage generated in the coil is proportional to the relative velocityof the moving mass. The natural period is close to 1 sec. During the experiment, the damping was set at0.7 of critical. Amplification of all frequencies greater than about 1 cps was nearly constant, and with 6 db
AMBIENT AND FORCED VIBRATION EXPERIMENTS 135
per octave falloff for frequencies smaller than 1 cps. This falloff for frequencies smaller than about 1 cps canbe quite advantageous in recording vibrations of structures with a fundamental period close to 2 sec or
longer. In this way, the low-frequency modes do not dominate in the record, thus facilitating the study ofhigher modes.
SECTION B-B SECTION A-A
B
0 EL 362.75'
21
19
, IB
I17
i1 -
14 -
13
12"
LL136
^I I
\\
HI
II
EL 103 75'.
B EL 45.75I
B
Figure 1. San Diego gas and electric building, NS and EW sections of the building
N28'.6 I/2° 30'.0° 30'.0"
14'.6'
VIBRATION GENERATORS
177'.1
30.O" 30, ' 28.61/2"
Figure 2. Typical floor plan with location of Ranger seismometers, A, B and C
An Earth Sciences SC-201A Signal Conditioner was used to amplify and control simultaneously fouroutputs from the Ranger Seismometers. Each data channel on the signal conditioner has amplification of upto 350,000 and attenuation from 0 to 82 db. Depending on the level of building vibration during this
136 MIHAILO D . TRIFUNAC
experiment, various attenuator settings were used ranging from 40 to 58 db. Recorded signals were usuallykept within about 1 v in amplitude.
The measured displacements were of the order of 10-3 cm or 101L. It is of interest that during the forcedexcitation of the same building, amplitudes were of the order of 1 mm or about 100 times greater .21, 34 Thelevel of the ambient vibration of a structure like the San Diego Gas and Electric Building depends mainlyon the intensity of wind. During the weekend of 19-20 July 1969, when measurements were conducted, wind
intensity was relatively low.The voltage proportional to the relative velocity of the seismic mass was recorded by a Lockheed Elec-
tronics Model 417 Magnetic Tape Recorder. In order to have immediate visual inspection of the vibrations,the seismic signals were simultaneously recorded on two Mark 220 Brush Recorders. Each of these recordershas two channels so that all four outputs from the seismometers could be displayed simultaneously.
Measuring procedures. When measuring ambient or shaker-excited building vibrations, one usuallyassumes that the structure can be approximated by a one-dimensional, linear, damped, discrete or continuoussystem. In some cases23 measurements indicated that floor diaphragms are sufficiently stiff so that the aboveassumption is acceptable, and this assumption was made in the case of the San Diego Gas and Electric
Building.The measurements in the building were conducted in the following way. To obtain translational mode-
shapes and associated frequencies, two seismometers were permanently located on the twentieth floor in thenorth stairwell (Figure 2). One instrument was oriented in the north and the other in the east direction.Two other instruments oriented in the same directions were located on the roof during the first measurement,then on the twentieth floor, the eighteenth floor and successively downward by two-storey increments;
measurements were also taken on the thirteenth floor.In an ideal situation, to measure the translational modes all instruments would be placed in the centre
of the structural cross-section or in the centre of torsion. However, the centre of torsion was not known atthe time these tests were performed, and furthermore, the floor was carpeted at the centre of the building(placing an instrument on a carpet would have some undesirable filtering effects for certain frequencies). Itwas therefore decided to place all instruments for the translational measurements in the north stairwell
directly on the concrete slabs (Figure 2).To obtain information about the torsional frequencies, three experiments were conducted at the twentieth,
thirteenth and twelfth floors. In these tests, two instruments oriented EW were placed in the extreme NEand SW corners of the tower as indicated in Figure 2.
Measurement of wind-induced vibrations does not require calibration of all instruments so that they givethe same amplitudes when excited by the same base motion. Nor is it necessary to find the actual amplitudesrecorded, because all that is ever used in determining mode shapes is the relative amplitude of the same two
instruments at a given frequency.Data analysis. Four simultaneous outputs were recorded on magnetic tape during all stages of measure-
ment. Through analogue-to-digital conversion, 200 discrete points per sec were generated from each of theseanalogue records. Noise containing frequencies close to 30 cps and higher was present in some recordsduring the whole experiment. It was not possible to determine precisely the origin of this noise, but it seemslikely that it was caused by mechanical systems in the building, such as air conditioners, elevators or othersthat were not shut off during the measurement. Because all frequencies that can be used for building analysislie well below 30 cps, and to ease the data processing, the original records were passed through low-passfilters. This filtering was performed by successive application of equally weighted, running mean digitalfilters over time intervals of 0.03, 0.02 and 0.01 s. The overall resulting filter response function is somewhatsharper than that given by a single running mean filter but still has a form similar to sin x/x functions It
essentially filters out all frequencies above 30 cps. After smoothing, the original data with 200 pts/s weredecimated to give 50 pts/s.
On the average, about 1 min or more of the vibration was recorded on the tape for each experiment duringthe field measurement. One typical interval, 20.46 s long, corresponding to 1024 data points, was selected
from each of these records for further analysis.The Fourier amplitude spectrum for each 20.46 s interval was obtained by using the Cooley-Tukey
AMBIENT AND FORCED VIBRATION EXPERIMENTS 137
algorithm ,29 which requires 2M equally spaced data points, where M is an integer . Four Fourier amplitudeand phase spectra were computed for each test. In addition, it was necessary to find the ratio of the spectrafrom records made on the test floors to the spectra computed at the reference level (Floor 20). Before theseratios were computed , the Fourier spectra were smoothed so that the spectrum at the ith point fi was replacedby f7M as follows:
3 iM 2fi+ 4;(fi+i+3 i-1)
By taking the ratio of the Fourier amplitude spectrum at a test floor and the spectrum at the twentiethfloor, one obtains an amplitude proportional to the mode shape amplitude at the test floor for a givenfrequency of vibration . During this operation some spectral peaks at various floor levels were found not tobe at the same frequency . Such phenomena were also reported in the case of shaker -induced vibrations.23One possible explanation for this is that, because of variable wind speed and direction , various modes ofvibration are excited in different amounts from one experiment to the other . Thus, if there are two modeswith nearly the same frequencies , superposition of their Fourier amplitude spectra may lead to a shifting ofthe apparent peak. For this reason, it may be erroneous to determine characteristic frequencies from one ortwo spectrum peaks only . The distribution of spectral peaks versus frequencies from all thirteen floor testswas plotted , and the frequencies of natural vibration were picked to correspond with the points about whichthe data clustered.
Since Fourier amplitude spectra give only the modulus of the amplitude , phase spectra were used todetermine the positive (in phase) or negative (180 degrees out of phase ) sign of the mode amplitude.
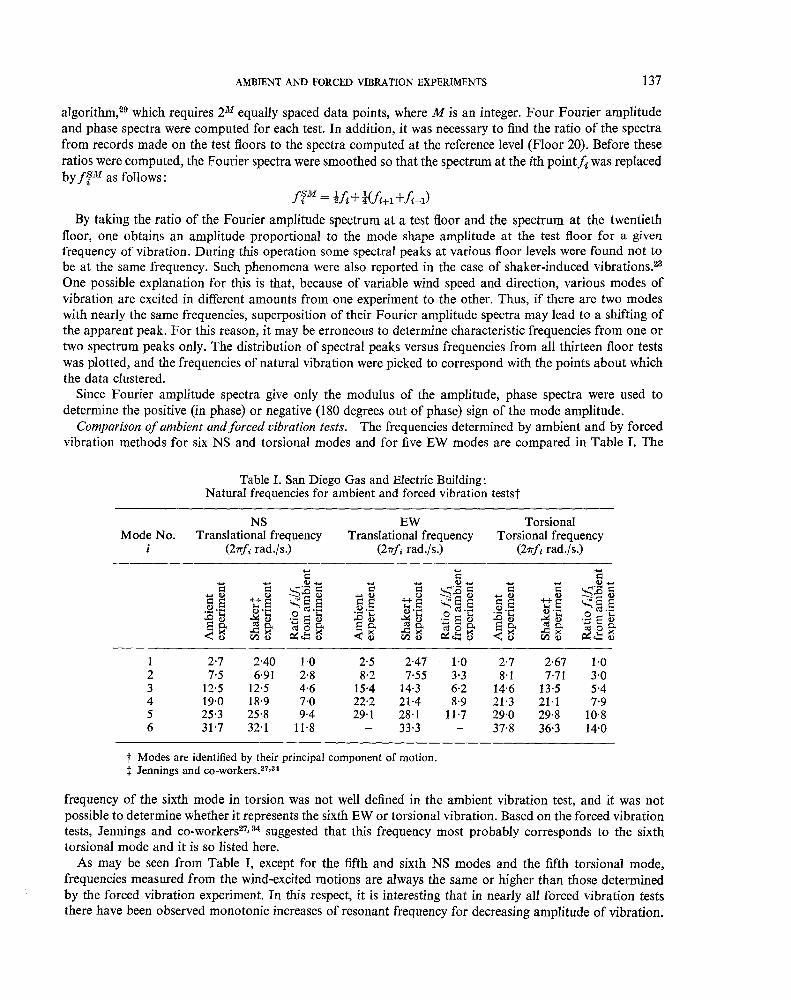
Comparison of ambient and forced vibration tests. The frequencies determined by ambient and by forcedvibration methods for six NS and torsional modes and for five EW modes are compared in Table I. The
Table I. San Diego Gas and Electric Building:Natural frequencies for ambient and forced vibration testsf
NS E W TorsionalMode No. Translational frequency Translational frequency Torsional frequency
i (27rf rad./s.) (27rf; rad./s.) (27rf rad./s.)
.+ N N 4)) ar 4)) N N +-. N N ^"fl N
E ^E `^cd.E N. `ZI E E ^E Efly aE `i E ` Z ,. E y sC y E
Xa ix Cso Ea C1 o E^
_M0
1 2.7 2.40 1.0 2.5 2.47 1.0 2.7 2.67 1.02 7.5 6.91 2.8 8.2 7.55 3.3 8.1 7.71 3.03 12.5 12.5 4.6 15.4 14.3 6.2 14.6 13.5 5.44 19.0 18.9 7.0 22.2 21.4 8.9 21.3 21.1 7.95 25.3 25.8 9.4 29.1 28.1 11.7 29.0 29.8 10.86 31.7 32.1 11.8 - 33.3 - 37.8 36.3 14.0
t Modes are identified by their principal component of motion.$ Jennings and co-workers.27'34
frequency of the sixth mode in torsion was not well defined in the ambient vibration test, and it was notpossible to determine whether it represents the sixth EW or torsional vibration. Based on the forced vibrationtests, Jennings and co-workers27, 34 suggested that this frequency most probably corresponds to the sixthtorsional mode and it is so listed here.
As may be seen from Table I, except for the fifth and sixth NS modes and the fifth torsional mode,frequencies measured from the wind-excited motions are always the same or higher than those determinedby the forced vibration experiment. In this respect, it is interesting that in nearly all forced vibration teststhere have been observed monotonic increases of resonant frequency for decreasing amplitude of vibration.

138 MIHAILO D. TRIFUNAC
For the range of their experiments, Jennings and Kuroiwa23 found that a decrease of resonance amplitudeby a factor close to 8 results in an increase of resonant frequency by about 2.5 per cent. On the average,frequencies determined by the wind and ambient excitation of the San Diego Gas and Electric Building areabout 4 per cent higher than those obtained by the shaker experiment. This shows that the ambient vibrationtests lead to frequency and mode determinations that are in agreement with shaker results.
It is informative to find the ratios of the observed higher frequencies with respect to the fundamentalfrequency. These ratios indicate a type of over-all structural response and are also given in Table I. Fromthese results it may be concluded that the building vibration in the NS direction (Figures 1 and 2) is pre-dominantly of the shear type, because the determined frequency ratios follow closely the ratios 1, 3,7,9, 11 ...which apply for the uniform shear beam. The results suggest that bending effects are more predominant in
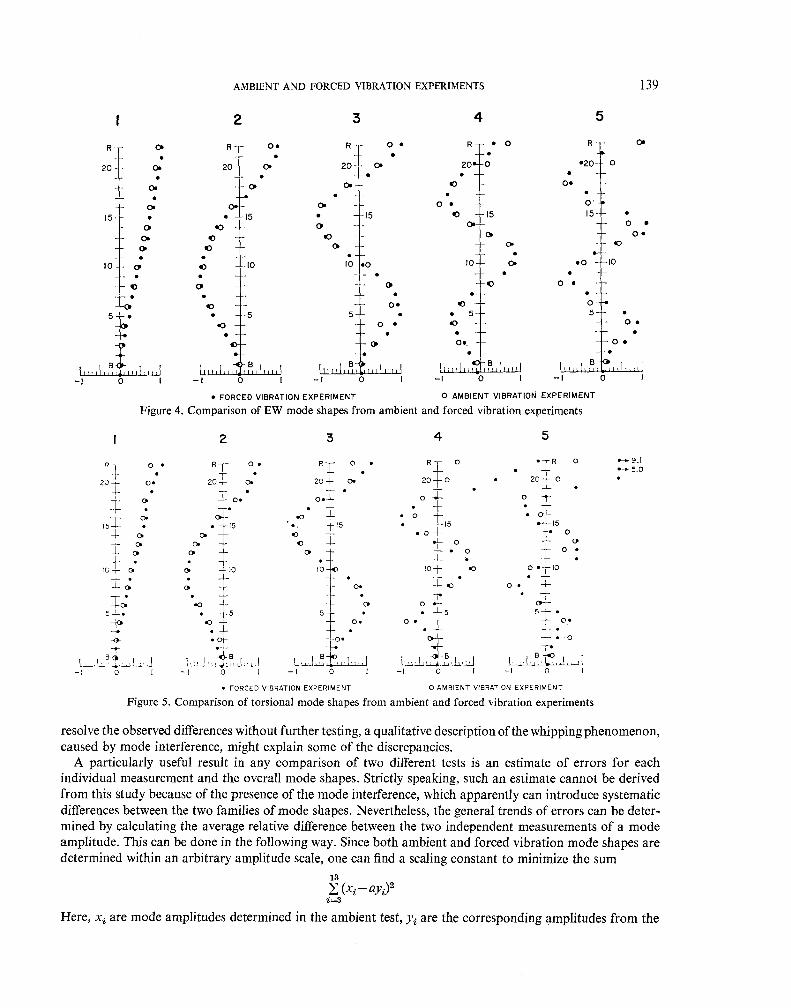
the EW direction. Torsional results show the same trend but to a lesser extent.Mode shapes determined from the ratio of the Fourier amplitude spectra are plotted in Figure 3 for the
NS direction, in Figure 4 for EW and in Figure 5 for torsional vibrations. Torsional, NS and EW fundamental
I 2R R 0.
20 C 20 O
3 4R I 1.
20 + •0
O .0 • O•
0. 0
10}0.
15 O•• 40 15 •b t15
0• •O 0•
4 Of o + o
}10
0 $}•
.0•o 15
-1 0 1
I
.o$ •
100
• •
R • O R • 0
4 0 2020
••O •O
• T
5
0
O O•p 6.
• 15 15
O
10 ♦ O•
0
.0
a5
0.+
i I B L I I f I. p,1,1B.,1^^^ 1I 0 I -1 0 I
4.
•4 05t
0.
0
B
-1 0 1
• FORCED VIBRATION EXPERIMENT 0 AMBIENT VIBRATION EXPERIMENT
Figure 3. Comparison of NS mode shapes from ambient and forced vibration experiments
frequencies are very closely spaced and the exact separation of modes is not possible from this set of data.For this reason, the first torsional and EW mode shapes are taken to have the same amplitudes.
Mode shapes from the forced vibration tests, as reported by Jennings and co-workers27 , 34 are also plottedin Figures 3-5. To allow a meaningful comparison the mode shapes from forced vibration tests were scaledso that they have the same mean of absolute mode amplitudes as the modes from ambient tests. In thisscaling the top-floor response was excluded to eliminate the influence of whipping caused by mode inter-ference. This effect will be discussed later in this paper.
Since the higher modes are near the resolving capability of both testing techniques, the sixth modes deter-mined in the preliminary report on ambient vibrations' 27 are not included here. It appears that at least threeor more experimental points between the two consecutive zeros are necessary to determine approximatelya mode shape.
Comparison of the ambient and forced vibration mode shapes show general agreement of results from
the two testing methods. The differences, found mainly from the upper floors, seem to be systematic and arerepresented by a divergence of the two families of curves. This divergence, called `whipping' by Jenningsand co-workers27, 34 is largest at the top of the building. The forced vibration test shows smaller deflectionsat the top of the structure for the fourth and fifth NS and the fourth EW modes. In all other cases wheresignificant differences appear, forced vibration tests lead to larger top-level amplitudes. This differencebecomes particularly important for higher torsional modes. Although it will not be possible to completely
AMBIENT AND FORCED VIBRATION EXPERIMENTS
2 4 5
R 0 R O•• •
20 o. 20 0.
0. Op. •
15 • • 15o •o0. O
0 O
IO p 0 CO
to
v T•05 • • ^5
•
0
+0
0
lot o•
+ O
139
R E O.
•20-t 0
0.
•0•
O •
o•15
-4-10
O5
O
B B B
-1 0 I -I O I -I 0 1
• FORCED VIBRATION EXPERIMENT
o e. -i- -1- O •• -1- t•
0.
BBIill( I ^,III I II I I I
B-2 IL^I I
-I 0 I -I 0 !
0 AMBIENT VIBRATION EXPERIMENT
Figure 4. Comparison of EW mode shapes from ambient and forced vibration experiments
3
Rm O •
20-+ 0-
0.+
o.• 15
IO o
2 3 4 5
• FORCED VIBRATION EXPERIMENT 0 AMBIENT VIBRATION EXPERIMENT
Figure 5. Comparison of torsional mode shapes from ambient and forced vibration experiments
resolve the observed differences without further testing, a qualitative description of the whipping phenomenon,caused by mode interference, might explain some of the discrepancies.
A particularly useful result in any comparison of two different tests is an estimate of errors for eachindividual measurement and the overall mode shapes. Strictly speaking, such an estimate cannot be derivedfrom this study because of the presence of the mode interference, which apparently can introduce systematicdifferences between the two families of mode shapes. Nevertheless, the general trends of errors can be deter-mined by calculating the average relative difference between the two independent measurements of a modeamplitude. This can be done in the following way. Since both ambient and forced vibration mode shapes aredetermined within an arbitrary amplitude scale, one can find a scaling constant to minimize the sum
13
(xi - ayi)2i=3
Here, xi are mode amplitudes determined in the ambient test, yi are the corresponding amplitudes from the
140 MIHAILO D. TRIFUNAC
forced vibration experiment and a is a constant. The subscripts i = 1, 2, 3, ...,13 correspond to the roof,twentieth floor, eighteenth floor, etc. The sum starts from i = 3 (i.e. eighteenth floor) in order to partiallyeliminate discrepancies caused by whipping and stops at i = 13 (A floor). A simple measurement of thepercentage differences relative to the peak ambient vibration amplitudes is then given by
100 13e=-^Ixz•-ai
11 i-3
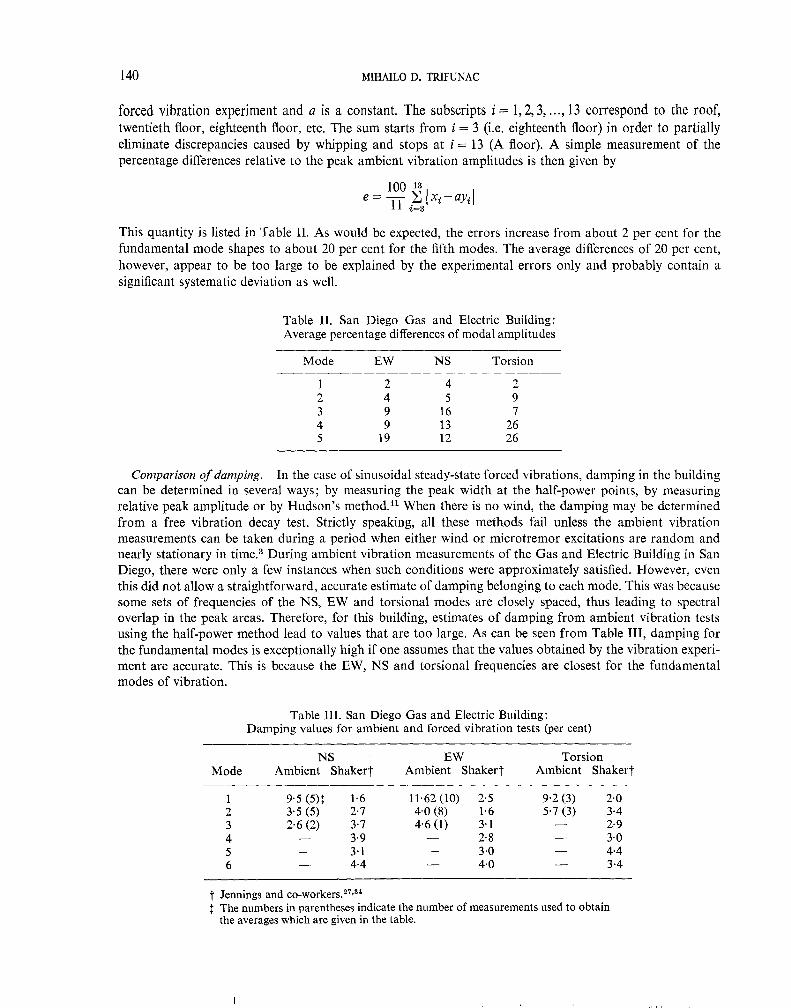
This quantity is listed in Table II. As would be expected, the errors increase from about 2 per cent for thefundamental mode shapes to about 20 per cent for the fifth modes. The average differences of 20 per cent,however, appear to be too large to be explained by the experimental errors only and probably contain asignificant systematic deviation as well.
Table II. San Diego Gas and Electric Building:Average percentage differences of modal amplitudes
Mode EW NS Torsion
1 2 4 22 4 5 93 9 16 74 9 13 265 19 12 26
Comparison of damping. In the case of sinusoidal steady-state forced vibrations, damping in the buildingcan be determined in several ways; by measuring the peak width at the half-power points, by measuringrelative peak amplitude or by Hudson's method.'1 When there is no wind, the damping may be determinedfrom a free vibration decay test. Strictly speaking, all these methods fail unless the ambient vibrationmeasurements can be taken during a period when either wind or microtremor excitations are random andnearly stationary in time.3 During ambient vibration measurements of the Gas and Electric Building in SanDiego, there were only a few instances when such conditions were approximately satisfied. However, eventhis did not allow a straightforward, accurate estimate of damping belonging to each mode. This was becausesome sets of frequencies of the NS, EW and torsional modes are closely spaced, thus leading to spectraloverlap in the peak areas. Therefore, for this building, estimates of damping from ambient vibration testsusing the half-power method lead to values that are too large. As can be seen from Table III, damping forthe fundamental modes is exceptionally high if one assumes that the values obtained by the vibration experi-ment are accurate. This is because the EW, NS and torsional frequencies are closest for the fundamentalmodes of vibration.
Table III. San Diego Gas and Electric Building:Damping values for ambient and forced vibration tests (per cent)
NS EW TorsionMode Ambient Shakert Ambient Shakert Ambient Shakert
1 9.5 (5)$ 1.6 11-62(10) 2.5 9-2(3) 2.02 3.5 (5) 2.7 4-0(8) 1.6 5.7 (3) 3.4
3 2-6(2) 3.7 4-6(l) 3.1 - 2.94 - 3.9 2.8 - 3.05 3.1 3.0 - 4.46 - 4.4 4.0 - 3.4
t Jennings and co-workers.27,34$ The numbers in parentheses indicate the number of measurements used to obtain
the averages which are given in the table.
AMBIENT AND FORCED VIBRATION EXPERIMENTS 141
More accurate values of damping could be obtained by computing Fourier amplitude spectra with higher
resolution and by the optimum location of seismometers. However, the difficulty in estimating the dampingvalues for this particular experiment was not considered too serious. It was not encountered in a similarambient vibration test of a thirty-nine storey steel frame building.'
Nine-storey reinforced concrete building
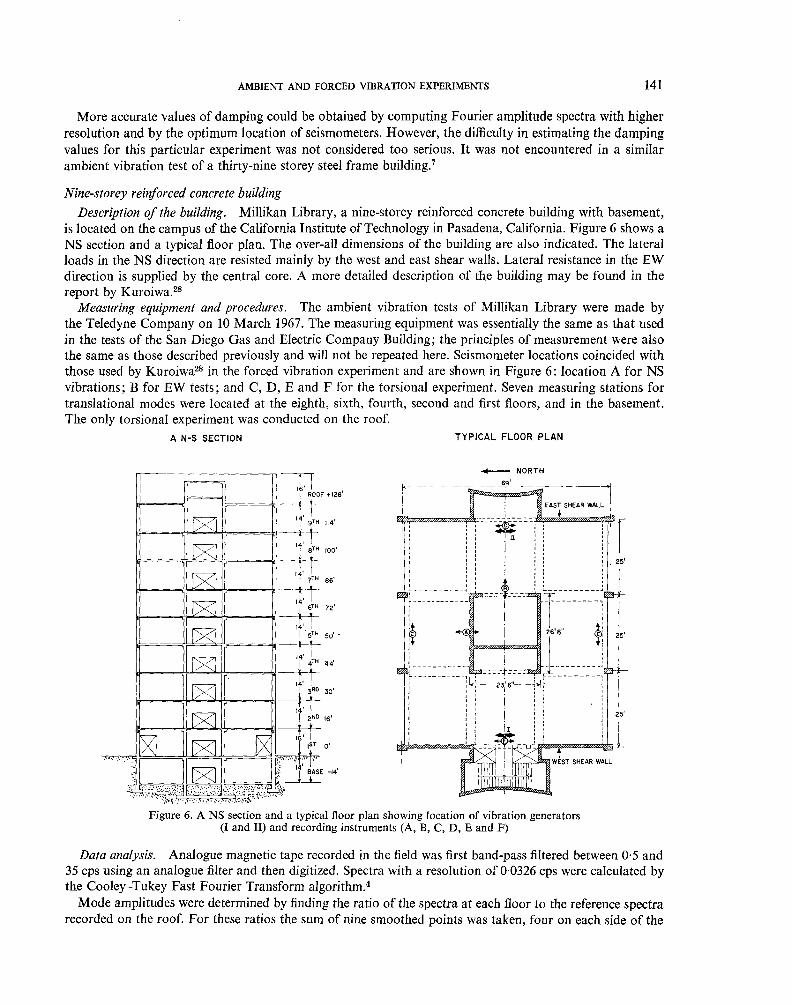
Description of the building. Millikan Library, a nine-storey reinforced concrete building with basement,is located on the campus of the California Institute of Technology in Pasadena, California. Figure 6 shows aNS section and a typical floor plan. The over-all dimensions of the building are also indicated. The lateralloads in the NS direction are resisted mainly by the west and east shear walls. Lateral resistance in the EWdirection is supplied by the central core. A more detailed description of the building may be found in thereport by Kuroiwa.28
Measuring equipment and procedures. The ambient vibration tests of Millikan Library were made bythe Teledyne Company on 10 March 1967. The measuring equipment was essentially the same as that usedin the tests of the San Diego Gas and Electric Company Building; the principles of measurement were alsothe same as those described previously and will not be repeated here. Seismometer locations coincided withthose used by Kuroiwa28 in the forced vibration experiment and are shown in Figure 6: location A for NSvibrations; B for EW tests; and C, D, E and F for the torsional experiment. Seven measuring stations fortranslational modes were located at the eighth, sixth, fourth, second and first floors, and in the basement.The only torsional experiment was conducted on the roof.
A N-S SECTION
R00
4 9TH
4 8TH
T.
14TH
5TH
4 FTH
3RD
2ND
^16157
^
r 128
114'
100'
86'
72'
44
30,
16'
0'
EAST SHEAR WALL '
WEST SHEAR WALL
Figure 6. A NS section and a typical floor plan showing location of vibration generators(I and II) and recording instruments (A, B, C, D, E and F)
25'
25'
Data analysis. Analogue magnetic tape recorded in the field was first band-pass filtered between 0.5 and35 cps using an analogue filter and then digitized. Spectra with a resolution of 0.0326 cps were calculated bythe Cooley-Tukey Fast Fourier Transform algorithm .4
Mode amplitudes were determined by finding the ratio of the spectra at each floor to the reference spectrarecorded on the roof. For these ratios the sum of nine smoothed points was taken, four on each side of the
TYPICAL FLOOR PLAN
l- .. NORTH
69,
142 MIHAILO D. TRIFUNAC
resonance peak. The square root of the ratio of the sum on the ith floor to the sum on the roof then gives
the ith point of the modeshape. As pointed out by Blanford and co-workers4 this method is appealing, sinceit weighs spectral estimates in proportion to their amplitudes. However, this approach cannot be used whentwo spectral peaks are close to each other or when they overlap, as was the case for ambient tests of theSan Diego Gas and Electric Company Building.
Blanford and co-workers4 determined the resonant frequencies from resonance curves by normalizingand averaging spectral peaks for seven different runs recorded on the roof. They determined the percentageof critical damping by finding which plastic overlay of a series of resonance curves fits best.
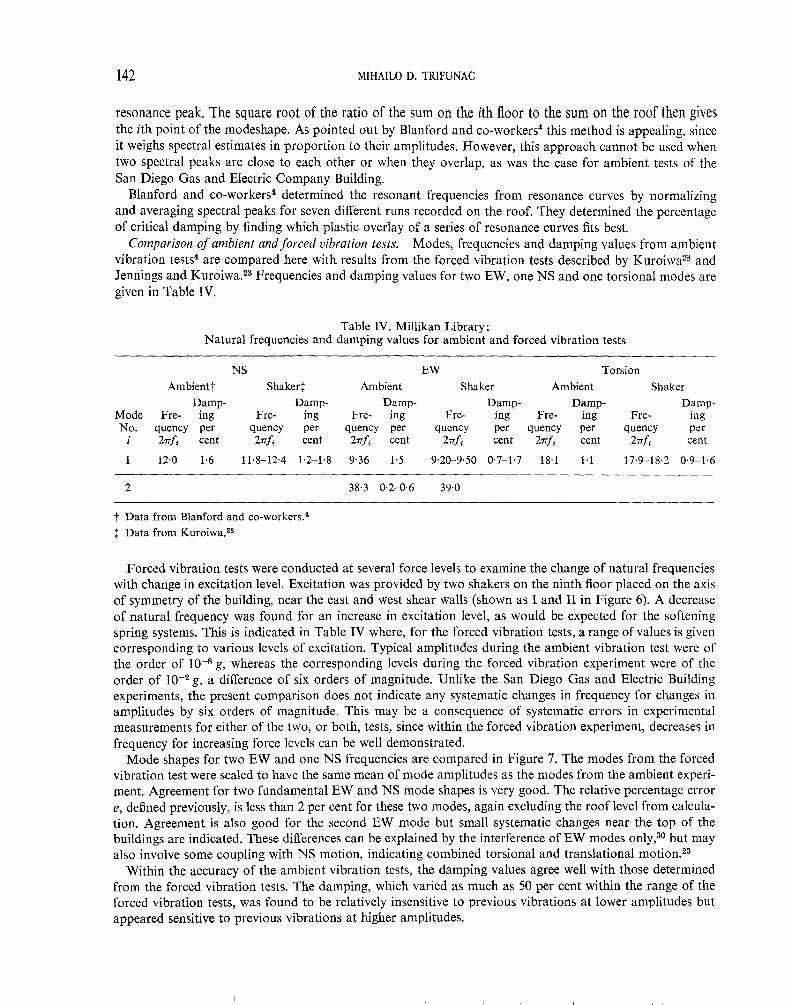
Comparison of ambient and forced vibration tests. Modes, frequencies and damping values from ambientvibration tests4 are compared here with results from the forced vibration tests described by Kuroiwa28 andJennings and Kuroiwa.23 Frequencies and damping values for two EW, one NS and one torsional modes aregiven in Table IV.
Table IV. Millikan Library:Natural frequencies and damping values for ambient and forced vibration tests
ModeNo.
Ambient t
Damp-Fre- ing
quency per27rff cent
NS EW Torsion
Shaker l Ambient Shaker Ambient Shaker
Damp- Damp- Damp- Damp- Damp-Fre- ing Fre- ing Fre- ing Fre- ing Fre- ing
quency per quency per quency per quency per quency per27rf2 cent 27rf, cent 27rf cent 27rff cent 27rf cent
12.0 1.6 11.8-12.4 1.2-1.8 9.36 1.5 9.20-9.50 0.7-1.7 18.1 1.1 17.9-18.2 0.9-1.6
2 38.3 0.2-0.6 39.0
t Data from Blanford and co-workers.4
$ Data from Kuroiwa.28
Forced vibration tests were conducted at several force levels to examine the change of natural frequencieswith change in excitation level. Excitation was provided by two shakers on the ninth floor placed on the axisof symmetry of the building, near the east and west shear walls (shown as I and II in Figure 6). A decreaseof natural frequency was found for an increase in excitation level, as would be expected for the softeningspring systems. This is indicated in Table IV where, for the forced vibration tests, a range of values is givencorresponding to various levels of excitation. Typical amplitudes during the ambient vibration test were ofthe order of 10-8 g, whereas the corresponding levels during the forced vibration experiment were of theorder of 10-2 g, a difference of six orders of magnitude. Unlike the San Diego Gas and Electric Buildingexperiments, the present comparison does not indicate any systematic changes in frequency for changes inamplitudes by six orders of magnitude. This may be a consequence of systematic errors in experimentalmeasurements for either of the two, or both, tests, since within the forced vibration experiment, decreases infrequency for increasing force levels can be well demonstrated.
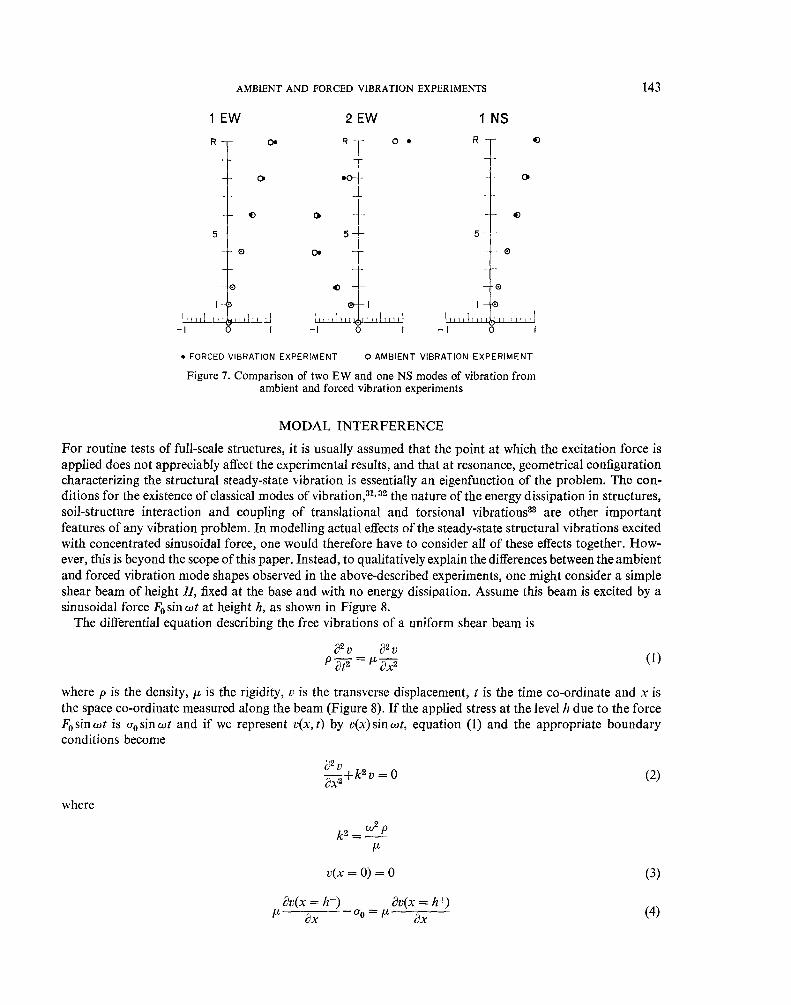
Mode shapes for two EW and one NS frequencies are compared in Figure 7. The modes from the forcedvibration test were scaled to have the same mean of mode amplitudes as the modes from the ambient experi-ment. Agreement for two fundamental EW and NS mode shapes is very good. The relative percentage errore, defined previously, is less than 2 per cent for these two modes, again excluding the roof level from calcula-tion. Agreement is also good for the second EW mode but small systematic changes near the top of thebuildings are indicated. These differences can be explained by the interference of EW modes only,30 but mayalso involve some coupling with NS motion, indicating combined torsional and translational motion.23
Within the accuracy of the ambient vibration tests, the damping values agree well with those determinedfrom the forced vibration tests. The damping, which varied as much as 50 per cent within the range of theforced vibration tests, was found to be relatively insensitive to previous vibrations at lower amplitudes butappeared sensitive to previous vibrations at higher amplitudes.
AMBIENT AND FORCED VIBRATION EXPERIMENTS
1 EW 2 EW I NS
. FORCED VIBRATION EXPERIMENT 0 AMBIENT VIBRATION EXPERIMENT
Figure 7. Comparison of two EW and one NS modes of vibration fromambient and forced vibration experiments
143
MODAL INTERFERENCE
For routine tests of full-scale structures, it is usually assumed that the point at which the excitation force isapplied does not appreciably affect the experimental results, and that at resonance, geometrical configurationcharacterizing the structural steady-state vibration is essentially an eigenfunction of the problem. The con-ditions for the existence of classical modes of vibration, 31, 32 the nature of the energy dissipation in structures,soil-structure interaction and coupling of translational and torsional vibrations33 are other importantfeatures of any vibration problem. In modelling actual effects of the steady-state structural vibrations excitedwith concentrated sinusoidal force, one would therefore have to consider all of these effects together. How-ever, this is beyond the scope of this paper. Instead, to qualitatively explain the differences between the ambientand forced vibration mode shapes observed in the above-described experiments, one might consider a simpleshear beam of height H, fixed at the base and with no energy dissipation. Assume this beam is excited by asinusoidal force F0 sin wt at height h, as shown in Figure 8.
The differential equation describing the free vibrations of a uniform shear beam is
01V _ a2v
p8t2 =iax2(1)
where p is the density, µ is the rigidity, v is the transverse displacement, t is the time co-ordinate and x isthe space co-ordinate measured along the beam (Figure 8). If the applied stress at the level h due to the forceF0 sin wt is Q° sin wt and if we represent v(x, t) by v(x) sin wt, equation (1) and the appropriate boundaryconditions become
2axe + k2 v = 0
where
/t
v(x=0)=0
av(x = h-) av(x = h+)
ax - a0 - ax
(2)
(3)
(4)
144
and
MIHAILO D. TRIFUNAC
av(x = H) 0(5)
ax
It can be shown that v(x) satisfying (2) and all boundary conditions (3)-(5) is given by
go 1 sinkx0 i x 5 h
v(x) =µk (1 /tan kh) -tan k(H- h) sin kh'
(6)
go 1 [tan k(H-h)sink(x- h)+ o k(x-h ] <HhS
Note that in plac
c s ) , x,µk (1/tan kh)-tank(H-h)
e of equation (1) a differential equation for forced vibration of a shear beam
2 2bvb(x-h)si t+
='nwQO
pate µax2( )
could have been used. In that case v(x) would have been given by
8Q H oo sin (i /2H) C;"(; x/2H)0 -h 7rV (X)(x) µ7r2 i=1^5.... 1- (4H2 pw2/i2 7r2 µ) l2 (6')
It can be shown that equations (6) and (6') are identical.It should be noted that the subsequent analysis is equally applicable to torsional vibrations as well, because
the basic differential equation governing torsional oscillations is of the same form as equation (1).When h = H, v(x) given by equation (6) reduces to
ao sinkxv(x) = µk
coskH (7)
From equation (7) we find that when k = k,, = {(2n + 1)/2) (7r/H), n = 0, 1, 2, ..., v(x) - oo. Since k2 = w2//32,with /3 = (µ/p)t the corresponding frequencies are
w(2n+1)
n 2 7r H, n = 0, 1, 2, ... (8)
These are the well known natural frequencies of a uniform shear beam with a property wi/wo = 1, 3, 5, ...for i = 0, 1, 2,... so frequently quoted. The normalized eigenfunctions v,,(x) are
vn(x) µkncos km, H =
sink,ti x (9)Oro
It can be shown that for any h, between zero and H, when kH--> (2n+1/2)7r, v(x) given by equation (6)tends to v(x) given by equation (7), i.e. one mode dominates completely the response and v(x)-^-vn(x).Therefore, irrespective of the point at which Fo sin wt is applied, at resonance the normalized mode shapesare given by equation (9).
It is obvious, however, that, while testing under complicated field conditions, it may become quite difficultto determine exactly the natural frequencies. The relative errors in determining natural frequencies of thebuildings discussed here are on the order of 2 to 5 per cent.
To qualitatively explain the nature of mode interference, which may lead to `whipping' of top floors, itwill be assumed here that 'mode shapes' measured during forced vibration tests are proportional to
sinkx, 0-<x-<hv*(k) sin kh[tan k(H- h) sin k(x- h)+cos k(x- h)], h5x5H
(10)
The `mode shapes' v *(x) representing the observed response for k kn, have a discontinuity of first derivativeat x = h (Figure 8) if k 0 k,,. They are derived from equation (6) and represent a mixture of all modes. Inactual experiments of lightly damped structures, however, one can partly eliminate displacement com-ponents which are 0 and 180° out of phase relative to the phase of the forcing function, and concentrate on

AMBIENT AND FORCED VIBRATION EXPERIMENTS 145
146 MIHAILO D. TRIFUNAC
the 90° out-of-phase components.2', 34 This may reduce mode interference, and thus whipping, above thepoint of excitation.
We next define a small perturbation parameter e in the following way
kH= 2(2n+l+e)
When e = 0, kH corresponds to equation (8) and the structure resonates at one of its natural frequencies.Relative percentage deviation, E, from a natural frequency is related to e by
2n+IE
100(12)
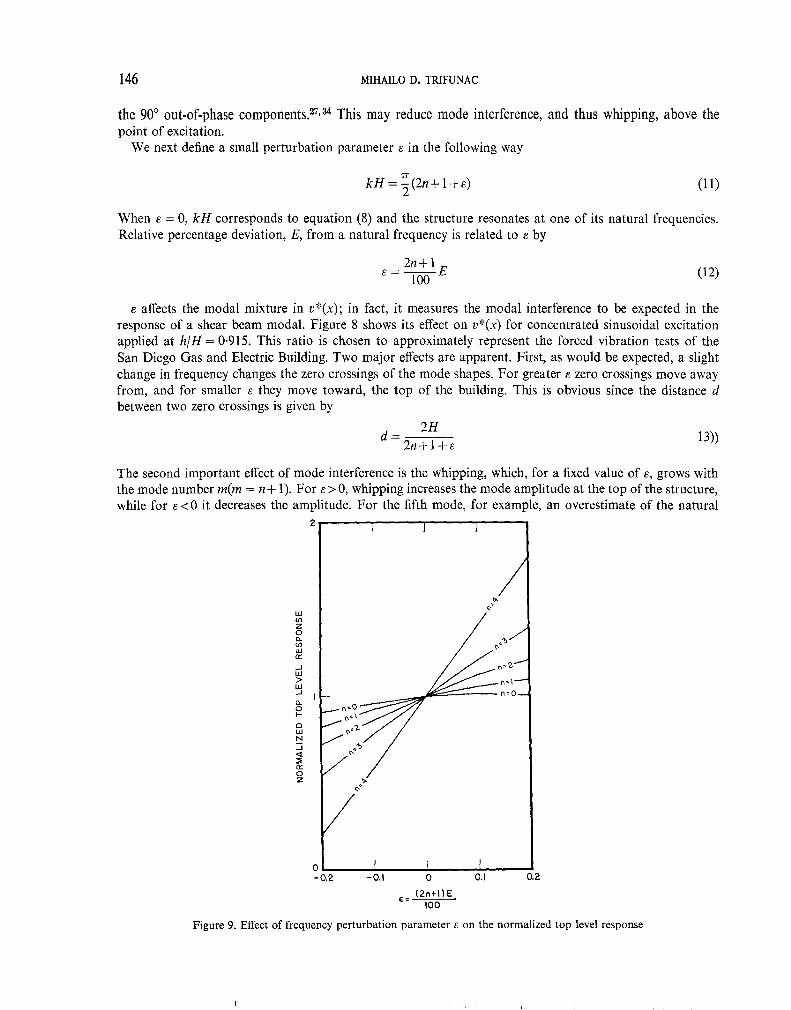
s affects the modal mixture in v*(x); in fact, it measures the modal interference to be expected in theresponse of a shear beam modal. Figure 8 shows its effect on v*(x) for concentrated sinusoidal excitationapplied at h/H = 0.915. This ratio is chosen to approximately represent the forced vibration tests of theSan Diego Gas and Electric Building. Two major effects are apparent. First, as would be expected, a slightchange in frequency changes the zero crossings of the mode shapes. For greater s zero crossings move awayfrom, and for smaller e they move toward, the top of the building. This is obvious since the distance dbetween two zero crossings is given by
2H
d 2n+1+s13))
The second important effect of mode interference is the whipping, which, for a fixed value of s, grows withthe mode number m(m = n + 1). For s>0, whipping increases the mode amplitude at the top of the structure,while for s < 0 it decreases the amplitude. For the fifth mode, for example, an overestimate of the natural
21
I
0-0.2 -0.1 0
(2n+1) E
0.1 0.2
C: 100
Figure 9. Effect of frequency perturbation parameter s on the normalized top level response
AMBIENT AND FORCED VIBRATION EXPERIMENTS 147
frequency of about 2 per cent (E ;z2) leads to a = 0.20, and an increase of the top level response by some80 per cent. Figure 9 summarizes the top-level response for various values of a and n.
Comparison of Figure 8 with Figures 3-5 and 7 shows that the simple approximate explanation suggestedabove might explain the observed differences between the ambient and forced vibration experiments. Unfor-tunately no direct correlation of the measured deviations can be made with this simple theory, since thenatural frequencies determined from the ambient vibration tests may be systematically low by several per centfor this comparison. This is because the level of excitation during the ambient tests was about two orders ofmagnitude smaller than the level during forced vibrations.
When a>0 the normalized amplitude at the top level increases; at the same time zero crossings moveaway from the top. Reversed behaviour accompanies a<0 (Figure 8 and equation (13)). The same generaltrend is true for most experimental measurements. Therefore, it might be concluded that the accuracy of theambient vibration tests is greater than indicated by a comparison in Table H. Shifting of zero crossings andwhipping, resulting from the mode interference when a#0, certainly cannot describe all the differencesbetween the two types of testing techniques, particularly when coupling between two transverse and atorsional mode takes place. However, analysis of the second EW translational mode of Millikan Librarysuggests that in some cases these two effects alone may be responsible for the gross behaviour of modes ofvibration observed during the forced vibration tests.
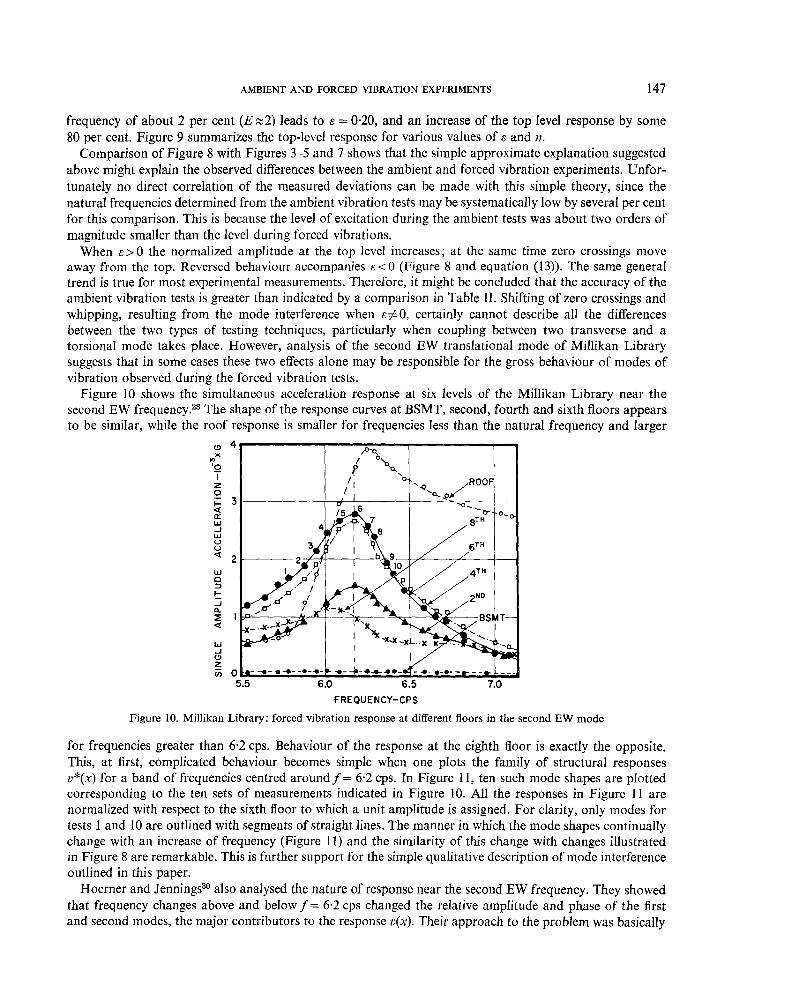
Figure 10 shows the simultaneous acceleration response at six levels of the Millikan Library near thesecond EW frequency.23 The shape of the response curves at BSMT, second, fourth and sixth floors appearsto be similar, while the roof response is smaller for frequencies less than the natural frequency and larger
4x
o_
z0
Q
WJW0UQ
W0
Ja
a
op Rq\
°/
.^ ROOF
^'g
/50_
°a
7^'p' TH8Q e
3 q 6THb 92
I pa
.
I0 4TH
d°
e2ND
dBSMT
'a
3
2
I
WJ
z
N 05.5 6.0 6.5
FREQUENCY-CPS
7.0
Figure 10. Millikan Library: forced vibration response at different floors in the second EW mode
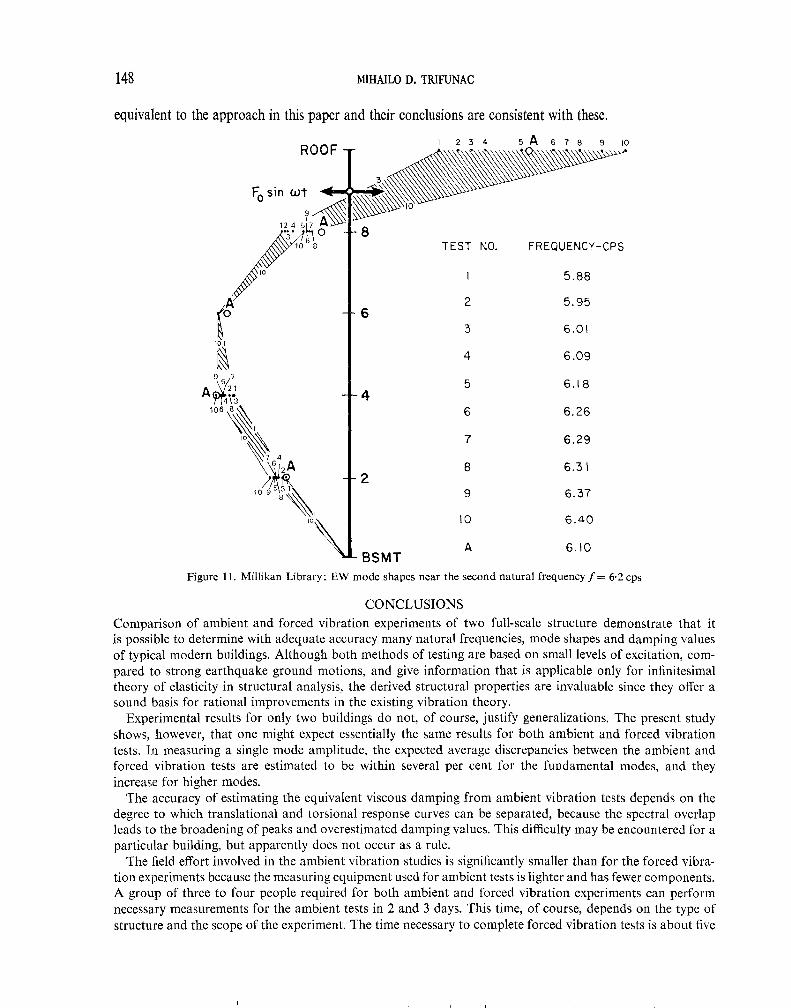
for frequencies greater than 6.2 cps. Behaviour of the response at the eighth floor is exactly the opposite.This, at first, complicated behaviour becomes simple when one plots the family of structural responsesv*(x) for a band of frequencies centred around f = 6.2 cps. In Figure 11, ten such mode shapes are plottedcorresponding to the ten sets of measurements indicated in Figure 10. All the responses in Figure 11 arenormalized with respect to the sixth floor to which a unit amplitude is assigned. For clarity, only modes fortests 1 and 10 are outlined with segments of straight lines. The manner in which the mode shapes continuallychange with an increase of frequency (Figure 11) and the similarity of this change with changes illustratedin Figure 8 are remarkable. This is further support for the simple qualitative description of mode interferenceoutlined in this paper.
Hoerner and Jennings3' also analysed the nature of response near the second EW frequency. They showedthat frequency changes above and below f = 6.2 cps changed the relative amplitude and phase of the firstand second modes, the major contributors to the response v(x). Their approach to the problem was basically
148 MIHAILO D . TRIFUNAC
equivalent to the approach in this paper and their conclusions are consistent with these.
ROOF -r
^p
o +8
-1-
10\
M
TEST
I
NO. FREQUENCY-CPS
5.88
2 5.956
3 6.01
4 6.09
5 6.184
6 6.26
7 6.29
8 6.312
9 6.37
10 6.40
A 6.10BSMT
Figure 11. Millikan Library: EW mode shapes near the second natural frequency f = 6.2 cps
CONCLUSIONS
Comparison of ambient and forced vibration experiments of two full-scale structure demonstrate that itis possible to determine with adequate accuracy many natural frequencies, mode shapes and damping valuesof typical modern buildings. Although both methods of testing are based on small levels of excitation, com-pared to strong earthquake ground motions, and give information that is applicable only for infinitesimaltheory of elasticity in structural analysis, the derived structural properties are invaluable since they offer asound basis for rational improvements in the existing vibration theory.
Experimental results for only two buildings do not, of course, justify generalizations. The present studyshows, however, that one might expect essentially the same results for both ambient and forced vibrationtests. In measuring a single mode amplitude, the expected average discrepancies between the ambient andforced vibration tests are estimated to be within several per cent for the fundamental modes, and theyincrease for higher modes.
The accuracy of estimating the equivalent viscous damping from ambient vibration tests depends on thedegree to which translational and torsional response curves can be separated, because the spectral overlapleads to the broadening of peaks and overestimated damping values. This difficulty may be encountered for aparticular building, but apparently does not occur as a rule.
The field effort involved in the ambient vibration studies is significantly smaller than for the forced vibra-tion experiments because the measuring equipment used for ambient tests is lighter and has fewer components.A group of three to four people required for both ambient and forced vibration experiments can performnecessary measurements for the ambient tests in 2 and 3 days. This time, of course, depends on the type ofstructure and the scope of the experiment. The time necessary to complete forced vibration tests is about five
F, sin wt Q-- ;"
.2 4 5
9
'4110
2 3 4 5 A 6 7 8 9 10
AMBIENT AND FORCED VIBRATION EXPERIMENTS 149
times longer. The total number of necessary measurements in ambient tests is significantly smaller, and alsoeach individual measurement requires a shorter time interval. On the other hand, data analysis is slightlymore complicated because it requires the Fourier analysis using digital computers.
Like forced vibration tests, ambient experiments may lead to the determination of up to six and moremodes of vibration. The number of mode shapes resolved depends mainly on the level of the high-frequencynoise and the number of measuring stations in the building. For transverse and torsional modes of vibrationof tall simple buildings, it is necessary to have at least three measured points between the two successivezeros to approximately determine the mode shape.
Whipping of the top floors, observed during the forced vibration tests, is attributed to modal interference,a consequence of the concentrated force excitation at a frequency only slightly different from the resonantfrequency. This phenomenon may lead to discrepancies between the ambient and forced vibration testspredominantly at top levels of a structure, but it does not seriously affect the lower portion of a mode shape.Presumably other mechanisms, such as damping, very close modes, coupling of transverse with transverseand torsional modes, etc., which also induce the response of several modes, could cause the same qualitativeeffect.
ACKNOWLEDGEMENTS
The author thanks Professors P. C. Jennings and D. E. Hudson and Mr. F. E. Udwadia of the CaliforniaInstitute of Technology for many valuable suggestions and critical reading of the manuscript. In addition,he is indebted to J. Healey of the Lamont-Doherty Geological Observatory for critical reading and editingof the manuscript.
This research was supported in part by the National Science Foundation Grant GK 1197X and theEarthquake Research Affiliates Programme while the author was at California Institute of Technology.The work was completed at the Lamont-Doherty Geological Observatory of Columbia University.
REFERENCES
1. U.S. Coast and Geodetic Survey, `Earthquake investigations in California, 1934-1935', Special publication No. 201,U.S. Dept. of Commerce, Washington, D.C. (1936).
2. R. Crawford and H. S. Ward, `Determination of the natural periods of building', Bull. Seism. Soc. Am. 54, 1743-1756(1964).
3. H. S. Ward and R. Crawford, `Wind induced vibrations and building modes', Bull. Seism. Soc. Am. 56, 793-813 (1966).4. R. B. Blanford, V. R. McLamore and J. Aunon, `Structural analysis of Millikan Library from ambient vibrations',
Earth Sciences Teledyne Co. Report No. 616-0268-2107 (1968).5. V. R. McLamore, `Ambient vibration survey of Chesapeake Bay Bridge', Teledyne Geotronics Rept. No. 0370-2152 (1970).6. M. D. Trifunac, `Wind and microtremor induced vibrations of a twenty-two story steel frame building,' Earthquake Eng.
Res. Lab., EERL 70-01, California Institute of Technology, Pasadena (1970).7. M. D. Trifunac, `Ambient vibration test of a thirty-nine story steel frame building', Earthquake Eng. Res. Lab., EERL
70-02, California Institute of Technology, Pasadena (1970).8. D. E. Hudson, `Synchronized vibration generators for dynamic tests of full-scale structures', Earthquake Eng. Res. Lab.,
California Institute of Technology, Pasadena (1962).9. W. 0. Keightley, `Vibration test of structures', Earthquake Eng. Res. Lab., California Institute of Technology, Pasadena
(1963).10. W. 0. Keightley, `A dynamic investigation of Bouquet Canyon Dam, Earthquake Eng. Res. Lab., California Institute of
Technology, Pasadena (1964).11. W. 0. Keightley, G. W. Housner and D. E. Hudson, `Vibration test of the Encino Dam intake tower', Earthquake Eng.
Res. Lab., California Institute of Technology, Pasadena (1961).12. R. B. Matthiesen and C. B. Smith, `A simulation of earthquake effects on the UCLA reactor using structural vibrations',
Department of Engineering, University of California, Los Angeles (1966).13. K. Kawasumi and K. Kanai, `Small amplitude vibration of actual buildings', Proc. 1st Wld Conf. Earthquake
Eng., Berkeley (1956).14. T. Hisada and K. Nakagawa, `Vibration tests on various types of buildings up to failure', Proc. 1st Wld Conf.
Earthquake Eng., Berkeley (1956).15. M. Takeuchi, `Vibrational characteristics of buildings, Part I. Vibrational characteristics of actual buildings determined
by actual tests', Proc. 2nd Wld Conf. Earthquake Eng., Tokyo (1960).16. K. Nakagawa, `Vibration characteristics of buildings, Part II. Vibrational characteristics of reinforced concrete buildings
existing in Japan', Proc. 2nd Wld Conf. Earthquake Eng., Tokyo (1960).17. N. N. Nielsen, `Dynamic response of multistorey buildings', Earthquake Eng. Res. Lab., California Institute of Technology,
Pasadena (1964).
150 MIHAILO D . TRIFUNAC
18. R. D. Hanson, `Post elastic dynamic response of mild steel structures', Earthquake Eng. Res. Lab., California Institute
of Technology, Pasadena (1965).19. R. D. Hanson, `Static and dynamic tests of a full-scale steel frame structure', Earthquake Eng. Res. Lab., California
Institute of Technology, Pasadena (1965).20. J. G. Bouwkamp and J. K. Blohm, `Dynamic response of a two-storey steel frame structure', Bull. Seism. Soc. Am. 56,
1289-1303 (1966).21. J. S. Benya, `A forced vibration study of a steel-framed building', M.Sc. Thesis, School of Engineering, University of
California, Los Angeles (1966).22. R. E. Englekirk and R. B. Matthiesen, `Forced vibration of an eight-storey reinforced concrete building', Bull. Seism.
Soc. Am. 57, 421-436 (1967).23. P. C. Jennings and J. H. Kuroiwa, `Vibration and soil-structure interaction tests of a nine-storey reinforced concrete
building', Bull. Seism. Soc. Am. 58, 891-916 (1968).24. R. D. Shanman, `A forced vibration study of a completed five-story steel frame building', M.Sc. Thesis, School of
Engineering, University of California, Los Angeles (1969).25. C. B. Smith and R. B. Matthiesen, `Forced vibration tests of the experimental gas-cooled reactor (EGCR)', Earthquake
Eng. and Struct. Lab. and Nuclear Energy Lab., University of California, Los Angeles (1969).26. R. Ibanez, R. B. Matthiesen, C. B. Smith and G. S. C. Wang, `San Onofre nuclear generating station vibration tests,
Nuclear Energy Lab. and Earthquake Eng. and Struct. Lab., University of California, Los Angeles (1970).27. P. C. Jennings, R. B. Matthiesen and J. B. Hoerner, `Forced vibration of a 22-storey frame building', Earthquake Eng.
Res. Lab., California Institute of Technology, Pasadena and Earthquake Eng. and Struct. Lab., University of California,Los Angeles (1971).
28. J. H. Kuroiwa, `Vibration test of a multistorey building', Earthquake Eng. Res. Lab., California Institute of Technology,Pasadena (1967).
29. J. W. Cooley and J. W. Tukey, `An algorithm for the machine calculation of complex Fourier series', Math. of Comp.19, 297-301 (1965).
30. J. B. Hoerner and P. C. Jennings, `Modal interference in vibration tests', J. Engng Mech. Div., Proc. Am. Soc. civ. Engrs,95, EM4, 827-839 (1969).
31. J. W. S. Rayleigh, The Theory of Sound, Macmillan, 1937.32. T. K. Caughey, `Classical normal modes in damped linear systems', J. appl. Mech. 27, 269-271 (1960).33. J. B. Hoerner, `Modal coupling and earthquake response of tall buildings', Earthquake Eng. Res. Lab., California
Institute of Technology, Pasadena (1971).34. P. C. Jennings, R. B. Matthieson and J. B. Hoerner, `Forced vibration of a tall steel frame building', Int. J. Earthquake
Engng Struct. Dyn., 1, 107-132 (1972).