in vivo absorption spectra of the two stable states of the euglena photoreceptor photocycle
TRANSCRIPT

In Vivo Absorption Spectra of the Two Stable States of the EuglenaPhotoreceptor Photocycle
Laura Barsanti1, Primo Coltelli2, Valtere Evangelista1, Vincenzo Passarelli1, Anna Maria Frassanito1,Nicoletta Vesentini3, Fabrizio Santoro4 and Paolo Gualtieri*1
1Istituto di Biofisica, Pisa, Italy2Istituto Scienza Tecnologia Informazione, Pisa, Italy3Istituto Fisiologia Clinica, Pisa, Italy4Istituto per i Processi Chimico-Fisici, Pisa, Italy
Received 7 April 2008, accepted 11 July 2008, DOI: 10.1111 ⁄ j.1751-1097.2007.00438.x
ABSTRACT
Euglena gracilis possesses a simple but sophisticated light
detecting system, consisting of an eyespot formed by carotenoids
globules and a photoreceptor. The photoreceptor of Euglena is
characterized by optical bistability, with two stable states. In
order to provide important and discriminating information on the
series of structural changes that Euglena photoreceptive
protein(s) undergoes inside the photoreceptor in response to
light, we measured the in vivo absorption spectra of the two
stable states A and B of photoreceptor photocycle. Data were
collected using two different devices, i.e. a microspectrophoto-
meter and a digital microscope. Our results show that the
photocycle and the absorption spectra of the photoreceptor
possess strong spectroscopic similarities with a rhodopsin-like
protein. Moreover, the analysis of the absorption spectra of the
two stable states of the photoreceptor and the absorption
spectrum of the eyespot suggests an intriguing hypothesis for
the orientation of microalgae toward light.
INTRODUCTION
Euglena gracilis is a fresh water flagellated unicellular alga
used as a photobiology tool by laboratories around the worldsince the turn of the century. This organism possesses a simplebut sophisticated light detecting system, consisting of an
eyespot formed by carotenoid globules and a photoreceptor(1). The structure of the photoreceptor can be defined as asuper lattice made up of closely stacked protein-membranelamellae separated by an aqueous phase. Each lamella is an
ordered condensed phase complex of light-sensory proteins (2).In general, as the cell rotates while swimming, the eyespotcomes between the light source and the photoreceptor, thus
modulating the light that reaches it, and regulating the steeringof the locomotory flagellum.
As a rule, prokaryotic and eukaryotic light-sensory proteins
must be capable of cyclic photoregeneration, with identifiedintermediates. All the photoreceptive proteins characterized upto now posses this property from the Halobacterium sensory
rhodopsins (3,4) to human rhodopsin, which has the possibilityof photoreversal, but is commonly regenerated from separatedcomponents (5).
All light-sensory proteins are known to attain the final
signal transducing states through multiple meta-stable andstable intermediate states. The chromophores themselvesundergo conformational changes in multiple intermediate
states and promote structural changes in entire proteins. Thischange in conformation subsequently leads to the formation ofa signaling state of sufficient stability to communicate the
process of photon absorption to a downstream signal trans-duction partner. These intermediate states seem to be essentialfor efficient light-signal conversion.
The photoreceptor of Euglena possesses optical bistability,
with two stable states, i.e. state A, nonfluorescent, and state B,fluorescent. Upon photoexcitation at 365 nm state A generatesstate B, which can be photochemically driven back to state A,
upon illumination at 436 nm. The kinetics of the photocycle wasmeasured, digitizing at constant rate, the fluorescence images ofthe Euglena cell photoreceptor (6), as well as the emission
fluorescence spectrum of state B (7). Only the absorptionspectrum of the nonfluorescent state A of the photoreceptor wasmeasured. In 1989 Gualtieri et al. (8) and subsequently in 1992
James et al. (9) measured the absorption spectrum of a singleEuglena paraflagellar swelling. Due to the great similaritybetween these spectra and the absorption curve of a rhodopsinb-band, both research groups suggested a pigment such as a
rhodopsin-like protein as the photosystem in Euglena.However, the investigations so far performed on this
microalga led to conflicting results as regards the nature of
its photoreceptor protein(s). Barsanti et al. (10) isolated aphotoactive protein from the photoreceptor of Euglena with anabsorption maximum at 515 nm, and a spectroscopic behavior
similar to that of the photoreceptor. They also extractedretinal from a photoreceptor preparation (11). They reportedthat the protein was a 27 kDa protein with a photocycle
resembling that of the Euglena photoreceptor, with at least onestable intermediate. However, Iseki et al. (12) biochemicallycharacterized a new type of blue light receptor flavoprotein, aphotoactivated adenyl cyclase (PAC), in the photoreceptor
organelle of the same algae. These authors reported thatthe protein, with a molecular mass of 400 000 and flavinadenine dinucleotide (FAD) as prosthetic group, is the major
*Corresponding author email: [email protected] (Paolo Gualtieri)� 2008TheAuthors. JournalCompilation.TheAmericanSociety ofPhotobiology 0031-8655/09
Photochemistry and Photobiology, 2009, 85: 304–312
304
constituent of the Euglena photoreceptor. The PAC fluores-cence under native condition was extremely weak, as thefluorescence of the protein-bound flavin was quenched by thesurrounding protein matrix (12). In the authors’ opinion,
the PAC acts as photoreceptor for the step-up photophobicresponse (transition from dark to light), but it is not involvedin the step-down photophobic response (transition from light
to dark). PAC noncovalently binds FAD, and is composed oftwo subunits similar to each other, containing two flavinbinding domains, F1 and F2, each followed by an adenylyl
cyclase catalytic domain, C1 and C2, respectively. F1 and F2in the PAC subunits are similar to the N-terminal region of theflavoprotein AppA from the purple photosynthetic bacterium
Rhodobacter sphaeroides (13). AppA was recently shown toact as a photoreceptor for blue light-dependent repression ofphotosynthesis genes (14). Analyzing similar sequences ondatabases, Gomelsky and Klug (15) suggested that these
domains may represent a new flavin binding fold and termedthem BLUF (sensors of blue light using FAD). Except for thecase of PAC in E. gracilis, BLUF domains have been found
only in bacteria. Recently the photocycle of a BLUF domainwas measured in the Cyanobacteria Synechocystis sp., andThermosynechococcus elongatus. All these BLUF sensors
exhibit a 10 nm redshift of the absorption spectrum of flavinupon blue light absorption. The heterologously expressed andassembled flavoprotein is reported as possessing a similarphotocycle (16).
In order to provide important and discriminating informa-tion on the series of structural changes that Euglena photo-receptive protein(s) undergoes inside the photoreceptor in
response to light, we measured the in vivo absorption spectra ofthe two stable states A and B of the photoreceptor photocycle.Data were collected using two different devices, i.e. a micro-
spectrophotometer and a digital microscope. The first deviceconsists of a microscope equipped with a continuous motor-ized filter monochromator and a photomultiplier, which
performs the absorption measurements in vivo directly on thephotoreceptor. The second device consists of a microscopeequipped with a digital camera and a software workstation,which allow the calculation of integrated optical density of
photoreceptor images acquired at selected wavelength. Bothtechniques achieved superimposable spectra, with a majorpeak in the stable state A at 498 nm, and a major peak in the
stable state B at 462 nm, with a blueshift of 36 nm.Our results show that the photocycle and the absorption
spectra of the photoreceptor have no similarities with the
spectroscopic features of the blue light receptor flavoproteincharacterized by Iseki et al. (12), while possessing strongspectroscopic similarities with a rhodopsin-like protein. More-over, the analysis of the absorption spectra of the two stable
states of the photoreceptor and the absorption spectrum of theeyespot suggests an intriguing hypothesis for the orientation ofmicroalgae toward light.
MATERIALS AND METHODS
Culture. Cells of E. gracilis strain Z (Sammlung Von AlgenKulturenGottingen, 1224–5 ⁄ 25) were grown axenically in autotrophicCramer-Myers medium (0.025 M)M) in sodium acetate (pH 6.8) (17),under constant temperature (24�C) and continuous illumination(2 · 102 lmol photons m)2 s)1).
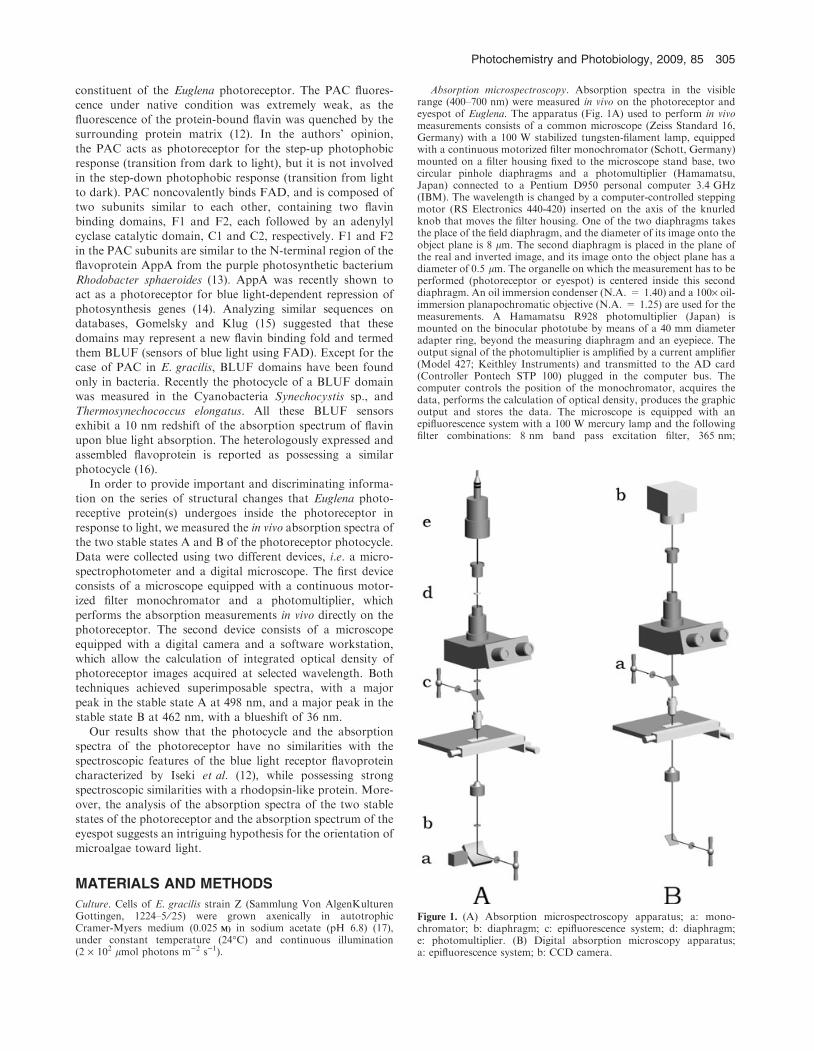
Absorption microspectroscopy. Absorption spectra in the visiblerange (400–700 nm) were measured in vivo on the photoreceptor andeyespot of Euglena. The apparatus (Fig. 1A) used to perform in vivomeasurements consists of a common microscope (Zeiss Standard 16,Germany) with a 100 W stabilized tungsten-filament lamp, equippedwith a continuous motorized filter monochromator (Schott, Germany)mounted on a filter housing fixed to the microscope stand base, twocircular pinhole diaphragms and a photomultiplier (Hamamatsu,Japan) connected to a Pentium D950 personal computer 3.4 GHz(IBM). The wavelength is changed by a computer-controlled steppingmotor (RS Electronics 440-420) inserted on the axis of the knurledknob that moves the filter housing. One of the two diaphragms takesthe place of the field diaphragm, and the diameter of its image onto theobject plane is 8 lm. The second diaphragm is placed in the plane ofthe real and inverted image, and its image onto the object plane has adiameter of 0.5 lm. The organelle on which the measurement has to beperformed (photoreceptor or eyespot) is centered inside this seconddiaphragm. An oil immersion condenser (N.A. = 1.40) and a 100· oil-immersion planapochromatic objective (N.A. = 1.25) are used for themeasurements. A Hamamatsu R928 photomultiplier (Japan) ismounted on the binocular phototube by means of a 40 mm diameteradapter ring, beyond the measuring diaphragm and an eyepiece. Theoutput signal of the photomultiplier is amplified by a current amplifier(Model 427; Keithley Instruments) and transmitted to the AD card(Controller Pontech STP 100) plugged in the computer bus. Thecomputer controls the position of the monochromator, acquires thedata, performs the calculation of optical density, produces the graphicoutput and stores the data. The microscope is equipped with anepifluorescence system with a 100 W mercury lamp and the followingfilter combinations: 8 nm band pass excitation filter, 365 nm;
Figure 1. (A) Absorption microspectroscopy apparatus; a: mono-chromator; b: diaphragm; c: epifluorescence system; d: diaphragm;e: photomultiplier. (B) Digital absorption microscopy apparatus;a: epifluorescence system; b: CCD camera.
Photochemistry and Photobiology, 2009, 85 305
chromatic beam splitter, 395 nm; barrier filter, 397 nm; 8 nm bandpass excitation filter, 436 nm; chromatic beam splitter, 460 nm; barrierfilter, 470 nm; 12 nm band pass excitation filter, 546 nm; a chromaticbeam splitter, 580 nm; a barrier filter, 590 nm. Eight seconds ofillumination at the selected wavelengths was used to drive thetransitions between the states.
All absorption spectra were recorded from 400 to 700 nm, with astep size of 5 nm and scan speed of 100 nm s)1. For each wavelength10 000 values of optical density were averaged. Measurements wereperformed on 20 different photoreceptors. For a detailed descriptionof the microspectrophotometric methodology, refer to Barsanti et al.(2007) (18).
Image analysis and digital absorption microscopy. The apparatus(Fig. 1B) used to perform in vivo measurements consists of a ZeissAxioplan microscope (Zeiss), with a 100 W stabilized tungsten-filament lamp, a 100· (N.A. 1.3) planapochromatic objective. Adigital CCD camera (Basler A312f; Basler, Germany) equipped withan IEEE 1394 interface was mounted in the TV microscope paths.
One-inch interferential filters (10 nm bandwidth) (Balzers, Ger-many) at 401, 409, 428, 440, 455, 470, 499, 520, 531, 549, 570 and598 nm were used to acquire quasi monochromatic images. For eachacquisition, the corresponding filter was placed in the illuminationpathway of the microscope. After monochromatic image acquisitionthe photoreceptor inside the cell and the background are detectedusing an automatic segmentation procedure based on an adaptivethresholding and region-growing algorithms (19). The average absor-bance value of the pixels and the integrated absorbance were calculatedon the region detected as photoreceptor. The microscope is equippedwith an epifluorescence system with a 100 W mercury lamp, and thefollowing filter combinations: 8 nm band pass excitation filter, 365 nm;chromatic beam splitter, 395 nm; barrier filter, 397 nm; 8 nm bandpass excitation filter, 436 nm; chromatic beam splitter, 460 nm; barrierfilter, 470 nm; 2 nm band pass excitation filter, 546 nm; a chromaticbeam splitter, 580 nm; a barrier filter, 590 nm. For image processing,Matrox Inspector 8.0 software was used (Matrox, Canada). Measure-ments were performed on 20 different photoreceptors.
Photography. Fluorescence photographs were recorded with anOlympus Camedia C-30303 digital camera (Olympus, Japan) mountedon the Zeiss Axioplan microscope.
RESULTS
The absorption spectra of the two stable states of Euglena
photoreceptors, state A (nonfluorescent) and state B (fluores-cent), were measured by means of both a microspectro-photometer and a digital microscope.
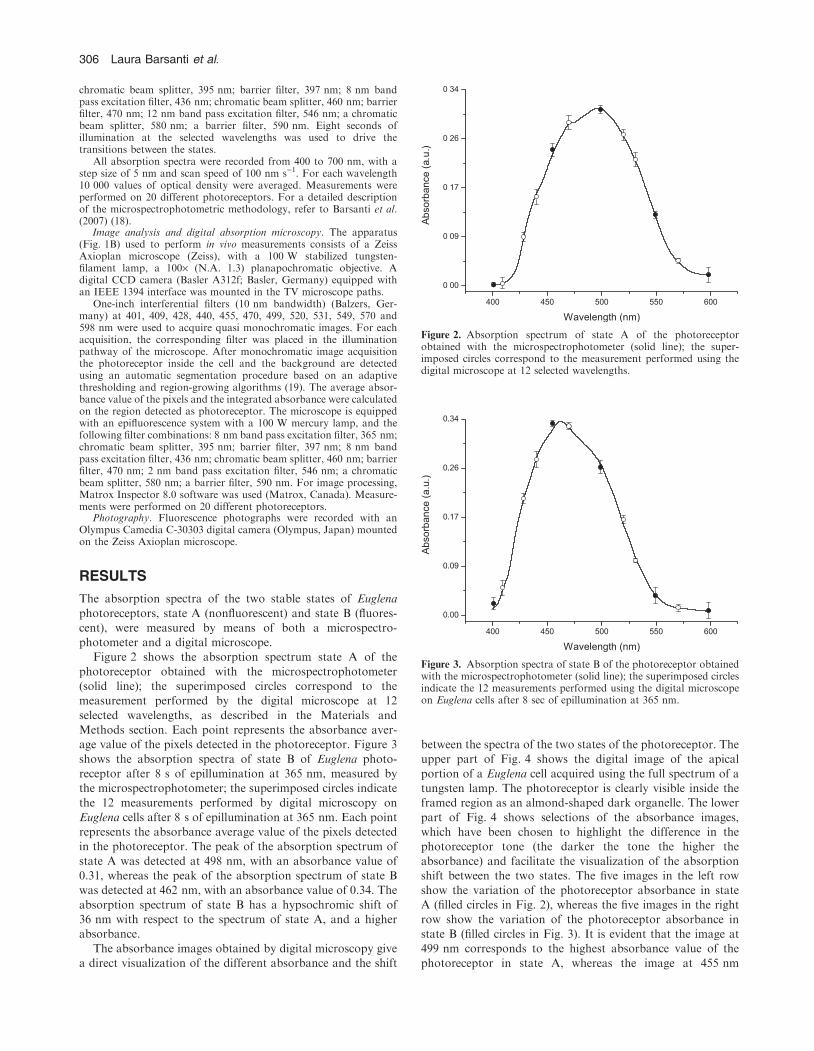
Figure 2 shows the absorption spectrum state A of the
photoreceptor obtained with the microspectrophotometer(solid line); the superimposed circles correspond to themeasurement performed by the digital microscope at 12
selected wavelengths, as described in the Materials andMethods section. Each point represents the absorbance aver-age value of the pixels detected in the photoreceptor. Figure 3
shows the absorption spectra of state B of Euglena photo-receptor after 8 s of epillumination at 365 nm, measured bythe microspectrophotometer; the superimposed circles indicate
the 12 measurements performed by digital microscopy onEuglena cells after 8 s of epillumination at 365 nm. Each pointrepresents the absorbance average value of the pixels detectedin the photoreceptor. The peak of the absorption spectrum of
state A was detected at 498 nm, with an absorbance value of0.31, whereas the peak of the absorption spectrum of state Bwas detected at 462 nm, with an absorbance value of 0.34. The
absorption spectrum of state B has a hypsochromic shift of36 nm with respect to the spectrum of state A, and a higherabsorbance.
The absorbance images obtained by digital microscopy givea direct visualization of the different absorbance and the shift
between the spectra of the two states of the photoreceptor. Theupper part of Fig. 4 shows the digital image of the apical
portion of a Euglena cell acquired using the full spectrum of atungsten lamp. The photoreceptor is clearly visible inside theframed region as an almond-shaped dark organelle. The lower
part of Fig. 4 shows selections of the absorbance images,which have been chosen to highlight the difference in thephotoreceptor tone (the darker the tone the higher the
absorbance) and facilitate the visualization of the absorptionshift between the two states. The five images in the left rowshow the variation of the photoreceptor absorbance in stateA (filled circles in Fig. 2), whereas the five images in the right
row show the variation of the photoreceptor absorbance instate B (filled circles in Fig. 3). It is evident that the image at499 nm corresponds to the highest absorbance value of the
photoreceptor in state A, whereas the image at 455 nm
Figure 2. Absorption spectrum of state A of the photoreceptorobtained with the microspectrophotometer (solid line); the super-imposed circles correspond to the measurement performed using thedigital microscope at 12 selected wavelengths.
Figure 3. Absorption spectra of state B of the photoreceptor obtainedwith the microspectrophotometer (solid line); the superimposed circlesindicate the 12 measurements performed using the digital microscopeon Euglena cells after 8 sec of epillumination at 365 nm.
306 Laura Barsanti et al.
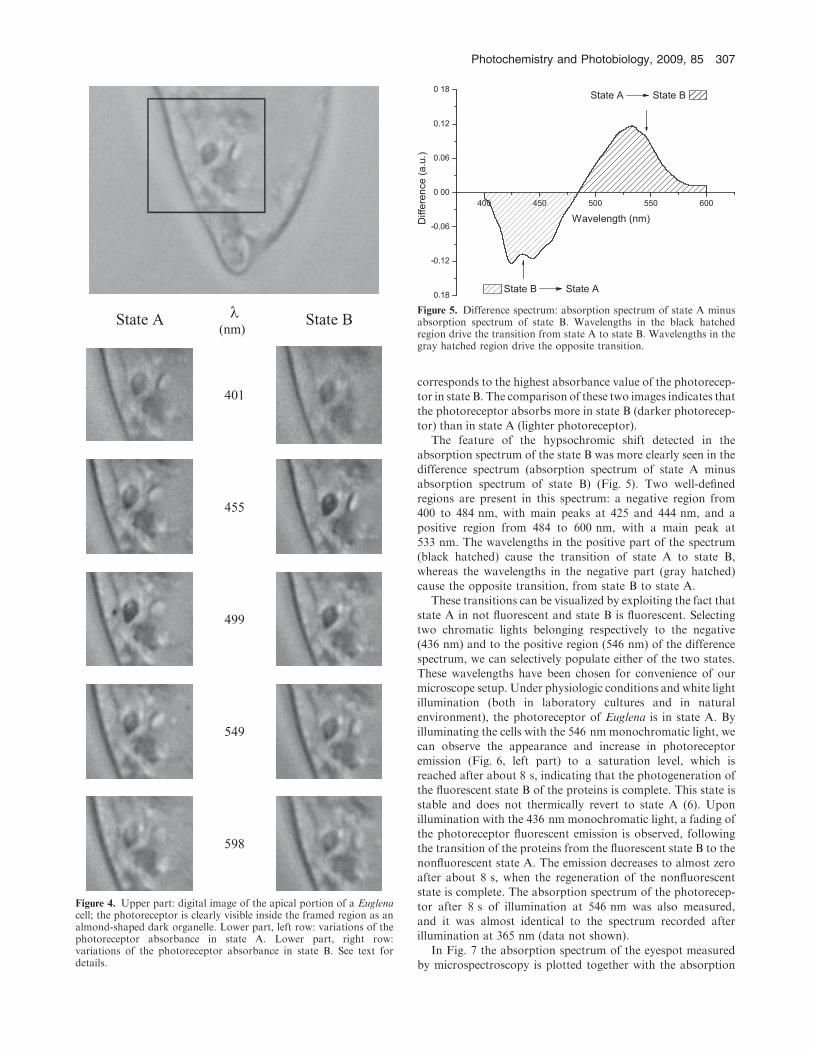
corresponds to the highest absorbance value of the photorecep-tor in state B. The comparison of these two images indicates thatthe photoreceptor absorbs more in state B (darker photorecep-
tor) than in state A (lighter photoreceptor).The feature of the hypsochromic shift detected in the
absorption spectrum of the state B was more clearly seen in the
difference spectrum (absorption spectrum of state A minusabsorption spectrum of state B) (Fig. 5). Two well-definedregions are present in this spectrum: a negative region from400 to 484 nm, with main peaks at 425 and 444 nm, and a
positive region from 484 to 600 nm, with a main peak at533 nm. The wavelengths in the positive part of the spectrum(black hatched) cause the transition of state A to state B,
whereas the wavelengths in the negative part (gray hatched)cause the opposite transition, from state B to state A.
These transitions can be visualized by exploiting the fact that
state A in not fluorescent and state B is fluorescent. Selectingtwo chromatic lights belonging respectively to the negative(436 nm) and to the positive region (546 nm) of the difference
spectrum, we can selectively populate either of the two states.These wavelengths have been chosen for convenience of ourmicroscope setup. Under physiologic conditions and white lightillumination (both in laboratory cultures and in natural
environment), the photoreceptor of Euglena is in state A. Byilluminating the cells with the 546 nm monochromatic light, wecan observe the appearance and increase in photoreceptor
emission (Fig. 6, left part) to a saturation level, which isreached after about 8 s, indicating that the photogeneration ofthe fluorescent state B of the proteins is complete. This state is
stable and does not thermically revert to state A (6). Uponillumination with the 436 nm monochromatic light, a fading ofthe photoreceptor fluorescent emission is observed, followingthe transition of the proteins from the fluorescent state B to the
nonfluorescent state A. The emission decreases to almost zeroafter about 8 s, when the regeneration of the nonfluorescentstate is complete. The absorption spectrum of the photorecep-
tor after 8 s of illumination at 546 nm was also measured,and it was almost identical to the spectrum recorded afterillumination at 365 nm (data not shown).
In Fig. 7 the absorption spectrum of the eyespot measuredby microspectroscopy is plotted together with the absorption
Figure 5. Difference spectrum: absorption spectrum of state A minusabsorption spectrum of state B. Wavelengths in the black hatchedregion drive the transition from state A to state B. Wavelengths in thegray hatched region drive the opposite transition.
Figure 4. Upper part: digital image of the apical portion of a Euglenacell; the photoreceptor is clearly visible inside the framed region as analmond-shaped dark organelle. Lower part, left row: variations of thephotoreceptor absorbance in state A. Lower part, right row:variations of the photoreceptor absorbance in state B. See text fordetails.
Photochemistry and Photobiology, 2009, 85 307

spectra of the two stable states of the photoreceptor proteins.The eyespot absorption spectrum perfectly matches the spec-
trum of state B.
DISCUSSION
The results of the present measurements performed with twodifferent techniques (microspectrophotometry and digitalabsorption microscopy) together with those previously
reported (6,7) give a detailed picture of the photochromicityof the paraflagellar swelling of Euglena. This organellepossesses a photocycle, with two stable states, state A
nonfluorescent, and state B fluorescent. The two states are
thermally stable and are readily interconvertible by light.
Consequently, the proportion of these two states inside thephotoreceptor protein pool can be varied in photosteady-statemixtures by irradiation at appropriate wavelengths.
The absorption spectrum of the nonfluorescent state A ofthe photoreceptor proteins has a band centered at 498 nm(Fig. 2) and can be superimposed on the in vivo absorption
spectrum recorded on an isolated photoreceptor by our group(8) and also on the spectrum recorded by James’s group on thereservoir region of Euglena (9), indicating a rhodopsin-likenature of the photoreceptor pigment. The absorption spectrum
of the fluorescent state B has a band centered at 462 (Fig. 3),indicating a 36 nm blueshift with respect to the spectrum ofstate A. The blueshift of state B and its higher absorbance with
respect to state A are clearly visualized by the digitalmicroscopy measurements (Fig. 4). The fluorescence spectrumof state B shows a band centered at 556–560 nm after
excitation with the selected microscope filter (7). Moreover,the fluorescence of the protein in state B allows us to visualizethe selective and exclusive photogeneration of the two states
(Fig. 6) using for example the two wavelengths, i.e. 436 and546 nm, of highest spectral energy of the high-pressuremercury lamp of our microscopic setup. For completenesswe should say that a positive UV region (not shown in Fig. 5)
could be added to this difference spectrum. We previouslyreported that 365 nm light drives the transition between stateA and state B (6), though we could not directly measure of the
absorption spectra of the two stable states in that regionbecause in vivo UV microspectroscopy is a very sophisticatedtechnique that necessitates an extremely complex instrumental
setup, not available in our laboratory. Here, we show againthis transition as it occurs in Euglena (Fig. 8A); and to stressthe fact that the two-stable photoproducts of this photocycleare a common feature of euglenoids, or at least of those
possessing a crystalline photoreceptor, we show the same
Figure 6. Transition between the two stable states of the photoreceptor: the 546 nm light drives the transition between state A and state B, theemission of the photoreceptor increases from zero to a maximum, following the photogeneration of the fluorescent state B, which is complete after8 s. Under the 436 nm light, the opposite transition from state B to state A occurs, the emission decreases following the regeneration of thenonfluorescent state, which is complete in about 8 s.
Figure 7. The absorption spectrum of the eyespot measured bymicrospectroscopy (dotted line) plotted together with the absorptionspectra of state A (black line) and state B (gray line). The eyespotabsorption spectrum perfectly matches the spectrum of state B.
308 Laura Barsanti et al.
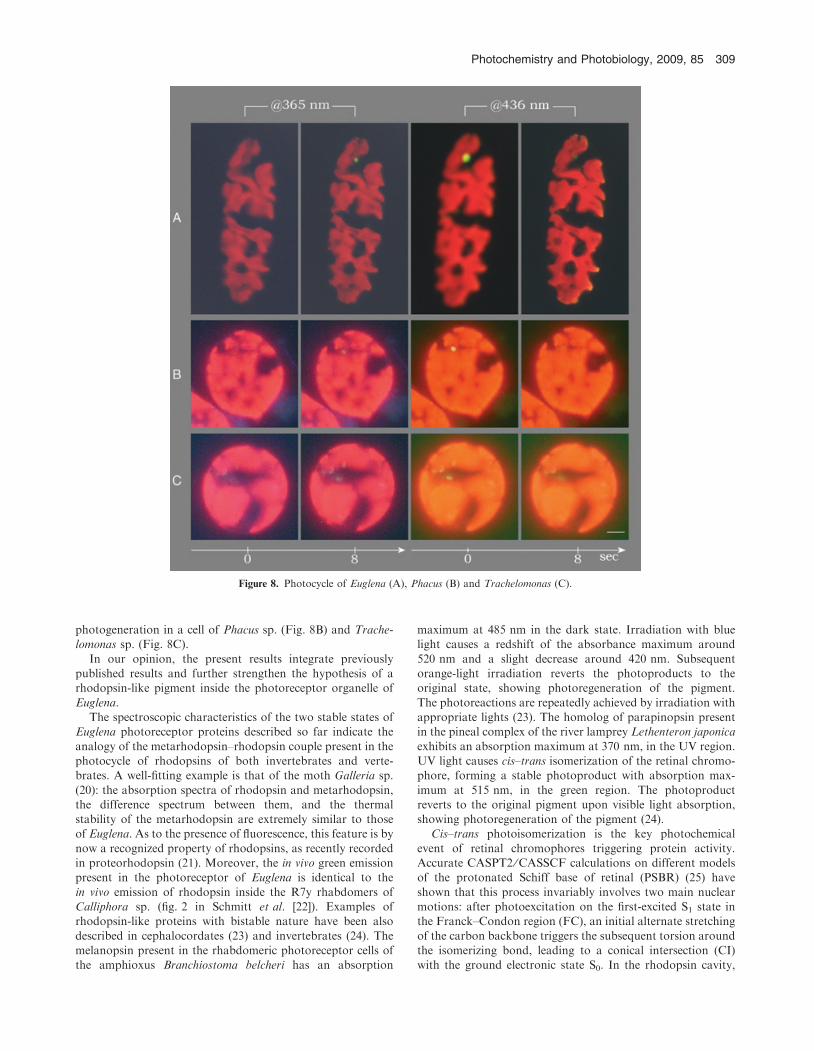
photogeneration in a cell of Phacus sp. (Fig. 8B) and Trache-lomonas sp. (Fig. 8C).
In our opinion, the present results integrate previouslypublished results and further strengthen the hypothesis of arhodopsin-like pigment inside the photoreceptor organelle of
Euglena.The spectroscopic characteristics of the two stable states of
Euglena photoreceptor proteins described so far indicate the
analogy of the metarhodopsin–rhodopsin couple present in thephotocycle of rhodopsins of both invertebrates and verte-brates. A well-fitting example is that of the moth Galleria sp.
(20): the absorption spectra of rhodopsin and metarhodopsin,the difference spectrum between them, and the thermalstability of the metarhodopsin are extremely similar to thoseof Euglena. As to the presence of fluorescence, this feature is by
now a recognized property of rhodopsins, as recently recordedin proteorhodopsin (21). Moreover, the in vivo green emissionpresent in the photoreceptor of Euglena is identical to the
in vivo emission of rhodopsin inside the R7y rhabdomers ofCalliphora sp. (fig. 2 in Schmitt et al. [22]). Examples ofrhodopsin-like proteins with bistable nature have been also
described in cephalocordates (23) and invertebrates (24). Themelanopsin present in the rhabdomeric photoreceptor cells ofthe amphioxus Branchiostoma belcheri has an absorption
maximum at 485 nm in the dark state. Irradiation with bluelight causes a redshift of the absorbance maximum around
520 nm and a slight decrease around 420 nm. Subsequentorange-light irradiation reverts the photoproducts to theoriginal state, showing photoregeneration of the pigment.
The photoreactions are repeatedly achieved by irradiation withappropriate lights (23). The homolog of parapinopsin presentin the pineal complex of the river lamprey Lethenteron japonica
exhibits an absorption maximum at 370 nm, in the UV region.UV light causes cis–trans isomerization of the retinal chromo-phore, forming a stable photoproduct with absorption max-
imum at 515 nm, in the green region. The photoproductreverts to the original pigment upon visible light absorption,showing photoregeneration of the pigment (24).
Cis–trans photoisomerization is the key photochemical
event of retinal chromophores triggering protein activity.Accurate CASPT2 ⁄CASSCF calculations on different modelsof the protonated Schiff base of retinal (PSBR) (25) have
shown that this process invariably involves two main nuclearmotions: after photoexcitation on the first-excited S1 state inthe Franck–Condon region (FC), an initial alternate stretching
of the carbon backbone triggers the subsequent torsion aroundthe isomerizing bond, leading to a conical intersection (CI)with the ground electronic state S0. In the rhodopsin cavity,
Figure 8. Photocycle of Euglena (A), Phacus (B) and Trachelomonas (C).
Photochemistry and Photobiology, 2009, 85 309
the torsion is actually coupled to other degrees of freedom togive rise to a more complex space-saving crankshaft motion(26). The S1 ⁄ S0 CI is actually a multidimensional intersectionspace involving also other nuclear coordinates, but its mini-
mum is encountered for �90� values of the torsion where othercoordinates beyond the torsion and the stretching are close totheir FC values (27). At the CI the system returns back to S0,
giving rise to a branched reaction with the possibility ofrecovering the initial reactant cis–trans isomer or reaching theproduct arrangement. The efficiency and selectivity of the
photoreaction are deeply affected by the environment, beingdifferent in the protein (28,29) and ⁄or in solvents of differentpolarity (30). Local minima and energy barriers along the S1minimum energy path (MEP) that connect the FC region tothe CI have been documented by accurate calculations forPSBR in rhodopsin (26); the existence of local minima lyingaway from the MEP, but easily reached from FC, has also
been postulated to explain the primary events of the photo-cycle in proteorhodopsin (21).
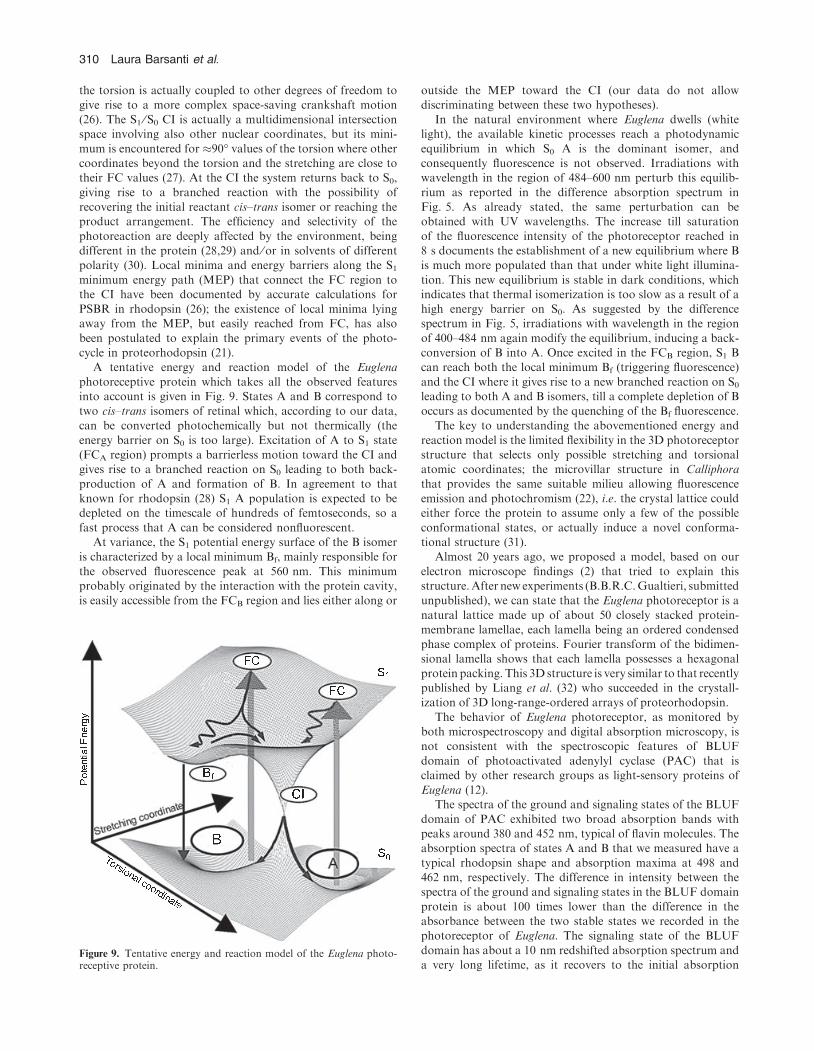
A tentative energy and reaction model of the Euglena
photoreceptive protein which takes all the observed featuresinto account is given in Fig. 9. States A and B correspond totwo cis–trans isomers of retinal which, according to our data,
can be converted photochemically but not thermically (theenergy barrier on S0 is too large). Excitation of A to S1 state(FCA region) prompts a barrierless motion toward the CI andgives rise to a branched reaction on S0 leading to both back-
production of A and formation of B. In agreement to thatknown for rhodopsin (28) S1 A population is expected to bedepleted on the timescale of hundreds of femtoseconds, so a
fast process that A can be considered nonfluorescent.At variance, the S1 potential energy surface of the B isomer
is characterized by a local minimum Bf, mainly responsible for
the observed fluorescence peak at 560 nm. This minimumprobably originated by the interaction with the protein cavity,is easily accessible from the FCB region and lies either along or
outside the MEP toward the CI (our data do not allowdiscriminating between these two hypotheses).
In the natural environment where Euglena dwells (whitelight), the available kinetic processes reach a photodynamic
equilibrium in which S0 A is the dominant isomer, andconsequently fluorescence is not observed. Irradiations withwavelength in the region of 484–600 nm perturb this equilib-
rium as reported in the difference absorption spectrum inFig. 5. As already stated, the same perturbation can beobtained with UV wavelengths. The increase till saturation
of the fluorescence intensity of the photoreceptor reached in8 s documents the establishment of a new equilibrium where Bis much more populated than that under white light illumina-
tion. This new equilibrium is stable in dark conditions, whichindicates that thermal isomerization is too slow as a result of ahigh energy barrier on S0. As suggested by the differencespectrum in Fig. 5, irradiations with wavelength in the region
of 400–484 nm again modify the equilibrium, inducing a back-conversion of B into A. Once excited in the FCB region, S1 Bcan reach both the local minimum Bf (triggering fluorescence)
and the CI where it gives rise to a new branched reaction on S0leading to both A and B isomers, till a complete depletion of Boccurs as documented by the quenching of the Bf fluorescence.
The key to understanding the abovementioned energy andreaction model is the limited flexibility in the 3D photoreceptorstructure that selects only possible stretching and torsionalatomic coordinates; the microvillar structure in Calliphora
that provides the same suitable milieu allowing fluorescenceemission and photochromism (22), i.e. the crystal lattice couldeither force the protein to assume only a few of the possible
conformational states, or actually induce a novel conforma-tional structure (31).
Almost 20 years ago, we proposed a model, based on our
electron microscope findings (2) that tried to explain thisstructure.After newexperiments (B.B.R.C.Gualtieri, submittedunpublished), we can state that the Euglena photoreceptor is a
natural lattice made up of about 50 closely stacked protein-membrane lamellae, each lamella being an ordered condensedphase complex of proteins. Fourier transform of the bidimen-sional lamella shows that each lamella possesses a hexagonal
protein packing. This 3D structure is very similar to that recentlypublished by Liang et al. (32) who succeeded in the crystall-ization of 3D long-range-ordered arrays of proteorhodopsin.
The behavior of Euglena photoreceptor, as monitored byboth microspectroscopy and digital absorption microscopy, isnot consistent with the spectroscopic features of BLUF
domain of photoactivated adenylyl cyclase (PAC) that isclaimed by other research groups as light-sensory proteins ofEuglena (12).
The spectra of the ground and signaling states of the BLUF
domain of PAC exhibited two broad absorption bands withpeaks around 380 and 452 nm, typical of flavin molecules. Theabsorption spectra of states A and B that we measured have a
typical rhodopsin shape and absorption maxima at 498 and462 nm, respectively. The difference in intensity between thespectra of the ground and signaling states in the BLUF domain
protein is about 100 times lower than the difference in theabsorbance between the two stable states we recorded in thephotoreceptor of Euglena. The signaling state of the BLUF
domain has about a 10 nm redshifted absorption spectrum anda very long lifetime, as it recovers to the initial absorption
Figure 9. Tentative energy and reaction model of the Euglena photo-receptive protein.
310 Laura Barsanti et al.
behavior in the subsequent dark adaptation in about 900 s(33). In our case the spectrum of the photogenerated state B is36 nm blueshifted and the whole photoreceptor recovers to theinitial absorption behavior in about 8 s. The transition
between the two stable states A and B of the Euglenaphotoreceptor photocycle is driven by selected wavelengthsas reported in Fig. 5, unlike that of BLUF, which depends
upon an on–off mechanism of blue light. The transitions in theEuglena photoreceptor can be repeated many times (6).
Above all evidence, two points are worthy of men-
tion—first, only a feeble fluorescent emission is reported inthe BLUF protein found in Euglena by Iseki et al. (12). Inorder to see a fluorescent signal the protein has to be denatured
by boiling. On the contrary the emission intensity of theEuglena photoreceptor when the photoreceptive proteins are instate B is strong and clearly visible (Figs. 6 and 8) (7); second,the 546 nm light that we used for the photoregeneration of the
fluorescent state B as reported in Fig. 6 is not a wavelengthabsorbed by BLUF proteins neither in the ground nor in thesignaling state. However, our data do not exclude the presence
of a PAC in the Euglena photoreceptor, but indicate that thephotoreceptive mechanism is based on a rhodopsin-likeprotein. The analysis of the spectra of the two states A and
B and that of the eyespot effectively describes the functioningof Euglena orientation.
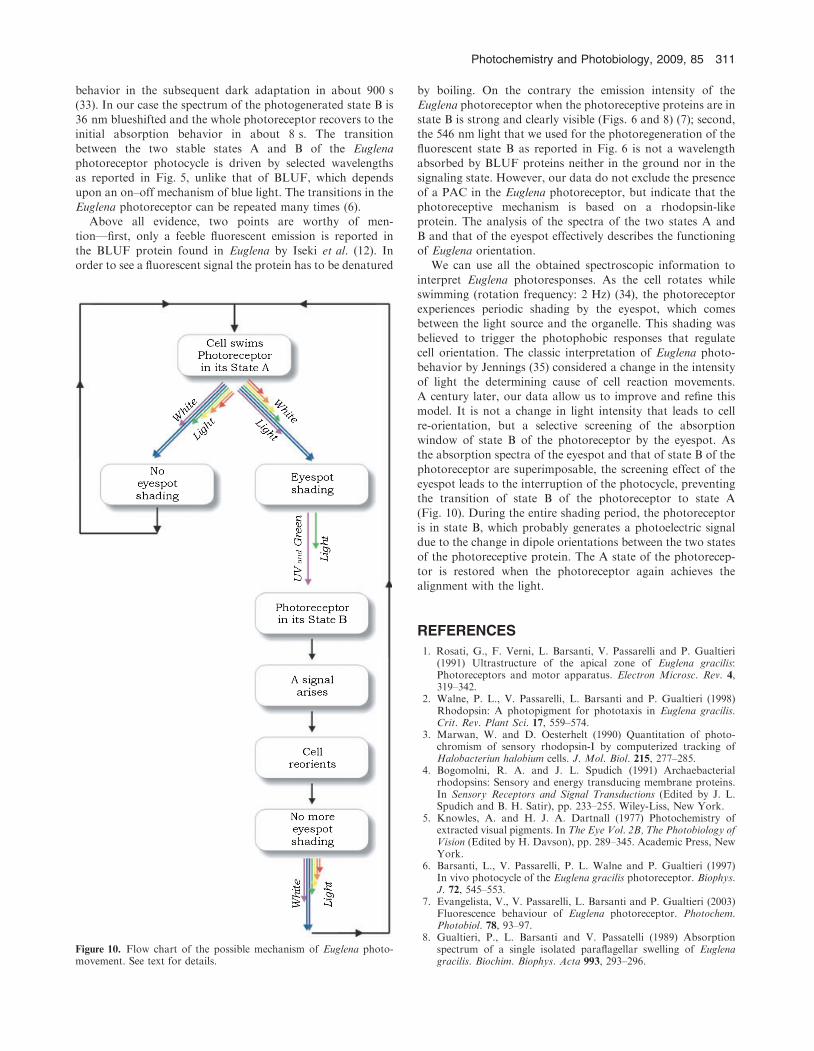
We can use all the obtained spectroscopic information to
interpret Euglena photoresponses. As the cell rotates whileswimming (rotation frequency: 2 Hz) (34), the photoreceptorexperiences periodic shading by the eyespot, which comesbetween the light source and the organelle. This shading was
believed to trigger the photophobic responses that regulatecell orientation. The classic interpretation of Euglena photo-behavior by Jennings (35) considered a change in the intensity
of light the determining cause of cell reaction movements.A century later, our data allow us to improve and refine thismodel. It is not a change in light intensity that leads to cell
re-orientation, but a selective screening of the absorptionwindow of state B of the photoreceptor by the eyespot. Asthe absorption spectra of the eyespot and that of state B of thephotoreceptor are superimposable, the screening effect of the
eyespot leads to the interruption of the photocycle, preventingthe transition of state B of the photoreceptor to state A(Fig. 10). During the entire shading period, the photoreceptor
is in state B, which probably generates a photoelectric signaldue to the change in dipole orientations between the two statesof the photoreceptive protein. The A state of the photorecep-
tor is restored when the photoreceptor again achieves thealignment with the light.
REFERENCES
1. Rosati, G., F. Verni, L. Barsanti, V. Passarelli and P. Gualtieri(1991) Ultrastructure of the apical zone of Euglena gracilis:Photoreceptors and motor apparatus. Electron Microsc. Rev. 4,319–342.
2. Walne, P. L., V. Passarelli, L. Barsanti and P. Gualtieri (1998)Rhodopsin: A photopigment for phototaxis in Euglena gracilis.Crit. Rev. Plant Sci. 17, 559–574.
3. Marwan, W. and D. Oesterhelt (1990) Quantitation of photo-chromism of sensory rhodopsin-I by computerized tracking ofHalobacteriun halobium cells. J. Mol. Biol. 215, 277–285.
4. Bogomolni, R. A. and J. L. Spudich (1991) Archaebacterialrhodopsins: Sensory and energy transducing membrane proteins.In Sensory Receptors and Signal Transductions (Edited by J. L.Spudich and B. H. Satir), pp. 233–255. Wiley-Liss, New York.
5. Knowles, A. and H. J. A. Dartnall (1977) Photochemistry ofextracted visual pigments. In The Eye Vol. 2B, The Photobiology ofVision (Edited by H. Davson), pp. 289–345. Academic Press, NewYork.
6. Barsanti, L., V. Passarelli, P. L. Walne and P. Gualtieri (1997)In vivo photocycle of the Euglena gracilis photoreceptor. Biophys.J. 72, 545–553.
7. Evangelista, V., V. Passarelli, L. Barsanti and P. Gualtieri (2003)Fluorescence behaviour of Euglena photoreceptor. Photochem.Photobiol. 78, 93–97.
8. Gualtieri, P., L. Barsanti and V. Passatelli (1989) Absorptionspectrum of a single isolated paraflagellar swelling of Euglenagracilis. Biochim. Biophys. Acta 993, 293–296.
Figure 10. Flow chart of the possible mechanism of Euglena photo-movement. See text for details.
Photochemistry and Photobiology, 2009, 85 311
9. James, T. W., F. Crescitelli, E. R. Loew and W. N. McFarland(1992) The eyespot of Euglena gracilis: A microspectrophotomet-ric study. Vision Res. 9, 1583–1591.
10. Barsanti, L., V. Passarelli, P. L. Walne and P. Gualtieri (2000) Thephotoreceptor protein of Euglena gracilis. FEBS Lett. 482, 247–251.
11. Gualtieri, P., P. Pelosi, V. Passarelli and L. Barsanti (1992)Identification of a rhodopsin photoreceptor in Euglena gracilis.Biochim. Biophys. Acta 1117, 55–59.
12. Iseki, M., S. Matsunaga, A. Murakami, K. Ohno, K. Shiga,K. Yoshida, M. Sugai, T. Takahashi, T. Hori and M. Watanabe(2002) A blue-light-activated adenylyl cyclase mediates photoa-voidance in Euglena gracilis. Nature 415, 1047–1051.
13. Masuda, S. and C. E. Bauer (2002) AppA is a blue light photo-receptor that antirepresses photosynthesis gene expression inRhodobacter sphaeroides. Cell 110, 613–623.
14. Han, Y., S. Braatsch, L. Osterloh and G. Klug (2004) A eukary-otic BLUF domain mediates light-dependent gene expression inthe purple bacterium Rhodobacter sphaeroides 2.4.1. Proc. NatlAcad. Sci. USA 101, 12306–12311.
15. Gomelsky, M. and G. Klug (2002) BLUF: A novel FAD-bindingdomain involved in sensory transduction in microorganisms.Trends Biochem. Sci. 27, 497–500.
16. Okajima, K., S. Yoshihara, Y. Fukushima, X. Geng,M. Katayama, S. Higashi, M. Watanabe, S. Sato, S. Tabata,Y. Shibata, S. Itoh and M. Ikeuchi (2005) Biochemicaland functional characterization of BLUF-type flavin-bindingproteins of two species of cyanobacteria. J. Biochem. 137, 741–750.
17. Cramer, M. and J. Myers (1952) Growth and photosyntheticcharacteristics of Euglena gracilis. Arch. Mikrobiol. 17, 384–402.
18. Barsanti, L., V. Evangelista, A. M. Frassanito, N. Vesentini,V. Passarelli and P. Gualtieri (2007) Absorption microscopy,theory and applications in the case of the photosynthetic com-partment. Micron 38, 197–213.
19. Gualtieri, P. and L. Barsanti (1987) Identification of cellular andsubcellular features by means of digital microscopy. Int. J.Biomed. Comp. 20, 79–86.
20. Goldman, L. J., S. N. Barnes and T. H. Goldsmith (1975)Microspectrophotometry of rhodopsin and metarhodopsin in themoth Galleria. J. Gen. Physiol. 66, 383–404.
21. Lenz, M. O., R. Huber, B. Schmidt, P. Gilch, R. Kalmbach,M. Engelhard and J. Wachtveitl (2006) First step of retinalphotoisomerization in proteorhodospin. Biophys. J. 91, 255–262.
22. Schmitt, A., A. Vogt, K. Friedmann, R. Paulsen and A. Huber(2005) Rhodopsin patterning in central photoreceptor cells of
the blowfly Calliphora vicina: Cloning and characterization ofCalliphora rhodopsins Rh3, Rh5 and Rh6. J. Exp. Biol. 208, 1247–1256.
23. Koyanagi, M., K. Kubokawa, H. Tsukamoto, Y. Shichida andA. Terakita (2005) Cephalocordate melanopsin: Evolutionarylinkage between invertebrate visual cells and vertebrate photo-sensitive retinal ganglion cells. Curr. Biol. 15, 1065–1069.
24. Koyanagi, M., E. Kawano, Y. Kinugawa, T. Oishi, Y. Shichida,S. Tamotsu and A. Terakita (2004) Bistable UV pigment in thelamprey pineal. Proc. Natl Acad. Sci. USA 101, 6687–6691.
25. Gonzales-Luque, R., M. Garavelli, F. Bernardi, M. Merchan,M. A. Robb and M. Olivucci (2000) Computational evidence infavour of a two-state-two-mode model of the retinal chromophorephotoisomerization. Proc. Natl Acad. Sci. USA 97, 9379–9384.
26. Frutos, L. M., T. Andruniow, F. Santoro, N. Ferre andM. Olivucci (2007) Tracking the excited state time evolution of thevisual pigment with multi-configurational quantum chemistry.Proc. Natl Acad. Sci. USA 104, 7764–7769.
27. Migani, A., M. A. Robb and M. Olivucci (2003) Relationshipbetween photo-isomerization path and intersection space in aretinal chromophore model. J. Am. Chem. Soc. 125, 2804–2808.
28. Schoenlein, R. W., L. A. Peteanu, R. A. Mathies and C. V. Shank(1991) The first step in vision: Femtosecond isomerization ofrhodopsin. Science 254, 412–415.
29. Gai, F., K. C. Hasson, J. C. McDonald and P. A. Anfinrud (1998)Chemical dynamics in proteins: The photoisomerization of retinalin bacteriorhodopsin. Science 279, 1886–1891.
30. Logunov, S. L., L. Song and M. A. El-Sayed (1996) Excited-statedynamics of a protonated retinal Schiff base in solution. J. Phys.Chem. 100, 18586–18591.
31. Gabellieri, E., G. B. Strambini and P. Gualtieri (1988) Tryptophanphosphorescence and the conformation of liver alcohol dehydro-genase in solution and in the crystalline state. Biophys. Chem. 30,61–67.
32. Liang, H., G. Whited, C. Nguyen and G. D. Stucky (2007) Thedirected cooperative assembly of proteorhodopsin into 2D and 3Dpolarized arrays. Proc. Natl Acad. Sci. USA 104, 8212–8217.
33. Van der Horst, M. A., W. Laan, S. Yeremenko, A. Wende,P. Palm, D. Oesterhelt and K. J. Hellingwerf (2005) From primaryphotochemistry to biological function in the blue-light photo-receptors PYP and Appa. Photochem. Photobiol. Sci. 4, 688–693.
34. Ascoli, C., M. Barbi, C. Frediani and A. Mure (1978) Measure-ment of Euglena motion parameters by laser light scattering.Biophys. J. 24, 585–599.
35. Jennings, H. S. (1906) Behaviour of Lower Organisms. ColumbiaUniversity Press, New York.
312 Laura Barsanti et al.