tuning of photoreceptor spectral sensitivity in fireflies (coleoptera: lampyridae
TRANSCRIPT
ORIGINAL PAPER
T. W. Cronin á M. JaÈ rvilehtoM. WeckstroÈ m á A. B. Lall
Tuning of photoreceptor spectral sensitivityin ®re¯ies (Coleoptera: Lampyridae)
Accepted: 29 September 1999
Abstract Sexual communication between male and fe-male ®re¯ies involves the visual detection of species-speci®c bioluminescent signals. Fire¯y species varyspectrally in both their emitted light and in the sensi-tivity of the eye, depending on the time when each isactive. Tuning of spectral sensitivity in three ®re¯yspecies that occupy di�erent photic niches wasinvestigated using light and electron microscopy,microspectrophotometry, and intracellular recording tocharacterize the location and spectral absorption of thescreening pigments that ®lter incoming light, the visualpigments that receive this ®ltered light, and the visualspectral sensitivity. Twilight-active species had similarpink screening pigments, but the visual pigment ofPhotinus pyralis peaked near 545 nm, while that ofP. scintillans had a kmax near 557 nm. The night-activePhoturis versicolor had a yellow screening pigment thatwas uniquely localized, while its visual pigment wassimilar to that of P. pyralis. These results show that bothscreening and visual pigments vary among species.Modeling of spectral tuning indicates that the combi-nation of screening and visual pigments found in theretina of each species provides the best possible match ofsensitivity to bioluminescent emission. This combinationalso produced model sensitivity spectra that closely
resemble sensitivities measured either with electrore-tinographic or intracellular techniques. Vision in bothspecies of Photinus appears to be evolutionarily tunedfor maximum discrimination of conspeci®c signals fromspectrally broader backgrounds. Ph. versicolor, on theother hand, appears to have a visual system that o�ers acompromise between maximum sensitivity to, andmaximum discrimination of, their signals.
Key words Spectral sensitivity á Filter á Fire¯y áCompound eye á Vision ecology
Introduction
Fire¯ies have provided one of the great success stories instudies of vision ecology. Males emit species-speci®cbioluminescent ¯ash sequences as they ¯y at dusk ornight, locating potential mates by detectingcharacteristic answering ¯ashes from females perched onvegetation. Twilight-active species tend to producelemon-yellow to yellow-orange ¯ashes, in contrast tonocturnal species which in general ¯ash lime-green (Lallet al. 1980; Seliger et al. 1982a). However, there is noevidence that ®re¯ies recognize or respond to the colorsof ¯ashes, only their patterns (Buck 1937; Worthy andLall 1996).
Seliger et al. (1982a, b) elegantly demonstrated thatthe emission spectra of the various ®re¯y species aree�ective under the photic conditions prevailing duringthe activity period of each species (see also Endler 1993).While the night-active species retain a green (andpresumably ancestral) emission (Seliger et al. 1982a),twilight-active species produce yellow ¯ashes. Visualspectral sensitivity in these latter species is narrow andpeaks in yellow region of the spectrum (Lall et al. 1988),which improves the detection of bioluminescent signalsagainst the foliage background. In these species, theemission spectra of their lanterns match their visualspectral sensitivity functions (Lall et al. 1980, 1988;Seliger et al. 1982a, b).
J Comp Physiol A (2000) 186: 1±12 Ó Springer-Verlag 2000
T.W. Cronin (&)Department of Biological Sciences,University of Maryland Baltimore County,Baltimore, MD 21250, USAe-mail: [email protected].:+358-410-455-3449; Fax: +358-410-455-3875
M. JaÈ rvilehtoDepartment of Biology, University of Oulu, Oulu, 90570 Finland
M. WeckstroÈ mDepartment of Physical Sciences and Department of Physiology,University of Oulu, Oulu, 90220 Finland
A.B. LallDepartment of Biology, Howard University, Washington,D.C. 20059, USA
Seliger et al. (1982a) proposed that among twilight-active ®re¯y species, the detection of the bioluminescentsignals could be improved by reducing the environ-mental noise (e.g., sunlight, skylight, and re¯ection fromgreen foliage) by long-pass ®ltering a middle-wavelengthrhodopsin with an appropriate photostable pigmentscreen lying on top of the retina. In the terminology usedby Seliger et al. (1982a), the evolutionary tuning of®re¯y visual sensitivity to their species-speci®c require-ments occurs via the `screening pigment pathway' ratherthan the `opsin pathway', whereby the spectral absorp-tion of visual pigments would be the tuned feature(Seliger et al. 1982a). If this is the case, all species of®re¯ies may have similar or identical visual pigments,and the variation in spectral sensitivity among species isachieved solely through selective ®ltering of the retinallayer by colored screening pigments. Such anevolutionary `choice' would not come cost-free, as ®l-tering poses a serious penalty in the form of reducedoverall sensitivity, and one might expect the visual pig-ments of twilight-active species to be placed at longerwavelengths, more closely matching their pigment ®lters.
We decided to characterize the visual pigments of twotwilight-active species Photinus scintillans (an orange-yellow ¯asher active early in the evening) and P. pyralis(which ¯ashes lemon-yellow, and is active later intwilight), and to compare them to a night-active,green-¯ashing species, Photuris versicolor. We were thusable to examine closely the question of whether ®lteringalone explains their spectral sensitivity functions. Our®ndings demonstrate that variation occurs in both visualand ®ltering pigments, providing su�cient ¯exibility tooptimize signal detection in all three species.
Materials and methods
Animals
Male specimens were collected by hand-netting at twilight andnight in the vicinity of Baltimore, Maryland. Species identi®cationwas made on the basis of the ¯ash pattern of these males. Theywere kept in jars and provided with paper soaked in honey waterfor food and humidi®cation until use.
Anatomical and histological preparation
Electron microscopy
Dark-adapted ®re¯ies were decapitated in ®xation solution (2%paraformaldehyde and 2.5% glutaraldehyde in 0.1 mol á l)1 phos-phate bu�er at pH 7.4), post®xed with 1% osmium tetroxide, de-hydrated and embedded in epon. The embedded blocks withspecimens were videographed to allow for proper orientation whenblocks were trimmed. Thin sections counterstained with 2% uranylacetate and lead citrate were examined by transmission electronmicroscope (JEOL TEM SCAN 100CXII, Japan).
Specimens for scanning electron microscopy were ®xed in thesame way to minimize tissue distortion. Standard techniques wereemployed for dehydration, critical point drying, and sputter coat-ing. To expose internal structure, some specimens were brokenopen before coating. A ®eld-emission scanning electron microscope(JEOL FESEM, Japan) was used to examine the samples.
Light microscopy
To determine the distribution of screening pigments in vivo, someocular material was examined and photographed in fresh-frozeneyes, prepared and sectioned identically as for microspectropho-tometry (MSP), which is described in the next section.
Microspectrophotometry
Procedure
Animals to be examined were dark-adapted overnight. Sampleswere prepared for MSP in dim red light. First, whole heads wereremoved from the dark-adapted specimens and quick-frozen usingcryogenic spray (Histofreeze 2000, Fisher Scienti®c, USA). Thesewere mounted in a cryostat maintained at )25 °C to )30 °C andsectioned at thicknesses of 10±14 lm. Sections were mounted ininsect Ringer's (Muri and Jones 1983) between coverslips, pro-tected by a ring of silicone grease, and placed in the microspec-trophotometer.
The single-beam instrument used for this project has been de-scribed in Cronin (1985) and Cronin and Forward (1988). Sampleswere scanned from 400 nm to 700 nm at 1-nm intervals, using acircular spot 5 lm in diameter. The sequence of scanning wastypically as follows: (1) scan the dark-adapted photoreceptor twotimes, using the second scan to check for stability of the prepara-tion; (2) treat with 15 s of bright-red light (passed through aCorning CS2±61 ®lter) to convert most of the photopigment to themetarhodopsin state; and (3) treat with 15 s of bright-blue light(Corning CS5±56) to partially reconvert the pigment to a mixtureof rhodopsin and metarhodopsin. In some cases, treatments (2) and(3) were repeated several times in sequence to test for photore-versibility of the pigment system and for the presence of only asingle, bistable system. A few attempts were made to bleach thevisual pigments using bright-white light, but these bleaches werenot very successful (due to baseline shifts or scattering-inducedchanges in absorption spectral shape), and further analysis of thepigment system was carried out only using di�erence spectra forphotoconversion.
Analysis
Photoconversion di�erence spectra were analyzed by ®tting dif-ference spectra with model rhodopsin/metarhodopsin photopig-ment pairs, using A1-based rhodopsin templates (Palacios et al.1996), in combination with a metarhodopsin template generouslyprovided by G. D. Bernard. The average data value from 650 nmto 700 nm was subtracted from each di�erence curve as a ®rstcorrection for any residual baseline drift. Corrected spectra were®tted from 425 nm to 650 nm (the lower limit was chosen to limitthe e�ect of random spectral shape changes due to alterations inscattering). A brief check indicated that the rhodopsin would havea kmax near 550 nm, and would be paired with a metarhodopsinnear 485 nm, at an extinction ratio near 2.0. Therefore, the testparameters were allowed to range as follows: rhodopsin kmax, 500±600 nm (1-nm intervals); metarhodopsin kmax, 450±550 nm (1-nmintervals); extinction ratio (emaxM:emaxR), 1.0±3.0 (0.05 intervals).The model spectrum with the least sum of squares of deviationsfrom the data was taken to be the best ®t.
Electrophysiology
Standard techniques were utilized for recording intracellular re-ceptor potentials from the retinular cells in ®re¯y P. pyralis males,which were shipped from Baltimore, MD to Oulu, Finland duringthe summer months of 1993, 1994, and 1995. The details of themethod are given in WeckstroÈ m et al. (1991). A short summary ispresented below.
For electrical recording, live ®re¯ies were ®xed with beeswaxonto a platform placed at the center of the rotation of a Cardan
2
arm. The arm moved around the eye at a constant distance of45 mm. For impaling photoreceptors with microelectrodes, asmall hole was made in the cornea. This hole was ®lled withsilicon grease to prevent dehydration of the ocular tissue. Mic-roelectrodes were made with 1.5 mm diameter glass capillarytubing (Clark Electromedical, UK), pulled on a horizontalpipette puller (P-80 PC, Sutter Instruments, USA) and ®lled with2 mol á l)1 KCl solution. Their tip resistance varied from90±140 MW. The recording microelectrode was moved with apiezoelectric micromover (Burleigh Inchworm PZ-550, USA) intothe retina through the small hole made in the cornea. Theintracellular potentials were recorded by a high-impedance pre-ampli®er (SEC-05L, npi Electronics, Germany) ®ltered at 1 kHzand further ampli®ed by a low-pass dual channel elliptical ®lter(VBF-23, KEMO, UK) and displayed on an oscilloscope (Tek-tronix, USA). The signal recording, analysis, and storage wasperformed using a personal computer running an ASYST-based(Keithley, USA) program (Juusola et al. 1994).
A 150-W xenon light source in conjunction with a series of 11interference ®lters (half-band width �10 nm) from 341 nm to620 nm provided the photic stimuli. The light stimulated the eye viaa Y-shaped quartz ®ber-optic ®xed to the Cardan arm system. Theintensity of the stimulus was calibrated by a PIN photodiode and aradiometer (80-X Opt-O-Meter, United Detector Technology,USA). Stimulus intensity was controlled with a series of Wrattenneutral-density ®lters (Kodak, USA) such that similar numbers ofphotons were delivered at various wavelengths across the spectrum.The stimulus duration was 10 ms. Spectral sensitivity was com-puted from the amplitude of the intracellular response at eachwavelength after ®rst obtaining the V-log I function, permittingmillivolt response values to be converted into relative sensitivityfunctions.
Results
Structure of ®re¯y eyes
Fire¯ies have refracting superposition compound eyes(Exner 1891; see also Land 1980). In P. pyralis they areabout 1 mm in diameter, and each provides nearly aspherical ®eld of view (Fig. 1A, B). However, the eyesare located under a shelf-like pronotum, which acts likea baseball cap to block the visual ®eld at elevationsabove about 45E whenever the head is retracted(Fig. 1A). Horridge (1968, 1969) has already provided ageneral description of ®re¯y eyes of the genus Photuris,and our electron microscopy observations on P. pyralisare generally consistent with his ®ndings.
In P. pyralis, each ommatidium has a corneal lensabout 18±20 lm in diameter and about 10 lm thick,which grades seamlessly into a solid crystalline cone.The entire structure of cornea plus cone is about60 lm long. The outer surface of the cone has longi-tudinal grooves separated by about 1 lm, and thecone's structure becomes quite complex near its bor-ders due to the co-occurrence of the radial densitygradients and the longitudinal grooves. The cone issurrounded by a dense layer of numerous pigmentcells per ommatidium.
The clear-zone region separating the tips of the conesfrom the distal receptor layer is about 100 lm across. Itis divided into two layers, and is ®lled with a diversity ofcell types, of which the most numerous are the accessorypigment cells. These contain most of the dark screening
pigments, which vary in position with the adaptationalstate of the eye. Accessory pigment cells lack any de-tailed internal structure, but are electrodense with in-ternal pigment granules. The proximal layer of the clearzone, about 60 lm thick, does not contain pigmentgranules, but does show some di�erential staining and isgenerally electron dense.
The eye has heavy screening pigmentation in threedi�erent zones: (1) in the distal zone between the crys-talline cones, (2) in the proximal part of the clear zone,and (3) in the basal part of the actual retina. Typicalpigment granules are about 0.5 lm in diameter and areoften arranged in queues supported by a thin thread-likestructure. While the clear zone is ®lled with these gran-ules in light-adapted eyes, during dark adaptation theyare retracted into the top of the retina ± exposing the tipsof the rhabdoms ± and into the spaces between thebullet-shaped crystalline cones. In addition to the pig-mentation, each ommatidium has a crystalline tractconstructed by four cells, which separates at the top ofthe retina into four separate units. The retina itself isdivided into two distinct layers, which we call the outerand inner retina (Fig. 1B).
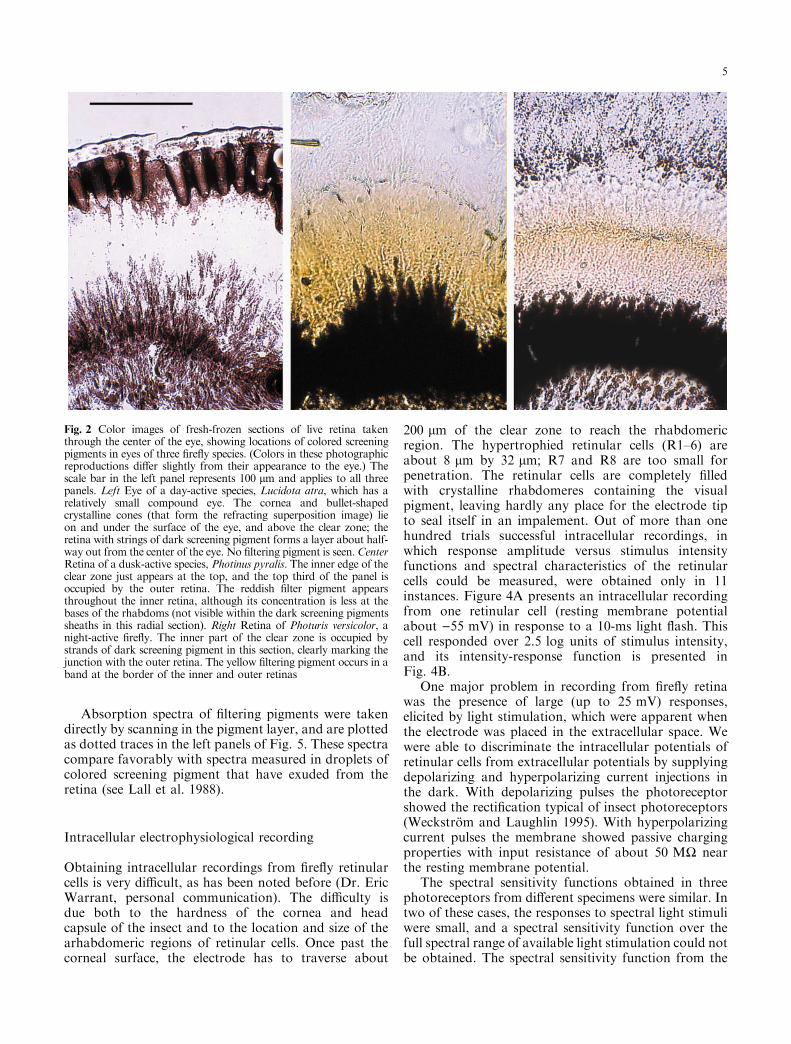
Surprisingly, there is little direct evidence in electronmicrographs of how the colored screening (®ltering)pigments are localized, although they may be placed inthe large balloon-like structures located in the ®lter zone(Fig. 1C). Nevertheless, these pigments are easilyvisualized in fresh-frozen sections of eyes (Fig. 2). Theday-active species, Lucidota atra (which is notbioluminescent), has no ®lter screen; its retina probablyresembles that of the ancestors of bioluminescent ®re¯ies,and we include an image of its retina for comparison withthe dusk- and night-active species. Filter material inP. pyralis appears reddish in color and is spread di�uselythroughout the inner retina. However, its color is mostintense at the junction with the outer retina and graduallyfades away towards the bases of the rhabdoms (Fig. 2).P. scintillans (not shown) has a smaller eye than doesP. pyralis, but its ocular structure and screening pigmentdistributions are very similar to those of the latterspecies. In Ph. versicolor, on the other hand, there is aclearly demarcated band of dense yellow material in theregion where the outer and inner retinas join (Fig. 2).
Microspectrophotometry
The best data were obtained in all species when cross-sections of photoreceptors near the base of the retinawere scanned, probably because in this region the basalscreening pigment projects between the rhabdoms,making their positions obvious. In the outer layer of theretina (occupied by single large rhabdoms), we found noevidence of a light-sensitive pigment responding in anyspecies in the scanned spectral range (400±700 nm).When the dark-adapted inner retina is given a saturatingexposure to long-wavelength light (the 50% transmis-sion point of the red ®lter is 619 nm), there is a loss in
3
absorption beyond about 525 nm, balanced by a some-what larger gain below this wavelength (Fig. 3). Thisphotoconversion is partially reversible to a new photo-steady-state mixture, using blue light, and from thismixture the system can be reversibly ¯ip-¯opped indef-initely by alternating saturating treatments of red andblue actinic light.
In all three ®re¯y species, these observations arefully consistent with the presence of a bistable pigmentsystem, interconverting between rhodopsin and meta-rhodopsin. The treatment of dark-adapted photore-ceptors causes the greatest change, as the
photopigment in the retina is almost completely in therhodopsin state at this time (Fig. 3). Subsequentreversals after red and blue actinic exposures switchbetween two photosteady-state mixtures of rhodopsinand metarhodopsin, and hence produce smallerdi�erences. Di�erence spectra were analyzed as de-scribed in Materials and methods, and the results aresummarized in Table 1. All three treatments (dark-to-red, red-to-blue, and blue-to-red) provide similar esti-mates for the rhodopsin kmax, mainly because thispigment is the only absorbing entity at longer wave-lengths. (Both the rhodopsin and the metarhodopsinabsorb near the peak for metarhodopsin, making itsposition more variable depending on the extinctionratio.) The visual pigment systems of P. pyralis andPh. versicolor are very similar indeed, consisting of arhodopsin with kmax � 545 nm interconverting with ametarhodopsin with kmax � 480 nm and peak absor-bance about twice that of the rhodopsin. P. scintillansis clearly di�erent; it has a rhodopsin peaking near557 nm paired with a 485-nm metarhodopsin. Nophotoreceptors containing blue- or UV-absorbing vi-sual pigment were ever located in any species.
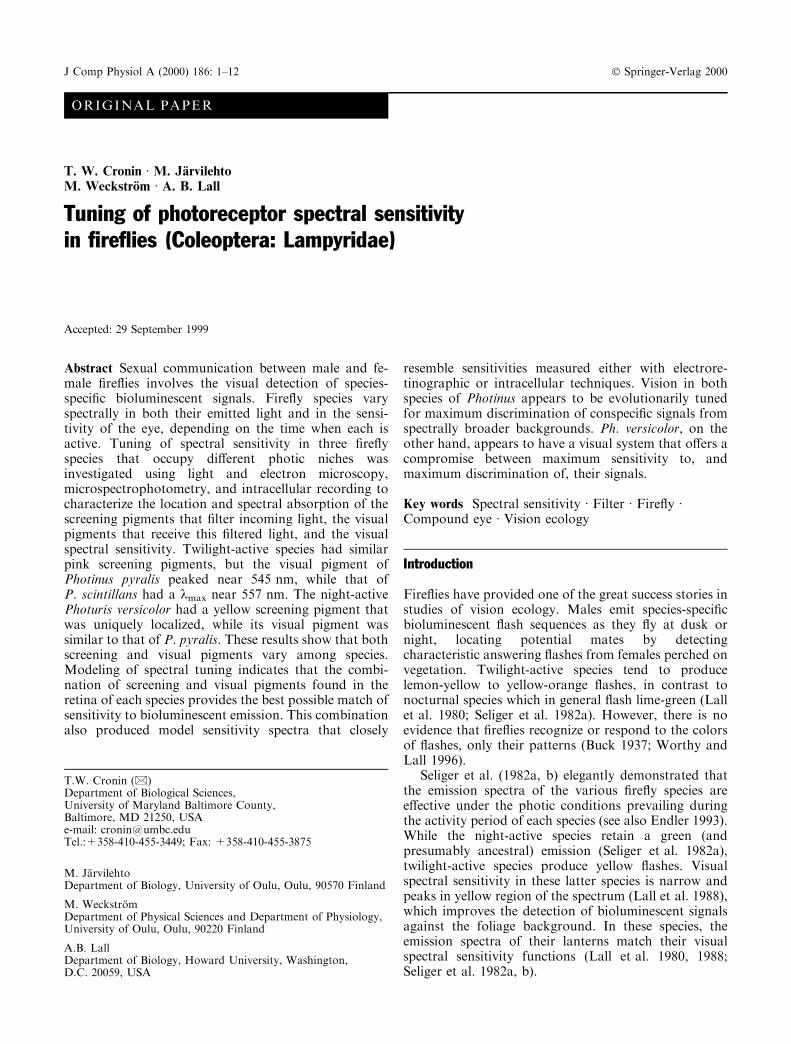
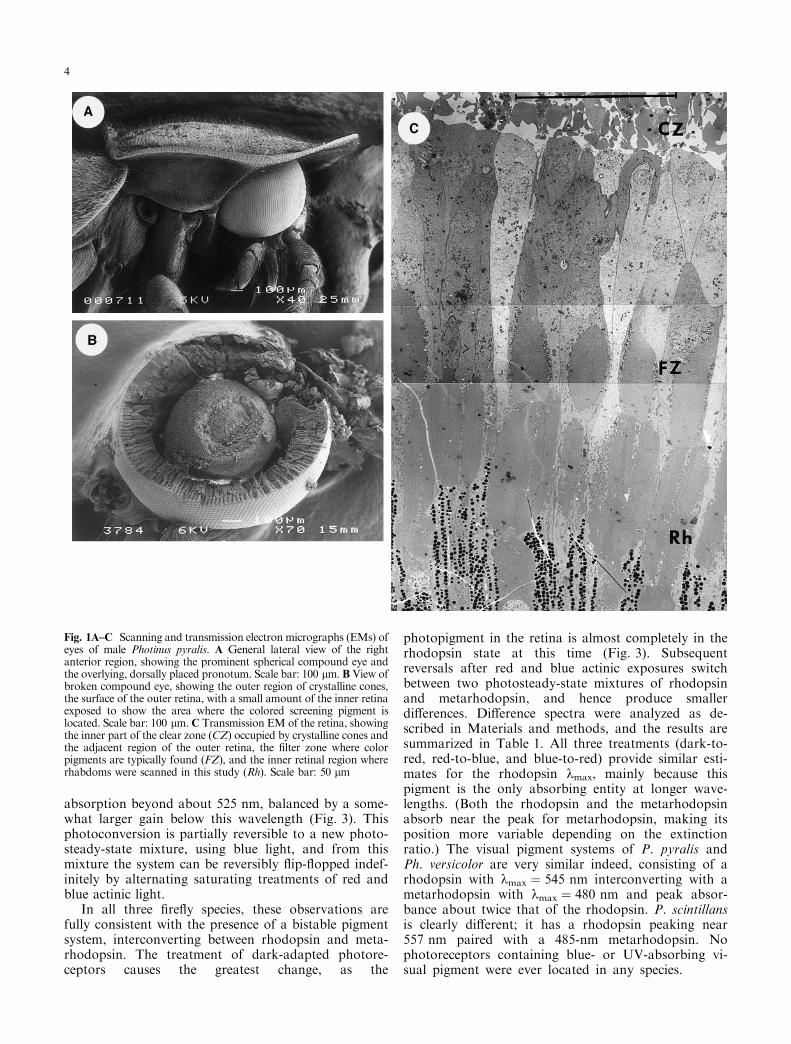
Fig. 1A±C Scanning and transmission electron micrographs (EMs) ofeyes of male Photinus pyralis. A General lateral view of the rightanterior region, showing the prominent spherical compound eye andthe overlying, dorsally placed pronotum. Scale bar: 100 lm. B View ofbroken compound eye, showing the outer region of crystalline cones,the surface of the outer retina, with a small amount of the inner retinaexposed to show the area where the colored screening pigment islocated. Scale bar: 100 lm. C Transmission EM of the retina, showingthe inner part of the clear zone (CZ) occupied by crystalline cones andthe adjacent region of the outer retina, the ®lter zone where colorpigments are typically found (FZ), and the inner retinal region whererhabdoms were scanned in this study (Rh). Scale bar: 50 lm
4
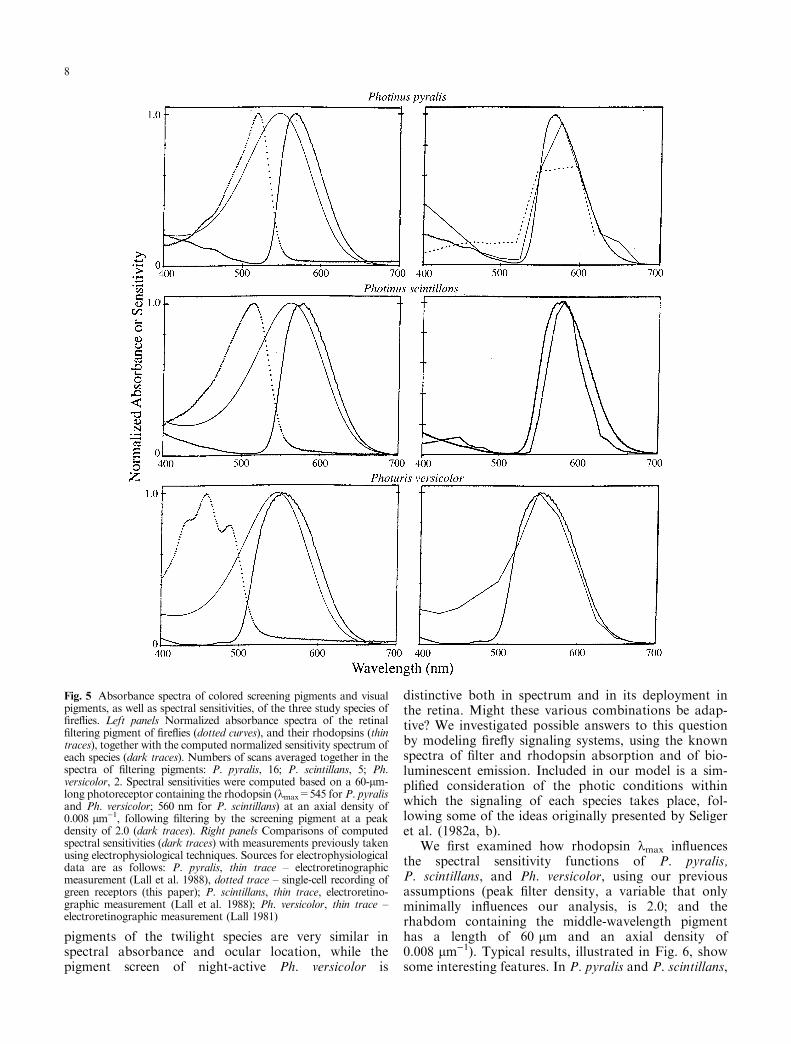
Absorption spectra of ®ltering pigments were takendirectly by scanning in the pigment layer, and are plottedas dotted traces in the left panels of Fig. 5. These spectracompare favorably with spectra measured in droplets ofcolored screening pigment that have exuded from theretina (see Lall et al. 1988).
Intracellular electrophysiological recording
Obtaining intracellular recordings from ®re¯y retinularcells is very di�cult, as has been noted before (Dr. EricWarrant, personal communication). The di�culty isdue both to the hardness of the cornea and headcapsule of the insect and to the location and size of thearhabdomeric regions of retinular cells. Once past thecorneal surface, the electrode has to traverse about
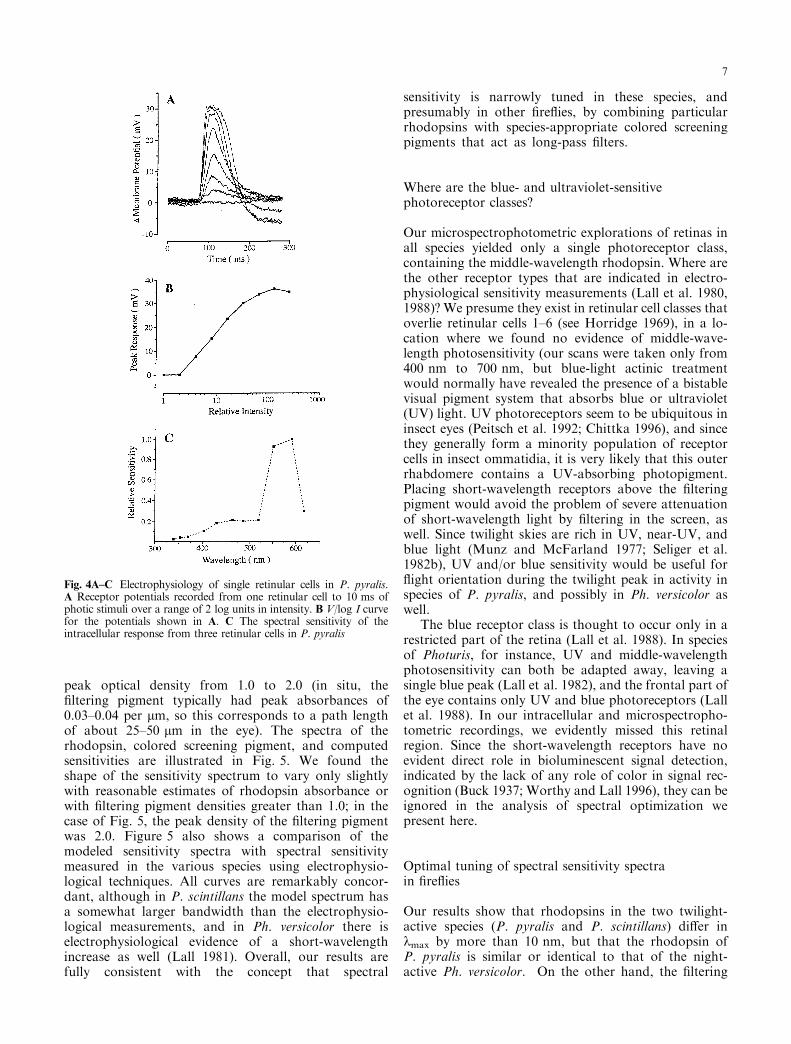
200 lm of the clear zone to reach the rhabdomericregion. The hypertrophied retinular cells (R1±6) areabout 8 lm by 32 lm; R7 and R8 are too small forpenetration. The retinular cells are completely ®lledwith crystalline rhabdomeres containing the visualpigment, leaving hardly any place for the electrode tipto seal itself in an impalement. Out of more than onehundred trials successful intracellular recordings, inwhich response amplitude versus stimulus intensityfunctions and spectral characteristics of the retinularcells could be measured, were obtained only in 11instances. Figure 4A presents an intracellular recordingfrom one retinular cell (resting membrane potentialabout )55 mV) in response to a 10-ms light ¯ash. Thiscell responded over 2.5 log units of stimulus intensity,and its intensity-response function is presented inFig. 4B.
One major problem in recording from ®re¯y retinawas the presence of large (up to 25 mV) responses,elicited by light stimulation, which were apparent whenthe electrode was placed in the extracellular space. Wewere able to discriminate the intracellular potentials ofretinular cells from extracellular potentials by supplyingdepolarizing and hyperpolarizing current injections inthe dark. With depolarizing pulses the photoreceptorshowed the recti®cation typical of insect photoreceptors(WeckstroÈ m and Laughlin 1995). With hyperpolarizingcurrent pulses the membrane showed passive chargingproperties with input resistance of about 50 MW nearthe resting membrane potential.
The spectral sensitivity functions obtained in threephotoreceptors from di�erent specimens were similar. Intwo of these cases, the responses to spectral light stimuliwere small, and a spectral sensitivity function over thefull spectral range of available light stimulation could notbe obtained. The spectral sensitivity function from the
Fig. 2 Color images of fresh-frozen sections of live retina takenthrough the center of the eye, showing locations of colored screeningpigments in eyes of three ®re¯y species. (Colors in these photographicreproductions di�er slightly from their appearance to the eye.) Thescale bar in the left panel represents 100 lm and applies to all threepanels. Left Eye of a day-active species, Lucidota atra, which has arelatively small compound eye. The cornea and bullet-shapedcrystalline cones (that form the refracting superposition image) lieon and under the surface of the eye, and above the clear zone; theretina with strings of dark screening pigment forms a layer about half-way out from the center of the eye. No ®ltering pigment is seen.CenterRetina of a dusk-active species, Photinus pyralis. The inner edge of theclear zone just appears at the top, and the top third of the panel isoccupied by the outer retina. The reddish ®lter pigment appearsthroughout the inner retina, although its concentration is less at thebases of the rhabdoms (not visible within the dark screening pigmentssheaths in this radial section). Right Retina of Photuris versicolor, anight-active ®re¯y. The inner part of the clear zone is occupied bystrands of dark screening pigment in this section, clearly marking thejunction with the outer retina. The yellow ®ltering pigment occurs in aband at the border of the inner and outer retinas
5
cell with the best signal-to-noise ratio is given in Fig. 4C,which shows a relatively narrow peak between 525 nmand 625 nm and a small secondary peak around 450 nm.
Discussion
Spectral tuning in ®re¯y retinas
While ®re¯ies are essentially nocturnal beetles, somespecies occupy the twilight photic niche and a few areactive even during the day. The visual systems of ®re¯iesare highly specialized for nocturnal vision, and they areno doubt used for tasks like those required by any ¯yinginsect: ¯ight control, navigation, avoiding obstacles, andso forth. It seems likely that when bioluminescence ®rstassumed a role in ®re¯y sexual communication, the lu-ciferase enzyme was selected to produce green biolumi-nescence emission to coincide with the spectralsensitivity of the species' visual system (Lall et al. 1980,1982; Seliger et al. 1982a, b). In modern ®re¯ies,screening pigments tune sensitivity in both nocturnaland twilight species. But the latter have unusuallynarrow visual sensitivity spectra because their screeningpigments severely attenuate sensitivity in the greenregion of the spectrum, producing a match between theshapes of the visual sensitivity and the yellowishbioluminescent emission spectra (Lall et al. 1980, 1988;see Fig. 5).
To examine the interaction of visual and screeningpigments in ®re¯y eyes, we modeled the expectedspectral sensitivity functions of photoreceptorscontaining a rhodopsin with kmax equal to 545 nm(P. pyralis or Ph. versicolor) or 557 nm (P. scintillans),as found in our analyses of di�erence spectra (seeTable 1), stimulated by light transitting the pink oryellow pigment found in the outer regions of theirretinas (e.g., Fig. 2). Our model is based on photore-ceptor cells 60 lm in length containing a rhodopsin atan axial density of 0.008 lm)1 (see Cronin andForward 1988), overlain by a layer of the appropriatecolored screening pigment (e.g., Fig. 2) ranging in
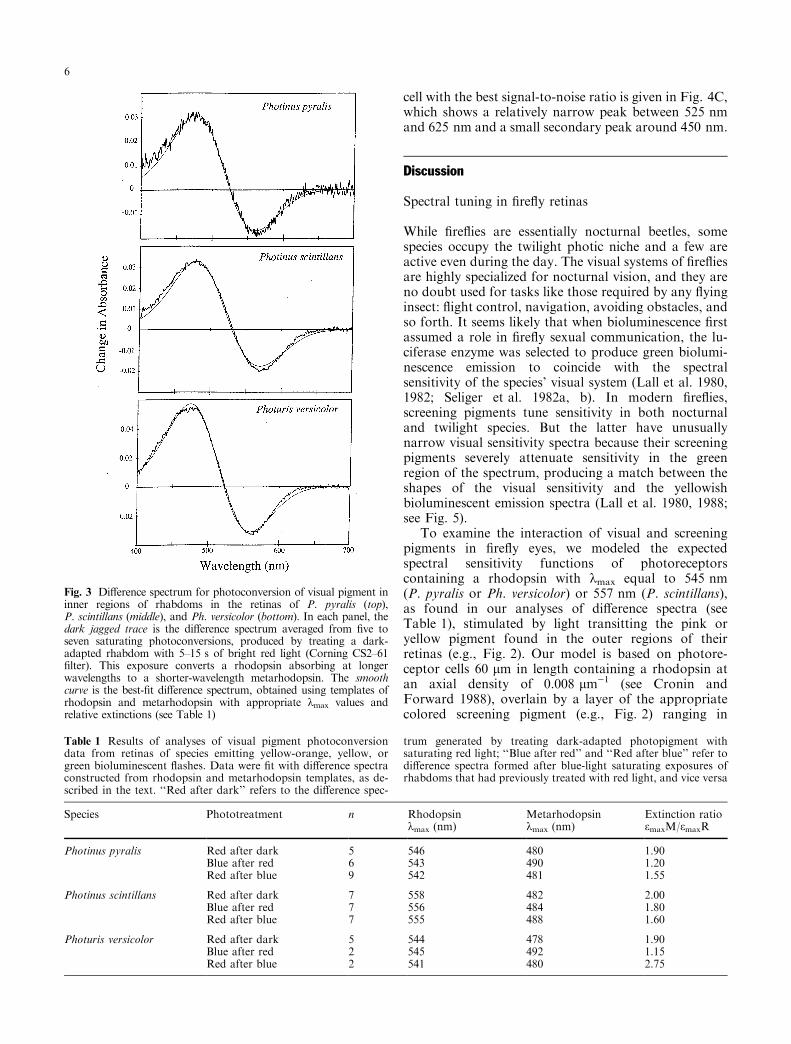
Fig. 3 Di�erence spectrum for photoconversion of visual pigment ininner regions of rhabdoms in the retinas of P. pyralis (top),P. scintillans (middle), and Ph. versicolor (bottom). In each panel, thedark jagged trace is the di�erence spectrum averaged from ®ve toseven saturating photoconversions, produced by treating a dark-adapted rhabdom with 5±15 s of bright red light (Corning CS2±61®lter). This exposure converts a rhodopsin absorbing at longerwavelengths to a shorter-wavelength metarhodopsin. The smoothcurve is the best-®t di�erence spectrum, obtained using templates ofrhodopsin and metarhodopsin with appropriate kmax values andrelative extinctions (see Table 1)
Table 1 Results of analyses of visual pigment photoconversiondata from retinas of species emitting yellow-orange, yellow, orgreen bioluminescent ¯ashes. Data were ®t with di�erence spectraconstructed from rhodopsin and metarhodopsin templates, as de-scribed in the text. ``Red after dark'' refers to the di�erence spec-
trum generated by treating dark-adapted photopigment withsaturating red light; ``Blue after red'' and ``Red after blue'' refer todi�erence spectra formed after blue-light saturating exposures ofrhabdoms that had previously treated with red light, and vice versa
Species Phototreatment n Rhodopsinkmax (nm)
Metarhodopsinkmax (nm)
Extinction ratioemaxM/emaxR
Photinus pyralis Red after dark 5 546 480 1.90Blue after red 6 543 490 1.20Red after blue 9 542 481 1.55
Photinus scintillans Red after dark 7 558 482 2.00Blue after red 7 556 484 1.80Red after blue 7 555 488 1.60
Photuris versicolor Red after dark 5 544 478 1.90Blue after red 2 545 492 1.15Red after blue 2 541 480 2.75
6
peak optical density from 1.0 to 2.0 (in situ, the®ltering pigment typically had peak absorbances of0.03±0.04 per lm, so this corresponds to a path lengthof about 25±50 lm in the eye). The spectra of therhodopsin, colored screening pigment, and computedsensitivities are illustrated in Fig. 5. We found theshape of the sensitivity spectrum to vary only slightlywith reasonable estimates of rhodopsin absorbance orwith ®ltering pigment densities greater than 1.0; in thecase of Fig. 5, the peak density of the ®ltering pigmentwas 2.0. Figure 5 also shows a comparison of themodeled sensitivity spectra with spectral sensitivitymeasured in the various species using electrophysio-logical techniques. All curves are remarkably concor-dant, although in P. scintillans the model spectrum hasa somewhat larger bandwidth than the electrophysio-logical measurements, and in Ph. versicolor there iselectrophysiological evidence of a short-wavelengthincrease as well (Lall 1981). Overall, our results arefully consistent with the concept that spectral
sensitivity is narrowly tuned in these species, andpresumably in other ®re¯ies, by combining particularrhodopsins with species-appropriate colored screeningpigments that act as long-pass ®lters.
Where are the blue- and ultraviolet-sensitivephotoreceptor classes?
Our microspectrophotometric explorations of retinas inall species yielded only a single photoreceptor class,containing the middle-wavelength rhodopsin. Where arethe other receptor types that are indicated in electro-physiological sensitivity measurements (Lall et al. 1980,1988)? We presume they exist in retinular cell classes thatoverlie retinular cells 1±6 (see Horridge 1969), in a lo-cation where we found no evidence of middle-wave-length photosensitivity (our scans were taken only from400 nm to 700 nm, but blue-light actinic treatmentwould normally have revealed the presence of a bistablevisual pigment system that absorbs blue or ultraviolet(UV) light. UV photoreceptors seem to be ubiquitous ininsect eyes (Peitsch et al. 1992; Chittka 1996), and sincethey generally form a minority population of receptorcells in insect ommatidia, it is very likely that this outerrhabdomere contains a UV-absorbing photopigment.Placing short-wavelength receptors above the ®lteringpigment would avoid the problem of severe attenuationof short-wavelength light by ®ltering in the screen, aswell. Since twilight skies are rich in UV, near-UV, andblue light (Munz and McFarland 1977; Seliger et al.1982b), UV and/or blue sensitivity would be useful for¯ight orientation during the twilight peak in activity inspecies of P. pyralis, and possibly in Ph. versicolor aswell.
The blue receptor class is thought to occur only in arestricted part of the retina (Lall et al. 1988). In speciesof Photuris, for instance, UV and middle-wavelengthphotosensitivity can both be adapted away, leaving asingle blue peak (Lall et al. 1982), and the frontal part ofthe eye contains only UV and blue photoreceptors (Lallet al. 1988). In our intracellular and microspectropho-tometric recordings, we evidently missed this retinalregion. Since the short-wavelength receptors have noevident direct role in bioluminescent signal detection,indicated by the lack of any role of color in signal rec-ognition (Buck 1937; Worthy and Lall 1996), they can beignored in the analysis of spectral optimization wepresent here.
Optimal tuning of spectral sensitivity spectrain ®re¯ies
Our results show that rhodopsins in the two twilight-active species (P. pyralis and P. scintillans) di�er inkmax by more than 10 nm, but that the rhodopsin ofP. pyralis is similar or identical to that of the night-active Ph. versicolor. On the other hand, the ®ltering
Fig. 4A±C Electrophysiology of single retinular cells in P. pyralis.A Receptor potentials recorded from one retinular cell to 10 ms ofphotic stimuli over a range of 2 log units in intensity. B V/log I curvefor the potentials shown in A. C The spectral sensitivity of theintracellular response from three retinular cells in P. pyralis
7
pigments of the twilight species are very similar inspectral absorbance and ocular location, while thepigment screen of night-active Ph. versicolor is
distinctive both in spectrum and in its deployment inthe retina. Might these various combinations be adap-tive? We investigated possible answers to this questionby modeling ®re¯y signaling systems, using the knownspectra of ®lter and rhodopsin absorption and of bio-luminescent emission. Included in our model is a sim-pli®ed consideration of the photic conditions withinwhich the signaling of each species takes place, fol-lowing some of the ideas originally presented by Seligeret al. (1982a, b).
We ®rst examined how rhodopsin kmax in¯uencesthe spectral sensitivity functions of P. pyralis,P. scintillans, and Ph. versicolor, using our previousassumptions (peak ®lter density, a variable that onlyminimally in¯uences our analysis, is 2.0; and therhabdom containing the middle-wavelength pigmenthas a length of 60 lm and an axial density of0.008 lm)1). Typical results, illustrated in Fig. 6, showsome interesting features. In P. pyralis and P. scintillans,
Fig. 5 Absorbance spectra of colored screening pigments and visualpigments, as well as spectral sensitivities, of the three study species of®re¯ies. Left panels Normalized absorbance spectra of the retinal®ltering pigment of ®re¯ies (dotted curves), and their rhodopsins (thintraces), together with the computed normalized sensitivity spectrum ofeach species (dark traces). Numbers of scans averaged together in thespectra of ®ltering pigments: P. pyralis, 16; P. scintillans, 5; Ph.versicolor, 2. Spectral sensitivities were computed based on a 60-lm-long photoreceptor containing the rhodopsin (kmax=545 for P. pyralisand Ph. versicolor; 560 nm for P. scintillans) at an axial density of0.008 lm)1, following ®ltering by the screening pigment at a peakdensity of 2.0 (dark traces). Right panels Comparisons of computedspectral sensitivities (dark traces) with measurements previously takenusing electrophysiological techniques. Sources for electrophysiologicaldata are as follows: P. pyralis, thin trace ± electroretinographicmeasurement (Lall et al. 1988), dotted trace ± single-cell recording ofgreen receptors (this paper); P. scintillans, thin trace, electroretino-graphic measurement (Lall et al. 1988); Ph. versicolor, thin trace ±electroretinographic measurement (Lall 1981)
8
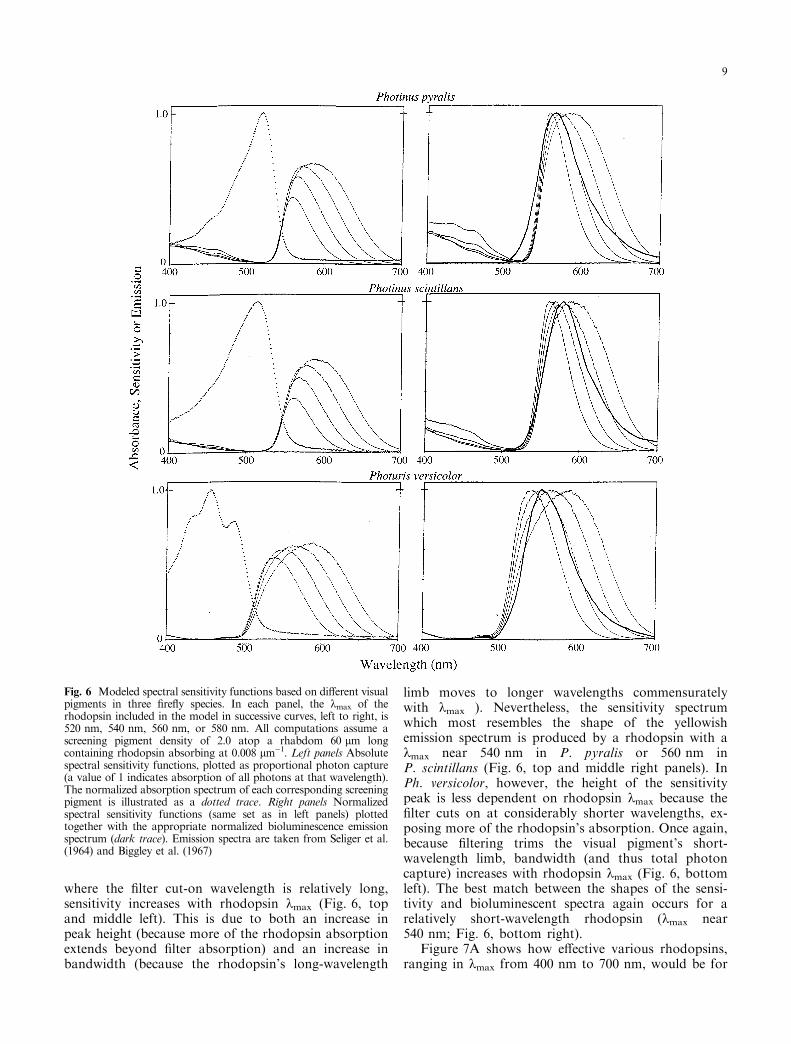
where the ®lter cut-on wavelength is relatively long,sensitivity increases with rhodopsin kmax (Fig. 6, topand middle left). This is due to both an increase inpeak height (because more of the rhodopsin absorptionextends beyond ®lter absorption) and an increase inbandwidth (because the rhodopsin's long-wavelength
limb moves to longer wavelengths commensuratelywith kmax ). Nevertheless, the sensitivity spectrumwhich most resembles the shape of the yellowishemission spectrum is produced by a rhodopsin with akmax near 540 nm in P. pyralis or 560 nm inP. scintillans (Fig. 6, top and middle right panels). InPh. versicolor, however, the height of the sensitivitypeak is less dependent on rhodopsin kmax because the®lter cuts on at considerably shorter wavelengths, ex-posing more of the rhodopsin's absorption. Once again,because ®ltering trims the visual pigment's short-wavelength limb, bandwidth (and thus total photoncapture) increases with rhodopsin kmax (Fig. 6, bottomleft). The best match between the shapes of the sensi-tivity and bioluminescent spectra again occurs for arelatively short-wavelength rhodopsin (kmax near540 nm; Fig. 6, bottom right).
Figure 7A shows how e�ective various rhodopsins,ranging in kmax from 400 nm to 700 nm, would be for
Fig. 6 Modeled spectral sensitivity functions based on di�erent visualpigments in three ®re¯y species. In each panel, the kmax of therhodopsin included in the model in successive curves, left to right, is520 nm, 540 nm, 560 nm, or 580 nm. All computations assume ascreening pigment density of 2.0 atop a rhabdom 60 lm longcontaining rhodopsin absorbing at 0.008 lm)1. Left panels Absolutespectral sensitivity functions, plotted as proportional photon capture(a value of 1 indicates absorption of all photons at that wavelength).The normalized absorption spectrum of each corresponding screeningpigment is illustrated as a dotted trace. Right panels Normalizedspectral sensitivity functions (same set as in left panels) plottedtogether with the appropriate normalized bioluminescence emissionspectrum (dark trace). Emission spectra are taken from Seliger et al.(1964) and Biggley et al. (1967)
9
capturing photons arriving from conspeci®c biolumi-nescence in these three species. These curves were gen-erated by dividing the product of sensitivity andnormalized bioluminescence by the area under the lu-minescence curve (summing at 1-nm intervals from400 nm to 700 nm), using Eq. 1:
P � R S�k�E�k�R E�k� �1�
where P is the total photon catch, and S(k) and E(k) arethe absolute sensitivity and normalized emission spectralvalues, respectively (curves in Figs. 5, 6).
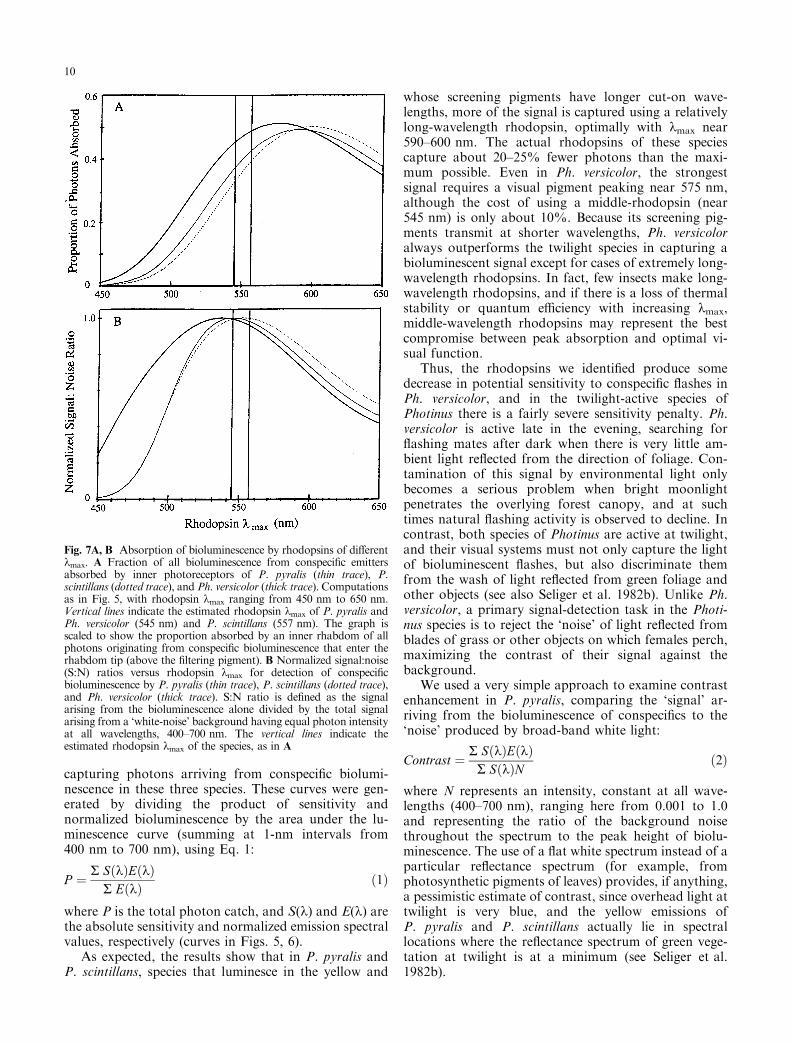
As expected, the results show that in P. pyralis andP. scintillans, species that luminesce in the yellow and
whose screening pigments have longer cut-on wave-lengths, more of the signal is captured using a relativelylong-wavelength rhodopsin, optimally with kmax near590±600 nm. The actual rhodopsins of these speciescapture about 20±25% fewer photons than the maxi-mum possible. Even in Ph. versicolor, the strongestsignal requires a visual pigment peaking near 575 nm,although the cost of using a middle-rhodopsin (near545 nm) is only about 10%. Because its screening pig-ments transmit at shorter wavelengths, Ph. versicoloralways outperforms the twilight species in capturing abioluminescent signal except for cases of extremely long-wavelength rhodopsins. In fact, few insects make long-wavelength rhodopsins, and if there is a loss of thermalstability or quantum e�ciency with increasing kmax,middle-wavelength rhodopsins may represent the bestcompromise between peak absorption and optimal vi-sual function.
Thus, the rhodopsins we identi®ed produce somedecrease in potential sensitivity to conspeci®c ¯ashes inPh. versicolor, and in the twilight-active species ofPhotinus there is a fairly severe sensitivity penalty. Ph.versicolor is active late in the evening, searching for¯ashing mates after dark when there is very little am-bient light re¯ected from the direction of foliage. Con-tamination of this signal by environmental light onlybecomes a serious problem when bright moonlightpenetrates the overlying forest canopy, and at suchtimes natural ¯ashing activity is observed to decline. Incontrast, both species of Photinus are active at twilight,and their visual systems must not only capture the lightof bioluminescent ¯ashes, but also discriminate themfrom the wash of light re¯ected from green foliage andother objects (see also Seliger et al. 1982b). Unlike Ph.versicolor, a primary signal-detection task in the Photi-nus species is to reject the `noise' of light re¯ected fromblades of grass or other objects on which females perch,maximizing the contrast of their signal against thebackground.
We used a very simple approach to examine contrastenhancement in P. pyralis, comparing the `signal' ar-riving from the bioluminescence of conspeci®cs to the`noise' produced by broad-band white light:
Contrast � R S�k�E�k�R S�k�N �2�
where N represents an intensity, constant at all wave-lengths (400±700 nm), ranging here from 0.001 to 1.0and representing the ratio of the background noisethroughout the spectrum to the peak height of biolu-minescence. The use of a ¯at white spectrum instead of aparticular re¯ectance spectrum (for example, fromphotosynthetic pigments of leaves) provides, if anything,a pessimistic estimate of contrast, since overhead light attwilight is very blue, and the yellow emissions ofP. pyralis and P. scintillans actually lie in spectrallocations where the re¯ectance spectrum of green vege-tation at twilight is at a minimum (see Seliger et al.1982b).
Fig. 7A, B Absorption of bioluminescence by rhodopsins of di�erentkmax. A Fraction of all bioluminescence from conspeci®c emittersabsorbed by inner photoreceptors of P. pyralis (thin trace), P.scintillans (dotted trace), and Ph. versicolor (thick trace). Computationsas in Fig. 5, with rhodopsin kmax ranging from 450 nm to 650 nm.Vertical lines indicate the estimated rhodopsin kmax of P. pyralis andPh. versicolor (545 nm) and P. scintillans (557 nm). The graph isscaled to show the proportion absorbed by an inner rhabdom of allphotons originating from conspeci®c bioluminescence that enter therhabdom tip (above the ®ltering pigment). B Normalized signal:noise(S:N) ratios versus rhodopsin kmax for detection of conspeci®cbioluminescence by P. pyralis (thin trace), P. scintillans (dotted trace),and Ph. versicolor (thick trace). S:N ratio is de®ned as the signalarising from the bioluminescence alone divided by the total signalarising from a `white-noise' background having equal photon intensityat all wavelengths, 400±700 nm. The vertical lines indicate theestimated rhodopsin kmax of the species, as in A
10
The results of this analysis (Fig. 7B) demonstrateconvincingly that the 545-nm rhodopsin of P. pyralis orthe 557-nm pigment of P. scintillans, in combinationwith the ®ltering pigment of each, indeed maximize thebrightness ratio between a yellow to yellow-orangebioluminescent ¯ash and a ¯at white background (andpresumably other, natural backgrounds for the reasonsjust described). This result holds for very dim back-grounds, only 0.1% of the brightness of the peak lumi-nescence, as well as for backgrounds at least as bright asthe ¯ash peak itself. An inspection of Fig. 6 shows whythis should be so; as ®rst demonstrated by Seliger et al.(1982a, b), matching the shape of the sensitivity functionto the luminescence literally screens out virtually allenvironmental photons acting as `noise' (for example,skylight or re¯ections from background foliage), leavingopen a window that admits few photons besides thoseemitted within the expected luminescent ¯ash.
In earlier analyses (Seliger et al. 1982a; Lall et al.1988), it was assumed that both P. pyralis and P.scintillans have the same visual pigment, withkmax=550 nm. The requirement to match narrow yellowvisual spectral sensitivity curves (Lall et al. 1988) tobioluminescence in these species required screeningpigments of di�erent maximum densities, estimated at1.6 in P. pyralis and 2.2 in P. scintillans. Such a densepigment layer would severely attenuate absolute sensi-tivity in P. scintillans, and the presence of a visual pig-ment with kmax placed even a few nanometers towardslonger wavelengths produces the desired tuning with asigni®cant improvement in overall sensitivity.
In summary, twilight-active species of Photinus en-hance their detection of ¯ash signals by optimizing con-trast between the yellow ¯ash and the blue or greenbackground, whereas night-active Ph. versicolor is tunedfor an increased capture of photons from the luminescentsignals of conspeci®cs. While the twilight species (P.pyralis, P. scintillans) ®t the classic model of sensoryevolution to maximize signal contrast (see also Seligeret al. 1982b), Ph. versicolormay have a visual system thatmakes a compromise between the demands of optimizingsignal strength and signal contrast (see Lythgoe 1972 andMcFarland andMunz 1975 for a discussion of sensitivityand contrast in vision). Its 545-nm visual pigment isplaced at wavelengths a bit too short for maximal cap-ture of bioluminescence (Fig. 7A), but a bit too long forgreatest signal-to-noise ratio (Fig. 7B). Since the noc-turnal photic environment within which it searches foranswering ¯ashes may be variably, and unpredictably,dark (and since there must be at least enough light topermit ¯ight), this evolutionary trade-o� seems war-ranted. Clearly, if Ph. versicolor is concerned solely withmaximizing sensitivity, there would be no point in in-corporating a yellow screening pigment into its retina.
In all cases, natural selection acts on these ®re¯yspecies to produce the same result: the detection withhigh reliability the signals of potential mates under thephotic conditions of their visual worlds. This isachieved by the coordinated tuning of bioluminescent
emission to visual spectral sensitivity, and by the re-jection of potentially contaminating environmentallight. In its path to this common goal, evolution hassubtly adjusted both the colored screening pigments ofthe eye and the middle-wavelength visual pigmentsplaced in the photoreceptors at the base of the retina.Fire¯ies occupy photic environments that are relativelysimple and predictable, and their long-distance signalsare carried exclusively by bioluminescence that hashighly consistent spectral properties. Consequently,they provide the best example we have of a visualsystem that is tuned almost exclusively to optimize thesuccess of intraspeci®c signaling.
Acknowledgements Our warmest thanks go to Ms. Riitta Harjula,who provided valuable assistance with the microscopy. All exper-iments are in compliance with current animal care guidelines of theUniversity of Maryland system. This report is based on worksupported by the National Science Foundation under grantsnumber BNS-8917183, IBN-9413357, and IBN-9724028 (to TWC),and BNS-9013076 (to ABL), and by the NIH under grant numberN16MS-SO-66-MO-8016 (to ABL).
References
Biggley WH, Lloyd JE, Seliger HH (1967) The spectral distributionof ®re¯y light. II. J Gen Physiol 50: 1681±1692
Buck JB (1937) Studies on the ®re¯y. II. The signal system andcolor vision in Photinus pyralis. Physiol Zool 10: 412±419
Chittka L (1996) Does bee color vision predate the evolution of¯ower color? Naturwissenschaften 83: 136±138
Cronin TW (1985) The visual pigment of a stomatopod crustacean,Squilla empusa. J Comp Physiol 156: 679±687
Cronin TW, Forward RB Jr (1988) The visual pigments of crabs.I. Spectral characteristics. J Comp Physiol A 162: 463±478
Endler JA (1993) Some general comments on the evolution anddesign of animal communication systems. Philos Trans R SocLond B 340: 215±225
Exner S (1891) Die Physiologie der facettierten Augen von Krebsenund Insecten. Deuticke, Leipzig
Horridge GA (1968) Pigment movement and the crystalline threadsof the ®re¯y eye. Nature (Lond) 218: 778±779
Horridge GA (1969) The eye of the ®re¯y Photuris. Proc R SocLond Ser B 171: 445±463
Juusola M, Kouvalainen E, JaÈ rvilehto M, WeckstroÈ m M (1994).Contrast gain, signal-to-noise ratio, and linearity in lightadapted blow¯y photoreceptors. J Gen Physiol 104: 593±621
Lall AB (1981) Electroretinogram and the spectral sensitivity of thecompound eyes in the ®re¯y Photuris versicolor (Coleoptera:Lampyridae): a correspondence between green sensitivityand species bioluminescence emission. J Insect Physiol 27: 461±468
Lall AB, Seliger HH, Biggley WH, Lloyd JE (1980) Ecology ofcolors of ®re¯y bioluminescence. Science 210: 560±562
Lall AB, Lord ET, Trouth CO (1982) Vision in the ®re¯y Photurislucicrescens (Coleoptera: Lampyridae). J Comp Physiol 135:21±27
Lall AB, Strother GK, Cronin TW, Seliger HH (1988) Modi®ca-tion of spectral sensitivities by screening pigments in the com-pound eyes of twilight-active ®re¯ies (Coleoptera: Lampyridae).J Comp Physiol A 162: 23±33
Land MF (1980) Compound eyes: old and new optical mecha-nisms. Nature (Lond) 287: 681±686
Lythgoe JN (1972) The adaptation of visual pigments to the photicenvironment. In: Dartnall HJA (ed) Handbook of sensoryphysiology VII/6 A. Springer, Berlin Heidelberg New York, pp504±580
11
McFarland WN, Munz FW (1975) The evolution of photopic vi-sual pigments in ®sh. Vision Res 15: 1071±1080
Munz FW, McFarland WN (1977) Evolutionary adaptations of®shes to the photic environment. In: Crescitelli F (ed) Hand-book of sensory physiology VII/5. Springer, Berlin HeidelbergNew York, pp 193±274
Muri RB, Jones GJ (1983) Microspectrophotometry of singlerhabdoms in the retina of the honeybee drone (Apis mellifera).J Gen Physiol 82: 469±496
Palacios AG, Goldsmith TH, Bernard GD (1996) Sensitivity ofcones from a cyprinid ®sh (Danio aequipinnatus) to ultravioletand visible light. Visual Neurosci 13: 411±421
Peitsch D, Fietz A, Hertel H, Souza J de, Ventura DF, Menzel R(1992) The spectral input systems of hymenopteran insectsand their receptor-based colour vision. J Comp Physiol A 170:23±40
Seliger HH, Buck JB, Fastie WG, McElroy WD (1964) The spec-tral distribution of ®re¯y light. J Gen Physiol 48: 95±104
Seliger HH, Lall AB, Lloyd JE, Biggley WH (1982a) On the colorsof ®re¯y bioluminescence. I. An optimization model. Photo-chem Photobiol 36: 673±680
Seliger HH, Lall AB, Lloyd JE, Biggley WH (1982a) On the colorsof ®re¯y bioluminescence. I. An optimization model. Photo-chem Photobiol 36: 673±680
Seliger HH, Lall AB, Lloyd JE, Biggley WH (1982b) On the colorsof ®re¯y bioluminescence. I. Experimental evidence for theoptimization model. Photochem Photobiol 36: 681±688
WeckstroÈ m M, Lauglin SB (1995) The ecology of voltage-gatedion channels in insect photoreceptors. Trends Neurosci 18:17±21
WeckstroÈ m M, Hardie RC, Lauglin SB (1991) Voltage-activatedpotassium channels in blow¯y photoreceptors and their role inlight adaptation. J Physiol (Lond) 440: 635±657
Worthy KM, Lall AB (1996) Action spectrum of the femaleresponse in ®re¯y Photinus pyralis (Coleoptera: Lampyridae).In: Soc Neurosci Abstr 22:1145 (no. 452.20)
12