integrity of the cone photoreceptor mosaic in oligocone trichromacy
TRANSCRIPT
Integrity of the Cone Photoreceptor Mosaic inOligocone Trichromacy
Michel Michaelides,1,2,3 Jungtae Rha,3,4 Elise W. Dees,5 Rigmor C. Baraas,5
Melissa L. Wagner-Schuman,6 John D. Mollon,7 Adam M. Dubis,8 Mette K. G. Andersen,9,10
Thomas Rosenberg,9 Michael Larsen,9,10 Anthony T. Moore,1,2 and Joseph Carroll4,6,8
PURPOSE. Oligocone trichromacy (OT) is an unusual cone dys-function syndrome characterized by reduced visual acuity,mild photophobia, reduced amplitude of the cone electroreti-nogram with normal rod responses, normal fundus appear-ance, and normal or near-normal color vision. It has beenproposed that these patients have a reduced number of normalfunctioning cones (oligocone). This paper has sought to eval-uate the integrity of the cone photoreceptor mosaic in fourpatients previously described as having OT.
METHODS. Retinal images were obtained from two brothers (13and 15 years) and two unrelated subjects, one male (47 years)and one female (24 years). High-resolution images of the conemosaic were obtained using high-speed adaptive optics (AO)fundus cameras. Visible structures were analyzed for density
using custom software. Additional retinal images were ob-tained using spectral domain optical coherence tomography(SD-OCT), and the four layers of the photoreceptor-retinalpigment epithelium complex (ELM, IS/OS, RPE1, RPE2) wereevaluated. Cone photoreceptor length and the thickness ofintraretinal layers were measured and compared to previouslypublished normative data.
RESULTS. The adult male subject had infantile onset nystagmuswhile the three other patients did not. In the adult malepatient, a normal appearing cone mosaic was observed. How-ever, the three other subjects had a sparse mosaic of conesremaining at the fovea, with no structure visible outside thecentral fovea. On SD-OCT, the adult male subject had a veryshallow foveal pit, with all major retinal layers being visible,and both inner segment (IS) and outer segment (OS) lengthwere within normal limits. In the other three patients, while allfour layers were visible in the central fovea and IS length waswithin normal limits, the OS length was significantly de-creased. Peripherally the IS/OS layer decreased in intensity,and the RPE1 layer was no longer discernable, in keeping withthe lack of cone structure observed on AO imaging outside thecentral fovea.
CONCLUSIONS. Findings are consistent with the visual deficitsbeing caused by a reduced number of healthy cones in the twobrothers and the adult female. In the unrelated adult subject,no structural basis for the disorder was found. These datasuggest two distinct groups on the basis of structural imaging.It is proposed that the former group with evidence of a reduc-tion in cone numbers is more in keeping with typical OT, withthe latter group representing an OT-like phenotype. These twogroups may be difficult to readily discern on the basis ofphenotypic features alone, and high-resolution imaging may bean effective way to distinguish between these phenotypes.(Invest Ophthalmol Vis Sci. 2011;52:4757–4764) DOI:10.1167/iovs.10-6659
The cone dysfunction syndromes are a heterogeneousgroup of disorders characterized by an early-onset reduc-
tion in central vision associated with a variable degree ofphotophobia and nystagmus, normal fundus examination, andreduced or absent cone responses with normal rod function onelectroretinography.1 As expected, the abnormal cone func-tion observed in these conditions results in markedly reducedor absent color discrimination, with the degree and pattern ofcolor loss being helpful in differentiating between these disor-ders.1 In contrast, oligocone trichromacy (OT) is an unusualcone dysfunction syndrome, characterized by normal or near-normal color vision despite an absent or reduced cone electro-retinogram.1–9
It has been proposed that these patients have a reducednumber of normal functioning cones (oligocone), with preser-vation of three spectrally distinct types of cone permitting
From the 1UCL Institute of Ophthalmology, London, United King-dom; 2Moorfields Eye Hospital, London, United Kingdom; Departmentsof 4Ophthalmology, 6Biophysics, and 8Cell Biology, Neurobiology, &Anatomy, Medical College of Wisconsin, Milwaukee, Wisconsin; 5De-partment of Optometry and Visual Science, Buskerud University Col-lege, Kongsberg, Norway; 7Department of Experimental Psychology,University of Cambridge, Cambridge, United Kingdom; 9Gordon NorrieCentre, National Eye Clinic, Glostrup, Denmark; and 10Department ofOphthalmology, University of Copenhagen, Glostrup Hospital, Copen-hagen, Denmark.
3Authors contributed equally to this study and therefore should beconsidered equivalent authors.
Supported by grants from the NIH (EY001931, EY017607,EY014537), Juvenile Diabetes Research Foundation (8-2002-130), theE. Matilda Ziegler Foundation for the Blind, Hope for Vision, an unre-stricted grant from Research to Prevent Blindness, Foundation FightingBlindness (USA), Moorfields Special Trustees, the Guide Dogs for theBlind Association, the National Institute for Health Research UK to theBiomedical Research Centre for Ophthalmology based at MoorfieldsEye Hospital, NHS Foundation Trust, and UCL Institute of Ophthalmol-ogy, and the Research Council of Norway (182768/V1 & 183789). JC isthe recipient of a Career Development Award from Research to Pre-vent Blindness. This investigation was conducted in facilities con-structed with support from the Research Facilities Improvement Pro-gram, Grant number C06 RR-RR016511, from the National Center forResearch Resources, National Institutes of Health.
Submitted for publication September 30, 2010; revised February14 and 25, 2011; accepted February 27, 2011.
Disclosure: M. Michaelides, None; J. Rha, None; E.W. Dees, None;R.C. Baraas, None; M.L. Wagner-Schuman, None; J.D. Mollon, None;A.M. Dubis, None; M.K.G. Andersen, None; T. Rosenberg, None; M.Larsen, None; A.T. Moore, None; J. Carroll, None
Presented in part at the annual meeting of the Association forResearch in Vision and Ophthalmology, Fort Lauderdale, Florida, April2010.
*Each of the following is a corresponding author: Michel Michael-ides, UCL Institute of Ophthalmology, 11-43 Bath Street, London, EC1V9EL, UK; [email protected] Carroll, Department of Ophthalmology, Medical College ofWisconsin, Milwaukee, WI, 53226; [email protected].
Retina
Investigative Ophthalmology & Visual Science, June 2011, Vol. 52, No. 7Copyright 2011 The Association for Research in Vision and Ophthalmology, Inc. 4757
trichromacy.2 Evidence in support of this hypothesis has beenobtained by Keunen et al.,4 who observed reduced foveal conephotopigment density with a normal time constant of pho-topigment regeneration in all four tested patients. In the ma-jority of patients who have been studied in detail to date, colorvision tests have revealed either completely normal color vi-sion or slightly elevated discrimination thresholds.2–9 Slightlyelevated discrimination thresholds are compatible with a re-duction in cone number. Further evidence is available fromanomaloscopy, which in one study was undertaken in all sixsubjects and revealed matching ranges within normal limits,6
indicating the presence of long- and middle-wave cones ofnormal spectral sensitivity at the macula; while the absence ofpseudoprotanomaly suggests that photopigment is present atnormal optical densities in individual cone photoreceptors.These findings when taken together support the hypothesis ofa reduced number of foveal cones with otherwise normalfunctioning residual cones.
In the majority of patients identified to date, no clear under-lying molecular genetic basis has been identified. There is someevidence suggesting that in limited cases hypomorphic mutationsin genes associated with the recessive cone dysfunction syn-drome, achromatopsia, may be involved (GNAT2, CNGA3,CNGB3, and PDE6C).7,9,10 However, some of these cases argu-ably have features more in keeping with incomplete achromatop-sia per se, rather than OT. In addition, only single heterozygousmissense variants have been identified in other subjects, therebyrendering their significance currently uncertain.7,10
Recently, optical coherence tomography (OCT) has been usedin an attempt to probe the structural basis of OT. Andersen et al.7
obtained images in four individuals and found that retinal thick-ness was normal at the fovea but mildly reduced in the parafovealand perifoveal regions. A general reduction in retinal layer reflec-tivity was also observed, with no other notable abnormalities inthe appearance of the different layers.7 Vincent et al.9 examined
a single case of OT and also reported qualitatively normal OCTimages. It thus remains unclear whether the reduced cone func-tion in OT is due to a reduced number of cones or whether thecones are present but not functioning normally.
In this study we used adaptive optics retinal imaging todirectly assess the integrity of the cone photoreceptor mosaicin four patients with OT. In addition, spectral domain OCT wasused to assess the integrity of the intraretinal layers, includingquantitative analysis of the photoreceptor inner and outersegment lengths. While the phenotypic heterogeneity de-scribed extends to the cellular level, our findings demonstratean important role for high-resolution imaging of photoreceptorstructure in more accurate classification of the phenotype inOT and other related photoreceptor disorders.
PATIENTS AND METHODS
Patients
This study followed the tenets of the Declaration of Helsinki (1983Revision) and was approved by the local ethics committees. Informedconsent was obtained from all subjects after the nature and possibleconsequences of the study were explained. We examined four pa-tients, whose clinical phenotype has been previously described indetail.6,7 JC-160 and JC-161 (brothers) are patients 1 and 2, respec-tively, in the report by Michaelides et al.6 JC-071 is patient A andRB-1002 is patient E in the publication by Andersen et al.7 For refer-ence, a brief summary of the clinical findings is shown in Table 1.
Methods
Adaptive Optics Retinal Imaging. Images of the photore-ceptor mosaic were obtained using one of two identical adaptiveoptics (AO) fundus cameras (housed at the Medical College of Wiscon-sin and Buskerud University College) employing a previously described
TABLE 1. Summary of Clinical Findings
JC-160 JC-161 JC-071 RB-1002
Sex Male Male Male FemaleAge, y 15 13 47 26Nystagmus None None Yes None (history of mild
congenital nystagmus)BCVA
OD 20/30 20/40 20/50 20/30OS 20/30 20/40 20/70 20/30
Refractive errorOD �0.75/�2.75 � 10 plano/�1.50 � 25 �1.00 �5.50/�1.25 � 50OS �0.50/�2.25 � 175 �0.75/�1.50 � 180 �0.50 �5.25/�1.00 � 135
Axial length, mmOD 24.22 25.08 22.34 21.18OS 24.14 25.22 22.71 21.23
Photopic single-flash* Absent Absent 54.0 4.56Photopic flicker response† Absent Absent 51.7 AbsentRayleigh match‡ �39–44 �39–44 41–41 38–43D-15 No errors No errors No errors No errorsIshihara plates No errors No errors No errors 3 errorsCambridge Color Test§ 187 (P) 302 (P) Not done 109 (P)
136 (D) 230 (D) 101 (D)399 (T) 171 (T) 813 (T)
Genetic summary No mutations found� No mutations found� c1208G�A p.Arg403Glnheterozygous CNGB3¶
No mutations found¶
Patients JC-160 and JC-161 are brothers. BCVA, best-corrected visual acuity.* Median amplitude (5–95th percentile) � 136 mV (76–201).† Median amplitude (5–95th percentile) � 101 mV (61–154).‡ All match ranges and midpoints are within normative values for the respective devices on which they were measured.§ Normal trivector values for protan (P), deutan (D), and tritan (T) axes are 69.3, 82.4, and 113.4.11
� Genes examined: CNGA3, CNGB3, RGS9, R9AP, OPN1MW/OPN1LW array.¶ Genes examined: CNGA3, CNGB3, GNAT2, KCNV2, PDE6C, OPN1MW/OPN1LW array.
4758 Michaelides et al. IOVS, June 2011, Vol. 52, No. 7
protocol.12 In brief, in a continuous closed-loop fashion, the eye’smonochromatic aberrations were measured over a 6.4 mm pupil witha Shack-Hartmann wavefront sensor and corrected for with a 52-channel deformable mirror (Imagine Eyes, Orsay, France). Once awavefront correction was obtained, a retinal image was acquired byilluminating the retina with a 1.8° diameter, 500 ms flash of lightcontrolled by a mechanical shutter. A back-illuminated, scientific-grade, 12-bit charge-coupled device (CCD) (Cam1M100-SFT, SarnoffCorporation, Princeton, NJ) captured images of the retina; acquisitionwas triggered electronically via a computer-controlled D/A module(DT9854; DataTranslation, Marlboro, MA) and associated driver circuit.This CCD is a frame transfer camera with a light-sensitive area of1024 � 512 pixels. During each 500 msec shutter-controlled exposure,continuously triggered images of the retina were collected at a framerate of 167 Hz with a 6 msec exposure.
Images were collected at different locations across the centralfovea. After background correction, all images were registered using acustom software program (MATLAB; MathWorks, Natick, MA) andaveraged. The location of individual cones was measured using anautomated algorithm, which also allowed manual addition or subtrac-tion of cones missed or selected in error by the algorithm.13,14
Spectral Domain Optical Coherence Tomography. Forall subjects, volumetric images of the macula were obtained usinghigh-definition optical coherence tomography (Cirrus HD-OCT; CarlZeiss Meditec, Dublin, CA). Volumes were nominally 6 mm � 6 mmand consisted of 128 B scans (512 A scans/B scan). Retinal thicknesswas calculated using the built-in macular analysis software (softwareversion 5.0), which is automatically determined by measuring thedifference between the inner limiting membrane (ILM) and retinalpigment epithelium (RPE) boundaries. In three subjects (JC-071, JC-160, JC-161), high-resolution spectral domain optical coherence to-mography (SD-OCT) images of the macula were acquired (Bioptigen,Research Triangle Park, NC). High-density line scans (1000 A scans/Bscan, 100 repeated B scans) were acquired through the foveal center.Line scans were registered and averaged to reduce speckle noise in theimage as previously described.15 Volumetric images were also acquired
(1000 A scans/B scan, 100 B scans/volume) to aid in aligning the linescan to the fundus image (Fig. 1). In the fourth subject (RB-1002),high-resolution SD-OCT images of the macula were obtained usinganother SD-OCT system (Spectralis; Heidelberg Engineering, Heidel-berg, Germany). The lateral scale of all OCT data sets was corrected forinterindividual differences in axial length (Zeiss IOL Master; Carl ZeissMeditech, Dublin, CA).
Foveal pit morphology was assessed based on a previously pub-lished algorithm (MATLAB; MathWorks, Natick, MA).16,17 Longitudinalreflectivity profiles (LRPs) were obtained as previously described.18
Using the LRP analysis, we assessed the inner segment (IS) and outersegment (OS) length at the fovea. IS length was defined as the peak-to-peak distance from the external limiting membrane (ELM) to theIS/OS, while OS length was defined as the peak-to-peak distance fromthe IS/OS to the first peak in the RPE complex (RPE1).18 We haveshown previously that these definitions result in IS and OS measure-ments that match those obtained from histology.18,19 For SD-OCT layeranalysis, we analyzed a normative database collected at the MedicalCollege of Wisconsin. This database has been previously published inpart13,18 and consists of 167 individuals (72 male, 95 female), with anaverage age of 32.6 � 15.4 years (range 7 to 60 years).
RESULTS
Adaptive Optics Imaging
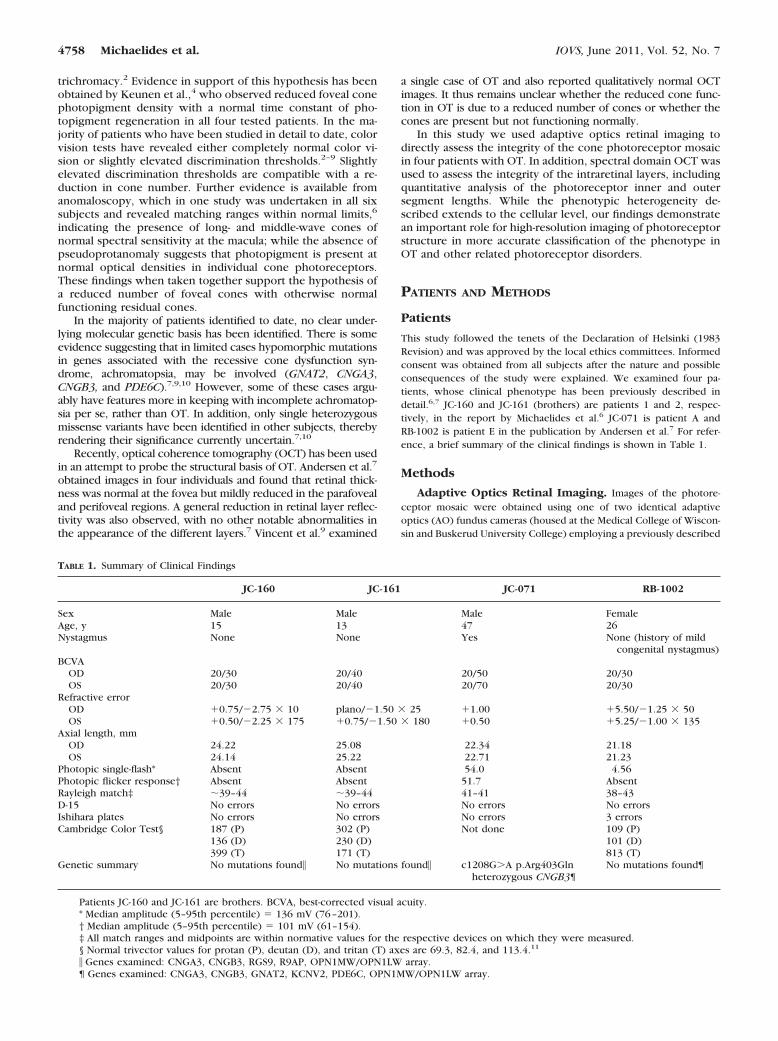
Reduced Cone Density in Oligocone Trichromacy. Thetwo brothers (JC-160 and JC-161) and adult female (RB-1002)had significantly disrupted cone mosaics (Fig. 2). The conedensity measured at �1° temporal to the fovea was markedlyreduced in all three subjects: 11,775 cones/mm2 (JC-160),25,225 cones/mm2 (JC-161), and 14,848 cones/mm2 (RB-1002)(Fig. 2). Normal cone density at this location has been shownpreviously to be 49,555 cones/mm2 (SD � 8707 cones/mm2).13 For reference, a normal age-matched retina is shownin Figure 2A, having a cone density of 41,850 cones/mm2. No
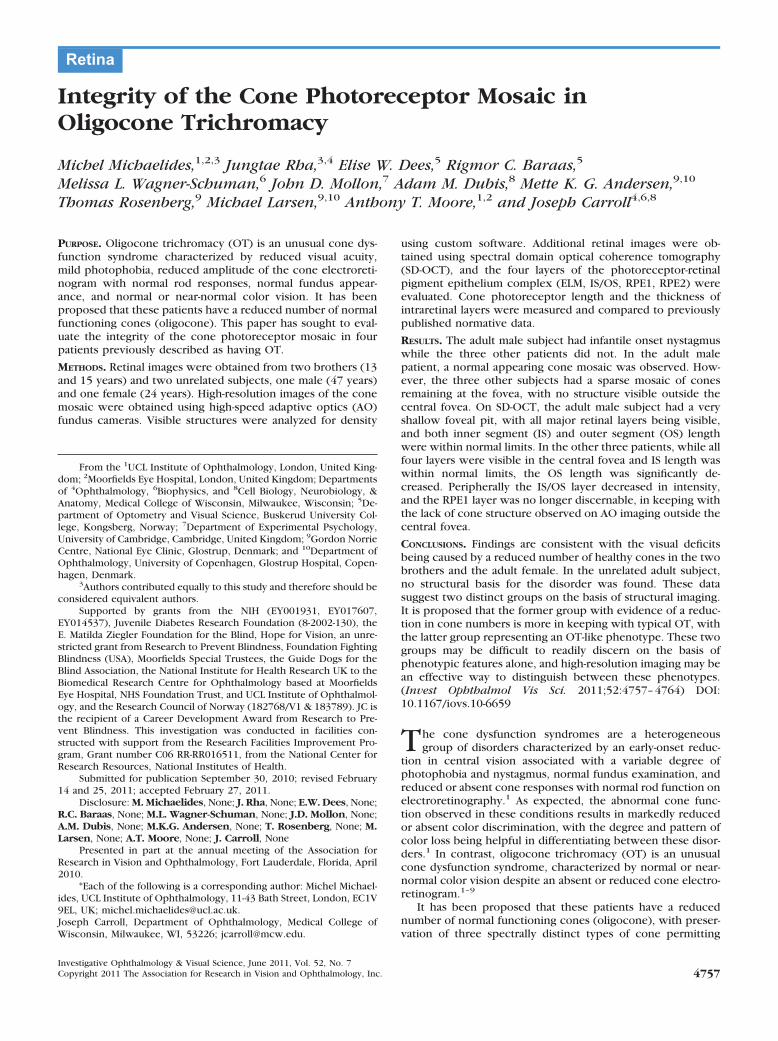
FIGURE 1. Fundus images from JC-160 (A), JC-161 (B), and RB-1002 (C)showing registration of the OCT scans(Fig. 6) and AO montages (Fig. 3).
FIGURE 2. Images of the cone pho-toreceptor mosaic at �1° temporal tothe fovea, JC-160 (B), JC-161 (C), andRB-1002 (D) compared with an age-matched normal (A). All three subjectshave dramatically disrupted mosaics.(E–H) Cone density is indicated by acolor scale overlaid onto the respec-tive mosaic images. The cone densityin these panels was 41,850 cones/mm2
(E, normal), 11,775 cones/mm2 (F, JC-160), 25,225 cones/mm2 (G, JC-161),and 14,848 cones/mm2 (H, RB-1002).Scale bar, 50 �m.
IOVS, June 2011, Vol. 52, No. 7 Cone Mosaic in Oligocone Trichromacy 4759
obvious cone structure could be seen outside the central foveain either brother or the female patient, with the imaged loca-tions having few (if any) waveguiding cones.
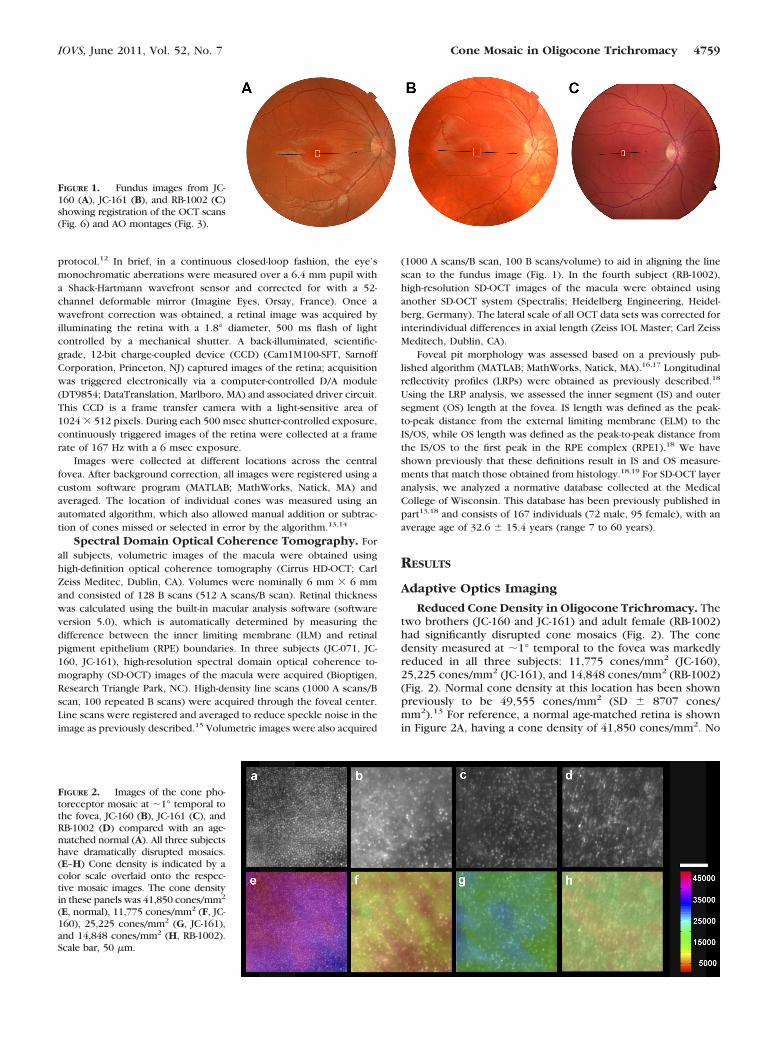
Altered Cone Density Topography in OligoconeTrichromacy. The averaged images from different locationsaround the central fovea were stitched together to producea larger montage for each of the two brothers and adultfemale (Fig. 3). Normal peak foveal cone density is 180,000cones/mm2.20 The peak cone density measured in the nor-mal retina shown in Figure 3A was 88,320 cones/mm2,measured at �0.25° (it was not possible to resolve the conesat the very center of the fovea due to an even higherdensity). In both brothers and the adult female, the conemosaic was found to be discontiguous and of dramaticallyreduced density: JC-160 (peak density � 32,143 cones/mm2), JC-161 (peak density � 29,281 cones/mm2), andRB-1002 (peak density � 27,143 cones/mm2). In addition,cone density was relatively uniform, in stark contrast to therapidly changing density profile observed in normal eyes atthis retinal location (Fig. 3A). These findings indicate that, inthese three patients, both cone density and cone distribu-tion are significantly disrupted.
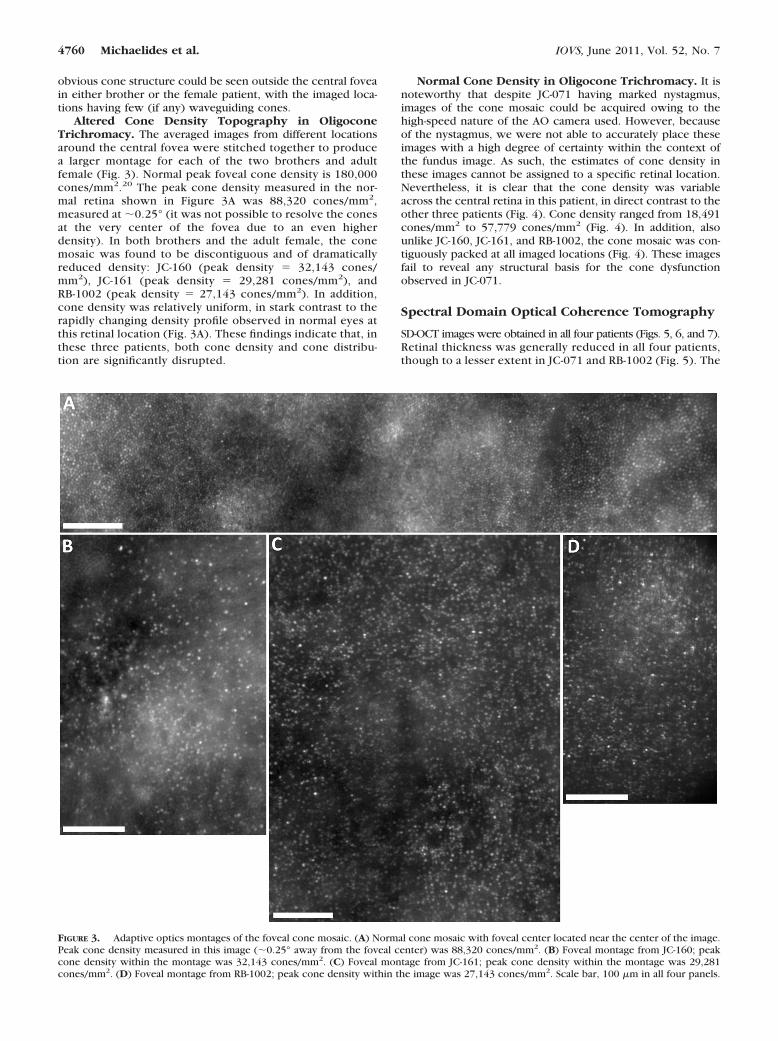
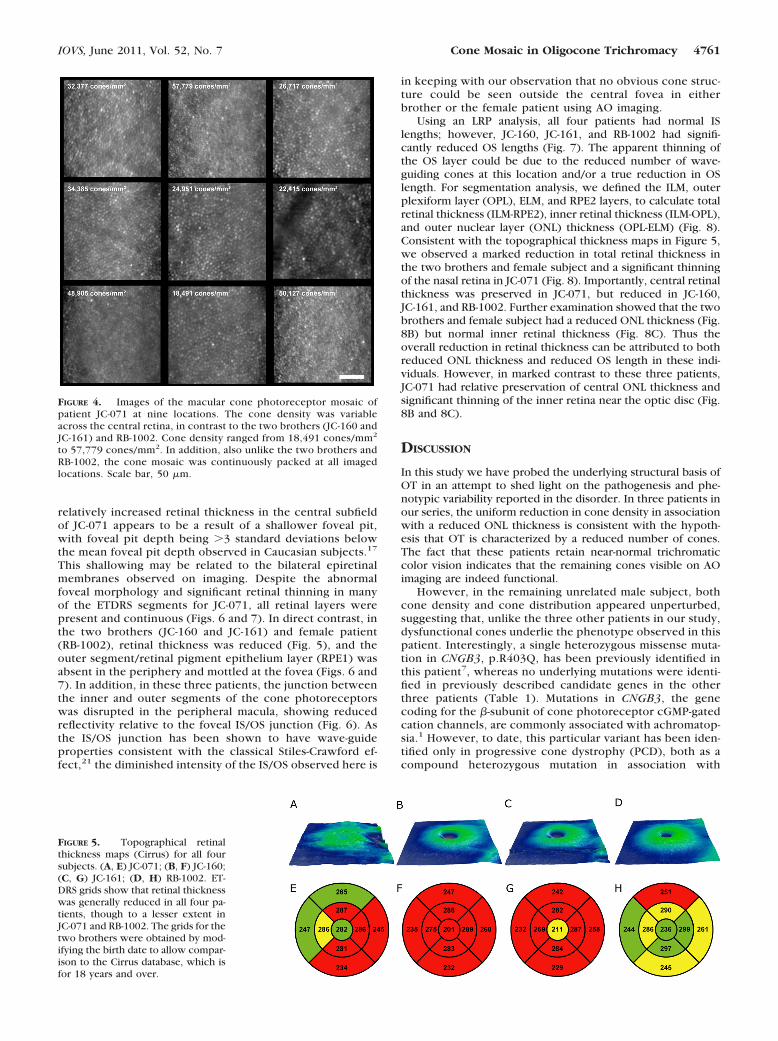
Normal Cone Density in Oligocone Trichromacy. It isnoteworthy that despite JC-071 having marked nystagmus,images of the cone mosaic could be acquired owing to thehigh-speed nature of the AO camera used. However, becauseof the nystagmus, we were not able to accurately place theseimages with a high degree of certainty within the context ofthe fundus image. As such, the estimates of cone density inthese images cannot be assigned to a specific retinal location.Nevertheless, it is clear that the cone density was variableacross the central retina in this patient, in direct contrast to theother three patients (Fig. 4). Cone density ranged from 18,491cones/mm2 to 57,779 cones/mm2 (Fig. 4). In addition, alsounlike JC-160, JC-161, and RB-1002, the cone mosaic was con-tiguously packed at all imaged locations (Fig. 4). These imagesfail to reveal any structural basis for the cone dysfunctionobserved in JC-071.
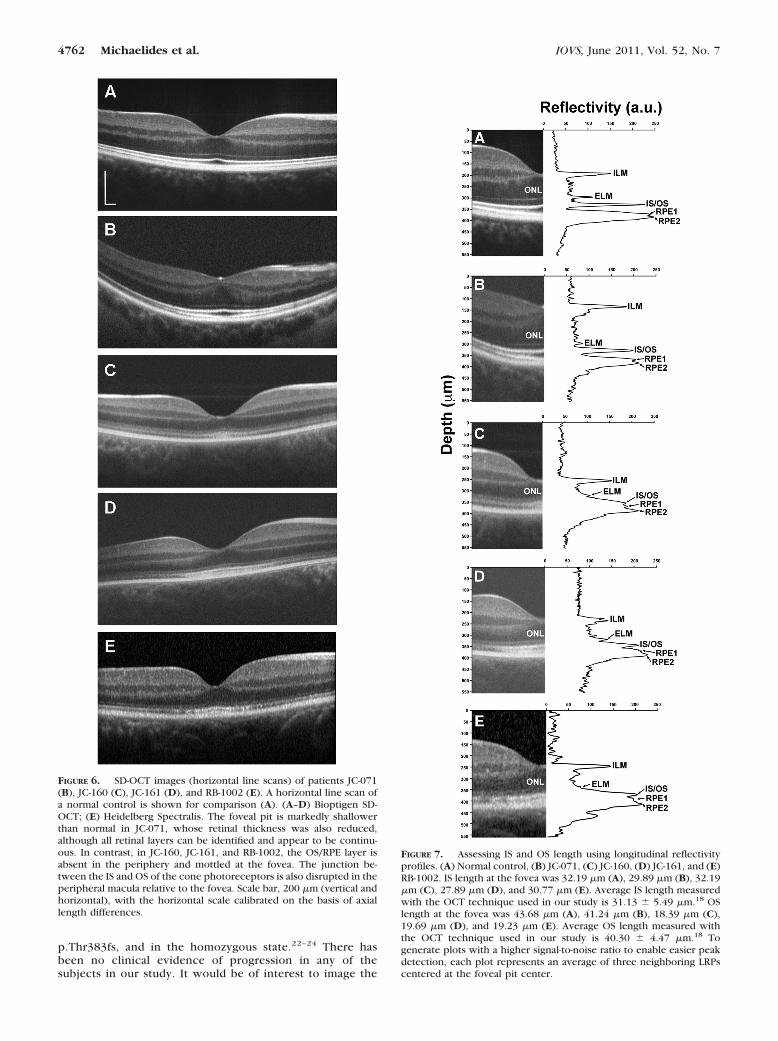
Spectral Domain Optical Coherence Tomography
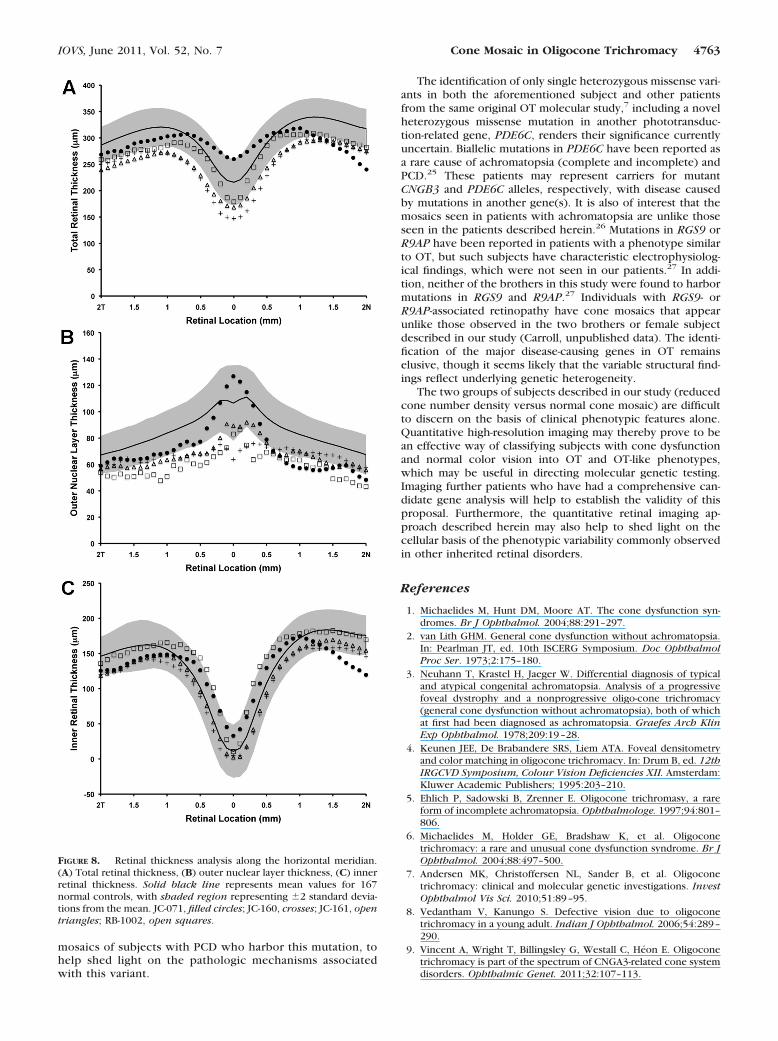
SD-OCT images were obtained in all four patients (Figs. 5, 6, and 7).Retinal thickness was generally reduced in all four patients,though to a lesser extent in JC-071 and RB-1002 (Fig. 5). The
FIGURE 3. Adaptive optics montages of the foveal cone mosaic. (A) Normal cone mosaic with foveal center located near the center of the image.Peak cone density measured in this image (�0.25° away from the foveal center) was 88,320 cones/mm2. (B) Foveal montage from JC-160; peakcone density within the montage was 32,143 cones/mm2. (C) Foveal montage from JC-161; peak cone density within the montage was 29,281cones/mm2. (D) Foveal montage from RB-1002; peak cone density within the image was 27,143 cones/mm2. Scale bar, 100 �m in all four panels.
4760 Michaelides et al. IOVS, June 2011, Vol. 52, No. 7
relatively increased retinal thickness in the central subfieldof JC-071 appears to be a result of a shallower foveal pit,with foveal pit depth being �3 standard deviations belowthe mean foveal pit depth observed in Caucasian subjects.17
This shallowing may be related to the bilateral epiretinalmembranes observed on imaging. Despite the abnormalfoveal morphology and significant retinal thinning in manyof the ETDRS segments for JC-071, all retinal layers werepresent and continuous (Figs. 6 and 7). In direct contrast, inthe two brothers (JC-160 and JC-161) and female patient(RB-1002), retinal thickness was reduced (Fig. 5), and theouter segment/retinal pigment epithelium layer (RPE1) wasabsent in the periphery and mottled at the fovea (Figs. 6 and7). In addition, in these three patients, the junction betweenthe inner and outer segments of the cone photoreceptorswas disrupted in the peripheral macula, showing reducedreflectivity relative to the foveal IS/OS junction (Fig. 6). Asthe IS/OS junction has been shown to have wave-guideproperties consistent with the classical Stiles-Crawford ef-fect,21 the diminished intensity of the IS/OS observed here is
in keeping with our observation that no obvious cone struc-ture could be seen outside the central fovea in eitherbrother or the female patient using AO imaging.
Using an LRP analysis, all four patients had normal ISlengths; however, JC-160, JC-161, and RB-1002 had signifi-cantly reduced OS lengths (Fig. 7). The apparent thinning ofthe OS layer could be due to the reduced number of wave-guiding cones at this location and/or a true reduction in OSlength. For segmentation analysis, we defined the ILM, outerplexiform layer (OPL), ELM, and RPE2 layers, to calculate totalretinal thickness (ILM-RPE2), inner retinal thickness (ILM-OPL),and outer nuclear layer (ONL) thickness (OPL-ELM) (Fig. 8).Consistent with the topographical thickness maps in Figure 5,we observed a marked reduction in total retinal thickness inthe two brothers and female subject and a significant thinningof the nasal retina in JC-071 (Fig. 8). Importantly, central retinalthickness was preserved in JC-071, but reduced in JC-160,JC-161, and RB-1002. Further examination showed that the twobrothers and female subject had a reduced ONL thickness (Fig.8B) but normal inner retinal thickness (Fig. 8C). Thus theoverall reduction in retinal thickness can be attributed to bothreduced ONL thickness and reduced OS length in these indi-viduals. However, in marked contrast to these three patients,JC-071 had relative preservation of central ONL thickness andsignificant thinning of the inner retina near the optic disc (Fig.8B and 8C).
DISCUSSION
In this study we have probed the underlying structural basis ofOT in an attempt to shed light on the pathogenesis and phe-notypic variability reported in the disorder. In three patients inour series, the uniform reduction in cone density in associationwith a reduced ONL thickness is consistent with the hypoth-esis that OT is characterized by a reduced number of cones.The fact that these patients retain near-normal trichromaticcolor vision indicates that the remaining cones visible on AOimaging are indeed functional.
However, in the remaining unrelated male subject, bothcone density and cone distribution appeared unperturbed,suggesting that, unlike the three other patients in our study,dysfunctional cones underlie the phenotype observed in thispatient. Interestingly, a single heterozygous missense muta-tion in CNGB3, p.R403Q, has been previously identified inthis patient7, whereas no underlying mutations were identi-fied in previously described candidate genes in the otherthree patients (Table 1). Mutations in CNGB3, the genecoding for the �-subunit of cone photoreceptor cGMP-gatedcation channels, are commonly associated with achromatop-sia.1 However, to date, this particular variant has been iden-tified only in progressive cone dystrophy (PCD), both as acompound heterozygous mutation in association with
FIGURE 4. Images of the macular cone photoreceptor mosaic ofpatient JC-071 at nine locations. The cone density was variableacross the central retina, in contrast to the two brothers (JC-160 andJC-161) and RB-1002. Cone density ranged from 18,491 cones/mm2
to 57,779 cones/mm2. In addition, also unlike the two brothers andRB-1002, the cone mosaic was continuously packed at all imagedlocations. Scale bar, 50 �m.
FIGURE 5. Topographical retinalthickness maps (Cirrus) for all foursubjects. (A, E) JC-071; (B, F) JC-160;(C, G) JC-161; (D, H) RB-1002. ET-DRS grids show that retinal thicknesswas generally reduced in all four pa-tients, though to a lesser extent inJC-071 and RB-1002. The grids for thetwo brothers were obtained by mod-ifying the birth date to allow compar-ison to the Cirrus database, which isfor 18 years and over.
IOVS, June 2011, Vol. 52, No. 7 Cone Mosaic in Oligocone Trichromacy 4761
p.Thr383fs, and in the homozygous state.22–24 There hasbeen no clinical evidence of progression in any of thesubjects in our study. It would be of interest to image the
FIGURE 7. Assessing IS and OS length using longitudinal reflectivityprofiles. (A) Normal control, (B) JC-071, (C) JC-160, (D) JC-161, and (E)RB-1002. IS length at the fovea was 32.19 �m (A), 29.89 �m (B), 32.19�m (C), 27.89 �m (D), and 30.77 �m (E). Average IS length measuredwith the OCT technique used in our study is 31.13 � 5.49 �m.18 OSlength at the fovea was 43.68 �m (A), 41.24 �m (B), 18.39 �m (C),19.69 �m (D), and 19.23 �m (E). Average OS length measured withthe OCT technique used in our study is 40.30 � 4.47 �m.18 Togenerate plots with a higher signal-to-noise ratio to enable easier peakdetection, each plot represents an average of three neighboring LRPscentered at the foveal pit center.
FIGURE 6. SD-OCT images (horizontal line scans) of patients JC-071(B), JC-160 (C), JC-161 (D), and RB-1002 (E). A horizontal line scan ofa normal control is shown for comparison (A). (A–D) Bioptigen SD-OCT; (E) Heidelberg Spectralis. The foveal pit is markedly shallowerthan normal in JC-071, whose retinal thickness was also reduced,although all retinal layers can be identified and appear to be continu-ous. In contrast, in JC-160, JC-161, and RB-1002, the OS/RPE layer isabsent in the periphery and mottled at the fovea. The junction be-tween the IS and OS of the cone photoreceptors is also disrupted in theperipheral macula relative to the fovea. Scale bar, 200 �m (vertical andhorizontal), with the horizontal scale calibrated on the basis of axiallength differences.
4762 Michaelides et al. IOVS, June 2011, Vol. 52, No. 7
mosaics of subjects with PCD who harbor this mutation, tohelp shed light on the pathologic mechanisms associatedwith this variant.
The identification of only single heterozygous missense vari-ants in both the aforementioned subject and other patientsfrom the same original OT molecular study,7 including a novelheterozygous missense mutation in another phototransduc-tion-related gene, PDE6C, renders their significance currentlyuncertain. Biallelic mutations in PDE6C have been reported asa rare cause of achromatopsia (complete and incomplete) andPCD.25 These patients may represent carriers for mutantCNGB3 and PDE6C alleles, respectively, with disease causedby mutations in another gene(s). It is also of interest that themosaics seen in patients with achromatopsia are unlike thoseseen in the patients described herein.26 Mutations in RGS9 orR9AP have been reported in patients with a phenotype similarto OT, but such subjects have characteristic electrophysiolog-ical findings, which were not seen in our patients.27 In addi-tion, neither of the brothers in this study were found to harbormutations in RGS9 and R9AP.27 Individuals with RGS9- orR9AP-associated retinopathy have cone mosaics that appearunlike those observed in the two brothers or female subjectdescribed in our study (Carroll, unpublished data). The identi-fication of the major disease-causing genes in OT remainselusive, though it seems likely that the variable structural find-ings reflect underlying genetic heterogeneity.
The two groups of subjects described in our study (reducedcone number density versus normal cone mosaic) are difficultto discern on the basis of clinical phenotypic features alone.Quantitative high-resolution imaging may thereby prove to bean effective way of classifying subjects with cone dysfunctionand normal color vision into OT and OT-like phenotypes,which may be useful in directing molecular genetic testing.Imaging further patients who have had a comprehensive can-didate gene analysis will help to establish the validity of thisproposal. Furthermore, the quantitative retinal imaging ap-proach described herein may also help to shed light on thecellular basis of the phenotypic variability commonly observedin other inherited retinal disorders.
References
1. Michaelides M, Hunt DM, Moore AT. The cone dysfunction syn-dromes. Br J Ophthalmol. 2004;88:291–297.
2. van Lith GHM. General cone dysfunction without achromatopsia.In: Pearlman JT, ed. 10th ISCERG Symposium. Doc OphthalmolProc Ser. 1973;2:175–180.
3. Neuhann T, Krastel H, Jaeger W. Differential diagnosis of typicaland atypical congenital achromatopsia. Analysis of a progressivefoveal dystrophy and a nonprogressive oligo-cone trichromacy(general cone dysfunction without achromatopsia), both of whichat first had been diagnosed as achromatopsia. Graefes Arch KlinExp Ophthalmol. 1978;209:19–28.
4. Keunen JEE, De Brabandere SRS, Liem ATA. Foveal densitometryand color matching in oligocone trichromacy. In: Drum B, ed. 12thIRGCVD Symposium, Colour Vision Deficiencies XII. Amsterdam:Kluwer Academic Publishers; 1995:203–210.
5. Ehlich P, Sadowski B, Zrenner E. Oligocone trichromasy, a rareform of incomplete achromatopsia. Ophthalmologe. 1997;94:801–806.
6. Michaelides M, Holder GE, Bradshaw K, et al. Oligoconetrichromacy: a rare and unusual cone dysfunction syndrome. Br JOphthalmol. 2004;88:497–500.
7. Andersen MK, Christoffersen NL, Sander B, et al. Oligoconetrichromacy: clinical and molecular genetic investigations. InvestOphthalmol Vis Sci. 2010;51:89–95.
8. Vedantham V, Kanungo S. Defective vision due to oligoconetrichromacy in a young adult. Indian J Ophthalmol. 2006;54:289–290.
9. Vincent A, Wright T, Billingsley G, Westall C, Heon E. Oligoconetrichromacy is part of the spectrum of CNGA3-related cone systemdisorders. Ophthalmic Genet. 2011;32:107–113.
FIGURE 8. Retinal thickness analysis along the horizontal meridian.(A) Total retinal thickness, (B) outer nuclear layer thickness, (C) innerretinal thickness. Solid black line represents mean values for 167normal controls, with shaded region representing �2 standard devia-tions from the mean. JC-071, filled circles; JC-160, crosses; JC-161, opentriangles; RB-1002, open squares.
IOVS, June 2011, Vol. 52, No. 7 Cone Mosaic in Oligocone Trichromacy 4763
10. Rosenberg T, Baumann B, Kohl S, et al. Variant phenotypes ofincomplete achromatopsia in two cousins with GNAT2 gene mu-tations. Invest Ophthalmol Vis Sci. 2004;45:4256–4262.
11. Ventura DF, Silveira LCL, Rodrigues AR, et al. Preliminary normsfor the Cambridge Colour Test. In: Mollon JD, Pokorny J, Kno-blauch K, eds. Normal & Defective Colour Vision. Oxford: OxfordUniversity Press;2003:331–339.
12. Rha J, Schroeder B, Godara P, Carroll J. Variable optical activationof human cone photoreceptors visualized using a short coherencelight source. Opt Lett. 2009;34:3782–3784.
13. Carroll J, Baraas RC, Wagner-Schuman M, et al. Cone photorecep-tor mosaic disruption associated with Cys203Arg mutation in theM-cone opsin. Proc Natl Acad Sci U S A. 2009;106:20948–20953.
14. Li KY, Roorda A. Automated identification of cone photoreceptorsin adaptive optics retinal images. J Opt Soc Am A Opt Image SciVis. 2007;24:1358–1363.
15. Tanna H, Dubis AM, Ayub N, et al. Retinal imaging using commer-cial broadband optical coherence tomography. Br J Ophthalmol.2010;94:372–376.
16. Dubis AM, McAllister JT, Carroll J. Reconstructing foveal pit mor-phology from optical coherence tomography imaging. Br J Oph-thalmol. 2009;93:1223–1227.
17. Wagner-Schuman M, Dubis AM, Nordgren RN, et al. Race- andsex-related differences in retinal thickness and foveal pit morphol-ogy. Invest Ophthalmol Vis Sci. 2011;52:625–634.
18. McAllister JT, Dubis AM, Tait DM, et al. Arrested development:high-resolution imaging of foveal morphology in albinism. VisionRes. 2010;50:810–817.
19. Hoang QV, Linsenmeier RA, Chung CK, Curcio CA. Photoreceptorinner segments in monkey and human retina: mitochondrial den-sity, optics, and regional variation. Vis Neurosci. 2002;19:395–407.
20. Curcio CA, Sloan KR, Kalina RE, Hendrickson AE. Human photo-receptor topography. J Comp Neurol. 1990;292:497–523.
21. Gao W, Cense B, Zhang Y, Jonnal RS, Miller DT. Measuring retinalcontributions to the optical Stiles-Crawford effect with opticalcoherence tomography. Opt Express. 2008;16:6486–6501.
22. Michaelides M, Aligianis IA, Ainsworth JR, et al. Progressive conedystrophy associated with mutation in CNGB3. Invest OphthalmolVis Sci. 2004;45:1975–1982.
23. Thiadens AA, Roosing S, Collin RW, et al. Comprehensive analysisof the achromatopsia genes CNGA3 and CNGB3 in progressivecone dystrophy. Ophthalmology. 2010;117:825–830.
24. Michaelides M, Hardcastle AJ, Hunt DM, Moore AT. Progressivecone and cone-rod dystrophies: phenotypes and underlying mo-lecular genetic basis. Surv Ophthalmol. 2006;51:232–258.
25. Thiadens AA, den Hollander AI, Roosing S, et al. Homozygositymapping reveals PDE6C mutations in patients with early-onsetcone photoreceptor disorders. Am J Hum Genet. 2009;85:240–247.
26. Carroll J, Choi SS, Williams DR. In vivo imaging of the photore-ceptor mosaic of a rod monochromat. Vision Res. 2008;48:2564–2568.
27. Michaelides M, Li Z, Rana NA, et al. Novel mutations and electro-physiologic findings in RGS9- and R9AP-associated retinal dysfunc-tion (Bradyopsia). Ophthalmology. 2010;117:120–127.
4764 Michaelides et al. IOVS, June 2011, Vol. 52, No. 7