in the 1970s the united states experienced inflation rates that
TRANSCRIPT
Which Price Index Should aCentral Bank Employ?
Roy H. Webb
I n the 1970s the United States experienced inflation rates that were highrelative to any other decade in the nation’s peacetime experience. Duringthat decade the consumer price index doubled, rising at a 7.4 percent
average annual rate. At one point in the early 1980s, the CPI inflation rateexceeded 14 percent for a full year. When inflation was that high, the choice ofwhich price index to employ to calculate inflation was a secondary concern forpolicymakers. As Figures 1 and 2 will indicate later in this article, commonlyused price indexes gave the same message: inflation in the 1970s and early1980s was relatively high.
The situation now is different. At low rates of inflation, differences amongprice indexes become more important. While it is difficult to imagine thedifference between 10.0 and 10.5 percent inflation affecting monetary policy,the difference between 1.0 and 1.5 percent inflation could lead to differentpolicy choices. Yet different price indexes can easily yield inflation rates thatdiffer by that 50 basis-point magnitude. Thus in this period of low inflation,the choice of which price index to use has become an important issue formonetary policy analysis.
This article begins with the premise that a central bank places a highweight on keeping inflation low. Several central banks have adopted a formalinflation target by making a public commitment to achieving a particular goalfor inflation, as discussed in Bernanke et al. (1999), for example. Centralbanks in other countries, including the United States, while not setting for-mal inflation targets, have nonetheless made it clear that low inflation is animportant policy concern.
The author gratefully acknowledges helpful comments from Huberto Ennis, Marvin Good-friend, Andreas Hornstein, and Thomas Humphrey. The views and opinions expressed in thisarticle are solely those of the author and should not be attributed to any other person or theFederal Reserve Bank of Richmond or the Federal Reserve System.
Federal Reserve Bank of Richmond Economic Quarterly Volume 90/2 Spring 2004 63
64 Federal Reserve Bank of Richmond Economic Quarterly
Based on that premise, this article explores several considerations thatlead to the choice of which price index to employ for setting monetary pol-icy. Several widely used price indexes are discussed, and the author presentsevidence that favors one particular index.
1. WHICH PRICE INDEX?
First Choices
Several grounds are given that could be used to choose which price index toemploy. As this article progresses, the set of possible choices will be narroweduntil one remains.
Credibility
A central bank seeking to maintain low inflation must at some point acquirecredibility for being willing and able to take the actions necessary to achieveits goals. As part of a strategy for low inflation, then, that central bank mustalso employ a price index that itself has credibility. That is, the price indexshould be the result of a well-grounded statistical program that is not subjectto political manipulation. The United States has many credible price indexesproduced by the Bureau of Labor Statistics and the Bureau of Economic Anal-ysis.
Breadth
The next choice is between a narrow price index, which includes prices ofonly a few items, or a broad price index with many items. Some analystshave advocated a narrow index of prices of a few raw materials on the groundsthat those prices can respond rapidly to changes in monetary conditions. Well-known examples include commodity price indexes that have been published bythe Commodity Research Bureau and the Journal of Commerce. An importantdrawback is that those prices can also respond rapidly to supply shifts ofindividual items, and as a result, movements in the index can reflect relativeprice changes rather than general price changes. Thus central banks have longgiven more prominence to broad price indexes in their policy deliberationsand have chosen broad price indexes for inflation targets.
Sector
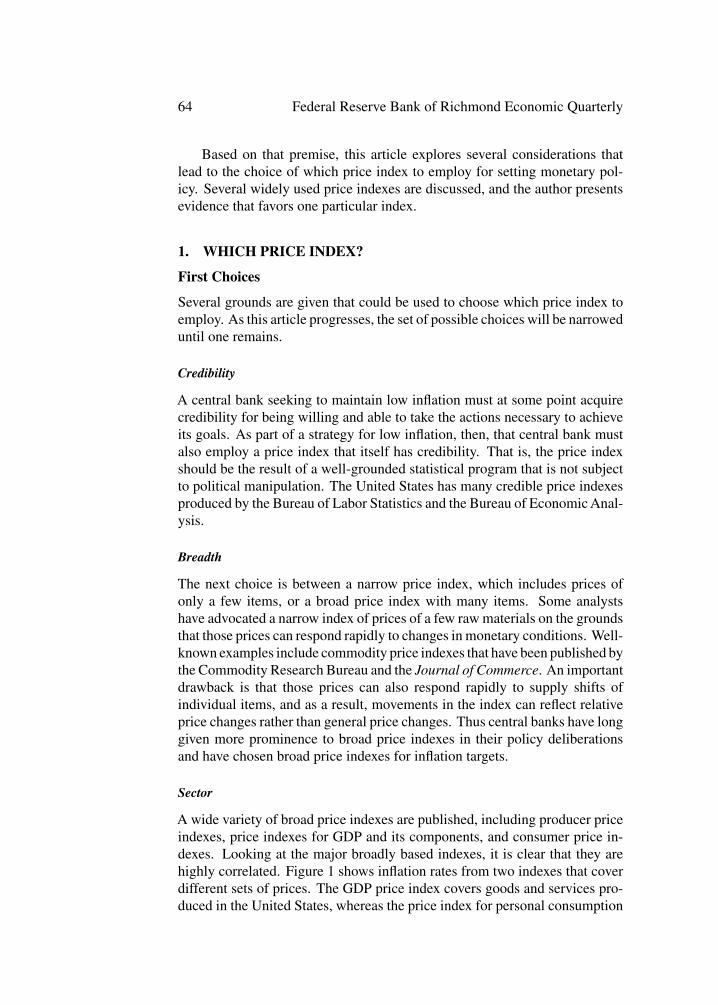
A wide variety of broad price indexes are published, including producer priceindexes, price indexes for GDP and its components, and consumer price in-dexes. Looking at the major broadly based indexes, it is clear that they arehighly correlated. Figure 1 shows inflation rates from two indexes that coverdifferent sets of prices. The GDP price index covers goods and services pro-duced in the United States, whereas the price index for personal consumption
R. H. Webb: Which Price Index? 65
Figure 1 Inflation Rates
expenditure (PCEPI) covers consumer spending in the GDP accounts. Sinceinflation rates calculated from those indexes are very similar, the choice canbe based on the need to acquire and maintain credibility with the public. Itis probable that members of the public are more likely to accept a monetarystrategy for low inflation if they can relate it to their everyday experience.Thus a measure of consumer prices that is believed to be relevant to individualhouseholds would be a natural choice. Consequently, every central bank thathas an explicit inflation target has chosen a measure of consumer prices.
2. THE CHOICE BETWEEN TWO CONSUMER INDEXES
In the United States, the best-known measure of consumer prices is the Con-sumer Price Index (CPI)1 published by the Bureau of Labor Statistics. It has a
1 Actually two versions of the CPI are published. The CPI-U covers all urban consumers,whereas the CPI-W covers urban wage and salary workers. In practice, the two indexes givevirtually identical inflation rates, and thus the two will not be distinguished in the text. Thefigures in this article include the CPI-U.
66 Federal Reserve Bank of Richmond Economic Quarterly
long track record and is widely used as an inflation index in government spend-ing and taxing programs as well as in private contracts. The CPI’s credibilityhas been enhanced by efforts of its producers to make a wealth of technicalinformation readily available to the public on the details of constructing theindex. The Bureau of Labor Statistics conducts an active research programthat has helped the index adapt to changes in the economy and improve overtime.
Setting the index apart from similar indexes in most other countries, theCommissioner of Labor Statistics has made a public commitment to usingeconomic theory to guide important decisions that are made in constructingthe index (Abraham 1997). Specifically, the concept of a cost-of-living indexis now used as an organizing principle for making decisions concerning theproduction of the CPI. A cost-of-living index can be defined as the minimumexpenditure required in a particular period to attain the same standard of livingas was achieved in a reference period, divided by actual expenditure in thereference period. Economic theory tells how a cost-of-living index can be cal-culated from a consumer’s preferences (for example, Diewert 1987), and theresulting index will correctly convert nominal income to real income. Statis-tical agencies in other countries have apparently shied away from employingcost-of-living methodology because it can be difficult to apply in real-worldsituations. The alternative, though, is that indexes constructed without thatdiscipline can be hard to interpret. For example, the price of owner-occupiedhousing is the largest single component, by far, in the CPI; yet the price ofowner-occupied housing is totally omitted in consumer price indexes in sev-eral other countries. That omission could not be defended in a cost-of-livingframework.2
Although the cost-of-living concept helps its producers answer practicalquestions that arise as the index is produced, the CPI is not a cost-of-livingindex. The Bureau of Labor Statistics did not scrap the existing CPI whenit decided to use the cost-of-living index as a benchmark. Instead, therehave been incremental improvements to the index since then. In comparingthe current CPI with an ideal cost-of-living index, the single most importantdifference is the formula that is used to construct the CPI. That formula doesnot account for the possibility of consumers responding to changing relativeprices by changing their expenditure patterns. Later in this article there will bea more detailed discussion of the CPI’s formula, and the appendix contains a
2 The perennial question of whether to include asset prices in the CPI can be evaluated in thecontext of a cost-of-living index. That approach indicates that the price of services of consumerdurables should be in the index and that there are two valid approaches to estimating the servicesof consumer durables. One is a Jorgenson (1963) user-cost formula, and the other estimatesan imputed flow of services. The latter is currently used in the CPI for owner-occupied housing,which estimates an owner’s equivalent rent from rental prices of similar structures. Importantly,the consumption of the services of a durable asset is independent of the method of financing theasset’s purchase. That financing decision is thus outside the scope of a cost-of-living index.
R. H. Webb: Which Price Index? 67
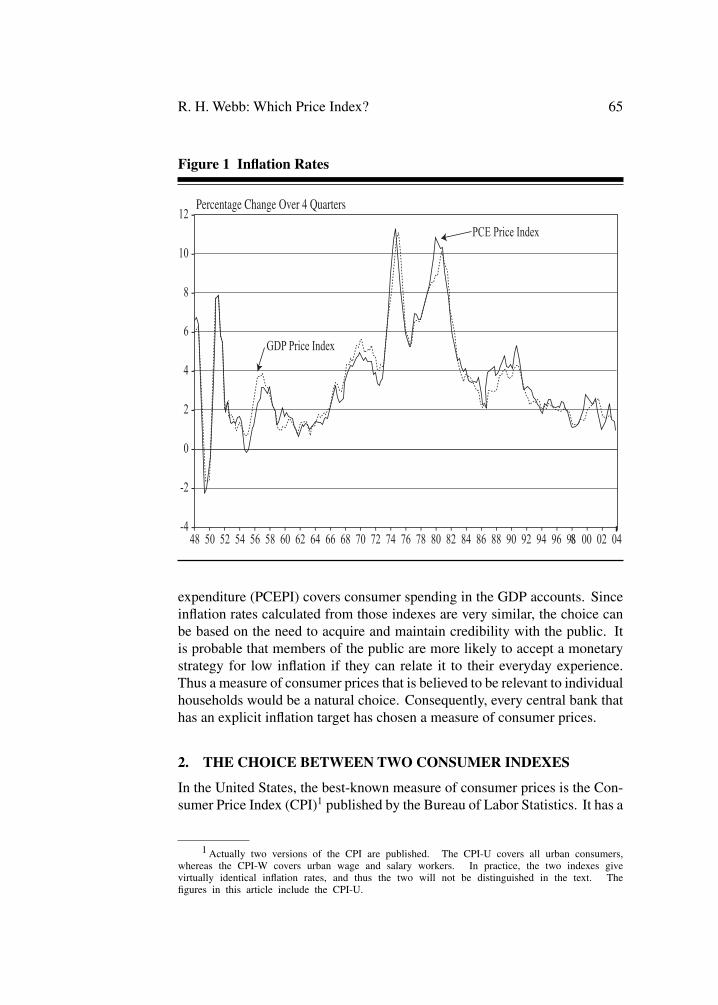
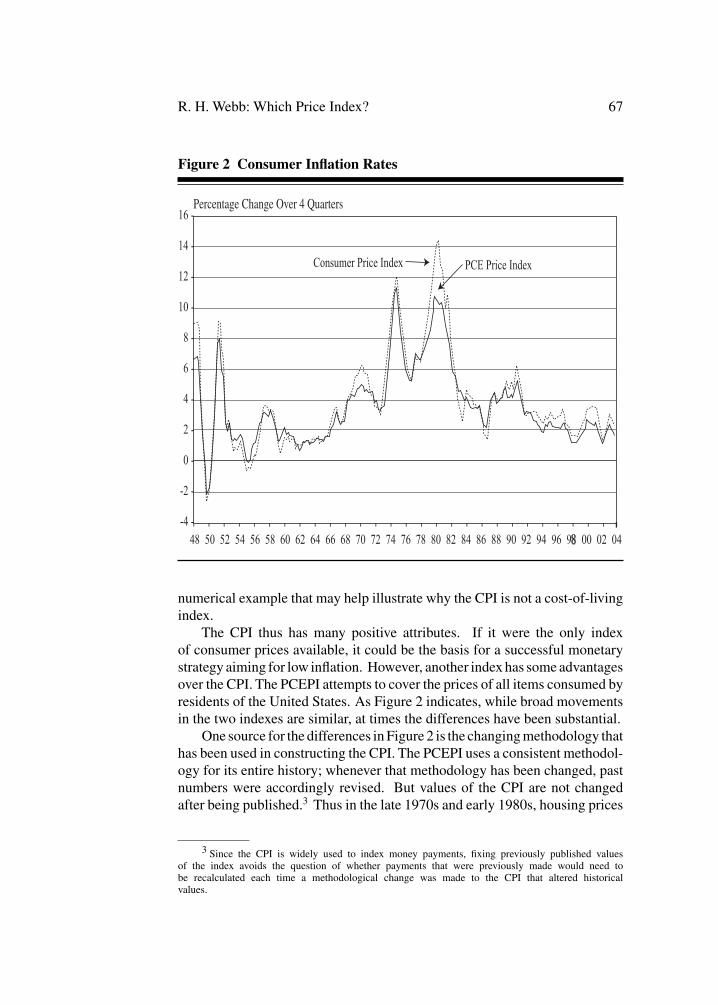
Figure 2 Consumer Inflation Rates
numerical example that may help illustrate why the CPI is not a cost-of-livingindex.
The CPI thus has many positive attributes. If it were the only indexof consumer prices available, it could be the basis for a successful monetarystrategy aiming for low inflation. However, another index has some advantagesover the CPI. The PCEPI attempts to cover the prices of all items consumed byresidents of the United States. As Figure 2 indicates, while broad movementsin the two indexes are similar, at times the differences have been substantial.
One source for the differences in Figure 2 is the changing methodology thathas been used in constructing the CPI. The PCEPI uses a consistent methodol-ogy for its entire history; whenever that methodology has been changed, pastnumbers were accordingly revised. But values of the CPI are not changedafter being published.3 Thus in the late 1970s and early 1980s, housing prices
3 Since the CPI is widely used to index money payments, fixing previously published valuesof the index avoids the question of whether payments that were previously made would need tobe recalculated each time a methodological change was made to the CPI that altered historicalvalues.
68 Federal Reserve Bank of Richmond Economic Quarterly
were overstated in the CPI, and inflation rates calculated using the CPI for thatperiod were consequently overstated (Blinder 1980).4
More relevant for current monetary policy, there are other differences be-tween the two indexes that affect current values of the indexes. Most importantis that while both indexes are weighted averages of prices, two different for-mulas are used to calculate those averages. The CPI, a Laspeyres index, usesweights for individual prices that represent an item’s importance in consumerexpenditure at a fixed point in time (in 2003, the weights were based on av-erage spending in the years 1999 and 2000). In symbols, the exact formulais
CPIt =∑
i qi,bpi,t∑i qi,bpi,b
, (1)
where CPIt is the value of the consumer price index at time t , qi,b is thequantity of item i consumed in the base period b (b �= t), pi,t is the price ofitem i in period t , and pi,b is the price of item i in the base period. In contrast,the PCEPI is a Fisher Ideal index, the geometric average of a Laspeyres indexlike the CPI and an index that uses current values of spending for the weightson prices. In symbols,
PCEPIt =√ ∑
i qi,t−1pi,t∑i qi,t−1pi,t−1
∑i qi,tpi,t∑
i qi,tpi,t−1, (2)
where qi,t is the quantity of item i consumed in period t . Note that the formulafor the PCEPI includes data on current period quantities qi,t that are omittedfrom the formula for the CPI. Also, the PCEPI does not have a fixed baseperiod; instead, the index values are calculated using data from the currentperiod and the previous period. Since there is not a designated base period,the index number for one particular period will be set to 100. The formula in(2) is then used to link adjacent periods together.
The difference in formulas is important because the CPI does not rou-tinely allow for changing expenditure patterns in response to relative pricechanges. This could be particularly important when technical progress resultsin falling prices of goods such as computers, cellular phones, and televisionsets. Failure to account for increasing spending on items with falling priceswould create a bias in the index that would lead it to rise more rapidly thanthe true cost of living. The Fisher Ideal index, however, allows for changingexpenditure patterns in a manner that allows it to approximate a cost-of-livingindex especially well and is thus known as a superlative index (Diewert 1987).
4 At that time, the CPI attempted to measure an average price of items purchased by arepresentative consumer, not the cost of living. It therefore included the purchase price of owner-occupied housing plus a measure of mortgage interest rates. By the mid-1980s, after the damagewas done and the index had overstated inflation, the current approach of pricing the service flowfrom owner-occupied housing was adopted.
R. H. Webb: Which Price Index? 69
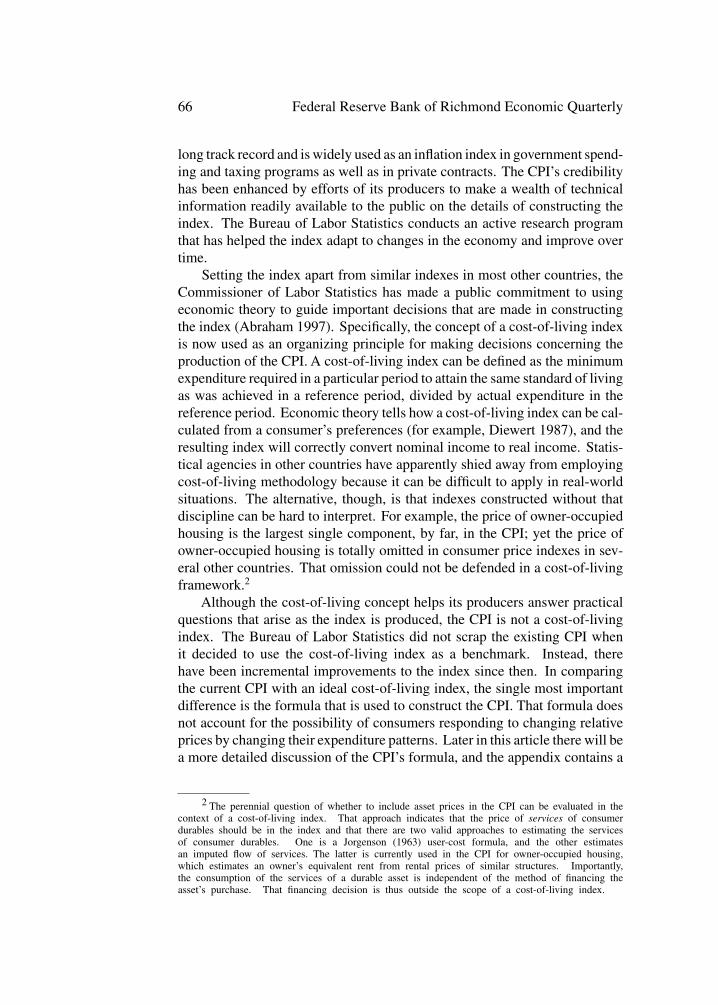
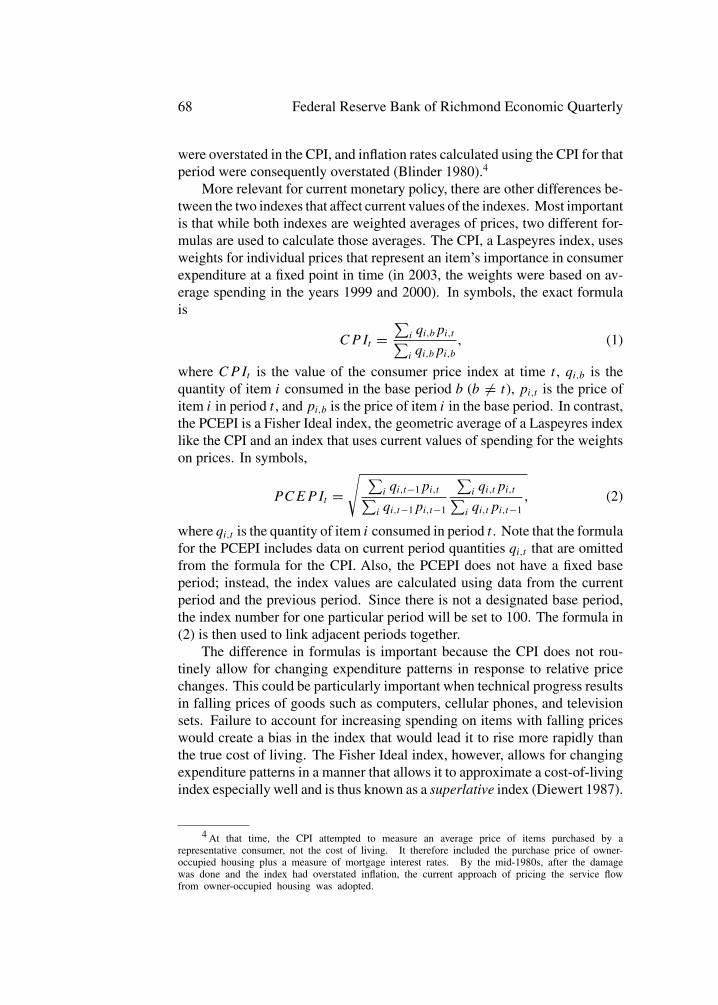
Figure 3 Consumer Inflation Rates
The appendix illustrates the construction of a Laspeyres index and a Fisherindex in a simple case with a large change in the pattern of expenditure.
It may seem that the difference in formulas would be an example of esoterictrivia; however, at low inflation rates, the magnitude of the difference can belarge when compared with the absolute rate of inflation. In order to focuson the difference between a superlative index and a Laspeyres index, it ishelpful to consider briefly a new index from the Bureau of Labor Statistics.The Chained-CPI (C-CPI) uses exactly the same price information as the CPIbut is based on another type of superlative index, a Tornquist index.5 Likethe Fisher index, the Tornquist index includes information on current periodquantities and thereby allows for changing expenditure patterns. Figure 3shows inflation rates calculated using the CPI, the C-CPI, and the PCEPI.
5 The formula for the Tornquist Index is∏
i (pi,t
pi,t−1)(si,t−1+si,t
2 ) where si is the expenditure
share of item i, that is, qipi∑j qj pj
. Note that current expenditures enter the formula through the
expenditure share term.
70 Federal Reserve Bank of Richmond Economic Quarterly
There is a noticeable difference between the CPI and the other two indexes.Over this period (the entire period for which the C-CPI is available), theaverage difference between the CPI and C-CPI was 44 basis points, which isentirely attributable to the different formulas. The average difference betweenthe two superlative indexes was only 5 basis points.
In addition to the different aggregating formulas, the prices and relativeimportance of various items can differ between the CPI and PCEPI. Most ofthe individual prices in the PCEPI are identical to those in the CPI. The mostnotable exception is spending for medical services, where the PCEPI usesinformation from producer price indexes. Moreover, a few items are coveredin one index but not another. Also, the relative importance of a particular itemcan differ considerably between the two indexes, since completely differentsources of information are used to determine relative importance. The PCEPIuses information to construct GDP, such as economic census data and industrytrade data. The CPI uses information from periodic Consumer ExpenditureSurveys. Some analysts (such as Lebow and Rudd 2001) have viewed theweights in the PCEPI as likely to be more accurate. In the survey data usedfor the CPI, a member of a household is asked to give information on spendingof all members of the household. If items accounting for a small portion ofspending tend to be missed or forgotten in the household survey, then thefraction of spending for big-ticket items would tend to be biased upward. Notsurprisingly, then, owner-occupied housing has a much larger weight in theCPI than in the PCEPI. To quantify the effect of different weights, Lebow andRudd compared the published CPI with an alternative CPI using PCE weights.From 1987 to 2000, the average inflation rate was 10 basis points lower whenusing the PCE weights.
Accordingly, due to the clearly superior formula for computing the indexand the probably superior item weights, changes in the PCEPI should providea better estimate of the true cost of living.
Limitations of Price Indexes
It is important to consider some limitations of both indexes. In a dynamiceconomy, the items available for purchase are constantly changing, with newitems being introduced continuously, some old items being improved, andother old items disappearing from the market. Accounting for new items is achallenge for producers of price indexes. For example, the Boskin Commis-sion Report (1996) noted that although there were 36 million cellular phonesin use at the time of the report, there was no price of cell phones in the CPI.Compounding the problem is the typical product cycle, in which a new goodinitially sells for a relatively high price, but as economies of scale are realizedand new competitors enter the market, the price falls rapidly before eventuallyleveling out. If the price of a new item does not enter a price index promptly,
R. H. Webb: Which Price Index? 71
then the interval of a rapidly falling price can be missed entirely, and the priceindex would therefore overstate inflation. Since the Boskin report was written,the Bureau of Labor Statistics has reduced—but not eliminated—the time ittakes for a new item to enter the CPI.
A related difficulty is accounting for quality change. If the greater durabil-ity or improved functionality of a product is not taken into account, then a priceindex will overstate the cost of living. And if quality improvements routinelyoutweigh quality deterioration, inflation can be overstated. Some detailedstudies of particular products have found that accounting for quality changewould have made a sizeable difference in recorded prices. Based on many ofthese studies, the Boskin Commission Report estimated that there was a 60basis-point upward bias in CPI inflation rates at that time, due to new productsand quality change. A more recent estimate by Lebow and Rudd puts the biasat 37 basis points. It should be emphasized that these estimates are subject toa large amount of imprecision. If it were easy for analysts to disentangle theportion of price changes that reflect quality change, it would probably be partof routine price index calculation already. At this time, improving estimatesof quality change is an ongoing challenge for statistical agencies.
3. CORE INDEXES
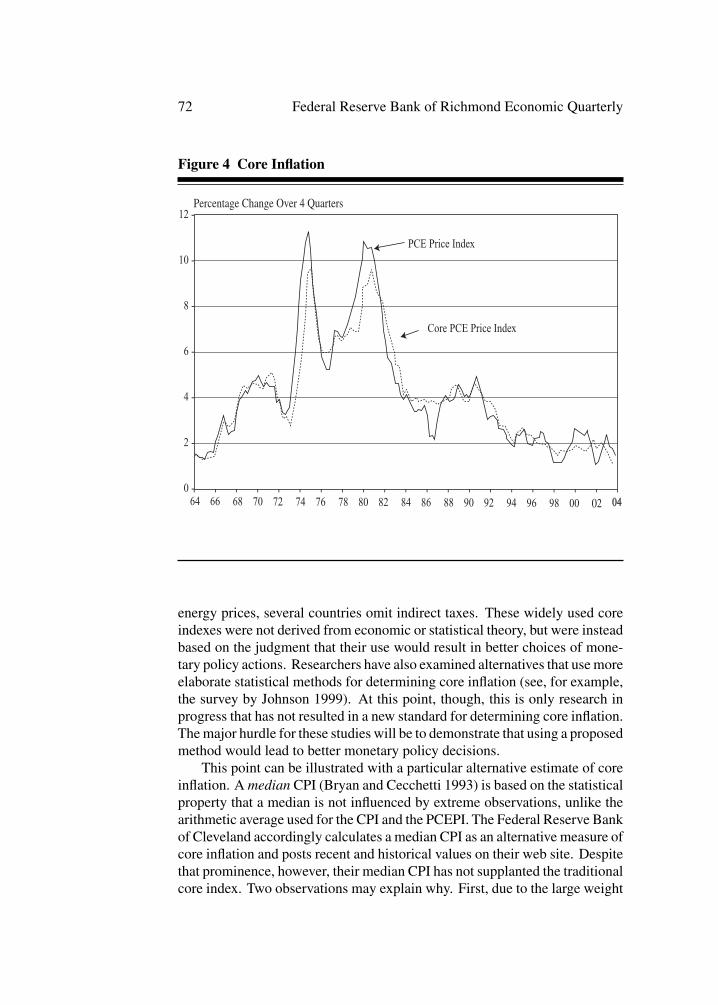
A final choice is between the PCEPI and a measure of core inflation. Forpurposes of monetary policy, it would not be desirable to respond to temporarychanges in measured inflation that are likely to be reversed. Thus policymakersin many countries pay particular attention to a core price index that excludessome items that account for a significant amount of short-run volatility in theindex but do not have much effect on the long-run trend. For several decades,inflation analysts in the United States have focused on a core price index thatexcludes food and energy prices. As illustrated in Figure 4, the core PCEPI isless volatile than the overall index; using the core index reduces the varianceof inflation rates in that figure by 31 percent. Most importantly, the core indexomits some significant fluctuations in the overall index that were soon reversedbut could have led to inappropriate monetary policy actions. For example, thecore index did not decline significantly in 1986 and did not rise significantly in2002–2003. In 1986, crude oil prices fell sharply and led to lower retail energyprices. In the latter episode, as energy prices increased sharply in responseto the approach of war in Iraq, the overall index signaled rising inflation, butthe core index signaled low, falling inflation. Finally, removal of energy andfood prices has had a small effect on the long-run trend. Over the 40-yearperiod illustrated in Figure 4, the PCEPI increased at a 4.05 percent annualrate, whereas the core PCE index increased at a 3.95 percent rate.
Most of the countries with full inflation targets have taken a similar ap-proach and employed a core index that omits a few items. Besides food and
72 Federal Reserve Bank of Richmond Economic Quarterly
Figure 4 Core Inflation
0
energy prices, several countries omit indirect taxes. These widely used coreindexes were not derived from economic or statistical theory, but were insteadbased on the judgment that their use would result in better choices of mone-tary policy actions. Researchers have also examined alternatives that use moreelaborate statistical methods for determining core inflation (see, for example,the survey by Johnson 1999). At this point, though, this is only research inprogress that has not resulted in a new standard for determining core inflation.The major hurdle for these studies will be to demonstrate that using a proposedmethod would lead to better monetary policy decisions.
This point can be illustrated with a particular alternative estimate of coreinflation. A median CPI (Bryan and Cecchetti 1993) is based on the statisticalproperty that a median is not influenced by extreme observations, unlike thearithmetic average used for the CPI and the PCEPI. The Federal Reserve Bankof Cleveland accordingly calculates a median CPI as an alternative measure ofcore inflation and posts recent and historical values on their web site. Despitethat prominence, however, their median CPI has not supplanted the traditionalcore index. Two observations may explain why. First, due to the large weight
R. H. Webb: Which Price Index? 73
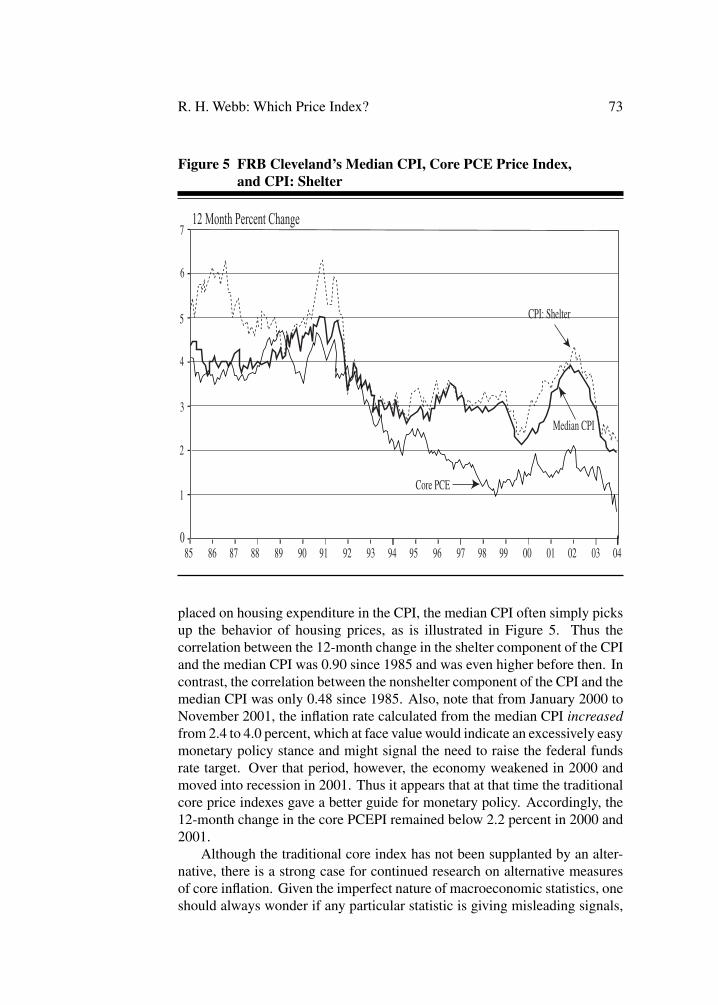
Figure 5 FRB Cleveland’s Median CPI, Core PCE Price Index,and CPI: Shelter
placed on housing expenditure in the CPI, the median CPI often simply picksup the behavior of housing prices, as is illustrated in Figure 5. Thus thecorrelation between the 12-month change in the shelter component of the CPIand the median CPI was 0.90 since 1985 and was even higher before then. Incontrast, the correlation between the nonshelter component of the CPI and themedian CPI was only 0.48 since 1985. Also, note that from January 2000 toNovember 2001, the inflation rate calculated from the median CPI increasedfrom 2.4 to 4.0 percent, which at face value would indicate an excessively easymonetary policy stance and might signal the need to raise the federal fundsrate target. Over that period, however, the economy weakened in 2000 andmoved into recession in 2001. Thus it appears that at that time the traditionalcore price indexes gave a better guide for monetary policy. Accordingly, the12-month change in the core PCEPI remained below 2.2 percent in 2000 and2001.
Although the traditional core index has not been supplanted by an alter-native, there is a strong case for continued research on alternative measuresof core inflation. Given the imperfect nature of macroeconomic statistics, oneshould always wonder if any particular statistic is giving misleading signals,
74 Federal Reserve Bank of Richmond Economic Quarterly
and the core PCEPI is no exception. Having well-studied alternatives couldthus be valuable to policymakers if at any time the traditional core index wereto be in doubt.
4. CONCLUSION
This article studies which price index to use for determining monetary policyactions. The best choice for the United States is currently the core price indexfor personal consumption expenditure. From 1996 to the end of 2003, thefour-quarter change in that index remained within a narrow range, 0.9 to 2.1percent. Like other macroeconomic statistics, price indexes are not precisiontools. Allowing for about a half percentage point of upward bias in the reportedinflation rate, the true cost of living has been rising very slowly for severalyears.
APPENDIX
A numerical example may help clarify the effects of different index formulas.Assume that there are two goods, apples and bananas, denoted with super-scripts a and b. There are two time periods, 0 and 1. Money income is y, andutility is u. I assume, y0 = $12.00, pa
0 = pb0 = $1 and u = √
qaqb, wherep represents a price and q is a quantity. Given the initial conditions, utilityis maximized at a level of 6.0 when 6 apples and 6 bananas are consumed.Using the equations in the text, both a Laspeyres index L and a Fisher indexF will have values of 1.00 in period 0.
Now, let y1 = $12.00, pa1 = $1.50, pb
1 = $0.50, and we can ask if realincome has risen, fallen, or remained unchanged. If we divide money incomeby a cost-of-living index, the real income rises if and only if utility rises.Given the utility function and new prices, the optimal quantities are qa
1 = 4and qb
1 = 12, and utility rises to approximately 6.93. In other words, theprice changes have allowed utility to increase significantly once quantities areallowed to adjust.
Consider first the Laspeyres formula given in equation 1; substituting thevalues above gives L1 = 6×1.5+6×0.5
6×1+6×1 = 1.00, and, therefore, real income inperiod 1 is $12.00. Although utility rose, real income, calculated by using aLaspeyres index, did not change. Now use the Fisher formula of equation 2:
F1 =√
6×1.5+6×0.56×1+6×1 × 4×1.5+12×0.5
4×1+12×1 =√
34 , and real income is approximately
$13.86. Thus the latter index correctly leads to rising real income with risingutility.
R. H. Webb: Which Price Index? 75
Finally, for comparison we can construct a cost-of-living index. We candefine the value as exactly 1.00 in period 0. The utility function has theproperty that utility is maximized when exactly half of income is spent on eachitem. Using that knowledge, the minimum expenditure in period 1 that achievesthe utility level of 6 is 3
√12, or approximately $10.39, which purchases
approximately 3.46 apples and 10.39 bananas. Thus the cost-of-living indexfor period 1 is 3
√12
12 , which in this case is exactly equal to the Fisher index. Inboth cases, a utility-maximizing consumer would buy more bananas, whichbecame less expensive and, correspondingly, fewer apples, which becamemore expensive. Both the cost-of-living index and the Fisher index correctlycaptured that changing expenditure pattern.
REFERENCES
Abraham, Katharine G. 1997. Testimony before the Subcommittee onHuman Resources, House Committee on Government Reform andOversight, April 30. Available at http://www.bls.gov/news.release/cpi.br043097.brief.htm (accessed April 6, 2004).
Bernanke, Ben S., Thomas Laubach, Frederic S. Mishkin, and Adam S.Posen. 1999. Inflation Targeting: Lessons from the InternationalExperience. Princeton: Princeton University Press.
Blinder, Alan. 1980. “The Consumer Price Index and the Measurement ofRecent Inflation.” Brookings Papers on Economic Activity 2: 539–65.
Boskin, Michael J., Ellen Dullberger, Robert J. Gordon, Zvi Griliches, andDale Jorgenson. 1996. “Toward a More Accurate Measure of the Cost ofLiving.” Final Report to the Senate Finance Committee from theAdvisory Commission to Study the Consumer Price Index, December 4.Available at http://www.ssa.gov/history/reports/boskinrpt.html (accessedApril 6, 2004).
Bryan, Michael F., and Stephen G. Cecchetti. 1993. “Measuring CoreInflation.” Federal Reserve Bank of Cleveland Working Paper 9304.
Diewert, W. E. 1987. “Index Numbers.” The New Palgrave: A Dictionary ofEconomics. Ed. John Eatwell, Murray Milgate, and Peter Newman. NewYork: Stockton Press 2: 767–80.
Johnson, Marianne. 1999. “Core Inflation: A Measure of Inflation for PolicyPurposes.” Bank for International Settlements Conference Paper.
76 Federal Reserve Bank of Richmond Economic Quarterly
Available at http://www.bis.org/publ/bisp05 p4.pdf (accessed April 6,2004).
Jorgenson, Dale W. 1963. “Capitol Theory and Investment Behavior.”American Economic Review 53 (May): 247–59.
Lebow, David E., and Jeremy B. Rudd. 2001. “Measurement Error in TheConsumer Price Index: Where Do We Stand?” Federal Reserve Board ofGovernors, Finance and Economics Discussion Series, 2001-61.