inflation targeting and communication: it pays off to read inflation reports
TRANSCRIPT

WP/08/234
Inflation Targeting and Communication: It Pays Off to Read Inflation Reports
Aleš Bulíř, Kateřina Šmídková, Viktor Kotlán,
and David Navrátil


© 2008 International Monetary Fund WP/08/234
IMF Working Paper IMF Institute
Inflation Targeting and Communication: It Pays Off to Read Inflation Reports
Prepared by Aleš Bulíř, Kateřina Šmídková, Viktor Kotlán, and David Navrátil1
Authorized for distribution by Enrica Detragiache
October 2008
Abstract
This Working Paper should not be reported as representing the views of the IMF. The views expressed in this Working Paper are those of the author(s) and do not necessarily represent those of the IMF or IMF policy. Working Papers describe research in progress by the author(s) and are published to elicit comments and to further debate.
Inflation-targeting central banks have a respectable track record at explaining their policy actions and corresponding inflation outturns. Using a simple forward-looking policy rule and an assessment of inflation reports, we provide a new methodology for the empirical evaluation of consistency in central bank communication. We find that the three communication tools—inflation targets, inflation forecasts, and verbal assessments of inflation factors contained in quarterly inflation reports—provided a consistent message in five out of six observations in our 2000–05 sample of Chile, the Czech Republic, Hungary, Poland, Thailand, and Sweden.
JEL Classification Numbers: E31, E43, E47, E58 Keywords: Inflation targeting, forecasting, monetary policy, transparency, emerging markets Authors’ E-Mail Address: [email protected], [email protected], [email protected],
1 The paper was started when A. Bulíř was on sabbatical leave at the Research Department of the Czech National Bank, and Project A4/03 was supported as a part of the CNB research program. K. Šmídková is Head of Research at the CNB, V. Kotlán is Head of Institutional Asset Management at Česká Spořitelna, and David Navrátil is Director of Economic Analyses at Česká Spořitelna. Jiří Škop, Rungporn Roengpitya, and Radu Păun provided excellent research assistance. We are indebted to Tamim Bayoumi, Alina Carare, Martin Čihák, Enrica Detragiache, Jan Filáček, Alexander Hoffmaister, Tomáš Holub, Martin Mandel, and Zdeněk Tůma for helpful suggestions. The paper benefited from seminars in the International Monetary Fund and Czech National Bank.

2
Contents Page
I. Why Inflation Targeting? .......................................................................................................3
II. Inflation Targeting and Communication ...............................................................................6 A. Central Bank Communication and Inflation Forecasts .............................................6 B. The Public .................................................................................................................7
III. Methodology and Sample Selection ..................................................................................10 A. Methodology ...........................................................................................................12 B. Sample Selection and Data......................................................................................14
IV. Empirical Findings.............................................................................................................15 A. Summary of Results ................................................................................................16 B. “The Central Bank that Cried Wolf”.......................................................................18 C. Robustness Checks..................................................................................................20
V. Conclusions: Is the Glass Half Empty or Half Full?...........................................................21 Tables 1. Inflation Targeters: Sample Characteristics.........................................................................15 2. Breakdown of Communication Results, Sample Average, 2000–05...................................16 3. Clarity of Communication, Sample Averages, 2000–05 .....................................................17 4. Clarity of Communication, Individual Countries, 2000–05 ................................................18 5. Clarity of Communication, the 2–Year Forecast Horizon, 2000–05...................................21 Figures 1. Inflation and Its Determinants, 2000-05 ................................................................................5 2. Inflation Forecasts, Policymaking, and Communication Under Conditional ........................8 3. The Public’s Scrutiny of Central Bank Communication .....................................................11 4. Monetary Policy Communication: 2000-05.........................................................................19 5. Clarity of Communication: Robustness Checks ..................................................................20 References................................................................................................................................22 Annex.......................................................................................................................................25

3
“[…] major element of best-practice inflation targeting is the communications strategy.”
Ben S. Bernanke (2003), Fed Chairman
“It is important for the public to understand the central bank’s actions, to the greatest extent possible […] in order for monetary policy to be most effective.”
Michael Woodford (2005)
Given the constraints on their scarce time, observation suggests that people follow simple rules of thumb.
Mervyn King (2005)
I. WHY INFLATION TARGETING?
The proliferation of inflation targeting has been attributed to the regime’s superior management of inflation expectations, either because inflation has stayed closer to targets in inflation-targeting banks than in other banks or because the former banks have efficiently communicated why it has deviated from these targets. Efficiently communicating central banks seem to manage to anchor medium-term inflation expectations to target (Svensson, 1997; Woodford, 2005; Eusepi and Preston, 2007).2 Indeed, central banks have referred to inflation targets and forecasts, typically conveyed through inflation reports, as their communication tools. This paper asks whether we can square these arguments with the recent experience of inflation targeting in emerging market countries.
Our analysis of central bank communication tools vis-à-vis the public confirms that inflation targeting permits a fine appreciation of monetary policy decisions. We find that while inflation targets were missed frequently, the majority of these misses could be understood from scrutinizing the publicly available communication tools: policy actions, inflation targets, inflation forecasts, and verbal assessments of inflation factors in inflation reports. Only in about one-sixth of all monetary policy decisions the individual communication tools contradicted each other and these decisions remained inconsistent.
Our analysis of communication under inflation targeting relies on published inflation reports. Understanding monetary policy decisions from the outside of the central bank has been always a difficult task, but inflation reports, the key communication tool under inflation targeting, should make such understanding a good deal easier. To the extent the empirical assessments of the consistency and clarity of central bank communication have been rare and do not provide a unified, replicable framework, we developed a new methodology. 2 The other argument in favor of inflation targeting, namely, explicit accountability of central bank governors for inflation developments, was never embraced by emerging-market countries. Inflation outturns were specified initially in governors’ contracts in New Zealand and other countries. However, this approach has weakened over time and explicit inflation contracts have been quietly dropped (Roger and Stone, 2005). Central bankers in emerging market countries are at best required to explain publicly deviations of inflation from targets, and most of them are not even required to do that, invoking so-called escape clauses if they deem that pursuing the inflation target too aggressively would affect output and employment adversely.

4
The testable implication of “inflation targeting as a communication device” is that anyone reading these reports should be able to understand the central bank’s decision-making process, especially in situations where such an understanding is difficult to obtain from observing policy actions, inflation targets, and forecasts only. The quality of monetary policy understanding is likely to have two components: (i) the formal quality of inflation reports, and (ii) the track record of connecting monetary policy decisions with inflation developments, both actual and expected. The formal quality of inflation reports has been scrutinized in detail and, predictably, some central banks communicate and write better than others (Blinder and others, 2001, Fracasso, Genberg, and Wyplosz, 2003; Roger and Stone, 2005). The attention paid to the track record of inflation targeting and the consistency of inflation reports with other communication tools have, however, been only skin deep.
The papers to date assessing inflation performance under inflation targeting have focused mostly on comparing inflation targets with inflation outcomes, with the predictable result of rather poor performance (Jonáš and Mishkin, 2003; Roger and Stone, 2005; Mishkin and Schmidt-Hebbel, 2007; and Filáček, 2007). We replicate this finding: in our sample inflation was more than one percentage point higher/lower than the target in more than one-half of all the annual observations, see the first panel in Figure 1. Moreover, inflation was mostly below the target—the central banks were undershooting their targets during 2000–05. Our sample covers five emerging market countries—Chile, the Czech Republic, Hungary, Poland, and Thailand—and the control country of Sweden. We use quarterly data from 2000 to 2005, with the exception of Hungary, which started with inflation targeting only in 2001.
The evidence suggests that inflation has deviated from the target on the account of the cyclical position—the estimated output gaps were mostly negative in all countries, with the exception of Sweden; see the second panel in Figure 1. In addition, the sample inflation reports recognized a number of correlated counter-inflationary factors during 2001–03 (third panel). It appears that while the central banks foresaw the undershooting of the inflation targets and lowered their policy rates in 2002/2003, they either could not or decided not to offset these shocks fully.
The main contribution of this paper is to employ all available information from published inflation reports, namely, inflation forecasts in the policy horizon, and verbal assessments of inflation factors. Regarding the former, by presenting an inflation forecast—conditional on a preset path of interest rates—below/above target, the central bank effectively signals its commitment to change the policy rate at some point. Regarding the latter, the signal sent through the forecast is augmented and modified by communicating various inflation factors, some of which may already be incorporated into the inflation forecast and some of which may not. For example, the policymakers may conclude that the domestic currency will appreciate/depreciate vis-à-vis its trading partners by more than assumed by the forecast, thus offsetting the need for a higher/lower policy rate indicated by the forecast.
We interpret both inflation forecasts and verbal assessments of inflation factors in the context of a simple forward-looking policy rule that is our approximation of how the public expects policymakers to react to the forecasts. Policymakers reacted less predictably than expected: we have found policy rates moving in a direction opposite to what was suggested by the

5
Figure 1. Inflation and Its Determinants, 2000-05
Source: Authors' calculations.
1/ Simple difference, in percentage points. A negative value indicates below-target inflation.2/ Actual GDP minus the Hodrick-Prescott filter; annualized, in percent of GDP.3/ 4-quarter average of three set of factors; positive and negative values indicate pro- and counter-inflation directions of inflation factors, respectively. The averages contain demand, supply, and external environment factors discussed in quarterly inflation reports.4/ One-year-ahead inflation forecast predicated on the policy rate change, using the the benchmark calibration ofthe Batini-Haldane policy rule; in percentage points. A negative/positive values indicate inflation forecast below/above the target given the change in the policy rate.
Inflation - Target 1/
-5
-4
-3
-2
-1
0
1
2
3
2000 2001 2002 2003 2004 2005
CZCH
HUPOSWTH
Implied Forecast Update 4/
-4
-2
0
2
4
2000 2001 2002 2003 2004 2005
CZCHHUPOSW
TH
GDP Gap 2/
-5
-4
-3
-2
-1
0
1
2
3
2000 2001 2002 2003 2004 2005
CZ CH HU POSW TH
Verbal Assessmentsof Inflation Factors 3/
-4
-3
-2
-1
0
1
2
3
4
2000 2001 2002 2003 2004 2005
CZ CH HU POSW TH

6
inflation forecast in about one-half of all the observations and explanations of these “monetary policy surprises” were communicated through verbal assessments of inflation factors in the inflation reports. The verbal assessments are, however, labor-intensive to collect and their incorporation into an empirical analysis poses special problems. They are difficult to quantify and compare over time, as inflation reports generally do not provide explicit numerical estimates of their impact. (We can certainly say that after reading, categorizing, and tabulating verbal assessments from some 140 inflation reports.) We admit also potential measurement errors with this approach. For example, if some shock is mentioned repeatedly, such as fiscal concerns in Poland, would it necessarily have a more serious or longer-lasting impact on inflation than a one-off increase in international oil prices? Do the authors of inflation reports suffer from reporting fatigue and do they refrain from repeating the same risk time and again?
Our analysis suggests that central bank communication— inflation targets, forecasts, and verbal assessments of inflation factors—worked reasonably well in our sample. Irrespective of missed inflation targets and forecasts, the majority of policy actions could be understood from the publicly available information. Only about one in six policy decisions was inconsistent in the sense that the inflation forecast, policy action, and verbal assessment were not aligned. About one-third of all monetary policy decisions were surprising in the sense that end-period inflation differed from the forecast by more than 1 percentage point despite overall consistent communication. These results are conditional on the following assumptions: (i) inflation reports contain all relevant information, (ii) this information was interpreted without systematic measurement errors, and (iii) policymakers did not have a disinflation bias, that is, they indeed targeted the rate of inflation they said they would target.
The paper is organized as follows. First, we outline the methodological issues involved in the assessment of inflation-targeting communication and describe our sample. Second, we discuss our results. Finally, we conclude and present the policy implications of our findings. Detailed country notes are presented in the Annex.
II. INFLATION TARGETING AND COMMUNICATION
Inflation targeting and central bank communication with the public have commonly been explained in the context of Svensson’s (1997) “inflation-forecast targeting.” Little testing has been done, however, on how comprehensible the individual components of central bank communication are. Do the verbal assessments complement the model-based inflation forecasts? Overall, does central bank communication leave the public well-informed about the future path of monetary policy? We answer these two questions by applying a simple forward-looking policy rule in the spirit of Batini and Haldane (1999) to our sample countries. This rule is a representation of how the public reconciles observed policy actions with inflation targets and official inflation forecasts. If reconciliation is difficult, the public then searches for additional explanations in the inflation reports.
A. Central Bank Communication and Inflation Forecasts
When central banks base their conditional inflation forecasts on preset paths of interest rates, they communicate the steps taken to keep inflation on target along the diagram shown in

7
Figure 2 (Bernanke and Woodford, 1997). They do so with the objective of stabilizing the public’s inflation expectations around the inflation target.3 The diagram stipulates that if the inflation forecast—conditional on unchanged rates—is outside of the target zone, the central bank is expected either to adjust its policy rate in order to bring inflation closer to the target, or to explain its inactivity. One would think that the diagram would need to be amended for unconditional forecasts, as they return inflation to target on account of rule-based policy rate adjustments during the forecast period. Thus, under unconditional forecasts, the expected policy adjustments are indicated directly, and the public would not need to scrutinize the inflation forecasts to derive an indication of future policy direction.
Direct communication of the future policy stance is a practical issue for our analysis—one central bank in our sample, the Czech National Bank (CNB), switched from conditional to unconditional forecasts in 2002/03, roughly in the middle of our 2000–05 sample. However, it turns out that the 4-quarter inflation forecasts were rarely on target during the period under consideration—the inflation forecast was more than 1 percentage point away from the target in 2002–04—and we argue that these inflation-to-target deviations were still interpreted by the public as an indication of future policy changes. First, the 4-quarter inflation forecasts are made for a shorter period than the full transmission period of 6 to 8 quarters. Unconditional inflation forecasts converge to the target in a longer horizon, after the rule-based policy rate changes had time to work through the system. Second, the Czech inflation was influenced by indirect-tax and administrative price shocks, the monetary policy relevance of which was difficult to communicate (see Annex for additional details). Consequently, we do not modify our diagram for unconditional forecasts of the CNB.
B. The Public
The inflation forecast directly affects public behavior as long as the central bank is expected to act on this forecast according to a strategy it laid out earlier. For example, if the central bank lets it be known that it follows a forward-looking strategy of inflation-forecast targeting, the public—that is, financial market analysts or specialist journalists, who disseminate their analysis through the usual channels—will try to reconcile the published forecasts with monetary policy decisions using a policy rule that approximates such a strategy. If they do not understand policy decisions from looking at the inflation forecast and targets, they will open the inflation reports and try to find out which additional inflation factors may have been considered by the policymakers. To this end, it should suffice to make use of information contained in the inflation reports: (i) the inflation forecasts and targets, (ii) the monetary policy decisions, and (iii) the verbal assessments of various current and expected inflation factors. The rules used by the public to understand the policymakers need not be identical to the rules used by the policymakers; indeed, the former are likely to be much simpler than the latter (King, 2005).
3 Direct comparisons of inflation expectation surveys in individual countries are complicated by the fact that these surveys ask different questions to different groups of respondents. See Holub and Hurník (forthcoming).

8
Figure 2. Inflation Forecasts, Policymaking, and Communication Under Conditional Forecasts 1/
1/ An inflation forecast predicated on a fixed or preset path of interest rates. Three-step reconciliation
The public reconciles policy decisions with a rule in three steps, in the end verifying whether the central bank communicated its decisions clearly. First, the public scrutinizes the inflation forecast and target for the suggested direction of monetary policy, anticipating that forecasts projecting inflation above/below target signal monetary tightening/loosening in the period ahead. Second, actual policy rate changes either validate or contradict the signal extraction based on the inflation-forecast. If the observed policy decisions correspond to the anticipated direction of monetary policy, the public’s expectations about the rule-based policymaking are validated, and the public’s expectations of inflation are likely to converge toward the inflation target (King, 2005). If, however, the observed policy changes contradict the signal extraction, the public will look for clarification of the monetary policy surprise.

9
Third, verbal assessments of current and future inflation factors contained in the inflation reports provide precisely such clarification. Unlike forecasts and policy rate adjustments, which are in a numerical format, verbal assessments are necessarily vaguer than policy actions. On the one hand, verbal assessments describe quantifiable information that may not be explicitly modeled in the forecasting framework, say, labor market conditions or global financial conditions. However, the policymaker may envision some impact of these developments on domestic inflation. On the other hand, verbal assessments reflect unquantifiable factors associated with the published forecast and the policymaker may reflect his uneasiness with the forecast by verbal qualifications (Šmídková, 2003). The policymaker’s qualifications thus mirror uncertainty about the data, forecasting model, or both. Most central banks employ a diverse group of policymakers, typically as a result of staggered nominations and time-limited contracts, and individual policymakers tend to emphasize different models or inflation factors in their deliberations.
In practice, three sets of events can occur. First, the central bank consistently communicates economic developments and its policy response and the public correctly anticipates the eventual inflation outturn. Second, the central bank provides a consistent explanation of its (otherwise appropriate) policies, but unanticipated shock(s) push inflation above/below the forecast and the public is surprised by the eventual inflation outcome. This is obviously a less favorable outturn. However, the public is likely to understand—owing to the central bank’s consistent communication—that the unanticipated shocks were the cause of the deviation from the target and central bank’s credibility will not be damaged. Third, the least favorable outturn is when the central bank’s inflation forecasts, policy moves, and verbal explanations are mutually inconsistent and the public is confused throughout the whole process. One need not to ask whether the public is surprised or not by the eventual inflation outturn—with inconsistent communication it cannot establish meaningful inflation expectations.
The above framework allows us to differentiate between inflation surprises and policy confusion. Surprises relate the eventual inflation outcome to otherwise consistent, rule-appropriate central bank communication. Such surprises, if infrequent and distributed on both sides of the inflation forecast, may not affect negatively the central bank’s reputation as the public knows that shocks happen and that it takes anywhere between 2 and 8 quarters for a monetary policy change to get transmitted into domestic prices. Moreover, surprises can be convincingly explained ex post (Banco Central do Brasil, 2003).
Confusion, in contrast, results from inconsistent communication, which does not allow the public to reconcile the policy actions, forecasts, and verbal assessments of inflation factors. Unlike surprises, the public is most definitely concerned about inconsistent communication, because such communication prevents it from forming meaningful inflation expectations and understanding the central bank’s behavior. Long-lasting inconsistent communication will force the public to read tea leaves instead of inflation reports, eventually decoupling the public’s inflation expectations from the inflation target and shattering the public’s belief that the central bank follows a simple and predictable policy rule.

10
Reading tea leaves
The way the public monitors the central bank’s communication can be expressed in a decision tree, Figure 3, incorporating in turn inflation forecasts, policy rate changes, and verbal assessments. Whenever a branch of the tree ends, the node is indicated in bold.
First, we explore some of the no-confusion outcomes, starting along the left half of the tree. The inflation forecast predicts inflation in the target range (node A) and the policymaker then keeps the policy rate unchanged (node A1). The branch of the tree then ends either with inflation on target/forecast (node A1a) or surprisingly missing the target (node A1b). Node A1a is the idyllic situation: the economy was in equilibrium, there were no significant inflation factors, the central bank did not have to move policy rates, no shocks happened, and inflation was predicted well.
Second, the policymaker may decide to change the policy rate despite the inflation forecast signaling near-target inflation (node A2), thus indicating either the presence of inflation factors outside of the forecasting model or a different weight attached to these factors than in the model forecast. In other words, the policymaker implicitly augmented the staff forecast prior to the actual decision. Policymakers may do so because they have either a larger information set or a more up-to-date one. They meet several weeks after the forecasting round started and so they consider newer data than the forecasting team. This update can be understood from the inflation report and so the public studies the verbal assessments to detect the additional inflation factors. These verbal assessments correspond to the inflation factors implied by the policymaker’s forecast update (node A21) and the eventual inflation outturn is predicted either correctly (a no-surprise node A21a) or incorrectly due to an unexpected shock (a surprise node A21b). Whereas node A21a provides another idyllic communication outturn, the public is surprised in node A21b.
Third, the least favorable outcome in this tree is the inconsistent signal when the forecast predicts on-target inflation, yet the policy rate is increased/decreased, while the verbal assessment indicates downward/upward inflation factors (node A22). The public cannot align the three inconsistent communication pieces (forecasts, policy rates, and verbal assessments) and if inflation at the end of the forecast period will be on target, the public will see this outcome as a fluke.
The right side of the tree is symmetrical, starting from the forecast predicting inflation outside of the target range, and resulting again in five end-nodes. As in the left side, the public understands the decision and is not surprised by the eventual inflation outturn (nodes B1a and B21a), understands the decision and is surprised (nodes B1b and B21b), or is confused (node B22).
III. METHODOLOGY AND SAMPLE SELECTION
In this section we (i) detail our methodology of linking inflation forecasts and policy rate changes with verbal assessments, and (ii) describe the sample data that we use in the estimation of the public’s decision tree. Individual country data and results are provided in the Annex.

Figure 3. The Public’s Scrutiny of Central Bank Communication
11

12
A. Methodology
With what policy rule would the public assess the central bank’s actions? The literature offers a plethora of rules, from the original, backward-looking Taylor rule (Taylor, 1993) to complex, forward-looking rules based on adaptive learning (Evans, Guse, and Honkapohja, 2007). Following King (2005), who argued that the public uses simple, “heuristic” policy rules, we chose a rule that is (i) simple, (ii) forward-looking, and (iii) enables subsequent inclusion of ad hoc, verbal information to encompass the inflation forecast targeting strategy. To this end, we chose a rule suggested by Batini and Haldane (1999), in which the policy rate reacts only to the inflation forecast deviating from the target. We do not believe that the public is interested in or capable of “estimating” a more complex rule with unobservable variables such as an output gap measure or an equilibrium exchange rate indicator.
A forward-looking policy rule
Let us assume that if the inflation forecast deviates from the target, the public expects the policymaker to adjust short-term interest rates based on the following rule:
( ) ( )( ),1 1
t j
F CB nt ti i iγ γ δ π π
+−= + − − +*
)
, (1)
where it is the policy instrument (the short-term nominal interest rate); denotes the inflation forecast formulated at time t at quarterly frequency (we use j=4, that is, 1-year-ahead expectations, and for robustness purposes also j=8, that is, 2-year-ahead expectations); π∗ is the inflation target; and in is a policy-neutral interest rate equal to the sum of an equilibrium real interest rate and the inflation target. The policy-neutral real rate is assumed to be either 3 percent, a typical number used in emerging market countries, or 2 percent, a typical number used in industrial countries. Parameters γ and δ, an interest rate-smoothing coefficient and the weight put on deviations of inflation from the target, respectively, are positive constants chosen by the policymaker. Following Batini and Haldane (1999), in the benchmark version of the rule we set these parameters equal to 0.3 and 2.0, respectively, and for robustness checks we explored also the values of 0.5 and 3.0, respectively. If the inflation forecast is above/below the target, the public expects the policy rates to be increased/lowered to offset the gap between expected inflation and the inflation target and—in line with the Taylor principle—the adjustment is more than proportional: (1−γ)δ > 1.
,F CBt jπ +
Implied forecast update
The public knows, of course, that the policymakers augment the inflation forecast with additional information. While such information is neither confidential nor private, the public almost certainly has a less comprehensive information set than the policymakers. So, the public would be keen to extract this additional information in order to see how policymakers augmented the inflation forecast. To this end, the public can obtain the implied forecast update by comparing the forecast derived from the observed policy-rate changes and a rule
to the officially published inflation forecast ( ,F Pπ ( ),F CBπ . The implied forecast can be obtained by rearranging (1):

13
( ), 1 *
1
nF P t tt j
i i iπ πγ δ δ
−+
Δ −= + +
− (2)
Thus, ,F Pπ measures what the public thinks inflation will be in period j, given the rule and the policy rate changes effected by the central bank. By subtracting from both sides we obtain our measure of the implied forecast update performed by the policymakers:
,F CBπ
( ) (, , ,1 *1
nF P F CB F CBt tt j t j t j
i i i )π πγ δ δ
−+ + +
Δ −− = + − −
−π π (3)
A non-zero difference between the simple rule-based forecast ( ),F Pπ and the central bank’s
official forecast ( ),F CBπ indicates that the policymakers found some additional information modifying the policy implications of the official, model-based forecast and decided to deviate from what was suggested by the staff. In Figure 2 this situation corresponds to the second-level forks in the tree, A2 and B2, when the policy rate is changed/kept while the inflation forecast is on/off target, respectively.
To understand why the policymaker deviated from the model-based forecast the public would need to know what information was considered in addition to the official forecast ( ),F CBπ .
For example, a pro-inflationary forecast update ( ), , 0F P F CBt j t jπ π+ +− > could be compelled by an
unexpected depreciation of the domestic currency. The larger the magnitude of these updates, the greater weight policymakers attached to these additional inflation factors as compared to the forecast. The estimates of implied inflation risk are plotted in the final panel of Figure 1.
Plowing through the verbal assessments
The public should find ready answers as to why the policymakers amended the staff forecast by perusing the various communications, such as the inflation reports, press releases, and policymaker interviews (Šmídková and Bulíř, 2007). The most comprehensive documents are inflation reports and we rely on them in the subsequent analysis, perusing the quarterly inflation reports and extracting all relevant verbal assessments. Each verbal comment was catalogued into a supply, demand, or external environment category, further divided into subcategories, and classified as pushing the rate of inflation either higher (+1) or lower (–1). Each factor was given an equal weight, because inflation reports generally do not provide information on the factors’ quantitative importance. All factors were then aggregated across categories to obtain an index-like measure of what the policymaker thought of the inflation factors in any given quarter (see Annex) or year (third panel of Figure 1).
We illustrate our methodology on Chile in 2000. The central bank lowered the policy rate by more than what was to be expected from the inflation forecast, thus signaling a strong counter-inflationary implied risk update (Figure 1, blue dashed line). At the same time, however, the Chilean inflation reports verbally mentioned mostly pro-inflation factors, mostly on the demand and external side, contradicting the model-based inflation forecast.

14
Extraction problem caveats
The framework described above hinges on the superior information content of the inflation reports as compared to other communication devices, and on the public’s ability to extract it. There are two potential criticisms of this approach, although neither stands up to serious scrutiny. First, it has been argued that the inflation report is primarily a staff document and that policymakers’ views are better found in other documents, such as central bank press releases or ex post interviews. We argue that the distinctions between the views of the staff and policymakers are mostly superficial, reflecting disagreements on the relative importance of various inflation factors. The policymaker is unlikely to come up with an issue that was not mentioned in the inflation report, and, at the same time, the staff are unlikely to omit an issue that the policymakers are known to care about. Empirically, the use of other sources of information (such as voting patterns for the Czech National Bank and press releases for the European Central Bank) do not improve the understanding of policies materially (Šmídková and Bulíř, 2007 and Bulíř, Čihák, and Šmídková, forthcoming, respectively).
Second, it has been argued that our bipolar grading of inflation factors (-1; 1) does not capture their relative importance for inflation developments. We argue that the public searches for a qualitative message in the text—rather than a quantitative one—and for the implications that the inflation factors are likely to have for future inflation and the monetary stance. The public expects that only relevant, large-enough inflation factors are discussed in inflation reports.
The communication timeline in our analysis is as follows. First, the inflation target is announced for the next one or two years. Second, the central bank publishes an official inflation forecast . Third, the public observes the evolution of policy interest rates,
computes rule-based inflation forecasts
( ,F CBt jπ + )
( ),F Pt jπ + on the basis of its understanding of the policy
rule, and derives an estimate of the implied forecast update. Fourth, if this update (implied risk) is large enough, the public scrutinizes the inflation reports for verbal assessments of inflation factors and tries to match them with the implied update. Finally, the public observes inflation at the end of each horizon and concludes that the central bank communicated (i) well and that there were no inflation surprises, (ii) well, but there were inflation surprises, or (iii) in a inconsistent manner, so that monetary policy could not be understood.
B. Sample Selection and Data
The objective of the paper was to examine communication under inflation targeting in a sample of European and non-European emerging market countries and compare the results with those of an industrial country. We excluded from the potential sample of 27 current inflation targeters (Freedman, Laxton, and Ötker-Robe, 2008) both large industrial and low-income countries, countries that either started inflation targeting after 2001 or that replaced IT with an alternative regime, and countries that do not publish detailed enough inflation reports. This left us with three European emerging-market countries (the Czech Republic, Hungary, and Poland); two non-European emerging-market countries (Chile and Thailand); and Sweden as the control country, see Table 1.

15
Table 1. Inflation Targeters: Sample Characteristics, 2000–05
Country Inflation targeting
introduced
“Fully-fledged IT” or “IT
lite”?1
Frequency and availability of inflation
reports
Type of inflation forecast
Inflation2 and type of price index
Openness (exports and imports as a
percentage of GDP)2
GDP per capita in constant US $2
Chile 1991 Fully-fledged Three times a year; http://www.bcentral.cl
Conditional on unchanged policy
rates
2.6 CPI 69.1 9,843
Czech Republic 1998 Fully-fledged Four times a year;
www.cnb.cz
Conditional on unchanged policy
rates until mid-2002,
unconditional thereafter
2.3 CPI 132.6 17,010
Hungary 2001 Lite Four times a year; www.mnb.hu
Conditional on unchanged policy
rates and exchange rates
5.9 CPI 132.0 14,858
Poland 1999 Lite Four times a year; www.nbp.pl
No reference to quantitative
forecasts
2.8 CPI 67.8 11,676
Sweden 1993 Fully-fledged Four times a year; www.riksbank.com
Conditional on unchanged policy
rates
1.5 CPI 84.7 27,864
Thailand 2000 Fully-fledged Four times a year; www.bot.or.th
Conditional on unchanged policy
rates
2.3 CPI and “core”
inflation
131.2 7,075
Source: National central bank websites; Carare and Stone (2003) and Stone (2003); World Economic Outlook (inflation and openness) and World Bank’s World Development Indicators (GDP per capita) 1 See Stone (2003) for definitions. 2 The average for 2001–05.
The sample countries differ considerably in their approach to inflation targeting. First, whereas Chile, the Czech Republic, Sweden, and Thailand were classified as “fully-fledged inflation targeters” by Stone (2003), Hungary and Poland were “lite” inflation targeters, meaning that the inflation target was not as the foremost policy objective and the regime has served mostly as a disinflation device. Second, whereas five countries used model-based forecasts during the sample period, Poland based its inflation forecasts on expert appraisals. Third, the definitions of the inflation target or the widths of target ranges differed as well.
IV. EMPIRICAL FINDINGS
In presenting the results we focus in turn on targets, forecasts, implied inflation forecast updates, and verbal assessments. Although we concentrate on the 4-quarter forecast horizon in Tables 2–4, in our robustness tests we find comparable results for the 8-quarter forecast horizon and also for alternative calibrations of the policy rule.

16
A. Summary of Results
First, central banks missed their inflation targets in more than one-half of all the observations. Poland missed all six end-year inflation targets by 1 percentage point or more, while Sweden, our industrial country, missed the target three times by 1 percentage point or more and also recorded two misses by 0.7 percentage points. This metric says, however, very little about the quality of communication or indeed about the inflation-targeting regime. The reasons for missing the targets varied across countries: some countries may have missed their targets intentionally to take advantage of favorable macroeconomic conditions to pursue so-called opportunistic disinflation (Orphanides and Wilcox, 2002), while others may have been subject to sizable exogenous shocks. The former explanation is supported by the fact that three-quarters of target misses were the result of below-target inflation and the latter by verbal assessments summarized in Annex.
Second, the central banks frequently signaled interest rate moves through their inflation forecasts (node B in Figure 2), see Table 2. The one-year inflation forecasts differed—by at least 1 percentage point—from the target in 12 cases (one-third of all available observations). Of all the off-target forecasts, nine (or three-quarters) were associated with below-target forecasts and three (one-quarter) with above-target forecasts.
Table 2. Breakdown of Communication Results, Sample Average, 2000–05
Node description Implication for the public Obs. In percent Node
On-target forecast Little need for additional information 23 65.7 AOff-target forecast Need for additional information 12 34.3 BTotal observations 35 100.0 A+B
Of which:No significant implied inflation risk signaled through policy rates No need for additional information 11 31.4 A1Significant implied inflation risks Need for additional information 12 34.3 A2No significant implied inflation risk signaled through policy rates No need for additional information 5 14.3 B1Significant implied inflation risks Need for additional information 7 20.0 B2Verbal assessments correspond to implied risks No need for additional information 11 31.4 A21Verbal assessments do not correspond to implied risks Confusion 1 2.9 A22Verbal assessments correspond to implied risks No need for additional information 3 8.6 B21Verbal assessments do not correspond to implied risks Confusion 4 11.4 B22On-target inflation, as expected No surprise 8 22.9 A1aOff-target inflation, unexpected Surprise 3 8.6 A1bOff-target inflation, as expected No surprise 1 2.9 B1aOn-target inflation, unexpected Surprise 4 11.4 B1bImplied risks and verbal assessment point to off-target inflation No surprise 7 20.0 A21aImplied risks and verbal assessment point to on-target inflation Surprise 4 11.4 A21bImplied risks and verbal assessment point to off-target inflation No surprise 3 8.6 B21aImplied risks and verbal assessment point to on-target inflation Surprise 0 0.0 B21b
Source: Authors’ calculations.
Notes: All calculations are based on 4-quarter-ahead inflation forecasts and the benchmark calibration of γ, δ, and the real equilibrium rate set equal to 0.3, 2.0, and 3 percent, respectively. Implied forecast updates are used if the indicator is 1 percentage point or more and verbal assessments of inflation factors are used if the annual average is larger than 0.5. The nodes and their codes correspond to those in Figure 2.
Third, we found sizable implied forecast updates in all countries. Of all 12 off-target forecasts five were followed by rule-consistent movements in policy rates (node B1), whereas seven were not (node B2). We found frequent implied forecast updates also in

17
situations of on-target forecasts (node A2). Of the 23 on-target inflation forecasts (node A) policy rates changed 12 times. Overall, the direction of the implied inflation risks was skewed toward counter-inflationary factors. This finding is related chiefly to the first half of our sample period, when inflation dropped to close to zero in our sample countries, perhaps reflecting the widening negative output gaps (see the country notes in the Annex).
Fourth, surprises were relatively infrequent—the sample central banks failed to anticipate eight, or one-quarter, of all inflation outcomes (nodes A1b, B1a, A21b, and B21b in Table 3). While all the information given to the public during the period was consistent, the end-period inflation was unexpectedly different from the forecast. Conversely, the banks forecasted inflation correctly in two-thirds of observations (nodes A1a, B1b, A21a, and B21a).
Table 3. Clarity of Communication, Sample Averages, 2000–05
Observations Percent of total Nodes
Consistent communication and no inflation outcome surprise 22 63 A1a, B1b ,
A21a, B21a
Consistent communication and inflation outcome surprise 8 23 A1b, B1a,
A21b, B21b
Inconsistent communication 5 14 A22, B22
Total 35 100
Source: Authors’ calculations.
Note: All calculations are based on 4-quarter-ahead inflation forecasts and the benchmark calibration of γ, δ, and the real equilibrium rate set equal to 0.3, 2.0, and 3 percent, respectively. Implied forecast updates are used if the indicator is 1 percentage point or more and verbal assessments of inflation factors are used if the annual average is larger than 0.5. The nodes and their codes correspond to those in Figure 2.
Fifth, five observations were classified as inconsistent, when the verbal assessments failed to clarify the implied inflation forecasts. While Hungary booked two cases of inconsistent communication in five observations and Poland and Thailand booked none, the remaining countries each had one case in six observations (Table 4).
To summarize, no single central bank in out sample stands out as an exceptionally good forecaster of inflation and communicator of its policies. On the one hand, all countries, except Hungary, had consistent, no-surprise record in one-half or more of all cases and the sample average was bested by the Czech Republic and Poland. While these two countries missed their inflation targets far more then the rest of the sample, they signaled these misses well in advance and, thus, avoided surprising the public.4 On the other hand, on average one-third of all annual inflation results were surprising and every country booked at least one surprise, sophistication of their forecasting systems notwithstanding. We can only speculate
4 The sum of squared inflation-to-target deviations was 25 and 40 for the Czech Republic and Poland, respectively, while the average for the remaining four countries was only 7.

18
about the reasons: perhaps the relatively more advanced inflation targeters in terms of modeling techniques—the Riksbank, Banco Central de Chile, Bank of Thailand, and Czech National Bank—have struggled to communicate forecasts based on their more sophisticated models as compared to the comparatively simpler forecasting and communication techniques employed by the lite targeters. Or perhaps the more sophisticated models provided—at least during our sample period—comparatively small forecasting and communication gains as compared to the techniques used by the lite targeters.
Table 4. Clarity of Communication, Individual Countries, 2000–05 Chile Czech
Republic Hungary Poland Sweden Thailand
Consistent communication and no inflation outcome surprise
50 67 40 67 50 50
Consistent communication and inflation outcome surprise
33 17 20 33 50 33
Inconsistent communication 17 17 40 0 0 17
Total 100 100 100 100 100 100.0 Source: Authors’ calculations.
Note: All calculations are based on 4-quarter-ahead inflation forecasts and the benchmark calibration of γ, δ, and the real equilibrium rate set equal to 0.3, 2.0, and 3 percent, respectively. Implied forecast updates are used if the indicator is 1 percentage point or more and verbal assessments of inflation factors are used if the annual average is larger than 0.5. Sample size = 35 observations. Totals may not add up due to rounding.
B. “The Central Bank that Cried Wolf”
The eventual classification notwithstanding, individual central banks differ in their communication. While policy rate changes broadly corresponded to the implied risk, all sample banks augmented their rate cuts with strong verbal comments about inflation risks. We observed 29 nonzero annual verbal assessments (of our 35 observations) and of these 17, or three-fifths, were pointing toward higher inflation (Figure 4). However, the sample banks lowered their policy rates in 24 cases (or two-thirds of all cases). To put is simply, the words contradicted the deeds: despite signaling sizable inflationary pressures, the central banks loosened monetary policy. Did these central banks “cried wolf” to avoid potential future criticism should their stance be found too accommodating ex post?
Hungary is a good example of a bank that “cried wolf”—while the central bank loosened the monetary stance four times during the sample period, verbal assessments indicated strong pro-inflationary pressures in three of those periods. It appears that the policymaker followed the staff forecast, but hedged his bets with strong words about inflation risks. Not all banks cried wolf, though. In Sweden the policy rate changes were always in line with verbal assessments, however, they contradicted the implied forecast update in one-half of all cases. The Czech 2004 observation is even more puzzling: the Czech National Bank increased the policy rate by 50 basis points against the background of counter-inflationary pressures identified by both the implied and comprehensive risks.

19
Figure 4. Monetary Policy Communication: 2000-05
Source: Authors' calculations; the benchmark calibration.
Notes: Implied risks and inflation factors are expressed in percentage points of inflation and 4-quarter averages, repectively. Positive and negative values indicate pro- and counter-inflation directions, respectively.
-4
-2
0
2
4
6
2000 2001 2002 2003 2004 2005
Inflation factors
Implied risks
Policy rate change-4
-2
0
2
4
6
2000 2001 2002 2003 2004 2005
Czech Republic
-4
-2
0
2
4
6
2001 2002 2003 2004 2005
Hungary
-4
-2
0
2
4
6
2000 2001 2002 2003 2004 2005
Poland
-4.8-7.5
6.8
-4
-2
0
2
4
6
2000 2001 2002 2003 2004 2005
Sweden
-4
-2
0
2
4
6
2000 2001 2002 2003 2004 2005
Thailand
Chile

20
C. Robustness Checks
Our results are robust to changes in the rule, data transformations, and sample adjustments. First, our results are unaffected by changes in the policy-rule parameters (Figure 5). For example, a much more aggressive policy rule—a higher parameter δ—is needed to generate materially different results. For example, setting δ equal to 5, as opposed to 2, halves the number of “inconsistent communication” observations. Such aggressiveness is hardly reasonable as it implies that the central bank would increase the policy rate by 3½ percentage points for every 1 percentage point differential between the inflation target and the 1-year-ahead forecast. In contrast, higher persistence in rate setting would increase the share of inconsistent communication: increasing γ from 0.3 to 0.5 will almost double its share.
Figure 5. Clarity of Communication: Robustness Checks 0 10 20 30 40 50 60 70 80 90 100
(1) Benchmarkcalibration
(2) More aggressivereaction to inflation
(3) Slower policy rateadjustment
(4) Lower realequilibrium interest rate
(5) Benchmarkcalibration with moreemphasis on shocks
Clear; no surprise Clear; surprise Confusing Source: Authors’ calculations. Notes: This chart summarizes the distribution of communication outcomes across alternative calibrations of the policy rule, ( ) ( )( ,
1 1t j
F CB nt ti i iγ γ δ π π
+−= + − − + )* . In the benchmark calibration γ, δ, and the real equilibrium
rate are set equal to 0.3, 2.0, and 3 percent, respectively. The verbal assessment inflation factors are 0.5 percentage point or more. In calibrations (2), (3), and (4) γ, δ, and the real equilibrium rate are set equal to 0.5, 3.0, and 3 percent, respectively. In calibration (5) the verbal assessment inflation factors are 1.0 percentage point or more.
Second, when we extend the forecast horizon to 8 quarters (Table 5), we obtain a marginally higher share of inconsistent communication on average, but it is concentrated in Poland, the lite country with a comparatively weak modeling framework of expert-based forecasts. Third, our results do not change materially by changing the definition of observed inflation from period-end to period-average (not shown here, but available on request).

21
Table 5. Clarity of Communication, the 2–Year Forecast Horizon, 2000–05 Chile Czech
Republic Hungary Poland Sweden Thailand Average
In percent of total observations Consistent communication and no inflation outcome surprise 75.0 25.0 0.0 50.0 75.0 50.0 45.8
Consistent communication and inflation outcome surprise 25.0 50.0 75.0 0.0 0.0 25.0 29.2
Inconsistent communication 0.0 25.0 25.0 50.0 25.0 25.0 25.0 Total 100.0 100.0 100.0 100.0 100.0 100.0 100.0
Source: Authors’ calculations. Note: All calculations are based on 8-quarter-ahead inflation forecasts and the benchmark calibration of γ, δ, and the real equilibrium rate set equal to 0.3, 2.0, and 3 percent, respectively. Implied forecast updates are used if the indicator is 1 percentage point or more and verbal assessments of inflation factors are used if the annual average is larger than 0.5. Sample size = 24 observations.
V. CONCLUSIONS: IS THE GLASS HALF EMPTY OR HALF FULL?
Our analysis of inflation targets, forecasts, policy actions, and verbal assessments of current and expected developments suggests that the inflation-targeting central banks in our sample communicated consistently. While both inflation targets and forecasts were missed frequently, the majority of these misses could be understood from scrutinizing publicly available information. About one-seventh of all monetary policy decisions remained inconsistent in the one-year horizon, as the implied forecast updates were contradicted by the verbal assessments contained in inflation reports. About one-third of all monetary policy decisions were found to be surprising—end-period inflation differed from the forecast by more than 1 percentage point despite overall consistent communication.
While the share of inflation outcome surprises and inconsistent communication may seem high to some readers, we find it hard to argue that the central banks in our sample could have achieved a success rate of 100 percent during the period under consideration. Supply shocks were large in all sample countries and so was the uncertainty regarding their impact on the economy, thus introducing uncertainty into central bank communication. In an environment of large and uncertain supply shocks monetary policy transparency may not be beneficial (Dennis and Williams, 2007).
The possibilities for extending our research are ample. Our categorization of communication tools can be further expanded to include the results of policymakers’ voting to provide information about the uncertainty surrounding the inflation forecast or additional communication devices. Our sample of six countries can be expanded to include both industrial countries and recent newcomers to inflation targeting. One could also explore alternative policy rules, including asymmetric ones, under which central banks would react differently to inflation forecasts above and below the target.

22
References
Banco Central do Brasil, 2003, “Open Letter Sent by Banco Central do Brasil’s Governor, Henrique de Campos Meirelles, to the Minister of Finance, Antonio Palocci Filho.” (Brasília: Banco Central do Brasil). Available via the internet: http://www.bcb.gov.br/?OL2003
Batini, Nicoletta, and Andrew G. Haldane, 1999, “Forward Looking Rules for Monetary Policy,” Bank of England Working Paper, No. 91 (London: Bank of England). Available via the internet: http://www.bankofengland.co.uk/publications/workingpapers/wp91.pdf.
Batini, Nicoletta, and Douglas Laxton, 2007, “Under What Conditions Can Inflation Targeting Be Adopted? The Experience of Emerging Markets,” in Monetary Policy under Inflation Targeting, ed. by Frederic Mishkin and Klaus Schmidt-Hebbel, (Santiago: Central Bank of Chile). Available via the internet: http://www.bcentral.cl/eng/studies/working-papers/406.htm
Bernanke, Ben S., 2003, “A Perspective on Inflation Targeting,” remarks at the Annual Washington Policy Conference of the National Association of Business Economists, Washington, D.C., March 25. Available via the internet: http://www.federalreserve.gov/Boarddocs/Speeches/2003/20030325/default.htm.
Bernanke, Ben S., and Michael Woodford, 1997, “Inflation Forecasts and Monetary Policy,” Journal of Money, Credit, and Banking, Vol. 29, No. 4, pp. 653–84.
Blinder, Alan, and others, 2001, How Do Central Banks Talk? (Geneva: International Center for Monetary and Banking Studies; London: Centre for Economic Policy Research).
Blinder, Alan, 2006, “Monetary Policy Today: Sixteen Questions and about Twelve Answers,” paper presented at the Banco de España Conference on “Central Banks in the 21st Century,” Madrid, June 8–9. Available via the internet: http://www.princeton.edu/~ceps/workingpapers/129blinder.pdf.
Bulíř, Aleš, Martin Čihák, and Kateřina Šmídková, forthcoming, “Writing Clearly: ECB’s Monetary Policy Communication,” IMF Working Paper (Washington: International Monetary Fund).
Carare, Alina, and Mark R. Stone, 2003, “Inflation Targeting Regimes,” IMF Working Paper No. 03/9 (Washington: International Monetary Fund). Available via the internet: http://www.imf.org/external/pubs/ft/wp/2003/wp0309.pdf.
Cecchetti, Stephen, and Michael Ehrmann, 1999, “Does Inflation Targeting Increase Output Volatility? An International Comparison of Policymakers’ Preferences and Outcomes,” NBER Working Paper, No. 13259 (Cambridge: National Bureau of Economic Research). Available via the internet: http://www.nber.org/papers/w13259.

23
Dennis, Richard, and John C. Williams, 2007, “Monetary Policy, Transparency, and Credibility: Conference Summary,” FRBSF Economic Letter, 2007-12 (San Francisco: Federal Reserve Bank of San Francisco). Available via the internet: http://www.frbsf.org/publications/economics/letter/2007/el2007-12.pdf.
Eusepi, Stefano, and Bruce Preston, 2007, “Central Bank Communication and Expectations Stabilization,” NBER Working Paper, No. 7426 (Cambridge: National Bureau of Economic Research). Available via the internet: http://www.nber.org/papers/w7426.
Evans, George W., Eran Guse, and Seppo Honkapohja, 2007, “Liquidity Traps, Learning and Stagnation,” mimeo. Available via the internet: http://economics.uoregon.edu/papers/UO-2007-9_Evans_Stagnation.pdf.
Fracasso, Andrea, Hans Genberg, and Charles Wyplosz, 2003, “How Do Central Banks Write?” Geneva Reports on the World Economy, Special Report 2, (Geneva: Center for Economic Policy Research). Available via the internet: http://hei.unige.ch/~wyplosz/IR_fgw.pdf.
Filáček, Jan, 2007, “Why and How to Assess Inflation-Target Fulfillment,” Czech Journal of Economics and Finance, Vol. 57, No. 11-12, pp. 577–94.
Freedman, Charles, Douglas Laxton and Inci Ötker-Robe, 2008, “On Implementing Full-Fledged Inflation-Targeting Regimes: Saying What You Do and Doing What You Say,” mimeo.
Geršl, Adam, and Tomáš Holub, 2006, “Foreign Exchange Interventions Under Inflation Targeting: The Czech Experience,” Contemporary Economic Policy, Vol. 24 (October), pp. 475–491.
Holub, Tomáš, and Jaromír Hurník, forthcoming, “Ten Years of Czech Inflation Targeting: Missed Targets and Anchored Expectations,” Emerging Markets Finance and Trade.
Jonáš, Jiří, and Frederick Mishkin, 2003, “Inflation Targeting in Transition Countries: Experience and Prospects,” NBER Working Paper, No. 9667 (Cambridge: National Bureau of Economic Research). Available via the internet: http://www.nber.org/papers/W9667.
King, Mervyn, 2005, Monetary Policy: Practice Ahead of Theory, Mais Lecture delivered at the Cass Business School, City University, London, May 17. Available via the internet: http://www.bankofengland.co.uk/publications/speeches/2005/speech245.pdf.
Kohn, Donald L., 2006, “Monetary Policy and Uncertainty,” speech at the Fourth Conference of the International Research Forum on Monetary Policy, Washington, D.C., December 1. Available via the internet: http://www.federalreserve.gov/newsevents/speech/kohn20061201a.htm.
Kotlán, Viktor, and David Navrátil, 2003, “Inflation Targeting as a Stabilisation Tool: Its Design and Performance in the Czech Republic,” Czech Journal of Economics and

24
Finance, Vol. 53, No. 5–6., pp. 220–42. Available via the internet: http://www.financeauver.org/pdf_eng/200305vk.pdf.
Mishkin, Frederick, and Klaus Schmidt-Hebbel, 2007, “Does Inflation Targeting Make a Difference?” NBER Working Paper, No. 12876 (Cambridge: National Bureau of Economic Research). Available via the internet: http://www.nber.org/papers/w12876.
Orphanides, Athanasios, and David Wilcox, 2002, “The Opportunistic Approach to Disinflation,” International Finance, Vol. 5 (Spring), pp. 47–71.
Roger, Scott, and Mark Stone, 2005, “On Target: The International Experience with Achieving Inflation Targets,” IMF Working Paper No. 05/163 (Washington: International Monetary Fund). Available via the internet: http://www.imf.org/external/pubs/ft/wp/2005/wp05163.pdf.
Rozkrut, Marek, and others, 2007, “Quest for Central Bank Communication: Does It Pay to Be ‘Talkative’?” European Journal of Political Economy, Vol. 23, pp. 176–206.
Stone, Mark R., 2003, “Inflation Targeting Lite,” IMF Working Paper, No. 03/12 (Washington: International Monetary Fund). Available via the internet: http://www.imf.org/external/pubs/ft/wp/2003/wp0312.pdf.
Svensson, Lars, 1997, “Inflation Forecast Targeting: Implementing and Monitoring Inflation Targets,” European Economic Review, Vol. 41, pp. 1111–46.
Šmídková, Kateřina, 2003, “Targeting Inflation under Uncertainty: Policy Makers’ Perspective,” CNB Research and Policy Note 2003/2 (Praha: Czech National Bank). Available via the internet: http://www.cnb.cz/en/research/research_publications/irpn/download/irpn_2_2003.pdf
Šmídková, Kateřina, and Aleš Bulíř, 2007, “Striving to Be ‘Clearly Open’ and ‘Crystal Clear’: Monetary Policy Communication of the CNB,” Czech Journal of Economics and Finance, Vol. 57, No. 11–12., pp.540–57.
Šmídková, Kateřina, and Miroslav Hrnčíř, 2000, “Transition to the Strategy of Inflation Targeting,” Eastern European Economics, Vol. 38, November–December, No. 6, pp.13–42.
Taylor, John B., 1993, “Discretion versus Policy Rules in Practice,” Carnegie-Rochester Conference Series on Public Policy, Vol. 39 (December), pp. 195–220.
Woodford, Michael, 2005, “Central Bank Communication and Policy Effectiveness,” in The Greenspan Era: Lessons for the Future, a symposium sponsored by The Federal Reserve Bank of Kansas City, Jackson Hole, Wyoming, August 25–27. Available via the internet: http://www.kc.frb.org/Publicat/sympos/2005/PDF/Woodford2005.pdf.

25
ANNEX
Chile: Country Note
Basic information about the IT regime. Chile started its transition toward inflation targeting in 1990, in the context of a crawling exchange rate regime, with inflation of about 20 percent. The currency, the peso, was floated only in 1999 and the central bank moved toward a full-fledged at that time. The mandate of the Banco Central de Chile (CBC) presently covers price stability only. The CBC sets its own inflation target and maintains instrument independence. Despite “fear of floating,” foreign exchange interventions have been rare. Four-monthly Monetary Policy Reports provide information on inflation forecasts.
Inflation targets and forecasts. The CBC targets headline inflation. Throughout the period, the continuous target was set as a range from 2 percent to 4 percent, with a midpoint of 3 percent and a policy horizon of 12–24 months. The CBC’s inflation forecasts are based on a publicly available model and its inflation reports closely follow the model structure. The decision-making process relies on conditional forecasts based on unchanged interest rates. The central bank has published three-, seven-, and eight-quarter-ahead projections.
Inflation record and monetary policy. For most of the period inflation was rarely outside of the target range. At end-2000 inflation peaked at 4.6 percent and in early 2004 it briefly dipped below 0 percent. The policy rate was on downward sloping path until 2004, with the exception of a technical increase in 2000.5 Since 2004 rates have been increasing gradually, returning to their 2000 level. The peso has been comparatively stable in real effective terms, with the exception of 2002–2003, when the currency weakened. Whereas external shocks dominated the beginning of the sample period, domestic demand shocks dominated in the second half of the period.
References
Banco Central de Chile, Monetary Policy Reports (2000–2006). Available via the internet: http://www.bcentral.cl/eng/.
Mishkin, Frederic S., 2004, “Can Inflation Targeting Work in Emerging Market Countries?” NBER Working Paper, No. 10646 (Cambridge: National Bureau of Economic Research).
Ortíz, Guillermo, 2002, “Monetary Policy in Changing Economic Environment: The Latin American Experience,” In Rethinking Stabilization Policy (Kansas City: Federal Reserve Bank of Kansas City).
5 In mid-2000 the central bank changed its policy instrument, resulting in a technical increase of about 300 basis points. Effectively, the policy stance remained unchanged at that time.

26
Figure 1. Chile: Inflation Developments, 2000-06
Source: Central Bank of Chile; World Economic Outlook and International Financial Statistics.
Definitions: Inflation projections are those announced in the first quarterly IT report of each year. Real interest rate(t) = Interest rate(t) - CPI(t).1/ In August 2001 the MP instrument was changed and the resulting 300 basis point increase is purely technical. Hence, the increase in the real rate is a mirage as well.
Inflation and Inflation Projections
-1
0
1
2
3
4
5
2000q1 2001q1 2002q1 2003q1 2004q1 2005q1 2006q1
(In
perc
ent)
Target bandCPI
CPI and Interest Rates
-2
0
2
4
6
8
2000q1 2001q1 2002q1 2003q1 2004q1 2005q1 2006q1
(In
perc
ent)
Policy rate 1/
CPI
"Real" interest rate 1/
CPI and the Policy Rate
y = 0.684x + 1.7062R2 = 0.3815
1
2
3
4
5
6
7
-1 0 1 2 3 4 5
CPI
Inte
rest
rate
27
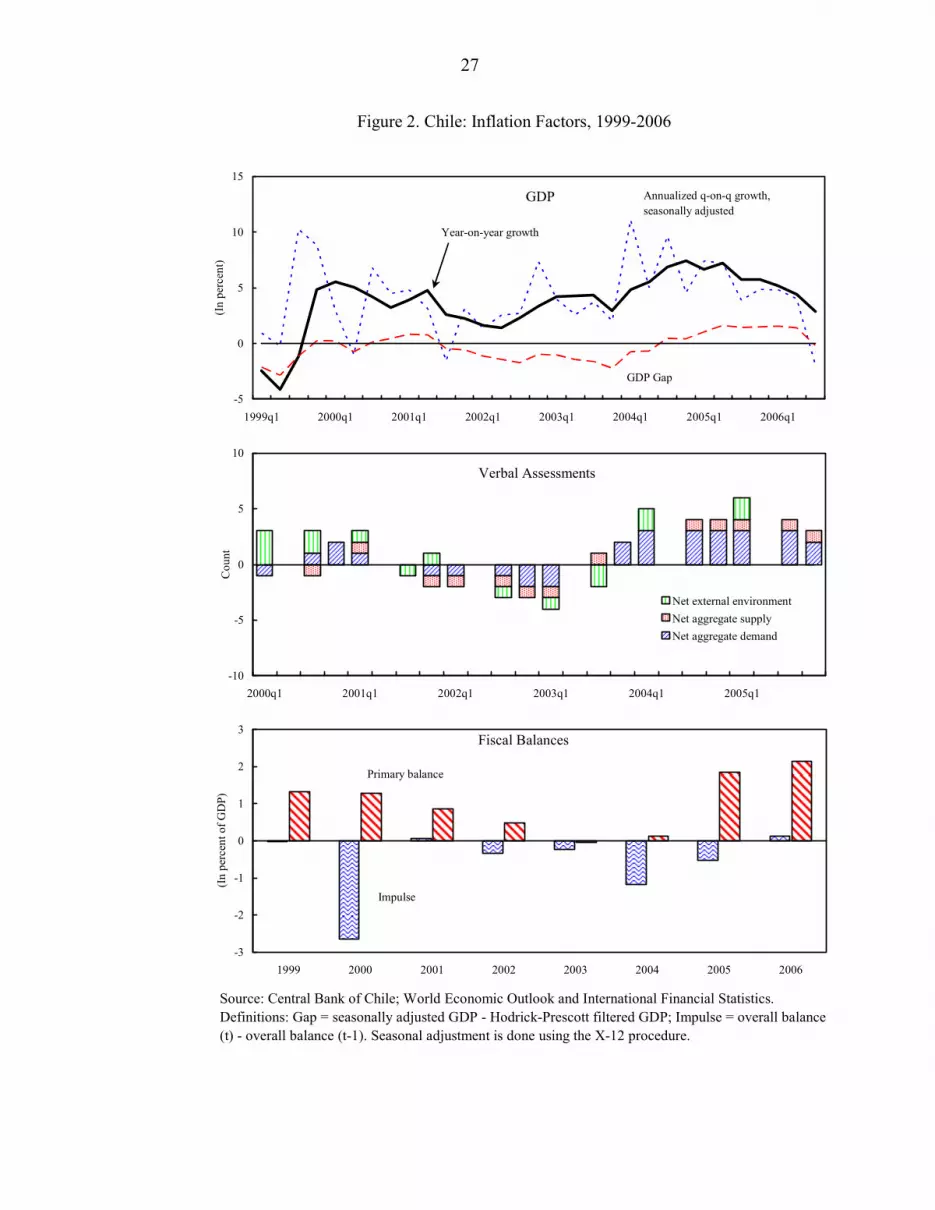
Figure 2. Chile: Inflation Factors, 1999-2006
Source: Central Bank of Chile; World Economic Outlook and International Financial Statistics.Definitions: Gap = seasonally adjusted GDP - Hodrick-Prescott filtered GDP; Impulse = overall balance (t) - overall balance (t-1). Seasonal adjustment is done using the X-12 procedure.
GDP
-5
0
5
10
15
1999q1 2000q1 2001q1 2002q1 2003q1 2004q1 2005q1 2006q1
(In
perc
ent)
Annualized q-on-q growth, seasonally adjusted
Year-on-year growth
GDP Gap
Verbal Assessments
-10
-5
0
5
10
2000q1 2001q1 2002q1 2003q1 2004q1 2005q1
Cou
nt
Net external environmentNet aggregate supplyNet aggregate demand
Fiscal Balances
-3
-2
-1
0
1
2
3
1999 2000 2001 2002 2003 2004 2005 2006
(In
perc
ent o
f GD
P)
Impulse
Primary balance

28
The Czech Republic: Country Note
Basic information about the IT regime. The Czech National Bank (CNB) introduced inflation targeting in December 1997 following the collapse of the koruna peg earlier in the year. The mandate of the CNB covers price stability only. The CNB sets its own inflation target, maintains instrument independence, and is not allowed to finance government deficits. The currency is freely floating, with rarely used foreign exchange interventions. Model-based inflation forecasts provide a basis for policy communication (Šmídková and Bulíř, 2007).
Inflation targets and forecasts. The CNB initially targeted so-called “net inflation” (CPI minus regulated prices and the impact of indirect taxes and subsidies), but switched to headline inflation (CPI) in 2002. The initially heuristic Inflation Reports steadily became more model-based, relying initially on conditional forecasts based on unchanged interest rates. The CNB gradually developed a full-fledged forecasting system, and in 2002/03 it switched to an advanced forecasting system underpinned by a calibrated output-gap model employing unconditional forecasts, further moving toward a dynamic general equilibrium model in 2008. Starting in mid-1999, the CNB published in each quarterly inflation report a set of six-quarter-ahead quarterly projections of inflation, extending the forecast period to eight quarters in 2001.
Inflation record and monetary policy. For most of the period inflation was below target and outside of the target band. In this regard, the CNB referred to external and/or exogenous shocks and explained that offsetting them would result in undesired macroeconomic fluctuations. In addition, some of the shock factors were classified as exemptions, which were part of the ex ante announced list of escape clauses. The policy interest rate (the two-week repo rate) was mostly on a downward sloping path during the analyzed period. The koruna recovered quickly from its 1997–98 low and the real exchange rate mostly fluctuated narrowly around its long-term appreciation trend.
References
Šmídková, Kateřina, and Aleš Bulíř, 2007, “Striving to Be “Clearly Open” and “Crystal Clear”: Monetary Policy Communication of the CNB,” Czech Journal of Economics and Finance, Vol. 57, no. 11-12, pp. 540–557.
Coats, Warren, Douglas Laxton, and David Rose, 2003, The Czech National Bank’s Forecasting and Policy Analysis System (Prague: Czech National Bank).
Czech National Bank, Inflation Reports (1998–2006). Available via the internet: http://www.cnb.cz/en/monetary_policy/inflation_reports/.
Geršl, Adam, and Tomáš Holub, 2006, “Foreign Exchange Interventions Under Inflation Targeting: The Czech Experience,” Contemporary Economic Policy, Vol. 24 (October), pp. 475–491.

29
Figure 1. The Czech Republic: Inflation Developments, 2000-06
Source: Czech National Bank; World Economic Outlook and International Financial Statistics.
Definitions: Inflation projections are those announced in the first quarterly IT report of each year. Real interest rate(t) = Interest rate(t) - CPI(t). 1/ End-year inflation targets for 2001 and 2002 were set for net inflation that is not directly comparable to headline inflation.
Inflation and Inflation Projections 1/
-1
0
1
2
3
4
5
6
2000q1 2001q1 2002q1 2003q1 2004q1 2005q1 2006q1
(In
perc
ent)
Target band
CPI
Point target
End-period target band
CPI and Interest Rates
-1
0
1
2
3
4
5
6
2000q1 2001q1 2002q1 2003q1 2004q1 2005q1 2006q1
(In
perc
ent)
Policy rateCPI
Real interest rate
CPI and the Policy Rate
y = 0.6484x + 2.0927R2 = 0.3325
0
1
2
3
4
5
6
-1 0 1 2 3 4
CPI
Inte
rest
rate

30
Figure 2. The Czech Republic: Inflation Factors, 1999-2006
Source: Czech National Bank; World Economic Outlook and International Financial Statistics.Definitions: Gap = seasonally adjusted GDP - Hodrick-Prescott filtered GDP; Impulse = overall balance (t) - overall balance (t-1). Seasonal adjustment is done using the X-12 procedure.
GDP
-5
-2
2
5
8
1999:1 2000:1 2001:1 2002:1 2003:1 2004:1 2005:1 2006:1
(In
perc
ent)
Annualized q-on-q growth, seasonally adjusted
Year-on-year growth
GDP Gap
Fiscal Balances
-4
-3
-2
-1
0
1
2
1999 2000 2001 2002 2003 2004 2005 2006
(In
perc
ent o
f GD
P)
Impulse
Primary balance
Verbal Assessments
-10
-5
0
5
10
2000q1 2001q1 2002q1 2003q1 2004q1 2005q1
Cou
nt
Net external environmentNet aggregate supplyNet aggregate demand

31
Hungary: Country Note
Basic information about the IT regime. The Magyar Nemzeti Bank (MNB) introduced inflation targeting in mid-2001, while widening, and eventually abolishing, the forint crawling peg. Price stability is the prime objective of the MNB and inflation targets are decided jointly between the Bank and the government. The MNB maintains instrument independence. The MNB initially appeared to be focused more on exchange rate stability than other inflation targeters in our sample, because the fast pass-through of the exchange rate was seen as the most efficient instrument for influencing domestic prices. The forint exchange rate fluctuated until February 2008 within a ± 15 percent, ERM2-like band, with a pre-announced central parity, defended, if necessary, by interventions.
Inflation targets and forecasts. The MNB targets headline inflation with no pre-announced exemptions. The targets are set for the year-end only, with a ± 1-percent band. They initially demarcated a disinflation path, and then stabilized around 3 percent. Inflation Reports are based on fan charts that show eight-quarter inflation forecasts with model-based estimates of uncertainty. The forecasts are conditional on unchanged interest and exchange rates during the forecasting period.
Inflation record and monetary policy. In the first half of the period under consideration, the MNB met the targets comfortably. Later on, inflation became volatile, exceeding the end-period targets in half of the remaining observations. The policy interest rate (the two-week central bank deposit rate) declined in line with inflation during 1999–2002 and, analogously, became volatile thereafter. According to the inflation reports, policy deliberations were dominated by domestic demand considerations, public wage growth in particular, and exchange rate volatility. The forint was comparatively strong vis-à-vis its trend, but more volatile than in other countries.
References
Hornok, Cecília, and Zoltán M. Jakab, 2002, “Forecasting Inflation – A Case Study on the Czech, Hungarian, Polish, Slovakian and Slovenian Central Banks,” MNB Background Studies 2002/2 (Budapest: Magyar Nemzeti Bank).
Jonáš, Jiří, and Frederick Mishkin, 2003, “Inflation Targeting in Transition Countries: Experience and Prospects,” NBER Working Paper, No. 9667 (Cambridge: National Bureau of Economic Research).
Magyar Nemzeti Bank, Reports on Inflation (2000–2006). Available via the internet: http://english.mnb.hu/.

32
Figure 1. Hungary: Inflation Developments, 2000-06
Source: Magyar Nemzeti Bank; World Economic Outlook and International Financial Statistics.
Definitions: Inflation projections are those announced in the first quarterly IT report of each year. Real interest rate(t) = Interest rate(t) - CPI(t).
Inflation and Inflation Projections
2
4
6
8
10
12
2000q1 2001q1 2002q1 2003q1 2004q1 2005q1 2006q1
(In
perc
ent)
End-period target band
CPI
CPI and Interest Rates
0
2
4
6
8
10
12
14
2000q1 2001q1 2002q1 2003q1 2004q1 2005q1 2006q1
(In
perc
ent)
Policy rate
CPI
"Real" interest rate
CPI and the Policy rate
y = 0.6293x + 5.3728R2 = 0.5787
4
6
8
10
12
14
2 4 6 8 10
CPI
Inte
rest
rate
12

33
Figure 2. Hungary: Inflation Factors, 1999-2006
Source: Magyar Nemzeti Bank; World Economic Outlook and International Financial Statistics.Definitions: Gap = seasonally adjusted GDP - Hodrick-Prescott filtered GDP; REER gap = REER (1999=100)- Hodrick-Prescott filtered REER; Impulse = overall balance (t) - overall balance (t-1). Seasonal adjustment is done using the X-12 procedure.
GDP
-3
0
3
6
9
12
1999q1 2000q1 2001q1 2002q1 2003q1 2004q1 2005q1 2006q1
(In p
erce
nt)
Annualized q-on-q growth, seasonally adjusted
Year-on-year growth
GDP Gap
Fiscal Balances
-8
-6
-4
-2
0
2
4
6
1999 2000 2001 2002 2003 2004 2005 2006
(In p
erce
nt o
f GD
P)
Impulse
Primary balance
Verbal Assessments
-10
-5
0
5
10
2001q1 2002q1 2003q1 2004q1 2005q1
Cou
nt
Net external environmentNet aggregate supplyNet aggregate demand

34
Poland: Country Note
Basic information about the IT regime. Poland introduced inflation targeting in 1999 and has operated an inflation-targeting “lite” regime during our sample period. The mandate of the Narodowy Bank Polski (NBP) covers price stability only. The NBP sets its own inflation target and maintains instrument independence. A pure floating exchange rate regime was introduced in April 2000, following a 10-year period during which the exchange rate served as a nominal anchor.
Inflation targets and forecasts. Initially, end-period inflation targets signaled the NBP’s disinflation goals, and from 2004 the NBP began targeting a horizontal band. All targets have been defined for the broad consumer price index. Historically, the NBP has published comparatively little information about the formalities of its inflation forecasting regime and inflation forecasts per se. During 2000–05 the inflation forecasts were only partly model-based, relying on conditional forecasts based on unchanged interest rates. The forecasting process was supported by expert forecasts of key macroeconomic variables, which were subsequently used in single-equation models. The publicly announced forecast was initially for five quarters only, but in 2002 it was extended to seven quarters.
Inflation record and monetary policy. The disinflation process was faster than signaled by the inflation targets and inflation was below the targeted path in the first half of the sample period. In the second half of the sample, inflation was more volatile, fluctuating above and below the target band. Verbally described shocks were both inflationary and deflationary, and external and supply side shocks were used to explain target undershooting. Policy interest rates (the 28-day NBP bill rate) remained relatively high in the 2000–01 period and declined to about 5 percent thereafter. The real exchange rate was comparatively volatile throughout the sample period.
References
Hornok, Cecília, and Zoltán M. Jakab, 2002, “Forecasting Inflation – A Case Study on the Czech, Hungarian, Polish, Slovakian and Slovenian Central Banks,” MNB Background Studies 2002/2 (Budapest: Magyar Nemzeti Bank).
Narodowy Bank Polski, Inflation Reports (1998–2006). Available via the internet: http://www.nbp.pl/Homen.aspx?f=en/publikacje/raport_inflacja/raport_inflacja.html.
Narodowy Bank Polski, Monetary Policy Strategy Beyond 2003.
Stone, Mark R., 2003, “Inflation Targeting Lite,” IMF Working Paper, No. 03/12 (Washington: International Monetary Fund). Available via the internet: http://www.imf.org/external/pubs/ft/wp/2003/wp0312.pdf.

35
Figure 1. Poland: Inflation Developments, 2000-06
Source: Bank Narodowy Polski; World Economic Outlook and International Financial Statistics.
Definitions: Inflation projections are those announced in the first quarterly IT report of each year. Real interest rate(t) = Interest rate(t) - CPI(t).
Inflation and Inflation Projections
0
2
4
6
8
10
12
2000q1 2001q1 2002q1 2003q1 2004q1 2005q1 2006q1
(In
perc
ent)
Target band
CPI
End-period target band
CPI and Interest Rates
0
5
10
15
20
2000q1 2001q1 2002q1 2003q1 2004q1 2005q1 2006q1
(In p
erce
nt)
Policy rate
CPI
"Real" interest rate
CPI and the Policy Rate
y = 1.5013x + 3.6025R2 = 0.8005
0
5
10
15
20
0 2 4 6 8 10
CPI
Inte
rest
rate
12

36
Figure 2. Poland: Inflation Factors, 1999-2006
Source: Bank Narodowy Polski; World Economic Outlook and International Financial Statistics.Definitions: Gap = seasonally adjusted GDP - Hodrick-Prescott filtered GDP; REER gap = REER (1999=100)- Hodrick-Prescott filtered REER; Impulse = overall balance (t) - overall balance (t-1). Seasonal adjustment is done using the X-12 procedure.
GDP
-6
-3
0
3
6
9
12
1999q1 2000q1 2001q1 2002q1 2003q1 2004q1 2005q1 2006q1
(In
perc
ent)
Annualized q-on-q growth, seasonally adjusted
Year-on-year growth GDP Gap
Fiscal Balances
-4
-2
0
2
4
1999 2000 2001 2002 2003 2004 2005 2006
(In
perc
ent o
f GD
P)
Impulse
Primary balance
Verbal Assessments
-10
-5
0
5
10
2000q1 2001q1 2002q1 2003q1 2004q1 2005q1
Cou
nt
Net external environmentNet aggregate supplyNet aggregate demand

37
Sweden: Country Note
Basic information about the IT regime. Sweden is one of the original, full-fledged inflation targeters—the Riksbank introduced inflation targeting in 1993. The mandate of the Riksbank covers price stability only. It sets its own target for CPI, maintains instrument independence, and is not allowed to finance government deficits. The currency is floating and foreign exchange interventions have been rare. One of the explicit goals of inflation targeting is to make the Riksbank’s deliberations known to a wider public, so that monetary policy is easier to follow and understand.
Inflation targets and forecasts. Throughout the period, the headline CPI target was set at 2 percent, with no band specified. During the sample period, inflation forecasts and reports were based on and followed the publicly available model. The decision-making process relied on conditional forecasts of unchanged interest rates. Starting in 2005, forecasts incorporated market expectations about policy interest rates.6 The Riksbank published a complete set of two-year-ahead quarterly projections.
Inflation record and monetary policy. During the period under consideration, the CPI index first grew steadily—from nil to 3 percent in the third quarter of 2001. It remained above the target until mid-2003, but moved below the target afterward. The Riksbank initially saw the long-term inflation outlook as broadly balanced, with a lot of uncertainty and a volatile external environment. Deflationary external and supply-side shocks later outweighed domestic demand inflationary pressures, except for the last couple of quarters, when overall inflationary pressures revived. The Riksbank repeatedly applied escape clauses, for example to account for the decline in oil prices in early 2003. The policy interest rates were stable around 4 percent until 2002 and declining afterward. The krona was relatively weak in real terms compared to the long-term trend, the only exception being a brief period in 2002–03.
References
Giavazzi, Francesco, and Frederic Mishkin, 2006, “An Evaluation of Swedish Monetary Policy 1995–2005,” Report for the Riksbank. Available via the internet: http://www.riksdagen.se/upload/Dokument/utskotteunamnd/200607/FiU/200607_RFR1_eng.pdf.
Heikensten, Lars, and Anders Borg, 2002, “The Riksbank’s Foreign Exchange Interventions – Preparations, Decision and Communication,” Economic Review, 1/2002.
Riksbank, Inflation Reports (1993–2006). Available via the internet: http://www.riksbank.se.
6 In 2007, after our sample ended, the Riksbank switched from conditional to unconditional forecasts.
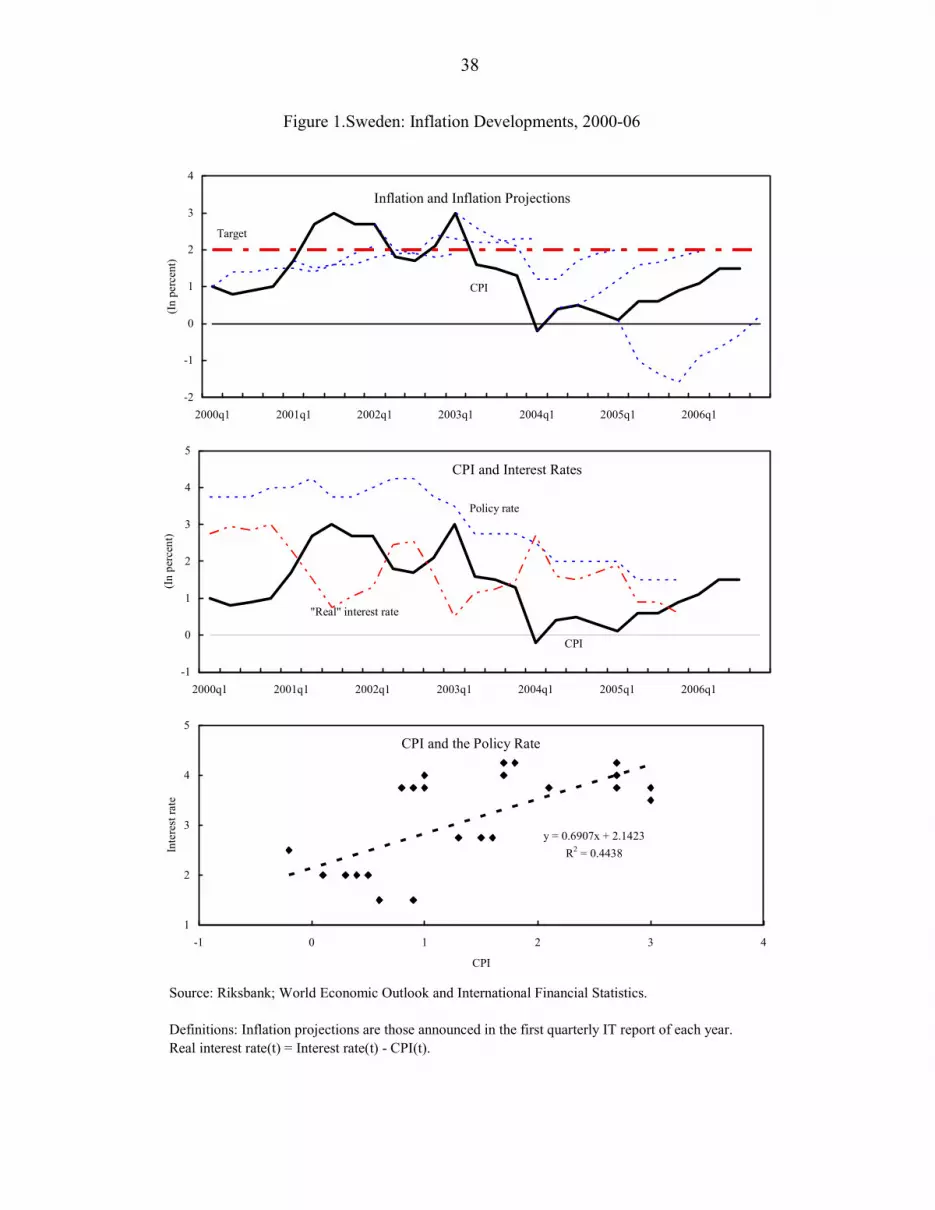
38
Figure 1.Sweden: Inflation Developments, 2000-06
Source: Riksbank; World Economic Outlook and International Financial Statistics.
Definitions: Inflation projections are those announced in the first quarterly IT report of each year. Real interest rate(t) = Interest rate(t) - CPI(t).
Inflation and Inflation Projections
-2
-1
0
1
2
3
4
2000q1 2001q1 2002q1 2003q1 2004q1 2005q1 2006q1
(In
perc
ent)
Target
CPI
CPI and Interest Rates
-1
0
1
2
3
4
5
2000q1 2001q1 2002q1 2003q1 2004q1 2005q1 2006q1
(In p
erce
nt)
Policy rate
CPI
"Real" interest rate
CPI and the Policy Rate
y = 0.6907x + 2.1423R2 = 0.4438
1
2
3
4
5
-1 0 1 2 3 4
CPI
Inte
rest
rate

39
Figure 2. Sweden: Inflation Factors, 1999-2006
Source: Riksbank; World Economic Outlook and International Financial Statistics.Definitions: Gap = seasonally adjusted GDP - Hodrick-Prescott filtered GDP; REER gap = REER (1999=100)- Hodrick-Prescott filtered REER; Impulse = overall balance (t) - overall balance (t-1). Seasonal adjustment is done using the X-12 procedure.
GDP
-3
0
3
6
9
12
1999q1 2000q1 2001q1 2002q1 2003q1 2004q1 2005q1 2006q1
(In
perc
ent)
Annualized q-on-q growth, seasonally adjusted
Year-on-year growth
GDP Gap
Fiscal Balances
-3
0
3
6
9
1999 2000 2001 2002 2003 2004 2005 2006
(In
perc
ent o
f GD
P)
Impulse
Primary balance
Verbal Assessments
-10
-5
0
5
10
2000q1 2001q1 2002q1 2003q1 2004q1 2005q1
Cou
nt
Net external environmentNet aggregate supplyNet aggregate demand

40
Thailand: Country Note Basic information about the IT regime. The Bank of Thailand (BOT) introduced inflation targeting in 2000. The mandate of the BOT is to maintain domestic and external stability. The BOT sets its own inflation target and maintains instrument independence. Thailand maintains a managed-float exchange rate regime, adopted in 1997, and the BOT intervenes when necessary in order to prevent excessive volatility. Model-based inflation forecasts provide a basis for monetary policy decisions and inflation, and GDP fan charts are used as communication tools.
Inflation targets and forecasts. The BOT targets core inflation, which excludes highly volatile items such as such as rice and gasoline. The target is a horizontal 0–3.5 percent range—the widest band in our sample of inflation-targeting countries. The inflation reports are model-based and information about forecast assumptions, outcomes, and the forecasting model are all made public. The forecasts cover eight quarters.
Inflation record and monetary policy. For most of the period core inflation was below the mid-point of the target range. Toward the end of the sample, core inflation picked up, but it remained inside the range. The pickup in inflation was explained mostly by external and supply-side factors. The policy interest rates (the 1-day repurchase rate) were stable until 2004 and increased sharply thereafter in response to inflationary pressures. The increase—300 basis points—was among the highest in our sample of countries. The Thai baht remained below its long-term real trend during the whole period, presumably as a result of the managed-float strategy.
References
Bank for International Settlements, 2005, “Foreign Exchange Market Intervention in Emerging Markets: Motives, Techniques and Implications.” BIS Papers, No. 24. (Basel: Bank for International Settlements). Available via the internet: http://www.bis.org/publ/bppdf/bispap24.pdf.
BOT, Inflation Reports (2000–2006). Available via the internet: http://www.bot.or.th.
BOT, The Bank of Thailand’s Macroeconomic Model for Inflation Targeting. Available via the internet: http://www.bot.or.th/BOTHomepage/BankAtWork/Monetary&FXPolicies/Monet_Policy/model.

41
Figure 1. Thailand: Inflation Developments, 2000-06
Source: Bank of Thailand; World Economic Outlook and International Financial Statistics.
Definitions: Inflation projections are those announced in the first quarterly IT report of each year. Real interest rate(t) = Policy rate(t) - CPI(t).
Inflation and Inflation Projections
-1
0
1
2
3
4
2000q1 2001q1 2002q1 2003q1 2004q1 2005q1 2006q1
(In
perc
ent)
Core inflation
Cor
e in
flatio
n ta
rget
ban
d (0
-3.5
%)
CPI and Interest Rates
-3
-1
1
3
5
7
2000q1 2001q1 2002q1 2003q1 2004q1 2005q1 2006q1
(In p
erce
nt)
Policy rate
CPI
"Real" interest rate
CPI and the Policy Rate
y = 0.4746x + 1.1073R2 = 0.4058
1
2
3
4
5
6
0 1 2 3 4 5 6 7
CPI
Inte
rest
rate

42
Figure 2. Thailand: Inflation Factors, 1999-2006
Source: Bank of Thailand; World Economic Outlook and International Financial Statistics.Definitions: Gap = seasonally adjusted GDP - Hodrick-Prescott filtered GDP; REER gap = REER (1999=100)- Hodrick-Prescott filtered REER; Impulse = overall balance (t) - overall balance (t-1). Seasonal adjustment is done using the X-12 procedure.
GDP
-8
-6
-4
-2
0
2
4
6
8
10
12
14
1999q1 2000q1 2001q1 2002q1 2003q1 2004q1 2005q1 2006q1
(In
perc
ent)
Annualized q-on-q growth, seasonally adjusted
Year-on-year growth
GDP Gap
Fiscal Impulse
-4
-2
0
2
1999 2000 2001 2002 2003 2004 2005 2006
(In
perc
ent o
f GD
P)
Verbal Assessments
-10
-5
0
5
10
2000q1 2001q1 2002q1 2003q1 2004q1 2005q1
Cou
nt
Net external environmentNet aggregate supplyNet aggregate demand