in part'ial fulfillment of the - mspace
TRANSCRIPT
Nei ghbourhood Sati sfacti on :
Contributing Factors in Varying Env'ironments.
Paul Laurence Smith
A Thesispresented to the University of Manitoba
in part'ial fulfillment of therequirements for the degree of
Master of City Planning
by
l^Jinnipeg, Manitoba, l98l

}JEIGHBOURHOOD f]ATISFACTiON :
CONTRTBUTING FACTORS IN VARYII,IG ENVIP.ON¡{ENTS"
BY
PAUL LAURENCE SMITI]
A thesis subrnitteci to the FacLrlty of CratJrurtc Strrdics ofthe Univcnity of Manitoba in partial fulfillrricnt of the. rcquirerne¡ts
of ti¡e degiee cf
MASTER OF CITY PLANNING
o'tgBi
Pc"ission has been granted to the LiBRAIìy or-- THE uNrvER-SITY OIr MANITOIIA to lcnd or sell co¡rics of this thesis, ro
thc NATIONAL LIBRARY OF CAÞJADA ro nricrofìlnr rl¡is
thesis a'd to lend or scll coples of the fiim. and UNIVERSITYIf ICROFILMS to pubiìsh an abstract of ilris ilresis.
Tlie ar¡thor reserves other publicatiou rights, rnd neitrrer the
thcsis nor extensive extracts fronl !t nray bc'¡lrìnted or other-
u,isc reploduced without the author's v¿rittclt ¡rcnrrission.
ABSTRACT
The present study was pnompted by the bel'ief that urban and
neíghbourhood pl ann'ing should rely on more than tradition, econom'ics,
and convenience in its decísion making, and attempt to incorporate
otherr more human consíderatíons into the shap'ing of urban form. One
of the fundamental means of achieving such a goal is to increase peop'les'
satisfaction with their residential environments or neighbourhoods.
Therefore, it is the intent of this study to ask the residents of vary-
ing neighbourhoods how satisfÍed they are with the'ir areas, and to
relate these results to the socio-economic and physîca1 characteristics
of the neighbourhoods in order to discover which conditions (if any)
are most frequently assoc'iated with higher ìevels of neíghbourhood sat-
isfactjon. It is hoped that this information will prove useful in the
planníng of future neìghbourhoods.
To thís end, the body of literature pertaining to this aspect
of planning was identifjed and reviewed, and from this a ljst of vari-
ables which were believed to have a s'ignìficant effect on sat'isfaction
was compiìed. These variables were 'incorporated in a questjonnaire
which was administered in thirteen neighbourhoods selected for their
varying characteristics of socio-economic status, street 'layout pattern,
access to urban Ínfrastructure, and location w'ithin the c'ity. The data
obtained was processed using a standard SPSS program, and the results
were crosstabulated in order to determine the strength and sìgnìficance
of various relationships. These relationships were used in testing
eight hypotheses related to neighbourhood satisfaction which had been
suggested by the focus of the study and by the literature review.
The results revealed that both socio-econom'ic and physical
design characteristics appeared to have some influence on a person's
satisfaction. At the same time, however, the testing of one hypothesis
showed that satisfaction levels varied wideìy among neighbourhoods
sharing essential'ly identical characteristics, while some other neigh-
bourhoods wjth d'issimjlar characteristics showed very s'imilar
sati sfaction I evel s.
It was also found that the relatjonship between satisfaction
and several perceptions of neighbourhood remained strong regardless of
the controì'ling variables used. Three of these perceptìons - the
'friendliness' of the area, its attractiveness, and the privacy itoffered - were the most highly associated with satisfaction, while two
more (the quaìity of the area as a place for children, and its 'jdenti-fiabiìity' as compared to nearby areas) also showed a strong association.
0ther findjngs showed that most people are satisfied with their
neighbourhoods; that on the whole, resjdents of'bay'areas showed
higher levels of both satisfaction and perceptions of neighbourhood
than residents of'grids'; and that higher ìevels of satisfaction were
strongly associated witr¡ hjgher educational attajnment, but not as
strongly with a person's age.
It is encouraging to note that several of the key perceptions
in determining satisfaction wjth ne'ighbourhood can be directìy
influenced by p'lanning activ'ities. Neighbourhood attractiveness and
maintainabil ity, privacy, 'identifjabil ity' , and the qua'l ìty of the
children's environment may all be influenced by the physìcal aspects
of neighbourhood pìann'ing. The present research suggests that positive
- ìl'1, -

perceptjons (and thus satisfaction) could best be fostered in areas
with definite 'edges' or boundaries, street layouts designed to enhance
maintaínability and privacy while reducing through traffic, and housing
'layouts designed to produce a series of micro-neighbourhood environments.
- tv -
AC KNOl^JL E DG EMENTS
When I began what was intended to be a short and simpìe
analysis of neighbourhood satisfactìon, I had only a vague idea of how
much material actual'ly existed on the topic and of how much ground the
investigat'ion would ultimately have to cover. This 'simple'p1ann'ing
thesis eventua'lly required a heaìthy dose of urban sociology,
quest'ionnaire design techniques, statistical anaìysis and'interpre-
tatjon, and computer techniques; doses which were made palatabie
primarily by the people administering them. My committee deserves
first mention in this regard for their valuable advice and persever-
ance: Dr. Raymond Currie of Socioìogy acted as advisor, braveìy
accepting the task of guiding a neophyte through the intricacjes of
data interpretation, and whose efforts helped to shape the study's
final direction and form; and my readers, Professors Mario Carvalho
and Basil Rotoff of City Plann'ing, whose conrnents brought into focus
several issues which helped to reinforce the validity of the research.
Others whose efforts and interest had a significant impact on the
study include Mr. Jim Chim, a fellow student who introduced me to the
SPSS program and who spent hours show'ing me which buttons to push (and
why); Professor Leo Driedger of Soc'iology, whose input during the
formative stages of the questionnaine was very useful; Muriel Innes,
typìst extraordjnaire; and the fellow students and friends who also
helped in many ways, even if onìy by keeping a straight face while
listening to my explanations of what it was all about. Specia'l thanks
in the latter regard go to Ms. Valerie Forcese, who patient'ly listened
to each rethinking of the study while providìng tremendous technical
-v-

and emotional support; and to my parents, whose support was jn every
way unreserved and invaluable - and who at the same t'ime managed to
raise the fìnding of new and subtler ways of saying "Shouldn't you be
working on your thesis?" to an art form.
-vi
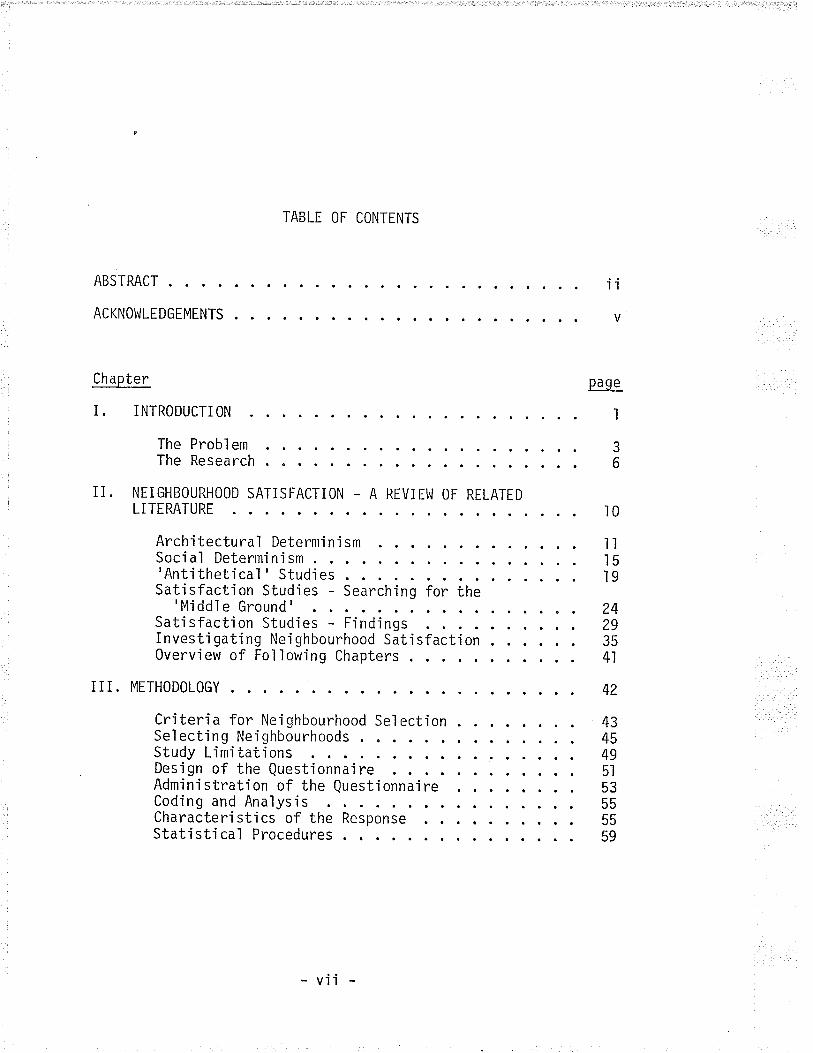
IABLE OF CONTENTS
ABSTRACT
ACKNOl^lLEDGEMENTS
Chapter
I. INTRODUCTiON
The Probl em
The Research
II. NEiGHBOURHOOD SATISFACTiON - A REVIEl^J OF RELATEDLITERATURE
Architectural Determini sm
1'l
page
I
42
434549
l0
J6
I59
2429354t
Social Determini sm
'Antithetical' StudiesSati sfacti on Studi es - Search'ing for the
'MiddleGround' . ..Satisfaction Studies - FindingsInvesti gating Neighbourhood SatisfactionOverview of Following Chapters
iII. METHODOLOGY
Criteria for Neighbourhood SelectionSel ecting Nei ghbourhoodsStudy Limi tationsDesign of the QuestionnajreAdm'inistration of the Questionna'ireCoding and AnaìysisCharacteristics of theStatisti cal Procedures
Response
5l53555559
- vll
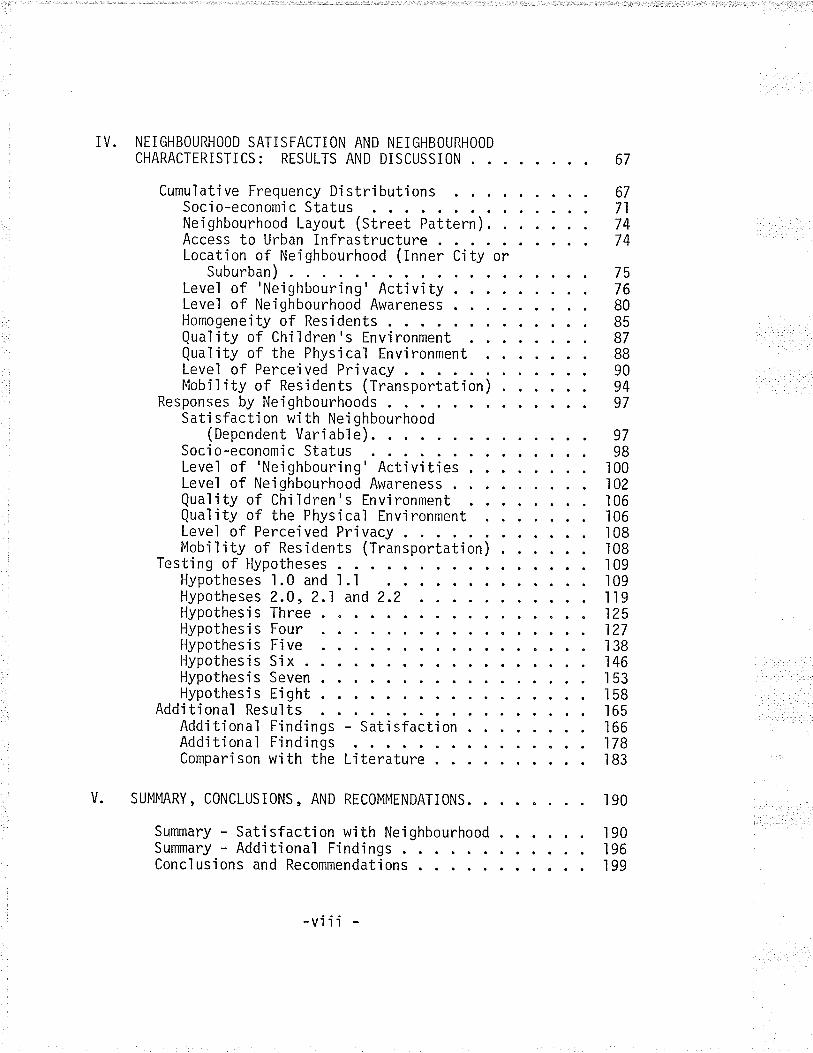
IV. NEIGHBOURHOOD SATISFACTION ANDCHARACTERISTiCS: RESULTS AND
Level of PerceiveMobility of Resid
Responses by NeighboSati sfaction wi th
(Dependent VarSocio-econonlic StLevel of 'Ne'i ghboLevel of Neighbou
NE I GHBOURHOOD
DI SCUSSI ON 67
Cumulative Frequency DistributjonsSocio-economic StatusNeighbourhood Layout (Street Pattern).Access to Urban InfrastructureLocation of Neighbourhood (Inner C'ity or
Suburban )Level of 'Neighbourìng' ActivityLevel of Neighbourhood AwarenessHomogeneìty of ResidentsQuality of Children's EnvironmentQuality of the Physicaì Env'ironment
67717474
757680858788909497
d Pri vacyents (Transportation)urhoodsNei ghbourhood'iab1e). 97
atus 98uring'Activities 100rhood Awareness 102
Quaì 'i ty of Chi I dren ' s En vi ronmentQua'l
'ity of the Physi cal Envi ronmentLevel of Percei ved Pri vacyMobility of Residents (Transportation)
106106108r08r09109ll9
Testing of HypothesesHypotheses I .0 and l.l
andHypotheses 2.0, 2Hypothesis ThreeHypothesìs FourHypothesis FjveHypothesis SixHypothesis SevenHypothesis Eight
Additional Results
.t 2.2. 125
127138146153158165166178
Additional FindingsAdditional FindingsComparison with the
- Satisfaction
Lìterature I 83
V. SUMMARY, CONCLUSIONS, AND RECOMMENDATIONS. 190
Summary - Satisfaction with Neighbourhood 190Summary - Additional Fìnd'ings 196Conclusions and Recommendations 199
-vlll
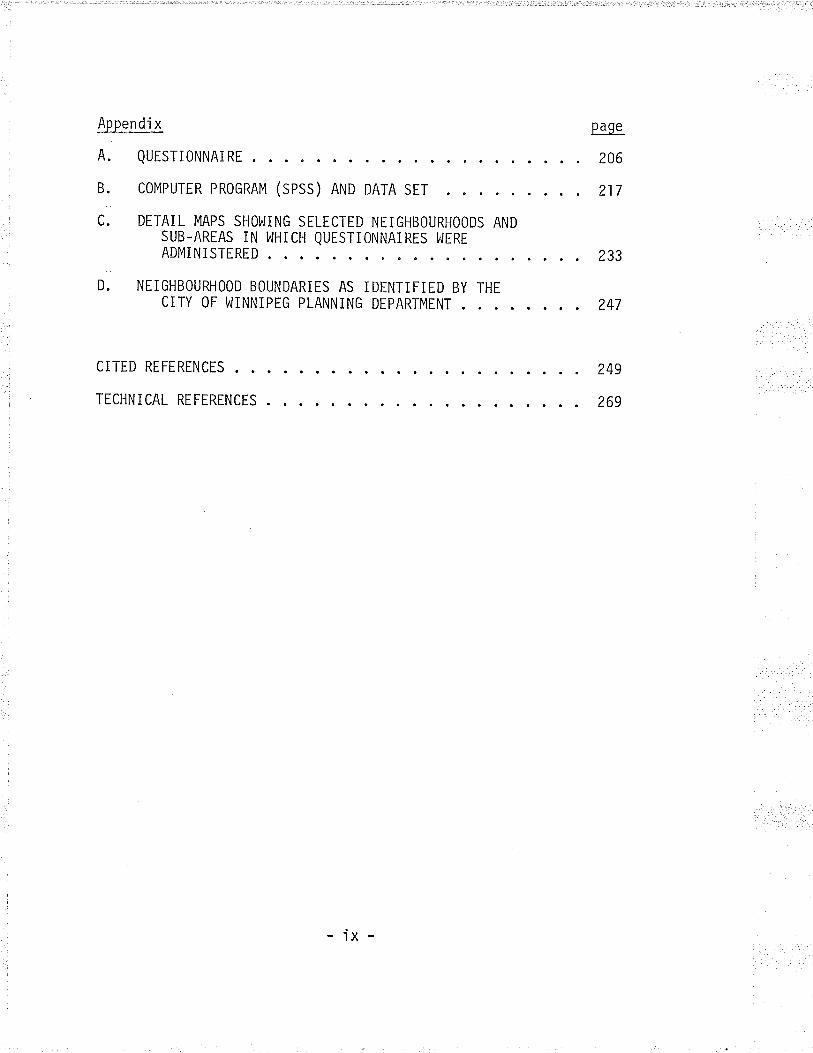
Appendi x
A. QUESTIONNAIRE
B. COMPUTER PROGRAM (SpSS) AND DATA SET
C. DETAIL MAPS SHOI^IING SELECTED NEIGHBOURHOODS ANDSUB-AREAS IN t^lHICH QUESTIONNAIRES Ì,JERE
ADMINISTERED
BY THE
page
206
217
233
247
249
269
D. NEIGHBOURHOOD BOUNDARIES AS IDENTIFIEDCITY OF l^JINNIPEG PLANNING DEPARTMTNT
CITED REFERENCES
TECHNICAL REFERENCES
- ix -
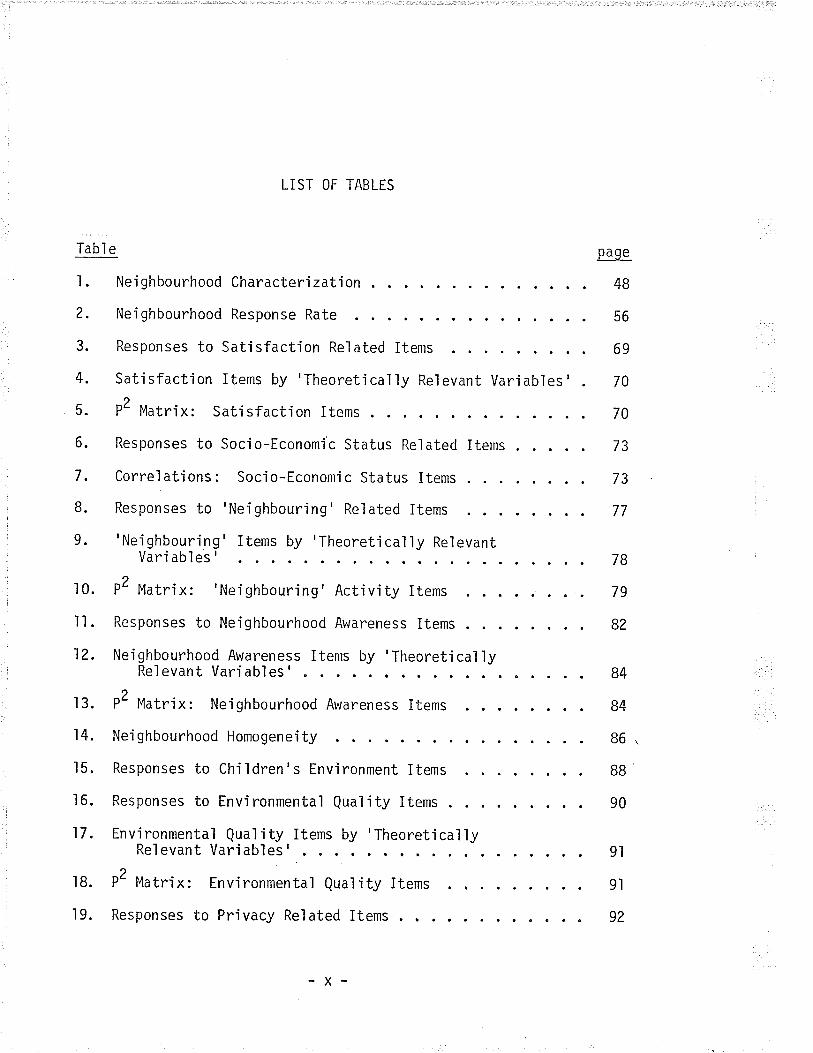
LIST OF TABLES
Tabl e
l. Ne'ighbourhood Characterizatjon
2. Neìghbourhood Response Rate
3. Responses to Satisfaction Related Items
4. Satisfaction Items by 'Theoretjcally Relevant Vari abl es '
5. P2 Matrix: Satisfaction Items
page
48
56
69
70
70
73
73
77
6. Responses to Socio-Economic Status Related
7. Correlations: Socio-Economic Status Items
8. Responses to 'Neighbouring' Related Items
Items .
t0.
il.12.
9.'Neighbouring' Items by'Theoretically RelevantVari abl es '
P2 Matr'¡x:'Neighbouring' Activity Items
Responses to Ne'ighbourhood Awareness ltems
Neighbourhood Awareness Items by'TheoreticaìlyRel evant Vari abl es '
P2 Matrix: Neighbourhood Awareness Items
Nei ghbourhood Homogeneity
Responses to Children's Environment Items
Responses to Environmental Quaìity Items
Envjronmental Quaìity Items by'TheoreticaìlyRelevant Variables'
P2 Matrix: Environmental Quaìity Items
Responses to Privacy Re'lated ltems
82
84
B4
78
79
9l
9l
92
13.
14.
15.
16.
17.
86'
B8
90
18.
19.
-x-

Tabl e
20. Privacy Related IVari abl es ' .
oP'Matrix: Priva
Responses to Mobi
Satisfaction with
Family Income by
Frequency of Cont
Perceptìon of NeiNei ghbourhood
tems by 'Theoreticaììy Relevant
page
103
103
105
105
107
107
iltlr4
ll5
93
9321.
22.
23.
24.
25.
26.
27.
30.
3l .
32.
33.
cy Reìated ltems
f ity Reìated Items
Neìghbourhood by Nei ghbourhood
Nei ghbourhood
Perceived Neighbourhood Friendl iness by Neighbourhood
96
98
99
l0t
l0l
28. Perceived Neighbo
29. Perceived QualityNei ghbourhood
act with Neighbours by Neighbourhood
:n:':'1':'.': lo:':':':o]".01 .
urhood Size by Neighbourhood
of Chi I dren ' s Envj ronment by
Percept'ion of Neighbourhood as Visualiy Attractive byNe i ghbourhood
Perceived Privacy by Neighbourhood
Number of Cars by Nei ghbourhood
Ihe Relationship of Satisfaction with Neighbourhood toVarious Socio-Economic and Physical Design Variables
34. Satisfaction by Neighbourhood by Income
Sat'isfaction by Neighbourhood by Street Layout .
35. Satisfaction among Neighbourhood Pairs with SimilarSocio-Economic Status and Similar Physica'lCharacteri sti cs i\z
36. Satisfaction among Neighbourhood Pairs wìth SimilarSoci o-Economi c Status and D'i ss imi I ar Physi caìCharacteristi cs lZ3
37. Satisfaction among Neighbourhood Pairs with DissimilarSocio-Economic Status and Similar Physica'lCharacteri sti cs 124
-xi
Tabl e
38. Sat'isfactíon by Neighbourhood
39. Satisfaction by Street Layout by Income
40. Satisfaction by Neíghbourhood by Income
41. Satisfaction by Street Layout by Maìe Occupation
42. Satisfaction by Street Layout by Maie Educat-ion
43. Satisfaction by Street Layout by Neighbourhood Location
44. Satisfactìon by Maintenance/Attractjveness
45. Satisfaction by Neighbourhood by Maintenance/Attracti veness
page
129
130
132
133
133
135
139
140
142
143
147
148
150
156
t59
160
l6l
162
167
46.
47.
48.
49.
50.
51.
52.
53.
54.
55.
56.
57.
58.
Satisfaction by Majntenance/Attractjveness by Income
satisfaction by Maintenance/Attractiveness by Street Layout
satisfact'ion by Perceived'Friendliness' of Neighbourhood
Satisfaction by Neighbourhood by' Frjendliness'
Satisfaction by 'Friendliness' by Income
Satisfaction by 'Friendliness' by Street Layout
Satisfaction by Neighbourhood Homo/Heterogeneity
Satisfaction by Neighbourhood Homo/Heterogeneìty byIn come
. l5l
. 155
Satisfaction by Privacy .
Satisfaction by Neighbourhood by Privacy
Satisfact'ion by Prìvacy by Income
Satisfaction by Privacy by Street Layout
Neighbourhood Satjsfact'ion by Perceived Neighbourhood'Friendl iness', Maintenance/Attractiveness and privacy
- xll
Tabl e
59. Perceived Nei ghbourhood 'Friendl jness' , Maintenance/Attractiveness, and Privacy between Pairs ofNeighbourhoods with Sjmilar Socio-Economic andPhysical Characteristics, and with Similar(ldest End - Wolseley) and Dissimilar(l^l'ildwood - Westwood) Levels of NeighbourhoodSati sfaction
page
170
184
60. Satjsfaction wjth Neighbourhood by Percejved Ne'ighbourhoodMaintenance/Attractjveness by Income 176
61. Prediction of Neighbourhood Sjze by Location ofNei ghbourhood
62. Neighbourhood Satisfaction by Maie Age, Fema'le Age 186
63. Neighbourhood Satisfaction by Frequency of informalSocial Contact with Neighbours r88
- xiii -
LIST OF FiGURES
Fi gure
l. Selected
2. P2 craph
Nei ghbourhoods
page
46
62
- x'tv -
Chapter I
I NTRODUCT I ON
One of the paradoxes of the twentjeth century ìs that jn a
t'ime of vast leaps forward in so many aspects of human knowledge, there
are still some fields of study whjch remain in a remarkably crude and
unscientific state. The accelerating pace of change in knowledge and
technology which characterizes the world of today only serves to under-
score the contrasts between those discipìines whjch have undergone and
adapted to revolut'ionary advances, and those which have apparently fallen
farther and farther behind a rapidìy transforming worìd. Strangeìy enough,
some of these 'stagnating' fields are nejther irrelevant nor obscure,
but actuaìly touch upon some of mankind's most basic and immediate needs.
One such need is for the provision of housing to shelter a rapidìy
increasing urban popuìation; and one such field is the practice of
neighbourhood planning.
It seems somewhat odd that even as we expanded our understand-
ing of the universe, the earth, the atom, and of the human body and mind,
we remained in comparative ignorance of the nature of the very envìron-
ments that we have chosen to bu'ild and tò live in. It would have seemed
oniy'logicaì for the city and especiaììy the neìghbourhood to have
immediate'ly aroused mankind's desire to innovate and improve; for
aìthough a relatively small group of people cannot be expected to alter
the entire world to suit their needs and desìres,'it should be well
wjthin their power to shape a smal'l part of it - their homes, their
gardens, their streets, their parks - in short, their neighbourhoods.
-l

2
Instead, we find that the task of shaping the urban environment
is no longer in the hands of the individual, but in those of the pro-
fessjonal pìanners. l^le also find that the p'lanners seem to be scarcely
more knowledgeabie or capable when faced wjth the probìem of producing
a satisfactory urban environment than they were when their profession
was first created. Their efforts have produced useful guìdelines
related to the problems of health, safety, and the efficient and eco-
nomical operation of urban systems - but seem to have produced almost
nothing regarding the 'quaìity of life' that peop'le experience. More
emphasis seems to be placed on the understanding of traffic patterns and
zoning bylaws than on understanding neighbourhoods and what makes them
satisfying places to live.
And so, almost a century after the establishment of a profes-
sion dedicated to the understanding and ìmprovement of the urban
environment, the p'lanning of residential neighbourhoods is still less
the careful practice of an artistic science than the routine applica-
tion of an unquestioned tradjtjon. Indeed, if the residents of a
suburb of the year 1900 suddenly found themselves'in one completed iust
this year, they would find remarkably little to surprise them in
its appearance, ìayout, or functioning. What might surprise them,
however, would be the changes in society and technology that eight
decades had brought; and then, upon a l'ittle reflection, they might
wonder why the neighbourhoods had not shown a corresponding change.
This line of thought raises an unsettìing question for those
professionals dealing with urban issues. It has been argued that the
basic pattern of urban neighbourhoods has seen remarkably littìe
change for many years now, while jn the same period of time the world
in which they are supposed to function has changed radjca'lìy; can'it
be that the planners, sociologists, and psychoìog'ists who have looked
into this problem have not been able to suggest any ways to change
neighbourhoods in order to increase their residents' satisfaction with
them as p'laces to Iive?
If it is assumed that this speculation has some truth in it, we
are again led to wonder why so little definite knowìedge has been pro-
duced about the urban environment as a place to live. Are we then to
conclude that the concerns of the urban milieu are so diffuse and vari-
able that it is ímpossible to formulate definite recommendations for
its improvement? 0r does pìanning simpìy not affect those factors
which produce 'improvements' or 'satisfaction' as far as urban resi-
dents are concerned? Are random, economic factors the onìy ones which
can have an effect on our cities' development? 0r might it be worth-
while to attempt to Ídentify some basic and fundamental relatjonshìps
between peopìe and the cities they create, in the hopes of being abìe
to incorporate such relationsh'ips into the pìanning of future neigh-
bourhoods?
l.l The Problem
Searching for 'fundamental relationships' jn the above context
may seem at first to be an overìy opt'imistic, if not futile quest.
After all, if such relationshìps actuaììy existed, would they not have
been discovered and documented many years ago? And'if human needs and
desires cannot be demonstrably reìated to the urban environment, why
4
bother with neighbourhood planning at alì?
Supporters of this viewpoint frequent'ly refer to studies
carried out in the suburbs of various American cities which found that
the degree of sociaj and physicaì planning which took place before a
neíghbourhood's construction could not be consistently related to the
degree of satjsfaction which was later feìt by its residents. In other
words, these studies seem to show that the residents of'less planned'
environments often found them to be equaì]y satisfying pìaces to live
as the residents of 'highly planned' neighbourhoods found theirs (gz,
136, 265 ) .
There is, however, another aspect of these findings which is
frequentiy overlooked. As Zehner po'ints out in his analys'is:
"In effect, environments tend to recruit and holdthose persons who expect to, and do, find thesesetti ngs sat'i sfyi ng . " (27 4:4)
This would make the suburbs of large American cjties one of the worst
possibìe places to look for differences in satisfaction levels, as
most of the residents would be those trying to get away from the poor
conditions wjthin the city itseìf. To such people, almost any suburban
net'ghbourhood would represent a c'lear improyement over the inner city
alternative, and their satisfaction ievels might weìl be produced by
this factor rather than by the characterìstics of the area itself.In terms of the present research, Zehner's hypothesis is an
interestÍng one not only because it would help to explain the findings
of the previously mentìoned studies, but because it would also seem to
indicate that people choosing among prospectiye neighbourhoods make a
conscious choice based on some criteria; and, if they later find that
some additional factor is reducing their satisfaction wjth the area,
they move on, while those who are still satisfied r"main.l Thjs would
imply that over t'ime, most neighbourhoods will become predominantly
populated by people who are'satisfied'with their environment, and that
those who decide to move on will do so until they find an area incorpor-
ating characteristics whích they find sati'rrying. upon investigatìon,
it is found that these assumptions are indeed borne out by the fjndings
of many studies (.l, 39, gg, 105,125, l3g, 155, 169,177,179, 1g0,244,
265, 274, 276, 277).
From thís evidence, it wou'ld seem 'logica'l to assume that most
índíviduals find some kinds of neighbourhoods more satisfying than others.
This leads us to ask two questions which are central to this study:
firstly, which factors have the strongest influence on a person's per-
ceíved satisfactíon with their neighbourhood? And secondìy, if these
factors can be identifÍèd, is it possib1e to use this knowledge to pìan
neíghbourhoods which are more satìsfying to greater numbers of people?
For the most part,'it is the latter question which led to the
present research. Another of the contributìng factors was the subjec-
tjve belief that planners, when mak'ing decisions affecting the qua'lity
of life of hundreds or even thousands of peopìe, still seldom know
what those peopìe want or need except in the vaguest of terms. And,
lFor^ a discussion of an ecologicaì model of the matching ofindividuals to sites, and their desire to move, see',Migration as anAdjustment to Environmental stress" by J. l,loìpert (zl0:éz). This:t!dy focusses on two aspects affecting the decision to move, thesebeing stress (e¡vironmental pressures, whether social or phyiicaì) andstrain (tne individual's reaction to the stress inducjng faätors).Also see Saegert's article on environments and stress (ãl+).

6
while the residents of established ne'ighbourhoods will sometimes let
their feelings be known if they believe that they wilì be adverseiy
affected by some proposed change, jt is most often left entirely to the
planners to shape the changes now taking place in our cities.
Since more and more of these changes must inevitab'ly come, itwould onìy seem wise for p'lanners to put much more emphasjs on the task
of systematical'ly increasing their understanding of human responses to
various neighbourhood and community environments, so that they may
attempt to preserve and reinforce those characteristics that people
find satisfying.
I.2 The Research
To this end, it is the jntent of this thesis to examine various
neíghbourhoods exhibiting d'iffering socio-economic and physicai layout
characteristics in order to determine the residents' perceived satis-
faction with their neighbourhoods. 0nce this has been done, the data
obtaìned can be used to examine to what extent and in what ways the
residents of varying environments differ in their perception of satis-
faction, and if any particular neighbourhood characteristics or groups
of characteristics are consistently associated with either high or low
levels of satisfaction.
In order to carry out this program of research, a considerable
amount of preliminary work had to be carried out. For exampìe, the
city in which the study took pìace (l^l'inn'ipeg, Manitoba) had to be sub-
divided into identifiable neighbourhoods, based on such determining
factors as the presence of physicaì boundaries, the degree of social
homogeneity, and others which wjll be detailed in the chapter dealing
with the methodology of the study. After the neighbourhoods were
identjfied, a set of socio-economjc and physìca1 layout 'scales' had
to be estabjished in order to provide a means of choosìng areas for
detailed examination, and a systematic method of grouping and comparing
the data obtained.
Idithin each of the areas chosen, a questionnajre was adminis-
tered in order to evaluate various neighbourhood and community
characteristics (both demographic and perceptual ), including the
residents' feel ings of 'neighbourhood satisfaction'. Finally, a com-
puter anaìys'is was performed in order to find out what factors have
the greatest effect on the perceived satjsfaction with neighbourhoods
heìd by population sub-groups living in varyìng environments; and,
whether any of the characteristi.cs of neighbourhoods and/or the peopìe
l'iving in them are consistently associated with high or low levels of
sati sfaction.
Should the study meet with a fair degree of success, it may
also prove possible to translate those characteristics which have been
demonstrated to be significant in producing satisfaction among people
jnto recommendatjons for the planning of future neìghbourhoods. If,on the other hand, no conclusive fìndings can be reached, it is
important to remember that onìy the focus of the study must be changed,
and not the goa'l itself . For in the near future, p'lanners must find
the knowledge from which they can develop an understanding and a sen-
sitivity for the peop'le and the environments that they wil'l deal with
- before they attempt to change them.
At thìs point, it is necessary to clarìfy two of the under'ly'ing
assumptions of this study. Fìrstly, it js assumed that both the neigh-
bourhood and the community are.recognjzable and functional units of the
modern city;1 and secondly, that both ner'ghbourhood (physica'l ) charac-
teristjcs and community (socia'l) characteristics pìay a role in
determin'ing a person's satisfaction with his or her residentjal envjron-
ment. Therefore, when the term.'neighbourhood satisfaction' is
encountered in following sections, ìt'is meant to refer to the satis-
faction wìth one's neighbourhood that is produced when both of these
aspects are combjned (for example, the houses, streets, and parks, p'lus
the people, friendships, and neighbouring activities), as this study
assumes that neíther operates jndependentìy of the other.
This assumption may not seem in any way unusual, but it'isonìythe most recent research into the genera'l area of 'neighbourhood
satisfaction'that has accepted the idea that both factors may exert
an influence on peopìes' percept'ions. when the concept of 'neighbour-
hood'was st.ill in its formative stages, the first assumption of
designers and p'lanners was that the physicaì organizatjon of an area
acted as the sole factor influencing the residents' satisfaction.
Later on, in the late 1950's and the'1960's, socjal scientistspointed
out the flaws in this simp'listic concept - but then took matters to
tIt is not within the scope of thÍs study to debate the exis-tence of 'neighbourhood' and 'community' or theìr importance to urbanresjdents; such arguments have been thorough'ly covered ìn many otherstudíes (48, 54, 92, l0g, ll7, 175, jBg, I g2,- 235, 236) and wìlltherefore onìy be mentioned in the literature review, when relevant.
the opposíte extreme by hypothesizing that on]y the social organization
of an area had any significance in that regard.
Each of these ideas was supported with great singìe-mindedness.
Today, however, researchers recognize that any phenomenon seldom has
a s'ingle cause, especialìy where human behaviour is involved. It would
therefore seem logjca] to assume (at the outset, at ìeast) that both
phys'ica1 and socjal factors can influence residents' perceived sat'is-
factjon with their neighbourhoods to a greater or lesser degree,
depending on the individual. It remains to be seen, however, whether
or not the results of the study support this view.
Before the study itself could be undertaken, it was firstnecessary to expand its scope and refine its goaìs jn order to reflectthe current state of the research jnto this subject. To thjs end, a
thorough anaìysis of the related literature was performed; itsfind1ngs
form the substance of the following chapter.
Chapter iI
NEIGHBOURHOOD SATISFACT]ON -A REVIEI^J OF RELATED LiTERATURE
Assembling an overview of the literature dealing w'ith the issue
of'neíghbourhood satisfaction' has proven, for the most part, to be an
arduous and unrewarding task. This is because the greater part of the
researchers'efforts in this regard appear to have been channelled into
the support or denial of the concept of'architectural determinism'on
a purely binary basis; depending on the writer's jntellectual or pro-
fessional background, design either accounted for the greater part of a
personls behaviour in an urban setting, or for none at all. Those who
took the latter view offered as an alternative a form of'socal deter-
minism', jn which the social organìzation of an area r^ras assumed to be
total'ly responsible for any feelings of satisfaction held by its resi-dents. unfortunately, this concept was almost useless to planners, in
that they could determine neither the form of socjal organizatjon nor
t,he type of peopìe to occupy an area prìor to its construction. This
lack of direction may have been partiaììy responsible for the rise of
an even less constructive hypothesis - one whjch claimed that the
concept of the 'neighbourhood unit' itself was an anachronism in an
increasingìy mobile and transient world, and that traditional pìanning
concepts were therefore useless in contemporary society.
The content of subsequent literature suggests that this conflictof ideas was partial]y'resolved' jn at least one way - any form ofneìghbourhood study wich would involve touching on either viewpointwas
- t0 -
i1
carefulìy avo'ided by researchers for quite a period of time. It is
unfortunate that this turned out to be the time when urban crises
began to make themselves obvious, and when the formation of a system-
atic basis for analyzing urban environments and prob'lems would have
best been begun. As it turned out, the few rational voices that tried
to establish a'midd'le ground'were drowned out by those from the
extremes. Their theories and findings vrere not to receive a wide
audience until on'ly recently, when some of the first tentative steps
were taken towards the establishment of a methodical and comprehensive
means of ana]yzing neighbourhood environments and the responses of
their residents towards them. This process is sti'lì go'ing on with
painful sïowness - and the end is nowhere in sight.
This brief overview does not g'ive a proper appreciation of the
growth and decline of the theories which were proposed, tested, and
vigorousìy defended (and attacked) by various groups of professionals
with an interest in the urban condition. In order to provide such an
appreciation, it will be necessary to expand on the tenets of each
major school of thought and on what their proponents and detractors
had to say. This does not pretend to be an exhaustive hjstorical
review, but will provide a summary of the most ìmportant lines of
thought and the conditions which gave rise to their appearance,
leadjng ultimateìy to the study of neighbourhood satisfaction.
2.I Architectural Determìnism
The concept of architectural (or design) determinism suggested
that the physica] characteristics of urban settings have a direct
12
effect on the way that peopìe behave. The extreme proponents of this
once widely held theory believed that the arrangement of housing and
facilities in a neighbourhood would not only influence but determine
the quality and distribution of social contacts among an area's resi-
dents, thus giving rise to'neighbourhood spirit'or satisfaction.
The researchers whose work was most often referred to in connect'ion
with this theory included Festinger, Schacter, and Back's report,
pubìished in 1950 (68); Kuper's work from 1953 (i32); Caplow and
Forman, also in i950 (a0); and l^lhyte, from 1957 (256). However, while
portions of these works were being c'ited by p'lanners and architects in
support of some rather extreme views, most of the theorists themselves
were actually mak'ing much more moderate claims.
For examp'le, Festinger, Schacter, and Back, jn their study of
the l,lestgate and l^lestgate I^Jest housing projects at the Massachusetts
Institute of Technology, found that:
"The architect who builds a house or desìgns asite pìan, who decides where the roads will andwill not go, and who decides whìch directionsthe house will face and how close together theywi I I be, al so 'is , to a 'large extent, deci di ngthe pattern of sociaj life among the people whowill live in those houses." (68:160)
This was the most wideìy cìrculated statement of the entire report,
due to its seemingly cìear-cut support of architectural determinism.
Somewhat less attention was given to a precedìng and more conditional
finding from the same report:
"In a community of people who are homogeneouswith respect to many of the factors whichdetermine the development of friendships, thephysicaì factors arising from the arrangementof houses are major determinants of what friend-ships wiìì develop and what social groupingswill be formed." (68:i51)
l3
In other words, the researchers were actualìy say'ing that physicaì
layout will on'ly have a significant effect when a homogeneous social
community is already in existence. Another example of the moderation
present ín the thinkjng of the early researchers appeared in a British
report prepared in 1943 by the National council of socia'l service,
titled "The Size and Social Structure of a Town", whjch said that:
"Though physical planning and administratjve, measures cannot by themselves change socia'lrelationships, they can, if wisely and pos'i-tively conceived, encourage and facilitatethe growth of tha.t spirit and fel'lowsh.ipwithout which true community life jsimpossible." (I78:b)
However, this sort of caution appears to have been thrown to the winds
during the post-war buiìding boom, when p'lanners and architects enjoyed
a position of considerable power and influence. During this perìod,
architectural determinism was at its height, and claims were made such
as those by l^lhyte:
"Given a few physicaì clues about the area,...you may come up with an unsettl ingìyaccurate diagnosis of who ìs in the gangand who isn't. " (256:366)
and by Capl ow and Forman:
"InteractÍon rises... with almost molecularsimpì ic'ity in terms of the spatìa'l patternof the communìty. " (40:366)
Again, however, it must be remembered that the pubì ication of such
views was an exception rather than a rule. As Broady, a critic of the
architectural determinism model states:
"It is more often found implr'cit in architects'thinking than in any clearly argued form: andit is probab'ly the more dangerous for that.,,(33:13)
l4
And, wh'ile it may not have had a c'learìy argued form, the notion was
evidently held widely enough for Broady to comment that:
"...one stands aghast at the naivety, thesheer lack of intellectual discipline whichoften marks the enthusiastjc designer'sconfrontation with social theory. r (33: I I )
In the light of these and other critjcisms, those who supported
the concept of architectural determinism were gradually silenced, as no
clear proofs of the theory could be produced in its defence.
Some offered a more reasoned outlook, such as Lee:
"But.single instances of archjtectural manipu-lation which fail or succeed do not invalidatethe process of architectural determinism. Itcould simp'ly mean that the wrong means havebeen chosen, or that we do not yet understandthe complex interlocking system of variablesthat is involved. This would seem plausiblefor a field where almost no research has beendone. The main misunderstanding arises whencritics attribute to architectural deterministsthe absurd claim that the built environment is theonly or even the main agent in the formation ofbehaviour. This is obvjousìy not the case, noris it 'impl ied in the concept as ordinariìyunderstood by scientjsts. Social forces !uchas family, school, and so on also shape humanbehaviour, probabìy wìth much'greater potency.The physical environment should not, however,be under-rated. It is ìong-endurjng andrel ati veìy cons j stent , and it frequenilyoperates in subtle concert wjth social forces,serving as a catalyst in the formation ofrelationships. between peopì e. " (l4l :256)
0n the whole, however, the concept of architectural determinism had
been effectively silenced, if not comp'leteìy suppressed. It is
interesting to note that many of the theory's most vocal criticsagreed that the physical environrnent could have some effect on peopìe,s
behaviour - for exampìe, Broady also said that:
l5
"Some physica'l forms, it is true, do havedetermjnate social consequences. But themost that physical desìgn can do, socio-ìogically, is to set conditjons that arefavourable or unfavourable to particularsocjal activities." (33:5'l ),
but objective views such as these were lost in the general rush to
condemn the theory's excesses. This was to have an unfortunate effect
on the field of neighbourhood studies, as we shall see with thebenefit
of hindsight in the following sectjons. Next, however, we wiìì lookat
some of the critjcism levelled at the concept of architectural deter-
minism, and at what its critics proposed to take its pìace.
2.2. Social Determinism
Inasmuch as the empirìcal basis for the theory of architectural
determinism was never fulìy documented, it is curjous that most of the
criticisms levelled at it by social theorists tended to rely just as
much upon subjective observation as did the object of their scorn. Itwas readily adm'itted by these theorists that huge gaps existed in the
knowledge on this subject; and yet, without a factually documented
base on which to support their viewpoint, the'ir majn spokesman feltsure enough to wrjte that the possibilìty of the buìlt environment
having an effect on a person's sense of community or satisfaction was
"...sheer specuìation masquerading as sociologicaì truth." (z+:tss)
The most common 'proof' offered in support of this v'iewpoint was the
results of several studies whjch had found a good deal of'neighbour-
hood spirit' present in urban slums, where physìcaì conditjons were
very poor. (76, zll)
16
This approach may appear quite reasonable, but there are two
inherent flaws. Firstly, one might similar'ly try to disprove the state-
ment'listenÍng to music makes peop'le happy'by pointing out that some
happy people have not been listening to music; a valid point, perhaps,
but one which does nothing to d'isprove the hypothesis. It merely
indicates that some other factor or factors are capable of producing
happiness - or in the case of neighbourhoods, satisfaction. Secondly,
their'proof'assumes that the people who have no other choice but to
live jn a slum will react in the same way to poor physicaì conditions
as the researchers would. In thjs way, many theorists obscured the
real issue by concentrating their efforts on denying that physical
factors had any effect on peop'le whatsoever.
Those who took a more reasoned approach noted that for the most
part, the supporters of architectural determinism had linked physicai
design (or more specifically, one aspect of it, that being 'prop'inqu'ity'
or physicaì nearness) with social contact, and little more. It was
then argued by these researchers that this contact by itself was not
a'lways sufficient to create neighbourly relat'ions or a sense of commun-
ity. And from thìs, 'it was hypothesized that there must be some
additional preconditions of a non-physica'l nature. For example, Gans
found that:
"Propi nquí ty not on'ly i ni ti ates rel ati onshi ps, but i taìso plays an important role in maintaining the ìessintensive ones, for the mere fact of living togetherencourages neighbours to make sure that the relation-ship between them remains positive. Propinquity cannotdetermine the intensity of the relationship, however;this is a function of the characteristics of the peoplei nvol ved. " ( 76: 136 )
17
In looking at the descriptions of the people 'involved in
previous stud'ies, sociologists found two clues poìnt'ing towards the
characteristic which they were ultimately to use in formulating a
theory to supercede that of architectural determinism. The fìrst was
the failure of several experiments with 'balanced communities' in which
families of varying socío-economic backgrounds were relocated into the
same nejghbourhood. This was done jn the hope that through the sharing
of local space and facilities, a sense of inter-gl^oup co-operation and
of community wouìd develop among the resjdents. Such attempts were
less than successful (132, L49, 181 , I87 , 266), and the concept was
speedi'ly dismissed (36, 75, 128) . The second clue was prov'ided in the
literature supporting archÍtectural determinism. Festinger, Schacter,
and Back had said jn their report that physical factors were major
determinants of friendship formation, but had then gone on to say that
thìs was only true "... in a community of people who are homogeneous
with respect to many of the factors whjch determine the development
of friendships." (09:tSt). They did not provide a clear definition of
these factors; it remained for researchers such as Greer and Gans to
hypothesize that the most important characteristics affecting peop'les'
choices and demands regardìng neighbourhood qualities were:
"... class - in all its economjc, soc'ia'l ,and cultural ramifications - and lifecycìe stage." (82:111)
Gans went on to note that most of the studies which supported the
concept of architectural determinism had examined areas where the
residents aìready showed great similarity in the above characteristics,
such as graduate student housjng and military housing districts.

18
This led Gans to conclude that:
"Homogeneity of residents turns out to bemore important as a determinant of socia-bi ì i ty than proximi ty. If the popu'lati onis heterogeneous, there is little socialcontact between neighbours, either onapartment-house f I oors or i n si ngì e-fami'ly-house blocks; if the people are homogeneous,there is ljke'ly to be considerable socialcontact in both house types." (82:iOB)
To summarize, then, it was these conclusions which led to the
formulation of the theory of social homogeneity, for which the chief
spokesmen were Gans, who produced several papers dealing with the sub-
ject during the period from 1961 to 1969 (75,77,79,83, 84); Dyckman,
also during the same period (62,63); l"lichelson, during the late 1960's
and the early '70's (165, 167); and Buttimer, pubìishing during the
early I970's (35,36). All of these works suggested that the pre-
requisite for the development of neighbourly relationships beyond the
stage of superficial pol'iteness was the presence of a fair degree of
similarity in social class, life style, and stage in the life cycle
among the resjdents of a given area.
This theory received wide support, and has considerable influence
today despite the fact that some of the major evidence in its support
was simp'ly the failure of several heterogeneous communities. Another
apparent difficulty with the theory of social homogeneity (from a
planner's point of view) is that it is primarily explanatory and
not predictive in nature. Planners would naturalìy ììke to know to
what extent sociologists feel that a neighbourhood should be homogeneous,
ìn order to increase their chances of causing feelings of community
and satisfaction to appear. But, as Gans concluded:
l9
"The proper solution js a moderate degreeof homogeneity, aìthough at this point noone knows how to define th'is degreeoperationa'lìy or how to develop plannìngguides for it." (Z+:10¡)
As has so often been the case jn the field of urban studies, reseachers
were proving to be far more adept at jdentifying problems than at
reaching solutions; empirical research into piannìng probìems had not
yet even come close to keeping pace with pureìy theoretical work.
However, the conclusions which social theorists had reached
left pìanners with a much bigger problem to consider - did thejr work
have any value at all? If the research that had been done was to be
taken at face value, physical design had only a very minor effect on a
person's behaviour or satisfact'ion, and then onìy if certajn social
conditjons were aìready in existence. To make matters worse, nobody
seemed able to state what forms these socjal conditions should take,
to what extent they should be present, or even how to go about creating
them. This left pìanners wondering just what it was that they couìd
expect to achieve, and how they were to do it.
2.3'Antithetical' Studies
There was a third position taken in the debate over which
factors had the most powerfuì effect on a person's perceptions and
behaviour in an urban setting. The main characteristic of the studies
produced by this school of thought was that they did not propose some
other factor to be more powerfuì than architectural or social ones;
rather, they took a compìeteìy different view, one that assumed that
it was impossible to link any of the attríbutes of 'neighbourhood' (as
20
defined by architectural determinism or socjal homogeneity) dìrectly
with 'community spirit' or with any form of satìsfactíon felt by an
area's resídents. This attitude was most clearìy expressed in one of
the few theories which appeared after that of social homogene'ity. The
theory of 'communjty eclipse', as it was known, hypothesized that inthe face of the tremendous increase in the average citizen's mobiìity
(and thus jn their choice of social contacts), the widening range of
ì'ifestyles to choose from, and the changing forms of social organiz-
atjon catering to these ìifestyles, the modern city no'ìonger contained
'neighbourhoods' in the traditional sense.
Stein, who gave this theory its name (ZZg), went on to claim
that both the theory of architectural determinjsm and the theory of
socìal determinism were comp'leteìy jrrelevant under these conditions
for two main reasons. Firstly, they both assumed that 'neighbourhood'
in either its physicaì or social aspects could be created and main-
tained in modern cities; and secondìy, they both assumedthatafeeling
of conirnun'ity spirit could be fostered through the existence of neigh-
bourhoods and explained by their physicaì or social characteristics
- both of which were ideas that the supporters of the theory of commu-
nity eclipse heìd to be totalìy removed from the realities of modern
urban life. Articles written in support of stein's viewpoint appeared
ìn the late 1960!s, such as those by Dennis ìn l968 (59), webber in
the same year (250), and by Stacey in 1969 (ZZ3).
The spread of this hypothetical position thus created a very
discourag'ing atmosphere for those researchers concerned wjth either
neighbourhood or conrnunity; the inevitable result was a backlash in
21
support of both. As Bernard put it,"People stiII Ijve next door to others,they eat, s'leep, live, hate, avoid, orseek out one another in a given locale
iÅål"li ;;l';,:i lffi.;'HilJl,,;;:l:action takes place...and to them theconcept of local community is far fromanachronjstic." (29)
During the period when the pos'ition of the 'antithetical'studies was
gain'ing some acceptance, Greer still chose to use locale as a key
concept in his studies of community, as dÍd Gans in his research jnto
the Italian communities of west Boston (76). Janowitz, ìn trying to
explain the renewed interest in community studies after a decline
during the .l950's stated that in his opínion, it was the inherent
'vìta'lity' of the s.ubiect which accounted for jts resurgence, and that
"...community study remains a basic vehicle for the holistic and com-
prehensive understanding of the metropo'litan condjtjon." (l2l) And
Alexander, jn his book A Pattern Language, incìuded both "identifiable
ne'ighbourhood" and "neighbourhood boundary" in his Iist of 'patterns,
which represented fundamental and desirable features in urban areas.
But despite this renewed confidence in the relevance of the
object of theír studies, and the voicing of the first opinions that
locale (or neighbourhood) might also have a role to play in its under-
standjng, there still remained an almost total lack of agreement among
the researchers in this field concernìng ìts most important aspects
and how they should be studied. And now, they not only had to contend
with a dualistic interpretation of urban resjdentjal space (neighbour-
hood/comnlunity), but had to justify their basìc premise - that
communíty and neighbourhood were relevant p'lanning and social units.
22
The most ììkely source of all this confusion and disagreement
was jn the consistent failure of p'lanners and sociologists to get
together to work out a middle ground from which a comprehensiveapproach
to the prob'lem could be launched. Perhaps Ruth Glass put it best when
she said that
"It is because the Utopìans have provídedplanners with their own home-made socioìogythat there has been a persìstent separatìon' between town pìanning and the social scjences
;r,.ll!rY:':;å',":;ïii: 3lo' ::'i:li?i;'defjnjte in its conclusions, is of course onewhich appeal s especial'ly to the di sc'ipl inesrepresented in the planning professjon."(86:401 )
This would seem to suggest that the pìanners'misunderstanding of the
nature of true socjologicaì research (and their resuìtìng determinist
bent) can trace its origins back to Sir Thomas More's sixteenthcentury
vision of "Utopia", in which the perfect society was picturedas having
a perfect city to live in. And, since the city was the easíer of the
two to visualize, people came to thjnk of it as "Utopia", andofsociety
as its pr^oduct rather than its creator.
So, we can see the basjs for the djsagreement between the two
discip'lines - socioìogists with p'lanners for their apparently s'impl isticapproach to the sociologica'l aspects of urban issues, and.pìanners with
sociologists due to theìr apparent inabj'lity to provìde conclusive
input towards immediate planning prob'lems (96).
Thìs stubborn refusal on the part of both professions toaccept
the validity of the other's poìnt of view may have been responsiblefor
that period when community and neighbourhood studies were carefulìy
23
avojded, and diverse'safe'topics were explored instead. For example,
this period saw studies performed on the rates of participation in
formal and informal associations both inside and outside the community
(17,28,7f,240); studies of the factors contributing to the desire
to move to another neighbourhood, coupled with studies of locational
preference (125, 177, 180, 173, 255); an jnvest'igat'ion jnto the con-
cept of 'social space' (35, 37); the study of behavjour-environment
'congruence' (22, 172, 208, 231, 257);'proxem'ics' (30, 99, 100, 22.l);
the syrrbolic mean'ing of space (6, 7, 12, 147, 230, 279); neighbourhood
'images' (¡8,52,70,103, 140, .l57); and 'mental maps' (88, 1?3,222).
Studies of 'congruence' and neighbourhood 'images seemed to have led
the fjeld in terms of the numbers of papers pubf ished, but all topics
received considerabl e attention.
This 'schism' in the efforts to understand the urban environ-
ment may eventually.prove to be a blessing (albeit a well-djsguised
one) for both pìanning and sociology. The 'architectural determjnism'
versus 'social homogene'ity' debate which had sapped the creative
efforts of many theorists was essentia'lìy over; these same theorjsts
were now compel I ed to seek out new and hopeful'ly more tenabl e avenues
of research. And so, while those studies undertaken in an attempt to
fill the vacuum left after the debate had subsided may have appeared
to deal wjth scattered and apparentìy unrelated top'ics, they did serve
to open up new areas of investigatìon for planning and socioìogy,
revitalizing their efforts and preparing the way for new forms of
neighbourhood and community studies - a 'mjddle ground' where the
expertise of both professjons could be appìied with positive effect.
24
?.4 Satisfaction Studies -Searching for the 'Middle Ground'
As the topics listed in the previous section illustrate,
satisfactibn studjes do not represent the only direction that planning
research has taken in the recent past; but to some researchers at least,
they do appear to offer one of the most dj rect approaches to the
probìem of incorporating peop'les' needs and desires into the physical
and socÍal environment - thus prov'iding the'middle ground'that both
pl anners and sociol og'ists can work from.
Early efforts by planners and architects to incorporate citizen
'input into the des'ign process seldom met with any great measure of
success. This was perhaps due to a combination of factors; a lack
of communication between designer and resjdent, professional bias
against the'layman's'opin'ion, and the difficulty the average person
has with 'reading' a plan still on paper. Nevertheless, there were
those who did not give up on the idea that the planning process and
ìts physical product could be made more responsive to those that itwas intended to serve. Their response was to approach the problem
from the oppos'ite direction; in other words, if citizen input during
the p'lanning period was proving difficult to implement and was pro-
duc'ing indeterminate results, then perhaps it would be more effective
to study a number of projects after they were compìeted and occupied
for a suitable period of time in order to see which ones were found
by theír resjdents to be more 'satisfying', and why.
As earìy as 1951, Leo Kuper had suggested that:
"Basic research is needed into the conditionunder whi ch 'commun'ity spi ri t' is found;
25
(and) the relevance of physÍcaì structuresand their arrangement, which is the elementthe pìanner controls, to thjs social psycho-1 ogi caì ent'ity. . . " (l 3l :24ì )
He also recommended that a serjes of experìments be undertaken along
these lines in order to dispe'l the 'pseudo-scientifìc approach' which
he felt had characterized previous planning theory and practìce. This
call for a systematic study was lost at the tjme in the heat of the
debate over architectural versus social determinism - but the idea did
suggest a basis for future'ratjonal'stud'ies, and was to appearagain
after several fundamental changes took place in the attitudes of both
planners and socio'logists.
One of these changes was the gradual acceptance of the idea
that the built environment did indeed play a role in'influencing the
residents of any g'iven area. One of the first hints of the idea's
revival (in a less extreme form, of course) came from Willmott and
Cooney, the joint authors of Family and Kinship in East London. This
study was considered by many'to deal quite a blow to the idea of
architectural determinism by point'ing out that the residents of an
urban slum, where the physical conditjons were quite poor, were
generaìly satisfied wjth their environment due to the socíaì organi-
zation which existed there. Nonetheless, in a later article pubìished
in 1963, they found that
"These conclusions about the lìmited influenceof physicaì des'ign are supported by a numberof other studies, most'ly American. But thatis not the end of the story. Though our initialfindìngs were along these lines, we came toreal jze at Dagenham what a number of othersurveys have shown - that, wjthin I imits andunder certain conditions, design can have animportant influence." (ZO3:124)
-
26
A more fundamental role for the built environment was pÍctured
by Alexander just six years later:
"...we must face squareìy, just what the task ofcity planning is: it is,in short, the desígn ofculture. A culture is a system of standardsituations. Each of these sjtuations specifiescertain roles, certain allowed limits of behaviorfor the persons in these roles, and the requ'isitespatial setting for this behavjor. Each sjtuationthus specifies a certaìn phys'ical pattern - andeach pattern recurs many thousands of times jn agiven c'ity. The form of the city ìs generated bythe combination of these patterns. In thjs sense,the city, viewed as a purely physical system,'isa direct concrete manifestation of the culture.Any attempt to change the physical organization isan indirect attempt to change the culture."(6:79)
It js important to note that each of these'patterns'which Alexander
went on to identify was closely associated wjth some kind of socíal
change. As he said,
"The environmental change, without the social,would accomplish nothing. But the reverse isalso true. These social changes cannot be madeunless the physica'l changes are made with them. "(o:as)
This last idea also describes the second of the fundamental changes
which took place - that is, the graduaì acceptance by planners and
sociologìsts of the validity of each others' theoretjcal positions,
and the desire to'incorporate both outlooks into a sìngle approach
to urban research. As Perloff put it,"It seems ìog'icaì to assume that efforts to createmore desirable cities would be significantìyadyanced if physical and social planning could bebrought together around a set of rather basic goalscomrnon to, and meanìngfuì for, both of theseactivities." (lB6:348)
This sentìment was closely echoed by Alexander, who said that:
27
"He have not found a way of making a coherent,criticizeable, and empiricalìy founded statementabout the kind of future we want for the livingof life in cities. So'long as the sp'lit betweenutopians and data-gatherers persists, i t.wi I I . notbe þossible to make such a statement." (6:78)
This last quote vojces the thjng that many planners and socioìogists
were comjng to realize - that desp'ite all of their theoretical clajms,
no empirical method had yet been developed that was of any rea'l use in
attempting to decide what an urban resídential area should be like from
a perceptuaì point of view. The desjre to ach'ieve this and to find a
useful measure to empìoy ìn such studies led to the third and final
change, whjch embodied two po'ints. The first of these was the recog-
nition that research carrjed out in the urban setting was the only way
to formulate or substantiate any hypotheses dealing with human per-
ceptions of the urban environment and with their response to it.Kuper put i't';il:ri:;'ìs
an experimenr, a desisn in sociarchange, and the soc'ial scientist may concievehis study in terms of experìmental desìgn,analysìng the behaviour of the group both priorand subsequent to the introductjon of new amen-ities... 0r he may...compare adapt'ive behaviourunder different conditions ìn urban neìghbour-hoods, with a view to generafizìng as to theconditions which are conducive to specifiedforms of ne"ighbourhood ì'ivi ng. " (131 :243)
A more concise expression of thjs thought was provìded by Studer,
who said in 1969 that:
"Designed env'ironments, then, should be bothconceptual'ized and realized as dynamic systemscapabìe of moving towards more appropriatestates. They should be viewed as experìmentsto test hypotheses and record relevant aspects."(231:19s)
28
The fìnal point to be made, then, is that many researchers
settled upon satisfaction studjes as one of the most promisÍng methods
of discovering how to move ne'ighbourhoods towards 'more appropriate
states'. As Rent and Rent put it when introducing a study of the
factors related to residential satìsfaction:
"Closely associated with life satisfactjongeneralìy, and that of the neighbourhoodor residential area, is the degree ofintegration or involvement of an individualin society...one could expect that asatisfjed resjdent might be ljkely toexhibit overt behavior which was conduciveto the physicaì maintenance and even socialorder of hjs resjdential area; dissatis-faction might be manifested jn contrastingbehavjour..." (lgg:462, 464)
And, more directly, Lans'ing and Marans had said that:
"An environment of hìgh qua'l ity may be definedas one that conveys a sense of well-being andsatisfaction to ìts popu'latjon through
:T:'::'ifilJi;.:i:l'ti,?:,BIT'icar'' social
In these and other statements, both p'lanners and socio'log'ists hypo-
thesized that a person's satisfaction with his or her residential
environment represented a valid measure of the quaìity of that environ-
ment - for the residents were the ones who were exposed to it on a day-
to-day basis. Satisfaction, theñ, became the focus of a number of
studies in whjch a common approach was to try to associate certain
features of neighbourhood or communìty with the residents' perceived
satisfaction. It was believed (or at least hoped) tfiat the knowledge
gained through such an approach might ultimately ìncrease the designers'
ability to create better residential envjronments for those peopìe who
would live in them. The principa] findings of these studies are

29
summarjzed in the following section.
2.5 Satisfaction Studjes - Findjngs
Despite this general (ìf tentative) agreement on the possi-
bilities offered by sat'isfaction studjes, the early efforts were not
considered to be very successful (l88). However, these apparent
failures could be largely attributed to methodoìogical shortcomings.
For example, inadequate scaìing techniques and the fajlure to relate
satisfaction to the differing characteristics of the people tested jn
the studjes were particular drawbacks of these first attempts. Th'is
sort of error is inevitable whenever a completeìy new body of research
is being established, and efforts were soon made to correct these
shortcomings. However, at least two major probìems remain; firstìy,there is still next to no consistency in.the methodology or in the
measures used among the research that has been carried out. This
makes it extremeìy dìfficult to combine or even to compare thejr data
with any meaningfuì results. Secondìy, there has not yet been an
attempt to introduce time as a variable'in the study of satisfact'ion.
These remain as the last major diffículties to be overcome before the
valjdity and usefulness of this type of study can be put to the test
through its appljcation in real-ljfe plann'ing sjtuations.
Nevertheless, an 'important body of work has already been
completed on the subject of neighbourhood satisfaction. In terms of
the intent of this study, six pieces of research stand out as the
'core'works (39, l38, 155,275,276,217) and about another twenty
are of considerable value (.l3, j4,25,50, 64,69, 90, 103, 134,131,
30
l5g,163, 177, lg0, 199,210,222,240,244,278,305). In the
jnterest of clarity (and brevity) their fíndings wìì1 be summarized
'in point form; a1so, the six'core' studies will be dealt wíth indiv'i-
dually while the rest will be grouped under one head'ing.
The Quality of American Ljfe: Perceptions, Evaluations and Satisfac-
tjons (Campbell, Converse, and Rodgers, 1974)
This study represents the broadest approach to the study of
satisfaction, covering as it does some seventeen aspects of satisfac-
tion with ljfe jn the United States. 'Neighbourhood' is one of these
aspects, as are 'community' and 'housing' . In a section deal 'ing w'ith
previous research, the authors report that:
"The most salient conclusions that can be drawn'from these past studjes can be briefly summarized.Most peop'le, including many of those 'living in'. rsubstandardf environments, tend to be fa'i11ycontent with the residential environment in whichthey ìive. The sociaì setting, includ'ing inter-personal relations, and the type of housìng (j.e.,whether or not one is I iving ì n singl e-fami'lyhousjng) are salient factors influencíng anindividual's level of satisfaction w'ith the commu-nity. Other important factors related to generaisatisfaction include the physical condìt'ions ofthe residential environment, the convenience ofhaving nearby public and private fac'ilities andservices, the size of one's dwelling, and thepresence of conditions, such as spacious, qu'iet,and safe surroundìngs." (39:218)
Other findings of thjs study incìude:
- people who have lived in a variety of residential situ-ations tend to be less satisfied wìth their presentsurroundings than those who have aìways lived jn similarsituations.
- there is a correlation between less education and livingin consjstent situations, and therefore a correlationbetween less educatjon and higher communìty satisfactjon.

3t
women and men show little or no difference in satisfactionlevels or in factors contrjbuting to satisfaction,although women do tend to show a slightly higher prefer-ence for a safe environment (for both themselves and forch'i1 dren ) .
younger peopl e tend to be I ess sati sf jed wìth thei rne'ighbourhoods than ol der peopl e.
gettíng along with neighbours, good property maintenance,personal safety, convenience to fac'ilities, and safetywith regard to property were found to account for one-third of the variance in connection with neíghbourhoodsati sfacti on .
Toward an Understanding of Community Satisfaction (Marans and Rodgers, I 975)
This study formed the basìs of the sections dealing w'ith neigh-
bourhood and commun'ity satisfaction in the previous work; therefore,
conclusions already attributed to that study will not be repeated here.
Additional findjngs indicate that:
- the correlation between lower educat'ion and highersatisfaction levels is also claimed to be a result ofage. The elderìy are assumed to have completed lesseducation than younger peopl e, and are at the same timedemonstrated to have higher ìevels of satisfaction.
- the length of residence in an area, if less than twentyyears, is shown to be poorìy re'lated to neighbourhoodsati sfacti on.
- life cycìe stage and education levels are shown to beamong the best predìctors of neighbourhood satisfactìon,with older and less educated people having h'igher levelsof sati sfaction.
Planned Residential Environments (Lansing, Marans, and Zehner, 1970)
Thjs study was conducted among ten communities which had been
classified by their degree of 'plannedness'. Among its findings were:
- all ten communities studied were highìy rated by theirresidents, a'lthough some variation was apparent.
32
'high'ly pìanned' communities were generally correlatedwith higher degrees of resident satisfactìon, with afew jnexpì icable except'ions.
the perceíved presence of safe p'lay spaces for childrenwas closely associated with neighbourhood satjsfaction.
accessibi'lity or nearness to facilitjes had a negatìveimpact on satisfaction as often as it had a positive one.
the maintenance of dwelling unìt exteriors and the compat-abil'ity w'ith neìghbours were found to be the strongestpredictors of neighbourhood satisfaction.
non-through traffic neighbourhoods (culs-de-sac and baystreet patterns) are rated rnore highly by their resídentsthan neighbourhoods with through streets.
while síngle famiìy hous'ing on a cul-de-sac street wascharacterized by a high level of satisfaction, town houseunits on similar streets showed much lower levels ofsati sfact i on .
dens'ity had very little effect on neighbourhood satisfac-tion except at extreme levels (at 2.49 units per acre orless, satisfaction was higher, while at 12.5 units peracre and up it was lower).
the length of residence in a neighbourhood was notstrongìyrelated to satisfaction wíth that neighbourhood.
privacy, a quiet environment, and not hearjng one'sneighbours were closely assocìated with satisfaction.
"Neiqhbourhood and Corni'nunity Satisfaction in New Towns and Less
Planned Suburbs" (Zehner, l97l)
This article's review of the earlier literature dealing wìth
this topic had found that they had:
r' . , . establ i shed or impì i ed the importance for nei ghbour-hood evaluations of privacy, social ìnteraction,compatabi ì ity, neighbourhood maì ntenance I evel , reì ativesocioeconomic standing of a person jn his neighbourhood,accessibílity to local facilities, and a variety of otherfactors. " (275:383)
Zehner's own research found that:

33
the plan or concept of a neighbourhood was a s'ignìfjcantconsideratjon both jn a resident's choice of ne'ighbourhoodand in later determjnìng their satisfaction with it.factors showing a high correlation wjth neighbourhoodsatisfactjon were maintenance level s, friendìy people,similar neighbours,'low nofse levels, and safe playareas for children.
factors showing 1ìttle or no correlation wjth neighbour-hood satisfaction jncluded length of residence, relativestanding of house value jn relation to neighbours, andfrequency of casual interaction w'ith neighbours.
while accessibì1ity to work, shoppìng, entertainment, andother facilities appeared to be 'important in the evaluationof a community (micro-ne'ighbourhood) setting, they hadlittle effect on neìghbourhood satisfaction itself.young famjlies found the quaìity of schools ìmportant indetermining sati sfaction.
'more planned areas' (new towns, in this example) receivedgenera'l1y higher satisfaction ratings than less pìannedareas.
Across the City Ljne: A l^Ihite Communjty in Transit'ion (Zehner and
Chapin,1973)
all areas studied showed high ìevels of satisfaction withthe neighbourhood.
there was only a weak correlation between accessibiiityto facilities and satisfaction.
peopìe living in mixed land use situations were lesssatisfied with theìr neighbourhoods than people'liv'ingin exclusively residential areas.
people liv'ing on thoroughfares were less satisfied withtheir neighbourhoods than people situated on non-throughor low traffic streets.
Indjcators of the Quality of Life ìn New comnrunities (Zehner,1gl7)
- satisfaction with one's immediate ne'ighbourhood anddwelIings is a primary determinant of satisfaction with

34
the larger community.
the age of the dwellìng un'it or neighbourhood as a wholeis not closely tied to satjsfaction.
the density of housing only had an effect on renters, andnot on owners; for renters, satjsfactjon decreased asdens i ty 'increased .
Related Studies (Various Authors)
Rather than mereìy repeat fjndjngs wh'ich have aìready been
covered in the review of the sjx 'core' studies, the work of theseother
researchers will be presented here only if it does not repeat earlìer
conclusions, if it offers a new interpretatìon of an earlier conclusion,
or ìf it represents a direct contradiction of an earlier conclusion.
- income appears to be related to higher ne'ighbourhoodsatisfaction in that those with a larger income have alarger number of nejghbourhoods to choose from, and aretherefore likelier to fjnd one which they percejve assat'isfactory. (Virirakìs, j968)
- suburban residents perceive theìr neighbourhoods to belarger than those living Ìn inner areas do. (Haney andKnowl es , 'l 978)
- casual contact wjth neighbours was more c'loseìy relatedto satisfaction in suburban communities than in centralones. (Greer, 1956)
- neighbourhood satisfaction is hìgher in homogeneous areas.( Fi sh, 1 976)
- higher traffic levels on a person's front street wereassociated with lower satisfaction levels, less casualcontact with neighbours, fewer acquaìntances, and asmaller perceived 'home territory'. (Appleyard andLintel 1 , 1972)
- the perceìved crime rate was not closeìy related toneighbourhood satisfaction. (Nervman and Duncan, 1979)
35
2.6 Invest'igating Neighbourhood Satisfaction
It is evident from the stated ìntent of thjs study that it must
be both descrjptive and expìanatory in nature. Therefore, the problem
of resolving the mass of information that has so far been reviewed jnto
a log'ical and comprehens'ive program of research is a considerable one.
It is fortunate, then, that the direction of the research and the liter-ature review jtself have convenient'ly provided a point of departure by
suggesting a number of hypotheses that may be tested in order to
determine whether or not thjs study's findings agree or disagree with
the findings of the research that has been carried out beforehand.
Undoubtedly, the .testing of these hypotheses will suggest others, and
still others may become evident ìn the course of the data analysis;
these will be dealt with as they occur. A short sectíon of the anaìysìs
wíll also be devoted to comparing those conclusions jn the previous
studjes which do not appear in the hypotheses to the fíndings of the
present study.
The first hypotheses to be examìned are the product of both the
previous research and the cument objective. Assumjng that both socio-
economic and physicaì design factors can have some effect on a person's
perceived satisfaction wjth their residential environment, we are faced
with three possibil ities: both. factors may exert an equa'l'ly powerfu'l
influence on satisfaction; one or the other may predominate in this
respect; or neither may have any significant effect at all. In order
to provide a basis for testìng these possibilities, the first hypothesis
is stated in two parts:

36
1.0 Both socio-economic and phys'ical design characteristicshave an effect on a person's perceiveã satisfactionwith his or her neighbourhood.
1-1 Socio-economic characteristics will have a greaterdetermíning effect on neighbourhood satisfaðtionthan phys'icaì design characteristics will have.
Assuming that the first hypothesis can be satisfactorìly demonstrated,
we are then led to the second hypothesis, wh.ich attempts to expand on
the possible effects of socÍo-economic and physicaì design character-
istics in an attempt to determine whether or not satisfaction with one,s
neighbourhood can be consistentìy related to these easiìy measured
neighbourhood characteristics, or whether it is too compìex a phenomenon
to be successfuì]y predicted by the variabJes used in this study.
?.0 Groups of peop'le exhibiting similar socio-economiccharacteristics and liv'ing in areas with similar phys'icalcharacteristics will feer approximately equal leväli orsatisfaction with their neighbourhoods-.
2.7 Groups of peop'le exhibiting similar socio-economiccharacteristics but living in areas with differingphysicaì characteristics will feel dissimilar levãlsof satisfaction with their nejghbourhoods.
2.2 Groups of-peop'le living in areas with similar physicaìcharacteristics but having dissimilar socio-ecônómiccharacteristics will feel dissimilar levels ofsatisfaction with their neighbourhoods.
The next group of hypotheses are more close'ly associated with
the conclusions of the 'satisfaction studìes' reviewed 'in the examin-
ation of the literature, and are primariìy intended to test the level
of agreement between the results of the present research and those of
the prev'ious studies, and to expand upon theìr findings wherever
possible. These hypotheses are as follows:
3. The higher the average socio-economic status held by thepeopìe of a neighbourhood, the higher their perceivädsatisfaction with that neighbourhood will be'.
37
This hypothesis was suggested by the fjndings of Virirakis, who
concluded that "... per capita income has a sìgn'ificant effect on
the strictness of the inhabitants' judgement about their community."
(Zq+:Sl) It is felt that in the case of the present study, those having
higher socio-economic status will be able to choose from a greater
number and variety of resídentjal envjronments, w'ith a corresponding
increase in the chance of finding satisfying surroundings.
4. Residents of 'more h'ighly pìanned'nejghbourhoodswill exhibit a genera'l'ly higher sat'isfaction levelthan residents of 'less planned' areas.
Lansing, Marans, and Zehner had found that 'more pìanned' areas
were generaily characterized by higher levels of resìdent satisfaction
in thejr study, carried out in 1970. As they put it, "... planned
communities. . . score high. . . (and) ne'ighbourhood satisfaction is lowest
in the... least planned areas." (igg:45, 103) In their terms, areas
exhi bi ti ng a 'h'igh ' I evel of p'l anni ng i ncorporated several des'ign
features, among which the most important was "... linlited... pubiic
pedestrian and vehicular through traffic..." (t3g:111). The importance
of this partìcular aspect of planning was backed up by the findings of
App'leyard and Lintell (f3) and by Zehner and Chapin (277:111), who
found that people living on thoroughfares were less satisfied than
those 'living on non-through traffic streets. In the present study,
then, the term 'more h'ighly planned' is meant to indicate those neìgh-
bourhoods in which the automobile is not given precedence over the
pedestrian. 0f the neighbourhoods chosen for detaìled examination by
this study, those areas with local street patterns laid out in the form
of 'bays' were consjdered to be 'more high'ly pìanned', while the

3B
standard rectangular block bounded on all sides by through streets (tne
'gríd' system) was deemed to be 'less pìanned'.
5. The higher the level of general neighbourhood majntenance(in terms of house and yard upkeep),-the hígher theresidents' satisfaction wjth that neighbourhood will be.
Neighbourhood maintenance was found to be the best sìngìe pre-
dictor of neighbourhood satisfaction by Lansing and Hendricks in their
study of the Detroit region done in 1967 (ì36:lBl). This relat'ionship
was also found jn studies carried out in other cities by Campbeì.l,
Converse, and Rodgers (39:240, 247), Zehner (215:383), Zehner and
Chapin (277:105),and by Lansing, Marans, and Zehner, who stated that
"...the neighbour:hood maintenance level is clearìy related to satjs-
faction in our sampìe..." (lSg:126). Therefore, it is expected that
this physical characteristic will also have a sìgnificant 'impact on
neighbourhood satisfactjon in the present research as well.
6. As the degree of perceived 'friendliness' of neighboursincreases,the feelings of satisfactìon that a personholds towards their neighbourhood wil I ,'increase as wel I .
This correlation was also wideìy agreed upon by researchers
looking 'into neighbourhood satisfaction. Once again, it was firstdemonstrated in the work of Lansing and Hendricks (136) who found that
an evaluation of one's neighbours as 'frìendìy' was a better predictor
of ne'ighbourhood satisfaction than the respondents' frequency of casual
interaction with those neighbours. Similar conclusions were reached
by Zehner (275:383), by Zehner and Chapin (2ll:ì05) who found that
friendljness was second only to neighbourhood maintenance in terms of
the strength of relationsh'ip to satisfaction, and by Marans and Rodgers
who stated that "The most important predictor (of macro-neighbourhood
39
satisfaction) js the respondents' assessment of thejr neighbours..."
(155:325). It is aìso expected that this hypothesis will be borne out
by the results of the present research.
7. The more homogeneous a neighbourhood's populatjon is(in terms of its socjo-economjc status), the higherthe level of satisfaction felt by those people will be.
Gans strongly suggested that the homogeneity of an area's resi-
dents was a most important determinant of a person's choices anddemands
in terms of neighbourhood characteristics (77:1ll) and was a more signi-
fjcant determjnant of soc jabi'lity than proxr'mity was (82:ì 08). At the
same tjme, he was not able to define to what degree a neighbourhood's
popu'lation should be homogeneous, how to plan to achieve homogeneity,
or even which background characteristics, interests, values, or behaviour
patterns gave people a feelìng of similarity and compatability (74:137).
Lansjng, Marans, and Zehner, in their 1970 study, attempted to measure
homogene'ity both subjectively (by asking people if they felt that their
neÍghbours were similar or dissimilar to themse'lves) and objectively
(by comparing their age, education, jncome, length of residence, race,
and their heighbourhood attitudes), with the result that 'consensùs'
(homogeneity) about qua'lities of the neighbourhood was found to be more
closely associated with satisfaction than were socio-economjc measures.
At the sane time, however, over eighty percent of those peopìe who
found their neighbours 'similar' also rated their ne'ighbourhoods most
highìy (138:ì25). A similar conclusion was reached by Zehner and
Chapin, who found that "...the most satjsfied residents were those in
neighbourhoods with "peopìe who are Ijke me"..." (277:105). Zehner's
study of new towns and suburbs concluded that'simi'larity! of neigh-
40
bours, when combjned wjth friendliness, was second only to the mainten-
ance level as a predictor of neighbourhood sat'isfaction (z7s:383).
And in 19760 Fjsh found that "...(tfre data) suggests that satisfaction
with the ne'ighbourhood is higher in homogeneous neighbourhoods." (69:159)
and attrjbuted it to the "...greater degree of social organ'ization in
homogeneous neighbourhoods that is support'ing and constrainìng the
behavíour of the resjdents and preserving the'ir control of the environ-
ment." (69:162). And so, even though some dìfficulty 'is ant'ic'ipated in
the constructjon of an adequate measure of homogeneity, it is expected
that some of the characteristjcs chosen will exhibit a significant
degree of correlation with higher ne'ighbourhood satisfaction.
B. The higher the degree of perce'ived privacy availableto a neighbourhood's residents, the higher theirsatisfaction levels will be.
Lansing, Marans and Zehner found that a person was more'rikely
to be satisfied with their neighbourhood when that neighbourhood was
also rated as 'quiet' (l38:ììB), as did Zehner (zl5:393). Marans and
Rodgers agreed with this conclusion and went on to say that neighbour-
hoods were rated more favourably by "...peopìe who had privacy and
adequate outdoor space near their home." (ls5:333). The research of
both Zehner and chapin (277) and Appìeyard and Lintell (13) pointed
out that neighbourhoods with less through traffic in terms of both
pedestrians and vehicles were mo,re favourably rated by their residents.
It is expected that the results of the present research will concur
wjth these findings.
. These eight hypotheses represent the major investigative thrust
of the current research. Others were suggested by the literature

41
review, but it was felt that these eight were the most s'ignifìcant in
plannìng terms. For example, previous work jnto neighbourhood satis-
faction indicated that both age and education had a high correlatjon
wjth satisfaction, but it should be obvjous that these would be
extremely difficult to translate into useful planning po'ljcies. A
secondary ajm of the investigation will be to identjfy other signifì-
cant relationships among the ident'ifiable neighbourhood characteristics.
2.7 Overview of Following Chapters
The following chapter will deal with the methodology of the
study, descríbing its setting up through the identificatjon of study
areas, the establishment of measurement techniques and scaling methods,
the use of sampiing techn'iques, and the formation of the questionnaire
which was administered. The statistical and computer analyses of the
resulting data wilì be described, and a summary of the data will be
presented
The fourth chapter wil'l present the actual findings and conclu-
sions of the study as they relate to the hypotheses in particular and
to neighbourhood satjsfaction and p'lanning in generaì. The fÍfth and
final section will deal with the implicatjons that the study holds for
the pìann'ing of future neighbourhoods, and the additional programs
of study necessary to answer further questions which will no doubt be
raised by the current research. The appendices will jnclude the
questíonnaire itself, various charts, graphs, and maps, and the raw
data which was obtained, in the hope that it may prove useful jn some
i:i:ti1l
future study-.
'.-: r..,- ' .:"'1,'ì-."..
Chapter i I I
METHODOLOGY
in attemptíng to establish a testing procedure capable ofaddressing the central question of this study (that is, can satisfact.ion
with one's neighbourhood be demonstrably related to other neighbourhood
characteristics) and its concomitant hypotheses, it soon became obvious
that a fairly sophistícated-methodoìogy would be required. To achieve
the necessary ìeve'l of comp'lexity, a questionnaire was developed by the
investigator in order to suppry the data upon which al'l ana'lyticaì pro-
cedures will be based. This questionnaire was administered in the
spring of 1979 to the householders of randomly selected síngìe detached
dwellings ìocated in thirteen different neighbourhoods, which were chosen
for their particular characteristjcs exhibjted in connection with three
variables - socio-economic status, physica'l design (street 'layout), and
access to urban infrastructure. Additional information was also obtained
through'sjte inspections, map anaìysis, and from demographic data from
Statistics Canada census reports and other sources, but the questionnaire
remains the principal source of the data obtained and anaìyzed. Allinformation gathered was then evaluated, categorized according to pre-
established scales, and then processed by computer through the SpsS
(stattstical Package for the Sociaì Sciences) programs availabje at the
University of Manitoba.
At the outset, the initiar phase of research involved the
setting up of criteria leading to the selection of ne'ighbourhoods to
be examined, and the design of the questionnaire. These operations
-42-
43
were carrjed out during the same time
process might well have a significant
simplify their presentation, however,
ology wiìl examine these operations in
presented above.
period, as it was felt that each
influence on the other. To
the next section of the method-
the order in which they were
3.1 Criteria for Nejghbourhood Selection
In order to provide the 'varying env'ironments' referred to inthe title of this study, a framework had to be set up to provide a
'logicaì basis for their selection. Two of the crjteria used in thjs
regard were dictated by one of the major premises of the study - that
both socio-economic and phys'icaì design variables have an ìnfluence on
a person's perceived satisfaction with their ne'ighbourhood. Therefore,
it was determjned that some aspect (or aspects) of each of these two
variables were to be chosen as criteria for the selection of any neigh-
bourhood for further study.
The choíces offered by the former variable were fairly straight-
forward; from the literature, it was evident that factors such as
jncome, ìeveì of education, and age were most likely to have an effect
on a person's satisfactjon with the'ir neighbourhood. The second vari-
able, however, presented a slight problem. The only factors which had
been discussed in the previous research dealing w'ith design character-
istics in relation to sat'isfactjon were somewhat subjective in nature.
For examp'le, the one which was found to have the strongest comelation
with satìsfaction was the level of neighbourhood maintenance, which
could be interpreted differently depending on the observer. l^Jhat was
44
wanted was a more objectjve aspect of neìghbourhood design; and in the
end, the one chosen turned out to be fa'irìy cìear-cut. The neìghbour-
hoods examined were selected to represent clear examples of a particular
street layout - being either'grid'or'bay'. It was felt that this
distinctjon was one of the most fundamental in terms of neighbourhood
design, with the grid system representing a through traffjc, automobile
oriented pattern, and the bay system represent'ing a local traffic,pedestrian oriented one. It was also felt that these patterns would be
easily understood and recognized by res'idents (an assumption later found
to be true).
The third variable employed in the selection of neighbourhoods
dealt with the overal'l pìacement of the area in relation to the 'infra-structure'of the c'ity. This term refers to a neighbourhood's ease of
access to shopping of various kinds, and to entertainment, recreational
and other facilities, with the emphasjs being placed on those within
waìking distance. Thìs variable was also chosen to represent the last
step in a log'ical progression of scale, with socio-economic factors
representing 'community' (the network of peop'le in an area), physica'l
'ìayout factors representing the larger neighbourhood, and access to
infrastructure representing the relation of the peopìe and the neigh-
bourhood to the ìarger urban whole.
It was decided that these three variables would be the onìy ones
used at this stage to 'identify neighbourhoods for detailed examination.
This decision was prompted by several factors, the first being
compìexity, and the second, resources. Assuming that onìy 'hìgh' and
'low'exampìes of socio-economic status and access to amenities in both
45
'grid' and 'bay' neighbourhoods were examined, eight cases were thus
produced. If two examples of each case were studied, this would
involve sixteen neighbourhoods, and the resources of the researcher
dictated that thjs number would represent the upper ljmit if an
adequate number of responses were to be obtained from each area. In
the end, some thirteen neighbourhoods were studied, as two of the
possible cases were not filled by any exampìes.
3.2 Sel ectjng Neighbourhoods
At this poínt, onìy one thing was left to be done before the
study couJd proceed; that is, to define and identify neighbourhoods to
choose from. Using demographic data available from Statistics Canada
(225,226,227) and the Ministry of State for Urban Affajrs (196),
hjstorical data on the periods of housing construction in the c'ity
(251 ), and maps showing the natural and man-made physica't boundaries
within the city, the researcher ìdentified some seventy neighbourhoods
within the city of winnipeg. It might be ìnteresting to note that at
a later date (July, 1979), the city of winnipeg Environmental planning
Department released a pre'liminary summary of the "Winnipeg Area
Characterizatjon Study" which included a nlap of all residential neìgh-
bourhoods (see Appendix D) whjch showed a remarkably good fìt with the
researcher's work, particu'larly in those areas whìch were ul timate'ly
chosen for detailed examj.nation (see F'igure ì ).
The next step was to characterize each of the seventy neigh-
bourhoods accordjng to each of the three selected variables. To
determine their socio-economic status, foun factors were considered -
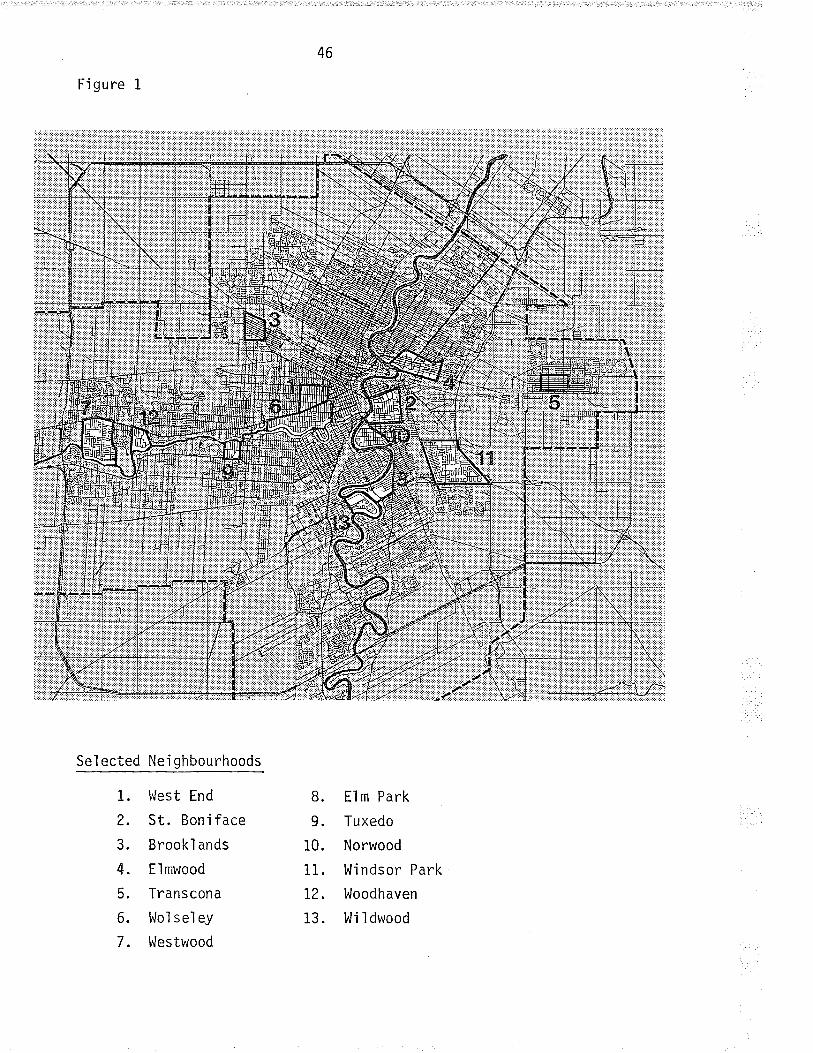
46
]:::l*:::::
Figure 1
Selected Nei ghbourhoods
1. l^lest End
2. St. Boniface
3. Brookl ands
4. Elmwood
5. Transcona
6. l.loì se'ley
7. Westwood
8. Elm Park
9. Tuxedo
10. Norwood
11. Windsor Park
12. Woodhaven
13. I^li ldwood
47
famjly income, level of education, job type, and the average value of
the housing unit (225,226). Layout was defined as be'ing either'bay'
or 'grid' in nature, but additional factors representing the presence
or absence of'edges'and'breaks' , and the occupying of sign'ifìcantìy
larger or smaller areas than the average neighbourhood were also con-
sidered. 'Edges' were defined as clear-cut boundaries to the neigh-
bourhood, whether physicaì or social in nature, while 'breaks' were
defined as anyth'ing which prevented a neighbourhood from being a
singìe contiguous residentíal area - for exampìe, a power l'ine right-
of-way, a rai'lway, or even a major thoroughfare. Access to infra-
structure was rated in relatjon to four types of destjnations
neighbourhood shoppi ng ( smal I er food stores, banks , drug stores , etc . ) ,
shoppìng centres, the central busjness djstrict, and entertainment/
recreation faciliti.es (movie theatres, theatres, commun'ity clubs,
parks, pì aygrounds, etc. ) .
Neighbourhoods were ranked on each of the above factors, and
a composjte score for each of the three selected variables was deter-
mined. Alì seventy were then compared and were characterized as beìng
either 'high', 'high average', 'average', 'low average', or 'low' in
terms of socio-economic class and access to infrastructure, and as
being either'bay'or'grid' in terms of physica'l design. At this
stage, ne'ighbourhoods which had been dìfficult to identify c'learly
during the in'it'ial procedure, whìch had few jdentifiable edges, had
sign'ificant breaks, and which were either very small or very ìarge in
area were eliminated, leav'ing some twenty-five to choose from. After
all considerations had been carefully rveighed, the final choices were

4B
made and thirteen neighbourhoods were selected (see Tabìe I and Figure
l; for a more detailed look at these areas, refer to Appendix C).
Table I
NEIGHBOURHOOD CHARACTERIZATION NEIGHBOURHOOD NAME
High Socio-economic Status NorwoodGrid Street Pattern WoodhavenHigh Access to Infrastructure
High Socio-..onGrid Street Pattern Elm ParkLow Access to Infrastructure
High Socio-economic Status WestwoodBay Street PatternHigh Access to Infrastructure
High Soc'io-economic Status Wjndsor ParkBay Street Pattern l,li I dwoodLow Access to Infrastructure
Low Socio-economic StatusGrid Street PatternH'igh Access to Infrastructure
Woì se'leySt. BonifaceWest End
Low Socio-economic StatusGrid Street PatternLow Access to Infrastructure
Brookl andsE I mwoodTranscona
Low Socio-economic StatusBay Street PatternHigh Access to Infrastructure
Low Socio-economic StatusBay Street PatternLow Access to Infrastructure
As Table I shows,'it was not possible to identify any neìgh-
bourhoods having those characteristics required to fill two of the
eìght possible cases - those being'bay'areds wjth low socio-economjc
status. These missing cases may seriousìy reduce the number of compari-
49
sons that can be made in the course of the data analysis, but it is
still possible that this situation can be remedíed when the actual
level of each respondent's socio-economjc status is determined from
the questionnaire. That is to sa¡r, even though aìl 'bay' areas were
initial ly characterized as being of h'igh soc'io-economic status (from
census data'averages'), it may be that there are a sufficient number
of individuals in those areas wjth.low enough socio-economjc status to
provide the data needed to fill the two missing cases.
Fortuitously, the choice of areas to be studjed has created
the opportunity to examine the effects of another neighbourhood char-
acterjstic on neighbourhood satisfaction - that being the influence of
an 'inner city' versus a 'suburban' location. Those ne'ighbourhoods
characterized as 'ìnner cíty' locations include the l^lest tnd, l^loìseìey,
St. Boniface, and Norwood, while Brooklands, Elmwood, ilm park,
Transcona, Tuxedo, westwood, I^Jildwood, I^lindsor park, and woodhaven are
classified as 'suburban' in nature.
3.3 Study Limitations
Many of the practicaì limitations of this study have aìready
been mentjoned; for exampìe, the resources available to the researcher
placed limits on the number of questìonnaíres that could be administered,
and thÍs in turn limjted the number of neighbourhoods whìch could be
examined. As it turned out, the number of different types of neigh-
bourhoods (as characterized by this study) was lower than expected,
and so this did not turn out to be a sjgnìficant probìem.
50
The types of neighbourhoods under consideration in this study
were further limited in that onìy those areas predominately composed
of singìe family detached housing were examined. This was done fortwo
reasons; firstly, it was believed that the resjdents of this type of
housjng wj1l show the effects of the influence of both socio-economic
and physícal design factors more clearìy than the resjdents of other
kinds of housing. It was felt that the residents of apartment or town-
house (row) units would be affected more strongly by the architectural
details of housing type and bu'iìding proximity, and would in most cases
feel less influenced by street ìayout due to housing and parking'lot
arrangements. Secondìy, it was found that these other kjnds of
housing seìdom occur over a large enough area to be considered a
'neighbourhood' rather than as a singìe 'development'. Therefore, 'it
was judged that these housjng types did not justify the additional
resources required for a full examination.
As a final restriction, only established neighbourhoods were
examjned. While it would have been interesting to see the responses
from a recently estabìished neighbourhood in comparison to an older
one' socio-economic data from the l97l Canadìan census relating speci-
ficalìy to such areas proved to be sketchy or non-exjstent. Also,
these new neighbourhoods were often poorìy defined spatia'llV (in terms
of'edges' or boundaries), and their street patterns were usua'l1y of
the 'spaghetti' (curviìinear) type, whjch was difficult to define
under the terms of this research.

5i
3.4 Design of the Questionnaire
Since the literature on the subject made it plain that a wide
variety of factors are involved in producing feelings of'neighbour-
hood satisfaction', it was accepted at the outset that the questíonnaire
would inevitably be a fairly iengthy one. In addition, owing to the
large number of peop'le to be surveyed, the questionnaire was also
'intended to be self-administered by the respondents, and to be answer-
able by either the male or female household head. Therefore, itbecame a priority'in its design that the questions should be easily
understood, and just as easìly answered. To achieve this, certain
types of questions which had been considered (such as map questìons,
some preference quest'ions, and open ended like/dislike questions,
for example) were eliminated, and the language and format used in the
rema jnder was sìmp'lified considerabìy.
In the end, some forty-one questions related to twelve major
va.rjables were retained (see sample questionnaire in Appendix A).
several questions were asked in connection with each of the major
variables (one dependent and eleven independent) under examination in
this study, thus prov'idìng the option of constructing a scale for each
variable, of usìng the one quest'ion which proved to be the best mea-
sure of the variab]e, or of using each question independently in
relation to the variable being tested. In order to eliminate mis-
understand'ings and to shorten the time required to fill out the
survey form, questions were asked in such a way that the respondent
mereiy had to circle one of the ans\4/ers on a five point scale
(usual]y i n the 'd'isagree strongìy/di sagree/undeci ded/agree/agree

52
strongly'format). Open ended questions were kept to a minimum; at
the same t'ime, however, the respondents were encouraged to expand on
thejr answers or write jn any comments if they felt that they had
some specific point to get across which was not dealt wjth in the
answer format prov'ided.
The twelve major variables tested in the questionnaire consjst
of the following:
l. satisfaction with neìghbourhood
2. socio-economic status
3. neighbourhood layout (street pattern)
4. access to urban infrastructure
5. location of neíghbourhood ('inner city or suburban)
6. level of 'neighbouring' activities
7. level of neighbourhood awareness
8. homogeneity of resjdents
g. qual i ty of chi I dren' s envi ronment
I 0 . qua ì 'i ty of the phys i ca I env i ronment
ll. level of perceived privacy
12. mobility of residents (in terms of transportation)
These variables were chosen to supp'ly the data needed to test the vali-
dity of each hypothesis and to address the ìarger intent of the study.
The dependent variable for all of the hypotheses examined in this
study is, of course, 'satisfaction with neighbourhood'; the other
varjab.les on the preceding 'list (as characterized by the questions
associated with them) act as' the independent variables. This will
be dealt with'in more detail in Chapter Four, which will
53
concentrate on the analysis of data and the acceptance or rejection
of the hypotheses.
Aga'in, it should be noted that each of the major variables has
several assocíated items on the questionnaire; details of the orjg'inai
operationalization scheme are given 'in Appendìx B, and more details
will be given in Chapter Four. Individual quest'ions were also jncluded
in order to test the relative importance of each independent varjable
jn terms of determin'ing each respondent's perceìved satisfaction with
his or her nejghbourhood.
A pretest was carried out in one of the subject ne'ighbourhoods
prior to its generaì distribution, with good results. 0nìy one question
needed minor change due to an error ìn the answer format. It was also
found in the post-completion interviews wjth these respondents that
there were few diffjculties in understandjng the various questjons;
there was also very little difficu'lty in answering them, and a h'igh
level of interest had been majntained throughout. Approximately
fifteen to twenty minutes was required to fill the questionnaire
compl etel y.
3.5 Adminjstration of the Questionnaire
0n the basis of the number of respondents required (it was
originally hoped to obta'in fifty from each neighbourhood) , 'it was
decided to mail out the questionnaires with a prepaid return
envelope encìosed. This would ensure del'ivery, while at the same
time offering the householder the convenìence of filljng out the
form at a convenient time. Also, since demographìc ínformation was
54
requested pertaining to both male and female household heads, the
questionnaire could be answered by either.
In each of the thirteen ne'ighbourhoods chosen, 175 questìon-
naires were delivered to the householders of randomly selected sing'le
detached dwellings. Or'igìnally, ít had been intended to adjust the
number of forms administered sììght'ly according to the relatjve popu-
latjon of each neighbourhood; later,'it was decided that the number of
single fami'ly detached households would provide a better basis for
such adjustments; and finally, this scheme was dropped entìre'ly.
This decisjon was made when it was found that the questionnaires
could not be evenly distributed within the boundarjes of the identified
neighbourhoods, for several reasons. Firstìy, single famiìy detached
housjng seìdom takes up the entire physical area of a neighbourhood.
The same thing also appìies to the location of clear examples of'bay'
or 'grid' street patterns. It was therefore decjded to concentrate
the questionnaires in a smaller area withìn each neighbourhood, after
checkjng that each proposed sub-area showed the same overall demo-
graph'ic characteristics as the larger neighbourhood as a whole. This
was done by examining the data for the much smaller'enumeration aneas'
of the census in relatjon to those for the larger'census tracts'
(227, 228).
From these figures,'it was found that each area under consider-
ation contained approx'imateìy 250 eligible households. By estimating
an overall return rate of about 40% (288:450), and with a desired
return rate of about fifty sampìes, at least 125 questionnaires would
have to be delivered in each ne'ighbourhood. However, by djstributing
55
the maxjmum number of forms which could be printed under the research
budget,'it was possible to send out the larger amount of 175.
3.6 Coding and Analysis
Most of the questjons used were of the five-point, 'strongly
disagree/d'isagree/undecìded/agree/agree strongly' format, and were
coded accordingly. 0f the rest, the majority were multipìe choice,
precoded ones; only a few were open ended. For the open ended questions,
scales were established after all the responses had been reviewed, so
that meaningfuì categories could be establjshed.
3.7 Characteristics of the Response
0f the 2275 questionnaires which were administered, some 659
were returned, constjtuting a response rate of 29%. Responses from
the thirteen neighbourhoods.ranged from a high of sl% (gg responses)
in wjldwood Park to a low of 1a% (24) in the west End (see Tabìe z).
According to Heberlejn and Baumgartner (2BB:450), a response rate of
29% is at the lower end of what they found to be the standard devi-
ation from an 'average' response to one mailing of a questìonnaire.
The characteristics of the questionnaire and the sanrpìe which probabìy
contributed to this relativeìy ìow response rate mr'ght include the
personal nature.of some of the items (demographic questions incìuding
income, marital and emp'loyment status, etc.), the lack of resources
requ'ired to nail out folìow-up questionnaires, and the low 'salience,
of the study topic to most peop'le. 'salience' in this case refers to
the importance, tíme'liness, and relevance of a subject to the person
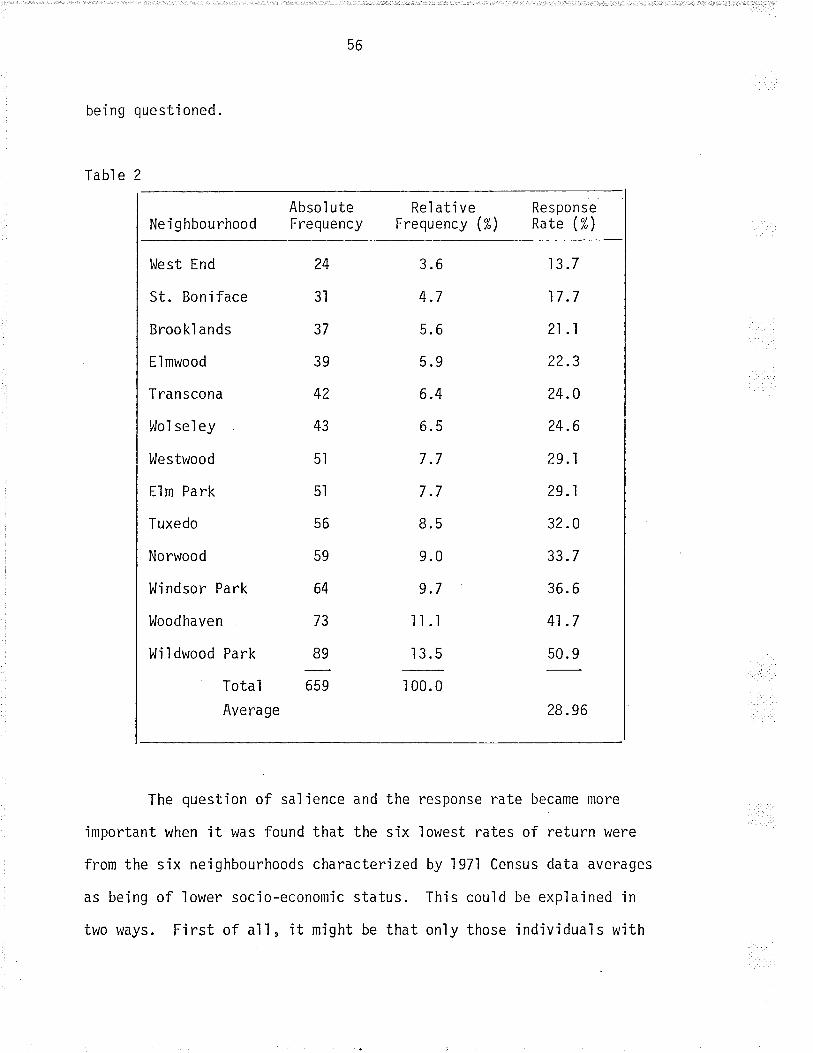
56
bei ng quest'ioned.
Tabl e 2
NeìghbourhoodAbso I uteFrequency
Rel ati veFrequency (%)
ResponseRate (%)
l^Jest End
St. Boniface
Brookl ands
Elmwood
Tran scona
Wo'l se'ley
l^lestwood
Elm Park
Tuxedo
Norwood
l,lindsor Park
I,rloodhaven
l,lildwood Park
Total
Average
24
3l
37
39
42
43
sl
5l
56
59
64
73
89
3.6
4.7
5.6
5.9
6.4
6.5
7.7
7.7
8.5
9.0
9.7
il.1
13.5
13.7
17 .7
21 .1
22.3
24.0
24.6
29.1
29.1
32.0
33.7
36. 6
41 .7
50. 9
659 100.0
28.96
The questjon of sal ience and the
important when it was found that the six
from the six neighbourhoods characterized
as being of lower socio-econonric status.
two ways. Fìrst of ai'l , it might be that
response rate became more
lowest rates of return were
by I 971 Census data averages
This could be explajned in
on'ly those individual s with
57
the characteristics of high socio-economjc status responded to the
quest'ionna'ire; and secondìy, only those individual s who are satìsfiedwith their neighbourhoods might have responded (assumìng that lower
income areas are less satisfied in this regard). Either expìanation
could involve the introductjon of a significant bjas into the data
base.
Several avenues of exproration were used to test for the
presence of these biases. In the former case, .it was found that a pre-
ponderance of the overall responses did indeed come from those in the
upper income, iob type, and education categories. This was not
unexpected, being the result of sampìing occupants of sing'le famiìy
detached housing exclusive'ly. 0n the whole, such persons wiìì tend
to be more well-to-do than those occupying other forms of housing in
a given area. An attempt was then made to compare the responses
obtained from the questionnaire agaìnst the exìsting census data
(from ì97ì and ì926) in order to see if the characteristics of the
respondents in each area were representative of the total neighbour-
hood populat-ion (in demographic terms). In each of the three measures
of socio-economic status used in thìs study (fanrily income, ma'le job
type' and male education level), a rarge majority of the overallpopuìation in the study areas are in the upper ends of the spectrum.
Therefore, the response rate courd be expìained just as welì by the
actual distribution of socio*economic status in the study neighbour-
hoods as by the response rate among part'icular status groups.
This was further confirmed by the distrìbution of responses
among the physicaì aspects of neighbourhood; Ín each case, the major_

58
ity of the returns showed the response whjch could be said to be
characteristic of a higher socio-economic status. For example, the
response rate among bay areas (whìch hadall been initialìy character-
Ízed as upper status areas) was at 39%, while for the grids, it was
only 26%. In the case of neighbourhood location, 32% of those ìivingìn suburban areas responded as compared to zz.4% in the ,inner c.ity'.A similar but weaker trend was found among those ìivíng in areas with
a low level of access to the urban infrastructure, who had an overall
response rate of 31%, while those with high access returned 27%.
It should be noted, however, that socio-economic status-is by
no means the sole determinìng factor of the response rate. For exampìe,
Brooklands and Tuxedo represent the extreme low and high ends of the
socio-economic scale, Yêt neither cornesponds to the lowest or highest
response rate. similar discrepancies exist jn the mjddle range as
welì, indicating that other factors are also at work.
The second possible source of bias which was discussed (ttrat
is, responses coming onìy from satisfied individuals) did not appear
to be particuìar'ly significant. }.Jhile a majority of peop'le did report
that they were tyê[.y satisfied' with their neighbourhoods, this was
onìy in keep'ing with the results of several reports (referred to inChapter One) which found that high levels of satisfaction with one,s
neighbourhood are the rule rather than the exception. Furthermore,
when the satisfaction levels of each of the study areas are compared,
a significant and consistent variation became apparent.
So we can see that on the whoìe, peop'le with 'lower, annual
family incomes ($12000 or less, approxinrateiy), 'blue collar,

59
occupatjons, and 'less' educatjon tended to respond less frequent'ly
than those who were characterized by hígher levels of these indjcators.
However, it is possible to identify a sufficient number of jndivjduals
with lower socio-economic characteristjcs from each of the nejghbour-
hoods to provide data for comparison purposes. Such individuals can
be treated as a group to test the s'ignificance of socio-economjc status
on a person's sat'isfaction with their neighbourhood and with other
factors. Natura'lly, the reliability of some observations will be
limited by the lower number of cases present Ín some categorìes or injndividual cells of the crosstabulations, but they should certainìy
prove to be sufficient for the purposes of this study.
3.8 Statistical Procedures
Since the intent of this study is to prov'ide both.descrjptive
and interpretive data on the relationship of 'neíghbourhood satisfac-
tion'to varjous characteristics of both peop'le and the'ir pìace of
residence, a nL.lmber of di fferent techniques wi'l'l be used.
As a f irst step, the simp'le cumulative frequency distribut'ions
of the obtained data will be presented. The responses will be grouped
accordjng to which of the twelve major (independent and dependent)
variables they are intended to test. For examp'le, under the firstof the major variables (the dependent variabìe, 'satisfaction with
Neighbourhood'), the re'sponses to the four relevant questr'ons w'ill be
presented - those being the residents' satisfaction with their neigh-
bourhood; their assessment of their neighbourhood as a pìace to own a
home as an investment; their feelings about whether their neighbour-
,t

60
hood will improve or decline in ten years; and their desire to move to
another neighbourhood. This procedure will then be repeated for the
el even 'independent vari abl es .
The second step wiì1 be to examine the distribution of
responses for each question, to identify the trends, and to perform
any 'recoding' or recombining of categories necessary to make the
results more useful and meaningful. For exampìe, in the responses to
the first question related to neighbourhood satjsfaction, it was found
that some 48% of the respondents professed themselves to be 'very
satisfied'with their neighbourhoods, while a total of only ìB% were
'very dissatisfied', 'dissatjsfied', or had 'mixed feelings'. In such
a case, the use of a five point scale was unworkable, and so it was
co]lapsed into a three point scale by combin'ing the first three
responses (noted above) into one. Sìmi'lar operations had to be carried
out in several other categories, and wi'll be dealt with as the data ispresented in Chapter Four.
The next step is to find out which questions act as the best
measure of each major varìable, and to confirm that they are a'll
measuring the same thing. It mìght be noted that while the question-
naire was designed in such a way that the individual items could be
combined into scales, preìiminary testing has shown that the pred.ic-
tive ability of one of the most important scales - that of socio-
economic status - was actually weaker than the predictive ability of
the questions when used ind'ividua'lìy. Therefore, scaìes will only be
used in those cases where they have a better abi'lity to predìct their
relationship to the dependent variable (neighbourhood satisfaction).
61
The statistic used to test each question's abi'lity to measure
the major variable to which it is related is the 'jndex of proportion-tafity' (P'), as outlined by Piazza (304). In brief, instead of examin'ing
the correlations of the items associated with one major varjable with
each other, this statistic examines the correlation of each item with
a number of other 'theoretica'lìy relevant variables'. By looking
at the relationships of individual items to the same set of theoreti-
ca'l'ly relevant variables, the similarities and differences between
each of the items become apparent. One of the clearest examples of
this occurs among the five items associated with the level of
'neighbouring' activitjes (frequency of socializing with neighbours;
frequency of borrowing/lending items with neighbours; good/bad relations
with neighbours; neighbourhood friendly/unfriend'ly; like/dislike peop'le
in neighbourhood), which were all compared with famiìy income, s'ize of
famiìy, length of residence, satisfaction wjth neighbourhood, desire to
move out, street layout, and neighbourhood location. All of the latter
variables were chosen on the basis of the fjndings of the previous
literature. l^lhen the Gamma values of the correlations between the two
sets of variables were graphed (see figure 2), all five items represent-
ing 'neighbouring' activities showed very similar curves, except when
compared to the two theoreticalìy reìevant variables related to
satisfaction with neighbourhood. Here, the two items which dealt
with actual social contact with one's neighbours showed considerable
difference from the three perceptual'ly oriented items.
To quantify the relationship among these variabìes, the 'index
of proportiona'lity' (P2) is calculated, which measures the degree of
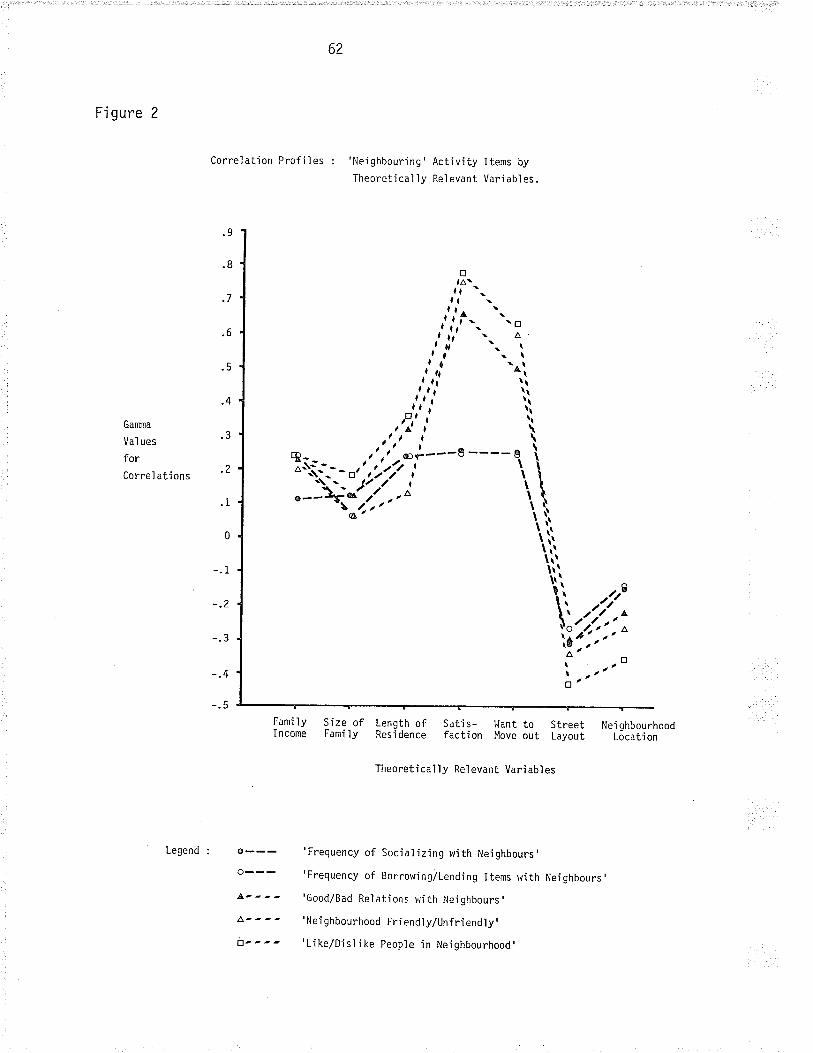
62
trIA\lllt \
.f In '-,t rtr' '. \ c)
i nl' "r o,
ll r \/',f 'ì,, , , \\, rr,, \l
,'7' l' \.r"' t \
T-:¡.. -,,",,:iir*i---e ---- \ \
"-\'j7..; \\\\\i\\r\
Ví;\ ,tr\ tttE'
Correlation Profiles : 'Neighbouring' Activity Items by
Theoretical ly Relevant Variables.
Theoreticalìy Relevant Varìables
@--- 'Frequency of Socializìng with Ne.ighbours'
o--- 'Frequency of Borrowìng/Lendìng Items rvìth Neighbours'
^- ' - - 'Good/Bad Relations with Neìghbours,
a'' - -'Neìghbourhood Friendly/Unfrìendìy,
L1- - - - 'Like/Disì ike Peopie in Neighbourhood'
Figure 2
Garma
Val ues
forCorrel ations
Family size_of Length of satis- want to street NeìghbourhoodIncome Fami ly Residence faction Move out Layout Lõcat.ion
Legend :
63
agreement between each of the ìtems when compared to the theoretically
relevant variables. lhe P2 statistic is measured for each paìr of
items; therefore, if the values of the correlatjons between any two
items and the theoretjcally relevant variables show a high degree of
'proport'ionality' - that is, they change in the same djrection and to
a simiìar degree from one theoretically reìevant var jable to the
next - then those two items have a high pz value. if the values of
the correlations for each item move in d'ifferent directions (increasing
instead of decreasing), or if there is a high degree of change as
compared to a low one, then there is a I ow p2 value. Referring to
Fígure 2, the values obtajned through the calculatjons djd show at
high P'score between the two items measuring sociaì contact (.g¡; a
value of 1.0 represents'perfect'proportionality) and among the
three perceptually oriented items (.g+ - .gg), but a lower relation-
ship between the two sets of items (.72 -.90). This suggests that
each set is measuring a different aspect of'neighbouring', and that
they should not be combined into a single scale. Through the use ofo
the P'statistic, we can eliminate ítems which are less related to
the major varjable'in question, and can sometimes choose one item as
the 'best' measure of a particular major variable.
Once the 'best' quest'ions associated with each of the twelve
major variables have been chosen, the results will be briefìy pre-
sented and djscussed wjth the responses broken down by each of the
thirteen neighbourhoods. After this has been done, the on'ly thing
that remains is to test the hypotheses and to look for other relation-
ships which might be useful to the field of neighbourhood pìanning.
64
The statistics used in the testing of hypotheses (through the
crosstabulation of the jtems associated with each of the major vari-
ables in question) are chì-square (x2) and Gamma (G). chi-square is
simp'ly a non-parametric test of statistìcal significance which heìps
us to determjne whether a systematic relationshjp exists between two
variables. This is done by computing the ce'll frequencies which would
be expected if no relationship is present between the variables being
tested, and comparing these values to the actual ones found in the
table itself. The result is a measure of probabiìity of the occurrence
of the observed frequencies; the smaller the probabiìity, the higher
the significance of the relatìonship of the two variables. The
researcher, however, must decide what level of signìficance will be
used as a cut-off point for confidence in the reìationshìp. Also,
chi-square itself on'ly heìps us to decide whether the variables are
independent or related. It does not tell us how strongìy they are
rel ated.
The statist'ic used to measure the strength of association
betwen variables in this study is Gamma (G). Gamma is a non-parametric,
s¡nrnetrícal measure for the association of ordinal varjables (ranked
but not 'equalìy' separated, as 'in attjtudinal measurements), whìch
are the type most cornmonly used in the present study. Gamma is one of
several measures which represents the proport'ionate reduction of error
made under two conditions; first, where the only informatjon js the
distribution of the dependent variable itself, and secondly, where
there is additional knowledge about the independent varjable and the
way the dependent variable is dìstributed within the categories of
65
that independent variable. These measures state the proportion by
which one can reduce errors made in the first situation by using infor-
mation from the second.
Gamma was selected 'in partìcular due to the preponderance of
ordjnal items in the questjonnaìre. For ordinal variables, the pre-
dictjon we are interested in deals with the rankjng of scores on these
variables, which means that we must be concerned with ,pairs, of
observatíons, as it takes at least two scores before the jdea of'rank'is meaningful. If the knowledge of ranking of pairs on one variable
is of no use in pred'ictíng rank order on the other variable, then the
measure of association will equaì zero; if alì pairs are discordant,
the relatjonship is perfectìy negative, and has a value of -1.0, and
if all pajrs are concordant, it is positive, and has a value of +.l.0.
Gamma is of particular use here because it is capable of measuring
both positive (same rank order) or negative (opposjte rank order)
assocjations between the second variable and the first. To summarize,
then, Gamma represents the proportionate reduction in errors in pre-
dictjng ranking that would be made by usjng the 'same' or 'opposite'
ranking rule rather than randomly predicting rankjng among pairs which
are ranked differentìy on both of the two variables in the tab'le (for
more detailed informatjon, see Loether and McTavish) (294:209).
Through an ana'lysis of the literature revjew and the focus of
the present study, e'ight hypotheses were established, each of which
uses 'Satisfaction with Neighbourhood' as the dependent variable. To
test the hypotheses in question, the items selected as the best measure
of'Satisfaction'will be correlated with the items chosen to represent

66
the independent variables, and the strength and djrection of the assocj-
ation among the items will determjne whether or not the hypothesis js
accepted or rejected, as outljned in the previous paragraph. Somet'imes,
however, to check the validity of an apparently cìear-cut relatìonship,
a controlling variab'le may have to be introduced. For example, jnitial
results indìcate a strong relatjonship between neìghbourhood satisfac-
tion and street ìayout pattern; but before this can be accepted with
any degree of confidence, it would be wise to test this relationship
whjle controlì'ing for socio-economic status. If the trend is stillpresent among persons of varying status, then t^Je may accept the rela-
tíonship as 'real ' .
Once all the hypotheses have been dealt with, the data will be
examined in order to see if any of the characteristics (or groups of
characteristics) of the respondents are consistently assoc'iated with
particular levels of satjsfaction. In other words, the research willtry to construct a profile of satisfied and dissatisfied residents,'in
the hope that they wìlì exhibit significant differences. From this,
it may prove possible to identify those characteristics whjch have the
strongest effect on 'satisfaction'. The same approach wiìì be app'lied
to neighbourhoods with similar characteristics and similar satisfaction
levels. Final'ly, the results of the present study wilì be compared to
the fjndings of the.previous research in thjs field. All of these pro-
cedures wjll be presented in the follow'ing chapter, whjch deals with
the test'ing and interpretation of the data obtajned through the
questionnaire.
Chapter iV
NEIGHBOURHOOD SATISFACTION AND NIIGHBOURHOOD CHARACTERiSTICS :
- RTSULTS AND DiSCUSSION
As descrjbed in the previous chapter, we wil'l now undertake a
detailed discussíon of the demographìc characteristjcs of the respon-
dents and thejr attitudes towards thejr particular neighbourhood.
4.1 Cumulative Frequency Distributions
Questions 37 through 40 were used to measure 'satisfactjon with
Neighbourhood' among the sampìe population; the complete questionnaire
can be found in Appendix A.
Question 37. 0n the whole, how satisfied are you with your
ne i ghbourhood?
(l = 'very dissatisfied'; 5 - 'very sat.isfied')
Quest'ion 38. Do you consider your ne'ighbourhood to be a good place ora poor place to own a home as an jnvestment?
(l = 'very poor'; 5 = 'very good')
Question 39. Do you thjnk that your neighbourhood will improve ordecl i ne j n 'qua'l i ty' over the next ten years ?
(l = 'decline greatly'; 5 = 'improve greatìy')
Questjon 40. To what extent do you agree with the statement: "I would
like to move to another neighbourhood right now."
(l = 'agree strongly'; 5 = 'disagree strongly')
-67-
68
As the data jn Table 3 shows, the majorìty of peopìe are either
satisfied or highly satisfjed wjth their neighbourhoods. The responses
to item 39, regarding the neighbourhoods' future improvement or decline,
showed a lower level of satisfaction than the other three items although
over 50% of the responses were still in the upper two categories. Item
37, the one most directly related to 'satisfaction with Neighbourhood',
showed the most bias towards the upper end of the response categories
with some 81% falling into the upper two categories. For this reason,
it was judged that thjs question would be most useful ìn the cross-
tabulations if the lowest three categorìes were combined jnto a singìe
category. It might be interesting to note that the prelimínary find'ings
of the study seem to indicate that the independent variables are most
clearly related to satisfaction when peop'le are 'very satisfjed' or when
they are 'less than satisfied' (the combination of the lowest three
categories).
To establish the ability of each of the four items to measure
satisfaction, they were correlated wjth five 'theoretical'ly relevant
variables': famí'ly income, friend'ly or unfrjendìy relations with neigh-
bours, length of residence, street'layout pattern, and attractive or
unattractive physica'l environment. These five variables are hypothe-
sized to have a certain relationship to sat'isfact'ion. Therefore, the
items chosen to represent satisfaction in the analyses must have con-
sjstent relationships to these five varjables if they are to measure tÉe
same attitude. These particular variables were selected as a result of
the literature review, where previous studies found them to have a
significant effect on a person's satisfaction with their neighbourhood.

69
Tabl e 3
RESPONSES TO SAT]SFACTION
(Adjusted Frequency inRELATED ITEMS
Percent) l
Very LowSatisfaction
12Very H'igh
Sati sfacti on5 Total
Qu.37 Satisfaction
Qu.38 Investment
Qu. 39 Change
Qu. 40 Move
1.7
2.9
3.5
4.7
2.7
6.8
15.2
7.6
3
13.8
12.3
30. I
12.1
33.7
26.1
38.7
I 9.8
47 .6
5l .B
12.5
55.7
loo% (656)
r o0% ( 658)
100% (657)
1oo% (655)
lrlhen the Gamma values of the correlatíons between the four items
measuring satisfaction and the fjve theoretical'ly relevant variables are
examined (Table 4), we find that all four items appear to be close'ly
related on the basis of the trends shown. This js confjrmed by the ,p2
matrix' (Table 5), in whjch the lowest P2 value is .Bg. This means that
all four items are measuring the same aspect of'satisfactÍon with
Ne'ighbourhood' and that any one of them could be used in this regard.
However, to simp'lify the testing procedures in future sections, on]y one
item will be used to represent satisfactjon, with that being ìtem 37
("0n the whole, how satìsfied are you with your neighbourhood?").
lPercentages have been adjustedthe SPSS program jn order to total 100%.questionnaires retur.ned was 659.
to account for missing dataThe total number of
bv
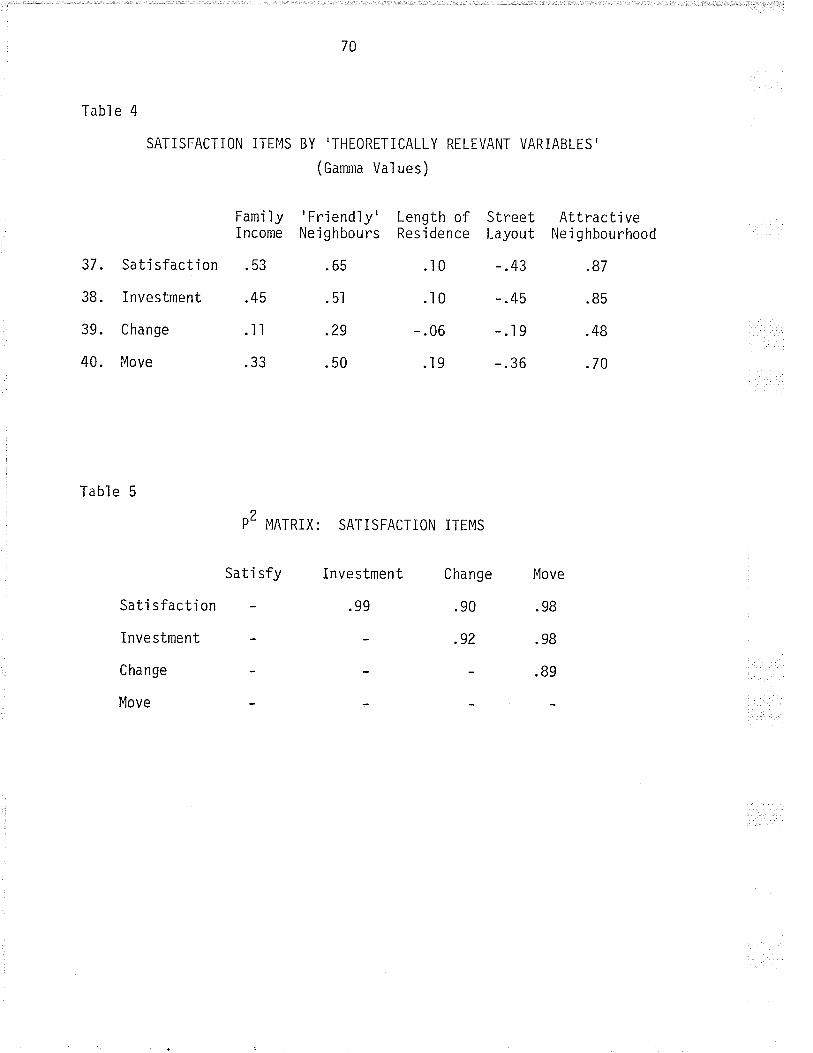
70
Tabl e 4
SATISFACTION ITTMS BY'THEORETICALLY RELEVANT VARIABLES'
(Gamma Vaì ues)
Fami ly 'Frr'end'ly' Length of Street AttractiveIncome Neighbours Residence Layout Neighbourhood
37. Satisfaction .53 .65 ."l0 -.43 .87
38. Investment .45 .51 .10 -.45 .85
39. Change .ll .29 -.06 -.19 .48
40. Move .33 .50 .19 -.36 .70
Table 5
oP. ¡,IATRIX: SATISFACTION ITEMS
Sati sfy Investment Change Move
Sati sfaction - .99 .90 .98
Investment--q2.gBChange - .89
Move
77
4.I.2 Socio-economic Status
Due to the inherent nature of this independent variabie, it was
handled in a slightly different manner than the others. It was found
that most of the items that quaìified as 'theoretica'lly relevant vari-
ables' for the P2 test were actuaJly other measures of socio-economic
status, and so ìt was decided to test the correlation of the conventjon-
a'lly selected items amongst themselves to determine if they were aìl
measuring the same aspect of this major variab'le, and to determine which
of the items would be used to represent'Socio-economic Status'in future
analyses. For this independent variable, the items selected in Canadian
Urban Trends: Neighbourhood Perspective Volume 3 (fg6) were used as a
starting point. This publication chose four items to measure socjo-
economic status: famiìy income, education level, occupation, and median
house value. The fìrst three of these were included in this study's
questionnaíre, with the latter two being divided into nale and
female categories.
Question 6. What is the present occupation of the household head(s)?(Please check one category for each household head, ifappìicable. If the categories shown are not specìficenough, please fill out the ìast space, marked '0ther'.)
(1 ='Managerial/Professionaì' ; I ='Manufacturing/Trades'; J = 'Clerical/Sales'; 4 - 'Education/SocìalServìces'; 5 - 'Primary/Labour'; $ = 'Retired';f ='Unemp'loyed'; 0 = No Response.)
Question 7. Into which of the fol'lowing categories does
famììy income of your household fall?
(1 =',$5000 - 6999'; 2 ='$7000 - 8999';
10999',; ! =',$11000 - 12999',; $ ='$13000
the total
J = ,99000
- 14999' ;
72
6 ='$15000 - lgggg' ; 7 ='$20000 - 24ggg, ; g ='$25000
. and up'; 0 = No Response)
Quest'ion 9. What is the maximum educatjonal level conrpleted by the
househol d head(s)?
(l ='None'; 2='Elementary';3 = 'High School';4 - 'Some University'; 5 - 'Technical Coììege';6 - 'Universìty Degree'; 7 = 'Post Graduate';0 = No Response)
After examjnation, a'l1 three of these items were recoded into fewer
categories, primarily on the basis of each category's relation to
'Satjsfactjon with Neighbourhood'. In the case of niale and female
occupation, the 'retired' and 'unemployed' categories (6 and 7,
respectiveìy) were coded to'no response', and'manufacturing - trades'
(2) was recoded into the 'managerial - professional' (l) classificat'ion.
Family'income was reduced to four categories from its origina] eight,
so that the new class'ifjcations were:
I ='$5000 - 6999',3 = ,$7ooo - l0ggg,,5 ='$11000 - l4ggg,, and
7 -'$.l5000 and up'. For male and female educatior,'none,(l) was
recoded to 'no response', and 'technical co'l'lege' (5) to 'high school'
(S), wfrile all university cìassifications (4,6,7) were combined into
a sìngìe category.
The responses are cìearìy concentrated in 'higher' status cate-
gories for both occupation and family income, with a slìghtly less strong
trend apparent for education (see Table 6). Again, thìs was initia'llypresumed to be the resuìt of confining the administration of the
quesiionnaire to areas of sing'le famiìy cietached housìng - an assumption
reinforced (if not absoluteìy confirmed) by census data for the neigh-
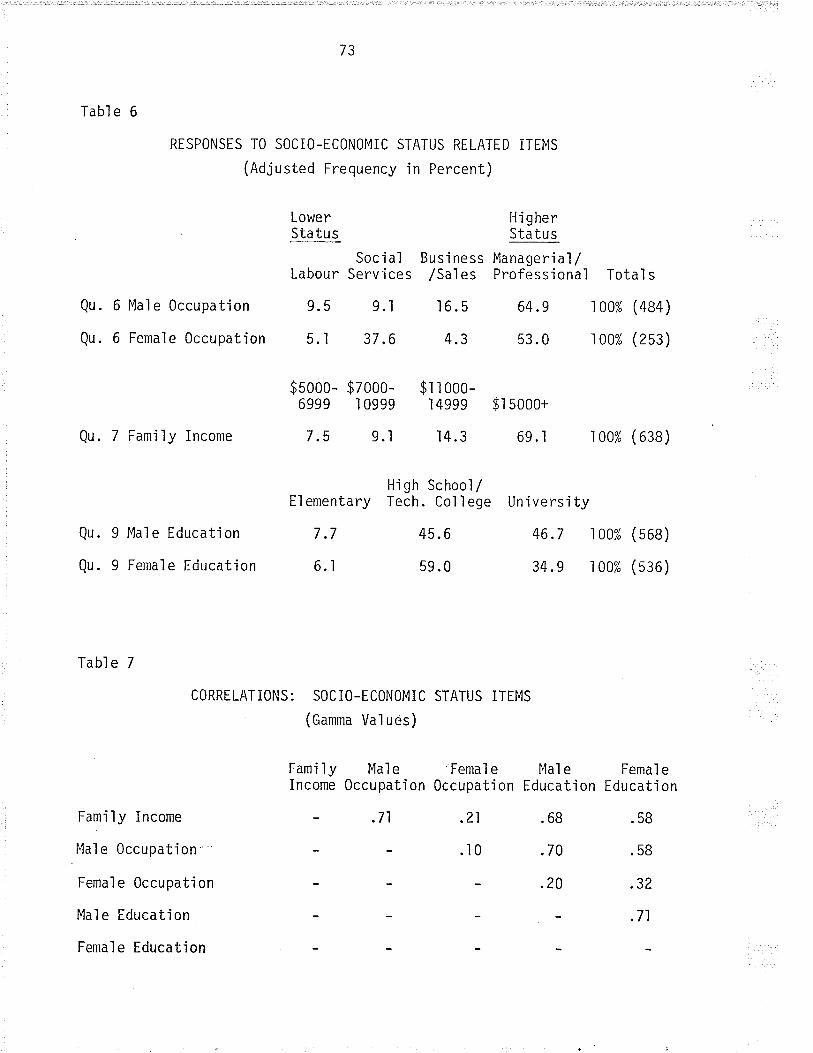
73
Tabl e 6
RESPONSES TO SOCIO-ECONOMIC STATUS RELATTD ITEMS
(Adjusted Frequency in Percent)
Qu. 6
Qu. 6
Mal e 0ccupatÍon
Femal e 0ccupation
LowerStatus
Soc i alLabour Services
9. 5 9.1
5.1 37.6
H'igherStatus
Business Managerìaì//Sal es Professional Total s
16.5 64.e 100% (484)
4.3 53.0 1Oo% (253)
Qu. 7 Famjly Income
$5ooo- $7ooo-6999 I 0999
7.5 9.i
$r r 000-14999 $l SOOO+
]4.3 69 . 1 r oo% ( 638)
Qu. 9
Qu. 9
Male Education
Female Education
Eì ementary
7.7
6.1
Hìgh School/Tech. Co'ì ì ege
45.6
59.0
University
46.7 100% (568)
34.e t00% (s36)
Table 7
Family Income
Mal e Occupation
Female 0ccupation
Mal e Education
Female Education
C0RRELATIONS: SOCI0-ECONOMIC STATUS ITEMS
(Gamma Vaì ues)
Fami'ly Mal e 'Femal eIncome 0ccupat'ion 0ccupat'ion
- .71 .21
.10
Mal eEducati on
.68
.70
.20
Femal eEducat'ion
.58
.58
.32
.71

74
bourhoods in quest'ion. (Refer to section 3.7 for a discussion of
possible biases. ) However, these responses do not indjcate which of the
five items acts as the'best'measure of'socio-economic status'.
To determine this, each of the five items was correlated with
every other item, and the resulting Gamma scores are given in Table 7.
From these, it is clear'ly seen that female education shows only a moderate
correlatjon with the other items, and female occupation onìy a weak one.
Therefore, three items will be used as measures of'socio-economic status',
with those being family income, male occupatjon, and male education.
These items will be used separate'ly, with family ìncome representing
'socjo-economjc status' in the testing of the hypotheses. The other two
items will on'ly be used when they have some particular relevance to the
test jn question.
4.1.3 Neighbourhood La.vout (Street Pattern)
This was not determìned through the questionnaìre, but by.means
of a map ana'lysis of the seventy neighbourhoods jdentìfìed by the study.
Through this analysìs (outljned in detail in Chapter Three), three neigh-
bourhoods wi th ' bay' street pat'terns were sel ected - Westwood , l^li ndsor
Park, and Wildwood. The other ten neighbourhoods - Brooklands, Elmwood,
Elm Park, Norwood, St. Boniface, Transcona, Tuxedo, the West End,
lnlolseley, and Woodhaven - were ali characterized as'grìd'areas.
4.1.4 Access to Urban Infrastructure
Th'is variable was also identified through the use of map anaìysìs.
Ïn a previous research project carrjed out while emp'loyed by the City of
l,üinnipeg, the researcher had identified areas of commercial development,
75
incl udÍng the central business district, shopping centres of all sizes,
and areas of 'strip' commercíal development. This research was quite com-
prehensive, and made the task of evaluating a neighbourhood's level of
access to ''infrastructure'much easier. To thjs map were added the other
aspects of infrastructure identified by this study, including sports and
recreation facilities, parks and sport fields, and entertajnment
facilities.
The strongest determinant of the relative ease of access was the
means used - that is, whether the'jnfrastructure'was reached by foot, by
bus, or by car. For local shopping and busíness needs and for sport fields
and parks, the emphasis was placed on þedestrian movement (especially for
the latter destjnations) and movement by car. For the other two destjna-
tions, the emphasis was on car and bus movement. The ease of access was
determjned by travel time and difficulty. As a result, six neighbourhoods
were found to have a'high' level of access to infrastructure, those being
Norwood, St. Boniface, the I,Jest End, Westwood, l^lolseley, and Woodhaven.
Those areas with relativeìy 'low' access to 'infrastructure were Brooklands,
El mwood, El m Park, Transcona, Tuxedo , l^lì ndsor park , and l^Ji I dwood.
4.1.5 Location of Neighbourhood (Inner City or Suburban)
Another simp'le map anaìysis was used to determine whether each
ne'ighbourhood was best described as being part of the 'inner city' or was
far enough away to be 'suburban' in nature. 'Innercity'areas are defined
as those which are at least partìa'lìy ìocated wjthin one mile of the
corner of Portage and Main. Four neighbourhoods - Norwood, St. Boniface,
the west End, and l,lolseley - were found to be'inner city'areas, whiìe
the other nine - Brooklands, Elmwood, Elm Park, Transcona, Tuxedo Westwood,
l.Iildwood, Ì.lindsor Park, and Woodhaven - were classified as 'suburban'.
76
4.1 .6 Level of 'Nejghbourjng' Activity
Question .l2.
How often would you say that you get together jnformaìly
w'ith neighbours? (For coffee or drinks, for examp'le. )
(l = 'never';5 = 'very often')
Question .l3.
How often do your household members borrow or lend jtems
to neighbours?
(l = 'never';5 ='very often')
Quest'ion i4. 0n the whole, do you have good or bad relations with your
nei ghbours?
(l = rveFJ bad'; g = 'very good')
Quest'ion ì 5. I^Ioul d you say that your neighbourhood i s a 'friendly' or
an 'unfriendly' one?
(l = 'veFy unfriendly'; 5 = rvery friendìy')
Question 16. 0n the whole, do you like or dislike the peopìe in your
nei ghbourhood?
(l = 'djslike very much'; 5 = 'like very much')
ïn the case of questions ì4,15, and 16, the responses are strongly
concentrated at the end of the scale indicating a'high'level of
neighbouring activity, while questions l2 and l3 show a very weak trend
towards 'low' neighbouring activity (see Table 8).
For the anaìysis of the P2 statistic for these five items, seven
'theoreticaììy reìevant variables' were chosen: family ìncome, size of
family, length of residence in the neighbourhood, satisfaction with
neighbourhood, desire to move out, street 'layout pattern, and neighbour-
hood location (jnner city or suburban). The Gamma values of the
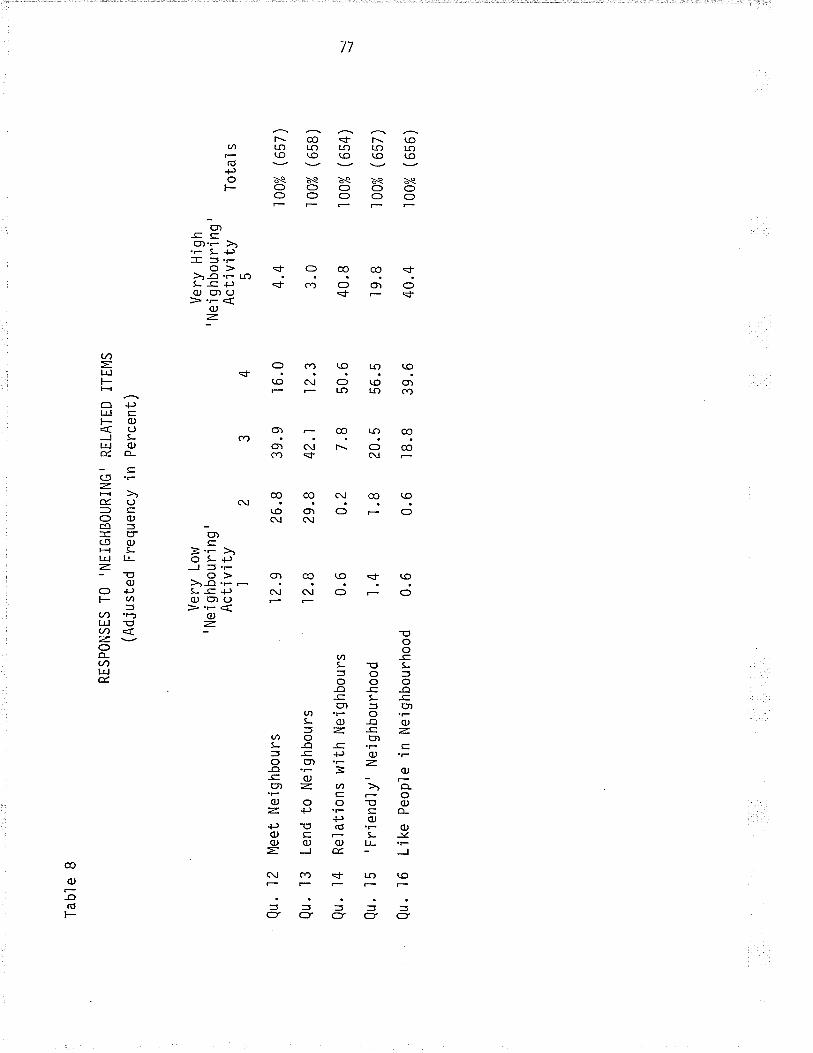
Tab
l e 8
Qu.
12
Qu.
l3
Qu.
14
Qu.
l5
Qu.
l6
Mee
t N
eigh
bour
s
Lend
to
Nei
ghbo
urs
Rel
atio
ns w
ith N
eigh
bour
s
' Frie
ndly
' N
eigh
bour
hood
Like
Peo
ple
in N
eigh
bour
hood
RE
SP
ON
SE
S T
O 'N
EiG
HB
OU
RIN
G' R
ELA
TE
D I
TE
MS
(Adj
uste
d F
requ
ency
in p
erce
nt)
Ven
y Lo
w' N
e i g
hbou
ri n
g '
Act
í v'
ityI
12.9
12.8
0.6
1.4
0.6
2
26.8
29.8
0.2
t.B 0.6
J
39.9
42.1 7.8
20.5
.l8.8
4
16.0
12.3
50.
6
56.5
39.6
Ver
y H
'igh
'Ne'
ighb
ouri
ng '
Act
i v'i ty
5 4.4
3.0
40.8
I 9.
8
40.4
Tot
al s
100%
(65
7)
r oo
% (
658)
r 00
% (
654
)
100%
(65
7)
1oo%
(65
6)
! \.I
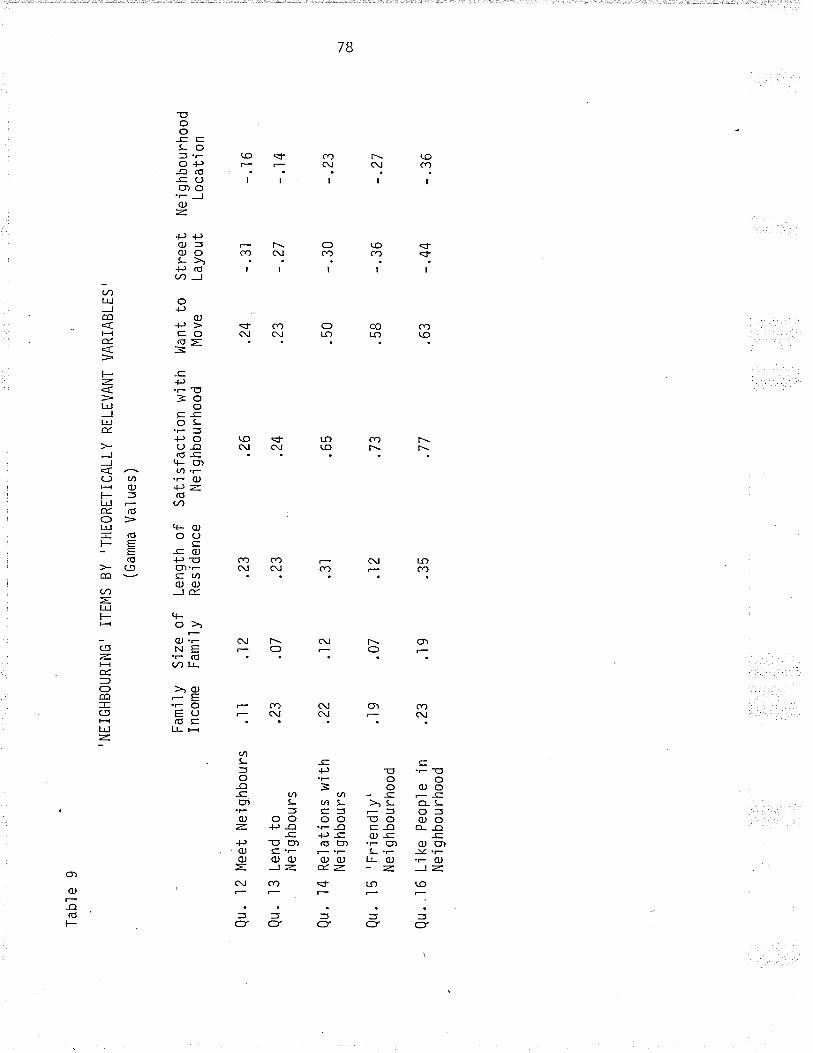
Tab
l e 9
Qu.
l2 M
eet
Nei
ghbo
urs
Qu.
13
Lend
to
Neì
ghbo
urs
'NE
IGH
BO
UR
ING
' IT
EM
S B
Y'T
HE
OR
ITIC
ALL
Y
RE
LEV
AN
T V
AR
IAB
LES
'
(Gam
ma
Va1
ues
)
Qu.
14
Qu.
l5
Fam
Íly S
ize
of L
engt
h of
Inco
me
Fam
ily R
esid
ence
Rel
atio
ns w
ithN
ei g
hbou
rs
'Frie
ndly
'N
ei g
hbou
rhoo
d
Qu.
.l 6
Li k
e P
eopl
e i
n
Ne
i ghb
ou r
hood
.ll .23
.22
.19
.23
.12
.07
.12
.07
.19
.23
.¿3
.31
Sat
isfa
ctio
n w
ith I,
.Jan
t to
Nei
ghb
ourh
ood
Mov
e
.26
.24
.65
,73
.77
.12
.35
.24
.23
.50
Ão
.63
Str
eet
Layo
ut
- .3
1
-.27
- .3
0
-. 3
6
-.44
Ne'
ighb
ourh
ood
Loca
ti on
-.16
-.14
_.23
_.27
_ .3
6
\ co
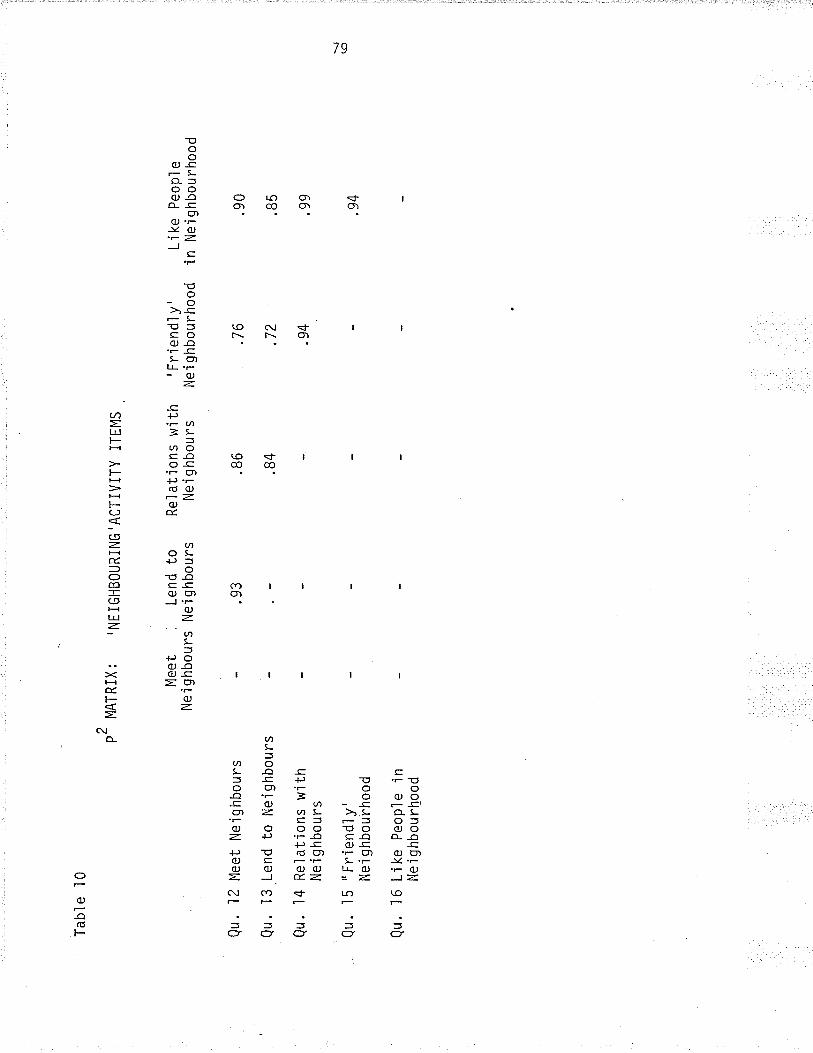
Tab
le l0
Qu.
l2 M
eet
Nei
ghbo
urs
Qu.
Qu.
Qu.
Qu.
p2 N
AT
RT
X:
l3 L
end
to N
eigh
bour
s
l4 R
elat
ions
with
Nei
ghbo
urs
15 "
Frie
nd1y
'N
ei g
hbou
ihoo
d
l6 L
ike
Peo
p'le
ìn
Ne
i ghb
ourh
ood
Mee
t ,
Lend
to
Neì
ghbo
urs
Nej
ghbo
urs
, N
EIG
HB
OU
RiN
G'A
CT
IVIT
Y IT
EM
S
.93
Rel
at'io
ns w
ithN
eigh
bour
s
.86
.84
' Frie
ndl
y'N
ei g
hbou
rhoo
d
.76
.72
.94
L i k
e P
eop'
l e
in N
eigh
bour
hood
.90
.85
.99
.94
! (o

80
correlat'ion are shown in Table 9, while the P2 statistics are shown in
Table 10. And, as the graph of the Gamma values cìear1y demonstrated
(see Figure 2; section 3.8), both quest'ion 12 (frequency of informal
meetings with neighbours) and quest'ion 13 (frequency of borrow'ing and
lending with neighbours) show a simjlar and much weaker relatìonship
with the two satisfaction related ìtems (satisfaction with neighbourhood
and the desire to move out) than the other three items. In all other
respects, the resultìng curves are very similar. This dev'iation in
connection with the satisfaction related items can be expìained in that
both meeting and lending with neighbours are measures of actual socjal
'contact', while the other three items are related to a person's per-
ceptions of their neighbours and of their neighbourhood as 'friend'ly'.
0n the basis of the P2 values (see Table 10), all of the jtems
appeared to be adequate measures of the level of'neighbouring'activì-
ties in an area; at least, there were no results which would c'learly
justify the exclusìon of any partìcular item. Question 16 ("0n the
whole, do you like or dislike the peopìe in your neighbourhood?") stood
out as the jtem most strongly correlated w'ith the others, and will be
the one used to represent the level of'neìghbouring'activities in the
testing of the hypotheses.
4.I.7 Level of Nejghbourhood Awareness
Three items were designed to measure a person'S awareness of
their neighbourhood as a physica'l entity. Qne of these items GZA¡
measured two aspects of a person'S awareness - their ability to recog-
njze and name the features forming the'edges'of their nejghbourhood,
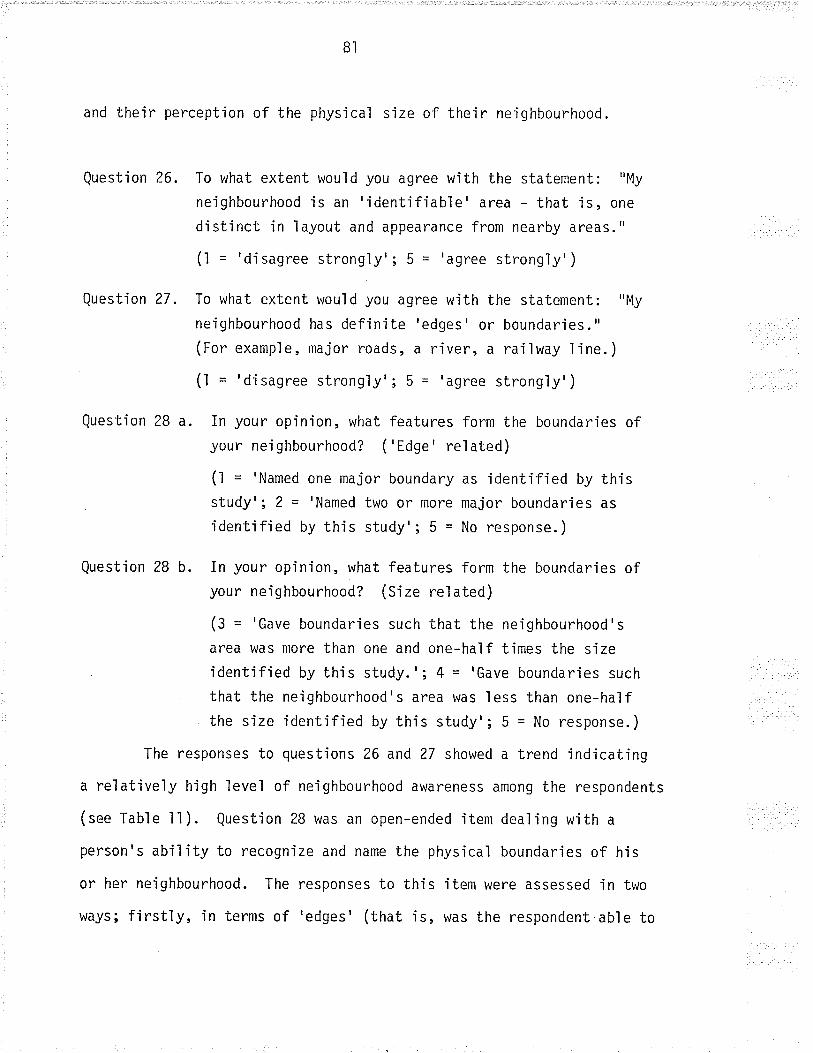
8l
and their percept'ion of the phys'ical size of the'ir neÍghbourhood.
Questi on 26. To what extent would you agree with the statement: "My
neighbourhood is an 'identifiable' area - that is, one
distinct in 'layout and appearance from nearby areas."
(l = 'disagree strongly'; 5 = 'agree strongly')
To what extent would you agree with the statement: "My
neighbourhood has defjnite 'edges' or boundaries."(For example, major roads, a river, a railway l'ine. )
(l = 'di sagree strongly' ; 5 = 'agree strong'ly' )
In your opin'ion, what features form the boundaries ofyour nei ghbourhood? ( 'tdge ' rel ated)
(l = 'Named one major boundary as jdentified by th'isstudy'', 2 = 'Named two or more major boundaries as
identified by this study'; 5 = No response.)
ïn your opinion, what features form the boundarjes ofyour neighbourhood? (Size related)
(3 = 'Gave boundaríes such that the neighbourhood's
area was more than one and one-half times the sizeidentified by this study.'; 4 = 'Gave boundaries such
that the neighbourhood's area was less than one-halfthe sÍze identified by this study'; 5 = No response.)
Questì on 27 .
Question 28 a.
Question 28 b.
The responses to questions 26 and 27 showed a trend 'indicatìng
a relatively high ìeve'l of neighbourhood awareness among the respondents
(see Table ll). Question 28 was an open-ended ìtem dealing with a
person's abifity to recognìze and name the physìcaì boundaries of his
or her neighbourhood. The responses to this'item were assessed in two
ways; firstìy, in terms of'edges' (that'is, was the respondent able to

82
Table 11
RESPONSTS TO NEIGHBOURHOOD AWARENESS ITEMS
(Adjusted Frequency in Percent)
Very Low Very HighAwareness Awareness
I2345Total
Qu.26 Neighbourhood 3.2 9.6 13.9 33.2 40.1 :¡0% (648)Identi fi abl e -'-
Qu ' 27 Nejshbourhood 2.0 4.8 6 .z 35 . 7 51 .3 r00% (645 )Has 'Edgest L'v
named one named two or moreedge edges
Qu. ZBa Name 'Edges' 28.2
I arger
Qu. z\b Give Size BB.5
7r.8 700% (3oe)
smaller
11.s rco% (313)
B3
name any boundaries, and if so, how well did they agree with the ones
identified by this study), and secondìy, jn terms of s'ize (did the
respondent identify an area that was larger, the same s'ize, or smaller
than the area identified by this study). in the former case, the
majority of respondents were able to identify two or more of their
neighbourhood's boundaries, and in the latter, the majority perceived
their ne'ighbourhoods to be significant'ly larger than the area identi-
fied by the study. Whether these responses also indicate a higher
level of neighbourhood awareness remains to be determjned.
In calculating the P2 statistic for neighbourhood awareness,
seven 'theoreticalìy relevant variables' were employed: family income,
the perceived 'friendliness' of the neighbourhood, the safety of people
and property in the neighbourhood, the appearance of the neighbourhood,
satisfactìon with the neighbourhood, the street layout pattern, and
the location of the neighbourhood (inner city or suburban).
The Gamma values for the correlat'ions between the nejghbourhood
awareness items and the theoreticaìly relevant variables show that the
feeling that a neighbourhood is 'identifiable' (quest'ion 26) js hishly
correlated with the feeling that a neighbourhood has definite 'edges'
or boundaries (see Table 12). The P2 values (rante i3) show that the
ability to name thoóe'edges' 'is poorìy related to the other three
items. They also show that the single item with the best assocjation
to the others is question 26 which deals with the res'idents' perceìved
'identifiabiìity' of theìr neighbourhood. Therefore, this item wi:ll be
the one used to represent awareness of neìghbourhood in future analyses.
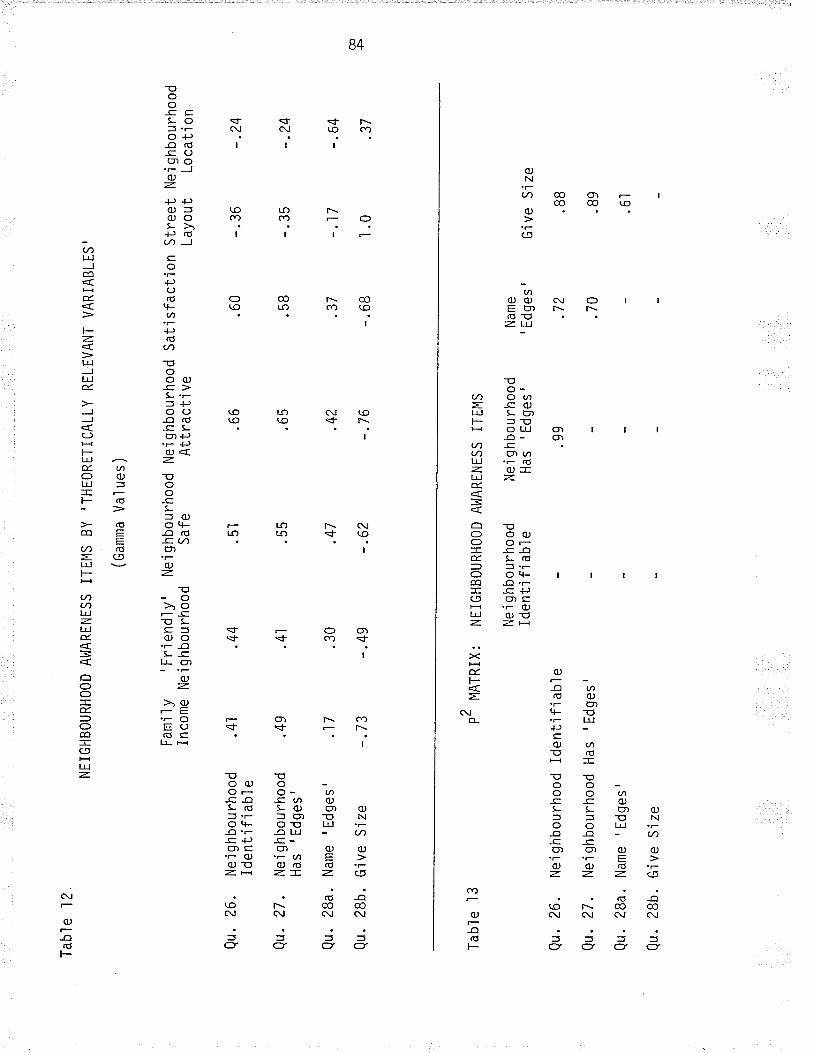
Tab
le 1
2
Qu.
26.
Nei
ghbo
urho
odId
entif
iabl
e
Qu.
27.
Nei
ghbo
urho
odH
as '
Edg
es'
Qu.
ZB
a. N
ame
'Edg
es'
Qu.
z\b
. G
jve
Siz
e
NE
IGH
BO
UR
HO
OD
A
I,JA
RE
NE
SS
IT
EM
S B
Y'T
HE
OR
ET
ICA
LLY
R
ELE
VA
NT
VA
RIA
BLE
S'
Fam
'i 'ìy
' F
rí e
ndl y
'In
com
e N
eigh
bour
hood
.41
.49
.17
-.73
Tab
le l3
P
2 M
R1R
IX'
(Gam
ma
Va'
l ue
s )
Nei
ghbo
urho
od N
eigh
bour
hood
Sat
isfa
ctio
nS
afe
Attr
acti
ve
.44
.41
.30
- .4
9
Qu.
26.
Nei
ghbo
urho
od id
entif
iabl
e
Qu.
27 .
Nei
ghb
ourh
ood
Has
' E
dges
'
Qu.
ZB
a. N
ame
'Edg
es'
Qu.
28b
. G
'ive
Sjz
e
.5.l
.55
.47
-.62
.66
.65
.42
-.76
NE
I G
HB
OU
RH
OO
D
Nei
ghb
ourh
ood
iden
ti fi
abl e
.60
.58
.37
-.68
Str
eet N
ei g
hbou
rhoo
dLa
yout
Loc
atio
n
AW
AR
EN
ES
S I
TE
MS
Ne'
ighb
ourh
ood
Has
'Edg
es'
.99
-. 3
6
-. 3
5
-.17
.l.0
-.?4
-.24
-.64 .3
7
Nam
e
' Edg
es'
.72
.70
Giv
e S
i ze
.88
.89
.61
æ Þ
B5
4. I .8 Homogenei t.y of Resi dents
Considerable disagreement was found in the literature over what
factors were the best measure of homogeneity, or even as to what values
of some measures constituted 'homogeneity' among resjdents, thus harking
back to Gans' statement that "...at th'is po'int, no one knows how to
define this degree (of homogeneity) operationa'l ly. .. " (7a:1 63) . However,
most of the measures chosen did deal in some way w'ith the three aspects
that he identified: "...class...l ife cycle stage...and the ways of
life..." (82:ìll). Class, of course, has already been defined in this
study as 'Socio-economic Status' which is derived from family income,
male occupation, and male education. Life cycle stage can be determined
from the items dealing with a person's marital status, â9€, and number
of children, and categorized as 'young childless', 'preschoolers domjn-
ant', 'school age children dominant', 'young adults dominant', and
'o1der, children gone/no children'. For the 'ways of life', the on'ly
measure included in the questionnaire was related to 'ethnic diversity',
whjch was described in Canadian Urban Trends: Ne'ighbourhood Perspective
(Volume 3) (196:7, 298-301 ). The 'Ethnic Diversity Index' is described
in this volume as:
Ethnic Diversity Index = 'l - , ti2
where P', represents the proportion of a census tract's popu'lation which
js jn the ethnic group'i'. One would calculate the proportion of the
tract's total population in each ethnic group, square each of these
proportions, sum these squares, and then subtract the total from l; an
index of 0 would jndicate a homogeneous census tract, whiie an index of
0.92 (rnaximum value) wouìd indicate that the popu'lation was heteroge-
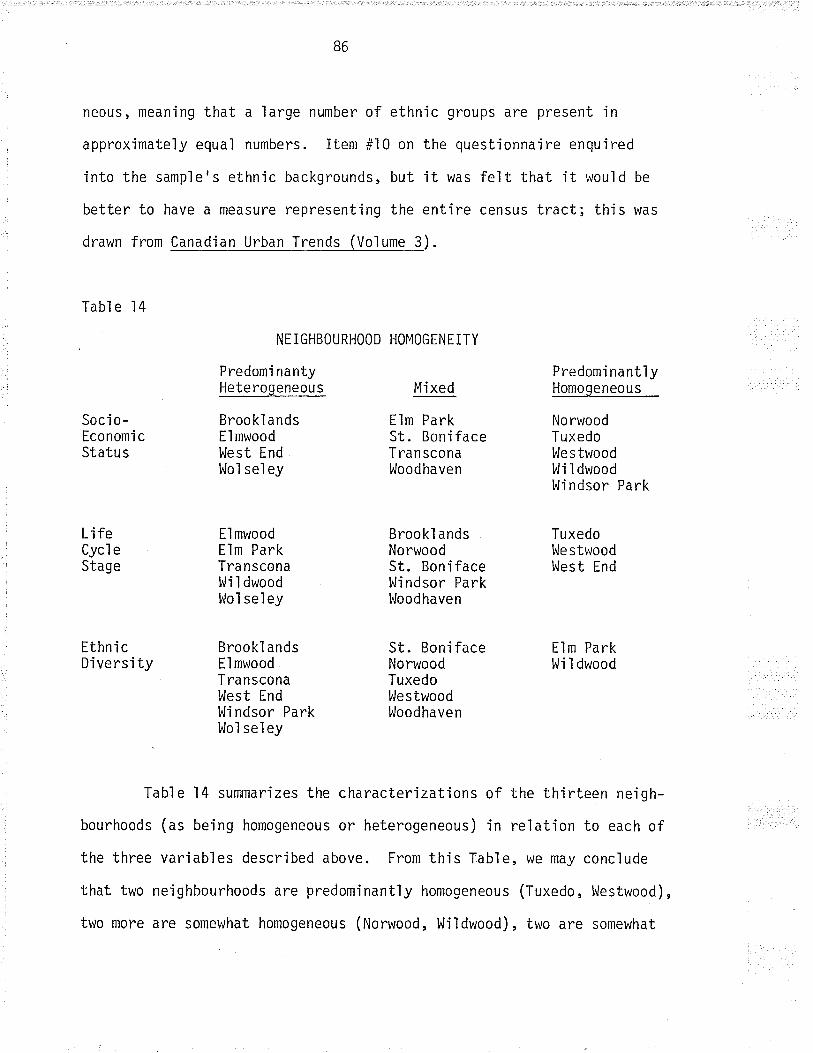
86
neous, meaning that a large number of ethnic groups are present in
approximately equal numbers. Item #10 on the questionnaire enquired
into the sample's ethn'ic backgrounds, but it was felt that it would be
better to have a measure represent'ing the entjre census tract; this was
drawn from Canadian Urban Trends (Volume 3).
Tabl e l4
Soc i o-Economi cStatus
LifeCycl eStage
Ethn i cDiversity
El mwoodElm ParkTra nsconal^Ji I dwoodWol seì ey
Brookl andsEl mwoodTransconalnlest EndI^]i ndsor ParkWo'l se'ley
Brookl andsNorwoodSt. Bonifacel¡lindsor Parkl^loodhaven
St. BonifaceNorwoodTuxedoWestwoodWoodhaven
NE IGHBOURHOOD
Predomi nantyHeterogeneous
Broo kl andsEl mwoodWest EndI^lo1 sel ey
HOMOGENE ITY
Mixed
Elm ParkSt. BonifaceTran sconaWoodhaven
Predomi nant'lyHomogeneous
NorwoodTuxedol^Jestwoodl,li I dwoodl^li ndsor Park
TuxedolJe stwoodl^lest End
Elm ParkWi I dwood
Table l4 summarizes the characterizations of the thirteen neigh-
bourhoods (as being homogeneous or heterogeneous) in relation to each of
the three variables described above. From thjs Table, we may conclude
that two neighbourhoods are predominant'ly homogeneous (Tuxedo, l,Jestwood),
two more are somewhat homogeneous (Norwood, l^Jildwood), two are somewhat

B7
heterogeneous (Brooklands and Transcona), and two are predomìnantly
heterogeneous (E'lmwood and l^lolseley). These eight neighbourhoods will
be used in testing the hypothesis and any other relationships involving
the homogeneíty of an area's residents as one of the variables.
4.1 .9 Qual ity of Chi I dren ' s Envj ronment
Question 17. Do you fee'l that your neighbourhood is a good pìace or a
poor place for children to grow up in?
(l = 'very poor'; 5 = 'very good')
Question ì8. What is your opinion ofthe quality of education provided
at your neighbourhood's schools?
(l = 'very poor'; 5 = 'very good')
Question .l9.
To what extent would you agree with the statement:"Children in my neighboúrhood have enough places to go
when they want to meet friends or play games."
(l = 'disagree strongiy'; 5 = 'agree strongly')
Question 20. To what extent would you agree wjth the statement: "Inmy neighbourhood, children of pre-school age have no
difficulty in finding children of a similar age to playwith. "
(l = 'disagree strongìy'; 5 = 'agree strongìy')
Table l5 shows high scores among all four items, indicating a
general satisfaction with the environment that children in the tested
neighbourhoods grow up in (among those peop'le having children). since
this independent variable is not used in connection with any hypothesis,
it wijl not be subjected to PZ anaìysis; it will, however, form part of
the testing when satisfaction with neighbourhood is more genera'lìy
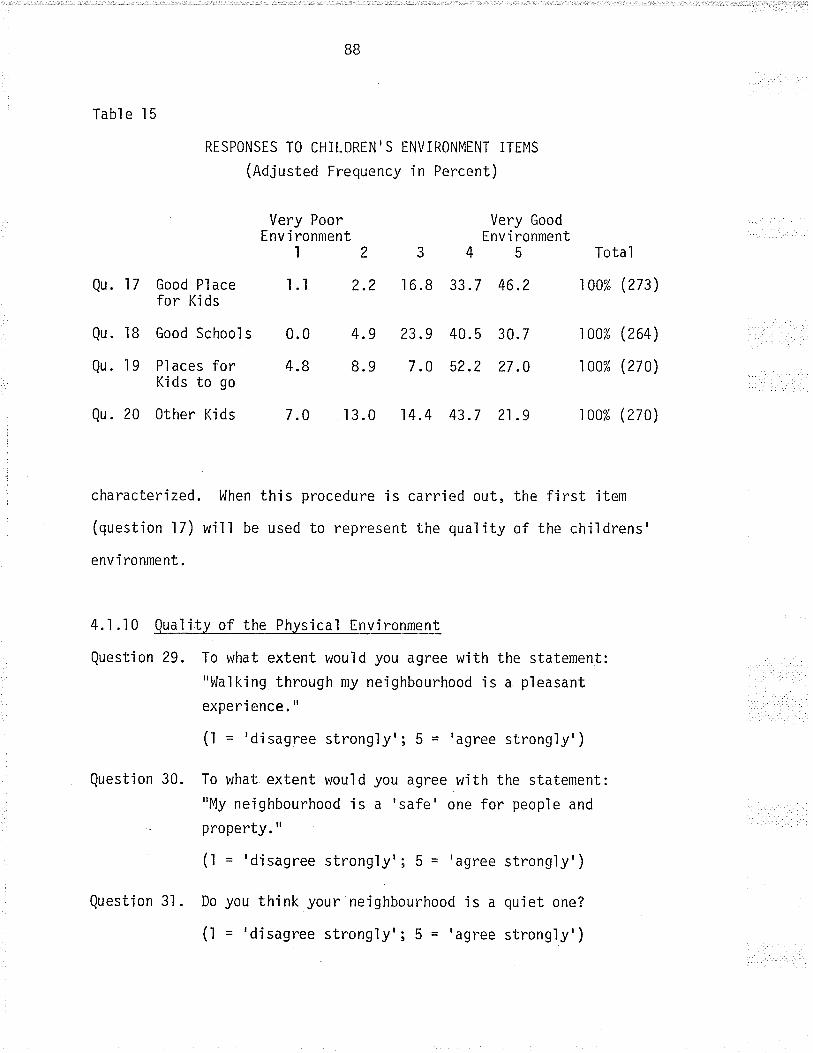
BB
Table 15
RTSPONSES TO CHILDREN'S TNVIRONMENT ITEMS
(Adjusted Frequency in Percent)
Very Poor Very GoodEnvironment Environment
12345Total
Qu. 17 Good Place l.l ?.2 16.8 33.7 46.2 100% (273)for Kids
Qu. l8 Good Schools 0.0 4.9 23.9 40.5 30.7 100% (264)
Qu. 19 Places for 4.8 8.9 7.0 52.2 27.0 100% (270)Kids to go
Qu. 20 Other Kjds 7.0 13.0 14.4 43.7 21.9 100% (270)
characterized. When this procedure is carried out, the first item
(question l7) wiìì be used to represent the quaì'ity of the childrens'
env i ronment .
4.1.'l0 Quality of the Physical Environment
Question 29. To what extent would you agree with the statement:
"ldalking through my neighbourhood is a pìeasant
experience. "
(l = 'disagree strongìy'; 5 = 'agree strongìy')
Question 30. To what extent would you agree with the statement:
"My neighbourhood is a 'safe' one for peop'le and
. property. "
(l = 'disagree strongìy'; 5 - 'agree strongìy')
Question 3'1. Do you think your neighbourhood js a quiet one?
(l = 'disagree strongìy'; 5 = 'agree strong'ly')
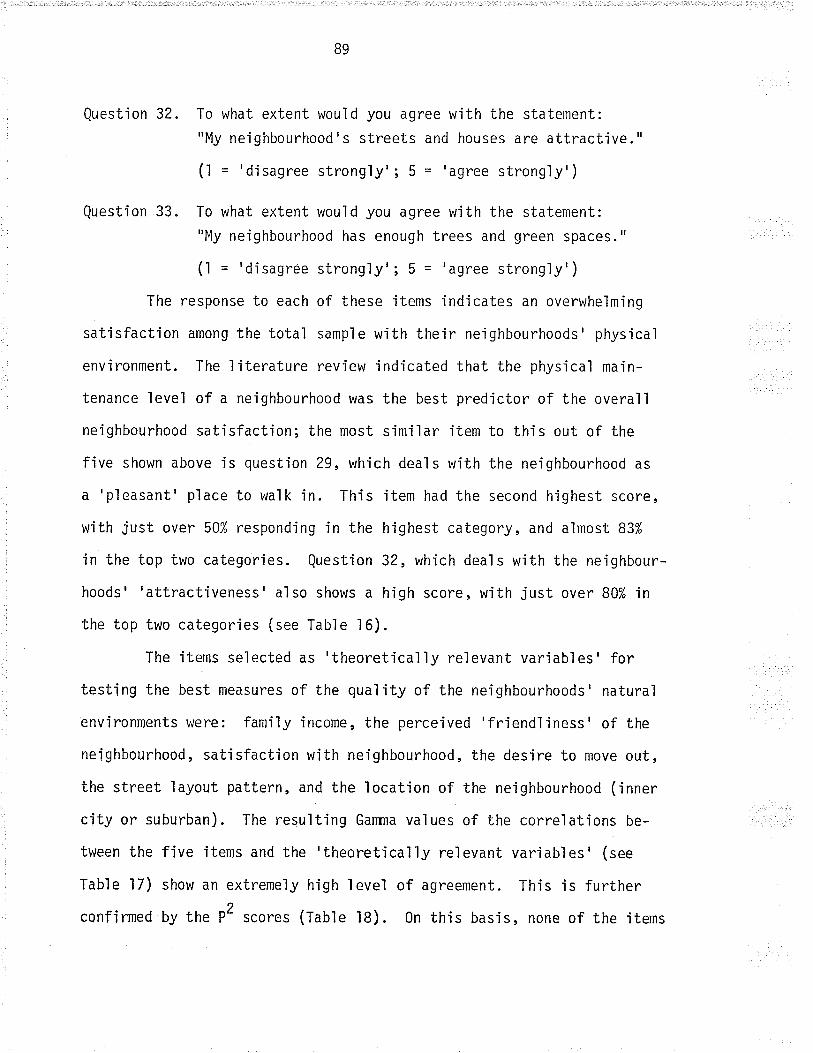
89
Questìon 32. To what extent would you agree wìth the statement:
"My neighbourhood's streets and houses are attractive."
(l = 'disagree strongly'; 5 = 'agree strongìy')
Questíon 33. To what extent would you agree wjth the statement:
"My neighbourhood has enough trees and green spaces."
(l = 'disagree strongìy'; 5 = 'agree strongly')
The response to each of these items indicates an overwheìming
satjsfaction among the total sampìe with their neighbourhoods' physicaì
environment. The literature review indicated that the phys'ical main-
tenance level of a neighbourhood was the best pred'ictor of the overall
neighbourhood satisfaction; the most similar item to this out of the
five shown above is question 29, which deals wjth the neighbourhood as
a'pleasant'p'lace to walk in. This item had the second highest score,
with iust over 50% respond'ing in the highest category, and almost 83%
in the top two categories. Question 32, which deals with the neighbour-
hoods' 'attractiveness'also shows a high score, with just over B0% in
the top two categories (see Table ì6).
The items selected as 'theoretica'lìy relevant variables' for
testing the best measures of the quaìity of the neighbourhoods' natural
environnents were: fami'ly income, the perceived 'friendliness' of the
neighbourhood, satisfaction with neighbourhood, the desire to move out,
the street layout pattern, and the location of the neighbourhood (ìnner
city or suburban). The resulting Ganma values of the correlations be-
tween the five items and the 'theoreticaì1y relevant varìables' (see
Table l7) show an extremely high leveì of agreement. This is further
confirmed by the P2 scor.s (fable 18). 0n this basis, none of the items
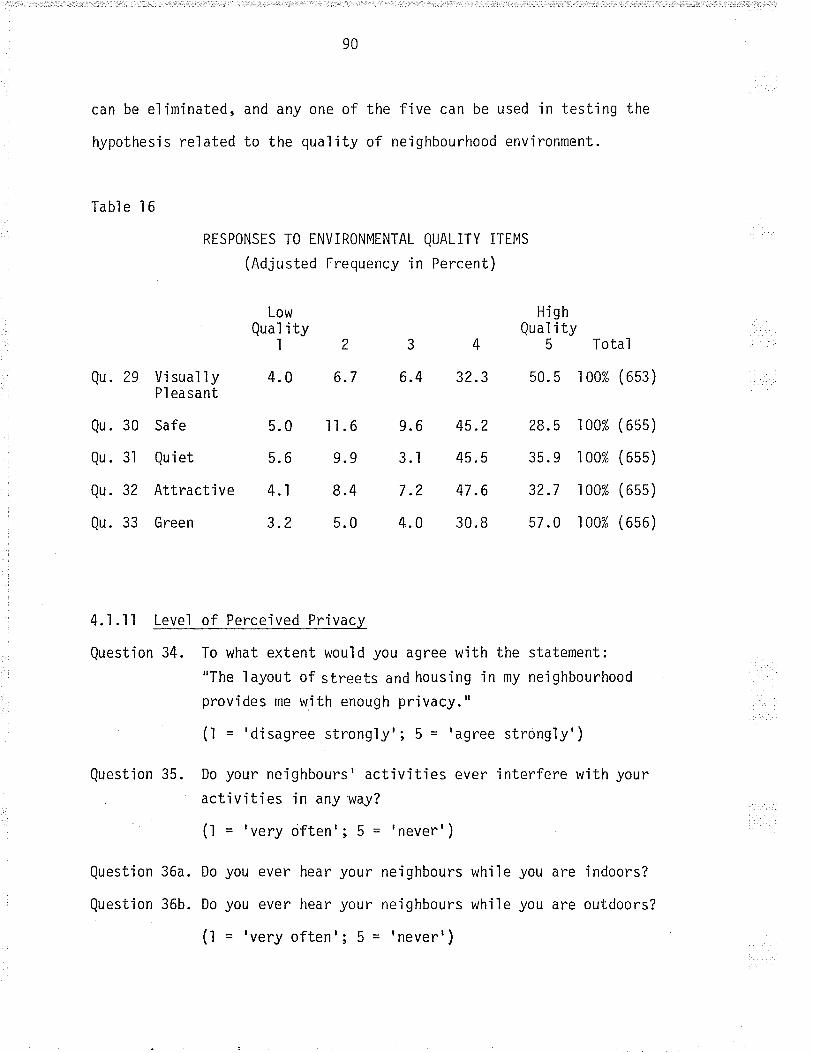
90
can be eliminated, and any one of the five can be used in test'ing the
hypothesis related to the qualìty of neighbourhood environment.
Table I 6
RESPONSES TO ENV]RONMENTAL QUALiTY iTEMS
(Adjusted Frequency in Percent)
Low HighQuaì ity Qual ity
12345Total
Qu. 29 Visua]ly 4.0 6.7 6.4 32.3 50.5 .l00% (653)Pl ea sant
Qu. 30 Safe 5.0 ll.6 9.6 45.2 28.5 100% (655)
Qu.3l Quiet 5.6 9.9 3.1 45.5 35.9 100% (655)
Qu. 32 Attractive 4.1 8.4 7.2 47.6 32.7 100% (655)
Qu.33 Green 3.2 5.0 4.0 30.8 57.0 100% (656)
4.l.ll Level of Perceived Privacy
Question 34. To what extent would you agree with the statement:
"The layout of streets and housing in my neighbourhood
provides me with enough privacy."
(l = ' di sagree strong'ly' ; 5 - 'agree strongl y' )
Quest'ion 35. Do your neighbours' activitìes ever interfere with your
activities in any way?
(l = 'very often'; 5 = 'never')
Question 36a. Do you ever hear your neighbours wh'ile you are jndoors?
Question 36b. Do you ever hea¡^ youi^ neighboui^s whjle you are outdoors?
(l = 'veFJ oftent; 5 = 'nevert)
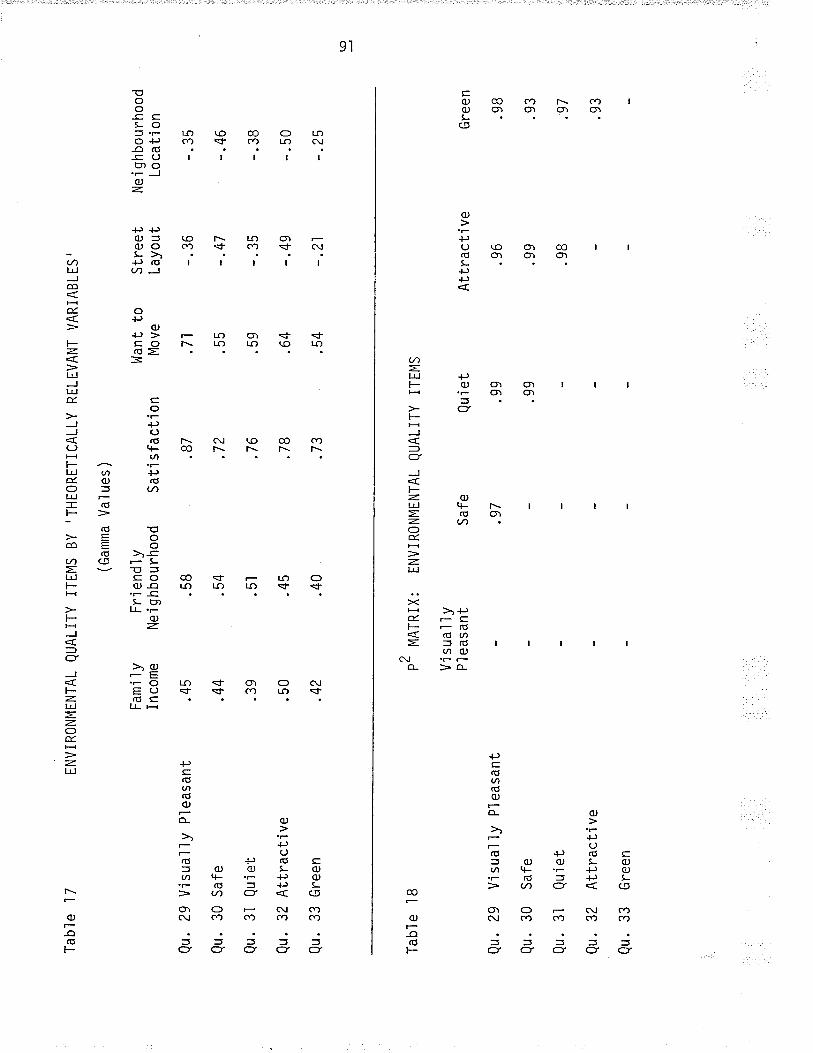
Tab
le 1
7
Qu.
29
Uis
ually
Pìe
asan
t
Qu.
30
Saf
e
Qu.
3l Q
uiet
Qu.
32
Attr
activ
e
Qu.
33
Gre
en
EN
VIR
ON
MT
NT
AL
QU
ALI
TY
IT
EM
S B
Y'T
HE
OR
ET
ICA
LLY
(Gam
ma
Vaì
ues
)
Fam
í 1y
I n
com
e
.45
.44
.39
.50
.42
Tab
le l8
Frì
end
1y
Ne
i ghb
ourh
ood
.58
.54
.51
.45
.40
Qu.
Qu.
Qu.
Qu.
Qu.
29 V
i sua
l 1y
P1
easa
nt
30 S
afe
3l
Qu'
i et
32 A
ttrac
tive
33 G
reen
Sat
i sfa
cti o
n
.87
.72
.76
.78
.73
RE
LEV
AN
T V
AR
IAB
LES
'
p2 N
AtR
tx:
Ví su
a'l1
yP
l eas
ant
Wan
t to
Mov
e
.71
.55
.59
.64
.54
EN
VIR
ON
ME
NT
AL
QU
ALI
TY
IT
EM
S
Str
eet
Layo
ut
-. 3
6
- .4
7
-. 3
5
-.49
-.21
Saf
e
.97
Neì
ghb
ourh
ood
Loca
ti on
-.35
-.46
-.38
_.50
-.25
Qui
et
.99
.99
Attr
acti
ve
.96
.99
.98
(O J
Gre
en
.98
.93
.97
.93

92
The first two items in the Table showing the responses of the sample
(faUle l9) have very similar trends, whjle the third is somewhat
simílar but has fewer responses in the highest category. The fourth
item shows a trend toward a lower degree of perceived privacy, which is
to be expected, as the questìon specifical'ly refers to the outdoors,
where one is much more likely to hear one's neighbours' activjties and
feel a correspondingìy ìower level of prìvacy. 0n the whole, however,
people seem to feel that their neighbourhoods prov'ide them with enough
privacy for their requirements.
Table l9
RESPONSES TO PRIVACY RELATED TTEMS
(Adjusted Frequency in Percent)
Qu.
Qu.
Qu.
Qu.
34
35
36a
36b
Pri vacy
Ne i ghbourAnnoy
Hear In
Hear Out
: LowPri vacy
t24.9 8. 9
2.4 2.0
3.8 4. l
7.6 16.l
344.7 40.6
.l4.0 40.1
22.1 40.9
45.9 26.0
HighPri vacy
5
40.9
4l .5
29.0
4.3
Total
r oo% ( 655)
loo% (656)
r 0o% (65r )
r oo% (644)
The 'theoreticaììy relevant variables' in this case are:
fam'ily income, the age of the male household head, the perception of
the 'friendliness' of the neighbourhood, the perceived 'quietness' of
the neighbourhood, satisfaction with neighbourhood, the street ìayout
pattern, and the location of the neighbourhood (inner city or suburban).
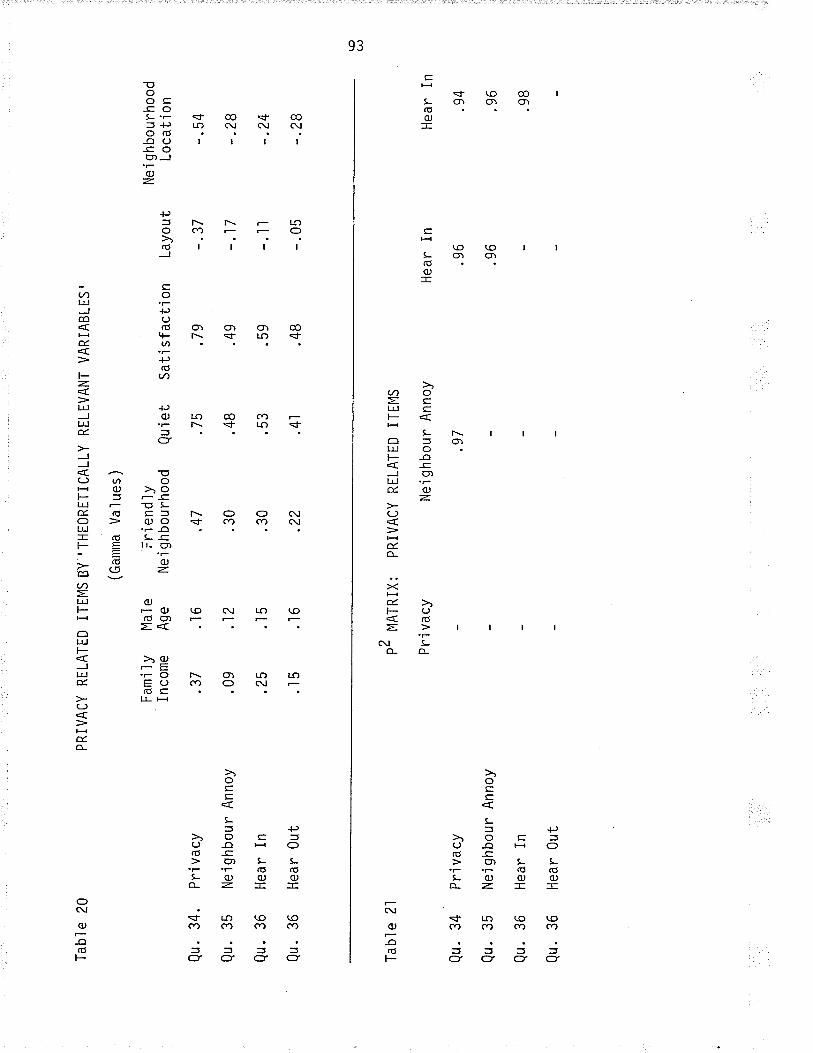
Tab
l e
20
Qu.
34.
Qu.
35
Qu.
36
Qu.
36
Pri
vacy
Nei
ghbo
ur A
nnoy
Hea
r In
Hea
r O
ut
PR
IVA
CY
RE
LAT
ED
IT
EM
S B
Y 'T
HE
OR
TT
ICA
LLY
Tab
le 2
l
Fam
i 1y
I nc
ome
.37
.09
.25
..l5
Qu.
34
Qu.
35
Qu.
36
Qu.
36
Mal
eA
ge ..l6
.12
.15
.16
(Gam
ma
Val
ues)
Fri
end'
lyN
ei g
hbou
rhoo
d
.47
.30
.30
.22
Pri
vacy
Neí
ghbo
ur A
nnoy
Hea
r In
Hea
r 0u
t
RT
LEV
AN
T V
AR
IAB
LES
'
Qui
et
.75
.48
.53
.41
p2 tu
lAT
RlX
:
Pri
vacy
Sat
i sfa
cti o
n
.79
.49
.59
.48
PR
IVA
CY
RE
LAT
ED
iTE
MS
Ne'
ighb
our
Ann
oy
.97
Layo
ut
-.37
-.17 -.ll
-.05
Nei
ghb
ourh
ood
Loca
t i o
n
-. 5
4
-.28
-.24
-.28
Hea
r In
.96
.96
Hea
r In
.94
.96
.98
ro (,
94
The Gamma values between the four items.and the selected variables
(faUle 20) show that the question directly invo'lving 'privacy' (#34)
shows the strongest trend of association, which the other three items
follow. These three items show a strong correlation with each other,
but do not show the same variation in relation to each of the'theoret-
icaììy relevant varjables' that the first question does. The P2 s.or"s
(Tabl e 21) i nd j cate that the quest'ion rel ated to 'pri vacy' i s hi gh'ly
correlated to the other three questions, wh'ile the one dealing with
hearing your neighbours while outdoors b/as slightly less correlated.
To simplify matters, however, the figures seem to justify the elimination
of the three 'secondary' questions (#¡S, 36a, and 36b). Therefore,
only the item dealing with the perceived privacy afforded by the neigh-
bourhood ìayout will be used to represent the 'Level of Perceived
Privacy' in future correlations.
4.I.12 Mobility of Residents (Transportation)
This variable is also one of those not directly connected with
any of the hypotheses. However, it was felt that a person's ability to
move around the city easi'ly, and the resulting exposure to a variety of
environments might have an effect on their perceived satisfaction with
their own neighbourhood, and therefore, this variable will be used in
correlations testing this relationship.
Please indicate... whether you find your neighbourhood
well located or poor'ly located in respect to thefollowing places:
Question ?2.
95
- your pl ace of work
- food stores- department stores
- entertai nment
- recreation- parks
- friends and relations
(l = rvery poor'; 5 = 'very good')
Question 23. Please indicate your most common means of getting to the
fol lowing destinations :
- your place of work
- food stores- department stores
- entertainment
- recreation- parks
- friends and relatives
(l = 'on foot'', 2 = 'by car'; 3 = 'by bus';4 = No Response)
Question 24. How many cars does your househojd currently operate?(open ended; 9 = No Response)
It seems obvious from the responses (fa¡le 22) that most people jn the
samp'le are rather mobile - almost 92% own at least one car, and most
find it easy to get to most types of dest'inations. In terms of the
means of transportation, the one used seems to represent the 'diffi-culty'of the trip and the nearness of the destination rather than any
particular limitation in terms of mobiìity.
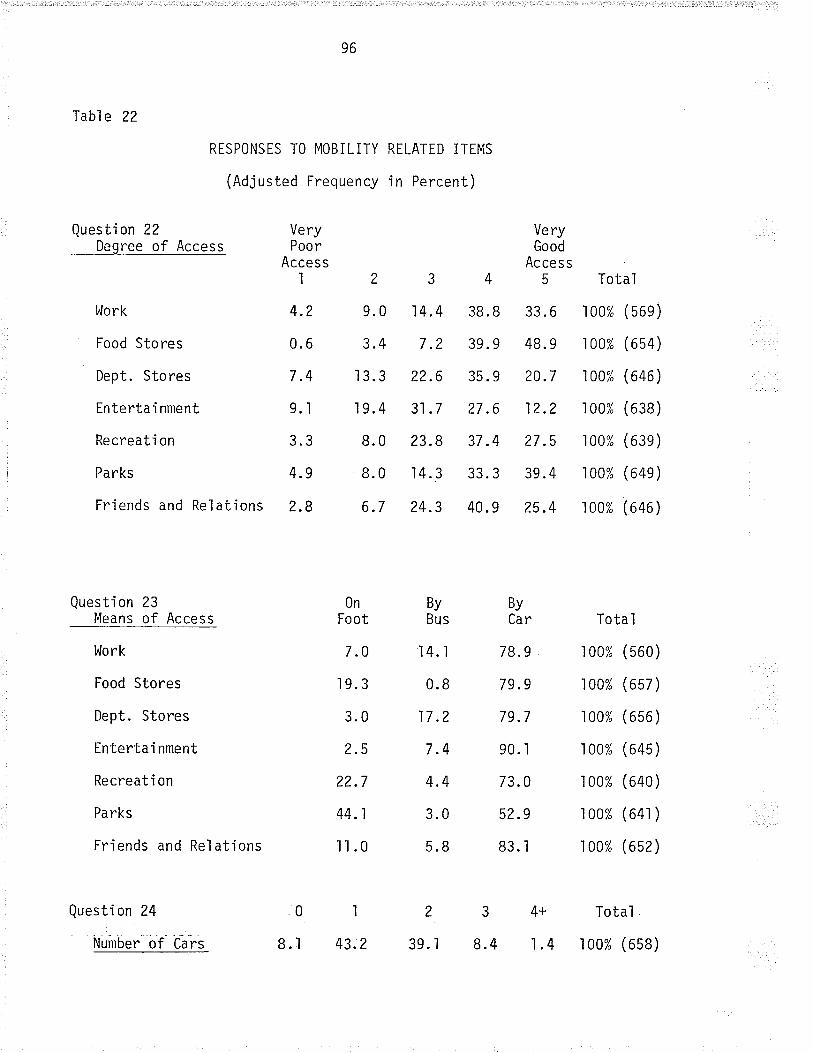
96
Table 22
RESPONSES TO MOBILITY
(Adjusted Frequency
RELATED ITEMS
'in Percent)
Questi on 22Degree of Access
VeryPoor
Accessl
4.2
0.6
7.4
9.l
3.3
4.9
2.8
2
9.0
3.4
13.3
19.4
8.0
8.0
6.7
3
14.4
7.2
22.6
3l .7
23.8
I4.3
24.3
4
38.8
39. 9
35. 9
27 .6
37 .4
JJ. J
40.9
VeryGood
Access5
33.6
48. 9
20.7
12.2
27.5
39.4
25.4
l,^Jork
Food Stores
Dept. Stores
Entertai nment
Recreati on
Parks
Friends and Rel at'ions
Total
roo% (56e)
100% (6s4)
1oo% (646)
roo% (638)
roo% (63e)
roo% (64e)
100% (646)
Total
r 0o% (560)
1oo% (657)
roo% (656)
r oo% (645)
roo% (640)
r oo% (64r )
r oo% (652)
Question 23Means of Access
Questi on 24
Number of Cars
0nFoot
7.0
19.3
3.0
2.5
22.7
44.1
ll.0
l
43.2
r4.I
0.8
17.2
7.4
4.4
3.0
5.8
ByCar
7 8.9
79.9
79.7
90. l
73.0
52.9
83. I
ByBus
Work
Food Stores
Dept. Stores
Entertai nment
Recreati on
Parks
Friends and Relations
0
8..|
2
39. I
3
8.4
4+
1.4
Total
r oo% (6s8)
97
4.2 Responses by Neighbourhoods
Before proceeding wìth the testing of the hypotheses, 'it might
be useful to present a more detailed look at the sample by showing the
variations in responses among the thirteen neighbourhoods. In order to
keep thìs section as brief as possible, only the responses for the most
important item assocjated with each of the major variables will be given.
Also, several of the major varjables have a]ready been broken down jnto
responses by neighbourhood; they are neighbourhood 'layout (street
pattern), access to urban infrastructure, ìocation of neighbourhood
(inner city or suburban), and homogeneity of residents. The data for
these four independent varjables will not be presented again in this
sect i on
4.2.1 Satisfaction with Nejghbourhood (Dependent Variable)
The single 'item used here to represent the dependent variable
'is question #37: "0n the whole, how satisfied are you with your neigh-
bourhood?". The responses to this item, broken down by neighbourhood,
are shown in Table 23.
For this Tabìe, the chi-square value is 0.00 (very significant)
and the Gamma value is 0.61 (a strong relationship). The Table shows
that there is a clear variation in the perce'ived sat'isfaction wjth
neighbourhood among the thirteen areas examined in this study. The
most significant difference occurs between the group formed by the
fírst six neighbourhoods and the group formed by the next seven. The
first six neighbourhoods are those which were initial'ly characterized
by census data information as 'lower' socio-economic status areas,
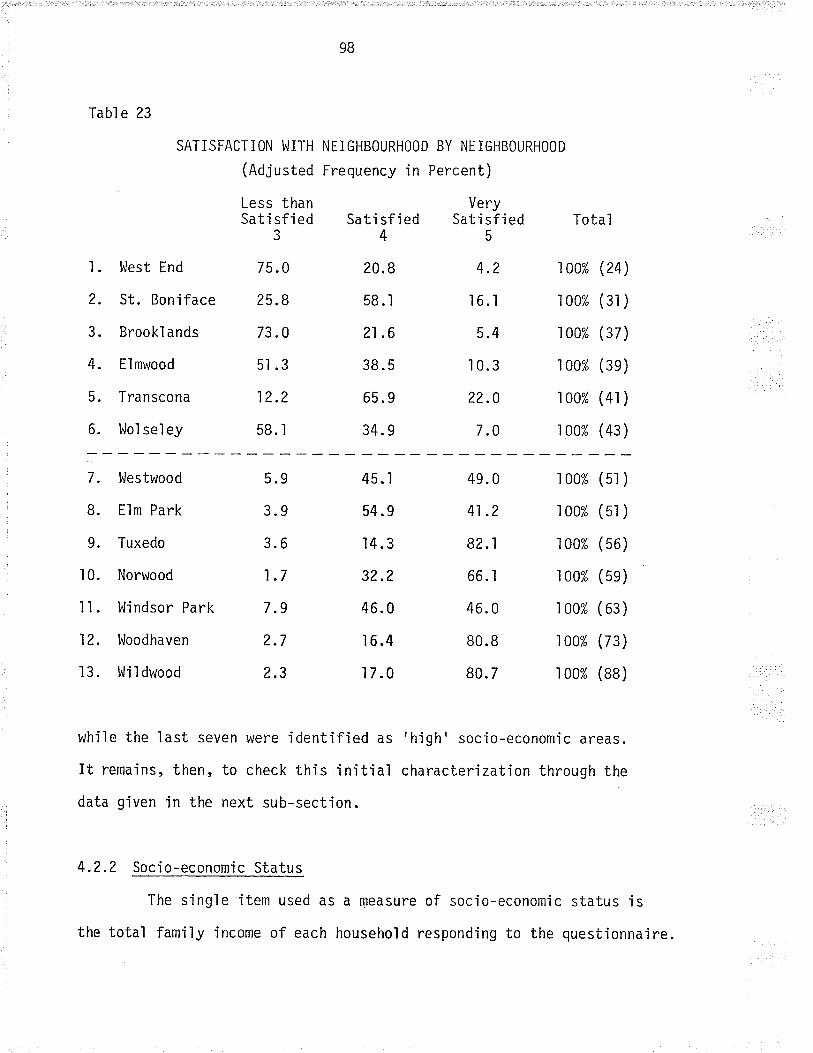
9B
Tabl e 23
1. West End
2. St. Boniface
3. Brookl ands
4. Elmwood
5. Transcona
6. I^lolseley
SATISFACTION WITH NTIGHBOURHOOD BY NEIGHBOURHOOD
(Adjusted Frequency in Percent)
Less than VerySatisfied Satisfied Satisfied Total
34575.0
25.8
73.0
5l .3
12.2
58. I
20. B
58.l
21 .6
s8.5
65.9
34. 9
4.2
I 6.1
5.4
10.3
22.0
7.0
too% (24)
r oo% (3r )
loo% (37)
r oo% (3e)
r oo% (4r )
loo% (43)
7 . l^Jestwood
8. Elm Park
9. Tuxedo
I 0. Norwood
I l. Windsor Park
12. l,loodhaven
13. l,'lildwood
5.9
3.9
3.6
1.7
7.9
2.7
2.3
45.1
54 .9
ì 4.3
32.2
46.0
t6.4
I 7.0
49.0
41 .2
82.1
66. l
46. 0
80.8
80. 7
loo% (5r )
r oo% (51 )
1oo% (56)
r oo% (5e)
r oo% ( 63)
1oo% (73)
loo% (88)
while the last seven were identified as
It remains, then, to check this inìtiaidata given in the next sub-section.
4.2.2 Socio-economic Status
The sing'le item used as
the total family income of each
'high' socio-economic areas.
characterization through the
a measure of socio-economic status is
household responding to the questionnaire.
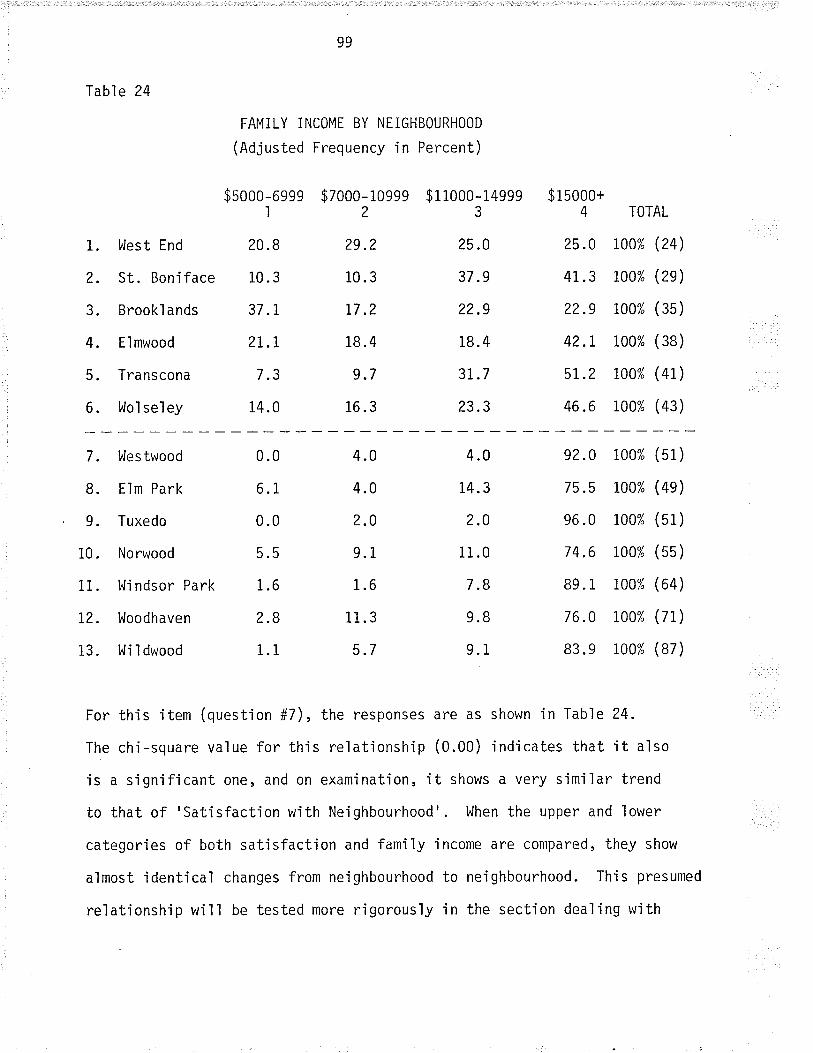
99
Table 24
1. West End
2. St. Boniface
3. Brooklands
4. Elmwood
5. Transcona
6 . f'rlo'l sel ey
FAMILY INCOME BY NEIGHBOURHOOD
(Adjusted Frequency in Percent)
$5000-6999I
20.8
i0.3
37.1
2t.1
7.3
14.0
$7000- 109992
29.2
10 .3
L7.2
18.4
9.7
16 .3
$ I 1000- 149993
25.0
37.9
22.9
18.4
31 .7
23.3
$ 15000+4
25.0
41 .3
22.9
42.t
5r.2
46.6
TOTAL
n0% (24)
loo% (2s)
1oo% (35)
1oo% (38)
loo% (4r)
Loo% (43)
7. Westwood
8. Elm Park
9. Tuxedo
10. Norwood
11. Wi ndsor Park
L2. l,Joodhaven
13. Wi I dwood
0.0
6.1
0.0
5.5
1.6
2.8
1.1
4.0
4.0
2.0
f.i1.6
11.3
5.7
4.0
14.3
2.0
11.0
7.8
9.8
9.1
e2.0 100% (51)
75.5 :lr,o% (4e)
e6.0 1oo% (51)
7 4 .6 ioo% (5s )
8e.1 1oo% (64)
76.0 roo% (7r)
83.e 1oo% (87)
For this item (questìon #7), the responses are as shown in Table 24.
The ch'i-square value for this relationship (O.OO) indicates that it also
is a significant one, and on examìnation, it shows a very sjmilar trend
to that of 'satisfaction with Neìghbourhood'. When the upper and lower
categories of both satisfaction and famiìy'income are compared, they show
almost ìdentical changes from neighbourhood to neighbourhood. This presumed
relationshjp w'iil be tested more rigorously in the section deal'ing with
100
the testing of the hypotheses.
4.2.3 Level of 'NeÍghbouring' ActiVitìes
As the items used jn measuring this 'independent varjable showed
two differing sets of responses to their'theoretica'liy relevant vari-
ables' (refer to Figure 2; sect'ion 3.8), it was felt that it might be
more meaningful if exanples of both types of items were represented here.
To represent the first type of relatjonshìp to the variables ('highìy'
correlated with satisfaction - see Table g), the jtem used was quest'ion
l5 ("l,lould you say that your neíghbourhood is a 'friendly' or an
'unfriend'ly'one?'1. The responses to thìs question (fa¡le 25) show the
pattern that has a'lso appeared in the prevìous comparisons; as one goes
up the list of neighbourhoods, the scores show a tendency to 'rise',with a noticeable'break point'occurring between the sixth and seventh
neighbourhoods.
The second type of relationship found between some of the items
'in the questionnaire and the 'theoreticaììy relevant variables' used in
the P2 test showed a much lower correlation with satisfaction related
items than the first set did, and the item chosen to represent this
aspect of the measurement of 'nei'ghbourìng' actjvities was question #12:
"How often would you say that you get together informally with nejghbours?",
for which the pattern of responses among the thjrteen neighbourhoods is
shown in Tabl e 26. For this item, we agal'n find a sjmilar trend towards
'rising'scores ìn the lowest category (ì), and a weaker one in category 3.
For the other categories, no comparable trend is jmmediately apparent.
Eyen among those neÍghbourhoods that scored very highly on the Table
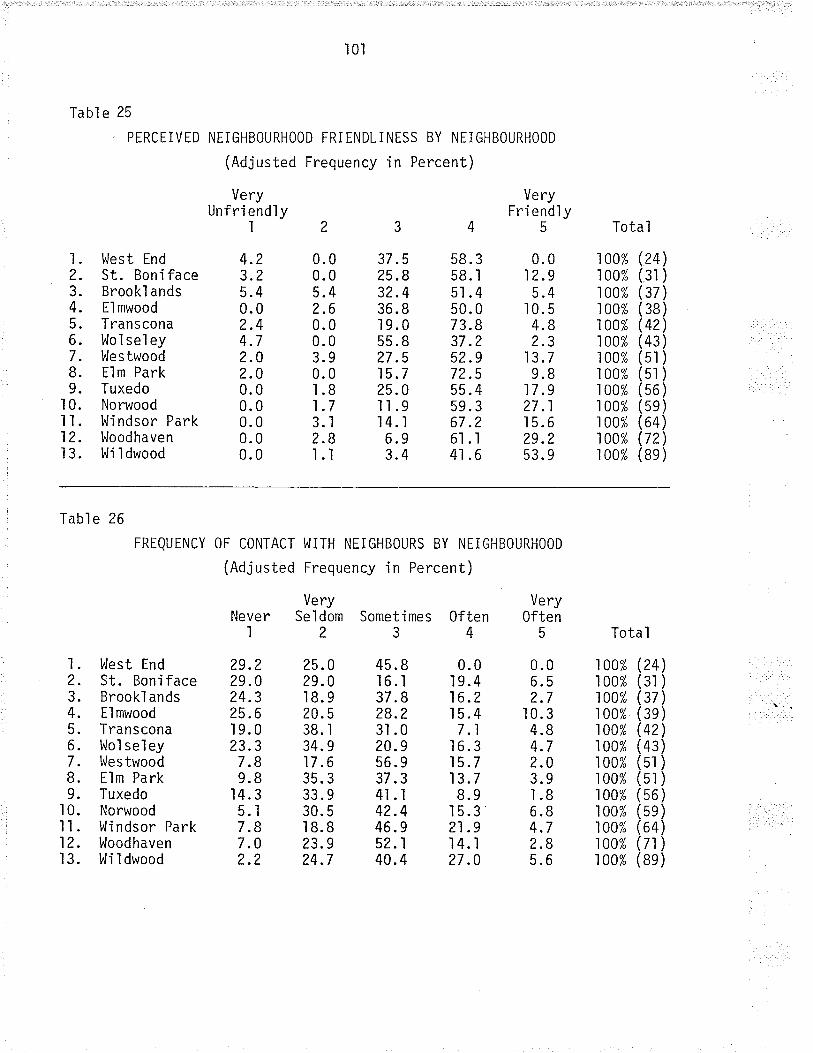
Tabl e 25
l. West End2. St. Boniface3. Brookl ands4. Elmwood5. Transcona6. Wo1 sei ey7 . l^lestwood8. Elm Park9. Tuxedo
I 0. NorwoodI l. Windsor Park12. WoodhavenI 3. W'i I dwood
l0l
PTRCEIVED NEIGHBOURHOOD FRIENDLINESS BY NTIGHBOURHOOD
(Adjusted Frequency in Percent)
VeryUnfri endìy
I
4.23.25.40.02.44.72.02.00.00.00.00.00.0
2
0.00.05.42.60.00.03.90.01.81.73.12.8l.l
3
37 .525.832.436.8I 9.055.827.515.725.0ll.9l4.l6.93.4
4
58. 358. I5l .450. 073.837.252.972.5s5.459.367.26l .l4l .6
VeryFri endl y
5
0.012.95.4
10.54.82.3
13.79.8
17 .927.115.629.253. 9
Total
100%100%100%100%100%100%100%100%100%100%100%100%100%
(24)(31 )(37 )(38)(42)(43 )(51)(51 )(56 )(5e)(64 )(72)(8e )
Table 26
l. West End2. St. Boniface3. Brookl ands4. Elmwood5. Transcona6. l,lolseìey7. Westwood8. Elm Park9. Tuxedo
I 0. Norwoodll. Windsor Park12. Woodhaven13. Wildwood
VeryNever Seldom Sometimes Often
1234
FREQUENCY OF CONTACT l^lITH NEIGHBOURS BY NEIGHBOURHOOD
(Adjusted Frequency in Percent)
29.2?9.024.325.6.l9.
023.37.89.8
14. 35.i7.87.02.2
25.029.0I8.920.538. l34. 917 .635. 333. 930. 518.823.924.7
45.816. I37. I28.23l .024.956. 937.34ì .142.446. 9s2. l40. 4
0.0I9.416.2t5.47.1
I6.3I5.713.78.9
ls.321.9l4.l27 .0
100%100%100%100%100%100%100%100%100%100%100%100%100%
Very0ften
5
0.06.52.7
10.34.84.72.03.91.86.84.72.85.6
Tota I
24)3l)37)3e)42)435l5l56596471
8e)
r02
showi ng ' Percej ved Nei ghbourhood Fri endl i ness ' , s uch as l,li I dwood ,
Woodhaven, and Norwood, the scores shown in Table 26 referring to the
'Frequency of Contact wjth Neighbours' show on'ly slightly more positive
responses than the other areas, which had been rated as much less
'friendly' by the'ir residents. From this, one can only conclude that
actual contact with one's nejghbours is not a prerequisite to the
feeling that one's neighbourhood is a friendìy one, and also that as long
as one perceives his or her neighbourhood to be friend'ly, they are likeìy
to be satisfied with their neighbourhood, regardìess of whether they
actually have sociaì contact with the peopìe in that area.
4.2.4 Level of Neighbourhood Awareness
Two Ítems will be presented for this variable as well, as two
comp'lete'ly different types of relationships were found between its associ-
ated items and their 'theoretical'ly relevant variables'. The first set
of items was found to be 'positively' correlated with 'Neighbourhood
Awareness', and the item selected to represent this as.pect of the relation-
ship is question #26: "To what extent would you agree with the statement:
"My neighbourhood is an'identifiable'area - that is, one distinct in
ìayout and appearance from nearby areas."" Again in Table 27 we see the
same general trend that was shovrn by the first several Tabjes gìving data
broken down by neighbourhood, but some individual differences do occur.
St. Bonìface, for example, had no responses in the lowest category (1),
a pattern which does not occur again until the uppermost four nerÏghbour-
hoods. Transcona and Elmwood residents felt that their neìghbourhoods were
very hard to identìfy (even in relation to the others of the first group of
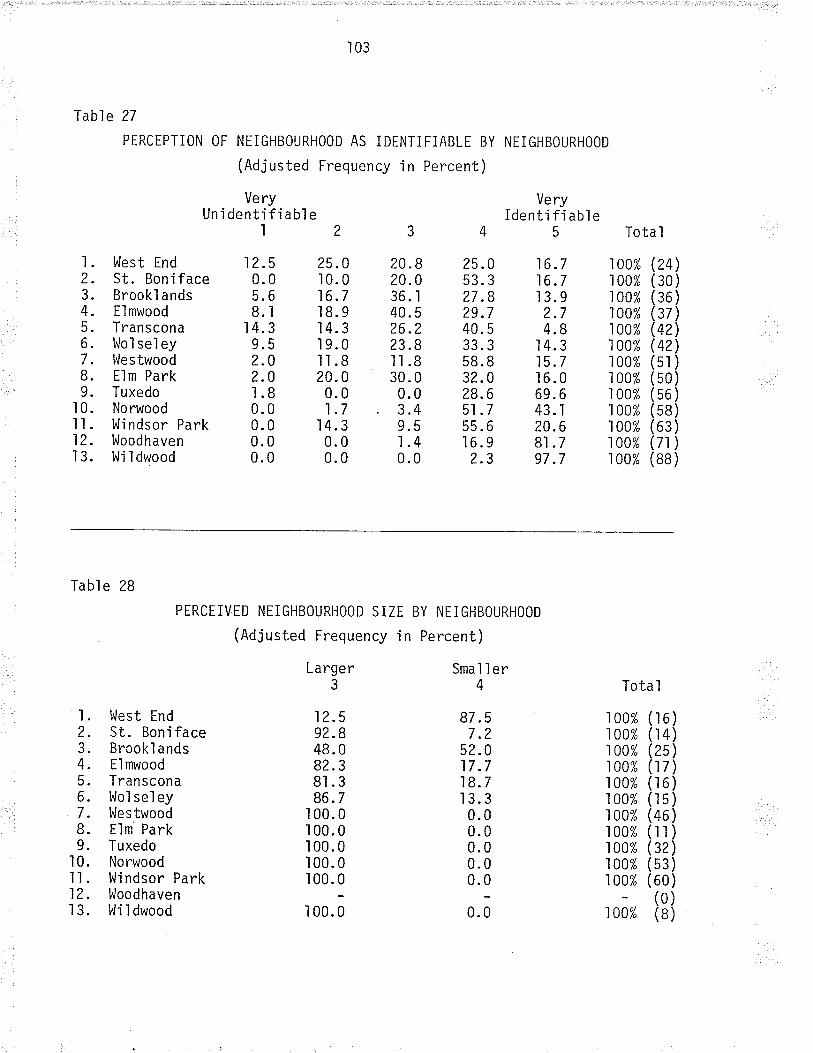
103
Table 27
PERCEPTION OF NTIGHBOURHOOD AS IDENTIFIABLE BY
(Adjusted Frequency ín Percent)
VeryUn i denti fi a bl e
1234
NT I GHBOURHOOD
VeryIdenti fi abl e
5 Total
l. West tnd2. St. Boniface3. Brookl ands4. Elmwood5. Transcona6. Wol sel ey7. Westwood8. Elm Park9. Tuxedo
I 0. Norwoodll. Windsor Park12. WoodhavenI 3. Wi I dwood
12.50.05.68.1
14.39.52.02.01.80.00.00.00.0
25.010. 016.7r 8.914.3t9.0ll.820.00.01.7
14.30.00.0
20.820.036. I40.526.223.8ll.830.00.03.49.51.40.0
25.053.327.829.740. 533. 358.832.028.651 .755.6.l6.9
2.3
16.716.713.92.74.8
14.315.716. 069.643. I20.68l .797 .7
100%100%100%100%100%100%100%100%100%100%100%100%100%
24)30)36)37)42)42)51)50)s6)58)63)71)88)
Table 28
l. West End2. St. Boniface3. Brooklands4. Elmwood5. Transcona6. l^Jo1 se'ley7. Westwood8. Elm Park9. Tuxedo
I 0. Norwoodll. Windsor Park12. l^loodhavenI 3. l¡li I dwood
PERCEIVED NEIGHBOURHOOD SIZE
(Adjusted Frequency'in
Larger3
12.592.848. 082. 38l .386.7
100.0100.0100. 0I 00.0100.0
I 00.0
BY NEIGHBOURHOOD
Pe rcen t )
Smal I er4
87.57.2
52.017 .7I8.713.30.00.00.00.00.0
0.0
Tota I
00%00%00%00%00%00%00%00%00%00%00%
(16)(14)(25)(17)(16)(15)(46 )(l I )(32 )(53 )(oo ¡(0)(8)toou
t04
six nejghbourhoods), although both areas did well 'in another question
which required them to actual'ly name their neighbourhood's boundaries.
A'lso, among the responses in the highest category (5), we see that the
'break point'does not occur after the sjxth ne'ighbourhood as jt did in
previous Tab'les, but after the.eighth (Elm Park).
One of the items was found to be Inegatively' related to
'Ne'ighbourhood Awareness', ôs the direction of its relationship to the
'theoreticalìy relevant variables' was always the inverse of the firstset's (see Table l2). The item representjng this aspect was generated
from a questíon which asked the respondents to name the physicaì features
which represented the 'ljmits' or boundaries of their neíghbourhoods.
The responses to this open-ended item were then categorized as: 'named
one major boundary' (l); 'named two or more major boundaries' (2)';'gave
an area more than one and one-half times the neighbourhood's size' (3);
and'gave an area less than one-half the neighbourhood's size' (4).
Response categories ì and 2 were treated as one item, and 3 and 4 as
another; we are interested in the latter in this case, and the,,responses
fon thìs are given in Table 28.
Again ín this Table the'break point'comes after the sixth neigh-
bourhood, but the actual results were somewhat unexpected. All of the
last seyen areas identified the size of their neighbourhoods as larger
than the areas defíned by th'is study (with the exception of lrloodhaven,
where all 72 respondents named at least one major boundary correct'ly),
while in the first six, a significant percentage of respondents found
their neighbourhoods to be smaller than the areas defined by the study.
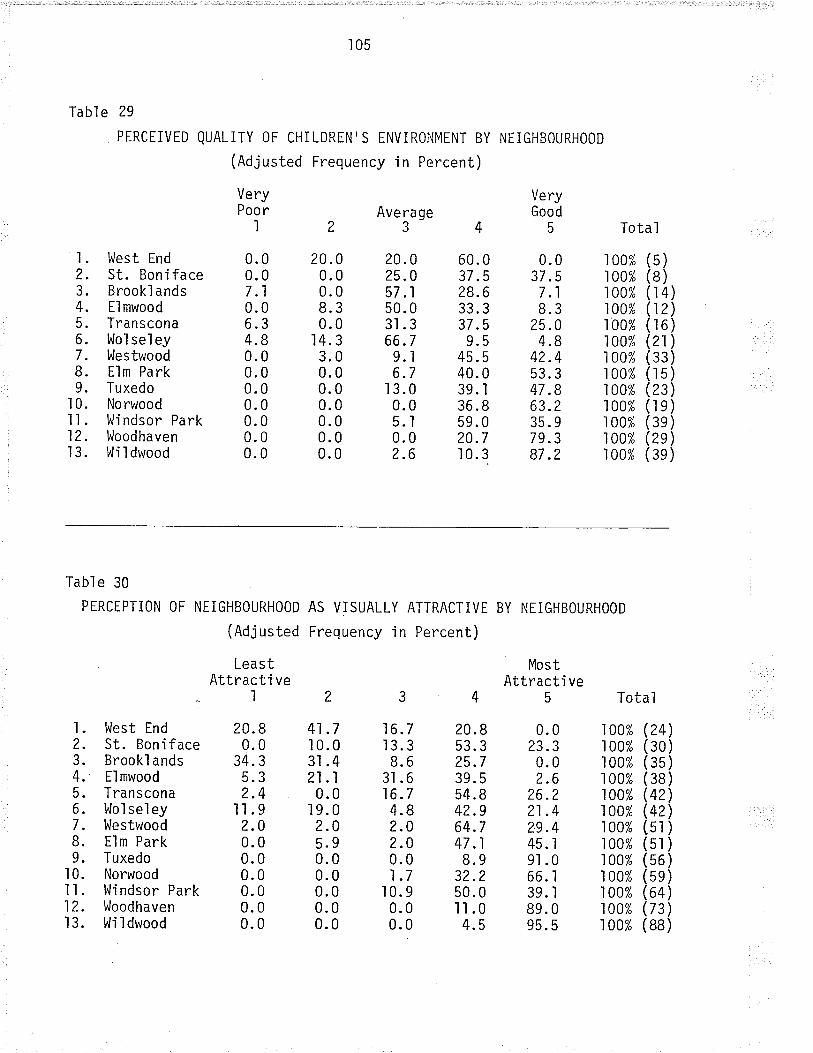
105
Table 29
l. West End2. St. Boniface3. Brookl ands4. Elmwood5. Transcona6. Wol sel ey7. WestwoodB. Elm Park9. Tuxedo
I 0. NorwoodI I . l^li ndsor Park12. WoodhavenI 3. t^li I dwood
PTRCEIVED QUALITY OF CHILDREN'S ENVIRONMENT BY
(Adjusted Frequency in Percent)
NE IGHBOURHOOD
VeryGood
5
VeryPoor
120.0 20.00.0 0.07 .1 0.00.0 8.36.3 0.04.8 14. 30.0 3.00.0 0.00.0 0.00.0 0.00.0 0.00.0 0.00.0 0.0
Average3
20.025.057 .l50. 03l .366.79.16.7
I 3.00.05.10.02.6
Total
60.0 0.037.5 37.528.6 7.133.3 8.337 .5 25.09.5 4.8
45. s 42.440.0 53.339. I 47 .B36.8 63.259.0 35. 920.7 79.310.3 87.2
100%100%100%100%100%100%100%100%100%100%100%100%100%
(5)(8)(l 4)(12)(16)(21)(33)(15)(23)(le)(3e)(2e)(3e )
Table 30
PERCEPTION OF NEIGHBOURHOOD AS VISUALLY ATTRACTiVE BY NEIGHBOURHOOD
(Adjusted Frequency in Percent)
LeastAttracti ve
MostAttracti ve
5 Total
I . Ì^lest End2. St. Boniface3. Brookl ands4. Elmwood5. Transcona6. l.loì seì ey7. Westwood8. Elm Park9. Tuxedo
I 0. NorwoodI l. Windsor Park12. WoodhavenI 3. l,Ji ldwood
I
20.80.0
34. 35.32.4
ll.92.00.00.00.00.00.00.0
2
41.710.03t .421.10.0.l9.
0?.05.90.00.00.00.00.0
3
16.7r 3.38.6
3t .616.74.82.02.00.01.7
10.90.00.0
20.8 0.053.3 23.3?5.7 0.039.5 2.654.8 26.242.9 21.464.7 ?9 .447 .1 45. i8.9 9t.0
32.2 66.1s0.0 39. Iil.0 89.04.5 95.5
100%100%100%100%100%100%100%100%100%100%100%100%100%
(24)(30)(35)(38)(+z¡(42)(51)(51)(56)(5e)(64)(73)(88)
106
4.2.5 Qual ity of Chil dren's Enyironmént
The item chosen to represent this varjable 'i s #17: "Do you fee'l
that your neighbourhood is a good p'lace or a poor p'lace for ch'ildren to
grow up in?" (see Table 29). From this data, jt seems that most neígh-
bourhoods are seen by their residents as a good p'lace for children,
although some rejatively 1ow scores occur among several of the fjrstgroup of six neighbourhoods. Again, a 'break poìnt' is apparent after
the first sìx neighbourhoods.
4.2.6 Quality of the Physical Envjronment
0f the five related items, the one chosen to represent this in-
dependent variable is #29: "To what extent would you agree wjth the
statement: "l^lal k'ing through my neighbourhood i s a pì easant experience. " ,
whjch was the most hjgh'ly correlated wìth satisfaction (see Tab'le 30).
Most neighbourhoods were general'ly perceived as 'attractive', w'ith the
exception of the West End, Brooklands, and to a lesser extent, Elmwood.
Again, St. Boniface shows a closer affinity in its responses to the last
seven neighbourhoods rather than to the first six. Also, the 'break
point'is not as clear in this case until after the seventh neighbour-
hood (l^lestwood). It might be interesting to note that the residents of
Westwood also had a relatively low score on 'Perceived Ne'ighbourhood
Friendliness' and on 'Perception of Neighbourhood as Identjfiable';
however, their 'Satisfaction with NeÍghbourhood''was still quite high.
Windsor Park has also shown sone'lower scores than the rest of the group
of seyen neighbourhoods (for'Neighbourhood Attractiveness','Quality of
Children's Environment','Perception of Neighbourhood as Identifiable',
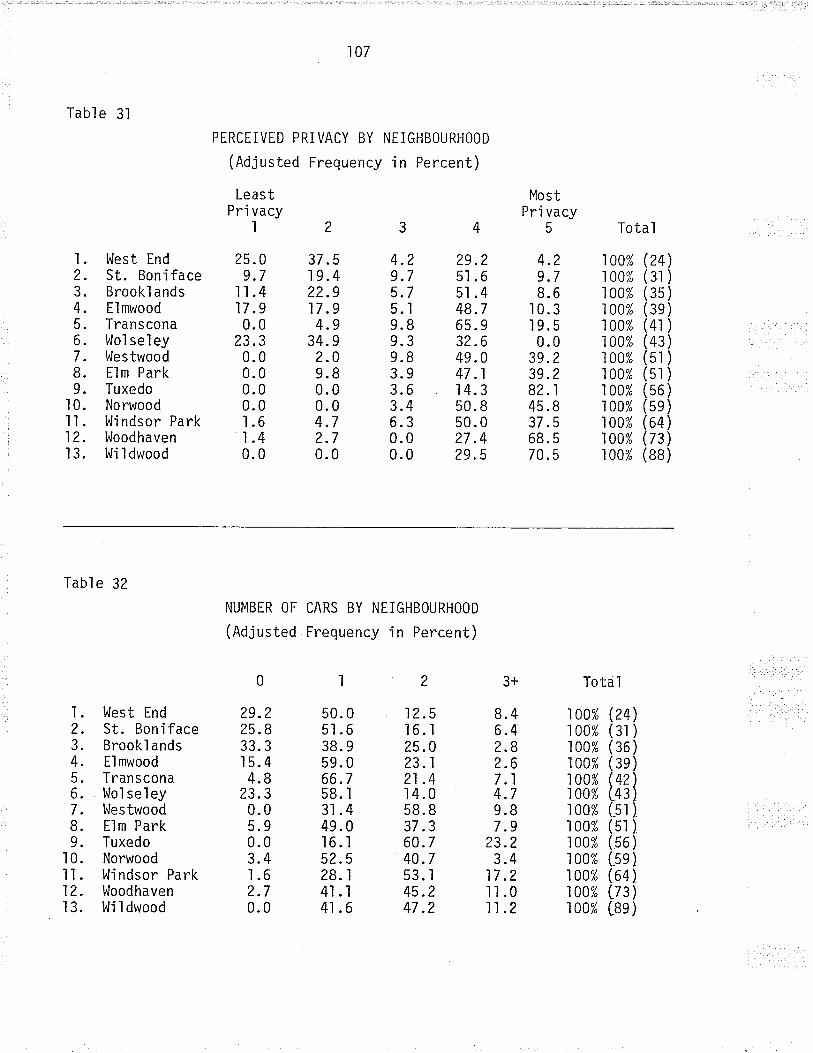
Table 3l
LeastPri vacy
I
I . West End ?5.02. St. Boníface 9.73. Brookl ands I I .44. Elmwood 17.95. Transcona 0.06. l^lo1 se'ley 23.37 . l^lestwood 0. 08. Elm Park 0.09. Tuxedo 0.0
I 0. Norwood 0.0I I . Wi ndsor Park I .612. Woodhaven 1.4I 3. l^li I dwood 0. 0
107
PERCEIVED PRIVACY BY NEIGHBOURHOOD
(Adjusted Frequency in Percent)
2
37 .519.422.917 .94.9
34.92.09.80.00.04.72.70.0
4
29.25l .65l .448.765. 932.649.047 .114.350. I50.027.429.5
MostPri vacy
5
4.29.78.6
10.319.50.0
39.239.282. l45 .837.568. 5
70. 5
Total3
4.29.75.75.19.89.39.83.93.63.46.30.00.0
100%100%100%100%100%100%100%100%100%100%100%100%100%
24)3l)35)3e)4l)43)5l )5l )56)5e)64)73)BB)
Table 32
NUMBIR OF CARS BY NEIGHBOURHOOD
(Adjusted Frequency in Percent)
l. West End2. St. Boniface3. Brooklands4. Elmwood5. Transcona6. Wol seley7. l,lestwood8. Elm Park9. Tuxedo
10. Norwoodll. l'^lindsor Park12. WoodhavenI 3. lii I dwooci
0
29.225.833.315.44.8
23.30.05.90.03.41.62.70.û
l
50. 051.638. 959. 066.758. I3l .449.0t6.I52.528.14l .l4i .6
2
12.5r6.l25.023.121 .4I 4.058.837 .360.740.753. I45.247 .Z
3+
8.46.42.82.67.14.79.87.9
23.23.4
17.2ll.0ll.2
Tota I
100%100%100%100%100%100%100%100%100%100%1A0%100%100%
(24)(31 )(36 )(3e )( 42],L+s )(_51 )(51 )[56 )(5e )(64 )(73 )(Be )
108
and 'Perceived Friendl'iness of Ne'ighbourhood'), but in this case itslevel of'Satjsfaction with Neighbourhood'was the lowest of the seven
neighbourhoods.
4.2.7 Level of Perceived Prjyacy
The sjngìe item chosen to represent this variable is question 34
("To what extent would you agree with the statement: "The layout of
streets and housing in my neighbourhood provides me with enough privacy."")
for which the results follow the previous'ly observed pattern, with one
exception; Transcona shows more sjmilarity to the group of seven neighbour-
hoods with higher socio-economic status than to the other five areas with
lower status. These results can be seen in Table 3.|.
4.2.8 Mobility of Residents (Transportation)
In terms of'actual'mobjlity, the jtem selected was #24: "How
many cars does your household currentìy operate?". For the respondents'
'perceived' mobility, however, rather than presenting a Table for each
of the seven kinds of destjnations (place of work, local food stores,
department stores, entertainment, recreation, parks, and frjends and
relatives), each wÍì'l simpìy be discussed in terms of its relation to
the 'actual'mobility of the residents of each nejghbourhood.
From Tabl e 32, u.te can see that the residents of Tuxedo are the
'most'mobiìe, while the peop'le in Westwood, Norwood, l^lindsor Park,
l,loodhaven, and l^Jildwood are 'highly' mobile as well. The 'least' mobile
areas are Booklands, the l,lest End, St. Boniface, and l^lolseìey (of which
109
only Brooklands was categorized as having 'lolv' access to urban infra-
structure and as'suburban' in nature). The'mobile' areas and the'less
mobile'areas showed little difference in their perceptions of thel'r ease
of access to most destinations, except in the case of recreation facili-ties as a destination, and to a lesser extent for parks and for the homes
of friends and relatives as destinations. In most cases as well, St.
Boniface residents responded in a manner resembì'ing those of'more mobile'
residents, while Brooklands' resjdents found themselves wjth very 'lo!'r'
access in most cases
In the next section, the data presented so far will be used to
test the eight hypotheses derived from the literature review in a manner
which will allow us to either accept or reject each of them. These data,
aìong with the results of some items which have not yet been presented,
may be used again jn the sections dealing with the characteristjcs of
'Satisfaction with Neighbourhood', and wjth other siginificant relation-
ships identified through the data analysis.
4.3 Testing of Hypotheses
4.3.1 Hypotheses 1.0 and l.l
Hypothesìs .l.0 Both socio-economic and physicaì design characteristicshave an effect on a person's perceived satisfaction withhis or her neighbourhood.
Hypothesis l.l Socio-economic characterjstìcs will have a greater deter-mining effect on neighbourhood satisfaction than physicaldesign characteristics wilì .
To test hypothesis .l.0 which suggesis that both the socio-economìc and
physicaì desìgn characteristics of a neighbourhood wilì have an impact
ll0
on a person's percejved satisfaction, the ìogical first step ìs to com-
pare the assoc'iation existing between the jtems used jn measuring the
Índependent varjables (socio-economic status and physical design charac-
tenistics) and those chosen to represent 'Satjsfaction with Neighbourhood'.
To simpìify the testing procedure for this and the other hypotheses, ithas been determined that in the case of the dependent yariable, only one
jtem will be used (question #39; "0n the whole, how satjsfied are you with
your ne'ighbourhood. " ).
Therefore, to test hypothes'is 1.0, we wi'll be examinìng both thet
significance (X') and strength (G) of the relationsh'ips between 'Satis-
faction with I'leighbourhood' and 'Socio-Economic Status' (famì1y income,
male job type, and male education), 'Neighbourhood Layout', 'Access to
Urban Infrastructure', and 'Location of Neighbourhood', in order to see
if both socjo-economjc and phys'icaì variables have a measurable effect on
neighbourhood satisfaction. Keeping in mind that a X2 value of close to
zero indìcates a very high level of signìficance and a Gamma value of
about .25 or more indicates a 'strong' association, we find jn Table 33
that the nearness to urban infrastructure has almost no relationship to
a person's satisfaction with neighbourhood, while all of the other vari-
ables appear to have a fairìy strong re'lationship with sat'isfaction
(note that the negative sjgn on some Gamma values is a consequence of
the ordering of the response categories). For all of the crosstabu-
lations, the higher the 'status' represented by the response category,
the more closely it is associated with satisfaction.
From this, one could assume that both socio-economic and physical
design factors exercise some influence over a person's satisfaction with
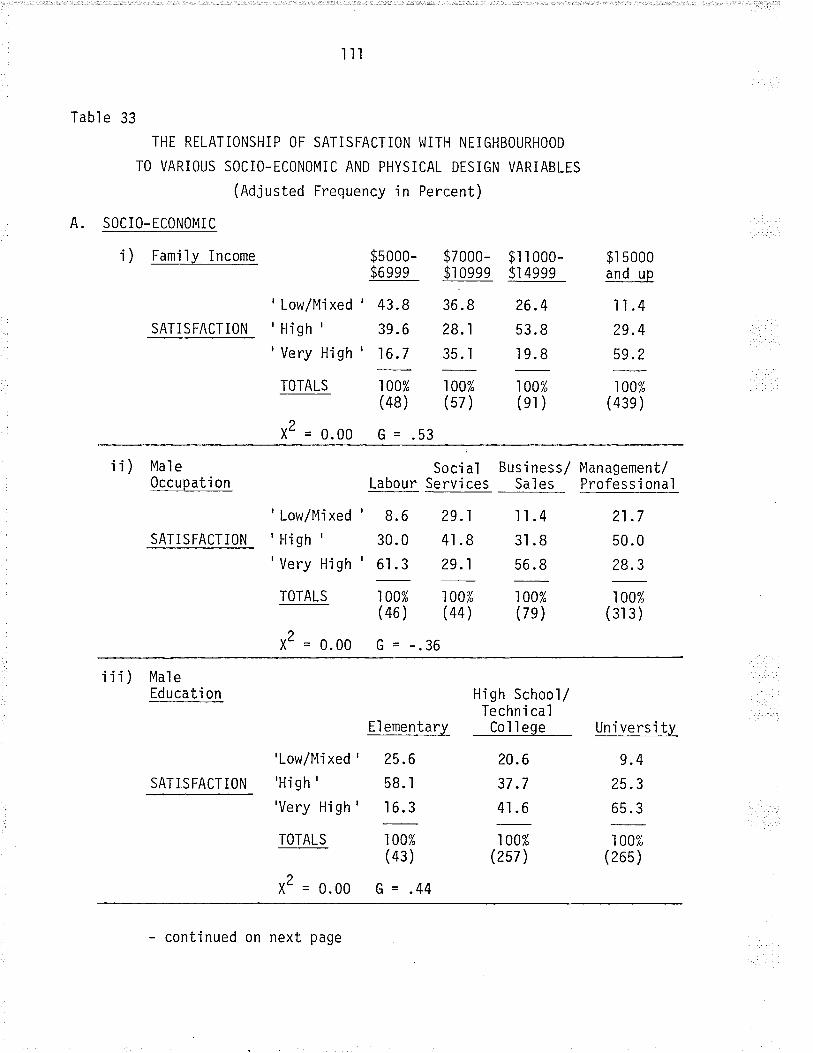
Table 33
lll
THE RELATIONSHiP OF SATISFACTION WITH NEIGHBOURHOOD
TO VARIOUS SOCIO-ECONOMIC AND PHYSICAL DESIGN VARIABLES
(Adjusted Frequency in Percent)
A. SOCIO-ECONOMIC
i ) Fami ly Income
SATISFACTION
'Low/Mixed
' H'igh '
'Very High
TOTALS
X2 = 0.00
$sooo-$oggg
' 43.9
39.6
' 16.7
$7000-$l oeee
36.8
28.1
35. I
$l I 000-$l 4ee9
26.4
53. Ir9.B
$l soooand up
ll.429.4
59.2
100%(43e )
100% 100%(48) (57)
G = .53
100%(el )
ii) Male0ccupati on
SATISFACTION
Labour
' 8.6 29.1 ll.430.0 41.8 31.8
' 6t . 3 29.1 56.8
Social Business/Services Sales
I'lan agement/Professional
21.7
50.0
28.3
'Low/Mixed
'High '
'Very High
TOTALS
X2 = 0.00
100%(46 )
G = -.36
100%(44 )
100%(7e)
100%(3r3)
iii) MaleEducati on
SATISFACTION
El ementary
'Low/Mi xed ' 25 .6
'High ' 58.l
High School/Techni cal
College
20.6
37 .7
4l .6
University
9.4
25.3
65 .3'Very High '
TOTALS
X2 = 0.00
r 6.3
I 00%(43 )
G = .44
100%(257)
100%(265)
- continued on next page
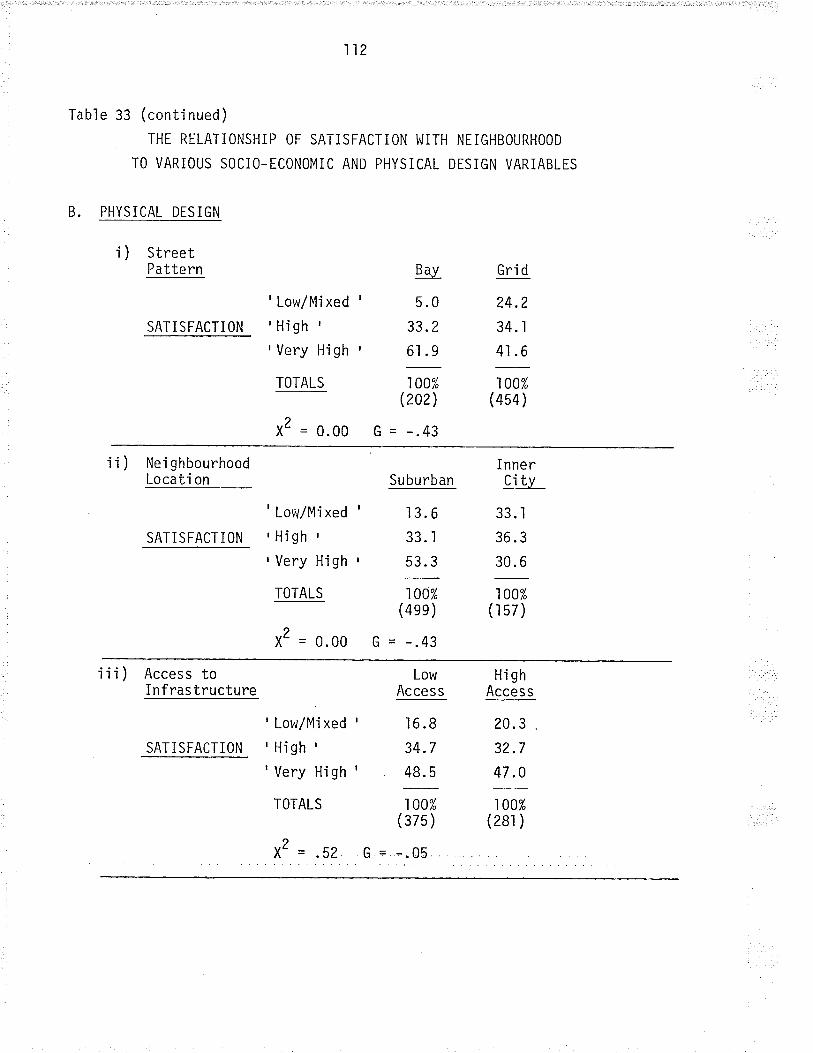
112
Table 33 (continued)
THE RELATIONSHIP OF SATISFACTION WITH NEIGHBOURHOOD
TO VARIOUS SOCIO-ECONOMIC AND PHYSiCAL DTSIGN VARIABLES
B. PHYSiCAL DESIGN
StreetPattern Gri d
24.2
34. I
4l .6
SATISFACTION
i)
'Low/Mixed
'High '
'Very High
TOTALS
X2 = 0.00
E-ex
5.0
33.2
6l .9
100%(202)
G = -.43
100%(454)
ii)
SATISFACTION
' Lor¿l/Mi xed
,High '
'Very High
TOTALS
X2 = 0.00
InnerCi ty
33. I
36.3
30.6
Nei ghbourhoodLocati on Suburban
13.6
33. I
53. 3
100%(4ee )
G = -.43
100%(r 57 )
iii) Access toI nfras tructure
SATISFACTION
LowAccess
Hi ghAccess
Low/Mì xed
High '
Very High
TOTALS
xZ = .52
16.8
34.7
48. 5
100%(375)
G = -.05
r 00%(281 )
20. 3
32.7
47.0
ll3
neighbourhood. To test this assumption further, let us now look at two
of these associatÍons (satisfaction by income and satisfaction by street
layout) in each of the thirteen neighbourhoods in order to see if the
association between 'higher' status and higher sat'isfaction levels
remains strong. In fact, Table 34 shows that jn most of the jndividual
neighbourhoods, satisfactjon levels remajn constant as income yaries; italso shows that the residents of several 'grid'neighbourhoods are just
as satjsfied with their areas as the resjdents of 'bay'areas are with
the i rs
From the first of these findings (satisfaction remains constant
in a neighbourhood as income varies), it mjght appear that income plays
only a small role in determining satìsfactjon. After all, if its effect
was sjgnificant, shouldn't those people with higher incomes be more
satisfied than those with lower incomes in any g'iven area? In fact,
there js a better explanatjon for thjs finding. In an earlier section,
we saw that the first six neighbourhoods presented in the Tables are
those which were characterized by census data averages as being of lower
socio-economic status, and the last seven neighbourhoods are those which
were characterized as hjgher status. If we then look at the sat'isfac-
tion levels of those peopìe in the various income categories in each of
these two groups of neighbourhoods, we find that in the seyen upper
status areas, those with hìgher incomes are mostly sat'isfied - and so
are those wjth lower incomes. l^ljthin the six lower status neighbourhoods,
those with higher incomes have relatively low satisfaction leveis, as do
those with lower incomes. In other words, it is the overall socio-
economic status of the areas (of which income is a part) that is the
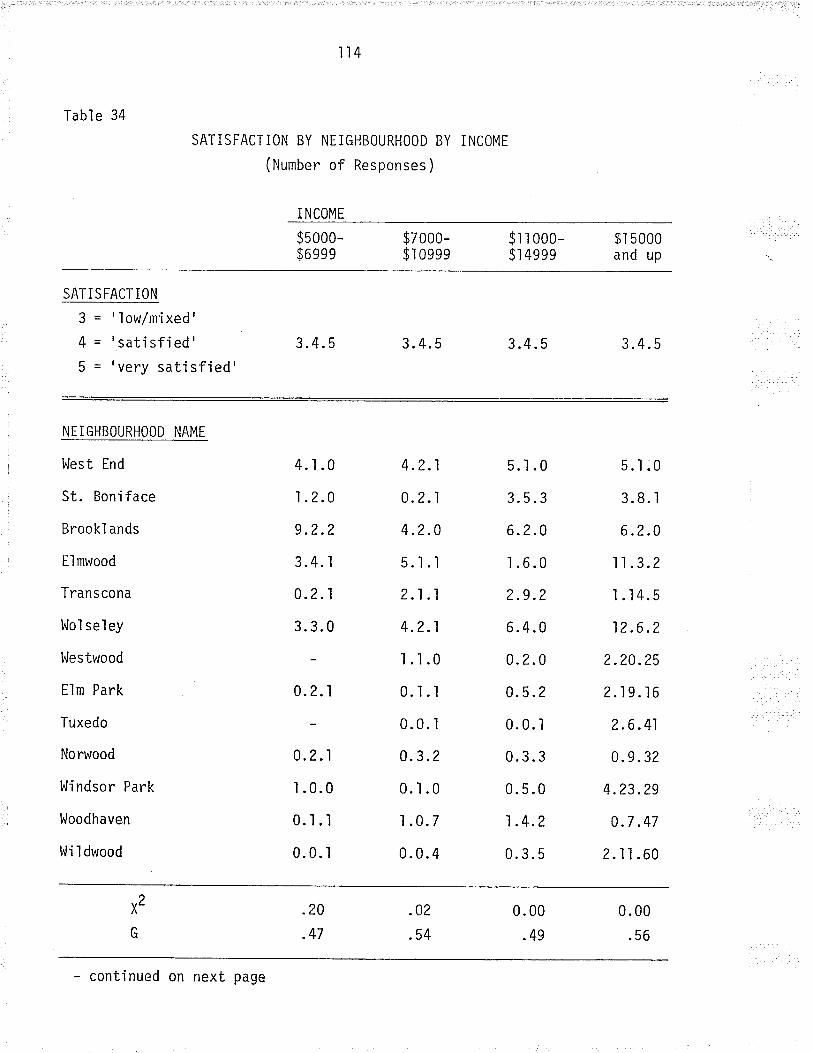
ll4
Table 34
SATISFACTiON BY NEIGHBOURHOOD BY INCOME
(Number of Responses)
I NCOME
$5000-$6ee9
$zooo-$l Oeee
$l r 000-$l 4e99
$l 5000and up
SATISFACTION
3 = 'low/mixed'4 = 'sati sfied'
West End
St. Boniface
Brookl ands
El mwood
Transcona
Ì^lo1 sel ey
l^lestwood
Elm Park
Tuxedo
Norwood
l^Jindsor Park
Woodhaven
Wi I dwood
3.4.5
4.t.0
1 .2.0
9.2.2
3.4. I
0.2.1
3. 3.0
0.2..l
0.2.1
I .0.0
0.t.l0.0. I
3.4.5
4 .2.1
0.2.1
4.2.0
s.l.i2.1 .1
4.2.1
1.1.0
0.1.i
0.0. I
0.3.2
0.1.0
1.0.7
0.0.4
3.4. 5
5..l.0
3.5.3
6.2.0
I .6.0
2.9 .2
6.4.0
0.2.0
0.5 .2
0.0.1
0.3.3
0.5.0
1.4.2
0.3.5
3.4.5$ = 'very satísfied'
NEIGHBOURHOOD NAME
5.1:0
3.8. 1
6.2.0
11.3.2
I .14.5
12.6 .2
2.20.25
2.19.16
2 .6 .41
0.9.32
4.23.29
0.7 .47
2.11.60
?X_
G
.20
.47
.02
.54
0. 00
.49
0. 00
.56
- continued on next page
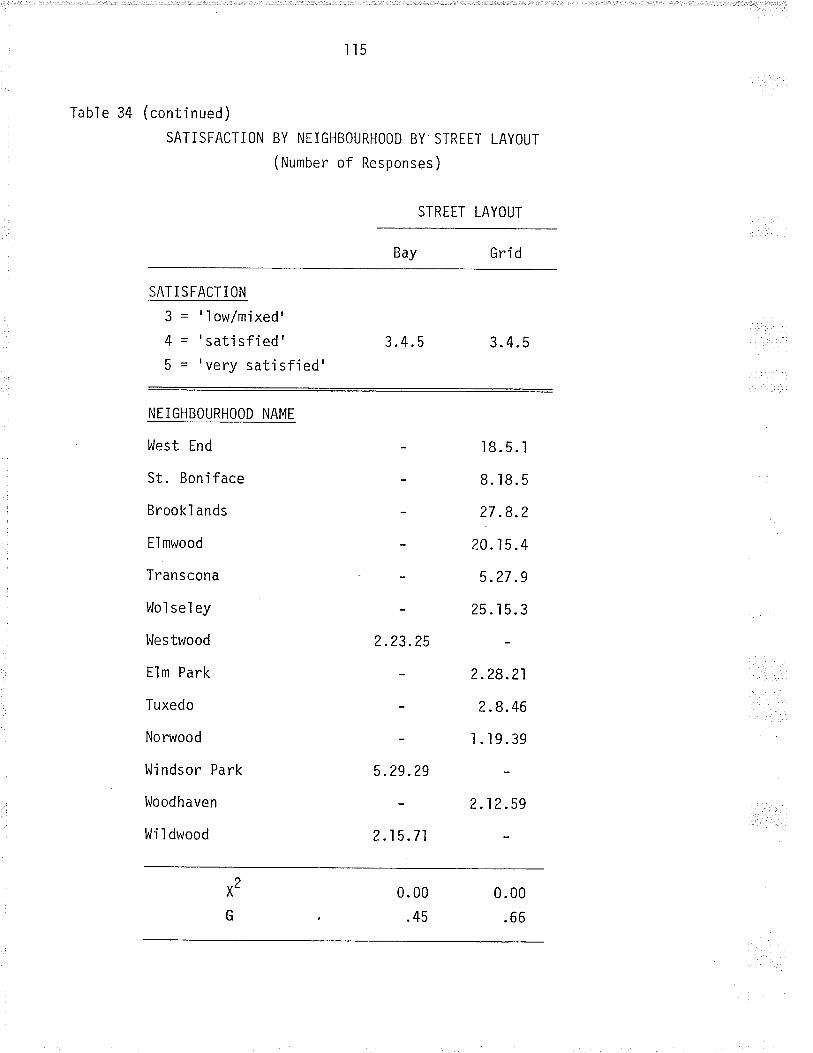
I l5
Table 34 ( conti nued )
SATISFACTION BY NEIGHBOURHOOD BY STREET LAYOUT
(Number of Responses)
STREET LAYOUT
Gri d
SATISFACTION
3 - 'low/mixed'4 = 'sati sfied' 3.4.5 3.4.55 = 'very satisfied'
NTIGHBOURHOOD NAMT
Bay
West End
St. Boniface
Brookl ands
El mwood
Transcona
Wol sel ey
Wes twood
Elm Park
Tuxedo
Norwood
l^Ji ndsor Park
l,loodhaven
l^li I dwood
2.23.25
5.29.29
2.15.71
18.5. I
B. 18. 5
27.8.2
20.15 .4
5.27 .9
25.15.3
2.28.21
2.8.46
1.19.39
2.12.59
x2
G
0. 00
.45
0. 00
.66
ll6
best predictor of nejghbourhood satisfactjon; a clear majority of
people in lower status areas are less satisfied than those'in upper
status areas. Therefore, these results strongly suggest that socio-
economic status characteristics do have an effect on a person's per-
ceived satisfaction with neighbourhood.
Can this test be appìied to physjcal factors as well? There
are no'bays'among the lower status nejghbourhoods, and withjn the
higher status group, severaì 'grids' have satisfaction levels which are
just as high as those among'bay'areas. So, for thjs variable, (street'layout), it would appear that while the overall trend is for 'bay' areas
to be more satisfjed, the effect is not consistent among each of the
study areas. However, at the individual neighbourhood leveì, income also
shows some jnconsjstencies. For exampìe, Woodhaven has a lower overall
income than l^lildwood, and is also a 'grid' area while Ì,lildwood is a 'bay';
and yet, Woodhaven has an almost identical satisfaction level. From this
we must assume that other factors as yet unidentified also have a sign'ifi-
cant effect on the percept'ion of sat'isfaction wjth neìghbourhoods.
To further test for the existence of a connection between street'layout and neighbourhood satisfaction, the distribution of satisfaction
levels was examined among the various income categories while hold'ing the
street layout pattern constant. The associatjon between satisfaction and
income was significant and strong among both 'bay' and 'grid' areas_29('bay', X'= 0.01, G = .39; 'grjd', X'= 0.00, G = .47). The distribu-
tion of responses jndicated that satjsfaction is highest among'bay'areas
(AZ.O"l" reported their satisfaction as 'very hìgh' compared to onìy 41 .B%
in the'grid'areas) and among those in the highest income categories (ìn
ll7
'bay' areas,64.8% were 'very satisfied' in the highest income category
compared to on'ly 33.3% in the next lower íncome category, and 55.S%
compared to 17.1% in 'grid' areas).
. l^Jhen we I ook at the resul ts of the above crosstabul ati on , i twould appear that'bay'areas are more satjsfied jn every jncome level
than'grid'areas; however, it is also true that all 'bay'areas are in
the suburbs, while'grid'areas are djstributed among the suburbs and
the 'inner city'. If we assume that 'suburban' areas are more satisfied
than'inner city' areas, then we must also control for neíghbourhood
location in order to get a true picture of satisfaction among'grid'
areas in relation to 'bays'. Thjs manipuìation of the data shows us
that while 'suburban grids' are indeed more satisfíed than 'inner citygrids' (47.5% versus 3l.l% jn the 'very satisfied' category, respec-
tively), 'bay' areas are more satisfied than either (62.0% in the 'very
satisfied' category). Those jn the highest income category are more
satisfÍed than those in any of the lower income categorìes in all three
types of areas. Therefore, it would seem justìfiable to say that both
socio-economic and physical design characteristjcs do have an effect on
satisfaction, aìthough there appear to be other influences at work which
can also significant'ly affect the satisfaction levels of any neighbour-
hood regardless of jts characteristics in the above nespects. some
effort will be made to deduce the nature of these influences and to'identify some of them in the last section of this chapter, which wjllfocus on the questions raised through the testing of the hypotheses.
To determine the acceptabi'lity of the second part of the firsthypothesis, we must attempt to assess the relative strengths of the

ll8
effect that socio-economic and physical design variables have on the
level of satjsfaction wjth neighbourhood. This was rendered somewhat
less pertjnent when it was discovered that other factors can have a
sìgnificant effect on the level of satjsfaction. Aìso, the results of
the previous testing indicated the complex'ity of these kinds of relation-
ships, making it very difficult to determine which of the two variables
in question has a greater impact on a person's satisfactjon wjth their
neighbourhood. As an example, it was found that satisfaction levels
were relativeìy unchanged in each neighbourhood as income varjed, and
that several 'grid'areas were more sat'isfied than the'bay'areas. Yet
at the same time, jt was also determined that satisfaction levels were
highest among'bay'neighbourhoods and also among those peopìe with the
highest income levels.
One method of determining whether socio-economic or physical
design characteristìcs have a stronger effect on satisfaction has aìready
been díscussed. As \{e saur in the test'ing of the first sub-section of
this hypothesis, the majority of people in upper status areas were
h'ighly sati sf i ed regardl ess of thei r persona'l j ncome . Al so , the majori ty
of people in lower status areas showed s'ignificantìy iower satisfaction
levels than those'in upper status areas - again, regard'less of persona'l
income. From this, it was assumed that the socio-economic character-
istics of an area did have an effect on satisfaction. When a similar
comparìson was made by substituting street patterns for income categor-
ies, it was found that people'in upper status areas were highly satisfied
regardless of whether their area was a 'bay' or a 'gnid', and that those
in the lower status areas were all less satisfied. Since the change in
ll9
satisfaction levels jn this comparison is produced by socio-economic
status rather than by the street pattern, it would seem that socio-
economic status is having a greater effect on satisfaction than physical
1 ayout.
These conclusjons suggest that both sub-sections of this hypo-
thesjs be accepted. However, in the first sub-section there is evidence
to suggest that other (and as yet unidentified) factors also have an
effect on satisfaction, and in the second sub-section, one of the four
possible cells in the principaì crosstabulation is empty ('bay' areas
of lower status).. Therefore, thjs acceptance should be consjdered
conditÍonal, pending the findings of the folìowing hypotheses.
4.3.2 Hypotheses 2. 0, 2. I , and 2 .2
Hypothesis 2.0 Groups of peopìe exhibiting sjmílar socio-economjccharacteristics and living in areas with similarphysica'l characteri stics wi I I feel approximate'lyequaì levels of satisfaction with theirneighbourhoods.
Hypothesis 2..l Groups of peop'le exhibiting sim'ilar socio-economiccharacteristìcs but living in areas with differingphysicaì characteristics will feel dissimilar levelsof satisfaction with their neighbourhoods.
Hypothesis 2.2 Groups of peopìe tiving in areas wìth similar physicalcharacteristics but having dissimilar socio-economiccharacteristics will feel dissimilar levels ofsatisfaction with their neighbourhoods.
In other to test the three sub-sections of this hypothesis, the thjrteen
neighbourhoods in the study were classified according to their relative
similarìty or dissimiìarity to each other in two main respects: socjo-
economic staius (as representeci by famiìy income, maìe occupation, and

r20
male education) and physical characteristics (street 'layout pattern and
neighbourhood location ('inner city' or'suburban')).
The latter case proved to be fairly símple. All three 'bay'
areas (Westwood, l.li ndsor Park, and l,l'i 'ldwood) were al so 'suburban ' and
therefore physica'l'ly similar. Four neighbourhoods were classified as
'inner city grids' (l^lest End, St. Boniface, l^lolseley, and Norwood),
while there were six 'suburban gr-id' areas (Brooklands, Elmwood,
Transcona, Elm Park, Tuxedo, and Woodhaven).
Classifying the neighbourhoods according to their similarity on
the three socio-economjc variables was sìight'ly less 'cut-and-dried'.
Previous studies (¡9,8i,244) have indjcated that income is the most
significant of the three variables under consideration, which immedi-
ateìy suggested the folìor^ring five pairings: Westwood and Tuxedo at the
top of the scale, followed by Norwood and Elm Park; in the middle
section of the income range are St. Boniface and Transcona, while
l^lolseley and Elmwood are below them, and Brooklands and tbe Ì^lest End
occupy the bottom end of the spectrum. I^Jhen the effects of male occupation
and education are considered, there are no variations signÍficant enough
to require a change in these pairings.
To test the three sub-sections of Hypothesis Two, these neighbour-
hoods must now be grouped into three categories: those neighbourhoods that
are both socio-economicaìly and physicaìly similar; those that are socio-
economically similar but physicaìly dìfferent; and those that are socio-
economicaï'ly dissimilar but physicalìy similar. In each of these three
categort'es, neighbourhoods will be tested in pairs owing to the diffi-culty of identifying more than two neighbourhoods at a time which share
121
the same characteristics when five variables are consídered. Comparing
paírs still offers a chance to cover a wide range of possibilities, as
can be seen in the testing of the first subsection, where 'middle status
suburban grids' (Elm Park and woodhaven), 'upper status suburban bays'
(l,lestwood and tlildwood), and 'lower status inner city grids' (west End
and l^lol se'ley) are al l represented.
The comparison of the satisfaction levels within each pair of
neighbourhoods which are similar in both socio-economic and physicaì
design characteristics (raule 35) indicates that two pairs (Elm park -
Woodhaven and l^Iestwood - Wildwood) diverge widely, and that one pair
(west End - l,lol seley) ¿tverges moderateìy. The resul ts for al I three
pairs are clearìy at odds with the hypothes'is, suggesting that sub-
section 2.0 be rejected.
Sub-section 2.'l requires the examination of pairs of neighbour-
hoods having similar socio-economic status but dissimiìar physica'l char-
acteristics. it is assumed in this hypothesis that the differences
between the neighbourhoods in each pair will cause varying'levels of
satisfactjon between them. In fact, as Tab'le 36 shows, two pairs
(Westwood - Tuxedo and l^Jindsor Park - Norwood) do exhibit the expected
results by having significantly different satisfaction levels. However,
the third pair (Elm Park (upper-middle status suburban grid) and
I,'lindsor Park (upper-middle status suburban bay)) shows a relativeìy
similar pattern. Therefore, sub-section z.l is also rejected.
The final sub-section deais with pairs of neighbourhoods that
are physica'l'ly sjmilar but which have dissimilar socìo-economic status
characteristics. Table 37 indicates that two pairs (west End - st.
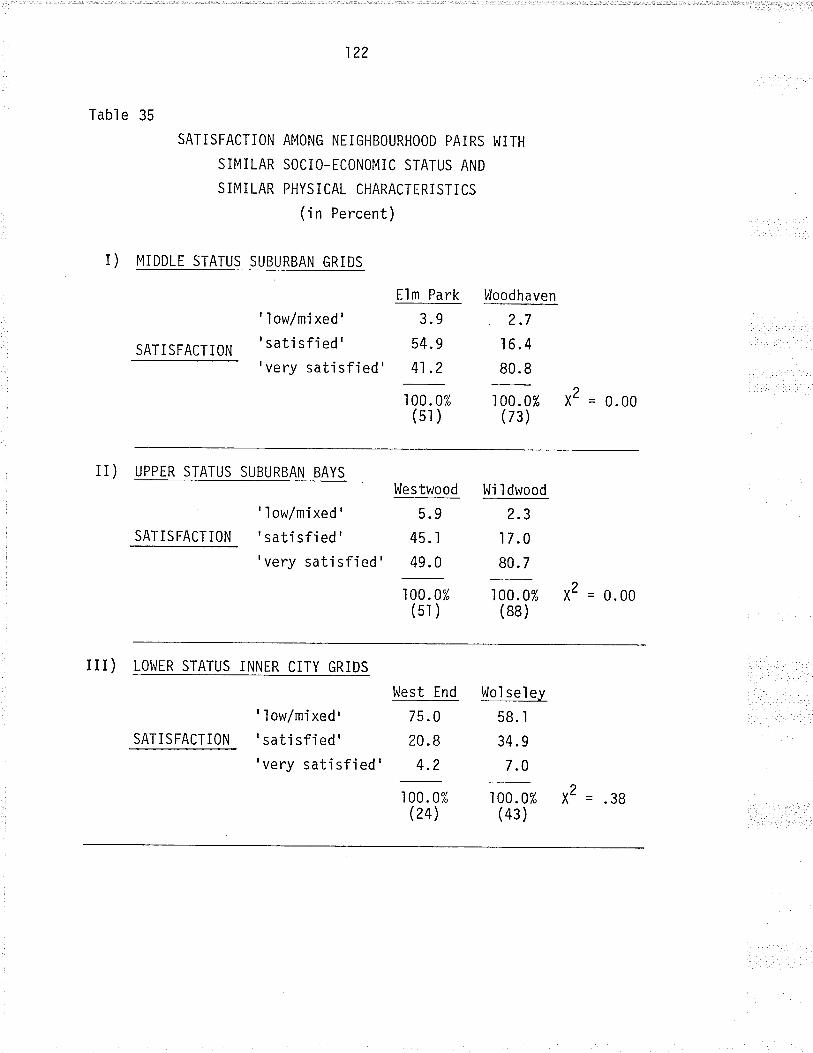
Table 35
1?2
SATISFACTION AMONG NEIGHBOURHOOD PAIRS I,{ITH
SIMILAR SOCIO-ECONOMIC STATUS AND
SIMILAR PHYSICAL CHARACTERISTICS
(ín Percent)
r) MiDDLE STATUS SUBURBAN GRIDS
SATISFACTiON
' I ow/mi xed'
' sati sfi ed '
'very satisfied'
Elm Park
3.9
54. 9
41.2
I 00.0%(51 )
Woodhaven
2.7
16.4
80.8
I 00.0%(73)
X2 = 0.00
iI) UPPER STATUS SUBURBAN BAYSt^lestwood Wi I dwood
SAT IS FACT ION
' 'low/mi xed '
' sati sfi ed '
'very satisfied'
5.9
45. I
49.0
100.0%(51 )
2.3
I 7.0
80. 7
I 00. 0%(88 )
X2 = 0.00
III) LOWER STATUS INNER CITY GRIDS
SATISFACTION
' ì ow/mi xed'
' sati sfi ed'
'very satisfied'
West End
75.0
20.8
4.2
100.0%(24)
l^Jol sel ey
58. l
34.9
7.0
100.0% X2 = .38(43 )
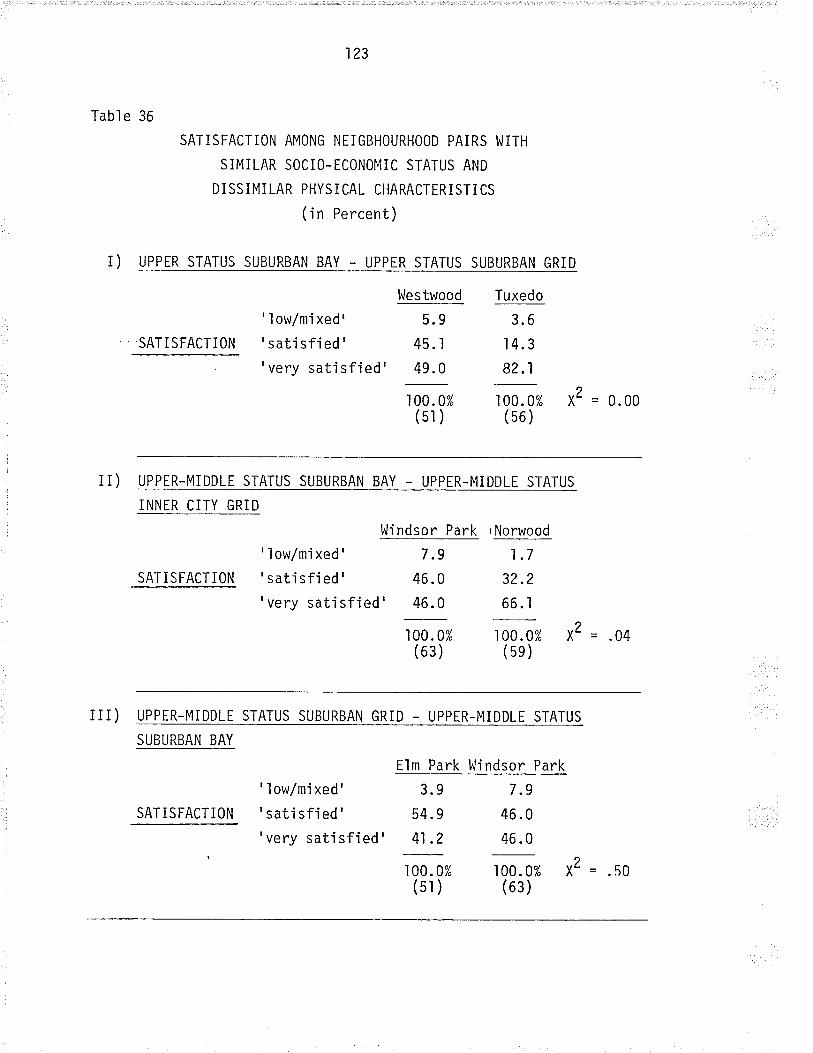
123
Table 36
SATISFACTiON AMONG NTIGBHOURHOOD PAIRS l^JITH
SIMILAR SOCIO-ECONOMIC STATUS AND
DISSIMILAR PHYSiCAL CHARACTERISTiCS
(in Percent)
I) UPPER STATUS SUBURBAN BAY - UPPER STATUS SUBURBAN GRID
Westwood Tuxedo
SATISFACTION
' I ow/mi xed'
'sati sfied''very satisfied'
5.9
45. I
49.0
I 00. 0%(5ì )
3.6
14.3
82. I
100.0%(56 )
X2 = 0.00
II) UPPER-MIDDLE STATUS SUBURBAN BAY - UPPER-MiDDLE STATUS
INNER CITY GRID
Windsor Park rNorwood
SATISFACTION
' 1 ow/mi xed'
' sati sfi ed'
'very satisfied'
1.7
32.2
66.1
100.0% X2 = .04(5e )
7.9
46.0
46.0
I 00. 0%(63 )
III) UPPTR-MIDDLE STATUS SUBURBAN GRID - UPPTR-MIDDLE STATUS
SUBURBAN BAY
Elm Park l^lindsor Park
SATiSFACTION
' I ow/mi xed'
' sati sfi ed'
'very satísfied'
3.9
54. 9
41 .2
7.9
46.0
46.0
I 00.0%(51)
I 00. 0%(63 )
x2 = .50
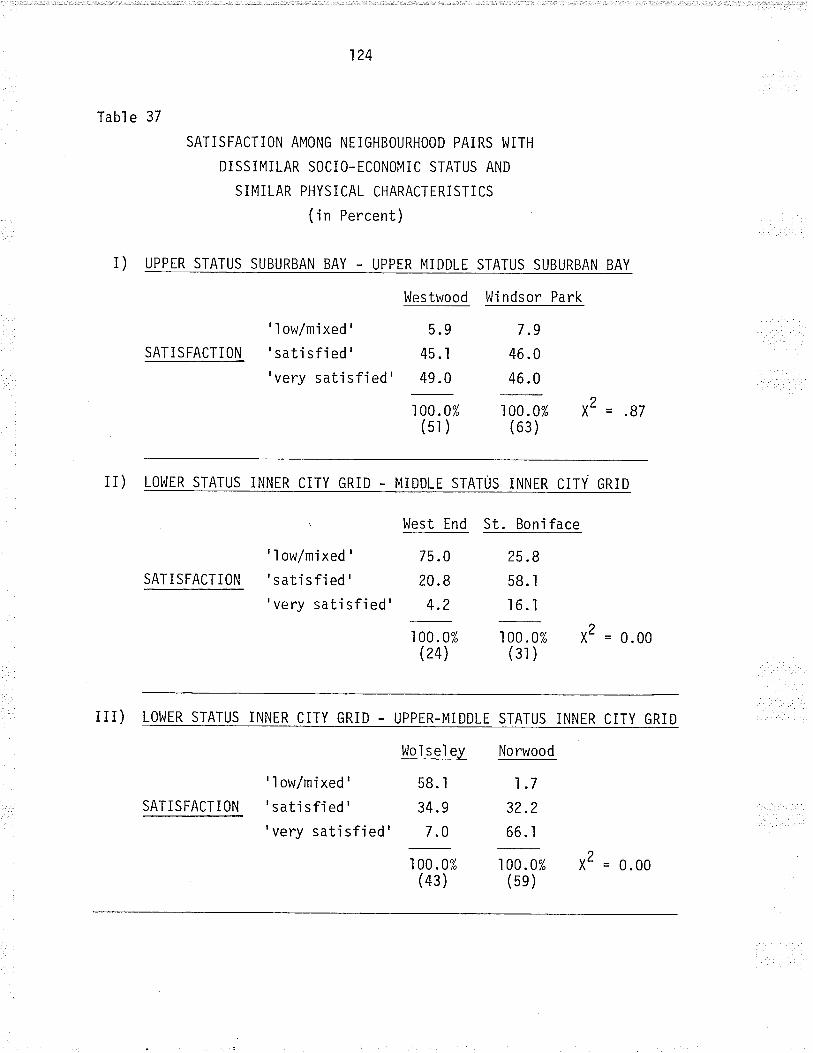
124
Tabl e 37
r)
SATISFACTION AMONG NEIGHBOURHOOD PAI RS I,JiTH
DISSIMILAR SOCIO-ECONOMIC STATUS AND
SIMILAR PHYSICAL CHARACTERISTICS
( in Percent)
UPPER STATUS SUBURBAN BAY - UPPIR MIDDLE STATUS SUBURBAN BAY
l^lestwood l^Ji ndsor Park
I ow/mixed'
SATISFACTi0N'satisfied''very sat'isfied'
5.9
45.1
49.0
7.9
46 .0
46.0
100.0%(51 )
100.0% XZ = .87(63 )
II) LOWER STATUS INNER CITY GRID - MiDDLE STATUS INNER CITY GRID
' 'l ow/mi xed '
'satisfied''very satisfied'
West End St. Boniface
SATISFACTION
X2 = 0.00
75.0
20.8
4.2
I 00.0%(24)
25.8
58. I
l6.l
I 00.0%(31)
III) LOWER STATUS INNER CITY GRID - UPPER-MIDDLE STATUS INNER CiTY GRID
SATiSFACTION
' 'l ow/mi xed '
'sati sfi ed '
'very satisfied'
Wol sel ey
58. 1
34.9
7.0
I 00.0%(43 )
Norwood
1.7
32.2
66. l
I 00.0%(5e )
X2 = 0.00

125
Boniface and Wolse'ley - Norwood) support the hypothesjs gìven in sub-
sectjon 2.2 by exhibit'ing differing ìeve1s of satisfaction, but also
that one pa'ir (Westwood - l^ljndsor Park) clearly contnadicts it by having
very similar satjsfaction levels. The conclusion embodied in this sub-
sectjon is therefore rejected.
[,Je have seen through the resul ts of the testi ng that nei ther
soc'io-economic status nor physical characteristjcs has a compiete'ly
determining influence on the relative feelings of satisfaction with
neighbourhood felt by an area's. residents. In conclusion, then, the
data does not consistently support any of the ideas put forward in this
hypothesis, and all three subsections must be rejected for this reason.
This result does rajse an interest'ing question, however. Is
there any factor or group of factors which can be used to predict satis-
faction or can satisfaction only be determined through direct testìng?
Thjs wíll be addressed in the final section of this chapter when neigh-
bourhoods with similar satisfac'ion levels will be examined for shared
characterjsticS in the hopes of formulating the basjs for a rough model
capabi e of pred'icti ng approximate sati sfact'ion I evel s among an area' s
resjdents. Such a model is not a priority for th'is study, and may not
prove possible owing to the data available and the level of compìexity
i nvol ved.
4.3. Hypothesis Three
Hypothesis Three The higher the average socio-econonric status heldby the peopìe of a neìghbourhood, the higher theìrperceived satisfaction with that ne'ighbourhood willha
1?6
To test this hypothesis, we will examine the relationship between the
three items associated with socio-econom'ic status (fami'ly ìncome, maìe
occupat'ion, and male education) and 'satisfaction with neighbourhood',
for both the aggregate data and for the same data broken down into
individual neighbourhoods.
Table 33 showed the results of the comparìson of each of the
three items measuring socio-economic status with the dependent variable
(satisfaction with neighbourhood). As we saw, all three correlatjons2
are significant (X'= 0.00) and relatively strong (income, G = .53;
occupation, G = -.36; and education, G = .44. The negative Gamma value
for occupation is a result of the ordering of the categories and stillindicates a correlation between higher status and hjgher satisfaction).
These results support the hypothesis.
As a further test, it was decided to examjne the relationsh'ip
between satisfaction and the item with the strongest correlation to
satisfaction within each individual neighbourhood, in order to see ifthe hypothesis held in each area. The result of this crosstabulation
(Satisfaction by Neighbourhood by Income) appeared in Table 34.
This table showed that Satisfaction with Neighbourhood is
affected very'little by the income category of the respondent; a con-
sistent pattern of satisfaction levels was observed in each income
category for almost every neighbourhood. In other words, if a neigh-
bourhood shows a low satisfaction level in jts lowest jncome category,
it is most likely to show a low satisfaction level in its highest income
category as well. Similarìy, a neighbourhood showjng a high leveì of
satisfaction will do so in its lowest as well as its highest income
127
category. The same effect is also observed when the other two measures
of soc'io-economic status (maìe occupation and education) are used as
contro I I ì ng vari abl es .
However, as was aìso pointed out in the d'iscussjon of Hypothes'is.l.0, it is the overall socÍo-economic status of a neighbourhood which is
the best predictor of its satisfaction level. Again, the residents of
all six lower status neighbourhoods showed significantly lower levels of
satisfaction (regardless of their individual incomes, occupations, or
education) than the residents of the upper status neighbourhoods.
Therefore, the findings of the tests used in regard to this hypo-
thesis can be summarized as follows:
- Income, male educatjon, and male occupation aìl
show a fairìy high degree of positive association
with satisfaction. (fa¡le 33)
- The residents of upper status neighbourhoods show
sìgnificantìy higher 'levels of satisfaction with
neighbourhood (X2 = 0.00, G = .86) than the
residents of lower status neighbourhoods showed
wi th thei rs. (faUl es 23 , 34 )
conclusion, this hypothesis has been supported by the data and should
considered accepted.
4.3.4 Hypothesis Four
Hypothesis Four Residents of 'more highìy pìanned' neighbourhoodswill exhibìt a generally hìgher satisfaction jevelthan residents of 'less planned' areas.
In
be
128
For the purpose of this study, it is assumed that a'bay' street pattern
constitutes a 'more h'ighìy planned' environment, and a 'grid' street
pattern a'less planned'one (refer to the discussion of Hypothes'is Four
in section 2.6). Therefore, in order to test this hypothesis, it is
necessary to examine the comparative satjsfaction levels in neighbour-
hoods characterized by these two types of street layout pattern. The
results of the simp'le correlation were shown in Table 33, whích indi-
cated a relatively strong association between 'bay' street patterns and
higher levels of satisfaction with nejghbourhood (XZ = 0.00, G = .43).
Looking at the responses of the individual neighbourhoods in
each category of street'layout reveals that this relationship is not
quite so simp'le (la¡le 38). For example, tfvo'gríd'areas have more
responses in the hìghest category of neighbourhood satisfaction than any
of the 'bay' areas, for which the satisfaction levels rank third, fifth,and sixth out of the total of thirteen neighbourhoods.
Controll'ing this correlation for income does little to clarifymatters for either grouped or aggregate data. For the aggregate (Tab]e
39), it can be seen that the low number of responses in the lower two
income categories have significantly decreased the reliabìlìty of the
measure of association. If the XZ scores are overlooked, we find that
the relationship between street pattern and neighbourhood satjsfactjon
is a'lways negative - that is, that'bay'areas aìways have the h'igher
level of satisfactíon in any income category. However, this relation-
ship is not aìways strong, fluctuating so widely that no reliable
observation can be made.
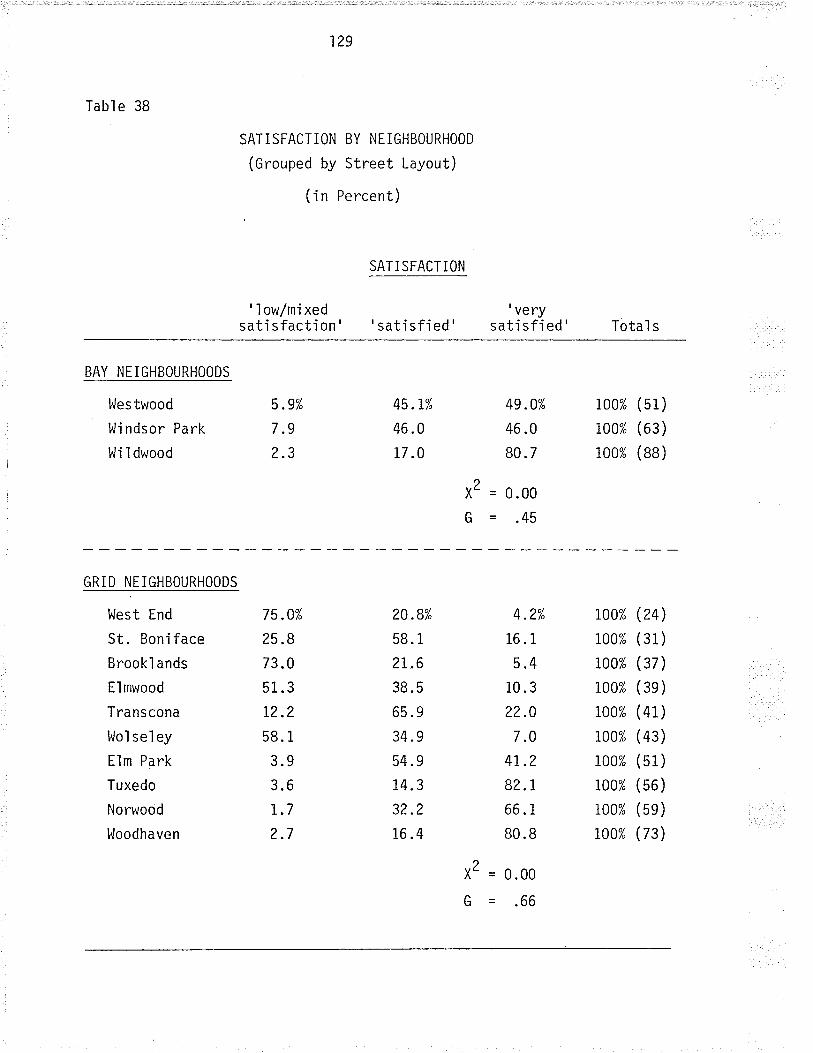
129
Table 38
SATISFACTION BY NEIGHBOURHOOD
(Grouped by Street Layout)
(in Percent)
SAT I SFACT ION
' I ow/mi xedsati sfacti on ' ' sati sfi ed '
'verysati sfi ed' Total s
BAY NEIGHBOURHOODS
l^les twood
Windsor Park
Wi I dwood
5.9%
7.9
2.3
45.1%
46.0
17 .0
49.0%
46.0
80.7
0.00
.45
1oo% (51)
1oo% (63)
ioo% (88)
x2=u-
GRID NEIGHBOURHOODS
l^lest End
St. Bon'iface
Brookl ands
Elmwood
Transcona
Ì,lol seì ey
Elm Park
Tuxedo
Norwood
l.loodhaven
75.0%
25.8
73.0
51 .3
t2.?58. 1
3.9
3.6
r.72.7
20.8%
58.1
2t.638.5
65 .9
34.9
54.9
14. 3
32.2
16.4
4.2%
16.1
5.4
10.3
22.0
7.0
4r.2
82.I66.1
80.8
= 0.00
= -66
t00% (24)
loo% (31)
r00% (37)
1oo% (3e)
1oo% (41)
loo% (43)
100% (s1)
100% (56)
100% (5e)
iOo% (73)
,'2À,
G

130
Table 39
SATISFACTION
3 - ''low/mixed'
a' = 'satisfied'g = 'very
sati sfi ed '
SATISFACTION BY STREET LAYOUT BY INCOME
(Number of Responses)
STREET LAYOUT
Bay Gri d
3.4.5 3.4.5
I NCOME
$sooo
$zooo -
$i1oo0 -
$ tsooo
- 6999
i0999
r4999
and up
1.0.1
r.2.4
0. 10.5
I .54. 1 14
?0.I9.7
20.L4.16
24.39 .73
42.75 .146
.32 -.20
.33 -.48
.03 - .62
0.00 - -24
l3l
When the same test is appìied to the individual neighbourhoods
(fante 40), the conclus'ion is again somewhat less than clear. It would
appear that in most cases, the satisfaction with neighbourhood feìt by
each area operates independent'ly of íncome level; that is, the pattern
of responses among the three levels of satisfaction does not show a
signìfjcant shift as income increases or decreases. From our earljer
findings concerning the effect of the overall socio-economic status of
an area on satisfaction, this result was an expected one.
When other measures of socio-economic status (male occupation,
Table 4l; male education level, Tab'le 42) are held constant, it was
aga'in found that no clear, overalì pattern emerged in the association
between satisfaction and either of the above items. Again, there was
considerable variation in the strength of the association between cate-
gories and also in their significance. One thing was noticeabìe,
however. For each of the three measures of socio-economic status, when
only the highest two categories were considered (containing ìn each case
no less than B0% of the overall responses), it was found that the Gamma
figure measuring the strength of the correlation decreased significantly
as the measure of status rose from the second highest to the highest
category. A conclusíon which could be drawn from such a pattern is that
as one's social and economjc status increases, the actual physical lay-
out of one's neighbourhood becomes less important, as other factors
become more significant to the person in question. The question remains,
then; is physicaì pìanning as represented by street pattern'important to
any popu'lation group?
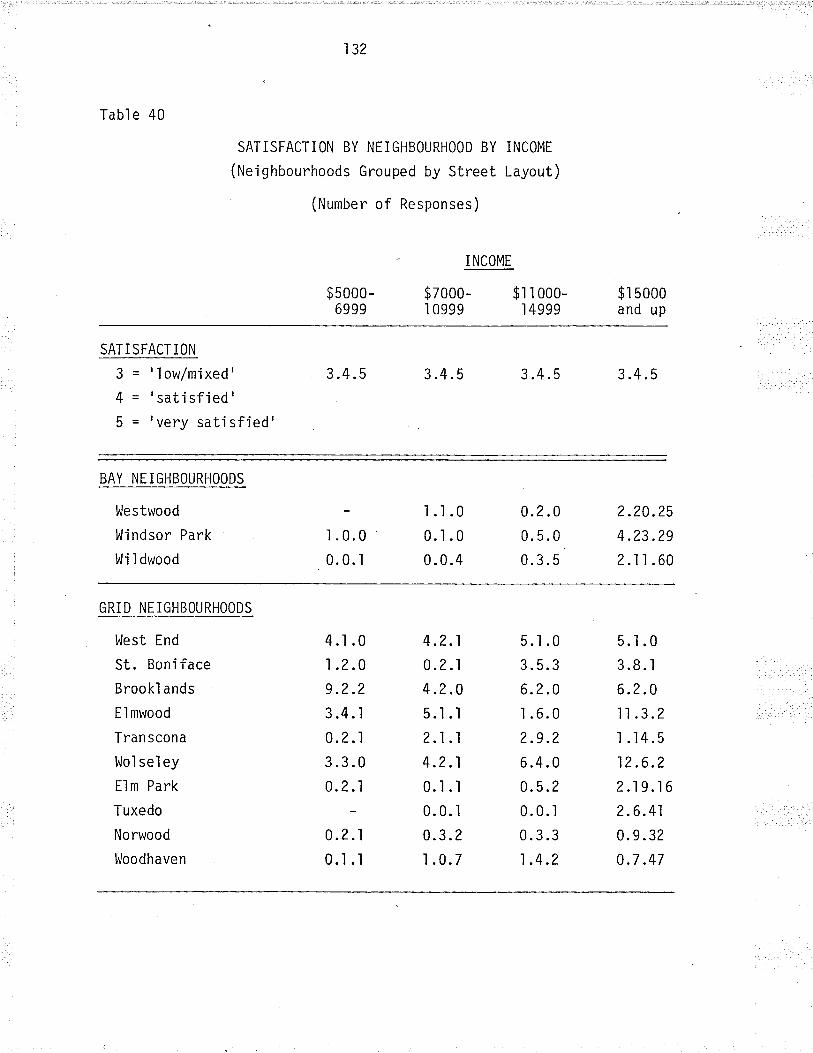
Tabl e 40
132
SATISFACTION BY NEIGHBOURHOOD BY INCOME
(Neighbourhoods Grouped by Street Layout)
(Number of Responses)
$sooo-6999
I NCOME
$7000- $r r ooo-I 0999 I 4999
$r 5000and up
SAT i SFACT ION
3 = 'l ow/mixed'
4 - 'sati sfied'5 = 'very satisfied'
3 .4.5 3.4.5 3.4.5 3.4.5
BAY NEIGHBOURHOODS
l^Jestwood
l^líndsor Park
Wi I dwood
1.0.00.0. I
1.1.00.1.00.0.4
0.2.00.5.00.3.5
2.20.25
4.23.292.11.60
GRID NEIGHBOURHOODS
West End
St. Boniface
Brookl ands
El mwood
Tran scona
l^lo'lsel ey
Elm Park
Tuxedo
Norwood
Ì,loodhaven
4.1 .0
1 .2.09 .2.2
3.4.1
0.2.1
3.3.00.2.l
0.2.1
0.1 .1
4 .2.1
0.2. t
4.2.05.1.1
2.1.t4.2.1
0.1..|
0.0. l0.3.2I .0.7
5.1 .0
3.s.36.2.01.6.02.9.2
6.4.00.5.2
0. 0.1
0.3.31 .4.2
5.1.03.8.1
6.2.011 .3.2
I .14.5
12.6.2
2.19.16
2.6.41
0.9.32
0.7 .47

133
Table 4l
SATISFACTION
3 = 'low/mixed'4 = 'satisfied'5 = 'very satisfied'
MALE OCCUPATION
Labour
Social Services
Bus i nes s/ Sa I es
Manageri a I /Profes s i onal
Table 42
SATISFACTION
J = 'low/mixed'4 = 'sati sfied'5 = 'very satisfied '
MALE EDUCATION
Eì ementary
High School/Technical College
University
SATiSFACTION BY STRIIT LAYOUT BY MALE OCCUPATION
(Number of Responses)
STREET LAYOUT
GRI DBAY
3. 4.5
0.2.50. 3.9
1.7.77 .46.85
3.4. 5
10.21 .8
5.ll.l622.26.16
20.48.107
.02
.21
.07
.10
SATISFACTION BY STREET LAYOUT BY MALE EDUCATION
(Number of Responses)
STREET LAYOUT
BAY GRID
0. 00
0. 00
.18
-.83-.54-.52- .05
-.93-.44
-. uv
3.4.5
0.1.33.32.42
6.30.72
3.4.5
11 .24.4
50. 65 . 65
a ^
It a ^1rv.J/.tut

134
One of the last tests to be made is to control the association
between street layout and neighbourhood satisfaction for location within
the city. All of the'bay'areas in the sample are in'suburban'
locations, while the'grids' are in both'suburban' and' jnner city'
locations. Perhaps, then, the 'inner city grids' are less satjsfied
than the'suburban grids', and are bringing down their overal'l result,
thus making 'bay'areas appear to be more satisfied. However, as Table
43 shows, the negat'ive association between the two varjahles remains
fairly strong, although the Gamma value has decreased from -0.43 in the
uncontrolled correlation to -0.33 in the one controlled for location.
From the variation in responses between 'inner city' and 'suburban'
'grids', it would appear that a 'suburban' location is associated wjth
higher levels of nejghbourhood satisfaction than an 'inner city'
I ocati on .
The results obtained through the testing of this hypothesis can
be summarized in the following manner:
- a relat'ively h'igh association exists between 'bay' street
patterns and higher levels of neighbourhood satisfaction.
(Table 33)
- when individual neighbourhoods of each street 'layout
are examined, some 'grid' areas exhibit h'igher levels
of satisfaction than some 'bay' neìghbourhoods. All
'bay' neighbourhoods rank highly in this regard, though.
(Table 38)
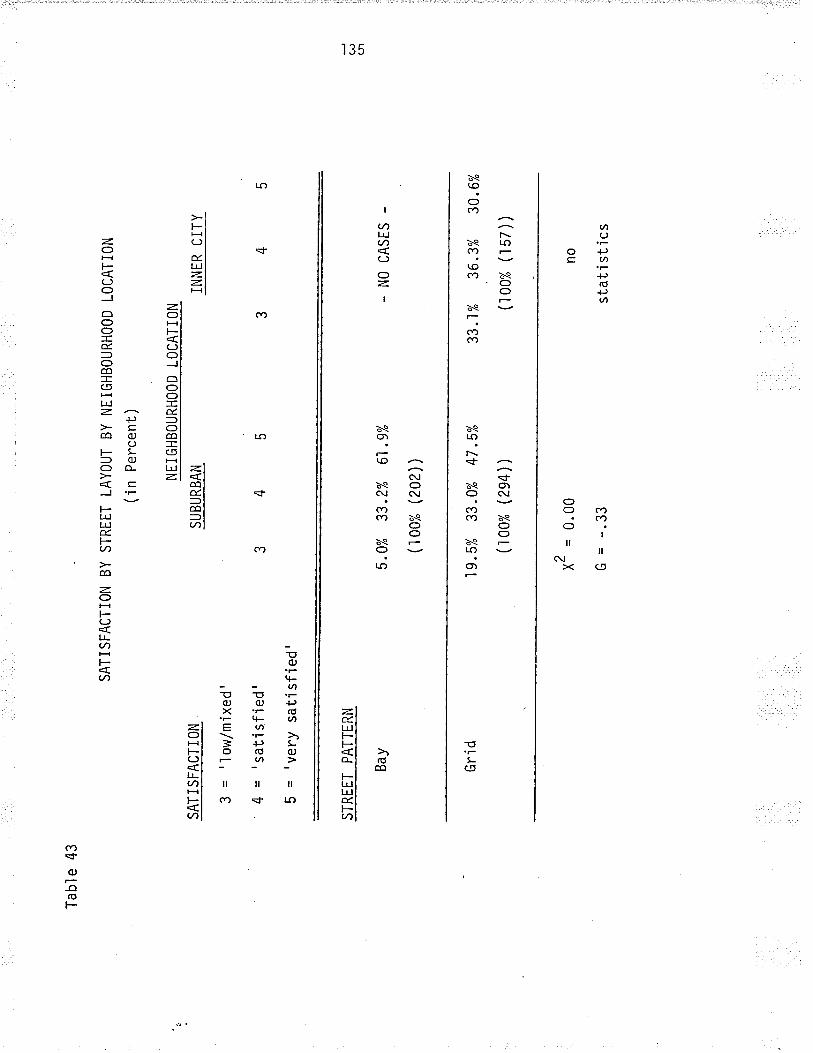
Tab
l e 4
3
SA
TIS
FA
CT
I O
N
3 =
'low
/mix
ed'
Q =
'sat
i sfie
d'
$ =
'ver
y sa
tisfie
d'
SA
TIS
FA
CT
ION
BY
ST
RE
ET
LA
YO
UT
BY
NE
IGH
BO
UR
HO
OD
LO
CA
TIO
N
(in P
erce
nt)
NE
IGH
BO
UR
HO
OD
LO
CA
TI
ON
ST
RE
ET
PA
TT
ER
N
Bay
SU
BU
RB
AN
Gri
d
5.0%
33.
2% 6
1.9%
(1oo
% (
202)
)
19.5
% 3
3.0%
47.
5%
(1oo
% (
2e4)
)
INN
ER
CIT
Y
X2
= 0
.00
G =
-.3
3
- N
O C
AS
ES
-
33 .1
% 3
6.3%
30.
6%
(1oo
% (
l5i))
no
stat
i stic
s
J (, (tr
136
when the correlation between street pattern and neigh-
bourhood satisfaction is examined within each income
category, it is found that the significance and strength
of this association varies wideiy; responses in the two
income categoríes showing s'ignificant X2 values between
street pattern and satisfaction show a very strong
correlation in the $11000 - $l+ggg category (Ç = -.62)
and a much weaker one in the highest income category
(G = - .24). (raUle 39)
this pattern is repeated when the correlation is
controlled for each of the two other socio-economic status
items (maìe occupation and education). In each case, the
strength of the correlation decreases as status increases.
(Table 41, 42)
when the correlation is again controlled for income and
the responses for individual ne'ighbourhoods are examined,
it becomes evident that a consístent pattern of satisfac-
tion is found jn each income category. In other words,
satisfaction in both 'bay' and'grìd' areas does not
increase with income, but maintains a similar distrjbu-
tion regardless of income. As pointed out previously,
the overall socio-economic status of the ne'ighbourhoods
appears to have a stronger effect on the satisfaction of
their residents than the street ìayout. However, we aìso
saw that some variation in satisfaction levels occurs
137
within each group of neighbourhoods. (Table 40)
- when the comelation between satisfaction and street'layout was controlled for the location of the neighbour-
hoods within the city, there was a relativeìy high
association between 'bay' areas and higher levels of
satisfaction (G = -.33). A higher level of satisfac-
tion was reported in 'bay' areas than in 'grid' areas,
and 'suburban grid' areas reported higher satjsfaction
I evel s than ' i nner cì ty gri ds ' . (faUl e 43 )
It is obvious from the results that this ìs a complex relatjon-
ship about which few definite conclusjons can be reached. 'Bay'
neighbourhoods do appear to be among the most highly satisfied, but this
effect'is partly removed by the status of the respondent. In some cases,
however, the effect is strengthened. From these results and from
ìogica'l analysis, it seems safe to assume that as socio-economic status
increases, the impact of street layout on one's satisfaction with neigh-
bourhood lessens. But are u/e in turn to assume from this that street
ìayout does have a s'ignificant effect at some status levels? Thjs must
remain unanswered at present, although some dìscussion of the question
will be made in the final sect'ion of this chapter which deals with the
probìems and findings of the study which go beyond the immediate scope
of the hypotheses. For now, due to the confused nature of the data, itwould seem safer to reject the hypothes'is pending the acquisition of
further results.
l38
4.3.5 Hypothesis Five
Hypothesis Fjve The hígher the level of general neighbourhoodmaintenance ('in terms of house and yard upkeep),the higher the residents' satisfactíon with thatneighbourhood will be.
Two measures of 'general neighbourhood maintenance' wjll be used in
testing thís hypothesis: #29., "To what extent wouJd you agree with the
statement: "Walking through my neighbourhood is a pìeasant experience."",
and #32., "To what extent would you agree with the following statement:
"My neighbourhood's streets and houses are attractive. "". l^lhen the
responses to these items are crosstabulated with the one measuring satis-
faction with neighbourhood (#s2., "0n the whole, horv satisfied are you
with your neighbourhood?"), the results for question #29 are x2 = 0.00
and G = .87, and for #32, X2 = 0.00 and G = .78 (see Tabl e 44), fndi-
cating a high degree of correlatjon between the sense that one,s
ne'ighbourhood presents a well-cared for appearance and the feeling of
satisfaction with that neighbourhood. This correlation is also clearìy
exhibited by the majority of the neighbourhoods in the study for both
i tems (see Tab'l e 45 ) .
When the two correlations are controlled for the income of the
respondents, the association remains strong at every level (see Tabìe 46;
minimum G = .70). when controlled for layout (see Tabìe 47) the
association again remains strong except in the crosstabulat.ion of
'satisfaction with Neighbourhood'with question #32 (...streets and
houses are attractive...) when controlled for'bay,areas, where the X2
drops to 0..l5 and the G to 0.32. This considerable reductjon in the
significance ancj sirengih of the assocjation in this instance can most
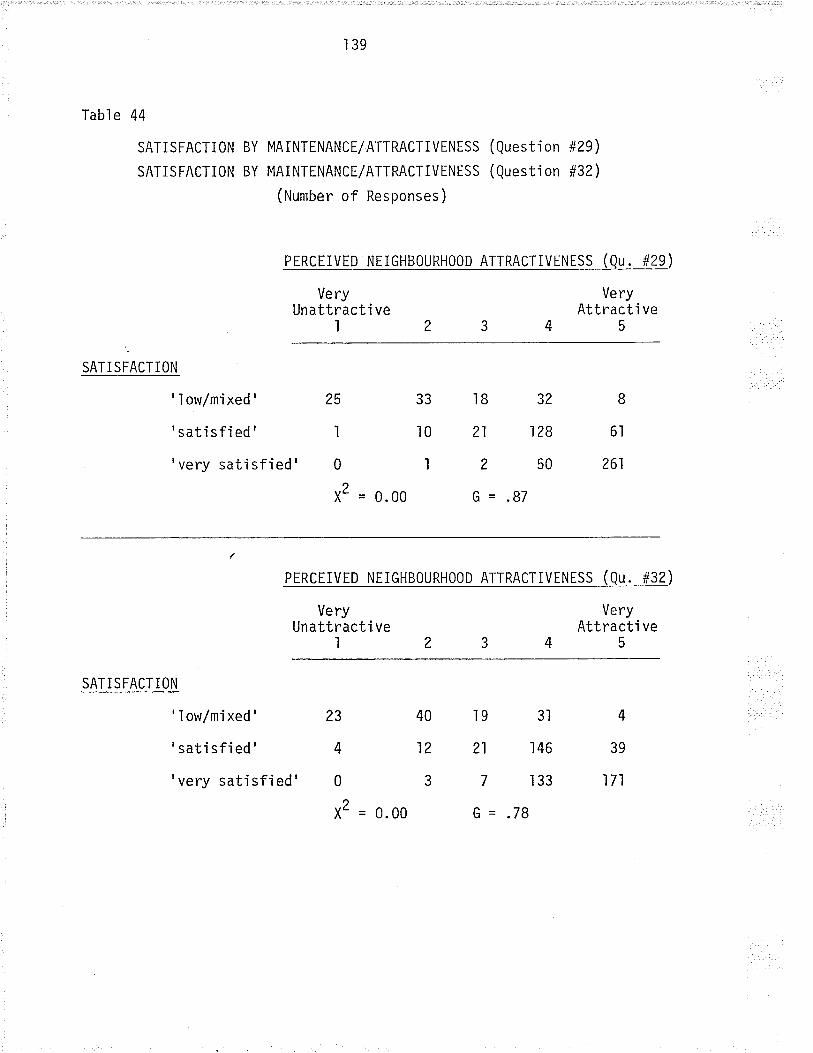
139
Tabl e 44
SATiSFACTI0N BY MAINTENANCE/ATTRACTIVENESS (Questi on #29)
SATISFACTION BY MAINTENANCE/ATTRACTIVENESS (Question #32)
(Number of Responses)
PERCEIVED NEIGHBOURHOOD ATTRACTIVENESS (Qu. #29)
VeryUnattracti ve
VeryAttracti ve
SATi SFACT I ON
12345
'lol/mixed' 25 33 l8 32 I
'satisfied' I l0 21 128 6l
'verysatisfied' 0 1 2 50 261
X2=0.00 G-.87
PERCEIVED NEIGHBOURHOOD ATTRACTIVENESS (Qu. #32)
Very VeryUnattracti ve Attracti ve
12345
SAT IS FACT ION
' 'low/mi xed ' 23 40 I 9 31 4
'satisfied' 4 12 21 146 39
'verysatisfied' 0 3 7 133 171
X2=0.00 G-.78
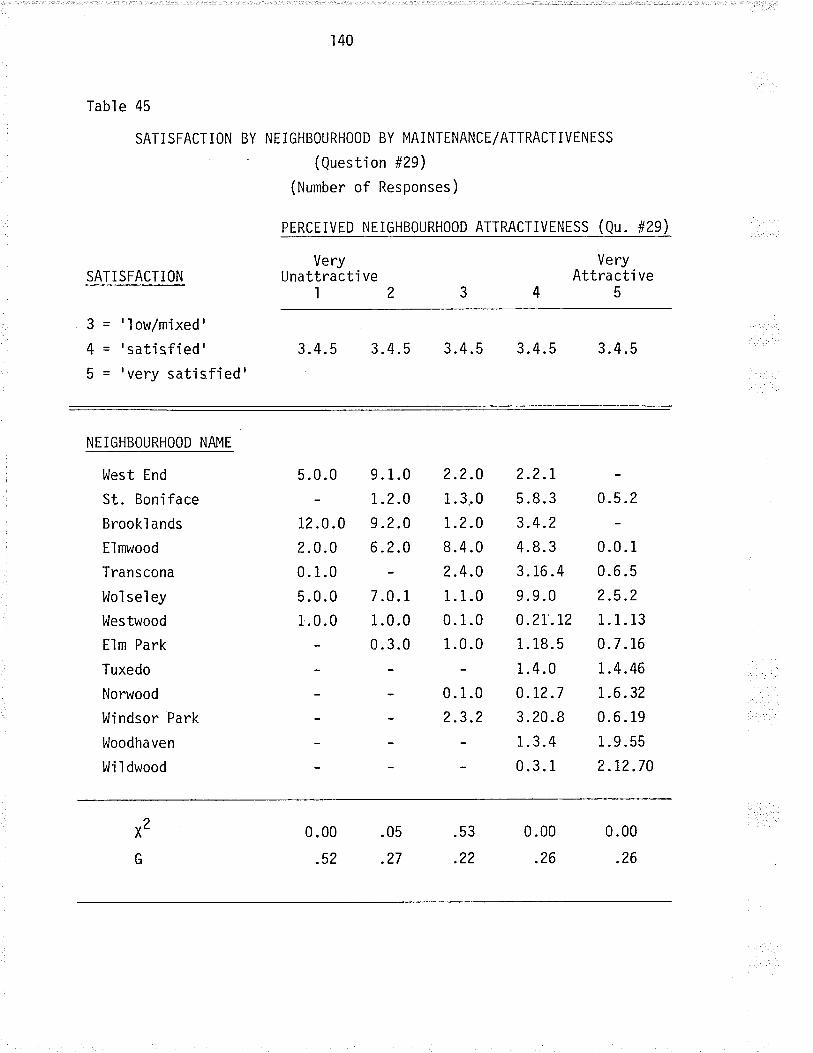
140
Table 45
SATISFACTION BY
SATISFACTION
'l ow/mixed'
' sati sfi ed'
'very satisfied'
VeryUnattracti ve
I
NEIGHBOURHOOD BY MAINTENANCE/ATTRACTIVENESS
(Questi on #29)
(Number of Responses)
PERCEIVED NEIGHBOURH0OD ATTRACTIVENESS (Qu . #29)
VeryAttracti ve
5
3=[=5-
3.4.5 3.4.5 3.4 .5 3 .4.5 3 .4.5
NEIGHBOURHOOD NAME
West End
St. Boniface
Brookl ands
Elmwood
Transcona
I^lol se'ley
l,Jestwood
Elm Park
Tuxedo
Norwood
bJi ndsor Park
hjoodhaven
l¡li I dwood
5 .0.0
12 .0 .0
2.0.00.1.05 .0.01.0.0
9. 1.0
7.2.09 .2.06 .2.0
7 .0.t1.0.00.3.0
2.2.01 .3..0
I.2.08.4.02.4.01.1.0
0.1.01.0.0
0.1.02.3.2
2.2.r5 .8.33.4.24.8.33. 16 .4
9.9.00.2t.121 . 18.5
1.4.00.12.73.20.8
1.3.40.3. 1
o.i.z
0.0.10.6 .5
2.5.21.1.13
0. 7. 16
t.4.46L.6.32
0.6 . 19
1 .9.55
2.t2.70
x2
G
0.00
.52
.05
.27
.53
.22
0 .00
.26
0.00
.26
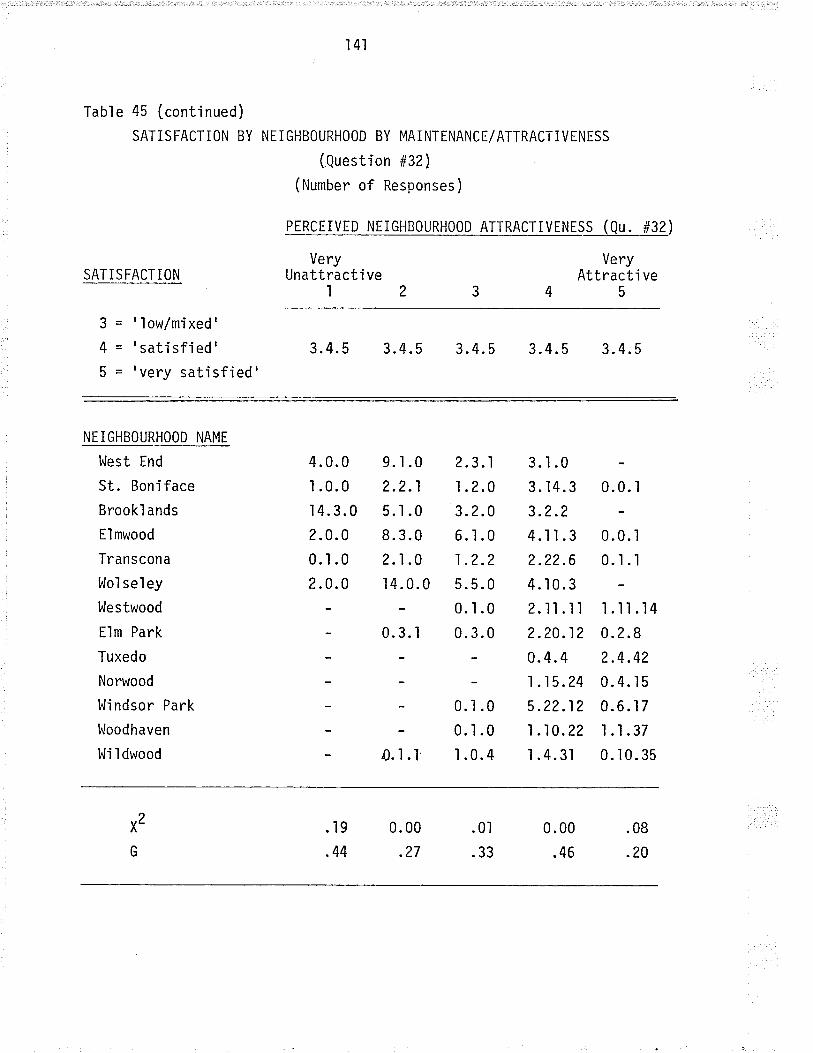
l4l
Table 45 (continued)
SATISFACTION BY
SATISFACTiONVery
Unattracti ve1
NEIGHBOURHOOD BY MAINTENANCE/ATTRACTIVENESS
(.Questíon #32 )
(Number of Responses)
P E Rc E I V ED N E I GH B0URH00D ATT RAcr ry$$!_(!9._ i!a)
VeryAttracti ve
5
a-J-
Q=
$=
' I ow/mixed'
' sati sfi ed'
'very satisfied'3. 4.5 3.4.5 3.4.5 3.4.5 3.4.5
NEIGHBOURHOOD NAME
l¡lest End
St. Boniface
Brookl ands
Elmwood
Transcona
l^loì seì ey
l^Jestwood
Elm Park
Tuxedo
Norwood
l.Jindsor Park
l^Joodhaven
l,li I dwood
4.0.0ì .0.014.3.0
2.0.00.1 .0
2.0.0
9.1.02.2.1
5.1.08.3.02.1.014.0.0
0.3. I
o.i.l
2.3.1
I .2.03. 2.0
6.1.01.2.2s.5.00..l.00.3.0
o.l .o0.t.01.0.4
3.t.03.14.3
3.2.24.1ì.32.22.6
4. I0.32.rì.il2.20.12
0.4.4l.ì5.245.22.12
1..l0.22
1.4.3.|
o.o.l
0.0.1
0.1 .1
l.ll.l40.2.82.4.42
0.4. I 5
0.6.1 7
1.t.370.10.35
x2
G
.t9
.44
0. 00
.27
.01
.33
0.00
.46
.08
.20
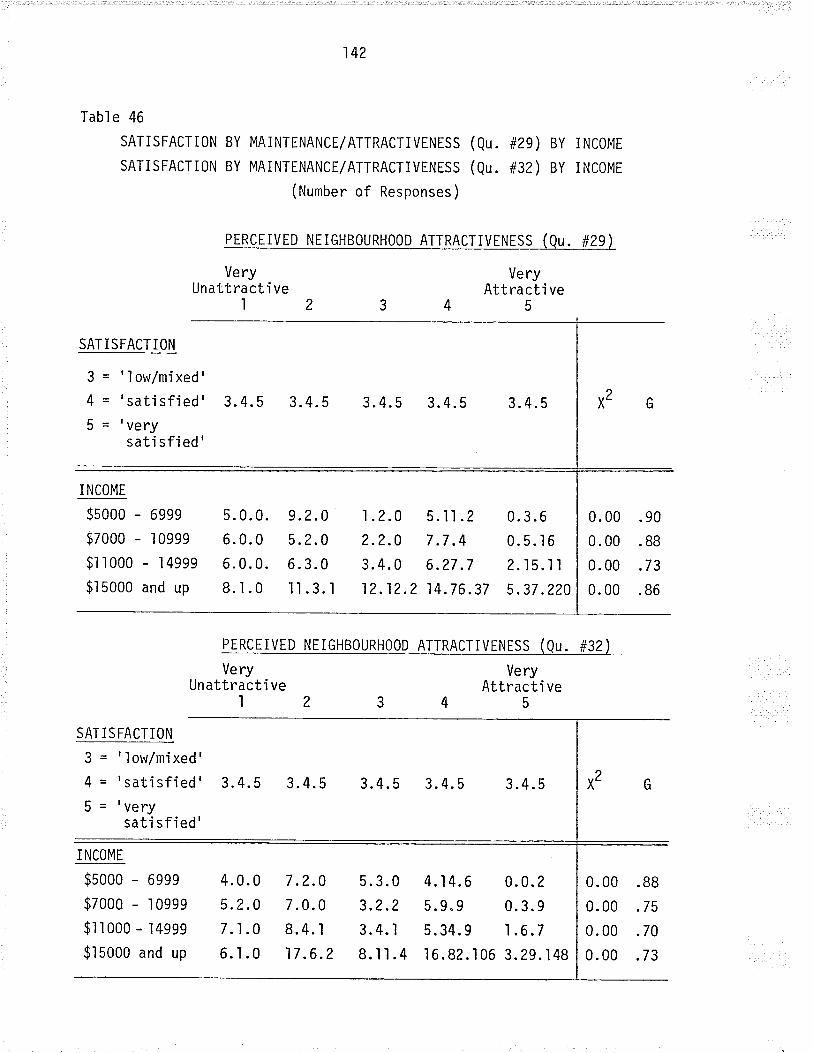
142
Table 46
SATISFACTI0N BY MAiNTENANCE/ATTRACTIVENTSS (Qu. #29) By INCOME
SATiSFACTION BY MAINTENANCE/ATTRACTIVENESS (Qu. #32) BY INCOME
(Number of Responses)
PERCEIVED NEIGHBOURH00D ATTRACTiVENESS (Qu. #29)
SATISFACTION
3 = 'low/mixed'4 ='satisfíed'g = 'very
sati sfi ed '
I NCOMT
VeryUnattract i ve
I
5. 0. 0.
6.0.06.0.0.8.t.0
VeryUnattracti ve
l
3.4.5 3.4. 5 3.4.5 3.4.5
VeryAttracti ve
5
3.4.5
$5000 -$7000 -$r r 000
$l 5000
6999
I 0999
- 14999
and up
9.2.05 .2.06. 3.0
11.3.1
1.2.02.2.03.4.012.12.2
s.il.27.7.46.27 .7
14.76.37
0.3.60.5.ì62.i5.ll5.37 .220
0.00 .90
0.00 . 88
0.00 .73
0.00 .86
PERCETVEp NETGHBOURHOOp ATTRACTTVENTSS (Qu. #32)
VeryAttracti ve
5
SATISFACTION
J = ''low/míxed'4 = 'satisfied'5 = 'very
sati sfied'
I NCOME
$s000 - 69e9
$7000 - r Oese
$il000 - 14999
$15000 and up
3.4.5 3.4.5 3.4. s 3.4. 5 3.4.5
4.0.0tro^J.L.V
7.1.06.1.0
7.2.0/.U.U
8.4. I17 .6.2
5.3.0J.¿.¿
3.4. lB.tI.4
4. I 4.6
0.v.v
5.34.9
I 6.82. I 06
0.0.2U.J.Y
1.6.7
3. 29. I 48
0.00 .88
0. 00 .75
0. 00 .70
0.00 .73
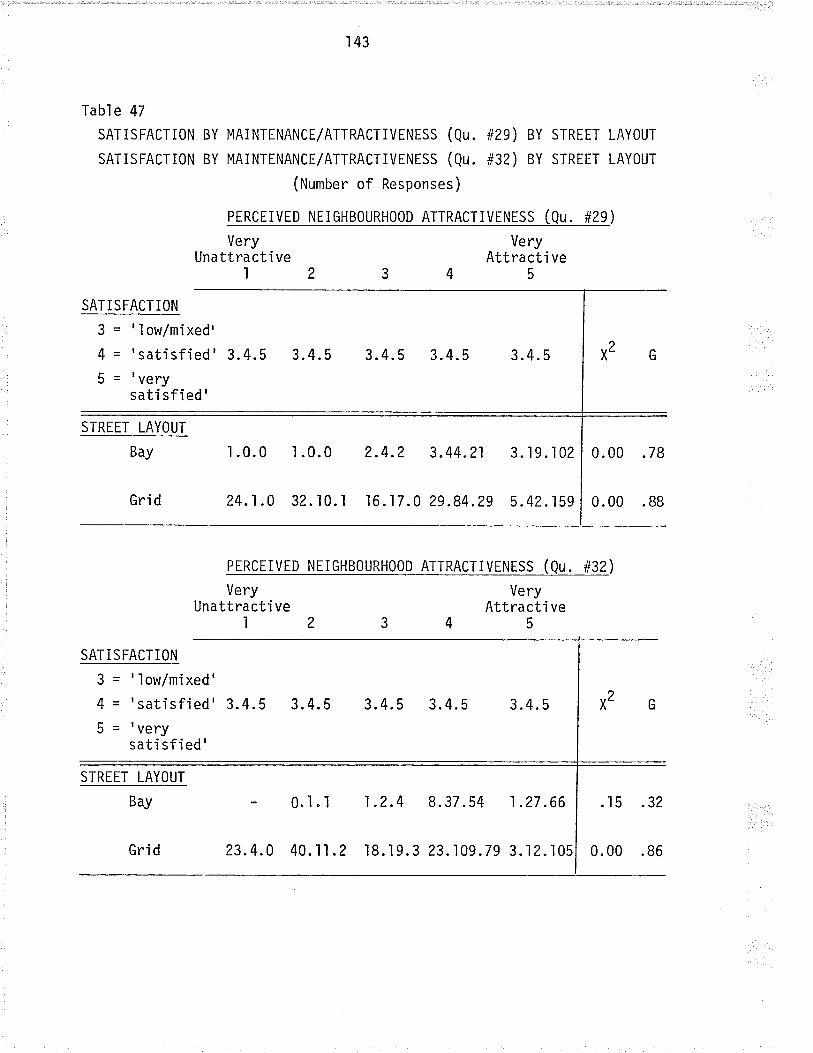
Tabl e 47
SATISFACTION
SATISFACTION
143
3.4. 5 3.4.5 3.4. 5
2.4.2 3.44.21
BY MAINTENANCE/ATTRACTIVTNESS (Qu. #29) BY STREET LAY0UT
BY MAINTENANCE/ATTRACTIVENESS (Qu. #32) BY STRETT LAY0UT
(Number of Responses)
PERCEIVED NEIGHBOURH00D ATTRACTIVTNESS (Qu. #29)
VeryUna ttracti ve
12
1.0.0
VeryAttracti ve
5
3.4. 5
SATISFACTION
J = '1ow/mixed'
Q = 'satisfied' 3.4.5g = 'very
sati sfied'
STREET LAYOUT
Bay
Gri d
3. 19. I 02
5.42. I 59
0.00
0. 00
.78
24.1.0 s2.l0.l 16.17.0 29.84.2e
PERCEIVED NEIGHBOURHO0D ATTRACTIT_EM!_(Qq- j!?)
.88
SATiSFACTION
J = 'low/mixed'Q = 'satisfied' 3.4.55 = 'very
sati sfi ed'
STREET LAYOUT
Bay
Gri d
3.4.5 3.4.5 3.4.5 3.4. 5
VeryAttracti ve
5
1 .2.4 8. 37 . 54 1 .27 .66
VeryUnattracti ve
I
- 0.1 .I
23.4.0 40.1t.2
.15
0. 00
.32
18.19 .3 23. 109.79 3.12.105 .86

744
likely be attríbuted to the distribution of responses wjthin this cross-
tabulation, which leaves many empty or near empty cells while most
responses are concentrated in only a few cells representing an approxi-
mately even split between two of the categories. A similar effect is
observed when this part'icular crosstabulation js controlled for layout
and income, and also for ìayout and neighbourhood locatjon. This effect
is not produced when controllìng for anything other than layout, nor is
it produced wl¡en using the other measure of neighbourhood maintenance.
Since these two measures were so highìy reìated in the P2 test (see
section 4.1.10), it is assumed that this reduction in significance and
strength'is the result of the mechanics of calculating the statist'ics
when such a data distribution is present, rather than due to any'real'
condi ti on.
When both crosstabulations are controlled for street ìayout and
for income, each income group in each street pattern showed a strongly
positive correlation between neighbourhood mal'ntenance and neìghbourhood
satisfaction (except in the one case described in the previous paragraph).
The same holds true where both street'layout and neighbourhood location
(characterized as either 'inner city' or 'suburban') are held constant.
In addition, in every case where separate observat'ions are made for 'bay'
and'grid'areas, the'bay' areas consistently show a higher percentage
of responses in the uppermost category of both neighbourhood maintenance
and of satisfaction.
The testjng of the hypothesìs led to the fol'lowilng conclusions:
- both measures of neighbourhood maintenance are strongly
associated with neighbourhood satisfaction, although more
peop'le felt that their neighbourhood's streets provided a
l4s
'very p'leasant' envjronment to walk in than felt that
the streets and houses of that neighbourhood were 'very
attractive'. (Table 44)
for both measures of neighbourhood majntenance, the
responses of the majority of the tested neighbourhoods
clearìy showed the relatíonship between a higher level
of maintenance and a higher level of satisfact'ion with
that neighbourhood. (fa¡le 45)
both measures, when controlled for fami'ly income, showed
that each income level was characterized by a strong
positive correlation between the independent and the
dependent variables. (fanie 46)
both measures, when controlled for street layout pattern,
continue to show a high positive correlation between the
independent and dependent variables. Also for both
measures, 'bay' iayouts show higher percentages of
respondents in the highest categories of both
'Satisfaction with Neighbourhood' and'Neighbourhood
Maintenance' than 'grid' areas. (faUl e 47)
when street layout and income were held constant, both
measures showed a strong positive correlation between
neighbourhood sat'isfaction and neighbourhood maintenance
for every income level in both types of street patterns.
Again, aìl 'bay' areas showed a consistent'ly higher
146
number of responses in the highest categorìes of
satisfaction and maintenance than the 'grid' areas.
- when the crosstabulations were controlled for both street
layout and neighbourhood location within the cjty, the
associatjon remajned strong, and 'bays' showed more
responses in the highest categorìes than 'grids'. At
:::,: ï:,';ïî;, l' l,ï:, ï: :.':. : :.,,. :', ,'' .,.:',.,,,.,,"'' categories than the 'inner city grids'.
0n the basis of these responses showing the consistent'ly strong and
pos-itive association between neighbourhood maintenance and sat'isfaction
with neighbourhood regardìess of socjo-economic or physicaì cond'itions,
this hypothesis should be considered as accepted.
4.3.6 Hypothesis Six
Hvpothesis Six ff.1!'.:i3ffi:,:l ffiï:ll:3,'Iil'i:lli;;:',?tsatisfaction that a person holds towards their
, neighbourhood will increase as well.
One 'item stood out as the'best'measure of the independent variable in
thÍs hypothesis, with that being question #16: "0n the whole, do you
like or disljke the people in your neighbourhood?1'. The results of the
simple crosstabulatjon of this item with the one measuring 'Satisfac-
tjon with Neighbourhood' are shown ìn Table 48, which indicates thatt
there is a hjgh degree of comelation between the two variables (X'=
0.00, G = .77). Sim'ilarìy, the results among each of the thìrteen neigh-
bourhoods (faUte 49) show that a feeling of friendliness toward ohe's
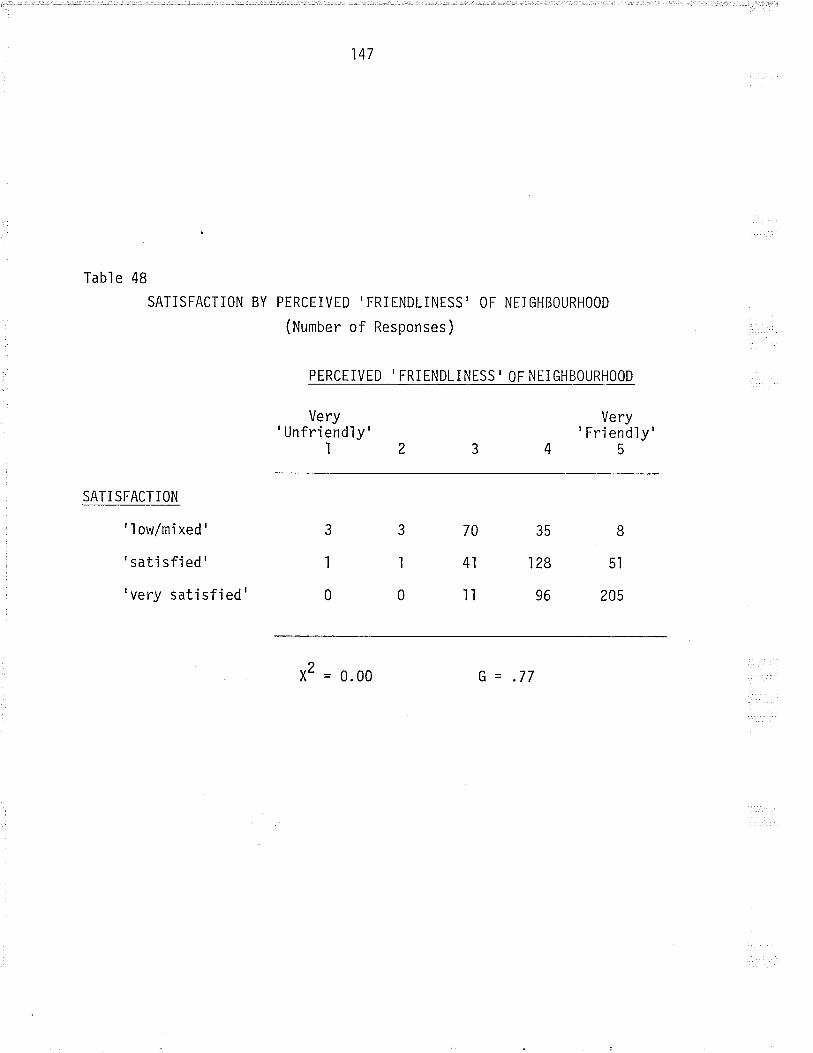
147
Table 48
SATISFACTION BY PERCEIVED'FRIENDLINESS' OF NEIGHBOURHOOD
(Number of Responses)
SATiSFACTiON
PERCEIVED' FRiENDLINESS' OF NTIGHBOURHOOD
Very Very'Unfriendly I I Friendly'
12345
33703581 I 41 128 5l
' I ow/mi xed '
'sati sfied'
'very satisfied' 0 0 ll 96 Z0S
X2 = 0.00 Ç=.77
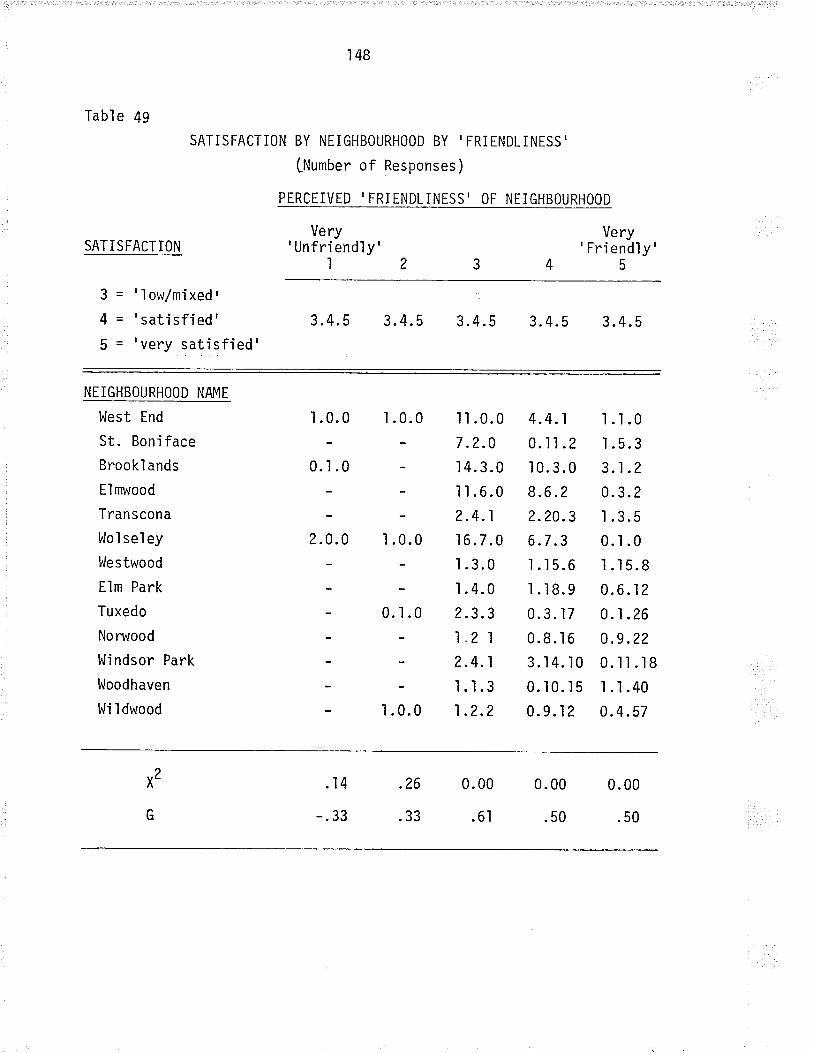
148
Table 49
SAT I SFACT ION
SATISFACTiON BY NEIGHBOURHOOD BY' FRIENDLINESS'
fNumber of Responses)
PERCIIVED' FRIENDLINESS' OF NEIGHBOURHOOD
Very'Unfriendìy'
l
Very'Friendiy'
5
3-4=
'l ow/mixed,
'satisfied''very satisfied'
3.4. 5 3.4.5 3.4.5 3.4.5 3.4. 5
NEIGHBOURHOOD NAME
West End
St. Boniface
Brookl ands
El mwood
Transcona
Woì sel ey
lrlestwood
Elm Park
Tuxedo
Nonr¡ood
l,llindsor Park
l,loodhaven
trli I dwood
1 .0.0
0.1 .0
z.o.o
ì .0.0
ì.0.0
0.1.0
1 .0.0
I I .0.07.2.0I 4.3.0I I .6.02.4.1
16.7.0
1 .3.0I .4.02.3.31.2 l2.4.1
t.ì.31.2.2
4.4.1
0.1t.2I 0. 3.0
8.6 .2
2.20.3
6.7 .3
1.15.6
I .18.9
0.3.ì70.8. I 6
3. 14. 10
0.10.15
0.9.12
1.1.0ì.5.33.1 .2
0.3.2I .3.50.ì.01.15.8
0.6.12
0. I .26
0.9 .22
0.1ì .18
1.1.40
0.4.57
x2
G
.14
-.33 .33
.26 0. 00
.6.|
0.00
.50
0. 00
.50
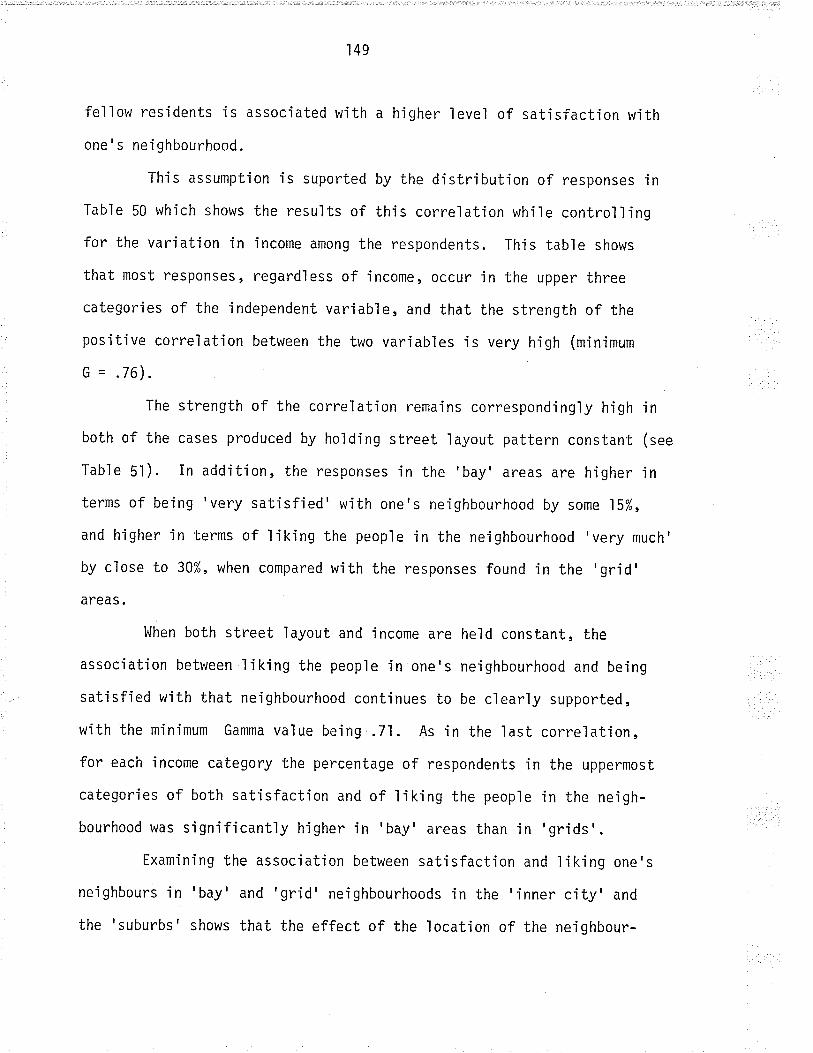
149
fellow residents is associated with a higher level of satisfaction with
one's neighbourhood.
This assumption is suported by the djstribution of responses in
Table 50 which shows the results of this correlation while contro'lling
for the variation in income among the respondents. This table shows
that most responses, regardìess of income, occur in the upper three
categories of the independent variable, and that the strength of the
positive corelation between the two variables is very high (minimum
c = .76).
The strength of the correlation remains correspondingly high 'in
both of the cases produced by hold'ing street layout pattern constant (see
Table 5l). in addition, the responses in the'bay'areas are higherin
terms of being'very satisfied'with one's neighbourhood by some ì5%,
and higher in terms of liking the people in the neighbourhood 'very much'
by c'lose to 30%, when compared with the responses found in the 'grid'areas.
When both street layout and income are held constant, the
associ ati on between ì i ki ng the peop'le i n one' s ne'i ghbourhood and bei ng
satisfied with that neighbourhood continues to be ciearly supported,
with the minimum Gamma value beìng .71. As in the last correìation,
for each income category the percentage of respondents in the uppermost
categories of both satisfaction and of iiking the peop'le in the neigh-
bourhood was significantìy higherin 'bay' areas than in 'grids, .
Examining the assocjation between satisfaction and'liking one's
neighbours in'bay' and'grid' neighbourhoods jn the'inner city' and
the'suburbs'shows that the effect of the location of the neighbour-
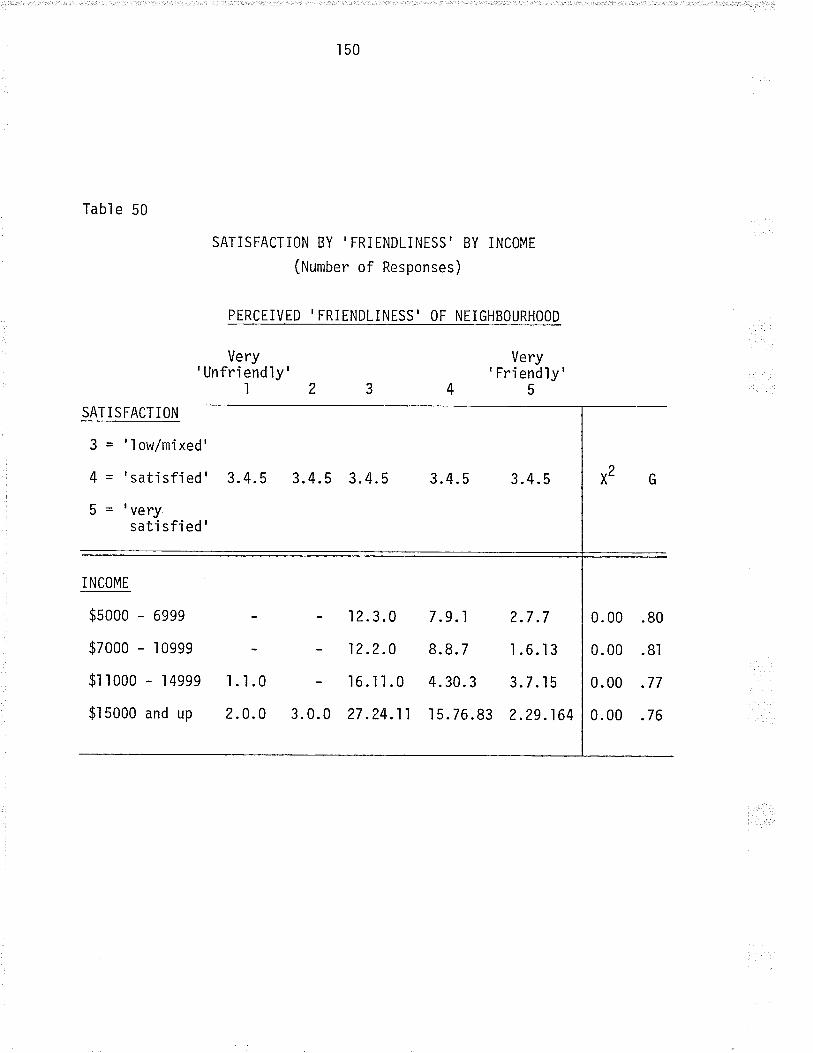
150
Table 50
SATISFACTION
J = 'ìow/mixed'
4 - 'satisfied'
5 = 'verysati sfi ed'
I NCOME
Very'Unfriendìy'
I
1.1.0
2.0.0
SATISFACTION BY 'FRIENDLINESS' BY INCOME
(Number of Responses)
PERCEIVED' FRIENDLINESS' OF NEIGHBOURHOOD
3.4.5 3.4.5 3.4.5 3.4. 5
Very'Friendìy'
5
3.4. 5
$sooo -
$7ooo -
$l I 000
$l 5ooo
6999
I 0999
- I 4999
and up
7 .9.1
8.8. 7
4. 30. 3
I 5. 76.83
2.7.7
1.6..l3
3.7.t5
2.29 .164
0.00 .80
0.00 .8.|
0.00 .77
0.00 .76
- 12.3.0
- 12.2.0
- 16.il.0
3. 0. 0 27 .24 .11
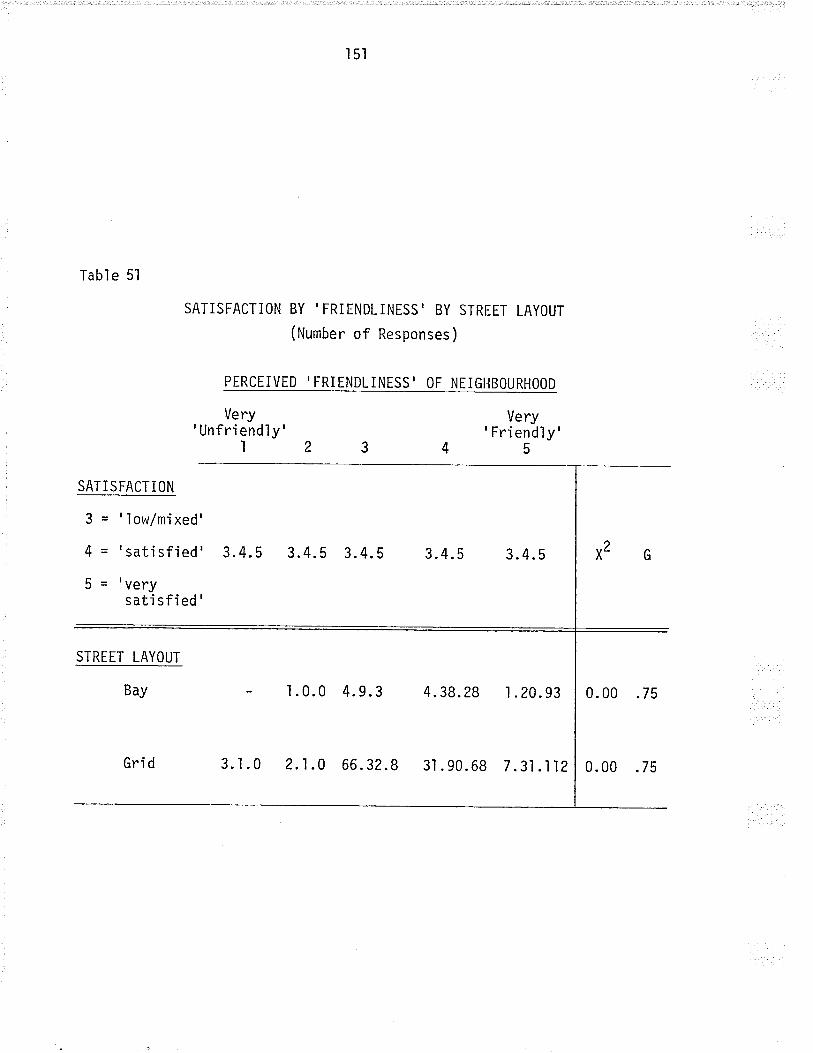
l5l
SATISFACTION BY 'FRIENDLINESS' BY STREET LAYOUT
(Number of Responses)
PERCEIVED' FRIENDLINESS' OF NEIGHBOURHOOD
Table 5l
SATISFACTION
3 - 'low/mixed'
4 = 'sati sfied'
5 - 'verysati sfied'
STREET LAYOUT
Bay
Gri d
Very' Unfri endly'
l2Very
' Friendìy'5
3.4. s3.4.5 3.4.5 3.4.5 3.4.5
4. 9.3 4. 38. 28 I .20.93 0. 00 .75
3.1.0 2.1.0 66.32.8 3l .90.68 7 .31.112 0. 00 .75
152
hoods on the correlation is not signifjcant. It also shows that'bay'
areas continue to have the larger proportion of responses ìn the
uppermost categories of each varíable, although the responses for the
'suburban grids'are somewhat higher than those of the'inner city
grids' .
The results of testing this hypothesis can be summarized as
fol I ows :
- there is a high degree of correlation (G = .77) between
liking the people in one's neighbourhood and being
satisfied with that neighbourhood. (Table 48)
- the above correlation remains strong in the responses
for each individual neighbourhood as well as for the
sample as a whole. (Table 49)
the correlation of the dependent and independent variables
remains strong in each income category. [Table 50)
the correlation remains very strong in areas of each
type of street 'layout pattern, with 'bay' areas having
higher levels of both satisfaction and of liking one's
nei ghbours .
when both street pattern and income are held constant,
the correlation remains very strong in each income
category for each type of street layout. In addt'tion,
'bay' areas again show higher satisfaction and a greater
'liking of the other peopìe in the neighbourlrood than
153
grid' areas show.
- finally, when holding constant street pattern and each
neighbourhood's location with'in the city, the correlation
still remains strong, and 'bay' areas have more responses
:;:t::::' or percentages) in hisher catesories than do
In conclusjon, then, it seems that we are justified in assuming that as
the perceived 'frjendliness' of one's nejghbours increases, one's satis-
factjon with neighbourhood increases correspondingly. The question
rema'ins, then, as to what factors tend to produce or encourage the
liking of one's neighbours. This questìon will be addressed in the final
section of this chapter following the djscussion of the hypotheses.
4.3.7 Hypothesi s Seven
Hvpothesis Seven iffi u;;,n:i'yir'r::,å ::å::l?:'!i:i,:r?'lill'lì;il.].'the level of satisfaction felt by those peopìe will be.
In section 4.1.8, Tuxedo and Westwood were identified as the most homo-
geneous neighbourhoods of the thirteen, whjle Norwood and ldildwood were
ranked as 'somewhat' homogeneous. At the same time, two areas were
'somewhat' heterogeneous (Brook'lands and Transcona), while two were
'predominantly' heterogeneous (E'lmwood and l,lolseìey) according to the
criteria used in this study. To test thìs hypothesis, two avenues must
be explored. Firstly, 'Sat'isfaction with Neighbourhood' among these
neighbourhoods must be compared, to see if satisfactjon is indeed higher
among more homogeneous areas than anrong those which are comparatively

154
heterogeneous.
Table 52 shows the simple distribution of 'satisfaction with
Neighbourhood' among the eight neighbourhoods (grouped in pairs ranging
from 'predomi nantìy heterogeneous ' to ' predom'inanily homogeneous , ) .
From this, we can see that there is a high degree of correlation between
homogeneity and higher levels of satisfactjon, and between heterogeneìty
and lower levels of satisfaction (x2 = 0.00, G = -0.s7). However,
further examination indicates that the four homogeneous neighbourhoods
are all of 'higher' socio-economic status, while the heterogeneous areas
are all characterized by relatjvely'lower'scores on the items measuring
socio-economic status.
Therefore, a second avenue must be expìored, in which the satis-faction levels among the eight neighbourhoods are tabulated while
controlìing for fami'ly income, in order to account for any bias intro-duced by the existing variations in economic status.
In order to do this, the economic compondnt of socio-economic
status (one of the three measures of homogene'ity and heterogeneity,
aìong with life cycìe stage ahd ethnic divers'ity) must be eliminated in
order to maintain statistical accuracy and relevance when controììing
the correlation for that same factor. When the neighbourhoods are
re-evaluated to account for this, however, no change was found to result
in their initial characterization as being homogeneous or heterogeneous.
Therefore the correlation was performed as intended, as shown in
Table 53.
From túis, we can see that homogeneìty and higher levels of
neighbourhood satisfaction remain highìy associated in each of the income

Tab
l e
52
Nei
ghb
ourh
ood
Nam
e
Tux
edo
'Pre
dom
ínan
tly
3.6
14.3
B
z.i
100%
(s6
)
wes
twoo
d H
omog
eneo
us'
5.9
4s.1
4g
.o
I 00
% (
sl )
Nor
woo
d ' s
omew
hat
1 .7
gz
.?
66 .
I I 00
% (
59 )
l{ild
woo
d H
omog
eneo
us'
2.3
17.0
80
.7
100%
(B
B)
SA
TiS
FA
CT
I0N
By
NE
IGH
B0U
RH
00D
H0M
0/H
ET
ER
OG
EN
EIT
y
(in P
erce
nt)
CH
AR
AC
TE
Ri
ZA
T I
ON
Bro
okla
nds
'som
ewha
t 73
.0
21.6
5.
4 lo
o% (
37)
Tra
nsco
na
Het
erog
en.o
ur'
1z.z
6s
.g
zz.0
10
0% (
41)
Elm
woo
d 'P
redo
mín
ant'l
y sr
.3
3g.s
10
.3
100%
(39
)
wo'
lsel
ey
Het
erog
eneo
us'
5g. r
34.9
7 .o
10
0% (
43)
'Low
/M
i xed
'
SA
TIS
FA
CT
ISN
' Sat
i sfi
ed'
'Ver
yS
ati s
fi ed
'
X2
= 0
.00
Tot
al s
G =
-.5
7
J (¡ (tr
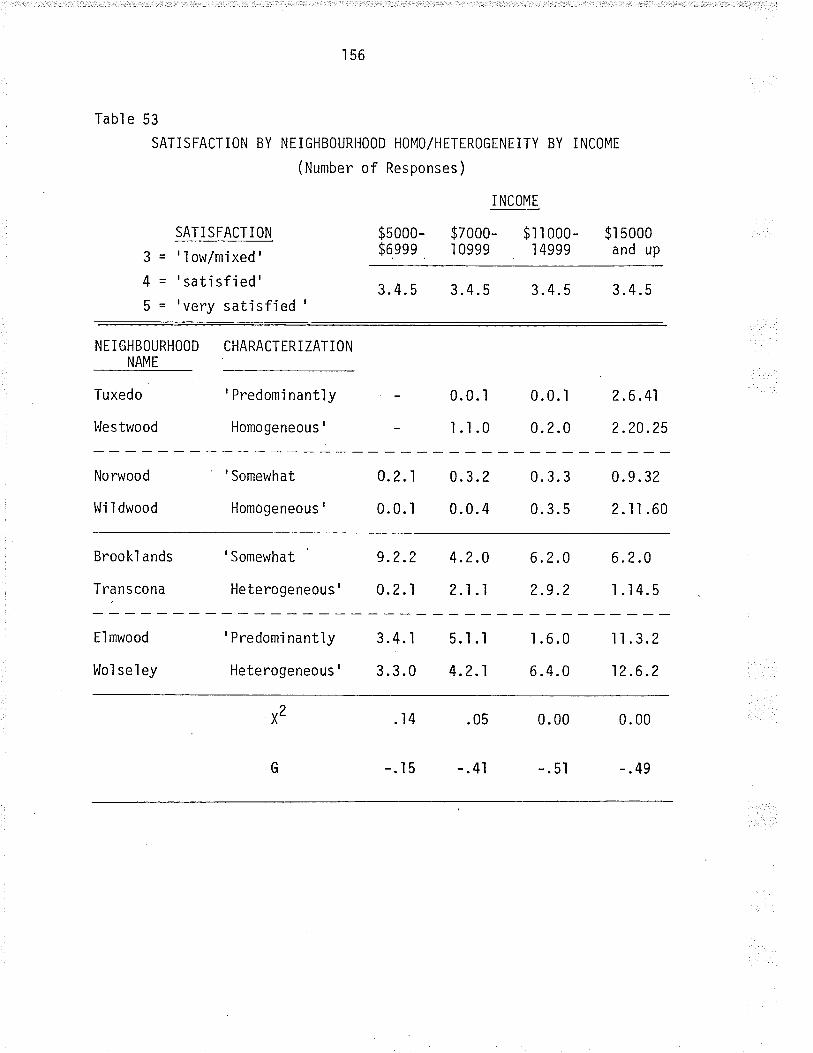
156
Tabl e 53
SATISFACTION BY
SATISFACTION
NE I GHBOURHOOD HOMO/H ETEROGENE ITY
(Number of Responses)
BY INCOME
I NCOME
$7ooo- $l r ooo-I 0999 14999J ='low/mixed'
4 - 'satisfied'5 = 'very satisfied '
$5000-$6 ee9
$r 5oo0and up
3.4.5 3.4.5 3.4.5 3.4.5
NEIGHBOURHOOD CHARACTTRIZATIONNAME
Tuxedo
l¡Jestwood
' Predomj nantìy
Homogeneous'
0.0. l
t.1.0
0.0. I
0.2.0
2.6.41
2.20.25
No rwood
Wi I dwood
'Somewhat
HomÒgeneous'
0.2.1
0.0.1
0.3.2
0.0.4
0.3.3
0. 3.5
0.9.32
2.11.60
Brookl ands
Transcona
'Somewhat
Heterogeneous'
9 .2.2
0.2.1
4.2.0
2.1.1
6 .2.0
2.9 .2
6.2.0
1.14.5
El mwood
l^loì sel ey
' Predomi nantìy
Heterogeneous'
3.4.1
3.3.0
s.l.t4.2.1
I .6.0
6 .4.0
11.3.2
12.6 .2
x2 .14
-.15
.05
-.4.|
0. 00
-. 5l
0. 00
-.49
157
categories except the lowest one ($5000 - $0ggg per year), where the low
strength of the association can be'large'ly attributed to the very low
number of respondents jn this category among the homogeneous neighbour-
hoods. Among the three remaining income categories, the lowest Gamma
value is -0.41 (which is still quite strong), with the higher satisfac-
tion levels agaín occuring among the homogeneous areas and the lower
satisfactÍon levels among the heterogeneous areas.
A brjef examination of the effect of physìcaì factors on the
relationship between heterogeneity and satisfaction indicates that
neither street iayout pattern nor neighbourhood location sign'ificantìy
affects the positive correlation between the two variables. it should
be noted that thjs was not an unexpected result.
However, even though both tests of the correlation support the
hypothesjs, other factors may be intervening in this relatjonship which
have not yet been identified. For exampìe, Westwood, which was character-
ized as a 'predominantìy' homogeneous neighbourhood, shows a lower
satisfaction level than either of the 'somewhat' homogeneous areas.
Símilarly, Brooklands (a 'somewhat' heterogeneous neÌghbourhood) has a
satisfaction level lower than either of the 'predonlinantìy' heterogeneous
areas. A limited amount of further testing faìled to turn up a variable
(or variables) to account for these results.
So, even though the data ind'icates a generaì support for this
hypothes'is, enough questìons remain to preclude its outright acceptance
wjthout a better understanding of the other factors whjch may have an
influence upon it. Some discussion of this will be nrade in the final
sectjon of this chapter.
t58
4.3.8 Hypothesis Eight
Hypothesis Eíght The higher the degree of perce'ived privacy availableto a neighbourhood's res'idents, the higher theirsatisfaction levels will be.
The most basic test of this hypothesis is the correlation between the
responses to the dependent variable (satisfaction) and those of item
#34: "To what extent would you agree with the statement: "The layout
of streets and housing in my neighbourhood provides me with enough
privacy."". Tables 54 and 55 show the results of thjs correlation for
the sample as a whole and when broken down by neighbourhood of residence.
From this data, we can see that the perceptìon of a higher degree of
privacy is associated with higher ìevels of satisfaction with neighbour-
hood for both aggregates and grouped responses.
To test this result further, we wi'lì examine the correlation
again while controlìing for socio-economic and then physica'l ìayout vari-
ables (see Tables 56 and 57): In the former case, we can see that the
coffel ati on between hi gher l evel s of percei ved pri vacy and hi gher 'l evel s
of satísfactjon remains strong (mìnimum Gamma value of .76) regardìess
of the family income of the respondent. In the latter correlation the
Gamma value for the'bay'neighbourhoods, while still high, is consider-
abìy'ìower than that of the'grid'neighbourhoods. At the same time,
however, some 52% of the'bu{' residents strongìy agree that their
neighbourhoods provide them with enough prìvacy and 62% are vey satjs-
fied with their neighbourhood, while the same fìgure for the 'grid'areasare 36% and 42% respect'iveìy.
0f course, all of the'bay'areas are located in suburban areas,
and some of the'grids'are in the inner city, which might lower the
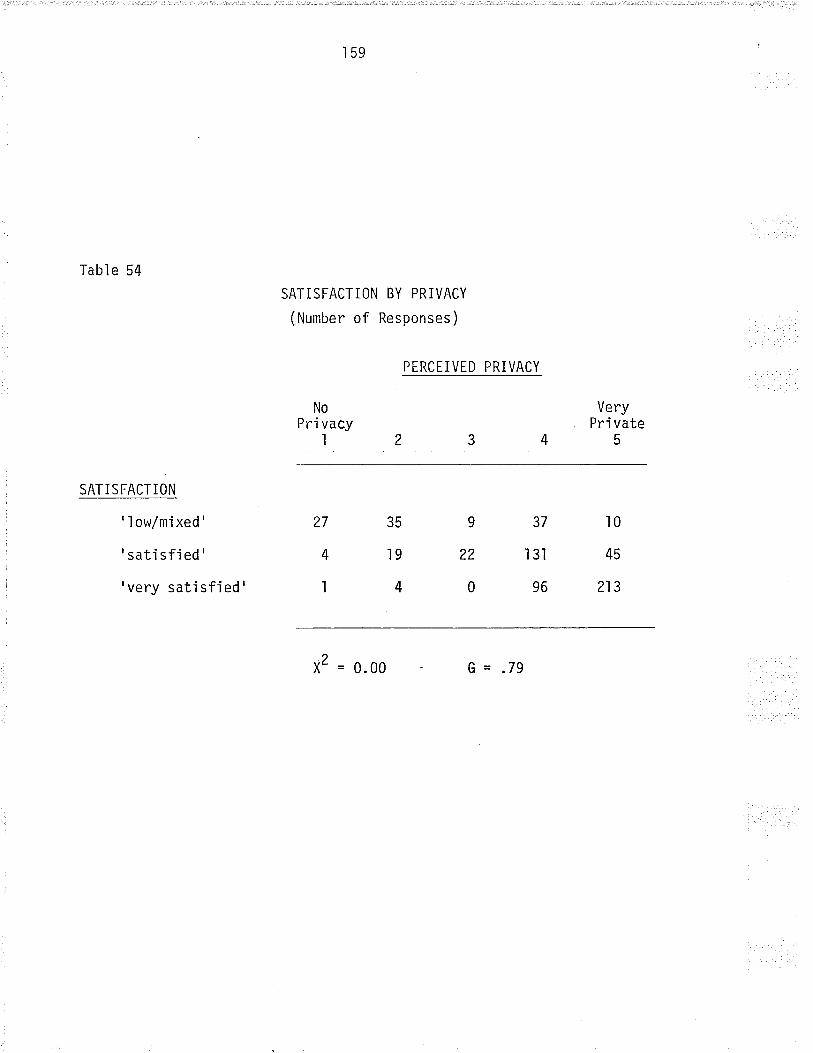
159
Iable 54
SATISFACTION BY PRIVACY
(Number of Responses)
SATISFACTION
PERCEIVED PRIVACY
No VeryPri vacy Pri vate
12345
27 35 9 37 l0
4 l9 22 l3ì 45
' I ow/mi xed'
' sati sfi ed'
'verysatisfied' I 4 0 96 213
X2=0.00 G=.79
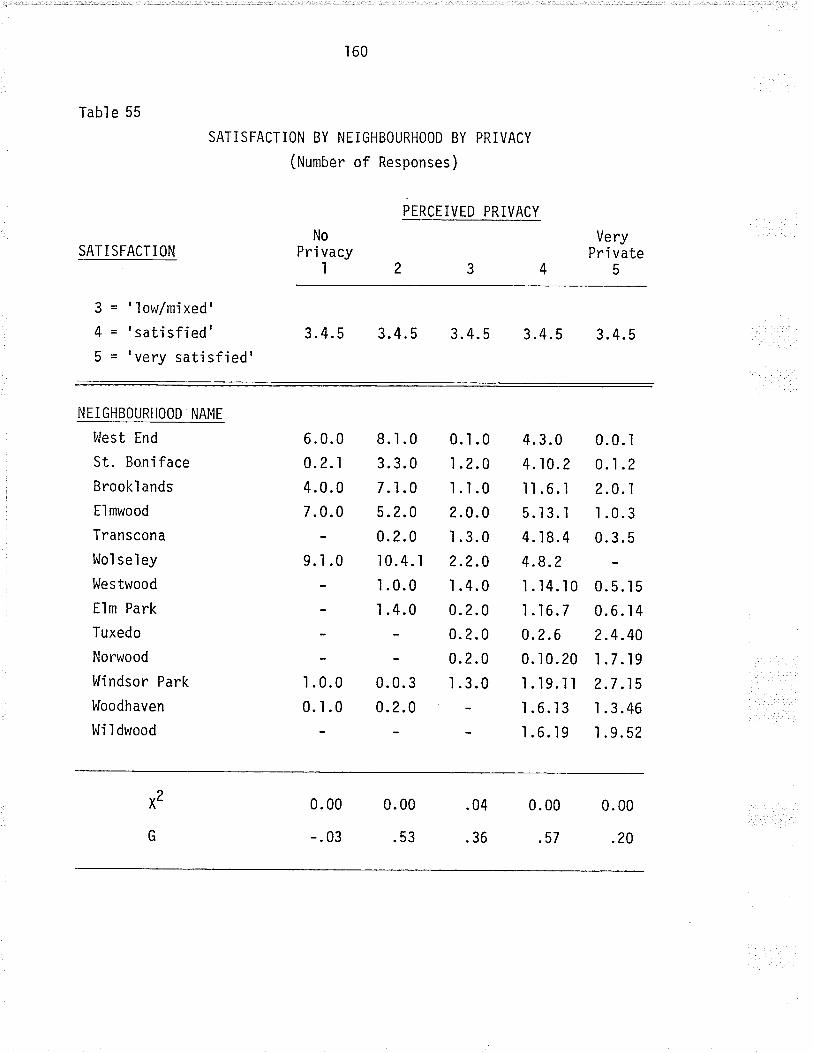
160
Table 55
SATISFACTION
3 = ' 'l ow/mi xed '
4 ='satísfied'5 - 'very satisfied'
SATISFACTION BY NEIGHBOURHOOD BY PRIVACY
(Number of Responses)
PIRCEIVED PRIVACY
NoPrí vacy
l
VeryPri vate
5
3.4.5 3.4. 5 3.4.5 3.4. 5 3. 4. 5
NEIGHBOURHOOD NAME
ï¡lest End
St. Boniface
Brookl ands
El mwood
Transcona
l^lol se'ley
l,lestwood
Elm Park
Tuxedo
Norwood
l^fíndsor Park
Woodhaven
l^li I dwood
6.0.00.2.1
4.0.07.0.0
9..l.0
l.o.oo']'o
8.t.03.3.07.ì.05.2.00.2.010.4. I
I .0.0
''1'o
0.0.30.2.0
0.ì.0I .2.0r.ì.02.0.01.3.02.2.0ì .4.00.2.00. 2.0
0.2.0,
:.0
4.3.04.10.2
ll.6.ls.l3.l4. 18.4
4.8.2l.l4.l01..l6.7
0.2.60.10.20
l.ì9.r1ì.6.t3I .6. l9
0.0. l0.1 .2
2.0.1
I .0.30. 3.5
0.5. l50.6. I 42.4.40.l.7.t9
2.7 .15
ì .3.46
1 .9.52
x2 0. 00
-.03
0. 00
.53
0. 00
.57
0. 00
.20
.04
.36
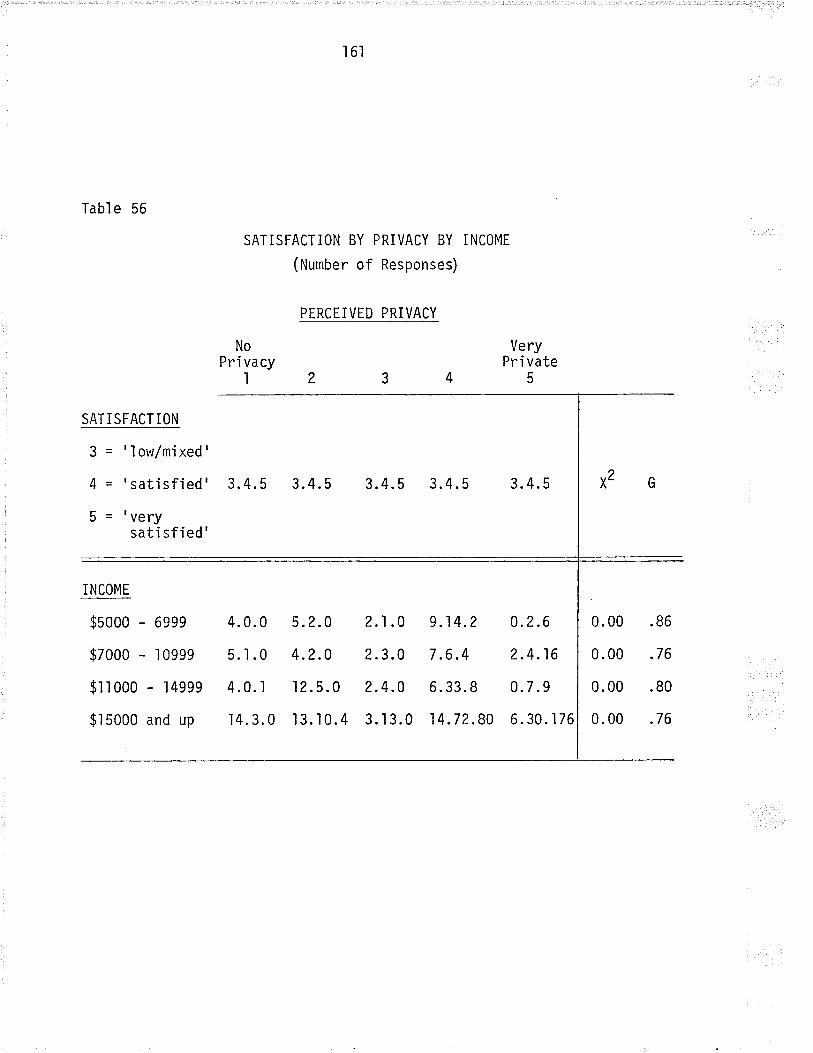
l6l
SATISFACTION BY PRIVACY BY iNCOME
(Number of Responses)
PERCEIVED PRIVACY
Tabl e 56
SATISFACTION
J = '1ow/mixed'
4 - 'satisfied'g = 'very
satí sfied'
INCOME
NoPri vacy
I
4.0.0
5.1.0
4.0.1
14.3.0
VeryPri vate
5
$5000 -
$7ooo -
$l I 000
$r sooo
6999
I 0999
- 14999
and up
5. 2.0
4.2.0
I2. s.0
13.10.4
I .1 4.2
7 .6.4
6. 33.8
14 .7 2 .80
3.4.5 x2
0.2.6
2.4.16
0.7 .9
6. 30. I 76
0.00 .86
0.00 .76
0.00 .80
0. 00 .76
3.4.5 3.4.5 3.4. 5 3.4.5
2.1 .0
2.3.0
2.4.0
3.13.0
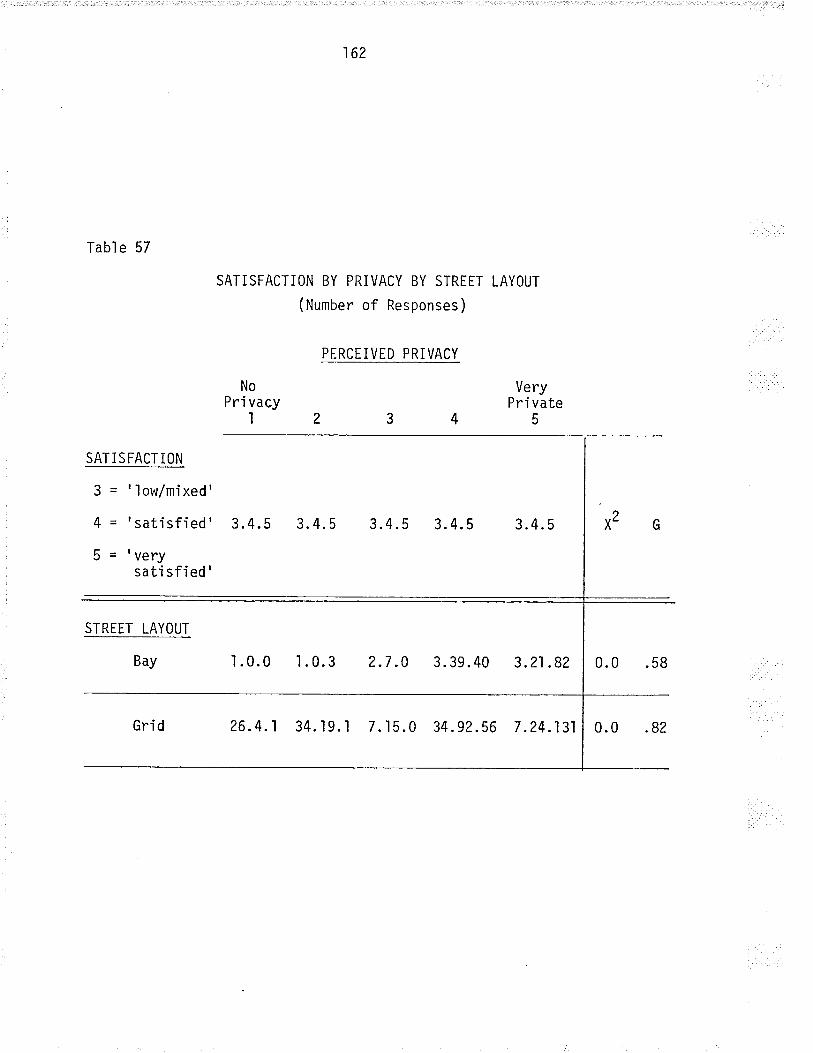
162
Table 57
SATISFACTION
J = 'low/mixed'
4 = 'satisfied'
5 = 'verysati sfied'
STREET LAYOUT
Gri d
SATiSFACTION BY PRIVACY BY STREET LAYOUT
(Number of Responses)
PERCEIVED PRIVACY
NoPri vacy
I
VeryPri vate
5
Bay
3.4. 5 3.4.5 3.4.5 3.4.5 3.4. 5
I .0.0 .l.0.32.7.0 3. 39.40 3.21 .82 0.0
26.4.1 34.19.1 7.15.0 34.92.56 7.24.131 0.0
.58
.82
163
overall level of perceived privacy for the 'grid'areas. when this isaccounted for we find that the 'suburban gríds, stjll show a hígh
correlation between higher privacy and hjgher satisfaction (as do the
'inner city grids'), and a lower level of perceìved privacy and satisfac-
tion than the 'bay' areas.
As a final test, we will look at the basic correlation while
controlling for street ìayout and income. Again, this shows that the
relatjonship between 'perceived privacy' and 'satisfaction w'ith neigh-
bourhood'is essentialiy independent of income in both ,bay'and'grid'
ìayouts, and that both perceived privacy and satisfactjon levels are
higher in 'bay' areas regardìess of jncome. Also recurring in thisparticular test are the clear differences in the pattern of the responses
of those who'agree strongìy', those who'agree,, and those in all of the
lower categories combined.
The find'ings connected with the testing of this hypothesis can
be summarized as follows:
- the level of perceived privacy and the level of
satisfaction with neighbourhood show a strong positive
coffe'lation (G = .19). (Tabìe 54)
- within almost all of the thirteen neighbourhoods tested,
a higher degree of perceived pr-ivacy was c'learìy
associated with higher levels of neighbourhood
satisfaction. (faUle 55)
- within each income category, a higher degree of privacy
was strongìy associated with higher ìeveis of neighbour-
164
hood satisfaction. (faUte 56)
for both types of street patterns, hìgher levels of
perceived prìvacy were associated with higher ìevels
of neighbourhood satisfactìon, with ,bay' street
ìayouts showing s'lightìy higher levels of both perceived
privacy and satisfaction. (Tabìe 57)
when both street pattern and neighbourhood location
('inner city' or 'suburban') were held constant, both
ìayout types in each location showed a hígh, positive
correlation between privacy and satisfaction, with ,bay,
street patterns showing slightly higher levels of
perceived privacy and neighbourhood satisfaction.
- when both income and street pattern were held constant
in the correlation, each income category in both ìayouts
showed a strongr positive association between privacy
and satisfaction, with 'bay' street patterns showing
slight'ly higher levels of both privacy and satisfactjon.
0n the basis of these findings, it wouìd seem safe to accept the hypo-
thesis that higher levels of perceived privacy are indeed associated
with higher levels of neighbourhood satisfaction.
In the final section of this chapter, those additional relation-ships uncovered by the testing of the hypotheses wijl be djscussed, as
will several others which were found while exanlin'ing the data in prepar-
ation for its analysis. In the interest of brevity, these will not be
165
exhaustive examinations, but will be presented as 'supported hypotheses'
to await final confirmation or refutation in future studies.
4.4 Additional Results
0nìy four of the eleven sub-sections contained withjn the hypo-
theses earned outright acceptance from the anaìysis of the residents'
responses. l.le saw that satisfactjon with one's neighbourhood could be
predicted well by a person's feelings of perceived privacy, by theirfeelings of their neighbourhood's 'friendliness', and by the perceived
level of neighbourhood maintenance. l,le also saw that socio-economic and
physical design variables did appear to have some infruence on a
person's feelings of satisfactjon with neighbourhood, although this
influence was apparently not strong enough to produce even approximate'ly
equal satisfaction levels among 'similar' groups of peop'le living in'similar' physicaì surroundìngs. This led to the question of whether a
person's satisfaction can be predicted by observable characteristics at
aì.l, or whether their perceptions were the real key to th'is relationship.
The results of the testing procedures often ended by raising
additional questions such as the one above. In addition, many other
relationsh'ips were put forward in the literature revjew which could be
tested through the ana'lysis of the available data. However, this would
be a lengthy procedure which would most likely raise other equa]]y
interesting questions. For this reason, onìy a few of the additional
questions i^aised will be addressed, and their ana'lyses wiìì be brief.
166
4.4.1 Additíonal Findings - Satisfaction
The procedures used in testing the hypotheses yjelded a consider-
able amount of ínformation related to neighbourhood satisfactjon. Inaddition to these findings, severa'l other relationships u/ere discovered
or suggested which were not jmmed'iately relevant to the testing, but
which did deserve some discussion.
First'ly, we saw from the preìiminary anaìysis of the data that
the responses to question 37.: "0n the whole, how satisfjed are you with
your neighbourhood?" had to be recombined into three categories from the
original five, with the lower three responses ('very dissatjsfied',
'dissatisfied' , and 'mixed feelings') being coììapsed into a s'ingìe
category, and the upper two ('satisfied' and 'very satisfied') remaíning
unchanged. The distrjbutíon of responses wìthin the origÍnal five
categories (refer to Table 3) was not, however, the only reason for this
recombi nati on.
One of the other findings of the initial anaìyses was that the
responses within the lowest three of the five categories of'Satisfaction
with Neighbourhood', when crosstabulated with other variables, showed a
h'igh degree of similarity among themselves, especially among those items
which showed a high degree of associatjon with satisfaction. For
examp'le, the perception of one's neighbourhood as 'friendìy', the degree
of nejghbourhood maintenance, and the degree of privacy were a'l'l found
to correlate well with satisfact'ion, and the results of thejr cross-
tabulations with the dependent variable (see Table 58) show that the
'breakpoints' among the five responses to the questìon concern'ing one's
level of satisfaction come after the third and fourth categories ('very
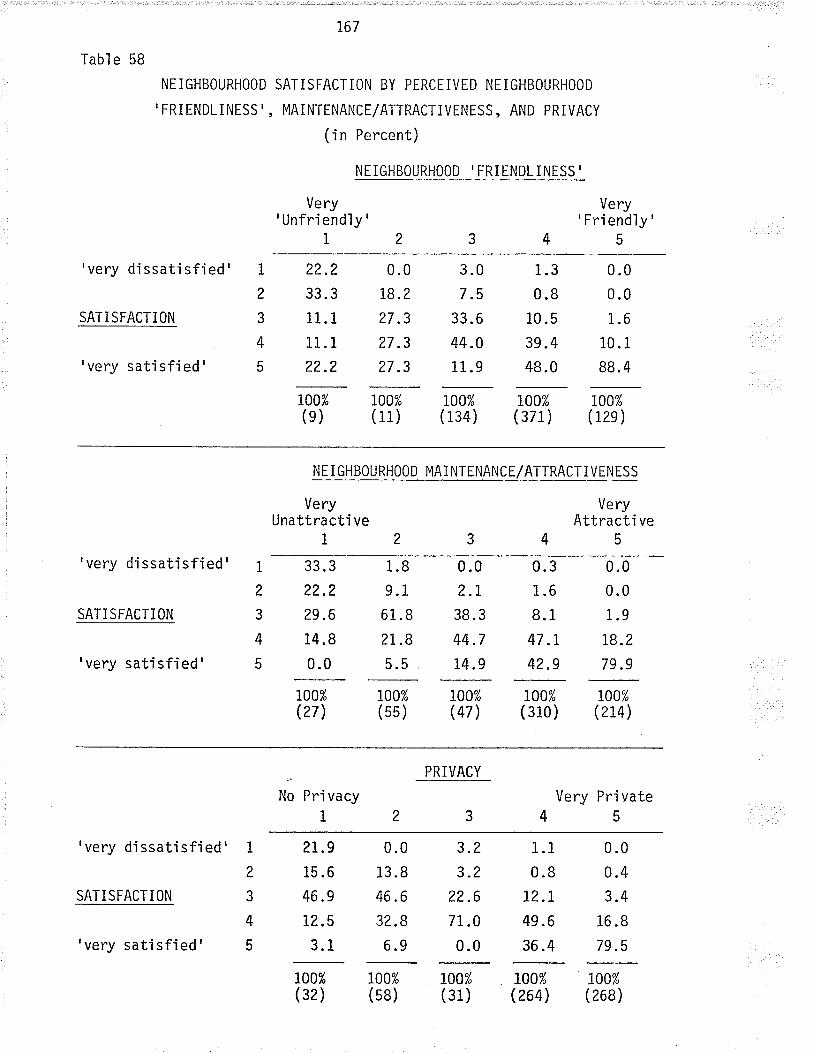
Tabl e 58
167
SATISFACTION BY PERCEIVED NEIGHBOURHOOD
MAINTENANCE/ATTRACTIVENESS, AND PRIVACY
(in Percent)
NEIGHBOURHOOD' FRIENDLINESS'
Very'Unfri endìy'
1
NE iGHBOURHOOD
'FRIENDLINESS' ,
1
2
3
4
5
Very' Fri endìy'
5
'very dissatisfied'
SATISFACTION
'very satisfied'
22.2
33.3
11.1
11.1
22.2
0.0
t8.227.3
27.3
27.3
3.0
7.5
33.6
44.0
i1.9
1.3
0.810.5
39.4
48.0
0.0
0.0
1.6
10.1
88.4
i00%(e)
rc0%( 11)
rc0%( 134)
n0%(371)
n0%(t?e)
NIIGHBOURHOOD MAINTENANCE/ATTRACTIVENESS
VeryUnattracti ve
1
VeryAttracti ve
5
'very dissatisfied'
SATISFACTION
'very satisfied'
1
2
3
4
5
33.3
22.2
29.6
14.8
0.0
1.8
9.1
61 .8
2t.B5.5
0.02.7
38.3
44.7
14.9
0.3
1.6
8.L
47.r42.9
0.0
0.0
1.9
r8.279.9
100%(27)
n0%(s5 )
l00%(47)
L00%(310)
rc0%(2r4)
PRIVACY
No Pri vacy1
Very Private45
'very dissatisfied'
SATISFACTION
1
2
J
4
5
21 .9
15.6
46 .9
12.5
3.t
0.0
13.8
46 .6
32. B
6.9
3.2
3.2
22.6
7r.00.0
1.1
0.812.r49 .6
36.4
0.0
0.43.4
16 .8
79.5
100%(32 )
100%( sB)
700%(264)
n0%(31)
'very satisfied'
rc0%(268)

168
dissatisfied','dissatisfied','mixed feeljngs'/'satisfied'/'verysatisfied'), and not after the second and third ('very dissatisfied' ,
'dissatisfíed'/'mjxed feel'ings'/'satisfied','very satisfied' ) as
might have been expected. This is especialìy evjdent when look'ing at
the h'ighest category in each of the three independent varíables (see
Table 59), where in each case the percentage of responses jn the lowest
three categories of satisfaction are very similar and show a consider-
able difference from either of the two higher satisfaction category
responses.
This relationship a'lso holds among a majority of the other items
showing a high correlation with satisfaction. Therefore, this would
Ímp'ly that there is a sign'ificant difference between those peopìe who
are 'satjsfied' with their neighbourhood and those-who are 'very
satisfied'- a difference which may often be covered up in other stud'ies
through the combining of a'lì responses indicating 'satísfaction'.
The next major question related to satjsfaction appeared when
the results of the testing of Hypothesis Two indicated that neighbour-
hoods wjth similar soc'io-economic and physìca'l characteristics did not
necessariìy have similar levels of satisfaction, and that dissimilar
areas did not necessariìy have djssimilar satisfaction levels. The
obvious question, then, is why the deviatjons from the expected response
occurred, and what factor or factors caused them.
In the first subsection of Hypothesis Two, it was found that two
of the three pairs of neighbourhoods tested, aìthough similar in socio-
economic and physical characteristics, had wìdely varying satisfaction
levels (refer to Table 35). On'ly one pair, consisting of'lower status
169
inner city grid' areas (the West tnd and Wolseley), showed relativeìy
similar levels of satisfaction wjth neighbourhood. In attempting to
explain these results, the data was examined for factors whjch the West
End and l,lolsejey shared, but in whích the other two pairs of ne"ighbour-
hoods d'iffered.
It was immediately noticeable that while all three pairs of
neighbourhoods examjned in Table 35 were similar in socío-economic and
physicaì design characteristics, there was considerable varjation in
their responses to other items. A few of these items showed patterns of
responses among each of the neighbourhood pairs which were similar to
the patterns shown by satisfaction; not surprisingly, these similaritjes
occurred among the items which had been found to have a strong and con-
sistent positíve assocjation with satisfaction during the testjng of the
hypotheses. For the ìtems dealing with the overal'l appearance and main-
tenance level of the neighbourhood, the perception of one's neighbour-
hood as'friendìy', and the residents'sense of privacy (as we]ì as the
feeling that one's neighbourhood is 'identifjable' from other areas and
the feeling that one's neighbourhood is a good place for chjldren to
grow up in), the West End and l^Jolseìey showed very sl'milar results, whi'le
the other two pairs showed djfferìng response patterns in the clear
majority of cases. For both pa'irs showing differing response patterns,
the neighbourhood with the lower satisfaction level also had the lower
level of per.ceived neighbourhood appearance and maintenance, 'friendli-ness', privacy, and so on (see Table 59).
t^lhen the next two sub-sections of Hypothesis Two are examined
(in which the pairs of neighbourhoods are similar in one characteristic
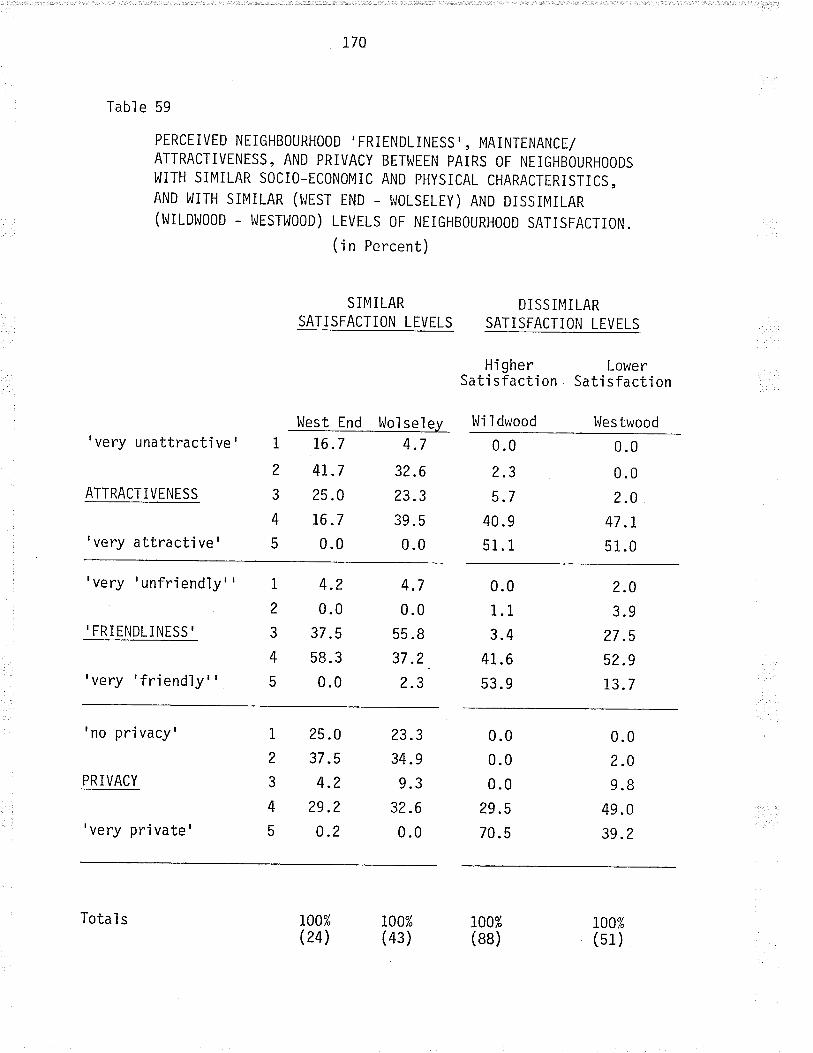
170
Tabl e 59
PERCEIVED NEIGHBOURHOOD' FRIENDLINISS
" MAINTENANCE/
ATTRACTIVENESS, AND PRIVACY BETI^JTEN PAIRS OF NEIGHBOURHOODSl^lITH SiMILAR SOCiO-ICONOMIC AND PHYSICAL CHARACTERISTiCS,AND WITH SIMILAR (WTST END - WOLSELEY) AND DISSiMILAR(l,JILDI^JOOD - I^JESTI^/OOD) LEVELS OF NEiGHBOURHOOD SATISFACTION.
(in Percent)
SII'IILARSATISFACTION LEVELS
DI SS IMI LAR
SATiSFACTION LEVELS
Hi gherSati sfacti on
LowerSati sfacti on
Wes twoodlnlest End l¡Jol sel ey þJi I dwood
'very unattractive'
ATTRACTIVENESS
'very attractive'
1
2
3
4
5
16.7
4r.725.0
76.7
0.0
4.7
3?.6
23.3
39.5
0.0
0.0
2.3
5.7
40.9
51.1
0.0
0.0
2.0
47.I51 .0
'very ' unfri end'ly' '
'FRIENDLINESS'
' very 'fri end'ly' '
1
2
3
4
5
4.2
0.037.5
58.3
0.0
4.7
0.055 .8
37.2
2.3
0.0
1.1
3.4
41.6
53.9
2.0
3.9
27.5
52.9
73.7
'no privacy'
PRIVACY
'very private'
1
2
3
4
5
25.0
37.5
4.2
29.2
0.2
23.3
34.9
9.3
32.6
0.0
0.00.0
0.0
29 .5
70.5
0.02.0
9.8
49 .0
39.2
lf0%(24)
700%(43)
100%(88)
n0%(51 )
Total s
17t
but different in the other; see Tables 36 and 37), we find that two pairs
of nejghbourhoods (Eìm Park - I'lindsor Park and Westwood - Windsor Park)
have similar satisfaction levels desp'ite their differences. For both of
these pairs, their responses to the five items jjsted previousìy agree
fairiy closely, espec'iaìiy among the three most important ones - per-
ceived neighbourhood 'friendliness', maintenance, and privacy. In
contrast, the neighbourhoods in the two cases that support the hypothes'is
(by having differing ìeveìs of satisfaction) do show sign'ifìcant differ-
ences among the three variables mentioned above; howeyer, it is again
found that in each case, the neighbourhood with the hjgher satisfaction
level has scored more highly in terms of those three variahles.
In terms of street pattern, it was found that while individual
'bay'ne'ighbourhoods did show some incons-istency in their relationship
to satisfactjon and to the three variables listed above, it was also
found that when the data was grouped simply by street iayout ('bay' or
'grid'), the responses from 'bay' neighbourhoods were consistentìy more
close'ly related to each of the items which had been found to be strongly
related to satisfaction than those from 'gridr areas. The crosstahula-
tions of street layout with perceived neighbourhood 'friendliness'
produced a Gamma value of -.36 and a X2 of 0,00 (the negative sign
indicating that the'bay''layout has a higher proportion of responses in
the upper categories of the other variable than the'grids'); with
neighbourhood attractiveness and maintenance, G = -.49, X2 = 0.00; with
privacy, G = -.37, X2 = 0.00; with the neighbourhood as a pìace for
children to grow up in, G = -.40, X2 = 0.00; and for neighbourhood
'identifiabi'l'ity', G = -.36, X2 = 0.00. The data therefore seems to
172
indicate that in an overall sense, 'bay'areas have a higher likelihood
of inducing those perceptions in their residents which lead to fee'lings
of neighbourhood satisfaction.
No one of the three main variables referred to above had a con-
sistent'ly more powerfu'l effect on a neighbourhood's satisfaction level
than the other two; however, it did appear from the data that either
the strength of the effect of each of these yariables upon satjsfaction
varies from neighbourhood to neighbourhood, or that other variables are
acting in concert with them to produce the changing'level of impact.
No relationship was found between the importance of'the type of people'
or of 'the neighbourhood appearance' in determining satisfaction (item #41
in the questionnaire) and those items which were most strongly or weakìy
related to each neighbourhood's satisfaction ranking. In other words,
even though Tuxedo did relatìvely poorìy in terms of its'friendliness'
rankjng, the results of item #41 did not indicate that the residents of
Tuxedo found neighbourhood 'friendlinesst to be ìess important in determ-
in'ing satisfaction than the residents of other neìghbourhoods found itto be. In any event, it can onìy be concluded that perceiyed neighbour-
hood 'friendliness', maintenance, and privacy do have a significant
effect on satisfaction.
This conclusion leads to another quest'ion - what factors contri-
bute to the above perceptions? As we have seen earlier (refer to sectjon
4.2.3), actual social contact with one's neighbours does not appear to
be a necessary precondition for a feeling of general neighbourhood
'friendliness' to develop. Unfortunateìy, there is nothing else in the
data whjch could be used to answer the above question. Other studies
173
have also suggested that the five items which have been identified inthjs study are strongìy associated with neighbourhood satjsfaction
(particu'larly 39, '138, and 275), but none have attempted to exp'la'in
what condítions lead to these perceptions. 0bvìousìy, an investigation
into this matter should be a priority in any future reseach dealing with
neighbourhood satisfaction.
An additional question pertaining to the relationshjp between
satisfaction wjth neighbourhood and perceived nejghbourhood'friendli-
ness'! appearance and maintenance, and privacy asks whether these three
variableSarepreconditionstothedevelopmentofsatisfactionor
feelings produced by satisfaction. In other words, is a person satjsfied
with their neighbourhood because they find the area to be attractive, or
do they find the area attractive because they are satisfjed with the
nei ghbourhood?
This js not entireìy an academic 'chicken or egg, question;
campbeì'l , converse, and Rodgers' study of the qua'lity of American lifeand the factors contributing to satisfaction found that:
"Almost without exception, there are positive correlationsbetween all of the doma'in satisfaction measures. Peopìewho say they are satisfied with one aspect of ljfe areìikeìy to report relativeìy high sat'isfaction where otherdomains are concerned. " (SS:0A)
If this is true, a person's general satisfaction with life may lead to
feelings of 'friendliness', neighbourhood attractiveness, and prìvacy,
which may in turn generate feelings of satisfaction with one's neighbour-
hood. If this is the case, it would make far more sense to investìgate
factors related to 'lìfe satisfaction' rather than those related to
neighbourhood satìsfaction.
174
'Life satisfaction' undoubted'ly does have some influence on
neighbourhood satisfaction; however, Campbeì1, Converse, and Rodgers
also concluded from the results of their study that:
"...objective characteristics of neíghbourhoods havean important influence on resident satisfaction. Thisinfluence, furthermore, can be explained by the apparentaccuracy with which peopìe perceive the objective attri-butes and iudge them agaìnst their personaìized standardsof comparison to form assessments of the suitability oftheir envi ronment. " (39:248)
This conclusion can only be substantiated indirectìy by the data obtajned
through the questjonnajre. For exampìe, people livjng in a neighbourhood
for less than one year have a s'lightìy lower level of satisfaction than
those who have lived there for a longer period (ìnterestingly enough,
there is practica]ly no difference between the sat'isfaction levels of
those who have lived in an area for just over a.year and those who have
lived there for seven years and more). At the same time, those who have
lived in a neighbourhood for less than oneyear have percept'ions of neigh-
bourhood 'friendliness' and attractiveness which are practica'l1y no
different than those who have lived there for a longer period. From
this, one might infer that satisfaction levels will eventual'ly'catch up'
with the percept'ions of the neighbourhood; or in other words, that one's
satisfaction level is shaped by one's perceptions.
Another interesting fìnding which was made during the course of
the analysis was that the level of sat'ìsfaction in any given neighbour-
hood tends to be consjstent throughout each of the four income categories
(ranging from $5000 - $6999 to $15000 and up). In other words, if the
satisfaction level of a given neìghbourhood is low, then a resident
earning $20000 per year is as ìikeìy to be dissatisfied or have mixed

175
feelings as a person earning $5000. Converseìy, a person earning a'low
income in a'satisfied'neighbourhood is just as likely to be'very
satisfied' or 'satisfied' as a person earning much more. Therefore, we
must ask what attributes or perceptions are shared by people wíth
varying incomes in a neighbourhood such that similar satisfaction levels
are produced.
As expected, the factors which have a consistent effect on satis-
faction regardìess of income are the fjve which were prev'iously
discussed: the perception of neighbourhood'friendliness', maintenance,
privacy, identifiabi'lity, and quality of childrens' environment. For
examp'le, a person who has a low income but who also feels that their
neighbourhood is well maintained and attractive is more f ikely to be
satisfied than a person with a highjncome but who feels that their
neighbourhood is poorìy maintained and unattractive (see Tabìe 60).
This same relationship aìso holds true for the other four variables.
To conclude the examination of satjsfaction related items, the
results of question #41 ("How important do you consider each of the
following factors to be when you try to decide how satisfjed you are with
your present neighbourhood? the type of hous'ing units/ the street
pattern/ the type of peop'le/ the way the neighbourhood looks/ the
'status' of the area/ nearness to your job/ nearness to food stores/
nearness to department stores/ nearness to friends and relatjves/ a wide
variety of local actÌvities." (l = 'very unìmportant', 5 = 'veFV
ìmportant')) wiìì be examined.
The factor that most people'identified as being the most impor-
tant in determining their satisfaction with their neighbourhoods was the
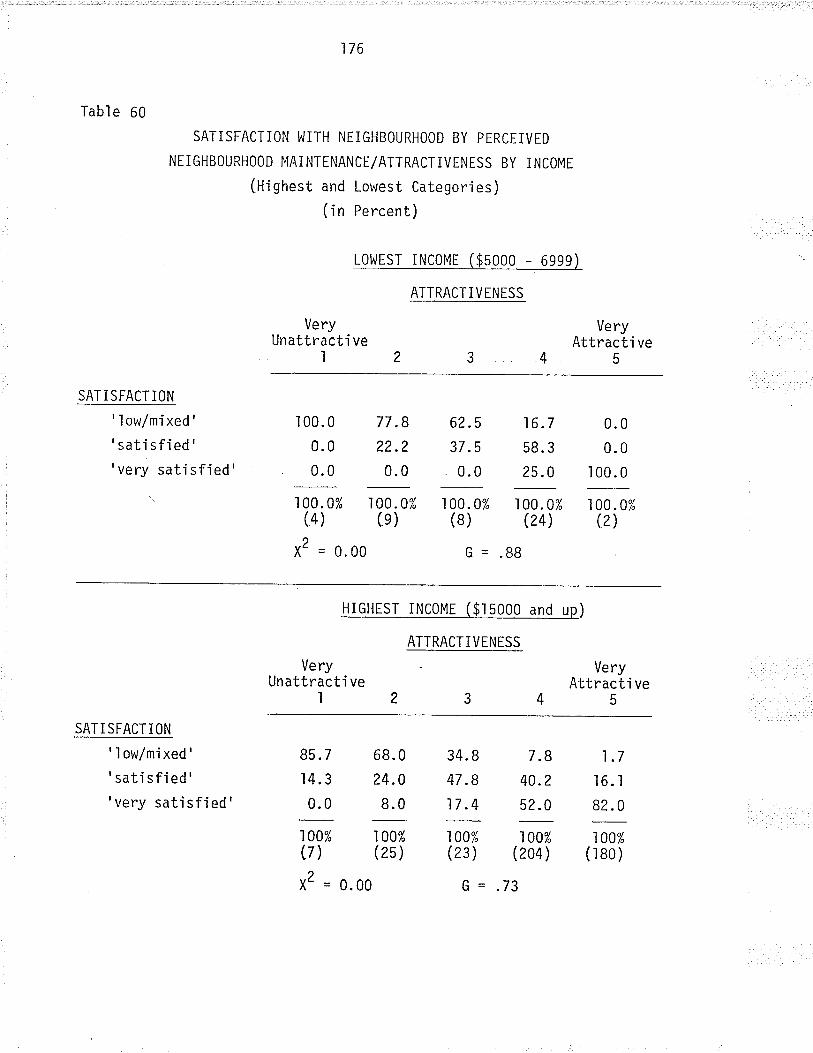
Table 60
SATISFACTION
'ìow/míxed'
' sati sfied''very satisfied'
176
SATISFACTION I,IITH NEIGHBOURHOOD BY PERCEiVED
NEIGHBOURHOOD MAINTENANCE/ATTRACTIVENESS BY INCOMI
(Highest and Lowest Categories)(in Percent)
LOWEST TNC0ME ($5000 - 69e9)
ATTRACT I V ENESS
VeryUnattracti ve
l
VeryAttracti ve
5
r 00.0
0.0
0.0
77.8
22.2
0.0
62.5
37 .5
0.0
100.0%(8)
t7-
16.7
58. 3
25.0
0.0
0.0
100.0
100.0% 100.0%(4) (e )
X2 = 0.00
100.0% 100.0%(24) (2)
.88
HIGHEST INC0ME ($15000 and up)
ATTRACTI VENISS
VeryUnattracti ve
I
VeryAttracti ve
5
SATISFACTiON
' 1 ow/mi xed '
'sati sfied''very satisfied'
85.7.l4.3
0.0
68.0
24.0
8.0
34.8
47.8
17 .4
7.8
40.2
52.0
1.7
16. I
82. 0
100% 100it(7) (25 )
X2 = 0.00
100% 100%(23) (204)
G-.73
100%(lB0)
177
way the neighbourhood looks ('very important' = 40.4%). The next most
'important factors were the type of housing ('very important'= 35.3%)
and the type of people in the neighbourhood ('very important'= 33.9%).
The fourth most important factor was the street pattern, which 26.3% of
the respondents found to be'very'important'in determining their satis-
faction. The rest of the factors had much lower levels of importance,
with the exception of the nearness to food stores ('very important'=
17 .6%).
Interestingly enough, the relative importance of each factor
appeared to be approximateìy the same in each of the thirteen ne'ighbour-
hoods as it was for the entire group of respondents. In each case,
there h/ere one or two ne'ighbourhoods which varied widely from the overall
response pattern, but on the whole the majority of neíghbourhoods
showed close agreement wjth the responses shown in the aggregate data.
In looking at the four most'important factors (the appearance of
the neighbourhood, the type of people living there, the housing type,
and the street pattern) it became apparent that the relative'importance
of the neighbourhood's appearance, the type of peop'le, and the type of
housíng were all relatively unaffected by the respondent's socio-
economic status, by his or her perceptions regarding the neighbourhood,
or by the physical characteristics of the ne'ighbourhood. in other words,
all of the population sub-groups in alì types of phys'icaì environments
attrìbuted almost the same degree of importance to these three factors
when determining their satjsfaction w'ith neighbourhood.
in the case of street'layout it was discovered that the residents
of'bay'areas found thìs factor to be much more important in determjning
178
satisfaction (XZ = 0.00, G = -.51) than those in 'grid' areas found
it to be. It was also found that the importance of street pattern in
determjning satisfaction showed a correlation wíth perceived privacyt)
(X" = 0.00, G = .32) and to perceived neighbourhood attractiveness (X'=
0.00, G =.31), which can probabìy be attributed to the fact that the
residents of'bay'areas found their ne'ighbourhoods to be more private,c(X'= 0.00, G = -.37) and more attractive (X'= 0.00, G = -.36) than
the residents of 'grid' areas found thejrs to be
These additjonal findings reinforce the earljer conclusjon that
'Satisfaction with Neighbourhood' 'is a comp'lex phenomenon produced by
the interactíon of a number of factors. Despite this, it is possible to
make a number of observations about neighbourhood satisfaction from the
testjng that has been done and the relationships which have become
evjdent. These observations will form part of the fifth and final
chapter, as will the possible directions that future studies might take
to identify methods of fostering feeljngs of satjsfactìon among urban
nei ghbourhoods
The next section of this chapter wi'lì present those additional
findings of the study which were not related to satisfaction but which
are of generaì interest or are related to the findings of the literature
rev i ew.
4.4.2 Additjonal Find'ings
The first question to be addressed in this section is whether
the street layout of'a neighbourhood has a stronger effect on the satis-
179
faction held by any particular group of peopìe as compared to another.
In the previous section, jt was seen that in some ne'ighbourhoods, the
street layout was a very important consideration for people trying to
determine how satisfied they were with thejr particular area. In
addjtjon, when testing Hypothesis Four, the results suggested that as
socio-economic status jncreased, the physical layout of one's neighbour-
hood became less related to satisfaction (refer to Tables 40,4.¡, and
42). To test this further, the item measuring the importance of street
layout in determinìng sat'isfaction (item #4.l) was crosstabulated w'ith
income, male occupation, and male education. In none of these three
cases was the relationship stronger among the lower status categories;
in fact, all of the lower categories in each of the correlations showed
a marked similarity, while the uppermost category showed a sign'ificantìy
stronger relationsh'ip with the importance of street ìayout in deter-
min'ing satisfaction. The data does, however, show a strong correlation
between the importance of street I ayout and the actual street 1 ayout
itself (G = -.51, X2 = 0.00), suggesting that those people who are
familiar with the 'bay' situation are more aware of the contributions
that physical organization characteristics can make towards one's sense
of satisfaction with nejghbourhood, while those ìiving in grid areas
(perhaps because they have never been exposed to any other arrangement)
see no advantage in their type of street pattern. However, jt was
impossible to identify any factors contributing to either of these
feelings from the available data, and the literature on the subject
offered no information pertaining to the questjon of whether street ìay-
out is more important to any particular group of people; therefore, no

lB0
definite conclusjons can be reached in this regard.
Next, we will attempt to determjne the reasons behind the vari-
ations from the expected results in the crosstabulation between
neighbourhood homogeneity and satisfactíon. As was noted in Tables 52
and 53, there was a consíderable difference between the satisfaction
levels of homogeneous and heterogeneous neighbourhoods. At the same
tjme, however, there was also considerable variation among each of the
two types of neighbourhood groups; both 'somewhat homogeneous' areas had
higher satisfaction levels than one of the 'predominantly homogeneous'
areas, and one of the 'somewhat heterogeneous' neighbourhoods was much
less satisfied than either of the 'predom'inantly heterogeneous' areas.
There are several explanations for these unexpected results.
It may be that the measures of neighbourhood homogeneity and hetero-
geneity used in this study were not those which are most relevant to
neighbourhood satisfaction; secondìy, (as Gans noted), the degree of
homogeneity required to produce satisfaction has not been defjned, and
some other measures of this factor may have to be included; and finally,Ít may be that homogeneity does not have as powerful an effect on satis-
faction as some other factors.
The first two possibilit'ies described above require the consider-
ation of additional factors in the definition of homogeneity and
heterogeneity; one such factor might be what Gans called the 'ways of
life' of the people in a neighbourhood. unfortunately, these were not
part of the data obtained, and no conclusions can be reached jn this
respect. The remaining avenue of investigation was to exanljne the data
from the neighbourhoods which produced the unexpectedìy high or 'low
181
levels of satisfaction in Table 52, in order to see if any factor or
factors were associated with these deviations. It was found-that no
factor jnvestigated in this study could account for these variations,
thus reinforcing the idea that it is the neighbourhood's homogeneity
in terms of its resjdents' 'ways of life'or some other unidentified
characteristic which is causing the unexpected results.
The testing of another assumption led to a few additional
findings about neíghbourhood awareness. T,'lhen it was found that higher
levels of satisfaction were associated with both greater feelings of
neighbourhood 'identifiability' and with the characterization of the
res i dents ' I ocal area as bei ng 'l arger than that ini ti a'l I ìy i dentif i ed
by this study, the question arose as to whether higher levels of perceived
neighbourhood 'identifiabi'lity' were associated with the feeling that the
neighbourhood was 'ìarger'. This relationshr'p was found to existI
(G = -.54, X'= 0.00). Also, it was found in a previous section that
when each neighbourhoods' perceived size was tabulated (refer to Table
?8), it appeared that the residents of the seven areas wìth higher
average incomes all identified their localities as occupy'ing a iarger
area than the study's own limits, while the six areas of lower income
averages showed a significant number of responses in both the 'larger'
and the'smaller'categories. This led to the question of how income
was related to neighbourhood awareness 'in general.
It was found that income did have a sign'ificant positive
correlation with the feeling that one's neighbourhood was an 'ident-
ifjable'area (G = .41, X2 = 0.00). Income also showed a high corre'lation
with other items measuring ne'ighbourhood awareness, such as the ability
182
to estímate the extent of the neighbourhood's physical area (G = -.73,,
X'= 0.00) and the feeling that the neighbourhood has definite'edges'o
(G = .49, X" = 0.00). At the same time, however, there is a poor
correlation between income and the ability to actualìy name those
'edges' (G = .17, X2 = .43).
Sjnce income had a lesser impact on satisfaction than the three
varjables identified earlier had (perceived neighbourhood'friendli-
ness', attractiveness and maintenance, and privacy), it was decided to
test if the same relatìonship heìd true for neighbourhood awareness. Itwas found that the perception of one's neighbourhood as an 'identifjable'
area was in each case more strongìy related to the three variables
listed above (G = .44,.67, and.56, respectively) than to income (G =
.41 ). In al I of these relationships, â hÌgher level of 'jdentifiabil ity'is assocíated with higher ìevels of the other variables. As a fjnal
test, the relationship between perceived neighbourhood' identjfiability'and income was controlled for the results of each of the three vari-
ables. l,lhile the percentage of responses in the highest category of
neighbourhood 'identifiabiìity' is 40.1% when it is crosstabu'lated with
income, it varies from 19.4% to 64.3% when compared with the lowest and
highest categories of privacy',22.2% to 69.8% when compared with the
lowest and highest categories of perceived neighbourhood 'friendliness';
and from 23.1/" to 66.7% when compared wjth the lowest and highest
categorÍes of neighbourhood maintenance and attractiveness. Therefore,
it seems more likely that the perception of neighbourhood 'ìdentifia-biì'ity' as welì depends to a greater extent on other perceptions about
the neighbourhood than on socio-economic or physical characteristics.
l83
4.4.3 Comparison with the Ljterature
Some of the assumptions to be tested to compare the results of
this study with the findjngs of the literature include the fol'low'ing:
residents of suburban neighbourhoods perceive their
neighbourhoods to be larger than those in inner cìty
areas.
- older residents are more satisfied with their neighbour-
hoods than younger residents.
- the hìgher the level of educational attajnment, the less
satisfaction with neighbourhood is felt.
- actual social contact with one's nejghbours 'is not as
Ímportant a determinant of satisfaction with neighbour-
hood as is the perception of one's neighbours and
neighbourhood as'friendly'.
Table 6l summarizes the data pertain'ing to the perception of neighbour-
hood sjze as compared with neighbourhood location (inner c'ity or sub-
urban). This crosstabulatjon indicates that residents of suburban areas
do indeed have a slight inclination to perceive theìr neighbourhood as
occupy'ing a ìarger physicaì area than residents of inner city areas. At
the same time, however, it was found that income had a much stronger
associatjon with the perception of neighbourhood size (G = -.73, yZ =
0.00), with higher income levels being associated with the perception of
a ìarger neighbourhood size. Since most suburban neighbourhoods are
more affluent than inner city areas, it may be that income has a signi-
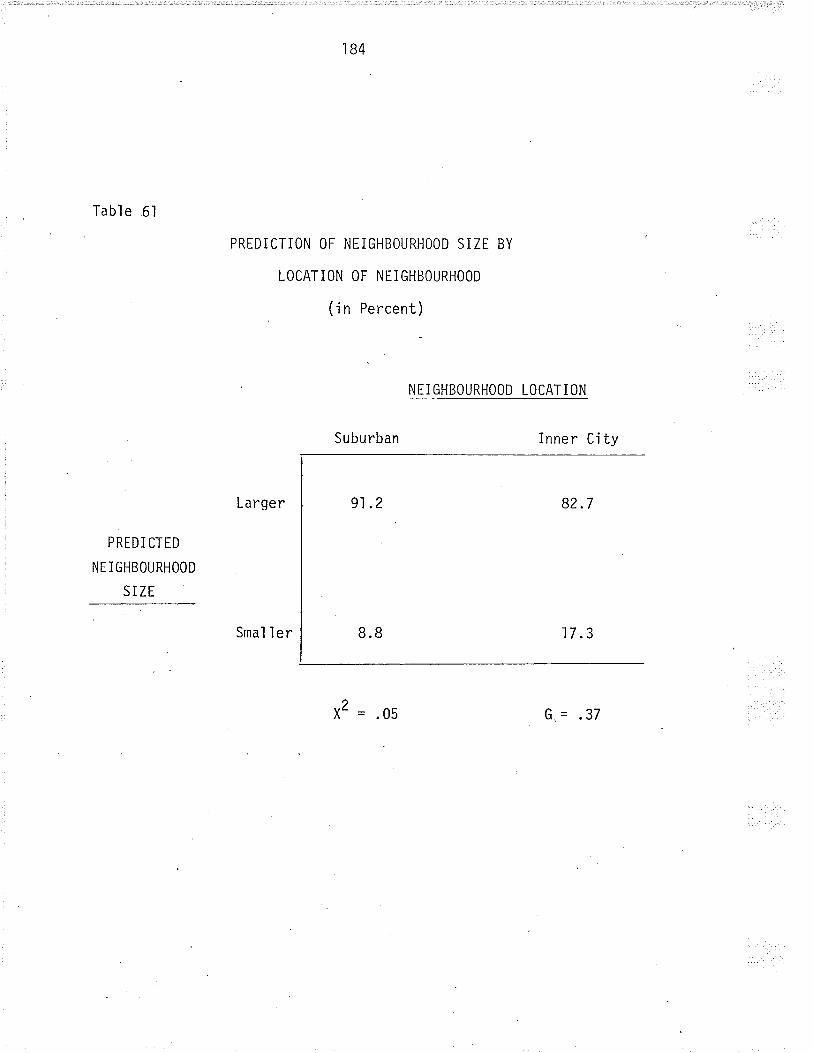
l84
Table 6l
PREDI CTED
NE IGHBOURHOOD
SIZE
PREDICTION OF NEIGHBOURHOOD SIZE
LOCATION OF NTIGHBOURHOOD
(in Percent)
BY
Suburban
NTIGHBOURHOOD LOCATION
Inner Ci ty
Larger
Smal I er
x2 = .05 Ç=.37
l85
ficant impact in this regard, as well as nejghbourhood location. When
each neighbourhood's response to neighbourhood size is examined (refer
to Table 28), all the upper income areas, regardìess of locatjon,
found their neighbourhood's size to be ìarger than that defined by the
study, thus indicatjng that some other factor is also at work., In
addition, very little difference could be found between the perceptions
of neighbourhood and their Ímportance in determinjng the satisfaction
of either suburban or jnner city areas.
When the relationship between age and satisfaction js examined
(see Table 62), jt is found that there is very littìe difference between
all those age groups from the age of 25 to 64; those younger than 25 are
the least satisfied group, while those from 6b to 69 are slightìy less
satisfied than the majority, and those 70 years and over are just as satis-
fied as the majority. The dip in satisfaction from age 65 to 69 might be
attributed to the stress of retirement. Otherwise jt does appear that
there is a relationship between age and satisfaction - but only when the
age of 25 is used as the'break point'. Satisfaction does not appear to
increase significantly beyond this point.
The relationship between male educational attainment and satjs-factjon was shown in Table 33. It is obvious that higher education is
assocjated with higher ìevels of satisfaction (G = .44, xz = 0.00), wrricn
d'irectìy contradjcts the findings of earlier research into satisfaction(Eg:140, 138:126, lb5:313)
The P2 testing of the variables concerned with the'Level of
Neighbouring Activities' (refer to sectjons 4.1.6 and 4.2.3) suggested
that actual social contact with one's neighbours is not a prerequisite
to the feeling that one's neighùourhood js a friendìy one, and that at
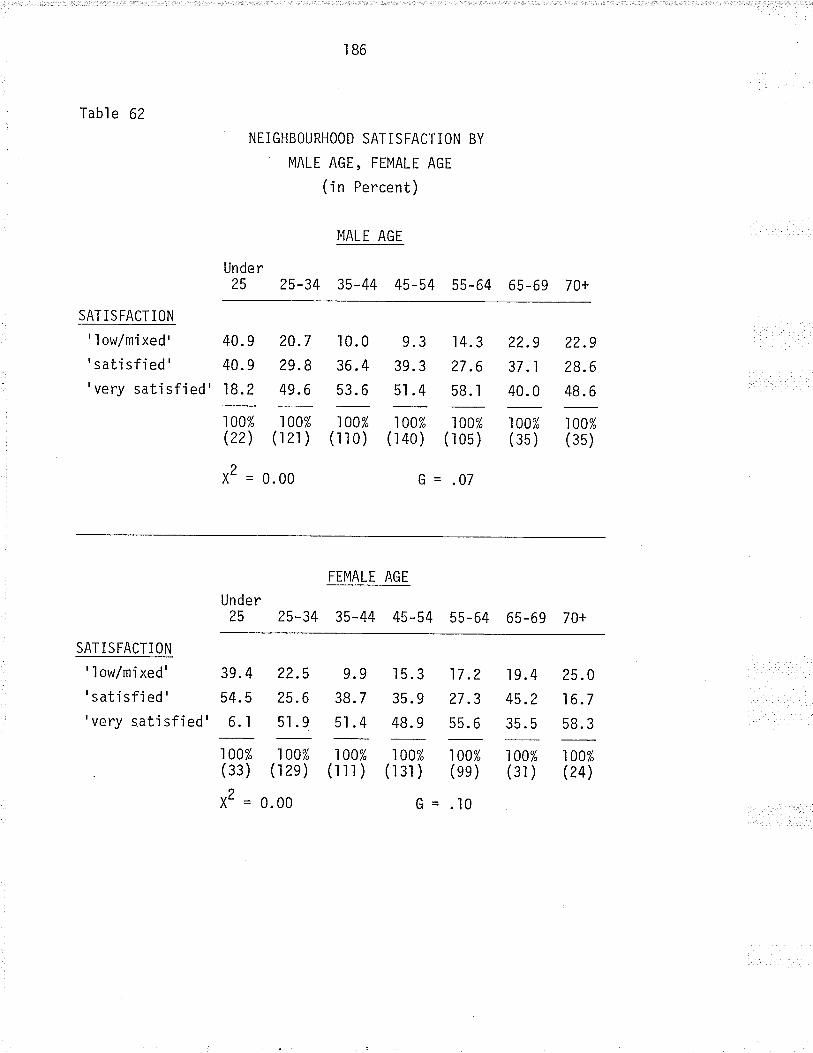
186
Table 62
NEIGHBOURHOOD SATISFACTION BY
MALE AGE, FEMALE AGE
(in Percent)
MALE AGI
Under25 25-34 35-44 45-54 55-64 65-69 70+
SAT IS FACT ION
'low/mixed' 40.9 20.7 10.0 9.3 14.3 ZZ.9 ZZ.9
'satisfied' 40.9 29.8 36.4 39.3 27.6 3t.i 28.6
'very satisfíed' 18.2 49.6 53.6 5l .4 bB.l 40.0 48.6
100% 100% 100% 100% 100% 100% 100%(22) (l2l) (ll0) (140) (105) (35) (35)
X2=0.00 G-.07
FEMALE AGI
Under25 25-34 35-44 45-54 55-64 65-69 70+
SAT ISFACTI ON
''low/mixed' 39.4 22.5 9.9 15.3 17.2 lg.4 25.0
'satisfied' 54.5 25.6 38.7 35.9 27.3 45.Z 16.1
'verysatjsfied'6.1 51.9 51.4 48.9 55.6 35.S 58.3
100% 100% 100% 100% 100% 100% 100%(33) (t2e) (lll) (l3l) (ee) (31) (24)
X2=0.00 c-.10

l87
'long as one perce'ives their neighbourhood to be 'friendìy' , they are
likely to be satjsfjed with their neighboürhood, regardless of whether
they interact with their neighbours or not. As a further test, Table 63
shows the relatjonship between satjsfactíon and the amount of casual
social contact one has with one's nejghbours (faUle 48 has already shown
the crosstabulation of satisfactíon with the perceptíon of one's neigh-
bourhood as 'frìendly'). When the latter correlatìon was examined among
each of the categories describing the frequency of social jnteraction
wjth one's neighbours, it was found that while the strength of the
relationship between satisfaction and perceived nejghbourhood'frjendli-
ness' is slightly lower when there is minimal social contact with one's
neighbours, the relat jonship 'is stil I pos'it'ive and relativeìy strong
(G =.54). Therefore, it would seem that social interactíon does have
some effect on the percept'ion of one's neighbourhood as a 'friend'ly'
place, but not a determíning one.
The last section of thÍs chapter will deal with the role of the
quaìity of the neighbourhood as an environment for children, and the
effects of this factor on overall neighbourhood satisfaction. The measure
of this variable which has the strongest association wjth satisfaction is
item #17: "Do you feeì that your neighbourhood is a good place or a poor't/
pìace for children to grow up ìn?" (X'= 0.00, G = .85). I^Jhen broken
down by neighbourhood (refer to Table 29), it was found that the lower
status neighbourhoods were rated by their residents as low qua'lìty
environments for children, while the residents of higher status areas
felt that their areas were very good for children. Variations in this
pattern did occur, however; Tuxedo, whjch ranked first in terms of satis-
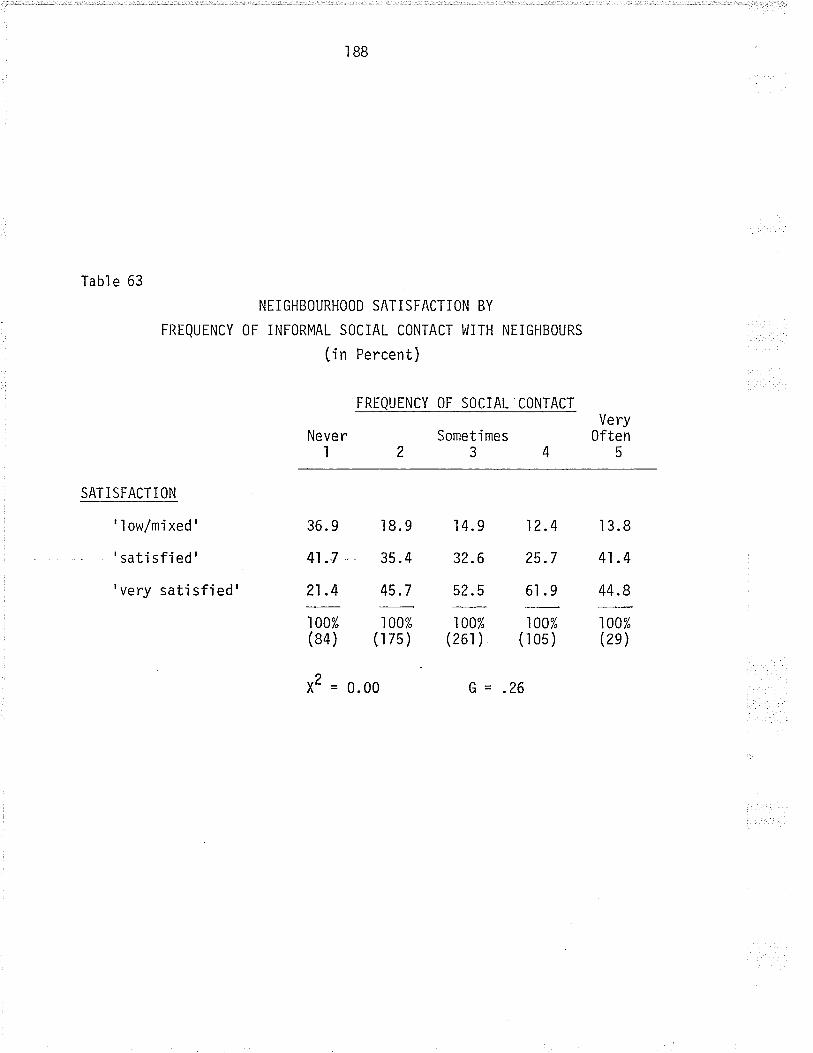
188
Tabl e 63
SATISFACTION
' ì ow/mi xed'
'satisfied'
'very satjsfied'
Never12
Very0ften
45
NEIGHBOURHOOD SATiSFACTION BY
FREQUENCY OF INFORMAL SOCIAL CONTACT l^lITH NEIGHBOURS
(in Percent)
FREQUENCY 0F S0CIAL CONTACT
Someti mes3
36. 9
41.7 -
21.4
18.9
35.4
45.7
14.9
32.6
52.5
100%(26r )
12.4
25.7
6l .9
I 3.8
41.4
44.8
100%(2e)
100%(r05)
1 00%(84 )
x2=
100%(r75)
0. 00 G=.26
189
faction with neíghbourhood ranked fourth in terms of the quality of
children's environment, and the hlest End, St. Boniface, and Elmwood (all
lower status areas) tra¿ no responses in the lowest category.
The percept'ion of one's neighbourhood as a good p'lace for
children to grow up'in showed good correlation with income (G = .53,c
X" = 0.00), the feeling that one's neighbourhood is 'identifiable' (G =
?,.59, X'= 0.00), with feelings of privacy (G = .57, X'= 0.00), with the
perception of one's neighbourhood as 'friendly' (G = .71, X2 = 0.00),
with the perception of one's ne'ighbourhood as being attractive and well
maintained (G = .74, xz = 0.00), with the perception of one's neighbour-
hood as'safe' for people and property (G = .71, XZ = 0.00), and with
'bay' street'layouts (G = -.40, xz = 0.00). From these results and from
those discussed at the beginn'ing of th'is section, it would seem that
this variable does pìay a very important role in determjning neighbour-
hood satísfaction.
This concludes the anaìysis of the data. In the final chapter,
a summary of the findings will be presented, and these will be compared
to the findings reached in the earlier literature on the subject.
Fjnalìy, the findings themselves will be anaìyzed to assess their
possibìe ímpact on the assumptions and methods presently used in the
practice of neighbourhood p'lanning, and some recommendations wilj be
made.

Chapter V
SUMMARY, CON'CLUSIONS, AND RECOMMINDATIONS
5.1 Summary - Satisfaction with Neighbourhood
This chapter will begin with a summary of those findjngs reìated
to satisfaction with neighbourhood that were revealed through the
testjng of the hypotheses and the additional investigations done to
elaborate on their conclusions. Both this summary and the summary of the
generaì findings wíìì be presented in point form, with each point being
followed by a comparison to the findings of the previous literature on
the subject in order to identify areas of agreement, contradiction, and
ampl i fi cation.
' l. In all of the tested areas, regardìess of the averagelevel of socio-economic status or the reiative quaìityof the physicaì environment, satisfaction with neighbour-hood tended to be ranked at the upper end of this item,sscale; that is to say, a ìarge majority of the responsesfell.into the upper two categories ('very satisfied, andt sati sfied' ).
This finding of the present study is in full agreement with those
reported by Campbell, Converse, and Rodgers'report (39), as well as
those of Zehner and chapin (zll), Marans and Rodgers (155), Lansing,
Marans, and Zehner (138), and virirakis (zqq), who also found that the
majority of residents in a nejghbourhood, regardless of the qua]ity of
ìts physicai environment, tended to report that they were satjsfied with
their area. No reports produced contradictory results.
2. The major differences among the responses of mostindividuais in terms of thãjr r.tponre to the itemdealing w'ith satisfaction with neighbourhood becomemost evident when the lowest three of the five
- 190 -

l9l
categories are combined into a sing'le one (jncluding'very dissatjsfied','dissatisfied', and'mixedfeelings'), and the upper two categories remain asis, thus formjng three categories in all.
This conclusion of the present study'is d'iffjcult to com-
pare to the results of the previous jiterature. Although satìsfaction
studies do appear to have used a similar multiple response coding of
each individual's level of satisfaction with their neighbourhood, most
appear to have concentrated on those responses which fell into the
highest category of satisfaction when examining the relationship between
this variable and other neighbourhood perceptions and characteristics.
However, when examÍning the simpìe distribution of satisfactjon scores
among those areas tested in previous studies, it does seem that the
responses do follow the general pattern described in the above point
(zls:381, 138:104) although some exceptions are evident in that a few of
these neighbourhoods had more responses in the category equivaìent to
'mixed feelings' in the present study.
3. Despite the prevìous point, the thirteen areas whichwere tested in the present study showed considerablevariation in terms of their residents' level ofperceived sat'isfaction wìth nejghbourhood.
Zehner's l97l artjcle (ZZS) and Lansing, Marans, and Zehners'
study of 1970 (l38) also observed that aìthough the majority of neigh-
bourhoods examined were high'ly rated by their residents, some variation
was immediately apparent.
4. Neighbourhoods which exhìbit simílar levels of socio-economic status and physìcaì characteristics do notnecessari'ly show simiìar ìevels of satisfaction withneighbourhood; nor do dìssimilar areas a'lways showvaryi ng I eve'l s of sati sfacti on.
192
No prev'ious studies have produced findings which can test or
amplìfy thjs conclusjon of the present study. However, as demonstrated
in the'testing of the second hypothesis and in the addjtional work done
in section 4.4.1, even those neighbourhoods exhibiting close similarityin socio-economíc and physical characteristics show wide'ly varying levels
of neighbourhood satisfaction, which suggests that there are other
factors which also have a determining effect. Many of the factors linked
with satisfaction in the prevíous literature are not of a demographic or
a physical nature, thus providing indirect support for the above
concl usion.
5- In terms of each individual's responses, satisfactionwith neighbourhood can be consistent'ly associated withsocio-economic and physicaì desìgn characteristics.
As we saw in the testing of Hypothesis One, socio-economjc status
had a definite determining effect on an individual's satisfaction with
neighbourhood. The physicaì design of the neighbourhood also appeared
to have an effect on satisfactjon, but one that was less powerfuì than
that of socio-economic status.
These findings are in agreement with the results of several
studies which have stated that socio-economic characteristjcs p'lay a
definite role in determining satisfaction (less education produces
higher satisfaction with neighbourhood (39); higher income produces
hìgher satisfaction levels (gg, e++)). Other studies have also attri-buted a significant impact to physical design factors (the presence of
nearby services and facilities increases satisfaction (sg); ,bay' areas
are more highìy satisfied than ,grid' areas (139, Zll)).

193
No studies contradict this finding of the present study, aìthough
several (most notably those which were authored or jointly authored by
Zehner) have produced results indicating that certain neighbourhood per-
cept'ions are more powerfu'l determinants of satisfaction than socio-
economic or physical design characteristics (Zlq:114).
6. l,lithin the 'large majority of the tested neighbourhoods(eìeven out of thirteen), the level of satiifactionwith neighbourhood shows little variation among thosegroups of residents wìth vary'ing socio-economic status;jnstead, a simi'lar pattern of satisfaction was foundamong each income group in these neighbourhoods.
As pointed out in the previous discussion, thìs find'ing directly
contradicts that of virjrakis (zqq). Little mention is made of the
connection between income and satisfaction in the studies writen after
Virirakis'was pubìished in 1968, perhaps because it was accepted as an
'obvious' truth. As shown in the present study, however, some lower
i4qomg neighbourhoods exhibit chara-cterjstics and perceptions - including
that of neighbourhood satisfaction - which are c'loser jn character to
those of neighbourhoods with much higher average incomes. At the same time,
it was also observed that in most neighbourhoods, peopìe with very ìow
incomes tended to share the same feelings of satisfaction wjth that area
as fellow residents with considerabìy higher saiaries. This seems to
ìmpìy that people with low incomes can be housed in a varjety of neìgh-
bourhood environments in such a way that they wiìì be satisfied with
their neighbourhood, ìf p'lanners, socioìogists, and arch'itects wjll only
take the time to learn how.
7. The relative 'impact that various perceptions of theneighbourhood have in determining an individual'ssatisfaction with their area tends to remainrelativeìy constant among varying popu'lation groups
194
in vary'ing phys'icaì environments.
This conclusion was drawn from the close association between
such neighbourhood percept-ions as 'friendliness' , maintenance and attrac-
tiveness, privacy, the quality of children's environment, and the
'identifiabiìity'of an area and one's satisfaction with neighbourhood.
All of these appear to be sign'ificant determinants of satisfact'ion in all
thirteen neighbourhoods and among aìì popuìat'ion sub-groups. The res-
ponses to item #41, which tested the importance of various factors in
determining satisfaction, also showed relatively'little variation due to
place of residence or demographic characteristics. One phys'ica'l feature,
however, djd appear to have a different effect on satisfact'ion in
differing areas; the satisfactìon attributed to the type of street lay-
out pattern was higher among 'bay' areas. For most of the other vari-
ables, people can show varying responses but may still feel that that
variable has a similar effect on satisfaction. In other words, one
person may fee'l that their neighbourhood is 'friendìy' and another may
feel that the neighbourhood is'unfriendìy', but both may feeì that a
neighbourhood's 'friendlin.rri is an important determinant of theìr over-
all satisfaction with the area. It should be noted, however, that as all
respondents occup'ied single detached dwelìings, a s'imilar result is not
surprising. If other housing and neighbourhood types had been incorpor-
ated in the study, more variation might have been apparent. Michelson's
study seems to agree with this assumption (lgB:278). The literature
dealing directìy with satisfaction does not appear to have assessed the
ìmpact of perceptions on the satisfaction of varying populations in
varying areas; rather, they appear to have concentrated on finding the
195
most sign'ificant factors in this regard in an overall sense. Therefore,
it is difficult to conclude whether the literature supports or contra-
dicts the conclusion arrived at by the present study.
8. Both those indivíduals that are 'very satisfied' andthose that are 'very dissatisfied' appear to considerthe same set of factors when determining how satisfiedthey are with their neighbourhood.
The data from the present study appears to support the above con-
clusion. As wíth the previous po'int, the literature does not focus on
this aspect of satisfaction, and therefore cannot direct'ly support or
contradict the point in question. Indirectly, though, most of the pre-
vious studjes agree that certain neighbourhood perceptions account for a
sign'ificant amount of a person's satisfaction with their neighbourhood.
Since the most important of these perceptions were almost al I character-
ized as opposing aspects of. a single item (i.e., 'poorly kept up - well
kept up';'unfrjendly - frjendly', etc. (138:l3l), it could be assumed
that these studies had found that these items had served to influence
peop'le who represented.themselves as being either'satisfied' or'dis-satisfjed', thus supporrt'ing the conclusjon of the present study
9. A person's perceptjons of their neighbourhood appearto have a significant determinìng effect on theirlevel of satisfaction with their neighbourhood.
The previous ljterature appears to lend support to this po'int in
that most studies agree that perceptions such as neighbourhood mainten-
ance and attractiveness, the'friendliness'of the area, prìvacy, and so
on have a very s'ign'ificant effect on one's feeling of satisfaction with
neighbourhood (ZlS:383, 138:ì3'l ).
196
10. The results of this study have suggested that themost important perceptions of the neighbourhoodin terms of determining one's satisfaction appearto be those whjch involve the area's 'frjendl.iness, ,its maintenance and attractiveness, and the levelof privacy it offers. Other important percept.ionsinclude,the quaìíty of the neighbourhood as a pìacefor children to grow up in and the 'identifiability'of the area as a pìace separate from surroundingareas.
As noted in the previous discussion, the literature also found
the above perceptions to be strongly'related to feelings of satisfaction
wjth neighbourhood. One other item found to be c'losely related to satis-faction in the previous literature was the perceived homogeneity
('similar - dissimilar' neighbours (l¡g:l3l)) of the area.
ll. 'Bay'areas appear to have a slighily higherassociation with the perceptions listed in theprevious poínt than 'grid' areas do.
Several of the studies examined in the course of the literaturereview suggested that 'bay.' .areas showed higher levels of satjsfaction
than 'grid' areas (with some individuar neighbourhoods provid.ing
exceptions (138:45)), but none addressed the question of whether the
residents of areas with different street patterns showed more o.r less
positive perceptjons of their neighbourhoods. Therefore, the literaturecannot be used to support or contradict the above conclusion.
5.2 Summary - Additional Findings
There is no significant relationship between aperson's age and their levei of satisfaction withneighbourhood except in the case of those undertwenty-five years of age, who are less satisfiedthan those who are older.

197
This fjnding of the present study partiaìly contradicts the
results of Marans and Rodgers' report of 1975 (lSS:314) which indicated
that satisfaction increased steadily with age, rather than levelling off
after a particuìar age. Another aspect of thìs correlation was also
outljned in the same report when it was suggested that the supposed
connection between old age and higher levels of satisfaction was con-
nected with the lower levels of educational attainment found among the
elder]y (lSS:313), as another of the 'líterature's findings suggested that
people with less education had higher satìsfaction with their neighbour-
hood (39:l 42, l3B:128). However, the present study's sample showed that
peopìe over twenty-fíve had roughly similar levels of education, which
were quite high; hjgher, in fact, than those under twenty-five.
Therefore, aìthough the data from the present study agrees that there is
a correlation between age and satisfaction with neighbourhood (in the
sense that those over twenty-five years of age are more satisfied than
those who are younger), it contradicts all other findings and assumptions
of the previous literature in respect to this correlation.
2. H'igher levels of educational'attainnlent areassociated with higher ìevels of satisfactionwith nejghbourhood.
This finding contradicts some of the conclusions of the previous
literature, which had found that "...respondents wìth at least a coìlege
education tend to evaluate their micro-neighbourhoods more criticaììy."(lSg:126). Virirakis also found that within individual communities,
higher educatìonal attainment was associated with lower satjsfaction
levels because the more educated had "...stricter judgement of community
conditions." (24a:2). At the same time, however, Virirakis also found
l98
"... commun'ities with higher satjsfaction indexes are on average
jnhabjted by better educated peopìe." (Zqq:ll).
3. Actual socia:l contact with one's neighbours is notnecessary for the development of the perception thatone's neighbourhood is a 'friendly' one, aìthough suchcontact will generalìy reínforce th'is perception.
This conclusion was consistent with Lansìng and Hendricks' report
of 1967 whích suggested that the evaluation of one's neighbours as
'friend'ly'was "...a better predictor of neighbourhood satisfaction than
the frequency of the respondent's interaction w'ith those neighbours."
(.136:lB3). At the same time, however, some of the findings of the pre-
vious literature had indicated that frequent social contact led to more
positive feelings towards one's residential area (40, 68). However,
these latter reports were both based on responses from high-density
apartment style developments with a highly homogeneous popuìation. In a
later study (129:106, 149), Keller suggested that perceptions of one's
neighbours were important deternrinants of neighbourhood satisfaction,
particularly among those whose socìo-economic level permitted a measure
of independence from neighbours - such as in the singìe famíly detached
housing examined ìn the present study
4. Residents of 'subur^ban' areas perceive theirneighbourhoods to be ìarger in physìcaì area thanthe residents of inner city' neighbourhoodsperceive the'irs to be.
This finding is consistent w'ith Haney and Knowles'study of 1978
(103). This result may also be connected to the following finding.
5. Peop'le with higher incomes perceìve their neighbour-hoods to be ìarger ìn physicaì area than those withlower incomes perceive theirs to be.
199
None of the findings of the previous literature address this
particular point. However, this conclusion would appear to support the
prev'ious point jn that there is also a good correlation between
'suburban' locations and higher average 'incomes.
6. Persons with higher average incomes find theirneighbourhoods to be more ''identifiable' thanthose with lower incomes find theirs to be.
Again, there is no mention of this aspect of neighbourhood per-
ceptions Ín the previous literature. However, inasmuch as there js a
good positive correlatjon in the simp'le distribut'ion of satísfaction
among income categories, and another good positjve correlatjon between
neighbourhood 'identifiabiìity' and satisfaction, it might be expected
that income and'identifiab'i'lity' should also be related.
5.3. Conciusions and Recommendations
The results of the present study have indicated that socio-
economic factors, physical design factors, and perceptions of neighbour-
hood alì appear to have some determining effect on a person's
satisfaction with neighbourhood. Now, what use can planners make of this
informatìon in attempting to design nrore satisfactory residentjal environ-
ments'in today's cities?
The phys'icaì factors which appeared to be most clearìy associated
with higher'levels of satisfactìon are'bay'street patterns and suburban
locations. This is not much help to planners, as most ne'ighbourhood
planning a'lready takes pìace in the suburbs, and one can hardly desìgn an
entire city of 'bays'. However, the increasing need for upgrading of
200
inner c'ity neighbourhoods should make planners take a better look at
the suburbs jn order to fjnd out why satisfaction is higher there. 0f
course, it'may be that it is simply produced by higher socio-economic
status, but there may be other factors operatíng there that planners
are not currentìy aware of.
Turníng to socjo-economic factors, we find that all of the vari-
ables examined in the present study are comp'lete'ly beyond the p'lanner's
control. However, it should be noted that some of the study's fjndings
have suggested that the importance of various factors in determining an
individual's satisfaction does not change with socio-economic status;
in other words, it appears that a person with low status will look at
the same criteria and attach the same importance to each when trying todetermine his or her satisfaction as a person of high status would.
Therefore, it would seem that p'lanning neìghbourhoods for low status
individuals should not be approached much djfferently than the planníng
of one for high status persons.
Finalìy, one of the most interesting findings of the present
study is that the effect of a person's perceptions of neighbourhood on
thejr satisfaction with neighbourhood appears to be a strong and con-
sjstent one. And, as with the factors contributìng to satisfaction,
these perceptions appear to be of equal importance to all status groups
and to have sjmilar effects on a person's satisfaction. Therefore, 'it
would seem that if future research could identify the factors which
produce positive perceptions of neighbourhood in residents, then p'lanners
could find ways to incorporate these factors into the design of future
nei ghbourhoods.
201
It should be noted at this po'int that any future research in this
direction might also find it profitable to re-test the conclusions of the
present study while using a much larger data base. Although most corre-
lations jn this research were checked in severaì ways, and many showed
strong and consistent results, the reliability of several findjngs remain
in question due to the relatively low number of responses occurring in
some of the cells of certain crosstabulations. Aga'in, however, the
results of the present study are for the most part consístent w'ith the
findings of the prev'ious literature, and it is felt that its additional
findings a'lso present a fairly accurate p'icture of the present situation
within the tested neighbourhoods.
Many other aspects of satisfaction and perceptions remajn to be
studied; but can any gu'ide'lines or hypotheses for plann'ing actions be
extracted from the results of the present study? Returning to the per-
ceptions of neighbourhood, it was found that several of those which were
identified as being the most c'lose'ly correlated with satisfactjon
(neìghbourhood maintenance and attractiveness,'friendliness', privacy,
the qua'l i ty of the chi I dren's envi ronment, 'and the area' s ' i denti fi abi I -
ity') can be influenced in one way or another by planning actìvities.
Onìy one of the five ('friendljness') appears to be beyond the pìanner's
d'irect jnfluence.
Another noticeable result (from a physical planner's po'int of
view) was that'bay'street'layouts appeared to be more highly associated
with positive perceptions of neighbourhood than.'grid' areas were. From
thìs, one might speculate that the layout of thìs type of ne'ighbourhood
has a certain'softness'as compared to the rigid geometry of'grid'
202
areas. The curvjng streets present a closed vista and may thus encour-
age the feeling of shared space with one's immediate neighbours. From
this, a feeling of 'friendliness' may deveìop. Less traffic passes
through this type of street pattern, which appears to promote fee'lings
of privacy and safety, both of which are strongly associated with satis-
factjon. It is also hypothesized that the higher leveì of 'visual
comp'lexity' in this type of residentíal environment may be associated
with more positive percept'ions of neighbourhood and higher neighbourhood
satisfaction. It is a'lso important for planners to recognjze that these
characteristics need not be l-imjted to 'bay' neighbourhoods.
It may welì be that the presence of the above characteristics
heìped to create the posit'ive perceptions which pìaced three'grid'areas
among the four most satisfied. 0f these, the part of Tuxedo which was
examined was made up of large, well-treed lots occupied by ìarge, well-
built and well maintained homes; which may have provided a degree of the
'softness' and 'visual complexity' referred to earlier. In additjon, itslocation between two major traffic collectors meant that there was a minj-
mum of non-resident traffic on its streets.- Woodhaven did not have large
lots throughout its area, but it was well treed and surrounded by the
river, a creek, and a goìf course which made it visualìy ìnteresting and
isolated it from nearby residentjal areas, thus making it easiiy'jdenti-fiable'to its resjdents. Norwood was also isolated, had a low level of
through traffic, and possessed a number of physica] features which
relieved the'rig'idity' of its 'grid' ìayout. It was nrore difficult tofind such characteristics among the nine less satisfied neighbourhoods,
especia'l]y among those in the inner city and those with lower average
203
I ncomes.
To sum up, it is suggested that future neighbourhoods be p'lanned
in such a way to reinforce those characteristics which seem to produce
positive perceptions among residents liv'ing in contact with them. Such
neighbourhoods should be more isolated from neighbouring areas. This
could be achieved by taking advantage of natural physical barriers such
as rivers, creeks, slopes, and other unbuildable s.ites in order to pro-
vide the neighbourhood with 'edges'. All neighbourhoods should have at
'least one'edge'consisting of an open, unbuilt area.
In situations where neighbourhoods must be adjacent, the use of
different detailing such as street lighting, tree species, buiiding
material, or some other unique feature might be used, even if on'ly along
the 'boundary line'. Neighbourhoods should be provided with some sort of
focus, and such a feature should be located at its centre rather than at
the períphery, so that the area is focussed inward" rather than outward.
The physicaì size of such a neighbourhood does not appear to be critical
as long as visual monotony is avoided and a sense of identifiability'
can be maintained.
Through traffic should be minimized by the proper use of a hier-
archy of streets organized around activ'ity centres and arterial routes.
Street layout could also be used in conjunction with housing orientation
to provide each unjt with a private area and to encourage the development
of 'micro-neighbourhoods' which are easily accessible to one another.
The residents of such ne'ighbourhoods should be encouraged to take an
active interest in their area through the provision of adequate meeting
spaces and through the development of the skills necessary to organize
204
neighbourhood activities. Zoning couid be made less restrictive 'in the
sense that non-conforming uses could be approved on merit by a consensus
sf the residents. Through this method', smarll cottage industries might
provide jobs and increased pride and interest in the area. A pool of use-
ful skjlls, books, and small equipment could be established so that
everyone could develop the ability to maintain their property. The main-
tenance of some pubiic propertíes mjght eventuaì'ly be turned over to the
residents by the city to encourage the development of local pride.
Some suggestions have been offered, but still more questjons
remain to be asked. For exampìe, what factors - physical or otherwjse -
actually produce posÍtive perceptions of neíghbourhood? Are perceptions
and satisfaction the same among various other housing types, or do
different perceptions and characteristics become more powerfuì determin-
ants of satisfaction? What physica'l p'lanning guidelines can be suggested
for neighbourhoods made up of these other housing types? And of course,
there is still that basic question - can neighbourhood planning affect a
person's perceptions, and thus their satisfaction? From the data and
from logicaì ana'lysis, it seems reasonable to expect that it can. Cities
are an express'ion of culture; just as'language shapes how we can think,
urban form shapes how we can live. This can be perceived as ejther a
limitation, or as a chalìenge to our ability to create better social and
physical environments within our citjes. The goal should be a better
general understanding of these environments, not just on the part of the
professionals, but on the part of every cit'izen. if p'lanning decisions
can be based on factors that actually make a difference in the quaìity of
peoplesl lives, and based on actual needs and wants rather than precon-

205
ceptjons and poìitical expediencies; when pìanning is tru'ly interactive
and when decisions are based on merit as well as ìega'l codes - then we
may hope'to create'more humane and 'ljveable' environments in our
cities, that everyone may enjoy.

Appendix A
QUESTI ONNAI RE
-206-
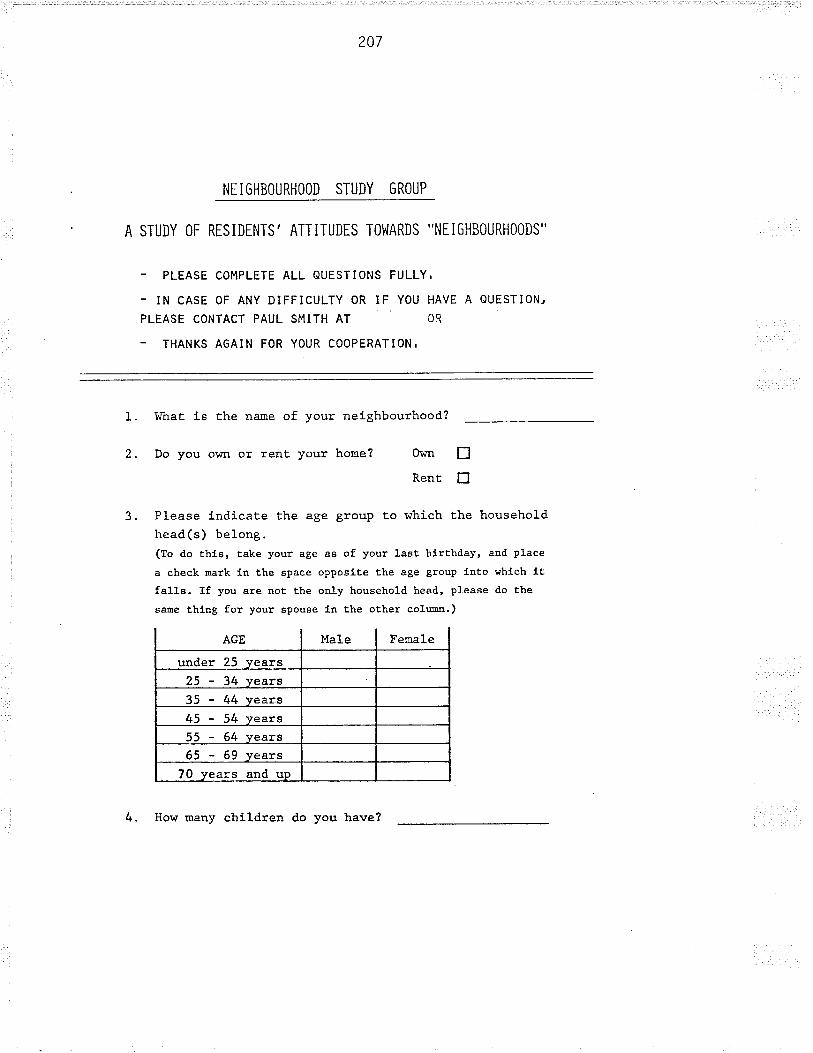
207
NEIGllBOURl.lOOD STUDY GROUP
A STUDY OF RESIDENTS' ATTITUDTS TOI,JARDS ''NEIGHBOURHOODS''
- PLEASE COMPLETE ALL OUESTIONS FULLY.
- IN CASE OF ANY DIFFICULTY OR IF YOU HAVE A OUESTION,
PLEASE CONTACT PAUL SM¡TH AT OR
- THANKS AGAIN FOR YOUR COOPERATION,
1.
2.
WhaÈ is the name of your neighbourhood?
Do you o\^in or rent your home? Ov¡n trRent fl
Please indicate the age grouP to which the householdhead(s) belong.(1o do thi6, take your age ae of your laat blrthday, aod place
a check -"rk fn the space opposLte the age group into whfch ltfalts. If you are not the only household head, please do the
sane thlng for your spouse Ín the other coLrnn.)
4. How nany children do you have?
3.
under 25 years25 - 34 Yearg35 - 44 Years45 - 54 years55 - 64 vearg
70 vears and

5. If you have children, whatE1dest yearsSecond yearsIhird years
208
are their ages?
Fourth yearsFifth yearsSixth years
$13000 - $14e99$rs000 - $r99e9$2ooóo - $24eee$25000 and up
6. l^Itrat is the present occupation of Ëhe household head(s)?(PJ-ease check one category for each household head, if appllcable.If the categorfes shoç'n are not speclflc enough, please fill outthe last space, márked 'Otherr.)
7. lnto r^¡hich of the followlng categories does Ëhetotal family income of your household fall?(Please check the correct box)
$s000 - $6eee tl$7000 - $8999 D
$e000 - $1oe9e tr$11000 - $12e99 n
How long have you been a resident in yourpres enÈ neighbourhood?(Please check Èhe correct box.)
Less Ëhan one yearI - 2 years3 - 4 years5 - 6 years
7 years and more
trDutr
8.
trnfItrtr
Managerial / Prof es s ionalClerical / Sales
Manufac turine /TradesPrimary/Labour
Education/Social ServLces
Other (Please state

9.
209
lfhat fe the maxl-mum educational level completedby the household head(s)?(Pleaee check the correct box for each household head.)
Please indicate Èhe eÈhnic group to which thehousehold head(s) belong.(Please check the correct box fo¡ each househotd heact.)
t0.
11. AbouÈ how many
heads) have innone
about 1 - 3
about 4 - 7
close friends do you (the householdyour neighbourhood?
tl abouË 8 -I2 iltl 13 or more tltr
Hieh SchoolSome Universit
Techntcal CollUnLversit
Post Graduate
British Isl_es
Italian
NaÈive IndianNetherlands
Scandinavian
Other (Please state
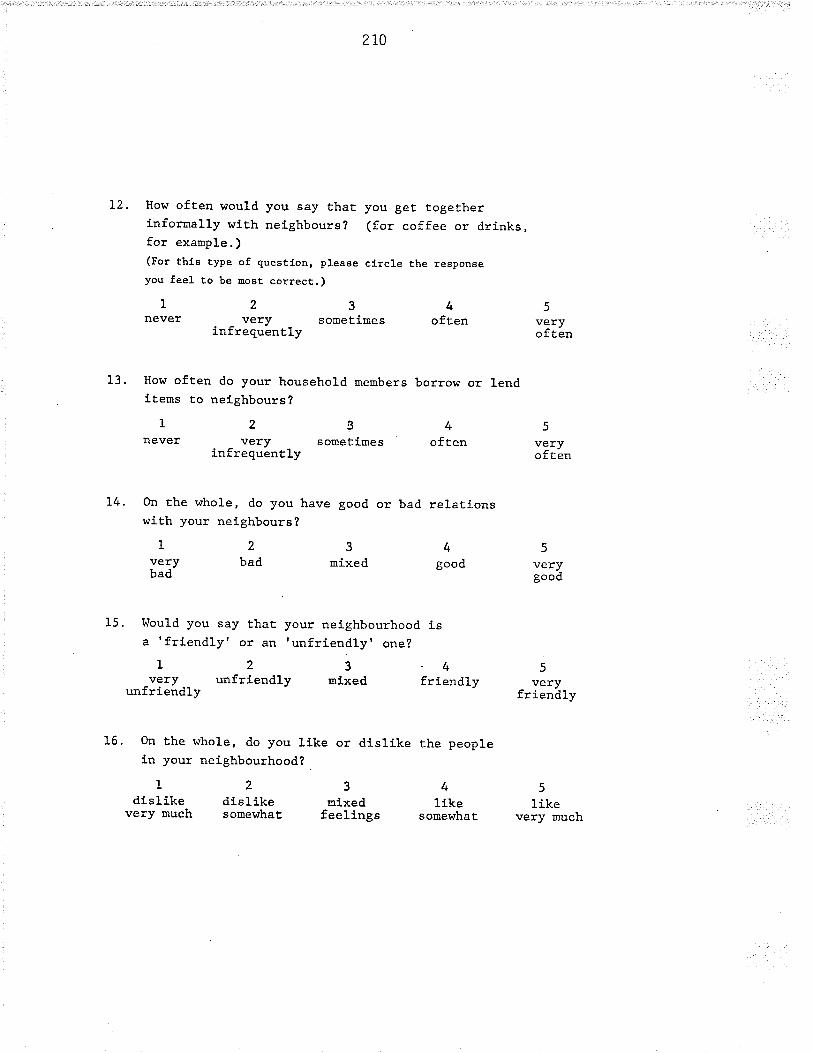
L2. How often would you say thatinformally with neighbours?for exanple. )(For thts type of questlon, pleaeeyou feel to be most correct.)
2r0
you geË together(for coffee or drinks,
circle t.he responae
Inever
23very sometLmes
infrequently
4often
5veryoften
13. How often do your household membersiÈems to neighbours?
t23never very sometimes
infrequently
borrow or lend
45often very
often
14. On the whole, do you have good orwith your nelghbours?
bad relations
4good
t-s
-4friendly
5
verygood
5very
friendly
5
likevery much
L2very badbad
3mixed
15. Would you say Èhat your neighbourhooda 'frLendly' or an 'unfriendlyt one?
L23_very unfrfendly mixed
unfriendly
16. On Èhe whole, do you like or disltke the peoplein your neighbourhood?
L234dislike dislike mixed likevery much somewhaE feelings somewhat
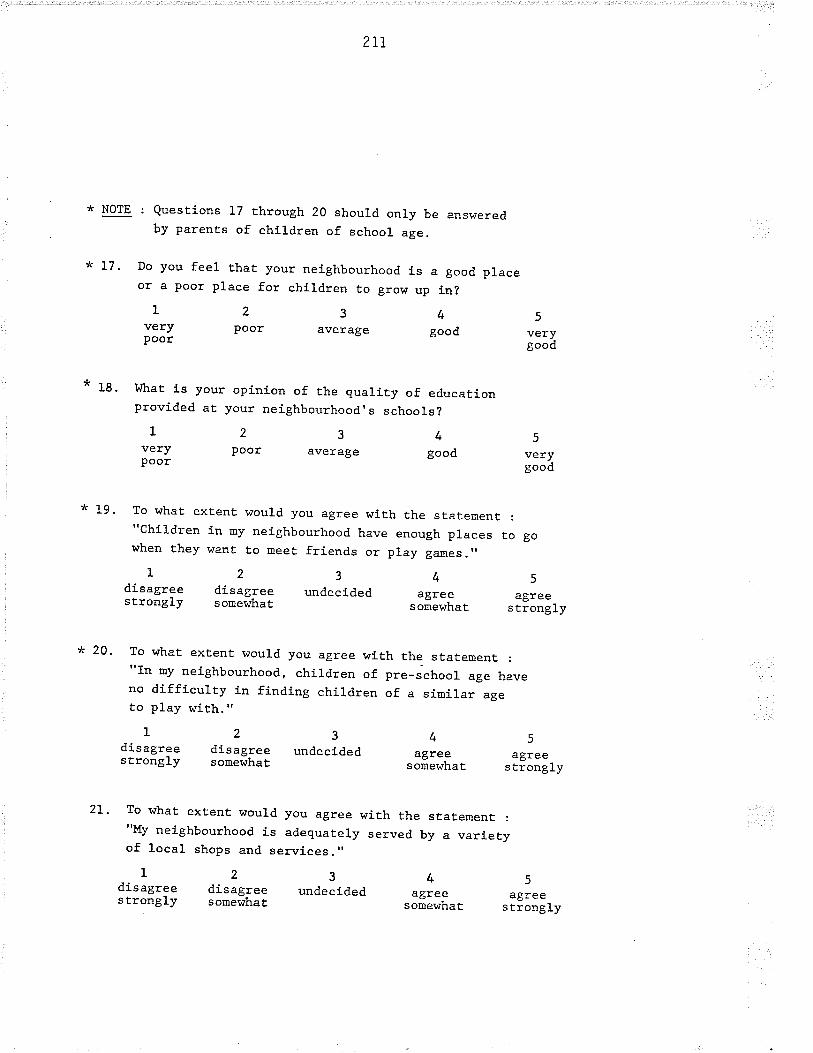
2II
:k NOTE : Questions 17 through 20 should only be answeredby parents of children of school age.
x L7. Do you feel that your neighbourhood is a good placeor a poor place for children to grow up in?
very poor average good veryPoor gooá
* 18. What is your opinion of Ëhe quality of educationprovided at your neighbourhood's schools?
very poor average good verypoor - gooá
* 19' To what extenË l¡ould you agree ¡.¡ith the statement :
"children in my neighbourhood have enough places to gowhen they r.¡ant to meet friends or play ga:nes .,,
disagree disag-ree undecLded agree agreestrongly somewhaÈ somewhat strongly
* 20. To what extenË would you agree with the state'ent :
"In my neighbourhood, children of pre_school age haveno difficulty in finding children of a similar ageto play with."
t2345disagree disag_ree undecl-ded agree agreestrongly somewhaË soñewhat strongly
2L. To v¡hat extent would you agree with the staÈe'ent :
"My neighbourhood is adequately served by a varietyof local shops and services. "
rz34sdisagree disag_ree undecided agree agreestrongly somervhaË soñewhaË strongly
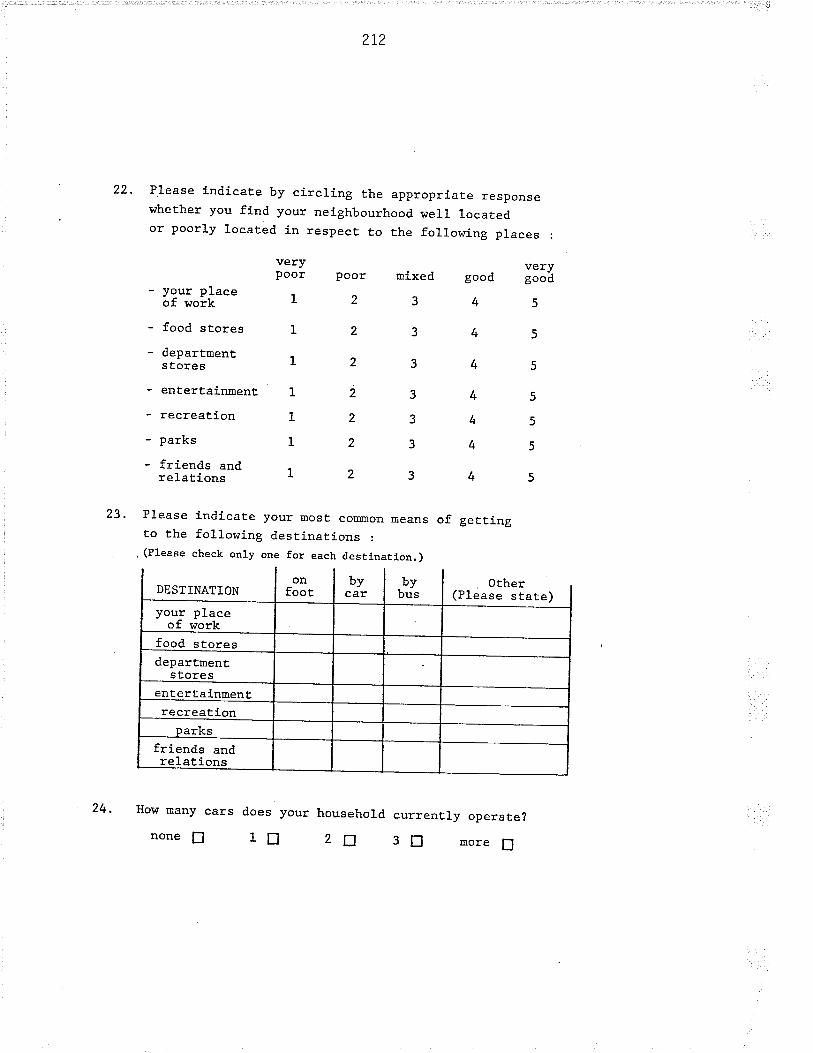
212
22. Please lndicate by circling the appropriate responsewhether you find your neJ_ghbourhood well locatedor poorly located Ín respect Ëo the fol_lowing places :
veryPoor Poor
- your placeór woit -- L 2
- food stores L z
- departmentstores L 2
mixed
3
3
3
3
3
3
verygood good
4s45
4s4
4
4
5
5
5
- entertainmenË 1
- recreation 1
- parks 1
DESTINATION
How many cars does your
nonetr 1t
2
2
2
23.
- friends andrelationsl2345
Please indicate your most contrnon rneansto the following destinations :
(P1ease check only one for each destination.)
of geÈÈing
_onlbylbytooËlcarlbus , Other(Please state)
24. household currenËly operate?
2E 3n moretr
your placeof work
food storesdepartmenË
s toresentertainmenËrecreation
friends andrelations

213
25. On the average, how ofËen do your household membergget out of the clty for a hollday or recreatLon?
lessthan 2_3 timesonce a year lJ a year U
once more than 3 _a year LJ times a year Ll
26. To what extent t¡ould you agree wlth the statemenÈ :
"My nelghbourhood Le an 'identifiabler area _ Èhat f.s,one df-sÈlnct Ln layouË and appearance from nearby areas.,,
disagree disag-ree undecided agree agreesÈrongly somelrhaE sornlewhat strongly
27. To vhat extenË would you agree with the statenenË :
"My neighbourhood has definiËe 'edges' or boundaries.,,(For example, maJor roads, a rfver, a railway lfne.)
L234sdisagree disag-ree undecided agree agreesÈrongly somewhaÈ som-ewhat sÈrongly
28. rn your opinion, what features form Ëhe boundariesof your neighbourhood?
Major Roads ft (please name)
A River nRailroade trOrher tr (please name)

214
29. To whaE extenË v¡ould you agree with"Walking through rny neighbourhood ls
t23disagree disagree undecldedstrongly somewhat
the statement :
a pleasant experience."
4aSree
5agree
somewhat strongly
30. To what extenË would"My neighbourhood iB
L2dlsagree disagreestrongly somewhat
you agree wfth the statement :
a 'safe' one for people and properÈy.
345undecided agree agree
somewhaÈ strongly
31.DoyouÈhinkyourneighbourhoodisaquiet@@oTLe?L2345
disagree disagree undecided agree agreest.rongly somevrhaË somewhat strongly
32. To vhaE. ext.ent woul-d
"My nefghbourhood's
L2disagree disagreestrongly somewhaÈ
33. To whaË extent v¡ould
"My nelghbourhood has
L2disagree disagreestrongly somewhat
you agree wlth the ,staËemqfit :
streets and houses are attsractive."
3undecfded
4aSree
5agree
somer{haÈ sËrongly
you agree with the sÈaÈemenÈ :
enough trees and green EPaces. "
34sundecided agree agree
somewhat strongly
34. To what exÈent would you agree with"The layout of streeÈs and housLngprovÍdes me with enough prf-vacy."
L23disagree disagree undecidedstrongly somewhaÈ
the 6taËeEenË :
in my neighbourhood
45agree agree
somewhat sËrongly
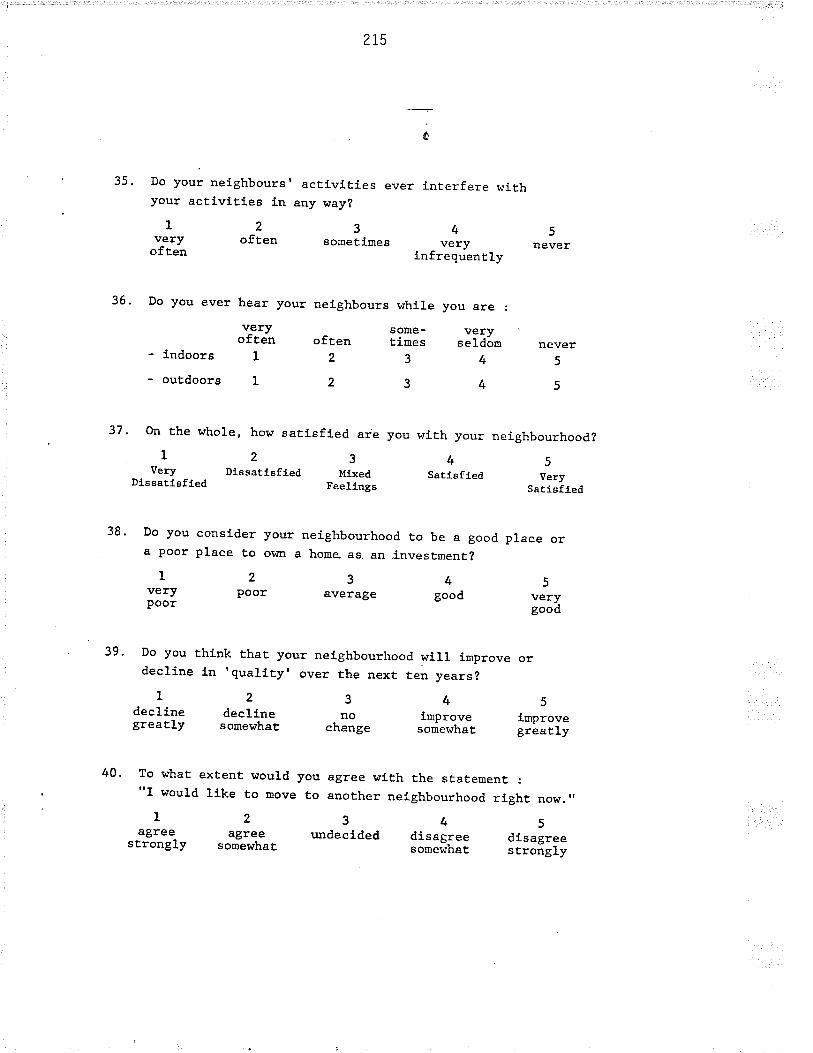
215
e
35. Do your neighbours' activr.tr-es ever interfere withyour activftLes in any way?
L2very oftenoften
36. Do you ever hear your nelghbours vrhile you are :
v-ery some- vervotten often times seldónL234L234
3eometfmeg
4very
infrequently5
never
indoors
outdoorg
never5
5
37. On the whoIe, hot¡ satlsfLed are you
L23Very Dfegatfefled HLxed
Dieeatlefl.ed ¡eelÍngs
with your neighbourhood?
4ss8ti6fled very
sarisffed
38. Do you consl-der your. a Poor place to own a
l2very PoorPoor
To what exËent would"I l¡ould ll-ke to oove
LZagree agree
6trongly somewhat,
neighbourhood to be a good placehoDe. as. an ÍnvesÈment?
34average good
5verygood
39. Do you think Ëhat your neighbourhood v¡ill improvedecline l-n 'quality' over Èhe next ten years?
L234decline decline no improvegreaÈly somewhat ehange somewhat
or
5improvegreatly
40. you agree with the sÈatemenÈ :
to anoÈher neighbourhood right no!r.,'
345undeclcled dl_sagree disagree
somewhaÈ strongly

216
4L, How fmportant do you conalder each of the followfngfactore to be vhen you try to decide how satisfiedyou are with your presenL neighbourhood?
FACTORSVery
UnlnporËant UnlmportantNo
DifferenceVery
IuporÈantImportant- the rype ofhousing unite.
Èhe sÈreeEatËern.
- the typeof people-
- the 'sÈatug.of the area.- nearness Ëo
- nearnesS Ëofood stores.
- nearneaa tofriends andrelatives- a v¡idevarieÈy oflocalactÍvities.
THrS CONCLUDES OUR QITESTTONNATRE. youR RESPONSESTTILL BE OF GREAT HELP To THIS STUDY; PLEASERNTURN TITEM AS SOON AS POSSIBLE IN THE STAì,ÍPEDENVELOPE PROVIDED. YOUR COOPERATION IS GREATLYAPPRECIATED.

Appendix B
C0MPUTER PROGRAM (SPSS)AND DATA SET
-2r7 -

218
5NÀRK
.//SI¡ARK JOB i ,Î=34,L=6r.rPÀtL SñlTHr/*î so/*ROUT9 PRINT 5ELF// EXEC SPSS//SYSIN DT' Û
RUN NÀIE NgIGHBOURHOOD STUDY GROUPFILg NÀIIE SATISFÀCTIONVÀR IÀBL E LIST SI'IPLI¡UII, NBHOOD, RESPONSE, TENU RE, ñÀLEÀGE, PI'LÀGE,
II À R IT ÀL, PÀIIS IZ E, L I FESTGE, I'IJO BTYPE, PJO BTYP E,FI NCOÈtE, LNlHP E S, ËEDCN, FEDCN, BETI.INIC, rrI H fiIC,NU H TFN D5. I,I EET N BS, LF DTON BS, PRN IIN BS, FR N LY N HD,LKPOLK S, GDFR K ID S, KI DGDED, PLÀ KI DG O, IO B EKI DS,SUFPS ERV,GDÀCCI¡R K, GDACCEÀ1, GDÀCCSTF, GÞÀCCFUN,GDACCREC.GDÀCCPFK, GDÀCCPND, GOTOIIRK, GOTOEÀT, GOTOST R,GOT OFU R, GOl OB EC, GOTO PAR X , G0TO FRN D. N U It CÀR S ,TAKEOPFT,IDENTHB, BOONDNB, NÀItEEDGE, NICESPOT,SÀPES POT,SHRHSPOT, BEÀUTSPT, GREENSPT, PP IYÀCY,NBRÀI¡NOY,HEÀR NBIN, H8NBOUl,SÀTISFT,GDINVEST,HOHCHNGE,HÀNI ñOY E. SÀTHOUSE, S ÀTROADS, SÀTFOLKS,sÀ TLOO KS, SÀTS1ÀT, SÀ TNFsR K. SÀ Ît¡FEÀT, S À1lrR5TR,s À1 NR PND, S ÀTÀ CT rV, SOCECON, LÀyOUÎ, ÀCC ESS, r FOUT
IHPÛT ¡I EDIUH CÀRDN oF CÀSES 659rNpul poRriAT PrxEDfF¡.0,F2.0,13Ê1.0,2À1,57p1.01RECODE ttETHnIC'PETHNIC(iÀ'=11 ('Br=21 (rFr=3) (rG'=4) (rIr=51
(.Jr=61 (rNr=7¡ (rDr=81 (rpr'91 (rsr=101 (rur=11) (.cr=121f 'E'=13) ('Or=14) (r Ër=151 ('Xt=01/SÀlISFY (1,2=31/SATNPFND (1=21 (5=41 / TfJoBtyPE,FJoBTYPE (6,7-01 (2=11 /FINCOñE 12=3) (r¡=5) (6,8=71,/ HBDCN,FEDCN (1=01 (5=3)(6'7=r¡l
vÀR IÀBELS SñPLFUñ,SÀHPLE nUñBER./NBHOOD . NÀIIE OP NETGHBOI]RHOOD,/RES PONSE. ÀGREE Í cIYEN H ÀHE '1,/TENURE,OTN YS NETl 2,/}IALEÀGE, IIÀLE ÀGE 3/PÈ1LAGE. FEI.tÀLE ÂGE 38lHÀRITAl, ÉÀRIlAL STÀTIIS 3C,/PASS IZ E, NU IIBER OT CHILDREN ÀT HOñ E I¡lLIFESTGE.SÎÀGE IN LIFE CÍCLE 5/ñJOBIYFE,OCqIPÀTrON - ñÀLE 6,/FJOBTYPE,OCCUPÀ1r0N - FEËÀtE 68,/FINCOnE, FÀt'tILY INCOItE 7,/LNTHRES,LEI¡GTH OT FESTDEFCE 8,/ItEDCN, ÉÀX. EDUCåTIOÌ¡ - ttÀLE 9,/FEDCN,ttÀX. EDIrCÀTrON - FEBÀtE 98,/ItETHNIC, ETHNTCTTY - tlÀLE 10/TETHFIC, EIHNICfTY - FEttÀtE 108,/NUITPFICDS,I OF FRIEIDS IN NEIGHFOf'AIIOOD 11lIfEEINBS,PREOOENCT OF INFOR!1ÀL GÀTHEF]NGS 12lLHDTOI¡BS,FREOI'ENCf OF LENDING ÀND BORFO¡IING't3,/FRNITNES,RELÀlIOI{SHIP TITH NETGHBOURS 14l!RNLYNHD,NEIGHBOURTIOOD ÀÎTITUDE 1 5,/LKFOLKS,LIKE PEOPI,E TN NETGHBOÌIRHOCD 16,/GDPPKIDS,GOOD NEIGHBOI'AHOOD FOR CHILDFEN 1?/' KIDGDED,OUÀLITT OF EDUCÀTION ÀT LOCÀL SCHOOTS 18lPLÀ KIDGO, PLÀCES FON CIII LDRE N TO GO 'I C,/IIOREKIDS.OTHER KlDS OP SIÌ.!ILÀR AGE 20,/supFsEpy,ENonGH Loc¡tL sHops ÀND sEFvtcEs 21,/cDÀccPRK,ccoD ÀccESs To ¡¡onK 22lGDÀCCEÀT.GOOD ÀCCESS TO FOOD STOFES 228lGDÀCCSTP,GOOD ÀCCESS TO DEPTIRTI1ENT STOFES 22ClGDACCFUN,GOOD ÀCCESS TC ENTFRTÄINüNNî 22D,/cDACCREC,cOOD ÀCCESS TO FECpEÀTl0N 22E,/GDÀCCPRK,GOOD ÀCCE5S TO PÀRKS 22Fl
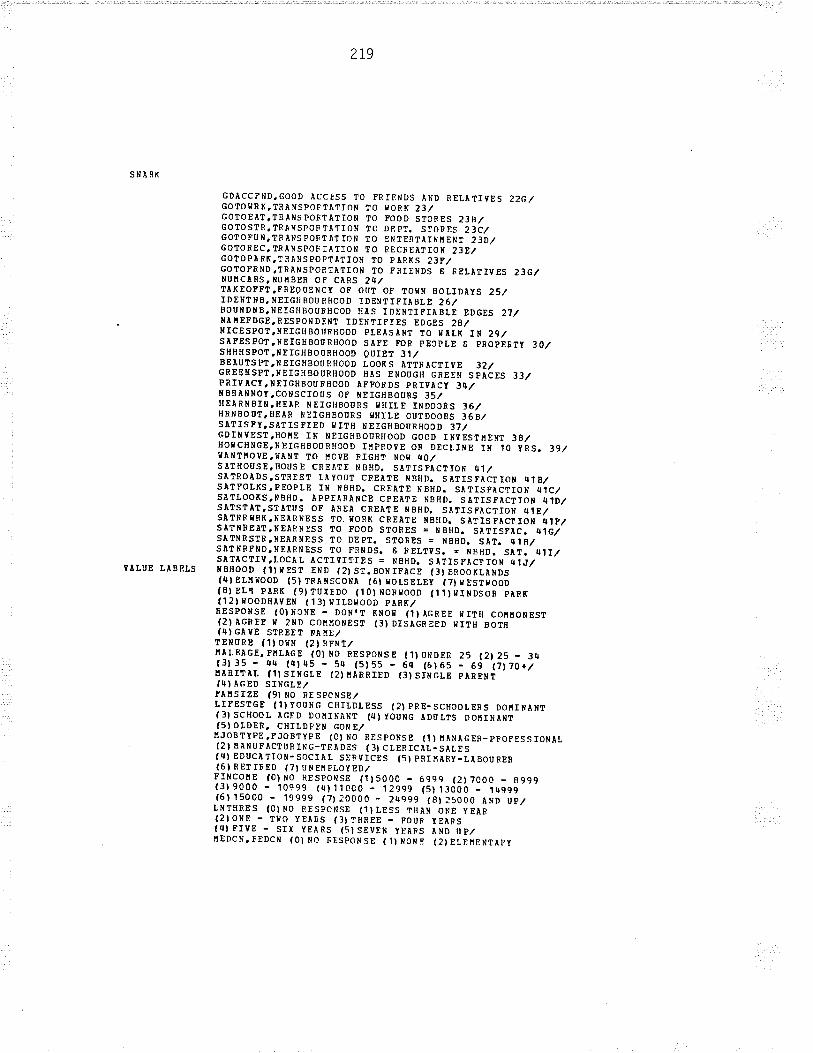
219
st¡ÀRK
YÀTUE IÀBELS
GDÀCCPND.GOOD ÀCCESS 1O pRIFNDS ÀND RELÀTMS 22C/coTof¡RK,TRÀNSpOFlÀlION TO t¿ORK 23,/GOlOEÀT,TRÀHSPOFlÀlION TO POOD STOFES 2]8,/GOTOSlR,TRÀr¡spoFTÀTIoN 1O DppT. STORES 23C,/GOTOFU!¡,TFÀNSPOFTÀTION TO ENTERTÀINHENT 230lGOTOREC,TRÀNSpOFlÀTION TO RECREÀr\.OÉ 238,/GOTOPÀRT,TRÀNSPOPTÀTTON TO PÀRXS 23F,/GOTOFEND,TRÀNSPORTÀTIOH TO FRIENDS S RELÀîIVES 23GlNUttcÀRS,ltuËBER oP cÀRs 24,/TÀXEOFFT,FREOOENCY OF OUT OF TOIII HOLTDÀYS 25/IDENTHE,I{EIGHBOURHOOD IDENTIPIÀBLE 26/BOUNDIIB,NEIGfIBOURHCOD HÀS IDENTIPIÀBLE EDGES 27,/NAtiEEDGE,nEspol¡DEt¡Î IDENTIpIES EDcES 28lt¡IcEspoT,NErcHBOrrFHOOD pLEÀStNT TO rdrLK In 29/SAFESPOT.NEIGHBOT]RHOOD SÀFE TOR PEgPLE E PNOPEBîY 30,/SHHHSPOT,I¡EIGHBOURHOOD QUIET 31,/BEÀUTSpT,NEIGHBOURH00D IOOKS ÀÎTRÀCÎM 32/GREEUSPT,NEIGHBOORHOOD HÀS ENOIlGH GREEN SPÀCES 33,/PRrVÀCT,NEIGHBOURROOD ÀpFOBDS pRrVÀCr 3S,/NBRÀNNOT,COHSCIOTS OF NEIcHBoURs 35,/HEÀRHBIII,fIEÀF NEIGHBOI'RS I{HILE INDOCRS 36lHRNBOOT,UEÀR NETGHBOIIRS ¡IHILE OUTDOORS 368,/sÀTISFy.SÀTISpIED 9IT8 NETGHBOÛRHOOD 37,/GDINyESI,HOilE IN HEIGHBO0RHOOD cOOD INyESTttDul 38,/HO¡tCHNGE,NETcHBOûnHOOD r¡lpRoyE o8 DECLIT¡E IN 1O rRS. 39,/raANT¡rovE,HÀNT 10 !r0VE RIcHT NOH 40,/5ÀlHOUSE,HOUSE CREÀÎE NBHD. SÀîISPÀCTION q1,/sÀTFOÀDS,STREET LÀyOÛT C8EÀTE ¡¡8HD. sÀTISFÀCTION l¡18,/SÀTFOLKS,PEOPLE IN ilBHD. CREÀ1E NBHD. SÀTISFÀCTION ¡¡1C,/SÀTIOOKS,HBHD. ÀPPTÀFÀNCE CFEATE NBHD. SÀTISTACTION 41D,/sÀTs1ÀT,sTÀTU5 OF ÀREÀ CREÀ1E NBHD. SÀTISFÀCTION r¡!E/sÀTNR¡tRK.NEIRNESS TO. nORK CFEÀTE NBHD. SÀTISpÀClION 41R,/SÀTNNEÀT.NEÀRNESS TO FOOD STORES = HBHD. SÀTISFÀC. 41GlSÀTNRSTR,NEÀRÈESS TO DEpT. STORES E NBHD. SÀT. rtlHlSÀlllRPND,NEÀRNESS TO FRNDS. 6 RELTyS. E NBHD. sÀT. tr1I,/SÀTÀCTIY,LOCÀL ÀCTMTIES = NBHD. SÀTfSFÀCfION 4liI,/HBHOOD IlIIIEST TND I2}ST.BONIPÀCE (3)BROOKLÀ[DS(r¡t ELilrooD (5) TBÀNSCoHÀ (6t ¡¡oLsELEÍ (?) fEsÎ900D(8) ELr pÀRK (9lluxEDo (1ol NORTOOD (.t1)rIùDSOR pÀ8K(121 HooDnÀvEN (131 r¡rLD¡{ooD pÀnK,/EESPONSE (0)N0NE - DON.T KNOH (1tÀcREE fITH COttäONEST(2)ÀGREE r 2ND COnrlONESl (3)DIsÀGREED HITH BO18(r¡) GÀ vE slPEEl nÀ nElTENnRE (1) ocH (2) RENT/rÀLEÀcE,FËLÀcE (01N0 BESpONSE (lluHDER 25 (2125 - 3t¡(3) 35 - 4¡¡ (q) .r5 - 54 (5) 55 - 6C (6) 65 - 69 l1l.to+/ËÀRITÀL (IISrNGLE (2'I'ÀRRIED (3}SINGLE PARENTf III ÀGED SINGLE,/FÀñSTZE 19}NO RESPCNSE,/LITESTGE (llyouHG cHITDLESS l2)pRE-scHcoLERs DollrNÀNTI3) SCIIOOL ÀGFD DOTIINÀNT (I¡} YOUNG ÀDI'LÎS DOIIINÀNT15) OLDER, CHTLDFEH GONE,/IlJOBTYPE,TJOBTYPE (O) NO RESPONSE (1I ¡1ANÀGER-PPOFESSIONÀL(21 ËÀNUFÀCTURING-TnÀDES (31 cLERIcÀL-sÀLE5lr¡l EDUCÀTION- SoCIÀL SEFVICES (51 pRIHÀRy_LÀBouRER(6I881 IRED (7t I,NEI'IPLOYED,/FrNCOÉE lC)No RESpOltsE (1)5000 _ 6999 (21?coo _ 8999t3) 9000 - 10999 (ql 1loco - 12999 (51 l3d0ô _ 1q9e9(6115000 - 19999 (7120000 - 2qe99 (S)25000 ÀND Up,/LNTHRES (OI I¡O BESPCNSE (1I LESS THÀN ONE YEAR(2IO¡¡E - TIiO YEÀRS (3}THREE - FOUR YEÀRS( I¡I PIVE . SI X YEÀ RS (5) SEVEN YNÀFS À ND I, P,/HEDCT¡. TEDCN (O) NO FESPOHSE ( 1} NON E (2} ELEIlENlÀPY
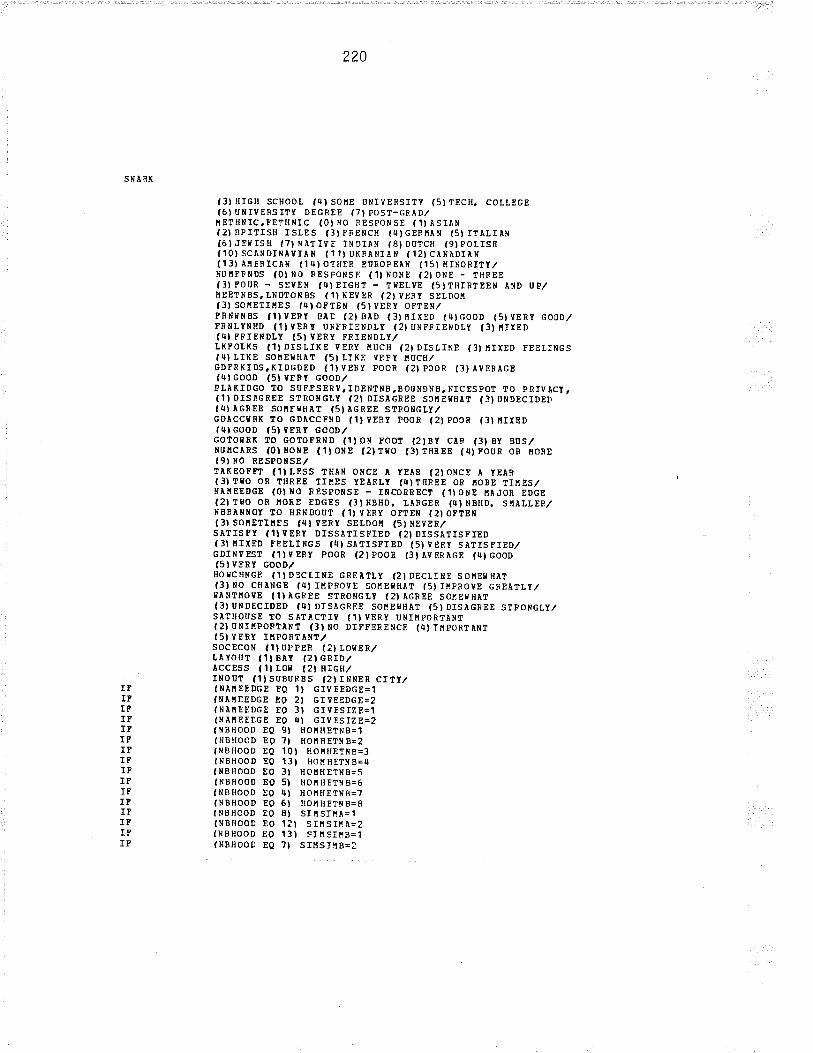
SNÀRK
220
f3)HrGH SCHOOL l4)SoHE UNTVERSITy (5)TECH. COLLEGEf6) UHIVEFSITY DEGREE (7I POST-GRÀ0,/IIElHNIC,FETHT¡IC (OI NO BESPONSE (1} ÀSTÀNl2l BPTTISH ISLES (3) pRENCH (4,CERñÀN 15ì rTÀLrÂr¡(6IJETISH I7I I¡ÀTIVE INDIÀN f8) DÛTCH (9)POLISñIlOI SCÀNDINÀVIÀN (11) UKRÀNIÀÈ (12) CÀNÀDTÀH(t3l AHERICÀN (1t¡) OlHEF EnROPEÀX (151 HINORIIr,/I¡UI'PBNDS (OINO FEsPONSE (lINONE (2}ONE - THREE(3} POUR . SEVEN (¿It EIGHT - THELVE (5tTHIRlEEI¡ ÀI¡D UP,/¡!EETNBS,LNDTONBS (1}T¡EVER (2} VERT SELDOI{l3) soËEÎIüES l4l OpIEN (51 VERy OFTEN/PRtlllNBs (llvERf BÀD (21 BÀD (3)ürxED (¡tlc0oD (5)vERy GooD,/PRNLYIIHD (1I VERY UNFNIENDLY (2} UNFFIENDLT (3} HITED(III FBIENDLY (5I VERY FRIENDLY/LKFOLKS (1I DISLTKE VERY I.IUCH I2} DISLIKE (3) üIXED FEELINGS(41 LrKE SOüErHÀT (5ì LrKE vEFy ñncH/GDPRKIDS,KTDGDED (1) VEBy pOOR (21 p00R (3) ÀvERÀcEIII)GOOD (5}YERY GOOD/PLÀKTDGO 10 SUPTSERV,IDBNTNB.BOUHDNB,NICESPOT TO PRIVÀCi,(11 DrsÀGREE STRONcLT (21 DISÀGREE sOüErHÀT (3) Ut¡DECIDED(I¡} ÀGREE SOIIFIJTIÀT (5) ÀGREE STROI¡GLT,/GDÀCCCRK 1O cDÀCCpUD lllVERy pooE (2)pocR (3)HItEDf fit GooD (51 YER r cooD,/GOIOíBK TO GOTOTRND (1tON FOOÎ (2lBy CtF l3t By Brs,/HUHcÀBS l0lNOr{E (1}ouE (2lTHo (3)THREE (¿r)pOUn OB rOBE(9) NO RESPoXSE/tÀr(EoFFr (1tLEss THÀN oNcE À yEÀB (21ONCE À IEÀR(3t Tfo oR THREE Tr!:ES yEÀFLy (4)THREE OB r'tOBE TIHTS,/HÀHEEDGE (0lHO BESpOt¡SE - rncoRBECT (.tlCHE HÀJOR EDGE(2) TTO OR IIOSE EDGES (3 I NBHD. LÀNGER (4) NBHD. SI!ÀLLER,/I¡BRÂNNOI 1O HRNBOUT (1)VERT OFTEN (2)OFTEN(31 sotlETIttEs l¡¡) vERT sELDoü (5) HEVER,/sÀTrsFI (llvERy DIssÀTrsFrED (2lDIS5ÀlISrrED(3) llIxED FEELINGS (¡ll SÀlISrrED (5)VERy SÀlr5rIED/GDINVEST (1)vERy pooR (2)pooB (3)ÀvERÀGE (4ìGOOD(5} YERT GOOD,/HOHCHNGE (lID9CLINE GREÀTLY (2}DECLINE 5OñETHÀT13l No cHÀNcE (4) IHPFOVE so¡tEHHÀT (5) rHpRovE cFEÀÎLy,/cÀHTr|ovE fllÀcREE slRONcLy (2) ÀcREE SOrEÍnÀT(3)UNDECTDED (r¡) DISÀGREE SOnEr¡HÀT (5)DrsÀGREE SIFONGLY,/SÀTHOUSE TO SÀTÀCTIV (1)VERY UNIITPORTÀNT(2t 0NrÉPoFTÀN1 (3) NO DTFFEBENCE (41 InPORT ÀNT(5} VERT IIIPORTÀHT/socEcoN (ll nPPEB (2) LOTJER,/LÀYOrT lll BÀY (2t cnID,/ÀccESs (tlLoH l2t HrcH,/INOUT (1) SUBURBS f2ì INNER CIlr,/lNÀIIEEDGE E0 1) GIvEEDGE=1lNÀItEEDGE E0 2) cIvEEDGE=2(NÀItEEDGE E0 3ì GIvESIzE=1(llÀ!íEEDGE EO 4) cMSIZE=2(NBHOOD EO 9l HOiHETNB=1lHBHooD E0 7l HotIHETNB=2lNBHooD EQ 101 HoÉHETNB=3{NBHooD E0 13ì HoItHETNB=4(RBHOOD EO 3I HOIIHETNE=5INBHOOD EO 5I HOTTHETHB=6INBHOOD E0 ¿¡l HoñHETNB=7(NBHOOD EO 6ì HOüHETNB=8fNBHooD E0 8l SIUSIHÀ=1(NBHooD EO 121 slnslÉA=2fNBHooD EO 13ì sInSIË8=1(NBHOOD EQ 7l Srüsr!'rB=2
IFIFIPfFrFIFIFIFIFIPIFIPIPIFlÞ
rF
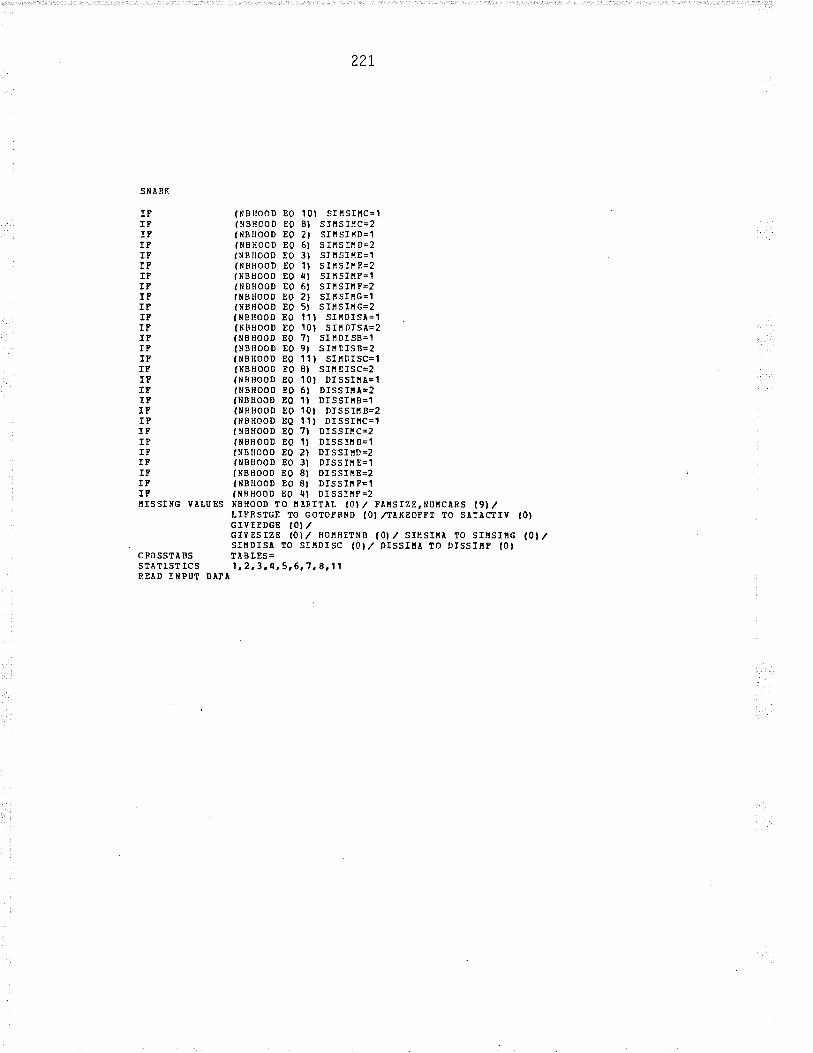
22r
SNABK
IFIPrFIFIFITIPT7IFIFIPIPIPfPrFITIFfPITIPIPIFrFIFIFIPIFITItISSING VÀLI'ES
C RO SSTÀ BSS1ÀTIST ICSREÀD IHPUÎ DÀIÀ
(NBHooD E0 101 SI llslllc=1(¡lBHooD E0 8l srHsldc=2fl¡BHooD E0 2) sItlsIrD=1lNBHo0D E0 6) sI¡1sI11 D=2lNBHooD E0 3) sIHsIËE=1(NBHooD E0 1l sIllSIËE=2INBHOOD E0 al SII'rSIltP=1{¡¡BHO0D E0 6t sIñsIftP=2(NBHOOD E0 2) SriSrrlc=1(NBHOOD E0 5l SInSIHG=2(NBHooD E0 11) sIËDIsÀ=1(NBHooD E0 10) SIllDIsÀ=2INBHoOD E0 7l sIllDISB=1(NBHOOD EO 9I SIIIDISB=2(NBHoOD EQ 111 SIIIDISC=1lNBHooD E0 8l sIllDJsc=2(l{BHooD E0 101 DIssIËÀ=1(NBHooD E0 6) DlsSIiÀ-2(NBHOoD EQ lì DrsSIÉB=1(NBHooD E0 101 DrsslHB=2(HBHOOD E0 11) DISSIËC=1( NBHooD EQ 7l DISSII|C=2(NBHo0D EQ 1) DISSIItD=1INBHOOD EO 2I DISSIIID=2INBHoOD E0 3l DIssI¡lE=1(NBHoOD E0 8) DIsSIíE=2fNBHOOD E0 8l DISSIñF=1INBHOOD EO 4) DISSIlIP=2NBHOOD TO tÀRrTÀL (0),/ rÀËSIZE,NUËCÀAS (9),/LIFESTGE TO GOTOTNND fO) /TÀKEOPFT TO SÀTÀCÎIV fO)Grv EEDGE (01 ,/GrvEsIzE (0ì,/ HoíHETNB (01/ SrHSIíÀ To SrüSIttc (0),/srüDrsÀ 1o sIBDIsc (0)./ DrsslnÀ 10 DIssIñF (0)TÀBLES=1,2,3.c,5,6,7.8,r1

222
CÀ8 DDAT A
0001011 1542353rr6521FF2223320000¿t54¡¡30122222222U41412221 113113r¡31 u3[5355t!tt42222000201122q10120 31¿¡0Gx133¡¡33000C355r¡¡t1113133222132212213111112221U5252442252222000301rr2501056155r¡08x2234rt3C000r¡0r¡¡¡333201t3333021112u22U25532??25355243342222200040102432r¡4671331G82214r¡f¡C0005r¡55542r¡31111331144fi3r¡r¡lr¡4551¡r¡4r¡l¡54tt44q44Uq22220005013164224375553cG112443C000025531312222222243q1222242442i2322445ui3't32222200060131662055525228c233rr45C0005r¡55332rt1112332035¡¡433534355rtrr43344345555tt32222000701t 20 1101J15503xc1 t 1't 1',t0000rlr¡r¡ tt21112222222'tr¡3r¡r¡ 11113131t r11152555355352?2200080 1210r¡10501ó503xx133433C00C2r14r¡q22411333331155132111r¿32233r¡355555343332222000901¡¡17520564352388223433000044044¡¡r¡¡¡211330211',tzrt112152532212',1111442tt4242222001.î0111322333364q3ÀÀ533444r¡4445¡¡5544qq211222233quq44q3q454rrr¡435222q44533322220011013105435052503X823344r10000.¡5¡¡553?r¡1't111330224rtf¡22¿t2¡trt433243111114q422222200120122222335731238F1133r¡4¡rt¡133331111331333331432f¡43r¡r¡5r¡411442555555555552222001301110.¡r¡25Ct¡550trI8532¿r3r¡0000¡¡5r¡54¡r¡¡q1212222144232ur¡2221¡l¡34333332335qq132222001r¡0 1022121215725r¡BC111333000C52r¡r¡3r¡r¡23113113033r¡24222443223222534424ttU432222001 50 12 1 074 1 5062 50q x p53¡¡3340000504rr332 30 r 333 33 0322 1 11222211132225554515544222200160 122201017015608I2333r¡3000Cr¡3r¡¿t43¡r311113130122322122232232124u|'/-q3qq43q222200170tr¡122201373334Dr2235r¡r¡CC000355341522321201245443235545354552r¡152353232222001s011107r¡05061503X83115r¡5000053551333011331212¡¡4¿t2112323533t¡242355tt355212222001901r¡14327r¡37554.toO333333233333332223222222211224',t',t112122212t1525552222222220020011175255618537881115f¡3C000545.¡3331221122223sttf¡1134211211111225r¡r¡333512222002 10'12 20r¡38 307130 3r 821 133 333¿¡ qt¡ 1r¡r¡r¡r¡4r¡013331301 3312224 U23313 343¿tr¡.r4455555222200220 11 14q21f¡457552rU¡¡334r¡44 q45U2\4422421322221u4243tt22 51¡r313221 5555qtt't3322222002101224423537553388332¡14300005r¡55533¿¡21112322tt55tt2242r¡44333qr¡2¡¡2441q55132222002rr0 1¡¡211201771160Gc122r¡4¡¡0000rr54r¡¿¡1't312122221tt21q2442125q33123432424423322220050022222223518566uF112r¡¡¡333tf555542252122211234422421143223213553tt3qq44q22220051021122201128354FF32tt5330000555413rt522222111r¡3¡t3521411511r¡35t¡qq4432424tt222200520211502353r¡7¡¡3uFF3234¡14C0004555q4¡¡4222222214453¡¡r¡4¡t433rr20rt¿¡51151155511222200530211112011t8156FI5¿t25r¡5C00C5,3555555222221124243qr¡r¡r¡f¡r¡4r¡345rt53r¡r¡2 144tt442222005't02013121257q¡¡33PF33255r¡5t33rr55322252232112124q044444¡¡5335543553¡r3333f322220055021106405060503xF5425¡¡500005053rr¡¡¡¡50133313004r¡3r¡¡¡q¡r4q4f¡qr¡435¡¡¡¡3u3143q3222200560211332231r¡7253FF3224¡r4r¡¿¡r¡¡¡4553334312222221¡¡qq35q5q54¿lr¡¡¡45¡¡5534544434422220057021104333072502xP5r¡3r¡r¡53.¡5r¡55555555313300101t¡1r15¡¡45¡r553155t¡355555555552222005 8021 't 652 0 56 6 1 5 2 r¡ B B 41 1 5rr 40 0 00 5 0 5 3 3 2 3 3 0 1 2 2 212 1 3 3 rr 2 3 r¡4 3 ¡t 0 50 3 rl r¡3 ¡l 54 55 5l 542222220059021 121222377i23PPq344t¡3C00005555555222222121t3302154 55550¡¡23¡¡2¡¡t|3555555222200600212101011C 8130 BX22l t 13000013 532q.¡ 1222?222qU24 3r¡214 5r¡5552211 1551 \531q1222?006102121010110 524081211r¡44000 C5555r¡ 553111 1 111004rt 0452251553522522ttq2t!U33q222200620212011010rr1304xp311r¡55000C55555235111111103t¡r13444qq3q43qqqq43343q334q2222006302114425317852r¡FF35rt5f¡555q3qq5433352222222335434q¡¡4544r¡3rtr¡rt4r¡.t¿ts221r343222200640211r¡4205r¡rr¡53CGG1t14¡¡r¡0000¡l4r{r¡3¡¡33112212212420r¡4q4445034¡¡44r¡3¡¡43433132222006502112222237tt355Fr¡05q330000q353335¡¡2122212145q14222524323332t1555q3u44322220066021102101026306xp232¿t¡lr¡0000455r¡333311222222q4413244423r¡3r,¡¡¡rrr¡¿¡r¡rtr¡35553¡¡22220067021103333035203xF1115r¡r¡l¡3r¡C\1q22q\\2222222133rt0¿rr.¡r¡¡tr¡445r¡rt3r¡t¡t¡32|l3333342222006802210t¡¡¡35023305X83q3535e00C53532552313311303551555r¡5153't¡¡u4r¡335rr2q54q52222006 90 21 1 5 52 5 566 I 5 2 2P F 3 2 23 3 3 C 0 0 Ct¡ 3 51 1 3¡¡ 2 0'13 3 21 21 1 52 0 4 1 2 ¡¡ 5 ¡¡ 4 q 1 34 [ 1 q 3 5 4135135222200?c021144225571¡523FOrt21544000Ct¡5534r¡¡¡5'12222221r1r¡¡t354¡¡t¡¡l¡trt¡¡4rt¡t45¡¡rtr¡43qU2rt22222007 10211504351065¿¡0FI322555000C455344¡¡¿¡'l.122221144t¡0555455tt5455r¡5t¡r¡¡l3t¡54334222200720212303333C5550px3¡t354rt55r¡5555555552't22211115534244524324r¡¡t55355r¡34333222200?30211112011r15133IrF32q55tlC000555¿¡3¡¡tr5212211214r¡¡l3l¡142t¡t¡352t¡55355554t¡53ut|2222007402115521r¡6665?3FD1224330000r¡4¡¡233q3212221124434422q2333233rt3',t',lUt¿423f22222200750211011010t¡4303xF1113330000t¡5523¡¡4¡¡222221211332q3u2r¡2r¡4r¡342r¡2211t¡3333322220076021222222345433FG333r¡rt54r¡44q5q233552222212144r¡3f¡45f¡5r¡r¡r¡454r¡55355r¡553rt422220077024100r¡95060500xr113r¡33000cr¡0¡¡40000011c000010000020r¡20¿r032333133333333222200780211652552755338P353545000C541¡t¡3r¡t¡t¡2132202143403¡¡¡r34¡r54333r¡35tt45trqquq422220079021201101042203xP3324440000r¡352323331322120¡¡2r¡02453425324223545tr32323522220080021105¿145016504xF11243400005152r¡r¡5¡¡313311303¡t5352r125¡¡550r¡5552134t!5544u22220 1 0 00 32 1 70¡r 0 56 0 1 530 px2 1 1 4 3 40 000 l¡ 0 4r¡ ¡ t¡ r¡ ¡¡ 01 30 0 0 30 1 3 q 4 qqo 2 4 r¡53 2r¡24 5 5u 44r¡5q r¡.¡2 2 2 1 1
010 10311¡¡323r¡3?05238G1335344r¡431¡5¿¡¡¡r¡22C22322222320U2t!42254r¡r¡324r¡'-1u4U24UU2322110102032105r¡ 1q0 2150 3 x83225r,¡3C 00 Cqq¿¡r¡ 2r¡3 r¡ 3131 11312 3 332q42 r¡r¡33 3345¡¡ 55555554 r¡2 2211010 30 31 111295662523cc32 33r¡ 3C 0005053 r¡r¡ 150222 20202453 2111 1211 132553 r¡ 32215555221101011031 174205671522Dc5315r¡300C0300000000't301030123233132322033301111111 111221101c 503213222317543 3SB 3r¡ 35533.¡ 1 11131r22q 222311 124 24 r¡ 1224 rt 2r¡3 3 33¡t3 r¡4 24r.¡2424¡¡22110 10 60 31 1 0 q 0 q 40 7 1 5 0 3 X Bl¡ 2 3 32 3 3 4 4 1 1 2 2 1 1 2 rl 2 0 r 3 3 1 1 1 1 r¡ 5 q 2 1 1
.l 1 1 1 3 3 3 2 2 ¡¡ 3 5 t¡ Ll 4 ¡¡ r¡ r¡ rt 3U2211
0107031110101J0353Crrx533r¡15C0002521121311322221r¡55311111r¡22',t1152r¡rrr¡r¡2255552211
223
CÀR DDÀTÀ
o 10 80 3o 1?0r¡5 5ó0 1r¡ 1Oc x3r¡3r¡4r¡C 00C 33 33333 3C221 1r 212 3 31 r¡33 3 3¡¡550 4¡¡55 11 1111 1'-t 112211
010903115r¡20s506533u8r¡445¡¡5C0001122222422222211¡¡55312t¡212331213'l¡¿45554555522110110031105q35040502XU211433C00C4C¡,t0C0053'13C222014u3212t34¡¡543244¡l¡¡qq13313222',11011 1031 122223177su38p1134431 z'tuq2at!3?21222222223550111r 3111't 11¡1344r¡4r¡1r¡2222211
01120111604555035208r322r¡43¡¡3214555333t¡22221?222q532r¡¡{134¡¡¿l 3r¡3t¡5333435r¡4322211ótlio¡l2oz32zot 1qosxc5r¡4q0q3u2210222323030333t013202¡rt¡3¡¡.t53333q2545¡¡215tr34221'l011 qO3C 20232 202110 3rC 11 1¡tr¡q3 531t¡ C53333 3013 311303 33 t¿ t¡323 54532 3 331 33 31333 3 33 2211
O1t5O312Z2ZZ35'rSqq2xI53t¡q¡13¡¡5t¡25t¡r¡3343322222222u34ì4t¡¡ll34q3244tr553443555342211òrlso¡110q¡¡050?t502xB¡¡31¡¡r¡rtCo0Oqo423¡¡2q01131330?qq3111154211114455555155552211ollzo¡1150¿r35316530SX321r¡34C00ctt552323422222722tr5u22241q454322u255555552222211O11BO3120qr¡530?t502xF5j15t¡53424t¡Ot¡422q30133313023t¡t¡¡¡3243455q5t¡44t¡t¡45414r¡442211o11903121olOf 5055308X512331C00Cr¡44213t¡3222222211tt5tt221¡¡541214355225511243qtt221',10120031 'r qq2 3537 653 3BB 21 132¡¡C 0004234331 1222222234q5q 2rrr¡ 21155431r¡ 154555555 352211
01210312023r20q2103rc5S3¡¡3300001r¡1111253133111033r¡311113t|50411114455¡¡253552211o12zo32l 552956613338cr133555C00050544t¡r¡4022222213452tr2214q4223254u35¡¡41543t12211otz¡o¡r z11z223z4t3qDD133333coo040co0oooo00ooc09¡¡t¡r¡tt11¿¡1523322212435545t¡tl 33221'l
01Zr¡03111121217513 3cc'r1 1313C 00Ot¡451 1311222222?23¡¡3211112132'1214'144 55334¡¡332211ot25o31 102101J.t r¡205xc23253¡¡000c555q133r¡3133223013¡¡21211 124543343232 tt344tr232211
0126031155295574523885314r¡40000444333c422221021t¡l¡¡3¡¡2244¡t3333¡¡454qqq144t¡tlr¡2211O1270jt1rt0r¡0S20653g6¡2lllrru00OO2.¡t¡2322t¡323222213t¡t¡2143r323t¡321t¡1535554t¡4332211012g031 1222325i5t33cc2333333342s555tt32tr222222223253232'l¡¡23333242333u245545221'l012 9031205rr95071r¡0 2xF222¡t¡¡30000 ¡r033332 3C 133 333030 14222224u3033r¡411 1111 1 1 112211
0130031,122213371533883¡¡q4r¡553322t¿2113352222221123433423223334345t¡35453334¡¡2211013103120233307 1202rF213¡l¡¡5434t¡555545553'1 11101022q4455¡¡55550554455454r¡¡¡54r¡221'lo1320311orrr¡1r¡033503xu3q143jC00c1c33j3or¡2222222221¡¡u00000032222225t)55554r¡4¿¡22110133031122223516332F833353335141531q12511211111r¡35r¡111¡15550333534¿¡55r¡55434221'l013 rro 31 1222 133rt?53 3F83224333u22444333332222211 13lq ¡¡4tI4¡¡ 344q 34q53 ¡l3r¡ 52tlr¡ 3 34221101350311604356015308I532r¡4r¡OOOO¿t022222301131321122'l 00000011132t¡3t¡253t¡4ttq232211O 13 6031 1652 0566 253 3pp 11 1¡¡r¡r¡c 0o0q 0502 33 3 0222 22212'lC 0 3 3314 3¡¡53r¡ 3r¡311 11 111 1112211ol5OOr¡11662 15663533Up322r¡230000¡¡O¡¡40000023222212352244245553332344¡¡4r¡3rt3332211o 151041 14422 531 8556DD 123433000C21 321113222222233tt3 3 32tt214t¡4 3t¡325ur¡ ¿l u33u322221101520¡¿1.t322¿¡354?533Cp23¡¡4343r¡t1r¡55¿¡321r¡2122221213t¡2231254r¡q233225545q32225221101530q11033r¡30r¡r¡1O3IF2q3r¡4r¡t¡4¡¡543¡133tl332222222232\33q43225q24335323q2222232211o15rr0r¡121122257'n 33û8252534000042¿¡3323321221'-12223212224r¡254¡¡43334235r¡3333422110t550r¡1r06q2506r503r82315r¡qC000201111220132022031t¡22tlq22155533rtqt¡¡¡4r¡315522221101560r¡t 177215661 5l2UU333r¡550000r¡051224¿¡0133311013t'l 5l¡54555525545333t¡2153552211O 1570 ¡¡r fl7225661522uu3314t¡3C 00C30213323 02200021211212111 11101113 5555515555 2211
01580¡¡t 1 332 3r¡r¡ 3 B5I3pFt¡33tI455555¡¡23323q 322221112q452 ¡¡ 55t¡ 5 555¡l55¡¡ 5t¡ r¡ 554uq4422211015904110r¡rr1 501 6505xc21133300001431111332333331i25 33224 1rr33333224q5555r¡¡¡ ¡¡22211
O16C0r¡1222212327531Fo2r¡r¡¡¡¿¡r¡0000333133222222222143 11224223r¡33321254t¡5ri3t¡233221101610rt115r¡2r¡51285368r2335r¡r¡OO0OOt¡4333t¡33222212'ttr233t¡2341¡¿¡54t¡5344431¡4355423221101620¡rt 1t¡{2351 l7 533 BB112r¡3300002 3211313222?2222q5u2 3443124¡¡ 3332 54245q555t¡522110163041 1222017253568U113r¡33C0002121233122222221tt2233r¡23¡¡241132311354r¡333tr42211016¡¡0r¡22t0t01502130Sr21235¡¡0000r¡121533121322221'rq53u4453555555115tt54545355221101650r¡1222201qr¡7231UU2323¿¡¿¡00003433135322222122tr1q23223412323322t¡4tlt¡3¡¡rt33u22110166041 16 620 5661522U p5rl 34q 30C0040qo4qr¡ r¡ 0130 3o3o l oo0c¡l¡¡4¡14543 43tI31 1 1111 1 1112211O 16?0r¡1 12120117 5l¡33r't Ut t 2u33C OOC24qqqgt¡t¡22222222-3 t¡43I t¡4t¡ tt 4555l¡313 t¡¡¡551¡33 3232211016 80r¡ 122120'l1r¡ r¡ 153 FU 11 133 3C O00r¡ 35t¡ 311t¡2332 2231t¡2I t¡l¡ 1¡¡q f¡455r¡ f¡q234r¡ 5tlt¡33 3 33221101690u11r¡326r¡375¡¡638855555533t¡5r¡r¡t¡c04¡¡ 0212C2201¡¡OO0r¡44t¡ ¡145044t¡341 115151 '151221'l
O 17 00r¡ I 1 r¡q2 2 3 3? B5 6 3 BU 5¡tr¡ 4t¡ 33 ¡¡23 5 l¡5 3 22 1 [ 2 f 2 2 22222 2t¡ 3 3 3 1 4 ¡¡ 43 3 2 r¡3 2 5 t¡ 2 4t¡34 4 4 3¡l 22 1 1
o 1710 r¡1 12032 250 r¡3 30UXr¡ i 35333 3qq2U4223!221221r 212 t¡r¡ 4r¡24tl2l¡r¡33 r¡t¡ 3¡¡ t¡ 33t¡4r¡4 r¡41¡ 2211
017 20 r¡2 2Or¡ l3 rr0r¡ 250 2X B?22r¡r¡¡¡3 4¡l¡¡r¡ r¡5323323223 r 120 I 35?4 31¡¡r¡ 3tl3 3 3242t¡ 3¡lt¡ut¡t¡ 4332211o 17 30¡¡1 1662 3566 353 3C8332334C00Cr¡ 0311 1110222 22213c¡¡'t 1 111 1 111 1 111 1 1 1555153 tr1r22'11
o17r¡Cr¡1r11212552333F0223433C0001t¡222t¡t¡33132'lt2l222l31t¡2tr133233t¡24r¡r¡33r¡q33q2211O17SOr¡120210102610?xBZ11OOOO0OOO5u2332!22222?213t¡t¡122LrZ'112223213421!tr2222\222'110t?6041155205r¡16r¡33rU11344r¡OO0O4244qr¡¡¡¿¡32312:21r¡r¡¡¡1r¡4424r.¡5544334334113r¡l¡4¿¡r¡2211O1?70r¡1 17623 5662 50ODD34rlq¡¡5C O0C1O21OO20O22? 2221 I l¡¡ 1¡¡2u4 2 r¡43 343354 t¡ 4441t|4 t¡t¡2211
01780¡¡ 1 1212125r¡6 33 5cc2504 33CO0o4 3211 11211222?22t¡ll 3J2242222133 r¡2 3 f¡ 5t¡25t1.3 33221101?9or¡113032¡¡3055308X22354r¡¡¡¿¡4¡14551111U2222?2213'l¡¡3?2¡¡214532¡¡4224r,¡351¡¡¡tlr¡242211o 1 I 004 1 2 3 22 l¡ 137 O 3 2O cX 2 3 244r¡ r¡ r¡ 33 4 3 r¡ 3 3 r¡rl 122 2 l2 r 2 I { ¡¡51 t¡ t¡l¡ r¡ 4 45 5 3 t¡ r¡ 4 t¡ ¡¡3 2 f¡r¡ 3 r¡ u 33 22 1 1
o181Or¡1155255336533GG1r¡3¡¡r¡3¡¡22423tt323q3222?2221t¡3323¡¡t¡3u¡¡5t13ttt¡24qq554t¡4r¡r¡2211o r 820r¡1 15522 537 652 3cc1213330000 3452202r¡0222 2221:t¡tr I33 33 ¡¡ 233 3ll33 r¡ f¡r¡t+r¡t¡ 4r¡ 1122 11
o 18 3041 20131207150 3XF5334¡r4C 0004 Cr¡33 3r¡r¡ 022?2 r 103 ¡¡r¡? 4l¡¡¡4 ¡¡ ¡¡54 24q451¡444tr44 4¡¡32211

224
CÀR DDATÀ
o18r¡041122232t116430cr122343244uu4434U3tr21221121313U4222l,,-tt3213t¡4252¿¡¡¡23tt23u221101850¡r1202313043405XC212U343322',1431'-t312322212211 3r¡321r¡3r¡454433224¡¡555¡t5¡¡4r¡22110186041 177225661522cc121r¡4¿lCOCC50qtrr¡444033333302320441421232322q4t¡t¡I¡34qqq42211019?0412112111461q3u811,1ttu3000C22s21122212222212343u3222244332425¡¡t¡552uf44221101880411604156I 1520 Ur55 3555C 00040u0054 5 0122222141t12 425t¡ r¡ tt555r¡q 55 3333313 t-1122110275051 1.r0334308530px222545c00Cr¡54323ùt¡'122222223353¡¡4t¡444qq¡¡5r¡t¡5¿¡3r¡41¡¡42332211OZ76053122ZOt127qr¡4cu343544C00Ct¡442i35422222121q4t14q4555r¡5r¡45544545533t¡q3322110277051 15522517756688332rt34000C455223332222222132u334¡¡2243333323t¡t¡55t¡544¡¡3221102780521112011471658p33244r¡0OOO¡¡3¡¡r¡3333222222214Uq344.¡l¡3¡¡q3qq3qq34{333313221102790511¿¡4234¡¡?653 3BB 124545444444¡r3121 421222212441 15q5¡r55555553513131242tt42211028C0511552256635338C2 12544C0004053232301232221t¡143¡¡t¡t¡{233124325¿r24r¡21qr¡U¡¡2211028 1051 1 1o1o 11071500X2224430000 44tr323352222222132435U53 5[¡¡t¡ t¡ 553 5q 255354 3 42221102820511rt¡¡2151785r1 388423r¡4¡¡0000¡¡4r¡r¡33142122222133r¡04q4q3q433r¡43¡¡f¡qq40¡¡33¡13221102830511r¡2233428533cD222¡¡4q33445444rrr¡r¡42122222144534U4t¡5¡¡l¡52¡¡31255453t¡433t¡221'l028¿r051 1??285661030 BI 111r¡340 0003 0300013113311301330r¡r¡44 5r¡53 04q 3311 11111 1 3122110285054 1¡¡035r¡6025208Iq34t¡¡¡tt45454C32345502222121r133¡tur¡545553355t¡53r¡543q434r¡2211028605¡¡ 15529¡¡32756 38n43 344r¡3 f¡44q044r¡44r¡022222213U41t¡34tr q q533 ¡¡ 3 321 1r 1111 1 1t 22110287054121201247273rp2215r¡3C000q5521355123222224330rr34¡¡5.r553r¡4335335355¡¡53221102s8051105425041503X82325r¡5000055544rrr¡41',|3111103t¡33555t¡5550q55q5rrt¡qq1555522211028905115522537tt42088311444C000!¡5554r¡r131221112124434t¡r¡¡¡4qqq4434tr33333r¡443¡r221102900511552255745228n122333C0002552255212321121211134r¡r1r.12q31434431q524r¡¿¡332211029 1O 5114423r¡136252GG1115131 35151551 11122122221tt 11011514¡¡ 133¡¡11'-t5255555522221102920511rr4223335533D054344532424q451335222222224q40q2144r¡4333333r¡r¡r¡¡¡¡lqt¡q53221102930511rr4225178533S81124r¡¡rC000u55223341222222142qU5f¡¡¡r¡55q44553544¡¡52¡¡r¡33q2211029¡t05r¡1r¡034¡¡308530FX334r¡4443122q55tt233222222234q204r¡rr33rt55r¡¡t3r¡5q35r¡33¡¡44422110295051120101¡¡C63t¡08X12244r¡0000415134442222 1121¡¡131q5q44q¡¡03¿¡tl2r¡r¡2q52121tt22211029605112221257 r¡4668p132545C0005rr5322q4222221 11323353¡¡lr¡r¡5445r¡4tr32343443r.r42211029?05112222237q2538U31244r¡000055r¡333¡¡3112221223q33q¡¡¡¡r¡4r¡3t¡3r¡4451¡30r¡45q3342211029 80521212',1 2!7 33538U32244 4C 00 04 1 ¡¡23 24522221121q I q2 4 44 r¡ rt q rl 3 3 332222443243542211029905t¡1322331t¡85338822¡r544rl3ztr1422122q213212212212324qtl2333443444442?r¡¡¡q422110300050 170¡¡156035308X323rt33C00030000000022222213340r¡4434¡t33333233r¡3r¡314.tq42211030105110?405060003X8232544000c50555555023322212330t1u444r¡555r¡3334r¡.¡t¡113343221103020511r¡rr23517853388533544C000r15543r¡3512222221355332r¡¡¡r¡r¡rl¡r3q035433435¡¡.¡¡lr¡22110303051133233575555Dr23¡t43rt43444rr¡¡33r¡3r¡223222213531tt344¡¡C333¡¡53r¡5q55q553r¡32211030 r¡051 1442tt557 523088 232r¡33000C42331422322222212tt40445r¡ 0 r¡ 3¡t 4rr34r¡ 1121111121221'l0305051151r2253q85330u213t¡4tr0000r¡55533332222222233503utrt¡¡¡0¡¡¡¡0t¡.¡303333¿155533221103060511r¡42.t¡t378523r0223rt3q55444552233411322223r¡1r¡032r¡4r¡45440¡¡35322515q¡¡5422110307053106rr35061503Xp354555C00040533445023221124330544r¡5¡¡532¡t4344r¡4r¡411¡4r¡4221103080511332235755235S333rt44.t44r¡52q3233tt22222221¡¡343r¡43r¡¿t3553r¡324444r¡¿¡2t¡r¡r¡{2211030905r¡'t32201346122FU1114f¡50000f¡244244tt32222221 r¡4¡¡05455553r¡44r¡4t¡555555555522110310051150q24108520cI223r¡4rr335025411q5322222223q441543r¡5t¡3rr3¡¡5354¡¡¡¡t¡23¿¡3332211031 10 52 166215664522rI32r¡4r¡r¡C 000f¡3 f¡4244 ¿t213222111¡¡q24r¡q 24 q¡¡3 2r¡424r¡r¡ ¡¡qr¡3¡t 3l¡422110312051 1442245755238U32344553433243234522221112225055r¡4r¡5¡¡32f¡445r¡rr4443¡¡3522211031 3052 1¡¡3253178533CC32233432535555555212222222r¡45153r¡455¡¡¡¡3¡¡r¡3554555554¡¡52211031405113222347t¡5330F35555555¡¡25341¡3t¡152r222111239'l¡¡35455¡r5¡¡54351¡3r¡tt334r¡r¡4221t03150511552 1566r¡533882r¡34r¡30000204444340222222',124r¡33222433333325¿¡5¡¡531t¡31222110316052 1303r¡4504530Cr23244455555554r¡5trtr212221',ttl¡4525r¡'tr¡54111rt44355r¡¡t3r¡51¡31¡2211020006320'¡4050?1302xc232333C0005052234301233330122¡¡1123{2r¡113112q3¡¡533q33tt22220201061266225661553cG121r¡330000403000020130000014r¡42r¡32r¡¡¡333321rt5155151'l 4322220202062202322023107Xprt¡¡355r¡C000554445551232111145t¡154245r¡3315555tr25515tl3t¡32222020306216629566153388111433C00C205553r¡2013331301152¡¡24r.¡r¡¡¡rl32f¡q3qr¡qr¡q31552q22220204064201101041104X8111543C0005353 11532',t222221¿¡r¡5252¡trt523¡t1q32r¡513r¡2r¡33332222020506212222372 3q6¡¡88223333321124f¡331121',1322221415 321 t 21 111131334 34r¡3333 3322220206062133222217tt?5882r¡¡t4330000¡t14334q5222211123543r¡312q21113322r¡rt51333333222202070612023330¡¡3203xí112333323r¡2434223331333330124232223243322224r¡rt5r¡q¡¡¡¡3¡¡22220208061220101502160oX33244¡¡C00Cr¡f¡5212r¡33133313014535r¡r145233 1r¡3¡lr¡4¿¡552t¡53u22222020 9061 1 q 013 r¡3 0 55¡t 0 BX 12 2¡¡q3 3 32't 2433002232322222tt332222232q3232132221122722222202100602112013361338P232333C0003¡¡41334i2222222143324233¡¡24333222qu443t¡.¡3332222021 106C1 3323t¡556500xx 12243333404 q5324u32222122143¡¡13323225t¡ltl323r¡ 35t¡tt3133322220212061 122212116464pc22331 1C000r¡454234421222221 1¡¡2't 11245't11 122215r¡5535533¿t2222021 106210210 101520 3xu 21144q0 00C 4 r¡rtr¡ UUUU22222121r¡ 24 1¿¡3q 3 r¡ 2¡¡ ¿t 1333t¡ 55 553r¡r¡ r¡ 4¡¡ 2222021tr0632332235r¡65338G233q3tt55r¡r¡555555553 13221213¿t52rrqq3534rt2qq2t¡52¡¡5555¡¡ttu22220215061133223376533up5355332311q4s5q21521222221u5531212r¡r¡3213221535533331u2222
225
¿¡ú ii,;ii021606213222337 u533up 35 35¡¡43 34.¡ qq55555322322221u3!32221 q 334 3 I I t 3 5555541 3 1u222202170622r¡0t¡853054308r122333343tr434212qq2222222123q2tr233r¡qr¡32r¡33q55555q55q52222021806321120 t12t¡133DD223¡¡33C0C04¡¡¡¡t¡24¡1311331 t 3Oo¿¡¡¡ 3r¡ 3232t)qZ 1 ¡¡5q3544q 13q33uZZZ202190612q323347655C88ttr¡¡¡44r¡32445555545¿¡2220A1223t1534322¡¡132'r34225¿¡5525034422220220063107¡¡35062503x8112544c000¿¡0¡¡t¡4442022222213303r¡2r¡2r¡rt3r¡33304224¡¡4144322222022106212010143336C8r3434r¡300002r¡51134411322110¿¡442r¡34qq4333r¡r¡¿¡5535r¡3433t!32222022206tr1222231q7¿t338P2234333432r¡rt5r¡4rr45222222214'-t4',t2122413r¡33124rr23535545422220223062122223118265cU255543334r¡5554555431221,t31rr553q¡¡24542424555534535qt!2222220224061105r¡05016506r822153t¡C000r¡4433333313333301¡¡¡t2rl¡¡44¡¡3343r¡r¡25rt4r¡4424223222202250621 504055C5r¡33Gr3325430000r¡r¡r¡.¡555521331111r¡00141145121t32135rt555555552222022606211010110t¡250cx233tr33c0005¡¡555r¡r¡rr22222'1214341524r¡5r¡5323r¡43433533333322220227062105¡t35071502xu111431¡000c¡¡05400'¡0013oo10otq¡¡0rt3¡¡qrlq533qr¡30111111t)q112222022806312222321a27qcc222u443t¡4445I¡45¿¡542222112242tt25r¿5uq2r¡q35r¡45qq¡rqtrq44322222022906222327 357 1 1 3 3 FF1 1 133 3323 34 1 1222t!22222222123u2 I 2r¡3 4353 33223 55 35133 3u5222202300611222q217436688¿tt¡3535¡1552555t¡44513232212134q25u235rrr¿rt3qr¡qrtq2r¡q1533332222023 1061221212147475utt2213322334t¡5r¡4t¡3333o0OOoo1urrqzzz1232222211153cq3q4q3q22220232061003333025r¡06x83334q0r¿¿¡¡¡0r¡0OOOOOO22Z22ZZZI¡553qq24qqrt32¡¡r¡S5r¡34q¡¡332222222023306212220111634¡¡F8111111000054r¡4q24't22222222U45252225243331225355r¡543222222023r¡060205425015503r8111333C000055555532222222132200'-t22423'112222545524334422220235061133223317555FP54tt434322trt¡4¡¡t¡42142132312112u32221q2q323222s2q5su\uqqzzz20236063'166295662555cc322¡¡4¡¡c00c5t¡44t¡¡¡4¡¡3122222133t12q42221522322ttquutr3u4q4222220237061154244556t¡33cG232t¡t¡l¡3323324q133322222221q3tt222{r¡r¡r¡q5354q53uqutrsuqqtr22220238061222201176t¡34885qt¡433000otr24t¡22¡r43133 1t30r¡253r¡34r¡r¡1331221342?3222?23222202390631212011172tr388123¿¡t¡¡¡000044555q5322222121tt251543r¡52332q4¡tt5¡lr¡5qq3333222202r¡0061 10q33 3027406r8 122¡r4r¡211 tr5rtsq4324212o2221q5sls\t¿r¡ 3131 1¿¡22q53qq3zq322222202t¡ l06t¡ 1 r¡32334565 23su522333132q2 433433tr22222223q12111i 2 r¡ I t l1 t 3t t 55s5545¡¡ qq22220242062101322016107xG21243335q4q44t¡ut142222222213q31¡¡3¡¡35133233224355rtr¡3J33222203500711tr42t¡3178573cs23251¡5t¡4455tr5544qq222222222tts31¡¡t3rt¡¡r¡4.¡3rr¿r3qüq5q¿¡444r¡¡ltl21035107'f 1222A111815688111t¡3¡¡000C54553Lttr4222222224¡¡q3q4¡¡5¡r3¡¡J3r¡5q35r¡¡¡q3r¡33¿¡3112103520711rtq23r¡17853388¡1335t¡5000043543334222222223453quqsqtt5qq4q35¡¡4¡¡qrt3¡132r¡11210353071130333'108330Gr233¡¡333342535535432222222234534uq5q5533¡¡5r15545512r¡[1r¡1121035q0711q322tr1185338812344¡¡33¡¡.¡¿¡4trqqt¡402222222ztr4t¡3¡t¡¡5555553r¡4345r¡44r¡qqr¡J3112103550711322232785638Gr¡q3545555u55554554222222223453tJSq55r¡553553555rtS5r¡r¡4r¡51121035607113322317853388533545t¡3¡¡¡¡5.r553tr3r¡322222214r¡¡¡31¡33r¡r¡r¡5q4q4q5q4t¡533q4r¡4112,1035707115523566q5658853255400005054222302222221u4q3uuu¡¡2r¡qr¡3rt535r¡¡¡44r¡13322 11210358071122222177133cc3324344322435tt3t!2322222222425355454255¡t3433444r¡r¡3r¡r¡2¡¡.t12103590711552255775338811rr¡10000050555555222222213551550555s4r¡55535555555s55112103600711432332775778G23354455q45554tI44522222222qtt53s-<4r¡q5rtr¡355q54q34211r¡¡¡33112103610711401051085t¡08x5qq54500005554443tr22222221r¡¡¡53f¡45555rr545555454442222q11210362071133223118343883334r¡55545555544343222222232q1q¡¡55q55¡l355qrt5r¡453rtq33¿¡11210363070 14r¡24317853688332¡¡t¡5q3¡¡tls3t¿u23tt3222222223rt53uqqq2¡¡3rt3rr5554q4q4322231t21036r¡071 't5¿r22314753388332f¡340000545q333tr222222224r¡53r¡r¡¡1555q32r¡rt24q41q32q32211210365071103323008503xct¡54545r¡4r¡r¡55542423222222213343r¡qq5q5rtq3qr¡3533¡¡rlr¡qr¡32211210366072r4q233177533DD222¡¡33r¡43O33rtr¡332322222222r¡343r¡r¡¡¡r¡rt3rrr¡¡¡r¡f¡2rl4rt44¡¡333331121036?07114r¡243118543GGt¡3¡¡ttt¡45r¡r¡4¡¡f¡55243421222223344344453¡14¿t3¡¡535435r¡2233¡¡rt1121036807110r¡33{¡0r¡350?rB223r¡3431r1r1555535411122222113tr4352rt55¡¡3q34525r¡444244rr33 112103690711403rt3206530Gx42344f¡r¡t¡r¡f¡.¡r¡55q4¿¡¿¡2222211244q3442r¡rlr¡4¡¡3r¡5rt44rt443r¡333211210370071133222547t¡33PP221555C0045\55554q22222222U5234U4\¡¡¡¡555553qq43434443r¡1121037 10711222221q817688111q5t¡0004453nqq42222212243534u4qqr.¡q544535555¡rr¡q33q5112103720711¡r423t117656588533r¡t¡5554552s535s5322221213r¡5J5¡¡q5s5r¡r¡35535r¡4r¡432q323112t037 3071 12033 300 6t¡ 308 X333t¡r¡ 55trr.r2 5454234tt22221222¡¡ ¡¡53 54q 5 q 55q {5535r¡ 4 \422uq251121037'¡0711442254285368Btr32435C0005t45505qq222222233¡¡5355555555r¡553555555544.tr¡112103750?2143233128r¡6truu233555554tr54¡¡t¡3q3tt3222222223q3s55sr¡5q53553555r¡532333q112103760711t¡32¡tl478533BBl¡¡35r¡555¡¡r¡tt\5534trq222222123q53r¡q¡¡¡¡q¡¡qq35535¿tri¡t533rtr¡qr¡1121037707 11222013r¡83338G332ttt¡ttoo005t¡5¡¡4543322221223q53545¿t5s55r¡55q55q3433q32¡¡11210378071'l 33233178535uD533434¡r¡r555q54qq44223222213243424555¡¡rt3r¡r¡354¿¡4444444¡l 112103790711Str2151785348853¿¡5t¡40o0oo45t¿25qs2222z22zuss1\3zur¡5qq3551555r¡423r¡33r¡.t12103800711¡¡t¡244138563GG3tt35554¡¡535355343u322222223q51q¡¡qq¡¡¡¡r¡¿¡15435r¡¡¡qr¡r¡3r¡J3311210381071120322108q¿toBr3¡¡5555C00C54554¡¡552222212124U3555r¡4q532554555554¡t55551121038207111¡01053051¡50ox2l3ut¡4000c53¡¡q3qr¡q222211213qr¡1q3q0q35q4r¡443r¡qr¡r¡qlq.t33lt210383071154235671562882225r¡qC00050542323022222?235535¡¡r¡¡¡¡¡5554srt445544r¡232331121038tr071133233118¡t33cct¡335555553525555552222222225535{¡u5555r¡¡¡5s455quu4r¡qq441121038 5071 1303 331075508 Xt¡ 32515r¡ 514 44q4244432222222344323utr4 4 r¡5 3 3r¡24 rr3 55a 32 2 331 121

226
CÀB DDÀ1 À
018607114322317856388234545r¡t¡555455uqs52222222234tr3uu40qqq53553551¡¿¡r¡r¡4q3lr¡t12103870711552tt532753tts8233535C00C54551¿¡3322222222tr55355t¡5qq¿¡3355q5¡¡¡¡l¡r¡3qr¡rt3r¡1't2103880711332231785548F5¡¡35455555555555552222222235tr355555552255r¡555s5srrr¡r¡45t121038?071103333C76303X82t¡45r¡51¡52¿¡r¡05535450222t12134f¡3r¡2r¡53¿¡53255355r¡3531rtr¡r¡51121039007114q22q1482338G333434C00C5355353322221223443145555555r¡5545555554¡¡r¡3r¡112103910711432231785338D122q1¡¡5¡¡44tt25523u122222223u420qq355r¡q52q5455utr4q222211121039207'l'122201126266DU2234q4000C505523333222222233q34t¡5q454{¡155r¡5543533¡¡tt3411210393071133253378533cc5335f¡55545505555552222222434034¡¡r¡¡¡¡lf¡r¡¡¡45545rtr¡4f¡t¡344r¡41!21039t¡0?1133223248573GG¿r321¡31¡44445554443q212222214243¡¡32r¡33443r¡52554r¡r¡445r¡5¡l 1121039507114423q1485r¡58U122q23442343:4125322221 12235513t¡q3qq34¡¡¡¡r¡r¡44rr3r¡¿¡24333112103960711504051 06560cI33¡r534C00C4¡¡442q232222222113t¡3q¡¡5r¡¡¡trl¡33¡¡r¡3455r.t4r¡r¡qr¡3311210397071160423702550Px11132323t¡¡r50553t¡4302222221211315r¡4rr3r¡43232151r545qq¡¡3¡¡11210399071120222177233Nnr¡r¡r¡¡l¡¡553115355223tt2222111142235555r¡¡¡55555355525223323112'l039?0711432332775608823zri¿¡r¡54r¡5555tr34432222222232tt34555¡¡r¡4q3q434r¡4543r+q3331121040007114r¡2334{7¡¡438p333¡lr¡r¡4544555444rrtr222222214q5344Urt1¡r¡rl534r¡2444r¡544u4r¡4112104250811322223764 33BPlr5¡r5r¡5544443¡¡t¡3r¡q322222222q552554r¡5r¡ql¡35s45qr¡rr4¿r3333512't10426082123222278u658P222t¡r¡4C0004r¡tl4r¡45322221122tt441455tr543224tr33544q4qq42412110tt270821332232q7531883¡r354555qr¡q55q33543222222'125525tr54555r¡r¡4535543542223412110¿¡280821222 1137833385222r¡34000055q21443222222224.4tt2q44q2243334¡14¿t434233323121104290821r¡42541r¡85r¡5p83¡¡3¡¡r¡454432442245522222221!431¡3q44rtrlr¡r¡f¡35rt25qr¡452t¡l¡r¡3512110430082122212516336GG-ì33544C00C24r¡144431222222143314r¡¡r45¿t54344353334344r¡341211043108213322331¡8533UU3131¡3q.¡q3q3552241422221222.¡34355t¡t¡555q34t¡3¡ltr¡¡r¡¿¡4qr¡q4r¡12110r¡3208214f¡2051?057588322sr¡4C000233223232222222242424443rtr¡4rt3r¡r¡234r¡¿t443333¡¡1211043308114r¡274018545883334¡¡55¡rtr55¡t5335552222122343425u555554355355r¡44q4r¡44¡¡12110¡¡34082203313027507x852241¡44553q544qUq4122222214342r142¡¡r¡¡¡¡¡444rt32q3443rtr¡t¡43121104350811762156615238C332qr¡5C0005052151¡401331221211¡25r¡4¡¡l¡q544¡¡5454¡¡r¡q¿t14¡tqq12110r¡36082170r¡2560656081333r¡t¡3000C404313300222222123tt1322q442223323r¡r¡.1551533312110r.r3708220210102210¡lxB112r¡rt4C000434223422222112143¿r2or14555¡¡544r¡455rr55r¡4r¡3rt41211043s082'lr¡422r¡1r¡8533cc512q44C00055532¿r5412221122qq53q35455¡¡5¡¡5525qqtr42311131211043908214323433?533P81234¡¡5t¡34124u124ttuzz222zzz3t525q¿tr¡525q3qqz5q5uuu2u2zs1211044008212220111756388223r¡¡¡¡¡c00035r¡325uq22222222q452555r¡5r¡r¡q3553504¡¡4r¡12'12t112110q410811222011181668U122r¡5t¡0000555555552222112144r¡35555555r¡355355¿¡q5q5q4qr¡121104t¡2081107t¡15063503x823¡¡¡¡q4000c'102235550222222123rt2545455¡¡435335535531¡¡311121104t¡ 3081 1552?517 854 6 BB53 3545000 C 5555tt55t1222222214052555r¡4 555455051 1 11111 111 12 t 1
0¡¡r¡rt082 l¡¡¡¡22417055588¡¡31¡5tr5533344t¡33tr53222221221q425q5rtq50435535¡trt5qrl¡¡333312110445081140323108530cr23353¡¡33¡¡tr44542qq42222222232q22rtq2¡¡4r¡s3qq2q22243r¡¡lrlr¡q12110t¡I¡60831332332183648832t|333t|3I¡4t|3531¡5542222'l.221434144tt455r¿32r¡4q35rt4q4r¡5rr¡¡4121104rr7083165235661521ccsttt¡555000c113123252222222122212¿tt2¡{¡¡5r¡¡¡r¡52245355555¡trr121t0¿¡48C841201011062608X1333430000323i1/./.tr322222221244244ttq¡¡3332r¡r¡345¡¡3¡1423222121104¿¡9082106495061503x8q335550000tr032232402322221 1t¡41535t¡3555q5555115511qrr4512110q500821222224tr8274DY322555C001535t¡35542122212235525¡¡r¡5553r¡355r¡3555533333¡t12110451082140r¡155055308x3334qq0000u23223tt4223222223q4244qqtt3333q¿¡23¡lr¡54r¡3q2r¡2121104520s2121201328135G8322t¡3400004352'144322222122r¡2q2q5rt¡¡5¡¡r¡r¡3r¡53¡¡q2231322331211c4530821222012¡¡72668833t1555c000r¡t¡3334q322222r21tr3{25555555535535¡¡3551¡1333r¡12110¡¡54082155215178537cF5¡r55r¡50000055555552222222245525555555535523555555555512110tr55080122223277476882'ì3¿t4r¡545t¡r¡3q2355522322121441¡2r¡5r¡rt5q5rr255¿¡5r¡35r132315512.l10q5608215520555752288332545C0002q323\q4222222114542555¿t5555r¡r¡5355q55q4r¡rr3312110457082155255t¡t¡55558B3535r¡t¡C00C4454344u2222222324tt14¿t445r¡5tt3tr435421r¡23q33312110r¡580821332331765r¡5cc3234r¡¡¡r¡422444323342222222123tt34424¡¡24r¡3r¡r¡44533r¡3rt3324 12110¿¡59082 122201177166À411144¡¡c00ct¡2423utr22222222144q2r1r¡5r¡r¡r¡55i44q433¡lr¡33333312110t¡60082 15524567q533c8222t¡¡¡t¡5¡¡45505335r¡4c2222221i2525.¡555r¡553r¡4355455¡¡1q23¡¡12110¿¡61082106435064503x83q24q5qqr¡3202't13tt5o2zzzz2o34qzqqqsSq5535525q3555tr¡3¡1312110462082122?123tt7433PU1:24¡¡¡¡00044452455422?2222235524ut¿tr555r,¡¡tqq45qqr¡rtq2¡¡33¡tl21l04610821201012C6330ttx3225r¡r¡c00c33311343222222213{43455¡¡rt4r.t5r¡55r¡4555555552312110¡r6tl08215521r¡668545G85315t¡r¡0o0043rrll4r¡4222Z2z2z24qzs2ric55lr¡3552q5555r¡q5r¡¡rr¡12110¡¡6508115522557552588¡¡¿¡35t¡5c0oc¿r5l¡22¡r4q3232222132q2¡¡r¡4r¡rrzl¡q3q¿¡35r¡3qq35sq3312tl0r¡6608213?201t¡t¡8233FF2llr¡qq0ooo¡¡55q4ttqr2232222'13252ri¡¡r¡¡¡5r¡333r¡43.t555sr¡5q3331211046708217623566556t¡BB¡¡t¡35¡¡5c000q0ü3234502332221r¡3q35r¡r¡555¡¡435535545Sr¡¡¡r¡r¡4312'l 10r¡68082105¡r0504r¡503xB22z333co002quz23323z321zio2zz2sz2qqqqq3qq354l4¡t34¿¡33212110¡¡69082155255t¡¡¡8523c8221r¡3q0000223111T32122222223u1r¡r¡535r¡{¡5r¡q52tr¡qr¡¿r33r¡3r1rr12110470082155225t¡¡¡753388r¡2J5r¡5co0o{¡q4123q32232222134q2555r¡s5r¡5r¡55r¡54qr¡qq3qql3121104710821332332285?6c8533¡¡r¡¡¡5t¡r¡22ut)33ttt1q32222221355354r155q1¡50552S434r¡r¡232301211047208215522517857088232r¡33c0cc112¡{111322322221435344r¡qr¡¡t5r¡4r¡r¡34¿¡q3r¡355535121I

227
CÀR DDATÀ
0 ¡¡? 3082 1 5 523 517I566 88222¡t4r¡0 0 0 Cl¡ q ¡¡ t¡,332 3 3 22 2 22 22 3 30 3 t¡3r¡ 3 2 2 3I2 r¡ t¡2 t¡ q 4l¡ tr3qtt42'112110r¡7'r083122212176tt60cr121415000cr¡r¡4235rt32222112232225u525533255¡¡55r¡542utr2U412110¡¡7508114322r¡4¿17533882334¡¡¡¡0000t¡55uq441¡32222223q2q322224tI433trr¡34t¡r¡t¡4¡J443r¡31211050 t0 91 13324 31'l I3 q¡¡UB r¡¡¡ 355553 r¡ 54 5455555222201223trq15¿¡5555553 55¡¡ 55553 -?l4r¡ 341211050 1091 'l 33233178r¡6688(31545555rtt)555455522221 12234r¡35¡1555554355r¡45555f¡¡¡q3rr4 12110502091105t¡2q0r¡5503x8532545CC0C2544445522222221353152455541355rt55555555rrr¡41211050 1091'l 442¡15170233Po1114r¡r¡C00Cq44l¡l¡31¡¡222222223lrtr25444544334rt35rt¡¡¡t440r¡q¡¡312'r10 50 tr0 9 31 332 2 31 1 857 qJJ 23 3 5r¡ 5r¡ q 3 4 55r¡4 f¡q 542222112 33 55 3 54¡14 54 4 r¡ 3 55q 3 q 4 4q¡¡f¡ 3 3 3fi 12110505091 10r¡ 34 t¡07050 2IG213332r¡43 r¡ 43533q4322222221345',1l¡33f¡ q 3t¡32 r¡r¡r¡4 3r¡r¡r144 4 33312110506091155235170533885334¡¡5e00C444¡¡3r¡5rt22222222355354q55555555555515t15155121105070911432r¡31¿¡8565sx4224333322rtr¡r¡r¡445¡¡222221212453¡¡55555554354r¡44541utt2241211050309111222211836388122rt33C002r¡55q2555222211223552555555332r¡555532553323212110509091 1¡¡422t¡178560S833 15¡¡5000Ctt555555522222122355255555554¡t5555555551 1 1 151211051109115522517845388212r¡230000q4t¿tr4u5322222224tt55354555555555r¡5554522222212110511091133243178r¡7t¡DU533545t¡5555555q55u22222122345254tr555¿¡5355r¡54q542533q412110512091111225116577885r¡2555C00C5552555522222222355154555555r¡5555555s515123121105130911r¡324417856588522r¡t¡53f¡52q553355522221123¡¡553555555555555555554444541211051tro91160435108530G1222155C00C555¡¡¡¡555222221223q33534r¡.t¿¡5555rt2r¡55554r¡444¡11211051 5091 1r¡ 3253rr7 856 48853353555¡¡ 1tr\43245422221 12234525r¡555 5533 55551¡3r¡r¡33r¡3r¡4 1211051609314323312057688t¡2243rrr¡55t¡5¡¡5r¡rt55U212211222153554555353555533¿¡r¡33r¡33r¡1211051709r1q322317855t¡cc232t¡445rrrr¡¡5q5u135522221 1223qr¡25q555rtq5J553r¡5555qqqr¡2312110518091132201128t¡7?JJ1115t¡¡¡c00a4323255322222122tt55355s55s¡¡r¡3553¡¡q¿t3r¡2r¡q242 1211051 9091 1¡¡023 q178 465G8322434r¡ 2¡13 45555535222221133 553 53455rt3 53 555555555q r¡3 3312 ! 1
052C092 15522517856688r¡2¿t555C00Cq453355422221 11244¿t35r¡t¡45r¡¿¡335545434433334312110521091155255178563DO322544000044\\3q5322222',1223553544455443554554443f¡55rt2121t05220911qr¡23r¡11856388133443C0004t|543t¡5322222123355353tr55555355tr543t¡44{r¡333121105230911772251783qqcc3315550000¿¡55r{q05522222111255155555555555355555533353121r052t¡î9115t¡254127557p82215r¡555¡¡r¡3543315U2222212225535555555435535r¡40¿¡3533rr2 121105250911r¡¡¡2351 185668s3324qq0000¡¡4tr¡¡4¡r54222222224542555555r¡4355rt554u4rtqq3¡t¡r1211052609114322317836t¡BD5tt35455r¡555555tt55522222122qss25u5s5555rt55555r¡5s4q3¡¡3212110527091120312108260Jr222¡r4¡¡000055S3255522222122354253555555355q5.¡5554252u212110528091155245118536882225¿¡5C00C54qrl¿¡553222211221455255555555355r¡354r¡5322222121105290911¿t423q177373881134t¡¡1000C35533q532132112125535u5555t¡5355r¡5q2u524t¡323121105310911r¡r¡2331785778c55354555¡¡54453255522?212223552554555533r¡5¡¡55¡tr¡rt53r¡3541211053 10911503r¡q108560Jr222¡¡34r¡3ur¡\qq334stt2222212335t¡253r¡55¡¡rtq35rtr¡5q¡t¿tr¡433333121t05320911552351181.¡3PS112455000C0555355421221123455255555555¡¡55r¡555555s{¡¡¡53 1211053109115324311826688512strqr¡5554555555522222122q5535555s5¡¡5r¡55555555r¡1334r¡1211053f¡09115425¡¡3705608833r¡r¡45532r¡2q4q1u5q22222123r¡5525q55555s35535555522tt22212110535091160¿l 153075308x533r¡r150000055t¡t¡q552222222tq5r¡15r¡555555u55ss5S55555q4r¡tztl0536091r?0¡r256025608x3325¡¡5C0005053r¡r¡5502222211355354555554055rr55555113355121105370911.t12t¡31785?6F833344t¡43444ql]43454222211224553555555rrq3.¡5¡t555555qr¡3r¡3121105380911332231781rt388122.t3333¡¡¡¡55555555222222222551525355r¡43355355q53qq22412110539091132222108317r82.¡q4r¡rt0001¡¡¡¡qr¡33532222212234.tt25U55555¡¡rt55r¡¡lr¡q3r¡333332121105¡¡J091105q45078506rc5221¡3qc0ooq0r¡33r¡530222212245q354q55sq3355r¡5032q11212312110541091 14tt23t¡17s5668c53t¡555555s¡t5r¡4355q22222ì23¡15535q5555r¡4355¡t55r¡354q323312110542092 15r¡255178r¡7?Bs22l4¡¡t¡c0005555!r55522222'12245s2sus55555q55q5s53q2333r¡112t1054 109114029t¡1082t|688¡t335r¡500005t¡55t¡55522222121355355255550355r.1 5r¡q3q3qqqr¡¡r121'l05t¡t¡091170425608560Fx¡¡3344t¡COOCuOu22354O22221233qr¡342q¡¡5¿¡qr¡¡¡q435qq4432433212t105¿r5091 16622517856tt0u522555000cr¡555555r,¡22222222ttss35s555555555355555555544121105460911652¡¡5178176881114tr3c000555q335r¡222?21232u515r¡55S5553s5{5rtuq¡{r¡54233121105'¡7091 1652t¡5668s618853255s000cq55555s522222r224s5355555555q55q5555sss53531211054909117723566157tlcc533r¡t¡t¡000C445r¡5555022222214553555555r¡r¡q553s5q55¡¡4q331 121105430911¡¡3223118576J822243454t¡5ttl¡rrr¡3r¡rr4Z2Z2Z12?2Utt3555555r¡53S5rtS554t¡¡rqrtr¡¡tr¡121105500911332334785538823355555r¡5t¡555t¡55522222122q5535r¡q5555s5555554¡¡5q34q341211055 10911 4 r¡2 3327 85?6JJ23 33 33r¡ 4425 r¡Sq255321321 1223 qr¡ 1qr¡¡r55 5qq r¡r¡5qq 3 3q{¡rr3 ¡¡ 3 22 12110552091110101308t¡308x533t¡33c000455323u52122't1234531q324533Sr¡r.t55555355553551211c553091122201128376cc¡¡21t¡34c0cor¡5-(¡'t335tt222z21z1tt45354r¡5s5r¡¿t355q5553s2S5q32121t055q09115521566856088¿¡435q5C000¡155005552222222235535555555qq555555555'12232121105550911552tI51783608F?22¡¡lr¡CC0C0555q5552222212235535t¡55555¡¡¿¡55q555r¡5344r¡42 1211057510212221217.837t¡8G555555C00C555555552.132t1214553555¡t55r¡5q55255555.¡r¡¿¡4rr5122205761011332232?847588t¡1355541tr3¡¡5u3¡¡4t¡¡¡2222z122zqrl3qqqr¡r¡r¡¡l33qqqqq¡¡q42qu23312220577101220313¡¡062308f5q355555555555555522222'11 2355355555¡¡r¡rrr¡q5r¡r¡r¡3r¡4u553tr'1Z2Zc5781011¡rt¡2t¡¡¡178530cctt54¡¡q¡¡a45521qu21itt222222zr¡2rr53q5555555r¡555555553333341222

228
cÀ8 DDÀ1À
0579101133243126566cC33255555¡¡55455555522221122r¡5535555555535555311¡21111211222c5801or¡1c6r¡35060503xp522r¡r¡r¡000000q4022u033220201r¡33332t¡4¡¡540q523r¡4Ul¡4444tt412220581101 1222C1225566F83t¡3555C00C55!tI45552222211 115535tt5r¡5t¡44253355r¡¡r¡354253122205821011322221784760S3¡¡3545C00244r¡33333222221223uq342f¡{¡3r¡543444r¡555\343332122205931011604q56055308Ir¡235¡¡5C0CC5055555502222221r¡r¿r¡354¡¡q{r4f¡435515324q114s221222058'¡1011203121082708X132.tr¡5C00C5255255221322121355354555455555f¡54445u4q222122205851021332121735348G333545C00r.t44U2455422221122255355555555445¿t55rr4t)33tr323122205861021552rr5376532Fp2135r¡¡¡e0004333134322222 121qr¡53r¡r¡r¡45555355453434U233231222058710??21201r¡5¡¡233FO322r¡r¡r¡C000¡¡5533355312211214¡¡5354r¡555533r¡15543t¡q45553312220588101 155215661433FF 12154¡¡C 0001 03r¡004¡¡023201212rt¡¡3511¡r44f¡5q55354 4q4q444u3'1222058910r1?620566656388222r¡q¡¡000C4U221222023322212trs1r¡t¡r¡¡¡¡¡54tr3553555533543321222O59OrOl16522¡¡6q852388533¡¡t¡5C00C4553334q322221224t)53tlr¡¡1454t15{54353tt44¡¡542{31222059!101132232¡¡?6533U0113¡¡4r¡C00C35q3¡¡3443222122 12553535r¡55554553555553qU333'122205921 011652S51775¡t388533555000C1r5qqs33[322222213553¡¡r¡r¡44q5r¡q5535r¡qr¡533q122122205931011552251?6530pr222r¡24C0004 15555553111111133335r¡r¡45554r¡5545333tru4555512220590101256215177533cC3325r¡¡¡C0C0¡¡553444422222221325345544r¡5554433¡¡t444t)5443212220595101130353307520px332555554r¡q55555552222222244535u5q {¿¡54¿t553555555353r¡51222059610110r¡325016503rF212r{3q0000utru3q25t1222222223u53t1uqA54532¡r53r¡r¡4¡¡5r¡q444¡¡12220597r021322231rt8543p8333¡¡¿¡55¡¡01¡454ttttU5422222121¡¡5535¡¡545¡135345¿¡545¿¡535333U12220598t02155225370543FF3r¡35r¡¡¡C0005555555422222222u00355555¡¡¿¡555555555555555412220599102',12122217736ULtFq42qqqC0005¡r54¡¡tt5522222221355355r¡5554335545q4frr¡43r¡r¡5312220600102 122222\71U55CC333r¡r¡¡¡555344ulrqU4322222122¡¡5535445.t455r¡553¡¡¡134¡¡33333r¡1222060r1021rr0323375430sC¡t3353555555555555522221222255154s45q4445s55s555544f¡34122206021011604 156035308X332r¡¿¡5000050r¡4444¡¡0222222,lr¡553rlr¡4r¡55344q5355555115551',12220603101160205692533U0r¡23534C000555rr3040123220213q535r¡5¡¡255r¡r¡r15355555tt123421222060rr1c21201012062608X3234r¡3C000424q54q522222221tru53555r¡55443553.¡.rtr54-?f¡tr44¡¡12220605101165235118531G8222¡¡¡¡5C000555223r¡5123222'-t234515555555535545uu5524tt24212220606101133233317534pU2225¿¡qq3q5q552244U22222122q¡¡515r¡5r¡55r15rt55345555554331t12220607101143253r¡765¡tr¡BB¡¡3351¡5¡¡342¡¡5¡¡5555512322122q55352445q35353355534243343',122206081011¡¡r¡223557533o022355555'¡55354333u222222211¡¡5354555t155r¡554554r¡5333333 12220609101 1?62056705{¡388523¡¡450000555324q4022221213553r¡55¡¡55r¡434433225422U22q1222061 Jl01 177225664533F8543555C000C054¡¡4¡¡30222222133\ 1r¡r¡444r¡rr445rr35¡145445¡¡4r¡31222061 1101 17620 566 ¡¡53388 5t¡3534C 000¡¡0t¡223¡¡¡t023 31 1213 4t¡ 3t¡ 354 5t¡45 4 r¡433 44[tq3442q212220612101156205660533CC2333r¡300005035555302222121¡{55t5r¡r¡r¡55011341355551541',1112220613102 122212qtt7343cc434¡¡3¿tC00044¡r4355532221122f¡553rt3445rr4425524414Utr333451222061 tr1011222011182468G222¡¡4¡r00005254q44422222221¡¡¡¡535r¡5455¡¡535r¡3555353r¡433312220615101122212176263p8123¡¡5¡¡C0004555434322222122t¡55.ì555555555553s53453tr3u3212220616101130201rq83335U222¡t33000C55432r¡¿¡312222222c4q3q34¡tqr¡3334¿r244r¡3435531212220617't01122212276365rF331¿t5r¡C00Ct1442332q222222213r¡535r¡rtrt5q3215535q45522444U122206181011232335765¡¡6pF233r¡r¡5r¡¡¡r¡r¡4q44444U22222222u\U3552rr5r¡r¡335535555q433333122206191011322331775r¡l¡rF5q3q555¡¡l¡r¡r15544r¡55313211211¡55't5r¡l¡555¡¡41¡5535tr45r¡34[4r¡5122206201011064450¡¡1503xc3335q5C00e05q4333r¡2222227135tt 3rt2r¡r¡q5r¡334535r¡¡¡5r¡45r¡354 12220621101 12222314733300233rt55555552u234tt322222222¡r5535tr55545tr35535r¡555u121241222062210113323317655508Sq3¡¡¡¡5t¡5¡¡tr¡¡535555522222223¡¡55354tr45r¡4l}r¡5535¡¡¿14445u4U41222062t10112220r1q8353Gr220q3q000024\3444322222222¡¡rt5353455rr553¿t533q44r¡¡¡344331222062410110423317857?8833¡¡5555r¡55555035553222112225535555555{rt55254r¡r¡41551r¡r¡122206251 02 13322217736688133r¡q45515r¡¡tr¡555542232222235535¿¡5555r¡¿¡35535¿14553¡t4tt3r¡122206261011752656755338D3334r¡30000404433330232222034¡t3¡¡4rl¡t535r¡34333333333333312220627102122212476175cø322540C00Cr¡552234322?211212r¡515¡15¡¡5qq4355r¡353443r¡r¡333122206281011r¡3243348533pr223rtrr1¡l¡qr¡3r¡4r¡3341¡321222122r¡r¡l¡34r¡r¡l¡rr3554q¡134433U32q23312220629101 1222225762q3n8555555000C55fr3r¡455222222212r¡53555555343554543¡,tU34423u12220633t04105¡¡95062503XD¡¡31r¡45C00000r¡qr¡rrr¡5022222213¡¡r¡35¿¡qq54q5355351r¡r¡4u155521222063 110'î103323048505X8553555535¡¡5555555522222122r¡55355555555455r¡555tr52qq455',12220632101105¡¡85071503X8333545000C3034223¡10222?1213t¡3lrr¡¡5¡¡55543rr52\t143433q44312220633101277225662533xX3325t¡5C000505t¡¡¡¿¡55022221212¡¡'¡355545543355q55t¡5441tru44'122206501111r¡423r.r148575885qtr555C0005t¡r¡q3¡12522222223q21C54q55¡¡5335425qr¡q4¡¡333331111065 1114155295617555cctt33¡¡t¡50000034tI4r¡3q322221213¿¡33¡¡3t¡r¡4q55453434¡¡4¡¡¿155554 111106521 l0 0r¡r¡23 330 853 5FF3r¡3rlr¡ 5r¡ t¡5¡¡ 54 ¡¡33 334 32 32 322t¡r¡ 5¡{ I5555555414534 qq 55q33 3 331 1 'l 1
0653111140334108530cX112023553225tr44442222222222¡¡(lrlr¡t¡q445¡¡40¡¡345454q54r¡331r11065'¡t11122222178r)668Br¡¿l¡¡r¡r¡5CC0C55534r¡4432222221r¡¡¡535r¡rrr¡r¡r¡54r¡543555rtr¡34r¡343111106551 111¡¡423 52q 85 33o0tr335t¡5554¡rq ¡¡r¡ 3t¡44.¡222222221¡¡5l¡¡ t¡t¡5q q qq 3 443 5¿¡5qq{3 3 3 33 11 110656111155225377522FS¡t3351r5000Crt5533r15521322217\2\3r¡¡¡5¡rr¡555q5ûl5u¿¡451¡¡42rr2 111106571 1 1 1 3322 317 85 3 3s B2rlrl5555 5552q51455522222222r¡¡¡rt 155555554 4 5544 5445r,¡¿¡ 423311 11

229
CÀR DDÀTÀ
0 658111 1f¡q24 ¿¡17857388:4 24545q53 5254tJ545222222224 4533 5r¡4 r¡555r¡ 553 5¡¡ 4 4r¡13 5r¡ 351 11106591111332331761408N1't1¡¡4442r¡3333_33r¡34322221211 3¿¡333¡¡¡¡433323332¡¡444r¡34444 111.t066ll 1 1 1 3322 34 4I tl3 28F221U3tt3324u4432234222221233q53r)u3{5544 44334 34r¿43442 32 11.t 10661111122201.lq8266FG3213t|t1C00C4t¡522533322221213q33555rr55232r¡3215q¡¡53q523¡¡11110662111132223576553xF33zrt44554r.r435f¡355522221122445332455r¡5r¡4544555454rr4¡¡4411110663111 1r¡r¡24.t377533G8332r¡r¡40 OO C23tt2223422222221t!t¿531t44f¡ l¡ 4r¡4 34q25 U4243222U31111066t|111 133233178564G81334444qt¡ 14441ztr44222222224453ttt)r¡r¡545q3¿¡332r¡r¡rtqr¡r¡¡,¡quq 11110 66 51 11 132243176533Pr 15q54555q 1 44533334222222?'124434u444r¡555553 52r¡r,t¡¡345q r¡41 1110666111122222177263c833254t¡555555552¡r5321321131155155455253355rt55r¡¿¡5555J5r1 11110667111 133222127tt46081334t¡u¿roo1 t)3q213tt23zz2i i2t3 qr¡34r¡qrrq 3qq24r¡3¡¡q44q1233 3¡t 111106681111222013',18237ÀÀ11232300c053513r11422222222455354555544345354¡¡rt5q242¡¡11111066911112221217726688233f¡3430424tt55155231222121r¡55333rt445\tt2342255553r¡3343111106701111442351tI8533sc2235¡l40OOO33t¿233542222222q35u3q3q555q435535¿¡2q52221331.t11067 11111303231085408X¡¡33¿¡q5r¡3q24253344U2232212234535544444334435r¡r¡3422¡¡342 1111067211 1 150f¡25307530PX233545000ltr4q3223U3222222220C0t!4¡¡555553r¡¿r3444343544231111067311114r¡2t¡412854608.r335q55¡¡555¡¡5rt44r{522222221345345¡154555453354r¡¡¡44333{3111.t067411114q223128544885¿13545444q2351142322222223tt343qut¡4ur¡r¡q2qq3355S55555r¡511110675111121212146163FP32243400005352234421221121tt423q244533424r¡355tt5rr334Zq31tt106761111332231295508s343qr¡q5¡r24r¡q534¡¡43223222212253555555s3js4q5544523¡¡33311110677t111432231 18553GP222545¿t355545¡r4453222222223q51555555¡¡s355q5r¡r¡rt433q4¡¡5111106781111222231781738F332¡13¡¡4r¡4qq2q334q322221122r¡cq3qr¡34¡¡qq234rrqqq4r¡423323r¡111106791111403251785408r3¡¡{54¿rCO0ort55334r¡32222222244433tt¡¡r¡¿¡l¡3334r¡2¡¡55r¡r¡¡¡3r¡43¿¡11110 68 011 1 1 r¡03 ¡¡ 540 7 5508 x33 34 4¿lr¡ r¡ q 45 5 5334t¡ 3 222 21 11 1t¡ 55 3 5t¡q55 5543 55r¡ 5 55r¡ 5q q r¡ 3 3¡¡ 1 1 t 10681111144243178566rp3224q5qq5qs453343322z222z22zq3qsq4r¡54¿lrr¡q35zqr¡44r¡r¡2221M0682111120323108¿lf¡0ttrt33¿t3343r¡1s15233412222',|12223214tr5¡¡55553242.r5¿¡55r¡5545511110683111244254$7'11tt38822244U443335532444222222222343tl\\455q4q554¡14¿15¡¡¡¡31333 1111068411113323317854tt8833355555535tr5445552222222225535555555335545rt4555333r¡¡¡1111068 51 l1 15r126466 3523GG3q3¡¡45444r15054344r1022 202222q53q\tr.¡¡r¿t5034¿¡rr3 4q 4q44q q qq 11.1 1068611113322312856¡¡BB5r¡2555555q555325s522223333¿¡55355r¡555r¡3js555ss553343351111068711114424q1285r¡5G81125q400005tt5tt333422222223r¡rt5355455rt55355r¡q¡t5q5231¡322 111106881111552056t¡653388133quqc00022q223222122222222q333q¿¡34q43q435qr¡34c3q333111106891 1115t¡233175530sxt¡33434q345¡¡553qq4q21322222qqq3444r¡¡¡q454¡¡545555555555511110690r11133233528534PF4q25¡t554¡¡qq5552234212222224trc3qu2q4q{rt2r¡r¡31444r¡r¡rtrt4rl4111106911r110q3330tt1502xFtt32t133q42312\2123qi12221213q53q3r¡r¡q453à3q235¡¡5¡¡3553¿rr¡11t1069211114q22¡137¡¡553uu353555r¡q34q54q233U212222234513¿¡2f¡rt4¡t5rt34¿¡23rr43r¡¡¡qr¡3331111069 311 'l 150224117533GG 3335¡l5C 0004353341 422222222\2q3 5rtqq3 r¡5q 245¡l¡¡ 5r¡q¡tq2q2331 11106941111r¡¡123rt3785438G¡¡33rt4¿t000052521333322222223243tr3tlq1133ã3q4543r¡4332333111106951 11133223474530ox222r¡44t¡44¡¡5q53q¿¡5rt2222212223u35u555455r¡rr54533r¡q3343331i1106961141322137qstt35so222333r,¡'¡¡f¡4q555345122222122t¡0q3q55¡r¿rr¡r¡32r¡5434445555523111106971111402651785338F33241¡400004353355t¡212221233q53¡¡sr¡,¡¡lu4q¡¡¿¡q:r¡¡¡r¡r¡l¡32rr433 111106981111r¡4235128566883334¡¡tr00oo¿¡t¡523qqq222222223qu3qs4q¡¡q3r¡2qq34uq3¡r3¡¡q3331t1106991111552351785?t¡Po223555C00C2153542222222221qq53512552q3i5525555r¡345r¡241111070 Dl 11 14t¡23 5118 56 3 BBt¡¡145t¡50 0o c2342134 4222221213qs3 55r¡q5au¡¡3 55r¡5r¡ 554133 3 33 1111070 11111342¿13178577Gsr¡5354544q54552231122222222tr5s3.¡5¡¡r¡3r¡5¡¡3¿rqzt5555r¡¿¡qq4qt1t107021111r¡03331¡0?¡t60Fx5335555q4t55531 31522222211r¡q535r¡452.¡54355r¡5s555245555111107031 11155235148533885335¡¡5000c055544¡¡432222223q4535u44r¡r¡553553555555553351111070t¡1'1 1120101106160Er111r¡4400005555355322222222r¡553555q4qq53554¿¡535424333¿¡1111070 5111 13222317853't88234555r'lt¡44 2251004422222222\4435q3555r¡3155¿¡55r¡rtq33¡¡331 t.r 11070611'1 1042t¡q1185448G343tl434ttt¡35453343422222223u3q3qq3555533rt512rrr¡45r¡¡¡r¡3r¡311110?071111222011184758r232r¡43C00C4442233322222222¡¡rr¿r333¡¡3233¿r343225r¡45r¡44413111f07081111tr0333108570Àx221555C00005422323222222223223qr¡4q4q553543455qq3q344311110709111103344075503xF122¡¡t¡r¡r¡55255553r¡35022222221233tr1g{rtq5qr¡r¡3254¡t5¡¡3¡lq35r¡11110?101111312332385q3UU4325tr4554231522335222222224553uqt¡t¡2q554553555553555r¡r¡11110711111120322306230Gx2t|1t|33000c5255244t¡213311301ttt¡ZStll,¡5ZsSss,¡zs,l,rz,¡z¡s:¿t31111071211114tr215126545us3325r¡50000555555t¡52t222122tlss3sr¡¡r55555¡r55q55555r¡r{554r¡ltt1071 311 1 1t¡03 4 ¡¡1075308x¡¡ 334tt5t¡ 3¡lr¡ 54¡¡333 3422 32222'l1qq ¡ ss,lã5 i53 ¡ 5s: s,¡,¡5ss,.¡,¡ ¡32111107251211222011762338812234300003r¡r¡444r¡¡¡222221213552555r¡5¡¡5335555515513¡¡2r¡3122107261211t¡42rt31785?¿¡BG't335¿¡5545c545uq45u22222223qs52suq5554¿r35535r¡3qrrq3q13312210727121176235663523c8233555c000¡¡o.rr¡33550222312135525sr¡555q5q5535335¡¡r¡tq3¡¡2 122107281211¡rr¡21317653388r¡324qq5¡¡q34!t)qu4ttq2222z2z2\5szs\tt55S55555q5qrrrtq35q333t22107291211t¡031410?5408x12243r¡535355555555?2222121¡¡5515r¡5r¡555r¡qr¡q22r¡¡¡r¡r¡l¡i¡r¡¡¡3¡¡1221073C1211552q56674t|3883334rr5C00c¿r24433432222222325525r¡¡¡555r¡¡¡355q5534U4222231221073 1121 13323312817t¡ 8U 122444555 55455 355322 221122r¡5525S¿¡ 55r¡55¡¡ 55r¡5q 3 55q3r¡ q r¡51221

230
CÀF DDÀ?À
073212115¡¡2 151765508f 3ll5r¡5000c44rr4tr05tt2222012120015t¡t¡U5555tt55454445¡¡r¡3333'12210733121211232376130Dx21124r¡000C43t¡23453222211211001t¡3¡¡l5rt3t¡¡¡r¡3235534313333122107341211222C1125255CC2334r¡r¡000C\q55t155q22221 122455255'¡.r55r¡r¡355545q554422221221o?351211tt32223765338prt33545555q535523422222222245525u14u 5t¡4335535r¡34q43r¡r¡3312210736't211332r¡3376533UG322¡l¡¡r¡r¡r¡4344u4UtlU4222222223tttt15¡¡555r¡55455¿r5441¡53¡¡ut¡3¿¡1221073i12115428¡¡175563sp22254555r¡rt5q5q345rt22222 1221552¡¡qqq55t¡535535455533333312210738121133212'17513588112¡¡r¡440r¡255555555223333223t¡525t¡555q54¡¡453r¡t¡q3¿¡35533212210739120166215663533885r.¡35r¡500005055455q0222012125¡¡255555555455554424¿¡24tt2212?1o7r¡0121 13222320733588122rt334552544444q32222212125525Uq5555325545r¡3¿1454443312210741122101355072505X855r¡555C000¡¡055555502222221255255555555r¡5535r¡r¡t¡551545512210742121 1 4422317 857088 3 3355554 23 455tt255422222112'15525554 5 r¡ 5tr 3 544 5 ¡¡ 24445U22U1221o7r¡312110?q250?1502xc332rr45000050r¡35255013321303502545555354554rrrr545U1t)242122',1074rr1211652056qr¡53588533¡t35C00C5r¡4r¡r{4r¡f¡2222212135525f,tt¡055333453533233333331221O7r¡ 512 t 1222011183 66DE33¡15550000545q455522222223255255555 55435555q¡145¡t33 3 33122107tr6121155295t¡77533c8tr33545C00034443ttqq2222222235.t25555555q4554544q443r¡442122107u772115q24sl78567F81225r¡55r¡5553543343222222232tru254455555355q5525532t¡33312210?¡¡ s121 1?0¡¡5 56075'¡0 ÀX3¡t55550 000q0¿¡r¡34450222221 1355155555 5553 553553 55214r¡r¡q 12210749121133223517436U82224¡¡5554443\423tr421222121qr¡5255554555355¡¡544443333331221o?50r21103101027507x85¡¡5555C0CC3554334522222111355255555st¡t¡355351¡34r¡33334¡¡122107511211201012074608X23rt555C000555t!45552222112145525t¡¡¡¡¡554tr255552233353333122107521211442241785?38841354'1000053q3333rt22222222355255445.¡¡¡3345q2q554223222'122107531211552151785728S233444C000434313412222222115524U5r¡¡¡15tr245255q551222111221O75r¡121106q45073303xc2334450000tr44r¡4554013211213t¡525t¡555t¡55q55354¡¡5534¡¡333122107551211 30333108560sr33354t¡5422455trq4442222222234525u4¡¡54t¡r¡35545r¡3r¡434tt4¡r412210756121'144224228577D832253r¡555555a4455t!222222233552¡¡555r¡r¡543553544343qr¡433122107571221552356665r¡r¡885325¡¡5C00040Uttt1tr440222222135525r¡t¡r¡5545q5535q1¡t¡4344r¡l¡¡¡122107581221504451065508X22¡tr14500005q55q55422221 1223552555q55r¡5355¿¡51¡t¿4r¡43333t¡122107591211tt4223277260cc2335334¿¡425555q¡¡553220022124515q1q5255q45¡¡35555544¡1q312210760121'15522522856588q23555000044533rt5522222122455255s455554544533r¡tr3333331221076',11211332221462668G233¡¡q¡¡5045rr3tt43l4.4q22221112r¡55255¿r452443¿¡555t¡qqq322131122107621211552 15675532SS3335¡rr¡000044433t15302222 121¿¡552555r¡¡¡4r¡53553543443332341221076312.1 15q235313533cc111323000C22221qu2223211234¡¡rtZr¡qr¡r¡5553235jq332u9tt222212210?64121160425108570812225240000tt2t¿422442222222333525555555525535r¡44442u42212210765121132232128355882rt35550000555q34u422222122q35255uu5.¡5335555545¡¡1111q4122'l076612110rr405017rr07X812254r¡000C53qtr3tr4222222122rt5525¡¡r¡545r¡435535q3q4423232122107671211?72051685u088333555c00005555555222222222552555u5553055555555u2222112210?68121122201.11 8266pu2000000000123334532222112215525q5s5555r¡55455r¡4443333212210169'1211222221283648U2ri3555C00053554trt¿22222222225525555554535555.¡¡¡r¡2t¡155qt¡1221017C12113223327855U88r1¡r5¡l¡1553535¡¡44r¡55532221121¡¡55255¡¡r¡5qrr3355354444433322 1221077112115522517857588rr324¿¡50000t145533qtt22222221rt55255555555455rr55444323332122107721211242011163r¡r¡OO233555C00C5453355!22222122c55255¡¡55454455rt555555333331221ol't 312110540 50r¡ 550 5X 821 t r¡r¡ 50 00 05U54t!U5422222221255252255 r¡ 1 t '1 3 rt2 3 55 55qq42221221017q1210322222771ó588231¡¡¡¡qC000rt2r¡4¡¡4U022321111r¡53055555555455553r¡54455¿t1r¡1221077512',1132233118565U85r¡35¡r¡¡54535r¡555553222221224552555555r¡¡¡35515545532223¡¡1221O77612115522¡r37655588334555C000544435522222222134525t¡r¡5555335523553524r¡t¡4312210771121132232177r¡338833355555525454¡155322221122355255555545rr5555555553033¡¡122107781211772956635r¡r¡n8424555C00C000555550222î221u4525555¿¡555355555555515555122',|077912',|106425062503X8r¡32¡145000C40U22t144022222213452¡¡t¡5r¡555545515r¡¡r4¡¡41 32r¡31221078012114rr205118534U82315rr400005555555522222222tt55254r¡555554553555555555551221078112110?t¡35061503r8422rrq4G00020332253033330202552r¡¡¡4r¡r¡455¡¡r¡q22322221553512210j821211772 1566r¡523cc503q4¡¡0000q043233q02220121r¡S525ut¡r¡55r¡3l45qr¡1rr5531544¡¡1221078 31 2 1 1 303 1 3 108550 8X22q5555540544q44u42221 1 1 22r¡55 1 555555555555s 555555ss 33 1 221078 rr121 1532rÌ rl318r¡ 3 6cD 1215555 55rt3 5¡¡42¡¡52123222224552555 55srt5 3 553 5q441¡r¡5q rt 2312210785121 133234128¡¡7388t¡335455443t¡3r¡3334422211 1122552 5t¡t¡r¡55t¡335r¡3532r¡t¡1232r¡31221078512115522537353388231¡lr¡4C00Ctt3433353222221111552555rt5555q554544¡¡rr¡¡r¡ll¿,¡¿¡r¡122107871211322231r16533885r¡355555545455555522221112r¡552555¡t555¡¡255r¡5535523r¡335122107881211332rr3¡¡??533882r¡r¡55553q25u44345522221 1223552555u5r¡4¡¡25555534r¡324¡¡24 122107891211rrr¡23¡t47755388553555555¡¡5q55555522221123r¡552Sq555554355341¡45q4r¡¡¡4r¡412210790121'17 529 56 605.¡ 3cc 3325tr5000 C55554 5r¡ 402222222¡¡552 55555 555555351 1 11 1144 32 12210791121 1203r¡ 310 83?0 CXt¡ l3tl044 ¡¡44 U4U44q5q22221 12135525r¡0rl5r¡5rr 3 q 5r¡qq 340 333 3 3r¡ 12210'1921211rt¡¡22r¡17753¡¡8X333¡¡r¿r¡5555555555552222222235525555555r¡255r¡551¡5r¡q¡¡q4q¡¡1221079312115520¡¡660533885335550000505¡¡335502222122¿t552555¿¡55r¡5r¡55r¡54455r¡qr¡4441121079tr121222213128277881110r¡35rr53r¡3r¡22q52222221212552555555r¡¡¡2554542341133r¡31221

23r
CÀF DDÀTÀ
07951211552356675t¡4BB233ri4r¡000c¿¡0¡¡33q5402222'l223u5zuqu45555r¡5r¡q5r¡4uqq1333312210796121122223304523G82334¡¡q¡¡554444U34542222212235525t¿4r¡54r¡33r¡555r¡4 4u235u2212210797121'165205128511c8qq¡¡545000C5ll'554u54?222212'11552555555t¡4355355r¡551t¿,Jq3q1221082 5131 1 r¡r¡21 121 355t¡ stt3 235555r¡55u 5¿¡ 33553 22211122155 3 55555 55r¡ 3 55q 5r¡q 352342 321 111082613215¿r2.¡412756q8843r¡4q.tC00Ctr4933434222222224552554q55q53q5qq55444¡lr¡33¿t1111082713113123315846388t¡r¡3545554r¡5554t155522221 12235535¿¡535q5q¡¡55¡¡5q5¡¡52q2235i11108281311203121084608X1223¡¡r¡C0005[t4455tr22222122455255U455¡¡r¡3554rrr¡¿¡4r¡23333411110829131133223228545c8543555r¡¿tt¡4t¡t¡5r¡3q5q2222112235535¡¡r¡5553r¡i555qr¡53r¡3454¡¡41,l11083013113323311853688t¡q355555555¡154t¡55532321'1122552555t155r¡3255r15r¡55223325qt11108311311q0323108570Àx3224t¡355532uuuu4542122222125525554545535545¡¡453q33244111.r083 2131'l 3323 34t¡ 857 3ss 5¿t3¡¡555r¡0r¡¿r44¡¡¡¡555222211133552 555rr5 54r¡3 5555¡¡ 5 35343 34¡l 1 111083 3131 1¡¡q24 411757788 523r¡rr5555¡¡5555555522222223u55 15555 55qrt 3 5555r¡s553¡¡q r¡ 2q 1 111083 rr131 13221217 8316 BC3 32r¡54C00C 4542t)55522222222355255555555r¡ 55453555¡¡533 22,t 11108351311r¡t¡214148564PP22455553r\144qqtt5422222222455?55tt5555rt2555555¡¡533332¡¡1.1 1t08361311332232185tt6s8532f¡3f¡32444¿¡4¿t33q322?211223q.tt1r¡q¿¡25qqqqqq32q4q4443333111108371311332q3227576u85335555r¡5r¡444qqu¡J-4222222214552555tr5555455553¡¡r.¡323333q.t11108381311322221785668tt22333200004tr455553222221221552555¿15s5¡¡335¡¡255r¡5r¡3rt¡t3311110839131122212276166881r¡3¿t5qC00Cr¡24¿t445432222221355255555q4.¡35545U5Utr442222111108r¡01312t¡r¡233t¡r¡615{G0232554.¡4r¡05¡¡q3355q32322122¡¡552555S55r¡5355q5.¡3r¡r¡21¡222211,1108r¡11311054250q6503x8232555000055555555322222213551545¿¡5555355rr5¿¡5rtqqqqtqq11110842't31122222277476ss53r¡5555¿r5t¡43533tr55222221123552555¡t54qq355q5r¡5qq33¡¡q4q111108431311212011?83?¡tFc224¡¡4r¡0000555¡¡555332221121¿¡55255q5s5qr¡255r¡535qq1¡lr¡33411t1084 r¡131 1 r¡422532 55tt 5 8823344r¡0oOOr¡ 44rtr¡r¡54222 22122355',1554q 555¡¡3 ¿¡54r¡ ¡¡44542222¡¡ 111r08r¡5131123201128476883¿lr¡4r¡50000445q455t¡2222112'1'U55255545¿¡3325545r¡5rtr¡r¡¡¡43qq1111084613115tr224¡¡775338833355500000231245q22222122u5q1555rr55r¡3355055q554322321r1108471 31'1.7622566156q883225550000505s5555022222214s535555s44r¡q55555555224224111108481311552356605338x¿¡33¡¡t¡50000q0q1255.¡0222222145525u545¡155r¡55rt5355553q33311110 8¡¡ 9131 14422t!17 857 688 5 q3555c00cq4 5r¡555r¡22221 122q553 5¡¡555 5qq 25srr 5 534sq2¿¡2 3¡¡ 1111085 C13312220 112I566B83r¡rt5550 0O0q 1q3255,r22?22't 22 4552 5r¡¡tr¡5 553 3 555555r¡53232 331t t l0851131 1222122772608r 123¿¡¡¡qo o0or¡sr¡trt¡qq4 222 221214ss2555q 5 5qq 25335q 5gq 1q3 3 q¡¡ 11 1108521311054050¡15503xD332r¡550000r¡3r¡333r¡422222221455355555545q55q5qq55q333331111085313115041510¡¡5308X33t¡445C00055311343222222213552555555342¡tr¡3555554322221111085t¡131155235278¿¡768833454¡|c00034q305532222212245525555554r¡Zr¡5.¡54qqq132222 11110855131122212177q338u253t123000023211153222221213542555555532r¡45rtr¡¡2r¡33j33311110856131122201218364P8221555CC0041t¡34t¡4q2222212135525555555q255¡¡5¡¡r¡r¡rr¡t2q2q2t1t108571311552351785r¡¡¡B84r¿4555000C42uu3555222222224552555q5q3215555r¡q5q¡¡3q24q11110858131 14¡¡23 417853 3GF5334455 55C¿¡ 13 13¡¡¿¡5 22 22212235535454 55¿¡.¡ 3 55¡¡555555q3 3 33 t 1 1108591311552351?8533883335550000¡¡553353¿r222222224552ss5255r¡qr¡5q22¡155533333311110860132 103123072506X8tt3tr555555r154q33q532222112135525r¡435r¡q¡¡355q544r¡r¡rr333341111086113115521566555¿t88q33555Ö0oor¡or¡3trq¡¡¡¡02222222q552s55r¡55r¡s55555qs5533444411110 8621 31 1 3223317 8570 B855r¡5555.155 5554555 522 zzz113qs5z55555 54q 255r¡ 5r¡23q¡¡31 122 1 1110863131143233178077882t¡55555r¡54q5534r¡55222222223552555555q4355q5q5q52131251111086q13113322317145tr883454r¡54rt55t¡2333554223211214552555555r¡32¿¡qq33¡¡4uz3trzu21,l110865131177235665523Pc33¡¡555000c5455q554222222224s535455555025555455s334fiqq1111086613115u22422837388323t¡45534535541t¡53222221211552555¡¡ssrirt355152r¡¿¡522l112lltl086713114r¡2731185??PF5355555r¡55t1554455422221123155 155r¡¡¡555¡¡r¡55q5qS¡¡52qrt225111108681311q32.¡t¡1485338s23355553qqu3tt32tt542222212235525t!s5555q35555¿¡555¡13433411110869131130101107r¡70cx123033000c133234532222222145525s53544r¡33321534535321211110870131155235t¡485338rq325550000555r¡555522222222u5s15555555rt¡¡55r¡5r¡2r¡q3¡¡3121i111087 1131122222117277JJt¡5455550rr54555255522221121455255555543355r¡52r¡5524433411110872131 1 3013 3108560 Fr2335rr45543 42tt3355322221't22355255555 55¡¡ r¡ 5555 3r¡ 4433 ¡r 3 231,r t 1087313215523512857?FF3434rrr¡C00c¡¡r¡4r¡3utr3222221224442qr¡454rt4.¡r¡rl4r¡.r5555r¡¿¡433311110 87¡1131 l qt¡22 517 8566DDt¡¿¡{r¡4 5000 o3 54¡tr¡rr54222 22122455255415 55r¡ 3 5¡¡353 5 4rr242222111'l08?5131130123208170sx331t¡5555452¿¡32t¡5543232212135525355s,¡q5qi:,¡sur¿¡5rt4{22qt1t108?6'l 31133222177556ro55r¡5555C55545r¡rt555222211111¡5525¡¡5¡¡55r¡325r¡r¡5r¡55rr3r¡5qq5111108771311t¡¿¡22q1{753lBBqq3555co0ct¡2r¡3355r¡2222112345s2s55r¡5rrr¿qJ5555r¡qcr¡r¡342qq111108781 11166235566511188r¡43545C 0OCr¡¡¡¡¡¡tr¡r¡55 O22Z111 225525r¡r¡¡¡5r¡r¡31¡tr¡55r¡r¡r¡Ì¡r¡ 2222j11,110879131133223178570cx5335t¡5555525t¡555551224211135525¿rq45¿¡rrqr¡55r¡5r¡5¡¡¡¡1321 2211.1,1088C13115r¡22r¡1285738S3435r¡5000Cr¡5.,¡rr¡55522222122354.155545554.¡5555r¡11121¡¡r¡4¡¡11110881131 13321321 85? 6cc333tr4 t¡002322 r¡ 1r¡r¡5 3222211 12r¡552 525¡¡ 5 r¡i 33 q ssr¡ r¡:.¡ r¡2333 331 t l1088213115t¡224278570cc2234¡¡353r¡t¡1t¡r1155322321123q55255q5qq3q25525¡¡5lr¡2q2222 1111088313114tr2231?75¡¡388333545540Cr¡3r¡2555332221',1213352555r¡55543554535¡¡33133251111088r¡131 1222231?85t¡388t¡45555s5552551255522221 1123552 555r¡5554 2 S55555 552r¡¿¡ 34r¡ 11 1r

232
CÀA DDATÀ
O BBS13t 1 122013rt 813 3G 0¡123¡¡55C000¡¡ 55'¡t¡5551222 2'12145u1555555555554 5¡¡¡¡ r¡55t¡3 3341 111
08861311502351?85?78822245¡10C00444423ut¿22222122455155555¿¡543555545{¡534¡13331.l11088?13213321357¡¡3550C2234t1rt52423454555422222221',|5525455555¡¡t¡tl55r¡r¡55r¡r¡5qq45111'l08881311222013tt12tr3881224440C0C¡¡3r¡4355322221222tt55154Ut)5t¡¿¡l¡355¡¡51¡'13431¡¡r¡3311110899131i222222792i7xr345555505s3i312555222201112552555355521533535s¡¡3r¡315r¡111108901311572151685r¡r¡BBr¡22555C01C55513555222221213552555555554553555551¡¡¡¡122 1111089 113215520517853q88533555C00Cq5¿14¡¡¡¡4t¡222222211552544454443554545555r¡4qu11111089213110134¡¡04050qx81123535555u131355222222222453244u555543¡¡55555343555551111089313110210102610r¡x8 121555C00C34¡¡333r¡322222221455255555554355t¡5tt555rtt¡¡lr¡331111089q132',t55245127576CCr¡32544C00051r¡5305332222121355',l.5¡¡55543t¡3553535352¡tr¡333111108951321?04256065308X52451¡5C00C3r¡4r¡¡¡55q222222211552555555t¡54553q¡¡u4r¡r¡2221r¡1111089613116Cr¡156035r¡ODXr¡435450000rt0r¡3355r¡0222112145215tr54554r¡r¡555555555222331111089713112222311857588S4355555q455s¡I4S55222222233551555t¡55t¡53555535342222rrq11110898131 122222577423ss5445rt50000425r¡3555223222223552q'-1445tt3435545334q33333311110899131170r¡056035308x233555C00000¡¡3345¿¡02222121000000000000000000c0000000011110900131 1q0223205570cG333544545rt¡¡.¡t¡33¡¡5 32222112235525t¡4551¡l¡325r¡45t¡¿r¡¡431¡4 33r.l I11l090 11 31 1 66235664565883335450000222222220222222225525555555555535¡¡54511 1 1 1 3t 1 1 1
O902t31 lqq¿Zqt¡¡e54rrBB534q5553st¡q24223r¡u222221221552555555t¡.r345553t¡q55222231111090 3131 105q4 402 5504x8321445C 000423224utt2222221125325555554q355t¿511 1132r¡r¡¡¡¡¡1111o90r¡1311¡¡4205528534pp31355500004r¡4¡¡05552222 11244552555555553555535552333231111090513113035310?560SX45554554425\5q5455222222134552555555t|535545¡¡tl4tl3¡l.r3551111090613114425317857?883q35555r¡45r¡5r¡333r¡3222221224552544555¡¡3255t¡5tlt¡4r.lt¡4¡¡3r¡¡¡'l 111
09c21311r¡q2242q853r¡cs53344q554¿ttt3q225532222112225u'1535554533q5¿tr¡5t¡4I¡3r¡¡¡33¡¡111109081311400152065708xr¡q5555c000¿¡355555r¡222221'134552555t¡55q3355353r¡¿lt¡32332311110909131107q55061503x80q25550000r¡05r{q'¡5402221021455255555555¡¡55¡¡5¡¡4r¡r¡214242111'lo91t 131 1q222227726700222¡¡r¡4oO0ort5¡¡5r¡5523222 222145425trq55 4343 4tr 354 52r¡25 3122'l 1 1t091 1131 15520 56625558U5334r¡¡¡O00C4or¡¡rr¡55.¡02221 1213552 5¡¡¿r¿t554445555444¡¡Ur¡¡¡r¡l¡q 111t0912131105425026505XC53355550005rr533tt4522222222[55255555554255r¡5t¡5555r¡t¡¿¡tlq1l110913131 12220125716ttcc135r¡5500004r¡rr3355532321121q54255545554355¿¡5434q4qq3331111

Appendix C
DETAIL MAPS SHOl^JING SELECTEDNEIGHBOURHOODS AND SUB-AREASIN Ì/\lHICH QUESTiONNAIRES l,lEREADMI NISTE RED
-233-
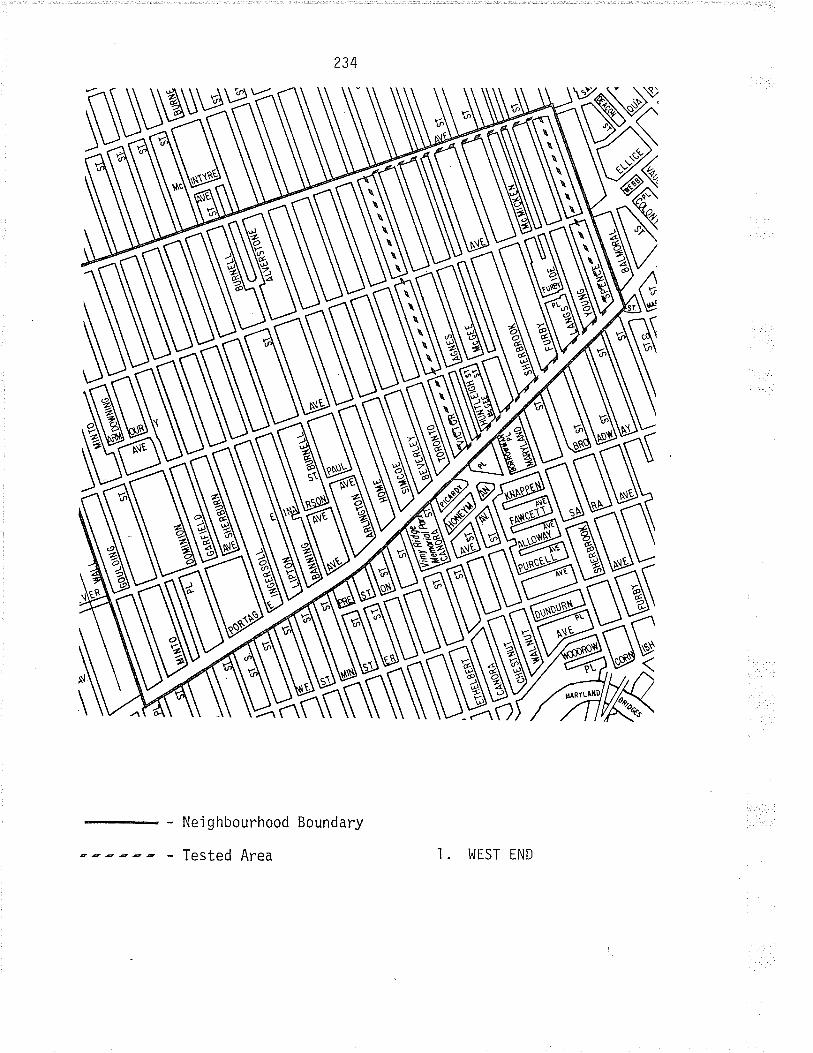
- Neighbourhood Boundary
EzE - Tested Area I. WEST TND
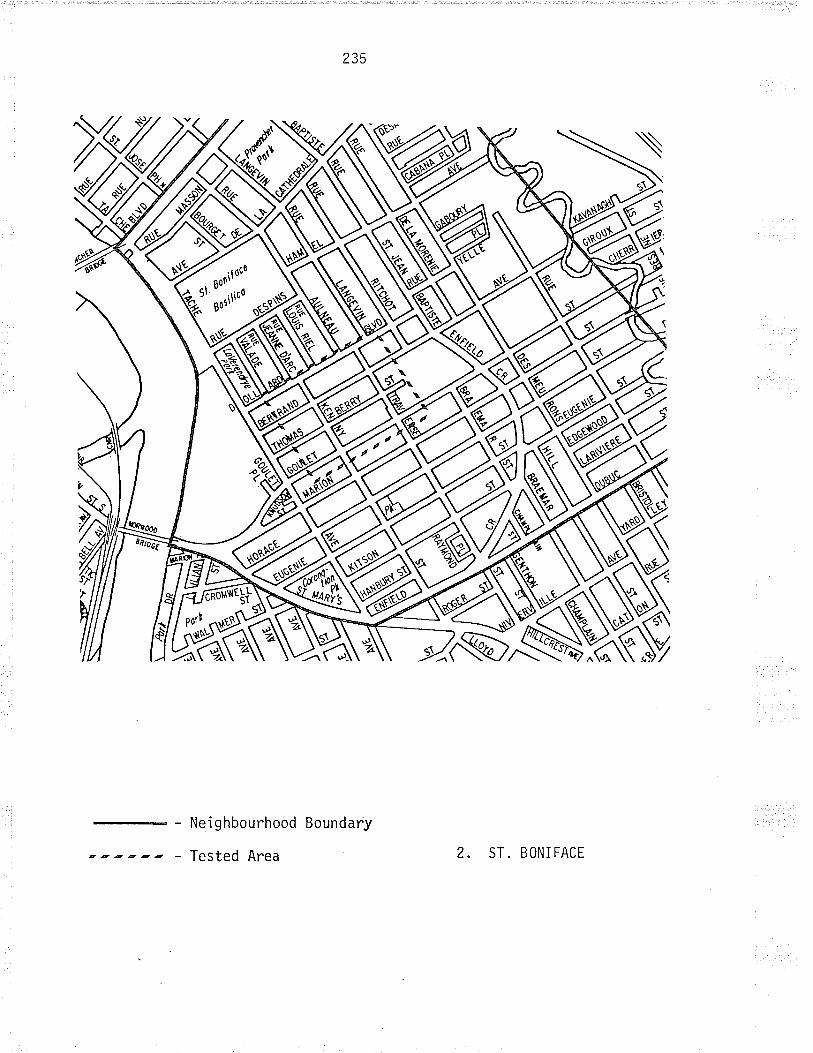
235
- Neighbourhood Boundary
,,zzzÊ - Tested Area
qonif oce
5l " .,1ico
2. ST. BONIFACE
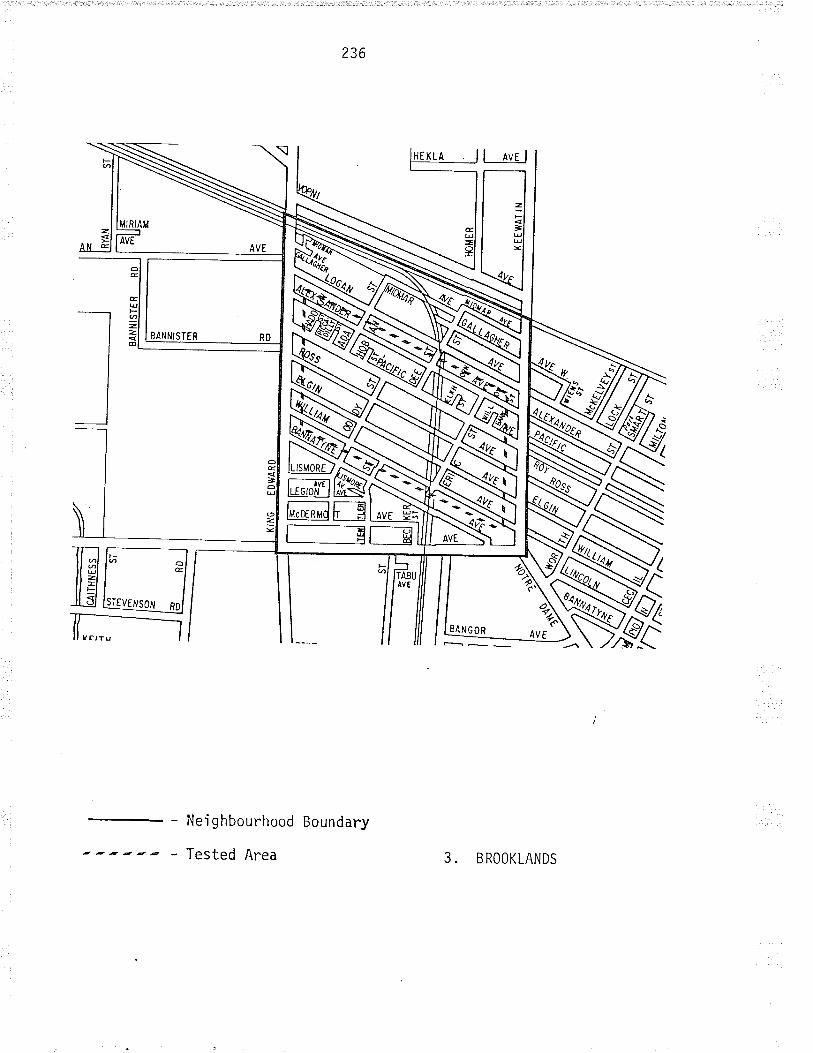
236
Boundary- Neighbourhood
--E - Tested Area
| ¡vrl
EANNISTER RD
3. BROOKLANDS
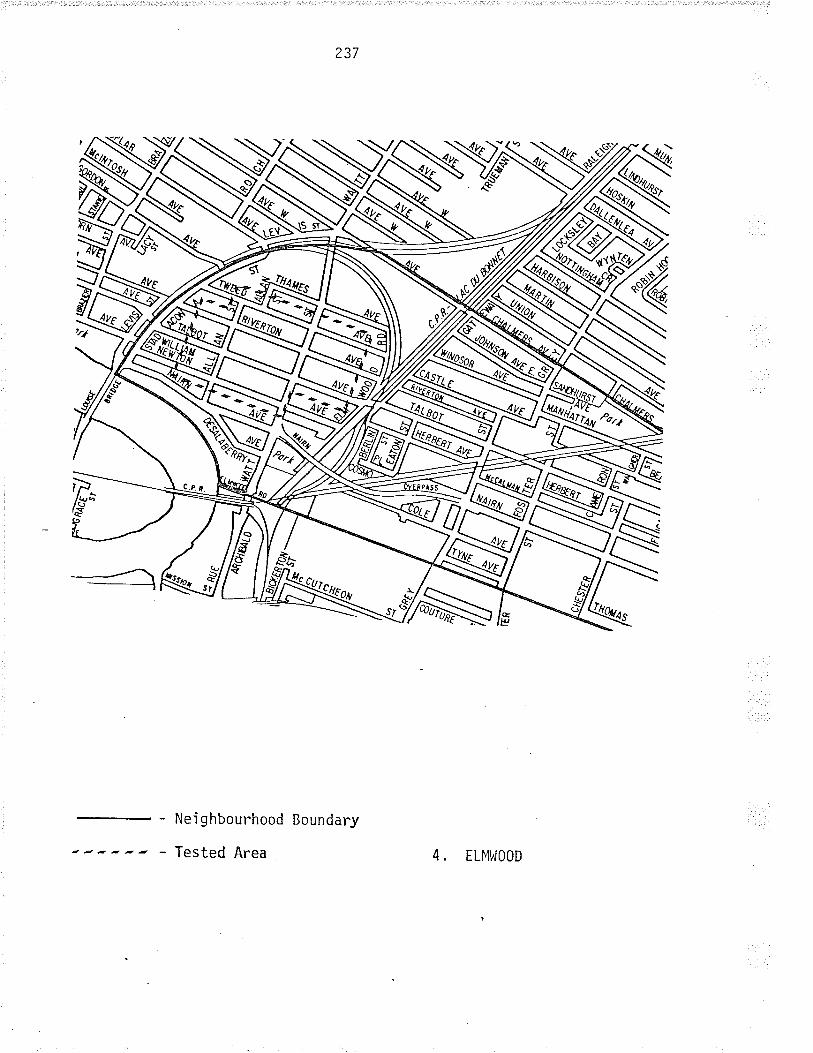
ffiw
237
- Neighbourhood Boundary
- Tested Area
E,oreq
4. ELI'11^i00D
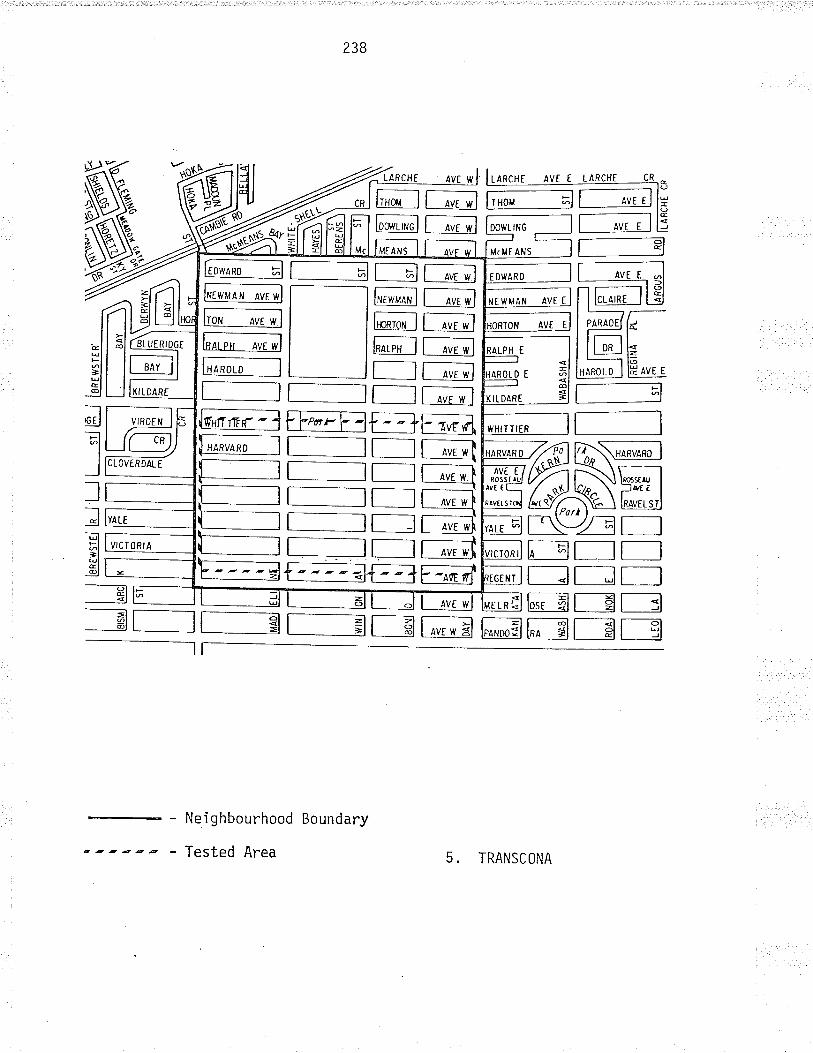
238
ffi-lt-;"ll1 F* ---f-l;"rc,lEf-----------.õ.|l-lf-^;l-;lr--l
N[;ñIIJ
IHE-I L------r lalHnnoLo I l-- ¡ve r
r------E
eMÐmÆr_lflt--;lr_E[=f=[g
-__---o_|dl<l
õl [-=l--=G[--ã
æa
TOcJ
CR
l;*ñ;l fì* ''l
llIBEI
t-^-*lt--^tr*ll--^* -ltì*lf_*;lf^* -l@f-^'.- |r^;ìlI our*i
ñt-dGC
r---r-e[;"'*lIII lñ*lI lffi;rI lr--__l
fFP.FFaæ
r,lEææ
NÉt-*r ãll--
I l*rnu¡ ru nvr wl
lm' *;ñ; *;lf;*ñ--_l
lø'ñ'ftrlF-ñ--lt------lfl\-------------rt'"'- a
vtcï0RlA
Neighbourhood Boundary
Tested Area 5. TRANSCONA-zzzEz
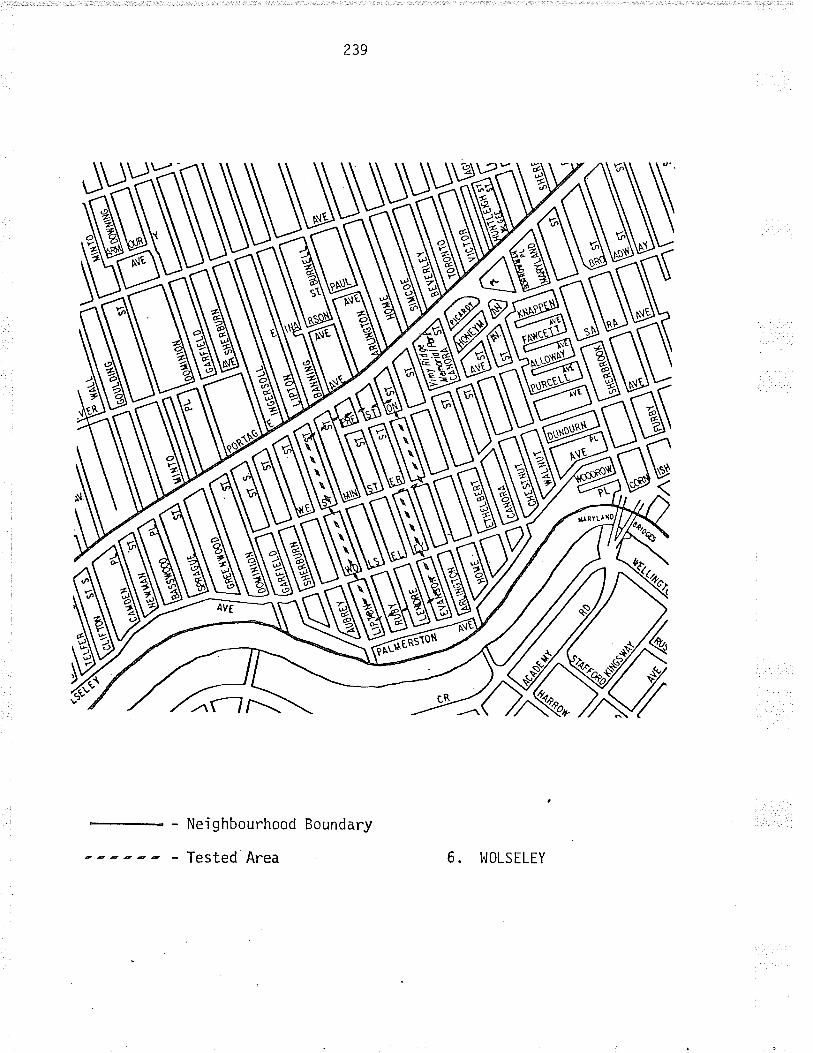
239
- Neighbourhood Boundary
,-- - Tested Area 6. WOLSELEY
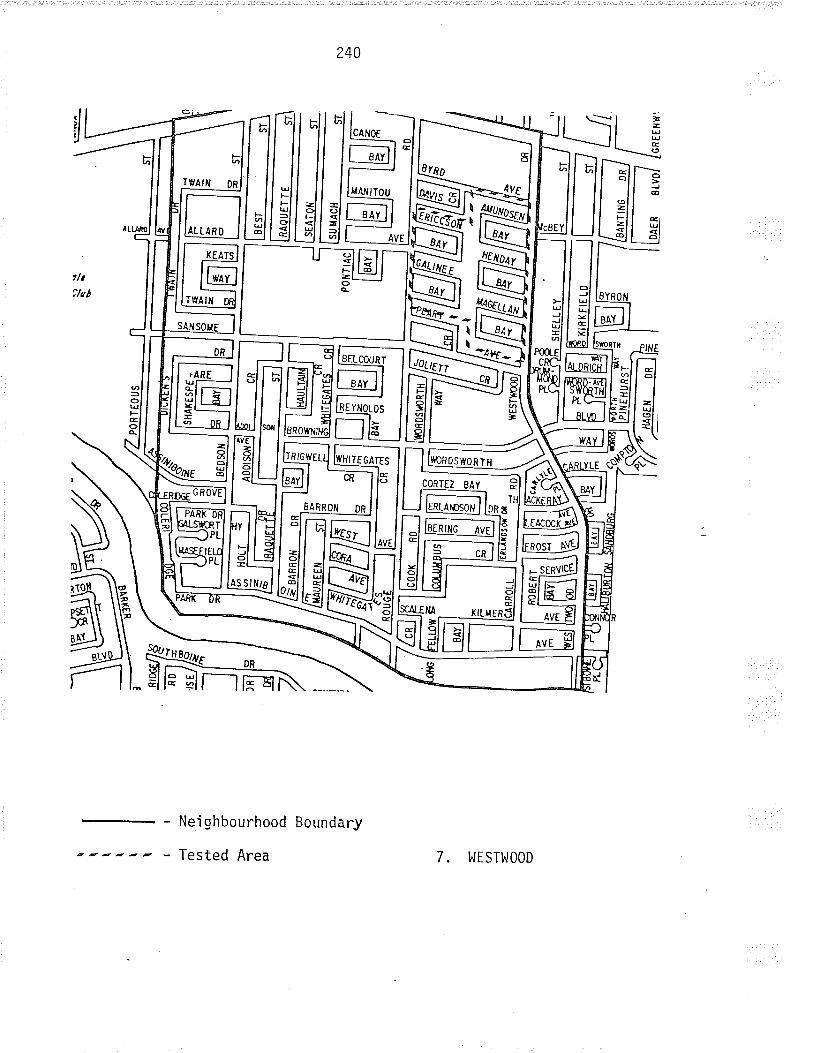
240
ruill EluIõJGmrJl
IHWI er*l
EARROII OR
coRTEz BAy Ê
- Ne.ighbourhood Boundary
--z - Tested Area 7. I^ITSTNOOD
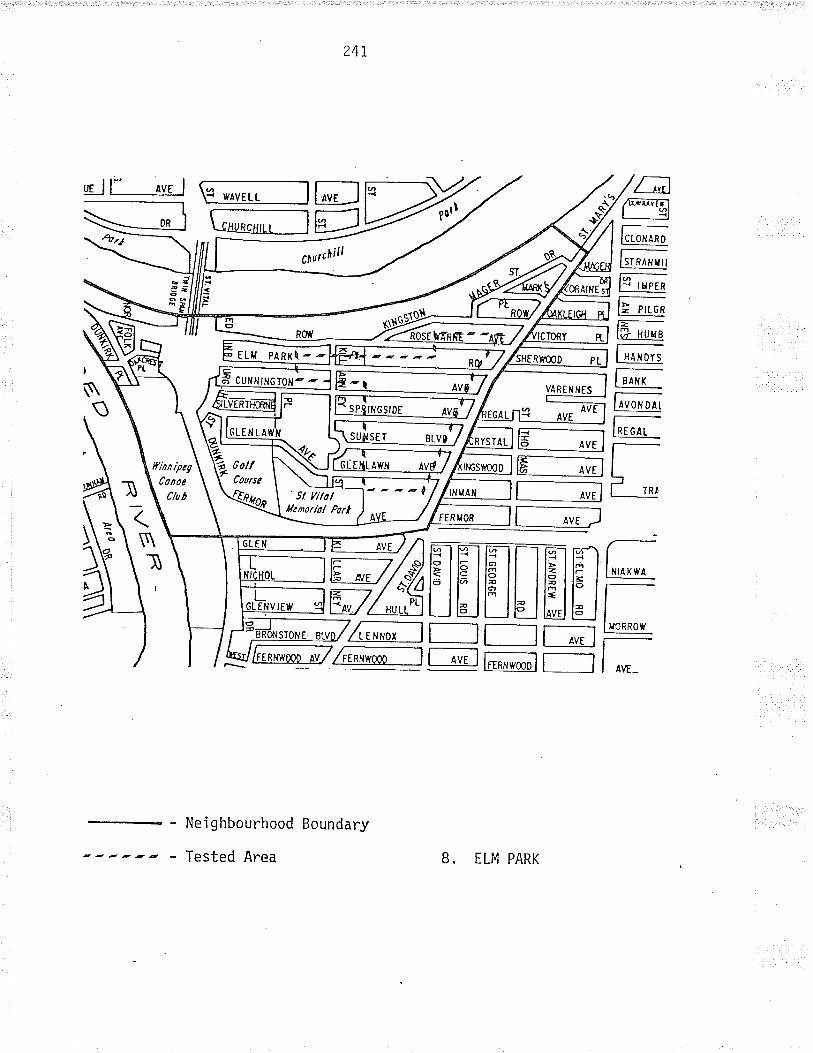
241
Í WÂVELL E]Ð E**t
Fr**l6li IxPER
l= r*tl'=---lF Huus
l;**E*[rr-*r'
chuchill
t\
$\s
l=_-__--------ìt-¡to ÁvE I
lË--*il[-- AA
f-;JñIl^-
HTi_;I
flilF*-*;l/t¡t*mo nu
- -ioæo-l l--Añl
Nei ghbourhood
Tested Area
Boundary
ugj l-' oue I
5 ¡r¡r p¡ìit;:-z---
------rRrv /
Ðcu'H,,riron-Il l-r ñ,-;n I/Æ .v-EnffiE
GLEHLÂ/97
6oll ÂwH ¡vdCourse
' Sl lilollcnorio/
¡r,,)-1--', ¿F/( t
-EE B. ELM PARK
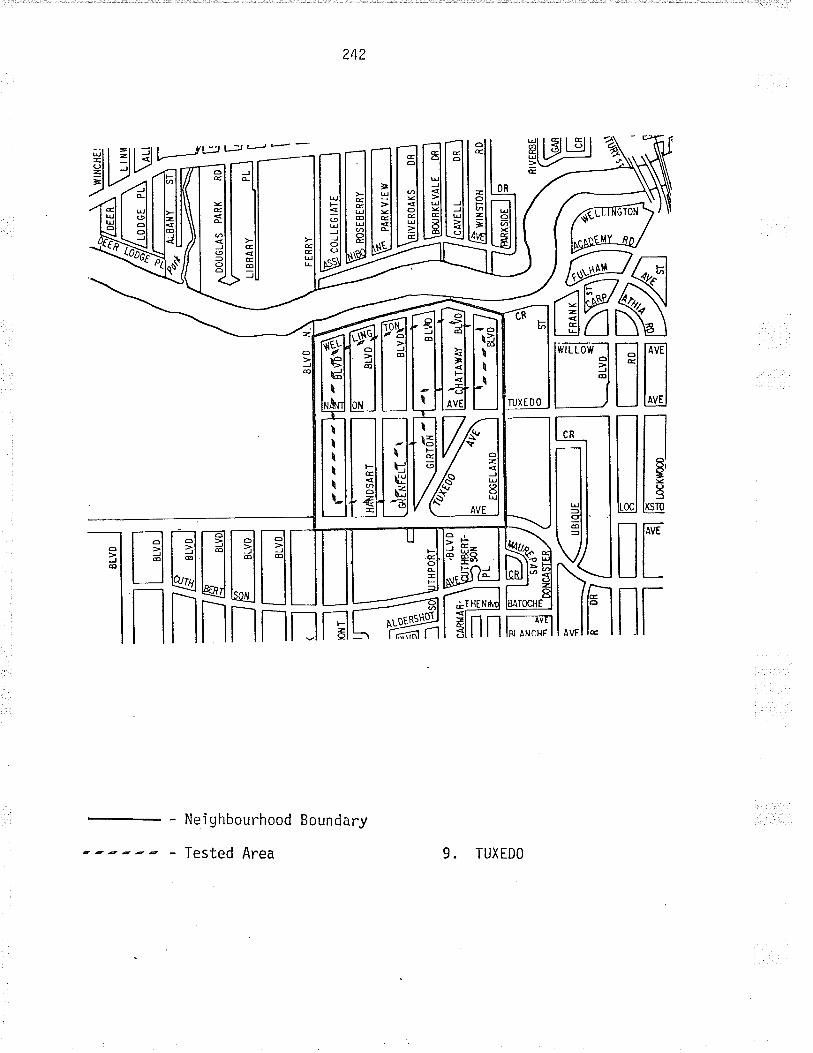
ìr tl ll tt -{
z,lD
.olJ
l ¿
.(-
f (O
(Ð5
o-
ct o-5
-5
o= Aro
o o- @ o 5 o- 9J -t (<
l[il
lfl;¡
'-,//g
*i
P 1 C X n1 I O
=ru
t= 'l il
þÆtv
#./-
r \-
Llì-
!tt
\
-T
Lopc
E P
L\ \
ÀLr
\rÄ
L8Â
riY S
Tì
Ir-
l vz^l
tIt.
LÂS
PA
RK
RD
I tJ
-f,, t,\
Ï t
t. \Iov
\
I
r--3
l rilt
f-3w
M @ [*tr
l;l
EÃ
ffi-"
o- *
ffi'*
l
Dì
N) Þ N)
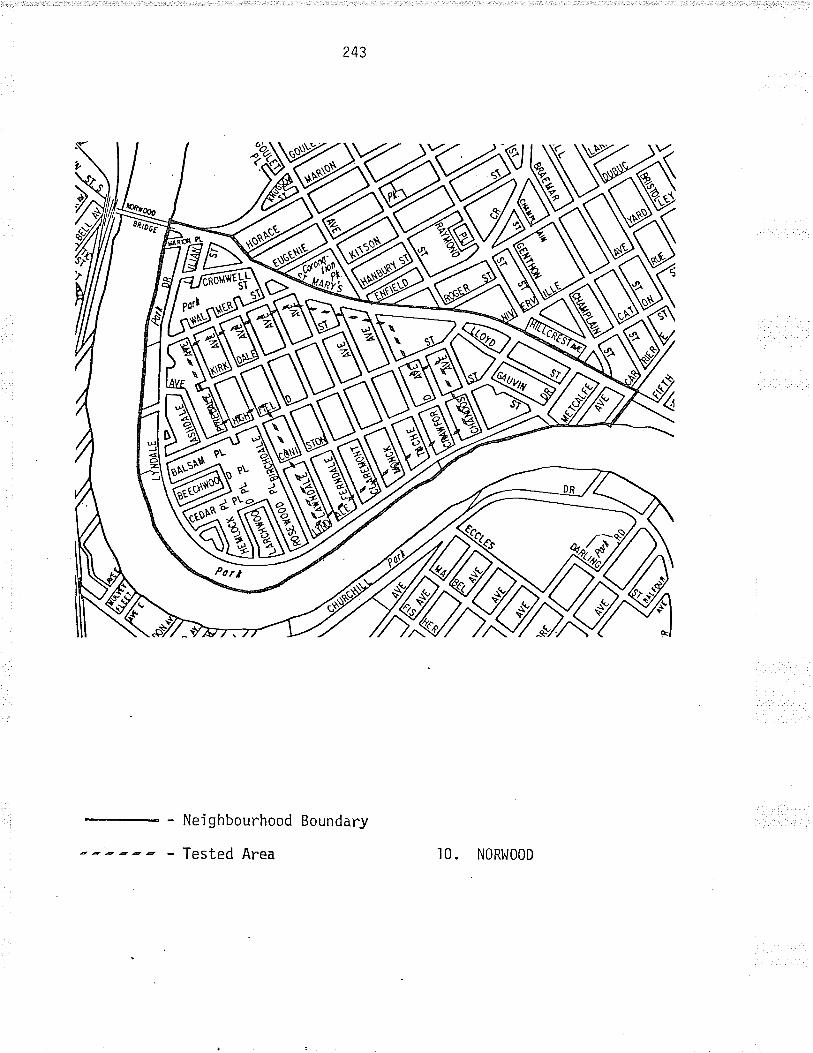
243
- Neighbourhood Boundary
- Tested Area
Hffi
l0 . N0Rt^t00D
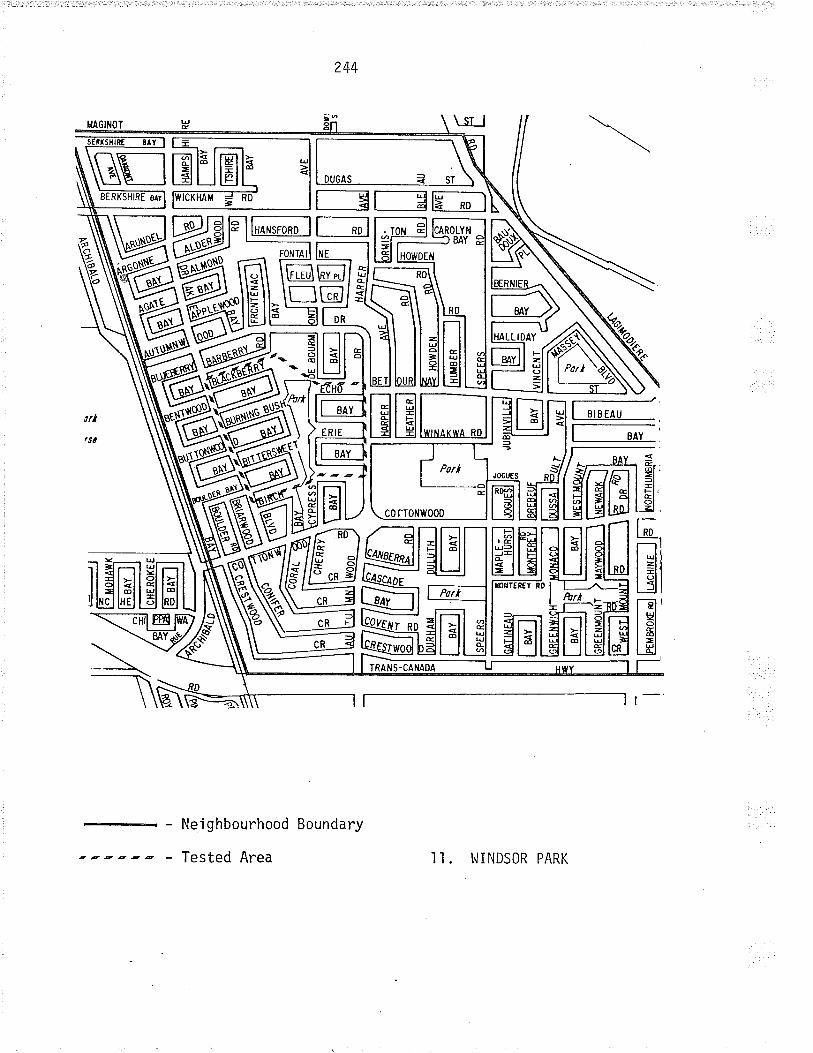
244
iRrsfiinf B¡Y-l-
GilEE]H[1 -I
. EERKSHIRE uyl llvlcKHÂH i RD
I f-[-Elä;-l=
@E
'fuú
\ç1
EEM
-
- Neighbourhood Boundary
,--ãzE - Tested Area ]I. WINDSOR PARK
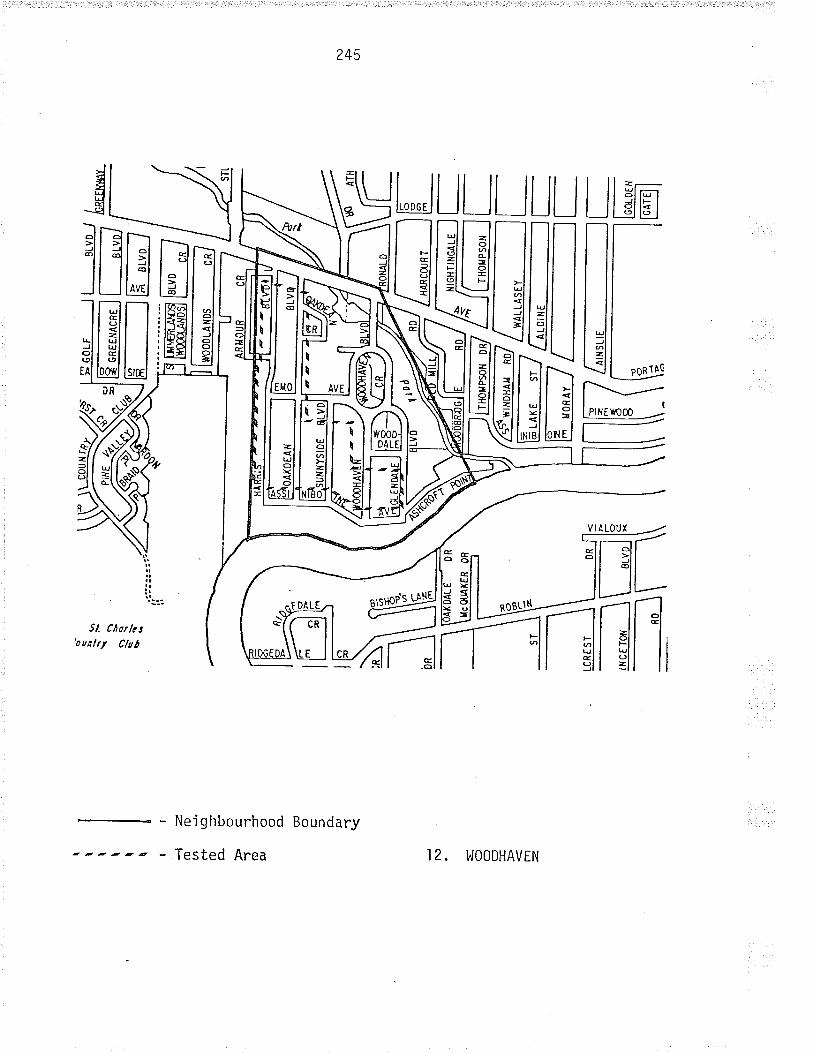
J LJLJ
JEI
Hß
245
Boundary
hJL]
H
il
_dL
ìE
JH
re
fi,
E
|!
-
- Neighbourhood
-----d - Tested Area 12. WOODHAVEN
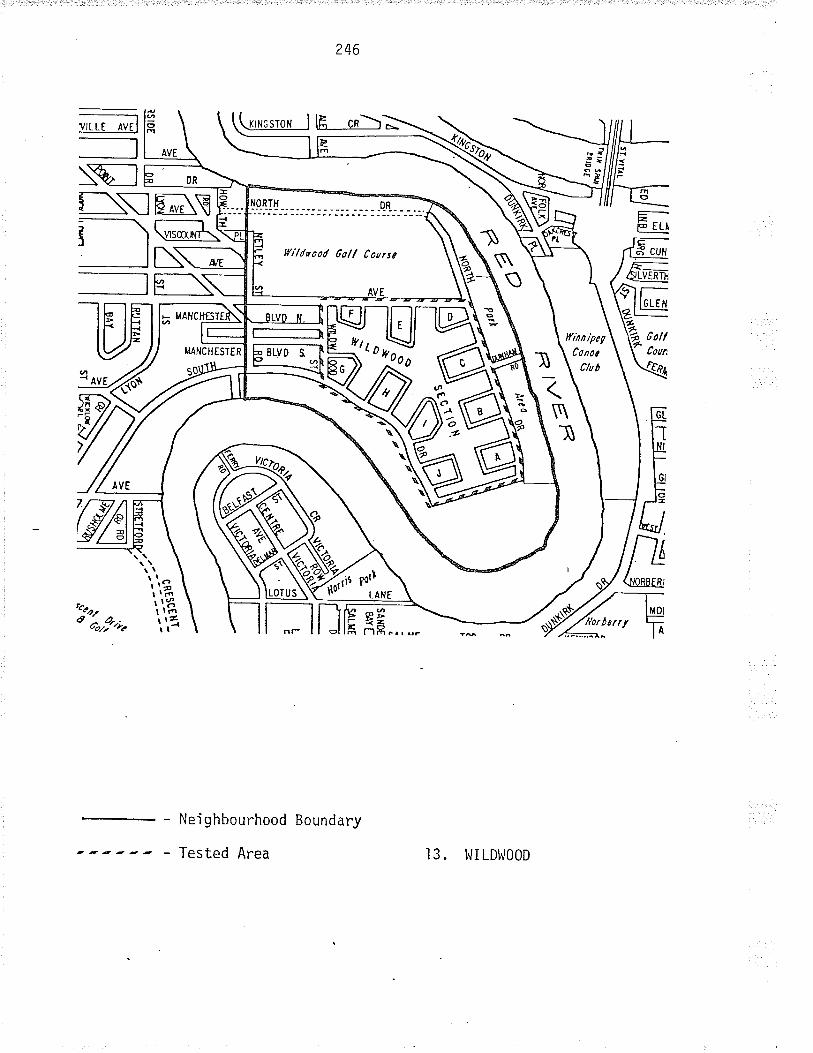
:wÍ
ilËl
LJIä
JI
rors
l*
1tü D
Aq Ð /
) û id'rt
fx l= lô lã t: r fl rl
f\) Þ Oì
¿,
L_ l=
4Wt)
o ¡ -
I \Q
1tql
;
ST t
è- îr-lt
aIIII
zn/
NY
* -S \ s s ç) s cl o
ËtF
]m
rÆR
j-fis
-::l
u_"Æ
À õt l-.-Ë
io rÐ
st$
lRnù
i llo
u ø
x
I
6r
\À\\'
'- \
.$
ffi
'--;-
f'*:
ffi&-=
5¿
et N //
áñ re
)#ô
¡od
-¿ l5 I%'l.'_
l -l
)
\ll2;
4;
I rl rl tl rl tt -t- 9,
9.
(-f
(OO
='
o-
cr of-
f(D
:tA
JOo o-
o_ \
\?,
\ ? ç+ ñ
¡>Ð
"r-
Hrv
s
I rv
e0H
vs
6p Ë l*
<.€
.- x
Lo'il
õ-T
Fl-l
ã
(! o c J o- 9J 1 (<
(, t- ç, a O (f

Appendìx D
NEI GHBOURHOOD BOUNDARI ES
AS IDENTIFIED BY THE CITYOF I,lINNIPEG PLANNINGDTPARTMENT
-247 -
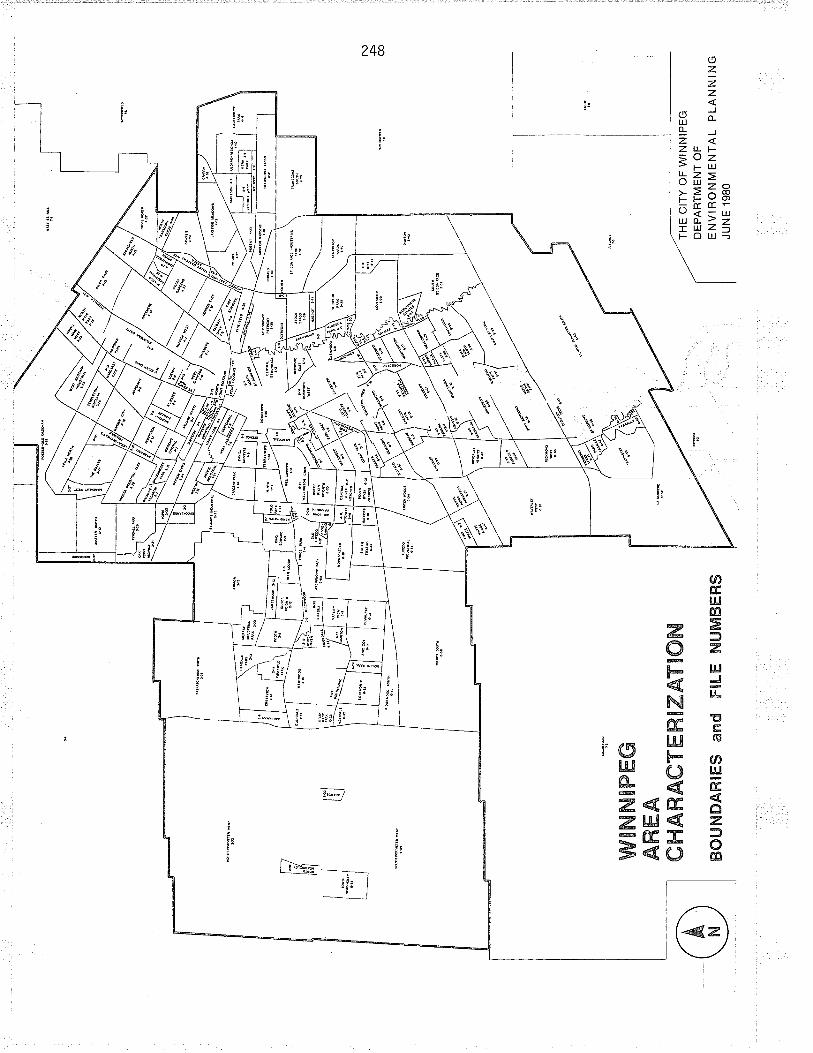
WåN
NÄ
Pffi
ffiÅ
mffi
AÇ
ffiA
RA
ffiT
ffiffi
BZ
AT
Bffi
N
BO
UN
ÐA
R¡E
S a
rìd
F¡L
E $
UU
Nfit
sER
S
N) Þ co
..-tn
tcrr
Y
oF w
TN
NT
PE
G
DE
PA
RT
ME
NT
OF
EN
VIR
ON
ME
NT
AL
PLA
NN
ING
JUN
E 1
980
2.
J.
CITED REFERENCTS
l. Abu-Lughod, J. and M.M. Foley. "The consumer votes by Moving."!\ej9hbgrhgo9, Cit s: An Intqgrated Reader inUrban Socio'logy. R. Gutman ãnd D. rk:ffizo: 460-478.
Adams, t.J. (ChairmanConcept in Theory andI 949) : 67-88.
- panel discussion). "The Ne'ighborhoodAppl i cati on . " lqnd tconomi cs . 25 ( February
Akin, 0. "contextual Fittingness of Everyday Activity Encounters."Environmental De:jg_!_lglegtçh. Volume 0ne: Selected papers
l,l. F. E. preisner (editor).' -
Stroudsburg: Dowden, Hutchinson, and Ross Inc., 1913: l23-13S.
Alexander, C. Notes on the Synthesis of Form. Cambridge: HarvardUniversity Presffi
5. Alexander, C. "The City as a Mechanism for Sustaining Human Contact."Environment fqr Man: The Ne¡!_rjlly_rggrl. l,l.R. Ewald Jr. (editor).
7: 60-1 02.
Alexander, c. "Major changes in Environmentar Form Required by!ocia'l and Psychoìogi caì Demands. " Ekistics. (August 1 969) : -
78-85
Al exander, C. , S. Ishi kawa, M. Si I verstejn , et a'l . A patternlalguagg: Jowns, s, Construction. New yorkJ--0xforã-University Press, 1977
Aìtman, i. "Some Perspectives on the Study of Man - EnvjronmentPhenomena." RepLesentative. Research in social psychorogy. 4 (l),1973: 1 09-.l 2
4.
6.
7.
8.
9.
10.
ll
Well-Being in Public Hous'ing Families. "(December 1974): 495-516.
App'leyard , D. The Urban Envi ronment: Se'l ected Bi bl i ography.Monticel l o: Co
Appìeyard, D. "Environmental Planning and social scjence: Strategiesfor Environmenta'l Decision Making. " l,Jorkìng paper #2j7. Berkeìey:Institute of Urban and Regìonaì Development, Unjversity of Califoinia,1973.
Angrist, S.S. "Dimensions ofEnvironment and Behavior. 6
Appleyard, D. "The EnvironmentAmerican Planning Associat,'ion.
a Social Symbo'|. " Journal of the(Apri'l ìe79) : 143-153.
AS
4512.
-249-
250
Appieyard, D. and M. LjntelI. "The Env'ironmentalStreets: The Residents' Vìewpoìnt. " Journal of
Quaì i ty of Cì tythe American
13.
14.
15.
16.
lnstitute of Planners. 38 (March 1912J; 84:T01
Arti ni an , v-A'. 'lThe tl ementary School cl assroom: A study of Bui ì tEnvironment. " E.D.R.A.: Proceedings of the SecoEnvjronmental 0 . Eastman
Ashcraft, N. and A.E. Scheflen. People Space: The Making andBreaking of Human Boundaries. ¡tew y
Athanasiou, R. and G.A. Yoshioka. "The Spatial Character ofFriendship Formation." Environment and Behavior. 5 (March '1973):43-65
17 . Axeìrod, M. "Urban Structure and Social Participation. "Sociological Review. 21 (February 1956): l3-lB.
18. Bagiey, C. "The Built Environment as an Influence on Personaì'ityand social Behavior: A spatial Study." psycholoq.y and the BuiltEnvironment. D. Canter and T.R. Lee (edj dÞ¡ess,-l 9-74-: I 56-l 58.
19. Barresi, c.M. and J.H. Lindqu'ist. "The urban commun'ity: AttitudesToward Ne'ighborhood and Urban Renewal. " Urban Affairs Quarterly5 (March 1970): 278-289.
20. Bauer, c. "social Questions fn Housing and community planning."Journal of Social Issues. I & Z (l9Sl): l-33.
21. Bauman, Karl E. "status Inconsistency, Satisfactory SocjalInteraction, and Community Satisfaction jn an Area of Rapid Growth."Social Forces. 47 (September l968): 45-SZ
22. Bechtel, R.B. Enclosing Behavjor. Stràudsburg: Dowden, Hutchjnson,and Ross Inc. , 1977.
?3. Beì ì , G. , E. Randal I , and J. Roeder (edi tors ) .
gnd.Huma!'ì Beþqvjor: An Annotated Bibl iography.Dowden, Hutchinson, and Ross Inc., 1973.
24. Bell, G. and J. Tyrwhitt. Human Identity in the Urban Environment.Harmondsworth: Penguin Books , 1WT.
25. Bell, l^J. "Social Choice, Life Styìes, and Suburban Residence. "The Suburba¡_lqrug_dly. l^1. Dobriner (editor). New york: G. p.ffizs-247
Ameri can
Urban Env'ironmentsStroudsburg:
27. Beìi, bl. and M. Boat. "urban Neighborhoods and Informal socialRelations. " American Journar of Socíorogy. 62 (19s7): 391-39g.
28. Be]1 , l.l. and M.T. Force. "urban Neighbourhood rypes andfgrilcipation in Formal Associations. " n .21 (February 1956): 25-34
29. Bernard, J. Jhe Sociology of community. Glenview: scott, Foremanand Company, 1973.-
30. Bogardus, E.S. social Distance. yellow Springs: Antioch press,I 959.
31. Botka, D. "A Descriptive Model of social contacts t^Jithin aCommunity." tkistics. jll (August l9i0): ll0-116.
32. Broady, l,l. "socjal planning in the city Region. " Journal of theTown Planning Institute. 23 (May ì968): 219-ZZ1
33. Broady, M. (editor). Planning For people: Essays on the socjalContext of Planning. gOg.
34. Brooks, R.0. New Towns and communar values: A case Study ofColumbia, Mary
35. Buttimer, A. "social Space and the Plannjng of Residential Areas."Environment and Behaviour. 4 (september lslz): 279-319.
36. Buttimer, A. "Sociology and planning.,' Studies in Socjal Science!d Planning. l. Forbes (editor). EdinbuPress Ltd. , 1974-. 114-i?l .
37. Buttimer, A. "social Space 'in interdiscipìinary perspect.ive.,'Beqdings in Socjal Geography. E. Jones (editor). London: 0xfordUniversity Press, lgZS: Tæ--197.
26. Bel'l , W. "The City, theThe New Urbanization. S.
251
Suburb, and a Theory of Social Choice. "Greer, et al (edÍtors). New york:
I 32-l 68.
"Residential Areas: Planning,Studies in Social Science and
press
The Quality of American1974.
St. Martin-s Fress J968:
Buttimer, A. and S.T. McDonald.Perceptions, and Preferences. "Planning. J. Forbes (editor).Ltd., 1974: 163-182.
38.
39. Cqmpbell, 4., P. Converse, and Ì^l. Rodgers.Life. New York: Russel i Sage Foundai-ion,
40. capìow, T. and R. Forman. "Neighbourhood Interaction in aHomogeneous community. " American Sociological Review. l5 (lgso):357-366
252
41. Carey, L. anÇ R. Mapes.Social Activity on New Ho sford,1s77.
42- cam, S. "The city of the Mind. " E¡vironment for Man: The Next,Tijlly:ggfs. l,l.R. Ewald Jn. (ea-itoUnivers-ity-press, 1967 : lgl _¿26
43. Chan, Y. -M. ,'Toward an Integrated TheoryMaster's Thesis, University of Manitoba,
44 . Ç!upi l'r , F. S, _ .
,'Thg psychoì ogy of Hous i ng.(October l95t): Ï-t-5.45. Chapin, F.S., Jr. and H.C. Hightower, "Household Activity patterns
and Land use." Journa'l of thé Amerióan institute of planiers.3l (Ausust tOAS)
46. Chermayeff, S. and C. Alexander. lglLmunity_g!4_U_yg_çy. GardenCi ty: Anchor Books , I 965
47. Cohen, S.H. "spatiaì pattern andin Geographic perception.', ph. D.Denver, 1973.
of Nei ghbourhood Pi ann'ing . "1977 .
" Social Forces. 30
Neighbourhood Awareness: A StudyDì ssertation, Universi ty of
48. colljson, P. "Town pranning and the Neighborhood unit concept.,,publ ic Administration . 32 (igS+) : qAS_4ø5.
49. Cooley, C. H- Social Organization. Glencoe: The Free press, ì969.
50. cooper, c:c. Easter Hil I village: gqmq social Implícations ofDesign. Irlew y
51. county council of, Essex. A Design Guide for Residential Areas.Tiptree: The Anchor p."rt
52' Craik, K'H-.. "Tf. Comprehension of the Everyday Physicaì Environment.,,Journal of the American Institute of planñers.' s+"1¡ãnúa.v lg6gl, -
53' crothers, R- "Factors Rerated to the community index ofsatisractoriness. " Ekisrics. r (Augusr igToii -ìðirrõö.
54. Dahir, J. The Neighborhood unit plan: Its_ lpread and Acceptance.New York t
55' Darke, J. and R. Darke. "Physical and SocÍal Factors in NeighbourRelations," l^Jorking Paper #4ì, centre for rnvironmental Studies, 1969.
253
56. Davìs, G. and R. Roizen. "Architectural Determinants of StudentSatisfaction jn colìege Resjdence Halls. " t.D.R.A. Two. J. Archeaand C. Eastman (editors), l97l: (m'icroform)-2e-aa,-
57. Dean, J.P., 'jlh. Myths of Housing Reform. " American SocjologicalReview. 14 (Apri'l '1949) : 281-ZBg
58. Deasy, c.M. Design for Human Affairs. New York: John r^rjìey andS0ns,1974.
59. DenniS, N. "The Popularity of the Neighbourhood Community ldea."Beading_s in urban Sociology. R. E. Pahl (ed'itor). 0xford: pergamonPress, 1 968: 74-92.
60. Dewey, R. "The Nejghborhood, urban Ecology, and city pìanners."American Sociological Review. lS (August .l950):
502-501.
61. Dubos, R.J. "Man Adapting: Limitations and potentìalities."Environment for Man: The Next Fjfty Years. tnJ.R. Ewald Jr. (editor).
6i: l l -25.
62. Dyckman, J.l,J. "0n Men, M'ice, and Moles: Notes on physica'l pìanning,Environment and Community." Journal of the American Institute ofPl anners. 27 ( February l 96l )
63. Dyckman, J.l¡'l. "city Planning and the Treasury of Science. "Environment for Man: The Next Fifty years. l,J.R. Ewald Jr. (editor).
6i: Zt-SZ.
64. Ermuth, F. ResÍdential Satisfaction and urban EnvironmentalPreferences_. ,Yõrk-Unìversity, 1974.
65. Fava, s. F. "suburbanism as a l^lay of Life. " American SociologicalReview. 21 (l 956) : 34-37
66. Feldman, A.S. and C. Tilly. "The Interaction of Social and PhysicaìSpace. " American Sociol ogical Review . 25 (l 960) : BZ7-gg4.
67. Fell'in, P. and E. Litwak. "Neighborhood Cohesion Under Conditjonsof Mobility. " Nmerican sociological Review. zB (June '1963):364-376.
68. Festinger, L., S. Schachter, and K. Back. Social pressures inInformal Groups. New York: Tavistock publîõãTionsl-Tgsg.
69. Fish, G.S. "The Effect of Heterogeneity on Neighborhood SocialBehaviour." The Behavioral Basis of Des'ign. Book One: SelectedPapers (E.n.R Russell (editors).stroudsburg: Dowden, Hutchinson and Ross Inc., 1976: lsz-.l63.
254
70. Flachsbart, P.G. and G.L. Peterson. "Dynamjcs of preference forVisual Attributes of Housing Env'ironments. " Environmental DesignResearch.Volume0ne:SelectedPapers(Fourffie).Wl Preiser (editqr)" Stroudsburg: 'Dowdòn, Hutch'inson, and Ross Inc.1973: 98-l 05.
71. Foley, D.L. "the use of Local Facilities in a Metropoìis.',American Journal of socíology. 56 (November lg50): '238-246.
72. Form, w.H. "status stratificatíon in a planned community.',Amerícan sociological Review. r0 (0ctober 1945): 605-6i3.
73. Fríed, M. and P. Gleicher. "Somein an Urban Slum." Journal of the
Sources of Residential SatisfactionAmerican Institute of Planners.
27 (l 961 ) : 305-31 5.
Gans, H.Rel ati onsInsti tute
76.
75.
74.
Gans, H.J. The urban villagers. New york: The Free press , 1962.
"Planning and Social Life:in Suburban Communities- "
Friendship and NeighbourJournal of the American¡ffiof Pl anners. 27 ( I 96ì ) :
Gans, H.J. "the Balanced community: Homogeneity or Heterogeneityin Resídential Areas?" Journal of the Rmeiican institute oiPl anners . 27 (l 961 ) : 1lÇlga.-
77. Gans, H. "Urbanism and Suburbanism as l^lays ofof Ðefinitions." Human Behaviour and Soãial(editor). Boston: Houghton Mifflin, 1962:
Li fe: AProces ses .
Reeval uati onA. M. Rose
78. Gans, H.J. "Effects of the Move From Cityqo¡dition. L.J. Duhl (editor). New york:1¡5:1Ç1.
79. Gans, H.J. The Levittowners: ways of Life and politics in a NewSrbr.bun Co*
80. Gans, H.J. "Planning - and city p'lanning - for Mental Health."f ani ng_ I'legal opol i s , vol ume I I : How to Mánage an urbani zed worl d.
lo.81. Gans, H.J. "Social and Physicaì Planning for the Eliminatjon of
urban Poverty." urban planning and Socíál policy. B.J. Friedenand R. Morris (ed Inc., 196g: 39_53.
82. Gans, H.J. "urbanism and suburbanism as ways of Life.,, Readingsin urban sog_g_l_ggy. R. E. pahr (editor). 0xford: pergamõnTress-,ffi83. Gans, H.J. People gnd plans: Essays on urban problems and
Solutìons. New York:
625-648.
to Suburb. " The UrbanBasi c Books ,J963:
255
86.
84. Gans, H.'lPlanning for people, NotPlannjng. ì (1969): 33_4b.
85- Gìass, R. (editor). üglociai gackground of a plan. London:Routledge and Kegan pã¡1, I
Glass, R. "The Evaruatíon of pranning: some sociorogicarconsiderations. " International sociai science Jg!r!gi. --i l (1959) :393-409
87. 9009, 1.R., S.M. Sr'ege't , and A.p. Bay (editors).Implications of Archítecture for Humän'Behavior.Charl es
Buildings. " Environment and
Improvement Areas. " Town
88- Gould, P. and R. lrlhiet. Me¡lgl xqpå. Harmondsworth: pelican Books,197 4.
89. Graham, P. "prioritjes for Action ínPl anning Review. 42 (l 971 ) : 45-60.
90. Greer, s. "urbanism Reconsidered: A comparative study of LocalAreas in a Metropolis." American sociological Revie!." 21 iiõsol,I 9-25
91. Greer, S. The Emerging City. New york:
92. 9fopius, l^l. Rebuilding Our Communitjes.I 945.
93. Gulick, J., C.t. Bowerman, and K.W. Back.in-the City: Attitudes and participatìon.fr!, Chapin Jr. , and S. F. I^lefss (ediiors ).I 962: 3l 5-358.
94. Gutman, R. "Site pranning and Sociar Behaviour.,,Issues. ZZ (October 1966): 103_115.
The Free Press, 1962.
Chì cago : Paul Theobo'ld ,
"Newcomer Encul turati on" Urban Growth Dynami cs.rue@
Journal of Social
The American Sociolog'ist.95. Gutman, R. "Architecture and Socjo'logy.,'ì0 (November 1975): Z1}-ZZB
96' Gutman, R. The Place of Architecture in Sociology. Research Centrefor Urban un #li,-ËrincetonUniversity, 1glí.
97. Gutman, R. and B. l,'|estergaard. Building Evaluation, User Satisfaction,and Design. Working paper #ì, p
98. Hacon, R.J._ "Ne'ighbourhoods or Neighbourhood Units.,, Thesocìological Review. 3 (December r öss) : zss-zao.
Therapy bv. Des'iSpri nsTieTdi
256
99. Hal l, E.T. T[q silent Langgggq. Garden c'ity: Doubreday and co. ,Inc. , I 959.
100. Hall, E.T. "Proxemics - The Study of Man's Spatia'l Relationships. "lnlan's Image in Medicine and Anthropology. I. Gardston (editor).New York: International univeisitìes press, ì963: 4zz-44s.
l0l. Hall, E.T. The Hidden Djmension. Garden City: Anchor Books, 1969.
102. Hallet, s.J. "Plann'ing, Poìitics, and Ethics.", Environment for Man:fhe.Next Fifty Years. l.J.R. Ewald Jr. (editor). -EToomîñgton:Indiana Univers'ity Press , 1967 : Z3Z-248.
103. Haney, l^J.G. and E.S. Knowles. "Perception of Neighbourhood by Cityand suburban Res jdents. " Human Ecol ogy. 6 (June l gTg) : z0l--2]t4.-
I 04. Harrjson, J.D. and l,l.A. Howard. "The Rore of Meaning in the urbanImage." Environment and Behaviour. 4 (December 1972): 3g9-411.
105. Hartman, C.W. "Social Values and Housing 0rientations. " Journalof Social issues . 22 ( I 966) : I I 3-l 3l .
Form: An Analysis of" Papers of the Regional
I 06. Harvey, D. "Social Processes and Spatiaì
107. Heimstra, N.!^l. and L.H. McFar'ling. Environmentaì psychology.Monterey: Brooks/Cole Publishing CoF
108. Hendricks, F. and M. MacNair. "concepts of EnvironmentalHenoricKS, r-. ano M. fïacNalr. "concepts of Environmental QualìtyStandards Based on Life Styìes. " Ek'istics. 177 (August 1970):I 39- I 44.
the Conceptua'l Probl ems of Ci ty Pì annì ng.Sçjqce Association. 25 (1970) : 4t-69.
109. Herbert, G. -"Jh. Neìghborhood Unit Principle and Organic Theory."American Sociological Review. 2 (Juìy 'l963): 165-21 l.
ll0. Hester, R.T. Jr. Nejghbourhood space. Stroudsburg: Dowden,Hutchi nson , and Ros s inc. ,-l 975.
lll. Hì'lìery, G.A. Jr. "Definitions of Community: Areas of Agreement. "Rural Sociology. 20 (1955): ll l-123.
112. Hole, v. "social Effects of planned Rehousing." Town plannjngReview. 30 (July I 959) : I 6l -l 23.
ll3. Horton, F.E. and D.R. Reynoìds. "Effects of Urban Spatia'ì Structureon Individual Behavior. " Econom'ic Geography. 4l (1971 ): 36-49.
ll4. Hunter, A. "The urban Neighborhood: Its Anaìytical and socialcontexts." urban Affairs Quarterry. r4 (March 1g7g): 267-287.
257
ll5.
I 16.
1t7 .
Iatridis, D. "social Scientjsts in physicaìA Practitioner's Viewpoìnt." International
Development Pìanning:Social Science Journall8 (1966): 473-493.
Isaacs, R. "The Neighbourhood Theory."Institute of Planners. j4 (July lg4A):
Isaacs, R.R. "Attack on the Neighborhood unit Formula.', urban|louslng' w.!.c. wheaton, c. Milgram, and M.E. Meyerson (eãiTors).New York: The Free Press, 1966: 109-114.
ll8. Ittelson, w.H. "Some Issues Facing A Theory of Envinonment andBehavior. "Environmental Psychologyl , Mqn anã Hts Physica'l setting.H.M. Rrosfr .New York: Holt, Rinehart, and Winston, 1976: Si-Sg.
ll9. Jackson, J.N. The Canadian_!l_!y_. Toronto: McGraw-Hill Ryerson Ltd.,1973.
Journal of the Ameri canffi
120. Jacobs, J. The Death and Life of Great American cities. New York:Vintage Books, l96T:
121 . Janowi tz , Ir1. " Introduction. " The Soci al Order of the Sl um.G. Suttles. Chicago: Universi ii_ix.
122. Kaiser, E., S. l,,leiss, R. Burby, and J. Donnelly. NeìghborhoodEnvironments and Resident Satisfaction: A Survey oFicanpants an¿L'vrrvr'rs¡rLr qrq rru>rucnL JclLr5rclcLlon: A )urvey oï uccupants and
_.cslg] i lu. . c.nt.i f
123. Kapìan, s., "cognìtive Maps in perception and Thought.,' Image andEnvironment:CoqnitjveM@aviõr.R.M.Downs8.
"'
124. Kasl, S.v. "Effects of Housing on Nental and physical Health.,,Man-Environment Systems. 4 (Juiy 1974): 207-226.
125- Kasl, S.V. and E. Harburg. "Perceptions of the Neighborhood and the
North Caroìina, 1910.
Desire to Move Out." Journal of the American Instiiute of planners.38 (Se ptember 1972): 3l 8-324.
1?6. Kates, R.l,l. "stimulus andJournal of Social Issues.
Symbol: The View From the Bridge."22 (1e66): 21-28.
127 . Kates, R.[.l. and J. F. wohrwi;ll . "Man's Response to the physì caìEnvironment." Journal of social Issues. zz (1966): l5-20.
128. Kel ler, s. "Social class 'in physicaì pìannìng. " InternationalSocial Science Journal. l8 (l 966): 494-512.
129. Keììer, S. The Urban Neighbourhood. New York: Random House,1968.
130. King, L.J. and R.G. Golìedge. cities, space, and Behavjour: TheElements of Urban Geography. tle7E.
Kuper. L. "social science Research and the pranning of urbanNeighbourhoods. " Social Forces . Zg (March l95l ) : 237-?43.
|rp:r, L., "Blueprint for Living Together.', Living in Towns.L. Kuper (editor). London: Cresset press,1953t-ì12õ2.
.l33. Kuz, T-J., E. Barii, D. Hiebert, A. Morrison, and c. skonberg."l.ljnnipeg - A Multivariate Ana'lysis. " t^rinnipeg: The Departmentof tnvironment Planning, ì979.
l3l .
132.
I 34.
I 35.
I s7.
140.
l4l .
258
Lamanna, R. "value consensus Among urban Residents.', Journal ofthe American Institute of planners. 30 (1964) : 3l74ZT.
Lang, J., C. Burnettê, W.Moleski, and D. Vachon. Designing forlqmqn Behaviour: Architecture and the Behavioural s¡ìãñces.-Stroudsburg: Dowden, Hutchi
136. Lansing, J.B. and G. Hendricks. Living Patterns and Attitudes jnthe Detroit Regign. Detroit: De
@2.Lansing, J.B. and R.l^1. Marans. "fva'luation of Neighbourhood Quality."Journal of the American Institute of planners. gS-(May 1969):'tgs-i99.
138. Lansjng, J.8., R.w. Marans, and R.B. Zehner. planned ResidentialEnvironments.AnnArbor:SurveyResearchCenffiSõ¡lãî Rese-arch, University of Michigan, 1970.
139. Laska, S.B. and D. spain. "urban poìicy and plannìng jn the wakeof Gentrification: Anticipating Renovator's Demands. " Journal ofthe American Planning Association. 45 (0ctober ]lgl9): 523-53T1
Lee, T.R. "Urban Neighbourhood as a Socio-Spatiaì Schema.Rel ations . 21 (l 968) : 241-Z6t .
Lee, T.R. "Psychology and Architectural Determinism.',Journal . I 54 (August I 97ì ) : 253-62, 475-83, 651 -659.
" Human
Archi tects'
142. Lee, T.R. "The Effect of the Built Environment on Human Behavi our. "Ekisrics. 34 (l 972): 20-24.
143. Lee, T.R. "Psychology and Living Space.,,R.M. Downs and D. Stea (editors). Chicago:1973: 87-108.
Image and Environment.Al di ne Publ j shì ng Co. ,
144' Ljtwak, E., and P. Fellin. "Neighbourhood Cohesion Under Condítionsof Mobi I j tv. " Ameri can Sociological Review . zB iJuñä-lgoãi '
- áaq'-ha.
145' Loring, I^'l. C. Jr. "Housing Characterist jcs and Social D-isorganìzation.',Social problems. 3 (lgSOi: 160_168.
259
Lowenthaì, D. "Research in Environmental perceptionPerspect'ives on current problems. " Environmeni'and
146.
I 50.
t5l.
153.
and Behavi our :
Behavior. 4(September 1972): æ3-342.
147. Lynch, K. The Image of the city. cambridge: Mir press, 1960.
148. Lynch, K. and L. Rodwin. "A Theor:y of urban Form." Neighbourhood,Çi ty, and Metrgpgl i s.__8. Gutman an¿ o. nopenoã (å¿t toËf . New york :Random House :1qn: 756_776.
.l49. Madge, J.H.. "Some Aspects of Social Mixing ín Worchester.,, Livingin Towns. L. Kuper.
'London: cresset preðs, lg53: 265-294.
Mann, P. "The concept of Neighbourliness." American Journal ofSociology. 60 (september I gS4): I 63_168.
Mann, P. "The Sociaìly Balanced NeighbourhoodPl anni ng Revi ew . 29 (July I 959) : gí_gg.
152. Mann, P. (editor). ln åpproach to urban slsjplpgy. London:Routledge and Kegan ffi
Unit. " Town
Environment on Behavior:Communi ty Development :
Marans, R.l^l. "The Influence of physícaìPlanned vs. Unplanned Communíties.i' N.,
157. Maurer, R. and J,C. Baxter. "Images of theAmong Black-, Angìo-, and MexicanlAmericanand Behavior. (December I 972): 35l _38g.
Pl qnni ng Process , Impl ementati on , andTrne cial Concerns..F. I^leiss, E.J. ser, a v ì tors ) . Chapel Eìcenter for urban q¡! Resionaì studies," uÀiveriìii-.r-ñðiir.'Carol ina, I 971 : 375-412.
154. Marans, R-l.l. Buri. Hr*un Ng.d. und ,h" Hgrrjng Enuj.onr.nt. AnnArbor : Insti t vers j ty of Ni cÏöin ,"ì'öZs.155' Marans, R.l.l. and..W- Rodgers. "Toward an Understanding of Communìtysatisfaction. " Metropoiitg¡_augric¡: In contemporar! perspective.
å:!, Huryley and .ications,1975: 299-352.
156' Martin, lll.T. "The structuring of Social Relationships Engendered bysuburban Residence." Americañ sociorogicar Reviàw.'ãr-ïRugust1956): 446-453.
Neighbourhood and CityChildren. " Environment
260
I 58. Mayo, J. M.Behaviour.375-397.
Jr. "Effects of" Envi ronment and
Street FormsBehavi or.
on Suburban NeighbourìngI I (Septembe r 1979) :
159. McClure, J.F, "The Utilization of Individual and NeighbourhoodCharacteristics.to Analyze Participation in Voluntary"Àiiociations.',Ph.D. Dissertat.ion, Brandeis Uníversity, 1973.
160. Mead, M. "cultural Determinants of Behavior. " Behaviour andEvolution. A. Roe and G.G. simpson .(editors). l,¡ew-rãvml leUnftãFfîEy Press, tg67: 480-503.
I 6l . Mel lor, J. R. urban socÍolpgy_jn_grr_ulLqnized Society. London:Routl edge and
162' Mercer, C. LiYing in Cíties: Psychology a!4 the Urban Envjronment.London: Pengui
163.
164.
165.
Michelson, w. "An Empirical Anaìysis of urban EnvironmentalPreferences." Jqq¡1al of the American Instjtute of planners.(November I 966 )l-- 355:360.
Michelson, W. "Potentjal Candidates for the4_lqgjul Anaìysis from a Natjonwide Survey."0gat): je0-196.
32
Michelson, l^1. "Urban Sociology as an Aid to UrbanDevelopment: Some Research Stiategies. " Journal
Designers' Paradise,Social Forces. 46
Phys i caìof the Ameri canInstitute of planners. 3 (March lÕ69): lO5:ffi
166. Michelson, I^1. "Social Insights toLow Income Families.,' Ekisiícs. 4
Guide the Desígn of Housing for(1968): 252-255.
167. Michelson, I,l. Man and His_urlgq_Environment: A SocioloqicalApproach. Read
.
168. Michelson, l^1. Environmental choice, Human Behaviour, andResidential Sat .rr, 1977.
fl]ìgram, S. "The txperíence of Living in citfes.,' Ekistics.177 (Aususr 1970): i+s-lso.
Moore, G.T. "Knowing About Environmental Knowing: The currentState of Theory and Research in Envìronmental colnition.,, -'.Environment and Behaviorn. ll (March l979): 33_70
Moos, R.H. "systems for the Assessment and classification ofHuman Environments: An 0verview." Issues in social Ecoloov:Human Milieus. R.H. Moos and p:M. t o:NãtlõnaT-Þress Books , ]tg74.
I 69.
I 70.
171 .
172. Moos, R.H. and p. Sommers.Space and Building Design. "Determinants of Behaviour.@zsi
.261
B.M. "Socioeconomic StatusEnvironmqnt and Behaviour.
"The Arch i tectural tnvi ronment : phys ì calThe Human Context: EnvironmentalR rt:
I 08-l 40.
173. Moriarty,Choice. "
t7 4. Mo*is, R-N. and J. Mogey. The Soci_o]_ogy of Hgusing: Studies atBerinsfíerd. London: -nóutt@i, r965.
175. Mumford, L. "fh..Neighbourhood and the Neighbourhood unit.,,Town pranning Review.- 24 (,lanuaiy-rõsIl, zs6-270.
176' Musil, J' llÞqn socioloqv-sn!-!ranning. centre for EnvironmentarStudies, Un ìy ì969.
177 - Nathanson, c.4., J.S. Newman, E. Moen, and H. Hiltabiddle. ,,Movingflan¡ Among Residents of a Néw town.i;'Jäùrnur of the AmerjcanInstitute of pranners. 42 (Jury rgzo),ffi
178. National Council of Social Science.of a Town. London: 1943.
179.Neumann,B.,R.Mezoff,andA.H.Richmond.@and urban Renewaì in Toronto. Publications of tñõ-Rãsearch Group
,nr' Ïiéj"";h; Hasue: Marínus Nijhoff,1973.
180' Newman, s'J- And G.J. Duncan. "Residential problems, Dissatisfaction,îü9nl?o'llll;,,.@ .-¡Ã;;;ï'l8l. Nicholson, J.H. New Cpnmunities in Britain. London: NationalCouncil of Social
and Residential Locational6 ( December 1974): 448-469.
The Size and Social Structure
182. 0nibokun, 4.G.,'EvaluatingAn Application of a Systemð
Consumers' Sati sfaction with Housi ng:.Approach. " lqq¡naì of the American(Mayì974): ffi
.Comelates of Residential Satisfaction.(September ì976) : 323-344
Institute of Planners. 40
I83. 0ni bokun , A. G.Environment and
"Social SystemBehaviour. B
184. 0rleans, p. "Differentiar cognition of urban Residents: Effectsof social scgrq.on Mapping." -lmaqã an¿ Ënvtronment. R.M. DownsandD.Stea(editors).'cñicagffi.co.,.lgzs.
ll5-130.
l85. Perin, C. l,líth Man ifr Mind: An Interdis<tói Ënviron
262
186. Perloff, H.S. "Common Goals and the Linking of Physicaì and SocialPlann'ing. " urban planni@. B.J. Frieden andR. Momis (e Inc.,l96g: 346_359.
187. Perraton, J.K. "Commun'ity Planning - an Analysis of Certain SocialAims. " Journal of rown planning Iñstitute. -s¡ (1967): 9b-gg.
l88. Perraton, J.K. "PJan Evaluation: A Review of Research Relevantto the Choice of Objective and Criteria for Plan Evaluation."Cambrídge: Land Use and Bui I t Form Studies ï^Jorki ng Paper #67 , 1973.
l89. .Perry, c-4. "Thg Neighborhood unit Formula. " urban Housing.l^1. L. C - t^lheaton , G. Mi 1 gram, and M. E. Meyerson (ediTõrs-) . New york :The Free Press, l966: 94-109.
190. Peterson, G.L. "A Model of preference: Quantitative Anaìysis ofThe Perception of the Visual Appearance of Residential t'teighborhoods.Journal of Regional Science. 7 (1967): l9-31.
l9l. Popenoe, David. "Urban Residential Differentiation.', Ekistjcs.216 (November 1973): 365-373.
192. Powdriìì, E.A. Vocabulary of Land Planning. London: The EstatesGazette Ltd., 196î:-
193. Prieser, lrl.F.E. Environment and Spatial Behavior: a SelectedBibl iography. Mo l.
194. Proshansky, H.M. "Methodology 'in Envì ronmental psychol ogy:Problems and Issues. " Human Factors. l4 (1glz): 45ì-+oo.
195. Rainwater, L. "Fear and the House-as-Haven in the Lower Class.,'Urbqnism, Urbanizatio!1, and Change: Comparative Perspectives.p. sleyPublishing Co., 1969: 29.|-30.|
196. fuy, D-M. (editor). Canadian Urban Trends Volume 3: NeighbourhoodPerspecti ve. Toronto
1g7. Reade, E. "some Notes Toward a Socio]ogy of planning: The casefor self-Awareness," Journar of Town plánninq Instiiute. 54(May 1968): 214-218.
198. Reed, P. "situated Interaction: Normative and Non-Normative Basesof Patterned Socìal Behavíour." Community for Urban and CommunityStudies Paper #55, University of Toronto.
199. Rent, G.s. and c.S. Rent. "Low-Income Housing: Factorsto Residential Satisfaction." Environnrent anã Behaviour.Rel ated
l0(December l978): 459-488.
26s
200. Rjchman, A. "Planning Residential Envjronments: The socialPerformance Standard" Joq¡4¡¡ì of the American Planning Ássocjation.45 (October 1979). aagm
201 . Richman, A, a¡d .F.!. Chap'in Jr. "A Review of the Soc jal and physicalConcepts of the Neighbourhood as a Basis for Planníng ResjdentiälEnvironments." 0ccasional papers Serjes #50, 1977.
202. Rjchmond, A.H. Ethnic Resig.nUal. Seg.atioToronto. Toront rkúñìversi ty, 1972. -
Land
206. Robson, B.T. Urban Social Areas. London: 0xford University Press,1975.
207 . Rosow, I. "The Social
203.. Reimer, S. "Hidden Dimensions of Neìghbourhood planning.,,Economics . 26 (May '1950) : 197-ZO1 .
204. Reimer, s. _:'yillages ìn Metropolis.,' glitish Journal of Sociology, 2 (Marchlg5l): Sl-+S.
205. R'ivizzigno, V.L. "Individual Differences in the Cognit'ive Structurringof anUrbanArea." 0nDetuïil-,ingCggljt]v ."R.G. Golledge (edito
,1975: 471-482.
Envi ronment. "27 (ì e6ì ) : 127 -133.
208. Rothblatt, D_.I, _uHousjng and Human Needs." Town planning Review.42 (le7t ): t30-144.
209. Rusch,'C.[ll. "0n the Relation of Form to Behavior." Design MethodsGroup Newsletter. 3 (0ctober I 969) : g-l I .
210. Ruston/Tomany and Associates. Wìnnipeq Publ!c Attitude Surve.y.Winnipeg: Wìnnipeg Deveìopment
211 - , Saaninen. T.F. Perception of Environment. I^Jashjngton: AssociationofAmerjcan Geogr ge Geogrãphy, ResourcePaper #5, lgog: --.-J J'-r"J' "
212. Saarinen, T. Environmenta ourBoston: Hough
213. sachs, H. "Planning For community." Officjal Archjtecture andPlanning, U.K. (June t97l): +SS-qSe.
Effects ofInstitut_e
the Physicalof Pl anners.
?14. Saegert, S. "stress-Inducing and Reducing Quaìities of Environnrents.,,Environmental Pgychology: Mán and liis phySjSe]__gg_!_!ilg. (second
in iãàiiä.r).New York: Holt, Rinehart and I¡Jinston, ì976: 2lB-223.
264
215. Sanoff, H. "Socia'l Perception ofthe Ecological Neighbourhood."Eki sti cs. 30 ( I 970) : I 30-l 32.
216. Schorr, A.L. "Housing and ltsMetropoìis. R. Gutman and D.House , 1970: 709-129.
Effects. " Neighborhood, City, andPopenoe (edi m
217 . Simme'l , G. "The Metropoì is and Mental Li fe. " Nei ghborhood , Cl'-!yD. Popenoe (editorsl- llew-YérÏland Metropolis. R. Gutman and
Random House , 1970:. 7ll -787 .
Journal of Social Issues.
218. Skinner, B:F. Beyond Freedom and Dignity. New York: Bantam/VintageBooks, 1972
219. smith, P.F. The Dynamics of urbanism. London: HutchjnsonEducational,
220. Sommer, R. "studies in personaJ Space." Socjometry. z? (1g59):247 -260.
221 . Sommer, R. "Man's proximate Environment. ,,
23 (l 900) : 59-69.
222. spencer, D. "An Evaluation of cognitìve Mapping in NeighbourhoodPerception. " university of Bìrmiñgham, centre ior urbañ andRegionaì Studies, Research Memorandum #23, lr973.
223. stacey, M. "The Myth of community studies." British Journal ofSociolosy. 20 (1969): lr34-lr47.
224. stainbrook, M.E. "Architects Not Onìy Design Hospitals; They AlsoDesign Human Behavior. " ttþCer¡_tslpiigt. ioo (Närch iéooii" l0ó.
225. Statistics canada. 1gl1 census of canada: population and Hous-iCharacteri sti cs Census Tracts alinni Cata ue 95-723 (ct-Series A. tawa: Information Canada,
226. and Housi n
5-753 ( ct-238ttawa: Information Canada"
227.
statistics canada. 1971 census of canada: populationCharacteristics by C
228.
229.
Statistics canada. 1976 census.gf canadai populatjon and Housjngthpractgri sti gs , Ge-n
Labour Force Dutu1 978.
1976 census of canada Enumeration Areas: l^linnipeg. (microfiche)
Steìn, M.R. The Eclipse of com[unity: An interpretation ofA'n."i.un Stud 60.
230. Steinitz, C-. "Meaning and the Congruence of Urban Form and Activity. "Journal of the American Inst'itute ót pianners. 34 (Julv rsoaj
231. Studer, R.G:_ "The Dynamjcs of Behavior-Contingent physicaì Systems.,,Ekistics. 27 (March 1969): t85-197.
232. suttles, G. The Social co¡iltuçlion of communities. chicago: TheUniversity of
"Community Design: The Search for participation inSociety. " Metropol itan America: in Comtemporary
A.H. Hawley ge1975: 252-297.
234. sweetser, F.L. Jr. "A New Emphasis for Neighborhood Research.,,American Sociological Review. (August 1g4z\: szs-sgi.--
235. Tannenbauffi,.J. "f!..Nef ghbourhood: A Socio-Psychoìogicaì Ana'lysis. "Land Economics. 24 (November l94B): 35g_369.
265
233. Suttles, G. D.a Metropol itanPerspective.Publ ications,
236. Tetlow, J. "Sources
239. Thorns, D. Suburbia. Frogmore : Pal adi n , 1973 .
242. Tylor, W.R. "The Neighbourhood UnitTown Planning Review. l0 (July 1939)
of the Neighborhood ldea.(April ì959): ll3-llb.
237. The 0pen university. -The Future city. portsmouth: The OpenUniversity Press, I 97l .
238. The 0pen univer_sity. The city as a Social__Sy¡_!g!.. portsmouth:The 0pen Universíty prffi
" Journal of Town
240. Tomeh, A.K. "Informal Group Participation and Residental patterns.,'American Journal of Sociology . 70 (i gO+) : Zg_35.
241. Treasurywala, M.-R. "The Effect of spailat Layout and Social!iryilarity-on. urban-Neighbouring.', Mäster's T-hesir, uniu."rity ofBritish Columbia, 1914.
243. Vi ri raki s , J. "The Human97 -109 .
Príncip'le in Town P'lanning.',: I 74-l 86.
Community. " Ekistjcs. 24 (July 1e67):
244. vj.rirakis, J. community Indqx of satisfactoriness: Effect ofF9ggation, Inco
,1968.-245. virirakiS, J., R.J. crothers, and D. Botka. "Resident'ssatisfaction with Their community." Ekistics. zg (Jrnã 19t2):
499-502
246. Vivrett' W,Ít _"Planning for Peopìe: Minnesota Experimental City. "New Commu un¿;. falseffi(edltors). Chapel Hill: Center for Urban and Regional Studíês,Uníversity of North Carolina, l97l: 247_Z7S
247. lnlaldorf, D. . uNeighbourhood unít Assessment - simple or complex?,,Official Architecture and p.Ianning. (March 1967)':
-siz-áll
248. l{arren, D. I. "The Functiolaì .Diversity of urban Neighbourhoods. ,,
urban Affairs Quarterly. r3 (December- 1977): l5l-i ig.--249' l'rjebber, M.M- "0rder in Diversity: Community l.lithout propinquity.,,
cities and spacg. L. l^lingo, Jr.- (editor). Baltimore: Johnsffios: 23-s4:
266
!{ebber, M.M. "The post-city Age." Daedalus. (Fall 196g): l09l_lll0.Toronto: Univeristy of Toronto
250.
251.
252.
259. Willis, M.ResídentialReview. 39
260. l,Jillis, M.g (l g0g) :
lnleir, T.R. At'las of l,Jjnnipeg.Press, I 978.-l*lellman, B. "who_Needs Igighbourhoods?,' The city: AttachingMo9ern_Iyths. _A-T. Powell (edítor). Toroñto: McLelJand and stewartLtd., 1972: 94-100.
253. l,,leì 1man, B. and B. Leighton. ',Networks, Neighbourhoods, andcommunities: Approaches t9 the study oi il,."ôorrrniiy-Question.,,urban AffairS Quarterry. i4 (March iglg): 363-390.
254- }.Iestern, J.S., p.D. t¡reìdon, and T.T. Huang. "Housing andsatísfaction with Environment in singaporõ.', ¿ournâi ði-Ü.,.. 40 (rqåv igz+1ffi. -255. wheeler, J.0. "Residential Location by 0ccupational Status.,,
Urban Studies. 5 (1968): 24_32
256. Whyte, lrl.H. Jr. The 0rganization Man. Garden City: Doubleday, 1g57.
257. tr{icker, A.[rI. "processes which Mediate Behaviour-Environmentcongruence." Behavioural Science. 1l (1grz):- zas-211.
258. l^Jilkinson, R. and E.M. Sigsworth. ',Attitudes to the HousingEnvironment.: An Anal,ysis-of Private und Lo.ul Authoriiy Househotdsjl_gqlêy, Leeds, and york. " urban studi.i,-ur.--iJun.' jgjzj; - --I 93-209.
"Socio'l ogicaì AspectsGroupings Proposed in(Ju'ly l96B) : 296-306.
"Sociologicaì AspectsI 85-l 90.
of Urban Structure: Comparison ofPl anni ng New Towns. " Town pl anr¡þg
of Urban Structure. " Eki sti cs .
267
261 . wíl lmott, P. The Evolutíon of a community. London: Rout'ledgeand Kegan paul
262. [.lillmott, P. "sociai Research and New Communities." Journal ofthe America¡ Institute of Planning. 33 (November l967fl--387:59i.263. l^lil lmott, P. and E. cooney. "community pr anning
Research: A Problem of Collaboration.ì' JournaiInstitute of Planning . 24 (1963) : 1123-176
and Socioìogicalof the American
264. l,lílner, D.M. and R.p. [.lalkley. "Effects of Housing on Health andPerformance. " The urban condition. L.J. Duhl (eoitor). New york:Basic Books,lgW
265. l.JiIson, R.L. "Livabi'lity of the city: Attitudes and urban?guglopment. " urban Growth _.D,ylamiçs ,
jn a nar Cjuiiãr ofCities. F.S._C ,1967- 35e-3ee.
266- Wilson, R. "Difficult Housing Estates. " Tavistock pamphlet Series,#5,1963.
267' ldírth, L. uHousing as a Field of Sociolog'icaì Research." AmericanSociologicâl Review. tZ (Apri1 1941): lgZ_l+S.
268- l.Iirth, L. "urbanism as a l,lay of Life.,' Neighþourhood, city, anduetropolis. R. Gutman and D. popenoe (edm:Random House, lg70: 54-69.
269. WohlwiII, J.F. "The physicaìPsychology of Stimulation. "
Environment: A ProblemJournal of Social Issues.
for a2? (1e66):
29-34.
270. l,loì pert, J.Journal of
"Migration as an Adjustment to Environmental Stress."spçial Issues. ZZ (1906): _92-102.
27'l Yoshioka, G. and R. Athanasiou. "Effect of site plan and socialstatus variables on Distance to Friends' Homes.u Þiô.ãä¿iñé, ðtthe 79th Annual convention of the American psycholõicãäËñãiltion.
?72. Young, M. and P. wilmott.. Famil.v and Kinship in East London.Glencoe: Free press, ìtgST
273. Zannaras, G.. ''An Empirical Anaìysis of urban NejghbourhoodPercept'ion. ". Master's Thesis, 0hio State universítv, lg6g.
274. Zehner, R.B. "satisfaction with Neighbourhoods: The Effects ofsocial compatabil ity, Residential Deñsity, and Site planning. "Ph.D. Dissertation, University of Michigän, 'lg70.
268
275. Zehner, R.B. "Neighbourhood and community satisfaction in NewTowns and Less planned suburbs." Journal of the AmericanInstitute of pranners. 3T (Novemnffi
276. Zehner, R.B. Uqlcators of the Qualitv of Life in New Communities.Cambridge: Aa
277- Zehner' R.?: and F.s. chapin, Jr. Aç¡oss the city Line: A l,.lhiteCommunity in Transition. Lexington
278. Zehner, R.B. and R.l¡1.Objectives, and LifeAmerican Institute of
"Residential Density, plann-ingCommunities." Journal of the39 (September l97lf :
--f S7-S+5.
279. Zeisel, J. "Symbolic Meaning of Space and the physical Djmensjonof Social Relations." cities in change, studies on the urbanCondition. J. l^lalton aãñA-mcon, Inc. , i973 252-263
Marans.in Pl anned
Pl anners .
280. Blalock, H.M. (editor). causaj Models in the social scjences.Chicago: Aldine,1970.
281- Blishen, B.R. "The Construction and Use of an Occupational ClassScale. " CanÊdian Society: Sociological Perspectivôs, B.R. Blishen,F. t. Jone ronto:Macmiììan, 1968: 417-485.
282. Bonjean, C.M. Sociologicql lr{easurement: An Inventory of Scalesand Indices. S .
283. Burton, T.L. and G.E. cherry. Social Research Techniques forPl anners. London: George Al le
284. cochran, l,l.G. sampling Techniques. New york: wiìey,1963.
285. Goììedge, R.G. and G. Rushton. Murtidíme¡llprel_lqg-Ung: Reviewqnd Çeographi ca'l Appl i cati ons .American Geographers, lglL
286. Gorden, R.L. Unjdímensional Scaling of Social Variables. New york:The Free Pres
287. Hansen, M.H., l^1.N. Hurwitz, and i,l.G. Madow. sample Survey Methodsand Theory. New Yonk: l^li ì ey, I 953
288. Heberlein, T.A. and R. Baumgartner. "Factors Affecting ResponseRates to Mailed Questionnares: A Quantitative Analysið or thePublished Literature." American Sociological Review. 43 (August1978) z 447-462.
289- Hoìlingshead, A.B. and F.C. Redlich. ''The Index of Social position. "social class and Mental l!]¡ess: A community Study. New york:.
290. Kish, L. Survey sampling. New york: J. wiley and sons, 1965.
?91. Kohout, F.J. statistics for social scientists. New york:J. l^li ì ey and S
292. Lazarsfeld, P.F. and A.H. Barton. "Quaìitative Measurement in thesociai Sciences: classifi.catìon, Typorogies, and Indexes.,, policysciences. D. Lerner and H.D. Lassweil (editors). Stanford:
-Stañfoìñã- Uni vers i ty press , I 963
293. Lindsey, J"K" Inferences ffom sociologlcal Survey Data : A unifiedApproach. San 973.
TECHNICAL REFERENCES
-269-
?70
294. Loether, H.J. and D.G. McTavish. Descrjptive statistics forSoci oi ogi sts. Boston : Al ìyn and
295. Mendenhal.l , l^J. Introduction to Probabil ltV an¿ Statistics. (tfr-irAedition). gelmo
296. Mendenhall, l.J., L. Ott, and R.L. scheaffer. Elementary SurveySampling. Belmont: Duxbury press , 1971
297. Michelson, l,l.M. (editor). Behavioural Research Methods jnEnvironmental Design. Stro d Rossffi
298. Míller, D.C. Handbook of Research Desjgn and Social Measurement.New York: nav
299. Mueller, J.H. and K.F. Schuessler. Statistical Reasoning inSociology. Boston: Houghton-Mi ffl i
300. Nie, N.H., c.H. Hull, J.G. Jenkins, K. steinbrenner, and D.H. Bent.Statistic@cial Sciences (second edition).
301. Oppenheim, A.N. Questionnaire Design and Attitude Measurement.London: Heineman
302. Parten, Mildred. su!"veys, polls, and Samples: practicalProcedures. New V OO.
303. Plil lip:, B.s. social Research: Strategy and Statistics. (secondedition). New
304- Piazza, T. "The Analysis of Attitude Items." Amerjcan Journal ofsociology. 86 (1980): 584-603.
Ravitz, M.J. "use of the Attitude survey in Neighbourhood pìanning.Journal of the ,Americân Institute of planners . zl (1957): 179-183.
Ross, H.L. "The Locaì Communìty: A SurveySociological Review. 27 (1962)': i5-84. '
Selltiz, C., M. Hahoda, Ir,l. Deutsch, and S. Cook.in Social Relations. New York: Holt, l9Sg.
305.
306.
307.
Approach. " American
Research Methods
308. Shevky, E. and trl. Bell. Spc.¡'aì Area AnalrAppl i cati on a nd Computati nfordUniversity Press
309. silverman, E.N. and L.A. Brody. Statistics: A common senseApproach. Boston: Prindl e, l^Jebe
271
310. simmiê, J._ "social Survey Methods in Town planning." Journal ofthe Town Planning Institute of Britain. 5 (1968)i zzzZ7l.-
3ll. wallin, P.A. "Guttman Scale for Measuring women's Neighbouring.,'Amerjcan Journal of Sociol!gy. 59 (19b3); 2ß-246.
312. l^lebb, E.J. , D.T. Campbeì 1 , R. D. Schwartz, and L. Sechrest.Unobtrusive Measures: Non-reactive Research in the Social Sciences.Chi cago: Rand McNaäy, T966.
313. ltlolf, R. "The Measurement of tnvironments." Testing Problems inPergpective. A. Anastasi (editor). l^Jashingtoffion Education, 1966.
314. Zeise'l , H. Say It l,lith Figures. New york: Harper and Row, 1968.