impact of fertilizer subsidy on maize production: a case
TRANSCRIPT

IMPACT OF FERTILIZER SUBSIDY ON MAIZE PRODUCTION: A CASE
STUDY OF CENTRAL RURAL DEVELOPMENT AREA IN SWAZILAND
2018
LUNGILE NONHLANHLA RENATA GININDZA


IMPACT OF FERTILIZER SUBSIDY ON MAIZE PRODUCTION: A CASE
STUDY OF CENTRAL RURAL DEVELOPMENT AREA IN SWAZILAND.
LUNGILE NONHLANHLA RENATA GININDZA
(BSc. Agric Econ. & Management)
A THESIS SUBMITTED IN PARTIAL FULFILMENT OF THE
REQUIREMENTS FOR THE DEGREE OF
MASTER OF SCIENCE
in
AGRICULTURAL AND APPLIED ECONOMICS
of the
University of Swaziland
*******
May, 2018
_________________________
Dr. D. V. Dlamini, Supervisor
______________________________
Prof. A. S. Bamire, External Examiner
____________________________
Dr. S. G. Dlamini, Co-Supervisor


ii
COPYRIGHT
Permission has been granted to the Library of the Luyengo Campus of the University of
Swaziland to lend copies of this Research Project Report.
The author reserves other publication rights and neither the Master’s Thesis (or
Dissertation) nor extensive extracts from it may be printed or reproduced without the
author’s written permission.
Copyright © Lungile N. R. Ginindza, 2018

iii
IMPACT OF FERTILIZER SUBSIDY ON MAIZE PRODUCTION: A CASE
STUDY OF CENTRAL RURAL DEVELOPMENT AREA IN SWAZILAND.
ABSTRACT
The Government of Swaziland, in compliance with the Fertilizer Summit, initiated the fertilizer
Subsidy to increase maize production to ensure food and nutrition security. The objectives of the
study were to examine socio economic characteristics of beneficiaries and non-beneficiaries of
the fertilizer subsidy and evaluate the impact of the fertilizer subsidy on maize output under the
Central Rural Development Area of Swaziland. The country has been experiencing low
production of maize due to high cost of fertilizer for a long time. Quantitative, cross sectional
data for 2014/15 and a case study were employed for the study. Primary data was collected
through personal interviews from purposively selected 42 beneficiaries and 44 non-beneficiaries
of maize farm household. Descriptive statistics in R software was used to obtain the socio
economic characteristics of the respondents. Propensity Score Matching, Average Treatment
Effect, Average Treatment Effect on Treated, Least Squares Regression Model, using Zelig in
RStudio, were used to determine the impact of fertilizer subsidy on maize production in the study
area. The first finding was that there was no difference between the socioeconomic characteristics
of beneficiaries and non-beneficiaries of fertilizer subsidy. Secondly, the subsidy had a positive
impact on maize output however the improvement was not substantial as expected. It wa
concluded that fertilizer subsidy have not brought the anticipated improvement on maize
production in Swaziland. It is recommended that alternative policy instruments may be introduced
to complement the fertilizer subsidy.
Key words: fertilizer subsidy, beneficiaries and non-beneficiaries, alternative policy, maize
output, propensity scores matching.

iv
DECLARATION
I, Lungile Ginindza, hereby declare that the dissertation, which I hereby submit for the degree of
MSc in Agricultural and Applied Economics at the University of Swaziland, is my own work and
has not been previously submitted by me for a degree at this or any tertiary institution.

v
DEDICATION
To my late loving parents: Daniel and Bertha Ginindza, my three siblings: Vusi, Mlondy and
Sanele as well as my three kids: Carol, Menziwe and Wonder Dube.
vi
ACKNOWLEDGEMENTS
Great gratitude goes to God Almighty who has been with me and gave me strength to complete
this thesis. The production of this thesis was made possible by the unwavering support of my
supervisor, Dr. D. V. Dlamini and co-supervisor, Dr. S. Dlamini who set a clear roadmap for me
from the outset by seeing through my idea. Not forgetting Prof. T. T. Awoyemi for some advice
and Prof. J. Ajetomobi who guided me on the use of R software in Econometrics. His vigorous
effort in advising me as I analyzed is highly cherished. My gratitude goes to all of them for their
tireless guidance, patience and ever-critical eye, for believing in me and guiding me on valuable
research skills.
I recognize the Government of Swaziland, the Public Service, for providing me with the
opportunity and financial support to complete my Masters of Agricultural and Applied Economics
at Luyengo Campus, University of Swaziland. I appreciate the Department of Agricultural
Economics and Management committee for their constructive comments. Sincere thanks goes to
Institute of Post-Graduate Studies through Dr. D. Earnshaw for backing. A number of individuals
are highly appreciated for their words of encouragement including my colleagues at the
University. Their sacrifice will always be valuable to me, therefore, I thank them profoundly for
their encouragement even in hard times. Not to mention the Manzini South Inkhundla Officers for
availing their office space to be able to surf the net, their support in that regard is highly enthused
as it was by God’s Grace to have such an opportunity. I acknowledge the Extension Officers and
respondents from the Central RDA for their cooperation including the enumerators during field
survey. Gratitude is sent to my three kids and siblings for their encouragement and support during
the development and completion of this thesis. Above all I thank God for that which He has done
for me. God is with me.

vii
TABLE OF CONTENTS
CONTENT Page
COPYRIGHT ........................................................................................................................ ii
ABSTRACT .......................................................................................................................... iii
DECLARATION.................................................................................................................. iv
DEDICATION....................................................................................................................... v
ACKNOWLEDGEMENTS ................................................................................................ vi
TABLE OF CONTENTS ................................................................................................... vii
LIST OF TABLES ................................................................................................................ x
LIST OF FIGURES ............................................................................................................. xi
LIST OF APPENDICES .................................................................................................... xii
ABBREVIATIONS / ACRONOMY ................................................................................ xiii
CHAPTER 1- INTRODUCTION ........................................................................................ 1
1.1 Background of the Study .............................................................................................. 1
1.2 Statement of the Problem .............................................................................................. 2
1.3 Objectives of the study.................................................................................................. 4
1.4 Statement of Hypotheses............................................................................................... 4
1.5 Justification for the study .............................................................................................. 4
1.6 Scope and Limitation of the Study................................................................................ 5
1.7 Definition of Terms....................................................................................................... 5
1.8 Organization of the study .............................................................................................. 6
CHAPTER 2- LITERATURE REVIEW ....................................................................... 7
2.1 Theoretical Review ....................................................................................................... 7
2.1.1 The theory of Neoclassic Economics ................................................................. 7
2.1.2 Production: technology in the production function ............................................ 8
2.1.3 Theories of fertilizer ........................................................................................... 8
2.1.4 Government intervention .................................................................................... 8
2.1.5 Agricultural Input Subsidies theory .................................................................... 9

viii
2.1.6 Impact assessment theory ................................................................................. 12
2.1.8 Farm household theory ..................................................................................... 14
2.2 Empirical Review........................................................................................................ 15
2.2.1 Empirical Estimates of the Impact of Subsidies in Sub-Saharan Africa .......... 15
2.2.2 Empirical evidence from Impact Evaluations .................................................. 17
2.2.3 Review of Empirical Models ............................................................................ 18
2.3 Methodological Review .............................................................................................. 20
2.3.1 Impact Assessment Approaches and Application ............................................ 20
2.3.2 Propensity-Score Matching (PSM) ................................................................... 22
2.3.2 Rubin Causal Model ................................................................................................ 25
2.4 Conceptual review ...................................................................................................... 29
2.5 Chapter Summary ....................................................................................................... 38
CHAPTER 3 - METHODOLOGY.................................................................................... 41
3.1 Research Design.......................................................................................................... 41
3.2 Study Area .................................................................................................................. 41
3.3 Target Population ........................................................................................................ 43
3.4 Sampling procedure and Sample size ......................................................................... 43
3.5 Data Sources and method of Data collection .............................................................. 45
3.6 Data compilation, coding and cleaning ....................................................................... 45
3.7 Data analysis and Modelling ....................................................................................... 46
3.7.1 Method of Data Analysis .................................................................................. 46
3.7.2 Average Treatment Effect and Average Treatment Effect on Treated ............. 49
3.7.3 Least Squares Regression Model ...................................................................... 49
3.8 Chapter Summary ....................................................................................................... 51
CHAPTER 4 - RESULTS AND DISCUSSION ............................................................... 52

ix
4.1 Socio economic characteristics of the Respondents ................................................... 52
4.2 Impact of the Fertilizer Subsidy on maize output ....................................................... 58
4.2.1 Propensity Score Matching Results .................................................................. 58
4.2.3 Least Squares Regression /Multiple Regression Estimates of Maize Output .. 62
CHAPTER 5 - SUMMARY, CONCLUSIONS AND RECOMMENDATIONS .......... 66
5.1 Summary ..................................................................................................................... 66
5.2 Conclusions ................................................................................................................. 70
5.3 Recommendations ....................................................................................................... 72
REFERENCES .................................................................................................................... 76
APPENDICES ..................................................................................................................... 83

x
LIST OF TABLES
Table ............................................................................................................................. Page
3. 1: Selected respondents from different communities. ................................................... 44
3. 2: Description of variables used for Propensity Score Matching ................................. 48
4. 1: Distribution of socio economic characteristics of Respondents: gender, age, marital
status status and education ................................................................................................ 53
4. 2: Distribution of socio economic characteristics of Respondents: occupation, farm
household size, labourers and experience with 86 sample size ........................................ 54
4. 3: Socio economic characteristics of selected quantitative variables for respondents
with 86 with 86 sample size. ............................................................................................. 55
4. 4: Distribution of Socio economic characteristics of Respondents: Income, Source of
Income, Income, Access to credit, Farm Size and Farm Power with 86 sample size ....... 57
4. 5: Standardized Summary of Matched data (Sample characteristics and estimated
Impacts Impacts of subsidy with 84 sample size) ............................................................. 59
4. 6: Matching Results of Percent Balance Improvement with 84 sample size ................ 60
4. 7: Matching Results of Nearest Nearbour Matching Method with 84 sample size ...... 60
4. 8: Average Treatment Effect and Simulation of Average Treatment Effect on the
Treated – Treated - Maize output difference of respondents with 84 sample size ............ 62
4. 9 Estimates of Least Squares Regression on data after matching with 84 sample ....... 64

xi
LIST OF FIGURES
Figure Page
3. 1: Map of Swaziland showing location of some RDAs including Ludzeludze RDA
(CRDA) ............................................................................................................................. 42

xii
LIST OF APPENDICES
Appedix Page
Appendix A: R output ....................................................................................................... 84
Appendix B: 𝑹� Codes ...................................................................................................... 89
Appendix C: Questionnaire............................................................................................... 91
Appendix D: Choice variables .......................................................................................... 96

xiii
ABBREVIATIONS / ACRONOMY
AEZs Agro ecological Zones
AU African Union
CFSAM Crop and Food Security Assessment Mission
CRDA Central Rural Development Area
CSN Committee on World of Food Security
FANPRAN Food Agriculture and Natural Resources Policy Analysis Network
FAO Food and Agriculture Organization of the United Nations
FNS Food and Nutrition Security
FS Fertilizer Subsidy
GDP Gross Domestic Product
ICN International Conference on Nutrition
IFAD International Fund for Agricultural Development
MEPD Ministry of Economic Planning and Development
MOA Ministry of Agriculture
MT Metric Tonnes
NDMA National Disaster Management Agencies
NPK Nitrogen, Phosphorus and Potassium
PPP Public Private Partnership
PSM Propensity Score Matching
R RStudio
RDA Rural Development Area
SNL Swazi Nation Land
SSA sub-Saharan Africa
UNDP United Nations Development Programme
VAT Value Added Tax
WFP World Food Programme

1
CHAPTER 1
INTRODUCTION
1.1 Background of the Study
Maize is the most predominant crop grown on Swazi Nation Land (SNL), as it occupies
80 % of total area under crop production since maize is the staple food of Swaziland and
the main crop grown by the vast majority of the smallholder sector, largely for
subsistence purposes (Food Agriculture and Natural Resources Policy Analysis Network,
2003). Dwellers on the SNL are under abject poverty due to a number of obstacles
preventing them from breaking through poverty. Additionally, there is low agriculture
production in the country attributed to a number of factors such as high fertilizer costs,
unaffordability, lack of agricultural extension agents to capacitate farmers even on
fertilizer application; distance travelled by farmers to fertilizer markets, distance to
agricultural rural development areas (RDAs offices), difficult road access, poor linkages
to market, limited availability of irrigation water and vulnerability, illiteracy, lack of
access to financial institutions, climatic changes and lack of health facilities to cite a few.
Subsidies can be defined as policy tools used to support specific sectors or socio-
economic groups of an economy. Minot and Benson (2009) state that regardless of their
potential benefits, subsidies have been criticized as inefficient means of allocating scarce
public resources that may result in negative effects on social and environmental
resources. It is worth to noting that depending on the implementation strategy and the
situation, policies can be beneficial, destructive, or have no apparent impact. The
Government of Swaziland has been providing agricultural interventions that offer the
possibility of accelerating the development of smallholder agriculture with a limited
contribution of financial resources from the public sector.
The Government of Swaziland, in compliance with the Fertilizer Summit (African Union,
2006) including other declarations and maize farmer’s concerns, the government

2
committed herself by initiating the Fertilizer Subsidy by procuring fertilizer for maize
farmers at a subsidized price in order to increase maize production, ensure food and
nutrition security. A loan of about E500 million was received by the government of
Swaziland from the government of India to initiate the TURNKEY project as Public
Private Partnership between the two governments. Notably, the FSP was part of the
TURNKEY Project to ensure Food Security through increased maize production by Soil
condition, Farm Mechanization, Granular and Fertilizer Application. The Government of
Swaziland contributed 50% and the maize farmers 50%, in monetary it was E1, 000.00
during the 2014/2015 season and E2, 000.00 the two conservative seasons (MOA, 2015),
where the subsidized farm households received 6 bags of Nitrogen, Potassium and
Phosphorus (N.P.K.), 4 bags of Limestone Ammonium Nitrate and 1 bag of 25 kg of
seeds. The Fertilizer Subsidy was given to farmers in the high potential agro ecological
zones including farm households under the Central Rural Development Area (CRDA).
However, this Central Rural Development Area is one of the highest maize production
areas due to its potential weather patterns. Thus, the criterion of selecting the CRDA for
the study was due to its favourable climatic condition to produce maize.
1.2 Statement of the Problem
In a world of perfectly competitive markets, conventional economic analysis
demonstrates that subsidies are not desirable as they systematically result in economic
inefficiencies, welfare losses and large fiscal costs. Market failure in fertilizer subsidy
exist in Swaziland due to that a number of Swazi farmers are not in a position to use
fertilizer effectively, or to use optimally. This is because they lack proper training and
cannot afford to buy the fertilizer. In some cases fertilizer is not physically available in
proximity to where they stay resulting to high transport costs. In such cases, fertilizer
subsidies would be economically justified to address the market failures and poor
incentives faced by some farmers.

3
The Government of Swaziland made substantial efforts to increase investments in the
agricultural sector, by providing fertilizer subsidy but these investments have produced
limited results due to inefficiency. Swaziland agriculture continues to face significant
development challenges: productivity remains low, food production has failed to keep
pace with population growth, and food insecurity is rising, especially in rural areas
(World Bank, 2011). Regardless of government interventions, there has been continuous
decline in maize production and serious gap in supply of maize in the country which has
contributed to a 45 % food price increase since 1998. This development eroded the
purchasing power of poor households, and reduced their access to food (World Bank,
2011). Adding to that, maize is the staple food of Swaziland yet she is not self-sufficient.
Research has shown that fertilizer is a powerful productivity enhancing input (Kabuya,
2011) yet there is low usage of fertilizer application in Swaziland including the Central
Rural Development Area resulting to low maize production due high cost of fertilizer as
some maize farmers are poor, do not have the know-how and some cannot afford the cost
of fertilizer inputs. Wideru (2015) opined that fertilizers remain important in global food
production, yet fertilizer application rates in sub-Saharan Africa are far below the global
average.
In compliance to the Fertilizer Summit (AU, 2006) and based on low fertilizer usage
resulting to low maize production, the Government of Swaziland invested in the Fertilizer
Subsidy for maize farmers at a subsidized price. The subsidy program was intended to
contribute to efforts to boost domestic maize production by the through rural
development areas.
Recognizing the fertilizer subsidy as a policy issue, since its resurgence in Swaziland by
2014/15, there is scanty research existing to assess the impact of the Fertilizer Subsidy on
maize production at farm household level. Whilst some writers reviewed the aspects of
impact of Fertilizer Subsidy on maize production, income and consumption in different
African countries, there is little hard policy evidence exist on the impact of the fertilizer
subsidy on maize production in Swaziland as per the Abuja Declaration. Hence, this case
4
study tried to empirically investigate the impact of the programme on outcome variables
as indicators of the impact of the fertilizer subsidy.
1.3 Objectives of the study
The main objective of the study is to investigate the impact of Fertilizer Subsidy on
increasing maize production at farm household level in Swaziland.
The specific were to:
1. Examine the socio economic characteristics of beneficiaries and non-beneficiaries
of the Fertilizer Subsidy under the Central Rural Development Area.
2. Evaluate the impact of the Fertilizer Subsidy on production of maize in the study
area.
1.4 Statement of Hypotheses
The hypotheses of the study in null form were:
H0 1: There is no difference between the socioeconomic characteristics of
beneficiaries and non-beneficiaries of fertilizer subsidy in the study area.
H0 2: Fertilizer Subsidy has no impact on maize production in the study area.
1.5 Justification for the study
This study may assist policy makers, programme planners, programme managers,
evaluators and analysts to target interventions and measure progress on agricultural
intervention. As the world is moving towards evidence-based policy making, the study
may add to the body of knowledge. Few Scholars at the university apply Propensity
Score Matching and Average Treatment Effect to evaluate impact thus the study may be a
first rigorous quantitative study to use PSM. Justifying continuous investments in the
programme, the Government of Swaziland (Ministry of Agriculture) and development
partners must be convinced about the impacts of the fertilizer subsidy on increasing
maize production. Thus, decision makers may make informed decision on the fertilizer

5
subsidy from the study. Moreover, the programme utilized public funds since the
government acquired a loan from India as Public Private Partnership (PPP), hence the
need for the government to be accountable in the use of the funds.
1.6 Scope and Limitation of the Study
Limitations are matters and occurrences arising in a study which are out of the
researcher’s control; they limit the breadth and depth to which a study can reach (Simon
& Goes, 2013). The study focused on beneficiaries and non-beneficiaries of fertilizer
subsidy under the Central Rural Development Area as a case which is situated in the
Manzini region of Swaziland, to investigate the maize producing farm households who
benefited and those who did not benefit from the Fertilizer Subsidy in 2014/15. The other
aspects of the TURNKEY project such as administration costs and uses were not
considered in the study. The study results may not apply to other farmers in the other
RDAs due to time frame. The RDA was selected purposively because it is under the
agricultural ecology which is climatically favourable for maize production, easily
accessible and considering time factor required to complete the study.
The study focused on maize than other crops grown in the area. Also the information
given by the respondents depended on the ability of the respondents to recall. Therefore,
the study examined the socio economic characteristics of the Fertilizer Subsidy on
beneficiaries and non-beneficiaries under the Central Rural Development Area in 2014/15
and evaluated the impact of the Fertilizer Subsidy on maize output. Though impact study
of a given intervention encompasses the subsequent/ spillover effects on production,
income, environment, on social welfare, food and nutrition security, in general, this study
was limited to maize output.
1.7 Definition of Terms
Fertilizer Subsidies: defined as policy tools used to support specific sectors or socio-
economic groups of an economy.
Farm Household: a farmer who owns not more than 1 hectare.

6
Unit: data point: e.g. farm household
Treatment: binary indicator (in this study) also called intervention
Treated: units who received fertilizer subsidy=1
Control: units who did not fertilizer subsidy=0
Factual: the set of observed units with their respective treatment assignment (Rosenbaum
2010)
Counterfactual: the factual set with flipped treatment assignment (Rosenbaum, 2010)
Beneficiaries: are farm households that benefited from the Fertilizer Subsidy.
Non-Beneficiaries: are farm households that did not benefit from the Fertilizer Subsidy.
Average Treatment Effect: The expected causal effect of T on Y: ATE: E [Y1 -Y0]
Increasing maize production: is one of the goals that most of the subsidies programmes,
thus making production an important variable of assessing the impact of the programmes.
1.8 Organization of the study
This chapter focused on the introduction which includes the background information
input subsidy and Fertilizer subsidy programme. The chapter defines the problem
statement, purpose and objectives of the study.
The remainder of the study is organized as follows: Chapter two discusses the Theoretical
review; Empirical review; Methodological review and Conceptual review as well as a
summary of the gap the study intends to fill. Chapter three gives the methodology and
data analyses used in the study. In chapter four, the results and discussion are presented.
Finally, chapter five presents the summary of findings, conclusion and recommendations
even for further research.

7
CHAPTER 2
LITERATURE REVIEW
The chapter discusses the theoretical, empirical, methodological and conceptual review.
The theoretical explain the government intervention, agricultural subsidy, maize
production, socio economic characteristics of smallholder maize producers. Theories
explained also include: neoclassical, production, fertilizer theories as well as agricultural
subsidy. Empirical studies by different authors are highlighted in the empirical review as
a last section. Methodological review discusses impact evaluation as well as the methods
used in the study: Propensity Score Matching, logistic regression as the foundation of the
study
2.1 Theoretical Review
This subsection explained different theories such as neoclassical economics, production
theory, fertilizer, agricultural subsidy, government intervention as well as impact
assessment theory.
2.1.1 The theory of Neoclassic Economics
Keynes (1936) criticized liberalism that inherited optimism of markets power and
individuals rationality. He mentioned that the market is subjected to wider economic
cycles. It is emphasized the complication of human behaviour and argued that it is
characterized by what is called human spirit. This means that human behavior is directly
promoted by optimism and skepticism which is influenced by emotions and instincts such
as greed, anger and love. Neoclassical theory, highlights issues like favoring individuals
over the society and limited size of governmental operation in commercial interaction
despite their ideological connotation as predetermined in neoclassical models (Keynes,
1936). In addition, it found that the neoliberal undertones in the neoclassical economics
are difficult to neglect as they compose a major political aspect in the theory.

8
2.1.2 Production: technology in the production function
According to theory of production is what firms do. Firms or farm households turn inputs
which is called factors of production into outputs. The theory of production describes and
predicts the relationship between inputs to the production process and resulting output
described by a production function. The production function describe the maximum crop
that a farm household can obtain under a given set of weather conditions with specific
amount of farm labour and fertilizer. According to Shanga (2013) recommended
quantities, fertilizers used in maize production do shift the production right upward. In
short, he stated that keeping other variables constant, application of a certain quantities of
fertilizer per acre would shift the farmer’s production possibility curve (PPC) rightward
(Shanga, 2013).
2.1.3 Theories of fertilizer
Theoretically, most cultivated soils cannot supply more than 20-25 % of the Nitrogen,
Potassium and Phosphorus (NPK) requirements, and thus adequate NPK is necessary if
high yields are to be maintained. When fertilizing maize, it is roughly estimated that for
providing each 100 kg grain: 2.43 kg N, 0.53 kg P and 1.8 kg K are required. In
fertilizing maize, information on the nutrient supplying power of the soil is essential.
Moreover, according to theory a farmer faces a number of options regarding to what to
produce given available land, labor, machinery, and equipment. Thus, farm manager must
not only decide how much of each particular commodity to be produced, but also how
available resources are to be allocated among alternative commodities. Also, the farmer
may be interested in maximizing profits but may have other goals as well.
2.1.4 Government intervention
According to the second Pareto Optimality principle, Government’s role is to redistribute
wealth and if such distribution is done in a transparent and accountable manner without
making other players worse off, that would be an added advantage (Chirwa, 2010).

9
Government intervention is motivated by other objectives other than efficiency. It can be
in response to self-interested government officials’ concerns with the income
consequences of the outcome of market forces and efficiency oriented policies, or in
response to the demands of organized interest groups; generally it is a combination of
both (Wiredu, 2015).
Arimond defines agricultural interventions as changes purposively introduced into an
existing agricultural system to promote new crops, technologies, management practices,
production and marketing methods and other innovations. The agriculture sector, a
supplier of food and essential nutrients, a source of income and employment, and an
engine of growth has important implications for nutrition and health.
2.1.5 Agricultural Input Subsidies theory
Doward & Chiwra, 2013 highlight the theoretical argument behind other research in
relation to subsidies that the beneficiaries should possess more assets because:
a) Beneficiaries save more due to reduced input cost. They have an added advantage.
Imagine a situation where the farmer must sell an asset in order to invest in maize
production but instead gets the inputs at half the price. Their assets are then spared while
it is the opposite for another farmer not benefiting.
b) Beneficiaries would be less risk averse as part of the risk is shared in the subsidy. That
enabled them to venture into more risky and profitable undertakings such as acquisition
of innovative assets or diversifying into high value crops.
c) They would have a wider profit margin and should therefore be able to acquire more
assets, whatever the source of money.
In this case, the government subsidy meets the cost half way. The higher the rate, the
lower is the final cost of the input. This improves productivity of farmers which is here
defined as output per hectare. Farm Input Subsidy Programme is advolerem.
Despite criticism and uncertain outcomes, subsidies on agricultural inputs, including
seeds and chemical fertilizers have been re-introduced in sub-Sahara Africa (Wiredu,
2015). The subsidies were initially intended to mitigate the effect of global price hikes on

10
vulnerable households. Generally, available evidence suggests that fertilizer subsidies for
instance have increased fertilizer use, yields, and agricultural production. However, the
success of the subsidy programs depends on implementation strategies.
Doward & Chiwra (2013) pointed three standard economic analysis: First, a subsidy only
generates a positive overall net economic return if there is some market failure so that the
downward shift in the supply curve is greater than the total cost of the subsidy. Second,
the size of the deadweight loss and the distribution of benefits between consumers and
producers depend on elasticities of supply and demand. This is important, as larger
deadweight losses are associated with increasing inefficiencies, and the distribution of
gains and costs between producers, consumers, and taxpayers has equity and poverty
reduction impacts, depending on the relative wealth and incomes of the producers,
consumers, and taxpayers concerned. Third, transfers to producers can be analyzed in
terms of inefficiencies associated with economic rents.
They further mentioned that rents arise in three ways. First, part of the cost of a general
input subsidy goes to reducing the cost of production for produce that would be produced
anyway (this is the producer surplus on produce that would be produced without the
subsidy). Second, producer transfers often end up affecting the demand for agricultural
land and labour, and bid up the demand for inputs. Third, where subsidized inputs are
rationed (officially or unofficially), then this leads to opportunities for those controlling
subsidized inputs (politicians, government officials, fertilizer suppliers, farmer
organization office bearers, etc.), to divert subsidized inputs from their intended
beneficiaries for a side payment or to demand payments from beneficiaries in return for
provision of subsidized inputs (Doward & Chiwra, 2013)..
Economic rents mean that even if there are net economic and social gains from a
subsidy, much of the subsidy cost may be a straight transfer from the state or taxpayers to
producers and suppliers of land, labour, and inputs without any economic gain, with the
relative shares of transfers depending on the elasticities of supply and demand.

11
Diversion from intended beneficiaries: input subsidies in developing countries have
commonly been intended for smallholder rather than commercial farmers. With a general
subsidy it is difficult to channel subsidized inputs to smallholders unless there are a
limited number of tightly controlled supply chains, clear ways of identifying intended
beneficiaries, and control of private fertilizer transactions.
Cross-border leakages: these arise when subsidized inputs are sold outside the country at
a discount. The value of the discount represents a straight loss from the transfer of
resources outside the country, with the loss of any chance of consumer benefit or
economic gain from increased input use.
The final point to note from analysis of input subsidies’ effects on product supply and
demand is that the extent of supply shifts is critical in determining deadweight losses, the
distribution of transfers between producers and consumers, and the extent of wider
economic gains. The supply shift depends upon the technical efficiency of input use
determined by the quality and appropriateness of the inputs to the product they are used
on, timing of their delivery to farmers, availability of complementary resources (for
example, seed and fertilizer together, market access), and technical skills in input use.
The analysis of product supply and demand impacts of input subsidies helps to identify
features of subsidies that are likely to yield more benefits and reduce the dangers of
things going wrong, with additional insights into where subsidies are most likely to be
useful, and into the ways that subsidies should be implemented. It suggested that inputs
subsidies should be focused: on producers who are not using inputs because of market
failures; on inputs for products where they can induce a substantial supply shift (and this
may also require complementary investments in, for example, other input supply,
extension and output markets’ infrastructure and services); and on inputs for products
with inelastic demand and supply (particularly inelastic demand) among poor producers
and consumers: staple grain production tends to have these characteristics in poor land-
locked countries or large countries with suitable agro-ecological conditions (Doward &
Chiwra, 2013).

12
Generally, subsidies of inputs are justified in the early stages of development by
stimulating introduction of new crops or the adoption of new techniques which has
proved to be beneficial (Kabuya, 2011). He stated that the advantage of subsidizing
inputs such as fertilizer, rather increasing the price of the commodities is that subsidies
directly encourage the use of inputs that increase productivity.
According to Kabuya (2011) for modernizing production, farmers are to pay for fertilizer,
chemicals for control of pest, disease, weeds, tools, equipment, machines and fuel. He
highlighted that the prices of these inputs are excessively high thus instead of increasing
the price of commodities produced, subsidies of agricultural inputs are directly
encouraged by subsidizing farmers in order to increase production.
Although input subsidies are directed at producers and at changing production methods
and producer behaviour, this analysis emphasizes the importance of consumer benefits in
addition to (or rather than) producer benefits for maximizing both economic and welfare
gains from subsidies. Input subsidies should also be implemented in ways that (a) reduce
deadweight losses and rents from straight transfers, (b) reduce leakages, and (c) have low
administration costs. Subsidies may also be less efficient instruments if they are primarily
aimed at delivering income transfers to producers and remote areas, because of high
deadweight and administration costs, generation of rents, and the difficulties in
developing/delivering complementary services needed for technically and economically
efficient use of subsidized inputs.
2.1.6 Impact assessment theory
According to Chibwe (2014), governments, institutions and other practitioners are keen
to determine the effectiveness of interventions designed to enhance sectors of their
countries economy such as poverty or employment. It is said that these policy quest are
only possible through impact evaluation exploring the change which were brought by the
intervention.

13
Furthermore, literature has showed that there is no universal definition from practitioners
which was agreed upon to define impact. Impact is defined as the positive and the
negative, primary and secondary long term effect produced by development intervention,
directly or indirectly intended or unintended, by the Development Assistant Committee
(DAC) of the Organization for Economic Corporation Development (OECD) (Minot,
2009). He mentioned that there are three criteria for assessing smart subsidies’ impact
include: efficiency, equity and sustainability.
Efficiency
Efficiency of a subsidy policy depends on the reason why the farmers are not using the
inputs, in this case, fertilizer or certified seeds. If the reason the farmers are not using
these inputs is due to high economic cost of delivering these inputs in comparison to the
benefits accruing from using the inputs, then smart subsidies can encourage the adoption
of these inputs. Moreover, if the lack or inadequate use of fertilizer and certified seeds is
due to market failures caused by such constraints as poor infrastructure and lack of access
to credit, then smart subsidies would prove inefficient. This is due to the fact that,
although some of the cost of these inputs would be transferred to the government, the
costs would still outweigh the economic benefits after the smart subsidy is terminated.
Equity
Smart subsidies are a very important tool of shifting resources from the rich to the poor
especially when targeting the poor smallholder farmers (Minot, 2009). On another note,
use of smart subsidies as a tool to achieve equity is seen as a trade-off between efficiency
and equity because, although the poor smallholder farmers are the ones mostly
constrained by market failures such as lack of credit, they may not be endowed with
resources such as skills, land or financial resources to use the subsidized inputs efficiently
(Ricker-Gilbert & Jayne, 2012). As a result, if the aim of the smart subsidy is pro-poor
growth targeting the poor smallholder farmers, even though it increases equity, it does so
at the expense of efficiency.

14
Sustainability
Baltzer & Hansen (2011) highlighted that sustainability of subsidies depends on whether
the use of the subsidized inputs and increased productivity remains after programs
termination or if the programs benefits surpass the cost of implementing the subsidy.
Actually, even if the program benefits exceed its costs, extending the program beyond its
time frame is often criticized. The criticism arises due to inefficiency and probability of
the program being used for personal or political gains by the persons controlling how the
subsidies are targeted (Baltzer and Hansen, 2011). Therefore, there is need for an exit
strategy which aim at a short term effect that will have a permanent impact. It is worth
noting that such short term effects include solving market failures, developing private
sector investment in agricultural input industry and smallholder access to agricultural
inputs. Evaluations, thus assess the potential of smart subsidies having a long term effect
on market failures and target population‘s households.
2.1.8 Farm household theory
In theory, Sadoulet and Janvry (1995) state that agricultural production is dependent on
Farm Households (FH) as farmers. They mentioned that poverty is predominant among
farm households. Farm Households are said to integrate production, consumption, and
reproduction decisions.
Again, it is stated that FH are semi-commercialized in terms of food production and
labour supply and they can be a net buyer/seller of food and a net supplier/employer of
labour. FH also can be self-sufficient in food and/ or labour. In Policy analysis, when all
markets work, the only linkage between production and consumption decisions is through
the level of farm income achieved in production.
Again, when not all markets work, there are direct interrelations between production and
consumption decisions. In both cases, policies that affect the price of goods (factors) both

15
produced (used) and consumed (sold) thus have complex implications for production and
welfare (Sadoulet and Janvry, 1995).
Additionally, Farm Households differ by a set of characteristics (zk, k = 1..., s) such as
age and sex composition, race and religion, and urbanization status that affect the pattern
of demand. From a policy standpoint, it is important to estimate the impact of these
characteristics on demand to establish the determinants of observed household-specific
consumption levels, help target government programs such as food aid on particular
classes of households, and determine the amount of assistance needed to bring the
malnourished to acceptable consumption standards.
2.2 Empirical Review
There is rich empirical literature on the analysis of impact of seed and fertilizer subsidies.
Researchers estimated the impact of these subsidies in various studies in different
countries in Sub Saharan Africa. But each study differs in its underlying objectives as
well as in the model and the variables under examination. In fact, several studies have
looked at the effect of fertilizer subsidies on increasing maize yield (Xu Guan, Jayne and
Black, 2009) in other countries. Direct impact studies included the effects on maize
output (Chibwana, et al., 2010).
2.2.1 Empirical Estimates of the Impact of Subsidies in Sub-Saharan Africa
Sibande (2016) opined that there are several studies on the impact of the recently
implemented farm input subsidy programmes in sub-Saharan Africa (SSA). He stated that
the literature shows that there were more studies focusing on Malawi and Zambia.
Probably because these two countries were among the first to reintroduce the large scale
farm input subsidies in this region in the early 2000s. The recent studies have focused on
both direct and general equilibrium impact of farm input subsidies (Sibande, 2016).

16
In Malawi, the subsidy program was found to increase maize production (Holden and
Lunduka, 2010a). Ricker-Gilbert and Jayne (2011), using a six year data on fertilizer use
found that using an additional kilogram of the subsidized fertilizer in the current year of
production increases maize production by 1.82 kilograms in that year while using an
additional kilogram of fertilizer for the last three years increases maize production by
3.16 kilograms. Chibwana, et al. (2011) used a two stage regression model to control for
selection bias to estimate the impact of Malawi‘s Farm Input Subsidy Program on the
allocation decision of farmers in Kasungu and Machinga districts.
The study found out that there was a positive correlation between participation in the
program and the size of land allocated to maize and tobacco production. The study also
found out that maize yields increased by an average of 447 kg/ha for hybrid maize and
249 kg/ha for local maize. Sheahan et al. (2012), used data from the nationwide
household survey data spanning 13 years to estimate the profitability of nitrogen
application rates on maize fields. The study found out that even though fertilizer use was
profitable, but this requires adoption of complementary practices such as good
management.
The empirical review done by (Druilhe and Hurlé, 2012) demonstrated that there was no
single policy instrument that can increase fertilizer use as there is myriad of reasons why
farmers are (not) using fertilizers. Fertilizer subsidies only tackle the price constraint, in a
temporary/punctual manner. Thus, highlighted the importance of understanding the
incentives and constraints behind fertilizer use to evaluate the adequacy of fertilizer
subsidies, improve the design to channel it where it is most needed and assess their
relative performance compared to alternatives (Druilhe and Hurlé, 2012).
The Malawian government implemented its subsidies through the Starter Pack program
whereby smallholder farmers were given 10 to 15 kg of fertilizer, was meant to serve 0.1
hectare. By 2000, the program was changed to Targeted Input Program (TIP) (Lameck,
2016). Ricker-Gilbert et al. (2013) stated that input subsidies took both a developmental
role and a food security promoting role in many African countries, with seven African

17
countries investing an average of 2 billion United States dollars in subsiding inputs a
figure which represents a huge proportion of public expenditure for most African
countries. They highlighted that Sub-Saharan Africa, having the lowest fertilizer use
averaged at 8kg/ha, has indeed taken to subsidizing their farmers to increase input use as
well as ensuring food security. Input costs especially fertilizers and hybrid seed, are
relatively high in Sub-Saharan Africa chiefly due to high transaction costs which are
attributed to the poor transport systems that prevail in these countries making them
unaffordable to the ordinary farmer (Dorward & Chirwa, 2011).
2.2.2 Empirical evidence from Impact Evaluations
The impact evaluation of the Agricultural Input Subsidy Programme (AISP) in Malawi
found a broadly positive impact of the subsidy on input use, agricultural output and
national food security, although the impact of the subsidy itself on both national and
household food security and poverty could not be isolated in the analysis. Incremental use
of inputs was determined by the volumes of sales of subsidized input and the level of
displacement from commercial sales as a result of the subsidy. The review of the targeted
AISP found that subsidized fertilizer sales rose by 34% in the first year and by 54% in the
third year of the programme. Also effects on incremental input use were reduced by quite
substantial displacement, 20-30% in 2005 and 2006 (Chibwana, et al., 2010).
Evidence from study done by Druilhe & Hurlé (2012) mentioned that among the fifteen
subsidy programmes implemented in sub-Saharan Africa since the early 2000s, that were
reviewed in their paper, ten of them have implemented large-scale subsidies. Those could
be classified into two categories: universal subsidies (untargeted, pan-national price
support for specific crops) implemented in West African countries (Burkina Faso,
Senegal, Mali, Nigeria, Ghana); and targeted subsidies, which are found in East and
Southern Africa (Kenya, Malawi, Rwanda, the United Republic of Tanzania, Zambia).
These ten programmes were large in magnitude (millions of beneficiaries) and they have
been implemented over a long time (3–5 years, sometimes even a decade). They are
18
usually quite costly (US$ 100–160 million/year) and largely funded by national
governments (50 to 100%) (Druilhe & Hurle, 2012).
Evidence on the impact of the subsidy itself from other sources is generally positive but
inconclusive. While it seems that fertilizer use increases everywhere (300% in Rwanda,
20% in Mali) albeit with varying degree of market displacement, effects on production
also are varied. Positive impacts were found in Rwanda, Mali and the United Republic of
Tanzania, among others. Rwanda maize production rose by 7.9% up from 3.8% before
the programme was implemented (Chibwana, et al., 2010). Some studies looked at the
impact of fertilizer subsidies on crowding out private sector sales (Xu, Burke, Jayne &
Govereh, 2009; Ricker-Gilbert & Jane 2009).
2.2.3 Review of Empirical Models
Empirical results using propensity score were illustrated by different studies. Saigenji
and Manfred (2009) have evaluated the impact of contract farming participation on
income by applying Propensity Score Matching in north western Vietnam. They found
that a positive significant effect of contract participation on income by about 8,000 VND
daily per capita. They used family size, proportion of adults, age, education, ethnicity,
number of household member in association and number of income sources.
A study conducted by Sanga (2013) indicated that post subsidy programme period had an
average of 77758 tons compared to 58453 tons of the pre fertilizer subsidy period.
Furthermore, findings indicated that there were differences in production between the
users of fertilizer and non-users of fertilizer for the year 2012. Degnet, et al. (2010) have
used the PSM method to analyze the impact of food security program on household food
consumption in northern Ethiopia, which is the first of its kind to apply the method in the
country. The study examined the impact of household food calorie intake of an integrated
food security program. The estimated results provide evidence that i has a positive and
statistically significant effect on food calorie intake. The study also found that the
programme has differential impact depending on family size, land ownership and gender

19
of household. Overall, the paper provided evidence that supporting integrated food
security programs is important to improve food security in rural areas.
The reviewed literature underscores the fact that fertilizer subsidy is very important to the
lives of many nations. Given the poor natural endowments of African soils aggravated by
poor management and sometimes damaging soil practices, it is broadly stated that
substantial increases in inorganic fertilizer use are necessary to restore and maintain the
fertility of African soils and enhance their productivity (Minot and Benson, 2009).
Despite the well-known successes of fertilizer subsidy programmes in the Green
Revolution in Asia, fertilizer subsidies in Africa still remain a controversial issue.
Again, proponents of fertilizer subsidies emphasize the need to boost agricultural
productivity among resource poor farmers through fertilizer subsidies in the face of a
growing population and a decreasing supply of agricultural land (Henao and Baanante,
1999). In their argument, they state that subsidies represent transfers to the poor and it is
more efficient than other anti-poverty programs like school feeding programs and
conditional cash transfer.
Druilhe and Hurlé (2012) recognized that low fertilizer use in SSA stems from a set of
failures in input markets, complicated by broader rural development constraints. They
further mentioned that on the demand side, poor price incentives (low and volatile prices
of outputs), highly seasonal and variable production, lack of liquidity or credit and lack of
knowledge about fertilizers undermine farmers’ capacity to adopt the technology or their
ability to reap the benefits of its use. It is stated that with low and dispersed demand, the
industry remains largely underdeveloped and suppliers also cannot make the economies
of scale that would reduce the high costs of transporting, stocking and distributing
fertilizers and eventually reduce the price to farmers. Again, at local level, transport and
storage facilities may be simply inexistent. Overall, it is estimated that transport and
distribution costs (and various taxes) represent up to 50% of the final retail price in SSA
versus 20% only in Asian countries (Bumb, 2009).

20
2.3 Methodological Review
This section reviewed the methods used to evaluate impact. This section also outlines:
Impact assessment Approaches, and application, impact evaluation, experimental
approach, non-experimental approach, Matching- Propensity Score Matching, Rubin
Causal Model and Least Squares Regression model.
2.3.1 Impact Assessment Approaches and Application
In its broadest sense, impact assessment is the process of identifying the anticipated or
actual impacts of a development intervention, on those social, economic and
environmental factors which the intervention is designed to affect or may inadvertently
affect. Then, any type of evaluation seeks to answer descriptive, normative and cause-
and-effect questions (Imas & Rist, 2009). Descriptive questions determine what is
happening in relation to relationships among the stakeholder while normative questions
aim at finding out the whether the inputs, activities and outputs are being realized. On the
other hand, cause-and–effect questions assess whether the outcome is being realized and
the difference that these outcomes has on the targeted population, especially the maize
household that benefited from the subsidy.
As such, impact assessment seeks to answer a cause-and-effect relationship. Unlike
general evaluation that may give answers to many questions, impact evaluation is
structured around a particular impact of a program on an outcome of interest (Gertler et.
al., 2011). In this study, the outcome of interest was maize output, increase in maize
production of beneficiaries. Looking at the effect of any outcome on a population, the
basic question comprises of a causal inference. This is where one finds out what impact
that these outcomes have had on the target population. However, such an endeavour
raises the challenge of excluding all the other factors except the intervention so as to
quantify the effect of a program on the population.

21
As a result, impact assessment methods are used to exclude other factors that may have
brought about a similar impact. In an effort to exclude these factors the ideal
measurement would be looking at the same individual at the same time but at different
points of the intervention. This would give us the impact of the program since we would
be comparing what the individual would have been without the intervention and what he
would have been with the intervention. But it would be impossible to look at the same
individual at the same time but in different situations (Ferraro, 2009). This situation is
called a counterfactual and it is the main challenge in any evaluation study. Thus, the aim
of impact assessment methods is solving the counterfactual problem. Evaluation studies
accomplish this by coming up with a comparison or control group that that can be
compared to the population in a program. This is also a the key problem in evaluation
because getting a control group that have the same characteristics as the people in a
program can prove to be difficult in a real life situation.
Impact evaluation
Impact evaluations are technical exercises that rely on econometric and statistical models.
There are three main kinds of impact evaluation designs. These are experimental, quasi
experimental and non-experimental with which are respectively associated with control
groups, comparison groups, and non-participants. Impact Evaluation (IE) rigorously
measures the impact that a project has on beneficiaries. It typically does this by
comparing outcomes between beneficiaries and a control group. Evaluation may take
place before approval of an intervention (ex ante), after completion (ex post), or at any
stage in between.
Experimental Approach
Randomized Selection Method
This method is commonly derived from the program or intervention administrative rules.
Most programs have either a limitation in the amount of recourses or operational
capacity. Thus, this limits the number of participants that can be allowed in a program. A
program‘s administrative rules help in choosing who participates in a particular program.

22
These may include observed characteristics (e.g. age, poverty level), unobserved
characteristics (e.g. risk attitude, skills), lottery or even in order of registration to the
program. After using the rules to choose those that deserve to be in the program, the
assignment to the program is done. Randomized assignment is where the program
participants are chosen randomly among the deserving population. Thus, creates an
estimate of the counterfactual since the people who did not receive treatment but were
eligible are used.
Non-Experimental Approach
Matching
Matching method relies heavily on observed characteristics in order to construct a control
group that acts as the counterfactual. In respect to this, the method makes an assumption
that there are no unobserved characteristics between the participants and the non-
participants that is correlated with the outcome being measured (Heckman et al., 1998).
By using the observed characteristics, matching uses statistical techniques to construct a
control group from non-participants that has similar characteristics as participants in a
program. Thus, the impact is measure by comparing the average outcome for the non-
participants and the average outcome among the statistically matched non-participants
based on observable characteristics.
2.3.2 Propensity-Score Matching (PSM)
Propensity score matching is a statistical technique in which a treatment case is matched
with one or more control cases based on each case’s propensity score. This matching can
help strengthen causal arguments in quasi-experimental and observational studies by
reducing selection bias. Propensity score methods are applicable as there is desire to
estimate the impact of an intervention, and it is particularly relevant when the
intervention is not applied on a randomized basis but we think we have the major
background variables that influence which treatment is received. Rosenbaum & Rubin
(1983) reported that PSM (specific non-experimental evaluation method) method is

23
specifically designed to assist researchers in drawing causal inferences in observational
studies. The propensity score is a conditional probability that an individual is assigned to
the treatment group.
Moreover, Propensity Score Matching (PSM) has become a popular approach to estimate
causal treatment effects. It is widely applied when evaluating labor market policies, for
instance (Dehejia & Wahba, (1999), but empirical examples can be found in very diverse
fields of study. It applies for all situations where one has a treatment, a group of treated
individuals and a group of untreated individuals. The objective of their paper was to
evaluate the impact of fertilizer subsidy using this method and identify the difference in
outcomes: level of productivity and household net income between beneficiaries and non-
beneficiaries of the programme since the propensity score method dramatically highlights
the fact that most of the comparison units are very different from the treated units.
Therefore, PSM is used to measure the impact of the fertilizer subsidy intervention
average treatment effect on the treated or outcome variables. According to Rubin (1979),
Propensity scores are usually used with large samples by matching the cases between
groups. Thus, he said it has been shown to reduce selection bias. However, Quigley
(2003) said with smaller sample there may be insufficient power to produce meaningful
results due to the fact that there is need to further examine the ability of propensity cores
to produce usable results with small samples. Thus, this study tried to apply Propensity
score matching in small sample.
Propensity Score Analysis
The use of propensity score analysis (PSA) was introduced by Heckman in 1979 and
Rosenbaum and Rubin in 1983 (Rosenbaum, 2004). Although both Heckman and
Rosenbaum and Rubin discussed estimating treatment effects when the assignment of
treatment was nonrandom, Heckman’s work used different terminology and focused
mostly on Observational studies (Rosenbaum 2004). The use of PSM methods in
economics is relatively new (Rosenbaum, 2004). Specifically, in this study, conducting
propensity score matching in R was used using the MatchIt package with nearest-
neighbor 1-to-1 matching. Though there is other software than R for conducting

24
propensity score matching, R has been chosen because it is open-source software and is
widely used by data scientists across many different fields.
When the propensity score is estimated, different algorithms would be employed in order
to identify matching partners. The Nearest-Neighbor Algorithm is the most applied
algorithm, so we used this algorithm in our estimations. Propensity score matching is a
statistical technique in which a treatment case is matched with one or more control cases
based on each case’s propensity score as access to agro-dealers. On the other hand, PSM
is chosen instead of regression discontinuity method because regression discontinuity
needs a large number of farmers next to the discontinuity to draw meaningful decision
but this is difficult because the further one moves from the discontinuity line the more the
variable characteristics vary. Regression discontinuity also yields a local treatment effect
just like instrumental variable approach. A dependent variable, Y, is a binary variable
taking the value 1 indicating project participation. Since Y is binary the error term in the
model is also binary. The independent variables (sex, age, marital status, education,
occupation, family size and amount contributed) are used to measure probability of the
variable.
Rubin (2010) explain logistic regression that is used to analyze relationships between a
dichotomous dependent variable and metric or dichotomous independent variables.
Logistic regression combines the independent variables to estimate the probability that a
particular event occurred. In fact, for any given case, logistic regression computes the
probability that a case with a particular set of values for the independent variable is a
member of the modeled category. In order to assess the impact of an intervention, it
requires to make an inference about the outcomes that would have been observed for
project beneficiaries had they not participated in the programme (counterfactual).
Here, an ideal comparison group from the study was picked. The comparison group is
matched to the treatment group on the basis of a set of observed characteristics or using
the predicted probability of participation given observed characteristics (propensity
score).

25
2.3.2 Rubin Causal Model
One of the most common methods of matching is the propensity score matching
developed by Rosenbaum and Rubin (1983). The Rubin causal model (RCM), also
known as the Neyman–Rubin causal model, is an approach to the statistical analysis of
cause and effect based on the framework of potential outcomes, named after Donald
Rubin. The name "Rubin causal model" was first coined by Rubin's graduate school
colleague, Paul W. The method is often preferred since it matches the participants and
non-participants by creating a common probability of participation using observable
characteristics which is called the propensity score. The non-participants with the same or
closest propensity score produces an estimate of the counterfactual. The average outcome
of participants and non-participants with the same score are then compared to get the
impact of an intervention.
A causal effect is the difference between an observed outcome and its counterfactual. The
Rubin causal model conceptualizes causal inference in terms of potential outcomes under
treatment and control, only one of which is observed for each unit.
Let Yi denote the potential outcome for unit i if the unit receives treatment, and let Yi0
denote the potential outcome for unit i in the control regime. The treatment effect for
observation i is defined by ti = Yi1 −Yi0. Causal inference is a missing data problem
because Yi1 and Yi0 are never both observed. Let Ti be a treatment indicator equal to 1
when i is in the treatment regime and 0 otherwise. The observed outcome for observation
i is then Yi = TiYi1 + (1 − Ti) Yi0.
Rosenbaum and Rubin (1983, 1984) showed that the basis for using propensity scores
relies on three theories which they developed. These theories include: 1) Propensity
scores balance observed covariates; 2) If it suffices to adjust for covariates, then it
suffices to adjust for their propensity score; and 3) Estimated propensity scores are better
at removing biases than true propensity scores because estimated propensity scores also
remove chance imbalances on the covariates. Propensity score matching involves
selecting subsets of the treatment and control groups with similar covariate distributions

26
(propensity scores) and matching them to estimate the causal effects of the treatment
(Rosenbaum & Rubin, 1984).
They opined that once matched on propensity scores, any differences between groups are
thought to be estimates of the treatment effect. This method is chosen due to various
advantages that it has over other methods. PSM being a non-experimental method, it is
appropriate for this study because the program does not have experimental farmers who
act as the control group. Generally, PSM is estimated by using logit (or probit) regression
with the covariates collected from the participants as X and participant’s status on the
treatment variable as Y (Rosenbaum, 2004). The covariates in the logit model are non-
treatment variables such as the participant’s background characteristics. The estimated
propensity score abstracts the information of these covariates. Using such estimated
propensity scores, a researcher can match a participant from the treatment group with a
participant from the control group to facilitate causal inference.
In this study, cross tabulation was used to estimate the distribution of the respondents
using dplyr package in R. Using PSM, the impact of participation is the average treatment
effect on the treated (Rosenbaum & Rubin, 1983). This is the difference between the
outcome in the participants and the counterfactual. Average Treatment effect on the
treated (ATT) can be represented as:
ATT = E (Y1 – Y0|J = 1, X) =E (Y1|J =1, X) – E (Y0|J =1, X)
Where participation is denoted by J, and J = 1 for participation and J = 0 for non-
participation. X is a set of observable household characteristics that explain participation
in fertilizer subsidy. Y1 represents outcomes for participants and Y0 outcomes for non-
participants. Since the counterfactual, E (Y0|J = 1X), is not observable in the data, the
average outcome in the control group, E (Y0|J = 0, X), will be used to estimate it. PSM is
used to identify households in the control group that have similar observable
characteristics with the participants. In practice, it may be difficult to ensure that the
matched control for each participant has exactly the same covariates.

27
According to Ho, Imai, King, and Stuart (2007), they mentioned that MatchIt is used for
improving parametric statistical models and reducing model dependence by
preprocessing data with semi-parametric and non-parametric matching methods. It is
pointed that MatchIt works in conjunction with the R programming language and
statistical software, and run on any platform where R is installed. MatchIt is designed for
causal inference with a dichotomous treatment variable and a set of pretreatment control
variables.
It is highlighted further that Matching sometimes increases efficiency by eliminating
heterogeneity or deleting observations outside of an area where a model can reasonably
be used to extrapolate, but one needs to be careful not to lose too many observations in
matching or efficiency will drop more than the reduction in bias that is achieved.
Preprocessing methods include: sub classification, nearest neighbor, optimal, and genetic
matching. For many of these methods the propensity score is defined as the probability of
receiving the treatment given the covariates. MatchIt chose the nearest neighbor method
because it result in the lowest mean differences between groups (Ho et, al., 2007).
They mentioned that MatchIt is designed for causal inference with a dichotomous
treatment variable and a set of pretreatment control variables. The MatchIt function in R
was used in the study. The main command matchit () implements the matching procedure.
The percent improvement in balance for each of the balance measures was defined as
100((|a| − |b|)/|a|), where a- is the balance before and b is the balance after matching. For
each set of units (original and matched data sets, with weights used as appropriate in the
matched data sets), the following statistics were provided showing: Means of Treated and
Means Control, the weighted means in the treated and control groups; Standard Deviation
Control showed the standard deviation calculated in the control group; Mean Diff is the
difference in means between the groups and the final three columns of the summary
output indicated summary statistics of a Q-Q plot. Those columns gave the median,
mean, and maximum distance between the two empirical quantile functions (treated and
control groups). The plots of the two empirical quantile functions themselves provide

28
further insight into which part of the covariate distribution has differences between the
two groups. Zelig package was also used in the study.
2.3.3 Socio economic characteristics affecting Maize production
According to Wiredu (2015), there are several factors affecting maize production such as:
household size; age of economically active persons; proportion of economically active
persons in the household; the proportion of educated persons in the household; the
proportion of males in the household; participation in off farm income generating
activities; household per capita expenditure; the number of arable crops produced; access
to extension; and access to information from neighbors influence consumption of the
three food nutrients in various ways. Actually, rural households are more likely to acquire
life-style assets like mobile phones, television, and vehicles with increases in income. A
similar result is found that educated persons are more health conscious and therefore
consume lesser calories to decrease obesity.
Older farmers are more experienced in farming activities and are better to assess the risks
involved in farming than younger farmers as highlighted by (Rebecca, 2011). She also
stated that reducing inequalities in human and physical capital between male and female
farmers will potentially increase output and technical efficiency (Rebecca, 2011).
Ephraim (2003) described the insignificance of the gender of the farmer, although
suggesting that female controlled maize farm are more efficient it showed that gender is
not an important factor in explaining efficiency. Adding to that, education has potential to
enhance farm efficiency and knowledge with regard to agricultural production. Therefore
educated farmers would be able to apply better farming methods (Rebecca, 2011). Farm
size plays a major role in farming thus farm size is highly significant for positively
affecting the technical efficiency of smallholder maize producers.
Khan & Saeed (2011), their findings showed that access to credit contributed positively
to the farmers’ efficiency and that it may enable farmers to purchase productive inputs on
time thus may lead to higher productive efficiencies. This shows that the higher to credit

29
a farm household is to access to credit, the more efficient the farm household becomes.
As a result, if production credit is invested on the farm, it is expected that this will lead to
higher levels of output.
2.4 Conceptual review
This section outlines the key concepts that were used in the study. The key concepts:
government intervention in agriculture, maize production, food and nutrition security,
rural development area, socio economic characteristics, agricultural input subsidy and
fertilizer subsidy of Swaziland.
2.4.1 Government intervention in Agriculture
Governments in both developed and developing countries intervene in agriculture with a
view of achieving a wide range of economic and social objectives. World Bank (2011)
highlighted in the Rural Sector Review that recent evidence on public spending in the
agricultural sector reviewed that budget allocation for the sector as a share of total
government spending has increased in recent years. Agricultural spending in Swaziland
rose from 4.7 % of GDP in 2006 to 7.2 % in 2009/10 (World Bank, 2011). In fact, the
reasons for government intervention are diverse and varied. Some of the most cited
reasons for intervention are self-sufficiency, employment creation, support small-scale
producers for adopting modern technologies and inputs, reduce price instability and
improve the income of farm households.
Since 1971, Swaziland has been developing Swazi Nation Land (SNL) through its rural
development area programmes as a way of improving the livelihoods of the large number
of the poor people. In 2000, the Government of the Kingdom of Swaziland formulated a
poverty reduction strategy and action plan to tackle declining economic growth and
increasing poverty. The government pledged to reduce poverty by more than half by
2015, and ultimately to eliminate it by 2022 (International Fund for Agricultural
Development (IFAD), 2014).

30
Government of Swaziland has been providing agricultural interventions that offer the
possibility of accelerating the development of smallholder agriculture with a limited
contribution of financial resources from the public sector: Improve delivery of extension
services: train farmers on agricultural technology for instance fertilizer application,
though the Field Officers are not enough to train farmers; Promote increased use of
improved inputs: through Crop and livestock productivity, seed, fertilizer, improved
animal breeds, and veterinary supplies; Strengthen capacity of farmers and farmers’
organizations: Efforts have been made to promote the modernization of the smallholder
through the Swaziland National Agricultural Union as well as Improve water use
efficiency. Swaziland has made good progress in improving access to water for
agriculture. Recent evidence shows that smallholders have benefited from public
irrigation schemes, although to a lesser extent than commercial farmers.
2.4.2 Maize Production and Markets
Maize (Zea mays) is an important source of staple food in Swaziland yet she is not self-
sufficient. Between 2001 and 2013, domestic demand has trended upwards. However,
despite area expansion domestic production has remained relatively constant at
approximately 80,000 MT resulting in Swaziland remaining a deficit maize producer,
realizing an average short-fall of 65,000 MT per year (United States Department of
Agriculture, 2013).
Most maize in Swaziland is produced in the Middleveld, which produces 45 %, followed
by the Highveld, with 28 %, the Lowveld with 23 % and the Lubombo Plateau with 4 %
(FANPRAN, 2003). On another note, Swaziland’s 10.4 % of available arable land
produces on average (2010 – 2015) 55 % of the country’s maize requirements annually
(Ministry of Agriculture, 2016). The remaining 45 % is imported since there is serious
gap in supply of maize (Crop and Food Security Assessment Mission (CFSAM), 2015).
During the 2016-17 cropping season, according to the Ministry of Agriculture (2016),
maize production fell from a high of 101,000 Metric Tonnes (MT) in 2014 to 81,000 MT

31
in 2015. Swaziland produced only 34,000 MT down from 94,000 MT in 2015-16 (-64 %)
and down from the five year average (2011-2015) of 92,000 MT (-63 %). As per the
national requirements, 20 % has been produced as per national cereal requirement for the
2016-17 marketing season. The remaining 80 % (197,000 MT) was imported (MOA,
2016).
In fact, maize deficit has been prolonged by dry spells and storms that found the crop at
its critical stage thus food availability in the country was threatened by continuous dry
spells in 2014/ 15 marketing season (CFSAM, 2015). Thus, about 5.5 % of the population
were reportedly severely food insecure and in need of assistance, with another 18%
moderately food insecure. This overall 23.5% food insecurity is in sharp contrast with the
very low 3 % registered in 2014 (CFSAM, 2015). The National Food Balance Sheet
2014/2015, indicated that there was need for food aid in order to meet the country’s
requirements due to the huge shortfall indicated (National Disaster Management Agency,
2015). Viewing the magnitude of the impact of the two consecutive years (2014/15 and
2015/16) of drought on the population, in 2016, the Swazi government declared a State of
National Emergency (MOA, 2016).
According to CFSAM (2015), National maize production in 2015 was estimated at 81
623 tonnes, 31 % below the bumper harvest of 2014 and 6 % lower than the five-year
average. The sharp year-on-year contraction was mainly due to a reduction in yields
following the rainfall deficits in the second half of the cropping season. However, well
above average plantings, despite a low area harvested/planted ratio in parts of the
country, partly offset the impact of reduced yields and prevented a steeper national
production decline.
In Swaziland, farm sizes are small on average; the vast majority of households hold less
than 1 ha of agricultural land, and only 2 % of households hold 4 ha or more. Consistent
with traditional land tenure arrangements, agricultural land is controlled mainly by men,
as reflected in the fact that about 75 % of agricultural households are male-headed.
Access to tractors and machinery remains limited, so most farming activities are carried

32
out by animals or by humans. Use of hired labor is uncommon, and household members
remain the most important labor source of agricultural labor. Rainfed agriculture
dominates; only about 15 percent of households have access to irrigation facilities. These
features reflect the subsistence orientation of the vast majority of agricultural households,
almost all of which are located on SNL. SNL farmers heavily dependent on servicing by
Government institutions, unlike the commercial farmers found on TDL, who rely almost
entirely on the private sector for services and support.
Farm households have been highly vulnerable to production risks due to natural
conditions and climatic shocks, as well as to the marketing risks due to price fluctuation,
opportunistic buying behavior. Synonymous with small-scale farming in the rest of
Southern Africa, maize production, in SNL is almost entirely dependent on rains
(CFSAM, 2015).
Swaziland has a very protectionist approach vis-à-vis the importation of food goods,
especially white maize (Ministry of Agriculture, 2016). Swaziland controls its white
maize flow through the National Maize Corporation (NMC). NMC is a parastatal which
has a monopoly over maize importations and plays a key role in insuring Swaziland’s
food security. The primary mandate of NMC is to guarantee a competitive market for
farmers, effectively operating as a buyer of last resort, and providing sufficient maize
supplies to satisfy national demand thus ensure food and nutrition security.
Food and Nutrition Security
According to the National Food Security Policy (2005), the World Declaration on
Nutrition and the Plan of Action for Nutrition emanating from the International
Conference on Nutrition (ICN) in Rome, governments pledged to make all efforts to
eliminate or reduce substantially, before the next millennium, starvation and famine;
widespread chronic hunger; under-nutrition, especially among children, women and the
aged; micronutrient deficiencies, especially iron, iodine and vitamin A deficiencies; diet-

33
related communicable and non-communicable diseases; impediments to optimal breast-
feeding; and inadequate sanitation, poor hygiene and unsafe drinking-water.
On another note, fertilizer subsidies can be an instrument to increase productivity in SSA
and thus help solve the food availability dimension of food security. However, their
design needs to be improved to raise their efficiency and allow tackling other dimensions
of food insecurity. FAO has a role to play in supporting governments in this task (Druilhe
& Hurlé, 2012). The main goal of fertilizer subsidy is to increase maize production thus
ensure food and nutrition security. However, the contribution of fertilizer subsidies to
national food and nutrition security strategies remains highly controversial. What was
established, however, is such that programmes have become unavoidable in the
agricultural policy portfolio. They have become a widely used policy instrument, to
which governments devote very large shares of their national budgets, and this makes
them de facto central to supporting national agricultural and food security strategies. It is
also unanimously recognized that, in view of their mixed record, subsidies where they
exist must be improved in order to raise their effectiveness.
Also, low agriculture production is a major constraint in the country, hence the people are
struggling to meet their needs, and this has been because they lack some of the resources
to improve their productivity (Signh, Masuku & Thwala, 2015). They mentioned Dixon
& Macarov (1998) who highlighted that poverty is the lack of basic human needs, such as
clean water, nutrition, health care, education and shelter because of in ability to afford
them. According to McGreevy (1980), he summarized poverty as a state of being unable
to access sufficient income to provide certain physical or social needs. Poverty in rural
areas is inflicted by several factors which include; illiteracy, unemployment, lack of land
for commercial farming, unconducive climatic conditions, lack of water resources, poor
infrastructure development which opens opportunities for investment.
Most people agree on the uniqueness of agriculture the production cycle, dependence on
weather, susceptibility to price swings, to name a few, as it justifies a certain level of
government involvement. Dixon and Macarov (1998) reported that poverty is the lack of

34
basic human needs, such as clean water, nutrition, health care, education and shelter
because of in ability to afford them. While McGreevy (1980) summarizes poverty as a
state of being unable to access sufficient income to provide certain physical or social
needs. Poverty in rural areas is inflicted by several factors which include; illiteracy,
unemployment, lack of land for commercial farming, unconducive climatic conditions,
lack of water resources, poor infrastructure development which opens opportunities for
investment. Women are more vulnerable to poverty on contrary they can own land and
manage their finances (United Nations Organization, 2010). Poverty is of sustainable
rural development depends on, developing and implementing comprehensive strategies
for dealing with climate change, drought, desertification and natural disaster elaborated
(Naude, 1999).
Rural Development Area
Rural livelihoods are enhanced through effective participation of rural people and rural
communities in the management of their own social, economic and environmental
objectives by empowering people in rural areas, particularly women and youth through
the Agricultural Extension offices, organizations such as local cooperatives and by
applying the bottom-up approach. Many farmers in the rural settings participate in
farming as the activity of generating income for their households and also selling part of
the produce for community settlers. Historically, African smallholder farmers managed
the fertility of their croplands mainly by leaving fields in fallow regularly and, in some
regions, by applying animal manure (Minot & Benson, 2009).
In many important agricultural areas, however, they stated that increasing rural
population densities are reducing the land available for crops and pasture, posing
challenges for both of these approaches to soil fertility management. As such,
significantly greater use of inorganic fertilizer has been an increasingly important factor
to ensure that farmers in Africa are able to farm profitably and to boost production to
meet the food needs of the continent. Enabling farmers to expand their use of inorganic
fertilizer is a key challenge facing African governments. The evidence is fairly clear that

35
the fertilizer subsidies governments implemented in the 1970s and 1980s had a high
fiscal cost, largely displaced private-sector input distribution systems, and were not very
effective in stimulating output or assisting the poor.
Agricultural Input Subsidies – Fertilizer Subsidy
In 2006, the African Fertilizer Summit came up with the Abuja Declaration which
emphasized that African Union member should increase fertilizer use rate, from a rate of
8 kg per hectare to an average of 50 kg per hectare by 2015. One of the ways of achieving
this was to grant targeted fertilizer subsidies (AU, 2006). Similarly, the Alliance for a
Green Revolution in Africa (AGRA) has also been vocal in the proposal of use of
fertilizer subsidy and certified seeds in increasing production in SSA citing the success of
such an initiative in Malawi (Druilhe & Barreiro-Hurle, 2012).
According to Minot (2009), fertilizer subsidies were common in SSA in the 1960s to
1980s. It is mentioned that these subsidies were implemented through government owned
bodies. Such bodies controlled importation and distribution of the subsidized fertilizer
hence leaving out the private sector. Agricultural input subsidies were a major component
of agricultural development strategies in sub-Saharan Africa (SSA) in the 1970s and
1980s. Again, Universal price subsidies on fertilizers were common from the 1960s to the
1980s in sub-Saharan Africa (SSA) and in Asia (Druilhe & Hurlé, 2012).
In recent years, large-scale input subsidy programs have re-emerged across the continent,
and their reintroduction gained particular momentum following the first African Fertilizer
Summit, which was held in Nigeria in 2006 (AU, 2006). Today, seven African
governments alone spend roughly US$2.0 billion on fertilizer promotion programs each
year. As poor farmers cannot afford the inputs and technologies needed to increase
productivity, an important means to improve food security is crucial (Druilhe & Hurlé,
2012. Thus, agricultural input subsidies like the fertilizer subsidy are a way of
incentivizing farmers to procure inputs like fertilizer and seeds.

36
Despite the debate about their appropriateness as policy tools, agricultural input subsidies
have been re-introduced in sub-Saharan Africa with the initial intention of mitigating the
effect of global food price hikes, which peaked in 2008 (Wideru, 2015). The new
generation of subsidy programs are expected to improve access and use of fertilizers,
increase agricultural production and productivity, and ultimately improve the well-being
of arable crop farmers. Again, evidence available for countries in eastern Africa, suggests
that the programs have largely succeeded in increasing productivity, production, incomes,
and food security (Wideru, 2015).
He further highlights that fertilizers are applied to meet specific nutritional needs of
crops, and to minimize potential environmental hazards of continuous cropping.
Additionally, fertilizers increase productivity and investment returns in crop production
systems (Olagunju & Salimonu, 2010), and thus enhance household, national, and global
food availability. Therefore, fertilizer application is critical for sustaining global food
security and well-being.
Druilhe & Hurlé (2012) pointed out clearly that by making fertilizer cheaper, input
subsidies may raise fertilizer use. However, they argue that the level of fertilizer use will
only be optimal from an economic perspective if households benefiting from the subsidy
are facing market failures. They highlighted two main market failures when analyzing
fertilizer use in SSA: farmer lack of knowledge and lack of fertilizer market
development. This implies targeting and while maximizing distributional impacts it also
raises greater implementation issues and creates more opportunities for political
interference in distributing and allocating benefits.
One should be mindful that, even in the presence of subsidies, profitability might not be
achieved in all and any contexts. Raising the technical efficiency of input use through
improved agricultural practices (e.g. following best practices from integrated soil fertility
management and conservation agriculture approaches) is critical in promoting sustainable
benefits. Also, this raises the importance of devoting public resources to a set of
complementary measures that will strengthen the demand for fertilizer (Druilhe & Hurlé,

37
2012). Other studies looked at the relationships between the subsidy, productivity, output
and asset levels which is the input-output relation. The first two i.e. government
expenditure and subsidies are inputs while the rest are outputs, outcomes and impacts.
The outputs, outcomes or impacts could be characterized by long/short term,
direct/indirect consequences on the beneficiaries and the community at large. For non-
beneficiaries, the scenario would be different and such differences should be significant if
the policy has any impact.
Fertilizer Subsidy of Swaziland– Turnkey Project
The Fertilizer Subsidy (FS) was a Three year program (2014-17) aimed at assisting small
scale farmers to improve maize production in order to attain food self-sufficiency and
food security for the country by subsidizing the basic inputs of seed and fertilizer. The
support program aimed at providing the following bulk inputs: 6 bags per ha 2:3:2 (38) x
50 Kilograms (Kg); 3 bags LAN (28%) x 50 Kg and 25 Kg Seed. The objectives were: to
achieve food self-sufficiency through the improvement in the production of Maize as a
staple crop in the high maize potential areas of the country; to increase small scale farmer
access to inputs such as fertilizer and Seed and to target 21,500 ha, each household
providing one ha of land (MOA, 2012).
The fertilizer subsidy of Swaziland was targeted assigned as per the climatic condition. In
fact, the Government of Swaziland has not been providing agricultural input subsidies
(fertilizer subsidy) to maize farmers as revealed during the National Agriculture Summit
(2007), whereas maize is the main staple food of Swaziland. Thus, there was need to
subsidize maize farmers due to the escalating costs of fertilizer which resulted to low
application of fertilizer, low maize production, food and nutrition insecurity. To
ameliorate the efficient application of fertilizer, the Government initiated the TURNKEY
project which included Fertilizer Subsidy Programme in the 2014/15 cropping season,
with financial support from the Government of India. The programme’s provisional
number of targeted farmers stood at 21 750 farmers; however, only about 3 723 farmer
received support in the 2014/15 agricultural campaign, as the programme initially

38
focused on farmers in the more productive Agricultural Ecological Zones of Highveld
and moist Middleveld. However, under the Central Rural Development Area, 800
targeted farm households benefited from the fertilizer subsidy. It was expected that the
number of recipients will increase during the following cropping season.
According to FAO (2015), the subsidy package was that registered farmers pay 50% of
the cost for one 25 kg bag of maize seeds, four 50 kg bags of LAN fertilizer and six 50 kg
bags of NPK fertilizer. The criteria for selection was that farmers must register and were
expected to produce at least 80 bags of maize from one hectare (FAO, 2015). It was
further stated that the distribution was to be done by Farm Chemicals Ltd as the sole
importer and distributor of inputs (FAO, 2015).
2.5 Chapter Summary
Based on the reviews, vast literature exist related to fertilizer subsidies and maize
production. Neoclassic theory is pointed in the review since it revealed individual
favouring over the society this is why it is relevant to the study since the fertilizer
subsidy was given to individuals such as the producers over the consumers which had an
effect to the society as whole this result to deadweight loss. Again, in order to produce
maize effectively, necessary fertilizer application like NPK is essential to increase
production to ensure food and nutrition security.
According to literature, maize remains one of the important sources of staple foods in
Swaziland and is predominately grown on SNL for subsistence purposes (FANPRAN,
2003). However, despite government interventions, there is evidence, the country don’t
meet supply and demand of maize, thus recently, the government initiated fertilizer
subsidies in order to increase maize production and ensure food security.
As per the Abuja declaration, governments in the sub Saharan Africa were requested to
subsidized farmers with fertilizer to ensure efficient use. In re-introduction of subsidies,
different advocacies of subsidies have been put into place. Thus recently, the government

39
initiated fertilizer subsidies in order to increase maize production and ensure food
security. However, the country demand maize more than what is supplied domestic that is
why the country have shortage thus import maize to cover the shortage of what is
demanded.
On another note, there a number of important factors affecting the efficiency of
smallholder maize producers such as: oxen holding, farm size, use of maize seed,
education level, use of fertilizer, herbicides, farmers’ age and experience, distance of the
farm to the main access road, household size/labor, gender, usage of hand hoe, off farm
income, farmers’ membership to associations, access to development agents, and access
to credit.
Also, several studies have been conducted to assess impacts of fertilizer subsidies. These
studies seem to have a coinciding argument on the success of the program in increasing
the fertilizer uses, and improve production where guidelines were adhered. The study
assessed different authors who dealt with fertilizer subsidy on different levels, however,
this study focused of fertilizer subsidy and maize output of beneficiaries and non-
beneficiaries.
Literature revealed that the Propensity Score Matching (PSM) technique, first proposed
by Rosenbaum (2010), is an econometric approach that is used by researchers to evaluate
the effects or impacts of a programme intervention on social or economic outcomes. The
study discovered that Propensity score matching has become a popular impact evaluation
method to estimate the average treatment effect on the treated of the intervention
worldwide on different interventions. However, there are few research findings that are
done recently applying the method to assess impact of an intervention in and out of the
country. The study noted that this approach accounts for sample selectivity bias in
programme interventions, since selection of beneficiaries into such programmes are often
nonrandom and therefore is subject to sample selection bias. PSM is used in analysis of
data from quasiexperiments to balance two nonequivalent groups on observed
characteristics to obtain more accurate estimates of the effects of a treatment

40
(beneficiaries of intervention) on which the two groups differ (Luellen, Shadish & Clark,
2005).
Although most of the theories discussed in the study are at the macro level, the present
study tends to narrow down on the factors influencing the maize output of farm
households by using descriptive statistics, PSM in the CRDA. The reviewed factors of
fertilizer subsidy of farm household serve as the theoretical underpinning for the choice
of explanatory variables used in the PSM in chapter three. It is worth mentioning that
there are several socio economic characteristics affecting maize production. Thus, the
study applied the PSM compare two groups: beneficiaries and non- beneficiaries based
on socio economic characteristics and compare selected choice variables with maize
output of those that receive fertilizer subsidy. Thus, this study will attempt to add to the
body of knowledge addressing fertilizer subsidy in CRDA using these different models:
Propensity Score Matching, Rubin Causal Model and Least Squares Regression model.
This chapter reviewed the literature based on: theoretical, empirical as well as
methodological. The main evaluation tool discussed is the Propensity Score Matching
will be used in the study. Empirical findings from other authors were reviewed.
41
CHAPTER 3
METHODOLOGY
This chapter describes the method of the study: research design, target population, sample
size, sources of data and data collection. Data analysis and modelling is also described in
the study including Propensity Score Matching method.
3.1 Research Design
The study employed a quantitative approach using a cross-sectional research design
(Busk, 2005) to investigate the impact of the Fertilizer subsidy programme over time in
the 2014/15 agricultural growing season. Also, the study used cross sectional data since
one or more variables were collected at a point in time thus it was not time series.
Quantitative design was used as it allows measurement of relationships between two
variables and a case study was used. Real life data set acquired from the Central RDA
beneficiaries and non-beneficiaries were used for the study. Cross section design was
explored because it facilitated a snap shot evaluation at a particular point in time in
2014/15 agricultural season, when the subsidy started.
3.2 Study Area
The study area was the Central Rural Development Area (Ludzeludze RDA) under
Ministry of Agriculture in Swaziland. The RDA is situated under the Ludzeludze
Development area, Manzini region. Again, the Central RDA incorporates three
geographical regions of Swaziland, that is, Dry Middleveld, Wet Middleveld and the
Highveld and it is the largest in terms of area coverage. The area was selected for the
study as it has high potential and may be referred to as one of Swaziland’s grain basket.
The area is covered by croplands (69%), forests (19%) and grasslands (12%). The mean
farm size varies between 1.6 ha and 2.5 ha with an estimated number of 35 000 farmers
(CRDA Report, 2017). Most households grow subsistence crops, principally and
vegetables as cash crops and about 65% own cattle. Maize is as the vital economical back
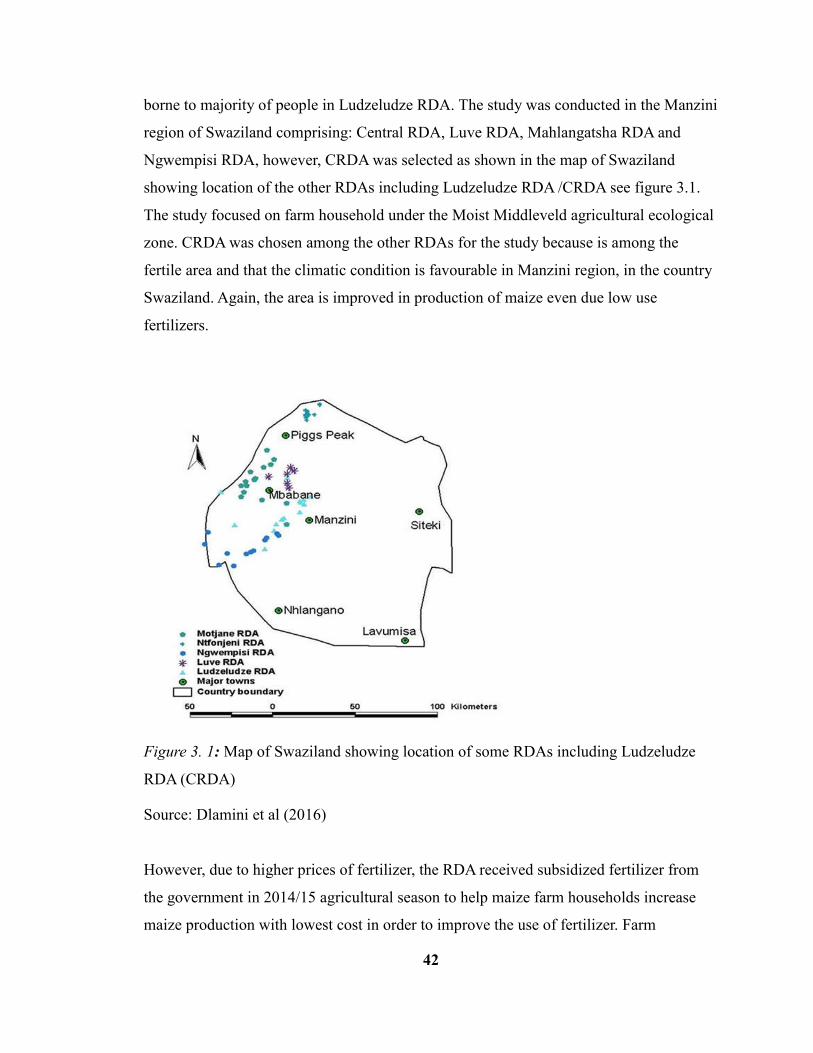
42
borne to majority of people in Ludzeludze RDA. The study was conducted in the Manzini
region of Swaziland comprising: Central RDA, Luve RDA, Mahlangatsha RDA and
Ngwempisi RDA, however, CRDA was selected as shown in the map of Swaziland
showing location of the other RDAs including Ludzeludze RDA /CRDA see figure 3.1.
The study focused on farm household under the Moist Middleveld agricultural ecological
zone. CRDA was chosen among the other RDAs for the study because is among the
fertile area and that the climatic condition is favourable in Manzini region, in the country
Swaziland. Again, the area is improved in production of maize even due low use
fertilizers.
Figure 3. 1: Map of Swaziland showing location of some RDAs including Ludzeludze
RDA (CRDA)
Source: Dlamini et al (2016)
However, due to higher prices of fertilizer, the RDA received subsidized fertilizer from
the government in 2014/15 agricultural season to help maize farm households increase
maize production with lowest cost in order to improve the use of fertilizer. Farm

43
households were requested to pay for the fertilizer subsidy 1000 SZL / Emalangeni each.
Farm household who did not benefit procured fertilizer for themselves to produce maize.
3.3 Target Population
The target population of the study was the Fertilizer Subsidy beneficiaries and non-
beneficiaries in maize production. The beneficiaries was the treatment group while the
non-beneficiaries, the control group. There were 800 beneficiaries of the Fertilizer
Subsidy Programme’s up-to-date list from the Agriculture Officer of CRDA that received
subsidy in the 2014/15 agricultural season. The target population were the 800
beneficiaries of the programme on fertilizer subsidy programme who benefited and those
who did not benefit from the fertilizer subsidy. Additionally, based on the estimated
number of 35 000 farm households, as stated in the CRDA report, a list from the
Agricultural Officer was employed for those that did not receive fertilizer subsidy as
target population for the non-beneficiaries.
3.4 Sampling procedure and Sample size
A sample design was done to collect the data. The study used a representative sample
survey of eligible beneficiaries and non-beneficiaries who benefited from the subsidy in
the agro ecological zones of the Moist Middleveld in 2014/15. In order to determine the
impact of the fertilizer subsidy, farm households were stratified into two groups
consisting of beneficiaries and non-beneficiaries.
Sampling frame was a list of farmers who were beneficiaries from the Agriculture Officer
and non-beneficiaries obtained from the Ludzeludze RDA Field Officer, under the
Ministry of Agriculture in Swaziland. Sampling technique was purposive sample for the
case study as it may be generalized since quantitative results can be generalizable
whereas the qualitative results may not be (Khandekar et al, 2010). The sampling
population was purposively selected because of limited resources that the RDA did not
having number of farmers in the RDA especially non-beneficiaries.

44
The non-beneficiaries (control) was kept as large as possible to increase the likelihood of
finding good matches for the participants (Baser, 2006) in order to do the Propensity
Score Matching. The case study was adopted because it deals with specific targets thus
was considered for the study, more so that is a case study Beneficiaries of the subsidy
was the treatment group, and the non-beneficiaries was the control group which were
selected from different communities within the CRDA office: Boyane, Dwaleni,
Ludzeludze, Mahlanya, Mbekelweni, Mpini, Nyakeni, Mbeka, ESiyeni, Ngonini,
Nhlambeni, Nsenga, Masekweni, Ngcayini, Sibuyeni, Sigombeni, Zombodze as well as
Makholweni to cite a few as shown in Table 3.1.
Table 3. 1
Selected respondents from different communities.
Source: Author’s field survey
Communities Respondents
Boyane 2
Dwaleni 1
Ludzeludze 8
Mahlanya 1
Mbekelweni 4
Mpini 1
Nyakeni 2
Mbeka 1
ESiyeni 2
Ngonini 1
Nhlambeni 1
Nsenga 21
Masekweni 1
Ngcayini 3
Sibuyeni 3
Sigombeni 5
Zombodze 28
Makholweni 1
Total 86

45
3.5 Data Sources and method of Data collection
The primary data was collected through a well-structured questionnaire of beneficiaries
and non-beneficiaries of the fertilizer Subsidy on maize production through the Ministry
of Agriculture, Extension Department at the Rural Development Area with the assistance
of the Senior Extension Officers.
Interviews were conducted after the questionnaire (Appendix E) was developed.
Demographic, socioeconomic, agronomic, production, institutional characteristics of
households was collected from both the Fertilizer Subsidy Programme beneficiaries and
non-beneficiaries for both objectives. Respondents Selected from different communities
under the CRDA. The independent variables that affected the impact included: Gender,
age, marital status, education, occupation, family size and the amount contributed by
individual member also descriptive analysis which includes the use of frequency,
percentages, means, and standard deviations.
Ethical Consideration
Before going to the field all necessary permission were obtained from the Ministry of
Agriculture- Central Rural Development Area office. The Agricultural Extension Officer
including the Field Officer in place were consulted and they gave permission to visit the farm
households. Ethics of the study was employed as information gathered from the beneficiaries and
non- beneficiaries was treated with confidentiality. The intention was to maintain high standard of
ethics and avoid disclosure of personal information for the respondents.
3.6 Data compilation, coding and cleaning
Data were encoded on Microsoft Excel and recoded on RStudio which is a new
appropriate statistical analyses through statistical software (R) has great potential in
econometrics for research. Coding was done before and after data collection by
numbering the questionnaire. Encoding and recoding was done after collecting the data.
Data cleaning was done subject to statistical analysis to generate descriptive statistics.

46
Data was analyzed with the use of descriptive statistics generated from the
Comprehensive R Archive Network (CRAN).
The data set for this case study was intended to answer at least the following research
questions: What were the socio economic characteristics of beneficiaries and non-
beneficiaries? Secondly, what was the impact of the fertilizer subsidy programme on the
treatment on maize output?
3.7 Data analysis and Modelling
Both descriptive and inferential statistics were used to analyze data obtained. The socio
economic characteristics were described using Tables, frequency counts and percentages,
measures of central tendency and dispersion such as mean, median, quantiles. Also
descriptive analysis includes mean, standard deviations, t-values for beneficiaries and
non-beneficiaries. Welch t-test was used for 3 selected quantitative variables. In addition,
the study used histogram, QQ and scatter plots. The inferential statistics were conducted
with the means of Propensity scores and Econometric Model.
3.7.1 Method of Data Analysis
Data was organized using Microsoft Excel to consolidate all returned data from the
CRDA from respondents (beneficiaries and non-beneficiaries). For the first objective to
examine the socio economic characteristics, Descriptive statistic in R using dplyr
package, cross tabulation, Tables, frequency, counts, percentages. Choice variables: were
Gender, Age, Education, farm household size, farming experience, education. For
quantitative analysis, Age, Farm household size and farm household experience were
analyzed. The study used Welch’s t-test, which is a two-sample location test, used to test
the hypothesis that two populations have equal means.
Based on the second objective, Propensity Score Matching (PSM) in R, Nearest neighbor
1:1 method, Average Treatment Effect -parametric analysis, Average Treatment effect on
Treated estimates and Least Squares Regression Model were used, using MatchIt and

47
Zelig packages. Simulation study, explored covariates with small sample size for the case
study. Visual presentation QQ Plot, jitter plot were done. Covariate selection were
weighted outcome (maize output), Gender, Age, Education, farm size, income, credit,
experience. Response variable included: maize output, Independent variables: Benefited,
income (2013/14), Gender, experience and credit. Descriptive analysis, Econometrics and
comparative analysis were done.
Propensity score analysis (PSA) is a technique that balances pretreatment covariates,
making the causal effect inference from observational data as reliable as possible. PSM
uses information from a pool of units that do not participate in the intervention to identify
what would have happened to participating units in the absence of the intervention.
Propensity score matching is a statistical technique in which a treatment case is matched
with one or more control cases based on each case’s propensity score. This matching
strengthen causal arguments in quasi-experimental and observational studies by reducing
selection bias. The aim of matching is to find the closest comparison group from a sample
of non- participants.
Whilst there are other software than R for conducting propensity score matching, R was
chosen because it is open-source software and is widely used by data scientists across
many different fields. R was used in the study as it is a very flexible (and free) statistical
software package which can be downloaded from the URL in the R Core Team 2014.
The study also used MatchIt package by Ho, Imai, King, and Stuart (2006),
Nonparametric preprocessing for parametric causal inference. MatchIt is the main
command of the package MatchIt, which enables parametric models for causal inference
to work better by selecting well-matched subsets of the original treated and control
groups. This method involve two-step process: does matching, then user does outcome
analysis. This had a Built-in diagnostics. However, the study used the Nearest Neighbor
method for preprocessing.

48
Table 3. 2
Description of variables used for PSM
Source: Survey data, 2017
Variables Description Measurement Expected
signs
Authors
AGFH Age of Farm household Number of
years
+ Dorward (2009)
GENDFH Gender of Farm Household D = 1 if male;
0 female
+/- Bunde (2014)
MSTFM Marital Status of Farm
household
D = 1 if
married; 0 =D
+ Sianjase (2013)
EDFH Education of Farm Household Categorical +/- Minde et al
(2009)
OCCFH Occupation of Farm Household Number of
years
- Crawford et al
(2006)
INCOFH Income of 2013/14 of Farm
Household
Continuous +/- Sianjase (2013)
SOUINC Source of farm Household
Income
+ (Khandekar et al,
2010)
FSIZFH Farm Size of Farm Household Farm size
squared
- Dorward and Poulton
(2008)
FMEXP Farming experience Number of
years
+/-
Sanga P. (2013)
OMA Maize of output crop produced
for year 2014/15
Kilogram for
maize in kg
+ Sanga P. (2013)
LFM Number of labourers of
household
who assist in the farm
Number + Lister, N. M. (2011)

49
3.7.2 Average Treatment Effect and Average Treatment Effect on Treated
Average Treatment Effect and Average Treatment Effect on the Treated was estimated,
however, the average treatment effect on the treated was quite robust. This was done
estimating the coefficients in the control group alone. It was done by conducting nearest
neighbor matching with a logistic regression-based propensity score which gave the
results shown in Appendix A and B. Then the same simulation procedure in order to
impute the counterfactual outcome for the control group was computed. Balance was
checked numerically and graphically. Covariates were selected and were pooled together
with treaded and control units (beneficiaries and non- beneficiaries respectively).
Pooled Average Treatment Effect for the Treated: Y – EV. So, the ATT (Average
Treatment Effect on the Treated) was obtained after using Zelig, which estimated the
Average Treatment Effect overall (ATE):
When the best balance was achieved, the study ran parametric analysis. Then, the
explanatory variables were set at their means and changed the treatment variable from a 0
to a 1: as illustrated in Appendix A.
3.7.3 Least Squares Regression Model
Variable of choice were selected and constructed a Linear model using R including
Independent variable and 5 dependent variables as shown in Appendix C, R code output.
However some variables were dropped from the model on the basis of low significance
level and low contribution in improving the overall significance of the estimation model.
The study used least squares regression analysis to estimate the best linear predictor for
the specified dependent variable of Maize output. Based on the formula, Y was the
outcome variable, mymodel was the selected model which in this case was least squares
(ls), and z.out is the output object from zelig. This output object indicate estimated
coefficients, standard errors, and other typical outputs from the chosen statistical model.
Then, the contents were examined via summary (z.out) or plot (z.out), but the idea of
Zelig was that these statistical results were typically only intermediate quantities needed
to compute the ultimate quantities of interest, which in the case of matching are usually

50
causal inferences. To get these causal quantities, Zelig’s other two commands were used
as shown in Appendix B.
Least Squares Regression Model
Y= 0+
1X
1+
2X
2 + 3 X 3 +
4X
4 + 5 X 5 + µ
Where:
Response variable: Y = Maize Output (in Kilograms)
X 1
= Benefited (Those who received fertilizer subsidy)
X 2= Gender (male= 0, female=1)
X 3 = Income of previous year 2013/14 (SZL)
X4 = Experience (years in farming)
X 5 = Credit access (received credit to buy fertilize)
0… 5 = Parameters were estimated
μ = Random error
Defining variable of choice for Least Squares Regression
Maize Output (Y) was measured in terms of Kgs cultivated by beneficiaries of fertilizer.
It is expected to be indirectly related to productivity because most evidence shows an
inverse relationship between farm size and productivity.
Benefited (X1
) was treatment: Beneficiaries =0 or non-beneficiaries =1. It was expected
those that received subsidy to have a positive effect on output, the higher one attains it.
Gender (X2) was measured in male=1 or female=0. It was expected that gender have a
positive relationship between on maize output.
Income of 2013/14 (X 3 ): was measured as sales from maize sold the previous year
2013/14. It was expected that having income would enabled them to pay for subsidy
buying seeds, fertilizers, mechanical, transport cost and labour.

51
Experience (X4): The number of years a farm household has been growing maize was
expected to positively influence his management expertise, skills and enhance fertilizer
application thus improve maize output. It is expected that there is no explicit relationship
between productivity and experience because it is usually a quadratic. In agriculture,
experience matters most when there are innovations as it helps overcome barriers.
Access to credit (X 5 ): It is expected that farm household have access to credit or loans to
pay for inputs costs such as fertilizer. It is expected that farmers who access credit from
finance institutions are likely to increase maize production.
Least Squares Regression /Multiple Regression Estimates of Maize Output
The study used least squares regression analysis to estimate the best linear predictor for
the specified dependent variable of Maize output. The R software was used to estimate
the parameters and marginal effects of the determinants of the extent of maize output by
farm households. Thus, to see if the set of predictor variables is useful to predict the
response variables the Zelig package was used to fit the model which printed test statistic
and the p value on the two sided test. Thus, to test is simply interpreting the results.
3.8 Chapter Summary
This chapter presented method of the study, research design, and analysis of the study.
The methods used formed the foundation of the study. Interviews were conducted to
collect real data where the Propensity Score Matching was explored using cross
tabulation from dplyr package, in R for the socio economic characteristics, to get counts,
frequency and mean and standard deviation. Welch t-test was used for selected
quantitative variables (Appendix A), PSM, MatchIt and Zelig packages were used to
match data before and after. Then, ATE, ATT and Least Squares Regression was applied,
formula found in Zelig to even do the F-test to assess the impact of the fertilizer subsidy.
Summary of output, R codes /syntax used are shown in Appendix A and B.

52
CHAPTER FOUR
RESULTS AND DISCUSSION
The chapter presents the empirical results where cross tabulating farm household and data
manipulation of Socio economic Characteristics’ distribution profile by treatments were
obtained. Socio economic Characteristics of the farm households who are beneficiaries
(treatment) of the subsidized fertilizer with the non-beneficiaries (control) of fertilizer in
section 4.1. Selected quantitative variables indicate: average/ mean, standard deviation
and t-test value for respondents are shown in this section. Empirical findings for the
impact of fertilizer subsidy on beneficiaries and non-beneficiaries using propensity score,
average treatment effect on treated as well as least squares regression analysis are
presented in section 4.2.
4.1 Socio economic Characteristics of the Respondents
By cross tabulating farm household and data manipulation, Socio economic
Characteristics ‘indicate beneficiaries and non-beneficiaries in ount or frequency and
Percentages. The results showed the total numbers of respondents of 86, where 42 were
beneficiaries, 44 non-beneficiaries. There were 41 (48%) male and 45 (52%) female
respondents as shown in Table 4.1.There were 52.38 % female beneficiaries more than
men who were 47.62% which showed gender equity. Large proportions of the
respondents were within the age group of 41 and above years accounting for 74.42%.
These showed that respondents were the most active groups in production with decision-
making at household level in the CRDA. The other respondents belonged to the age
group of 33-40, 26-32 and 18-25 years with 17.44%, 4.65% and 3.49% respectively.
Results showed that 70.93% of all respondents were married.In addition, 14% of all
respondents were single; 13% widowed, 1% divorced and 1% cohabiting.

53
Also, that a large proportion of respondents (86.7%) had secondary and high school level
of education. Few respondents had college education (15%), Primary education (13%),
adult education (7%) and 5% had no formal education.
Table 4. 1:
Distribution of socio economic characteristics of Respondents: gender, age, marital
status and education
Item Benefi
ciaries
Non-
beneficiarie
s
Benefici
aries
Non-
beneficia
ries
Respo
ndents
Count Count Percent
age
% Total
Count
Total %
Gender
Female 22 23 52.38 52.27 45 52.33
Male 20 21 47.62 47.73 41 47.67
Age (years)
18-25 1 2 2.38 4.55 3 3.49
26-32 1 3 2.38 6.82 4 4.65
33-40 7 8 16.67 18.18 15 17.44
Above 41 33 31 78.57 33.00 64 74.42
Marital status
Single 3 9 7.14 20.45 12 13.95
Widowed 4 7 9.52 15.91 11 12.79
Married 34 27 80.95 61.36 61 70.93
Divorced 1 0 2.38 0.00 1 1.16
Cohabiting 0 1 0.00 2.27 1 1.16
Education
None 0 4 0.00 9.09 4 4.65
Adult
Education/
Sebenta
2 4 4.76 9.09 6 6.98
Primary 4 7 9.52 15.91 11 12.79
Secondary + 29 23 69.05 52.27 52 60.47
College + 7 6 16.67 13.64 13 15.11
Source: Author’s calculation using dplyr in R, 2017
Table 4.2 shows that 34.88% of the respondents have their own farms, 33.72% were self-
employed, 19.77 % were employed, 10.47% were unpaid family and 1.16% were
unemployed.
Also, 53.1% of respondents had a family size ranging between 5 and 7 members, 29.4%
had a family size of between 8 and 10 members; while 15% had a family size of more
than 10 members. The distribution of respondents with labourers ranging from 4 to 6

54
were 41 (47.67%), those with 0 to 3 labourers were 36 (41.86%) and those with labourers
above 7 were 9 (10.47%).
Also, a large proportion of respondents had experience in maize production ranging from
31 to above 40 years of experience about (46.52 %).
Table 4. 2:
Distribution of socio economic characteristics of Respondents: occupation, farm
household size, labourers and experience with 86 sample size
Item Benefi
ciaries
Non-
beneficia
ries
Benefi
ciaries
Non-
benefici
aries
Respo
ndents
Count Count Percent
age
% Total
Count
Total
%
Occupation
Paid
employed
7 10 16.67 22.73 17 19.77
Self-
employed
17 12 40.48 27.27 29 33.72
Unpaid
Family
7 2 16.67 4.55 9 10.47
Own Farm 10 20 23.81 45.45 30 34.88
Unemploye
d
1 0 2.38 0.00 1 1.16
Farm household
size
0 to 5 14 13 33.33 29.55 27 31.40
6 to 10 4 9 9.52 20.45 13 15.12
11 to 15 23 20 54.76 45.45 43 50.00
above 16 1 2 2.38 4.55 3 3.49
Labourers
0 to 3 18 18 40.91 42.86 36 41.86
4 to 6 21 20 47.73 47.62 41 47.67
above 7 5 4 11.36 9.52 9 10.47
Experience
0 to 10 7 8 16.67 18.18 15 17.44
11 to 20 7 11 16.67 25.00 18 20.93
21 to 30 5 8 11.9 18.18 13 15.11
31 to 40 11 9 26.19 20.45 20 23.26
above 40 12 8 28.57 18.18 20 23.26
Source: Author’s calculation using dplyr in R, 2017

55
Socio economic characteristics of Quantitative variables for farm households discussed
are age (in years), farm household size, and farm household experience of beneficiaries
and no-beneficiaries are shown in Table 4.3. Results indicated that majority are 74% of
the household heads fall within the age category above 41 whilst 1% are above 18 years
of age. The average mean range was 4 due to the coding which were those above 41.
Thus, the age estimated to be 41 or above with average household size is 8. The results
are in line with Ricker Gilbert et al. (2011) found that households with older heads may
have strong, long-term networks with the government officials charged with vetting the
beneficiaries of subsidized fertilizer.
This shows that large household sizes ensure adequate supply of family labour for maize
production activities. The Welch sample t-test shows that there is no significant difference
in family size between the beneficiary of fertilizer subsidy and non-beneficiaries. Again,
large families enable household members to earn additional income from non-farm
activities (Al-Hassan, 2008). Maize producing farm households in the Central Rural
Development Centre have 45 years of farming experience on average, implying that older
farm households are more experience in the RDA.
Table 4.3:
Socio economic characteristics for selected quantitative variables for respondents with
86 sample size.
Mean Standard
deviation
Quantitative Variable Beneficia
ries
Non-
Benefici
aries
Beneficiarie
s
Non-
Benefici
aries
t-
value
Remarks
Age
(years)
52
55
13.3
11.3
-0.98
Not
Significant
Farm household size
(number of people in
household)
9
7.4
4.33
3.39
1.36
Not
significant
Farm household
experience (number of
years in farming)
28
30
15.9
14.9
-0.76
Not
Significant
Source: Author’s calculation, 2017

56
Results in Table 4.3 shows income of respondents where a large proportion (94%) of
them earned less than SZL 20, 0000, only 5 % had ranging income from SZL 20,001 to
40,000 and only one of them earned above SZL 40,000 from maize in the year 2013/14.
The results also show that fertilizer use intensity by income earning households that
benefited in the fertilizer subsidy is higher by 98% than that of non-beneficiaries income
earning household heads by 91% but not substantial.
The relatively lower use of fertilizer among these farmers may be attributed to a greater
dependency on household heads coupled with attitudinal behavior which requires
continuous sensitization and education.
Results show sources of income for the respondents by treatments. Respondents sourced
income from: maize production with the largest proportion of 33.72%; wages (23.26%);
pensions and or elderly grants (15.12%); 12.79% other crops such as vegetables and
sweet potatoes to name a few. About 8.14% was from business and 6.98% were from
livestock production.
The distribution of the respondents by treatments with respect to access to credit showed
that about 93.18% of the non-beneficiaries did not have access to credit in order to pay
for subsidy or procure subsidy. Only 9.52% had access to credit from different sources.
Farm size is one of the crucial factors in the production process which need to be
fertilized in order to increase production. Table 4.3 shows the large proportion of land
owned by the respondents. Distribution of farm size cultivated by the respondents
indicated that 46 (53.49 %) had the farm size of l.5- 5 ha; 25 (29.07 %) had the farm size
of and 15 (17.44 %) had l less than 1 ha.
Farm power used by respondents showed that 55% used Community Tractor, while 33%
used Government tractor and only 3% used own tractors and others respectively.
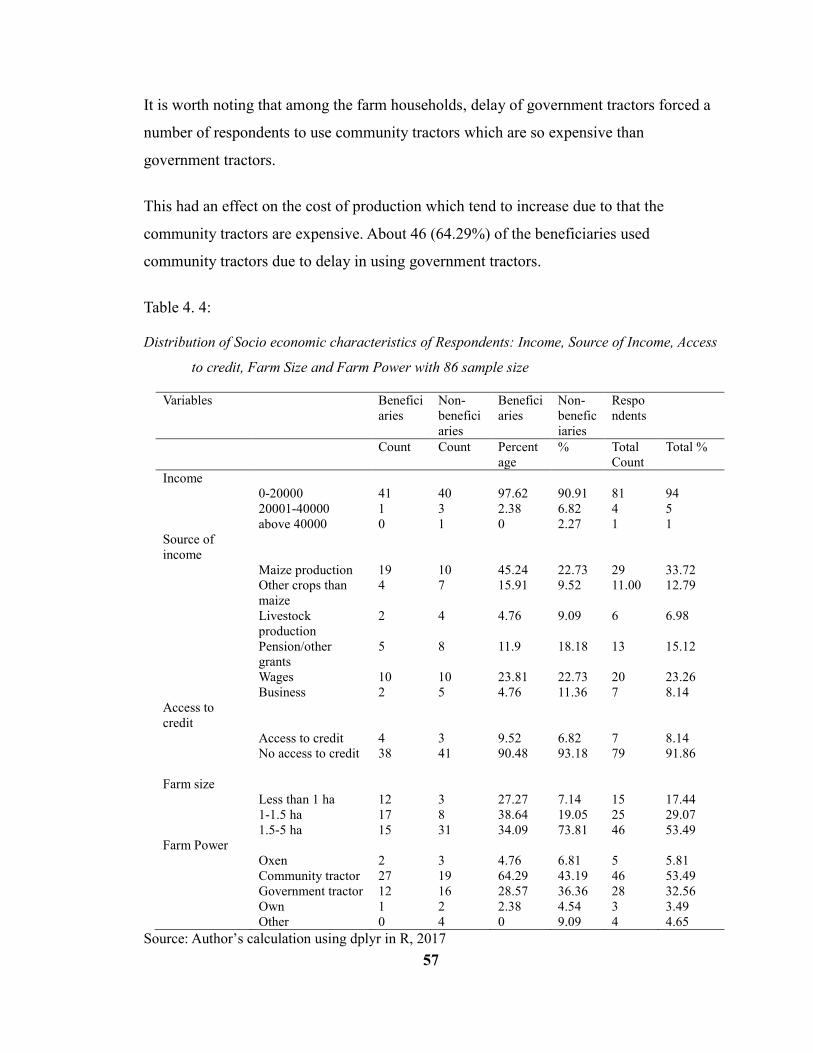
57
It is worth noting that among the farm households, delay of government tractors forced a
number of respondents to use community tractors which are so expensive than
government tractors.
This had an effect on the cost of production which tend to increase due to that the
community tractors are expensive. About 46 (64.29%) of the beneficiaries used
community tractors due to delay in using government tractors.
Table 4. 4:
Distribution of Socio economic characteristics of Respondents: Income, Source of Income, Access
to credit, Farm Size and Farm Power with 86 sample size
Variables Benefici
aries
Non-
benefici
aries
Benefici
aries
Non-
benefic
iaries
Respo
ndents
Count Count Percent
age
% Total
Count
Total %
Income
0-20000 41 40 97.62 90.91 81 94
20001-40000 1 3 2.38 6.82 4 5
above 40000 0 1 0 2.27 1 1
Source of
income
Maize production 19 10 45.24 22.73 29 33.72
Other crops than
maize
4 7 15.91 9.52 11.00 12.79
Livestock
production
2 4 4.76 9.09 6 6.98
Pension/other
grants
5 8 11.9 18.18 13 15.12
Wages 10 10 23.81 22.73 20 23.26
Business 2 5 4.76 11.36 7 8.14
Access to
credit
Access to credit 4 3 9.52 6.82 7 8.14
No access to credit 38 41 90.48 93.18 79 91.86
Farm size
Less than 1 ha 12 3 27.27 7.14 15 17.44
1-1.5 ha 17 8 38.64 19.05 25 29.07
1.5-5 ha 15 31 34.09 73.81 46 53.49
Farm Power
Oxen 2 3 4.76 6.81 5 5.81
Community tractor 27 19 64.29 43.19 46 53.49
Government tractor 12 16 28.57 36.36 28 32.56
Own 1 2 2.38 4.54 3 3.49
Other 0 4 0 9.09 4 4.65
Source: Author’s calculation using dplyr in R, 2017

58
4.2 Impact of the Fertilizer Subsidy on maize output
4.2.1 Propensity Score Matching Results
Results showed the effectiveness of the propensity scores matching as it worked very
well for the data set. Matching results for selected socio economic variables are outlined
in this section before and after Matching. Distribution of the Treatment and Comparison
are indicated in Appendix A showing the characteristics of the two comparison groups
and treatment group before matching.
The histograms before matching on the left differ to a great extent even though the
histograms after matching on the right are very similar. To infer, both the numerical and
visual data show that the matching was successful.
The mean difference between treatment and control group before matching was 0.21 for
the nearest neighbor (1:1) under sample size 86. The results were in line with Rubin
(1996) who indicated that including variables that are strongly related to the treatment but
unrelated to outcome may decrease the efficiency of the estimate treatment effects. The
mean of years of farming experience were 30 years, 15.84 standard deviation and 28.4
years, for beneficiaries and non- beneficiaries respectively after matching with 84 sample
size. In essence, majority of the farmers have had long number of years in the production
of maize and this means they were well experienced in the business. The mean difference
1.71 clearly showed that without applying propensity score matching methods, there are
more bias as revealed by the choice of variables that were used to estimate propensity
score.

59
Table 4. 5
Standardized Summary of Matched data (Sample characteristics and estimated Impacts
of the subsidy) with 84 sample size
Variable Means
Treated
Means
Control
Standard
Deviation
Control
Mean
Differen
ce
Quantile-
Quantile
Median
Quantile-
Quantile
Mean
Quantile-
Quantile
Max
Distance 0.61 0.39 0.22 0.21 0.25 0.21 3.70
Gender 0.48 0.48 0.51 0.00 0.00 0.00 0.00
Age 3.71 3.57 0.80 0.14 0.00 0.14 1.00
Education 3.98 3.62 1.06 0.36 0.00 0.36 2.00
Experience 30.35 28.64 15.84 1.71 4.00 3.76 1.30
Income,
13/14
3309.04 4793.33 12834.70 -1484.29 0.00 3087.14 3.80
Credit 0.10 0.07 0.26 0.02 0.00 0.02 1.000
Farm size 2.67 2.10 0.79 0.57 1.00 0.57 1.000
Source: Author’s calculation using Zelig in R, 2017
Summary Statistics: Note: 1. Distance-Propensity score; Means Treated and Means Control
showed the weighted means in the treated and control groups 2. SD Control is the standard
deviation calculated in the control group 3. Mean Diff is the difference in means between the
groups 4. The Q-Q columns give the median, mean, and maximum distance between the two
empirical quantile functions (treated and control groups).
Table 4.6 shows results of percent improvement of respondents after applying the nearest
matching methods across the 1000 simulation runs mean differences were as follows: the
propensity score was 6.7%, gender was 100%, age was 15%, 21% for education, 32% for
experience, -3% for Income for 2013/14, 12 % credit and 5% farm size.

60
Table 4. 6
Matching Results of Percent Balance Improvement with 84 sample size
Variable Mean
Diff.
eQQ
Med
eQQ
Mean
eQQ Max
Distance 6.69 3.62 10.55 4.76
Gender 100.00 0.00 0.00 0.00
Age 15.38 0.00 25.00 0.00
Education 21.24 0.00 28.57 0.00
Experience 32.48 20.00 18.97 0.00
Income13/14 -2.49 0.00 -32.77 0.00
Credit 12.00 0.00 50.00 0.00
Farm size 4.52 0.00 7.69 50.00
Source: Author’s computation using Zelig in R, 2017
Results indicated in Table 4.7 show that only two respondents were unmatched and none
were discarded during the match. Again when matching all treatment, results showed that
there were 44 control (beneficiaries) and 42 treated (non-beneficiaries) but after matching
there were 42 control; and 42 treated. Thus, 84 were then used for matching.
Distributions of propensity score for treatment were identical for both matched and
unmatched data for all those matching methods because all individuals in treatment group
were involved in those matching methods.
Table 4. 7
Matching Results for Nearest Matching Method with 84 Sample Size
Treatments Control (Non-
Beneficiaries)
Treated
(Beneficiaries)
All 44 42
Matched 42 42
Unmatched 2 0
Discarded 0 0
Source: Author’s computation using R, 2017

61
Additionally, the Quantile-Quantile plots and the histograms, the weights that result after
matching were used to create the plots. Findings showed that the empirical distributions
were the same in the treated and control groups, the points in the Q-Q plots lied on the 45
degree line as shown in Appendix C. The Q-Q plot displayed quantiles of covariates in a
group against quantiles of the same covariates in the other group. Visual presentation is
shown in appendix C where Jitter plot indicated distribution of Propensity Scores with
nearest neighbor (1:1). The jitter plots indicated the distance measure and displayed the
overall distribution of propensity scores in the treated and control groups.
The size of each point is proportional to the weights given to that unit. In the same figure,
the desired outcome of the successful matching was virtually observed to have similar
distributions of propensity scores for the matched treated and control groups. Prior to the
match, both groups were equally distributed.
The distribution for the propensity scores after match for the treated subsidy was slightly
distributed on the right and the control subsidy was slightly distributed on the left. In
particular, the propensity score method highlights the fact that most of the control units
comparison were very different from the treated. Thus, when a few comparisons were
made remaining after discarding, the choice of matching algorithm becomes essential.
4.2.2 Analyses after Conducting Matching
Table 4.8 indicated the difference between observed and the expected values outcome.
This means that the treatment effect for the control units is the effect of control (observed
control outcome minus the imputed outcome under treatment from the model). Hence,
combining treatment effects just reverse the signs of the estimated treatment effect of
control. The findings indicated that there is no difference between the treated and the
control. Average Treatment Effect results show that the means for the pooled average
treatment was estimated to be 972.10 kg implying that there was slight difference
between the two groups (beneficiaries and non-beneficiaries). Then, conducted the same
simulation procedure in order to impute the counterfactual outcome for the control group.

62
Also, results show the first difference in Average Treatment Effect on Treated maize
output as 329.23 kg. This showed that those who received a full subsidy from
Government, ceteris paribus, experienced a positive impact when comparing the mean
group with the control group.
Table 4. 8:
Average Treatment Effect and Simulation of Average Treatment Effect on the Treated -
Maize output difference of respondents with 84 sample size
Average Treatment effect Simulation of Average Treatment Effect on the
Treated
Item Pooled
Expected
Values: E (Y|X)
Pooled
Average
Treatment
Effect for the
Treated: Y –
EV
Pooled
Expected
Values: E
(Y|X)
Pooled Average
Treatment
Effect for the
Treated: Y –
EV
First
Differences
in Expected:
Values
E(𝑌|𝑋1)-E
(Y|X)
Mean 973.33 972.10 1305.13 1309.69 329.23
Sd 131.59 863.40 138.12 895.03 193.19
50% 976.91 924.80 1309.71 1323.49 334.41
2.5% 711.05 -705.35 1032.84 -478.83 -44.20
97.5% 1237.02 2751.50 1567.37 3054.47 701.12
sd (ate.all) - standard error of ATE
Source: Author’s calculation, 2017
However, it was slightly substantial compared to the control. The study found a positive
relationship between fertilizer subsidy programme and maize output, application of right
quantities of fertilizers especially the beneficiaries, holding other inputs constant. This
was due to the availability of fertilizer at a subsidized price.
4.2.3 Least Squares Regression /Multiple Regression Estimates of Maize Output
Results in Table 4.9 indicated that maize output (Y) is not associated with those that
benefited in receiving fertilizer subsidy after controlling for gender, income of 2013/14,
credit and experience. The null hypothesis shows that there is association between maize
output and benefited, controlling for gender, income, credit, and experience while the

63
alternative hypothesis shows that maize output is associated with those that benefited
after controlling for gender, income, credit and experience. It worth noting that the
coefficients of gender and experience were negative, suggesting as maize output increase,
gender and experience decrease.
Table 4.9 also indicates that for one unit increase in income, maize output increase by 5.7
kg, holding others factors constant at 10 % level of significance. Table 4.9 indicated that
for an increase by one lilangeni of credit, maize output increased by 9.64 kg, holding
other things constant, at 10 % level of probability. The estimated effect of fertilizer
subsidy was +3.254 kg even though it is not statistically significant (p-value = 3.412).
The results showed that credit has a great potential for improving maize output by in the
study area. However, this finding is similar to that of Waluse (2012) and, Dolisca and
Curtis (2008) who found that farmers who used credit were more efficient.
The study revealed that the respondents are educated as a large percentage of them have
reached secondary level which can have an effect in applying fertilizer effectively.
The results is consistent with what other researchers such as Zhou (2010) that contributed
that education gives farmers better access to information about the fertilizers and more
knowledge of how much fertilizer to use.
On the other hand, the results indicated age of farm household that showed older age so
that could be that older farmers have more experience in farming and have better access
to the technologies than younger farmers. It is mentioned that older farmers are more risk
averse and prudent than younger farmers and have a higher likelihood of applying greater
amounts of fertilizer (Zhou et al., 2010).
From the F tables, the results showed that for 5 and 78 degree of freedom the 1 percent
critical F value is 5.72. Therefore, the probability of obtaining an F value of as much as
or greater than 10.69 is much smaller than 1%; actually the p value is only 0.0005. Thus,
based on theory, F-test of a regression of all instruments on fertilizer subsidy reject the
null that full set of instruments is not related to beneficiaries (F11, 27) is 3.41, p < 0.001).

64
The results indicate the coefficient of multiple determination the proportion of the
variation in the dependent variable (maize output) that is explained by the regression on
the collection of independent variables for those that benefited from subsidy, gender,
income for 2013/14, credit and experience. The R 2 of this regression was 0.419, 42%
which was relatively weak. Also, as R 2 increases, standard error of estimates decrease
showing the better fit.
Table 4. 9
Estimates from Least Squares Regression of the selected independent variable and
response variables after matching
Variable Estimate Std. Error t value
Beneficiaries
3.254 * 1.917 1.697
Income, 2013/14
5.650*** 9.984 5.659
Gender
-2.358 1.950 -1.209
Experience
-9.584 1.950 -1.521
Credit
9.462*** 3.501 2.702
(Intercept)
1.057*** 2.451 4.312
Residual standard error: 873.4 on 78 degrees of freedom
Multiple R-squared: 0.4193, Adjusted R-squared: 0.3821
F-statistic: 11.27 on 5 and 78 DF, p-value: 3.412
* - estimate is significant at 10 % level **- estimate is significant at 5 % level
***- estimate is significant at 1 % level
Df= degree of freedom Benefited – Beneficiaries, those received subsidy
Source: Authors Data Analysis, 2017
Note: *p**p***p<0.01

65
4.3 Chapter Summary
This chapter presents the results of the socio economic characteristics and impact of
fertilizer subsidy showing different distribution of socioeconomic characteristics by
treatments. In determining the impact of the programme, propensity score results, average
treatment results on treated indicated that the mean output of the respondents were
slightly significant. Multiple regression results of relationship between Maize output and
some selected socio-economic variables were explained.

66
CHAPTER FIVE
SUMMARY, CONCLUSIONS AND RECOMMENDATIONS
The summary and conclusion for the study is presented in this chapter followed by
recommendations even for future research.
5.1 Summary
The purpose of this study was to investigate the impact of fertilizer subsidy on maize
production: the case Central Rural Development Area in Swaziland. The specific
objectives were to examine the socio economic characteristics of beneficiaries and non-
beneficiaries of the fertilizer subsidy under the Central Rural Development Area. Also,
to evaluate the impact of the Fertilizer Subsidy on production of maize in the study area.
No literature on fertilizer subsidy in Swaziland focusing at the rural development area
level.
The study employed quantitative, cross section survey for 2014-15 agricultural season as
a case study under Central Rural Development area to 86 respondents which included 44
non-beneficiaries and 42 beneficiaries. The study focused on beneficiaries and non-
beneficiaries under the Central Rural Development area on maize production using propensity
score matching (non-experimental) when limited by small sample size as a case study. The study
used primary data, collected through a well-structured questionnaire. The cross sectional
design was explore because it was a snapshot evaluation at a particular point in time. The
study used multiple steps in selecting and analyzing the real data using PSM. This
method was chosen due to various advantages that it has over other methods. PSM being
a non-experimental method, it is appropriate for this study because the program does not
have experimental farmers who act as the control group. R was used in the study as it is a
very flexible (and free) statistical software package.
Firstly, to examine socio economic characteristics, Descriptive statistic in R was used,
using dplyr package, cross tabulation to produce tables, frequency, counts as well as

67
percentages. Data exploration and manipulation were employed in this study using
mutate, select and filter to highlight. Secondly, to evaluate the impact of the fertilizer
subsidy, ATE, ATT and Least Squares Regression for Continuous Dependent Variables
were employed using MatchIt and Zelig packages in R to match data before and after.
PSM addressed selection bias. After matching, 84 respondents were obtained and 2 were
unmatched. It is worth noting that the QQ plot, histograms and jitter plots were able to
inform the normality of two groups the beneficiaries and non-beneficiaries.
Results showed that a number of respondents had primary education which is in line with
Rebeca (2011) that educated farm household may be able to apply fertilizer effectively.
Also, from the results, the case study showed that more women were beneficiaries of the
fertilizer subsidy in 2014/15 was in line with Ephraim (2003) who described the
insignificance of the gender of the farmer, although suggesting that female controlled
maize farm are more efficient implying that gender is not an important factor in
explaining efficiency.
Findings indicated that access to farm credit is a major challenge facing respondents in
the CRDA more so the non-beneficiaries, who did not participate, some mentioned they
did not have enough money to pay for the subsidy.
Results show that those who did not benefit, if they had access to credit may be the non-
beneficiaries may have participated in the fertilizer subsidy. Thus, farm household
normally have wide-ranging intentions for participating in any agricultural development
projects rather than aligning themselves to the specific objectives of a project.
Additionally, the findings showed that a large proportion of the beneficiaries their age on
average was 52 and for the non-beneficiaries was 54 which are in line with Rebecca
(2011) who argued that older farmers are more experienced in farming activities and are
better to assess the risks involved in farming than younger farmers. She also stated that
reducing inequalities in human and physical capital between male and female farmers
may potentially increase output and technical efficiency.

68
Considering the farm household size, findings showed that family size on average was 9
for the beneficiaries and 8 for the non-beneficiaries, which was slight different thus was
not significant at t value 1.36.
Also, comparing farm household experience on average for the beneficiaries, it was 27
year and 30 years for the non-beneficiaries was not significant at t-value -0.7.
Farm size plays a major role in farming thus farm size is highly significant for positively
affecting the technical efficiency of smallholder maize producers. Farm power need to be
reconsidered for production of maize to increase because even beneficiaries used
community tractors which are costly than government tractors which may have delayed
in planting for most of the farmers who even got the subsidy. The government of
Swaziland should devise strategies on servicing the beneficiaries with government
tractors on time to reduce the cost of production for increased maize production. On
another note, the lack of proper design of the subsidy programme in some instances may
lead to rent-seeking behaviour and gross abuse of the fertilizer subsidy notwithstanding
the huge fiscal burden on the economy.
The Least Squares Model was used to analyze the farm household characteristics that
influenced the probability of maize output in the fertilizer subsidy, those who received
subsidy while the Average Treatment Effect and Average Treatment Effect on the treated
was used to analyze the effects of participation in the programme on quantities of maize
output fertilizer. Results from ATT revealed that the fertilizer subsidy on maize output
had a positive impact on beneficiaries when comparing with non-beneficiaries during the
year 2014/15 under the CRDA.
Using PSM, ATT, it was established that fertilizer subsidy has a positive and significant
impact on maize output and total maize production in the CRDA. The average treatment
effect (ATE) estimate generated by an evaluation that compares the average outcomes of
FS beneficiaries with average outcomes of non-beneficiaries (control group) of eligible
farm household indicated the average impact of the programme on eligible farm

69
households who used fertilizer subsidy. Nevertheless, it was observed that the propensity
score matching is a useful tool for reducing selection bias and strengthening causal
conclusions.
Furthermore, there was a linear regression fit within each subclass while controlling for
the estimated propensity score (distance) and other covariates. After matching, the
difference were striking under experience which indicated value 4 which showed it was
greater than 0 hence showing deviations between the groups. In theory, values greater
than 0 indicate deviations between the groups in some part of the empirical distributions
as seen for experience.
Also, there is no difference between the beneficiaries and non-beneficiaries in terms of
production. This was noted in the average treatment effect results where there was slight
difference in term of maize output produced by both groups. This implies that there is no
significant difference for benefiting in subsidy and not benefiting. In addition, maize
output between the two matched groups were not significant since the difference mean
was slightly different. It is worth noting that some of the effects that affect the both two
groups were similar since most of them highlighted there similar challenges that were
faced by both group.
On another note, non-beneficiaries indicated that market access for fertilizer were far
from them which resulted in them traveling long distances from their homesteads to
procure fertilizer and which make them to buy very few bags of fertilizer due to high
transport costs. Thus, there in need to decentralize market access to reduce the high costs
incurred by farm households. Assertion in literature state that distance confines rural farm
households to perpetual production of low maize.
Thus, fertilizer subsidy may have positive effects in that it may increase fertilizer
consumption (use), which in turn may increase maize output and production of maize. On
other hand, it may contribute to soil degradation and other environmental damage arising
from the imbalanced use of fertilizers. There is therefore need to protect farm households

70
from other external factors. Household heads with higher level of education are more
likely to increase the sales of maize. Education is believed to increase a household’s
understanding of market dynamics and therefore improve decisions about the amount of
maize sold. The positive and negative effect of age of household head on the extent of
maize output has been established.
It is acknowledge that the findings has limitations to the Central Rural Development
Area, conditional of receiving and not receiving fertilizer subsidy in 2014/15, thus,
cannot be generalized to other beneficiaries or non-beneficiaries in other part of the
country. Also, the problem of attrition bias when considering the results is recognized,
since there were dropouts in the variables that had unique study related characteristics,
resulting a difference between initial and ending samples. This was noted in the study
where 86 sample size was first used and later 84 sample size was used after matching,
however, the rate of attrition was low. According to Schulz & Grimes (2002), the rate
may be of no concern if the rate of attrition under 5% while rate in excess in 20% may
have concern. Thus, recognizing and addressing some these problems in research is
crucial that even academic economist, understanding the process of attrition can help in
order to control for it. Briefly, attrition bias happens when participants drop out from a
study. Thus, the study suggest the use of good tracking system with detailed contact
information.
5.2 Conclusions
The following conclusions are based from the study. The study employed R for
descriptive and econometric analysis of determinants of the Fertilizer Subsidy on the
maize output of beneficiaries to evaluate the impact through the Least Square Regression
Model which estimated the best linear predictor for the response variable of Maize output
using the choice independent variables.
Governments in countries in Sub-Saharan Africa often use subsidies with the aim of
building and strengthening private sector led agricultural input sectors. For a country like

71
Swaziland undergoing subsidy reform, the information provided through this analysis of
the impact of fertilizer subsidy on maize production the case of Central Rural
Development Area, provides an important base by which to compare the likely impact of
the fertilizer subsidy in the country. Findings indicated that at least 3 of the 5 variables
are related to the response variable maize output thus conclude that the predictor
variables: those that benefited, received previous income and access to credit are
associated with maize output. Based on the findings, fertilizer subsidy has not brought
anticipated improvement on maize production in Swaziland, especially in CRDA. Thus,
fertilizer subsidy has no impact on maize production in the study area. Quantitative
variables was able to indicate the average age of farm household, the average farm
household size as well as average farming experience.
The Propensity Score Matching, using Least Squares Regression model, was used to
quantify the magnitude and direction of the factors influencing maize output. PSM
methods compared treatment effects across participant and matched nonparticipant units,
with the matching conducted on a range of observed characteristics as shown in average
treatment effect and average treatment on treated results.
Furthermore, evidence from other authors opined that fertilizer subsidies are effective on
raising fertilizer use and increasing maize production, however, it may result to
unsustainable fiscal cost for economy. The main conclusion from this study can be
summarized as follows: the impact of the fertilizer subsidy on maize production: the case
of Central Rural Development Area in Swaziland may become stronger if policy makers
may complement subsidy with other projects aimed at improving access to basic services
in the targeted areas such as roads, agricultural offices and markets.
To infer, there was no difference between the socioeconomic characteristics of
beneficiaries and non-beneficiaries of fertilizer subsidy. The fertilizer subsidy had a
positive impact on maize output however the improvement was insignificant as expected.
The conclusion of the study is that fertilizer subsidy has not brought the anticipated

72
improvement on maize production in Swaziland. Fertilizer Subsidy has no impact on
maize production in the study area.
In general, there are important and significant differences between farm households who
did and did not receive fertilizer subsidy. In terms of maize outcome, in 2014/15 harvest
season, shown the ATT result, the average maize output was 329.23 kilograms for
beneficiaries which was significantly higher compared to the maize output of non-
beneficiaries.
5.3 Recommendations
Recommendations for farm households maize producers must apply fertilizer effectively
in order to increase maize production in the study area thus contribute to the country.
Also, they need to increase the applications of the fertilizer by adhering to recommended
rates to improve their efficiency is essential. The frequency of above 41 years of age farm
households in CRDA case, implies that government should introduce incentives to
encourage young maize producers. Thus, policy interventions aimed at increasing
education of farm households on fertilizer application may be put in place. A focus on
farm household' skills on fertilizer application for instance, especially when it comes to
the organization of the production process, may also help increase efficiency.
As fertilizer is an essential input in agriculture, strong fertilizer related policies are crucial
for any national effort aimed at improving agricultural productivity. Policies and
interventions that increase the farmer’s knowledge about how to apply fertilizer and the
benefits of doing so are frequently employed in conjunction with fertilizer subsidy
programs. This may be a very effective policy approach to increase farmers’ knowledge
about fertilizer profitability and profit-maximizing application procedures. On another
note, socio economic characteristics may be considered fundamental in designing
government intervention in aiding in fertilizer subsidy.

73
Overall, the empirical findings of this thesis have important policy implications, although
maize is the main food staple and as such is an important determinant of food and
nutrition security in Swaziland, focusing and allocating more farm input subsidy
resources on one crop and neglecting other crops (like cassava) and agricultural
interventions may render such programmes less useful. This is because consumption of
maize only cannot provide all the required adequate important nutrients. Though farm
households may not acquire credit, it is recommended that they may save from the
produce obtained in order to buy fertilizer and other inputs on time. Additionally, the
need to combine fertilizer subsidy with credit policy may go a long way to allow farm
household beneficiaries actually benefit from the subsidy.
The involvement of civil society groups, community development, farmers association
and traditional leaders is necessary to help curb political exploitation of the fertilizer
subsidy programme.
The study has produced additional results that may offer potential policy directions, such
as the correction of markets failures. Additional policy options may focus on easing
access to bank credit, which may help farmers invest in machinery and equipment, and
reach a minimum capital stock. Thus, policies addressing market failures may prove more
efficient in promoting input use. Additionally, input subsidies may prove efficient if they
solve distortions created by market failures and inefficient if they do not (Baltzer &
Hansen, 2011).
Policy makers may aim at creating employment opportunities for the extension sector
since the Extension Officers play a major role in technology and skills transfer to farmers.
Also, there may need periodic upgrading of the skills of extension officers on most
effective way of technology package and delivery. Extension Officers may be well
motivated to do regularly visit provided they are given incentives too in order to monitor
the progress of farm households.

74
Though government provides fertilizer subsidy, according to theory, it is not sufficient
condition if there is inefficiency of capital intensive infrastructure and capital extensive
infrastructure. Thus, it is recommended that alternative policy instruments must be
introduced to complement the fertilizer subsidy. Effective policy solutions for increasing
fertilizer use may be aimed at reducing the impacts of the farm households’ physical
distance from fertilizer. Improving rural extension services as well as on-site
demonstrations may be beneficial to farm households by providing knowledge of soil
quality and by raising awareness of the negative effects of excess fertilizer use (Zhou et,
al. (2011). It is recommended that policies deliberately target the poor farm household
and support farm households to access input on credit to increase the use of fertilizer thus
increase maize production.
Rigorous impact evaluations of fertilizer subsidy are needed to determine whether the
value of additional crop production resulting from the subsidy exceeds the full cost of the
program. Furthermore, documentation of success stories of Fertilizer Subsidy’s
beneficiaries is recommended. Again, increase in fertilizer and efficiency use may be
done by promoting improved crop management practices such as crop rotation with
legumes, change in density and spacing patterns of seeds and placement of fertilizer and
seeds at early planting, time weeding, and applying fertilizer in response to rainfall and
conservation agriculture.
Based on the empirical analysis in this study, future research is suggested to focus on the
following research agenda. Cross-country and regional analysis to compare the effects of
farm input subsidies may be important to provide more lessons since more countries
especially in sub-Saharan Africa are now implementing farm input subsidies, but using
different designs.
It was clear that Propensity Score Matching was a useful tool for reducing selection bias
and strengthening causal conclusions as it was used in the study. Thus, encourage other
scholars to use this tool. Again, future research for scholars should focus of conducting
time series, look at the three conservative years of the Fertilizer Subsidy since its

75
existence in Swaziland. The study recommends that future researchers and evaluators use
Propensity Score Matching to their repertoire of data analysis technique. This is based on
the results obtained after using propensity scores.
Although this study has focused on Central Rural Development area, the research
methodology and survey techniques are highly relevant for studying similar problems in
other rural development areas which received the fertilizer subsidy. This case study only
focused on 2014/15 agricultural season as it was cross sectional thus it would be better if
the trends of maize production would be assessed (do time series). Particularly, future
research should examine: yield-impacting inputs, welfare analysis, characteristics, and
practices that have the potential to be influenced by policy. Further, this study suggests
that farmers in Swaziland, generally, are not necessarily profit-maximizing with their
current fertilizer application, so future aspects should examine whether they are profit-
maximizing with other inputs.
It is recommended that future researchers undertake critical correlation studies examine
the impact of fertilizer subsidy on productivity, income, welfare and other development
indicators such as incomes and food and nutrition security. Such studies need to consider
more causal and interpretive approaches in order to predict future economic outcomes,
deeper understanding and advice for policy change.

76
REFERENCES
African Union (2006). Abuja Declaration on Fertilizer for an African Green Revolution.
NEPAD.
http://www.nepad.org/system/files/Abuja%20Declaration%20on%20Fertilizers%
20for%20an%20African%20Green%20Revolution.pdf (Accessed: May, 2017).
Angrist, J. D., and Alan B. Krueger (1991). “Does Compulsory School Attendance Affect
Schooling and Earnings?” The Quarterly Journal of Economics 106 (4), 979–
1014.
Bunde, A.O., Kibet, K., Daphen, O. O., Mugo, S.W. and Chomboi, K.C (2014). Impact of
Fertilizer Input Subsidy on Maize Production in Nandi North District, Kenya.
International Journal of Sciences: Basic and Applied Research (IJSBAR). Volume
15, No1, pp 520-540.
Bower, K. M. (2003a). The Two-Sample t-test and Randomization Test. Six Sigma
Forum, June 13, 2003.
Carter, M. R. (1984). Identification of the Inverse Relationship between Farm Size and
Productivity: An Empirical Analysis of Peasant Agricultural. Oxford Economic
Papers, 36 (1) 131-145.
Carte, M. R.; Laajaj, R.; Yang, D. (2013). The Impact of Voucher Coupons on the Uptake
of Fertilizer and Improved Seeds: Evidence from a Randomized Trial in
Mozambique. Forthcoming, American Journal of Agricultural Economics Papers
and Proceedings.16pp.
Committee on World of Food Security, 2009. Reform of the Committee on World of
Food Security: Final Version, Available at:
ftp://ftp.fao.org/docrep/fao/meeting/018/k7197e.pdf.
Chibwana, C., Fisher M., Jumbe, C., Masters, W. and Shively G. (2010). Measuring the
Impact of Malawi f arm Input Subsidy Program”. Contributed paper presented at
the Africa Association of Agricultural Economists (AAAE) conference, Cape
Town, South Africa.
Chibwana, C. and Fisher M. (2011). The Impact of agricultural input subsidies in Malawi.
International Food Policy Research Institute.
Chibwana, C., Fisher M. and Shively G. (2012). Cropland Allocation Effects of
Agricultural Input Subsidies in Malawi. World Development 40(1): 124-133.
Chilufya, G. C. (2017). Improved Maize Marketing Systems in Swaziland. Food Security,
Impact, Resilience, Sustainability, Transformation (FIRST) Programme.
Chirwa, E. W., Matita, M. M., Mvula, P. M., and Dorward, A. (2011). Impacts of the
Farm Input Subsidy Programme in Malawi. Paper prepared for Malawi
Government / DFID Evaluation of Malawi Farm Input Subsidy Programme,
School of Oriental and African Studies, University of London.
77
Chirwa, T. G. (2010). Program Evaluation of Agricultural Input Subsidies in Malawi
using Treatment Effects: Methods and Practicability based on Propensity Scores.
MPRA Paper No. 20878.
Chirwa, E. & Dorward, E. (2013). Agricultural Input Subsidies The Recent Malawi
Experience (1st ed). Oxford, University Press: United Kingdom.
Chirwa, T. (2010). Program evaluation of agricultural input subsidies in Malawi using
treatment effects: Methods and practicability based on propensity scores.
Millennium Challenge Account, Malawi.
Crop and Food Security Assessment Mission (CFSAM), (2015). Special Report
FAO/WFP Crop and Food Supply Assessment Mission (CFSAM).
Crawford, E. W., T. S. Jayne and Kelly, A. K. (2006). Alternative approaches for
promoting fertilizer use in Africa. Agriculture and Rural Development Discussion
Paper 22, Washington, DC, World Bank.
Dehejia, R.H. and Wahba, S. (2002). Propensity Score-Matching Methods for Non-
experimental Causal Studies. Review of Economics and Statistics 84 (1), 151–
161.
Dlamini S. I, Masuku, B. M. and Rugambisa, J. I. (2012). Technical efficiency of maize
production in Swaziland: A Stochastic frontier approach. African Journal of
Agricultural Research, 7(42), 5628-5636.
Dlamini, S., Tesema, M. W. and Assefa, Y. (2016). Small Scale Farmers’ Knowledge and
Perceptions of Maize Insect Pests and their Management in Highveld and Middleveld
Regions of Swaziland. International Journal of Development Research 06 (07), 8307-
8312.
Dorward, A. R. and C. Poulton (2008). The Global Fertilizer Crisis and Africa. Future
Agricultures Briefing. Brighton, Future Agricultures.
Dorward, A. R. and Chirwa (2009). The Agricultural Input Subsidy Programme 2005 to
2008: Achievements and Challenges. London, School of Oriental and African
Studies.
Duflo, E.; Kremer, M. Robinson, J. (2008). How high are rates of return to fertilizer?
Evidence from field experiments in Kenya. The American Economic Review 98
(2), 482–488.
Eboh, E., Uja C. and Amaechina E. (2006). Do Government subsidies benefit rural
farmers in Nigeria? Making sense of existing data. Africa Institute of Applied
Economics. Enugu.
FANRPAN (2003). Maize Marketing Policy Strategy for Swaziland. Food Agriculture
and Natural Resources Policy Network.
Food and Agriculture Organization of the United Nations (2011). Developing a Response
Analysis Framework. Rome.
78
FAO (2015). Special report: FAO/WFP Crop and Food Security Assessment Mission to
Swaziland. Rome: FAO.
FAO (2016). Global Information and Early Warning System (GIEWS).Country Briefs.
Frankenberger, T. R., Oshaug, A. and Smith, L. C. (1997). A definition of nutrition
security. CARE Mimeo.
Fufa, B. and R. Hassan (2006). Determinants of Fertilizer Use on Maize in Eastern
Ethiopia: A Weighted Endogenous Sampling Analysis of the Extent and Intensity
of Adoption. Agrekon 45 (1), 38–49.
Gujarati, D.N (2003) Basic Econometrics, 4th ed. Boston, McGraw Hill.
Ho, D. E., Imai, K., King, G., and Stuart, E. A. (2007). MatchIt: Nonparametric
Preprocessing for Parametric Causal Inference, Journal of Statistical Software,
http://gking.harvard.edu/matchit.
Ho, D., Imai, K., King, G. and Stuart, E. (2007). Matching as Nonparametric
Preprocessing for Reducing Model Dependence in Parametric Causal Inference,
Political Analysis 15(3): 199-236, http://gking.harvard.edu/files/abs/matchp-
abs.shtml.
Ho, D., Imai K, King, G. and Stuart, E. (2007b). Matchit: Nonparametric Preprocessing
for Parametric Causal Inference, Journal of Statistical Software,
http://gking.harvard.edu/matchit/.
Imai, K., King, G., and Lau, O. (2006). Zelig: Everyone’s Statistical Software,
http://gking.harvard.edu/zelig.
Randolph, J. J., Falbe, K., Manuel, A., Kureethara, and Balloun, J. L. (2014). A Step-by-
Step Guide to Propensity Score Matching in R. Practical Assessment, Research &
Evaluation, 19(18). http://pareonline.net/getvn.asp?v=19&n=18 Accessed: June
2017.
Kabuya, F. I. (2011). Monograph for Southern African Agricultural and Food Policy:
Advancing Knowledge. LAP LAMBERT Academic Publishing.
Kelly, V., Crawford, E. W. and Ricker-Gilbert, J. (2011). The New Generation of African
Fertilizer Subsidies: Panacea or Pandora’s Box? Food Security Group Policy.
Department of Agricultural, Food and Resource Economics, Michigan State
University.
Knoke, D. and Burke, P. J. (1980). Log-linear models. Beverly Hills, California: Sage
Publications.
Lameck, C. (2016). Impact of agricultural subsidies to smallholder maize farmers of
Mbeya District Council in Tanzania. Unpublished MSc. Thesis in the Graduate
School of the Ohio State University, Graduate Program in Agricultural and
Extension Education.

79
Lister, N. M. (2011). Agricultural Subsidies, Productivity and Rural Assets: The effect of
Farmer Input Support Programme (FISP) on small scale farmers in Mwembeshi
Chibombo District of Zambia. Unpublished MSc. Thesis, Institute of Social
Studies, The Hague The Netherlands.
Mabuza, M. L., Hendricks, S. L., Ortmann, G. F. and Sithole, M. M. (2009). The impact
of food aid on maize prices and production in Swaziland. Agrekon, 48, 1.
Minde, I., J. T.S., J. Ariga, G. J. and E. Crawford (2008). Fertilizer Subsidies and
Sustainable Agricultural Growth in Africa: Current Issues and Empirical
Evidence from Malawi, Zambia, and Kenya. Paper prepared for the Regional
Strategic Agricultural Knowledge Support System (Re-SAKSS) for Southern
Africa, Draft.
Ministry of Economic and Development Planning (2017). Economic Review and
Outlook.
Minot, N. and Benson, T. (2009). Fertilizer subsidies in Africa. Are vouchers the answer?
IFPRI Brief 60.
Ministry of Agriculture (2010). Farmers Identification of The Input Subsidy Support
Programme in Swaziland.
Ministry of Agriculture (2016). Swaziland Market Assessment Report.
Mulinga, N., Niyonsaba, L. and Urujeni, S. (2016). Subsidies inputs policy implications
in Rwanda. Department of Rural Development and Agricultural Economics,
University of Rwanda.
National Disaster Management Agency (2015). Swaziland Comprehensive National
Drought Response Plan Draft.
Ochola O. R.V. (2015). Fertilizer subsidies: a study of policy effects on maize in Kenya.
Unpublished MSc. Thesis, Chinese Academy of Agricultural Sciences,
Agricultural Information Institute.
Ouma, J. O., H. de Groote, and G. Owuor (2006). Determinants of Improved Maize Seed
and Fertilizer Use in Kenya: Policy Implications. In International Association of
Agricultural Economists Conference, Gold Coast, Australia, pp. 16.
Passmore, D. L., and Dominic, A. M. (1984). Application of logistic regression
techniques in survey research. Journal of Vocational Educational Research, 9
(Winter), 1-9.
Rebecca, B. T. (2011). Technical Efficiency in Maize Production by Small-Scale Farmers
in Ga-Mothiba, Limpopo Province, South Africa. MSc Thesis. University of
Limpopo Private Bag X1106, Sovenga, South Africa. 84p.

80
Prasad, R. (1978). Management practices for improving maize yields. In technology for
increasing food production (ed. J.C. Holmes) FAO, Rome. 554-558.Sauche11, V.
(1969):
Randolph, J. J., Falbe, K., Manuel, A. K. and Balloun, J. L. (2014). A Step-by-Step Guide
to Propensity Score Matching in R. Practical Assessment, Research & Evaluation,
19(18). http://pareonline.net/getvn.asp?v=19&n=18
R Core Team (2007). ls: Least Squares Regression for Continuous Dependent Variables
in Christine Choirat, Christopher Gandrud, James Honaker, Kosuke Imai, Gary
King, and Olivia Lau, "Zelig: Everyone's Statistical Software,"
http://zeligproject.org/
Ricker-Gilbert, J., Jayne, T. and Shively, G. (2013). Addressing the “wicked problem” of
input subsidy programs in Africa. Applied Economic Perspectives and Policy,
35(2), 322- 340.
Ricker-Gilbert J, Jayne, TS & Chirwa E, 2011. Subsidies and crowding out: A double-
hurdle model of fertilizer demand in Malawi. American Journal of Agricultural
Economics 93(1): 26–42.
Rosenbaum, P. R. and Rubin, D. B. (1983). The central role of the propensity score in
observational studies for causal effects. Biometrika 70, 41-55.
Rosenbaum, P. R. (2004). Matching in Observational Studies. Quoted in Applied
Bayesian Modeling and Causal Inference from Incomplete-Data Perspectives, eds,
A. Gelman and X-L Meng (pp. 15-23). Hoboken: Wiley.
Rubin, D. B. (1974). Estimating Causal Effects of Treatments in Randomized and Non -
randomized Studies. Journal of Educational Psychology 66: 688701.
Rubin, D. B. and Thomas, N. (1996). Matching using estimated propensity scores,
relating theory to practice. Biometrics 52, 249-264.
Sadoulet, E. and A. de Janvry (1995). Quantitative Development Policy Analysis.
Baltimore and London: The John Hopkins University Press.
Sanga, P. (2013). The Impact of Subsidized Fertilizer on Maize Production and
Household income in Tanzania: The Case of Sumbawanga Municipality, Rukwa Unpublished MSc. Thesis, Mzumbe University.
Schulz K. F. and Grimes D. A. Sample size slippages in randomized trials: exclusions and
lost and wayward. Lancet: 359:781-85.
Shenduli, A. (1998). The role of farmers groups networks in the adoption and discussion
of agricultural technologies in upper Mgeta. Morogoro rural district, Morogoro:
Sokoine University of Agriculture.
Shively, G. E. and Ricker-Gilbert J. (2013). Measuring the Impacts of Agricultural Input
Subsidies in Sub-Saharan Africa: Evidence from Malawi's Farm Input Subsidy

81
Program. Global Policy Research Institute (GPRI) Policy Briefs Volume 1 | Issue
1 Article 4.
Sianjase A. (2013). Impacts of Farmer Input Support Programme on beneficiaries-The
case of Gwembe District. Unpublished MSc. Thesis. The University of Zambia,
Lusaka.
Sibande, L. C. (2016). Essays on the Impact of Farm Input Subsidies on Farm
Households in Malawi. Unpublished PhD Dissertation. School of Economics,
University of Kent, Canterbury, United Kingdom.
Simelane, C. (2015, September 4). Agriculture ministry distributing inputs to farmers
Swazi Observer. Retrieved from http://www.observer.org.sz/news/
Simatele, M. (2006). ‘Food Production in Zambia: The Impact of Selected Structural
Adjustment Policies’. African Economic Research Consortium.
Signh, A. S., Masuku, M. and Thwala, N. Z. (2015). Impact of Microprojects Programme
on Rural Households Income in Swaziland. International Journal For Economics,
Commerce and Management, 3 (11), 2348 0386.
Thompson, C. F. (2009). Swaziland Business Year Book 2006. Xinadi Printing and
Graphics, Mbabane, Swaziland.
Udry, C. and Bardhan, P. (1999). Development Microeconomics 1st ed. Oxford University
Press
United States Department of Agriculture (2013). Foreign Agricultural Services:
Swaziland Maize Production, Supply and Distribution.
http://www.fas.usda.gov/psdonline/psdQuery.aspx
United Nations, (1984). Guiding Principles for design and Use of Monitoring and
Evaluation in Rural Development Projects and Programmes. Administrative
Committee on Coordination Task Force on Rural Development. Rome.
Walsh, Anthony (1987). Teaching Understanding and Interpretation of Logit Regression.
Teaching Sociology, 15 (April), 178-183.
Wiredu, A. N. (2015). Impacts of Fertilizer Subsidy on Farm-Level Productivity and
Food Security: A Case Study of Rice-Producing Households in Northern Ghana.
Unpublished PhD Dissertation. Institute of Agricultural Economics and Social
Sciences in the Tropics and Subtropics, University of Hohenheim, Ghana.
World Bank, (2011). Swaziland Rural Sector Review Priorities for the Development of
Smallholder Agriculture in Swaziland. Agricultural and Rural Development Unit
(AFTAR) Country Department AFCS.1
Yamane, T. (1967). Statistics: An Introductory Analysis, 2nd Ed. New York: Harper and
Row.
Yanggen, D., Kelly, V., Reardon, T. and Naseem A. (1998). Incentives for fertilizer use in
Sub Saharan Africa: Review of Empirical Evidence on Fertilizer Response and

82
Profitability. International Development Working Paper No. 70, Michigan State
University, East Lansing, Mich., U.S.A.
Zhou, Y., Yang H., Mosler H., Abbaspour, K. C. (2010). Factors affecting farmers’ decisions on
fertilizer use: A case study for the Chaobai watershed in Northern China. J. Sustain. Dev.
4(1):80-102.

83
APPENDICES

84
Appendix A: R output
Welch Two Sample t-test
AGE
data: stat$acage by stat$Benefited
t = -0.98233, df = 82.822, p-value = 0.3288
alternative hypothesis: true difference in means is not equal to 0
95 percent confidence interval:
-7.881188 2.670149
sample estimates:
mean in group 0 mean in group 1
52.21591 54.82143
EXPERIENCE
data: stat$experience by stat$Benefited
t = -0.76182, df = 83.98, p-value = 0.4483
alternative hypothesis: true difference in means is not equal to 0
95 percent confidence interval:
-9.166578 4.088656
sample estimates:
mean in group 0 mean in group 1
27.81818 30.35714
FAMILY EXPERIENCE
data: stat$farmhhsize by stat$Benefited
t = 1.3638, df = 81, p-value = 0.1764
alternative hypothesis: true difference in means is not equal to 0
95 percent confidence interval:
-0.5235187 2.8049040
sample estimates:
mean in group 0 mean in group 1
8.545455 7.404762

85
Figure 4.1: QQ Plots for the Un matched and Matched for Treated and Control
Figure 4.2: Jitter Plot of show Distribution of Propensity Scores with 86 sample size, Nearest
Neighbor (1:1)
Source: Author’s computation, 2017

86
Figure 4.3. Multidimensional Histograms of Propensity Score for Matched and Unmatched
Individual in Both Treatment and Control Groups for All Runs of Simulation with 86 sample size.
Source: Author’s computation, 2017
Output
names(dat4)
library(MatchIt)
[1] "Benefited" "Gender" "Age" "education" "experience"
[6] "income" "credit" "farmsize" "output"
m_out<-matchit(Benefited~Gender+Age+education+experience+income+
credit+farmsize, data = dat4, method = "nearest")
m_sout <- summary(m_out) m_sout
Summary of balance for all data:
Means Treated Means Control SD Control Mean Diff eQQ Med
distance 0.6061 0.3760 0.2226 0.2301 0.263
Gender 0.4762 0.4773 0.5053 -0.0011 0.000
Age 3.7143 3.5455 0.8199 0.1688 0.000
education 3.9762 3.5227 1.1307 0.4535 0.000
experience 30.3571 27.8182 15.9363 2.5390 5.000
income 3309.0476 4757.2727 12563.4335 -1448.2251 0.000
credit 0.0952 0.0682 0.2550 0.0271 0.000
farmsize 2.6667 2.0682 0.7894 0.5985 1.000
eQQ Mean eQQ Max
distance 0.2400 3.836e-01
Gender 0.0000 0.000e+00
Age 0.1905 1.000e+00
education 0.5000 2.000e+00
experience 4.6429 1.300e+01

87
income 2325.2381 3.800e+04
credit 0.0476 1.000e+00
farmsize 0.6190 2.000e+00
Summary of balance for matched data:
Means Treated Means Control SD Control Mean Diff eQQ Med
distance 0.6061 0.3914 0.2160 0.2147 0.2535
Gender 0.4762 0.4762 0.5055 0.0000 0.0000
Age 3.7143 3.5714 0.8007 0.1429 0.0000
education 3.9762 3.6190 1.0581 0.3571 0.0000
experience 30.3571 28.6429 15.8435 1.7143 4.0000
income 3309.0476 4793.3333 12834.7019 -1484.2857 0.0000
credit 0.0952 0.0714 0.2607 0.0238 0.0000
farmsize 2.6667 2.0952 0.7905 0.5714 1.0000
eQQ Mean eQQ Max
distance 0.2147 3.654e-01
Gender 0.0000 0.000e+00
Age 0.1429 1.000e+00
education 0.3571 2.000e+00
experience 3.7619 1.300e+01
income 3087.1429 3.800e+04
credit 0.0238 1.000e+00
farmsize 0.5714 1.000e+00
Percent Balance Improvement:
Mean Diff. eQQ Med eQQ Mean eQQ Max
distance 6.6853 3.617 10.5546 4.7648
Gender 100.0000 0.000 0.0000 0.0000
Age 15.3846 0.000 25.0000 0.0000
education 21.2411 0.000 28.5714 0.0000
experience 32.4808 20.000 18.9744 0.0000
income -2.4900 0.000 -32.7667 0.0000
credit 12.0000 0.000 50.0000 0.0000
farmsize 4.5208 0.000 7.6923 50.0000
Sample sizes:
Control Treated
All 44 42
Matched 42 42
Unmatched 2 0
Discarded 0 0
m_dat <- match.data(m_out)
library(Zelig)
names(m_dat)
z_out <- zelig(output~Benefited +income+ Gender+experience+credit, model="ls", data=m_dat)
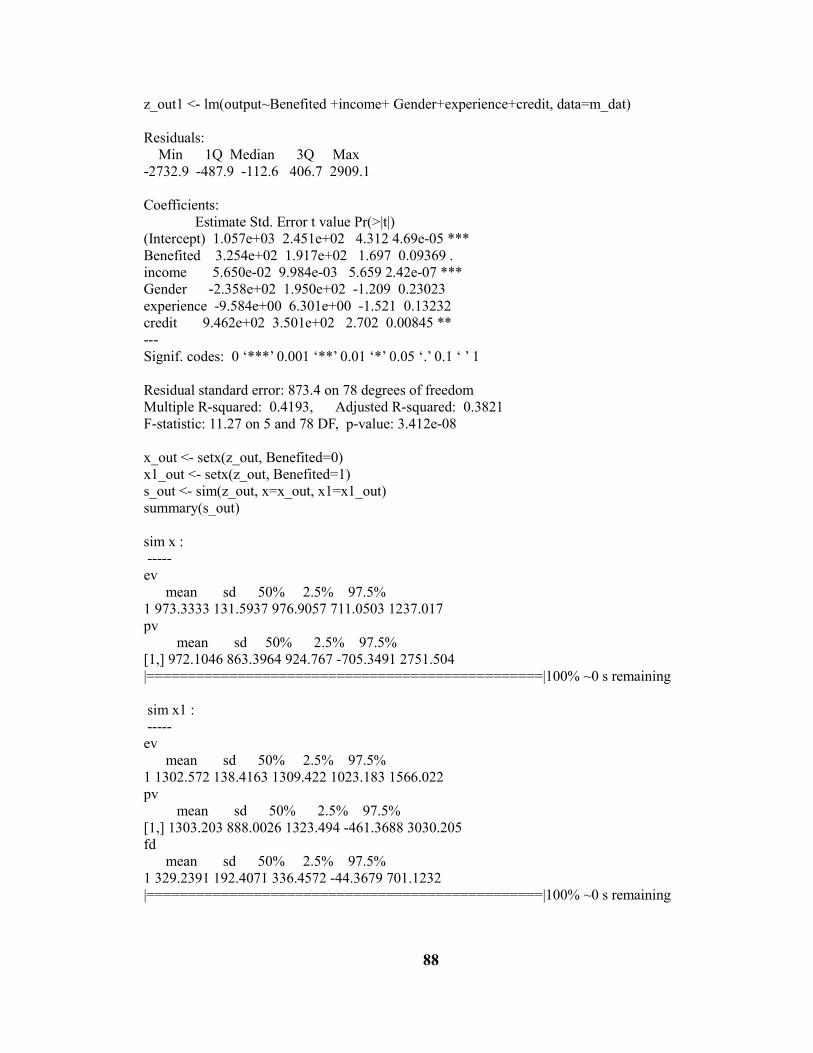
88
z_out1 <- lm(output~Benefited +income+ Gender+experience+credit, data=m_dat)
Residuals:
Min 1Q Median 3Q Max
-2732.9 -487.9 -112.6 406.7 2909.1
Coefficients:
Estimate Std. Error t value Pr(>|t|)
(Intercept) 1.057e+03 2.451e+02 4.312 4.69e-05 ***
Benefited 3.254e+02 1.917e+02 1.697 0.09369 .
income 5.650e-02 9.984e-03 5.659 2.42e-07 ***
Gender -2.358e+02 1.950e+02 -1.209 0.23023
experience -9.584e+00 6.301e+00 -1.521 0.13232
credit 9.462e+02 3.501e+02 2.702 0.00845 **
---
Signif. codes: 0 ‘***’ 0.001 ‘**’ 0.01 ‘*’ 0.05 ‘.’ 0.1 ‘ ’ 1
Residual standard error: 873.4 on 78 degrees of freedom
Multiple R-squared: 0.4193, Adjusted R-squared: 0.3821
F-statistic: 11.27 on 5 and 78 DF, p-value: 3.412e-08
x_out <- setx(z_out, Benefited=0)
x1_out <- setx(z_out, Benefited=1)
s_out <- sim(z_out, x=x_out, x1=x1_out)
summary(s_out)
sim x :
-----
ev
mean sd 50% 2.5% 97.5%
1 973.3333 131.5937 976.9057 711.0503 1237.017
pv
mean sd 50% 2.5% 97.5%
[1,] 972.1046 863.3964 924.767 -705.3491 2751.504
|================================================|100% ~0 s remaining
sim x1 :
-----
ev
mean sd 50% 2.5% 97.5%
1 1302.572 138.4163 1309.422 1023.183 1566.022
pv
mean sd 50% 2.5% 97.5%
[1,] 1303.203 888.0026 1323.494 -461.3688 3030.205
fd
mean sd 50% 2.5% 97.5%
1 329.2391 192.4071 336.4572 -44.3679 701.1232
|================================================|100% ~0 s remaining

89
Appendix B: 𝑹� Codes
names(dat4)
library(MatchIt)
m_out<-matchit(Benefited~Gender+Age+education+experience+income+
credit+farmsize, data = dat4, method = "nearest")
m_sout <- summary(m_out)m_sout
library(stargazer)
stargazer(msout, type="html", summary=F, out="msout.htm")
plot(m_out)
plot(m_out,type = "jitter")
plot(m_out, type = "hist")
m_dat <- match.data(m_out)
library(Zelig)
names(m_dat)
z_out <- zelig(output~Benefited +income+ Gender+experience+credit, model="ls", data=m_dat)
z_out1 <- lm(output~Benefited +income+ Gender+experience+credit, data=m_dat)
x_out <- setx(z_out, Benefited=0)
x1_out <- setx(z_out, Benefited=1)
s_out <- sim(z_out, x=x_out, x1=x1_out)
summary(s_out)

90
m_out1 <- matchit(Benefited~Gender+Age+education+experience+income+credit+farmsize, data
= dat4, method = "nearest")
m_dat1 <- match.data(m_out1, "control")
z_out1 <- zelig(output~Benefited +income+ Gender+experience+credit, model="ls",
data=m_dat1)
m_dat2 <- match.data(m_out1, "Benefited")
x_out1 <- setx(z_out1, data=m_dat2, cond = TRUE)
s_out1 <- sim(z_out1, x=x_out1)

91
Appendix C: Questionnaire
RESEARCH THESIS QUESTIONNAIRE FOR THE BENEFICIARIES AND NON-
BENEFICIARIES OF THE FERTILIZER SUBSIDY PROGRAMME, THE YEAR 2014/15
Dear Respondent!
I, Lungile Ginindza, a student of Master of Science in Agricultural and Applied Economics (MSc.
AAE) at the University of Swaziland, Luyengo Campus, pursue a Master’s Thesis to investigate
the impact Fertilizer Subsidy Programme in Swaziland on maize production of farm household: a
case study of Central Rural Development Area, research for academic purpose only. All
information provided remains confidential. Any inconvenience is highly regretted.
To this end, I kindly request that you complete my, 22 questionnaire, your response is of the
utmost importance to me. Where additional knowledge is required, please feel free to provide it.
Yours Sincerely
Lungile Ginindza - 105457
Student

92
RESEARCH THESIS QUESTIONNAIRE
Respondent Number……………..
Farm Household Name…..……………………………………………..Mobile Number………………….
Rural Development Area……………………………………….. Community
Name…………………………….
ID Number……………………………………………..
Enumerator……………………………………………..
Section A: Demographics Characteristics
Please answer the following questions by ticking (√) the relevant block or writing down your answer in the
space provided. Note: IGNORE Codes 1-7 to be used by student.
Q1. Agro Ecological Zone: Moist Middleveld
………………………………….Region………………………
Q2. Gender of Farm Household: 1. Female [1]…….. 2. Male [2] ………………………….
Q3. Age of Farm Household:
Years Tick Codes
18-25 1
26-32 2
33-40 3
41 and above 4
Q4. Marital Status of Farm Household head:
Marital Status Tick Codes
Single 1
Married 2
Widowed 2
Divorced/ Separated 4
Cohabiting 5
Q5. Level of Education of Farm household head
Education Tick Code
None 1
Adult Education/ Sebenta 2
Primary 3
Secondary 4
College + 5
Q6. Employment status / Occupation (Tick one) Code Paid Employed Household head engaged in formal paid employment [1]
Self Employed Household head engaged in self-employment [2]
Unpaid Family Household head working as unpaid family helper [3]
Own farm Household head self-employed in agriculture [4]
Un Employed Household head not working [5]
Q7. Farm Household size (number)
a) How many are you in your family?……………………
Q8 Labour
b) What was the number of family workers on the farm in the year 2014/15 cropping
season?.....................

93
Q9. Experience in Agriculture a) How long have you been farming, growing maize?................................(Years)
Section B: Socio-Economic Indicators
Note: IGNORE Codes 1-6, to be used by student.
Q10. Farm Household Income
(a) How much income did you get from the sale of maize in the year 2014/15? E......................................
(b) What is the main source of income in your family?
Tick Code
Maize production 1
Other crops than maize production 2
Livestock production 3
Pension / Elderly grants 4
Wages 5
Business 6
Q11. Access to credit
a) Did you have access to credit to buy agricultural inputs such as fertilizer? Yes [1] / No [2]................
b) If Yes, from where?..............................
Section C. Agronomic Characteristics
Q12. Farm size (hectares)
a) How big was your farm in 2014/15 you planted? Tick Code
Less than 1 ha 1
1- 1.5 ha 2
1.5 – 5 ha 3
b) Farm Power
What did you use for growing maize in the year 2014/ 15 cropping season? Tick one
Oxen 1
Community Tractor 2
Government Tractor 3
Own 4
Other 5
Q13. Beneficiaries of the Fertilizer Subsidy Programme in 2014/15
a) Did you receive fertilizer subsidy for maize production in the year 2014/15 cropping season? Yes [1]/No
[2]…….
b) If yes, how much did you pay for the subsidy in the year 2014/15 cropping season?
E................................
c) What was the distance you travelled to make payments for the subsidized fertilizer?........................ (Km)
d) From which Agro dealer did you receive the fertilizer
subsidy?...........................................................................
e) How many bags of fertilizer did you receive from the fertilizer subsidy
programme?.........................(bags)
f) What was the distance you travelled to collect subsidy from the agro dealers?....................... (Km)
g) Was it convenient for you where you collected the fertilizer subsidy? Yes [1] /No
[2]..............................................
h) What other subsidy did you receive in the year 2014/15 cropping season? ………………………………
i) Were you able to apply fertilizer effectively in your acres after being subsidized? Yes [1]/ No
[2].....................
j) What constraints did you face for the subsided fertilizer?
1) ……………………………………………...........................................
2) ……………………………………………………………………
3) ……………………………………………………………………
k) After harvesting, how do you do to earn money?.....................................

94
l) Do you think fertilizer support should continue? Yes [1]/No [2]...................................
Q14. Non-beneficiaries of the Fertilizer Subsidy Programme a) Did you receive fertilizer subsidy in the year 2014/15? Yes [1]/ No [2]…………………..
b) If no, why are you not benefiting from the fertilizer subsidy programme?................................
c) How much did you pay for the fertilizer at the access shops/ agro dealers?.................................(E)
d) What is the distance you travelled to make payments for unsubsidized fertilizer?......................
e) From which Agro dealer did you receive the fertilizer?...............................................................
f) How many bags of fertilizer did you buy for the unsubsidized fertilizer?........................(bags)
g) What was the distance you travelled to collect fertilizer from access shop/agro
dealers?.....................(Km)
h) Was it convenient for you where you collected the fertilizer? Yes [1]/No
[2]...................................................
i) Were you able to apply fertilizer effectively from the fertilizer you bought? Yes [1]/No [2].......................
j) What constraints did you face for the unsubsidized fertilizer?
1)..............................................................................................................
2)………………………………………………………………………..
3)………………………………………………………………………..
Q15. Soil Testing
a) Have you tested your soil during the planting season in 2014/15? Yes [1]/No [2].......................
b) What is your soil pH?.................................
c) How far is the distance from your home to where you do soil testing?.................................. (Km)
Section D
Q16. Production/ Output Characteristics a) Which variety of maize did you cultivate in the year 2014/15 cropping season?.................................
b) What was the optimal yield did you receive?.................................................
c) How many bags (sacks) did you produce in the year 2014/15 cropping season?......................(bags)
d) How many bags did you produce before fertilizer subsidy?....................................(bags)
e) What was the price of a bag of maize per 100 kg in the year 2014/15 cropping season?
E...........................
Or how much did you sell per 100 kg in 2014/15 cropping season? E.............................
Q17. Access to food
Did your household receive enough food throughout the year 2014/15? Yes [1]/ No [2]………………..
Q18. Rainfall
a) How much rainfall did you receive in 2014/15?...........................(mm)
b) Did you receive enough rainfall? Yes [1]/ No [2]..................................
Q19. Distance to Agricultural Extension Office / Rural Development Area (RDA) (km)
a) How far is the distance from your home to Agricultural Extension
Office/RDA?.......................(Km)
b) Did you receive advice from Field Officers in the year 2014/15? Yes [1]/ No
[2].............................
c) Did you receive training on fertilizer application in the year 2014/15? Yes [1]/ No
[2]......................
d) If yes, were you able to apply effectively through their advice? Yes [1]/ No
[2]..............................
Q20. Are you a member of the Swaziland National Farmers Union? Yes [1]/ No [2]......................
Q21. Weather Risk in the year 2014/15 a) Were you affected by weather risk? Yes [1]/No [2]……………………..
b) If yes, what were the specific weather risks that maize production faced in the year 2014/15 cropping
season?..................
c) How were you affected as a farmer?..........................................
Q22. Overall assessment and impact for Fertilizer Subsidy Programme users

95
a) What can you say about the impact of fertilizer subsidy programme on your household’s life? Tick one/
impact
Very big positive impact (i.e., long term and permanent positive impact) 1
Good impact (mainly temporary benefit, but some permanent impact) 2
Very small positive impact (small temporary benefit) 3
Partly positive, partly negative (i.e., mixed with the overall impact being
almost zero)
4
Negative impact (I got into problem as a result) 5
Note: IGNORE Codes 1-6, to be used by student.
Thank you for your cooperation.

96
Appendix D: Choice variables
Benefited Gender Age education experience income credit Farm size output
0 1 4 1 32 0 0 3 100
0 1 4 1 70 21000 0 2 750
0 1 2 1 11 8000 0 2 500
0 0 1 5 50 0 0 3 750
0 0 4 4 28 0 0 2 750
0 0 4 5 31 0 0 3 400
0 1 4 2 42 0 0 2 250
0 0 4 4 20 0 1 3 500
0 0 4 1 53 0 1 3 1250
0 1 3 4 16 920 0 1 400
0 0 4 4 3 35000 1 1 6000
0 1 4 3 50 0 0 2 1250
0 1 4 4 10 0 0 2 350
0 0 4 2 10 4000 0 3 700
0 0 4 2 40 0 0 3 1750
0 1 4 3 16 1500 0 3 2500
0 0 4 3 26 0 0 2 1500
0 1 4 4 5 0 0 2 50
0 1 4 5 10 0 0 2 250
0 1 3 4 15 3400 0 1 800
0 0 2 4 20 0 0 1 2500
0 0 4 4 10 5000 0 3 600
0 0 2 5 22 4000 0 2 100
0 1 4 4 24 0 0 2 100
0 0 4 2 10 0 0 1 300
0 1 4 4 16 0 0 1 100
0 1 4 4 30 0 0 1 400
0 1 4 4 40 0 0 1 300
0 0 4 4 27 0 0 3 3000
0 0 1 5 11 0 0 1 100
0 1 4 4 29 0 0 3 100

97
0 0 4 3 60 0 0 3 500
0 0 3 4 10 20000 0 2 5000
0 1 4 3 35 0 0 3 400
0 0 3 4 39 0 0 2 200
0 0 4 3 40 63000 0 2 1500
0 1 4 4 19 0 0 2 0
0 1 3 4 39 3500 0 3 500
0 0 3 4 45 0 0 1 1250
0 1 4 3 50 0 0 2 250
0 0 4 4 30 0 0 2 800
0 0 3 5 20 40000 0 3 4000
0 1 3 4 20 0 0 1 0
0 0 4 4 40 0 0 1 350
1 0 4 4 20 2500 0 2 100
1 0 3 3 4 0 0 2 500
1 1 4 5 40 3000 0 3 950
1 0 4 4 8 0 0 3 250
1 0 4 4 45 20000 0 3 4000
1 0 4 4 50 0 1 3 2250
1 1 3 4 3 25000 1 3 4100
1 0 4 4 32 5000 0 3 500
1 0 4 5 45 0 0 3 600
1 0 3 4 4 80 0 3 1500
1 1 4 4 38 0 0 2 500
1 1 4 5 32 0 0 3 1250
1 0 3 4 23 0 0 3 1150
1 1 3 4 15 3500 0 2 2500
1 0 1 4 16 0 0 1 1650
1 0 4 4 57 0 0 2 1000
1 1 4 4 40 0 0 3 1300
1 1 4 4 54 0 0 3 1000
1 1 4 4 45 0 0 2 0
1 1 4 4 45 2000 0 2 1500

98
1 0 4 5 19 7500 0 3 750
1 1 4 4 33 0 0 1 1000
1 1 3 2 36 0 1 3 750
1 0 4 3 45 400 0 1 1250
1 1 4 3 48 2000 0 3 1250
1 0 4 4 32 3500 0 3 500
1 1 4 5 45 18000 0 3 1500
1 0 4 3 20 4000 0 3 1500
1 0 4 4 27 5500 0 3 1350
1 1 2 2 16 0 0 3 750
1 0 4 4 30 12000 0 3 1500
1 1 4 5 37 0 0 3 1800
1 1 4 4 40 0 0 2 1250
1 0 4 4 38 8000 0 3 1000
1 1 4 4 10 0 0 3 1500
1 1 4 4 43 6000 1 3 1500
1 0 3 4 10 6000 0 3 1600
1 0 4 5 25 5000 0 3 900
1 0 4 4 10 0 0 3 1000
1 1 4 4 45 0 0 3 1000
1 1 4 4 20 0 0 3 1000
1 0 4 4 30 0 0 3 1500
