executive summary fertilizer outlook 2019 – 2023
TRANSCRIPT
1 IFA Strategic Forum, Dubai, 26-28 November 2016 “Short-Term Fertilizer Outlook 2016-2017” P. Heffer and M. Prud’homme, IFA
A/19/81 June 2019
Executive Summary Fertilizer Outlook 2019 – 2023 Production & International Trade, Market Intelligence and Agriculture Services
International Fertilizer Association (IFA)
IFA Annual Conference
11-13 June 2019 Montreal (Canada)
This Executive Summary was prepared by the Agriculture, Production & International Trade and Market Intelligence Services, on the occasion of the 87th IFA Annual Conference held in Montreal (Canada) in June 2019. It draws on two reports that will be available after the IFA Annual Conference to IFA members only: the IFA report “Medium-Term Outlook for World Agriculture and Fertilizer Demand: 2018/19-2023/24” and the IFA report “Medium-Term Outlook for Fertilizers and Raw Materials Global Supply: 2019-2023”.
The Production & International Trade Service:
Michel Prud’homme, Senior Director José de Sousa, Program Manager – Supply Virginie Couturier, Senior Market Analyst – Phosphate Products Olivier Rousseau, Senior Market Analyst – Potash & NPK Sylvie Marcel-Monnier, Project Coordinator
The Market Intelligence Service:
Marina Simonova, Director
The Agriculture Service:
Patrick Heffer, Senior Director Armelle Gruère, Fertilizer Demand Program Manager Samy Beltaief, Policy Analyst
Copyright © 2019 International Fertilizer Association - All Rights Reserved
Disclaimer of Liability for IFA Reports/Presentations
IFA endeavours to base its reports and presentations on accurate information, to the extent reasonably possible under the circumstances. However, neither IFA nor its members warrant or guarantee any information IFA publishes or presents, and they disclaim any liability for any consequences, direct or indirect, arising from the use of or reliance upon IFA publications or presentations by any person at any time.
1
IFA Annual Conference, Montreal, 11-13 June 2019 “Fertilizer Outlook 2019 - 2023”, PIT, Market Intelligence and Agriculture Services, IFA
ECONOMIC AND POLICY CONTEXT
2019: slowing momentum
Global growth fell sharply in the first quarter of 2019 and will remain weak throughout the year. Both global trade and investment are weaker. While job creation is sustaining consumption growth, living standards have not recovered from the 2008 financial crisis.
Trade tensions are affecting global economic growth, which is forecast at only 3.3% in 2019 before climbing to 3.6% in 2020, according to the International Monetary Fund (IMF). The World Bank and the Organisation for Economic Co-operation and Development (OECD) have published lower estimates: the World Bank anticipates that global growth will reach 2.6% in 2019 and 2.7% in 2020, while the OECD forecasts that it will be 3.2% in 2019 and 3.4% in 2020.
In the United States (US), growth remains relatively solid but is projected to be more moderate in 2020 as the boost from tax cuts fades. Uncertainty about China is high, as its growth is slowing faster than expected. India’s growth is expected to pick up as it benefits from lower oil prices and a looser monetary policy than expected. Brazil’s recovery from the 2015-16 recession is forecast to continue. Mexico and Indonesia appear stable. Argentina and Turkey should gradually recover while remaining fragile. Growth in Europe remains weak. Trade tensions have had a negative impact on manufacturing, hitting Germany and Italy hardest. Weak trade and low economic confidence, together with the possibility that Brexit will eventually take place, are a drain on growth. Slow growth in Japan will likely continue as exports drop and the size of the workforce shrinks.
Beyond 2020, global growth is expected to remain stable at about 3.6%, supported by the continued expansion of emerging economies such as China and India (despite gradually lower growth in China) but slowed by relatively modest growth in advanced and other emerging market economies such as Russia, Mexico and Turkey.
Oil prices fell from US$81 a barrel for Brent crude in October 2018 to US$71 in May 2019. Weakening global growth and risks due to the escalation of trade conflicts are creating an additional downward strain on prices. Oil prices are expected to decline further in 2019: the United States Energy Information Administration (EIA) forecasts that Brent crude spot prices could drop as low as US$61 in 2019.
Increasing uncertainties
In 2018, macroeconomic risks intensified. Financial market volatility returned, and global economic growth seemed to gain momentum. In 2019, the global economy is going forward at a slower pace, but it could improve if trade tensions are resolved. Nonetheless, the global balance of risks still leans towards the negative side. Escalating trade tensions may impact financial markets, which could in turn affect access to credit by vulnerable countries. The global debt burden is another source of concern, as it totals 225% of world gross domestic product (GDP) according to the IMF, significantly higher than before the 2008 financial crisis.
Growing political and economic tensions between major powers are creating the main uncertainties. As the world enters a period of fragmentation following a period of globalization, global reconfiguration could entail unforeseen risks. In this respect, increased cooperation between countries to meet global challenges is unlikely to advance significantly in the short and medium term.
A significant policy focus on environment
There were calls to improve nitrogen (N) use efficiency and to mitigate the impact of N losses to the environment at the fourth session of the United Nations Environment Assembly (UNEA) in March 2019, during which the first ever global resolution on nitrogen (N) was adopted. The resolution on sustainable nitrogen management calls on the Executive Director of UN Environment, inter alia, to “consider the options to facilitate better coordination of policies across the global N cycle at the national, regional and global levels, including consideration of the case to establish an intergovernmental coordination mechanism on N policies.”
2 IFA Annual Conference, Montreal, 11-13 June 2019
“Fertilizer Outlook 2019 - 2023” PIT, Market Intelligence and Agriculture Services, IFA
The Food and Agriculture Organization of the United Nations (FAO) is expected to adopt in June 2019 the first International Code of Conduct for the Sustainable Use and Management of Fertilizers. It provides a locally-adaptable framework and a voluntary set of best practices to serve the various stakeholders directly or indirectly involved in fertilizers.
In India, fertilizer subsidy levels for the 2019/20 crop season remained unchanged compared with their 2018/19 levels. India is working on subsidy reform that includes plans to deposit the fertilizer subsidy directly in farmers’ bank accounts. The recently elected government may announce additional reforms in the coming months.
Agreement has been reached on the new European Union (EU) Fertilizer Regulation. It will enter into force this summer and will be implemented from 2022. This regulation includes a new limit on cadmium in phosphorus (P) fertilizer, which will be set at 60 mg/kg P2O5 and implemented immediately after a transition period of three years. Equally important, it has a much wider scope than the previous fertilizer regulation as it includes products (e.g. industry by-products, organic fertilizers and biostimulants) whose use could reduce the consumption of mineral fertilizer in the medium to long term. The EU is also working on biodegradability criteria for polymer coatings of controlled-release fertilizers. Moreover, EU policies that address climate change are expected to impact fertilizer use where they target N losses to the environment.
WORLD AGRICULTURE
Global cereal production to expand in 2019/20
After setting a record in 2016/17, boosted by favorable weather, global cereal production contracted by 2% in 2017/18 and remained stable in 2018/19. In 2019/20 it is expected to increase by 2% and could reach the 2016/17 record level again. Looking at the main cereals, production of coarse grains is expected to rise slightly, wheat production would rebound after a drop, and rice output would remain stable.
Until early May 2019, an expansion of global maize area in 2019/20 had been anticipated. However, severe flooding in the US could prevent a portion of its maize crop being planted. Cereal utilization has shown steady progress during the last few years, supported by ample supplies. It exceeded production in 2018/19 for the first time in at least six years, resulting in a small decline in global stocks. Nonetheless, the stocks-to-use ratio remained comfortable. As of late May 2019, opinion was divided on the direction of stocks in the approaching season, with no significant increase or decrease expected. Until April 2019, ample availabilities had maintained prices at generally stable but subdued levels. US maize prices surged in May 2019 due to the significant delays in planting.
After a drop in 2017/18, global soybean production recovered and reached a new record in 2018/19. Global soybean utilization continued rising, but remained below production. Growth in soybean use has been held back by Chinese import duties on US soybeans, implemented since July 2018, and the current outbreak of African swine fever in East Asia. The anticipated accumulation of global stocks in 2018/19 and persisting uncertainty about the trade war between China and the US have exerted pressure on soybean prices. The global soybean area could expand slightly in 2019/20, but a return to average yields could reduce output. If soybean use were to rise above production, a marginal reduction in global stocks could be anticipated. After a weather-related drop in 2018/19, rapeseed production is expected to continue decreasing slightly in 2019/20. Rapeseed prices have trended downwards since October 2018 due to large stocks and trade tensions between China and Canada. Global palm oil production has quickly resumed a firm growth pattern following a sharp fall in 2015/16 caused by El Niño. Stocks have accumulated and put pressure on palm oil prices. A small increase in area in 2019/20 should translate into new production gains. These ample supplies should boost utilization. Palm oil stocks are expected to increase only slightly.
3
IFA Annual Conference, Montreal, 11-13 June 2019 “Fertilizer Outlook 2019 - 2023”, PIT, Market Intelligence and Agriculture Services, IFA
Despite a fall in sugar production in 2018/19, international prices have continued to suffer from oversupply. Production is expected to contract further and to be below consumption in 2019/20, which could result in slightly higher prices.
Global cotton production is anticipated to rise by 6% or 7% in 2019/20 after a weather-related drop in 2018/19. The expected small increase in mill use will not be enough to reduce still heavy stocks, despite China’s regular auctions of its reserve. Trade tensions between China and the US exerted pressure on cotton prices in 2018/19.
Uncertainty complicates forecasts beyond 2019/20
The OECD and the FAO anticipate that global food demand will grow at a reduced pace over the next decade compared to the previous one. While population expansion remains the driving force behind demand for food, it is slowing gradually. Furthermore, per capita food consumption is expected to increase more slowly as it approaches saturation levels in some markets. Overall, slower growth in consumption than in the past decade is expected for cereals, vegetable oil, roots and tubers, meat and fish. However, demand for dairy foods and sugar is expected to continue expanding at a relatively firm pace, supported by rising incomes in developing countries. Demand for poultry meat will continue to drive growth in meat consumption due to its relative lower prices. Demand for feed will continue to grow faster than demand for livestock products, reflecting continued intensification of animal production and declining grassland area.
The expansion of global crop production in the next decade will follow the same trend as demand for agricultural commodities. Gains in output will come mostly from higher yields thanks to better varieties, improved fertilizer use, and the adoption of improved production practices. Crop area is expected to increase very little, with the increases mostly in Latin America, Asia and Oceania but also in Russia. Western Europe and North America could continue to lose some cropland. Soybean is the crop that will benefit most from expanded area in Latin America.
Looking at specific crops, as of early June 2019 there was considerable uncertainty regarding future trends in maize and soybean production and demand due to the ongoing trade dispute between the US and China and the spread of African swine fever in East Asia.
FERTILIZER DEMAND
Contracting consumption in North America affects the 2018/19 fertilizer year
Following 1.3% growth in 2017/18, global fertilizer consumption is seen as dropping by 1.0% in 2018/19, to 190 Mt. This contraction reflects a combination of low international prices for most crops; unfavorable weather in important agricultural and fertilizer-consuming areas (e.g. the central US and eastern Australia); currency depreciation in some fertilizer-importing countries, especially Turkey and Pakistan; trade tensions between China and the US and between Russia and Ukraine; sanctions against Iran; and increasing emphasis on the more efficient use of fertilizers in developed countries and China. Demand outside China is seen as down by 1.3%.
Revision of historical time series
Compared to IFASTAT, historical consumption data used in this report for 2016/17 have been revised up by 2.4 Mt for N and 1.3 Mt for P, and revised down by 0.5 Mt for K. China accounts for most of the revision: +1.5 Mt for N, +1.7 Mt for P and -0.7 Mt for K. This revision will be reflected in the next update of the IFASTAT consumption database.
Global consumption is anticipated to contract more moderately for N and K (-0.4% and -1.0%, respectively) than for P (-2.3%). Regionally, fertilizer demand is forecast to decline in Western & Central Europe, Eastern Europe and Central Asia (EECA), North America, West Asia and Oceania. It would remain stable in Africa and grow only modestly in East Asia, South Asia and Latin America.
4 IFA Annual Conference, Montreal, 11-13 June 2019
“Fertilizer Outlook 2019 - 2023” PIT, Market Intelligence and Agriculture Services, IFA
The largest year-on-year (y/y) change is expected in North America, with a contraction tentatively forecast at 1.5 Mt assuming weather conditions in the central US improve by the end of the planting season.
A firm rebound in perspective for 2019/20, driven by North America and South Asia
Global fertilizer demand is expected to rebound in 2019/20, assuming a return to average weather conditions and the expansion of cereal area. It could also be supported by higher crop prices should the 2019 US crop change the supply/demand balances for grain and oilseeds. However, trade uncertainties and the spread of the African swine fever in East Asia could potentially have an impact on the agricultural outlook and depress crop prices further. Demand is anticipated to increase by 2.6% to 195 Mt in absence of major unexpected geopolitical or economic shocks.
Demand is anticipated to fully recover for the three nutrients, with rebounds of 3.1% for P, 2.7% for K, and 2.4% for N.
No change in fertilizer demand is forecast in East Asia, with marginal y/y changes for all three nutrients, and in Western & Central Europe, where the drop in N demand would be almost entirely offset by increased demand for P and K. Demand is seen as expanding in all other regions. An 8% rebound is forecast in North America, while strong growth between 4% and 6% y/y is expected in Africa, EECA, South Asia and West Asia. Expansion in the rest of the world is seen as more modest, between 1% and 3% y/y. Large increases in volume are forecast in North America (+1.9 Mt) and South Asia (+1.6 Mt).
Medium-term demand growth prospects are deteriorating
The medium-term outlook for world agriculture remains broadly unchanged compared with previous years, but agricultural production growth rates are steadily declining. In addition, expectations to improve fertilizer use efficiency and recycle more organic nutrient sources will put pressure on fertilizer demand in developed countries and an increasing number of emerging economies.
Demand in South Asia and Africa will continue to be highly influenced by fertilizer subsidies, which are subject to frequent changes.
Despite robust demand in Sub-Saharan Africa, EECA, Latin America and South Asia, the current context indicates modest prospects for the expansion of global fertilizer demand during the next five years. The average annual growth rate continues to decline, reflecting, inter alia, contracting demand in China.
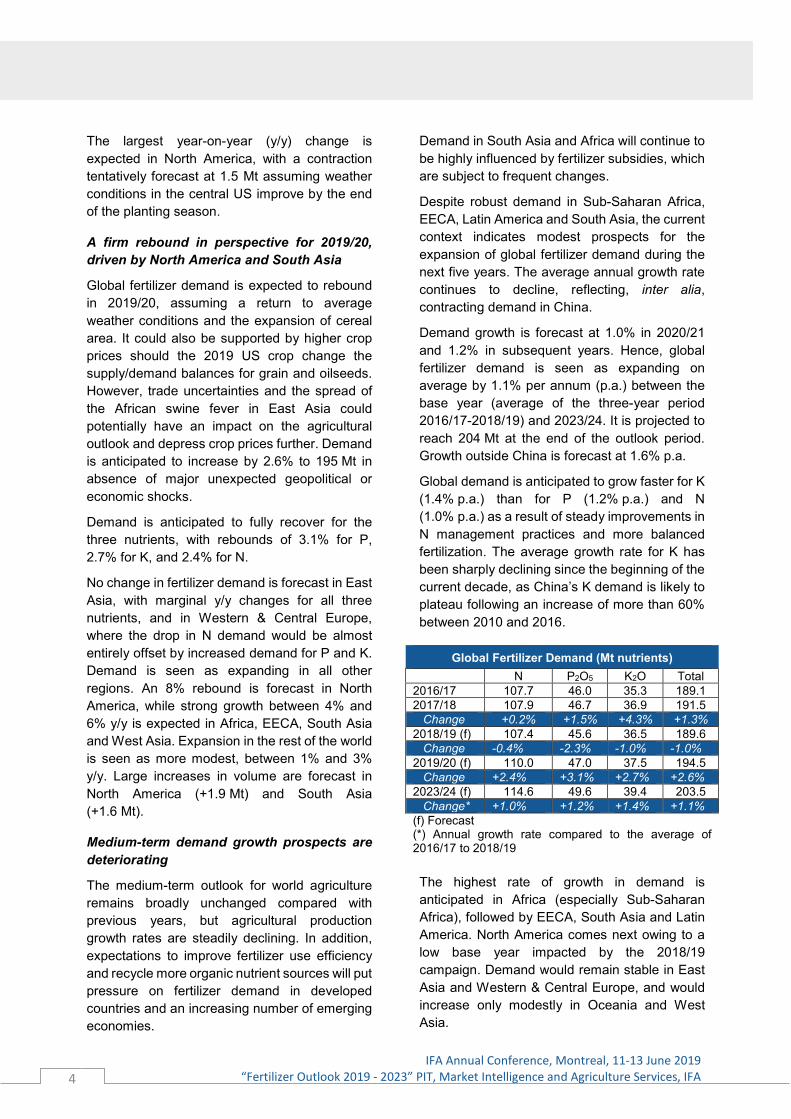
Demand growth is forecast at 1.0% in 2020/21 and 1.2% in subsequent years. Hence, global fertilizer demand is seen as expanding on average by 1.1% per annum (p.a.) between the base year (average of the three-year period 2016/17-2018/19) and 2023/24. It is projected to reach 204 Mt at the end of the outlook period. Growth outside China is forecast at 1.6% p.a.
Global demand is anticipated to grow faster for K (1.4% p.a.) than for P (1.2% p.a.) and N (1.0% p.a.) as a result of steady improvements in N management practices and more balanced fertilization. The average growth rate for K has been sharply declining since the beginning of the current decade, as China’s K demand is likely to plateau following an increase of more than 60% between 2010 and 2016.
Global Fertilizer Demand (Mt nutrients) N P2O5 K2O Total 2016/17 107.7 46.0 35.3 189.1 2017/18 107.9 46.7 36.9 191.5 Change +0.2% +1.5% +4.3% +1.3% 2018/19 (f) 107.4 45.6 36.5 189.6 Change -0.4% -2.3% -1.0% -1.0% 2019/20 (f) 110.0 47.0 37.5 194.5 Change +2.4% +3.1% +2.7% +2.6% 2023/24 (f) 114.6 49.6 39.4 203.5 Change* +1.0% +1.2% +1.4% +1.1% (f) Forecast (*) Annual growth rate compared to the average of 2016/17 to 2018/19
The highest rate of growth in demand is anticipated in Africa (especially Sub-Saharan Africa), followed by EECA, South Asia and Latin America. North America comes next owing to a low base year impacted by the 2018/19 campaign. Demand would remain stable in East Asia and Western & Central Europe, and would increase only modestly in Oceania and West Asia.
5
IFA Annual Conference, Montreal, 11-13 June 2019 “Fertilizer Outlook 2019 - 2023”, PIT, Market Intelligence and Agriculture Services, IFA
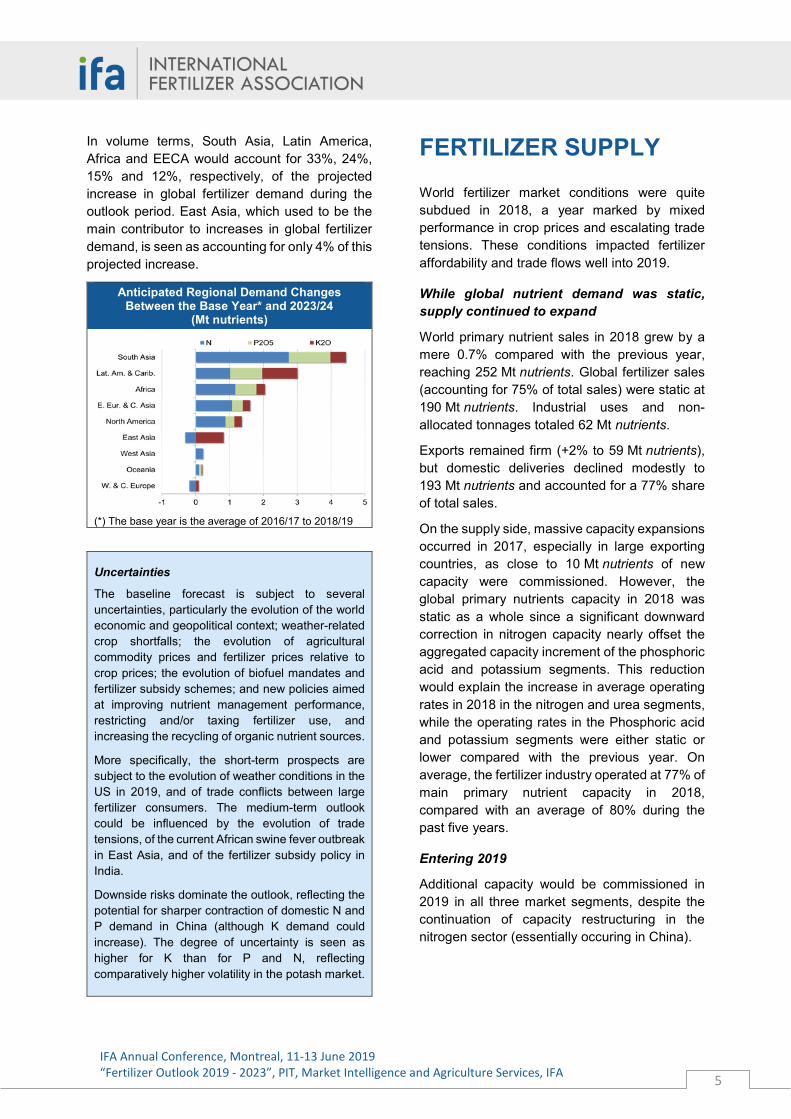
In volume terms, South Asia, Latin America, Africa and EECA would account for 33%, 24%, 15% and 12%, respectively, of the projected increase in global fertilizer demand during the outlook period. East Asia, which used to be the main contributor to increases in global fertilizer demand, is seen as accounting for only 4% of this projected increase.
Anticipated Regional Demand Changes Between the Base Year* and 2023/24
(Mt nutrients)
(*) The base year is the average of 2016/17 to 2018/19
Uncertainties
The baseline forecast is subject to several uncertainties, particularly the evolution of the world economic and geopolitical context; weather-related crop shortfalls; the evolution of agricultural commodity prices and fertilizer prices relative to crop prices; the evolution of biofuel mandates and fertilizer subsidy schemes; and new policies aimed at improving nutrient management performance, restricting and/or taxing fertilizer use, and increasing the recycling of organic nutrient sources.
More specifically, the short-term prospects are subject to the evolution of weather conditions in the US in 2019, and of trade conflicts between large fertilizer consumers. The medium-term outlook could be influenced by the evolution of trade tensions, of the current African swine fever outbreak in East Asia, and of the fertilizer subsidy policy in India.
Downside risks dominate the outlook, reflecting the potential for sharper contraction of domestic N and P demand in China (although K demand could increase). The degree of uncertainty is seen as higher for K than for P and N, reflecting comparatively higher volatility in the potash market.
FERTILIZER SUPPLY World fertilizer market conditions were quite subdued in 2018, a year marked by mixed performance in crop prices and escalating trade tensions. These conditions impacted fertilizer affordability and trade flows well into 2019.
While global nutrient demand was static, supply continued to expand
World primary nutrient sales in 2018 grew by a mere 0.7% compared with the previous year, reaching 252 Mt nutrients. Global fertilizer sales (accounting for 75% of total sales) were static at 190 Mt nutrients. Industrial uses and non-allocated tonnages totaled 62 Mt nutrients.
Exports remained firm (+2% to 59 Mt nutrients), but domestic deliveries declined modestly to 193 Mt nutrients and accounted for a 77% share of total sales.
On the supply side, massive capacity expansions occurred in 2017, especially in large exporting countries, as close to 10 Mt nutrients of new capacity were commissioned. However, the global primary nutrients capacity in 2018 was static as a whole since a significant downward correction in nitrogen capacity nearly offset the aggregated capacity increment of the phosphoric acid and potassium segments. This reduction would explain the increase in average operating rates in 2018 in the nitrogen and urea segments, while the operating rates in the Phosphoric acid and potassium segments were either static or lower compared with the previous year. On average, the fertilizer industry operated at 77% of main primary nutrient capacity in 2018, compared with an average of 80% during the past five years.
Entering 2019
Additional capacity would be commissioned in 2019 in all three market segments, despite the continuation of capacity restructuring in the nitrogen sector (essentially occuring in China).
6 IFA Annual Conference, Montreal, 11-13 June 2019
“Fertilizer Outlook 2019 - 2023” PIT, Market Intelligence and Agriculture Services, IFA
On a net basis, close to 3 Mt nutrients of new capacity is projected to come on stream in 2019 for primary products (ammonia, phosphoric acid and potash).
The reduction of nitrogen capacity in China would impact its potential balance surpluses and affect global trade flows. Meanwhile, new nitrogen capacity (ammonia and/or urea) is coming on stream in EECA, Latin America, Africa and India. In the phosphate segment, large granulation units for P fertilizers are scheduled to start commercial production in Africa (Morocco, Egypt, Tunisia), West Asia (Saudi Arabia, Turkey), Latin America (Brazil) and South Asia (India). In the potash segment, new greenfield operations would start production in EECA (Russia) while incremental capacity expansions are expected to be completed in Canada and China.
Increasing regulatory pressure on production and products
In many jurisdictions, at regional, national and sub-national levels, the fertilizer industry is subject to new supply-related regulations. Policymakers are adopting new regulations on fertilizers, product and plant certifications, and tailings management due to environmental and safety considerations. In late May 2019 the Council of the European Union ratified the new EU Fertilizer Regulation, which contains, inter alia, specific clauses on cadmium content in P fertilizers.
With respect to carbon tax schemes, several countries have announced new initiatives to mitigate greenhouse gas (GHG) emissions by implementing carbon taxes or emission trading schemes/emission trading systems (ETS). According to the World Bank (Carbon Pricing Dashboard, June 2019), by late 2018 close to 46 national and 28 sub-national governments had instituted some form of carbon pricing, as carbon taxes and ETS, covering about 14% of global carbon emissions. In 2019 three additional jurisdictions (including in China and South Africa) plan to implement carbon pricing schemes, altogether adding an incremental coverage of about 7% of global GHG emissions. In South Africa a carbon tax came into effect in early June 2019.
Such schemes are under consideration for the future in 11 countries. In three of these countries the chemical industry would be covered (which might include fertilizers): Mexico (launching a three-year ETS pilot phase), Turkey (developing draft legislation and pursuing pilot studies on several sectors) and Viet Nam (implementing National Appropriate Mitigation Actions: first in the waste and steel sectors and later in the cement, chemical fertilizer, wind power and biogas sectors). In late May 2019 about 80 countries had indicated to the United Nations that they intend to increase their GHG emission reduction pledges under the 2015 Paris climate agreement ahead of schedule (i.e. before 2020). The Paris agreement was designed to let countries set their own targets to control GHG emissions and to ramp them up in coming years.
Concerning safety aspects, industrial accidents in early 2019 at plants and tailings dams/piles around the world have prompted regulators to assess and adopt new (more stringent) standards. Entering 2019, accidents in several countries (e.g. China, Brazil, Russia, India) had led to implementation of new safety standards and policies regulating plant operations and plant locations; or, in certain cases, leading to permanent shutdowns. In a few Chinese provinces the chemical industry faces some major restructuring, along with a significant reduction in the number of plants. Also in China, phosphogypsum tailings management will become mandatory in several large phosphate-producing provinces, implying a cap on future P fertilizer production. Globally, the fertilizer industry’s satisfactory safety and environmental performance remains a prerequisite for maintaining its licence-to-operate. More fertilizer producers are seeking registration in high-standard certification programmes.
Trade sanctions impact fertilizer flows and global growth
In recent years the pace of trade liberalization has slowed while restrictive trade measures have increased.
7
IFA Annual Conference, Montreal, 11-13 June 2019 “Fertilizer Outlook 2019 - 2023”, PIT, Market Intelligence and Agriculture Services, IFA
Trade policy actions in 2018/2019 impacted movements of commodities, including fertilizers. They comprised a variety of initiatives such as trade defense measures, import bans and administrative import barriers. A few countries have imposed some import duties on NPK fertilizers (Nigeria, Viet Nam) or adopted anti-dumping measures on various N products (Ukraine, India, Australia, as well as in the EU). In early 2019 China applied a zero export tariff on all fertilizers and potash products.
The most striking trade actions since 2018 have related to US-imposed sanctions on Iran and the escalation of trade tensions between the US and China. These trade tensions have had greater impacts on the trade of agricultural commodities than on fertilizers. However, in early 2019 the US sanctions on Iran led to a major diversion of urea and ammonia trade flows and a substitution of supply sources for traditional importers.
In mid-2019 the risk of rising trade tensions surged on the back of announcements of higher import tariffs in the US and possible retaliation by China. Further escalation of trade tensions and the associated increases in policy uncertainty would further weaken economic growth. The largest portion of the impact would be manifested in 2019, given the timeline of tariff implementation. According to the IMF (World Economic Outlook, April 2019), global economic expansion decelerated in the second half of 2018 after two years of strong growth. This slowdown was driven by an increase in trade tensions, a decline in business confidence, tightening financial conditions, and greater policy uncertainty across many economies. The IMF has projected global growth at 3.3% in 2019 and 3.6% in 2020, compared with 3.6% in 2018.
Ammonia feedstock prices are moving downward in the near term
According to the World Bank (Commodity Markets Outlook, April 2019), energy prices diverged in the first quarter of 2019 following a period of high volatility throughout 2018. Entering 2019, production cuts by the Organization of the Petroleum Exporting Countries (OPEC) lifted oil prices while high US shale gas production and exports depressed natural gas prices.
Crude oil prices are projected to be US$66/barrel in 2019 and US$65/barrel in 2020. Natural gas prices fell sharply in 2019 due to rising liquefied natural gas (LNG) exports from the US and Australia, weaker demand because of mild weather, and the restarting of nuclear power plants in Japan. Future natural gas prices in Europe and Japan, respectively, are projected to drop by 18% and 28% between 2018 and 2023 while marginally rising in the US (+2%). According to the China International Chemical Consulting Corporation (CICCC), ammonia feedstock prices in China would show a substantial increase for natural gas (+28% vs. 2018) while declining for coal (-3%).
According to the International Energy Agency (Gas 2018, June 2018), LNG would be the main driver of inter-regional natural gas trade growth, sustained by strong export capacity expansion in the US, Australia, Russia and Qatar. Some 140 billion cubic metres (bcm) of new liquefaction capacity is seen as emerging between 2018 and 2023, increasing global capacity by almost 30%. The US, currently the world’s top producer, would account for 45% of growth in global production and 75% of LNG export growth.
Growing capacity in all segments in the near term
Between 2018 and 2023 the fertilizer industry would invest close to US$110 billion in constructing 70 new production units, adding 65 Mt products of capacity. Investments in new capacity are seen as accelerating in all sectors, but new nitrogen capacity would account for two-thirds of planned capital expenditures during the forecast period. Capacity would increase in the three main fertilizer segments in 2018, but more rapidly in the potash sector (+13%) than in the phosphoric acid (+8%) and ammonia (+4%) sectors.
On a regional basis, fertilizer capacity is seen as decreasing in Europe (N and phosphoric acid), East Asia (China for N) and North America (phosphoric acid). EECA will register the main capacity increments in all three segments, with a massive 30% increase for potash.
8 IFA Annual Conference, Montreal, 11-13 June 2019
“Fertilizer Outlook 2019 - 2023” PIT, Market Intelligence and Agriculture Services, IFA
Africa (Morocco) will contribute most to global capacity growth for phosphoric acid, followed by EECA (Russia, Kazakhstan), West Asia (mainly Saudi Arabia) and Latin America (Brazil).
A key feature of future capacity is the subtstantial growth of ammonia/urea capacity in South Asia, notably India, where the addition of 9 Mt of urea capacity will move this country into quasi self-sufficiency by 2023/2024, assuming the timely completion of all planned projects and an adequate/reliable supply of feedstock.
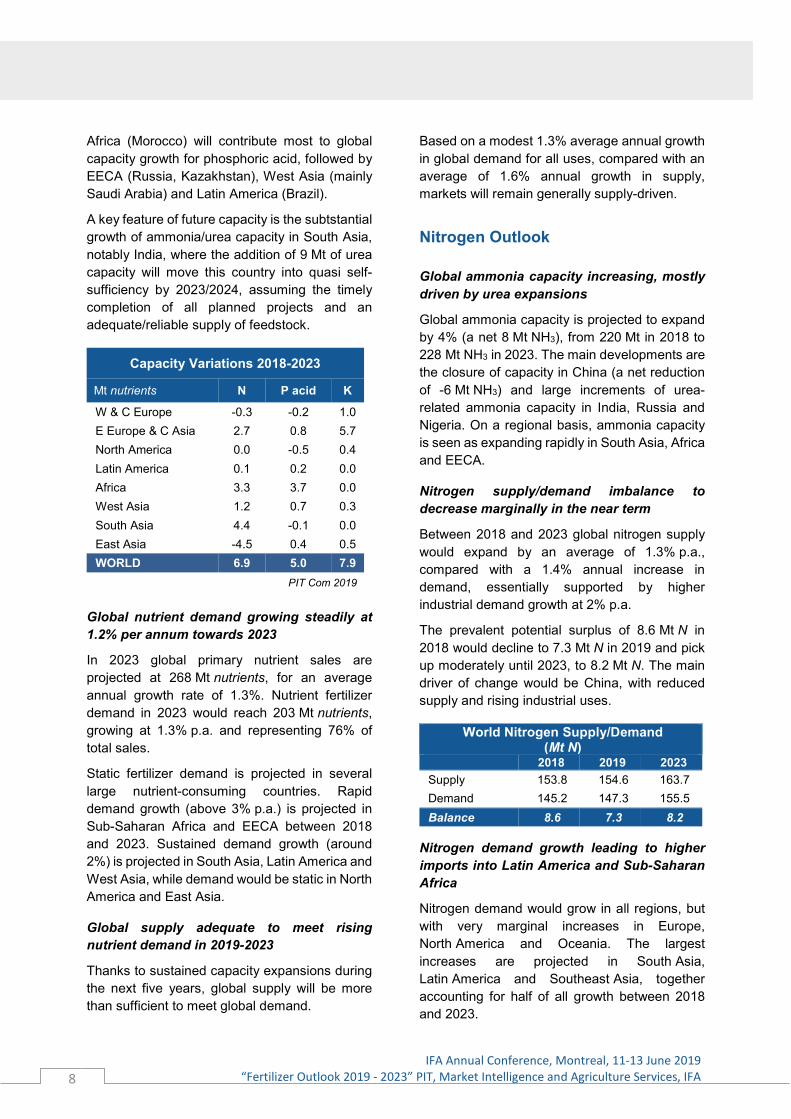
Capacity Variations 2018-2023
Mt nutrients N P acid K
W & C Europe -0.3 -0.2 1.0 E Europe & C Asia 2.7 0.8 5.7 North America 0.0 -0.5 0.4 Latin America 0.1 0.2 0.0 Africa 3.3 3.7 0.0 West Asia 1.2 0.7 0.3 South Asia 4.4 -0.1 0.0 East Asia -4.5 0.4 0.5 WORLD 6.9 5.0 7.9
PIT Com 2019
Global nutrient demand growing steadily at 1.2% per annum towards 2023
In 2023 global primary nutrient sales are projected at 268 Mt nutrients, for an average annual growth rate of 1.3%. Nutrient fertilizer demand in 2023 would reach 203 Mt nutrients, growing at 1.3% p.a. and representing 76% of total sales.
Static fertilizer demand is projected in several large nutrient-consuming countries. Rapid demand growth (above 3% p.a.) is projected in Sub-Saharan Africa and EECA between 2018 and 2023. Sustained demand growth (around 2%) is projected in South Asia, Latin America and West Asia, while demand would be static in North America and East Asia.
Global supply adequate to meet rising nutrient demand in 2019-2023
Thanks to sustained capacity expansions during the next five years, global supply will be more than sufficient to meet global demand.
Based on a modest 1.3% average annual growth in global demand for all uses, compared with an average of 1.6% annual growth in supply, markets will remain generally supply-driven.
Nitrogen Outlook
Global ammonia capacity increasing, mostly driven by urea expansions
Global ammonia capacity is projected to expand by 4% (a net 8 Mt NH3), from 220 Mt in 2018 to 228 Mt NH3 in 2023. The main developments are the closure of capacity in China (a net reduction of -6 Mt NH3) and large increments of urea-related ammonia capacity in India, Russia and Nigeria. On a regional basis, ammonia capacity is seen as expanding rapidly in South Asia, Africa and EECA.
Nitrogen supply/demand imbalance to decrease marginally in the near term
Between 2018 and 2023 global nitrogen supply would expand by an average of 1.3% p.a., compared with a 1.4% annual increase in demand, essentially supported by higher industrial demand growth at 2% p.a.
The prevalent potential surplus of 8.6 Mt N in 2018 would decline to 7.3 Mt N in 2019 and pick up moderately until 2023, to 8.2 Mt N. The main driver of change would be China, with reduced supply and rising industrial uses.
World Nitrogen Supply/Demand (Mt N)
2018 2019 2023 Supply 153.8 154.6 163.7 Demand 145.2 147.3 155.5 Balance 8.6 7.3 8.2
Nitrogen demand growth leading to higher imports into Latin America and Sub-Saharan Africa
Nitrogen demand would grow in all regions, but with very marginal increases in Europe, North America and Oceania. The largest increases are projected in South Asia, Latin America and Southeast Asia, together accounting for half of all growth between 2018 and 2023.
9
IFA Annual Conference, Montreal, 11-13 June 2019 “Fertilizer Outlook 2019 - 2023”, PIT, Market Intelligence and Agriculture Services, IFA
Rising demand in Latin America and Sub-Saharan Africa will create significant import opportunities in the near term. East Asia will shift from a region with a surplus position to one with an increasing deficit, as a result of a massive reduction of China’s potential surpluses and sustained nitrogen demand in Southeast Asia.
Global seaborne ammonia export supply is expanding, but from a limited number of stand-alone projects
Global seaborne ammonia export availability is projected to increase by a net 10% compared with 2018, to 19.7 Mt in 2023, with regions West and East of Suez adding a net 0.8 Mt and 0.9 Mt, respectively.
In the regions West of Suez, the main addition comes from a stand-alone export facility in Russia (Kingisepp) while a new ammonia unit in the US Gulf of Mexico (Freeport) may revert to opportunistic offshore sales. No change in export supply is seen in Europe or Latin America. Ammonia imports would likely rise in North Africa and, possibly, in the Mediterraean basin.
In the regions East of Suez, ammonia export capacity would expand in Saudi Arabia, Oman and Indonesia; imports are seen as rising in India and East Asia.
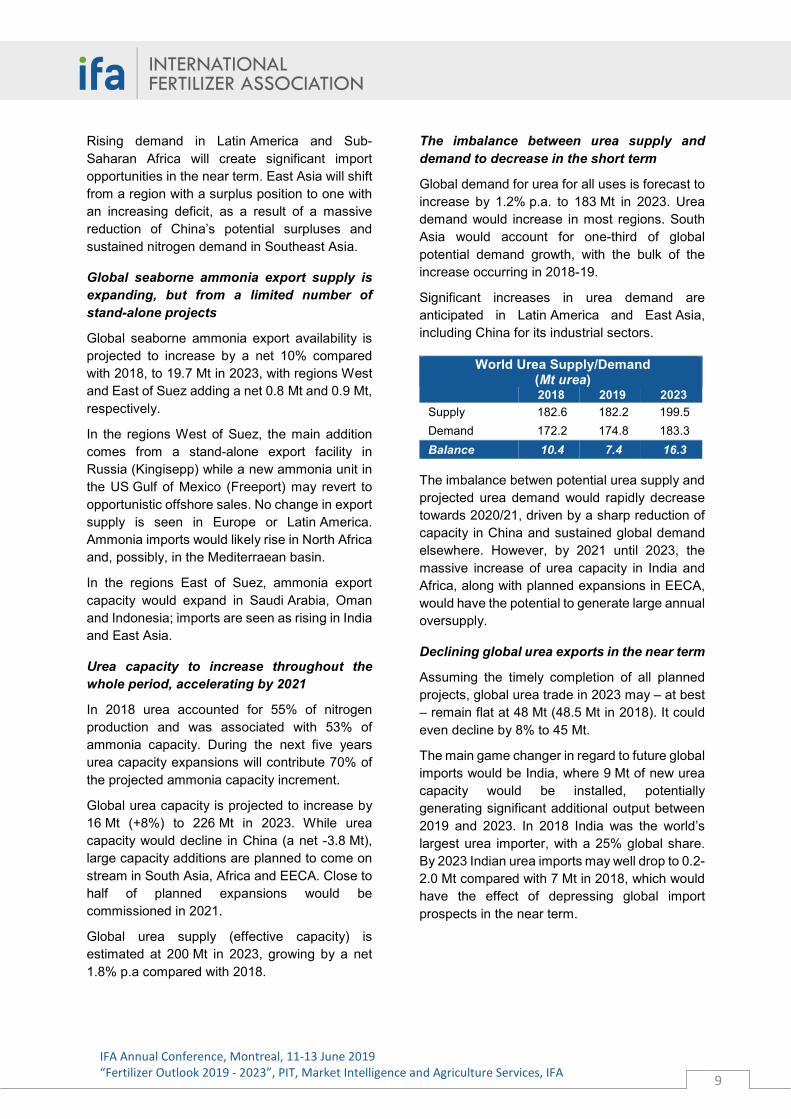
Urea capacity to increase throughout the whole period, accelerating by 2021
In 2018 urea accounted for 55% of nitrogen production and was associated with 53% of ammonia capacity. During the next five years urea capacity expansions will contribute 70% of the projected ammonia capacity increment.
Global urea capacity is projected to increase by 16 Mt (+8%) to 226 Mt in 2023. While urea capacity would decline in China (a net -3.8 Mt), large capacity additions are planned to come on stream in South Asia, Africa and EECA. Close to half of planned expansions would be commissioned in 2021.
Global urea supply (effective capacity) is estimated at 200 Mt in 2023, growing by a net 1.8% p.a compared with 2018.
The imbalance between urea supply and demand to decrease in the short term
Global demand for urea for all uses is forecast to increase by 1.2% p.a. to 183 Mt in 2023. Urea demand would increase in most regions. South Asia would account for one-third of global potential demand growth, with the bulk of the increase occurring in 2018-19.
Significant increases in urea demand are anticipated in Latin America and East Asia, including China for its industrial sectors.
World Urea Supply/Demand (Mt urea)
2018 2019 2023 Supply 182.6 182.2 199.5 Demand 172.2 174.8 183.3 Balance 10.4 7.4 16.3
The imbalance betwen potential urea supply and projected urea demand would rapidly decrease towards 2020/21, driven by a sharp reduction of capacity in China and sustained global demand elsewhere. However, by 2021 until 2023, the massive increase of urea capacity in India and Africa, along with planned expansions in EECA, would have the potential to generate large annual oversupply.
Declining global urea exports in the near term
Assuming the timely completion of all planned projects, global urea trade in 2023 may – at best – remain flat at 48 Mt (48.5 Mt in 2018). It could even decline by 8% to 45 Mt.
The main game changer in regard to future global imports would be India, where 9 Mt of new urea capacity would be installed, potentially generating significant additional output between 2019 and 2023. In 2018 India was the world’s largest urea importer, with a 25% global share. By 2023 Indian urea imports may well drop to 0.2-2.0 Mt compared with 7 Mt in 2018, which would have the effect of depressing global import prospects in the near term.
10 IFA Annual Conference, Montreal, 11-13 June 2019
“Fertilizer Outlook 2019 - 2023” PIT, Market Intelligence and Agriculture Services, IFA
Phosphate Outlook
Phosphate rock supply continues to increase, but at a slightly lower rate
The global phosphate rock supply is projected to grow from 235 Mt in 2018 to 254 Mt in 2023, an increase of 8%.
Africa would account for 75% of the net increase during the outlook period. At the same time, a major reduction of rock supply observed in North America during the past five years (-5 Mt in 2013-2018) appears to have come to an end and the supply in the region is expected to remain in the order of 30 Mt in the near term.
Nearly three-quarters of additional phosphate rock supply would come from existing operating producers. Most of the 19 Mt expansion would be earmarked for captive downstream production. Guinea-Bissau is expected to emerge as a new phosphate rock supplier towards the end of the outlook period.
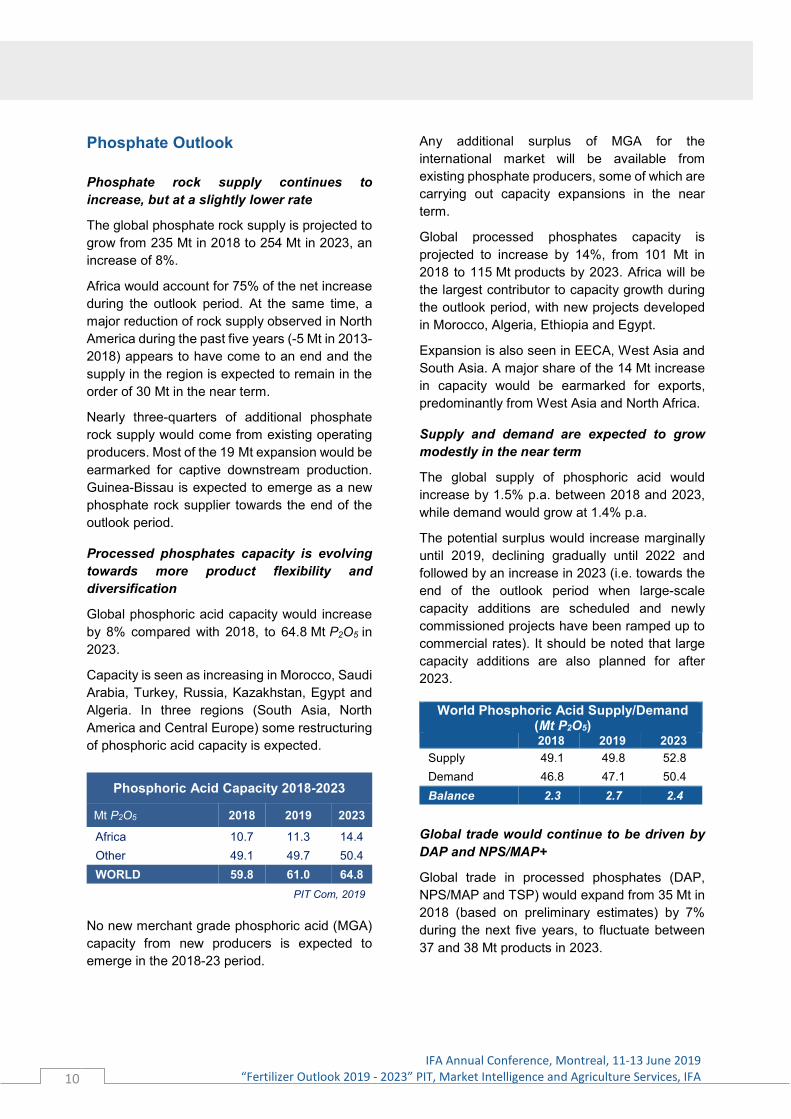
Processed phosphates capacity is evolving towards more product flexibility and diversification
Global phosphoric acid capacity would increase by 8% compared with 2018, to 64.8 Mt P2O5 in 2023.
Capacity is seen as increasing in Morocco, Saudi Arabia, Turkey, Russia, Kazakhstan, Egypt and Algeria. In three regions (South Asia, North America and Central Europe) some restructuring of phosphoric acid capacity is expected.
Phosphoric Acid Capacity 2018-2023
Mt P2O5 2018 2019 2023 Africa 10.7 11.3 14.4 Other 49.1 49.7 50.4 WORLD 59.8 61.0 64.8
PIT Com, 2019
No new merchant grade phosphoric acid (MGA) capacity from new producers is expected to emerge in the 2018-23 period.
Any additional surplus of MGA for the international market will be available from existing phosphate producers, some of which are carrying out capacity expansions in the near term.
Global processed phosphates capacity is projected to increase by 14%, from 101 Mt in 2018 to 115 Mt products by 2023. Africa will be the largest contributor to capacity growth during the outlook period, with new projects developed in Morocco, Algeria, Ethiopia and Egypt.
Expansion is also seen in EECA, West Asia and South Asia. A major share of the 14 Mt increase in capacity would be earmarked for exports, predominantly from West Asia and North Africa.
Supply and demand are expected to grow modestly in the near term
The global supply of phosphoric acid would increase by 1.5% p.a. between 2018 and 2023, while demand would grow at 1.4% p.a.
The potential surplus would increase marginally until 2019, declining gradually until 2022 and followed by an increase in 2023 (i.e. towards the end of the outlook period when large-scale capacity additions are scheduled and newly commissioned projects have been ramped up to commercial rates). It should be noted that large capacity additions are also planned for after 2023.
World Phosphoric Acid Supply/Demand (Mt P2O5)
2018 2019 2023 Supply 49.1 49.8 52.8 Demand 46.8 47.1 50.4 Balance 2.3 2.7 2.4
Global trade would continue to be driven by DAP and NPS/MAP+
Global trade in processed phosphates (DAP, NPS/MAP and TSP) would expand from 35 Mt in 2018 (based on preliminary estimates) by 7% during the next five years, to fluctuate between 37 and 38 Mt products in 2023.
11
IFA Annual Conference, Montreal, 11-13 June 2019 “Fertilizer Outlook 2019 - 2023”, PIT, Market Intelligence and Agriculture Services, IFA
Potash Outlook
Ongoing capacity growth, with an additional 8 Mt K2O expected to be brought on stream between 2018 and 2023
Global potassium capacity is forecast to increase by an overall 13%, from 59.9 Mt K2O in 2018 to 67.8 Mt K2O in 2023. This equates to a net increment of 8 Mt K2O, most of which is represented by new projects expected to be commissioned in Russia and Belarus, as well as an increase in North America and West Asia. Some restructuring would take place in Western Europe, resulting in negative growth of MOP capacity for the region. However, large-scale polyhalite capacity development is nearing completion in the United Kingdom and may bring new supply to the market by the end of the outlook period. In product terms, global potassium capacity in 2023 would reach 122.6 Mt products, expanding by a net 21.5 Mt compared with 101.1 Mt in 2018, with MOP contributing 9.9 Mt.
EECA and North America will account for 92% of potential potash supply growth in 2018-2023
In 2017-18, new MOP supply was commissioned in Latin America (Bolivia) and Central Asia (Turkmenistan). Global potassium supply would increase to 55.0 Mt K2O in 2023, a net increment of 6.4 Mt K2O or 13% growth compared with 2018. In terms of MOP equivalent, global potash supply would reach 92 Mt in 2023.The EECA and North America would account for around 36% and 34% of potential supply, respectively, in 2023. North America’s share would shrink slightly, from 36% of global capacity in 2018 to 34% in 2023. The two other major regions with potential supply in 2023 are East Asia (13%) followed by West Europe (7%).
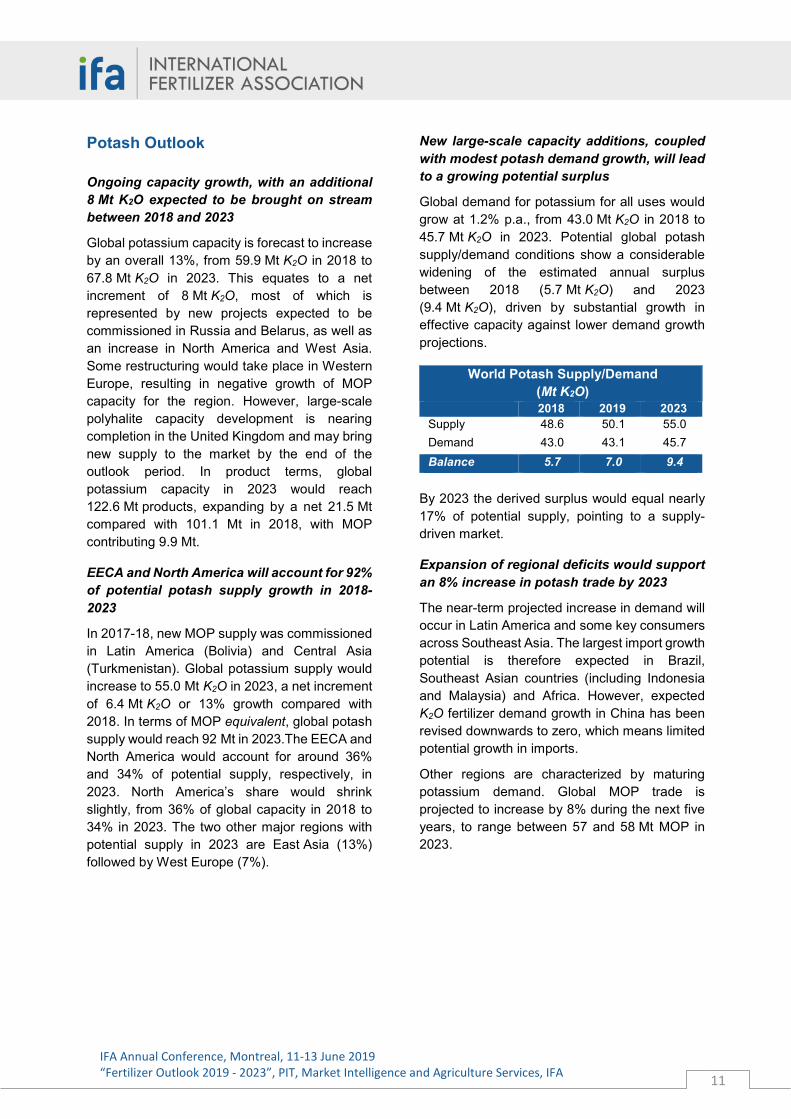
New large-scale capacity additions, coupled with modest potash demand growth, will lead to a growing potential surplus
Global demand for potassium for all uses would grow at 1.2% p.a., from 43.0 Mt K2O in 2018 to 45.7 Mt K2O in 2023. Potential global potash supply/demand conditions show a considerable widening of the estimated annual surplus between 2018 (5.7 Mt K2O) and 2023 (9.4 Mt K2O), driven by substantial growth in effective capacity against lower demand growth projections.
World Potash Supply/Demand (Mt K2O)
2018 2019 2023 Supply 48.6 50.1 55.0 Demand 43.0 43.1 45.7 Balance 5.7 7.0 9.4
By 2023 the derived surplus would equal nearly 17% of potential supply, pointing to a supply-driven market.
Expansion of regional deficits would support an 8% increase in potash trade by 2023
The near-term projected increase in demand will occur in Latin America and some key consumers across Southeast Asia. The largest import growth potential is therefore expected in Brazil, Southeast Asian countries (including Indonesia and Malaysia) and Africa. However, expected K2O fertilizer demand growth in China has been revised downwards to zero, which means limited potential growth in imports.
Other regions are characterized by maturing potassium demand. Global MOP trade is projected to increase by 8% during the next five years, to range between 57 and 58 Mt MOP in 2023.
IFA Strategic Forum, Dubai, 26-28 November 2016 “Short-Term Fertilizer Outlook 2016-2017” P. Heffer and M. Prud’homme, IFA
12