impact of cng on vehicular pollution in delhi: a note
TRANSCRIPT
Transportation Research Part D 9 (2004) 409–417www.elsevier.com/locate/trd
Notes and comments
Impact of CNG on vehicular pollution in Delhi: a note
Vinish Kathuria
Madras School of Economics, Gandhi Mandapam Road, Chennai 600 025, India
Available online
Abstract
Besides mandating the use of CNG, a number of other policy instruments have been enacted that has
helped improve the air quality in Delhi. This paper investigated two issues––whether enactment of policyinstruments has affected ambient air quality and whether CNG conversion has impinged on the pollution
profile. Daily ambient air quality data from June 1999 to September 2003 from the busiest crossing in Delhi
do not indicate an all-round improvement in ambient quality. The NOx has risen after the conversion
whereas SPM and PM10 have shown only marginal fall; CO has shown a significant decline.
� 2004 Elsevier Ltd. All rights reserved.
Keywords: Compressed natural gas; Delhi; Air pollution
1. Introduction
The adverse morbidity and mortality effect of air pollutants like suspended particulate matter(SPM), respirable suspended particulate matter (RSPM or PM10), sulfur dioxide (SO2), carbonmonoxide (CO) and Ozone (O3) are well documented. In the case of Delhi, the situation deteri-orated in the 1990s as vehicles growth outpaced population growth and economic development;vehicle had risen to nearly 3.6 million by 2001. During the period, Delhi’s population increasedfrom 9.5 to 13.8 million and road-length from 22,000 to 25,000 km. The World Bank estimatedthat a person was dying every 70 min in Delhi in 1995 from air pollution (Brandon and Hom-mann, 1995). The Supreme Court (SC) of India ruled in 1998 that all the public transport shouldmove away from diesel to CNG by 31 March 2001 and by December 1, 2002 all the buses wereconverted to CNG.The CNG is a clean-burning alternative fuel for vehicles with a significant potential for
reducing harmful emissions especially fine particles. In diesel engines, a major part of the fuel
E-mail address: [email protected] (V. Kathuria).
1361-9209/$ - see front matter � 2004 Elsevier Ltd. All rights reserved.
doi:10.1016/j.trd.2004.05.003
410 V. Kathuria / Transportation Research Part D 9 (2004) 409–417
remains unburnt, making up particulate emissions. Nylund and Lawson (2000) finds dieselcombustion emits 84 grams per kilometer (gms/km) of such components as compared to 11 gms/km in CNG and the level of GHGs emitted from natural gas exhaust is 12% lower than dieselwhen the entire life cycle of the fuel is considered. CNG run vehicles also have quieter operation,less vibrations and less odour than equivalent diesel engines. However, high vehicle cost, shorterdriving range, heavy fuel tank, expensive distribution and storage network and potential per-formance and operational problems compared to liquid fuels are some of the drawbacks of CNG(Watt, 2001).
2. Policy instruments in Delhi
A numbers of policy instruments––both command and control (CAC) and market-basedinstruments (MBI) 1––have been implemented in Delhi to combat pollution since 1998. However,the most controversial of these is the CNG conversion. Table 1 gives the chronological CNGimplementation.Table 2 offers details of the effects of policies covering June 1999 to September 2003 for the
BSZM (Bahadur Shah Zafar Marg)––the busiest crossing in Delhi. 2 It indicates that the SO2
level, which has never violated the legal standard, showed further decline, whereas, NOx levelsrose continuously from 2000 and especially after CNG conversion. With respect to SPM andPM10, they have fallen especially in 2003, but the level of violations have remained static. COlevels, although are still above the allowable 2% levels of violations, have shown a consistent fall,possibly due to the CNG conversion. The t-test shows that the mean values of all the parametersfor the year 2003 are significantly different (at 5% level) than for 2002.The assertion that the conversion to CNG reduces the particulates levels has not been estab-
lished. A look at trend figures, however, shows that after every significant policy event the pollutionlevels do fall but not in a sustained manner (e.g., Fig. 1 relates to SO2 and NO2). One of the reasonsfor this transitory impact could be that almost 200,000 vehicles join the existing fleet annually. Tosee how long the effect of the policy instruments lasted, an econometric model is developed.
3. Econometrics analysis
The short term effects are investigated by considering implementation of a policy leads to animmediate fall in pollution. Since vehicle emissions depend on a number of factors such as
1 The policy instruments can be applied at five stages––pre-combustion stage needing upgradation in fuel quality
(stage I); combustion stage requiring engine modifications (stage II); and post-combustion stage necessitating exhaust
treatment devices like catalytic converters (stage III). Besides, few ‘non-technical’ instruments can be aimed at
consumers, requiring behavioral adaptations either in the transport mode or necessitating periodic maintenance check.
Any instrument intended for these behavioral changes would either be before stage I (i.e., stage 0) or after stage III (i.e.,
stage IV) (Kathuria, 2002).2 The site choice is vital for three other reasons; it measures the near-road emissions; it has a well maintained
monitoring station of CPCB for PM10 parameter; and it is unaffected by infrastructure related measures like metro-rail,
or fly-overs.
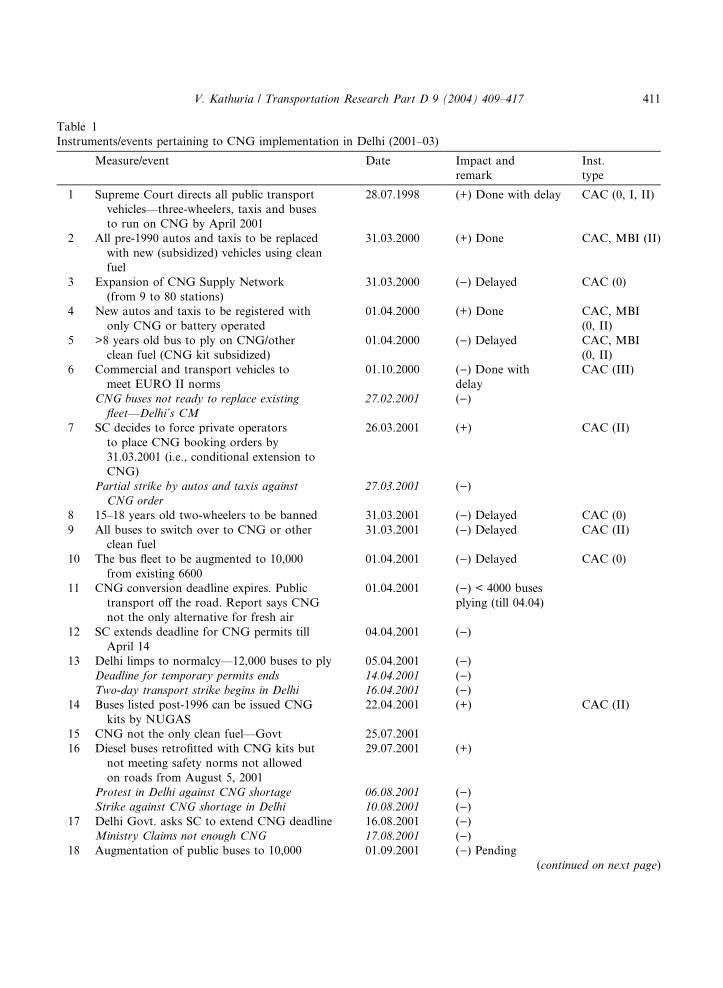
Table 1
Instruments/events pertaining to CNG implementation in Delhi (2001–03)
Measure/event Date Impact and
remark
Inst.
type
1 Supreme Court directs all public transport
vehicles––three-wheelers, taxis and buses
to run on CNG by April 2001
28.07.1998 (+) Done with delay CAC (0, I, II)
2 All pre-1990 autos and taxis to be replaced
with new (subsidized) vehicles using clean
fuel
31.03.2000 (+) Done CAC, MBI (II)
3 Expansion of CNG Supply Network
(from 9 to 80 stations)
31.03.2000 ()) Delayed CAC (0)
4 New autos and taxis to be registered with
only CNG or battery operated
01.04.2000 (+) Done CAC, MBI
(0, II)
5 >8 years old bus to ply on CNG/other
clean fuel (CNG kit subsidized)
01.04.2000 ()) Delayed CAC, MBI
(0, II)
6 Commercial and transport vehicles to
meet EURO II norms
01.10.2000 ()) Done withdelay
CAC (III)
CNG buses not ready to replace existing
fleet––Delhi’s CM
27.02.2001 ())
7 SC decides to force private operators
to place CNG booking orders by
31.03.2001 (i.e., conditional extension to
CNG)
26.03.2001 (+) CAC (II)
Partial strike by autos and taxis against
CNG order
27.03.2001 ())
8 15–18 years old two-wheelers to be banned 31.03.2001 ()) Delayed CAC (0)
9 All buses to switch over to CNG or other
clean fuel
31.03.2001 ()) Delayed CAC (II)
10 The bus fleet to be augmented to 10,000
from existing 6600
01.04.2001 ()) Delayed CAC (0)
11 CNG conversion deadline expires. Public
transport off the road. Report says CNG
not the only alternative for fresh air
01.04.2001 ()) < 4000 buses
plying (till 04.04)
12 SC extends deadline for CNG permits till
April 14
04.04.2001 ())
13 Delhi limps to normalcy––12,000 buses to ply 05.04.2001 ())Deadline for temporary permits ends 14.04.2001 ())Two-day transport strike begins in Delhi 16.04.2001 ())
14 Buses listed post-1996 can be issued CNG
kits by NUGAS
22.04.2001 (+) CAC (II)
15 CNG not the only clean fuel––Govt 25.07.2001
16 Diesel buses retrofitted with CNG kits but
not meeting safety norms not allowed
on roads from August 5, 2001
29.07.2001 (+)
Protest in Delhi against CNG shortage 06.08.2001 ())Strike against CNG shortage in Delhi 10.08.2001 ())
17 Delhi Govt. asks SC to extend CNG deadline 16.08.2001 ())Ministry Claims not enough CNG 17.08.2001 ())
18 Augmentation of public buses to 10,000 01.09.2001 ()) Pending(continued on next page)
V. Kathuria / Transportation Research Part D 9 (2004) 409–417 411
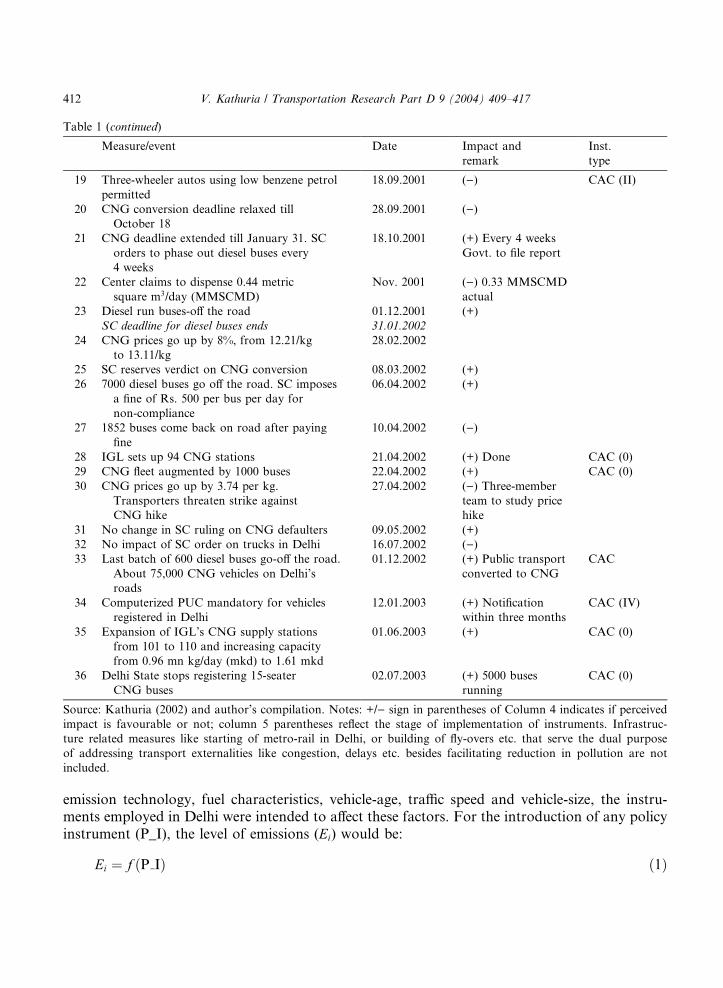
Table 1 (continued)
Measure/event Date Impact and
remark
Inst.
type
19 Three-wheeler autos using low benzene petrol
permitted
18.09.2001 ()) CAC (II)
20 CNG conversion deadline relaxed till
October 18
28.09.2001 ())
21 CNG deadline extended till January 31. SC
orders to phase out diesel buses every
4 weeks
18.10.2001 (+) Every 4 weeks
Govt. to file report
22 Center claims to dispense 0.44 metric
square m3/day (MMSCMD)
Nov. 2001 ()) 0.33 MMSCMD
actual
23 Diesel run buses-off the road 01.12.2001 (+)
SC deadline for diesel buses ends 31.01.2002
24 CNG prices go up by 8%, from 12.21/kg
to 13.11/kg
28.02.2002
25 SC reserves verdict on CNG conversion 08.03.2002 (+)
26 7000 diesel buses go off the road. SC imposes
a fine of Rs. 500 per bus per day for
non-compliance
06.04.2002 (+)
27 1852 buses come back on road after paying
fine
10.04.2002 ())
28 IGL sets up 94 CNG stations 21.04.2002 (+) Done CAC (0)
29 CNG fleet augmented by 1000 buses 22.04.2002 (+) CAC (0)
30 CNG prices go up by 3.74 per kg.
Transporters threaten strike against
CNG hike
27.04.2002 ()) Three-memberteam to study price
hike
31 No change in SC ruling on CNG defaulters 09.05.2002 (+)
32 No impact of SC order on trucks in Delhi 16.07.2002 ())33 Last batch of 600 diesel buses go-off the road.
About 75,000 CNG vehicles on Delhi’s
roads
01.12.2002 (+) Public transport
converted to CNG
CAC
34 Computerized PUC mandatory for vehicles
registered in Delhi
12.01.2003 (+) Notification
within three months
CAC (IV)
35 Expansion of IGL’s CNG supply stations
from 101 to 110 and increasing capacity
from 0.96 mn kg/day (mkd) to 1.61 mkd
01.06.2003 (+) CAC (0)
36 Delhi State stops registering 15-seater
CNG buses
02.07.2003 (+) 5000 buses
running
CAC (0)
Source: Kathuria (2002) and author’s compilation. Notes: +/) sign in parentheses of Column 4 indicates if perceived
impact is favourable or not; column 5 parentheses reflect the stage of implementation of instruments. Infrastruc-
ture related measures like starting of metro-rail in Delhi, or building of fly-overs etc. that serve the dual purpose
of addressing transport externalities like congestion, delays etc. besides facilitating reduction in pollution are not
included.
412 V. Kathuria / Transportation Research Part D 9 (2004) 409–417
emission technology, fuel characteristics, vehicle-age, traffic speed and vehicle-size, the instru-ments employed in Delhi were intended to affect these factors. For the introduction of any policyinstrument (P_I), the level of emissions (Ei) would be:
Ei ¼ f ðP IÞ ð1Þ
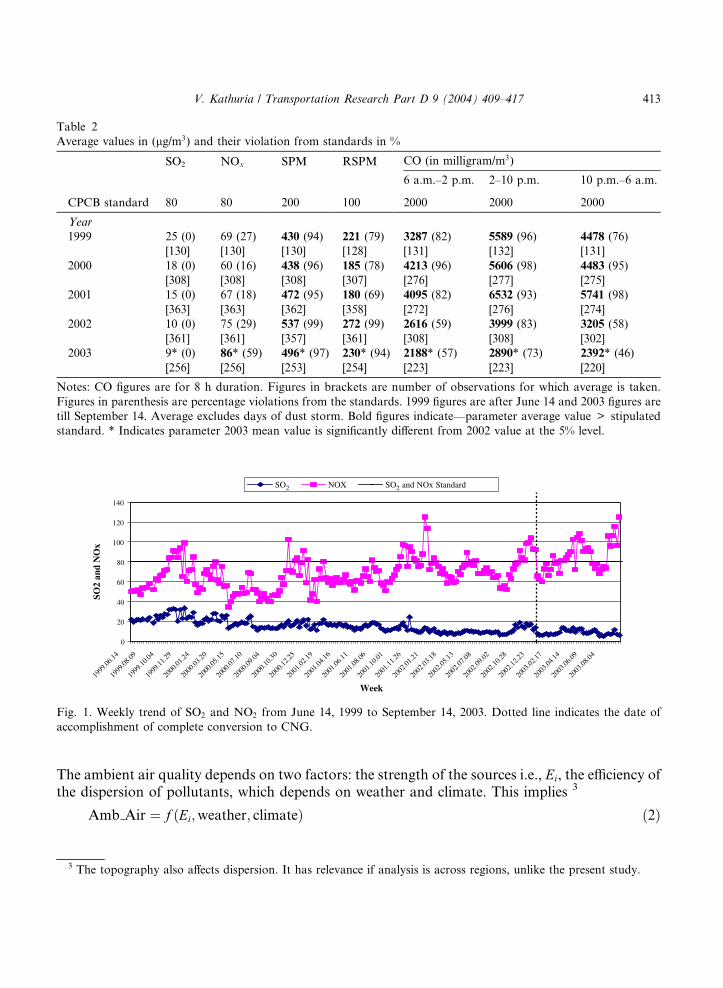
Table 2
Average values in (lg/m3) and their violation from standards in %
SO2 NOx SPM RSPM CO (in milligram/m3)
6 a.m.–2 p.m. 2–10 p.m. 10 p.m.–6 a.m.
CPCB standard 80 80 200 100 2000 2000 2000
Year
1999 25 (0)
[130]
69 (27)
[130]
430 (94)
[130]
221 (79)
[128]
3287 (82)
[131]
5589 (96)
[132]
4478 (76)
[131]
2000 18 (0)
[308]
60 (16)
[308]
438 (96)
[308]
185 (78)
[307]
4213 (96)
[276]
5606 (98)
[277]
4483 (95)
[275]
2001 15 (0)
[363]
67 (18)
[363]
472 (95)
[362]
180 (69)
[358]
4095 (82)
[272]
6532 (93)
[276]
5741 (98)
[274]
2002 10 (0)
[361]
75 (29)
[361]
537 (99)
[357]
272 (99)
[361]
2616 (59)
[308]
3999 (83)
[308]
3205 (58)
[302]
2003 9* (0)
[256]
86* (59)
[256]
496* (97)
[253]
230* (94)
[254]
2188* (57)
[223]
2890* (73)
[223]
2392* (46)
[220]
Notes: CO figures are for 8 h duration. Figures in brackets are number of observations for which average is taken.
Figures in parenthesis are percentage violations from the standards. 1999 figures are after June 14 and 2003 figures are
till September 14. Average excludes days of dust storm. Bold figures indicate––parameter average value > stipulated
standard. * Indicates parameter 2003 mean value is significantly different from 2002 value at the 5% level.
0
20
40
60
80
100
120
140
1999
.06.14
1999
.08.09
1999
.10.04
1999
.11.29
2000
.01.24
2000
.03.20
2000
.05.15
2000
.07.10
2000
.09.04
2000
.10.30
2000
.12.25
2001
.02.19
2001
.04.16
2001
.06.11
2001
.08.06
2001
.10.01
2001
.11.26
2002
.01.21
2002
.03.18
2002
.05.13
2002
.07.08
2002
.09.02
2002
.10.28
2002
.12.23
2003
.02.17
2003
.04.14
2003
.06.09
2003
.08.04
Week
SO2
and
NO
x
SO2 NOX SO2 and NOx Standard
Fig. 1. Weekly trend of SO2 and NO2 from June 14, 1999 to September 14, 2003. Dotted line indicates the date of
accomplishment of complete conversion to CNG.
V. Kathuria / Transportation Research Part D 9 (2004) 409–417 413
The ambient air quality depends on two factors: the strength of the sources i.e., Ei, the efficiency ofthe dispersion of pollutants, which depends on weather and climate. This implies 3
3 Th
Amb Air ¼ f ðEi;weather; climateÞ ð2Þ
e topography also affects dispersion. It has relevance if analysis is across regions, unlike the present study.
414 V. Kathuria / Transportation Research Part D 9 (2004) 409–417
From (1) and (2), we have
4 M
affecti
affecti
Amb Air ¼ f ðP I;weather; climateÞ ð3Þ
Temperature, rainfall, wind speed etc. are the variables accounting for weather. With its semi-arid climate, Delhi experiences only three seasons: dry (April–June); monsoon (July–September);and winter season (October–March). Parameters like SPM increase in summer due to dustyconditions, whereas, rainfall ‘scavenges’ particulates. During winter, low ambient temperatures,lower mixing depth, temperature inversion, higher consumption of fuel aggravate the pollutionproblem, especially the NOx.Any pollution parameter usually has a short-term persistent effect unless strong wind disperses
it or rain scavenges it. This persistent effect can be captured with one-day lags. Another variableaffecting the ambient air quality is the volume of traffic. This has two components vehicles on theroad ðv roadÞ and newly registered vehicles ðv regÞ. Vehicles on road reflect the economic activityin the area that might vary depending upon the day of the week. 4 Thus the model could be:
Amb Airt ¼ f ðAmb Airt�1;P I;weather; climate; v road; v regÞ ð4Þ
The lag values of air quality parameter forced the dropping of observations for which previousday no reading was taken. Eighteen observations had to be dropped due to dusty weather con-ditions which may have affected the ambient air quality. This leaves 1352 observations for SPMand NOx. For PM10 and SPM no reading on some days due to instrument failures, left 1324 and1315 observations respectively.The variable policy instrument (P_I) has been constructed as a dummy taking a value 1 if the
time elapsed after enacting a policy is a week or less. Rainfall (Rfall––rain during the day inmillimetre), maximum (MaxT) and minimum (MinT) temperature were taken newspapers andcapture daily meteorological variations. Climatic conditions are captured through three seasonaldummies (Season_dummy) for summer, rainy and winter seasons. Since the level of activityinfluences vehicles in use, and hence the ambient air quality, this is controlled for by using daydummies (Day_dummy). In absence of data on daily registration, a daily time trend (Time)variable has been constructed that partially captures vehicle registration. A yearly dummy(Year_dummy) is introduced to account for population increase and other unobserved factors.Table 1 indicates the CNG conversion implementation was often delayed. Such events could
have given inappropriate signals. To allow such delays, the variable ‘PI_delayed’ is included. Afurther variable (Holiday) is also included. To allow for the CNG implementation effect a dummythat takes the value 1 after December 1, 2002 and zero otherwise is included. Assuming a linearrelationship between ambient air quality and various factors affecting pollution, the model is:
SPMðPM10 or NOxÞt ¼ b0 þ dCNGþ b1SPM ðor PM10or NOxÞt�1 þ b2P Iþ b3Rfallþ b4MaxTþ b5MinTþ b6–7Season dummy
þ b8–9Year dummyþ b10Timeþ b11–16Day dummy
þ b17PI delayþ b18Holidayþ ut ð5Þ
any fly-overs have been constructed in recent past in Delhi to improve traffic movement, thereby indirectly
ng emissions. However, no such fly-over has been constructed in the vicinity of our study site. As a result, variable
ng traffic speed was not included.
V. Kathuria / Transportation Research Part D 9 (2004) 409–417 415
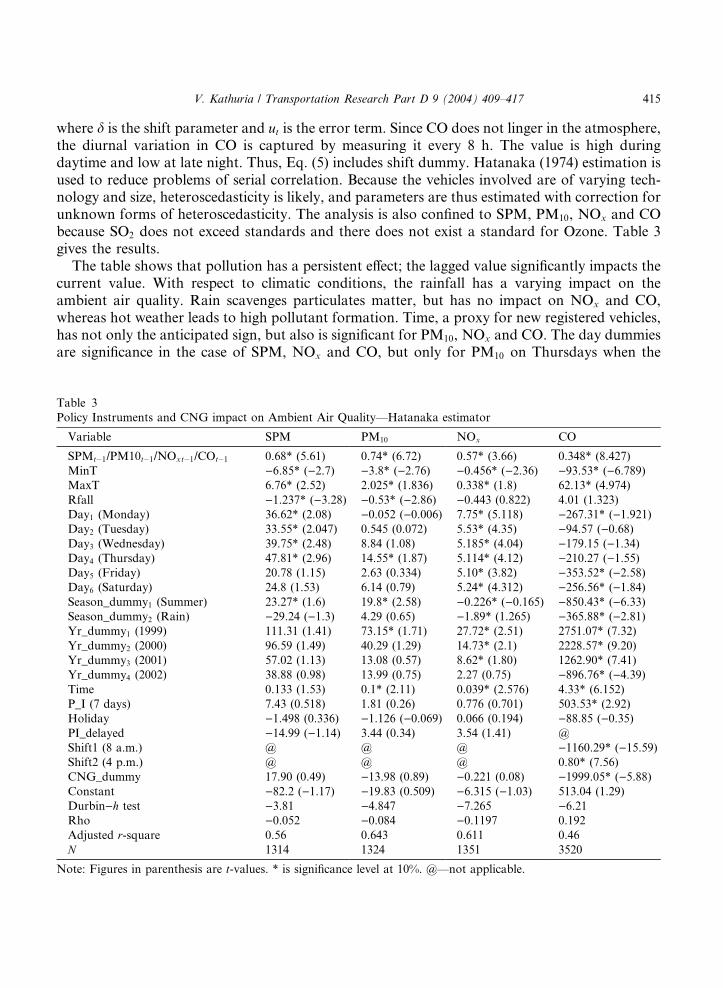
where d is the shift parameter and ut is the error term. Since CO does not linger in the atmosphere,the diurnal variation in CO is captured by measuring it every 8 h. The value is high duringdaytime and low at late night. Thus, Eq. (5) includes shift dummy. Hatanaka (1974) estimation isused to reduce problems of serial correlation. Because the vehicles involved are of varying tech-nology and size, heteroscedasticity is likely, and parameters are thus estimated with correction forunknown forms of heteroscedasticity. The analysis is also confined to SPM, PM10, NOx and CObecause SO2 does not exceed standards and there does not exist a standard for Ozone. Table 3gives the results.The table shows that pollution has a persistent effect; the lagged value significantly impacts the
current value. With respect to climatic conditions, the rainfall has a varying impact on theambient air quality. Rain scavenges particulates matter, but has no impact on NOx and CO,whereas hot weather leads to high pollutant formation. Time, a proxy for new registered vehicles,has not only the anticipated sign, but also is significant for PM10, NOx and CO. The day dummiesare significance in the case of SPM, NOx and CO, but only for PM10 on Thursdays when the
Table 3
Policy Instruments and CNG impact on Ambient Air Quality––Hatanaka estimator
Variable SPM PM10 NOx CO
SPMt�1/PM10t�1/NOxt�1/COt�1 0.68* (5.61) 0.74* (6.72) 0.57* (3.66) 0.348* (8.427)
MinT )6.85* ()2.7) )3.8* ()2.76) )0.456* ()2.36) )93.53* ()6.789)MaxT 6.76* (2.52) 2.025* (1.836) 0.338* (1.8) 62.13* (4.974)
Rfall )1.237* ()3.28) )0.53* ()2.86) )0.443 (0.822) 4.01 (1.323)
Day1 (Monday) 36.62* (2.08) )0.052 ()0.006) 7.75* (5.118) )267.31* ()1.921)Day2 (Tuesday) 33.55* (2.047) 0.545 (0.072) 5.53* (4.35) )94.57 ()0.68)Day3 (Wednesday) 39.75* (2.48) 8.84 (1.08) 5.185* (4.04) )179.15 ()1.34)Day4 (Thursday) 47.81* (2.96) 14.55* (1.87) 5.114* (4.12) )210.27 ()1.55)Day5 (Friday) 20.78 (1.15) 2.63 (0.334) 5.10* (3.82) )353.52* ()2.58)Day6 (Saturday) 24.8 (1.53) 6.14 (0.79) 5.24* (4.312) )256.56* ()1.84)Season_dummy1 (Summer) 23.27* (1.6) 19.8* (2.58) )0.226* ()0.165) )850.43* ()6.33)Season_dummy2 (Rain) )29.24 ()1.3) 4.29 (0.65) )1.89* (1.265) )365.88* ()2.81)Yr_dummy1 (1999) 111.31 (1.41) 73.15* (1.71) 27.72* (2.51) 2751.07* (7.32)
Yr_dummy2 (2000) 96.59 (1.49) 40.29 (1.29) 14.73* (2.1) 2228.57* (9.20)
Yr_dummy3 (2001) 57.02 (1.13) 13.08 (0.57) 8.62* (1.80) 1262.90* (7.41)
Yr_dummy4 (2002) 38.88 (0.98) 13.99 (0.75) 2.27 (0.75) )896.76* ()4.39)Time 0.133 (1.53) 0.1* (2.11) 0.039* (2.576) 4.33* (6.152)
P_I (7 days) 7.43 (0.518) 1.81 (0.26) 0.776 (0.701) 503.53* (2.92)
Holiday )1.498 (0.336) )1.126 ()0.069) 0.066 (0.194) )88.85 ()0.35)PI_delayed )14.99 ()1.14) 3.44 (0.34) 3.54 (1.41) @
Shift1 (8 a.m.) @ @ @ )1160.29* ()15.59)Shift2 (4 p.m.) @ @ @ 0.80* (7.56)
CNG_dummy 17.90 (0.49) )13.98 (0.89) )0.221 (0.08) )1999.05* ()5.88)Constant )82.2 ()1.17) )19.83 (0.509) )6.315 ()1.03) 513.04 (1.29)
Durbin)h test )3.81 )4.847 )7.265 )6.21Rho )0.052 )0.084 )0.1197 0.192
Adjusted r-square 0.56 0.643 0.611 0.46
N 1314 1324 1351 3520
Note: Figures in parenthesis are t-values. * is significance level at 10%. @––not applicable.
416 V. Kathuria / Transportation Research Part D 9 (2004) 409–417
economic activity is at its peak. The sign and significance of year dummies reflect that pollution in1999 to 2002 higher than for 2003 and especially so for PM10, NOx and CO.It is also seen that enacting a policy instrument (P_I) has not led to any fall in the air-pollution,
and indeed for CO, the impact seems to be perverse. The success of any instrument dependsmainly on the expectation of the people. The conjecture that this may be the result of the pop-ulation’s experiences with delays in policy implementation in the past (i.e., PI_delayed), however,is not verified in terms of statistical significance, although it has the right sign in the cases of PM10
and SPM.The insignificance of (P_I) and perverse sign for CO raises a question; is the 7-day period too
long? If in the intervening period, a number of new vehicles are registered, the pollution loadwould have reverted back to the old level. To see whether even for a brief period, the instrumentaffected the pollution profile, the model is run with P_I constructed as a dummy variable taking aunitary value for 5 days, 3 days, 2 days, and 1 day respectively after an enactment. The resultsindicate that the impacts of P_I on different pollutants, though insignificant was negative (exceptfor PM10) in the first two days but after that become positive. In case of PM10, pollution level fallsignificantly immediately after the enactment of a policy.The results also show that the introduction of CNG has led only to a fall in CO. The decline
however may not continue for long. This is because the present downward shift has taken placefrom an initially very high value (i.e., above 3500 mg/m3 for CO), which is much higher than thestandard levels of the pollutant (2000 mg/m3). An important reason for the insignificant (and un-anticipated) effect of CNG conversion for SPM, PM10 and NOx could be the retrofitted CNGvehicles. To meet deadlines, several buses operators, as well as gasoline-driven three-wheelersoperators, retrofitted their engines from liquid fuel to CNG. The studies from elsewhere indicatethat poor conversions of some gasoline vehicles to CNG vehicles 5 have led to higher emissions,operational problems and even accidents.
Acknowledgements
I am extremely thankful to Durba Biswas for collecting the data for two years. My thanks tothe referees and the chief editor for the comments. The usual disclaimers apply.
References
Brandon, C., Hommann, K., 1995. The cost of inaction: valuing the economy-wide cost of environmental degradation
in India. United Nations University, Proceedings of the Symposium on Global Sustainability, Tokyo.
Hatanaka, M., 1974. An efficient estimator for the dynamic adjustment model with autocorrelated errors. Journal of
Econometrics 2, 199–220.
Kathuria, V., 2002. Vehicular pollution control in Delhi. Transportation Research–Part D 7, 373–387.
5 For example, the International Association for Natural Gas Vehicles in a study has found that of 1.5 million
vehicles running on natural gas worldwide most are gasoline vehicles converted to CNG. (Source: www.iangv.org/html/
ngv/stats.html.)
V. Kathuria / Transportation Research Part D 9 (2004) 409–417 417
Nylund, N.O., Lawson, A., 2000. Exhaust emissions from natural gas vehicles. International Association of natural gas
Vehicles, VTT Energy, Helsinki.
Watt, G.M., 2001. Natural gas vehicle transit bus fleets: the current international experience. IANGV review paper,
available at <http:/www.iangv.org/html/sources/reports/iangv_bus_report.pdf>.