impact analysis of faults in an ev - mathworks
TRANSCRIPT

16 Sept’ 20
Aseem RoutrayCTO OrganizationKPIT Technologies Limited
Impact Analysis of Faults in an EV
1
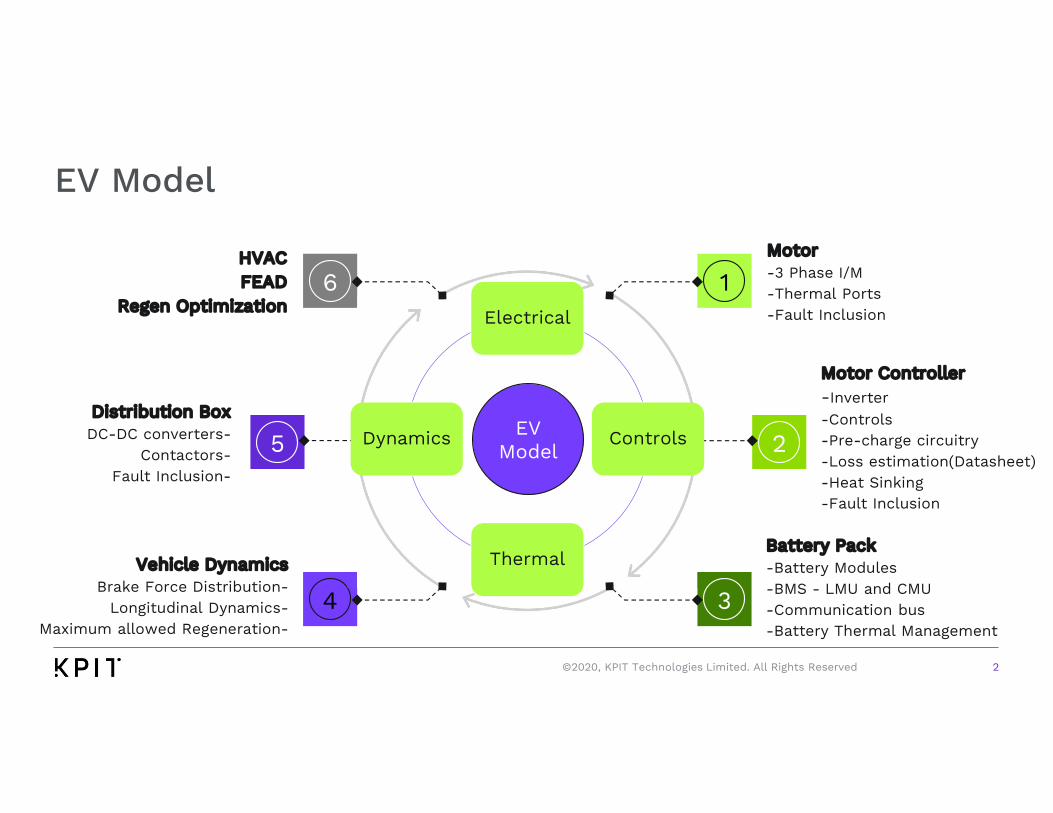
EV Model
6
5
4
1
2
3
Motor -3 Phase I/M-Thermal Ports-Fault Inclusion
Motor Controller-Inverter-Controls-Pre-charge circuitry-Loss estimation(Datasheet)-Heat Sinking-Fault Inclusion
Battery Pack-Battery Modules-BMS - LMU and CMU-Communication bus-Battery Thermal Management
HVACFEAD
Regen Optimization
Vehicle DynamicsBrake Force Distribution-
Longitudinal Dynamics-Maximum allowed Regeneration-
Distribution BoxDC-DC converters-
Contactors-Fault Inclusion-
2
Electrical
Controls
Thermal
Dynamics EV Model
©2020, KPIT Technologies Limited. All Rights Reserved
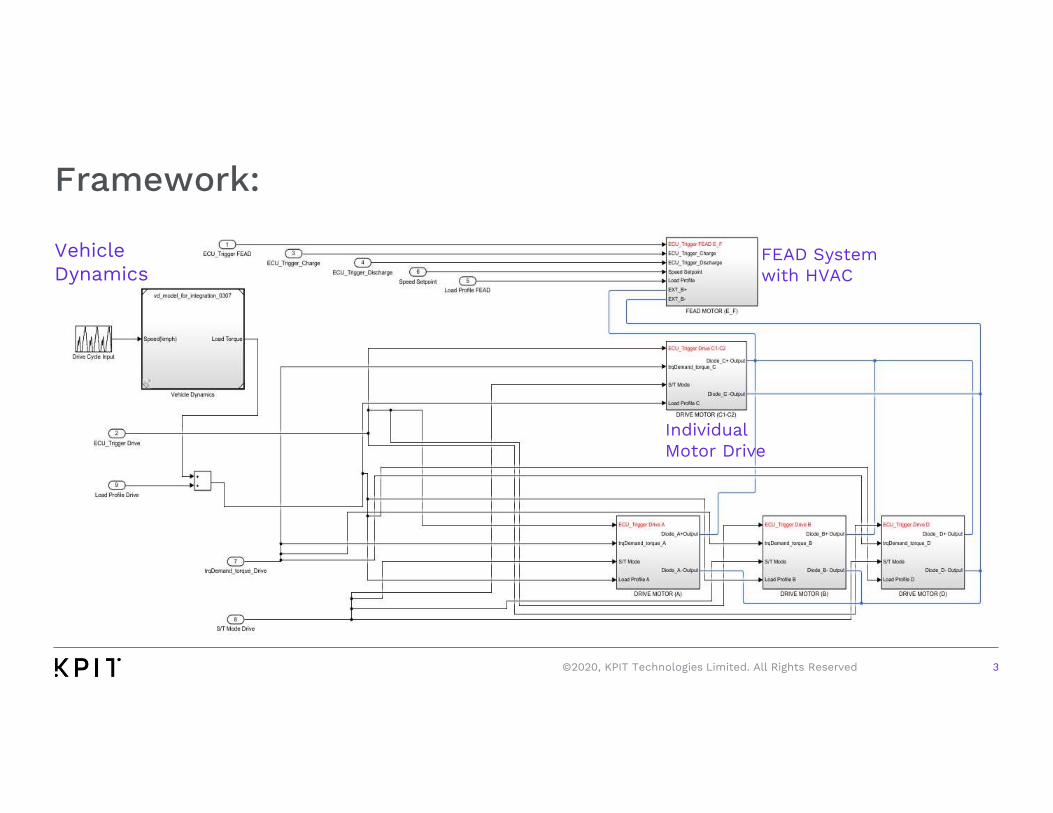
Framework:
3
Vehicle Dynamics
FEAD System with HVAC
Individual Motor Drive
©2020, KPIT Technologies Limited. All Rights Reserved
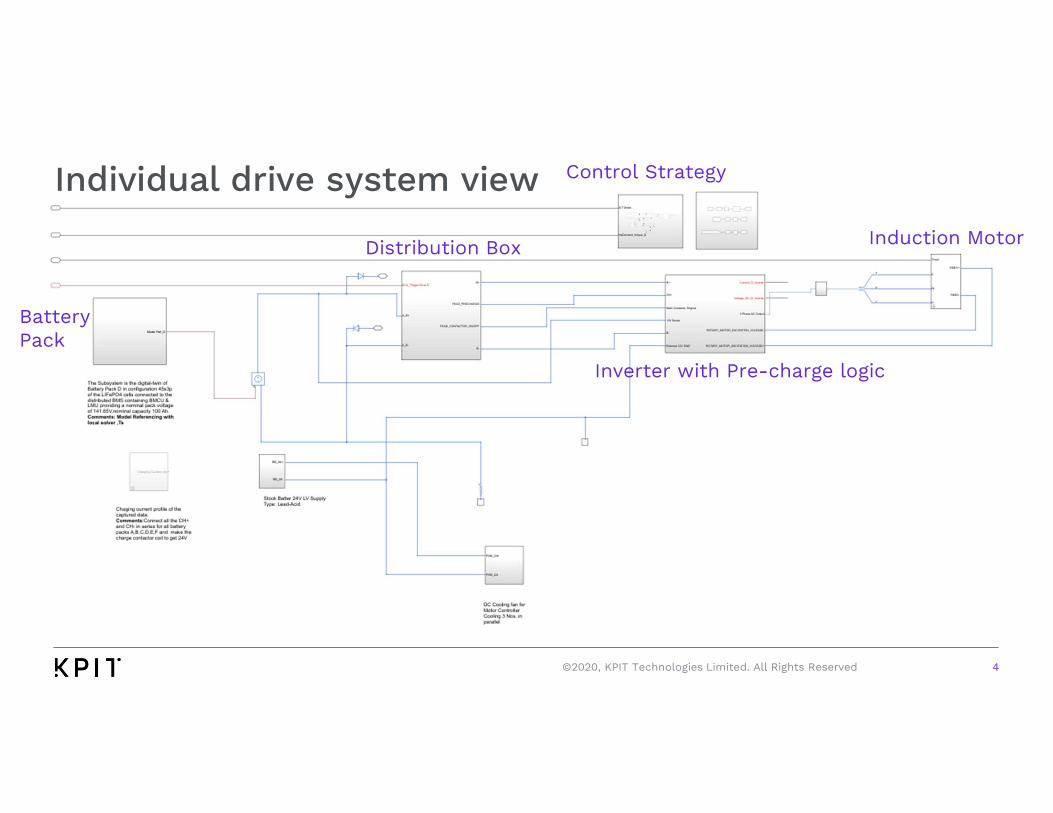
Individual drive system view
4
Battery Pack
Distribution Box
Inverter with Pre-charge logic
Control Strategy
Induction Motor
©2020, KPIT Technologies Limited. All Rights Reserved
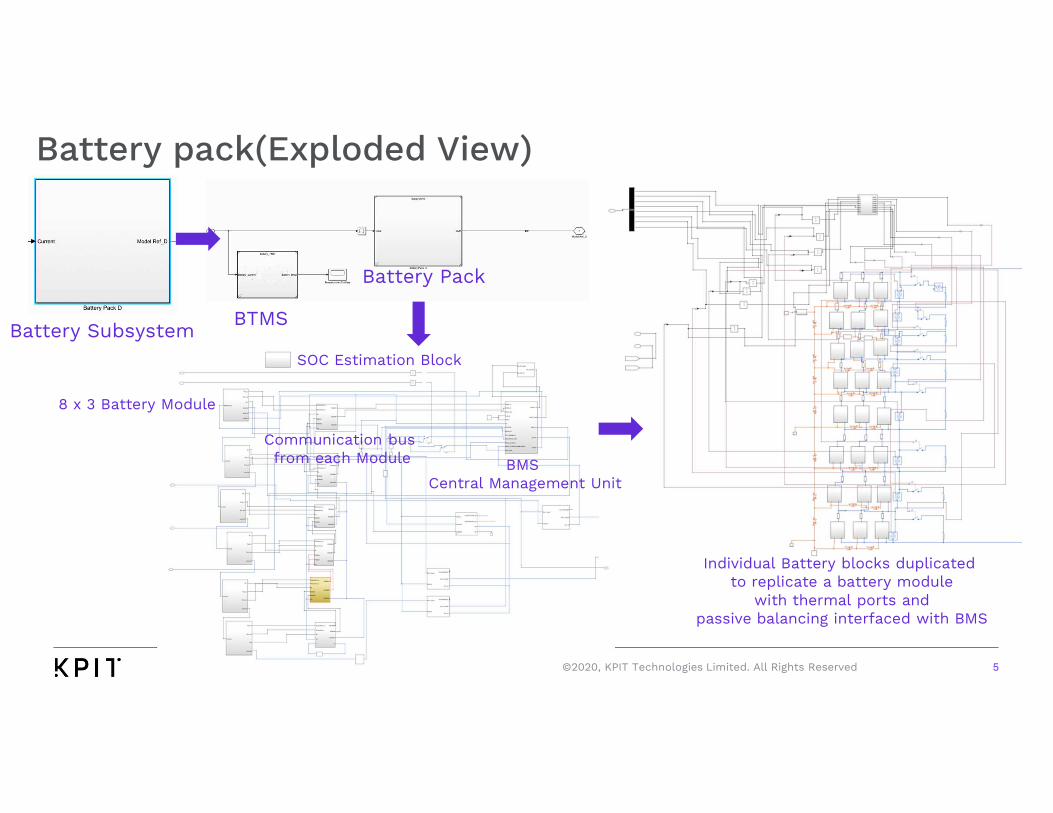
Battery pack(Exploded View)
5
Battery SubsystemBTMS
Battery Pack
8 x 3 Battery Module
Communication busfrom each Module BMS
Central Management Unit
SOC Estimation Block
Individual Battery blocks duplicatedto replicate a battery module
with thermal ports andpassive balancing interfaced with BMS
©2020, KPIT Technologies Limited. All Rights Reserved
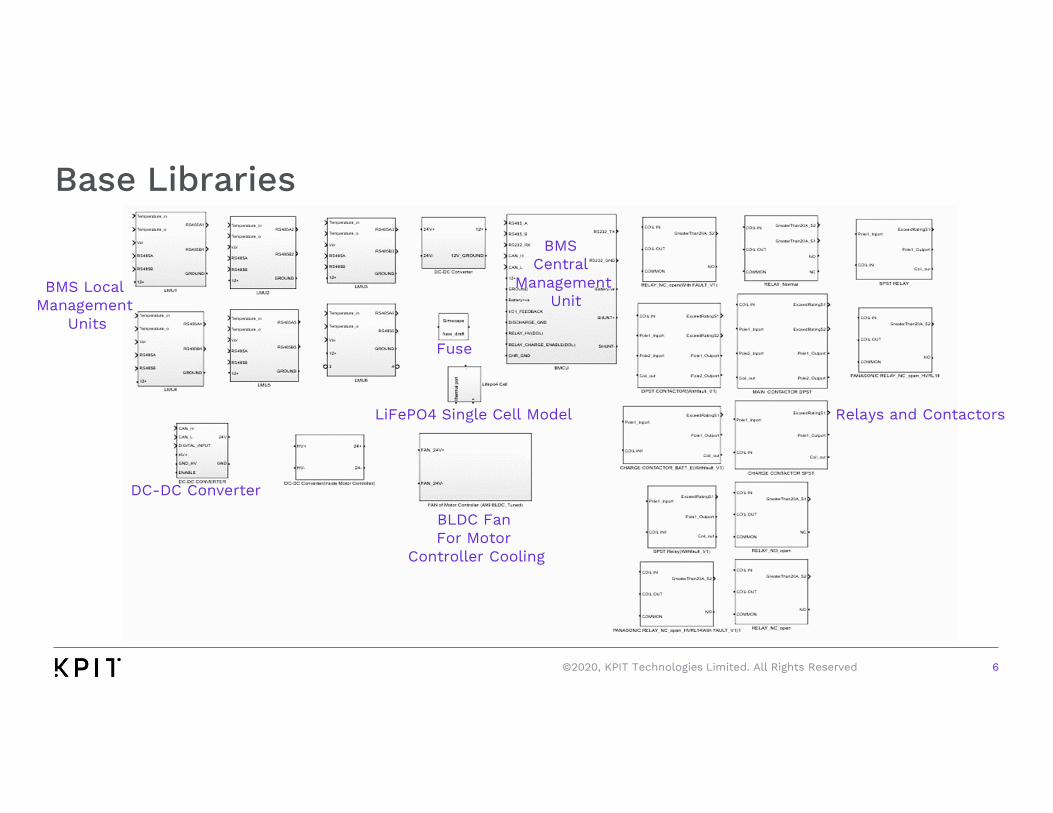
Base Libraries
6
BLDC Fan For Motor
Controller Cooling
DC-DC Converter
BMS Central
ManagementUnit
BMS Local Management
Units
Relays and ContactorsLiFePO4 Single Cell Model
Fuse
©2020, KPIT Technologies Limited. All Rights Reserved
7
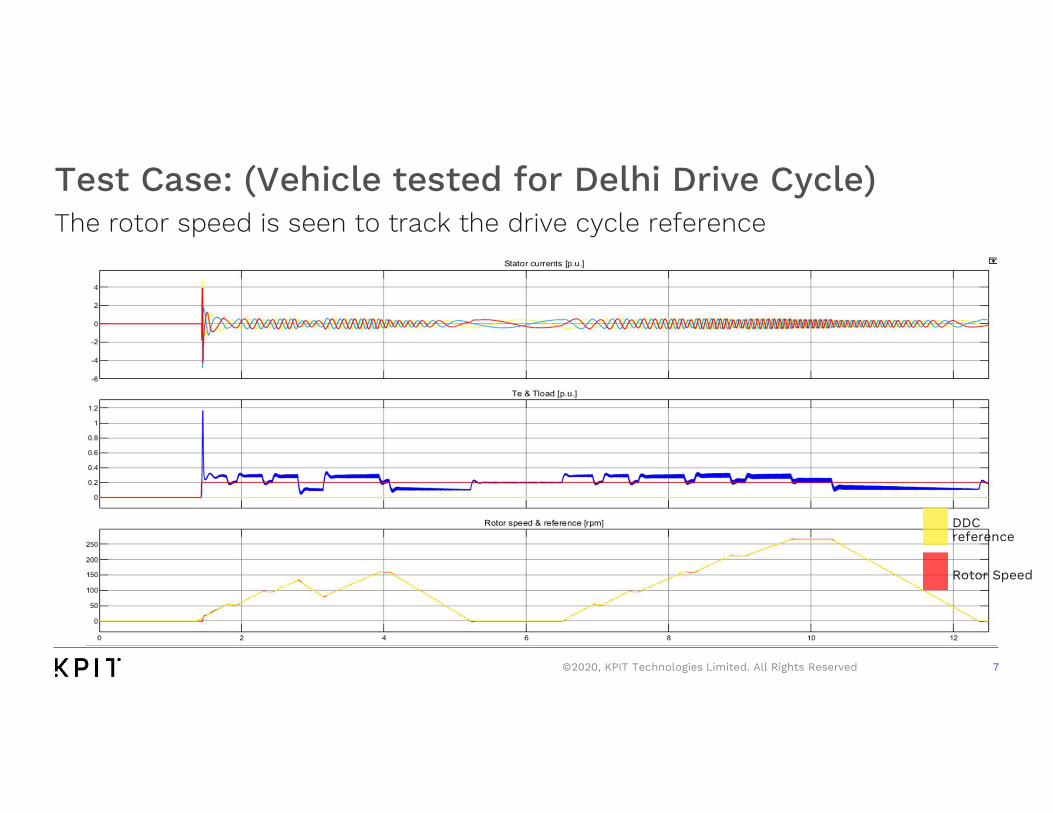
Test Case: (Vehicle tested for Delhi Drive Cycle) The rotor speed is seen to track the drive cycle reference
DDC reference
Rotor Speed
©2020, KPIT Technologies Limited. All Rights Reserved
8
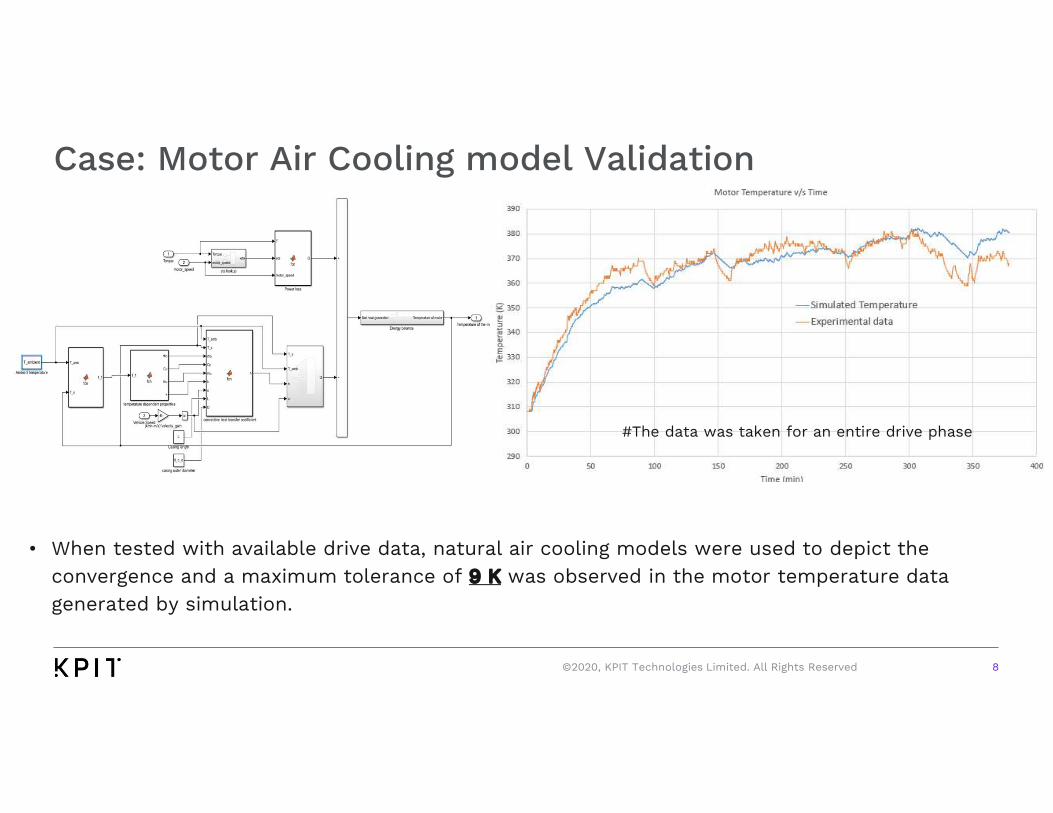
Case: Motor Air Cooling model Validation
• When tested with available drive data, natural air cooling models were used to depict the convergence and a maximum tolerance of 9 K was observed in the motor temperature data generated by simulation.
#The data was taken for an entire drive phase
©2020, KPIT Technologies Limited. All Rights Reserved
9
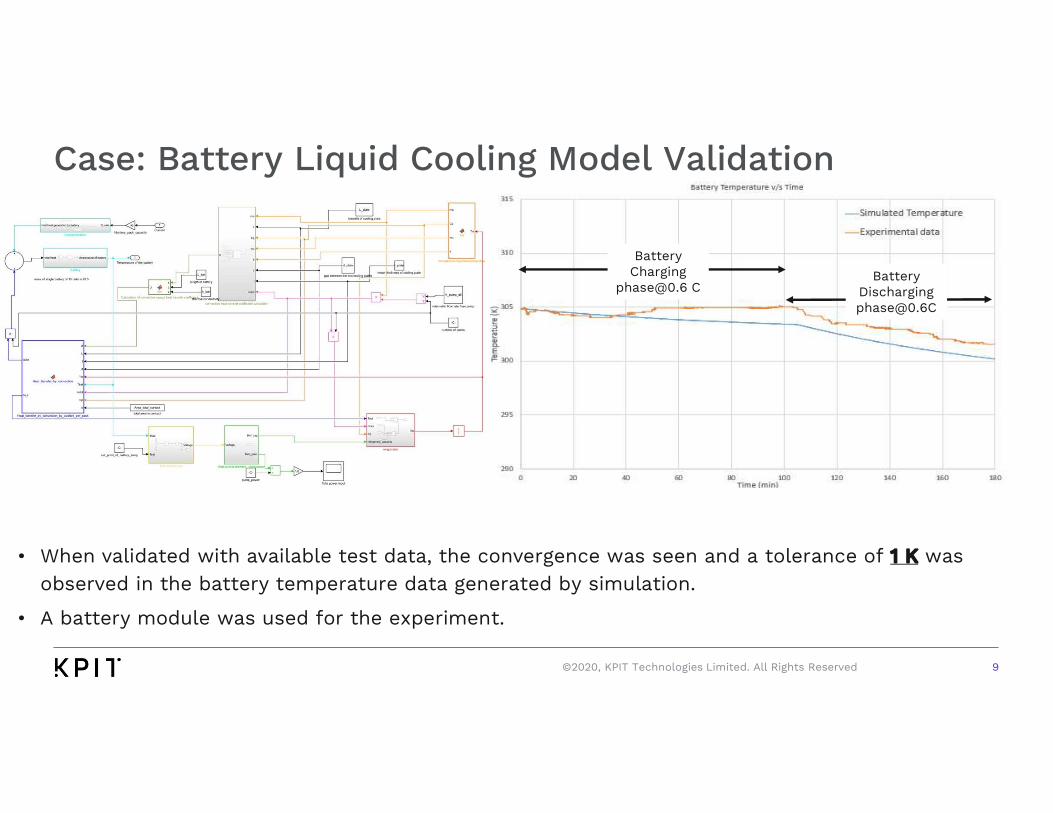
Case: Battery Liquid Cooling Model Validation
• When validated with available test data, the convergence was seen and a tolerance of 1 K was observed in the battery temperature data generated by simulation.
• A battery module was used for the experiment.
Battery Charging
[email protected] CBattery
Discharging [email protected]
©2020, KPIT Technologies Limited. All Rights Reserved
10
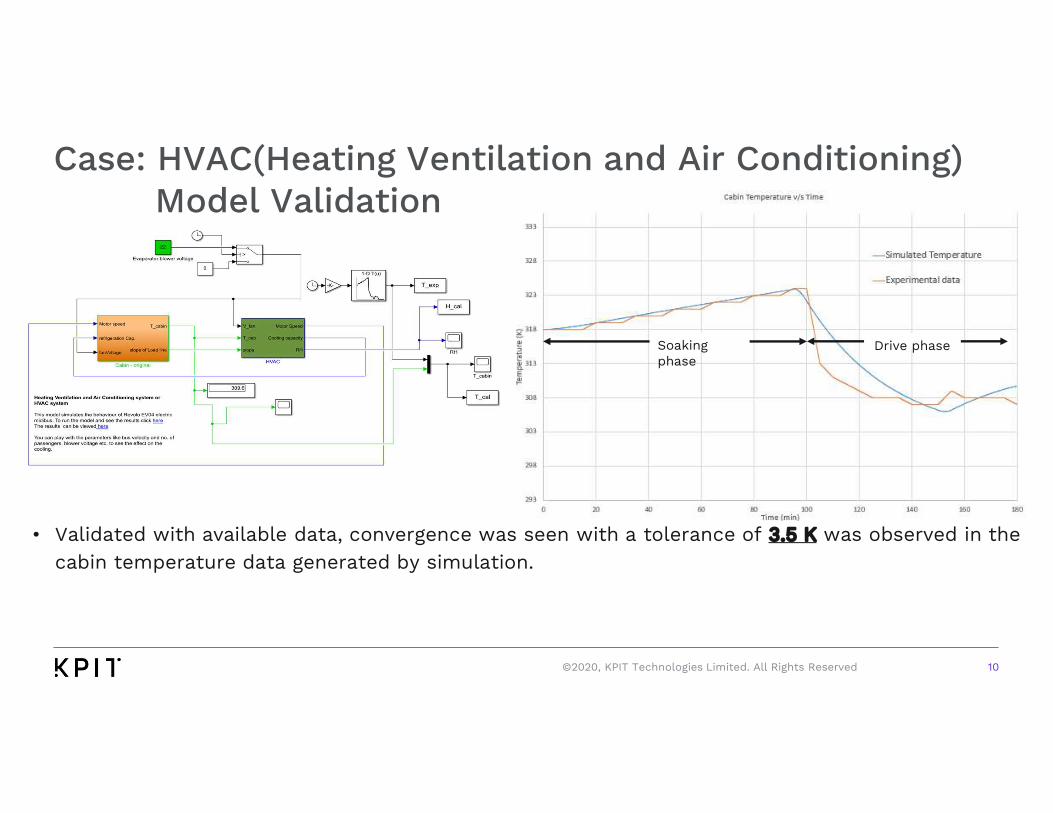
Case: HVAC(Heating Ventilation and Air Conditioning) Model Validation
• Validated with available data, convergence was seen with a tolerance of 3.5 K was observed in the cabin temperature data generated by simulation.
Soaking phase
Drive phase
©2020, KPIT Technologies Limited. All Rights Reserved
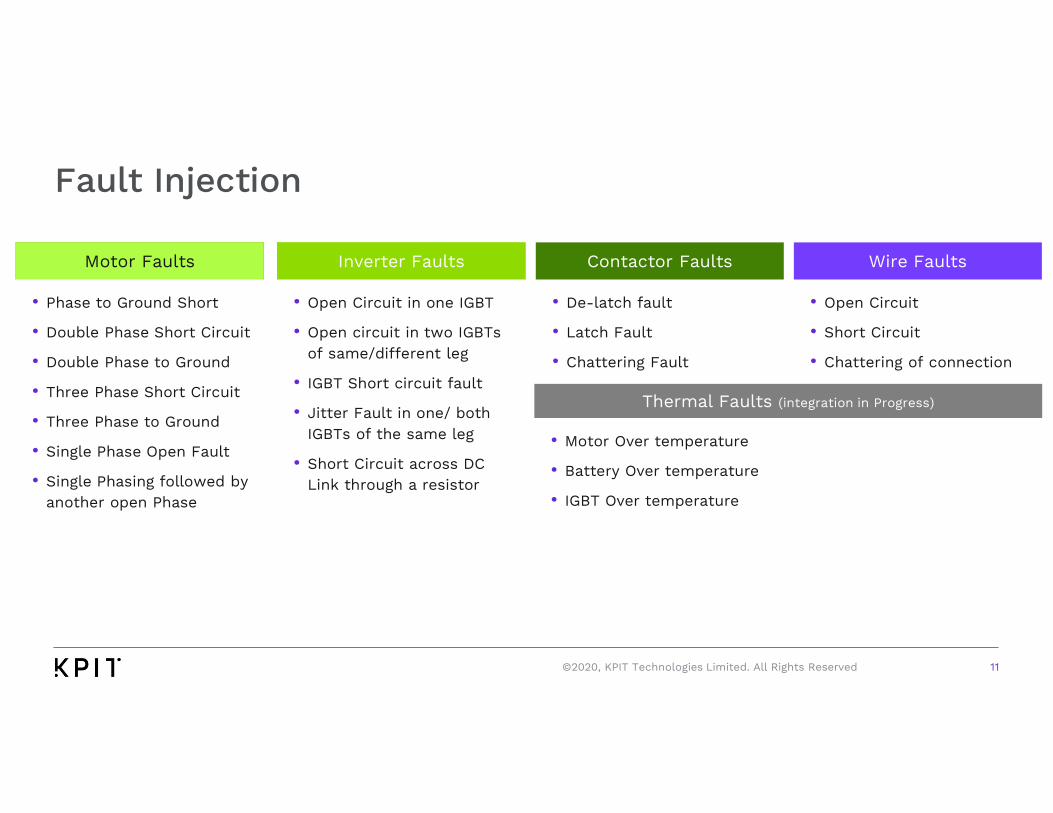
Fault Injection
Inverter Faults
• Open Circuit in one IGBT
• Open circuit in two IGBTs of same/different leg
• IGBT Short circuit fault
• Jitter Fault in one/ both IGBTs of the same leg
• Short Circuit across DC Link through a resistor
Contactor Faults
• De-latch fault
• Latch Fault
• Chattering Fault
Wire Faults
• Open Circuit
• Short Circuit
• Chattering of connection
11
Motor Faults
• Phase to Ground Short
• Double Phase Short Circuit
• Double Phase to Ground
• Three Phase Short Circuit
• Three Phase to Ground
• Single Phase Open Fault
• Single Phasing followed by another open Phase
Thermal Faults (integration in Progress)
• Motor Over temperature
• Battery Over temperature
• IGBT Over temperature
©2020, KPIT Technologies Limited. All Rights Reserved
12
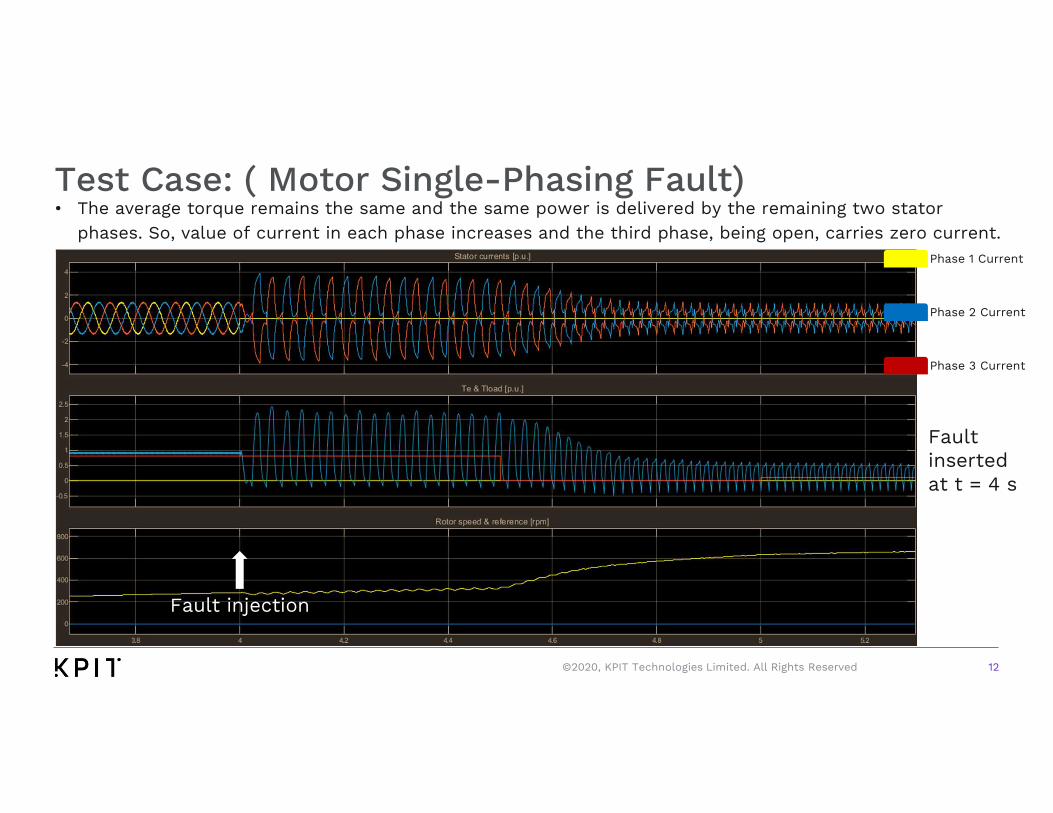
Test Case: ( Motor Single-Phasing Fault)• The average torque remains the same and the same power is delivered by the remaining two stator
phases. So, value of current in each phase increases and the third phase, being open, carries zero current.Phase 1 Current
Phase 2 Current
Phase 3 Current
Fault inserted at t = 4 s
Fault injection
©2020, KPIT Technologies Limited. All Rights Reserved
13
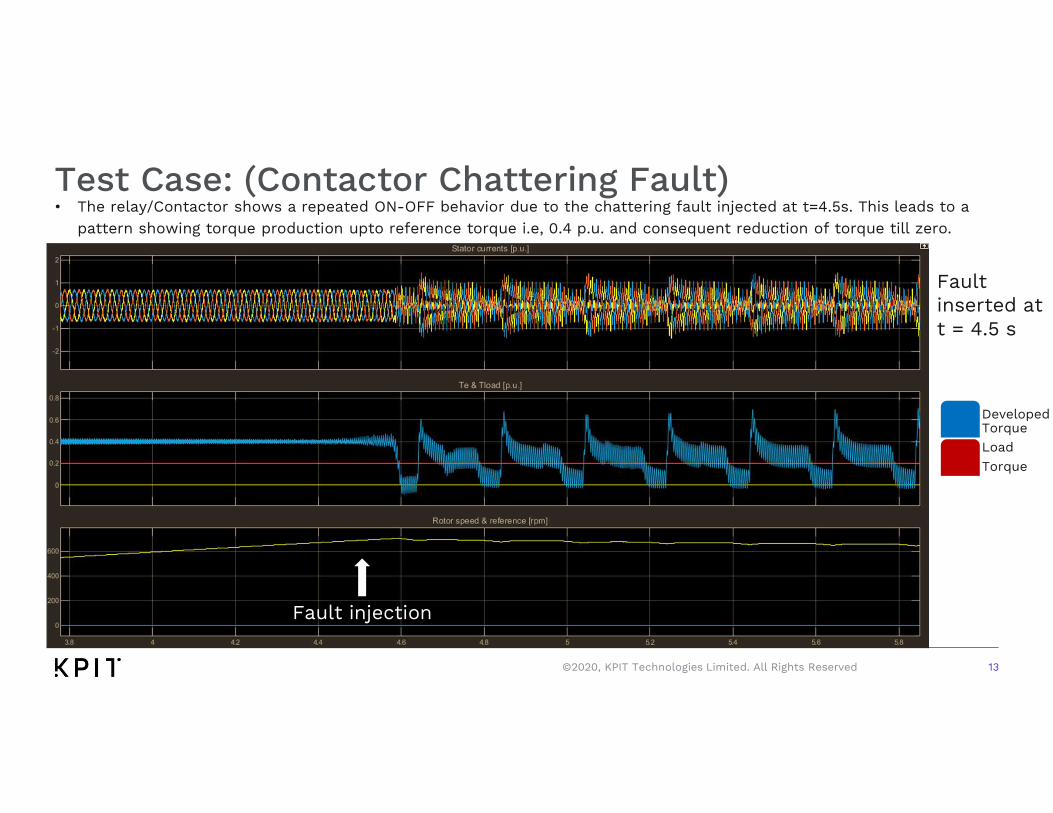
Test Case: (Contactor Chattering Fault)• The relay/Contactor shows a repeated ON-OFF behavior due to the chattering fault injected at t=4.5s. This leads to a
pattern showing torque production upto reference torque i.e, 0.4 p.u. and consequent reduction of torque till zero.
Developed TorqueLoad Torque
Fault inserted at t = 4.5 s
Fault injection
©2020, KPIT Technologies Limited. All Rights Reserved
14
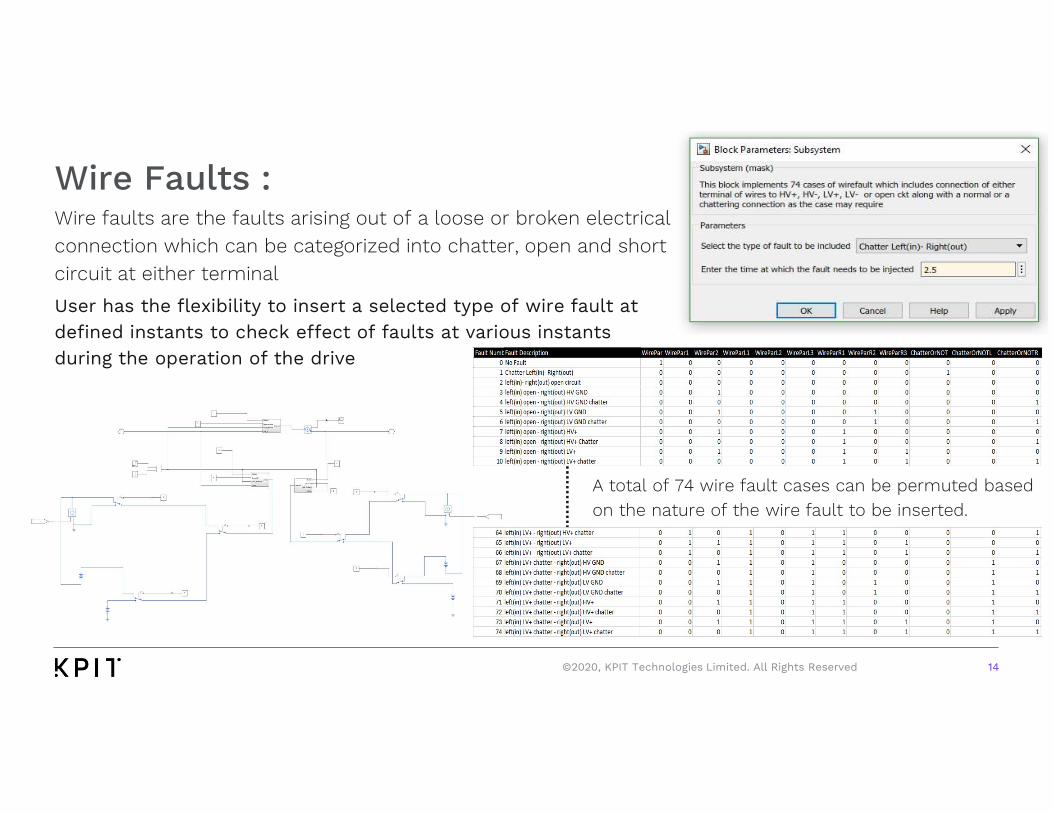
Wire Faults :
User has the flexibility to insert a selected type of wire fault at defined instants to check effect of faults at various instants during the operation of the drive
Wire faults are the faults arising out of a loose or broken electrical connection which can be categorized into chatter, open and short circuit at either terminal
A total of 74 wire fault cases can be permuted based on the nature of the wire fault to be inserted.
©2020, KPIT Technologies Limited. All Rights Reserved
15
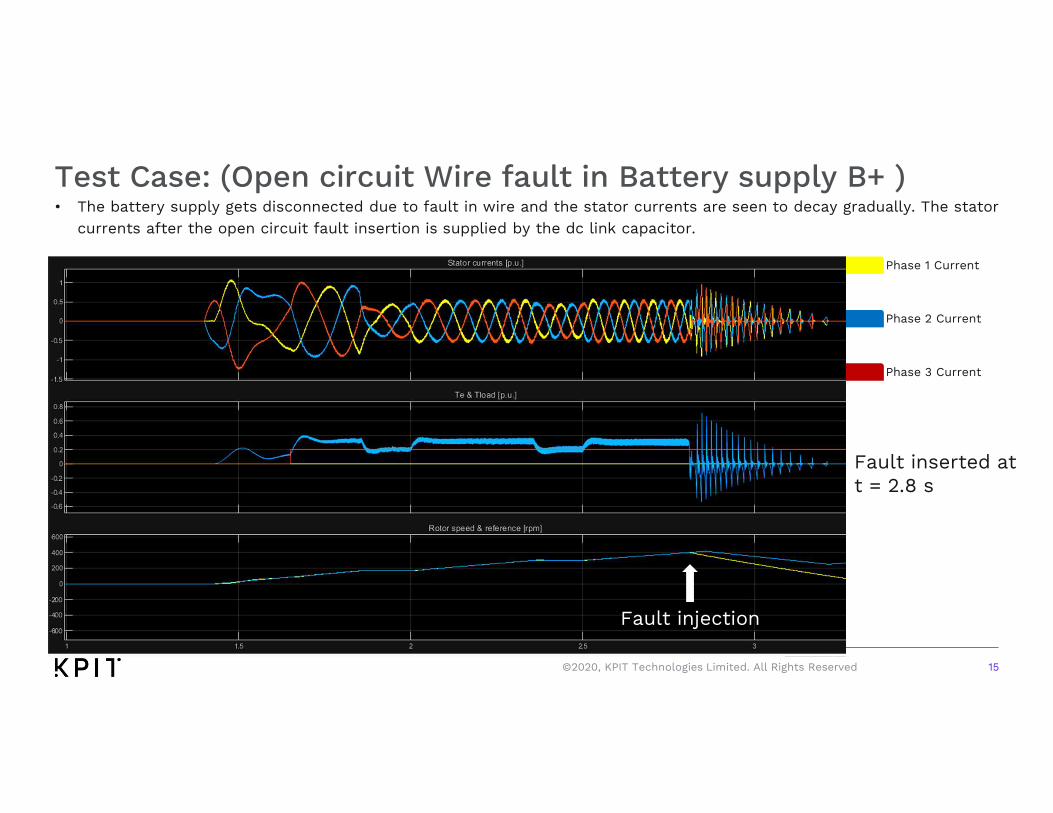
Test Case: (Open circuit Wire fault in Battery supply B+ )• The battery supply gets disconnected due to fault in wire and the stator currents are seen to decay gradually. The stator
currents after the open circuit fault insertion is supplied by the dc link capacitor.
Phase 1 Current•
Phase 2 Current•
Phase 3 Current•
Fault inserted at t = 2.8 s
Fault injection
©2020, KPIT Technologies Limited. All Rights Reserved
16
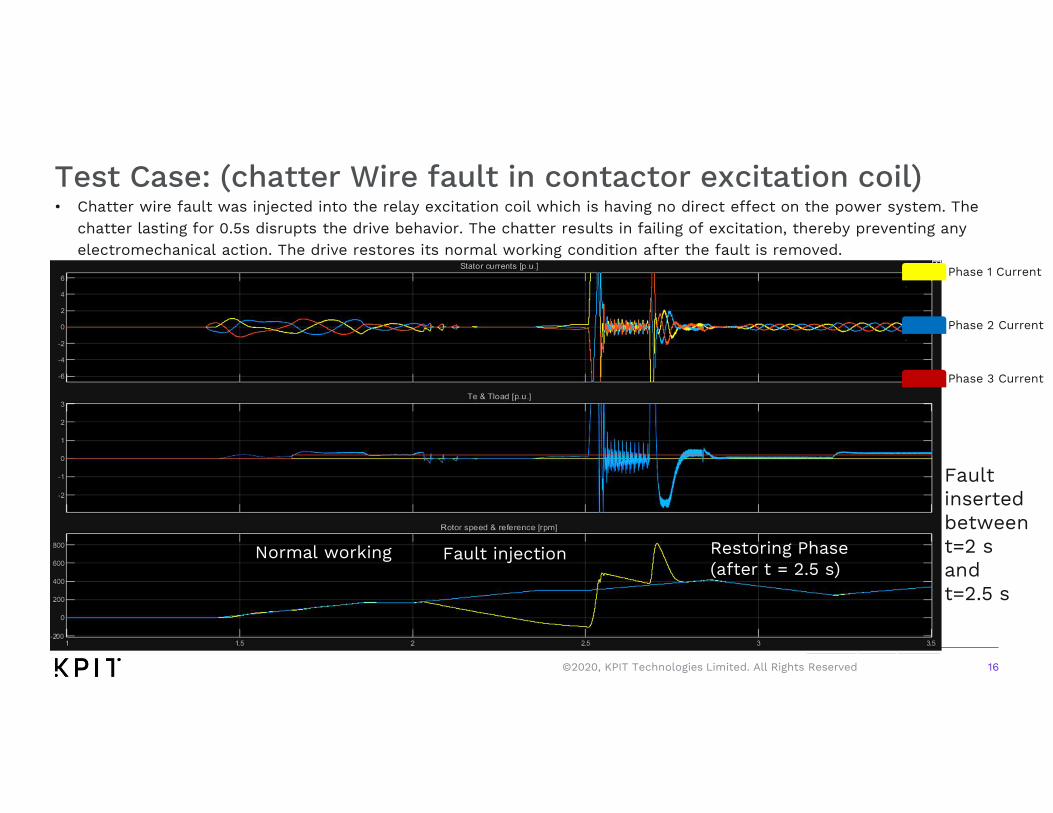
Test Case: (chatter Wire fault in contactor excitation coil)• Chatter wire fault was injected into the relay excitation coil which is having no direct effect on the power system. The
chatter lasting for 0.5s disrupts the drive behavior. The chatter results in failing of excitation, thereby preventing any electromechanical action. The drive restores its normal working condition after the fault is removed.
Fault inserted between t=2 sandt=2.5 s
Normal working Fault injection Restoring Phase (after t = 2.5 s)
Phase 1 Current•
Phase 2 Current•
Phase 3 Current•
©2020, KPIT Technologies Limited. All Rights Reserved
17©2020, KPIT Technologies Limited. All Rights Reserved
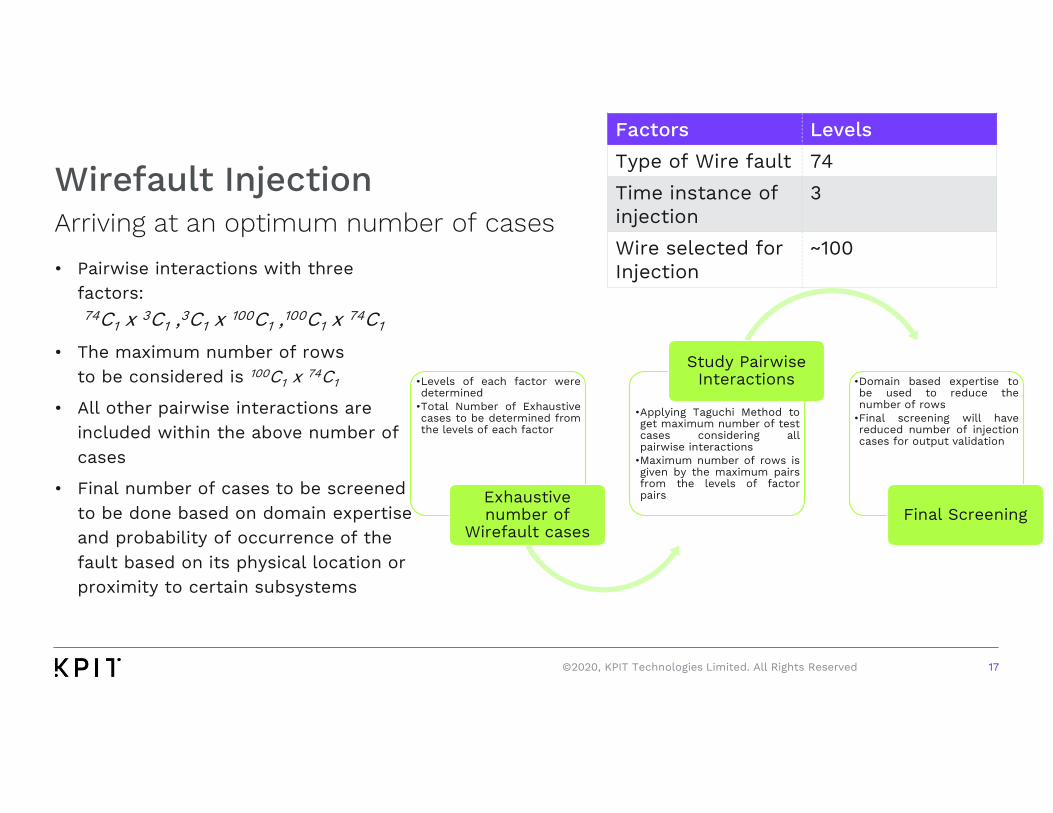
Arriving at an optimum number of cases
Wirefault Injection
•Levels of each factor weredetermined
•Total Number of Exhaustivecases to be determined fromthe levels of each factor
Exhaustive number of
Wirefault cases
•Applying Taguchi Method toget maximum number of testcases considering allpairwise interactions
•Maximum number of rows isgiven by the maximum pairsfrom the levels of factorpairs
Study Pairwise Interactions •Domain based expertise to
be used to reduce thenumber of rows
•Final screening will havereduced number of injectioncases for output validation
Final Screening
Factors Levels
Type of Wire fault 74
Time instance of injection
3
Wire selected for Injection
~100• Pairwise interactions with three
factors:74C1 x 3C1 ,3C1 x 100C1 ,100C1 x 74C1
• The maximum number of rowsto be considered is 100C1 x 74C1
• All other pairwise interactions are included within the above number ofcases
• Final number of cases to be screenedto be done based on domain expertise and probability of occurrence of the fault based on its physical location or proximity to certain subsystems
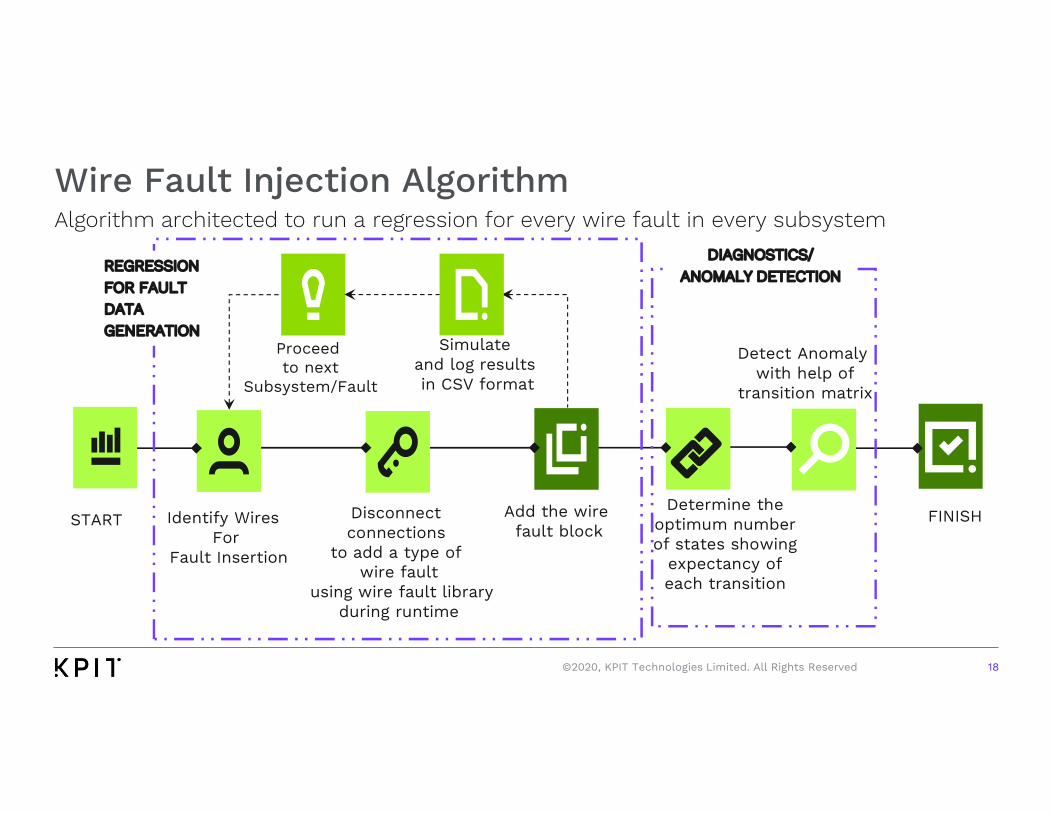
Wire Fault Injection AlgorithmAlgorithm architected to run a regression for every wire fault in every subsystem
START FINISH
18
Proceedto next
Subsystem/Fault
Simulate and log results in CSV format
Disconnect connections
to add a type of wire fault
using wire fault libraryduring runtime
Determine the optimum number of states showing
expectancy of each transition
Identify Wires For
Fault Insertion
REGRESSION FOR FAULT DATA GENERATION
DIAGNOSTICS/ ANOMALY DETECTION
Detect Anomalywith help of
transition matrix
Add the wire fault block
©2020, KPIT Technologies Limited. All Rights Reserved
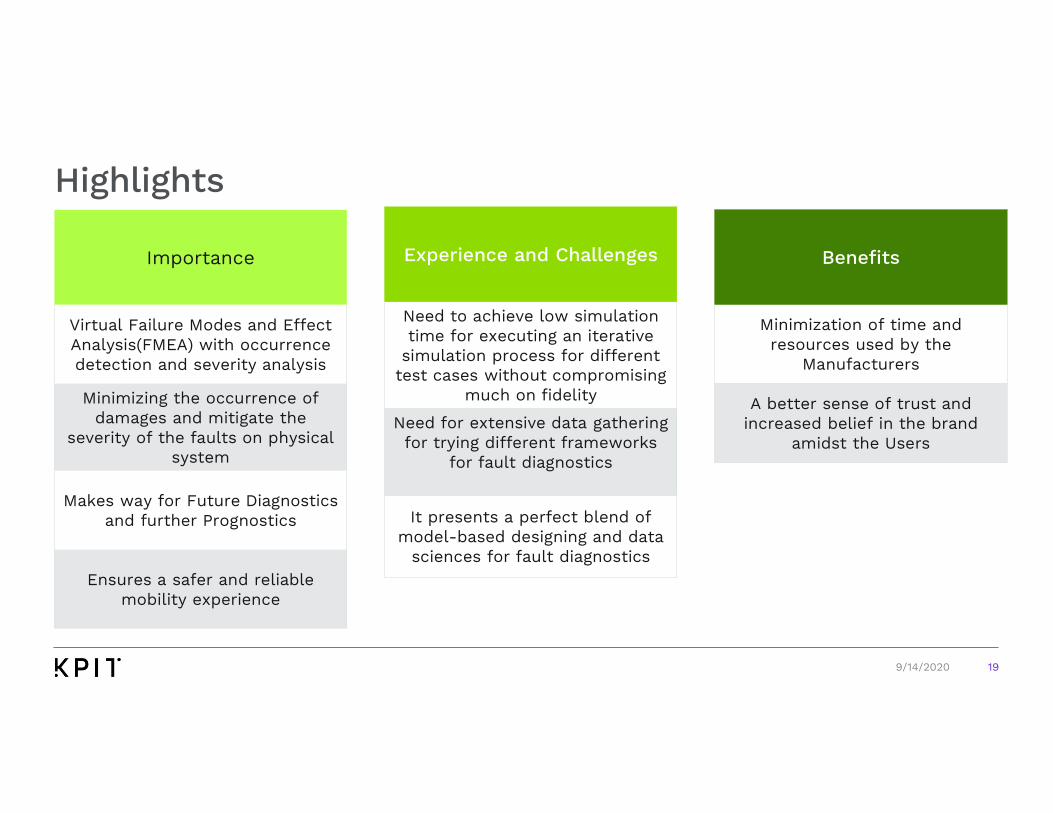
Highlights
Importance
Virtual Failure Modes and Effect Analysis(FMEA) with occurrence detection and severity analysis
Minimizing the occurrence of damages and mitigate the
severity of the faults on physical system
Makes way for Future Diagnostics and further Prognostics
Ensures a safer and reliable mobility experience
Experience and Challenges
Need to achieve low simulation time for executing an iterative
simulation process for different test cases without compromising
much on fidelity
Need for extensive data gathering for trying different frameworks
for fault diagnostics
It presents a perfect blend of model-based designing and data
sciences for fault diagnostics
Benefits
Minimization of time and resources used by the
Manufacturers
A better sense of trust and increased belief in the brand
amidst the Users
199/14/2020

Thank You
Let’s reimagine mobility
20