ijatcse65842019.pdf - world academy of research in science
TRANSCRIPT
Sangeeta Kamboj et al., International Journal of Advanced Trends in Computer Science and Engineering, 8(4), July- August 2019, 1464 - 1471
1464
ABSTRACT The paper deals with the determination of Dynamic Thermal Line Rating (DTLR) of a power distribution line at different air temperatures. The estimated sag measurements using Global Positioning System (GPS) at different values of air temperature are used for evaluation of DTLR of a line in real time. A direct mathematical model for calculating DTLR using GPS based sag measurements has been developed and discussed in the paper. A combination of Digital Signal Processing (DSP) techniques such as Bad Data Identification and Modification (BDIM), Least Square Estimation (LSE) and Haar Wavelet Transform (HWT) has been used to improve accuracy of observed GPS altitude measurements. It has been observed that measurement accuracy can be significantly improved using HWT. A graphical user interface (GUI) has been developed to display the GPS measurements, sag information and DTLR at a substation. The developed system is beneficial to distribution utilities for monitoring the operation of distribution lines at varying conductor temperatures. Key words : Bad Data Identification and Modification (BDIM), conductor sag, distribution system, DTLR, GPS, least square estimation (LSE), Haar wavelet transform (HWT). 1. INTRODUCTION Due to rise in energy consumption in the form of electrical energy, loading of transmission and distribution lines is rising. Increased line loadings give rise to higher ohmic losses, which in turn generate higher conductor temperatures with an increase in conductor sag and reduced ground clearances. Maintaining clearances has always been a primary requirement in electric utility operations and, it can be measured using either direct [1-5] or indirect methods [6]. The overhead conductor sag can increase due to temperature and loading conditions of a conductor and thus it needs to be monitored in real time for mechanical protection of power lines.
As far as the state of the art is concerned, a video sago meter has been developed and discussed in available literature [5]. The video sago meter is costlier and regular maintenance is required for proper operation of it [3], [5]. Various DTLR methods for transmission system operators have been proposed by many researchers [8-11]. The EPRI has developed sagometer, conductor temperature sensors, rating calculation methodologies, and Dynamic Thermal Circuit Rating (DTCR) software. The operators may know the true thermal limits of operation so they can seize opportunities to deliver more power during high demand. The combination of all these products and field test results is referred to as EPRI’s DTCR Technology. DTCR was developed for optimizing the power transfer capacity of existing transmission assets at relatively low cost. The traditional methods adopted by the utility industry are DTLR models such as Weather Based, Conductor Temperature Based and Sag/Tension Based Model.
The GPS is satellite based radio positioning and navigation system and operated by the U.S. Air force from GPS master control station (MCS) at Falcon Air force Base in Colorado Springs, Colorado. It was declared operational for civilian users in December 1993. It provides extremely accurate position in three dimension and time information to users worldwide[7]. GPS have become much more convenient and accurate tool for overhead conductor sag measurement of power lines using advanced GPS technology and data processing software.
In the available literature although bench testing experiments have been done to evaluate the proper functioning of GPS receiver in high voltage environment. But the field tests have not been conducted under loaded conditions using GPS technology for direct measurement of overhead power line conductor sag by placing GPS receiver on the power line itself in real time. In this paper, GPS receiver BT359 along with polymer insulator has been used to collect altitude data of a 440 V distribution line having span length 60 m and located at Sector 3, Kurukshetra, Haryana, India. A mathematical model for directly computing DTLR using GPS based estimated sag has been developed. A Combination of DSP techniques such as bad data identification and modification (BDIM), least square estimation (LSE) and Haar wavelet transform (HWT) has been used for error reduction in observed GPS altitude measurements.
Monitoring Dynamic Thermal Line rating of overhead conductor using real time sag measurement by GPS
Sangeeta Kamboj 1*, Ratna Dahiya 2 1 Electrical and Instrumentation Engineering Department, Thapar Institute of Engineering and Technology,
Patiala, Punjab, India 2 Electrical Engineering Department, National Institute of Technology, Kurukshetra, Haryana, India
ISSN 2278-3091
Volume 8, No.4, July – August 2019 International Journal of Advanced Trends in Computer Science and Engineering
Available Online at http://www.warse.org/IJATCSE/static/pdf/file/ijatcse65842019.pdf https://doi.org/10.30534/ijatcse/2019/65842019
Sangeeta Kamboj et al., International Journal of Advanced Trends in Computer Science and Engineering, 8(4), July- August 2019, 1464 - 1471
1465
2. GPS DATA COLLECTION AT DIFFERENT
TEMPERATURES
2.1 Components used in Experimental Set Up
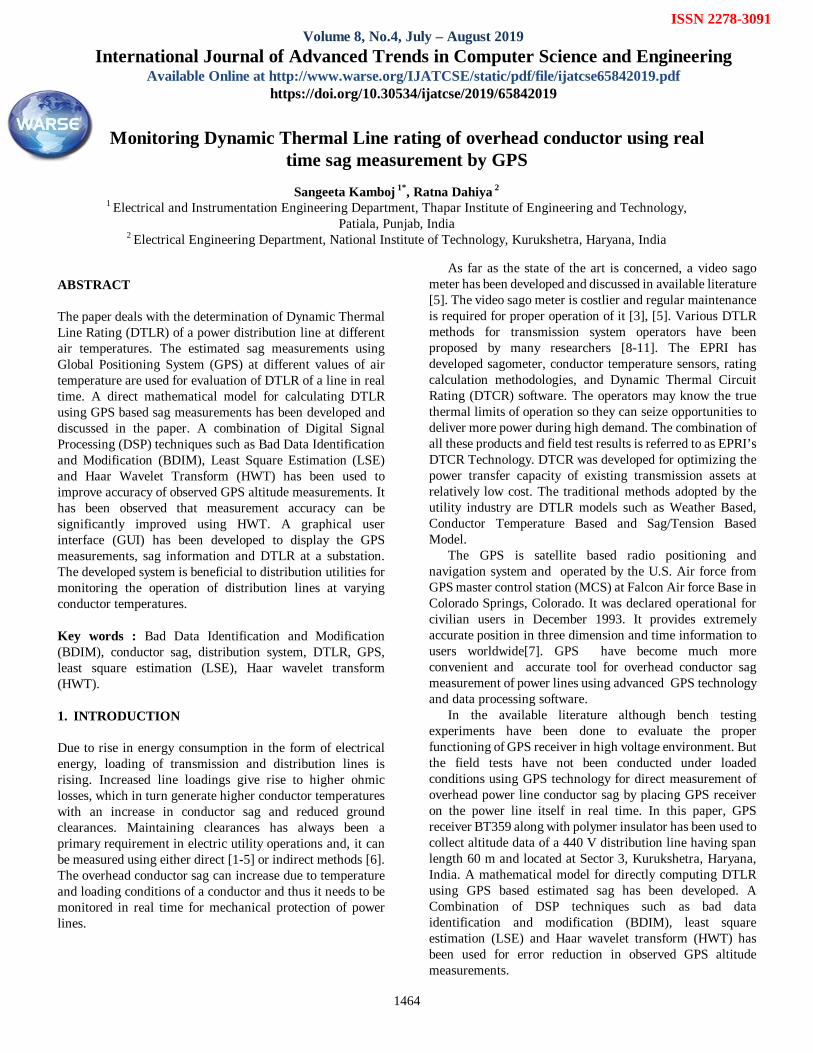
The GPS based overhead conductor sag measuring system consists of various components as shown in Figure1. GPS signals are received by the US Global Sat GPS receiver BT359. The relevant information given by GPS receiver is in the form of standard NMEA0183 sentences and it is transferred to a laptop via Bluetooth link. The information in standard NMEA0183 sentences is processed using GPS software “NMEA/GPS data logger" and gives conductor position of the respective power line in terms of longitude (x), latitude (y) and altitude (z) at that instant of time. The main interest is in the altitude information from GPS logger software for computing sag of the overhead conductor. It is also possible to integrate this overhead conductor sag measurement of power lines with the existing energy management system (EMS) module of the power companies.
Figure 1: Main components of GPS based overhead conductor sag
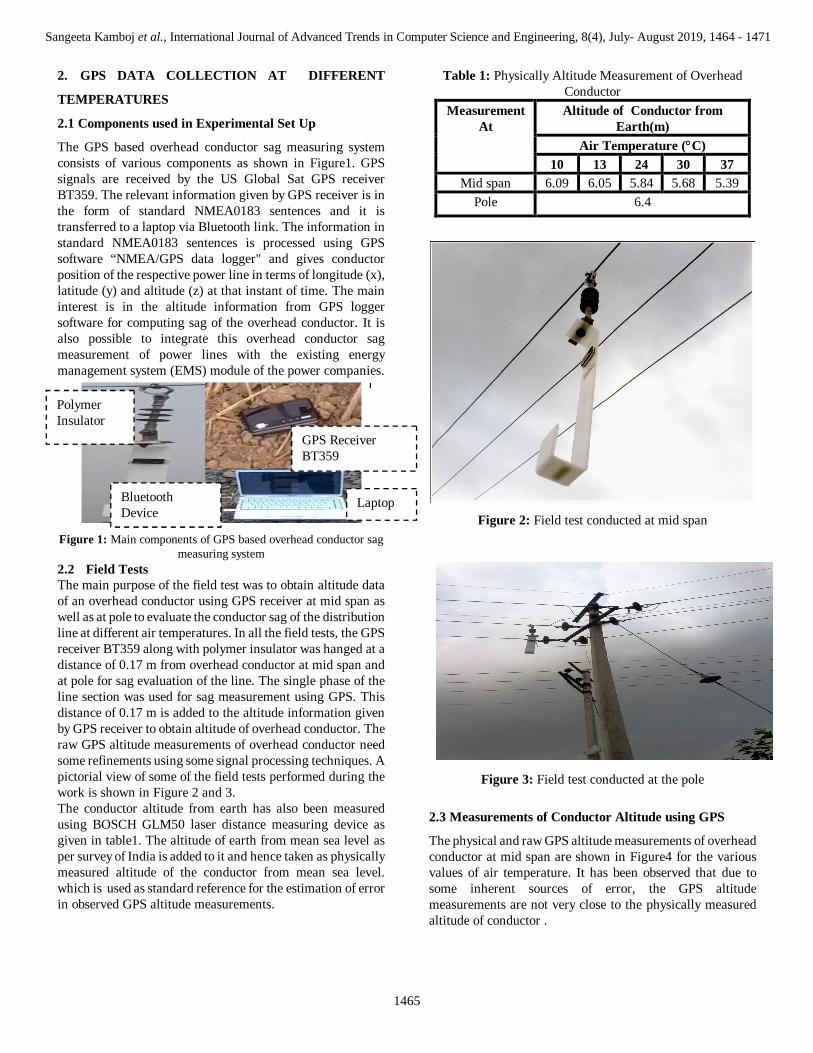
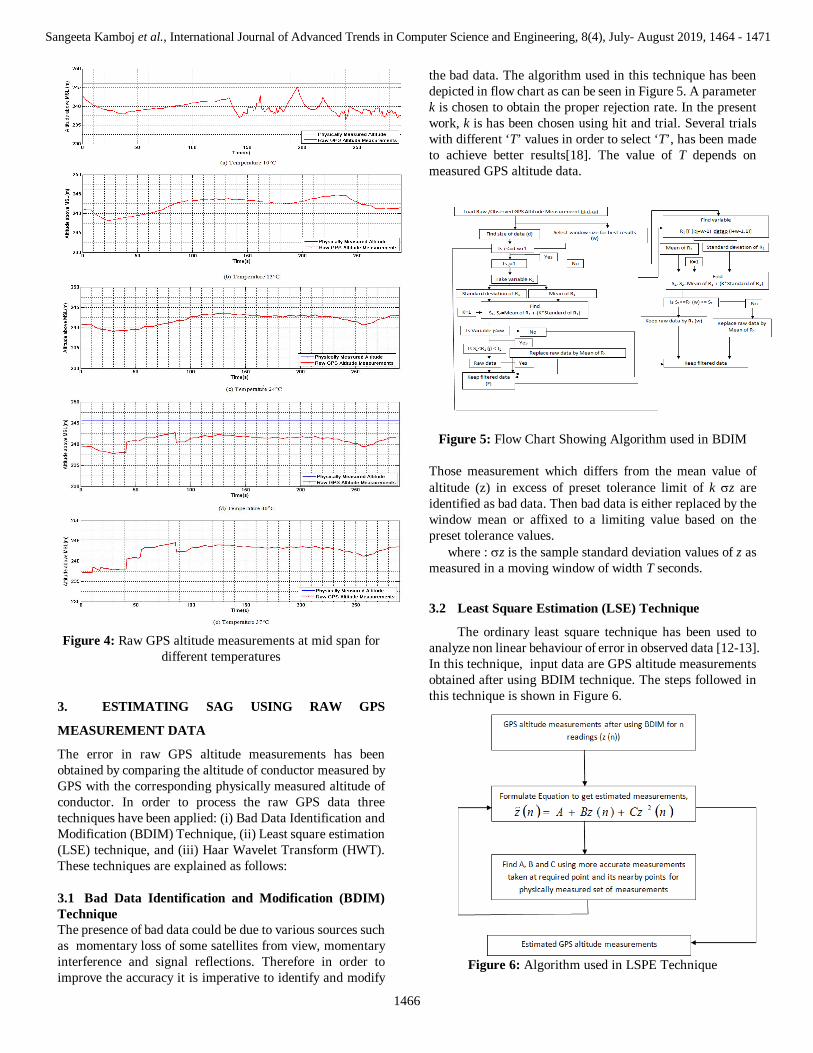
measuring system 2.2 Field Tests The main purpose of the field test was to obtain altitude data of an overhead conductor using GPS receiver at mid span as well as at pole to evaluate the conductor sag of the distribution line at different air temperatures. In all the field tests, the GPS receiver BT359 along with polymer insulator was hanged at a distance of 0.17 m from overhead conductor at mid span and at pole for sag evaluation of the line. The single phase of the line section was used for sag measurement using GPS. This distance of 0.17 m is added to the altitude information given by GPS receiver to obtain altitude of overhead conductor. The raw GPS altitude measurements of overhead conductor need some refinements using some signal processing techniques. A pictorial view of some of the field tests performed during the work is shown in Figure 2 and 3. The conductor altitude from earth has also been measured using BOSCH GLM50 laser distance measuring device as given in table1. The altitude of earth from mean sea level as per survey of India is added to it and hence taken as physically measured altitude of the conductor from mean sea level. which is used as standard reference for the estimation of error in observed GPS altitude measurements.
Table 1: Physically Altitude Measurement of Overhead Conductor
Measurement At
Altitude of Conductor from Earth(m)
Air Temperature (C) 10 13 24 30 37
Mid span 6.09 6.05 5.84 5.68 5.39 Pole 6.4
Figure 2: Field test conducted at mid span
Figure 3: Field test conducted at the pole
2.3 Measurements of Conductor Altitude using GPS
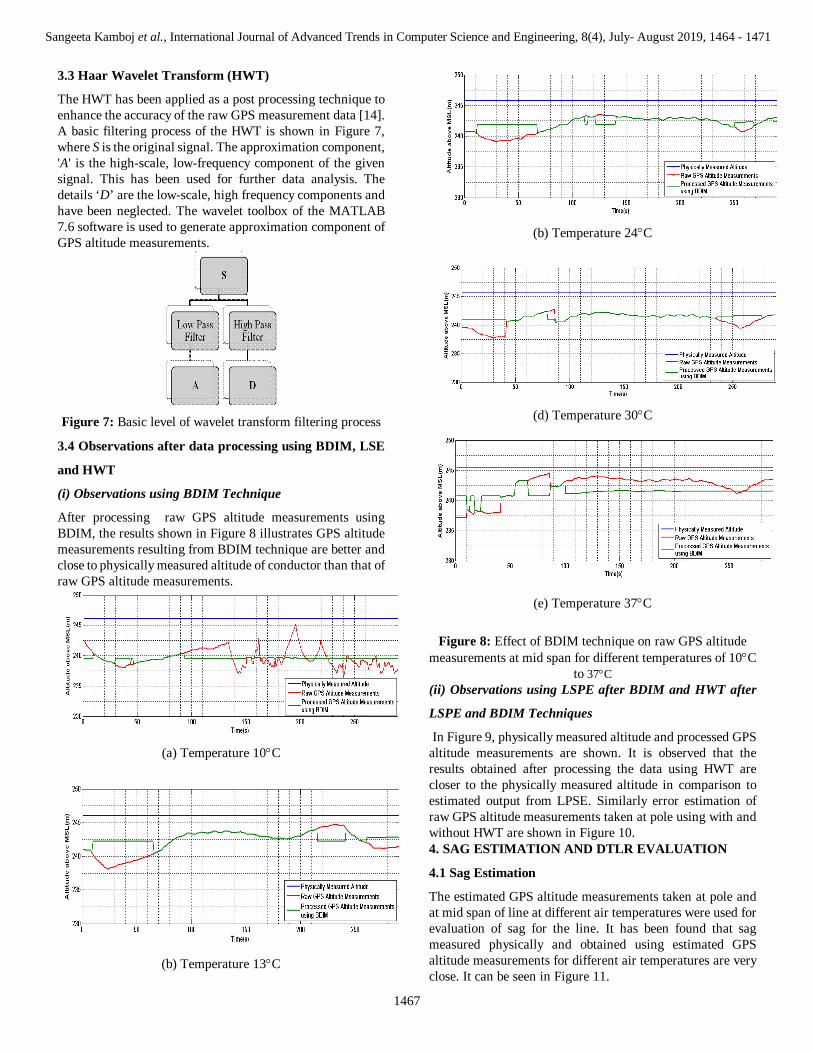
The physical and raw GPS altitude measurements of overhead conductor at mid span are shown in Figure4 for the various values of air temperature. It has been observed that due to some inherent sources of error, the GPS altitude measurements are not very close to the physically measured altitude of conductor .
GPS Receiver BT359
Polymer Insulator
Bluetooth Device
Laptop
Sangeeta Kamboj et al., International Journal of Advanced Trends in Computer Science and Engineering, 8(4), July- August 2019, 1464 - 1471
1466
Figure 4: Raw GPS altitude measurements at mid span for
different temperatures
3. ESTIMATING SAG USING RAW GPS
MEASUREMENT DATA
The error in raw GPS altitude measurements has been obtained by comparing the altitude of conductor measured by GPS with the corresponding physically measured altitude of conductor. In order to process the raw GPS data three techniques have been applied: (i) Bad Data Identification and Modification (BDIM) Technique, (ii) Least square estimation (LSE) technique, and (iii) Haar Wavelet Transform (HWT). These techniques are explained as follows: 3.1 Bad Data Identification and Modification (BDIM) Technique The presence of bad data could be due to various sources such as momentary loss of some satellites from view, momentary interference and signal reflections. Therefore in order to improve the accuracy it is imperative to identify and modify
the bad data. The algorithm used in this technique has been depicted in flow chart as can be seen in Figure 5. A parameter k is chosen to obtain the proper rejection rate. In the present work, k is has been chosen using hit and trial. Several trials with different ‘T’ values in order to select ‘T’, has been made to achieve better results[18]. The value of T depends on measured GPS altitude data.
Figure 5: Flow Chart Showing Algorithm used in BDIM
Those measurement which differs from the mean value of altitude (z) in excess of preset tolerance limit of k z are identified as bad data. Then bad data is either replaced by the window mean or affixed to a limiting value based on the preset tolerance values.
where : z is the sample standard deviation values of z as measured in a moving window of width T seconds.
3.2 Least Square Estimation (LSE) Technique
The ordinary least square technique has been used to analyze non linear behaviour of error in observed data [12-13]. In this technique, input data are GPS altitude measurements obtained after using BDIM technique. The steps followed in this technique is shown in Figure 6.
Figure 6: Algorithm used in LSPE Technique
Sangeeta Kamboj et al., International Journal of Advanced Trends in Computer Science and Engineering, 8(4), July- August 2019, 1464 - 1471
1467
3.3 Haar Wavelet Transform (HWT)
The HWT has been applied as a post processing technique to enhance the accuracy of the raw GPS measurement data [14]. A basic filtering process of the HWT is shown in Figure 7, where S is the original signal. The approximation component, 'A' is the high-scale, low-frequency component of the given signal. This has been used for further data analysis. The details ‘D’ are the low-scale, high frequency components and have been neglected. The wavelet toolbox of the MATLAB 7.6 software is used to generate approximation component of GPS altitude measurements.
Figure 7: Basic level of wavelet transform filtering process
3.4 Observations after data processing using BDIM, LSE
and HWT
(i) Observations using BDIM Technique
After processing raw GPS altitude measurements using BDIM, the results shown in Figure 8 illustrates GPS altitude measurements resulting from BDIM technique are better and close to physically measured altitude of conductor than that of raw GPS altitude measurements.
(a) Temperature 10C
(b) Temperature 13C
(b) Temperature 24C
(d) Temperature 30C
(e) Temperature 37C
Figure 8: Effect of BDIM technique on raw GPS altitude measurements at mid span for different temperatures of 10C
to 37C (ii) Observations using LSPE after BDIM and HWT after
LSPE and BDIM Techniques
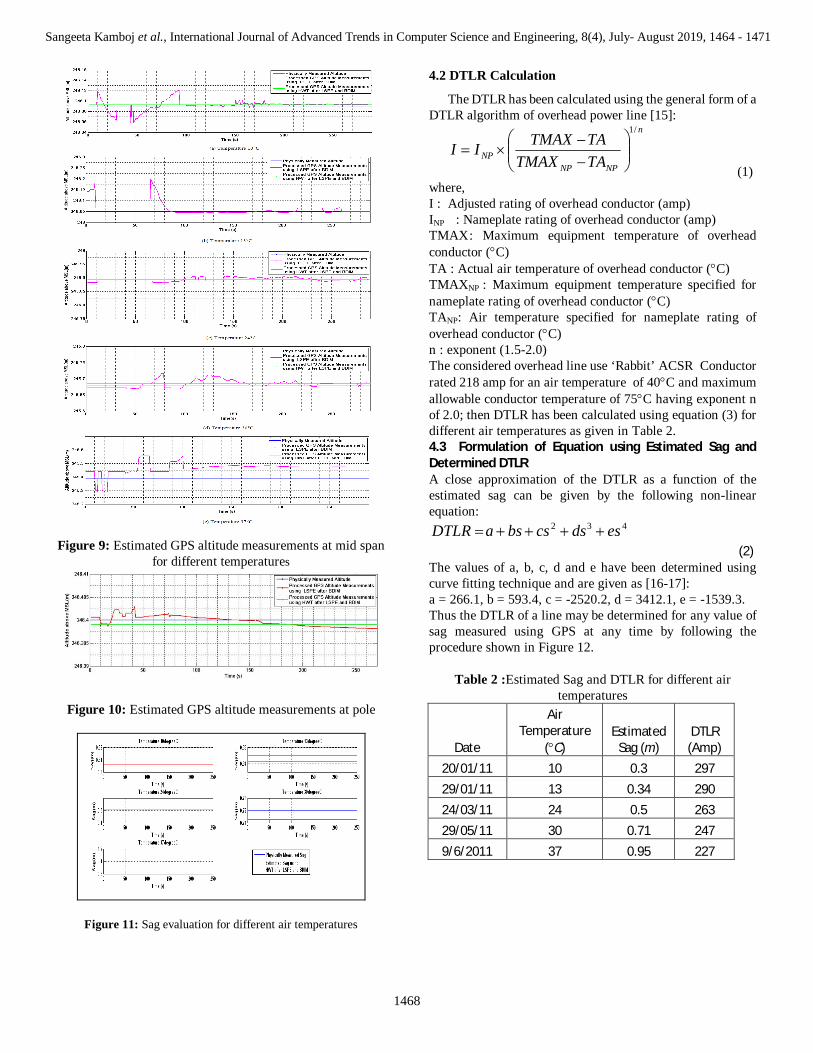
In Figure 9, physically measured altitude and processed GPS altitude measurements are shown. It is observed that the results obtained after processing the data using HWT are closer to the physically measured altitude in comparison to estimated output from LPSE. Similarly error estimation of raw GPS altitude measurements taken at pole using with and without HWT are shown in Figure 10. 4. SAG ESTIMATION AND DTLR EVALUATION
4.1 Sag Estimation
The estimated GPS altitude measurements taken at pole and at mid span of line at different air temperatures were used for evaluation of sag for the line. It has been found that sag measured physically and obtained using estimated GPS altitude measurements for different air temperatures are very close. It can be seen in Figure 11.
Sangeeta Kamboj et al., International Journal of Advanced Trends in Computer Science and Engineering, 8(4), July- August 2019, 1464 - 1471
1468
Figure 9: Estimated GPS altitude measurements at mid span
for different temperatures
Figure 10: Estimated GPS altitude measurements at pole
Figure 11: Sag evaluation for different air temperatures
4.2 DTLR Calculation
The DTLR has been calculated using the general form of a DTLR algorithm of overhead power line [15]:
n
NPNPNP TATMAX
TATMAXII/1
(1)
where, I : Adjusted rating of overhead conductor (amp) INP : Nameplate rating of overhead conductor (amp) TMAX : Maximum equipment temperature of overhead conductor (C) TA : Actual air temperature of overhead conductor (C) TMAXNP : Maximum equipment temperature specified for nameplate rating of overhead conductor (C) TANP: Air temperature specified for nameplate rating of overhead conductor (C) n : exponent (1.5-2.0) The considered overhead line use ‘Rabbit’ ACSR Conductor rated 218 amp for an air temperature of 40C and maximum allowable conductor temperature of 75C having exponent n of 2.0; then DTLR has been calculated using equation (3) for different air temperatures as given in Table 2. 4.3 Formulation of Equation using Estimated Sag and Determined DTLR A close approximation of the DTLR as a function of the estimated sag can be given by the following non-linear equation:
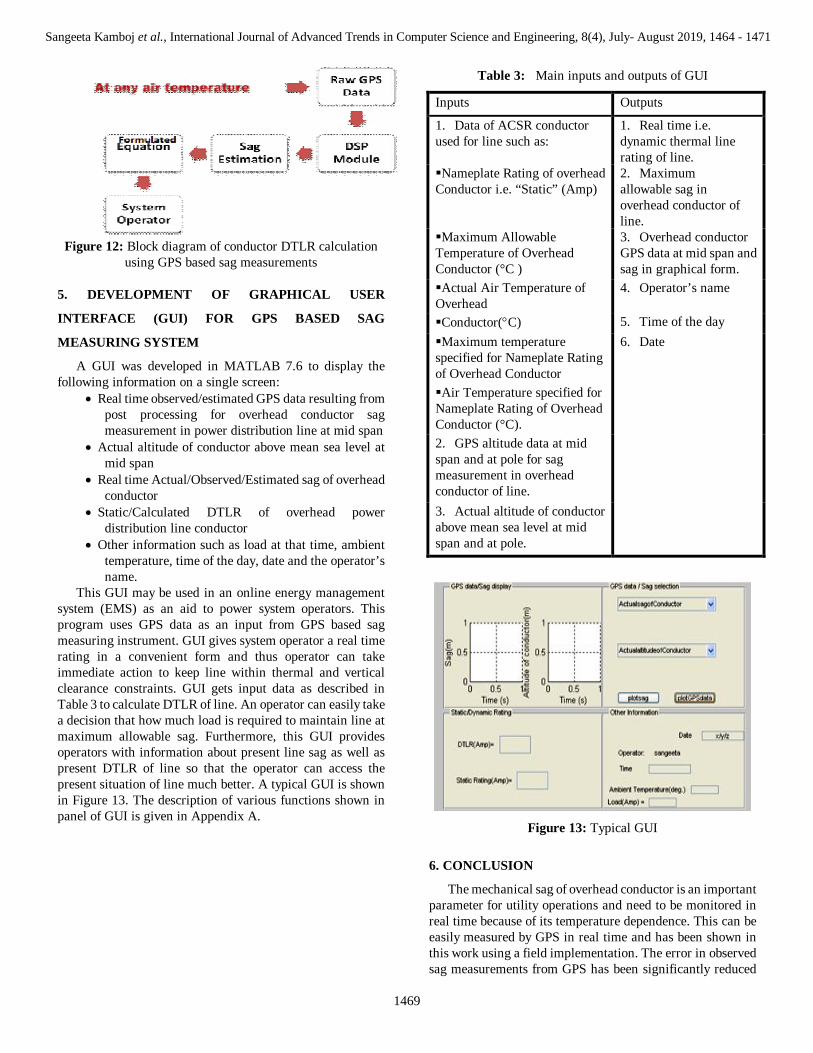
432 esdscsbsaDTLR (2) The values of a, b, c, d and e have been determined using curve fitting technique and are given as [16-17]: a = 266.1, b = 593.4, c = -2520.2, d = 3412.1, e = -1539.3. Thus the DTLR of a line may be determined for any value of sag measured using GPS at any time by following the procedure shown in Figure 12.
Table 2 :Estimated Sag and DTLR for different air
temperatures
Date
Air Temperature
(C) Estimated
Sag (m) DTLR
(Amp) 20/01/11 10 0.3 297 29/01/11 13 0.34 290 24/03/11 24 0.5 263 29/05/11 30 0.71 247 9/6/2011 37 0.95 227
Sangeeta Kamboj et al., International Journal of Advanced Trends in Computer Science and Engineering, 8(4), July- August 2019, 1464 - 1471
1469
Figure 12: Block diagram of conductor DTLR calculation
using GPS based sag measurements
5. DEVELOPMENT OF GRAPHICAL USER
INTERFACE (GUI) FOR GPS BASED SAG
MEASURING SYSTEM
A GUI was developed in MATLAB 7.6 to display the following information on a single screen:
Real time observed/estimated GPS data resulting from post processing for overhead conductor sag measurement in power distribution line at mid span
Actual altitude of conductor above mean sea level at mid span
Real time Actual/Observed/Estimated sag of overhead conductor
Static/Calculated DTLR of overhead power distribution line conductor
Other information such as load at that time, ambient temperature, time of the day, date and the operator’s name.
This GUI may be used in an online energy management system (EMS) as an aid to power system operators. This program uses GPS data as an input from GPS based sag measuring instrument. GUI gives system operator a real time rating in a convenient form and thus operator can take immediate action to keep line within thermal and vertical clearance constraints. GUI gets input data as described in Table 3 to calculate DTLR of line. An operator can easily take a decision that how much load is required to maintain line at maximum allowable sag. Furthermore, this GUI provides operators with information about present line sag as well as present DTLR of line so that the operator can access the present situation of line much better. A typical GUI is shown in Figure 13. The description of various functions shown in panel of GUI is given in Appendix A.
Table 3: Main inputs and outputs of GUI
Inputs Outputs
1. Data of ACSR conductor used for line such as:
1. Real time i.e. dynamic thermal line rating of line.
Nameplate Rating of overhead Conductor i.e. “Static” (Amp)
2. Maximum allowable sag in overhead conductor of line.
Maximum Allowable Temperature of Overhead Conductor (°C )
3. Overhead conductor GPS data at mid span and sag in graphical form.
Actual Air Temperature of Overhead
4. Operator’s name
Conductor(C) 5. Time of the day Maximum temperature specified for Nameplate Rating of Overhead Conductor
6. Date
Air Temperature specified for Nameplate Rating of Overhead Conductor (°C).
2. GPS altitude data at mid span and at pole for sag measurement in overhead conductor of line.
3. Actual altitude of conductor above mean sea level at mid span and at pole.
Figure 13: Typical GUI
6. CONCLUSION
The mechanical sag of overhead conductor is an important parameter for utility operations and need to be monitored in real time because of its temperature dependence. This can be easily measured by GPS in real time and has been shown in this work using a field implementation. The error in observed sag measurements from GPS has been significantly reduced
Sangeeta Kamboj et al., International Journal of Advanced Trends in Computer Science and Engineering, 8(4), July- August 2019, 1464 - 1471
1470
using a combination of signal processing techniques such as LSE, BDIM and HWT in a sequential order. It has been observed that HWT can significantly improve the accuracy of estimated data. The direct relation between mechanical sag and DTLR can be used to calculate DTLR of a power line using GPS based estimated sag. The sag measurements can be displayed with the help of a GUI on a screen. The operator may observe overhead conductor sag and DTLR directly on a screen so that one can take operational decision to keep the power line within thermal and vertical clearance constraints.
APPENDIX Panel Functions in GUI
Panel Descriptor Function 1 GPS data/Sag
display This panel display GPS data and sag in overhead conductor of power transmission/distribution line in a graphical form using plot command depending on selection of actual/estimated GPS altitude data and actual/estimated sag.
2 GPS data / Sag selection
This panel describes the following: One sector to select GPS data either observed or estimated resulting from HWT with LSPE method and actual altitude of overhead conductor at mid span above mean sea level. Other sector select Sag in overhead conductor of power transmission/distribution line either actual or estimated obtained using HWT with LSPE method. Plot command is used to display the respective GPS data and sag in overhead conductor of power transmission/distribution line in panel1.
3 Static/Dynamic Rating
This panel show specified nameplate i.e. “static” rating given by designer of power transmission/distribution line and calculated real time rating i.e. DTLR of
line.
4 Other Information
This panel describes the following: Present load at line, Ambient temperature at that time, the time of the day, the operator’s name and the date.
ACKNOWLEDGEMENT The authors acknowledge the cooperation of Assistant Executive Engineer, Sh. Naseeb Singh, M&P Divison, Kurukshetra, Haryana, India to carry out the proposed research work.
REFERENCES 1. C.M. Bons, U.F. Krekeler, G.T. Heydt, Y. Hoverson, J.
Schilleci, and B.A. Agarwa. Application of the global positioning system to the measurement of overhead power transmission conductor sag, IEEE Trans on Power Systems, Vol. 17, pp. 273-278,2002. https://doi.org/10.1109/61.974218
2. C.M, Bonsu, G.T. Heydt. Real time digital processing of GPS measurements for transmission engineering, IEEE Trans on Power Systems, Vol. 18, pp. 177-182, 2003. https://doi.org/10.1109/TPWRD.2002.803803
3. C.M. Bonsu and G.T. Heydt. Overhead Transmission Conductor Sag: A novel measurement technique and the relation of sag to real time circuit ratings, Electric Power Components and Systems, Vol. 31, pp. 61-69, 2003. https://doi.org/10.1080/15325000390112062
4. S.S. Komarigiri, S.A. Mahajan. Sag monitoring device based on a cluster of code based GPS receivers, in Proc. 2008 IEEE Power and Energy Society General Meeting, Calgary, , 26 -30 July 2009, pp. 1-7. https://doi.org/10.1109/PES.2009.5275349
5. S.M. Mahajan, U.M. Singareddy. Real time GPS data processing for sag measurement on a transmission line, in Proc. 2008 IEEE Power India Conference, New Delhi, India, 12-15 Oct. 2008, pp. 1-6. https://doi.org/10.1109/ICPST.2008.4745230
6. R.G. Olsen, K.S. Edward. A new method for real time monitoring of high voltage transmission line conductor sag, IEEE Trans on Power Systems, Vol. 17,pp. 1142-1152, 2002. https://doi.org/10.1109/TPWRD.2002.804015
Sangeeta Kamboj et al., International Journal of Advanced Trends in Computer Science and Engineering, 8(4), July- August 2019, 1464 - 1471
1471
7. T. Pratt, C. Bostain, J. Allnutt. Satellite communication, Singapore: John Wiley &Sons, 2005.
8. G.J. Ramon. Dynamic thermal line rating: Summary and Status of the State-of-the-Art Technology, IEEE Trans on Power Systems, Vol. 2, pp. 851-856, 1987. https://doi.org/10.1109/TPWRD.1987.4308190
9. D.A. Douglass, A. Edris. Real-Time monitoring and dynamic thermal rating of power transmission circuits, IEEE Trans on Power Systems, Vol. 11, pp. 1407-1415, 1996. https://doi.org/10.1109/61.517499
10. D.A. Douglass, A. Edris, G.A. Pritchard. Field application of a dynamic thermal circuit rating method, IEEE Trans on Power Systems, 1997, Vol. 12, pp. 823-831. https://doi.org/10.1109/61.584390
11. The Valley Group Inc, CAT-1 Transmission Line Monitoring System, Brochure. http://www.cat-1.com/files/brochures/CAT-1.pdf
12. G.M. Phillips, P.J. Taylor. Theory and Applications of Numerical Analysis, Second Edition, Academic Press, New York, CA, 1996.
13. G. Strang. Linear Algebra and its Applications, New York, Academic Press, 1976.
14. M. Misiti, Y. Misiti, G. Oppenheim, J. M. Poggi. User's Guide: Wavelet Toolbox for Use with MATLAB, The MathWorks Inc., Natick, MA, 1997.
15. D. A. Douglass, A. -A Edris. Real time monitoring and dynamic thermal rating of power transmission circuits, IEEE Trans on Power Delivery, Vol. 11, pp. 1407-1415, July 1996. https://doi.org/10.1109/61.517499
16. S.C. Gupta and V. K. Kapoor. Fundamentals of Mathematical Statistics, Tenth Edition, New Delhi, S. C. and Sons, 2002.
17. S. Kamboj, R. Dahiya. Evaluation of DTLR of power distribution line from sag measured using GPS, in Proc. 2011 IEEE International Conference on Energy, Automation, and Signal, Bhubaneswar, Odisha, India, pp. 1-6. https://doi.org/10.1109/ICEAS.2011.6147154