19th world congress of soil science symposium 2.4.2 soil
TRANSCRIPT

19th World Congress of Soil Science
Symposium 2.4.2
Soil minerals and contaminants
Soil Solutions for a Changing World,
Brisbane, Australia
1 – 6 August 2010
ii
Table of Contents
Page
Table of Contents ii
1 Adsorption of Phenol by HDTMA-modified Organoclay 1
2 An assessment of cadmium availability in upland field soils using isotope dilution
4
3 Analysis of trace organic compounds from a dairy factory milk processing plant “wastewater” used to irrigate soils
8
4 Anion adsorption and transport in an unsaturated High-humic Andosol
11
5 Arsenic and lead contaminated rice soils in the Guandu Plain, Northern Taiwan
15
6 Arsenic mobilisation induced by bacterial iron reduction and competing phosphorous
19
7 Biogeochemical Interactions between Fe(II)/(III) Species Cycles And Transformation of Reducible Substrates in Subtropical Soils
23
8 Buffering soil-water acidity in chlorinated solvent bioremediation schemes
27
9 Can solid-state phosphorus-31 nuclear magnetic resonance spectra be improved by wet chemical extraction of paramagnetics?
31
10 Cd and Zn speciation and mobility in contaminated soil: physical micro-characterization techniques, chemical extraction methods and isotopic exchange kinetics
35
11 Chemistry of trace and heavy metals in bauxite residues (red mud) from Western Australia
39
12 Denitrification in a Chinampa soil of Mexico City as affected by methylparathion
43
13 Diffuse reflectance spectroscopy study of heavy metals in agricultural soils of the Changjiang River Delta, China
47
14 Distribution of soil heavy metal contamination around industrial complex zone, Shiraz, Iran
51
15 Effect of ionic strength on cadmium adsorption onto kaolinite in single- and multi-element systems
55
16 Effect of organic and inorganic amendments on sorption of Cr(VI) and Cr(III) in soil
58
17 Effect of Water Management, Tillage options and Phosphorus Rates on Rice in an Arsenic-Soil-Water System
62
18 Factors influencing nitrate retention in 3 Andisol profiles in Kyushu, Japan
66
iii
Table of Contents (Cont.)
Page
19 Fe(III) Reduction in Soils from South China 70
20 Geochemical approach for toxic metal leaching and migration from defunct mining site
74
21 Identification criteria for fougerite and nature of the interlayered anion
78
22 Immobilization of Pseudomonas sp. strain ADP: a stable inoculant for the bioremediation of atrazine
82
23 Interaction between Reductive Transformation of 2-Nitrophenol and Adsorbed Fe(II) Species
86
24 Is Dealumination Limited to the Waikato Region of New Zealand, or is it Wider Spread?
90
25 Magnetic Properties of Urban Topsoil in Baoshan District, Shanghai and Its Environmental Implication
93
26 pH dependent charge and phosphate sorption by Thai Kandiudox 97
27 Proteome Analysis for Identifying Effect of the Natural Clay Mineral Illite on the Enhanced Growth of Cherry Tomato(Lycopersicon esculentum)
101
28 Role of Clay Minerals in Controlling the Fate of Exceptionally Toxic Organic Contaminants in the Environment
105
29 Secondary fate of pathogenic bacteria in livestock mortality biopiles Grant Posters
108
30 Soil sorption of cesium on calcareous soils of Iran 112
31 The adsoption of Strontium on soils developed in arid region as influenced by clay content and soluble cations
116
32 Trace elements in phosphorites of different provenance 120
33 Transformation of soil iron minerals under static batch and flow through conditions: application for soil remediation
123
34 Use of inorganic and organic wastes for in situ immobilization of Pb and Zn in a contaminated soil
127
© 2010 19th World Congress of Soil Science, Soil Solutions for a Changing World 1 – 6 August 2010, Brisbane, Australia. Published on DVD.
1
Adsorption of Phenol by HDTMA-modified Organoclay Binoy Sarkar
A,B*, Yunfei XiA,B, Megharaj MallavarapuA,B GSR KrishnamurtiB and Ravi NaiduA,B CERAR – Centre for Environmental Risk Assessment and Remediation, University of South Australia, Mawson Lakes Campus, Mawson Lakes Boulevard, SA 5095. [email protected] CRC CARE – Cooperative Research Centre for Contamination Assessment and Remediation of the Environment, PO Box 486, Salisbury South, SA 5106, Australia.
Abstract Naturally occurring clay materials can be modified organically by quaternary ammonium cations resulting into clay products commonly known as organoclays. Such organic modification alters the nature of clay from hydrophilic to hydrophobic, imparting enhanced interaction of the clay products towards hydrophobic pollutants in the environment. These materials can also be used to remediate ionisable organic contaminants such as phenol. The present study presents the adsorption of phenol by hexadecyl trimethyl ammonium (HDTMA) modified bentonite in aqueous medium. It was found that modification of bentonite by HDTMA hugely improved the adsorption of phenol as compared to the unmodified bentonite. Adsorption kinetics and isotherms were also studied. Key words
Organoclay, adsorption, phenol, Freundlich isotherm, bentonite, hydrophobicity. Introduction
Natural materials such as clays are profitably effective to immobilise toxic environmental contaminants due to their inexpensive availability, environmental stability and high adsorptive and ion exchange properties. Additionally, clay materials can potentially be modified using a variety of chemical/physical treatment to achieve the desired surface properties for best immobilisation performance of specific compounds. For example, most natural aluminosilicate clays are highly hydrophilic, and consequently show very low adsorption for hydrophobic organic contaminants. However when surfaces of these materials are modified by introducing long chain organic compounds, high sorption of organic contaminants can be achieved (Boyd et al. 1988; Xi et al. 2004; 2005; Xu and Zhu 2009). Ionisable organic contaminants such as phenol can also be adsorbed by organoclays (Zhu et al. 2000). Objective of the present study is to determine the adsorption capacity of organically modified Witheroo bentonite for phenol. Materials and method
Organoclay HW2CEC was prepared by modifying Witheroo bentonite with cationic surfactant, hexadecyl trimethyl ammonium (HDTMA) in hydrothermal cation exchange reaction (Frost et al. 2008). Surfactant loading was adjusted as twice the CEC of the clay. Kinetic experiment was carried out to standardise the equilibration time for phenol sorption onto the organoclay at 230C and at initial pH 4.8. Also phenol adsorption isotherm was established.
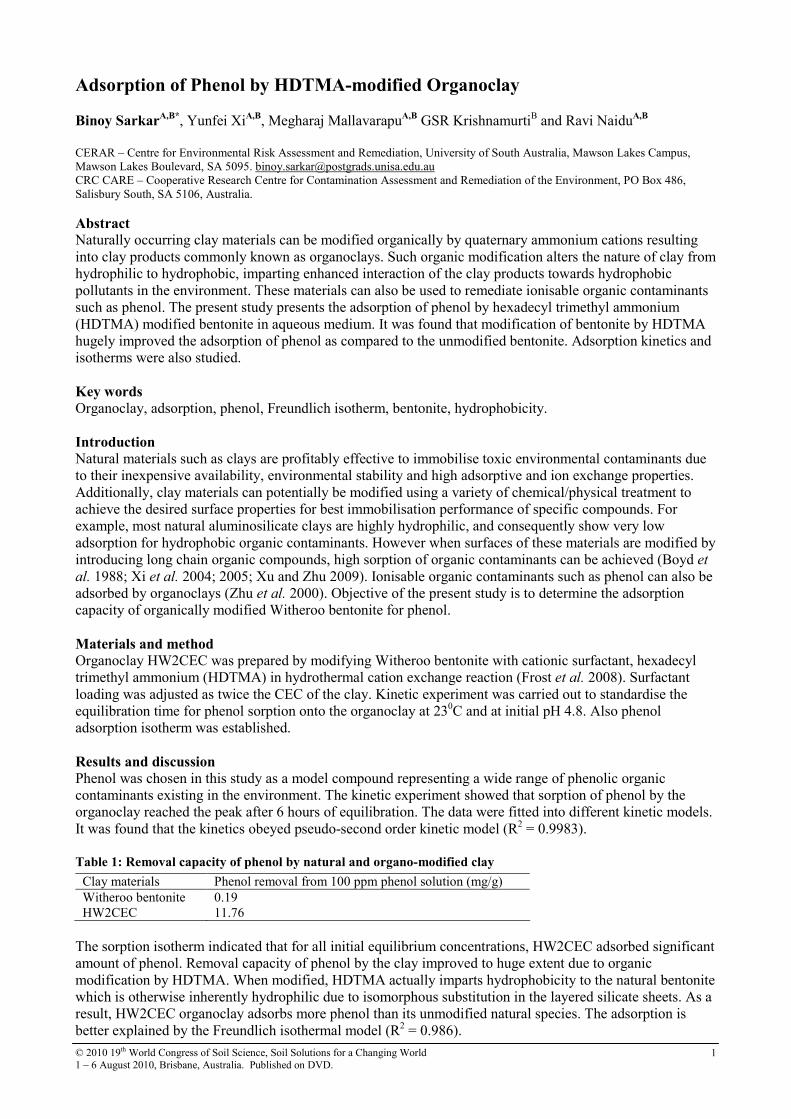
Results and discussion Phenol was chosen in this study as a model compound representing a wide range of phenolic organic contaminants existing in the environment. The kinetic experiment showed that sorption of phenol by the organoclay reached the peak after 6 hours of equilibration. The data were fitted into different kinetic models. It was found that the kinetics obeyed pseudo-second order kinetic model (R2 = 0.9983). Table 1: Removal capacity of phenol by natural and organo-modified clay
Clay materials Phenol removal from 100 ppm phenol solution (mg/g) Witheroo bentonite 0.19 HW2CEC 11.76
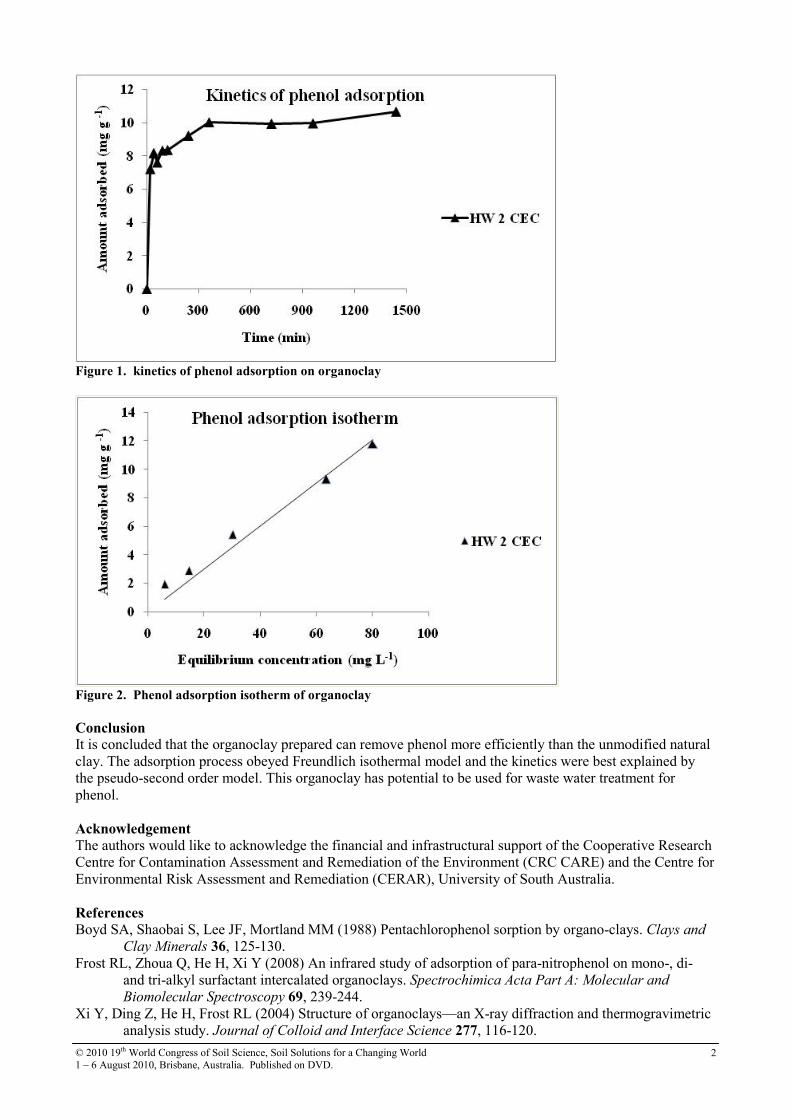
The sorption isotherm indicated that for all initial equilibrium concentrations, HW2CEC adsorbed significant amount of phenol. Removal capacity of phenol by the clay improved to huge extent due to organic modification by HDTMA. When modified, HDTMA actually imparts hydrophobicity to the natural bentonite which is otherwise inherently hydrophilic due to isomorphous substitution in the layered silicate sheets. As a result, HW2CEC organoclay adsorbs more phenol than its unmodified natural species. The adsorption is better explained by the Freundlich isothermal model (R2 = 0.986).
© 2010 19th World Congress of Soil Science, Soil Solutions for a Changing World 1 – 6 August 2010, Brisbane, Australia. Published on DVD.
2
Figure 1. kinetics of phenol adsorption on organoclay
Figure 2. Phenol adsorption isotherm of organoclay
Conclusion It is concluded that the organoclay prepared can remove phenol more efficiently than the unmodified natural clay. The adsorption process obeyed Freundlich isothermal model and the kinetics were best explained by the pseudo-second order model. This organoclay has potential to be used for waste water treatment for phenol.
Acknowledgement
The authors would like to acknowledge the financial and infrastructural support of the Cooperative Research Centre for Contamination Assessment and Remediation of the Environment (CRC CARE) and the Centre for Environmental Risk Assessment and Remediation (CERAR), University of South Australia. References
Boyd SA, Shaobai S, Lee JF, Mortland MM (1988) Pentachlorophenol sorption by organo-clays. Clays and Clay Minerals 36, 125-130.
Frost RL, Zhoua Q, He H, Xi Y (2008) An infrared study of adsorption of para-nitrophenol on mono-, di- and tri-alkyl surfactant intercalated organoclays. Spectrochimica Acta Part A: Molecular and
Biomolecular Spectroscopy 69, 239-244. Xi Y, Ding Z, He H, Frost RL (2004) Structure of organoclays—an X-ray diffraction and thermogravimetric
analysis study. Journal of Colloid and Interface Science 277, 116-120.

© 2010 19th World Congress of Soil Science, Soil Solutions for a Changing World 1 – 6 August 2010, Brisbane, Australia. Published on DVD.
3
Xi Y, Frost RL, He H, Kloprogge T, Bostrom T (2005) Modification of Wyoming montmorillonite surfaces using a cationic surfactant. Langmuir 21, 8675-8680.
Xu L, Zhu L (2009) Structures of OTMA- and DODMA-bentonite and their sorption characteristics towards organic compounds. Journal of Colloid and Interface Science 331, 8-14.
Zhu L, Chen B, Shen X (2000) Sorption of phenol, p-nitrophenol, and aniline to dual cation organobentonites from water. Environmental Science and Technology 34, 468-475.
© 2010 19th World Congress of Soil Science, Soil Solutions for a Changing World 1 – 6 August 2010, Brisbane, Australia. Published on DVD.
4
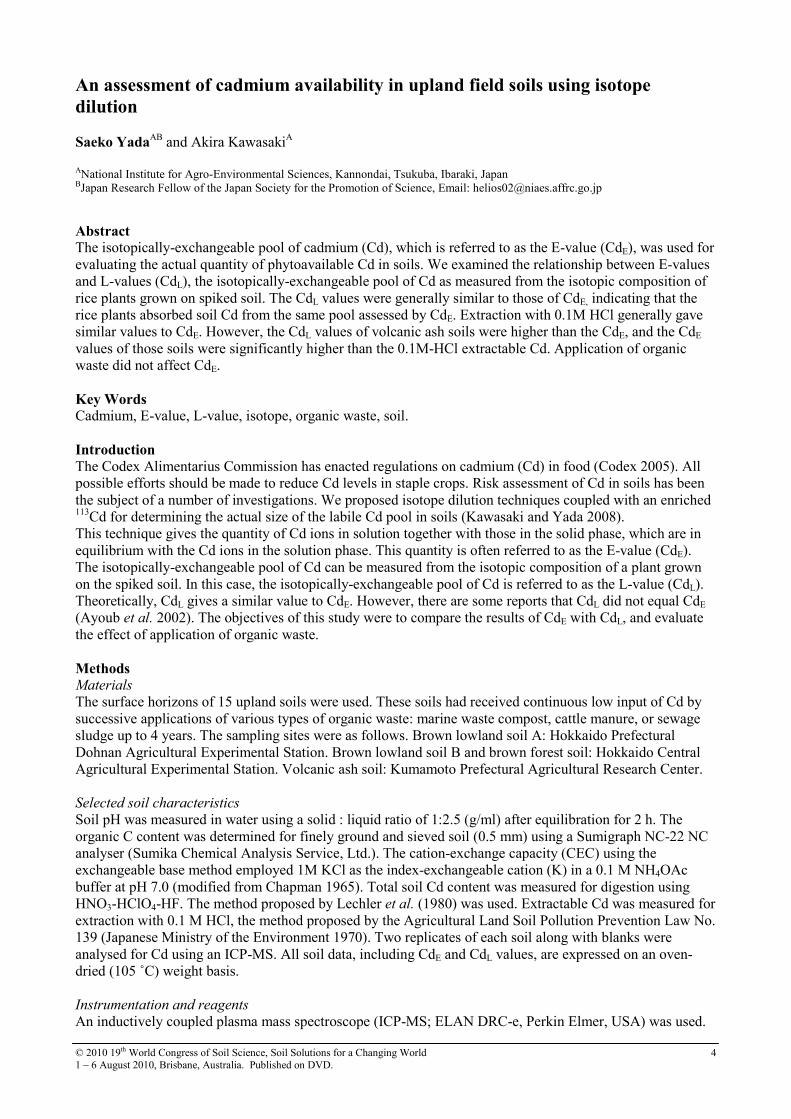
An assessment of cadmium availability in upland field soils using isotope
dilution Saeko Yada
AB and Akira KawasakiA ANational Institute for Agro-Environmental Sciences, Kannondai, Tsukuba, Ibaraki, Japan BJapan Research Fellow of the Japan Society for the Promotion of Science, Email: [email protected]
Abstract The isotopically-exchangeable pool of cadmium (Cd), which is referred to as the E-value (CdE), was used for evaluating the actual quantity of phytoavailable Cd in soils. We examined the relationship between E-values and L-values (CdL), the isotopically-exchangeable pool of Cd as measured from the isotopic composition of rice plants grown on spiked soil. The CdL values were generally similar to those of CdE, indicating that the rice plants absorbed soil Cd from the same pool assessed by CdE. Extraction with 0.1M HCl generally gave similar values to CdE. However, the CdL values of volcanic ash soils were higher than the CdE, and the CdE values of those soils were significantly higher than the 0.1M-HCl extractable Cd. Application of organic waste did not affect CdE. Key Words Cadmium, E-value, L-value, isotope, organic waste, soil. Introduction
The Codex Alimentarius Commission has enacted regulations on cadmium (Cd) in food (Codex 2005). All possible efforts should be made to reduce Cd levels in staple crops. Risk assessment of Cd in soils has been the subject of a number of investigations. We proposed isotope dilution techniques coupled with an enriched 113Cd for determining the actual size of the labile Cd pool in soils (Kawasaki and Yada 2008). This technique gives the quantity of Cd ions in solution together with those in the solid phase, which are in equilibrium with the Cd ions in the solution phase. This quantity is often referred to as the E-value (CdE). The isotopically-exchangeable pool of Cd can be measured from the isotopic composition of a plant grown on the spiked soil. In this case, the isotopically-exchangeable pool of Cd is referred to as the L-value (CdL). Theoretically, CdL gives a similar value to CdE. However, there are some reports that CdL did not equal CdE
(Ayoub et al. 2002). The objectives of this study were to compare the results of CdE with CdL, and evaluate the effect of application of organic waste. Methods Materials
The surface horizons of 15 upland soils were used. These soils had received continuous low input of Cd by successive applications of various types of organic waste: marine waste compost, cattle manure, or sewage sludge up to 4 years. The sampling sites were as follows. Brown lowland soil A: Hokkaido Prefectural Dohnan Agricultural Experimental Station. Brown lowland soil B and brown forest soil: Hokkaido Central Agricultural Experimental Station. Volcanic ash soil: Kumamoto Prefectural Agricultural Research Center. Selected soil characteristics
Soil pH was measured in water using a solid : liquid ratio of 1:2.5 (g/ml) after equilibration for 2 h. The organic C content was determined for finely ground and sieved soil (0.5 mm) using a Sumigraph NC-22 NC analyser (Sumika Chemical Analysis Service, Ltd.). The cation-exchange capacity (CEC) using the exchangeable base method employed 1M KCl as the index-exchangeable cation (K) in a 0.1 M NH4OAc buffer at pH 7.0 (modified from Chapman 1965). Total soil Cd content was measured for digestion using HNO3-HClO4-HF. The method proposed by Lechler et al. (1980) was used. Extractable Cd was measured for extraction with 0.1 M HCl, the method proposed by the Agricultural Land Soil Pollution Prevention Law No. 139 (Japanese Ministry of the Environment 1970). Two replicates of each soil along with blanks were analysed for Cd using an ICP-MS. All soil data, including CdE and CdL values, are expressed on an oven-dried (105 ˚C) weight basis.
Instrumentation and reagents
An inductively coupled plasma mass spectroscope (ICP-MS; ELAN DRC-e, Perkin Elmer, USA) was used.
© 2010 19th World Congress of Soil Science, Soil Solutions for a Changing World 1 – 6 August 2010, Brisbane, Australia. Published on DVD.
5
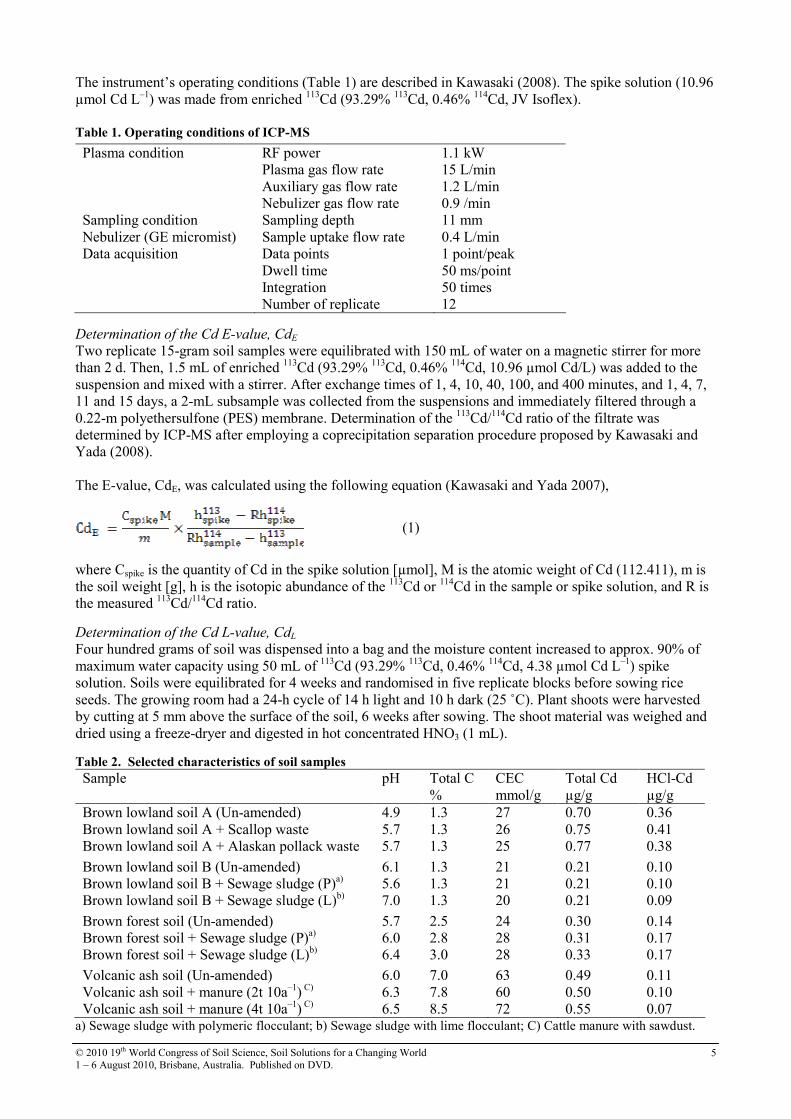
The instrument’s operating conditions (Table 1) are described in Kawasaki (2008). The spike solution (10.96 µmol Cd L–1) was made from enriched 113Cd (93.29% 113Cd, 0.46% 114Cd, JV Isoflex). Table 1. Operating conditions of ICP-MS
Plasma condition RF power 1.1 kW Plasma gas flow rate 15 L/min Auxiliary gas flow rate 1.2 L/min Nebulizer gas flow rate 0.9 /min Sampling condition Sampling depth 11 mm Nebulizer (GE micromist) Sample uptake flow rate 0.4 L/min Data acquisition Data points 1 point/peak Dwell time 50 ms/point Integration 50 times Number of replicate 12
Determination of the Cd E-value, CdE
Two replicate 15-gram soil samples were equilibrated with 150 mL of water on a magnetic stirrer for more than 2 d. Then, 1.5 mL of enriched 113Cd (93.29% 113Cd, 0.46% 114Cd, 10.96 µmol Cd/L) was added to the suspension and mixed with a stirrer. After exchange times of 1, 4, 10, 40, 100, and 400 minutes, and 1, 4, 7, 11 and 15 days, a 2-mL subsample was collected from the suspensions and immediately filtered through a 0.22-m polyethersulfone (PES) membrane. Determination of the 113Cd/114Cd ratio of the filtrate was determined by ICP-MS after employing a coprecipitation separation procedure proposed by Kawasaki and Yada (2008). The E-value, CdE, was calculated using the following equation (Kawasaki and Yada 2007),
(1)
where Cspike is the quantity of Cd in the spike solution [µmol], M is the atomic weight of Cd (112.411), m is the soil weight [g], h is the isotopic abundance of the 113Cd or 114Cd in the sample or spike solution, and R is the measured 113Cd/114Cd ratio.
Determination of the Cd L-value, CdL
Four hundred grams of soil was dispensed into a bag and the moisture content increased to approx. 90% of maximum water capacity using 50 mL of 113Cd (93.29% 113Cd, 0.46% 114Cd, 4.38 µmol Cd L–1) spike solution. Soils were equilibrated for 4 weeks and randomised in five replicate blocks before sowing rice seeds. The growing room had a 24-h cycle of 14 h light and 10 h dark (25 ˚C). Plant shoots were harvested by cutting at 5 mm above the surface of the soil, 6 weeks after sowing. The shoot material was weighed and dried using a freeze-dryer and digested in hot concentrated HNO3 (1 mL).
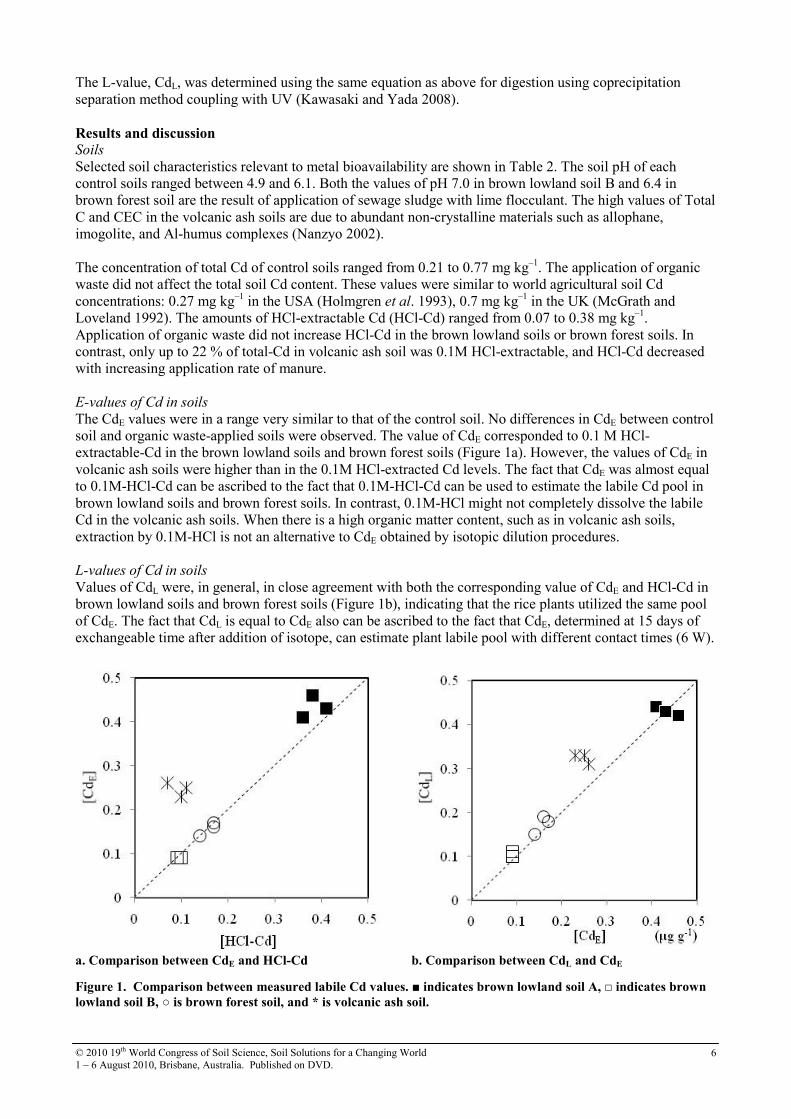
Table 2. Selected characteristics of soil samples
Sample pH
Total C %
CEC mmol/g
Total Cd µg/g
HCl-Cd µg/g
Brown lowland soil A (Un-amended) 4.9 1.3 27 0.70 0.36 Brown lowland soil A + Scallop waste 5.7 1.3 26 0.75 0.41 Brown lowland soil A + Alaskan pollack waste 5.7 1.3 25 0.77 0.38 Brown lowland soil B (Un-amended) 6.1 1.3 21 0.21 0.10 Brown lowland soil B + Sewage sludge (P)a) 5.6 1.3 21 0.21 0.10 Brown lowland soil B + Sewage sludge (L)b) 7.0 1.3 20 0.21 0.09 Brown forest soil (Un-amended) 5.7 2.5 24 0.30 0.14 Brown forest soil + Sewage sludge (P)a) 6.0 2.8 28 0.31 0.17 Brown forest soil + Sewage sludge (L)b) 6.4 3.0 28 0.33 0.17 Volcanic ash soil (Un-amended) 6.0 7.0 63 0.49 0.11 Volcanic ash soil + manure (2t 10a–1) C) 6.3 7.8 60 0.50 0.10 Volcanic ash soil + manure (4t 10a–1) C) 6.5 8.5 72 0.55 0.07
a) Sewage sludge with polymeric flocculant; b) Sewage sludge with lime flocculant; C) Cattle manure with sawdust.
© 2010 19th World Congress of Soil Science, Soil Solutions for a Changing World 1 – 6 August 2010, Brisbane, Australia. Published on DVD.
6
The L-value, CdL, was determined using the same equation as above for digestion using coprecipitation separation method coupling with UV (Kawasaki and Yada 2008). Results and discussion Soils
Selected soil characteristics relevant to metal bioavailability are shown in Table 2. The soil pH of each control soils ranged between 4.9 and 6.1. Both the values of pH 7.0 in brown lowland soil B and 6.4 in brown forest soil are the result of application of sewage sludge with lime flocculant. The high values of Total C and CEC in the volcanic ash soils are due to abundant non-crystalline materials such as allophane, imogolite, and Al-humus complexes (Nanzyo 2002). The concentration of total Cd of control soils ranged from 0.21 to 0.77 mg kg–1. The application of organic waste did not affect the total soil Cd content. These values were similar to world agricultural soil Cd concentrations: 0.27 mg kg–1 in the USA (Holmgren et al. 1993), 0.7 mg kg–1 in the UK (McGrath and Loveland 1992). The amounts of HCl-extractable Cd (HCl-Cd) ranged from 0.07 to 0.38 mg kg–1. Application of organic waste did not increase HCl-Cd in the brown lowland soils or brown forest soils. In contrast, only up to 22 % of total-Cd in volcanic ash soil was 0.1M HCl-extractable, and HCl-Cd decreased with increasing application rate of manure. E-values of Cd in soils
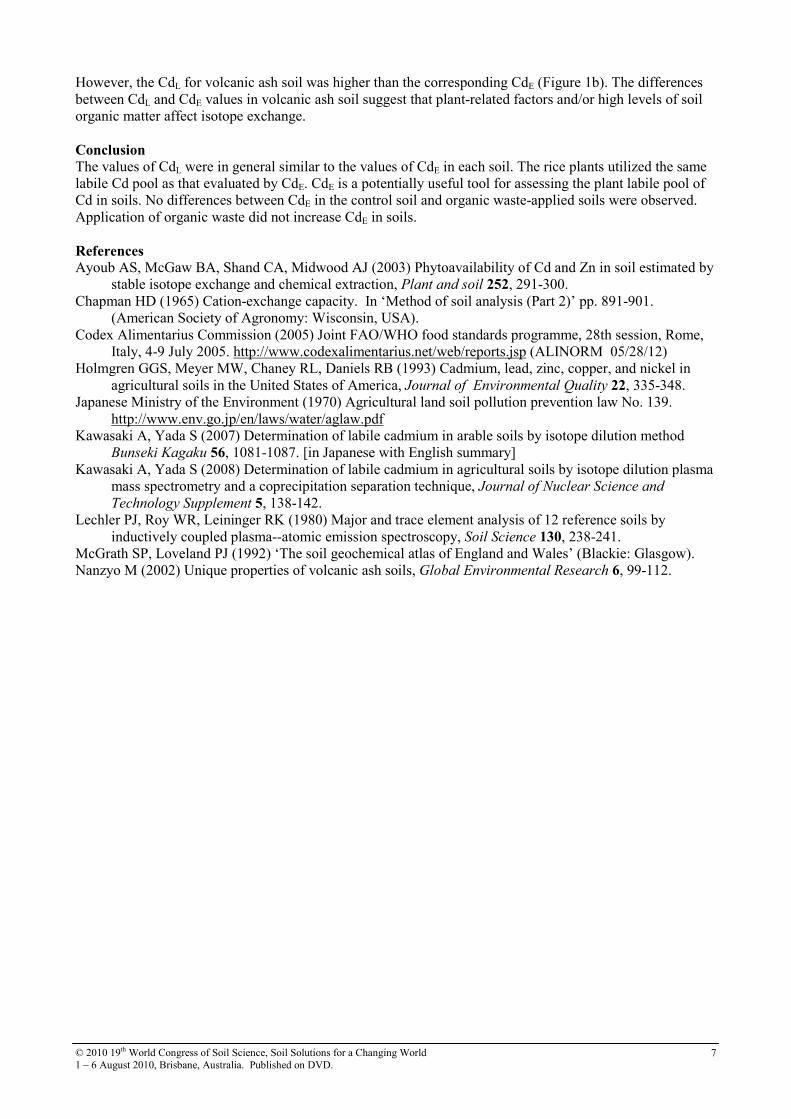
The CdE values were in a range very similar to that of the control soil. No differences in CdE between control soil and organic waste-applied soils were observed. The value of CdE corresponded to 0.1 M HCl-extractable-Cd in the brown lowland soils and brown forest soils (Figure 1a). However, the values of CdE in volcanic ash soils were higher than in the 0.1M HCl-extracted Cd levels. The fact that CdE was almost equal to 0.1M-HCl-Cd can be ascribed to the fact that 0.1M-HCl-Cd can be used to estimate the labile Cd pool in brown lowland soils and brown forest soils. In contrast, 0.1M-HCl might not completely dissolve the labile Cd in the volcanic ash soils. When there is a high organic matter content, such as in volcanic ash soils, extraction by 0.1M-HCl is not an alternative to CdE obtained by isotopic dilution procedures. L-values of Cd in soils
Values of CdL were, in general, in close agreement with both the corresponding value of CdE and HCl-Cd in brown lowland soils and brown forest soils (Figure 1b), indicating that the rice plants utilized the same pool of CdE. The fact that CdL is equal to CdE also can be ascribed to the fact that CdE, determined at 15 days of exchangeable time after addition of isotope, can estimate plant labile pool with different contact times (6 W).
a. Comparison between CdE and HCl-Cd b. Comparison between CdL and CdE
Figure 1. Comparison between measured labile Cd values. ■ indicates brown lowland soil A, □ indicates brown
lowland soil B, ○ is brown forest soil, and * is volcanic ash soil.
© 2010 19th World Congress of Soil Science, Soil Solutions for a Changing World 1 – 6 August 2010, Brisbane, Australia. Published on DVD.
7
However, the CdL for volcanic ash soil was higher than the corresponding CdE (Figure 1b). The differences between CdL and CdE values in volcanic ash soil suggest that plant-related factors and/or high levels of soil organic matter affect isotope exchange. Conclusion
The values of CdL were in general similar to the values of CdE in each soil. The rice plants utilized the same labile Cd pool as that evaluated by CdE. CdE is a potentially useful tool for assessing the plant labile pool of Cd in soils. No differences between CdE in the control soil and organic waste-applied soils were observed. Application of organic waste did not increase CdE in soils. References Ayoub AS, McGaw BA, Shand CA, Midwood AJ (2003) Phytoavailability of Cd and Zn in soil estimated by
stable isotope exchange and chemical extraction, Plant and soil 252, 291-300. Chapman HD (1965) Cation-exchange capacity. In ‘Method of soil analysis (Part 2)’ pp. 891-901.
(American Society of Agronomy: Wisconsin, USA). Codex Alimentarius Commission (2005) Joint FAO/WHO food standards programme, 28th session, Rome,
Italy, 4-9 July 2005. http://www.codexalimentarius.net/web/reports.jsp (ALINORM 05/28/12) Holmgren GGS, Meyer MW, Chaney RL, Daniels RB (1993) Cadmium, lead, zinc, copper, and nickel in
agricultural soils in the United States of America, Journal of Environmental Quality 22, 335-348. Japanese Ministry of the Environment (1970) Agricultural land soil pollution prevention law No. 139.
http://www.env.go.jp/en/laws/water/aglaw.pdf Kawasaki A, Yada S (2007) Determination of labile cadmium in arable soils by isotope dilution method
Bunseki Kagaku 56, 1081-1087. [in Japanese with English summary] Kawasaki A, Yada S (2008) Determination of labile cadmium in agricultural soils by isotope dilution plasma
mass spectrometry and a coprecipitation separation technique, Journal of Nuclear Science and Technology Supplement 5, 138-142.
Lechler PJ, Roy WR, Leininger RK (1980) Major and trace element analysis of 12 reference soils by inductively coupled plasma--atomic emission spectroscopy, Soil Science 130, 238-241.
McGrath SP, Loveland PJ (1992) ‘The soil geochemical atlas of England and Wales’ (Blackie: Glasgow). Nanzyo M (2002) Unique properties of volcanic ash soils, Global Environmental Research 6, 99-112.
© 2010 19th World Congress of Soil Science, Soil Solutions for a Changing World 1 – 6 August 2010, Brisbane, Australia. Published on DVD.
8
Analysis of trace organic compounds from a dairy factory milk processing plant
“wastewater” used to irrigate soils Michael William Heaven
A, David NashA,D, Karl WildB, Vincent VerheyenC, Alicia CruickshankC, Rachel McGeeA and Mark WatkinsA AFuture Farming Systems Research Division, Department of Primary Industries, 1301 Hazeldean Road, Ellinbank, Victoria, 3821, Australia. BBurra Foods Pty. Ltd., 47 Station Street, Korumburra, Victoria, 3950, Australia. CSchool of Applied Science and Engineering, Bldg. 2W, Gippsland Campus Monash University, Churchill, 3842, Victoria, Australia. DCorresponding author. Email [email protected]
Abstract
Clean wastewater streams from a milk processing dairy factory are reused for irrigation of a nearby recreation oval in South-Eastern Australia. The wastewaters and drainage from both irrigation and rainfall events were analysed for general wastewater constituents and trace level, semi-volatile organic compounds. Samples were pre-concentrated using SPE cartridges, derivatised and analysed using GC-MS. Initially, phenol and nitrogen containing compounds that may adversely affect receiving waters were investigated. These compounds could originate from the wastewaters, irrigation infrastructure or the soil itself. The results tentatively suggest that there are few compounds in either the wastewaters or drainage that are of concern for receiving waters. Importantly there appear to be a range of compounds that originate from the soil. Key Words
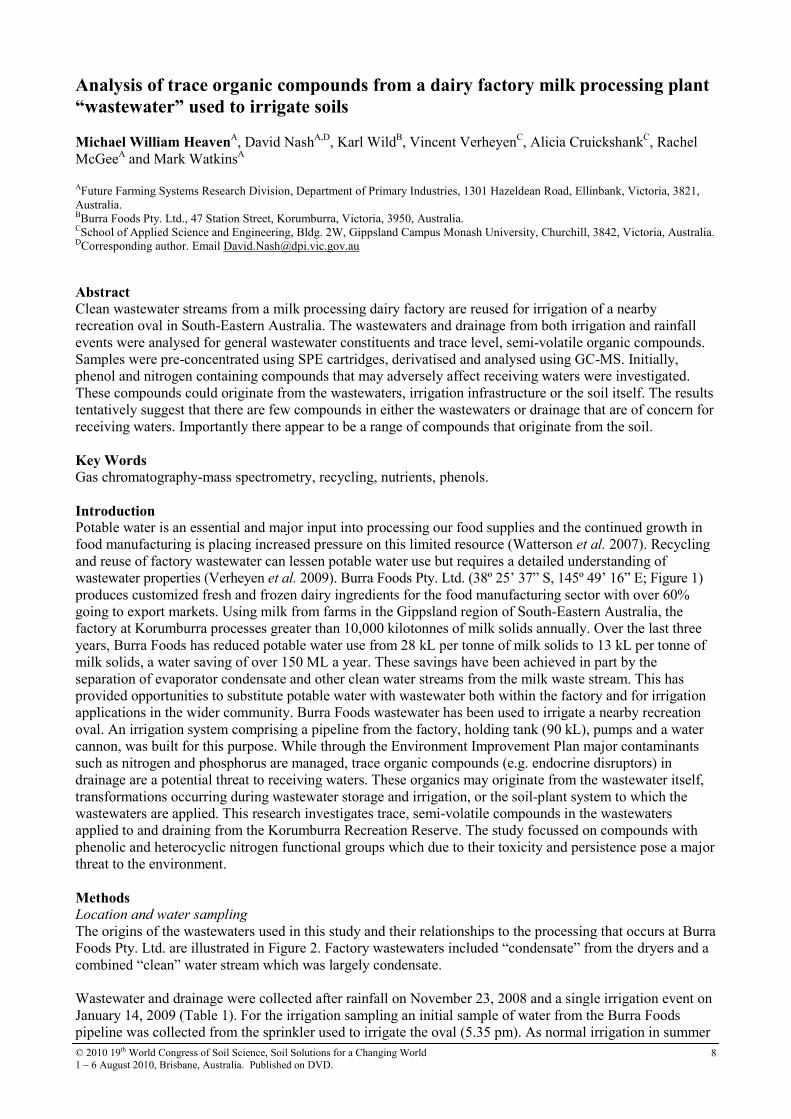
Gas chromatography-mass spectrometry, recycling, nutrients, phenols. Introduction Potable water is an essential and major input into processing our food supplies and the continued growth in food manufacturing is placing increased pressure on this limited resource (Watterson et al. 2007). Recycling and reuse of factory wastewater can lessen potable water use but requires a detailed understanding of wastewater properties (Verheyen et al. 2009). Burra Foods Pty. Ltd. (38º 25’ 37” S, 145º 49’ 16” E; Figure 1) produces customized fresh and frozen dairy ingredients for the food manufacturing sector with over 60% going to export markets. Using milk from farms in the Gippsland region of South-Eastern Australia, the factory at Korumburra processes greater than 10,000 kilotonnes of milk solids annually. Over the last three years, Burra Foods has reduced potable water use from 28 kL per tonne of milk solids to 13 kL per tonne of milk solids, a water saving of over 150 ML a year. These savings have been achieved in part by the separation of evaporator condensate and other clean water streams from the milk waste stream. This has provided opportunities to substitute potable water with wastewater both within the factory and for irrigation applications in the wider community. Burra Foods wastewater has been used to irrigate a nearby recreation oval. An irrigation system comprising a pipeline from the factory, holding tank (90 kL), pumps and a water cannon, was built for this purpose. While through the Environment Improvement Plan major contaminants such as nitrogen and phosphorus are managed, trace organic compounds (e.g. endocrine disruptors) in drainage are a potential threat to receiving waters. These organics may originate from the wastewater itself, transformations occurring during wastewater storage and irrigation, or the soil-plant system to which the wastewaters are applied. This research investigates trace, semi-volatile compounds in the wastewaters applied to and draining from the Korumburra Recreation Reserve. The study focussed on compounds with phenolic and heterocyclic nitrogen functional groups which due to their toxicity and persistence pose a major threat to the environment. Methods Location and water sampling
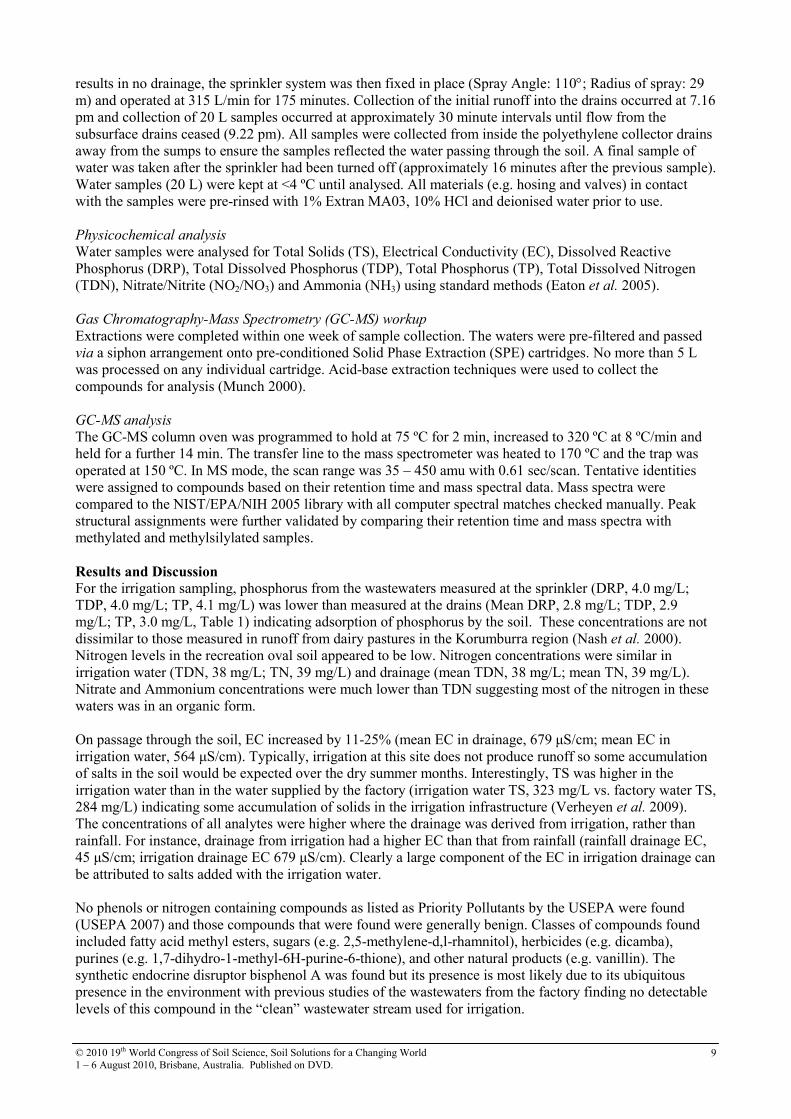
The origins of the wastewaters used in this study and their relationships to the processing that occurs at Burra Foods Pty. Ltd. are illustrated in Figure 2. Factory wastewaters included “condensate” from the dryers and a combined “clean” water stream which was largely condensate. Wastewater and drainage were collected after rainfall on November 23, 2008 and a single irrigation event on January 14, 2009 (Table 1). For the irrigation sampling an initial sample of water from the Burra Foods pipeline was collected from the sprinkler used to irrigate the oval (5.35 pm). As normal irrigation in summer
© 2010 19th World Congress of Soil Science, Soil Solutions for a Changing World 1 – 6 August 2010, Brisbane, Australia. Published on DVD.
9
results in no drainage, the sprinkler system was then fixed in place (Spray Angle: 110°; Radius of spray: 29 m) and operated at 315 L/min for 175 minutes. Collection of the initial runoff into the drains occurred at 7.16 pm and collection of 20 L samples occurred at approximately 30 minute intervals until flow from the subsurface drains ceased (9.22 pm). All samples were collected from inside the polyethylene collector drains away from the sumps to ensure the samples reflected the water passing through the soil. A final sample of water was taken after the sprinkler had been turned off (approximately 16 minutes after the previous sample). Water samples (20 L) were kept at <4 ºC until analysed. All materials (e.g. hosing and valves) in contact with the samples were pre-rinsed with 1% Extran MA03, 10% HCl and deionised water prior to use. Physicochemical analysis
Water samples were analysed for Total Solids (TS), Electrical Conductivity (EC), Dissolved Reactive Phosphorus (DRP), Total Dissolved Phosphorus (TDP), Total Phosphorus (TP), Total Dissolved Nitrogen (TDN), Nitrate/Nitrite (NO2/NO3) and Ammonia (NH3) using standard methods (Eaton et al. 2005). Gas Chromatography-Mass Spectrometry (GC-MS) workup
Extractions were completed within one week of sample collection. The waters were pre-filtered and passed via a siphon arrangement onto pre-conditioned Solid Phase Extraction (SPE) cartridges. No more than 5 L was processed on any individual cartridge. Acid-base extraction techniques were used to collect the compounds for analysis (Munch 2000). GC-MS analysis
The GC-MS column oven was programmed to hold at 75 ºC for 2 min, increased to 320 ºC at 8 ºC/min and held for a further 14 min. The transfer line to the mass spectrometer was heated to 170 ºC and the trap was operated at 150 ºC. In MS mode, the scan range was 35 – 450 amu with 0.61 sec/scan. Tentative identities were assigned to compounds based on their retention time and mass spectral data. Mass spectra were compared to the NIST/EPA/NIH 2005 library with all computer spectral matches checked manually. Peak structural assignments were further validated by comparing their retention time and mass spectra with methylated and methylsilylated samples. Results and Discussion
For the irrigation sampling, phosphorus from the wastewaters measured at the sprinkler (DRP, 4.0 mg/L; TDP, 4.0 mg/L; TP, 4.1 mg/L) was lower than measured at the drains (Mean DRP, 2.8 mg/L; TDP, 2.9 mg/L; TP, 3.0 mg/L, Table 1) indicating adsorption of phosphorus by the soil. These concentrations are not dissimilar to those measured in runoff from dairy pastures in the Korumburra region (Nash et al. 2000). Nitrogen levels in the recreation oval soil appeared to be low. Nitrogen concentrations were similar in irrigation water (TDN, 38 mg/L; TN, 39 mg/L) and drainage (mean TDN, 38 mg/L; mean TN, 39 mg/L). Nitrate and Ammonium concentrations were much lower than TDN suggesting most of the nitrogen in these waters was in an organic form. On passage through the soil, EC increased by 11-25% (mean EC in drainage, 679 µS/cm; mean EC in irrigation water, 564 µS/cm). Typically, irrigation at this site does not produce runoff so some accumulation of salts in the soil would be expected over the dry summer months. Interestingly, TS was higher in the irrigation water than in the water supplied by the factory (irrigation water TS, 323 mg/L vs. factory water TS, 284 mg/L) indicating some accumulation of solids in the irrigation infrastructure (Verheyen et al. 2009). The concentrations of all analytes were higher where the drainage was derived from irrigation, rather than rainfall. For instance, drainage from irrigation had a higher EC than that from rainfall (rainfall drainage EC, 45 µS/cm; irrigation drainage EC 679 µS/cm). Clearly a large component of the EC in irrigation drainage can be attributed to salts added with the irrigation water. No phenols or nitrogen containing compounds as listed as Priority Pollutants by the USEPA were found (USEPA 2007) and those compounds that were found were generally benign. Classes of compounds found included fatty acid methyl esters, sugars (e.g. 2,5-methylene-d,l-rhamnitol), herbicides (e.g. dicamba), purines (e.g. 1,7-dihydro-1-methyl-6H-purine-6-thione), and other natural products (e.g. vanillin). The synthetic endocrine disruptor bisphenol A was found but its presence is most likely due to its ubiquitous presence in the environment with previous studies of the wastewaters from the factory finding no detectable levels of this compound in the “clean” wastewater stream used for irrigation.
© 2010 19th World Congress of Soil Science, Soil Solutions for a Changing World 1 – 6 August 2010, Brisbane, Australia. Published on DVD.
10
Table 1. Physicochemical results of wastewaters used for irrigation along with results from the drainage after
rainfall.
Sample DRP TDP TP TDN TN TS EC NH3 NO3 Type Time (mg/L) (mg/L) (mg/L) (mg/L) (mg/L) (mg/L) (S/cm) (mg N/L) (mg N/L)
Sprinkler System 5:35 pm 4.0 4.0 4.1 38.5 39.1 323 564 0.2 3.5 Drain 7:16 pm 2.4 2.5 2.5 39.0 39.2 554 747 0.1 6.9 Drain 7:50 pm 2.9 2.8 2.9 40.8 41.3 506 698 0.1 6.9 Drain 7:19 pm 2.9 2.9 3.0 37.3 38.7 427 670 0.1 6.8 Drain 8:49 pm 2.9 3.3 3.3 39.2 40.6 458 639 0.1 6.8 Drain 9:05 pm 2.7 3.0 3.1 36.1 38.4 457 642 0.2 9.8 22-23/11/08 rainfall (Drain)
overnight 0.1 0.1 0.1 0.4 0.4 11 45 0.1 8.3
Figure 1. Location of the Burra Foods milk
processing factory in Korumburra (38º 25’
37” S, 145º 49’ 16” E), Victoria, Australia.
Figure 2. Schematic of water flows at Burra Foods Pty. Ltd.
milk processing factory. Sampling points was taken from the
Irrigation Output, both before irrigation onto the recreation
oval and after irrigation but before entry into the creek. Conclusion Physiochemical and GC-MS analyses on wastewaters used for irrigation of soils in Korumburra suggest that they to pose little risk to the environment. Similarly, it would appear that the nutrients in drainage from the Korumburra recreation reserve poses no greater risk to the environment than might be expected to have occurred had the drainage been from grazed pastures. Trace organic compounds found after passage through the soil are either ubiquitous or benign to both the environment and human health. References Eaton AD, Clesceri LS, Rice EW, Greenberg AE (2005) 'Standard Methods for the Examination of Water
and Wastewater.' (APHA: Washington DC).
Munch J (2000) Determination of phenols in drinking water by solid phase extraction and capillary column gas chromatograph/mass spectrometry (GC/MS) Method 528 Rev 1. (Ed US EPA)(Cincinnati: Ohio).
Nash D, Hannah M, Halliwell D, Murdoch C (2000) Factors Affecting Phosphorus Export from a Pasture-Based Grazing System. Journal of Environmental Quality 29, 1160-1166.
USEPA (2007) Test Methods for Evaluating Solid Waste (SW-846). (US EPA).
Verheyen V, Cruickshank A, Wild K, Heaven MW, McGee R, Watkins M, Nash D (2009) Soluble, semivolatile phenol and nitrogen compounds in milk-processing wastewaters. Journal of Dairy Science 92, 3484-3493.
Watterson I, Whetton P, Moise A, Timbal B, Power S, Arblaster J, McInnes K (2007) Regional Climate Change Projections. In 'Climate Change in Australia' pp. 49-75. (CSIRO).

© 2010 19th World Congress of Soil Science, Soil Solutions for a Changing World 1 – 6 August 2010, Brisbane, Australia. Published on DVD.
11
Anion adsorption and transport in an unsaturated high-humic Andosol Hidetaka KatouA and Nobiru KozaiB ANational Institute for Agro-Environmental Sciences, Tsukuba, 305-8604 Japan, Email [email protected] BInstitute of Agro-environmental Research, Kumamoto Prefectural Agricultural Research Center, Koshi, Kumamoto 861-1113, Japan.
Abstract
Contrary to the common notion that Andosols having a high organic carbon content possess a negligible to very weak anion exchange capacity, these soils often contain large amounts of adsorbed sulfate, implying their potential to adsorb nitrate and other weakly-adsorbing anions. The objective of this study is to determine chloride and nitrate adsorption isotherms in a high-humic Andosol under conditions that mimic those found in the field. Koshi soil (Hydric Pachic Melanudand), premixed with CaCl2 or CaCl2–Ca(NO3)2 solution at different concentrations, was packed into columns, and one-dimensional water absorption experiments were conducted. The anion content profiles in the columns showed varying degrees of anion retardation relative to water, depending on the initial anion content. Anion adsorption by soil, Qn, and the liquid-phase concentration, Cn, prior to the water imbibition were estimated from the plots of the anion content vs. water content in the region beyond the “plane of separation”, where the antecedent solution was accumulated. The anion adsorption isotherm constructed from these estimates was successfully employed in the anion transport model to reproduce the measured anion content profiles. These results show that the current notion that adsorption of monovalent electrolyte anions is negligible in high-humic Andosols should be reconsidered. Key Words Anion adsorption, anion exchange, humic Andosol, retardation, nitrate leaching, unsaturated flow. Introduction It is widely recognized that Andosols having a high organic carbon content possess a negligible to very weak anion exchange capacity (Wada and Okamura 1980; Dahlgren et al. 2004), precluding the possibility of retarded transport and reduced leaching of nitrate in the soils. However, large amounts of adsorbed sulfate often found in high-humic Andosols, particularly those from subsurface layers (Miki et al. 2009), suggest the existence of electrical positive charge and possibility of further anion adsorption in these soils. In the present study, we investigated adsorption/transport of weakly-adsorbing monovalent anions in a high-humic Andosol. One-dimensional water absorption experiments were conducted in soil columns premixed with CaCl2 or CaCl2–Ca(NO3)2 solution at different concentrations to determine Cl– and NO3
– adsorption isotherms by the unsaturated transient flow method (Katou et al. 2001). The method has an advantage that the adsorption isotherm can be determined under conditions similar to those expected during transport processes in soil, and has been successfully applied to the determination of anion adsorption in an Andosol subsoil (Katou et al. 2001; Katou 2004) as well as pesticide sorption in unsaturated soils (Ahmad et al. 2005; Ochsner et al. 2006). The inferred adsorption isotherm was then employed in an anion transport model to test its ability to reproduce the measured anion content profiles. Materials and Methods Soil
The soil used in the present study was the air-dried subsoil of Koshi Andosol (Hydric Pachic Melanudand) taken from the experimental field of the Institute of Agro-environmental Research, Kumamoto Prefectural Agricultural Research Center at Koshi, Kumamoto, Japan. The soil, taken from the 40 cm depth, had a total carbon content of 62.4 g/kg, exchangeable Ca2+, Mg2+, and K+, respectively, of 138 mmolc/kg, 18.1 mmolc/kg, and 7.0 mmolc/kg, an initial NO3
– content of 2.3 mmolc/kg, and 0.01 M NaOH-extractable SO42–
of 50.9 mmolc/kg. The soil was passed through a 1-mm sieve and used without any pretreatment. One-dimensional water absorption experiments
One hundred grams of the air-dried soil, at a gravimetric water content of about 0.19 kg/kg, was moistened with one of the CaCl2 or CaCl2–Ca(NO3)2 mixed solutions listed in Table 1, to give an initial water content wn ≈ 0.32 kg/kg. The moistened soil was thoroughly mixed and repacked into sectionable columns of 2.1 cm
© 2010 19th World Congress of Soil Science, Soil Solutions for a Changing World 1 – 6 August 2010, Brisbane, Australia. Published on DVD.
12
in internal diameter to a bulk density ρ ≈ 0.75 Mg/m3 so that initial volumetric water content θn ≈ 0.24 m3/m3. One-dimensional, horizontal water absorption experiments were conducted by supplying distilled water from a Marriotte bottle to the proximal end of the column. After terminating each experiment, the column was rapidly sectioned and the soil samples immediately weighed and air-dried. From the water content profiles, the plane of separation, x* (m), which identifies the front of the invading water, was found for each column using the relation (Smiles and Philip 1978).
(1)
where x is the distance (m), θ is the volumetric water content (m3 m–3), and θs is the water content at the proximal end of the soil column. The anion contents in soil were determined by the method described by Katou et al. (1996). One gram of soil was shaken for 15 min with 100 mL of 0.01 M NaOH, and after centrifugation the supernatant solution was analyzed for Cl–, NO3
–, and SO42– by ion chromatography.
Table 1. Summary of the initial liquid-phase anion concentration, Cn, and initial anion adsorption, Qn,
determined by the unsaturated transient water absorption experiments.
Estimates from M vs. (θ/ρ) plot for Cl– for NO3
– Salt solution incorporated Column
No.
Cn (mmolc/L)
Qn (mmolc/kg)
Cn (mmolc/L)
Qn (mmolc/kg)
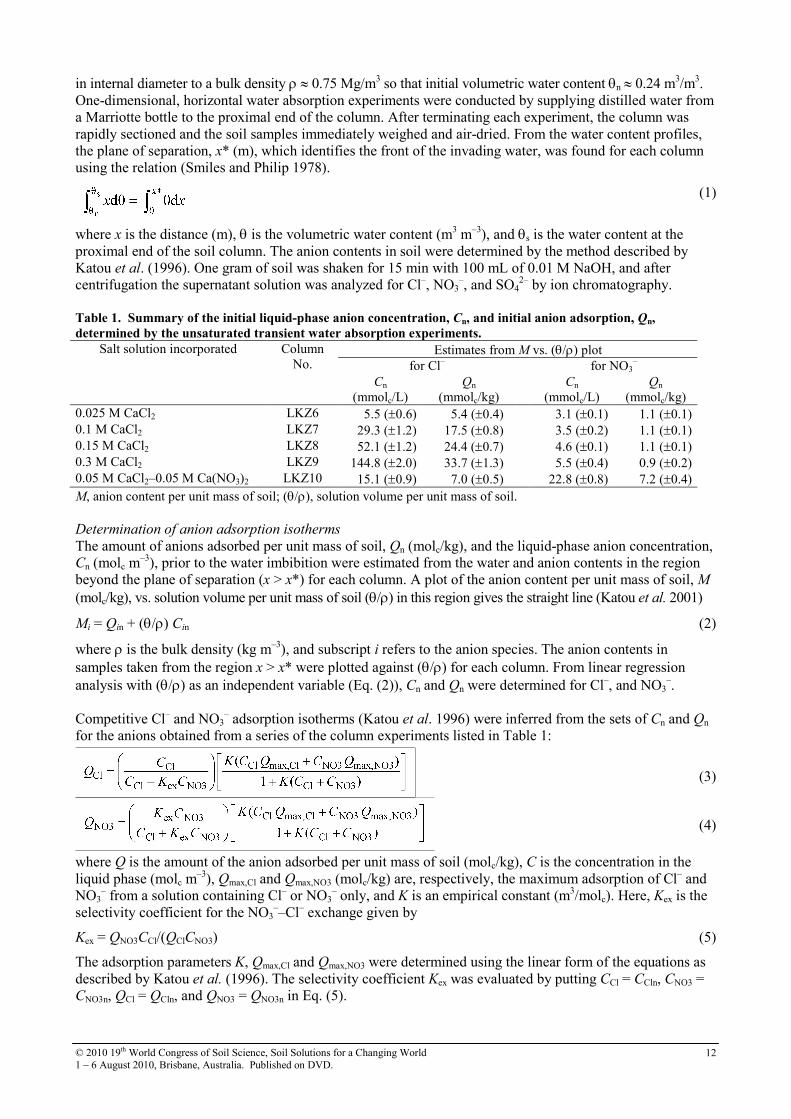
0.025 M CaCl2 LKZ6 5.5 (±0.6) 5.4 (±0.4) 3.1 (±0.1) 1.1 (±0.1) 0.1 M CaCl2 LKZ7 29.3 (±1.2) 17.5 (±0.8) 3.5 (±0.2) 1.1 (±0.1) 0.15 M CaCl2 LKZ8 52.1 (±1.2) 24.4 (±0.7) 4.6 (±0.1) 1.1 (±0.1) 0.3 M CaCl2 LKZ9 144.8 (±2.0) 33.7 (±1.3) 5.5 (±0.4) 0.9 (±0.2) 0.05 M CaCl2–0.05 M Ca(NO3)2 LKZ10 15.1 (±0.9) 7.0 (±0.5) 22.8 (±0.8) 7.2 (±0.4) M, anion content per unit mass of soil; (θ/ρ), solution volume per unit mass of soil. Determination of anion adsorption isotherms
The amount of anions adsorbed per unit mass of soil, Qn (molc/kg), and the liquid-phase anion concentration, Cn (molc m
–3), prior to the water imbibition were estimated from the water and anion contents in the region beyond the plane of separation (x > x*) for each column. A plot of the anion content per unit mass of soil, M (molc/kg), vs. solution volume per unit mass of soil (θ/ρ) in this region gives the straight line (Katou et al. 2001)
Mi = Qin + (θ/ρ) Cin (2)
where ρ is the bulk density (kg m–3), and subscript i refers to the anion species. The anion contents in samples taken from the region x > x* were plotted against (θ/ρ) for each column. From linear regression analysis with (θ/ρ) as an independent variable (Eq. (2)), Cn and Qn were determined for Cl–, and NO3
–. Competitive Cl– and NO3
– adsorption isotherms (Katou et al. 1996) were inferred from the sets of Cn and Qn for the anions obtained from a series of the column experiments listed in Table 1:
(3)
(4)
where Q is the amount of the anion adsorbed per unit mass of soil (molc/kg), C is the concentration in the liquid phase (molc m
–3), Qmax,Cl and Qmax,NO3 (molc/kg) are, respectively, the maximum adsorption of Cl– and NO3
– from a solution containing Cl– or NO3– only, and K is an empirical constant (m3/molc). Here, Kex is the
selectivity coefficient for the NO3––Cl– exchange given by
Kex = QNO3CCl/(QClCNO3) (5)
The adsorption parameters K, Qmax,Cl and Qmax,NO3 were determined using the linear form of the equations as described by Katou et al. (1996). The selectivity coefficient Kex was evaluated by putting CCl = CCln, CNO3 = CNO3n, QCl = QCln, and QNO3 = QNO3n in Eq. (5).
© 2010 19th World Congress of Soil Science, Soil Solutions for a Changing World 1 – 6 August 2010, Brisbane, Australia. Published on DVD.
13
Results and Discussion
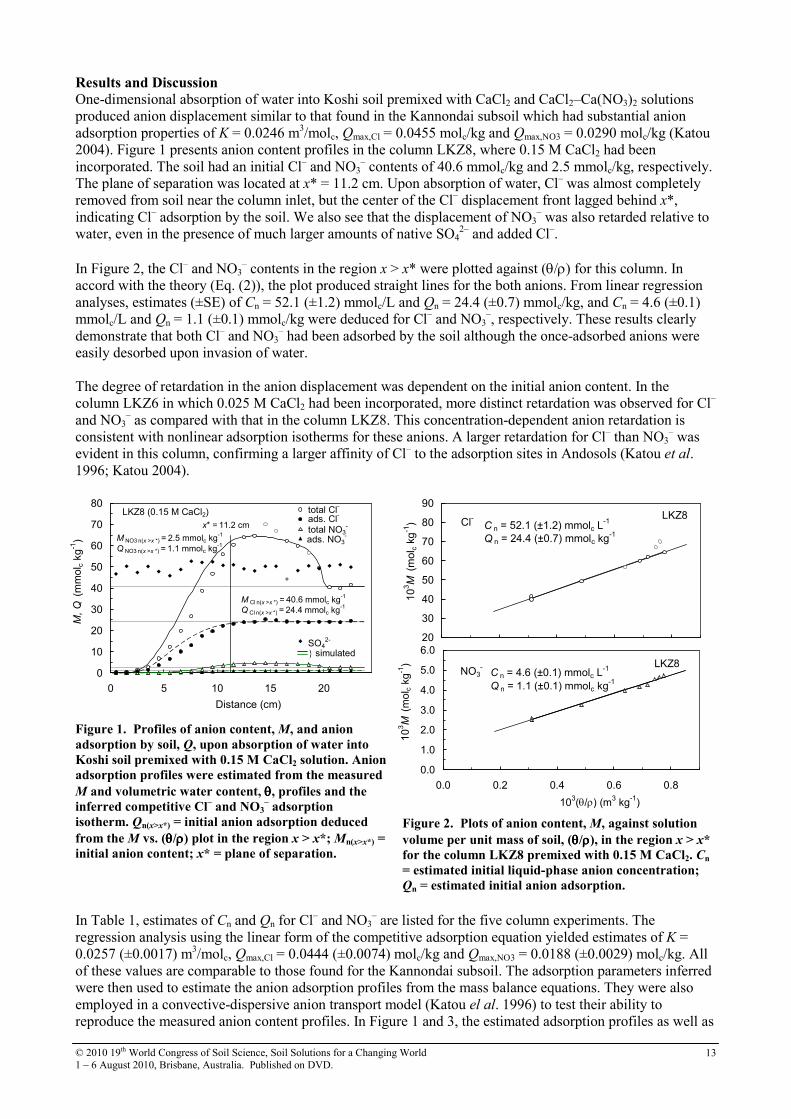
One-dimensional absorption of water into Koshi soil premixed with CaCl2 and CaCl2–Ca(NO3)2 solutions produced anion displacement similar to that found in the Kannondai subsoil which had substantial anion adsorption properties of K = 0.0246 m3/molc, Qmax,Cl = 0.0455 molc/kg and Qmax,NO3 = 0.0290 molc/kg (Katou 2004). Figure 1 presents anion content profiles in the column LKZ8, where 0.15 M CaCl2 had been incorporated. The soil had an initial Cl– and NO3
– contents of 40.6 mmolc/kg and 2.5 mmolc/kg, respectively. The plane of separation was located at x* = 11.2 cm. Upon absorption of water, Cl– was almost completely removed from soil near the column inlet, but the center of the Cl– displacement front lagged behind x*, indicating Cl– adsorption by the soil. We also see that the displacement of NO3
– was also retarded relative to water, even in the presence of much larger amounts of native SO4
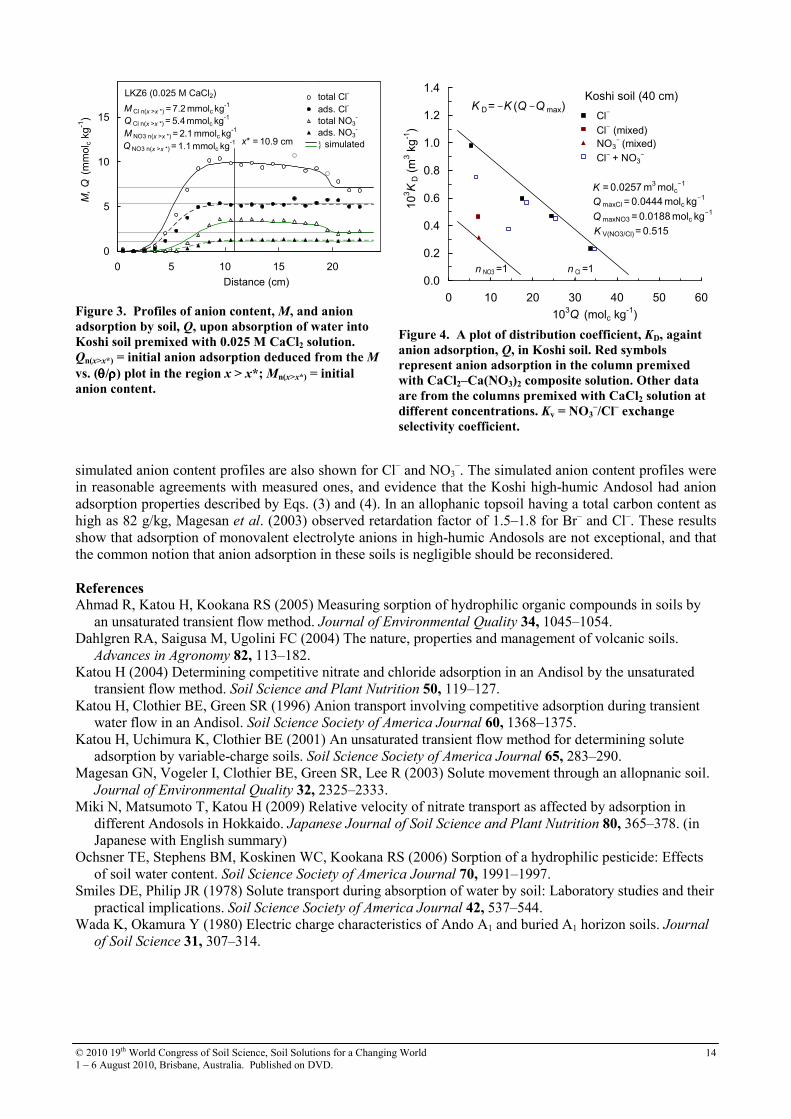
2– and added Cl–. In Figure 2, the Cl– and NO3
– contents in the region x > x* were plotted against (θ/ρ) for this column. In accord with the theory (Eq. (2)), the plot produced straight lines for the both anions. From linear regression analyses, estimates (±SE) of Cn = 52.1 (±1.2) mmolc/L and Qn = 24.4 (±0.7) mmolc/kg, and Cn = 4.6 (±0.1) mmolc/L and Qn = 1.1 (±0.1) mmolc/kg were deduced for Cl– and NO3
–, respectively. These results clearly demonstrate that both Cl– and NO3
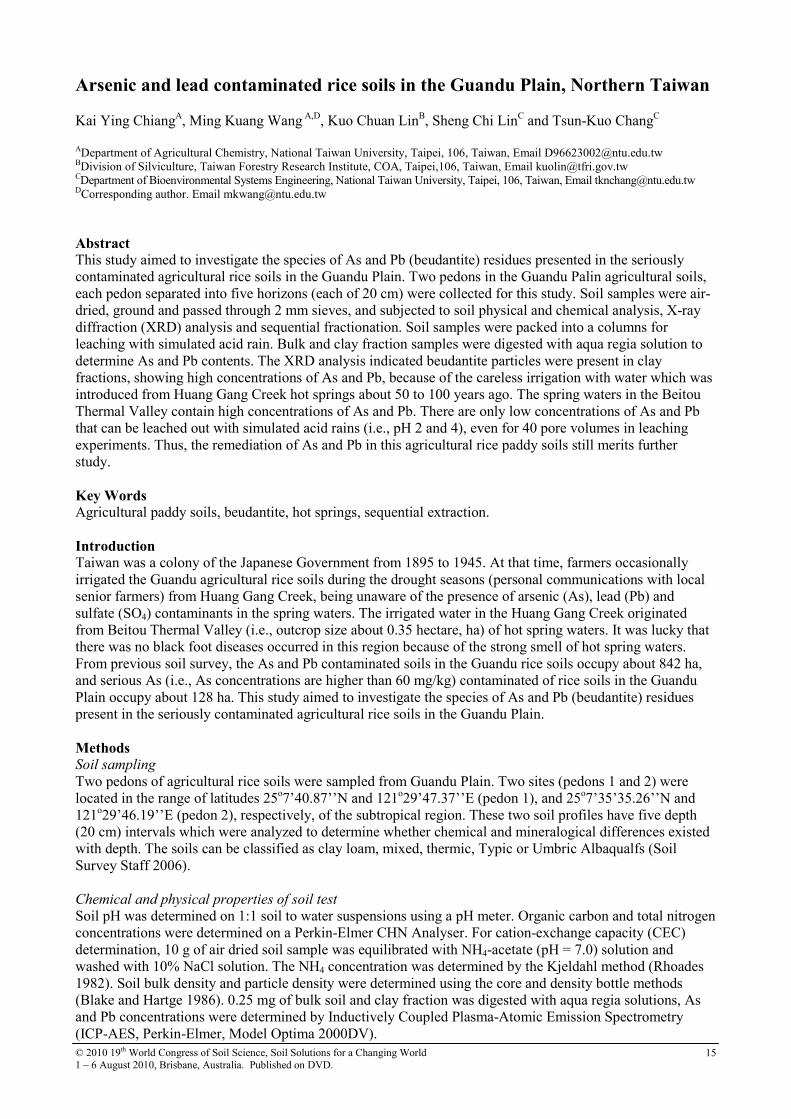
– had been adsorbed by the soil although the once-adsorbed anions were easily desorbed upon invasion of water. The degree of retardation in the anion displacement was dependent on the initial anion content. In the column LKZ6 in which 0.025 M CaCl2 had been incorporated, more distinct retardation was observed for Cl– and NO3
– as compared with that in the column LKZ8. This concentration-dependent anion retardation is consistent with nonlinear adsorption isotherms for these anions. A larger retardation for Cl– than NO3
– was evident in this column, confirming a larger affinity of Cl– to the adsorption sites in Andosols (Katou et al. 1996; Katou 2004).
Figure 1. Profiles of anion content, M, and anion
adsorption by soil, Q, upon absorption of water into
Koshi soil premixed with 0.15 M CaCl2 solution. Anion
adsorption profiles were estimated from the measured
M and volumetric water content, θθθθ, profiles and the
inferred competitive Cl– and NO3
– adsorption
isotherm. Qn(x>x*) = initial anion adsorption deduced
from the M vs. (θθθθ/ρρρρ) plot in the region x > x*; Mn(x>x*) =
initial anion content; x* = plane of separation.
Figure 2. Plots of anion content, M, against solution
volume per unit mass of soil, (θθθθ/ρρρρ), in the region x > x*
for the column LKZ8 premixed with 0.15 M CaCl2. Cn
= estimated initial liquid-phase anion concentration;
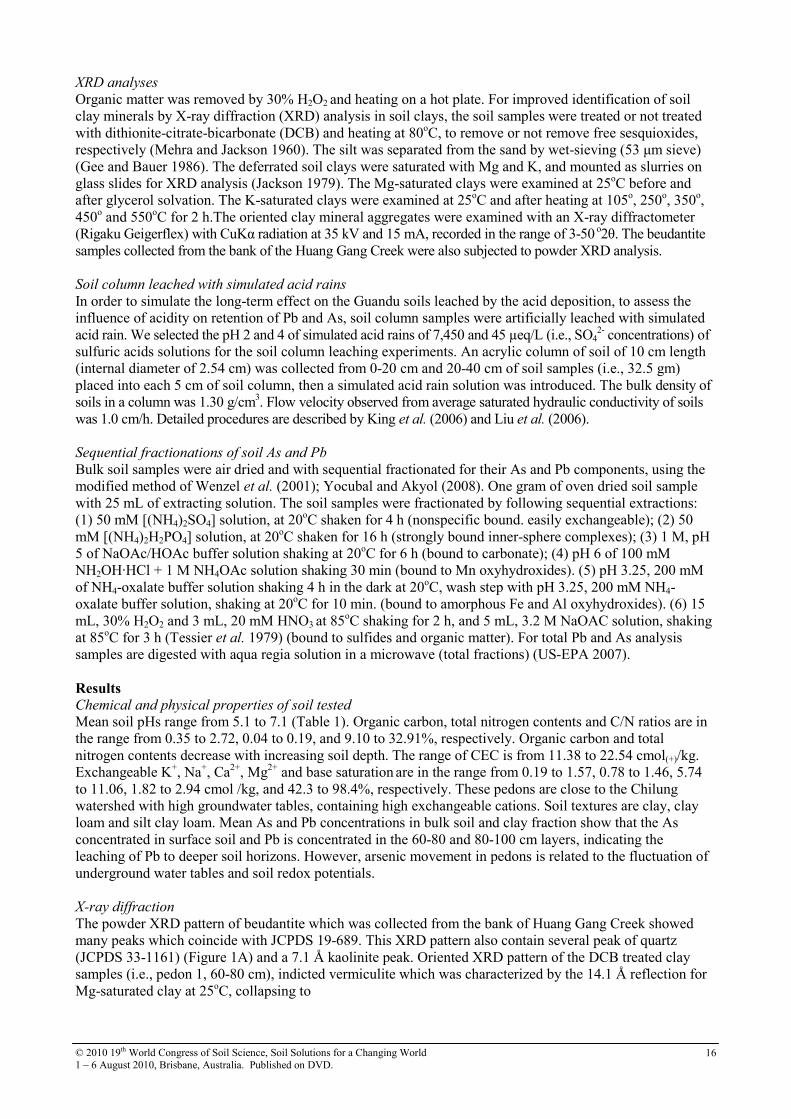
Qn = estimated initial anion adsorption. In Table 1, estimates of Cn and Qn for Cl– and NO3
– are listed for the five column experiments. The regression analysis using the linear form of the competitive adsorption equation yielded estimates of K = 0.0257 (±0.0017) m3/molc, Qmax,Cl = 0.0444 (±0.0074) molc/kg and Qmax,NO3 = 0.0188 (±0.0029) molc/kg. All of these values are comparable to those found for the Kannondai subsoil. The adsorption parameters inferred were then used to estimate the anion adsorption profiles from the mass balance equations. They were also employed in a convective-dispersive anion transport model (Katou el al. 1996) to test their ability to reproduce the measured anion content profiles. In Figure 1 and 3, the estimated adsorption profiles as well as
0
10
20
30
40
50
60
70
80
0 5 10 15 20
Distance (cm)
M, Q (mmol c kg-1)
} simulated
M Cl n(x >x *) = 40.6 mmolc kg-1
SO42-
Q Cl n(x >x *) = 24.4 mmolc kg-1
x* = 11.2 cm
M NO3 n(x >x *) = 2.5 mmolc kg-1
Q NO3 n(x >x *) = 1.1 mmolc kg-1
total Cl-
ads. Cl-
total NO3-
ads. NO3-
LKZ8 (0.15 M CaCl2)
20
30
40
50
60
70
80
90
0.0 0.2 0.4 0.6 0.8
103M (mol c kg-1) C n = 52.1 (±1.2) mmolc L
-1
Q n = 24.4 (±0.7) mmolc kg-1
Cl- LKZ8
0.0
1.0
2.0
3.0
4.0
5.0
6.0
0.0 0.2 0.4 0.6 0.8
103(θ/ρ) (m3
kg-1)
103M (mol c kg-1)
C n = 4.6 (±0.1) mmolc L-1
Q n = 1.1 (±0.1) mmolc kg-1
NO3- LKZ8
© 2010 19th World Congress of Soil Science, Soil Solutions for a Changing World 1 – 6 August 2010, Brisbane, Australia. Published on DVD.
14
Figure 3. Profiles of anion content, M, and anion
adsorption by soil, Q, upon absorption of water into
Koshi soil premixed with 0.025 M CaCl2 solution.
Qn(x>x*) = initial anion adsorption deduced from the M
vs. (θθθθ/ρρρρ) plot in the region x > x*; Mn(x>x*) = initial
anion content.
Figure 4. A plot of distribution coefficient, KD, againt
anion adsorption, Q, in Koshi soil. Red symbols
represent anion adsorption in the column premixed
with CaCl2–Ca(NO3)2 composite solution. Other data
are from the columns premixed with CaCl2 solution at
different concentrations. Kv = NO3–/Cl
– exchange
selectivity coefficient.
simulated anion content profiles are also shown for Cl– and NO3
–. The simulated anion content profiles were in reasonable agreements with measured ones, and evidence that the Koshi high-humic Andosol had anion adsorption properties described by Eqs. (3) and (4). In an allophanic topsoil having a total carbon content as high as 82 g/kg, Magesan et al. (2003) observed retardation factor of 1.5–1.8 for Br– and Cl–. These results show that adsorption of monovalent electrolyte anions in high-humic Andosols are not exceptional, and that the common notion that anion adsorption in these soils is negligible should be reconsidered. References Ahmad R, Katou H, Kookana RS (2005) Measuring sorption of hydrophilic organic compounds in soils by
an unsaturated transient flow method. Journal of Environmental Quality 34, 1045–1054. Dahlgren RA, Saigusa M, Ugolini FC (2004) The nature, properties and management of volcanic soils.
Advances in Agronomy 82, 113–182. Katou H (2004) Determining competitive nitrate and chloride adsorption in an Andisol by the unsaturated
transient flow method. Soil Science and Plant Nutrition 50, 119–127. Katou H, Clothier BE, Green SR (1996) Anion transport involving competitive adsorption during transient
water flow in an Andisol. Soil Science Society of America Journal 60, 1368–1375. Katou H, Uchimura K, Clothier BE (2001) An unsaturated transient flow method for determining solute
adsorption by variable-charge soils. Soil Science Society of America Journal 65, 283–290. Magesan GN, Vogeler I, Clothier BE, Green SR, Lee R (2003) Solute movement through an allopnanic soil.
Journal of Environmental Quality 32, 2325–2333. Miki N, Matsumoto T, Katou H (2009) Relative velocity of nitrate transport as affected by adsorption in
different Andosols in Hokkaido. Japanese Journal of Soil Science and Plant Nutrition 80, 365–378. (in Japanese with English summary)
Ochsner TE, Stephens BM, Koskinen WC, Kookana RS (2006) Sorption of a hydrophilic pesticide: Effects of soil water content. Soil Science Society of America Journal 70, 1991–1997.
Smiles DE, Philip JR (1978) Solute transport during absorption of water by soil: Laboratory studies and their practical implications. Soil Science Society of America Journal 42, 537–544.
Wada K, Okamura Y (1980) Electric charge characteristics of Ando A1 and buried A1 horizon soils. Journal of Soil Science 31, 307–314.
0.0
0.2
0.4
0.6
0.8
1.0
1.2
1.4
0 10 20 30 40 50 60
103Q (molc kg
-1)
103K
D (m
3 kg-1)
Koshi soil (40 cm)
Cl-
K D = -K (Q-Qmax)
NO3- (mixed)
K = 0.0257 m3 molc
-1
Q maxCl = 0.0444 molc kg-1
Q maxNO3 = 0.0188 molc kg-1
K V(NO3/Cl) = 0.515
n Cl =1n NO3 =1
Cl- (mixed)
Cl- + NO3
-
0
5
10
15
0 5 10 15 20
Distance (cm)
M, Q (mmol c kg-1)
} simulated
M Cl n(x >x *) = 7.2 mmolc kg-1
Q Cl n(x >x *) = 5.4 mmolc kg-1
x* = 10.9 cmM NO3 n(x >x *) = 2.1 mmolc kg
-1
Q NO3 n(x >x *) = 1.1 mmolc kg-1
total Cl-
ads. Cl-
total NO3-
ads. NO3-
LKZ6 (0.025 M CaCl2)
© 2010 19th World Congress of Soil Science, Soil Solutions for a Changing World 1 – 6 August 2010, Brisbane, Australia. Published on DVD.
15
Arsenic and lead contaminated rice soils in the Guandu Plain, Northern Taiwan Kai Ying ChiangA, Ming Kuang Wang A,D, Kuo Chuan LinB, Sheng Chi LinC and Tsun-Kuo ChangC ADepartment of Agricultural Chemistry, National Taiwan University, Taipei, 106, Taiwan, Email [email protected] BDivision of Silviculture, Taiwan Forestry Research Institute, COA, Taipei,106, Taiwan, Email [email protected] CDepartment of Bioenvironmental Systems Engineering, National Taiwan University, Taipei, 106, Taiwan, Email [email protected] DCorresponding author. Email [email protected]
Abstract This study aimed to investigate the species of As and Pb (beudantite) residues presented in the seriously contaminated agricultural rice soils in the Guandu Plain. Two pedons in the Guandu Palin agricultural soils, each pedon separated into five horizons (each of 20 cm) were collected for this study. Soil samples were air-dried, ground and passed through 2 mm sieves, and subjected to soil physical and chemical analysis, X-ray diffraction (XRD) analysis and sequential fractionation. Soil samples were packed into a columns for leaching with simulated acid rain. Bulk and clay fraction samples were digested with aqua regia solution to determine As and Pb contents. The XRD analysis indicated beudantite particles were present in clay fractions, showing high concentrations of As and Pb, because of the careless irrigation with water which was introduced from Huang Gang Creek hot springs about 50 to 100 years ago. The spring waters in the Beitou Thermal Valley contain high concentrations of As and Pb. There are only low concentrations of As and Pb that can be leached out with simulated acid rains (i.e., pH 2 and 4), even for 40 pore volumes in leaching experiments. Thus, the remediation of As and Pb in this agricultural rice paddy soils still merits further study. Key Words Agricultural paddy soils, beudantite, hot springs, sequential extraction. Introduction Taiwan was a colony of the Japanese Government from 1895 to 1945. At that time, farmers occasionally irrigated the Guandu agricultural rice soils during the drought seasons (personal communications with local senior farmers) from Huang Gang Creek, being unaware of the presence of arsenic (As), lead (Pb) and sulfate (SO4) contaminants in the spring waters. The irrigated water in the Huang Gang Creek originated from Beitou Thermal Valley (i.e., outcrop size about 0.35 hectare, ha) of hot spring waters. It was lucky that there was no black foot diseases occurred in this region because of the strong smell of hot spring waters. From previous soil survey, the As and Pb contaminated soils in the Guandu rice soils occupy about 842 ha, and serious As (i.e., As concentrations are higher than 60 mg/kg) contaminated of rice soils in the Guandu Plain occupy about 128 ha. This study aimed to investigate the species of As and Pb (beudantite) residues present in the seriously contaminated agricultural rice soils in the Guandu Plain. Methods Soil sampling
Two pedons of agricultural rice soils were sampled from Guandu Plain. Two sites (pedons 1 and 2) were located in the range of latitudes 25o7’40.87’’N and 121o29’47.37’’E (pedon 1), and 25o7’35’35.26’’N and 121o29’46.19’’E (pedon 2), respectively, of the subtropical region. These two soil profiles have five depth (20 cm) intervals which were analyzed to determine whether chemical and mineralogical differences existed with depth. The soils can be classified as clay loam, mixed, thermic, Typic or Umbric Albaqualfs (Soil Survey Staff 2006). Chemical and physical properties of soil test
Soil pH was determined on 1:1 soil to water suspensions using a pH meter. Organic carbon and total nitrogen concentrations were determined on a Perkin-Elmer CHN Analyser. For cation-exchange capacity (CEC) determination, 10 g of air dried soil sample was equilibrated with NH4-acetate (pH = 7.0) solution and washed with 10% NaCl solution. The NH4 concentration was determined by the Kjeldahl method (Rhoades 1982). Soil bulk density and particle density were determined using the core and density bottle methods (Blake and Hartge 1986). 0.25 mg of bulk soil and clay fraction was digested with aqua regia solutions, As and Pb concentrations were determined by Inductively Coupled Plasma-Atomic Emission Spectrometry (ICP-AES, Perkin-Elmer, Model Optima 2000DV).
© 2010 19th World Congress of Soil Science, Soil Solutions for a Changing World 1 – 6 August 2010, Brisbane, Australia. Published on DVD.
16
XRD analyses
Organic matter was removed by 30% H2O2 and heating on a hot plate. For improved identification of soil clay minerals by X-ray diffraction (XRD) analysis in soil clays, the soil samples were treated or not treated with dithionite-citrate-bicarbonate (DCB) and heating at 80oC, to remove or not remove free sesquioxides, respectively (Mehra and Jackson 1960). The silt was separated from the sand by wet-sieving (53 µm sieve) (Gee and Bauer 1986). The deferrated soil clays were saturated with Mg and K, and mounted as slurries on glass slides for XRD analysis (Jackson 1979). The Mg-saturated clays were examined at 25oC before and after glycerol solvation. The K-saturated clays were examined at 25oC and after heating at 105o, 250o, 350o, 450o and 550oC for 2 h.The oriented clay mineral aggregates were examined with an X-ray diffractometer (Rigaku Geigerflex) with CuKα radiation at 35 kV and 15 mA, recorded in the range of 3-50 o2θ. The beudantite samples collected from the bank of the Huang Gang Creek were also subjected to powder XRD analysis. Soil column leached with simulated acid rains
In order to simulate the long-term effect on the Guandu soils leached by the acid deposition, to assess the influence of acidity on retention of Pb and As, soil column samples were artificially leached with simulated acid rain. We selected the pH 2 and 4 of simulated acid rains of 7,450 and 45 µeq/L (i.e., SO4
2- concentrations) of sulfuric acids solutions for the soil column leaching experiments. An acrylic column of soil of 10 cm length (internal diameter of 2.54 cm) was collected from 0-20 cm and 20-40 cm of soil samples (i.e., 32.5 gm) placed into each 5 cm of soil column, then a simulated acid rain solution was introduced. The bulk density of soils in a column was 1.30 g/cm3. Flow velocity observed from average saturated hydraulic conductivity of soils was 1.0 cm/h. Detailed procedures are described by King et al. (2006) and Liu et al. (2006). Sequential fractionations of soil As and Pb
Bulk soil samples were air dried and with sequential fractionated for their As and Pb components, using the modified method of Wenzel et al. (2001); Yocubal and Akyol (2008). One gram of oven dried soil sample with 25 mL of extracting solution. The soil samples were fractionated by following sequential extractions: (1) 50 mM [(NH4)2SO4] solution, at 20oC shaken for 4 h (nonspecific bound. easily exchangeable); (2) 50 mM [(NH4)2H2PO4] solution, at 20oC shaken for 16 h (strongly bound inner-sphere complexes); (3) 1 M, pH 5 of NaOAc/HOAc buffer solution shaking at 20oC for 6 h (bound to carbonate); (4) pH 6 of 100 mM NH2OH·HCl + 1 M NH4OAc solution shaking 30 min (bound to Mn oxyhydroxides). (5) pH 3.25, 200 mM of NH4-oxalate buffer solution shaking 4 h in the dark at 20oC, wash step with pH 3.25, 200 mM NH4-oxalate buffer solution, shaking at 20oC for 10 min. (bound to amorphous Fe and Al oxyhydroxides). (6) 15 mL, 30% H2O2 and 3 mL, 20 mM HNO3 at 85oC shaking for 2 h, and 5 mL, 3.2 M NaOAC solution, shaking at 85oC for 3 h (Tessier et al. 1979) (bound to sulfides and organic matter). For total Pb and As analysis samples are digested with aqua regia solution in a microwave (total fractions) (US-EPA 2007). Results
Chemical and physical properties of soil tested
Mean soil pHs range from 5.1 to 7.1 (Table 1). Organic carbon, total nitrogen contents and C/N ratios are in the range from 0.35 to 2.72, 0.04 to 0.19, and 9.10 to 32.91%, respectively. Organic carbon and total nitrogen contents decrease with increasing soil depth. The range of CEC is from 11.38 to 22.54 cmol(+)/kg. Exchangeable K+, Na+, Ca2+, Mg2+ and base saturation are in the range from 0.19 to 1.57, 0.78 to 1.46, 5.74 to 11.06, 1.82 to 2.94 cmol /kg, and 42.3 to 98.4%, respectively. These pedons are close to the Chilung watershed with high groundwater tables, containing high exchangeable cations. Soil textures are clay, clay loam and silt clay loam. Mean As and Pb concentrations in bulk soil and clay fraction show that the As concentrated in surface soil and Pb is concentrated in the 60-80 and 80-100 cm layers, indicating the leaching of Pb to deeper soil horizons. However, arsenic movement in pedons is related to the fluctuation of underground water tables and soil redox potentials. X-ray diffraction
The powder XRD pattern of beudantite which was collected from the bank of Huang Gang Creek showed many peaks which coincide with JCPDS 19-689. This XRD pattern also contain several peak of quartz (JCPDS 33-1161) (Figure 1A) and a 7.1 Å kaolinite peak. Oriented XRD pattern of the DCB treated clay samples (i.e., pedon 1, 60-80 cm), indicted vermiculite which was characterized by the 14.1 Å reflection for Mg-saturated clay at 25oC, collapsing to
© 2010 19th World Congress of Soil Science, Soil Solutions for a Changing World 1 – 6 August 2010, Brisbane, Australia. Published on DVD.
17
Table 1. Chemical and physical properties of soil tested.
Pedon Soil depth pH Organic C Total N C/N CEC Base Saturation Sand Clay Texture (cm) (----------%---------) ratio cmol (+) /kg (%) (-----%-----)
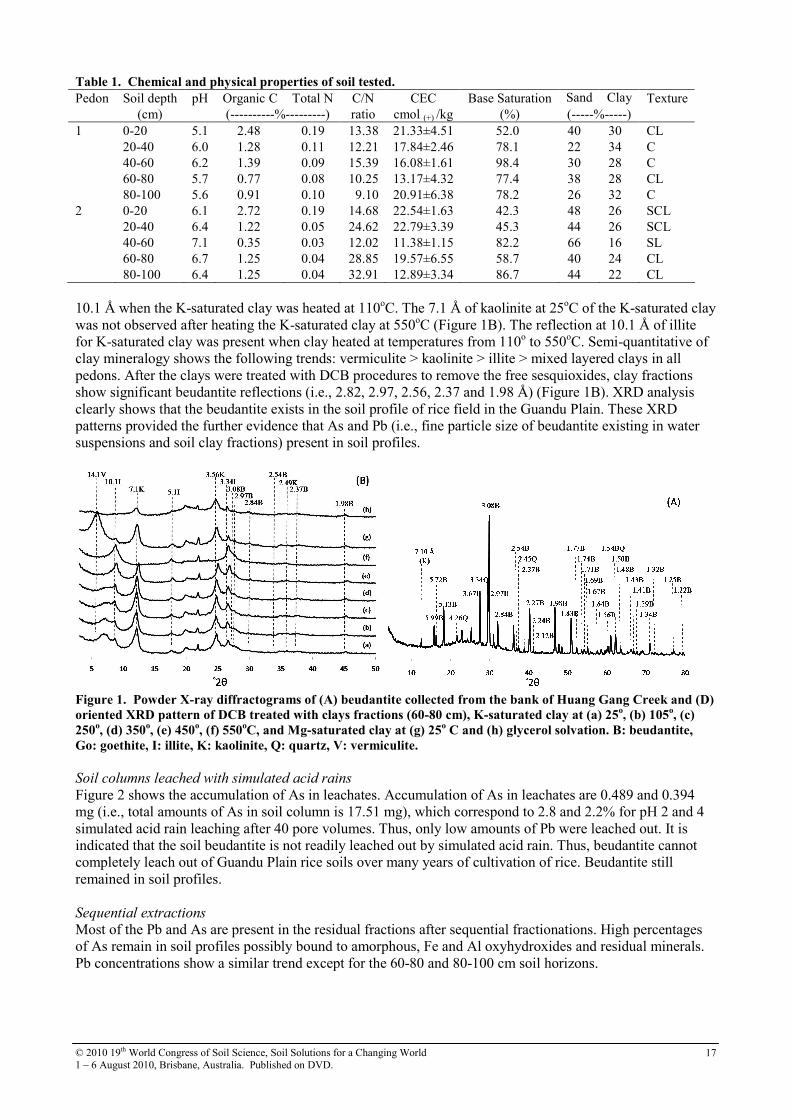
1 0-20 5.1 2.48 0.19 13.38 21.33±4.51 52.0 40 30 CL 20-40 6.0 1.28 0.11 12.21 17.84±2.46 78.1 22 34 C 40-60 6.2 1.39 0.09 15.39 16.08±1.61 98.4 30 28 C 60-80 5.7 0.77 0.08 10.25 13.17±4.32 77.4 38 28 CL 80-100 5.6 0.91 0.10 9.10 20.91±6.38 78.2 26 32 C 2 0-20 6.1 2.72 0.19 14.68 22.54±1.63 42.3 48 26 SCL 20-40 6.4 1.22 0.05 24.62 22.79±3.39 45.3 44 26 SCL 40-60 7.1 0.35 0.03 12.02 11.38±1.15 82.2 66 16 SL 60-80 6.7 1.25 0.04 28.85 19.57±6.55 58.7 40 24 CL 80-100 6.4 1.25 0.04 32.91 12.89±3.34 86.7 44 22 CL 10.1 Å when the K-saturated clay was heated at 110oC. The 7.1 Å of kaolinite at 25oC of the K-saturated clay was not observed after heating the K-saturated clay at 550oC (Figure 1B). The reflection at 10.1 Å of illite for K-saturated clay was present when clay heated at temperatures from 110o to 550oC. Semi-quantitative of clay mineralogy shows the following trends: vermiculite > kaolinite > illite > mixed layered clays in all pedons. After the clays were treated with DCB procedures to remove the free sesquioxides, clay fractions show significant beudantite reflections (i.e., 2.82, 2.97, 2.56, 2.37 and 1.98 Å) (Figure 1B). XRD analysis clearly shows that the beudantite exists in the soil profile of rice field in the Guandu Plain. These XRD patterns provided the further evidence that As and Pb (i.e., fine particle size of beudantite existing in water suspensions and soil clay fractions) present in soil profiles.
Figure 1. Powder X-ray diffractograms of (A) beudantite collected from the bank of Huang Gang Creek and (D)
oriented XRD pattern of DCB treated with clays fractions (60-80 cm), K-saturated clay at (a) 25o, (b) 105
o, (c)
250o, (d) 350
o, (e) 450
o, (f) 550
oC, and Mg-saturated clay at (g) 25
o C and (h) glycerol solvation. B: beudantite,
Go: goethite, I: illite, K: kaolinite, Q: quartz, V: vermiculite.
Soil columns leached with simulated acid rains
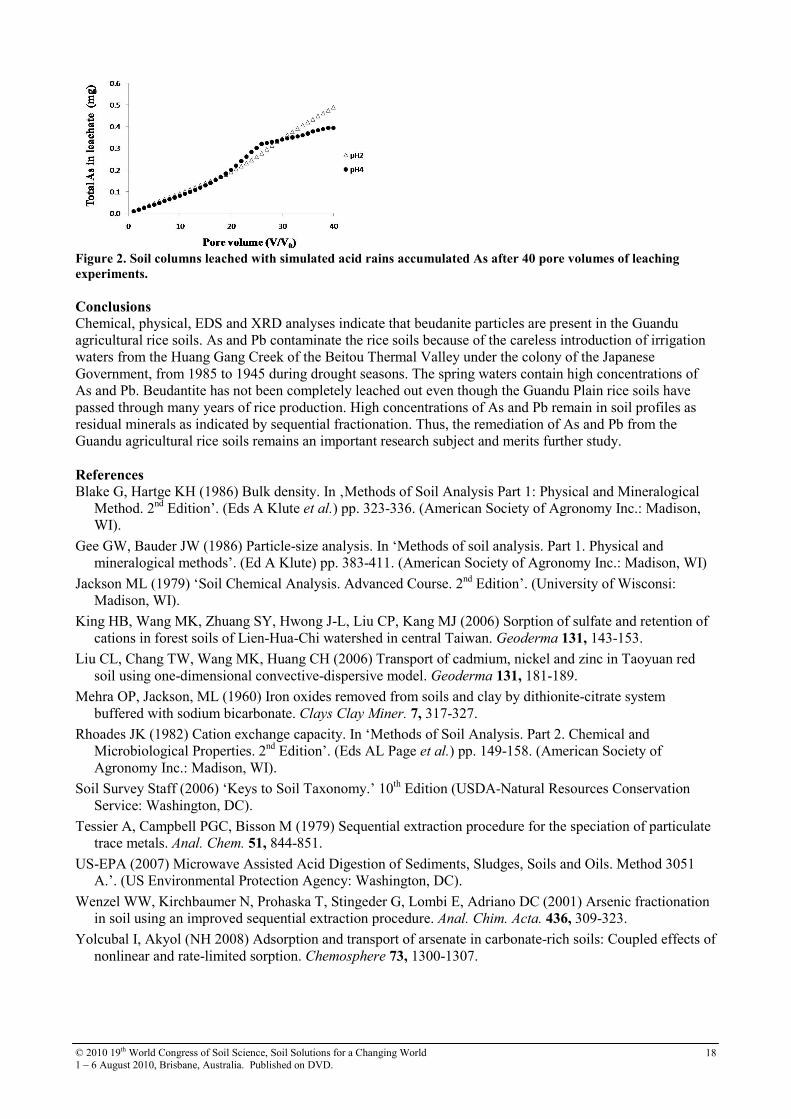
Figure 2 shows the accumulation of As in leachates. Accumulation of As in leachates are 0.489 and 0.394 mg (i.e., total amounts of As in soil column is 17.51 mg), which correspond to 2.8 and 2.2% for pH 2 and 4 simulated acid rain leaching after 40 pore volumes. Thus, only low amounts of Pb were leached out. It is indicated that the soil beudantite is not readily leached out by simulated acid rain. Thus, beudantite cannot completely leach out of Guandu Plain rice soils over many years of cultivation of rice. Beudantite still remained in soil profiles. Sequential extractions
Most of the Pb and As are present in the residual fractions after sequential fractionations. High percentages of As remain in soil profiles possibly bound to amorphous, Fe and Al oxyhydroxides and residual minerals. Pb concentrations show a similar trend except for the 60-80 and 80-100 cm soil horizons.
© 2010 19th World Congress of Soil Science, Soil Solutions for a Changing World 1 – 6 August 2010, Brisbane, Australia. Published on DVD.
18
Figure 2. Soil columns leached with simulated acid rains accumulated As after 40 pore volumes of leaching
experiments.
Conclusions
Chemical, physical, EDS and XRD analyses indicate that beudanite particles are present in the Guandu agricultural rice soils. As and Pb contaminate the rice soils because of the careless introduction of irrigation waters from the Huang Gang Creek of the Beitou Thermal Valley under the colony of the Japanese Government, from 1985 to 1945 during drought seasons. The spring waters contain high concentrations of As and Pb. Beudantite has not been completely leached out even though the Guandu Plain rice soils have passed through many years of rice production. High concentrations of As and Pb remain in soil profiles as residual minerals as indicated by sequential fractionation. Thus, the remediation of As and Pb from the Guandu agricultural rice soils remains an important research subject and merits further study. References
Blake G, Hartge KH (1986) Bulk density. In ‚Methods of Soil Analysis Part 1: Physical and Mineralogical Method. 2nd Edition’. (Eds A Klute et al.) pp. 323-336. (American Society of Agronomy Inc.: Madison, WI).
Gee GW, Bauder JW (1986) Particle-size analysis. In ‘Methods of soil analysis. Part 1. Physical and mineralogical methods’. (Ed A Klute) pp. 383-411. (American Society of Agronomy Inc.: Madison, WI)
Jackson ML (1979) ‘Soil Chemical Analysis. Advanced Course. 2nd Edition’. (University of Wisconsi: Madison, WI).
King HB, Wang MK, Zhuang SY, Hwong J-L, Liu CP, Kang MJ (2006) Sorption of sulfate and retention of cations in forest soils of Lien-Hua-Chi watershed in central Taiwan. Geoderma 131, 143-153.
Liu CL, Chang TW, Wang MK, Huang CH (2006) Transport of cadmium, nickel and zinc in Taoyuan red soil using one-dimensional convective-dispersive model. Geoderma 131, 181-189.
Mehra OP, Jackson, ML (1960) Iron oxides removed from soils and clay by dithionite-citrate system buffered with sodium bicarbonate. Clays Clay Miner. 7, 317-327.
Rhoades JK (1982) Cation exchange capacity. In ‘Methods of Soil Analysis. Part 2. Chemical and Microbiological Properties. 2nd Edition’. (Eds AL Page et al.) pp. 149-158. (American Society of Agronomy Inc.: Madison, WI).
Soil Survey Staff (2006) ‘Keys to Soil Taxonomy.’ 10th Edition (USDA-Natural Resources Conservation Service: Washington, DC).
Tessier A, Campbell PGC, Bisson M (1979) Sequential extraction procedure for the speciation of particulate trace metals. Anal. Chem. 51, 844-851.
US-EPA (2007) Microwave Assisted Acid Digestion of Sediments, Sludges, Soils and Oils. Method 3051 A.’. (US Environmental Protection Agency: Washington, DC).
Wenzel WW, Kirchbaumer N, Prohaska T, Stingeder G, Lombi E, Adriano DC (2001) Arsenic fractionation in soil using an improved sequential extraction procedure. Anal. Chim. Acta. 436, 309-323.
Yolcubal I, Akyol (NH 2008) Adsorption and transport of arsenate in carbonate-rich soils: Coupled effects of nonlinear and rate-limited sorption. Chemosphere 73, 1300-1307.
© 2010 19th World Congress of Soil Science, Soil Solutions for a Changing World 1 – 6 August 2010, Brisbane, Australia. Published on DVD.
19
Arsenic mobilisation induced by bacterial iron reduction and competing
phosphorous Juscimar SilvaA, Jaime WV MelloA , Massimo GasparonB, Walter AP AbrahãoA, Virgínia ST CiminelliC ASoil Department, Federal University of Viçosa, Viçosa, MG, Brazil, 36570-000 Email [email protected] BSchool of Earth Science, The University of Queensland, St. Lucia, Queensland 4072, Australia Email [email protected] CDepartment of Metallurgical and Materials Engineering, Federal University of Minas Gerais, Brazil Email
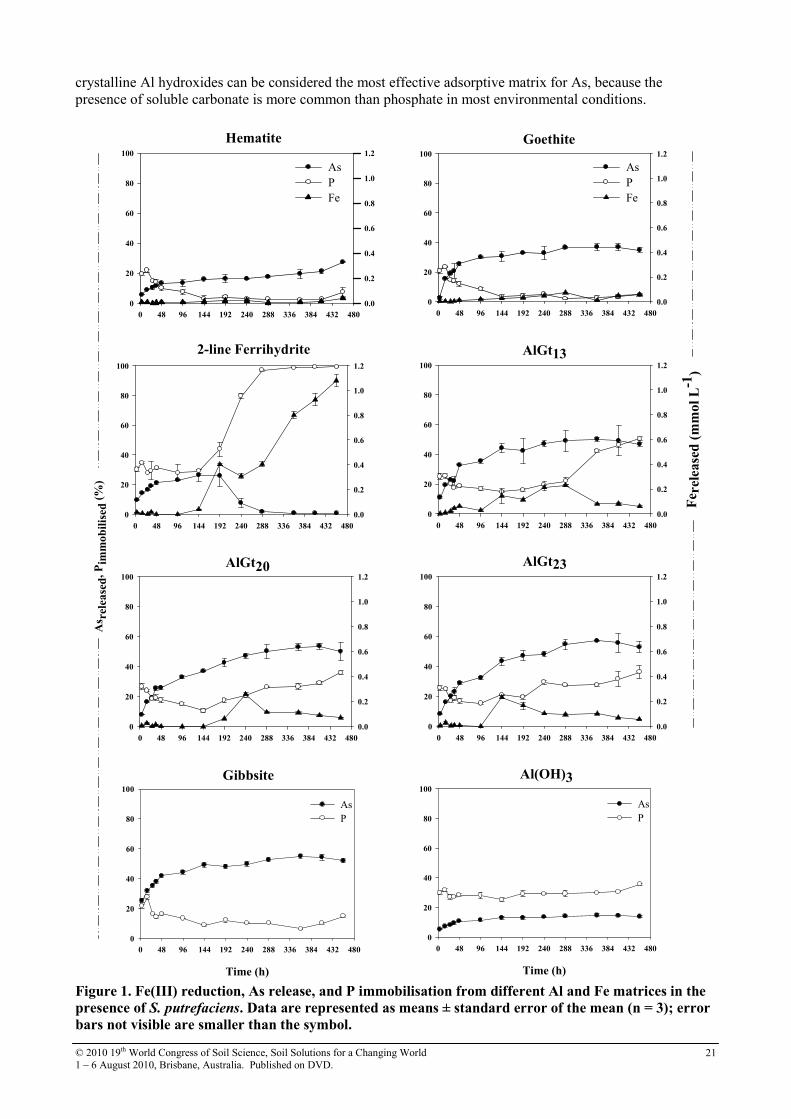
Abstract Dissimilatory Fe reducing bacteria play a fundamental role in catalysing the redox transformations that ultimately control the mobility of As in aquatic environments. In this study we investigated the stability of As retained by Al and Fe (hydr)oxides (hematite, goethite, 2-line ferrihydrite, three Al-goethites, gibbsite, and a poorly crystalline Al hydroxide) under anoxic conditions in the presence of S. putrefaciens cells and phosphate as a competing ion. S. putrefaciens cells were able to bind on mineral surfaces and utilise both noncrystalline and crystalline Fe (hydr)oxides as electron acceptor releasing As into solution. Phosphate competed strongly with arsenate and its efficiency seemed to be governed by the nature of the binding mechanism between As and adsorbent surface. High propotion of sorbed As were desorbed by phosphate from gibbsite followed by Al-goethites. Reflecting its low crystallinity, Al hydroxide was the most efficient in retaining arsenate on its surface followed by ferrihydrite, goethite, and hematite. Key Words Biological reduction, phosphate, arsenate, Al-goethite, Al and Fe (hydr)oxide. Introduction Aluminium and Fe (hydr)oxides are ubiquitous reactive constituents of soils and sediments, and play a fundamental role in the biogeochemical cycle of many elements (e.g. P, S, As, Pb). The environmental distribution of As is controlled by both Al and Fe (hydr)oxides in most oxidised environments, and the main technologies for the removal of As from contaminated waters are based on coagulation/precipitation or adsorption involving Al or ferric compounds. Although ferric compounds have lower solubility in relation to Al ones and greater binding affinity for As, they are unstable under low Eh conditions. Consequently, the bacterially-induced reductive dissolution of Fe (hydr)oxides may release previously adsorbed As into the environment. (Cummings et al. 1999; Zachara et al. 2001). The presence of Al substituting Fe in the Fe (hydr)oxides structures depresses the reductive dissolution of Fe (hydr)oxides (Schwertmann 1984; Torrent et al. 1987). Bousserrhine et al. (1999) also demonstrated that biological reduction of Al, Cr, Mn, and Co-goethites was decreased as substitution increased. Natural attenuation of As by adsorption onto these minerals may be also limited by oxyanions competing for the sorption sites (Hongshao and Stanforth 2001; Sahai et al. 2007; Zhang et al. 2008). Due to similar acid dissociation constants, phosphate (pKa1 = 2.1, pKa2 = 7.2, pKa3 = 12.3) behaves much like arsenate (pKa1 = 2.2, pKa2 = 6.9, pKa3 = 11.4). Therefore, investigations of the competition between anions can provide insight into the reactions occurring on the mineral surface (Hongshao and Stanforth 2001). The aim of this work was to investigate arsenate release from Al-goethites and other synthetic Al and Fe (hydr)oxides influenced by dissimilatory Fe reduction and competing phosphate. Materials and Methods
Synthesis of Al and Fe (Hydr)oxides
Hematite (Hm), Goethite (Gt), 2-line Ferrihydrite (Fh), and three Al-goethites (AlGts) with different Al for Fe substitution (13, 20, and 23 cmol Al per mol of Fe) were synthesised according to Schwertmann and Cornell (2000). Gibbsite (Gb) was prepared according to Kyle et al. (1975). Similarly, a poorly crystalline Al hydroxide [Al(OH)3] was also prepared, but with the suppression of the heating step to preserve low crystallinity. These adsorbents were loaded with sufficient As(V) to achieve their maximum adsorption capacity (Silva 2008).
© 2010 19th World Congress of Soil Science, Soil Solutions for a Changing World 1 – 6 August 2010, Brisbane, Australia. Published on DVD.
20
Influence of competing ions
The effect of P on As release under anaerobic conditions were performed taking 0.1000 g of As-loaded adsorbents which were equilibrated with 96 mL of a sterile basal medium, containing 5 mmol/L phosphate (as KH2PO4), 20 mmol/L NH4Cl, 1.34 mmol/L KCl, 10 mmol/L CaCl2, 0.34 mmol/L MgCl2, 10 mmol/L lactate, and 4.0 mL of Shewanella putrefaciens cell suspension in a 125 mL screw cap plastic bottle. The mixture was buffered at pH 7.0 by adding 10 mmol/L 1,4-piperazinediethanesulfonic acid (PIPES). The suspensions were purged with high-purity N2 and anaerobically incubated in a glovebox for about 500 h. Aliquots were periodically taken, filtered through 0.22 µm membrane filters, acidified using concentrated HNO3, and stored for further analyses of Al, As, and Fe by ICP-OES (Perkin Elmer Optima 3300 DV) at The University of Queensland. Typical detection limits (3σ) of 0.42 µmol/L were obtained for As. Results and Discussions Influence of phosphate as competing anion
Similar As desorption trends were observed for all materials. The fraction of desorbed As decreased in the following order: Gb ≥ AlGts > Hm > Gt > Fh > Al(OH)3. The As release commenced within 4 h after the addition of phosphate, then increased sharply in the next 40 hours, and then gently decreased thereafter (Figure 1). For example, nearly 70 % of the total As in Gt was released within 48 h. Considering that soluble Fe was not detected during the initial stage of the experiment (4 – 48 h), the As displacement may be exclusively attributed to ligand exchange reactions with phosphate. Substantial amounts of As were released from Gb and Al-goethites, typically more than 50 % within the duration of the experiment (450 h). This should be entirely ascribed to exchange by phosphate on the Gb surface, but for AlGts part of the released amount must be attributed to biological iron reduction. Al-goethites followed similar kinetics, and the fraction of mobilised As was higher as the structural Al increased (Figure 1). Our data is also consistent with the results of Masue et al. (2007), who reported increasing As(V) desorption by phosphate from poorly crystalline Al-Fe hydroxides as the Al:Fe ratio increased, reaching almost total arsenate desorption from pure Al hydroxide after 24 h. The highest P immobilisation (almost 30 % of the added P) was measured in the solutions that had reacted with poorly crystalline (hydr)oxides (Fh and Al(OH)3) and Al-goethites. Considering that all the solid matrices were subjected to reaction with the same sterile basal medium, P immobilisation due to Ca-P precipitation should have been exactly the same for all the matrices. Therefore, the enhanced P immobilization observed for Fh, Al(OH)3, and AlGts compared to well crystalline (hydr)oxides can be ascribed to P adsorption onto sites not occupied by As, because P immobilization is not accompanied by release of As. Previous investigations have shown that surface coverage in the competitive adsorption experiments is higher than the adsorption of the individual ions (Hongshao and Stanforth 2001; Zhang and Selim 2008) suggesting that there are some specific sites for each ion as well as other sites that can adsorb both (Manning and Goldberg 1996). A distinct behaviour was observed for Fh, where the amount of As released reached its maximum 192 h after the beginning of the experiment, and then suddenly decreased to almost zero. This trend coincides with P immobilisation and is possibly due to precipitation of a vivianite-like phase with significant As-P substitution [Fe(II)
3[(As, P)O4]2.8H2O].
Conclusion This study investigated the mechanisms and extent of As remobilisation from Al-goethites and other synthetic Al and Fe (hydr)oxides under anoxic conditions induced by microbial activity, and competing P. Poorly crystalline Al hydroxide was the most efficient matrix in holding arsenate firmly on its surface, followed by Fh and Gt. Less than 15 % of the As bound to Al hydroxide was desorbed by phosphate, and arsenate adsorption kinetic data for Al hydroxide show that more than 92 % of the arsenate was adsorbed in nearly 6 h (Silva 2008). Although both Al and Fe hydroxides proved to be the most efficient matrices in retaining As, Al hydroxides have an advantage over Fh under reducing conditions. Fh became more stable than poorly crystalline Al hydroxides only after 240 hours incubation time and in the presence of relatively high levels of P and Fe. Once soluble Fe increased to a certain level, it combined with phosphate to form vivianite [Fe3(PO4)2 8H2O], as predicted by thermodynamic equilibria. Vivianite can act as a sink for soluble As and thus limit its mobility. This mechanism has significant environmental implications for the fate of As in eutrophic and reducing aquatic systems. In general, however, poorly
© 2010 19th World Congress of Soil Science, Soil Solutions for a Changing World 1 – 6 August 2010, Brisbane, Australia. Published on DVD.
21
crystalline Al hydroxides can be considered the most effective adsorptive matrix for As, because the presence of soluble carbonate is more common than phosphate in most environmental conditions.
0 48 96 144 192 240 288 336 384 432 480
0
20
40
60
80
100
0.0
0.2
0.4
0.6
0.8
1.0
1.2
0 48 96 144 192 240 288 336 384 432 480
As r
elea
sed
, P
imm
ob
ilis
ed (
%)
0
20
40
60
80
100
0.0
0.2
0.4
0.6
0.8
1.0
1.2
As P Fe
Hematite
0 48 96 144 192 240 288 336 384 432 480
0
20
40
60
80
100
0.0
0.2
0.4
0.6
0.8
1.0
1.2
As PFe
Goethite
2-line Ferrihydrite AlGt13
0 48 96 144 192 240 288 336 384 432 480
0
20
40
60
80
100
0.0
0.2
0.4
0.6
0.8
1.0
1.2
AlGt20
0 48 96 144 192 240 288 336 384 432 480
0
20
40
60
80
100
0.0
0.2
0.4
0.6
0.8
1.0
1.2
AlGt23
0 48 96 144 192 240 288 336 384 432 480
0
20
40
60
80
100
Fe r
elease
d (
mm
ol
L-1
)
0.0
0.2
0.4
0.6
0.8
1.0
1.2
Gibbsite
Time (h)
0 48 96 144 192 240 288 336 384 432 480
0
20
40
60
80
100
As
P
Al(OH)3
Time (h)
0 48 96 144 192 240 288 336 384 432 480
0
20
40
60
80
100
As
P
Figure 1. Fe(III) reduction, As release, and P immobilisation from different Al and Fe matrices in the
presence of S. putrefaciens. Data are represented as means ± standard error of the mean (n = 3); error
bars not visible are smaller than the symbol.

© 2010 19th World Congress of Soil Science, Soil Solutions for a Changing World 1 – 6 August 2010, Brisbane, Australia. Published on DVD.
22
Aluminium and Fe (hydr)oxides are ubiquitous in the environment, and goethite is one of the thermodynamically most stable iron oxides (Cornell and Schwertmann 2003). Thus, the presence of goethite with high structural Al may contribute not only to improve the As(V) adsorption capacity of soils and sediments, but also to diminish its mobilisation under reducing conditions. However, the use of phosphate-based fertilisers and microbial metabolism may add further complexity to the mechanisms of As desorption from soils and sediments. In water treatment, hydrous ferric oxides have been used extensively to remove As from contaminated water. However, the disposal of As-rich residues under reducing conditions, as might occur at mine waste disposal sites (Masue et al. 2007), is a very concerning issue, because the redox transformation of Fe(III) to Fe(II) mediated by dissimilatory iron reducing bacteria may lead to As mobilisation. Hence, as Al is not redox sensitive, the use of a poorly crystalline Al(OH)3 matrix may represent a good alternative for the removal of As from contaminated water. Our experiments showed that indeed both poorly crystalline Al(OH)3 and Al-goethites, and, under specific environmental conditions, ferrihydrite, can be the most efficient matrix for As retention.
Acknowledgement
The support from Minas Gerais State Foundation- FAPEMIG and Brazilian Research Council is gratefully acknowledged. Part of this study was carried out while the first author was an Academic Visitor at The University of Queensland (UQ), with funding from CNPq (Brazil). Funding was also provided by a UQ grant.
References Bousserrhine N, Gasser U, Jeanroy E, Berthelin J (1999) Bacterial and chemical reductive dissolution of Mn,
Co, Cr, and Al-substituted goethites. Geomicrobiology Journal 16, 245-258. Cummings DE, Caccavo JrF, Fendorf S, Rosenzweig F (1999) Arsenic mobilization by the dissimilatory
Fe(III)-reducing bacterium Shewanella alga BrY. Environmental Science & Technology 33, 723-729. Hongshao Z, Stanforth R (2001) Competitive Adsorption of Phosphate and Arsenate on Goethite.
Environmental Science & Technology 35, 4753-4757. Sahai N, Lee YJ, Xu H, Ciardelli M, Gaillard J-F (2007) Role of Fe(II) and phosphate in arsenic uptake by
coprecipitation. Geochimica et Cosmochimica Acta 71, 3193-3210. Schwertmann U (1984) The Influence of Aluminum on Iron-Oxides. 9. Dissolution of Al-Goethites in 6m
HCl. Clay Mineralogy 19, 9-19. Silva J (2008) Effectiveness and stability of aluminium and iron oxides nanoparticles for arfsenate
adsorption. PhD Thesis, Federal University of Viçosa, Minas Gerais. Torrent J, Schwertmann U, Barron V (1987) The Reductive Dissolution of Synthetic Goethite and Hematite
in Dithionite. Clay Mineralogy 22, 329-337. Zachara JM, Fredrickson JK, Smith SC, Gassman PL (2001) Solubilization of Fe(III) oxide-bound trace
metals by a dissimilatory Fe(III) reducind bacterium. Geochimica et Cosmochimica Acta 65, 75-93. Zhang H, Selim HM (2008) Competitive sorption-desorption kinetics of arsenate and phosphate in
soils. Soil Science 173, 3-12. Zhang JS, Stanforth R, Pehkonen SO (2008) Irreversible adsorption of methyl arsenic, arsenate, and
phosphate onto goethite in arsenic and phosphate binary systems. Journal of Colloid and Interface Science 317, 35-43.
© 2010 19th World Congress of Soil Science, Soil Solutions for a Changing World 1 – 6 August 2010, Brisbane, Australia. Published on DVD.
23
Biogeochemical Interactions between Fe(II)/(III) Species Cycles and
Transformation of Reducible Substrates in Subtropical Soils Fangbai LiA, Shungui ZhouA, Li ZhuangA, Liang TaoA, Xiaomin LiA, Chunyuan WuA, Tongxu LiuA AGuangdong Key Laboratory of Agricultural Environment Pollution Integrated Control, Guangdong Institute of Eco-environmental and Soil Sciences, Guangzhou, China, E-mail [email protected] (Prof. Li)
Abstract This study provides fundamental information on the interactions between iron cycles and transformation of reducible substrates. We introduce five important topics including (1) Fe(II) adsorbed on minerals and dissimilatory iron reduction; (2) interactions between the iron cycle and dechlorination of pesticides; (3) interactions between the iron cycle and nitrogen cycles; (4) interactions between the iron cycle and the transformation of heavy metals; and (5) humic acids as electron shuttles. We proposed the mechanism of interaction between iron redox cycle and reductive dechlorination, nitrate reduction, heavy metal reduction and carbon cycles. This contribution demonstrates the important role of DIRB and iron cycles on the transformation of reducible substrates under anaerobic environments, and provides scientific information for in-situ bioremediation of reducible pollutants in Fe(III)-rich environments. Key Words
Iron cycle, dissimilatory iron-reducing bacteria (DIRB), reducible transformation, subtropical soil, dechlorination, nitrate reduction, heavy metal Introduction Iron is the most abundant transition metal in soil, and is also an essential plant nutrient. Many subtropical soils contain large amounts of free iron oxides with special biogeochemistry. The iron cycle in subtropical soils is very important to both biological and chemical environmental processes. In the presence of dissolved organic matters (DOM), iron oxides can be reduced. In rhizosphere soils, root exudates including various forms of DOM can enhance the dissolution of iron oxides, resulting in the formation of various dissolved or adsorbed Fe(III)/Fe(II) species. DIRB can drive the reductive dissolution of iron oxides, and then generate biogenic Fe(II) species with lower redox potential (Lovley 1987; 2004). Therefore, the transformation of reducible substrates may strongly depend on the biogeochemistry of iron species. In particular, the iron cycle plays a vital role in cycles of nitrogen and carbon, the availability of heavy metal (Cle´menta et al. 2005; Jickells et al. 2005). The aims of the study are to investigate and discuss the roles of Fe(II) species and DIRB in reductive transformation of pesticides, nitrate and heavy metal; and then to consider the implication of iron cycles in the field of soil science. Materials and Methods We have reported the experimental procedure in detail (Li et al. 2008; 2009b; 2009c). Results and Discussion Fe(II) adsorbed on minerals and dissimilatory iron reduction
Fe(II) adsorption onto minerals is an important environmental process because the surface-complex Fe(II) enables a facile reductive transformation of organic/inorganic pollutants in contaminated soils (Stumm and Sulzberger 1992). Adsorbed Fe(II) is known to be very reactive, acting as a reductant for elements including As(V), U(VI), Cr(VI) and Cu(II). Adsorbed Fe(II) is far more easily oxidized if bound by mineral surfaces than dissolved Fe(II). A general consensus is that the mineral surface provides hydroxyl groups to stabilize Fe(II), leading to the formation of surface-complex Fe(II) species such as ≡SOFe+ and ≡SOFeOH0 with lower redox potential compared to aqueous Fe(II) species. The negative shift of the redox potential proved to be indicative of the enhancement of Fe(II) reactivity. However, despite of the above well-recognized conclusion, there is a lack of experimental evidence regarding the magnitude of redox potential response to the variation in the identity of surface-complex Fe(II) species. In order to investigate these insights, we have established an electrochemical system to characterize the redox behavior of the adsorbed Fe(II) in the interfacial phase by cyclic voltammetry (CV). The redox potential of Fe(II) adsorbed on alumina, titanic and silica is 0.190, 0.140, 0.265, respectively at pH=6.7, while that on lepidrocite, goethite and hematite is 0.255, 0.229, 0.203, respectively at pH=6.5 in 0.2 M NaCl and 28 mM MOPS solution (Li et al. 2009a). At circumneutral pH values, iron exists primarily as insoluble, solid-phase minerals. Dissimilatory iron
© 2010 19th World Congress of Soil Science, Soil Solutions for a Changing World 1 – 6 August 2010, Brisbane, Australia. Published on DVD.
24
reduction is an important pathway to form adsorbed Fe(II) bound on minerals. Microbial iron reduction includes assimilatory and dissimilatory iron reduction. Recently, dissimilatory iron reduction has been paid great attention (Weber et al. 2006). Both Fe(III) oxides and a variety of complexed Fe(III) species can be used as terminal electron acceptor in dissimilatory iron reduction. At a circumneutral pH, dissimilatory iron redox cycling can significantly affect the geochemistry of hydromorphic soil and sediments, leading to DOM mineralization, mineral dissolution and weathering and the mobilization or immobilization of heavy metals. Interactions between iron cycle and dechlorination of pesticides
The system of DIRB S12, goethite and chlorinated pesticides (DDT and pentachlorophenol) showed an interactions between reduction of iron oxides and dechlorination of DDT driven by dissimilatory Fe(III)-reducing bacterium (Li et al. 2009b; 2009c; 2009d). The results showed that DDT can be degraded by DIRB and DDT removal was more effective in the system of DIRB and α-FeOOH, though α-FeOOH can not degrade DDT. The enhanced degradation of DDT was mainly attributable to biogenic Fe(II) on the surface of α-FeOOH. The cyclic voltammetry results provided evidence of a decrease in redox potential of Fe(II) in the system, which contributed to the enhancement of Fe(II) reactivity and a subsequent increase of DDT degradation. DDT was only degraded to DDD by DIRB alone, while in the system of DIRB and α-FeOOH, DDT degradation followed a sequential reductive dechlorination process as DDT to DDD to DDMS to DBP. Interactions among CY01, and reduction of iron oxides and reduction of 2,4- dichlorophenoxyacetic acid (2, 4-D) were also reported by our group (Wu et al. 2009). This case demonstrated the ability of Comamonas
koreensis CY01 to obtain energy for microbial growth by coupling the oxidation of electron donors to dissimilatory Fe(III) reduction, and also the enhanced 2,4-D biodegradation by the presence of Fe(III) oxides under anaerobic conditions. The results suggested that the anaerobic respiration of strain CY01 can utilize ferrihydrite, goethite, lepidocrocite or hematite as the terminal electron acceptor. Under anaerobic conditions, dissimilatory Fe(III) reduction and 2,4-D biodegradation occurred simultaneously. The presence of Fe(III) (hydr)oxides would significantly enhance 2,4-D biodegradation, probably due to that the reactive mineral-bound Fe(II) species generated from dissimilatory Fe(III) reduction abiotically reducing 2,4-D. With the demonstrated ability of reducing both Fe(III) (hydr)oxides and 2,4-D, strain CY01 was proven to be a new bacterial strain for studying the interaction between reductive dechlorination and dissimilatory Fe(III) reduction. Theses contributions demonstrated the important role of DIRB and iron oxide in pesticides transformation under anaerobic environments, and provided scientific support and information for in-situ bioremediation of chlorinated organic pollutants in Fe(III)-rich environments. Interactions between iron cycle and nitrogen cycles
Interactions between iron redox cycle and nutrient cycles have been paid great attention (Cle´menta et al. 2005; Jickells et al. 2005). It had been reported that there was a biological process that uses Fe(III) as an electron acceptor while oxidizing ammonium to nitrite for energy production. Ammonium oxidation under iron reducing anaerobic conditions is thermodynamically feasible and might potentially be a critical component of N cycle in sediments (Cle´menta et al. 2005). However, it had been reported that ferrous iron as an electron donor was capable of reducing nitrate in anaerobic, sedimentary environments (Jørgensen et al. 2009). Reduction of nitrate to ammonia can proceed at appreciable rates in abiotic systems in the presence of green rust compounds [FeII
4FeIII2(OH)12SO4·yH2O] at ambient pH (Hansen et al. 1996). The presence of
crystalline iron oxide surfaces accelerates low-temperature reduction of NO3- coupled to Fe(II) oxidation at
pH values greater than 8.0 (Ottley et al. 1997). Microbially catalyzed nitrate reduction coupled to Fe(II) oxidation under anaerobic environment has also been reported (Straub et al. 1996; Weber et al. 2001), and the role of biogenic Fe(II) was taken into consideration for nitrogen cycling (Weber et al. 2001)). Our group found the potential for microbially catalyzed NO3
- reduction with iron oxide by using Klebsiella pneumoniae strain L17 under anaerobic conditions. The results showed that L17 had the capacity of nitrate/nitrite reduction, and α-FeOOH can increase the reduction rate significantly, but the biogenic adsorbed Fe(II) was not enough to reduce so much nitrogen. And a hypothesis mechanism was proposed as that iron oxide mediated electron transfer from cells to nitrate/nitrite. This study could be helpful to deeply understand the relationship between the redox cycles of Fe and N in subsurface sedimentary environments. Interactions between iron cycle and the transformation of heavy metals
Accumulation and persistence of heavy metals in the soil environment has been paid great interest in the possible long-term changes in solubility of metals adsorbed and coprecipitated by minerals. Iron oxides can act as a kind of important adsorbent of heavy metals. Abiotic and biotic iron redox cycle can immobilize
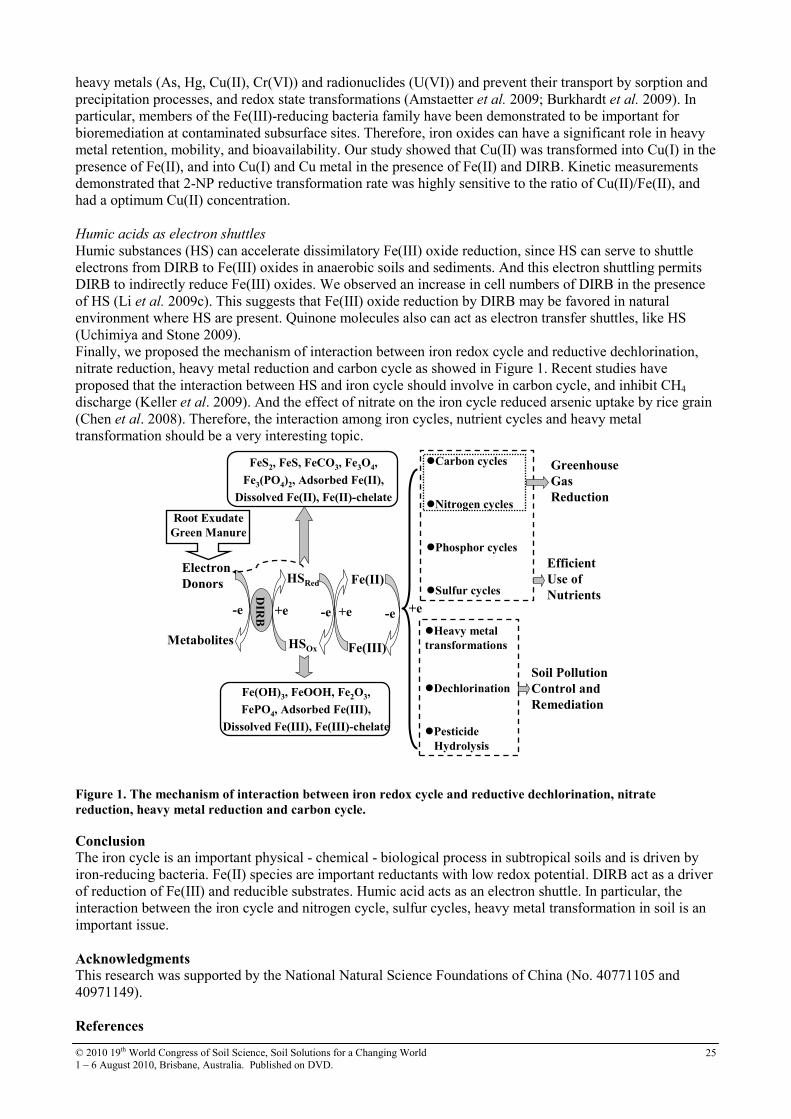
© 2010 19th World Congress of Soil Science, Soil Solutions for a Changing World 1 – 6 August 2010, Brisbane, Australia. Published on DVD.
25
heavy metals (As, Hg, Cu(II), Cr(VI)) and radionuclides (U(VI)) and prevent their transport by sorption and precipitation processes, and redox state transformations (Amstaetter et al. 2009; Burkhardt et al. 2009). In particular, members of the Fe(III)-reducing bacteria family have been demonstrated to be important for bioremediation at contaminated subsurface sites. Therefore, iron oxides can have a significant role in heavy metal retention, mobility, and bioavailability. Our study showed that Cu(II) was transformed into Cu(I) in the presence of Fe(II), and into Cu(I) and Cu metal in the presence of Fe(II) and DIRB. Kinetic measurements demonstrated that 2-NP reductive transformation rate was highly sensitive to the ratio of Cu(II)/Fe(II), and had a optimum Cu(II) concentration. Humic acids as electron shuttles
Humic substances (HS) can accelerate dissimilatory Fe(III) oxide reduction, since HS can serve to shuttle electrons from DIRB to Fe(III) oxides in anaerobic soils and sediments. And this electron shuttling permits DIRB to indirectly reduce Fe(III) oxides. We observed an increase in cell numbers of DIRB in the presence of HS (Li et al. 2009c). This suggests that Fe(III) oxide reduction by DIRB may be favored in natural environment where HS are present. Quinone molecules also can act as electron transfer shuttles, like HS (Uchimiya and Stone 2009). Finally, we proposed the mechanism of interaction between iron redox cycle and reductive dechlorination, nitrate reduction, heavy metal reduction and carbon cycle as showed in Figure 1. Recent studies have proposed that the interaction between HS and iron cycle should involve in carbon cycle, and inhibit CH4 discharge (Keller et al. 2009). And the effect of nitrate on the iron cycle reduced arsenic uptake by rice grain (Chen et al. 2008). Therefore, the interaction among iron cycles, nutrient cycles and heavy metal transformation should be a very interesting topic.
Figure 1. The mechanism of interaction between iron redox cycle and reductive dechlorination, nitrate
reduction, heavy metal reduction and carbon cycle.
Conclusion The iron cycle is an important physical - chemical - biological process in subtropical soils and is driven by iron-reducing bacteria. Fe(II) species are important reductants with low redox potential. DIRB act as a driver of reduction of Fe(III) and reducible substrates. Humic acid acts as an electron shuttle. In particular, the interaction between the iron cycle and nitrogen cycle, sulfur cycles, heavy metal transformation in soil is an important issue. Acknowledgments This research was supported by the National Natural Science Foundations of China (No. 40771105 and 40971149). References
HSRed
HSOx
DIR
B
Metabolites
Electron
Donors Fe(II)
Fe(III)
-e +e -e +e -e +e
�Carbon cycles
�Nitrogen cycles
�Phosphor cycles
�Sulfur cycles
FeS2, FeS, FeCO3, Fe3O4,
Fe3(PO4)2, Adsorbed Fe(II),
Dissolved Fe(II), Fe(II)-chelate
Fe(OH)3, FeOOH, Fe2O3,
FePO4, Adsorbed Fe(III),
Dissolved Fe(III), Fe(III)-chelate
Root Exudate
Green Manure
�Heavy metal
transformations
�Dechlorination
�Pesticide
Hydrolysis
Greenhouse
Gas
Reduction
Efficient
Use of
Nutrients
Soil Pollution
Control and
Remediation
© 2010 19th World Congress of Soil Science, Soil Solutions for a Changing World 1 – 6 August 2010, Brisbane, Australia. Published on DVD.
26
Amstaetter K, Borch T, Larese-Casanova P, Kappler A (2009) Redox Transformation of Arsenic by Fe(II)-Activated Goethite (r-FeOOH). Environmental Science & Technology DOI: 10.1021/ es901274s.
Burkhardt E-M, Akob DM, Bischoff S, Sitte J, Kostka JE, Banerjee D, Scheinost AC, Ksel K (2009) Impact of Biostimulated Redox Processes on Metal Dynamics in an Iron-Rich Creek Soil of a Former Uranium Mining Area. Environmental Science & Technology DOI: 10.1021/es902038e.
Chen XP, Zhu YG, Hong MN, Kappler A, Xu YX (2008) Effects of different forms of nitrogen fertilizers on arsenic uptake by rice plants. Environ. Tox. Chem. 27(4), 881-887.
Cle´menta J-C, Shresthab J, Ehrenfelda JG, Jaffe PR (2005) Ammonium oxidation coupled to dissimilatory reduction of iron under anaerobic conditions in wetland soils. Soil Bio. & Biochem. 37, 2323-2328.
Dong LH, Cordova-Kreylos AL, Yang JS, Yuan HL, Scow KM (2009) Humic acids buffer the effects of urea on soil ammonia oxidizers and potential nitrification. Soil Bio. & Biochem. DOI: 10. 1016 / j. soilbio. 2009.04.023.
Jickells TD, An ZS, Andersen KK, Baker AR, Bergametti G, Brooks N, Cao JJ, Boyd PW, Duce RA, Hunter KA, Kawahata H, Kubilay N, laRoche J, Liss PS, Mahowald N, Prospero JM, Ridgwell AJ, Tegen I, Torres R (2005) Global Iron Connections Between Desert Dust, Ocean Biogeochemistry, and Climate. Science 308, 67-71.
Jørgensen CJ, Jacobsen OS, Elberling B, Aamand J (2009) Microbial oxidation of pyrite coupled to nitrate reduction in anoxic groundwater sediment. Environmental Science & Technology 43, 4851-4857.
Hansen HCB, Koch CB, Nancke-Krogh H, Borggaard OK, Sørensen J (1996) Abiotic nitrate reduction to ammonium: Key role of green rust. Environmental Science & Technology 30, 2053-2056.
Li FB, Wang XG, Liu CS, Li YT, Zeng F, Liu L (2008) Reductive transformation of pentachlorophenol on the interface of subtropical soil colloids and water. Geoderma 148, 70-78
Li FB, Tao L, Feng CH, Li XZ, Sun KW (2009) Electrochemical Evidences for Promoted Interfacial Reactions: The Role of Adsorbed Fe(II) onto γ-Al2O3 and TiO2 in Reductive Transformation of 2-Nitrophenol. Environmental Science & Technology 43(10), 3656-3661.
Li FB, Li XM, Zhou SG, Zhuang L, Xu W, Liu TX (2009b) Reductive dechlorination of DDT in dissimilatory iron-reducing system of Shewanella decolorationis S12 and α-FeOOH. Environmental
Pollution (In press). Li XM, Zhou SG, Li FB, Wu CY, Zhuang L, Xu W, Liu L (2009c) Fe(III) oxide reduction and carbon
tetrachloride dechlorination by a newly isolated Klebsiella pneumoniae strain L17. J. Appl. Microbiol. 106, 130-139.
Li XM, Li YT, Li FB, Zhou SG, Feng CH (2009d) Interactively interfacial reaction of iron-reducing bacterium and goethite for reductive dechlorination of chlorinated organic compounds. Chin. Sci. Bull. 54(16), 2800-2804.
Lovley DR (1987) Organic matter mineralization with the reduction of ferric iron: A review. Geomicrobiol.
J. 5, 375-399. Lovley DR (2004) Dissimilatory Fe(III) and Mn(IV) Reduction. Adv. Microbiol. Physiol. 49, 219-286. Ottley CJ, Davison W, Edmunds WM (1997) Chemical catalysis of nitrate reduction by iron(II). Geochim.
Cosmochim. Acta. 61, 1819-1828. Stumm W, Sulzberger B (1992) The cycling of iron in natural environments-considerations based on
laboratory studies of heterogeneous redox processes. Geochim. Cosmochim. Acta. 56(8), 3233-3257. Wu CY, Li FB, Zhou SG, Zhuang L (2009) Fe(III)-Enhanced Anaerobic Degradation of 2,4-
Dichlorophenoxyacetic Acid by a Dissimilatory Fe(III)-Reducing Bacterium Comamonas Koreensis CY01. FEMS Microbio. Eco. (In press).
Straub KL, Benz M, Schink B, Widdel F (2009) Anaerobic, nitrate-dependent microbial oxidation of ferrous iron. Appl. Environ. Microbiol. 62, 1458-1460.
Uchimiya M, Stone AT (2009) Reversible redox chemistry of quinines: Impact on biogeochemical cycles. Chemosphere 77, 451-458.
Weber KA, Picardal FW, Roden EE (2001) Microbially catalyzed nitrate-dependent oxidation of biogenic solid-phase Fe(II) compounds. Environmental Science & Technology 35, 1644-1650.
© 2010 19th World Congress of Soil Science, Soil Solutions for a Changing World 1 – 6 August 2010, Brisbane, Australia. Published on DVD.
27
Buffering soil-water acidity in chlorinated solvent bioremediation schemes D. A. BarryA, C. RobinsonB, E. LacroixA, C. HolligerA and A. BrovelliA
AInstitut d’ingénierie de l’environnement, Ecole polytechnique fédérale de Lausanne, 1015 Lausanne, Switzerland, Emails [email protected], [email protected], [email protected], [email protected] BCivil and Environmental Engineering Department, University of Western Ontario, London, Ontario, N6A 5B8 Canada, Email [email protected]
Abstract Chlorinated solvents form a significant part of groundwater contamination worldwide. They are difficult to remove via physical means, and anaerobic source-zone remediation based on provision of fermentable e-donor is an attractive clean-up dechlorination option. However, organic acids and HCl lower the groundwater pH and thereby stall the microbial consortia responsible for the biodegradation process. Often, the soil’s natural buffering capacity will be exceeded, in which case a strategy of adding buffer to the groundwater is a priori beneficial to maintain dechlorination. Geochemical modelling was used to investigate the feasibility of adding naturally occurring buffering minerals to the groundwater for pH control. The simulations revealed that anorthite has the potential to be used as a sustainable pH buffering mineral. Key Words TCE, PCE, e-donor, BUCHLORAC, groundwater alkalinity, kaolinite. Introduction In industrialised countries, more-dense-than-water nonaqueous phase liquids (DNAPLs) are widespread groundwater contaminants. Tetrachloroethene (PCE) and trichloroethene (TCE), both chlorinated solvents, are frequent sources of long-term groundwater contamination (Oolman et al. 1995). Anaerobic source-zone bioremediation is an attractive option, with the goal of enhancing the dechlorination sequence (Figure 1): PCE/TCE/DCE (dichloroethenes)/VC (vinyl chloride)/ETH (ethene, harmless). Aulenta et al. (2006) reviewed source-zone remediation research, stating that “in situ anaerobic bioremediation of chlorinated solvents is a cost-effective, expanding technology for the cleanup of chlorinated solvent-contaminated sites. However, this technology is knowledge-intensive and its application requires a thorough understanding of the microbiology, ecology, hydrology and geochemistry of chlorinated solvent-contaminated aquifers”. They identified research areas such as small-scale field experiments, experiments with complex water chemistry (as found in the field), effect of transport processes on the e-donor fermentation/dechlorination kinetics, and control of supply of fermentable substrates. The major microbial processes and associated groundwater chemistry involved in chlorinated solvent degradation are shown in Figure 1, along with a brief explanation of the processes involved. A simple diagram of the source zone remediation concept is shown in Figure 2. This figure illustrates the difficulties with source zone schemes. Placement and timing of e-donor supply, buffer and bioaugmented microbial communities impacts on the scheme viability due to inefficient mixing. Below, the question of the overall buffer requirement is addressed by modelling of the geochemical processes involved (Figure 1), but the complex flow and transport processes to optimize the delivery of this buffer are not considered (Figure 2). Buffer requirement, timing and placement
While dechlorination of TCE to cis-dichloroethene (cis-DCE) will often proceed with pH in the 5-6 range, microorganisms responsible for the further dechlorination of cis-DCE are inhibited at this low pH. So, sustained source zone dechlorination has the potential to overwhelm even reasonably well buffered systems. Where the natural buffering capacity is low, or excessive pH drops are observed, a buffering agent such as sodium bicarbonate is typically added to raise and/or neutralize the pH to ensure sustained dechlorination. McCarty et al. (2007) calculated the extent of dechlorination likely to occur prior to pH inhibition for a range of donors and initial groundwater alkalinity. They demonstrated that buffer amendment is likely required for the effective continuation of TCE degradation in DNAPL source areas. Their investigation raised a number of important questions including: the amount of buffering agent required to maintain the pH at a suitable level for dehalogenating bacteria, the influence of mineralogy on the soil’s natural buffering capacity, and the influence of competitive H2-consuming side reactions on the level of acidity generated. Robinson et al.

© 2010 19th World Congress of Soil Science, Soil Solutions for a Changing World 1 – 6 August 2010, Brisbane, Australia. Published on DVD.
28
Fermentation
4 Acetoclastic methanogenesis Hydrogenotrophic methanogenesis
Iron reduction Sulphate reduction 7
5 6
8
13 DNAPL-water mass transfer
14 Processes directly involved in pH
changes
Dechlorination of PCE and
intermediates
Acetate H2
Electron Donor
CH4
Fe3+ Fe
2+
SO42-
HS
-
PCE Ethene TCE DCE VC
1
2
3
4
5
6
9
10 11
12
DNAPL
13
7
8
Dechlorination through
cometabolism by sulphate
reducers Acetate acts as the electron
donor in the biological
reaction
H2 acts as the electron
donor in the biological
reaction
1 2 3
9 12
14
14
14 14 14 14
Other geochemical reactions can occur depending
on the ions and minerals present
ETH
Homoacetogenic reaction
Figure 1. PCE and TCE degrade anaerobically, acting as electron acceptors, and thus require an organic
substrate as an e-donor (electron donor). Fermentation of the latter provides H2 as the e-donor. Electron
acceptors such as iron and sulphate compete for H2, reducing the amount available for dechlorination. Rapid
dechlorination leads to groundwater acidification and microbial inhibition (Holliger et al. 1993; Zhuang and
Pavlostathis 1995; Bhatt et al. 2007).
Figure 2. A source-zone remediation scheme. Chlorinated solvent is spilled or otherwise discharged into the
groundwater, its spreading affected strongly by local porous medium properties, forming a long-term
contamination source. Source zone remediation involves up-gradient e-donor addition and bioaugmentation with
dehalorespiring bacteria.
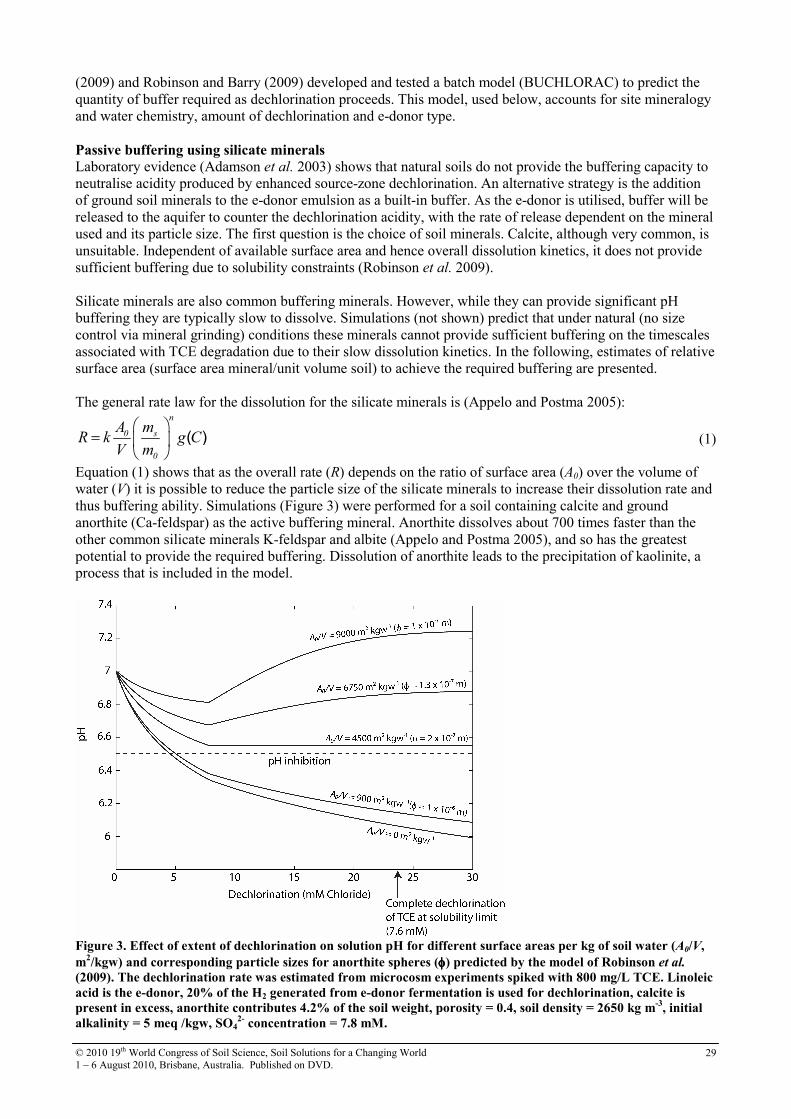
© 2010 19th World Congress of Soil Science, Soil Solutions for a Changing World 1 – 6 August 2010, Brisbane, Australia. Published on DVD.
29
(2009) and Robinson and Barry (2009) developed and tested a batch model (BUCHLORAC) to predict the quantity of buffer required as dechlorination proceeds. This model, used below, accounts for site mineralogy and water chemistry, amount of dechlorination and e-donor type. Passive buffering using silicate minerals
Laboratory evidence (Adamson et al. 2003) shows that natural soils do not provide the buffering capacity to neutralise acidity produced by enhanced source-zone dechlorination. An alternative strategy is the addition of ground soil minerals to the e-donor emulsion as a built-in buffer. As the e-donor is utilised, buffer will be released to the aquifer to counter the dechlorination acidity, with the rate of release dependent on the mineral used and its particle size. The first question is the choice of soil minerals. Calcite, although very common, is unsuitable. Independent of available surface area and hence overall dissolution kinetics, it does not provide sufficient buffering due to solubility constraints (Robinson et al. 2009). Silicate minerals are also common buffering minerals. However, while they can provide significant pH buffering they are typically slow to dissolve. Simulations (not shown) predict that under natural (no size control via mineral grinding) conditions these minerals cannot provide sufficient buffering on the timescales associated with TCE degradation due to their slow dissolution kinetics. In the following, estimates of relative surface area (surface area mineral/unit volume soil) to achieve the required buffering are presented. The general rate law for the dissolution for the silicate minerals is (Appelo and Postma 2005): n
0 s
0
A mR k g C
V m
=
( ) (1)
Equation (1) shows that as the overall rate (R) depends on the ratio of surface area (A0) over the volume of water (V) it is possible to reduce the particle size of the silicate minerals to increase their dissolution rate and thus buffering ability. Simulations (Figure 3) were performed for a soil containing calcite and ground anorthite (Ca-feldspar) as the active buffering mineral. Anorthite dissolves about 700 times faster than the other common silicate minerals K-feldspar and albite (Appelo and Postma 2005), and so has the greatest potential to provide the required buffering. Dissolution of anorthite leads to the precipitation of kaolinite, a process that is included in the model.
Figure 3. Effect of extent of dechlorination on solution pH for different surface areas per kg of soil water (A0/V,
m2/kgw) and corresponding particle sizes for anorthite spheres (φφφφ) predicted by the model of Robinson et al.
(2009). The dechlorination rate was estimated from microcosm experiments spiked with 800 mg/L TCE. Linoleic
acid is the e-donor, 20% of the H2 generated from e-donor fermentation is used for dechlorination, calcite is
present in excess, anorthite contributes 4.2% of the soil weight, porosity = 0.4, soil density = 2650 kg m-3
, initial
alkalinity = 5 meq /kgw, SO42-
concentration = 7.8 mM.
© 2010 19th World Congress of Soil Science, Soil Solutions for a Changing World 1 – 6 August 2010, Brisbane, Australia. Published on DVD.
30
Conclusions
The simulation results in Figure 3 demonstrate that: • When only calcite is present (A0/V = 0 m2 /kgw) the pH drops to 5.99 for 30 mM Cl- produced. Complete
dechlorination of TCE at its solubility limit corresponds to 24 mM Cl- produced. • If anorthite and calcite are present in their natural state (anorthite as 0.1 mm spheres; A0/V = 0.9 m2 /kgw),
the pH reduces to 6 with 10-4 mmol /kgw of anorthite dissolved for 30 mM Cl- produced (not plotted). Due to the low dissolution rate, this is similar to there being no anorthite present.
• As the particle size of anorthite is reduced, its dissolution rate increases and it acts as an effective buffering agent. Figure 3 shows that an anorthite particle size of 1.3 × 10⁻⁷ m (small!) leads to the optimal dissolution rate for pH control, with 3.1× 10⁻² mmol /kgw of anorthite dissolving for 30 mM Cl- produced. The groundwater pH is highly sensitive to particle sizes of around 10-7 m.
• The pH response to dechlorination changes after 7.8 mM Cl- is produced. This results from SO42- being
depleted, at which time all of the H2 generated from fermentation is used for dechlorination. Then, less acetic acid is formed and less acidity is produced. For particle sizes of 10-7 m and 1.3 × 10⁻⁷ m, this results in the pH increasing as the rate at which alkalinity is added to the solution from anorthite dissolution exceeds the rate at the acidity is generated from dechlorination (and donor fermentation).
• If the particle size for anorthite is too small (< 10-7 m), dissolution is too rapid and the groundwater becomes alkaline, inhibiting the microorganism activity. The optimal particle size depends on the field conditions and remediation scheme to be implemented. A possibility is to use a consortium of silicate minerals with a range of dissolution rates (including K-feldspar, albite) to achieve more stable pH control.
These results suggest that pH control engineering remediation schemes can be achieved, although several practical issues still need investigating, such as the feasibility of achieving very small ground mineral sizes. Acknowledgements
This research was supported by SNF 200021_120160. References
Adamson DT, McDade JM, Hughes JB (2003) Inoculation of a DNAPL source zone to initiate reductive dechlorination of PCE. Environmental Science and Technology 37, 2525-2533.
Appelo CAJ, Postma D (2005) ‘Geochemistry, Groundwater and Pollution.’ (AA Balkema: Leiden).
Aulenta F, Majone M, Tandoi V (2006) Enhanced anaerobic bioremediation of chlorinated solvents: Environmental factors influencing microbial activity and their relevance under field conditions. Journal of Chemical Technology and Biotechnology 81, 1463-1474.
Holliger C, Schraa G, Stams AJM, Zehnder AJB (1993) A highly purified enrichment culture couples the reductive dechlorination of tetrachloroethene to growth. Applied and Environmental Microbiology 59, 2991-2997.
McCarty PL, Chu MY, Kitanidis PK (2007) Electron donor and pH relationships for biologically enhanced dissolution of chlorinated solvent DNAPL in groundwater. European Journal of Soil Biology 43, 276-282.
Oolman T, Godard ST, Pope GA, Jin M, Kirchner K (1995) DNAPL flow behavior in a contaminated aquifer – Evaluation of field data. Ground Water Monitoring and Remediation 15, 125-137.
Robinson C, Barry DA (2009) Design tool for estimation of buffer requirement for enhanced reductive dechlorination of chlorinated solvents in groundwater. Environmental Modelling and Software 24, 1332-1338.
Robinson C, Barry DA, McCarty PL, Gerhard JI, Kouznetsova I (2009) pH control for enhanced reductive bioremediation of chlorinated solvent source zones. Science of the Total Environment 407, 4560-4573.
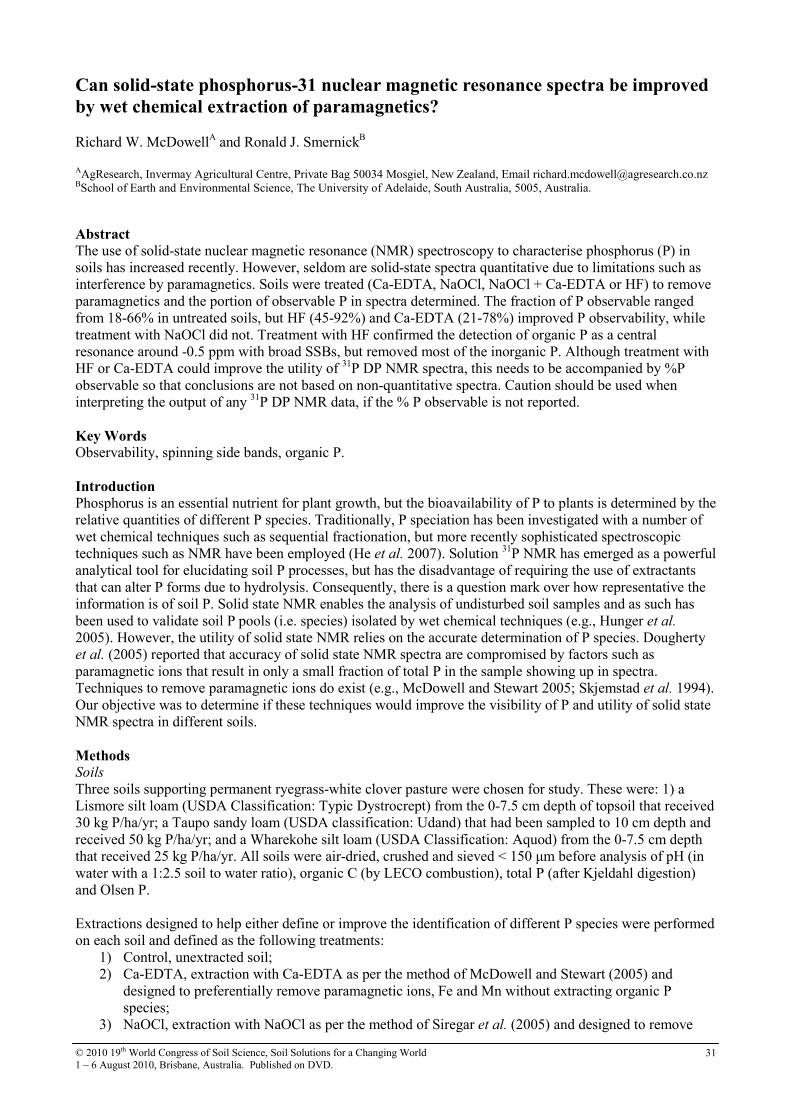
© 2010 19th World Congress of Soil Science, Soil Solutions for a Changing World 1 – 6 August 2010, Brisbane, Australia. Published on DVD.
31
Can solid-state phosphorus-31 nuclear magnetic resonance spectra be improved
by wet chemical extraction of paramagnetics? Richard W. McDowellA and Ronald J. SmernickB
AAgResearch, Invermay Agricultural Centre, Private Bag 50034 Mosgiel, New Zealand, Email [email protected] BSchool of Earth and Environmental Science, The University of Adelaide, South Australia, 5005, Australia.
Abstract
The use of solid-state nuclear magnetic resonance (NMR) spectroscopy to characterise phosphorus (P) in soils has increased recently. However, seldom are solid-state spectra quantitative due to limitations such as interference by paramagnetics. Soils were treated (Ca-EDTA, NaOCl, NaOCl + Ca-EDTA or HF) to remove paramagnetics and the portion of observable P in spectra determined. The fraction of P observable ranged from 18-66% in untreated soils, but HF (45-92%) and Ca-EDTA (21-78%) improved P observability, while treatment with NaOCl did not. Treatment with HF confirmed the detection of organic P as a central resonance around -0.5 ppm with broad SSBs, but removed most of the inorganic P. Although treatment with HF or Ca-EDTA could improve the utility of 31P DP NMR spectra, this needs to be accompanied by %P observable so that conclusions are not based on non-quantitative spectra. Caution should be used when interpreting the output of any 31P DP NMR data, if the % P observable is not reported. Key Words Observability, spinning side bands, organic P. Introduction
Phosphorus is an essential nutrient for plant growth, but the bioavailability of P to plants is determined by the relative quantities of different P species. Traditionally, P speciation has been investigated with a number of wet chemical techniques such as sequential fractionation, but more recently sophisticated spectroscopic techniques such as NMR have been employed (He et al. 2007). Solution 31P NMR has emerged as a powerful analytical tool for elucidating soil P processes, but has the disadvantage of requiring the use of extractants that can alter P forms due to hydrolysis. Consequently, there is a question mark over how representative the information is of soil P. Solid state NMR enables the analysis of undisturbed soil samples and as such has been used to validate soil P pools (i.e. species) isolated by wet chemical techniques (e.g., Hunger et al. 2005). However, the utility of solid state NMR relies on the accurate determination of P species. Dougherty et al. (2005) reported that accuracy of solid state NMR spectra are compromised by factors such as paramagnetic ions that result in only a small fraction of total P in the sample showing up in spectra. Techniques to remove paramagnetic ions do exist (e.g., McDowell and Stewart 2005; Skjemstad et al. 1994). Our objective was to determine if these techniques would improve the visibility of P and utility of solid state NMR spectra in different soils. Methods Soils
Three soils supporting permanent ryegrass-white clover pasture were chosen for study. These were: 1) a Lismore silt loam (USDA Classification: Typic Dystrocrept) from the 0-7.5 cm depth of topsoil that received 30 kg P/ha/yr; a Taupo sandy loam (USDA classification: Udand) that had been sampled to 10 cm depth and received 50 kg P/ha/yr; and a Wharekohe silt loam (USDA Classification: Aquod) from the 0-7.5 cm depth that received 25 kg P/ha/yr. All soils were air-dried, crushed and sieved < 150 µm before analysis of pH (in water with a 1:2.5 soil to water ratio), organic C (by LECO combustion), total P (after Kjeldahl digestion) and Olsen P. Extractions designed to help either define or improve the identification of different P species were performed on each soil and defined as the following treatments:
1) Control, unextracted soil; 2) Ca-EDTA, extraction with Ca-EDTA as per the method of McDowell and Stewart (2005) and
designed to preferentially remove paramagnetic ions, Fe and Mn without extracting organic P species;
3) NaOCl, extraction with NaOCl as per the method of Siregar et al. (2005) and designed to remove
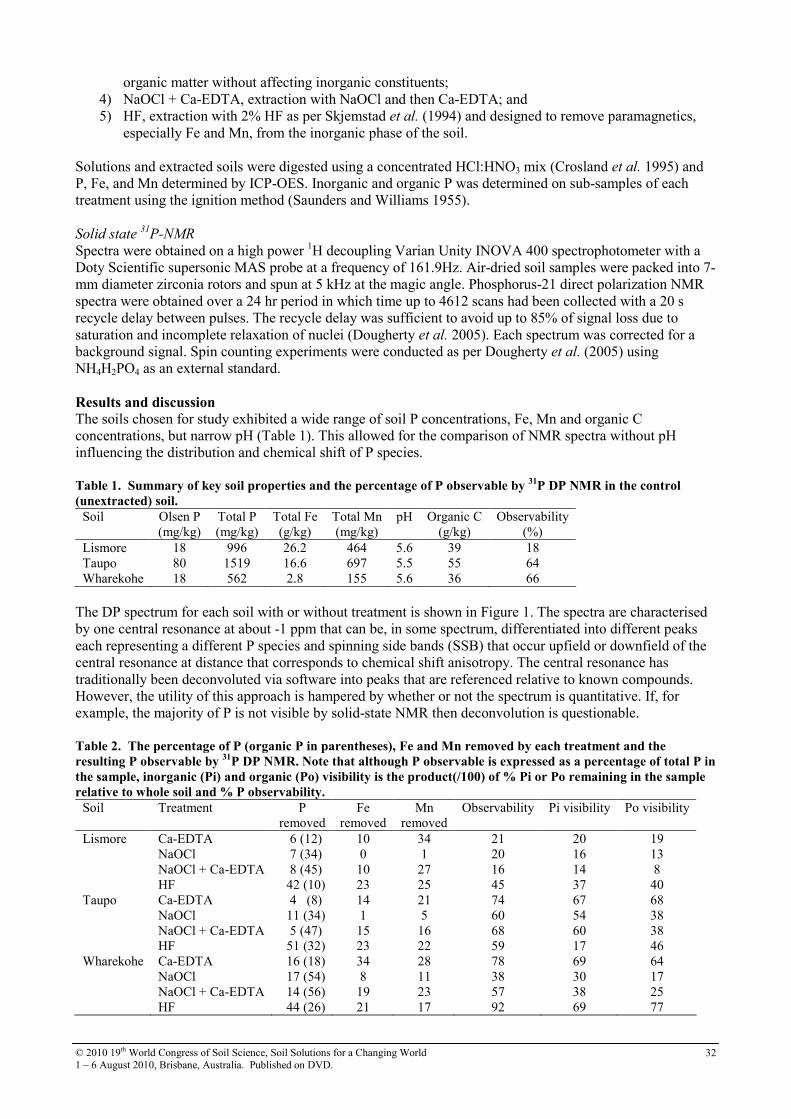
© 2010 19th World Congress of Soil Science, Soil Solutions for a Changing World 1 – 6 August 2010, Brisbane, Australia. Published on DVD.
32
organic matter without affecting inorganic constituents; 4) NaOCl + Ca-EDTA, extraction with NaOCl and then Ca-EDTA; and 5) HF, extraction with 2% HF as per Skjemstad et al. (1994) and designed to remove paramagnetics,
especially Fe and Mn, from the inorganic phase of the soil. Solutions and extracted soils were digested using a concentrated HCl:HNO3 mix (Crosland et al. 1995) and P, Fe, and Mn determined by ICP-OES. Inorganic and organic P was determined on sub-samples of each treatment using the ignition method (Saunders and Williams 1955). Solid state
31P-NMR
Spectra were obtained on a high power 1H decoupling Varian Unity INOVA 400 spectrophotometer with a Doty Scientific supersonic MAS probe at a frequency of 161.9Hz. Air-dried soil samples were packed into 7-mm diameter zirconia rotors and spun at 5 kHz at the magic angle. Phosphorus-21 direct polarization NMR spectra were obtained over a 24 hr period in which time up to 4612 scans had been collected with a 20 s recycle delay between pulses. The recycle delay was sufficient to avoid up to 85% of signal loss due to saturation and incomplete relaxation of nuclei (Dougherty et al. 2005). Each spectrum was corrected for a background signal. Spin counting experiments were conducted as per Dougherty et al. (2005) using NH4H2PO4 as an external standard. Results and discussion
The soils chosen for study exhibited a wide range of soil P concentrations, Fe, Mn and organic C concentrations, but narrow pH (Table 1). This allowed for the comparison of NMR spectra without pH influencing the distribution and chemical shift of P species. Table 1. Summary of key soil properties and the percentage of P observable by
31P DP NMR in the control
(unextracted) soil.
Soil Olsen P (mg/kg)
Total P (mg/kg)
Total Fe (g/kg)
Total Mn (mg/kg)
pH Organic C (g/kg)
Observability (%)
Lismore 18 996 26.2 464 5.6 39 18 Taupo 80 1519 16.6 697 5.5 55 64 Wharekohe 18 562 2.8 155 5.6 36 66
The DP spectrum for each soil with or without treatment is shown in Figure 1. The spectra are characterised by one central resonance at about -1 ppm that can be, in some spectrum, differentiated into different peaks each representing a different P species and spinning side bands (SSB) that occur upfield or downfield of the central resonance at distance that corresponds to chemical shift anisotropy. The central resonance has traditionally been deconvoluted via software into peaks that are referenced relative to known compounds. However, the utility of this approach is hampered by whether or not the spectrum is quantitative. If, for example, the majority of P is not visible by solid-state NMR then deconvolution is questionable. Table 2. The percentage of P (organic P in parentheses), Fe and Mn removed by each treatment and the
resulting P observable by 31
P DP NMR. Note that although P observable is expressed as a percentage of total P in
the sample, inorganic (Pi) and organic (Po) visibility is the product(/100) of % Pi or Po remaining in the sample
relative to whole soil and % P observability.
Soil Treatment P removed
Fe removed
Mn removed
Observability
Pi visibility Po visibility
Lismore Ca-EDTA 6 (12) 10 34 21 20 19 NaOCl 7 (34) 0 1 20 16 13 NaOCl + Ca-EDTA 8 (45) 10 27 16 14 8 HF 42 (10) 23 25 45 37 40 Taupo Ca-EDTA 4 (8) 14 21 74 67 68 NaOCl 11 (34) 1 5 60 54 38 NaOCl + Ca-EDTA 5 (47) 15 16 68 60 38 HF 51 (32) 23 22 59 17 46 Wharekohe Ca-EDTA 16 (18) 34 28 78 69 64 NaOCl 17 (54) 8 11 38 30 17 NaOCl + Ca-EDTA 14 (56) 19 23 57 38 25 HF 44 (26) 21 17 92 69 77
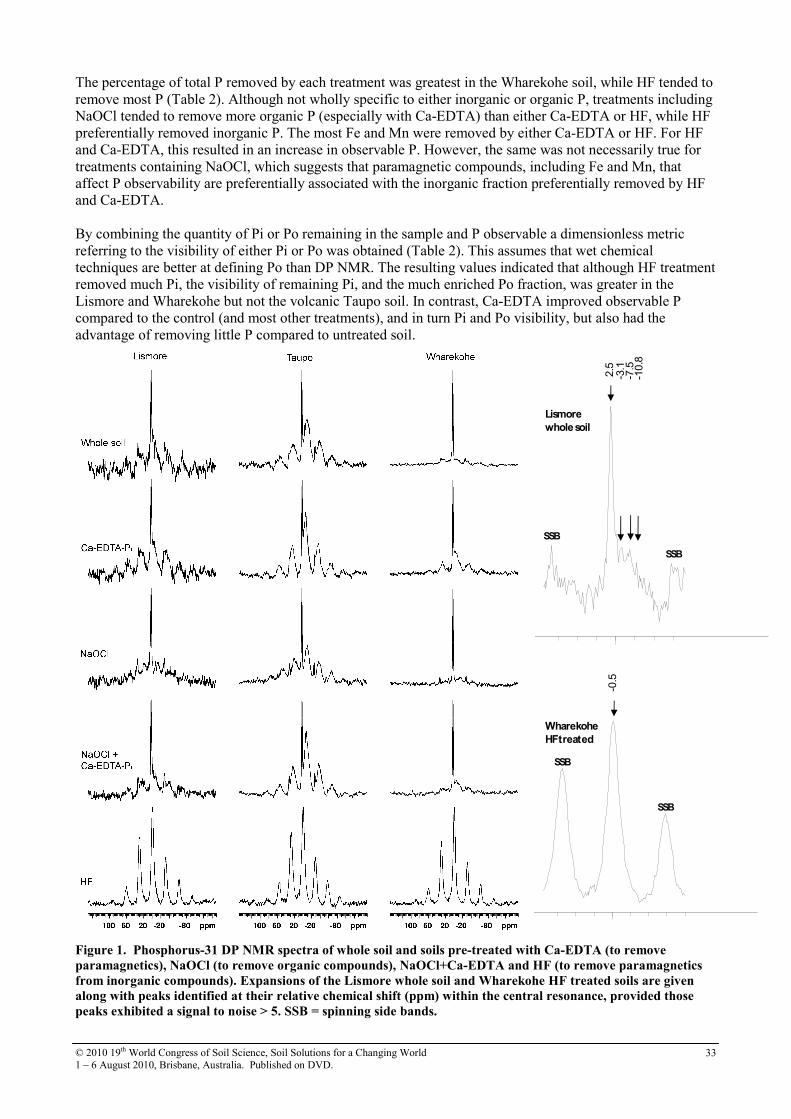
© 2010 19th World Congress of Soil Science, Soil Solutions for a Changing World 1 – 6 August 2010, Brisbane, Australia. Published on DVD.
33
The percentage of total P removed by each treatment was greatest in the Wharekohe soil, while HF tended to remove most P (Table 2). Although not wholly specific to either inorganic or organic P, treatments including NaOCl tended to remove more organic P (especially with Ca-EDTA) than either Ca-EDTA or HF, while HF preferentially removed inorganic P. The most Fe and Mn were removed by either Ca-EDTA or HF. For HF and Ca-EDTA, this resulted in an increase in observable P. However, the same was not necessarily true for treatments containing NaOCl, which suggests that paramagnetic compounds, including Fe and Mn, that affect P observability are preferentially associated with the inorganic fraction preferentially removed by HF and Ca-EDTA. By combining the quantity of Pi or Po remaining in the sample and P observable a dimensionless metric referring to the visibility of either Pi or Po was obtained (Table 2). This assumes that wet chemical techniques are better at defining Po than DP NMR. The resulting values indicated that although HF treatment removed much Pi, the visibility of remaining Pi, and the much enriched Po fraction, was greater in the Lismore and Wharekohe but not the volcanic Taupo soil. In contrast, Ca-EDTA improved observable P compared to the control (and most other treatments), and in turn Pi and Po visibility, but also had the advantage of removing little P compared to untreated soil.
0
0
Lismore
whole soil
Wharekohe
HF treated
SSB
SSB
SSB
SSB
-0.5
2.5
-3.1
-7.5
-10.8
Figure 1. Phosphorus-31 DP NMR spectra of whole soil and soils pre-treated with Ca-EDTA (to remove
paramagnetics), NaOCl (to remove organic compounds), NaOCl+Ca-EDTA and HF (to remove paramagnetics
from inorganic compounds). Expansions of the Lismore whole soil and Wharekohe HF treated soils are given
along with peaks identified at their relative chemical shift (ppm) within the central resonance, provided those
peaks exhibited a signal to noise > 5. SSB = spinning side bands.
© 2010 19th World Congress of Soil Science, Soil Solutions for a Changing World 1 – 6 August 2010, Brisbane, Australia. Published on DVD.
34
The utility of these treatments appear to confirm a coarse speciation or confirmation of P into Pi or Po forms. Our data agreed with that of Dougherty et al. (2005) by confirming that Po, enriched in the HF treated soil, appeared to have SSB that were much broader compared to spectra dominated by sharp peaks in the central resonance - characteristic of Pi (Figure 1). In a recent spectral analysis of dairy manure, He et al. (2009) also showed that SSB were more pronounced in samples after extraction with either water or sodium acetate. However, no consideration was given of the observability or visibility of P within the sample. Given the use of solid state NMR as a technique to confirm other wet chemical techniques, it is important that peak allocations of P species be correct. Generally, it is good practice to assign a peak to a P species only if the signal to noise ratio is greater than 5. The sample most likely to be quantitative was the Wharekohe HF treated soil (92% observable). However, in this sample only one peak at -0.5 ppm could be assigned (signal to noise ratio of 25). In contrast, several peaks with signal to noise ratios > 5 were able to be separated using deconvolution software on the spectrum of the Lismore untreated soil, but only 18% of P was detectable by the NMR (Figure 1). A similar distribution of peaks was evident for the Taupo and Wahrekohe control soils, but the observability of P, and likelihood for quantitative data, in these samples was greater. This work highlights the potential for inaccurate conclusions if factors such as observable P are not taken into account. Conclusion Treatment of soils with Ca-EDTA, NaOCl, NaOCl + Ca-EDTA or HF to remove paramagnetics and improve the quantitation of solid state NMR spectra yielded mixed results. In general, the NaOCl treatments preferentially removed Po, but did not improve the detection (via spin counting) of P by the NMR. Treatment with HF and Ca-EDTA improved P observability compared to the original soil and for HF, confirmed the detection of Po as a central resonance around -0.5 ppm with broad SSBs. The low quantity of P removed and improvement in observability suggests that treatment with Ca-EDTA may be of benefit in generating quantitative data, but requires additional work. We conclude that there is some potential for treatments to improve the quantitation of 31P DP NMR spectra, but caution should be used when interpreting the output of any 31P DP NMR data if the % P observable is not reported. References
Crosland AR, Zhao FJ, McGrath SP, Lane PW (1995) Comparison of aqua regia digestion with sodium carbonate fusion for the determination of total phosphorus in soils by inductively coupled plasma atomic emission spectroscopy (ICP). Communications in Soil Science and Plant Analysis 26, 1357-1368.
Dougherty WJ, Smernick RJ, Chittleborough DJ (2005) Application of spin counting to the solid-state 31P NMR analysis of pasture soils with varying phosphorus content. Soil Science Society of America Journal
69, 2058-2070.
He Z, Honeycutt W, Xing B, McDowell RW, Pellechia PJ, Zhang T (2007) Solid-state Fourier transform infrared and 31P nuclear magnetic resonance spectral features of phosphate compounds. Soil Science 172, 501-515.
He Z, Honeycutt WC, Griffin TS, Cade-Menun BJ, Pellechia PJ, Dou Z (2009) Phosphorus forms in conventional and organic dairy manure identified by solution and solid state P-31 NMR spectroscopy. Journal of Environmental Quality 38, 1909-1918.
Hunger S, Sims J, Sparks DL (2005) How accurate is the assessment of phosphorus pools in poultry litter by sequential extraction. Journal of Environmental Quality 34, 382-389.
McDowell RW, Stewart I (2005) An improved technique for the determination of organic phosphorus in sediment and soils by 31P nuclear magnetic resonance spectroscopy. Chemistry and Ecology 21, 11-22.
Saunders WMH, Williams EG (1955) Observations on the determination of total organic phosphorus in soils. Journal of Soil Science 6, 254-267.
Siregar A, Kleber M, Mikutta R, Jahn R (2005) Sodium hypochlorite oxidation reduces soil organic matter concentrations without affecting inorganic soil constituents. European Journal of Soil Science 56, 481-490.
Skjemstad JO, Clarke P, Taylor JA, Oades JM, Newman RH (1994) The removal of magnetic materials from surface soils. A solid state 13C CP/MAS n.m.r. study. Australian Journal of Soil Research 32, 1215-1229.
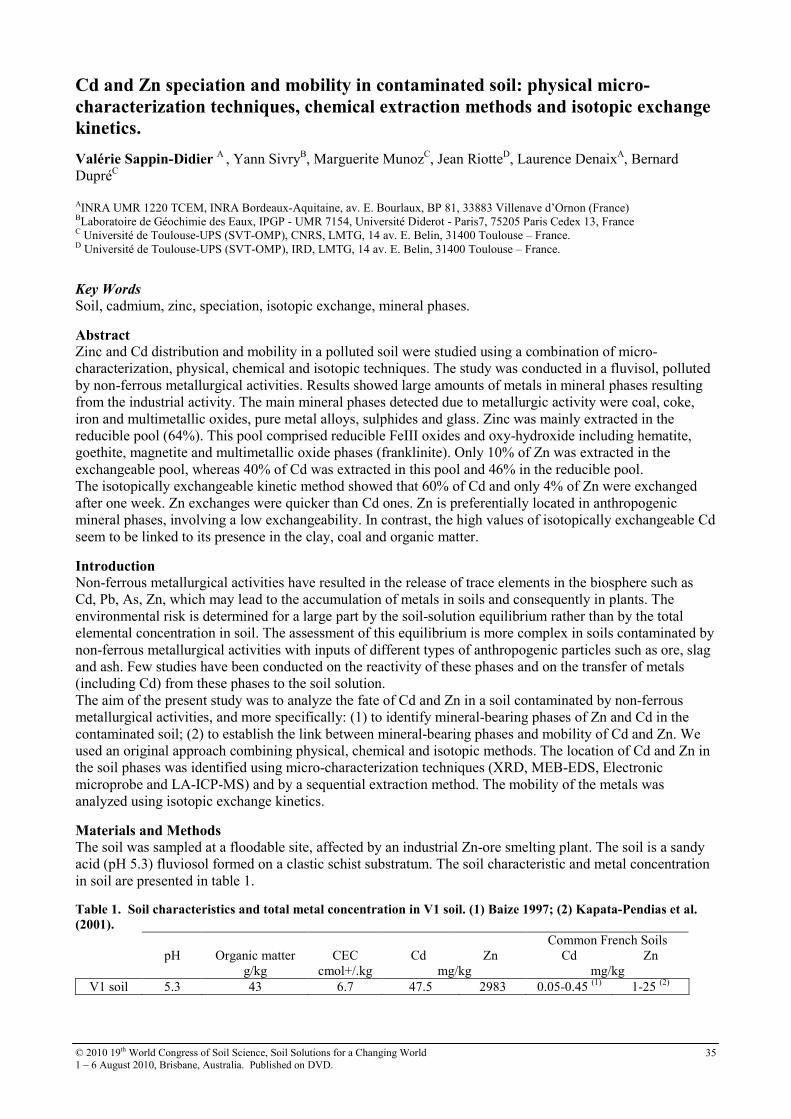
© 2010 19th World Congress of Soil Science, Soil Solutions for a Changing World 1 – 6 August 2010, Brisbane, Australia. Published on DVD.
35
Cd and Zn speciation and mobility in contaminated soil: physical micro-
characterization techniques, chemical extraction methods and isotopic exchange
kinetics.
Valérie Sappin-Didier A , Yann SivryB, Marguerite MunozC, Jean RiotteD, Laurence DenaixA, Bernard DupréC
AINRA UMR 1220 TCEM, INRA Bordeaux-Aquitaine, av. E. Bourlaux, BP 81, 33883 Villenave d’Ornon (France) BLaboratoire de Géochimie des Eaux, IPGP - UMR 7154, Université Diderot - Paris7, 75205 Paris Cedex 13, France C Université de Toulouse-UPS (SVT-OMP), CNRS, LMTG, 14 av. E. Belin, 31400 Toulouse – France. D Université de Toulouse-UPS (SVT-OMP), IRD, LMTG, 14 av. E. Belin, 31400 Toulouse – France.
Key Words
Soil, cadmium, zinc, speciation, isotopic exchange, mineral phases.
Abstract Zinc and Cd distribution and mobility in a polluted soil were studied using a combination of micro-characterization, physical, chemical and isotopic techniques. The study was conducted in a fluvisol, polluted by non-ferrous metallurgical activities. Results showed large amounts of metals in mineral phases resulting from the industrial activity. The main mineral phases detected due to metallurgic activity were coal, coke, iron and multimetallic oxides, pure metal alloys, sulphides and glass. Zinc was mainly extracted in the reducible pool (64%). This pool comprised reducible FeIII oxides and oxy-hydroxide including hematite, goethite, magnetite and multimetallic oxide phases (franklinite). Only 10% of Zn was extracted in the exchangeable pool, whereas 40% of Cd was extracted in this pool and 46% in the reducible pool. The isotopically exchangeable kinetic method showed that 60% of Cd and only 4% of Zn were exchanged after one week. Zn exchanges were quicker than Cd ones. Zn is preferentially located in anthropogenic mineral phases, involving a low exchangeability. In contrast, the high values of isotopically exchangeable Cd seem to be linked to its presence in the clay, coal and organic matter.
Introduction Non-ferrous metallurgical activities have resulted in the release of trace elements in the biosphere such as Cd, Pb, As, Zn, which may lead to the accumulation of metals in soils and consequently in plants. The environmental risk is determined for a large part by the soil-solution equilibrium rather than by the total elemental concentration in soil. The assessment of this equilibrium is more complex in soils contaminated by non-ferrous metallurgical activities with inputs of different types of anthropogenic particles such as ore, slag and ash. Few studies have been conducted on the reactivity of these phases and on the transfer of metals (including Cd) from these phases to the soil solution. The aim of the present study was to analyze the fate of Cd and Zn in a soil contaminated by non-ferrous metallurgical activities, and more specifically: (1) to identify mineral-bearing phases of Zn and Cd in the contaminated soil; (2) to establish the link between mineral-bearing phases and mobility of Cd and Zn. We used an original approach combining physical, chemical and isotopic methods. The location of Cd and Zn in the soil phases was identified using micro-characterization techniques (XRD, MEB-EDS, Electronic microprobe and LA-ICP-MS) and by a sequential extraction method. The mobility of the metals was analyzed using isotopic exchange kinetics.
Materials and Methods
The soil was sampled at a floodable site, affected by an industrial Zn-ore smelting plant. The soil is a sandy acid (pH 5.3) fluviosol formed on a clastic schist substratum. The soil characteristic and metal concentration in soil are presented in table 1.
Table 1. Soil characteristics and total metal concentration in V1 soil. (1) Baize 1997; (2) Kapata-Pendias et al.
(2001).
Common French Soils pH Organic matter CEC Cd Zn Cd Zn g/kg cmol+/.kg mg/kg mg/kg
V1 soil 5.3 43 6.7 47.5 2983 0.05-0.45 (1) 1-25 (2)
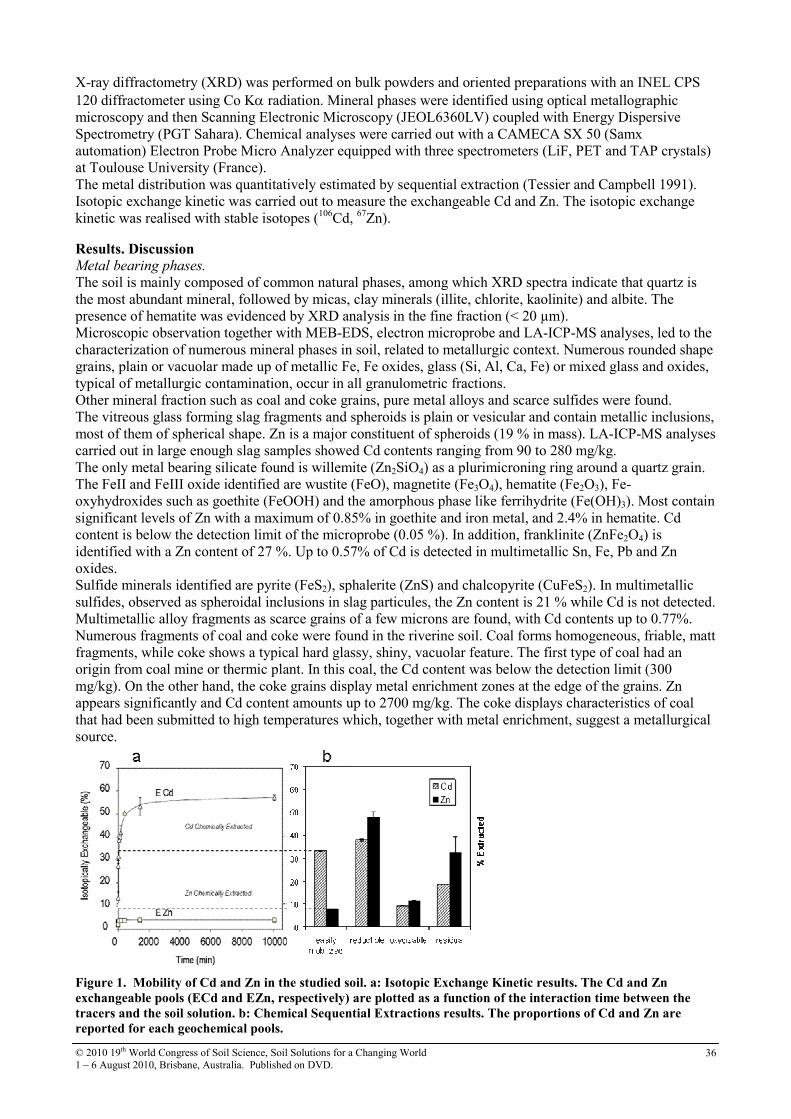
© 2010 19th World Congress of Soil Science, Soil Solutions for a Changing World 1 – 6 August 2010, Brisbane, Australia. Published on DVD.
36
X-ray diffractometry (XRD) was performed on bulk powders and oriented preparations with an INEL CPS 120 diffractometer using Co Kα radiation. Mineral phases were identified using optical metallographic microscopy and then Scanning Electronic Microscopy (JEOL6360LV) coupled with Energy Dispersive Spectrometry (PGT Sahara). Chemical analyses were carried out with a CAMECA SX 50 (Samx automation) Electron Probe Micro Analyzer equipped with three spectrometers (LiF, PET and TAP crystals) at Toulouse University (France). The metal distribution was quantitatively estimated by sequential extraction (Tessier and Campbell 1991). Isotopic exchange kinetic was carried out to measure the exchangeable Cd and Zn. The isotopic exchange kinetic was realised with stable isotopes (106Cd, 67Zn).
Results. Discussion
Metal bearing phases.
The soil is mainly composed of common natural phases, among which XRD spectra indicate that quartz is the most abundant mineral, followed by micas, clay minerals (illite, chlorite, kaolinite) and albite. The presence of hematite was evidenced by XRD analysis in the fine fraction (< 20 µm). Microscopic observation together with MEB-EDS, electron microprobe and LA-ICP-MS analyses, led to the characterization of numerous mineral phases in soil, related to metallurgic context. Numerous rounded shape grains, plain or vacuolar made up of metallic Fe, Fe oxides, glass (Si, Al, Ca, Fe) or mixed glass and oxides, typical of metallurgic contamination, occur in all granulometric fractions. Other mineral fraction such as coal and coke grains, pure metal alloys and scarce sulfides were found. The vitreous glass forming slag fragments and spheroids is plain or vesicular and contain metallic inclusions, most of them of spherical shape. Zn is a major constituent of spheroids (19 % in mass). LA-ICP-MS analyses carried out in large enough slag samples showed Cd contents ranging from 90 to 280 mg/kg. The only metal bearing silicate found is willemite (Zn2SiO4) as a plurimicroning ring around a quartz grain. The FeII and FeIII oxide identified are wustite (FeO), magnetite (Fe3O4), hematite (Fe2O3), Fe-oxyhydroxides such as goethite (FeOOH) and the amorphous phase like ferrihydrite (Fe(OH)3). Most contain significant levels of Zn with a maximum of 0.85% in goethite and iron metal, and 2.4% in hematite. Cd content is below the detection limit of the microprobe (0.05 %). In addition, franklinite (ZnFe2O4) is identified with a Zn content of 27 %. Up to 0.57% of Cd is detected in multimetallic Sn, Fe, Pb and Zn oxides. Sulfide minerals identified are pyrite (FeS2), sphalerite (ZnS) and chalcopyrite (CuFeS2). In multimetallic sulfides, observed as spheroidal inclusions in slag particules, the Zn content is 21 % while Cd is not detected. Multimetallic alloy fragments as scarce grains of a few microns are found, with Cd contents up to 0.77%. Numerous fragments of coal and coke were found in the riverine soil. Coal forms homogeneous, friable, matt fragments, while coke shows a typical hard glassy, shiny, vacuolar feature. The first type of coal had an origin from coal mine or thermic plant. In this coal, the Cd content was below the detection limit (300 mg/kg). On the other hand, the coke grains display metal enrichment zones at the edge of the grains. Zn appears significantly and Cd content amounts up to 2700 mg/kg. The coke displays characteristics of coal that had been submitted to high temperatures which, together with metal enrichment, suggest a metallurgical source.
Figure 1. Mobility of Cd and Zn in the studied soil. a: Isotopic Exchange Kinetic results. The Cd and Zn
exchangeable pools (ECd and EZn, respectively) are plotted as a function of the interaction time between the
tracers and the soil solution. b: Chemical Sequential Extractions results. The proportions of Cd and Zn are
reported for each geochemical pools.
© 2010 19th World Congress of Soil Science, Soil Solutions for a Changing World 1 – 6 August 2010, Brisbane, Australia. Published on DVD.
37
Geochemical pool
The metal distribution has been quantitatively estimated by a sequential extraction procedure to discriminate between heavy metals (1) easily mobilizable (water-soluble, exchangeable and acido-soluble) (2) reducible pool, (3) oxidizable pool and (4) residual pool (Figure 1b). The chemical extraction provides additional information on metal scavenging or affinities when considering the cumulated amounts for each geochemical pool. The (1) pool represents 41 % and 10.4% of total Cd and Zn, respectively. Contaminants may be adsorbed on iron oxide and oxy-hydroxide phases identified in this soil. The contribution of weak-bond sites on other particles such as coal, coke and vitreous spheroids should be taken into account. According to Arpa et al. (2000), it would be an efficient metal scavenging via ion exchange with carboxylic acid and phenolic hydroxyl functional groups on its surface. The large discrepancy between Cd and other metals (1% of As, Pb, Sn extracted) suggests that the way of Cd contamination may have been different from other metals: part of Cd was probably brought under dissolved form whereas other metals were included in particles. The (1) pool may correspond to metal adsorbed on clays (kaolinite, illite and chlorite), thanks to exchangeable interfoliaceous cations/high surface charges. The (2) pool was constituted of 3 steps. The 1st step extracts theoretically the Mn oxides, the 2nd step extracts amorpheous iron oxy-hydroxides and the 3rd step the crystallised oxides. During the 1st step, 20% of Mn and 0.2 % of Fe were extracted. The 2nd and 3rd steps extract 19 and 21 % of Fe, respectivelly, and 22 and 12 % of Mn, respectivelly. Cd is released at 1st step (16%), but also in similar proportions as Mn in 2nd and 3rd steps (13% and 9 % respectively). This suggests that Cd is linked to the Mn oxides, either adsorbed or incorporated in their structure. Finally, the (2) pool contains the largest amounts of Cd and Zn, with 38 and 48 %, respectively. It concerns metal included on FeIII oxides and oxy-hydroxides detected in this soil (goethite, hematite, franklinite and magnetite) and also likely the multimetallic oxide phases, in which up to 5700 mg/kg of Cd was detected. The (3) pool represents only 11.5 and 15.4 % of Cd and Zn, respectively. It corresponds to metallic elements complexed with organic matter, associated with sulphides and other reduced phases such as FeII oxides, pure metal phases and alloys. These latter might significantly contribute to this pool since they contain up to 7700 mg/kg of Cd. Very small amounts of Cd and Zn are present in the (4) pool.
The exchange kinetic is very different between Cd and Zn (Figure 1a). The amount of Cd isotopically exchanged increased exponentially during the first day, to reach ~60% of the total Cd after one week. Equilibrium was not fully reached, which implies that maybe all the exchangeable Cd was not quantified. In other words, isotopically exchangeable Cd represents probably slightly more than 60% of total Cd. The amount of isotopically exchangeable Zn was strongly lower than that of Cd (4% of the total Zn) and the equilibrium value was reached before the end of the first day. Cd and Zn isotopic exchange kinetics are also very differents. During the first 30 minutes, the ECd value reaches 55% of the total exchangeable pool (i.e. 32 % of total Cd), whereas EZn reaches up to 78% of this pool during this same time. Then, Zn exchanges are smaller but faster than Cd exchanges in this soil. In comparison to the sequential extractions results, it appears that the proportion of exchangeable Zn is slightly lower than the easily mobilized Zn (pool 1). On the contrary, the amount of isotopically exchangeable Cd is higher than the Cd easily mobilized (pool 1). Thus, the isotopically exchangeable Cd not only takes into account the Cd mobilized (pool 1), but also part of reducible pool. This result is consistent to that of Ahnstrom and Parker (2001), who show the absence of any direct correspondence between the Cd fractions determined by the sequential extraction and the IE Cd. These authors argue that the soluble/exchangeable, sorbed/carbonate and oxidizable fractions measured by the sequential extractions contribute to the measure of IE Cd. The assumption is that the isotopically exchangeable Cd takes into account the Cd in pool 1 and part of Cd extracted in the pools 2 and 3.
Conclusion The combination of physical characterization techniques and chemical analyses in a polluted soil has helped to connect the low proportion of chemically exchangeable Zn to the anthropogenic origin of Zn bearing mineral phases. Zinc is localized in reducible phases (franklinite, multimetallic oxide, Fe oxide). It is much mobilized and exchangeable (4%). In contrast, Cd is highly exchangeable in this soil, s shown by chemical extractions and isotopic exchanges. The cadmium was detected in 4 mineral phases: coke, alloys multimetallic, multimetallic oxides and slag glass. But its distribution on clay and organic matter may explain the fastness of exchanges.

© 2010 19th World Congress of Soil Science, Soil Solutions for a Changing World 1 – 6 August 2010, Brisbane, Australia. Published on DVD.
38
References
Ahnstrom ZAS, Parker D (2001) Cadmium reactivity in metal-contaminated soils using a coupled stable isotope dilution-sequential extraction. Envrironment Science and Technologie 35, 121-126.
Baize D (1997) Teneurs totales en éléments traces métalliques dans les sols (France). (Ed. INRA: Paris) 410p.
Kabata-Pendias A, Pendias H (2001) Trace Elements in Soils and Plants (Boca Raton,Florida, USA)
Tessier A, P Campbell (1991) Comment on pitfalls of sequential extraction. Water Research 25, 115-117.
© 2010 19th World Congress of Soil Science, Soil Solutions for a Changing World 1 – 6 August 2010, Brisbane, Australia. Published on DVD.
39
Chemistry of trace and heavy metals in bauxite residues (red mud) from
Western Australia Markus GräfeA, Matthew LandersA, Ryan TapperoB, Craig KlauberA, Grace HutomoA, Bee GanA, Alton GrabschA, Peter AustinA, and Ian DaviesA
ACSIRO-Processing Scie nce & Engineering, Australian Minerals Research Centre, 7 Conlon Street, Waterford – WA, 6122, Australia. BBeamline X-27A, National Synchrotron Light Source, Brookhaven National Laboratory, 75 Brookhaven, Bldg. 725B, Upton – New York, 11973-5000 USA.
Introduction Bauxite residue is a mineral slurry left behind after extracting alumina from bauxitic ores using the Bayer process. Bauxite residues are strongly alkaline, have a high salt content and electrical conductivity (EC) dominated by sodium (Na+), and its constituent particles are compacted upon drying imparting a high bulk density. By the year 2000, the alumina industry had produced circa 2 billion tons (Bt) of bauxite residue and is estimated to reach the 4 Bt mark at its current production rate by 2015 (Power et al. 2009). Amongst refiners and stakeholders of alumina refineries, it is well accepted that continued production of alumina is dependent upon a reliable, long-term disposal system for bauxite residues. Therefore, significant efforts have been undertaken over the past 25 years to find suitable utilization options, other than storage. In particular, utilization as a soil amendment or conversion into soil are high priority as they would enable a high-tonnage end-use outside of existing bauxite residue disposal areas (Klauber and Gräfe 2009). For many bauxite residues, trace metals can be of concern and may exceed regulatory levels in certain circumstances (Goldstein and Reimers 1999; Anon 2000; Kutle et al. 2004). Some bauxite residues may emit ionising radiation above natural background rates due to the presence of naturally occurring radioactive materials (NORMs): 238U and/or 228, 230, 232Th and members of their decay chains (Bardossy and Aleva 1990; Pinnock 1991; von Philipsborn and Kuhnast 1992; Wong and Ho 1993; McPharlin et al. 1994; Cooper et al. 1995; Somlai et al. 2008). Little is known about the speciation of various metals and NORMs in bauxite residues, particularly with regard to pH neutralisation and the accompanying changes in the mineral and solution phases (Patel et al. 1986; Goldstein and Reimers 1999; Kutle et al. 2004). Potentially toxic metals and NORMs arise via the original bauxite, therefore, bauxite residues from different bauxitic ores are likely to vary in type and concentration of respective metal species. Thus, any single study is limited in its scope to the origin of the bauxite and the processing conditions at a particular alumina refinery. In this study, we are investigating bauxite residue from an alumina refiner processing Darling Range (Western Australia) bauxite in a low temperature (~ 145oC) digest. Aims and Objectives
The aim of this study is to provide a comprehensive description of the speciation of potentially toxic metals and NORMs and their mineralogical settings. To achieve this, the objectives are to determine the mineralogy of untreated and treated bauxite residues employing a suite of techniques including quantitative X-ray diffraction, optical microscopy, QEMScan (quantitative evaluation of mineralogy by scanning electron microscopy) and TEM. A synchrotron-based X-ray microprobe (X27A, National Synchrotron Light Source, Brookhaven National Laboratory, Upton, New York) is used to overcome detection limits using the conventional techniques and to determine the chemical speciation of various metals and NORMS using X-ray absorption fine structure (µXAFS) spectroscopy at the micrometer scale. In this study we will show results of untreated bauxite residues from dust development experiments probed at three depths in drained and non-drained residue drying configurations. Results from conventional laboratory analyses
The untreated bauxite residue, expressed as oxide wt %, were composed of primarily iron (56 wt %), aluminium (15 wt %), sodium (3.8 wt %), titanium (4.5 wt %), silica (5.0 wt %) and calcium (1.25 wt %). The potentially harmful metals in these samples are, inter alia, V (1270 mg/kg), Cr (615 mg/kg), Ga (90 mg/kg), As (35 mg/kg), Th (30 mg/kg) and U (3 mg/kg). Quantitative X-ray diffraction analysis (Figure 1) revealed that the samples are circa 50 % X-ray amorphous. The crystalline constituents are composed of up to 80% goethite and hematite, some quartz (3-5 wt%), rutile/anatase and ilmenite (1-2 wt %) and many minor phases remnant from the original bauxite ore (e.g., mica, boehmite) and some newly formed under the

© 2010 19th World Congress of Soil Science, Soil Solutions for a Changing World 1 – 6 August 2010, Brisbane, Australia. Published on DVD.
40
conditions of the Bayer process (e.g., natroalunite, noselite). Upon contact with water, these solids will impart a pH of circa 12.8.
Figure 1. Quantitative X-ray diffraction analysis of core segments 7-1, 7-5 and 7-10 using the Rietveld method.
Corundum was used as internal standard (~10 wt %). On average, each sample contained approximately 50 wt
% X-ray amorphous phases. Of the 50 % X-ray crystalline material, 40-50% is goethite and 20-30 % is hematite.
Both Fe-oxide phases display displacement of XRD reflections to higher degree 2 theta values indicating
isomorphous substitution of Fe by a smaller cation in the octahedral cavity. The remaining phases are present at
less than 5 wt %.
QEMScan and optical microscopy analyses of the micron size fraction show intimate associations of Fe, Al and Ti oxide particles existing as adjacent layers to each other, which are easily identifiable with an optical microscope (Figure 2). The QEMScan analysis suggests that these layers are composed of hematite, goethite, boehmite, and un-identifiable AlFeTi and AlFeTiSi rich oxides. These particles are remnants from the undissolved bauxite ore, while the sub-micron particles cement these larger particles into massive, hard agglomerates. Transmission electron microscopy with EDS and selected area electron diffraction (SAED) revealed that the cementing agents are between 5 and 20 nm in size, do not diffract, and are composed primarily of Fe with minor elemental contents of Al, Ti, Si, Ca and V.
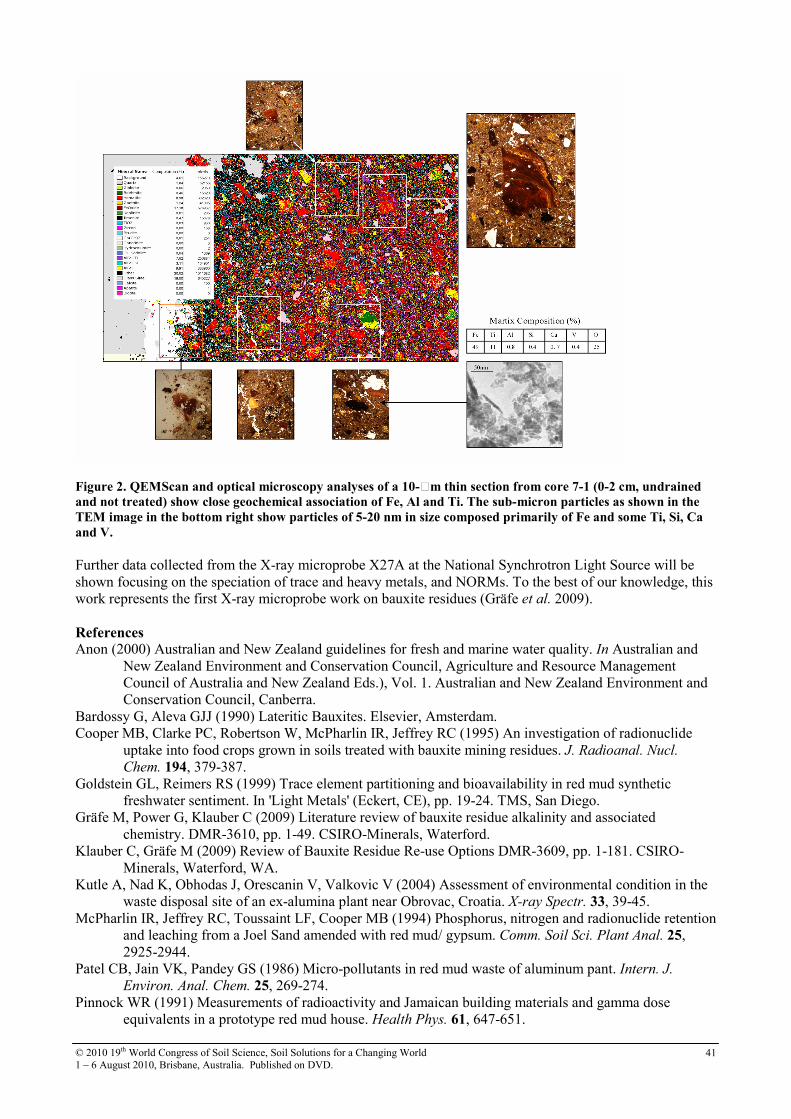
© 2010 19th World Congress of Soil Science, Soil Solutions for a Changing World 1 – 6 August 2010, Brisbane, Australia. Published on DVD.
41
Figure 2. QEMScan and optical microscopy analyses of a 10-m thin section from core 7-1 (0-2 cm, undrained
and not treated) show close geochemical association of Fe, Al and Ti. The sub-micron particles as shown in the
TEM image in the bottom right show particles of 5-20 nm in size composed primarily of Fe and some Ti, Si, Ca
and V.
Further data collected from the X-ray microprobe X27A at the National Synchrotron Light Source will be shown focusing on the speciation of trace and heavy metals, and NORMs. To the best of our knowledge, this work represents the first X-ray microprobe work on bauxite residues (Gräfe et al. 2009). References Anon (2000) Australian and New Zealand guidelines for fresh and marine water quality. In Australian and
New Zealand Environment and Conservation Council, Agriculture and Resource Management Council of Australia and New Zealand Eds.), Vol. 1. Australian and New Zealand Environment and Conservation Council, Canberra.
Bardossy G, Aleva GJJ (1990) Lateritic Bauxites. Elsevier, Amsterdam. Cooper MB, Clarke PC, Robertson W, McPharlin IR, Jeffrey RC (1995) An investigation of radionuclide
uptake into food crops grown in soils treated with bauxite mining residues. J. Radioanal. Nucl. Chem. 194, 379-387.
Goldstein GL, Reimers RS (1999) Trace element partitioning and bioavailability in red mud synthetic freshwater sentiment. In 'Light Metals' (Eckert, CE), pp. 19-24. TMS, San Diego.
Gräfe M, Power G, Klauber C (2009) Literature review of bauxite residue alkalinity and associated chemistry. DMR-3610, pp. 1-49. CSIRO-Minerals, Waterford.
Klauber C, Gräfe M (2009) Review of Bauxite Residue Re-use Options DMR-3609, pp. 1-181. CSIRO-Minerals, Waterford, WA.
Kutle A, Nad K, Obhodas J, Orescanin V, Valkovic V (2004) Assessment of environmental condition in the waste disposal site of an ex-alumina plant near Obrovac, Croatia. X-ray Spectr. 33, 39-45.
McPharlin IR, Jeffrey RC, Toussaint LF, Cooper MB (1994) Phosphorus, nitrogen and radionuclide retention and leaching from a Joel Sand amended with red mud/ gypsum. Comm. Soil Sci. Plant Anal. 25, 2925-2944.
Patel CB, Jain VK, Pandey GS (1986) Micro-pollutants in red mud waste of aluminum pant. Intern. J. Environ. Anal. Chem. 25, 269-274.
Pinnock WR (1991) Measurements of radioactivity and Jamaican building materials and gamma dose equivalents in a prototype red mud house. Health Phys. 61, 647-651.

© 2010 19th World Congress of Soil Science, Soil Solutions for a Changing World 1 – 6 August 2010, Brisbane, Australia. Published on DVD.
42
Power G, Gräfe M, Klauber C (2009) Review of Current Bauxite Residue Management, Disposal and Storage: Practices, Engineering and Science. DMR-3608, pp. 44. CSIRO-Minerals, Waterford.
Somlai J, Jobbagy V, Kovacs J, Tarjan S, Kovacs T (2008) Radiological aspects of the usability of red mud as building material additive. J. Haz. Mat. 150, 541-545.
von Philipsborn H, Kuhnast E (1992) Gamma-spectrometric characterization of industrially used African and Australian bauxites and their red mud tailings. Rad. Protect. Dosim. 45, 741-744.
Wong JWC, Ho GE (1993) Use of waste gypsum in the revegetation on red mud deposits-A greenhouse study. Waste Manag. Res. 11, 249-256.
© 2010 19th World Congress of Soil Science, Soil Solutions for a Changing World 1 – 6 August 2010, Brisbane, Australia. Published on DVD.
43
Denitrification in a Chinampa soil of Mexico City as affected by
methylparathion Blanco-Jarvio A.
a, Chávez-López C. a, Luna-Guido M. b, Dendooven L. b, Cabirol Nc,*
a Instituto de Ingeniería, Coordinación de Bioprocesos ambientales, Universidad Nacional Autónoma de México (UNAM), Mexico city, b Laboratorio de Ecologia de Suelos, GIB, Cinvestav, Mexico City, c Facultad de Ciencias, Departamento de Biología Celular, Universidad Nacional Autónoma de México (UNAM), Mexico City.
Abstract Chinampas are raised garden beds used for agriculture in the southeastern part of the Valley of Mexico since pre-Hispanic times. In modern times, large amounts of pesticides, such as methylparathion, have been used with an unknown effect on soil processes, such as denitrification and the ratio of N2O-to-N2. Soil from a Chinampa was amended with nitrate (NO3
-) with or without chloramphenicol known to inhibit de novo synthesis of enzymes, with or without acetylene (C2H2) known to inhibit the reduction of nitrous oxide (N2O) to dinitrogen (N2) and spiked with or without methylparathion. Methylparathion increased the concentration of NO2
- and removal of NO3- from soil, but increased the emission of N2O and N2. The concentration of NO2
-
, the removal of NO3- production, and the N2O and N2 emission rates were generally larger when the aerobic
conditioning of the soil was less than 14 days. It was found that methylparathion increased the denitrification process and showed no inhibitory effects on emissions of N2O or N2.
Key words
Chloramphenicol; dynamics of mineral N; nitrous oxide to dinitrogen ratio; organophosphorous pesticide Introduction In Xochimilco (Mexico City), agriculture is done in a unique way called ‘Chinampa’ since pre-Hispanic times. Chinampa is a pre-Columbian form of agriculture whereby sediment from canals is collected regularly and applied to human-made islands forming raised garden beds called chinampas. They contributed greatly to the development of indigenous cultures that occupied the southeastern part of the Valley of Mexico, i.e. Tenochtitlan. The soils are deep and discontinuous and due to the human influence some authors classify them as Anthrosols (INECOL 2002). Chinampas are intensively cultivated whereby different pesticides, such as clorpiriphos, methylparathion, malathion, lindane and atrazine, are used in large quantities (CICOPLAFEST 2008). Little information is available how methylparathion might affect soil processes. However, Zhang et al. (2006) found that in a soil contaminated with methylparathion the diversity and structure of microbial communities changed. Negative effects on non-targeted soil microorganisms have been reported when pesticides are applied and microbial activity and diversity is reduced in soil (Johnsen et al. 2001; Locke and Zablotowicz 2004; IPCC 2007b). Nevertheless, other studies found that fumigation increased organic matter degradation rates (Locke and Zablotowicz 2004). Recently, it has been reported that fumigation with pesticides increased nitrous oxide (N2O) emissions (Spokas and Wang 2003; Spokas et al. 2005; Spokas et al. 2006). This suggests that pesticides might affect the denitrification process. However, little information exists about how these pesticides might affect the gaseous products of the denitrification process, i.e. the N2O-to-N2 ratio. Denitrification is a respiratory microbial process by which oxides of nitrogen serve as electron acceptors for respiratory electron transport in anaerobic conditions. As a result nitrate (NO3
-) is reduced to nitrite (NO2-)
and then gaseous products mainly N2O and dinitrogen (N2) (Knowles 1982; Simek et al. 2000). Denitrification has been studied intensively as it is an important contributor to the emission of N2O. N2O is a strong greenhouse gas with a global warming potential that is 300 times more powerful than carbon dioxide (for time horizon of 100 years) (IPCC 2001).
De novo synthesis of the reductases involved in denitrification process is inhibited by chloramphenicol while acetylene (C2H2) inhibits the activity of nitrous oxide reductase (Smith and Tiedje 1979). As such, the N2O-to-N2 ratio of the denitrification process can be determined when C2H2 is used while chloramphenicol at low
© 2010 19th World Congress of Soil Science, Soil Solutions for a Changing World 1 – 6 August 2010, Brisbane, Australia. Published on DVD.
44
concentrations allows to study the denitrification capacity of the soil upon sampling (Knowles 1982; Pell et al. 1996). The objective of this study was to determine the effect of the pesticide methylparathion on dynamics of the denitrification process in a Chinampa soil using acetylene and chloramphenicol as selective inhibitors.
Methods Soil samples were collected in the Chinampa of Xochimilco in San Gregorio Atlapulco (Xochimilco, Mexico City, Mexico). As part of a study into the effects of methylparathion on soil processes one Chinampa soil was sampled. The sampling site of 4500 m2 was divided in three equal plots. Soil was sampled by augering the 0-15 cm layer of the three plots with a stony soil auger diameter 7 cm (Eijkelkamp, Nl). The soil of each plot was pooled and sieved (5 mm). Sub-samples of soil were amended with or without methylparathion and incubated aerobically at 22±2oC for 28 days. At the onset of the experiment and every seven days, soil was amended with or without acetylene (C2H2) or chloramphenicol and incubated anaerobically for 48 h while dynamics of NO3
-, NO2- and N2O were monitored, after 0, 6, 24 and 48 h, three sub-samples of each treatment (n = 4),
plot (n = 3) and amended with or without pesticide (n = 2) were selected at random for assays of NO3-, NO2
- and N2O. The headspace of each flask was sampled and analysed for N2O. The concentrations of N2O were corrected for gas dissolved in the water (Moraghan and Buresh 1977). After measurement of N2O, samples were analysed for NO2
- and NO3- as described earlier. Data for NO2
- were corrected for the formation of NO2-
through the degradation of chloramphenicol (Dendooven et al. 1994). Emission of N2O was regressed on elapsed time using a linear regression model which was forced to pass through the origin but allowed different slopes (production rates) for each treatment. This approach is supported by theoretical considerations that no N2O was produced at time zero and the atmosphere in the flask contained no N2O as the headspace was flushed with N. Production of NO2
- and NO3- was regressed on
elapsed time using a linear model that was not forced to pass through the origin and allowed different slopes (production rates) for each treatment. Results The concentration of NO3
- decreased over time (Table 1). In the SMP soil, day of sampling or treatment had no significant effect on the decrease in concentration of NO3
- (Table 1). In the CMP soil, the decrease in the concentration of NO3
- was slowest in soil conditioned aerobically for 7 days and the fastest for soil incubated for 28 days, while treatment had no significant effect on it. Methylparathion had no significant effect on the concentration of NO3
- in soil (Table 2). No clear pattern emerged in the concentrations of NO2
- during the different anaerobic incubation. In the SMP soil, the concentration of NO2
- (mean of all treatments) was significantly larger at day 0 and 7 than at day 14 and 28. In CMP soil, the mean concentration of NO2
- was significantly larger at day 7 than at day 14 and 28, but significantly lower than at the onset of the experiment (p < 0.05) (Table 1). In the SMP soil, the mean concentration of NO2
- was largest when amended with C2H2 plus chloramphenicol and lowest in the unamended SMP soil. In CMP soil, the concentration of NO2
- increased significantly when amended with chloramphenicol compared to soil not amended with chloramphenicol. The concentration of NO2
- was significantly larger in the CMP soil than in the SMP soil (p < 0.05) (Table 2).
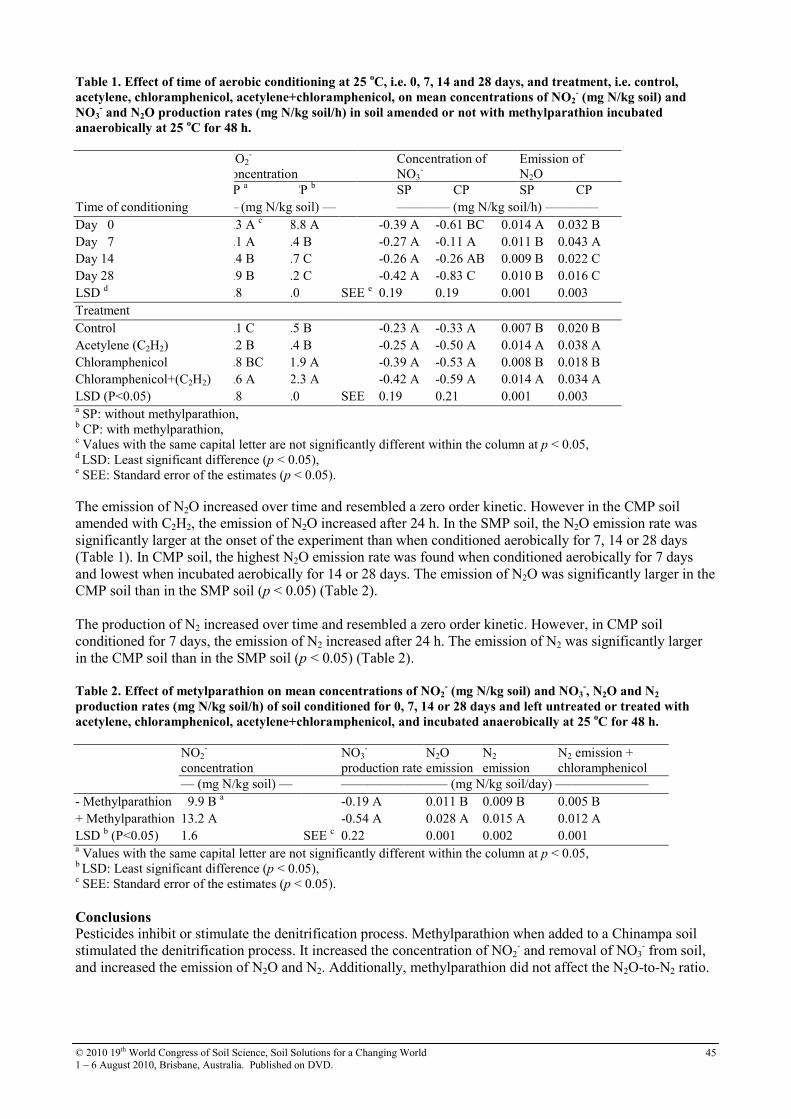
© 2010 19th World Congress of Soil Science, Soil Solutions for a Changing World 1 – 6 August 2010, Brisbane, Australia. Published on DVD.
45
Table 1. Effect of time of aerobic conditioning at 25 oC, i.e. 0, 7, 14 and 28 days, and treatment, i.e. control,
acetylene, chloramphenicol, acetylene+chloramphenicol, on mean concentrations of NO2- (mg N/kg soil) and
NO3- and N2O production rates (mg N/kg soil/h) in soil amended or not with methylparathion incubated
anaerobically at 25 oC for 48 h.
NO2-
concentration Concentration of
NO3-
Emission of N2O
SP a CP b SP CP SP CP Time of conditioning — (mg N/kg soil) — ———— (mg N/kg soil/h) ————
Day 0 8.3 A c 18.8 A -0.39 A -0.61 BC 0.014 A 0.032 B Day 7 9.1 A 9.4 B -0.27 A -0.11 A 0.011 B 0.043 A Day 14 6.4 B 6.7 C -0.26 A -0.26 AB 0.009 B 0.022 C Day 28 5.9 B 7.2 C -0.42 A -0.83 C 0.010 B 0.016 C LSD d 0.8 2.0 SEE e 0.19 0.19 0.001 0.003
Treatment
Control 6.1 C 8.5 B -0.23 A -0.33 A 0.007 B 0.020 B Acetylene (C2H2) 7.2 B 9.4 B -0.25 A -0.50 A 0.014 A 0.038 A Chloramphenicol 6.8 BC 11.9 A -0.39 A -0.53 A 0.008 B 0.018 B Chloramphenicol+(C2H2) 9.6 A 12.3 A -0.42 A -0.59 A 0.014 A 0.034 A LSD (P<0.05) 0.8 2.0 SEE 0.19 0.21 0.001 0.003 a SP: without methylparathion, b CP: with methylparathion, c Values with the same capital letter are not significantly different within the column at p < 0.05, d LSD: Least significant difference (p < 0.05), e SEE: Standard error of the estimates (p < 0.05). The emission of N2O increased over time and resembled a zero order kinetic. However in the CMP soil amended with C2H2, the emission of N2O increased after 24 h. In the SMP soil, the N2O emission rate was significantly larger at the onset of the experiment than when conditioned aerobically for 7, 14 or 28 days (Table 1). In CMP soil, the highest N2O emission rate was found when conditioned aerobically for 7 days and lowest when incubated aerobically for 14 or 28 days. The emission of N2O was significantly larger in the CMP soil than in the SMP soil (p < 0.05) (Table 2). The production of N2 increased over time and resembled a zero order kinetic. However, in CMP soil conditioned for 7 days, the emission of N2 increased after 24 h. The emission of N2 was significantly larger in the CMP soil than in the SMP soil (p < 0.05) (Table 2).
Table 2. Effect of metylparathion on mean concentrations of NO2
- (mg N/kg soil) and NO3
-, N2O and N2
production rates (mg N/kg soil/h) of soil conditioned for 0, 7, 14 or 28 days and left untreated or treated with
acetylene, chloramphenicol, acetylene+chloramphenicol, and incubated anaerobically at 25 oC for 48 h.
NO2-
concentration NO3
- production rate
N2O emission
N2 emission
N2 emission + chloramphenicol
— (mg N/kg soil) — ———————— (mg N/kg soil/day) ———————
- Methylparathion 9.9 B a -0.19 A 0.011 B 0.009 B 0.005 B + Methylparathion 13.2 A -0.54 A 0.028 A 0.015 A 0.012 A LSD b (P<0.05) 1.6 SEE c 0.22 0.001 0.002 0.001 a Values with the same capital letter are not significantly different within the column at p < 0.05, b LSD: Least significant difference (p < 0.05), c SEE: Standard error of the estimates (p < 0.05).
Conclusions Pesticides inhibit or stimulate the denitrification process. Methylparathion when added to a Chinampa soil stimulated the denitrification process. It increased the concentration of NO2
- and removal of NO3- from soil,
and increased the emission of N2O and N2. Additionally, methylparathion did not affect the N2O-to-N2 ratio.
© 2010 19th World Congress of Soil Science, Soil Solutions for a Changing World 1 – 6 August 2010, Brisbane, Australia. Published on DVD.
46
References
CICOPLAFEST (2008) Control del Proceso y Uso de Plaguicidas, Fertilizantes y Sustancias Tóxicas. (http://www.sagarpa.gob.mx/cicoplafest/).
Dendooven L, Splatt P, Anderson JM (1994) The use of chloramphenicol in the study of the denitrification process: some side-effects. Soil Biology & Biochemistry 26, 925-927.
INECOL (2002) Final report In: Programa rector de restauración ecológica área natural protegida zona sujeta a conservación ecológica ‘Ejidos de Xochimilco y San Gregorio Atlapulco” (http://ramsar.conanp.gob.mx/documentos/fichas/50.pdf).
IPCC (2001) Climate Change (2001) The Scientific Basis. Contribution of working group I to the third assessment report of the intergovernmental panel on climate change. (Eds JT Houghton, Y Ding, DJ Griggs, M Noguer, PJ van der Linden, X Dai, K Maskell, C.A Johnson). 881 pp. (Cambridge University Press, Cambridge).
IPCC (2007a) Climate Change 2007: The Physical Science Basis. Contribution of working group I to the fourth assessment report of the intergovernmental panel on climate change. (Eds S Solomon, D Qin, M Manning, Z Chen, M Marquis, K.B Averyt, M Tignor, H.L Miller) 996 pp. (Cambridge University Press).
IPCC (2007b) Climate Change 2007: Mitigation of Climate Change. Contribution of working group III to the fourth assessment report of the intergovernmental panel on climate change. (Eds B Metz, OR Davidson, PR Bosch, R Dave, LA Meyer.) pp. 499-532. (Cambridge University Press)
Johnsen K, Jacobse SS, Torsvik V, Sorensen J (2001) Pesticide effects on bacterial diversity in agricultural soils. Biology and Fertility of Soils 33, 454-459.
Knowles R (1982) Microbiological Reviews 46, 43–70. Locke MA, Zablotowicz RM (2004) Pesticides in Soil – Benefits and limitations to soil health. In ‘Managing
Soil Quality: Challenges in Modern Agriculture’ (Eds. P Schjonning, S Elmholt, BT Christensen) pp. 239-260. (CABI Publishing)
Rojas RT (1983) La agricultura chinampera. Compilación histórica. Dirección de difusion cultural. Cuadernos universitarios. Agronomía 7,181-211.
Simek M, Cooper JE, Picek T, Santruckova H (2000) Denitrification in arable soils in relation to their physico-chemical properties and fertilization practice. Soil Biology & Biochemistry 32, 101–110.
Spokas K, Wang D (2003) Stimulation of nitrous oxide production resulted from soil fumigation with chloropicrin. Atmospheric Environment 37, 3501–3507.
Spokas K, Wang, D, Venterea R (2005) Impact of soil fumigation with chloropicrin and methyl isothiocyanate on greenhouse gases. Soil Biology & Biochemistry 37, 475–485.
Spokas K, Wang D, Venterea R, Sadowsky M (2006) Mechanisms of N2O production following chloropicrin fumigation. Applied Soil Ecology 31, 101–109.
Zhang R, Jiang J, Gu JD, Li S (2006) Long term effect of methylparathion contamination on soil microbial community diversity estimated by 16S rRNA gene cloning. Ecotoxicology 15, 523-530.
© 2010 19th World Congress of Soil Science, Soil Solutions for a Changing World 1 – 6 August 2010, Brisbane, Australia. Published on DVD.
47
Diffuse reflectance spectroscopy study of heavy metals in agricultural soils of the
Changjiang River Delta, China Junfeng JiA, Yinxian SongA, Xuyin YuanB and Zhongfang YangC ASchool of Earth Sciences and Engineering, Nanjing University, Jiangsu Province, China, Email [email protected]; [email protected]. BCollege of Environment and Engineering, Hehai University, China, Email [email protected] CSchool of Earth Sciences and Resources, China University of Geosciences, China, Email [email protected]
Abstract
Heavy metal contamination of soil is becoming an increasingly serious problem in the Changjiang River Delta (China) as a result of rapid economic development. Conventional methods for investigating the contamination based on raster sampling and laboratory analysis are time-consuming and relatively expensive. Diffuse reflectance spectroscopy (DRS) within the visible-near-infrared (VNIR) region (400-2500 nm) has been widely used to identify spectrally active constituents in soils. Correlations between heavy metals (Cd, Cr, Pb, Cu, Zn, Hg and As) and DRS spectra of agricultural soils from Changjiang River Delta were studied to assess their binding forms. The results show that Cr, Cu, Zn and As have stronger negative correlation coefficients with the spectral bands attributed to the absorption features of iron oxides, clays and organic matter, suggesting they are strongly bound to these soil constituents. However, Cd, Pb and Hg only display a significant correlation with the spectral region related to organic carbon, indicating that binding with organic matter is important for these metals. This finding is consistent with the fact that Cr, Cu, Zn and As have significant correlations with Fe2O3, Al2O3 and TOC, but Cd, Pb and Hg only display a significant correlation with TOC. Key Words Soil contamination; Heavy metals; Diffuse reflectance spectroscopy. Introduction Heavy metal contamination of soil results from anthropogenic activity and influences the physical and chemical characteristics of soil ecosystems. Enrichment of heavy metals in soil and their accumulations in agricultural products presents a risk to human health. Potentially toxic elements could be involved in physico-chemical reactions as well as interaction with soil components like minerals, humic matter, metal oxides, microorganisms and/ or ligands. Conventional methods of heavy metal identification such as inductively coupled plasma (ICP), atomic absorption spectrometry (AAS) or operationally defined sequential extraction can measure physico-chemical data directly, but are time-consuming and relatively expensive. Diffuse reflectance spectroscopy (DRS) in visible-near infrared (VNIR) region (400-2500 nm) has been used to rapidly analyse and monitor soil constituents both conveniently and accurately. Through VNIR DRS, soil constituents such as iron oxides (Ji et al. 2002; Madeira et al. 1997), organic matter (Fidencio et al. 2002), carbonate (Ben-Dor and Banin 1990), and clay minerals (Rossel et al. 2009) can be quantitatively determined. Heavy metals in soil are often absorbed or bounded by spectrally active constituents, which make it possible to study the characteristics of metals in soil using VNIR DRS. Previous research has emphasized the prediction and monitoring of heavy metal in soil and sediment (Wu et al. 2005; Xia et al. 2007; Moros et al. 2009). This study aims to investigate the binding forms of heavy metals in agriculture soils from a fast developing area, the Changjiang River Delta of China, using the DRS approach.
Methods
Soil Sampling
A total of 122 samples of paddy rhizosphere and non-rhizosphere soils were collected from 61 locations in the Changjiang River Delta (Figure 1); 61 rhizosphere soils were sampled around the paddy root (depth < 20 cm), and 61 non-rhizosphere soils collected from areas without paddy plants (< 20 cm). The soil samples were air-dried at 25℃ for 2 weeks and sieved with a 2 mm sieve to remove large debris, stones, and pebbles before analysis. Chemical analysis
As and Hg were measured by using AFS 230E Cold Vapor Atmospheric Fluorescence Spectrometry. Cd was analyzed with graphite-furnace atomic absorption spectrometry by AAS ZEEnit60. Cr, Cu, Pb, Zn, Al2O3,
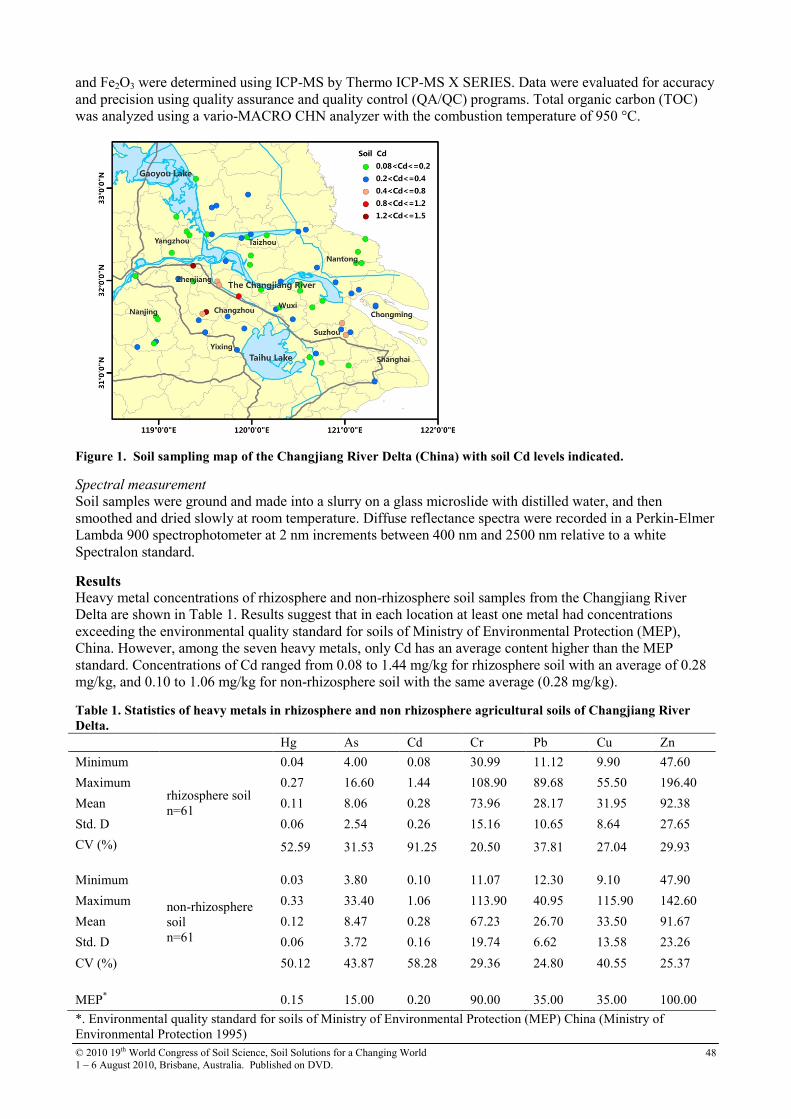
© 2010 19th World Congress of Soil Science, Soil Solutions for a Changing World 1 – 6 August 2010, Brisbane, Australia. Published on DVD.
48
and Fe2O3 were determined using ICP-MS by Thermo ICP-MS X SERIES. Data were evaluated for accuracy and precision using quality assurance and quality control (QA/QC) programs. Total organic carbon (TOC) was analyzed using a vario-MACRO CHN analyzer with the combustion temperature of 950 °C.
Figure 1. Soil sampling map of the Changjiang River Delta (China) with soil Cd levels indicated.
Spectral measurement
Soil samples were ground and made into a slurry on a glass microslide with distilled water, and then smoothed and dried slowly at room temperature. Diffuse reflectance spectra were recorded in a Perkin-Elmer Lambda 900 spectrophotometer at 2 nm increments between 400 nm and 2500 nm relative to a white Spectralon standard.
Results Heavy metal concentrations of rhizosphere and non-rhizosphere soil samples from the Changjiang River Delta are shown in Table 1. Results suggest that in each location at least one metal had concentrations exceeding the environmental quality standard for soils of Ministry of Environmental Protection (MEP), China. However, among the seven heavy metals, only Cd has an average content higher than the MEP standard. Concentrations of Cd ranged from 0.08 to 1.44 mg/kg for rhizosphere soil with an average of 0.28 mg/kg, and 0.10 to 1.06 mg/kg for non-rhizosphere soil with the same average (0.28 mg/kg).
Table 1. Statistics of heavy metals in rhizosphere and non rhizosphere agricultural soils of Changjiang River
Delta.
Hg As Cd Cr Pb Cu Zn
Minimum 0.04 4.00 0.08 30.99 11.12 9.90 47.60
Maximum 0.27 16.60 1.44 108.90 89.68 55.50 196.40
Mean 0.11 8.06 0.28 73.96 28.17 31.95 92.38
Std. D 0.06 2.54 0.26 15.16 10.65 8.64 27.65
CV (%)
rhizosphere soil n=61
52.59 31.53 91.25 20.50 37.81 27.04 29.93
Minimum 0.03 3.80 0.10 11.07 12.30 9.10 47.90
Maximum 0.33 33.40 1.06 113.90 40.95 115.90 142.60
Mean 0.12 8.47 0.28 67.23 26.70 33.50 91.67
Std. D 0.06 3.72 0.16 19.74 6.62 13.58 23.26
CV (%)
non-rhizosphere soil n=61
50.12 43.87 58.28 29.36 24.80 40.55 25.37
MEP* 0.15 15.00 0.20 90.00 35.00 35.00 100.00
*. Environmental quality standard for soils of Ministry of Environmental Protection (MEP) China (Ministry of Environmental Protection 1995)
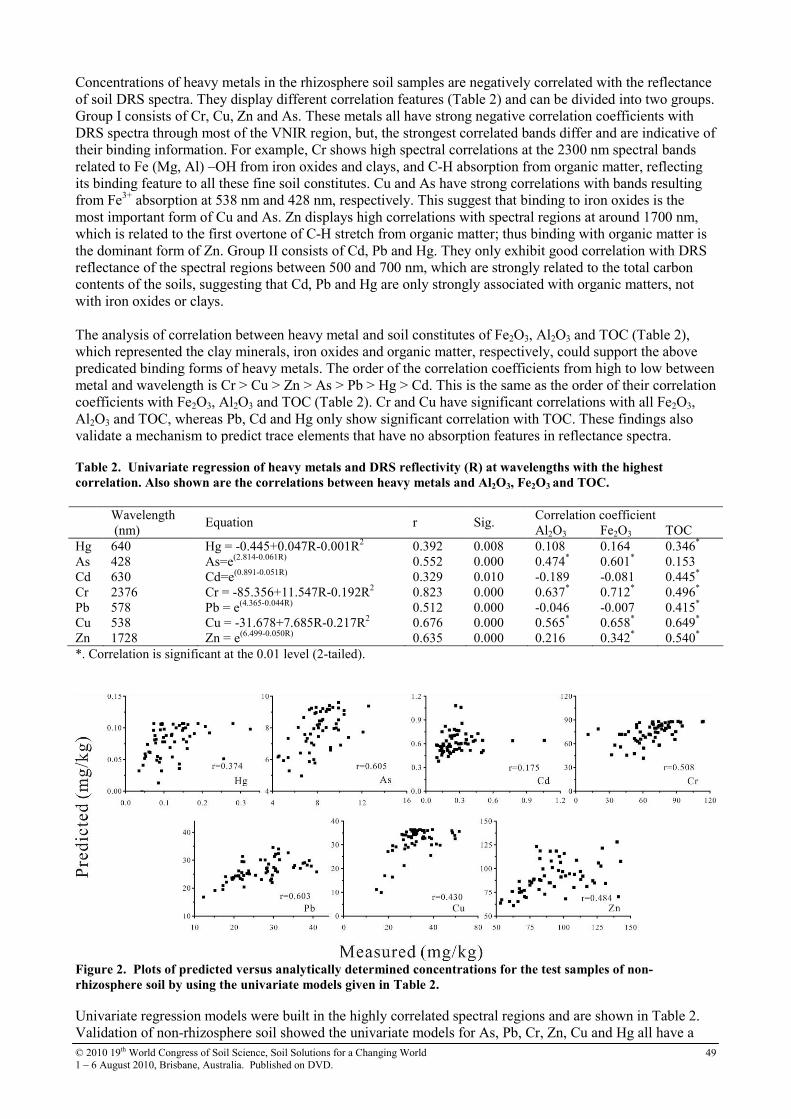
© 2010 19th World Congress of Soil Science, Soil Solutions for a Changing World 1 – 6 August 2010, Brisbane, Australia. Published on DVD.
49
Concentrations of heavy metals in the rhizosphere soil samples are negatively correlated with the reflectance of soil DRS spectra. They display different correlation features (Table 2) and can be divided into two groups. Group I consists of Cr, Cu, Zn and As. These metals all have strong negative correlation coefficients with DRS spectra through most of the VNIR region, but, the strongest correlated bands differ and are indicative of their binding information. For example, Cr shows high spectral correlations at the 2300 nm spectral bands related to Fe (Mg, Al) –OH from iron oxides and clays, and C-H absorption from organic matter, reflecting its binding feature to all these fine soil constitutes. Cu and As have strong correlations with bands resulting from Fe3+ absorption at 538 nm and 428 nm, respectively. This suggest that binding to iron oxides is the most important form of Cu and As. Zn displays high correlations with spectral regions at around 1700 nm, which is related to the first overtone of C-H stretch from organic matter; thus binding with organic matter is the dominant form of Zn. Group II consists of Cd, Pb and Hg. They only exhibit good correlation with DRS reflectance of the spectral regions between 500 and 700 nm, which are strongly related to the total carbon contents of the soils, suggesting that Cd, Pb and Hg are only strongly associated with organic matters, not with iron oxides or clays. The analysis of correlation between heavy metal and soil constitutes of Fe2O3, Al2O3 and TOC (Table 2), which represented the clay minerals, iron oxides and organic matter, respectively, could support the above predicated binding forms of heavy metals. The order of the correlation coefficients from high to low between metal and wavelength is Cr > Cu > Zn > As > Pb > Hg > Cd. This is the same as the order of their correlation coefficients with Fe2O3, Al2O3 and TOC (Table 2). Cr and Cu have significant correlations with all Fe2O3, Al2O3 and TOC, whereas Pb, Cd and Hg only show significant correlation with TOC. These findings also validate a mechanism to predict trace elements that have no absorption features in reflectance spectra. Table 2. Univariate regression of heavy metals and DRS reflectivity (R) at wavelengths with the highest
correlation. Also shown are the correlations between heavy metals and Al2O3, Fe2O3 and TOC.
Correlation coefficient
Wavelength (nm)
Equation r Sig. Al2O3 Fe2O3 TOC
Hg 640 Hg = -0.445+0.047R-0.001R2 0.392 0.008 0.108 0.164 0.346* As 428 As=e(2.814-0.061R) 0.552 0.000 0.474* 0.601* 0.153 Cd 630 Cd=e(0.891-0.051R) 0.329 0.010 -0.189 -0.081 0.445* Cr 2376 Cr = -85.356+11.547R-0.192R2 0.823 0.000 0.637* 0.712* 0.496* Pb 578 Pb = e(4.365-0.044R) 0.512 0.000 -0.046 -0.007 0.415* Cu 538 Cu = -31.678+7.685R-0.217R2 0.676 0.000 0.565* 0.658* 0.649* Zn 1728 Zn = e(6.499-0.050R) 0.635 0.000 0.216 0.342* 0.540* *. Correlation is significant at the 0.01 level (2-tailed).
Figure 2. Plots of predicted versus analytically determined concentrations for the test samples of non-
rhizosphere soil by using the univariate models given in Table 2.
Univariate regression models were built in the highly correlated spectral regions and are shown in Table 2. Validation of non-rhizosphere soil showed the univariate models for As, Pb, Cr, Zn, Cu and Hg all have a
© 2010 19th World Congress of Soil Science, Soil Solutions for a Changing World 1 – 6 August 2010, Brisbane, Australia. Published on DVD.
50
significant prediction potential (Figure 2), suggesting the potential of using remote sensing data in the future for the rapid mapping of contaminated areas in agriculture fields of Changjiang River Delta. Conclusion This study suggests that analysis of DRS within the VNIR region can be used for extracting the binding forms and for prediction of heavy metal concentration in agriculture soils. The results show that heavy metals Cr, Cu, Zn and As have stronger negative correlation coefficients with the spectral bands attributable to the absorption features of iron oxides, clay, and organic matter, suggesting they are strongly bound to these soil constitutes. The metals Cd, Pb and Hg only display significant correlation with the spectral region related to TOC, indicating binding with organic matter is important for these metals. This finding was consistent with the fact that the correlation coefficients between the first group and Fe2O3, Al2O3 and TOC were higher than that of latter group. The binding of elements by the spectrally active constituents of soils is the mechanism by which we assess the spectrally featureless heavy metals. This observation suggests that remote sensing data has the potential to rapidly map contaminated areas in agriculture fields of the Changjiang River Delta. Acknowledgements: This study was financially supported by the National Natural Science Foundation of China (Grant 40625012) and China Geological Survey(GZTR02-01). References
Ben-Dor E, Banin A (1990) Near-infrared reflectance analysis of carbonate concentration in soils. Applied Spectroscopy 44, 1064-1069.
Cozzolino D, Moron A (2003) The potential of near-infrared reflectance spectroscopy to analyse soil chemical and physical characteristics. Journal of Agricultural Science 140, 65-71.
Fidencio PH, Poppi RJ, de Andrade JC (2002) Determination of organic matter in soils using radial basis function networks and near infrared spectroscopy. Analytica Chimica Acta 453, 125-134.
Ji JF, Balsam W, Chen J, Liu LW (2002) Rapid and quantitative measurement of hematite and goethite in the Chinese loess-paleosol sequence by diffuse reflectance spectroscopy. Clays and Clay Minerals 50, 208-216.
Madeira J, Bedidi A, Cervelle B, Pouget M, Flay N (1997) Visible spectrometric indices of hematite (Hm) and goethite (Gt) content in lateritic soils: the application of a Thematic Mapper (TM) image for soil-mapping in Brasilia, Brazil. International Journal of Remote Sensing 18, 2835-2852.
Ministry of Environmental Protection P (1995) Environmental quality standard for soils (in Chinese). Ministry of Environmental Protection of PRC, Beijing, PRC, Available from: http://kjs.mep.gov.cn/hjbhbz/bzwb/trhj/trhjzlbz/199603/W020070313485587994018.pdf.
Moros J, de Vallejuelo SFO, Gredilla A, de Diego A, Madariaga JM, Garrigues S, de la Guardia M (2009) Use of Reflectance Infrared Spectroscopy for Monitoring the Metal Content of the Estuarine Sediments of the Nerbioi-Ibaizabal River (Metropolitan Bilbao, Bay of Biscay, Basque Country). Environmental Science & Technology 43, 9314-9320.
Rossel RAV, Cattle SR, Ortega A, Fouad Y (2009) In situ measurements of soil colour, mineral composition and clay content by vis-NIR spectroscopy. Geoderma 150, 253-266.
Wu YZ, Chen J, Ji JF, Tian QJ, Wu XM (2005) Feasibility of reflectance spectroscopy for the assessment of soil mercury contamination. Environmental Science & Technology 39, 873-878.
Xia XQ, Mao YQ, Ji J, Ma HR, Chen J, Liao QL (2007) Reflectance spectroscopy study of Cd contamination in the sediments of the Changjiang River, China. Environmental Science & Technology 41, 3449-3454.
© 2010 19th World Congress of Soil Science, Soil Solutions for a Changing World 1 – 6 August 2010, Brisbane, Australia. Published on DVD.
51
Distribution of soil heavy metal contamination around industrial complex zone,
Shiraz, Iran
Ata ShakeryA, Farid MoorB and Ladan RazikordmahallehC AFaculty of Earth Science, University Shirazi, St Adabiat, Shiraz, Iran, Email [email protected] BFaculty of Earth Science, University Shirazi, St Adabiat, Shiraz, Iran, Email [email protected] CSoil and Water Pollution Burea, Department of environment, Pardisan Pak, Teharan, Iran, Email [email protected]
Abstract Concentrations of heavy metals (As, Co, Cu, Ni, Mo, Pb and Zn) were studied in the soils of Shiraz industrial complex zone, south Shiraz, Iran to asses metal contamination due to industrialization, urbanization and agricultural activities. Soil samples were collected from three depths. The A and C horizons are enriched with metals such as Ni, As, Mo, Cu, Pb, and Zn, compared with the B horizon. The average abundance order of heavy metal contents in soil depth are: Ni>Zn>Cu>Co>Pb>As>Mo. The contamination factor (CF) and modified degree of contamination (mCd)base of background values in the three sampled depths for Cu, Zn, Co, Ni, Mo and As are moderate. The results of enrichment factor (EF) show that using Sc concentration in the average shale produces higher average EF values for Ni, Co, and Mo as compared to average values determined using the actual Sc content in lower core baseline values (background). The results of the principal component analysis (PCA) show Zn, Co, Ni, Sc, Cu, Al and Fe come from a similar source and are not influenced by anthropogenic sources. High loading of Zn, Co, Cu and Ni with Clay, Al and Fe indicate the active role played by Al and Fe hydroxides and clay content on distribution and sorption of the studied heavy metals in soil. Also, PCA results indicate that As, Mo and Pb behave differently at different depths. Key Words Soil contamination, enrichment factor, factor analysis, Shiraz industrial complex zone. Introduction Contamination of soils by heavy metals is the most serious environmental problem and has significant implications for human health process (Dang et al. 2002; Obiajunwa et al. 2002). Sources such as atmospheric deposition, waste disposal, fertilizer application and wastewater in agricultural land constitute the major anthropogenic inputs. Generally the distribution of heavy metals is influenced by the nature of parent materials, climatic conditions, and their relative mobility depending on soil parameters, such as mineralogy, texture and classification of soil (Krishna and Govil 2007). Some physicochemical properties of soils such as pH and OC are important parameters that control the accumulation and the availability of heavy metals in the soil environment. The main objectives of this paper are (1) to determine the range and distribution of heavy metals concentrations in the soils of Shiraz industrial complex zone for monitoring purposes (2) to asses the principle physical and chemical parameters, affecting heavy metals distribution in the three sampled soil depths, and (3) to evaluate the anthropogenic and lithogenic contribution. Materials and methods
A total of 36 samples from three soil depths were collected in September 2007. Three composite samples were collected from each bore well. The sample depths are (1) 0 to 20Cm, (2) 20 to 80Cm and (3) 80 to 140Cm. In the laboratory, after air drying the soil samples at room temperature, the samples were passed through a 2mm nylon sieve. The <2mm fraction was ground in an agate mortar and pestle and passed through a 63 micron sieve to obtain silt and clay fractions. pH and organic carbon (OC) were measured using standard analytical methods. The concentrations of the constituent elements were measured using ICP-OES methods. Equations
The Cif is the ratio obtained by dividing the mean concentration of each metal in the soil (Ci
o-1) by the baseline or background value (concentration in unpolluted soil, Ci
n) (Abrahim 2005): Cif = Ci
o-1/ Cin Equation
for the calculation of the overall degree of contamination mCd=∑i=n Cif (Liu et al. 2005).
Where n = number of analysed elements and i = ith element (or pollutant) and Cf = Contamination factor.

© 2010 19th World Congress of Soil Science, Soil Solutions for a Changing World 1 – 6 August 2010, Brisbane, Australia. Published on DVD.
52
The reference values were taken on one hand, for heavy metals from the average Shale (Eq (1)) (Turekian et al. 1961), and on the other hand, the background concentrations of heavy metals in study area (Eq. (2)); to determine a relative range of enrichment factors. EF1= ([M)/[Sc]) soil / ([M]/[Sc] Shale , EF2= ([M)/[Sc]) soil ([M]/[Sc] background Where [M] = total heavy metal concentration measured in soil sample (mg/kg) and [Sc] =total concentration of Sc (mg/kg). In this study, a simplified approach to risk assessment based on comparing the measured level of contamination in the soils with background and mean worldwide values soil were adopted. Results and discussion The results of soils texture and the concentrations of selected heavy metals, along with Sc, Fe and Al in the three sampled depths show that soil texture spreads out from a clay end-member to a silty - sandy end member with an average ratio of clay over silt and sand being 1.07 and 3.19, respectively. The highest and lowest average organic carbon (OC) content in A and B are (0.1%) and (0.063%), respectively. Soil pH varies between 7.79 and 8.7. The average abundance order of heavy metal contents in the three sampled soil depths are: Ni>Zn>Cu>Co>Pb>As>Mo. This order is similar to that found in the background samples. According to Kabata-Pendias (2007), the mean abundance order of elements in unpolluted Cambisols-loamy soils with more than20% clay fractions is Zn> Pb>Ni>Cu >Co>As>Mo. The comparison mean concentration of the analysed heavy metals in the three sampled soil depths with mean worldwide values (Kabata-Pendias et al. 2001) reveal higher Ni, Cu, Co, As, and Mo content, and lower Pb and Zn content (Figure 1).
0
20
40
60
80
100
120
140
160
180
Cu Zn Co Ni As Mo Pb
Mean concenteration(mg/Kg)
worldwide soil
A(0-20Cm)
B(20-80)
C(80-140)
Figure 1. Comparison of mean heavy metals values in different soil depths with mean worldwide values (mg/kg).
Significant positive correlations among various metals in the soils are evident. Ni, Co, Zn and Cu are significantly correlated according to Pearsonۥs coefficient, expect for Cu in the B depth (0.52<r<0.60). As is less significantly related to the above elements (0.26<r<0.58), except for Co in the B and C depths (0.7<r<0.76). Negative and less significant correlations of Ni, Co, Cu and Zn with OC indicate that soil's organic carbon lack the active sites needed for adsorbing these metals. Some heavy metals such as Zn, Co, Ni and Cu are strongly and significantly correlated with total Al and Fe contents in the three sampled soil depths (0.5<r<0.98). A significant correlation also exists between Zn, Co, Ni, Cu and clay content, especially in samples from A and C depths, probably reflecting the role of clay minerals in the adsorption of heavy metals.
The results show EF values for Pb in A and C depths are enriched compared to the average abundances of background level. The EF value for Cu, Co, Zn, and As is < 2 in the three sampled soil depths. The calculated EF using average Shale values indicate that Ni and Mo(except in B depth) are enriched while EF values for Cu, Zn, Co, As and Pb are <2. Table 1 shows the results of contamination factors in the three sampled soil depths. The results and comparison with threshold of metal in natural background soil and mean worldwide values reveal some degree of heavy metal contamination. The contamination factor base of background soil in three depths for Cu, Zn, Co, Ni, and As is moderate. The highest CF is observed for Pb which is considerable in A and C depths and moderate in B. The results of CF with mean worldwide values reveal Zn, and Pb have low concentration factors, while Cu, Co, As and Mo show moderate CF. The highest CF is observed for Ni which is very high in the three soil depths.
In the present study, estimates are obtained for the initial factors from principal component analysis (Abollino et al. 2002; Liu et al. 2003). The most commonly PCA type producing more interpretable components is the varimax rotation, which is applied in the current study. The results of factor analysis for selected heavy metals along with Sc, Al, Fe, Clay, pH and OC data in three sampled soil depths are tabulated in table 2. The strong association of elements such as Zn, Co, Ni, Sc, Cu, Al and Fe in most soil samples

© 2010 19th World Congress of Soil Science, Soil Solutions for a Changing World 1 – 6 August 2010, Brisbane, Australia. Published on DVD.
53
suggests a similar source. The results of enrichment factor for Zn, Co, Ni and Cu indicate that these metals are not or less influenced by anthropogenic activities. Also, high loading of these heavy metals with Clay, Al and Fe agrees with the measured correlation coefficients and indicate that Al and Fe hydroxides and clay content play a significant role in the distribution and sorption of these heavy metals in the soil (Figure 2). Table 1. Contamination factors (Cf) and modified degree of contamination (mCd) using lower core baseline
values (background) and mean worldwide values for heavy metals in fine fraction soils from the study area. D ep th B ase lin e S um C f m C d
C u Zn C o N i As M o P b
0 -2 0C m B ack g rou n d 1 .7 2 1 .5 4 1 .2 5 2 .1 4 3 .0 2 1 .8 8 3 .5 7 1 5 .1 2 2 .1 6
2 0 -80Cm B ack g rou n d 1 .2 3 1 .1 9 1 .1 2 1 .7 2 2 .0 8 1 .3 1 1 .9 6 1 0 .6 1 1 .5 2
8 0 -14 0Cm B ack g rou n d 1 .4 4 1 .3 7 1 .2 1 1 .9 2 2 .7 2 1 .9 4 3 .3 7 1 3 .9 7 2 .0 0
A ve ra g e 1 .4 6 1 .3 7 1 .1 9 1 .9 3 2 .6 1 1 .7 1 2 .9 7 1 3 .2 3 1 .8 9
0 -2 0C m M ean w o rld w id e 2 .1 3 0 .8 0 2 .3 7 8 .5 6 2 .5 1 2 .2 8 0 .6 3 1 9 .2 9 2 .7 6
2 0 -80Cm M ean w o rld w id e 1 .5 3 0 .6 2 2 .1 4 6 .8 7 1 .7 3 1 .5 9 0 .3 4 1 4 .8 2 2 .1 2
8 0 -14 0Cm M ean w o rld w id e 1 .8 0 0 .7 2 2 .2 9 7 .7 9 2 .2 6 2 .3 6 0 .5 9 1 7 .8 0 2 .5 4
A ve ra g e 1 .8 2 0 .7 2 2 .2 6 7 .7 4 2 .1 7 2 .0 8 0 .5 2 1 7 .3 1 2 .4 7
C on tam in a tio n F a c to rs
Table 2. Principal component analysis for experimented variables at different soil depths.
Element 1 2 3 4
Sc 0.98 0.02 -0.11 0.15
Al 0.97 -0.01 -0.10 0.16
Zn 0.97 -0.07 0.01 0.19
Ni 0.97 -0.04 -0.13 0.08
Co 0.91 0.26 0.14 0.09
Fe 0.89 0.13 -0.14 -0.14
Clay 0.85 -0.09 0.21 0.00
Cu 0.81 0.43 -0.12 0.16
Mo -0.09 0.98 -0.03 0.00
As 0.45 0.58 -0.39 -0.02
OC -0.07 -0.06 0.89 -0.23
Pb 0.15 -0.20 0.63 0.63
pH 0.12 0.08 -0.23 0.90
% of Variance 54.28 12.52 11.82 10.75
Cumulative % 54.28 66.80 78.61 89.37
Rotated Component Matrix
Element 1 2 3 4
Al 0.97 0.20 0.06 0.06
Sc 0.93 -0.16 -0.08 -0.04
Ni 0.93 0.28 0.15 -0.02
Zn 0.91 0.33 0.14 -0.04
Fe 0.78 0.33 0.43 0.07
Clay 0.72 0.19 0.01 0.46
Cu 0.31 0.89 -0.01 -0.08
pH -0.15 -0.86 0.05 -0.33
As -0.03 0.75 0.35 0.47
Co 0.40 0.67 0.34 0.18
OC 0.11 0.10 0.89 -0.11
Pb 0.08 0.03 0.76 0.49
Mo 0.02 0.28 0.07 0.94
% of Variance 37.85 23.33 14.19 13.17
Cumulative % 37.85 61.18 75.37 88.54
Rotated Component Matrix
Element 1 2 3 4
Zn 0.98 -0.03 -0.01 -0.04
Ni 0.97 -0.02 0.06 0.08
Al 0.93 0.08 0.10 -0.09
Fe 0.92 0.22 0.26 -0.11
Clay 0.90 0.03 -0.15 0.25
Co 0.85 -0.27 0.13 -0.20
Sc 0.85 0.28 0.23 0.02
Cu 0.77 0.05 -0.31 0.24
Pb -0.08 0.95 -0.03 0.02
Mo 0.41 0.65 0.12 -0.47
OC -0.08 0.05 0.80 0.32
As 0.58 -0.10 0.63 -0.22
pH 0.12 -0.07 0.20 0.85
% of Variance 53.89 11.94 10.53 9.89
Cumulative % 53.89 65.83 76.35 86.24
Rotated Component Matrix
0 to 20cm 20 to 80 cm 80 to 140 cm
CoZnCuNiMoAsPb
Enrichment factor
2.5
2.0
1.5
1.0
.5
0.0
ZnCuPbAsCoMoNi
Enrichment factor
3.5
3.0
2.5
2.0
1.5
1.0
.5
0.0
Figure 2. Diagram of enrichment factors for selected heavy metals in background and average shale at soil
depths
The results of factor analysis show As behaves differently in the three sampled depths. That is in the A and B depths, As displays high and low positive loading (component 2) with Mo, and Cu while in C depth, As represent (component 1) significant loading with Al, Fe, Zn, Cu, Ni and Co and high loading with OC (component 3). The reason is probably the role played by clay minerals, OC and Al and Fe hydroxides. Also positive loading of As, Cu and Co in component 1 and 2 in soil samples reflects contribution of both geogenic and anthropogenic sources. Mo displays high loading with As in A and with Pb in C depth, while showing moderate loading (component 4) with Pb in B depth. The variable behavior of Mo probably reflects various sources of these elements. The high positive correlation between OC and some elements such as Pb and As reflects the probable role of OC in controlling the mobility of these elements. Conclusion Shiraz industrial complex zone and Gharebagh plain are contaminated due to many years of random dumping of hazardous waste and free discharge of effluents by the industries, agriculture, and municipal
Background Average shale
© 2010 19th World Congress of Soil Science, Soil Solutions for a Changing World 1 – 6 August 2010, Brisbane, Australia. Published on DVD.
54
waste from Shiraz City. Even if the dumping and discharging of effluents totally stops at surface soil, the contamination would still remain for many years to come in the subsoil. Risk assessments based upon soil quality guidelines prove that the soil is a serious health risk to humans.The application of contamination factor (CF) and modified degree of contamination (mCd) with background values for Co, Ni, Cu, Zn and As show moderate and Pb reveals considerable contamination in soils of Shiraz industrial complex zone. These elevated amounts may enter into the food chain and thus pose a hazard to human and animal health. The result of enrichment factor (EF) show that using the Sc concentration in the average shale produces higher average EF values for Ni, Co, and Mo as compared to average values determined using the actual Sc content in lower core baseline values (background). Principal component analysis (PCA) shows distinctly different elemental associations in the three sampled soil depths. The strong associations of elements such as Zn, Co, Ni, Cu, Al, Fe in most soil samples are founded. Also high loading of Zn, Co, Cu and Ni with Clay, Al and Fe indicate that Al and Fe hydroxides and clay content play significant roles in the distribution and sorption of these heavy metals in soil. However, it is assumed that anomalous concentrations of Ni, Pb, Mo and As in most soil samples represent anthropogenic and lithogenic origin. According to the environmental quality criteria for soils, the study area in future would require remediation. This study generally concludes that statistical methods are strong tools for monitoring current environmental quality of industrial soils in terms of heavy metals accumulation and predicting future soil contamination.
References Dang Z, Liu C, Haigh MJ (2002) Mobility of Heavy Metals Associated with the Natural Weathering of Coal
Mine Soils. Environ Pollut. 118, 419-426. Obiajunwa EI, Pelemo DA, Owalabi SA, Fasai MK, Johnson-Fatokun FO (2002) Characterization of Heavy
Metal Pollutants of Soils and Sediments around a Crude- Oil Production Terminal using EDXRF. Nucl Instr Methods Phys B 194, 61–64.
Krishna AK, Govil PK (2007) Soil Contamination due to Heavy Metals from an Industrial Area of Surat, Gujarat, Western India. Environ Moni Assess 124, 263-275.
Abrahim GMS (2005) Holocene Sediments of Tamaki Estuary: Characterisation and Impact of Recent Human Activity on an Urban Estuary in Auckland, New Zealand. PhD thesis, University of Auckland, Auckland, New Zealand.
Liu WH, Zhao JZ, Ouyang ZY, Solderland L, Liu GH (2005b) Impacts of Sewage Irrigation on Heavy Metal Distribution and Contamination in Beijing, China. Environmental International 32, 805-812.
Turekian KK, Wedepohl DH (1961) Distribution of the Elements in Some Major Units of the Earth’s Crust. Bulletin Geological Society of America 72, 175-192.
Kabata-Pendias A, Mukherjee AB (2007) ‘Trace Elements from Soil to Human’. (Springer Berlin: Heidelberg, New York).
Kabata-Pendias A, Pendias H (2001) ‘Trace Elements in Soil and Plants’ 3rd edn. (CRC Press). Abollino O, Aceto M, Malandrino M, Mentasti E, Sarzanini C, Barberis R (2002) Distribution and Mobility
of Metals in Contaminated Sites. Chemometric Investigation of Pollutant Profiles. Environ Pollut. 119, 177- 93.
Liu WX, XD Li, Shen ZG, Wang DC, Wai OWH, Li YS (2003) Multivariate Statistical Study of Heavy Metal Enrichment in Sediments of the Pearl River Estuary. Environ Pollut. 121, 377- 88.
Kaiser HF (1960) The Application of Electronic Computers to Factor Analysis. Edu. Psychol. Meas. 20, 141-151.
© 2010 19th World Congress of Soil Science, Soil Solutions for a Changing World 1 – 6 August 2010, Brisbane, Australia. Published on DVD.
55
Effect of ionic strength on cadmium adsorption onto kaolinite in single- and
multi-element systems Prashant Srivastava A, B, Balwant Singh C A Faculty of Agriculture, Food and Natural Resources, University of Sydney, NSW 2006, Australia B Current Address: Cooperative Research Centre for Contamination Assessment and Remediation of the Environment, Environmental Sciences Building (X), University of South Australia, Mawson Lakes, SA 5095, Australia, Email [email protected] C Faculty of Agriculture, Food and Natural Resources, University of Sydney, NSW 2006, Australia, Email [email protected]
Abstract
Cadmium (Cd) adsorption on kaolinite was studied at three ionic strengths (I) viz., 0.01, 0.1 and 0.5 using NaNO3 as a background electrolyte and at an equilibrium pH 6. Applied concentration of Cd ranged from 16.7 to 950.0 µM in the single-element system, whereas, applied concentration of Cd and other metals (Cu, Pb and Zn) ranged from 4.2 to 237.5 µM each in the multi-element system. Cd adsorption increased with increase in equilibrium concentration at any ionic strength and decreased with increase in ionic strength at any given equilibrium concentration in both single- and multi-element systems. At I = 0.5, the adsorption isotherm approached linearity, whereas, at I = 0.01, the adsorption isotherms reached a plateau at higher equilibrium concentrations in both single- and multi-element systems. The difference between Cd adsorption I = 0.5 and I = 0.1 was greater in the single element system than the multi-element system. A similar pattern was observed for difference between Cd adsorption at I = 0.1 and I = 0.01, however the magnitude of the difference was much greater in the latter case. Key Words Cadmium, adsorption, kaolinite, ionic strength Introduction Cadmium is one of the most toxic and commonly occurring heavy metals in contaminated environments. Use of phosphatic fertilizers in crop production is the major source of Cd contamination in agricultural soils (Syers and Cisse 2000). Other sources of Cd contamination in soils include metal plating, smelting and mining industries, cadmium-nickel battery manufacturing, paints and pigments and alloy industries (Kadirvelu and Namasivayam 2003). Cadmium is known to have toxic effects on plants, animals and humans even at low concentrations (Nriagu 1980). For example, Cd poisoning causes damage to lung, liver and kidney, bone lesions, cancer and hypertension, and dreaded itai-itai disease (ATSDR 1999). Clay minerals in soils act as a natural scavenger of contaminants from soil through various ion exchange and adsorption-desorption reactions (Singh et al. 2000; Jobstmann and Singh 2001). Kaolinite is a 1:1 non-swelling clay mineral that is predominant in tropical weathered soils, and can exist as mobile or immobile colloid (Kaplan et al. 1995). Factors such as pH, ionic strength, equilibration period, temperature, adsorbate and competing ions are very critical in governing the adsorption behaviour of Cd in soils (Srivastava et al. 2005). Under a given set of conditions, Cd can be expected to behave differently when it is present in single- and multi-element systems due to varied degrees of competition in the system. The effects of factors other than ionic strength have been studied widely on various substrates; however, information on the ionic strength effects on metal adsorption on kaolinite is scarce, especially in multi-element systems (Srivastava 2005). In the present study, Cd adsorption on kaolinite as a function of ionic strength was studied in the single-element system, when Cd was present alone, and in a multi-element system, when Cd was present along with other commonly occurring heavy metals - Cu, Pb and Zn.
Methods
Cadmium adsorption isotherm experiments were conducted in single- and multi-element systems at three ionic strengths (I) viz., 0.01, 0.1 and 0.5, using 6.67 g/L kaolinite and NaNO3 as the background electrolyte at pH 6. Cadmium concentration was varied between 16.7 and 950.0 µM in the single-element system and Cd, Cu, Pb and Zn concentrations varied between 4.2 and 237.5 µM each in the multi-element system. The molar concentration of each metal in the multi-element system was a quarter of the Cd concentration in the single-element system, and therefore the total metal concentration remains the same (16.7 to 950.0 µM) in both systems. This was done to evaluate the competition between Cd and other metals at similar total metal
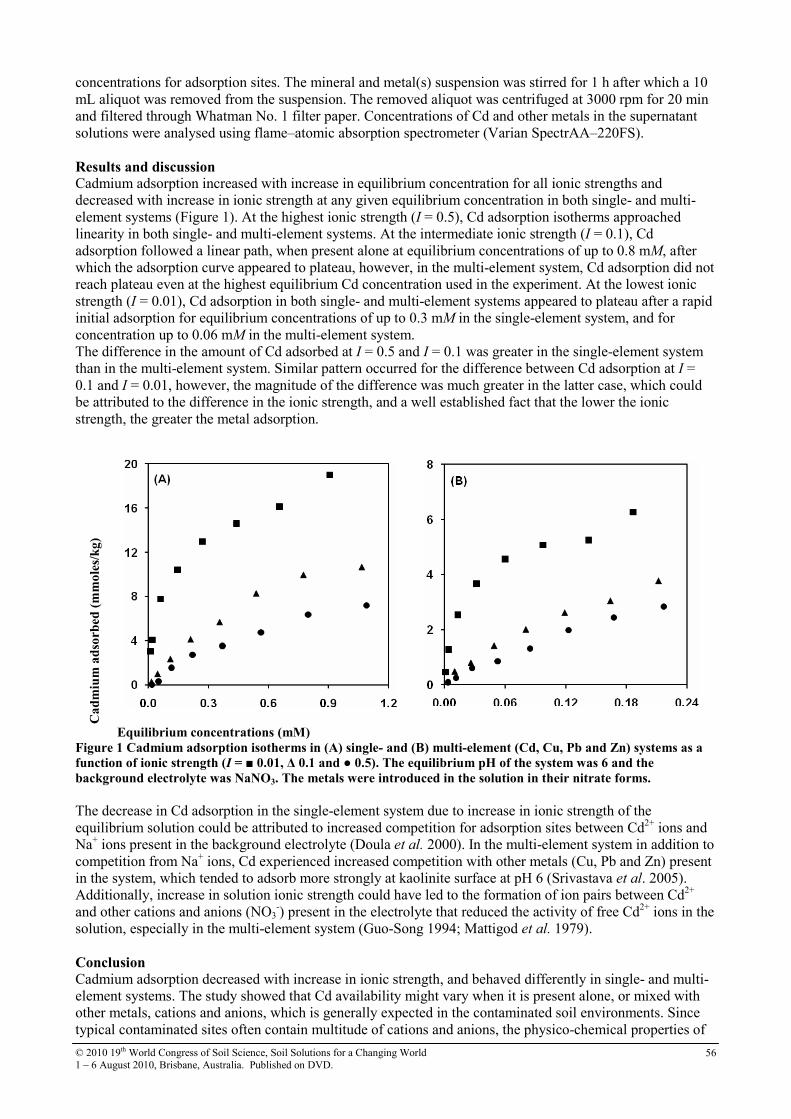
© 2010 19th World Congress of Soil Science, Soil Solutions for a Changing World 1 – 6 August 2010, Brisbane, Australia. Published on DVD.
56
concentrations for adsorption sites. The mineral and metal(s) suspension was stirred for 1 h after which a 10 mL aliquot was removed from the suspension. The removed aliquot was centrifuged at 3000 rpm for 20 min and filtered through Whatman No. 1 filter paper. Concentrations of Cd and other metals in the supernatant solutions were analysed using flame–atomic absorption spectrometer (Varian SpectrAA–220FS). Results and discussion Cadmium adsorption increased with increase in equilibrium concentration for all ionic strengths and decreased with increase in ionic strength at any given equilibrium concentration in both single- and multi-element systems (Figure 1). At the highest ionic strength (I = 0.5), Cd adsorption isotherms approached linearity in both single- and multi-element systems. At the intermediate ionic strength (I = 0.1), Cd adsorption followed a linear path, when present alone at equilibrium concentrations of up to 0.8 mM, after which the adsorption curve appeared to plateau, however, in the multi-element system, Cd adsorption did not reach plateau even at the highest equilibrium Cd concentration used in the experiment. At the lowest ionic strength (I = 0.01), Cd adsorption in both single- and multi-element systems appeared to plateau after a rapid initial adsorption for equilibrium concentrations of up to 0.3 mM in the single-element system, and for concentration up to 0.06 mM in the multi-element system. The difference in the amount of Cd adsorbed at I = 0.5 and I = 0.1 was greater in the single-element system than in the multi-element system. Similar pattern occurred for the difference between Cd adsorption at I = 0.1 and I = 0.01, however, the magnitude of the difference was much greater in the latter case, which could be attributed to the difference in the ionic strength, and a well established fact that the lower the ionic strength, the greater the metal adsorption.
Ca
dm
ium
ad
sorb
ed (
mm
ole
s/k
g)
Equilibrium concentrations (mM)
Figure 1 Cadmium adsorption isotherms in (A) single- and (B) multi-element (Cd, Cu, Pb and Zn) systems as a
function of ionic strength (I = ■ 0.01, ∆ 0.1 and ● 0.5). The equilibrium pH of the system was 6 and the
background electrolyte was NaNO3. The metals were introduced in the solution in their nitrate forms.
The decrease in Cd adsorption in the single-element system due to increase in ionic strength of the equilibrium solution could be attributed to increased competition for adsorption sites between Cd2+ ions and Na+ ions present in the background electrolyte (Doula et al. 2000). In the multi-element system in addition to competition from Na+ ions, Cd experienced increased competition with other metals (Cu, Pb and Zn) present in the system, which tended to adsorb more strongly at kaolinite surface at pH 6 (Srivastava et al. 2005). Additionally, increase in solution ionic strength could have led to the formation of ion pairs between Cd2+ and other cations and anions (NO3
-) present in the electrolyte that reduced the activity of free Cd2+ ions in the solution, especially in the multi-element system (Guo-Song 1994; Mattigod et al. 1979).
Conclusion
Cadmium adsorption decreased with increase in ionic strength, and behaved differently in single- and multi-element systems. The study showed that Cd availability might vary when it is present alone, or mixed with other metals, cations and anions, which is generally expected in the contaminated soil environments. Since typical contaminated sites often contain multitude of cations and anions, the physico-chemical properties of
© 2010 19th World Congress of Soil Science, Soil Solutions for a Changing World 1 – 6 August 2010, Brisbane, Australia. Published on DVD.
57
soil solution, such as pH, electrical conductivity and ionic strength must be taken into account in predicting Cd availability and devising different remediation strategies for a given contaminated site. References ATSDR (1999) Toxicological profile for cadmium, US Department of Health and Human Services, Public
Health Services (Agency for Toxic Substances and Disease Registry), Atlanta, GA. Doula M, Ioannou A, Dimirkou A (2000) Thermodynamics of Copper Adsorption-Desorption by Ca-
Kaolinite. Adsorption 6, 325-335. Guo-Song H (1994) Adsorption kinetics of Pb2+ and Cu2+ on variable charge soils and minerals: V. effects of
temperature and ionic strength. Pedosphere 4, 153-164. Jobstmann H, Singh B (2001) Cadmium sorption by hydroxy-aluminium interlayered montmorillonite.
Water Air and Soil Pollution 131, 203-315. Kadirvelu K, Namasivayam C (2003) Activated carbon from coconut coirpith as metal adsorbent: adsorption
of Cd(II) from aqueous solution. Advanced in Environmental Research 7, 471–478. Kaplan DI, Bertsch PM, Adriano DC (1995) Facilitated transport of contaminant metals through an acidified
aquifer. Ground Water 33, 708-718. Mattigod SV, Gibali AS, Page AL (1979) Effect of ionic strength and ion pair formation on the adsorption of
nickel by kaolinite. Clays and Clay Minerals 27, 411-416. Nriagu JO (1980) Cadmium in the Environment. John Wiley and Sons, New York. Singh B, Alloway BJ, Bochereau FJM (2000) Cadmium sorption behavior of natural and synthetic zeolites.
Communications in Soil Science and Plant Analysis 31, 2775-2786. Srivastava P (1995) Competitive adsorption-desorption of Cd, Pb, Cu and Zn on kaolinite. PhD Thesis.
University of Sydney, Australia. Srivastava P, Singh B, Angove M (2005) Competitive adsorption behaviour of heavy metals onto kaolinite.
Journal of Colloid and Interface Science 290, 28-38 Syers JK, Cisse L (2000) Regional differences in the inputs of cadmium to soils. In ‘SCOPE Workshop on
Environmental Cadmium in the Food Chain: Sources, Pathways, and Risks’. Belgian Academy of Sciences, Brussels, 13-16 September, 2000.
© 2010 19th World Congress of Soil Science, Soil Solutions for a Changing World 1 – 6 August 2010, Brisbane, Australia. Published on DVD.
58
Effect of organic and inorganic amendments on sorption of Cr(VI) and Cr(III)
in soil Zahir RawajfihA and Najwa NsourB
ADepartment of Natural Resources and Environment, Jordan University of Science and Technology, P.O. Box 3030, Irbid 22110, Jordan, Email [email protected] BCenter of Environmental Studies, Hashemite University, P.O. Box 150459, Zarqa 13115, Jordan, Email [email protected]
Abstract
Chromium retention by soil and soil amended with organic and inorganic substances was investigated. Heavy metals are sorbed by a variety of soil phases with hydroxyl groups on their surfaces and edges including the clay minerals, where sorption reactions are often rapid. Clay minerals represented by the SiO–H appear to play an important role in the sorption of Cr(VI) and Cr(III). Soil and amended soil treated with solutions containing Cr(III) adsorbed 1.3 to 9 times more Cr than those treated with Cr(VI). The adsorption of the Cr(VI) and Cr(III) in the soils with organic amendments was in the order: oak > pine > olive oil mill residues > reed > soil. While the adsorption of the Cr(VI) and Cr(III) in the soils with inorganic amendments was in the order: coal > clay > oil shale > soil > zeolite. When the equilibrium concentration of chromate was 85 mg/L, for example, the adsorption capacity for the soil and soil-organic amendments mixtures was 0.063, 0.15, 0.18, and 0.45 mg/g, for soil, reed, oil mill residues, oak and pine, respectively. The adsorption capacity for soil-inorganic amendments mixtures was 0.05, 0.07, 0.09, and 0.17 mg/g, for zeolite, oil shale, clay, and coal, respectively. Key Words
Chromium sorption; biomass, clay, oil shale, oil mill, zeolite. Introduction Soil contaminating chromium is released into the environment through various industrial activities, including electroplating, mining, pulp and paper production, timber treatment and petroleum refining (Yu et al. 2004). Chromium exists in soils in two stable oxidation states, Cr(III) and Cr(VI). These two oxidation states of Cr have very different behaviors (Lee et al. 2005). Chromium(VI) exists in oxyanion forms, CrO4
2− and Cr2O72−,
under most conditions, and therefore it has high mobility in soils. Even at low concentration, Cr(VI) is considered carcinogenic and mutagenic to humans (Stewart et al. 2003). On the other hand, cationic Cr(III) is highly adsorbable by soil particles and is an essential human nutrient (Zayed et al. 1998). Since Cr(III) is considered less mobile, less soluble and less toxic than Cr(VI) (Bartlett and Kimble 1976), the existing remediation of Cr(VI)-contaminated sites usually involves the reduction of Cr(VI) into Cr(III) to reduce its mobility and toxicity (Patterson and Fendorf 1997). Adding organic materials to Cr(VI)-contaminated soils to promote Cr(VI) reduction is a commonly used method. In addition to accomplishing the intended remediation, this method is also environmentally friendly, inexpensive, and can reuse agricultural organic residues. Several researches have demonstrated that various organic materials, such as powdered leaves, biosolid composts, farm yard manure and brown seaweed can enhance the Cr(VI) reduction because of the dissolved organic carbon (DOC) and the small organic compounds released from the organic materials (Park et al. 2004). The objectives of this work were: to study the influence of organic and inorganic amendments on adsorption of Cr(III) and Cr(VI) when mixed with soil, and to measure, describe, and explain the equilibrium sorption characteristics; and to examine the sorptive capacity of soil amended with organic and inorganic substances as a possible technique for chromium immobilization in the environment and its availability for leaching in soil and plant uptake.
Materials and methods
Soil
The soil used in this study was taken from the 0 to 25-cm layer of a site in the Ajlun agricultural region of nourhern Jordan. The soil organic carbon (OC) content was determined by the Walkley-Black method. The pH and electrical conductivity were measured in soil suspensions with a soil to water ratio of 1:1 (w/v). The cation exchange capacity was determined by the method outlined by EPA. Particle size distribution was determined by the hydrometer method. Calcium Carbonate (%CaCO3) was determined by the acid neutralization method. Total free iron oxides were determined using the citrate-bicarbonate-dithionite
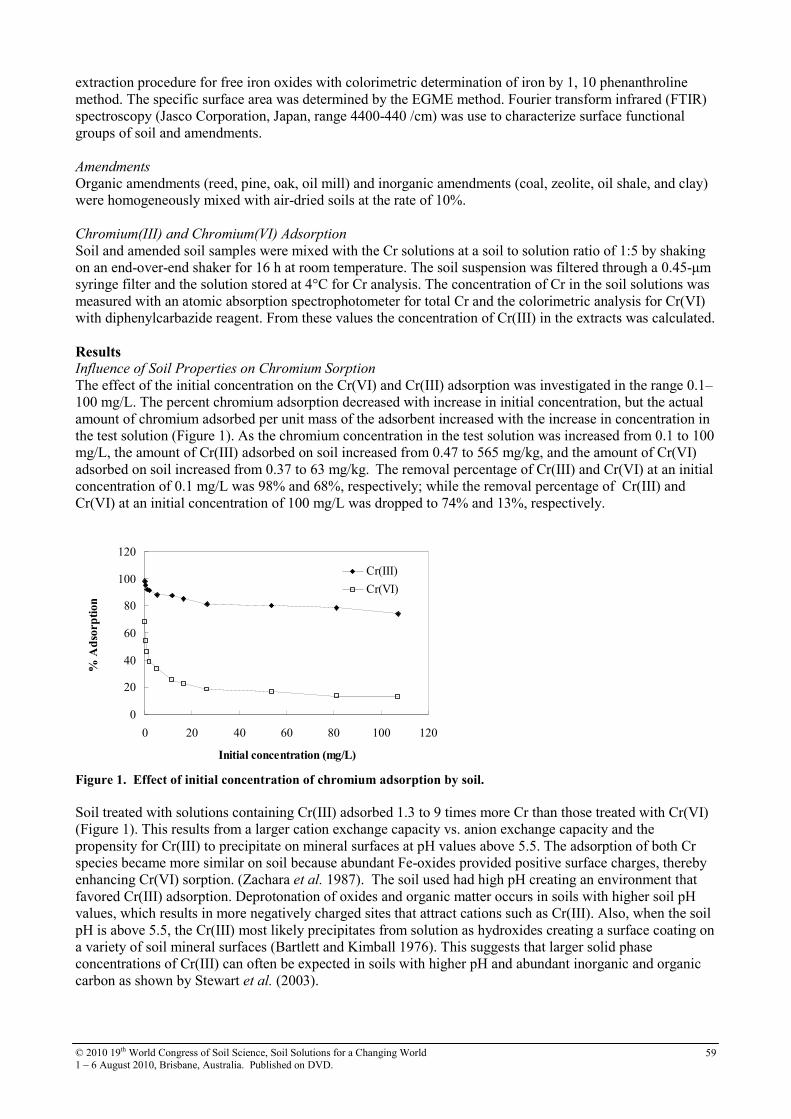
© 2010 19th World Congress of Soil Science, Soil Solutions for a Changing World 1 – 6 August 2010, Brisbane, Australia. Published on DVD.
59
extraction procedure for free iron oxides with colorimetric determination of iron by 1, 10 phenanthroline method. The specific surface area was determined by the EGME method. Fourier transform infrared (FTIR) spectroscopy (Jasco Corporation, Japan, range 4400-440 /cm) was use to characterize surface functional groups of soil and amendments.
Amendments
Organic amendments (reed, pine, oak, oil mill) and inorganic amendments (coal, zeolite, oil shale, and clay) were homogeneously mixed with air-dried soils at the rate of 10%. Chromium(III) and Chromium(VI) Adsorption
Soil and amended soil samples were mixed with the Cr solutions at a soil to solution ratio of 1:5 by shaking on an end-over-end shaker for 16 h at room temperature. The soil suspension was filtered through a 0.45-µm syringe filter and the solution stored at 4°C for Cr analysis. The concentration of Cr in the soil solutions was measured with an atomic absorption spectrophotometer for total Cr and the colorimetric analysis for Cr(VI) with diphenylcarbazide reagent. From these values the concentration of Cr(III) in the extracts was calculated.
Results Influence of Soil Properties on Chromium Sorption
The effect of the initial concentration on the Cr(VI) and Cr(III) adsorption was investigated in the range 0.1–100 mg/L. The percent chromium adsorption decreased with increase in initial concentration, but the actual amount of chromium adsorbed per unit mass of the adsorbent increased with the increase in concentration in the test solution (Figure 1). As the chromium concentration in the test solution was increased from 0.1 to 100 mg/L, the amount of Cr(III) adsorbed on soil increased from 0.47 to 565 mg/kg, and the amount of Cr(VI) adsorbed on soil increased from 0.37 to 63 mg/kg. The removal percentage of Cr(III) and Cr(VI) at an initial concentration of 0.1 mg/L was 98% and 68%, respectively; while the removal percentage of Cr(III) and Cr(VI) at an initial concentration of 100 mg/L was dropped to 74% and 13%, respectively.
0
20
40
60
80
100
120
0 20 40 60 80 100 120
Initial concentration (mg/L)
% A
dso
rpti
on
Cr(III)
Cr(VI)
Figure 1. Effect of initial concentration of chromium adsorption by soil.
Soil treated with solutions containing Cr(III) adsorbed 1.3 to 9 times more Cr than those treated with Cr(VI) (Figure 1). This results from a larger cation exchange capacity vs. anion exchange capacity and the propensity for Cr(III) to precipitate on mineral surfaces at pH values above 5.5. The adsorption of both Cr species became more similar on soil because abundant Fe-oxides provided positive surface charges, thereby enhancing Cr(VI) sorption. (Zachara et al. 1987). The soil used had high pH creating an environment that favored Cr(III) adsorption. Deprotonation of oxides and organic matter occurs in soils with higher soil pH values, which results in more negatively charged sites that attract cations such as Cr(III). Also, when the soil pH is above 5.5, the Cr(III) most likely precipitates from solution as hydroxides creating a surface coating on a variety of soil mineral surfaces (Bartlett and Kimball 1976). This suggests that larger solid phase concentrations of Cr(III) can often be expected in soils with higher pH and abundant inorganic and organic carbon as shown by Stewart et al. (2003).
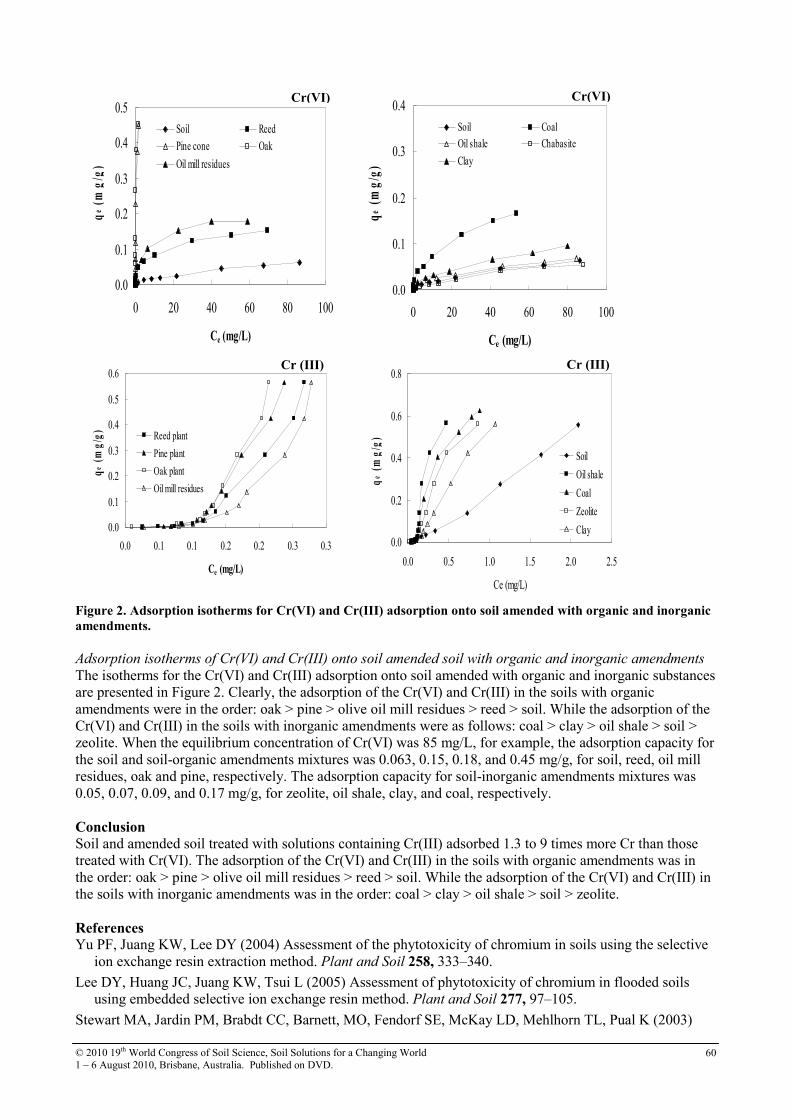
© 2010 19th World Congress of Soil Science, Soil Solutions for a Changing World 1 – 6 August 2010, Brisbane, Australia. Published on DVD.
60
0.0
0.1
0.2
0.3
0.4
0.5
0 20 40 60 80 100
Ce (mg/L)
qe
(mg
/g)
Soil Reed
Pine cone Oak
Oil mill residues
0.0
0.1
0.2
0.3
0.4
0 20 40 60 80 100
Ce (mg/L)
qe
(m
g/g
)
Soil Coal
Oil shale Chabasite
Clay
Cr (III)
0.0
0.1
0.2
0.3
0.4
0.5
0.6
0.0 0.1 0.1 0.2 0.2 0.3 0.3
Ce (mg/L)
qe
(m
g/g
)
Reed plant
Pine plant
Oak plant
Oil mill residues
Cr (III)
0.0
0.2
0.4
0.6
0.8
0.0 0.5 1.0 1.5 2.0 2.5
Ce (mg/L)
qe
(m
g/g
)
Soil
Oil shale
Coal
Zeolite
Clay
Figure 2. Adsorption isotherms for Cr(VI) and Cr(III) adsorption onto soil amended with organic and inorganic
amendments. Adsorption isotherms of Cr(VI) and Cr(III) onto soil amended soil with organic and inorganic amendments
The isotherms for the Cr(VI) and Cr(III) adsorption onto soil amended with organic and inorganic substances are presented in Figure 2. Clearly, the adsorption of the Cr(VI) and Cr(III) in the soils with organic amendments were in the order: oak > pine > olive oil mill residues > reed > soil. While the adsorption of the Cr(VI) and Cr(III) in the soils with inorganic amendments were as follows: coal > clay > oil shale > soil > zeolite. When the equilibrium concentration of Cr(VI) was 85 mg/L, for example, the adsorption capacity for the soil and soil-organic amendments mixtures was 0.063, 0.15, 0.18, and 0.45 mg/g, for soil, reed, oil mill residues, oak and pine, respectively. The adsorption capacity for soil-inorganic amendments mixtures was 0.05, 0.07, 0.09, and 0.17 mg/g, for zeolite, oil shale, clay, and coal, respectively. Conclusion
Soil and amended soil treated with solutions containing Cr(III) adsorbed 1.3 to 9 times more Cr than those treated with Cr(VI). The adsorption of the Cr(VI) and Cr(III) in the soils with organic amendments was in the order: oak > pine > olive oil mill residues > reed > soil. While the adsorption of the Cr(VI) and Cr(III) in the soils with inorganic amendments was in the order: coal > clay > oil shale > soil > zeolite. References Yu PF, Juang KW, Lee DY (2004) Assessment of the phytotoxicity of chromium in soils using the selective
ion exchange resin extraction method. Plant and Soil 258, 333–340.
Lee DY, Huang JC, Juang KW, Tsui L (2005) Assessment of phytotoxicity of chromium in flooded soils using embedded selective ion exchange resin method. Plant and Soil 277, 97–105.
Stewart MA, Jardin PM, Brabdt CC, Barnett, MO, Fendorf SE, McKay LD, Mehlhorn TL, Pual K (2003)
Cr(VI) Cr(VI)
Cr (III)
Cr (III)

© 2010 19th World Congress of Soil Science, Soil Solutions for a Changing World 1 – 6 August 2010, Brisbane, Australia. Published on DVD.
61
Effects of contaminant concentration, aging, and soil properties on the bioaccessibility of Cr(III) and Cr(VI) in soil. Soil Sediment Contaminants 12, 1–21.
Zayed A, Lytle CM, Qian J, Terry N (1998) Phytoaccumulation of trace elements by wetland plants. I. Duckwood, Journal of Environmental Qualality 27, 715–721.
Bartlett R.J, Kimble JM (1976) Behavior of chromium in soils. I. Trivalent forms. Journal of Environmental
Qualality 5, 379–383.
Patterson R, Fendorf S (1997) Reduction of hexavalent chromium by amorphous iron sulfide, Environmental
Science and Technology 31, 2039–2044.
Park D, Yun YS, Park JM, (2004) Reduction of hexavalent chromium with the brown seaweed Ecklonia biomass. Environmental Science and Technology 38, 4860–4864.
Zachara JM, Girvin DC, Schmidt RL, Resch CT (1987) Chromate adsorption on amorphous iron oxyhydroxide in the presence of major groundwater ions. Environmental Science and Technology 21, 589–594.
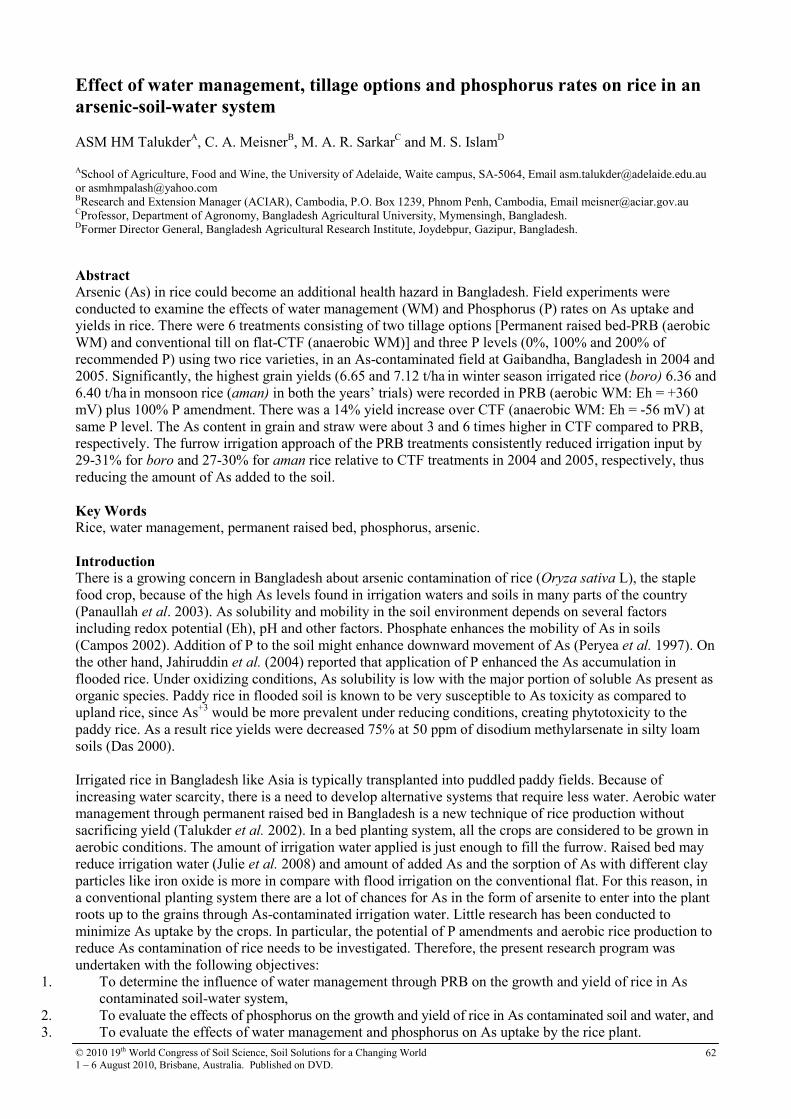
© 2010 19th World Congress of Soil Science, Soil Solutions for a Changing World 1 – 6 August 2010, Brisbane, Australia. Published on DVD.
62
Effect of water management, tillage options and phosphorus rates on rice in an
arsenic-soil-water system ASM HM TalukderA, C. A. MeisnerB, M. A. R. SarkarC and M. S. IslamD
ASchool of Agriculture, Food and Wine, the University of Adelaide, Waite campus, SA-5064, Email [email protected] or [email protected] BResearch and Extension Manager (ACIAR), Cambodia, P.O. Box 1239, Phnom Penh, Cambodia, Email [email protected] CProfessor, Department of Agronomy, Bangladesh Agricultural University, Mymensingh, Bangladesh. DFormer Director General, Bangladesh Agricultural Research Institute, Joydebpur, Gazipur, Bangladesh.
Abstract Arsenic (As) in rice could become an additional health hazard in Bangladesh. Field experiments were conducted to examine the effects of water management (WM) and Phosphorus (P) rates on As uptake and yields in rice. There were 6 treatments consisting of two tillage options [Permanent raised bed-PRB (aerobic WM) and conventional till on flat-CTF (anaerobic WM)] and three P levels (0%, 100% and 200% of recommended P) using two rice varieties, in an As-contaminated field at Gaibandha, Bangladesh in 2004 and 2005. Significantly, the highest grain yields (6.65 and 7.12 t/ha in winter season irrigated rice (boro) 6.36 and 6.40 t/ha in monsoon rice (aman) in both the years’ trials) were recorded in PRB (aerobic WM: Eh = +360 mV) plus 100% P amendment. There was a 14% yield increase over CTF (anaerobic WM: Eh = -56 mV) at same P level. The As content in grain and straw were about 3 and 6 times higher in CTF compared to PRB, respectively. The furrow irrigation approach of the PRB treatments consistently reduced irrigation input by 29-31% for boro and 27-30% for aman rice relative to CTF treatments in 2004 and 2005, respectively, thus reducing the amount of As added to the soil. Key Words Rice, water management, permanent raised bed, phosphorus, arsenic.
Introduction There is a growing concern in Bangladesh about arsenic contamination of rice (Oryza sativa L), the staple food crop, because of the high As levels found in irrigation waters and soils in many parts of the country (Panaullah et al. 2003). As solubility and mobility in the soil environment depends on several factors including redox potential (Eh), pH and other factors. Phosphate enhances the mobility of As in soils (Campos 2002). Addition of P to the soil might enhance downward movement of As (Peryea et al. 1997). On the other hand, Jahiruddin et al. (2004) reported that application of P enhanced the As accumulation in flooded rice. Under oxidizing conditions, As solubility is low with the major portion of soluble As present as organic species. Paddy rice in flooded soil is known to be very susceptible to As toxicity as compared to upland rice, since As+3 would be more prevalent under reducing conditions, creating phytotoxicity to the paddy rice. As a result rice yields were decreased 75% at 50 ppm of disodium methylarsenate in silty loam soils (Das 2000).
Irrigated rice in Bangladesh like Asia is typically transplanted into puddled paddy fields. Because of increasing water scarcity, there is a need to develop alternative systems that require less water. Aerobic water management through permanent raised bed in Bangladesh is a new technique of rice production without sacrificing yield (Talukder et al. 2002). In a bed planting system, all the crops are considered to be grown in aerobic conditions. The amount of irrigation water applied is just enough to fill the furrow. Raised bed may reduce irrigation water (Julie et al. 2008) and amount of added As and the sorption of As with different clay particles like iron oxide is more in compare with flood irrigation on the conventional flat. For this reason, in a conventional planting system there are a lot of chances for As in the form of arsenite to enter into the plant roots up to the grains through As-contaminated irrigation water. Little research has been conducted to minimize As uptake by the crops. In particular, the potential of P amendments and aerobic rice production to reduce As contamination of rice needs to be investigated. Therefore, the present research program was undertaken with the following objectives:
1. To determine the influence of water management through PRB on the growth and yield of rice in As contaminated soil-water system,
2. To evaluate the effects of phosphorus on the growth and yield of rice in As contaminated soil and water, and 3. To evaluate the effects of water management and phosphorus on As uptake by the rice plant.
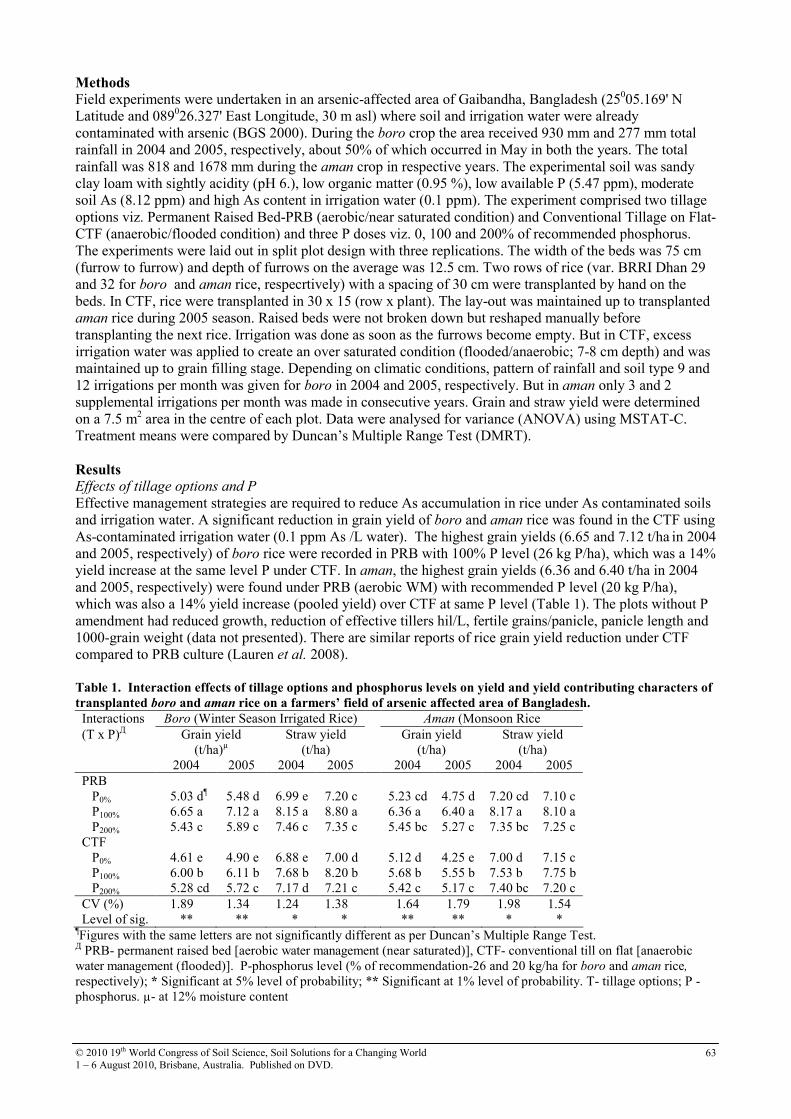
© 2010 19th World Congress of Soil Science, Soil Solutions for a Changing World 1 – 6 August 2010, Brisbane, Australia. Published on DVD.
63
Methods
Field experiments were undertaken in an arsenic-affected area of Gaibandha, Bangladesh (25005.169' N Latitude and 089026.327' East Longitude, 30 m asl) where soil and irrigation water were already contaminated with arsenic (BGS 2000). During the boro crop the area received 930 mm and 277 mm total rainfall in 2004 and 2005, respectively, about 50% of which occurred in May in both the years. The total rainfall was 818 and 1678 mm during the aman crop in respective years. The experimental soil was sandy clay loam with sightly acidity (pH 6.), low organic matter (0.95 %), low available P (5.47 ppm), moderate soil As (8.12 ppm) and high As content in irrigation water (0.1 ppm). The experiment comprised two tillage options viz. Permanent Raised Bed-PRB (aerobic/near saturated condition) and Conventional Tillage on Flat-CTF (anaerobic/flooded condition) and three P doses viz. 0, 100 and 200% of recommended phosphorus. The experiments were laid out in split plot design with three replications. The width of the beds was 75 cm (furrow to furrow) and depth of furrows on the average was 12.5 cm. Two rows of rice (var. BRRI Dhan 29 and 32 for boro and aman rice, respecrtively) with a spacing of 30 cm were transplanted by hand on the beds. In CTF, rice were transplanted in 30 x 15 (row x plant). The lay-out was maintained up to transplanted aman rice during 2005 season. Raised beds were not broken down but reshaped manually before transplanting the next rice. Irrigation was done as soon as the furrows become empty. But in CTF, excess irrigation water was applied to create an over saturated condition (flooded/anaerobic; 7-8 cm depth) and was maintained up to grain filling stage. Depending on climatic conditions, pattern of rainfall and soil type 9 and 12 irrigations per month was given for boro in 2004 and 2005, respectively. But in aman only 3 and 2 supplemental irrigations per month was made in consecutive years. Grain and straw yield were determined on a 7.5 m2 area in the centre of each plot. Data were analysed for variance (ANOVA) using MSTAT-C. Treatment means were compared by Duncan’s Multiple Range Test (DMRT).
Results Effects of tillage options and P
Effective management strategies are required to reduce As accumulation in rice under As contaminated soils and irrigation water. A significant reduction in grain yield of boro and aman rice was found in the CTF using As-contaminated irrigation water (0.1 ppm As /L water). The highest grain yields (6.65 and 7.12 t/ha in 2004 and 2005, respectively) of boro rice were recorded in PRB with 100% P level (26 kg P/ha), which was a 14% yield increase at the same level P under CTF. In aman, the highest grain yields (6.36 and 6.40 t/ha in 2004 and 2005, respectively) were found under PRB (aerobic WM) with recommended P level (20 kg P/ha), which was also a 14% yield increase (pooled yield) over CTF at same P level (Table 1). The plots without P amendment had reduced growth, reduction of effective tillers hil/L, fertile grains/panicle, panicle length and 1000-grain weight (data not presented). There are similar reports of rice grain yield reduction under CTF compared to PRB culture (Lauren et al. 2008).
Table 1. Interaction effects of tillage options and phosphorus levels on yield and yield contributing characters of
transplanted boro and aman rice on a farmers’ field of arsenic affected area of Bangladesh.
Interactions Boro (Winter Season Irrigated Rice) Aman (Monsoon Rice (T x P)Д Grain yield Straw yield Grain yield Straw yield (t/ha)µ (t/ha) (t/ha) (t/ha) 2004 2005 2004 2005 2004 2005 2004 2005 PRB P0% 5.03 d¶ 5.48 d 6.99 e 7.20 c 5.23 cd 4.75 d 7.20 cd 7.10 c P100% 6.65 a 7.12 a 8.15 a 8.80 a 6.36 a 6.40 a 8.17 a 8.10 a P200% 5.43 c 5.89 c 7.46 c 7.35 c 5.45 bc 5.27 c 7.35 bc 7.25 c CTF P0% 4.61 e 4.90 e 6.88 e 7.00 d 5.12 d 4.25 e 7.00 d 7.15 c P100% 6.00 b 6.11 b 7.68 b 8.20 b 5.68 b 5.55 b 7.53 b 7.75 b P200% 5.28 cd 5.72 c 7.17 d 7.21 c 5.42 c 5.17 c 7.40 bc 7.20 c CV (%) 1.89 1.34 1.24 1.38 1.64 1.79 1.98 1.54 Level of sig. ** ** * * ** ** * *
¶Figures with the same letters are not significantly different as per Duncan’s Multiple Range Test. Д PRB- permanent raised bed [aerobic water management (near saturated)], CTF- conventional till on flat [anaerobic water management (flooded)]. P-phosphorus level (% of recommendation-26 and 20 kg/ha for boro and aman rice, respectively); * Significant at 5% level of probability; ** Significant at 1% level of probability. T- tillage options; P -phosphorus. µ- at 12% moisture content
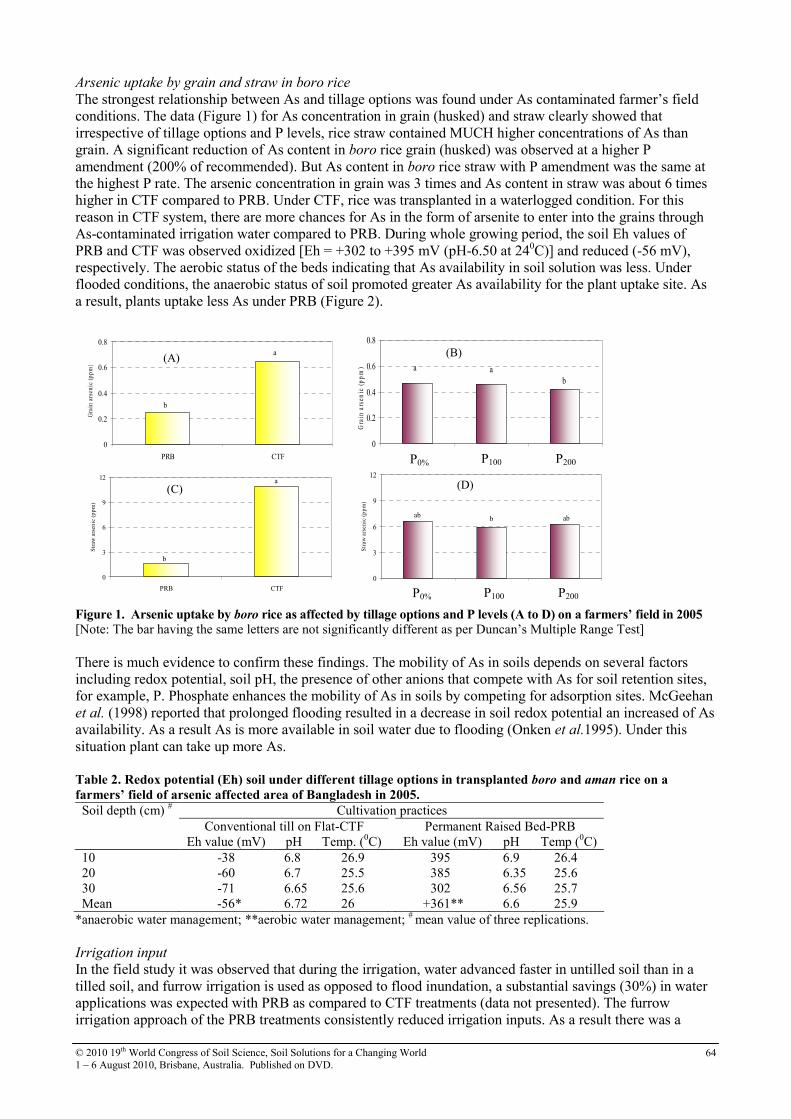
© 2010 19th World Congress of Soil Science, Soil Solutions for a Changing World 1 – 6 August 2010, Brisbane, Australia. Published on DVD.
64
Arsenic uptake by grain and straw in boro rice
The strongest relationship between As and tillage options was found under As contaminated farmer’s field conditions. The data (Figure 1) for As concentration in grain (husked) and straw clearly showed that irrespective of tillage options and P levels, rice straw contained MUCH higher concentrations of As than grain. A significant reduction of As content in boro rice grain (husked) was observed at a higher P amendment (200% of recommended). But As content in boro rice straw with P amendment was the same at the highest P rate. The arsenic concentration in grain was 3 times and As content in straw was about 6 times higher in CTF compared to PRB. Under CTF, rice was transplanted in a waterlogged condition. For this reason in CTF system, there are more chances for As in the form of arsenite to enter into the grains through As-contaminated irrigation water compared to PRB. During whole growing period, the soil Eh values of PRB and CTF was observed oxidized [Eh = +302 to +395 mV (pH-6.50 at 240C)] and reduced (-56 mV), respectively. The aerobic status of the beds indicating that As availability in soil solution was less. Under flooded conditions, the anaerobic status of soil promoted greater As availability for the plant uptake site. As a result, plants uptake less As under PRB (Figure 2).
Figure 1. Arsenic uptake by boro rice as affected by tillage options and P levels (A to D) on a farmers’ field in 2005 [Note: The bar having the same letters are not significantly different as per Duncan’s Multiple Range Test]
There is much evidence to confirm these findings. The mobility of As in soils depends on several factors including redox potential, soil pH, the presence of other anions that compete with As for soil retention sites, for example, P. Phosphate enhances the mobility of As in soils by competing for adsorption sites. McGeehan et al. (1998) reported that prolonged flooding resulted in a decrease in soil redox potential an increased of As availability. As a result As is more available in soil water due to flooding (Onken et al.1995). Under this situation plant can take up more As. Table 2. Redox potential (Eh) soil under different tillage options in transplanted boro and aman rice on a
farmers’ field of arsenic affected area of Bangladesh in 2005.
Cultivation practices Conventional till on Flat-CTF Permanent Raised Bed-PRB
Soil depth (cm) #
Eh value (mV) pH Temp. (0C) Eh value (mV) pH Temp (0C) 10 -38 6.8 26.9 395 6.9 26.4 20 -60 6.7 25.5 385 6.35 25.6 30 -71 6.65 25.6 302 6.56 25.7 Mean -56* 6.72 26 +361** 6.6 25.9
*anaerobic water management; **aerobic water management; # mean value of three replications.
Irrigation input
In the field study it was observed that during the irrigation, water advanced faster in untilled soil than in a tilled soil, and furrow irrigation is used as opposed to flood inundation, a substantial savings (30%) in water applications was expected with PRB as compared to CTF treatments (data not presented). The furrow irrigation approach of the PRB treatments consistently reduced irrigation inputs. As a result there was a
abab b
0
3
6
9
12
P 0% P 100% P 200%
Str
aw a
rsen
ic (
pp
m)
P0% P100
P200
(D)
a
b
0
0.2
0.4
0.6
0.8
PRB CTF
Gra
in a
rsen
ic (p
pm
)
(A) a a
b
0
0.2
0.4
0.6
0.8
P 0% P 100% P 200%
Gra
in a
rsen
ic (
pp
m)
P0% P100
P200
(B)
a
b
0
3
6
9
12
PRB CTF
Str
aw a
rsen
ic (
pp
m)
(C)
© 2010 19th World Congress of Soil Science, Soil Solutions for a Changing World 1 – 6 August 2010, Brisbane, Australia. Published on DVD.
65
reduced amount of As deposited to the soil in PRB by the As contaminated irrigation water (0.1 ppm). Yearly, 30% less As was deposited to the soil compared to CTF system through irrigation water during boro season. Lauren et al. (2008) observed that the furrow irrigated raised bed system consistently reduced irrigation inputs by 21-33% for wheat, 14-38% for rice and 16-33% for mungbean relative to CTF treatments. On a per hectare basis, these reductions translate into annual irrigation input savings of between 0.4 and 3.1 ML. Furthermore, farmers would likely have significant cost savings for fuel by pumping less water.
Conclusion
Arsenic has a negative impact on yield and yield components of rice. Phosphorus amendment and aerobic WM also had potential effects on grain yield. Aerobic WM reduced As toxicity compared to anaerobic WM for all P levels. Water management is a potential tool to reduce As contamination of grain and straw to levels safe for human and cattle consumption in the As affected areas of Bangladesh. The possibility of potential health hazards for As in foodstuffs are dependent on As species and its accumulation and metabolism in the body systems of human or cattle. So, it should be further studied. Aerobic rice culture might be the alternate option to maximize yields of rice, reduce or minimize As accumulation and toxicity in rice without access to irrigation in As contaminated areas of Bangladesh.
References
BGS (British Geological Servey) (2000). ‘Groundwater Studies of Arsenic Contamination in Bangladesh’ (British Geological Survey and Mott MachDonald (UK) for the Government of Bangladesh, Ministry of Local Government, Rural Development and Cooperatives, Department of Public Health Engineering and Department for International Development: UK).
Campos, V (2002). Arsenic in groundwater affected by phosphate fertilizers at São Paulo, Brazil. Environ. Geol. 42, 83-87.
Das, HK (2000). ‘Bangladesh Arsenic. Bhayabahata O Sambhabbya Protikar (Bengali)’. (Bangla Academy: Dhaka).
Jahiruddin M, Islam MR, Shah AL, Islam S, Ghani, MA (2004). Effects of Arsenic Contamination on Yield and Arsenic Accumulation in crops. In ‘Proceedings for workshop on arsenic in the food chain: Assessment of arsenic in the water-soil-crop system’. (Ed MAL Shah, MA Rashid, MH Rashid, MR Mandal, MA Ghani) pp. 39-51. (BARI: Gazipur, Dhaka, Bangladesh).
Lauren JG, Shah G, Hossain MI, Talukder ASMHM, Duxbury JM, Meisner CA, Adhikari C (2008). Research station and on-farm experiences with permanent raised beds through the Soil Management Collaborative Research Support Program. In ‘Proceedings of permanent beds and rice residue management for rice–wheat systems in the Indo-Gangetic Plain. Ludhiana, India 7-9 September 2006’. ACIAR Proceedings No. 127. (Eds E Humphreys, CH Roth) pp 124-132.
McGeehan SL, Fendorf SE, Naylor DV (1998). Alteration of arsenic sorption in flooded-dried soils. Soil Sci. Am. J. 62, 828-833.
Onken BM, Hossner LR (1995). Plant uptake and determination of arsenic species in soil solution under flooded conditions. J. Envirn. Qual. 24, 373-381.
Panaullah GM, Ahmed ZU, Rahman GKMM, Jahiruddin M, Miah MAM, Farid ATM, Biswas BK, Lauren JG, Loeppert RH, Duxbury JM, Meisner, CA (2003). The Arsenic Hazard in the Irrigation Water-Soil-Plant System in Bangladesh:A Preliminary Assessment. In ‘Proceedings of 7th International Conference on the Biogeochemistry of Trace Elements. Uppsala, Sweden, June 10-15, 2003’.
Peryea FJ, Kammereck R (1997). Phosphate-enhanced movement of arsenic out of lead arsenate contaminated top soil and through uncontaminated subsoil. Water Air Soil Pollut. 93, 243–254.
Talukder ASMHM, Sufian MA, Meisner CA, Duxbury JM, Lauren JG, Hossain ABS (2002). Rice, wheat and mungbean yields in response to N levels and management under a bed planting system. In ‘Proceedings of the 17th World Congress of Soil Science, Bangkok, Thailand’. Vol no.1. Symposium no. 11, 351.
© 2010 19th World Congress of Soil Science, Soil Solutions for a Changing World 1 – 6 August 2010, Brisbane, Australia. Published on DVD.
66
Factors influencing nitrate retention in 3 Andisol profiles in Kyushu, Japan Hideo Kubotera
A and Shin-Ichiro WadaB ANational Agricultural Research Center for Kyushu Okinawa Region, Koshi, Kumamoto, Japan, Email [email protected] BSchool of Agriculture, Kyushu University, Fukuoka, Japan, Email [email protected]
Abstract We measured nitrate retention in 43 soil samples from 3 uncultivated Andisol profiles in Kyushu, Japan. In this study, nitrate retention—also termed nitrate holding capacity (NHC)—was calculated from the recovery ratio for nitrate that had been added to soils as part of a 5 mmol/L potassium nitrate solution. We then conducted a multiple regression analysis on the relationship between NHC and 3 factors that affect the soil’s positive charge: total carbon, pH (H2O), and Alo. The multiple correlation coefficient between these 3 factors and NHC was 0.918** (n = 43). The partial regression coefficient yielded the following equation for NHC estimation: NHC (cmolc/kg) = -0.001400 × total carbon (g/kg) - 0.124400 × pH (H2O) + 0.004735 × Alo (g/kg) + 0.802387. The appreciable consistency between the measured and estimated NHC suggests the possibility of broad-based estimation of nitrate retention in these soils and the development of nitrate retention characteristic maps from the existing soil analytical data and soil maps. Key Words NHC (nitrate holding capacity), multiple regression analysis, total carbon, pH (H2O), Alo Introduction Kyushu is one of the 4 major islands of Japan and is located in the southwest of the Japanese archipelago. Kyushu has several active volcanoes such as Aso, Unzen, Kuju, Kirishima, and Sakurajima, and Andisols are widely spread over central and southern Kyushu; their distribution area accounts for 66.9% of upland field soils in Kyushu (Soil Conservation Project 1991). Major agricultural activities in Kyushu include the cultivation of vegetables, tea, and intensive livestock farming, in which a large amount of nitrate is added to soils as chemical fertilizers and manure. As a result, there is a high risk of groundwater pollution by nitrate in these areas. Nitrate retention due to positive charge in soil materials affects the movement of nitrate in soils. The positive charge in soil materials is pH-dependent variable. It occurs especially in Oxisols, Ultisols, Alfisols, Spodosols, and Andisols (Qafoku et al. 2004). In these soils, the positive charge retains the anion and retards its downward leaching (Wong et al. 1987; Ishiguro et al. 1992; Katou et al. 1996; Feder and Findeling 2007; Maeda et al. 2008). Therefore, it is important for reducing the environmental load due to nitrate leaching to determine and utilize the positive charge characteristics of Andisols in Kyushu. Since there is little data on nitrate retention of Andisols in Kyushu, we investigated its nitrate retention ability. Nitrate retention in Andisols is affected by several factors. The positive charge in Andisols is mainly due to the protonization of Al-OH in allophane and imogolite; therefore, Sio or Alo that reflects the allophane and imogolite content is positively correlated with nitrate retention (Tani et al. 2004; Maeda et al. 2008). The abundance of carbon has been reported as a negative influencing factor on nitrate retention (Nanzyo et al. 1993; Perrott 1978; Tani et al. 2004). In addition, nitrate retention is influenced by soil pH because the positive charge of soils is pH-dependent. If we can obtain clear relationships between these factors and nitrate retention in Kyushu Andisols, it is possible to derive an equation for the estimation of nitrate retention based on these factors. This equation can be applied to the existing analytical data for the broad-based estimation of nitrate retention in various Andisols and can help in the development of nitrate retention characteristic maps based on existing soil maps. This paper reports the measured nitrate retention for 43 samples from 3 Andisol profiles in Kyushu and the relationships between nitrate retention and above-mentioned factors, i.e., total carbon, pH (H2O), and Alo. Materials and methods In this study, we analyzed samples of uncultivated soils to eliminate the effect of external factors such as fertilizer application. Samples were collected from 3 Andisol profiles in Kyushu (Figure 1). The Takaono profile is located on a gentle mountain foot slope of Aso-somma in Ozu Town, Kumamoto Prefecture. Its geographic coordinates are 32º53′29″N and 130º54′29″E, and its elevation is 250 m above sea level. This soil is classified into a Hydric Pachic Melanudand, with a depth of 420 cm, and it has 15 horizons. The craters of

© 2010 19th World Congress of Soil Science, Soil Solutions for a Changing World 1 – 6 August 2010, Brisbane, Australia. Published on DVD.
67
the Aso volcano, located 16 km eastward from this profile, were the main source of the parent material, tephra, for this soil. The Kunimi profile is located on a gentle mountain side slope in Unzen City, Nagasaki Prefecture, and its geographic coordinates are 32º48′23″N and 130º17′14″E with an elevation of 380 m above sea level. This soil is a Hydric Melanudand with a depth of 260 cm, and it has 8 horizons. The Unzen volcano, located 5 km southward from this profile, was the main source of tephra for this profile. The Hanamure profiles is located on a gentle mountain foot slope in Kokonoe Town, Oita Prefecture, and its geographic coordinates are 33º8′37″N and 131º16′5″E and it is situated 900 m above sea level. The soil here is a Hydric Melanudand, with a depth of 483 cm, and it has 22 horizons. The craters of Kuju volcano, located 5 to 7 km southward of this profile, were the main source of tephra for this profile. The Aso volcano, located 33 km southward, also provided tephra for the Hanamure profile. No tephra layer was observed in Takaono and Kunimi profiles, whereas the Hanamure profile contained 4 layers of slightly weathered to weathered tephra. Forty-three samples, i.e., all the horizons in these profiles except for 2 very thin layers in the Hanamure profile, were collected and analyzed. Total carbon was determined through a dry combustion method using ELEMENTAR Analysensysteme Vario EL. The pH (H2O) value was determined by 1:2.5 extraction using a glass electrode. Alo was measured by Blakemore et al.’s method (1981) using ICP-AES (Seiko Instruments SPS4000). The nitrate retention of the soils was determined by Kubotera and Wada’s method (2008). In this method, 7.5 mL of 5 mmol/L potassium nitrate solution was added to 5 g of air-dried fine earth samples in centrifuge tubes; the mixture was shaken for 30 min and centrifuged. The nitrate ion concentration of the supernatant was then measured by colorimetric analysis using Bran-Luebbe Autoanalyzer (a [mmol/L]). The concentration of water-soluble nitrate ions in the samples was also determined by the same procedure (b [mmol/L]). The sum of the concentrations of the used nitrate solution and water-soluble nitrate ions in the sample (5+b [mmol/L]) was considered as the concentration of the initial solution. The difference in nitrate ion concentrations between the initial solution and the supernatant after treatment (5+b-a [mmol/L]) was considered as the nitrate ion concentration retained by the soils. Since the samples were obtained from uncultivated soils, they contained little nitrate. Thus, the value of b for our samples was zero, except for the A horizons of each profile. Nitrate retention measured by this method is hereafter termed nitrate holding capacity (NHC).
T: Takaono
K: KunimiH: Hanamure
KT
H
100 km
Kyushu Island
Figure 1. Location of the profiles studied.
Results
NHC of the horizons and the effects of total carbon, pH (H2O), and Alo on NHC
The NHC, total carbon, pH (H2O), and Alo contents in the studied profiles are shown in Figure 2. The total carbon and pH (H2O), which were expected to show negative relationships with NHC, are plotted inversely in the figure. In the Takaono profile, the NHC ranged from 0.100 to 0.481 cmolc/kg. The NHC was smallest in the A horizon (0-24 cm), and it showed a tendency to gradually increase down the profile, but with fluctuations. The charts for total carbon and Alo show a remarkable resemblance to that of the NHC, indicating that the NHC has a strong negative relationship with total carbon and a positive relationship with Alo contents of the Takaono profiles. The pH (H2O) had a small variance in this profile and did not show a relationship with the NHC. In the Kunimi profile, the NHC ranged from 0.110 to 0.356 cmolc/kg. It was smallest in the A horizon (0-35 cm) and increased down the profile in a manner similar to that found in the Takaono profile. The total carbon content showed a fluctuation similar to that of the NHC. Contrary to our expectations, a weak positive
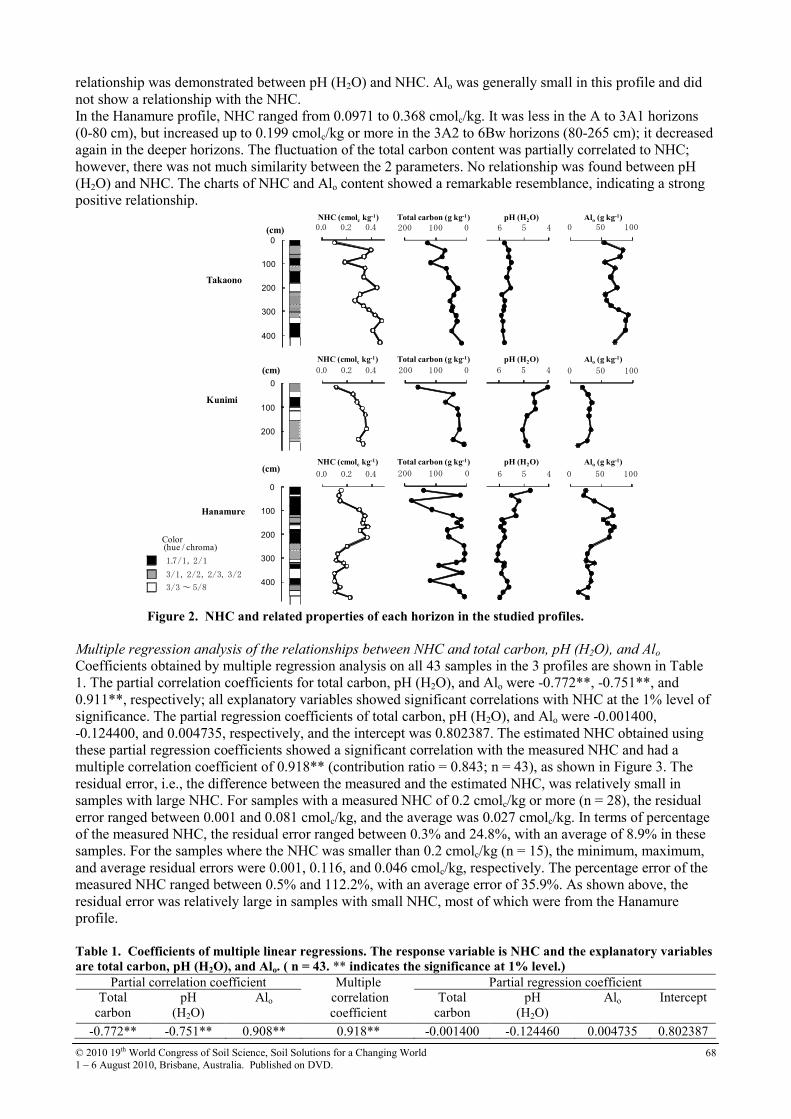
© 2010 19th World Congress of Soil Science, Soil Solutions for a Changing World 1 – 6 August 2010, Brisbane, Australia. Published on DVD.
68
relationship was demonstrated between pH (H2O) and NHC. Alo was generally small in this profile and did not show a relationship with the NHC. In the Hanamure profile, NHC ranged from 0.0971 to 0.368 cmolc/kg. It was less in the A to 3A1 horizons (0-80 cm), but increased up to 0.199 cmolc/kg or more in the 3A2 to 6Bw horizons (80-265 cm); it decreased again in the deeper horizons. The fluctuation of the total carbon content was partially correlated to NHC; however, there was not much similarity between the 2 parameters. No relationship was found between pH (H2O) and NHC. The charts of NHC and Alo content showed a remarkable resemblance, indicating a strong positive relationship.
0.0 0.2 0.4 0100200 0 50 100 456
0.0 0.2 0.4 0100200 0 50 100 456
0.0 0.2 0.4 0100200 0 50 100 456
0
100
200
300
400
0
100
200
0
100
200
300
400
NHC (cmolc kg-1) Total carbon (g kg-1) Alo (g kg-1)pH (H2O)
(cm)
(cm)
(cm)
Takaono
Kunimi
Hanamure
NHC (cmolc kg-1) Total carbon (g kg-1) Alo (g kg-1)pH (H2O)
NHC (cmolc kg-1) Total carbon (g kg-1) Alo (g kg-1)pH (H2O)
Color(hue / chroma)
1.7/1, 2/1
3/1, 2/2, 2/3, 3/2
3/3 ~ 5/8
Figure 2. NHC and related properties of each horizon in the studied profiles.
Multiple regression analysis of the relationships between NHC and total carbon, pH (H2O), and Alo Coefficients obtained by multiple regression analysis on all 43 samples in the 3 profiles are shown in Table 1. The partial correlation coefficients for total carbon, pH (H2O), and Alo were -0.772**, -0.751**, and 0.911**, respectively; all explanatory variables showed significant correlations with NHC at the 1% level of significance. The partial regression coefficients of total carbon, pH (H2O), and Alo were -0.001400, -0.124400, and 0.004735, respectively, and the intercept was 0.802387. The estimated NHC obtained using these partial regression coefficients showed a significant correlation with the measured NHC and had a multiple correlation coefficient of 0.918** (contribution ratio = 0.843; n = 43), as shown in Figure 3. The residual error, i.e., the difference between the measured and the estimated NHC, was relatively small in samples with large NHC. For samples with a measured NHC of 0.2 cmolc/kg or more (n = 28), the residual error ranged between 0.001 and 0.081 cmolc/kg, and the average was 0.027 cmolc/kg. In terms of percentage of the measured NHC, the residual error ranged between 0.3% and 24.8%, with an average of 8.9% in these samples. For the samples where the NHC was smaller than 0.2 cmolc/kg (n = 15), the minimum, maximum, and average residual errors were 0.001, 0.116, and 0.046 cmolc/kg, respectively. The percentage error of the measured NHC ranged between 0.5% and 112.2%, with an average error of 35.9%. As shown above, the residual error was relatively large in samples with small NHC, most of which were from the Hanamure profile. Table 1. Coefficients of multiple linear regressions. The response variable is NHC and the explanatory variables
are total carbon, pH (H2O), and Alo. ( n = 43. ** indicates the significance at 1% level.)
Partial correlation coefficient Partial regression coefficient Total
carbon pH
(H2O) Alo
Multiple correlation coefficient
Total carbon
pH (H2O)
Alo
Intercept
-0.772** -0.751** 0.908** 0.918** -0.001400 -0.124460 0.004735 0.802387
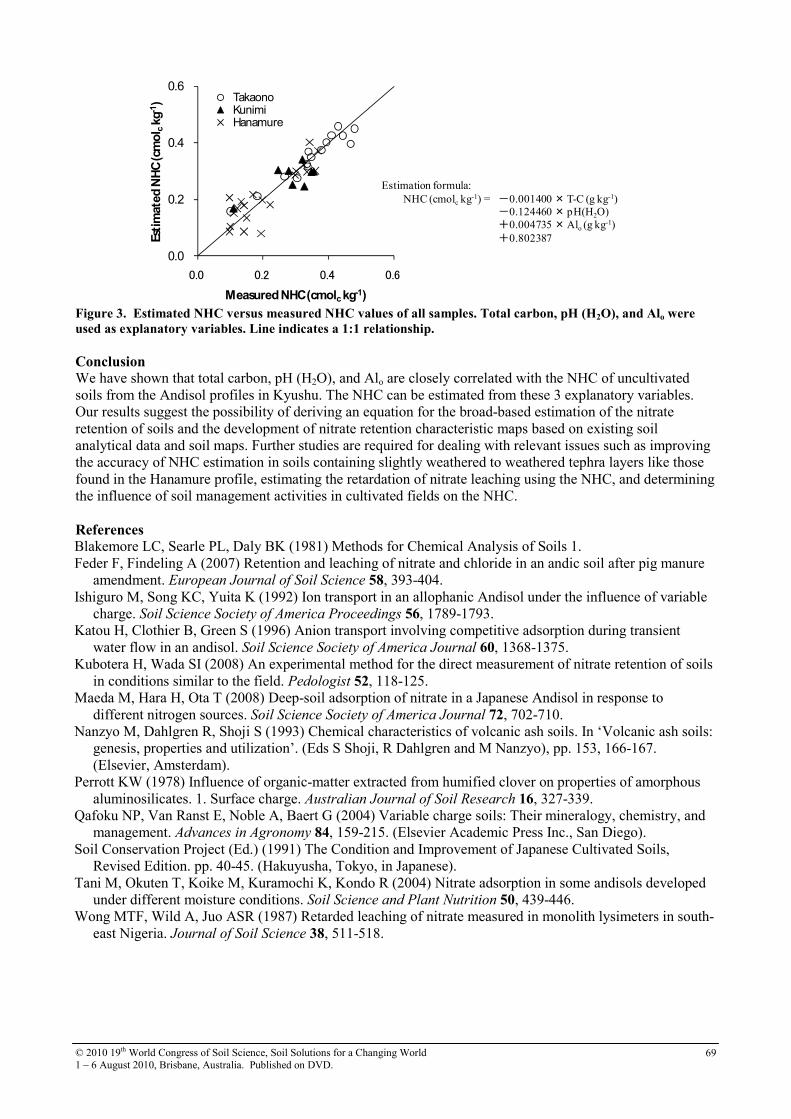
© 2010 19th World Congress of Soil Science, Soil Solutions for a Changing World 1 – 6 August 2010, Brisbane, Australia. Published on DVD.
69
0.0
0.2
0.4
0.6
0.0 0.2 0.4 0.6
Estimated NHC (cmol ckg-1)
Measured NHC (cmolckg-1)
TakaonoKunimiHanamure
Estimation formula:NHC (cmolc kg-1) = -0.001400 × T-C (g kg-1)
-0.124460 × pH(H2O)+0.004735 × Alo (g kg-1)+0.802387
Figure 3. Estimated NHC versus measured NHC values of all samples. Total carbon, pH (H2O), and Alo were
used as explanatory variables. Line indicates a 1:1 relationship.
Conclusion We have shown that total carbon, pH (H2O), and Alo are closely correlated with the NHC of uncultivated soils from the Andisol profiles in Kyushu. The NHC can be estimated from these 3 explanatory variables. Our results suggest the possibility of deriving an equation for the broad-based estimation of the nitrate retention of soils and the development of nitrate retention characteristic maps based on existing soil analytical data and soil maps. Further studies are required for dealing with relevant issues such as improving the accuracy of NHC estimation in soils containing slightly weathered to weathered tephra layers like those found in the Hanamure profile, estimating the retardation of nitrate leaching using the NHC, and determining the influence of soil management activities in cultivated fields on the NHC. References Blakemore LC, Searle PL, Daly BK (1981) Methods for Chemical Analysis of Soils 1. Feder F, Findeling A (2007) Retention and leaching of nitrate and chloride in an andic soil after pig manure
amendment. European Journal of Soil Science 58, 393-404. Ishiguro M, Song KC, Yuita K (1992) Ion transport in an allophanic Andisol under the influence of variable
charge. Soil Science Society of America Proceedings 56, 1789-1793. Katou H, Clothier B, Green S (1996) Anion transport involving competitive adsorption during transient
water flow in an andisol. Soil Science Society of America Journal 60, 1368-1375. Kubotera H, Wada SI (2008) An experimental method for the direct measurement of nitrate retention of soils
in conditions similar to the field. Pedologist 52, 118-125. Maeda M, Hara H, Ota T (2008) Deep-soil adsorption of nitrate in a Japanese Andisol in response to
different nitrogen sources. Soil Science Society of America Journal 72, 702-710. Nanzyo M, Dahlgren R, Shoji S (1993) Chemical characteristics of volcanic ash soils. In ‘Volcanic ash soils:
genesis, properties and utilization’. (Eds S Shoji, R Dahlgren and M Nanzyo), pp. 153, 166-167. (Elsevier, Amsterdam).
Perrott KW (1978) Influence of organic-matter extracted from humified clover on properties of amorphous aluminosilicates. 1. Surface charge. Australian Journal of Soil Research 16, 327-339.
Qafoku NP, Van Ranst E, Noble A, Baert G (2004) Variable charge soils: Their mineralogy, chemistry, and management. Advances in Agronomy 84, 159-215. (Elsevier Academic Press Inc., San Diego).
Soil Conservation Project (Ed.) (1991) The Condition and Improvement of Japanese Cultivated Soils, Revised Edition. pp. 40-45. (Hakuyusha, Tokyo, in Japanese).
Tani M, Okuten T, Koike M, Kuramochi K, Kondo R (2004) Nitrate adsorption in some andisols developed under different moisture conditions. Soil Science and Plant Nutrition 50, 439-446.
Wong MTF, Wild A, Juo ASR (1987) Retarded leaching of nitrate measured in monolith lysimeters in south-east Nigeria. Journal of Soil Science 38, 511-518.
© 2010 19th World Congress of Soil Science, Soil Solutions for a Changing World 1 – 6 August 2010, Brisbane, Australia. Published on DVD.
70
Fe(III) reduction in soils from South China Chengshuai LiuA, Manjia ChenA and Fangbai LiA AGuangdong Key Laboratory of Agricultural Environment Pollution Integrated Control, Guangdong Institute of Eco-Environmental and Soil Sciences, Guangzhou 510650, China, Email [email protected], [email protected]
Abstract The content of Fe in soils in South China is high and the Fe reduction process is important for contaminants transformation in this region. In this study, 23 soil samples from South China were used to study the effects of soil characteristics and weathering parameters on the Fe reduction processes. The total Fe reduction rates ranged from 5.8% to 38.4% and the dissolved Fe reduction rates ranged from 0.04% to 7.9% in different soils. The high soil weathering intensity would inhibit Fe reduction. Both the total Fe reduction rate and dissolved Fe reduction rate were positively linear related with the weathering coefficients SiO2/Al2O3 and Al2O3/Fe2O3. High soil pH would accelerate the dissolved Fe reduction rate, and there was positive linear relationship between them. The content of organic matter in soils had no obvious effect on the Fe reduction process. The key relationships identified between soil properties and Fe reduction processes in this study should be generally applicable to this region for understanding the Fe cycle in soils. Key Words Fe cycle, reduction, soil weathering, subtropical soils, South China. Introduction
The redox cycling of Fe plays pivotal roles in geochemical cycles of contaminants in natural environments. Redox transformations of Fe(III) oxides and oxyhydroxides in soils, which are important reaction interface for many metals and metalloids, can affect the environmental fate and transport of contaminants (Tas and Pavlostathis 2007). Fe(III) reduction produces Fe(II), which is an effective reductant when present at Fe(III) oxide surfaces (Li et al. 2008a). Contaminants that are amenable to surface-mediated reduction in soils by solid-associated Fe(II) include chlorinated aliphatic and nitroaromatic hydrocarbon compounds and certain heavy metals and radionuclides (Li et al. 2008b). Several factors may control the rates of Fe reduction, especially in soils, in which there are numerous complex components. The soils in South China were developed under subtropical monsoon climate, which resulted in the high-degree weathered extent with the main type of red soils (Schoonen et al. 1998). The minerals such as iron oxides are enriched in these soils, and the Fe cycle is the important geochemical process for the contaminants transformation in soils in South China (Liu 1993). More important is that Fe reduction is pivotal for stimulate the detoxification process of contaminated soils and it is also the main step of Fe species cycle in natural environment (Roden 2004). So, it is important and interesting to investigate the Fe reduction in different soils, especially in the soils with high content Fe. And furthermore, the soils developed from different parent materials have different physicochemical properties, and the weathering chronosequence of soils also lead to the different properties, which may be vital for the Fe reduction in the soils. To better understand the Fe reduction process in the red soils from South China with different properties and weathering chronosequence, in this study, we conducted a laboratory experiment to investigate the Fe reduction in 23 soils which developed from different parent materials and also with different weathering chronosequence. The obtained results of this study are anticipated to be valuable and important for understanding and adjusting the geochemical process of contaminants, which are now universal in the soils in South China. Materials and Methods
Study Sites
Twenty-three soil samples, including twelve Ferrosols, six Ferrolasols, three Anthrosols, and two Argosols types, were collected from South China. All of the samples were collected from the soil depth of 0-15 cm. The 23 soils samples were developed from different parent materials, in which three from Granite, three from Basalt, two from Sedimentary rocks, four form Hazle, three from Alluvial deposit, and five from Quaternary Period red earth.
© 2010 19th World Congress of Soil Science, Soil Solutions for a Changing World 1 – 6 August 2010, Brisbane, Australia. Published on DVD.
71
Soil properties analysis and Fe reduction experiments
Please find the detail analysis methods for determining the soil pH, the content of organic matters, the content of total Fe and dissolved Fe, the content of Al and Si in Handbook of Soil Analysis. Standard anaerobic techniques were used for all the Fe reduction experiments. An anaerobic media were boiled and cooled under a constant stream of O2-free N2, dispensed into aluminum-sealed culture bottles under the same gas phase, capped with butyl rubber stopper, and sterilized by autoclaving (121 oC, 20 min). Besides the sterilized media, inoculation and sampling were conducted by using sterile syringes and needles. All vials were incubated in a Bactron Anaerobic/Environment ChamberII (Shellab, Shedon Manufacturing Inc., Cornelius, OR) at 30 oC in dark. Fe (III) reduction in soil was prepared by 0.5 g soil sample and anoxic suspensions including 30 mM PIPES buffer (pH7), 10 mM lactate acid, and washed suspensions S12 which gave a final cell concentration of about 108 cells/mL. The total concentration of Fe(II), including dissolved and sorbed Fe(II), was determined by extracting Fe(II) from the samples using 1.5 M HCl for 1.5h (Fredrickson and Gorby 1996) and assaying the extract using 1,10-phenanthroline colorimetric method. Dissolved Fe(II) was determined by removing the soil and sorbed Fe(II) from the aqueous phase using a 0.22 µm syringe filter by 1,10-phenanthroline (Roden and Zachara 1996). Results
Soil characteristics
A broad range of soil characteristics were represented across the 23 soil samples, and soil pH, soil organic matter, the weathering coefficients were obtained in this study. Soil pH ranged from 4.55 to 7.3. The Ferralosols were significant more acidic (4.55-5.11) than other soils types, including Ferrosols (4.91-7.3), Anthrosols (6.09-6.24), and Argosols (5.64-7.3). The soil organic contents ranged from 0.24% to 6.57%, in which there was no significant difference in organic matter content between the different soil types. The content of Fe standardized as Fe2O3 ranged from 1.03% to 19.6%, which differentiated greatly. The three soils developed from Basalt had the highest Fe content that all were more than 10%. The Al and SiO2 content were also different in these 23 soils samples. The Al content standardized as Al2O3 ranged from 7.22% to 29. 75% and the SiO2 content ranged from 40.0% to 65.8%. The weathering degree were high for the studied soils, in which the weathering coefficients of SiO2/Al2O3 ranged 2.42 to 13.2, and coefficients of Al2O3/Fel2O3 ranged from 2.06 to 11.5, while there also is no significant difference both between in the soil types and parent materials. Fe reduction in soil
There were obvious Fe reduction process for all the soil samples, and the difference of Fe reduction rates were significant for the different soil samples. As to the total Fe reduction, Typic Hapli-Udic Ferralosols (S-TF2) and Typic Gleyi-Stagnic Anthrosols (A-TGA2) achieved the highest Fe reduction rates of 38.4% and 31.4%, respectively. The Fe reduction rates of most of the soils (16 samples) ranged from 10.0% to 20.0%. Only five soil samples, including Xanthic Hapli-Udic Ferralosols (B-XF), Typic Rhodi-Udic Ferralosols (B-TF), Rhodic Hapli-Udic Ferrosols (B-RF), Leachic Carbonati-Udic Ferrosols (L-LF2), and Xanthic Hapli-Udic Ferrosols (G-XF1), achieved the low Fe reduction rates, which were all lower than 10%. Fe reduction occurred mainly on the surface of the soils. However, some of Fe can be easily dissolved when the soils were suspended with water, and the dissolved Fe can also be reduced. The dissolved Fe reduction rates ranged from 0.03% to 7.94%, which were much lower than those of total Fe for every soil. And also, varied Fe reduction rates were obtained in different soils. S-TF2 also achieved the highest dissolved Fe reduction rate of 7.94%, while the dissolved Fe almost can not occurred in Typic Ari-Udic Ferrosols (Q-TF) only with the rate of 0.03%. Discussion The 23 soil samples used in this study represent a diversity of physicochemical properties typical of red soils from South China in subtropical area. Thus, key relationships identified between soil properties and Fe reduction processes should be generally applicable to this region. Owing to the high content of Fe in the soils from South China, the geochemical processes of the contaminants in these soils can be relevant with the Fe cycle, especially the Fe reduction. However, the characteristics and the weathering intensity of the soils are important for determining the Fe reduction process. The soil pH mainly affected the reaction activity in the solution while the surface of soils was only slightly affected by it. The organic matter in soils were constitute of complicated components, in which only those
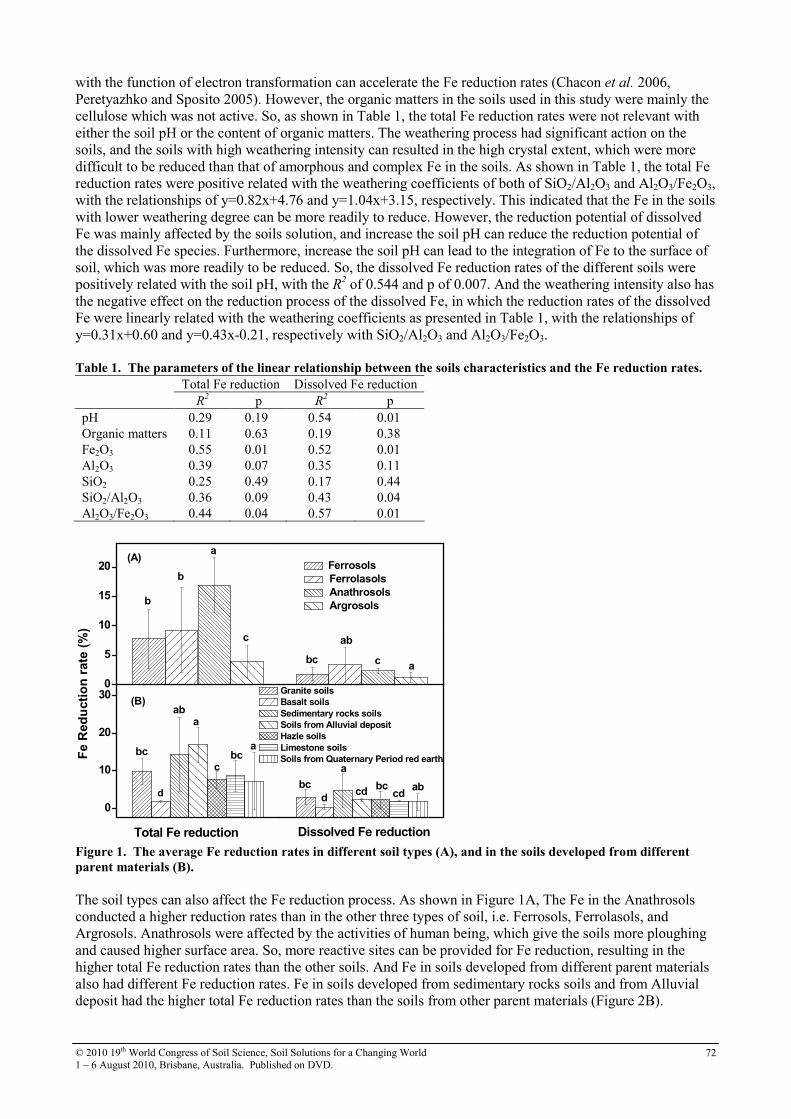
© 2010 19th World Congress of Soil Science, Soil Solutions for a Changing World 1 – 6 August 2010, Brisbane, Australia. Published on DVD.
72
with the function of electron transformation can accelerate the Fe reduction rates (Chacon et al. 2006, Peretyazhko and Sposito 2005). However, the organic matters in the soils used in this study were mainly the cellulose which was not active. So, as shown in Table 1, the total Fe reduction rates were not relevant with either the soil pH or the content of organic matters. The weathering process had significant action on the soils, and the soils with high weathering intensity can resulted in the high crystal extent, which were more difficult to be reduced than that of amorphous and complex Fe in the soils. As shown in Table 1, the total Fe reduction rates were positive related with the weathering coefficients of both of SiO2/Al2O3 and Al2O3/Fe2O3, with the relationships of y=0.82x+4.76 and y=1.04x+3.15, respectively. This indicated that the Fe in the soils with lower weathering degree can be more readily to reduce. However, the reduction potential of dissolved Fe was mainly affected by the soils solution, and increase the soil pH can reduce the reduction potential of the dissolved Fe species. Furthermore, increase the soil pH can lead to the integration of Fe to the surface of soil, which was more readily to be reduced. So, the dissolved Fe reduction rates of the different soils were positively related with the soil pH, with the R2
of 0.544 and p of 0.007. And the weathering intensity also has the negative effect on the reduction process of the dissolved Fe, in which the reduction rates of the dissolved Fe were linearly related with the weathering coefficients as presented in Table 1, with the relationships of y=0.31x+0.60 and y=0.43x-0.21, respectively with SiO2/Al2O3 and Al2O3/Fe2O3. Table 1. The parameters of the linear relationship between the soils characteristics and the Fe reduction rates.
Total Fe reduction Dissolved Fe reduction R
2 p R
2 p
pH 0.29 0.19 0.54 0.01 Organic matters 0.11 0.63 0.19 0.38 Fe2O3 0.55 0.01 0.52 0.01 Al2O3 0.39 0.07 0.35 0.11 SiO2 0.25 0.49 0.17 0.44 SiO2/Al2O3 0.36 0.09 0.43 0.04 Al2O3/Fe2O3 0.44 0.04 0.57 0.01
0
10
20
30(B)
Granite soils
Basalt soils
Sedimentary rocks soils
Soils from Alluvial deposit
Hazle soils
Limestone soils
Soils from Quaternary Period red earth
abcd
bccd
a
d
bc
abc
c
aab
d
bc
Dissolved Fe reduction Total Fe reduction
Fe Reduction rate (%)
0
5
10
15
20
ac
ab
bc
c
a
b
b
Ferrosols
Ferrolasols
Anathrosols
Argrosols
(A)
Figure 1. The average Fe reduction rates in different soil types (A), and in the soils developed from different
parent materials (B).
The soil types can also affect the Fe reduction process. As shown in Figure 1A, The Fe in the Anathrosols conducted a higher reduction rates than in the other three types of soil, i.e. Ferrosols, Ferrolasols, and Argrosols. Anathrosols were affected by the activities of human being, which give the soils more ploughing and caused higher surface area. So, more reactive sites can be provided for Fe reduction, resulting in the higher total Fe reduction rates than the other soils. And Fe in soils developed from different parent materials also had different Fe reduction rates. Fe in soils developed from sedimentary rocks soils and from Alluvial deposit had the higher total Fe reduction rates than the soils from other parent materials (Figure 2B).

© 2010 19th World Congress of Soil Science, Soil Solutions for a Changing World 1 – 6 August 2010, Brisbane, Australia. Published on DVD.
73
Conclusion
The Fe reduction processes of different soils in South China were affected by the soil characteristics and the weathering coefficients. The high weathering intensity of the soils can inhibit the reduction rates of the total Fe in soils, while the soil pH and content of organic matters was not related with the total Fe reduction rates. The dissolved Fe reduction rates were positively related with the soil pH, and they were also related with the soil weathering coefficients. Acknowledgments
This research was supported by the National Natural Science Foundations of China (No. 40771105 and 40971149). References Chacon N, Silver WL, Dubinsky EA, Cusack DF (2006) Iron reduction and soil phosphorus solubilization in
humid tropical forests soils: the roles of labile carbon pools and an electron shuttle compound. Biogeochemistry 78, 67–84.
Fredrickson JK, Gorby YA (1996) Environmental processes mediated by iron-reducing bacteria. Current Opinion in Biotechnology 7, 287–29.
Li FB, Wang XG, Li YT, Liu CS, Zeng F, Zhang LJ, Hao MD, Ruan HD (2008a) Enhancement of the reductive transformation of pentachlorophenol by polycarboxylic acids at the iron oxide–water interface. Journal of Colloid and Interface Science 321, 332–341
Li FB, Wang XG, Liu CS, Li YT, Zeng F, Liu L (2008b) Reductive transformation of pentachlorophenol on the interface of subtropical soil colloids and water. Geoderma 148, 70-78.
Liu AS (1993) Soils in Guangdong Province. Scientific Publisher of China, Beijing. (In Chinese). Peretyazhko T, Sposito G (2005) Iron(III) reduction and phosphorous solubilisation in humid tropical forest
soils. Geochimica et Cosmochimica Acta 69, 3643–3652. Roden EE (2004) Analysis of long-term bacterial vs. chemical Fe(III) oxide reduction kinetics. Geochimica
et Cosmochimica Acta 68, 3205–3216. Roden EE, Zachara JM (1996) Microbial reduction of crystalline iron(III) oxides influence of oxide surface
area and potential for cell growth. Environmental Science and Technology 30, 1618–1628. Schoonen MAA, Xu Y, Strongin DR (1998) An introduction to geocatalysis. Journal of Geochemical
Exploration 62, 201-215. Tas DO, Pavlostathis SG (2007) The influence of iron reduction on the reductive biotransformation of
pentachloronitrobenzene. European Journal of Soil Biology 43, 264-275.
© 2010 19th World Congress of Soil Science, Soil Solutions for a Changing World 1 – 6 August 2010, Brisbane, Australia. Published on DVD.
74
Geochemical approach for toxic metal leaching and migration from defunct
mining site Junko HaraA, Yoshishige KawabeB and Takeshi KomaiC AInstitute for Geo-Resources and Environment, National Institute of Advanced Industrial Science and Technology, Tsukuba, Japan, Email [email protected] BInstitute for Geo-Resources and Environment, National Institute of Advanced Industrial Science and Technology, Tsukuba, Japan, Email [email protected] CInstitute for Geo-Resources and Environment, National Institute of Advanced Industrial Science and Technology, Tsukuba, Japan, Email takeshi-komai @aist.go.jp
Abstract Toxic metal migration in the geo-environment spreads pollution and it is necessary to conduct reasonable and economical risk management. This work analyses the leaching of toxic metals from rock and soils around a hydrothermal alteration region, and estimates the effect of coexisting minerals and soluble elements on leaching and migration of toxic elements. The leaching of toxic metals is controlled by mainly Fe, Al and Ca concentrations in host rock, and high contents of them prevent leaching. Leaching and migration also strongly depend on colloidal materials, especially iron oxide and Al/Fe-humus complex. These materials prevent the leaching of toxic elements but toxic elements adsorb on them and are transported downstream. In particular, arsenic transport is clearly observed in the research area. Key Words Leaching, colloid, toxic metal, migration, chelate Introduction The concentration of contaminants in subsurface soils is estimated by public environmental measurements and assessment methods in each country. However, the migration of toxic metals in soil media is variously changed by coexisting ion species and colloids. Some parts of contaminants leached from subsurface soils migrate and accumulate as adsorbate on colloids, and this migration behaviour is affected by physicochemical parameters. In particular, crystalline ~ amorphous aluminosilicate, hydroxide, and humic matter adsorb and retain ion species in pore water, and are reported to control the soil physicochemical character by acting on water retention and aggregation of soil (Jonge et al. 2004). This research aimed to clarify the speciation of mineral and colloids in soil media, and the effect of coexisting ion or colloids on toxic metal – pore water interaction. In addition, we explored which speciation has high potential to migrate the toxic metals in this research area. Methods Research area
This research field is Osaru River basin in northern part of Japan. In the watershed of this river, many mining sites used to work until scores of years ago and several hydrothermal alteration zones were distributed in each tributary around mining sites. Surface sediments in Osaru River basin are quaternary volcanic sediments and fluvial sediments. Only the downstream part is not covered by volcanic ash and exposes the fluvial or deltaic sediments. High-level Arsenic, Zinc, Copper, Mercury sites are detected in some alteration zones. Among them, 790mg/kg of arsenic was accumulated in the outcrop layer in a pyrophyllite-kaolinite alteration zone. The rock samples in alteration site were collected from each tributary as host materials, and alluvial soils were also collected from the main Osaru River. Figure 1 shows the distribution of alteration area and mining sites in the Osaru River basin. The soil sampling points of this study are also pointed out in Figure 1. The collected samples were sealed in plastic bags and kept in a refrigerator at 4°C. Analytical methods
Soil and rock samples were air-dried at room temperature, crushed and sieved to <2 mm. In the case of soil samples, plant and coarse fragments were removed in this procedure and a part of the sieved samples was crushed to powder. On the other hand, the rock samples were homogeneously crushed to powder. The <2 mm sieved rock samples were also sieved to obtain 1–2 mm samples. The <2 mm soil samples and 1–2 mm rock samples were used for water leachate tests for metals. The leachates tests were conducted under the following conditions: 3 g of rock or soil sample was reacted with 30

© 2010 19th World Congress of Soil Science, Soil Solutions for a Changing World 1 – 6 August 2010, Brisbane, Australia. Published on DVD.
75
ml of water and shaken at 200 rpm for 6 h in a 50 ml centrifuge tube. These procedures were carried out at room temperature and atmospheric pressure. After centrifugation at 3000 rpm for 20 min, the leachate was filtered through a 0.45 µm membrane. The heavy metal concentrations of the leachates were analysed using ICP-MS (ICPM-8500, Shimadzu, Co. Ltd.). In addition, pH was measured at a soil/water ratio of 1:2.5, and EC at a soil/water ratio of 1:5. Total organic carbon (TOC) was determined by ignition weight loss methods, and the phosphate absorption coefficient (PAC) was measured by the ammonium phosphate method using UV/VIS (PharmaSpec UV-1700, Shimadzu Co. Ltd.). The bulk chemical composition of powdered rock and soil samples was also measured by X-ray fluorescence analysis (EDX-720, Shimadzu Co. Ltd.). The CEC was measured by strontium chloride- ammonium acetate solution method (Kamewada and Shibata 1997). The colloid content in soils was estimated by using 3 type of chelating agent (dithionite-citrate, acidic oxalate and pyrophosphate). This method is mainly based on speciation and quantification of amorphous colloids by using the difference of leaching ability for each chelate (Parfitt and Childs 1988). Acidic oxalate selectively elutes amorphous ~ quasicrystalline aluminosilicate, amorphous iron minerals, alumina- or iron-humus complexes. Pyrophosphate elutes alumina and iron- humus complexes. Dithionite act as reducer and reduces free iron oxide, so that dithionite-citrate can elute free amorphous ~ crystalline iron oxide as citrate chelate. The concentration of Si, Al and Fe were measured by ICP-MS to calculate the colloid content of five fractions: goethite + hematite colloid, ferrihydrite colloid, allophane + imogolite colloid, alumina-humus complex, and iron-humus complex. Additionally, arsenic concentration in each leachate was also measured and estimates made of the arsenic rich colloidal fraction. Results Soil chemical property
Quartz and plagioclase were identified from every soil sample, and smectite (montmorillonite and nontronite) were also detected from the soils in midstream ~ downstream regions. Some soils include chlorite, cristobalite, magnetite and dolomite under the influence of a hydrothermal alteration zone. Table 1 shows the chemical aspect of soil samples. Only upstream soil sample denotes slightly acidic condition (pH=5.3), high TOC (21%) and low CEC as compared with the other samples. The soils in midstream to downstream have pH=6.07 ~ 6.68 and about 5% TOC. Average CEC is 15~20 [cmol(+)/kg] and major exchangeable cation is Ca. The leaching concentration of arsenic increases downstream. Figure 2 shows the relation between CEC and leaching concentration of heavy metals in water leachate test. Although the selectivity of heavy metal adsorption to smectite is changed by content of organic materials, reduced iron and carbonate, the adsorption selectivity among Cu, Pb and Zn are reported as Cu ≑ Pb ≫ Zn under neutral pH and about 5% of TOC condition (Sipos et al. 2009). The leaching concentration of Cu is increased in proportion to CEC increase. Although Pb leaching represents a small concentration due to the originally lower content than Cu and Zn, Zn is also increased with CEC but decreases above 18 cmol(+)/kg of CEC. This phenomena indicates that Cu has higher adsorption selectivity and preferentially adsorbs on smectite. Figure 1. The spatial distribution of mining site and
alteration region in Osaru River basin, northern Japan.
Circle points (○) are soil-sampling points.
Rock samples were collected within alteration region.
Osaru R.
river linewatershedmine
Roseki mine
Toya Lake
chlorite-illite zone
smectite zone
silicified zone
kaolinite (±smectite) zone
pyrophyllite-kaolinite zone
silicified zone
smectite zone
kaolinite zone
high-sulfidation type low-sulfidation type
Fe
Toya Takarada
NakatoyaIzawa
Kamaya
AuHakuro
S
S
Yutoku
Tokushunbetsu
S
S
S
S
Konai
Toseki
Benkei
Horobetsu Ioh
Tokuryu
IzawaOtaki
soil sampling point
7
1
2
3
4
5
6
8
Osaru R.
river linewatershedmine
Roseki mine
Toya Lake
chlorite-illite zone
smectite zone
silicified zone
kaolinite (±smectite) zone
pyrophyllite-kaolinite zone
silicified zone
smectite zone
kaolinite zone
high-sulfidation type low-sulfidation type
chlorite-illite zone
smectite zone
silicified zone
kaolinite (±smectite) zone
pyrophyllite-kaolinite zone
silicified zone
smectite zone
kaolinite zone
high-sulfidation type low-sulfidation type
Fe
Toya Takarada
NakatoyaIzawa
Kamaya
AuHakuro
S
S
Yutoku
Tokushunbetsu
S
S
S
S
Konai
Toseki
Benkei
Horobetsu Ioh
Tokuryu
IzawaOtaki
soil sampling point
77
11
22
33
44
55
66
88
5 10 15 20 250
5
10
15
20
25
30
Concentration [ppb]
C EC [cm ol(+)/kg]
C u Pb Zn
Figure 2. The relationship between CEC
and leaching concentration of heavy
metals in the water leachate test.

© 2010 19th World Congress of Soil Science, Soil Solutions for a Changing World 1 – 6 August 2010, Brisbane, Australia. Published on DVD.
76
Table 1. Soil chemical property and metal concentration of water leachate test.
Sample No. 1 2 3 4 5 6 7 8 pH 5.30 6.42 6.07 6.32 6.59 6.40 6.15 6.19 EC 7.11 5.59 1.95 2.86 6.78 3.00 4.93 6.83 TOC [wt%] 21 8 4 4 4 4 5 5 PAC [%] 20.9 7.8 4.2 4.1 3.8 3.5 4.9 5.4 CEC [cmol(+)/kg] 5.73 15.63 18.80 14.07 20.60 19.11 17.89 21.37 Ca [cmol(+)/kg] 3.92 12.41 15.57 11.06 14.09 13.99 13.75 15.81 Mg [cmol(+)/kg] 0.85 1.67 2.19 2.19 2.33 3.28 2.35 3.37 K [cmol(+)/kg] 0.73 1.32 0.38 0.37 3.92 1.38 1.37 1.82 Na [cmol(+)/kg] 0.23 0.23 0.66 0.45 0.26 0.46 0.42 0.37 Cu [ppb] 2.14 8.45 13.04 8.59 22.38 16.06 19.62 25.67 Pb [ppb] 1.08 2.57 3.13 1.89 1.70 1.23 1.41 1.54 Zn [ppb] 4.56 11.55 16.56 8.08 8.24 5.75 10.94 12.18 As [ppb] 0.92 0.88 1.32 1.62 1.90 3.37 8.00 17.92 Leaching phenomena of toxic elements
Figure 3 shows the pH dependence of metal leaching. Elution ratio shows the ratio of leaching concentration to bulk contents for each element. Both of arsenic and lead show the amphoteric metal character in this leachate test. In the case of arsenic, high ferric contents (Fe > 10 wt%) prevent arsenic leaching, and especially low arsenic leaching samples are rich in goethite and metahalloysite. On the other hand, the low lead leaching sample is rich in sulphur. The kaolinite or goethite rich rock samples also prevent arsenic leaching under a slightly acidic condition, and Ca rich rocks poor leaching ratio with neutral to basic conditions.
2 3 4 5 6 7 8 9 101E-6
1E-5
1E-4
1E-3
0.01
0.1
1
10
elution ratio [%]
pH
rocksoil
Pb
high S
Figure 3. The pH dependence of lead and arsenic leaching from soil and rock samples.
Amorphous ~ quasicrystalline colloid
The contents of amorphous ~ quasicrystalline colloid in each soils is summarised in Figure 4. The soil in upstream region includes 350 mg/kg of colloid, which is highest in this river basin. Ferrihydrite and alumina-humus complex are the main colloids. The content of alumina- humus complex decreases downstream, and 70 ~80 % of colloid become ferrihydrite. Ferrihydrite was observed in arsenic rich river sediments in the some tributaries near the mining site (Hara 2008). The leaching concentration of arsenic increases downstream in the Osaru River basin (Table 1), arsenic contents in the main 3 colloid fractions are summarized in Figure 5. Most arsenic exists with ferrihydrite colloid. Arsenic is assumed to adsorb on ferrihydrite and transport downstream with ferrihydrite colloid. Ferrihydrite is easy to form in ferric rich condition and easily fixes the arsenic (Klaus et al. 1998), but it exists as a metastable phase in natural environments. Therefore it transforms to goethite under neutral pH condition over several months to several years (Schwerthmann and Cornell 1991). Although phase transition is delayed by metal adsorption (Jambor and Dutrizac 1998), the goethite content in soil in river mouth is increasing (Figure 5). One of the reasons is that soil environment becomes reductives due to high groundwater level around river mouth. Arsenic adsorbs on ferrihydrite as As(Ⅴ) under an oxidative condition, but if it alters to a reductive condition, arsenic is reduced to As(Ⅲ) and As(Ⅲ) continuously reduced to HAsO2 (As(0)) under pH=3 ~ 6.5 based on a thermodynamic phase equilibrium calculation. So that the adsorption of arsenic on iron oxide is decreased. Goethite is widely distributed in this river basin, but arsenic adsorption is only observed on goethite in
2 3 4 5 6 7 8 9 101E-6
1E-5
1E-4
1E-3
0.01
0.1
1
elution ratio [%]
pH
rock soil
As
high Fe
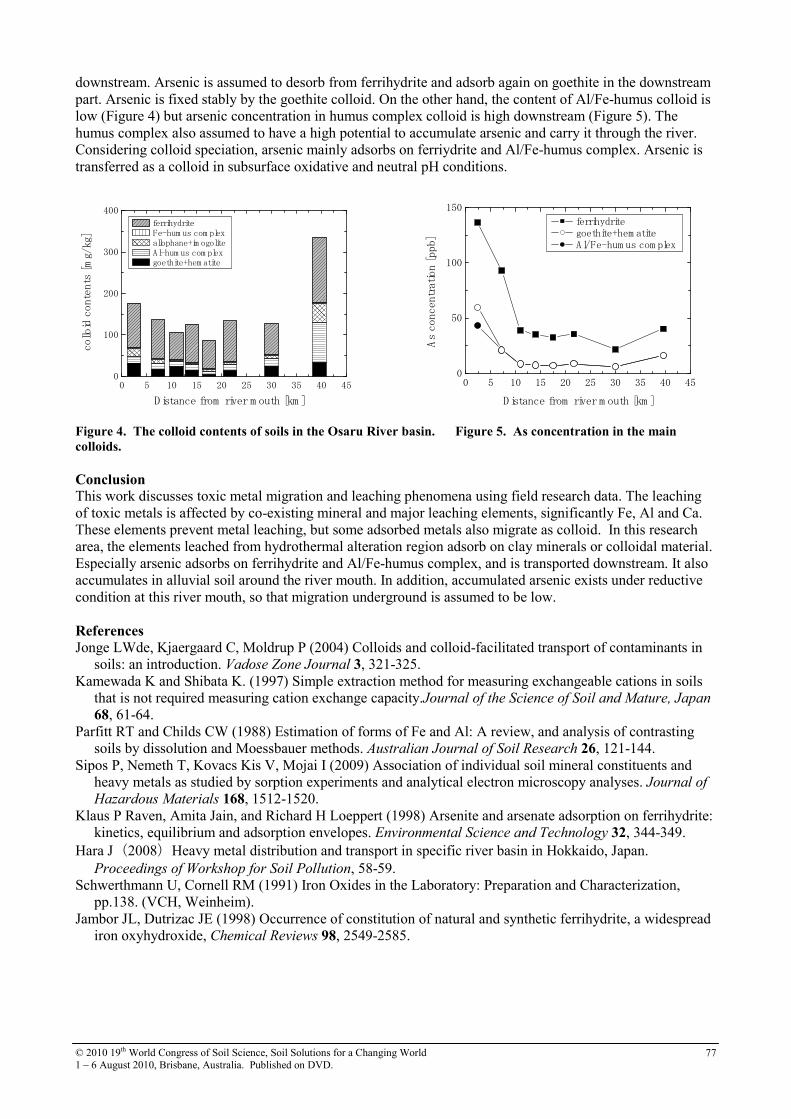
© 2010 19th World Congress of Soil Science, Soil Solutions for a Changing World 1 – 6 August 2010, Brisbane, Australia. Published on DVD.
77
downstream. Arsenic is assumed to desorb from ferrihydrite and adsorb again on goethite in the downstream part. Arsenic is fixed stably by the goethite colloid. On the other hand, the content of Al/Fe-humus colloid is low (Figure 4) but arsenic concentration in humus complex colloid is high downstream (Figure 5). The humus complex also assumed to have a high potential to accumulate arsenic and carry it through the river. Considering colloid speciation, arsenic mainly adsorbs on ferriydrite and Al/Fe-humus complex. Arsenic is transferred as a colloid in subsurface oxidative and neutral pH conditions.
Figure 4. The colloid contents of soils in the Osaru River basin. Figure 5. As concentration in the main
colloids.
Conclusion This work discusses toxic metal migration and leaching phenomena using field research data. The leaching of toxic metals is affected by co-existing mineral and major leaching elements, significantly Fe, Al and Ca. These elements prevent metal leaching, but some adsorbed metals also migrate as colloid. In this research area, the elements leached from hydrothermal alteration region adsorb on clay minerals or colloidal material. Especially arsenic adsorbs on ferrihydrite and Al/Fe-humus complex, and is transported downstream. It also accumulates in alluvial soil around the river mouth. In addition, accumulated arsenic exists under reductive condition at this river mouth, so that migration underground is assumed to be low. References
Jonge LWde, Kjaergaard C, Moldrup P (2004) Colloids and colloid-facilitated transport of contaminants in soils: an introduction. Vadose Zone Journal 3, 321-325.
Kamewada K and Shibata K. (1997) Simple extraction method for measuring exchangeable cations in soils that is not required measuring cation exchange capacity.Journal of the Science of Soil and Mature, Japan 68, 61-64.
Parfitt RT and Childs CW (1988) Estimation of forms of Fe and Al: A review, and analysis of contrasting soils by dissolution and Moessbauer methods. Australian Journal of Soil Research 26, 121-144.
Sipos P, Nemeth T, Kovacs Kis V, Mojai I (2009) Association of individual soil mineral constituents and heavy metals as studied by sorption experiments and analytical electron microscopy analyses. Journal of Hazardous Materials 168, 1512-1520.
Klaus P Raven, Amita Jain, and Richard H Loeppert (1998) Arsenite and arsenate adsorption on ferrihydrite: kinetics, equilibrium and adsorption envelopes. Environmental Science and Technology 32, 344-349.
Hara J(2008)Heavy metal distribution and transport in specific river basin in Hokkaido, Japan. Proceedings of Workshop for Soil Pollution, 58-59.
Schwerthmann U, Cornell RM (1991) Iron Oxides in the Laboratory: Preparation and Characterization, pp.138. (VCH, Weinheim).
Jambor JL, Dutrizac JE (1998) Occurrence of constitution of natural and synthetic ferrihydrite, a widespread iron oxyhydroxide, Chemical Reviews 98, 2549-2585.
0 5 10 15 20 25 30 35 40 450
50
100
150
D istance from river m outh [km ]
As concentration [ppb]
ferrihydrite goethite+hem atite Al/Fe-hum us com plex
0 5 10 15 20 25 30 35 40 450
100
200
300
400
colloid contents [mg/kg]
D istance from river m outh [km ]
ferrihydrite Fe-hum us com plex allophane+im ogolite Al-hum us com plex goethite+hem atite
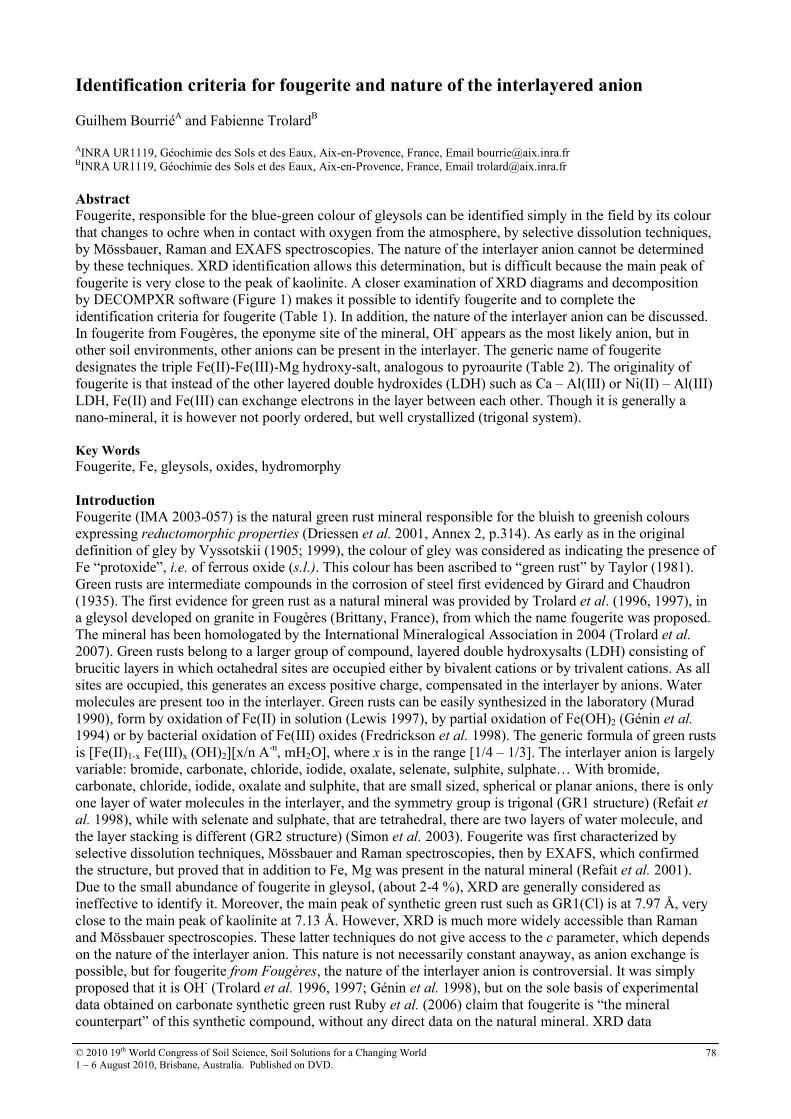
© 2010 19th World Congress of Soil Science, Soil Solutions for a Changing World 1 – 6 August 2010, Brisbane, Australia. Published on DVD.
78
Identification criteria for fougerite and nature of the interlayered anion Guilhem BourriéA and Fabienne TrolardB AINRA UR1119, Géochimie des Sols et des Eaux, Aix-en-Provence, France, Email [email protected] BINRA UR1119, Géochimie des Sols et des Eaux, Aix-en-Provence, France, Email [email protected]
Abstract Fougerite, responsible for the blue-green colour of gleysols can be identified simply in the field by its colour that changes to ochre when in contact with oxygen from the atmosphere, by selective dissolution techniques, by Mössbauer, Raman and EXAFS spectroscopies. The nature of the interlayer anion cannot be determined by these techniques. XRD identification allows this determination, but is difficult because the main peak of fougerite is very close to the peak of kaolinite. A closer examination of XRD diagrams and decomposition by DECOMPXR software (Figure 1) makes it possible to identify fougerite and to complete the identification criteria for fougerite (Table 1). In addition, the nature of the interlayer anion can be discussed. In fougerite from Fougères, the eponyme site of the mineral, OH- appears as the most likely anion, but in other soil environments, other anions can be present in the interlayer. The generic name of fougerite designates the triple Fe(II)-Fe(III)-Mg hydroxy-salt, analogous to pyroaurite (Table 2). The originality of fougerite is that instead of the other layered double hydroxides (LDH) such as Ca – Al(III) or Ni(II) – Al(III) LDH, Fe(II) and Fe(III) can exchange electrons in the layer between each other. Though it is generally a nano-mineral, it is however not poorly ordered, but well crystallized (trigonal system). Key Words
Fougerite, Fe, gleysols, oxides, hydromorphy Introduction Fougerite (IMA 2003-057) is the natural green rust mineral responsible for the bluish to greenish colours expressing reductomorphic properties (Driessen et al. 2001, Annex 2, p.314). As early as in the original definition of gley by Vyssotskii (1905; 1999), the colour of gley was considered as indicating the presence of Fe “protoxide”, i.e. of ferrous oxide (s.l.). This colour has been ascribed to “green rust” by Taylor (1981). Green rusts are intermediate compounds in the corrosion of steel first evidenced by Girard and Chaudron (1935). The first evidence for green rust as a natural mineral was provided by Trolard et al. (1996, 1997), in a gleysol developed on granite in Fougères (Brittany, France), from which the name fougerite was proposed. The mineral has been homologated by the International Mineralogical Association in 2004 (Trolard et al. 2007). Green rusts belong to a larger group of compound, layered double hydroxysalts (LDH) consisting of brucitic layers in which octahedral sites are occupied either by bivalent cations or by trivalent cations. As all sites are occupied, this generates an excess positive charge, compensated in the interlayer by anions. Water molecules are present too in the interlayer. Green rusts can be easily synthesized in the laboratory (Murad 1990), form by oxidation of Fe(II) in solution (Lewis 1997), by partial oxidation of Fe(OH)2 (Génin et al. 1994) or by bacterial oxidation of Fe(III) oxides (Fredrickson et al. 1998). The generic formula of green rusts is [Fe(II)1-x Fe(III)x (OH)2][x/n A-n, mH2O], where x is in the range [1/4 – 1/3]. The interlayer anion is largely variable: bromide, carbonate, chloride, iodide, oxalate, selenate, sulphite, sulphate… With bromide, carbonate, chloride, iodide, oxalate and sulphite, that are small sized, spherical or planar anions, there is only one layer of water molecules in the interlayer, and the symmetry group is trigonal (GR1 structure) (Refait et al. 1998), while with selenate and sulphate, that are tetrahedral, there are two layers of water molecule, and the layer stacking is different (GR2 structure) (Simon et al. 2003). Fougerite was first characterized by selective dissolution techniques, Mössbauer and Raman spectroscopies, then by EXAFS, which confirmed the structure, but proved that in addition to Fe, Mg was present in the natural mineral (Refait et al. 2001). Due to the small abundance of fougerite in gleysol, (about 2-4 %), XRD are generally considered as ineffective to identify it. Moreover, the main peak of synthetic green rust such as GR1(Cl) is at 7.97 Å, very close to the main peak of kaolinite at 7.13 Å. However, XRD is much more widely accessible than Raman and Mössbauer spectroscopies. These latter techniques do not give access to the c parameter, which depends on the nature of the interlayer anion. This nature is not necessarily constant anayway, as anion exchange is possible, but for fougerite from Fougères, the nature of the interlayer anion is controversial. It was simply proposed that it is OH- (Trolard et al. 1996, 1997; Génin et al. 1998), but on the sole basis of experimental data obtained on carbonate synthetic green rust Ruby et al. (2006) claim that fougerite is “the mineral counterpart” of this synthetic compound, without any direct data on the natural mineral. XRD data
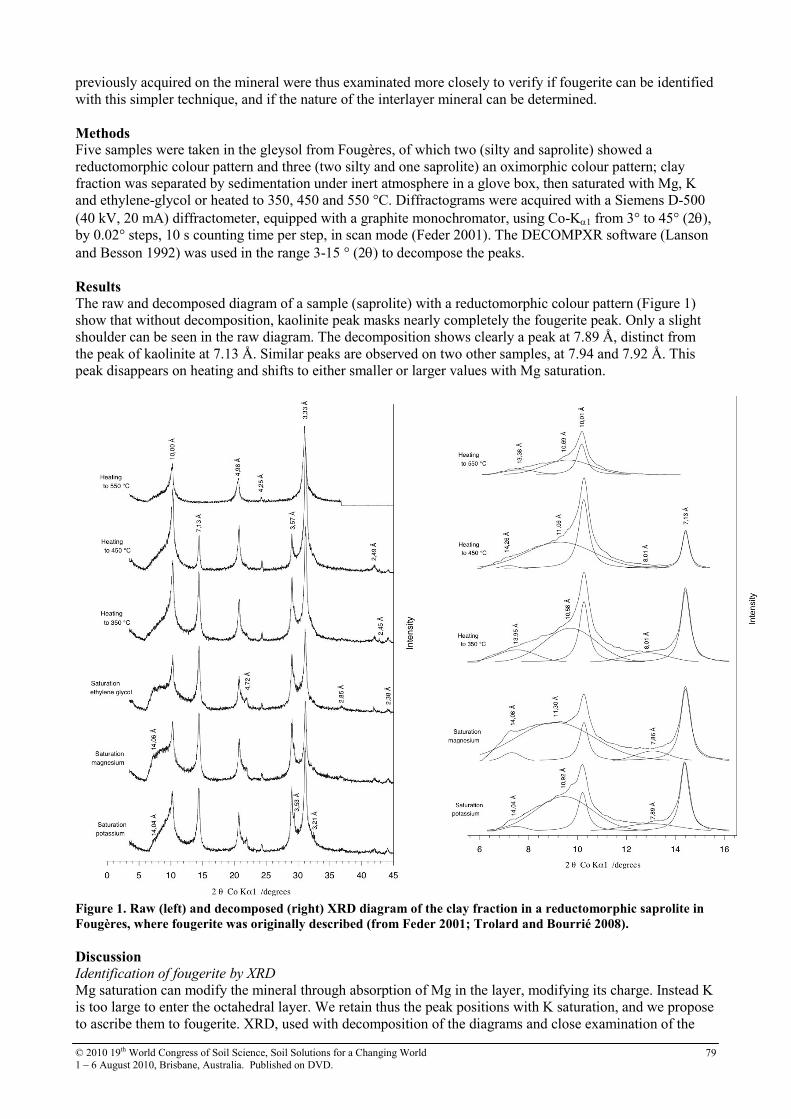
© 2010 19th World Congress of Soil Science, Soil Solutions for a Changing World 1 – 6 August 2010, Brisbane, Australia. Published on DVD.
79
previously acquired on the mineral were thus examinated more closely to verify if fougerite can be identified with this simpler technique, and if the nature of the interlayer mineral can be determined. Methods Five samples were taken in the gleysol from Fougères, of which two (silty and saprolite) showed a reductomorphic colour pattern and three (two silty and one saprolite) an oximorphic colour pattern; clay fraction was separated by sedimentation under inert atmosphere in a glove box, then saturated with Mg, K and ethylene-glycol or heated to 350, 450 and 550 °C. Diffractograms were acquired with a Siemens D-500 (40 kV, 20 mA) diffractometer, equipped with a graphite monochromator, using Co-Kα1 from 3° to 45° (2θ), by 0.02° steps, 10 s counting time per step, in scan mode (Feder 2001). The DECOMPXR software (Lanson and Besson 1992) was used in the range 3-15 ° (2θ) to decompose the peaks. Results
The raw and decomposed diagram of a sample (saprolite) with a reductomorphic colour pattern (Figure 1) show that without decomposition, kaolinite peak masks nearly completely the fougerite peak. Only a slight shoulder can be seen in the raw diagram. The decomposition shows clearly a peak at 7.89 Å, distinct from the peak of kaolinite at 7.13 Å. Similar peaks are observed on two other samples, at 7.94 and 7.92 Å. This peak disappears on heating and shifts to either smaller or larger values with Mg saturation.
Figure 1. Raw (left) and decomposed (right) XRD diagram of the clay fraction in a reductomorphic saprolite in
Fougères, where fougerite was originally described (from Feder 2001; Trolard and Bourrié 2008).
Discussion
Identification of fougerite by XRD
Mg saturation can modify the mineral through absorption of Mg in the layer, modifying its charge. Instead K is too large to enter the octahedral layer. We retain thus the peak positions with K saturation, and we propose to ascribe them to fougerite. XRD, used with decomposition of the diagrams and close examination of the
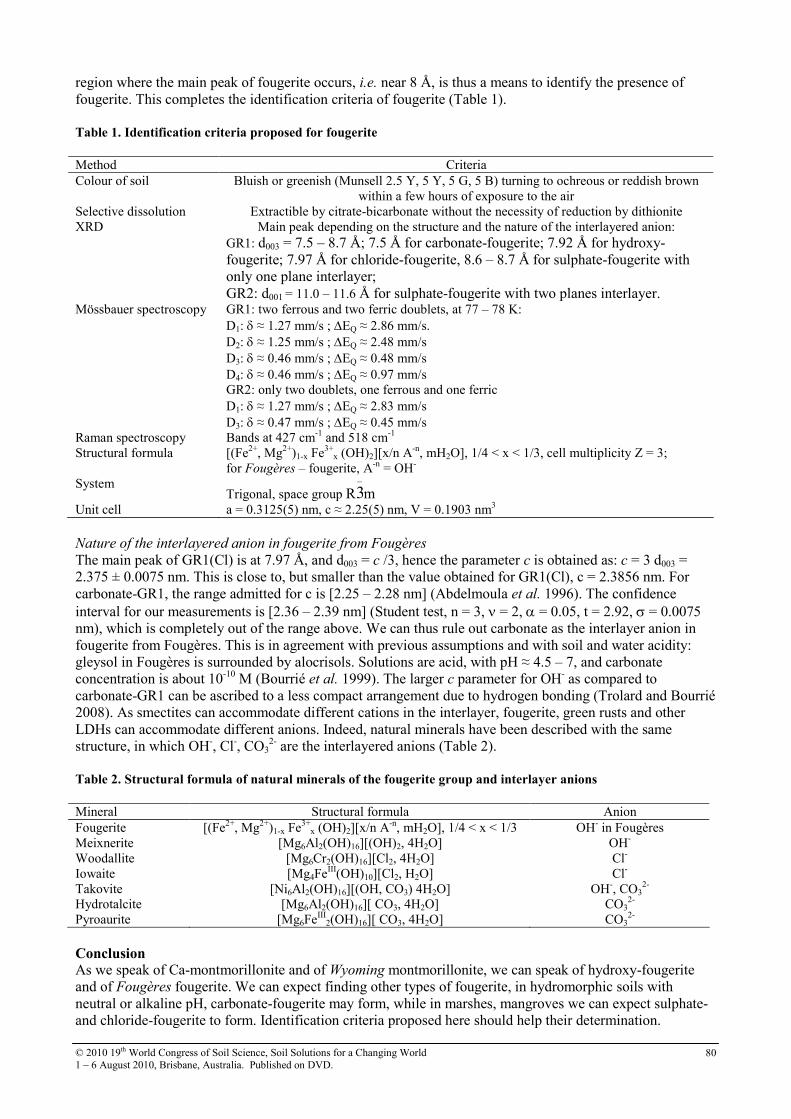
© 2010 19th World Congress of Soil Science, Soil Solutions for a Changing World 1 – 6 August 2010, Brisbane, Australia. Published on DVD.
80
region where the main peak of fougerite occurs, i.e. near 8 Å, is thus a means to identify the presence of fougerite. This completes the identification criteria of fougerite (Table 1). Table 1. Identification criteria proposed for fougerite
Method Criteria Colour of soil Bluish or greenish (Munsell 2.5 Y, 5 Y, 5 G, 5 B) turning to ochreous or reddish brown
within a few hours of exposure to the air Selective dissolution Extractible by citrate-bicarbonate without the necessity of reduction by dithionite XRD Main peak depending on the structure and the nature of the interlayered anion:
GR1: d003 = 7.5 – 8.7 Å; 7.5 Å for carbonate-fougerite; 7.92 Å for hydroxy-fougerite; 7.97 Å for chloride-fougerite, 8.6 – 8.7 Å for sulphate-fougerite with only one plane interlayer; GR2: d001 = 11.0 – 11.6 Å for sulphate-fougerite with two planes interlayer.
Mössbauer spectroscopy GR1: two ferrous and two ferric doublets, at 77 – 78 K: D1: δ ≈ 1.27 mm/s ; ∆EQ ≈ 2.86 mm/s. D2: δ ≈ 1.25 mm/s ; ∆EQ ≈ 2.48 mm/s D3: δ ≈ 0.46 mm/s ; ∆EQ ≈ 0.48 mm/s D4: δ ≈ 0.46 mm/s ; ∆EQ ≈ 0.97 mm/s GR2: only two doublets, one ferrous and one ferric D1: δ ≈ 1.27 mm/s ; ∆EQ ≈ 2.83 mm/s D3: δ ≈ 0.47 mm/s ; ∆EQ ≈ 0.45 mm/s
Raman spectroscopy Bands at 427 cm-1 and 518 cm-1 Structural formula [(Fe2+, Mg2+)1-x Fe3+
x (OH)2][x/n A-n, mH2O], 1/4 < x < 1/3, cell multiplicity Z = 3; for Fougères – fougerite, A-n = OH-
System Trigonal, space group R3
−m
Unit cell a = 0.3125(5) nm, c ≈ 2.25(5) nm, V = 0.1903 nm3 Nature of the interlayered anion in fougerite from Fougères
The main peak of GR1(Cl) is at 7.97 Å, and d003 = c /3, hence the parameter c is obtained as: c = 3 d003 = 2.375 ± 0.0075 nm. This is close to, but smaller than the value obtained for GR1(Cl), c = 2.3856 nm. For carbonate-GR1, the range admitted for c is [2.25 – 2.28 nm] (Abdelmoula et al. 1996). The confidence interval for our measurements is [2.36 – 2.39 nm] (Student test, n = 3, ν = 2, α = 0.05, t = 2.92, σ = 0.0075 nm), which is completely out of the range above. We can thus rule out carbonate as the interlayer anion in fougerite from Fougères. This is in agreement with previous assumptions and with soil and water acidity: gleysol in Fougères is surrounded by alocrisols. Solutions are acid, with pH ≈ 4.5 – 7, and carbonate concentration is about 10-10 M (Bourrié et al. 1999). The larger c parameter for OH- as compared to carbonate-GR1 can be ascribed to a less compact arrangement due to hydrogen bonding (Trolard and Bourrié 2008). As smectites can accommodate different cations in the interlayer, fougerite, green rusts and other LDHs can accommodate different anions. Indeed, natural minerals have been described with the same structure, in which OH-, Cl-, CO3
2- are the interlayered anions (Table 2). Table 2. Structural formula of natural minerals of the fougerite group and interlayer anions
Mineral Structural formula Anion Fougerite [(Fe2+, Mg2+)1-x Fe3+
x (OH)2][x/n A-n, mH2O], 1/4 < x < 1/3 OH- in Fougères Meixnerite [Mg6Al2(OH)16][(OH)2, 4H2O] OH- Woodallite [Mg6Cr2(OH)16][Cl2, 4H2O] Cl-
Iowaite [Mg4FeIII(OH)10][Cl2, H2O] Cl- Takovite [Ni6Al2(OH)16][(OH, CO3) 4H2O] OH-, CO3
2-
Hydrotalcite [Mg6Al2(OH)16][ CO3, 4H2O] CO32-
Pyroaurite [Mg6FeIII2(OH)16][ CO3, 4H2O] CO3
2- Conclusion As we speak of Ca-montmorillonite and of Wyoming montmorillonite, we can speak of hydroxy-fougerite and of Fougères fougerite. We can expect finding other types of fougerite, in hydromorphic soils with neutral or alkaline pH, carbonate-fougerite may form, while in marshes, mangroves we can expect sulphate- and chloride-fougerite to form. Identification criteria proposed here should help their determination.

© 2010 19th World Congress of Soil Science, Soil Solutions for a Changing World 1 – 6 August 2010, Brisbane, Australia. Published on DVD.
81
References
Abdelmoula M, Refait P, Drissi SH, Mihe JP, Génin JMR (1996) Conversion electron Mössbauer spectroscopy and X-ray diffraction studies of the formation of carbonate-containing green rust one by corrosion of metallic iron in NaHCO3 and (NaHCO3 + NaCl) solutions. Corrosion Science 38, 623-663.
Bourrié G, Trolard F, Génin JMR, Jaffrezic A, Maître V, Abdelmoula M (1999) Iron control by equilibria between hydroxy-Green Rusts and solutions in hydromorphic soils. Geochimica et Cosmochimica Acta 63, 3417-3427.
Driessen P, Deckers J, Spaargaren O, Nachtergaele F (Eds) (2001) Lecture notes on the major soils of the world. (FAO, World Soil Resources Reports 94: Roma).
Feder F (2001) Dynamique des processus d’oxydo-réduction dans les sols hydromorphes - Monitoring in situ de la solution du sol et des phases ferrifères. Thèse de Doctorat, Université d’Aix-Marseille.
Fredrickson JK, Zachara JM, Kennedy DW, Dong H, Onstott TC, Hinman NW, Li SM (1998) Biogenic iron mineralization accompagnying the dissimilatory reduction of hydrous ferric oxide by a groundwater bacterium. Geochimica et Cosmochimica Acta 62, 3239-3257.
Génin JMR, Olowe AA, Resiak B, Confente M, Rollet-Benbouzid N, L'Haridon S, Prieur D (1994) Products
obtained by microbially-induced corrosion of steel in a marine environment: role of green rust two. Hyperfine Interactions 93, 1807-1812.
Génin JMR, Bourrié G, Trolard F, Abdelmoula M, Jaffrezic A, Refait P, Maître V, Humbert B, Herbillon A (1998) Thermodynamic equilibria in aqueous suspensions of synthetic and natural Fe(II) - Fe(III) green rusts; occurrences of the mineral in hydromorphic soils. Environmental Science and Technology 32, 1058-1068.
Girard A, Chaudron G (1935) Sur la constitution de la rouille. Comptes-Rendus de l’Académie des Sciences,
Paris 200, 127-129.
Lanson B, Besson G (1992). Characterization of the end of smectite-to-illite transformation: decomposition of X ray patterns. Clays and Clay Minerals 40, 40-52.
Lewis LW (1997). Factors influencing the stability and properties of green rusts. In ‘Soils and Environments.’ (Eds K. Auerswald, H. Stanjek, JM. Bigham) Adv. GeoEcol., 30, pp. 345-372 (Catena Verlag: Reiskirchen).
Murad E (1990). Application of 57Fe Mössbauer spectroscopy to problems in clay minerals and soil science: possibilities and limitations. Advances in Soil Science 12, 125-157.
Refait P, Abdelmoula M, Génin JMR (1998) Mechanisms of formation and structure of green rust one in aqueous corrosion of iron in the presence of chloride ions. Corrosion Science 40, 1547-1560.
Refait P, Abdelmoula M, Trolard F, Génin JMR, Ehrhardt JJ, Bourrié G (2001) Mössbauer and XAS study of a green rust mineral; the partial substitution of Fe2+ by Mg2+. American Mineralogist 86, 731-739.
Ruby C, Upadhyay C, Géhin A, Ona-Nguema G, Génin JMR (2006) In situ redox flexibility of FeII-III oxyhydroxycarbonate green rust and fougerite. Environmental Science and Technology 40, 4696-4702.
Simon L, François M, Refait P, Renaudin G, Lelaurain M, Génin JMR (2003) Structure of the Fe(II-III) layered double hydroxysulphate green rust two from Rietveld analysis. Solid State Sciences 5, 327-334.
Taylor RM (1981) Color in soils and sediments. A review. In : ‘International Clay Conference 1981’ (Eds H Van Olphen, F Veniale), Developments in Sedimentology 35, pp. 749-761 (Elsevier: Amsterdam).
Trolard F, Bourrié G (2008) Geochemistry of Green Rusts and Fougerite: A Reevaluation of Fe cycle in Soils. In ‘Advances in Agronomy’ (Ed D Sparks) Vol. 99, pp. 227-288.
Trolard F, Abdelmoula M, Bourrié G, Humbert B, Génin JMR (1996) Mise en évidence d’un constituant de type « rouilles vertes » dans les sols hydromorphes – Proposition de l’existence d’un nouveau minéral : la « fougérite ». Comptes-Rendus de l’Académie des Sciences, Paris 323, IIa, 1015-1022.
Trolard F, Génin JMR, Abdelmoula M, Bourrié G, Humbert B, Herbillon A. (1997) Identification of a green rust mineral in a reductomorphic soil by Mössbauer and Raman spectroscopies. Geochimica et
Cosmochimica Acta 61, 1107-1111. Trolard F, Bourrié G, Abdelmoula M, Refait P., Feder F (2007) Fougerite, a new mineral of the pyroaurite -
iowaite group: description and crystal structure. Clays and Clay minerals 55, 323-334. Vysotskii GN (1905) Gley. Pochvovedeniye, 4, 291-327. (original paper in russian). ----------------- (1999) Gley. An abridged publication of Vysotskii 1905 on the 257th Anniversary of the
Russian Academy of Sciences. Eurasian Soil Science 32, 1063-1068.
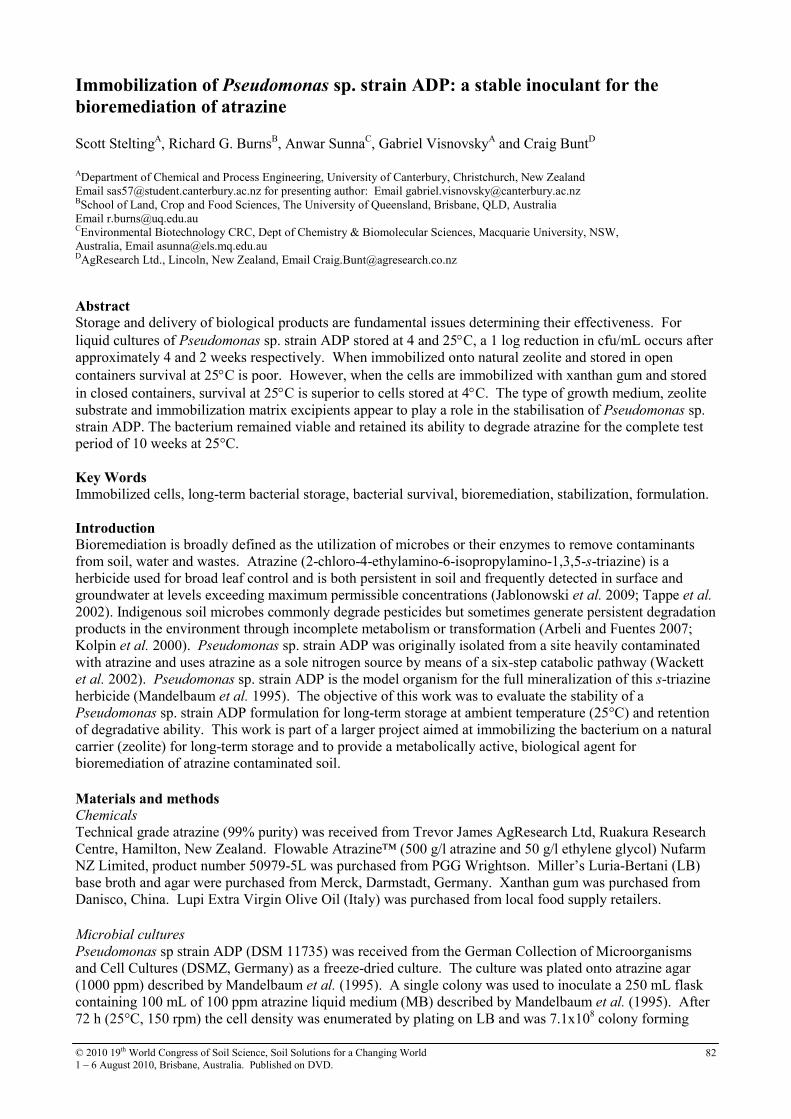
© 2010 19th World Congress of Soil Science, Soil Solutions for a Changing World 1 – 6 August 2010, Brisbane, Australia. Published on DVD.
82
Immobilization of Pseudomonas sp. strain ADP: a stable inoculant for the
bioremediation of atrazine Scott SteltingA, Richard G. BurnsB, Anwar SunnaC, Gabriel VisnovskyA and Craig BuntD ADepartment of Chemical and Process Engineering, University of Canterbury, Christchurch, New Zealand Email [email protected] for presenting author: Email [email protected]
BSchool of Land, Crop and Food Sciences, The University of Queensland, Brisbane, QLD, Australia Email [email protected] CEnvironmental Biotechnology CRC, Dept of Chemistry & Biomolecular Sciences, Macquarie University, NSW, Australia, Email [email protected] DAgResearch Ltd., Lincoln, New Zealand, Email [email protected]
Abstract Storage and delivery of biological products are fundamental issues determining their effectiveness. For liquid cultures of Pseudomonas sp. strain ADP stored at 4 and 25°C, a 1 log reduction in cfu/mL occurs after approximately 4 and 2 weeks respectively. When immobilized onto natural zeolite and stored in open containers survival at 25°C is poor. However, when the cells are immobilized with xanthan gum and stored in closed containers, survival at 25°C is superior to cells stored at 4°C. The type of growth medium, zeolite substrate and immobilization matrix excipients appear to play a role in the stabilisation of Pseudomonas sp. strain ADP. The bacterium remained viable and retained its ability to degrade atrazine for the complete test period of 10 weeks at 25°C. Key Words
Immobilized cells, long-term bacterial storage, bacterial survival, bioremediation, stabilization, formulation. Introduction Bioremediation is broadly defined as the utilization of microbes or their enzymes to remove contaminants from soil, water and wastes. Atrazine (2-chloro-4-ethylamino-6-isopropylamino-1,3,5-s-triazine) is a herbicide used for broad leaf control and is both persistent in soil and frequently detected in surface and groundwater at levels exceeding maximum permissible concentrations (Jablonowski et al. 2009; Tappe et al. 2002). Indigenous soil microbes commonly degrade pesticides but sometimes generate persistent degradation products in the environment through incomplete metabolism or transformation (Arbeli and Fuentes 2007; Kolpin et al. 2000). Pseudomonas sp. strain ADP was originally isolated from a site heavily contaminated with atrazine and uses atrazine as a sole nitrogen source by means of a six-step catabolic pathway (Wackett et al. 2002). Pseudomonas sp. strain ADP is the model organism for the full mineralization of this s-triazine herbicide (Mandelbaum et al. 1995). The objective of this work was to evaluate the stability of a Pseudomonas sp. strain ADP formulation for long-term storage at ambient temperature (25°C) and retention of degradative ability. This work is part of a larger project aimed at immobilizing the bacterium on a natural carrier (zeolite) for long-term storage and to provide a metabolically active, biological agent for bioremediation of atrazine contaminated soil. Materials and methods Chemicals
Technical grade atrazine (99% purity) was received from Trevor James AgResearch Ltd, Ruakura Research Centre, Hamilton, New Zealand. Flowable Atrazine™ (500 g/l atrazine and 50 g/l ethylene glycol) Nufarm NZ Limited, product number 50979-5L was purchased from PGG Wrightson. Miller’s Luria-Bertani (LB) base broth and agar were purchased from Merck, Darmstadt, Germany. Xanthan gum was purchased from Danisco, China. Lupi Extra Virgin Olive Oil (Italy) was purchased from local food supply retailers. Microbial cultures
Pseudomonas sp strain ADP (DSM 11735) was received from the German Collection of Microorganisms and Cell Cultures (DSMZ, Germany) as a freeze-dried culture. The culture was plated onto atrazine agar (1000 ppm) described by Mandelbaum et al. (1995). A single colony was used to inoculate a 250 mL flask containing 100 mL of 100 ppm atrazine liquid medium (MB) described by Mandelbaum et al. (1995). After 72 h (25°C, 150 rpm) the cell density was enumerated by plating on LB and was 7.1x10⁸ colony forming
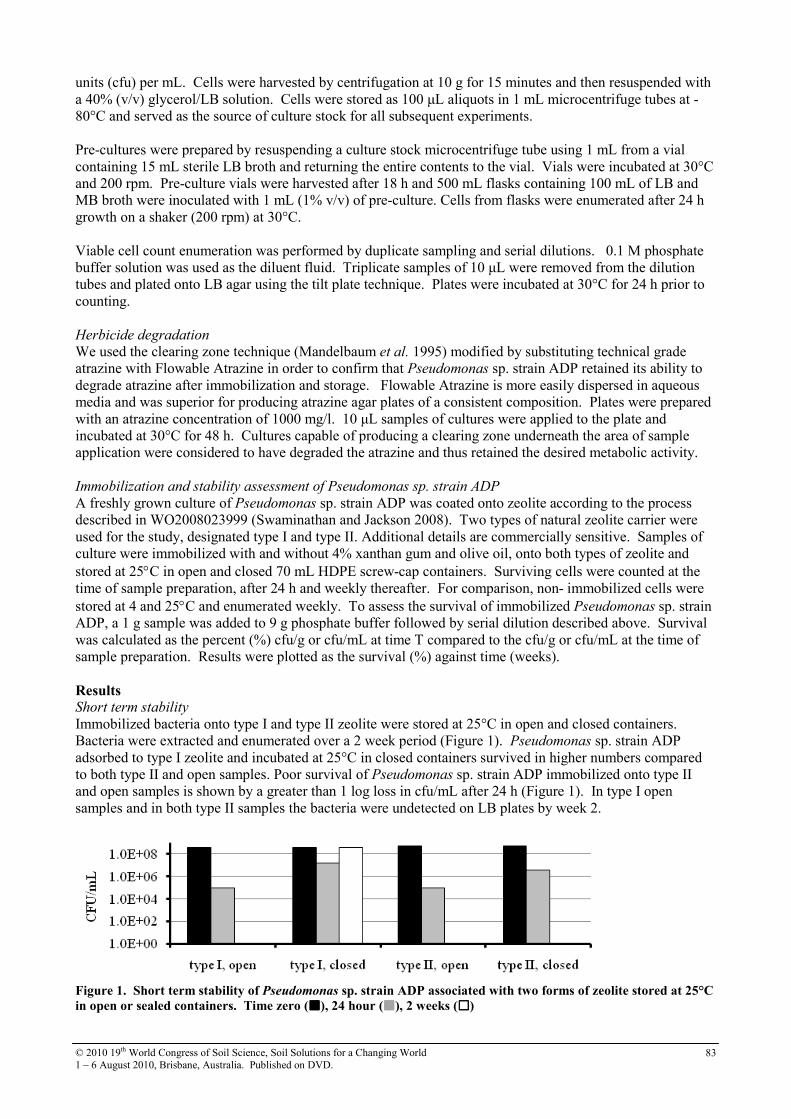
© 2010 19th World Congress of Soil Science, Soil Solutions for a Changing World 1 – 6 August 2010, Brisbane, Australia. Published on DVD.
83
units (cfu) per mL. Cells were harvested by centrifugation at 10 g for 15 minutes and then resuspended with a 40% (v/v) glycerol/LB solution. Cells were stored as 100 µL aliquots in 1 mL microcentrifuge tubes at -80°C and served as the source of culture stock for all subsequent experiments. Pre-cultures were prepared by resuspending a culture stock microcentrifuge tube using 1 mL from a vial containing 15 mL sterile LB broth and returning the entire contents to the vial. Vials were incubated at 30°C and 200 rpm. Pre-culture vials were harvested after 18 h and 500 mL flasks containing 100 mL of LB and MB broth were inoculated with 1 mL (1% v/v) of pre-culture. Cells from flasks were enumerated after 24 h growth on a shaker (200 rpm) at 30°C. Viable cell count enumeration was performed by duplicate sampling and serial dilutions. 0.1 M phosphate buffer solution was used as the diluent fluid. Triplicate samples of 10 µL were removed from the dilution tubes and plated onto LB agar using the tilt plate technique. Plates were incubated at 30°C for 24 h prior to counting. Herbicide degradation
We used the clearing zone technique (Mandelbaum et al. 1995) modified by substituting technical grade atrazine with Flowable Atrazine in order to confirm that Pseudomonas sp. strain ADP retained its ability to degrade atrazine after immobilization and storage. Flowable Atrazine is more easily dispersed in aqueous media and was superior for producing atrazine agar plates of a consistent composition. Plates were prepared with an atrazine concentration of 1000 mg/l. 10 µL samples of cultures were applied to the plate and incubated at 30°C for 48 h. Cultures capable of producing a clearing zone underneath the area of sample application were considered to have degraded the atrazine and thus retained the desired metabolic activity. Immobilization and stability assessment of Pseudomonas sp. strain ADP
A freshly grown culture of Pseudomonas sp. strain ADP was coated onto zeolite according to the process described in WO2008023999 (Swaminathan and Jackson 2008). Two types of natural zeolite carrier were used for the study, designated type I and type II. Additional details are commercially sensitive. Samples of culture were immobilized with and without 4% xanthan gum and olive oil, onto both types of zeolite and stored at 25°C in open and closed 70 mL HDPE screw-cap containers. Surviving cells were counted at the time of sample preparation, after 24 h and weekly thereafter. For comparison, non- immobilized cells were stored at 4 and 25°C and enumerated weekly. To assess the survival of immobilized Pseudomonas sp. strain ADP, a 1 g sample was added to 9 g phosphate buffer followed by serial dilution described above. Survival was calculated as the percent (%) cfu/g or cfu/mL at time T compared to the cfu/g or cfu/mL at the time of sample preparation. Results were plotted as the survival (%) against time (weeks).
Results Short term stability
Immobilized bacteria onto type I and type II zeolite were stored at 25°C in open and closed containers. Bacteria were extracted and enumerated over a 2 week period (Figure 1). Pseudomonas sp. strain ADP adsorbed to type I zeolite and incubated at 25°C in closed containers survived in higher numbers compared to both type II and open samples. Poor survival of Pseudomonas sp. strain ADP immobilized onto type II and open samples is shown by a greater than 1 log loss in cfu/mL after 24 h (Figure 1). In type I open samples and in both type II samples the bacteria were undetected on LB plates by week 2.
Figure 1. Short term stability of Pseudomonas sp. strain ADP associated with two forms of zeolite stored at 25°C
in open or sealed containers. Time zero (����), 24 hour (����), 2 weeks (����)
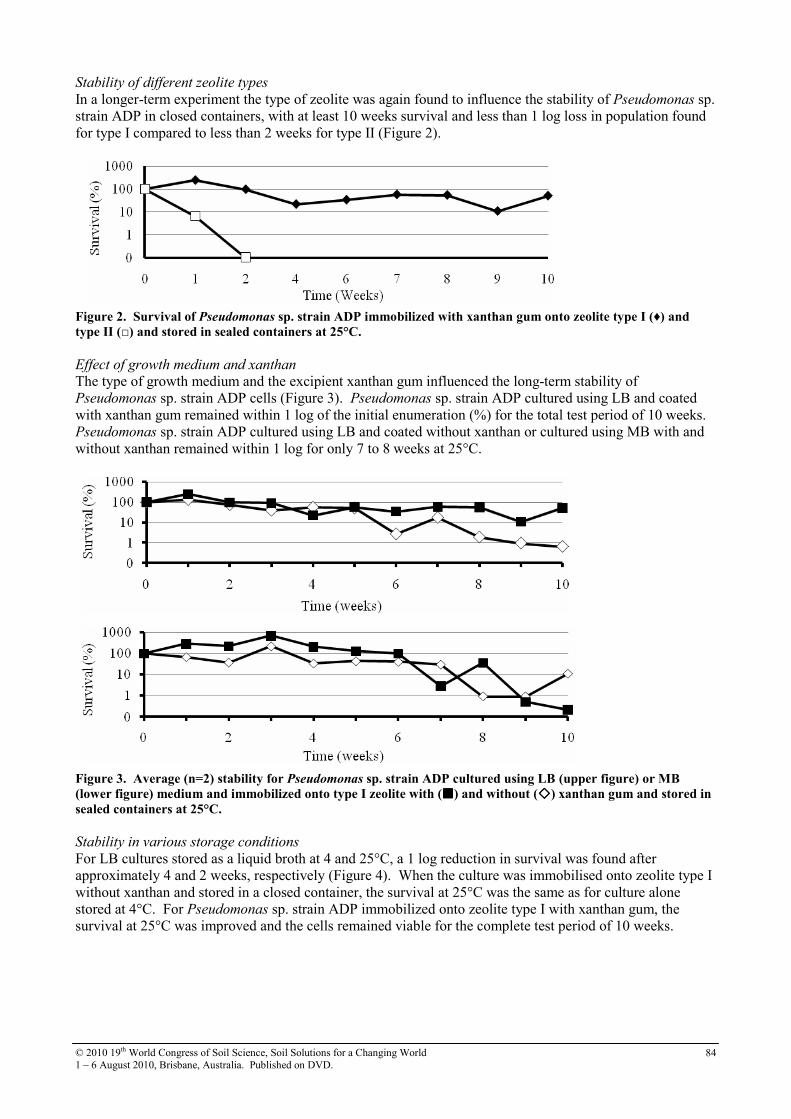
© 2010 19th World Congress of Soil Science, Soil Solutions for a Changing World 1 – 6 August 2010, Brisbane, Australia. Published on DVD.
84
Stability of different zeolite types
In a longer-term experiment the type of zeolite was again found to influence the stability of Pseudomonas sp. strain ADP in closed containers, with at least 10 weeks survival and less than 1 log loss in population found for type I compared to less than 2 weeks for type II (Figure 2).
Figure 2. Survival of Pseudomonas sp. strain ADP immobilized with xanthan gum onto zeolite type I (♦) and
type II (□) and stored in sealed containers at 25°C.
Effect of growth medium and xanthan
The type of growth medium and the excipient xanthan gum influenced the long-term stability of Pseudomonas sp. strain ADP cells (Figure 3). Pseudomonas sp. strain ADP cultured using LB and coated with xanthan gum remained within 1 log of the initial enumeration (%) for the total test period of 10 weeks. Pseudomonas sp. strain ADP cultured using LB and coated without xanthan or cultured using MB with and without xanthan remained within 1 log for only 7 to 8 weeks at 25°C.
Figure 3. Average (n=2) stability for Pseudomonas sp. strain ADP cultured using LB (upper figure) or MB
(lower figure) medium and immobilized onto type I zeolite with (����) and without (����) xanthan gum and stored in
sealed containers at 25°C.
Stability in various storage conditions
For LB cultures stored as a liquid broth at 4 and 25°C, a 1 log reduction in survival was found after approximately 4 and 2 weeks, respectively (Figure 4). When the culture was immobilised onto zeolite type I without xanthan and stored in a closed container, the survival at 25°C was the same as for culture alone stored at 4°C. For Pseudomonas sp. strain ADP immobilized onto zeolite type I with xanthan gum, the survival at 25°C was improved and the cells remained viable for the complete test period of 10 weeks.
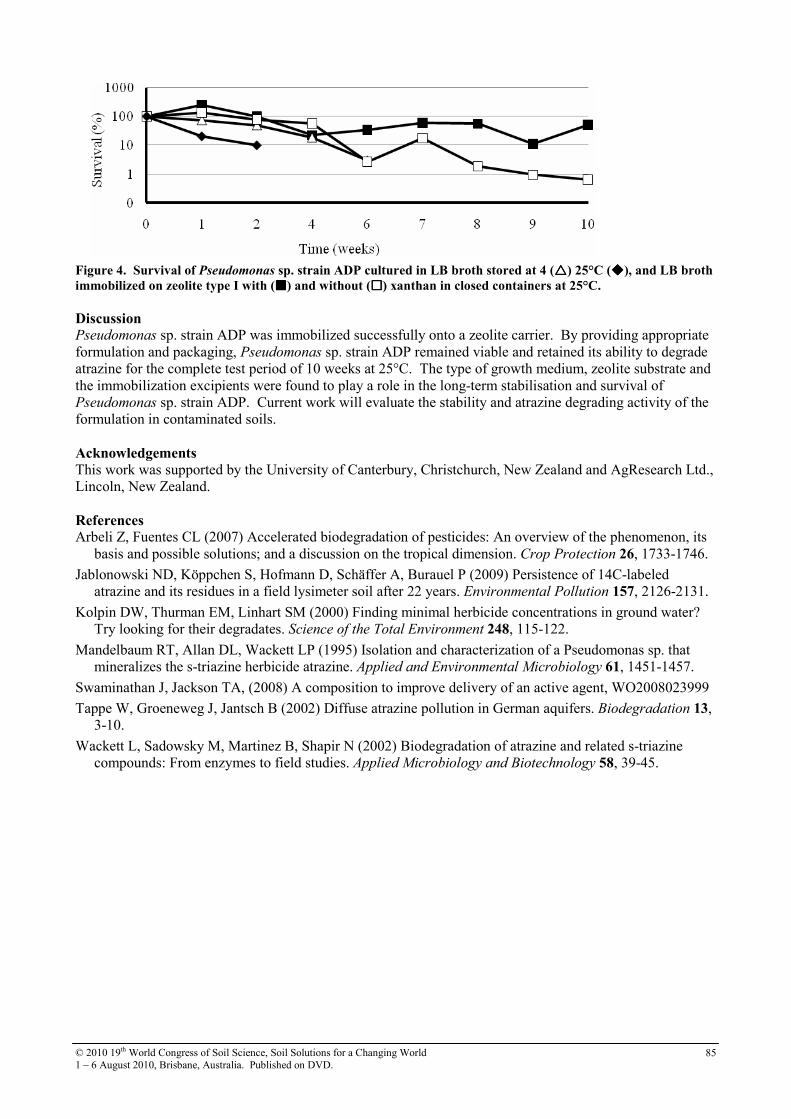
© 2010 19th World Congress of Soil Science, Soil Solutions for a Changing World 1 – 6 August 2010, Brisbane, Australia. Published on DVD.
85
Figure 4. Survival of Pseudomonas sp. strain ADP cultured in LB broth stored at 4 (����) 25°C (����), and LB broth
immobilized on zeolite type I with (����) and without (����) xanthan in closed containers at 25°C.
Discussion Pseudomonas sp. strain ADP was immobilized successfully onto a zeolite carrier. By providing appropriate formulation and packaging, Pseudomonas sp. strain ADP remained viable and retained its ability to degrade atrazine for the complete test period of 10 weeks at 25°C. The type of growth medium, zeolite substrate and the immobilization excipients were found to play a role in the long-term stabilisation and survival of Pseudomonas sp. strain ADP. Current work will evaluate the stability and atrazine degrading activity of the formulation in contaminated soils. Acknowledgements
This work was supported by the University of Canterbury, Christchurch, New Zealand and AgResearch Ltd., Lincoln, New Zealand. References Arbeli Z, Fuentes CL (2007) Accelerated biodegradation of pesticides: An overview of the phenomenon, its
basis and possible solutions; and a discussion on the tropical dimension. Crop Protection 26, 1733-1746.
Jablonowski ND, Köppchen S, Hofmann D, Schäffer A, Burauel P (2009) Persistence of 14C-labeled atrazine and its residues in a field lysimeter soil after 22 years. Environmental Pollution 157, 2126-2131.
Kolpin DW, Thurman EM, Linhart SM (2000) Finding minimal herbicide concentrations in ground water? Try looking for their degradates. Science of the Total Environment 248, 115-122.
Mandelbaum RT, Allan DL, Wackett LP (1995) Isolation and characterization of a Pseudomonas sp. that mineralizes the s-triazine herbicide atrazine. Applied and Environmental Microbiology 61, 1451-1457.
Swaminathan J, Jackson TA, (2008) A composition to improve delivery of an active agent, WO2008023999
Tappe W, Groeneweg J, Jantsch B (2002) Diffuse atrazine pollution in German aquifers. Biodegradation 13, 3-10.
Wackett L, Sadowsky M, Martinez B, Shapir N (2002) Biodegradation of atrazine and related s-triazine compounds: From enzymes to field studies. Applied Microbiology and Biotechnology 58, 39-45.
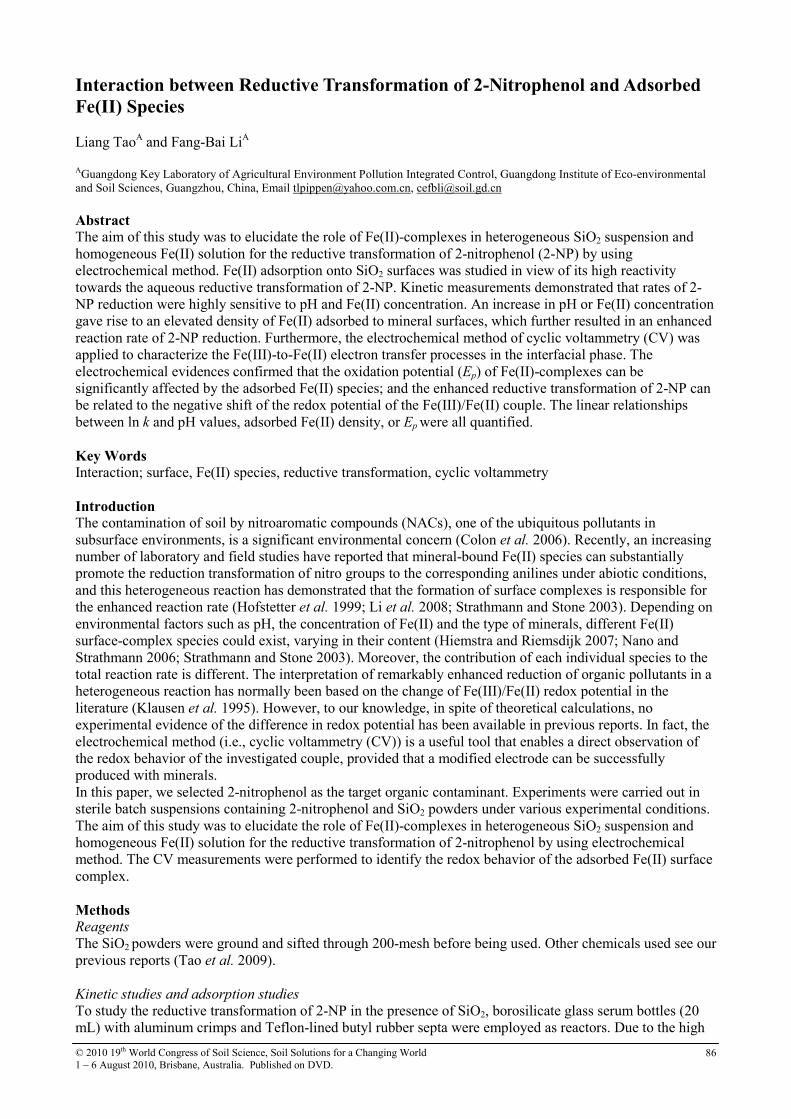
© 2010 19th World Congress of Soil Science, Soil Solutions for a Changing World 1 – 6 August 2010, Brisbane, Australia. Published on DVD.
86
Interaction between Reductive Transformation of 2-Nitrophenol and Adsorbed
Fe(II) Species Liang TaoA and Fang-Bai LiA AGuangdong Key Laboratory of Agricultural Environment Pollution Integrated Control, Guangdong Institute of Eco-environmental and Soil Sciences, Guangzhou, China, Email [email protected], [email protected]
Abstract The aim of this study was to elucidate the role of Fe(II)-complexes in heterogeneous SiO2 suspension and homogeneous Fe(II) solution for the reductive transformation of 2-nitrophenol (2-NP) by using electrochemical method. Fe(II) adsorption onto SiO2 surfaces was studied in view of its high reactivity towards the aqueous reductive transformation of 2-NP. Kinetic measurements demonstrated that rates of 2-NP reduction were highly sensitive to pH and Fe(II) concentration. An increase in pH or Fe(II) concentration gave rise to an elevated density of Fe(II) adsorbed to mineral surfaces, which further resulted in an enhanced reaction rate of 2-NP reduction. Furthermore, the electrochemical method of cyclic voltammetry (CV) was applied to characterize the Fe(III)-to-Fe(II) electron transfer processes in the interfacial phase. The electrochemical evidences confirmed that the oxidation potential (Ep) of Fe(II)-complexes can be significantly affected by the adsorbed Fe(II) species; and the enhanced reductive transformation of 2-NP can be related to the negative shift of the redox potential of the Fe(III)/Fe(II) couple. The linear relationships between ln k and pH values, adsorbed Fe(II) density, or Ep were all quantified. Key Words Interaction; surface, Fe(II) species, reductive transformation, cyclic voltammetry Introduction The contamination of soil by nitroaromatic compounds (NACs), one of the ubiquitous pollutants in subsurface environments, is a significant environmental concern (Colon et al. 2006). Recently, an increasing number of laboratory and field studies have reported that mineral-bound Fe(II) species can substantially promote the reduction transformation of nitro groups to the corresponding anilines under abiotic conditions, and this heterogeneous reaction has demonstrated that the formation of surface complexes is responsible for the enhanced reaction rate (Hofstetter et al. 1999; Li et al. 2008; Strathmann and Stone 2003). Depending on environmental factors such as pH, the concentration of Fe(II) and the type of minerals, different Fe(II) surface-complex species could exist, varying in their content (Hiemstra and Riemsdijk 2007; Nano and Strathmann 2006; Strathmann and Stone 2003). Moreover, the contribution of each individual species to the total reaction rate is different. The interpretation of remarkably enhanced reduction of organic pollutants in a heterogeneous reaction has normally been based on the change of Fe(III)/Fe(II) redox potential in the literature (Klausen et al. 1995). However, to our knowledge, in spite of theoretical calculations, no experimental evidence of the difference in redox potential has been available in previous reports. In fact, the electrochemical method (i.e., cyclic voltammetry (CV)) is a useful tool that enables a direct observation of the redox behavior of the investigated couple, provided that a modified electrode can be successfully produced with minerals. In this paper, we selected 2-nitrophenol as the target organic contaminant. Experiments were carried out in sterile batch suspensions containing 2-nitrophenol and SiO2 powders under various experimental conditions. The aim of this study was to elucidate the role of Fe(II)-complexes in heterogeneous SiO2 suspension and homogeneous Fe(II) solution for the reductive transformation of 2-nitrophenol by using electrochemical method. The CV measurements were performed to identify the redox behavior of the adsorbed Fe(II) surface complex. Methods Reagents
The SiO2 powders were ground and sifted through 200-mesh before being used. Other chemicals used see our previous reports (Tao et al. 2009). Kinetic studies and adsorption studies
To study the reductive transformation of 2-NP in the presence of SiO2, borosilicate glass serum bottles (20 mL) with aluminum crimps and Teflon-lined butyl rubber septa were employed as reactors. Due to the high
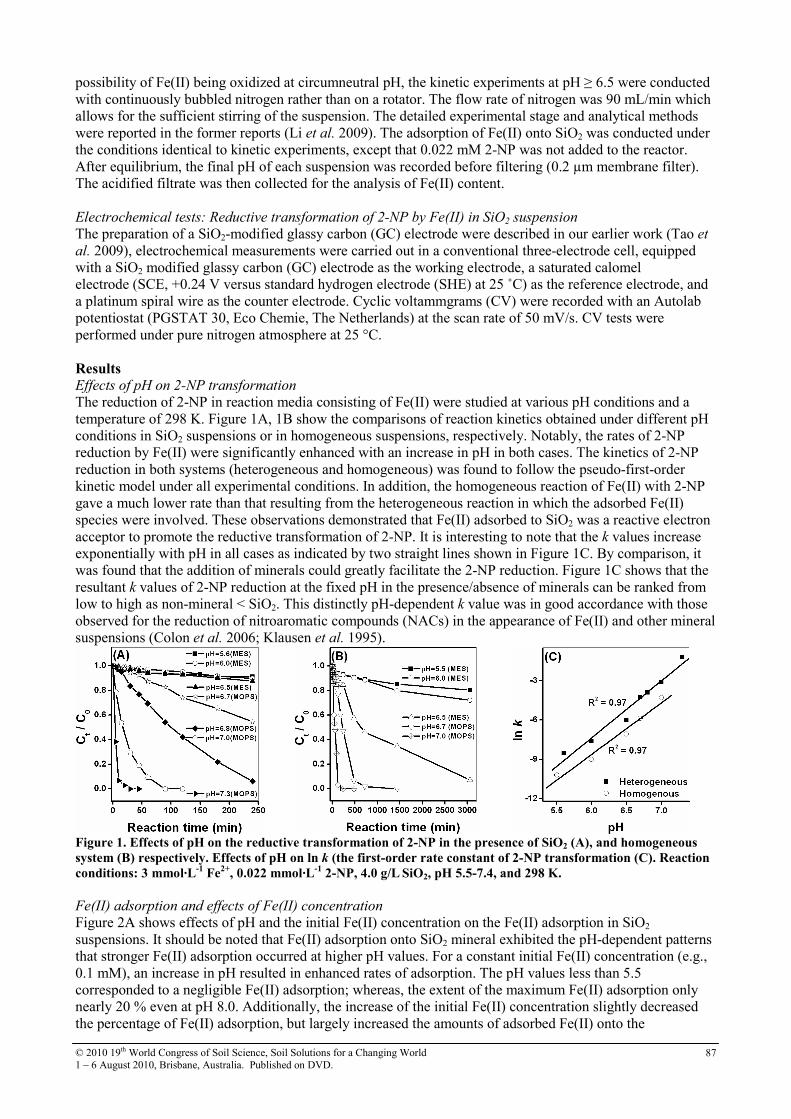
© 2010 19th World Congress of Soil Science, Soil Solutions for a Changing World 1 – 6 August 2010, Brisbane, Australia. Published on DVD.
87
possibility of Fe(II) being oxidized at circumneutral pH, the kinetic experiments at pH ≥ 6.5 were conducted with continuously bubbled nitrogen rather than on a rotator. The flow rate of nitrogen was 90 mL/min which allows for the sufficient stirring of the suspension. The detailed experimental stage and analytical methods were reported in the former reports (Li et al. 2009). The adsorption of Fe(II) onto SiO2 was conducted under the conditions identical to kinetic experiments, except that 0.022 mM 2-NP was not added to the reactor. After equilibrium, the final pH of each suspension was recorded before filtering (0.2 µm membrane filter). The acidified filtrate was then collected for the analysis of Fe(II) content. Electrochemical tests: Reductive transformation of 2-NP by Fe(II) in SiO2 suspension
The preparation of a SiO2-modified glassy carbon (GC) electrode were described in our earlier work (Tao et al. 2009), electrochemical measurements were carried out in a conventional three-electrode cell, equipped with a SiO2 modified glassy carbon (GC) electrode as the working electrode, a saturated calomel electrode (SCE, +0.24 V versus standard hydrogen electrode (SHE) at 25 ˚C) as the reference electrode, and a platinum spiral wire as the counter electrode. Cyclic voltammgrams (CV) were recorded with an Autolab potentiostat (PGSTAT 30, Eco Chemie, The Netherlands) at the scan rate of 50 mV/s. CV tests were performed under pure nitrogen atmosphere at 25 °C. Results
Effects of pH on 2-NP transformation
The reduction of 2-NP in reaction media consisting of Fe(II) were studied at various pH conditions and a temperature of 298 K. Figure 1A, 1B show the comparisons of reaction kinetics obtained under different pH conditions in SiO2 suspensions or in homogeneous suspensions, respectively. Notably, the rates of 2-NP reduction by Fe(II) were significantly enhanced with an increase in pH in both cases. The kinetics of 2-NP reduction in both systems (heterogeneous and homogeneous) was found to follow the pseudo-first-order kinetic model under all experimental conditions. In addition, the homogeneous reaction of Fe(II) with 2-NP gave a much lower rate than that resulting from the heterogeneous reaction in which the adsorbed Fe(II) species were involved. These observations demonstrated that Fe(II) adsorbed to SiO2 was a reactive electron acceptor to promote the reductive transformation of 2-NP. It is interesting to note that the k values increase exponentially with pH in all cases as indicated by two straight lines shown in Figure 1C. By comparison, it was found that the addition of minerals could greatly facilitate the 2-NP reduction. Figure 1C shows that the resultant k values of 2-NP reduction at the fixed pH in the presence/absence of minerals can be ranked from low to high as non-mineral < SiO2. This distinctly pH-dependent k value was in good accordance with those observed for the reduction of nitroaromatic compounds (NACs) in the appearance of Fe(II) and other mineral suspensions (Colon et al. 2006; Klausen et al. 1995).
Figure 1. Effects of pH on the reductive transformation of 2-NP in the presence of SiO2 (A), and homogeneous
system (B) respectively. Effects of pH on ln k (the first-order rate constant of 2-NP transformation (C). Reaction
conditions: 3 mmol·L-1
Fe2+
, 0.022 mmol·L-1
2-NP, 4.0 g/L SiO2, pH 5.5-7.4, and 298 K.
Fe(II) adsorption and effects of Fe(II) concentration
Figure 2A shows effects of pH and the initial Fe(II) concentration on the Fe(II) adsorption in SiO2 suspensions. It should be noted that Fe(II) adsorption onto SiO2 mineral exhibited the pH-dependent patterns that stronger Fe(II) adsorption occurred at higher pH values. For a constant initial Fe(II) concentration (e.g., 0.1 mM), an increase in pH resulted in enhanced rates of adsorption. The pH values less than 5.5 corresponded to a negligible Fe(II) adsorption; whereas, the extent of the maximum Fe(II) adsorption only nearly 20 % even at pH 8.0. Additionally, the increase of the initial Fe(II) concentration slightly decreased the percentage of Fe(II) adsorption, but largely increased the amounts of adsorbed Fe(II) onto the
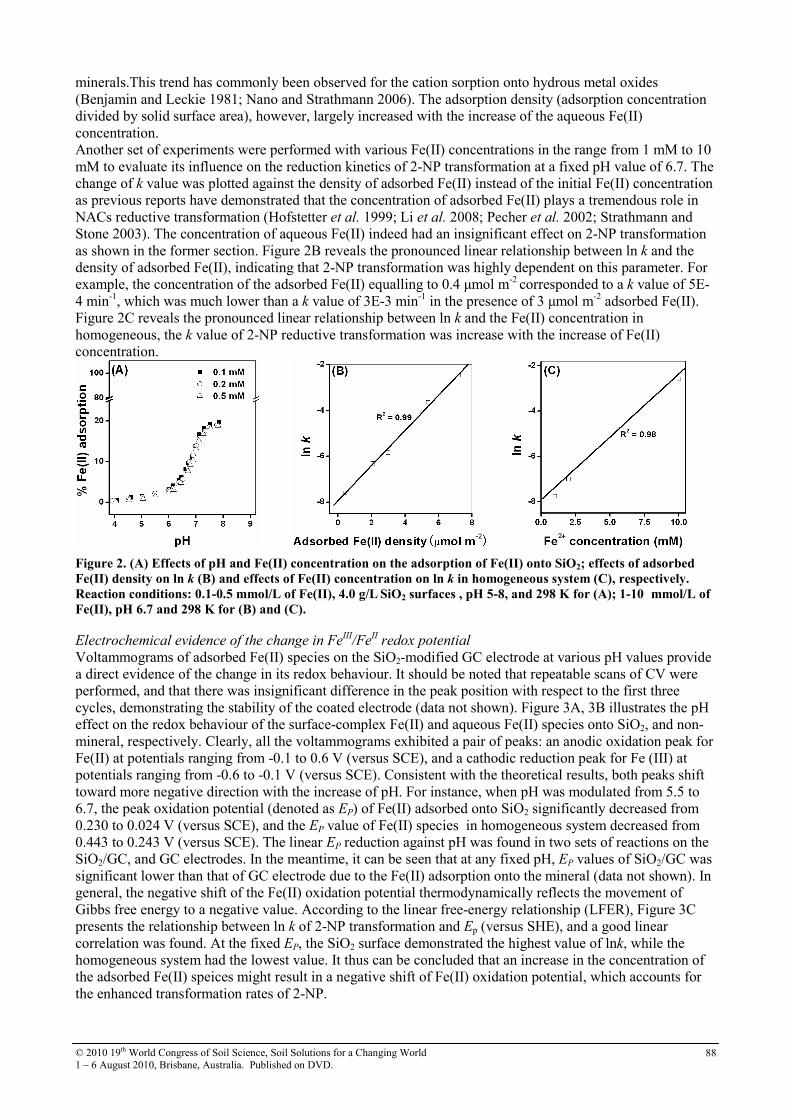
© 2010 19th World Congress of Soil Science, Soil Solutions for a Changing World 1 – 6 August 2010, Brisbane, Australia. Published on DVD.
88
minerals.This trend has commonly been observed for the cation sorption onto hydrous metal oxides (Benjamin and Leckie 1981; Nano and Strathmann 2006). The adsorption density (adsorption concentration divided by solid surface area), however, largely increased with the increase of the aqueous Fe(II) concentration. Another set of experiments were performed with various Fe(II) concentrations in the range from 1 mM to 10 mM to evaluate its influence on the reduction kinetics of 2-NP transformation at a fixed pH value of 6.7. The change of k value was plotted against the density of adsorbed Fe(II) instead of the initial Fe(II) concentration as previous reports have demonstrated that the concentration of adsorbed Fe(II) plays a tremendous role in NACs reductive transformation (Hofstetter et al. 1999; Li et al. 2008; Pecher et al. 2002; Strathmann and Stone 2003). The concentration of aqueous Fe(II) indeed had an insignificant effect on 2-NP transformation as shown in the former section. Figure 2B reveals the pronounced linear relationship between ln k and the density of adsorbed Fe(II), indicating that 2-NP transformation was highly dependent on this parameter. For example, the concentration of the adsorbed Fe(II) equalling to 0.4 µmol m-2 corresponded to a k value of 5E-4 min-1, which was much lower than a k value of 3E-3 min-1 in the presence of 3 µmol m-2 adsorbed Fe(II). Figure 2C reveals the pronounced linear relationship between ln k and the Fe(II) concentration in homogeneous, the k value of 2-NP reductive transformation was increase with the increase of Fe(II) concentration.
Figure 2. (A) Effects of pH and Fe(II) concentration on the adsorption of Fe(II) onto SiO2; effects of adsorbed
Fe(II) density on ln k (B) and effects of Fe(II) concentration on ln k in homogeneous system (C), respectively.
Reaction conditions: 0.1-0.5 mmol/L of Fe(II), 4.0 g/L SiO2 surfaces , pH 5-8, and 298 K for (A); 1-10 mmol/L of
Fe(II), pH 6.7 and 298 K for (B) and (C). Electrochemical evidence of the change in Fe
III/Fe
II redox potential
Voltammograms of adsorbed Fe(II) species on the SiO2-modified GC electrode at various pH values provide a direct evidence of the change in its redox behaviour. It should be noted that repeatable scans of CV were performed, and that there was insignificant difference in the peak position with respect to the first three cycles, demonstrating the stability of the coated electrode (data not shown). Figure 3A, 3B illustrates the pH effect on the redox behaviour of the surface-complex Fe(II) and aqueous Fe(II) species onto SiO2, and non-mineral, respectively. Clearly, all the voltammograms exhibited a pair of peaks: an anodic oxidation peak for Fe(II) at potentials ranging from -0.1 to 0.6 V (versus SCE), and a cathodic reduction peak for Fe (III) at potentials ranging from -0.6 to -0.1 V (versus SCE). Consistent with the theoretical results, both peaks shift toward more negative direction with the increase of pH. For instance, when pH was modulated from 5.5 to 6.7, the peak oxidation potential (denoted as EP) of Fe(II) adsorbed onto SiO2 significantly decreased from 0.230 to 0.024 V (versus SCE), and the EP value of Fe(II) species in homogeneous system decreased from 0.443 to 0.243 V (versus SCE). The linear EP reduction against pH was found in two sets of reactions on the SiO2/GC, and GC electrodes. In the meantime, it can be seen that at any fixed pH, EP values of SiO2/GC was significant lower than that of GC electrode due to the Fe(II) adsorption onto the mineral (data not shown). In general, the negative shift of the Fe(II) oxidation potential thermodynamically reflects the movement of Gibbs free energy to a negative value. According to the linear free-energy relationship (LFER), Figure 3C presents the relationship between ln k of 2-NP transformation and Ep (versus SHE), and a good linear correlation was found. At the fixed EP, the SiO2 surface demonstrated the highest value of lnk, while the homogeneous system had the lowest value. It thus can be concluded that an increase in the concentration of the adsorbed Fe(II) speices might result in a negative shift of Fe(II) oxidation potential, which accounts for the enhanced transformation rates of 2-NP.
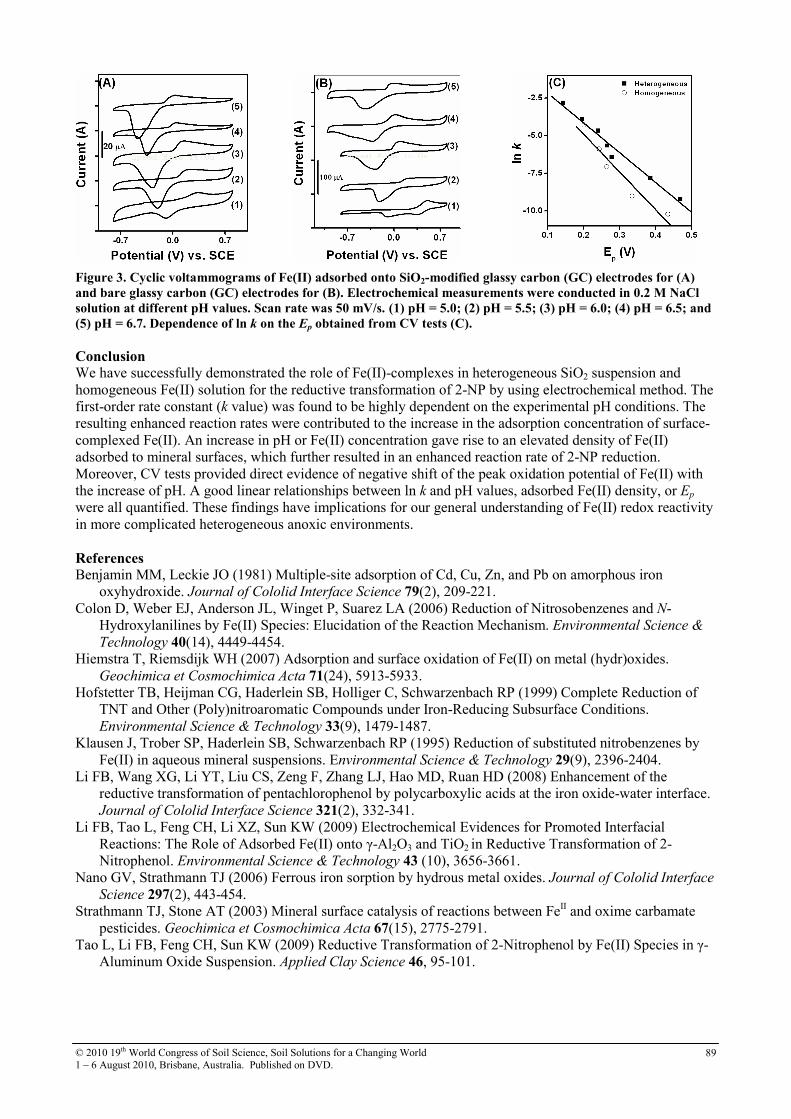
© 2010 19th World Congress of Soil Science, Soil Solutions for a Changing World 1 – 6 August 2010, Brisbane, Australia. Published on DVD.
89
Figure 3. Cyclic voltammograms of Fe(II) adsorbed onto SiO2-modified glassy carbon (GC) electrodes for (A)
and bare glassy carbon (GC) electrodes for (B). Electrochemical measurements were conducted in 0.2 M NaCl
solution at different pH values. Scan rate was 50 mV/s. (1) pH = 5.0; (2) pH = 5.5; (3) pH = 6.0; (4) pH = 6.5; and
(5) pH = 6.7. Dependence of ln k on the Ep obtained from CV tests (C). Conclusion We have successfully demonstrated the role of Fe(II)-complexes in heterogeneous SiO2 suspension and homogeneous Fe(II) solution for the reductive transformation of 2-NP by using electrochemical method. The first-order rate constant (k value) was found to be highly dependent on the experimental pH conditions. The resulting enhanced reaction rates were contributed to the increase in the adsorption concentration of surface-complexed Fe(II). An increase in pH or Fe(II) concentration gave rise to an elevated density of Fe(II) adsorbed to mineral surfaces, which further resulted in an enhanced reaction rate of 2-NP reduction. Moreover, CV tests provided direct evidence of negative shift of the peak oxidation potential of Fe(II) with the increase of pH. A good linear relationships between ln k and pH values, adsorbed Fe(II) density, or Ep
were all quantified. These findings have implications for our general understanding of Fe(II) redox reactivity in more complicated heterogeneous anoxic environments. References Benjamin MM, Leckie JO (1981) Multiple-site adsorption of Cd, Cu, Zn, and Pb on amorphous iron
oxyhydroxide. Journal of Cololid Interface Science 79(2), 209-221. Colon D, Weber EJ, Anderson JL, Winget P, Suarez LA (2006) Reduction of Nitrosobenzenes and N-
Hydroxylanilines by Fe(II) Species: Elucidation of the Reaction Mechanism. Environmental Science &
Technology 40(14), 4449-4454. Hiemstra T, Riemsdijk WH (2007) Adsorption and surface oxidation of Fe(II) on metal (hydr)oxides.
Geochimica et Cosmochimica Acta 71(24), 5913-5933. Hofstetter TB, Heijman CG, Haderlein SB, Holliger C, Schwarzenbach RP (1999) Complete Reduction of
TNT and Other (Poly)nitroaromatic Compounds under Iron-Reducing Subsurface Conditions. Environmental Science & Technology 33(9), 1479-1487.
Klausen J, Trober SP, Haderlein SB, Schwarzenbach RP (1995) Reduction of substituted nitrobenzenes by Fe(II) in aqueous mineral suspensions. Environmental Science & Technology 29(9), 2396-2404.
Li FB, Wang XG, Li YT, Liu CS, Zeng F, Zhang LJ, Hao MD, Ruan HD (2008) Enhancement of the reductive transformation of pentachlorophenol by polycarboxylic acids at the iron oxide-water interface. Journal of Cololid Interface Science 321(2), 332-341.
Li FB, Tao L, Feng CH, Li XZ, Sun KW (2009) Electrochemical Evidences for Promoted Interfacial Reactions: The Role of Adsorbed Fe(II) onto γ-Al2O3 and TiO2 in Reductive Transformation of 2-Nitrophenol. Environmental Science & Technology 43 (10), 3656-3661.
Nano GV, Strathmann TJ (2006) Ferrous iron sorption by hydrous metal oxides. Journal of Cololid Interface Science 297(2), 443-454.
Strathmann TJ, Stone AT (2003) Mineral surface catalysis of reactions between FeII and oxime carbamate pesticides. Geochimica et Cosmochimica Acta 67(15), 2775-2791.
Tao L, Li FB, Feng CH, Sun KW (2009) Reductive Transformation of 2-Nitrophenol by Fe(II) Species in γ-Aluminum Oxide Suspension. Applied Clay Science 46, 95-101.
© 2010 19th World Congress of Soil Science, Soil Solutions for a Changing World 1 – 6 August 2010, Brisbane, Australia. Published on DVD.
90
Is Dealumination Limited to the Waikato Region of New Zealand, or is it Wider
Spread?
Taylor MDA, Kim NDA, Taylor AB, Guinto DC. AEnvironment Waikato, PO Box 4010, Hamilton East, Hamilton 3247, New Zealand, Email [email protected] BAuckland Regional Council, Private Bag 92-012, Auckland 1142, New Zealand CEnvironment Bay of Plenty, P O Box 364, Whakatane 3158, New Zealand
Abstract Dealumination is a term used to describe an increase in the concentration of acid recoverable Al as a result of accelerated weathering or chemical attack of primary crystalline and short-range order aluminosilicates (Taylor & Kim. In Press Australian Journal of Soil Research 47 (8)). Briefly, this process has been observed in farmed soils but not in soils under background or forestry land uses. Two specific mechanisms that could favour Al mobilisation from clay surfaces include partial dissolution by local areas of high acidity associated with fertiliser granules, and surface complexation and extraction by the fluoride and residual hydrofluoric acid present in phosphate fertilisers. The process of dealumination has been identified in farmed soils in the Waikato region. This study assesses if this process is occurring in two neighbouring regions, Auckland and the Bay of Plenty by comparing regional soil quality monitoring data from the three regions. As the sites used for regional soil quality sampling are resampled on a 5-6 year rotation, trend in data over time, including the speed of this process, were also estimated. Key Words
Dealumination, accelerated weathering, aluminium, fluorine, fertiliser. Introduction
Soil quality monitoring programs are carried out in the Auckland, Bay of Plenty and Waikato regions to assess soils for production and environmental protection. Monitoring in the Waikato region identified an increase in strong acid recoverable Al and associated elements in farmed soils compared to background soils. These results have been interpreted as the potentially interesting soil process, dealumination, as the mechanism for the observed increases (Taylor & Kim In Press Australian Journal of Soil Research 47 (8)). This paper shows Waikato region results for Al, and a cluster of elements associated with aluminosilicates, were unusual in the context of known sources. Given their high natural concentrations (above 2%), we did not expect any common external source to be able to cause a measurable increase in Fe or Al in farmed soils. In keeping with this, Fe showed no such evidence of a concentration increase in farmed soils. By contrast, farmed soils showed a significant (p<0.0001) concentration increase in acid-recoverable Al. This increase was remarkable, not so much for the size of the enrichment factor (1.5), but for the element involved and the amount of additional Al represented – an additional 13,700 mg/kg of acid-extractable Al in the farmed soils, at the time of publication.
Two specific mechanisms were presented that could favour Al mobilisation from clay surfaces including partial dissolution by local areas of high acidity (about pH 2) associated with phosphate fertiliser granules, and surface complexation and extraction by the fluoride and residual hydrofluoric acid present in phosphate fertilisers. New Zealand soils are regarded as being naturally low in P (McLaren & Cameron 1990) and require inputs of phosphate fertilisers for optimal production. A typical rate of application on a dairy farm in the Waikato region is about 400kg superphosphate/ha/y. Superphosphate fertiliser contains about 1-3% F.
To assess if this process is isolated to the Waikato region, or more widespread, data from the two neighbouring regions, Auckland and Bay of Plenty is compared with that from the Waikato region.
Methods
Soil quality monitoring
Soil quality monitoring sites were chosen to cover a representative range of soil types and land uses. Sampling consisted of 25 soil cores (0-100 mm) over a 50 m transect, which are combined to form composites for analysis (Sparling et al. 2002).

© 2010 19th World Congress of Soil Science, Soil Solutions for a Changing World 1 – 6 August 2010, Brisbane, Australia. Published on DVD.
91
Sites were identified on the basis of their current land use and what is known of their land use history. There are far fewer not farmed sites than farmed land sites. They were all long-term forest, or wetlands, uninfluenced by anthropogenic activities for the life of the trees. Some of these sites may have been logged or cleared by early generations, but atmospheric inputs in New Zealand soils are relatively low, and for the most part these sites are regarded as being close enough to background to serve as a useful point of comparison. Farmed sites included pastoral cropping and horticultural land uses.
Samples are analysed for an established set of soil quality chemical and physical parameters following Sparling et al. (2002) and for 32 elements following EPA 200.2 (total recoverable metals hydrochloric/nitric acid digestion). Measurements were made at IANZ-accredited laboratories (soil quality chemistry at Landcare Research, Palmerston North, soil quality physical parameters at Landcare Research, Hamilton, and elemental analysis by ICP-MS at Hill Laboratories, Hamilton).
Statistics
Relative enrichment (or depletion) of Al in farmed soils was determined by calculating the ratio of the mean results from farmed soils with the mean from not farmed soils. Where necessary, data was transformed to form a normal distribution. Pooled Student’s t-tests were used to assess significance of the difference between each pair of means. For the subset of samples from sites sampled twice, about 5 year apart, significance was assessed using paired Student’s t-tests after data was transformed to a normal distribution.
Results
Consistent with the results from the Waikato region, results from the Auckland and Bay of Plenty regions showed statistically higher concentrations of Al in farmed soils compared to background ones (Table 1), indicating the dealumination process is not isolated to the Waikato region but is more widespread. However, the magnitude of the increase was much less in soils from the Bay of Plenty than that in soils from Auckland or Waikato. The reason for the reduced magnitude of the increase in the Bay of Plenty region is not clear but there are regional differences in climate, soil type and land use. Auckland is more northern and warmer than the others and the Bay of Plenty is more eastern and dryer. All 3 regions contain relatively young soils formed from volcanic tephra, while the Auckland and Waikato regions also contain soils formed from sedimentary rock. Pastoral farming is predominant in all 3 regions but horticulture (kiwifruit) is significant in the Bay of Plenty. Monitoring is continuing and the influence of the above variables on total recoverable Al will be further investigated once additional data is collected.
Table 1. Strong acid recoverable Al in farmed and not farmed soils from 3 regions of New Zealand Mean Al in mg/kg and (number of samples) Auckland Bay of Plenty Waikato
Farmed soils 21000 (54) 16900 (79) 36700 (170) Not farmed soils 13200 (15) 14100 (17) 20600 (23) Enrichment Factor 1.6 1.2 1.8 P (pooled t-test) <0.015 <0.015 <0.0001
Across the 3 regions, 71 farmed and 8 not farmed sites had been sampled twice, approximately 5 years apart (Table 2). There was a significant increase in Al for farmed soils (p< 0.0001), a mean increase of about 6000 mg/kg, or about 1000-1200 mg/kg/y. There was no significant change (p>0.05) for not farmed soils.
Table 2. Trends in strong acid recoverable Al in farmed and not farmed soils Mean Al in mg/kg Year 1 Year 5
p (paired t-test)
Farmed (n=71) 25200 31500 <0.0001 Not Farmed (n=8) 21600 17100 >0.05
The impact and significance of this dealumination process on soil properties, soil quality and productivity is still to be established. Given this process has been identified in some of the major farming areas of New Zealand, there is some urgency in making certain the actual mechanism, and ascertaining its effects on soil properties and implications to soil management.
Conclusion
The dealumination process is not isolated to the Waikato region but is also found in adjoining regions. This process may be influenced by climate, soil type and the type of farming, but assessing the influence these factors requires further data.

© 2010 19th World Congress of Soil Science, Soil Solutions for a Changing World 1 – 6 August 2010, Brisbane, Australia. Published on DVD.
92
This process is relatively quick and strong acid recoverable Al is increasing in farmed soils with a mean increase of about 1000-1200 mg/kg/y. The actual mechanism of dealumination needs to be verified, and its effects on soil properties and implications to soil management need to be ascertained. References Sparling GP, Rijkse WC, Wilde H, van der Weerden T, Beare M, Francis G (2002) Implementing soil
quality indicators for land: Research Report for 2000-2001 and finial report for MfE Project Number 5089. Landcare Research Contract Report: LC0102/015. (Landcare Research, Hamilton).

© 2010 19th World Congress of Soil Science, Soil Solutions for a Changing World 1 – 6 August 2010, Brisbane, Australia. Published on DVD.
93
Magnetic properties of urban topsoil in Baoshan district, Shanghai and its
environmental implication
Qi JiangA, Xue-Feng HuA, Ji WeiA, Shan LiA and Yang LiA ADepartment of Environmental Science and Engineering, Shanghai University, Shanghai, China, Email [email protected]
Abstract
Heavy metal contents and magnetic properties (χlf、χfd%) in topsoil of 123 urban sites in Baoshan District, Shanghai were detected to study the significant correlations between heavy metals and χlf. The results indicate that spatial variation of χlf in the urban topsoil is significant: the highest χlf of 1127×10-8m3/kg was observed in industrial soil while the lowest of 18×10-8m3/kg in agricultural soil. Significant correlations between χlf and χfd% implies the soil is dominated by anthropogenic multi-domain (MD) and stable single domain (SSD) grains. A close relationship between χlf and heavy metal contents in the topsoil is found. χlf values in the topsoil are excellently correlated with Zn, Cr, Mn, Cu, Pb, Cd and Fe, with the coefficients (R) of 0.665, 0.416, 0.607, 0.533, 0.639, 0.520 and 0.503, respectively. Those in industrial soil, are roadside and topsoil are also significantly correlated with heavy metals; but those in the agricultural soil do not reach the significant level. It indicated that the magnetic techniques can be used for monitoring soil pollution in Shanghai. Key Words Baoshan District, Shanghai; urban topsoil; heavy metal; magnetic susceptibility. Introduction Recently, there is a growing interest in using magnetic techniques for monitoring environmental pollution (Wonnyon et al. 2009; Kim et al. 2007). Statistic assessment demonstrates by analyzing susceptibility values, heavy metal concentrations in large soil data set (Ruiping et al. 2006; Blundell et al. 2009; Monika et al. 2007; Tetyana et al. 2004) showed anthropogenic influence on the magnetic properties of soils. Many studies (Lu et al. 2006; 2008) have reported excellent relationships between χlf and the contents of some heavy metals in industrial/urban soils. Soils near urban and industrial zones have an increased magnetic susceptibility (Thompson and Oldfield 1986; Tadeusz et al. 2007; Blundell 2009; Xia 2008; Xie 2001). Magnetic measurements show that the main magnetic components in urban topsoil are multidomain grains of ferrimagnetic minerals, which are introduced by industrial activities(Flanders 1994), automobile exhaust(Matzka 1999; Muxworthy 2001; Shilton 2005; Maher 2008) and deposition of atmospheric particulates(Kim et al. 2007). Methods
Close to the Yangtze River on the north, Baoshan District is the traditional industrial base in Shanghai as well as the main vegetable base. Soil samples were selected considering diversities of land utilization including agricultural soils (31), industrial soils (30), road side (31) and residential areas (31). About 8 g. soil samples (<2.0 mm) were packed, and magnetic susceptibility was measured at low (0.47 kHz) and high (4.7 kHz) frequency by a Bartington MS2 dual frequency sensor. χfd% was calculated from the percentage of (χlf −χhf)/χlf. Soils (0.154 mm) were digested with a mixture solution of concentrated HNO3-HF-HClO4. Cu, Zn, Pb, Cr, Mn and Ni were analyzed by air–acetylene flame atomic absorption spectrophotometry (AAS), Cd by the graphite furnace AAS, while Fe (Fed) was determined according to o-phenonthroline spectrophotometry. Results Spatial variation of heavy metal accumulation in the urban topsoil is observed (Table.1). The χlf value ranged from 18×10-8m3/kg(agricultural soils) to 1127×10-8m3/kg(industrial soils) with the mean value of 148×10-
8m3/kg. The mean concentrations of χlf in the agricultural soils and industrial soils were 52×10-8m3/kg and 239×10-8m3/kg respectively. It was measured that χfd of urban topsoil is less than 4%. The mean χfd value of industrial zones is 1.8%, which is similar to agricultural areas with a mean value of 1.8%. The value of χlf is increased in the order of industrial area> roadside > residential area> agricultural area, and in the order of agricultural area> roadside > residential areas> industrial area for χfd%.
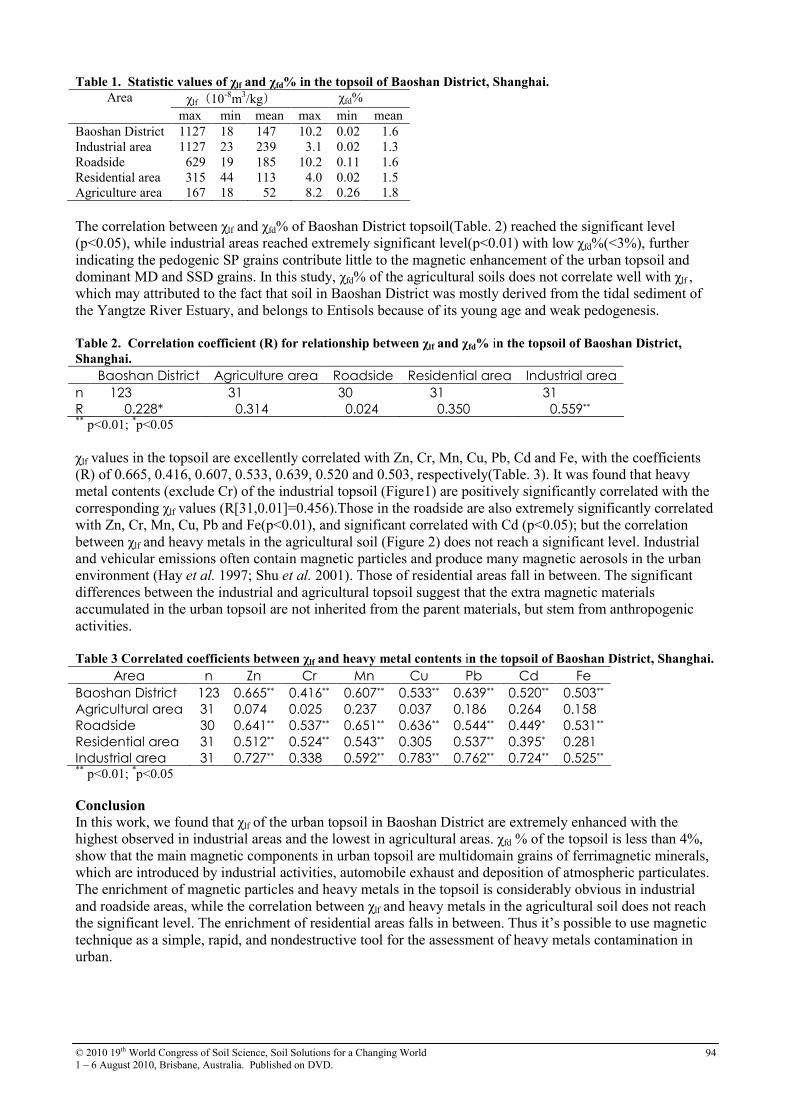
© 2010 19th World Congress of Soil Science, Soil Solutions for a Changing World 1 – 6 August 2010, Brisbane, Australia. Published on DVD.
94
Table 1. Statistic values of χlf and χfd% in the topsoil of Baoshan District, Shanghai.
χlf(10-8m3/kg) χfd% Area
max min mean max min mean Baoshan District 1127 18 147 10.2 0.02 1.6 Industrial area 1127 23 239 3.1 0.02 1.3 Roadside 629 19 185 10.2 0.11 1.6 Residential area 315 44 113 4.0 0.02 1.5 Agriculture area 167 18 52 8.2 0.26 1.8 The correlation between χlf and χfd% of Baoshan District topsoil(Table. 2) reached the significant level (p<0.05), while industrial areas reached extremely significant level(p<0.01) with low χfd%(<3%), further indicating the pedogenic SP grains contribute little to the magnetic enhancement of the urban topsoil and dominant MD and SSD grains. In this study, χfd% of the agricultural soils does not correlate well with χlf , which may attributed to the fact that soil in Baoshan District was mostly derived from the tidal sediment of the Yangtze River Estuary, and belongs to Entisols because of its young age and weak pedogenesis. Table 2. Correlation coefficient (R) for relationship between χlf and χfd% in the topsoil of Baoshan District,
Shanghai.
Baoshan District Agriculture area Roadside Residential area Industrial area
n 123 31 30 31 31
R 0.228* 0.314 0.024 0.350 0.559** ** p<0.01; *p<0.05 χlf values in the topsoil are excellently correlated with Zn, Cr, Mn, Cu, Pb, Cd and Fe, with the coefficients (R) of 0.665, 0.416, 0.607, 0.533, 0.639, 0.520 and 0.503, respectively(Table. 3). It was found that heavy metal contents (exclude Cr) of the industrial topsoil (Figure1) are positively significantly correlated with the corresponding χlf values (R[31,0.01]=0.456).Those in the roadside are also extremely significantly correlated with Zn, Cr, Mn, Cu, Pb and Fe(p<0.01), and significant correlated with Cd (p<0.05); but the correlation between χlf and heavy metals in the agricultural soil (Figure 2) does not reach a significant level. Industrial and vehicular emissions often contain magnetic particles and produce many magnetic aerosols in the urban environment (Hay et al. 1997; Shu et al. 2001). Those of residential areas fall in between. The significant differences between the industrial and agricultural topsoil suggest that the extra magnetic materials accumulated in the urban topsoil are not inherited from the parent materials, but stem from anthropogenic activities. Table 3 Correlated coefficients between χlf and heavy metal contents in the topsoil of Baoshan District, Shanghai.
Area n Zn Cr Mn Cu Pb Cd Fe
Baoshan District 123 0.665** 0.416** 0.607** 0.533** 0.639** 0.520** 0.503**
Agricultural area 31 0.074 0.025 0.237 0.037 0.186 0.264 0.158
Roadside 30 0.641** 0.537** 0.651** 0.636** 0.544** 0.449* 0.531**
Residential area 31 0.512** 0.524** 0.543** 0.305 0.537** 0.395* 0.281
Industrial area 31 0.727** 0.338 0.592** 0.783** 0.762** 0.724** 0.525** ** p<0.01; *p<0.05
Conclusion
In this work, we found that χlf of the urban topsoil in Baoshan District are extremely enhanced with the highest observed in industrial areas and the lowest in agricultural areas. χfd % of the topsoil is less than 4%, show that the main magnetic components in urban topsoil are multidomain grains of ferrimagnetic minerals, which are introduced by industrial activities, automobile exhaust and deposition of atmospheric particulates. The enrichment of magnetic particles and heavy metals in the topsoil is considerably obvious in industrial and roadside areas, while the correlation between χlf and heavy metals in the agricultural soil does not reach the significant level. The enrichment of residential areas falls in between. Thus it’s possible to use magnetic technique as a simple, rapid, and nondestructive tool for the assessment of heavy metals contamination in urban.
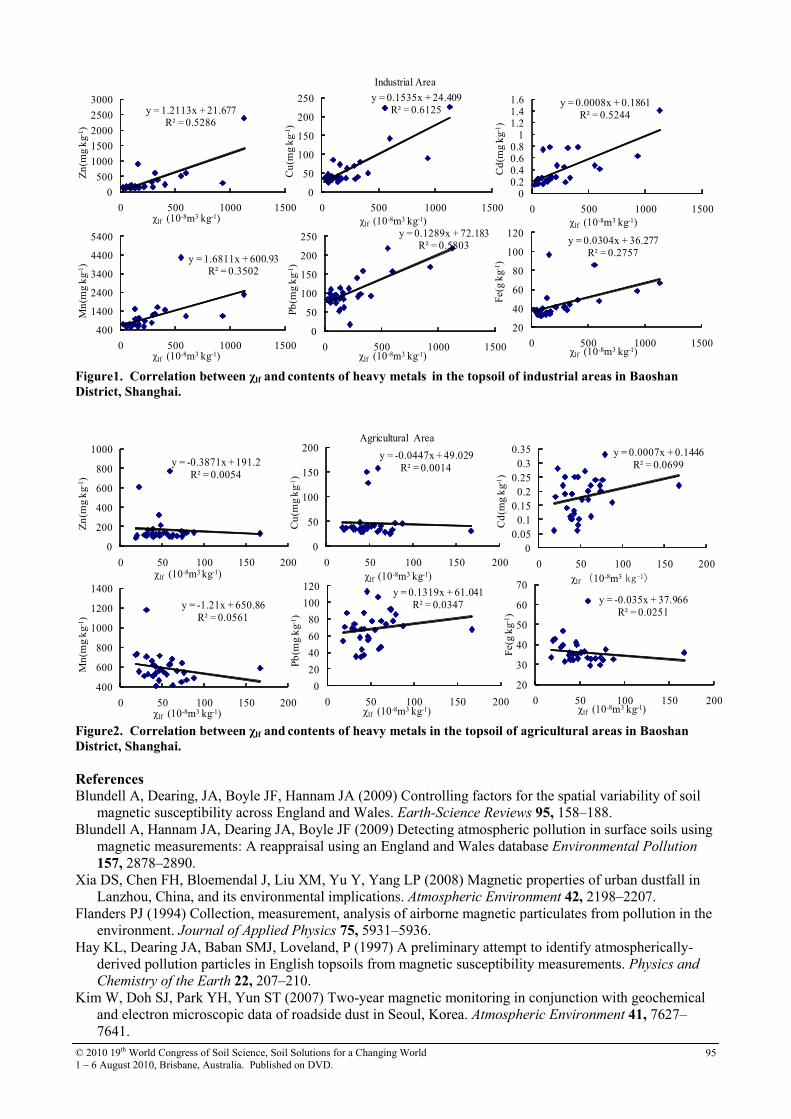
© 2010 19th World Congress of Soil Science, Soil Solutions for a Changing World 1 – 6 August 2010, Brisbane, Australia. Published on DVD.
95
Industrial Area
y = 1.6811x + 600.93R² = 0.3502
400
1400
2400
3400
4400
5400
0 500 1000 1500
Mn
(mg
kg-
1)
χlf (10-8m3 kg-1)
y = 0.1535x + 24.409R² = 0.6125
0
50
100
150
200
250
0 500 1000 1500
Cu
(mg
kg-
1)
χlf (10-8m3 kg-1)
y = 0.0008x + 0.1861R² = 0.5244
00.20.40.60.8
11.21.41.6
0 500 1000 1500
Cd
(mg
kg-
1)
χlf (10-8m3 kg-1)
y = 0.0304x + 36.277R² = 0.2757
20
40
60
80
100
120
0 500 1000 1500
Fe(
g k
g-1 )
χlf (10-8m3 kg-1)
y = 0.1289x + 72.183R² = 0.5803
0
50
100
150
200
250
0 500 1000 1500
Pb
(mg
kg-
1 )
χlf (10-8m3 kg-1)
y = 1.2113x + 21.677R² = 0.5286
0
500
1000
1500
2000
2500
3000
0 500 1000 1500
Zn
(mg
kg-
1 )
χlf (10-8m3 kg-1)
Figure1. Correlation between χlf and contents of heavy metals in the topsoil of industrial areas in Baoshan
District, Shanghai.
Agricultural Area
y = -1.21x + 650.86R² = 0.0561
400
600
800
1000
1200
1400
0 50 100 150 200
Mn
(mg
kg-
1)
χlf (10-8m3 kg-1)
y = -0.0447x + 49.029R² = 0.0014
0
50
100
150
200
0 50 100 150 200
Cu
(mg
kg-1
)
χlf (10-8m3 kg-1)
y = 0.0007x + 0.1446R² = 0.0699
00.05
0.10.15
0.20.25
0.30.35
0 50 100 150 200
Cd
(mg
kg-
1)
χlf (10-8m3 kg-1)
y = -0.035x + 37.966R² = 0.0251
20
30
40
50
60
70
0 50 100 150 200
Fe(
g k
g-1)
χlf (10-8m3 kg-1)
y = 0.1319x + 61.041R² = 0.0347
0
20
40
60
80
100
120
0 50 100 150 200
Pb
(mg
kg-
1)
χlf (10-8m3 kg-1)
y = -0.3871x + 191.2R² = 0.0054
0
200
400
600
800
1000
0 50 100 150 200
Zn
(mg
kg-
1)
χlf (10-8m3 kg-1)
Figure2. Correlation between χlf and contents of heavy metals in the topsoil of agricultural areas in Baoshan
District, Shanghai.
References
Blundell A, Dearing, JA, Boyle JF, Hannam JA (2009) Controlling factors for the spatial variability of soil magnetic susceptibility across England and Wales. Earth-Science Reviews 95, 158–188.
Blundell A, Hannam JA, Dearing JA, Boyle JF (2009) Detecting atmospheric pollution in surface soils using magnetic measurements: A reappraisal using an England and Wales database Environmental Pollution 157, 2878–2890.
Xia DS, Chen FH, Bloemendal J, Liu XM, Yu Y, Yang LP (2008) Magnetic properties of urban dustfall in Lanzhou, China, and its environmental implications. Atmospheric Environment 42, 2198–2207.
Flanders PJ (1994) Collection, measurement, analysis of airborne magnetic particulates from pollution in the environment. Journal of Applied Physics 75, 5931–5936.
Hay KL, Dearing JA, Baban SMJ, Loveland, P (1997) A preliminary attempt to identify atmospherically-derived pollution particles in English topsoils from magnetic susceptibility measurements. Physics and Chemistry of the Earth 22, 207–210.
Kim W, Doh SJ, Park YH, Yun ST (2007) Two-year magnetic monitoring in conjunction with geochemical and electron microscopic data of roadside dust in Seoul, Korea. Atmospheric Environment 41, 7627–7641.
© 2010 19th World Congress of Soil Science, Soil Solutions for a Changing World 1 – 6 August 2010, Brisbane, Australia. Published on DVD.
96
Sheng-Gao LU, Shi-Qiang BAI Li-Xia FU (2008) Magnetic Properties as Indicators of Cu and Zn Contamination in Soils. Pedosphere 18, 479–485
Maher BA, Moore C, Matzka J (2008) Spatial variation in vehicle-derived metal pollution identified by magnetic and elemental analysis of roadside tree leaves. Atmospheric Environment 42, 364–373.
Matzka J, Maher BA (1999) Magnetic biomonitoring of roadside tree leaves:identification of spatial and temporal variations in vehicle-derived particulates. Atmospheric Environment 33, 4564–4569.
Hanesch M., Rantitsch G, Hemetsberger S, Scholger R (2007) Lithological and pedological influences on the magnetic susceptibility of soil: Their consideration in magnetic pollution mapping. Science of the Total Environment 382, 351– 363.
Muxworthy AR, Matzka J, Petersen N (2001) Comparison of magnetic parameters of urban atmospheric particulate matter with pollution and meteorological data. Atmospheric Environment 35, 4379–4386.
Ruiping S, Cioppa MT (2006) Magnetic survey of topsoils in Windsor–Essex County, Canada. Journal of Applied Geophysics. 60, 201– 212
Lu SG, Bai SQ (2006) Study on the correlation of magnetic properties and heavy metals content in urban soils of Hangzhou City, China. Journal of Applied Geophysics 60, 1–12
Shilton VF, Booth CA, Smith JP, Giess P, Mitchell DJ, Williams CD (2005) Magnetic properties of urban street dust and their relationship with organic matter content in the West Midlands, UK. Atmospheric
Environment 39, 3651–3659. Xie S, Dearing JA, Boyle JF, Bloemendal J, Morse AP (2001) Association between magnetic properties and
element concentrations of Liverpool street dust and its implications. Journal of Applied Geophysics 48, 83–92.
Shu J, Dearing JA, Morse AP, Yu L, Yuan N (2001) Determining the sources of atmospheric particles in Shanghai, China, from magnetic and geochemical properties. Atmospheric Environment 35, 2615–2625.
Tadeusz M, Strzyszcz Z, Rachwal M (2007) Mapping particulate pollution loads using soil magnetometry in urban forests in the Upper Silesia Industrial Region, Poland. Forest Ecology and Management 248, 36–42.
Tetyana B, Scholger R, Stanjek H (2004) Topsoil magnetic susceptibility mapping as a tool for pollution monitoring: repeatability of in situ measurements. Journal of Applied Geophysics 55, 249– 259.
Thompson R, Oldfield F (1986) ‘Environmental Magnetism’. (London: Allen and Unwin). Wonnyon K, Doh SJ, Yu Y (2009) Anthropogenic contribution of magnetic particulates in urban roadside
dust. Atmospheric Environment. 43, 3137–3144.

© 2010 19th World Congress of Soil Science, Soil Solutions for a Changing World 1 – 6 August 2010, Brisbane, Australia. Published on DVD.
97
pH dependent charge and phosphate sorption by Thai Kandiudox
Worachart WisawapipatA, Irb KheoruenromneA,*, Anchalee SuddhiprakarnA and Robert J. GilkesB ADepartment of Soil Science, Faculty of Agriculture, Kasetsart University, Bangkok 10900, Thailand BSchool of Earth and Environment, Faculty of Natural and Agricultural Sciences, University of Western Australia, WA, Australia *Corresponding author. Email [email protected]
Abstract Surface charge and phosphate sorption characteristics five Kandiudox formed on basalt under the tropical monsoonal climate in Thailand have been investigated. These soils are acidic with moderate organic matter and cation exchange capacity values and quite high amounts of microcrystalline and amorphous iron oxides. Kaolinite is the major clay mineral with moderate amounts of goethite and hematite, and minor amounts of maghemite and gibbsite. The soils have high variable charge with the magnitudes of charge and the rate of change in surface charge with pH differing between the soils. The contents of organic matter, Fe and Al organic complexes exert a strong influence on the rate of change in negative surface charge with pH (Ac). These soils have high values of phosphate sorption capacity reflecting their clayey texture, and microcrystalline and amorphous iron oxide contents. Liming of these soils will decrease Al toxicity and P fixation, and increase cation exchange capacity. Key Words Organic matter, kaolinite, microcrystalline iron oxides, variable charge, P sorption. Introduction
Oxisols are variable charge soils (Qafoku et al. 2004) which are widespread in the Tropics and comprise a vital economic resource for agriculture in many countries. In Thailand, most Oxisols developed on basalt in the Southeast Coast region support tropical orchards. These soils are generally acidic and infertile with low values of cation exchange capacity. The mineralogy of the clay fraction of these soils is dominated by kaolinite and sesquioxides that exhibit variable charge on their surfaces and contribute to high P sorption capacity. To develop management approaches for efficient plant production of these soils there is a need to clarify their chemistry which includes the pH dependent surface charge and phosphate sorption characteristics. Methods
Soil sampling and characterization
Five profiles of Oxisols from the Southeast Coast Thailand were investigated. Pedon analysis in soil pits was carried out at each site, including detailed profile description and sampling of soil from their genetic horizons. Samples from all genetic horizons were used for determining their physicochemical properties, where samples of the prominent genetic horizons of these soils (Ap, Bt, Bto and Bo) were used for investigating their surface charge and P sorption characteristics. Bulk soil samples were air–dried and crushed to pass through a 2 mm sieve before laboratory analysis. Particle size distribution was determined by the pipette method. The specific surface area (SSA) was measured by the N2–BET method with a Micromeritics Gemini III 2375 surface analyzer. Soil pH was determined in water and in 1M KCl using 1:1 soil:liquid, and in 1M NaF (pH 8.0) with 1:50 soil:liquid (Fieldes and Perrott 1966). Organic carbon (OC) was determined by the Walkley and Black wet oxidation procedure (Nelson and Sommers 1996) and calculation of organic matter content (OM) in the relationship OM = OC × 1.724 was used. Cation exchange capacity (CEC) was determined by saturating the exchange sites with an index cation (NH4
+) using 1 N NH4OAc at pH 7.0. Crystalline, non crystalline, and organic forms of Fe, Al, and Mn were extracted by the specific extractants dithionite–citrate–bicarbonate solution (DCB) (Fed, Ald, Mnd), 0.2M ammonium oxalate solution at pH 3.0 (Feo, Alo, Mno), and sodium pyrophosphate solution (Fep, Alp, Mnp), respectively. Dissolved Fe, Al, and Mn were measured using atomic absorption spectrophotometry.
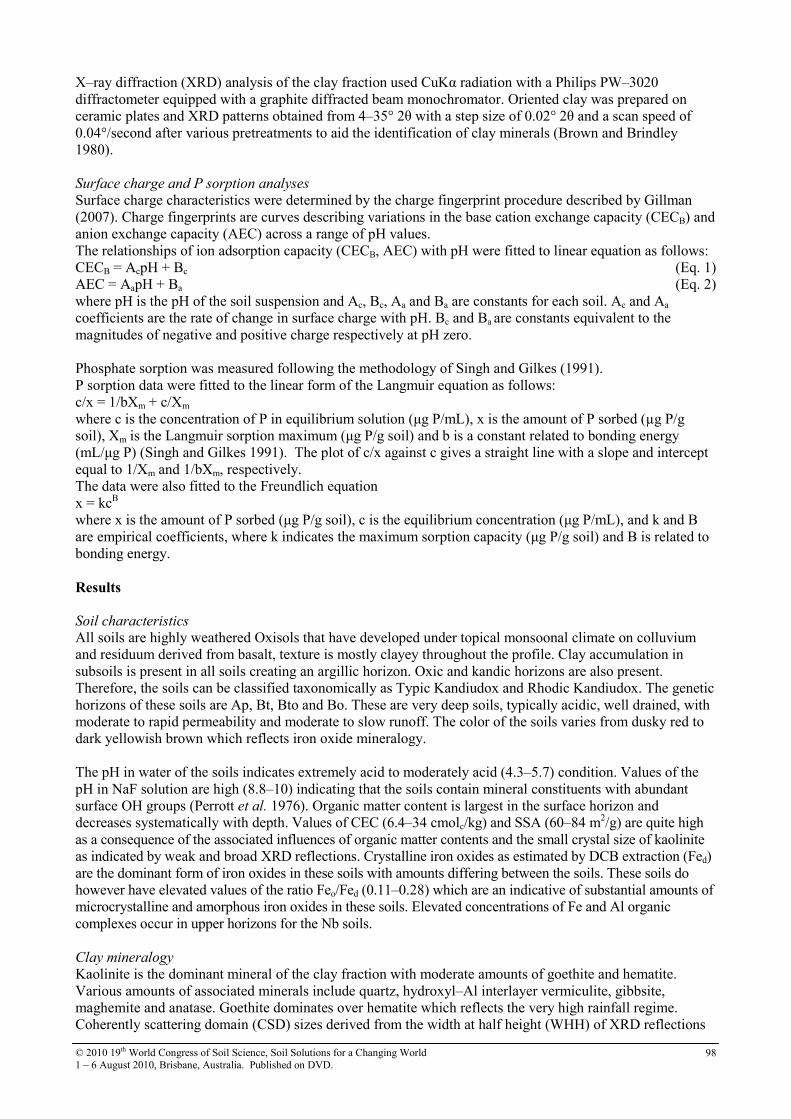
© 2010 19th World Congress of Soil Science, Soil Solutions for a Changing World 1 – 6 August 2010, Brisbane, Australia. Published on DVD.
98
X–ray diffraction (XRD) analysis of the clay fraction used CuKα radiation with a Philips PW–3020 diffractometer equipped with a graphite diffracted beam monochromator. Oriented clay was prepared on ceramic plates and XRD patterns obtained from 4–35° 2θ with a step size of 0.02° 2θ and a scan speed of 0.04°/second after various pretreatments to aid the identification of clay minerals (Brown and Brindley 1980). Surface charge and P sorption analyses
Surface charge characteristics were determined by the charge fingerprint procedure described by Gillman (2007). Charge fingerprints are curves describing variations in the base cation exchange capacity (CECB) and anion exchange capacity (AEC) across a range of pH values. The relationships of ion adsorption capacity (CECB, AEC) with pH were fitted to linear equation as follows: CECB = AcpH + Bc (Eq. 1) AEC = AapH + Ba (Eq. 2) where pH is the pH of the soil suspension and Ac, Bc, Aa and Ba are constants for each soil. Ac and Aa coefficients are the rate of change in surface charge with pH. Bc and Ba are constants equivalent to the magnitudes of negative and positive charge respectively at pH zero. Phosphate sorption was measured following the methodology of Singh and Gilkes (1991). P sorption data were fitted to the linear form of the Langmuir equation as follows: c/x = 1/bXm + c/Xm where c is the concentration of P in equilibrium solution (µg P/mL), x is the amount of P sorbed (µg P/g soil), Xm is the Langmuir sorption maximum (µg P/g soil) and b is a constant related to bonding energy (mL/µg P) (Singh and Gilkes 1991). The plot of c/x against c gives a straight line with a slope and intercept equal to 1/Xm and 1/bXm, respectively. The data were also fitted to the Freundlich equation x = kcB
where x is the amount of P sorbed (µg P/g soil), c is the equilibrium concentration (µg P/mL), and k and B are empirical coefficients, where k indicates the maximum sorption capacity (µg P/g soil) and B is related to bonding energy. Results Soil characteristics
All soils are highly weathered Oxisols that have developed under topical monsoonal climate on colluvium and residuum derived from basalt, texture is mostly clayey throughout the profile. Clay accumulation in subsoils is present in all soils creating an argillic horizon. Oxic and kandic horizons are also present. Therefore, the soils can be classified taxonomically as Typic Kandiudox and Rhodic Kandiudox. The genetic horizons of these soils are Ap, Bt, Bto and Bo. These are very deep soils, typically acidic, well drained, with moderate to rapid permeability and moderate to slow runoff. The color of the soils varies from dusky red to dark yellowish brown which reflects iron oxide mineralogy. The pH in water of the soils indicates extremely acid to moderately acid (4.3–5.7) condition. Values of the pH in NaF solution are high (8.8–10) indicating that the soils contain mineral constituents with abundant surface OH groups (Perrott et al. 1976). Organic matter content is largest in the surface horizon and decreases systematically with depth. Values of CEC (6.4–34 cmolc/kg) and SSA (60–84 m2/g) are quite high as a consequence of the associated influences of organic matter contents and the small crystal size of kaolinite as indicated by weak and broad XRD reflections. Crystalline iron oxides as estimated by DCB extraction (Fed) are the dominant form of iron oxides in these soils with amounts differing between the soils. These soils do however have elevated values of the ratio Feo/Fed (0.11–0.28) which are an indicative of substantial amounts of microcrystalline and amorphous iron oxides in these soils. Elevated concentrations of Fe and Al organic complexes occur in upper horizons for the Nb soils.
Clay mineralogy
Kaolinite is the dominant mineral of the clay fraction with moderate amounts of goethite and hematite. Various amounts of associated minerals include quartz, hydroxyl–Al interlayer vermiculite, gibbsite, maghemite and anatase. Goethite dominates over hematite which reflects the very high rainfall regime. Coherently scattering domain (CSD) sizes derived from the width at half height (WHH) of XRD reflections

© 2010 19th World Congress of Soil Science, Soil Solutions for a Changing World 1 – 6 August 2010, Brisbane, Australia. Published on DVD.
99
using the Scherrer equation indicate that the average size of soil kaolinite crystals is very small (9–14 nm). This may reflect relatively large content of Fe in the soil contributing to greater levels of Fe substitution for Al in soil kaolinite resulting in a smaller crystal size (Hart et al. 2003).
Surface charge characteristics
All soils reveal strong variable charge behavior with the magnitudes of negative and positive charges and the rate of change in surface charge with pH differing between the soils (Figure 1). Magnitudes of both negative and positive charges for these Kandiudox are relatively large which is presumably due to their more clayey texture and larger contents of sesquioxides. Surface horizons have greater negative variable charges than do subsurface horizons due to their greater contents of organic matter. The contents of organic matter, and Fe and Al organic complexes (Alp, Fep) have a strong effect on the rate of change in negative surface charge with pH (Ac) (Figure 2). The soils contain abundant sesquioxides, mostly goethite with hematite and traces of gibbsite and maghemite which variously contribute to the positive surface charge. Appreciable amounts of noncrystalline iron and aluminum oxides as indicated by oxalate extractable Fe and Al are present in these soils and will contribute substantially to positive surface charge (Sposito 1989).
-5
0
5
10
3.0 3.5 4.0 4.5 5.0 5.5 6.0 6.5 7.0 7.5 8.0
CEC Nb2_Ap
CEC Nb2_Bt3
CEC Nb2_Bto1
AEC Nb2_Ap
AEC Nb2_Bt3
AEC Nb2_Bto1
CECB and AEC (cmol c/kg)
CEC
AEC
pH
-5
0
5
10
3.0 3.5 4.0 4.5 5.0 5.5 6.0 6.5 7.0 7.5 8.0
CEC Ti3_Ap
CEC Ti3_Bo1
CEC Ti3_Bto1
AEC Ti3_Ap
AEC Ti3_Bo1
AEC Ti3_Bto1
CECB and AEC (cmol c/kg)
CEC
AEC
pH
(a) (b)
-5
0
5
10
3.0 3.5 4.0 4.5 5.0 5.5 6.0 6.5 7.0 7.5 8.0
CEC Nb2_Ap
CEC Nb2_Bt3
CEC Nb2_Bto1
AEC Nb2_Ap
AEC Nb2_Bt3
AEC Nb2_Bto1
CECB and AEC (cmol c/kg)
CEC
AEC
pH
-5
0
5
10
3.0 3.5 4.0 4.5 5.0 5.5 6.0 6.5 7.0 7.5 8.0
CEC Ti3_Ap
CEC Ti3_Bo1
CEC Ti3_Bto1
AEC Ti3_Ap
AEC Ti3_Bo1
AEC Ti3_Bto1
CECB and AEC (cmol c/kg)
CEC
AEC
pH
(a) (b)
Figure 1. Charge fingerprints for surface and subsurface horizons of whole soil samples for Ti3(a) and Nb2(b)
Thai Kandiudox.
y = 0.024x + 1.42
R2 = 0.76
0
1
2
3
4
0 20 40 60 80
OM (g/kg)
Ac (cmol c/kg/pH)
y = 0.11x + 1.29
R2 = 0.67
0
1
2
3
4
0 5 10 15 20
Alp (g/kg)
y = 0.17x + 1.44
R2 = 0.61
0
1
2
3
4
0 3 6 9 12
Fep (g/kg)
y = 0.024x + 1.42
R2 = 0.76
0
1
2
3
4
0 20 40 60 80
OM (g/kg)
Ac (cmol c/kg/pH)
y = 0.11x + 1.29
R2 = 0.67
0
1
2
3
4
0 5 10 15 20
Alp (g/kg)
y = 0.17x + 1.44
R2 = 0.61
0
1
2
3
4
0 3 6 9 12
Fep (g/kg)
Figure 2. Significant relationships of the charge coefficient (Ac) with OM, Alp and Fep for Thai Kandiudox.
Phosphate sorption characteristics
The P sorption data are well described by both Langmuir and the Freundlich equations (mean R2 = 0.98 and 0.96, respectively). The good fit of both equations to the data is partly due to the limited range of equilibrium concentrations which are generally lower than 1 µg/mL so that other P-Retention/precipitation processes do not occur (Barrow 2006). The coefficient of determination (R2) for the Langmuir equation is slightly higher than for the Freundlich equation which is consistent with the finding of Siradz (2000) and Hartono et al. (2005) for Indonesian soils. Values of Langmuir P sorption maximum (Xm) for these soils range from 833 to 1250 µg/g, while the Freundlich coefficient (k) which is also a measure of the abundance of P sorption sites in a soil ranges from 521 to 1694 µg/g. The considerable values of P sorption capacity for these soils reflect
© 2010 19th World Congress of Soil Science, Soil Solutions for a Changing World 1 – 6 August 2010, Brisbane, Australia. Published on DVD.
100
the heavy texture and sesquioxidic mineralogy which provide abundant adsorption sites. Iron oxides are responsible for most of the P sorption by the clay fraction (Fontes and Weed 1996).
Management approaches
This result suggests that these soils could be ameliorated by conventional agricultural practices such as surface organic matter management and additions of fertilizer and liming application. Liming decreases aluminum toxicity and increases the abundance of negatively charge sites in soils that contain variable charge constituents. Surface organic matter management can also increase a number of available sites for negative variable charge and can restrain P fixation by sesquioxides due to the formation of Fe and Al oxide complexes. Conclusions Kaolinite and iron oxides are major soil constituents and the small crystal sizes of these soil kaolinite and microcrystalline iron oxides may exerts a substantial influence on charge properties and variously contribute to their fertility. These soils show strong variable charge behavior and high P sorption capacity. Acknowledgments The authors are grateful to The Royal Golden Jubilee Ph.D. Program under the Thailand Research Fund for financial support and to the laboratory staff at the School of Earth and Environment, UWA, particularly Mr. Michael Smirk for assistance with chemical analysis. References Barrow NJ (2006) A mechanistic model for describing the sorption and desorption of phosphate by soil. European Journal of Soil Science 34, 733–750. Brown G, Brindley GW (1980) X–ray diffraction procedures for clay mineral identification. In ‘Crystal
Structures of Clay Minerals and Their X–ray Identification’. (Eds GW Brindley, G Brown) pp. 305–359. (Spottiswoode Blallantyne Ltd.: London)
Fontes MPF, Weed SB (1996) Phosphate adsorption by clays from Brazilian Oxisols: relationships with specific surface area and mineralogy. Geoderma 72, 37–51.
Gillman GP (2007) An analytical tool for understanding the properties and behaviour of variable charge soils. Australian Journal of Soil Research 45, 83–90.
Hart RD, Wiriyakitnateekul W, Gilkes RJ (2003) Properties of soil kaolins from Thailand. Clay Minerals 38, 71–94.
Hartono A, Funakawa S, Kosak T (2005) Phosphorus sorption–desorption characteristics of selected acid upland soils in Indonesia. Soil Sci. Plant Nutr. 51, 787–799.
Qafoku NP, Van Ranst E, Noble A, Baert G (2004) Variable charge soils: Their mineralogy, chemistry and management. Advances in Agronomy 84, 159–215.
Singh B, Gilkes RJ (1991) Phosphorus sorption in relation to soil properties for the major soils types of South–Western Australia. Australian Journal of Soil Research 29, 603–618.
Siradz S (2000) Mineralogy and Chemistry of Red Soils of Indonesia. Ph.D. Thesis, The University of Western Australia, Perth.
Sposito G (1989) ‘The Chemistry of Soils.’ (Oxford University Press: New York)
© 2010 19th World Congress of Soil Science, Soil Solutions for a Changing World 1 – 6 August 2010, Brisbane, Australia. Published on DVD.
101
Proteome analysis for identifying effect of the natural clay mineral illite on the
enhanced growth of cherry tomato (Lycopersicon esculentum) Hee-Jung Kim
A, Hong-Ki KimA, Sang-Moon KwonA, Seok-Eon LeeA, Seok-Soon HanA, Moon-Soon LeeB, Sun-Hee WooC, Jong-Soon ChoiD, Jai-Joung KimA, Keun-Yook Chung
A, *
ADepartment of Agricultural Chemistry, Chungbuk National University, Cheongju 361-763, Korea, Email [email protected] (O)82-43-261-3383; (F)82-43-271-5921 BDepartment of Industrial Plant, Chungbuk National University, Cheongju 361-763, Korea CDepartment of Crop Science, Chungbuk National University, Cheongju 361-763, Korea
DProteomics Team, Korea Basic Science Institute, Daejeon 305-333, Korea *Corresponding Author:[email protected], (O)82-43-261-3383, (F)82-43-261-271-5921
Abstract
Illite is neutral in electrical charge and contains a variety of trace elements. Especially, potassium (K) is present in it; it can neutralize soil acidity and provide other nutrients to the soil. It can improve the soil quality and help the plant root extend. Also, it is well known that the illite may be used as a soil conditioner, can increase the contents of sugar in crop plants and crop productivity, and decrease the application amounts of pesticide used for the protection of plants from pests. It is frequently reported that the illite may function as a soil conditioner for the agricultural purposes. Cherry tomato (Lycopersicon esculentum), selected as the target crop vegetable in this study, is known to contain high amount of vitamins that play a role in retarding the senescence of skin and preventing cancer. It is also easy to cultivate and to eat and is rich in sugar. In this study, we tried to elucidate the enhanced effect of illite on the growth of cherry tomato through the use of proteomic analysis. The experimental results demonstrated that the size of cherry tomato was 11-23% greater due the application of illite relative to non application. Two dimensional electrophoresis(2-DE) and MALDI-TOF-MS were used to separate and identify the differentially expressed proteins extracted from the leaf of the cherry tomato and involved in the enhanced growth of cherry tomato induced by the particulate(PA) and powder(PW) forms of illite, respectively. From this study, compared to non application(P0), eleven proteins differentially expressed in the leaf of cherry tomato on the application of PA and PW forms of illite, were characterized by 2-DE and MALDI-TOF-MS, respectively. Key Words
Natural clay mineral, Illite, Soil conditioner, Cherry tomato, Proteome, 2-Dimensional gel electrophoresis(2-DE), Matrix-assisted laser desorption ionization-time of flight/time of flight mass spectrometry (MALDI-TOF-MS) Introduction The proteome is a collection of proteins expressed by the genome constituting all genes of living cells, the purpose of which is to evaluate the proteins in terms of the kinds and amount of protein and the environment in which the proteins are expressed. It is a technique used for studying the kind, distribution, location, amount, properties, network, and function of the proteins systematically and collectively expressed by the genome at the specific physiological conditions. Proteomics is often considered more of a technology than a science. The techniques of proteomics serve as a powerful tool by which the multi-proteins in a cell can be screened, to characterize not the behavior of the single protein molecule, but the entire network inherent to a biological system. Proteomics elucidates the cellular functions not at the gene levels but at the protein levels. Proteomics is a powerful tool that is widely used to evaluate the function of proteins related to specific metabolism in the biological sciences, such as plant, animal, and microbiology. Therefore, the purpose of this study is to elucidate and characterize the expressed the proteins extracted from the leaf samples of cherry tomato treated and untreated with the particulate (PA) and powder (PW) forms of illite through the use of 2-DE and MALDI-TOF-MS, respectively. Materials and Methods Materials
Two forms of illite, particulate (PA) and powder (PW), which are produced in the area of Yeongdong of Chungbuk province, Korea, were used as soil conditioners in this study. Cultivation and treatment
The seedlings of cherry tomato were pre-cultivated in the box with dimension of 60cm X 30cm for two
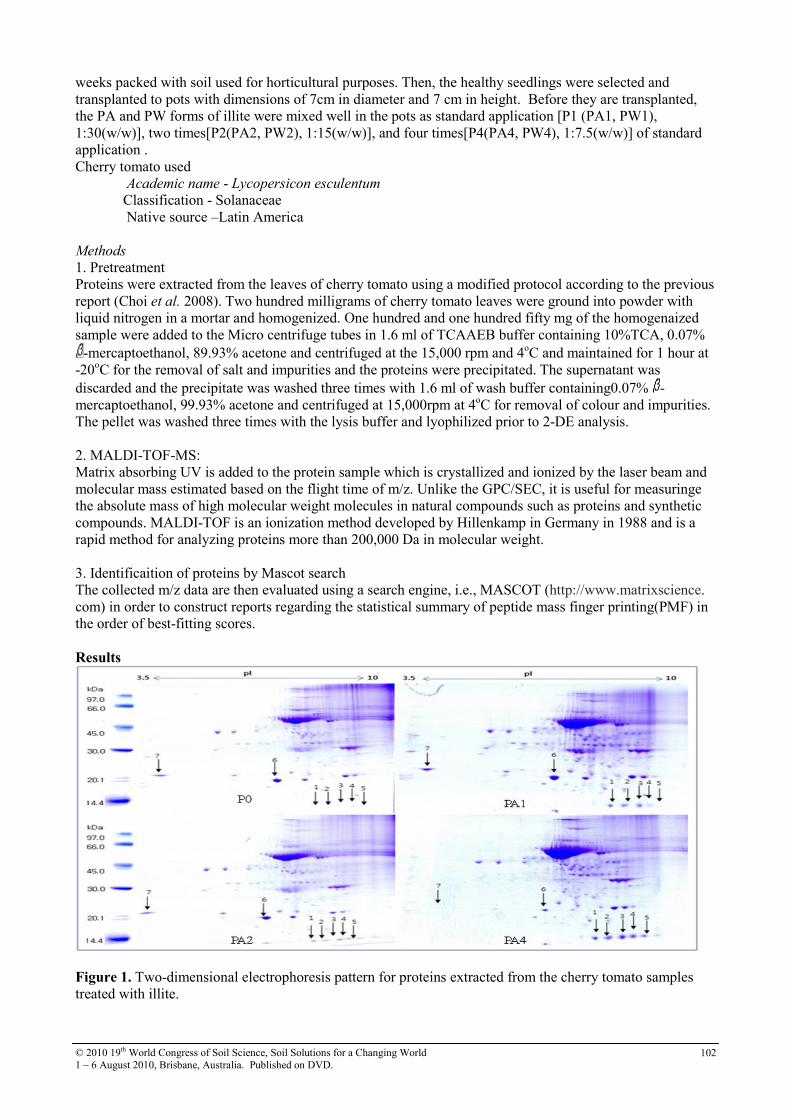
© 2010 19th World Congress of Soil Science, Soil Solutions for a Changing World 1 – 6 August 2010, Brisbane, Australia. Published on DVD.
102
weeks packed with soil used for horticultural purposes. Then, the healthy seedlings were selected and transplanted to pots with dimensions of 7cm in diameter and 7 cm in height. Before they are transplanted, the PA and PW forms of illite were mixed well in the pots as standard application [P1 (PA1, PW1), 1:30(w/w)], two times[P2(PA2, PW2), 1:15(w/w)], and four times[P4(PA4, PW4), 1:7.5(w/w)] of standard application . Cherry tomato used Academic name - Lycopersicon esculentum Classification - Solanaceae Native source –Latin America Methods
1. Pretreatment Proteins were extracted from the leaves of cherry tomato using a modified protocol according to the previous report (Choi et al. 2008). Two hundred milligrams of cherry tomato leaves were ground into powder with liquid nitrogen in a mortar and homogenized. One hundred and one hundred fifty mg of the homogenaized sample were added to the Micro centrifuge tubes in 1.6 ml of TCAAEB buffer containing 10%TCA, 0.07%
-mercaptoethanol, 89.93% acetone and centrifuged at the 15,000 rpm and 4oC and maintained for 1 hour at -20oC for the removal of salt and impurities and the proteins were precipitated. The supernatant was discarded and the precipitate was washed three times with 1.6 ml of wash buffer containing0.07% -mercaptoethanol, 99.93% acetone and centrifuged at 15,000rpm at 4oC for removal of colour and impurities. The pellet was washed three times with the lysis buffer and lyophilized prior to 2-DE analysis. 2. MALDI-TOF-MS: Matrix absorbing UV is added to the protein sample which is crystallized and ionized by the laser beam and molecular mass estimated based on the flight time of m/z. Unlike the GPC/SEC, it is useful for measuringe the absolute mass of high molecular weight molecules in natural compounds such as proteins and synthetic compounds. MALDI-TOF is an ionization method developed by Hillenkamp in Germany in 1988 and is a rapid method for analyzing proteins more than 200,000 Da in molecular weight. 3. Identificaition of proteins by Mascot search The collected m/z data are then evaluated using a search engine, i.e., MASCOT (http://www.matrixscience. com) in order to construct reports regarding the statistical summary of peptide mass finger printing(PMF) in the order of best-fitting scores. Results
Figure 1. Two-dimensional electrophoresis pattern for proteins extracted from the cherry tomato samples treated with illite.
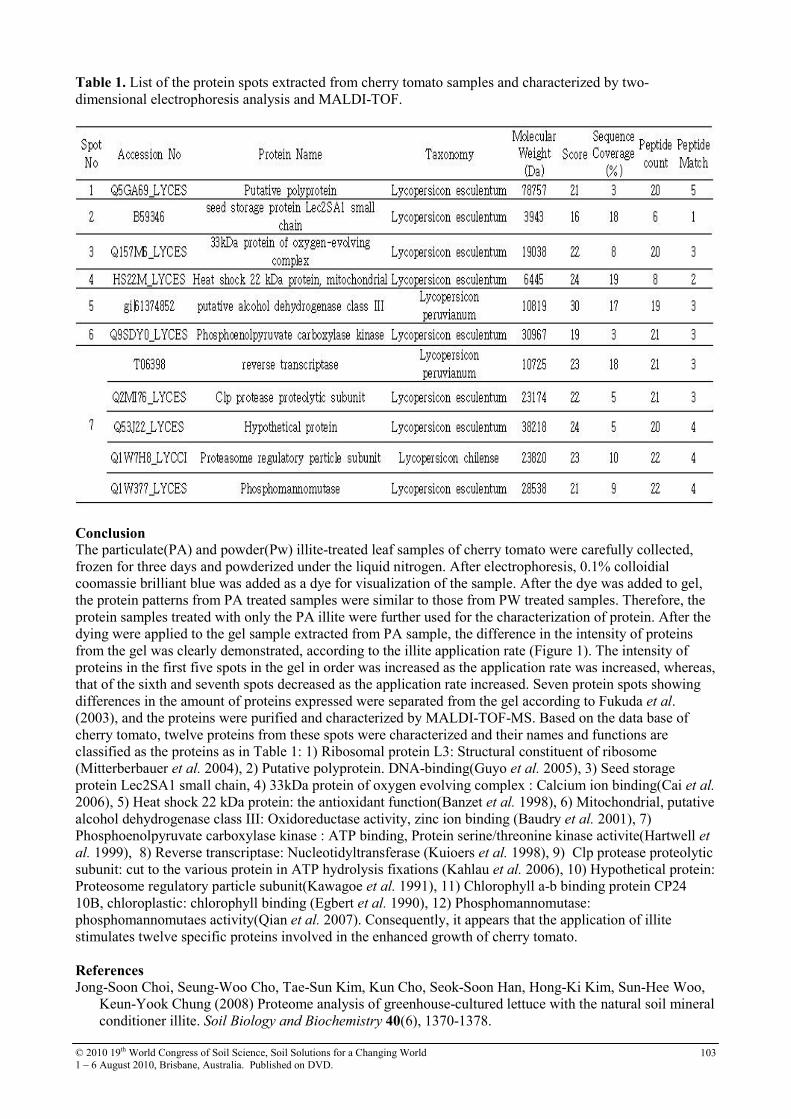
© 2010 19th World Congress of Soil Science, Soil Solutions for a Changing World 1 – 6 August 2010, Brisbane, Australia. Published on DVD.
103
Table 1. List of the protein spots extracted from cherry tomato samples and characterized by two-dimensional electrophoresis analysis and MALDI-TOF.
Conclusion The particulate(PA) and powder(Pw) illite-treated leaf samples of cherry tomato were carefully collected, frozen for three days and powderized under the liquid nitrogen. After electrophoresis, 0.1% colloidial coomassie brilliant blue was added as a dye for visualization of the sample. After the dye was added to gel, the protein patterns from PA treated samples were similar to those from PW treated samples. Therefore, the protein samples treated with only the PA illite were further used for the characterization of protein. After the dying were applied to the gel sample extracted from PA sample, the difference in the intensity of proteins from the gel was clearly demonstrated, according to the illite application rate (Figure 1). The intensity of proteins in the first five spots in the gel in order was increased as the application rate was increased, whereas, that of the sixth and seventh spots decreased as the application rate increased. Seven protein spots showing differences in the amount of proteins expressed were separated from the gel according to Fukuda et al. (2003), and the proteins were purified and characterized by MALDI-TOF-MS. Based on the data base of cherry tomato, twelve proteins from these spots were characterized and their names and functions are classified as the proteins as in Table 1: 1) Ribosomal protein L3: Structural constituent of ribosome (Mitterberbauer et al. 2004), 2) Putative polyprotein. DNA-binding(Guyo et al. 2005), 3) Seed storage protein Lec2SA1 small chain, 4) 33kDa protein of oxygen evolving complex : Calcium ion binding(Cai et al. 2006), 5) Heat shock 22 kDa protein: the antioxidant function(Banzet et al. 1998), 6) Mitochondrial, putative alcohol dehydrogenase class III: Oxidoreductase activity, zinc ion binding (Baudry et al. 2001), 7) Phosphoenolpyruvate carboxylase kinase : ATP binding, Protein serine/threonine kinase activite(Hartwell et al. 1999), 8) Reverse transcriptase: Nucleotidyltransferase (Kuioers et al. 1998), 9) Clp protease proteolytic subunit: cut to the various protein in ATP hydrolysis fixations (Kahlau et al. 2006), 10) Hypothetical protein: Proteosome regulatory particle subunit(Kawagoe et al. 1991), 11) Chlorophyll a-b binding protein CP24 10B, chloroplastic: chlorophyll binding (Egbert et al. 1990), 12) Phosphomannomutase: phosphomannomutaes activity(Qian et al. 2007). Consequently, it appears that the application of illite stimulates twelve specific proteins involved in the enhanced growth of cherry tomato. References
Jong-Soon Choi, Seung-Woo Cho, Tae-Sun Kim, Kun Cho, Seok-Soon Han, Hong-Ki Kim, Sun-Hee Woo, Keun-Yook Chung (2008) Proteome analysis of greenhouse-cultured lettuce with the natural soil mineral conditioner illite. Soil Biology and Biochemistry 40(6), 1370-1378.

© 2010 19th World Congress of Soil Science, Soil Solutions for a Changing World 1 – 6 August 2010, Brisbane, Australia. Published on DVD.
104
Lee SS, Han SS, Choi GS, Ahn HJ, Kim HK, Chung KY, Woo SH, Lee CW (2005) Effect of the treatment and concentration of the natural soil mineral applied as the soil conditioner on the growth of lettuce in the glass house. In ‘Proceedings of the Korean Society of Agriculture and Environment’.
Tisdale SL, Nelson WL, Beaton JD (1985) 4th ed. Soil Fertility and Fertilizers, Fourth ed. MacMillan. Pandy A, Mann M (2000) Proteomics to study genes and genomes. Nature 405, 837-846. Prasad TK (1996) Mechanism of chilling-induced oxidative stress injury and tolerance in developing maize
seedlings: Changes in antioxidant system, oxidation of proteins and lipids, and protease activities. Plant J. 10, 1017-1026.
© 2010 19th World Congress of Soil Science, Soil Solutions for a Changing World 1 – 6 August 2010, Brisbane, Australia. Published on DVD.
105
Role of clay minerals in controlling the fate of exceptionally toxic organic
contaminants in the environment Cliff T. JohnstonA,D, Kiran RanaA, Stephen A. BoydB, Brian J. TeppenB and Thomas J. PinnavaiaC
APurdue University, Crop, Soil & Environmental Sci., West Lafayette, IN USA 47907 USA. BMichigan State University, Crop and Soil Science, East Lansing, MI USA. CMichigan State University, Department of Chemistry, East Lansing, MI USA. DCorresponding author. Email [email protected]
Abstract Understanding the chemical mechanisms of interaction of dioxins with soils and sediments are critical to understanding their environmental fate, transport and bioavailabilty. Recently, expandable clay minerals have been shown to have a higher-than-expected affinity for these exceptionally toxic, nonpolar compounds. To gain additional perspective, this study focused on the interaction of dioxin congeners with expandable clay minerals by integrating macroscopic batch sorption experiments, spectroscopic analysis and computational methods. In addition, preliminary data on the bioavailability of dioxin sorbed to clay minerals will be presented. Maximum dioxin sorption occurred on clay minerals exchanged with weakly hydrated monovalent cations (e.g., Cs+). Regarding clay specificity, highest sorption was observed on saponite, a trioctahedral smectite with isomorphous substitution in the tetrahedral sheet. Of the cation-smectite variables explored in this study, the nature of the exchangeable cation was the most significant determinant followed by the type of clay. In order to investigate the influence of chlorine substitution, we compared the sorption of dibenzo-p-dioxin (DD) and 1-chloro-dibenzo-p-dioxin (1ClDD). For all of the smectites studied, sorption of 1ClDD was greater than that of DD. Polarized FTIR and Raman spectra of sorbed DD and 1ClDD on the clay minerals revealed information about the orientation of the sorbed species and, in the case of DD on saponite, specific information about the interaction of the sorbed DD species with the interlayer cation. Specifically, Raman spectra of dioxin associated with Cs-saponite showed that the molecular symmetry of the interlayer species was reduced. The exception toxicity of vertebrate animals to chlorinated dioxins occurs through activation of the aryl hydrocarbon receptor (AhR). Working in collaboration with the Center for Integrative Toxicology at Michigan State University, we at the early stages of examining the bioavailability of dioxins sorbed to clay minerals. Key Words Dioxin, bioavailability, FTIR, Raman spectroscopy, sorption, smectite. Introduction Dioxins represent a group of polychlorinated dibenzo-p-dioxins, polychlorinated dibenzo furans, and polychlorinated biphenyl compounds. They are persistent toxic organic pollutants, hydrophobic, and are resistant to degradation and tend to accumulate in soil and sediments. Although soil organic matter (SOM) has been traditionally thought to be responsible for the sequestration of these hydrophobic compounds (Chiou et al. 1983), recent evidence has shown that smectites have a greater affinity for dioxin than SOM (Liu et al. 2009; Rana et al. 2009). Additional support for the link between dioxins and clay minerals has been provided by the observation of elevated levels of PCDDs found in prehistoric clay deposits in the United States, Germany and Spain (Ferrario et al. 2000; Rappe 1994). The congener pattern found from these prehistoric clay deposits is unique to clays and is distinct from the congener patterns of anthropogenic dioxins. The overall goal of this study was to gain a molecular level understanding about how selected dioxins interact with clay minerals. The first objective was to combine batch sorption, molecular spectroscopy, X-ray diffraction and computational methods to identify the molecular mechanism(s) of interaction. The second was to examine how the degree of chlorination influence sorption processes. The third objective is a work in progress and that is to assess the bioavailability of sorbed dioxins to mice in oral exposure studies. Materials and methods Clay minerals and chemicals
Dibenzo-p-dioxin (DD) and 1-chloro-dibenzo-p-dioxin (1ClDD) with > 99% purity were purchased from Chem Service, West Chester, PA. Smectite clays (SapCa-2 saponite, SWy-2 montmorillonite, and Upton

© 2010 19th World Congress of Soil Science, Soil Solutions for a Changing World 1 – 6 August 2010, Brisbane, Australia. Published on DVD.
106
montmorillonite) were obtained from the Source Clays Repository of The Clay Minerals Society (Purdue University, West Lafayette, IN). The < 2-µm clay fraction was obtained followed by saturation with Na+, K+, Rb+ and Cs+ cations. Batch sorption isotherms Sorption isotherms of 1ClDD and DD from water were conducted by the batch equilibrium method (Liu et al. 2009 and Rana et al. 2009). Mixtures of smectite and aqueous solution of DD or 1ClDD were equilibrated for 24h at room temperature (23±2 ºC).The equilibrium supernatant concentration of DD or 1ClDD was measured using a Shimadzu SLC-10 high-performance liquid chromatography (HPLC) system equipped with a UV detector; set at the maximum absorption wavelength 223 nm (for DD) and 227 nm (for 1ClDD), and a 15 cm x 4.6 mm x 5 mm Supelcosil ABZ PLUS column. The mobile phase was a mixture of 80% methanol (for DD) or acetonitrile (for 1ClDD) and 20% water with a flow rate of 1.0 ml/min The amount of DD and 1ClDD sorbed was calculated based on the amount of DD and 1ClDD lost from the solution. Spectroscopic analysis
Self supporting clay films (SSCF) of DD- or 1ClDD- smectite complexes were prepared from suspension obtained from batch sorption experiment. 1. FTIR analysis: Infrared spectra of SSCF and reference DD or 1ClDD in KBr and in polar solvents
(ATR-FTIR) were obtained on a Perkin-Elmer GX2000 Fourier Transform Infrared (FTIR) spectrometer equipped with deuterated triglycine (DTGS) and Mercury-cadmium-telluride (MCT) detectors, an internal wire grid IR polarizer, and a KBr beam splitter.
2. Raman Analysis: Raman spectra of crystalline DD, DD in CCl4, and SSCF of clay–DD complex were obtained on an Acton Research Corporation SpectroPro500 spectrograph. A Melles–Griot helium–neon laser with 632.8 nm wavelength and a power output of 35 mW measured at the laser head was used as the excitation source. Raman-scattered radiation was collected in a 180-degree backscattering configuration. The entrance slits to the spectrograph were set to 50 mm. The spectrograph used a holographic super notch filter to eliminate Rayleigh scattering. The detector was a Princeton Instruments liquid N2 cooled CCD detector. The spectrograph was calibrated daily using a Ne–Ar calibration lamp based upon known spectral lines.
Results Sorption isotherms of DD and 1ClDD from water to smectites are shown in Figure 1. In prior work, sorption of DD by Cs-smectite was found to be greater than that of sorption to SOM (Liu et al. 2009). Sorption of both DD and 1ClDD on smectite was strongly influenced by the type of smectite and the nature exchangeable cations present in smectite interlayer.
Figure 1. HPLC derived batch isotherm representing DD and 1ClDD uptake from water by Cs saturated
smectite (saponite, Upton and SWy-2) and SOM (A) and homoionic saponite saturated with different
exchangeable cations (B). The amount sorbed by soil organic matter was estimated using the equation: log
KOM= 0.904log KOW - 0.779 (Chiou 1983). Log Kow for DD and 1ClDD are 4.3 and 4.9 (Schwarzenbach et al.
2003), and water solubilities are 0.901 and 0.42 mg/L (ASTDR 1998).
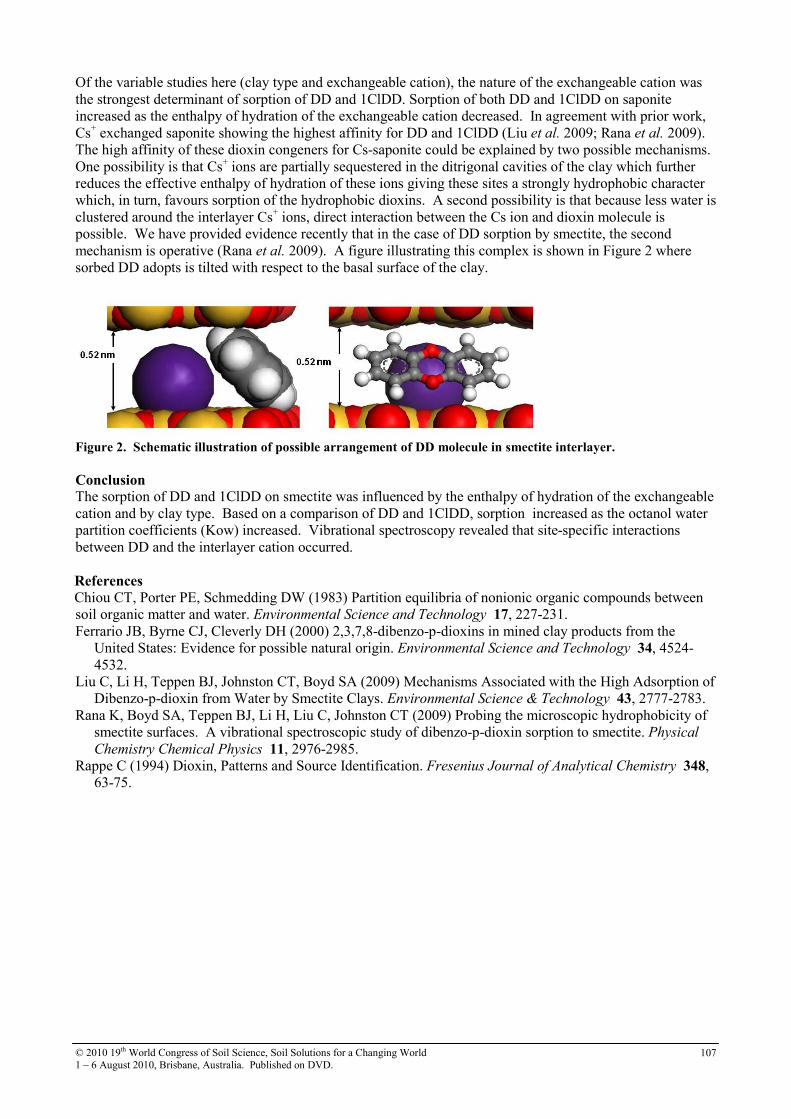
© 2010 19th World Congress of Soil Science, Soil Solutions for a Changing World 1 – 6 August 2010, Brisbane, Australia. Published on DVD.
107
Of the variable studies here (clay type and exchangeable cation), the nature of the exchangeable cation was the strongest determinant of sorption of DD and 1ClDD. Sorption of both DD and 1ClDD on saponite increased as the enthalpy of hydration of the exchangeable cation decreased. In agreement with prior work, Cs+ exchanged saponite showing the highest affinity for DD and 1ClDD (Liu et al. 2009; Rana et al. 2009). The high affinity of these dioxin congeners for Cs-saponite could be explained by two possible mechanisms. One possibility is that Cs+ ions are partially sequestered in the ditrigonal cavities of the clay which further reduces the effective enthalpy of hydration of these ions giving these sites a strongly hydrophobic character which, in turn, favours sorption of the hydrophobic dioxins. A second possibility is that because less water is clustered around the interlayer Cs+ ions, direct interaction between the Cs ion and dioxin molecule is possible. We have provided evidence recently that in the case of DD sorption by smectite, the second mechanism is operative (Rana et al. 2009). A figure illustrating this complex is shown in Figure 2 where sorbed DD adopts is tilted with respect to the basal surface of the clay.
Figure 2. Schematic illustration of possible arrangement of DD molecule in smectite interlayer.
Conclusion The sorption of DD and 1ClDD on smectite was influenced by the enthalpy of hydration of the exchangeable cation and by clay type. Based on a comparison of DD and 1ClDD, sorption increased as the octanol water partition coefficients (Kow) increased. Vibrational spectroscopy revealed that site-specific interactions between DD and the interlayer cation occurred. References
Chiou CT, Porter PE, Schmedding DW (1983) Partition equilibria of nonionic organic compounds between soil organic matter and water. Environmental Science and Technology 17, 227-231. Ferrario JB, Byrne CJ, Cleverly DH (2000) 2,3,7,8-dibenzo-p-dioxins in mined clay products from the
United States: Evidence for possible natural origin. Environmental Science and Technology 34, 4524-4532.
Liu C, Li H, Teppen BJ, Johnston CT, Boyd SA (2009) Mechanisms Associated with the High Adsorption of Dibenzo-p-dioxin from Water by Smectite Clays. Environmental Science & Technology 43, 2777-2783.
Rana K, Boyd SA, Teppen BJ, Li H, Liu C, Johnston CT (2009) Probing the microscopic hydrophobicity of smectite surfaces. A vibrational spectroscopic study of dibenzo-p-dioxin sorption to smectite. Physical Chemistry Chemical Physics 11, 2976-2985.
Rappe C (1994) Dioxin, Patterns and Source Identification. Fresenius Journal of Analytical Chemistry 348, 63-75.
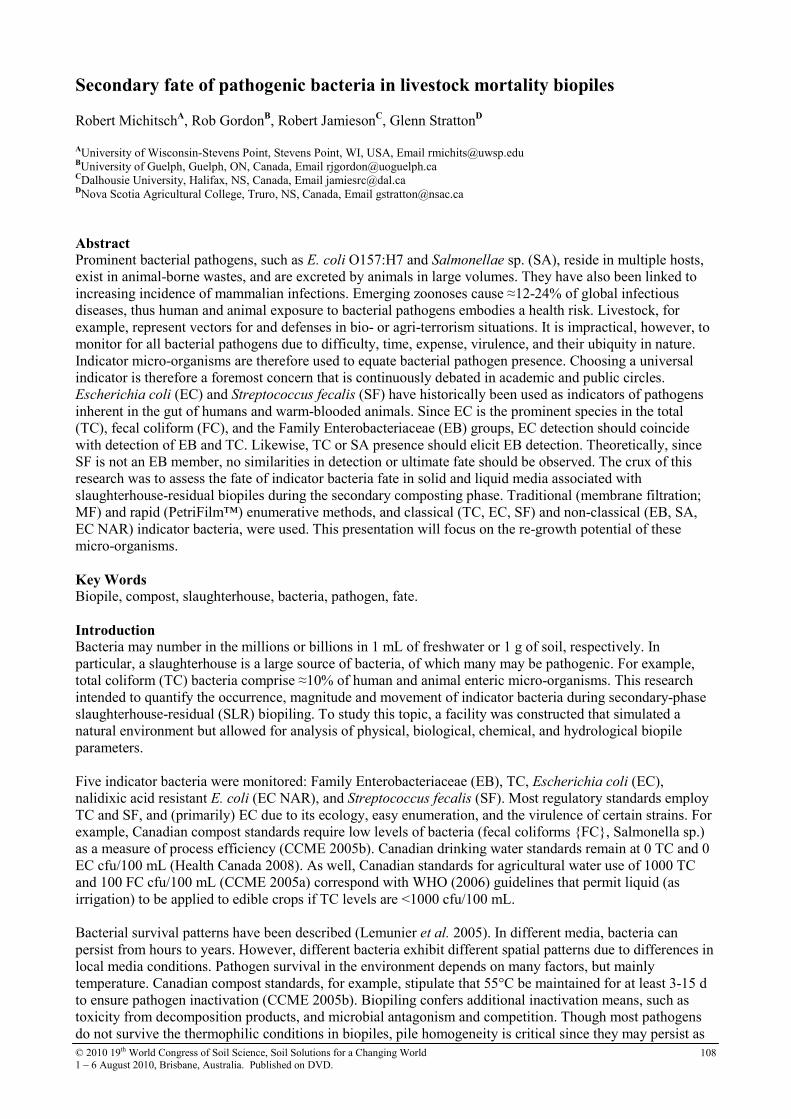
© 2010 19th World Congress of Soil Science, Soil Solutions for a Changing World 1 – 6 August 2010, Brisbane, Australia. Published on DVD.
108
Secondary fate of pathogenic bacteria in livestock mortality biopiles Robert MichitschA, Rob GordonB, Robert JamiesonC, Glenn StrattonD AUniversity of Wisconsin-Stevens Point, Stevens Point, WI, USA, Email [email protected] BUniversity of Guelph, Guelph, ON, Canada, Email [email protected] CDalhousie University, Halifax, NS, Canada, Email [email protected] DNova Scotia Agricultural College, Truro, NS, Canada, Email [email protected]
Abstract Prominent bacterial pathogens, such as E. coli O157:H7 and Salmonellae sp. (SA), reside in multiple hosts, exist in animal-borne wastes, and are excreted by animals in large volumes. They have also been linked to increasing incidence of mammalian infections. Emerging zoonoses cause ≈12-24% of global infectious diseases, thus human and animal exposure to bacterial pathogens embodies a health risk. Livestock, for example, represent vectors for and defenses in bio- or agri-terrorism situations. It is impractical, however, to monitor for all bacterial pathogens due to difficulty, time, expense, virulence, and their ubiquity in nature. Indicator micro-organisms are therefore used to equate bacterial pathogen presence. Choosing a universal indicator is therefore a foremost concern that is continuously debated in academic and public circles. Escherichia coli (EC) and Streptococcus fecalis (SF) have historically been used as indicators of pathogens inherent in the gut of humans and warm-blooded animals. Since EC is the prominent species in the total (TC), fecal coliform (FC), and the Family Enterobacteriaceae (EB) groups, EC detection should coincide with detection of EB and TC. Likewise, TC or SA presence should elicit EB detection. Theoretically, since SF is not an EB member, no similarities in detection or ultimate fate should be observed. The crux of this research was to assess the fate of indicator bacteria fate in solid and liquid media associated with slaughterhouse-residual biopiles during the secondary composting phase. Traditional (membrane filtration; MF) and rapid (PetriFilm™) enumerative methods, and classical (TC, EC, SF) and non-classical (EB, SA, EC NAR) indicator bacteria, were used. This presentation will focus on the re-growth potential of these micro-organisms. Key Words Biopile, compost, slaughterhouse, bacteria, pathogen, fate. Introduction Bacteria may number in the millions or billions in 1 mL of freshwater or 1 g of soil, respectively. In particular, a slaughterhouse is a large source of bacteria, of which many may be pathogenic. For example, total coliform (TC) bacteria comprise ≈10% of human and animal enteric micro-organisms. This research intended to quantify the occurrence, magnitude and movement of indicator bacteria during secondary-phase slaughterhouse-residual (SLR) biopiling. To study this topic, a facility was constructed that simulated a natural environment but allowed for analysis of physical, biological, chemical, and hydrological biopile parameters. Five indicator bacteria were monitored: Family Enterobacteriaceae (EB), TC, Escherichia coli (EC), nalidixic acid resistant E. coli (EC NAR), and Streptococcus fecalis (SF). Most regulatory standards employ TC and SF, and (primarily) EC due to its ecology, easy enumeration, and the virulence of certain strains. For example, Canadian compost standards require low levels of bacteria (fecal coliforms {FC}, Salmonella sp.) as a measure of process efficiency (CCME 2005b). Canadian drinking water standards remain at 0 TC and 0 EC cfu/100 mL (Health Canada 2008). As well, Canadian standards for agricultural water use of 1000 TC and 100 FC cfu/100 mL (CCME 2005a) correspond with WHO (2006) guidelines that permit liquid (as irrigation) to be applied to edible crops if TC levels are <1000 cfu/100 mL. Bacterial survival patterns have been described (Lemunier et al. 2005). In different media, bacteria can persist from hours to years. However, different bacteria exhibit different spatial patterns due to differences in local media conditions. Pathogen survival in the environment depends on many factors, but mainly temperature. Canadian compost standards, for example, stipulate that 55°C be maintained for at least 3-15 d to ensure pathogen inactivation (CCME 2005b). Biopiling confers additional inactivation means, such as toxicity from decomposition products, and microbial antagonism and competition. Though most pathogens do not survive the thermophilic conditions in biopiles, pile homogeneity is critical since they may persist as
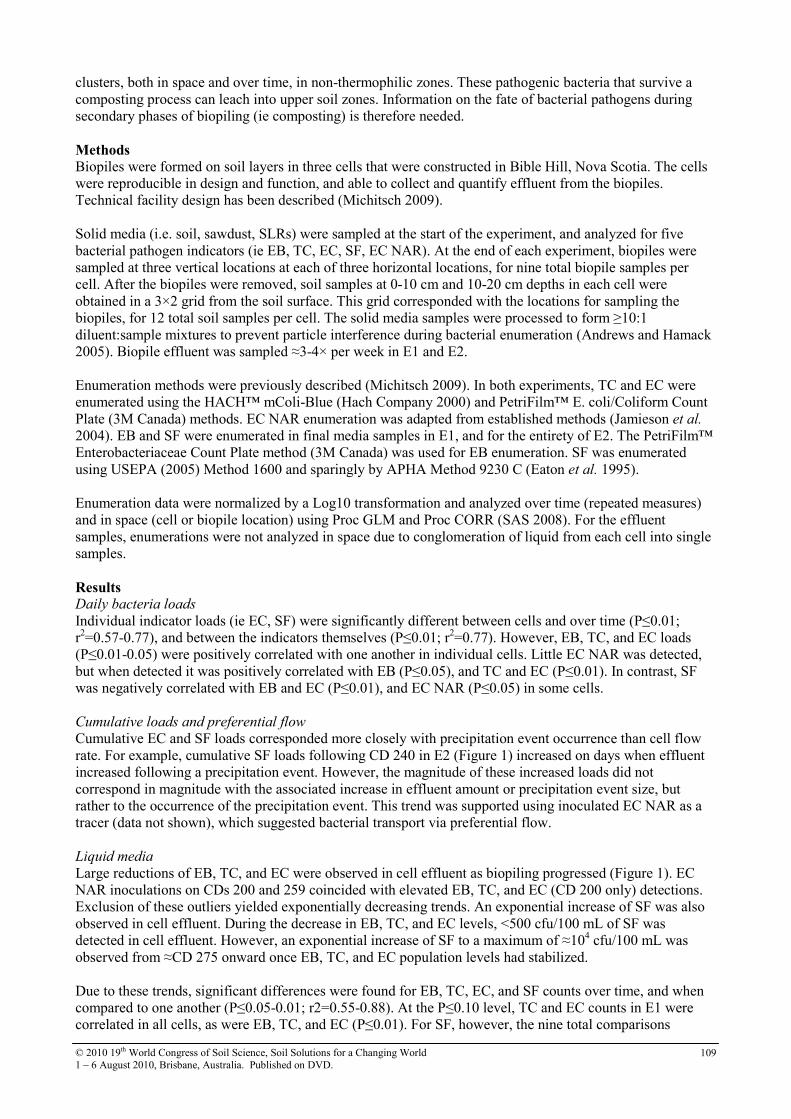
© 2010 19th World Congress of Soil Science, Soil Solutions for a Changing World 1 – 6 August 2010, Brisbane, Australia. Published on DVD.
109
clusters, both in space and over time, in non-thermophilic zones. These pathogenic bacteria that survive a composting process can leach into upper soil zones. Information on the fate of bacterial pathogens during secondary phases of biopiling (ie composting) is therefore needed. Methods
Biopiles were formed on soil layers in three cells that were constructed in Bible Hill, Nova Scotia. The cells were reproducible in design and function, and able to collect and quantify effluent from the biopiles. Technical facility design has been described (Michitsch 2009). Solid media (i.e. soil, sawdust, SLRs) were sampled at the start of the experiment, and analyzed for five bacterial pathogen indicators (ie EB, TC, EC, SF, EC NAR). At the end of each experiment, biopiles were sampled at three vertical locations at each of three horizontal locations, for nine total biopile samples per cell. After the biopiles were removed, soil samples at 0-10 cm and 10-20 cm depths in each cell were obtained in a 3×2 grid from the soil surface. This grid corresponded with the locations for sampling the biopiles, for 12 total soil samples per cell. The solid media samples were processed to form ≥10:1 diluent:sample mixtures to prevent particle interference during bacterial enumeration (Andrews and Hamack 2005). Biopile effluent was sampled ≈3-4× per week in E1 and E2. Enumeration methods were previously described (Michitsch 2009). In both experiments, TC and EC were enumerated using the HACH™ mColi-Blue (Hach Company 2000) and PetriFilm™ E. coli/Coliform Count Plate (3M Canada) methods. EC NAR enumeration was adapted from established methods (Jamieson et al. 2004). EB and SF were enumerated in final media samples in E1, and for the entirety of E2. The PetriFilm™ Enterobacteriaceae Count Plate method (3M Canada) was used for EB enumeration. SF was enumerated using USEPA (2005) Method 1600 and sparingly by APHA Method 9230 C (Eaton et al. 1995). Enumeration data were normalized by a Log10 transformation and analyzed over time (repeated measures) and in space (cell or biopile location) using Proc GLM and Proc CORR (SAS 2008). For the effluent samples, enumerations were not analyzed in space due to conglomeration of liquid from each cell into single samples. Results Daily bacteria loads
Individual indicator loads (ie EC, SF) were significantly different between cells and over time (P≤0.01; r2=0.57-0.77), and between the indicators themselves (P≤0.01; r2=0.77). However, EB, TC, and EC loads (P≤0.01-0.05) were positively correlated with one another in individual cells. Little EC NAR was detected, but when detected it was positively correlated with EB (P≤0.05), and TC and EC (P≤0.01). In contrast, SF was negatively correlated with EB and EC (P≤0.01), and EC NAR (P≤0.05) in some cells. Cumulative loads and preferential flow
Cumulative EC and SF loads corresponded more closely with precipitation event occurrence than cell flow rate. For example, cumulative SF loads following CD 240 in E2 (Figure 1) increased on days when effluent increased following a precipitation event. However, the magnitude of these increased loads did not correspond in magnitude with the associated increase in effluent amount or precipitation event size, but rather to the occurrence of the precipitation event. This trend was supported using inoculated EC NAR as a tracer (data not shown), which suggested bacterial transport via preferential flow. Liquid media
Large reductions of EB, TC, and EC were observed in cell effluent as biopiling progressed (Figure 1). EC NAR inoculations on CDs 200 and 259 coincided with elevated EB, TC, and EC (CD 200 only) detections. Exclusion of these outliers yielded exponentially decreasing trends. An exponential increase of SF was also observed in cell effluent. During the decrease in EB, TC, and EC levels, <500 cfu/100 mL of SF was detected in cell effluent. However, an exponential increase of SF to a maximum of ≈104 cfu/100 mL was observed from ≈CD 275 onward once EB, TC, and EC population levels had stabilized. Due to these trends, significant differences were found for EB, TC, EC, and SF counts over time, and when compared to one another (P≤0.05-0.01; r2=0.55-0.88). At the P≤0.10 level, TC and EC counts in E1 were correlated in all cells, as were EB, TC, and EC (P≤0.01). For SF, however, the nine total comparisons
© 2010 19th World Congress of Soil Science, Soil Solutions for a Changing World 1 – 6 August 2010, Brisbane, Australia. Published on DVD.
110
between SF and the three EB indicators (i.e. 3 contrasts by 3 cells) resulted in three negative, one positive, and five insignificant correlations at the P≤0.05 level.
Calendar Day (2007)
310 325 340 355 370
CFU/100ml
0
2000
4000
6000
8000
Streptococcus fecalis (E2)
Calendar Day (2007)
310 325 340 355 370
CFU/100ml
0
20
40
60
80
100
Escherichia coli (E2)
Calendar Day (2007)
160 190 220 250 280
CFU/100ml
0
2000
4000
6000
8000
10000
Streptococcus fecalis (E2)
Calendar Day (2007)
160 190 220 250 280
CFU/100ml
0
10000
20000
30000
40000
Escherichia coli (E2)
Figure 1. Escherichia coli and Streptococcus fecalis levels (cfu/100 mL) in biopile effluent. Primary (left hand
side) and secondary biopiling phases are shown.
Conclusion Due to an established hierarchy, detection of EC elicits the detection of TC, as does TC for EB. As well, EC NAR mimics EC behaviour but is not present in the environment, thus it is used as a tracer of pathogenic bacteria that should similarly elicit EB, TC and EC detection. Since SF is not a member of the Family Enterobacteriaceae, its detection should not mimic the fate of EB or its members. These trends were observed in this research. It was found that large (>15 mm) and intense (1-4 d) precipitation events generated nearly 90% of indicator bacteria loads. It was also found that annual indicator bacteria loads comprised <0.01% of their levels contributed by the input media (Michitsch 2009), thus, biopiling the SLRs inactivated or retained the micro-organisms with much success. Members of the EB group and SF exhibited distinctly different transport behaviour, which was a novel finding that suggested FC:FS ratios should not be used to monitor for pathogen presence. Resurgent SF populations as EC levels declined suggested that re-growth and persistence may occur under certain conditions, such as high moisture content and lower temperature. However, SF levels reduced exponentially in biopile effluent during secondary-phase biopiling. Though EC declined to 0 cfu/100 mL, EB (E2 only) and TC (E1 and E2) were still detected in effluent samples at the end of biopiling. This suggested that EB and TC persisted. Conversely, the exponential increase of SF in E2 suggested that it also persisted during adverse conditions until the biopile environment became hospitable for its growth. Statistical analyses confirmed these growth trends. As well, the inconsistent correlations for SF with the other indicators highlighted the different survival capabilities of these families of bacteria.
© 2010 19th World Congress of Soil Science, Soil Solutions for a Changing World 1 – 6 August 2010, Brisbane, Australia. Published on DVD.
111
The presence of the indicator bacteria in some final biopile and soil samples confirmed their survival and persistence in spite of osmotic stress, temperature extremes, pH fluctuations, predation, etc. Some bacteria likely became dormant, entered a viable-but-not-culturable (VBNC) state, inhabited protective biofilms, or hid within particle cores. Though EB and TC are ubiquitous in nature, the presence of SF in final biopile samples supported this reasoning. In summary, pathogenic bacteria may persist in different media for long times in viable or VBNC states, with the potential to re-grow. In this research, the SLRs and inoculated EC NAR represented large sources of indicator bacteria, whereas the soil was void of EC and SF. However, exponentially decreasing populations of EB, TC, and EC were observed in cell effluent. This highlighted the suitability of biopiling for pathogen inactivation. Indicator presence in final biopile and soil samples, however, suggested their persistence but not migration from the media. As well, SF was observed to exponentially re-grow once other indicator species declined and under less ideal environmental conditions. This highlighted the differences in survivability between the indicator bacteria. The behaviour of EC NAR supported inactivation as the primary process in the biopiles. However, the biopiles constituted continual sources of the indicator bacteria due to persistence in isolated locations and changes in dominant species. This suggested that tertiary biopiling phases and secondary methods should be performed to ensure pathogen degradation and that nutrient reserves have been depleted to prevent re-growth.
References
Andrews WH, Hamack TSE (2005) Microbiological methods. In ‘Official methods of analysis of AOAC International: Association of Official Analytical Chemists International’. (Eds W Horwitz, GW Latimer Jr.)
CCME (2005a) Canadian water quality guidelines for the protection of agricultural water uses: Summary table (Canadian Council for Ministers of the Environment) ceqg-rcqe.ccme.ca/
CCME (2005b) Guidelines for compost quality: Report No. PN 1340. (Canadian Council for Ministers of the Environment, Winnipeg, Manitoba)
Eaton AD, Clesceri LS, Greenberg AE (1995) Standard methods for the examination of water and wastewater. (APHA, AWWA, WEF, Washington DC)
Hach Company (2000) The use of indicator organisms to assess public water safety. Technical Information Series - Booklet No. 13. www.hach.com/fmmimghach?/CODE%3AL7015547%7C1
Health Canada (2008) Guidelines for Canadian drinking water quality: Summary table. www.hc-sc.gc.ca/ewh-semt/alt_formats/hecs-sesc/pdf/pubs/water-eau/sum_guide-res_recom/summary-sommaire-eng.pdf
Jamieson RC, Joy DM, Lee H, Kostaschuk R, Gordon RJ (2004) Persistence of enteric bacteria in alluvial streams. Journal of Environmental Engineering and Science 3, 203-212.
Lemunier M, Francou C, Rousseaux S, Houot S, Dantigny P, Piveteau P, Guzzo J (2005) Long-term survival of pathogenic and sanitation indicator bacteria in experimental biowaste composts. Applied and Environmental Microbiology 71, 5779-5786.
Michitsch RC (2009) Bacterial Pathogen Fate in Slaughterhouse-residual Biopiles. Ph.D. thesis. (Process Engineering and Applied Science, Dalhousie University, Halifax, Nova Scotia).
SAS (2008) The SAS system for Windows: Release 9.1.3. (SAS Institute, Cary, North Carolina). USEPA (2005) USEPA Method 1600: Enterococci in water by membrane filtration using membrane-
enteroccus indoxyl-β-D-glucoside agar (mEI). ID# EPA-821-R-04-023. (United States Environmental Protection Agency, Office of Water, Washington DC).
WHO (2006) Guidelines for the safe use of wastewater, excreta, and greywater. Volume 2. Wastewater use in agriculture. (World Health Organization, Geneva, Switzerland).
© 2010 19th World Congress of Soil Science, Soil Solutions for a Changing World 1 – 6 August 2010, Brisbane, Australia. Published on DVD.
112
Soil sorption of cesium on calcareous soils of Iran
Rayehe MirkhaniA, *, Mohammad Hassan RoozitalabB, Saadollah TeimouriA, Naser KhaleghpanahA AAgricultural, Medical and Industrial Research School, Nuclear Science and Technology Research Institute, Atomic Energy Organization of Iran, P.O. Box 31485-498, Karaj, Iran. Email [email protected] BICARDA- Office, Tehran, Iran
Abstract
The adsorption behaviour of Cs on two selected calcareous soils (clay and silty clay loam) with contrasting physical and chemical characteristics was studied by means of a batch method. Cs sorption characteristic was determined at 22.5±0.5 ◦C and in the presence of 0.01M CaCl2. Freundlich isotherms were found to fit well with experimental data for different levels of adsorbed Cs. Results shown that clayey soil adsorbed more Cs higher than soils having silty clay loam texture. Key Words Cs adsorption, Calcareous soils, Freundlich isotherm Introduction Cs is an important radionuclide for several reasons: it exhibits almost unlimited solubility; its inventory in radioactive waste is significant (Poinssot et al. 1999). One of the radioisotopes of cesium, 137Cs, is relatively long-lived and poses considerable radioecological problems (Staunton and Roubaud 1997). The main sources of 137Cs contamination of soil are global fallout from the atmosphere as a result of atmospheric nuclear weapons testing, ground surface and underground nuclear explosions, and accidental release from nuclear facilities. Along with these large-scale sources of 137Cs contamination of soil, there have been some cases of local contamination that might increase the radiation dose to population in nearby areas (Nabyvanets et al. 2000). Furthermore, because of its chemical similarity to K, Cs is readily assimilated by terrestrial and aquatic organisms (Poinssot et al. 1999). The study of sorption-desorption phenomena of contaminants by soils is of great interest from an environmental and agricultural point of view. The knowledge of sorption-desorption characteristics by soils is useful in predicting transport in soil water systems and uptake by plants (Smolders et al. 1997). It is well known that ion exchange reactions occur dominantly between Cs ions and clay minerals. The bio-availability of Cs+ in natural systems depends to a large extent on the adsorption properties of the solid phase (Atun and Kilislioglu 2003). Cesium uptake by plants depends on adsorption/desorption and fixation/release reactions in the soil as well as root uptake processes controlled by the plant. The aqueous chemistry of Cs+ in the environment is controlled by sorption reactions to mineral phases, particularly micaceous clay minerals (Francis and Brinkley 1976). Cs+ is strongly and selectively sorbed by the phyllosilicate fraction of soils, sediments, and suspended particulates (Tamura and Jacobs, 1960). Cs+ engages in ion-exchange reactions with hydrated cations on planar sites on expansible layer silicates (e.g., Smectites) with selectivity and trend selective fashion to wedge or frayed edge sites (FES) that develop along the weathered periphery of micas (e.g., biotite and muscovite) and their immediate weathering products (hydrous-mica, illite) (Zachara et al. 2002). In addition to the dependence of Cs sorption on phyllosilicate minerals, Cs sorption correlates also strongly with the cation exchange capacity (Grutter et al. 1990). Also, several factors control Cs sorption to soil such as metal concentration, pH, ionic strength and temperature. The adsorption of cesium depends upon the cationic composition of the exchange complex. This is because the so-called adsorption reaction is in fact an exchange phenomenon. Therefore, the adsorption depends upon the relative affinities of Cs and the charge-compensating cations. The order of decreasing affinity is generally reported to be Cs+ > NH4
+ > K+ > Na+ > Ca+2 (Staunton and Roubaud 1997). Zachara et al. (2002) reported that the electrolyte cations have competed with Cs+ in micaceous subsurface sediments from the Hanfrod site (USA) for both high and low-affinity sites according to the trend K+ >> Na+ ≥ Ca+2. At high concentration, Cs+ adsorption occurred only on high-affinity sites. Na+ was an effective competitor for the high-affinity sites at high salt concentrations. The adsorption behavior of Cs ions on a montmorillonite-type clay was investigated in the presence of potassium ions by Atun and Kilislioglu (2003). They used Freundlich isotherm parameters to characterize a site distribution function, which provides information about the affinity ratio of adsorption sites of Cs+ and K+ ions. The addition of K+ to the CsCl solution at different concentrations reduced the amount of Cs+ adsorbed on clay.
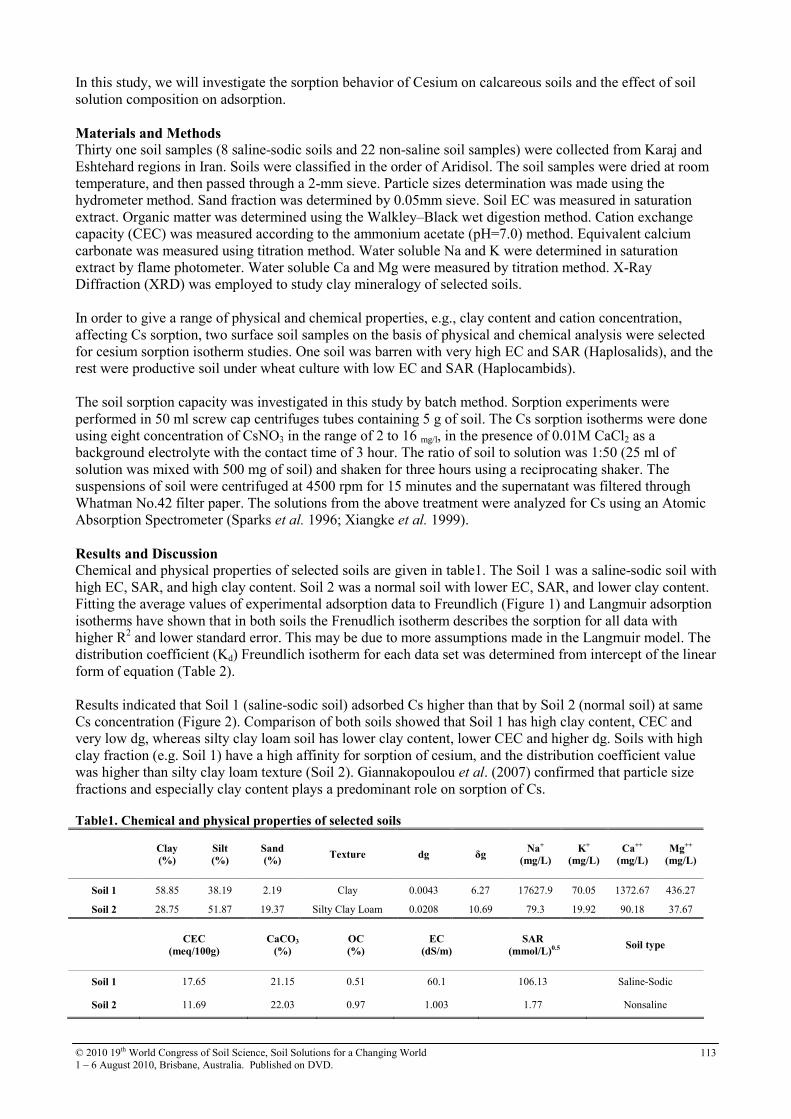
© 2010 19th World Congress of Soil Science, Soil Solutions for a Changing World 1 – 6 August 2010, Brisbane, Australia. Published on DVD.
113
In this study, we will investigate the sorption behavior of Cesium on calcareous soils and the effect of soil solution composition on adsorption. Materials and Methods Thirty one soil samples (8 saline-sodic soils and 22 non-saline soil samples) were collected from Karaj and Eshtehard regions in Iran. Soils were classified in the order of Aridisol. The soil samples were dried at room temperature, and then passed through a 2-mm sieve. Particle sizes determination was made using the hydrometer method. Sand fraction was determined by 0.05mm sieve. Soil EC was measured in saturation extract. Organic matter was determined using the Walkley–Black wet digestion method. Cation exchange capacity (CEC) was measured according to the ammonium acetate (pH=7.0) method. Equivalent calcium carbonate was measured using titration method. Water soluble Na and K were determined in saturation extract by flame photometer. Water soluble Ca and Mg were measured by titration method. X-Ray Diffraction (XRD) was employed to study clay mineralogy of selected soils. In order to give a range of physical and chemical properties, e.g., clay content and cation concentration, affecting Cs sorption, two surface soil samples on the basis of physical and chemical analysis were selected for cesium sorption isotherm studies. One soil was barren with very high EC and SAR (Haplosalids), and the rest were productive soil under wheat culture with low EC and SAR (Haplocambids). The soil sorption capacity was investigated in this study by batch method. Sorption experiments were performed in 50 ml screw cap centrifuges tubes containing 5 g of soil. The Cs sorption isotherms were done using eight concentration of CsNO3 in the range of 2 to 16 mg/l, in the presence of 0.01M CaCl2 as a background electrolyte with the contact time of 3 hour. The ratio of soil to solution was 1:50 (25 ml of solution was mixed with 500 mg of soil) and shaken for three hours using a reciprocating shaker. The suspensions of soil were centrifuged at 4500 rpm for 15 minutes and the supernatant was filtered through Whatman No.42 filter paper. The solutions from the above treatment were analyzed for Cs using an Atomic Absorption Spectrometer (Sparks et al. 1996; Xiangke et al. 1999). Results and Discussion Chemical and physical properties of selected soils are given in table1. The Soil 1 was a saline-sodic soil with high EC, SAR, and high clay content. Soil 2 was a normal soil with lower EC, SAR, and lower clay content. Fitting the average values of experimental adsorption data to Freundlich (Figure 1) and Langmuir adsorption isotherms have shown that in both soils the Frenudlich isotherm describes the sorption for all data with higher R2 and lower standard error. This may be due to more assumptions made in the Langmuir model. The distribution coefficient (Kd) Freundlich isotherm for each data set was determined from intercept of the linear form of equation (Table 2). Results indicated that Soil 1 (saline-sodic soil) adsorbed Cs higher than that by Soil 2 (normal soil) at same Cs concentration (Figure 2). Comparison of both soils showed that Soil 1 has high clay content, CEC and very low dg, whereas silty clay loam soil has lower clay content, lower CEC and higher dg. Soils with high clay fraction (e.g. Soil 1) have a high affinity for sorption of cesium, and the distribution coefficient value was higher than silty clay loam texture (Soil 2). Giannakopoulou et al. (2007) confirmed that particle size fractions and especially clay content plays a predominant role on sorption of Cs.
Table1. Chemical and physical properties of selected soils
Clay
(%)
Silt
(%)
Sand
(%) Texture dg δg
Na+
(mg/L)
K+
(mg/L)
Ca++
(mg/L)
Mg++
(mg/L)
Soil 1 58.85 38.19 2.19 Clay 0.0043 6.27 17627.9 70.05 1372.67 436.27
Soil 2 28.75 51.87 19.37 Silty Clay Loam 0.0208 10.69 79.3 19.92 90.18 37.67
CEC
(meq/100g)
CaCO3
(%)
OC
(%)
EC
(dS/m)
SAR
(mmol/L)0.5 Soil type
Soil 1 17.65 21.15 0.51 60.1 106.13 Saline-Sodic
Soil 2 11.69 22.03 0.97 1.003 1.77 Nonsaline
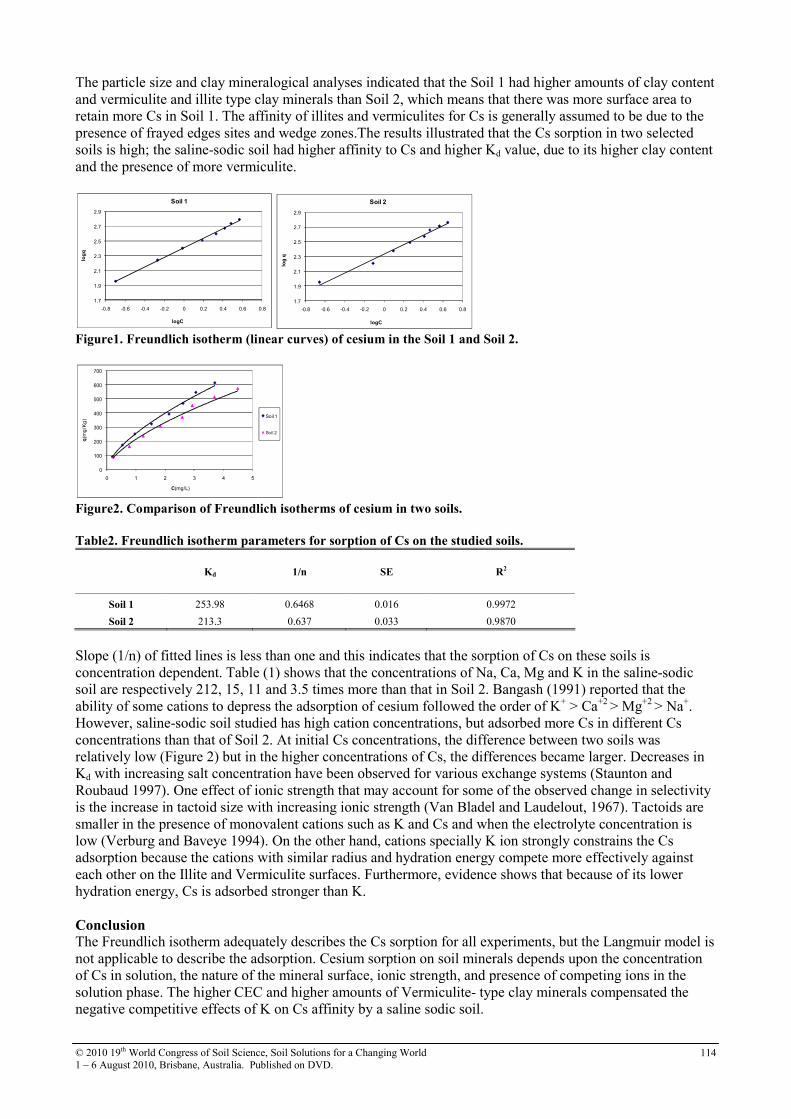
© 2010 19th World Congress of Soil Science, Soil Solutions for a Changing World 1 – 6 August 2010, Brisbane, Australia. Published on DVD.
114
The particle size and clay mineralogical analyses indicated that the Soil 1 had higher amounts of clay content and vermiculite and illite type clay minerals than Soil 2, which means that there was more surface area to retain more Cs in Soil 1. The affinity of illites and vermiculites for Cs is generally assumed to be due to the presence of frayed edges sites and wedge zones.The results illustrated that the Cs sorption in two selected soils is high; the saline-sodic soil had higher affinity to Cs and higher Kd value, due to its higher clay content and the presence of more vermiculite.
1.7
1.9
2.1
2.3
2.5
2.7
2.9
-0.8 -0.6 -0.4 -0.2 0 0.2 0.4 0.6 0.8
logq
logC
Soil 1
1.7
1.9
2.1
2.3
2.5
2.7
2.9
-0.8 -0.6 -0.4 -0.2 0 0.2 0.4 0.6 0.8
log q
logC
Soil 2
Figure1. Freundlich isotherm (linear curves) of cesium in the Soil 1 and Soil 2.
0
100
200
300
400
500
600
700
0 1 2 3 4 5
q(mg/Kg)
C(mg/L)
Soil 1
Soil 2
Figure2. Comparison of Freundlich isotherms of cesium in two soils.
Table2. Freundlich isotherm parameters for sorption of Cs on the studied soils.
Kd 1/n SE R2
Soil 1 253.98 0.6468 0.016 0.9972
Soil 2 213.3 0.637 0.033 0.9870
Slope (1/n) of fitted lines is less than one and this indicates that the sorption of Cs on these soils is concentration dependent. Table (1) shows that the concentrations of Na, Ca, Mg and K in the saline-sodic soil are respectively 212, 15, 11 and 3.5 times more than that in Soil 2. Bangash (1991) reported that the ability of some cations to depress the adsorption of cesium followed the order of K+ > Ca+2 > Mg+2 > Na+. However, saline-sodic soil studied has high cation concentrations, but adsorbed more Cs in different Cs concentrations than that of Soil 2. At initial Cs concentrations, the difference between two soils was relatively low (Figure 2) but in the higher concentrations of Cs, the differences became larger. Decreases in Kd with increasing salt concentration have been observed for various exchange systems (Staunton and Roubaud 1997). One effect of ionic strength that may account for some of the observed change in selectivity is the increase in tactoid size with increasing ionic strength (Van Bladel and Laudelout, 1967). Tactoids are smaller in the presence of monovalent cations such as K and Cs and when the electrolyte concentration is low (Verburg and Baveye 1994). On the other hand, cations specially K ion strongly constrains the Cs adsorption because the cations with similar radius and hydration energy compete more effectively against each other on the Illite and Vermiculite surfaces. Furthermore, evidence shows that because of its lower hydration energy, Cs is adsorbed stronger than K. Conclusion The Freundlich isotherm adequately describes the Cs sorption for all experiments, but the Langmuir model is not applicable to describe the adsorption. Cesium sorption on soil minerals depends upon the concentration of Cs in solution, the nature of the mineral surface, ionic strength, and presence of competing ions in the solution phase. The higher CEC and higher amounts of Vermiculite- type clay minerals compensated the negative competitive effects of K on Cs affinity by a saline sodic soil.
© 2010 19th World Congress of Soil Science, Soil Solutions for a Changing World 1 – 6 August 2010, Brisbane, Australia. Published on DVD.
115
References
Atun G, Kilislioglu A (2003) Adsorption behavior of cesium on montmorillonite-type clay in the presence of potassium ions. Journal of Radioanalytical and Nuclear Chemistry 258(3), 605-611.
Bangash MA, (1991) Adsorption of fission products and other radionuclides on inorganic exchangers. A thesis of PHD in chemistry, University of the Punjab, Lahore.
Francis CW, Brinkley FS (1976) Preferential adsorption of 137Cs to micaceous minerals in contaminated freshwater sediment. Nature 260, 511-513.
Giannakopoulou F, Haidouti C, Chronopoulou A, Gasparatos D (2007) Sorption behavior of cesium on various soils under different pH levels. Journal of Hazardous Materials 149, 553-556.
Grutter A, von Gunten HR, Kohler M, Rossler E (1990) Sorption, desorption and exchange of cesium on glaciofluvial deposits. Radiochimica Acta 50, 177-184.
Nabyvanets BY, Gesell TF, Jen MH, Chang WP (2000) Distribution of 137Cs in soil along Ta-han river valley in Tau-Yuan County in Taiwan. Journal of Environmental Radioactivity 54, 391-400.
Poinssot C, Baeyens B, Bradbury MH (1999) Experimental and modeling studies of cesium sorption on illite. Geochimica et cosmochimica Acta 63, 3217-3227.
Smolders E, Brande KVD, Merckx R (1997) Concentration of 137Cs and K in soils solution predict the plant availability of 137Cs in soils. Environmental Science & Technology 31, 3432-3438.
Sparks DL, Page AL, Helmke PA, Leoppert RH, Soltanpour PN, Tabatabai MA, Johnston GT, Sumner ME (1996) Methods of soil analysis, Soil Science Society of American, Madison, Wisconsin, USA.
Staunton S, Roubaud M (1997) Adsorption of 137 Cs on montmorillonite and illite: effect of charge compensating cation, ionic strength, concentration of Cs, K and fulvic acid. Clay and Clay minerals 45(2), 251-260.
Tamura T, Jacobs DG (1960) Structural implications in cesium sorption. Health Phys 2: 391–398. Van Bladel R, Laudelout h (1967) Apparent irreversibility of ion-exchange reactions clay suspensions. Soil
Science 104, 134-137. Verburg K, Baveye p (1994) Hysteresis in the binary exchange of cations on 2:1clay minerals: A critical
review. Clay and Clay Minerals 42, 207-220 Xiangke W, Wenming D, Jinzhou D, Zuyi T (1999) Sorption and desorption of radiocesium on calcareous
soil: Results from batch and column investigations. Journal of Radioanalytical and Nuclear Chemistry 783-787.
Zachara JM, Smith SC, Liu C, McKinley JP, Serne RJ, Gassman PL (2002) Sorption of Cs+ to micaceous subsurfaces sediments from Hanford site USA. Geochimica et cosmochimica Acta 66(2), 193-211.

© 2010 19th World Congress of Soil Science, Soil Solutions for a Changing World 1 – 6 August 2010, Brisbane, Australia. Published on DVD.
116
The adsorption of Strontium on soils developed in arid region as influenced by
clay content and soluble cations Naser KhaleghpanahA, Mohammad Hassan RoozitalabB, Abbas MajdabadiA, *Rayehe MirkhaniA AAgricultural, Medical and Industrial Research School, Nuclear Science and Technology Research Institute, Atomic Energy Organization of Iran, P.O. Box 31485-498, Karaj, Iran. B ICARDA-Office, Tehran, Iran, *Email: [email protected]
Abstract The retention of strontium from solutions (concentration range 2 to 30 mg/l) by soils developed under arid conditions of Iran was investigated using a batch technique. Sr sorption characteristics a clayey and a silty clay loam soil were examined at room temperature and with 0.01M CaCl2 as a background electrolyte. Sorption processes are found to show a Freundlich-type behavior. Results indicated the clay content and ionic strength play predominant role on sorption of Sr. At soil with high soluble cations (saline-sodic soil) less strontium was adsorbed at lower concentrations of strontium due to greater competition with other cations especially with soluble Ca and Mg. Electrical conductivity and ratio of soluble Ca and Mg to total soluble cations is important especially in soils with high EC and SAR. Key Words Strontium adsorption, Freundlich isotherm, Soils of arid region. Introduction
The investigation of sorption-desorption phenomena of contaminants by soils is of great importance from the viewpoint of environment and agriculture. The knowledge of sorption-desorption characteristics of contaminants by soils is useful in simulation and prediction of contaminant transport and diffusion in soil-water systems and uptake by plants (Smolders et al. 1997; Cox et al. 1995). One of the important contaminants is radionuclides. The interest in the behavior of Sr in soils has mainly brought about by the fact that long-lived radionuclide of 90Sr (T1/2 = 28.8 y), which is produced by nuclear fission and one of the radionuclides most frequently released from low-level radioactive waste to the environment. The sorption characteristics of radiostrontium on various soils, sediments and minerals have been the subject of many recent investigations (Shenber and Eriksson 1993). Therefore, it is of great importance to understand the sorption behavior of radiostrontium in the environment in order to control the mobility of this element in the environment. Many studies have demonstrated that the transport of radiostrontium in soil is faster than that of other elements such as cesium, cobalt and plutonium. In this sense, radiostrontium has a greater threat to our environment than other radionuclides (Bachhuber et al. 1982; Price 1991). The sorption and migration of strontium in soil could be influenced by many factors and the nature of radionuclides in the solution as well as chemical and mineralogical nature and physical environment of the soil (Yasuda and Uchida 1993; Lieser et al. 1986). CaCO3 has a negative contribution to the sorption due to its interaction with the other solid components in the soil to suppress Sr sorption on the other solid components (Jinzhou et al. 1996). The Sr adsorption mechanism in soil is mainly an ion exchange reaction, and adsorbed Sr could not exist in the fixation fraction (Krouglov et al. 1998). In addition, adsorption of Mg+2 and Ca+2 are in competition with Sr+2. Indeed, the amount of sorbed Sr in soil was observed to decrease with increasing Mg and Ca concentrations in soil solution (Bunde et al. 1997). Bascetin and Atun (2006) studied the adsorption behavior of Kaolinite and Montmorillonite minerals and their mixtures with Sr ion were studied by a batch method. The Freundlich parameters were used to characterize a site distribution function for binary exchange between Sr and Na. The adsorption capacity of clay mixtures decreased as kaolinite fractions increased. The sorption and desorption of radionuclide 90Sr+2 were investigated by Zhang et al. (2006) on calcareous soil using batch technique. It was found that the sorption is dependent on ionic strength, and fulvic acid enhances the sorption of 90Sr+2 on calcareous soil. The present work was performed in order to investigate behavior of Sr adsorption in a saline-sodic soil and a normal soil developed in arid environment in Central Iran.
© 2010 19th World Congress of Soil Science, Soil Solutions for a Changing World 1 – 6 August 2010, Brisbane, Australia. Published on DVD.
117
Material and Methods
The soil samples used in this study, which are representatives of the calcareous soils in Iran, were collected from the surface horizons (0-25cm) in Karaj and Eshtehard regions from dominant soil series. The soils were classified in the order Aridisols. After being air-dried at room temperature and passed through a 2 mm sieve, the selected properties of the soil samples were analyzed. Particle size analyses were performed by hydrometer method for determination of clay fraction. Sand fraction (0.05-2mm) was determined by 0.05 mm sieve. The EC values were measured in saturation extract. Organic carbon was determined by the dichromate oxidation method. The CaCO3 was determined by titration method and the cation exchange capacity (CEC) was measured according to the ammonium acetate (pH=7.0) method. The soil samples were treated in triplicate. Clay minerals were identified using X-Ray Diffraction (XRD) analysis on the sub-2 µm fraction.
The two soils studied showed a wide range of physical and chemical properties. One soil was barren with very high EC and SAR values (Haplosalids), and the other was normal productive soil under wheat cultivation with low EC and SAR (Haplocambids).
The adsorption of Sr was measured using a batch technique at room temperature (22.5±0.5). Adsorption experiment was performed in 50 ml screw cap centrifuges tubes. The Sr adsorption isotherms were obtained using eight concentration of SrNO3 in the range 2 to 30 mg/l, in the presence of 0.01 M CaCl2.The time selected for full equilibrium was 3 hours.
A 25 ml of each concentration was mixed with 0.5 g of soil (1:50), and the samples was shaken for 3 hours, using a reciprocating shaker. The soil suspensions were centrifuged at 4500 rpm for 15 minutes and the supernatant was filtered through Whatman No.42 filter paper. Sr concentrations of the supernatants were determined by Atomic Absorption Spectrometer. The amounts of Sr sorbed were deduced from the difference between the solution concentration added and Sr concentration remaining in the supernatant (Bohn et al. 1985; Sparks et al. 1996; Jinzhou et al. 1996).
Results and Discussion The values for particle size distributions, concentrations of soluble cations, CEC and organic carbon content for each soil type are given in Table 1.The particle size distribution shows higher amount of clay content of the saline-sodic soil compared to normal soil. The particle size and clay mineralogical analyses indicated that the Soil 1 had higher amounts of clay content (%58.85) and vermiculite and illites type clay minerals and Soil 2 contained lower amount clay content (% 28.75). These differences were also reflected by the higher value of CEC in the saline-sodic soil.
The Freundlich isotherm equation has been used to describe the adsorption characteristics of soils at the end of 3-hour. It was found that the data are not consistent with Langmuir isotherm. Freundlich isotherms are illustrated in Figure 1 from the experimental data obtained. Table 2 shows the Freundlich adsorption parameters, correlation coefficients (R2) and standard error (SE) of fitting. In saline-sodic soil the slope (1/n) of the best fitted line was higher than 1, whereas in normal soil 1/n was less than 1. As it is observed from Figure 2, comparison of Freundlich isotherms in both soils shows that higher amount of Sr adsorption occurs in Soil 1 than Soil 2. But in lower concentrations of Sr, less than about 10 mg/l strontium, Soil 2 adsorbed more Sr than the Soil 1.
Table 1. Selected chemical and physical properties the studied soils
Clay
(%)
Silt
(%)
Sand
(%) Texture dg δg
Na+
(mg/L)
K+
(mg/L)
Ca++
(mg/L)
Mg++
(mg/L)
Soil 1 58.85 38.19 2.19 Clay 0.0043 6.27 17627.9 70.05 1372.67 436.27
Soil 2 28.75 51.87 19.37 Silty Clay Loam
0.0208 10.69 79.3 19.92 90.18 37.67
CEC
(meq/100g)
CaCO3
(%)
OC
(%)
EC
(dS/m)
SAR
(mmol/L)0.5
Soil type
Soil 1 17.65 21.15 0.51 60.1 106.13 Saline-Sodic
Soil 2 11.69 22.03 0.97 1.003 1.77 Nonsaline
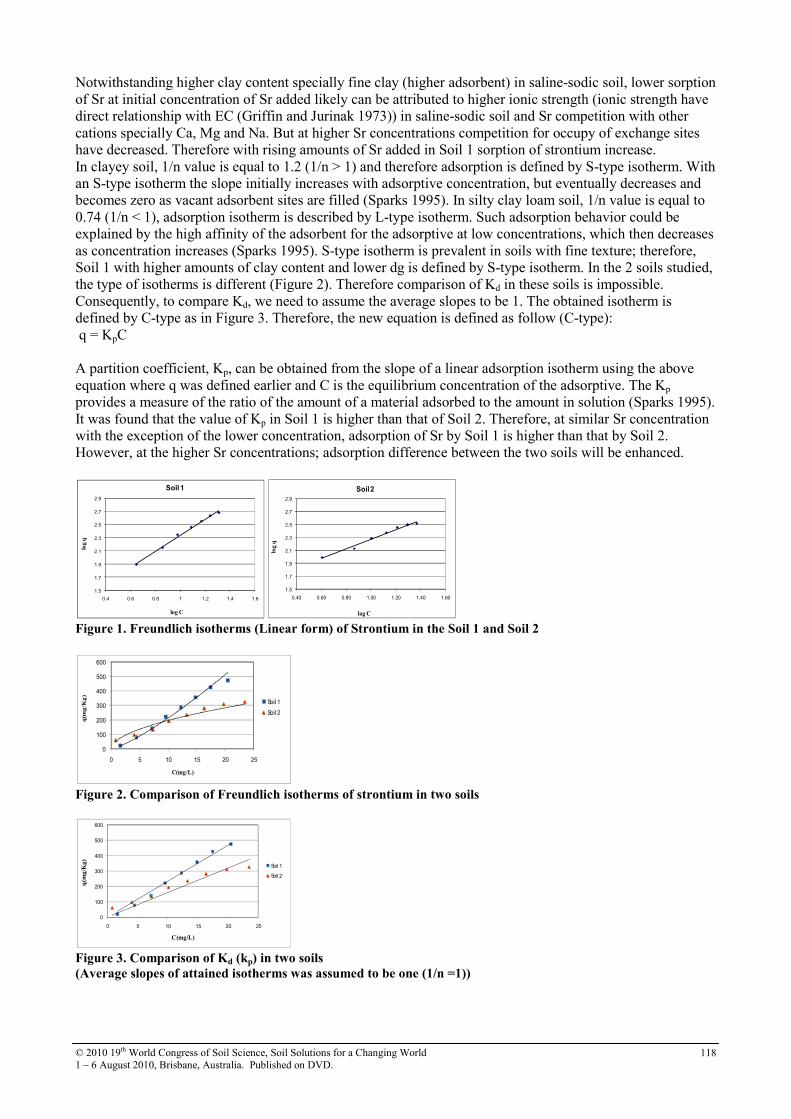
© 2010 19th World Congress of Soil Science, Soil Solutions for a Changing World 1 – 6 August 2010, Brisbane, Australia. Published on DVD.
118
Notwithstanding higher clay content specially fine clay (higher adsorbent) in saline-sodic soil, lower sorption of Sr at initial concentration of Sr added likely can be attributed to higher ionic strength (ionic strength have direct relationship with EC (Griffin and Jurinak 1973)) in saline-sodic soil and Sr competition with other cations specially Ca, Mg and Na. But at higher Sr concentrations competition for occupy of exchange sites have decreased. Therefore with rising amounts of Sr added in Soil 1 sorption of strontium increase. In clayey soil, 1/n value is equal to 1.2 (1/n > 1) and therefore adsorption is defined by S-type isotherm. With an S-type isotherm the slope initially increases with adsorptive concentration, but eventually decreases and becomes zero as vacant adsorbent sites are filled (Sparks 1995). In silty clay loam soil, 1/n value is equal to 0.74 (1/n < 1), adsorption isotherm is described by L-type isotherm. Such adsorption behavior could be explained by the high affinity of the adsorbent for the adsorptive at low concentrations, which then decreases as concentration increases (Sparks 1995). S-type isotherm is prevalent in soils with fine texture; therefore, Soil 1 with higher amounts of clay content and lower dg is defined by S-type isotherm. In the 2 soils studied, the type of isotherms is different (Figure 2). Therefore comparison of Kd in these soils is impossible. Consequently, to compare Kd, we need to assume the average slopes to be 1. The obtained isotherm is defined by C-type as in Figure 3. Therefore, the new equation is defined as follow (C-type): q = KpC A partition coefficient, Kp, can be obtained from the slope of a linear adsorption isotherm using the above equation where q was defined earlier and C is the equilibrium concentration of the adsorptive. The Kp provides a measure of the ratio of the amount of a material adsorbed to the amount in solution (Sparks 1995). It was found that the value of Kp in Soil 1 is higher than that of Soil 2. Therefore, at similar Sr concentration with the exception of the lower concentration, adsorption of Sr by Soil 1 is higher than that by Soil 2. However, at the higher Sr concentrations; adsorption difference between the two soils will be enhanced.
1.5
1.7
1.9
2.1
2.3
2.5
2.7
2.9
0.4 0.6 0.8 1 1.2 1.4 1.6
log q
log C
Soil 1
1.5
1.7
1.9
2.1
2.3
2.5
2.7
2.9
0.40 0.60 0.80 1.00 1.20 1.40 1.60
log q
log C
Soil 2
Figure 1. Freundlich isotherms (Linear form) of Strontium in the Soil 1 and Soil 2
0
100
200
300
400
500
600
0 5 10 15 20 25
q(m
g/K
g)
C(mg/L)
Soil 1
Soil 2
Figure 2. Comparison of Freundlich isotherms of strontium in two soils
0
100
200
300
400
500
600
0 5 10 15 20 25
q(m
g/K
g)
C(mg/L)
Soil 1
Soil 2
Figure 3. Comparison of Kd (kp) in two soils
(Average slopes of attained isotherms was assumed to be one (1/n =1))

© 2010 19th World Congress of Soil Science, Soil Solutions for a Changing World 1 – 6 August 2010, Brisbane, Australia. Published on DVD.
119
Table 2. Freundlich and C-type equation parameters for Sr adsorption on studied soils
Kd 1/n SE R
2
Kp
1/n =1
Soil 1 13.33 1.210 0.025 0.993 23.43
Soil 2 33.81 0.738 0.028 0.983 15.98
Conclusion The sorption of Sr in selected soils could be influenced by many factors specially clay content, predominant clay mineral, EC, SAR, dg. The Freundlich isotherm adequately describes the Sr adsorption for concentrations higher than 2mg/L strontium. In addition to the effect of EC and ionic strength on Sr sorption, the ratio of water soluble Ca and Mg cations to total soluble cations are important factors especially in soils with high EC and SAR. In Soil 1 which contains higher amounts of clay content and higher amounts of vermiculite and illites, thus, Sr has been adsorbed more at the surface of the clay minerals. References
Bachhuber H, Bunzl K, Schimmack WG (1982) The migration of 137Cs and 90Sr in multilayered soils: results from batch, column, and fallout investigations. Nuclear Technology 59, 291-301.
Bascetin E, Atun G (2006) Adsorption behavior of strontium on binary mineral mixtures of Montmorillonite and Kaolinite. Applied Radiation and Isotopes 957- 964
Bohn H, McNeal B, O’Connor G (1985) Soil Chemistry. Wiley, 341pp
Bunde RL, Rosentreter JJ, Liszewski MJ, Hemming CH, Welhan J (1997) Effects of calcium and magnesium on strontium distribution coefficients. Environmental Geology 32, 219–229.
Cox, L., Hermosin, M. C., Cornejo, J. (1995) Adsorption and desorption of thiazafluron as a function of soil properties. International Journal of Environmental Analytical Chemistry 58, 305-314
Griffin Gp, Jurinak JJ (1973) Estimation of activity coefficients from the electrical conductivity of natural aquatic systems and soil extracts. Soil Science 116, 26-30.
Jinzhou D, Wenming D, Xiangke W, Zuyi T (1996) Sorption and desorption of radiostrontium on calcareous soil and its solid components. Journal of Radioanalytical and Nuclear Chemistry 203, 31-36.
Krouglov SV, Kurinov AD, Alexakhin RM (1998) Chemical fraction of 90Sr, 106Ru, 137Cs and 144Cs in Chernobyl-contaminated soils: an evolution in the course of time. Journal of Environmental Radioactivity 38, 59–76.
Lieser KH, Gleitsmann B, Peschke S, Steinkopff T (1986) Colloids formation and sorption of radionuclides in natural systems. Radiocemica Acta, 40, 39-47
Price KR, (1991) The Depth Distribution of 90Sr, 137Cs, and 239'240pu in Soil Profile Samples. Radiochimeca
Acta 54, 145-147
Shenber MA, Eriksson A (1993) Sorption behavior of cesium in various soils. Journal of Environmental
Radioactivity 19, 41–51.
Smolders E, Brande KVD, Merckx R (1997) Concentration of 137Cs and K in soils solution predict the plant availability of 137Cs in soils. Environmental Science & Technology 31, 3432-3438.
Sparks DL, Page AL, Helmke PA, Leoppert RH, Soltanpour PN, Tabatabai MA, Johnston GT, Sumner ME (1996) Methods of soil analysis, Soil Science Society of American, Madison, Wisconsin, USA
Sparks DL, (1995) Environmental soil chemistry. CRC Press, Boca Raton, F L.
Yasuda H, Uchida S (1993) Statistical approach for the estimation of strontium distribution coefficient. Environmental Science Technology 27, 2462–2465.
Zhang ML, Ren A, Shao D, Wang X (2006) Effect of fulvic acid and ionic strength on the sorption of radiostrontium on Chinese calcareous soil and its solid components. Journal of Radioanalytical and Nuclear Chemistry 268 (1), 33-36.
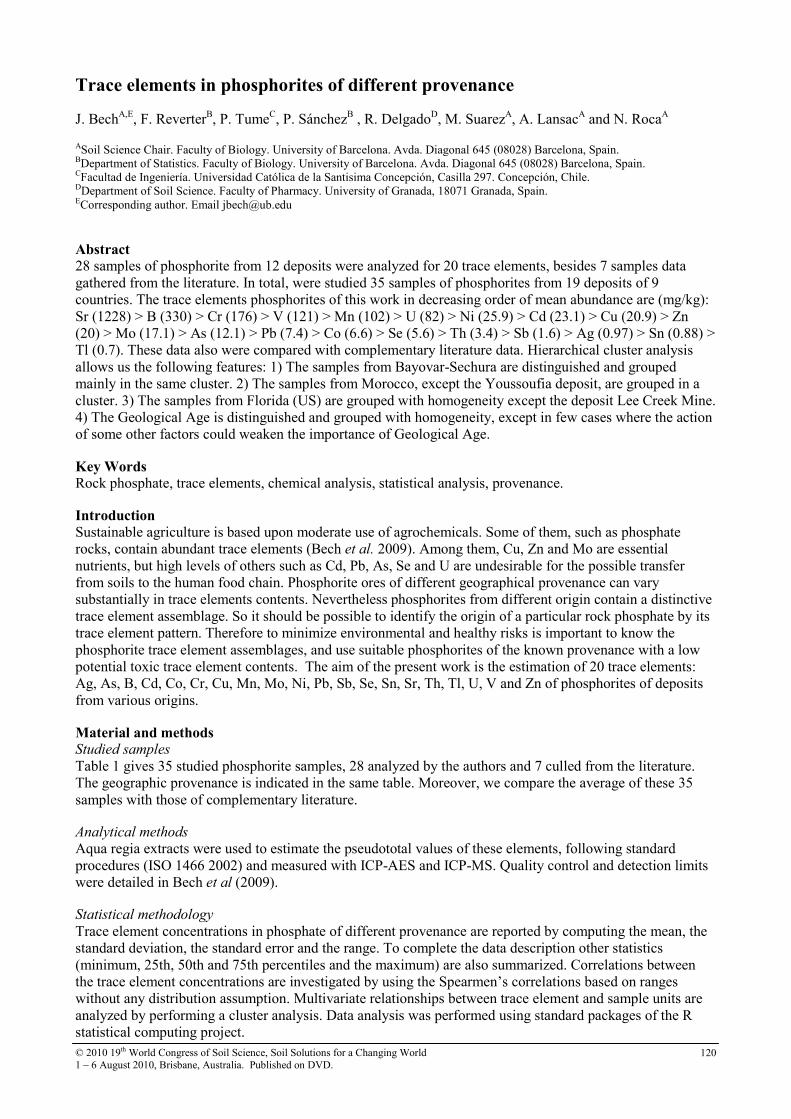
© 2010 19th World Congress of Soil Science, Soil Solutions for a Changing World 1 – 6 August 2010, Brisbane, Australia. Published on DVD.
120
Trace elements in phosphorites of different provenance J. BechA,E, F. ReverterB, P. TumeC, P. SánchezB , R. DelgadoD, M. SuarezA, A. LansacA and N. RocaA ASoil Science Chair. Faculty of Biology. University of Barcelona. Avda. Diagonal 645 (08028) Barcelona, Spain. BDepartment of Statistics. Faculty of Biology. University of Barcelona. Avda. Diagonal 645 (08028) Barcelona, Spain. CFacultad de Ingeniería. Universidad Católica de la Santisima Concepción, Casilla 297. Concepción, Chile. DDepartment of Soil Science. Faculty of Pharmacy. University of Granada, 18071 Granada, Spain. ECorresponding author. Email [email protected]
Abstract 28 samples of phosphorite from 12 deposits were analyzed for 20 trace elements, besides 7 samples data gathered from the literature. In total, were studied 35 samples of phosphorites from 19 deposits of 9 countries. The trace elements phosphorites of this work in decreasing order of mean abundance are (mg/kg): Sr (1228) > B (330) > Cr (176) > V (121) > Mn (102) > U (82) > Ni (25.9) > Cd (23.1) > Cu (20.9) > Zn (20) > Mo (17.1) > As (12.1) > Pb (7.4) > Co (6.6) > Se (5.6) > Th (3.4) > Sb (1.6) > Ag (0.97) > Sn (0.88) > Tl (0.7). These data also were compared with complementary literature data. Hierarchical cluster analysis allows us the following features: 1) The samples from Bayovar-Sechura are distinguished and grouped mainly in the same cluster. 2) The samples from Morocco, except the Youssoufia deposit, are grouped in a cluster. 3) The samples from Florida (US) are grouped with homogeneity except the deposit Lee Creek Mine. 4) The Geological Age is distinguished and grouped with homogeneity, except in few cases where the action of some other factors could weaken the importance of Geological Age. Key Words Rock phosphate, trace elements, chemical analysis, statistical analysis, provenance.
Introduction
Sustainable agriculture is based upon moderate use of agrochemicals. Some of them, such as phosphate rocks, contain abundant trace elements (Bech et al. 2009). Among them, Cu, Zn and Mo are essential nutrients, but high levels of others such as Cd, Pb, As, Se and U are undesirable for the possible transfer from soils to the human food chain. Phosphorite ores of different geographical provenance can vary substantially in trace elements contents. Nevertheless phosphorites from different origin contain a distinctive trace element assemblage. So it should be possible to identify the origin of a particular rock phosphate by its trace element pattern. Therefore to minimize environmental and healthy risks is important to know the phosphorite trace element assemblages, and use suitable phosphorites of the known provenance with a low potential toxic trace element contents. The aim of the present work is the estimation of 20 trace elements: Ag, As, B, Cd, Co, Cr, Cu, Mn, Mo, Ni, Pb, Sb, Se, Sn, Sr, Th, Tl, U, V and Zn of phosphorites of deposits from various origins. Material and methods Studied samples
Table 1 gives 35 studied phosphorite samples, 28 analyzed by the authors and 7 culled from the literature. The geographic provenance is indicated in the same table. Moreover, we compare the average of these 35 samples with those of complementary literature. Analytical methods
Aqua regia extracts were used to estimate the pseudototal values of these elements, following standard procedures (ISO 1466 2002) and measured with ICP-AES and ICP-MS. Quality control and detection limits were detailed in Bech et al (2009). Statistical methodology
Trace element concentrations in phosphate of different provenance are reported by computing the mean, the standard deviation, the standard error and the range. To complete the data description other statistics (minimum, 25th, 50th and 75th percentiles and the maximum) are also summarized. Correlations between the trace element concentrations are investigated by using the Spearmen’s correlations based on ranges without any distribution assumption. Multivariate relationships between trace element and sample units are analyzed by performing a cluster analysis. Data analysis was performed using standard packages of the R statistical computing project.
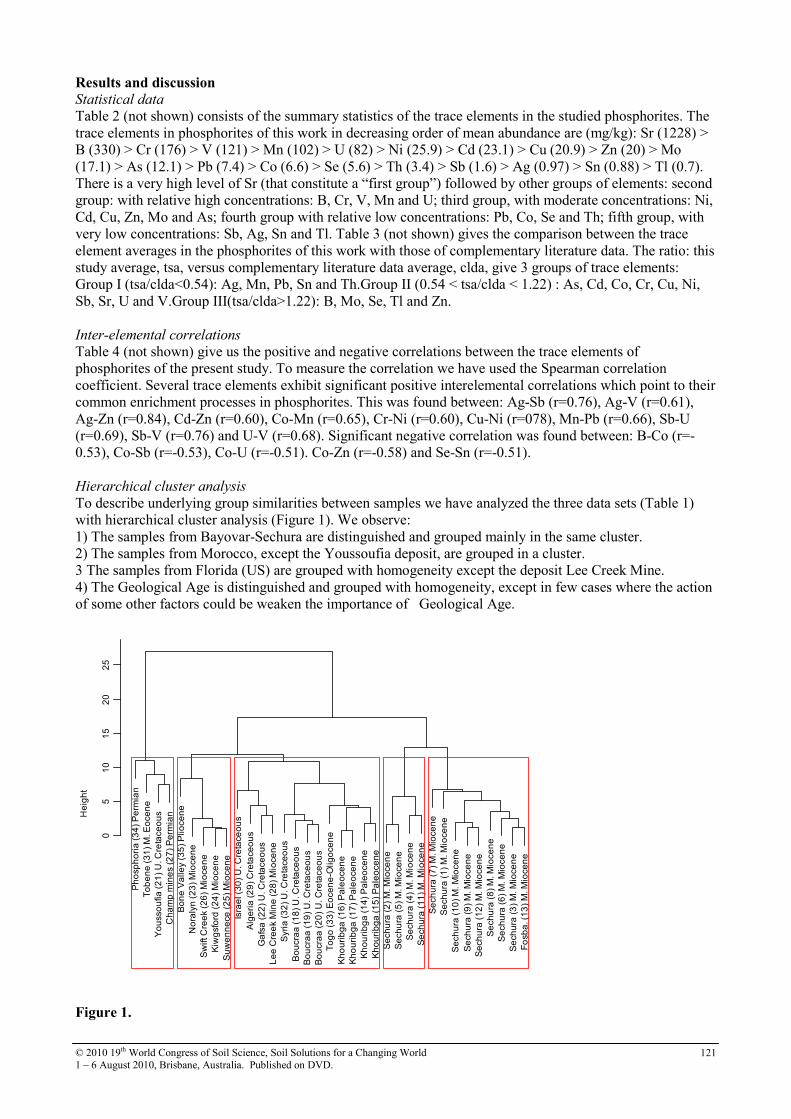
© 2010 19th World Congress of Soil Science, Soil Solutions for a Changing World 1 – 6 August 2010, Brisbane, Australia. Published on DVD.
121
Results and discussion
Statistical data
Table 2 (not shown) consists of the summary statistics of the trace elements in the studied phosphorites. The trace elements in phosphorites of this work in decreasing order of mean abundance are (mg/kg): Sr (1228) > B (330) > Cr (176) > V (121) > Mn (102) > U (82) > Ni (25.9) > Cd (23.1) > Cu (20.9) > Zn (20) > Mo (17.1) > As (12.1) > Pb (7.4) > Co (6.6) > Se (5.6) > Th (3.4) > Sb (1.6) > Ag (0.97) > Sn (0.88) > Tl (0.7). There is a very high level of Sr (that constitute a “first group”) followed by other groups of elements: second group: with relative high concentrations: B, Cr, V, Mn and U; third group, with moderate concentrations: Ni, Cd, Cu, Zn, Mo and As; fourth group with relative low concentrations: Pb, Co, Se and Th; fifth group, with very low concentrations: Sb, Ag, Sn and Tl. Table 3 (not shown) gives the comparison between the trace element averages in the phosphorites of this work with those of complementary literature data. The ratio: this study average, tsa, versus complementary literature data average, clda, give 3 groups of trace elements: Group I (tsa/clda<0.54): Ag, Mn, Pb, Sn and Th.Group II (0.54 < tsa/clda < 1.22) : As, Cd, Co, Cr, Cu, Ni, Sb, Sr, U and V.Group III(tsa/clda>1.22): B, Mo, Se, Tl and Zn. Inter-elemental correlations
Table 4 (not shown) give us the positive and negative correlations between the trace elements of phosphorites of the present study. To measure the correlation we have used the Spearman correlation coefficient. Several trace elements exhibit significant positive interelemental correlations which point to their common enrichment processes in phosphorites. This was found between: Ag-Sb (r=0.76), Ag-V (r=0.61), Ag-Zn (r=0.84), Cd-Zn (r=0.60), Co-Mn (r=0.65), Cr-Ni (r=0.60), Cu-Ni (r=078), Mn-Pb (r=0.66), Sb-U (r=0.69), Sb-V (r=0.76) and U-V (r=0.68). Significant negative correlation was found between: B-Co (r=-0.53), Co-Sb (r=-0.53), Co-U (r=-0.51). Co-Zn (r=-0.58) and Se-Sn (r=-0.51). Hierarchical cluster analysis
To describe underlying group similarities between samples we have analyzed the three data sets (Table 1) with hierarchical cluster analysis (Figure 1). We observe: 1) The samples from Bayovar-Sechura are distinguished and grouped mainly in the same cluster. 2) The samples from Morocco, except the Youssoufia deposit, are grouped in a cluster. 3 The samples from Florida (US) are grouped with homogeneity except the deposit Lee Creek Mine. 4) The Geological Age is distinguished and grouped with homogeneity, except in few cases where the action of some other factors could be weaken the importance of Geological Age.
Phosphoria (34) Permian
Tobene (31) M. Eocene
Youssoufia (21) U. Cretaceous
Champ mines (27) Permian
Bone Valley (35) Pliocene
Noralyn (23) Miocene
Swift Creek (26) Miocene
Kiwgsford (24) Miocene
Suwennece (25) Miocene
Israel (30) U. Cretaceous
Algeria (29) Cretaceous
Gafsa (22) U. Cretaceous
Lee Creek Mine (28) Miocene
Syria (32) U. Cretaceous
Boucraa (18) U. Cretaceous
Boucraa (19) U. Cretaceous
Boucraa (20) U. Cretaceous
Togo (33) Eocene-Oligocene
Khouribga (16) Paleocene
Khouribga (17) Paleocene
Khouribga (14) Paleocene
Khouribga (15) Paleocene
Sechura (2) M. Miocene
Sechura (5) M. Miocene
Sechura (4) M. Miocene
Sechura (11) M. Miocene
Sechura (7) M. Miocene
Sechura (1) M. Miocene
Sechura (10) M. Miocene
Sechura (9) M. Miocene
Sechura (12) M. Miocene
Sechura (8) M. Miocene
Sechura (6) M. Miocene
Sechura (3) M. Miocene
Fosba. (13) M. Miocene
05
10
15
20
25
d
Height
Figure 1.
© 2010 19th World Congress of Soil Science, Soil Solutions for a Changing World 1 – 6 August 2010, Brisbane, Australia. Published on DVD.
122
Table 1.
Set 1: Samples of naturally occurring rocks of Bayovar-Sechura analyzed in this work Country Deposit Bed Geological Age Sample No. Peru Area I I-C Middle Miocene 1 Peru Area I I-B-A Middle Miocene 2 Peru Area I I-1 Middle Miocene 3 Peru Area I I-1-2 Middle Miocene 4 Peru Area I I-1-2-3 Middle Miocene 5 Peru Area I I-3 Middle Miocene 6 Peru Area II II-1 Middle Miocene 7 Peru Area II II-5 Middle Miocene 8 Peru Area II II-6 Middle Miocene 9 Peru Area II II-7-top Middle Miocene 10 Peru Area II II-7-volcanic tuff Middle Miocene 11 Peru Area II II-7-base Middle Miocene 12 Set 2: Samples obtained from commercial sources analyzed in this work Country Deposit Phosphate producer Peru Fosbayóvar Minera Bayovar Middle Miocene 13 Morocco Khouribga KIID Office Chérifien des Phosphates Paleocene 14 Morocco Khouribga KIISB Office Chérifien des Phosphates Paleocene 15 Morocco Khouribga KIISL Office Chérifien des Phosphates Paleocene 16 Morocco Khouribga KIIC Office Chérifien des Phosphates Paleocene 17 Morocco Boucraa BGA Phosphates de Boucraa, S.A. Upper Cretaceous 18 Morocco Boucraa BGB Phosphates de Boucraa, S.A. Upper Cretaceous 19 Morocco Boucraa BGC Phosphates de Boucraa, S.A. Upper Cretaceous 20 Morocco Youssoufia YN Office Chérifien des Phosphates Upper Cretaceous 21 Tunisia Gafsa Compagnie des Phosphates de Gafsa Upper Cretaceous 22 Central Florida, USA Noralyn Imc-Agrico Miocene 23 Kiwgsford Imc-Agrico Miocene 24 North Florida, USA Suwennece Occidental Chemical Co. Miocene 25 Swift Creek Occidental Chemical Co Miocene 26 Idaho, USA Champ mines NU-West Industries Permian 27 North Carolina, USA Lee Creek Mine TexasGulf Inc. Miocene 28 Set 3: Samples of literature data Country Deposit Reference Algeria Undeterminated Sattouf (2007) Cretaceous 29 Israel Undeterminated Sattouf (2007) Upper Cretaceous 30 Senegal Tobene Samb (2002) Middle Eocene 31 Syria Undeterminated Sattouf (2007) Upper Cretaceous 32 Togo Undeterminated Sattouf (2007) Eocene-Oligocene 33 USA Phosphoria Formation Gulbrandsen (1966) Permian 34 Florida, USA Bone Valley Altschuler (1980) Pliocene 35 Conclusions The trace elements in phosphorites of this work in decreasing order of mean abundance (mg/kg) are: Sr (1228) > B (330) > Cr (176) > V (121) > Mn (102) > U (82) > Ni (25.9) > Cd (23.1) > Cu (20.9) > Zn (20) > Mo (17.1) > As (12.1) > Pb (7.4) > Co (6.6) > Se (5.6) > Th (3.4) > Sb (1.6) > Ag (0.97) > Sn (0.88) > Tl (0.7). Several trace elements exhibit significant positive interelemental correlations which point to their common enrichment processes in phosphorites. The negative correlations are in agreement with the geochemical affinities between these pairs of elements. In the case of positive correlations, the agreement geochemical is only partial: There are different factors, not only geochemicals, of enrichment of trace element phosphorites. The cluster analysis allowed three main groups: Bayovar-Sechura, Morocco, except the Youssoufia deposit, and Florida (US), are grouped with homogeneity except the deposit Lee Creek Mine. References
Bech J, Suarez M, Reverter F, Tume P, Sánchez P, Bech J, Lansac A (2009) Selenium and other trace elements in phosphate rock of Bayovar-Sechura (Peru). Journal of Geochemical Exploration spec. issue. doi: 10.1016/j.gexplo.2009.08.004
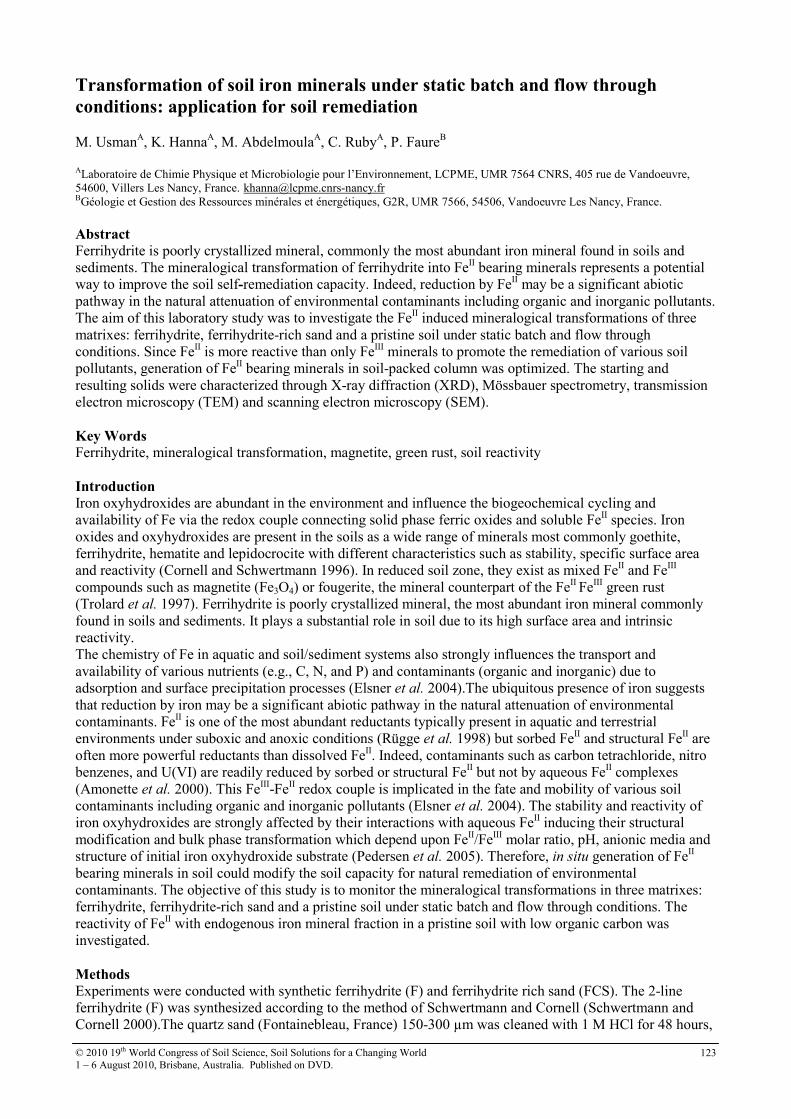
© 2010 19th World Congress of Soil Science, Soil Solutions for a Changing World 1 – 6 August 2010, Brisbane, Australia. Published on DVD.
123
Transformation of soil iron minerals under static batch and flow through
conditions: application for soil remediation M. UsmanA, K. HannaA, M. AbdelmoulaA, C. RubyA, P. FaureB ALaboratoire de Chimie Physique et Microbiologie pour l’Environnement, LCPME, UMR 7564 CNRS, 405 rue de Vandoeuvre, 54600, Villers Les Nancy, France. [email protected] BGéologie et Gestion des Ressources minérales et énergétiques, G2R, UMR 7566, 54506, Vandoeuvre Les Nancy, France.
Abstract
Ferrihydrite is poorly crystallized mineral, commonly the most abundant iron mineral found in soils and sediments. The mineralogical transformation of ferrihydrite into FeII bearing minerals represents a potential way to improve the soil self-remediation capacity. Indeed, reduction by FeII may be a significant abiotic pathway in the natural attenuation of environmental contaminants including organic and inorganic pollutants. The aim of this laboratory study was to investigate the FeII induced mineralogical transformations of three matrixes: ferrihydrite, ferrihydrite-rich sand and a pristine soil under static batch and flow through conditions. Since FeII is more reactive than only FeIII minerals to promote the remediation of various soil pollutants, generation of FeII bearing minerals in soil-packed column was optimized. The starting and resulting solids were characterized through X-ray diffraction (XRD), Mössbauer spectrometry, transmission electron microscopy (TEM) and scanning electron microscopy (SEM).
Key Words Ferrihydrite, mineralogical transformation, magnetite, green rust, soil reactivity Introduction Iron oxyhydroxides are abundant in the environment and influence the biogeochemical cycling and availability of Fe via the redox couple connecting solid phase ferric oxides and soluble FeII species. Iron oxides and oxyhydroxides are present in the soils as a wide range of minerals most commonly goethite, ferrihydrite, hematite and lepidocrocite with different characteristics such as stability, specific surface area and reactivity (Cornell and Schwertmann 1996). In reduced soil zone, they exist as mixed FeII and FeIII compounds such as magnetite (Fe3O4) or fougerite, the mineral counterpart of the FeII FeIII green rust (Trolard et al. 1997). Ferrihydrite is poorly crystallized mineral, the most abundant iron mineral commonly found in soils and sediments. It plays a substantial role in soil due to its high surface area and intrinsic reactivity. The chemistry of Fe in aquatic and soil/sediment systems also strongly influences the transport and availability of various nutrients (e.g., C, N, and P) and contaminants (organic and inorganic) due to adsorption and surface precipitation processes (Elsner et al. 2004).The ubiquitous presence of iron suggests that reduction by iron may be a significant abiotic pathway in the natural attenuation of environmental contaminants. FeII is one of the most abundant reductants typically present in aquatic and terrestrial environments under suboxic and anoxic conditions (Rügge et al. 1998) but sorbed FeII and structural FeII are often more powerful reductants than dissolved FeII. Indeed, contaminants such as carbon tetrachloride, nitro benzenes, and U(VI) are readily reduced by sorbed or structural FeII but not by aqueous FeII complexes (Amonette et al. 2000). This FeIII-FeII redox couple is implicated in the fate and mobility of various soil contaminants including organic and inorganic pollutants (Elsner et al. 2004). The stability and reactivity of iron oxyhydroxides are strongly affected by their interactions with aqueous FeII inducing their structural modification and bulk phase transformation which depend upon FeII/FeIII molar ratio, pH, anionic media and structure of initial iron oxyhydroxide substrate (Pedersen et al. 2005). Therefore, in situ generation of FeII bearing minerals in soil could modify the soil capacity for natural remediation of environmental contaminants. The objective of this study is to monitor the mineralogical transformations in three matrixes: ferrihydrite, ferrihydrite-rich sand and a pristine soil under static batch and flow through conditions. The reactivity of FeII with endogenous iron mineral fraction in a pristine soil with low organic carbon was investigated. Methods Experiments were conducted with synthetic ferrihydrite (F) and ferrihydrite rich sand (FCS). The 2-line ferrihydrite (F) was synthesized according to the method of Schwertmann and Cornell (Schwertmann and Cornell 2000).The quartz sand (Fontainebleau, France) 150-300 µm was cleaned with 1 M HCl for 48 hours,
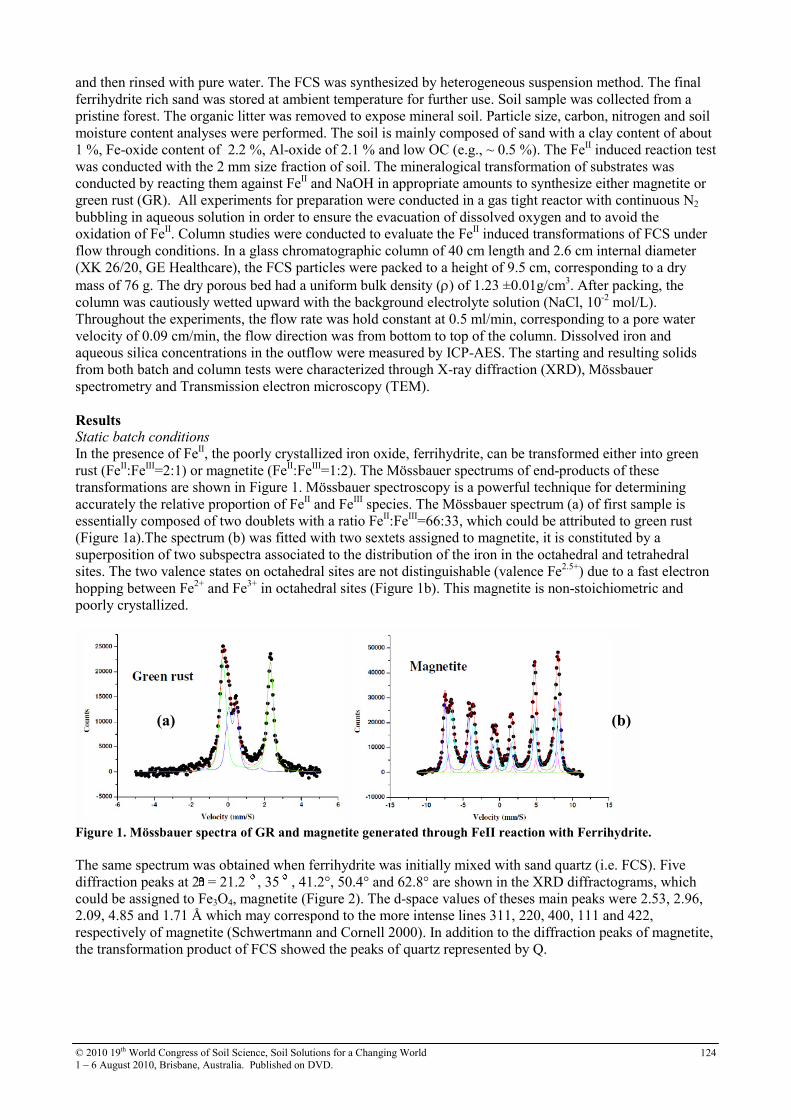
© 2010 19th World Congress of Soil Science, Soil Solutions for a Changing World 1 – 6 August 2010, Brisbane, Australia. Published on DVD.
124
and then rinsed with pure water. The FCS was synthesized by heterogeneous suspension method. The final ferrihydrite rich sand was stored at ambient temperature for further use. Soil sample was collected from a pristine forest. The organic litter was removed to expose mineral soil. Particle size, carbon, nitrogen and soil moisture content analyses were performed. The soil is mainly composed of sand with a clay content of about 1 %, Fe-oxide content of 2.2 %, Al-oxide of 2.1 % and low OC (e.g., ~ 0.5 %). The FeII induced reaction test was conducted with the 2 mm size fraction of soil. The mineralogical transformation of substrates was conducted by reacting them against FeII and NaOH in appropriate amounts to synthesize either magnetite or green rust (GR). All experiments for preparation were conducted in a gas tight reactor with continuous N2 bubbling in aqueous solution in order to ensure the evacuation of dissolved oxygen and to avoid the oxidation of FeII. Column studies were conducted to evaluate the FeII induced transformations of FCS under flow through conditions. In a glass chromatographic column of 40 cm length and 2.6 cm internal diameter (XK 26/20, GE Healthcare), the FCS particles were packed to a height of 9.5 cm, corresponding to a dry mass of 76 g. The dry porous bed had a uniform bulk density (ρ) of 1.23 ±0.01g/cm3. After packing, the column was cautiously wetted upward with the background electrolyte solution (NaCl, 10-2 mol/L). Throughout the experiments, the flow rate was hold constant at 0.5 ml/min, corresponding to a pore water velocity of 0.09 cm/min, the flow direction was from bottom to top of the column. Dissolved iron and aqueous silica concentrations in the outflow were measured by ICP-AES. The starting and resulting solids from both batch and column tests were characterized through X-ray diffraction (XRD), Mössbauer spectrometry and Transmission electron microscopy (TEM).
Results Static batch conditions
In the presence of FeII, the poorly crystallized iron oxide, ferrihydrite, can be transformed either into green rust (FeII:FeIII=2:1) or magnetite (FeII:FeIII=1:2). The Mössbauer spectrums of end-products of these transformations are shown in Figure 1. Mössbauer spectroscopy is a powerful technique for determining accurately the relative proportion of FeII and FeIII species. The Mössbauer spectrum (a) of first sample is essentially composed of two doublets with a ratio FeII:FeIII=66:33, which could be attributed to green rust (Figure 1a).The spectrum (b) was fitted with two sextets assigned to magnetite, it is constituted by a superposition of two subspectra associated to the distribution of the iron in the octahedral and tetrahedral sites. The two valence states on octahedral sites are not distinguishable (valence Fe2.5+) due to a fast electron hopping between Fe2+ and Fe3+ in octahedral sites (Figure 1b). This magnetite is non-stoichiometric and poorly crystallized.
Figure 1. Mössbauer spectra of GR and magnetite generated through FeII reaction with Ferrihydrite.
The same spectrum was obtained when ferrihydrite was initially mixed with sand quartz (i.e. FCS). Five diffraction peaks at 2 = 21.2 , 35 , 41.2°, 50.4° and 62.8° are shown in the XRD diffractograms, which could be assigned to Fe3O4, magnetite (Figure 2). The d-space values of theses main peaks were 2.53, 2.96, 2.09, 4.85 and 1.71 Å which may correspond to the more intense lines 311, 220, 400, 111 and 422, respectively of magnetite (Schwertmann and Cornell 2000). In addition to the diffraction peaks of magnetite, the transformation product of FCS showed the peaks of quartz represented by Q.
(a) (b)
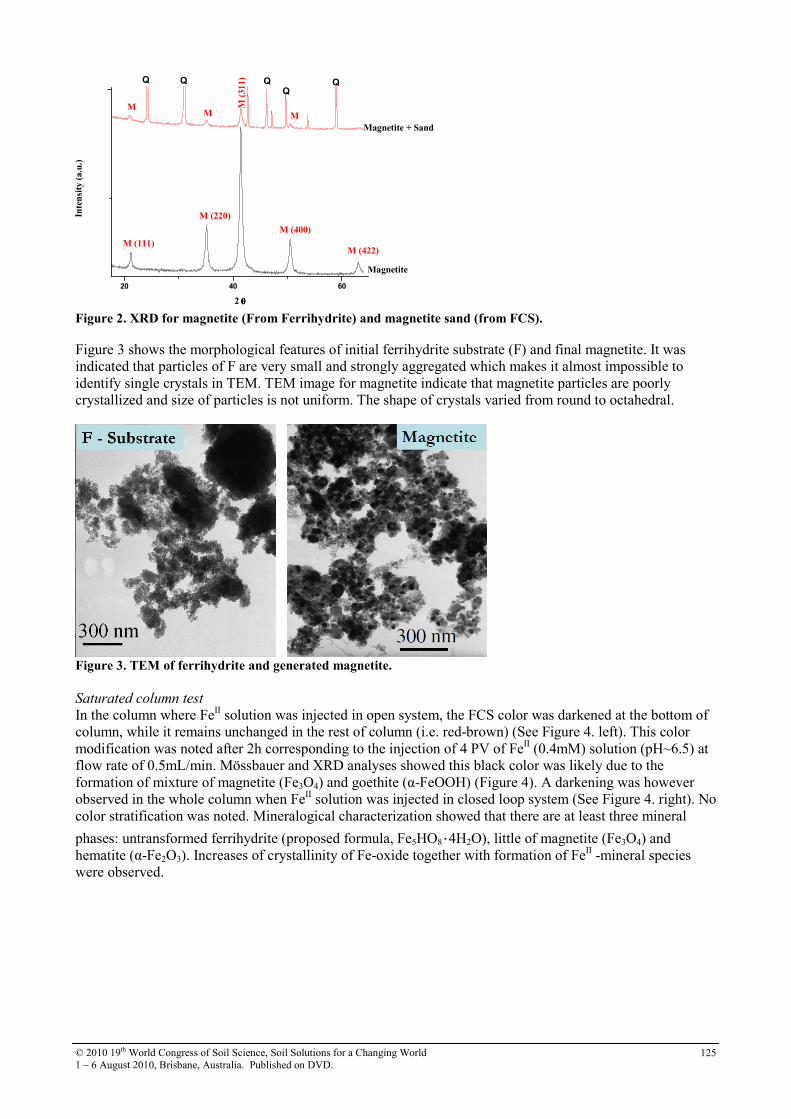
© 2010 19th World Congress of Soil Science, Soil Solutions for a Changing World 1 – 6 August 2010, Brisbane, Australia. Published on DVD.
125
20 40 60
Q
Q QQQ
Magnetite + Sand
Magnetite
M
M (422)
MM
M (400)M
(311)
M (220)
M (111)
Inte
nsi
ty (
a.u
.)
2 θθθθ Figure 2. XRD for magnetite (From Ferrihydrite) and magnetite sand (from FCS).
Figure 3 shows the morphological features of initial ferrihydrite substrate (F) and final magnetite. It was indicated that particles of F are very small and strongly aggregated which makes it almost impossible to identify single crystals in TEM. TEM image for magnetite indicate that magnetite particles are poorly crystallized and size of particles is not uniform. The shape of crystals varied from round to octahedral.
Figure 3. TEM of ferrihydrite and generated magnetite.
Saturated column test
In the column where FeII solution was injected in open system, the FCS color was darkened at the bottom of column, while it remains unchanged in the rest of column (i.e. red-brown) (See Figure 4. left). This color modification was noted after 2h corresponding to the injection of 4 PV of FeII (0.4mM) solution (pH~6.5) at flow rate of 0.5mL/min. Mössbauer and XRD analyses showed this black color was likely due to the formation of mixture of magnetite (Fe3O4) and goethite (α-FeOOH) (Figure 4). A darkening was however observed in the whole column when FeII solution was injected in closed loop system (See Figure 4. right). No color stratification was noted. Mineralogical characterization showed that there are at least three mineral
phases: untransformed ferrihydrite (proposed formula, Fe5HO8·4H2O), little of magnetite (Fe3O4) and hematite (α-Fe2O3). Increases of crystallinity of Fe-oxide together with formation of FeII -mineral species were observed.
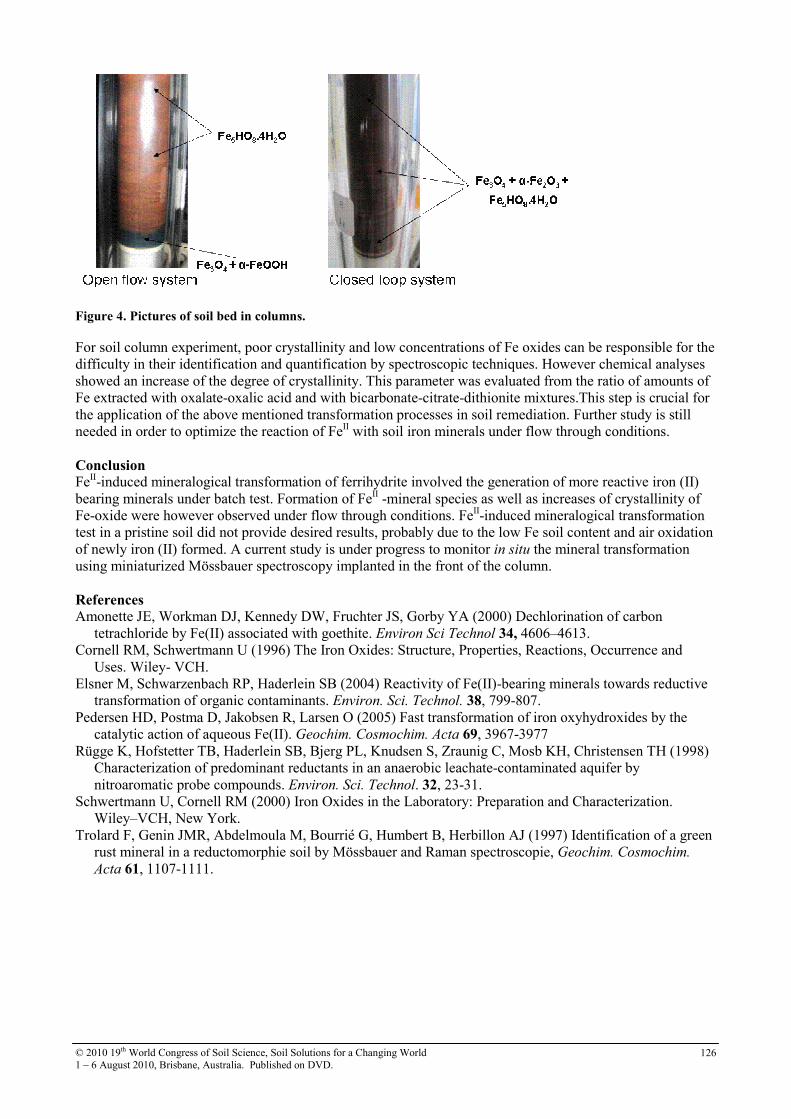
© 2010 19th World Congress of Soil Science, Soil Solutions for a Changing World 1 – 6 August 2010, Brisbane, Australia. Published on DVD.
126
Figure 4. Pictures of soil bed in columns.
For soil column experiment, poor crystallinity and low concentrations of Fe oxides can be responsible for the difficulty in their identification and quantification by spectroscopic techniques. However chemical analyses showed an increase of the degree of crystallinity. This parameter was evaluated from the ratio of amounts of Fe extracted with oxalate-oxalic acid and with bicarbonate-citrate-dithionite mixtures.This step is crucial for the application of the above mentioned transformation processes in soil remediation. Further study is still needed in order to optimize the reaction of FeII with soil iron minerals under flow through conditions. Conclusion FeII-induced mineralogical transformation of ferrihydrite involved the generation of more reactive iron (II) bearing minerals under batch test. Formation of FeII -mineral species as well as increases of crystallinity of Fe-oxide were however observed under flow through conditions. FeII-induced mineralogical transformation test in a pristine soil did not provide desired results, probably due to the low Fe soil content and air oxidation of newly iron (II) formed. A current study is under progress to monitor in situ the mineral transformation using miniaturized Mössbauer spectroscopy implanted in the front of the column. References Amonette JE, Workman DJ, Kennedy DW, Fruchter JS, Gorby YA (2000) Dechlorination of carbon
tetrachloride by Fe(II) associated with goethite. Environ Sci Technol 34, 4606–4613. Cornell RM, Schwertmann U (1996) The Iron Oxides: Structure, Properties, Reactions, Occurrence and
Uses. Wiley- VCH. Elsner M, Schwarzenbach RP, Haderlein SB (2004) Reactivity of Fe(II)-bearing minerals towards reductive
transformation of organic contaminants. Environ. Sci. Technol. 38, 799-807. Pedersen HD, Postma D, Jakobsen R, Larsen O (2005) Fast transformation of iron oxyhydroxides by the
catalytic action of aqueous Fe(II). Geochim. Cosmochim. Acta 69, 3967-3977 Rügge K, Hofstetter TB, Haderlein SB, Bjerg PL, Knudsen S, Zraunig C, Mosb KH, Christensen TH (1998)
Characterization of predominant reductants in an anaerobic leachate-contaminated aquifer by nitroaromatic probe compounds. Environ. Sci. Technol. 32, 23-31.
Schwertmann U, Cornell RM (2000) Iron Oxides in the Laboratory: Preparation and Characterization. Wiley–VCH, New York.
Trolard F, Genin JMR, Abdelmoula M, Bourrié G, Humbert B, Herbillon AJ (1997) Identification of a green rust mineral in a reductomorphie soil by Mössbauer and Raman spectroscopie, Geochim. Cosmochim.
Acta 61, 1107-1111.
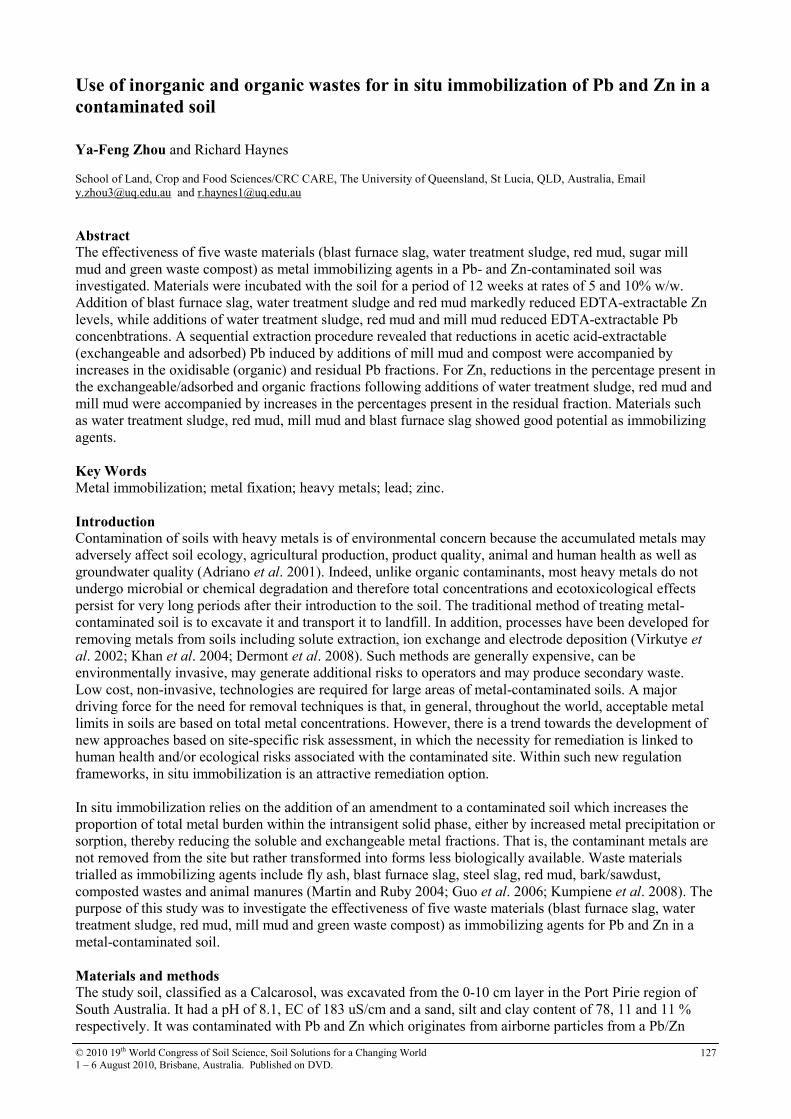
© 2010 19th World Congress of Soil Science, Soil Solutions for a Changing World 1 – 6 August 2010, Brisbane, Australia. Published on DVD.
127
Use of inorganic and organic wastes for in situ immobilization of Pb and Zn in a
contaminated soil
Ya-Feng Zhou and Richard Haynes School of Land, Crop and Food Sciences/CRC CARE, The University of Queensland, St Lucia, QLD, Australia, Email [email protected] and [email protected]
Abstract The effectiveness of five waste materials (blast furnace slag, water treatment sludge, red mud, sugar mill mud and green waste compost) as metal immobilizing agents in a Pb- and Zn-contaminated soil was investigated. Materials were incubated with the soil for a period of 12 weeks at rates of 5 and 10% w/w. Addition of blast furnace slag, water treatment sludge and red mud markedly reduced EDTA-extractable Zn levels, while additions of water treatment sludge, red mud and mill mud reduced EDTA-extractable Pb concenbtrations. A sequential extraction procedure revealed that reductions in acetic acid-extractable (exchangeable and adsorbed) Pb induced by additions of mill mud and compost were accompanied by increases in the oxidisable (organic) and residual Pb fractions. For Zn, reductions in the percentage present in the exchangeable/adsorbed and organic fractions following additions of water treatment sludge, red mud and mill mud were accompanied by increases in the percentages present in the residual fraction. Materials such as water treatment sludge, red mud, mill mud and blast furnace slag showed good potential as immobilizing agents. Key Words
Metal immobilization; metal fixation; heavy metals; lead; zinc. Introduction Contamination of soils with heavy metals is of environmental concern because the accumulated metals may adversely affect soil ecology, agricultural production, product quality, animal and human health as well as groundwater quality (Adriano et al. 2001). Indeed, unlike organic contaminants, most heavy metals do not undergo microbial or chemical degradation and therefore total concentrations and ecotoxicological effects persist for very long periods after their introduction to the soil. The traditional method of treating metal-contaminated soil is to excavate it and transport it to landfill. In addition, processes have been developed for removing metals from soils including solute extraction, ion exchange and electrode deposition (Virkutye et al. 2002; Khan et al. 2004; Dermont et al. 2008). Such methods are generally expensive, can be environmentally invasive, may generate additional risks to operators and may produce secondary waste. Low cost, non-invasive, technologies are required for large areas of metal-contaminated soils. A major driving force for the need for removal techniques is that, in general, throughout the world, acceptable metal limits in soils are based on total metal concentrations. However, there is a trend towards the development of new approaches based on site-specific risk assessment, in which the necessity for remediation is linked to human health and/or ecological risks associated with the contaminated site. Within such new regulation frameworks, in situ immobilization is an attractive remediation option. In situ immobilization relies on the addition of an amendment to a contaminated soil which increases the proportion of total metal burden within the intransigent solid phase, either by increased metal precipitation or sorption, thereby reducing the soluble and exchangeable metal fractions. That is, the contaminant metals are not removed from the site but rather transformed into forms less biologically available. Waste materials trialled as immobilizing agents include fly ash, blast furnace slag, steel slag, red mud, bark/sawdust, composted wastes and animal manures (Martin and Ruby 2004; Guo et al. 2006; Kumpiene et al. 2008). The purpose of this study was to investigate the effectiveness of five waste materials (blast furnace slag, water treatment sludge, red mud, mill mud and green waste compost) as immobilizing agents for Pb and Zn in a metal-contaminated soil. Materials and methods The study soil, classified as a Calcarosol, was excavated from the 0-10 cm layer in the Port Pirie region of South Australia. It had a pH of 8.1, EC of 183 uS/cm and a sand, silt and clay content of 78, 11 and 11 % respectively. It was contaminated with Pb and Zn which originates from airborne particles from a Pb/Zn
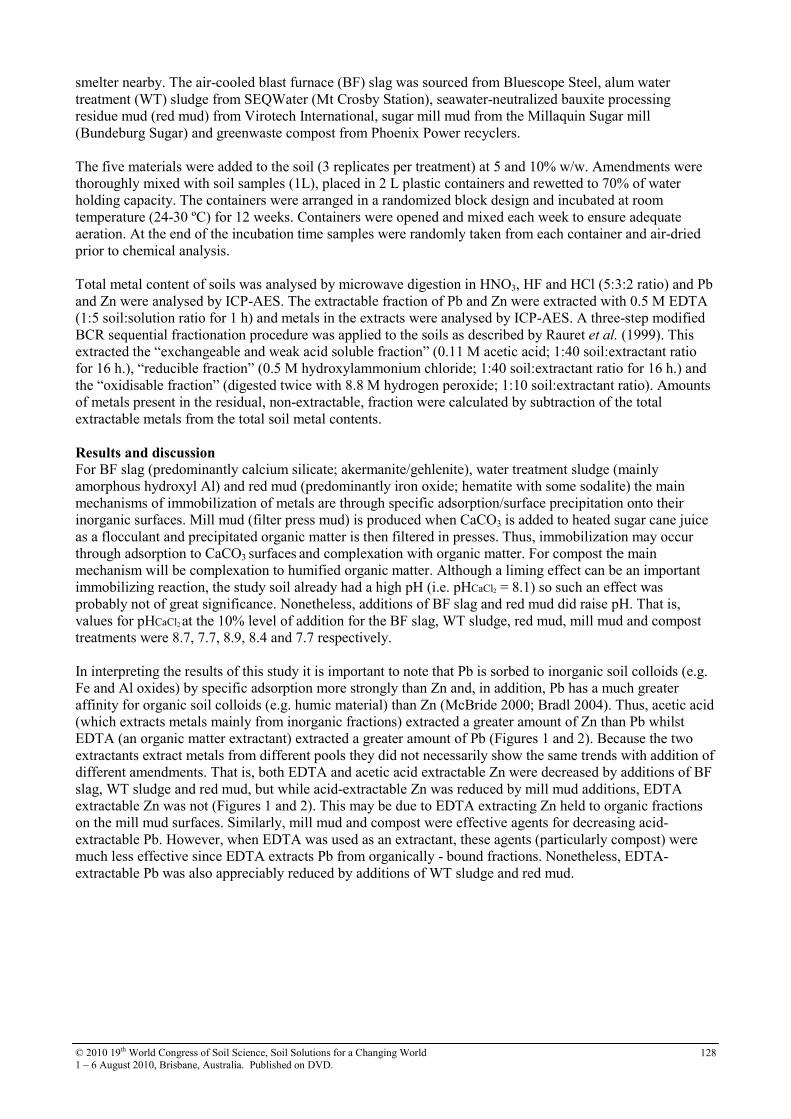
© 2010 19th World Congress of Soil Science, Soil Solutions for a Changing World 1 – 6 August 2010, Brisbane, Australia. Published on DVD.
128
smelter nearby. The air-cooled blast furnace (BF) slag was sourced from Bluescope Steel, alum water treatment (WT) sludge from SEQWater (Mt Crosby Station), seawater-neutralized bauxite processing residue mud (red mud) from Virotech International, sugar mill mud from the Millaquin Sugar mill (Bundeburg Sugar) and greenwaste compost from Phoenix Power recyclers. The five materials were added to the soil (3 replicates per treatment) at 5 and 10% w/w. Amendments were thoroughly mixed with soil samples (1L), placed in 2 L plastic containers and rewetted to 70% of water holding capacity. The containers were arranged in a randomized block design and incubated at room temperature (24-30 ºC) for 12 weeks. Containers were opened and mixed each week to ensure adequate aeration. At the end of the incubation time samples were randomly taken from each container and air-dried prior to chemical analysis. Total metal content of soils was analysed by microwave digestion in HNO3, HF and HCl (5:3:2 ratio) and Pb and Zn were analysed by ICP-AES. The extractable fraction of Pb and Zn were extracted with 0.5 M EDTA (1:5 soil:solution ratio for 1 h) and metals in the extracts were analysed by ICP-AES. A three-step modified BCR sequential fractionation procedure was applied to the soils as described by Rauret et al. (1999). This extracted the “exchangeable and weak acid soluble fraction” (0.11 M acetic acid; 1:40 soil:extractant ratio for 16 h.), “reducible fraction” (0.5 M hydroxylammonium chloride; 1:40 soil:extractant ratio for 16 h.) and the “oxidisable fraction” (digested twice with 8.8 M hydrogen peroxide; 1:10 soil:extractant ratio). Amounts of metals present in the residual, non-extractable, fraction were calculated by subtraction of the total extractable metals from the total soil metal contents. Results and discussion
For BF slag (predominantly calcium silicate; akermanite/gehlenite), water treatment sludge (mainly amorphous hydroxyl Al) and red mud (predominantly iron oxide; hematite with some sodalite) the main mechanisms of immobilization of metals are through specific adsorption/surface precipitation onto their inorganic surfaces. Mill mud (filter press mud) is produced when CaCO3 is added to heated sugar cane juice as a flocculant and precipitated organic matter is then filtered in presses. Thus, immobilization may occur through adsorption to CaCO3 surfaces and complexation with organic matter. For compost the main mechanism will be complexation to humified organic matter. Although a liming effect can be an important immobilizing reaction, the study soil already had a high pH (i.e. pHCaCl2 = 8.1) so such an effect was probably not of great significance. Nonetheless, additions of BF slag and red mud did raise pH. That is, values for pHCaCl2 at the 10% level of addition for the BF slag, WT sludge, red mud, mill mud and compost treatments were 8.7, 7.7, 8.9, 8.4 and 7.7 respectively.
In interpreting the results of this study it is important to note that Pb is sorbed to inorganic soil colloids (e.g. Fe and Al oxides) by specific adsorption more strongly than Zn and, in addition, Pb has a much greater affinity for organic soil colloids (e.g. humic material) than Zn (McBride 2000; Bradl 2004). Thus, acetic acid (which extracts metals mainly from inorganic fractions) extracted a greater amount of Zn than Pb whilst EDTA (an organic matter extractant) extracted a greater amount of Pb (Figures 1 and 2). Because the two extractants extract metals from different pools they did not necessarily show the same trends with addition of different amendments. That is, both EDTA and acetic acid extractable Zn were decreased by additions of BF slag, WT sludge and red mud, but while acid-extractable Zn was reduced by mill mud additions, EDTA extractable Zn was not (Figures 1 and 2). This may be due to EDTA extracting Zn held to organic fractions on the mill mud surfaces. Similarly, mill mud and compost were effective agents for decreasing acid-extractable Pb. However, when EDTA was used as an extractant, these agents (particularly compost) were much less effective since EDTA extracts Pb from organically - bound fractions. Nonetheless, EDTA-extractable Pb was also appreciably reduced by additions of WT sludge and red mud.
© 2010 19th World Congress of Soil Science, Soil Solutions for a Changing World 1 – 6 August 2010, Brisbane, Australia. Published on DVD.
129
0
200
400
600
800
1000
1200
1400
1600
1800
2000
1 2
Acetic acid extractable metals (mg/kg)
CKAir-cooled BF slag (5%)
Air-cooled BF slag (10%)Water treatment sludge (5%)
Water treatment sludge (10%)Red mud (5%)Red mud (10%)
Mill mud (5%)Mill mud (10%)
Compost (5%)Compost (10%)
0.0
200.0
400.0
600.0
800.0
1000.0
1200.0
1 2
EDTA extractale metals (mg/kg) Control
Air-cooled BF slag (5%)Air-cooled BF slag (10%)Water treatment sludge (5%)Water treatment sludge (10%)Red mud (5%)Red mud (10%)Mill mud (5%)Mill mud (10%)Compost (5%)Compost (10%)
Many limitations surround sequential fractionations since they are semi-quantitative and not completely selective, open to redistribution and only operationally defined. They are, however, considered the best available method of gaining knowledge on the forms in which metals are present in soils. The simple fractionation procedure used here showed that for Pb, large reductions in the percentage present in exchangeable/adsorbed (acetic acid extractable) fraction when mill mud and compost were added were accompanied by concomitant increases in those present in the organic (oxidisable) and residual fractions (Table 1). For Zn, reductions in the percentage present in the exchangeable/adsorbed fraction induced by additions of WT sludge, red mud, and mill mud were accompanied by reductions in the percentages present in the organic fraction and large increases in those present in the residual fraction (Table 2). Where predominantly inorganic materials (BF slag, WT sludge, red mud) were added, increases in the residual fraction were probably as a result of adsorbed metals undergoing slow reactions (i.e. diffusion into adsorbent surfaces and occlusion by precipitation) and becoming less extractable. For the addition of compost and mill mud, the increases in Pb in the residual fraction (Table 1) are probably related to Pb becoming very strongly chelated by stable organic material. Table 1. Sequential extraction of Pb from a contaminated soil after incubation with five waste materials
Treatments Acetic acid
extractable
(%)
Reducible
(%)
Oxidizable
(%)
Residual
(%)
CK 30 11 6 53 BF slag 29 11 7 52 WT sludge 25 11 5 59 Red mud 19 14 4 62 Mill mud 2 18 11 69 Compost 14 11 10 66
Table 2. Sequential extraction of Zn from a contaminated soil after incubation with five waste materials
Treatments Acetic acid
extractable
(%)
Reducible
(%)
Oxidizable
(%)
Residual
(%)
CK 25 13 13 49 BF slag 21 10 12 57 WT sludge 17 13 4 65 Red mud 19 16 5 60 Mill mud 19 14 9 58 Compost 24 13 9 54
Figure 1 Effect of incubation of a contaminated soil
with five waste materials on EDTA-extractable Pb
and Zn
Pb Zn Pb Zn
Figure 2 Effect of incubation of a contaminated
soil with five waste materials on acetic acid-
extractable Pb and Zn
© 2010 19th World Congress of Soil Science, Soil Solutions for a Changing World 1 – 6 August 2010, Brisbane, Australia. Published on DVD.
130
Conclusions
Of the waste materials trialled as immobilizing agents, WT sludge, red mud and mill mud seemed most effective for Pb and BF slag, WT sludge and red mud most effective for Zn. However, for immobilization to be an effective remediation strategy bioavailable metals must be reduced in the long-term. For that reason the experiment will be sampled again after one-years reaction time of the amendments with the soil. In addition plant growth/metal uptake and soil microbial activity will be examined at that time. References Adriano DC (2001) Trace Elements in Terrestrial Environments; Biogeochemistry, Bioavailability and Risks
of Metals. (Springer, New York). Bradl HB (2004) Adsorption of metal ions on soils and soils constituents. Journal of Colloid and Interface
Science 277, 1-18. Dermont G, Bergeron M, Mercier M, Richer-Lafleche M (2008) Soil washing for metal removal: a review of
physical/chemical technologies and field applications. Journal of Hazardous Materials 152, 1-31. Guo G, Zhou Q, Ma LQ (2006) Availability and assessment of fixing additives for in situ remediation of
heavy metal contaminated soils: a review. Environmental Monitoring and Assessment 116, 513-528. Khan FI, Husain T, Hejazi, R (2004) An overview and analysis of site remediation technologies. Journal of
Environmental Management 71, 95-122. Kumpiene J, Lagerkvist A, Maurice C (2008) Stabilization of As, Cr, Cu, Pb and Zn in soil using
amendments – a review. Waste Management 28, 215-225. Martin TA, Ruby MV (2004) Review of in situ remediation technologies for lead, zinc and cadmium in soil.
Remediation 14, 21-32. McBride MB (2000) Chemisorption and precipitation reactions. In ‘Handbook of Soil Science’. (Ed ME
Sumner) pp. B265-B302. (CRC Press, Boca Raton).. Rauret G, Lopez-Sannchez JF, Sahuquillo A, Rubio R, Davidson CM, Ure AM, Quevauviller Ph (1999)
Improvement of the BCR three step sequential extraction procedure prior to certification of new sediment and soil reference materials. Journal of Environmental Monitoring 1, 57-61.
Virkutyte J, Sillanpaa M, Latostenmaa P (2002) Electrokinetic soil remediation – critical overview. Science of the Total Environment 289, 97-121.