(ii) srceo3 between 1273 k and 1723 k - core
TRANSCRIPT
General rights Copyright and moral rights for the publications made accessible in the public portal are retained by the authors and/or other copyright owners and it is a condition of accessing publications that users recognise and abide by the legal requirements associated with these rights.
• Users may download and print one copy of any publication from the public portal for the purpose of private study or research. • You may not further distribute the material or use it for any profit-making activity or commercial gain • You may freely distribute the URL identifying the publication in the public portal
If you believe that this document breaches copyright please contact us providing details, and we will remove access to the work immediately and investigate your claim.
Downloaded from orbit.dtu.dk on: Dec 21, 2017
Thermoelastic and structural properties of ionically conducting cerate perovskites: (II)SrCeO3 between 1273 K and 1723 K
Knight, Kevin S.; Haynes, Richard; Bonanos, Nikolaos; Azough, Feridoon
Published in:Dalton Transactions
Link to article, DOI:10.1039/c5dt00041f
Publication date:2015
Document VersionPeer reviewed version
Link back to DTU Orbit
Citation (APA):Knight, K. S., Haynes, R., Bonanos, N., & Azough, F. (2015). Thermoelastic and structural properties of ionicallyconducting cerate perovskites: (II) SrCeO3 between 1273 K and 1723 K. Dalton Transactions, 44(23), 10773-10784. DOI: 10.1039/c5dt00041f
Thermoelastic and structural properties of ionically conducting cerate perovskites: (II) SrCeO3 between 1273 K and 1723 K
Kevin S. Knight, ab* Richard Haynes,a Nikolaos Bonanos,c Feridoon Azough,d
a ISIS Facility, STFC Rutherford Appleton Laboratory, Harwell Oxford, Didcot, Oxfordshire, OX11 0QX, UK
b Department of Earth Sciences, The Natural History Museum, Cromwell Road, London, SW7 5BD, UK
c Department of Energy Conversion and Storage, Technical University of Denmark, Frederiksborgvej 399, 4000 Roskilde, Denmark
d Materials Science Centre, School of Materials, University of Manchester, Grosvenor Street, Manchester, M13 9PL, UK
*Corresponding author. Tel.: +44 1235 445220; fax: +44 1235 445720
E-mail address: [email protected] (K. S. Knight)
ABSTRACT
The temperature dependence of the crystal structure and the thermoelastic properties of SrCeO3 have been determined from Rietveld refinement of high resolution, neutron time-of-flight powder diffraction data collected in 5 K intervals between 1273 K and 1723 K. No evidence was found for critical behaviour in the amplitudes of the modes that soften in zone boundary phase transitions in perovskite-structured phases suggesting SrCeO3 may remain orthorhombic, space group Pbnm from 1.2 K up to the 1 atm melting point of 2266 K. The temperature variation of the crystal structure has been determined from mode decomposition techniques and the structural evolution has been inferred from the temperature-dependences of the spontaneous shear strain and the order parameter associated with the anti-phase tilt. Thermoelastic properties have been derived from the temperature variation of the unit cell, isobaric heat capacity, and atomic displacement parameters and shows good agreement
with earlier work carried out on the lightly doped system SrCe0.95Yb0.05O ( ~ 3). Temperature-dependent corrections for the bond valence parameters for strontium and cerium are reported.
Keywords: SrCeO3, Crystal structure, Thermoelastic properties, Protonic conductor, Neutron Diffraction
Introduction
The study of the structural and thermoelastic properties of perovskite-structured oxides as a function of temperature and pressure has relevance in fields as diverse as mineralogy1 and geophysics2, through to materials science3,4 and condensed-matter physics5. As an example, the physical properties of SrCeO3 have been extensively investigated: (i) as a model phase to characterize fission product inclusions in high burn up UO2 nuclear fuel6, (ii) as the host structure for hydrogen-based fuel cells7, and (iii), due to its potential to act an isostructural clone phase for the dominant phase of the Earth’s lower mantle, perovskite-structured MgSiO3
8.
The crystal structure of SrCeO3 at ambient temperature in space group Pnma (or alternative settings of the same space group, Pbnm, or Pmcn) has been determined from powder X-ray diffraction data9, and this structure was refined to higher precision in the anion coordinates from time-of-flight, powder neutron diffraction data10. The temperature dependence of the crystal structure of the protonic
conducting phase SrCe0.95Yb0.05O ( ~ 3)11 has been studied in 25 K steps between 373 K and 1273 K12 finding no evidence for critical behaviour in either of the two primary order parameters i.e. no evidence for incipient structural phase transitions, in agreement with conclusions drawn from isobaric heat capacity measurements made at higher temperatures. Vibrational Debye temperatures calculated from fitting the temperature-variations of the isotropic, or isotropic equivalent atomic displacement parameters, has shown that the two cations have similar characteristic temperatures (Sr 222(1) K; Ce 265(2) K) and that these are significantly separated in energy from those determined for the two crystallographically inequivalent anion sites (O1, 4c, 494(4) K; O2, 8d, 479(3) K)12. The Debye temperature of SrCeO3 has been estimated at 359 K from measurements of the longitudinal and transverse sound velocities6, however this value was calculated assuming a bulk modulus of 64 GPa, which is far removed from the value determined directly from the equation-of-state (110.1 GPa)13. The isobaric heat capacity has been determined on several occasions; between 5 K and 1500 K14, 298.15 K and 1700 K15, and 270 K to 900 K16, with no evidence being found for structural phase transitions in the temperature interval 5 K – 1700 K. Fitting the isobaric heat capacity to a variety of Debye-based vibrational density of states models17 has shown that a single Debye moment is
insufficient to characterise the material, and that below 300 K, SrCeO3 behaves as a Debye-like solid, but with two characteristic temperatures, 206(6) K, and 604(7) K12. The observation of two characteristic Debye temperatures in the approximated vibrational density of states, and two, well-separated vibrational Debye temperatures for the cations, and anions, appears to be common in perovskite-structured compounds being observed in CaTiO3
18, LaGaO319 and BaCeO3
20 suggesting a commonality in the phonon density of states for simple ionic perovskite-structured phases.
Despite the clear lack of evidence from heat capacity measurements for structural phase transitions up to 1700 K, HRTEM images of SrCeO3 synthesised at 1673 K21 indicate the presence of anti-site disorder, or possibly ferroelastic twin domains which would be expected in a structural phase transition in which the crystal system had changed. There remains, therefore, an ambiguity as to whether SrCeO3 undergoes a high temperature structural phase transition between 1273 K and 1700 K.
As the order parameters for structural phase transitions in simple perovskite-structured compounds are proportional to the amplitudes of the symmetry-adapted basis-vectors of the aristotype
phase that transform as the irreducible representations (irreps) 4R and/or 3M , and moreover, as these
only involve displacements of the anions22, it is necessary to use neutron, not X-ray diffraction, for detailed structural characterisation. In addition, the spontaneous strains that develop at these zone-boundary phase transitions in perovskite-structured phases are generally small, and hence it is equally important that data are collected at high real space resolution. In this investigation of the thermoelastic properties and potential high temperature structural phase transitions in SrCeO3, we have utilised the advantages of neutron diffraction over X-ray diffraction, and an instrument with an almost Q-
independent resolution (Q = 4sin/) of 5 10-4.
Experimental
Synthesis
Polycrystalline SrCeO3 was prepared by solid state reaction of SrCO3, and CeO210. Starting materials
were mixed, pre-reacted at 1273 K and then ground and re-fired at 1473 K, and again at 1673 K.
Finally the product was ground to <100 m and fired at 873 K.To produce a suitable sample for neutron diffraction, SrCeO3 powder was uniaxially compressed at a pressure of 100 MPa to produce pellets of diameter 10 mm and height 12 mm. The pellets were then sintered in air at 1673 K for 4 hours; heating and cooling rates were 180 K h-1.
High resolution powder neutron diffraction
High resolution powder neutron diffraction data were collected using the HRPD diffractometer of the ISIS spallation neutron source in time-of-flight range 30 – 130 ms which corresponds to a d-spacing range of 0.6 – 2.6 Å in the backscattering detector bank. The pelleted sample was located in a thin foil vanadium sample container in the hot-zone of a modified ISIS furnace equipped with vanadium
elements and heat shields. The furnace was pumped down to a vacuum of ~ 5 10-4 mbar and the sample slowly heated to 1273 K over a two hour period. The sample was then equilibrated at this temperature for two further hours before commencement of data collection. Data were collected at
1273 K for 80 Ah (approximately 2 h), then in 5 K steps to 1723 K with a protocol of 4 short data
collections (15 Ah, 12 Ah or 10 Ah, duration depending on temperature) followed by a longer
data collection (80 Ah, 60 Ah or 50 Ah, duration depending on temperature). An equilibration period of 5 minutes was applied once the sample had reached the set point temperature, and the
temperature variation during data collection was 0.1 K at all temperatures.
The neutron diffraction data from two detector banks with mean Bragg angles of 86.164 and
45 were focused, normalised to the incident flux distribution and corrected for wavelength-dependent detector efficiency. The reduced data were further corrected for self-shielding for a sample with
measured number density 8.4 10-3 Å-3, calculated cross sections of 21.89 b for scattering, and 1.91 b at a wavelength of 1.98 Å for wavelength-dependent absorption. Two histograms of data in the time-
of-flight range 32 – 120 ms, corresponding to d-spacing ranges of 0.62 – 2.4 Å at 2 = 168.329, and
0.88 – 3.39 Å at 2 = 90, were used in profile refinement, as implemented in the GSAS package23.
Results and discussion
To test for the presence of structural phase transitions, each of the ninety one data sets was examined for changes in the multiplicities of the pseudocubic h00, hh0 and hhh reflections, and secondly, for the presence of superlattice reflections at the R, M, and X points of the pseudocubic Brillouin zone. The former is diagnostic of changes in the pseudocubic metric, the latter for changes in the octahedral tilt patterns. Taken together, both can readily be related to the true unit cell metric and space group of a new hettotype phase24, 25. No evidence was found for changes in the fundamental reflection multiplicities, and no class of superlattice reflection was lost in the temperature interval 1273 K to 1723 K, hence the space group of SrCeO3 (Pbnm) is unchanged at high temperature from that determined under ambient conditions 9, 10. The 1273 K data set of SrCeO3 was fitted first using the
structural model of SrCe0.95Yb0.05O ( ~ 3) that had been determined from data collected at the identical temperature12. Convergence from this trial solution was rapid for a model with isotropic atomic displacement parameters for the cations, and anisotropic atomic displacement parameters for the anions. A typical result from the longer data collections is listed in Table 1, and the quality of fit is
illustrated in Figure 1, for data collected at 1573 K for 50 Ah; estimated standard deviations in the fractional coordinates for the shorter data collections are of the order of 1.5 larger than those listed.
Thermal expansion behaviour
The temperature-variation of the lattice parameters, the unit cell volume, and their respective thermal expansion coefficients is illustrated in Figure 2. All three axes exhibit positive thermal expansion coefficients over the whole temperature interval, and in the case of the a, and c axes, the temperature-dependence is close to linear except at the highest temperatures. By contrast, the b axis, which frequently exhibits anomalous behaviour in temperature in perovskite-structured phases (in the Pbnm setting of the space group)26, shows a marked non-linear behaviour that begins at ~1500 K. All data were fitted to an empirical quartic polynomial expansion in temperature, l(T) = l0 + l1T + l2T
2 + l3T3 +
l4T4 (1273 K T 1723 K), shown as the full black line on the Figure, with the fitting coefficients, li,
detailed in Table 2. The relationship between the axial thermal expansion coefficients derived for
space group Pbnm with ideal octahedra (a (d ln(a)/dT) = c (d ln(c)/dT) + b (d ln(b)/dT)), which
was found to be close to exact in SrCe0.95Yb0.05O ( ~ 3)12, is found to break down above 1273 K in
SrCeO3, however, for all temperatures measured, a > c > b. The mean axial and volumetric
thermal expansion coefficients for the temperature range 1273 K T 1723 K and their associated standard uncertainties are listed as footnotes to Table 2.
Spontaneous strain
The analysis of the superlattice reflection intensities, and the lack of changes in the fundamental reflections, indicate that there are no structural phase transitions in the interval 1273 K to 1723 K, however the thermodynamic evolution of the Pbnm phase of SrCeO3 can be inferred from the temperature dependence of the spontaneous strain27, 28. To allow the simple use of the tabulated symmetry-adapted form of the strains29, it is necessary to transform the lattice parameters to the standard setting of the space group (Pnma: lattice parameters differentiated from Pbnm by primed symbols in the expressions shown below). Furthermore, as there is no aristotype phase in this system to allow extrapolation of the reference lattice parameter, a0(T), into the hettotype phase, we make the approximation that the reference lattice parameter can be calculated from the experimentally determined unit cell volume ((V(T)/4)1/3). As a result of this approximation, the volume strain, ea, is an inaccessible parameter. Using a Landau free energy expansion (G) to 6th order in the order parameters (q2, q4), quadratic in strain (ei) and linear in order-parameter-strain-coupling29, three symmetry adapted strains can be calculated; the volume strain, ea, the orthorhombic strain, eox, and the tetragonal strain etx. The symmetry adapted strains are given by combinations of the linear strain components e1, e2, e3 as29
a 1 2 3
ox 1 2
tx 3 1 21
(2 )3
e e e e
e e e
e e e e
where
01
0
0 02 3
0 0
'/ 2
'/ 2 '/ 2
b ae
a
a a c ae e
a a
.
For the space group Pnma, eox = 0, additionally, there exists a shear strain e4, and ea cannot be determined from our data for the reasons outlined above.
0 04
0 0
'/ 2 '/ 2a a c ae
a a
On the basis that the derivative of the free energy with respect to strain is zero, the strain/order parameter relationships are given by28, 29
24
4 02 6 7 442
5 5
2 23 2 4 4
tx 0 011 12
2
4
qe
Cq
q qe
C C
for order parameters q2 (related to the in-phase tilt), and q4 (related to the anti-phase tilt), coupling
constants i and bare elastic constants of the (hypothetical) aristotype phase, 0ijC .
The essential features of the temperature variations of the tetragonal strain etx and the shear strain e4 are illustrated in Figure 3 along with the temperature dependence of the order parameter q4 and the evolution of the order parameter q2 with q4. Order parameters were extracted from the unit cell parameters and fractional coordinates using mode decomposition30, as described in the subsequent section describing the temperature-dependence of the crystal structure. From the Figure it can be seen that: (i) the order parameter associated with the in-phase tilt, q2, varies linearly with that associated with the anti-phase tilt, q4, and (ii), that the square of q4 varies linearly with temperature. Substitution of these expressions into the strain/order parameter relations allows them to be fitted as a function of temperature, as shown by the full lines on this Figure. Interpretation of the tetragonal strain is complicated due to the lack of data at higher temperature, and the clear absence of structural phase transitions to higher symmetry phases. For the isostructural compound SrZrO3, analysis of the evolution of the tetragonal strain from phases with space groups Imma at temperatures above 1023 K, and I4/mcm above 1343 K indicates both transitions are related to the aristotype phase by the same instability with tricritical evolution29, 31. The deviation of the tetragonal strain in the Pnma phase from the trend developed in the Imma phase was found to be consistent with tricritical character at the Pnma – Imma phase transition29. If the temperature variation of the spontaneous strain e4 of SrCeO3 is
considered, the magnitude of 044
5
C would be expected to be significantly greater than
2 6 72
52q
and hence to a good approximation e4 varies as 24q . The temperature dependence
of 24q is linear, as shown in Figure 3c, and hence the evolution of the crystal structure as given by the
Landau free energy G behaves as if there exists a (potentially hypothetical) high temperature second order phase transition, and that 6th order terms in the free energy expansion of the order parameters are small enough to be ignored.
Crystal structure, cation bond valence sums, and atomic displacement parameters
It has been well-established that the structural changes in any perovskite-structured compound as a function of any thermodynamic variable are most easily appreciated using the technique of mode decomposition30, 32-33 rather than the earlier semi-empirical methods that have been proposed34. Furthermore, mode decomposition is the only technique to correctly determine the magnitudes of the order parameters (tilt angles) free from the effects of octahedral distortive modes26. In particular, and of relevance to this work, it affords a simple means of explaining the structural variations (bond lengths, polyhedral volumes) for perovskite-structured materials, and this has been carried out for a
number of temperature, and pressure-dependent studies of compounds with space group Pbnm (Pnma)12, 13, 18-20, 26, 35.
For each temperature, the amplitudes of the seven symmetry-adapted basis-vectors of the (hypothetical) aristotype phase of SrCeO3 that are consistent with space group Pbnm36-38 were determined from the unit cell parameters and fractional coordinates30, and these are illustrated in Figure 4 with low-order polynomials fitted to these data, shown as the full black lines. Displacements associated with the anion are shown in Figures 4a,b, those for the cations as Figures 4c-g: amplitudes related to the primary order parameters (anti-phase tilt, and in-phase tilt) are illustrated in Figures
4c,d. With the exception of the displacement that transforms as the irrep 2M , which is only found to
show an appreciable magnitude in systems with Jahn-Teller active B-site cations39, all other mode amplitudes are all found to reduce with increasing temperature indicating a structural evolution to higher symmetry. Additional evidence for the likely absence of displacive phase transitions in SrCeO3 at temperatures significantly above 1748 K can be seen from the temperature-dependence of the two
displacements that transform as the irreps 4R and 3M which show no evidence for critical softening
in the temperature range investigated. Estimation of any potential phase transition temperature by extrapolation of these two mode magnitudes to zero amplitude shows it to occur significantly above the experimental 1 atm. melting temperature of 2266 K6.
Bond lengths for the octahedral CeO6 octahedron, and the 8-fold coordinated Sr cation polyhedron at 1573 K are tabulated in Table 1, and shown graphically for the SrO8 polyhedron in Figure 5; Atom labelling is identical to earlier work carried out on KCaF3
30.
The full temperature-dependence of the five symmetry independent bond lengths in the irregular SrO8 polyhedron are illustrated in Figure 6, where the full black lines on each of these figures shows the predicted behaviour of the bonds30 based on the quartic parameterisation of the unit cell constants, and the low-order polynomial parameterisation of the seven symmetry-adapted basis-vector amplitudes. Agreement between the observed bond lengths and the calculated temperature variation is excellent in all cases. At 1573 K, the Sr – O bond linear thermal expansion coefficients
are in the order Sr – O1(1) (10.12 10-5 K-1) > Sr – O2(1) (5.22 10-5 K-1) > Sr – O2(5) (3.29 10-5
K-1) > Sr – O2(3) (2.84 10-5 K-1) > Sr – O1(3) (2.38 10-5 K-1), with that associated with Sr – O1(1) being found to be on average a factor of two greater than the other Sr – O bond expansivities over the whole temperature range. Analysis of the contributions of the individual modes to the large expansion coefficient of this bond shows it can be attributed to the sympathetic displacements associated with
both the cation and anion modes that transform as the irrep 5X , and that the contribution from the b
axis is significantly smaller. Despite the magnitude of the linear thermal expansion associated with the
a axis and the sympathetic displacement associated with the anti-phase tilt ( 4R ), the bond expansivity
of Sr – O1(3) is significantly reduced due to large antipathetic contributions from both the anion and
cation displacements that transform as the irreps 5R and 5X . The cation – anion O2 bonds in
perovskite-structured phases are generally more difficult to parameterise than those to O1 as they have components in 3 dimensions due to them lying out of the mirror plane. Furthermore, in materials with space group Pbnm that exhibit strong critical behaviour in the tilt modes, it is generally found that the axial thermal expansions, the tilt modes, and cation displacement modes dominate the anion – O2 bond expansion behaviour. In the case of SrCeO3 at high temperature the behaviour of these bonds
are dominated by the cation displacement mode that transforms as the irrep 5X and the two tilt
displacements that transform as 5R and 5X . The contribution from the thermal expansion of the
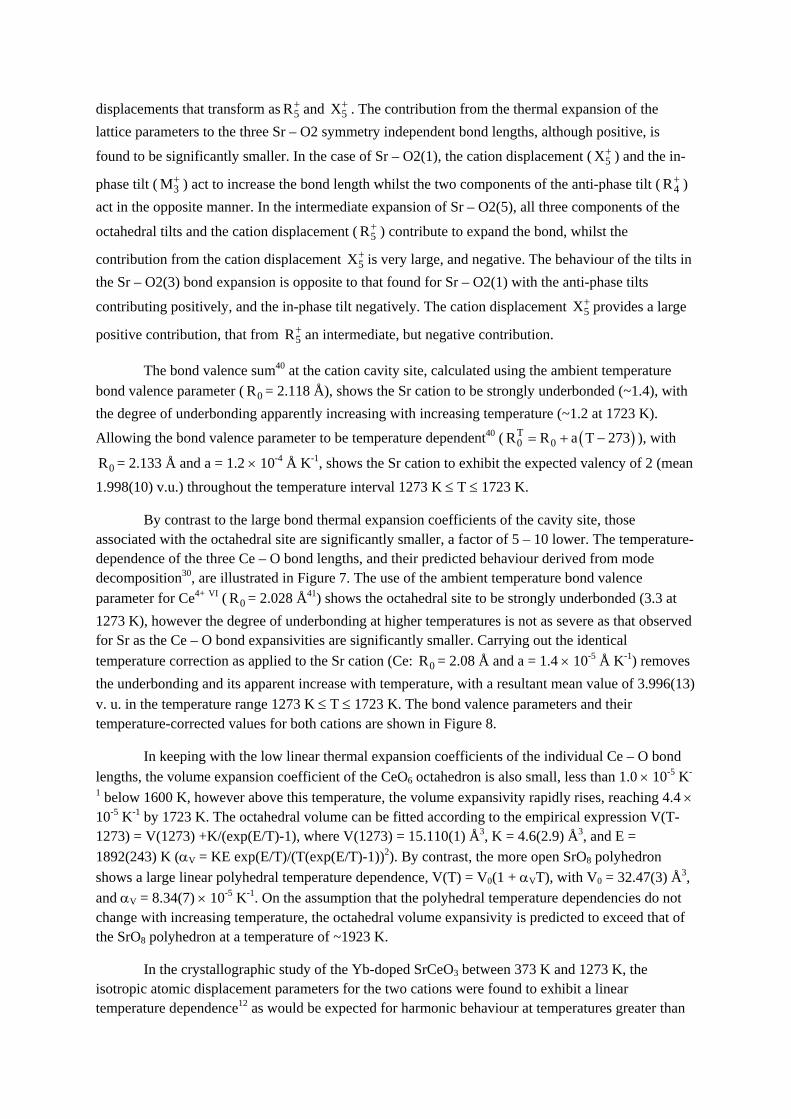
lattice parameters to the three Sr – O2 symmetry independent bond lengths, although positive, is
found to be significantly smaller. In the case of Sr – O2(1), the cation displacement ( 5X ) and the in-
phase tilt ( 3M ) act to increase the bond length whilst the two components of the anti-phase tilt ( 4R )
act in the opposite manner. In the intermediate expansion of Sr – O2(5), all three components of the
octahedral tilts and the cation displacement ( 5R ) contribute to expand the bond, whilst the
contribution from the cation displacement 5X is very large, and negative. The behaviour of the tilts in
the Sr – O2(3) bond expansion is opposite to that found for Sr – O2(1) with the anti-phase tilts
contributing positively, and the in-phase tilt negatively. The cation displacement 5X provides a large
positive contribution, that from 5R an intermediate, but negative contribution.
The bond valence sum40 at the cation cavity site, calculated using the ambient temperature
bond valence parameter ( 0R = 2.118 Å), shows the Sr cation to be strongly underbonded (~1.4), with
the degree of underbonding apparently increasing with increasing temperature (~1.2 at 1723 K).
Allowing the bond valence parameter to be temperature dependent40 ( T0 0R R a T 273 ), with
0R = 2.133 Å and a = 1.2 10-4 Å K-1, shows the Sr cation to exhibit the expected valency of 2 (mean
1.998(10) v.u.) throughout the temperature interval 1273 K T 1723 K.
By contrast to the large bond thermal expansion coefficients of the cavity site, those associated with the octahedral site are significantly smaller, a factor of 5 – 10 lower. The temperature-dependence of the three Ce – O bond lengths, and their predicted behaviour derived from mode decomposition30, are illustrated in Figure 7. The use of the ambient temperature bond valence
parameter for Ce4+ VI ( 0R = 2.028 Å41) shows the octahedral site to be strongly underbonded (3.3 at
1273 K), however the degree of underbonding at higher temperatures is not as severe as that observed for Sr as the Ce – O bond expansivities are significantly smaller. Carrying out the identical
temperature correction as applied to the Sr cation (Ce: 0R = 2.08 Å and a = 1.4 10-5 Å K-1) removes
the underbonding and its apparent increase with temperature, with a resultant mean value of 3.996(13)
v. u. in the temperature range 1273 K T 1723 K. The bond valence parameters and their temperature-corrected values for both cations are shown in Figure 8.
In keeping with the low linear thermal expansion coefficients of the individual Ce – O bond
lengths, the volume expansion coefficient of the CeO6 octahedron is also small, less than 1.0 10-5 K-
1 below 1600 K, however above this temperature, the volume expansivity rapidly rises, reaching 4.4 10-5 K-1 by 1723 K. The octahedral volume can be fitted according to the empirical expression V(T-1273) = V(1273) +K/(exp(E/T)-1), where V(1273) = 15.110(1) Å3, K = 4.6(2.9) Å3, and E =
1892(243) K (V = KE exp(E/T)/(T(exp(E/T)-1))2). By contrast, the more open SrO8 polyhedron
shows a large linear polyhedral temperature dependence, V(T) = V0(1 + VT), with V0 = 32.47(3) Å3,
and V = 8.34(7) 10-5 K-1. On the assumption that the polyhedral temperature dependencies do not change with increasing temperature, the octahedral volume expansivity is predicted to exceed that of the SrO8 polyhedron at a temperature of ~1923 K.
In the crystallographic study of the Yb-doped SrCeO3 between 373 K and 1273 K, the isotropic atomic displacement parameters for the two cations were found to exhibit a linear temperature dependence12 as would be expected for harmonic behaviour at temperatures greater than
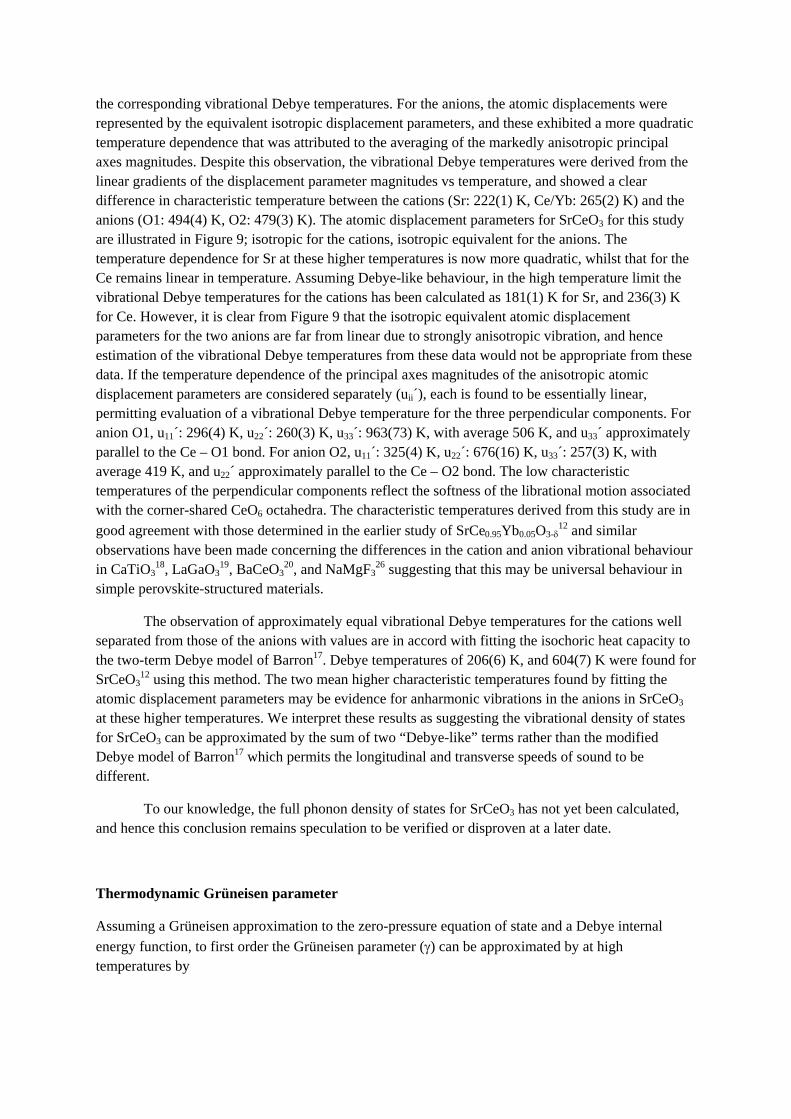
the corresponding vibrational Debye temperatures. For the anions, the atomic displacements were represented by the equivalent isotropic displacement parameters, and these exhibited a more quadratic temperature dependence that was attributed to the averaging of the markedly anisotropic principal axes magnitudes. Despite this observation, the vibrational Debye temperatures were derived from the linear gradients of the displacement parameter magnitudes vs temperature, and showed a clear difference in characteristic temperature between the cations (Sr: 222(1) K, Ce/Yb: 265(2) K) and the anions (O1: 494(4) K, O2: 479(3) K). The atomic displacement parameters for SrCeO3 for this study are illustrated in Figure 9; isotropic for the cations, isotropic equivalent for the anions. The temperature dependence for Sr at these higher temperatures is now more quadratic, whilst that for the Ce remains linear in temperature. Assuming Debye-like behaviour, in the high temperature limit the vibrational Debye temperatures for the cations has been calculated as 181(1) K for Sr, and 236(3) K for Ce. However, it is clear from Figure 9 that the isotropic equivalent atomic displacement parameters for the two anions are far from linear due to strongly anisotropic vibration, and hence estimation of the vibrational Debye temperatures from these data would not be appropriate from these data. If the temperature dependence of the principal axes magnitudes of the anisotropic atomic displacement parameters are considered separately (uii´), each is found to be essentially linear, permitting evaluation of a vibrational Debye temperature for the three perpendicular components. For anion O1, u11´: 296(4) K, u22´: 260(3) K, u33´: 963(73) K, with average 506 K, and u33´ approximately parallel to the Ce – O1 bond. For anion O2, u11´: 325(4) K, u22´: 676(16) K, u33´: 257(3) K, with average 419 K, and u22´ approximately parallel to the Ce – O2 bond. The low characteristic temperatures of the perpendicular components reflect the softness of the librational motion associated with the corner-shared CeO6 octahedra. The characteristic temperatures derived from this study are in
good agreement with those determined in the earlier study of SrCe0.95Yb0.05O3-12 and similar
observations have been made concerning the differences in the cation and anion vibrational behaviour in CaTiO3
18, LaGaO319, BaCeO3
20, and NaMgF326 suggesting that this may be universal behaviour in
simple perovskite-structured materials.
The observation of approximately equal vibrational Debye temperatures for the cations well separated from those of the anions with values are in accord with fitting the isochoric heat capacity to the two-term Debye model of Barron17. Debye temperatures of 206(6) K, and 604(7) K were found for SrCeO3
12 using this method. The two mean higher characteristic temperatures found by fitting the atomic displacement parameters may be evidence for anharmonic vibrations in the anions in SrCeO3 at these higher temperatures. We interpret these results as suggesting the vibrational density of states for SrCeO3 can be approximated by the sum of two “Debye-like” terms rather than the modified Debye model of Barron17 which permits the longitudinal and transverse speeds of sound to be different.
To our knowledge, the full phonon density of states for SrCeO3 has not yet been calculated, and hence this conclusion remains speculation to be verified or disproven at a later date.
Thermodynamic Grüneisen parameter
Assuming a Grüneisen approximation to the zero-pressure equation of state and a Debye internal
energy function, to first order the Grüneisen parameter () can be approximated by at high temperatures by
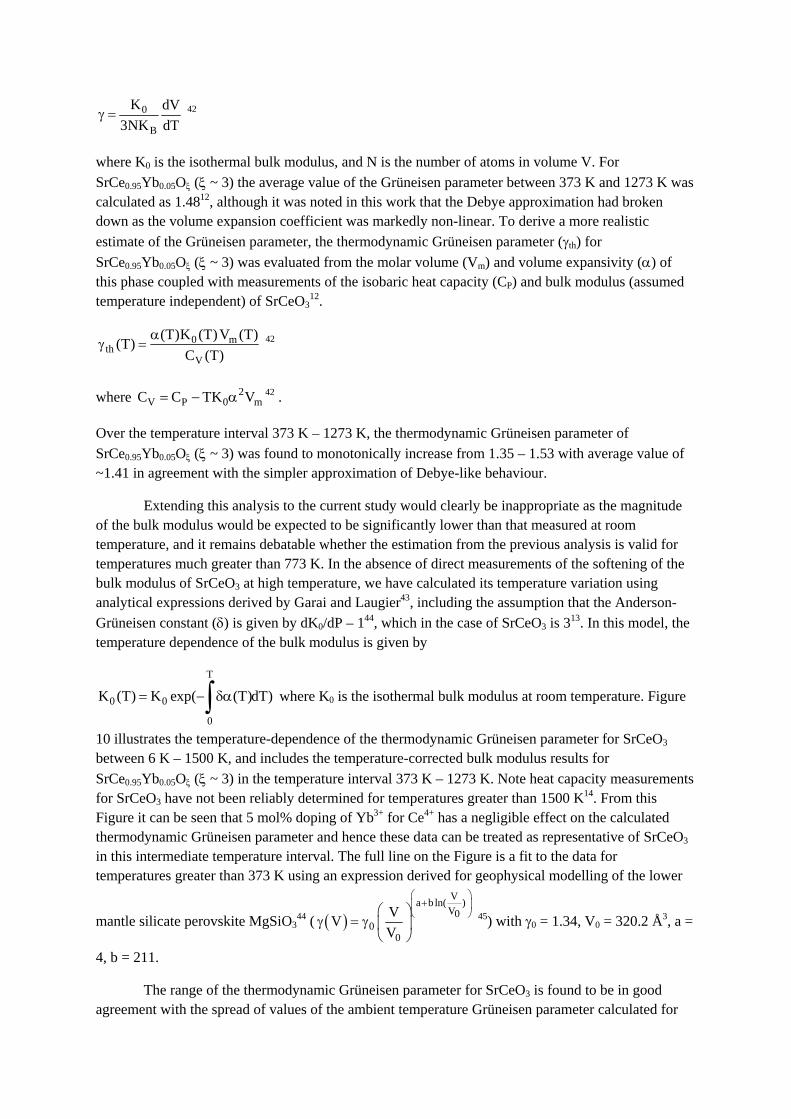
0
B
K dV
3NK dT 42
where K0 is the isothermal bulk modulus, and N is the number of atoms in volume V. For
SrCe0.95Yb0.05O ( ~ 3) the average value of the Grüneisen parameter between 373 K and 1273 K was calculated as 1.4812, although it was noted in this work that the Debye approximation had broken down as the volume expansion coefficient was markedly non-linear. To derive a more realistic
estimate of the Grüneisen parameter, the thermodynamic Grüneisen parameter (th) for
SrCe0.95Yb0.05O ( ~ 3) was evaluated from the molar volume (Vm) and volume expansivity () of this phase coupled with measurements of the isobaric heat capacity (CP) and bulk modulus (assumed temperature independent) of SrCeO3
12.
0 mth
V
(T)K (T)V (T)(T)
C (T)
42
where 2V P 0 mC C TK V 42 .
Over the temperature interval 373 K – 1273 K, the thermodynamic Grüneisen parameter of
SrCe0.95Yb0.05O ( ~ 3) was found to monotonically increase from 1.35 – 1.53 with average value of ~1.41 in agreement with the simpler approximation of Debye-like behaviour.
Extending this analysis to the current study would clearly be inappropriate as the magnitude of the bulk modulus would be expected to be significantly lower than that measured at room temperature, and it remains debatable whether the estimation from the previous analysis is valid for temperatures much greater than 773 K. In the absence of direct measurements of the softening of the bulk modulus of SrCeO3 at high temperature, we have calculated its temperature variation using analytical expressions derived by Garai and Laugier43, including the assumption that the Anderson-
Grüneisen constant () is given by dK0/dP – 144, which in the case of SrCeO3 is 313. In this model, the temperature dependence of the bulk modulus is given by
T
0 0
0
K (T) K exp( (T)dT) where K0 is the isothermal bulk modulus at room temperature. Figure
10 illustrates the temperature-dependence of the thermodynamic Grüneisen parameter for SrCeO3 between 6 K – 1500 K, and includes the temperature-corrected bulk modulus results for
SrCe0.95Yb0.05O ( ~ 3) in the temperature interval 373 K – 1273 K. Note heat capacity measurements for SrCeO3 have not been reliably determined for temperatures greater than 1500 K14. From this Figure it can be seen that 5 mol% doping of Yb3+ for Ce4+ has a negligible effect on the calculated thermodynamic Grüneisen parameter and hence these data can be treated as representative of SrCeO3 in this intermediate temperature interval. The full line on the Figure is a fit to the data for temperatures greater than 373 K using an expression derived for geophysical modelling of the lower
mantle silicate perovskite MgSiO344 (
Va b ln( )
V00
0
VV
V
45) with 0 = 1.34, V0 = 320.2 Å3, a =
4, b = 211.
The range of the thermodynamic Grüneisen parameter for SrCeO3 is found to be in good agreement with the spread of values of the ambient temperature Grüneisen parameter calculated for
other AIIBIVO3 perovskite structured compounds: MgSiO3 (1.5145), BaHfO3 (0.8312), BaSnO3 (1.3712), BaZrO3 (0.9712), BaUO3 (0.9912), BaCeO3 (1.9212), BaMoO3 (1.3912), SrHfO3 (1.2712), SrRuO3 (1.5612), SrMoO3 (1.0612).
Conclusions
SrCeO3 is one of the rare examples of a perovskite-structured compound that exhibits octahedral tilting without undergoing structural phase transitions with increasing temperature. The temperature range that it remains in the same space group, Pbnm, 1.2 K – 1723 K, is probably the largest that has been experimentally determined for a perovskite-structured compound, and hence its potential as a clone phase to infer the behaviour of the lower mantle phase MgSiO3 remains high. The lack of critical behaviour in the amplitudes of the modes that are proportional to the two symmetry-independent order parameters suggests that SrCeO3 may remain orthorhombic up to the melting point, although the possibility of first order phase transitions at higher temperature obviously cannot be discounted. Evaluation of the spontaneous shear strain e4 as a function of temperature is indicative of a structural evolution in a second order manner with a hypothetical aristotype structure existing above the 1 atm melting point. The evolution of the crystal structure is dominated by the two cation displacement modes, and to a lesser extent, the two octahedral tilt modes.
Within a simple modified Debye approximation, at low temperatures SrCeO3 behaves as though it has two characteristic temperatures in the vibrational density of states, and this behaviour has been found to continue to very high temperature where vibrational Debye temperatures for the cations and anions remain well separated in energy. Over the temperature range 200 K – 1200 K, the thermodynamic Grüneisen parameter for SrCeO3 shows on a small temperature variation (1.2 – 1.4), however at temperatures above 1200 K it is found to increase rapidly due to the plateauing of the isochoric heat capacity whilst the molar volume, and the linear thermal expansion coefficient are increasing in a non-linear manner.
Consideration of the thermodynamic and structural variations of SrCeO3 and SrCe0.95Yb0.05O
( ~ 3) as a function of temperature suggests that low levels of aliovalent doping of trivalent rare earths for cerium has little effect on the crystallographic behaviour in this perovskite.
References
1 R. H. Mitchell, Perovskites Modern and Ancient, Almaz Press, Ontario, 2002. 2 A. Navrotsky and D. J. Weidner (Eds.), Perovskite: A Structure of Great Interest to
Geophysics and Materials Science, Geophysical Monograph Series Volume 45, American Geophysical Union, Washington D.C., 1989.
3 T. Ishihara (Ed.), Perovskite Oxide for Solid Oxide Fuel Cells, Springer, New York, 2009. 4 M. Borowski (Ed.), Perovskites: Structure, Properties and Uses, Nova Science Publishers,
New York, 2010. 5 K. A. Müller and T. W. Kool (Eds.), Properties of Perovskites and Other Oxides, World
Scientific Publishing, Singapore, 2010. 6 S. Yamanaka, K. Kurosaki, T. Oyama, H. Muta, M. Uno, T. Matsuda and S-I. Kobayashi, J.
Am. Ceram. Soc., 2005, 88, 1496. 7 H. Iwahara, T. Esaka, H. Uchida and N. Maeda, Solid State Ionics, 1981, 3/4, 359.
8 A. Navrotsky, Science, 1999, 284, 1788. 9 A. Saiki, Y. Seto, H. Seki, N. Ishizawa, M. Kato and N. Mizutani, Nippon Kagaku Kaishi,
1991, 1, 25. 10 K. S. Knight and N. Bonanos, Mater. Res. Bull., 1995, 30, 347. 11 N. Bonanos, B. Ellis and M. N. Mahmood, Solid State Ionics, 1988, 28-30, 579. 12 K. S. Knight, J. Electroceram., 2011, 27, 143. 13 K. S. Knight, W. G. Marshall, N. Bonanos and D. J. Francis, J. Alloy Compd., 2005, 394, 131. 14 E. H. P. Cordfunke, A. S. Booij and M. E. Huntelaar, J. Chem. Thermodyn., 1998, 30, 437. 15 R. Saha, R. Babu, K. Nagarajan and C. K. Mathews, J. Nucl. Mater., 1989, 167, 271. 16 B.-T. Melekh, VM. Egorov, Yu. M. Baikov, N. F. Kartenko, Yu. N. Filin, M. E. Kompan, I. I.
Novak, G. B. Venus and V. B. Kulik, Solid State Ionics, 1997, 97, 465. 17 T. H. K. Barron, CINDAS Data Series on Materials Properties, 1998, 1-4, 1. 18 K. S. Knight, J. Alloy Compd., 2011, 509, 6337. 19 K. S. Knight, J. Solid State Chem., 2012, 194, 286. 20 K. S. Knight and N. Bonanos, Solid State Ionics, 2013, 232, 112. 21 G. C. Mather, F. M. Figueiredo, J. Romero de Paz and S. Garcia-Martin, Inorg. Chem., 2008,
47, 921. 22 R. A. Cowley, Phys. Rev., 1964, 134, A981. 23 R. B. Von Dreele and A. C. Larson, Los Alamos National Laboratory Report, LAUR 86-748,
1986. 24 A. M. Glazer, Acta Crystallogr. A, 1975, 31, 756. 25 C. J. Howard and H. T. Stokes, Acta Crystallogr. A, 2005, 61, 93. 26 K. S. Knight, Am. Mineral., 2014, 99, 824. 27 K. Aizu, J. Phys. Soc. Jap., 28, 706. 28 M. A. Carpenter, E. K. H. Salje and A. Graeme-Barber, Eur. J. Mineral., 10, 621. 29 R. E. A. McKnight, C. J. Howard and M. A. Carpenter, J. Phys.: Condens. Matter, 2009, 21,
015901. 30 K. S. Knight, Can. Mineral., 2009, 47, 381. 31 C. J. Howard, K. S. Knight, B. J. Kennedy and E. H. Kisi, J. Phys.: Condens. Matter, 2009,
12, L677. 32 J. M. Perez-Mato, D. Orobengoa and M. I. Aroyo, Acta Crystallogr., 2010, A66, 558. 33 H. Montgomery, Proc R. Soc., 1969, A 309, 521. 34 N. W. Thomas, Acta Crystallogr., 1998, B54, 585. 35 K. S. Knight, Can. Mineral., 2011, 49, 793. 36 W. Cochran and A. Zia, Phys. Status Solidi, 1968, 25, 273. 37 C. N. W. Darlington, Acta Crystallogr., 2002, A58, 66. 38 C. N. W. Darlington, Acta Crystallogr., 2002, A58, 299. 39 M.A. Carpenter and C.J. Howard, Acta Crystallogr., 2009, B65, 134. 40 I. D. Brown, The Chemical Bond in Inorganic Chemistry: The Bond Valence Model, Oxford
University Press, Oxford, 2002. 41 N. E. Brese and M. O’Keefe, Acta Crystallogr., 1991, B47, 192. 42 D.C. Wallace, Thermodynamics of Crystals, Wiley, New York, 1972. 43 J. Garai and A Laugier, J. Appl. Phys., 2007, 101, 023514. 44 Y. A. Chang, J. Phys. Chem. Solids, 1967, 28, 697. 45 A. R. Oganov, J. P. Brodholt and G. D. Price, Earth Planet. Sc. Lett., 2001, 180, 555.
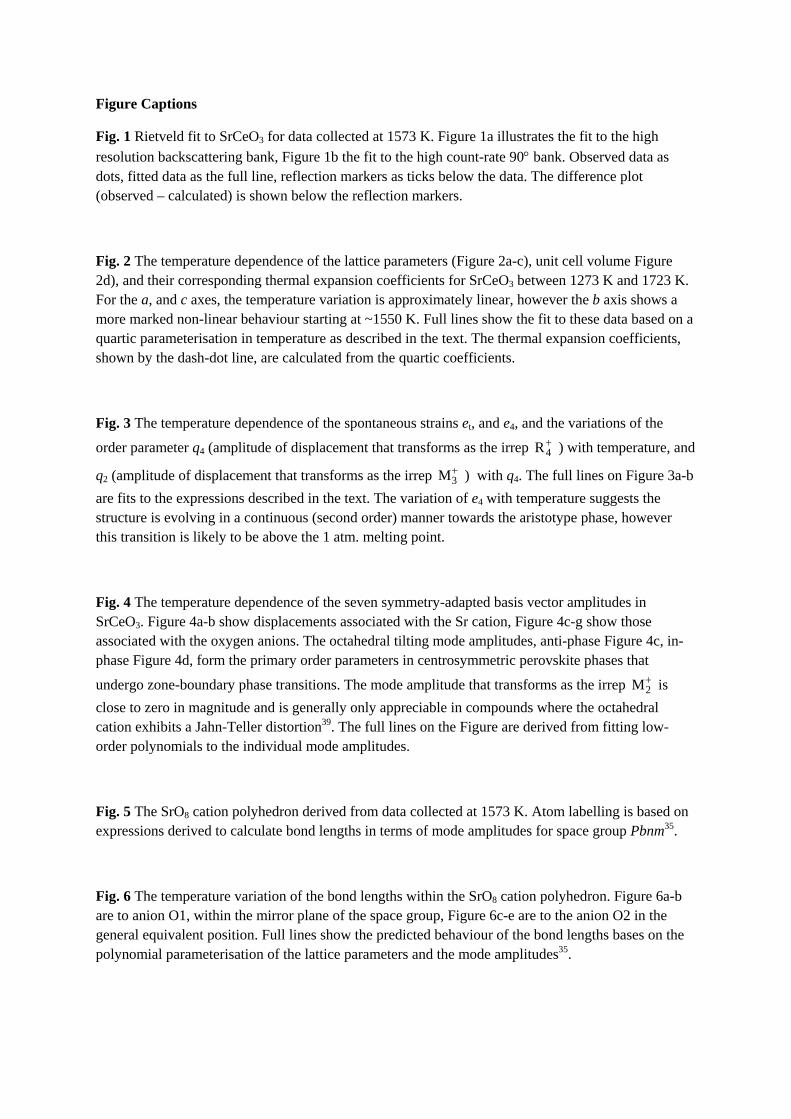
Figure Captions
Fig. 1 Rietveld fit to SrCeO3 for data collected at 1573 K. Figure 1a illustrates the fit to the high
resolution backscattering bank, Figure 1b the fit to the high count-rate 90 bank. Observed data as dots, fitted data as the full line, reflection markers as ticks below the data. The difference plot (observed – calculated) is shown below the reflection markers.
Fig. 2 The temperature dependence of the lattice parameters (Figure 2a-c), unit cell volume Figure 2d), and their corresponding thermal expansion coefficients for SrCeO3 between 1273 K and 1723 K. For the a, and c axes, the temperature variation is approximately linear, however the b axis shows a more marked non-linear behaviour starting at ~1550 K. Full lines show the fit to these data based on a quartic parameterisation in temperature as described in the text. The thermal expansion coefficients, shown by the dash-dot line, are calculated from the quartic coefficients.
Fig. 3 The temperature dependence of the spontaneous strains et, and e4, and the variations of the
order parameter q4 (amplitude of displacement that transforms as the irrep 4R ) with temperature, and
q2 (amplitude of displacement that transforms as the irrep 3M ) with q4. The full lines on Figure 3a-b
are fits to the expressions described in the text. The variation of e4 with temperature suggests the structure is evolving in a continuous (second order) manner towards the aristotype phase, however this transition is likely to be above the 1 atm. melting point.
Fig. 4 The temperature dependence of the seven symmetry-adapted basis vector amplitudes in SrCeO3. Figure 4a-b show displacements associated with the Sr cation, Figure 4c-g show those associated with the oxygen anions. The octahedral tilting mode amplitudes, anti-phase Figure 4c, in-phase Figure 4d, form the primary order parameters in centrosymmetric perovskite phases that
undergo zone-boundary phase transitions. The mode amplitude that transforms as the irrep 2M is
close to zero in magnitude and is generally only appreciable in compounds where the octahedral cation exhibits a Jahn-Teller distortion39. The full lines on the Figure are derived from fitting low-order polynomials to the individual mode amplitudes.
Fig. 5 The SrO8 cation polyhedron derived from data collected at 1573 K. Atom labelling is based on expressions derived to calculate bond lengths in terms of mode amplitudes for space group Pbnm35.
Fig. 6 The temperature variation of the bond lengths within the SrO8 cation polyhedron. Figure 6a-b are to anion O1, within the mirror plane of the space group, Figure 6c-e are to the anion O2 in the general equivalent position. Full lines show the predicted behaviour of the bond lengths bases on the polynomial parameterisation of the lattice parameters and the mode amplitudes35.
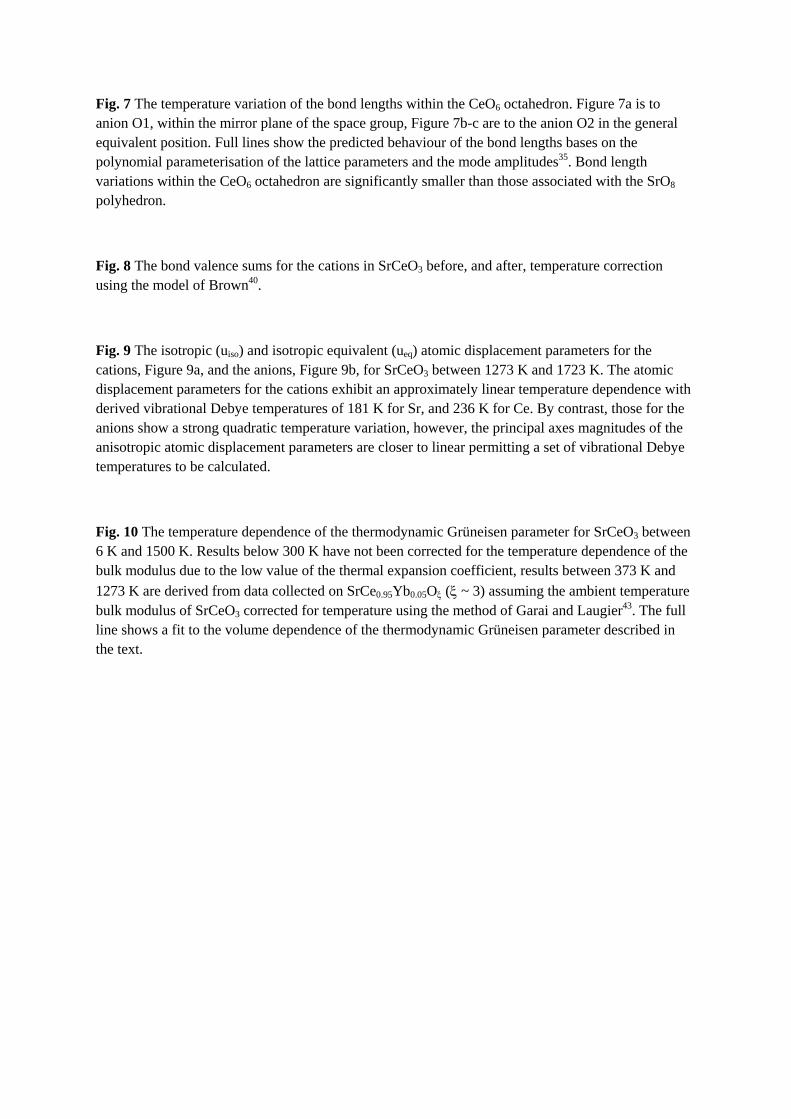
Fig. 7 The temperature variation of the bond lengths within the CeO6 octahedron. Figure 7a is to anion O1, within the mirror plane of the space group, Figure 7b-c are to the anion O2 in the general equivalent position. Full lines show the predicted behaviour of the bond lengths bases on the polynomial parameterisation of the lattice parameters and the mode amplitudes35. Bond length variations within the CeO6 octahedron are significantly smaller than those associated with the SrO8 polyhedron.
Fig. 8 The bond valence sums for the cations in SrCeO3 before, and after, temperature correction using the model of Brown40.
Fig. 9 The isotropic (uiso) and isotropic equivalent (ueq) atomic displacement parameters for the cations, Figure 9a, and the anions, Figure 9b, for SrCeO3 between 1273 K and 1723 K. The atomic displacement parameters for the cations exhibit an approximately linear temperature dependence with derived vibrational Debye temperatures of 181 K for Sr, and 236 K for Ce. By contrast, those for the anions show a strong quadratic temperature variation, however, the principal axes magnitudes of the anisotropic atomic displacement parameters are closer to linear permitting a set of vibrational Debye temperatures to be calculated.
Fig. 10 The temperature dependence of the thermodynamic Grüneisen parameter for SrCeO3 between 6 K and 1500 K. Results below 300 K have not been corrected for the temperature dependence of the bulk modulus due to the low value of the thermal expansion coefficient, results between 373 K and
1273 K are derived from data collected on SrCe0.95Yb0.05O ( ~ 3) assuming the ambient temperature bulk modulus of SrCeO3 corrected for temperature using the method of Garai and Laugier43. The full line shows a fit to the volume dependence of the thermodynamic Grüneisen parameter described in the text.
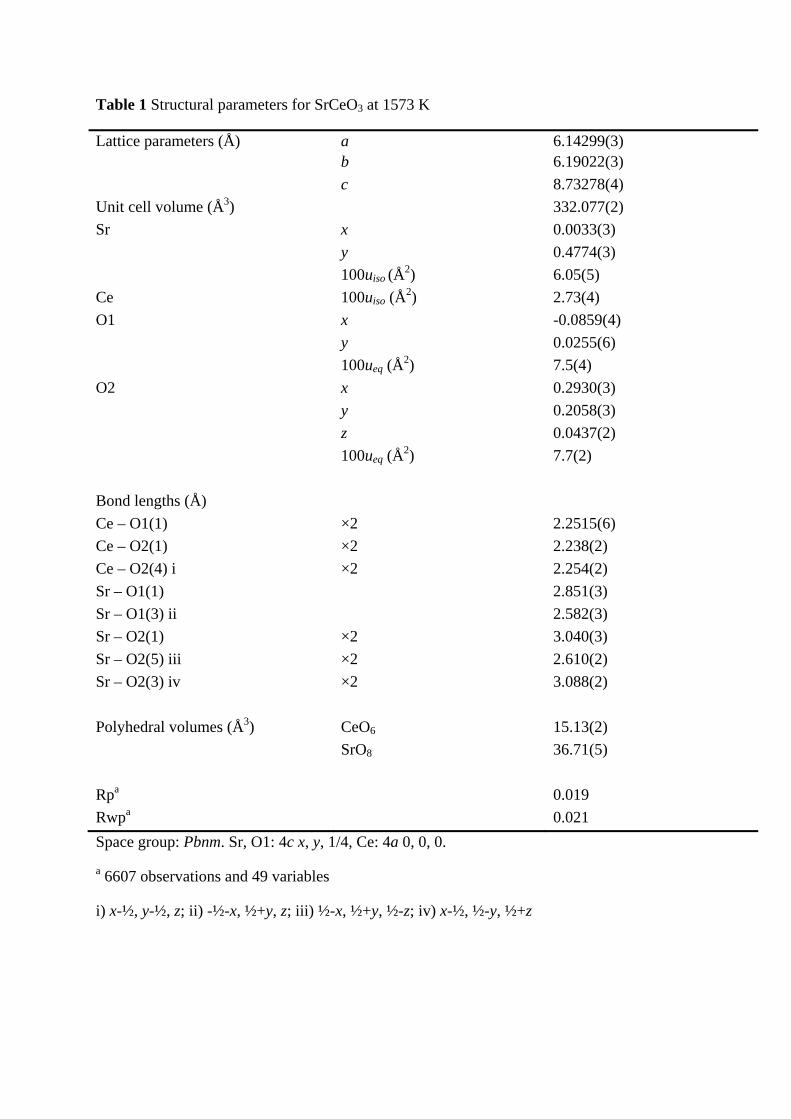
Table 1 Structural parameters for SrCeO3 at 1573 K
Lattice parameters (Å) a 6.14299(3) b 6.19022(3)
c 8.73278(4)
Unit cell volume (Å3) 332.077(2)
Sr x 0.0033(3)
y 0.4774(3)
100uiso (Å2) 6.05(5)
Ce 100uiso (Å2) 2.73(4)
O1 x -0.0859(4)
y 0.0255(6)
100ueq (Å2) 7.5(4)
O2 x 0.2930(3)
y 0.2058(3)
z 0.0437(2)
100ueq (Å2) 7.7(2)
Bond lengths (Å)
Ce – O1(1) ×2 2.2515(6)
Ce – O2(1) ×2 2.238(2)
Ce – O2(4) i ×2 2.254(2)
Sr – O1(1) 2.851(3)
Sr – O1(3) ii 2.582(3)
Sr – O2(1) ×2 3.040(3)
Sr – O2(5) iii ×2 2.610(2)
Sr – O2(3) iv ×2 3.088(2)
Polyhedral volumes (Å3) CeO6 15.13(2)
SrO8 36.71(5)
Rpa 0.019
Rwpa 0.021
Space group: Pbnm. Sr, O1: 4c x, y, 1/4, Ce: 4a 0, 0, 0.
a 6607 observations and 49 variables
i) x-½, y-½, z; ii) -½-x, ½+y, z; iii) ½-x, ½+y, ½-z; iv) x-½, ½-y, ½+z
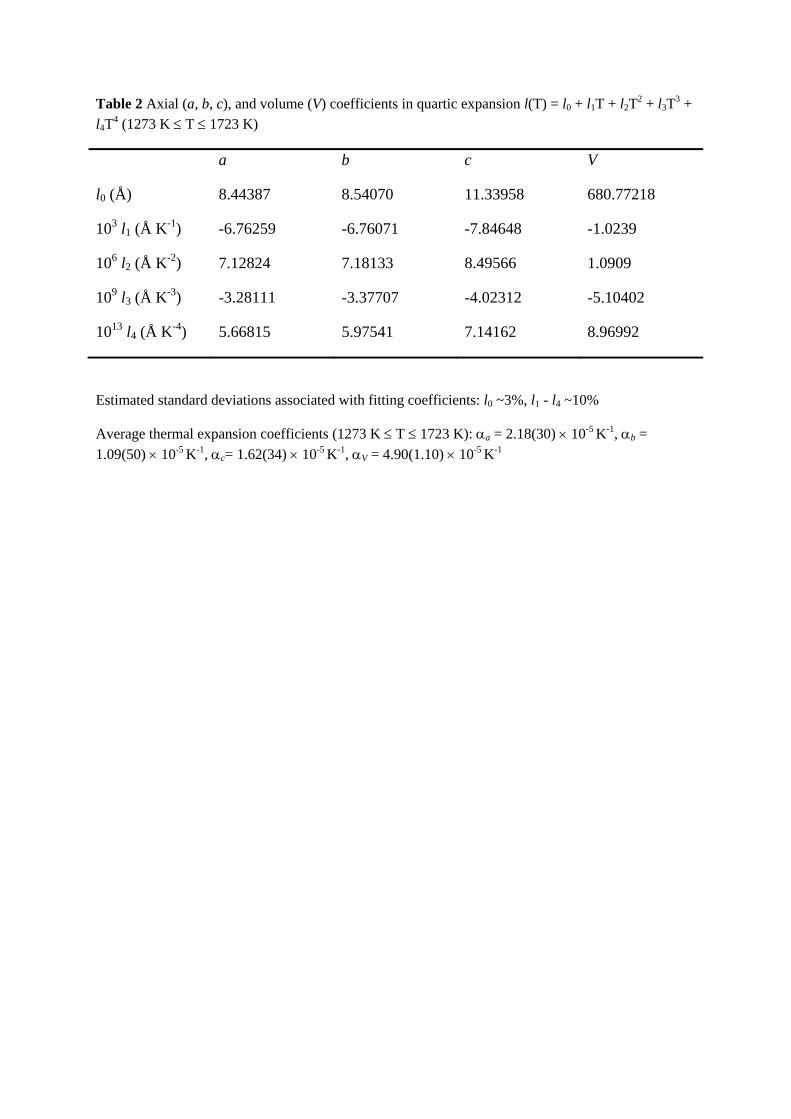
Table 2 Axial (a, b, c), and volume (V) coefficients in quartic expansion l(T) = l0 + l1T + l2T2 + l3T
3 +
l4T4 (1273 K T 1723 K)
a b c V
l0 (Å) 8.44387 8.54070 11.33958 680.77218
103 l1 (Å K-1) -6.76259 -6.76071 -7.84648 -1.0239
106 l2 (Å K-2) 7.12824 7.18133 8.49566 1.0909
109 l3 (Å K-3) -3.28111 -3.37707 -4.02312 -5.10402
1013 l4 (Å K-4) 5.66815 5.97541 7.14162 8.96992
Estimated standard deviations associated with fitting coefficients: l0 ~3%, l1 - l4 ~10%
Average thermal expansion coefficients (1273 K T 1723 K): a = 2.18(30) 10-5 K-1, b =
1.09(50) 10-5 K-1, c= 1.62(34) 10-5 K-1, V = 4.90(1.10) 10-5 K-1
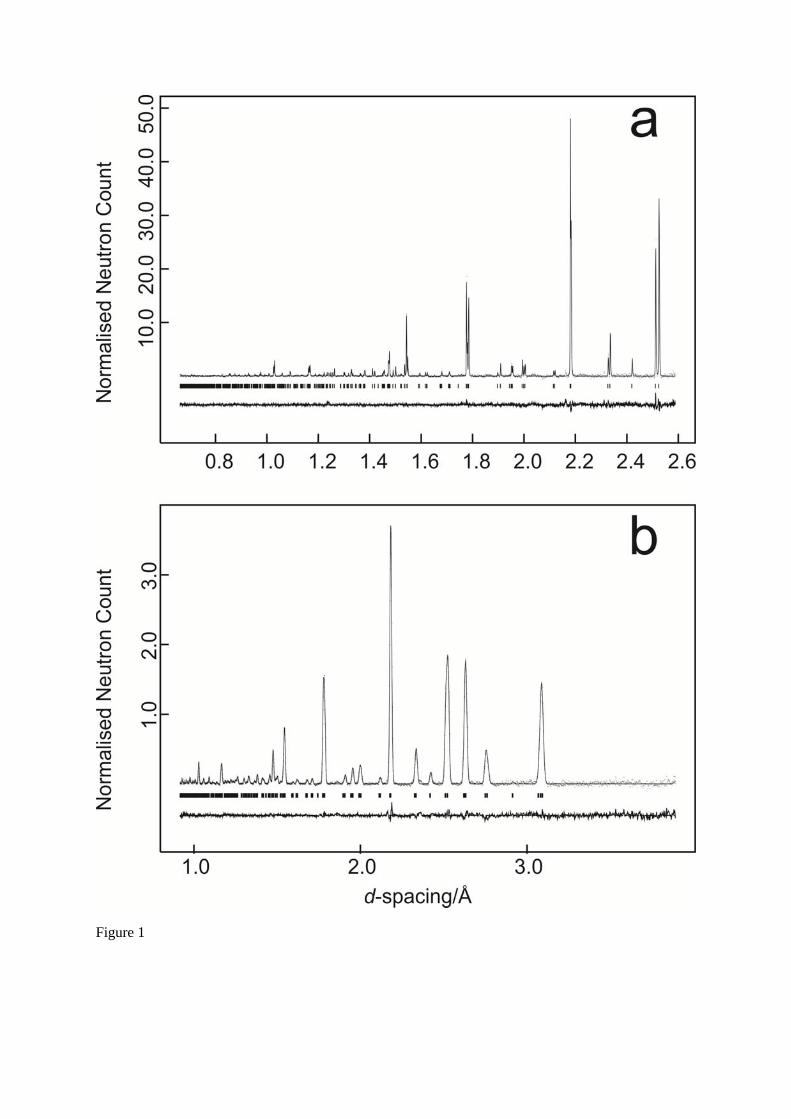
Figure 1
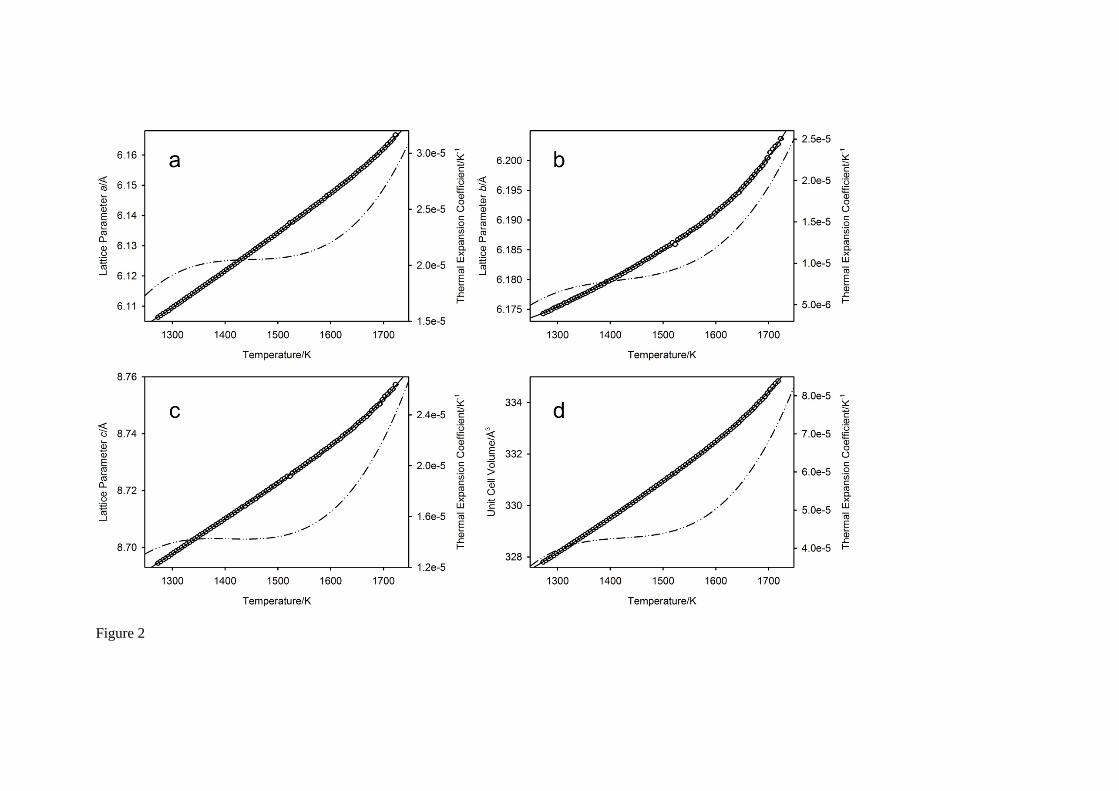
Figure 2
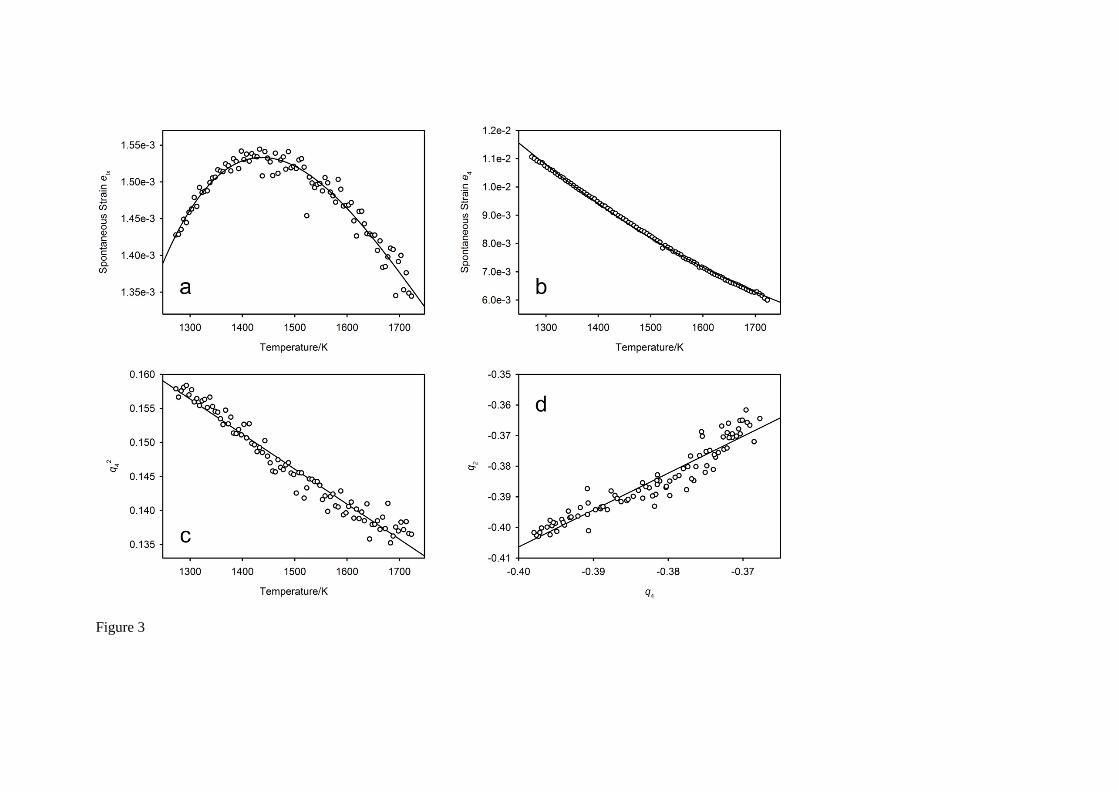
Figure 3
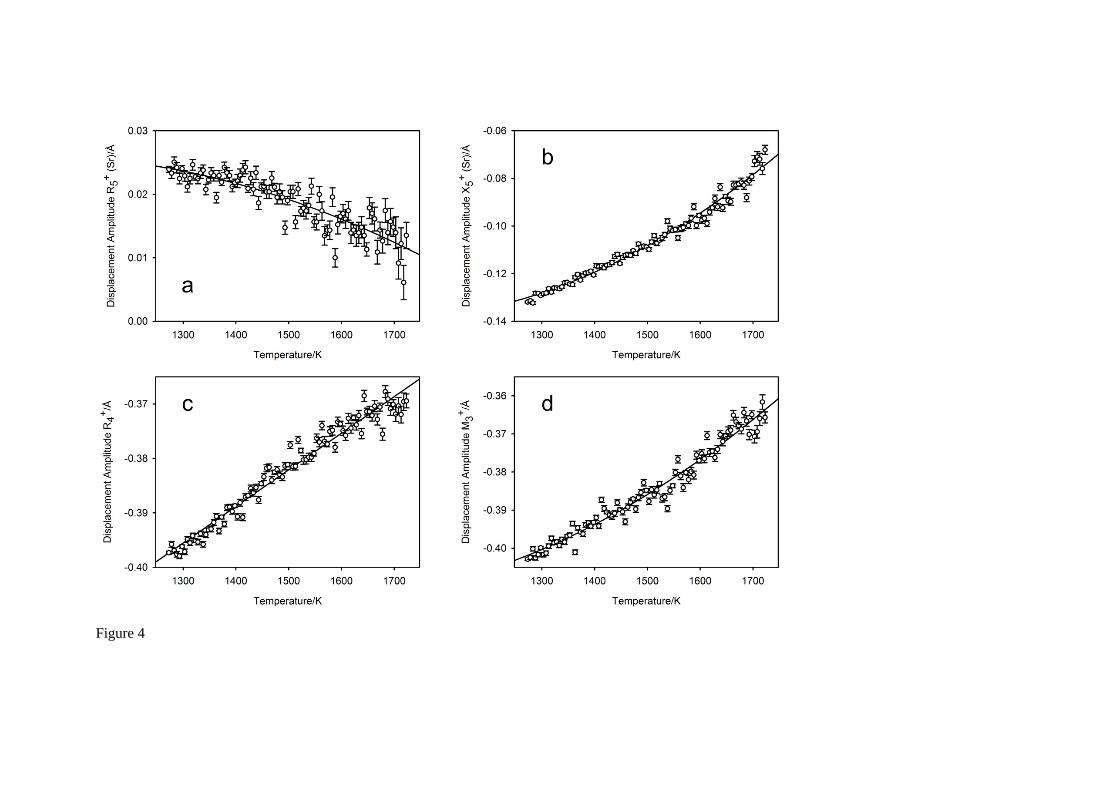
Figure 4
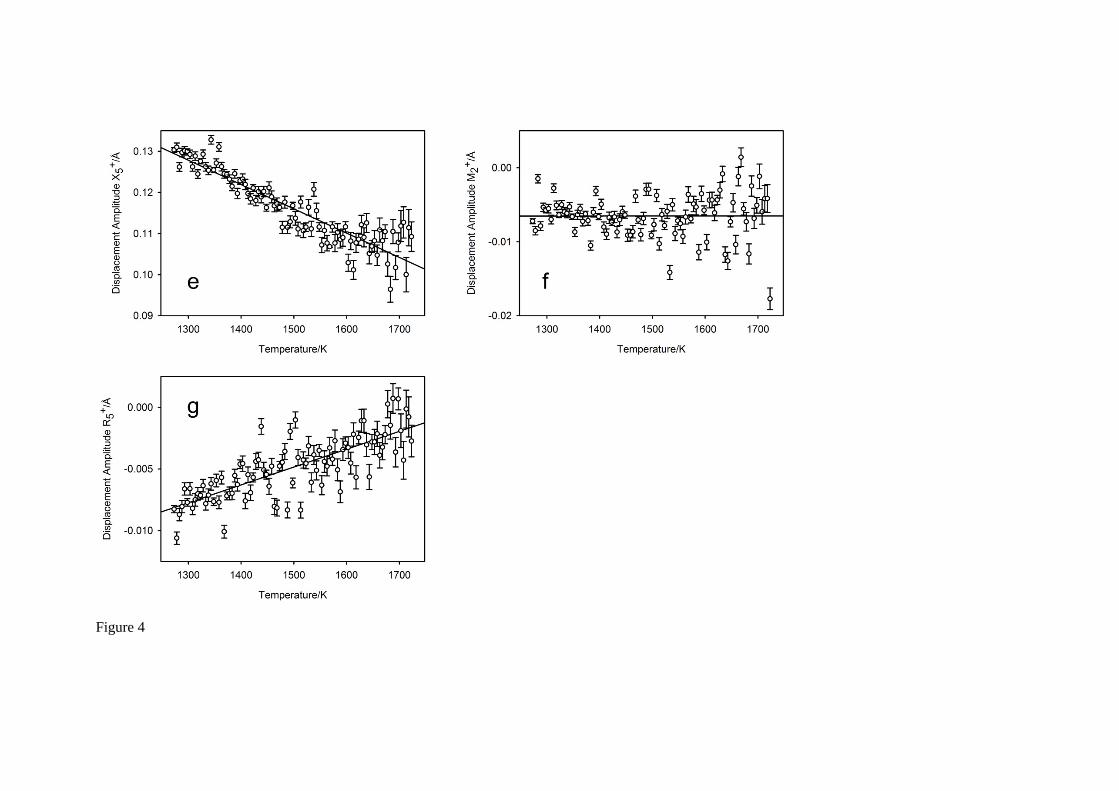
Figure 4
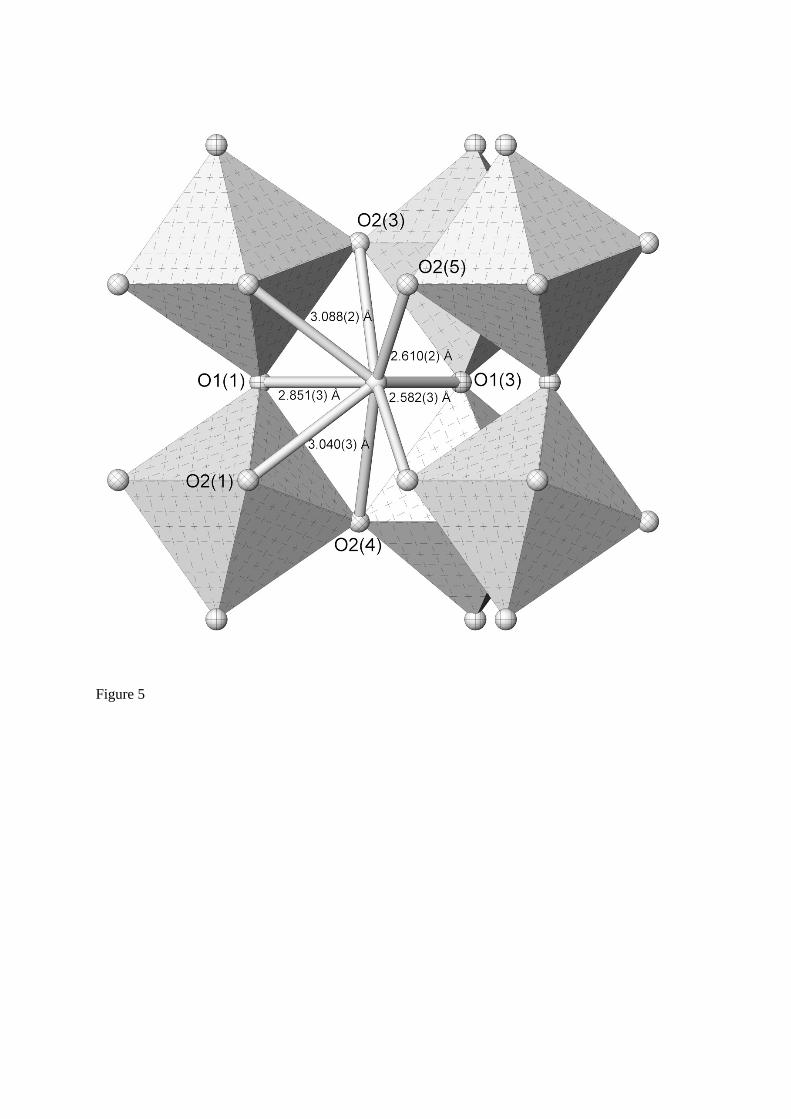
Figure 5
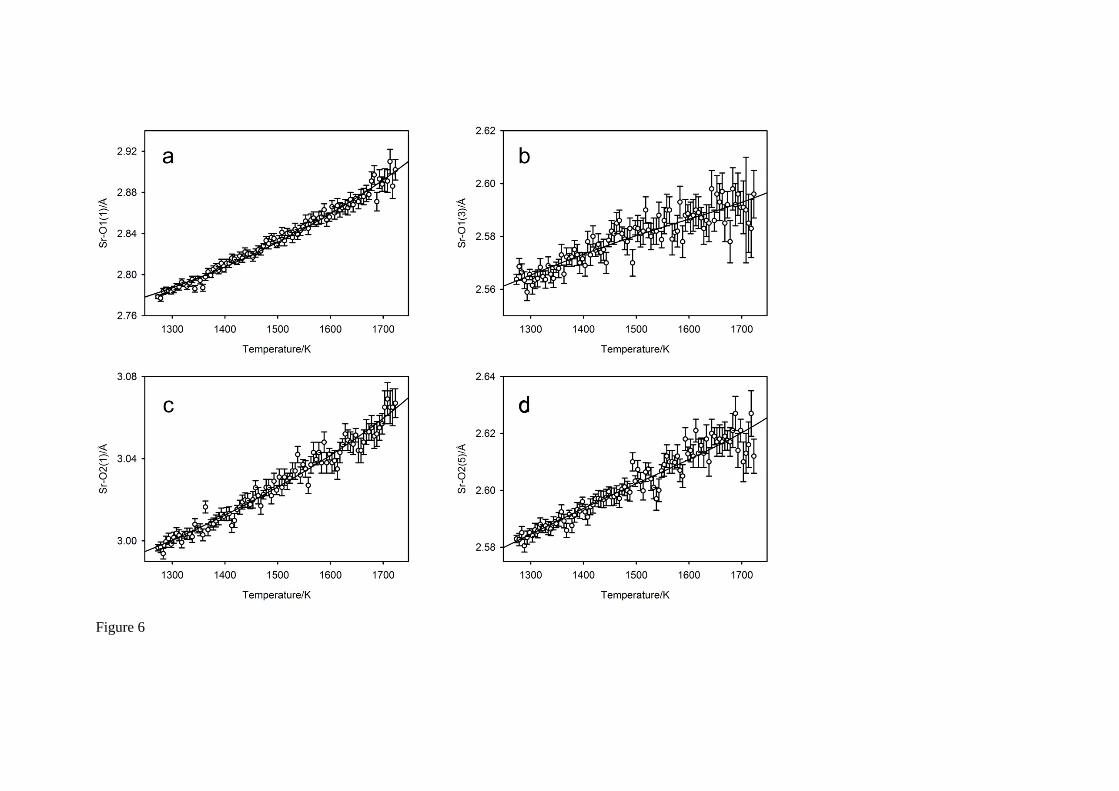
Figure 6
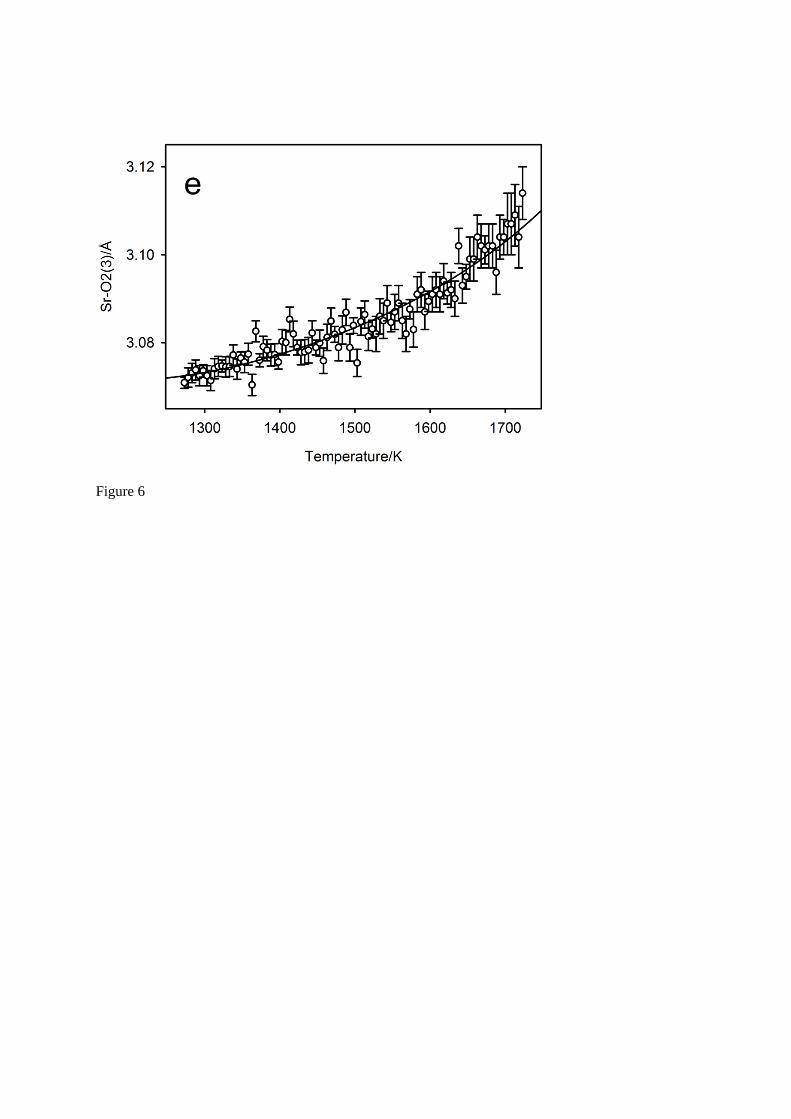
Figure 6
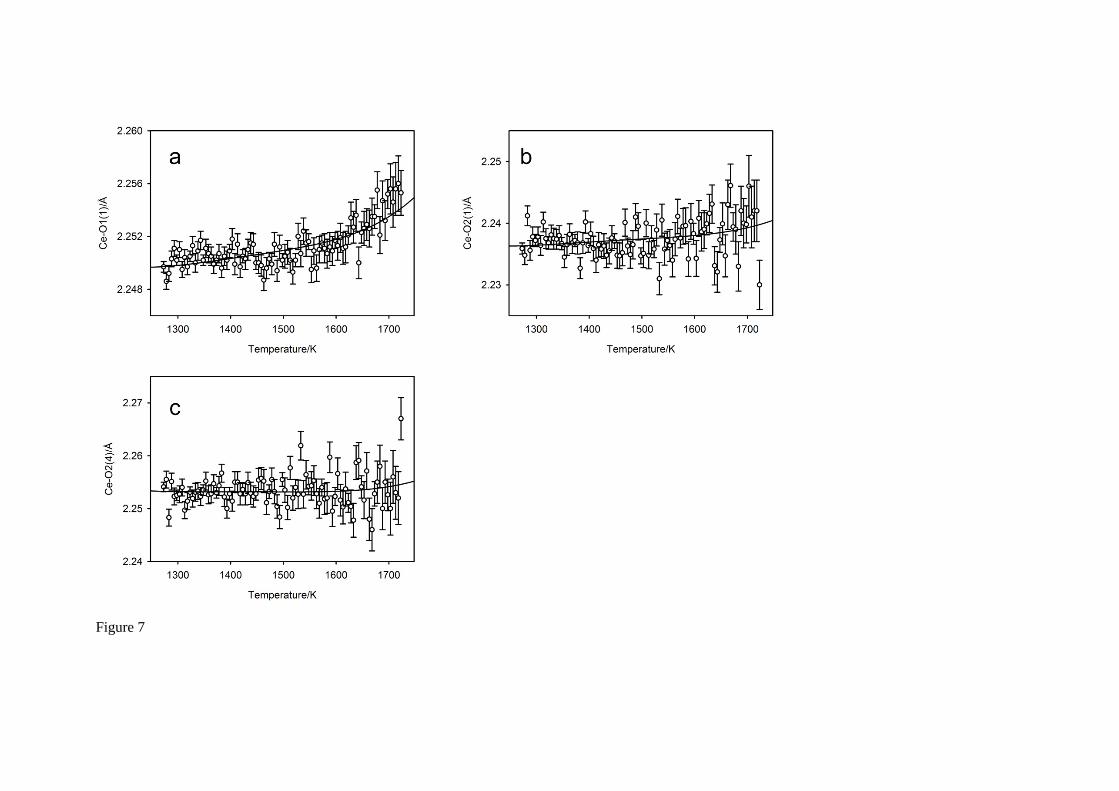
Figure 7
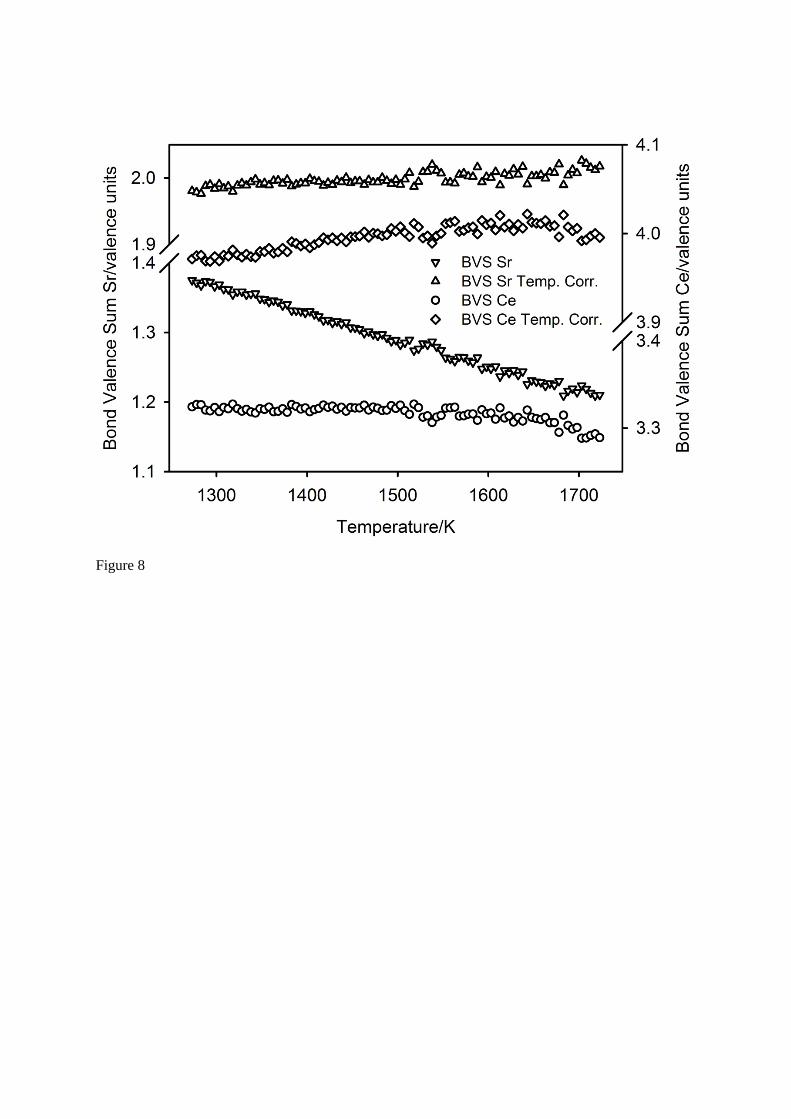
Figure 8
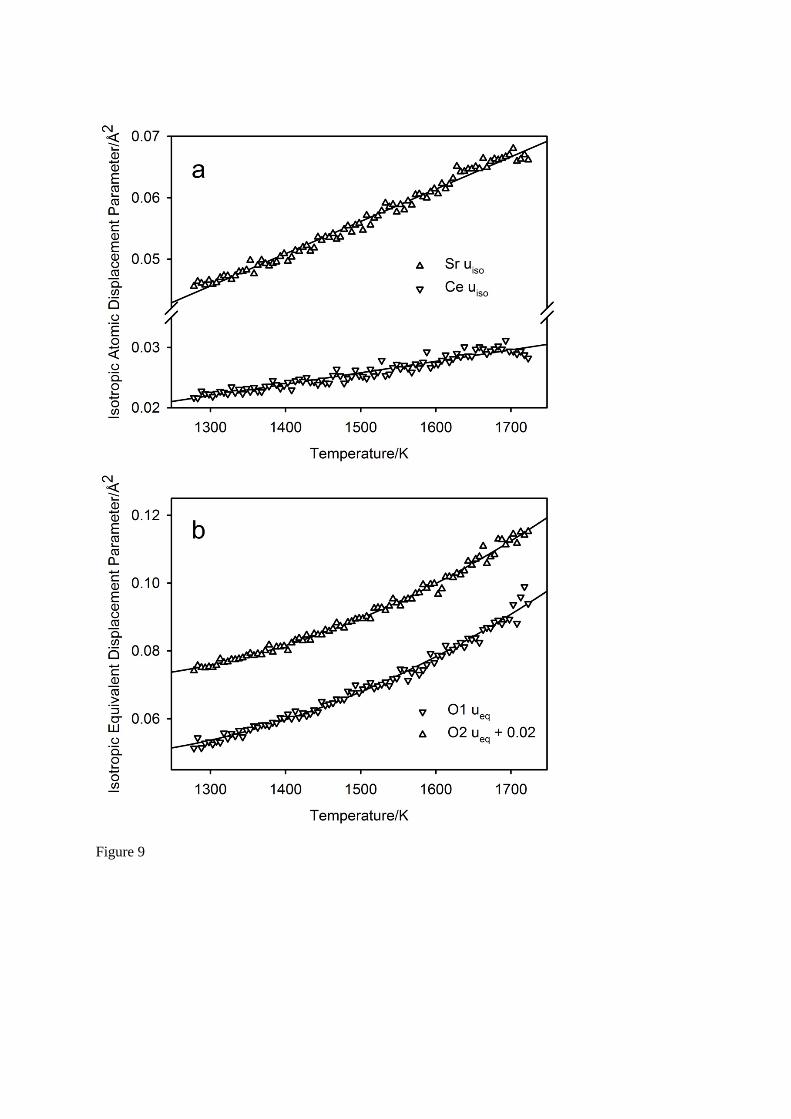
Figure 9
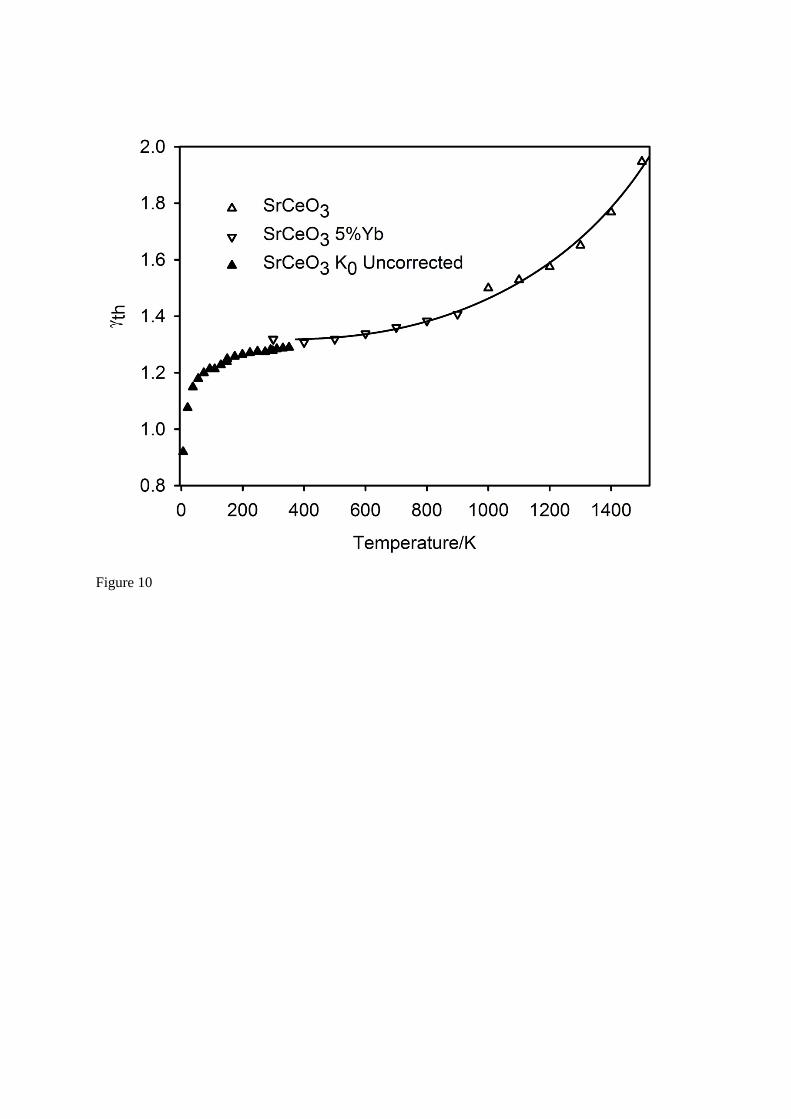
Figure 10