ii. reply to the comments made by conservation action trust
TRANSCRIPT


i. Certified Compliance Report issued by MoEFCC RO, Bangalore
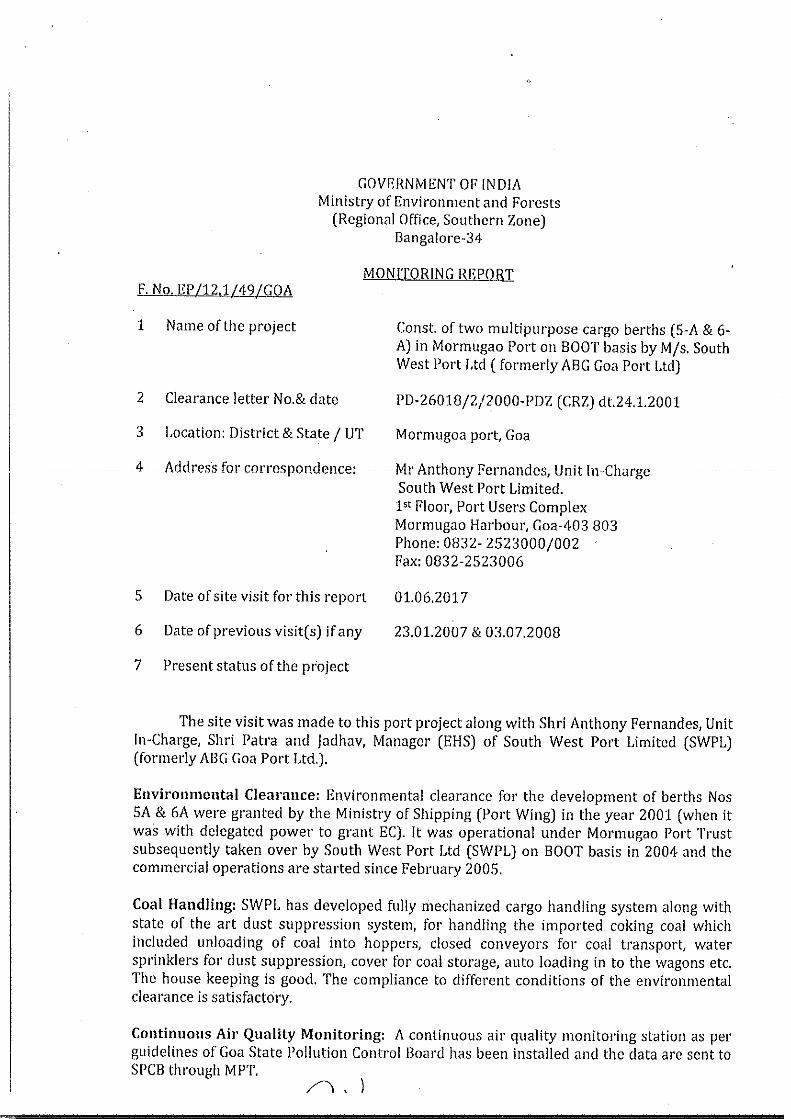


ii. Reply to the comments made by Conservation Action Trust (CAT)

Point wise reply to the comments made by Conservation Action Trust, Mumbai
Project Proposed Terminal Capacity Enhancement at Berth 5A-6A of Mormugao Port for Handling Coal And Coal Products, Iron Ore and Limestone including Unitised and Steel Products at Mormugao Port Trust, Mormugao, Goa
Project No. File No. 10-5/2015-IA-III, Proposal No. IA/GA/MIS/26758/2015
Reference Agenda item No. 21.2.23, Minutes of 21st Meeting of Expert Appraisal Committee (Infra-2) for Projects related to All Ship Breaking Yard including Ship Breaking Unit, Airport, Common Hazardous Waste Treatment, Storage and Disposal Facilities, Ports and Harbours, Aerial Ropeways, CETPs, Common Municipal Solid Waste Management Facility, Building/Construction Projects,
Townships and Area Development Projects held on 21-24 August, 2017 in the Ministry of Environment, Forest and Climate Change
Indira Paryavaran Bhawan New Delhi 110 003
21st August, 2017
Sr. Comments Proponent’s submissions
1. The proposed project location should be mapped on the approved CZMP.
The proposed project is located within an operational, notified Major Port since 2004. No change in the waterfront component of the existing terminal is proposed.
Tideline demarcation for the project has been carried out by M/s IRS, Anna University, Chennai in September, 2016. The same has been duly
submitted as part of the CRZ Clearance
process to the Goa CZMA and to the MoEFCC. CRZ NOC from GCZMA is obtained vide letter dated 18.08.2017.
2. It is not clear if all the previous conditions granted to the facilities at Mormugao Port Trust
have been complied or not. All the compliance and monitoring reports should be made available in the public domain.
M/s South west Port operates a Terminal inside the MPT premises
under tenancy basis. The EC conditions granted to the Terminal (vide’ letter dated 24 January, 2001) have been certified by the Regional Office, MoEFCC, Bangalore (vide’ letter dated 13 June,
2017) and have been duly submitted to the MoEFCC for scrutiny.
3. The Cumulative impact assessment of proposed project along with all the other existing and
proposed projects in Mormugao should be carried out. All the reports should be made available in the public domain.
Environmental Impact Assessment for the proposed Terminal capacity
enhancement by modernization has been carried out based on ToRs issued by the MoEFCC vide’ their letter dated 19th June, 2015. The project has completed Public Consultation process in April, 2017
following due procedure, inter alia, making the EIA Reports public, as

prescribed in the EIA Notification, 2006
(amended).
4. The project proponent should furnish a copy of the Disaster Management Plan and the Maximum Credible Accident Scenario.
Risk Analysis and Disaster Management Plan is part of the EIA Report, Chapter 6.
5. All the copies of consent to establish and consent to operate given by the Goa State Pollution Control Board should be provided with the Compliance and monitoring reports for the same.
Copies of Consent to Operate issued by Goa State Pollution Control Board and their respective compliances is being made available to the MoEFC.
6. We would like to bring to your notice that the
public hearing for the proposed project was held on 20th March 2017 at Vasco Residency, Main Hall, Vasco. More than a thousand locals turned up for the public hearing to oppose the project. Due to space constraints, the public hearing was
postponed.
No reply is solicited from the Project
proponent.
7. The public hearing was again conducted on 26th April 2017 at Tilak Maidan, Vasco-da-Gama. We had submitted our written suggestions, questions, and comments via email on 18th March 2017 and 24th April 2017. We had also submitted
a hard copy of our representations to the GSPCB authorities during the public hearing conducted on 26th April 2017.
Replies to all written representations were duly submitted to the GSPCB on 10.06.2017, and is hoisted in GSPCB website.
Replies to written representations received from Conservation Action Trust were covered in the replies at sr. no. 110.
8. The copies of our comments and copy of our written submission acknowledged by GSPCB is
attached for your ready reference.
No reply is solicited from the Project proponent.
9. Despite this, our representations are not considered in the public hearing proceedings and
we have not received response to our
submissions. We have pointed this out via email dated 10th August 2017. A copy of the same is also attached herewith.
Replies to all written representations were duly submitted to the GSPCB on
10.06.2017, and is hoisted in GSPCB
website. Replies to written representations received from Conservation Action Trust were covered in the replies at sr. no. 110. The submissions is available for verification.
10. The concerns raised by us during the public hearing have also apparently not been addressed.
Replies to all written representations were duly submitted to the GSPCB on 10.06.2017, and is hoisted in GSPCB website.
Replies to written representations received from Conservation Action Trust were covered in the replies at sr. no. 110. The submissions is available for verification.
11. There was a strong opposition to the proposed project during the public hearing. Please find a link to news article highlighting the major concerns raised by the locals during the public hearing. (http://timesofindia.indiatimes.com/city/goa/43-speakers-hundreds-of-voices-oppose-mpt-
plans/articleshow/58388641.cms)
No reply is solicited from the Project proponent.

12. We would like to request the committed to direct
the project proponent to give a response to our comments and incorporate the same into the
public hearing proceedings pursuant to which we will be able to send our submissions for the proposed project.
The EIA Report has been finalised after
addressing all the material environmental concerns expressed
during Public Consultation process, and by making appropriate changes in the draft EIA Report per procedure provided in the EIA Notification, 2006 (amended)
13. Till then the project should be deferred.
No reply is solicited from the Project proponent.

iii. CRZ related documents as per para 4.2 (i) of CRZ Notification, 2011

1
FORM I
PROPOSED CONCEQUENTIAL TERMINAL CAPACITY
ENHANCEMENT AT BERTH 5A-6A OF MORMUGAO PORT,
MORMUGAO, GOA
Prepared for
GOA COASTAL ZONE MANAGEMENT AUTHORITY (GCZMA), GOA
Submitted By
M/s South West Port Ltd.

2
Form-I for seeking clearance for project attracting CRZ notification
BASIC INFORMATION:
Name of the Project:- Proposed Terminal Capacity Enhancement at Berth 5A-6A of
Mormugao Port for Handling Coal and Coal Products, Iron Ore and
Limestone including Unitised and Steel Products
Location or site alternatives under consideration:- This is a modernisation project of the
existing port facility. Hence, site alternative study is not required
Size of the project (in terms of total area):- Mordenisation of existing cargo handling capacity
from 7.5 mmtpa to Bulk handling to 13 mmtpa and multiple unitised
cargo and Steel product at about 2 mmtpa.
13 MTPA of bulk (consisting of coal, iron ore, lime stone, dolomite,
bauxite, mineral ores, fertiliser and other misc. cargo), and about
2 MTPA of unitised cargo (consisting of steel bars, coils, flats and
plates, and other steel products)
CRZ classification of the area: The project area belongs to CRZ-IB, CRZ-II, CRZ-IV
Expected cost of the project: 210 Crores
Contact Information: Mr. Rashmiranjan Patra
Vice President- Strategy & Planning
1st Floor, Port Users Complex
Mormugao Port, Goa
Mail: [email protected]
Phone: +91 832-2523000
Fax. +91 832-2523006

3
II. ACTIVITY
1. Construction, operation or decommissioning of the Project involving actions, which will
cause physical changes in the locality (topography, land use, changes in water bodies, etc.)
S.No. Information/Checklist
confirmation Yes/No
Details thereof (with approximate
quantities /rates, wherever
possible) with source of
information data
1.1
Permanent or temporary change
in land use, land cover or
topography including increase in
intensity of land use (with
respect to local land use plan)
No The berths are operational and the
proposed project is enhancement of
the cargo handling capacity.
1.2 Details of CRZ classification as
per the approved Coastal Zone
Management Plan?
Yes CRZ IB, CRZ-II, CRZ-IV
1.3 Whether located in CRZ-I area? Yes CRZ IB
1.4 The distance from the CRZ-I
areas.
Yes Berths lies in the inter-tidal zone
CRZ IB
1.5 Whether located within the
hazard zone as mapped by
Ministry of Environment and
Forests/National Disaster
Management Authority?
NO No
1.6 Whether the area is prone to
cyclone, tsunami, tidal surge,
subduction, earthquake etc.?
No There is no record of occurrence of
floods, landslides and cloud bursts
in the area.
The project site is seismically not
active zone.
1.7 Whether the area is prone for
saltwater ingress?
No No
1.8 Clearance of existing land,
vegetation and buildings? No Not Applicable
1.9 Creation of new land uses? No Not Applicable
1.10 Pre-construction investigations
e.g. bore holes, soil testing?
No Not Applicable.
1.11 Construction works? No Not Applicable
1.12 Demolition works? No Not Applicable
1.13
Temporary sites used for
construction works or housing of
construction workers?
No Local labourers shall be deployed
for any development works at the
site.

4
S.No. Information/Checklist
confirmation Yes/No
Details thereof (with approximate
quantities /rates, wherever
possible) with source of
information data
1.14
Above ground buildings,
structures or earthworks
including linear structures, cut
and fill or excavations
No Not Applicable
1.15 Underground works including
mining or tunneling? No Not Applicable
1.16 Reclamation works? No Not Applicable
1.17 Dredging? No Not Applicable
1.18 Offshore structures? No Not Applicable
1.19 Production and manufacturing
processes? No Not Applicable
1.20 Facilities for storage of goods or
materials? Yes
Covered bulk cargo storage with
wind shields.
Covered shed steel products
1.21
Facilities for treatment or
disposal of solid waste or liquid
effluents?
Yes
The activity does not produce any
industrial effluent. The domestic
waste water will be treated in a
septic tank and soak pit as is done at
present.
The solid waste shall be segregated
and disposed as per the norms.
1.22 Facilities for long term housing
of operational workers? No Not envisaged
1.23 New road, rail or sea traffic
during construction or operation? No Not envisaged
1.24
New road, rail, air waterborne or
other transport infrastructure
including new or altered routes
and stations, ports, airports etc?
No Not envisaged
1.25
Closure or diversion of existing
transport routes or infrastructure
leading to changes in traffic
movements?
No Not envisaged
1.26 New or diverted transmission
lines or pipelines? No Not envisaged
1.27 Impoundment, damming,
culverting, realignment or other No Not applicable

5
S.No. Information/Checklist
confirmation Yes/No
Details thereof (with approximate
quantities /rates, wherever
possible) with source of
information data
changes to the hydrology of
watercourses or aquifers?
1.28 Stream crossings? No Not applicable
1.29 Abstraction or transfer of water
from ground or surface water? No Not applicable
1.30 Changes in water bodies or the
land surface affecting drainage
or run-off
No
There are no alterations in the
existing drainage network. The
drainage facility, if required for the
enhancement project shall be
merged with the existing facilities.
1.31 Transport of personnel or
materials for construction,
operation or decommissioning?
Yes No major construction activities are
involved.
During the operational there shall be
transportation of cargo to the port.
Also the personnel involved in
operational activities shall be
transported to the region.
1.32
Long-term dismantling or
decommissioning or restoration
works?
No Not envisaged
1.33
Ongoing activity during
decommissioning which could
have an impact on the
environment?
No Not envisaged
1.34
Influx of people to an area in
either temporarily or
permanently?
Yes Only the operators, technical staff
would be coming to the site
1.35 Introduction of alien species? No Not applicable
1.36 Loss of native species or genetic
diversity? No Not applicable
1.37 Any other actions? No Not applicable

6
2. Use of Natural resources for construction or operation of the Project (such as land,
water, materials or energy, especially any resources that are non-renewable or in short
supply):
S.No. Information/checklist
confirmation Yes/No
Details thereof (with approximate
quantities /rates, wherever possible)
with source of information data
2.1 Land specially undeveloped
or agricultural land (ha)
No Not applicable
2.2 Water (expected source and
competing users)
Yes The requirement shall be met from existing
allocation of Goa PWD for existing
operations.
About 500 KLD of water would be
required for full operation.
2.3 Minerals (MT) No Not envisaged
2.4 Construction material –
stone, aggregates, and/ soil
(expected source-MT)
No Not envisaged
2.5 Forests and timber (source-
MT)
No No use of timber is envisaged in the
proposed expansion of Jetty
2.6 Energy including electricity
and fuels (source, competing
users) Unit: fuel (MT),
energy (MW)
Yes The power will be drawn from the Goa
State Electricity Board.
Approximately 7 MVA of power shall be
required when the entire project is in
operation.
2.7 Any other natural resources
(use appropriate standard
units)
No Not envisaged
3. Use, storage, transport, handling or production of substances or materials, which could
be harmful to human health or the environment or raise concerns about actual or
perceived risks to human health.
S.No. Information/Checklist
confirmation Yes/No
Details thereof (with approximate
quantities /rates, wherever possible)
with source of information data
3.1
Use of substances or materials,
which are hazardous (as per
MSIHC rules) to human health or
the environment (flora, fauna,
and water supplies)
No
Not envisaged
3.2
Changes in occurrence of disease
or affect disease vectors (e.g.
insect or water borne diseases)
No Not envisaged

7
S.No. Information/Checklist
confirmation Yes/No
Details thereof (with approximate
quantities /rates, wherever possible)
with source of information data
3.3 Affect the welfare of people e.g.
by changing living conditions? No Not envisaged
3.4
Vulnerable groups of people who
could be affected by the project
e.g. hospital patients, children,
the elderly etc.,
No Not envisaged
3.5 Any other causes No Not applicable
4. Production of solid wastes during construction or operation or decommissioning
(MT/month).
S.No. Information/Checklist
confirmation Yes/No
Details thereof (with approximate
quantities /rates, wherever
possible) with source of
information data
4.1 Spoil, overburden or mine
wastes Yes
A very little amount of solid waste is
envisaged during the development
phase. The waste shall be segregated
and disposed through CPCB
authorised vendors.
4.2
Municipal waste (domestic and
or commercial wastes)
Yes All municipal solid waste generated
from the sewage treatment will be
used within the jetty site for
plantation as manure.
4.3
Hazardous wastes (as per
Hazardous Waste
Management Rules)
Yes
The spent oil will be given to the
recycler authorised by SPCB. Other
wastes like soiled packaging
material, discarded batteries, etc. will
be sent to the authorised agency for
incineration.
4.4 Other industrial process wastes Yes Not envisaged
4.5 Surplus product No Not envisaged
4.6 Sewage sludge or other sludge
from effluent treatment Yes
Biological sludge generated shall be
mixed with the vermi-composed
manure and used for horticulture.
4.7 Construction or demolition
wastes
Yes Small quantity of metallic scrap
waste is expected to be generated
during installation activities. This
scrap will be used as melting scrap in
steel making.

8
S.No. Information/Checklist
confirmation Yes/No
Details thereof (with approximate
quantities /rates, wherever
possible) with source of
information data
4.8 Redundant machinery or
equipment
No Not envisaged
4.9 Contaminated soils or other
materials No Not envisaged
4.10 Agricultural wastes No Not envisaged
4.11 Other solid wastes No Not envisaged
5. Release of pollutants or any hazardous, toxic or noxious substances to air (Kg/hr)
Information/Checklist
confirmation Yes/No
Details thereof (with approximate
quantities /rates, wherever possible)
with source of information data
5.1 Emissions from combustion of
fossil fuels from stationary or
mobile sources
Yes The emissions like smoke are expected
from ships carrying cargo and the
vehicles carrying cargo in and from the
port area.
Proper mitigation measures would be
implemented to minimize the impacts.
5.2 Emission from production
processes
No The proposed project caters to services
for loading / unloading of raw materials
and product from ships.
Dust emissions from loading unloading
activities, transfer operations etc. can
be expected.
5.3 Emissions from materials
handling including storage or
transport
Yes Fugitive dust will be generated from
the material handling activities.
Dust suppression systems with water
sprinklers/dry fog system will be
provided to prevent the fugitive dust
emissions.
Further, the development of Greenbelt
would prevent the fugitive dust
emissions.
5.4 Emissions from construction
activities including plant and
equipment
Yes Fugitive Dust only.

9
5.5 Dust or odours from handling of
materials including construction
materials, sewage and waste
Yes Dust emissions from raw material
handling will be generated. Suitable
dust suppression and dust extraction
equipments will be installed for dust
suppression.
There is no possibility of any odour
generation as there are no organic
solvents / processes involved.
5.6 Emissions from incineration of
waste
No Not envisaged
5.7 Emissions from burning of
waste in open air (e.g. slash
materials, construction debris)
No Not envisaged
5.8 Emissions from any other
sources
No Not envisaged
6. Generation of Noise and Vibration, and Emissions of Light and Heat.
S.No. Information/Checklist
confirmation Yes/No
Details thereof (with approximate
quantities /rates, wherever possible)
with source of information data
6.1 From operation of equipment
e.g. engines, ventilation plant,
crushers
Yes During construction phase i.e.
upgradation of facilities noise will be
generated from activities and
equipments.
During operational phase noise will be
generated from loading /unloading
activities.
Proper mitigation measures shall be
deployed to attenuate the noise
generated.
6.2 From industrial or similar
processes
No Not envisaged
6.3 From construction or
demolition
No No major construction activities are
envisaged in the project
6.4 From blasting or piling No Not envisaged
6.5 From construction or
operational traffic
Yes Proper mitigation measures shall be
deployed to attenuate the noise
generated.
6.6 From lighting or cooling
systems
No Not envisaged
6.7 From any other sources No Not envisaged

10
7. Risks of contamination of land or water from releases of pollutants into the ground or
into sewers, surface waters, groundwater, coastal waters or the sea.
S.No. Information/Checklist
confirmation Yes/No
Details thereof (with approximate
quantities /rates, wherever possible)
with source of information data
7.1
From handling, storage, use
or spillage of hazardous
materials
No Not envisaged
7.2
From discharge of sewage or
other effluents to water or
the land (expected mode and
place of discharge)
Yes
The sewage water will be treated in
septic tanks and soak pit. Treated
sewage will be used for horticulture
within the port area.
7.3
By deposition of pollutants
emitted to air, onto the land
or into water
No Not envisaged
7.4 From any other sources No Not envisaged
7.5
Is there a risk of long term
build-up of pollutants in the
environment from these
sources?
No Not envisaged
8. Risk of accidents during construction or operation of the Project, which could affect
human health or the environment
S.No. Information/Checklist
confirmation Yes/No
Details thereof (with approximate
quantities /rates, wherever possible)
with source of information data
8.1
From explosions, spillages,
fires etc from storage,
handling, use or production
of hazardous substances
No Not envisaged
8.2 From any other causes No Not envisaged
8.3
Could the project be affected
by natural disasters causing
environmental damage (e.g.
floods, earthquakes,
landslides, cloudburst etc)?
Yes
During the design stage, the possible
effects of natural disasters will be
considered and necessary precautionary
measures would be built-in and
implemented.

11
9. Factors which should be considered (such as consequential development) which could
lead to environmental effects or the potential for cumulative impacts with other existing
or planned activities in the locality
Sr.
No.
Information/Checklist
Confirmation
Yes/
No
Details thereof (with approximate
quantities/ rates, wherever possible)
with source of information data
9.1 Lead to development of
supporting, facilities, ancillary
development or development
stimulated by the project which
could have impact on the
environment
Yes
Existing and ancillary facilities will
improve.
Supporting infrastructure (roads,
power supply, waste or waste
water treatment, etc)
Yes Existing infrastructure facilities will be
expanded / extended to take care of the
project.
Housing development No -
Extractive industries No -
Supply industries Yes The material is sent by Indian Railways at
present and the mode will continue to be
the same.
Other -
9.2 Lead to after use of the site, which
could have an impact on the
environment
No -
9.3 Set a precedent for later
developments
No This facility is inside a major port and is
for receiving stacking and despatching to
the intended industries. No ancillary
industries are envisaged.
9.4 Have cumulative effects due to
proximity to other existing or
planned projects with similar
effects
No -

12
III ENVIRONMENTAL SENSITIVITY
S.No. Areas Name/
Identity
Aerial distance (within 15 km)
Proposed project location boundary
1 Areas protected under
international conventions,
national or local legislation for
their ecological, landscape,
cultural or other related value
No The project is in the existing
operational facility. There are no
ecological, landscapes, cultural or other
sensitive areas around the project site.
2 Areas which are important or
sensitive of ecological reasons –
wetlands, water courses or other
water bodies, coastal zone,
biospheres, mountains, forests
No The project is in the existing
operational facility.
3 Areas used by protected,
important or sensitive species of
flora or fauna for breeding,
nesting, foraging, resting, over
wintering, migration
No There are no protected for sensitive
flora and fauna near the site.
4 Inland, coastal, marine or
underground waters
Yes The facilities are in the coastal marine
areas of Mandovi - Zuari estuary,
located inside a Major Port.
5 State, national boundaries No -
6 Routes or facilities used by the
public for access to recreation or
other tourist, pilgrim areas
No Not applicable
7 Defence installations No Not applicable
8 Densely populated or built-up
area
No Capacity enhancement of the existing
facility by increased mechanisation
and associated operational efficiency.
9 Areas occupied by sensitive
man made land uses (hospitals,
schools, places of worship,
community facilities)
No Not applicable
10 Areas containing important,
high quality or scarce resources
(ground water resource, surface
resources, forestry, agriculture,
fisheries, tourism, minerals)
No No scarce resources are present around
the site.
11 Areas already subjected to
pollution or environmental
damage. (those where existing
No The proposed activity is in the
operational berths.
13
S.No. Areas Name/
Identity
Aerial distance (within 15 km)
Proposed project location boundary
legal environmental standards
are exceeded)
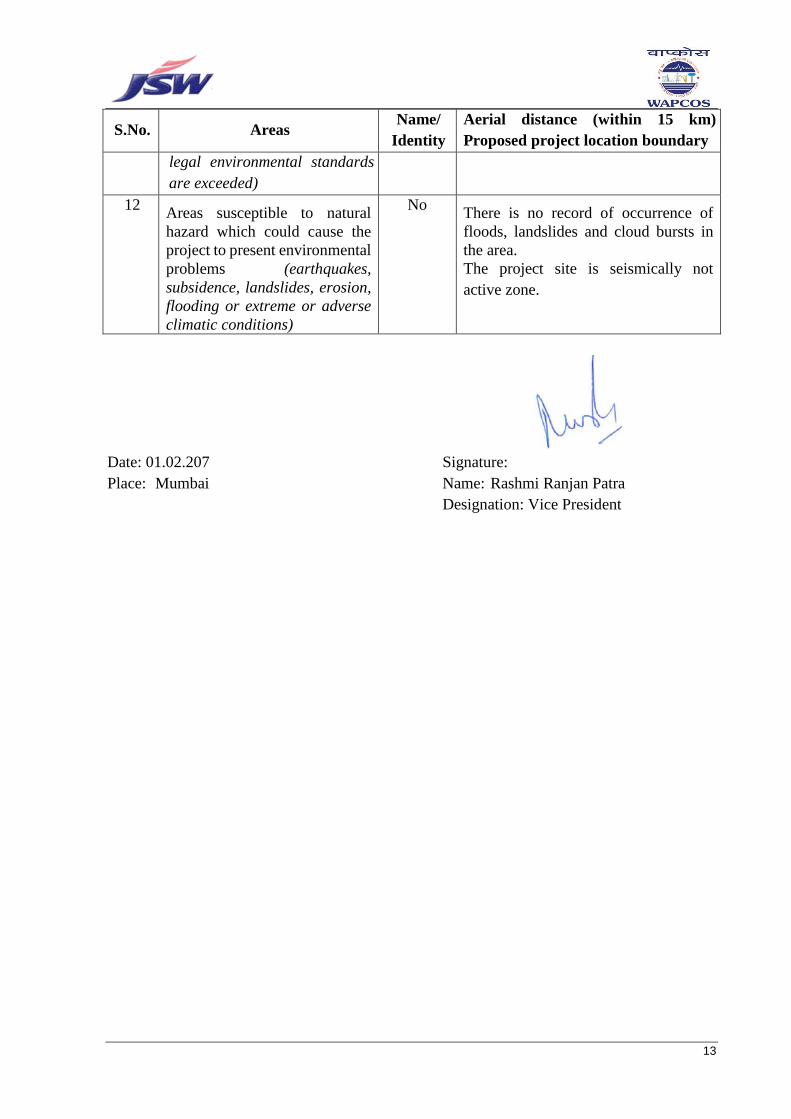
12 Areas susceptible to natural
hazard which could cause the
project to present environmental
problems (earthquakes,
subsidence, landslides, erosion,
flooding or extreme or adverse
climatic conditions)
No There is no record of occurrence of
floods, landslides and cloud bursts in
the area.
The project site is seismically not
active zone.
Date: 01.02.207 Signature:
Place: Mumbai Name: Rashmi Ranjan Patra
Designation: Vice President

Environmental Impact Assessment Study for
Proposed Terminal Capacity Enhancement at
Berth 5A-6A of Mormugao Port, Mormugao, Goa
South West Port Limited, Mormugao, Goa
FINAL REPORT1
September, 2017
1 Prepared after addressing all the material environmental concerns expressed during Public Consultation process, and by
making appropriate changes in the draft EIA Report as per procedure provided in the EIA Notification, 2006 (amended).
(A Government of India Undertaking)
76 C, Sector 18, Gurugram - 122015, Haryana, INDIA
+91-124-2397396, [email protected]
Sl. No. 162, QCI NABET Accredited Consultant

-----------------------------------------------------------------------------------------------------------------------------------------------
EIA Study for capacity enhancement at berth 5A & 6A of SWPL, Goa i Final Report, September, 2017
CONTENTS
CHAPTER 1.0 INTRODUCTION
1.1 BACK GROUND 1-1
1.2 JSW GROUP Profile 1-2
1.3 PROJECT Profile 1-5
1.4 CONNECTIVITY 1-7
1.4.1 Air Connectivity 1-7
1.4.2 Road Connectivity 1-7
1.4.3 Rail Connectivity 1-7
1.5 NEED FOR THE EIA STUDY 1-8
1.6 OBJECTIVES OF THE EIA STUDY 1-8
1.7 POLICY, LEGAL AND ADMINISTRATIVE FRAMEWORK 1-9
1.8 EIA STUDY METHODOLOGY 1-11
1.9 STAGES IN AN EIA STUDY 1-11
2.0 OUTLINE OF THE REPORT 1-12
CHAPTER 2.0 PROJECT DESCRIPTION
2.1 PROJECT BACKGROUND 2-1
2.2 NEED FOR THE PROJECT 2-3
2.3 LOCATION OF THE PROJECT 2-5
2.4 EXISTING NAVIGATION FACILITIES 2-6
2.5 EXISTING & PROPOSED CARGO CAPACITY 2-6
2.6 FACILITIES AT THE TERMINAL 2-7
2.7 CARGO HANDLING, STORAGE & TRANSPORTATION 2-10
2.7.1 Break Bulk Cargo (Import Cargo) 2-10
2.7.2 Steel Slab / Coil, Steel Finished Products (Export Cargo) 2-10
2.7.3 Environment Regulatory Mechanization 2-11
2.8 CONSEQUENTIAL CAPACITY ENHANCEMENT 2-12
2.9 STACYARD CAPACITY 2-14
2.10 WAGON LOADING SYSTYEM 2-14

-----------------------------------------------------------------------------------------------------------------------------------------------
EIA Study for capacity enhancement at berth 5A & 6A of SWPL, Goa ii Final Report, September, 2017
2.11 STACKER/RECLAIMERS IN STACKYARD 2-15
2.11.1 Capacity 2-15
2.11.2 New Stacker/Reclaimer 2-15
2.12 BELT CONVEYOR SYSTEM 2-16
2.12.1 Receiving Conveyor 2-16
2.12.2 Despatch Conveyors 2-17
2.12.3 Bypass Conveyor for direct Dispatch 2-18
2.13 TRAFFIC POTENTIAL 2-19
CHAPTER 3.0 ENVIRONMENTAL BASELINE STATUS
3.1 GENERAL 3-1
3.2 STUDY AREA 3-2
3.3 METEOROLOGY 3-3
3.4 BATHYMETRY 3-7
3.5 CYCLONES 3-7
3.6 SEDIMENT TRANSPORT 3-8
3.7 TOPOGRAPHY ANAD GEOLOGY 3-8
3.8 TIDES 3-9
3.9 WAVES 3-9
3.10 CURRENTS 3-11
3.11 GROUNDWATER QUALITY 3-12
3.12 SOIL QUALITY 3-15
3.13 LANDUSE PATTERN 3-16
3.14 SHORELINE CHANGE STATUS 3-18
3.15 AMBIENT AIR QUALITY 3-19
3.16 NOISE LEVELS 3-29
3.17 MARINE ECOLOGY 3-30
3.17.1 Methodology adopted for Analyses 3-32
3.17.2 Marine Water Quality 3-38
3.17.3 Marine Sediment Quality 3-44
3.17.4 Marine Microbiology 3-46
3.17.5 Chlorophyll Pigments 3-49

-----------------------------------------------------------------------------------------------------------------------------------------------
EIA Study for capacity enhancement at berth 5A & 6A of SWPL, Goa iii Final Report, September, 2017
3.17.6 Phytoplankton 3-49
3.17.7 Zooplankton 3-53
3.17.8 Benthos 3-57
3.17.9 Sea weed and Sea grass 3-63
3.17.10 Corals and associate faunal assemblages 3-64
3.17.11 Turtle Nesting 3-64
3.17.12 Windowpane Oyster 3-66
3.17.13 Mangrove Distribution 3-66
3.18 TERRESTRIAL ECOLOGY 3-67
3.18.1 FLORA 3-67
3.18.2 FAUNA 3-74
3.18.3 Eco-sensitive zones 3-83
3.19 FISHERIES 3-85
3.20 ARCHEOLOGICALLY IMPORTANT SITES 3-92
3.21 SENSITIVE INSTALLATIONS 3-95
3.21.1 Defense Installations 3-95
3.21.2 Densely Populated/ Builtup Area/ Educational Institutes 3-95
3.21.3 Hospitals 3-96
3.21.4 Liquid Cargo Handling at MPT 3-99
3.22 SOCIO-ECONOMIC STATUS 3-99
3.22.1 Demographic Profile 3-99
3.22.2 Caste Profile 3-101
3.22.3 Literacy Levels 3-103
3.22.4 Occupational Profile 3-105
3.22.5 Major Diseases reported in MPT Hospital 3-109
3.23 TOURISM 3-109
CHAPTER 4.0 IMPACT ASSESSMENT & MITIGATION MEASURES
4.1 INTRODUCTION 4-1
4.2 IMPACT DURING IMPLEMENTATION PHASE 4-1
4.2.1 Water Environment 4-1
-----------------------------------------------------------------------------------------------------------------------------------------------
EIA Study for capacity enhancement at berth 5A & 6A of SWPL, Goa iv Final Report, September, 2017
4.2.2 Biological Environment 4-2
4.2.3 Land Environment 4-4
4.2.4 Air Environment 4-5
4.2.5 Noise Environment 4-7
4.3 IMPACTS DURING OPERATION PHASE 4-10
4.3.1 Water Environment 4-10
4.3.2 Biological Environment 4-14
4.3.3 Land Environment 4-15
4.3.4 Air Environment 4-17
4.3.5 Noise Environment 4-21
4.4 SOCIO-ECONOMIC IMPACTS 4-21
4.5 MITIGAGATION MEASURES MATRIX 4-23
CHAPTER 5.0 ENVIRONMENTAL MANAGEMENT PLAN (EMP)
5.1 INTRODUCTION 5-1
5.2 EMP DURING IMPLEMENTATION PHASE 5-1
5.2.1 Water Environment 5-1
5.2.2 Land Environment 5-2
5.2.3 Air Environment 5-2
5.2.4 Marine Ecology 5-3
5.2.5 Solid Waste Management 5-3
5.3 EMP DURING OPERATION PHASE 5-3
5.3.1 Air Environment 5-3
5.3.2 Water Environment 5-11
5.3.3 Noise Control Measures 5-13
5.3.4 Solid Waste Management 5-14
5.3.5 Terrestrial Ecology 5-14
5.3.6 Greenbelt Development 5-15
5.4 ENVIRONMENT MANAGEMENT CELL 5-16
CHAPTER 6.0 RISK ANALYSIS & DISASTER MANAGEMENT PLAN
6.1 INTRODUCTION 6-1

-----------------------------------------------------------------------------------------------------------------------------------------------
EIA Study for capacity enhancement at berth 5A & 6A of SWPL, Goa v Final Report, September, 2017
6.2 APPROACH TO DMP 6-2
6.3 OBJECTIVES 6-3
6.4 IDENTIFICATION AND ASSESSMENT OF HAZARDS 6-4
6.4.1 Coal Storage and Fire Risk 6-5
6.5 DISASTER CONTROL/RESPONSE PLAN 6-6
6.5.1 Emergency Plan for Natural Disasters 6-6
6.5.2 Medical Emergency Plan 6-13
6.6 TRAINING AND DEVELOPMENT 6-14
6.7 COMPONENTS OF DMP 6-16
6.7.1 Onsite DMP 6-16
6.7.2 Key Personnel and Responsibilities in Event of Emergency 6-17
6.7.3 Communication Facilities for Emergency 6-22
6.7.4 Details of First aid and Hospital Services 6-22
6.7.5 Rehearsal and Testing 6-23
6.7.6 Offsite Action on Event of Emergency 6-23
CHAPTER 7.0 CORPORATE SOCIAL RESPONSIBILITY (CSR)
7.1 GENESIS 7-1
7.2 CSR ACTIVITIES 7-1
7.2.1 School & Education Sector 7-2
7.2.2 Community Health 7-2
7.2.3 Sports Activity 7-3
7.2.4 Livelihood and Empowerment 7-4
7.2.5 Environment 7-4
7.2.6 Infrastructure Development 7-5
7.3 BUDGET 7-5
CHAPTER 8.0 ENVIRONMENTAL MONITORING PROGRAMME
8.1 INTRODUCTION 8-1
8.2 AREAS OF CONCERN 8-1
8.3 IMPLEMENTATION PHASE 8-2
8.3.1 AMBIENT AIR QUALITY 8-2
-----------------------------------------------------------------------------------------------------------------------------------------------
EIA Study for capacity enhancement at berth 5A & 6A of SWPL, Goa vi Final Report, September, 2017
8.3.2 NOISE 8-2
8.4. OPERATION PHASE 8-2
8.4.1 Marine Water & Sediment Quality 8-2
8.4.2 AMBIENT AIR QUALITY 8-4
8.4.3 NOISE 8-4
8.4.4 BIOLOGICAL ENVIRONMENT 8-4
8.5 SUMMARY OF ENVIRONMENTAL MONITORING PROGRAM 8-4
8.6 ENVIRONMENTAL MANAGEMENT CELL 8-6
8.7 BUDGET 8-6
CHAPTER 9.0 COST ESTIMATE FOR ENVIRONMENT MANAGEMENT
9.1 ENVIRONMENTAL MANAGEMENT PLAN (EMP) 9-1
9.2 ENVIRONMENTAL MONITORING PROGRAMME (EMoP) 9-1
CHAPTER 10.0 DISCLOSURE OF CONSULTANTS
10.1 DISCLOSURE OF CONSULTANTS ENGAGED IN EIA STUDY 10-1
CHAPTER 11.0 PUBLIC HEARING
11.1 BACKGROUND 11-1
11.2 ISSUES RAISED BY PUBLIC DURING PH 11-1
ANNEXURES
ANNEXURE-I Ambient Air Quality Standards
ANNEXURE-II Ambient Noise Standards
ANNEXURE-III Certified Compliance Report from RO, MoEFCC, Bangalore
ANNEXURE-IV ToR Letter from MoEFCC, New Delhi
ANNEXURE-V CRZ map
ANNEXURE-V I CRZ Recommendation from GCZMA, Goa
ANNEXURE-V II ToR Compliances in the EIA study
ANNEXURE-VIII NABET Accreditation Certificate of the Consultant

-----------------------------------------------------------------------------------------------------------------------------------------------
EIA Study for capacity enhancement at berth 5A & 6A of SWPL, Goa vii Final Report, September, 2017
LIST OF TABLES
Table 2.1: Existing and proposed cargo handling capacity at SWPL
Table 2.2: Existing bert facility at SWPL
Table 2.3: Existing and proposed backup facility
Table 2.4: Coal Imported through Mormugao Port
Table 3.1: Meteorological conditions in the project area
Table 3.2: Tide levels with respect to Chart Datum (CD)
Table 3.3: Deep water wave climate (Probability of exceedance in % of time)
Table 3.4: Operational wave climate (Probability of exceedance in % of time)
Table 3.5: Current measurements at Vasco Bay
Table 3.6: Groundwater quality in the study area
Table 3.7: Soil quality in the study area
Table 3.8: Landuse pattern of the study area
Table 3.9: Location detail of ambient air quality monitoring stations
Table 3.10: Results of ambient air quality status
Table 3.11: Summary of ambient air quality status
Table 3.12: Location details of noise monitoring stations
Table 3.13: Ambient noise level in the study area [Unit: dB(A)]
Table 3.14: Equivalent noise levels in the study area
Table 3.15: Marine sampling locations and its geographical co-ordinates
Table 3.16: Physico - chemical characteristics of marine water
Table 3.17: Nutrients in the water samples analysed from study area
Table 3.18: Heavy metals in the water samples analysed from study area
Table 3.19: Results of sediment samples analysed from study area
Table 3.20: Heavy metals in sediment samples analysed from study area
Table 3.21: Bacterial population in marine water analysed from study area
Table 3.22: Bacterial population in sediments analysed from study area
Table 3.23: Chlorophyll a, Phaeo-pigments and Total Biomass in marine water
Table 3.24: Abundance and density of Phytoplankton in marine water
Table 3.25: Diversity indices, a-Shannon diversity (H’); b-Margalef richness (d)
and c-Pielou’s evenness (J’) calculated for Phytoplankton
-----------------------------------------------------------------------------------------------------------------------------------------------
EIA Study for capacity enhancement at berth 5A & 6A of SWPL, Goa viii Final Report, September, 2017
Table 3.26: Abundance and density Zooplankton in marine water
Table 3.27: Diversity indices, a-Shannon diversity (H’); b-Margalef richness (d)
and c-Pielou’s evenness (J’) calculated for Zooplankton
Table 3.28: Abundance and density of Macro-benthos in sediments
Table 3.29: Diversity indices, a-Shannon diversity (H’); b-Margalef richness (d)
and c-Pielou’s evenness (J’) calculated for Macro-benthos
Table 3.30: Abundance and density of Meio-benthos in sediments
Table 3.31: Diversity indices, a-Shannon diversity (H’); b-Margalef richness (d)
and c-Pielou’s evenness (J’) calculated for Meio-benthos
Table 3.32: Location of Turtle Nesting grounds in Goa
Table 3.33: Plant species recorded in South Goa forest division
Table 3.34: List of Mammals reported in the study area
Table 3.35: List of Bird species reported in the study area
Table 3.36: List of Reptiles reported in the study area
Table 3.37: List of Amphibian species reported in the study area
Table 3.38: Fish species reported in Goan waters
Table 3.39: Marine fish landing center in the study area
Table 3.40: List of Inland fish landing centers in the study area
Table 3.41: Five-year marine fish catch at Goa for 15 years
Table 3.42: Fish catch at different Fish Landing Centers
Table 3.43: Fish catch at different Fish Landing Centers in South Goa
Table 3.44: Fish Catch at different Fish Landing Centers of North Goa
Table 3.45: Fishermen population in the study area
Table 3.46: List of Health centers in the study area
Table 3.47: Demographic profile of study area
Table 3.48: Caste profile of study area
Table 3.49: Educational profile of study area population
Table 3.50: Occupational profile of study area population
Table 3.51: Major Disease recorded in MPT Hospital

-----------------------------------------------------------------------------------------------------------------------------------------------
EIA Study for capacity enhancement at berth 5A & 6A of SWPL, Goa ix Final Report, September, 2017
Table 4.1: Emission limits for DG sets prescribed by CPCB
Table 4.2: Permissible limits during daytime for different land uses
Table 4.3: Maximum Exposure Periods specified by OSHA
Table 4.4: Water requirement at the port facility
Table 4.5: Mitigation measures in the Matrix form
Table 5.1: Type of solid waste generated and its disposal
Table 6.1: Summary of the Disaster Preparedness Plans
Table 6.2: Actions to be taken in Cyclone Emergency
Table 6.3: Actions to be taken in Tsunami Emergency
Table 8.1: Summary of Environmental Monitoring Programme for Project
Implementation Phase
Table 8.2: Summary of Environmental Monitoring Programme for Project
Operation Phase
Table 9.1: Summary of cost estimate for implementing Environmental
Management Plan (EMP)
Table 9.2: Cost estimate for EMoP during project implementation phase
Table 9.3: Cost estimate for EMoP during project operation phase
Table 10.1: List of experts involved in EIA study
Table 11.1: Major issues raised by public during the PH and its response by PP
-----------------------------------------------------------------------------------------------------------------------------------------------
EIA Study for capacity enhancement at berth 5A & 6A of SWPL, Goa x Final Report, September, 2017
LIST OF FIGURES
Figure 1.1: Location of the Mormugao Port
Figure 1.1: Google Image showing Berth 5A & 6A of Mormugao Port
Figure 2.1: Location of Berth 5A & 6A at Mormugao Port
Figure 2.2: MPT Navigation Chart
Figure 2.3: Layout of the Terminal
Figure 3.1: Study area map
Figure 3.2: Temperature variations in the project area
Figure 3.3: Rainfall variations in the project area
Figure 3.4: Mean wind speed variations in the project area
Figure 3.5: Wind rose diagram for the month of March to May, 2015
Figure 3.6: Storm tracks applicable for the region (Source IMD)
Figure 3.7: Sampling location map
Figure 3.8: FCC of the study area
Figure 3.9. Land use pattern of the study area
Figure 3.10: Status of Shoreline change in the study area
Figure 3.11: Map showing study area for marine ecological survey
Figure 3.12: Population density of Phytoplankton recorded from study area
Figure 3.13: Percentage composition of Phytoplankton recorded from study area
Figure 3.14: Population density of Zooplankton recorded from study area
Figure 3.15: Percentage composition of Zooplankton recorded from study area
Figure 3.16: Population density of Macro-benthos
Figure 3.17: Percentage composition of Macro-benthos
Figure 3.18: Population density of Meio-benthos
Figure 3.19: Percentage composition of Meio-benthos
Figure 3.20: Turtle nesting grounds in Goa
Figure 3.21: Eco sensitive zone map of Goa

-----------------------------------------------------------------------------------------------------------------------------------------------
EIA Study for capacity enhancement at berth 5A & 6A of SWPL, Goa xi Final Report, September, 2017
Figure 3.22: Demographic profile of study area
Figure 3.23: Caste profile of study area
Figure 3.24: Literacy profile of study area polpulation
Figure 3.25: Occupational profile of study area population
Figure 4.1: Fugitive Dust model output for PM10
Figure 5.1: Water sprinkler system at ship unloader facility
Figure 5.2 A: The water spray/mist system in the berth hopper for dust
suppression
Figure 5.2 B: The water spray arrangement on the berth conveyor with the dust
hood
Figure 5.2 C: Water spray system at the transfer towers and conveyor systems
Figure 5.3: Water sprinkler system at stack yards
Figure 5.4: Windshield at stack yard to control wind generated dust suspension
Figure 5.5: The Silo Wagon Loading System
Figure 5.6: Covered shed for bulk cargo storage at the Terminal
Figure 5.7: Water balance diagram during operation phase
Figure 5.8: Organization structure for Environment Management Cell (EMC)
Figure 6.1: Organization Chart of Onsite Emergency Management Team
Key Personnel

----------------------------------------------------------------------------------------------------------------------------------------------- EIA Study for capacity enhancement at berth 5A & 6A of SWPL, Goa 1-1 EIA Report, September, 2017
Chapter 1.0 INTRODUCTION
1.0 BACK GROUND
Mormugao Port is a Major Port on the west coast of India in service to the
nation’s maritime trade for a longer period. It is located at latitude 15° 25’ N and
longitude 73° 47’ E between two Major Ports of New Mangalore in south and
Mumbai in north. It is located at the mouth of the river Zuari. The location of
Mormugao Port on the west coast of India is depicted in the Figures 1.1 and 1.2.
The Port serves the geographical regions of Goa, Karnataka and parts of
Maharashtra and Andhra Pradesh. Major commodities being handled at the Port
are Coal, Iron Ore, POL and general cargo items. Because of the proximity of
the Port with various mining regions in Goa, the Port assumed the role of a
premier Iron Ore exporting port of the country. However, the requirements of coal
from various steel industries and power generating units have made it an
attractive and cost effective destination for coal imports and steel exports.
Figure 1.1: Location of Mormugao Port

----------------------------------------------------------------------------------------------------------------------------------------------- EIA Study for capacity enhancement at berth 5A & 6A of SWPL, Goa 1-2 EIA Report, September, 2017
Figure 1.2: Google Image showing Berth 5A & 6A at Mormugao Port
The Port has 7 cargo handling berths of which two are dedicated coal berths,
one dedicated iron ore berth and a dedicated POL berth and the remaining
general cargo berths. Apart from these 7 berths, there is also a dedicated berth
for cruise vessels and a non-cargo berth which is proposed to be earmarked for
the exclusive use of Navy and Coast Guard and 6 nos Mooring Dolphins. There
is 7.5 km of entrance channel with the depth of outer channel being 14.4 m and
that of the inner channel being 14.1 m. The Port has a total land area of 530
acres (approx.).
South West Port Ltd. (SWPL), a JSW group company operates two berths,
namely berth no. 5A & 6A in the Mormugao Port on BOOT basis to handle its
group cargo.
1.2 JSW GROUP Profile
JSW Group is one of the fastest growing business conglomerates with a strong
presence in the core economic sector. This enterprise has grown from a steel

----------------------------------------------------------------------------------------------------------------------------------------------- EIA Study for capacity enhancement at berth 5A & 6A of SWPL, Goa 1-3 EIA Report, September, 2017
rolling mill in 1982 to a multi business conglomerate worth US $ 11.0 billion
within a short span of time. As part of the US $ 16.5 billion O. P. Jindal Group,
JSW Group has diversified interests in Steel, Energy, Minerals and Mining,
Infrastructure, Cement and Information Technology.
JSW Steel Limited (JSWSL), the flag ship company of JSW group is one of the
largest steel producers of the Country. The company has manufacturing facilities
located at Vijayanagar in Karnataka, Salem in Tamil Nadu, and Vasind, Tarapur,
Dolvi, & Kalmeshwar in Maharashtra. JSW Steel has present capacity to produce
steel of 18.0 million tonnes per annum (MTPA). The group presently engaged in
the fields of steel, cement and aluminum production, power generation and
Infrastructure development.
JSW Steel at Vijayanagar is one of the India’s largest integrated steel company
with an annual capacity of about 14.3 MTPA. The company has manufacturing
facilities located at Vijayanagar in Karnataka, Salem in Tamil Nadu, Vasind,
Tarapur and Dolvi in Maharashtra. The product range includes Pellets, Slabs,
HRC, HR Plates / Sheets, CR Coils, GP/GC and Colour Coated Coils/Sheets,
Bars, Rounds and Reinforcement bars.
JSW Energy Ltd. (JSWEL) is the first Independent Power Producer (IPP) set up
in the state of Karnataka. The company has set up 2 units of 130 MW each and
two units of 300 MW each and all these units are generating power using Corex
gas and coal. JSWEL supply power to JSW Steel Ltd., and to Power Trading
Corporation. JSWEL would require 4 MTPA of coal for its 1200 MW power plant
at Vijayanagar.
Another subsidiary, JSW Energy (Ratnagiri) Ltd, is operating a 1200 MW Coal
fired power plant at Jaigarh, Dist, Ratnagiri, Maharashtra. Another unit is
functional at Barmer, Rajasthan producing about 1080 MW lignite fired power.
The JSW Infrastructure Ltd (JSWIL) is a JSW Group company which is presently
into development of ports, rail/road and inland water connectivity, development of

----------------------------------------------------------------------------------------------------------------------------------------------- EIA Study for capacity enhancement at berth 5A & 6A of SWPL, Goa 1-4 EIA Report, September, 2017
port based SEZ and other related infrastructure developments works along with
terminal handling operations and port management. Buoyed by the Group’s
cargo support, experience in marine infrastructure development and operations,
JSW Infrastructure Ltd. ventured into development of Greenfield ports across the
coast of India.
South West Port Ltd, a JSWIL group company, has developed two berths,
namely berth no. 5A & 6A in Murmugao Port, Goa on BOOT basis.
JSW Jaigarh Port Ltd. (JSWJPL), a subsidiary of JSW Infrastructure Ltd.
developed as Greenfield all weather Port facility at Jaigarh in Ratnagiri Dist. by
entering a 50-year concession agreement with the Maharashtra Maritime Board
(MMB). Presently, Jaigarh Port is undergoing a major expansion plan in its
second phase.
In the initial Phase, the Port has an installed capacity of about 10 MTPA of dry
and liquid cargo. JSWJPL is meeting the coal requirements of the operational
1200 MW power plant of JSW Energy in its first phase. In the second phase
expansion, the port has planned to handle other cargoes like bauxite, raw sugar,
fly ash, cement, iron ore, fertilizers, fertilizer raw materials, edible oil, molasses
and chemicals, containerized cargoes, POL and LNG. Rail, road and inland
waterway connectivity projects for the port are also being taken up
simultaneously to propel the growth further by connecting the port seamlessly
with the hinterland. The LNG facility is being developed by H-Energy Gateway
Private Limited (HEGPL), Mumbai.
JSW Dharamtar Port Ltd., another subsidiary of JSW Infrastructure Ltd.at Dolvi in
Raigad District of Maharashtra, is an existing port and terminal facility, located in
Amba River about 23 Nautical Miles away from Mumbai Harbour by sea route.
The port has 331.5 m jetty with a depth of 4.5 metres, capacity to handle about
8.0 million tonnes per annum of cargo. The port facility is being expanded with
construction of additional jetty length upto 1750 m in phases to handle various
cargoes about 35.0 million tonnes per annum.

----------------------------------------------------------------------------------------------------------------------------------------------- EIA Study for capacity enhancement at berth 5A & 6A of SWPL, Goa 1-5 EIA Report, September, 2017
JSW Dharamtar Port can handle bulk and break-bulk cargo. The Port currently
handle entire import & part of export requirement of JSW Steel Plant at Dolvi in
Maharashtra. The cargo handled includes limestone pellets and lumps, dolomite,
hot briquette iron, sponge iron, PCI coal, scrap, and iron ore lumps, fines and
pellets. Dharamtar Port currently looks after JSW Group’s Dolvi and Kalmeshwar
Steel Plants’ export-import (EXIM) requirements.
1.3 PROJECT Profile
Mormugao Port Trust (MPT) is strategically located to cater to the needs of the
coal requirement of steel and power plants of its hinterland in Karnataka and
elsewhere. Although MPT is ideally located to serve the industries in the
hinterlands, a lot of cargo including coal is imported through some of the ports
situated in eastern coast of India despite the fact that the rail distance from these
port to the industries are much more compared to Mormugao Port. Apart from
the fact that the South Western Railway network is heavily congested, the
industries prefer the eastern coast ports viz. Gangavaram, due to their ability to
handle larger cape size vessels resulting in saving the sea freight.
Imports/Exports through Capesize vis-à-vis Panamax vessels will result in freight
advantage and thereby the industries stand to benefit. This will also make
imports cheaper and exports more competitive leading to overall economic
growth and employment creation.
SWPL is presently handling coal, limestone and steel products at berth 5A & 6A
by using a mix of multipurpose and specialized material handling cranes
depending on availability and ship cargo. The entire unloading and evacuation
chain of bulk cargo right from unloading from ships to conveyance to stacks,
reclamation and rail wagon loading is mechanized. The Terminal does not
handle any bulk cargo in non-mechanized manner (jetty dumping, loading of
trucks by pay-loaders, high-heaping of coal stockpiles, loading of cargo on trucks
by pay loaders) and does not evacuate any cargo by road route.
The SWPL Terminal mainly caters to the 14 MTPA Steel Plant of JSW Steel
Vijayanagar plant at Torangallu, Sandur Taluk of Bellary District, North
----------------------------------------------------------------------------------------------------------------------------------------------- EIA Study for capacity enhancement at berth 5A & 6A of SWPL, Goa 1-6 EIA Report, September, 2017
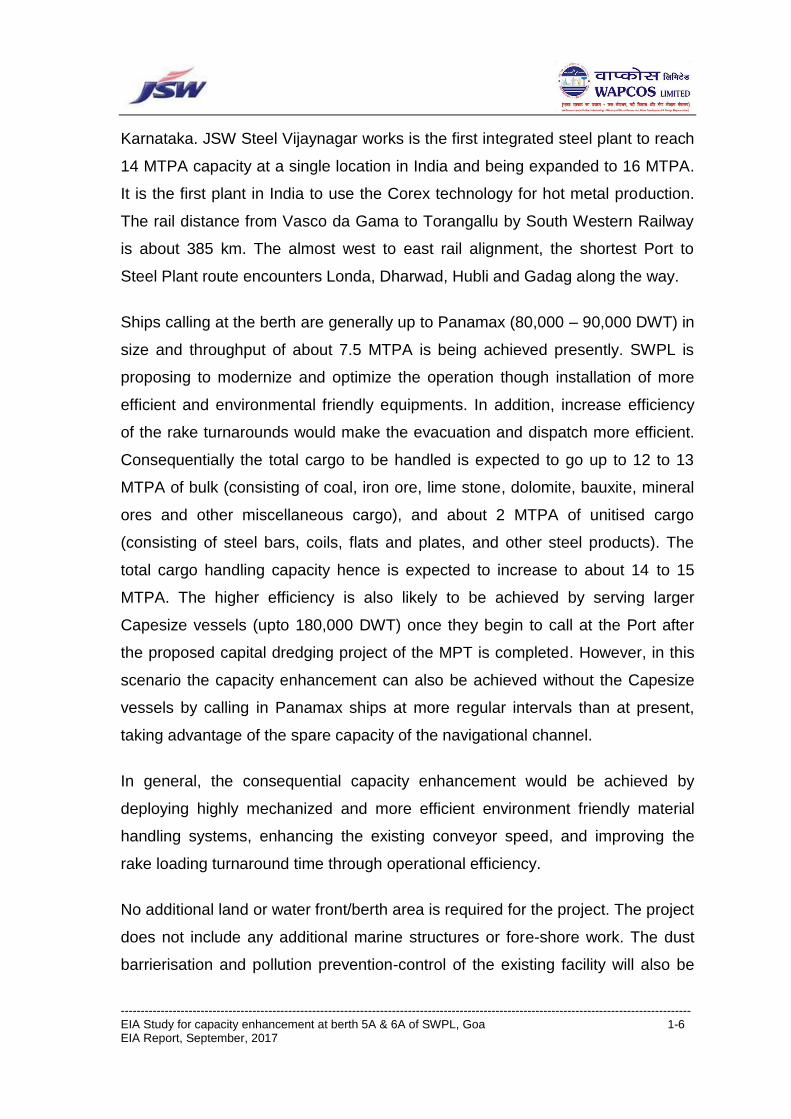
Karnataka. JSW Steel Vijaynagar works is the first integrated steel plant to reach
14 MTPA capacity at a single location in India and being expanded to 16 MTPA.
It is the first plant in India to use the Corex technology for hot metal production.
The rail distance from Vasco da Gama to Torangallu by South Western Railway
is about 385 km. The almost west to east rail alignment, the shortest Port to
Steel Plant route encounters Londa, Dharwad, Hubli and Gadag along the way.
Ships calling at the berth are generally up to Panamax (80,000 – 90,000 DWT) in
size and throughput of about 7.5 MTPA is being achieved presently. SWPL is
proposing to modernize and optimize the operation though installation of more
efficient and environmental friendly equipments. In addition, increase efficiency
of the rake turnarounds would make the evacuation and dispatch more efficient.
Consequentially the total cargo to be handled is expected to go up to 12 to 13
MTPA of bulk (consisting of coal, iron ore, lime stone, dolomite, bauxite, mineral
ores and other miscellaneous cargo), and about 2 MTPA of unitised cargo
(consisting of steel bars, coils, flats and plates, and other steel products). The
total cargo handling capacity hence is expected to increase to about 14 to 15
MTPA. The higher efficiency is also likely to be achieved by serving larger
Capesize vessels (upto 180,000 DWT) once they begin to call at the Port after
the proposed capital dredging project of the MPT is completed. However, in this
scenario the capacity enhancement can also be achieved without the Capesize
vessels by calling in Panamax ships at more regular intervals than at present,
taking advantage of the spare capacity of the navigational channel.
In general, the consequential capacity enhancement would be achieved by
deploying highly mechanized and more efficient environment friendly material
handling systems, enhancing the existing conveyor speed, and improving the
rake loading turnaround time through operational efficiency.
No additional land or water front/berth area is required for the project. The project
does not include any additional marine structures or fore-shore work. The dust
barrierisation and pollution prevention-control of the existing facility will also be
----------------------------------------------------------------------------------------------------------------------------------------------- EIA Study for capacity enhancement at berth 5A & 6A of SWPL, Goa 1-7 EIA Report, September, 2017
brought to the level of state-of-art protection to ensure lesser total pollution from
the proposed facility.
1.4 CONNECTIVITY
1.4.1 Air Connectivity
Goa International Airport is a civil enclave at INS Hansa, a Naval airfield located
at Dabolim near Vasco da Gama. The airport caters to scheduled domestic and
international air services.
1.4.2 Road Connectivity
Goa has four National Highways passing through it. NH-66 (ex NH-17) runs
along India's west coast and links Goa to Mumbai in the north and Mangalore to
the south. NH-4A running across the state connects the capital Panjim to
Belgaum in east, linking Goa to cities in the Deccan. The NH-366 (ex NH-17A)
connects NH-66 to Mormugao Port from Cortalim. The new NH-566 (ex NH-17B)
is a four-lane highway connecting Mormugao Port to NH-66 at Verna via Dabolim
Airport, primarily built to ease pressure on the NH-366 for traffic to Dabolim
Airport and Vasco da Gama. NH-768 (ex NH-4A) links Panjim and Ponda to
Belgaum and NH-4. Goa has a total of 224 km (139 mi) of national highways,
232 km (144 mi) of state highway and 815 km of district highway. However, the
proposed project does not use or envisaged to any road transport for cargo
transportation in future.
1.4.3 Rail Connectivity
Goa has two rail lines, one run by the South Western Railway and the other by
the Konkan Railway. The line run by the South Western Railway was built during
the colonial era linking the port town of Vasco da Gama, Goa with Belgaum,
Hubli, Karnataka via Margao. The Konkan Railway line, which was built during
the 1990s, runs parallel to the coast connecting major cities on western coast. At
present, cargo transport is generally being carried out through south western
railways and continue to do so in future. The existing rail is adequate for the
envisaged capacity enhancement and proposed expansion of railways is not
required for the purpose.

----------------------------------------------------------------------------------------------------------------------------------------------- EIA Study for capacity enhancement at berth 5A & 6A of SWPL, Goa 1-8 EIA Report, September, 2017
1.5 NEED FOR THE EIA STUDY
The proposed projects require CRZ clearance under Coastal Regulation Zone
(CRZ) Notification (January 2011) and Environmental clearance as per the
clause No. 7 (e) of the schedule of EIA notification of September 2006 and
subsequent amendments. Environmental Impact Assessment (EIA) study needs
to be conducted as per the guidelines stipulated in the EIA notification of
September 2006 and CRZ Notification of January 2011. It is proposed to conduct
an EIA study to assess the impacts likely to accrue as a result of various
activities of the proposed projects. A suitable Environmental Management Plan
(EMP) will then be suggested to ameliorate the adverse impacts. Based on this,
an Environmental Monitoring Programme (EMoP) shall be delineated as part of
the EIA study to ensure proper implementation of EMP.
1.6 OBJECTIVES OF THE EIA STUDY
The major thrust of the EIA study shall be to assess the impacts of various
activities of proposed project on various components of the environment. The
study shall cover the impacts on water quality, noise, air quality, terrestrial
ecology, wildlife, aquatic ecology including fisheries, etc. The study will include
collection of baseline data, prediction of impacts and formulation of
Environmental Management Plan (EMP) for amelioration of the adverse impacts.
The study area is the area within 10 km radius of the project with proposed site
as centre. The objectives of the Environment Impact Assessment study are to:
determine the baseline status of the marine ecology, terrestrial
environmental conditions, Ambient Air Quality, Land use, Noise levels,
Socioeconomic aspects of the study area.
identify and assess the probable impacts of the project activity on marine
and terrestrial environment in the study area.
suggest adequate mitigation measures to minimize the impacts during
operational phases of the project.
recommend Environment Management Plan to ensure that the project
implementation does not impact the environment adversely.

----------------------------------------------------------------------------------------------------------------------------------------------- EIA Study for capacity enhancement at berth 5A & 6A of SWPL, Goa 1-9 EIA Report, September, 2017
preparation of Risk assessment and Disaster Management Plan
considering the project activity.
1.7 POLICY, LEGAL AND ADMINISTRATIVE FRAMEWORK
The Terminal obtained CRZ and Environmental Clearance (EC) from Ministry of
Shipping (Port Wing) vide letter no PD-26018/2/200-PDZ(CRZ) dated 24th
January, 2001. Half yearly compliance reports of the EC are sent to the regional
office of MoEFCC, Bangalore regularly. Certified copy of the EC compliance
report obtained from the MoEFCC RO, Bangalore is given in Annexure III. The
Terminal also operates under valid Consent to Operate issued by the Goa State
Pollution Control Board, consent no. 5/2580/04-PCB/CI-36 dated 10th April, 2015
and renewed.
The proposed projects inter alia, require Environmental Clearance under clause
No. 7 (e) of the schedule of EIA Notification of September 2006 and subsequent
amendments, and CRZ clearance under Coastal Regulation Zone (CRZ)
Notification (January 2011). Application for EC was made in Form I and PFR to
the Ministry of Environment and Forests, New Delhi on 09th February, 2015. The
proposal was discussed in the 148th meeting of the EAC, Infra-2. ToR for EIA
study was issued by the MoEFCC vide its letter no. F.No.10-5/2015-IA.III, dated
19th June, 2015 as given in Annexure IV.
Environmental Impact Assessment (EIA) study has been conducted by M/s
WAPCOS Ltd. a Govt. of India Undertaking (Mini Ratna), an organization under
the Ministry of Water Resources, River Development and Ganga Rejuvenation.
WAPCOS Ltd. holds QCI NABET Accreditation, Category “A’’ in the Ports and
Harbour sector.
The EIA study was based on one season environmental baseline monitoring
conducted in Summer, 2016 (4th March to 28th May, 2016 for air & noise
monitoring, and 9th to 10th May, 2016 for terrestrial and marine ecology). The
draft EIA Report was submitted to the Goa State Pollution Control Board on date
16th September, 2016. It was published by GSPCB to initiate the Public

----------------------------------------------------------------------------------------------------------------------------------------------- EIA Study for capacity enhancement at berth 5A & 6A of SWPL, Goa 1-10 EIA Report, September, 2017
Consultation process on 16th January, 2017. Public hearing for the project was
announced on 17th February, 2017 following the due process of advertising in
newspapers and other means as provided for in the EIA Notification, 2006
(amended) but was postponed by the Dist. Collector, North Goa on law and order
grounds. The Public Hearing was announced again on 20th March, 2017 at
Vasco Residency, Main Hall, Vasco, Goa. Before the proceedings of the Public
Hearing could begin, a section of the attendees objected to the arrangements
made for the Public Hearing stating that the Public Hearing venue was too small
to accommodate the local people who were willing to voice their concerns for and
against the project. Considering the demand of the local people sympathetically,
the Additional Deputy Magistrate presiding over the Public Hearing announced
that the Hearing will be postponed and will be reconvened at a larger venue.
The Public Hearing was re-arranged on 26th April, 2017 at Tilak Maidan Football
Stadium, Vasco, Goa following the due process of advertising in newspapers and
other means as provided for in the EIA Notification, 2006 (amended). Details of
the Public Hearing (e.g. GSPCB/Newspaper Notifications, Minutes of Meeting,
SWPL’s response to the MoM and to the written representations received for the
project, passed on by the GSPCB, and other relevant documents and
correspondences etc.) is presented in Chapter 11 and reported separately. The
present EIA Report is finalised based on the comments and observations
recorded during the Public Consultation process.
Mormugao Port Trust, the BOOT concessioner Port of JSW South West Port Ltd.
(SWPL) is proposing to expand the overall cargo handling capacity of the
Mormugao Port by capital dredging of the navigational channel and harbour from
the present about - 14.1 m CD to about - 19.5 m CD by thereby debottlenecking
the Port from draft limitation and making the Port cape-compliant.
The MPT has also proposed to redevelop its presently unutilised Berths 8 and 9
and barge berths west of SWPL Terminal. Both the above-mentioned projects
have obtained ToR for EIA from the MoEFCC, have carried out the EIA and have

----------------------------------------------------------------------------------------------------------------------------------------------- EIA Study for capacity enhancement at berth 5A & 6A of SWPL, Goa 1-11 EIA Report, September, 2017
carried out Public Hearing together along with the JSW South West Port Ltd. at
the same venue one day after the JSPL Pubic hearing.
The EIA Consultant for both the proposed MPT projects is M/s WAPCOS Ltd. By
virtue of the projects being few meters away from each-other, the EIA Report
prepared by WAPCOS Ltd. has congruent impact boundary and share few
common baseline environmental monitoring stations. A list of sensitive elements
present within 15 km of the SWPL site has been updated in Chapter 3.
The present EIA Report is finalised based on the comments and observations
recorded during the Public Consultation process, and further improved after the
21st expert appraisal committee (EAC) meeting.
Application to the Goa Coastal Zone Management Authority (GCZMA) for CRZ
Clearance has been made inter alia in the prescribed Form I, EIA Report and
project-specific CRZ Map prepared in 1:4000 scale by Institute of Remote
Sensing (IRS), Chennai, one of the agencies authorised by the MoEFCC under
the CRZ Notification, 2011 (amended) to demarcate HTL, LTL and preparation of
CRZ map. The CRZ map is annexed to this report as Annexure V. CRZ
recommendation from GCZMA is obtained vide their letter dated 18.08.2017
(Annexure VI).
1.8 EIA STUDY METHODOLOGY
As per the Ministry of Environment, Forests & Climate Change (MOEFCC)
guideline, the study area for the EIA study has been considered as 10 km radius
as project influence area (PIA) from the proposed project site at the centre.
Adherence of the ToRs issued for the EIA study by the MoEFCC on 19th June,
2015 for the capacity enhancement project is given in Annexure VII.
In addition to the above, the EIA Report also follows the EIA Report format as
given in the Appendix III of EIA Notification, 2006 with relevant modifications, and
the Standard ToR for the Port and Harbour published by MoEFCC in April, 2015.

----------------------------------------------------------------------------------------------------------------------------------------------- EIA Study for capacity enhancement at berth 5A & 6A of SWPL, Goa 1-12 EIA Report, September, 2017
1.9 STAGES IN AN EIA STUDY
The purpose of this section is to enumerate the steps involved in an
Environmental Impact Assessment (EIA) Study. The same are given in following
paragraphs.
Scoping: An exhaustive list of all likely impacts drawing information from as
many sources as possible shall be prepared to assess the impacts due to
various activities of proposed port. The next step shall be to select a manageable
number of attributes, which are likely to be affected as a result of the proposed
project. Various criteria applied for selection of the important impacts which are
as follows:
magnitude
extent
significance
special sensitivity
Baseline study: Before the start of the project, it is essential to ascertain the
baseline levels of appropriate environmental parameters, which could be
significantly affected by the implementation of the project. The planning of
baseline survey shall emanate from shortlisting of impacts prepared during
identification. The baseline study involves both field work and review of existing
documents, which is necessary for identification of data which may already have
been collected for other purposes.
Impact Assessment: is essentially a process to forecast the future
environmental conditions of the project area that might be expected to occur as a
result of the proposed project. An attempt is generally made to forecast future
environmental conditions quantitatively to the extent possible. But for certain
parameters which cannot be quantified, the general approach is to discuss such
intangible impacts in quantitative terms so that planners and decision-makers are
aware of their existence as well as their possible implications.

----------------------------------------------------------------------------------------------------------------------------------------------- EIA Study for capacity enhancement at berth 5A & 6A of SWPL, Goa 1-13 EIA Report, September, 2017
Environmental Monitoring Programme: An Environmental Monitoring
Programme shall be delineated for implementation to oversee the environmental
safeguards, and to ascertain the agreement between prediction and reality and
to suggest remedial measures not foreseen during the planning stage which may
arise during the operation.
Risk Assessment and Disaster Management Plan: Suitable Risk Assessment
outline Disaster Management Plan (DMP) is prepared considering the proposed
project activities.
Environmental Management Plan: For the proposed coastal development
projects an Environmental Management Plan (EMP) is formulated to maximize
the positive environmental impacts and minimize the negative ones. After
selection of suitable environmental mitigation measures, the cost required for
implementation of various management measures is estimated, to have an idea
of their cost-effectiveness.
2.0 OUTLINE OF THE REPORT
The contents of the EIA report are as follows:
Chapter 1: The chapter gives an overview of the need for the project, objectives
and need for EIA study etc. The methodology adopted for conducting the EIA
study for the proposed project is described in this chapter.
Chapter 2: A brief write-up on various project components, infrastructure
available at the port, etc. has been covered in this chapter.
Chapter 3: Baseline environmental conditions including physical, biological and
socio-economic parameters, resource base and infrastructure have been
described in this Chapter. The baseline study involved both field work and review
of existing documents, which is necessary for identification of data which may
already have been collected for other purposes.

----------------------------------------------------------------------------------------------------------------------------------------------- EIA Study for capacity enhancement at berth 5A & 6A of SWPL, Goa 1-14 EIA Report, September, 2017
Chapter 4: Prediction is essentially a process to forecast the future
environmental conditions of the project area that might be expected to occur as a
result of the proposed project activity.
Chapter 5: Environmental Management Plan (EMP) for amelioration of
anticipated adverse impacts likely to occur as a result of the project is presented
in this chapter.
Chapter 6: Risk Assessment demonstrates the preparation of Disaster
Management Plan (DMP) that will be executed to handle the situation, if any
emergency occurs.
Chapter 7: This chapter depicts the SWPL contribution towards the socio-
economic and aesthetic development of the local people and region.
Chapter 8: Environmental Monitoring Program (EMoP) for implementation during
the construction and operational phase of the project.
Chapter 09: This chapter indicates the cost estimation towards implementing the
environmental management plan and monitoring program.
Chapter 10: This chapter specifies the consultants engaged and the resources
deployed for preparation of the environmental impact assessment report.
Chapter 11: This chapter depicts proceeding of the Public Hearing conducted for
the proposed project as per the EIA Notification, 2006 (amended).

-----------------------------------------------------------------------------------------------------------------------------------------------
EIA Study for capacity enhancement at berth 5A, 6A of Mormugao Port 2-1 EIA Report, September, 2017
Chapter 2.0 PROJECT DESCRIPTION
2.1 PROJECT BACKGROUND
Mormugao Port Trust (MPT) is strategically located to cater the needs of the coal
requirement of steel and power plants of its hinterland in Karnataka. The main
user for MPT is currently JSW steel Limited. JSW steel Limited, Vijayanagar
imports about 5.5 million tons of coal/coking coal, 1 million ton of lime stone, and
exports about 1 million ton of finished steel products through MPT. However, the
coal requirement of JSW is in excess of 15 million tons and thus, has to depend
on ports on the Eastern Coast like Krishnapatnam for part of its coal imports
despite the fact that MPT is closer to the steel plant situated at Vijayanagar.
Utilization of other port infrastructure on the east as well as west coast for receipt
of raw material and despatch of finished cargoes depends on several factors,
such as distance from the port from the Steel Plant, capacity availability in the
ports, availability of stock holding in the port backup, rate of evacuation of cargo
from the port, congestion in the rail network and steaming distance of the raw
material and finished cargoes from the points of origin and destination
respectively. The choice between utilising a new point of maritime entry and
dispatch vis-a-vis expansion in an existing maritime facility is carried out based
on techno-economic feasibility.
Coal imports for JSW at MPT are carried out at Berth No. 5A and 6A which is
operated by South West Port Ltd. (SWPL), a group company of JSW
Infrastructure Ltd. (JSWIL). Cargo is evacuated by the South Western Railways
using their rolling stock through the existing Vasco-Belgaum-Hubli network.
SWPL is proposing to deploy highly mechanised and efficient environment
friendly material handling systems so that the cargo handling capacity at the
berth is increased consequentially to meet its demand, and in the process
reducing environmental pollution by retrofitting state of art latest dust entrapment
systems. SWPL is presently handling cargos like coal, limestone and steel
-----------------------------------------------------------------------------------------------------------------------------------------------
EIA Study for capacity enhancement at berth 5A, 6A of Mormugao Port 2-2 EIA Report, September, 2017
products at berth 5A & 6A by cranes, ship unloaders and wagon loading system.
Ships calling at the berth are generally up to Panamax (80,000 – 90,000 DWT) in
size and throughput of about 7.5 MTPA is being achieved presently. MPT has
proposed dredging of the approach channel and port area for permitting
navigation of Cape Size Vessels of up to 180,000 DWT.
MPT has proposed to deepen the approach channel to suit the navigational
requirements of Capesize vessels. The outer channel which is presently dredged
to -14.4 m is to be deepened to -19.8 m and the inner Channel from -14.1 m to
-19.5 m. This will facilitate navigation of Capesize Vessels at any state of the
tide. The proposal is presently in the Environmental Clearance (EC) process.
SWPL is proposing to modernise and optimise the operation though installation
of more efficient and environmental friendly equipments of higher capacity. The
higher efficiency is also likely to be achieved by servicing larger Capesize
vessels (up to 180,000 DWT) as and when they call on to the Terminal after
dredging is completed by MPT. However, the higher efficiency and capacity
enhancement can also be achieved without the Capesize vessels by calling
Panamax type ships at more frequent intervals than at present using the spare
capacity of the approach channel.
In addition to the increased efficiency of the rake turnarounds after deployment of
in-motion wagon loading system and further implementing Engine On Load
(EOL) scheme which would make the evacuation faster. Consequentially the
total cargo to be handled is expected to go up to 13 to 14 MTPA of bulk
(consisting of coal, iron ore, lime stone, dolomite, bauxite, mineral ores and other
misc. cargo), and about 2 MTPA of unitised cargo (consisting of steel bars, coils,
flats and plates, and other steel products). The total cargo handling capacity at
the terminal, hence is expected to increase to about 15 to 16 MTPA.
This consequential capacity enhancement shall be achieved by deploying highly
mechanised and efficient handling systems to achieve shorter dwell time of cargo
in the Terminal coupled with faster evacuation.

-----------------------------------------------------------------------------------------------------------------------------------------------
EIA Study for capacity enhancement at berth 5A, 6A of Mormugao Port 2-3 EIA Report, September, 2017
2.2 NEED FOR THE PROJECT
SWPL currently operates two berths (Berth 5A and 6A) in the Mormugao Port,
Goa, and is handling coal, lime stone and steel products. Ships presently calling
at the berths are generally up to 80,000 – 90,000 DWT (Panamax size vessels).
Consequent upon the completion of dredging for the draft depth of 19.8 m by
Mormugao Port, the port would be able to handle Capesize vessels up to
180,000 DWT capacities. Accordingly, to support this Government initiative,
SWPL has proposed to modify the existing material handling equipment and
enhance the port handling facility to handle larger vessels thereby helping the
country to save the valuable foreign exchange by reducing the logistics cost
through the economies of scale. The cargo handling equipment are about
13 years old and needs replacement. Hence, selecting suitable equipment for
handling up to Capesize vessels are done, though the deepening and bringing
Capesize vessels are not central to the capacity enhancement plan. Therefore,
with or without Capesize vessels, the proposed capacity enhancement can
proceed for replacing the aging equipment with better and more environment
friendly equipments.
The consequential capacity enhancement shall be achieved by deploying highly
mechanised and efficient environment friendly material handling system,
enhancing the existing conveyor speed, and improving the rake loading
turnaround time through operational efficiency. The proposed modernization will
lead to shorter dwell time of cargo in the Terminal and faster evacuation. The
systems proposed under modernization are also more environment friendly.
The proposed project does not involve any increase in the Terminal Land Area
and Water Front. No additional land or any kind of land acquisition will be
required to carry out the proposed modernization activity, no construction of new
berths or lengthening of existing berths or any kind of civil engineering
intervention will be required. Hence the proposed increased capacity is the direct
result of the better and more efficient equipment and handling methods. The
implementation of the project will lead to increase in port efficiency, better

-----------------------------------------------------------------------------------------------------------------------------------------------
EIA Study for capacity enhancement at berth 5A, 6A of Mormugao Port 2-4 EIA Report, September, 2017
utilization of existing resources and overall net reduction in pollution level due to
retrofitting material handling systems with latest dust entrapment systems and
barriers.
Since the increase in productivity is due implementation of better and more
efficient equipment which are new and fitted with state of the art dust control
systems, thereby result in reduction in the overall pollution load. This is
consequent upon the fact that the increase in productivity at the berths shall be
achieved without disturbing its local environment. The salient features of the
project are given below;
i. Located inside the Port premises
ii. No additional land area or waterfront is involved
iii. Increase in productivity is due to better equipments
iv. The pollution load reduces due to consequential implication of
environmental safeguards by deploying eco-friendly material handling
systems
Port conservancy operations including maintenance of navigation depths in the
channel and harbour, and all water side operations such piloting, navigation, tug
assistance for berthing, ensuring adherence of ISPS codes, MARPOL, bilge and
ballast water, etc. are vested with MPT. Scope of the Terminal is removal of
cargo from the vessels, in-terminal storage and evacuation by railway route. The
Terminal does not handle any bulk cargo in non-mechanized manner (jetty
dumping, loading of trucks by pay-loaders, high-heaping of coal stockpiles,
loading of cargo on trucks by pay loaders) and does not evacuate any cargo by
road route.
2.3 LOCATION OF THE PROJECT
The location of the berth 5A, 6A is in the existing port facilities of Mormugao Port,
Goa. The port is located at the mouth of the Zuari estuary. The imagery showing
berth 5A, 6A at Mormugao Port is shown in Figure 2.1. The port is well
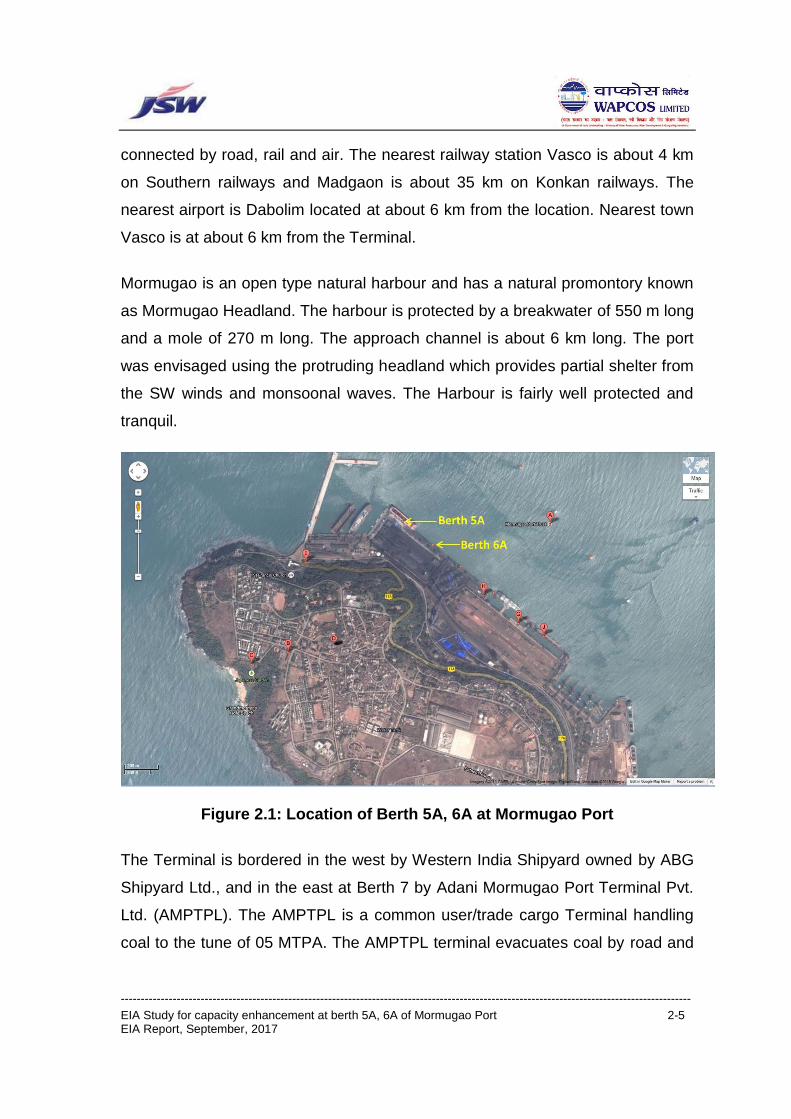
-----------------------------------------------------------------------------------------------------------------------------------------------
EIA Study for capacity enhancement at berth 5A, 6A of Mormugao Port 2-5 EIA Report, September, 2017
connected by road, rail and air. The nearest railway station Vasco is about 4 km
on Southern railways and Madgaon is about 35 km on Konkan railways. The
nearest airport is Dabolim located at about 6 km from the location. Nearest town
Vasco is at about 6 km from the Terminal.
Mormugao is an open type natural harbour and has a natural promontory known
as Mormugao Headland. The harbour is protected by a breakwater of 550 m long
and a mole of 270 m long. The approach channel is about 6 km long. The port
was envisaged using the protruding headland which provides partial shelter from
the SW winds and monsoonal waves. The Harbour is fairly well protected and
tranquil.
Figure 2.1: Location of Berth 5A, 6A at Mormugao Port
The Terminal is bordered in the west by Western India Shipyard owned by ABG
Shipyard Ltd., and in the east at Berth 7 by Adani Mormugao Port Terminal Pvt.
Ltd. (AMPTPL). The AMPTPL is a common user/trade cargo Terminal handling
coal to the tune of 05 MTPA. The AMPTPL terminal evacuates coal by road and

-----------------------------------------------------------------------------------------------------------------------------------------------
EIA Study for capacity enhancement at berth 5A, 6A of Mormugao Port 2-6 EIA Report, September, 2017
rarely by rail route. Other industrial activities and operations in the MPT and
nearby area are given in Chapter III.
2.4 EXISTING NAVIGATION FACILITIES
The Port of Mormugao has a 250 m wide channel that is 5.2 km long in the Outer
Channel and 2.3 km long in the Inner Channel. Channel depths range from
14.1 m in the Inner Channel to 14.4 m in the Outer Channel. Navigation chart of
MPT area with the channel demarcated is shown in Figure 2.2.
The maximum fully laden vessel draft that can be accommodated within the
harbour at all stages of the tide is 13.4 m allowing for under-keel clearances.
However, vessels are sometimes loaded up to 14.1 m draft, departing only on
the high tide.
Figure 2.2: MPT Navigation Chart
2.5 EXISTING & PROPOSED CARGO CAPACITY
SWPL is having two mechanized berths (namely 5A, 6A) in MPT handles both
Break Bulk and Dry Bulk with present capacity of 7.5 MMTPA, and proposed to

-----------------------------------------------------------------------------------------------------------------------------------------------
EIA Study for capacity enhancement at berth 5A, 6A of Mormugao Port 2-7 EIA Report, September, 2017
enhance its handling capacity capable to handle about 15 MMPTA. The existing
and proposed cargo details are given in the following Table 2.1.
Table 2.1: Existing and proposed cargo handling capacity at SWPL
S. No. Cargo details Capacity (MMTPA)
Existing 7.5
01 Coal /Coke/ Coking coal, Lime Stone 6.5
02 Steel Slab /Coil/Steel products 1.0
Proposed 15.0
01 Coal /Coke/ Coking coal/Lime stone/Iron
Ore/Dolomite/Bauxite, & other natural Mineral
Ore
13.0
02 Steel Slab /Coil/ Unitised Steel products 2.0
2.6 FACILITIES AT THE TERMINAL
SWPL in its berth 5A, 6A are handling various dry bulk and break bulk cargo for
export and import of group cargoes for its hinterland industries. The existing
berthing facility and discharge capacity of various cargoes are given in Table 2.2.
Table 2.2: Existing berth facility at SWPL
Berth No.
Use Cargo handled Vessel capacity
Draught Average Discharge
5A Export Steel Slabs & Coils Handymax 13.5 8000 tons
6A Import Coal & Flux Panamax 14.5 35000 tons
The salient features of the existing terminal and cargo handling facilities are
given which are as follows;
A. Berth - Existing berths is about 450 m long
(combined 5A and 6A) and 26 m wide
and is designed for large size vessels

-----------------------------------------------------------------------------------------------------------------------------------------------
EIA Study for capacity enhancement at berth 5A, 6A of Mormugao Port 2-8 EIA Report, September, 2017
B. Conveyor System
From Berth to Stackyard
o Capacity (TPH) - 2400 (Rated); 3280 (Design)
o Belt Speed - 3.4 m/sec
From Stackyard to Despatch
o Capacity (TPH) - 1500 (Rated); 1800 (Design)
o Belt Speed - 3.4 m/sec
o Pipe Conveyor - 1800 TPH (Rated) & 2200 TPH
(Design);
550 mm nominal dia; 4.5m/sec speed
C. Stackyard Capacity
Coal - ~180,000 tonnes (in 3 stockpiles)
- ~280 m long
D. Stacker / Reclaimers (2 Nos.)
Stacking Capacity - 2400 TPH (Nominal)
- 2880 TPH (Max.)
Reclaiming Capacity - 1500 TPH (Nominal)
- 1800 TPH (Max.)
E. Wagon Loading
Wagon Loading arrangement (Travelling Type)
o Wagon loading rate - 1800 TPH
o Rake length can be loaded at
a time
- Half Rake
F. In Motion Wagon Loading Silo
System loading rate
One full rake can be loaded at a
time
- 3600 TPH
Some upgradation of the Terminal such as installation of In-motion Wagon
Loading System and Grab Ship Unloaders has been carried out in order to
switch to cleaner sources of energy, increase operational efficiency, achieve
better environmental and safety compliance and update the material handling to
the recent vintage since the Terminal was commissioned. The above have also

-----------------------------------------------------------------------------------------------------------------------------------------------
EIA Study for capacity enhancement at berth 5A, 6A of Mormugao Port 2-9 EIA Report, September, 2017
been done as part of our working philosophy of continuously investing in newer
technology. Some of the earlier material handling equipment were more than 12
years old and were driven by diesel engines for ensuring mobility and lift.
Therefore, the current electrically driven equipments are more environment
friendly compared to conventional loading/unloading equipment and wagon
loading system. Other existing equipment such as Stacker cum Reclaimer, Pipe
Conveyor, Mobile Harbour Cranes, etc. will be deployed to achieve the desired
cargo handling target of 15 MTPA based on the peaking loads and operational
flexibility. The installed and proposed equipment will realize their full capacity
potential after the other physical bottlenecks in the system are removed and
Environmental Clearance from MoEFCC and other statutory clearances, and
applicable NOC’s from concerned regulatory agencies are obtained.
Project specific tideline in cadastral scale with the layout of the Terminal has
been prepared by IRS, Anna University, Chennai in September, 2016 for CRZ
clearance procedure of the project. The CRZ map is given in Annexure V. The
high tide line corresponding to the Terminal is a solid strata and is not likely to
have any shoreline change, erosion or shore collapse due to implementation of
the capacity enhancement project.
The Layout of the Terminal is given in Figure 2.3. As modernization activity will
involve replacement of the present material handling system by faster drives and
higher capacity conveyance systems, no significant change in the layout is
envisaged.

-----------------------------------------------------------------------------------------------------------------------------------------------
EIA Study for capacity enhancement at berth 5A, 6A of Mormugao Port 2-10 EIA Report, September, 2017
Figure 2.3: Layout of the Terminal
2.7 CARGO HANDLING, STORAGE & TRANSPORTATION
2.7.1 Break Bulk Cargo (Import Cargo)
(Coal, Coke, Coking Coal, Limestone, Iron Ore, Bauxite, Dolomite
etc.)
Modernization of the Terminal will continue the material handling philosophy, and
pollution and safety safeguards as used in the present operation. The cargo
would be discharged from the vessel by using Grab Ship Un-loaders into their
inbuilt hoppers Mobile Harbour Crane into the Mobile Hopper/GSU chutes. They
will feed to a Stacker Reclaimer through the conveyors system for stacking in the
stack yard as per the operational requirement.
For transportation, the second Stacker Reclaimer will reclaim cargo and feed to
the Wagon Loader / Silo through the reclaiming stream conveyors and load the
empty rakes. During rake loading through the Wagon Loader, wagons will be
stationary and the wagon loader will be mobile whereas through the In-motion

-----------------------------------------------------------------------------------------------------------------------------------------------
EIA Study for capacity enhancement at berth 5A, 6A of Mormugao Port 2-11 EIA Report, September, 2017
Wagon Loading/Silo system, the wagons will be mobile. The cargoes would be
handled and transported through a fully mechanized system and hence there is
no spillage. Also, all the stack yards are barricaded by GI barricades and RCC
wall to avoid any over spillage.
2.7.2 Steel Slab / Coil, Steel Finished Products (Export Cargo)
Steel slab, coal and steel finished products handling at the Terminal is a
significantly low pollution potential activity by virtue of nature of the cargo. The
steel slabs / coils, finished steel products, etc. would be received by wagons at
SWPL Railway siding and the cargo would be unloaded by using Gantry Cranes
and loaded onto trucks/trailers and taken to the storage yards (piled concrete
platforms and paved/concreted areas) and to the special purpose covered steel
sheds.
The steel is loaded on the export vessel using Forklifts & Trailers, to transport it
alongside the Jetty and Vessel gears/ Mobile Harbour Cranes will be used to
load into the vessel holds.
The cargo would be received / dispatched from Receipt & Despatch yard of MPT.
The haulage from R&D yard upto SWPL boundary will be done by MPT. SWPL
has its own Railway yard within its boundary wherein four rail lines are connected
to the interfacing rail lines laid by MoPT up to SWPL boundary. Engine-on-Load
Scheme, announced by Indian Railways is under implementation, wherein SWPL
will get a dedicated engine for the placement and removal of rakes from Vasco to
SWPL rail siding and vice versa during loading of rakes through Silo.
Evacuation of Terminal cargo by Indian Railways is an ongoing operation. No
expansion of the railway line by the Indian Railways is necessary to
accommodate additional cargo proposed to be handled as part of the capacity
enhancement project, as the existing rail infrastructure is sufficient to handle
additional cargo envisaged due to proposed capacity enhancement of the
terminal.
-----------------------------------------------------------------------------------------------------------------------------------------------
EIA Study for capacity enhancement at berth 5A, 6A of Mormugao Port 2-12 EIA Report, September, 2017
2.7.3 Environment Regulatory Mechanisation
SWPL has developed fully mechanized cargo handling system along with state
of the art dust suppression system, for handling imported coal and other
commodities. The facility would be developed ensuring that pollution is controlled
through effective mechanized systems supplemented with automatic water
based Dust Suppression System (DSS), while achieving maximum operational
efficiency of throughput and faster evacuation through efficient mechanized
modern wagon Loading system.
Throughout the year, cargo is also covered with tarpaulins to avoid emissions
through wind during summer and rain water not to ingress in the cargo during
Monsoon. Additionally, constructed wind breaking wall of 12 m high towards
eastern side of stack yard and are covering filled railway wagons the tarpaulin to
avoid emission / spillage in the transit. Water sprinklers installed around cargo
stockpiles and nozzles at all the cargo discharge points so that the dust particles
are not allowed to be airborne
In addition to the atomized water sprinkling and AQUADYNE system, one 12 KL
capacity water tanker with sprinkling, firefighting and road sprinkling arrangement
is provided. Also one highly efficient rotary boom type road sweeping machine is
in place for sweeping the berths, roads and paved area to mitigate any dust
emissions from rare spillage and vehicular movements. Detailed spillage control
and dust suppression mechanism is described in chapter 5 (Environmental
Management Plan).
The coal stockpiles are covered with geotextile sheets at all time, except at the
location of reclaiming and stacking, where handling is carried out under
continuous sprinkling of water. A wind breaking wall of 12 m height is also
provided towards eastern side of stack yard. In order to further reduce
opportunities of wind borne dusting, technical feasibility study and engineering
design for a longitudinal storage shed to enclose the coal stockpiles is underway
and is given in chapter 5.

-----------------------------------------------------------------------------------------------------------------------------------------------
EIA Study for capacity enhancement at berth 5A, 6A of Mormugao Port 2-13 EIA Report, September, 2017
2.8 CONSEQUENTIAL CAPACITY ENHANCEMENT
Break bulk cargo is unloaded from the vessels by using Harbour Cranes/Ship
Unloaders on the berth having higher capacities. For the ship size under
consideration, 2 Unloaders of at least 2500 TPH is the minimum unloading rate
for the Iron ore shipment trade. For unloading of coking coal maximum unloading
rate per unloader is limited to 2000 TPH because of disadvantage of large grab
size required to handle coal and relatively lighter cargo. Initially the Unloaders
may operate at 1500 TPH for Iron Ore/Coal till the downstream system is
upgraded.
Since SWPL is an operating Terminal, the unloading efficiency of about 65-70%
of the rated capacity could be achieved with the skilled operators. Moreover, it
will be able to monitor the ship arrival so that there will not be undue waiting at
the Port even at 75% berth occupancy.
Due to capacity enhancement at the terminal due to better mechanisation,
assessment of the terminal capacity of the existing berth is analysed to establish
the requirement of downstream facilities such as stackyard, receiving/stacking
conveyors etc. The existing and proposed upgradation at the back up facility is
given in Table 2.3.
Table 2.3: Existing and proposed backup facility
Parameter Existing Facility Proposed Upgradation
Conveyor Belt speed 3.4 m/s 4.6 m/s
SCR: Stacking
Reclaiming
2800 TPH
1800 TPH
3000 TPH
2200 TPH
Rake loading Time Wagon Loader
2:30 – 3:00 hrs.
In-motion Wagon Loading
System
1:00 – 1:30 hrs.
Rake Unloading Time
(Break Bulk)
10-13 hrs. 6-8 hrs.
Rakes handled (per day) 6-8 nos. 12-15 nos.
Vasco to Vasco Rake
turnaround time
18 hr 6 hr
-----------------------------------------------------------------------------------------------------------------------------------------------
EIA Study for capacity enhancement at berth 5A, 6A of Mormugao Port 2-14 EIA Report, September, 2017
Upon the increase in unloading and dispatch efficiencies through conveyor
speed enhancement, decrease in rake turnaround time at the Terminal, the
cargo handling volume consequently increase from present 7.5 MTPA to
15 MTPA. Also, ships presently calling at the terminal are generally upto about
90,000 DWT. In iron ore and coal trade, higher size vessels are being used world
over and with the facility being enhanced to handle upto 180,000DWT, it is
anticipated that, on an average, higher vessels (say 120,000 to 130,000 DWT)
will call at the terminal which would increase the capacity because of the lesser
vessel trips and saving time due to peripheral activities of about 6 hours per trip.
However, the Terminal is proposing to debottleneck its materials handling and
evacuation mechanism in the Terminal backup side and improving rail loading
time to increase the turnaround time in the Terminal. This capacity enhancement
is possible with the present ship sizes and is achievable irrespective of the MPT
harbour becoming cape-compliant as proposed by the MPT. This is further
explained in the following sections.
2.9 STACKYARD CAPACITY
Stackyard is a critical interface between receipt of cargo from ship and dispatch
by wagons which absorbs the mismatch between the inflow and outflow of cargo
during operations and it is desirable the same to be sized adequately for smooth
functioning of the terminal as well as achieving the targeted throughput.
Existing stackyard capacity is adequate and can be maintained by faster
evacuation and on-line direct loading from vessel to the Silo for loading on to the
Rakes.
2.10 WAGON LOADING SYSTEM
The Silo in the Wagon Loading Station will be filled prior to commencement of
wagon loading operation and reclaiming system will continue to operate during
wagon loading to ensure supply of balance material to fill the rake. Silo of 4000
tonnes is adequate if effective reclaiming rate is 2200 TPH (i.e. rated 1800 TPH
-----------------------------------------------------------------------------------------------------------------------------------------------
EIA Study for capacity enhancement at berth 5A, 6A of Mormugao Port 2-15 EIA Report, September, 2017
@ 70% efficiency) for loading a rake of 3800 tonne in one hour, i.e. when a rake
moves at 0.65 - 0.80 km/hour.
Equipment will be sized to receive material from conveyors at the rated load for
continuous wagon loading while the rake is in motion. The performance of the
Terminal is critically dependent on the performance of the dispatch system.
The capacity of single track In-motion Wagon Loading Station depends on;
o Actual train loading time,
o Minimum gap required between two consecutive loading cycles due to
various reasons not related to cargo handling operation.
For instance, a silo with 4000 tonne capacity will be adequate to load a rake of
3800 tonnes in one hour if the effective reclaiming rate is 2200 TPH and will be
ready to load the next rake in 45 minutes, i.e. frequency could be minimum
1 hour 30 min.
Even if the frequency of rake loading is 2 hours, the Facility will have the
capability to load 15 to 18 rakes per day. Hence, key factor is reclaiming rate,
higher the reclaiming capacity (dispatch capacity) lower is the silo size and time
gap between two Rakes loading cycles.
2.11 STACKER/RECLAIMERS IN STACKYARD
2.11.1 Capacity
2 nos. existing Stacker/Reclaimers are rated for stacking and reclaiming at 2400
TPH and 1800 TPH respectively for Coal. It will be necessary to change stacking
capacity of the machine to 4000 TPH (rated) for Coal, and 5000 TPH (rated) for
Iron Ore in order to match the ship unloading capacity at the berth.
Similarly, the reclaiming capacity (dispatch capacity) shall be increased to enable
the Wagon Loading Station to have 1.30 hours loading cycle, i.e. capability to
commence wagon loading on two consecutive rakes in 1.30 hours.

-----------------------------------------------------------------------------------------------------------------------------------------------
EIA Study for capacity enhancement at berth 5A, 6A of Mormugao Port 2-16 EIA Report, September, 2017
Reclaiming Capacity
Hence the effective reclaiming capacity of the Stacker/ Reclaimer is expected to
be in the range of 2200 TPH (both for Iron Ore and Coal), where the
corresponding silo capacity requirement is about 4000 tonnes (both for Iron Ore
and Coal). Considering reclaiming efficiency as 75%, the rated reclaiming
capacity shall be about 2800 TPH, say 3000 TPH.
2.11.2 New Stacker/Reclaimer
Because of the necessity of capacity increase, the existing equipment shall be
replaced with new equipment for building the system capability of sustained
dispatch of rakes upto 15 to 18 per day. Changing the track centre required for
stability of the Stacker / Reclaimer with extended boom and higher capacity can
be provided using the existing piles at the stackyard. A track centre of 9 m is
envisaged.
Alternatively, if capability of sustained daily despatch in the order of 10 to 12
rakes are not required, existing Stacker / Reclaimer may be examined for
modification for handling of Iron Ore and increased in capacity assuming boom
extension is not feasible.
If capacity increase of the existing Stacker / Reclaimer is not at all feasible,
effective dispatch rate to silo can possibly be maintained at the level of 2200
TPH, the rated capacity of the existing Pipe Conveyor instead of 1800 TPH
(reclaiming capacity @ 1800 TPH with 70% efficiency) by combining reclaiming
output with direct loading from berth.
2.12 BELT CONVEYOR SYSTEM
2.12.1 Receiving Conveyor
The existing receiving belt conveyor has to be upgraded by increasing their
speeds to match the ship unloading capacity.

-----------------------------------------------------------------------------------------------------------------------------------------------
EIA Study for capacity enhancement at berth 5A, 6A of Mormugao Port 2-17 EIA Report, September, 2017
Receiving and Stacking Conveyors as existing:
a) Belt Width - 1600 mm
b) Trough - 35 deg.
c) Speed - 3.6 m/sec.
d) Rated Capacity - 3000 TPH (for Coal)
Iron Ore being of higher density than Coal, existing belt width of 1600 mm will
have enough reserve cross-sections to carry Iron Ore even at higher capacity
than 5000 TPH. However, Coal, with lower density than Iron Ore, will require
wider belt than 1600 mm to carry 4000 TPH matching the Unloader capacity at
berth.
Following changes would be done in the receiving conveyors if these are to be
enhanced to convey Coal and Iron Ore at 4000 TPH and 5000 TPH respectively.
Material Belt Remarks
Width/Trough Speed
Coal
a) 4000 TPH (rated)
1800 mm / 35 deg. 1600 mm /45 deg.
~4.6 m/sec. 4.9 m/sec.
With existing belt width of 1600 mm, 35 deg trough, the speed required will be about 5.4 m/s. which is high for such relative short conveyor length. Fill factor as 91% and 100% at rated and design capacity respectively.
b) 3500 TPH (rated)
1600 mm /45 deg. 4.6 m/sec. Changing 35 deg trough to 45 deg of the existing belt will convey upto 3500 TPH Coal.
Iron Ore (5000 TPH – rated)
a)1600 mm / 35 deg.
~2.8 m/sec. Actual speed required Even existing belt width/ trough/
speed are suitable. 1600 mm /45 deg.
~2.6 m/sec. Actual speed required
If the receiving conveyor system is to be designed for 4000 TPH Coal, it will
require either;

-----------------------------------------------------------------------------------------------------------------------------------------------
EIA Study for capacity enhancement at berth 5A, 6A of Mormugao Port 2-18 EIA Report, September, 2017
a) change of belt width from the existing 1600 mm to 1800 mm along with
other associated components, like stringer frame, wider pulleys, chutes,
etc., which will involve more cost and time for implementation, or
b) increase in belt speed to ~5.4 m/s of the existing conveyor operating Coal
with more than 4.6 m/sec is not desirable.
c) increase of belt speed to 4.9 m/s is a feasible option
Hence, it is proposed to operate the system at capacity of 4000 TPH for Coal
with belt width of 1600 mm but changing the trough from 35 deg to 45 deg by
changing the brackets of idlers and enhancing the speed from 3.6 upto 4.9 m/s.
2.12.2 Despatch Conveyors
Existing despatch conveyors comprise the following: a) Conveyors
Belt Width - 1400 mm
Trough - 35 deg.
Belt Speed - 3.6m/sec.
Capacity
- Rated : 1800 TPH (Coal)
Design : 2200 TPH
b) Pipe Conveyor
Pipe Dia - 550 mm (2100 mm wide belt)
Belt Speed - 4.5 m/sec.
Capacity
- Rated : 1800 TPH (Coal)
Design : 2200 TPH
Drive - With VFD Control
The dispatch conveyors, since they work in conjunction with the Stacker/
Reclaimer, are governed by the existing reclaiming capacity (1800 TPH), if the
same Stacker/Reclaimers are retained. These conveyors will be common for
handling Iron Ore and Coal.
Iron Ore being heavier material, it will have lower fill factor on troughed belts and
also in the pipe conveyor for the required capacity. However, no advantage

-----------------------------------------------------------------------------------------------------------------------------------------------
EIA Study for capacity enhancement at berth 5A, 6A of Mormugao Port 2-19 EIA Report, September, 2017
would be derived due to limitations in handling number of rakes/day, by
increasing the capacity of conveyors unless reclaiming capacity is enhanced.
Pipe Conveyor needs to be modified or preferably replaced with matching
capacity of reclaiming system if new Stacker/Reclaimer, as recommended is
adopted to achieve sustained enhancement of the Terminal capacity.
2.12.3 Bypass Conveyor for direct Despatch
It has been proposed to provide connectivity of receiving conveyors with the
despatch conveyors for direct despatch of cargo unloaded at berth. A new
bypass conveyor, via a new belt feeder, will discharge on existing conveyor,
which has been extended to feed the pipe conveyor.
The capacity of bypass system has been planned with matching capacity of the
dispatch conveyors, i.e. 1800 TPH. Part cargo will be diverted to stockyard, when
unloading rate at berth is higher than 1800 TPH. A belt weigher on conveyor will
be installed to control the feed rate at the bypass conveyor. The planned drive
units will be replaced with hydraulic motors for speed variation.
2.13 TRAFFIC POTENTIAL
Coking coal is mainly imported by JSW steel plants located in the hinterland of
the port. The traffic volume in respect of this cargo is dependent upon the
capacity of steel plants, their production program and policy with regard to using
imported coal. During last 3 years, there has been a steady increase in coal
imports. In the recent years the International price for Iron Ore has gone down
appreciably. This has made import of the Iron Ore at low prices to the Indian
Sub-continent affordable. The Western Australian and Brazilian Iron Ore with
higher Iron content has made the life of steel makers’ lot easier. Accordingly,
berth 5A and 6A is likely to see an increase in the import capacity of coal. Iron
ore is another probable cargo which could be handled at the berths. Since both
are similar type of cargo, handling them with the same material handling systems
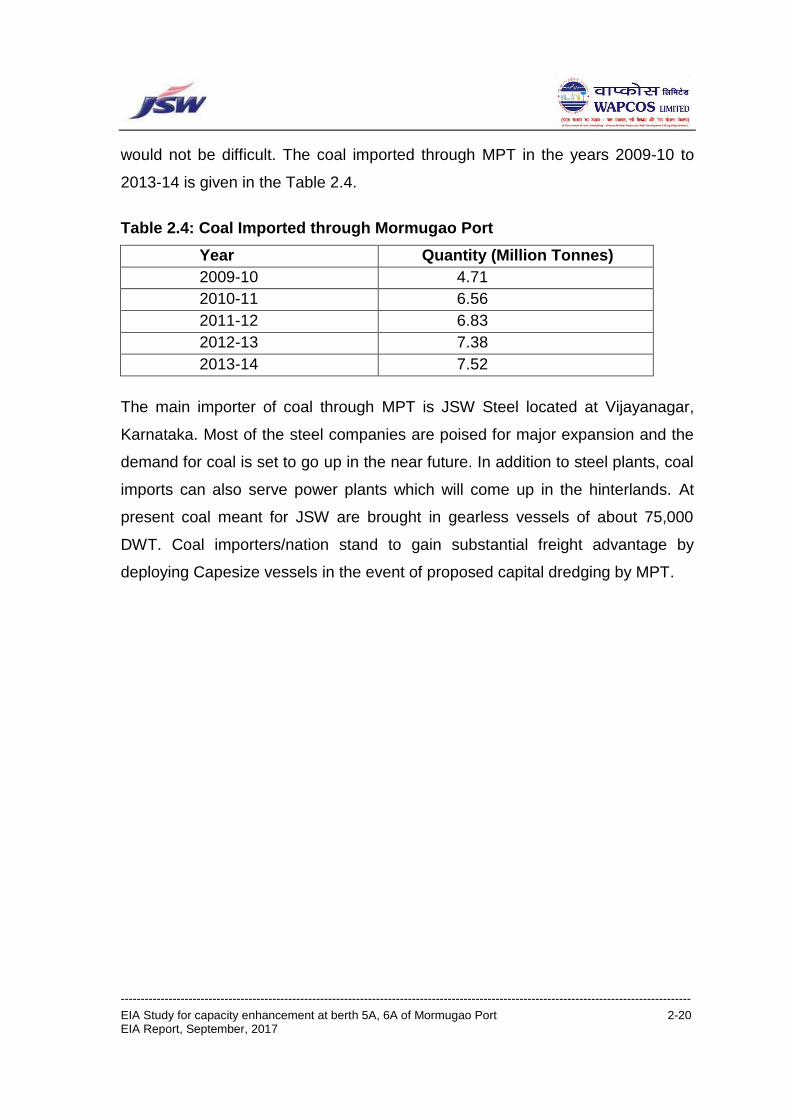
-----------------------------------------------------------------------------------------------------------------------------------------------
EIA Study for capacity enhancement at berth 5A, 6A of Mormugao Port 2-20 EIA Report, September, 2017
would not be difficult. The coal imported through MPT in the years 2009-10 to
2013-14 is given in the Table 2.4.
Table 2.4: Coal Imported through Mormugao Port
Year Quantity (Million Tonnes)
2009-10 4.71
2010-11 6.56
2011-12 6.83
2012-13 7.38
2013-14 7.52
The main importer of coal through MPT is JSW Steel located at Vijayanagar,
Karnataka. Most of the steel companies are poised for major expansion and the
demand for coal is set to go up in the near future. In addition to steel plants, coal
imports can also serve power plants which will come up in the hinterlands. At
present coal meant for JSW are brought in gearless vessels of about 75,000
DWT. Coal importers/nation stand to gain substantial freight advantage by
deploying Capesize vessels in the event of proposed capital dredging by MPT.
---------------------------------------------------------------------------------------------------------------------------------------------
EIA Study for Capacity Enhancement at Berth 5A, 6A of SWPL, Goa 3-1
Final Report, September, 2017
Chapter 3.0 ENVIRONMENTAL BASELINE STATUS
3.0 GENERAL
Assessment of baseline environment of the project area is an important component of
the EIA study. As a part of the study, a Scoping Matrix was prepared, based on which,
various parameters to be anaysed for assessment of baseline environmental were
identified. The assessment of environmental impacts due to construction and
commissioning of proposed cargo capacity enhancement at the berths requires a
complete and scientific consideration of various environmental aspects and their
interaction with the natural resources, namely, physico-chemical parameters i.e.
meteorology, geology, soil, land use and water quality, biological parameters i.e.
terrestrial flora and fauna, marine flora and fauna, fish species, etc in the study area.
It also includes the socio-economic parameters i.e. demography, occupational profile,
etc. As a part of the EIA study, a large quantum of related data available with various
departments including Forest Department, Fisheries Department, and Directorate of
Economics & Statistics were collected and analysed. Field studies for primary data
collection on various parameters were also carried out as part of the EIA study.
As a part of the EIA study, the baseline status has been ascertained on the following
environmental aspects:
Meteorology
Bathymetry
Cyclones
Sediment Transport
Topography
Tides
Waves
Currents
Grownd Water Quality
Soil Quality
Landuse Pattern
Shoreline Change Status
Ambient Air Quality
Noise Level
Marine Ecology
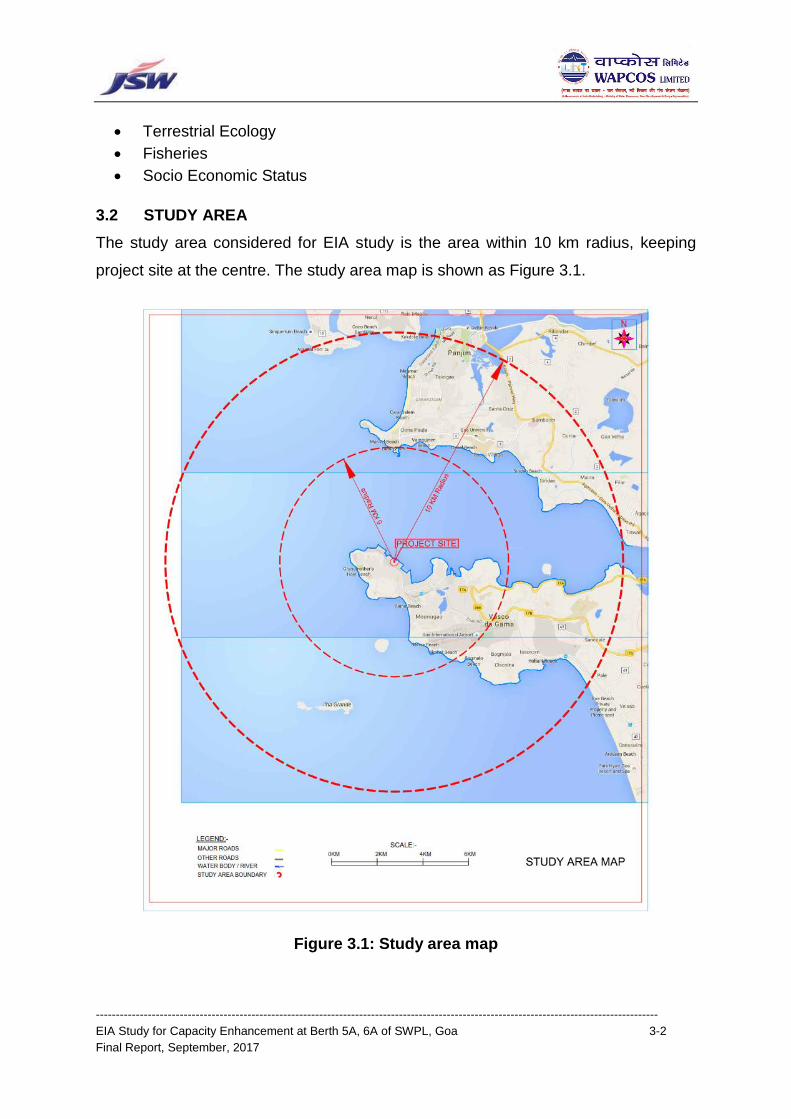
---------------------------------------------------------------------------------------------------------------------------------------------
EIA Study for Capacity Enhancement at Berth 5A, 6A of SWPL, Goa 3-2
Final Report, September, 2017
Terrestrial Ecology
Fisheries
Socio Economic Status
3.2 STUDY AREA
The study area considered for EIA study is the area within 10 km radius, keeping
project site at the centre. The study area map is shown as Figure 3.1.
Figure 3.1: Study area map

---------------------------------------------------------------------------------------------------------------------------------------------
EIA Study for Capacity Enhancement at Berth 5A, 6A of SWPL, Goa 3-3
Final Report, September, 2017
3.3 METEOROLOGY
Goa experiences a tropical monsoon climate under the Köppen climate classification.
Goa, being in the tropical zone and near the Arabian Sea, has a hot and humid climate
for most of the year. The calendar year in the project area can be divided into four
main seasons. The winter season lasts from December to February followed by pre-
monsoon or summer season from March to May. The monsoon season begins in June
and continues upto mid-October. The period from mid-October to November
constitutes the post-monsoon season.
The average meteorological conditions of the Marmugao as per observation of IMD
from 1981-2010 are summarized given in Table 3.1.
Table 3.1: Meteorological conditions in the project area
Month Temperature (oC) Rainfall
(mm)
Relative Humidity Mean Wind
Speed (kmph) Maximum Minimum 08.30 17.30
January 31.8 21.9 0.4 72 64 7.1
February 31.3 22.3 0 75 67 8.4
March 31.9 24.2 0.2 78 71 9
April 32.8 26.2 3.7 76 71 9.4
May 33.2 27.1 90.6 76 73 9.9
June 30.7 25.2 831.5 87 84 13.4
July 29.2 24.5 824.5 89 86 14.9
August 28.9 24.2 550.2 90 87 11.7
September 29.9 24.3 256.3 88 83 7.4
October 31.6 24.6 136 82 78 6
November 33.1 23.8 19.7 70 67 5.4
December 32.7 22.5 5 67 63 5.9
Total 2718
Average 31.4 24.2 79 74 9.0
Source: IMD, Mormugao
Temperature: Slight variation in the daily maximum temperatures is observed
throughout the year, as it ranges from 28.9 0C to 33.2 0C. The minimum temperatures,
however show greater variations, ranging from 21.9 0C to 27.1 0C. Goa has a short
winter season between mid-December and February. The monthwise temperature
variations in the project area is shown in Figure 3.2.

---------------------------------------------------------------------------------------------------------------------------------------------
EIA Study for Capacity Enhancement at Berth 5A, 6A of SWPL, Goa 3-4
Final Report, September, 2017
Figure 3.2: Temperature variations in the project area
Rainfall: The total annual rainfall in the project area district is 2718 mm. Majority of
the rainfall is received in the months from June to September. Usually maximum
average monthly rainfall of 831 mm occurs in June. There is practically no rainfall from
December to April. The average rainy days in a year are about 94. The monthwise
rainfall received in Mormugao is depicted in Figure 3.3.
Figure 3.3: Rainfall variations in the project area
0
100
200
300
400
500
600
700
800
900
Rai
nfa
ll (m
m)
Month
Rainfall (mm)

---------------------------------------------------------------------------------------------------------------------------------------------
EIA Study for Capacity Enhancement at Berth 5A, 6A of SWPL, Goa 3-5
Final Report, September, 2017
Winds: The mean sea wind varies from 2 on the Beaufort scale in November to 4 in
July. The annual mean sea wind speed is of the order of 13.6 kmph. In an average
year, there are 316 days with wind speed varying between 0 to 3 on the Beaufort scale
and 48 days with winds varying between 4 to 7 on the Beaufort scale.
The predominant wind direction changes with the time of the year. During the period
from June–September, wind blows from the west and south-west. During the
remaining period, the wind direction is from NE, ESE during the evening. The highest
speed of 105 km/hr was recorded in June 1994. Winds of force more than 10 on the
Beaufort scale are not expected. The wind speed ranged from 5.4 kmph to 14.9 kmph.
The monthwise variations in mean wind speed in the project area are shown in the
Figure 3.4. Wind rose diagram for the period from March to May, 2015 is shown in
Figure 3.5.
Figure 3.4: Mean wind speed variations in the project area
0
2
4
6
8
10
12
14
16
Me
an W
ind
Sp
pe
d (
kmp
h)
Month
Mean windSpeed (Kmph)

---------------------------------------------------------------------------------------------------------------------------------------------
EIA Study for Capacity Enhancement at Berth 5A, 6A of SWPL, Goa 3-6
Final Report, September, 2017
Figure 3.5 : Wind rose diagram for the month of March to May, 2015
Relative Humidity
Mean yearly relative humidity at 0830 hours is 79% and 74% at 1730 hours. The
monthly average humidity is lowest in December (63%) and highest in monsoon
months from July to September (85%).
Visibility
Sometimes mist develops during sunrise on the west coast, above latitude 16° N, but
disperses thereafter. Smog hangs over the land at Goa from November to March
obscuring everything in view mostly after sunrise and occasionally in the evenings.
However, the smog lasts only for short durations. Visibility is generally good for most
part of the year.

---------------------------------------------------------------------------------------------------------------------------------------------
EIA Study for Capacity Enhancement at Berth 5A, 6A of SWPL, Goa 3-7
Final Report, September, 2017
3.4 BATHYMETRY
The current bathymetry chart shows that in the outer channel the proposed dredge
level of 19.8 m is available at a distance of 10 km away from the inner channel. Depth
of the order of 14 m exists at the entrance of the inner channel and towards the harbour
basin and turning circle area the depth is reducing up to 13.1 m.
Seabed Features
The sea bed exhibits an even low to medium level of reflectivity, indicative of silty clays
and sands, with a few patches of higher reflectivity indicating the presence of isolated
highly weathered bed rock. In the outer channel, highly weathered bed rock patches
are also seen above the dredging limit of 19.8m.
3.5 CYCLONES
In general West Coast of India is less prone to cyclonic storms compared to the east
coast. From the information reported by India Meteorological Department (IMD), a total
of 1034 disturbances occurred in the Bay of Bengal during the period from 1891 to
1970 of which 363 intensified to cyclonic storms, the rest being ‘depressions’. On an
average the number of cyclonic disturbances per year during this period was about
13. However, if the data is updated to 1990, the number of cyclonic events per annum
works out to be 16, varying from a minimum of 8 to a maximum of 18.
The above cyclones may be divided into two broad categories. The first group consists
of cyclones that originate in the Bay of Bengal and cross the East coast at certain
locations. These storms pass over the Indian landmass and lose their strength before
crossing the West coast. The second group consists of cyclones that cross over to the
Arabian Sea at the southern tip of the Indian Peninsula and veer northwards towards
Saurashtra. These cyclones are much stronger and more dangerous for the west coast
and normally occur during the transition months of May and November. Tracks of the
cyclones in the Arabian Sea from 1877 to 1992 are presented in Figure 3.6.

---------------------------------------------------------------------------------------------------------------------------------------------
EIA Study for Capacity Enhancement at Berth 5A, 6A of SWPL, Goa 3-8
Final Report, September, 2017
Figure 3.6: Storm tracks applicable for the region (Source IMD)
3.6 SEDIMENT TRANSPORT
Unlike the East coast, West coast exhibits very low rates of “Littoral Drift”. This is
primarily due to the high tidal range, where the waves act on different parts of the flat
offshore lower beach and the action on the beach above the high tide level are
restricted to a very short time interval. Under such circumstances, it is difficult to
discern the direction of the net drift as this is likely to change with local shoreline
configuration.
3.7 TOPOGRAPHY AND GEOLOGY
The region is generally hilly including a portion of the Western Ghat rising to
1200 m above Mean Sea Level. The Mormugao head land adjoining the Harbour
is hilly; the height varies from 20 m to 60 m. As the area is flanked by hills, back
land is limited for development of Port.

---------------------------------------------------------------------------------------------------------------------------------------------
EIA Study for Capacity Enhancement at Berth 5A, 6A of SWPL, Goa 3-9
Final Report, September, 2017
The State of Goa is located on the Western Dharwar craton. It constitutes the north-
westerly extension of the greenstone-granitoid terrain of Karnataka, comprising rocks
of the Peninsular Gneissic Complex (PGC) and Dharwar Supergroup of Precambrian
age. The PGC is well exposed along the Western Ghats in North Goa and around
Chauri and Quepem in the South Goa. The rocks of the Dharwar Supergroup are
represented by the northern extension of the Shimoga schist belt locally classified as
‘Goa Group’ (Gokul et al, 1985). The rocks of the PGC and the Goa Group are intruded
by mafic-ultramafic complexes, younger granites and mafic intrusives. A narrow strip
in the north eastern corner of the State is covered by Deccan Traps of late Cretaceous-
lower Eocene age. Most of these rocks are often hidden below a thick weathered
lateritic cap and/or a soil cover varying thickness. As per IS 1893, the site falls under
Seismic Zone III.
3.8 TIDES
The nature of tide prevailing at Mormugao is mainly semi-diurnal exhibiting two high
and two low waters in a tidal day. The mean tidal variation is of the order of 1.6 m at
spring tide and around 0.7 m at neap tides. Based on Indian Naval Hydrographic Chart
No. 2020, the tide levels with respect to chart datum at Mormugao Harbour are given
in Table 3.2.
Table 3.2: Tide levels with respect to Chart Datum (CD)
Higher High water at Spring +2.3 m
Mean Higher High Water (MHHW) +1.9 m
Mean Lower High Water (MLHW) +1.8 m
Mean Higher Low Water (MHLW) +1 m
Mean Lower Low Water (MLLW) +0.5 m
Mean Sea Level (MSL) +1.3 m
3.9 WAVES
Mormugao harbour on the southern side where berths are located is protected by a
breakwater and mole and generally it is the waves from directions between SW and
NW that could affect the tranquillity in the harbour. The deep water waves from NW

---------------------------------------------------------------------------------------------------------------------------------------------
EIA Study for Capacity Enhancement at Berth 5A, 6A of SWPL, Goa 3-10
Final Report, September, 2017
generally have a small % probability exceedence and do not affect harbour tranquillity
significantly since their heights get reduced by the time they reach the harbour. Wave
periods during the monsoons tend to be longer than during the rest of the year when
NW winds prevail.
As part of the master plan study by MPT, HOWE India constructed the wave rose
diagram from the visually observed wave heights during the period 1949 to 1962, from
the area bounded by Latitude 10°N to 20°N and Longitude 70°E to 80°E. These wave
analysis indicated that the yearly average probability of exceedence of the wave height
of 2 m for the Westerly direction would be;
Direction Exc. Hs = 2 m SW 4.7 % W 4.5% NW 0.4 %
The deep water wave climate is summarized in Table 3.3.
Table 3.3: Deep water wave climate (Probability of exceedance in % of time)
HS = 1.0 m 2.0 m 3.0 m 4.0 m
SW 12.2 8.7 4.7 2.2
W 21.6 13.6 7.4 3.0
NW 8.4 2.0 0.6 0.2
Due to refraction, shoaling and breaking, the wave direction and wave height will
change while travelling from deep water to the harbour entrance. Generally by
refraction the waves from NW turn to WNW. Waves from W and NW reduce in height.
All wave conditions higher than Hs = 4 m are reduced by wave breaking. The
operational wave climate at the harbour entrance is presented in Table 3.4.
Table 3.4: Operational wave climate (Probability of exceedance in % of time)
The extreme wave climate at the harbour entrance is as follows:
HS = 1.0 m 2.0 m 3.0 m 4.0 m
SW 12.2 8.7 4.7 2.2
W 21.6 13.6 7.4 3.0
NW 8.4 2.0 0.6 0.2

---------------------------------------------------------------------------------------------------------------------------------------------
EIA Study for Capacity Enhancement at Berth 5A, 6A of SWPL, Goa 3-11
Final Report, September, 2017
Frequency of occurrence Hs
4.7 m 10/year
5.0 m 1/year
5.4 m 1/10 years
5.8 m 1/100 years
Extreme wave conditions at harbour entrance will occur mainly during the monsoon.
The period of the extreme waves varies between T = 7 S and 13 S.
3.10 CURRENTS
The currents in the region outside the sheltered harbour have been found to be
generally less than one knot, during fair season and are mainly caused by tidal ebb
and flow. Within the sheltered harbour, indicated current strengths are of the order of
30 to 40 cm/sec. During heavy monsoon rains, current pattern is altered during the
fair season but the current strength does not get appreciably altered.
As a part of the field observations in Vasco bay, current observations were earlier
taken at two locations (CM1 – 15° 26’ 00”N, 73° 48’ 18” E , CM2 – 15o24’ 21”N, 73°
48’ 42” E). A summary of the current measurements is given in Table 3.5.
Table 3.5: Current measurements at Vasco Bay
CM1 (Water depth, 7 m) CM2 (Water
depth, 3.5 m)
Near surface Mid depth Near bottom Near bottom
Maximum
Speed (cm/s)
68 31 29 57
Minimum
Speed (cm/s)
0 0 0 0
Predominant
Direction
ESE- WNW ESE-WNW ESE - WNW ESE
Measurements at open location (CM1) indicate that the predominant flow is in the
ESE-WNW direction, while at the location (CM2) close to the shore, the predominant
direction is ESE. The flow of currents is predominantly due to the tidal currents. During
flood water, flow is towards Zuari River while during the ebbing, the reversal of flow
takes place. The maximum current velocity was observed as 68 cm /sec.

---------------------------------------------------------------------------------------------------------------------------------------------
EIA Study for Capacity Enhancement at Berth 5A, 6A of SWPL, Goa 3-12
Final Report, September, 2017
3.11 GROUND WATER QUALITY
As a part of the field studies, water samples were collected at various locations in the
study area. Sampling Locations are listed below:
GW1- ST Harbour Gate No.1
GW2- ST Harbour Gate No. 2
GW3- V3 SET Workshop Baina Goa
GW4- Sasmolem Baina Goa
GW5- Vasco near Railway Station
The results of the water quality analysis is given Tables 3.6, and the sampling locations
are shown in Figure 3.7.
Figure 3.7: Sampling location map

---------------------------------------------------------------------------------------------------------------------------------------------
EIA Study for Capacity Enhancement at Berth 5A, 6A of SWPL, Goa 3-13
Final Report, September, 2017
Table 3.6: Ground water quality in the study area
Parameters Locations BIS Stds-IS:10500-1991 GW-1 GW-2 GW-3 GW-4 GW-5
pH 4.60 5.10 4.90 5.60 5.50 6.5-8.5
Temperature, oC 33.4 33.7 33.5 33.4 33.5 -
Electrical Conductivity at
25°C, S/cm
184 191 452 444 124 -
Total Alkalinity (as HCO3), mg/l
29.6 29.9 124 188 18.6 200
Chlorides (as Cl),mg/l
17.6 15.5 42.3 43.3 9.79 250
Total Hardness (as CaCO3), mg/l
84.0 80.0 248 256 72 200
Calcium (as CaCO3), mg/l
11.2 25.6 56.1 80.2 17.6 75
Magnesium (as CaCO3),mg/l
13.6 13.9 19.4 33.6 6.8 30
Nitrate (as NO3), mg/l
0.07 4.07 0.08 7.78 1.41 45
Sulphate (as SO4), mg/l
13.8 13.2 4.37 14.4 5.41 200
Phosphate (as PO4), mg/l
<0.04 <0.04 <0.04 <0.04 <0.04 -
Total Silica (as SiO2), mg/l
19.2 3.5 4.2 8.3 2.9 -
BOD (3 days at 27°C), mg/l
0.5 <0.1 <0.1 <0.1 <0.1 -
COD, mg/l 1.41 <1.0 <1.0 <1.0 <1.0 -
Oil & Grease, mg/l <2.0 <2.0 <2.0 <2.0 <2.0 -
Sodium (as Na), mg/l
56.8 30.7 9.9 34.1 25.9 -
Potassium (as K), mg/l
25 5.5 1.4 8.3 4.4 -
Phenolic Compounds (as C6H5OH), mg/l
<0.001 <0.001 <0.001 <0.001 <0.001 0.001
Iron (as Fe), mg/l 0.4 0.4 0.3 0.02 0.2 0.3
Arsenic (as As), mg/l
<0.01 <0.01 <0.01 <0.01 <0.01 0.05
Total Chromium (as Cr), mg/l
<0.01 <0.01 <0.01 <0.01 <0.01 0.05
Mercury (as Hg), mg/l
<0.01 <0.01 <0.01 <0.01 <0.01 0.001
Copper (as Cu), mg/l
<0.01 <0.01 <0.01 <0.01 <0.01 0.05
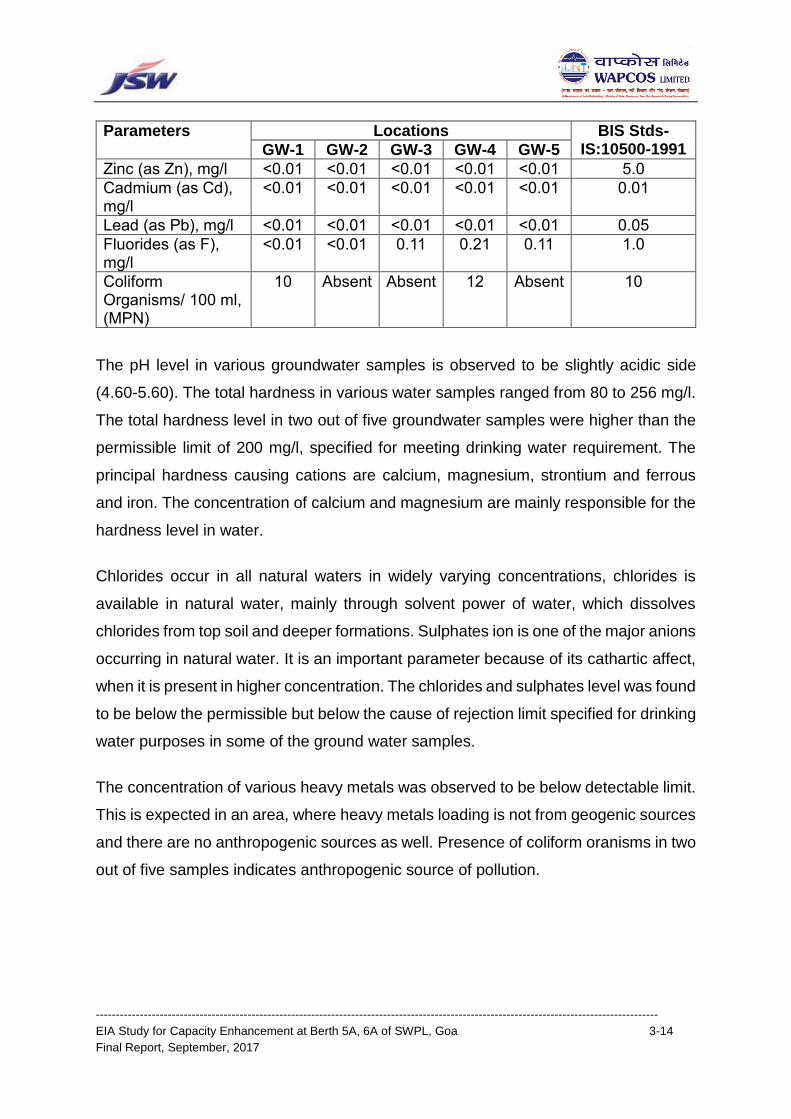
---------------------------------------------------------------------------------------------------------------------------------------------
EIA Study for Capacity Enhancement at Berth 5A, 6A of SWPL, Goa 3-14
Final Report, September, 2017
Parameters Locations BIS Stds-IS:10500-1991 GW-1 GW-2 GW-3 GW-4 GW-5
Zinc (as Zn), mg/l <0.01 <0.01 <0.01 <0.01 <0.01 5.0
Cadmium (as Cd), mg/l
<0.01 <0.01 <0.01 <0.01 <0.01 0.01
Lead (as Pb), mg/l <0.01 <0.01 <0.01 <0.01 <0.01 0.05
Fluorides (as F), mg/l
<0.01 <0.01 0.11 0.21 0.11 1.0
Coliform Organisms/ 100 ml, (MPN)
10 Absent Absent 12 Absent 10
The pH level in various groundwater samples is observed to be slightly acidic side
(4.60-5.60). The total hardness in various water samples ranged from 80 to 256 mg/l.
The total hardness level in two out of five groundwater samples were higher than the
permissible limit of 200 mg/l, specified for meeting drinking water requirement. The
principal hardness causing cations are calcium, magnesium, strontium and ferrous
and iron. The concentration of calcium and magnesium are mainly responsible for the
hardness level in water.
Chlorides occur in all natural waters in widely varying concentrations, chlorides is
available in natural water, mainly through solvent power of water, which dissolves
chlorides from top soil and deeper formations. Sulphates ion is one of the major anions
occurring in natural water. It is an important parameter because of its cathartic affect,
when it is present in higher concentration. The chlorides and sulphates level was found
to be below the permissible but below the cause of rejection limit specified for drinking
water purposes in some of the ground water samples.
The concentration of various heavy metals was observed to be below detectable limit.
This is expected in an area, where heavy metals loading is not from geogenic sources
and there are no anthropogenic sources as well. Presence of coliform oranisms in two
out of five samples indicates anthropogenic source of pollution.

---------------------------------------------------------------------------------------------------------------------------------------------
EIA Study for Capacity Enhancement at Berth 5A, 6A of SWPL, Goa 3-15
Final Report, September, 2017
3.12 SOIL QUALITY
As a part of field studies, soil sample was collected at at various locations in the study
area. Sampling Locations are listed below.
S1- ST Harbour Gate No.1
S2- ST Harbour Gate No. 2
S3- V3 SET Workshop Baina Goa
S4- Sasmolem Baina Goa
S5- Vasco near Railway Station
The results of soil quality analysis are shown in Table 3.7.
Table 3.7: Soil quality in the study area
S.No. Parameters Stations
S1 S2 S3 S4 S5
1. pH 8.02 8.06 8.19 7.94 8.02
2. Bulk Density, g/cm3 1.33 1.30 1.45 1.42 1.36
3. Total Kjeldahl Nitrogen, % w/w
0.19 0.06 0.03 0.08 0.11
4. Phosphorous (as P), mg/kg 60.8 64.6 72.3 104 127
5. Phosphate (as P), mg/kg 64.1 66.3 77.9 110 130
6. Organic Matter, % 2.92 1.53 0.81 2.05 1.80
7. Sodium Absorption Ratio 0.62 0.55 0.60 0.76 0.76
8. Sodium (as Na), mg/kg 181 185 188 257 212
9. Potassium (as K), mg/kg 672 557 217 478 780
10. Texture Sandy Clay Loam
Sandy Clay Loam
Sandy Clay
Sandy Clay Loam
Sandy Clay Loam
11. Particle Size Distribution
Very Coarse Sand (<2000-
1000)
Coarse sand (<1000-500)
Medium Sand (<500-250)
Fine Sand (<250-100)
Very Fine Sand (<100-
50)
Silt (<50 - 2)
Clay (<2)
22.7
18.6 24.4 0.73 7.95 14.7 10.7
24.1
18.1 23.9 0.29 7.33 15.9 10.1
28.1
17.1 20.0 0.82 8.49 16.0 9.28
24.6
19.7 22.1 0.72 7.68 14.5 10.4
24.0
20.1 22.8 0.44 8.11 14.6 9.76
The pH of soil at various sites lies within neutral range. The levels of NPK indicates
moderate to high soil productivity.

---------------------------------------------------------------------------------------------------------------------------------------------
EIA Study for Capacity Enhancement at Berth 5A, 6A of SWPL, Goa 3-16
Final Report, September, 2017
3.13 LANDUSE PATTERN
The landuse pattern of the study area has also been assessed using satellite data.
The Resources at-2 LISS-IV, Path 096, Row 062, sub-scene-A, dated 15.12.2014,
digital satellite was procured from National Remote Sensing Agency (NRSA),
Hyderabad for assessing the landuse pattern of the study area. The FCC of the study
area is shown in Figure 3.8, and the classified imagery of the study area is enclosed
as Figure 3.9. The landuse pattern is summarized in the Table 3.8.
Figure 3.8: FCC of the study area

---------------------------------------------------------------------------------------------------------------------------------------------
EIA Study for Capacity Enhancement at Berth 5A, 6A of SWPL, Goa 3-17
Final Report, September, 2017
Figure 3.9: Land use pattern of the study area
Table 3.8 : Landuse pattern of the study area
S. No. Category Area (ha) Area (%)
1 Dense Vegetation 2056 4.92
2 Open Vegetation 2664 6.38
3 Open Land/Barren Land 3721 8.91
4 Sand 259 0.62
5 Water Body 31434 75.24
6 Agricultural Land 1057 2.53
7 Builtup Area 589 1.41
Total 41780 100.00
The major landuse category is water body accounting for about 75.24% of the total
study area. The area under dense and open vegetation in the study area is 4.92% and
6.38 % respectively. The agricultural area accounts for about 2.53% of the Study Area,
while built-up area accounts for 1.41% of the total Study Area.

---------------------------------------------------------------------------------------------------------------------------------------------
EIA Study for Capacity Enhancement at Berth 5A, 6A of SWPL, Goa 3-18
Final Report, September, 2017
3.14 SHORELINE CHANGE STATUS
West coast exhibits very low rates of littoral drift, primarily due to the high tidal range,
where the waves act on different parts of the flat offshore lower beach and the action
on the beach above the high tide level are restricted to a very short time interval. As it
is difficult to distinguish the direction of the net drift, its effect on the local shoreline
remains unchanged.
Apart from this, the operating berths are erosion protected with under deck pitching,
so no shoreline change corresponding to the waterfront is likely to happen. Therefore,
the existing shoreline along the Mormugao Port trust is quite stable without any
significant changes in the shoreline along its coast. This can be substantiated from the
study report on “Use of Satellite data for detection of violation of land use along the
Coastal Regulation Zone and Impact of Port structures on Shoreline Changes” by
Ministry of Earth Sciences (MoES), prepared for the Ministry of Environment and
Forests (MoEF), New Delhi. The shoreline change is reported along the coast off
South Goa, other than the coast of Mormugao Port.
Sametime, the “National Assessment of Shoreline change, Goa coast” maps are also
prepared by National Centre for Sustainable Coastal Management (NCSCM),
Chennai, an institute under MoEFCC. The map indicates no change in the shoreline
in the port berth area, but a small stretch of the coast towards north of the port is
accreding and stable. However, most of the sholeline along the zuari river is rocky
coast and is devoid of any shoreline change. The shoreline change map of the project
area prepared by NCSCM is shown in Figure 3.10.
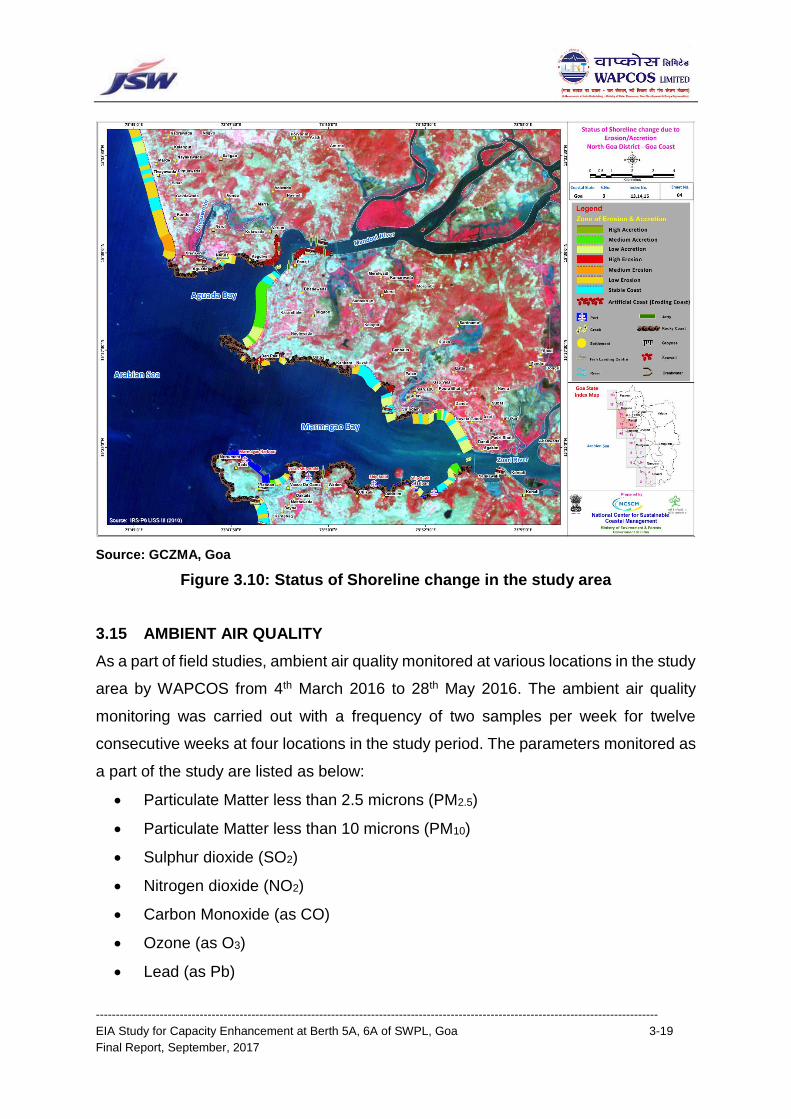
---------------------------------------------------------------------------------------------------------------------------------------------
EIA Study for Capacity Enhancement at Berth 5A, 6A of SWPL, Goa 3-19
Final Report, September, 2017
Source: GCZMA, Goa
Figure 3.10: Status of Shoreline change in the study area
3.15 AMBIENT AIR QUALITY
As a part of field studies, ambient air quality monitored at various locations in the study
area by WAPCOS from 4th March 2016 to 28th May 2016. The ambient air quality
monitoring was carried out with a frequency of two samples per week for twelve
consecutive weeks at four locations in the study period. The parameters monitored as
a part of the study are listed as below:
Particulate Matter less than 2.5 microns (PM2.5)
Particulate Matter less than 10 microns (PM10)
Sulphur dioxide (SO2)
Nitrogen dioxide (NO2)
Carbon Monoxide (as CO)
Ozone (as O3)
Lead (as Pb)
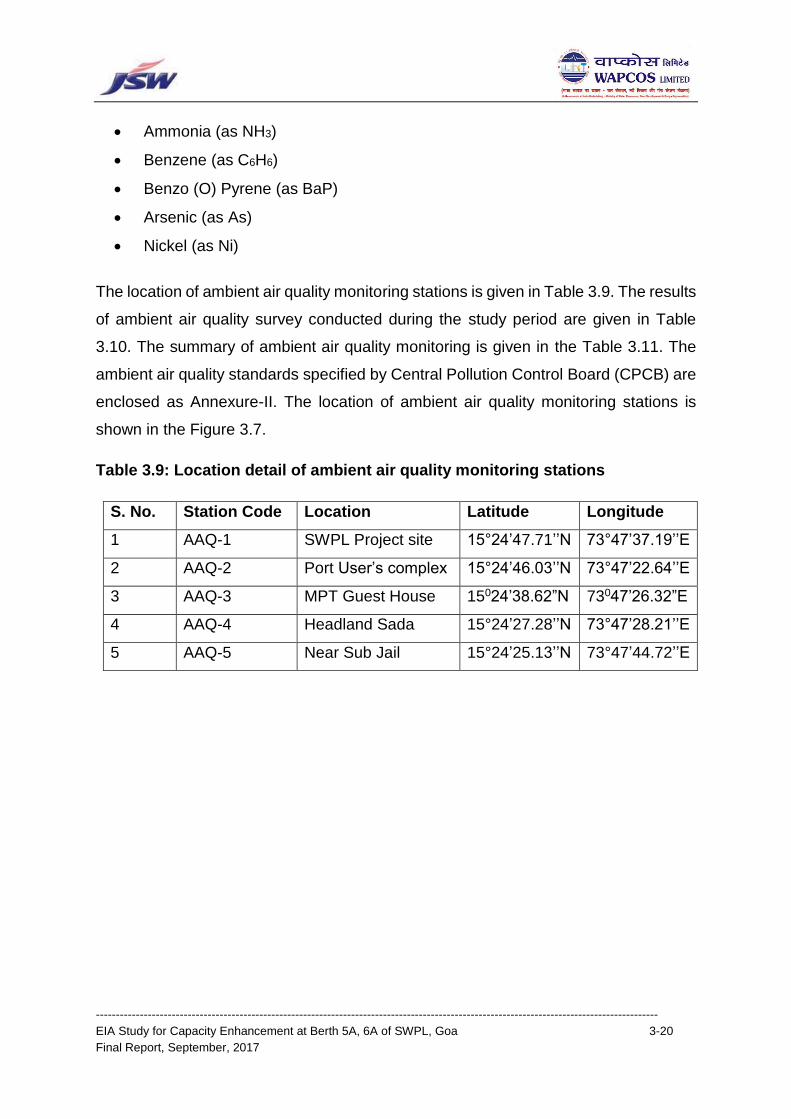
---------------------------------------------------------------------------------------------------------------------------------------------
EIA Study for Capacity Enhancement at Berth 5A, 6A of SWPL, Goa 3-20
Final Report, September, 2017
Ammonia (as NH3)
Benzene (as C6H6)
Benzo (O) Pyrene (as BaP)
Arsenic (as As)
Nickel (as Ni)
The location of ambient air quality monitoring stations is given in Table 3.9. The results
of ambient air quality survey conducted during the study period are given in Table
3.10. The summary of ambient air quality monitoring is given in the Table 3.11. The
ambient air quality standards specified by Central Pollution Control Board (CPCB) are
enclosed as Annexure-II. The location of ambient air quality monitoring stations is
shown in the Figure 3.7.
Table 3.9: Location detail of ambient air quality monitoring stations
S. No. Station Code Location Latitude Longitude
1 AAQ-1 SWPL Project site 15°24’47.71’’N 73°47’37.19’’E
2 AAQ-2 Port User’s complex 15°24’46.03’’N 73°47’22.64’’E
3 AAQ-3 MPT Guest House 15024’38.62”N 73047’26.32”E
4 AAQ-4 Headland Sada 15°24’27.28’’N 73°47’28.21’’E
5 AAQ-5 Near Sub Jail 15°24’25.13’’N 73°47’44.72’’E

---------------------------------------------------------------------------------------------------------------------------------------------
EIA Study for Capacity Enhancement at Berth 5A, 6A of SWPL, Goa 3-21
Final Report, September, 2017
Table 3.10: Results of ambient air quality status
S. No.
Date of Sampling
PM2.5 PM10 SO2 NO2 CO O3 Pb NH3 C6H6 BaP As Ni
µg/m3 µg/m3 µg/m3 µg/m3 mg/m3 µg/m3 µg/m3 µg/m3 µg/m3 ng/m3 ng/m3 ng/m3
Sampling Location-1 – SWPL Project site
01 04-05/03/2016 36.2 79.5 23.5 38.4 0.5 57 ND 13 0.2 ND ND ND
02 07-08/03/2016 35.5 76.8 25.3 46.7 0.5 41.2 ND 11.5 0.7 ND ND ND
03 10-11/03/2016 37.5 82.2 24.8 54.5 0.7 46.2 ND 14.6 0.6 ND ND ND
04 14-15/03/2016 42.0 98.0 27.5 44.6 0.7 48.4 ND 13.6 0.8 ND ND ND
05 17-18/03/2016 47.5 95.2 26.8 46.5 0.8 45 ND 15.6 0.6 ND ND ND
06 21-22/03/2016 37.2 78.1 26.6 42.5 0.7 48.1 ND 14.5 0.4 ND ND ND
07 24-25/03/2016 36.0 78.5 22.6 55.7 0.7 54.6 ND 13 0.3 ND ND ND
08 28-29/03/2016 48.5 99.2 24.7 51.4 0.8 41.6 ND 15.3 0.5 ND ND ND
01 04-05/04/2016 47.5 99.4 23.5 38.7 0.6 57 ND 13 0.2 ND ND ND
02 07-08/04/2016 38.8 85.6 24.8 46.2 0.6 51 ND 15.7 0.4 ND ND ND
03 11-12/04/2016 45.0 92.2 28.8 51.3 0.6 51 ND 14.3 0.3 ND ND ND
04 15-16/04/2016 34.5 85.2 24.5 36.4 0.6 43 ND 14.1 0.3 ND ND ND
05 18-19/04/2016 34.7 82.5 27.4 49.9 0.6 43 ND 15.1 0.4 ND ND ND
06 22-23/04/2016 33.0 79.5 27.0 49.6 0.9 48 ND 14.4 0.3 ND ND ND
07 25-26/04/2016 44.3 98.5 26.9 56.7 0.8 56 ND 13 0.3 ND ND ND
08 29-30/04/2016 34.2 75.0 25.8 56.8 0.7 43 ND 15.1 0.2 ND ND ND
01 02-03/05/2016 40.2 85.2 27.4 45.7 0.5 53 ND 14.6 0.5 ND ND ND
02 06-07/05/2016 35.5 72.2 27.3 45.3 0.8 47 ND 14.3 0.6 ND ND ND
03 09-10/05/2016 34.5 80.2 25.6 46.5 0.7 56 ND 14.2 0.5 ND ND ND
04 13-14/05/2016 33.2 76.5 31.5 50.4 0.6 53 ND 14.5 0.5 ND ND ND
05 16-17/05/2016 30.5 69.5 29.5 49.0 0.6 50 ND 15.2 0.7 ND ND ND
06 20-21/05/2016 30.5 72.5 28.4 46.0 0.6 55 ND 11.7 0.4 ND ND ND
07 23-24/05/2016 32.0 72.2 29.8 44.3 0.6 56 ND 11.5 0.5 ND ND ND
08 27-28/05/2016 30.5 64.5 26.5 51.0 0.7 64 ND 11.7 0.6 ND ND ND
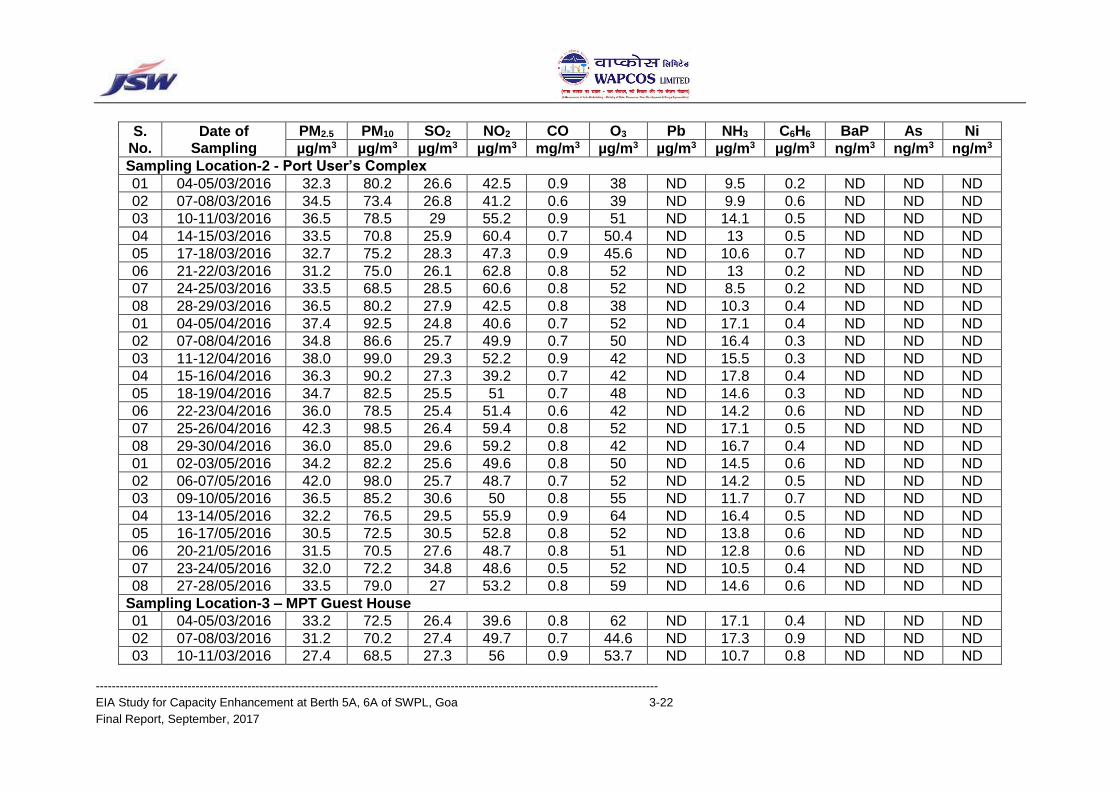
---------------------------------------------------------------------------------------------------------------------------------------------
EIA Study for Capacity Enhancement at Berth 5A, 6A of SWPL, Goa 3-22
Final Report, September, 2017
S. No.
Date of Sampling
PM2.5 PM10 SO2 NO2 CO O3 Pb NH3 C6H6 BaP As Ni
µg/m3 µg/m3 µg/m3 µg/m3 mg/m3 µg/m3 µg/m3 µg/m3 µg/m3 ng/m3 ng/m3 ng/m3
Sampling Location-2 - Port User’s Complex
01 04-05/03/2016 32.3 80.2 26.6 42.5 0.9 38 ND 9.5 0.2 ND ND ND
02 07-08/03/2016 34.5 73.4 26.8 41.2 0.6 39 ND 9.9 0.6 ND ND ND
03 10-11/03/2016 36.5 78.5 29 55.2 0.9 51 ND 14.1 0.5 ND ND ND
04 14-15/03/2016 33.5 70.8 25.9 60.4 0.7 50.4 ND 13 0.5 ND ND ND
05 17-18/03/2016 32.7 75.2 28.3 47.3 0.9 45.6 ND 10.6 0.7 ND ND ND
06 21-22/03/2016 31.2 75.0 26.1 62.8 0.8 52 ND 13 0.2 ND ND ND
07 24-25/03/2016 33.5 68.5 28.5 60.6 0.8 52 ND 8.5 0.2 ND ND ND
08 28-29/03/2016 36.5 80.2 27.9 42.5 0.8 38 ND 10.3 0.4 ND ND ND
01 04-05/04/2016 37.4 92.5 24.8 40.6 0.7 52 ND 17.1 0.4 ND ND ND
02 07-08/04/2016 34.8 86.6 25.7 49.9 0.7 50 ND 16.4 0.3 ND ND ND
03 11-12/04/2016 38.0 99.0 29.3 52.2 0.9 42 ND 15.5 0.3 ND ND ND
04 15-16/04/2016 36.3 90.2 27.3 39.2 0.7 42 ND 17.8 0.4 ND ND ND
05 18-19/04/2016 34.7 82.5 25.5 51 0.7 48 ND 14.6 0.3 ND ND ND
06 22-23/04/2016 36.0 78.5 25.4 51.4 0.6 42 ND 14.2 0.6 ND ND ND
07 25-26/04/2016 42.3 98.5 26.4 59.4 0.8 52 ND 17.1 0.5 ND ND ND
08 29-30/04/2016 36.0 85.0 29.6 59.2 0.8 42 ND 16.7 0.4 ND ND ND
01 02-03/05/2016 34.2 82.2 25.6 49.6 0.8 50 ND 14.5 0.6 ND ND ND
02 06-07/05/2016 42.0 98.0 25.7 48.7 0.7 52 ND 14.2 0.5 ND ND ND
03 09-10/05/2016 36.5 85.2 30.6 50 0.8 55 ND 11.7 0.7 ND ND ND
04 13-14/05/2016 32.2 76.5 29.5 55.9 0.9 64 ND 16.4 0.5 ND ND ND
05 16-17/05/2016 30.5 72.5 30.5 52.8 0.8 52 ND 13.8 0.6 ND ND ND
06 20-21/05/2016 31.5 70.5 27.6 48.7 0.8 51 ND 12.8 0.6 ND ND ND
07 23-24/05/2016 32.0 72.2 34.8 48.6 0.5 52 ND 10.5 0.4 ND ND ND
08 27-28/05/2016 33.5 79.0 27 53.2 0.8 59 ND 14.6 0.6 ND ND ND
Sampling Location-3 – MPT Guest House
01 04-05/03/2016 33.2 72.5 26.4 39.6 0.8 62 ND 17.1 0.4 ND ND ND
02 07-08/03/2016 31.2 70.2 27.4 49.7 0.7 44.6 ND 17.3 0.9 ND ND ND
03 10-11/03/2016 27.4 68.5 27.3 56 0.9 53.7 ND 10.7 0.8 ND ND ND
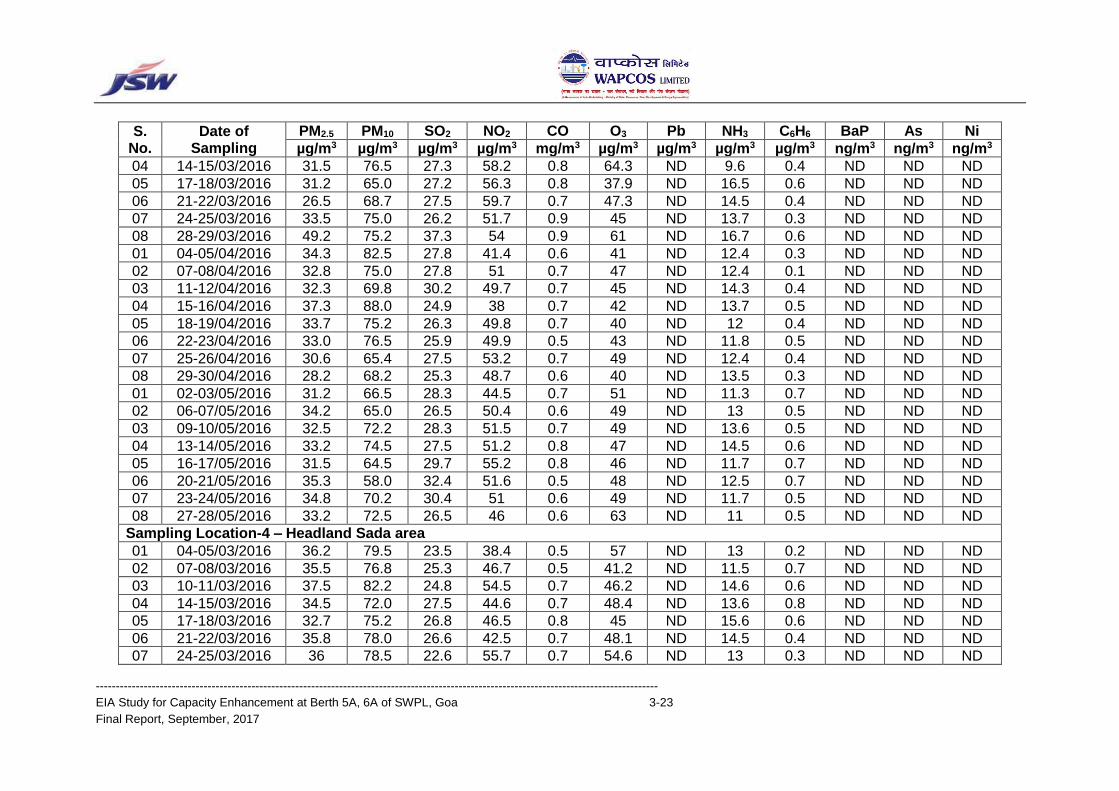
---------------------------------------------------------------------------------------------------------------------------------------------
EIA Study for Capacity Enhancement at Berth 5A, 6A of SWPL, Goa 3-23
Final Report, September, 2017
S. No.
Date of Sampling
PM2.5 PM10 SO2 NO2 CO O3 Pb NH3 C6H6 BaP As Ni
µg/m3 µg/m3 µg/m3 µg/m3 mg/m3 µg/m3 µg/m3 µg/m3 µg/m3 ng/m3 ng/m3 ng/m3
04 14-15/03/2016 31.5 76.5 27.3 58.2 0.8 64.3 ND 9.6 0.4 ND ND ND
05 17-18/03/2016 31.2 65.0 27.2 56.3 0.8 37.9 ND 16.5 0.6 ND ND ND
06 21-22/03/2016 26.5 68.7 27.5 59.7 0.7 47.3 ND 14.5 0.4 ND ND ND
07 24-25/03/2016 33.5 75.0 26.2 51.7 0.9 45 ND 13.7 0.3 ND ND ND
08 28-29/03/2016 49.2 75.2 37.3 54 0.9 61 ND 16.7 0.6 ND ND ND
01 04-05/04/2016 34.3 82.5 27.8 41.4 0.6 41 ND 12.4 0.3 ND ND ND
02 07-08/04/2016 32.8 75.0 27.8 51 0.7 47 ND 12.4 0.1 ND ND ND
03 11-12/04/2016 32.3 69.8 30.2 49.7 0.7 45 ND 14.3 0.4 ND ND ND
04 15-16/04/2016 37.3 88.0 24.9 38 0.7 42 ND 13.7 0.5 ND ND ND
05 18-19/04/2016 33.7 75.2 26.3 49.8 0.7 40 ND 12 0.4 ND ND ND
06 22-23/04/2016 33.0 76.5 25.9 49.9 0.5 43 ND 11.8 0.5 ND ND ND
07 25-26/04/2016 30.6 65.4 27.5 53.2 0.7 49 ND 12.4 0.4 ND ND ND
08 29-30/04/2016 28.2 68.2 25.3 48.7 0.6 40 ND 13.5 0.3 ND ND ND
01 02-03/05/2016 31.2 66.5 28.3 44.5 0.7 51 ND 11.3 0.7 ND ND ND
02 06-07/05/2016 34.2 65.0 26.5 50.4 0.6 49 ND 13 0.5 ND ND ND
03 09-10/05/2016 32.5 72.2 28.3 51.5 0.7 49 ND 13.6 0.5 ND ND ND
04 13-14/05/2016 33.2 74.5 27.5 51.2 0.8 47 ND 14.5 0.6 ND ND ND
05 16-17/05/2016 31.5 64.5 29.7 55.2 0.8 46 ND 11.7 0.7 ND ND ND
06 20-21/05/2016 35.3 58.0 32.4 51.6 0.5 48 ND 12.5 0.7 ND ND ND
07 23-24/05/2016 34.8 70.2 30.4 51 0.6 49 ND 11.7 0.5 ND ND ND
08 27-28/05/2016 33.2 72.5 26.5 46 0.6 63 ND 11 0.5 ND ND ND
Sampling Location-4 – Headland Sada area
01 04-05/03/2016 36.2 79.5 23.5 38.4 0.5 57 ND 13 0.2 ND ND ND
02 07-08/03/2016 35.5 76.8 25.3 46.7 0.5 41.2 ND 11.5 0.7 ND ND ND
03 10-11/03/2016 37.5 82.2 24.8 54.5 0.7 46.2 ND 14.6 0.6 ND ND ND
04 14-15/03/2016 34.5 72.0 27.5 44.6 0.7 48.4 ND 13.6 0.8 ND ND ND
05 17-18/03/2016 32.7 75.2 26.8 46.5 0.8 45 ND 15.6 0.6 ND ND ND
06 21-22/03/2016 35.8 78.0 26.6 42.5 0.7 48.1 ND 14.5 0.4 ND ND ND
07 24-25/03/2016 36 78.5 22.6 55.7 0.7 54.6 ND 13 0.3 ND ND ND

---------------------------------------------------------------------------------------------------------------------------------------------
EIA Study for Capacity Enhancement at Berth 5A, 6A of SWPL, Goa 3-24
Final Report, September, 2017
S. No.
Date of Sampling
PM2.5 PM10 SO2 NO2 CO O3 Pb NH3 C6H6 BaP As Ni
µg/m3 µg/m3 µg/m3 µg/m3 mg/m3 µg/m3 µg/m3 µg/m3 µg/m3 ng/m3 ng/m3 ng/m3
08 28-29/03/2016 34.5 81.2 24.7 51.4 0.8 41.6 ND 15.3 0.5 ND ND ND
01 04-05/04/2016 37.4 88.6 23.5 38.7 0.6 57 ND 13 0.2 ND ND ND
02 07-08/04/2016 32.8 85.6 24.8 46.2 0.6 51 ND 15.7 0.4 ND ND ND
03 11-12/04/2016 36 78.4 28.8 51.3 0.6 51 ND 14.3 0.3 ND ND ND
04 15-16/04/2016 34.5 85.2 24.5 36.4 0.6 43 ND 14.1 0.3 ND ND ND
05 18-19/04/2016 34.7 82.5 27.4 49.9 0.6 43 ND 15.1 0.4 ND ND ND
06 22-23/04/2016 33 79.5 27 49.6 0.9 48 ND 14.4 0.3 ND ND ND
07 25-26/04/2016 44.3 84.5 26.9 56.7 0.8 56 ND 13 0.3 ND ND ND
08 29-30/04/2016 34.2 75.0 25.8 56.8 0.7 43 ND 15.1 0.2 ND ND ND
01 02-03/05/2016 40.2 85.2 27.4 45.7 0.5 53 ND 14.6 0.5 ND ND ND
02 06-07/05/2016 35.5 72.0 27.3 45.3 0.8 47 ND 14.3 0.6 ND ND ND
03 09-10/05/2016 31.7 72.5 25.6 46.5 0.7 56 ND 14.2 0.5 ND ND ND
04 13-14/05/2016 33.2 76.5 31.5 50.4 0.6 53 ND 14.5 0.5 ND ND ND
05 16-17/05/2016 30.5 59.5 29.5 49 0.6 50 ND 15.2 0.7 ND ND ND
06 20-21/05/2016 30.5 72.5 28.4 46 0.6 55 ND 11.7 0.4 ND ND ND
07 23-24/05/2016 32 72.2 29.8 44.3 0.6 56 ND 11.5 0.5 ND ND ND
08 27-28/05/2016 30.5 77.0 26.5 51 0.7 64 ND 11.7 0.6 ND ND ND
Sampling Location-5 – Near Sub Jail
01 04-05/03/2016 33.3 76.5 26.9 46.7 0.8 53 ND 13 0.2 ND ND ND
02 07-08/03/2016 34.2 68.6 34 55.3 0.6 42.1 ND 10.2 0.7 ND ND ND
03 10-11/03/2016 35 63.5 31 58.3 0.9 58 ND 13.2 0.7 ND ND ND
04 14-15/03/2016 32.5 71.8 27.1 51.7 0.9 52 ND 10.3 0.6 ND ND ND
05 17-18/03/2016 34.7 74.2 31 49 0.7 44.1 ND 14.4 0.6 ND ND ND
06 21-22/03/2016 32.2 76.4 37.2 64.5 0.9 44.1 ND 17.2 0.2 ND ND ND
07 24-25/03/2016 33.5 69.5 29.7 58.2 0.9 51.7 ND 11 0.7 ND ND ND
08 28-29/03/2016 38.5 81.2 28.7 57.7 0.9 49.7 ND 18.2 0.2 ND ND ND
01 04-05/04/2016 39.3 96.5 29.3 56.2 0.8 43 ND 22.6 0.3 ND ND ND
02 07-08/04/2016 35.8 85.5 27.3 48.2 0.9 49 ND 18.2 0.2 ND ND ND
03 11-12/04/2016 42.9 99.0 34.2 50.3 0.7 49 ND 13.7 0.3 ND ND ND

---------------------------------------------------------------------------------------------------------------------------------------------
EIA Study for Capacity Enhancement at Berth 5A, 6A of SWPL, Goa 3-25
Final Report, September, 2017
S. No.
Date of Sampling
PM2.5 PM10 SO2 NO2 CO O3 Pb NH3 C6H6 BaP As Ni
µg/m3 µg/m3 µg/m3 µg/m3 mg/m3 µg/m3 µg/m3 µg/m3 µg/m3 ng/m3 ng/m3 ng/m3
04 15-16/04/2016 37.3 91.2 29.3 35.1 0.6 47 ND 14.5 0.5 ND ND ND
05 18-19/04/2016 34.7 82.2 29.2 51.2 0.6 51 ND 13.7 0.5 ND ND ND
06 22-23/04/2016 36.8 74.5 27.4 48.5 0.7 47 ND 13.5 0.5 ND ND ND
07 25-26/04/2016 32.3 98.5 29.5 57.4 0.6 51 ND 14.2 0.3 ND ND ND
08 29-30/04/2016 32.5 75.2 27.3 58.3 0.8 45 ND 14.2 0.4 ND ND ND
01 02-03/05/2016 36.2 99.1 22.3 52.1 0.7 49 ND 16.8 0.5 ND ND ND
02 06-07/05/2016 39.5 99.2 25.8 54.2 0.7 51 ND 15.4 0.6 ND ND ND
03 09-10/05/2016 36.5 86.2 31.3 48.5 0.4 53 ND 14.6 0.5 ND ND ND
04 13-14/05/2016 34.2 78.5 28.3 49.8 0.8 51 ND 13.1 0.7 ND ND ND
05 16-17/05/2016 31.0 74.5 26.3 49.7 0.5 50 ND 16.4 0.6 ND ND ND
06 20-21/05/2016 32.5 69.5 30.6 50.6 0.5 48 ND 14.7 0.6 ND ND ND
07 23-24/05/2016 32.0 72.2 33.7 52.5 0.7 51 ND 13.4 0.4 ND ND ND
08 27-28/05/2016 34.5 80.0 28.3 49.8 0.8 58 ND 10.8 0.7 ND ND ND

---------------------------------------------------------------------------------------------------------------------------------------------
EIA Study for Capacity Enhancement at Berth 5A, 6A of SWPL, Goa 3-26
Final Report, September, 2017
Table 3.11: Summary of ambient air quality status
Station Maximum Minimum Average
Particulate Matter2.5 (PM2.5) (Unit: µg/m3)
Project site 48.5 30.5 37.5
Port User’s complex 42.3 30.5 35.9
MPT Guest House 49.2 26.5 33.0
Headland Sada area 44.3 13.5 34.6
Near Sub Jail 42.9 31.0 35.0
Particulate Matter10 (PM10) (Unit: µg/m3)
Project site 99.4 64.5 82.4
Port User’s complex 99.0 68.5 81.3
MPT Guest House 88.0 58.0 71.5
Headland Sada area 88.6 59.5 77.7
Near Sub Jail 99.2 63.5 81.0
Sulphur Dioxide (SO2) (Unit: µg/m3)
Project site 31.5 22.6 26.5
Port User’s complex 34.8 24.8 27.7
MPT Guest House 37.3 24.9 28.0
Headland Sada area 31.5 22.6 26.5
Near Sub Jail 37.2 22.3 29.4
Nitrogen Dioxide (No2) (Unit: µg/m3)
Project site 56.8 36.4 47.7
Port User’s complex 62.8 37.2 50.9
MPT Guest House 59.7 38.0 50.3
Headland Sada area 56.8 36.4 47.7
Near Sub Jail 64.5 35.1 52.2
Carbon Monoxide (CO) (Unit: mg/m3)
Project site 0.9 0.5 0.7
Port User’s complex 0.9 0.5 0.8
MPT Guest House 0.9 0.5 0.7
Headland Sada area 0.9 0.5 0.7
Near Sub Jail 0.9 0.4 0.7
Ozone (O3) (Unit: µg/m3)
Project site 64.0 41.2 50.3
Port User’s complex 64.0 38.0 48.8
MPT Guest House 64.3 37.9 48.5
Headland Sada area 64.0 41.2 50.8
Near Sub Jail 58.0 42.1 49.5
Ammonia (NH3) (Unit: µg/m3)
Project site 15.7 11.5 13.9
Port User’s complex 17.8 8.5 13.6
MPT Guest House 17.3 9.6 13.2
Headland Sada area 15.7 11.5 13.8
Near Sub Jail 22.6 10.2 14.5
Benzene (C6H6) (Unit: µg/m3)
Project site 0.8 0.2 0.4
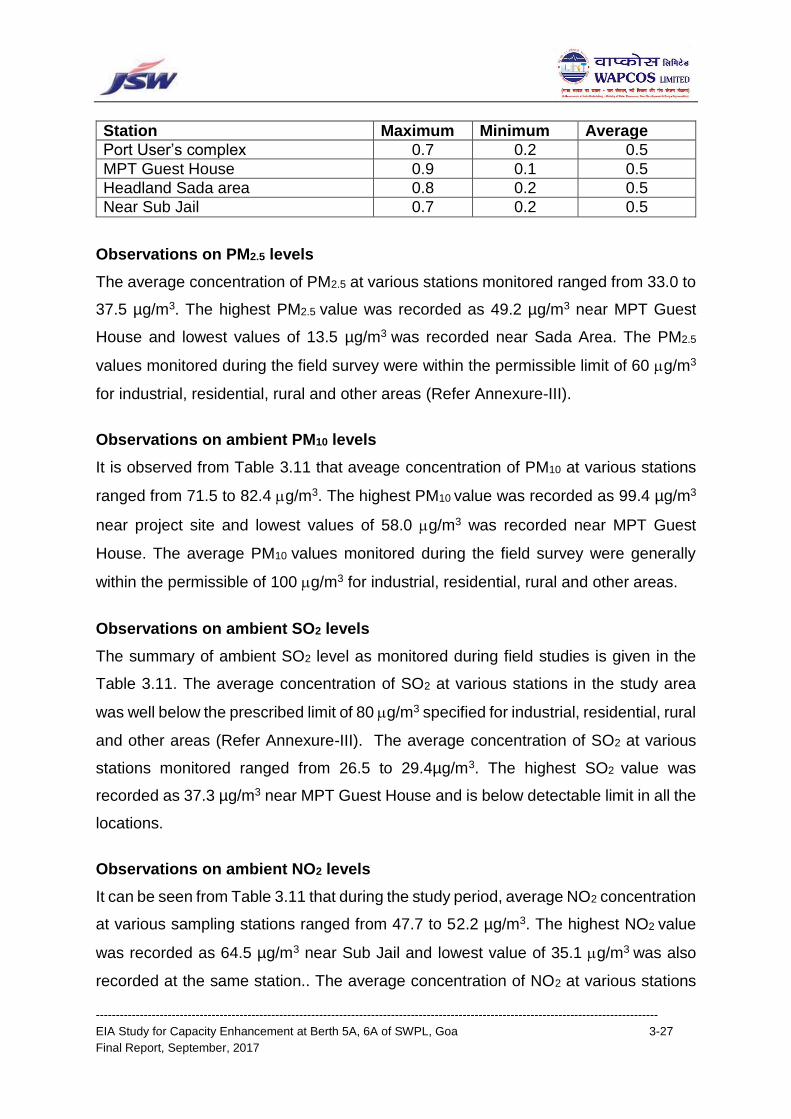
---------------------------------------------------------------------------------------------------------------------------------------------
EIA Study for Capacity Enhancement at Berth 5A, 6A of SWPL, Goa 3-27
Final Report, September, 2017
Station Maximum Minimum Average
Port User’s complex 0.7 0.2 0.5
MPT Guest House 0.9 0.1 0.5
Headland Sada area 0.8 0.2 0.5
Near Sub Jail 0.7 0.2 0.5
Observations on PM2.5 levels
The average concentration of PM2.5 at various stations monitored ranged from 33.0 to
37.5 µg/m3. The highest PM2.5 value was recorded as 49.2 µg/m3 near MPT Guest
House and lowest values of 13.5 µg/m3 was recorded near Sada Area. The PM2.5
values monitored during the field survey were within the permissible limit of 60 g/m3
for industrial, residential, rural and other areas (Refer Annexure-III).
Observations on ambient PM10 levels
It is observed from Table 3.11 that aveage concentration of PM10 at various stations
ranged from 71.5 to 82.4 g/m3. The highest PM10 value was recorded as 99.4 µg/m3
near project site and lowest values of 58.0 g/m3 was recorded near MPT Guest
House. The average PM10 values monitored during the field survey were generally
within the permissible of 100 g/m3 for industrial, residential, rural and other areas.
Observations on ambient SO2 levels
The summary of ambient SO2 level as monitored during field studies is given in the
Table 3.11. The average concentration of SO2 at various stations in the study area
was well below the prescribed limit of 80 g/m3 specified for industrial, residential, rural
and other areas (Refer Annexure-III). The average concentration of SO2 at various
stations monitored ranged from 26.5 to 29.4µg/m3. The highest SO2 value was
recorded as 37.3 µg/m3 near MPT Guest House and is below detectable limit in all the
locations.
Observations on ambient NO2 levels
It can be seen from Table 3.11 that during the study period, average NO2 concentration
at various sampling stations ranged from 47.7 to 52.2 µg/m3. The highest NO2 value
was recorded as 64.5 µg/m3 near Sub Jail and lowest value of 35.1 g/m3 was also
recorded at the same station.. The average concentration of NO2 at various stations

---------------------------------------------------------------------------------------------------------------------------------------------
EIA Study for Capacity Enhancement at Berth 5A, 6A of SWPL, Goa 3-28
Final Report, September, 2017
in the study area was observed to be well below the prescribed limit of 80 g/m3
specified for industrial, residential, rural and other areas.
Observations on ambient CO levels
The average concentration of CO at various stations monitored ranged from 0.7 to 0.8
mg/m3. The highest CO value was recorded as 0.9 mg/m3 and lowest values of 0.4
mg/m3 were recorded near Sub Jail Area. The CO values monitored during the field
survey were below permissible limit of 2 mg/m3 for industrial, residential, rural and
other areas.
Observations on ambient O3 levels
It is observed from Table 3.11 that average concentration of Ozone (O3) at various
stations ranged from 48.5 to 50.8 g/m3. The highest Ozone value was recorded as
64.3 µg/m3 near MPT Guest house and lowest values of 37.9 g/m3 were also
recorded at the same station. The Ozone values monitored during the field survey
were below the permissible limit of 100 g/m3 for industrial, residential, rural and other
areas.
Observations on ambient NH3 levels
The average concentration of Ammonia (NH3) at various stations monitored are
ranged from 13.2 to 14.5 µg/m3. The highest NH3value was recorded as 22.6 µg/m3
near Sub Jail, and lowest values of 8.5 µg/m3 was recorded near Port User’s Complex.
The NH3 values monitored during the field survey were below permissible limit of 400
g/m3 for industrial, residential, rural and other areas.
Observations on ambient C6H6 levels
It is observed from Table 3.11, that the average concentration of C6H6 at various
stations ranged from 0.4 to 0.5 g/m3. The highest C6H6 value was recorded as 0.9
µg/m3 near MPT Guest House and lowest values of 0.1 g/m3 were also recorded in
the same station. The C6H6 values monitored during the field survey were below the
permissible limit of 5 g/m3 for industrial, residential, rural and other areas.

---------------------------------------------------------------------------------------------------------------------------------------------
EIA Study for Capacity Enhancement at Berth 5A, 6A of SWPL, Goa 3-29
Final Report, September, 2017
3.16 NOISE LEVELS
Baseline noise data has been measured using a weighted sound pressure level meter.
The survey was carried out in calm surroundings. Sound Pressure Level (SPL)
measurement in the outside environment was made using sound pressure level meter.
Hourly noise meter readings were taken at each site, and equivalent day time and
night time noise levels were estimated. The ambient noise levels were recorded at 7
locations and details are listed Table 3.12. The hourly ambient noise levels recorded
at various locations are listed in Table 3.13. The day time and night time noise levels
are presented in Table 3.14. The ambient noise standards are enclosed as Annexure-
III. The sampling stations of the noise monitoring are shown in Figure 3.6.
Table 3.12: Location details of noise monitoring stations
S.No. Noise monitoring station
1 Near Project site
2 D- Type Quarters ST colony
3 D Type Quarter Near Sub Jail ST
4 ST Guest House
5 JSW Office Port Complex Building
6 A Type Quarters, Bogda Bharat Line
7 Vasco- Hotel Westend
Table 3.13: Ambient Noise Level in the study area [Unit: dB(A)]
Time Stations
S1 S2 S3 S4 S5 S6 S7
6AM-7AM 42.3 47.1 46.4 45.7 49.8 51.7 46.9
7AM-8AM 44.3 50.2 47.9 46.9 52.7 54.0 49.9
8AM-9AM 45.6 51.5 51.4 47.8 53.9 54.9 52.2
9AM-10AM 47.5 51.2 53.6 48.8 54.9 55.2 50.9
10AM-11AM 47.6 51.4 54.9 50.9 57.3 56.9 50.1
11AM-12PM 48.5 52.7 56.4 52.8 58.4 54.1 48.4
12PM-1PM 50.3 53.2 57.4 53.7 59.8 54.9 50.9
1PM-2PM 51.6 53.7 58.0 52.8 60.8 55.0 47.9
2PM-3PM 51.6 52.5 57.2 54.8 61.0 58.4 52.1
3PM-4PM 52.6 53.5 57.4 52.9 60.3 59.4 53.1
4PM-5PM 53.2 54.1 57.2 50.9 61.1 60.0 51.4
5PM-6PM 54.6 54.8 59.0 53.2 61.4 61.2 49.7
6PM-7PM 55.6 53.1 56.9 52.7 58.2 58.0 52.2
7PM-8PM 53.2 51 55.0 51.8 56.1 56.0 48.2
8PM-9PM 50.2 47.1 53.0 49.8 51.8 56.9 49.9

---------------------------------------------------------------------------------------------------------------------------------------------
EIA Study for Capacity Enhancement at Berth 5A, 6A of SWPL, Goa 3-30
Final Report, September, 2017
Time Stations
S1 S2 S3 S4 S5 S6 S7
9PM-10PM 47.6 43.2 50.4 47.2 47.7 52.2 45.2
10PM-11PM 45.6 41.1 46.2 45.1 46.2 50.2 41.7
11PM-12AM 43.2 40.1 43.2 41.9 43.0 46.7 40.1
12AM-1AM 40.2 39.5 41.2 39.8 40.1 43.3 37.8
1AM-2AM 37.2 37.2 40.2 38.2 38.0 40.1 34.2
2AM-3AM 36.1 38.2 39.5 38.8 38.7 38.5 37.4
3AM-4AM 38.2 40.5 41.6 41.2 40.2 42.5 39.8
4AM-5AM 39.2 42.1 43.5 42.2 41.1 45.4 31.4
5AM-6AM 41.6 43.5 45.7 45.1 44.2 47.4 42.9
Table 3.14: Equivalent noise levels in the Study Area
S. No. Noise monitoring station Leq(day) Leq(night)
1 Near Project site 51.28 40.39
2 D- Type Quarters ST colony 52.29 38.83
3 D- Type Quarter near Sub Jail ST 55.87 42.69
4 ST Guest House 51.70 40.94
5 Port User’s Complex 58.24 41.12
6 A Type Quarters, Bogda Bharat Line 57.16 44.90
7 Vasco- Hotel Westend 50.59 38.36
It may be seen from the Table 3.14, that the day time equivalent noise level ranged
from a minimum of 50.59 dB (A) to a maximum of 58.24 dB (A). The night time
equivalent noise level ranged from a minimum of 38.36 dB (A) to a maximum of 44.90
dB (A). The day and night time equivalent noise level at various sites located close to
residential areas and commercial area were compared with Ambient Noise Standards
(Refer Annexure-III) and were observed to be well below the permissible limit
specified.
3.17 MARINE ECOLOGY
The prime objective of ecological survey is to study the baseline status of marine
biodiversity, physiochemical and biological charecteristics of marine water and
sediments in the study area. Anticipated impacts on marine ecology during
construction and operation phases of the proposed modernization of the terminal have
been evaluated based on the baseline status of various parameters of marine
environment in the study area. These impacts will be ascertained by superimposing

---------------------------------------------------------------------------------------------------------------------------------------------
EIA Study for Capacity Enhancement at Berth 5A, 6A of SWPL, Goa 3-31
Final Report, September, 2017
the impacts due to the planned activities on the baseline environmental status.
Mitigation measures in the form of an Environmental Management Plan (EMP) have
also been outlined as a part of the EIA report. To accomplish this task, Experts from
the Centre of Advanced Study (CAS) in Marine Biology of Annamalai University,
Tamilnadu during 9th and 10th May 2016. During the survey marine water and sediment
were collected across two different depths (surface and subsurface) from 7 different
stations. Samples for biological parameters i.e. phytoplankton, zooplankton, macro-
benthos, meio-benthos and microbial samples besides sea weeds, sea grasses, and
fishery resources were also collected from various stations. The geographical location
of the each sampling stations are given in Table 3.15 and shown in Figure 3.11.
Table 3.15: Marine sampling locations and its geographical coordinates
S. No. Station Code Latitude (N) Longitude (E)
1 ST-1 15°25'31.51"N 73°48'54.87"E
2 ST-2 15°26'8.47"N 73°47'14.30"E
3 ST-3 15°25'14.31"N 73°45'48.10"E
4 ST-4 15°24'46.15"N 73°46'53.04"E
5 ST-5 15°25'9.87"N 73°47'34.58"E
6 ST-6 15°24'54.20"N 73°47'50.96"E
7 ST-7 15°24'15.90"N 73°46'50.06"E
Figure 3.11: Map showing the study area for marine ecological survey

---------------------------------------------------------------------------------------------------------------------------------------------
EIA Study for Capacity Enhancement at Berth 5A, 6A of SWPL, Goa 3-32
Final Report, September, 2017
3.17.1 Methodology adopted for Analyses
Water and Sediment Sampling
Water samples were collected at the surface and sub-surface level using Universal
water sampler and transferred to the pre-cleaned polypropylene and glass containers.
Sediment samples were collected using Van veen grab transferred to clean polythene
bags and transported to the shore. The samples were air-dried and the plant root and
other debris were removed and stored for further analysis.
In-situ Analysis
The physical parameters such as temperature, salinity and pH were measured in-situ
in the field. The sub-surface temperature was measured with a mercury thermometer
(0.02 C accuracy) and the pH was measured by a calibrated pH pen (pH ep-3
model). Salinity was estimated using a Hand Refractometer (Atago, Japan). Turbidity
was measured with the help of Nephelometer. Water samples collected for dissolved
oxygen estimation were transferred carefully to BOD bottles. The DO was immediately
fixed and brought to the shore for further analysis.
Preservation and Laboratory Analysis
After collection, the samples were immediately cooled to 4C and then brought to the
laboratory in insulated thermocool boxes. For dissolved heavy metals, the water
samples were acidified immediately after the collection. On reaching laboratory, water
samples were filtered through Whatman GF/C filter paper and analysed for organic
matter and other nutrients. Unfiltered samples were used for the estimation of total
nitrogen and total phosphorus. All the analyses were carried out by adopting Standard
procedures for samples of aquatic origin. The methodology for each analysis is briefly
given below:
Total Suspended Solids (TSS)
The total suspended solid is measusred as the difference in the filter paper weight
(dried filter paper before filteration and after filteration) and the volume of water filtered.
The TSS valuses are expresses as mg/l.

---------------------------------------------------------------------------------------------------------------------------------------------
EIA Study for Capacity Enhancement at Berth 5A, 6A of SWPL, Goa 3-33
Final Report, September, 2017
Dissolved Oxygen (DO) and Biochemical Oxygem Demand (BOD)
The modified Winkler’s method as described by Strickland and Parsons (1972) was
adopted for the estimation of dissolved oxygen fixed at the field. The BOD was
computed simply as the difference between the 1st day DO and 5th day DO after
incubation at 20 C. The values are expressed in mg/l.
Nitrate and Nitrite
The nitrate and nitrite content of samples were analysed by following the method
described by Strickland and Parsons (1972). The nitrite was estimated from highly
coloured azo dye formed by the addition of N (1-Napthyl) ethylene diaminedihydro-
chloride and sulfanilamide into the solution was then measured at 543 nm in a
spectrophotometer. The same procedure was followed for the estimation of nitrate.
For this, nitrate was reduced to nitrite by passing the sample through copper coated
cadmium column. The calculated values are expressed in mol of Nitrogen/l.
Ammonical Nitrogen
Ammonium (NH4) was determined by indophenol blue method. The NH4 in the sample
is allowed to react in a moderately alkaline solution with hypochlorite to give
monochloramine which in presence of phenol, with catalytic amounts of nitroprusside
ions and excess of hypochlorite produces the indophenol blue. The blue color was
then measured at 630 nm wavelength using spectrophotometer.
Inorganic Phosphate
The single solution mixed reagent procedure developed by Murphy and Riley (1962)
was followed for the estimation of dissolved inorganic phosphate levels in water
samples. This involves the conversion of phosphate into phosphomolybdic acid, which
was then reduced to molybdenum blue color complexes and then the intensity of
colour was measured at 882 nm in a spectrophotometer. The calculated values are
expressed in µmol of Phosphate/l.
Total Phosphorus (TP)
The Total Phosphorus in water samples was estimated by adopting the method
described by Menzel and Corwin (1964). This procedure involves the conversion of

---------------------------------------------------------------------------------------------------------------------------------------------
EIA Study for Capacity Enhancement at Berth 5A, 6A of SWPL, Goa 3-34
Final Report, September, 2017
organically bound phosphate into inorganic phosphate by wet oxidation of samples
with potassium persulphate in an autoclave for 30 min at 15 lbs pressure. The
converted inorganic phosphate was then estimated by using the method described by
Murphy and Riley (1962). The calculated value is expressed in µmol of Phosphorus/l.
Total Nitrogen (TN)
The Total Nitrogen in water samples was estimated by adopting the method described
by Strickland and Parsons (1972). This procedure involves the conversion of
organically bound nitrogen into inorganic nitrogen by wet oxidation of samples with
potassium persulphate in an autoclave for 30 min at 15 lbs pressure. The converted
inorganic nitrogen was then estimated by using the method described by Strickland
and Parsons (1972). The calculated value is expressed in µmol of Nitrogen/l.
Reactive Silicate
The reactive silicate content of water was estimated by following the method of
Strickland and Parsons (1972). In this method, the intensity of blue color formed by
silico-molybdate complex was measured at 810 nm in a spectrophotometer and the
calculated values are expressed in µmol of Silica/l.
Dissolved Organic Carbon (DOC)
The DOC in the water sample was measured using a TOC analyser (Shimadzu TOC-
VCPH) by following high temperature catalytic oxidation method. The accuracy and
precision of the DOC measurements were checked once in every five samples with
Certified Reference Material (CMR) and the accuracies were found to be within the
± 1% level. For instrument calibration internal standards of 2, 5, 10, 15 and 20 mg l-1
were prepared using potassium hydrogen phthalate (KHC8H4O4). The accuracy and
precision was checked by analyzing one known standard equivalent to concentration
of sample, once in every ten sample and found to be within the ± 1% level.
Petroleum Hydrocarbon (PHc)
The PHc in the water sample was determined with the help Spectrofluorometer after
solvent extraction of the water samples.

---------------------------------------------------------------------------------------------------------------------------------------------
EIA Study for Capacity Enhancement at Berth 5A, 6A of SWPL, Goa 3-35
Final Report, September, 2017
Heavy Metals & Major Ions
For the determination of dissolved heavy metals, the acidified water sample was
solvent extracted using APDC-MIBK solution. Hexavalent Chromium (Cr6+) was
anlysed after extraction with APDC-NaDDC solution. The solution extracts were
analysed through Atomic Absorption Spectrophotometer (Perkin Elmer 4100).
Mercury was analysed through Cold Vapor Technique using AAS. The major ions like
calcium, magnesium, sodium, potassium were analyzed using Flame Photometer by
following the standard methods for the examination of water and wastewater manual
APHA, 2006. Similarly, the Chloride and Fluoride were also analysed titrametrically by
following the manual APHA, 2006.
Sediment Analysis
For the analysis of soil textural composition and pH, the air-dried sediment samples
were used as such. For all other analyses, sediment samples were ground to fine
powder and dried in an oven at 110C to constant weight for an hour.
Total Organic Carbon
The estimation of total organic carbon in sediment was performed by adopting the
method of El Wakeel and Riley (1956). The procedure involves chromic acid digestion
and subsequent titration against Ferrous ammonium sulphate solution in the presence
of 1-10 phenonthroline indicator. The values calculated are expressed in mg C/g of
sediment.
Heavy Metals
The heavy metals in sediment samples were analysed after acid digestion of the
sapmes with aqua regia. The solution extracts were analysed through Atomic
Absorption Spectrophotometer (Perkin Elmer 4100). Mercury was analysed through
Cold Vapor Technique using AAS.
Petroleum Hydrocarbon (PHc)
The PHc in the sediemt sample was determined using a Spectrofluorometer after the
solvent extraction.

---------------------------------------------------------------------------------------------------------------------------------------------
EIA Study for Capacity Enhancement at Berth 5A, 6A of SWPL, Goa 3-36
Final Report, September, 2017
Bacteriological analysis methods
Collection of samples
Surface water samples were collected in 30ml sterile screw capped bottles for
bacteriological assessment. Enough air space was left in the bottles to allow thorough
mixing. Precautionary measures were taken to avoid contamination through handling.
For microbial assessment in sediment samples, a known quantity of samples was
collected from the grab samples using sterilised spatula. The central portion of the
collected sediment was aseptically transferred into sterile polyethylene bags. All the
samples were brought to the laboratory in portable ice box soon after collection and
bacteriological analyses were carried out with necessary dilution.
Enumeration of Total Viable Counts (TVC)
TVC was enumerated by adopting the spread plate method using Zobell’s Marine Agar
medium (EA123, Hi-Media, Mumbai). The samples (water and sediment) were diluted
using the sterile sea water and 0.1 ml of the diluted sample was pippeted into the
petriplates containing Zobell’s Marine Agar and it was spread using a ‘L’ shaped glass
spreader. The plates after inoculation were incubated in an inverted position at a
temperature of 28+2°C for 24 to 48 h. The colonies were counted and the population
density expressed as Colony Forming Unit (CFU) per ml or g of the sample. The
bacterial colonies were picked up from the pertidishes and re-streaked in appropriate
nutrient agar plates thrice before a pure culture was established in agar slants.
Enumeration of Total Coliforms
Macconkey agar with 0.15% bile salt, crystal violet and NaCl has been recommended
in accordance with USP/Nfxi (1) for the detection, isolation and enumeration of
coliforms and intestinal pathogens in water, dairy products, pharmaceutical
preparations, etc. The agar weighing 51.5 g in 1000 ml distilled water was heated up
to the boiling point to dissolve the medium completely and sterilized by autoclaving at
15 lbs pressure (121°C) for 15 min. suitably diluted samples were inoculated in the
petriplates containing medium and were incubated for 48 h. After incubation, the
colonies of E. coli appeared with pink color.

---------------------------------------------------------------------------------------------------------------------------------------------
EIA Study for Capacity Enhancement at Berth 5A, 6A of SWPL, Goa 3-37
Final Report, September, 2017
M-FC agar was employed for detection and enumeration Faecal Coliforms by the
membrane filter technique at higher temperature (44.5°C). The agar weighing 52 g
was suspended in 1000 ml of distilled water and heated up to the boiling point to
dissolve the medium completely, 10ml of Rosolic acid (dissolved in 0.2 N NaOH) was
added, heated with frequent agitation and boiled for 1 min. Then the medium was
cooled to 50°C. Finally, the medium was poured into small 60mm plates. Samples
filtered by Millipore apparatus using 0.45µm Whatman filter papers were impregnated
in the petriplates. After 48 h of incubation, the colonies of E. coli appeared with blue
colour.
Chlorophyll Pigments
The samples were filtered through Whatman GF/C filter papers and the chlorophyll
was extracted into 90% acetone. The resulting colored acetone extract was measured
in a spectrophotometer at different wave lengths and the same acetone extracts were
acidified and measured for the phaeo-pigments. The detailed methodology as
described in APHA manual (1989) was followed.
Phytoplankton
Phytoplankton samples were collected from the surface waters of the study area by
towing a plankton net (mouth diameter 0.35 m) made of bolting silk [No.30 mesh size
48 µm) for half an hour. These samples were preserved in 5% neutralized formalin
and used for qualitative analysis. For the quantitative analysis of phytoplankton, the
settling method as described by Sukhanovo (1978) was adopted. Numerical plankton
analysis was carried out using Utermohl's inverted plankton microscope.
Phytoplankton species was identified using the standard works of Hustedt (1930-
1966), Venkataraman (1939), Cupp (1943), Subramanian (1946), Prescott (1954),
Desikachary (1959 and 1987), Hendey (1964), Steidinger and Williams (1970) and
Taylor (1976) and Anandet al. (1986).
Zooplankton
Zooplankton samples were collected from the surface waters of the study area by
horizontal towing of plankton net with mouth diameter of 0.35 m, made of bolting silk

---------------------------------------------------------------------------------------------------------------------------------------------
EIA Study for Capacity Enhancement at Berth 5A, 6A of SWPL, Goa 3-38
Final Report, September, 2017
(No. 70 mesh size 200 µm) for half an hour. After collection, the samples were
preserved in 5% neutralized formalin and used for quantitative analysis. The
zooplankton collected were identified to the species level using the classical works of
Dakin and Colefax (1940), Davis (1955), Kasthurirangan (1963) and Wickstead (1965)
and Damodara Naidu (1981). For the quantitative analysis of zooplankton, a known
quantity of water (100 L) was filtered through a bag net (0.33 mm mesh size) and
filtrate was made up to 1 litre in a wide mouthed bottle and then enumerated using
Utermohl’s inverted plankton microscope. The plankton density is expressed as
number of organisms/m3.
Benthic Community
For studying the benthic organisms, sediment samples were collected using Van Veen
grab which covered an area of 0.1m2. The wet sediment was sieved with varying mesh
sizes (0.5 mm - macrofauna and 0.062 mm - meiofauna) for segregating the
organisms. The organisms retained in the sieve were fixed in 5-7% formalin and
stained further with Rose Bengal solution for easy spotting at the time of sorting. After
a day or two, the organisms were sorted into various groups. The number of organisms
in each grab sample was expressed as number per meter square. All the species were
sorted, enumerated and identified to the advanced taxonomic level possible with the
consultation of available literature. The works of Fauvel (1953), Day (1967) were
referred for polychaetes; Barnes (1980) and Lyla et al. (1999) for crustaceans; Subba
Rao et al. (1991) and Ramakrishna (2003) for molluscs.
3.17.2 Marine Water Quality
The water quality parameters analysed in the Mormugao coastal water is given in
Table 3.16 and 3.17 respectively. The range of physico-chemical parameters was
found to be within the permissible range. Similarly, other chemical parameters such
as DO, BOD, nutrients were also at the optimal concentration with a few exceptions
which might be owing to the prevailing seasonal variation.

---------------------------------------------------------------------------------------------------------------------------------------------
EIA Study for Capacity Enhancement at Berth 5A, 6A of SWPL, Goa 3-39
Final Report, September, 2017
Table 3.16: Physico-chemical characteristics of marine water in the study area
Station Water Temp.
(°C)
EC (µC/cm)
Salinity (psu)
pH DO (mg/l)
BOD (mg/l)
TSS (mg/l)
Turbidity (NTU)
ST-1S 29.7 71.9 34.5 8.3 4.7 2.3 15.2 6.3
ST-1B 26.3 56.7 34.9 7.9 5.5 2.5 18.9 6.7
ST-2S 31.3 73.9 35.7 8.6 3.7 2.8 14.8 6.2
ST-2B 30.4 69.0 35.2 8.4 4.4 2.3 19.3 6.9
ST-3S 31.9 59.6 35.0 8.7 4.3 2.0 19.6 6.9
ST-3B 30.2 47.5 34.2 8.2 5.0 2.3 22.6 7.7
ST-4S 30.2 58.8 35.9 8.7 5.2 1.3 23.2 8.0
ST-4B 29.4 49.0 34.7 8.3 5.9 1.5 28.5 8.4
ST-5S 29.1 57.5 35.3 8.5 6.4 1.8 24.8 7.8
ST-5B 28.5 49.8 34.6 8.1 5.9 2.3 29.2 8.9
ST-6S 29.7 60.8 35.7 8.6 5.0 2.0 21.7 8.1
ST-6B 28.3 55.1 35.2 8.2 5.4 2.3 26.5 8.6
ST-7S 30.9 73.8 35.7 8.4 4.8 2.2 18.8 7.3
ST-7B 30.5 61.0 34.9 8.0 5.6 2.6 19.9 7.8
Table 3.17: Nutrients in the water samples analysed from study area
Station NO2 NO3 NH4 TN TP IP SiO4 TOC PHc
(µmol/l) (µgC/l) ( µg/l)
ST-1S 0.93 3.41 0.49 14.48 2.00 1.78 31.77 109.0 1.690
ST-1B 0.82 3.90 0.70 19.93 2.90 0.98 35.93 113.5 1.325
ST-2S 1.05 3.55 0.49 23.90 2.89 1.29 27.35 119.6 1.523
ST-2B 0.98 4.08 0.67 28.55 3.75 1.56 34.81 121.3 1.722
ST-3S 0.92 4.15 0.60 30.43 3.67 1.71 29.55 123.9 1.590
ST-3B 1.45 4.63 0.84 35.73 4.07 2.09 32.34 118.6 1.642
ST-4S 0.94 4.11 0.69 33.68 3.89 2.17 30.45 124.4 1.809
ST-4B 1.00 5.21 0.75 30.97 4.11 2.87 35.82 126.7 1.960
ST-5S 1.37 4.67 0.81 32.49 3.77 2.00 32.67 117.1 1.857
ST-5B 1.65 5.00 0.91 37.89 4.01 2.64 39.10 127.7 1.973
ST-6S 1.05 3.36 0.77 32.31 3.37 1.89 36.78 120.9 1.902
ST-6B 1.26 4.09 0.83 34.84 3.87 2.31 43.78 123.2 1.963
ST-7S 0.83 3.05 0.57 25.25 3.50 1.67 31.04 118.7 1.723
ST-7B 1.09 3.77 0.69 29.08 3.93 1.96 37.97 120.6 1.823
Water Temperature
Temperature affects the ability of water to hold the oxygen. The water temperature in
the water column ranged between 26.3 to 31.9°C. The maximum water temperature
was at ST-3 and minimum was recorded at ST-1.

---------------------------------------------------------------------------------------------------------------------------------------------
EIA Study for Capacity Enhancement at Berth 5A, 6A of SWPL, Goa 3-40
Final Report, September, 2017
Electrical Conductivity (EC)
The Electrical Conductivity varied from 47.5 to 73.9 (µS/cm). The lowest value was
recorded at ST-3 and the highest value was recorded at station ST-2.
Salinity
The water salinity varied from 34.5 to 35.9 PSU. The salinity was found to be lower at
ST-1 and higher at ST-4.
pH
pH is an importatnt indicator of chemical change in water, it is affected by temperature,
pressure, chemical contaminants, photosynthetic and microorganisms activities. Pollution
can change the pH of water, which in turn can harm living organisms in water. Sea water
pH values ranges from 6.5 to 9.0, as per the water quality criteria for class SW-IV waters
(Harbour Waters). The pH value varied between 7.9 and 8.7 with minimum value recorded
at ST-1 and maximum was recorded at ST-4.
Total Suspended Solids (TSS)
The total suspended solids values ranged between 14.8 and 29.2 mg/l. The minimum
value was recorded at ST-2 and maximum was recorded at ST-5.
Turbidity
The turbidity values were varied between 6.0 and 8.9 NTU. The lower value was at
ST-2 and the maximum level was at ST-5.
Dissolved oxygen (DO)
The Dissolved Oxygen level as per the water quality criteria for class SW-IV waters
(Haebour Waters) should be 3 mg/l or 40% saturation value, considering the biodegradation
of oil and inhibition to oxygen production through photosynthesis. The dissolved oxygen
level in the water column varied between 3.7 and 6.4 mg/l which indicates good quality
of water in the study area. The lower value was at ST-2 and higher level was at ST-5.
Biological Oxygen Demand (BOD)
BOD levels to maintain the water quality relatively free from pollution caused by swage amd
other decomposable wastes ,as per the water quality criteria for class SW-IV waters

---------------------------------------------------------------------------------------------------------------------------------------------
EIA Study for Capacity Enhancement at Berth 5A, 6A of SWPL, Goa 3-41
Final Report, September, 2017
(Haebour Waters) is 3 mg/l. However BOD values observed in the water samples
collected from the study area The BOD values varied between 1.3 and 2.8 mg/l with
minimum value at ST-4 and the maximum value was recorded at ST-2.
Nutrients
The life supporting processes in the sea requires a range of inorganic substances, of
which, the role of nitrogen, phosphorus and silicate are considered to be immense in
marine ecosystem. Among the nitrogenous compounds, nitrite, nitrate and ammonia
are the major constituents, which play a key role in the growth and proliferation of
primary producers like phytoplankton, which in turn in the distribution of secondary and
tertiary consumers. The results of various parameters recorded are given in the
following paragraphs.
Nitrite (NO2)
The nitrite level varied from 0.82 to 1.65 µmol/l with maximum was recorded at ST-5
and the minimum was recorded at ST-1.
Nitrate (NO3)
Nitrate concentration ranged between 3.05 and 5.21 µmol/l with minimum
concentration at ST-7 and the maximum value was recorded at ST-4.
Ammonical Nitrogen (NH4)
The ammonia concentration varied from 0.49 to 0.91 µmol/l. The maximum
concentration was recorded at ST-5 and the minimum was at ST-1 & 2.
Total Nitrogen (TN)
Total nitrogen values ranged from 14.48 to 37.89 µmol/l. The minimum value was at
ST-1 and the maximum value was recorded at ST-5.
Total Phosphorus (TP)
Total Phosphorus ranged from 2.00 to 4.11 µmol/l with minimum value was recorded
at ST-1 and the maximum value was at ST-4.

---------------------------------------------------------------------------------------------------------------------------------------------
EIA Study for Capacity Enhancement at Berth 5A, 6A of SWPL, Goa 3-42
Final Report, September, 2017
Inorganic Phosphate (IP)
The inorganic phosphate values ranged between 0.98 and 2.87 µmol/l with maximum
value was recorded at ST-4 and the minimum was at ST-1.
Reactive Silicate (SiO4)
The silicate values ranged between 27.35 and 43.78 µmol/l. The minimum (27.35
µmol/l) and the maximum (43.78 µmol/l) values were recorded at ST-2 and ST-6
respectively.
Total Organic Carbon (TOC)
The dissolved organic carbon level ranged between 109 and 127 µgc/l with minimum
value (109 µgc/l) was recorded at ST-1 and the maximum (127 µgc/l) at ST-5.
Petroleum Hydrocarbon (PHc)
PHc level in the water column fluctuated between 1.325 and 1.973 µg/l. The maximum
was recorded at ST-5 and the minimum was recorded at ST-1.
HEAVY METALS
The heavy metal present in the water sample is given in Table 3.18.
Table 3.18: Heavy metals in the waters samples analysed from study area
Station Fe Zn Mn Cd Ni Cr Pb Cu Hg
(µg/l)
ST-1S 12.67 14.64 29.00 1.12 1.30 2.00 1.79 3.72 0.30
ST-1B 19.20 10.23 30.56 1.03 1.03 2.39 2.00 4.23 0.35
ST-2S 24.71 20.90 28.03 0.95 0.55 2.08 3.36 4.98 0.37
ST-2B 20.01 23.87 31.93 1.20 0.89 2.38 3.09 3.91 0.41
ST-3S 22.03 23.67 28.89 0.94 0.56 2.88 3.24 4.98 0.36
ST-3B 21.61 19.81 30.30 0.88 0.79 3.03 3.89 4.75 0.38
ST-4S 22.83 21.56 30.67 1.09 0.99 3.10 3.65 5.04 0.39
ST-4B 25.35 23.89 31.87 1.37 1.13 3.47 3.98 5.43 0.47
ST-5S 20.76 20.44 34.57 1.05 1.05 3.00 3.66 5.19 0.32
ST-5B 24.53 22.36 36.72 1.23 1.35 3.27 4.78 6.86 0.37
ST-6S 19.25 19.93 30.78 0.98 1.03 2.58 3.00 4.58 0.34
ST-6B 21.04 21.18 33.12 1.11 1.17 2.79 3.34 5.84 0.38
ST-7S 16.83 17.31 29.67 0.81 0.73 2.12 3.23 5.06 0.31
ST-7B 19.54 19.90 31.57 0.96 0.90 2.39 3.65 5.43 0.34

---------------------------------------------------------------------------------------------------------------------------------------------
EIA Study for Capacity Enhancement at Berth 5A, 6A of SWPL, Goa 3-43
Final Report, September, 2017
Iron (Fe)
The iron level varied from 12.67 to 25.97 µg/l. The maximum was recorded at ST-4
and the minimum was recorded at ST-1 during this survey.
Zinc (Zn)
Zinc is an essential trace element which is required in minimum quantity for the
wellbeing of the aquatic animals. The zinc level varied from 10.23 to 23.89 µg/l. The
maximum was recorded at ST-4 and the minimum was recorded at ST-1.
Manganese (Mn)
The Manganese level varied from 28.03 to 36.72 µg/l. The maximum was recorded at
ST-5 and the minimum was recorded at ST-2 during this survey.
Cadmium (Cd)
The Cadmium level varied from 0.81 to 1.37 µg/l. The maximum was recorded at ST-
4 and the minimum was recorded at ST-7.
Nickel (Ni)
The Nickel level varied from 0.55 to 1.35 µg/l. The maximum level was recorded at
ST-5 and the minimum was recorded at ST-2.
Chromium (Cr)
The chromium level varied from 2.00 to 3.47 µg/l. The maximum value was recorded
at ST-4 and the minimum was recorded at ST-1.
Lead (Pb)
The Lead level ranged from 1.79 to 4.78 µg/l with maximum value was recorded at
ST-5 and the minimum was recorded at ST-1.
Copper (Cu)
The copper level varied from 3.72 to 6.86 µg/l. The maximum was recorded at ST-5
and the minimum was recorded at ST-1.

---------------------------------------------------------------------------------------------------------------------------------------------
EIA Study for Capacity Enhancement at Berth 5A, 6A of SWPL, Goa 3-44
Final Report, September, 2017
Mercury (Hg)
The mercury level varied from 0.28 to 0.47 µg/l. The maximum value was recorded at
ST-4 and the minimum was recorded at ST-1.
3.17.3 Marine Sediment Quality
As regards soil texture, the sand, silt and clay fraction at each station along with their
textural classification indicated that the sand and silt composition was higher when
compared to clay during this survey. Sediment analysis result is given in Table 3.19.
Table 3.19: Results of sediment samples analysed from the study area
Station pH Sand (%) Silt (%) Clay (%) TOC (mgC/g) PHc (µg/g)
ST-1 8.0 56.6 34.2 9.11 4.73 0.62
ST-2 8.5 76.3 22.0 1.61 6.52 0.59
ST-3 8.7 71.5 23.2 5.31 5.79 0.63
ST-4 8.6 80.2 12.2 7.63 6.17 0.74
ST-5 8.8 31.2 60.0 8.76 5.52 0.80
ST-6 8.4 13.2 66.7 20.1 4.59 0.71
ST-7 8.6 70.4 21.6 8.01 5.79 0.66
Sediment pH
The soil pH varied from maximum of 8.8 at ST-5 and minimum of 8.0 at station ST-1.
Texture
Sand content varied from 13.2 to 80.2 % with maximum value at ST-4 and the
minimum at ST-6; maximum silt content (66.7 %) was found at ST-6 and the minimum
(12.2 %) at ST-4 and the maximum clay (20.1 %) was found at ST-6 and the minimum
(1.61 %) at ST-2.
Total organic Carbon (TOC)
The total organic carbon level ranged between 4.59 and 6.52 mgC/g. The maximum
level (6.52 mgC/g) was found at ST-2 and the minimum (4.59 mgC/g) at ST-6.
Sediment PHc
The sediment PHc level varied from 0.59 to 0.80 µg/g. The maximum was recorded at
ST-5 and the minimum was recorded at ST-2.

---------------------------------------------------------------------------------------------------------------------------------------------
EIA Study for Capacity Enhancement at Berth 5A, 6A of SWPL, Goa 3-45
Final Report, September, 2017
HEAVY METALS
The concentration of heavy metals in sediment samples indicates that it is well within
the ERM (Effective Range Median) which means there are no possibilities of heavy
metal contamination in the region. The analysis results of heavy metals in the sediment
sample are given in Table 3.20.
Table 3.20: Heavy metals in sediment samples analysed from study area
Station Fe Zn Mn Cd Ni Cr Pb Cu Hg
(µg/g)
ST-1 40.23 26.6 227 4.67 13.5 6.73 3.81 13.9 0.41
ST-2 43.90 18.3 373 2.50 17.7 8.00 4.34 20.8 0.35
ST-3 48.72 20.7 398 4.03 15.0 6.67 6.73 21.7 0.58
ST-4 53.01 30.3 402 6.39 11.7 8.18 5.16 22.2 0.68
ST-5 67.84 23.9 362 5.38 19.8 6.05 8.37 28.3 0.49
ST-6 50.81 27.4 528 4.73 15.8 7.38 6.75 25.6 0.55
ST-7 49.32 19.4 277 3.47 13.7 5.07 5.43 19.3 0.39
Iron (Fe)
The Iron level varied from 40.23 to 67.84 µg/g. The maximum was recorded at ST-5
and the minimum was recorded at ST-1 during this survey.
Zinc (Zn)
Zinc level varied from 18.3 to 30.3 µg/g. The maximum value was recorded at ST-4
and the minimum was recorded at ST-2 during this survey.
Manganese (Mn)
The Manganese level varied from 227 to 528 µg/g. The maximum value was recorded
at ST-6 and the minimum was recorded at ST-1.
Cadmium (Cd)
The Cadmium level varied from 2.50 to 6.39 µg/g. The maximum was recorded at ST-
4 and the minimum was recorded at ST-2.
Nickel (Ni)
The nickel level varied from 11.7 to 19.8 µg/g. The maximum was recorded at ST-5
and the minimum was recorded at ST-4 during this survey.

---------------------------------------------------------------------------------------------------------------------------------------------
EIA Study for Capacity Enhancement at Berth 5A, 6A of SWPL, Goa 3-46
Final Report, September, 2017
Chromium (Cr)
The Chromium level varied from 5.07 to 8.18 µg/g. The maximum was recorded at
ST-4 and the minimum was recorded at ST-7.
Lead (Pb)
The lead level varied from 3.81 to 8.37 µg/g. The maximum was recorded at ST-5 and
the minimum was recorded at ST-1 during this survey.
Copper (Cu)
The copper level varied from 13.9 to 28.3. The maximum value was recorded at ST-5
and the minimum was recorded at ST-1 during this survey.
Mercury (Hg)
The mercury level varied from 0.35 to 0.68 µg/g. The maximum was recorded at ST-4
and the minimum was recorded at ST-2 during this survey.
3.17.4 Marine Microbiology Marine Water
The total viable count (TVC) in water samples ranged from 27x102 to 24x104 CFU/ml.
The maximum count was found at ST-5 and the minimum at ST-1. The Total coliform
(TC) count is varied from 20x102 to 22x104 CFU/ml with high colony count observed
at ST-5 and low count at ST-1. The E. coli (EC) count ranged from 16x102 to 12x104
CFU/ml with a maximum value found at ST-6 and the low value at ST-1. The Faecal
coliform (FC) count is varied from 20x102 to 13x104 CFU/ml with the high values at
ST-6 & 7 and low value at ST-1. The Streptococcus faecalis (SF) count ranged from
11x102 to 10x104 CFU/ml. The highest value was recorded at ST-5 and the lowest was
at ST-1. The Shigella count (SH) varied from 18x102 to 13x104 CFU/ml with the high
value at ST-6 and the low value at ST-1. The Pseudomonas aeurginosa (PA) count
ranged from 16x102 to 12x104 CFU/ml with the high values at ST-6 and the low values
at ST-1. The Salmonella (SL) colony count varied from 18x102 to 12x104 CFU/ml with
the higher values at ST-5 and the lower value at ST-1. The Vibrio parahaemolyticus
(VP) colony count varied from 12x102 to 13x104 CFU/ml with the high value at ST-4
and the low value at ST-1. The Vibrio cholera (VC) colony was found to be varied from
---------------------------------------------------------------------------------------------------------------------------------------------
EIA Study for Capacity Enhancement at Berth 5A, 6A of SWPL, Goa 3-47
Final Report, September, 2017
22x102 to 20x104 CFU/ml. The high colony count was observed at ST-4 and the low
count was recorded at ST-1 (Table-3.21).
Marine Sediment
In sediment samples, the total viable count (TVC) varied between 32x104 to 28x104
CFU/g. The maximum value was found at ST-7 and the minimum at ST-1. The Total
coliform (TC) count varied from 25x104 to 18x106 CFU/g with high colony count at ST-
6 and the low count at ST-1. The E. coli (EC) count ranged from 09x104 to 16x106
CFU/g with the high value at ST-6 and the low value at ST-1. The Faecal coliform (FC)
count was found to be varied from 23x104 to 18x106 CFU/g with the high value at ST-
5 and the low value at ST-1. The Streptococcus faecalis (SF) count ranged between
11x104 to 13x106 CFU/g. The high value was recorded at ST-6 and the low value was
recorded at ST-1. The Shigella counts (SH) varied from 21x104 to 19x106 CFU/g with
the high values at ST-4 and the low values at ST-1. The Pseudomonas aeurginosa
(PA) count ranged from 09x104 to 11x106 CFU/g with the high values found at ST-6
and the low values at ST-1. The Salmonella (SL) colony count varied from 13x104 to
14x106 CFU/g with the high value found at ST-6 and the low value at ST-1. The Vibrio
parahaemolyticus (VP) colony count varied from 13x104 to 23x106 CFU/g with the high
values found at ST-7 and low values at ST-1. The other species Vibrio cholerae (VC)
colony was found to be varied from 22x104 to 17x106 CFU/g with the high colony count
at ST-7 and low count at ST-1 (Table-3.22).

---------------------------------------------------------------------------------------------------------------------------------------------
EIA Study for Capacity Enhancement at Berth 5A, 6A of SWPL, Goa 3-48
Final Report, September, 2017
Table 3.21: Bacterial population in marine water analysed from study area
Station TC VP VC SL FC EC SH PA SF TVC
ST-1 20x102 12 x102 22 x102 18 x102 20 x102 16x102 18x102 16 x102 11 x102 27 x102
ST-2 15 x103 24 x103 19 x103 20 x103 13x103 10x103 23x103 14 x103 10 x103 22 x103
ST-3 24 x103 18 x103 22 x103 23 x103 16x103 13x103 17x103 11x103 16 x103 28 x103
ST-4 18x104 13 x104 20 x104 08 x104 10x104 08x104 12x104 08 x104 08x104 16 x104
ST-5 22x104 10 x104 16 x104 12 x104 07 x104 06x104 09 x104 06 x104 10 x104 24 x104
ST-6 16x104 08 x104 19 x104 07 x104 13 x104 12x104 13x104 12x104 08 x104 18 x104
ST-7 20 x104 05 x104 07 x104 10 x104 13x104 11x104 08x104 04x104 09 x104 23 x104
Table 3.22: Bacterial population in sediments analysed from study area
Stations TC VP VC SL FC EC SH PA SF TVC
ST-1 25 x104 13 x104 22 x104 13 x104 23 x104 09x104 21x104 09x104 11 x104 32 x104
ST-2 22 x105 12 x105 18 x105 23 x105 24x105 20x105 06x105 15x105 12 x105 28 x105
ST-3 20 x105 12 x105 16 x105 21x105 13x105 16x105 07x105 10x105 16x105 29 x105
ST-4 11x106 16 x106 13 x106 11 x106 16 x106 13x106 19x106 09x106 09 x106 25 x106
ST-5 15 x106 15 x106 11 x106 09 x106 18x106 10x106 16x106 10x106 11 x106 20 x106
ST-6 18 x106 18 x106 11 x106 14x106 16x106 16x106 17x106 11x106 13 x106 27 x106
ST-7 17 x106 23 x106 17 x106 10 x106 13x106 15x106 12x106 09x106 08 x106 28 x106

---------------------------------------------------------------------------------------------------------------------------------------------
EIA Study for Capacity Enhancement at Berth 5A, 6A of SWPL, Goa 3-49
Final Report, September, 2017
3.17.5 Chlorophyll Pigments
Chlorophyll a (mg/m3), Phaeopigments (mg/m3), and Total biomass
In the present study, chlorophyll a in the water sample varied from 0.42 to 2.55 mg/m3
with maximum value at ST-3 and the minimum at ST-5. The Phaeopigments varied
from 0.33 to 1.96 mg/m3 with maximum value at ST-7 and the minimum value at
ST-4. Total biomass varied from 17.9 to 42.5 ml/100 m3 with maximum value at ST-3
and minimum at ST-5 (Table 3.23).
Table 3.23: Chlorophyll a, Phaeopigments and Total biomass in marine water
Stations
Chlorophyll a
(mg/m3)
Phaeopigments
(mg/m3)
Total biomass
(ml/100 m3)
ST-1 0.65 0.94 25.9
ST-2 1.17 0.42 25.6
ST-3 2.55 1.34 42.5
ST-4 0.98 0.33 27.9
ST-5 0.42 0.43 17.9
ST-6 1.27 0.44 23.4
ST-7 2.23 1.96 33.9
3.17.6 Phytoplankton
In the present study period, species belonging to three groups namely diatoms,
dinoflagellates and blue greens were recorded. Of these, diatoms were found to be
the dominant group with 40 species. Dinoflagellates formed next group with 5 species
and blue greens came last in the order with 4 species in all the stations.
Among the diatoms, Bellerochea malleus, Cerataulina orientalis, Coscinodiscus
centralis, C. granii, Chaetoceros affinis, C. curvisetus, Leptocylindrus danicus,
Skeletonema costatum, Diatoma anceps, Thalassionema nitzschioides, Triceratium
favus, Cyclotella sp. Nitzschia sp. Planktonella sol, Odentella mobilensis, O. sinensis,
Pleurosigma normani, Rhizosolenia alata, R. styliformis and Streptotheca sp were
found to be the commonly occurring species in the samples collected in various
stations. Coming to dinoflagellates, Ceratium furca, C. trichoceros, Prorocentrum
micans and Protoperidinium oceanicum and blue green Anabeana sp. and Spirulina
sp. Tricodesmium erythraeum showed consistency in their occurrence in the samples

---------------------------------------------------------------------------------------------------------------------------------------------
EIA Study for Capacity Enhancement at Berth 5A, 6A of SWPL, Goa 3-50
Final Report, September, 2017
collected from the study area. The abundance and density of phytoplankton at various
sampling stations are given in Table 3.24.
Table 3.24: Abundance and density of Phytoplankton in marine water
Phytoplanktons ST-1 ST-2 ST-3 ST-4 ST-5 ST-6 ST-7
(Cells/ltr)
Blue greens
Oscillatoria sp. 0 60 90 0 0 120 75
Lyngbya sp 40 0 85 180 135 0 60
Spirulina sp. 440 120 132 0 0 60 60
Tricodesmium erythraeum
50 255 180 0 90 30 0
Diatoms
Bacteriastrum hyalinum
60 60 150 90 0 60 320
Bellerochea malleus
135 135 0 128 0 30 140
Cerataulina orientalis
0 0 0 90 90 0 90
Chaetoceros curvisetus
0 0 60 125 30 30 0
C. diversus 90 90 0 30 0 255 0
Coscinodiscus perferatus
0 0 60 150 120 0 105
C. centralis 0 210 125 90 75 0 0
C. gigas 60 0 120 0 75 90 0
C. granii 310 440 0 30 0 115 0
Coscinodiscus sp 125 15 60 30 0 0 230
Cyclotella sp. 225 105 30 75 90 125 0
Dinophysis sp 0 0 60 0 135 40
Ditylum brightwelli 0 0 90 0 60 35 0
Diatoma anceps 150 125 120 105 0 0 120
Eucampia zoodicus
0 0 66 0 90 210 30
Fragilaria sp. 175 90 125 110 0 60 120
Grammatophora marina
0 0 120 45 0 30 60
Gyrosigma balticum
0 90 90 135 75 105 0
Leptocylindrus danicus
200 0 60 75 90 45 190
Lithodesmium undulatum
885 120 520 410 120 0 290
Navicula granulata 0 0 0 0 90 39 0

---------------------------------------------------------------------------------------------------------------------------------------------
EIA Study for Capacity Enhancement at Berth 5A, 6A of SWPL, Goa 3-51
Final Report, September, 2017
Phytoplanktons ST-1 ST-2 ST-3 ST-4 ST-5 ST-6 ST-7
Nitzschia closterium
330 135 60 60 0 90 175
N. longisima 110 60 75 0 0 45 415
Odontella aurita 30 0 450 125 145 30 120
O. mobiliensis 120 75 90 30 15 330 0
O. sinensis 100 0 450 30 90 220 45
Planktonella sol 0 0 90 0 125 220 120
Pleurosigma elongatum
130 0 180 185 *0 110 45
Pleurosigma normanii
415 165 150 90 45 0 550
Rhizosolenia alata 0 135 120 60 0 220 845
R. imbricate 243 0 30 0 0 133 30
R. styliformis 0 0 330 0 0 640 0
Skeletonema costatum
75 80 125 120 0 85 450
Stephanophysis palmeriana
155 0 0 0 120 135 0
Streptotheca sp 0 450 0 330 0 120 135
Thalassionema nitzschioides
220 220 330 330 60 45 0
Thalassiosira subtilis
10 0 120 0 0 0 243
Thalassiothrix frauenfeldii
0 0 120 0 55 120 0
Triceratium favus 155 65 330 330 0 45 0
T. reticulatum 10 410 0 220 210 210 345
Dinoflagellates
Ceratium furca 0 65 220 220 120 0 210
C. tripos 0 220 350 0 0 127 455
C. trichoceros 450 60 225 350 455 135 220
Prorocentrum micans
145 0 85 225 133 0 120
Potoperidinium oceanicum
90 0 225 0 0 510 0
Total 5733 4055 6498 4603 2938 5009 6453
Population density
Density of phytoplankton varied from 2,938 to 6,498 Cells/l with maximum at ST-3 and
minimum at ST-5 (Figure 3.12).

---------------------------------------------------------------------------------------------------------------------------------------------
EIA Study for Capacity Enhancement at Berth 5A, 6A of SWPL, Goa 3-52
Final Report, September, 2017
Figure 3.12: Population density of Phytoplankton recorded from study area
Percentage composition
When the results of percentage composition of phytoplankton were viewed,
diatoms constituted the maximum with 75% to the total followed by dinoflagellates
with 16% and blue greens with 9% of the total (Figure 3.13).
Figure 3.13: Percentage composition of Phytoplankton recorded from study area
0
1000
2000
3000
4000
5000
6000
7000
ST-1 ST-2 ST-3 ST-4 ST-5 ST-6 ST-7
Cell/l
9%
75%
16%
Blue greens
Diatoms
Dinoflagellates

---------------------------------------------------------------------------------------------------------------------------------------------
EIA Study for Capacity Enhancement at Berth 5A, 6A of SWPL, Goa 3-53
Final Report, September, 2017
Diversity Indices
In Marmugao port waters, the data collected on phytoplankton species were
subjected to various diversity indices. The species diversity (H’) varied from 3.540
to 4.940 with maximum in ST-2 and minimum in ST-4. The species richness (d)
ranged between 3.163 and 4.321 with maximum in ST-5 and minimum in ST-3.
The species evenness varied from 0.814 to 0.943 with maximum in ST-6 and
minimum in ST-4 (Table 3.25).
Table 3.25: Diversity indices, a-Shannon diversity (H’); b-Margalef richness (d) and c-Pielou’s evenness (J’) calculated for Phytoplankton
Station H' (diversity) d (richness) J' (evenness)
ST-1 4.475 3.557 0.895
ST-2 4.940 3.939 0.863
ST-3 4.024 3.163 0.828
ST-4 3.540 3.368 0.814
ST-5 3.772 4.321 0.909
ST-6 4.469 3.428 0.943
ST-7 3.914 4.104 0.902
3.17.7 Zooplankton
During the study period, three groups of macro zooplankton namely, calanoida,
cyclopoida, and harpacticoida and 2 groups of micro zooplankton namely,
spirotricha and larval forms and group “others” of zooplankton were recorded.
Among these, calanoida were found to be the dominant group with 11 species.
Larval forms came as next dominant group with 7 species. Cyclopoida and
harpacticdoia came next in the order with 5 species each and spirotricha with 4
species. While group “Others” showed only meager contributions in the collection.
Among the calanoida, Acartia danae, Acrocalanus gibber, A. gracilis, Labidocera
sp. Nannocalanus minor, Paracalanus parvus, Temora discaudata and
cyclopoida, Oithona rigida, O.brevicornis, O. similis, Corycaeus danae and larval
forms, gastropod veliger, bivalve veliger, barnacle nauplii and harpacticoida,
Macrosetella aculata, Microsetella norvegica were found to be the frequenters in
the collections. In the case of spirotricha Tintinnopsis cylindrica, T. uruguayensis
Sagitta sp. Oikopleura parva showed consistency in their occurrence in the

---------------------------------------------------------------------------------------------------------------------------------------------
EIA Study for Capacity Enhancement at Berth 5A, 6A of SWPL, Goa 3-54
Final Report, September, 2017
samples collected in various stations. The abundance and density of zooplanktons
at various sampling stations is given in Table 3.26.
Table 3.26: Abundance and density of Zooplankton in marine water
(in Nos/m3)
Zooplankton ST-1 ST-2 ST-3 ST-4 ST-5 ST-6 ST-7
Acartia danae 0 0 0 0 225 0 110
A. spinicauda 245 135 0 0 120 280 0
Acrocalanus giber
350 225 120 75 0 0 50
A. gracilis 325 0 125 450 120 350 0
Calanopia minor
35 0 0 0 130 0 185
Centropages furcatus
0 110 110 125 235 65 225
Labidocera pavo
125 0 210 120 0 46 50
Nannocalanus minor
54 125 315 650 0 150 20
Paracalanus parvus
320 145 20 0 85 0 375
Pontella sp. 80 0 0 410 350 40 50
Temora discaudata
350 350 175 0 250 25 350
Cyclopoida
Oithona brevicornis
0 225 210 25 0 350 120
O. rigida 540 350 0 540 0 540 0
O. similis 50 110 840 40 80 0 250
Corycaeus danae
0 140 540 350 240 145 0
C. catus 65 0 350 20 90 95 350
Harpacticoida
Macrosetella aculata
350 350 220 110 0 0 237
M. gracilis 0 0 0 450 230 120 225
Microsetella norvegica
345 160 350 0 0 0 150
M. rosea 145 350 0 120 115 0 140
Euterpina acutiforns
350 0 0 0 350 650 0
Spirotricha
Favella brevis 350 350 60 350 0 45 125
Tintinnopsis cylindrical
540 350 120 250 125 0 210

---------------------------------------------------------------------------------------------------------------------------------------------
EIA Study for Capacity Enhancement at Berth 5A, 6A of SWPL, Goa 3-55
Final Report, September, 2017
Zooplankton ST-1 ST-2 ST-3 ST-4 ST-5 ST-6 ST-7 T.uruguayensis 225 0 350 85 0 0 320
Oikopleura parva
0 420 0 225 320 420 0
Larval forms
Barnacle naupilii
255 705 50 30 125 325 320
Bivalve veliger 0 0 350 0 150 540 0
Copepod nauplius
0 325 0 225 225 100 0
Crustacean nauplius
150 0 350 120 0 350 60
Gastropod veliger
0 350 60 0 45 225 220
Mysis larva 875 515 0 850 85 0 120
Polychaete larva
0 0 745 0 195 0 180
Others
Lucifer hanseni
0 0 0 125 0 350 135
Sagitta sp 0 465 120 20 120 20 0
Total 6124 6255 5790 5765 4010 5231 4577
Population density
Unlike phytoplankton, zooplankton density varied from 4,010 to 6,255 Nos/m3 with
maximum value at ST-2 and minimum at ST-5 (Figure 3.14).
Figure 3.14: Population density of Zooplankton recorded from study area
0
1000
2000
3000
4000
5000
6000
7000
ST-1 ST-2 ST-3 ST-4 ST-5 ST-6 ST-7
Nos/…
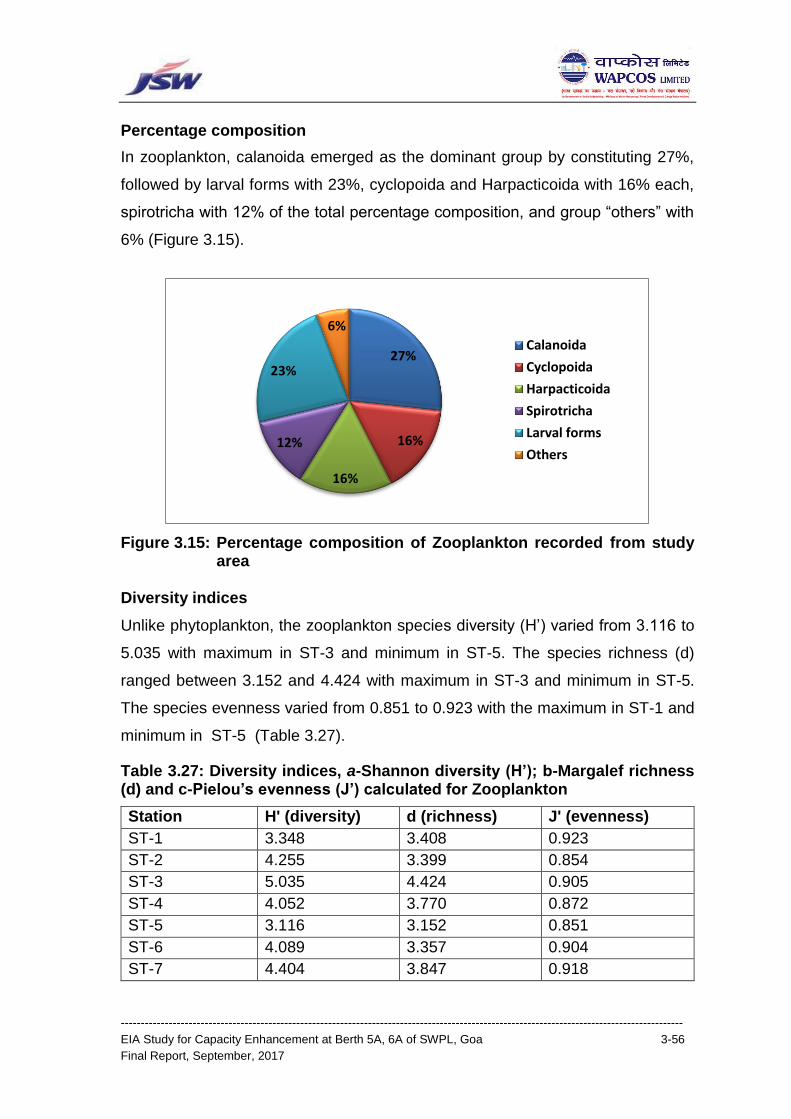
---------------------------------------------------------------------------------------------------------------------------------------------
EIA Study for Capacity Enhancement at Berth 5A, 6A of SWPL, Goa 3-56
Final Report, September, 2017
Percentage composition
In zooplankton, calanoida emerged as the dominant group by constituting 27%,
followed by larval forms with 23%, cyclopoida and Harpacticoida with 16% each,
spirotricha with 12% of the total percentage composition, and group “others” with
6% (Figure 3.15).
Figure 3.15: Percentage composition of Zooplankton recorded from study area
Diversity indices
Unlike phytoplankton, the zooplankton species diversity (H’) varied from 3.116 to
5.035 with maximum in ST-3 and minimum in ST-5. The species richness (d)
ranged between 3.152 and 4.424 with maximum in ST-3 and minimum in ST-5.
The species evenness varied from 0.851 to 0.923 with the maximum in ST-1 and
minimum in ST-5 (Table 3.27).
Table 3.27: Diversity indices, a-Shannon diversity (H’); b-Margalef richness (d) and c-Pielou’s evenness (J’) calculated for Zooplankton
Station H' (diversity) d (richness) J' (evenness)
ST-1 3.348 3.408 0.923
ST-2 4.255 3.399 0.854
ST-3 5.035 4.424 0.905
ST-4 4.052 3.770 0.872
ST-5 3.116 3.152 0.851
ST-6 4.089 3.357 0.904
ST-7 4.404 3.847 0.918
27%
16%
16%
12%
23%
6%
Calanoida
Cyclopoida
Harpacticoida
Spirotricha
Larval forms
Others

---------------------------------------------------------------------------------------------------------------------------------------------
EIA Study for Capacity Enhancement at Berth 5A, 6A of SWPL, Goa 3-57
Final Report, September, 2017
3.17.8 Benthos
Macro-benthos
During the present investigation, four groups of benthic organisms namely
polychaetes, crustaceans, bivalves and gastropods were recorded. Of these,
polychaetes constituted the dominant group followed by crustaceans, gastropods
and bivalves. Altogether 44 species of macro fauna were recorded. Of these,
polychaetes topped the list with 25 species. Crustaceans were found to be the next
dominant group in the order of abundance with 7 species. Bivalves and gastropods
with 6 species each of the total benthic organisms collected. Among the
polychaetes, Armandia sp., Prionospio pinnata, Eunice sp., Goniada emerita,
Lumbrinereis sp., Notomastus aberrans, Nereis sp., Nephtys sp., Magelona cincta,
were found to be the most commonly occurring species in the samples collected
in Mormugao coastal waters. Coming to crustaceans Angeliera sp., Ampithoe
romondi, Gammarus sp. and in bivalves, veligers of Anadara, Donax and
gastropods Cerithidea cingulata and Turris veligers were found to be the common
species in the collection.
The abundance and density of Macrobenthos at various sampling stations is given
in Table 3.28.
Table 3.28: Abundance and density of Macro-benthos in sediments
(in Nos/m2)
Macrobenthos ST-1 ST-2 ST-3 ST-4 ST-5 ST-6 ST-7
Polychaetes
Armandia sp. 0 75 50 25 0 0 0
Armandia
longicaudata
25 0 25 0 0 0 25
Capitella capitata 0 50 0 0 50 0 0
Cossura coasta 0 0 0 0 0 25 0
Cirratulus
concinnus
50 0 25 25 25 25 50
Eunice sp. 100 25 0 25 0 0 100
Goniada emerita 0 50 0 50 25 50 0
Exogone clavator 0 0 100 75 0 0 0
Lumbrineris sp. 0 0 0 0 0 0 0

---------------------------------------------------------------------------------------------------------------------------------------------
EIA Study for Capacity Enhancement at Berth 5A, 6A of SWPL, Goa 3-58
Final Report, September, 2017
Macrobenthos ST-1 ST-2 ST-3 ST-4 ST-5 ST-6 ST-7
Nephtys sp. 0 25 75 0 50 50 0
Nereis sp. 0 0 0 25 25 0 0
Notomastus
aberans
25 50 50 100 0 25 25
Perinereis capensis 25 0 0 0 25 0 25
Platynereis sp. 75 100 0 50 25 50 75
Phylo capensis 100 0 25 0 25 25 100
Prionospio
capensis
0 0 0 100 0 0 0
Prionospio cirrifera 0 0 0 0 0 25 0
Prionospio pinnata 75 0 75 0 0 0 75
Syllis sp. 0 100 0 50 100 100 0
Glycera longipinnis 0 0 50 0 0 25 0
Glycera alba 0 0 125 150 0 0 0
Pygospio elegans 0 100 50 0 0 0 0
Sabellides sp. 125 75 100 50 50 0 125
Magelona cincta 0 100 0 75 0 0 0
Serpula sp. 0 50 0 0 25 0 0
Crustaceans
Ampithoe rubricate 125 25 25 0 150 0 125
Ampithoe romondi 0 50 0 0 50 25 0
Angeliera sp. 25 0 0 50 0 0 25
Campylaspis sp. 50 25 50 25 50 0 50
Gammarus sp. 0 0 0 0 0 0 0
Gynodiastylis sp. 100 150 75 0 0 50 100
Paragnathia
formica
0 125 0 0 50 0 0
Bivalves
Anadara veligers 0 50 0 0 0 0 0
Anadora granosa 50 50 0 25 0 0 50
Cardium veligers 50 0 50 50 75 50 50
Donax veligers 0 0 100 100 50 50 0
Meretrix veligers 0 125 0 0 0 0 0
Meretrix casta 100 50 0 0 0 0 75
Gastropods
Bullia veligers 50 0 100 75 0 0 50
Cerithidea
cingulate
0 0 0 0 50 50 0
Littorina veligers 75 25 100 0 0 0 75

---------------------------------------------------------------------------------------------------------------------------------------------
EIA Study for Capacity Enhancement at Berth 5A, 6A of SWPL, Goa 3-59
Final Report, September, 2017
Macrobenthos ST-1 ST-2 ST-3 ST-4 ST-5 ST-6 ST-7
Nassarius
variegatus
0 50 25 50 50 25 0
Natica veligers 0 25 0 0 25 0 0
Turris veligers 50 0 50 50 0 50 50
Total 1275 1550 1325 1225 975 700 1250
Population density
The population density varied from 700 to 1550 Nos. m-2 with maximum value at
ST- 2 and minimum at ST-6 (Figure 3.16).
Figure 3.15: Population density of Macro-benthos
Percentage composition
When the results of percentage composition of benthic fauna were viewed,
polychaetes topped the list with 59% to the total benthic organisms. Crustaceans,
bivalves and gastropods contributed with 18%, 12% and 11% respectively to the
benthic samples collected (Figure 3.17).
0
200
400
600
800
1000
1200
1400
1600
1800
ST-1 ST-2 ST-3 ST-4 ST-5 ST-6 ST-7
Nos/m2
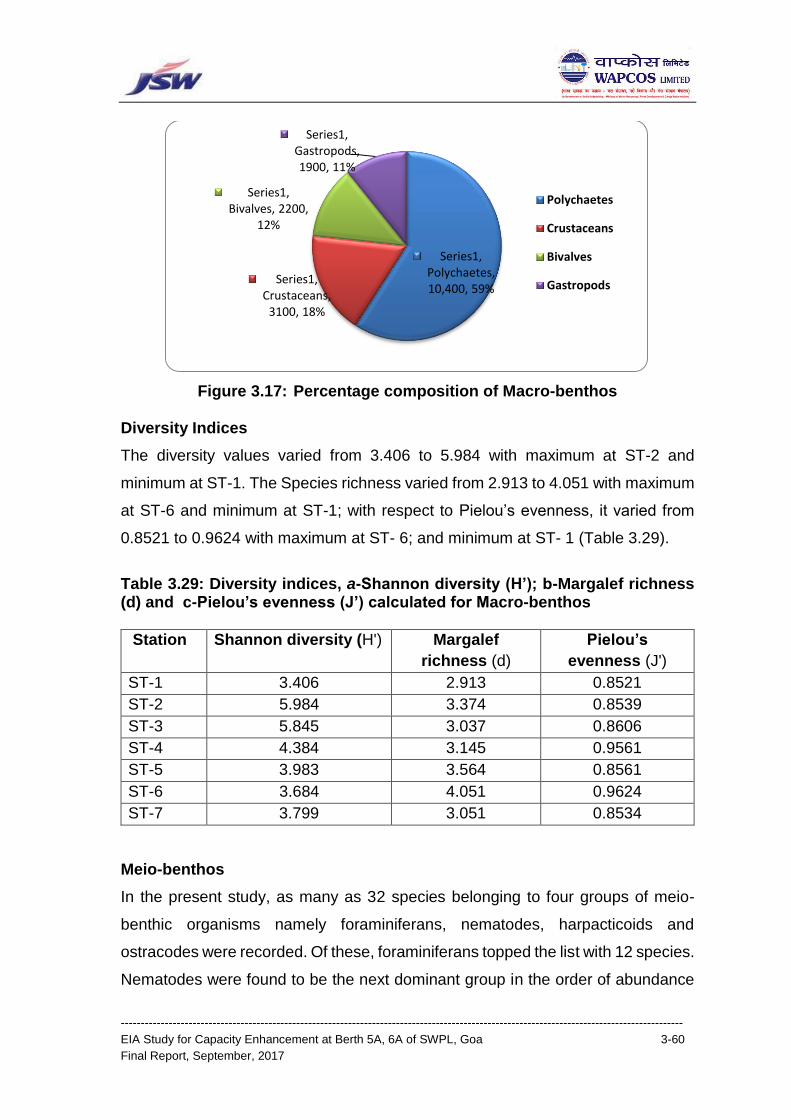
---------------------------------------------------------------------------------------------------------------------------------------------
EIA Study for Capacity Enhancement at Berth 5A, 6A of SWPL, Goa 3-60
Final Report, September, 2017
Figure 3.17: Percentage composition of Macro-benthos Diversity Indices
The diversity values varied from 3.406 to 5.984 with maximum at ST-2 and
minimum at ST-1. The Species richness varied from 2.913 to 4.051 with maximum
at ST-6 and minimum at ST-1; with respect to Pielou’s evenness, it varied from
0.8521 to 0.9624 with maximum at ST- 6; and minimum at ST- 1 (Table 3.29).
Table 3.29: Diversity indices, a-Shannon diversity (H’); b-Margalef richness (d) and c-Pielou’s evenness (J’) calculated for Macro-benthos
Station Shannon diversity (H') Margalef
richness (d)
Pielou’s
evenness (J')
ST-1 3.406 2.913 0.8521
ST-2 5.984 3.374 0.8539
ST-3 5.845 3.037 0.8606
ST-4 4.384 3.145 0.9561
ST-5 3.983 3.564 0.8561
ST-6 3.684 4.051 0.9624
ST-7 3.799 3.051 0.8534
Meio-benthos
In the present study, as many as 32 species belonging to four groups of meio-
benthic organisms namely foraminiferans, nematodes, harpacticoids and
ostracodes were recorded. Of these, foraminiferans topped the list with 12 species.
Nematodes were found to be the next dominant group in the order of abundance
Series1, Polychaetes, 10,400, 59%
Series1, Crustaceans,
3100, 18%
Series1, Bivalves, 2200,
12%
Series1, Gastropods, 1900, 11%
Polychaetes
Crustaceans
Bivalves
Gastropods

---------------------------------------------------------------------------------------------------------------------------------------------
EIA Study for Capacity Enhancement at Berth 5A, 6A of SWPL, Goa 3-61
Final Report, September, 2017
with 11 species. Harpacticoids and ostracodes came next with 6 and 3 species
respectively.
Among the foraminiferans, Ammonia beccari, Bolivina abbreviate, and were
commonly found in all the stations. With respect to nematodes, Desmoscolex sp.,
Theristus sp., Astomonema sp., and Viscosia sp., were found to be the common
species in the samples collected in various stations. Coming to ostracodes,
Basslerites liebaui, Diasterope schmitti, and harpacticoids, Diarthrodes sp., were
found to be common species in the collection. The details are given in Table 3.30.
Table 3.30: Abundance and density of Meio-benthos in sediments
(in Nos/10 cm2)
Meiobenthos ST-1 ST-2 ST-3 ST-4 ST-5 ST -6 ST -7
Nematodes
Astomonema sp. 5 5 5 0 19 14 5
Daptonema conicum 4 0 6 0 4 9 6
Desmoscolex sp. 6 7 10 5 17 22 4
Draconema sp. 0 0 6 8 0 0 0
Halalaimus filum 4 6 6 0 22 22 5
Microlaimus sp. 6 3 6 9 6 15 6
Neochromodora sp. 6 7 0 6 0 4 5
Odontophora sp. 4 3 6 3 7 0 7
Stephanolaimus sp. 6 4 7 6 5 6 5
Theristus sp. 6 6 0 0 5 2 0
Viscosia sp. 8 3 6 0 0 3 9
Foraminiferans
Ammonia beccarii 6 6 4 11 4 8 8
Amphisorus sp. 4 9 13 0 7 9 5
Astrorotalia inflata 3 5 0 11 3 0 11
Bolivia abbreviata 3 3 5 5 4 0 0
Eponides repandus 6 6 6 4 7 5 0
Globigerina sp. 6 0 6 5 4 7 9
Quinqueloculina sp. 0 5 0 5 7 5 8
Rosalina bertheloti 8 0 3 0 8 6 0
Spirillina limbata 6 4 6 12 8 5 0
Spiroloculina sp. 7 0 5 0 3 6 5
Textularia
agglutinans 7 5 6 4 5 6 6

---------------------------------------------------------------------------------------------------------------------------------------------
EIA Study for Capacity Enhancement at Berth 5A, 6A of SWPL, Goa 3-62
Final Report, September, 2017
Meiobenthos ST-1 ST-2 ST-3 ST-4 ST-5 ST -6 ST -7
Cornoboides advena 6 0 5 15 4 3 5
Harpacticoids
Apodopsyllus
vermiculiformis 1 5 4 2 3 1 0
Cervinia sp. 3 5 8 5 2 0 2
Cylindropsyllus sp. 3 1 2 3 1 2 1
Diarthrodes sp. 5 1 4 4 2 3 8
Laophonte thoracica 4 8 6 4 4 3 4
Laptastocus sp. 1 6 6 0 6 8 6
Ostrocodes
Basslerites liebaui 5 4 3 5 3 0 5
Diasterope schmitti 3 0 2 5 3 4 0
Tanella kingmaii 2 0 5 1 0 2 3
Total 144 117 157 138 173 180 138
Population density
The population density of meiofauna varied from 117 to 180 nos/10cm2 with
maximum at ST-6 and minimum at ST-2 (Figure 3.18).
Figure 3.18: Population density of Meio-benthos
Percentage composition
The results of percentage composition of meio-fauna revealed that foraminiferans
constituted the maximum with 48% of the total meio-benthic organisms.
0
20
40
60
80
100
120
140
160
180
200
ST-1 ST-2 ST-3 ST-4 ST-5 ST-6 ST-7
Nos/10 cm2

---------------------------------------------------------------------------------------------------------------------------------------------
EIA Study for Capacity Enhancement at Berth 5A, 6A of SWPL, Goa 3-63
Final Report, September, 2017
Nematodes, ostracodes and harpacticoids contributed with 38%, 9%, and 5%
respectively to the total meio-benthic samples collected as shown in Figure 3.19.
Figure 3.19: Percentage composition of Meio-benthos Diversity Indices
The diversity values varied from 3.213 to 6.782 with maximum at ST-3 and
minimum at ST-5. Species richness varied from 4.772 to 5.678 with maximum at
ST-5 and minimum at ST-2. Pielou’s evenness varied from 0.849 to 0.974 with
maximum at ST-2 and minimum at ST- 5 (Table 3.31).
Table 3.31: Diversity indices a-Shannon diversity (H’); b-Margalef richness (d) and c-Pielou’s evenness (J’) calculated for Meio-benthos
3.17.9 Sea weed and Sea grass
The studies carried out by Pereria and Almeida -2014, indicates the presenece of
sea weed species in various parts of Goa. However, only patchy distribution of
Station Shannon diversity (H')
Margalef richness(d)
Pielou’s evenness (J')
ST-1 4.445 5.537 0.967
ST-2 6.422 4.772 0.974
ST-3 6.782 5.363 0.951
ST-4 4.312 4.896 0.956
ST-5 3.213 5.678 0.849
ST-6 3.542 5.546 0.945
ST-7 3.405 5.367 0.878
---------------------------------------------------------------------------------------------------------------------------------------------
EIA Study for Capacity Enhancement at Berth 5A, 6A of SWPL, Goa 3-64
Final Report, September, 2017
seaweeds namely Gelidium pusillium, Gracilaria foliifera, Lithophyllum
orbiculatum, Hypnea spinella, Acanthophora muscoides, Acanthophora spicifera,
Bostrychia tenella, Ralfsia verrucosa, Sphacelaria rigidula, Canistrocarpus
crispatus, Dictyopteris australis, Padina antillarum, Padina australis, Padina
gymnospora, Padina pavonica, Spatoglossum asperum, stochospermum
polypodioides were reported in the study area during the premonsoon season.
Similarly, the sea grass species namely Cymodocea serrulata was reported in the
study area. During the present survey, no significant occurance of sea grass and
sea weed species are observed in the study area.
3.17.10 Corals and associated faunal assemblages
The occurance of coral reef in the Grade island has been documented by
researchers recently (Shesdev Patro et al., 2015). The nearest habitate of corals
from the proposed site is Grand island located at about 7 km form the proposed
site. Sreekanth et al., 2015 reported the presence of Carijoa riisei from the Grand
island are Carijoa riisei (730 46’ 46.605” E, 150 21’ 0.636” N) at a depth of 10–12
m. The study also concluded that the occurrence of the species in Grande Island
as a new locational record and could not assess the impact on the reef due to lack
of baseline data on the reef health. The most abundant families that depend on
the natural reefs are, Caesionidae (fusiliers), Pomacentridae (damsel fishes),
Tetraodontidae (pufferfishes) and Chaetodontidae (butterfly fishes). Planktivores
and carnivores dominated the natural reefs followed by omnivores and herbivores.
3.17.11 Turtle Nesting
Goa with a small coastal length of 120 km, records one of the earliest community
based initiatives in sea turtle conservation, next to Kerala. Sporadic nesting of olive
ridley and leatherback turtles has been recorded all along the coast of Goa but
recent nesting records are only of olive ridleys. Of the 120 km coastline, about
8 km in Goa have been identified as major nesting sites and are being protected
by the Forest Department of the State Government of Goa. These sites are Morjim
in north Goa, and Galgibaga and Agonda in south Goa. Nesting takes place
between October and March each year. All the turtle nesting grounds are beyond

---------------------------------------------------------------------------------------------------------------------------------------------
EIA Study for Capacity Enhancement at Berth 5A, 6A of SWPL, Goa 3-65
Final Report, September, 2017
10 km radius or outside the study area of the project. The location of turtle nesting
grounds is given in the Table 3.32.
Table 3.32: Location of Turtle Nesting Grounds in Goa
Source: WWF Report on Marine turtles along the Indian Coast, 2013.
Galibaga is the southern most location of nesting range with a poor density. It is a
fairly undulating shoreline with sparse vegetation and witnesses the nesting of
turtles in the breeding season. Besides the four major locations mentioned above,
the other coastal stretches that also witness the sporadic nesting are Mobor,
Kavellossim, Colva, Majorda, Varca and Betalbatim. However they do not fall in
the 10 km radius of the study area. The details of the Turtle nesting grounds in
Goa are depicted in Figure 3.20.The occurrence of other endangered species like
Dugongs etc. was not found during the survey.
Figure 3.20: Turtle nesting grounds in Goa
S. No. Nesting Beach Co-ordinates
1. Mandrem 15” 38’ 57.25’N 73˚ 42’ 55.0.4’E
2. Ashvem 15” 38’ 47.39’N 78˚ 43’ 00.17’E
3. Morjim 15” 36’ 53.25’N 73” 44’ 09.34’E
4. Agonda 15” 02’ 24.04 N 73” 59’ 16.66’E
5. Galgibaga 14” 57’ 32.07 N 74” 02’ 56.64 E

---------------------------------------------------------------------------------------------------------------------------------------------
EIA Study for Capacity Enhancement at Berth 5A, 6A of SWPL, Goa 3-66
Final Report, September, 2017
3.17.12 Windowpane Oyster
The coastline of Goa is bestowed with a neumorous variety of flora fauna. The
abundance of Placuna placenta (Linne) also called as windowpane oysters are
found around the San Jacnito island and the same has been reported by many
researchers. There is a healthy population in the Chicalim Bay. They are highly
assymetrical bivavle. Characteristically large, flat, thin, pearly, sub-orbicular,
transluscent shell with a mica-like appearance and are primarily a heterotrophic
filter feeder (Campbell). Diet consists of plankton and free-floating detritus.
3.17.13 Mangrove Distribution
The nearest identified mangroves are observed in Siridao area of Zuari creek, at
a distance of about 7 to 9 km ranging from sparse to dense vegetation from the
proposed project site. In the study area there are patches of mangroves located
along the sides of the River Zuari.
In Goa the mangroves Mangrove stands are best developed along deltaic coasts
or in estuaries where soft mud comprised of fine silt and clay and rich in organic
matter is available for growth of seedlings. Quartzitic and granitic alluvial are poor
substrata, whereas volcanic soils are highly productive for mangroves (Macnae,
1968). The soil of Goa may be broadly classified into three main types:
(1) Laterites of high and low level type formed by natural metamorphosis and
degeneration of underlying rocks along the ghats.
(2) Red gravely soil derived from micaceous granite gneiss, covering the
undulating plateau mixed with medium black soil adjoining riverbanks.
(3) Alluvial soils including coastal alluvium along the coastal belt and in low-
lying situations.
The details of the mangrove species found in the study area:
Avicennia officinalis
Avicennia alba
Acanthus illicifolius
Aegiceras corniculatum
Excoecaria agallocha
---------------------------------------------------------------------------------------------------------------------------------------------
EIA Study for Capacity Enhancement at Berth 5A, 6A of SWPL, Goa 3-67
Final Report, September, 2017
Rhizophora mucronata
Rhizophora apiculata
Bruguiera gymnorrhiza
3.18 TERESTRIAL ECOLOGY
3.18.1 FLORA
The State of Goa has 38.5 % of its land under forest cover, which is much higher
than the national average. In absolute terms, 1,424.38 sq. km. of area is under
forest, of which 1,224.38 sq. km. is government forest and 200 sq. km. is private
forest. The physiography of the Goa district chiefly comprises undulating terrain of
Western Ghats in a series of hills with several off-shoots and spours gradually
merging in the west. The western ghat is the source of two prominent rivers in Goa
viz. Mandovi and Zuari that flow off into the Arabian Sea near Panaji and Vasco-
da-Gama. Forests are mostly confined to the eastern portion of the Western Ghats
in the foothill slopes of Satari, Sanquem, and Canacona talukas. Scattered in
patches are several private forests owned by the village communities, temples and
private individuals. As per the classification of Champion and Seth 1968, following
forest types can be observed in the South Goa district.
Evergreen and Semi- Evergreen Forests
Along the north-eastern and south-eastern portions bordering Karnataka state, few
evergreen and semi- evergreen vegetation occur in the deep gorges and ravines
of Sanguem, Satari and Canacona talukas. On the precipitous aspect the tree
growth is mostly stunted having low timber value. The trees of common occurrence
are Babbi (Calophyllum wightianum), Jambul (Syzygium cumuni), Ambo
(mangifera indica), Onval (Mimusops elengi), Otamb (Ariocarpus lakoocha),
Patpanas (Artocarpus hirsute), Nag Gulum (Mesua ferrea), Hopea wightiana,
Bhirand (Garcina indica), Gulum (Machilus Macarantha), Chandodo (Macaranga
peltata), Bhenoro (Sterculia villosa), Bibo (Semecarpus anacardium), Holigarna
arnottiana and Mallotus sp. The undergrowth is comprised of Colebrookea
oppositifolia, Wendlandia spp., Triumfetta rhomboidea, Hemigraphis spp.,
Callicarpa tanata, Saulria indica, Ixora brachiata, Woodfordia floriabunda, Lobelia

---------------------------------------------------------------------------------------------------------------------------------------------
EIA Study for Capacity Enhancement at Berth 5A, 6A of SWPL, Goa 3-68
Final Report, September, 2017
nicotianaefolia. The common bamboos occurring in these forests are Velu
(Bambusa arundinacea) and Kanaki (Dendrocalamus strictus). Bhet (Calamus
tannuas) is the important cane of evergreen belt.
Moist Deciduous Forest
This type of forest occurs along the foot hill slopes of hill tract from north to south
and spurs leading towards west. This type of forests is distributed in about 385
square kilometers, providing the timber and fuel wood requirement of the district
Natural teak is of sporadic occurrence in these forests, The prominent tree species
in this zone are Maretha (Terminalia crenulata), Quinzol (Terminalia paniculata),
Zambo (Xylia xylocarpa), Nano (Lagerstroemia lanceolata), Ghoting (Terminalia
belterica), Sissoo (Dalbergla latifolia), Edu (Adina Cardifolia), Kalam (Mitragyna
parvifolia), Karmal (Dillenia pentagyna), Assan (Pterocarpus marsupium) and
Kusum (Schleichera oleosa).
In the under storey the common tree species found are Dhaman (Grewia
illiaefolia), Shiras (Albizzia lebbek), Belati (Albizzia procera), Kanvanch (Bridelia
retusa), Shivan (Gmelina arborea), Moi (Lamnea coromandelica), Bel (Aegle
marmelos), Kadukavath (Hydnocarpus laurifolia), Malotus phillippinensis, Char
(Buchanania latifolia), khair (Acacia catechu), Shanta Kudo (Wrightia tinctoria) and
Mumeo (Careya arborea).The shrubby vegetation consists mostly of Galai (Randia
dumetorum), Kevani (Helicteres isora), Karvi (Strobilanthes callosus), Jino (Leea
indica), Glycosmis pentaphylla, Ardisia solanacea, Ranbhendi (Urena lobatta),
Karvand (Carissa carandas), Fleminhia congesta, Clerodendron infortunalum,
Nagur Cudo (Holorrhena antihysenterica) Karbel (Murraya koenigli) and
Tabernaemontana heynaena . Also fern species of Pteris, Selaginella and
Ophiglossum are seen on the moist forest floor. The common climbers of these
forests are Ukshi (Calycopteris floribunda), Krishnasarva (Ichnocarpus frutescens)
Ghotival (Smilax spp.) Shembi (Caesalpinia sepiaria), Vagati (Wagatea spicata)
and Caesalpinia nuga. The ground flora represented by herbs and grasses.

---------------------------------------------------------------------------------------------------------------------------------------------
EIA Study for Capacity Enhancement at Berth 5A, 6A of SWPL, Goa 3-69
Final Report, September, 2017
Littoral and swamp forest
Littoral and Swampy forests can be further divided in three categories viz: Beach
forest, Tidal or Mangrove forest and Fresh water swamp forest. The common
plants of beach forests are Casuarina equisetifolia, Callophyllum littoralis, Cocus
nucifera, Manikara littoralis, Thespesia sp, Spinfex littoreus and number of twiners
and climbers. Tidal or mangrove forest is predominant in the area. A luxuriant
growth of mangrove and associated species can be observed along the estuaries
and back water of the coastal region. Common species of this forest comprised of
Rhizophora mucronata, Acanthus ilicifolius, Avicennia officinalis, Sonneratia
caseolaris, Kandelia candel and associate species. The important plant species
found in swamp forest are Cephalenthus, Holoptelia sp, Murray sp. Cana sp and
variety of grasses.
Vegetation Composition in the Study Area
The vegetation composition at the proposed project area mainly consists of trees,
shrubs and herbs. The tree components other than Mangroves occur with a
composition of Phiramgisaro (Casuarina equisetifolia) Naal (Cocos nucifera),
Oondi (Calophyllum, inophyllum), Ambo (Mangifera indica), Moi (Lannea
coromandelica), Kaju (Anacardium occidentale), Bhendi (Thespecia populinea),
Kudo (Hollarhena antidysentric), Nano (Lagerstroemia lanceolata), Onwal
(Mimusops elengi), Jamun (Syzgium cuminii) and Zamba (Xylia xylocarpa) etc.
The other associates such as shrubs are Calycopteris floribunda, Ixora coccinea,
Tabernamontana heyneana, Microcos paniculata, Derris trijoliata, Caesalpinia
crista, Vitex negundo, Clerodendron inermi, intermixed with herbs include
Achyranthes aspera, Malvastrum sp, Halophila beccarii, Sesuvium
portulacastrum, Leucas aspera,Phylanudiflora, Arthrocnemum indicum,
Melanthera biflora, sedges like Cyperus arenarius, Fimbristilis and grasses with
Themeda triandra, Spinifex littorens, Digitariaadscendens etc. The list of floral
species observed in the South Goa district is enlisted in Table 3.33.

---------------------------------------------------------------------------------------------------------------------------------------------
EIA Study for Capacity Enhancement at Berth 5A, 6A of SWPL, Goa 3-70
Final Report, September, 2017
Table 3.33: Plant species recorded in South Goa forest division
Botanical Name Common/Local Name
Family Habit IUCN Status
Dendrocalamus strictus
Mango Poaceae Bamboo NA
Dioscorea sp - Dioscoriaceae Climber NA
Mukia maderaspatana - Cucurbitacea Climber NA
Passiflora foetida Running pop Passifloraceae Climber NA
Smilax zeylanica Ghot vel or Kaval kamti.
Smilacaceae Climber NA
Acrostichum aureum - Pteridaceae Fern LC
Cynodon dactylon Haryali Poaceae Grass NA
Dactyloctenium aegyptium
- Poaceae Grass NA
Digitaria adscendens - Poaceae Grass NA
Eragrostis uniloides - Poaceae Grass NA
Saccharum spontaneum
- Poaceae Grass LC
Spinifex littoreus Saramto Poaceae Grass NA
Themeda triandra Karad Poaceae Grass NA
Achyranthes aspera Aghado Acanthaceae Herb NA
Ageratum conyzoides - Asteraceae Herb NA
Alternanthera sessilis - Amaranthaceae Herb LC
Arthrocnemum indicum
- Chenopodiaceae Herb NA
Boerhavia diffusa L. Punnarva Nyctaginaceae Herb NA
Cyanotis axillaris - Commelinaceae Herb LC
Datura innoxia Datura Solanaceae Herb NA
Eclipta alba Mako Asteraceae Herb LC
Eichhornia crassipes - Pontederiaceae Herb NA
Elephantopus scaber - Asteraceae Herb NA
Halophila beccarii - Hydrocharitaceae Herb Vu
Hedyotis herbacea - Rubiaceae Herb NA
Hemidesmus indicus Dudhshiri Asclepidiaceae Herb NA
Hyptis suaveolens - Lamiaceae Herb NA
Ipomea pes- caprae Maryadvel Convolvulaceae Herb NA
Justiciasimplex - Malvaceae Herb NA
Launaea sarmentosa - Asteraceae Herb NA
Leucas aspera Tumbo Lamiaceae Herb NA
Malvastrum sp - Malvaceae Herb NA
Melanthera biflora - Asteraceae Herb NA
Mimosa pudica - Mimosaceae Herb LC
Mollugo oppositifolia - Molluginaceae Herb NA
Nymphaea nouchali KasturiSalak Nymphaeaceae Herb LC

---------------------------------------------------------------------------------------------------------------------------------------------
EIA Study for Capacity Enhancement at Berth 5A, 6A of SWPL, Goa 3-71
Final Report, September, 2017
Botanical Name Common/Local Name
Family Habit IUCN Status
Nymphaea pubescens KamalSalak Nymphaeaceae Herb LC
Ocimum omericanum Ramtulas Lamiaceae Herb NA
Phyla nudiflora - Verbenaceae Herb NA
Portulaca quadrifida Bhumygol Portulacaceae Herb NA
Sesuvium portulacastrum
- Aizoaceae Herb NA
Sida acuta Bala, /Chikna Malvaceae Herb NA
Sida cordata - Malvaceae Herb NA
Tridax procumbens - Asteraceae Herb NA
Triumfetta rhomboidea Tupkati Tiliaceae Herb NA
Musa paradisiaca Keli Musaceae Large herb
NA
Cyperus pangorei - Cyperaceae Sedge LC
Cyperusarenarius - Cyperaceae Sedge NA
Adathoda vasica Aduso Acanthaceae Shrub NA
Ananas comosus Ananas Annonaceae Shrub NA
Caesalpinia sp. - Caesalpiniaceae Shrub NA
Calamus sp. - Arecaceae Shrub NA
Calotropis gigantea Rui,Dhavirui Asclepidiaceae Shrub NA
Calycopteris floribunda
Uski Combretaceae Shrub NA
Cassia tora Taykhilo Mimosaceae Shrub NA
Clerodendron inermi Siritmari Verbenaceae Shrub NA
Colubrina asiatca - Rhamnaceae Shrub NA
Derris heterophylla - Fabaceae Shrub NA
Ixora coccinea Pitkoli Rubiaceae Shrub NA
Lantana camara - Verbenaceae Shrub NA
Leea indica Jino Leeaceae Shrub NA
Lobelia nicotianaefolia Baknal Campanulaceae Shrub NA
Microcos paniculata Asale, chivara Malvaceae Shrub NA
Moullava spicata Wagati Caesalpiniaceae Shrub NA
Murraya koenigii Karphil, Karipatha Rutaceae Shrub NA
Phoenix loureiroi - Arecaceae Shrub NA
Plumeria sp. - Apocynaceae Shrub NA
Randia deumatorum Gel Rubiaceae Shrub NA
Tabernamontana heyneana
Kudo Apocynaceae Shrub NA
Tephrosia purpurea - Fabaceae Shrub NA
Thespecia lampa Ran Bhendi Malvaceae Shrub NA
Thevetia peruviana - Apocynaceae Shrub NA
Vitex altissima Bavalgi Verbenaceae Shrub NA
Vitex negundo Limgud Verbenaceae Shrub NA
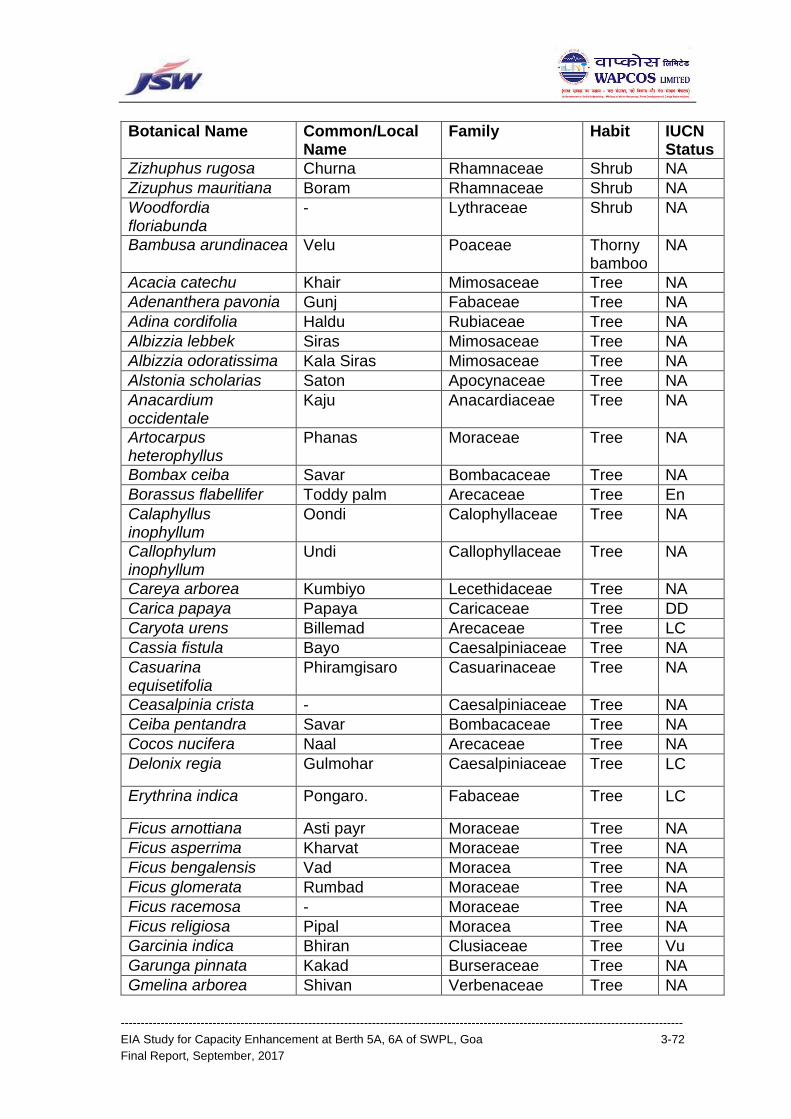
---------------------------------------------------------------------------------------------------------------------------------------------
EIA Study for Capacity Enhancement at Berth 5A, 6A of SWPL, Goa 3-72
Final Report, September, 2017
Botanical Name Common/Local Name
Family Habit IUCN Status
Zizhuphus rugosa Churna Rhamnaceae Shrub NA
Zizuphus mauritiana Boram Rhamnaceae Shrub NA
Woodfordia floriabunda
- Lythraceae Shrub NA
Bambusa arundinacea Velu Poaceae Thorny bamboo
NA
Acacia catechu Khair Mimosaceae Tree NA
Adenanthera pavonia Gunj Fabaceae Tree NA
Adina cordifolia Haldu Rubiaceae Tree NA
Albizzia lebbek Siras Mimosaceae Tree NA
Albizzia odoratissima Kala Siras Mimosaceae Tree NA
Alstonia scholarias Saton Apocynaceae Tree NA
Anacardium occidentale
Kaju Anacardiaceae Tree NA
Artocarpus heterophyllus
Phanas Moraceae Tree NA
Bombax ceiba Savar Bombacaceae Tree NA
Borassus flabellifer Toddy palm Arecaceae Tree En
Calaphyllus inophyllum
Oondi Calophyllaceae Tree NA
Callophylum inophyllum
Undi Callophyllaceae Tree NA
Careya arborea Kumbiyo Lecethidaceae Tree NA
Carica papaya Papaya Caricaceae Tree DD
Caryota urens Billemad Arecaceae Tree LC
Cassia fistula Bayo Caesalpiniaceae Tree NA
Casuarina equisetifolia
Phiramgisaro Casuarinaceae Tree NA
Ceasalpinia crista - Caesalpiniaceae Tree NA
Ceiba pentandra Savar Bombacaceae Tree NA
Cocos nucifera Naal Arecaceae Tree NA
Delonix regia Gulmohar Caesalpiniaceae Tree LC
Erythrina indica Pongaro. Fabaceae Tree LC
Ficus arnottiana Asti payr Moraceae Tree NA
Ficus asperrima Kharvat Moraceae Tree NA
Ficus bengalensis Vad Moracea Tree NA
Ficus glomerata Rumbad Moraceae Tree NA
Ficus racemosa - Moraceae Tree NA
Ficus religiosa Pipal Moracea Tree NA
Garcinia indica Bhiran Clusiaceae Tree Vu
Garunga pinnata Kakad Burseraceae Tree NA
Gmelina arborea Shivan Verbenaceae Tree NA

---------------------------------------------------------------------------------------------------------------------------------------------
EIA Study for Capacity Enhancement at Berth 5A, 6A of SWPL, Goa 3-73
Final Report, September, 2017
Botanical Name Common/Local Name
Family Habit IUCN Status
Grewia tillifolia Dhaman Tiliaceae Tree NA
Helicters isora Kivan Malvaceae Tree NA
Hibiscus tiliaceus Belipata Malvaceae Tree NA
Holigarnaarnottiana Ranbibo Anacardiaceae Tree NA
Hollarhena antidysentric
Kudo Apocynaceae Tree NA
Holoptelia integrifolia Vavalo Ulmaceae Tree NA
Hopea wightiana Pay Dipterocarpaceae Tree NA
Lagerstroemia lanceolata
Nano Lythraceae Tree NA
Lannea coromandelica
Moi Anacardiceae Tree NA
Mallotus phillipinensis Bems, Sendri. Euphorbiacea Tree NA
Mangifera indica Ambo Anacardiaceae Tree DD
Manilkara hexandra Kirni Sapotaceae Tree NA
Mimusops elengi Onwal Sapotaceae Tree NA
Morinda citrifolia - Rubiaceae Tree NA
Polyalthia fragrans Miryo, Mirio Annonaceae Tree NA
Pongamia pinnata Karanji Fabaceae Tree LC
Pterocarpus marsupium
Asan Fabaceae Tree Vu
Saraca indica Asoka Sapindaceae Tree NA
Schleichera oleosa Kusum Sapindaceae Tree NA
Semecarpus anacardium
Biboi Anacardiaceae Tree NA
Spondia mangifera Ambado Anacrdiaceae Tree NA
Sterculia villosa Aployo suplo Sterculiaceae Tree NA
Syzgium caryophyllatum
Bhedas Myrtaceae Tree NA
Syzgium cumini Jamun Myrtaceae Tree NA
Thespecia populinea Bhendi Malvaceae Tree NA
Trewia nudiflora Bomovaro petari Euphorbiacea Tree NA
Wrightia tinctoria Kalakundo Apocynaceae Tree LC
Xylia xylocarpa Zamba Mimosaceae Tree NA
Tectona grandis Teak Verbinaceae Tree NA
Terminalia crenulata Maretha Combretaceae Tree NA
Terminalia paniculata Quinzol Combretaceae Tree NA
Dalbergla latifolia Sisso Fabaceae Tree NA
Dillenia pentagyna Karmal Dilleniaceae Tree NA
Albezia procera Belati Mimosaceae Tree NA
Aegal marmelos Bel Rutaceae Tree NA
Wrightia tinctoria Shanta kudo Apocyanaceae Tree NA
Strobilanthes callosus Karvi Acanthaceae Shrub NA

---------------------------------------------------------------------------------------------------------------------------------------------
EIA Study for Capacity Enhancement at Berth 5A, 6A of SWPL, Goa 3-74
Final Report, September, 2017
Botanical Name Common/Local Name
Family Habit IUCN Status
Urena lobatta Ranbhendi Malvaceae Shrub NA
Fleminhia congesta - Fabaceae Shrub NA
Holorrhena antihysenterica
Nagur Cudo Apocyanacea Shrub NA
Wagatea spicata Yagati Caesalpiniaceae Climber NA
Source: Departement of Forests, Government of Goa.
Note: LC= Least Concern, VU= Vulenerable, En= Endangered, NA= Not Assessed, DD-Data deficient
3.18.2 FAUNA
Mammals
There are almost fifty species of mammals found in the State. Most of these are
unfortunately hardly ever visible to the average visitor. Among the mammals found
in the study area are common Jackal, Monkeys, Indian civet, wild dog, Indian hare,
Gaur, Indian porcupine, Wild boar and the mongoose. Monkeys are found all
across Goa. The most common species is the pink-bottomed macaque followed
by the Hanuman langur. Goa has four species of bats, the fruit bat, the Dormers
bat, the rufous horse-shoe bat, and the Malay fox vampire. Flying foxes are also
present in large numbers. Most of these are found in the rural interior areas. The
Indian giant squirrel, the smaller three-striped squirrel and the five-striped palm
squirrel are also found in most areas. Commonly found mammals in the study area
district and details of their conservation status as per IUCN List of threatened
animals are given in Table 3.34.
Table 3.34: List of Mammals reported in the study area
S. No. Zoological Name English Name IUCN
STATUS
1. Axis axis Spotted deer LC
2. Bandicota indica Bandicoot rat LC
3. Bos gaurus Gaur or Indian bison VU
4. Canis aureus Jackal LC
5. Cervus unicolor Sambar VU
6. Cuon alpinus Wild dog EN
7. Cynopterus brachyotis Indian fulvous fruit bat LC
8. Delphinus tropicalis linn Common Dolphin DD

---------------------------------------------------------------------------------------------------------------------------------------------
EIA Study for Capacity Enhancement at Berth 5A, 6A of SWPL, Goa 3-75
Final Report, September, 2017
S. No. Zoological Name English Name IUCN
STATUS
9. Prionailurus bengalensis Leopard cat LC
10. Felis chaus Jungle cat LC
11. Funambulus palmarum Common palm squirrel LC
12. Herpestes edwardsii Common grey mongoose LC
13. Hyaena hyaena Striped hyaena NT
14. Hystrix indica Porcupine LC
15. Lepus nigricollis Indian Hare LC
16. Loris tardigradus Red Slender loris EN
17. Lutra lutra Eurasian Otter NT
18. Lutra perspicillata Smooth coated Otter Vu
19. Macaca radiata Bonnet macaque LC
20. Manis crassicaudata Indian pangolin EN
21. Megaderma spasma Indian false vampire bat LC
22. Melursus ursinus Sloth bear VU
23. Muntiacus muntjak Barking deer LC
24. Mus booduga Indian field mouse LC
25. Otomopos wroughtoni Wronghton’s freetailed bat DD
26. Panthera pardus Leopard VU
27. Panthera tigris Tiger EN
28. Paradoxurus
hermaphroditus
Palm civet cat LC
29. Petaurista petaurista Common flying squirrel LC
30. Phocoena phocoena Porpoise LC
31. Pipistrellus dormeri Dormers bat LC
32. Presbytis entellus Common Langur VU
33. Pteropus giganteus Flying Fox LC
34. Rattus rattus House Rat LC
35. Ratufa macroura Malabar Giant Squirrel NT
36. Rhinolophus luctus Horse shoe bat LC
37. Suncus murinus (Linnaeus) House shrew LC
38. Sus scrofa Wild Boar LC
39. Tatera indica Indian Gerbille LC
40. Tragulus meminna Mouse deer LC
41. Tursiops aduncus Indian bottlenose dolphin DD
42. Viverricula indica Small Indian civet cat LC

---------------------------------------------------------------------------------------------------------------------------------------------
EIA Study for Capacity Enhancement at Berth 5A, 6A of SWPL, Goa 3-76
Final Report, September, 2017
Birds
Goa has an abundant birdlife. There are some very colourful species found in the
State and among these are the three common species of kingfisher: the stork-
billed kingfisher is the largest and most distinctive, the breasted kingfisher and and
the common kingfisher are the others. Other common and brightly coloured
species include the grass-green, blue and yellow bee-eaters, the golden oriole,
and the Indian roller, Hoopes, purple sunbirds, and several kinds of bulbuls,
babblers and drongos. The exotic paradise flycatcher is fairly widespread in Goa
and among the region's most exquisite birds.
The snowy white cattle egret, the large egret and the little egret and herons are
most common in the paddy fields along with cows and buffaloes. The beautiful
white bellied fish eagle, the brahminy kite and the pariah kite are birds of prey
found around towns and fishing villages. House crows, jackdaws, king vultures and
the white-backed vulture are also seen in most areas. In the state's forests are
found the grey hornbill, the Indian pied hornbill and the magnificent great pied
hornbill, several species of woodpecker including the lesser goldenback
woodpecker and the Indian great black woodpecker, the red junglefowl, the grey
or Sonnerat's jungle fowl. The commonly reported birds in goa and their
conservation status as per IUCN List are given in the Table 3.35.
Table 3.35: List of Bird species reported in the study area
S.
No.
Scientific name Common name IUCN
status
1 Accipiter badius Shikra VU
2 Acridotheres fuscus Jungle Myna LC
3 Acrocephalus aedon Thick billed Warbler LC
4 Acrocephalus agricola Paddyfield Warbler LC
5 Aegithina tiphia Common Iora LC
6 Alcedo atthis Common Kingfisher LC
7 Amaurornis phoenicurus White-breasted Waterhen LC
8 Anas acuta Northern Pintail LC
9 Anas clypeata Northern Shoveler LC
10 Anas crecca Common Teal LC
11 Anas poecilorhyncha Spot-billed LC

---------------------------------------------------------------------------------------------------------------------------------------------
EIA Study for Capacity Enhancement at Berth 5A, 6A of SWPL, Goa 3-77
Final Report, September, 2017
S.
No.
Scientific name Common name IUCN
status
12 Anas querquedula Garganey LC
13 Anastomus oscitans Asian Openbill LC
14 Anhinga melanogaster Oriental Darter NT
15 Anthus richardi Richards Pipit LC
16 Apus pacificus Large White Rumped Swift LC
17 Aquila pomarina Lesser Spotted Eagle LC
18 Ardea cinerea Grey Heron LC
19 Ardea purpurea Purple Heron LC
20 Ardeola grayii Indian Pond-Heron LC
21 Bubulcus ibis Cattle Egret LC
22 Cacomantis passerinus Grey-bellied Cuckoo LC
23 Calandrella brachydactyla Greater Short-toed Lark LC
24 Calidris temminckii Temminck's Stint LC
25 Celeus brachyyurus Rufous woodpecker LC
26 Centropus sinensis Greater Coucal LC
27 Ceryle rudis Pied Kingfisher LC
28 Chalcophaps indica Emerald Dove LC
29 Charadrius alexandrinus Kentish plover LC
30 Charadrius dubius Little ringed plover LC
31 Chloropsis aurifrons Gold fronted chloropsis LC
32 Circaetus gallicus Short-toed Snake-Eagle LC
33 Circus aeruginosus Western Marsh Harrier LC
34 Columba elphinstonii Nilgiri Wood-Pigeon VU
35 Columba livia Rock Pigeon LC
36 Copsychus malabaricus White-rumped Shama LC
37 Copsychus saularis Magpie robin LC
38 Coracina mealnoptera Black headed cuckoo shrike LC
39 Corvus macrorhynchos Jungle crow LC
40 Corvus splendens House Crow LC
41 Cuculus varius Common Hawk-Cuckoo LC
42 Cyornis tickelliae Tickell’s blue flycatcher LC
43 Cypsirus Parvus Palm Swift LC
44 Dendrocitta vagabunda Indian tree pie LC
45 Dendrocopos mahrattensis Yellow-crowned Woodpecker LC
47 Dendrocygna javanica Lesser Whistling teal LC
48 Dicaeum agile Thick billed Flowerpecker LC
49 Dicaeum erythrorhynchos Tickell’s Flowerpecker LC
50 Dicrurus aeneus Bronzed Drongo LC

---------------------------------------------------------------------------------------------------------------------------------------------
EIA Study for Capacity Enhancement at Berth 5A, 6A of SWPL, Goa 3-78
Final Report, September, 2017
S.
No.
Scientific name Common name IUCN
status
51 Dicrurus caerulescens White bellied Drongo LC
52 Dicrurus hottentottus Hair crested Drongo LC
53 Dicrurus macrocercus Black Drongo LC
54 Dicrurus paradiseus Greater racket tailed drongo LC
55 Dinopium benghalense Lesser golden back
woodpecker
LC
56 Dryocopus javensis White-bellied Woodpecker LC
57 Ducula badia Mountain Imperial-Pigeon LC
58 Dumetia hyperythra White throated Babbler LC
59 Egretta gularis Western Reef-Egret LC
60 Elanus caeruleus Black-winged Kite LC
61 Eremopterix grisea Ashy-crowned Sparrow-Lark LC
62 Eumyias thalassina Verditer flycatcher LC
63 Fulica atra Common Coot LC
64 Gallicrex cinerea Watercock LC
65 Gallinula chloropus Common Moorhen LC
66 Galloperdix spadicea Red Spurfowl LC
67 Gallus sonneratii Grey Junglefowl LC
68 Glareola lactea Small Pratincole LC
69 Gorsachius melanolophus Malayan Night Heron LC
70 Halcyon pileata Black-capped Kingfisher LC
71 Halcyon smyrnensis White-throated Kingfisher LC
72 Haliaeetus leucogaster White-bellied Fish-Eagle LC
73 Haliastur indus Brahminy Kite LC
74 Hemicircus canente Heart-spotted Woodpecker LC
75 Hemiprocene longipennis Crested tree swift LC
76 Hemipus picatus Pied flycathcher shrike LC
77 Himantopus himantopus Black-winged Stilt LC
78 Hirundo concolor Dusky Crag Martin LC
79 Hirundo daurica Red rumped Swallow LC
80 Hirundo smithii Wire tailed Swallow LC
81 Hypothymis azurea Black-naped Monarch LC
82 Iole indica Yellow-browed Bulbul LC
83 Irena puella Asian Fairy-bluebird LC
84 Lanius schach Long tailed Shrike LC
85 Leptoptilos javanicus Lesser Adjutant VU
86 Lonchura malacca Black headed Munia LC
87 Lonchura striata White Rumped Munia LC

---------------------------------------------------------------------------------------------------------------------------------------------
EIA Study for Capacity Enhancement at Berth 5A, 6A of SWPL, Goa 3-79
Final Report, September, 2017
S.
No.
Scientific name Common name IUCN
status
88 Megalaima haemacephala Crimson breasted Barbet LC
89 Megalaima viridis White cheeked Barbet LC
90 Merops leschenaulti Chestnut headed bee-eater LC
91 Merops orientalis Little Green Bee-eater LC
92 Merops philippinus Blue-tailed Bee-eater LC
93 Mesophoyx intermedia Intermediate Egret LC
94 Milvus migrans Black Kite LC
95 Motacilla citreola Citrine Wagtail LC
96 Motacilla madaraspatensis Large Pied wagtail LC
97 Muscicapa dauurica Asian Brown Flycatcher LC
98 Mycteria leucocephala Painted Stork NT
99 Myiophonus horsfieldii Malabar Whistling-Thrush LC
100 Nectarinia asiatica Purple Sunbird LC
101 Nectarinia lotenia Loten’s Sunbird LC
102 Nectarinia zeylonica Purple rumped Sunbird LC
103 Nycticorax nycticorax Black-crowned Night-Heron LC
104 Nyctyornis athertoni Blue bearded bee-eater LC
105 Oriole oriolus Golden oriole LC
106 Oriolus xanthornus Black headed oriole LC
107 Orthotomus sutorius Common Tailor bird LC
108 Oxylophus jacobinus Pied Cuckoo LC
109 Pandion haliaetus Osprey LC
110 Passer domesticus House Sparrow LC
111 Pavo cristatus Indian Peafowl LC
112 Pelargopsis capensis Stork-billed Kingfisher LC
113 Pellorneum ruficeps Spotted Babbler LC
114 Perdicula asiatica Jungle Bush-Quail LC
115 Pericrocotus cinnamomeus Small minivet LC
116 Pericrocotus cinnamomeus Small Minivet LC
117 Pericrocotus flammeus Scarlet Minivet LC
118 Picumnus innominatus Speckled Piculet LC
119 Pitta brachyura Indian Pitta LC
120 Ploceus philippinus Indian Baya LC
121 Pomatorhinus horsfieldii Indian Scimitar-Babbler LC
122 Porphyrio porphyrio Purple Swamphen LC
123 Porzana fusca Ruddy-breasted Crake LC
124 Prinia hodgsonii Grey-breasted Prinia LC
125 Prinia inornata Plain Prinia LC

---------------------------------------------------------------------------------------------------------------------------------------------
EIA Study for Capacity Enhancement at Berth 5A, 6A of SWPL, Goa 3-80
Final Report, September, 2017
S.
No.
Scientific name Common name IUCN
status
126 Prinia socialis Ashy Prinia LC
127 Psittacula krameri Rose ringed parakeet LC
128 Psittacula kyanocephala Blossom headed parakeet LC
129 Pycnonotus cafer Red vented Bulbul LC
130 Pycnonotus jocosus Red whiskered Bulbul LC
131 Pycnonotus luteolus White browed Bulbul LC
132 Rhipidura albicollis White throated fantail
flycatcher
LC
133 Saxicola caprata Pied bush chat LC
134 Saxicoloides fulicata Indian Robin LC
135 Sitta frontalis Velvet-fronted Nuthatch LC
136 Spilornis cheela Crested Serpent-Eagle LC
137 Spizaetus cirrhatus Changeable Hawk-Eagle LC
138 Sterna aurantia River Tern NT
139 Sterna bengalensis Lesser Crested-Tern LC
140 Sterna nilotica Gull-billed Tern LC
141 Streptopelia chinensis Spotted Dove LC
142 Sturnus pagodarum Brahminy Myna LC
143 Sturnus roseus Rosy Starling LC
144 Tachybaptus ruficollis Little Grebe LC
145 Terpsiphone paradisi Paradise flycatcher LC
146 Treron pompadora Pompadour Green-Pigeon LC
147 Tringa cinerea Terek Sandpiper LC
148 Tringa erythropus Spotted Redshank LC
149 Tringa glareola Wood Sandpiper LC
150 Tringa hypoleucos Common Sandpiper LC
151 Tringa nebularia Common Greenshank LC
152 Turdoides striatus Jungle Babbler LC
153 Turdus merula Eurasian Blackbird LC
154 Upupa epops Hoopoe LC
155 Vanellus indicus Red-wattled Lapwing LC
156 Vanellus malabaricus Yellow-wattled Lapwing LC
Source: Departement of Forests, Government of Goa.

---------------------------------------------------------------------------------------------------------------------------------------------
EIA Study for Capacity Enhancement at Berth 5A, 6A of SWPL, Goa 3-81
Final Report, September, 2017
Reptiles
The State has a large reptilian/amphibian population. This includes the ubiquitous
common house gecko, a variety of frogs and the common skink, monitor lizard,
Garden Lizard. Twenty-three species of snakes are found in Goa. The
nonpoisonous variety of snakes include the common blind snake, the Russell sand
boa, the Indian python, the Indian wart snake, trinket snake, Indian rat snake,
golden tree snake, common wolf snake, ,chequered keelback, striped keelback,
Indian gamma and common green whip snake. Details of commonly observed
reptilian fauna in the study area and their conservation status as per IUCN List are
given in Table 3.36.
Table 3.36: List of Reptile species reported in the study area
S.
No.
Scientific name Common name IUCN
STATUS
Snakes
1 Ahaetulla nasutus Vine Snake LC
2 Amphiesma stolatum Buff striped keel back NE
3 Boiga forsteni Forsten’s Cat Snake. LC
4 Boiga trigonata Common Indian Cat
Snake.
LC
5 Bungarus caeruleus Common Indian Krait VU
6 Calliophis nigrescens LC
7 Cerberus rhynchops Dogfaced water Snake LC
8 Chrysopelea ornata Golden back tree Snake LC
9 Coelognathus helena Trinket Snake VU
10 Dendrelaphis tristis Bronzeback tree Snake NE
11 Echis carinatus Saw scaled Viper LC
12 Enhydrina schistosa Hook-nosed Sea Snake LC
13 Eryx johnii Johns sand boa LC
14. Gongylophis conicus Common Sand Boa DD
15 Grypotyphlops acutus Beaked worm snake LC
16 Lycodon aulicus Common Wolf snake NE
17. Macropisthodon plumbicolor Green keelback. LC
18. Naja naja Indian Spectacled Cobra. LC
19 Oligodon arnensis Common Kukri snake LC
20 Oligodon taeniolatus Variegated Kukri Snake LC
21. Ophiophagus hannah King Cobra VU

---------------------------------------------------------------------------------------------------------------------------------------------
EIA Study for Capacity Enhancement at Berth 5A, 6A of SWPL, Goa 3-82
Final Report, September, 2017
Source: Departement of Forests, Government of Goa.
Amphibians
Amphibians are important components of many ecosystem and they play a vital
role as predators in the food chain. They are good indicators of habitat quality due
to their permeable skins, dual life mode and limited dispersal capabilities. Most of
species inhabit arboreal, aquatic and terrestrial habitat. Most of amphibians are
belongs to the family Ranidae and species like common Indian toad, Painted frog,
green frog and Rana spp. are common in the area (Table 3.37).
Table 3.37: List of Amphibian species reported in the study area
S No. Scientific name Common name IUCN STATUS
Amphibians
1. Duttaphrynus
melanostictus (schnieder)
Indian toad LC
2. Hoplobatrachus tigerinus Indian bull frog LC
3. Euphlyctis cyanophlyctis Indian skipper frog LC
4. Sphaerotheca breviceps Indian burrowing frog LC
5. Rhacophorus malabaricus Malabar gliding frog LC
6. Rana malabarica Fungoid frog LC
Note: LC-Least concern, DD–Data Defecient, VU-vulnerable, EN-Endangered.
22. Ptyas mucosa Indian Rat Snake LC
23. Python molurus Indian Rock Python VU
24. Ramphotyphlops braminus Brahminy worm snake LC
25 Trimeresurus malabaricus Malabar Pit Viper LC
26 Trimeresurus gramineus Bamboo Pit Viper LC
27 Uropeltis macrolepis
macrolepis
Bombay shield tail LC
28. Vipera russelii Russels Viper LC
29. Xenochrophis piscator Checkered keelback LC
Lizards, Skinks
1 Calotes rouxii Rouxii lizard LC
2 Calotes versicolor Indian garden lizard LC
3 Chamaeleo zeylanicus Indian chameleon LC
4 Draco dussumieri Flying lizard LC
5 Mabuya macularia Bronze skink LC

---------------------------------------------------------------------------------------------------------------------------------------------
EIA Study for Capacity Enhancement at Berth 5A, 6A of SWPL, Goa 3-83
Final Report, September, 2017
3.18.3 Eco-sensitive Zones
The Eco-sensitive Zones declared as Protected Areas in Goa by the Ministry of
Environment and Forests and Climate Change are:
(i) Cotigao Wildlife Sanctuary, South Goa
(ii) Netravali Wildlife Sanctuary, South Gao
(iii) Bhagwan Mahaveer Wildlife Sanctuary and National Park, North Goa
(iv) Madei Wildlife Sanctuary, North Goa
(v) Bondla Wildlife Sanctuary, North Goa
(vi) Dr. Salim Ali Wildlife Sanctuary, North Goa
Of the above ecosensitve zones only Dr. Saliim Ali Wild life sanctuary falls within
15 kms radius of the study area. The Dr. Salim Ali Bird Sanctuary, Goa lies
between latitudes 15º 31' 36.03" N and 15º 30' 35.35" N and longitudes 73º 52'
14.31" E and 73º 50' 44.12" E in the North Goa District of Goa State and extending
over an area of 1.78 square kilometres. Location of the sanctuary is shown in
Figure 3.21. It is a rich mangrove formation at the confluence of Mapusa river and
Mandovi river. The sanctuary exclusively shelters varieties of amphibians, otters,
crocodiles, varieties of fish, aquatic birds, shore birds and arboreal birds and
reptiles, fruit bat (Pteropus spp.) commonly occur in the area, migratory birds,
adjutant storks and raptorial birds like osprey visit the protected area annually.

---------------------------------------------------------------------------------------------------------------------------------------------
EIA Study for Capacity Enhancement at Berth 5A, 6A of SWPL, Goa 3-84
Final Report, September, 2017
Figure 3.21: Eco-sensitive Zone Map of Goa
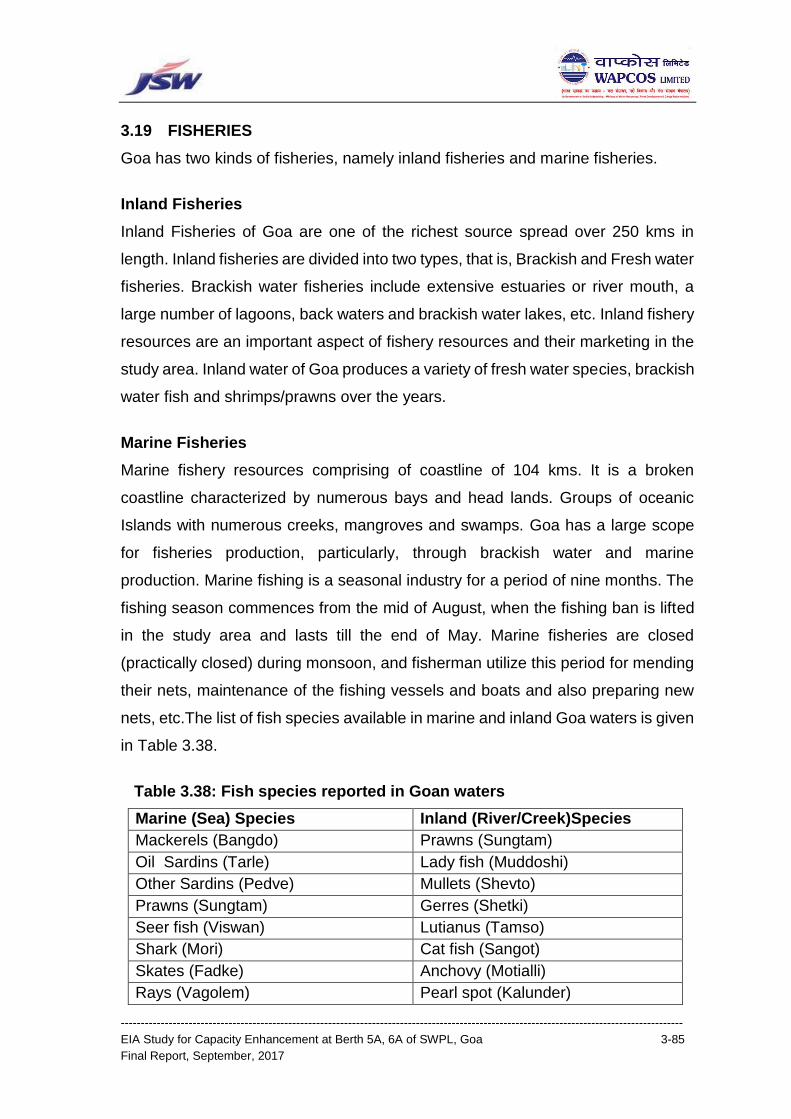
---------------------------------------------------------------------------------------------------------------------------------------------
EIA Study for Capacity Enhancement at Berth 5A, 6A of SWPL, Goa 3-85
Final Report, September, 2017
3.19 FISHERIES
Goa has two kinds of fisheries, namely inland fisheries and marine fisheries.
Inland Fisheries
Inland Fisheries of Goa are one of the richest source spread over 250 kms in
length. Inland fisheries are divided into two types, that is, Brackish and Fresh water
fisheries. Brackish water fisheries include extensive estuaries or river mouth, a
large number of lagoons, back waters and brackish water lakes, etc. Inland fishery
resources are an important aspect of fishery resources and their marketing in the
study area. Inland water of Goa produces a variety of fresh water species, brackish
water fish and shrimps/prawns over the years.
Marine Fisheries
Marine fishery resources comprising of coastline of 104 kms. It is a broken
coastline characterized by numerous bays and head lands. Groups of oceanic
Islands with numerous creeks, mangroves and swamps. Goa has a large scope
for fisheries production, particularly, through brackish water and marine
production. Marine fishing is a seasonal industry for a period of nine months. The
fishing season commences from the mid of August, when the fishing ban is lifted
in the study area and lasts till the end of May. Marine fisheries are closed
(practically closed) during monsoon, and fisherman utilize this period for mending
their nets, maintenance of the fishing vessels and boats and also preparing new
nets, etc.The list of fish species available in marine and inland Goa waters is given
in Table 3.38.
Table 3.38: Fish species reported in Goan waters
Marine (Sea) Species Inland (River/Creek)Species
Mackerels (Bangdo) Prawns (Sungtam)
Oil Sardins (Tarle) Lady fish (Muddoshi)
Other Sardins (Pedve) Mullets (Shevto)
Prawns (Sungtam) Gerres (Shetki)
Seer fish (Viswan) Lutianus (Tamso)
Shark (Mori) Cat fish (Sangot)
Skates (Fadke) Anchovy (Motialli)
Rays (Vagolem) Pearl spot (Kalunder)

---------------------------------------------------------------------------------------------------------------------------------------------
EIA Study for Capacity Enhancement at Berth 5A, 6A of SWPL, Goa 3-86
Final Report, September, 2017
Marine (Sea) Species Inland (River/Creek)Species
KowalaCoval (Velli) Betki (Channok)
Golden Anchovy (Kapsale) Milk Fish (Gholsi)
Cat fish (Sangot) Megalops (Keri)
Sciaenoids (Dodiaro) Scatophagus (Mutre)
Butter fish (Saundale) Ambasis (Burante)
Jew fish (Ghol) Crabs (kurlio)
Indian Salmon (Rawao) Black water Clams (kubye)
Silver belly (kampi) False Clams (Tisrio)
Lobster (Shivod) Oysters (Kalwam)
Soles (Lepo) Mussel (Xinanee)
Silver Bars (karli) Lepo
Pomfrets (Paplet) Indian salmon
Lady fish (Muddoshi) Balle Reddish
Mullets (Shevto) Others (Pedve, Saundale)
Caranx (Tonki,Concoretc)
Others Clupeids
Bombay Duck (Bombil)
Sepia (Manki)
Perches (Gobro)
Crabs (Kurlio)
Ambasis (Burante)
Ribbon fish (Balle)
Thread fin (Dara Rane)
Herrings
Tunafish
Horse Mackerals
Leather Jacket (Diana)
Indian Shad
Source: Directorate of Fisheries, Government of Goa.
Finfish distribution
With respect to finfish distribution, the following species namely Pampus argentus,
Ilisha striatula, Pampus chinenis, Hyporhamphus dussumieri, Scomberoides
lysan, Lutjanus malabaricus, Harpadon nehereus, Cynoglossus linga, Rastrelliger
kanagurta, Cynoglossus arel and Carangoides caeruleopinnatus were
predominantly recorded nearby in and around Karwad fish landing center, which
is located near Mormugoa port waters.

---------------------------------------------------------------------------------------------------------------------------------------------
EIA Study for Capacity Enhancement at Berth 5A, 6A of SWPL, Goa 3-87
Final Report, September, 2017
Fish Landing
Proposed project is located in South Goa, which has one major, 3 medium and 4
minor fish landing Centers. Three fish landing centers of North Goa also falls with
in the study area of the proposed project. Inland fish landing centers are present
only in the Tiswadi Taluaka of the study area. The details of marine and inland fish
landing centers in Goa are given in Tables 3.39 and 3.40 respectively.
Table 3.39: Marine fish landing centre in the study area
S.No. District Fish Landing Centre
1 North Goa Siridao
Nauxi
Dauna Paula
2 South Goa Khari wada, Vasco
Baina
Bogmalo
Source: Directorate of Fisheries, Government of Goa.
Table 3.40: List of Inland fish landing centers in the study area
Tiswadi Taluka
1. St. Estevam 4. Chorao 7. Neura
2. Cumbharjua 5. Mandur 8. Agaciam
3. Diwar 6. Goa velha 9. Curca
Source: Directorate of Fisheries, Government of Goa.
Marine fish production during last 15 years have been anlysed. The marine fish
production of Goa in the average consolidation of five years in last fifteen years
showed a total sustainable steady growth of 81638 tonnes during the period of
2001-05 to 99427 tonnes in 2011-2015 thereby giving a hike of 21.79%. The
details of five year average marine fish catch in Goa for 15 years are given in the
Table 3.41. Trend of specie-wise production of marine fisheries during the period
2010 to 2015 in Goa is given in Table 3.42.

---------------------------------------------------------------------------------------------------------------------------------------------
EIA Study for Capacity Enhancement at Berth 5A, 6A of SWPL, Goa 3-88
Final Report, September, 2017
Table 3.41: Five year marine fish catch at Goa for 15 years (Unit : MT)
Species Average
production
2001-2005
Average
production
2006-2010
Average
production
2011-2015
Mackerals(Bangdo) 9279 17564 14833
Sardines(Tarlo) 29149 28084 46094
Cat Fish(Sangot) 1475 1914 651
Shark Fish(Mori) 1432 1500 283
Seer Fish(Wiswan) 3857 3044 2039
Prawns(Sungtam) 5203 8986 8730
Pomprets(Paplet) 694 402 702
Cuttle Fish(Manki) 1340 1278 2100
Tuna(Bokdo) 1035 1634 3041
Ribbon Fish(BAlle) 3110 2134 628
Reef Cod(Gobro) 788 316 1033
KowalaKowal(velli) 482 416 589
Golden Anchovy (Kapsale) 57 18 23
Silver Belly(Kampi) 2885 2020 1743
Soles(Lepo) 2087 1844 3745
Silver Bar(Karli) 451 376 89
Crabs(Kurlio) 876 1009 1210
Sciaenoids(Dodiaro) 2546 2141 1654
Butter Fish(Soundale) 491 926 707
Others 14401 13200 9533
Total 81,638 88,806 99,427
Source: Goan fish trails, Volume-III-2016, Dept. of Fisheries, Government of Goa.
Table 3.42: Fish catch at different Fish Landing Centers (Unit: in tonnes)
Species Annual fish catch at Goa
2010 2011 2012 2013 2014 2015
Mackerals(Bangdo) 23831 22128 17860 12994 10308 10876
Sardines(Tarlo) 23732 26391 34329 31629 80849 57270
Cat Fish(Sangot) 1402 1545 364 383 598 367
Shark Fish(Mori) 3159 375 234 281 307 216
Seer Fish(Wiswan) 1229 1884 1616 2751 1621 2363
Prawns(Sungtam) 9970 8008 8968 8380 9283 9012
Pomprets(Paplet) 185 376 174 1342 643 977
Cuttle Fish(Manki) 1341 1012 1180 4422 2150 1737
Tuna(Bokdo) 2524 3801 2621 3520 1368 3896

---------------------------------------------------------------------------------------------------------------------------------------------
EIA Study for Capacity Enhancement at Berth 5A, 6A of SWPL, Goa 3-89
Final Report, September, 2017
Ribbon Fish(BAlle) 839 49 644 1107 376 966
Reef Cod(Gobro) 1303 5 495 1409 1262 1993
KowalaKowal(velli) 279 438 562 1046 618 282
Golden Anchovy
(Kapsale)
2 -- 50 29 2 33
Silver Belly(Kampi) 1584 1012 1146 3328 1991 1240
Soles(Lepo) 1606 3995 3683 2579 3982 4487
Silver Bar(Karli) 219 62 98 54 121 110
Crabs(Kurlio) 763 1236 1160 830 1256 1568
Sciaenoids(Dodiaro) 1376 1448 1629 1425 1802 1966
Butter Fish
(Soundale)
1116 978 656 594 676 630
Others 10002 11482 9159 9881 8894 8251
Total 87062 86185 86628 87984 128107 108240
Source: Goan fish trails, Volume-III-2016, Dept. of Fisheries, Government of Goa.
As per the fish landing data collected from Department of Fisheries, Government
of Goa. Khariwada, Vasco is the largest fish landing centre in the study area. The
details of fish catch recorded by the department of fisheries at different fish
Landing Centers in the study area from 2013 to 2015 in South Goa are given in
Table 3.43, and from 2013 to 2014 in North Goa are given in Table 3.44.
Table 3.43: Fish catch at different Fish Landing Centers in South Goa
(Unit: in tonnes)
S.
N.
Species Khari wada Baina Bogmalo
2013 2014 2015 2013 2014 2015 2013 2014 2015
1 Mackerals
(Bangdo)
6465 2668 3711 150 339 186 17 97 16
2 Sardines
(Tarlo)
4056 6022 7325 273 141 116 11 89 9
Other
sardines
0 1463 0 78 0 0 7
3 Catfish
(Sangot)
143 195 67 0 0 28 0 0 0
4 Shark fish
(Mori)
0 12 6 9 2 7 2 0 1
5 Seer fish
(Wiswan)
81 98 114 14 14 23 3 5 2
6 Prawns
(Sungtam)
1811 2312 1539 39 203 30 10 36 17

---------------------------------------------------------------------------------------------------------------------------------------------
EIA Study for Capacity Enhancement at Berth 5A, 6A of SWPL, Goa 3-90
Final Report, September, 2017
Source: Department of Fisheries, Government of Goa, Goa.
Table 3.44: Fish Catch at different Fish Landing Centers of North Goa
(Unit: in tonnes)
S.
N.
Species Siridao Nauxi Dauna Paula
2013 2014 2013 2014 2013 2014
1 Mackerals(Bangdo) 31 50 17 32 50 68
2 Sardines(Tarlo) 39 91 32 52 65 99
3 Catfish(Sangot) 5 6 0 8 2 2
4 Shark fish(Mori) 0 1 0 0 0 1
7 Pomfrets
(Pap let)
102 18 120 2 5 76 0 0 0
8 Cuttle fish
(Manki)
622 192 88 24 11 5 6 4 5
9 Tuna(Bokdo) 473 29 469 0 1 0 0 0 9
10 Ribbon fish
(Balle)
119 18 80 0 2 0 0 0 0
11 Reef Cod
(Gobro)
129 28 0 4 3 0 1 1 0
12 Kowalakowal
(Velli)
177 45 13 14 5 0 2 21 0
13 Golden
Anchovy
(Kapsale)
0 0 26 2 0 0 0 0 0
14 SilverBelly
(kampi)
1125 292 501 56 36 87 14 42 7
15 Soles(Lepo) 651 510 357 44 45 74 6 2 14
16 Silver Bar
(karli)
0 7 41 0 _ 4 0 _ 0
17 Crabs (kurlio) 268 281 145 18 13 75 7 5 14
18 Sciaenoids
(Dodiaro)
343 495 201 45 32 51 14 3 1
19 Butter fish
(Soundale)
160 274 158 18 28 51 7 0 1
20 Lady fish 0 0 8 0 0 0 0 0 0
21 Mullet 0 0 9 0 0 7 0 0 2
22 Carnix 0 0 2 0 0 6 0 0 0
23 Perches 0 0 0 0 0 2 0 0 0
24 Lobster 0 0 0 0 0 0 0 0 1
25 Thresdfin 0 0 17 0 0 0 0 0 0
26 Others 1188 1032 716 80 107 102 47 203 40
Total 7392 14528 19191 369 987 3023 2160 508 2161

---------------------------------------------------------------------------------------------------------------------------------------------
EIA Study for Capacity Enhancement at Berth 5A, 6A of SWPL, Goa 3-91
Final Report, September, 2017
S.
N.
Species Siridao Nauxi Dauna Paula
2013 2014 2013 2014 2013 2014
5 Seer fish(Wiswan) 0 1 0 0 0 0
6 Prawns(Sungtam) 21 42 27 50 67 89
7 Pomprets(Pap let) 0 1 0 0 0 2
8 Cuttle fish (Manki) 0 2 2 7 4 6
9 Tuna(Bokdo) 0 1 0 0 0 0
10 Ribbon fish (Balle) 0 0 0 0 0 0
11 Reef Cod (Gobro) 0 5 2 0 2 3
12 Kowalakowal(Velli) 15 56 22 21 32 41
13 Golden Anchovy
(Kapsale)
0 0 1 0 4 0
14 SilverBelly(kampi) 0 5 1 _ 2 1
15 Soles(Lepo) 6 15 6 23 25 22
16 Silver Bar(karli) 0 2 4 3 11 2
17 Crabs (kurlio) 7 45 33 52 28 47
18 Sciaenoids(Dodiar
o)
1 35 3 6 7 27
19 Butter fish
(Soundale)
0 0 0 4 1 0
20 Others 47 68 38 63 76 78
Total 2185 426 2201 321 2389 488
Source: Dapartment of Fisheries, Government of Goa
Fisherman Population
The project study area consists of 10 fishing vailages, of which 4 villages falls in
Mramugao and 6 villages are in Tiswadi Taluka. As per the Marine Fisheries
cencus 2010 (Goa) Published by Ministry of Agriculture & CMFRI, total of 405
fishermen families are registered in the study area. The study area has a total 2274
fishermen population. A Population of fisherman in the study area Taluka is given
in Table 3.45.
Table 3.45: Fishermen population in the study area
S.No Name of Village Fishermen
Families
Traditional
Fishermen Families
Fisherfolk
population
Taluk:Marmagoa
1 Vasco-Da-Gama 45 45 262
2 Baina 71 69 421

---------------------------------------------------------------------------------------------------------------------------------------------
EIA Study for Capacity Enhancement at Berth 5A, 6A of SWPL, Goa 3-92
Final Report, September, 2017
S.No Name of Village Fishermen
Families
Traditional
Fishermen Families
Fisherfolk
population
3 Bogmalo 23 15 109
4 Velsao 66 66 348
Taluk: Tiswadi
5 Caranzalem 20 20 100
6 Dona-Paula 20 20 98
7 Nauxi 19 19 86
8 Odxel 26 26 155
9 Siridona 90 90 548
10 Agassaim 25 25 147
Total 405 395 2274
Source: Goan fish trails, Volume-III-2016, Dept. of Fisheries, Government of Goa.
3.20 ARCHEOLOGICALLY IMPORTANT SITES
The project area has several archeologically important monuments protected
under the international conventions, national or local legislation. Several churches
and forts of archaeological and historical importance are located in the study area
are and some of them are protected and /or world heritage centers site. Status of
the important forts and church located in the study area are summerised in
following section:
Mormugoa Fort, Vasco
Mormugao Fort was build in 1624, was considered as one of the major costal forts
in Goa. The fort is located to the north of Vasco Da Gama town and south of
Murmogao Port. The Mormugao Fort covered a total region of six miles in
circumference, contained towering bulwarks, three magazines, five prisons, a
chapel and quarters for the guard. It had 53 guns and a garrison with 4 officers,
and was an important fortress on the western coast. A coastal fort, sprawled over
6 miles, built by the Portuguese in 1624 solely to offer them supremacy against
marine attacks, Mormugao Fort is today situated among some of Goa’s most
visited tourist attractions like Varca Beach.

---------------------------------------------------------------------------------------------------------------------------------------------
EIA Study for Capacity Enhancement at Berth 5A, 6A of SWPL, Goa 3-93
Final Report, September, 2017
Church of Our Lady of Rosary (1542-1549), Old Goa
This Church built in Manueline style on the holy hill, located approximately 9.5 kms
form the present project site. There are two chapels and three altars with the main
altar dedicated to Our Lady of Rosary.
REIS Magos Fort, Bardez
This fort was built on the banks of the Mandovi river, located about 12 kms from
the project site. The Reis Magos Fort was converted to a sub-jail to lodge short
term convicts. It was also used to lodge freedom fighters working for the liberation
of Goa, when the movement intensified in 1950's . The Fort functioned as jail till
1993 and during this period a number of modifications were carried out.
In 2007, a tripartite agreement was signed between the Govt of Goa, INTACH and
the Hamlyn Trust to restore and re-sue the fort as a Cultural Centre. The
restoration was sponsored by the HHT. Fort was thrown open on 5th June 2012.
Our Lady of Exile Church, Desterro
A primitive chapel dedicated to St Thomas was built in 1672 in Desterro, Goa. This
Chapel to St Thomas was then replaced with the present chapel dedicated to Our
Lady of Exile at Desterro also called ‘Nossa Senhora do Desterro, Goa’ in
Portuguese which was affiliated to the St Andrew’s Parish in Vasco. In January
1997, the new parish was created of Our Lady of Exile Church, Desterro, Goa.
Aguada Fortress (Upper), Condolim
The fort Aguada built of laterite stone in 1512 comprises a lower fortification with
bastions all around and an upper fort. The fort besides offering a safe berth to
Portuguese ships was also their water storing point since the place had a perennial
water supply. The word Aguada in Portuguese means a watering place. This fort
is located around 9 km from the present project site.
Fortification Wall of Aguada Fortress (Lower), Condolim
Fortification wall of aguada fortress was built in 1612 by Portuguese and
overlooking the Arabian Sea. It serves as a place for watering to Portuguese
Armadas and a point for keeping close watch on intruders entering into the

---------------------------------------------------------------------------------------------------------------------------------------------
EIA Study for Capacity Enhancement at Berth 5A, 6A of SWPL, Goa 3-94
Final Report, September, 2017
Mandovi River. It has one bastion protruding towards the sea and four smaller
bastions at different intervals. Fortification wall is around 9 KM from the present
project site.
Our Lady of Health Church, Sancole
Our Lady of Health Church at Sancoale is located about 12 km from the project
site. This church is also known as Nossa Senhora de Saude Church. Today only
a part of the church's facade stands on the banks of the Zuari River. The erstwhile
Portuguese Government had declared it a national monument on 19.3.1937. The
Patron of Goa Blessed Joseph Vaz wrote his famed ''Letter of Bondage'' at this
church in 1677.
Ruins of Shanta Durga Temple, Salcete
Ruins of Shanta Durga Temple, Salcete is located about 11km from project
location. The original temple at Quelossim (Keloshi) in Salsete was destroyed by
the Portuguese in 1564. The goddess was transferred to Kavalem and worship
was continued there.
Ruins of Manguesh Temple, Cortalim, Salcete
The 18th century, Shri Mangesh Temple, lies on the north west of Ponda in Priol.
Considered to be the most important temple in Goa, it belongs to the typical Goan
Hindu temple style of architecture. This picturesque little temple is built on a hilltop
amidst sprawling farmlands. The temple has shrines of Parvati (consort of Shiva –
Destroyer of the Universe) and Ganesha (the elephant-god of Prosperity and
Wisdom). Most of the Goan temples are noted for their chiseled architecture and
their distinctive style.
British Cemetry at Dona Paula, Panaji
The British Cemetery is situated at a distance of 5 km from the study area. It was
built around the year 1802 by the British, It is considered to be more than 180
years old and is the the only remnant of the British occupation of the territory of
Goa during the Napoleonic period wars from 1799 to 1813 to prevent Goa from
falling into the hands of the French The cemetery has 56 gravestones of sepulchral

---------------------------------------------------------------------------------------------------------------------------------------------
EIA Study for Capacity Enhancement at Berth 5A, 6A of SWPL, Goa 3-95
Final Report, September, 2017
relics and 47 well preserved tombs are found at the site, The tombs date from 1808
and to 1912.
Ruins of Kaivalya Math at Consua, Cortalim
There are two caves scooped in Laterite. It might have been used for meditation.
3.21 SENSITIVE INSTALLATIONS
3.21.1 Defense Installations
Defence installations situated within 5 Km from the proposed project location are
listed below:
INS Hansa, is military airbase and operates from Dabolim Airport.
INS Mandovi is located along the banks of Mandovi river in Panaji. It was
established as a Sailors Training Establishment in 1976. The National Defence
College at INS mandovi aims to impart training in national and international
security to select senior Civil and Defence Officers.
INS Gomantak caters to the logistics and manitanence support.
INHS Jeevanti is the naval hospital located in Vasco-da-gama
Goa Shipyard Limited designs and builds sophisticated ships for Navy and Coast
Guard with the aim of achieving self-sufficiency in this vital technology.
It also builds commercial vessels like Offshore Supply Vessels, Oceanographic
and Coastal Research Vessels, Fishing Vessels, Dredgers, Tugs, etc. Apart from
shipbuilding it also carries out ship repairs and promotes use of indigenous
equipment such as computers, radar, communication equipment, auxiliary
machinery, electrical fittings and domestic equipment.
Signal Training Centre (HQ 2), comprises of a headquarters, a military training
regiment and technical training regiments. This centre is the largest military
establishment in the state of Goa and the only local services establishment
available for aid to the civil power.
3.21.2 Densely Populated / Builtup Area / Educationoal Institutes
The headland sada and Vasco are situated beside the Murmugoa Port Trust and
has a densely populated builtup area. The area also houses the MPT colonies and
hospital run by the MPT. The Murmugao Municipal Corpporation comprises of the
---------------------------------------------------------------------------------------------------------------------------------------------
EIA Study for Capacity Enhancement at Berth 5A, 6A of SWPL, Goa 3-96
Final Report, September, 2017
areas of Vasco and Sada. Panajim and Sridao are the other densly populated
areas with in 15 km from the proposed project. The total population with in the
15 km radius of the proposed project site as per Census of India 2011 is of the
order of 2,67,477.
NIO is an important establishment located at about 5 km from the proposed project
site located. NIO established over 40 years has grown into a large oceanographic
laboratory of international repute focusing on the understanding of special
oceanographic features of the Northern Indian Ocean.
The other organisations of importance within the study area are National Centre
for Antarctica and Ocean Research (NCAOR), District Jail, Central warehouse,
Indian Maritime Institue. There are schools, colleges and other educational
institutions in the study area.
The cemeteries of importance within the 15km radius are Talegoa Church
Cemetery, St. Andrews Church Cemetery, Murumugoa Cemetery, British
Cemetery Sinquerim Cemetery, Vasco District cemetery. Apart from the above
mentioned built up areas there a lot of places of worship and commercial centeres
that includes the trourist homes, Hotels, Lodges and other State and private
offices. The area is well connected by roads and railways.
3.21.3 Hospitals
The important hospitals located within 15 km area includes the Goa Medical
College Cum Hospital, SMRC’s V M Salgaocar Hospital, Mormugoa Port Trust
Hospital, Chicalim Cottage Hospital.
Goa Medical College
Goa Medical College is the successor of the 'Escola Medico Cirungica de Goa'
established by the Portuguese in the year 1842. In the year 1963, this Medical
School was upgraded as Goa Medical College, attached to the Bombay University
and later in the year 1983 affiliated to Goa University. This is one of the prestigious
institution of the country, recognized by the Medical Council of India, admits
100 students for undergraduate M.B.B.S. Course, while 72 Post-Graduate are
---------------------------------------------------------------------------------------------------------------------------------------------
EIA Study for Capacity Enhancement at Berth 5A, 6A of SWPL, Goa 3-97
Final Report, September, 2017
admitted every year. The Goa Medical College Hospital were initially operating
from Panaji and Ribandar, shifted to Bambolim in the year 1991, has presently
1000 beds, whereas 80 bedded TB and Chest Disease Hospital functions from
St.Inez, Panaji. Similarly, a 20 bedded Rural Health and Training Centre is situated
in Mandur. The entire complex at Goa Medical College, Bambolim is spread in an
area of 11,34,798 Sq Mts.
SMRC’s V M Salgaocar Hospital, 118 bedded multi-specialty hospital with a 50
bedded Cardiology Department including CCU, Non-Invasive and Invasive Setup.
Chicalim Cottage Hospital
The Cottage hospital is one of the six maor hsopitals of Directorate of helath
services, Governemnt of Goa. The Cottage Hospital, serves as referral Hospital.
Mormugoa Port Trust Hospital
Mormugao Port Trust has its own 100 bedded hospital, having fully equipped
indoor and outdoor departments at Headland and first Aid Centres at Mormugao
Harbour, MPT Workshop and at MOHP area. Medical facilities in the disciplines of
General Medicine, General Surgery, Obstetrics & Gynecology, Pediatrics,
Ophthalmology and Dentistry are available to the employees and their
dependents. These are further supported by other Anesthesiology, Pathology,
Radiology, Orthopedics. The hospital has also extended medical facilities of
Ayurvedic and Homeopathic treatment to the employees and their families.
Whenever necessary, arrangements for external specialist consultations/ referral
are made in the interest of the patient. Apart from medical officers, the hospital is
enriched with qualified and experienced nursing personnel and paramedical staff.
Chicalim Cottage Hospital
The Cottage hospital is one of the six maor hsopitals of Directorate of helath
services, Governemnt of Goa. The Cottage Hospital, serves as referral Hospital.
The primary health care infrastructure has been developed as a three tier system
such as Sub-Centres, Primary Health Centres and Community Health Centres.
Sub-Centre is the most peripheral contact point between the Primary Health Care
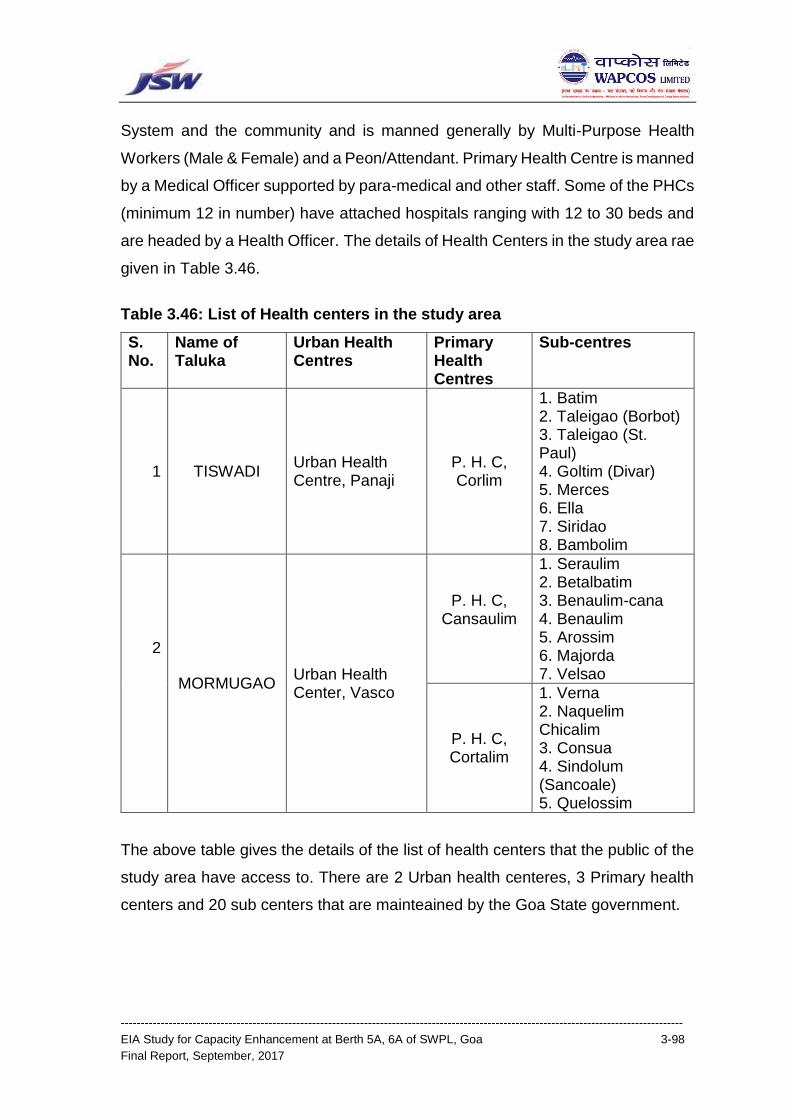
---------------------------------------------------------------------------------------------------------------------------------------------
EIA Study for Capacity Enhancement at Berth 5A, 6A of SWPL, Goa 3-98
Final Report, September, 2017
System and the community and is manned generally by Multi-Purpose Health
Workers (Male & Female) and a Peon/Attendant. Primary Health Centre is manned
by a Medical Officer supported by para-medical and other staff. Some of the PHCs
(minimum 12 in number) have attached hospitals ranging with 12 to 30 beds and
are headed by a Health Officer. The details of Health Centers in the study area rae
given in Table 3.46.
Table 3.46: List of Health centers in the study area
S. No.
Name of Taluka
Urban Health Centres
Primary Health Centres
Sub-centres
1 TISWADI Urban Health Centre, Panaji
P. H. C, Corlim
1. Batim 2. Taleigao (Borbot) 3. Taleigao (St. Paul) 4. Goltim (Divar) 5. Merces 6. Ella 7. Siridao 8. Bambolim
2
MORMUGAO Urban Health Center, Vasco
P. H. C, Cansaulim
1. Seraulim 2. Betalbatim 3. Benaulim-cana 4. Benaulim 5. Arossim 6. Majorda 7. Velsao
P. H. C, Cortalim
1. Verna 2. Naquelim Chicalim 3. Consua 4. Sindolum (Sancoale) 5. Quelossim
The above table gives the details of the list of health centers that the public of the
study area have access to. There are 2 Urban health centeres, 3 Primary health
centers and 20 sub centers that are mainteained by the Goa State government.
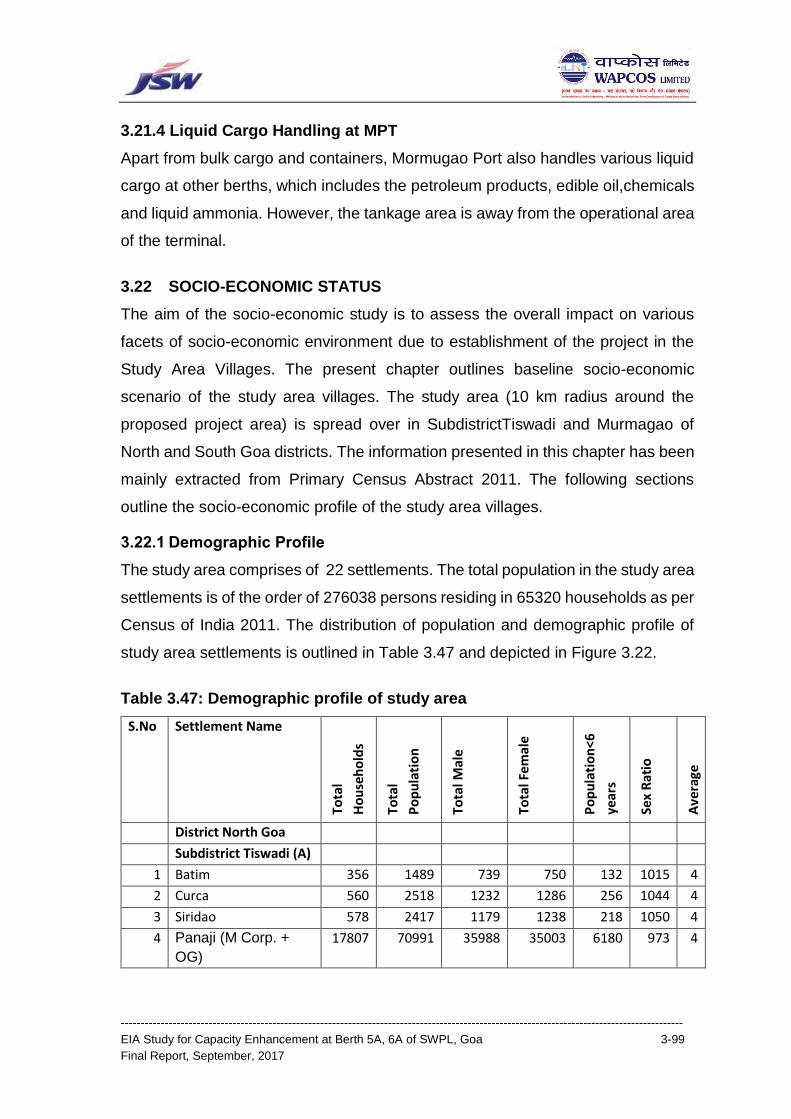
---------------------------------------------------------------------------------------------------------------------------------------------
EIA Study for Capacity Enhancement at Berth 5A, 6A of SWPL, Goa 3-99
Final Report, September, 2017
3.21.4 Liquid Cargo Handling at MPT
Apart from bulk cargo and containers, Mormugao Port also handles various liquid
cargo at other berths, which includes the petroleum products, edible oil,chemicals
and liquid ammonia. However, the tankage area is away from the operational area
of the terminal.
3.22 SOCIO-ECONOMIC STATUS
The aim of the socio-economic study is to assess the overall impact on various
facets of socio-economic environment due to establishment of the project in the
Study Area Villages. The present chapter outlines baseline socio-economic
scenario of the study area villages. The study area (10 km radius around the
proposed project area) is spread over in SubdistrictTiswadi and Murmagao of
North and South Goa districts. The information presented in this chapter has been
mainly extracted from Primary Census Abstract 2011. The following sections
outline the socio-economic profile of the study area villages.
3.22.1 Demographic Profile
The study area comprises of 22 settlements. The total population in the study area
settlements is of the order of 276038 persons residing in 65320 households as per
Census of India 2011. The distribution of population and demographic profile of
study area settlements is outlined in Table 3.47 and depicted in Figure 3.22.
Table 3.47: Demographic profile of study area
S.No Settlement Name
Tota
l
Ho
use
ho
lds
Tota
l
Po
pu
lati
on
Tota
l Mal
e
Tota
l Fem
ale
Po
pu
lati
on
<6
year
s
Sex
Rat
io
Ave
rage
Fam
ily S
ize
District North Goa
Subdistrict Tiswadi (A)
1 Batim 356 1489 739 750 132 1015 4
2 Curca 560 2518 1232 1286 256 1044 4
3 Siridao 578 2417 1179 1238 218 1050 4
4 Panaji (M Corp. +
OG)
17807 70991 35988 35003 6180 973 4

---------------------------------------------------------------------------------------------------------------------------------------------
EIA Study for Capacity Enhancement at Berth 5A, 6A of SWPL, Goa 3-100
Final Report, September, 2017
S.No Settlement Name
Tota
l
Ho
use
ho
lds
Tota
l
Po
pu
lati
on
Tota
l Mal
e
Tota
l Fem
ale
Po
pu
lati
on
<6
year
s
Sex
Rat
io
Ave
rage
Fam
ily S
ize
5 Morambi-O-Grande
(Merces) (OG) WARD
NO.-0032 (Rural MDDS
CODE:626737)
386 1523 768 755 139
983 4
6 Renovadi (OG) WARD
NO.-0033 (Rural MDDS
CODE:626738)
125 500 259 241 42 931 4
7 Cujira (OG) WARD NO.-
0035 (Rural MDDS
CODE:626740)
296 1229 601 628 122 1045 4
8 Taleigao (OG) (Part)
WARD NO.-0036 (Rural
MDDS CODE:645598)
6003 24201 12402 11799 2356 951 4
9 Durgawadi (OG) (Part)
WARD NO.-0037 (Rural
MDDS CODE:645599)
388 1610 830 780 180 940 4
10 Murda (CT) 1803 7517 3699 3818 782 1032 4
11 Calapor (CT) 3514 14077 7118 6959 1443 978 4
12 Bambolim (CT) 1165 6885 4812 2073 525 431 6
13 Goa Velha (CT) 1055 4322 2129 2193 427 1030 4
Subtotal (A) 34036 139279 71756 67523 12802 941 4
Subdist Mormugao (B)
14 Dabolim 1433 6027 3142 2885 699 918 4
15 Sao Jacinto Island 48 195 104 91 16 875 4
16 Cuelim 430 1777 839 938 173 1118 4
17 Pale 473 1990 1010 980 202 970 4
18 Issorcim 189 841 434 407 61 938 4
19 Chicolna 669 2680 1350 1330 274 985 4
20 Mormugao (M Cl) 21524 94393 49633 44760 10025 902 4
21 Chicalim (CT) 1483 6933 3921 3012 618 768 5
22 Sancoale (CT) 5035 21923 11657 10266 2693 881 4
Subtotal (B) 31284 136759 72090 64669 14761 897 4
Total(A+B) 65320 276038 143846 132192 27563 919 4
Source: Primary Census Abstract, 2011.

---------------------------------------------------------------------------------------------------------------------------------------------
EIA Study for Capacity Enhancement at Berth 5A, 6A of SWPL, Goa 3-101
Final Report, September, 2017
Figure 3.22: Demographic profile of study area
The male and female population in study area settlements comprises about
52.11% and 47.89% respectively of the total population. The population
comprising of children below the age of 6 years accounts for about 9.9% of the
total population in the study area settlements. The sex ratio (no. of females per
1000 males) and average family size in the study area settlements is 919 and 4
persons per family respectively.
3.22.2 Caste Profile
The caste wise distribution of population in study area settlements on the basis of
caste is summarized in Table 3.48 and depicted in Figure 3.23. The General Caste
is the dominant caste in the study area accounting for about 92.50% of the total
population followed by Schedule Tribes, which account 5.31% of the total
population. Schedule Castes account for only 2.19% of the total population of
study area settlements.
Table 3.48: Caste profile of study area
S.
No Settlement Name
Total
Population
Schedule
Caste
Schedule
Tribe
General
Caste
District Goa
Subdistrict Tiswadi
1 Batim 1489 12 21 1456
2 Curca 2518 11 497 2010
3 Siridao 2417 0 1265 1152
4 Panaji (M Corp. + OG) 70991 1707 4586 64698
Subdistrict Tiswadi (A)
Subdistrict Mormugao (B)
60000
65000
70000
75000
Total Male Total Female
Subdistrict Tiswadi (A) Subdistrict Mormugao (B)

---------------------------------------------------------------------------------------------------------------------------------------------
EIA Study for Capacity Enhancement at Berth 5A, 6A of SWPL, Goa 3-102
Final Report, September, 2017
S.
No Settlement Name
Total
Population
Schedule
Caste
Schedule
Tribe
General
Caste
5
Morambi-O-Grande (Merces)
(OG) WARD NO.-0032 (Rural
MDDS CODE:626737) 1523 5 0 1518
6
Renovadi (OG) WARD NO.-
0033 (Rural MDDS
CODE:626738) 500 1 2 497
7
Cujira (OG) WARD NO.-0035
(Rural MDDS CODE:626740) 1229 4 1 1224
8
Taleigao (OG) (Part) WARD
NO.-0036 (Rural MDDS
CODE:645598) 24201 1097 2869 20235
9
Durgawadi (OG) (Part) WARD
NO.-0037 (Rural MDDS
CODE:645599) 1610 29 25 1556
10 Murda (CT) 7517 81 314 7122
11 Calapor (CT) 14077 427 1211 12439
12 Bambolim (CT) 6885 172 839 5874
13 Goa Velha (CT) 4322 20 116 4186
Subtotal(A) 139279 3566 11746 123967
Subdistrict Mormugao
14 Dabolim 6027 65 307 5655
15 Sao Jacinto Island 195 0 0 195
16 Cuelim 1777 2 841 934
17 Pale 1990 6 76 1908
18 Issorcim 841 4 5 832
19 Chicolna 2680 45 376 2259
20 Mormugao (M Cl) 94393 2161 480 91752
21 Chicalim (CT) 6933 76 234 6623
22 Sancoale (CT) 21923 114 597 21212
Subtotal(B) 136759 2473 2916 131370
Subtotal(A+B) 276038 6039 14662 255337
Source: Primary Census Abstract, 2011.

---------------------------------------------------------------------------------------------------------------------------------------------
EIA Study for Capacity Enhancement at Berth 5A, 6A of SWPL, Goa 3-103
Final Report, September, 2017
Figure 3.23: Caste profile of study area
3.22.3 Literacy Levels
The details of literate and illiterate population amongst the total population of study
area settlements are shown in Table 3.49. It is observed that about 81.62% of the
total population in the study area settlements is literate, while about 18.38% are
illiterate. The male and female literacy rate of the study area settlements is 84.53%
and 78.45% respectively (Figure 3.24).
Table 3.49: Educational profile of study area population
S.No.
Village Names
To
tal
Po
pu
lati
on
Po
pu
lati
on
Lit
era
te
Ma
le L
ite
rate
Fem
ale
Lit
era
te
Po
pu
lati
on
Illite
rate
Ma
le Illit
era
te
Fem
ale
Illite
rate
District North Goa
Subdistrict Tiswadi (A)
1 Siridao 2417 1786 929 857 631 250 381
2 Panaji (M Corp. + OG) 70991 60071 31090 28981
10920
4898 6022
3 Cujira (OG) WARD NO.-0035 (Rural MDDS CODE:626740)
1229 1033 516 517 196 85 111
4 Taleigao (OG) (Part) WARD NO.-0036 (Rural MDDS CODE:645598)
24201 19755 10441 9314 4446 1961 2485
5 Durgawadi (OG) (Part) WARD NO.-0037 (Rural MDDS CODE:645599)
1610 1345 710 635 265 120 145
0
20000
40000
60000
80000
100000
120000
140000
Schedule Caste Schedule Tribe General Caste
Subdistrict Tiswadi (A) Subdistrict Mormugao (B)

---------------------------------------------------------------------------------------------------------------------------------------------
EIA Study for Capacity Enhancement at Berth 5A, 6A of SWPL, Goa 3-104
Final Report, September, 2017
S.No.
Village Names
To
tal
Po
pu
lati
on
Po
pu
lati
on
Lit
era
te
Ma
le L
ite
rate
Fem
ale
Lit
era
te
Po
pu
lati
on
Illite
rate
Ma
le Illit
era
te
Fem
ale
Illite
rate
6 Murda (CT) 7517 6117 3066 3051 1400 633 767
7 Calapor (CT) 14077 11628 6043 5585 2449 1075 1374
8 Bambolim (CT) 6885 5971 4362 1609 914 450 464
9 Goa Velha (CT) 4322 3473 1779 1694 849 350 499
Subtotal (A) 133249 111179 58936 52243 22070 9822 12248
District South Goa
Subdistrict Mormugao
1 Dabolim 6027 4739 2550 2189 1288 592 696
2 Issorcim 841 718 383 335 123 51 72
3 Chicolna 2680 2117 1127 990 563 223 340
4 Mormugao (M Cl) WARD NO.-0001
3659 3433 2379 1054 226 104 122
5 Mormugao (M Cl) WARD NO.-0002
2518 2136 1127 1009 382 166 216
6 Mormugao (M Cl) WARD NO.-0003
3071 2547 1355 1192 524 211 313
7 Mormugao (M Cl) WARD NO.-0004
3852 3228 1828 1400 624 288 336
8 Mormugao (M Cl) WARD NO.-0005
4462 3488 1949 1539 974 407 567
9 Mormugao (M Cl) WARD NO.-0006
4059 3361 1715 1646 698 324 374
10 Mormugao (M Cl) WARD NO.-0007
3428 2348 1348 1000 1080 466 614
11 Mormugao (M Cl) WARD NO.-0008
4791 3384 1893 1491 1407 587 820
12 Mormugao (M Cl) WARD NO.-0009
5507 4468 2448 2020 1039 448 591
13 Mormugao (M Cl) WARD NO.-0010
4387 3688 1956 1732 699 284 415
14 Mormugao (M Cl) WARD NO.-0011
1954 1708 882 826 246 106 140
15 Mormugao (M Cl) WARD NO.-0012
3897 2841 1565 1276 1056 447 609
16 Mormugao (M Cl) WARD NO.-0013
4175 3453 1894 1559 722 303 419
17 Mormugao (M Cl) WARD NO.-0014
4103 3501 1839 1662 602 260 342
18 Mormugao (M Cl) WARD NO.-0015
5661 3901 2290 1611 1760 768 992
19 Mormugao (M Cl) WARD NO.-0016
5171 4191 2249 1942 980 462 518

---------------------------------------------------------------------------------------------------------------------------------------------
EIA Study for Capacity Enhancement at Berth 5A, 6A of SWPL, Goa 3-105
Final Report, September, 2017
S.No.
Village Names
To
tal
Po
pu
lati
on
Po
pu
lati
on
Lit
era
te
Ma
le L
ite
rate
Fem
ale
Lit
era
te
Po
pu
lati
on
Illite
rate
Ma
le Illit
era
te
Fem
ale
Illite
rate
20 Mormugao (M Cl) WARD NO.-0017
6061 4736 2558 2178 1325 592 733
21 Mormugao (M Cl) WARD NO.-0018
11104 9056 4755 4301 2048 999 1049
22 Mormugao (M Cl) WARD NO.-0019
4517 3669 1948 1721 848 364 484
23 Mormugao (M Cl) WARD NO.-0020
8016 6931 3570 3361 1085 499 586
24 Chicalim (CT) 6933 5886 3478 2408 1047 443 604
25 Sancoale (CT) 21923 16656 9429 7227 5267 2228 3039
Subtotal (B) 132797 106184 58515 47669 26613 11622 14991
Total (A+B) 266046 217363 117451 99912 48683 21444 27239
Source: Primary Census Abstract, 2011.
Figure 3.24: Literacy profile of study area population
3.22.4 Occupational profile
The details on occupational profile in the study area settlements are given in the
Table 3.50. It is observed that 41.59% of the total population is engaged in some
form of economically productive activity or vocational activity, and have been
designated as Total Working population. On the other hand, Non-workers or
persons who are dependent on the population, which is engaged in economically
productive work accounts for about 58.41% of the total population. Among the
0
20000
40000
60000
80000
100000
120000
Population Literate Population Illitertae
Subdistrict Tiswadi (A) Subdistrict Mormugao (B)

---------------------------------------------------------------------------------------------------------------------------------------------
EIA Study for Capacity Enhancement at Berth 5A, 6A of SWPL, Goa 3-106
Final Report, September, 2017
population that is working about 89.47% has been designated as Main workers
while the remaining 10.53% has been designated as Marginal workers. In main
working population Main worker Cultivators are 1.40%, Main Worker Agricultural
Labour 0.49%, Main Workers Household Industry 1.29% and Main Workers Other
96.82%. The occupational profile is depicted in Figure 3.25.
Figure 3.25: Occupational profile of study area population
Subdistrict Tiswadi (A)
Subdistrict Mormugao(B)
0
20000
40000
60000
80000
100000
Total WorkingPopulation
Non WorkingPopulation
Subdistrict Tiswadi (A) Subdistrict Mormugao(B)

---------------------------------------------------------------------------------------------------------------------------------------------
EIA Study for Capacity Enhancement at Berth 5A, 6A of SWPL, Goa 3-107
Final Report, September, 2017
Table 3.50: Occupational profile o the study area population
S.No
Settlement Name
To
tal P
op
ula
tio
n
To
tal W
ork
ing
Po
pu
lati
on
Main
Wo
rkers
Main
Wo
rker
Cu
ltiv
ato
rs
Main
Wo
rkers
Ag
ricu
ltu
re
Main
Wo
rkers
Ho
useh
old
s
Main
Wo
rkers
Oth
er
Marg
inal W
ork
ers
Marg
inal W
ork
ers
Cu
ltiv
ato
r
Marg
inal A
gri
cu
ltu
ral
Lab
ou
r
Marg
inal W
ork
ers
Ho
useh
old
Marg
inal O
ther
Wo
rkers
No
n-W
ork
ing
Po
pu
lati
on
Subdistrict Tiswadi
1 Batim 1489 422 347 42 3 26 276 75 6 6 5 58 1067
2 Curca 2518 925 877 58 9 6 804 48 3 6 1 38 1593
3 Siridao 2417 867 676 69 13 15 579 191 14 11 3 163 1550
4 Panaji (M Corp. + OG) 70991 30220 27709 206 77 299 27127 2511 57 43 125 2286 40771
5 Morambi-O-Grande (Merces) (OG) WARD NO.-0032 (Rural MDDS CODE:626737)
1523 594 540 1 0 1 538 54 5 1 0 48 929
6 Renovadi (OG) WARD NO.-0033 (Rural MDDS CODE:626738)
500 186 168 0 2 2 164 18 1 0 0 17 314
7 Cujira (OG) WARD NO.-0035 (Rural MDDS CODE:626740)
1229 481 409 5 2 7 395 72 2 2 3 65 748
8 Taleigao (OG) (Part) WARD NO.-0036 (Rural MDDS CODE:645598)
24201 10437 9582 67 36 111 9368 855 19 22 63 751 13764
9 Durgawadi (OG) (Part) WARD NO.-0037 (Rural MDDS CODE:645599)
1610 645 597 3 0 4 590 48 1 0 0 47 965

---------------------------------------------------------------------------------------------------------------------------------------------
EIA Study for Capacity Enhancement at Berth 5A, 6A of SWPL, Goa 3-108
Final Report, September, 2017
S.No
Settlement Name
To
tal P
op
ula
tio
n
To
tal W
ork
ing
Po
pu
lati
on
Main
Wo
rkers
Main
Wo
rker
Cu
ltiv
ato
rs
Main
Wo
rkers
Ag
ricu
ltu
re
Main
Wo
rkers
Ho
useh
old
s
Main
Wo
rkers
Oth
er
Marg
inal W
ork
ers
Marg
inal W
ork
ers
Cu
ltiv
ato
r
Marg
inal A
gri
cu
ltu
ral
Lab
ou
r
Marg
inal W
ork
ers
Ho
useh
old
Marg
inal O
ther
Wo
rkers
No
n-W
ork
ing
Po
pu
lati
on
10 Murda (CT) 7517 3015 2626 14 14 74 2524 389 8 3 21 357 4502
11 Calapor (CT) 14077 5743 5239 46 28 87 5078 504 10 9 24 461 8334
12 Bambolim (CT) 6885 4429 4252 33 4 8 4207 177 2 14 3 158 2456
13 Goa Velha (CT) 4322 1771 1506 29 21 137 1319 265 12 19 2 232 2551
Subtotal (A) 139279 59735 54528 573 209 777 52969 5207 140 136 250 4681 79544
Subdistrict Mormugao
14 Dabolim 6027 2563 2434 174 19 34 2207 129 15 21 4 89 3464
15 Sao Jacinto Island 195 54 52 6 0 0 46 2 0 1 1 0 141
16 Cuelim 1777 673 613 71 103 14 425 60 7 13 1 39 1104
17 Pale 1990 701 585 46 14 11 514 116 3 64 1 48 1289
18 Issorcim 841 359 354 28 0 16 310 5 0 0 0 5 482
19 Chicolna 2680 1032 937 68 5 41 823 95 13 5 4 73 1648
20 Mormugao (M Cl) 94393 36929 32208 415 114 343 31336 4721 88 33 158 4442 57464
21 Chicalim (CT) 6933 3438 3201 20 5 35 3141 237 13 16 6 202 3495
22 Sancoale (CT) 21923 9310 7795 41 36 53 7665 1515 38 66 48 1363 12613
Subtotal (B) 136759 55059 48179 869 296 547 46467 6880 177 219 223 6261 81700
Total (A+B) 276038 114794 102707 1442 505 1324 99436 12087 317 355 473 10942 161244
Source: Primary Census Abstract, 2011.

---------------------------------------------------------------------------------------------------------------------------------------------
EIA Study for Capacity Enhancement at Berth 5A, 6A of SWPL, Goa 3-109
Final Report, September, 2017
3.22.5 Major Diseases reported in MPT Hospital
Information on the common diseases reported in the MPT hospital from 2010 to 2015
was collected. The most common diseases are Head Trauma (HT), followed by GF.
The details of the cases registered for various diseses are given in Table 3.51.
3.23 TOURISM
Tourism is one of the dominant industries of Goa. North Goa beaches act as the major
tourist destination and maximum hotels are located there. There are a lot of tourist
desitnation in and around the study area includes various beaches, monuments of
archeological importance etc. Some of the beaches includes Caranzelm beach, Donna
Paula view point, Bambolim beach, Bogmalo beach, Baina beach, and salcete beach.
The other destination in the study area is the Naval aviation meseum, Murmugoa Fort,
Aguda Fort, the grande Island, Dr. Salim Ali bird sanctuary etc.

---------------------------------------------------------------------------------------------------------------------------------------------
EIA Study for Capacity Enhancement at Berth 5A, 6A of SWPL, Goa 3-110
Final Report, September, 2017
Table 3.51: Major Disease recorded in MPT Hospital (2010 to 2015)
Year
HT IHD CVA Asthma COPD ALD GF Renal PSY Malaria Dengue Chikungunya Enteric Fever
Others
2010 - 2011 303 23 10 23 76 32 144 12 - 16
26 42 17 465
2011 - 2012 327 12 2 19 70 37 100 5 1 20
1 6 4 407
2012 - 2013 225 37 21 25 46 52 149 11 21 11
1 21 8 607
2013 - 2014 215 28 11 8 52 24 111 3 2 15
- 15 - 386
2014 - 2015 212 18 6 10 62 29 77 3 2 4
- 4 - 301

---------------------------------------------------------------------------------------------------------------------------------------------
EIA Study for Capacity Enhancement at Berth 5A, 6A of SWPL, Goa 3-111
Final Report, September, 2017
REFERENCES
1. Shesdev Patro, P. Krishnan, M. Gopi, S. Raja, C. R. Sreeraj, Purvaja
Ramachandran, R. Ramesh* Snowflake coral, Carijoa riisei from Grand Island,
Goa: a case of invasion of an alien species or re-establishment of a native
species, Current Science, vol. 109, No. 6, 2015
2. G. B. Sreekanth, N. Manju Lekshmi, N. P. Singh and Ajey Patil, Fish
assemblages of Grande Island, situated along Southwest Coast of India,
Biodiversity & Evaluation: Perspectives and Paradigm shifts; pp. 123-125,
2015.
3. Sujeeth Kumar Dongre, Sea trutle nesting status in Goa in Marine turtles along
the Indian Coast - Distribution, Status, Threats and Management Implications;
Eds., WWF India pp. 127-133, 2013.

----------------------------------------------------------------------------------------------------------------------------------------------- EIA Study for capacity enhancement at berth 5A & 6A of SWPL, Goa 4-1 Final Report, September, 2017
Chapter 4.0 IMPACT ASSESSMENT &
MITIGATION MEASURES
4.1 INTRODUCTION
This chapter identifies environmental, social and health impacts and mitigation
measures associated with the project implementation and operation of activity with
the proposed modernization and consequential capacity enhancement at the
terminal. For each aspect, the section identifies and describes both generic and
specific potential impacts that might arise as a result of the project’s
implementation and operations.
The project does not involve with potential construction works. The major activities
will include the enhancement of material handling systems, and storage of raw
materials, if necessary.
Potential sources of environmental impact from operations may include shipping
movements, discharge of wastewater and solid waste, accidental spillage, cargo
unloading/loading and storage, noise pollution, air pollution due to material transfer
and handling.
In view of the above, we analyze the likely environmental impacts in two phases
of the project to suggest the mitigation measures;
Implementation phase, and
Operation phase
4.2 IMPACTS DURING IMPLEMENTATION PHASE
Various Impacts during the implementation phase of modernisation of the terminal
were observed and adequate mitigation measures are suggested for the same.
4.2.1 Water Environment
Water shall not be abstracted from any surface or ground water body in the
implementation phase of the project. No existing resources/water sources
----------------------------------------------------------------------------------------------------------------------------------------------- EIA Study for capacity enhancement at berth 5A & 6A of SWPL, Goa 4-2 Final Report, September, 2017
(surface/groundwater), which are currently being used by the villagers for the
purpose of obtaining drinking water and/or water for irrigation or other purposes.
Impacts on Water Quality
The total number of work force proposed to be deployed during the project
implementation is very small and the proposed project is located within the
Mormugao Port. The labourers will be coming from nearby areas and no labour
camps are proposed at the project site. Thus, considering the location of the
project, labour population involved in the project implementation activities shall use
the existing sanitation facilities of Mormugao Port. There is an existing sewage
handling facilities in operation at the Mormugao Port, which can handle the
additional inputs due to the proposed modernization facilities in the port.
The only impacts envisaged on the surface and ground water quality of the area,
during implementation phase is the accidental spillage of oil or fuel from machinery
that may run off into near-by surface and groundwater water bodies and/or
uncontrolled liquid effluents from the project implementation site.
Mitigation Measures
Wastewater from the washing and other project implementation activities
shall be treated accordingly and reused.
Local people will be employed; hence, no labour camps will be required on
the site.
Workers shall use the existing toilets at the site.
No additional waste water discharge or solid waste generation during the
implementation phase is envisaged.
4.2.2 Biological Environment
Impact on Terrestrial Ecology
There is a built-up area in the headland Sada which has a dense population. The
present project does not envisage any land acquisition or clearing of vegetation.
The project is proposed within the existing facility only, thus, no immediate impact
on terrestrial ecology and environment is envisaged. Dr. Saliim Ali Wild life

----------------------------------------------------------------------------------------------------------------------------------------------- EIA Study for capacity enhancement at berth 5A & 6A of SWPL, Goa 4-3 Final Report, September, 2017
sanctuary is about 12.5 km from the project location. However, there is no
anticipated impacts due to modernization of the terminal.
Mitigation Measures
No terrestrial vegetation is envisaged to be cleared for the project
implementation.
Necessary material handling systems will be erected within the footprint of
the project site.
Impact on Freshwater Biology
The erection of material handling systems will not have any impact on the
freshwater bodies considering its location and operational philosophy. Hence no
mitigation measures are required.
Impact on Marine Biology
The proposed project envisages modernization of material handling systems at the
terminal. Proposed project does not involve dredging, reclamation and
construction in the sea, as the entire facility will be within existing terminal area.
There is no need of construction of new roads, and additional land acquisition for
the proposed development is not envisaged. Dredging of channel for cape size
vessels is not part of the proposed project. Hence, no significant impact is
anticipated due to the proposed project on marine environment.
Mitigation Measures
As a general rule, the developer will ensure that untreated effluents are not
discharged into the marine environment.
There will be no disposal of unused material into the sea. Thus the impact
on ecology is temporary and reversible.
Impact on Mangroves ecosystem
The present project does not envisage any new construction hence there will not
be any change in the land use pattern.

----------------------------------------------------------------------------------------------------------------------------------------------- EIA Study for capacity enhancement at berth 5A & 6A of SWPL, Goa 4-4 Final Report, September, 2017
Mitigation Measures
The mangroves are present in the intertidal regions of the Rivers Mandovi and
Zuari. This is almost 7 to 9 Kms from the proposed project location. The main
stress for the mangroves is from deforestation and trawl nets and drag nets that
have been a main reason for wiping off the newly germinating mangroves.
Though there is no impact due to the present project on the mangroves, as a part
of the CSR activities it is suggested to take up afforestation with consultation of
the forest department. It is suggested to work with mangrove conservation
agencies in replenishing the mangroves along the deltaic regions of River
Mandovi. Thereby, afforestation of the mangroves will also help in reducing the
stress of declining biotic growth in the system due to various anthropogenic
pressures.
Impact on corals ecosystem
The corals are primarily found in the area adjacent to the Grande Island. There is
no development on the water front in the present project. Hence there will be no
impact due to the mechanization/ modernization of the berths.
The Chicalim Bay is found to be a host of a wide variety of marine biota including
the Placuna placenta or popularly called the windowpane oyster. However, it is not
in the vicinity of the proposed project though it falls under the study area.
Therefore, there will not be any impact on the Chicalim Bay or the biota present in
the Bay due to this modernization project.
4.2.3 Land Environment
Impact on Land use/Landscape
The proposed project site is located within SWPL area and does not envisage the
change in land use. The proposal does not involve with potential construction
activities at the site, except construction of foundation for the installation of cargo
handling equipments. Hence, no major impact is anticipated on land use during
the project implementation phase.

----------------------------------------------------------------------------------------------------------------------------------------------- EIA Study for capacity enhancement at berth 5A & 6A of SWPL, Goa 4-5 Final Report, September, 2017
Mitigation Measures
All materials will be disposed as per the Goa State Pollution Control Board
(GSPCB) norms.
Land would be properly leveled, so that no isolated pools and puddles are
created.
Impacts on Soil Quality
There is no major change is in the land use/landscape; hence no major impacts
are anticipated on the soil quality. The waste generated will be reused for leveling
and enrichment of land. Thus there will be no major impact on the soil quality
during the project implementation phase.
Mitigation Measures
Developer shall take adequate measures to prevent disposal of any waste
generated which may contaminate the soil.
Waste management plans as per the GPCB norms will be strictly followed
to prevent spills and leakage into the soil.
4.2.4 Air Environment
Impacts on Ambient Air Quality
The major pollutant in the implementation phase is SPM being air-borne due to
vehicular movement and operation of loading and unloading equipment. Vehicular
movement and operation of DG Sets may generate pollutants such as NOx, CO
and HC during project implementation. However, the requirement of construction
material is very minimal in the proposed project. Hence, increase in gaseous and
fugitive emissions would be very less and not expected to contribute significantly
to the ambient air quality and will be within the prescribed limits for industrial
regions.
Mitigation Measures
The following measures are suggested to control air pollution:
Contractor will be responsible for maintaining properly functioning of
equipments to minimize emissions.

----------------------------------------------------------------------------------------------------------------------------------------------- EIA Study for capacity enhancement at berth 5A & 6A of SWPL, Goa 4-6 Final Report, September, 2017
Equipment and vehicles will be turned off when not used for extended
periods of time.
Unnecessary idling of vehicles will be prohibited.
Effective traffic management to be undertaken to avoid significant delays in
and around the project area.
Road damage caused by sub-project activities will be promptly attended to
with proper road repair and maintenance work.
Water sprinkling during the construction work.
Air Pollution control due to DG sets
The Central Pollution Control Board (CPCB) has issued emission limits for
generators up to 800 KW. The same are outlined in Table 4.1, and are
recommended to be followed during the project implementation phase.
Table 4.1: Emission limits for DG sets prescribed by CPCB
Parameter Emission limits (gm/kw hr)
NOx 9.2
HC 1.3
CO 2.5
PM 0.3
Smoke limit* 0.7
Note: *Light absorption coefficient at full load (m-1)
The above standard needs to be followed by the contractor operating the DG sets.
The other measures are recommended as given below:
Location of DG sets and other emission generating equipment should be
decided keeping in view the predominant wind direction so that emissions
do not effect nearby residential areas.
Stack height of DG sets to be kept in accordance with CPCB norms, which
prescribes the minimum height of stack to be provided with each generator
set to be calculated using the following formula:
H = h+0.2x √KVA

----------------------------------------------------------------------------------------------------------------------------------------------- EIA Study for capacity enhancement at berth 5A & 6A of SWPL, Goa 4-7 Final Report, September, 2017
Where, H = Total height of stack in metre
h = Height of the building in metres where the generator set is installed
KVA = Total generator capacity of the set in KVA
4.2.5 Noise Environment
Impacts on Noise Levels
The noise from equipments will be a temporary phenomenon. However, noise
levels from equipments may result into significant impacts due to operation of
several equipments at a time.
Noise levels from construction equipment are predicted at different distances and
at terminal perimeter using random distribution of this equipment in the Jetty area.
It is also assumed that only one-third of these equipment will be in operation and
deployed at 200 m and beyond from the periphery of the terminal.
Ambient noise levels were found below the permissible limit both during day and
night time. Present noise level has been determined for nearby areas. It is
observed that the noise levels are well within the norms, but they observed to be
slightly higher during peak hours. The temporary noise impacts in the immediate
vicinity will be due to project implementation activity and vehicular movement.
Temporary impacts in the immediate vicinity along the sites due to noise generated
from project implementation activities superimposed by existing vehicular noise
are of utmost importance. The magnitude of impact will depend upon specific types
of equipment to be used, the construction methods employed and scheduling of
the work. Various mitigation measures and controls will be adopted for minimize
noise levels.
The magnitude of impact will not be significant as the construction machinery
employed will adhere to high quality, the vehicles such as trucks, dumpers, tempos
etc. engaged will also be of good working condition (Euro II machines) so that
impact due to noise is well within the permissible limits. The noise level likely to

----------------------------------------------------------------------------------------------------------------------------------------------- EIA Study for capacity enhancement at berth 5A & 6A of SWPL, Goa 4-8 Final Report, September, 2017
generate during implementation activity will be in the range of 80 – 90 dB (A).
These noise level generated from source will decrease with increase in the
distance from the source because of the wave divergence. The decrease in noise
level with the increase in distance follows the empirical formulae given below:
SPL2 = SPL1 – 20 Log10 (r2/r1)
Where, SPL1 and SPL2 are the sound pressure levels at distance r1 and r2
respectively.
Considering the stationary construction equipment as point source strength of 90
dB (A) at a reference distance of 2 m, computed distances required to meet the
permissible limits during the daytime for different land uses are mentioned in the
Table 4.2.
Table 4.2: Permissible limits during daytime for different land uses
Type of Land Use Permissible Limits
(Day time)
Distance
Required (m)
Residential 55 dB (A) 113 m
Commercial 65 dB (A) 36 m
Industrial 75 dB (A) 11 m
Silence Zone 50 dB (A) 200 m
Mitigation Measures
The contractors will be required to maintain proper functioning of the equipment
and comply with occupational safety and health standards. The equipments will be
fitted with noise suppression devices and mufflers.
Equipments shall be properly maintained and will be provided with mufflers.
Staging of equipment and unnecessary idling of equipment within noise
sensitive areas to be avoided whenever possible.
Monitoring of noise levels will be conducted during the project
implementation phase. In case noise levels are exceeding the pre-
determined acceptable noise levels contractor will stop the work and take
necessary measures to minimise the noise levels.

----------------------------------------------------------------------------------------------------------------------------------------------- EIA Study for capacity enhancement at berth 5A & 6A of SWPL, Goa 4-9 Final Report, September, 2017
The following Noise Standards for DG sets are recommended for the running of
DG sets during the implementation:
The maximum permissible sound pressure level for new diesel generator
sets with rated capacity up to 1000 KVA shall be 75 dB(A) at 1 m from the
enclosure surface.
Noise from the DG set should be controlled by providing an acoustic
enclosure or by treating the enclosure acoustically.
Acoustic Enclosure should be made of CRCA sheets of appropriate
thickness and structural/sheet metal base. The walls of the enclosure
should be insulated with fire retardant foam so as to comply with 75 dBA at
1m sound level specified by CPCB.
Acoustic enclosure/acoustic treatment of the room should be designed for
minimum 25 dB(A) Insertion Loss or for meeting the ambient noise
standards, whichever is on the higher side.
DG set shall also be provided with proper exhaust muffler.
Proper efforts to be made to bring down the noise levels due to the DG set,
outside its premises, within the ambient noise requirements by proper sitting
and control measures.
A proper routine and preventive maintenance procedure for the DG set shall
be followed in consultation with DG set manufacturer which would help in
reduction in noise levels of DG sets.
It is known that continuous exposure to noise levels above 90 dB(A) affects the
hearing of the workers/operators and hence has to be avoided. Other physiological
and psychological effects have also been reported in literatures, but the effect on
hearing acuity has been specially stressed. To prevent these effects, it has been
recommended by international specialist organizations that the exposure period of
affected persons be limited as specified in Table 4.3.

----------------------------------------------------------------------------------------------------------------------------------------------- EIA Study for capacity enhancement at berth 5A & 6A of SWPL, Goa 4-10 Final Report, September, 2017
Table 4.3: Maximum Exposure Periods specified by OSHA
Maximum equivalent continuous
Noise level dB(A)
Unprotected exposure period per day
for 8 hrs/day and 5 days/week
90 8
95 4
100 2
105 1
110 ½
115 ¼
120 No exposure permitted at or above this
level
4.3 IMPACTS DURING OPERATION PHASE 4.3.1 Water Environment
Impact on Ground water/Surface water Quality
During operation phase ground water quality may be affected as result of the
seepage of waste water generated from dust suppression measures, domestic
sources, and oil spills. However, this capacity enhancement project is not
envisaged to affect the ground/surface water quality of the region.
Water Requirement
The water requirement for the port facility shall be made from the existing water
supply of Mormugao Port and the additional water requirement shall be met from
the treated water of CETP operated by PWD. The project does not involve any
ground/surface water withdrawal from local resources. The details of the existing
and proposed water consumption due to capacity enhancement at the terminal are
given in Table 4.4.
Table 4.4: Water requirement at the port facility
Particulars Existing in M³/day Proposed in M³/day
A. TOTAL WATER
CONSUMPTION
310 500
1) Domestic 10 20
2) Greenbelt/ Dust Suppression 200 380

----------------------------------------------------------------------------------------------------------------------------------------------- EIA Study for capacity enhancement at berth 5A & 6A of SWPL, Goa 4-11 Final Report, September, 2017
Particulars Existing in M³/day Proposed in M³/day
3) Fire Fight 100 100
B. EFFLUENT GENERATED 1.0 4.0
a) Biodegradable 1.0 4.0
2) Domestic 1.0 4.0
b) Non-Biodegradable Nil Nil
2) Domestic Nil Nil
C. LOSSES 209 396
1) Domestic 9.0 16
2) Green Belt 50 80
4) Dust Suppression 150 300
Mitigation Measures
The Port operations will ensure that there will be no impact on surface or
groundwater quality in the region.
The sewage likely to be generated shall be treated with existing sanitation
facilities at SWPL.
Domestic sewage shall be transferred to the existing sewage handling
facilities in operation at Mormugao Port after primary treatment.
Ships/barges will not be allowed to release any oily bilge waste or ballast
water in the sea and hence wastes from the ships will also not affect any
surface or groundwater quality.
Any effluents from the Port which have leachable characteristics will be
segregated and recycled/disposed as per CPCB guidelines.
On an overall analysis it may thus be concluded that surface or groundwater
bodies will not be impacted during the Port operations.
Impacts on Marine water quality
The major quantity of liquid waste that would be generated in the normal day-to-
day operations at the terminal includes domestic effluents, berth washings, runoff

----------------------------------------------------------------------------------------------------------------------------------------------- EIA Study for capacity enhancement at berth 5A & 6A of SWPL, Goa 4-12 Final Report, September, 2017
(during monsoon) etc. These wastes have a potential to pollute marine water, if
disposed untreated. The potential sources of impacts on marine water quality
during the Port operations are:
Disposal of Jetty related wastes
Disposal of ship generated wastes
Escapement of cargo, and
Effluent from coal stack yard
Mitigation Measures
All effluents are routed through a treatment plant/settling pond, as
appropriate, can largely mitigate impacts from the effluent from domestic
and day to day operations.
Jetty operations would also produce solid waste such as garbage, debris,
and left over plastic items, containers, etc. which if not properly disposed
might influence the near shore areas. Approved dumpsites and recycling
measures will be taken to responsibly dispose off other wastes.
Effluent form coal stock yard would contain suspended solids. It is proposed
to be treated in a settling tank. The sludge so produced will be mainly coal
dust, which can be dried on sludge drying beds. The dried sludge, which
has fuel value, can then be distributed amongst the villagers. During
monsoon months, the sludge will be stored separately, in a structure with
adequate storage capacity. The collected water can be reused sprinkling on
coal stack yard. It would reduce the water demand for sprinkling.
The International Convention for the Prevention of Pollution from Ships, 1973, as
modified by the protocol of 1978 (MARPOL, 73/78), has issued guidelines for
prevention of Marine Pollution. These are listed in subsequent paragraphs and
should be strictly adhered to for prevention of marine pollution.
Ships/barges are prohibited to discharge oil or oily water such as oily bilge
water containing more than 15 ppm of oil within 19 km (12 miles) of land.

----------------------------------------------------------------------------------------------------------------------------------------------- EIA Study for capacity enhancement at berth 5A & 6A of SWPL, Goa 4-13 Final Report, September, 2017
Chemicals are evaluated for environmental hazard which may cause
environmental hazards if discharged into the sea (categories A, B, C and
D). Discharge into the sea of the most harmful chemicals (category A) is
prohibited. Tank washings and other residues of less harmful substances
(categories B, C and D) may only be discharged keeping in mind certain
conditions e.g. total quantity of discharge, distance from the shore, depth of
water prescribed depending on the hazards. There are no restrictions on
substances such as water, wine, acetone etc.
Harmful substances in the packaged form should not be disposed into the
coastal sea.
Sewage generated at the ship should not be disposed off into the sea,
unless it is treated or it is disposed off at a certain distance from land.
Garbage produced on ship must be kept on board and discharged either
ashore or into the sea under certain conditions, such as distance from the
land; discharge of all plastics is prohibited.
Leachate Generation
Proposed project envisages the storage of coal in closed stack yard. Runoff from
coal piles due to sprinkling and storm water can be very acidic and high in
suspended and dissolved solids and heavy metals and might contaminate the
ground and surface waters.
However, there is no significant leachate generation is perceived from the water
spraying on the coal pile. As coal is porous in nature, maximum or total water
sprayed on it is absorbed. The water spraying is done periodically only to dowse
the fire during stack piling. Thus the sprayed water gets fully absorbed in the stock
pile which does not allow to runoff.
Mitigation Measures
The rain water surface runoff shall be collected in settling tank connected to plot
garland drains having concrete lining. The clear water will be used for dust

----------------------------------------------------------------------------------------------------------------------------------------------- EIA Study for capacity enhancement at berth 5A & 6A of SWPL, Goa 4-14 Final Report, September, 2017
suppression and the settled material shall be dumped back to the stockyard, so
that leachate generation remains insignificant.
4.3.2 Biological Environment
Impact on Marine Biology
Potential sources of impacts on the marine biological environment essentially arise
from pollution by shipping and Jetty operations. These include waste and
wastewater discharges, accidents and spillage containing oil, heavy metals etc.
Due to the proposed mechanization and capacity enhancement there will be a
marginal increase in the vessel movement. However, the improved cargo handling
equipments and dust suppression systems will minimize the fall off thereby reduce
the stress on the marine environment.
Mitigation Measures
The developer will ensure that untreated effluents are not discharged into
the marine environment. The ships will also not be permitted to discharge
wastes or untreated effluents in the sea.
Project is expected to have no detrimental effect on fish and hence no
impact on fisheries during the operations phase. However, any fishing
within the Jetty limits will be prohibited for safety and security reasons.
Impact on Coral Ecosystem
The corals are primarily found in the area adjacent to the Grande Island. The corals
are not native to the coast of Goa. The origin of the corals is from drifting along
with the current and from the ballast waters of the ships. The favorable water
climate has helped the corals to colonize this part of Goa. In spite of the port
operations it has been found that the corals have been thriving, shows that the port
activities do not exert pressure on the corals. However, researches have pointed
out that the tourists’ activity and unscientific diving and fishing has become a single
source of threat to the corals.

----------------------------------------------------------------------------------------------------------------------------------------------- EIA Study for capacity enhancement at berth 5A & 6A of SWPL, Goa 4-15 Final Report, September, 2017
Impacts on Marine Biota
There is a lot of sensitive ecosystem around the MPT, where the present project
is proposed. However, there will not be any anticipated adverse impacts due to the
modernization at the berths. Due to the enhanced capacity handling, there will be
a marginal increase in the vessels that shall be berthed in the Berth 5A and 6A.
However, there is no impact due to the additional vessels visiting the port due to
the proposed project.
The Chicalim Bay is found to be a host of a wide variety of marine biota including
the Placuna placenta or popularly called the windowpane oyster. However, it is not
in the vicinity of the proposed project though it falls under the study area.
Therefore, there will not be any impact on the Chicalim Bay or the biota present in
the Bay due to this modernization project.
Impacts on Mangroves
The mangroves are found in the deltaic regions of the River Mondovi. Though they
are in the study area they are away from the operations and since no new land
cover change is expected, and there will not be any significant impact on the
mangroves of the study area.
4.3.3 Land Environment
Impacts on Land Use/Landscape
No permanent change in the landuse and landscape is envisaged in the project.
Hence, no likely impact is envisaged during the project operation phase. Though
there are a number of heritage buildings and places of worship they will not be
affected, as the area of operation will be restricted to the port premises only. The
Department of Archeology already protects most of the historic monuments and
hence no adverse impacts are expected.
Dr. Salim Ali Wild life sanctuary falls within the study area. As the project will be in
the existing facilities that has been in operation for a long time, there is no expected
adverse impacts due to the modernization and cargo capacity enhancement at the
terminal.

----------------------------------------------------------------------------------------------------------------------------------------------- EIA Study for capacity enhancement at berth 5A & 6A of SWPL, Goa 4-16 Final Report, September, 2017
Mitigation Measures
The modernization will lead to a fall in the emissions during cargo handling due to
the use of modern handling equipments and advanced dust suppression systems.
At present the cargo is stored in covered stockyards. Also a wind shield is provided
along the stack yard. Hence no additional mitigation measures are required.
The increase in the capacity will lead to increase in the train rakes and this will
have an impact on the air quality around the tracks. Regular monitoring and
regulation of the speed of the trains in densely populated areas can considerably
reduce the fine dust from re-suspension. However, to control fallouts from trains,
it is suggested to transport the cargo in closed containers. Some methods of
effective fugitive dust suppression are;
Specific load profile guidelines.
Applying a topper agent to loaded coal.
Covering of the wagons with HDPE covers.
The increase in cargo transportation due to capacity enhancement shall be
accommodated in the existing rail infrastructure and no expansion of tracks is
proposed. Hence impact on the railways is not envisaged. There shall be no impact
on the roadways as the evacuation of cargo will be mainly through trains. No road
transport of cargo is part of the proposed project.
Impact on Soil Quality
The Port is located within the inter-tidal and the sub-tidal area and hence no major
impacts are anticipated on the land environment during its operations. There will
also not be any land disposal of liquid wastes generated from landside berth or
shipping operations.
Mitigation Measures
The developer shall take adequate preventive any land disposal of solid
wastes generated from Jetty or ship operations which may adversely impact

----------------------------------------------------------------------------------------------------------------------------------------------- EIA Study for capacity enhancement at berth 5A & 6A of SWPL, Goa 4-17 Final Report, September, 2017
soil quality surface runoff of oil, paints, fuel, and lubricant spillage due to
land-side Jetty operations which many contaminate the soil.
Waste Management Plan will be implemented, and care will be taken so
that there are no accidental spills and leakages.
Used lubricant oil will be re-used wherever possible for the maintenance of
the machinery and will not be disposed on land or in the sea. Thus, there
will be no potential contamination hazard to soils due to spillage of fuels and
lubricant oils.
4.3.4 Air Environment
Impact on Ambient Air Quality
Vehicular movements at the Port during operation phase will not only contribute to
the ambient air quality. Fugitive emissions from other sources (during dry cargo
storage in open yards and transfer in conveyors, handling and transfer of raw
materials such as ores), emissions from ships are not expected to contribute
significantly to the ambient air quality in the port.
The following cargoes will be handled at the Terminal during its operational phase;
Coal/Coking Coal
Limestone
Iron Ore
Dolomite
Bauxite
Mineral Ores
HR coils
Steel Products
The handling details of various cargoes in the port are given in the following
paragraphs:
Coal, Lime Stone, Minerals, and Steel Products
Handling Equipment: Grab Ship Unloader
Conveying Equipment: Closed Conveyors

----------------------------------------------------------------------------------------------------------------------------------------------- EIA Study for capacity enhancement at berth 5A & 6A of SWPL, Goa 4-18 Final Report, September, 2017
Reclaiming: Stacker/ Reclaimers
Storage: Closed/Open storage Stack yards, Steel Sheds
Provided with dust suppression, wind shields, green belt and water sprays
Dispatch through Rakes
Mitigation Measures
Cargoes e.g. Coal, Limestone, Iron Ore, and Mineral Ores will be handled
in bulk form. For such cargoes, fugitive emissions are not generated.
Entire operation would be handled in closed conveyor system. Thus, no air
pollution is envisaged.
Coal dust would to be cleaned regularly from coal stack pile areas using
water sprays. The water can be channeled from various locations and
brought to a common pond for treatment prior to disposal.
Air Pollution due to coal handling
Coal will be stored at coal storage yard in coal stock piles with an approximate
maximum height of 7-8 m with side slope of 35o. During unloading and storage at
coal stockyard, the following sources/activities could lead to air pollution:
Dust caused by displacement of air
Dust blown out by the wind
Wind erosion from disposal sites
The above sources are described in the following paragraphs;
Dust caused by displacement of air
As the coal is loaded, it displaces air of quantum equal to its volume, which leads
to entrainment of dust. As the air enters the environment at the location, where the
coal is released at the stock yard, the air entrains the coal dust along with it and
leads to entrainment of fugitive dust.

----------------------------------------------------------------------------------------------------------------------------------------------- EIA Study for capacity enhancement at berth 5A & 6A of SWPL, Goa 4-19 Final Report, September, 2017
Dust generated by the Impact
The falling product has a certain velocity and the moment it hits the foregoing
product that has already been loaded into the Rakes. This velocity represents a
certain amount of kinetic energy that causes breakage of the product and therefore
generates dust at the point of impact.
Dust blown out by the wind
As soon as the product leaves the spout, the wind can blow through the falling
stream of product and will blow out the smaller and lighter particles.
Mitigation Measures
All the mechanized handling systems and other associated equipments
such as hoppers, belt conveyors, stacker cum reclaimers shall have
integrated dust suppression systems.
Imported Coal from Indonesia, Australia and Africa are generally high
moisture content and handling such coal result in less emission.
Coal and other dusty cargoes would be covered.
Water sprinkling dust suppression systems will be provided at strategic
transfer points.
Windshield of 12 m height would be provided at the stock yard.
Covered storage shed.
Impact prediction for Fugitive Coal Dust
Fugitive emission of uncaptured coal dust after rigorous implementation of dust
suppression system has been estimated by application of mathematical modelling
for area source. The contributing sources of fugitive dust from the terminal post
DSS are uncovered portions of stock piles where stacking or reclamation is going
on. This fugitive emission may be caused by strong winds acting upon the coal
fraction while material handling operations on the stockpile is going on. No
significant or detectable emissions are caused from the grab unloading, closed
conveyance and wagon loading parts of the operations due to confined handling
of the cargo.
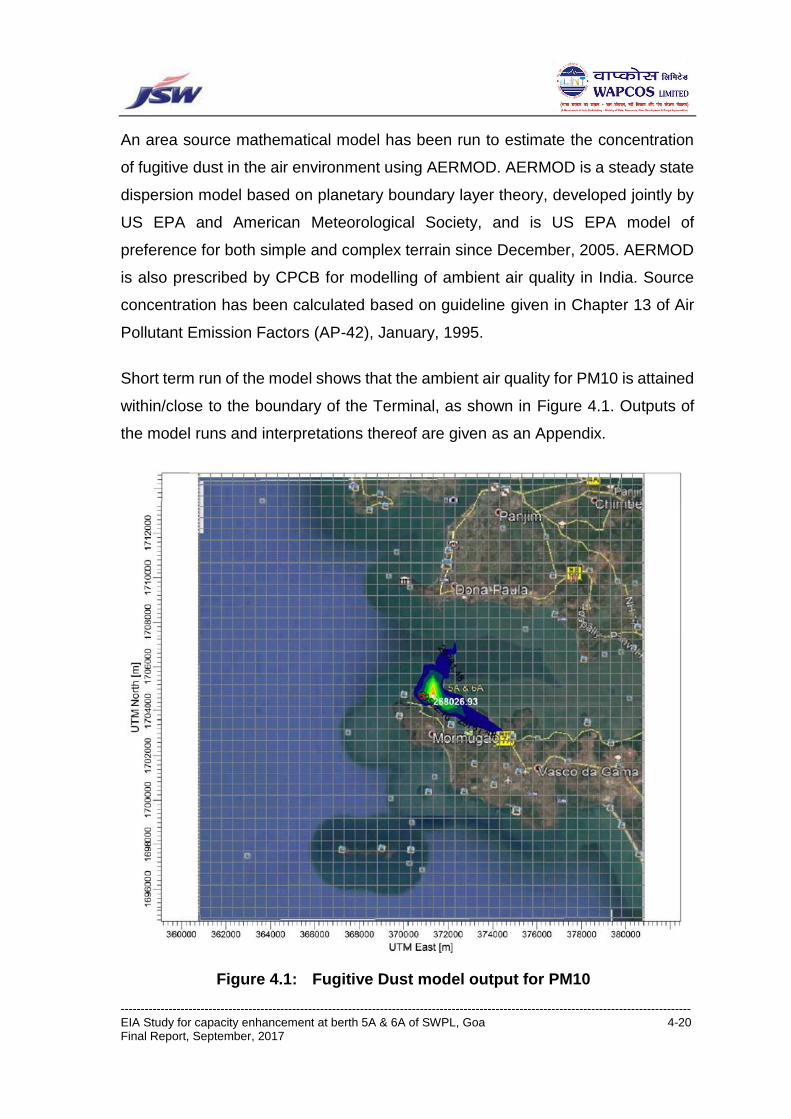
----------------------------------------------------------------------------------------------------------------------------------------------- EIA Study for capacity enhancement at berth 5A & 6A of SWPL, Goa 4-20 Final Report, September, 2017
An area source mathematical model has been run to estimate the concentration
of fugitive dust in the air environment using AERMOD. AERMOD is a steady state
dispersion model based on planetary boundary layer theory, developed jointly by
US EPA and American Meteorological Society, and is US EPA model of
preference for both simple and complex terrain since December, 2005. AERMOD
is also prescribed by CPCB for modelling of ambient air quality in India. Source
concentration has been calculated based on guideline given in Chapter 13 of Air
Pollutant Emission Factors (AP-42), January, 1995.
Short term run of the model shows that the ambient air quality for PM10 is attained
within/close to the boundary of the Terminal, as shown in Figure 4.1. Outputs of
the model runs and interpretations thereof are given as an Appendix.
Figure 4.1: Fugitive Dust model output for PM10

----------------------------------------------------------------------------------------------------------------------------------------------- EIA Study for capacity enhancement at berth 5A & 6A of SWPL, Goa 4-21 Final Report, September, 2017
4.3.5 Noise Environment
Potential Impact on Noise Levels
The material handling equipments and vehicular movement are the main sources
of noise pollution during the operational phase. The proper mitigation measure can
reduce the noise pollution.
Mitigation Measures
All the equipments and vehicles shall adhere to high quality and good
working conditions with noise generated within the permissible standards.
The project developer will ensure that the berths are designed such that the
sound pressure level in any situation (including emergencies such as
blowing of safety/relief valves) shall not exceed 115 dB (A) and that the
impulse noise level shall not exceed 135 dB (A).
Appropriate standards regarding maximum allowed noise levels will be
stipulated in the EPC contract.
The noise levels will not exceed permissible limits 60 dB (A) at the perimeter
of the terminal area.
4.4 SOCIO-ECONOMIC IMPACTS
The impacts on the socio-economic environment of the project area could arise
due to the following:
Impacts on structures, assets, standing crops, etc.
Impacts on livelihood
Impact on public infrastructure and civic amenities
Impact on health and safety
Impacts on Structures, Assets, Standing Crops
The capacity enhancement facility ort shall be developed entirely on the existing
facility in the port. Thus, the impacts due to loss of land, structures, assets or
standing crops are not envisaged. The modernization and capacity enhancement
at the terminal shall not lead to acquisition of private land or home steads entail
displacement of people.

----------------------------------------------------------------------------------------------------------------------------------------------- EIA Study for capacity enhancement at berth 5A & 6A of SWPL, Goa 4-22 Final Report, September, 2017
Impacts on Livelihood (fishing activities)
The project will have no detrimental effect on the coast, as the proposed capacity
enhancement at the port is mostly on the landward site. Further no fishing
activities exist in the Jetty limits. The project is also located away from any
designated offshore fishing areas. Hence, the project is expected to have no
detrimental effect on fish and hence commercial fisheries.
The project is likely to enhance the socio-economic conditions in the region
through greater economic opportunities and multiplier effect in terms of creation of
service and small industry opportunities to support the project.
Impacts on Public Infrastructure and Civic Amenities
The potential impacts of the project on local public infrastructure and civic
amenities could arise due to pressure on resources (power, water, roads) due to
the project implementation activities.
The electricity requirement for terminal activities will be self-generated and the
developer shall not source electricity from the villages during the project
implementation/ operation activities. No existing resources/water sources
(surface/ groundwater) that are currently being used by the locals for the purpose
of obtaining drinking water and/or water for irrigation or other purposes will be
tapped into. Drinking water requirements during the operation phase will be met
through tankers.
Impacts on Health & Safety
Given the minimal intrusion into the existing natural resources of the region (land,
freshwater sources), adequate measures for dust suppression (the only credible
source impacting the air environment), adequate distance from nearest habitation,
and no adverse health impacts are expected, either during project implementation
or operations of the project.
Due to modernization of equipments with high degree of mechanization and
retrofitting state of the art dust suppression systems and barriers at all the strategic
----------------------------------------------------------------------------------------------------------------------------------------------- EIA Study for capacity enhancement at berth 5A & 6A of SWPL, Goa 4-23 Final Report, September, 2017
locations beginning from unloading, conveying (closed loop conveyor), and
stacking, until rake loading will result in net reduction in emissions. Hence,
pollution due to coal handling and other bulk cargos will not have any significant
impact on the health of the local habitants. Same time, transportation in covered
rakes at present which will continue to do so in future also, will have no adverse
impact on the health and safety of the local population.
4.5 MITIGATION MEASURES MATRIX
The likely Impact due to this modernization and consequential capacity
enhancement proposal is assessed and mitigation measures on the land, water,
air, noise, ecology and socio-economic environment are derived. The mitigation
measures in the matrix format is given in Table 4.5.

----------------------------------------------------------------------------------------------------------------------------------------------- EIA Study for capacity enhancement at berth 5A & 6A of SWPL, Goa 4-24 Final Report, September, 2017
Table 4.5: The Mitigation Measures in Matrix Form.
Phase Sources Mitigation Measures
Land Environment
Implementation
Phase
• Change in land
use/landscaping
• No change in the landscape since no major construction activity
is involved.
• Hence no likely impact on the cultural heritage landscapes,
churches, temples, educational establishments, hospitals, etc.
Operation Phase • Solid wastes generated at
the site
• Waste minimization and recovery methods.
• There is no possibility of mixing of wastes from different cargoes.
• Disposal of any generated hazardous and non-hazardous waste
will be done through authorized agencies and norms.
• Municipal waste is segregated. Non-biodegradable waste is
given to Municipality.
• No like impact on the cultural heritage landscapes, churches,
temples, educational establishments, hospitals, etc.
Water Environment
Implementation
Phase
• Equipment modernization
activities
• No major construction activities are involved, hence no likely
impact is envisaged.
Operation Phase • Domestic waste water
• Release of ballast water
from vessel
• Sewage generated shall be treated with the available existing
facilities of MMC.
• No release of ballast water is permitted near Port area.

----------------------------------------------------------------------------------------------------------------------------------------------- EIA Study for capacity enhancement at berth 5A & 6A of SWPL, Goa 4-25 Final Report, September, 2017
Phase Sources Mitigation Measures
• Spillage from dust
suppression measures
• Sprinkled water for DSS is absorbed in the coal stockpile.
• Surface runoff is collected in settling tank connected to garland
drains for suitable treatment.
Air Environment
Implementation
Phase
• Emissions from equipment
and system modernisation
• Regular maintenance of machineries and equipment's.
Operation Phase • Fugitive dust emission
from handling of cargoes
• Vehicular traffic
• DG sets
• Coal has 9-11% moisture, resistant to dusting.
• Spraying of water over cargo and during handling.
• Year round covering of stock piles, covered storage shed.
• Windshields.
• Transportation of coal by closed pipe conveyor, closed conveyor
galleries, single point closed silo loading.
• Closed hoppers with water fogging system.
• In transit, rakes covered with tarpaulin.
• Periodic maintenance of roads and regular sweeping by
sweeping machines.
• Road water sprinkling.
• DG set – scheduled maintenance.
Noise Environment

----------------------------------------------------------------------------------------------------------------------------------------------- EIA Study for capacity enhancement at berth 5A & 6A of SWPL, Goa 4-26 Final Report, September, 2017
Phase Sources Mitigation Measures
Implementation
Phase
• Modernization activities • Protective equipments for workers.
• Scheduled maintenance of equipment/ vehicles to reduce noise
levels and vibrations.
Operation Phase • Cargo handling and other
operational activities
• Acoustic treatment of high noise equipment.
• Provision of protection devices (ear muffs/plugs) is provided to
the workers operating in the vicinity of high noise generating
machineries.
• DG set – scheduled maintenance
Ecology
Implementation
Phase
• Modernization activities • No spillage in marine ecosystem.
• No likely Impact on the terrestrial ecology.
• No marine area expansion. Hence, no likely impact on the marine
ecology, viz. Chicalim Bay, Grande Island, etc.
• No likely impact on the mangroves, corals, and Windowpane
oyster.
Operation Phase • Pollution from ship
movement
• Jetty operations
• Waste water discharge
• Pollution prevention as per the protocol MARPOL, 73/78.
• No release of ballast water is permitted in the Port area.
• All cargo handling equipment in the berth are spillage controlled.
• No waste water discharge is possible in the marine environment.
• No likely Impact on the terrestrial ecology.

----------------------------------------------------------------------------------------------------------------------------------------------- EIA Study for capacity enhancement at berth 5A & 6A of SWPL, Goa 4-27 Final Report, September, 2017
Phase Sources Mitigation Measures
• No likely impact on the marine ecology, viz. Chicalim Bay, Grande
Island, etc.
• No likely impact on the mangroves, corals, and Windowpane
oyster.
Socio-economic Environment
Implementation
Phase
• Labour deployment due to
modernization activities
• No outside labour is proposed to be deployed.
• Local labor shall be deployed. Hence, no likely impact during
project implementation.
• No land acquisition.
Operation Phase • Labour deployment
• Impact on Livelihood of
fishing community
• Impact on public
infrastructure and civic
amenities
• Impact on health and
safety
• Local labour is proposed to be deployed.
• No fishing activity in the port area.
• Fishing activity is mostly in the offshore areas. Hence, no likely
impact on the offshore fishing activity.
• No impact on the local power supply.
• No withdrawal of ground water and or use of surface water.
• No road transport is envisaged. Hence, no impact on the road
infrastructure.
• Adequate dust suppression measures to control air emissions.
Hence reduction in air pollution.
• No likely impact on the public infrastructure and civic amenities.
• No likely impact on the health and safety of local population.
EIA Study for Capacity Enhancement at Berth 5A, 6A of SWPL, Goa 5-1 Final Report, September, 2017
Chapter 5.0 ENVIRONMENT MANAGEMENT PLAN
5.1 INTRODUCTION
Environmental Management Plan (EMP) is formulated as an essential part of the
in EIA study to ensure that appropriate interventions are put in place to enhance
the beneficial effects likely to accrue from the project and ameliorate the adverse
effects from project activities, simultaneously to ensure compliance of statutory
environmental parameters. The Environmental Management Plan (EMP) for the
proposed project can be classified into the following categories:
EMP during project implementation phase
EMP during project operation phase
5.2 EMP DURING IMPLEMENTATION PHASE
Construction in the project will not involve any heavy civil works as the
equipment will be installed on the existing foundations which have design
capacity to bear loads of the new machinery. No construction on or near the
berths will be necessary.
Equipment will be transported by road on truck trailers and will be spliced either
by bolting together or welding. This proposed benign erection activity will not
have any significant impact on the environment. The dismantled equipment will
be cut into small pieces and scrapped to vendors on where-is basis.
The Terminal capacity enhancement is about modernisation of an existing
operation completely on the Port backup/land side. No change on the
berth/marine side is proposed. No berth or water side activates are proposed as
part of the project.

EIA Study for Capacity Enhancement at Berth 5A, 6A of SWPL, Goa 5-2 Final Report, September, 2017
5.2.1 Water Environment
The site fabrication activities in the implementation phase will not require any
water and will not generate any effluent. Additional sewage from fabrication
staff/workforce will be accommodated in the Terminal STP.
5.2.2 Land Environment
On completion of fabrication activities, the fabrication contractor will remove all
fabrication wastages and debris, etc. as a part of the contract agreement.
Handling of paints and thinners will be carried out over wooden pallet supported
boards. Site paintings will be carried out with spray guns ensuring minimum drift
losses. All sand blasting will be carried out within fabric booths.
5.2.3 Air Environment
Control of Emissions and Noise
Minor air quality impacts may be caused by emissions from construction
vehicles, equipment and DG sets brought by the fabrication contractor for
welding purpose, and emissions from transportation traffic. The following
measures will be followed recommended to control air pollution:
Contractor will be responsible for maintaining properly functioning
construction equipment to minimize exhaust.
Construction equipment and vehicles will be turned off when not used for
extended periods of time.
Unnecessary idling of construction vehicles to be prohibited to control
emissions and noise.
Effective traffic management to be undertaken to avoid significant delays
in and around the project area.
Road damage caused by sub-project activities will be promptly attended to
with proper road repair and maintenance work.
Noisy fabrication activities will not be carried out beyond day light hours.

EIA Study for Capacity Enhancement at Berth 5A, 6A of SWPL, Goa 5-3 Final Report, September, 2017
All stationary engine driven equipment will be mandatorily acoustically
enclosed or acoustically treated.
5.2.4 Marine Ecology
This capacity enhancement project involves modernization of the the
mechanized material handling system on the landward site of the berths. No
construction activity is involved in the seaward side of the existing berths.
However, care shall be taken to ensure that no construction debris find way to
the waters off the berths.
5.2.5 Solid Waste Management
Fabrication contractor’s workers shall use the existing Terminal canteen facility.
All the solid wastes arising from the fabrication activity will be collected, handled
and disposed per established practices of the Terminal.
5.3 EMP DURING OPERATION PHASE
5.3.1 Air Environment
Break Bulk
During project operation phase, one of the major activities would be handling of
bulk cargoes such as coal, coke, iron ore, lime stone, dolomite, bauxite, mineral
ores, etc. These cargos are potential sources of dust and may contribute to
fugitive dust emissions if not handled properly. The following management plan
would reduce the impact of such emissions on the general environment.
The impacts due to dust emissions could be substantially managed by
containment and reduction of emissions. The reduction in the emissions is
achieved by continuous spraying of water so that the surface remains moist and
the dust gets suppressed.
Imported coal from Indonesia, Australia and Africa are generally having
high moisture contents, often times exceeding 20%, Thus, handling of
such coal at the port would result in lesser dust emission.
EIA Study for Capacity Enhancement at Berth 5A, 6A of SWPL, Goa 5-4 Final Report, September, 2017
Dust suppression systems will be provided at the hopper and at the point
of discharge on the berth conveyor as well as the feeder underneath
hopper at the ship unloader (Figure 5.1 and 5.2). Mist and fog sprayers
will be used for this purpose.
Dust suppression systems will be provided at all transfer points in the
conveying and transfer systems to limit residual dust in the discharge area
(Figure 5.2). Nozzles with capacity to atomise 2-6 RPM of water at
4-8 kg/cm2 pressure has been envisaged for this purpose. With all the
above-mentioned measures, no emission is anticipated from the main
length of the conveyors.
Stack yard will be provided with water spraying system (Figure 5.3). The
sprinkler system would consist of pressurised high through sprinklers jets
of capacity 4–5 RPM at pressure upto 12 kg kg/cm2, which will operate at
an inclination of 30–40 degree with respect to the horizontal. Each
sprinkler will have a throw range of 25 m and will be installed at 30 m
intervals all along the stockpiles.
For wind generated dust generation, a windshield with a wire mesh
fencing with fast growing creepers up to a height of 14 m around the
coal/other bulk stack yard has been proposed (Figure 5.4).
Even the In-motion wagon loading system would be complying with the
zero emission standards as shown in Figure 5.5.
In addition to all the above measures, greenbelt development for the dust
suppressions.
One highly efficient road sweeping machine is in place for sweeping the
roads and paved area to mitigate any dust emissions through vehicular
movements.
The Terminal is provided with AQUADYNE water fogging system, in the hoppers,
which receives the unloaded material from the ship, at the Junction towers and in
the conveying systems. Since this works on the fogging technology, the water
droplets are of stipulated size and type to effectively control the finest fugitive

EIA Study for Capacity Enhancement at Berth 5A, 6A of SWPL, Goa 5-5 Final Report, September, 2017
emissions. In the stack yard area, the stocks are under cover, and only are
opened at the time of stacking and reclaiming, the sprinkling is carried under
such conditions and therefore increased moisture contents limits the emissions
completely.
Covered Storage Shed
Bulk cargo such as coal is proposed to be stored inside the covered shed. This
covered structure with 125 m width and 275 m length will be self-contained with
handling equipments like stacker/reclaimers. The firefighting and dust
suppression system also shall be provided inside the covered storage so the
fugitive emission is controlled. Covered storage shed proposed at the Terminal is
shown in the Figure 5.6.
In addition, separate covered shed for storage of unitized steel product is
planned at the terminal. This shed will store Cold Rolled (CR) coils to protect
from the environmental effects.
Steel and Unitised cargo (Export cargo)
Steel and unitized cargo shall be handled in break bulk form, and is not likely to
contribute to dust emissions. Steel products would be handled at the facility
through Fork lifts and Gantry Cranes and stored in covered shed. Those cargos
are then dispatched through rakes or roads with fully covered so that and no
emission at this point is envisaged.

EIA Study for Capacity Enhancement at Berth 5A, 6A of SWPL, Goa 5-6 Final Report, September, 2017
Figure 5.1: Water sprinkler system at ship unloader facility

EIA Study for Capacity Enhancement at Berth 5A, 6A of SWPL, Goa 5-7 Final Report, September, 2017
Figure 5.2 A: The water spray/mist system in the berth hopper for
dust suppression
Figure 5.2 B: The water spray arrangement on the
berth conveyor with the dust hood

EIA Study for Capacity Enhancement at Berth 5A, 6A of SWPL, Goa 5-8 Final Report, September, 2017
Figure 5.2 C: Water spray system at the transfer towers and conveyor systems

EIA Study for Capacity Enhancement at Berth 5A, 6A of SWPL, Goa 5-9 Final Report, September, 2017
Figure 5.3: Layout showing sprinkler system at Stackyard

EIA Study for Capacity Enhancement at Berth 5A, 6A of SWPL, Goa 5-10 Final Report, September, 2017
Figure 5.4: Windshield at Stackyard to control wind generated dust suspension

EIA Study for Capacity Enhancement at Berth 5A, 6A of SWPL, Goa 5-11 Final Report, September, 2017
Figure 5.6: Covered Shed for coal cargo storage at the Terminal

EIA Study for Capacity Enhancement at Berth 5A, 6A of SWPL, Goa 5-12 Final Report, September, 2017
Figure 5.5: The Silo Wagon Loading System
5.3.2 Water Environment
There are two sources of wastewater generation due to the proposed project
development. One is the domestic wastewater and the second is the small
quantity of water collected from the stack yard in the monsoon season. Both of
these waste streams need to be treated appropriately.
Runoff water from coal and other bulk cargo stack yard
Water is sprayed over coal cargo in a controlled manner for dust suppression and
to douse fire as necessary. The water sprinkled on the coal for dust suppression
gets absorbed by the coal. As the coal heaps are continuously covered, rain
water does not come in contact with coal heap. Very little leachate is produced

EIA Study for Capacity Enhancement at Berth 5A, 6A of SWPL, Goa 5-13 Final Report, September, 2017
due to the water sprinkling/fogging and firefighting activity. The occasional
leachate flows into the dump pond where the coal particle settles. The sludge
resulted are cleaned periodically and disposed as per norms. Clean over flow
from the garland drains after dust settlement can be collected and recycled for
dust suppression and excess overflow will be discharged into outfall drain.
Sludge so produced will be mainly coal dust, would be put back in the stack yard.
Domestic waste water
The waste water generation during the operation phase is mainly from the
canteen and employee sanitary facility. The amount of effluent generation from
these facilities shall be about 4 m3/day, and treated in the soak pit/setting tank
before supplying to existing STP facility at Mormugao Port for further treatment
and disposal. The Terminal presently uses 200-250 kld treated sewage from the
STP of MPT. Additional quantity of water for dust suppression is proposed to be
sourced from the presently operational 2300 kld CETP at Baina operated by
PWD. The water balance diagram proposed to be used in the terminal during
operation phase is given in Figure 5.7.
Figure 5.7: Water balance diagram during operation phase

EIA Study for Capacity Enhancement at Berth 5A, 6A of SWPL, Goa 5-14 Final Report, September, 2017
Marine Water Pollution
No oil cargo is presently being handled at the Terminal. SWPL is not involved in
the water side operation of the berths. Port conservancy including Oil Spill
Contingency management is the responsibility of the landlord Port, the MPT.
It is strictly ensured that no cargo remnants find their way to the marine water at
the edge of the berths. The Terminal has rotary broom suction vehicles as shown
in the following picture which pick up cargoes remnants if any created due to
occasional spill over from the cargo handling equipment.
5.3.3 Noise Control Measures
During operation phase, noise generation is envisaged from the cargo handling
equipments, vehicle movements in the Terminal, etc. Following measures shall
be adopted to maintain the noise levels within the prescribed limits;
Preference shall be given to equipments that produce low noise.
Adequate personal protective equipment (PPE) shall be provided to the
persons working in high noise areas.
Noise from the DG sets shall be controlled by providing an acoustic
enclosure or by treating the enclosure acoustically.
EIA Study for Capacity Enhancement at Berth 5A, 6A of SWPL, Goa 5-15 Final Report, September, 2017
5.3.4 Solid Waste Management
All the solid wastes arising in the premises is properly classified and disposed off
as per the Goa SPCB norms. The non-hazardous solid waste generated from the
activity is of the order of 0.5 tonnes/month. The composition of various solid
waste materials generated is given in the Table 5.1.
Table 5.1: Type of solid waste generated and its disposal
S. No. Solid Wastes Quantity tons/month) Disposal
1 Scrap Steel 26.25 Sale
2 Wooden Planks 13.5 Sale
3 Garbage 0.12 Given to MMC/MPT
garbage disposal facility
The scrap steel and the wooden planks are sold to the vendors immediately
without piling at the site.
Disposal of Wastes
Degradable component
The degradable portion of the solid waste is disposed suitably. The degradable
portion is taken as about 38.9%.
Non-Degradable component
The non- degradable portion such as plastic bottles, cans, etc. is disposed off
through an authorized vendor.
5.3.5 Terrestrial Ecology
As discussed earlier, no significant impact is envisaged on terrestrial ecology in
the area due to the proposed project. However, there will be some fugitive
emissions during the implementation and operation phases of the proposed
project. But the impacts due to these emissions will be insignificant. However,
further tree plantation program along the roads in and around the project area will
be taken up. In addition, ornamental trees and shrubs will also be grown at the

EIA Study for Capacity Enhancement at Berth 5A, 6A of SWPL, Goa 5-16 Final Report, September, 2017
proposed site to not only improve the bio-aesthetics but to contribute to a healthy
state of terrestrial ecology in the area.
5.3.6 Greenbelt Development
Greenbelt has been developed around various project appurtenances of the
proposed project, which will go a long way to achieve environmental protection
and mitigation of pollution levels in the area.
Depending upon the topo-climatological conditions and regional ecological
status, selection of the appropriate plant species has been made. The various
criteria adopted for selecting the species for greenbelt development are:
Plants should be fast growing
Preferably perennial and evergreen
Indigenous
Resistant to SPM pollution
Should maintain the ecological and hydrological balance of the region.
The general considerations involved while developing the greenbelt are:
Trees growing up to 10 m or above in height with perennial foliage
should be planted around the perimeter of the proposed project area
and on both sites of the conveyor belt.
Planting of trees should be undertaken in appropriate encircling rows
around the project site.
Trees should also be planted along the roadside.
Since, the tree trunk area is normally devoid of foliage upto a height of
3 m, it may be useful to have shrubbery in front of the trees so as to
give coverage to this portion.
Taking into consideration the above parameters, the greenbelt development plan
has been evolved for the proposed alternatives to reduce the pollution levels to
the maximum possible extent. Budget estimated for development of greenbelt in
the project area is about Rs. 21 lacs.
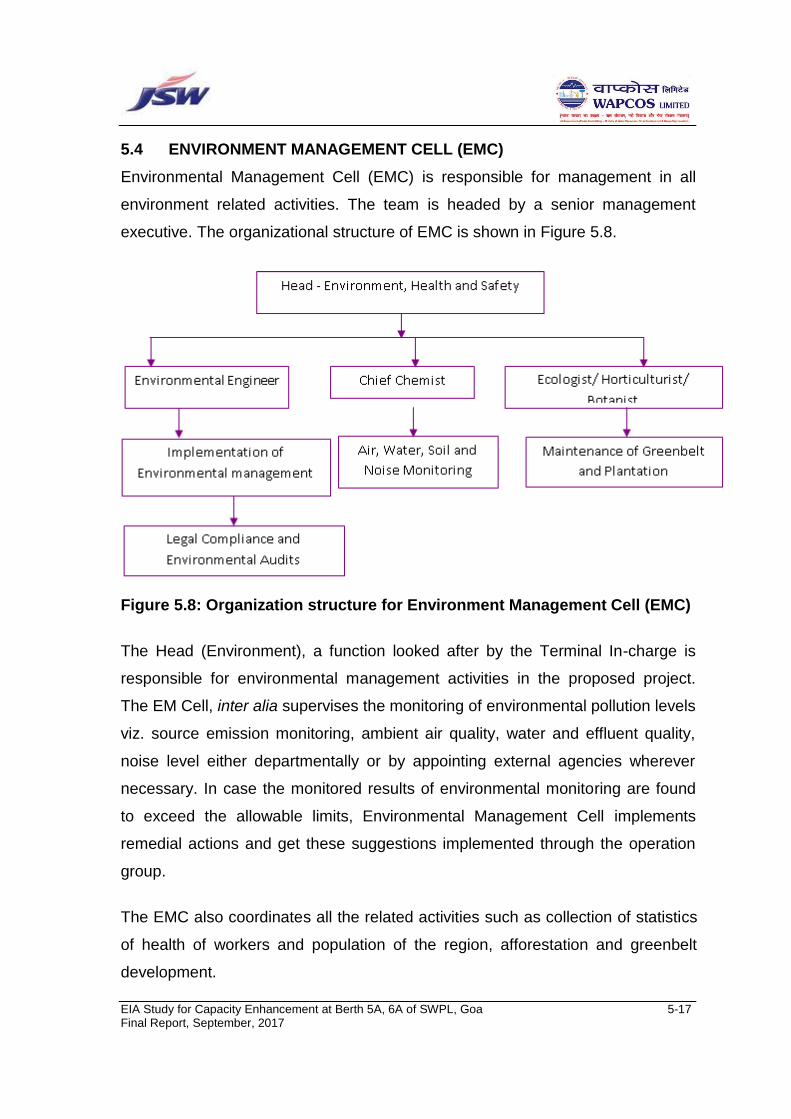
EIA Study for Capacity Enhancement at Berth 5A, 6A of SWPL, Goa 5-17 Final Report, September, 2017
5.4 ENVIRONMENT MANAGEMENT CELL (EMC)
Environmental Management Cell (EMC) is responsible for management in all
environment related activities. The team is headed by a senior management
executive. The organizational structure of EMC is shown in Figure 5.8.
Figure 5.8: Organization structure for Environment Management Cell (EMC)
The Head (Environment), a function looked after by the Terminal In-charge is
responsible for environmental management activities in the proposed project.
The EM Cell, inter alia supervises the monitoring of environmental pollution levels
viz. source emission monitoring, ambient air quality, water and effluent quality,
noise level either departmentally or by appointing external agencies wherever
necessary. In case the monitored results of environmental monitoring are found
to exceed the allowable limits, Environmental Management Cell implements
remedial actions and get these suggestions implemented through the operation
group.
The EMC also coordinates all the related activities such as collection of statistics
of health of workers and population of the region, afforestation and greenbelt
development.

EIA Study for Capacity Enhancement at Berth 5A, 6A of SWPL, Goa 6-1 Final Report, September, 2017
Chapter 6.0 RISK ANALYSIS &
DISASTER MANAGEMENT PLAN
6.1 INTRODUCTION
Risk assessment forms an integral part of EIA study. Risk assessment study
deals with identifying and evaluating the magnitude of impending risks to which
the neighboring population is exposed due to occurrence of accidents involved in
the project construction and implementation. This influences in demonstrating the
guidelines for preparation of disaster management plan, which will be executed
to handle the situation, if any emergency occurs.
A major emergency in works is one, which has the potential to cause injury or
loss of life. It may cause extensive damage to the property and serious disruption
both inside and outside the works. Depending on its magnitude and escalation
potential, it may require the assistance of outside emergency services to handle
it effectively. Although the emergency may be caused by a number of different
factors viz. unsafe conditions, human error, natural causes, acts of
disruption/terrorism, etc.
Emergency/disaster is an undesirable occurrence of events of such magnitude
and nature that adversely affect operations, cause loss of human lives and
property as well as damage to the environment. Ports and related infrastructure
are vulnerable to various kinds of natural and manmade disasters. Examples of
natural disaster are flood, cyclone, tsunami, earthquake, lightning, etc.,
Manmade disasters include fires, explosion, leakage of toxic gases, terrorist
activities, sabotage, etc. It is impossible to reasonably forecast the time and
nature of disaster, which might strike a common user infrastructure. An effective
disaster management plan helps to minimize the losses in terms of human lives,
assets and environmental damage and resumes working condition as soon as
possible.
EIA Study for Capacity Enhancement at Berth 5A, 6A of SWPL, Goa 6-2 Final Report, September, 2017
Disaster Management Plan (DMP) forms an integral part of any risk assessment
and management exercise; any realistic DMP can only be made after proper risk
assessment study of the activities and the facilities provided in the installation.
Correct assessment and evaluation of the potential hazards, advance meticulous
planning for prevention and control, training of personnel, mock drills and liaison
with outside services available can minimize losses to the facility’s assets, rapidly
contain the damage effects and effectively rehabilitate the damage areas.
6.2 APPROACH TO Disaster Management Plan (DMP)
Modern approach to disaster management involves the following two steps;
Risk Identification
Risk Evaluation
Risk identification entails:
Identification of hazardous events in the installation, which can cause loss
of capital equipment, loss of operation, threatens health and safety of
employees, threaten public health and damage to the environment.
Identification of risk is important processes & areas, to determine effective
risk reduction measures.
Risk evaluation involves calculation of damage potential of the identified hazards
with probable damage distances, termed as consequence analysis. Quantitative
risk assessment further evaluates the actual risk due to a probable event
occurring over a period of time by factoring in the probability of the event
occurring, or frequencies of occurrence of the event.
The effect of a hazardous event in atmosphere, and consequent damage in case
of accident may depend on:
Wind speed
Wind direction
Atmospheric stability
Port assets & population exposed in the direction of wind
EIA Study for Capacity Enhancement at Berth 5A, 6A of SWPL, Goa 6-3 Final Report, September, 2017
Action plan depends largely on results of risk assessment data and may include
one or more of the following:
Plan for preventive as well as predictive maintenance.
Augment facilities for safety, firefighting, medical (both equipment and
manpower) as per requirements of risk analysis.
Evolve emergency handling procedure both onsite and offsite.
Practice mock drill for ascertaining preparedness for tackling hazards/
emergencies at any time of the day.
An important element of mitigation is emergency planning, i.e. recognizing that
accidents are possible, assessing the consequences of such accidents and
deciding on the emergency procedures, both onsite and offsite, that would need
to be implemented in the event of an emergency. Emergency plans are likely to
be separate for on-site as well as off-site matters, but they must be consistent
with each other, i.e. they must be related to the same assessed emergency
conditions. While an on-site plan will always be the responsibility of the works
management, different legislation may place the responsibility for the off-site plan
elsewhere.
6.3 OBJECTIVES
The overall objectives of the emergency plan are to:
Localize the emergency and, if possible eliminate it.
Minimize the effects of the accidents on people and property.
Elimination will require prompt action by operators and works emergency staff
using, for example, fire-fighting equipment, etc.
Minimizing the effects may include rescue, first aid, evacuation, rehabilitation and
giving information promptly to people living nearby.

EIA Study for Capacity Enhancement at Berth 5A, 6A of SWPL, Goa 6-4 Final Report, September, 2017
6.4 IDENTIFICATION AND ASSESSMENT OF HAZARDS
Storms/floods, inventory fire, cyclones and tsunamis are potential disasters for
the port. Their likelihood of occurrence and the resulting risk of damage have
been incorporated into the design analysis of the Port. Disaster preparedness
plans is summarized in Table 6.1.
Table 6.1: Summary of the Disaster Preparedness Plans
Disaster Description Response Plan Stages
Storms Depending on the
magnitude the storms can
partially and temporarily
splash over the deck of the
jetty, thereby affecting its
operation
Deck level design
based on storm
surge history of
the location
Preparedness
Plan
Secure insurance
coverage.
Alert,
Response
Recovery
Earthquake Proposed site is not in an
earthquake prone zone
(Zone III Low intensity zone,
as per IS 1893 (Part 1):
2002)). Hence, probability of
occurrence of earthquake of
significant intensity are very
rare..
Building and
Construction has
adhered to/will
adherer to relevant
IS standards for
structural design and
construction.
Planning,
Response,
Damage
Assessment
and
Recovery.
Fire Local fire spots in the coal
inventory can cue
firefighting operations in the
terminal.
Fire Prevention
and Preparedness
Plan
Install firefighting
equipment
Electrical work will
be done by
certified
electrician.
Provide Insurance
coverage.
Response,
Planning Fire
Drills,
Damage
Assessment.
Cyclone High winds and coupled
torrential rains may disrupt
operations of the terminal
Cyclone
preparedness plan
Alert,
Response
Recovery

EIA Study for Capacity Enhancement at Berth 5A, 6A of SWPL, Goa 6-5 Final Report, September, 2017
temporarily
Tsunami High waves may disrupt
operations of the terminal
temporarily
Tsunami
preparedness plan
Alert,
Response
Recovery
Medical Medical emergencies can
occur at any moment and
therefore requires a quick
and coordinated effort to
respond to the need
Medical
Emergency Plan
First aid
equipment and
trained staff
Response,
Recovery
The proposed development will take into consideration all the potential disasters
and plan accordingly to mitigate any negative effects of these disasters on the
project infrastructure.
6.4.1 Coal Storage and Fire Risk
The terminal stokpiles significant quantity of coal at any point of time. Coal is not
a hazardous commodity as per MSIHC Rules, 1989.
The coal in the stack catches fire only when the coal contains high percentage of
Sulphur stored for longer period. The SWPL terminal mainly handles coke and
thermal coal, so there is very less chance of catching fire. In any case, maximum
dwell time of the coal at the terminal is not in excess of 10 days. So chance of
fire further reduces.
Fires in coal stock pile ae unlikely, the same do not occure in the Terminal based
on experience of several years. Generally, if any fire starts in the stckpile, it will
start as localised hot-spots which are easy to spot and can be immediate doused
using fire water moitors.
The coal stacks are covered with waterproof sheets and protected at the sites
from collapse by crash barriers. Fire, if any, in the covered stockpile can not
remain undeteced for more than 15 to 20 minutes.

EIA Study for Capacity Enhancement at Berth 5A, 6A of SWPL, Goa 6-6 Final Report, September, 2017
The firefighting arrangements in the SWPL Terminal comprise TAC
conforming/approved annular fire water hydrant system provided with fire and
foam monitors, completely capable of containing any kind of fire within the
battery limit of the Terminal. No offsite spread of fire is likely from the terminal.
A 5000 MT doble integrity cup-in-tank type ammonia storage tank of M/s Zuari
Industries Ltd is located south of the Adani Mormugoa Port Terminal about 500
m from the coal stack yards of the SWPL Termial. The distance is too large for a
coal stack fire to have any kind of risk on the on the ammonia tank. The POL
bulk tanks of IOCL, HPCL and the three Phosphoric acid tanks of Zuari
Industries Ltd. south of the fishing jetty are at a distance of about 1.85 km from
the SWPL Terminal.
6.5 DISASTER CONTROL/RESPONSE PLAN
Disaster may arrive without any warning, unexpectedly in spite of all precautions
and preventive measures taken. However, an efficient control/response plan can
minimize the losses in terms of property, human lives and damage to the
environment can be the minimum.
6.5.1 Emergency Plan for Natural Disasters
Due to its location (west coast), the terminal is not likely to be exposed to natural
disasters of cyclones and tsunami. However, the operations will have
preparedness for any unlikely event of natural origin.
Both the disasters give a short to very short notice, have potential to cause
sudden and widespread damage to the Port infrastructure and the population
beyond it, and make recover efforts difficult due to total collapse of administrative
and welfare machinery.
It is essential for DMPs of a Terminal to have special provision for meeting with
the challenges of cyclones and tsunamis. Since they do not give a long lead
warning, pre-meditate and pre-rehearsed action between the first intimation and
the onset of the event becomes crucial for effectiveness. Since both events

EIA Study for Capacity Enhancement at Berth 5A, 6A of SWPL, Goa 6-7 Final Report, September, 2017
involve mass evacuation and widespread public notice, DMPs for cyclone and
tsunami can ill-afford to be complicated.
(a) Emergency measures during a Cyclone
IMD usually gives a 24 to 36 hours early warning on the onset of cyclone right
from the time a depression starts forming in the Bay of Bengal or Arabian Sea.
Aided by weather satellite, path of a cyclone can be traced almost in real time.
The path of the cyclone can be reliably predicted and early warning/alerts can be
given 10 to 12 hours prior to the hit of the cyclone. Table 6.2 gives the actions to
be taken before, during and after a cyclone by the Port authorities.
Table 6.2: Actions to be taken in Cyclone Emergency
Sr. Action Responsibility
Actions before the Cyclone
1. The Control Room (CR) will depute a Nodal Person
to be on standby for receiving cyclone alert
messages from MPT, DG Shipping, DG Lighthouse
and Lightships, and Distt. Collector, as also from AIR
and DD news telecasts and keep the CR In-charge
abreast of the situation.
Marine Control
Room (MCR) In-
charge
2. The Terminal In-charge will start taking Cyclone
Action 12 hours before the forecast time of hit. He will
issue cyclone warning in the terminal by asking the
Nodal Person to play out warning on the Terminal
paging channel, and individual call to all the HODs
including Port security at the gate complex to be on
high alert for further instructions.
Terminal In-charge
Nodal Person in
MCR.
3. The Terminal In-charge will order implementation of
Port shutdown and evacuation 8 hours before the
time of hit.
Following actions will be taken:
a. Cargo handling operation on the Port backup
(bulk cargo area and on the berths) will be
Terminal In-charge
Dry Cargo
Department

EIA Study for Capacity Enhancement at Berth 5A, 6A of SWPL, Goa 6-8 Final Report, September, 2017
Sr. Action Responsibility
stopped. All machinery will be folded back,
retracted, fixed, moored and close-secured.
b. All material handling on the berths will be
stopped. Outriggers of the cranes will be lifted
and secured, booms and hoists retracted and
secured in position, and the cranes to be
locked and tide down with tie down hooks
provided on the berths.
c. All vessels berthed on the Terminal will be
unmoored and set to sail to the anchorage
area assisted by tugs.
d. All loose material stored on the Terminal will
be covered by tarpaulin and secured on the
ground through grommets to the hooks
provided on the edges of the hard stands.
e. The ventilators of the covered godowns will be
opened to provide cross movement of cyclonic
winds.
f. Terminal In-charge will ask the HOD through
the Nodal Person to relieve all the employees
on duty except few who will be needed for final
shutdown.
g. A jeep with battery power loudspeakers will be
pressed to announce Cyclone Warning in local
language on the nearby area as instructed by
the MPT.
Dry Cargo
Department
MCR Traffic and
VTMS In-charge,
Tug masters
Dry Cargo
Department
Transport and
Materials
Coordinator
Transport and
Materials
Coordinator
Terminal In-
charge, Nodal
Person, HODs.
4. The Terminal In-charge will order complete
evacuation of the Terminal including the HODs 4
hours before the time of hit.
Following actions will be taken:
Terminal In-
charge, Nodal
Person
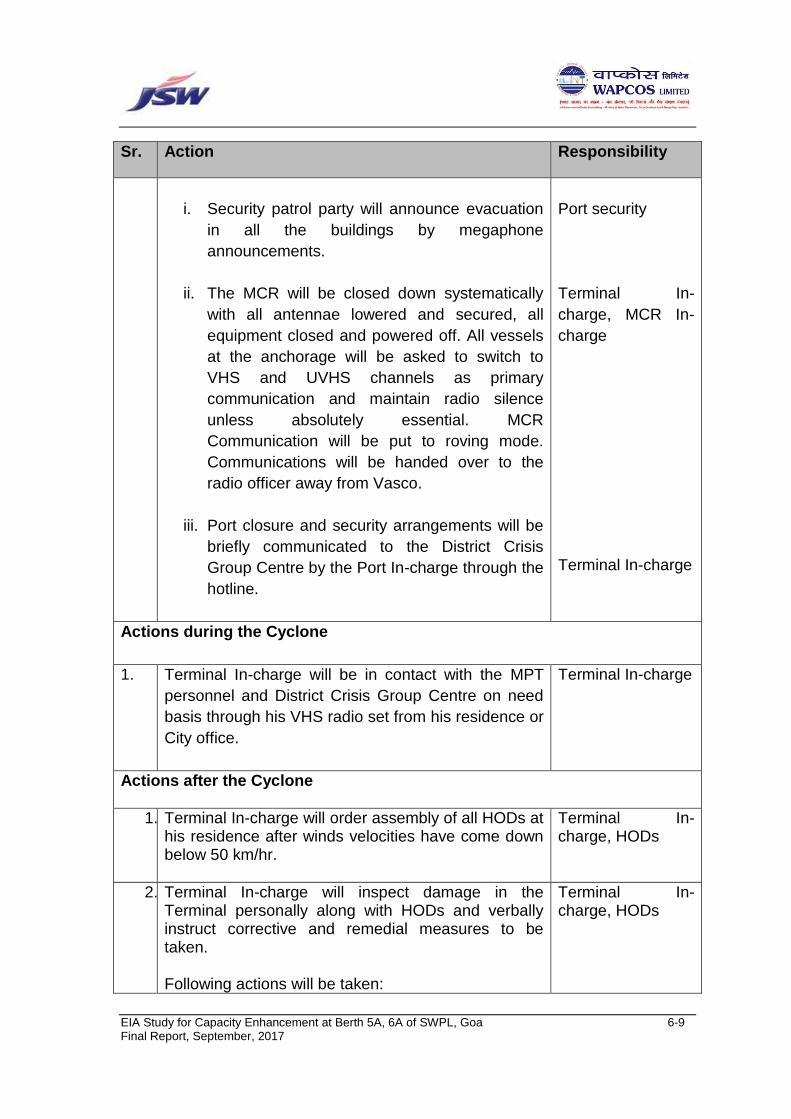
EIA Study for Capacity Enhancement at Berth 5A, 6A of SWPL, Goa 6-9 Final Report, September, 2017
Sr. Action Responsibility
i. Security patrol party will announce evacuation
in all the buildings by megaphone
announcements.
ii. The MCR will be closed down systematically
with all antennae lowered and secured, all
equipment closed and powered off. All vessels
at the anchorage will be asked to switch to
VHS and UVHS channels as primary
communication and maintain radio silence
unless absolutely essential. MCR
Communication will be put to roving mode.
Communications will be handed over to the
radio officer away from Vasco.
iii. Port closure and security arrangements will be
briefly communicated to the District Crisis
Group Centre by the Port In-charge through the
hotline.
Port security
Terminal In-
charge, MCR In-
charge
Terminal In-charge
Actions during the Cyclone
1. Terminal In-charge will be in contact with the MPT
personnel and District Crisis Group Centre on need
basis through his VHS radio set from his residence or
City office.
Terminal In-charge
Actions after the Cyclone
1. Terminal In-charge will order assembly of all HODs at his residence after winds velocities have come down below 50 km/hr.
Terminal In-charge, HODs
2. Terminal In-charge will inspect damage in the Terminal personally along with HODs and verbally instruct corrective and remedial measures to be taken. Following actions will be taken:
Terminal In-charge, HODs

EIA Study for Capacity Enhancement at Berth 5A, 6A of SWPL, Goa 6-10 Final Report, September, 2017
Sr. Action Responsibility
a. The MCR will be reopened and all
communication and navigation equipment restarted, calibrated and synchronized.
b. Vessel stationed at anchored will be supplied
with necessary supplies and spares if required by Port supply and pilot boats. Any medical causality will be rescued and hospitalized if necessary.
c. All debris and wasted material spilled due to wind and rain will be collected, checked for contamination, and disposed off in a well-designed pit in the Terminal premises.
d. Damage to structural work of the Terminal,
namely the cranes and other tall material handling structures (conveyor galleries, watch towers, building glasses) will be inspected and necessary repairs and cleaning will be undertaken. Structures whose stability is under question will be cordoned off till they are inspected in detail and cleared for general use.
e. Water supply will be tested for portability, and other sanitary services resumed after suitable inspection. Water accumulated due to heavy rains will be drained and area dried, sprayed with disinfectant, etc.
f. Status of Terminal will be communicated to the District Crisis Group Centre by the Port In-charge through the hotline
MCR In-charge Harbor master Transport and Materials Coordinator Engineering department Communications and Medical Coordinator Terminal In-charge.
3. After the Terminal housekeeping has been brought to order, all machineries will be sequentially tested. Terminal operations will be resumed with berthing of cargo handling vessels
Terminal In-charge.
4. Terminal medical, logistics, communication and personnel facilities will be suitably extended to the Crisis Group Centre Team the leadership of the Dist. Collector for any further relief work as desired by the local and dist. administration.
Terminal In-charge.

EIA Study for Capacity Enhancement at Berth 5A, 6A of SWPL, Goa 6-11 Final Report, September, 2017
(b) Emergency measures during a Tsunami
Early warning for a tsunami can be as short as one hour. Tsunami can be
predicted by a network of seismic detection centers installed by the bordering
nations after the December 2004 tsunami, as well as deep sea telemetered
buoys placed by the MoES. Tsunami warning will be communicated to the
Terminal MCR by the District Crisis Group Centre by telephone/emergency
hotline.
Rapid action after the alert is critical to effective tsunami response. Unlike
cyclone, tsunami is not accompanied by tell-tale disturbed weather and high
winds, therefore Port must effectively communicate and elicit urgent action in this
regard. Table 6.3 gives the actions to be taken in a Tsunami emergency.
Table 6.3: Actions to be taken in Tsunami Emergency
Sr. Action Responsibility
a. Actions before the Tsunami
1. The MCR will initiate high–intensity emergency tsunami warning through all communications channel including Terminal paging channel, and individual call to all the HODs, including Terminal security at the gate complex with clear instruction to shut down all operations possible within 20 minutes, and move as far as possible from the sea front using any means of transportation available, including running away.
MCR In-charge
2. The MCR In-charge will carry out the following understanding authorization of the Terminal In-charge. Following actions will be taken:
a. All cargo handling operation on the Terminal
and backup will be stopped immediately. All machinery will be folded back, retracted, fixed, moored and close-secured. Outriggers of the cranes will be lifted and secured, booms and hoists retracted and secured in position, and the cranes to be locked and tide down with tie
MCR In-charge Dry Cargo Department
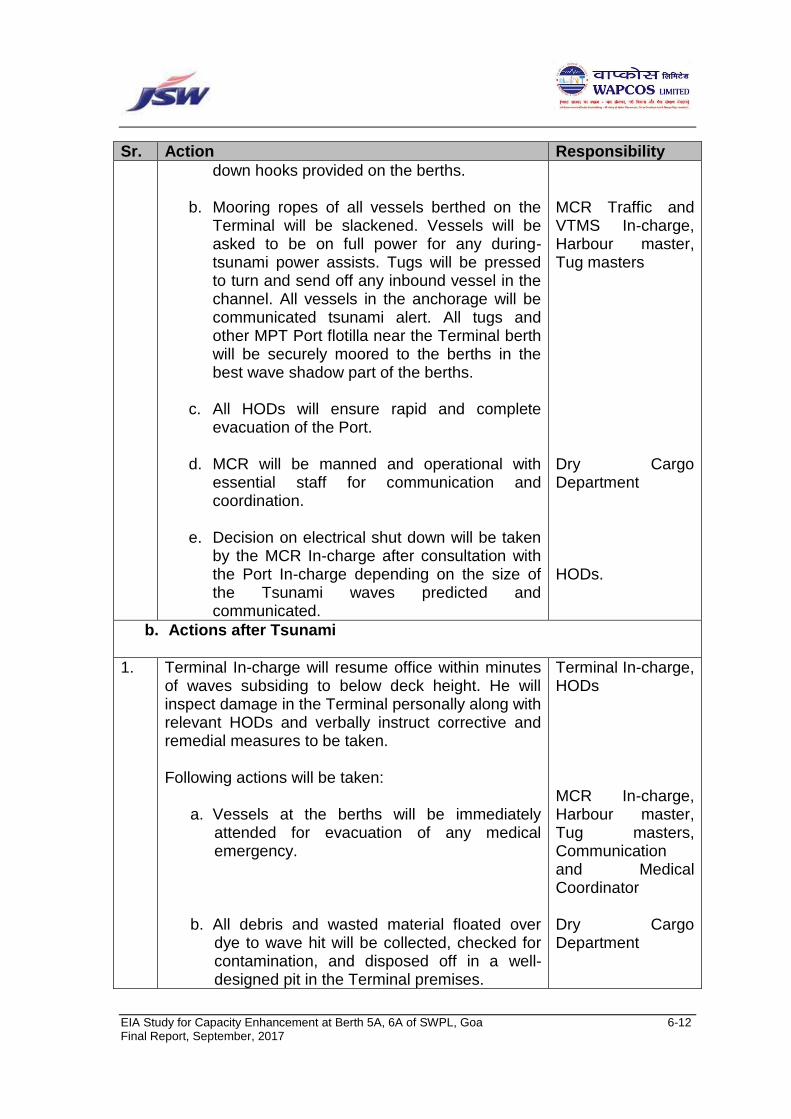
EIA Study for Capacity Enhancement at Berth 5A, 6A of SWPL, Goa 6-12 Final Report, September, 2017
Sr. Action Responsibility
down hooks provided on the berths.
b. Mooring ropes of all vessels berthed on the Terminal will be slackened. Vessels will be asked to be on full power for any during-tsunami power assists. Tugs will be pressed to turn and send off any inbound vessel in the channel. All vessels in the anchorage will be communicated tsunami alert. All tugs and other MPT Port flotilla near the Terminal berth will be securely moored to the berths in the best wave shadow part of the berths.
c. All HODs will ensure rapid and complete
evacuation of the Port.
d. MCR will be manned and operational with essential staff for communication and coordination.
e. Decision on electrical shut down will be taken by the MCR In-charge after consultation with the Port In-charge depending on the size of the Tsunami waves predicted and communicated.
MCR Traffic and VTMS In-charge, Harbour master, Tug masters Dry Cargo Department HODs.
b. Actions after Tsunami
1. Terminal In-charge will resume office within minutes of waves subsiding to below deck height. He will inspect damage in the Terminal personally along with relevant HODs and verbally instruct corrective and remedial measures to be taken. Following actions will be taken:
a. Vessels at the berths will be immediately attended for evacuation of any medical emergency.
b. All debris and wasted material floated over
dye to wave hit will be collected, checked for contamination, and disposed off in a well-designed pit in the Terminal premises.
Terminal In-charge, HODs MCR In-charge, Harbour master, Tug masters, Communication and Medical Coordinator Dry Cargo Department

EIA Study for Capacity Enhancement at Berth 5A, 6A of SWPL, Goa 6-13 Final Report, September, 2017
Sr. Action Responsibility
c. Damage to civil and structural work of the
Terminal, namely the berths, cranes, etc. will be inspected and necessary repairs and cleaning will be undertaken. Structures whose stability is under question will be cordoned off till they are inspected in detail and cleared for general use.
d. Water supply will be tested for portability, and other sanitary services resumed after suitable inspection. Water accumulated due to wave hit will be drained and area dried, sprayed with disinfectant, etc.
e. Status of Terminal will be communicated to the District Crisis Group Centre by the Terminal In-charge through the hotline
Engineering department Communications and Medical Coordinator Terminal In-charge
2. After the Terminal housekeeping has been brought to order, all machineries will be sequentially tested. Port operations will be resumed after starting the unloading and stacking equipment.
Terminal In-charge.
3. Port medical, logistics, communication and personnel facilities will be suitably extended to the Crisis Group Centre Team the leadership of the Distt. Collector for any further relief work as desired by the local and distt. administration.
Terminal In-charge.
6.5.2 Medical Emergency Plan
The proposed development plan is to implement a medical emergency plan. A
medical emergency is an injury or illness from pre-existing conditions or from any
operational cause that poses an immediate threat to a person's life or long term
health. These emergencies may require assistance from another person, who
should ideally be suitably qualified to do so, although some of these emergencies
can be dealt with by the victim themselves. Dependent on the severity of the
emergency, and the quality of any treatment given, it may require the

EIA Study for Capacity Enhancement at Berth 5A, 6A of SWPL, Goa 6-14 Final Report, September, 2017
involvement of multiple levels of care, from a first-aider to an emergency
physician through to specialist surgeons.
Purpose of the Plan
The primary objective of the medical response plan is to:
Establish the coordinating mechanism necessary to respond to a health
situation and to implement basic first aid treatment where applicable.
Develop and implement a coordinating mechanism necessary to secure
appropriate emergency transportation to a recognized health institution.
Basic First Aid
The basic first aid treatment in the event of a medical emergency should be
made available. First Aid is the provision of limited care for an illness or injury,
which is provided, usually by a certified person, to a sick or injured patient until
definitive medical treatment can be accessed. It generally consists of series of
simple, sometimes lifesaving, medical techniques, that an individual, either with
or without formal medical training, can be trained to perform with minimal
equipment. This equipment usually involves the medical supplies commonly
found in a first aid kit.
Transportation of Patient
Assessing the condition of the person/s, the person/s must be transported to a
recognized health institution for further treatment as quickly as possible to the
nearest health institution at Vasco or Panaji where professional doctors and
nurses are available for 24 hours.
6.6 TRAINING AND DEVELOPMENT
Risks and hazards abound in our society and therefore the proposed
development is no exception. The Emergency Committee will develop a training
and development program. This program will cover basic areas designed to
minimize and prevent injury and illness where possible. This program will not be

EIA Study for Capacity Enhancement at Berth 5A, 6A of SWPL, Goa 6-15 Final Report, September, 2017
required to divulge in general or in details about the many risks and hazards that
exist or affect the project.
Training is the field concerned with workplace learning to improve performance.
Such training can be generally categorized as on-the-job or off-the-job. On-the-
job describes training that is given in a normal working situation, using the actual
tools, equipment, documents or materials that they will use when fully trained.
On-the-job training is usually most effective for vocational work. Off-the-job
training takes place away from normal work situation which means that the
employee is not regarded as productive worker when training is taking place. An
advantage of off-the-job training is that it allows people to get away from work
and totally concentrate on the training being given. This is most effective for
training concepts and ideas.
(a) Storm Preparedness Plan
Storms caused by heavy rains/Cyclone can cause severe property damage and
flooding, especially considering the project environment. Moreover, the
restoration time is virtually unknown with these types of sustained damages. With
this in mind, the EM Cell of the Terminal will carry out training in the form of drills
to fine-tune and sort out the preparation process. These drills are important in
accessing the integrity and functionality of the preparedness plan.
(b) Fire Prevention and Response Plan
Fire outbreaks are dangerous if not contained and extinguished in time. Time is
of the essence when dealing with fires. The EM Cell will ensure that the several
persons chosen from all departments are trained to fight a fire. These employees
will be termed as essential employees. Firefighting trained employees will be
termed as essential employees. A list of firefighters will be displayed on Terminal
gate. It will be ensured that three Firefighting trained essential employees are
rostered in every shift of Terminal operation
EIA Study for Capacity Enhancement at Berth 5A, 6A of SWPL, Goa 6-16 Final Report, September, 2017
(c) Medical Emergency
Effective life-saving first aid requires hands-on training by experts, especially
where it relates to potentially fatal illnesses and injuries, such as those that
require Cardiopulmonary Resuscitation (CPR), as the procedures may be
invasive, and carry a risk of further injury to the patient. First aid training will be
provided to the selected employees from every department including security.
These employees will be termed as essential employees. A list of first aiders will
be displayed on Terminal gate. It will be ensured that one First Aid trained
essential employee is rostered in every shift of Terminal operation.
6.7 COMPONENTS OF DISASTER MANAGEMENT PLAN (DMP)
An onsite emergency is one, which is having negligible effects outside the
Terminal premises and can primarily be controlled by internal facilities and
resources available. Some help may be required from external agencies or local
authorities. Absence of any storage of hazardous commodities within the
Terminal will ensure that hazard consequences will be well within the boundary,
which can be easily mitigated by following the Onsite DMP. The existing
Terminal has an onsite emergency plan which has been reviewed for the
proposed capacity enhancement.
Offsite emergency affecting the neighboring areas and population outside the
Terminal premises, requiring substantial contribution from local authorities and
institutions like police, civil defense, state hospital and civil administration in
addition to state fire services, etc. is not required for the type and magnitude of
operation of the Terminal. The Terminal will take part in the overall emergency
preparedness plan of the MPT for natural disaster of large magnitude such as
tsunami and cyclone as instructed by MPT and the local civil administration.
6.7.1 Onsite Disaster Management Plan (DMP)
The section gives an outline of the DMP in implementation at the Terminal.
Details that are part of the Onsite DMP are:
Name and address of the person furnishing the information.

EIA Study for Capacity Enhancement at Berth 5A, 6A of SWPL, Goa 6-17 Final Report, September, 2017
Key personnel of the Organization and responsibilities assigned to them in
case of an emergency.
Outside Organization if involved in assisting during an onsite emergency:
- Type of accidents
- Responsibility assigned.
Details of liaison arrangement between the Organizations.
Information on the preliminary hazard analysis:
- Type of accidents.
- System elements or events that can lead to a major accident.
- Hazards.
- Safety relevant components.
Details about the site:
- Location of dangerous substances.
- Seat of key personnel.
- Emergency control room.
Likely dangers to the Terminal
Enumerate effects of
- Stress and strain caused during normal operation.
Details regarding
- Warning, alarm, safety and security systems.
- Alarm and hazard control plans in the line with disaster control and
hazard control planning, ensuring the necessary technical and
organizational precautions.
- Reliable measuring instruments, control units and servicing of such
equipments.
- Precautions in designing of the foundations and load bearing parts of
the building.
- Continuous surveillance of operations.
- Maintenance and repair work according to the generally recognized
rules of good engineering practices.

EIA Study for Capacity Enhancement at Berth 5A, 6A of SWPL, Goa 6-18 Final Report, September, 2017
Details of communication facilities available during emergency and those
required for an offsite emergency.
Details of firefighting and other facilities available and those required for
an offsite emergency.
Details of first aid and hospital services available and its adequacy.
6.7.2 Key Personnel and Responsibilities in Event of Emergency
It is to be understood that the first few minutes after the start of an incident are
most vital in prevention of escalation. Therefore, the personnel available at the
site on round-the-clock will play an important role. Some of them will be the
identified “Key Persons”. Since the Terminal facilities are to be operated by
highly skilled officers/operators with the help of “Terminal In-Charge/Dy. Terminal
Manager”, in the emergency he will also act as “Chief Controller” for incidence
and he will nominate different “Emergency Coordinators” to control emergency
situation.
The role of various coordinators is to assess the situation from time-to-time, take
appropriate decisions in consultation with the “Chief Controller” and to provide
timely resources to the “Key Persons” to fight the emergency. “Key Persons” as
far as is possible are available during shift on a round the clock basis. An
organogram of the officers at the liquid cargo operations during emergency is
presented as Figure 6.1.
Figure 6.1: Organization Chart of Onsite Emergency Management Team
Fire & Safety
Co-ordinator
Engineering
Co-ordinator
Communication
& Medical,
Coordinator
Finance
Co-ordinator
Transport &
Materials
Coordinator
Chief Emergency Controller
Co-ordinator

EIA Study for Capacity Enhancement at Berth 5A, 6A of SWPL, Goa 6-19 Final Report, September, 2017
Key Personnel
The senior most officer present in the Terminal at the time of the incident will be
the designated the “Chief Emergency Controller”.
Duties and Responsibilities of Key Persons and Coordinators
a. Chief Emergency Controller
He will report at the “Emergency Control Centre” and will assume overall
responsibility of the works and its personnel. His duties will be:
To assess the magnitude of the situation and decide whether a major
emergency exists or is likely to develop, requiring external assistance.
To inform district emergency chief (i.e. District Collector).
To exercise direct operational control over areas other than those
affected.
Assess the magnitude of the situation and decide if staff needs to be
evacuated from the assembly points to identified safe places.
To continuously review and direct shutting down of Port sections and
operations in consultation with the other key personnel.
To liaise with senior officials of Police, Fire Brigade, Medical and local
administration, and pass on information on possible effects on the
surrounding areas, outside the factory premises.
To liaise with various coordinators to ensure casualties are receiving
adequate attention and traffic control movement within the work is well
regulated.
To arrange for a log of the emergency to be maintained in the Emergency
Control Centre.
To release authorized information to press through the Media Coordinator.
To control rehabilitation of the affected persons and the affected areas
after the emergency.
b. Fire and Safety Coordinator
The main responsibilities of Fire and Safety Coordinator will be:

EIA Study for Capacity Enhancement at Berth 5A, 6A of SWPL, Goa 6-20 Final Report, September, 2017
To immediately take charge of all firefighting operations upon sounding of
the alarm.
To guide the firefighting team and provide logistics support for effectively
combating the fire.
To barricade the area at appropriate locations in order to prevent the
movement of vehicular traffic.
To operate the mutual aid scheme and call for additional external help in
firefighting.
To organize relieving groups for firefighting.
To inform the Chief Controller and give “All Clear” signal when the fire
emergency is over.
c. Engineering Coordinator
Responsibilities of Engineering Coordinator will be:
To liaise with chief controller and various other Coordinators
To stop/regulate all operations within the jetty
To switch off main Instrument Control Panel
To stop all engineering works and instruct contractors and their employees
to leave the area
To assess the water level in the fire water reservoir and supply
engineering tools, fire-fighting materials and equipments to various
Coordinators
To start all pumps to replenish water and switch on the fire engine for hot
standby.
To liaise with transport coordinator to arrange for external water supply
and fuel for generators/engines.
To attend mechanical fault/failure of fire water pump and facilities.
To assess situation in consultation with chief controller and if required,
start/provide electric supply to certain areas/points.

EIA Study for Capacity Enhancement at Berth 5A, 6A of SWPL, Goa 6-21 Final Report, September, 2017
d. Communication and Medical Coordinator
Duties and responsibilities of the Communication and Medical Coordinator
will be:
To liaise with Chief Controller and various other Coordinator.
To take over entire communication system (external as well as internal).
To arrange to distribute Walkie-Talkie/ VHF sets to various other coordinators.
To inform police, fire brigade, civil authorities, hospitals & request for
speedy help.
To arrange for vehicles/ambulance for evacuation and causalities.
To set and activate first aid center and arrange to mobilize medical team
Arrange to procure required drugs and appliances.
Arrange to transfer causalities to other hospitals/first aid center.
To maintain a register for causalities (type of injury, number, hospitalization)
To inform families of the causalities.
e. Finance Coordinator
The Asst. Manager (Finance) or his nominee:
Release finances (cash/cheques etc.) as directed by the Chief Controller.
Assist Material Coordinator in enactment of emergency procurement
procedures and by deputing his staff.
To liaise with Insurance Company personnel.
f. Transport and Materials Coordinator
Duties and responsibilities of Transport and Materials Coordinator will be:
To liaise with Chief Controller and other Coordinators.
To arrange issue of materials from warehouse round-the-clock during the
emergency period.
To arrange emergency procurements from local dealers or from
neighboring industries.
To arrange transportation of materials from warehouse to the site in
consultation with other Coordinators.

EIA Study for Capacity Enhancement at Berth 5A, 6A of SWPL, Goa 6-22 Final Report, September, 2017
To arrange for police, help for control of traffic & public outside the affected
area of the jetty premises.
To arrange for entry for authorized personnel/vehicles only.
To mobilize necessary vehicles as required by various Coordinators
To arrange for regulating the traffic inside the Port area.
To arrange to evacuate all unnecessary personnel from the Port and
arrange for vehicles/ambulance for evacuation and casualties.
To control and disperse crowd from the scene of fire.
To mobilize all the firefighting spare equipment/ refills/hosepipes/trolleys
etc. form the neighboring units, if required.
To monitor stock of all firefighting equipments and replenish them as and
when required.
6.7.3 Communication Facilities for Emergency
The following are the communication facilities are provided at the Terminal for
emergency;
One 3.0 km range Electric Siren to announce nature of emergency.
For inter-location communications requisite number of P&T telephones will
be provided including tie lines and hot lines for communication with district
emergency services, authorities, hospitals, etc.
The inter-terminal paging and public address system will have the
following features:
- All call with answer back
- Group call with answer back
- Interfacing with walkie-talkies
- Field call stations
Walkie-Talkies and mobile phones will be deployed for mobile-to-mobile
and mobile-to-stationary communication.
A broad communication diagram outlining interactions between various
role players will be set up and rehearsed.

EIA Study for Capacity Enhancement at Berth 5A, 6A of SWPL, Goa 6-23 Final Report, September, 2017
6.7.4 Details of First Aid and Hospital Services
Fully stocked first aid boxes shall be placed at strategic locations. A visiting
medical practitioner from Vasco will be made available on call in case of
emergency duty. The onsite medical center will be equipped with facilities for
treatment of mechanical injuries, burn injuries and electric shock. An ambulance
will be available in the port round-the-clock.
Personal Protective Equipment (PPE)
The following PPEs and other emergency handling equipment are stocked to be
issued to the trained key personnel during an emergency.
Fire proximity suit
Fire entry suit
Self-contained Breathing Apparatus with one spare cylinder (30 minutes)
Water gel blanket
Safety helmet
Rubber hand gloves for use in electrical jobs
Power tool
The quantities available will be sufficient to meet the needs of emergency
handling personnel.
6.7.5 Rehearsal and Testing
'Fire Drills' are carried out periodically to test out the laid down system and
facilities. The emergency handlers also "act out" their individual roles in
accordance with the emergency procedures laid down to demonstrate that the
entire emergency response system can perform efficiently and accurately. Mock
drills for emergency are conducted twice a year.
6.7.6 Offsite Action in Event of Emergency
SWPL participates in the offsite DMP coordinated by the MPT and following
external agencies, whose responsibilities are listed as follows:
Police
Fire Brigade of Directorate of Fire and Emergency Services, Goa

EIA Study for Capacity Enhancement at Berth 5A, 6A of SWPL, Goa 6-24 Final Report, September, 2017
Medical Services
Technical Agencies
Rehabilitation Agencies
Electricity Board
Responsibilities of the Services
1. Police
Control traffic & mob by cordoning off the area.
Arrange for evacuation of people on advice from the Site Controller/District
Collector.
Broadcast/communicate through public address systems to the community
on advice from the District/Sub Collector.
Inform relatives about details of injured and casualties.
2. Fire Brigade
Fighting fire & preventing its spread.
Rescue & salvage operation.
3. Medical/Ambulance
First Aid to the injured persons.
Shifting critically injured patients to the hospitals at Vasco, Chicalim and Panaji
Providing medical treatment.
4. Technical/Statutory Bodies
The body constitutes Factory Inspectorate, Pollution Control Board, and
Technical Experts from large industries, such as Zuari Agro, etc.
Provide all technical information to the emergency services, as required.
Investigate the cause of the disaster.
5. Rehabilitation
Arrange for evacuation of persons to nominated rescue center and
arrange for their food, medical and hygienic requirements.

EIA Study for Capacity Enhancement at Berth 5A, 6A of SWPL, Goa 6-25 Final Report, September, 2017
Coordinating with the Insurance Companies for prompt disbursement of
compensation to the affected persons.
Maintain communication channels of nearby industries like telephone;
telex etc. in perfect working condition.
6. Electricity Board
To regulate/re-connect the power supply to the Terminal if specifically
asked for by the Terminal.

EIA Study for Capacity Enhancement at Berth 5A,6A of SWPL, Goa 7-1 Final Report, September, 2017
Chapter 7.0 CORPORATE SOCIAL RESPONSIBILITY (CSR)
7.1 GENESIS
As a responsible corporate citizen, JSW as integrated its environment, HR and
ethical business policies with appropriate community engagement and gender
equity. In tune with this, JSW Foundation works closely with the village
communities and creates synergies with other verticals of the JSW Group, to
assimilate their intervention in a social development framework.
An independent Trust named JSW Foundation, administers the social
development initiatives of the JSW Group companies. Every year, the
Foundation in consultation with CSR teams at the Port, finalizes set of activities
that get built into the business plan. The JSW Foundation lays emphasis on
maintaining a continuum of social development thinking into the conduct of these
activities.
The major activities of JSW Foundation are in the areas of;
School & Education Sector
Community Health
Sports Activity
Livelihood and Empowerment, especially for women
Environment
Infrastructure Development
7.2 CSR ACTIVITIES
JSW Group is facilitating the social activities in the following core areas with the
help of Municipal Corporation, Education and Health Department of State
Government, Local Community and Non-Governmental Organizations as part of
the CSR activity. South West Port Ltd. (SWPL), Goa as such is engaged in
delivering various CSR activities in project area in the following sectors.

EIA Study for Capacity Enhancement at Berth 5A,6A of SWPL, Goa 7-2 Final Report, September, 2017
7.2.1 School & Education Sector
JSW Group has been in the forefront of the education sector. The Foundation is
facilitating necessary infrastructure and involved in various developmental
activities for the students.
JSW Group as a part of its social responsibility has provided following facilities
periodically in the local schools;
Provide school benches to Govt. Primary School, Sada
Contributions (like water filter, projector, chairs, yoga mats, and digital
camera) to differently abled children of New Dwan Ashadeep Special
School, Headland Sada
Infrastructure development in local schools
7.2.2 Community Health
Unlike Education, JSW Group is always in the forefront of the development of the
health sector since its inspection. The JSW group is organizing health camps
and blood donation camps in co-ordination as part of the social activity plan.
Safe drinking water; provide water filter to strategic places at Headland
Sada
Organize blood donation camp in collaboration with Hospicio Hospital,
Goa

EIA Study for Capacity Enhancement at Berth 5A,6A of SWPL, Goa 7-3 Final Report, September, 2017
Organize health camps
Water treatment plants (Filters) at Anganwadi centers
7.2.3 Sports Activity
JSW Group as a responsible corporate is always a step ahead in sports
development for the students and local youths. The group is encouraging sports
activities among local students by organizing various sports competitions in the
schools. Some of the notable activities are:
Provide playing equipments to New Dawn Ashadeep Special School,
Headland Sada
Organizing partner of Goa Marathon
Organize various sports activities to differently abled children of New
Dwan Ashadeep Special School, headland Sada

EIA Study for Capacity Enhancement at Berth 5A,6A of SWPL, Goa 7-4 Final Report, September, 2017
7.2.4 Livelihood and Empowerment
JSW Group as a responsible corporate is attempting to strengthen the livelihood
of the local fishing community by facilitating the necessary materials for the
sustainable development of their fishing activities. Also, the Group shall empower
the local woman community through various training programs/schemes with the
help of local governance as a part of the CSR plan.
The following social activities are being carried out as part of the livelihood and
empowerment of the local community;
Provide stainless steel containers to Anganwadi centers at Headland
Sada
Financial assistance for a vocational center for women empowerment in
Vasco
7.2.5 Environment
JSW Group as an environment responsible corporate is involved in the following
activities and shall be strengthened further to protect the environment as part of
the CSR activity plan.
Construction of waste management shed at IDC, Cacora
Provide waste bins to schools; under Swachh Bharat Abhiyaan
Beautification (tree plantation) of highway median from Goa Airport to
Varanapuri
Renovation of parks and forest reserves
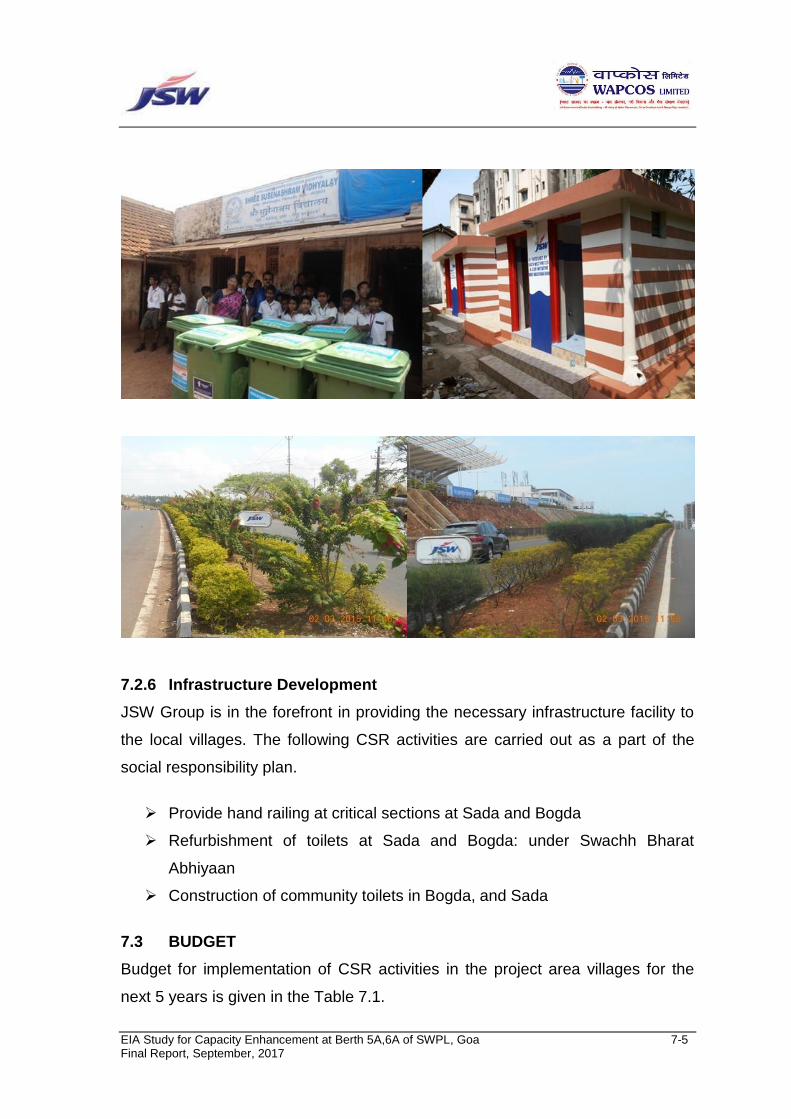
EIA Study for Capacity Enhancement at Berth 5A,6A of SWPL, Goa 7-5 Final Report, September, 2017
7.2.6 Infrastructure Development
JSW Group is in the forefront in providing the necessary infrastructure facility to
the local villages. The following CSR activities are carried out as a part of the
social responsibility plan.
Provide hand railing at critical sections at Sada and Bogda
Refurbishment of toilets at Sada and Bogda: under Swachh Bharat
Abhiyaan
Construction of community toilets in Bogda, and Sada
7.3 BUDGET
Budget for implementation of CSR activities in the project area villages for the
next 5 years is given in the Table 7.1.

EIA Study for Capacity Enhancement at Berth 5A,6A of SWPL, Goa 7-6 Final Report, September, 2017
Table 7.1: CSR Budget for next 5 years (Rupees in Lacs)
Name of the Category 2017-18 2018-19 2019-20 2020-21 2021-22 Grand Total
Improving Living Conditions 30 33 36 39 42 180
Promoting Social
Development 50 53 56 59 62 280
Swachcha Bharat Abhiyan 20 23 26 29 32 130
Addressing Environmental
Issues 25 28 31 34 37 155
Contingency 10 13 16 19 22 80
Grand Total 135 150 165 180 195 825

EIA Study for Capacity Enhancement at Berth 5A, 6A of SWPL, Goa 8-1 Final Report, September, 2017
Chapter 8.0 ENVIRONMENTAL MONITORING PROGRAM
8.1 INTRODUCTION
Continuous environmental monitoring is an essential component for ascertaining
environmental performance of any developmental Project. It is an integral part of
any environmental assessment process.
Environmental monitoring during implementation phase shall comprise:
Ensuring presence of and adherence to appropriate permits, certificates,
authorizations
Compliance with the EMPs, work instructions, best construction practise and
specific government regulations/directions if made available
Construction in the project will not involve any heavy civil works as the equipment
will be installed on the existing foundations which have design capacity to bear
loads of the new machinery. No construction on or near the berths will be
necessary.
Equipment will be transported by road on truck trailers and will be spliced either by
bolting together or welding. This proposed benign erection activity will not have any
significant impact on the environment. The dismantled equipment will be cut into
small pieces and scrapped to vendors on where-is basis.
8.2 AREAS OF CONCERN
From the continuous change in environmental baseline monitoring point of view, the
important parameters are marine water quality, ambient air quality, noise, etc.
Suggested monitoring parameters and programs are described in the subsequent
sections.

EIA Study for Capacity Enhancement at Berth 5A, 6A of SWPL, Goa 8-2 Final Report, September, 2017
8.3 IMPLEMENTATION PHASE
8.3.1 AMBIENT AIR QUALITY
Ambient air quality monitoring shall be monitored at three stations close to the
construction sites. The monitoring will be conducted during the implementation
phase. Relevant parameters to be monitored are PM10, PM2.5, SO2 and NOx. An
amount of Rs. 12 lakh has been budgeted for this purpose. Actual spending may
differ from the budgeted amount. The ambient air quality monitoring shall be
conducted by an agency approved by Goa State Pollution Control Board.
8.3.2 NOISE
Noise level monitoring during implementation phases will be carried out near the
zones of activity. Noise monitoring will also be conducted by an agency approved by
Goa State Pollution Control Board. Cost estimates for noise monitoring are inclusive
in the Rs. 12 lakh as mentioned above.
8.4 OPERATION PHASE
8.4.1 Marine Water & Sediment Quality
The chemical characteristics of marine water, sediment quality and biological
parameters will be monitored once in a year, preferably in the pre monsoon season
during project operation phase. Both surface and bottom waters will be sampled and
analyzed. The parameters to be monitored are as follows:
Marine Water
Physico-chemical parameters
pH
SS
Salinity
DO and BOD

EIA Study for Capacity Enhancement at Berth 5A, 6A of SWPL, Goa 8-3 Final Report, September, 2017
Phosphates
Nitrites and Nitrates
Ammonium
PHc
Phenols
Biological parameters
Light penetration
Chlorophyll and other phyto pigments
Primary Productivity
Phytoplankton
Zooplankton
Coliforms
Marine Sediment
Physico-chemical parameters
pH
Texture
Total Kjeldahl Nitrogen
Organic Carbon
Phosphorus
PHc
Biological Parameters
- Benthic Meio-fauna
- Benthic Macro-fauna
The marine water and sediment sampling and analysis will be conducted by a
capable external agency. A provision of Rs. 2 lakh/year has been earmarked for this
purpose.

EIA Study for Capacity Enhancement at Berth 5A, 6A of SWPL, Goa 8-4 Final Report, September, 2017
8.4.2 AMBIENT AIR QUALITY
Ambient air quality monitoring is recommended to be monitored at three stations
fixed after discussion with the Goa State Pollution Control Board. The monitoring
can be conducted at a frequency as directed by the GSPCB. The parameters to be
monitored are PM10, PM2.5, SO2 and NOx. An amount of Rs. 12 lakh/year has been
earmarked for this purpose.
8.4.3 NOISE
Noise level monitoring during operation phases will be carried out at locations as
suggested by the Goa State Pollution Control Board. Cost estimates for noise
monitoring during operation phase is Rs. 1 lakh/year.
8.4.4 BIOLOGICAL ENVIRONMENT
Sites of greenbelt development will be monitored once every year, preferable pre-
monsoon in the operation phase to study the growth of various species and to
identify the needs if any, such; as for irrigation, fertilizer dosing, pesticides, etc.
Greenbelt shall be raised and maintained by a professional horticulture agency.
8.5 SUMMARY OF ENVIRONMENTAL MONITORING PROGRAM
The summary of Environmental Monitoring Programme to be followed during
implementation and operation phases is given in Tables 8.1 & 8.2
Table 8.1: Summary of Environmental Monitoring Programme for the Project
Implementation Phase
S.
No.
Aspects Parameters to be
monitored
Frequency of
monitoring
Location
1 Ambient air
quality
PM10, PM2.5, SO2 &
NOx, CO
During fabrication Close to
construction/f
abrication
sites or as
suggested by

EIA Study for Capacity Enhancement at Berth 5A, 6A of SWPL, Goa 8-5 Final Report, September, 2017
S.
No.
Aspects Parameters to be
monitored
Frequency of
monitoring
Location
GSPCB
2 Ambient Noise
Quality.
Equivalent noise
Levels
During construction/
fabrication activities
Construction/f
abrication
sites or as
suggested by
GSPCB
Table 8.2: Summary of Environmental Monitoring Programme for the
Project Operation Phase
S. No. Aspects Parameters to be
monitored
Frequency of
monitoring
Location
1 Marine water
Physico-
chemical
parameters
pH, SS, Salinity, DO
and BOD, Phosphates,
Nitrites and Nitrates,
Ammonium, PHc,
Phenols
Once, pre-
monsoon
3 to 4 sites
Biological
parameters
Light penetration,
Chlorophyll and other
phyto pigments,
Primary Productivity,
Phytoplankton,
Zooplankton, Coliforms
Once, pre-
monsoon
3 to 4
sites
2 Sediments
` Physico-
chemical
parameters
pH, Texture, Total
Kjeldahl Nitrogen,
Organic Carbon,
Phosphorus, PHc
Once, pre- monsoon
3 to 4 sites
Biological
parameters
Benthic Meio-fauna,
Benthic Macro-fauna
Once, pre-monsoon
3 to 4 sites
3 Ambient air
quality
PM10, PM2.5, SO2 &NOx As suggested/
directed by
GSPCB
Project
area or as
suggested

EIA Study for Capacity Enhancement at Berth 5A, 6A of SWPL, Goa 8-6 Final Report, September, 2017
S. No. Aspects Parameters to be
monitored
Frequency of
monitoring
Location
by GSPCB
5. Noise Equivalent Noise Level As suggested/
directed by
GSPCB
Project
area and
sites within
1 km of the
project
area or as
suggested
by GSPCB
8.6 ENVIRONMENTAL MANAGEMENT CELL (EMC)
South West Port Limited, Goa has a functioning EM cell which takes care of day to
day operations of the pollution control hardware, its maintenance and
implementation of the environmental management systems, including adherence to
statutory conditions laid out in the various permissions and liaison with the statutory
agencies. Environmental parameters are being monitored at prescribed frequency
by engaging the approved Consultants/Laboratory. Environmental Management Cell
of SWPL will be responsible for implementation of various measures outlined in the
Environmental Management Plan. The Environmental Management Cell shall also
integrate the Environmental Monitoring Programme specified for the proposed
project with the existing Monitoring Programme and coordinate its implementation.
All necessary resources for the EMP implementation will be made available by
SWPL.
8.7 BUDGET
The cost required for implementation of Environmental Monitoring Program (EMoP)
during project implementation and operation phase is given in Chapter 9 Cost
Estimates. The spending on the monitoring programme may be increased on
discretion of the company as required.
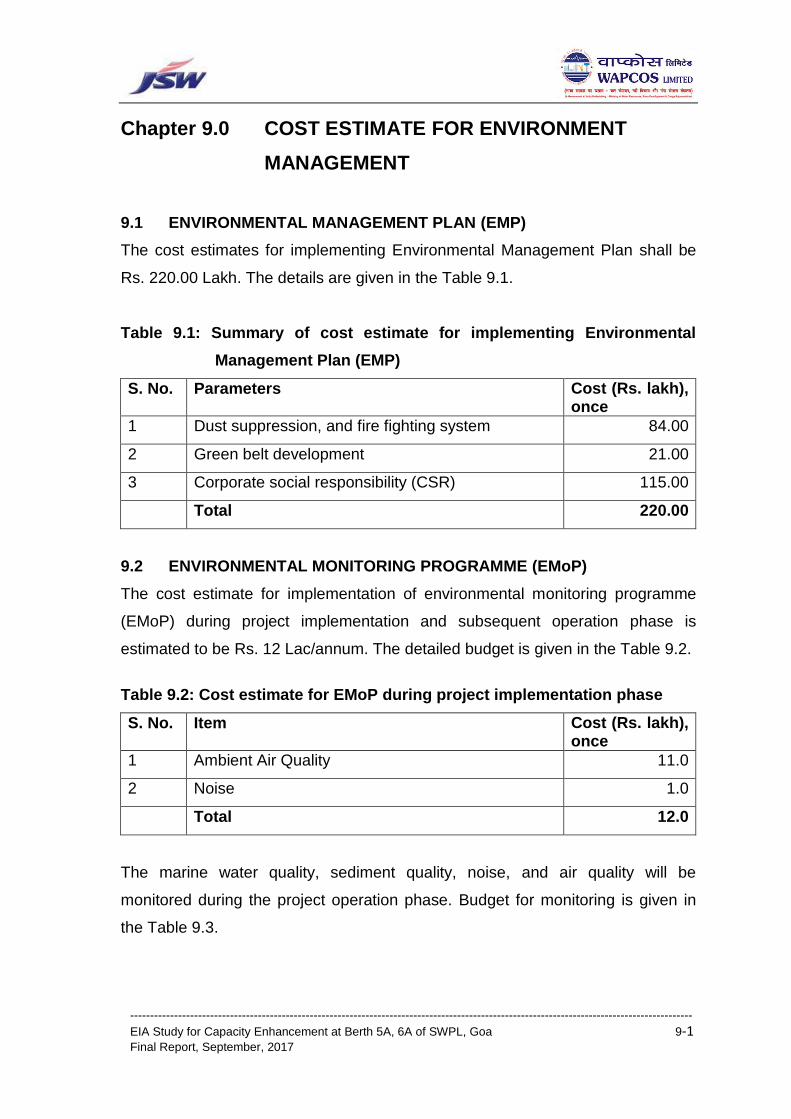
---------------------------------------------------------------------------------------------------------------------------------------------
EIA Study for Capacity Enhancement at Berth 5A, 6A of SWPL, Goa 9-1 Final Report, September, 2017
Chapter 9.0 COST ESTIMATE FOR ENVIRONMENT
MANAGEMENT
9.1 ENVIRONMENTAL MANAGEMENT PLAN (EMP)
The cost estimates for implementing Environmental Management Plan shall be
Rs. 220.00 Lakh. The details are given in the Table 9.1.
Table 9.1: Summary of cost estimate for implementing Environmental
Management Plan (EMP)
S. No. Parameters Cost (Rs. lakh), once
1 Dust suppression, and fire fighting system 84.00
2 Green belt development 21.00
3 Corporate social responsibility (CSR) 115.00
Total 220.00
9.2 ENVIRONMENTAL MONITORING PROGRAMME (EMoP)
The cost estimate for implementation of environmental monitoring programme
(EMoP) during project implementation and subsequent operation phase is
estimated to be Rs. 12 Lac/annum. The detailed budget is given in the Table 9.2.
Table 9.2: Cost estimate for EMoP during project implementation phase
S. No. Item Cost (Rs. lakh), once
1 Ambient Air Quality 11.0
2 Noise 1.0
Total 12.0
The marine water quality, sediment quality, noise, and air quality will be
monitored during the project operation phase. Budget for monitoring is given in
the Table 9.3.

---------------------------------------------------------------------------------------------------------------------------------------------
EIA Study for Capacity Enhancement at Berth 5A, 6A of SWPL, Goa 9-2 Final Report, September, 2017
Table 9.3: Cost estimate for EMoP during project operation phase
S. No. Item Cost (Rs. lakh), yearly
1 Marine Water and Sediment Quality 3.5
2 Ambient Air Quality 12.0
3 Noise 1.00
Total 16.50
The cost figures given in the chapter are estimates. More resources will be
allocated for monitoring if felt necessary and as directed by the GSPCB and other
statutory authorities.

----------------------------------------------------------------------------------------------------------------------------------------------- EIA Study for Capacity Enhancement at Berth 5A, 6A of SWPL, Goa 10-1 Final Report, September, 2017
Chapter 10.0 DISCLOSURE OF CONSULTANTS
10.1 DISCLOSURE OF CONSULTANTS ENGAGED IN EIA STUDY
The EIA study has been conducted by WAPCOS Ltd., a Government of India
Undertaking under Ministry of Water Resources. WAPCOS Ltd. is a QCI NABET
accredited EIA Consultancy Organization, with Category A accreditation in Ports and
Harbors. Certificate of QCI NABET Accreditation is given in Annexure VIII. WAPCOS
Ltd. has a full-fledged Centre for Environment which has conducted the EIA study.
The list of the experts involved in the EIA study is given in Table 10.1.
Table 10.1: List of experts involved in EIA study
S. No. Name Expertise Signature
1. Dr. Aman Sharma EIA Coordinator
2. Mr. A. S. Leo Air Pollution Expert
3. Dr. S.K. Tyagi Ecology and Bio-
diversity Expert
4. Mr. R.V. Ramana Noise Expert
5. Dr. K.K. Gaur Social Expert
6. Mr. S.M. Dixit Air Quality Expert
7. Mrs. Moumita
Mondal Ghosh Landuse Expert
8. Mr. Swapan Kumar
Bandopadhyay
Risk and DMP Expert

----------------------------------------------------------------------------------------------------------------------------------------------- EIA Study for Capacity Enhancement at Berth 5A, 6A of SWPL, Goa 11-1 Final Report, September, 2017
Chapter 11.0 PUBLIC HEARING
11.1 BACKGROUND
Public hearing (PH) for the proposed terminal capacity enhancement at berth 5A,
6A of Mormugao Port by South West Port Ltd. (SWPL), Goa has been conducted
as per the revised EIA Notification dated 14.09.2006 (as amended). Notice for
the PH was issued both in vernacular language Marathi (Tarun Bharat), Konkani
(Bhangarbhuim) and in English (The Navhind Times, Herald, Indian Express)
daily newspapers on dated 26.03.2017. The PH was conducted by Goa State
Pollution Control Board (GSPCB) at Tilak Maidan, Vasco-Da-Gama, Goa on date
26.04.2017 at 10:30 AM onwards.
The panel members for the PH meeting are Collector & Dist. Magistrate, South
Goa (Chairman), Addl. Dist. Collector II & Addl. Dist. Magistrate, South Goa,
Environmental Engineer, GSPCB, Panaji, Goa and Scientist ‘C’, GSPCB, Panaji,
Goa. The meeting is also attended by the representatives of project proponent
(PP) and EIA consultants’ M/s WAPCOS Limited, and ROOTS EHS advisory.
11.2 ISSUES RAISED BY PUBLIC DURING PH
The PP was asked to give a detailed presentation about the project and its
environmental and socio-economic benefits to the public. The participants were
then invited to give their objections and suggestions. After the detailed
consultation based on the view of the public, the panel members prepared the
proceedings. The proceedings and the clarifications of PP to the objections/
suggestions raised by public during PH and to their written submissions,
becomes part of this report as an additional report. The major issues raised by
public during the PH and its clarifications are given in Table 11.1.

----------------------------------------------------------------------------------------------------------------------------------------------- EIA Study for Capacity Enhancement at Berth 5A, 6A of SWPL, Goa 11-2 Final Report, September, 2017
Table 11.1: Major issues raised during Public Hearing (PH) and its reposnse by PP
S. No. Objection/suggestions SWPL Response
01 Commented on the ambient air quality
data collection and the Indian
standards used for comparison.
The project site which is northern face of the SADA headland is surrounded by sea
(immediately in the north and in the south). The fugitive particulate matter originated from
Terminal is largely controlled by pollution control measures implemented at the site.
Further, these very low concentration emissions, if any, is not likely to travel over larger
distances under normal atmospheric conditions. Accordingly, the AAQ monitoring stations
have been located in the downward wind direction.
The results are compared as per the CPCB guideline, standards.
02 Concern about increase in emissions
from increased trucks and train
transportation.
There is no road transportation of cargo at present and the same is not proposed in the
modernization phase as well.
The covering of train cargo cars is carried out immediately and automatically, after the loading
operation using the in-motion wagon loading system with all round rope sealing thus not
leaving any possibility of any escapement of cargo. This is a zero-exception and zero error
activity, carried out with utmost stringency by the project proponent.
03 Concern about the double tracking of
the south west railways and its impact
on villagers.
The project proponent has not proposed any double tracking of railway. The facility is
independent of the doubling of the tracks as the spare capacity of the present tracks would be
sufficient to take care of the proposed enhancement.
04 Concerned about dredging activity and
its impact on Khariwada, which will
result in collapse of houses.
The project proponent has not proposed any dredging as part of the proposed modernization.
The modernization and consequential increase in capacity is independent of the dredging
activity.
05 Concerned about coal pollution in the
houses in Khariwada and its health
effects.
The coal stacks are provided with two level protection, with complete covering of the stacks
with sprinkling of water, when either stacking or reclaiming operation is in progress. Secondly,
the yard is surrounded with wind barriers of adequate size, to prevent any emissions from the
stacks.

----------------------------------------------------------------------------------------------------------------------------------------------- EIA Study for Capacity Enhancement at Berth 5A, 6A of SWPL, Goa 11-3 Final Report, September, 2017
S. No. Objection/suggestions SWPL Response
06 Comment on Form I about
suppressing the impact on nearby
environment caused by surrounding
activities.
The present proposal is for modernization and consequential increase in capacity. Due to
better equipment and practices the pollution levels are likely to reduce. In addition, it is located
in an operating port with regular monitoring for ambient condition. Hence there was no
suppression of any facts. The impacts due to various activities are duly acknowledged in the
EIA report.
07 Concern about use of 700 KLD of
water for spraying on coal, where
there is shortage of water in the Vasco
city.
The quantity was optimized to 500 KLD as mentioned in the EIA report, The Port Terminal
presently uses 200-250 KLD treated sewage from the STP of MPT. The additional quantity of
water for dust suppression is proposed to be sourced from the presently operational 2300
KLD CETP at Baina operated by PWD.
08 Suggestion for covered shed for coal
storage.
Engineering feasibility for the pre-engineered covered structure is underway. Covered shed
for storage of coal shall be developed at the Terminal.
09 Environmental Impact on Bio-diversity
Heritage site at Chicalim- Sancoale
Bay has not been assessed in the
draft EIA report.
The proposal is modernization of an existing operation. No new area or water front is involved.
The environmental impact is assessed and included in the final EIA report.
10 Comment about no measures
undertaken to control coal dust
pollution.
Ambient air analysis carried out as part of the EIA as well as other routine monitoring carried
out by project proponent and Goa State Pollution Control Board indicate the ambient air
standards are within the stipulated margin in and around the Terminal.
The fugitive particulate matter originated from Terminal is largely controlled by pollution
control measures implemented at the site.
11 Contaminated coal water is
discharged into the sea after being
used for dust suppression. This
polluted water is discharged into the
sea and results in large black patches
in the sea, killing the flora and fauna.
Water is sprayed over coal in a controlled manner and it is entrained/absorbed in the cargo.
No effluent from the Port Terminal is discharged into the sea. The leachate if any is collected
in a dump (settling) Pond, where the sediments settles. The settled solids then collected
periodically and safely disposed.

----------------------------------------------------------------------------------------------------------------------------------------------- EIA Study for Capacity Enhancement at Berth 5A, 6A of SWPL, Goa 11-4 Final Report, September, 2017
S. No. Objection/suggestions SWPL Response
12 No provision for disaster management
plan, if disasters occur due to fire and
cyclone, as other tanks also located
nearby.
EIA report, Risk Analysis and Disaster Management Plan deals with natural and man-made
calamities, and a preparedness and response plan for the same.
13 EIA report uses 2011 census data,
which is old and should not be relied
upon, because we are now in the year
2017 for which fresh data should have
been collected.
Census data of 2011 has been referred as secondary data for baseline study, which is as per
EIA Guidance Manual and is an accepted practice. As no direct significant social impact is
scoped for the EIA, primary data has not been collected.
14 Conducting 3 different PH for the 3
projects, as all are interdependent and
can’t exist in isolation.
The proposed modernization and capacity enhancement project is not dependent on the
capital dredging proposed by MPT, however it will benefit from the same as large size vessels
could call on the SWPL Terminal. This can also be achieved by calling Panamax vessels at
more frequent using the spare channel.
15 Concern about destruction of marine
biodiversity in the local area.
The project is operational since 2004 at the proposed site. The increase in capacity is only
consequential to the modernization of the facility and no additional waterfront or land is to be
utilized.
Environmental Baseline Status, in various sections covers the details of the marine and
terrestrial biodiversity study, and does indicate any threat to the biodiversity.
16 Concern about 3 no. of air quality
monitoring stations proposed during
the project operation.
Three monitoring stations to be placed near to impact the area of operation are felt adequate
to cover impacts of operation phase in ambient air quality. However, we will take MoEFCC/
GSPCB’s directions in this regard.
17 Concern that no fishing activity in the
vicinity of the project side. Report is
silent on extent of fishing vessels and
activity at the Khariwada Jetty.
No fishing is allowed in the Port area and near the channel due to security reasons as the Port
is ISPS compliant.
Fishing activity is duly discussed in the EIA report.

----------------------------------------------------------------------------------------------------------------------------------------------- EIA Study for Capacity Enhancement at Berth 5A, 6A of SWPL, Goa 11-5 Final Report, September, 2017
S. No. Objection/suggestions SWPL Response
18 Concern about turtle breeding in the
Baina beach.
Isolated and random egg laying events are not classified as turtle breeding grounds and is not
reported elsewhere.
19 Corals near Grande Island will be
destroyed due to dredging which is
part of the project.
The fact that corals have been recently discovered at Grande Island has been duly mentioned
in the EIA report.
Dredging is not part of the proposal.
The present proposal which is modernization at the berths are insignificant to have any impact
which is nearly 7-8 km away by sea route.
20 Marine biology sampling is done in
two days
Marine sample collection was carried out from seven stations at different depths in two days’
time. In-situ parameters were analyzed at the site and the other samples were preserved and
taken for analysis which took several days to analyze in the laboratory.
21 Baseline data on marine biodiversity is
silent on endangered marine life.
Sensitive and endangered coastal life forms such as corals, turtles, dugongs, sea weeds,
mangroves, etc. have been duly discussed in the respective sections in the EIA report,
22 Concern about the CSR expenditure
by the project proponent.
About 2 % of the total profit is spent on CSR. PP is committed to spent about 825 lacs on
CSR activity in coming 5 years.
23 Concern about leachate generation in
the terminal from coal cargo runoff.
Water is sprayed over bulk cargo in a controlled manner and it is entrained/absorbed in the
cargo, leachate, if any is collected in the settling tank and disposed off after treatment.
24 Concern about employment
opportunities given to the local Goans.
At present employment to the local goans at SWPL is about 60%.
The proposal will open to employment opportunity to the locals.
25 Concern about covering of coal stacks
and its height.
Coal cargo is covered round the clock with tarpaulin, except at the time of stacking/reclaiming
which is carried out under water sprinkling. Coal is stacked upto a permissible height.
26 Concern about future generation who
will suffer from carcinogenic diseases
and impure air due the increases coal
handing and transportation
SWPL terminal is provided with AQUA DYNE water fogging system, in the hoppers, which
receives unloaded material from the ship, at the Junction towers and in the conveying
systems. Due to Fogging technology, the water droplets are of stipulated size and type to
effectively control the finest fugitive emissions. In the stackyard area the stocks are under

----------------------------------------------------------------------------------------------------------------------------------------------- EIA Study for Capacity Enhancement at Berth 5A, 6A of SWPL, Goa 11-6 Final Report, September, 2017
S. No. Objection/suggestions SWPL Response
cover, and only are opened at the time of stacking and reclaiming, the sprinkling is carried
under such conditions and therefore increased moisture contents limits the emissions
completely.
27 Public esteemed about CSR activities
carried out by SWPL on women
empowerment, education,
environment protection through
Swacch Bharat Abhiyan, etc.
Views are agreed and appreciated
28 Appreciated that in SWPL, to protect
environment war footing steps are
being taken. All workers’ safety is
considered.
Views are agreed and appreciated.
29 Demand for employment opportunity. Views are agreed and appreciated
30 Appreciated that Terminal has helped
small business making units like
Hotels, GHs, etc, making economic
condition of people increase.
Views are agreed and appreciated
31 Concern about expansion of port and
additional air pollution of Ozone, SO2,
NO2,
will impact vegetation and
monuments.
There is no primary or secondary source of tropospheric ozone from the project.
There are no point sources of fuel combustion based pollutants, such as SO2 and NOx in the
project (Except DG sets which are on standby duty and are operated occasionally)
32 Public suggested various mitigation
measures including covered shed for
bulk cargoes like coal.
All the bulk cargoes in the Terminal are tarpaulin covered at present.
However, covered shed is also proposed to be developed for the coal cargo storage.

----------------------------------------------------------------------------------------------------------------------------------------------- EIA Study for Capacity Enhancement at Berth 5A, 6A of SWPL, Goa 11-7 Final Report, September, 2017
S. No. Objection/suggestions SWPL Response
33 Concern about dredging which will
affect bentho-pelagic coupling.
Damage houses, and landslides.
No dredging has been proposed as part of our modernization and consequential capacity
enhancement project.
34 There are reports of presence of
marine mammals like Dolphins in the
neritic zone off Baina cost.
Sensitive and endangered coastal life forms such as corals, turtles, dugongs, sea weeds,
mangroves, etc. have been duly discussed in the EIA report.
35 Concern about marine life and
biodiversity of the Vasco Bay and
Zuari River.
The proposal is about modernization of an existing operation completely on the Port
backup/land side. No change in the berth/marine side is proposed. Impact is not likely due to
the expansion proposal.
36 Concern about displacement of fisher
folk community due to dredging, by
road construction works, and doubling
of Railway tracks.
No dredging is proposed as part of this project. So also, road transportation and road
expansion is part of this proposal.
No expansion of railway line by Indian Railways is necessary to accommodate additional
cargo proposed to be handled as part of the capacity enhancement project, as the existing rail
infrastructure is sufficient to handle additional cargo.
37 Concern about ballast water
management guideline which is not in
place at the port
Ballast water guidelines are communicated to the vessels by MPT and the same are enforced
strictly as known to us.
38 Washing of barges in transit and
dumping left over coal and ore in
Mandovi and Zuari will increase river
pollution causing unpredictable and
irreversible effects on ecology and
livelihood.
SWPL does not use barges for coal handling at present, and not envisaged in the future.
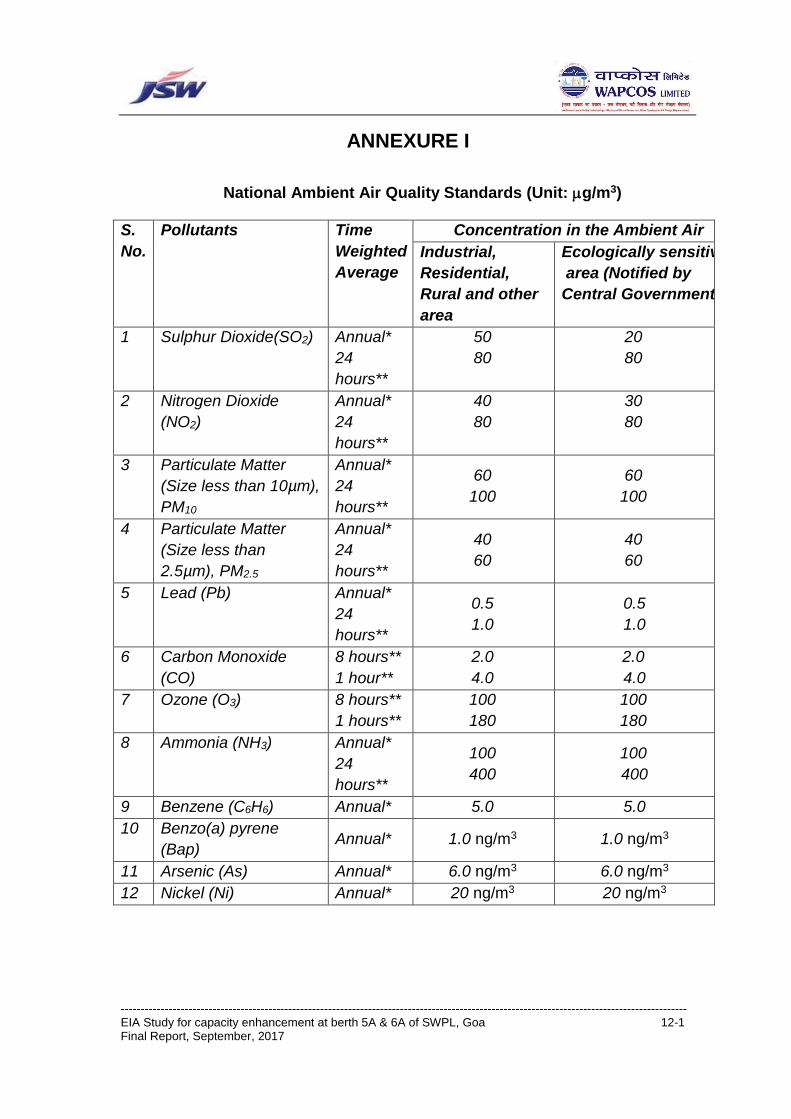
---------------------------------------------------------------------------------------------------------------------------------------------- EIA Study for capacity enhancement at berth 5A & 6A of SWPL, Goa 12-1 Final Report, September, 2017
ANNEXURE I
National Ambient Air Quality Standards (Unit: g/m3)
S.
No.
Pollutants Time
Weighted
Average
Concentration in the Ambient Air
Industrial,
Residential,
Rural and other
area
Ecologically sensitive
area (Notified by
Central Government)
1 Sulphur Dioxide(SO2) Annual*
24
hours**
50
80
20
80
2 Nitrogen Dioxide
(NO2)
Annual*
24
hours**
40
80
30
80
3 Particulate Matter
(Size less than 10µm),
PM10
Annual*
24
hours**
60
100
60
100
4 Particulate Matter
(Size less than
2.5µm), PM2.5
Annual*
24
hours**
40
60
40
60
5 Lead (Pb) Annual*
24
hours**
0.5
1.0
0.5
1.0
6 Carbon Monoxide
(CO)
8 hours**
1 hour**
2.0
4.0
2.0
4.0
7 Ozone (O3) 8 hours**
1 hours**
100
180
100
180
8 Ammonia (NH3) Annual*
24
hours**
100
400
100
400
9 Benzene (C6H6) Annual* 5.0 5.0
10 Benzo(a) pyrene
(Bap) Annual* 1.0 ng/m3 1.0 ng/m3
11 Arsenic (As) Annual* 6.0 ng/m3 6.0 ng/m3
12 Nickel (Ni) Annual* 20 ng/m3 20 ng/m3

---------------------------------------------------------------------------------------------------------------------------------------------- EIA Study for capacity enhancement at berth 5A & 6A of SWPL, Goa 12-2 Final Report, September, 2017
Note:
* Annual arithmetic mean of minimum 104 measurements in a year at a particular
site taken twice a week 24 hourly at a uniform interval.
** 24 hourly or 08 hourly or 01 hourly monitored values, as applicable, shall be
complied with 98% of the time in a year. 2% of the time, they may exceed the
limits but not on two consecutive days of monitoring.

---------------------------------------------------------------------------------------------------------------------------------------------- EIA Study for capacity enhancement at berth 5A & 6A of SWPL, Goa 12-3 Final Report, September, 2017
ANNEXURE- II
Ambient Noise Standards
------------------------------------------------------------------------------------------------------------ Area Category Limits in dB(A)Leq Code of Area ---------------------------------------------- Day time Night time ------------------------------------------------------------------------------------------------------------ A. Industrial Area 75 70
B. Commercial Area 65 55
C. Residential Area 55 45
D. Silence Zone 50 40
------------------------------------------------------------------------------------------------------------
Note: 1. Day time 6 A.M. and 9 P.M.
2. Night time is 9 P.M. and 6 A.M.
3. Silence zone is defined as areas upto 100 meters around such
premises as hospitals, educational institutions and courts. The
silence zones are to be declared by competent authority. Use of
vehicular horns, loudspeakers and bursting of crackers shall be
banned in these zones.
4. Environment (Protection) Third Amendment Rules, 2000 Gazette
notification, Government of India, date 14.2.2000.

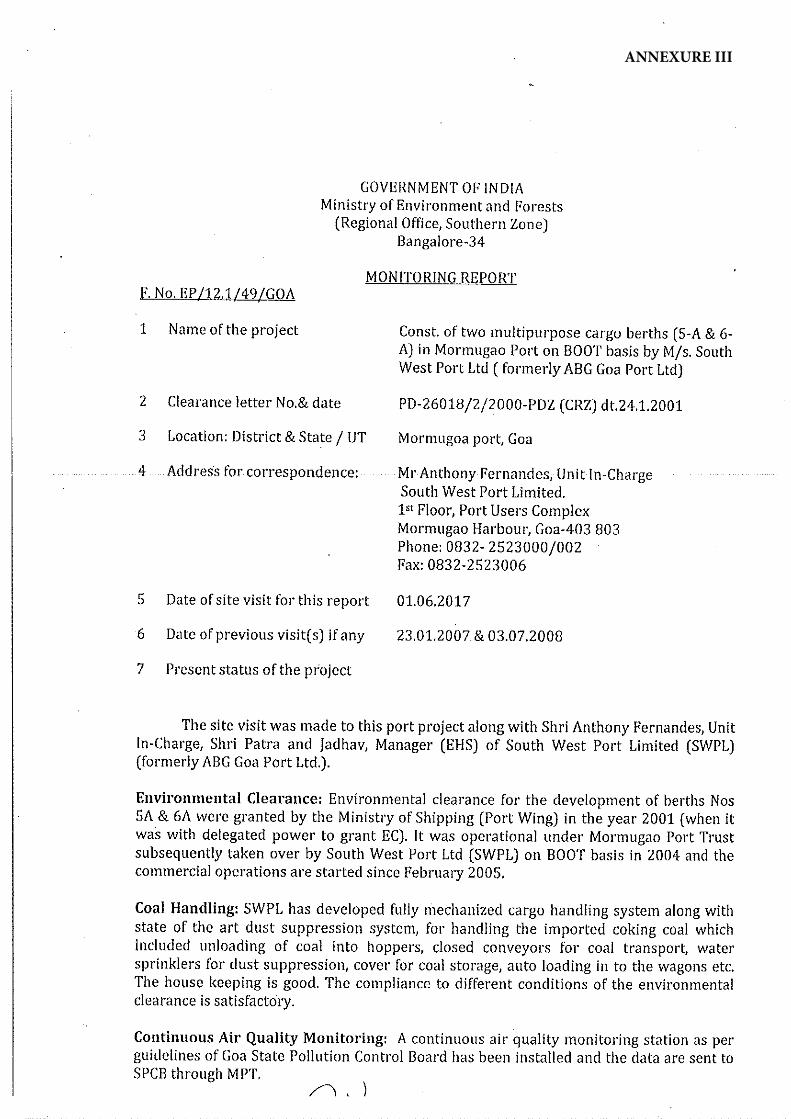
ANNEXURE III

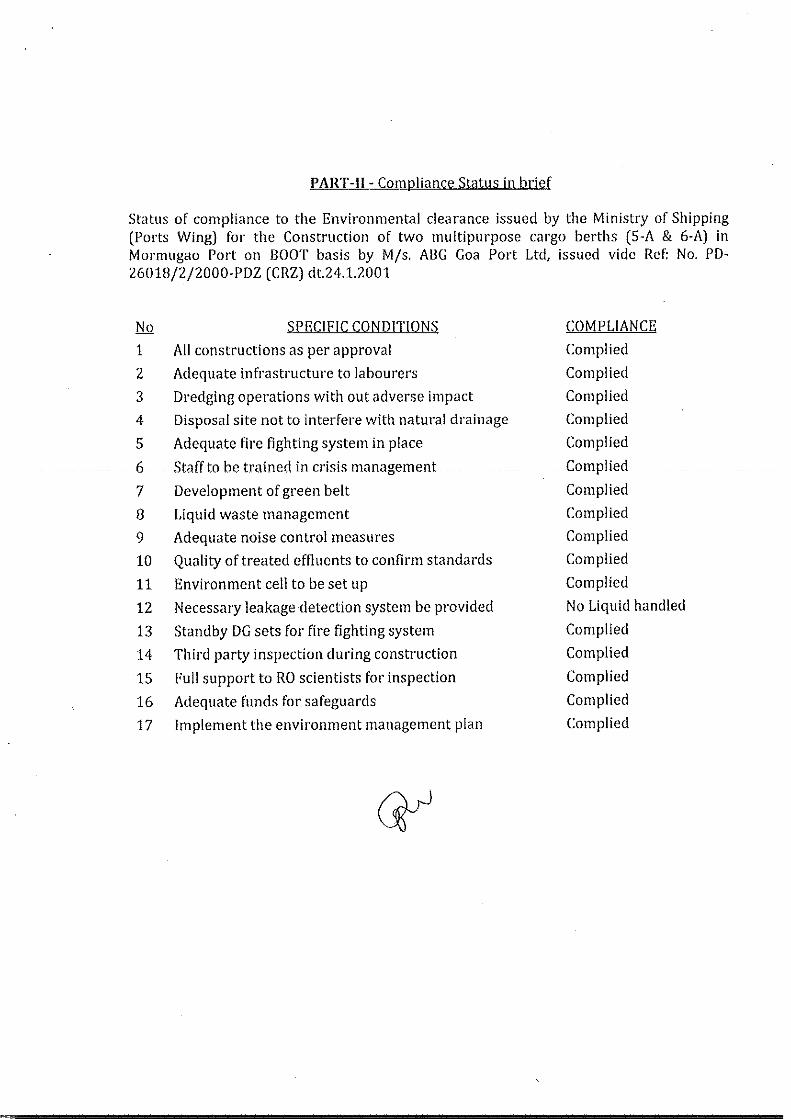


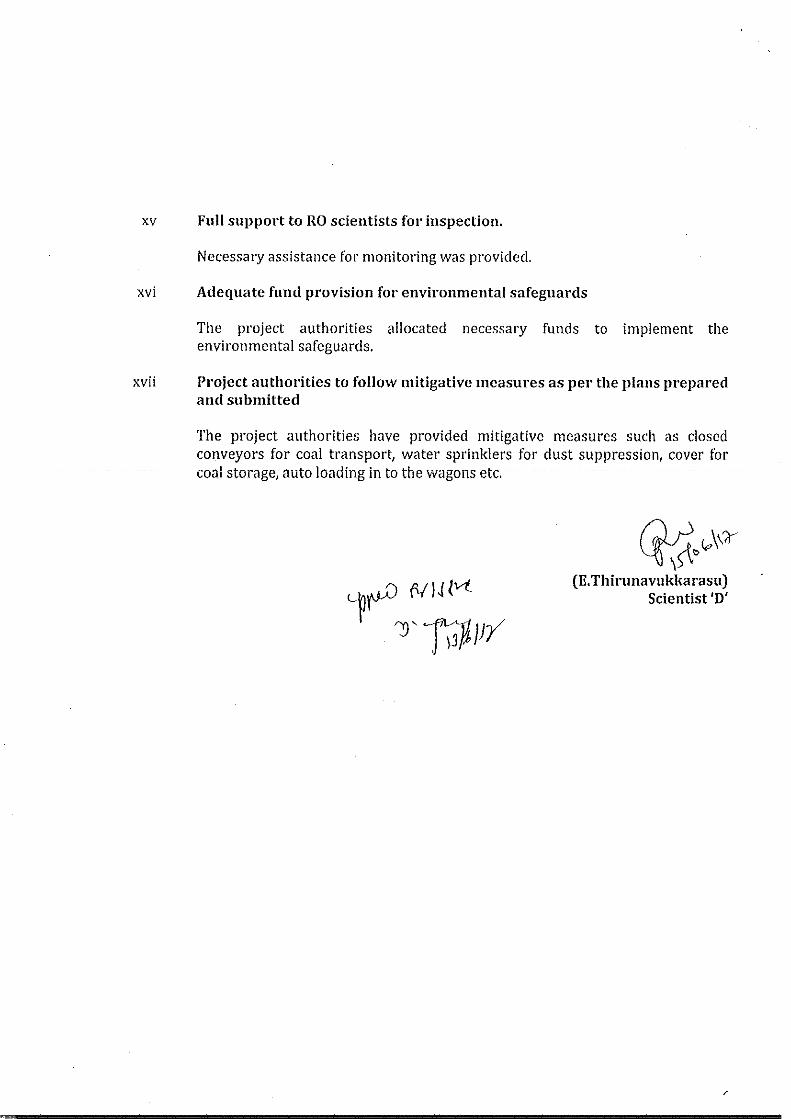

ANNEXURE IV


ANNEXURE V


ANNEXURE VI

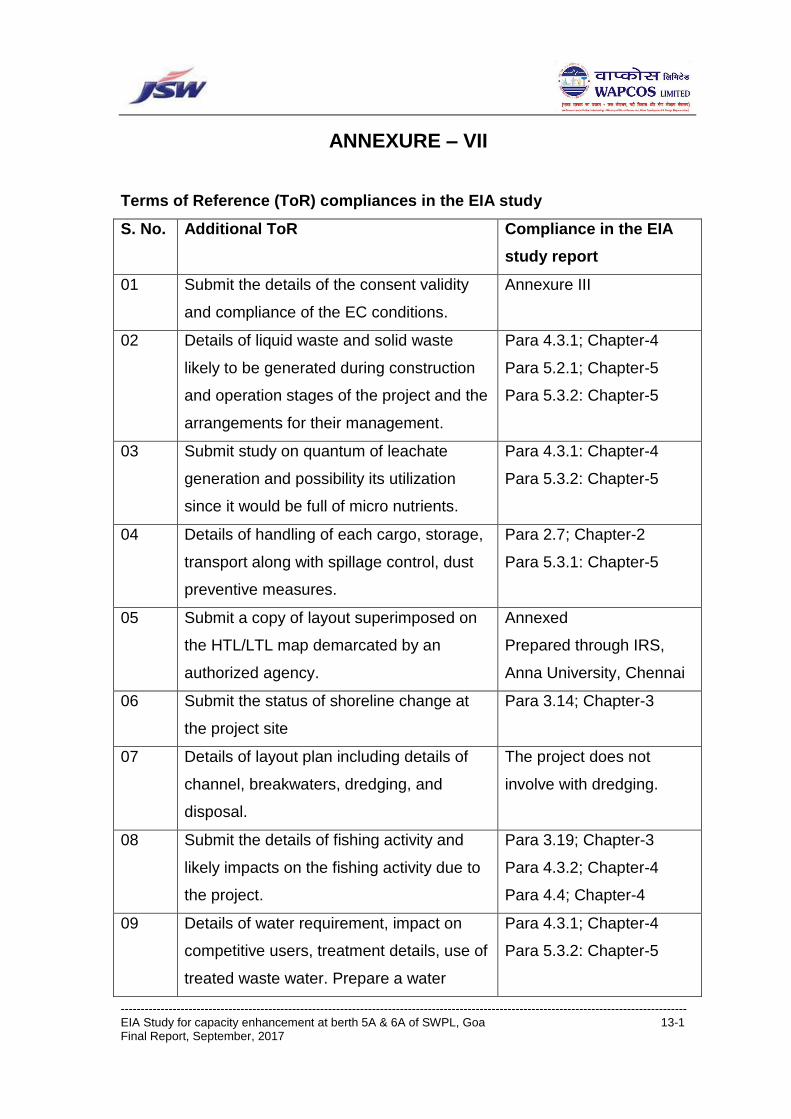
---------------------------------------------------------------------------------------------------------------------------------------------- EIA Study for capacity enhancement at berth 5A & 6A of SWPL, Goa 13-1 Final Report, September, 2017
ANNEXURE – VII
Terms of Reference (ToR) compliances in the EIA study
S. No. Additional ToR Compliance in the EIA
study report
01 Submit the details of the consent validity
and compliance of the EC conditions.
Annexure III
02 Details of liquid waste and solid waste
likely to be generated during construction
and operation stages of the project and the
arrangements for their management.
Para 4.3.1; Chapter-4
Para 5.2.1; Chapter-5
Para 5.3.2: Chapter-5
03 Submit study on quantum of leachate
generation and possibility its utilization
since it would be full of micro nutrients.
Para 4.3.1: Chapter-4
Para 5.3.2: Chapter-5
04 Details of handling of each cargo, storage,
transport along with spillage control, dust
preventive measures.
Para 2.7; Chapter-2
Para 5.3.1: Chapter-5
05 Submit a copy of layout superimposed on
the HTL/LTL map demarcated by an
authorized agency.
Annexed
Prepared through IRS,
Anna University, Chennai
06 Submit the status of shoreline change at
the project site
Para 3.14; Chapter-3
07 Details of layout plan including details of
channel, breakwaters, dredging, and
disposal.
The project does not
involve with dredging.
08 Submit the details of fishing activity and
likely impacts on the fishing activity due to
the project.
Para 3.19; Chapter-3
Para 4.3.2; Chapter-4
Para 4.4; Chapter-4
09 Details of water requirement, impact on
competitive users, treatment details, use of
treated waste water. Prepare a water
Para 4.3.1; Chapter-4
Para 5.3.2: Chapter-5

---------------------------------------------------------------------------------------------------------------------------------------------- EIA Study for capacity enhancement at berth 5A & 6A of SWPL, Goa 13-2 Final Report, September, 2017
S. No. Additional ToR Compliance in the EIA
study report
balance chart.
10 The air quality monitoring should be carried
out according to the notification issued on
16th November, 2009.
Para 3.15: Chapter-3
11 Details of litigation pending against the
project, if any.
No
12 Examine road/rail connectivity to the
project site and impact on the existing
traffic network due to the proposed project.
Para 1.4: Chapter-1

ANNEXURE VIII


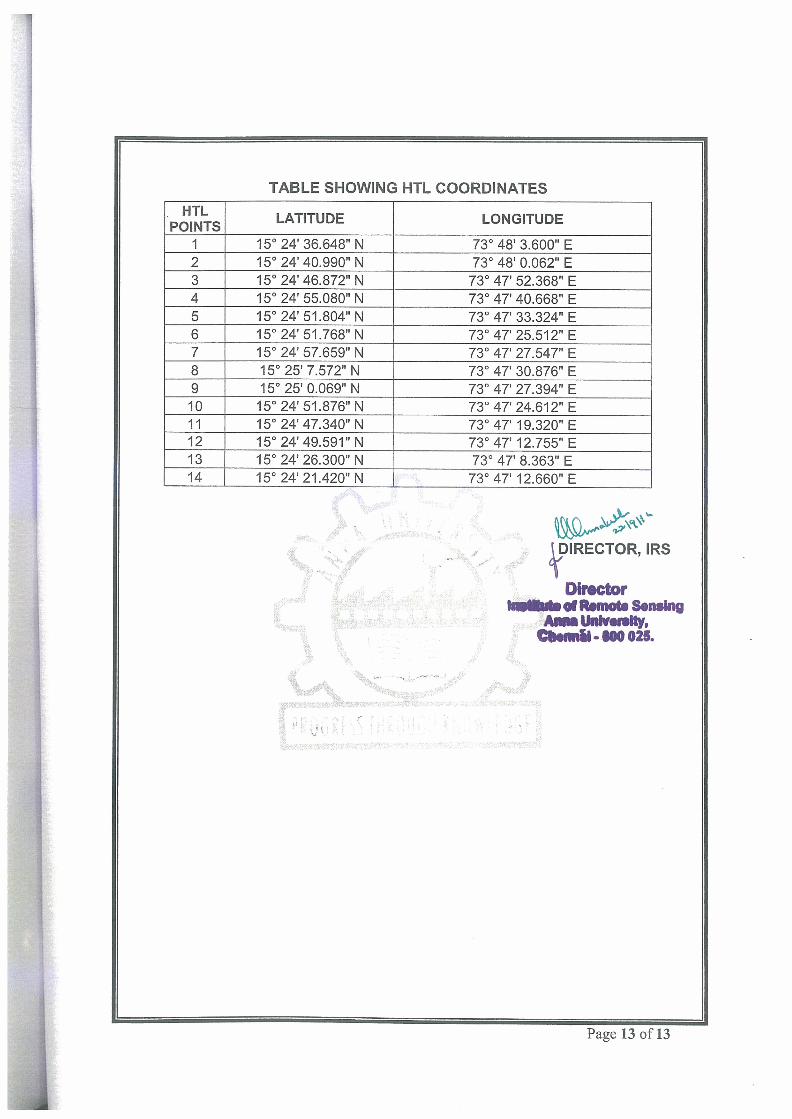
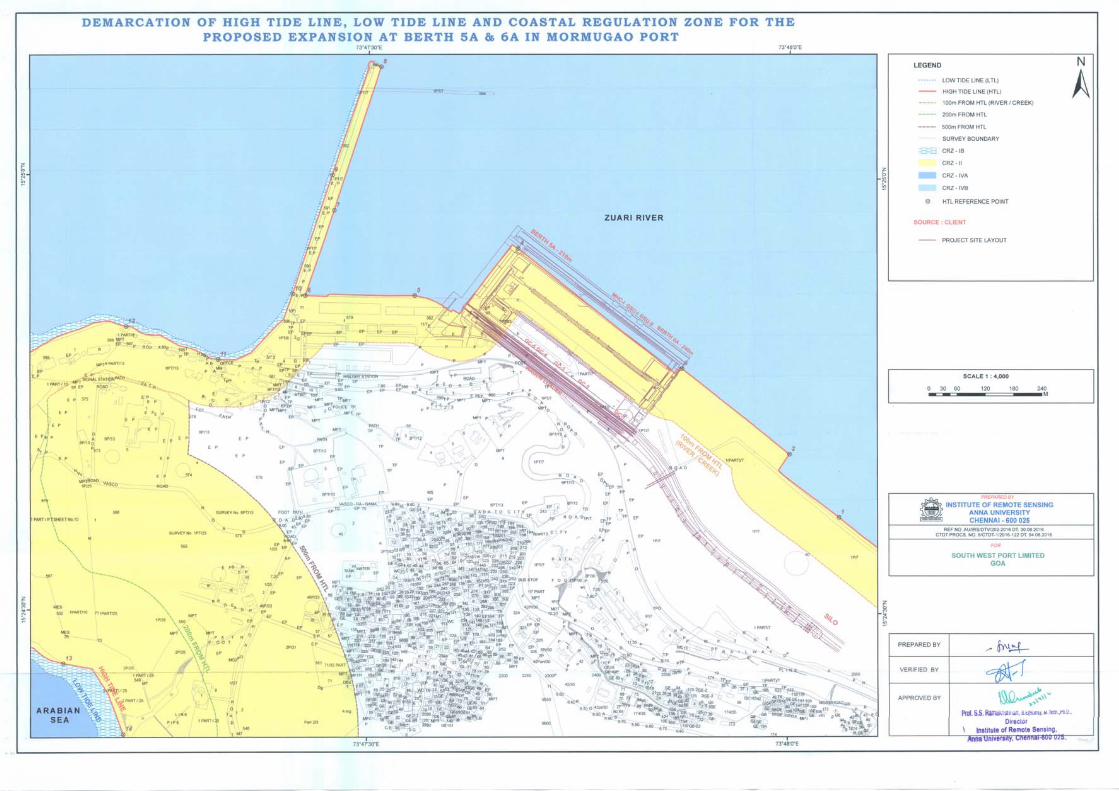


( GOA STATE POLLUTION CONTROL BOARD
(An ISO 9001-2008 Certified Board)
Phone Nos : 91-832-2436567,2438528 "TnT" M e m b e r s e c r e t a ^ G S P C B S m S - g S p c b . g o a @ n i C . i n
2438563, 2438550 » Environment Engineer, GSPCB - [email protected] , , _ .. n o „ ,A,<,„R S T S : Scientist, [email protected]
Tel / Fax No. 083Z-24JB WO "iSjfeSir Asst. Env Engineer, GSPCB - [email protected]
VP' Asst. Law Officer, GSPCB - [email protected]
No. v' $01"? /13-PCB/ \\A-& Date.^'()9;2 '20 U
Consent io Establish under Section 26 of the Water (Prevention & Control of Pollution) Act, 1974 & under Section 21 of the Air (Prevention & Control of Pollution) Act.
[To be referred as Water Act and Air Act respectively)
Consent to Establish is hereby granted to:
M/s. S O U T H W E S T P O R T L 1 M I T I E D (Large Scale Enterprise)
(Modernization of Wagon Loading System) (Red Category)
Chalta No. 1 of P.T. Sheet No. 7, Berth No. 5A & 6A,
I s ' Floor, Port Users Complex, Mormugao Harbour,
Mormugao Goa
Located in the area declared under the provisions of the Water Act and Air Acl subject to the provisions o f the Act and the Rules and the Orders that may be made further and subject to the following terms and conditions:
1. The Consent to Establish is valid up to Commissioning o f the facility as listed in serial no. 2 for a period of three years from the date of issue.
2. This Consent to Establish is valid for the installation as mentioned below: Sr. No Description _ _ ] Quantity
Modernization and Installation of Rapid In - Motion Wagon Loading System at Berth No. 5A & 6A
3- C O N D I T I O N S R E Q U I R E D T O B E C O M P L I E D U N D E R T H E W A T E R A C T :
(i) The daily quantity of industrial effluent from the facility shall not exceed N I L
(ii) The daily quantity o f domestic effluent from tiie facility shall not exceed N I L
Dempo Towers, 1st Floor, EDC Patto Plaza, Panaji, Goa 403 001

4. C O N D I T I O N S R E Q U I R E D T O B E C O M P L I E D U N D E R T H E A I R A C T : (i) The unit shall take adequate measures for control o f noise levels from its own sources
within the premises in respect o f noise. The limits are as follows Category of Area/ Zone Limits in dB (A) Leg Category of Area/ Zone
Day time Night time Industrial Area 75 70 Commercial Area 65 55 Residential Area 55 45 Silence Zone 50 40 Day time is reckoned between 6 a.m. to 10 p.m. and night time is reckoned between 10
p.m. to 6 a.m.
5. The unit shall make adequate arrangements and adopt mechanism for controlling the dust pollution.
6. G E N E R A L C O N D I T I O N S :
(i) The unit should obtain all permissions / approvals as required under the prevalent Rules / Acts in force.
(ii) The unit shall apply for Consents to Operate of the Board as required under section 25(1) (b & c) o f the Water (Prevention and Control o f Pollution) Act, 1974 and under section 21 of the Air (Prevention and Control of Pollution) Act, 1981 in the prescribed application form, 45 days before commissioning o f the plant
(ih) This Consent does not entitle the party to commence activities until and unless all the other Permissions as required under the relevant statutes are obtained by the party and this Consent lo Operate is confined to matters arising out of the Air Act and Water Act only.
To, M/s. South West Port Limited (Chalta No. 1 ofP.T. Sheet No. 7. Berth No. 5A & 6A), 1 s l Floor, Port Users Complex. Mormugao Harbour, Mormugao Goa
Copy to: - I Accounts Section 2 Concerned Kile 3 Guard File
Received Consent fee of: The capital Investment of the unit is Rs. 45 Crores Challan no. Amount Date 6408 Rs. 30, 200/- 12/07/2013
M E M B E R S E C R E T A R Y G O A S T A T E P O L L U T I O N C O N T R O L B O A R D