identification of the in vivo elastic properties of common carotid arteries from mri: a study on...
TRANSCRIPT
Identi�cation of the in vivo elastic properties of1
common carotid arteries from MRI: a study on2
subjects with and without atherosclerosis.3
4
A. Franquet1, S. Avril1, R. Le Riche2, P. Badel1, F.C. Schneider3, C. Boissier4,5
J-P. Favre56
1 CIS-EMSE, CNRS UMR 5146, Ecole Nationale Supérieure des Mines, Saint-Etienne F-42023,France7
2 CNRS UMR 6158 and H. Fayol Institute, Ecole Nationale Supérieure des Mines, Saint-Etienne F-42023,France8
3 Radiology Department, University Hospital, GRT-PAR UR4672, Université Jean Monnet, Saint-Etienne F-42023,9
France10
4 Vascular Medicine Department, University Hospital, GRT-PAR UR4672, Université Jean Monnet, Saint-Etienne11
F-42023, France12
5 Cardiovascular Surgery Department, University Hospital, GRT-PAR UR4672, Université Jean Monnet, Saint-13
Etienne F-42023, France14
Abstract15
The sti�ness of the arterial wall, which is modi�ed by many cardiovascular16
diseases such as atherosclerosis, is known to be an indicator of vulnerability.17
This work focuses on the in vivo quanti�cation of the sti�ness of the common18
carotid artery (CCA) by applying the Magnitude Based Finite Element Model19
Updating (MB-FEMU) method to 13 healthy and diseased volunteers aged20
from 24 to 76 years old. The MB-FEMU method is based on the minimisa-21
tion of the deviation between the image of a deformed artery and a registered22
image of this artery deformed by means of a �nite elements analysis. Cross23
sections of the neck of each subject at di�erent times of the cardiac cycle are24
1
hal-0
0805
128,
ver
sion
1 -
27 M
ar 2
013
recorded using a Phase Contrast cine-MRI. Applanation tonometry is then per-25
formed to obtain the blood pressure variations in the CCA throughout a heart26
beat. First, a time averaged elastic modulus of each CCA between diastole27
and systole is identi�ed and a sti�ening of the artery with age and disease is28
observed. Second, four elastic moduli are identi�ed during a single heart beat29
for each artery, highlighting the nonlinear mechanical behaviour of the artery.30
A sti�ening of the artery is observed and quanti�ed at systole in comparison31
to diastole.32
Keywords33
Identi�cation, mechanical properties, elasticity, �nite elements analysis, in vivo anal-34
ysis, MRI, artery35
1 Introduction36
Arterial sti�ness is known to be a crucial indicator for the diagnosis of arterial health37
[14]. This indicator provides information on the ageing of the artery, or on the38
progress of diseases such as atherosclerosis [19, 37] which mainly concerns the coro-39
nary and the carotid arteries. Identifying the elastic properties of the Common40
Carotid Artery (CCA) of a patient could then be a tool for improving diagnoses.41
A variety of noninvasive techniques have been developed and used to try to iden-42
tify the arterial sti�ness in vivo. The Pulse Wave Velocity for instance is an indicator43
of the mean arterial sti�ness. It is estimated by measuring the travel time of a wave44
between two measurement sites [33]. More advanced methods are used for the lo-45
cal assessment of the arterial sti�ness. Many studies track the change of arterial46
diameter during heart beat by ultrasounds [30, 21, 4, 6, 3, 2]. The blood pressure47
is generally measured in parallel on the brachial artery. The elastic modulus is then48
deduced from these measurements by using assumptions such as the perfect circu-49
larity of the artery with a free outer contour. For instance [30] have shown that the50
elastic modulus of the CCA tends to increase with age. If this kind of approaches has51
the advantage to be simple, and can be used for a rapid examination, the complex52
nonlinear mechanical behaviour of arteries [11, 13, 28] cannot be assessed by a unique53
2
hal-0
0805
128,
ver
sion
1 -
27 M
ar 2
013

modulus without requiring the linearisation of the stress-strain curve. To this aim,54
other studies have considered nonlinearities and identi�ed either nonlinear [25, 23] or55
multi-linear [8, 15, 16] constitutive properties of the artery. Eventhough the artery is56
still simpli�ed as a tube, these recent studies have incorporated a surrounding tissue57
around the artery. It has been shown that the surrounding tissue plays an important58
role in the strain which e�ectively occurs in the artery (and as a consequence, on59
the stresses) and then must be included in the models for the identi�cation of the60
mechanical properties [38, 24, 22, 27, 10]. Similarly the measurement of the blood61
pressure is a sensitive step since it is directly involved in the estimation of the elastic62
properties [17, 10]. A new methodology for identifying the mechanical properties of63
tissues from MRI has recently been designed in our team [10]: the Magnitude Based64
Finite Element Model Updating Method (MB-FEMU) works by registering a tem-65
plate image using a Finite Element Analysis. The registered image, which depends66
on the elastic properties input to the FE model, is compared to a target image. The67
identi�cation of the elastic properties of the FE model consists in minimising the68
di�erence between the target and the registered image by iteratively updating the69
elastic properties. The template and the target images are two experimental images70
obtained using a cine Magnetic Resonance Imaging (MRI) sequence at di�erent times71
of the cardiac cycle.72
In the current work, we investigate the identi�cation of the elastic modulus of73
the CCA invivo using the MB-FEMU method. It has been applied in clinical con-74
ditions to 9 healthy volunteers (24 to 63 years old) and 4 volunteer patients with75
atherosclerosis (68 to 76 years old). A unique elastic modulus is �rst considered76
before studying the evolution of the elastic modulus through the cardiac cycle. The77
in�uence of the surrounding tissue and of the measurement of the blood pressure on78
the identi�ed mechanical properties is discussed in details.79
3
hal-0
0805
128,
ver
sion
1 -
27 M
ar 2
013
2 Methods80
2.1 Subjects and patients81
The following research protocol was approved by the review board of Saint-Etienne82
University Hospital and informed consent was obtained from all subjects. The sub-83
jects studied were separated into three groups. The �rst group was named the �Young84
healthy subjects� and was composed of 4 men without any declared disease aged from85
24 to 26 years old. The second group of subjects (dubbed �Mid-age healthy subjects�)86
was made of 5 healthy subjects (1 woman and 4 men) aged from 51 to 63 years old.87
The third group, named �Old diseased patients� was composed of 3 men with se-88
vere (>80% diameter reduction) unilateral carotid bifurcation occlusive disease and89
1 woman with a bilateral post-radiation stenosis (>80%) aged from 68 to 76 years90
(report to the Table 1).91
The mechanical properties of the CCA were estimated from Magnetic Resonance92
2D images. A dedicated (1st and 2nd groups) or additional (3rd group) Phase Con-93
trast (PC) sequence was used to obtain slices of the neck at di�erent times of the94
cardiac cycle (cine MRI). The acquisition of PC images lasts approximately 5 min-95
utes depending on the heart rate of each individual. The subjects spent a total time96
of approximately 30 minutes in the MRI (including 3 slices of the arterial tree in cine97
MRI, positioning MR sequences -Time Of Flight-, Turbo Spin Echo sequences -T198
and T2 weighted images-). In this study only the PC cine MRI of one slice of the99
CCA was used. The patients spent 45 minutes in the device including the additional100
sequence and the routine pre-surgical cerebral sequence.101
15 minutes after the MRI the subjects and patients had an applanation tonom-102
etry examination in order to measure the variation of their blood pressure during a103
cardiac cycle (a probe is applied on the carotid artery by a trained physician to de-104
rive the physiological signal). Blood pressure was also measured before and after the105
MRI (and during the MRI for 2 healthy subjects). For all the healthy subjects, an106
additional echography was performed in order to measure the Intima-Media Thick-107
ness of their common carotid. The experimental protocol is summarised in Figure108
1.109
4
hal-0
0805
128,
ver
sion
1 -
27 M
ar 2
013

Table 1: Description of the subjects. Three groups were de�ned: the �Young Healthysubjects� (YH) group, the �Mid Age Healthy subjects� (MAH) group and the �OldDiseased patients� (OD) group. IMT is the Intima Media Thickness which wasmeasured by ultrasounds except for the OD group where values from the literaturewere used [7].
Subject Gender Age Height Weight Diseased IMT left/rightPatient (years) (cm) (kg) artery (mm)
YH1 M 25 185 85 No 0.45/0.45YH2 M 24 183 80 No 0.43/0.43YH3 M 25 182 85 No 0.45/0.45YH4 M 26 180 70 No 0.44/0.44
MAH1 M 59 163 72 No 0.83/0.72MAH2 M 63 179 72 No 0.56/0.49MAH3 M 51 175 74 No 0.62/0.51MAH4 M 53 165 65 No 0.56/0.47MAH5 F 57 155 62 No 0.58/0.48OD1 F 70 158 57 Left/Right 0.70/0.70OD2 M 68 182 87 Right 0.73/0.73OD3 M 75 170 82 Right 0.73/0.73OD4 M 76 178 78 Right 0.73/0.73
2.2 Imaging modalities110
Magnetic Resonance Imaging was used with a Phase Contrast sequence to provide the111
cross section of the carotid artery at di�erent time steps (cine MRI). A 3T Siemens112
Verio combined with a 4-Channel �ex coil was used with a 2D spin echo FLASH113
sequence to provide series of images during the cardiac cycle. The acquisition of114
images was synchronised with the physiological signal which was captured by an115
infrared spectroscopy device �xed on the subject's �nger. A single 4 mm thick slice116
was used. The 2D in plane resolution was 0.586 mm×0.586 mm. The slice's position117
was 27 mm below the carotid bifurcation which was located on Time Of Flight images.118
Its orientation was chosen to cut the two common carotid arteries perpendicularly.119
The acquisition frequency was set automatically for each subject depending on his or120
her heart rate, providing between 35 and 50 images per cardiac cycle. Note that these121
5
hal-0
0805
128,
ver
sion
1 -
27 M
ar 2
013

Figure 1: Description of the experimental protocol for a healthy subject. Afteradmission at the radiological service, the blood pressure is measured by a trainedphysician using a digital sphygmomanometer. The MR exam lasts approximately 30minutes depending in part on the heart rate of each subject. Note that the diseasedpatients spend 15 more minutes in the tube for their routine pre-surgical MR exam.The blood pressure is then measured in the radiological service one more time. Thesubjects reach the service of vascular medicine and after few minutes of rest, havean applanation tonometry examination with a trained physician where their bloodpressure is recorded in order to scale their wave form obtained by tonometry. Finally,for the healthy subjects, it was possible to perform an echography in order to measurethe Intima Media Thickness.
images were reconstructed from several cardiac cycles although an image sample at122
each time step was recorded at each cardiac cycle. The magnitude of images was123
digitised with a 12 bits resolution so that each voxel has an integer value between 0124
and 4, 095.125
For each subject and each artery, a region of interest of 21 × 21 pixels centred126
on the carotid was delineated on the magnitude PC images which yields the raw127
2D experimental images recorded at di�erent time steps. The images were �ltered128
6
hal-0
0805
128,
ver
sion
1 -
27 M
ar 2
013

along the time axis using a temporal Gaussian �lter with a kernel size σ = 1.5.129
Each carotid was considered as independent so that the total number of experiments130
reached 2× 13 = 26 specimens.131
2.3 Identi�cation method132
The Magnitude-Based Finite Element Model Updating method (MB-FEMU), which133
has some common features with the Modality Independent Elastography method134
[36], was developed in a previous work [10]. The principle is to build up a registered135
image from an initial, measured, template image using a displacement �eld computed136
by a Finite Element Analysis. The elastic properties of the �nite elements model are137
updated until the registered image matches a target measured image. The template138
and the target images correspond to the initial undeformed and deformed (i.e. after139
the application of external forces) states, respectively. In our case, the imaged object140
was a cross section of the CCA, and the force applied between the template and the141
target was the di�erential blood pressure. This technique requires the acquisition142
of both the images of the artery at two di�erent times of the cardiac cycle, and the143
di�erential blood pressure between these two times. Note also that a correction of144
rigid motions between the template and the target images was applied before the use145
of the MB-FEMU (see Section 2.5.2). The �ow-chart of the method is summarised146
in Figure 2.147
The identi�cation of the mechanical properties was achieved by minimising a148
cost function de�ned as the di�erence in intensity between the target image and the149
registered image:150
J2(E) =1
2 ·Npix
Npix∑i=1
(I itarget − I iregistered (E)
)2(1)
This cost function was calculated only at the pixels where the partial volume151
e�ect occurs: the pixels are �lled with di�erent materials so their intensity values152
depend on the proportion of the di�erent materials. A binary mask was de�ned to153
this aim, as the dilation of a �rst binary mask which contains the pixels where the154
inner contour of the artery was found (see Section 2.4.1). The �rst binary mask155
7
hal-0
0805
128,
ver
sion
1 -
27 M
ar 2
013
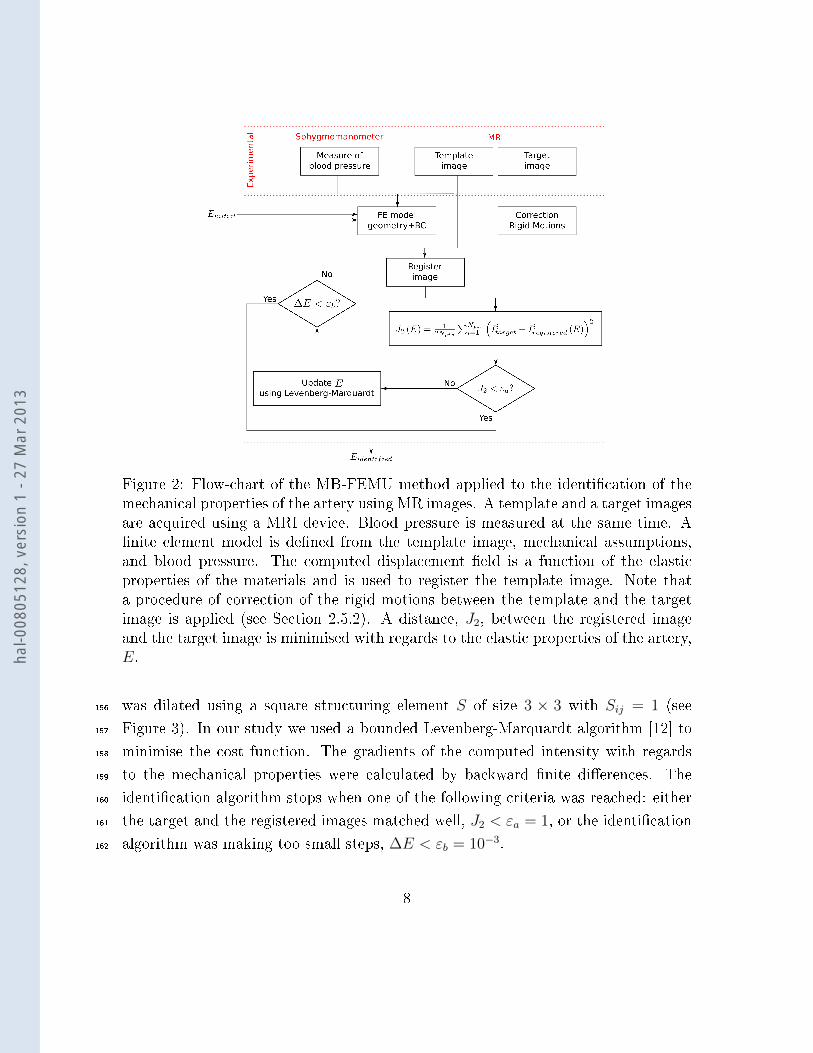
Figure 2: Flow-chart of the MB-FEMU method applied to the identi�cation of themechanical properties of the artery using MR images. A template and a target imagesare acquired using a MRI device. Blood pressure is measured at the same time. A�nite element model is de�ned from the template image, mechanical assumptions,and blood pressure. The computed displacement �eld is a function of the elasticproperties of the materials and is used to register the template image. Note thata procedure of correction of the rigid motions between the template and the targetimage is applied (see Section 2.5.2). A distance, J2, between the registered imageand the target image is minimised with regards to the elastic properties of the artery,E.
was dilated using a square structuring element S of size 3 × 3 with Sij = 1 (see156
Figure 3). In our study we used a bounded Levenberg-Marquardt algorithm [12] to157
minimise the cost function. The gradients of the computed intensity with regards158
to the mechanical properties were calculated by backward �nite di�erences. The159
identi�cation algorithm stops when one of the following criteria was reached: either160
the target and the registered images matched well, J2 < εa = 1, or the identi�cation161
algorithm was making too small steps, ∆E < εb = 10−3.162
8
hal-0
0805
128,
ver
sion
1 -
27 M
ar 2
013

(a) Example of a template im-age from which the inner con-tour of the artery (white) wasextracted (see Section 2.4.1).
(b) Binary mask de�ned forthis example.
Figure 3: Example of the de�nition of a binary mask on a template image. The costfunction was only calculated where the binary mask is not null. The details of howthe contour was obtained are described in Section 2.4.1.
2.4 Finite elements models and mechanical assumptions163
2.4.1 FE model: geometry, boundary conditions and mesh de�nition164
The geometry of the 2D FE models was derived from the initial (diastole) PC MR165
images of each subject. Each carotid was considered as independent so that two166
FE models were de�ned by subject, each representing a semi-neck. Three materials167
were segmented: (i) the inner contour of the carotid was determined by an automatic168
algorithm based on a Fourier polynomial description (see [10] for details). The artery169
was then de�ned as an homogeneous media and derived from this contour outwards170
with a thickness measured on an ultrasonic device (Intima Media Thickness (IMT) on171
the distal wall of each carotid artery). For the third experimental group (�old diseased172
group�), the IMT was not measured for non-medical reasons so thicknesses found in173
the literature [7] were used (0.70 mm for the woman and 0.73 mm for the men).174
(ii) An homogeneous material which surrounds the artery was segmented manually175
on the same initial image. The contours de�ned followed �rstly, the jugular vein,176
secondly the external contour of the neck, and �nally the spine. (iii) An arti�cial third177
material was created around the surrounding tissue. It had no mechanical in�uence178
and was only used for an easy implementation of our registration algorithm. Note179
that the radiological convention was applied throughout the manuscript. It means180
9
hal-0
0805
128,
ver
sion
1 -
27 M
ar 2
013

that the left artery is located at the right of the spine and vice versa. The di�erences181
between the left and right geometries will be discussed in the Discussion section.182
For the boundary conditions, the spine was �xed and a vertical symmetry was183
assumed since the semi-neck only was modelled for each experiment. A uniform184
pressure was applied on the inner arterial wall. It corresponds to the di�erential185
blood pressure measured on each subject between the deformed and the undeformed186
states.187
The mesh consisted in approximately 8, 000 quadratic triangles (6 nodes) for each188
FE model. This type of element can provide accurate displacement �elds for those189
types of problems [9]. The element size was re�ned on the artery's contour and190
close to it. Finally the artery had approximately 1, 000 elements and the surround-191
ing tissue approximately 7, 000. The third �arti�cial� material had a coarse mesh192
(approximately 100 elements).193
The FE computation ran on the 6.8 version of Abaqus© standard and took194
approximately 5 seconds on a desktop PC (Core Quad 2.5 GHz, 4 GB RAM).195
2.4.2 Mechanical assumptions196
As a �rst approximation the three materials were considered as linear elastic since197
we work on the di�erential state between diastole and systole so only the tangent198
behaviour of the stress-strain relationship was taken into account. We assumed a199
2D plane strain problem in the �nite deformation framework. Quasi static conditions200
were postulated because heart beat frequency was approximately 1 Hz.201
The elastic properties of the surrounding tissue were set in the FE model to202
E = 30 kPa with a Poisson's ratio ν = 0.49 [29]. The elastic properties of the203
�arti�cial� tissue were set to have no mechanical in�uence: E = 10−6 kPa and ν = 0.204
We checked that the presence of this arti�cial tissue in the FE model had no in�uence205
on the displacement �elds. The Poisson's ratio of the CCA was set to ν = 0.49. The206
elastic modulus of the artery was unknown and had to be recovered.207
10
hal-0
0805
128,
ver
sion
1 -
27 M
ar 2
013

2.5 Identi�ed variables208
2.5.1 Elastic properties of the common carotid arteries209
The aim of this study is �rst to study the elastic properties of the CCA. The other210
variables such as the mechanical properties of the surrounding material, the blood211
pressure, or the geometry of the FE model was supposed to be known. We further212
investigate the e�ects of these properties on the identi�ed elastic properties of the213
artery. For one subject and one side, we performed a total of 5 di�erent identi�-214
cations of the elastic properties of the CCA, which comprise one identi�cation for215
the diastole-systole average behaviour and 4 identi�cations at successive parts of the216
cardiac cycle in which the template and target images are chosen.217
Table 2: Description of the 5 di�erent couples of template/target images used foreach hand side on each subject/patient.
Identi�cationTemplate image Target image
procedure
(a) End-diastole Mid-systole(b) Mid-systole End-systole(c) Mid-diastole End-systole(d) End-diastole Mid-diastole(e) End-diastole End-systole
The reader can refer to the Figure 4 for an illustration of the di�erent identi�ca-218
tion times. The mid-systole time was de�ned as the time from the end-diastole to219
recover 50% of the systolic pressure. The same calculation was applied to recover220
the mid-diastole time. The procedures (a) to (d) in Table 2 describe the variation of221
the elastic properties through the cardiac cycle. The procedures (b) and (c) use the222
deformed FE model obtained at the end of the identi�cation procedures (a) and (d),223
respectively. Note that only the geometry was imported and not the stress �eld. The224
imposed boundary conditions in pressure are described in Section 2.6. The procedure225
(e) uses the most deformed images that are, on the one hand the diastolic or initial226
image as the template, and on the other hand the systolic image as the target. In227
this case, the measured pulse pressure was applied.228
11
hal-0
0805
128,
ver
sion
1 -
27 M
ar 2
013

Figure 4: Illustration of the subsections of the cardiac cycle de�ned to identify 4+1di�erent elastic moduli throughout a cardiac cycle (identi�cation procedures (a) to(d), the target and template images are chosen according to this scheme and thepressure applied as a boundary condition is the corresponding di�erential pressure).The identi�cation procedures (b) and (c) use the deformed geometries obtained atthe end of the identi�cations (a) and (d) respectively. For the procedures (c) and (d)the template image is taken later in time than the target image in order to keep apositive pressure in�ation. The identi�cation procedure (e) uses the measured pulsepressure as a boundary condition and the images at diastole and systole .
2.5.2 Correction of the in-plane translation229
As described previously, the FE models were determined from the initial image.230
During the increase of pressure in the arterial tree, in-plane movements of the artery231
can potentially occur due the real complex 3D geometry. These movements are a232
translation of the artery in the cutting plane, that cannot be taken into account233
directly with our 2D FE model. Then, before each identi�cation procedure, we234
estimated the in-plane translation of the artery by (i) �rst, de�ning a region of interest235
(ROI) on a �correction image� (template image registered with a displacement �eld236
of the FE model with Eartery = 600 kPa. This region of interest was a square that237
contains the artery. The square's limits were deduced from the binary mask used.238
(ii) Second, we performed a normalised cross-correlation between this ROI and the239
correction image, and this ROI and the target image. The di�erence between the240
12
hal-0
0805
128,
ver
sion
1 -
27 M
ar 2
013

locations of the maximum of these normalised cross-correlations gives the estimated241
correction vector that is used throughout the identi�cation procedure (see Figure242
5). In summary, a complete identi�cation procedure consists in the estimation of243
the in-plane translation of the artery, and then of the identi�cation of the elastic244
properties of the CCA using the MB-FEMU method. The e�ect of this correction245
vector is discussed later in the article.246
2.6 Determination of the blood pressure247
The diastolic and systolic blood pressure were measured several times during the248
protocol. Di�erent digital or manual sphygmomanometers were used. It was assumed249
that the pressure in the CCA is the same as the pressure measured in the brachial250
artery. For several subjects, the blood pressure was measured before, during and after251
the MR exam on the left arm. In addition to these measurements of the diastolic and252
systolic pressures, an applanation tonometry examination was performed. It consists253
in applying a probe on the neck of the subject/patient for obtaining the pro�le of254
pressure variations throughout a cardiac cycle. A second approach was designed here255
for obtaining this data. The approach consists in estimating an index, called the �P-256
index� for �Pressure index�, based on the mean deformation of the artery throughout257
the cardiac cycle. The idea behind the P-index is that the instantaneous artery size,258
as measured by MRI, is representative of its internal pressure.259
The P-index is determined for each subject and for each neck-side. Considering260
the 2D+t set of images, the �rst image (diastole state) is subtracted from every261
image frame for which the P-index has to be computed (see Figure 6). Then the262
P-index is de�ned as:263
P-indexraw (t) = 1Npix
∑Npix
i=1 I i (t)− I i (t0)
P-index (t) = P-indexraw(t)−min(P-indexraw(t))max(P-indexraw(t))−min(P-indexraw(t))
(2)
where Npix is the number of pixels of the binary mask (Figure 3); i is the ith pixel in264
this set of pixels; t0 is the initial time (diastole).265
Once the P-index is calculated, it is used to determine which image frame is266
respectively at the mid-systole time, end-systole time, mid-diastole time and end-267
13
hal-0
0805
128,
ver
sion
1 -
27 M
ar 2
013

Figure 5: Principle of the correction of the translation between the template andthe target image. The template image is �rst registered using an elastic modulus ofthe artery of 600 kPa. The ROI is chosen as the circumscribed square of the binarymask. A normalised cross-correlation between the ROI and the registered imagegives a map where the maximum can be located. This corresponds to the location ofthe ROI in the registered image. The same operation is computed between the ROIand the target image to �nd the best location of the ROI in the target image. Thedi�erence between these two sets of coordinates gives the correction vector.
diastole time (see Figure 4). The end-diastole and end-systole images can be deter-268
mined directly: the end-diastole image is the �rst image and the end-systole image269
is the image where the P-index reaches its maximum. The mid-states (mid-diastole270
and mid-systole) images were chosen when the P-index reaches 50 % of its maximal271
value.272
14
hal-0
0805
128,
ver
sion
1 -
27 M
ar 2
013

(a) Set of images throughoutthe cardiac cycle. This exam-ple is made up with 37 framesequally distributed throughoutthe cardiac cycle.
(b) The �rst image (diastole)is subtracted to every imageframe.
(c) The binary mask (Figure 3)is applied.
(d) Example of P-index pro�le through-out a cardiac cycle.
Figure 6: Principle of calculation of the P-index.
3 Results273
3.1 Geometries of the subjects arteries274
All the geometries were segmented independently. The diameter of the arteries was275
estimated from the cross-sectional area A of the 2D in-plane shape of the artery276 15
hal-0
0805
128,
ver
sion
1 -
27 M
ar 2
013

(D = 2√
(A/π), see Figure 3). The mean diameter of the healthy arteries is277
6.45±0.70 mm while the 5 diseased arteries have a mean diameter of 6.66±1.54 mm.278
Table 3: Equivalent diameters of the arteries of the subjects taking part to theexperiment.
Subject/ Diameters (mm)Patient Left Right
YH1 6.81 6.46YH2 5.70 6.22YH3 6.32 6.71YH4 6.33 6.33
MAH1 6.05 6.60MAH2 7.17 6.65MAH3 7.40 6.25MAH4 6.62 6.78MAH5 5.45 5.39OD1 5.57 5.06OD2 6.00 6.64OD3 8.48 9.04OD4 5.68 7.01
The FE geometries were derived from the initial (diastole) image of each subject279
(see A). The variability of neck morphologies is evident. Oblong shapes (YH1, YH2,280
YH3, YH4, MAH1, MAH3, MAH5, OD1, OD4) and round shapes (OD2) can be281
observed as well as more angular shapes (MAH2, MAH4, OD3). Jugular veins (the282
internal jugular here) on a unique subject also present some variability. Two subjects283
exhibit a split vein close to the artery on one side only (MAH4 and MAH5). The284
vein is crushed for subjects YH4, MAH2 and MAH3 (one side), and for patient OD4.285
The locations of the artery with regards to the spine also varies signi�cantly (see286
Table 4). On the average, this distance is 7 mm but it varies from 2 mm to 12 mm287
between di�erent individuals.288
16
hal-0
0805
128,
ver
sion
1 -
27 M
ar 2
013

Table 4: Approximate distance between the spine and the inner contour of the CCA.
Subject/ Distance (mm)Patient Vertebral column - artery
Left Right
YH1 11 12YH2 7 9YH3 7 9YH4 4 6
MAH1 2 6MAH2 9 4MAH3 7 5MAH4 4 5MAH5 10 10OD1 7 6OD2 4 7OD3 5 9OD4 12 12
3.2 Blood pressure289
The results of the determination of the blood pressure in the CCA are shown in B.290
The P-index shows a pro�le that consists in a �rst rapid increase and then a decrease291
until reaching almost zero at the end-diastole state.292
Di�erences between the P-index pro�les and the pressure pro�les obtained by293
applanation tonometry are signi�cant. Figure 7 shows the di�erence in the initial294
slope de�ned as (1− Slope P-index/Slope Tonometer)× 100. On the average, there295
is a ratio between both initial slopes of −28.24 %. This ratio is of −67.41± 0.07 %296
for the YH group, −35.91 ± 14.08 % for the MAH group and −34.49 ± 33.37 %297
and 50.50 ± 72.99 % for the healthy and the diseased arteries of the OD group,298
respectively. These di�erences between initial slopes induce a time o�set between299
the systole of the P-index and the systole from the pressure pro�le.300
17
hal-0
0805
128,
ver
sion
1 -
27 M
ar 2
013

(a) Initial slopes of the pressure pro�le and ofthe P-index pro�le.
(b) Slope ratios for the young subjects (YH), themid-age subjects (MAH) and the old patients(OD).
Figure 7: Comparison between the initial slopes of the P-index and of the tonometerpressure.
3.3 Identi�ed elastic moduli301
The values of the identi�ed elastic moduli are reported in Table 5. An indicator of302
the quality of image registration is also reported, de�ned as:303
DI = 100×J2
(Eidentified
artery
)J∞2
(3)
where J∞2 corresponds to the distance between the target image and the template304
image (only across the binary mask). J∞2 is the value of the objective function305
when neither deformation nor correction of displacement is allowed (see Figure 8).306
The DI index characterises the reduction of the cost function with the identi�cation307
procedure.308
18
hal-0
0805
128,
ver
sion
1 -
27 M
ar 2
013

Table 5: Identi�cation results
Subject Identi�cation Elastic modulus (kPa) DI (%)
Procedure Left Right Left Right
YH1
(a) 221 192 25.79 13.27
(b) 349 303 50.48 56.06
(c) 455 193 38.86 23.94
(d) 185 456 13.19 20.79
(e) 289 325 8.08 11.61
YH2
(a) 147 395 38.45 63.74
(b) 662 213 88.69 56.39
(c) 236 234 51.84 63.93
(d) 208 347 43.36 55.38
(e) 228 288 25.95 38.89
YH3
(a) 177 204 30.72 33.19
(b) 793 1890 75.33 86.36
(c) 250 308 34.03 31.24
(d) 322 374 19.21 27.26
(e) 318 363 10.15 14.85
YH4
(a) 132 119 23.82 40.93
(b) 228 187 53.66 53.00
(c) 230 128 50.43 38.20
(d) 129 134 15.75 27.33
(e) 224 490 36.21 21.83
MAH1
(a) 211 934 58.18 33.25
(b) 499 848 86.33 28.99
(c) 246 317 76.99 73.64
(d) 292 167 55.06 17.83
(e) 265 921 53.47 35.47
MAH2
(a) 374 338 51.17 47.84
(b) 640 801 71.91 81.89
Continued on next page
19
hal-0
0805
128,
ver
sion
1 -
27 M
ar 2
013

Table 5 � Continued from previous page
Subject Identi�cation Elastic modulus (kPa) DI (%)
Procedure Left Right Left Right
(c) 423 580 69.01 71.07
(d) 401 364 42.40 47.71
(e) 446 464 40.61 42.84
MAH3
(a) 368 264 64.76 80.53
(b) 503 574 83.25 88.03
(c) 367 258 76.15 82.68
(d) 448 604 72.20 86.64
(e) 483 520 54.71 73.13
MAH4
(a) 200 386 49.69 66.78
(b) 10843 1057 99.06 84.96
(c) 454 545 64.76 62.84
(d) 598 625 67.18 61.08
(e) 503 563 35.85 47.30
MAH5
(a) 445 1281 47.55 13.95
(b) 357 290 90.54 62.87
(c) 642 1013 81.72 54.61
(d) 285 245 56.89 59.61
(e) 420 502 55.03 15.64
OD1
(a) 8781 5418 98.12 94.40
(b) 600 7727 124.07 98.01
(c) 50000 600 100.36 100.00
(d) 812 655 68.39 74.65
(e) 2239 6423 96.14 94.66
OD2
(a) 229 449 68.16 53.92
(b) 213 724 55.81 89.48
(c) 325 437 55.13 83.50
(d) 406 491 67.54 69.42
Continued on next page
20
hal-0
0805
128,
ver
sion
1 -
27 M
ar 2
013
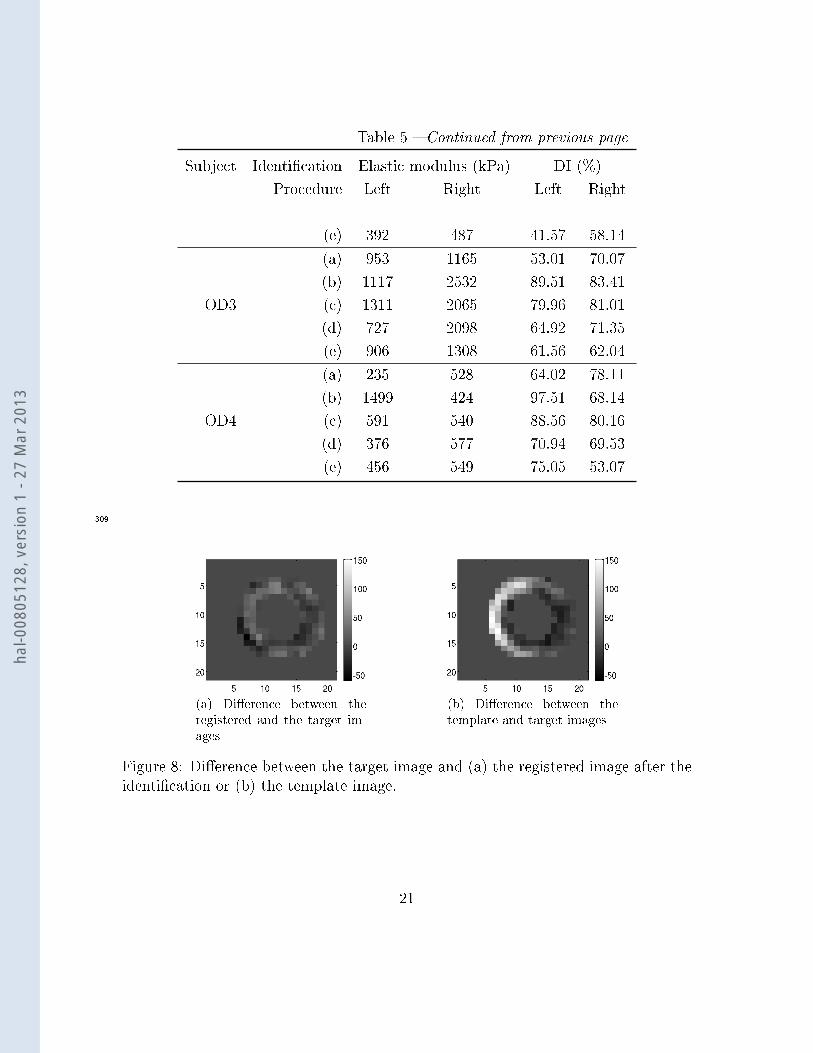
Table 5 � Continued from previous page
Subject Identi�cation Elastic modulus (kPa) DI (%)
Procedure Left Right Left Right
(e) 392 487 41.57 58.14
OD3
(a) 953 1165 53.01 70.07
(b) 1117 2532 89.51 83.41
(c) 1311 2065 79.96 81.01
(d) 727 2098 64.92 71.35
(e) 906 1308 61.56 62.04
OD4
(a) 235 528 64.02 78.11
(b) 1499 424 97.51 68.14
(c) 591 540 88.56 80.16
(d) 376 577 70.94 69.53
(e) 456 549 75.05 53.07
309
(a) Di�erence between theregistered and the target im-ages
(b) Di�erence between thetemplate and target images
Figure 8: Di�erence between the target image and (a) the registered image after theidenti�cation or (b) the template image.
21
hal-0
0805
128,
ver
sion
1 -
27 M
ar 2
013

3.3.1 Elastic modulus310
Using the MB-FEMU method, the elastic moduli of the CCA (left and right) of each311
subject is identi�ed. First, we calculated the global modulus throughout the whole312
cardiac cycle. The global modulus is estimated with the diastole image as template313
image and the systole image as target image. The pressure which is applied as314
a boundary condition in the model is the di�erence between diastolic and systolic315
pressures measured on each subject.316
Figure 9: Global elastic modulus identi�ed throughout a whole cardiac cycle.
E�ect of age and disease The results show an increase in the elastic modulus of317
the CCA with age and disease (see Figure 9). The YH group exhibits a mean elastic318
modulus of 315±29 kPa. It is 38 % inferior to the mean modulus of the MAH group319
(509 ± 65 kPa). The means of the OD group has not been calculated due to a lack320
of data.321
E�ect of the surrounding tissue It has been shown previously that, through a322
sti�ness compensation e�ect, the identi�ed elastic modulus of the CCA Eartery using323
the MB-FEMU is in�uenced by the estimation of the elastic properties of the sur-324
rounding tissue Esurrounding [10]. Figure 10a shows how the estimation of these elastic325
properties can a�ect the identi�ed elastic properties of the artery, Eartery. If Eartery326
when Esurrounding = 30 kPa is taken as a reference, Eartery is overestimated by 19 %327
22
hal-0
0805
128,
ver
sion
1 -
27 M
ar 2
013
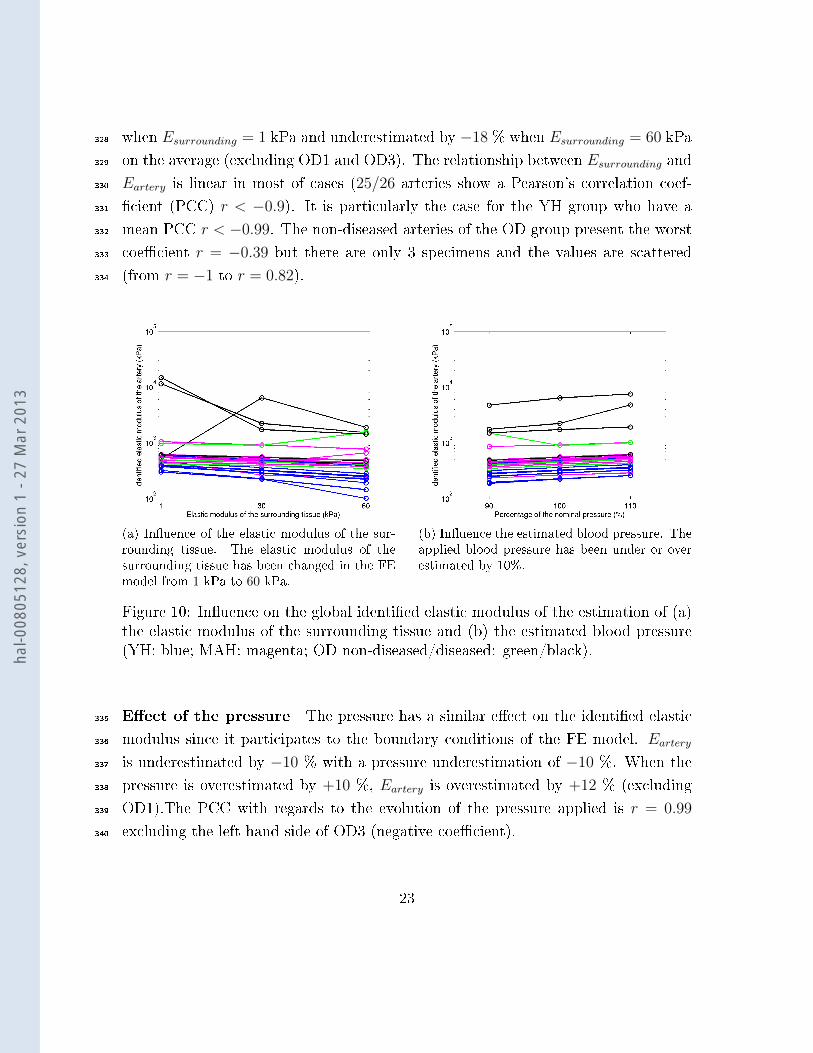
when Esurrounding = 1 kPa and underestimated by −18 % when Esurrounding = 60 kPa328
on the average (excluding OD1 and OD3). The relationship between Esurrounding and329
Eartery is linear in most of cases (25/26 arteries show a Pearson's correlation coef-330
�cient (PCC) r < −0.9). It is particularly the case for the YH group who have a331
mean PCC r < −0.99. The non-diseased arteries of the OD group present the worst332
coe�cient r = −0.39 but there are only 3 specimens and the values are scattered333
(from r = −1 to r = 0.82).334
(a) In�uence of the elastic modulus of the sur-rounding tissue. The elastic modulus of thesurrounding tissue has been changed in the FEmodel from 1 kPa to 60 kPa.
(b) In�uence the estimated blood pressure. Theapplied blood pressure has been under or overestimated by 10%.
Figure 10: In�uence on the global identi�ed elastic modulus of the estimation of (a)the elastic modulus of the surrounding tissue and (b) the estimated blood pressure(YH: blue; MAH: magenta; OD non-diseased/diseased: green/black).
E�ect of the pressure The pressure has a similar e�ect on the identi�ed elastic335
modulus since it participates to the boundary conditions of the FE model. Eartery336
is underestimated by −10 % with a pressure underestimation of −10 %. When the337
pressure is overestimated by +10 %, Eartery is overestimated by +12 % (excluding338
OD1).The PCC with regards to the evolution of the pressure applied is r = 0.99339
excluding the left hand side of OD3 (negative coe�cient).340
23
hal-0
0805
128,
ver
sion
1 -
27 M
ar 2
013

3.3.2 Evolution of the elastic modulus during a cardiac cycle341
We have then identi�ed elastic moduli at di�erent times of the cardiac cycle:342
a Between the diastole and the mid-systole343
b Between the mid-systole and the systole344
c Between the systole and the mid-diastole345
d Between the mid-diastole and the diastole346
Each modulus is estimated with the appropriate template and target images347
determined from the considered fraction of the cardiac cycle. The pressures which are348
applied as boundary conditions in the model are calculated using the P-index pro�les.349
Results are shown in Figure 11 for the YH, MAH and OD group. The identi�cation in350
the OD1 case has been excluded because it has failed, which numerically means that351
the Levenberg-Marquardt algorithm stops due to a null gradient and DI > 100 %.352
The YH group has an average elastic modulus of 325 kPa over the whole cardiac353
cycle whereas the MAH group has an average elastic modulus of 752 kPa. The value354
of the elastic modulus for the YH group starts from 198 kPa during the �rst fraction355
of the cardiac cycle (see Figure 4), then it increases to 578 kPa in the second fraction356
of the cardiac cycle, and is �nally stable in the two last fractions until the return to357
the diastole state (254 kPa and 269 kPa). The evolution of the elastic modulus of the358
artery through the cardiac cycle is similar for the MAH group, with a higher elastic359
modulus in the (b) fraction of the cardiac cycle than in the (a) fraction (619 kPa360
on the average versus 511 kPa, excluding MAH4), and a stable modulus during361
the diastolic phase ((c): 488 kPa on the average, (d): 381 kPa) (see Figure 11e).362
The number of data for the OD group is very limited so that the means are not363
meaningful.364
24
hal-0
0805
128,
ver
sion
1 -
27 M
ar 2
013

4 Discussion365
4.1 E�ect of the age and of disease on the sti�ness366
The results show that there is an increase of +38% of the global elastic modulus367
of the artery between the YH group and the MAH group. A Student's t-test on368
the identi�ed modulus of Table 5 (identi�cation procedure (e)) reveals a signi�cant369
di�erence between the means of these two groups with a p-value1 p = 0.9968 2.370
These �ndings are in agreement with the literature. The large study of [30] shows371
that there was a signi�cant increase of the sti�ness of the carotid arteries for males372
and females from 40 years old to 64 years old. This increase has also been pointed373
out in the review of [26]. The low number of data points for old and diseased patients374
renders di�cult the interpretation of the mean values, and other experiments should375
be conducted. We can note that the diseased artery is always sti�er than the non-376
diseased artery for patients OD2, OD3 and OD4 who have a unilateral lesion (392 kPa377
vs 487 kPa, 906 kPa vs 1732 kPa, 456 kPa vs 549 kPa, respectively).378
4.2 Comparision between the P-index pro�le and pressure379
pro�les obtained by the applanation tonometry technique380
It is interesting to see the di�erences between the blood pressure measured by appla-381
nation tonometry and the P-index pro�les. For all cases excepted the old diseased382
patients, the pressure increase as seen through the P-index is slower than that seen383
by tonometry. These di�erences could be explained by the possible inertia of the384
artery to be deformed or by the MRI artefacts. Figure 7 reveals that the di�erence385
of slope between the P-index and the tonometry during the systole evolves with age386
and disease in the same way as the sti�ness of the artery: YH<MAH (p = 0.9989),387
1the p-value is the probability of having an observation at least as extreme as the observationif the hypothesis H0 is true. Low p-values (lower than a chosen signi�cance level) may induce arejection of H0.
2data �t a standard distribution, the variances are assumed to be unequal (Behrens-Fisherproblem [18]), unilateral test with the null hypothesis H0: �mean from data set 1 is lower thanmean from data set 2�
25
hal-0
0805
128,
ver
sion
1 -
27 M
ar 2
013

MAH<non-diseased OD (p = 0.5248), non-diseased OD<diseased OD (p = 0.9698)3.388
4.3 Evolution of elastic properties throughout the cardiac cy-389
cle390
Arteries are known to be nonlinear [11, 13]. Since we have considered a linear me-391
chanical behaviour, we have identi�ed di�erent elastic properties at di�erent fractions392
of the cardiac cycle. Note that there is a clear increase of the elastic modulus just393
before the end-systole (identi�cation at the (b) part of the cardiac cycle) for both394
the YH group (p = 0.95) and the MAH group (p = 0.74)4. There is also a signi�cant395
decrease of the elastic modulus during the return to diastole (identi�cation at the (c)396
part of the cardiac cycle) for both groups (p = 0.93 and p = 0.82, respectively5).The397
decrease of the elastic modulus between the cardiac cycle parts (c) and (d) is not398
clear (p = 0.40 and p = 0.83 for the YH group and the MAH group, respectively).399
We have also seen that the moduli from the identi�cation procedures (a), (c) and400
(d) are relatively close for both groups (198→ 269 kPa and 381→ 488 kPa, respec-401
tively). In both groups the elastic modulus is minimum during the �rst part of the402
cardiac cycle, then increases during systole, and �nally decreases during the return403
to diastole and goes back to its initial value for the identi�cation procedure (d). The404
lack of data on the OD group has prevented to perform the t-tests. Other authors405
were able to observe the di�erences between the elastic modulus of the artery at di-406
astole and systole: [8] have studied the propagation of shear waves in arteries using407
ultrasounds. They found on a unique subject that the elastic modulus steps up from408
258 kPa during diastole to 402 kPa during systole. It is an increase of +56 % which409
is less than what we found on the YH group (+191 %) and higher than what we410
found on the MAH group (+21 %). Interestingly, the tested subject was 30 years411
old while the mean age of the YH group was 25 years old and the mean age of the412
3unpaired Student's t-test, data �t a standard distribution, the variances are assumed to beunequal, unilateral test with the null hypothesis H0: �mean from data set 1 is lower than meanfrom data set 2�
4paired Student's t-test, the di�erence between the paired data �t a standard distribution,unilateral test with the null hypothesis H0: �mean from data set 1 is lower than mean from dataset 2�)
5null hypothesis H0: �mean from data set 1 is higher than mean from data set 2�
26
hal-0
0805
128,
ver
sion
1 -
27 M
ar 2
013
MAH group was 57 years old.413
4.4 On the importance of an accurate measurement of the414
blood pressure415
Results from Section 3.3.1 and previous tests on the MB-FEMU method [10] have416
pointed out the major role of the blood pressure for the estimation of the artery's417
sti�ness in vivo. We have found that the identi�ed elastic modulus of the artery is418
directly in�uenced by how the blood pressure is measured. In the literature, many419
authors used a direct formula that links the elastic modulus to the variation of420
diameter of the artery [30, 21]. The e�ect of the measurement of pressure is then421
also crucial. In a previous article [10] we noticed the substantial variation of the422
pulse pressure of a subject just before the MRI and 15 minutes after the exam (pulse423
pressure PMRI = 85 mmHg vs PMRI+15 min = 62 mmHg) while the normal value is424
P = 40 mmHg. In the present study, the blood pressure of three healthy subjects425
was measured every 2 minutes using a programmable digital sphygmomanometer426
throughout the whole MR exam. An in�ation armband was �xed on the arm of the427
subject before the exam. The results are shown in Figure 12. They reveal signi�cant428
changes of the blood pressure during the MR exam. These changes may be explained429
in part by the stress provoked by the exam. We can see on the curves that MAH2 has430
apparently increased his systolic and diastolic pressures after 18 minutes in the MRI.431
This increase is correlated to the start of the PC sequence which is very noisy due432
to the �ip of the magnetic �eld. On the contrary, the diastolic and systolic pressures433
of MAH3 and MAH4 are relatively stable, with a tendency to decrease. If we look434
at the pulse pressure, and if we consider the mean pulse pressure of each subject as435
the reference, the variation is very important during the exam (−17 % /+ 14 % for436
MAH2, −21 % / + 18 % for MAH3 excluding the �rst data, −15 % / + 12 % for437
MAH4). This variation of blood pressure has also consequences on images because438
it introduces blur on the contour of the artery: indeed each frame image is the439
reconstruction of a k-space which has been �lled during several cardiac cycles [5]. If440
the blood pressure was di�erent between the cardiac cycles, the displacement of the441
artery would also be di�erent. This could explain the special shapes of the P-index442
27
hal-0
0805
128,
ver
sion
1 -
27 M
ar 2
013

for certain subjects and patients (YH4, MAH3, MAH4, MAH5, OD2).443
Moreover in this study we considered that the pulse pressure in the CCA was444
identical to the pulse pressure in the brachial artery. In reality, it has been reported445
that the pulse pressure in the brachial is typically larger to that in the CCA by446
about 10 − 14 mmHg [32, 31]. In our case it means that the identi�ed moduli are447
slightly overestimated. The applanation tonometry exam could estimate the pulse448
pressure in the carotid after a proper calibration [34, 20], but it has not been used449
here because the procedures are time consuming and not compatible with our clinical450
conditions.451
4.5 Assumptions made within the Finite Element Model452
In this study, as well as in our previous work [10], we have underlined the in�uence453
of the mechanical properties of the surrounding tissue. The elastic properties of454
the surrounding tissue can be potentially identi�ed simultaneously with the elastic455
properties of the artery as in [22]. But this induces several di�culties: (i) The total456
identi�cation time is multiplied by three. (ii) The solution is potentially not unique,457
whereas it is the case when only one modulus is identi�ed. (iii) The obtained solutions458
can be meaningless with regard to the physics. Here the choice of a homogeneous459
model of the surrounding tissue is not realistic. The surrounding medium is much460
more complex and heterogeneous (muscle, tendons, fascias, etc.) but since we focused461
only on the mechanical properties of the artery we have chosen not to re�ne the462
FE model. In addition, the correction of images that occurs at the beginning of463
each identi�cation procedure has been designed to incorporate rigid displacements464
that are due to the real 3D geometry of the neck. Our implementation was fast465
and simple. It is then possible to recover the coordinates of the correction vector466
simultaneously with the elastic properties of the artery with a limited impact on467
the total identi�cation time since no additional FE computation is necessary. The468
geometry of the FE models is important because it imposes strong constraints on469
the registration framework. We have seen that the diameters of the arteries and470
more generally the morphologies of the subjects and patients di�er signi�cantly from471
one subject to another and even among the subjects and patients themselves. But472
28
hal-0
0805
128,
ver
sion
1 -
27 M
ar 2
013

no correlation appears between the diameter of the artery and the identi�ed elastic473
modulus, or between the distance between the artery and the spine and the elastic474
modulus. This means that the geometry of the FE model is crucial for an accurate475
identi�cation, but its in�uence on the mean identi�ed elastic modulus is limited.476
Other approaches such as the �hyperelastic warping� [35] exist which, by releasing477
some of the assumptions on the geometry, could improve the results.478
4.6 Limitation479
Two words of caution are needed for clinical use of the proposed identi�cation480
method. First, if the patient is taking medications that a�ect the mechanical proper-481
ties of the arteries such as beta-blockers, the identi�ed mechanical properties of the482
arteries will include the e�ect of the medication. If the patient is taking medications483
that a�ect the blood pressure without changing the mechanical properties of the484
arteries, the method will correctly identify the mechanical properties of the arteries485
because the actual blood pressure is estimated and used as a boundary condition.486
Second, if the patient su�ers severe cardiac rhythm disorders, the MRI images can487
be blurred because a single image is reconstructed from images taken during several488
cardiac cycles [5, 1]. In this case, a �ner analysis of the MRI reconstruction method489
coupled with accurate in situ blood pressure measurements could be appropriate but490
such research topic is out of the scope of this work.491
5 Conclusion492
In this study we successfully applied the MB-FEMU method [10] for identifying the493
in vivo elastic moduli of the common carotid arteries of 13 healthy subjects and494
sclerosed patients from 24 to 76 years old based on data provided by cine MRI.495
These data have been obtained in clinical conditions from existing Phase Contrast496
MR sequence. This approach requires to record at the same time the blood pressure.497
An increase of the artery's sti�ness with age and atherosclerosis has been observed.498
More experiments are however needed to determine if the diseased arteries can be499
distinguished from non-diseased arteries based on the analysis of sti�ness. The vari-500
29
hal-0
0805
128,
ver
sion
1 -
27 M
ar 2
013

ation of the elastic modulus of the artery during a single cardiac cycle has also been501
observed and a sti�ening of the artery during systole has been underlined. This502
opens the door to the identi�cation of the nonlinear mechanical properties of the503
artery in vivo. Additional steps are nevertheless required, such as the necessity of a504
very accurate measurement of the blood pressure, and the use of an appropriate FE505
model with a re�ned surrounding media. The MB-FEMU method is promising for506
the identi�cation of heterogeneous and complex in vivo mechanical properties of any507
artery, and the application of this method on atherosclerosed sites could improve our508
knowledge about the biomechanical properties of plaques.509
Acknowledgements510
This work is part of the Imandef Project (in vivo mechanical identi�cation of tissues511
using medical imaging, grant ANR-08-JCJC-0071) funded by the ANR (French Na-512
tional Research Agency). We would like to thank the volunteers for their time and513
implication.514
We would like to thank the Journal of the Mechanical Behaviour of Biomedical515
Materials (please visit http://www.journals.elsevier.com/journal-of-the-mechanical-516
behavior-of-biomedical-materials/).517
References518
[1] M. A. Bernstein, K. F. King, and X. J. Zhou. Handbook of MRI pulse sequences.519
Elsevier Inc., 2004.520
[2] P. Boutouyrie, D. P. Germain, J-N. Fiessinger, B. Laloux, J. Perdu, and S. Lau-521
rent. Increased Carotid Wall Stress in Vascular Ehlers-Danlos Syndrome. Cir-522
culation, 109(12):1530�1535, 2004.523
[3] P. Boutouyrie, D. P. Germain, A-I. Tropeano, B. Laloux, F. Carenzi, M. Zidi,524
X. Jeunemaitre, and S. Laurent. Compressibility of the Carotid Artery in Pa-525
tients With Pseudoxanthoma Elasticum. Hypertension, 38(5):1181�1184, 2001.526
30
hal-0
0805
128,
ver
sion
1 -
27 M
ar 2
013
[4] P. J. Brands, A. P. G. Hoeks, J. Willigers, C. Willekes, and R. S. Reneman.527
An integrated system for the non-invasive assessment of vessel wall and hemo-528
dynamic properties of large arteries by means of ultrasound. Eur J Ultrasound,529
9:257�266, 1999.530
[5] M. A. Brown and R. C. Semelka. MRI: basic principles and applications. John531
Wiley & Sons, Inc., Hoboken, New Jersey, 3rd edition, 2003.532
[6] C. Bussy, P. Boutouyrie, P. Lacolley, P. Challande, and S. Laurent. Intrinsic533
sti�ness of the carotid arterial wall material in essential hypertensives. Hyper-534
tension, 35(5):1049�1054, 2000.535
[7] L. E. Chambless, A. R. Folsom, L. X. Clegg, A. R. Sharrett, E. Shahar, F J.536
Nieto, W. D. Rosamond, and G. Evans. Carotid Wall Thickness is Predictive537
of Incident Clinical Stroke. Am J Epidemiol, 151(5):478�487, 2000.538
[8] M. Couade, M. Pernot, C. Prada, E. Messas, J. Emmerich, P. Bruneval,539
A. Criton, M. Fink, and M. Tanter. Quantitative assessment of arterial wall540
biomechanical properties using shear wave imaging. Ultrasound Med Biol,541
36(10):1662�1676, 2010.542
[9] A. Franquet, S. Avril, R. Le Riche, and P. Badel. Identi�cation of heterogeneous543
elastic properties in stenosed arteries: a numerical plane strain study. Comput544
Methods Biomech Biomed Engin, 15(1):49�58, 2012.545
[10] A. Franquet, S. Avril, R. Le Riche, F. C. Schneider, P. Badel, C. Boissier, and546
Z-Y. Li. A new method for the in vivo identi�cation of mechanical properties547
in arteries from cine MRI images: theoretical framework and validation. IEEE548
Trans Med Imaging, 2012.549
[11] Y. C. Fung. Biomechanics : Mechanical properties of living tissues. Springer-550
Verlag, New-York, 2nd edition, 1993.551
[12] F. Guyon and R. Le Riche. Least Squares Parameter Estimation and the552
Levenberg-Marquardt Algorithm : Deterministic Analysis, Sensitivities and553
31
hal-0
0805
128,
ver
sion
1 -
27 M
ar 2
013

Numerical Experiments. Technical report, Institut National des Sciences Ap-554
pliquées, 2000.555
[13] G. A. Holzapfel. Biomechanics of Soft Tissues with Application to Arterial556
Walls. In J. A. C. Martins and E. A. C. Borges Pires, editors, Mathematical and557
Computational Modeling of Biological Systems, pages 1�37. Centro Internacional558
de Matemática CIM, 2002.559
[14] J. L. Izzo and B. E. Shyko�. Arterial Sti�ness: Clinical Relevance, Measurement,560
and Treatment. Rev Cardiovasc Med, 2(1):29�40, 2001.561
[15] A. V. Kamenskiy, Y. A. Dzenis, J. N. MacTaggart, T. G. Lynch, S. A. Ja�ar562
Kazmi, and I. I. Pipinos. Nonlinear mechanical behavior of the human common,563
external, and internal carotid arteries in vivo. J Surg Res, 176(1):329�336, 2012.564
[16] T. Khamdaeng, J. Luo, J. Vappou, P. Terdtoon, and E. E. Konofagou. Arte-565
rial sti�ness identi�cation of the human carotid artery using the stress-strain566
relationship in vivo. Ultrasonics, 52(3):402�411, 2012.567
[17] K. Kim, W. F. Weitzel, J. M. Rubin, H. Xie, X. Chen, and M. O'Donnell. Vas-568
cular intramural strain imaging using arterial pressure equalization. Ultrasound569
Med Biol, 30(6):761�771, 2004.570
[18] S-H. Kim and A. S. Cohen. On the Behrens-Fisher Problem: A Review. J Educ571
Behav Stat, 23(4):356�377, 1998.572
[19] B. A. Kingwell, T. K. Wadell, T. L. Medley, J. D. Cameron, and A. M. Dart.573
Large artery sti�ness predicts ischemic threshold in patients with coronary574
artery disease. J Am Coll Cardiol, 40(4):773�779, 2002.575
[20] J. Kips, F. Vanmolkot, D. Mahieu, S. Vermeersch, I. Fabry, J. de Hoon, L. Van576
Bortel, and P. Segers. The use of diameter distension waveforms as an alter-577
native for tonometric pressure to assess carotid blood pressure. Physiol Meas,578
31(4):543�553, 2010.579
32
hal-0
0805
128,
ver
sion
1 -
27 M
ar 2
013

[21] S. Laurent, X. Girerd, J. J. Mourad, P. Lacolley, L. Beck, P. Boutouyrie, J. P.580
Mignot, and M. Safar. Elastic modulus of the radial artery wall material is581
not increased in patients with essential hypertension. Arterioscler Thromb,582
14(7):1223�1231, 1994.583
[22] S. Le Floc'h. Modulographie vasculaire : Application à l'identi�cation in-vivo584
du module de Young local des plaques d'athérosclérose. PhD thesis, Université585
Joseph Fourier (Grenoble I), 2009.586
[23] H. Liu, G. Canton, C. Yuan, C. Yang, K. Billiar, Z. Teng, A. H. Ho�man,587
and D. Tang. Using In Vivo Cine and 3D Multi-Contrast MRI to Determine588
Human Atherosclerotic Carotid Artery Material Properties and Circumferential589
Shrinkage Rate and Their Impact on Stress/Strain Predictions. J Biomech Eng,590
134(1):011008, 2012.591
[24] Y. Liu, C. Dang, M. Garcia, H. Gregersen, and G. S. Kassab. Surrounding592
tissues a�ect the passive mechanics of the vessel wall: theory and experiment.593
Am J Physiol Heart Circ Physiol, 293(6):H3290�3300, 2007.594
[25] I. Masson, P. Boutouyrie, S. Laurent, J. D. Humphrey, and M. Zidi. Charac-595
terization of arterial wall mechanical behavior and stresses from human clinical596
data. J Biomech, 41(12):2618�2627, 2008.597
[26] M. F. O'Rourke, J. A. Staessen, C. Vlachopoulos, D. Duprez, and G. E. Plante.598
Clinical applications of arterial sti�ness; de�nitions and reference values. Am J599
Hypertens, 15(5):426�444, 2002.600
[27] D. W. Park, M. S. Richards, J. M. Rubin, J. Hamilton, G. H. Kruger, and601
W. F. Weitzel. Arterial elasticity imaging: comparison of �nite-element analysis602
models with high-resolution ultrasound speckle tracking. Cardiovasc Ultrasound,603
8:22, 2010.604
[28] E. Peña, V. Alastrué, A. Laborda, M. A. Martínez, and M. Doblaré. A con-605
stitutive formulation of vascular tissue mechanics including viscoelasticity and606
softening behaviour. J Biomech, 43(5):984�989, 2010.607
33
hal-0
0805
128,
ver
sion
1 -
27 M
ar 2
013
[29] D. Périé, C. E. Aubin, M. Lacroix, Y. Lafon, and H. Labelle. Biomechanical608
modelling of orthotic treatment of the scoliotic spine including a detailed rep-609
resentation of the brace-torso interface. Med Biol Eng Comput, 42(3):339�344,610
2004.611
[30] W. A. Riley, R. W. Barnes, G. W. Evans, and G. L. Burke. Ultrasonic Measure-612
ment of the Elastic Modulus of the Common Carotid Artery. Stroke, 23(7):952�613
956, 1992.614
[31] M. E. Safar and J. Blacher. Carotid Versus Brachial Pulse Pressure in Elderly615
Persons. J Am Coll Cardiol, 51(25):2440�2441, 2008.616
[32] M. E. Safar and A. Kakou. Carotid and brachial blood pressure � measurements617
in hypertensive subjects. Revista Brasileira de hipertensao, 15(3):122�124, 2008.618
[33] H. Tomiyama, T. Arai, Y. Koji, M. Yambe, K. Motobe, G. Zaydun, Y. Ya-619
mamoto, S. Horu, and A. Yamashina. The age related increase in arterial sti�-620
ness is augmented in phases according to the severity of hypertension. Hypertens621
Res, 27(7):465�470, 2004.622
[34] F. Verbeke, P. Segers, S. Heireman, R. Vanholder, P. Verdonck, and L. M. Van623
Bortel. Noninvasive assessment of local pulse pressure: importance of brachial-624
to-radial pressure ampli�cation. Hypertension, 46(1):244�248, 2005.625
[35] A. I. Veress, N. Phatak, and J. A. Weiss. Deformable Image Registration626
with Hyperelastic Warping. In J S Suri, D L Wilson, and S Laxminarayan,627
editors, Handbook of Biomedical Image Analysis, pages 487�534. Kluwer Aca-628
demic/Plenum, New-York, 3rd edition, 2004.629
[36] C. W. Washington and M. I. Miga. Modality independent elastography (MIE): a630
new approach to elasticity imaging. IEEE Trans Med Imaging, 23(9):1117�1128,631
2004.632
[37] A. Wykretowicz, P. Gerstenberger, P. Guzik, A. Milewska, T. Krauze,633
K. Adamska, A. Rutkowska, and H. Wysocki. Arterial sti�ness in relation to634
subclinical atherosclerosis. Eur J Clin Invest, 39(1):11�16, 2009.635
34
hal-0
0805
128,
ver
sion
1 -
27 M
ar 2
013

[38] X. Zhang and J. F. Greenleaf. The sti�ening of arteries by the tissue-mimicking636
gelatin. IEEE Trans Ultrason Ferroelectr Freq Control, 53(8):1534�1539, 2006.637
A Finite element models for subjects and patients638
See Figures 13, 14 and 15.639
B Evolution of the blood pressure by applanation640
tonometry and P-index641
See Figures 16, 17 and 18.642
35
hal-0
0805
128,
ver
sion
1 -
27 M
ar 2
013

(a) Young healthy subjects (b) Mid-age healthy subjects
(c) Old diseased patients with non-diseased ar-teries
(d) Old diseased patients with diseased arteries
(e) Mean elastic moduli identi�ed for the YHand the MAH groups at each time of the cardiaccycle.
Figure 11: Evolution of the elastic modulus during the cardiac cycle. The di�erentpoints correspond to di�erent fractions of the cardiac cycle.
36
hal-0
0805
128,
ver
sion
1 -
27 M
ar 2
013
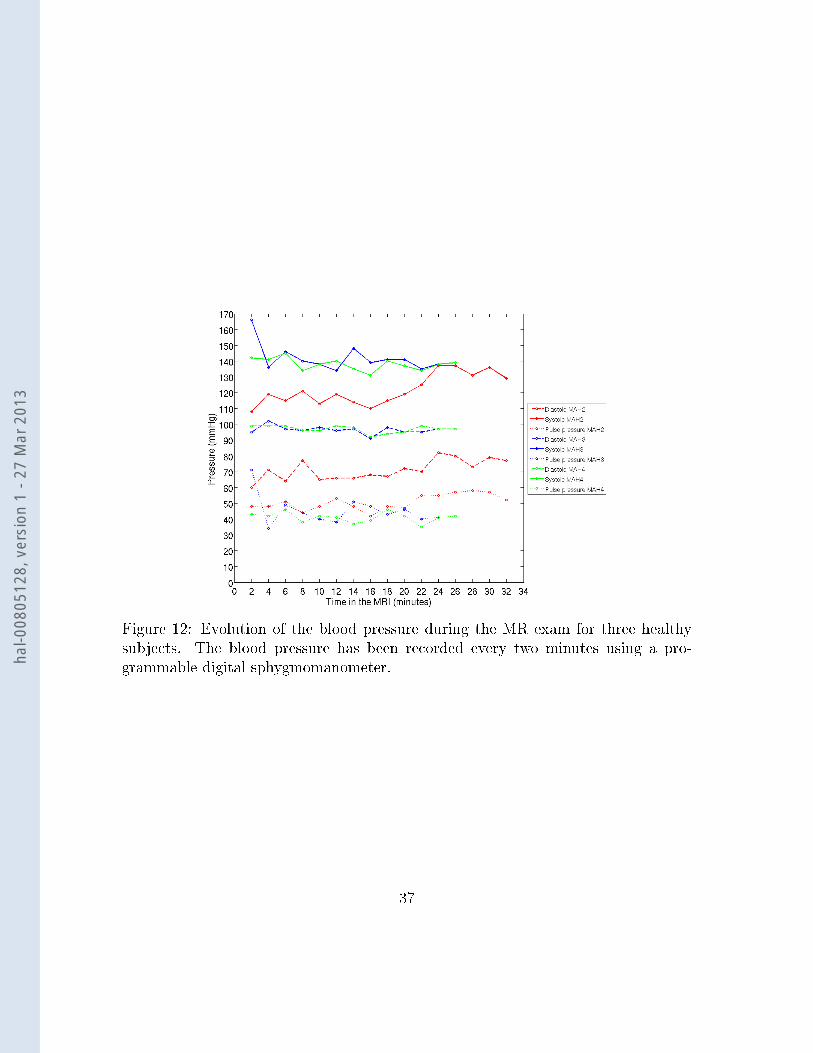
Figure 12: Evolution of the blood pressure during the MR exam for three healthysubjects. The blood pressure has been recorded every two minutes using a pro-grammable digital sphygmomanometer.
37
hal-0
0805
128,
ver
sion
1 -
27 M
ar 2
013

(a) Right YH1 (b) Left YH1 (c) Right YH2 (d) Left YH2
(e) Right YH3 (f) Left YH3 (g) Right YH4 (h) Left YH4
Figure 13: FE models of the �Young Healthy subjects� (YH) group. Note that theradiological convention has been used so left and right hand sides are reversed fromthe common usage.
38
hal-0
0805
128,
ver
sion
1 -
27 M
ar 2
013

(a) Right MAH1 (b) Left MAH1 (c) Right MAH2 (d) Left MAH2
(e) Right MAH3 (f) Left MAH3 (g) Right MAH4 (h) Left MAH4
(i) Right MAH5 (j) Left MAH5
Figure 14: FE models of the �Mid-Age Healthy subjects� (MAH) group. Note thatthe radiological convention has been used so left and right hand sides are reversedfrom the common usage.
39
hal-0
0805
128,
ver
sion
1 -
27 M
ar 2
013

(a) Right OD1 (b) Left OD1 (c) Right OD2 (d) Left OD2
(e) Right OD3 (f) Left OD3 (g) Right OD4 (h) Left OD4
Figure 15: FE models of the �Old Diseased patients� (OD) group. Note that theradiological convention has been used so left and right hand sides are reversed fromthe common usage.
40
hal-0
0805
128,
ver
sion
1 -
27 M
ar 2
013

(a) YH1 (b) YH2
(c) YH3 (d) YH4
Figure 16: Young healthy subjects: curves of the blood pressure measured by tonom-etry or deduced from the images based on the P-index (left and right hand sides).Note that the time and the pressure are normalised.
41
hal-0
0805
128,
ver
sion
1 -
27 M
ar 2
013

(a) MAH1 (b) MAH2
(c) MAH3 (d) MAH4
(e) MAH5
Figure 17: Mid-age healthy subjects: curves of the blood pressure measured bytonometry or deduced from the images based on the P-index (left and right handsides). Note that the time and the pressure are normalised.42
hal-0
0805
128,
ver
sion
1 -
27 M
ar 2
013

(a) OD1 (b) OD2
(c) OD3 (d) OD4
Figure 18: Old patients: curves of the blood pressure measured by tonometry ordeduced from the images based on the P-index (left and right hand sides). Note thatthe time and the pressure are normalised.
43
hal-0
0805
128,
ver
sion
1 -
27 M
ar 2
013