i community perceptions and adaptation to climate change
TRANSCRIPT

i
School of Media, Culture and Creative Arts
Department of Social Sciences and International Studies
Community Perceptions and Adaptation to Climate Change in Coastal
Bangladesh
M. Mokhlesur Rahman
This thesis is presented for the Degree of
Doctor of Philosophy
of
Curtin University
March 2014

ii
Dedicated
to
My parents
iii
Declaration
To the best of my knowledge and belief this thesis contains no material previously
published by any other person except where due acknowledgement has been made.
This thesis contains no material which has been accepted for the award of any other
degree or diploma in any university.
Signature: …………………………………………………..
Date: ………1 January 2015………………………………………….
iv
Acknowledgements
The huge task of completing a doctoral thesis obviously demands the support and
encouragement of many - from family, friends, and colleagues and more importantly
from supervisors. Throughout my journey towards this accomplishment my wife
Runa has been the great source of encouragement to fulfill the dream of my father
who wanted to see all his children become highly educated but who died when I was
in primary school. My mother who died at 101 in October 2013 allowed me to come
to Australia in my effort to fulfill my father’s dream. My children were always
considerate of the separation from my family for the sake of my study but were
curious about what it could bring me at the end.
Professor Bob Pokrant, my supervisor, all along has been a guide and often a critic
of my quick conclusions on various aspects of the interim research findings. He
always encouraged me to be critical while reaching conclusions on issues and taught
me that human societies consist of people caught up in complex webs of socio-
political relations and diverse meanings, which become ever more complex when
we seek to embed those relations and meanings within coupled social ecological
systems. My supervisor’s philosophical guidance both enlightened me and
sharpened my analytical capacity to focus on the tasks indispensable to complete
my journey that I started four years back. Bob, like a mysterious but life saving
lighthouse, helped me to explore unknown intellectual waters and guided me back to
shore. I am grateful to Bob for his encouragement and guidance as my supervisor as
well as his confidence in my ability to carry out research work of this magnitude.
I am also thankful to my thesis committee for the facilitation and support required to
accomplish this research work. I wish to express my gratitude to Curtin’s post
graduate office administrators and to the Department of Social Sciences and
International Studies for providing administrative and logistical support in carrying
out the research. I also thankfully acknowledge the help of Britt Pokrant, wife of my
Supervisor, who emailed me some useful reference materials on Bangladesh during
the thesis writing.
I conducted my field research in a remote coastal setting of southwest Bangladesh
and collected a large data set from both men and women of the communities of two
v
villages (Fultala and Chakbara) under Shyamnagar sub-district of Satkhira district.
They gave me their full support and gave up their valuable time to provide me with
various data and information. Without their contribution, the thesis would not have
been possible and I thank them sincerely. My research assistants, Shahidul Islam
Sharif, Nur Hossain and Pintu Biswas of the Center for Natural Resources Studies
(CNRS) contributed greatly to the thesis through their understanding of the local
contexts of the research and their capacity to gather field data often under difficult
circumstances. I am indebted to them.
I acknowledge the time that local government officials, primary school teachers and
field staff of NGOs sacrificed in responding to questionnaire surveys and KIIs. To
Shaidul Islam, data entry operator of CNRS, who shouldered a huge burden in
entering all the quantitative raw data into computer and to Fakrul Islam, IT Manager
of CNRS, who analysed the data and produced reports despite their busy schedules, I
give my sincere thanks. I express my sincere thanks to my long term colleagues and
friends at CNRS, Anisul Islam, Shachin Halder, Mahbubul Hasan and Masood
Siddique for their encouragements and support during field work and in the
interpretation and write-up phase of thesis writing. Tajnin and Tariqul Islam, GIS
Analysts of CNRS, are thanked for their time in preparing GIS maps for the thesis.
The contribution of Hafizur Rahman of CNRS who conducted field level mapping
of various aspects of the two study villages is gratefully acknowledged. Finally, I
express my sincere thanks to Dr. Dewan Ashraf, Lecturer in Spatial Sciences at
Curtin University and to Mr. Rashedul Hassan, Doctoral student in the same
department for their day to day encouragement and sharing of relevant reference
materials on Bangladesh which was useful for completing my thesis.
vi
Abstract
This study examines the ways in which the inhabitants of two coastal communities
of southwestern Bangladesh perceive and encounter weather /climate related hazards
in their everyday lives. The study villages border the Sundarbans Reserved Forest –
the world’s largest single unit of mangroves, which is exposed to various climate
related hazards such as cyclones, storm surges, sea level rise, salinity intrusion and
erosion. It explores local people’s understanding of changing weather patterns and
related impacts on their local environments and livelihoods and the measures they
undertake to adapt to such impacts. The study also examines within resilience and
transformation frameworks the effectiveness and sustainability of such community
level adaptation measures in response to the impacts and uncertainties associated
with current and future climate and non-climate related stressors. The study analyses
the impacts of various past development interventions, such as coastal polders,
upstream river water diversions, shrimp farming, conversions and privatization of
canals and rivers on local environment and livelihoods and their implications for
weather/climate induced vulnerabilities.
A mix of qualitative (focused group discussions, key informants interview, trend
analyses, case studies) and quantitative (household census, questionnaire survey,
knowledge attitude and practice survey) approaches was employed to gather data
from various occupational groups, local government representatives, NGO staff and
primary schools teachers. A Livelihood Vulnerability Index tool was employed to
analyse the climate vulnerability of the study communities. Land use and GIS
mapping was done to measure village changes in resource systems over time. Field
surveys were aided by two part-time research assistants and field study findings
were supplemented by desk-based reviews of relevant literatures.
Field findings revealed the study area was impacted by various exogenous and
endogenous past development interventions that had increased the risks and
magnitude of weather/ climate change impacts on local social-ecological systems.
Local people observed warmer and longer summers with erratic rainfall and shorter
and warmer winters, frequent rough sea conditions. They understood these changes
to be both historically grounded and relatively new and linked to both weather-
vii
related and non-weather-related processes in the local environment. Thus, corrupt
practices and poor maintenance of embankments intensified the impact of cyclonic
activity while over-fishing, poor management of fish sanctuaries in the Sundarban,
and official failure to implement fish conservation acts combined with prolonged
pre/early monsoon drought in affecting fish migration, low recruitment and lower
yields. The two villages, while geographically close to each other, showed
differences in their perceptions and concerns about climate related stressors. Social
vulnerabilities were shaped by geographical location, socio-economic conditions,
local resource systems, land uses, livelihood options, and access to resources and
institutional governance, which interacted with biophysical hazards to bring about
variations in local people’s capacity to respond to such hazards.
Community adaptation initiatives to weather stressors were mostly short term and
resilience-based rather than medium to longer term transitional or transformative
forms. Some initiatives (water management and rice, wetland and mangrove
restorations) were based on ecosystems approaches to adaptation with potential to
benefit communities in a changing climate. A lack of awareness, capacity and focus
on weather/climate change, institutional weakness, poor governance and a lack of
local readiness to adapt were barriers to translating local adaptive capacity into
actual adaptation. The study suggests that a combination of community-based
adaptation (CBA) and a focus on ecosystems based approaches (EbA) that go
beyond a traditional resilience framework may help local communities to deal
sustainably with weather and non-weather stressors in the longer term. This requires
a more proactive role by government agencies, NGOs and local government with the
active participation of local communities to make transformational change in the
face of climate change impacts.
viii
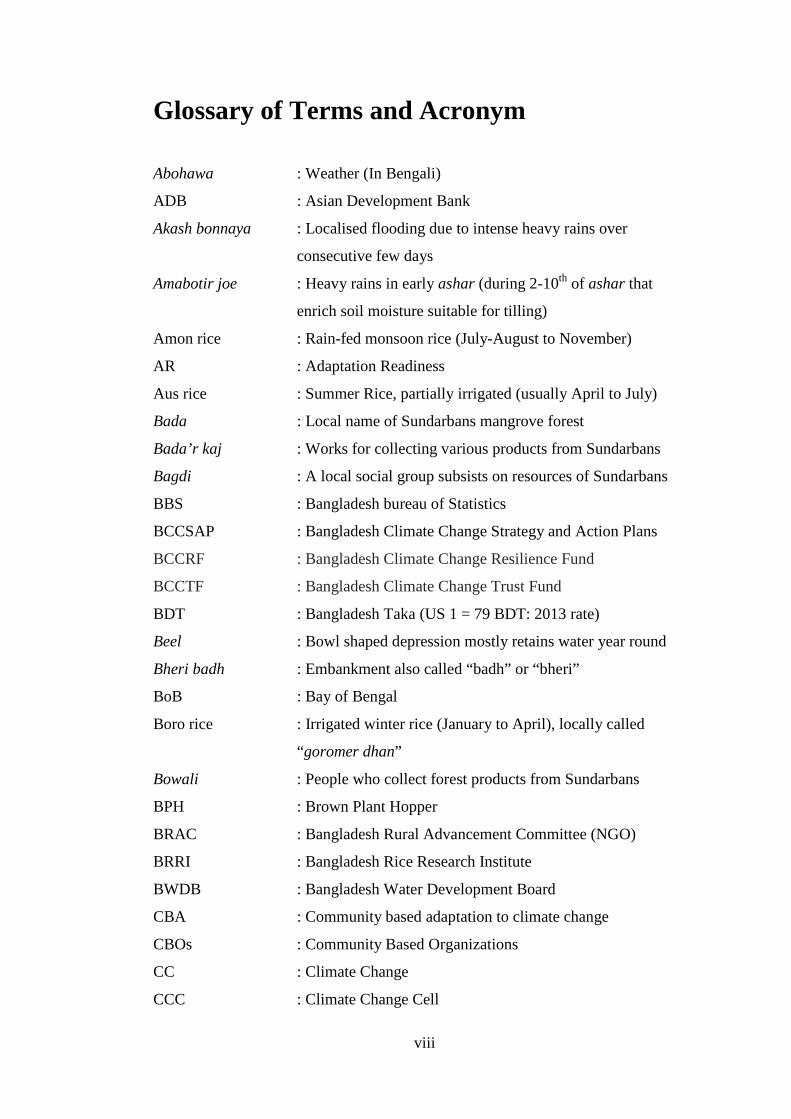
Glossary of Terms and Acronym Abohawa : Weather (In Bengali)
ADB : Asian Development Bank
Akash bonnaya : Localised flooding due to intense heavy rains over
consecutive few days
Amabotir joe : Heavy rains in early ashar (during 2-10th of ashar that
enrich soil moisture suitable for tilling)
Amon rice : Rain-fed monsoon rice (July-August to November)
AR : Adaptation Readiness
Aus rice : Summer Rice, partially irrigated (usually April to July)
Bada : Local name of Sundarbans mangrove forest
Bada’r kaj : Works for collecting various products from Sundarbans
Bagdi : A local social group subsists on resources of Sundarbans
BBS : Bangladesh bureau of Statistics
BCCSAP : Bangladesh Climate Change Strategy and Action Plans
BCCRF : Bangladesh Climate Change Resilience Fund
BCCTF : Bangladesh Climate Change Trust Fund
BDT : Bangladesh Taka (US 1 = 79 BDT: 2013 rate)
Beel : Bowl shaped depression mostly retains water year round
Bheri badh : Embankment also called “badh” or “bheri”
BoB : Bay of Bengal
Boro rice : Irrigated winter rice (January to April), locally called
“goromer dhan”
Bowali : People who collect forest products from Sundarbans
BPH : Brown Plant Hopper
BRAC : Bangladesh Rural Advancement Committee (NGO)
BRRI : Bangladesh Rice Research Institute
BWDB : Bangladesh Water Development Board
CBA : Community based adaptation to climate change
CBOs : Community Based Organizations
CC : Climate Change
CCC : Climate Change Cell
ix
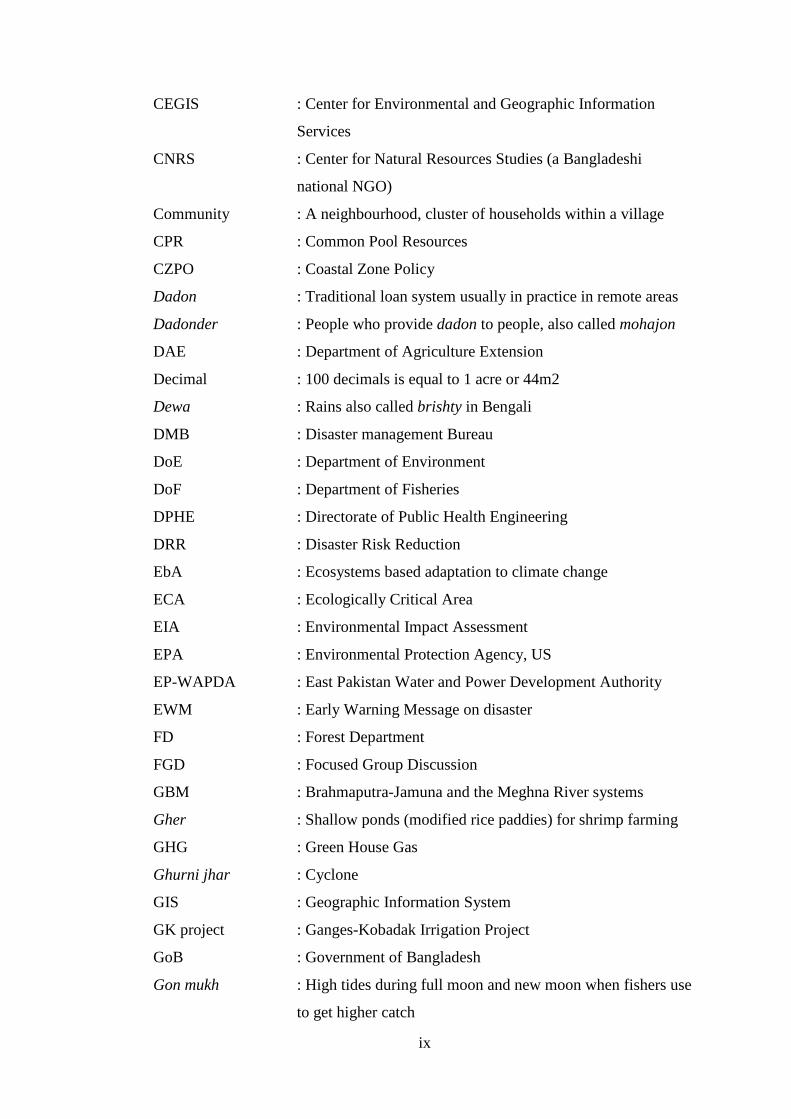
CEGIS : Center for Environmental and Geographic Information
Services
CNRS : Center for Natural Resources Studies (a Bangladeshi
national NGO)
Community : A neighbourhood, cluster of households within a village
CPR : Common Pool Resources
CZPO : Coastal Zone Policy
Dadon : Traditional loan system usually in practice in remote areas
Dadonder : People who provide dadon to people, also called mohajon
DAE : Department of Agriculture Extension
Decimal : 100 decimals is equal to 1 acre or 44m2
Dewa : Rains also called brishty in Bengali
DMB : Disaster management Bureau
DoE : Department of Environment
DoF : Department of Fisheries
DPHE : Directorate of Public Health Engineering
DRR : Disaster Risk Reduction
EbA : Ecosystems based adaptation to climate change
ECA : Ecologically Critical Area
EIA : Environmental Impact Assessment
EPA : Environmental Protection Agency, US
EP-WAPDA : East Pakistan Water and Power Development Authority
EWM : Early Warning Message on disaster
FD : Forest Department
FGD : Focused Group Discussion
GBM : Brahmaputra-Jamuna and the Meghna River systems
Gher : Shallow ponds (modified rice paddies) for shrimp farming
GHG : Green House Gas
Ghurni jhar : Cyclone
GIS : Geographic Information System
GK project : Ganges-Kobadak Irrigation Project
GoB : Government of Bangladesh
Gon mukh : High tides during full moon and new moon when fishers use
to get higher catch
x
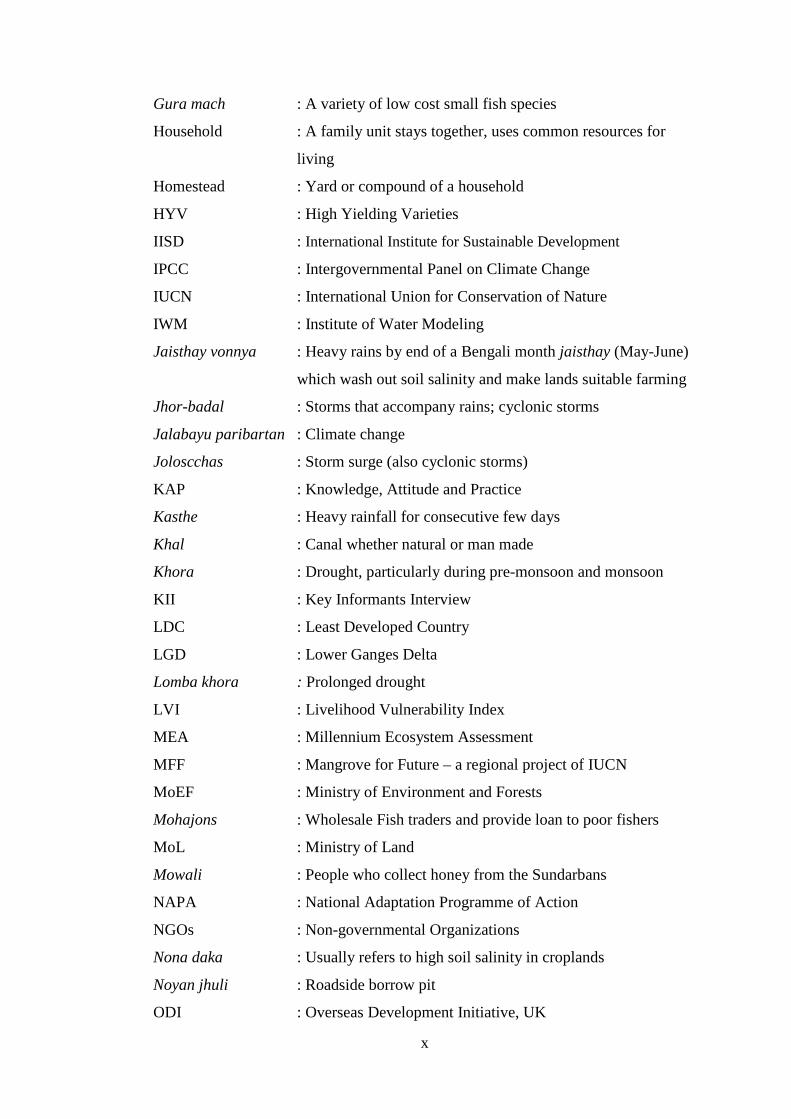
Gura mach : A variety of low cost small fish species
Household : A family unit stays together, uses common resources for
living
Homestead : Yard or compound of a household
HYV : High Yielding Varieties
IISD : International Institute for Sustainable Development
IPCC : Intergovernmental Panel on Climate Change
IUCN : International Union for Conservation of Nature
IWM : Institute of Water Modeling
Jaisthay vonnya : Heavy rains by end of a Bengali month jaisthay (May-June)
which wash out soil salinity and make lands suitable farming
Jhor-badal : Storms that accompany rains; cyclonic storms
Jalabayu paribartan : Climate change
Joloscchas : Storm surge (also cyclonic storms)
KAP : Knowledge, Attitude and Practice
Kasthe : Heavy rainfall for consecutive few days
Khal : Canal whether natural or man made
Khora : Drought, particularly during pre-monsoon and monsoon
KII : Key Informants Interview
LDC : Least Developed Country
LGD : Lower Ganges Delta
Lomba khora : Prolonged drought
LVI : Livelihood Vulnerability Index
MEA : Millennium Ecosystem Assessment
MFF : Mangrove for Future – a regional project of IUCN
MoEF : Ministry of Environment and Forests
Mohajons : Wholesale Fish traders and provide loan to poor fishers
MoL : Ministry of Land
Mowali : People who collect honey from the Sundarbans
NAPA : National Adaptation Programme of Action
NGOs : Non-governmental Organizations
Nona daka : Usually refers to high soil salinity in croplands
Noyan jhuli : Roadside borrow pit
ODI : Overseas Development Initiative, UK

xi
Okal bonnaya : Untimely flooding (either early or late in the season)
PDO-ICZMP : Project Development Office for Integrated Coastal Zone
Management Plan
PSF : Pond sand filter - a device to filter pond water for drinking
Rooling : Rough sea conditions (Rolling in English)
SAR : Second Assessment Report of IPCC
Shada mach : Bony fish species cultivate with shrimps (white fishes)
Shrimp PL : Post larvae of shrimps stock in ghers for grow out
SLA : Sustainable Livelihood Approach
SLR : Sea Level Rise
SRF : Sundarbans Reserved Forest – World’s largest single unit of
mangrove forest
TRM : Tidal river management
UDCC : Upazila Development Coordination Committee
UDMC : Union Disaster Management Committee
UFO : Upazila Fisheries Officer
UKCIP : United Kingdom Climate Impacts Programme
UNCBD : United National Convention on Biological Diversity
UNDRO : United Nations Disaster Relief Organization
UNDP : United Nations Development Programme
UNDP-GEF : Global Environmental Facility of UNDP
UNFCCC : United Nations Framework Convention on Climate Change
UNICEF : United Nations International Fund for Children
UNISDR : United Nations International Strategy for Disaster Reduction
UNO : Upazila Nirbahi Officer (Chief Executive of Uapzila)
Upazila : An administrative unit under a district or a sub-district
UP (Union Parishad) : Lowest administrative unit under local government
UP Chairmen : Administrative Head of UP, elected locally
UP member : Administrative Head of a ward under a UP
VGD : Vulnerable Group Development – a safety net package
VGF : Vulnerable Group Feeding – a safety net package
Village : A community comprised of several clusters of households

xii
xiii
Table of Contents
Chapter 1: Introduction ................................................................................. 1 Climate change, vulnerability and adaptation in Bangladesh ......................................... 1
Uncertainties in managing climate change induced threats ............................................ 4
Pre-existing vulnerability and climate induced impacts .................................................. 7
Responses to climate induced threats in Bangladesh and research gaps ......................... 9
Community adaptation actions and wider adaptation landscapes ................................. 13
Research aims ................................................................................................................. 15
Theoretical Considerations ............................................................................................ 16
Climate, Climate change, Weather: From IPCC to Village Communities .................... 16
Understanding Vulnerability to Climate/Weather Stressors .......................................... 19
Assessment of Vulnerability to climate change ............................................................ 28
Livelihood Vulnerability Index (LVI) ........................................................................... 30
Understanding adaptation to climate change ................................................................. 31
Assessment of local adaptation actions ......................................................................... 33
Adaptation readiness ..................................................................................................... 39
Place of the research ...................................................................................................... 41
Chapter 2: Methodology .............................................................................. 43 Introduction .................................................................................................................... 43
Research Approach ........................................................................................................ 43
Selection of case study villages ..................................................................................... 46
Survey methods .............................................................................................................. 47
Qualitative Methods ....................................................................................................... 49
Quantitative methods ..................................................................................................... 53
Village Level Land Use Change Mapping .................................................................... 55
Addressing sensitivity in the field .................................................................................. 56
Methods of Analysis ...................................................................................................... 58
Conclusion ..................................................................................................................... 61
xiv
Chapter 3: Biophysical and Socioeconomic Environment of the Study Area ..................................................................................................... 62
Introduction ................................................................................................................... 62
Coastal zone of Bangladesh ........................................................................................... 62
Introduction to the study area ........................................................................................ 67
Rivers, embankments and people .................................................................................. 71
Social and Institutional Settings of the study area ......................................................... 73
Household characteristics of study villages .................................................................. 74
Key livelihood activities ................................................................................................ 79
Summary ........................................................................................................................ 83
Chapter 4: Biophysical Changes and Local Vulnerability ....................... 85 Prologue ........................................................................................................................ 85
Introduction .................................................................................................................... 86
Past interventions: Exogenous forcing in the water sector and local vulnerability ....... 87
Past interventions: Endogenous forcing and local vulnerability ................................... 91
Collective Action, Disaster Risk Reduction and Vulnerability ..................................... 98
Story of rice farmers in Fultala village: transformation and vulnerabilities ............... 101
Story of shrimp PL collectors of Chakbara: Availability of PL and vulnerability ...... 105
Summary ....................................................................................................................... 110
Chapter 5: Community Perceptions and Understanding of Changing Weather ..................................................................................... 111
Introduction ................................................................................................................. 111
Communities and their understanding of climate change ........................................... 111
Community, climate and Livelihood ........................................................................... 113
Community perceptions on changing weather/climate patterns .................................. 121
Trends in climate parameters ....................................................................................... 129
Summary ...................................................................................................................... 132
Chapter 6: Community, Weather and Livelihoods ................................. 133 Introduction ................................................................................................................. 133
Local fishers’ observation of weather factors and coastal fisheries ............................. 133
Fish traders’ observation on weather, fish supply and trading ..................................... 139
Honey collectors’ (mowals) observation of weather issues ......................................... 142
xv
Shrimp farmers observation of weather related stressors ............................................ 143
Agriculture farmers’ observation of weather related stressors .................................... 144
Differentiated effects of weather stressors on different occupational groups ............. 147
Community comments on weather and non-weather related problems ...................... 153
Summary ....................................................................................................................... 158
Chapter 7: Livelihood Vulnerability to Weather Stressors ................... 160 Introduction ................................................................................................................. 160
Vulnerability and its Multiple Faces ........................................................................... 160
Vulnerability of local communities ............................................................................. 162
Livelihood Vulnerability Index of Chakbara and Fultala communities ...................... 164
Exposure of the systems to weather induced stressors and extremes .......................... 165
Sensitivity of the system to weather induced stressors ................................................ 168
Adaptive capacity to cope with weather induced stressors ......................................... 174
Overall LVI of the villages .......................................................................................... 185
Summary ...................................................................................................................... 188
Chapter 8: Adapting to weather-induced environmental changes ........ 189 Introduction ................................................................................................................. 189
Community efforts to adapt to weather-related threats ............................................... 189
Household water security: Renovation of cyclone affected ponds ............................. 190
Adjustment to gher inundation resulting from cyclones and coastal flooding ............. 191
Adjustment to coastal flooding: Houses on raised plinths ........................................... 193
Adjustment to drought-salinity related mortality of white fish/shrimps in ghers ........ 194
Adjustment to fish habitat degradation due to cyclones ............................................... 195
Adjustment to increased tiger attacks after the recent cyclones ................................... 195
Fishers’ adaptation response to rough sea conditions ................................................. 196
Adjustment to coastal erosion through restoration of mangroves ............................... 197
Adjustment to scarcity of freshwater through rehabilitation of canal .......................... 198
Adaptive agriculture - an NGO-farmer effort to climate resilient farming system ..... 200
Farmers’ 8-point concerns for adaptive agriculture in the coastal zone ...................... 205
UP’s annual development activities ............................................................................ 210
Fisheries and Agriculture Extension services of central government ........................ 212
Analysis of local adaptation actions ............................................................................ 213
xvi
Adaptation schemes in relation to EbA framework .................................................... 215
Adaptation schemes in relation to the ‘resilience to transformation ‘framework ........ 216
Adaptation schemes in relation to the “incremental to transformative” framework .... 221
Summary ...................................................................................................................... 225
Chapter 9: Adaptation Readiness to Changing Weather Patterns ....... 226 Introduction .................................................................................................................. 226
Adaptation, Adaptive Capacity and Adaption Readiness ............................................. 227
Local Adaptation Readiness ........................................................................................ 228
Local understanding of relevant national laws and acts ............................................... 231
Functions of development agencies – state of governance ......................................... 237
Capacity of Local government in disaster management ............................................. 244
Community views and priorities in relation to weather issues and adaptation ........... 246
Common Pool Resources (CPRs) management .......................................................... 251
State of safety net and disaster risk reduction activities at local level ........................ 254
Views of local NGO staffs on barriers to local adaptation readiness .......................... 258
Local Adaptation Readiness index .............................................................................. 261
Summary ....................................................................................................................... 262
Chapter 10: Summary and Conclusion .................................................... 264 Context Specificity and Local Priorities in an Age of Climate Change ...................... 264
Making adaptation happen on the ground: from coping to adaptation readiness ......... 268
Contributions of the research to theory ....................................................................... 271
Policy implications ...................................................................................................... 273
Adaptation Readiness .................................................................................................. 274
Common Property Resources, Environmental Spaces and Ecosystems-based
Adaptation .................................................................................................................... 274
Future Research Directions .......................................................................................... 275
Adaptation governance– political economy of DRR and CCA .................................... 275
Environment induced migration/displacement ............................................................ 276
Estimation of loss and damage due to climate change impacts ................................... 276
Ecosystems vulnerability to climate change impacts .................................................. 277
References ................................................................................................................... 278
Appendices ................................................................................................................. 293
xvii
List of Figures Figure 1.1: Key spheres of the concept of vulnerability ............................................... 22
Figure 1.2: Climate vulnerability and its components ................................................... 24
Figure 1.3: Relationships between climate change, coping range, vulnerability
thresholds and adaptation ............................................................................................. 27
Figure 1.4: Two interpretations of vulnerability to climate change: (1.4a) outcome
vulnerability, (1.4b) contextual vulnerability ................................................................ 29
Figure 1.5: Schematic presentation of LVI approach of climate vulnerability
assessment .................................................................................................................... 32
Figure 1.6: Ecosystem degradation, climate change and EbA ...................................... 36
Figure 1.7: Conceptualization of the links between adaptive capacity and
adaptation in an adaptation readiness framing ............................................................. 40
Figure 1.8: Conceptual model of local level adaptation readiness adopted for
the research .................................................................................................................... 41
Figure 2.1: Schematic presentation of research methods and tools used ...................... 45
Figure 2.2: Methods of generating village level changes of attribute data over time
(from 1970 to 2012) using CS maps and GIS tools: A partial view of Fultala village .. 57
Figure 2.3 Photographs of field data collection ..................................................................... 60
Figure 3.1 Map of Bangladesh shows study area ........................................................... 65
Figure 3.2 Project villages .............................................................................................. 68
Figure 3.3: Households with size of homestead lands in study villages ........................ 76
Figure 3.4: Activity Calendar: livelihood production and extraction activities of
Chakbara and Fultala villagers ....................................................................................... 84
Figure 4.1: Location of Farakka Barrage ....................................................................... 89
Figure 4.2: Changes of physical assets in Fultala and Chakbara villages: 1970-2012 ... 92
Figure 4.3.a: Asset bases in Fultala village in 1970 ...................................................... 94
Figure 4.3.b: Asset bases in Fultala village in 2012 ....................................................... 94
Figure 4.4.a: Asset bases in Chakbara village in 1970 .................................................. 95
Figure 4.4.b: Asset bases in Chakbara village in 2012 ................................................... 95
Figure 4.5: Communities and UP members’ responses on "taking 18 months is a
long time to fix embankment after cyclone Aila-2009 and is longer than required" .. 101
Figure 4.6: Men and women harvesting rice in Fultala village .................................... 102
Figure 4.7: Women collecting shrimp PL from river ................................................... 103

xviii
Figure 5.1: Communities' awareness on changing climate .......................................... 114
Figure 5.2: Communities' observation of changes in climate factors in their locality . 117
Figure 5.3: Communities' observation of reasons for high salinity ............................. 118
Figure 5.4: Villagers' and UP members' observations on rainfall patterns and insect
infestations in crops ..................................................................................................... 120
Figure 5.5: Community Knowledge and Perceptions of Changes in Local Weather
Patterns and Related Issues .......................................................................................... 121
Figure 5.6: Community awareness of Green House Effect (GHE) .............................. 122
Figure 5.7: Communities understanding on greenhouse effects ................................. 123
Figure 5.8: Community Knowledge of Greenhouse Gases ......................................... 124
Figure 5.9: Observation of weather-related attributes by the villagers and UP
members ...................................................................................................................... 125
Figure 5.10: Average annual rainfall (mm) of Satkhira district, Bangladesh
from 1948-2011 ........................................................................................................... 130
Figure 5.11: Trend in average monsoon (June to September) and June rainfall
(mm) in Satkhira district from 1948 to 2011 ................................................................ 130
Figure 5.12: Average maximum temperature (0C) of Satkhira district, Bangladesh
from 1950-2010 ............................................................................................................ 131
Figure 5.13: Average minimum temperature (0C) of Satkhira district, Bangladesh
from 1950-2010 ........................................................................................................... 132
Figure 6.1: Drivers for declining fisheries production and biodiversity in SRF area .. 142
Figure 6.2: Fishers Traders’ observations of weather factors affecting fisheries ........ 144
Figure 6.3: Effects of 12 day akash bonnaya on local livelihoods (August 2011) ...... 146
Figure 6.4: Impact of reduced rains on livelihoods of coastal communities ............... 147
Figure 6.5 Weather stressors affect the livelihoods of occupational groups ................ 151
Figure 6.6: Vulnerability of poor natural resources users of SRF ................................ 159
Figure 7.1: Vulnerability spider diagram of the major components of the Livelihood
Vulnerability Index (LVI) for Chakbara and Fultala ................................................... 187
Figure 7.2: Vulnerability triangle diagram of the contributing factors of the
Livelihood Vulnerability Index-IPCC (LVI-IPCC) for Chakbara and Fultala ............ 188
Figure 8.1: A woman making house on raised plinth to protect from flooding ........... 206
Figure 8.2: Mangroves planted to along embankment to protect land from tidal
erosion .......................................................................................................................... 211
xix
Figure 8.3: A Canal is rehabilitated to store rainwater for irrigation and fisheries ...... 213
Figure 8.4: Boro rice cultivation in shrimp gher in chakbara village ........................... 215
Figure 8.5: Barriers in agriculture-based adaptation: A case from saline tolerant
winter rice farming in Chakbara village, Shyamnagar upazila, Bangladesh .............. 217
Figure 8.6: Manual land leveling in the absence of cattle ........................................... 219
Figure 8.7: Percentage of Schemes Implemented by UPs in 2010-2011 .................... 221
Figure 9.1: Communities' knowledge on development rules and acts ........................ 235
Figure 9.2: Current management practices in line of climate change adaptation ........ 238
Figure 9.3: Adaptation enabling activities of Gabura and Munshigonj UPs ................ 245
Figure 9.4: Primary school teachers’ knowledge on UDMC ...................................... 246
Figure 9.5: Community views on dealing with weather/climate problems ................ 249
Figure 9.6: Community responses on various aspects of CPRs in Fultala areas ......... 253
Figure 9.7: Perceived barriers to pro-poor management of CPRs in study areas ......... 254
Figure 9.8: NGO field staff's understanding of barriers to CC adaptation ................... 260
Figure 9.9: UP members understanding of barriers to adaptation ............................... 260
Figure 9.10: Local adaptation Readiness scores based on community responses ....... 262
Figure 10.1: Relationship between hazard of place, time of hazards, land use of
place and extent of damage .......................................................................................... 272
List of Tables Table 1.1: Types of ecosystems services and benefits .................................................. 36
Table 1.2: Attributes of adaptation for resilience, transition and transformation .......... 38
Table 2.1: Village selection decision matrix based of reconnaissance field visits
in June-July 2010 (villages in shaded rows selected for in-depth case study) ............. 46
Table 2.2: Institutional stakeholders for key informant interview (KII) ....................... 50
Table 2.3: Participants of FGDs and pair wise ranking of climate induced problems .. 52
Table 2.4: Data collected through household census from two study villages .............. 54
Table 2.5: Key Methodological Framework and Relevance to Thesis Chapters .......... 59
Table 3.1: Study villages in Shyamnagar sub-district under Satkhira district .............. 70
Table 3.2: Households socioeconomic features of two project villages ....................... 76
Table 4.1: Changes of physical asset bases of Fultala and Chakbara
villages: 1970-2012 ....................................................................................................... 92
Table 4.2: Impact of development interventions on the Kadamtali River:
1949 to 2010 ................................................................................................................... 96

xx
Table 4.3: Changes of crop varieties and the local environment in
Fultala: 1980 to 2012 .................................................................................................... 103
Table 4.4: Declining availability of shrimp PL and associated income ....................... 107
Table 4.5: Changes of land use and livelihoods of Chakbara village .......................... 108
Table 5.1: Changes of seasonal features as perceived by the local communities
compared to 20 years ago ............................................................................................. 126
Table 6.1: Comparison of fish catches in SRF canals: 2005 and 2010 ........................ 139
Table 6.2: Weather stressors affecting aquaculture and agriculture in Chakbara
and Fultala villages: 2007-2012 ................................................................................. 144
Table 6.3: FGD participants in pair wise ranking exercise on CC problems ............... 152
Table 6.4: Livelihood impacts of three most prominent weather stressors on various
occupational groups ..................................................................................................... 152
Table 6.5: Five Priority problems affecting the local livelihoods ................................ 154
Table 6.6: The Bagdi fishers’ priority reasons for declining fish in SRF .................... 156
Table 7.1: Four categories of vulnerability factors according to the dimensions
of sphere and knowledge domains ............................................................................... 163
Table 7.2: LVI-IPCC assessment components and indicators .................................... 165
Table 7.3: LVI Sub-component values and their indexed values ................................. 176
Table 7.4: Indexed major component LVI for Chakbara and Fultala villages ............ 185
Table 7.5: LVI-IPCC contributing factors calculation for study villages ................... 188
Table 8.1: Community level adaptation actions reviewed in this research ................ 192
Table 8.2: Place of adaptation schemes in “Resilience to Transformational”
framework ................................................................................................................... 219
Table 8.3: Place of adaptation schemes in “Incremental to Transformative”
framework .................................................................................................................... 222
Table 9.1: Relevant rules, acts and regulations crucial for adaptation in the coast ..... 231
Table 9.2: Operating cost of one trip of fishers operating goisha jal ........................... 242
Table 9.3: Extent to which safety net services reached the households ....................... 255
Table 9.4: Governments safety net benefits and governance .................................... 256
List of Appendices Appendix-1: Calculating the LVI: composite index approach ..................................... 293
Appendix 2.a: Awareness of some key national laws and acts by the people of study villages and adaptation readiness score ....................................................................... 303
xxi
Appendix 2.b: Effectiveness of some key central government agencies in the area and readiness score as judged by villagers .................................................................. 303
Appendix 2.c: Effectiveness of Local Government (UP) activities in the area and readiness score as judged by the villagers ................................................................... 304
Appendix-2.d: Community attitude to CC and responses to tackle impacts in the area and readiness score as judged by the villagers ............................................................. 304
Appendix-2.e: Current state of protection and management of CPRs (Common Pool Resources) in the area and readiness score as judged by the villagers ......................... 305
Appendix-2.f: Current state of safety net and DRR activities in the area and readiness score as judged by the villagers 305
1
Chapter 1: Introduction
This study examines the ways in which the inhabitants of two coastal villages
located in the southwest of Bangladesh perceive and encounter weather and weather-
related hazards, threats and shocks in their everyday lives. It has three main research
objectives. The first concerns what coastal peoples see as the most important
weather /climate related hazards they face. This involves an examination of the
extent to which coastal peoples differentiate changes in local environmental
conditions as a result of “weather/climate dependent” stressors or of other non-
human and natural stressors .The second examines how local understandings and
experiences translate into adaptive strategies. The third question focuses on the
relationship between local people and the public agencies with which they deal. In
particular, it examines how local people evaluate the functions of mainstreaming
public agencies towards supporting community level adaptation to impacts of
changing weather/climate factors. The remainder of this chapter provides a general
introduction to the thesis and outlines the content of the thesis chapters.
Climate change, vulnerability and adaptation in Bangladesh
The subject of climate change has taken on major global significance in recent years
as it becomes clearer from the climate science that the planet is getting warmer with
potentially devastating implications for all life forms. However, not all countries are
likely to be affected in the same way and some are considered to be more vulnerable
to climate change impacts. Bangladesh is one of those countries. There is much
evidence to show that Bangladesh is likely to be severely impacted by climate
change and the country is preparing itself for such an eventuality through the
development of adaptation policies and practices. In Bangladesh itself, it is the
coastal zone that is regarded as particularly vulnerable (MoEF, 2005; MoEF, 2009;
Stern, 2006).
I started my research in these remote coastal communities during a time of repeated
weather induced disasters that shook the country. Between 2007 and 2009
2
Bangladesh experienced two floods, four cyclones (super cyclone “Sidr” in
November 2007, two cyclones “Bijli” and “Nargis” in April 2008 and, cyclone
“Aila” in May 2009) and prolonged pre and early-monsoon drought in 2009. Such a
high variability of climate within such a short span of time is a new experience for
Bangladeshis but these climate/ weather-induced events had a disproportionate and
negative impact upon the production and extraction sectors in the coastal zone
compared to mainland areas of the country. However, disasters due to climate
variability and extremes are not new in Bangladesh (such as floods, cyclones, and
drought). What is new are recent increases in the frequency, intensity and
uncertainties of such climate induced events and processes under changing global
climate systems.
Bangladesh’s location and related socio-economic features expose it to climate-
induced hazards (Ali, 1999; MoEF, 2005; Stern, 2006). First, its location at the
mouth of the funnel of the Bay of Bengal (BoB) exposes it to one of the world’s
major tropical cyclone formation zones. Second, the country lies on one of the
largest deltas in the world and at the end of one of the world’s largest drainage
basins. The combined catchment of three major river systems in the region (Ganges,
Brahmaputra and Meghna Rivers) is greater than the size of Bangladesh, and 92% of
it remains outside the country, making it prone to river flooding and bank erosion
every year. Third, the entire northeastern and southeastern parts of Bangladesh lie at
the foothills of the Meghalyan and Tipra hills range of India which is one of the
highest rainfall zones of the world, which makes the country susceptible to
flashfloods and consequent damages to lives and assets (MoEF, 2009). Fourth, the
710km coastline, with elevations of below 10m of MSL along the coastal plains,
exposes the country to permanent inundation from sea level rise (SLR), coastal
flooding, salinity intrusion and erosion (CZPO, 2005). Fifth, these major river
systems contribute to the high fertility and productivity of Bangladesh and
interference with river flows can have major consequences for the lower riparian
ecologies and livelihoods. Sixth, the high population density (around 1,000/sq.km)
in a small country of 144,550 sq km makes it one of the most land hungry countries
of the world with per capita agricultural land availability of 0.05 ha (Qusem, 2011).
Seventh, Bangladesh is still a rural and agrarian based country with a majority of
the population dependent on climate sensitive production (agriculture and
3
aquaculture) and extraction sectors (fishing and other natural resources from coastal
zones, hill slopes and forest resources), making it highly exposed to the shocks of
weather induced threats. Finally, poverty, low awareness of climate change issues,
lack of technology and poor governance impede the efforts of building adaptive
capacity to absorb external shocks from climate change and climate variability.
However, the severity of impacts of climate change varies over different
geographical landscapes due to distinct geomorphological and socio-economic
features which determine the level of exposure and sensitivity of a system to climate
perturbations and extremes (Cutter et al., 2008; Adger, 2006).
Among the various vulnerable locations, coastal areas of Bangladesh are more
exposed to climate induced threats due to higher sensitivity associated with
geophysical and socio-economic factors (IPCC, 1995:34; IPCC, 2007:317; MoEF,
2005). The Bangladesh National Adaptation Programme of Action (NAPA) (MoEF,
2005) stated that the coastal environment (ecosystems) and livelihoods are exposed
to multiple climate induced hazards such as rising temperature, erratic rainfall, early
and monsoon droughts, cyclones and storm surges, tidal and rain-based flooding,
and salinity intrusion. In addition, sea level rise (SLR) is expected to further
aggravate the current extent and magnitude of risks. Some estimates suggest a sea
level rise of 30cm and 50cm in the Bay of Bengal in 2030 and 2050 respectively
(Kumar et al., 2002; CEGIS, 2006) which would create irreversible impacts on
coastal environments and livelihoods, including displacement of six to eight million
people due to permanent inundation of land by 2050 (IPCC, 2007: 330; MoEF,
2009:14) and increased salinisation (Allison et al., 2003). However, the degree of
climate induced impacts would not be common to all coastal communities but vary
by location and by the levels of vulnerability of occupational and other groups in
different locations. Communities dependent on resource extraction (fishing, honey
collection, crab collection) for a livelihood are considered to be more directly
vulnerable to climate-related hazards than others (MoEF 2005, 2009). In the face of
current and future hazards associated with climate variability and change, adaptation
planning for the coastal zone based on a full examination of the vulnerability,
resilience and adaptive capacity of coastal populations has become more urgent in
official discourse (Adger and Vincent, 2004). Of particular importance is the need
to give greater official recognition of the impact of climate change on the structure
4
and function of ecosystems and biodiversity and the potential for growing resource
conflicts among coastal users (Barnett and Adger, 2007).
The global recognition of Bangladesh as a front-line state in the response to climate
change has led to increased emphasis on climate in development planning. While
globally the focus has been on mitigation initiatives, at the national level adaptation
is considered the prime option for the least developed countries such as Bangladesh.
Bangladesh has a long history of accommodating to climate-induced and other non-
climate hazards. One of the central issues in developing a climate-resilient approach
to development is the extent to which traditional adaptation measures can be used or
modified to deal with a new generation of threats and the changes required in
developing planning to meet the twin objectives of improved living standards and a
sustainable climate change adaptation strategy. However, pathways to adaptation to
moderate climate change induced hazards are constrained due to lack of available
methods and information on proper estimates of site-specific climate induced
impacts and climate vulnerability (IPCC, 2007:72). One of the objectives of this
research is to examine the typology of climate induced stressors currently affecting
the coastal communities in the study villages, their levels and types of vulnerability,
their responses to such stressors, and the effectiveness of such responses to tackle
future uncertainties.
Uncertainties in managing climate change induced threats
Developing a climate change strategy is constrained by uncertainties associated with
future climate change, as specific impacts by each climate factor undergoing change
are still not clearly known (Dessai and Holmes, 2007). For example, if average
winter temperature rises by 20 Celsius and remains so for a longer time scale, the
specific impacts of such change in temperature on social-ecological systems over
different locations of the country are not well known and thus planning adaptation
actions to tackle this uncertainty due to temperature rise is problematic. It is difficult
to design adaptation strategies and actions without a clear picture of the impacts of
climate variability and change on the social-ecological systems of a given
geographical location such as the coast. The coastal zone is not unique in its
geomorphological and socioeconomic features and thus exposure to external stimuli
such as effects of climate change and extremes vary spatially and socio-ecologically.
5
For example, the 710km long coastal zone of Bangladesh is divided into two vertical
sub-zones: a lower area facing the Bay of Bengal and referred to as the exposed
coast, and an upper part or interior coast (PDO-ICZMP, 2004). Each has its
distinctive characteristics - the exposed coast is more vulnerable to climate induced
hazards than the interior coast. Therefore it is expected that the impacts of SLR,
cyclones and salinity would vary between the two sub-zones. In addition, the coastal
zone is subdivided horizontally into three sub-zones (eastern, central and western)
and each has distinctive features in terms of morphology, hydrology, salinity and
land use patterns (Pramanik, 1983; Islam, 2001; Islam, 2004). Beyond these broad
official zonal divisions, there is wide variability within each zone in land elevation,
hydrology, land use, livelihoods, disaster proneness and exposure to coastal hazards.
For example, the southeastern edge of the Sundarbans Reserved Forest (SRF) is less
saline prone than the southwestern part (Islam, 2011:80). As such land use,
livelihoods and the extent of vulnerability to weather stressors are different in
different zones of the SRF. Even within a small spatial boundary within a sub-zone,
there is much variation between villages in terms of their land elevation and use
patterns, livelihoods, exposure to disaster and vulnerability to coastal hazards. As
such within each such coastal sub-zone, low lying tidal plains and small islands are
more exposed to and would be disproportionately impacted by climate related
hazards such as cyclones, SLR and salinity intrusion.
Besides the spatial variability in the coastal zone in terms of differentiated social,
economic, ecological conditions and resources endowments, the assessment of
climate change induced threats and vulnerability and planning for effective
adaptation is further complicated by a lack of general awareness of climate change
issues among local peoples. Local people, including government officials and
NGOs, have limited understanding of the causes and consequences of climate
change on local social ecological systems, including the means (adaptation) by
which to moderate such climate-induced adversities (Reynolds et al., 2010). This
issue is taken up in Chapter 5 and is followed in Chapter 6 by a detailed examination
of local people’s observations and interpretations of the impacts of changing climate
on their local environment and livelihoods.
The complexities of scale and location related to weather/ climate change impacts
have led some observers to raise the question of where the starting point for
6
adaptation should be. This study argues that one important starting point is the local
level through a detailed analysis of the specific changes in weather and weather-
related events and processes and their impacts on local social-ecological systems. In
developing adaptation strategies to deal with predicted or projected impacts, one
approach is referred to as “first generation” vulnerability assessment which focuses
on evaluation of climate impacts on communities and aims for determining
“potential” adaptation framed as “from impacts to adaptation” (Fussel and Klein,
2006). Fussel and Klein (2006) also refer to a second approach that starts from the
vulnerability point of view, which they refer to as “second generation” vulnerability
assessment. By this is meant that emphasis is placed on understanding how
vulnerable the communities are in a given area to the effects of current changes in
weather and their potential vulnerability to future changes, including those
associated with climate change. This approach has been referred to as” from
vulnerability to feasible adaptation”. The core difference between the two
approaches is that the first generation approach focuses on responses to biophysical
hazards, which inhere in the nature of the climate threat. The second generation
approach shifts the focus to the underlying societal causes of vulnerability, which
shape the adaptive capacity of a given community to deal effectively with natural
and human-induced hazards. An important element of second generation approach is
the consideration of various relevant non-climate factors (demographic, social,
economic, technological and biophysical drivers) that in turn shape the sensitivity of
a system of concern to climate change induced hazards. Such capacity is
differentially and unequally distributed in all communities. Thus, the most
vulnerable are those with the lowest socially determined capacity (adaptive capacity)
to respond to hazards. Kelly and Adger (2000) refer to this as the “wounded soldier”
approach. The capacity to adapt to the effects of changing weather factors is also
unevenly distributed within and across nations, regions and even at local levels
within small geographical areas (Smit and Wandel, 2006; IPCC, 2007). Thus
adaptation planning based on generic adaptive capacity may result in unsustainable
or maladaptive outcomes. A focus on place-based climate vulnerability assessment
can help to resolve this uncertainty.
This research considers the ‘impacts to adaptation’ pathway, with its focus on
reacting to impacts, has costs associated with learning to adapt from losses and

7
investing in strategies that may be unnecessary due to failed projections. In contrast,
the livelihood vulnerability based pathway is more iterative and builds on local
experience and capacity of concerned communities.
The uncertainties associated with site specific variations in the extent of
climate/weather induced risks are compounded by significant local environmental
changes. These result from multiple past and ongoing development interventions
(both exogenous and endogenous in origin). For instance, as an exogenous case,
upstream withdrawal of Ganges river water by India through the Farakka barrage
adversely impacted on the social-ecological systems of the entire lower Ganges delta
in the southwestern part of Bangladesh where the study villages are located. By
contrast, local changes in land use such as the shift from rice farming to shrimp
farming (endogenous) increased localized salinity that affected the biophysical and
social environment. As such, identifying, differentiating and incorporating the
impacts of past development interventions are necessary components of the weather/
climate vulnerability assessment, and they provide key inputs in the development of
adaptation strategies and plans at the local level.
Pre-existing vulnerability and climate induced impacts
While the impacts of anthropogenic climate change and climate variability are
considered to have begun to affect environmental resources and livelihoods (MoEF,
2005; Huq and Ayers, 2008; MoEF, 2009), these are not of the greatest concern to
rural peoples in Bangladesh (Raihan et al., 2010). Rural livelihoods are, in reality,
shaped and governed by a multiplicity of interacting social, economic, cultural,
political and environmental factors in which ‘climate’ is one of the contributing
factors (Raihan et al., 2010; IPCC, 2007). Thus changes in local environments and
livelihoods are often due to a combination of climate and non-climate factors. Non-
climate drivers such as land use change, land degradation, pollution, water
diversions, population growth, and changes in policy have direct and indirect
influences on climate change impacts (IPCC, 2007: 84). As such, it is important to
analyse the context in which the concerned communities live, act and make their
livelihoods and plan for the future. These factors are often cross-scale in nature and
are influenced and guided by national development policies and strategies. Their
effects are deemed important in assessing climate change impacts and developing
8
adaptation strategies and actions. For example, current khas land management
policy failed to ensure protection and the pro-poor management of state owned land
in the country.
Bangladesh being a least developed country, its economic growth and poverty
reduction efforts are constrained by a multiplicity of factors related to lack of
advanced technologies, weak capacity to plan and implement development activities,
lack of funds, overpopulation, recurrent natural disasters and poor governance (Ali,
1999; Stern, 2006). Weak perspective planning and poor consideration of
environmental issues, non- compliance with Environmental Impact Assessments
(EIA) in physical development projects (such as flood control investments, road
development) and conversions of natural ecosystems and drainage channels impair
development outcomes (Shamsuddin &Talukder, 2012). For example, investment in
flood control projects has largely benefited the large land owners at the expense of
open capture fisheries and wetland biodiversity, upon which many poor people
depend for their livelihoods (Minkin et al., 1997). Poor fishers’ livelihoods based on
fishing in open waters have become more vulnerable independent of climate change
impacts (Thompson and Sultana, 1996). Many such development schemes have
proved to be maladaptive and created adverse impacts on environment, biodiversity,
soil fertility and community livelihoods (Mirza and Ericksen, 1996; Alexander et al.,
1998; Halls et al., 1998). Most of these large scale development schemes are
exogenous in origin and not rooted in local conditions or the agency of local
peoples. These development schemes are considered largely climate neutral in
planning but their impacts have exacerbated the adversities associated with changing
climate. This has shouldered communities with a “double burden” due to their
“double exposure” (Olmos, 2001) to climate and non-climate stressors, which in turn
further increases their vulnerability to hazards and shocks.
Besides the impacts of large scale exogenous development schemes, various
endogenous localized actions that facilitate conversion of ecosystems and their
changing management regimes also create problems and affect local social functions
and livelihoods, which in turn increase the vulnerability of poor communities. For
example, the illegal grabbing, conversion and restricted access to khas land (state-
owned wetland and cultivable land) and changes in localized land use has caused
adverse impacts on the livelihoods of poor communities. My research area and
9
project villages are located within 10km of the periphery of the SRF (Sundarbans
Reserved Forest) and as such within the Ecologically Critical Area (ECA) declared
by the Government of Bangladesh (GoB, 1999) in recognition of the largely
negative impact of human actions on the forest and urgent need to undertake
development schemes.
The IPCC fourth assessment (synthesis) report recognizes difficulties in assessing
specific effects of climate change due to past interventions and other non-climate
drivers. It comments:
Effects of climate changes on human and some natural systems are
difficult to detect due to adaptation and non-climatic drivers (IPCC,
2007:72).
However, the aspect of pre-existing vulnerability of local people owing to past and
ongoing development schemes is seldom considered in recent climate change
adaptation projects in Bangladesh. The UNDP assisted community-based adaptation
project on the Bangladesh coast and conducted a climate vulnerability assessment in
its four project sites. However, they put limited emphasis on pre-existing
vulnerabilities caused by past development schemes (such as shrimp farming, land
grabbing, coastal polders), which means they disregarded the wider underlying
causes of societal vulnerability, which may have implications for the effectiveness
of climate vulnerability and adaptation schemes (Nandy et al., 2013).
This research examines the impacts of such exogenous and endogenous
development schemes on local social ecological systems. This second generation
approach to vulnerability assessment seeks to show that pre-existing impacts have
already made people vulnerable to stressors and shocks and have had an effect on
identifying the precise impacts of recent changes in weather patterns (possibly
linked to climate change) on local ecosystems and livelihoods (Chapter 4). Under
conditions of scientific uncertainty about the specific impacts of climate change and
climate variability across spatial and social landscapes of the country, the
Government of Bangladesh (GoB), NGOs and bilateral donors have collectively
under taken various measures to deal with the issue.
Responses to weather induced threats in Bangladesh and research gaps
10
The development of effective local level adaptation strategies to tackle weather
induced impacts is constrained by the scientific uncertainties regarding the specific
local impacts of changing weather patterns. There is much literature on the likely
impacts of climate change but most is generic and applicable to the broader sub-
regional, regional or global scales. Climate change modeling has contributed to our
understanding of climate change trends and impacts at a broader scale but has been
less successful in providing the detailed knowledge required to assist local
communities in planning adaptation strategies for the long-term. To provide that
understanding, the Global Facility for Disaster Reduction and Recovery (GFDRR,
2011) recommended that it is essential to conduct detailed vulnerability assessments
at the local level to develop appropriate adaptation programmes to tackle climate
change impacts. Despite the inadequacy of current micro level climate modeling,
local people themselves have noticed erratic patterns in local weather and their
concomitant impacts on their livelihoods. They have attempted to use their own
local knowledge to deal with these changes but given the unpredictability of climate
patterns and high variability, there is concern that such knowledge is insufficient and
possibly maladaptive, leading to increased vulnerability. Government has become
increasingly aware of the need to assist local communities, especially through the
mainstreaming of adaptation into local development planning.
Bangladesh has been identified as highly vulnerable to climate change and
increasing international and national attention is being paid to developing policies
and programmes to deal with it (MoEF, 2005; Stern, 2006). The first official
document on priority and urgent adaptation measures for Bangladesh was the NAPA
prepared and submitted to the UNFCCC in 2005 (MoEF, 2005). The Bangladesh
NAPA aimed at developing “priority” adaptation interventions through a
participatory process from the grass roots to sub-national and national level public
consultations. NAPA was to be the document of the “people” of Bangladesh
comprising of communities priority adaptation schemes rather than those of the
Government. While reviewing the NAPA adaptation schemes I contacted colleagues
at the newly formed Climate Change Cell (CCC) within the Department of
Environment (MoE) about how the priorities were arrived at and whose priorities
were to be served. They informed me that the document was based upon extensive
consultation with grass roots communities and that recommended actions were later

11
discussed at district and national levels and finalised as a priority adaptation package
for place-based communities living on the frontline of climate change impacts.
However, the consultation outcomes were found biased in favour of experts’ or
facilitators’ opinions and preferences (Raihan et al., 2010; Ayers, 2010).
The first priority project of NAPA was the “mangrove afforestation in the coastal
zone to provide protection of the communities from cyclones and storm surges”.
While such an initiative is important in terms of the protection of ecosystem health
and biodiversity, land formation, community livelihoods, income generation, and
mitigation (through carbon sequestration), it raises some important issues. The first
issue concerns the balancing of short term community needs with longer term
adaptation-mitigation strategies. Thus, mangroves take 20-25 years to attain maturity
and reach a height able to give protection against cyclones. However, poor
communities which subsist from hand to mouth on very low daily incomes do not
necessarily see the benefit of such an initiative to meet their urgent livelihood needs.
Second, NAPA provided a list of priority adaptation actions through an expert-
driven consultative process without conducting vulnerability analyses of the local
communities exposed to climate change impacts. Third, it ignored the social aspects
of climate change impacts and focused largely on the biophysical aspects of climate
change such the impacts on water, agriculture and fisheries. In the central coastal
zone, 46-68% of households are landless with no land of their own for crop farming
or fish culture and they survive on fishing and seasonal engagement in various on
and off farm wage laboring activities. The NAPA priority schemes in aquaculture
and agricultural adaptation focused largely on those with cultivable land and
although it may provide marginal or spill over benefits for the landless poor, it
contributed much less to enhancing their adaptive capacity to face climate related
challenges as the majority of the vulnerable population comprises landless poor and
most of them do not have ponds or cropland for aquaculture or agriculture of their
own. They can only get marginal benefits as wage laborers from NAPA suggested
agriculture and aquaculture adaptation schemes. NAPA, though a globally
recognized participatory process of identifying community driven priority adaptation
interventions of the least developed countries (LDCs), it has missed the opportunity
to reflect local voices and needs. To this end, Jessica Ayers commented on the
Bangladesh NAPA in the following terms:
12
…Bangladesh NAPA paid inadequate attention to creating
opportunities for vulnerable communities to contest the dominant
framing of climate risk, or contribute meaningfully in the
identification of the underlying factors that drive vulnerability on the
ground (Ayers, 2010:238).
The approach taken in this study focuses on developing adaptation strategies based
on an assessment of the social or livelihood vulnerabilities of local communities to
climate change shocks. While it is important to understand the exposure and
sensitivity of place based communities to climate-induced hazards, it is essential that
the communities improve their adaptive capacity to respond. This approach is
missing in the NAPA’s prioritized list of adaptation interventions.
Besides NAPA, The Bangladesh Climate Change Strategy and Action Plan
(BCCSAP) first prepared in 2008 and finalized in 2009 by the Ministry of
Environment and Forest (MoEF) is the only document endorsed by the Government
of Bangladesh being used to fund adaptation-mitigation projects in Bangladesh
(MoEF, 2009). The BCCSAP is a ten year long plan (2009-2018) comprises 44
programmes under six pillar on both mitigation and adaptation options. However, it
is an expert-led document based on the views of policy elites (Raihan et al.,
2010:64) and as such community voices are not reflected in the design of the
strategy nor are based on vulnerabilities of local communities facing climate change
threats. The strategy also lacks guidelines as to how the adaptation-mitigation
projects will be planned, designed and implemented. Raihan et al., (2010:64)
reviewed the BCCSAP and commented:
...the BCCSAP makes no reference to policy and gives no directions
to formulate a national climate change policy within its action plan. It
is said that the implementation of proposed programmes will be
backed by sectoral policies, but issues related to climate change are
almost absent in those policies.
The Climate Change Cell (CCC) of the Department of Environment commissioned
several field studies to generate knowledge on climate change impacts,
vulnerabilities and adaptation. One such study on “climate change, gender and
vulnerable groups” (CCC, 2009.a) provided a description of the biophysical hazards
13
of some disaster prone areas of the country but lacked analysis of climate
vulnerability of the local communities (their exposure, sensitivity and adaptive
capacity). The study also lacked comparative accounts of vulnerability among the
sites studied which could have contributed to the designing of site specific
adaptation strategies based on their varying degrees and types of vulnerability. IPCC
Third Assessment Report also stressed that there are considerable knowledge gaps in
the nature and extent of exposure, sensitivity and adaptive capacity of physical,
natural and social systems to climate change stimuli across geographical scales,
which constrains designing effective adaptation and mitigation options. It
recommended more empirical research in these areas of climate vulnerability across
scales (IPCC, 2001:72).
In Bangladesh, adaptation planning is largely constrained by the compounded effects
of both climate and non-climate related stressors and effects that collectively
increase the vulnerability of local communities. No comprehensive climate
vulnerability assessment (level of exposure and sensitivity to diverse climate
induced hazards and adaptive capacity) has been done as yet to unpack the ground
reality of climate and non-climate related problems.
In the light of the above considerations, this research assesses at the micro level the
livelihood vulnerability of communities to climate change impacts in the coastal
zone. It has two main objectives. The first is to provide inputs for designing
grassroots adaptation strategies and actions through deepening the understanding of
differentiated levels of vulnerabilities, across diverse occupational groups of place-
based communities. The second is to contribute to methodological aspects of climate
vulnerability assessment by providing an authentic picture of community
vulnerability to climate change stressors and extremes. This will provide a basis for
further refinement and replication at different and wider scales and thus contribute to
enhanced knowledge and capacity in the area of climate vulnerability assessment.
Community adaptation actions and wider adaptation landscapes
People living in vulnerable coastal settings of Bangladesh have adapted to hazards
for centuries based on their local knowledge, perceptions and skills that have arisen
out of their day to day interactions with local environmental and other social-
institutional conditions (Parvin et al., 2008). It is thus important that adaptation
14
planning should be designed with the active participation of coastal communities
who are intimately connected to the ecosystems that underpin their livelihoods.
Based on local experience, communities in different climate sensitive areas of
Bangladesh have already started adapting to changing climate through the adoption
of a wide array of local technologies and approaches in the areas of agriculture,
aquaculture, water, housing and the like with or without outside support (Rahman
and Islam, 2013). However, most of these adaptation actions are undertaken at
household rather than community or ecosystems levels, which have reduced the
scope for collective action and community learning opportunities.
In an attempt to mobilise wider community resources to deal with climate change,
several approaches have been suggested. One of which is the Community-Based
Adaptation (CBA) approach, which is being practiced globally to moderate climate
change impacts at the grassroots level (Huq and Reid, 2007). CBA is based on the
principle that local communities have adequate knowledge, skills, capacity and
social networks to plan and design locally appropriate adaptation actions based on
their real life experience in dealing with climatic perturbations and their impact on
livelihoods and local environments (Dodman and Mitlin, 2013). CBA is defined as:
…a community-led process, based on communities’ priorities, needs,
knowledge and capacities, which should empower people to plan for and
cope with the impacts of climate change (Reid et al., 2009: 13).
Two such projects are now being implemented in the coastal zone of Bangladesh
with UNDP-GEF funding. Central to the success of CBA is that local communities
take the lead rather than relying on expert-driven short-cut pathways.
The other approach being much discussed in the global adaptation discourse is that
of Ecosystems-based Adaptation (EbA) discussed in more detail later in the study..
This approach harnesses the capacity of nature (ecosystems such as wetlands,
forests) to buffer communities against the adverse impacts of climate change
through providing various ecosystem services, which include provisioning,
regulatory, supporting and cultural services (MEA, 2005). EbA is said to benefit
local communities by recognizing the inter-connectivity between ecological, social-
cultural, economic and institutional structures (Midgley et al., 2012). It is based on
the premise that ecosystems such as wetlands, forests, coastal zone, mangroves,
15
coral reefs and hill slopes will be impacted heavily by climate change induced
stressors, resulting in the degradation of ecosystem functions and their ability to
provide goods and services to the human population. UNFCCC, in recognition of
effectiveness of EbA in adaptation to climate change across scale, has stated:
The role of ecosystems in adaptation is relevant to, and can be
applied at, many levels, such as the regional, national, sub-national
and local levels, and in all regions. Ecosystem-based approaches to
adaptation are found to be most appropriately integrated into broader
adaptation and development strategies, complementing, rather than
being an alternative to, other approaches (UNFCCC, 2011:4).
This research draws on both the EbA and CBA approaches in examining community
level adaptation actions (see Chapter 8).
It is argued however that such approaches are insufficient for the implementation of
effective adaptation actions without reference to what has been called ‘readiness for
adaptation’ (Ford and King, 2013). This refers to ensuring that enabling social and
institutional environments and supportive policy regimes are in place to guide and
facilitate implementation of adaptation interventions at local level. It means that
unless the required enabling factors such as local community willingness to adapt
and relevant institutional capacity to plan, design, implement and monitor adaptation
actions under a climate resilient policy framework with responsive governance are
ready and supportive of taking adaptation measures, a system that has adequate
adaptive capacity may fail to effectively adapt to weather /climate induced
perturbations and extremes. This is the subject of Chapter 9.
Research aims
In the light of the previous discussion, this study examines the ways in which local
people perceive and encounter weather and weather-related hazards, threats and
shocks in their day to day lives. This focus will be of relevance in assessing the
responsiveness of mainstream development agencies community efforts through
improved climate risk reduction strategies (“local adaptation readiness”).
My research takes a vulnerability approach and focuses on community perceptions,
vulnerabilities and adaptive readiness at the local level. By local level, I mean place-

16
based village communities located on the exposed coast of the southwest and other
stakeholders who facilitate community development processes at village level. As
such, my research focuses on three interrelated aspects. These are (i) village
occupational groups who experience different kinds of vulnerabilities linked to both
climate and non-climate factors and processes; (ii) community responses to coastal
hazards, which vary according to occupational patterns, land use changes and access
to local resource systems and their differentiated exposure, sensitivity and adaptive
capacity; and (iii) the extent of adaptation readiness at local level to tackle the
adverse impacts of climate.
The study has two practical or policy-related implications. First, it makes available
data on community understandings and observations of changing patterns of climate
in relation to their livelihoods options and practices and their vulnerabilities to a new
generation of threats. Second, the data can serve to support strategies at community
level to adjust to changing climate and its impacts. Such strategies can draw on
people’s local knowledge of living with natural and human-induced hazards over
generations and the methods they have used to respond to such hazards.
With this backdrop, this research seeks to contribute to the understanding of these
issues by focusing on the perceptions and strategies of local communities in their
efforts to adapt to climate-related natural and human-induced hazards in the
Bangladesh’s coastal zone.
Theoretical Considerations
At the core of the research is community understanding and vulnerabilities to the
impacts of climate change and climate variability in the coastal zone of Bangladesh
and their strategies to adapt to moderate such impacts. In what follows I draw on the
empirical, theoretical and policy-related literature on vulnerability and adaptation to
climate change as a framework for an examination of selected local community
understanding of climate and weather issues.
Climate, Climate change, Weather: From IPCC to Village Communities
To understand local people’s understanding of climate, it is useful to discuss four
concepts from the general literature around which climate change impacts are

17
discussed. These concepts are: climate, climate change, climate variability and
weather (IPCC, 2012).
According to the IPCC (2012:557), climate is defined as:
The average weather or more rigorously, as the statistical description
in terms of the mean and variability of relevant quantities over a
period of time ranges from months to thousands or millions of years.
The standard period for averaging these variables is 30 years, as defined by the
World Meteorological Organization (IPCC, 2012). The relevant quantities are most
often surface variables such as temperature, precipitation, and wind. Climate in a
wider sense is the state, including a statistical description, of the climate system.
From the definition, one can understand that long term (say 20 to 30 years) average
of various climate related attributes (temperature, precipitation, wind, etc.) of a
given geographical place denotes “climate” for the area of concern, which could be a
country, a region or the entire globe.
Climate change is defined as:
A change in the state of the climate that can be identified (e.g., by
using statistical tests) by changes in the mean and/or the variability of
its properties and that persists for an extended period, typically
decades or longer (IPCC, 2012:557).
Climate change may be due to natural internal processes or external forcing or to
persistent anthropogenic changes in the composition of the atmosphere or in land
use. Climate change is said to occur when the average climate properties including
variability in a given area change and remain so for longer periods (20-30 years).
Climate variability refers to
…variations in the mean state and other statistics (such as standard
deviations, the occurrence of extremes, etc.) of the climate at all spatial and
temporal scales beyond that of individual weather events (IPCC, 2012:557).
Variability may be due to natural internal processes within the climate system
(internal variability), or to variations in natural or anthropogenic external forcing
(external variability). Climate variability is manifested as changes in frequency of
18
weather events like cyclones, droughts, precipitation beyond the normal regular
weather events.
Weather is defined as follows:
Atmospheric condition at any given time or place. It is measured in terms of
such things as wind, temperature, humidity, atmospheric pressure,
cloudiness, and precipitation. In most places, weather can change from hour-
to-hour, day-to-day, and season-to-season (EPA, 2013:W1).
EPA defined climate in a narrow sense as the "average weather", or more rigorously,
as the statistical description in terms of the mean and variability of relevant
quantities over a period of time (30 years). EPA also differentiated between
“climate” as what one expects (e.g. cold winters) and 'weather' as what one gets (e.g.
a blizzard).
These abstract concepts circulate among climate experts and policy makers but have
little resonance at the level of the local communities in this study. Although local
people confront, experience and respond to these climate and weather related factors
in their day to day livelihood activities, they do not use such concepts, at least not in
the way they are used by experts. Their own weather vocabularies are much more
tied to their actual experiences of weather and weather-related events and processes.
Although a few community members have received training or orientation from
local NGOs on “climate change”, for the most part they have just “heard” such
phrases as ‘climate change’ (jalabayu paribartan in Bengali) but are unaware of
what they mean. One such training participant from one study village (Fultala) said
in an interview: “I heard in the training, somewhere in the world ice is melting and
for which our coastal land will permanently go under sea water in future”. He was
unable to say why ice is melting when or where it is likely to impact on coastal
Bangladesh.
Discussions of climate and climate change are rarely heard in the local communities
studied except through NGOs and the occasional visits of government officials in
the area. However, if one shifts the conversation to local weather, villagers are much
more forthcoming about what they understand by it and how it affects their lives.
Generally, by the word weather they understand sunlight (rowd), temperature (taap),
clouds (megh), rains (bristy) and wind (batash). The days with rains and storms
19
they refer to as “bad weather” (kharap abohawya) and sunny days with clear sky, no
storm or strong wind they call “good weather” (bhalo abohawya). The idea and
meaning of weather is embedded in the community vocabulary around local
understanding of factors such as rainfall, drought, cold, seasons, tides, which have
been integral parts of their lives and livelihoods over generations. In addition,
understandings of weather vary, inter alia, by occupational groups, age, political
status and gender even in the same village.
To facilitate my field work, I used local terms related to recent rainfall patterns,
drought conditions, salinity levels and the like in comparison to the past to get their
views on recent changes of these weather factors and how these changes influenced
their livelihood assets and activities (see Chapters 5 and 6).
Understanding Vulnerability to Climate/Weather Stressors
Vulnerability is an old concept related to hazard risk perceptions. In the past, it was
often linked to biophysical hazards and used in engineering fields to assess the
likelihood of infrastructures collapsing or malfunctioning when exposed to the
impact of hazards like earthquakes (Hewitt, 1997; Twigg, 2007). Later the concept
was brought into a variety of development disciplines and linked to disaster risk,
food security, hunger, poverty and the like. According to Cannon (2008), the term
has become a “slippery” one used in a wide array of fields. Although schools of
thought define vulnerability differently, there is general agreement that it refers to
“susceptibility of a system to being harmed” or having a “potential for loss” when
exposed to hazards or stressors (UNDRO, 1980; Cutter, 1996; Cutter et al., 2003;
UNISDR, 2004). Vulnerability is generally considered a negative feature of society
or community but Gallopin (2006) argues that it can have positive outcomes in so
far as it generates transformative change. An example from Southwest Bangladesh is
where waterlogging induced people to take up integrated hydroponics (floating
agriculture) and aquaculture that facilitated the productive use of land and water
year round (Irfanullah et al., 2011).
Earlier analyses of vulnerability centered on biophysical hazards and resultant loss
to human systems assuming that humans were passive receivers of disaster and
suffered losses when exposed to a hazard (UNDRO, 1980). More recently scholars
from a range of disciplines such as development policy research, environmental

20
change, food security, epidemiology, disaster risk and climate change have defined
vulnerability in different ways relevant to their disciplinary interests and approaches
(Adger, 2006; Smit & Wandel, 2006; Deressa et al., 2009). As such, vulnerability
lacks a single universally acceptable definition (Deressa et al., 2009). For example,
scholars of natural hazards and epidemiological research define vulnerability as the
“degree to which a system is susceptible to being harmed by exposure to a
perturbation or stress, in conjunction with its ability to cope, recover or
fundamentally adapt” (Kasperson et al., 2001). The UNISDR (2004) defines
vulnerability as the ‘‘conditions determined by physical, social, economic and
environmental factors or processes which increase the susceptibility of a community
to the impact of hazards’’. Here vulnerability is rooted in a society’s internal
structures, including local socioeconomic and environmental conditions that
determine risk when exposed to a hazard event. In other words, vulnerability refers
to the capacity of the system to confront the hazard and is defined as “the
characteristics of a person or group and their situation (skills, education, access to
information, social networks, etc.) that influence their capacity to anticipate, cope
with, resist and recover from the impact of a natural hazard” (Wisner et al.,
2004).Vulnerability, in most cases is viewed as conditional to the intensity and
frequency of a hazard event and the potential for loss when exposed (UNISDR,
2004; Wisner, 2002). Wisner (2002) underlines that difficulties in recovering from
the negative impacts of a hazard are also part of vulnerability and thus include
coping capacity in vulnerability assessment. Thus, vulnerability not only
incorporates the weakness of a system’s exposure to a specific hazard but also its
capacity to cope with the stressor.
Cutter (1996) emphasizes three distinct components of vulnerability. These are i)
risk of exposure to hazardous conditions, ii) the capacity to respond (coping or
adaptive capacity), and iii) the attributes of places where the hazard originated such
as the vulnerability of people living in a flashflood zone (place of hazard). Cutter
(1996:533) proposes a “hazards of place” model that includes a geographical domain
as vulnerability is the likelihood that an individual or group will be exposed to and
adversely affected by a hazard within a specific geographic domain (hazards of
place).

21
Cutter et al. (2003) suggested vulnerability research and assessments should focus
on three strands: “exposure” as an essential factor that makes people vulnerable to
hazards; “social and institutional” conditions as a component of vulnerability; and
the “places” or “origins” of hazards integrated with the exposure and societal
responses. Cutter et al. (2009:2) define vulnerability as:
…the susceptibility of a given population, system, or place to harm
from exposure to the hazard and directly affects the ability to prepare
for, respond to, and recover from hazards and disasters.
In addition to susceptibility and coping capacity, vulnerability includes adaptive
capacity, exposure and the interaction with perturbations and stresses (Turner et al.,
2003). The concept has been continuously broadened to encompass various elements
that contribute to the vulnerability of a system such as susceptibility, exposure,
coping capacity and adaptive capacity. It also depends on underlying physical,
social, economic, environmental and institutional settings that shape vulnerability
(Birkmann, 2006) (Figure 1.1).
In the context of sustainable development, vulnerability refers to a “condition” and a
“determinant” of poverty and marginalization (Malone, 2009). It is expressed as the
ability or capacity of people to avoid and cope with or recover from the harmful
impacts of factors that disrupt their livelihoods. These factors are often beyond their
immediate control such as hazard extremes, changes of government policy, and the
longer term decline or changes in availability of resources. With regard to climate
change, vulnerability relates to rapid onset of sudden shocks (frequent cyclones),
and slow onset events (like temperature rise, sea level rise) which result in the
disruption of livelihoods through crop failure, low productivity, water scarcity and
so forth (IISD, 2003). Adger (2003) defines social vulnerability as the exposure of
groups of people or individuals to perturbation caused by changes in the bio-
physical environment, including climate variability and change. Clark et al.
(1998:59) define vulnerability to hazards as:
…‘people’s differential incapacity to deal with hazards, based on the
position of the groups and individuals within both the physical and
social worlds’.
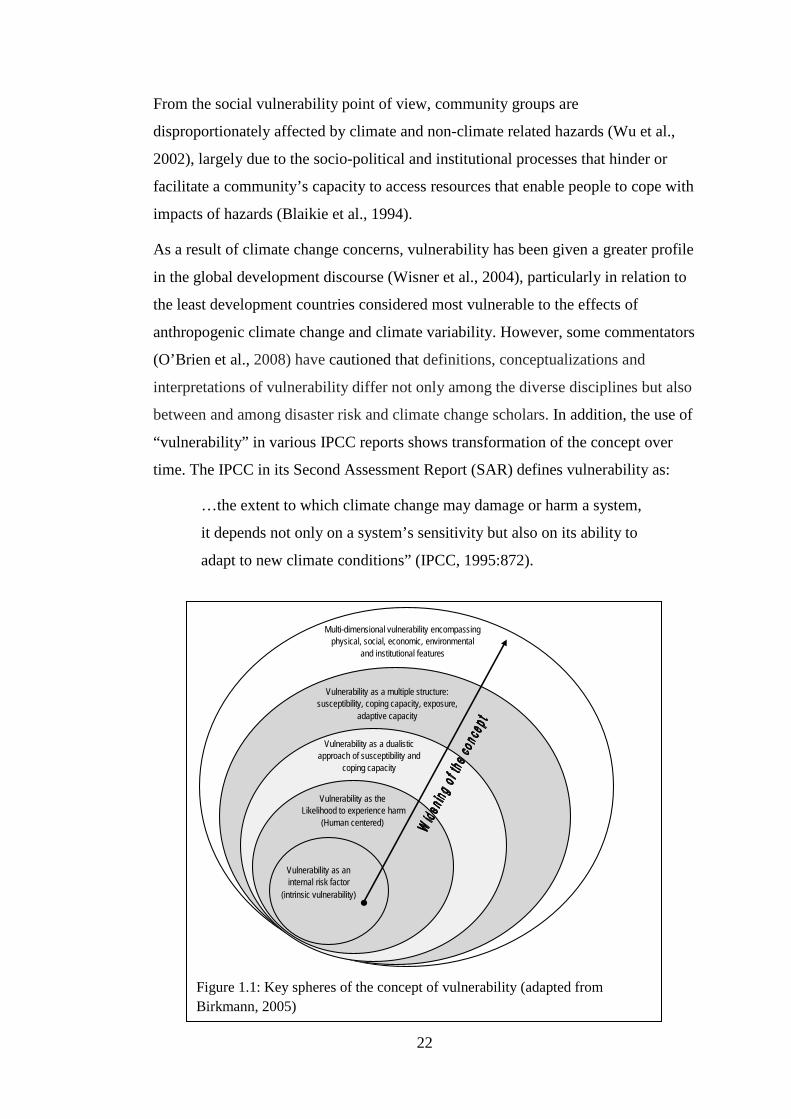
22
From the social vulnerability point of view, community groups are
disproportionately affected by climate and non-climate related hazards (Wu et al.,
2002), largely due to the socio-political and institutional processes that hinder or
facilitate a community’s capacity to access resources that enable people to cope with
impacts of hazards (Blaikie et al., 1994).
As a result of climate change concerns, vulnerability has been given a greater profile
in the global development discourse (Wisner et al., 2004), particularly in relation to
the least development countries considered most vulnerable to the effects of
anthropogenic climate change and climate variability. However, some commentators
(O’Brien et al., 2008) have cautioned that definitions, conceptualizations and
interpretations of vulnerability differ not only among the diverse disciplines but also
between and among disaster risk and climate change scholars. In addition, the use of
“vulnerability” in various IPCC reports shows transformation of the concept over
time. The IPCC in its Second Assessment Report (SAR) defines vulnerability as:
…the extent to which climate change may damage or harm a system,
it depends not only on a system’s sensitivity but also on its ability to
adapt to new climate conditions” (IPCC, 1995:872).
Figure 1.1: Key spheres of the concept of vulnerability (adapted from Birkmann, 2005)
Multi-dimensional vulnerability encompassing
physical, social, economic, environmental and institutional features
Vulnerability as a multiple structure: susceptibility, coping capacity, exposure,
adaptive capacity
Vulnerability as a dualistic approach of susceptibility and
coping capacity
Vulnerability as the Likelihood to experience harm
(Human centered)
Vulnerability as an internal risk factor
(intrinsic vulnerability)

23
This definition omits climate variability as a stressor. The Third Assessment Report
(TAR) of IPCC widened the concept and defined vulnerability as
…the degree to which a system is susceptible to, or unable to cope
with, adverse effects of climate change, including climate variability
and extremes. Vulnerability is a function of the character, magnitude,
and rate of climate variation to which a system is exposed, its
sensitivity, and its adaptive capacity” (IPCC, 2001:388).
The fourth assessment report of IPCC (2007) repeats TAR’s view of vulnerability
and the special report of IPCC (2012) states that “…vulnerability is a result of
diverse historical, social, economic, political, cultural, institutional, natural
resources, and environmental conditions and processes” (IPCC, 2012:32).
Adger (2006) argues that a person or society can be vulnerable not only due to their
exposure to environmental change but also due to social change. He emphasizes the
importance of resilience building and concludes that “…resilient ecosystems and
resilient human societies can better adapt to both physical and socio-political
stresses” (Adger, 2006: 278).
The discussion so far points to three important factors in understanding
vulnerability. These are exposure to the hazards (whether external or internal
stimuli), sensitivity (likelihood of harm) and adaptive capacity (capacity to
withstand, cope, recover and transform when exposed to any hazardous condition)
(Figure 1.2). In fact, exposure and sensitivity together determine the potential
impacts of climate change on a system, while adaptive capacity is a measure of the
extent to which a system can respond to such impacts to moderate harm or exploit
benefits of changed conditions (Rosenzweig et al., 2011). These key concepts are
discussed in greater detail below.
Exposure
Exposure is considered as one of the core components of vulnerability in climate
research (IPCC, 2001; Adger, 2006). Generally, exposure refers to the degree,
duration and extent in which a system remains in contact with or is subject to
hazards (Adger, 2006; Kasperson et al., 2005). That is, exposure refers to the
background climate conditions and stimuli against which a system operates and any
changes in those conditions (IPCC, 2001).

24
The IPCC special report (2012) elaborates the concept, focusing on context. It refers
to exposure as:
“…the presence (location) of people, livelihoods, environmental
services and resources, infrastructure, or economic, social, or cultural
assets in places that could be adversely affected by physical events
and which, thereby, are subject to potential future harm, loss, or
damage” (IPCC, 2012:32).
According to these views, exposure is a vital component of vulnerability and
should be included in climate vulnerability assessments (IPCC, 2012; Hahn
et al., 2009). In addition to exposure, another important factor determining
the vulnerability of a system to climate variability is its “sensitivity” to such
climate and other perturbations when exposed.
Sensitivity
The IPCC Second Assessment report (IPCC, 1995:5) defines sensitivity as
… the degree to which a system will respond to a change in climatic
conditions (e.g., the extent of change in ecosystem composition,
structure, and functioning, including primary productivity, resulting
from a given change in temperature or precipitation).
The IPCC Fourth Assessment Report is more explicit, defining sensitivity as:
Figure 1.2: Climate vulnerability and its components (modified from Allen Consulting (2005)
Sensitivity Exposure
Potential Impact
Vulnerability
Adaptive Capacity
Climate Variability and Change
25
… [the] degree to which a system is affected, either adversely or
beneficially, by climate variability or change. The effect may be
direct (e.g., a change in crop yield in response to a change in the
mean, range or variability of temperature) or indirect (e.g., damages
caused by an increase in the frequency of coastal flooding due to sea
level rise) (IPCC, 2007:881).
The IPCC fifth assessment report endorsed this definition of sensitivity but added
…”or species” after the word system (IPCC, 2014). Climate-related stimuli
encompass all the elements of climate change, including mean climate
characteristics, climate variability, and the frequency and magnitude of extremes
(IPCC, 2001). The effects of these stimuli may be direct as when, for example, there
is a change in crop yield in response to a change in the mean, range or variability of
temperature, or indirect such as when an increase in coastal flooding results in
growing salinization of soil, thus affecting crop yields (IPCC, 2001). Sensitivity of a
system to climate induced perturbations is reflected as its “responsiveness” to the
extent it is harmed or benefitted in relation to the degree of changes in the severity
of that perturbation. For example, a variety of rice may be damaged if it remains
inundated by flood water for more than five consecutive days while a flood tolerant
variety can survive even if it remains submerged for ten consecutive days. The
vulnerability of exposed systems thus varies according to the sensitivity of rice
varieties to the spatio-temporal perturbations such as the number of days in which
the rice is flooded
The figure 1.2 shows that exposure and sensitivity to climate stimuli together create
a potential condition for a system to become vulnerable. However, vulnerability is
also shaped by the capacity of the system itself to respond to exposure and
sensitivity. This is captured by the term “adaptive capacity”, which is the ability of a
system to moderate harm.
Adaptive capacity
Adaptive capacity is defined as “…the properties of a system to adjust its
characteristics or behavior, in order to expand its coping range under existing
climate variability or future climate conditions” (Brooks 2003:8; Brooks and Adger
2004). According to the IPCC fourth assessment report, adaptive capacity is:
26
the “ability (or potential) of a system to adjust successfully to climate
change (including climate variability and extremes) to: (i) moderate
potential damages; (ii) to take advantage of opportunities; and/or (iii)
to cope with the consequences”(IPCC, 2007:869).
Thus adaptive capacity is considered a desirable property or positive attribute of a
system to reduce vulnerability (Engle, 2011).
Operationally, adaptive capacity is the ability to design and implement effective
adaptation strategies or react to evolving hazards and stresses so as to reduce the
likelihood of the occurrence and/or the magnitude of harmful outcomes resulting
from climate-related hazards. Socioeconomic factors such as institutions,
governance, and resource management are important elements in adaptive capacity.
Some are generic (education, income, access to resources) and some are specific to
climate induced hazards (local knowledge, technology). In summary, the more
adaptive capacity a system possesses, the greater the chances of it being adaptive (or
less vulnerable) to impacts of weather/climate stressors and thus is less vulnerable.
Another widely used concept in vulnerability and adaptation framework is the
“copying capacity” which is often used as a synonym for “adaptive capacity”.
Coping capacity is defined as:
…ability of people, organizations, and systems, using available skills,
resources, and opportunities, to address, manage, and overcome
adverse conditions (IPCC, 2012:558).
The strengthening of coping capacities usually helps build resilience to withstand the
effects of natural and human-induced hazards (UNISDR, 2004). Levina & Tirpak
(2006:13) however, argue that “coping capacity” and “adaptive capacity” could
mean the same thing if both concepts refer to the natural ability of a system to adjust
to hazards, which implies that adaptation measures will further increase this ability.
They go on to argue that adaptive capacity of a system differs from coping capacity,
where adaptive capacity implies the extent to which the system is capable of
adapting. Turner et al. (2003) distinguish “coping capacity” from “adaptive
capacity” and regarded both as components of resilience of a system, while Smit and
Wandel (2006) consider “coping capacity” to mean a shorter-term capacity just to
survive and designate “adaptive capacity” for long term or more sustainable
27
adjustments to perturbations. In this context, Levina and Tirpak (2006:13) clarified
that, “coping capacity” of a system can be increased with adaptation measures while
“adaptive capacity” (which is broader in scope) already includes “copying capacity”,
plus possible adaptation measures, and cannot be increased beyond a certain point
when the system becomes vulnerable (Levina & Tirpak, 2006:13).
In climate vulnerability assessment another important concept is the “coping range”,
which is defined as:
…the variation in climate stimuli that a system can absorb without producing
significant impacts (IPCC, 2001:370).
In other words, the capacity of a system to accommodate deviations from “normal”
climatic conditions describes the “coping range”, which can vary among systems
and regions. Beyond the coping range or critical threshold, the tolerance of the
system is exceeded and it runs in to a vulnerable state (Fellmann, 2012).
Conceptually, adaptive capacity represents the potential of a system to adapt rather
than actual adaptation (Brooks, 2003) which implies that through adaptation the
coping range of a system can be expanded (or adjusted) further to adjust to a certain
level in order to moderate climate induced threats. However, the coping range of a
system has limits which may vary due to contextual features. Beyond a certain
coping range a system becomes vulnerable even after adaptation measures have been
implemented because adaptation has also its limits set by the adaptive capacity
(Fellmann, 2012) of the system (Figure 1.3).

28
Within the vulnerability discourse, “resilience” is another concept that refers to the
ability of a system to recover from the effect of shocks and stressors that cause harm
(UKCIP, 2003). IPCC defines resilience as:
The ability of a social or ecological system to absorb disturbances while
retaining the same basic structure and ways of functioning, the capacity for
self-organisation, and the capacity to adapt to stress and change (IPCC,
2007:880).
According to the IPCC definition, resilience is closely related to “coping range’, as it
emphasises the amount of change a system can tolerate. Klein et al. (2004) proposed
that adaptive capacity be considered:
…an umbrella concept that includes the ability to prepare and plan for
hazards, as well as to implement technical measures before, during and after
a hard event… and the resilience be treated as one property that influences
adaptive capacity.
In comparison to adaptation, resilience differs in meaning and scope as resilience
involved a return to a state of equilibrium after a disturbance while adaptation
(adaptive capacity) goes further to include making adjustments and realizing the
benefits of disturbance. Thus, the latter is more robust and takes a longer term
perspective and is of greater relevance to slow operating weather/climate induced
threats.
Assessment of Vulnerability to climate change
Figure 1.3: Relationships between climate change, coping range, vulnerability thresholds and adaptation (adapted from Fellmann, 2012).
29
In recent literature, there is greater emphasis on socio-economic factors, especially
institutions, governance and management, as central in building the adaptive
capacity of a system (Smith and Pilifosova, 2001; Brooks and Adger, 2004; Adger et
al., 2007). Practically, the adaptive capacity of a system is subject to human actions
that influence the biophysical and the socio-political elements of a system (IPCC,
2012). The emphasis on socio-economic factors plays a major role in distinguishing
two broad approaches to vulnerability, that refer to outcome and contextual
vulnerability. These approaches give different emphasis to natural and social
components in assessing vulnerability.
30
One way of analyzing vulnerability is based on what is referred to as the ‘end point
‘consideration or ‘outcome vulnerability’ (Kelly & Adger, 2000; Fellmann, 2012;
O’Brien at al., 2007). This approach seeks to assess and quantify the net impacts on
a system after adaptation measures have been implemented. It focuses on the
biophysical aspect of vulnerability and adaptive capacity and emphasizes
technological solutions for adaptation and mitigation (new seeds varieties, improved
technologies). The second approach is known ‘contextual vulnerability’. It considers
vulnerability as the present inability of a system to cope with the changing climate
(Figure 1.4). This inability is explained by social, economic, political and
institutional conditions rather than biophysical aspects, although these latter play a
role in the complex interplay between ‘nature’ and ‘society’. It can be said that the
contextual vulnerability approach argues that it is the current vulnerability of the
system in question to climate stimuli that determines the adaptive capacity of a
system while the end point or outcome vulnerability approach focuses on how the
adaptive capacity of a system determines its vulnerability. Socio-economic
indicators of adaptive capacity include generic ones such as education, income and
health while some are specific to particular climate-induced perturbations and also
based on hazards of place such as coastal salinity and the presence of flashflood
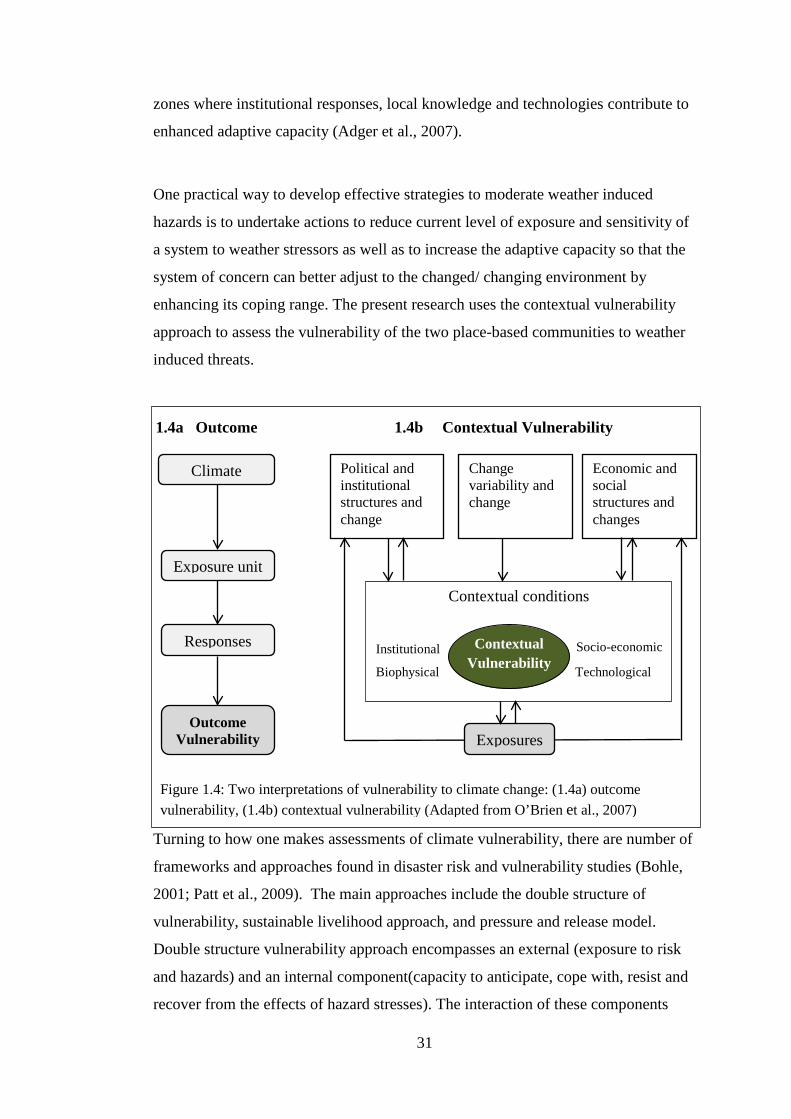
31
zones where institutional responses, local knowledge and technologies contribute to
enhanced adaptive capacity (Adger et al., 2007).
One practical way to develop effective strategies to moderate weather induced
hazards is to undertake actions to reduce current level of exposure and sensitivity of
a system to weather stressors as well as to increase the adaptive capacity so that the
system of concern can better adjust to the changed/ changing environment by
enhancing its coping range. The present research uses the contextual vulnerability
approach to assess the vulnerability of the two place-based communities to weather
induced threats.
Turning to how one makes assessments of climate vulnerability, there are number of
frameworks and approaches found in disaster risk and vulnerability studies (Bohle,
2001; Patt et al., 2009). The main approaches include the double structure of
vulnerability, sustainable livelihood approach, and pressure and release model.
Double structure vulnerability approach encompasses an external (exposure to risk
and hazards) and an internal component(capacity to anticipate, cope with, resist and
recover from the effects of hazard stresses). The interaction of these components
Contextual conditions
Exposures
Climate
Exposure unit
Responses
Outcome Vulnerability
Political and institutional structures and change
Change variability and change
Economic and social structures and changes
Contextual Vulnerability
Institutional
Biophysical Technological
Socio-economic
1.4a Outcome
1.4b Contextual Vulnerability
Figure 1.4: Two interpretations of vulnerability to climate change: (1.4a) outcome vulnerability, (1.4b) contextual vulnerability (Adapted from O’Brien et al., 2007)
32
shapes the vulnerability of a given system (Bohle, 2001). This approach suggests
that assessment of mere exposure to external hazards is not enough to determine
vulnerability. Rather, the assessment needs to be conducted simultaneously to
characterize relevant external and internal factors that collectively determine the
vulnerability of a given system. Indicators of double structure vulnerability,
therefore, include biophysical hazards (exposure) as well as the internal capacity of a
system, which includes social, economic, political and institutional structures and
processes that influence vulnerability. By contrast, the sustainable livelihood
approach (SLA) focuses on sustainability and livelihoods issues. Key elements of
SLA comprise five livelihood assets or capitals (. human, social, financial, natural
and physical capital) including access to and control over such capitals by the
marginalized groups to achieve livelihoods outcomes (Chambers and Conway,
1992). Here the vulnerability context is viewed as shocks, trends and seasonality and
the influence of changing policy and institutional processes for the sustained
livelihood strategies and outcomes (Chambers and Conway, 1992). However, access
and control over productive capitals is subject to the capacity of the marginalized
groups to maintain social relations and their empowered positionality in the local
power structure. Hence the approach also covers the external (shocks, trends,
seasonality, institutional policy and processes) and internal factors (capacity to
maintain social relations and create niche in local power structure) and provides the
potential to apply relevant indicators and processes in climate vulnerability
assessment. Another approach is the Pressure and Release model ( PAR ) which
focuses on disaster as the intersection of two forces, namely, processes that create
vulnerability of a system and the natural hazard events that have potential to create
disaster (Wisner et al., 2004). The PAR approach stresses that the vulnerability and
development of potential disaster is the outcome of a process of increasing pressure
and the opportunities to relieve the pressure. As such vulnerability of a system is
generated under three progressive phenomena. These are root causes (social,
economic, demographic political systems including power structures) that determine
access to and sustainability of resource systems. These create dynamic pressures
that comprise all processes and activities (skills, markets, resource degradations, soil
and water productivity, rapid urbanization, land use changes etc.) that transform root
causes into unsafe conditions such as people living in dangerous locations,
unprotected structures and facilities, low income levels, irregular access to and
33
availability of livelihood assets, lack of early disaster preparedness and warning
systems, etc. Assessment of vulnerability of a system thus requires consideration all
these conditions to be assessed in a given social-ecological setting.
The double structure and SLA approaches were found to be useful as these are based
on and consider contextual vulnerability framework. Giving due consideration to
contextual vulnerability, the Livelihood Vulnerability Index (LVI) model was
developed by researchers at the University of Wisconsin, USA for assessing climate
vulnerability. It was first used in an African context (Hahn et al., 2009) and draws
on various relevant indicators under seven major components which make up the
three contributory factors in vulnerability research of exposure, sensitivity and
adaptive capacity (Hahn et al., 2009).
Livelihood Vulnerability Index (LVI)
Recognizing the multiplicity of factors that collectively constitute the climate
vulnerability of local communities, the LVI approach provides a composite index to
express climate vulnerability of a system in a given setting. The LVI uses the
UNDP’s human development index method that defines the quality of life of a
nation based on multiple indicators expressed as a composite index. This method
also draws inputs and adopted indicators from the sustainable livelihood approach
(SLA), which has been shown to be useful in assessing the ability of households to
withstand natural and human-induced shocks such as floods, cyclones, change of
policy and institutional processes. While the SLA framework originally addressed
aspects of sensitivity and adaptive capacity of households to environmental changes,
it has been developed further to take account of a new generation of threats
associated with climate variability and change (IPCC, 2007). The LVI approach also
incorporates the external (exposure to hazards and socio-political vulnerabilities)
and internal aspects (coping capacity of a system to anticipate, resist and recover
from hazards) of vulnerability and related indicators as proposed by Bohle (2001) in
his double structure vulnerability analysis.
The LVI approach integrates the exposure component of vulnerability based on site
specific empirical data on climate induced hazards and stressors that have
differential spatial and temporal effects on the livelihoods of different community
groups. It uses multiple indicators related to climate induced hazards to assess the

34
exposure component, various social and economic indicators to assess the extent of
the adaptive capacity of local communities, and several indicators related to water,
food and health to assess the sensitivity of the communities to climate hazards
(Figure 1.5). Like SLA, a major advantage of the method is that it uses primary data
collected through household survey and relies less on secondary data which often do
not reflect the ground reality of specific sites at a given time. Data analysis has two
stages. The first expresses the LVI as a composite index comprising of seven major
components that constitute the climate vulnerability. Second, the data from the seven
major components are aggregated into three vulnerability contributory factors such
as exposure, sensitivity and adaptive capacity. The LVI is the subject of chapter 7.
Understanding adaptation to climate change
The discussion now turns to the concept of adaptation itself. It has become a central
feature of contemporary development discourses and is regarded as a major option
for developing countries to tackle impacts of climate change and climate variability
(Huq et al., 2003; IPCC, 2007). Although adaptation has its roots in ecology in
describing ecosystems’ natural processes of adjusting to external stressors and
maintaining normal functions (Berkes et al., 2003), it is now being increasingly
applied to the interface between human and ecological systems and how human
systems can accommodate the adverse impacts of anthropogenic climate change and
climate variability.
Adaptation is defined and understood in various ways. The IPCC Second
Assessment Report defines adaptation as:
…the degrees to which adjustments are possible in practices,
processes, or structures of systems to projected or actual changes of
climate. Adaptation can be spontaneous or planned, and can be
carried out in response to or in anticipation of changes in conditions
(IPCC, 1995:5).

35
Smit et al. (1999:200) define adaptation as
…adjustments in ecological-social-economic systems in response to actual or
expected climatic stimuli, their effects or impacts.
Brooks (2003: 8) defines it as
…adjustments in a system’s behaviour and characteristics that enhances its
ability to cope with external stresses.
The UK Climate Impact Programme (UKCIP, 2003:111) refers to adaptation as
…the process or outcome of a process that leads to a reduction in
harm or risk of harm,or realization of benefits associated with climate
variability and climate change.
This definition speaks of both “process” and “outcome” and explicitly mentions
beneficial outcomes in addition to reductions in risk of harm. Smit and Wandel
(2006:282) in consideration of human aspects, define adaptation as
Figure 1.5: Schematic presentation of LVI approach of climate vulnerability assessment (based on the LVI approach of Hahn et al., 2009)
Sensitivity Adaptive Capacity
Vulnerability (To climate change impacts)
Major Components of Sensitivity
-Access to Water - Access to Food
- Access to Health
(Presented as composite index of above 3 major
components of sensitivity)
Major Component of Exposure
-Natural disasters and climate variables at local level
(Presented as composite index of above major component of
exposure)
Exposure
Major Components of Adaptive Capacity
-Demographic variables - Livelihood options
- Social networks (Presented as composite index of above 3 major
components of sensitivity)
Sub-components of Sensitivity
Numbers of sub-components under each
major component of Sensitivity
Sub-components of Adaptive Capacity
Numbers of sub-components under each
major component of Adaptive Capacity
(Aggregates of 7 major components in to 3 IPCC vulnerability contributing factors)

36
…a process, action or outcome in a system (household, community,
group, sector, region, country) in order for the system to better cope
with, manage or adjust to some changing condition, stress, hazard,
risk or opportunity.
The definition focuses on “actions” aimed at reducing vulnerability which can be
measured as outcomes (Maguire and Cartwright, 2008). IPCC Third Assessment
Report (2001:365) provides a broader definition of adaptation as:
…adjustment in natural or human systems in response to actual or
expected climatic stimuli or their effects, which moderates harm or
exploits beneficial opportunities.
This term refers to changes in processes, practices or structures to moderate or offset
potential damages or to take advantage of opportunities associated with changes in
climate. Despite variations between these various definitions, all focus on a key
aspect that through adaptation (whether a process or action or outcome) a system
makes adjustment to and/or takes advantage of climate change induced
perturbations. For the purpose of this research, I will be guided by the IPCC’s
definition in examining adaptation actions or schemes at community and other
organizational levels.
Assessment of local adaptation actions
There are a number of types of adaptation categorized according to their timing and
spontaneity. For example, an adaptation action can be anticipatory or reactive (time
of adaptation) as well as autonomous or planned (its degree of spontaneity) (Smit et
al., 2000). The IPCC (2007:869) defines autonomous (or spontaneous adaptation)
adaptation as:
…adaptation that does not constitute a conscious response to climatic
stimuli but is triggered by ecological changes in natural systems and
by market or welfare changes in human systems.
In contrast, planned adaptation is defined as:
…adaptation that is the result of a deliberate policy decision based on
an awareness that conditions have changed or are about to change and
37
that action is required to return to, maintain, or achieve a desired
state.
Anticipatory or proactive adaptation is adaptation that is carried out or organized
prior to any impacts of climate change being observed. An example would be the
raising of pond dykes in anticipation of possible flooding. Reactive adaptation, on
the other hand, takes place after the occurrence of a hazard as when people raise
their homes on plinths after a flood. However, whether an adaptation is reactive or
proactive depends greatly upon context and time. Reacting to an event can also be
seen as a sort of planning for future events of the same sort. This research looks at
the various kinds of adaptation practices in the two study villages in terms of these
two adaptation continua.
In addition to a focus on specific adaptation strategies at the village level, the study’s
approach has been influenced by scholars and practitioners in the areas of collective
action and ecological sustainability. In particular, two approaches stand out. These
are community-based adaptation (CBA) and ecosystems-based adaptation (EbA).
The concept of CBA originated from research on community-based development
defined as development that includes local beneficiaries in its design and
management (Ghazala and Rao, 2004:1). Ayers and Forsyth (2009:26) define
community-based adaptation (CBA) as:
Strategies …generated through participatory process, involving local
stakeholders and development and disaster-reduction practitioners,
rather than being restricted to impacts-based scientific inputs alone.
As such, expertise in vulnerability reduction must come from local
community-based case studies and indigenous knowledge of locally
appropriate solutions to climate variability and extremes.
In theory, CBA or any community based development initiative focus on poorer and
more vulnerable sections of the community with a view to engaging them as active
agents in the process of adaptation and development, (Kates, 2000). Obstacles to
such engagement include national and local political structure, expert-dominated
policy and overarching and non-transparent institutional issues (Dodman and Mitlin,
2013). Dodman and Mitlin (2013:1) go on to argue that:
38
CBA needs to recognise the considered experience of participatory
development to date, particularly in relation to local involvement in
project planning and implementation, as well as acknowledging the
specific challenges raised by climate change. Without attention to risks
and uncertainty, political structures and institutions, the necessarily
multi-level nature of adaptation policy and programming, and the links
between mitigation and adaptation politics and practice, outcomes of
CBA interventions are unlikely to support pro-poor development.
The second approach gives greater attention to ecological sustainability as a central
element of adaptation planning. This approach is often referred to as ecosystem
based adaptation (EbA) which seeks to incorporate ecological concerns into
planning as it is argued that ecosystems such as wetland, forests, coastal zone, and
mangroves will be severely impacted by climate change resulting in a loss of
ecosystem goods and services for local communities (CBD, 2009; Chapin et al.,
2004). The core idea of EbA is to ensure the capacity of ecosystems to generate
essential services for climate change adaptation and requires ecosystems to be
managed as components of a larger adaptation landscape of which human activities
are a part (Devisscher, 2010). It can be defined as:
…management of ecosystems within interlinked social-ecological systems to
enhance ecological processes and services that are essential for resilience to
multiple pressures, including climate change (CBD 2009; Chapin et al.,
2004; Piran et al., 2009).
EbA builds on increasing evidence that natural resources play an important and cost‐
effective role in adaptation (Colls et al., 2009; World Bank, 2009;). An optimal EbA
strategy is based on maintaining ecological functions at the landscape scale in
combination with multi-functional land uses and multi-scalar benefits for multi-
occupational groups, including the extreme poor. It involves management of land
use (rice, other crops, vegetables, strip and riparian vegetation) inter-tidal systems
and functions (mangroves, biodiversity), wetland (fish ponds, shrimp ghers, sweet
and saline waters, fish, crabs, mollusks, and shrimp Post Larvae (PL). Such
management includes multiple occupational groups such as farmers, mangrove and
wetland users.
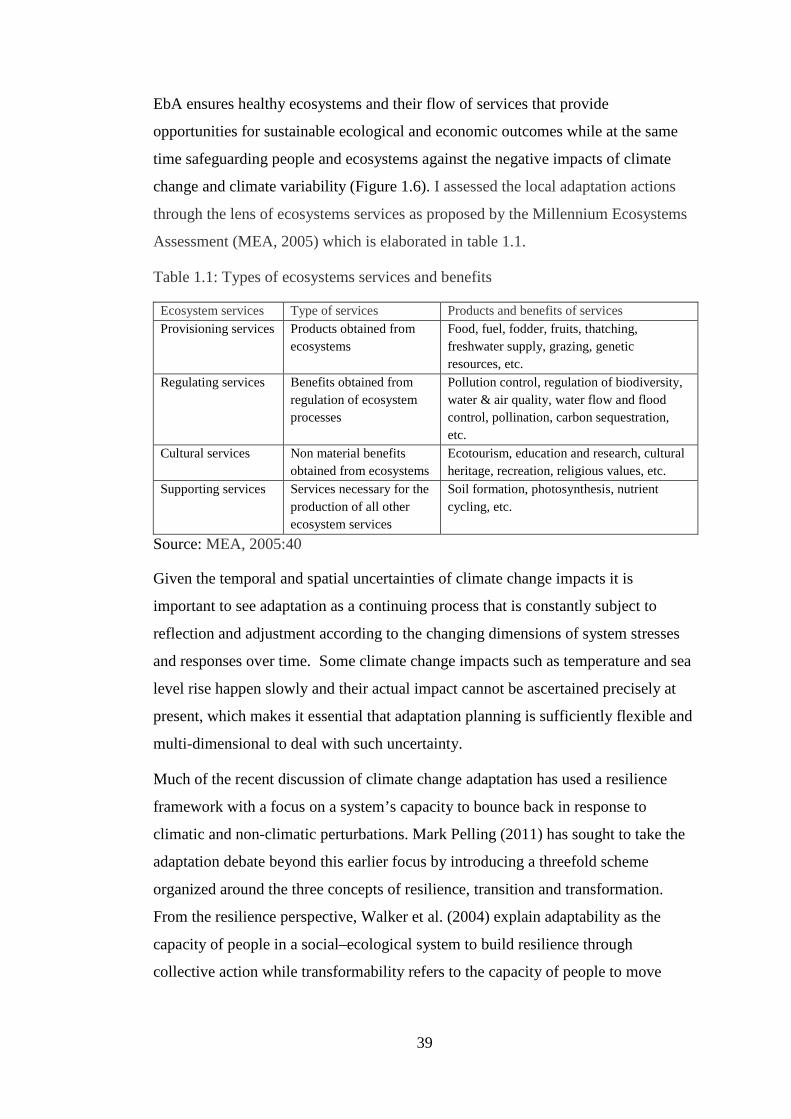
39
EbA ensures healthy ecosystems and their flow of services that provide
opportunities for sustainable ecological and economic outcomes while at the same
time safeguarding people and ecosystems against the negative impacts of climate
change and climate variability (Figure 1.6). I assessed the local adaptation actions
through the lens of ecosystems services as proposed by the Millennium Ecosystems
Assessment (MEA, 2005) which is elaborated in table 1.1.
Table 1.1: Types of ecosystems services and benefits
Ecosystem services Type of services Products and benefits of services Provisioning services Products obtained from
ecosystems Food, fuel, fodder, fruits, thatching, freshwater supply, grazing, genetic resources, etc.
Regulating services Benefits obtained from regulation of ecosystem processes
Pollution control, regulation of biodiversity, water & air quality, water flow and flood control, pollination, carbon sequestration, etc.
Cultural services Non material benefits obtained from ecosystems
Ecotourism, education and research, cultural heritage, recreation, religious values, etc.
Supporting services Services necessary for the production of all other ecosystem services
Soil formation, photosynthesis, nutrient cycling, etc.
Source: MEA, 2005:40
Given the temporal and spatial uncertainties of climate change impacts it is
important to see adaptation as a continuing process that is constantly subject to
reflection and adjustment according to the changing dimensions of system stresses
and responses over time. Some climate change impacts such as temperature and sea
level rise happen slowly and their actual impact cannot be ascertained precisely at
present, which makes it essential that adaptation planning is sufficiently flexible and
multi-dimensional to deal with such uncertainty.
Much of the recent discussion of climate change adaptation has used a resilience
framework with a focus on a system’s capacity to bounce back in response to
climatic and non-climatic perturbations. Mark Pelling (2011) has sought to take the
adaptation debate beyond this earlier focus by introducing a threefold scheme
organized around the three concepts of resilience, transition and transformation.
From the resilience perspective, Walker et al. (2004) explain adaptability as the
capacity of people in a social–ecological system to build resilience through
collective action while transformability refers to the capacity of people to move
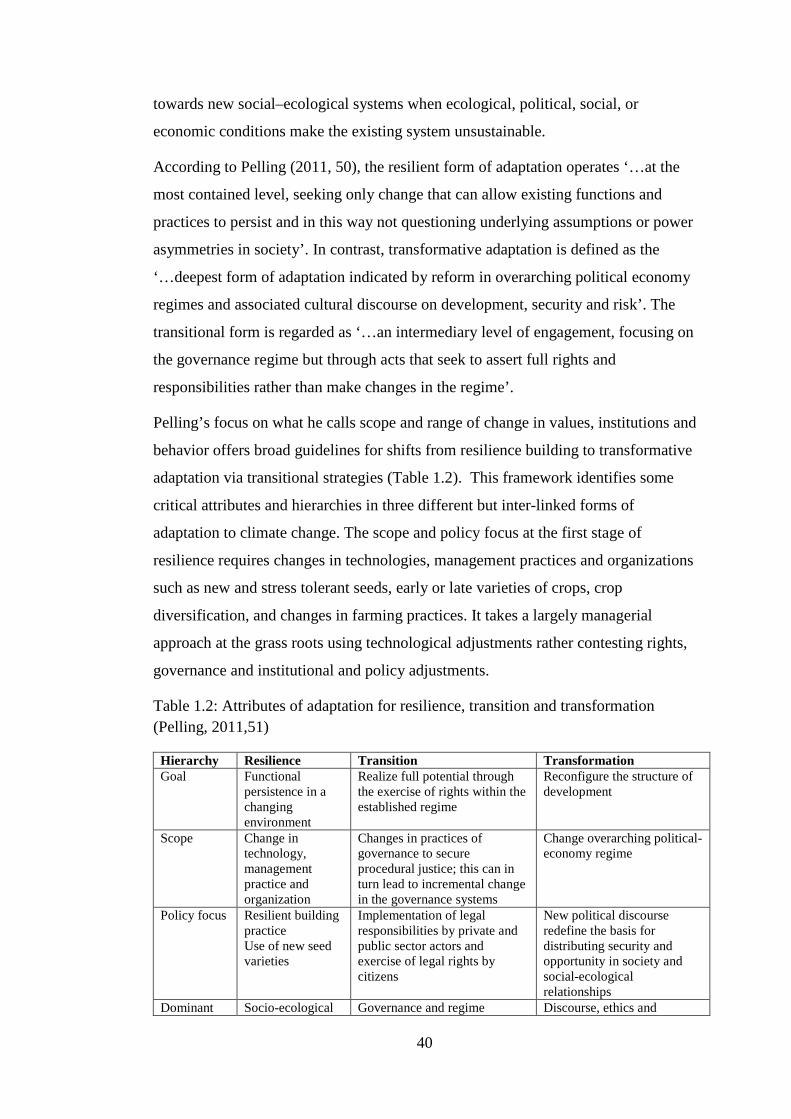
40
towards new social–ecological systems when ecological, political, social, or
economic conditions make the existing system unsustainable.
According to Pelling (2011, 50), the resilient form of adaptation operates ‘…at the
most contained level, seeking only change that can allow existing functions and
practices to persist and in this way not questioning underlying assumptions or power
asymmetries in society’. In contrast, transformative adaptation is defined as the
‘…deepest form of adaptation indicated by reform in overarching political economy
regimes and associated cultural discourse on development, security and risk’. The
transitional form is regarded as ‘…an intermediary level of engagement, focusing on
the governance regime but through acts that seek to assert full rights and
responsibilities rather than make changes in the regime’.
Pelling’s focus on what he calls scope and range of change in values, institutions and
behavior offers broad guidelines for shifts from resilience building to transformative
adaptation via transitional strategies (Table 1.2). This framework identifies some
critical attributes and hierarchies in three different but inter-linked forms of
adaptation to climate change. The scope and policy focus at the first stage of
resilience requires changes in technologies, management practices and organizations
such as new and stress tolerant seeds, early or late varieties of crops, crop
diversification, and changes in farming practices. It takes a largely managerial
approach at the grass roots using technological adjustments rather contesting rights,
governance and institutional and policy adjustments.
Table 1.2: Attributes of adaptation for resilience, transition and transformation (Pelling, 2011,51)
Hierarchy Resilience Transition Transformation Goal Functional
persistence in a changing environment
Realize full potential through the exercise of rights within the established regime
Reconfigure the structure of development
Scope Change in technology, management practice and organization
Changes in practices of governance to secure procedural justice; this can in turn lead to incremental change in the governance systems
Change overarching political-economy regime
Policy focus Resilient building practice Use of new seed varieties
Implementation of legal responsibilities by private and public sector actors and exercise of legal rights by citizens
New political discourse redefine the basis for distributing security and opportunity in society and social-ecological relationships
Dominant Socio-ecological Governance and regime Discourse, ethics and
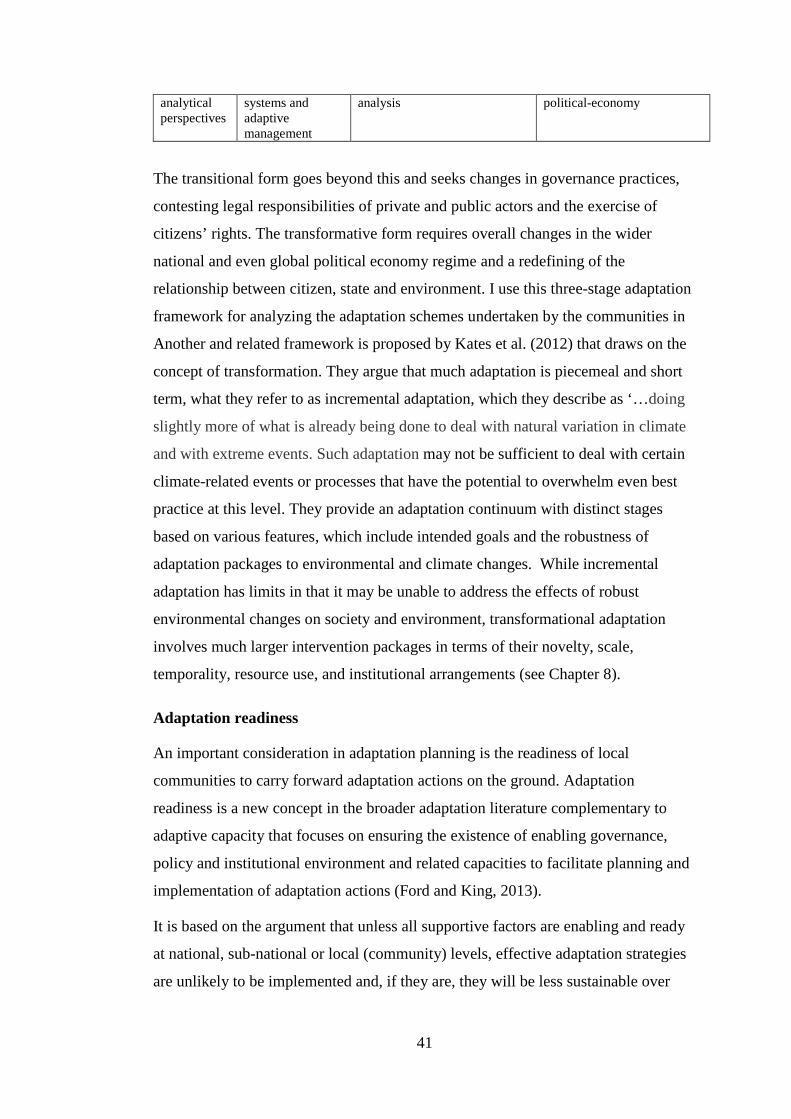
41
analytical perspectives
systems and adaptive management
analysis political-economy
The transitional form goes beyond this and seeks changes in governance practices,
contesting legal responsibilities of private and public actors and the exercise of
citizens’ rights. The transformative form requires overall changes in the wider
national and even global political economy regime and a redefining of the
relationship between citizen, state and environment. I use this three-stage adaptation
framework for analyzing the adaptation schemes undertaken by the communities in
Another and related framework is proposed by Kates et al. (2012) that draws on the
concept of transformation. They argue that much adaptation is piecemeal and short
term, what they refer to as incremental adaptation, which they describe as ‘…doing
slightly more of what is already being done to deal with natural variation in climate
and with extreme events. Such adaptation may not be sufficient to deal with certain
climate-related events or processes that have the potential to overwhelm even best
practice at this level. They provide an adaptation continuum with distinct stages
based on various features, which include intended goals and the robustness of
adaptation packages to environmental and climate changes. While incremental
adaptation has limits in that it may be unable to address the effects of robust
environmental changes on society and environment, transformational adaptation
involves much larger intervention packages in terms of their novelty, scale,
temporality, resource use, and institutional arrangements (see Chapter 8).
Adaptation readiness
An important consideration in adaptation planning is the readiness of local
communities to carry forward adaptation actions on the ground. Adaptation
readiness is a new concept in the broader adaptation literature complementary to
adaptive capacity that focuses on ensuring the existence of enabling governance,
policy and institutional environment and related capacities to facilitate planning and
implementation of adaptation actions (Ford and King, 2013).
It is based on the argument that unless all supportive factors are enabling and ready
at national, sub-national or local (community) levels, effective adaptation strategies
are unlikely to be implemented and, if they are, they will be less sustainable over
42
time. Ford and King (2013:5), who have done the pioneering work on this topic,
define adaptation readiness as:
…the extent to which human systems (e.g. nations, regions,
businesses, communities, etc.) are prepared to adapt, providing an
indication or measure of the likelihood of adaptation taking place.
They propose a framework that points to the existence of several barriers that may
affect the implementation of adaptation schemes even where the necessary adaptive
capacity is in place. In their view, adaptation is not only a technical matter but
includes political, social, institutional and governance issues. Trust and commitment
are considered central to successful adaptation and it is important to build up the
appropriate institutional framework that maximizes these core values. The concept is
particularly useful in the current research as many members of the local
communities studied have no or low trust in local government and local level central
government officials. Raihan et al., (2010) documented that local communities in
Bangladesh claim that the upazila and district level government officials seldom pay
visits to their locality and help solve their day to day problems related to their
livelihoods, health, disaster and other issues. Corrupt practices in disaster relief and
rehabilitation activities in cyclone Aila1 response and recovery activities in the
coastal zone created distrust among communities and institutional actors which
affected adaptation readiness on the ground and impaired the taking place of
effective adaptation (Raihan, et al., 2010: Mahmud and Prowse, 2012).
1 Cyclone Aila hit the southwestern coast of Bangladesh on 25 May 2009.

43
The concerns expressed by Raihan and his colleagues informed this research in that
it looks at local or community level adaptation readiness aspects and analyses
various relevant issues. These include awareness of and compliance with relevant
state laws and acts, performance of relevant government agencies mandated for local
development, community attitudes towards adaptation and their trust in local and
central government officials and their capacity and transparency in implementing
adaptation schemes.
Adaptation readiness goes beyond evaluating adaptive capacity, which gives a
picture of the theoretical potential of adaptation, and is concerned with whether
supportive measures and conditions exist for adaptation. In general sense it is argued
that if a system has enough adaptive capacity, it is more likely that the system can
better adapt to environmental changes in a given setting. However, a system may
have adaptive capacity but whether that capacity can be translated into adaptation
action is another matter. There may be institutional and other constraints and
barriers on translating adaptive capacity into actual action within a particular system
of interest (Figure 1.7). Adaptation readiness is concerned with the overall
preparedness of all related social and institutional systems to support planning,
designing and implementing adaptation actions on the ground. This concept cross-
cut the resilience-transformation continuum discussed earlier as it refers to the
translation of adaptive capacity into actual action for either resilience or
transformation.
Ford & King (2013) propose a national level framework for adaptation readiness
comprised of six overarching factors that contribute to enhancing adaptation
Figure 1.7: Conceptualization of the links between adaptive capacity and adaptation in an adaptation readiness framing (adapted from Ford & King, 2013)
Adaptive Capacity
Adaptation
Policy
Lack of political will
Legal obstacles
Absence of financial resources for adaptation
Limited coordination between actors Failures in collective
decision-making
Conflicting objectives among interest groups
Lack of clarity over who is responsible for action
Uncertainty over information for adaptation decision making
Set of Barriers
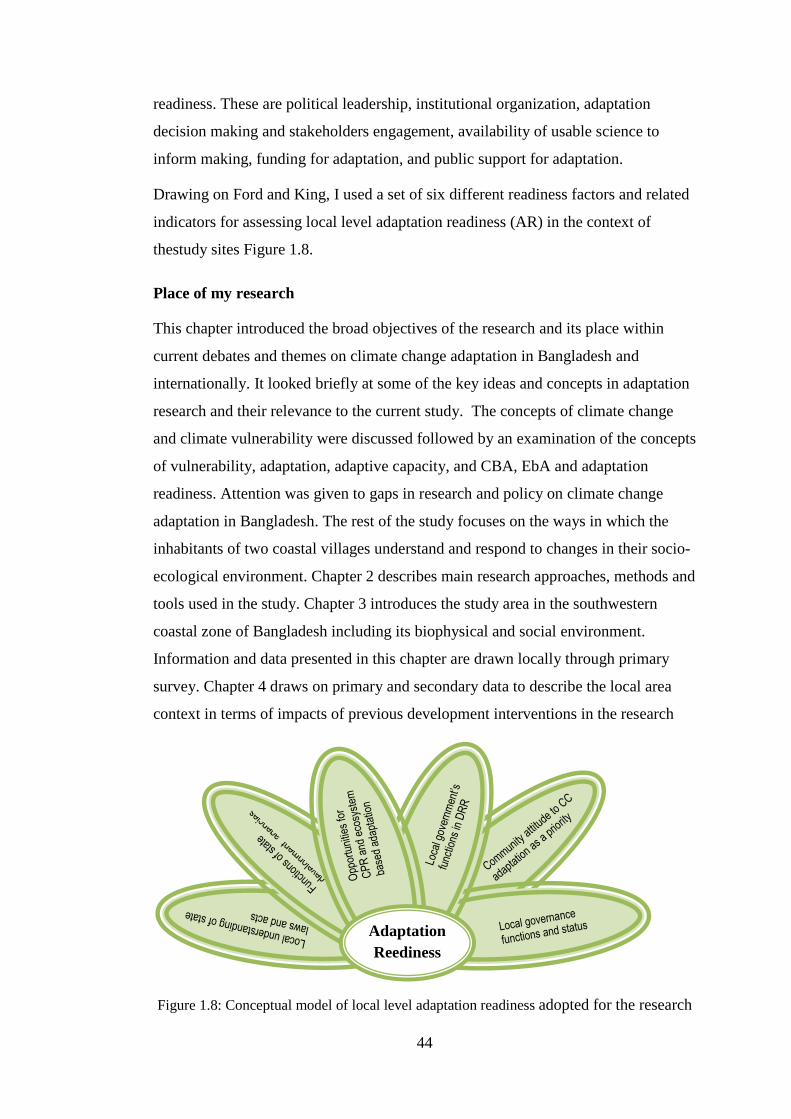
44
readiness. These are political leadership, institutional organization, adaptation
decision making and stakeholders engagement, availability of usable science to
inform making, funding for adaptation, and public support for adaptation.
Drawing on Ford and King, I used a set of six different readiness factors and related
indicators for assessing local level adaptation readiness (AR) in the context of
thestudy sites Figure 1.8.
Place of my research
This chapter introduced the broad objectives of the research and its place within
current debates and themes on climate change adaptation in Bangladesh and
internationally. It looked briefly at some of the key ideas and concepts in adaptation
research and their relevance to the current study. The concepts of climate change
and climate vulnerability were discussed followed by an examination of the concepts
of vulnerability, adaptation, adaptive capacity, and CBA, EbA and adaptation
readiness. Attention was given to gaps in research and policy on climate change
adaptation in Bangladesh. The rest of the study focuses on the ways in which the
inhabitants of two coastal villages understand and respond to changes in their socio-
ecological environment. Chapter 2 describes main research approaches, methods and
tools used in the study. Chapter 3 introduces the study area in the southwestern
coastal zone of Bangladesh including its biophysical and social environment.
Information and data presented in this chapter are drawn locally through primary
survey. Chapter 4 draws on primary and secondary data to describe the local area
context in terms of impacts of previous development interventions in the research
Adaptation Reediness
Figure 1.8: Conceptual model of local level adaptation readiness adopted for the research
45
sites themselves and wider region as a prologue to a discussion of the impacts of a
new generation of threats associated with climate-related changes.
Chapter 5 examines community perceptions and understanding of climate change as
a new generation of threats to local people’s lives and livelihoods. It presents
findings based on extensive primary data gathered through a KAP survey of village
communities, local government representatives, primary school teachers and local
staff of NGOs working in the area. Chapter 6 describes community observations and
concerns relevant to the effects of climate change and climate variability on the
livelihoods of various occupational groups in the study area. It shows that the
villages and the different occupational communities they contain have different
concerns over various climate induced problems affecting their lives and livelihoods
and the relevance of these differences for local adaptation programme development.
Chapter 7 analyses the livelihood vulnerability of the communities of the two project
villages considered as case study sites for the research. The livelihood vulnerability
index developed for the two villages is based on primary data collected from the
relevant villages supplemented by climate related data from the local Meteorological
Department. Chapter 8 presents community efforts, sometimes supported by outside
agencies, to adjust to or cope with the local environmental changes brought about by
climate variability and change. It also examines the annual development plans of
local government (UP) and governmental agriculture extension services at local
level including a brief analysis of barriers to adaptation in the area.
Chapter 9 focuses on issues relevant to “local adaptation readiness” in the area. It
seeks to highlight the extent to which the project communities and mainstream
development agencies of the central government are aware of the adaptation
measures needed to adapt to the impacts of a new generation of threats and
uncertainty associated with climate change and climate variability. This chapter is
largely based on primary data collected through applying KAP survey. Chapter 10
summaries the key findings of the project and makes some recommendations for
future research. The next chapter summarises the study approach, methods and tools.

46
Chapter 2: Methodology
Introduction
This chapter describes the overall research approach including the flow of
information and data sources and analytical aspects that I adopted in conducting the
field research during the course of my study. It begins by describing the research
approach, criteria for selecting case study villages and the different qualitative and
quantitative methods and tools used, which included GIS base mapping of land use
change in the study villages. The period of field research was from mid-2010 to
early 2012. Finally it presents the data analysis methods used.
Research Approach
The research was carried out in the southwestern coastal zone of Bangladesh at the
southern edge of the Lower Ganges Delta (LGD) that merges with the Sundarbans
Reserved Forest (SRF). Case studies on two place-based communities in the sub-
district of Shyamnagar under Satkhira district form the core of my research
approachand the sources of primary data. I selected two case study villages
purposively from a range of possible sites in the area in alignment with my research
objectives (Miles and Huberman, 1994). The case study villages were intensively
studied and I generated robust data sets on different social and occupational groups
on livelihoods, land use changes, disaster and climate or weather induced threats and
the like (Curtis et al., 2000).
I was assisted in my field work by two part time Research Assistants (RAs), Mr.
Shahidul Islam and Mr. Nur Hossain of CNRS (Center for Natural Resource
Studies), a Bangladeshi pro-environmental NGO that operates in different parts of
the country including Shyamnagar where I conducted the research. Mr. Islam is a
graduate in social science and has over 10 years of work experience in the area of
community-based natural resources management (CB-NRM) at the field level. Mr.
Hossain holds a diploma in agriculture with 3 years work experience in agriculture
and micro-credit. Hossain transferred to another part of the country and was
replaced by Mr. Pintu Biswas (Diploma in Agriculture). As paid employees of
47
CNRS their living and travelling costs were paid. However, we often shared meals,
the costs of which were met by me.
During initial orientation session the RAs received training on various technical and
methodological aspects of the study and field work. One particular question asked
by one of the RAs was the purpose and relevance of the research. My response was
that the research had both academic and policy aims and that the relevance of the
research to these aims would become clearer as the project progressed. I started my
field work with an open mind aiming to explore the project’s research questions,
which necessitated the use of a variety of research approaches and techniques. To
this end, apart from using quantitative methods, I relied heavily on qualitative
methods of data gathering which allowed me to explore more deeply local issues
related to historical change, changes in land use and livelihoods patterns, and
community responses to disasters and local environmental changes caused by
climate and non-climate related stressors and extremes. Figure 2.1 summarises the
detailed data collection steps and methods.
My case study approach included Focus Group Discussions (FGDs), Key Informants
Interviews (KII), transect walks, participants observation, pair wise rankings, trend
analysis and participant observation. These were applied in different time periods
with different sub-sets of communities in project villages. For example, I conducted
field work in Fultala village earlier than that of Chakbara village as Chakbara had
been severely affected by cyclone Aila in May 2009 and the whole village remained
inundated with tidal saline water until early 2011. Initially I conducted several KIIs
with elderly people of the village including women involved in different occupations
such as fishing, shrimp post larve (or shrimp PL) collection, shrimp farming, honey
collection and crab collection. This gave me a broad understanding of the context of
the village in relation to disaster vulnerability, impacts of cyclone Aila, embankment
management, land use and livelihood changes over time and livelihood dependence
of people on the resources of Sundarbans Reserved Forest (SRF), including primary
understanding of climate (or weather) variability related issues. Based on this
primary understanding of the relevant context of the areas in relation to my research
objectives, I finalized the data collection tools, checklists and drafted questionnaire
for quantitative surveys.

48
Figure 2.1: Schematic presentation of research methods and tools used in the study.
Selection of study area
-Field visit -Contextual analyses - Decision matrix
Selection of case study villages
Literature review Reconnaissance field visits
Quantitative - Household census -Household survey -KAP (knowledge, attitude and practice) survey
Determination of survey methods and
tools
- Transect walk - Observation - FGDs (focus group discussion) and KII (key Informant Interview)
Understanding of issues relevant to my research questions
Qualitative - KII, FGD, case studies -Pair-wise ranking - Land use mapping
Incorporate feedback from field testing
Designing, field testing and finalizing
of survey tools Incorporate feedback
from field testing
Editing, cleaning and analyses of data using MS Access software
Data collection and report generation
Transcription of KII, FGD and pair-wise
ranking data
Validating quantitative outputs with qualitative
/ i
Interpretation of Data outputs /maps and
Thesis writing
Validating qualitative outputs with quantitative outputs
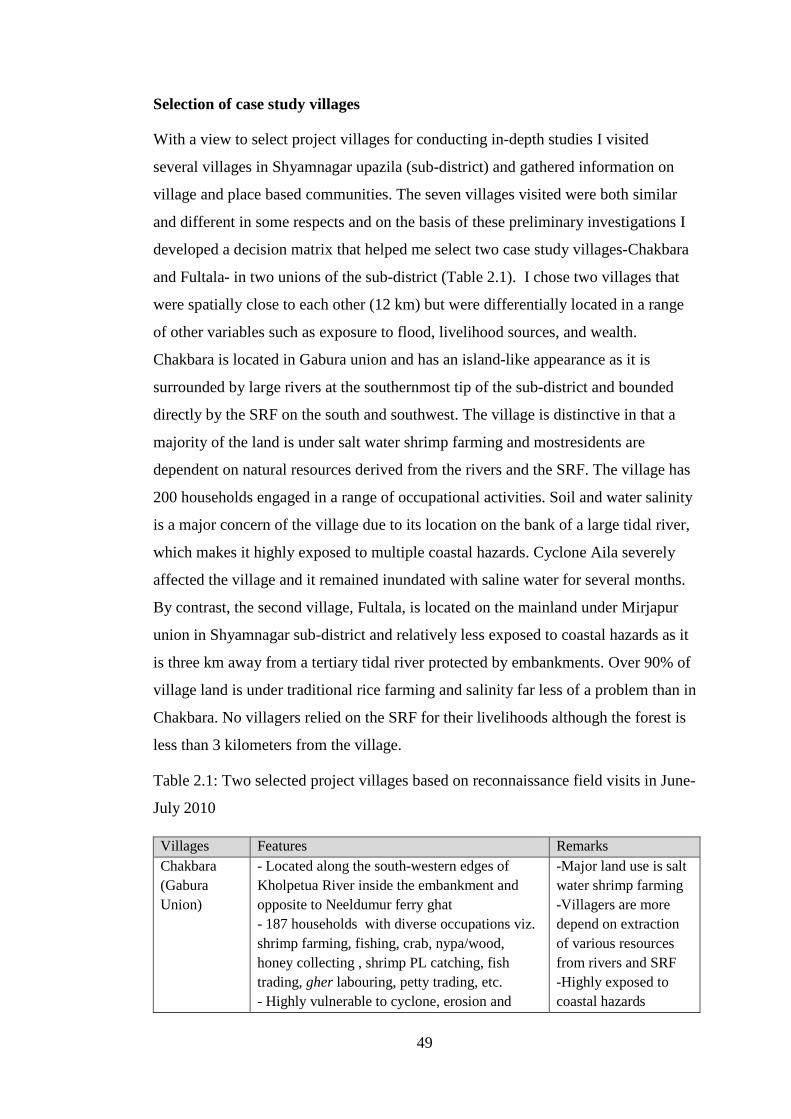
49
Selection of case study villages
With a view to select project villages for conducting in-depth studies I visited
several villages in Shyamnagar upazila (sub-district) and gathered information on
village and place based communities. The seven villages visited were both similar
and different in some respects and on the basis of these preliminary investigations I
developed a decision matrix that helped me select two case study villages-Chakbara
and Fultala- in two unions of the sub-district (Table 2.1). I chose two villages that
were spatially close to each other (12 km) but were differentially located in a range
of other variables such as exposure to flood, livelihood sources, and wealth.
Chakbara is located in Gabura union and has an island-like appearance as it is
surrounded by large rivers at the southernmost tip of the sub-district and bounded
directly by the SRF on the south and southwest. The village is distinctive in that a
majority of the land is under salt water shrimp farming and mostresidents are
dependent on natural resources derived from the rivers and the SRF. The village has
200 households engaged in a range of occupational activities. Soil and water salinity
is a major concern of the village due to its location on the bank of a large tidal river,
which makes it highly exposed to multiple coastal hazards. Cyclone Aila severely
affected the village and it remained inundated with saline water for several months.
By contrast, the second village, Fultala, is located on the mainland under Mirjapur
union in Shyamnagar sub-district and relatively less exposed to coastal hazards as it
is three km away from a tertiary tidal river protected by embankments. Over 90% of
village land is under traditional rice farming and salinity far less of a problem than in
Chakbara. No villagers relied on the SRF for their livelihoods although the forest is
less than 3 kilometers from the village.
Table 2.1: Two selected project villages based on reconnaissance field visits in June-
July 2010
Villages Features Remarks Chakbara (Gabura Union)
- Located along the south-western edges of Kholpetua River inside the embankment and opposite to Neeldumur ferry ghat - 187 households with diverse occupations viz. shrimp farming, fishing, crab, nypa/wood, honey collecting , shrimp PL catching, fish trading, gher labouring, petty trading, etc. - Highly vulnerable to cyclone, erosion and
-Major land use is salt water shrimp farming -Villagers are more depend on extraction of various resources from rivers and SRF -Highly exposed to coastal hazards
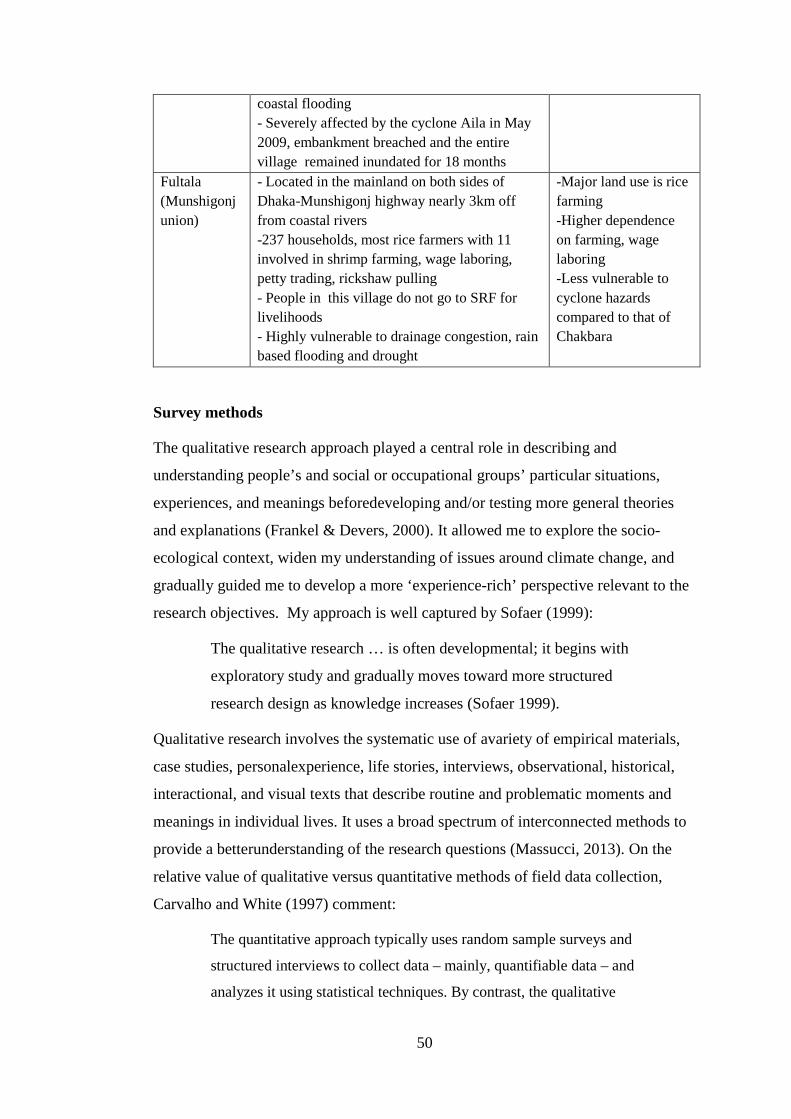
50
coastal flooding - Severely affected by the cyclone Aila in May 2009, embankment breached and the entire village remained inundated for 18 months
Fultala (Munshigonj union)
- Located in the mainland on both sides of Dhaka-Munshigonj highway nearly 3km off from coastal rivers -237 households, most rice farmers with 11 involved in shrimp farming, wage laboring, petty trading, rickshaw pulling - People in this village do not go to SRF for livelihoods - Highly vulnerable to drainage congestion, rain based flooding and drought
-Major land use is rice farming -Higher dependence on farming, wage laboring -Less vulnerable to cyclone hazards compared to that of Chakbara
Survey methods
The qualitative research approach played a central role in describing and
understanding people’s and social or occupational groups’ particular situations,
experiences, and meanings beforedeveloping and/or testing more general theories
and explanations (Frankel & Devers, 2000). It allowed me to explore the socio-
ecological context, widen my understanding of issues around climate change, and
gradually guided me to develop a more ‘experience-rich’ perspective relevant to the
research objectives. My approach is well captured by Sofaer (1999):
The qualitative research … is often developmental; it begins with
exploratory study and gradually moves toward more structured
research design as knowledge increases (Sofaer 1999).
Qualitative research involves the systematic use of avariety of empirical materials,
case studies, personalexperience, life stories, interviews, observational, historical,
interactional, and visual texts that describe routine and problematic moments and
meanings in individual lives. It uses a broad spectrum of interconnected methods to
provide a betterunderstanding of the research questions (Massucci, 2013). On the
relative value of qualitative versus quantitative methods of field data collection,
Carvalho and White (1997) comment:
The quantitative approach typically uses random sample surveys and
structured interviews to collect data – mainly, quantifiable data – and
analyzes it using statistical techniques. By contrast, the qualitative
51
approach is defined as one that typically uses purposive sampling and
semi-structured or interactive interviews to collect data – mainly,
data relating to people’s judgments, attitudes, preferences, priorities,
and/or perceptions about a subject – and analyzes it through
sociological or anthropological research techniques.
They conclude that both methods have strengths and weakness. The strengths of
quantitative method include making data aggregation possible, providing data and
results whose reliability is measurable and allowing simulation of different policy
options. The weaknesses include sampling and non-sampling errors, missing what is
not easily quantifiable and failing to capture intra-household issues. By contrast, the
strengths of qualitative methods are that they allow for a more contextually
grounded and richer definition of concepts such as “drivers of change” in complex
social ecosystem systems, they give more insight into causal processes, and provide
more accurate and depth of information (‘thick description’) on certain questions.
Their weaknesses include lack of generalizability and difficulties in verifying
information. Carvalho and White (1997) and McGee (2000) characterize
quantitative approaches as having breadth and qualitative approaches as having
depth. This study combines both approaches in an attempt to ensure a balance
between the diversity of local experiences and changes and the specific and in-depth
particularities of such experiences and changes.
Qualitative Methods
Key Informant Interview (KII)
Climate change is a new topic of research, more particularly, in rural setting where
the word climate seems abstract to the majority of local communities. As a means of
tapping local people’s understandings of climate or weather related problems and
issues, one of the methods used was that of the KII. Being an outsider, I first
explored the study villages and their environs, paying particular attention village
livelihoods, and their historical and present-day experiences of natural and human-
induced hazards, disaster events and processes and the wider issue of climate
change. A KII is an established qualitative survey tool that involves face to face
discussions/interviews with local persons who have good knowledge of the area, can
provide important insights into local worlds and can also assist as gatekeepers,
facilitating access to people, events and information (Jimenez, 1985). Using an

52
open-ended, semi/unstructured checklist based interviews, KII enabledme as an
outside researcher to gain many insightsinto local problems and issues, to raise
questions, and to analyze phenomena from different perspectives (Bogdan and
Taylor, 1975; Okamura, 1985). These informal interviewswere important in
designing FGD checklists, adjusting the number of focus groups to be discussed and
finalizing the structured interview schedule (Bryman, 1988).
In the first year of research, I conducted 29 KIIs using semi structured interview
checklists with representatives of various institutional stakeholders at the field level
(Table 2.2). A range of techniques are available when conducting KII. These are
informal talks, personal interviews, formal written questionnaires, telephone
interviews, group interviews or community forums and public hearings (McKillip,
1987). I relied on informal talks and personal interviews of the key informants using
a flexible checklist.
I and my RAs conducted all the semi-structured interviews except those with field
level BWDB (Bangladesh Water Development Board) officials which were done by
the RAs. For the local and international NGOs, I focused on their current activities
on disaster risk reduction and climate change adaptation, their understanding of local
vulnerability and initiatives taken by local communities in managing hazards and
other concerns. With government officials from departments of forests, agriculture
and fisheries I emphasised on their observation of climate related problems in the
locality and their current programmes/ activities to address climate related problems
in fisheries, agriculture and forests. Among the main issues of concern among both
officials and local people were shrimp farming versus rice farming, climate, fisheries
and agriculture, the status and abundance of various non-timber forest products
(NTFPs) of the SRF (fish capture, crabs, honey, nypa palm, catkin grass) and
problems related to access to SRF. The latter included the management of fisheries
in the SRF and the problem of increasing numbers of tiger attacks and were the key
discussion points with the local forest department staff.
At the outset of all interviews, I disclosed the purpose of the interview and
objectives of my research work before proceeding further. We used checklists as a
guide while interviewing respondents at government, NGO and community levels
including facilitating FGD sessions. Table 2.2 provides a summary of the number
and types of main stakeholders involved in the KIIs.
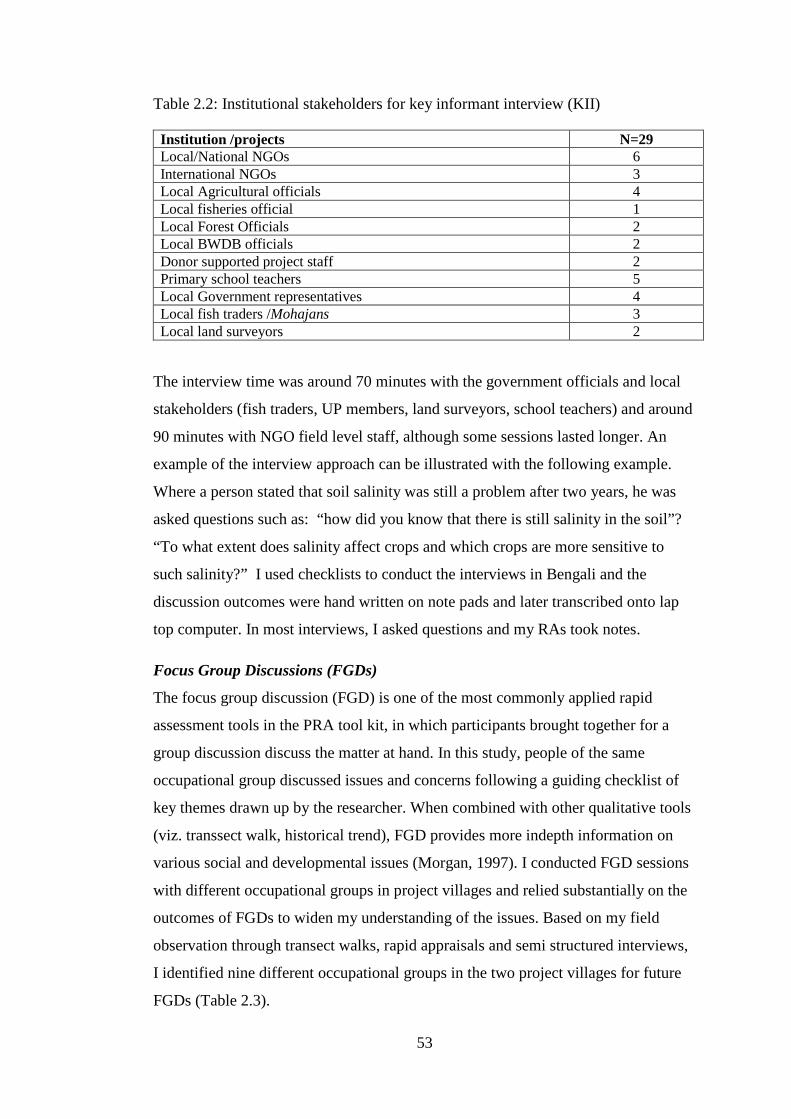
53
Table 2.2: Institutional stakeholders for key informant interview (KII)
Institution /projects N=29 Local/National NGOs 6 International NGOs 3 Local Agricultural officials 4 Local fisheries official 1 Local Forest Officials 2 Local BWDB officials 2 Donor supported project staff 2 Primary school teachers 5 Local Government representatives 4 Local fish traders /Mohajans 3 Local land surveyors 2
The interview time was around 70 minutes with the government officials and local
stakeholders (fish traders, UP members, land surveyors, school teachers) and around
90 minutes with NGO field level staff, although some sessions lasted longer. An
example of the interview approach can be illustrated with the following example.
Where a person stated that soil salinity was still a problem after two years, he was
asked questions such as: “how did you know that there is still salinity in the soil”?
“To what extent does salinity affect crops and which crops are more sensitive to
such salinity?” I used checklists to conduct the interviews in Bengali and the
discussion outcomes were hand written on note pads and later transcribed onto lap
top computer. In most interviews, I asked questions and my RAs took notes.
Focus Group Discussions (FGDs)
The focus group discussion (FGD) is one of the most commonly applied rapid
assessment tools in the PRA tool kit, in which participants brought together for a
group discussion discuss the matter at hand. In this study, people of the same
occupational group discussed issues and concerns following a guiding checklist of
key themes drawn up by the researcher. When combined with other qualitative tools
(viz. transsect walk, historical trend), FGD provides more indepth information on
various social and developmental issues (Morgan, 1997). I conducted FGD sessions
with different occupational groups in project villages and relied substantially on the
outcomes of FGDs to widen my understanding of the issues. Based on my field
observation through transect walks, rapid appraisals and semi structured interviews,
I identified nine different occupational groups in the two project villages for future
FGDs (Table 2.3).

54
The FGD sessions were conducted at village level as well as at the CNRS office
located at Munshigonj Bazar, 3 km from Fultala and 9 km from Chakbara. My first
attempt to hold the FGD session with women in Chakbara village failed due to the
intervention of a male person from the village. He took it upon himself to speak for
the women. We repeatedly requested him to stop and to allow the women to speak to
which he replied that they knew nothing about the issues under discussion. I stopped
the session and brought the women to the CNRS office to continue the FGD.
Each FGD session lasted around three hours, including introduction and explanation
of the purpose of the session. The actual time taken exceeded in most cases our
original intention of completing FGD sessions in two hours. In addition to invited
attendees of six to eight people, in most sessions sometimes up to five other persons
sat in voluntarily. Sessions were carried at the CNRS office at Munshigonj Bazaar of
Shyamnagar upazila and at village level. Participants who came to CNRS office
were offered a lunch and transport. Group discussions in Bengali were recorded
instantly on large brown paper sheets by the RAs and later transcribed into English
on my laptop. Table 2.3 lists characteristics of the FGD participants. The bulk of
participants were men, although women from rice farming and shrimp PL collecting
households were also involved.
Table 2.3: Participants of FGDs and pair wise ranking of climate induced problems
Occupational groups Village N= 60 (FGD participants)
1.Rice farmers Fultala 7
2.Women (Rice farming households) Fultala 8
3.Shrimp farmers Chakbara 7
4.Shrimp and rice farmers Fultala 7
5.Sea going fishers Chakbara 6
6.Women shrimp PL collectors Chakbara 6
7.Fishers fishing in rivers and SRF Chakbara 7
8.Honey collectors Chakbara 6
9.Crab Collectors Chakbara 6
With the FGD participants I conducted a pair wise ranking exercise of climate
induced problems facing different occupational groups in the villages. Pairwise
55
ranking is an effective PRA tool in social development studies to identify or assess
priority problems or solutions from a number of options or alternatives. Some
researchers also use this tool in climate change adaptation research in prioritizing
climate related problems and priority adaptation options (Ndathi et al., 2011; Codjoe
et al., 2011). I divided the FGD topics into two parts. In the first part, I discussed the
climate related problems they observed and encountered in their daily lives,
including in their work. In the second part, I used the pair wise ranking tool to
prioritize climate related problems by different occupational groups. The major part
of chapter 6 is based on the findings of the FGD and the pair wise ranking exercise.
Case studies and participant observation
I conducted several case studies on specific issues relevant to the two project
villages. These included the drivers of changes in village land use over time such as
embankment construction, breaching and maintenance in Chakbara village, land
grabbing and conversions of state owned canals and rivers in Fultala village and
their impacts on local social ecological systems.
The case studies brought to the surface some of the main institutional structures and
practices that underlie the activities of village people. They help to reveal the
unequal distribution of valued resources and how this inequality is manifested in
daily practice. For example, dadon is a traditional money lending system in the
country usually practiced in remote areas where levels of poverty are high. In the
coastal areas the dadon system is an age old practice where official or formal loans
and credit systems are inadequate or absent. In the case of fishers, mohajans or
money lenders usually provide advance credit to poor fishers and other resources
with exorbitantly high interest rates and with other conditions. To understand how
this system works, I conducted a case study of fisheries dadon system and held
several meetings with mohajons as well as dadon receiving fishers. The results of
this case study can be found in chapter 7. In addition to case study interviews, I
made systematic field observations and KII with the help of village level maps (CS
maps and hard copy Google maps).
Participant observation was applied at various times, especially in observing climate
resilient rice farming practices where farmers were trained to identify harmful insect
pests under a CNRS project on community based adaptation in agriculture. Farmers
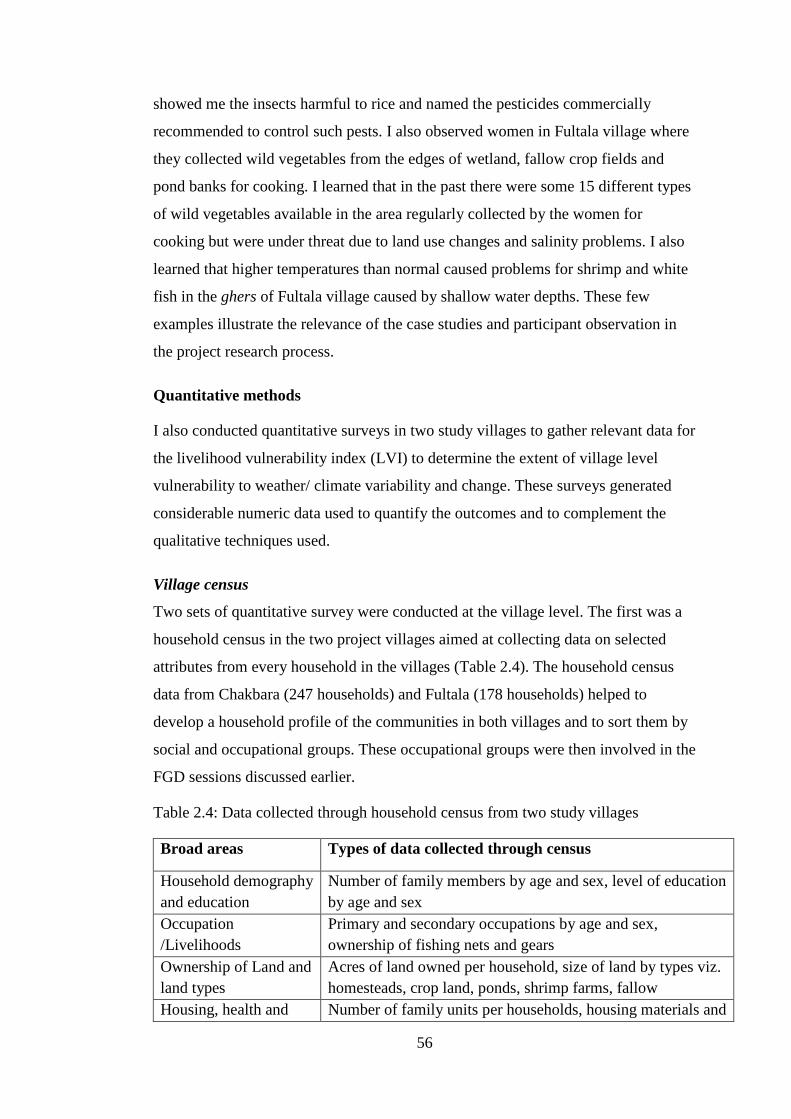
56
showed me the insects harmful to rice and named the pesticides commercially
recommended to control such pests. I also observed women in Fultala village where
they collected wild vegetables from the edges of wetland, fallow crop fields and
pond banks for cooking. I learned that in the past there were some 15 different types
of wild vegetables available in the area regularly collected by the women for
cooking but were under threat due to land use changes and salinity problems. I also
learned that higher temperatures than normal caused problems for shrimp and white
fish in the ghers of Fultala village caused by shallow water depths. These few
examples illustrate the relevance of the case studies and participant observation in
the project research process.
Quantitative methods
I also conducted quantitative surveys in two study villages to gather relevant data for
the livelihood vulnerability index (LVI) to determine the extent of village level
vulnerability to weather/ climate variability and change. These surveys generated
considerable numeric data used to quantify the outcomes and to complement the
qualitative techniques used.
Village census
Two sets of quantitative survey were conducted at the village level. The first was a
household census in the two project villages aimed at collecting data on selected
attributes from every household in the villages (Table 2.4). The household census
data from Chakbara (247 households) and Fultala (178 households) helped to
develop a household profile of the communities in both villages and to sort them by
social and occupational groups. These occupational groups were then involved in the
FGD sessions discussed earlier.
Table 2.4: Data collected through household census from two study villages
Broad areas Types of data collected through census
Household demography and education
Number of family members by age and sex, level of education by age and sex
Occupation /Livelihoods
Primary and secondary occupations by age and sex, ownership of fishing nets and gears
Ownership of Land and land types
Acres of land owned per household, size of land by types viz. homesteads, crop land, ponds, shrimp farms, fallow
Housing, health and Number of family units per households, housing materials and
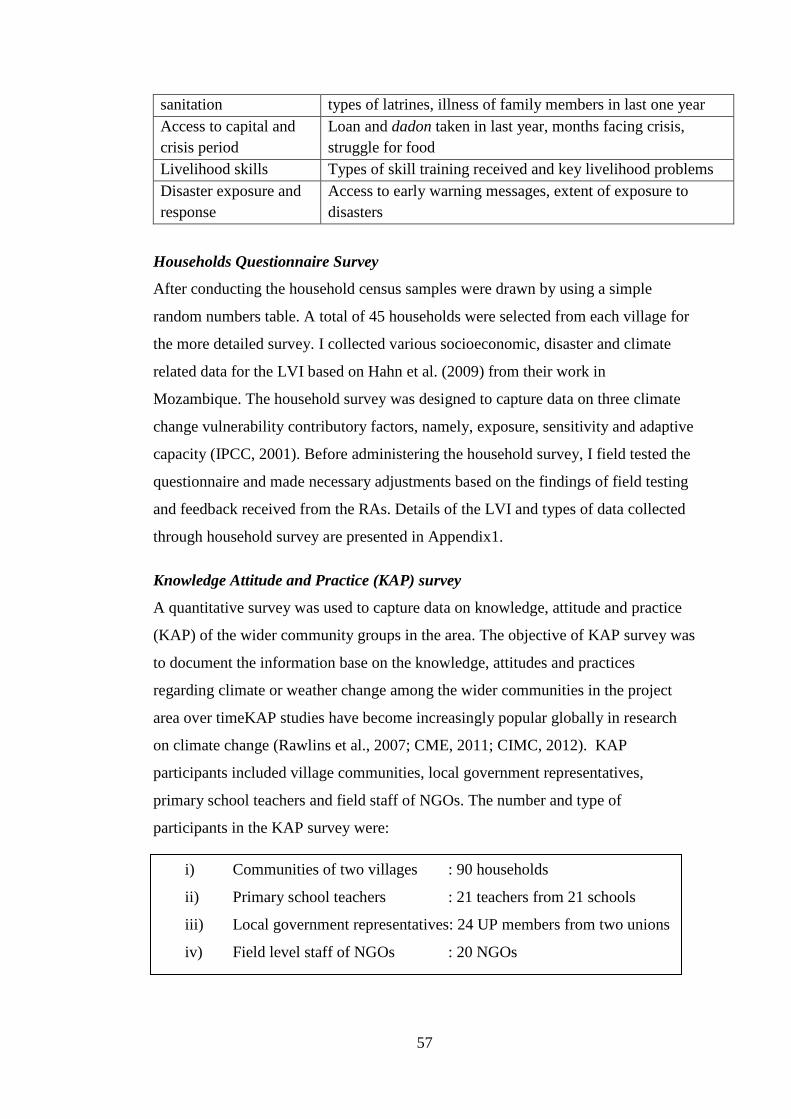
57
sanitation types of latrines, illness of family members in last one year Access to capital and crisis period
Loan and dadon taken in last year, months facing crisis, struggle for food
Livelihood skills Types of skill training received and key livelihood problems Disaster exposure and response
Access to early warning messages, extent of exposure to disasters
Households Questionnaire Survey
After conducting the household census samples were drawn by using a simple
random numbers table. A total of 45 households were selected from each village for
the more detailed survey. I collected various socioeconomic, disaster and climate
related data for the LVI based on Hahn et al. (2009) from their work in
Mozambique. The household survey was designed to capture data on three climate
change vulnerability contributory factors, namely, exposure, sensitivity and adaptive
capacity (IPCC, 2001). Before administering the household survey, I field tested the
questionnaire and made necessary adjustments based on the findings of field testing
and feedback received from the RAs. Details of the LVI and types of data collected
through household survey are presented in Appendix1.
Knowledge Attitude and Practice (KAP) survey
A quantitative survey was used to capture data on knowledge, attitude and practice
(KAP) of the wider community groups in the area. The objective of KAP survey was
to document the information base on the knowledge, attitudes and practices
regarding climate or weather change among the wider communities in the project
area over timeKAP studies have become increasingly popular globally in research
on climate change (Rawlins et al., 2007; CME, 2011; CIMC, 2012). KAP
participants included village communities, local government representatives,
primary school teachers and field staff of NGOs. The number and type of
participants in the KAP survey were:
i) Communities of two villages : 90 households
ii) Primary school teachers : 21 teachers from 21 schools
iii) Local government representatives: 24 UP members from two unions
iv) Field level staff of NGOs : 20 NGOs

58
Structured pre-coded questionnaires were used to conduct the KAP survey. The
questionnaire had three broad sections: current knowledge of stakeholders on
climate change issues; their attitude to relevant climate change issues in relation to
local perspectives; and current local practices that either address or have potential to
address climate change induced problems in the area. The KAP findings are
presented in chapters 5, 6, 8 and chapter 9.
Village Level Land Use Change Mapping
The project villages have both undergone changes in village characteristics and land
use patterns over time. To capture the historical changes in the village, I carried out
detailed mapping of the villages using maps and checklists. The mapping of various
villages attributes were done using micro level parcel maps (CS – Cadastral Survey
maps) collected from the Directorate of Land Records in Dhaka and used in
documenting at village level land use patterns existed in1970. Relevant village level
attribute data were recorded in data record forms as well as various attribute data/
signatures wiredrawn on the maps directly using different color pens. The CS maps
with marked signatures (polygons, lines) of attributes were then scanned and
digitized on screen using GIS technology (ArcGIS 9.3 and ArcView 3.3 softwares).
The final maps were produced by the GIS Analyst at the CNRS through colour
codes of polygons and lines and the areas of polygons were quantified for making
inter-village comparisons with relevant recent attributes. The mapping activity in the
villages and environs was carried out by the RAs with the help of local land
surveyors (locally called Amin).
To document the current (2012) land use patterns and resource systems of the
villages, mapping was done using recent Google maps (2012). The old CS maps and
recent Google maps were then compared to depict the changes in village attributes,
including land use, between 1970 and 2012. Before starting the fieldwork, Google
maps of project villages were digitized onscreen based on the identifiable image
signatures (such as ponds, settlements, rivers, and canals, which are easily
identifiable in satellite images). The digitized Google maps were then verified in the
field for accuracy. I used two types of base maps for capturing village attributes: the
CS maps of 1970 to capture land uses in the past, and a Google map of 2012 for
mapping the current situation. Figure 2.2 shows a partial view of Fultala village with
59
steps that I followed to produce the land use change maps using the CS maps and
Google maps.
Addressing sensitivity in the field
The project adopted several techniques to minimize or avoid unwanted problems,
disturbances and non-responsiveness of respondents. For example, people who
occupied khas land and built homes illegally on river banks, road side slopes and
boro pits/ ditches were unwilling to answer questions related to the legal status of
their homes and their rights over land and ditches. Most claimed the land was
recorded in their names and thus they were legal owners. We cross-checked this
information regarding legal ownerships of such land with other villagers and found
that most of the houses were built on khas land illegally, and the road side borrows
pits were illegally grabbed through bribing local officials and other influential
people.
Another sensitive issue was that of banditry in the SRF. Bandits have been known to
take people hostage and demand ransom money from fishers, honey collectors and
other SRF resource users. FGD participants in Chakbara were hesitant to talk about
the issue as they feared reprisals. The research team itself was possibly under threat
as we were told that there were many agents/allies of the bandits among the local
population. In order to minimize the concerns, we asked about security related issues
when in the SRF for fishing or collecting other resources. We changed the wording
of questions in the questionnaire and checklists and avoided the use of terms such as
“bandit”.
The research team was all male which presented some difficulties in a society with
strong patriarchal norms about contacts between men and women. In some families,
even elderly women were hesitant, unwilling or shy about talking to men from
outside the village. In Fultala I talked to women sitting on the veranda while the
women sat inside their rooms. There was a cloth fence between the room and
veranda so conversation was possible
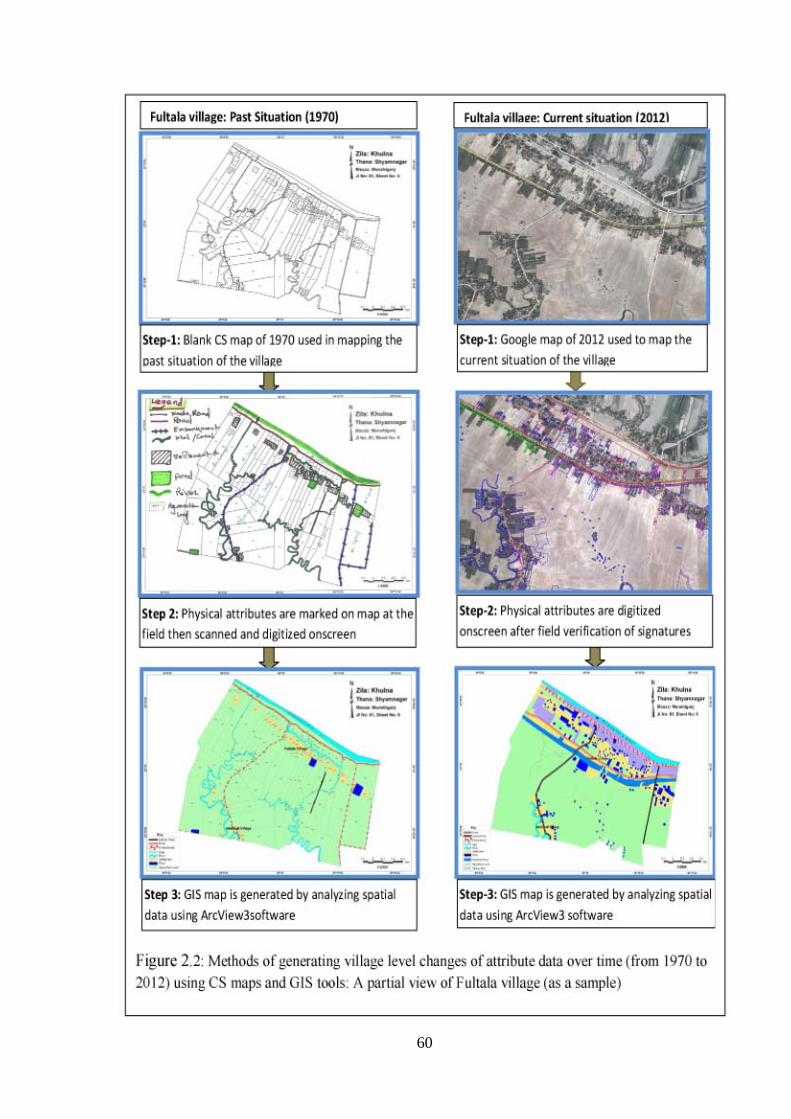
60
61
My RAs did not face such restrictions as they had long term working relationships
with the majority of the households and were allowed by both men and women to
conduct KII and FGDs with women in the study villages. In some cases, we used
beneficiary/ participating women members of CNRS projects to help organise FGD
sessions with women. Figure 2.3 shows some photographs of field data collections.
Methods of Analysis
In addition to the research methods discussed above, I reviewed published materials
from available secondary sources to provide a theoretical background to the study.
An institutional analysis was done at local level on the roles and responsibilities of
various actors engaged in grass roots development. The LVI analysis was based
almost entirely on primary data collected from the two villages through the village
census and household survey. The household survey data were coded manually and
entered into the computer after manual editing and computer aided cleaning tools
(logical checks) and the data were then analyzed using MS Access software. The
LVI study outcomes are presented in chapter 5. Similarly, the KAP survey data were
also manually coded and computerized using MS Access software. Findings of KAP
survey are presented in chapter 6 and 7.
The analytical findings based on qualitative data are presented in chapters 4 to 7.
Resource mapping outputs at village level that captured changes in physical resource
systems over time were computerized and spatial analyses of village attribute data
were done by applying the GIS tools (ArcGIS9.3 and ArcView3.3). Findings of the
GIS-based data and maps are presented in Chapter 4. A summary of key methods
and tools applied to gather primary and secondary data is presented in Table 2.5.
Table 2.5: Key Methodological Framework and Relevance to Thesis Chapters
Methods and tools Broader outputs /Key milestones Relevance to Thesis
KII, FGD, observation, transect walk
-Village selection decision matrix based on location, land use, occupation, livelihoods, disaster proneness -Two study villages selected as units of current research with place based communities
Basis for and sources of primary data for the thesis
Review of literature related to climate change, vulnerability and adaptation
-Understanding of theories related to weather, climate, vulnerability, adaptation and disasters -Theoretical considerations and framework for the current research work developed
Chapter 1& 2 and chapters (6, 7, 8, 9)
100% households (HHs) census (Chakbara-178
-HH demography, land holding, occupational pattern, Key livelihoods, Disaster exposure
Chapter 3 and 7
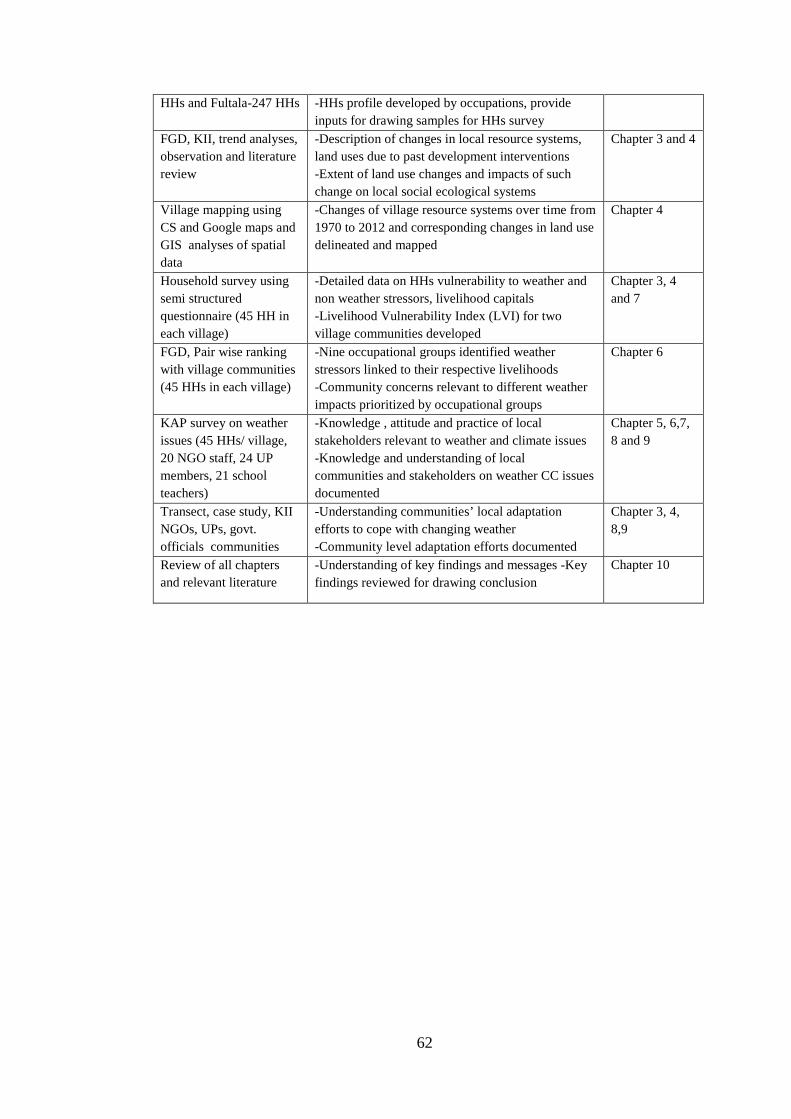
62
HHs and Fultala-247 HHs -HHs profile developed by occupations, provide inputs for drawing samples for HHs survey
FGD, KII, trend analyses, observation and literature review
-Description of changes in local resource systems, land uses due to past development interventions -Extent of land use changes and impacts of such change on local social ecological systems
Chapter 3 and 4
Village mapping using CS and Google maps and GIS analyses of spatial data
-Changes of village resource systems over time from 1970 to 2012 and corresponding changes in land use delineated and mapped
Chapter 4
Household survey using semi structured questionnaire (45 HH in each village)
-Detailed data on HHs vulnerability to weather and non weather stressors, livelihood capitals -Livelihood Vulnerability Index (LVI) for two village communities developed
Chapter 3, 4 and 7
FGD, Pair wise ranking with village communities (45 HHs in each village)
-Nine occupational groups identified weather stressors linked to their respective livelihoods -Community concerns relevant to different weather impacts prioritized by occupational groups
Chapter 6
KAP survey on weather issues (45 HHs/ village, 20 NGO staff, 24 UP members, 21 school teachers)
-Knowledge , attitude and practice of local stakeholders relevant to weather and climate issues -Knowledge and understanding of local communities and stakeholders on weather CC issues documented
Chapter 5, 6,7, 8 and 9
Transect, case study, KII NGOs, UPs, govt. officials communities
-Understanding communities’ local adaptation efforts to cope with changing weather -Community level adaptation efforts documented
Chapter 3, 4, 8,9
Review of all chapters and relevant literature
-Understanding of key findings and messages -Key findings reviewed for drawing conclusion
Chapter 10

63
Figure 2.3: Photographs of field data collection: Clockwise: 1) My Research Assistant (Sharif)
interviewing a women respondent; 2) My Supervisor (Prof. Bob Pokrant) and I in a meeting
with farmers of Fultala; 3) I am in an FGD session with women in Fultala (conservative family-
women sitting inside the room); 4) Research Assistant (Nur Hossain) in FGD with women
farmers of Fultala; 5) Research Assistant (Sharif) and I in an FGD session with farmers in
Chakbara, 6) My Supervisor I in a discussion with Chakbara villagers.

64
Conclusion
This chapter has described the project’s research approaches, methods and tools
used to gather data and information from primary and secondary sources and the
methods of data analysis and interpretation. It briefly mentioned the socio-cultural
sensitivities I encountered and how I sought to overcome them. The next chapter
provides a description of the research site and the various resource systems upon
which village livelihoods are based.
65
Chapter 3: Biophysical and Socioeconomic Environment of
the Study Area Introduction
This chapter gives an overview of the environmental and social context of the study
area. In describing the environment, emphasis is placed on the biophysical and
socio-economic components including changes in the socio-ecological environment
brought about by various shocks and stresses that have impacted on the area from
time to time. I start by giving an overview of the coastal zone of Bangladesh in
general followed by a description of the study area located along the southwestern
coast tidal plain of the lower Ganges delta. I discuss the ecological setting of the two
villages their socio-economic organization in the Shyamnagar sub-district under
Satkhira district. Information presented in this chapter is based on secondary sources
and primary data collected through household survey, focused group discussions
(FGDs) and Key Informants Interviews (KII) with village residents and other
individuals at local and national levels.
Coastal zone of Bangladesh
Bangladesh has a coastline of 710km, which faces the Bay of Bengal (BoB) in the
south. It has diverse morphological features ranging from dynamic unstable coasts to
more settled land, areas with high elevated hilly terrain to low lying coastline below
mean sea levelsubject to recurrent tidal flooding (CZPO, 2005). The coastal zone of
Bangladesh (hereafter CZ) comprises of 19 districts and 147 sub-districts out of a
total of 64 and 460 respectively covering an area of 47,201km2 which is 32% of the
total landmass of the country (PDO-ICZMP, 2004; CZPO, 2005). Based on the
proximity to the sea or lower estuary and exposure to hazards, the coastal zone is
divided into two sub-zones, an ‘exposed coast’ (areas at the extreme south and
bounded by the sea directly) and the ‘interior coast’ located north of the exposed
coast, bounded by land or rivers and away from the sea (PDO-ICZMP, 2003). Of the
147 coastal sub-districts, 48 under 12 districts represent the ‘exposed coast’ and
considered highly vulnerable to coastal hazards (cyclones, storm surges, sea level

66
rise, salinity, coastal flooding, erosion) compared to that of the ‘interior coast’
(Figure 3.1). The coastal zone of Bangladesh can also be sub-divided spatially into
three sub-zones, based on morphological features (Pramanik, 1983; Islam, 2001;
Islam, 2004):
• Eastern coastal zone - stretches from Bodormokam, the southern tip of
mainland Teknaf sub-district to the Feni river estuary in Feni district. The
zone is narrow and possesses higher elevated land and hilly areas with soil
features dominated by submerged sands and mudflats (Islam, 2001). Most of
this zone is stable compared to other sub-zones and thus erosion and
accretion is minimal in this part of the coast.
• Central coastal zone - extends from the Feni River estuary point to the
eastern corner of the Sundarbans Reserved Forest (SRF) – the world’s largest
single mangrove forest and is more dynamic in nature with continuous
erosion and accretion. The River Meghna is the drainage outlet of a large
catchment of three mighty rivers in South Asia viz. the Ganges, Brahmaputra
and Meghna (GBM) which drain water from an area larger than the size of
Bangladesh – over 92% drainage catchment of the country is outside its
borders. Annually an estimated 2.4 billion tons of silt are deposited in the
Bay of Bengal by the GBM River systems (Milliman and Meade, 1983).
• Western coastal zone - covering greater Khulna district to the Raimongal
River on the southwest border with West Bengal, India. The entire area is
part of the floodplain of the Ganges River and thus called Ganges Tidal Plain
or lower Ganges delta. The SRF covering 6,017sq.km is located in this sub-
zone (FD, 2004). This sub-zone is relatively stable compared to the central
coast but suffers from higher salinity and tidal flooding. Average land
elevation of this sub-zone is below 1.5 m mean sea level and thus susceptible
to tidal flooding.
This complex coastal zone with varying morphology, hydro dynamics,
environmental and resource endowments, including patterns of community
livelihoods across the coast line, is protected by earthen embankments constructed in
the nineteen sixties in order to protect people, crops and assets from cyclones,
coastal flooding and salinity (Schmidt, 1969).

67
The densely populated coastal zone accommodates 35.1 million people, the majority
of whom are landless poor, and many live in geographically vulnerable areas such as
coastal embankments and some small and dynamic island that are highly exposed to
climate extremes. Some of the unsettled coastal islands where people live are still
below the mean sea level and are subject regular tidal inundation and thus not
suitable for long-term human habitation. Rich and diverse fisheries, fertile land,
profitable aquaculture potential, mangrove forests, cattle grazing land in newly
accreted land, and salt production have attracted mainly poor people to settle and
make their livelihoods in the coastal zone (MoEF, 2005). Although land is fertile,
there is high salinity for 4-5 months a year during winter when rainfall is very low.
During the monsoon, people cultivate mainly monsoon rice (amon rice) in most of
the coastal land. Except for parts of the southwestern and southeastern coasts, people
can grow two to three crops a year within the embanked areas adopting farming of
diverse non rice crops such as chili, pulses, soybean, cucumber and water melon
(CCC, 2009.b). Apart from the agriculture and livestock activities, aquaculture is
another profitable and lucrative livelihood in the coastal area and much of the land
in the southwest and southeast are now under fish (carps and catfish) and shrimp
aquaculture (Paul and Vogl, 2011). Livestock (mainly buffalo) rearing in newly
accreted chars (island) in the Bay of Bengal has been a common practice in the
coastal zone by the better-off but has also created opportunities for the poor to get
jobs as ranchers. In most cases, these poor buffalo grazers are helped by the buffalo
owners to get permanently settled in these newly accreted islands, which requires a
lengthy legal process in obtaining official transfer of the land. . The landless who
take care of the buffalo herds in the low lying newly accreted char land in the coast
(lower estuary) take huge risks in living in such locations where government support
is largely absent (Rahman & Biswas, 2013). Often these low-lying lands are
unprotected by embankments and highly unstable and unsuitable for human
habitation. In the land adjoining the SRF, people from upstream areas settled and
cleared many areas of the forest in the past, particularly during British rule (1770s-
1947). They survived on agriculture, fishing and harvesting the various resources of
the SRF.
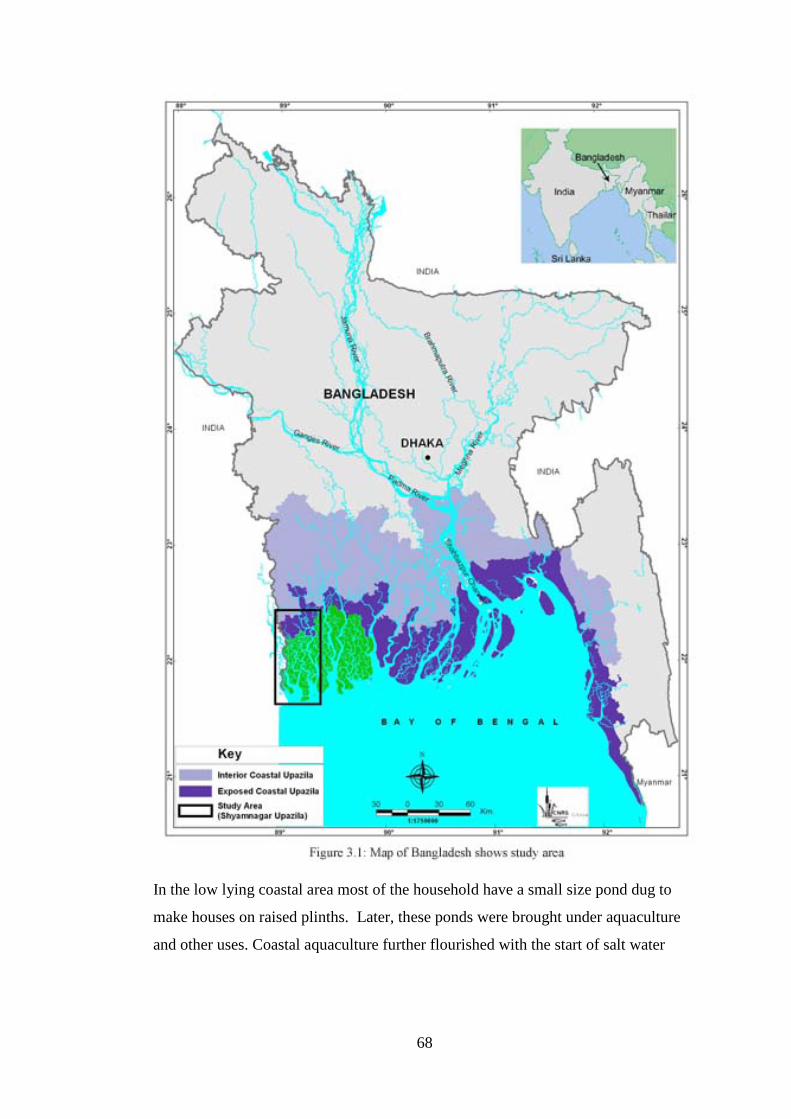
68
In the low lying coastal area most of the household have a small size pond dug to
make houses on raised plinths. Later, these ponds were brought under aquaculture
and other uses. Coastal aquaculture further flourished with the start of salt water
69
shrimp farming in converted rice paddies called ghers2 in areas within the coastal
polders where salinity of water is higher. Salt water shrimp farming first started in
the southeastern district of Cox’s Bazar and in the southwestern district of Satkhira
where salinity levels were high enough to support shrimp farming. The coastal zone
of Bangladesh not only supports the people in production based livelihoods but also
creates wider opportunities for communities to subsist on extractive resources viz.
fishing, collecting timber and non timber resources from coastal waters and SRF.
The SRF is regarded as a rich natural treasure for its potential to serve people with
its multiple resource systems year round. A rich diversity of fish, shrimp and crabs,
nypa palm, honey, wax, fuel, wood, grasses & thatching materials are some of the
resources of SRF that have been benefiting the communities over centuries (FAO,
1994; Chowdhury & Asrafi, 2008). The SRF alone provide direct livelihood support
to over 300,000 Bangladeshis (Hossain, 2001). Besides, this dense patch of
mangrove swamp also serves as the natural protective barrier against cyclones and
storm surges.
Apart from the livelihood benefits and disaster risk reduction services, the SRF is a
world heritage site, and the first Ramsar site in Bangladesh that provides home for
diverse flora and fauna unique in the country and in the region. These include the
Bengal Tiger, marsh crocodiles, spotted deer, dolphins, sea turtles nesting sites and
many species of resident and migratory birds. All these natural habitats, mangroves
and unique biodiversity of flora and fauna still survive despite having been
repeatedly disturbed by multiple natural and human-induced hazards in the form of
cyclones, storm surges, erosion, salinity, expansion of settlements, agriculture and
shrimp farming, and wood cutting.
The coastline along the southern boundary faces the Bay of Bengal is subject to
tropical cyclones (CZPO, 2005) with a major tropical cyclone hitting Bangladesh
coast every 3 years. This means that communities often have little time to recover
from one cyclone before the next one arrives (MoEF, 2009). Over the last 100 years
508 tropical cyclones formed in the Bay of Bengal of which 17% hit Bangladesh
coast with variable impact in the form of human deaths and injuries and property
2Ghers are shallow ponds in converted rice paddies made to farm shrimps and white fish in coastal saline prone areas of Bangladesh
70
damage. The great Bhola cyclone in 1970 alone took 500,000 lives with an instant
loss of other assets including crops and infrastructure. The 1991 cyclone also
caused the death of over 140,000 people with major loss of crop and other asset
losses. Two recent cyclones that hit the country in 2007 (Sidr) and 2009 (Aila)
caused less human death compared to previous cyclones, but left huge damage of
physical assets and coastal production systems. Sidr alone caused loss and damage
of over US $ 1.6 billion.Rahman and Biswas (2013) analyzed data on cyclones for
the last 200 years and found that the number of occurrences of major cyclones has
increased in the recent decades from only three during 1846-1896 to thirteen during
1897-1947 rising to 51 during 1948-1998.
The Bangladesh NAPA (National Adaptation Programme of Action) highlighted that
the coastal zone will be particularly vulnerable to the combined effects of climate
change, sea level rise, subsidence, and changes of upstream river discharge, cyclone
and coastal embankments (BCAS/RA/Approtech, 1994; WB, 2000). This will
produce four key physical effects: saline water intrusion; drainage congestion;
extreme events; and changes in coastal morphology which would further intensify
the vulnerability of the coastal population (WB, 2000). Apart from natural hazards,
the coastal zone of Bangladesh, particularly the southwestern coast has also been
impacted by various anthropogenic shocks over time that influenced changes in land
uses and livelihood patterns of the people..
Introduction to the study area
The study area is located at the southwestern coast of Bangladesh in Shyamangar
upazila (sub-district) under Satkhira district protected by the SRF (Sundarbans
Reserved Forest)on the south (Figure 3.1). The area was selected due to the
convergence of various processes relevant to climate and non-climate hazards,
which have affected people’s livelihoods. The analysis of peoples’ vulnerability to
climate and non-climate stressors provides an opportunity to understand local
people’s perceptions of climate change and the steps they are taking to adapt to
changing local social and ecological circumstances. The Shyamnagar upazila is
located at the southern end of Satkhira district and is exposed to the sea as well as
the SRF to the south. The study area is located at the southernmost part of the
upazila close to the SRF while the east, north and western sides are bounded by land

71
used for salt water shrimp farming, settlements and roads. The northwestern part of
the upazila shares a common border with India while the southwestern part is
bounded by the Indian part of the Sundarbans.
The entire coastal area of this upazila is protected by embankments along the rivers.
In making the embankments, many canals and small rivers were either completely
closed or water flow was regulated by sluice gates. There is erosion and accretion of
land along the rivers. In some areas the SRF is expanding and moving towards the
settlements, by eroding the coastal embankment. In an effort to make adjustments to
the erosion, the embankments are realigned almost every year in some of the river
points as seen along the Chunar River at of Burigoalini and Munshigonj unions and
Dumuria and Chakbara villages of Gabura union.
I carried out in depth case studies in two villages named Chakbara under Gabura
union and Fultala under Munshigonj union of Shyamnagar upazila. (Figure 3.2).
Being located in the vicinity of the SRF, people from Chakbara, especially the poor
have higher dependence than Fultala on fisheries and various other forest-based
natural resources for their livelihoods. Although currently overexploited, a good
numbers of people still depend on the diverse resources (fish, crabs, shrimps, honey,
72
nypa palm, grasses, woods, etc. are the major resources) of the SRF. Apart from
livelihood resources, SRF also provides home to rich wildlife fauna including the
Bengal tiger, deer, boars, monkeys, marsh crocodiles, dolphins and varieties of
birds. Considering the unique biodiversity value and high exploitation of resources,
three designated areas of the SRF at southern end have been declared as wildlife
sanctuaries and a World Heritage Site and the first Ramsar site in Bangladesh. The
periphery of SRF (10 km radius) is declared as an ecologically critical area (ECA)
by the Government of Bangladesh under the Environment Conservation Act 1995
(MoEF, 1999).
The then East Pakistan Water and Power Development Authority (EP-WAPDA)
constructed permanent embankments along the entire coast line between 1967 and
1968 in order to protect the area from tidal surges, the intrusion of saline water and
to protect the amon rice crop, which was the only rice crop grown in the area at that
time. However, the protective embankment and water control structures facilitated
salt water shrimp farming in the area, which had a negative impact on amon rice
cultivation.
The growth of the shrimp culture industry was so rapid that in a few years it
engulfed the entire area and almost completely changed the land use from rice
cultivation to salt water shrimp farming. Salt water shrimp farming started more than
25 years ago in Munshigonj and Burigoalini unions between 17 and 18 years ago in
Gabura union. Currently, shrimp farming covers most of the cropland of Gabura
union except some areas where due to land elevation watering is difficult and
whereamon rice is cultivated in monsoon. Before shrimp farming, people used to
grow amon rice and vegetables. Freshwater white fish species such as shol (Channa
striata –large snakehead), taki (Channa punctata- small snakehead), and boal
(Wallago attu– large catfish) were fairly common in rivers, canals and beels in this
island union. Rice farming, fishing and the SRF were the key sources of livelihood
before the introduction of shrimp ghers. In its early days, shrimp farming was
controlled by urban investors and local rich people who were politically powerful
and able to influence the local poor as well as local administration including the
local government (union parishad). At that time, small land holders were pressured
to rent out their land on hari (rent) to large shrimp farmers instead of doing shrimp
farming individually. Many outside large investor/ farmers pulled out after the
73
outbreak of viral white spot syndrome in the late 1990s that created spaces for many
smallholders to get back their land. MMany small farmers now farm shrimps by
themselves.
By contrast, in the village Fultala, located in the coastal high saline zone, the major
land use is rice farming, vegetable cultivation, fish culture in ponds and road side
ditches including limited shrimp-cum-rice farming. The village is well connected to
growth centers by motorable road and thus the communication system is far better
than that of Chakbara. People in Fultala do not go to the SRF but depend more on
local agriculture based wage laboring, rickshaw pulling, earth cutting and seasonal
migration to distant places. Fultala, due to its geographical location on the mainland,
is less exposed to coastal hazards.
Rivers, embankments and people
The use of embankments in the coastal area to protect rice is an old practice. During
the British colonial era, an embankment was small in dimensions, usually about 1.4
m wide and 1.8 m height. Every year, usually in the month of July-August, in some
places the embankments were breached by tidal water. The representatives of the
Zamindars3 (traditional landlords) used to visit the embankments during monsoon to
oversee local people/ farmers who repaired weak areas and raised the embankment
height if needed. The Zamindars made such work mandatory for the local people.
Usually if a farmer had 5 bigha4 of land (0.61 ha), he was given an area of
approximately 4.6 m embankment to maintain. It was the Zamindar’s retainers who
determined which embankments were to be maintained and by whom and rule
breakers were prevented from farming to ensure compliance.
The River Kholpetua, flowing east to west on the northern edges of the villages
Chakbara and Dumuria, was previously narrower and deeper. Elderly people of the
village stated that some 50 years ago the depth of river was over 15 m near
Chakbara and Dumuria villages, and the width of the river was just half what it is
3A Zamindar was an aristocrat, typically hereditary, who held enormous tracts of land and held control over his peasants. The Zamindars reserved the right to collect taxes (often for military purposes). The Zamindari system was originally a way of collecting taxes from peasants during Mogul times. After 1793, the British sought to turn them into progressive land owners while paying limited tax. For many, improving the land and waters under their control was less important than delegating the working of the land to the peasantry from whom they derived rent. 4 1 bigha equals to 0.33 acre of land (0.134 ha)
74
now. In the past water currents were slower because of the presence of multiple
active river channels, which allowed tidal waters to go upstream. People started
observing sedimentation, erosion and widening of rivers immediately after the start
of the withdrawal of water from the Ganges by the Farakka barrage on the Indian
side of the border in 1975. Rivers started widening and informants stated that rivers
in the SRF area became shallower and wider and more dynamic while their upper
reaches that used to feed the SRF with freshwaters became drier and some became
dry and moribund.
Although local people used to regulate coastal flooding by making small seasonal
bunds, elderly people in project villages could recall that the first embankments were
constructed by the Zamindars during the British regime. Elderly villagers reported
that in 1916 the first embankment or bundh was constructed in this area by the local
Zamindar, Hemnatha Shaynnal, who lived in Kolkata. The employees of Mr.
Shaynnal came to the area and organized local people to construct the bundh. The
width of bundh at that time ranged from 1.4 m to-1.7 m with the height variability
between 1.8 and 2.1 m. The alignment of the first bundh constructed was about 105
m north (inside the Kholpetua River) from the present embankment alignment.
Villagers used to call this embankment “Moniber First Bundh”. The word “Monib”
means “owner or ruler” and “bundh” means dyke. The slopes and scaffolding area of
the embankment were full of mangrove trees and bushes so that the dyke did not get
eroded easily. People often sighted tigers on the embankment and crocodiles in the
river near to Chakbara and Dumuria villages. They cultivated rain fed amon rice in
the raised land and fished in the low-lying beel areas for most of the year.
In 1926 when the first Moniber bundh was threatened and almost washed away by
tidal waters, a second bundh was constructed 37 m north from the alignment of
existing embankment which was named “Moniber Second Bundh”. During the
Pakistan period (1947-1970) local villagers continued to repair the embankment as
and when required. Usually the Chowkider (Watchman or Gatekeeper) monitored
the embankment and whenever repairs wererequired he informed the local UP
Chairman (called President of the UP during Pakistan regime, locally elected with
responsibility for looking after local development issues). The Chairman distributed
the responsibility to repair respective allocated portions to local villagers based on
landownership and the financial conditions of households. The village leaders
75
(Mattabbors) called all the villagers and started the repairwork, which was
monitored by the local Chairman. Every year people repaired the bundh during the
pre-monsoon (March-April) and closely monitored the conditions of bundhs from
the beginning of the monsoon (June) until rice was harvested in November.
In 1953 the Third bundh was constructed, some 27 years after the construction of the
second. It took about 2 years to complete through engagement of local people and
hired labourers.
In 1968, the EP-WAPDA constructed a new embankment along the current
alignment as part of its new coastal embankment construction plan. The dimensions
were wider (27 m base with 3 m top and 3 m height). This was the third
embankment in the current alignment constructed in one year around the entire
Gabura union. The Muniber Bundh was retained when the new embankment was
constructed. While constructing the embankment, WDB also installed four sluice
gates in Gabura union for drainage purposes. After construction, repair work (earth
filling to raise the height) was done in the mid-1980s. Since the 1960s, no major
shifts of alignment were needed except in some places due to localized erosion of
river banks.
While the Gabura union has continued to have major problems maintaining the
embankments to protect them from cyclones and tidal inundation, Fulata village has
suffered from illegal occupation and conversions of rivers and canals and shortages
of freshwater for irrigating their rice crops.
Social and Institutional Settings of the study area
There are nine UPs (Union Parishads) in this sub-district5. Each union is
administered by a body of elected representatives comprised of nine ward members,
three women members and an administrative secretary and the whole council is
headed by an elected Chairman. All Chairmen of the unionsunder a sub-district are
coordinated and guided by the Upazila Nirbahi Officer (UNO – the Chief Executive
of the upazila). As per the constitution of the Government of Bangladesh, UPs are
the lowest tier of the local government system administered centrally by the
5Union Parishad or Union Council is the local government body and the lowest administrative boundary governed by locally elected representatives for a period five years
76
Ministry of Local Government and Rural Development (MoLGRD). The UP is the
grass roots nodal point for various government committees and structures for
providing day to day support and services to the communities of respective
constituencies. For example, the lowest tier of the National Disaster Management
Committee (DMC) is at the UP level and the UP Chairman heads the Union Disaster
Management Committee (UDMC) vested with the responsibility of planning and
execution of disaster related activities at the union level.
At the upazila level there is the Upazila Development Coordination Committee
(UDCC) where all UP chairmen and all government agency officials are members. It
is chaired by the elected upazila Chairman and is administratively coordinated by
the UNO as representative of central government. Respective line agency officials
such as the Department of Fisheries, Department of Agriculture Extension,
Department of Cooperatives, Women Affairs, etc. render their services to the
communities in coordination with the UPs. Besides, there are special departments
like the Forest Department (FD) and the Water Development Board (BWD) that are
represented in the Shyamnagar upazila but these departments do not operate in all
upazilas of the country. In general, the administrative processes and institutional set
up is more or less identical in all the upazilas of Bangladesh. However, community
level social, economic, cultural and livelihood attributes vary from sub-district to
sub-district, union to union, village to village depending on their social and
economic characteristics, which are largely determined by land and asset holding,
education and occupation and one’s position in local political networks.
Household characteristics of study villages
Chakbara has a smaller population than Fultala. There are 178 households in
Chakbara with a population of 783, while Fultala has 247 households with 1,100
people (Table 3.2). Average family size was 4.4 people per household in Chakbara
and 4.45 in Fultala (household census from 2010). However, the number of female
headed households was greater in Chakbara–13.5% or 24 households compared with
only 4% (10 households) in Fultala. More than half of households (54%) in
Chakbara village do not have their own homesteads. They either live on khas6 land,
6State owned land, by law, landless poor get preference in accessing cultivable khas land on long term basis
77
on embankments or on friends’ and relatives’ land. In Fultala, only 17.4% of
households do not have their own homestead land. This indicates higher poverty and
landlessness in Chakbara village. A major reason for this difference is that in
Chakbara, most land has been converted to shrimp farming and remains under water
(ghers7) for much of the year. In Fultala rice farming dominates and there is more
land available for expansion of homesteads.
Regarding educational status, significant differences were found between the two
villages. Census data shows that 41% of household heads in Chakbara were illiterate
compared with only 15% in Fultala. The villages are sharply different in terms of
occupational status and livelihoods features. In Chakbara nearly half of the
household heads’ (44.4%) primary occupations or livelihood means is shrimp post-
larvae collection (male and female headed households combined) while in Fultala
51% are crop farmers of rice and vegetables. With regard to villagers’ second most
important occupation, in Chakbara 13% of households are shrimp farmers while in
Fultala nearly 18% are dependent on wage laboring in agriculture. In the case of
female-headed households, occupational dependence varied by gender and village.
With regard to primary occupation, 62.5% of female- headed households in
Chakbara are dependent on shrimp post-larvae collection while in Fultala 60% of
female-headed households are engaged in household activities rather than direct
income earning outside the home (Table 3.2). In both villages, women are engaged
in off-farm activities, particularly wage work, as their second most important
occupation – 21% of female head households in Chakbara are engaged in off-farm
activities compared with 20% in Fultala.
In rural Bangladesh, size of homestead land is an important indicator of householder
well being and social status. Wealthy families have higher land ownership, a good
income from agriculture, aquaculture, service and/or business investments. Wealthy
families have larger homes on more land. In Chakbara 30% of families or almost
every third family has homestead land of up to 0.004 ha only compared with 2.4%
households in Fultala (Figure 3.3). Every second family in Chakbara has homestead
land from 0.004 - 0.008 ha compared with only 2% of families in Fultala. The data
shows that over 50% of families in Fultala village have homestead areas over 0.04
7Ghers are shallow ponds made by converting rice paddies for shrimp farming in the coastal zones of Bangladesh

78
ha compared with only 5% of households in Chakbara village (Figure 3.3). Land
scarcity is an important factor in accounting for village differences in land and
homestead size. Chakbara is located on low-lying land with shrimp farming
covering much of the area.
The villages vary widely in terms of the construction materials of houses. Concrete
houses are costly and durable and are an indicator of a higher standard of living.
While both villages have a high proportion of households whose homes are made
from non-concrete materials, which indicates a general lack of prosperity in both
villages. Fultala is better off in this regard. In Fultala, 5.3% and 13.4% households
had concrete floors and wall materials compared to 0% and 1.7% respectively in
Table 3.2: Households socioeconomic features of two project villages
HHs features Name of Villages
Chakbara Fultala No of HHs 178 247 Total population of villages 783 1,100 Family size 4.4 4.45 Female headed HHs 13.5 % 4.0% HH have own homestead land 46.1% 83.4% HHs heads with no formal literacy 10.1% 14.6% HH heads can only write his/ her names 30.9% 2.8% HH heads aged above 60 years 15.7% 14.2%
Top most primary occupation of HH heads (total) 44.4% - Shrimp PL catching
51.0% Rice Farming
Second most primary occupation of HH heads (total) ) 12.9% Shrimp farms 17.8% agri. laborers Top most primary occupation of HH heads (female headed HHs)
62.5% - Shrimp PL catching
60% HH activities
Second most primary occupation of HH heads (female headed HHs)
20.8% off-farm wages
20% on-farm wages
Top most secondary occupation of HH heads (total) 63.5% fishing 31.6% earth cutting
Second most secondary occupation ( HH heads (total) 41.6% earth cutting 21.5% on-farm wages
30.3 50
13.5 1.7
3.4 1.2
2.4 2
18.2 24.7
20.6 32
HHs having hometead land upto 0.004 ha
HHs having hometead land between 0.004 - 0.008 ha
HHs having hometead land between 0.012-0.2 ha
HHs having hometead land between 0.024-0.04 ha
HHs having hometead land between 0.04 -0.08 ha
HHs having hometead land above 0.16 ha
Figure 3.3: Households with size of homestead land in study villages (village census: n=247 Fultala and n= 178 Chakbara)
Chakbara Fultala
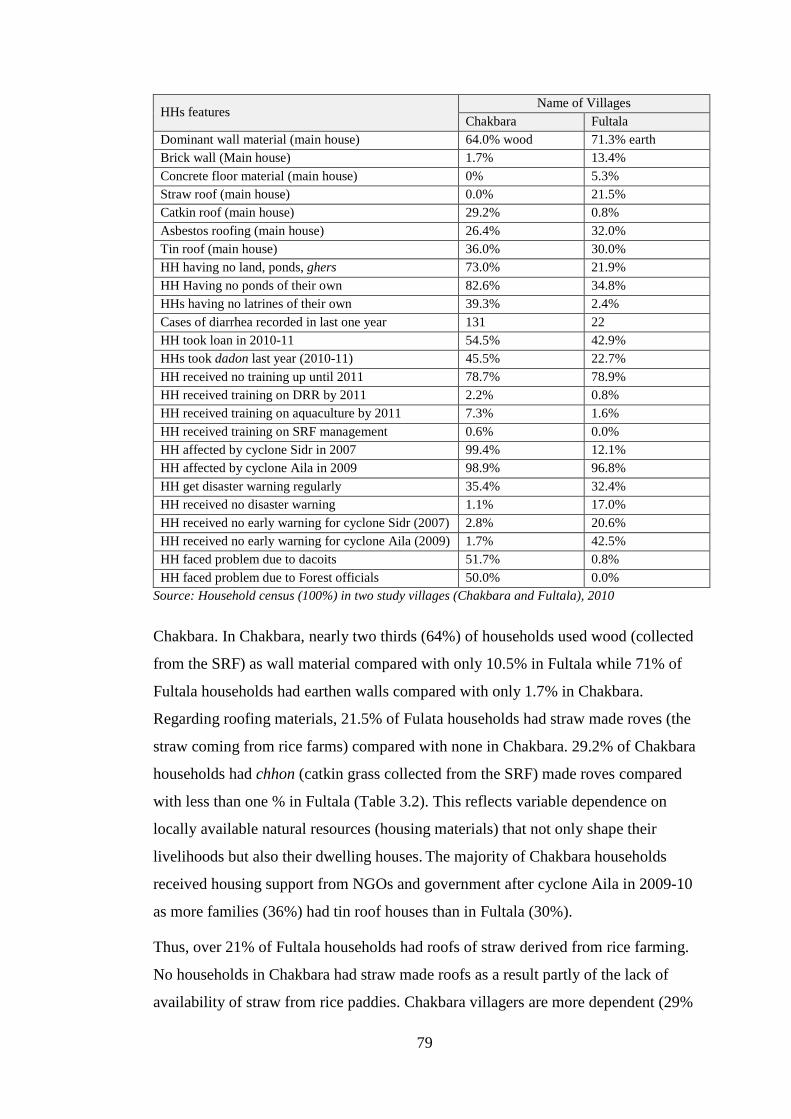
79
HHs features Name of Villages
Chakbara Fultala Dominant wall material (main house) 64.0% wood 71.3% earth Brick wall (Main house) 1.7% 13.4% Concrete floor material (main house) 0% 5.3% Straw roof (main house) 0.0% 21.5% Catkin roof (main house) 29.2% 0.8% Asbestos roofing (main house) 26.4% 32.0% Tin roof (main house) 36.0% 30.0% HH having no land, ponds, ghers 73.0% 21.9% HH Having no ponds of their own 82.6% 34.8% HHs having no latrines of their own 39.3% 2.4% Cases of diarrhea recorded in last one year 131 22 HH took loan in 2010-11 54.5% 42.9% HHs took dadon last year (2010-11) 45.5% 22.7% HH received no training up until 2011 78.7% 78.9% HH received training on DRR by 2011 2.2% 0.8% HH received training on aquaculture by 2011 7.3% 1.6% HH received training on SRF management 0.6% 0.0% HH affected by cyclone Sidr in 2007 99.4% 12.1% HH affected by cyclone Aila in 2009 98.9% 96.8% HH get disaster warning regularly 35.4% 32.4% HH received no disaster warning 1.1% 17.0% HH received no early warning for cyclone Sidr (2007) 2.8% 20.6% HH received no early warning for cyclone Aila (2009) 1.7% 42.5% HH faced problem due to dacoits 51.7% 0.8% HH faced problem due to Forest officials 50.0% 0.0%
Source: Household census (100%) in two study villages (Chakbara and Fultala), 2010
Chakbara. In Chakbara, nearly two thirds (64%) of households used wood (collected
from the SRF) as wall material compared with only 10.5% in Fultala while 71% of
Fultala households had earthen walls compared with only 1.7% in Chakbara.
Regarding roofing materials, 21.5% of Fulata households had straw made roves (the
straw coming from rice farms) compared with none in Chakbara. 29.2% of Chakbara
households had chhon (catkin grass collected from the SRF) made roves compared
with less than one % in Fultala (Table 3.2). This reflects variable dependence on
locally available natural resources (housing materials) that not only shape their
livelihoods but also their dwelling houses. The majority of Chakbara households
received housing support from NGOs and government after cyclone Aila in 2009-10
as more families (36%) had tin roof houses than in Fultala (30%).
Thus, over 21% of Fultala households had roofs of straw derived from rice farming.
No households in Chakbara had straw made roofs as a result partly of the lack of
availability of straw from rice paddies. Chakbara villagers are more dependent (29%
80
of households) on chhon (catkin grass) made roof house as this grass is available in
the SRF. Only two households in Fultala had catkin grass for roofing. Landless and
poor Chakbara villagers living close to the SRF extract various non-timber products
(wood, catkin) from the nearby forest to make their houses while relatively better off
people in Fultala village use other available alternatives such as clayinstead of forest
products The variable dependence on the SRF for basic resources makes the
villagers variably sensitive to climate stressors. Scientific modeling suggests that a
one meter rise in sea level will destroy 75% of the SRF and the resources upon
which many depend. Similarly, increased salinity intrusion is likely todegrade the
quality soils of Fultala village, with major impacts on farming as well as availability
of materials for house building. Dealing with these risks makes it important for
local peoples to think of alternatives to these essential basic materials in adaptation
planning.
A good number of households in the study villages do not possess any land-based
livelihood assets such as cropland, fish ponds or shrimp ghersand thus fall under the
extreme poor category, subsisting on forest and land-water based extractive
resources, wage laboring in agriculture and shrimp ghers, earth cutting and various
other seasonal petty occupations including out-migration. The higher number of
households that fall under the extreme poor category indicates higher vulnerability
to various shocks. Nearly three quarters of total households (73%) in Chakbara have
no crop land, fish ponds or shrimp ghers, which indicates high poverty and high
vulnerability compared just over one-fifth (22%) in Fultala.
Extractive and production-based activities are both highly sensitive to various
climate and non-climate stressors and thus people from both villages have high
levels of vulnerability to shocks, even though their livelihood means are different.
This situation also indicates that there exists high variability among geographically
concentrated coastal communities in terms of their livelihoods, nature, extent and
types of exposure, sensitivity to stressors and thus their level of adaptive capacity to
cope with hazards impacts.
Availability and access to financial capital often help poor and marginalized families
to diversify their income opportunities and family incomes. In Bangladesh, there are
various formal and non formal micro finance facilities available. Local people have
access to two different forms of credit systems, loans from wealthy people (often
81
called mohajon) in the locality usually with high interest rates of around 100%
annually – also called mohajony loan) and micro credit from NGOs, with around
15% annual interest. Extreme poor households are usually excluded from access to
NGO loans.
The other means of accessing capital is through the dadon system. Here a trader
provides an advance to fishers, crab collectors, shrimp farmers and rice farmers on
condition that he or she must sell their produce or harvest at a lower price than the
market price that particular trader known as dadonder8 or mohajon. Many
commentators consider the dadon and mojhajony loan system as exploitative due to
its high interest rates and stringent terms and conditions. NGO micro credit is
considered less exploitative because of its low interest rate and flexibility in use of
funds. However, such loans follow a strict regime of weekly repayments, which can
be difficult for some borrowers (FGD with study villagers, 2010).
More Chakbara households are dependent on loan and dadon systems than in
Fultala. As reported 55% and 43% households in Chakbara and Fultala respectively
had borrowed loan in the last year (2010-11). During the same period, 46% and 23%
households from Chakbara and Fultala respectively received dadon for various
purposes. Although dadon is considered as a debt trap for the poor, there remain
hardly any other options for the extreme poor who are not considered reliable clients
by NGOs to get micro credit.
The household census data shows that until mid-2011, nearly 80% of households did
not receive any training to enhance their skills or assets, which indicates the poor
performance of both government and NGOs. In the case of disaster management,
only 2.2% and 0.8% households of Chakbara and Fultala villages respectively
received any relevant training. With regard to livelihood enhancement, only 7.3%
and 1.6% households from Chakbara and Fultala respectively were trained in fish
culture and only 0.6% households of Chakbara received any assistance with SRF
management. Until mid-2011, no training was given to communities on climate
change impacts, adaptation and climate resilient livelihoods. In summary, local
8Dadonders or mohajons are usually the traders. Those who provide loans to fishers are the ‘fish traders’ and those who lend to crab collectors are ‘crab traders’. They have offices at fish/crab landing centers and buy fish or crabs from fishers or collectors (mostly from those who borrowed dadon /money from them) and sell them to other retailers or wholesalers.

82
peoples have relied largely upon their own skills and resources to maintain their
livelihoods.
Key livelihood activities
Communities in the two study villages engaged in diverse extraction and production
based livelihood activities yearround (Figure 3.4). Fishingin the rivers and canals
inside and outside the Sundarbans is one of the oldest occupations in the area. In the
past, lower caste Hindu communities (such as Bagdi, Munda) dominated fishing,
which was regarded by the majority Muslim population as both a low caste and low
class occupation. More recently and partly as a result of increased shrimp farming,
which requires less labour than traditional rice growing, many Muslim poor have
shifted into fishing, which has led to increasing competition with traditional Hindu
fishers. In addition, the fishing industry as a whole has seen the introduction of new
fishing gear and craft, which has contributed to a further intensification of fishing
effort.
The fishers in the area can be grouped into three broad categories based on their
scale of operation, mode of fishing and fishing grounds. First, there are the sea-
going fishers who fish in the lower estuary or Bay of Bengal (BoB). Second, there
are fishers who operate mostly in the rivers and canal, both inside and outside the
SFR, and use several fishing. They often go as far as 30km from their villages and
many of them spend 2-5 days on each fishing trip. Third, there are local forest or
bada fishers who fish mostly in small rivers and canals inside the SFR and usually
within 15 km. from their villages. Among the bada fishers, there are traditional
Hindu, particular Bagdi, and Muslim fishers. There are over 100 from Chakbara and
Dumuria villages who fish in the lower estuary and in the BoB just south of the SRF
with some venturing further off-shore in winter when the sea is calm. They use two
types of fishing gear, bindi jal (Set bag net) and goisha jal (large gill net) with a
large mesh size. Common fishing locations in the lower estuary include
Manderbaria, Talpatti, Vehala, Kaila areas on the south west sides of the
Sundarbans, about 35-40km from their villages and it takes about 48 hours by
manually powered boat to reach there. They fish for such species as datina (Lutjenus
spp), bhol (Epinephelus fasciatus), vetki (Sea perch- Lates calcarifer), and med
(Marine catfish – Nemapteryx nenga). Most depend upon dadon from mahajons of
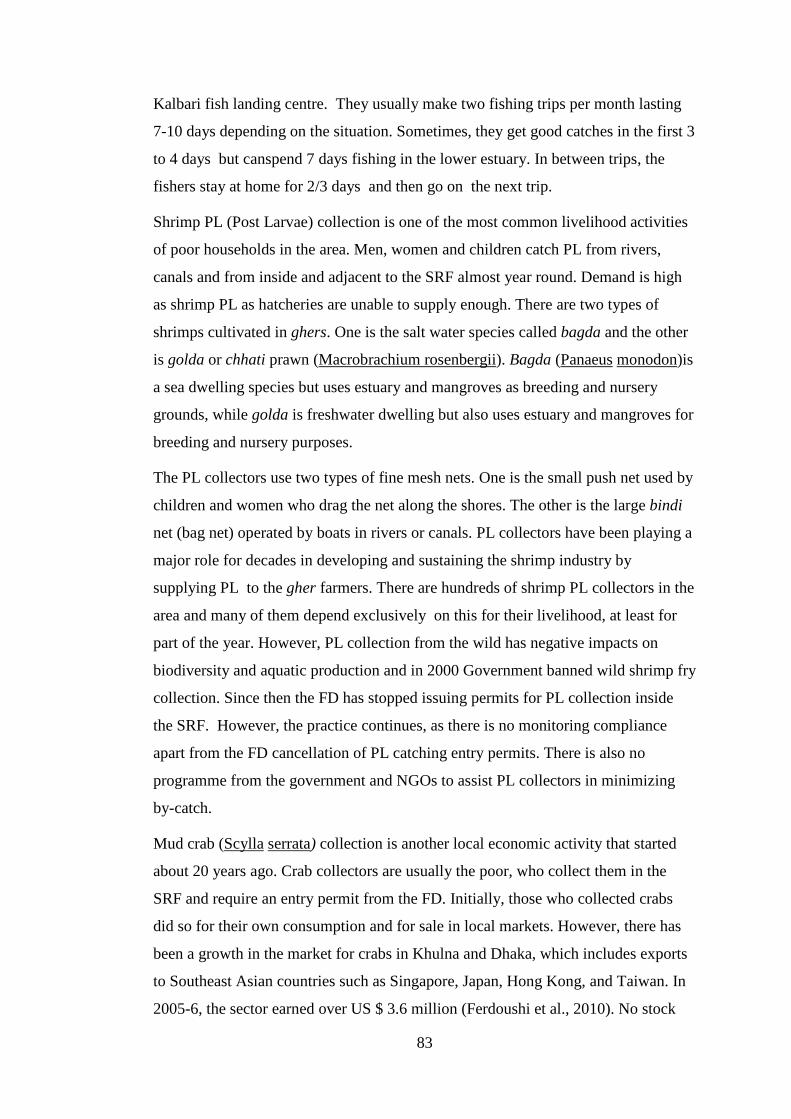
83
Kalbari fish landing centre. They usually make two fishing trips per month lasting
7-10 days depending on the situation. Sometimes, they get good catches in the first 3
to 4 days but canspend 7 days fishing in the lower estuary. In between trips, the
fishers stay at home for 2/3 days and then go on the next trip.
Shrimp PL (Post Larvae) collection is one of the most common livelihood activities
of poor households in the area. Men, women and children catch PL from rivers,
canals and from inside and adjacent to the SRF almost year round. Demand is high
as shrimp PL as hatcheries are unable to supply enough. There are two types of
shrimps cultivated in ghers. One is the salt water species called bagda and the other
is golda or chhati prawn (Macrobrachium rosenbergii). Bagda (Panaeus monodon)is
a sea dwelling species but uses estuary and mangroves as breeding and nursery
grounds, while golda is freshwater dwelling but also uses estuary and mangroves for
breeding and nursery purposes.
The PL collectors use two types of fine mesh nets. One is the small push net used by
children and women who drag the net along the shores. The other is the large bindi
net (bag net) operated by boats in rivers or canals. PL collectors have been playing a
major role for decades in developing and sustaining the shrimp industry by
supplying PL to the gher farmers. There are hundreds of shrimp PL collectors in the
area and many of them depend exclusively on this for their livelihood, at least for
part of the year. However, PL collection from the wild has negative impacts on
biodiversity and aquatic production and in 2000 Government banned wild shrimp fry
collection. Since then the FD has stopped issuing permits for PL collection inside
the SRF. However, the practice continues, as there is no monitoring compliance
apart from the FD cancellation of PL catching entry permits. There is also no
programme from the government and NGOs to assist PL collectors in minimizing
by-catch.
Mud crab (Scylla serrata) collection is another local economic activity that started
about 20 years ago. Crab collectors are usually the poor, who collect them in the
SRF and require an entry permit from the FD. Initially, those who collected crabs
did so for their own consumption and for sale in local markets. However, there has
been a growth in the market for crabs in Khulna and Dhaka, which includes exports
to Southeast Asian countries such as Singapore, Japan, Hong Kong, and Taiwan. In
2005-6, the sector earned over US $ 3.6 million (Ferdoushi et al., 2010). No stock

84
assessment or any kind of population study of mud crab has been done, so concerns
have been raised about its sustainability. The FD does little more than issue entry
permits for crab harvesting. Given the exposure and sensitivity of crabs to climate
change impacts (drought, salinity change) and the increasing number of people
involved in crab collection, it is uncertain how long it will take to deplete crab
resources. Catching of crab from the SRF is prohibited from December to February
and May to June to protect brood stocks (Ferdoushi et al., 2010).
Nypa palm or gol pata (Nypa fruticans) collection in the SFR has been going on for
generations. Locally, the collectors are called bawalies. Poor coastal people use gol
pata to make thatch for their homes and there is a good market in Khulna and other
coastal districts for housing and fencing materials. According to one estimate,
113,888 tons of gol pata is harvested annually from the SRF (Ahmed, 2006). These
bowalies also collect honey, grasses and catch fish from the SFR in different
seasons.
Honey collection from the SRF has a long history and was mainly collected for sale.
It is a seasonal occupation practiced by mowalies. They collect entry permits from
the FD by paying a government fee of BDT 550 (US $ 7) per person for one month.
The FD issue permits for collecting during 1 April to 30 May each year.
The honey collected from the Kholshi (Aegiceras comiculatum) tree is the best
quality (Rahman et al., 2001) but is sensitive to higher salinity and production
declines if salinity reaches 15ppt (Jalil, 2002). The honey collectors also collect
other forest resources in other seasons so most mowalies become bowalies at other
times of the year. Many fish in other seasons.
Crab fattening is a relatively new practice started about 20 years ago. Poor people
catch juvenile crab/soft shell crabs from within the SRF or buy from local markets
as rejected items, and rear them in small earthen ponds fenced with bamboo splits.
In two to three weeks the crabs attain marketable size and are sold at local markets.
Different NGOs have been providing technical and financial support to the poor in
crab fattening as an income generation scheme. Usually women members of the
family take care of crab pond management activities. Although crab fattening has a
good income earning potential for the poor and women, having no land is a barrier
to taking on such work. Most of the khas (state owned) land in the area that could

85
be used for such work has been taken by shrimp farmers and there is hardly any
common land upon which the poor could diversify their incomes.
Shrimp farming has become the major land use in the study area. Almost all the
cropland and beels have been converted to shrimp ghers. In Chakbara, 100% of the
land previously used for rice cultivation is now devoted to shrimp farming.
Although shrimp farming is economically profitable for some and earns important
foreign exchange, it has had many negative environmental and social impacts in this
area and across the country (Paul and Vogl, 2011).
Fish trading is a common practice and the wholesale fish market (or fish landing
centre) at Kalbari village under Burigoalini UP located at the bank of Chunar River
near Munshigonj Bazar was established in 1996. The market is a fish-landing centre
and a selling point for fish, crabs, and shrimp. There are 17 large whole sellers
(aratders) and about 50 small temporary traders. The traders are businessmen and
thus not involved in fishingand shrimp farming. They sell fish as middlemen and get
commission at 3% on total sale proceeds. The higher the quantity of fish landed, the
greater the commission they get. Besides trading, most lend money to poor fishers
and crab collectors on stringent terms and conditions, as discussed earlier. Fish
trading is considered a more remunerative and less physically demanding job than
fishing and crab collecting, which are laborious, risky and considered of low status.
The mohajans maintain strong connections with relevant institutional stakeholders
such as the Forest Department, Department of Fisheries, Police, upazila
administration, Union Parishads and NGOs. They have good knowledge of local
fishers and fisheries as their livelihoods depend upon them.
Summary
This chapter described the biophysical and socioeconomic environment of the
coastal zone and the two study villages and their environs. There have been several
physical changes over the past 40 years in the area, most of which have been due to
unplanned development interventions in land and water resources. In recent times
local people have begun to notice changes in local weather patterns, which have
added to the other non-climate stressors they have to deal with. The description of
the physical and economic environment of the study villages and their changes over
time provides the context for the remaining chapters. The next chapter provides a

86
more detailed account of the changes in the socio-ecological environments of the
two study villages over a 40 year period.
87
Figure 3.4: Activity Calendar: livelihood production and extraction activities of Chakbara and Fultala villagers in 2011
Livelihood Activities
Baishak (Apr-May)
Jaystha (May-Jun)
Ashar (Jun-Jul)
Sraban (Jul-Aug)
Vadra (Aug-Sep)
Ashyn (Sep-Oct)
Kartik (Oct-Nov)
Agrahayan (Nov-Dec)
Poush (Dec-Jan)
Magh (Jan-Feb)
Falgun (Feb-Mar)
Chaitra (Mar-Apr)
Fishing By goisha jal- lower estuary By bindi jal in the sea /BoB Fishing with pata jal in SRF Shrimp PL catching Bagda PL in SRF Bagda PL in rivers Golda PL in rivers & SRF Crab catching Crab catching in SRF Golpata (nypa) collection Boat repairing Entry pass collection Nypa collection Nypa selling Honey collection Honey collection -SRF Rice farming Amon seed bed Transplanting Harvesting Shrimp farming Gher cleaning and watering Stocking of golda /bagda PL Harvesting of shrimps White fish stocking Harvest of white fish Tilapia and vetki harvest
88
Chapter 4: Biophysical Changes in the Area, and Local
Vulnerability
Prologue
Walking across a narrow herring bone road in Fultala village, that connected
Chandipur village in the east to Kultali village in the west through Fultala helped
me get a broader overview of local ecological and livelihood conditions of the
people in this dynamic coastal landscape. Although the road eased means of
transportation, it segmented the wetland (Fultala Beel) basin into northern and
southern halves, which had already been impacted by land grabbing, conversions,
fragmentation, siltation and shortages of freshwater. On top of these, cyclone Aila in
2009 inundated the beel and caused the death of freshwater fish species that used to
colonise the beel and provide income and nutrition for the people living in adjoining
villages including Fultala. I saw a farmer ploughing to remove hisboro rice (winter
rice) seed beds, which contained standing seedlings colored yellow and looking
unhealthy. He blamed the salinity that damaged his rice seedlings and then
complained that cyclone induced soil salinity still persisted 2 years later. He went
on to blame the people who got hold of the state owned canal and converted it to
fish ponds, crop land and settlements, which would otherwise have been used as a
source of freshwater for farming and fishing for the wider communities. He finally
blamed the politicians and bureaucrats who facilitated privatizing, and the death of
the canals which used to be used as common pool resources (CPRs) in the area.
I understood the agony of the farmer and I came to four conclusions. First,
increased salinity is affecting the soil and water and thus farming and fishing in new
areas along the coast, which has increased the vulnerability of people not only
because of the cyclone’s immediate impacts but also by its longer term residual
impacts (prolonged soil salinity). Second, current state policies and institutions had
facilitated and legalized the grabbing and control of rivers and canals by the local
elites at the cost of a healthy environment, fishing opportunities, farming and food
security. Given this record, how could the state contribute to building resilience in
the face of climate change impacts? Third, in the absence of community associations

89
and common spaces for the local people to contest policy-state driven environmental
degradation, loss of CPR bases, poor governance and exclusion of poor would
continue unabated and that would affect the possibility of building more resilient
societies in areas highly exposed to climate change stressors. Fourth, we need to
know how aware the people of these remote coastal villages are of global climate
change and its implications for their livelihoods and related assets.Such awareness
is one part of a wider need to provide institutional readiness to face the challenges
of climate change, particularly in the coastal zone where a multiplicity of climate
and non-climate stressors are interwoven creating incremental impacts upon local
social and ecological systems. With this perspective, I decided to examine in greater
detail the natural and human-induced physical hazards thathad impacted upon the
local area prior to recent concerns over climate change and variability impacts.
Introduction
This chapter, and Chapter 7, describe the vulnerability of the people living in the
southwestern coastal zone areas with reference to my study area. In describing the
vulnerability context, I first discuss past development interventions, mainly in
various water sectors at a macro level, outside the study area (exogenous in nature)
and comment upon the impacts of those distant activities on water dynamics in the
Lower Ganges Delta (LGD), which have created pressures on local social and
ecological systems. Information on the exogenous forcing of changes resulting in
increased vulnerability comes largely from secondary sources and interviews with
elderly people. I then present data on micro level changes, which have happened
over the years within and adjacent to the study villages (endogenous forcing) and the
implications of such changes for the vulnerability context of local people. Data and
information used to describe the endogenous changes were collected using
household surveys, FGD, KII and resource and land use mapping (past and present)
with the local communities. This chapter can be treated as an examination of the pre-
climate change period in an attempt to ascertain the main vulnerabilities associated
with exogenous and endogenous development interventions carried out in the past.
Chapter seven provides a detailed analysis of the livelihood vulnerabilities of the
two village communities to weather-induced change impacts, drawing on the three
dimensions of exposure, sensitivity and adaptive capacity.

90
Past interventions: Exogenous forcing in the water sector and local
vulnerability
Over the past 50 years several development interventions have interfered with the
natural water flow regimes in the upstream as well as in the downstream river
systems that have severely affected the social and ecological systems in the LGD,
including the SRF. The construction of permanent coastal polders initiated by the
then EP-WAPDA in the 1960s aimed at protecting rice and other assets from salinity
and tidal flooding along the entire coastal zone of Bangladesh. From the mid-1960s
to the early 1970s, the project constructed 4,184 km of coastal embankments in 92
polders and protected 1.1 million hectares of cropland (Schimdt, 1969).
The coastal embankment project helped protect farmers from salinity intrusion and
tidal flooding within the polder areas, which in increased cropping intensity and
yields. Depending on land suitability and hydrological regimes, farmers within the
polder areas were able to cultivate two to three rice crops a year (Schimdt, 1969).
The salinity and flood protection measures, underpinned by the introduction of High
Yielding Varieties (HYV) of rice in early 1970s, benefitted farmers, share croppers
and landless agricultural wage labourers. The latter used to get farm based
employment opportunities almost the year round.
However, these benefits did not last long. As a result of ignorance of the ecological
aspects (hydro-morphology) of the active delta, construction faults and poor
operation and maintenance works in many places, from the early 1980s the area
began to experience drainage congestion, embankment failure, salinity infestation,
water logging and associated environmental and social problems (Shampa &
Paramanik, 2012). Shampa & Paramanik (2012) describe how the polders restricted
the lateral dispersion of tidal floods into floodplain basins that acted as conduits for
surge water from the lower estuary to travel further northward. This resulted in
increased salinity in areas previously free from such a problem. The construction of
embankments around coastal floodplains (tidal plains) led gradually to a build-up of
silt on river beds and raised the rivers above the floodplain basins.
Siltation also blocked the drainage channels outside the polders. The floodplains
were lowered, which caused subsidence and increased drainage congestion and
permanent water logging in many areas of the Lower Ganges Delta (LGD). Rice
91
farming and other activities were affected and many people left the region to seek
work (Shampa & Paramanik, 2012).
The construction of permanent dykes replaced the seasonal small scale localized
dyke construction. The permanent coastal embankments thus eroded the locally
adopted tidal river management (TRM) system of water control, rice farming and
land formation as these seasonal bunds used to facilitate the deposition of silts on
low lying floodplain basins in the dynamic coast (IWM, 2005).
The project aimed at increasing the area of irrigated agriculture by pumping water
from the Ganges River in the dry season at Bheramara point to three southwestern
districts of Kustia, Magura and Chowadanga. Although the project had limited initial
success, it failed toachieve all its objectives mainly due to reduced dry season flow
of Ganges River (ADB, 1998). In implementing the project, a number of secondary
and tertiary river systems were cut off from their source rivers (the Ganges and
Gorai Rivers), which affected many secondary and tertiary river systems and
resulted in a shortage of freshwater flows in the downstream of the LGD.
The GK project at the upper reach and the coastal embankment project at the lower
reach of the LGD started at the same time but were not well synchronized in terms
of maintaining flow regimes from the north to south, or across the interactions
between the tidal and non-tidal river systems in the middle reach of the LGD. As a
result, the problem of siltation of rivers and consequent drainage congestion and
permanent inundation of cropland and settlements began to be noticed in the middle
and lower reaches (between the two projects) from the early 1990s. The problem
was later compounded by upstream water diversions from the Ganges River in the
mid-1970s through the Farakka barriage in India.
Water diversions from upstream river systems and resultant vulnerability
The LGD experienced a major hydrological shock with the construction of the
Farakka Barrage on the Ganges River, 17km upstream in India from the Bangladesh
border (Figure 4.1). Mirza (1997 and 2004), Islam and Gnauck (2008) and Sen
(2010) reported severe impacts downstream from the Farakka barrage, which
diverted freshwater flows away from Bangladesh. These impacts include a reduction
in water flow especially in the Gorai-Madhumati-Kobadak River systems in the
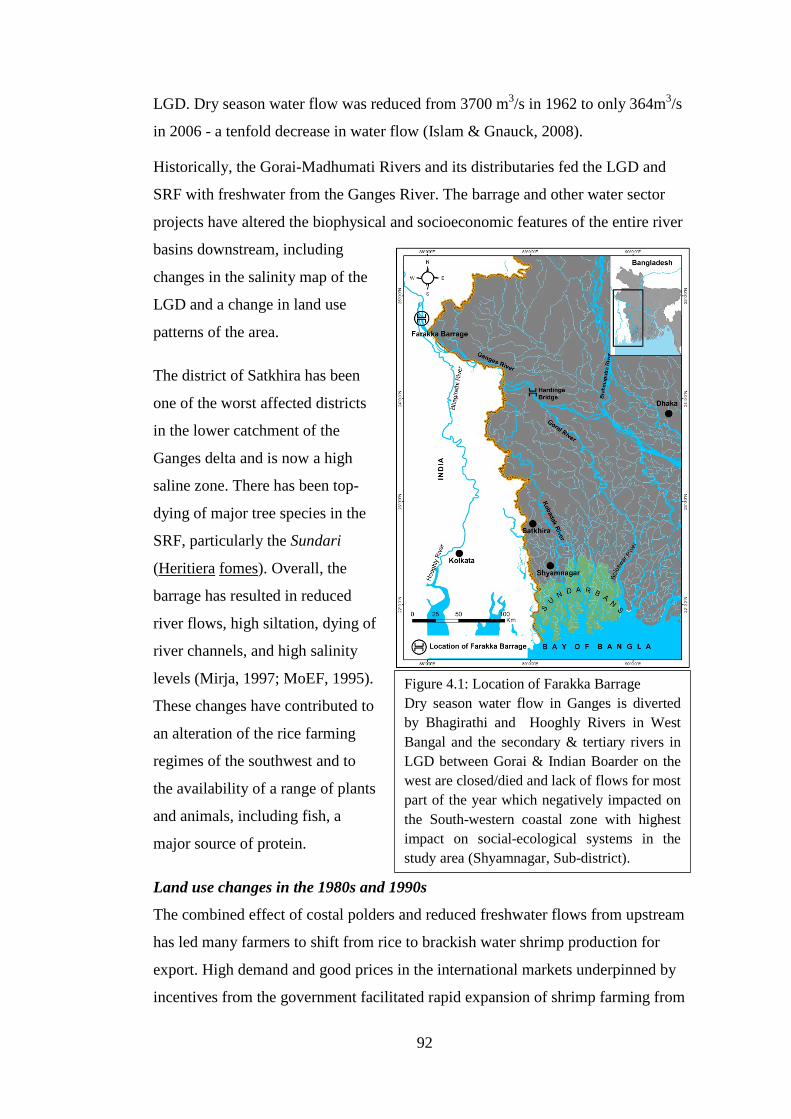
92
LGD. Dry season water flow was reduced from 3700 m3/s in 1962 to only 364m3/s
in 2006 - a tenfold decrease in water flow (Islam & Gnauck, 2008).
Historically, the Gorai-Madhumati Rivers and its distributaries fed the LGD and
SRF with freshwater from the Ganges River. The barrage and other water sector
projects have altered the biophysical and socioeconomic features of the entire river
basins downstream, including
changes in the salinity map of the
LGD and a change in land use
patterns of the area.
The district of Satkhira has been
one of the worst affected districts
in the lower catchment of the
Ganges delta and is now a high
saline zone. There has been top-
dying of major tree species in the
SRF, particularly the Sundari
(Heritiera fomes). Overall, the
barrage has resulted in reduced
river flows, high siltation, dying of
river channels, and high salinity
levels (Mirja, 1997; MoEF, 1995).
These changes have contributed to
an alteration of the rice farming
regimes of the southwest and to
the availability of a range of plants
and animals, including fish, a
major source of protein.
Land use changes in the 1980s and 1990s
The combined effect of costal polders and reduced freshwater flows from upstream
has led many farmers to shift from rice to brackish water shrimp production for
export. High demand and good prices in the international markets underpinned by
incentives from the government facilitated rapid expansion of shrimp farming from
Figure 4.1: Location of Farakka Barrage Dry season water flow in Ganges is diverted by Bhagirathi and Hooghly Rivers in West Bangal and the secondary & tertiary rivers in LGD between Gorai & Indian Boarder on the west are closed/died and lack of flows for most part of the year which negatively impacted on the South-western coastal zone with highest impact on social-ecological systems in the study area (Shyamnagar, Sub-district).
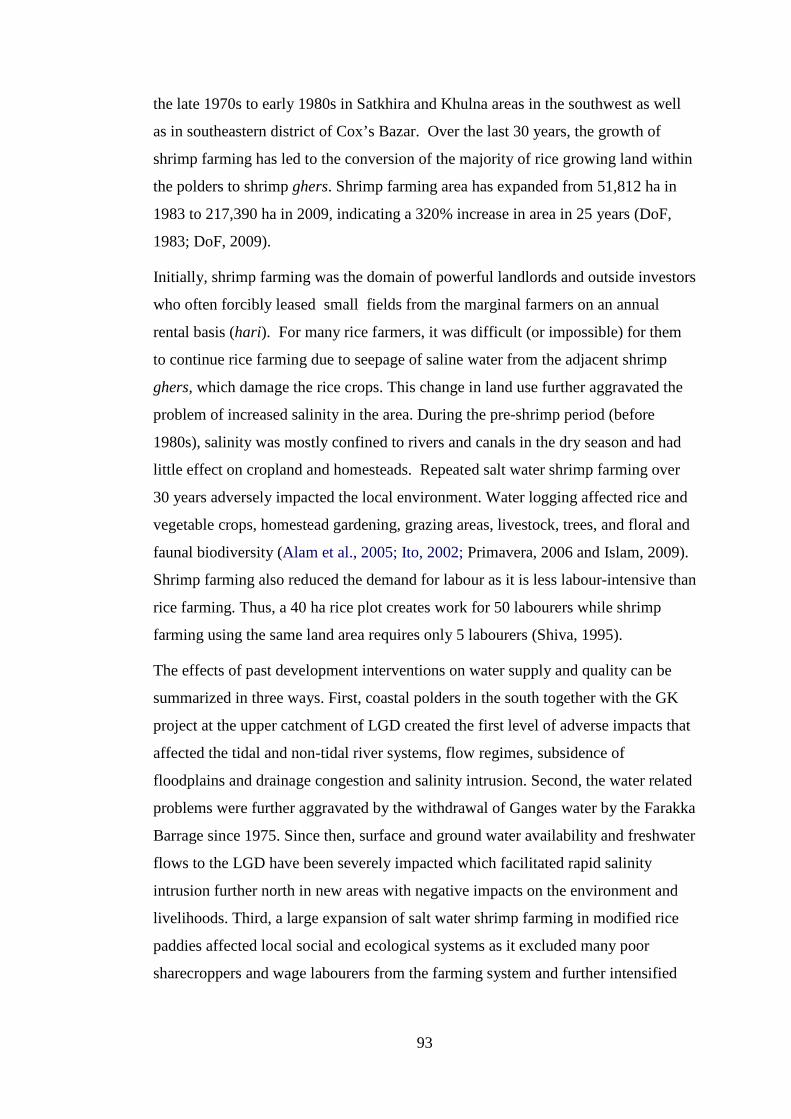
93
the late 1970s to early 1980s in Satkhira and Khulna areas in the southwest as well
as in southeastern district of Cox’s Bazar. Over the last 30 years, the growth of
shrimp farming has led to the conversion of the majority of rice growing land within
the polders to shrimp ghers. Shrimp farming area has expanded from 51,812 ha in
1983 to 217,390 ha in 2009, indicating a 320% increase in area in 25 years (DoF,
1983; DoF, 2009).
Initially, shrimp farming was the domain of powerful landlords and outside investors
who often forcibly leased small fields from the marginal farmers on an annual
rental basis (hari). For many rice farmers, it was difficult (or impossible) for them
to continue rice farming due to seepage of saline water from the adjacent shrimp
ghers, which damage the rice crops. This change in land use further aggravated the
problem of increased salinity in the area. During the pre-shrimp period (before
1980s), salinity was mostly confined to rivers and canals in the dry season and had
little effect on cropland and homesteads. Repeated salt water shrimp farming over
30 years adversely impacted the local environment. Water logging affected rice and
vegetable crops, homestead gardening, grazing areas, livestock, trees, and floral and
faunal biodiversity (Alam et al., 2005; Ito, 2002; Primavera, 2006 and Islam, 2009).
Shrimp farming also reduced the demand for labour as it is less labour-intensive than
rice farming. Thus, a 40 ha rice plot creates work for 50 labourers while shrimp
farming using the same land area requires only 5 labourers (Shiva, 1995).
The effects of past development interventions on water supply and quality can be
summarized in three ways. First, coastal polders in the south together with the GK
project at the upper catchment of LGD created the first level of adverse impacts that
affected the tidal and non-tidal river systems, flow regimes, subsidence of
floodplains and drainage congestion and salinity intrusion. Second, the water related
problems were further aggravated by the withdrawal of Ganges water by the Farakka
Barrage since 1975. Since then, surface and ground water availability and freshwater
flows to the LGD have been severely impacted which facilitated rapid salinity
intrusion further north in new areas with negative impacts on the environment and
livelihoods. Third, a large expansion of salt water shrimp farming in modified rice
paddies affected local social and ecological systems as it excluded many poor
sharecroppers and wage labourers from the farming system and further intensified
94
salinity and loss of biodiversity in the area. These external forcings were
compounded by endogenous development actions.
Past interventions: Endogenous forcing and local vulnerability
Changes in village land use
During my fieldwork, I observed many local level activities and actions within and
around the study villages (endogenous) that brought about changes in the
biophysical and socioeconomic characteristics of the area and which directly and
indirectly contributed to an increase in local vulnerability for some sections of the
population. Figures 4.2 summarises the changes in the physical asset bases in both
villages from 1970 to 2012.
There are similarities between the two villages with regard to specific physical or
demographic changes such as a reduction in crop land and an increase in the size of
settlements. New land uses include shrimp farms, borrow pits (road side ditches
usually dug out to raise road levels) and canals, new fallow land, and expansion of
natural mangroves. In Fultala, borrow pits were created as a result of the
construction of roads connecting the area with the district towns while in Chakbara a
few hectares of fallow land was created because of the impact of cyclone Aila that
rendered some land saline and unproductive (Table 4.1). Cyclone Aila hit the
southwestern coast of Bangladesh on 25 May 2009 and damaged crops across 0.13
million hectares of land, damaged or destroyed 61,377 houses either fully or
partially and affected around 3.9 million people (DMB, 2009). The growth of
natural mangrove in Chakbara occurred on the bank of the river Kholpetua as a
result of seeds floating from the SRF and settling on two sides of the river bank.
Local youths fenced the area and protected it from grazing (Figure 4.2).
Dramatic change in land use is seen in Chakbara, where all agricultural land was
converted to other uses, mainly shrimp farming. Local people in Chakbara reported
that some crop land used for amon rice cultivation existed up until 2011 on the
eastern part of the village but were converted to shrimp ghers after cyclone Aila
with the last rice fields converted to shrimp ghers in 2012. Currently, households of
Chakbara are completely dependent on rice from markets. In contrast, cropland in
Fultala village fell by 25% over the last 40 years and was used mainly for the
expansion of settlements and ponds. The area turned over to shrimp cultivation in
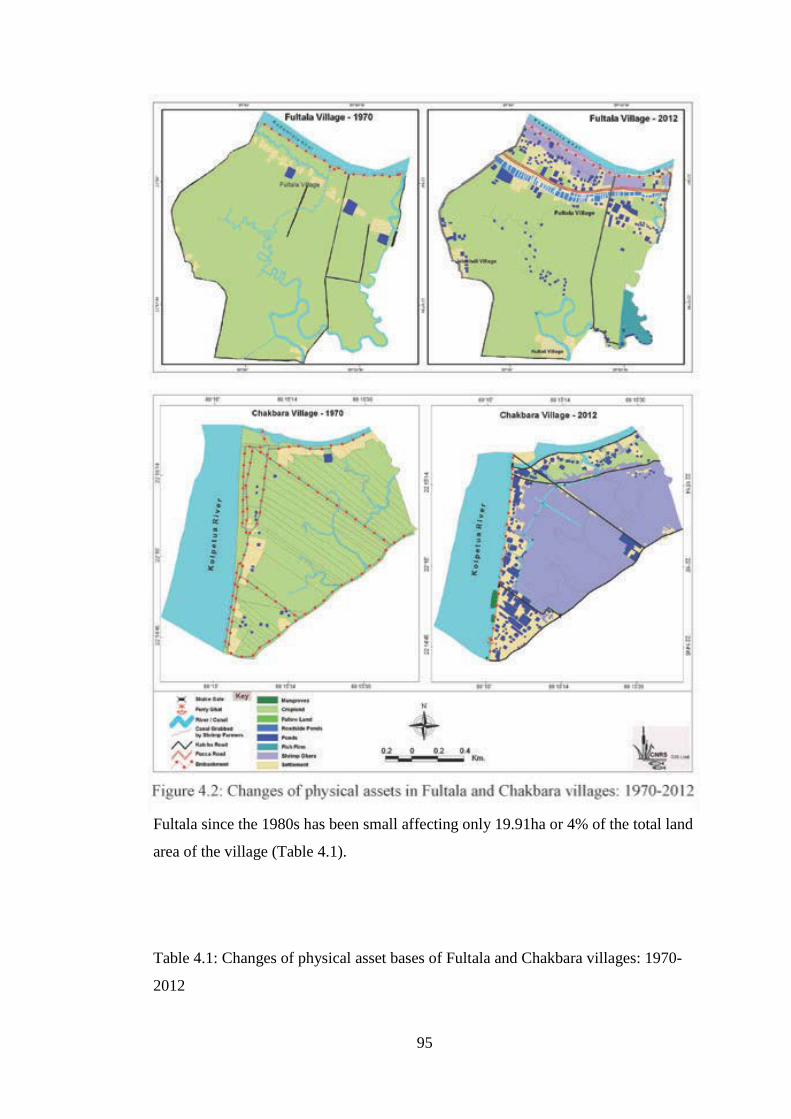
95
Fultala since the 1980s has been small affecting only 19.91ha or 4% of the total land
area of the village (Table 4.1).
Table 4.1: Changes of physical asset bases of Fultala and Chakbara villages: 1970-
2012
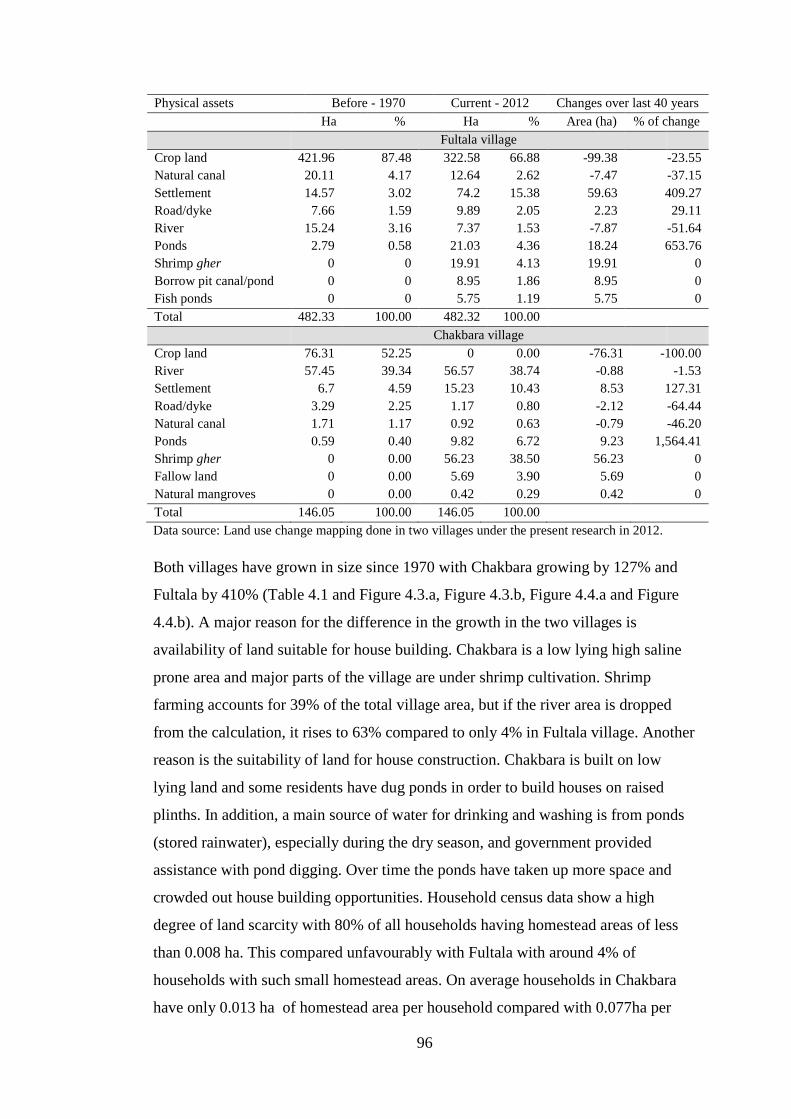
96
Physical assets Before - 1970 Current - 2012 Changes over last 40 years
Ha % Ha % Area (ha) % of change
Fultala village
Crop land 421.96 87.48 322.58 66.88 -99.38 -23.55 Natural canal 20.11 4.17 12.64 2.62 -7.47 -37.15 Settlement 14.57 3.02 74.2 15.38 59.63 409.27 Road/dyke 7.66 1.59 9.89 2.05 2.23 29.11 River 15.24 3.16 7.37 1.53 -7.87 -51.64 Ponds 2.79 0.58 21.03 4.36 18.24 653.76 Shrimp gher 0 0 19.91 4.13 19.91 0 Borrow pit canal/pond 0 0 8.95 1.86 8.95 0 Fish ponds 0 0 5.75 1.19 5.75 0 Total 482.33 100.00 482.32 100.00
Chakbara village
Crop land 76.31 52.25 0 0.00 -76.31 -100.00 River 57.45 39.34 56.57 38.74 -0.88 -1.53 Settlement 6.7 4.59 15.23 10.43 8.53 127.31 Road/dyke 3.29 2.25 1.17 0.80 -2.12 -64.44 Natural canal 1.71 1.17 0.92 0.63 -0.79 -46.20 Ponds 0.59 0.40 9.82 6.72 9.23 1,564.41 Shrimp gher 0 0.00 56.23 38.50 56.23 0 Fallow land 0 0.00 5.69 3.90 5.69 0 Natural mangroves 0 0.00 0.42 0.29 0.42 0 Total 146.05 100.00 146.05 100.00 Data source: Land use change mapping done in two villages under the present research in 2012. Both villages have grown in size since 1970 with Chakbara growing by 127% and
Fultala by 410% (Table 4.1 and Figure 4.3.a, Figure 4.3.b, Figure 4.4.a and Figure
4.4.b). A major reason for the difference in the growth in the two villages is
availability of land suitable for house building. Chakbara is a low lying high saline
prone area and major parts of the village are under shrimp cultivation. Shrimp
farming accounts for 39% of the total village area, but if the river area is dropped
from the calculation, it rises to 63% compared to only 4% in Fultala village. Another
reason is the suitability of land for house construction. Chakbara is built on low
lying land and some residents have dug ponds in order to build houses on raised
plinths. In addition, a main source of water for drinking and washing is from ponds
(stored rainwater), especially during the dry season, and government provided
assistance with pond digging. Over time the ponds have taken up more space and
crowded out house building opportunities. Household census data show a high
degree of land scarcity with 80% of all households having homestead areas of less
than 0.008 ha. This compared unfavourably with Fultala with around 4% of
households with such small homestead areas. On average households in Chakbara
have only 0.013 ha of homestead area per household compared with 0.077ha per

97
household in Fultala, which is six times higher. In the longer term, the scope for the
physical expansion of Chakbara is less compared with Fultala.
Although covering a small in area, natural canals have been reduced in size by
37.15% and 46.2% in Fultala and Chakbara respectively. In Chakbara, the canals
were merged with shrimp ghers while in Fultala they were converted to cropland,
ponds and settlements. The Kultalikhal that was once linked to the beel and crop
land of Fultala and Kultali villages has been converted by the khal leaseholders to
crop land and ponds where it passes through the beel and crop land and converted to
settlements where it passes through villages. A part of the Kultalikhal (see map in
figure 4.2) was re-excavated in the 1990s to store monsoon water to irrigate rice, but
was then leased out to local people who divided it up for private fish culture. Thus, it
lost its function as a common pool resource (CPR) for local people as a publicly
available source of water for rice farming and for fishing. In some places, canals
were taken illegally by the owners of adjacent land who claimed themselves as de
facto owners and converted them to either ponds or crop land.
In most villages, crop land is private property while the rivers, canals, and roadside
canals are owned by the state (khas land) and managed under government line
agencies and controlled at field level by the sub-district and district level
administrators. The ecological services and products of wetland (rivers, canals,
beels, borrow pit canals) have traditionally been central to the economic, social and
aesthetic lives of local people, especially poorer members of the community (MEA,
2005).During my field work, farmers in Fultala said that in the past they used water
from Kadamtali River, Kultalaikhal and road side borrow pit canals and ponds for
Figure 4.3.a: Asset bases in Fultala village in 1970
Cropland (89%) Canals (4.2%)Settlements (3%) Road/dyke (1.6)%River (1.5%) Ponds (0.6%)
Figure 4.3.b: Asset bases in Fultala village in 2012
Cropland (67%)Fishfarms (1.2%)Shrimp ghers (4.1%)Ponds (4.4%)Roadside ponds (1.9%)

98
irrigating rice and other crops in the dry season. Land grabbing and privatization of
khas land has deprived them of these services. The examples provided here are
indicative of a wider trend across the country where common pool resources have
been privatized, which together with a growing population seeking ever diminishing
resources, has resulted in growing asset inequality. In Kultali and Chakbara this has
meant that opportunities for growing three rice crops a year through the use of salt-
tolerant rice varieties have diminished and are available to fewer people.
River narrowing and its consequences
The wide river has been reduced to a narrow and winding canal and is almost
biologically dead. It was once navigable the year round by small to large size boats
and was until the 1950s the only means of transportation of people and goods. It has
lost its riverine character and is today called Kadamtalikhal instead of Kadamtali
River. Elderly people in Fultala village recounted that in the early 1900s the whole
area was part of the SRF and the river originated from Chunar River on the southeast
point of Munshigonj Bazar (a growth center) and meandered northwest through the
deep mangroves to be reunited with the Chunar River at Jabakhali point after
traversing 21 kilometers. In the middle of the river’s course, a growth center called
Golabari is located at a junction of rivers from where a branch traversed
southwesterly and met with the River Jamuna (a local river). At this time, the river
was 21km long, approximately 107 – 122 m wide and about 6 m deep. It was one
of the key navigation channels for carrying various products from the Sundarbans to
various growth centres and towns in the southwestern part of the Ganges delta.
Lines of boats carrying nypa palm, goran wood, fish, honey, catkin grass, rice, raw
Figure 4.4.a: Asset bases in Chakbara village in 1970
Cropland (52.3%) Canal (1.2%)Settlement (4.6%) Road/dyke (2.3)%River (39.3%) Pond (0.4%)
Figure 4.4.b: Asset bases in Chakbara village in 2012
Shrimp gher (38.5%) Pond (6.7%)Road/dyke (0.8%) Settlement (10.4%)Canal (0.6%) River (38.7%)Fallow land (3.9%) Mangroves (0.3)

99
materials used the river almost the year round. This river was also a route for deer
hunters going to the Sundarbans. Traditional Bengali boat races (“nouka bayice”) on
the river were also common in the post-monsoon. Most of the people had small
boats of their own for personal and commercial uses and navigation was an
economic and livelihood activity of many people. During the wet season when the
earthen road was difficult to use, people preferred to move by boat. The River
Kadamtali was thus an integral part of the social, economic and cultural life of the
people in the area. This all changed with the advent of development interventions in
water sector projects in the mid 1960s.
With the construction of the Kadamtali Sluice gate and an embankment at Jabakhali
in the 1960s, large boats were unable to use the river as there was no provision for a
wier to bypass the sluice gate. However, small boats continued to ply the river after
construction of the sluice gate by carrying them across to reach the rivers. In 1967,
another sluice gate was constructed at the mouth of Kadamtali River near its
confluence with the Chunar River at Munshigonj Bazar point, which had been the
cutoff point for the navigation in the Kadamtali River. This stopped navigation
completely. The changes that have happened to the river due to human interventions
over time are presented in Table 4.2.
The embankments and sluice gates were constructed to prevent tidal flooding and
increase rice production within the protected area. Soon after construction, two rice
crops were possible using freshwater from the river. However, local influential
people took control of the char land at the river bank for rice farming and settlement.
In Fultala village area 13 families, with the support of local elites, built homes on the
river embankment, which led to a further reduction of the river width and depth and
its subsequent drying out. One ex-UP member in the area acted as the key player in
allowing people to settle illegally on river banks.
Table 4.2: Impact of development interventions on the Kadamtali River: 1949 to
2010 (Source: Interview with three elderly farmers in Fultala in 2011)
Time line
Development interventions
Features of the river Use of river
Before 1960s
No intervention Natural setting
-River was wide and flowing; width ranged from 350 to 400 feet in dry and wet seasons
- Small and large boats for passengers and goods; -Boats carried nypa palm, fish,
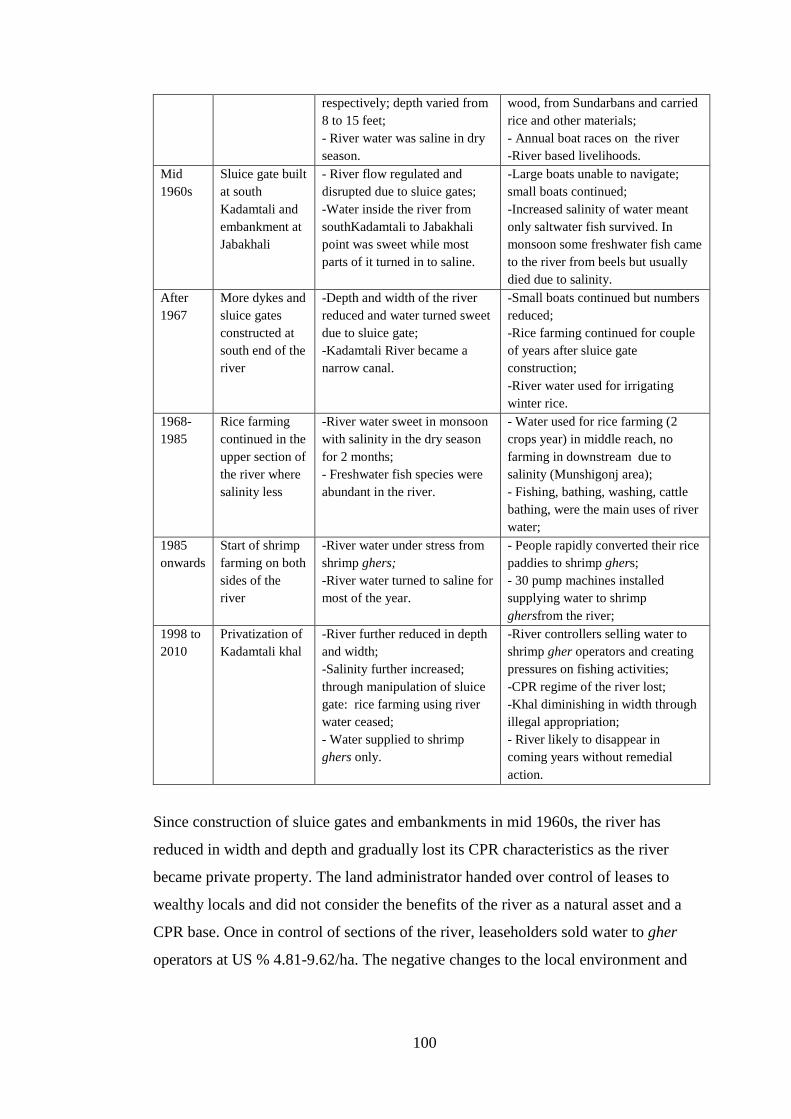
100
respectively; depth varied from 8 to 15 feet; - River water was saline in dry season.
wood, from Sundarbans and carried rice and other materials; - Annual boat races on the river -River based livelihoods.
Mid 1960s
Sluice gate built at south Kadamtali and embankment at Jabakhali
- River flow regulated and disrupted due to sluice gates; -Water inside the river from southKadamtali to Jabakhali point was sweet while most parts of it turned in to saline.
-Large boats unable to navigate; small boats continued; -Increased salinity of water meant only saltwater fish survived. In monsoon some freshwater fish came to the river from beels but usually died due to salinity.
After 1967
More dykes and sluice gates constructed at south end of the river
-Depth and width of the river reduced and water turned sweet due to sluice gate; -Kadamtali River became a narrow canal.
-Small boats continued but numbers reduced; -Rice farming continued for couple of years after sluice gate construction; -River water used for irrigating winter rice.
1968-1985
Rice farming continued in the upper section of the river where salinity less
-River water sweet in monsoon with salinity in the dry season for 2 months; - Freshwater fish species were abundant in the river.
- Water used for rice farming (2 crops year) in middle reach, no farming in downstream due to salinity (Munshigonj area); - Fishing, bathing, washing, cattle bathing, were the main uses of river water;
1985 onwards
Start of shrimp farming on both sides of the river
-River water under stress from shrimp ghers; -River water turned to saline for most of the year.
- People rapidly converted their rice paddies to shrimp ghers; - 30 pump machines installed supplying water to shrimp ghersfrom the river;
1998 to 2010
Privatization of Kadamtali khal
-River further reduced in depth and width; -Salinity further increased; through manipulation of sluice gate: rice farming using river water ceased; - Water supplied to shrimp ghers only.
-River controllers selling water to shrimp gher operators and creating pressures on fishing activities; -CPR regime of the river lost; -Khal diminishing in width through illegal appropriation; - River likely to disappear in coming years without remedial action.
Since construction of sluice gates and embankments in mid 1960s, the river has
reduced in width and depth and gradually lost its CPR characteristics as the river
became private property. The land administrator handed over control of leases to
wealthy locals and did not consider the benefits of the river as a natural asset and a
CPR base. Once in control of sections of the river, leaseholders sold water to gher
operators at US % 4.81-9.62/ha. The negative changes to the local environment and
101
the wider society as a result of CPR privatization increased the vulnerability of poor
people who once used the river for fishing, irrigation, bathing, washing
Collective Action, Disaster Risk Reduction and Vulnerability
The vulnerability of local people as a result of socio-ecological changes over the
past 50 can be illustrated by embankment breaching in Chakbara village mainly due
to cyclones, storm surges or high tides, poor maintenance and illegal structures.
Based on accounts provided by elderly people in Chakbara, a summary of
embankment breaching over the last 50 years (1972 -2009) is documented below:
1972 – Breached at Khalishabunia village (west of Chakbara) and inundated two
villages. The villagers collectively fixed the embankment but it again
breached during high tides. Later the Bangladesh Water Development Board
(BWDB) fixed the embankment.
1976 – Breached in September and inundated Chakbara and Jelekhali villages for
about 15 days and affected crops and assets including some houses. The
villagers collectively fixed the embankment in two weeks. Later BWDB
repaired the embankment after three months.
1988 – Breached at 6 points but damage small (3-5 feet only). Besides breaching,
surge water over topped the embankments at several points. Local UP
Chairman along with villagers fixed the embankment in 2 days and later
BWDB strengthened it further after 3 months.
1994 – Breached at Chakbara and several villages were flooded and the most
affected villages were Jelekhali, Chakbara and Khalishabunia. The UP
Chairman took quick initiative and fixed the problem with help from local
people.
1998 –Breached at Napitkhali village and inundated 3 to4 villages causing severe
damage. The embankment was quickly fixed by local people under the
guidance of the UP Chairman and later BWDB repaired the embankment.
2001– Breached and inundated Ghagramari and Jelekhali villages, which affected
60% of shrimp ghers. Local people fixed the embankment in 2 days with the
guidance of UP Chairman.

102
2007 –Cyclone Sidr breached the embankment at three points with initial width of
breaching points of 4.6 m but at low tide this increased to around 61 m at
each point. Local people collectively tried to fix the embankment over seven
days but failed due to strong tidal effects. Two months later BWDB fixed the
embankment.
2009 – Cyclone Aila breached the embankment at five points and the entire union
comprising of 15 villages remained inundated for 12-18 months from May
2009. This was the most catastrophic naturally-induced event in the history
of Gabura union. Tidal saline water damaged homesteads, houses, shrimp
ghers, fish ponds and roads. People took shelter on embankments and many
families moved to neighboring sub-districts, district towns and to Khulna,
Jessore and Dhaka. However, this time the community was unable to respond
quickly to fix the embankment and later strong monsoon tides widened
breaches even further. Finally 18-20 months after cyclone Aila (May 2009),
BWDB contractors fixed the breaching points of the embankment.
The description here shows that for part of the time local people with UP assistance
were able to act collectively repair embankment breaches but were unable to do so
in 2009. It is unclear why, after cyclone Aila, it took 18 months to repair the
embankment, especially when the breaching points were small and easily
manageable.
The majority of the local people in Chakbara and Fultala objected strongly to the
time it took to fix the embankment (Figure 4.5). Of the surveyed households in
Chakbara village, 96% people, based on their previous experience, opined that it was
illogical that such a long time was required to make repairs. All the 12 UP members
of Gabura union who participated in the survey also strongly objected to the time
taken. People of Fultala village and UP members of adjacent Munshigonj union gave
similar responses. This issue was politically sensitive, which became clear when I
spoke with people in Chakbara village near the breaching point (repairing work was
ongoing), who took shelter on the embankment. One Chakbara villager commented:
When the embankment was breached at this point it was only a meter
and half width, we could have easily fixed the point instantly and even it
was also possible next day through collective action when the width of
103
breaching further widened and people were ready to fix the breached
point. However, we were discouraged and told not to fix, rather wait to
get it further widened so that we get more relief materials and a fat
budget from the government for fixing the embankment …
At this point, another person told the informant not to say anything further about this and
everybody became silent. People had to wait and see the destruction caused by the
strong tidal inundation, and later a large budget was approved. By then the breaching
points had become very wide due to strong tidal forces. The work was then deferred
until the next dry season but further administrative delays meant that it was 18
months from the date of breaching to the final repair of the embankment, during
which time many people had suffered greatly. Communities of Chakbara and UP
members of Gabura also considered that it took too long to repair the embankment
(Figure 4.5).
The example given illustrates the complexities of governance in Bangladesh where
local politicians, district officers, government agencies, contractors and vendors
participate in networks of influence and control across communities and up to the
national level. In the case discussed, embankment construction, repair and
maintenance are the domain of the BWDB (Bangladesh Water Development Board),
which works closely with local UP Chairmen in implementing all activities at grass
roots level through engaging licensed and registered contractors or vendors. In
informal discussions with several local people, it was stated both explicitly and
indirectly that delays in repair were the result of political interference to increase
government funding at the local level for the benefit of the more powerful.
Further discussions with older people revealed that while coastal embankments were
necessary to save crops and other assets from cyclones, storm surges, tidal flooding
and salinity intrusion, the collective actions taken in the past which engaged both
local people and UP politicians had broken down by 2009. For example, many local
people believed that as shrimp farmers were badly affected by cyclone Aila, it
should have been their responsibility to repair embankments as they were wealthier
and had more political influence. It was asked why the wider community should
take the responsibility for embankment fixing rather than shrimp farmers who failed
to come forward to offer any specific assistance.
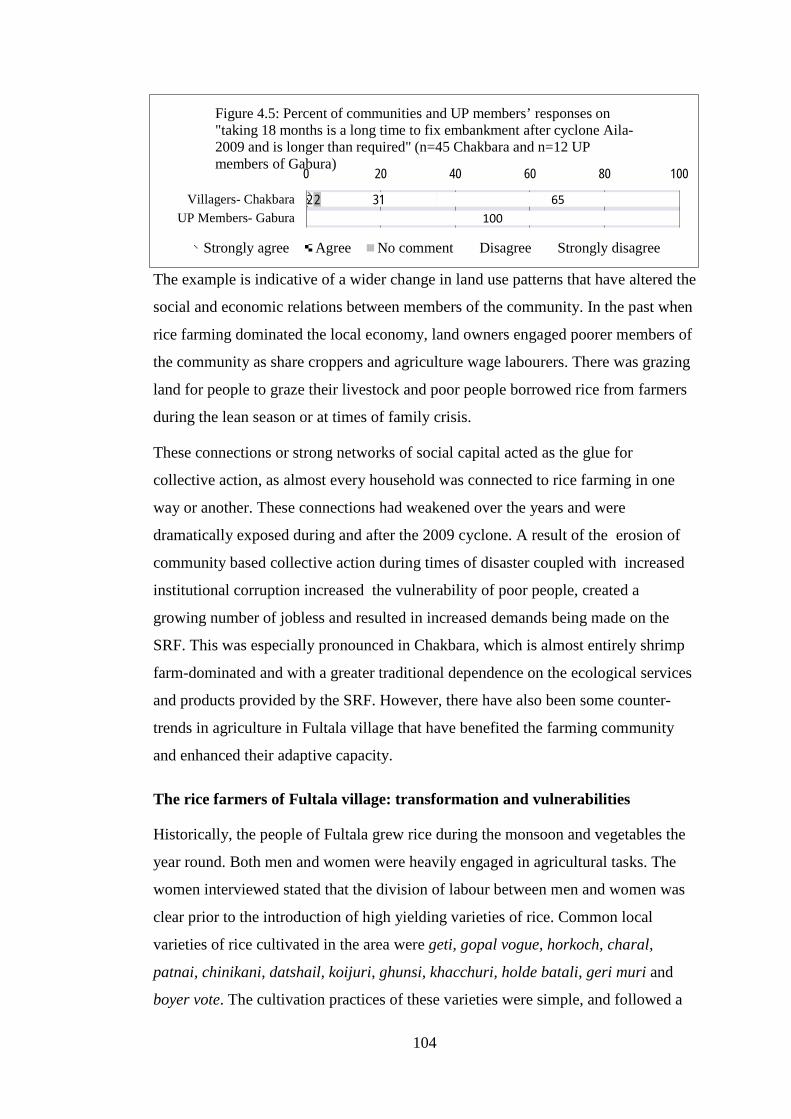
104
The example is indicative of a wider change in land use patterns that have altered the
social and economic relations between members of the community. In the past when
rice farming dominated the local economy, land owners engaged poorer members of
the community as share croppers and agriculture wage labourers. There was grazing
land for people to graze their livestock and poor people borrowed rice from farmers
during the lean season or at times of family crisis.
These connections or strong networks of social capital acted as the glue for
collective action, as almost every household was connected to rice farming in one
way or another. These connections had weakened over the years and were
dramatically exposed during and after the 2009 cyclone. A result of the erosion of
community based collective action during times of disaster coupled with increased
institutional corruption increased the vulnerability of poor people, created a
growing number of jobless and resulted in increased demands being made on the
SRF. This was especially pronounced in Chakbara, which is almost entirely shrimp
farm-dominated and with a greater traditional dependence on the ecological services
and products provided by the SRF. However, there have also been some counter-
trends in agriculture in Fultala village that have benefited the farming community
and enhanced their adaptive capacity.
The rice farmers of Fultala village: transformation and vulnerabilities
Historically, the people of Fultala grew rice during the monsoon and vegetables the
year round. Both men and women were heavily engaged in agricultural tasks. The
women interviewed stated that the division of labour between men and women was
clear prior to the introduction of high yielding varieties of rice. Common local
varieties of rice cultivated in the area were geti, gopal vogue, horkoch, charal,
patnai, chinikani, datshail, koijuri, ghunsi, khacchuri, holde batali, geri muri and
boyer vote. The cultivation practices of these varieties were simple, and followed a
2 2 31 65 100
0 20 40 60 80 100
Villagers- ChakbaraUP Members- Gabura
Figure 4.5: Percent of communities and UP members’ responses on "taking 18 months is a long time to fix embankment after cyclone Aila-2009 and is longer than required" (n=45 Chakbara and n=12 UP members of Gabura)
Strongly agree Agree No comment Disagree Strongly disagree
105
linear activity calendar linked to rainfall patterns explained by the women FGD
participants in Fultala:
At the first rains of the Bangla month jaisthya (mid-May to mid-June),
they prepared the seed bed, first week of ashar (mid-June to mid-July)
ploughed the land and started transplanting rice seedlings from first
week of sraban (mid-July to mid-August) and harvesting started from
mid agrahayan and ended in the same month (mid-November to mid-
December). They did not do any weeding nor did they apply any
fertilizer or pesticide in the rice field. Every year they had to follow
more or less the same farming calendar that was synchronized with the
climatic factors such as timely rainfall in pre-monsoon and monsoon.
If the pre-monsoon and monsoon rainfall was adequate, it washed out the soil
salinity from crop fields and created a favourable condition for rice farming. At
other times of the year, the land was too salty and people could not cultivate, leaving
a vast tract of cropland fallow, which remains the case today.
With the advent of new rice strains, the low yielding local varieties were gradually
replaced by high yielding varieties (HYVs) in Fultala and across the country. The
HYV amon varieties were also rain-fed and followed the same sowing and
harvesting calendar as that of local varieties. However, HYVs required weeding,
fertilizing and pesticides, which made farming more labour intensive. As a result,
local environmental resources and the gender-based division of labour started to
change in Fultala (Table 4.3). Women became more involved helping their male
partners in the crop fields in weeding and fertilizing activities. When the farmers
were busy with HYVs amon rice farming, another winter season and labour-
intensive high input-based irrigated HYV variety (boro rice, locally called goromer
dhan9) was introduced in the area in mid 1990s. This variety required much more
irrigation and farmers began to grow it in ponds, canals and road side borrow pits
where freshwater was available. This new rice variety followed a different calendar,
growing in the winter when rainfall is low and salinity at its peak. Farmers prepared
seed beds in early poush (mid-December to mid-January), transplanted seedlings
from early magh (mid-January to mid-February) and harvested in baishak (mid- 9Gorom means warm that we feel in summer and dhan means rice, this variety is planted in winter (January) and harvested in summer (around April).

106
April to mid-May) each year. However, these activities required more water, which
constituted a barrier to irrigation of the double cropping of rice in Fultala. However,
in discussions with local women, they stated that extra water from other sources was
not easily available as it had been taken by others (both legally and illegally) and
farmers were then charged for it or it was used for other purposes. While these new
HYV varieties increased rice production and contributed to some degree to greater
food security, there were some negative impacts on local biodiversity. HYV rice
needs intensive wedding that uprooted many aquatic flora which affected fish and
naturally grown wild vegetables. Similarly, the application of fertilizers and
pesticides polluted the environment. A second level impact occurred with boro rice
cultivation as water was extracted from ponds, ditches, canals and beels, thus
reducing water volume and affecting fish stocks. The various impacts of this shift to
HYV rice are summarized in Table 4.3.
Table 4.3: Changes of crop varieties and the local environment in Fultala: 1980 to
2012 Year Rice varieties
in the village Farming requirements Climate risk and
sensitivity Remarks
Early to late 1980s
Local aman varieties –rain-fed monsoon rice (low yield).
Seedbed and sowing Tilling land; Transplanting seedlings and harvesting; (Largely male members involved in farming activities).
Low risk and low sensitivity (having had predictable and enabling rainfall pattern).
Least impact on local environment; High abundance of local fish, aquatic vegetation in beels(food and fodder); Many poor families eat varieties of wild vegetables during crisis period.
Late 1980s to present
Introduction of HYV amon varieties as rain-fed monsoon rice (medium yield).
Seedbed and sowing, tilling land, transplanting seedlings and harvesting; + Weeding, fertilizing and applying pesticides;
(Female members joined the male members in some field farming activities).
Medium to high risks and medium to high sensitivity (low/ delayed monsoon rainfall and sudden high rainfall).
Rice yields increased, medium impact on local environment; Weeding, fertilizing and pesticides impacted on the abundance of freshwater fish, aquatic vegetation Currently freshwater fish and aquatic vegetation is almost gone; Poor people hardly get fish and aquatic vegetation for meeting their crises period.
Mid-1990s to present
Besides HYV amon, HYV Boro was introduced as winter rice in places with irrigation facilities
Seedbed and sowing, tilling land, transplanting seedlings and harvesting; + Weeding, Fertilizing and Applying pesticides; +
High risks and high sensitivity (higher salinity, lack of sweet water for irrigation, no or very low pre-monsoon rainfall).
Rice yields increased further, higher impacts on local environment, irrigation caused shortage of freshwater and social conflict, fertilizers, pesticides impacted local fish, aquatic vegetation,
107
(high yield). Irrigation (Higher involvement of women in farming (weeding, fertilizing + responsibility for manual irrigation).
land tilling by tractors damaged aquatic vegetation, mele (mat making plant); Cyclone-induced salinity killed remaining stock of mollusks, fish and vegetation in beels, canals and ponds.
Source: FGD with women members of farming households in Fultala in 2011.
Farmers in the pre-HYV period did not need to make contingency plans for rice
farming as climate factors (timely rains) in most years followed a regular pattern
and were more predictable compared with today To this end, Delwara Begum, a
woman from farming household of Fultala village said:
In the past, there was no need for making any plan for cultivating local
varieties of amon rice. Everything around rice farming was a kind of
regular job. Rainfall pattern used to follow a systematic rule - we knew
when it would rain and what we have to do. Every year we had to just
repeat the same farming practices. But now with the introduction of
HYV varieties coupled with erratic behavior of rainfall pattern we are in
trouble, often our plans fail – currently we do not get adequate rains in
time we need for farming.
Another housewife, Sufia Begum of Fultala village said:
Now every year we make plan and get ready for planting but there is no
jaisthay vannya10 thus we cannot prepare the seedbed in time and
therefore, we cannot sow seed during amabotir joe11 usually happens
during 5th to 10th of Bengali month of ashar (mid- June to mid-July)
which compelled us for delayed planting of seedlings, thus we get lower
yields and small quantity of hay but the cost of production remains the
same or even higher.
10In the past there used to be heavy rains by end of the Bengali month jaisthay usually after 20th which used to wash out salinity from the soil and to facilitate the process, people use to cut the bunds to drain the rainwater. Later, people again rebuilt the embankment to hold water for preparing the seed bed and sowing seeds. 11 After the jaisthaya vannay, there used to be heavy rains in early ashar (next month) usually during 2nd to 10thofashar called amabitir joe that contributed to enrich soil moisture suitable for tilling.
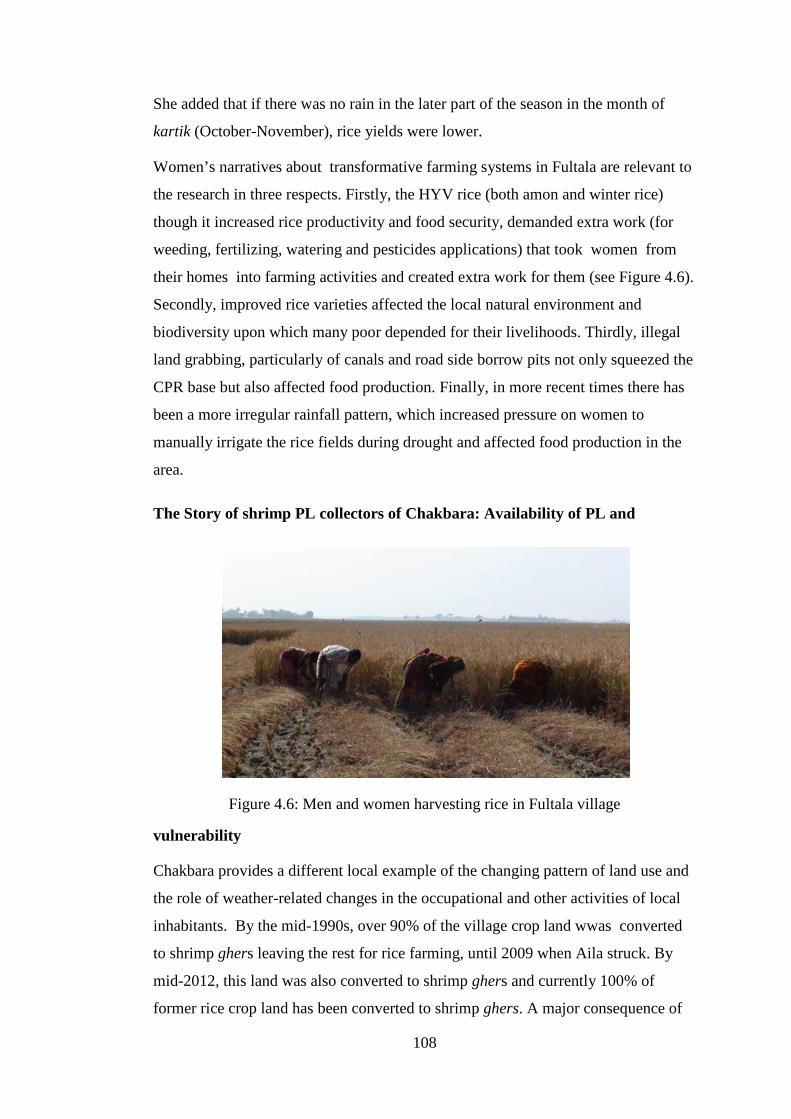
108
She added that if there was no rain in the later part of the season in the month of
kartik (October-November), rice yields were lower.
Women’s narratives about transformative farming systems in Fultala are relevant to
the research in three respects. Firstly, the HYV rice (both amon and winter rice)
though it increased rice productivity and food security, demanded extra work (for
weeding, fertilizing, watering and pesticides applications) that took women from
their homes into farming activities and created extra work for them (see Figure 4.6).
Secondly, improved rice varieties affected the local natural environment and
biodiversity upon which many poor depended for their livelihoods. Thirdly, illegal
land grabbing, particularly of canals and road side borrow pits not only squeezed the
CPR base but also affected food production. Finally, in more recent times there has
been a more irregular rainfall pattern, which increased pressure on women to
manually irrigate the rice fields during drought and affected food production in the
area.
The Story of shrimp PL collectors of Chakbara: Availability of PL and
vulnerability
Chakbara provides a different local example of the changing pattern of land use and
the role of weather-related changes in the occupational and other activities of local
inhabitants. By the mid-1990s, over 90% of the village crop land wwas converted
to shrimp ghers leaving the rest for rice farming, until 2009 when Aila struck. By
mid-2012, this land was also converted to shrimp ghers and currently 100% of
former rice crop land has been converted to shrimp ghers. A major consequence of
Figure 4.6: Men and women harvesting rice in Fultala village
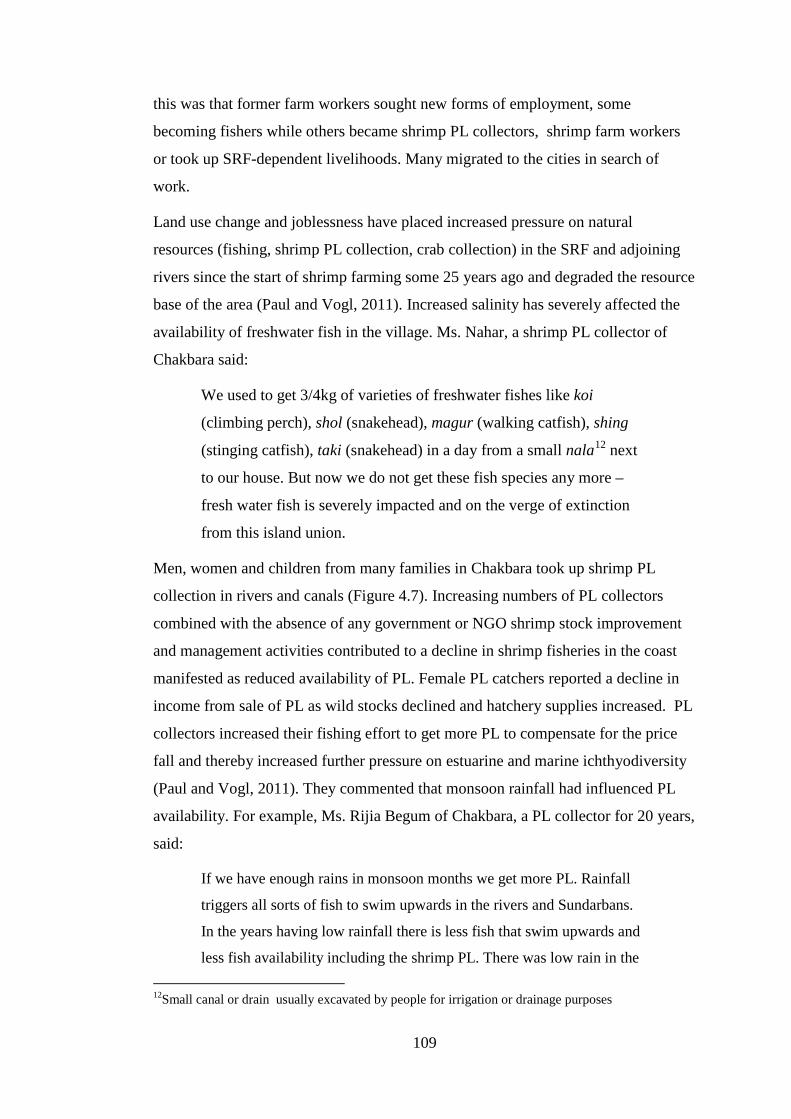
109
this was that former farm workers sought new forms of employment, some
becoming fishers while others became shrimp PL collectors, shrimp farm workers
or took up SRF-dependent livelihoods. Many migrated to the cities in search of
work.
Land use change and joblessness have placed increased pressure on natural
resources (fishing, shrimp PL collection, crab collection) in the SRF and adjoining
rivers since the start of shrimp farming some 25 years ago and degraded the resource
base of the area (Paul and Vogl, 2011). Increased salinity has severely affected the
availability of freshwater fish in the village. Ms. Nahar, a shrimp PL collector of
Chakbara said:
We used to get 3/4kg of varieties of freshwater fishes like koi
(climbing perch), shol (snakehead), magur (walking catfish), shing
(stinging catfish), taki (snakehead) in a day from a small nala12 next
to our house. But now we do not get these fish species any more –
fresh water fish is severely impacted and on the verge of extinction
from this island union.
Men, women and children from many families in Chakbara took up shrimp PL
collection in rivers and canals (Figure 4.7). Increasing numbers of PL collectors
combined with the absence of any government or NGO shrimp stock improvement
and management activities contributed to a decline in shrimp fisheries in the coast
manifested as reduced availability of PL. Female PL catchers reported a decline in
income from sale of PL as wild stocks declined and hatchery supplies increased. PL
collectors increased their fishing effort to get more PL to compensate for the price
fall and thereby increased further pressure on estuarine and marine ichthyodiversity
(Paul and Vogl, 2011). They commented that monsoon rainfall had influenced PL
availability. For example, Ms. Rijia Begum of Chakbara, a PL collector for 20 years,
said:
If we have enough rains in monsoon months we get more PL. Rainfall
triggers all sorts of fish to swim upwards in the rivers and Sundarbans.
In the years having low rainfall there is less fish that swim upwards and
less fish availability including the shrimp PL. There was low rain in the 12Small canal or drain usually excavated by people for irrigation or drainage purposes
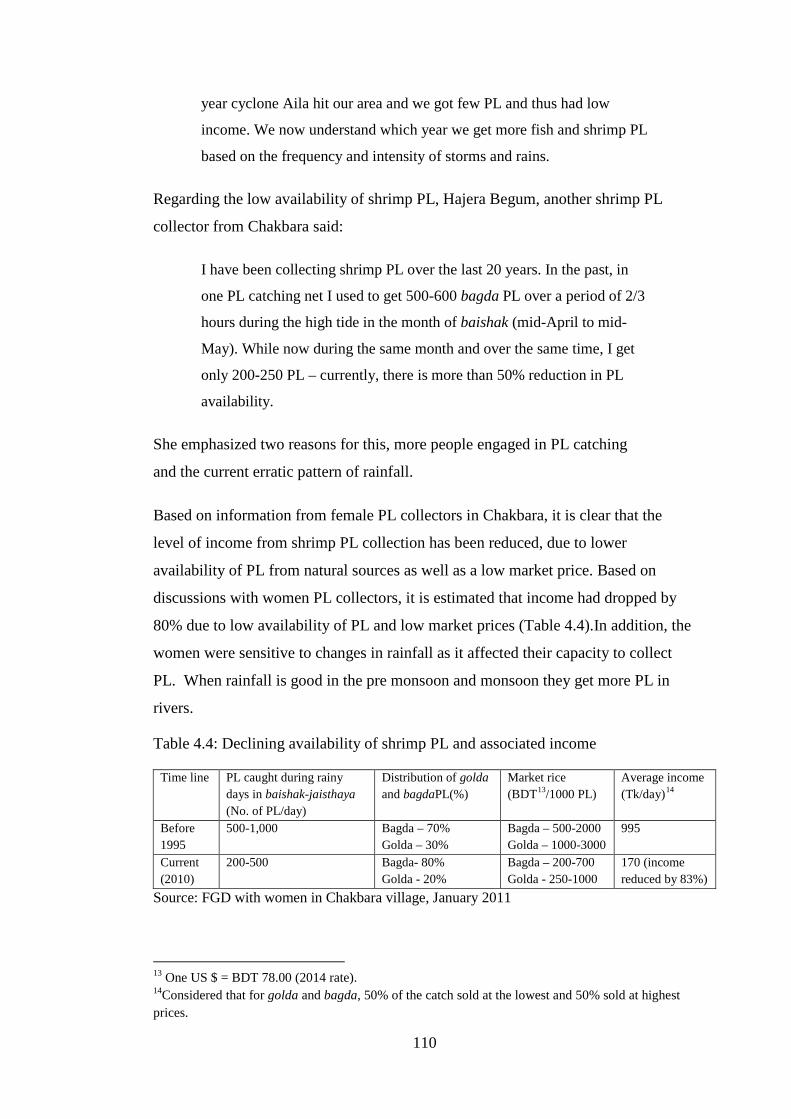
110
year cyclone Aila hit our area and we got few PL and thus had low
income. We now understand which year we get more fish and shrimp PL
based on the frequency and intensity of storms and rains.
Regarding the low availability of shrimp PL, Hajera Begum, another shrimp PL
collector from Chakbara said:
I have been collecting shrimp PL over the last 20 years. In the past, in
one PL catching net I used to get 500-600 bagda PL over a period of 2/3
hours during the high tide in the month of baishak (mid-April to mid-
May). While now during the same month and over the same time, I get
only 200-250 PL – currently, there is more than 50% reduction in PL
availability.
She emphasized two reasons for this, more people engaged in PL catching
and the current erratic pattern of rainfall.
Based on information from female PL collectors in Chakbara, it is clear that the
level of income from shrimp PL collection has been reduced, due to lower
availability of PL from natural sources as well as a low market price. Based on
discussions with women PL collectors, it is estimated that income had dropped by
80% due to low availability of PL and low market prices (Table 4.4).In addition, the
women were sensitive to changes in rainfall as it affected their capacity to collect
PL. When rainfall is good in the pre monsoon and monsoon they get more PL in
rivers.
Table 4.4: Declining availability of shrimp PL and associated income
Time line PL caught during rainy days in baishak-jaisthaya (No. of PL/day)
Distribution of golda and bagdaPL(%)
Market rice (BDT13/1000 PL)
Average income (Tk/day)14
Before 1995
500-1,000 Bagda – 70% Golda – 30%
Bagda – 500-2000 Golda – 1000-3000
995
Current (2010)
200-500 Bagda- 80% Golda - 20%
Bagda – 200-700 Golda - 250-1000
170 (income reduced by 83%)
Source: FGD with women in Chakbara village, January 2011
13 One US $ = BDT 78.00 (2014 rate). 14Considered that for golda and bagda, 50% of the catch sold at the lowest and 50% sold at highest prices.

111
From discussions with Chakbara villagers, I have categorized their perceptions of
how village life has changed into three time-related categories: the time before
shrimp culture or the pre-shrimp period; the time after shrimp farming began (the
shrimp period); and the time after the 2009 cyclone Aila. Based on the narratives of
women PL collectors, these events, especially for the poor households, can be
interpreted as “Happened to be good” for the ‘pre-shrimp period’, “The Not So
Good” for the ‘shrimp period’ and “The Downright Bad” for the ‘Post-Aila period’
(Table 4.5).
Table 4.5: Changes of land use and livelihoods of Chakbara village
Time scale Features and temporal changes Remarks
Before salt water shrimp culture (before 1990) Defined the period as “Happened to be Good”
-People cultivated amon rice, women grew homestead vegetables to meet own demands including income from selling; -High abundance of freshwater fish in beels and khals open for fishing by all (common pool resources); -People reared cattle, goats and poultry; -Poor women worked in rich people’s houses and got rice to meet a part of food demand. Many poor people survived on gleaning rice from fields after harvesting; -Men worked as farm laborers, fishers and forest resource collectors; -Rice farming, cattle rearing, fishing and forest resources formed the basis of livelihoods.
-People relied on natural resources; -Women involved in households works and homestead gardening ; -Managing rice (staple food), even for the poor was not difficult; -Had better environment and better household economy; -People collectively faced hazards – no visible conflict comparable with that between shrimp farmers and rice farmers or fishers or wage laborers.
Shrimp farming -Most beels/ rice land converted to shrimp Increased environmental
Figure 4.7: Women collecting shrimp PL from river

112
Time scale Features and temporal changes Remarks period (from 1990 to 2009) Defined as “The Not So Good” period
ghers.Limited rice farming continued in land not suitable for shrimp; -Homestead vegetable cultivation squeezed – could not meet household demand; -Rapid disappearance of livestock animals from the area due to loss of grazing fields and salinity; -Loss of freshwater fish from the beels and reduction in plant and crop diversity due to higher salinity; -Landless people lost jobs from rice farming, became fishers and engaged in SRF resource collection creating pressure on limited natural resources of SRF; -Women started work in shrimp ghers and in PL collection, which caused loss of biodiversity; -Women reported low availability of shrimp PL due to declining rainfall over the last 7/8 years.
degradation; -Women’s work extended: household work plus PL catching, shrimp gher labouring low availability of PL affected livelihoods of the poor; -Children worked in shrimp PL collection, which impacted on their education; -Socio-economic divisions widened.- the “rich shrimp farmers” versus “poor fishers or wage laborers”; -Social cohesion among people in managing disasters reduced.
Post-Aila period (From May 2009 to 2011) Defined the period as “The Downright Bad”
- Cyclone Aila-induced damage first of its kind in the known history of this village, villagers had to abandon their houses due to saline water inundation and live on embankment for more than a year; -All ponds, shrimp ghers remained inundated for more than a year and polluted soil and water; -Small scale shrimp farmers lost income and became poor with poor shrimp production over three consecutive years (2009, 2010 and 2011); -Most homestead tree species died due to prolonged saline water inundation; -Drinking water ponds in the area contaminated resulting in severe scarcity of drinking water -Due to cyclone and embankment breaching, shrimp culture stopped for three years; -Many people starved to cope with the situation.
-More pressure on natural resources (fish, forests, shrimp PL, crabs) and declining productivity; -Small shrimp farmers turned to earth cutting and, fishing for survival; - Class division widened with regard to disaster management, opportunistic fishing in damaged shrimp ghers, relief and rehabilitation activities; -Disasters increased, overall livelihood now become harder and living in this island is now become risky.
Source: FGD with women members of Chakbara in 2011.
The discussions shows that poor women PL collectors linked what they saw as
changes in weather patterns related to rainfall and drought with the availability of
shrimp PL in rivers and for a time were able to earn a living, although a poor one.
Recent changes in wild PL availability intensified labour inputs. The growth of
hatchery PL and changes in weather patterns combined to put great pressure on poor
households who were forced to rely more on resources from the SFR. These
observations prompted a more detailed analysis of community perceptions and
understanding of weather and weather-related changes and the extent to which these
can be linked to debates over climate change.

113
Summary
This chapter has shown that over the past 40 years a combination of various
exogenous and endogenous interventions and practices in the water sector impacted
upon local water regimes, land use and social-ecological systems. During that time
village environmental resources and land uses underwent major changes, including
the disappearance and shrinkage of canals, rivers, and crop land and the expansion
of areas of settlements and ponds. Shrimp ghers emerged in the 1980s as a major
land use, particularly in Chakbara village where 100% of rice crop land were
converted to shrimp ghers, which affected the livelihoods of rice farmers and wage
labourersand led to changes in local ecological systems and their biodiversity as a
result of increased salinity. Fultala, a village largely dependent on agriculture, was
shown to have experienced the adverse effects of leasing and conversion of canals,
road side borrow pits and rivers on local environments and rice farming. All these
past interventions and reduction in size of productive cropland and wetland have
collectively increased the livelihood vulnerability of local people before the effects
of changing weather regimes become visible. The next chapter focuses on the
changing weather patterns in the area and discusses local people’s perceptions and
understandings of these changes.
114
Chapter 5:
Community Perceptions and Understanding of Changing Weather
Introduction
This chapter focuses on community perceptions and knowledge on weather and
climate and climate change related issues. I document the perceptions and
knowledge of place-based communities in the project area, including the local
government representatives, field staff of NGOs and primary school teachers.
Targeting these other stakeholders groups was particularly important as they are
likely to play a major role in facilitating transformation in the lives of local people,
and thus their understanding of climate issues is important to help communities
develop effective adaptation strategies. Finally I present time-series national
meteorological data on rainfall and temperature for the study area to judge whether
community perceptions of weather changes align. Relevant data were collected by
administering a knowledge, attitude and practice (KAP) survey, focus group
discussions, and key informant interviews. The temperature and rainfall data for
Satkhira district were collected from the head office of the Meteorological
Department, Dhaka.
Communities and their understanding of climate change
The leading global scientific body that deals with global climate change, the
Intergovernmental Panel on Climate Change (IPCC), has confirmed that human-
induced climate change (CC) is now unequivocal and a reality. IPCC also confirms,
based on modeling and empirical observation that CC is occurring at a faster rate
than previously anticipated (IPCC, 2012). Rise of global temperatures at a faster rate
than normal is triggering changes in climate attributes and affecting the normal
rhythm in the structures and functions of physical and natural systems of the earth.
This in turn, exerts differential impacts on global ecosystems and human society
with developing countries particularly susceptible to adverse impacts of climate
change and climate variability. According to Working Group One of the IPCC 5th
115
Assessment Report (WG1 IPCC), global surface temperatures will likely increase by
1.50 and 2.00 compared to the period 1850 to 1900 by the end of the 21st century and
the concomitant global warming will have serious impacts on physical, natural,
social and economic systems. The coast zone of Bangladesh is being affected by
high tidal water levels. Increased and erratic patterns of precipitation, increased
droughts, melting of glaciers, shorter and warmer winters, sea level rise (SLR), and
increased incidence of severe cyclones are considered to be linked to climate change
caused by human activity (IPCC, 2007). Each of these physical changes due to CC
has multiple impacts on ecosystems and human society. Their collective impacts
could be great with the potential to jeopardize current and planned development
outcomes (Stern, 2006). It is also clear that Bangladesh is likely to be severely
impacted by CC and it is essential to build effective adaptation strategies upon a
solid foundation of knowledge of community understandings and perceptions of CC.
The central focus of this research is how coastal peoples view, understand and
respond to the weather and weather-related hazards that affect them.15 To do this I
targeted two coastal villages of Chakbara and Fultala comprising of various
occupational groups as well as other local development actors such as local
government or UP members, NGOs and primary school teachers. These latter play
important local leadership roles in several areas of community concern, including
disaster management and development planning. UPs have their own annual
development plans and implement development activities at the local level with
funding from the central government. The NGOs are civil society organizations that
work very closely with the communities and deal with their day to day problems
related to livelihoods, capacity development, disaster risk reduction, conflict
management and so forth. The primary school teachers are respected persons in the
society and people often seek their advice. For the climate related knowledge
survey, I interviewed 90 village households (45 from each of the two villages), field
staff of 20 NGOs, 24 UP members (12 from each of the two UPs) and 21 primary
school teachers in two concerned UPs.
15When referring to local climatic conditions, the word ‘weather’ will be used. Local people use the Bengali version of this word and it is important to distinguish it from climate, which has a wider reference.
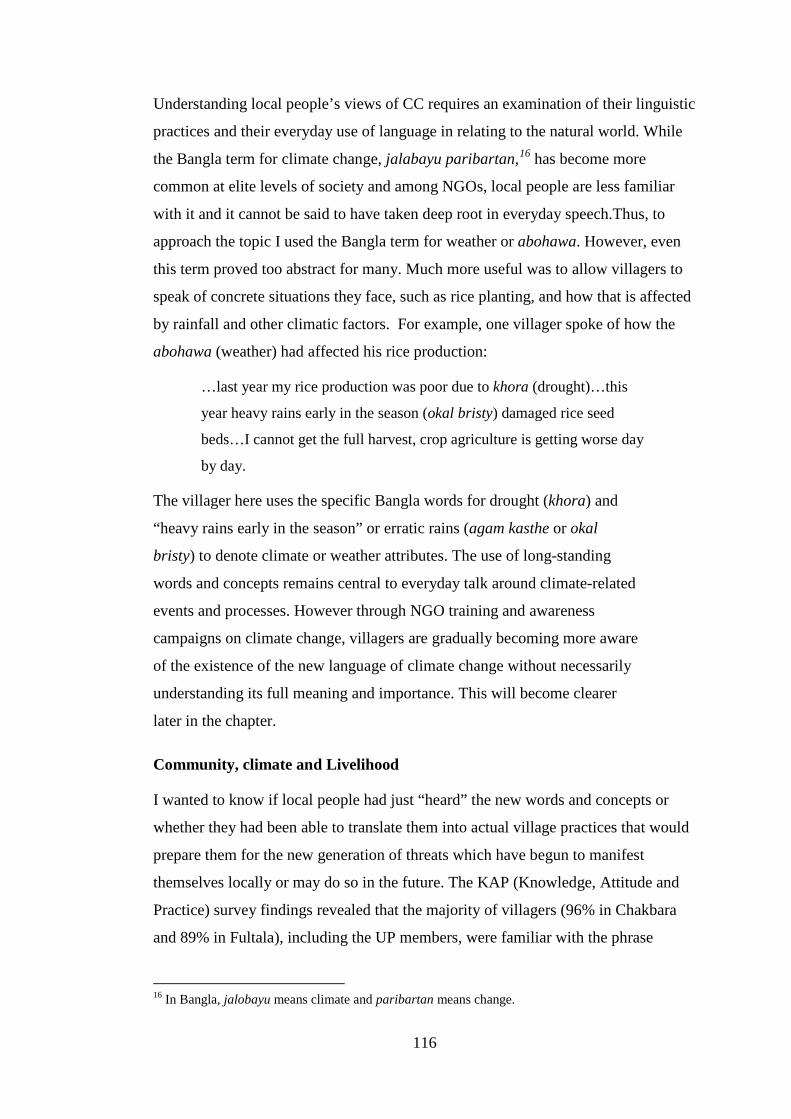
116
Understanding local people’s views of CC requires an examination of their linguistic
practices and their everyday use of language in relating to the natural world. While
the Bangla term for climate change, jalabayu paribartan,16 has become more
common at elite levels of society and among NGOs, local people are less familiar
with it and it cannot be said to have taken deep root in everyday speech.Thus, to
approach the topic I used the Bangla term for weather or abohawa. However, even
this term proved too abstract for many. Much more useful was to allow villagers to
speak of concrete situations they face, such as rice planting, and how that is affected
by rainfall and other climatic factors. For example, one villager spoke of how the
abohawa (weather) had affected his rice production:
…last year my rice production was poor due to khora (drought)…this
year heavy rains early in the season (okal bristy) damaged rice seed
beds…I cannot get the full harvest, crop agriculture is getting worse day
by day.
The villager here uses the specific Bangla words for drought (khora) and
“heavy rains early in the season” or erratic rains (agam kasthe or okal
bristy) to denote climate or weather attributes. The use of long-standing
words and concepts remains central to everyday talk around climate-related
events and processes. However through NGO training and awareness
campaigns on climate change, villagers are gradually becoming more aware
of the existence of the new language of climate change without necessarily
understanding its full meaning and importance. This will become clearer
later in the chapter.
Community, climate and Livelihood
I wanted to know if local people had just “heard” the new words and concepts or
whether they had been able to translate them into actual village practices that would
prepare them for the new generation of threats which have begun to manifest
themselves locally or may do so in the future. The KAP (Knowledge, Attitude and
Practice) survey findings revealed that the majority of villagers (96% in Chakbara
and 89% in Fultala), including the UP members, were familiar with the phrase
16 In Bangla, jalobayu means climate and paribartan means change.
117
Jalabayu Paribartan (or climate change) as they had heard it from multiple sources
(Figure 5.1). However, the majority (70-79%) had only heard the phrase recently
during the period from 2007 to 2011, which corresponds with the two devastating
cyclones, Sidr and Aila in November 2007 and May 2009 respectively. These events
triggered concern and debate about their cause, and to what extent they were linked
with changes in local weather patterns. Through local discussions, media reporting
and government activity in the coastal region, the language of climate change began
to enter everyday consciousness possibly on a scale not seen before.
Villagers confirmed that the NGOs and electronic media (mainly TV and radio)
played key roles in informing people about jalobayu paribartan. Over 60% and 45%
of people of Chakbara learned about climate change from media and NGOs
respectively compared with 60% and 20% respectively in Fultala. Other
information sources such as newspapers, reporters, friends and neighbors, and
school teachers reached a limited audience. While the communities at large had
some familiarity with the issue and language of climate change, further inquiry
revealed a more complex picture of the extent of community understanding of the
issue.
The majority of local people claimed to have fair knowledge of the drivers of
climate change when asked about its causes (Figure 5.1). UP members claimed
greater understanding than villagers and 75% and 83% of UP members in Gabura
and Munshigonj respectively said they knew the “reasons for changing climate”
compared to 62% and 67% of villagers in Chakbara and Fultala. Further inquiry
96% 89%
100% 100%
62% 67%
75% 83%
53% 60%
100% 92%
86% 90%
0 20 40 60 80 100
I heard about climate change - Villagers, ChakbaraI heard about climate change - Villagers, Fultala
I heard about climate change -UP members, GaburaI heard about climate change - UP members, Munshigonj
I have fair idea of reasons of CC - Villagers, ChakbaraI have fair idea of reasons of CC - Villagers, Fultala
I have fair idea of reasons of CC - UP members, GaburaI have fair idea of reasons of CC - UP members, Munshigonj
Climate is certainly changing - Villagers, ChakbaraClimate is certainly changing - Villagers, Fultala
Climate is certainly changing - UP members, GaburaClimate is certainly changing - UP members, Munshigonj
Climate is certainly changing - Primary school teachersClimate is certainly changing - NGO field staff
Figure 5.1: Percent of villagers' (n=90) and UP members' (n=24) awareness on changing weather/ climate factors (2012)

118
revealed that the majority of villagers (53% from Chakbara and 60% from Fultala)
agreed with the statement that climate change is “certainly" taking place (Figure
5.1). Among UP members, 100% and 92% of them in Gabura and Munshigonj
respectively agreed that they consider the climate is changing. The level of
awareness on changing climate is also found higher among the field staff of NGOs
(90%) and primary school teachers (86%). Although more than half of the villagers
had some awareness of climate change, nearly 50% remained unclear about what
constituted a climate change issue. These broad responses tell us something about
the extent of penetration of the climate change narratives into local lives. However,
they provide no detail of what such knowledge consists of and means to local
peoples.
To understand this further, I documented community observations about changes in
local weather and environmental change that convinced them that the changes
experienced were outside their normal experience and could be connected to wider
climate change. Such observed changes included increasing tidal heights, more
frequent natural disasters, hotter summers, prolonged drought and more erratic
patterns of rainfall, which have been linked to longer term climate change (MoEF,
2005; MoEF, 2009).
Community observations about such changes varied. For example, the majority
(80%) of people from Chakbara agreed that tidal height had increased compared
with only 11% of Fultala villagers (Figure 5.2). One explanation for this is spatial.
That is, Chakbara villagers live on the ocean edge and are more sensitive to small
changes in tidal heights than villagers in Fultala. Chakbara is surrounded by large
rivers where tidal influence is stronger and the community is highly susceptible to
inundation by salt water from high tides and embankment breaching or over topping
as has occurred several times in the past. Fultala is a mainland village and relatively
removed from this hazard. Villagers also noted an increased frequency of natural
disasters of different types including what they considered a greater frequency of
cyclones in the Bay of Bengal area in recent times (Figure 5.2).The FGD
participants from project villages discussed recent cyclonic events in the BoB areas:
In November 2007 we had the cyclone Sidr, then in next 6 months,
cyclone Nargis formed and made landfall in May 2008 and in the same
119
year after five months cyclone Rashmi hit in October and in next six
months cyclone Bijli hit in April 2009 and then after a month another
cyclone Aila hit us in May 2009. So in 18 months period we
experienced five cyclones and one damaging depression from the BoB,
seemed abnormally high within such a short period of time – one
cyclone in every three + months.
During the cyclone Aila in 2009, the majority of the villagers of Chakbara had to
leave their homes and stay elsewhere for some 18 months due to saline water
inundation of their homesteads, houses, cropland and shrimp ghers. The whole area
was subject to inundation with tidal saline water from rivers twice a day (tidal water)
through the breached embankment. The people of Fultala village reported that their
crop land were saline-affected due to inundation in 2009 from cyclone Aila . The
residual impact of saline water inundation of cropland continued to affect rice
production until the end of 2012. Besides cyclones, the rice crop was also damaged
due to intense rains and consequent flooding during the 2010 monsoon in low-lying
area and by drought in the late monsoon (2010), which damaged rice at higher
elevations. So the farmers with cropland at low and high elevations were affected
due to climate variability (cyclones, high rains and drought). Based on the soil
salinity in cropland of Fultala village, farmers assumed that another five years would
be required to get the salinity fully washed from the soil provided that another
cyclone did not inundate the area again.
The villagers of Fultala experienced 100% loss of amon rice seed beds due to
intense heavy rain-based flooding and inundation over two weeks in early August
2011. Most of the farmers had to replant and were late in transplanting seedlings.
They ended up with over 50% lower yields than normal and the cost of production
was much higher. The shrimp farmers also experienced losses from fish escaping
from flooded ghers. Some protected their ghers with net fencing but the shrimp and
fish died after heavy rains which affected gher water quality and local eco-systems.
.
Regarding recent changes in the extent of drought, half of Fultala residents stated
that there had been changes in the frequency and duration of low rainfall conditions
in the monsoon season (Figure 5.2). Monsoon rains are crucial for rice farming and
Fultala farmers said there had been no rainfall from 12 April to 26 May 2012, which
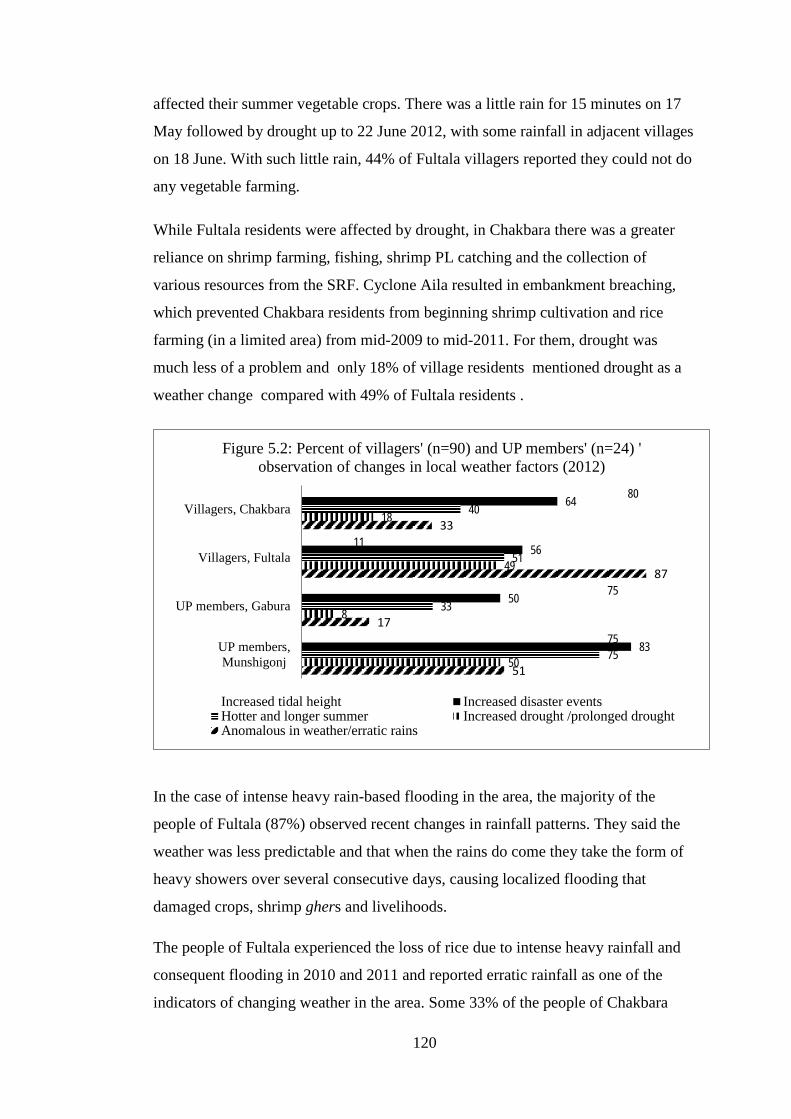
120
affected their summer vegetable crops. There was a little rain for 15 minutes on 17
May followed by drought up to 22 June 2012, with some rainfall in adjacent villages
on 18 June. With such little rain, 44% of Fultala villagers reported they could not do
any vegetable farming.
While Fultala residents were affected by drought, in Chakbara there was a greater
reliance on shrimp farming, fishing, shrimp PL catching and the collection of
various resources from the SRF. Cyclone Aila resulted in embankment breaching,
which prevented Chakbara residents from beginning shrimp cultivation and rice
farming (in a limited area) from mid-2009 to mid-2011. For them, drought was
much less of a problem and only 18% of village residents mentioned drought as a
weather change compared with 49% of Fultala residents .
In the case of intense heavy rain-based flooding in the area, the majority of the
people of Fultala (87%) observed recent changes in rainfall patterns. They said the
weather was less predictable and that when the rains do come they take the form of
heavy showers over several consecutive days, causing localized flooding that
damaged crops, shrimp ghers and livelihoods.
The people of Fultala experienced the loss of rice due to intense heavy rainfall and
consequent flooding in 2010 and 2011 and reported erratic rainfall as one of the
indicators of changing weather in the area. Some 33% of the people of Chakbara
80
11
75
75
64
56
50
83
40
51
33
75
18
49
8
50
33
87
17
51
Villagers, Chakbara
Villagers, Fultala
UP members, Gabura
UP members,Munshigonj
Figure 5.2: Percent of villagers' (n=90) and UP members' (n=24) ' observation of changes in local weather factors (2012)
Increased tidal height Increased disaster eventsHotter and longer summer Increased drought /prolonged droughtAnomalous in weather/erratic rains
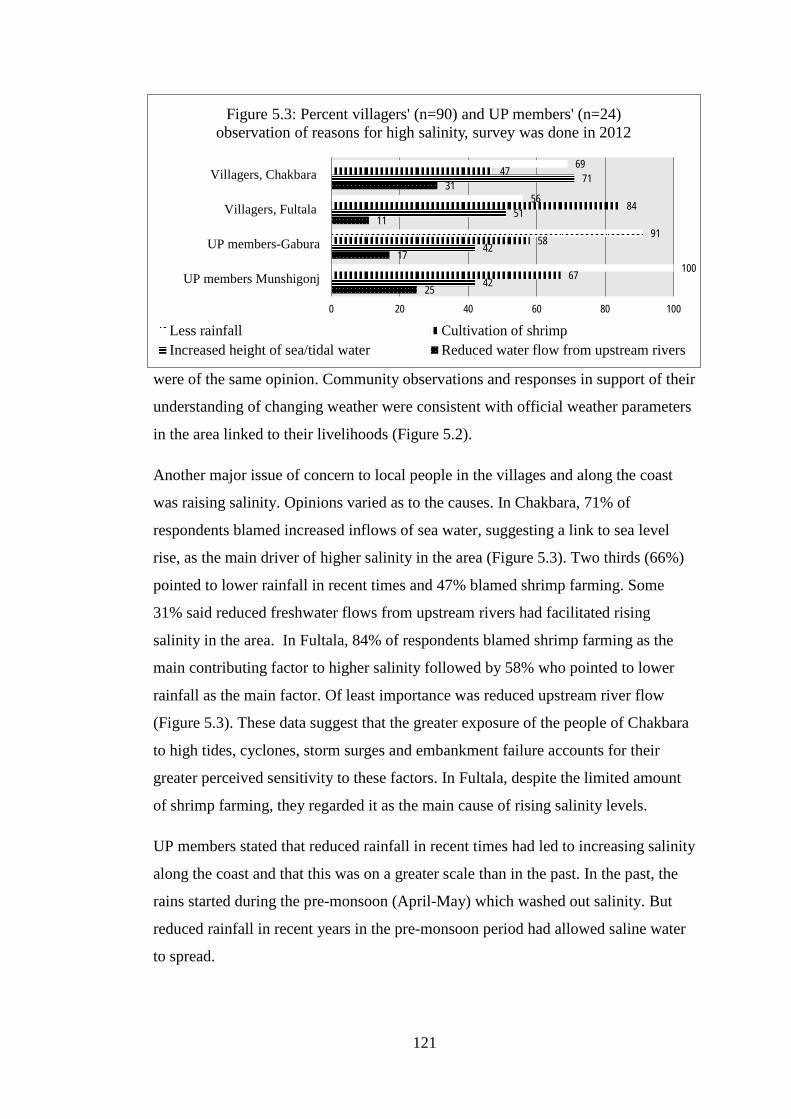
121
were of the same opinion. Community observations and responses in support of their
understanding of changing weather were consistent with official weather parameters
in the area linked to their livelihoods (Figure 5.2).
Another major issue of concern to local people in the villages and along the coast
was raising salinity. Opinions varied as to the causes. In Chakbara, 71% of
respondents blamed increased inflows of sea water, suggesting a link to sea level
rise, as the main driver of higher salinity in the area (Figure 5.3). Two thirds (66%)
pointed to lower rainfall in recent times and 47% blamed shrimp farming. Some
31% said reduced freshwater flows from upstream rivers had facilitated rising
salinity in the area. In Fultala, 84% of respondents blamed shrimp farming as the
main contributing factor to higher salinity followed by 58% who pointed to lower
rainfall as the main factor. Of least importance was reduced upstream river flow
(Figure 5.3). These data suggest that the greater exposure of the people of Chakbara
to high tides, cyclones, storm surges and embankment failure accounts for their
greater perceived sensitivity to these factors. In Fultala, despite the limited amount
of shrimp farming, they regarded it as the main cause of rising salinity levels.
UP members stated that reduced rainfall in recent times had led to increasing salinity
along the coast and that this was on a greater scale than in the past. In the past, the
rains started during the pre-monsoon (April-May) which washed out salinity. But
reduced rainfall in recent years in the pre-monsoon period had allowed saline water
to spread.
69
56
91
100
47
84
58
67
71
51
42
42
31
11
17
25
0 20 40 60 80 100
Villagers, Chakbara
Villagers, Fultala
UP members-Gabura
UP members Munshigonj
Figure 5.3: Percent villagers' (n=90) and UP members' (n=24) observation of reasons for high salinity, survey was done in 2012
Less rainfall Cultivation of shrimpIncreased height of sea/tidal water Reduced water flow from upstream rivers

122
These observations from local people and UP members were based on their long-
term experiences, rather than any scientifically grounded evidence base. They
compared what they regarded as normal weather with what they had become used to
experiencing in recent years. The changes had affected their production systems and
presented them with new challenges in adjusting farming systems to current weather
patterns.
Another observation made by local people was that insect populations had increased
in recent years. In particular, they mentioned about Stem Borer of rice or kalomatha
majra poka (Chilo polychyrysus), current poka or Brown Plant Hopper (Nilaparvata
lugens) and Rice Leaf Folder (Cnaphalocrocis medinalis) which damage rice.
Farmers gave the insect the name of current poka as it attacked in groups and spread
quickly and instantly damaged rice plants like an electric current.
Figure 5.4 summarises local peoples’ and UP members’ views on the impact of
changes in rainfall patterns and the growth in insect infestations. The data presented
does not differentiate among farmers by their asset base, but from discussions with
them and personal observations, those with access to stored water in ponds and
ditches were able to get moderate yields in drought years. However, practically all
local villagers claimed that crop production had been affected due to water stress in
drought years and that this had threatened their capacity to plan their cultivation
cycles.
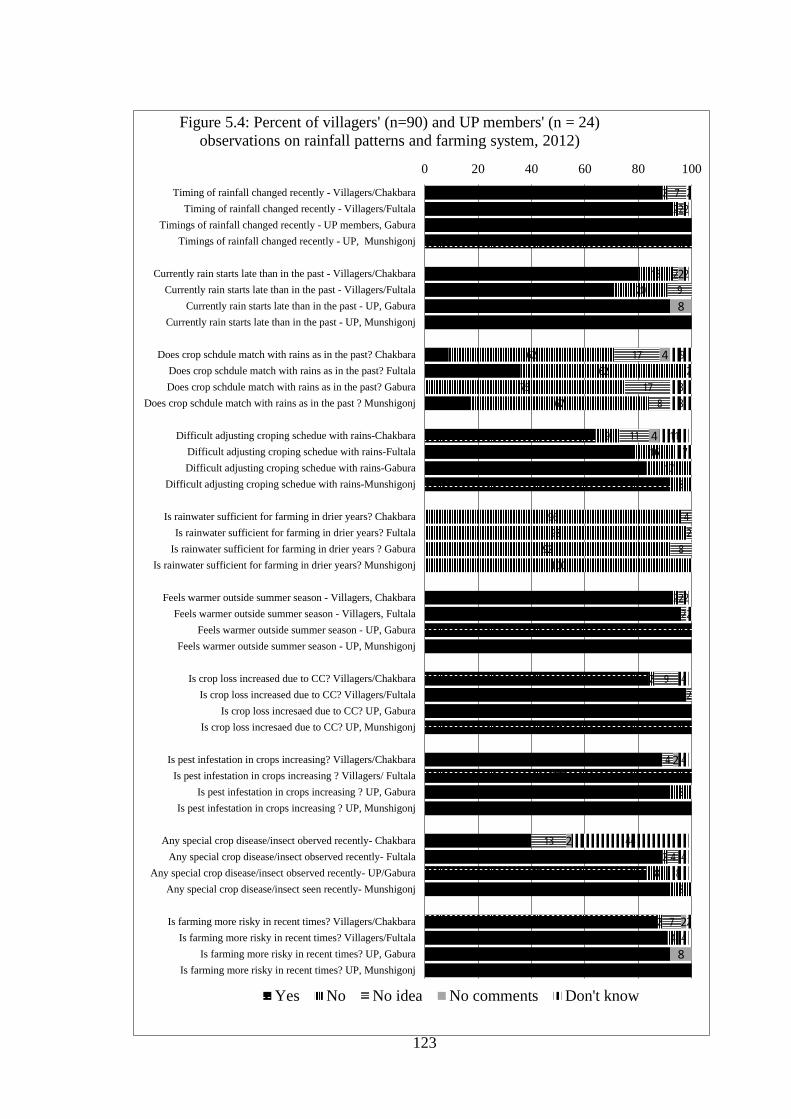
123
89 93
100 100
80 71
92 100
9 36
17
64 78
83 92
93 96 100 100
84 98 100 100
89 100
92 100
40 89
83 92
87 91 92
100
2 2
13 20
62 62
75 67
9 16
17 8
96 98
92 100
2
2
8
2 8
8
2 4
7 2
2 9
17
17 8
11
4 2
8
2 2
9 2
4
13 4
7
2
8
4
4
2
2
2
8
2 2
2
9 2
8 8
11 7
2 2
4
4
44 4
8
2 4
0 20 40 60 80 100
Timing of rainfall changed recently - Villagers/ChakbaraTiming of rainfall changed recently - Villagers/Fultala
Timings of rainfall changed recently - UP members, GaburaTimings of rainfall changed recently - UP, Munshigonj
Currently rain starts late than in the past - Villagers/ChakbaraCurrently rain starts late than in the past - Villagers/Fultala
Currently rain starts late than in the past - UP, GaburaCurrently rain starts late than in the past - UP, Munshigonj
Does crop schdule match with rains as in the past? ChakbaraDoes crop schdule match with rains as in the past? FultalaDoes crop schdule match with rains as in the past? Gabura
Does crop schdule match with rains as in the past ? Munshigonj
Difficult adjusting croping schedue with rains-ChakbaraDifficult adjusting croping schedue with rains-FultalaDifficult adjusting croping schedue with rains-Gabura
Difficult adjusting croping schedue with rains-Munshigonj
Is rainwater sufficient for farming in drier years? ChakbaraIs rainwater sufficient for farming in drier years? Fultala
Is rainwater sufficient for farming in drier years ? GaburaIs rainwater sufficient for farming in drier years? Munshigonj
Feels warmer outside summer season - Villagers, ChakbaraFeels warmer outside summer season - Villagers, Fultala
Feels warmer outside summer season - UP, GaburaFeels warmer outside summer season - UP, Munshigonj
Is crop loss increased due to CC? Villagers/ChakbaraIs crop loss increased due to CC? Villagers/Fultala
Is crop loss incresaed due to CC? UP, GaburaIs crop loss incresaed due to CC? UP, Munshigonj
Is pest infestation in crops increasing? Villagers/ChakbaraIs pest infestation in crops increasing ? Villagers/ Fultala
Is pest infestation in crops increasing ? UP, GaburaIs pest infestation in crops increasing ? UP, Munshigonj
Any special crop disease/insect oberved recently- ChakbaraAny special crop disease/insect observed recently- Fultala
Any special crop disease/insect observed recently- UP/GaburaAny special crop disease/insect seen recently- Munshigonj
Is farming more risky in recent times? Villagers/ChakbaraIs farming more risky in recent times? Villagers/Fultala
Is farming more risky in recent times? UP, GaburaIs farming more risky in recent times? UP, Munshigonj
Figure 5.4: Percent of villagers' (n=90) and UP members' (n = 24) observations on rainfall patterns and farming system, 2012)
Yes No No idea No comments Don't know
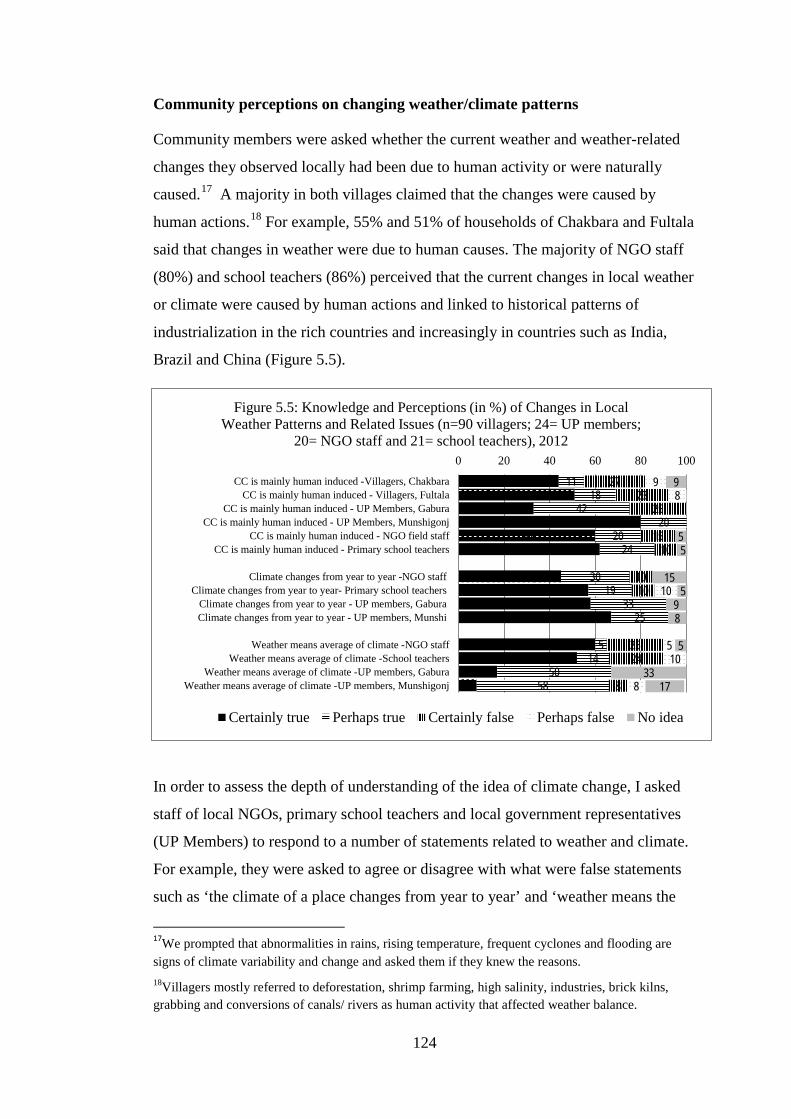
124
Community perceptions on changing weather/climate patterns
Community members were asked whether the current weather and weather-related
changes they observed locally had been due to human activity or were naturally
caused.17 A majority in both villages claimed that the changes were caused by
human actions.18 For example, 55% and 51% of households of Chakbara and Fultala
said that changes in weather were due to human causes. The majority of NGO staff
(80%) and school teachers (86%) perceived that the current changes in local weather
or climate were caused by human actions and linked to historical patterns of
industrialization in the rich countries and increasingly in countries such as India,
Brazil and China (Figure 5.5).
In order to assess the depth of understanding of the idea of climate change, I asked
staff of local NGOs, primary school teachers and local government representatives
(UP Members) to respond to a number of statements related to weather and climate.
For example, they were asked to agree or disagree with what were false statements
such as ‘the climate of a place changes from year to year’ and ‘weather means the
17We prompted that abnormalities in rains, rising temperature, frequent cyclones and flooding are signs of climate variability and change and asked them if they knew the reasons. 18Villagers mostly referred to deforestation, shrimp farming, high salinity, industries, brick kilns, grabbing and conversions of canals/ rivers as human activity that affected weather balance.
44 51
33 80
60 62
45 57 58
67
60 52
17 8
11 18
42 20
20 24
30 19
33 25
5 14
50 58
27 23
25
15 10
10 10
25 24
8
9 8
10
5 10
8
9
5 5
15 5
9 8
5
33 17
0 20 40 60 80 100
CC is mainly human induced -Villagers, ChakbaraCC is mainly human induced - Villagers, Fultala
CC is mainly human induced - UP Members, GaburaCC is mainly human induced - UP Members, Munshigonj
CC is mainly human induced - NGO field staffCC is mainly human induced - Primary school teachers
Climate changes from year to year -NGO staffClimate changes from year to year- Primary school teachers
Climate changes from year to year - UP members, GaburaClimate changes from year to year - UP members, Munshi
Weather means average of climate -NGO staffWeather means average of climate -School teachers
Weather means average of climate -UP members, GaburaWeather means average of climate -UP members, Munshigonj
Figure 5.5: Knowledge and Perceptions (in %) of Changes in Local Weather Patterns and Related Issues (n=90 villagers; 24= UP members;
20= NGO staff and 21= school teachers), 2012
Certainly true Perhaps true Certainly false Perhaps false No idea

125
average of the long term climate data of a given place’. Analyzing the responses, out
of 24 local government representatives who participated, none gave the correct
response concerning the meaning of the term “climate”. This was despite 75 to 83%
of UP members stating earlier that they had a fair idea of the reasons for climate
change (Figure 5.1 and Figure 5.5). Only 10% of the field level staff of NGOs and
primary school teachers responded correctly.
Regarding the concept of ‘weather’, more than half of the participating NGOs and
primary school teachers (60% NGO staff and 52% primary school teachers)
responded ‘yes’ to the false statement “weather means the average of long term
climate data of a given place” (Figure 5.5). The level of knowledge of UP members
of “climate” and “weather” was also very poor (Figure 5.5). Thus, while a high
proportion of community members of all groups said they believed the climate is
changing, fewer connected this to human activity, and even fewer understood basic
concepts such as weather and climate.
I then examined what NGO staff, primary school teachers and UP members
understood by greenhouse gases, the greenhouse effect and their links to global
warming and climate change. The reason for the focus on these groups was that they
were important resource persons linking local people to the wider government and
international community responsible for developing policies to deal with climate
change. The majority (60% - 100%) said they had a fair knowledge of the issues but
further investigation revealed that their level of awareness was limited. For example,
they had “heard” the phrase greenhouse effect but did not know what it actually
meant (Figure 5.6). In order to determine their level of understanding about the
greenhouse effect and related ideas, I asked them to respond to five multiple choice
questions (Figure 5.7).
Only 30% of NGO staff agreed with the statement that greenhouse gases were gases
in the atmosphere that trapped heat while 55% stated that it referred to air pollution
100 95
83 67
5 17
33
0 20 40 60 80 100
I am aware of Green House Effect (NGO field staff)I am aware of Green House Effect (Primary school…
I am aware of Green House Effect (UP Members, Gabura)I am aware of Green House Effect (UP Members,…
Figure 5.6: Awarness (in %) of NGO staff (n=20), School teachers (n=21) and UP members (n=24) on Green House Effect, 2012
Yes No
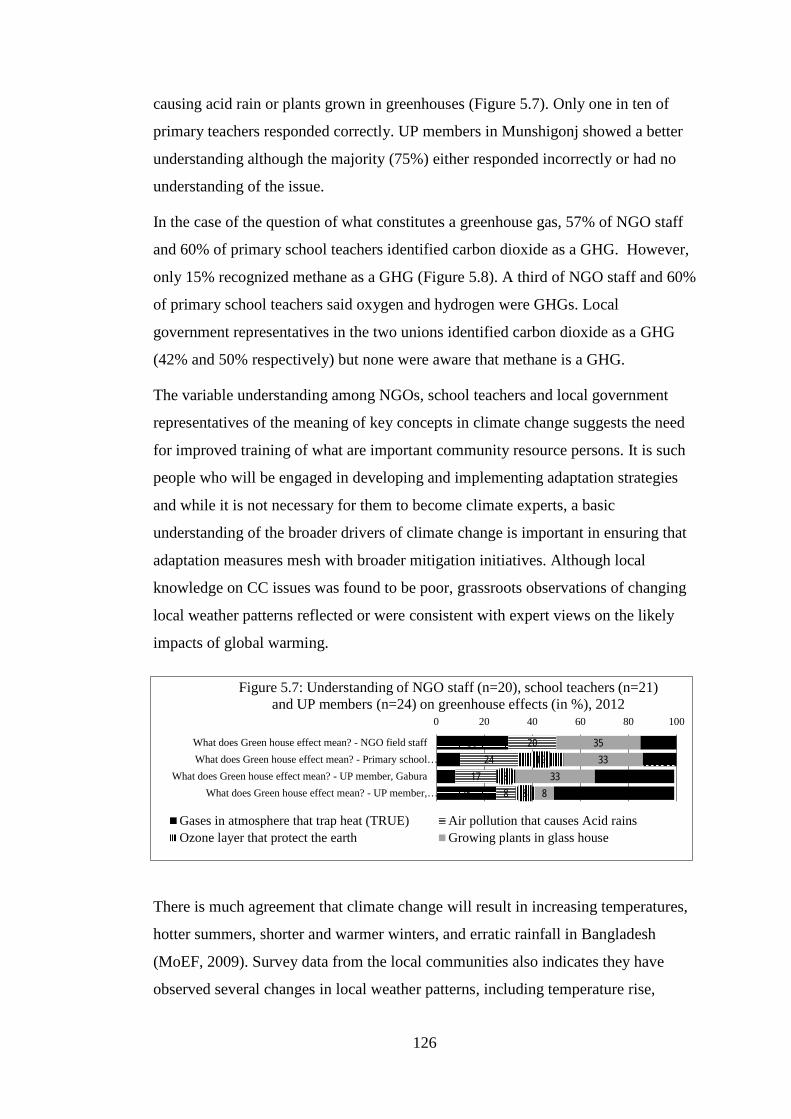
126
causing acid rain or plants grown in greenhouses (Figure 5.7). Only one in ten of
primary teachers responded correctly. UP members in Munshigonj showed a better
understanding although the majority (75%) either responded incorrectly or had no
understanding of the issue.
In the case of the question of what constitutes a greenhouse gas, 57% of NGO staff
and 60% of primary school teachers identified carbon dioxide as a GHG. However,
only 15% recognized methane as a GHG (Figure 5.8). A third of NGO staff and 60%
of primary school teachers said oxygen and hydrogen were GHGs. Local
government representatives in the two unions identified carbon dioxide as a GHG
(42% and 50% respectively) but none were aware that methane is a GHG.
The variable understanding among NGOs, school teachers and local government
representatives of the meaning of key concepts in climate change suggests the need
for improved training of what are important community resource persons. It is such
people who will be engaged in developing and implementing adaptation strategies
and while it is not necessary for them to become climate experts, a basic
understanding of the broader drivers of climate change is important in ensuring that
adaptation measures mesh with broader mitigation initiatives. Although local
knowledge on CC issues was found to be poor, grassroots observations of changing
local weather patterns reflected or were consistent with expert views on the likely
impacts of global warming.
There is much agreement that climate change will result in increasing temperatures,
hotter summers, shorter and warmer winters, and erratic rainfall in Bangladesh
(MoEF, 2009). Survey data from the local communities also indicates they have
observed several changes in local weather patterns, including temperature rise,
30 10 8
25
20 24
17 8
19 8
8
35 33
33 8
15 14
33 50
0 20 40 60 80 100
What does Green house effect mean? - NGO field staffWhat does Green house effect mean? - Primary school…
What does Green house effect mean? - UP member, GaburaWhat does Green house effect mean? - UP member,…
Figure 5.7: Understanding of NGO staff (n=20), school teachers (n=21) and UP members (n=24) on greenhouse effects (in %), 2012
Gases in atmosphere that trap heat (TRUE) Air pollution that causes Acid rainsOzone layer that protect the earth Growing plants in glass house
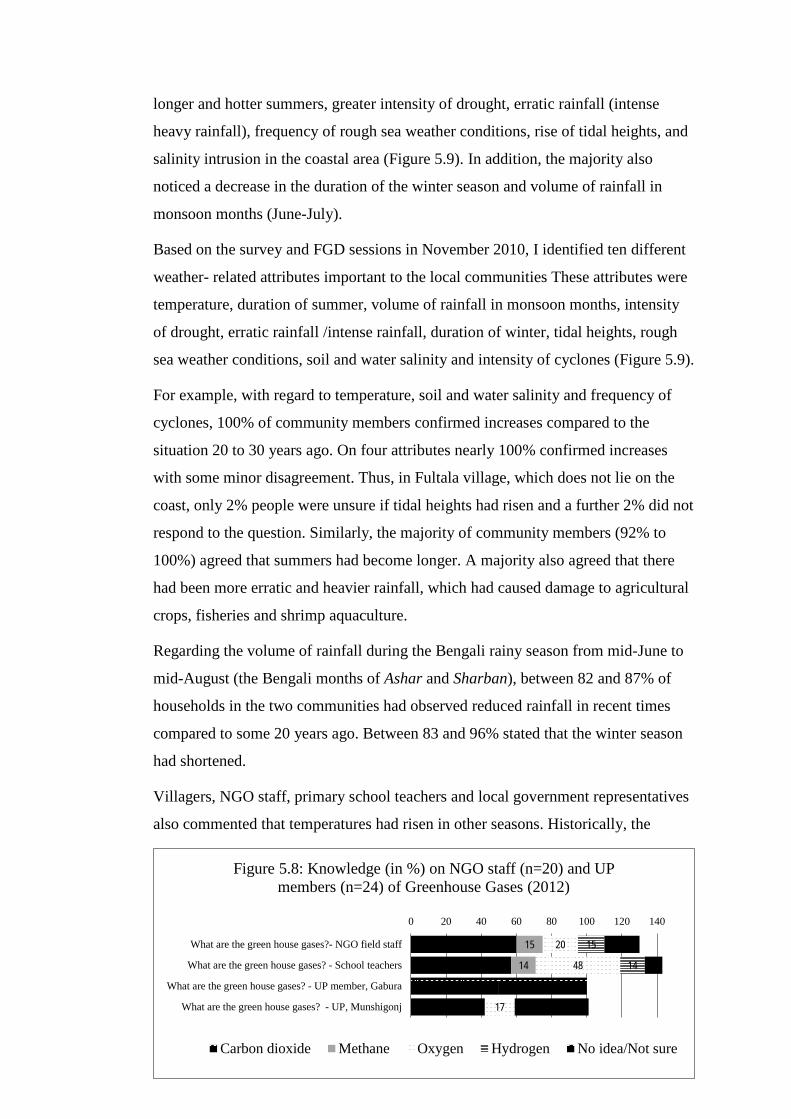
127
longer and hotter summers, greater intensity of drought, erratic rainfall (intense
heavy rainfall), frequency of rough sea weather conditions, rise of tidal heights, and
salinity intrusion in the coastal area (Figure 5.9). In addition, the majority also
noticed a decrease in the duration of the winter season and volume of rainfall in
monsoon months (June-July).
Based on the survey and FGD sessions in November 2010, I identified ten different
weather- related attributes important to the local communities These attributes were
temperature, duration of summer, volume of rainfall in monsoon months, intensity
of drought, erratic rainfall /intense rainfall, duration of winter, tidal heights, rough
sea weather conditions, soil and water salinity and intensity of cyclones (Figure 5.9).
For example, with regard to temperature, soil and water salinity and frequency of
cyclones, 100% of community members confirmed increases compared to the
situation 20 to 30 years ago. On four attributes nearly 100% confirmed increases
with some minor disagreement. Thus, in Fultala village, which does not lie on the
coast, only 2% people were unsure if tidal heights had risen and a further 2% did not
respond to the question. Similarly, the majority of community members (92% to
100%) agreed that summers had become longer. A majority also agreed that there
had been more erratic and heavier rainfall, which had caused damage to agricultural
crops, fisheries and shrimp aquaculture.
Regarding the volume of rainfall during the Bengali rainy season from mid-June to
mid-August (the Bengali months of Ashar and Sharban), between 82 and 87% of
households in the two communities had observed reduced rainfall in recent times
compared to some 20 years ago. Between 83 and 96% stated that the winter season
had shortened.
Villagers, NGO staff, primary school teachers and local government representatives
also commented that temperatures had risen in other seasons. Historically, the
60
57
50
42
15
14
20
48
17
15
14
20
10
50
42
0 20 40 60 80 100 120 140
What are the green house gases?- NGO field staff
What are the green house gases? - School teachers
What are the green house gases? - UP member, Gabura
What are the green house gases? - UP, Munshigonj
Figure 5.8: Knowledge (in %) on NGO staff (n=20) and UP members (n=24) of Greenhouse Gases (2012)
Carbon dioxide Methane Oxygen Hydrogen No idea/Not sure
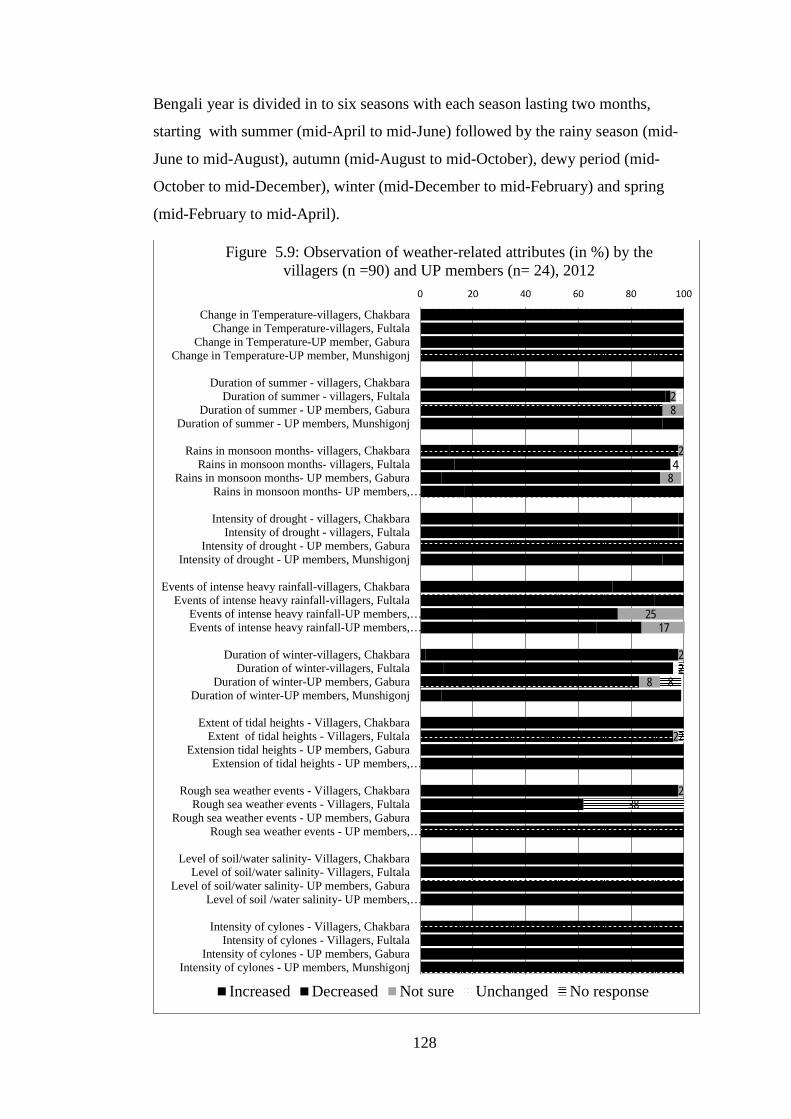
128
Bengali year is divided in to six seasons with each season lasting two months,
starting with summer (mid-April to mid-June) followed by the rainy season (mid-
June to mid-August), autumn (mid-August to mid-October), dewy period (mid-
October to mid-December), winter (mid-December to mid-February) and spring
(mid-February to mid-April).
100 100 100 100
100 93 92 92
11 13
8 17
98 98 100
92
73 89
25 67
2 9
8
100 96 100 100
98 62
100 100
100 100 100 100
100 100 100 100
2
8
87 82
83 83
2 2
8
27 11
50 17
96 87
83 91
2 8
2
8
25 17
2
8
2
2
4
2 8
2
38
0 20 40 60 80 100
Change in Temperature-villagers, ChakbaraChange in Temperature-villagers, Fultala
Change in Temperature-UP member, GaburaChange in Temperature-UP member, Munshigonj
Duration of summer - villagers, ChakbaraDuration of summer - villagers, Fultala
Duration of summer - UP members, GaburaDuration of summer - UP members, Munshigonj
Rains in monsoon months- villagers, ChakbaraRains in monsoon months- villagers, Fultala
Rains in monsoon months- UP members, GaburaRains in monsoon months- UP members,…
Intensity of drought - villagers, ChakbaraIntensity of drought - villagers, Fultala
Intensity of drought - UP members, GaburaIntensity of drought - UP members, Munshigonj
Events of intense heavy rainfall-villagers, ChakbaraEvents of intense heavy rainfall-villagers, Fultala
Events of intense heavy rainfall-UP members,…Events of intense heavy rainfall-UP members,…
Duration of winter-villagers, ChakbaraDuration of winter-villagers, Fultala
Duration of winter-UP members, GaburaDuration of winter-UP members, Munshigonj
Extent of tidal heights - Villagers, ChakbaraExtent of tidal heights - Villagers, Fultala
Extension tidal heights - UP members, GaburaExtension of tidal heights - UP members,…
Rough sea weather events - Villagers, ChakbaraRough sea weather events - Villagers, Fultala
Rough sea weather events - UP members, GaburaRough sea weather events - UP members,…
Level of soil/water salinity- Villagers, ChakbaraLevel of soil/water salinity- Villagers, Fultala
Level of soil/water salinity- UP members, GaburaLevel of soil /water salinity- UP members,…
Intensity of cylones - Villagers, ChakbaraIntensity of cylones - Villagers, Fultala
Intensity of cylones - UP members, GaburaIntensity of cylones - UP members, Munshigonj
Figure 5.9: Observation of weather-related attributes (in %) by the villagers (n =90) and UP members (n= 24), 2012
Increased Decreased Not sure Unchanged No response
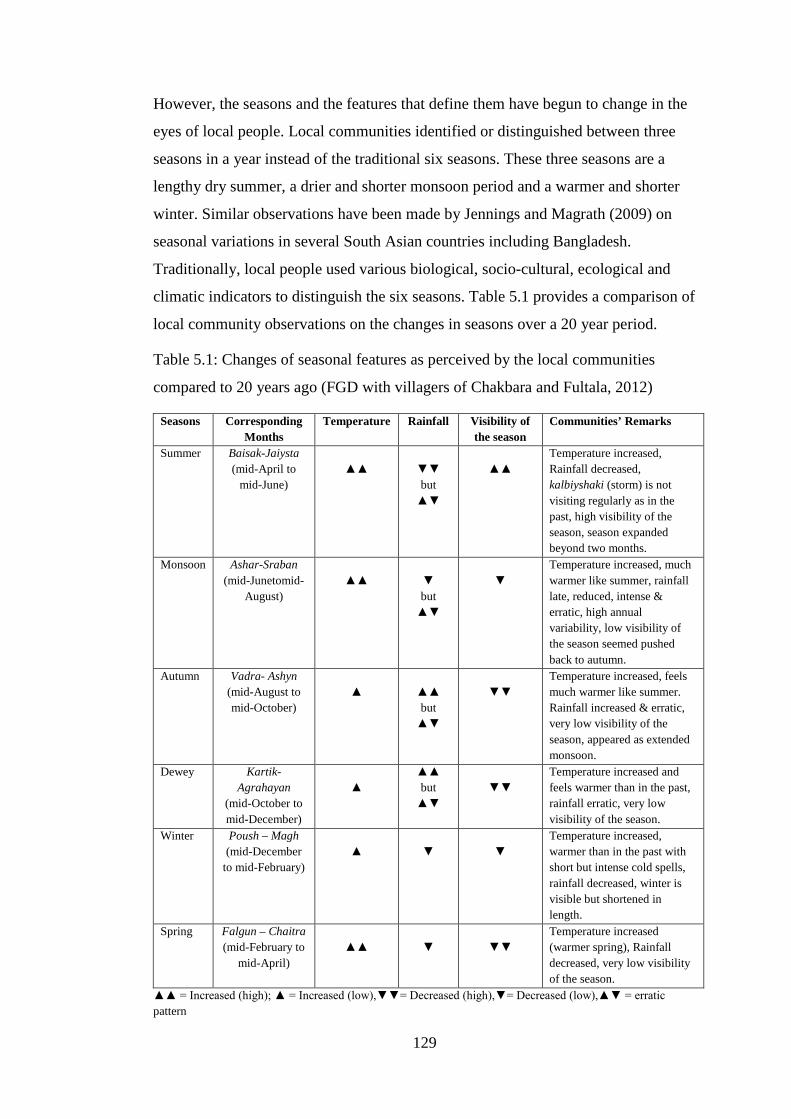
129
However, the seasons and the features that define them have begun to change in the
eyes of local people. Local communities identified or distinguished between three
seasons in a year instead of the traditional six seasons. These three seasons are a
lengthy dry summer, a drier and shorter monsoon period and a warmer and shorter
winter. Similar observations have been made by Jennings and Magrath (2009) on
seasonal variations in several South Asian countries including Bangladesh.
Traditionally, local people used various biological, socio-cultural, ecological and
climatic indicators to distinguish the six seasons. Table 5.1 provides a comparison of
local community observations on the changes in seasons over a 20 year period.
Table 5.1: Changes of seasonal features as perceived by the local communities
compared to 20 years ago (FGD with villagers of Chakbara and Fultala, 2012)
Seasons Corresponding Months
Temperature Rainfall Visibility of the season
Communities’ Remarks
Summer Baisak-Jaiysta (mid-April to
mid-June)
▲▲
▼▼ but
▲▼
▲▲
Temperature increased, Rainfall decreased, kalbiyshaki (storm) is not visiting regularly as in the past, high visibility of the season, season expanded beyond two months.
Monsoon Ashar-Sraban (mid-Junetomid-
August)
▲▲
▼ but
▲▼
▼
Temperature increased, much warmer like summer, rainfall late, reduced, intense & erratic, high annual variability, low visibility of the season seemed pushed back to autumn.
Autumn Vadra- Ashyn (mid-August to mid-October)
▲
▲▲ but
▲▼
▼▼
Temperature increased, feels much warmer like summer. Rainfall increased & erratic, very low visibility of the season, appeared as extended monsoon.
Dewey Kartik-Agrahayan
(mid-October to mid-December)
▲
▲▲ but
▲▼
▼▼
Temperature increased and feels warmer than in the past, rainfall erratic, very low visibility of the season.
Winter Poush – Magh (mid-December
to mid-February)
▲
▼
▼
Temperature increased, warmer than in the past with short but intense cold spells, rainfall decreased, winter is visible but shortened in length.
Spring Falgun – Chaitra (mid-February to
mid-April)
▲▲
▼
▼▼
Temperature increased (warmer spring), Rainfall decreased, very low visibility of the season.
▲▲ = Increased (high); ▲ = Increased (low),▼▼= Decreased (high),▼= Decreased (low),▲▼ = erratic pattern
130
In the past, local people were able to identify the six seasons by observing changes
in various features of natural systems at different times of the year. Apart from the
changes in weather factors, one such indicator was the presence of different birds at
different times of the year. The members of various occupational groups in
Chakbara and Fultala, including women, spoke of how the appearance of different
types of birds heralded the beginning or continuation of different seasons. They said
that this was no longer the case due to changes in the weather, land types and land
use patterns. Below a more detailed account of these changes is provided.
Summer in the past (Mid April - Mid June)
The appearance of a bird named bou katha kou (Indian cuckoo) and their call in late
night/ early morning indicated the presence of the hot summer. Another bird named
taltora (swift) also appeared in the latter part of summer. Villagers understood the
presence of summer by observing the flocks of taltora birds in the evening feeding
on flying ants. At the end of the season, these summer birds gradually disappeared.
Summer today
None of these birds are seen today, especially in Chakbara where the current land
use is shrimp farming. Villagers identified several causes of the decline in the
appearance of these birds. These were the conversion of cropland to shrimp ghers,
the destruction of trees and bushes from land clearing, persistent higher soil salinity,
lack of sweet water, lack of ants and the growth of the local population.
Monsoon in the past (Mid June - Mid August)
Following the hot summer, the monsoon arrived and heavy rains ensued. People
would plough the land with the onset of rainfall to saturate the soil and suitable for
planting rain-fed amon rice. During the tilling of land for transplanting rice, flocks
of a bird named shalik (pied moina) used to appear and eat the ground-based insects.
They also rested on water hyacinth in the canals and fed on various insects. The
appearance of shalik indicated the arrival of the Bengali month of ashar (mid-June
to mid-July: the first month of monsoon season). Upon completion of rice
transplantation by early August, these birds began to decline in numbers until mid-
August when the monsoon ended.
The monsoon today

131
The almost complete disappearance of rice farming in Chakbara has meant that
moinas are hardly seen in the area. Shrimp ghers destroyed the population of land-
based insects and thus depriving the moina of their main food source. The increasing
salinity of what were once sweet water canals and the decline of the water hyacinth
and other bushy areas also contributed to the disappearance of this bird, which once
indicated the appearance of monsoon.
Autumn in the past (mid-August - Mid October)
Following the monsoon, autumn was heralded by the appearance of a bird named
kana kua (the Lesser Caucal). The call of the kana kua in the evening indicated
sunset and people used the call to break their dawn to dusk fasting during the month
of Ramadan. In the past, clocks, TV and radios were not common in rural areas and
people relied on the natural clocks (such as call of certain birds at specific times) to
schedule many of their activities. The presence of sorail (lesser whistling teal),
pankouri (cormorant) and dahuk (water hen) in the wetland (canals, beel, ponds)
also indicated the appearance of autumn after the monsoon.
Autumn today
Kanakua and dahuk have disappeared asa result of the disappearance of swamp
areas now converted to shrimp ghers. Sorail and pankouri continue to visit but in
much smaller numbers.
Dewy season in the past (Mid October - Mid December)
After the autumn, the cooler dewy season appeared which corresponded with the
rice ripening and harvesting period and at this time flocks of babuy (weaver birds)
arrived in large numbers and made their hanging nests on the leaves of tall palm
trees. Flocks of bele hansh (cotton pigmy goose) and batang (common sand piper)
in wetland and shore areas also indicated autumn. These birds began to appear in the
later part of the dewy season and remained for the whole period of winter.
Dewy season today
No babuyare seen in the area as there has been a decline in palm trees for nesting
and rice fields for feeding. Palm tree decline is the result of higher demand for palm
trees as fuel in brick kilns and higher salinity, which the trees cannot tolerate. Fewer
belehansh and batangs are seen compared with the past.
Winter in the past (Mid December- Mid February)

132
Following the mild dewy season, the cold winter arrived and in December and
January flocks of birds called hot-titi (red winged lapwing), chil (kite) and kullaya
(raptors) appeared in the paddy fields after the harvesting of rice in the preceding
season. These were followed by several other authithipakhi or migratory birds which
stayed for the whole winter period.
Winter today
Currently no hot-tit, chil and kullaya birds are seen as a result of there being little or
no rice farming and the disappearance of rats and other wild food sources for such
birds in the area. Migratory birds are still seen in the area during winter but in fewer
numbers. Although fewer in number, local people still recognize the onset of the
winter season with their appearance.
Spring in the past (Mid February - Mid April)
After the cold winter, the mild and soothing spring appeared with its gentle breezes
and the call of the kokil (koel). Following the kokil, the long tailed shama (white-
rumpedshama) would appear as an indicator of spring. Towards the latter part of
spring, flocks of ghugu (doves) appeared, which indicated the end of spring and the
start of the hot summer from mid-April.
Spring today
Currently some koel and doves visit the area but the loss of trees and homestead
forests has reduced their numbers.
Overall, local people can no longer identify with the same degree of certainty the
seasons by natural indicators such as different birds in different seasons. As a result,
younger people in the study villages have lost some of the local ecological
knowledge and the practices that went with it.
Trends in climate parameters
The discussion so far has centered on local people’s observations of changes in their
weather and non-weather environments. To what extent are these observations
supported by meteorological data on rainfall and temperature changes? To examine
this question I collected rainfall and temperature data for Satkhira district from the
head office of Meteorological Department, Dhaka on historical trends between 1950
and 2010. In the case of annual average rainfall for the period 1948 to 2011, the

133
data shows an increasing trend (Figure 5.10). This contrasts with local people’s
observation that monsoon rains have fallen during the last five to 10 years.
However, the rainfall calculations for the monsoon season are done differently by
the Meteorological Department, which uses the four months of June, July, August
and September as the main monsoon months. Local communities follow the
traditional Bengali calendar of two months for each of the six seasons in a year,
which means that from their point of view the monsoon or rainy season lasts for two
months from mid-June to mid-August. Looking at the data for the early monsoon
rainfall for the month of June (average) for Satkhira area, it shows a decreasing trend
which is in conformity with the communities’ observation (Figure 5.11).
According to the record of Met Office, the annual mean temperature also shows an
upward trend over the past 60 years for Satkhira area. Figure 5.12 shows that the
annual mean maximum temperature trend of Satkhira is also in line with the national
0100200300400500600700
1948
1950
1952
1954
1957
1959
1961
1963
1965
1969
1971
1974
1976
1978
1980
1982
1984
1986
1988
1990
1992
1994
1996
1998
2000
2002
2004
2006
2008
2010
Figure 5. 11: Trend in average monsoon (June to September) and June rainfall (mm) in Satkhita district from 1948 to 2011
June Average Linear (June) Linear (Average)
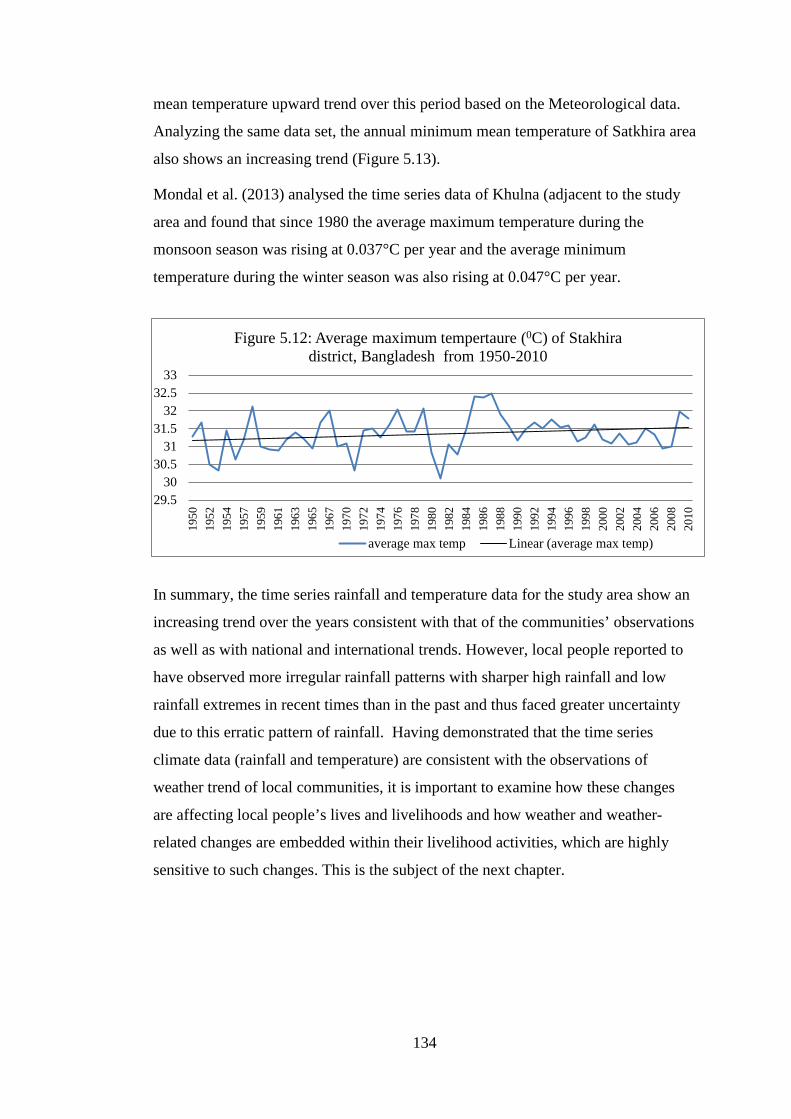
134
mean temperature upward trend over this period based on the Meteorological data.
Analyzing the same data set, the annual minimum mean temperature of Satkhira area
also shows an increasing trend (Figure 5.13).
Mondal et al. (2013) analysed the time series data of Khulna (adjacent to the study
area and found that since 1980 the average maximum temperature during the
monsoon season was rising at 0.037°C per year and the average minimum
temperature during the winter season was also rising at 0.047°C per year.
In summary, the time series rainfall and temperature data for the study area show an
increasing trend over the years consistent with that of the communities’ observations
as well as with national and international trends. However, local people reported to
have observed more irregular rainfall patterns with sharper high rainfall and low
rainfall extremes in recent times than in the past and thus faced greater uncertainty
due to this erratic pattern of rainfall. Having demonstrated that the time series
climate data (rainfall and temperature) are consistent with the observations of
weather trend of local communities, it is important to examine how these changes
are affecting local people’s lives and livelihoods and how weather and weather-
related changes are embedded within their livelihood activities, which are highly
sensitive to such changes. This is the subject of the next chapter.
29.530
30.531
31.532
32.533
1950
1952
1954
1957
1959
1961
1963
1965
1967
1970
1972
1974
1976
1978
1980
1982
1984
1986
1988
1990
1992
1994
1996
1998
2000
2002
2004
2006
2008
2010
Figure 5.12: Average maximum tempertaure (0C) of Stakhira district, Bangladesh from 1950-2010
average max temp Linear (average max temp)
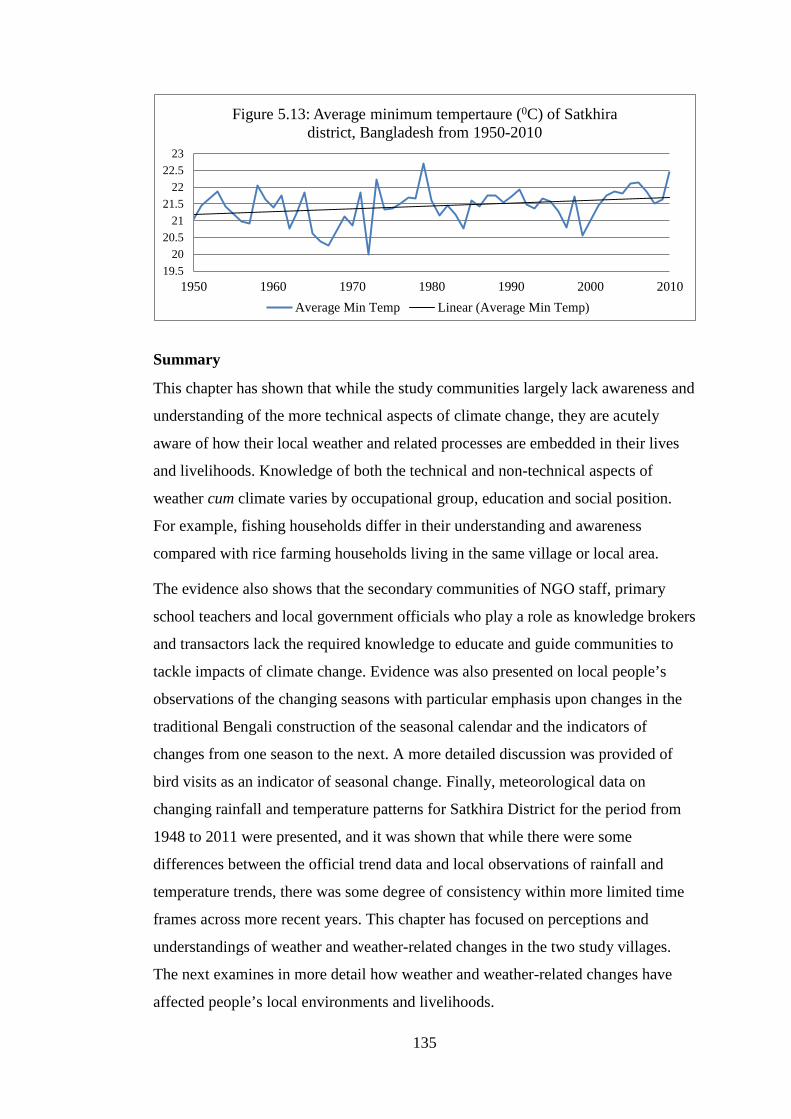
135
Summary
This chapter has shown that while the study communities largely lack awareness and
understanding of the more technical aspects of climate change, they are acutely
aware of how their local weather and related processes are embedded in their lives
and livelihoods. Knowledge of both the technical and non-technical aspects of
weather cum climate varies by occupational group, education and social position.
For example, fishing households differ in their understanding and awareness
compared with rice farming households living in the same village or local area.
The evidence also shows that the secondary communities of NGO staff, primary
school teachers and local government officials who play a role as knowledge brokers
and transactors lack the required knowledge to educate and guide communities to
tackle impacts of climate change. Evidence was also presented on local people’s
observations of the changing seasons with particular emphasis upon changes in the
traditional Bengali construction of the seasonal calendar and the indicators of
changes from one season to the next. A more detailed discussion was provided of
bird visits as an indicator of seasonal change. Finally, meteorological data on
changing rainfall and temperature patterns for Satkhira District for the period from
1948 to 2011 were presented, and it was shown that while there were some
differences between the official trend data and local observations of rainfall and
temperature trends, there was some degree of consistency within more limited time
frames across more recent years. This chapter has focused on perceptions and
understandings of weather and weather-related changes in the two study villages.
The next examines in more detail how weather and weather-related changes have
affected people’s local environments and livelihoods.
19.520
20.521
21.522
22.523
1950 1960 1970 1980 1990 2000 2010
Figure 5.13: Average minimum tempertaure (0C) of Satkhira district, Bangladesh from 1950-2010
Average Min Temp Linear (Average Min Temp)
136
Chapter 6: Community, Weather and Livelihoods
Introduction
This chapter examines community observations and concerns about weather and
weather-related issues focusing on variations across selected occupational groups
such as fishers, fish traders, shrimp farmers, rice farmers and honey collectors and
the effect of weather and weather events upon their livelihoods. It provides a basis
for analyzing the livelihood vulnerability of local communities in the face of future
climate change impacts and the planning of future climate change adaptation
strategies.
Local fishers’ observation of weather factors and coastal fisheries
Local fishers, like other occupational groups, have their own understandings of
weather, based upon generations of experience rooted in local fishing practices. Part
of these understandings includes reference to a number of key weather-related
events and processes. Among the most important are what local fishers refer to as
dewa or brishty (rains), jhor-badal (storms that accompany rains; cyclonic storms),
ghurni jhar (cyclone), joloscchas (storm surge), khora (drought, particularly during
pre monsoon and monsoon), lomba khora (prolonged drought) and rooling, from the
English word ’rolling’ (rough sea conditions). These events and processes play
major roles in fishers’ lives and livelihoods. Fishers have their own understandings
of how rainfall patterns are related to the local biology and ecology of coastal
fisheries. They are also aware that their livelihoods are affected by several non-
weather related activities that can intersect with the weather and alter their capacity
to fish sustainably.
Fishers explained that with the onset of rains, several species of fish from the sea
and lower estuary migrate upstream through the rivers to spawn in the vegetated
shallow areas within the mangrove forests, including the SRF. They reported that
during years of higher rainfall, they catch more fish as a result of successful
spawning. They observed that the same rule applied to crabs and shrimp, which were
able to rejuvenate their populations in coastal waters. They commented that fewer
137
rains over the last few years had manifested themselves in poor catches compared to
10 years ago. These observations provide some local evidence of the wider expert
view that the recruitment of fish is likely to be strongly affected by climate
variability, and that some fish stocks may become more vulnerable to overfishing.
Reduced dry season flow rates in South Asian rivers could result in reduced fish
yields due to impacts on spawning and larval dispersion of varieties of fishes
(Easterling et al., 2007). Regarding rains and fishers’ livelihoods, Mr. Musa, a crab
collector and fisher from Chakbara village commented:
If there is no ‘water from God’, we do not get things in abundance.
‘Dewa’ is the ‘water from the God’ as a blessing to us. If there is dewain
time in required quantity, we get plenty of fish, crabs, shrimps, wood
and honey and we can subsist on these resources with our children.
The fishers reported that over the last 10 to12 years, the use of harmful fishing gear
such as goisha jal (large gill net), charpata jal (nets that are set in inter-tidal chars in
high tide and catch trapped fish in low tide), bindi jal (set bag net) in river mouths at
the lower estuary is so widespread that few fish can swim upstream for spawning.
Among the various fishing nets, fishers pointed out that goisha jal is the most
detrimental to fishing activity. They reported that the large gravid fishes get caught
in goisha jals while en route upstream to spawn. They also commented that in
addition to the use of goisha jal, lomba khora or drought has contributed to a decline
in fish and fish species availability in the upstream areas of the SRF.
The fishers also noted that bad weather such as cyclonic storms made it difficult for
fishers downstream to use goisha jal, which was good for fish stocks and flows,
allowing them to swim upstream unimpeded to reach their spawning grounds.
However, such storms also prevented them from fishing as they have to come ashore
or take refuge inside the Sundarbans. Fishers used the term ‘disaster’ in some fishing
contexts. For example, Debendra, a Hindu fisher from nearby Chandipur village
who fished with Chakbara fishers stated:
During jolochhash or jhor-badal we cannot go fishing for 2/4 days and
we do not earn and often we had to starve. Therefore, we call this a
‘disaster’ even if all these jhor-badals do not damage our houses,
ghersor other properties. We are dependent on fishing for day to day

138
survival. If we cannot do fishing, even for a day, some of us are borrow
money from the mohajans to buy rice.
After the cyclones Sidr and Aila in 2007 and 2009, fishers said they paid greater
attention to cyclone warning or signals from the Metereological Office. They did not
fish if signal 3 was made, denoting rooling or rough sea conditions. However, they
mentioned that if the signal did not indicate a jolochhash or storm surge, they went
fishing. The fishers said that a great concern was the possibility of tufan or high
waves, which often formed during signal 3 conditions. Some fishers used small
boats in the lower estuariesduring signal 3, a risky proposition as rivers are wide and
waves are strong in high winds. Generally fishers considered that cyclone Aila had
caused great destruction to their livelihoods but had created greater awareness
among them about the need to take safety measures.
The fishers pointed out that if there are inadequate rains and storms, sea fish do not
move upstream into rivers and forests for spawning. They claimed that because of
poor rainfall in the last 7 or 8 years they caught fewer fish in upstream rivers and
canals and in the SRF. If there was lomba khora or prolonged drought during the pre
and early monsoon, a small fish locally called “amadi” did not migrate from the
lower estuary or the sea to rivers and canals. Speaking generally about recent
reductions in fish availability in rivers and canals within and adjacent to the SRF,
Chakbara fishers who used khal pata jals participated in an FGD session reached in
to a consensus and said:
Fifteen years back we used to go to the forest with khalpata jal for a 7-
day trip. It took 2 days to go to the fishing locations and 2 days to come
back. We got only 3 plus days for fishing. With two khal pata jals and 6
persons over a period of 3 plus days during a ‘gonmukh19’ period we
used to get 8/10 maunds (1 maund = 37.5kg) of fish. But now we catch
19Gon denotes a time period related to lunar cycle in the coastal area. Each gon period lasts for five days. Usually, three gons cross cut a month (30 days). In case of a new moon, gon starts from one day before the new moon and continues for four days. The next gon starts two days before the full moon and continues for three days and so on. Gon is also related to tides; during gon period people experience very strong high tides with increased wave heights. According to local fishers, they get higher catches during gon period compared with the non-gon period. Local people call this as “gonmukh”
139
for 5 days with 2 nets and hardly get 1 maund of fish – there is over 80%
reduction in catch quantity in 15 years.
The local fishers also reported that some species of fish such as paira (spotted skate
– Scotophagus arqus), vetki (Sea perch- Lates calcarifer), bhol (Epinephelus
fasciatus), kain magur (Plotosus canius), and seelet (Blackspot threadfin- Ploynemus
sextarius) are rarely found in the area. They estimated that catches had dropped by
around 70% compared to fifteen years ago. Some fish species such as bhangal
(Mullets – Liza spp.), med (Catfish – Nemapteryx nenga), mochon (Catfish – Arius
sona) are rarely caught in rivers inside the SRF. In drought years, kom brishty (less
rains) along with lomba khora (prolonged drought), raised water temperature and in
those years large fatty fish (those with adipose tissue) did not come to the rivers as
they did not like warm water in shallow rivers. The fishers say that the mochon fish
has huge fat (metaphorically stated as khasir moto charbi or fat like goats) and
preferred deep and cold water. They explained the warmer waters occurring as a
result of siltation coupled with low freshwater flows from upstream, which made
them shallower and warmer.
A similar observation was made by Cheung et al. (2009) that increasing water
temperature causes some species to shift from shallow coastal waters into deeper
cooler waters in the sea. Cheung et al. (2010) stated that the potential loss of catch
due to such temperature-induced shifting of marine fish could be up to 40% in some
fishing zones at a global scale. Increases in water temperature can affect the
metabolic activities of fish and slow down their growth rate and reduce their size,
with possible disappearance of certain capture fish species from coastal waters
(Roessig et al., 2004). A recent study conducted in 132 countries suggested that
Bangladesh is one of the four main countries likely to suffer from the impact of
climate change in capture fisheries (Allison, 2009).
The local capture fishers also observed changes in fishing grounds over time.
Twenty years ago they reported that they fished 15 km inside the SRF from the
Munshigonj point and caught good quantities of fish. They pointed that their
grandfathers used to fish at various locations within the SRF (Kukumari,
Khalishabunia, Chunkuri, Chalte bare, Ulubare, Lambakhal, Jhinukkhali, Chela
kathi, Sonakhali, most of which names are given by the fishers and other SRF
resource users) and caught two to three maunds (1 mound = 37.5 kg) of fish daily

140
per boat during the gon period. Today, fishers travel further south to the Bay of
Bengal to seek out new fishing grounds. Many previously fished locations are now
silted up and degraded. Recent reductions in monsoon rains also hampered fish from
migrating upstream from the sea for spawning, feeding and growth in upstream
rivers and mangroves. Cyclone-borne silts/sands are carried inwards by storm surges
and deposited in rivers and canals beds, which has altered the quality of fishing
habitats. Local fishers reported that after the cyclones many previously good fishing
locations were abandoned and they considered that fish stocks had moved to other
locations further downstream. One experienced fisher of Chakbara said:
Twenty years back we used to get large size ‘koi bhol (Long fin
grouper Epinephelus megachir) fish, each weighing 10-20kg in the
canals inside the Sundarbans, but now we get smaller ‘koi bhol’ fish
weighing around 5 kg and theyare found only near the sea. There is a
shifting of fish stock and fish are moving towards the sea due to
degradation of habitats upstream. It is difficult for the poor fishers
like us who cannot afford to arrange costly fishing gears and crafts
needed for fishing in the sea or in the lower estuary.
Local fishers reported higher water levels in the rivers during high tides and that the
salinity in river waters in the dry season had increased. It is important to note that
the fishers attributed the high water level in rivers to siltation of river beds and the
dying of rivers in the upstream rather than sea level rise (SLR). The causes of the
increased siltation and river deaths were explained by a combination of various
human interventions in the past such as the Ganges-Kobadak Irrigation Project in
the upstream, the Coastal Embankment Project in the nineteen sixties and the
Farakka Barrage project in the early nineteen seventies (Mirza, 2004).
Fishing operations are sensitive to seasonal weather patterns and fishers plan their
fishing operations in different locations at different times of the year depending on
weather conditions. The sea going fishers start fishing from Ashiyn (September-
October) which corresponds with the beginning of calm weather after the monsoon
and ends in Chaitra (by March) prior to the start of pre-monsoon storms and rough
weather conditions. During monsoon, sea fishers of Chakbara do not fish due to high
waves (tufan) and frequent rough sea conditions (rooling). The fishers observed that
141
recent increases in ‘rough sea’ (rooling) conditions affected their fishing operations.
These observations were supported by community and local government
representatives (Figure 5.9).
Ahmed (2008) has documented the observations of coastal fishers in Bangladesh
that there had been twelve rough sea weather conditions and warning signal number
3 issued during the peak 3 months of the hilsa (Tenualosa ilisha) fishing season in
2007 (from 22 July through 14 September) which, as per the standing order on
disaster, compelled the fishers to return home. Chakbara fishers experienced rough
sea conditions (signal 3) six times in 2009.
Sea going fishers interviewed commented that over the past five to six years, there
had been an increase in sudden and instant storm events (hotath jhor) in the sea
/lower estuary areas that lasted for 20 to 30 minutes. No warnings were given of
such localized events and some fishers lost nets and floats. Fishers stated these
events occurred two to three times a year, which they were increasing and in 2009
had resulted in the death of two fishers.
More generally, local people stated there had been less monsoon rains over the last
seven to eight years. For example, they mentioned that there are now (2010) fewer
and less regular rains during Ashar (mid-June to mid-July), the first month of the
Bengali “rainy season”. Ten years ago, rain fell almost every day in June, July and
August but today there had been a 40% reduction of monsoon rains.
Fishers had also observed changes in availability of wild varieties of “gura chingri”
(small shrimps), which they caught using special gear in specific locations. A fisher
from Chakbara said when there is drier monsoon, they catch fewer chingri
(shrimps). If there is less rain, water remains clear (transparent) and fish and shrimp
do not like to move upstream if the water is clean. Fishers gave an account of fish
catches five years ago of 60kg of fish on average every day using kathijal during the
period of gon. However, more recently the average daily catch during ‘gon’ had
fallen to around 20 kg, one third of previous catches.
There had also been changes in catch composition. Less valued fish now dominate
the catch. For example, the catch of 7th September 2010 at Paglahati fishing location
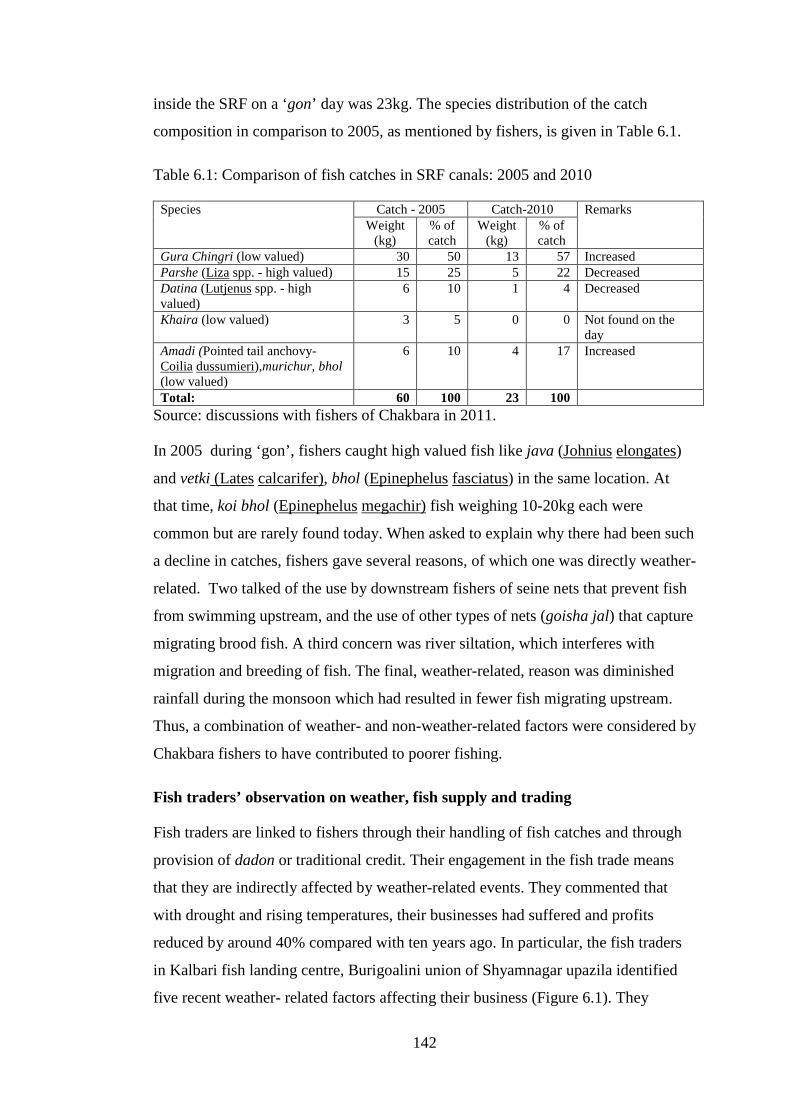
142
inside the SRF on a ‘gon’ day was 23kg. The species distribution of the catch
composition in comparison to 2005, as mentioned by fishers, is given in Table 6.1.
Table 6.1: Comparison of fish catches in SRF canals: 2005 and 2010
Species Catch - 2005 Catch-2010 Remarks Weight
(kg) % of catch
Weight (kg)
% of catch
Gura Chingri (low valued) 30 50 13 57 Increased Parshe (Liza spp. - high valued) 15 25 5 22 Decreased Datina (Lutjenus spp. - high valued)
6 10 1 4 Decreased
Khaira (low valued) 3 5 0 0 Not found on the day
Amadi (Pointed tail anchovy- Coilia dussumieri),murichur, bhol (low valued)
6 10 4 17 Increased
Total: 60 100 23 100 Source: discussions with fishers of Chakbara in 2011.
In 2005 during ‘gon’, fishers caught high valued fish like java (Johnius elongates)
and vetki (Lates calcarifer), bhol (Epinephelus fasciatus) in the same location. At
that time, koi bhol (Epinephelus megachir) fish weighing 10-20kg each were
common but are rarely found today. When asked to explain why there had been such
a decline in catches, fishers gave several reasons, of which one was directly weather-
related. Two talked of the use by downstream fishers of seine nets that prevent fish
from swimming upstream, and the use of other types of nets (goisha jal) that capture
migrating brood fish. A third concern was river siltation, which interferes with
migration and breeding of fish. The final, weather-related, reason was diminished
rainfall during the monsoon which had resulted in fewer fish migrating upstream.
Thus, a combination of weather- and non-weather-related factors were considered by
Chakbara fishers to have contributed to poorer fishing.
Fish traders’ observation on weather, fish supply and trading
Fish traders are linked to fishers through their handling of fish catches and through
provision of dadon or traditional credit. Their engagement in the fish trade means
that they are indirectly affected by weather-related events. They commented that
with drought and rising temperatures, their businesses had suffered and profits
reduced by around 40% compared with ten years ago. In particular, the fish traders
in Kalbari fish landing centre, Burigoalini union of Shyamnagar upazila identified
five recent weather- related factors affecting their business (Figure 6.1). They

143
explained that the recent increase in cyclone formation and frequent rough sea
conditions (shagor kharap) had resulted in fewer fish to sell, while they still had to
pay workers to handle and auction their fish. Some fish traders also dealt in shrimp,
and heavy rains had flooded shrimp ghers and fish ponds, resulting again in reduced
supplies.Traders also noted the reduction in monsoon rainfall and an increase in
drought-like conditions, and their effect on fish catches and supply to markets.
The fish traders not only noticed decline in fish supplies, but also loss of species
diversity in the area. They reported that availability of some species had reduced
substantially with some landed rarely in recent years. Among the sea dwelling
species, they mentioned bhangal and paira landings had reduced by 80%, vetki
(Latescal carifer) and mochon reduced by 70% and bhol (Epinephelus megachir),
datina (Sparus berda) by 60% and java and med by 50% compared to ten years ago.
There had also been a reduction in availability of river dwelling species. Taposhi
(Polynemus paradiseus) and chali chingri (a kind of small prawn) landings were
80% and 40% lower than in the past.
Citing an example, one fish trader checked his records, which showed that fish
landings during ashar to falgun (mid-June to mid-March) in 2009 for some fish
species had declined compared with seven to eight years ago.
• Komplit (spade fish –Ephippus orbis)- landed 1,376 kg in 2001/2 but only
11kg in 2009
• Bhol (grouper – Epinephelus megachir) landed 4,925 kg in 2001/2 but only
250 kg in 2009
• Rupchanda (pomfret – Pampus chinensis) landed 987 kg in 2001/2 but about
2 kg in 2009
• Gang chela (Decapterus spp.) fish landed 987 kg in 2001/2 but only about 40
kg in 2009
These data suggest that fish landings from the SRF had declined by three quarters in
under a decade. A fish trader of Kalbari fish landing centre said:
About 7/8 years during months of chaitra and baishak (mid-March to
mid-June) which is the lean period, we used to buy one truck of fish (4
tons) per day from the catch from Sundarbans but this year (2010) I
could not buy any fish in a week during the same period.
144
To this end, Mr. Moijuddin, another fish trader of Kalbari landing centre said:
Ten years ago, I used to buy 15-16 tons of fish per day during peak
months from this Kalbari fish landing centre and send them to four
different parts of the country (Jessore-100km, Barobajar-112km,
Jhenaida-140km and Barisal-250km). But this year (2010), I could buy
only half a ton per day.
The longer and drier summers had increased water salinity, affecting both open
capture fishing and shrimp farming with subsequent reductions in supply to traders.
Like fishers, fish traders made similar observations about increasing temperatures
with longer and hotter summers that had increased the cost of fish preservation.
Higher temperatures meant increased ice use. A trader with 20 years’ experience in
fish trading said:
15 years back, during the summer months (April-May) we used to buy
sea fish in the morning at around 8am and then put them in ice after 3
hours for preservation and our fish did not get spoiled. But now in the
same months we cannot keep fish even for an hour without ice. It is just
due to increased air temperature.
The situation has been compounded by reduced ice availability during summer
months due to frequent power disruptions. Currently, more ice is needed in summer
compared with six to seven years ago, some saying they needed almost double the
ice in summer months for the same amount of fish. Another trader noted that while
several years ago there were only about 10 traders at his landing centre, this had
increased to about 100 traders all competing for ice supplies that had failed to keep
up with demand, resulting in higher prices. One fisher trader observed:
Five years back price of one pata (slab) of ice varied between US $
1.15-1.28 in the monsoon months, and the price of the same amount of
ice in summer (chaitra-baishak) rose to US $ 5.13 at the highest. But
this year [2010] we had to pay higher costs even US $ 12.82 for a slab of
ice in the summer - two and half fold higher than what existed five years
back.
Regarding increasing air temperature and its impact on fish trading, Moijuddin, a
trader for 20 years at Kalbari fish landing centre, said:

145
This year in one consignment of fish to Barisal (about 250 km away) in
summer, 80-90% fish got spoiled due to higher temperature and less
icing. But I used to use the same amount of ice for a truck of fish 6/7
years back and that did not cause any problem. But now we need more
ice in summer due to increased air temperature and thus both the costs
and risks of fish preservation increased in recent time due to rising
temperature.
Overall fish traders said they understood that temperatures had risen and that there
were costs for them as a result. However, in FGD sessions with fishers and fish
traders, respondents identified various weather and non-weather related drivers and
stressors that affect coastal fisheriesand livelihoods of fisheries dependent
households and were unable to attribute any changes to weather alone (Figure 6.1),
Honey collectors’ (mowals’) observation of weather issues
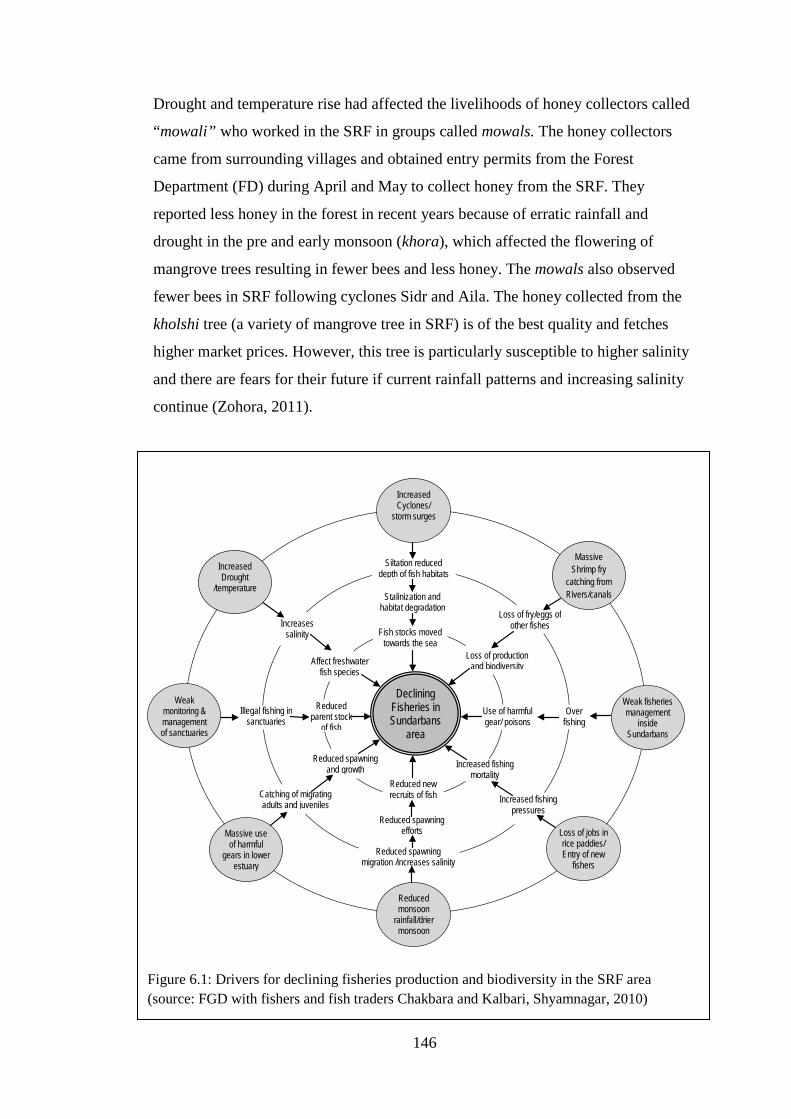
146
Drought and temperature rise had affected the livelihoods of honey collectors called
“mowali” who worked in the SRF in groups called mowals. The honey collectors
came from surrounding villages and obtained entry permits from the Forest
Department (FD) during April and May to collect honey from the SRF. They
reported less honey in the forest in recent years because of erratic rainfall and
drought in the pre and early monsoon (khora), which affected the flowering of
mangrove trees resulting in fewer bees and less honey. The mowals also observed
fewer bees in SRF following cyclones Sidr and Aila. The honey collected from the
kholshi tree (a variety of mangrove tree in SRF) is of the best quality and fetches
higher market prices. However, this tree is particularly susceptible to higher salinity
and there are fears for their future if current rainfall patterns and increasing salinity
continue (Zohora, 2011).
Figure 6.1: Drivers for declining fisheries production and biodiversity in the SRF area (source: FGD with fishers and fish traders Chakbara and Kalbari, Shyamnagar, 2010)
Reduced spawning migration /increases salinity
Reduced spawning efforts
Reduced new recruits of fish
Illegal fishing in sanctuaries
Siltation reduced depth of fish habitats
Loss of fry/eggs of other fishes
Stalinization and habitat degradation
Fish stocks moved towards the sea
Catching of migrating adults and juveniles
Reduced spawning and growth
Reduced parent stock
of fish
Loss of production and biodiversity
Increases salinity
Affect freshwater fish species
Over fishing
Use of harmful gear/ poisons
Increased fishing pressures
Increased fishing mortality
Weak monitoring & management of sanctuaries
Increased Drought
/temperature
Increased Cyclones/
storm surges
Massive
Shrimp fry catching from Rivers/canals
Massive use of harmful
gears in lower estuary
Loss of jobs in rice paddies/ Entry of new
fishers
Reduced monsoon
rainfall/drier monsoon
Weak fisheries management
inside Sundarbans
Declining Fisheries in Sundarbans
area
147
Shrimp farmers observation of weather related stressors
Turning to shrimp farmers in the locality, increased kasthe or intense rains over
several days had caused considerable damage to their farms. Shrimp farmers’ stock
ghers in winter (January-February) with bagda PL and rear them for 4-5 months
until the monsoon rains start and harvest most shrimp by June. At the onset of
monsoon rains (from June onwards) the salinity concentration of gher water is
reduced and salt water shrimp (bagda- Panaeus monodon) are harvested and sold.
To realize the benefits of the freshwater during the monsoon, farmers stock their
ghers with varieties of white fish species (tilapia, carps, and mullets) as additional
crops along with chhati or golda (Macrobrachium rosenbergii), the giant freshwater
prawn which has a high market value). These are reared to the end of the year
(December). This practice also reduces the risks to farmers in the case of bagda
(shrimp) disease and crop failure. Golda prawns (and some bagda) are grown with
herbaceous tilapia fish and white fish when shrimp are large enough to escape
predation. The polyculture of fish and shrimp is more common in Fultala than in
Chakbara where bagda shrimp farming dominates due to higher water salinity.
Shrimp farmers reported that because of reduced monsoon rains since 2005, the
salinity level of ghers had gone up, which caused fish kills, especially white fish.
While the shrimp farmers experienced losses e to drought or reduced monsoon rains
in some years, they also suffered from heavy rains in other years. The late monsoon
kasthe (continuous heavy rains for several days) in 2011 affected fish and shrimp
aquaculture farms in the area, including Fultala and Chakbara, in three ways (Figure
6.2; Table 6.2). First, the heavy rains after a period of long drought led to sudden
fluctuations in pond ecosystems (ecological changes such as rapid fluctuations in
pH) that caused mass mortality of both shrimp and white fish. Second, many ponds
and shrimp gherswere inundated and the stocked fish and shrimp escaped from the
ponds/ghers. Third, the dykes of many ghers collapsed due to heavy rains and many
farmers who had planted vegetables on the gher dykes lost their additional crops. In
addition, repairs to gher dykes increased production costs.
Agriculture farmers’ observation of weather related stressors
Farming on the coast is becoming increasingly risky due to recent changes in
weather patterns. The agricultural production system is very sensitive to small
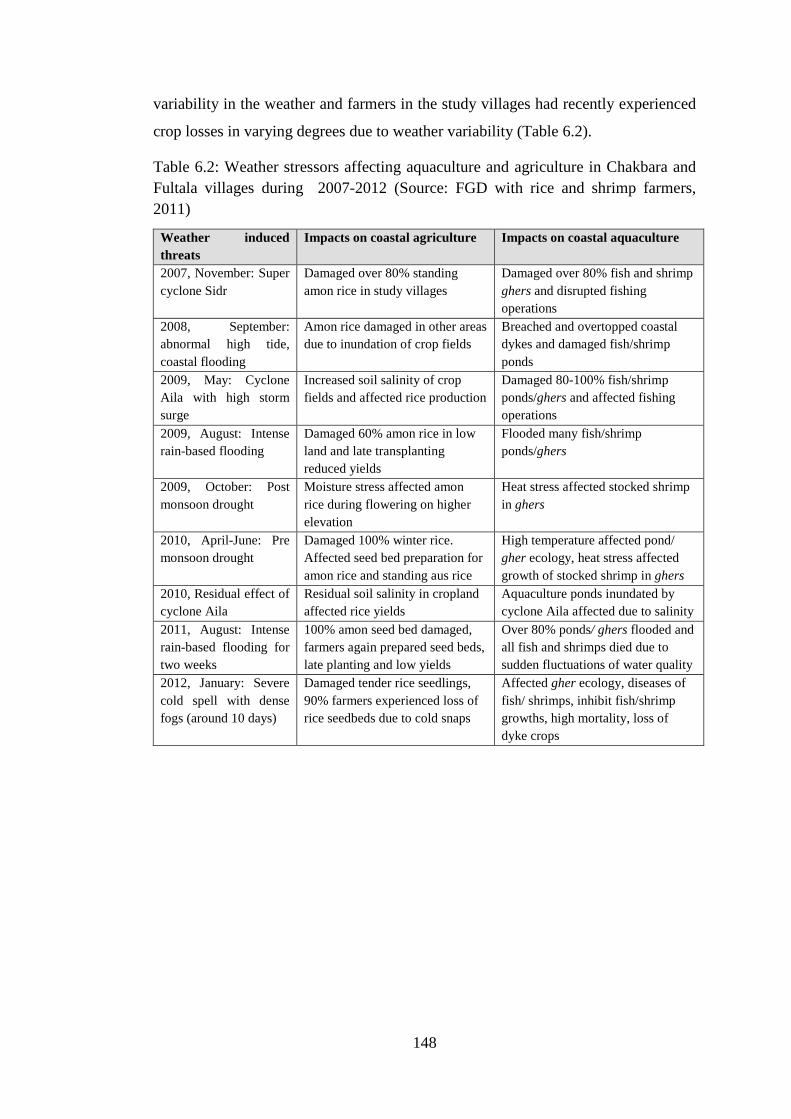
148
variability in the weather and farmers in the study villages had recently experienced
crop losses in varying degrees due to weather variability (Table 6.2).
Table 6.2: Weather stressors affecting aquaculture and agriculture in Chakbara and Fultala villages during 2007-2012 (Source: FGD with rice and shrimp farmers, 2011)
Weather induced threats
Impacts on coastal agriculture Impacts on coastal aquaculture
2007, November: Super cyclone Sidr
Damaged over 80% standing amon rice in study villages
Damaged over 80% fish and shrimp ghers and disrupted fishing operations
2008, September: abnormal high tide, coastal flooding
Amon rice damaged in other areas due to inundation of crop fields
Breached and overtopped coastal dykes and damaged fish/shrimp ponds
2009, May: Cyclone Aila with high storm surge
Increased soil salinity of crop fields and affected rice production
Damaged 80-100% fish/shrimp ponds/ghers and affected fishing operations
2009, August: Intense rain-based flooding
Damaged 60% amon rice in low land and late transplanting reduced yields
Flooded many fish/shrimp ponds/ghers
2009, October: Post monsoon drought
Moisture stress affected amon rice during flowering on higher elevation
Heat stress affected stocked shrimp in ghers
2010, April-June: Pre monsoon drought
Damaged 100% winter rice. Affected seed bed preparation for amon rice and standing aus rice
High temperature affected pond/ gher ecology, heat stress affected growth of stocked shrimp in ghers
2010, Residual effect of cyclone Aila
Residual soil salinity in cropland affected rice yields
Aquaculture ponds inundated by cyclone Aila affected due to salinity
2011, August: Intense rain-based flooding for two weeks
100% amon seed bed damaged, farmers again prepared seed beds, late planting and low yields
Over 80% ponds/ ghers flooded and all fish and shrimps died due to sudden fluctuations of water quality
2012, January: Severe cold spell with dense fogs (around 10 days)
Damaged tender rice seedlings, 90% farmers experienced loss of rice seedbeds due to cold snaps
Affected gher ecology, diseases of fish/ shrimps, inhibit fish/shrimp growths, high mortality, loss of dyke crops

149
Continuous heavy rainfall over a period of about two weeks (kasthe) during the
latter part of the traditional monsoon season (first half of August20 2011) caused
flooding and severe damage to rice crops in Shyamnagar area including Fultala
(Figure 6.3). This situation was further aggravated by drainage congestion in
Fultala. The main drainage channel had been the Kultali khal that flowed through
the middle of the Fultala-Kultali beels and crop fields. During the monsoon, excess
rain water was drained off through this khal.
However, for several years the government had permanently leased out major
sections of this khal to many people who over time used the khal for house
construction, crop land and fish culture ponds, which created drainage congestion
and consequent crop losses. Early August is critical for the coastal people as this is
the time for transplanting amon rice, which is the only rice crop in major parts of the
southwestern coastal zone. The livelihood of the majority of the people of Fultala is
dependent on amon rice, which is grown from the monsoon to post monsoon season.
During 2011, late monsoon heavy rainfall inundated all seedbeds (chator) of amon
rice in Fultala for more than two weeks, resulting in extensive damage. Farmers
20According to the Bengali calendar, the rainy season starts from mid-June and ends in mid-August each year.
Figure 6.2: Fish traders’ observation of weather factors affecting fisheries (Source: FGD with Fish traders at Kalbari fish landing centre, Shamanagar)
Reduced monsoon rainfall/drier
monsoon
Less fish and shrimp availability
Lower catch from rivers/forests
Sudden flooding/ inundation
Need more ice for fish preservation
High mortality of shrimp/fish in ponds
Shrimp/fish ponds over flooded
Shrimp/ fish escape from ponds
Less spawning/ recruitment of fish
Increases salinity in river/ponds
Pollution of gher / pond water
Higher fish preservation costs
Less fish in the market/ less profit
Scarcity/ higher price of ice
Cyclones / storm surge / rough sea
weather
Fishers cannot go out for fishing
Few people can go for fishing
Low catch from the lower estuary
Increased air and water
temperature
Increased Drought /dry
summer
Continuous heavy rains for
few days
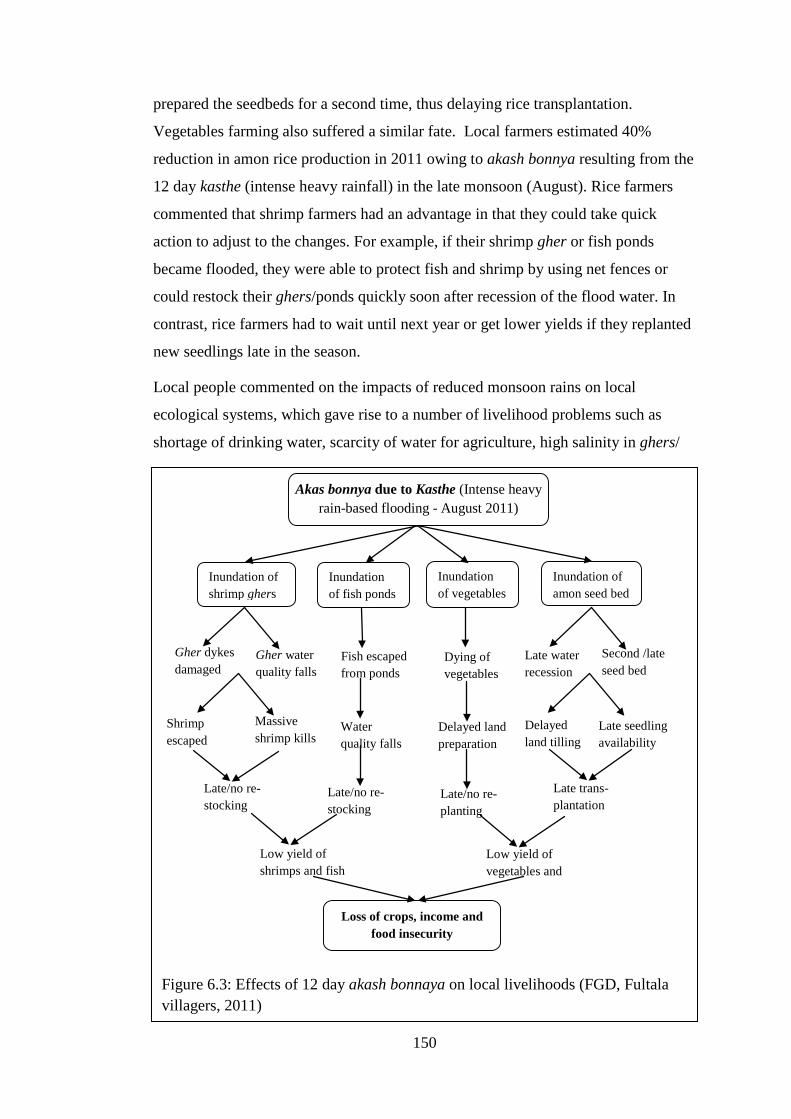
150
prepared the seedbeds for a second time, thus delaying rice transplantation.
Vegetables farming also suffered a similar fate. Local farmers estimated 40%
reduction in amon rice production in 2011 owing to akash bonnya resulting from the
12 day kasthe (intense heavy rainfall) in the late monsoon (August). Rice farmers
commented that shrimp farmers had an advantage in that they could take quick
action to adjust to the changes. For example, if their shrimp gher or fish ponds
became flooded, they were able to protect fish and shrimp by using net fences or
could restock their ghers/ponds quickly soon after recession of the flood water. In
contrast, rice farmers had to wait until next year or get lower yields if they replanted
new seedlings late in the season.
Local people commented on the impacts of reduced monsoon rains on local
ecological systems, which gave rise to a number of livelihood problems such as
shortage of drinking water, scarcity of water for agriculture, high salinity in ghers/
Figure 6.3: Effects of 12 day akash bonnaya on local livelihoods (FGD, Fultala villagers, 2011)
Inundation of amon seed bed
Inundation of shrimp ghers
Loss of crops, income and food insecurity
Late trans-plantation
Late seedling availability
Low yield of shrimps and fish
Shrimp escaped
Gher water quality falls
Massive shrimp kills
Gher dykes damaged
Delayed land tilling
Second /late seed bed
Late water recession
Inundation of fish ponds
Inundation of vegetables
Fish escaped from ponds
Water quality falls
Dying of vegetables
Late/no re-planting
Low yield of vegetables and
Late/no re- stocking
Late/no re- stocking
Delayed land preparation
Akas bonnya due to Kasthe (Intense heavy rain-based flooding - August 2011)

151
fish ponds, changes in fish migration and spawning in rivers and changes in the
flowering of forest trees affecting honey production (Figure 6.4). Reduced monsoon
rains over the last few years had made the soil and water saline to such a degree that
growing vegetables had become impossible in many areas in the coast (Ahmed and
Troell, 2010). This has implications for nutritional intake, human health and
poverty. It is also clear that a single weather stressor such as reduced monsoon rains
can have impacts on multiple sectors or resource systems (production and extraction
sectors) upon which the majority of poor people subsist (Figure 6.3). Although each
weather stressor has the potential to affect multiple sectors, its impact varies by
livelihood resource systems and occupational groups.
Differentiated effects of various weather stressors on different occupational
groups
Focus Group Discussions (FGDs) were held with different occupational groups in
the two project villages to document the range of stressors that affected their
Figure 6.4: Impact of reduced rains on livelihoods of coastal communities (Source: FGD with fishers, mowals, and crop and shrimp farmers in Chakbara and Fultala villages)
Reduced monsoon rainfall/ drier monsoon
Higher mortality of white fish in ghers
Increased risks, Low profits
Higher salinity in ghers/ fields
Fewer flowers in trees
Poor catch and low biodiversity
Affects crop farming
Low or no yield of crops
Higher salinity in gher waters
Low fish migration and poor spawning
Less availability of fish, crabs, shrimp PL
Less honey production
Low income /high poverty leads to high vulnerability
Fewer bees and fewer hives
Affects wider communities
Shortage of freshwater
Lack water for drinking/ cooking
Diseases, incur treatment costs
Affects honey collectors (mowals)
Affects fishers/ crab/ shrimp PL
collectors
Affects crop farmers
Affects shrimp farmers
152
livelihoods. The list of stressors was then grouped into two subsets: weather-related
and non-weather-related. Eight weather related stressors were identified and are
listed below:
• Increased temperatures - steady increase as a slow onset event and year round but felt especially during summer and monsoon.
• Prolonged drought – as a result of erratic rainfall, intermittent droughts occurring mainly during pre-monsoon and monsoon.
• Intense rainfall/ flooding – variable, unusually intense heavy rainfall inundated crop land, roads, fish /shrimp ponds, occurring mainly in late monsoon during the amon rice farming season.
• Rough sea conditions - more frequent in recent times during monsoon and late monsoon, instruction for the sea going fishers to come ashore and take safe refuge.
• Cyclones/ storm surges - variable, more frequent cyclone formation, usually in post monsoon but cyclone Aila hit during pre-monsoon.
• Increased water level during high tides - recent phenomenon and common year round but higher in late or post monsoon.
• Increased soil and water salinity – a slow onset event gradually increasing and extending further upstream especially in the dry season.
• Shorter and warmer winters - recent phenomenon, winter season reduced from two months to around 45 days, usually warmer than before but with some intermittent intense cold spell lasting a few days.
Although shorter and warmer winters were considered unusual, local people
considered this as of lesser importance than other factors in the pairwise ranking of
weather related problems. However, some agricultural farmers reported that the
week-long cold spell in January 2012 affected winter rice seedlings (cold stress) and
potatoes (late blight disease). Some expressed their concern that if the temperature in
winter rises further, it might create problems for rabi (winter) crops in future. The
other eight occupational groups did not report any negative impacts of cold spells or
shorter and warmer winters on their livelihoods.
The impacts of specific weather stressors varied by different occupational groups
largely due to their unequal livelihood dependence on different resource systems,
strategies and options. Sea going fishers are more affected by frequent “rooling” in
the sea (rough sea conditions). Rice farmers rated increased soil/ water salinity as a
major problem as they experienced crop failure. Shrimp farmers considered
153
increased salinity in their ponds/ghers as a major problem. A pair wise ranking
exercise was conducted for eight climate related stressors with nine different
occupational groups in the study villages to assess the effects of each of the weather
stressors on each group (Figure 6.5). The occupational groups in the villages were:
• Rice farmers –all from Fultala representing traditional rice farming communities.
• Shrimp farmers –all from Chakbara, well-off by local standards and had previously been rice farmers and forest users who had switched over to shrimp farming.
• Shrimp/ rice farmers –all from Fultala, they farmed rice and shrimp together in ghers and had rice crop lands.
• Sea going fishers –all from Chakbara and who in the past were either fishers or rice farmers and had switched to sea fishing, which was more lucrative than river fishing.
• River/forest fishers –all from Chakbara and fish in nearby rivers and the Sundarbans with small boats.
• Crab collectors – all from Chakbara village, previously engaged in fishing or shrimp PL collection but crab collection becoming more profitable.
• Women (farming families) – all from Fultala, apart from household work, they took part in farming activities alongside male members.
• Women (shrimp PL collectors) – all from Chakbara, prior to shrimp farming they engaged in farming or wage laboring. Fultala has no PL collector.
• Mowals (honey collectors)–all from Chakbara village, they collect honey for two months (April-May) and rest of the time subsist on fishing, shrimp PL catching, wage labouring, and shrimp gher work.
In general, increased temperatures have affected all the occupational groups but with
greatest impact on shrimp farmers through deterioration in water quality of ghers.
The crop/ rice farmers also experienced moisture stress, higher soil salinity and
consequent poor crop yields due to increased temperatures. While fishers were not
obviously affected in their fishing activities due to temperature rise, many of them
have small homestead ponds or land where they cultivate shrimp, fish and
vegetables, which were affected by temperature changes. However, river fishers said
their income had declined due to shifting of some fish species such as the large
catfish named med –Nemapteryx nenga from shallower areas to deeper areas, which
they suggested was due to a recent prolonged drought and an increase intemperature.
154
As can be seen in Figure 6.5, rice farmers of Fultala rated soil salinity, prolonged
drought and intense rainfall/ flooding as the major weather related problems that
affected their livelihoods. Frequent rough sea conditions were rated as the most
serious problem by the sea going fishers of Chakbara. Failure of fishing effort means
increased debt, which for many poor fishers results in reduced incomes, less food,
reduced social status, an incapacity to fulfill major family obligations, and asset
sales and further dependence on money lenders. The shrimp farmers of Chakbara
rated increased water height during high tides as the major problem for them (scored
7). The dykes are not very strong, with many weak points which can be breached if
tide pressure is high and can damage their ghers. Shrimp farmers considered dyke
breaching and inundation by saline water as more damaging than rainfall inundation
as it takes less time to repair ghers if damaged by rainfall by draining out and
refilling with river water.
High rainfall makes gher water sweeter as salinity is reduced, which kills salt water
shrimp. Heavy rainfall run-off deposits organic wastes into the ghers from the
catchments which de-oxygenate the gher water making it unsuitable for shrimp and
fish. Once a gher is flooded and degraded, it takes over a month for water conditions
to return to normal. During intense heavy rainfall in August 2011, shrimp escaped
and died in over 95% of ghers in the area. Rain based flooding had also severely
affected shrimp ghers two and three times from 2005 to 2011. Rainfall/rainwater is
good for washing out salinity from croplands that helps farmers start cultivation of
rice while at the the same time it causes negative impacts on shrimp due to the
dilution of gher water salinity which causes shrimp kills. Therefore, a single weather
event can have positive and negative effects on people depending on their livelihood
options and production systems.
Crab collectors prioritized intense continuous rainfall, frequent rough sea conditions
and cyclone/ storm surges as the major weather related problems affecting their
livelihoods. During continuous rainfall, fewer crabs are caught in the SRF, which
may be caused by lower salinity that leads to increased crab dispersal. During heavy
rainfall, they found it difficult to manoeuvre their small boats in the forest and many
crab collectors ceased working, which resulted in income losses. Similarly, during
rough sea conditions they found it difficult to fix their traps and keep their boats
stable in high waves. Crab collectors did not consider higher temperatures, salinity
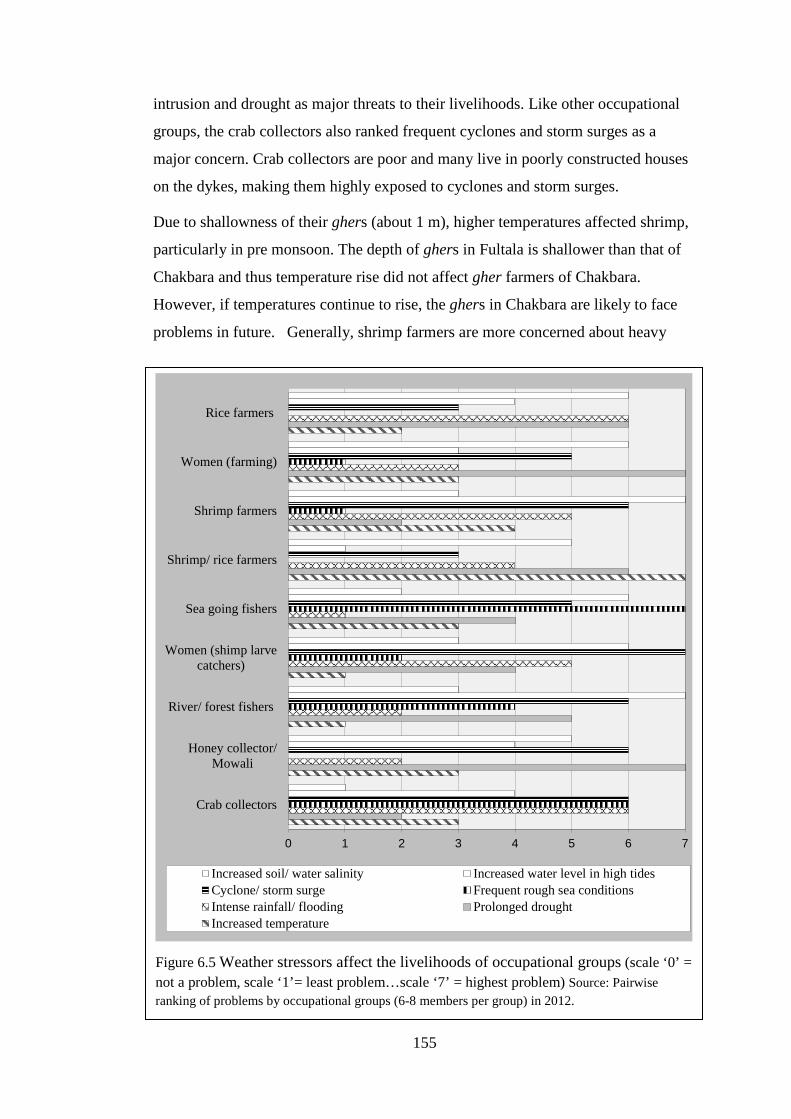
155
intrusion and drought as major threats to their livelihoods. Like other occupational
groups, the crab collectors also ranked frequent cyclones and storm surges as a
major concern. Crab collectors are poor and many live in poorly constructed houses
on the dykes, making them highly exposed to cyclones and storm surges.
Due to shallowness of their ghers (about 1 m), higher temperatures affected shrimp,
particularly in pre monsoon. The depth of ghers in Fultala is shallower than that of
Chakbara and thus temperature rise did not affect gher farmers of Chakbara.
However, if temperatures continue to rise, the ghers in Chakbara are likely to face
problems in future. Generally, shrimp farmers are more concerned about heavy
Figure 6.5 Weather stressors affect the livelihoods of occupational groups (scale ‘0’ = not a problem, scale ‘1’= least problem…scale ‘7’ = highest problem) Source: Pairwise ranking of problems by occupational groups (6-8 members per group) in 2012.
0 1 2 3 4 5 6 7
Crab collectors
Honey collector/Mowali
River/ forest fishers
Women (shimp larvecatchers)
Sea going fishers
Shrimp/ rice farmers
Shrimp farmers
Women (farming)
Rice farmers
Increased soil/ water salinity Increased water level in high tidesCyclone/ storm surge Frequent rough sea conditionsIntense rainfall/ flooding Prolonged droughtIncreased temperature

156
rainfall than drought as over the past six years they have experienced losses three to
four times more often from heavy rains than from drought. Drought or low rainfall
does affect production through lower yields. Table 6.3 shows the top three weather
related stressors for the different occupational groups.
Women shrimp PL collectors of Chakbara experienced less availability of PL in the
rivers during prolonged drought but ranked intense erratic rainfall/flooding as more
of a problem. They explained that during drought they get fewer shrimp PL but were
able to sell them at a higher price even with competition from PL hatcheries. They
pointed out that PL collected from natural sources (rivers, canals) continues to
command a high price from gher farmers as they are considered healthier and more
robust. They commented that ghers are not harmed as much by drought as by intense
rainfall and consequent flooding.
Table 6.3: FGD participants in pairwise ranking exercise on CC probelms
Source: Pairwise ranking exercises done separately with each group in two study villages in 2012
However, farmers usually do not stock their ghers during rainfall and it is then that
the demand for PL falls. PL traders do not buy PL during continuous rainfall so
with fewer buyers, prices go down.
Table 6.4: Livelihood impacts of three most prominent weather stressors on various occupational groups in two study villages (source: FGD and pairwise ranking in two study villages with 6-8 villagers of each occupational group in 2012)
Occupational groups
Top most problems 2nd most problems
3rd most problem
Remarks
1. Sea going fishers
Frequent rough sea conditions
Increased water level at high tides
Cyclones/ storm surges
Loss of livelihoods due to failure of fishing efforts
2. Shrimp farmers
Increased water level in high tides
Cyclones/ storm surges
Intense rainfall/ flooding
All these affect shrimp farms or put them at risk
3. Honey collectors
Prolonged drought Cyclones/ storm surges
Increased soil/ water salinity
Drought caused less honey in forests
4. Crab Collectors
Frequent rough sea conditions
Intense and heavy rainfall
Cyclones/storm surges
Less crabs in rainy days, hard to catch crabs in rough days
5. Forest/ river fishers
Increased water level in high tides
Cyclones/ storm surges
Prolonged drought
Cyclones, high tides damage house; less fish due to drought
6. Women (PL collectors)
Cyclone storm surge Increased water level at high tides
Intense rainfall/ flooding
Damage of houses; flooding lessened PL demand and price
7. Women (farming)
Prolonged drought Increased soil/water salinity
Cyclones/ storm surges
Drought + salinity +cyclones affect farming, land, ponds
8. Rice farmers Intense rainfall / flooding,
Prolonged drought
Increased soil/ water salinity
Flooding, drought and salinity damage crops
9. Rice & shrimp farmers
Increased temperature
Prolonged drought
Increased soil/ water salinity
Temperature affects shrimps; drought + salinity damage rice
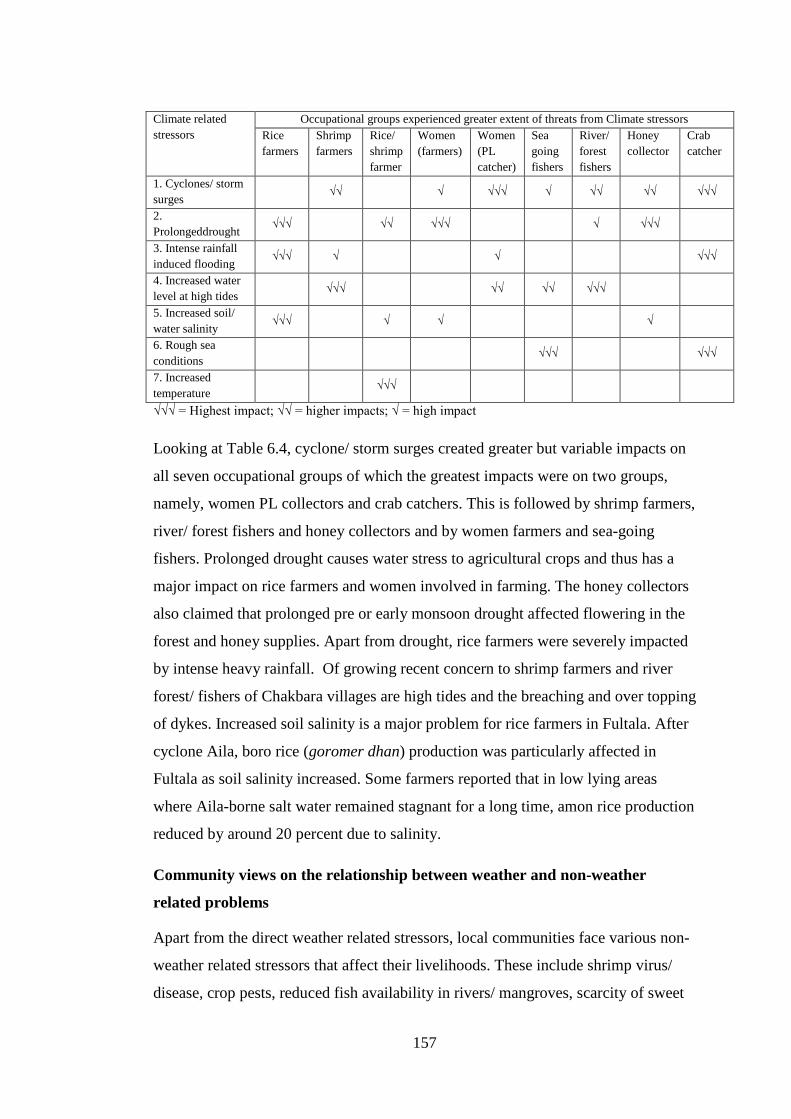
157
√√√ = Highest impact; √√ = higher impacts; √ = high impact
Looking at Table 6.4, cyclone/ storm surges created greater but variable impacts on
all seven occupational groups of which the greatest impacts were on two groups,
namely, women PL collectors and crab catchers. This is followed by shrimp farmers,
river/ forest fishers and honey collectors and by women farmers and sea-going
fishers. Prolonged drought causes water stress to agricultural crops and thus has a
major impact on rice farmers and women involved in farming. The honey collectors
also claimed that prolonged pre or early monsoon drought affected flowering in the
forest and honey supplies. Apart from drought, rice farmers were severely impacted
by intense heavy rainfall. Of growing recent concern to shrimp farmers and river
forest/ fishers of Chakbara villages are high tides and the breaching and over topping
of dykes. Increased soil salinity is a major problem for rice farmers in Fultala. After
cyclone Aila, boro rice (goromer dhan) production was particularly affected in
Fultala as soil salinity increased. Some farmers reported that in low lying areas
where Aila-borne salt water remained stagnant for a long time, amon rice production
reduced by around 20 percent due to salinity.
Community views on the relationship between weather and non-weather
related problems
Apart from the direct weather related stressors, local communities face various non-
weather related stressors that affect their livelihoods. These include shrimp virus/
disease, crop pests, reduced fish availability in rivers/ mangroves, scarcity of sweet
Climate related stressors
Occupational groups experienced greater extent of threats from Climate stressors Rice farmers
Shrimp farmers
Rice/ shrimp farmer
Women (farmers)
Women (PL catcher)
Sea going fishers
River/ forest fishers
Honey collector
Crab catcher
1. Cyclones/ storm surges
√√ √ √√√ √ √√ √√ √√√
2. Prolongeddrought √√√ √√ √√√ √ √√√
3. Intense rainfall induced flooding
√√√ √ √ √√√
4. Increased water level at high tides √√√ √√ √√ √√√
5. Increased soil/ water salinity
√√√ √ √ √
6. Rough sea conditions √√√ √√√
7. Increased temperature
√√√

158
water for drinking, cooking, and irrigation, embankment breaching, increased tiger
attacks, non-availability of jobs, barriers in accessing mangroves, siltation and
grabbing of rivers/ canals and increased banditry in the mangroves. Several of these
non-weather stressors interact with weather stressors and may, in fact, be partly
caused by weather stressors, as in the case of increasing tiger attacks and reduced
fish availability in the rivers and canals of SRF including lower estuarine waters.
Weather and non-weather stressors in combination can create greater impacts on
social ecological systems than either working in isolation (Pouliotte et al., 2009).
For instance, The Farakka barrage, a non-weather stressor, has had major and
generally negative impacts on the river and wetland systems and on salinity levels
with adverse effects on fisheries, agriculture, livestock, SRF, biodiversityand overall
livelihoods in the entire Lower Ganges Delta. One of the consequences of the
barrage, in combination with other factors, has been salt water penetration 100 km or
more inland along tributary channels during the dry season (Allison et al., 2003).
This multi-factoral effect is important to keep in mind when discussing local impacts
in the study villages.
Household census data on the nature and type of problems affecting the two villages
revealed five priority problems (Table 6.5) Three out of five priority problems of
Fultala were related to crop farming, namely, high insect infestation, increased
salinity of crop fields and rain-based flooding of crop land. Increased insect
infestation was rated as the most important problem (46% of households). Such
infestation included traditional pest and new insects that caused more damage than
in the past. However, it is difficult to say to what extent this is linked to changing
weather patterns.
Table 6.5: Five Priority problems affecting the local livelihoods (Source: household
census in Chakbara and Fultala in 2010)
Priority problems of the people of Fultala and Chakbara villages
Households mentioned (%)
Remarks
Village: Fultala – 247 households 1. Increased insect infestation in rice crops
46.2% Indirect weather factor
2. Salinity of crop fields after cyclone Aila
41.8% Indirect weather factor
3. Job scarcity in the locality 26.3% Non-weather related
4. Akash bonnaya or kasthe (rain- 16.2% Direct weather (intense heavy
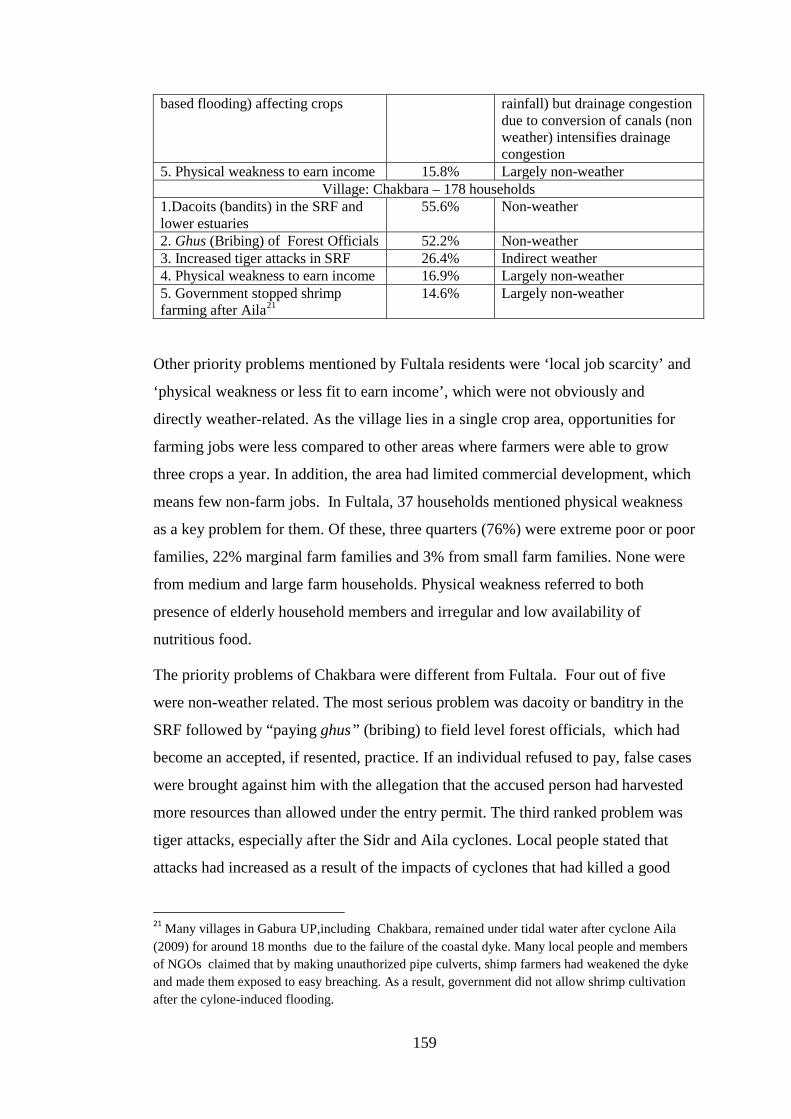
159
based flooding) affecting crops rainfall) but drainage congestion due to conversion of canals (non weather) intensifies drainage congestion
5. Physical weakness to earn income 15.8% Largely non-weather Village: Chakbara – 178 households
1.Dacoits (bandits) in the SRF and lower estuaries
55.6% Non-weather
2. Ghus (Bribing) of Forest Officials 52.2% Non-weather 3. Increased tiger attacks in SRF 26.4% Indirect weather 4. Physical weakness to earn income 16.9% Largely non-weather 5. Government stopped shrimp farming after Aila21
14.6% Largely non-weather
Other priority problems mentioned by Fultala residents were ‘local job scarcity’ and
‘physical weakness or less fit to earn income’, which were not obviously and
directly weather-related. As the village lies in a single crop area, opportunities for
farming jobs were less compared to other areas where farmers were able to grow
three crops a year. In addition, the area had limited commercial development, which
means few non-farm jobs. In Fultala, 37 households mentioned physical weakness
as a key problem for them. Of these, three quarters (76%) were extreme poor or poor
families, 22% marginal farm families and 3% from small farm families. None were
from medium and large farm households. Physical weakness referred to both
presence of elderly household members and irregular and low availability of
nutritious food.
The priority problems of Chakbara were different from Fultala. Four out of five
were non-weather related. The most serious problem was dacoity or banditry in the
SRF followed by “paying ghus” (bribing) to field level forest officials, which had
become an accepted, if resented, practice. If an individual refused to pay, false cases
were brought against him with the allegation that the accused person had harvested
more resources than allowed under the entry permit. The third ranked problem was
tiger attacks, especially after the Sidr and Aila cyclones. Local people stated that
attacks had increased as a result of the impacts of cyclones that had killed a good
21 Many villages in Gabura UP,including Chakbara, remained under tidal water after cyclone Aila (2009) for around 18 months due to the failure of the coastal dyke. Many local people and members of NGOs claimed that by making unauthorized pipe culverts, shimp farmers had weakened the dyke and made them exposed to easy breaching. As a result, government did not allow shrimp cultivation after the cylone-induced flooding.
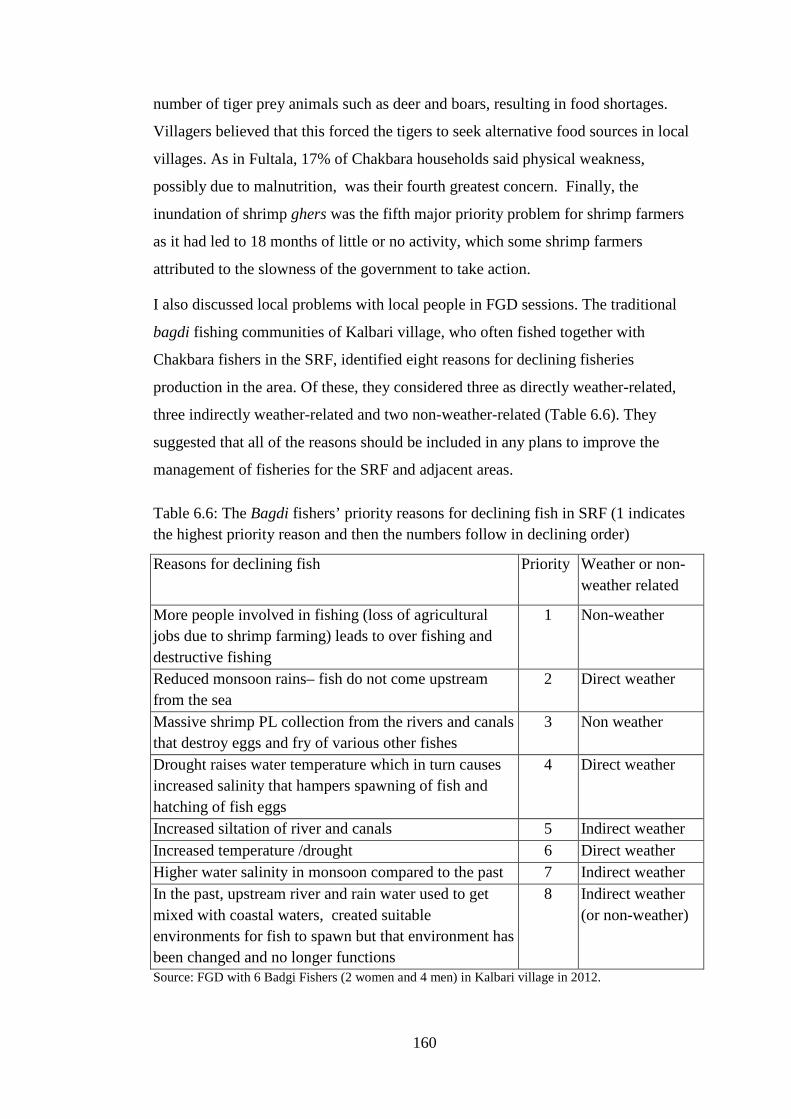
160
number of tiger prey animals such as deer and boars, resulting in food shortages.
Villagers believed that this forced the tigers to seek alternative food sources in local
villages. As in Fultala, 17% of Chakbara households said physical weakness,
possibly due to malnutrition, was their fourth greatest concern. Finally, the
inundation of shrimp ghers was the fifth major priority problem for shrimp farmers
as it had led to 18 months of little or no activity, which some shrimp farmers
attributed to the slowness of the government to take action.
I also discussed local problems with local people in FGD sessions. The traditional
bagdi fishing communities of Kalbari village, who often fished together with
Chakbara fishers in the SRF, identified eight reasons for declining fisheries
production in the area. Of these, they considered three as directly weather-related,
three indirectly weather-related and two non-weather-related (Table 6.6). They
suggested that all of the reasons should be included in any plans to improve the
management of fisheries for the SRF and adjacent areas.
Table 6.6: The Bagdi fishers’ priority reasons for declining fish in SRF (1 indicates the highest priority reason and then the numbers follow in declining order)
Reasons for declining fish Priority Weather or non-weather related
More people involved in fishing (loss of agricultural jobs due to shrimp farming) leads to over fishing and destructive fishing
1 Non-weather
Reduced monsoon rains– fish do not come upstream from the sea
2 Direct weather
Massive shrimp PL collection from the rivers and canals that destroy eggs and fry of various other fishes
3 Non weather
Drought raises water temperature which in turn causes increased salinity that hampers spawning of fish and hatching of fish eggs
4 Direct weather
Increased siltation of river and canals 5 Indirect weather Increased temperature /drought 6 Direct weather Higher water salinity in monsoon compared to the past 7 Indirect weather In the past, upstream river and rain water used to get mixed with coastal waters, created suitable environments for fish to spawn but that environment has been changed and no longer functions
8 Indirect weather (or non-weather)
Source: FGD with 6 Badgi Fishers (2 women and 4 men) in Kalbari village in 2012.
161
In discussing solutions to problems identified, local people suggested that both
weather and non-weather related factors need to be included in local development
planning (Figure 6.6). Figure 6.6 shows that among the weather related factors,
reduced monsoon rains, changes of season, increased temperature were noticeable in
the area. These weather changes manifested themselves as increasing cyclonic
storms, longer and warmer summers, shorter and drier monsoons and shorter and
warmer winters, including visible and regular prolonged droughts. All these
collectively had negative impacts on local social-ecological systems and increased
local vulnerability. People also referred to various non weather factors they
considered had intensified further local vulnerabilities. These included closure of
rivers upstream and water diversions (reduced freshwater flows), extensive
cultivation of brackishwater shrimp (causing soil and water salinity) and poor
governance and institutional issues which affected development processes. Below
are provideda few examples of their ideas for solutions.
In the case of rice farmers, they considered erratic rainfall, prolonged drought and
salinity as priority weather-related problems but equally emphasized other non-
weather related issues such as leasing arrangements and the conversion and illegal
appropriation of canals. The canal had previously been a source of freshwater for
irrigation and as drainage outlets for excess rainwater. Table 6.5 shows that Fultala
farmers ranked salinity of crop fields and kasthe or akash bonnya (intense rain-
based flooding) as priority problems. As a solution, they proposed that canals should
be returned to their original role as drainage channels in order to ease flooding and
wash outthe salinity from soils. In addition, they wanted the canals to act as storage
for monsoon rain water so they could expand the land devoted to groomer dhan
(winter rice) and vegetables. They saw these measures as increasing their food
security and providing employment for the poor and other villagers.
In Chakbara, embankment breaching and prolonged inundation were central
problems they faced. They underscored that poor maintenance of dykes by the
BWDB, coupled with illegal pipe culverts in dykes for exchange of water between
shrimp ghers and rivers by the shrimp farmers as something that needed to be dealt
with. They were particularly critical of the government authorities for their failure
to repair breached embankments.
162
In Fultala, there had been a major decline in freshwater capture fishing in beels22, in
canals and road side ditches/canals as a result of reduced rains, drought and salinity
(weather related) and leasing, land grabbing and conversion of canals to crop land,
fish ponds and settlements. This had changed water flow regimes with lost
connectivity with the river systems. However, while these weather-related changes
were of great importance, they pointed to non-weather factors such as poor
governance, political interference and corruption as major drivers of changes in
capture fisheries in the area.
Similarly, fishers mentioned drought (reduced pre monsoon and monsoon rains) and
increased temperature (weather related) as impacting on fish migration upstream.
However, they emphasized a lack of fisheries management in the SRF and in the
lower estuary, which included three wildlife sanctuaries within the SRF, as the main
institutional reasons for a decline in fisheries in the area. They also mentioned that
the cyclone-borne siltation degraded some suitable fish habitats in the upper reaches
of SRF (a weather related stressor) but gave greater emphasis to the indiscriminate
use of harmful fishing gear downstream of the SRF in the decline in fish availability.
In summary, local fishers identified a combination of weather and non-weather
changes and developments that had resulted in a decline in their natural resources
base. They considered government policy to be most at fault in failing to properly
manage fish stocks, fishing techniques, the actions of lower level forest officials and
provide effective governance of fish sanctuaries. In the past, fishing was dominated
by traditional lower-caste Hindu communities such as the kaibartto, malo, jalodas,
barmon, and bagdi but the unrestricted entry of thousands of Muslims seeking work
and employment over the past 40 years had resulted in considerable pressure on fish
stocks, fishing environments and fishers’ living standards (Pokrant et al., 1997). In
Chakbara and its environs, the small bagdi fishing community (minority fishing
dependent groups) had been particularly hard hit by these changes.
Summary
This chapter examined how different local occupational groups considered that
changes in local weather and non-weather related factors had affected their local 22Beels are bowl shaped natural depressions in floodplains or tidal plains which may retain water year round or part of the year
163
environment and livelihoods. What is clear is that while all people in the study
villages have been affected over the years by a combination of weather and non-
weather events and processes, these have had a differential impact on and
vulnerability of particular occupational and other groups. The importance of this
finding is that even where communities live very close to each other, they are
affected in different ways by physical hazards depending on the nature and type of
hazard and by differences in occupation, gender, access and control of assets and
other socially organized and determined processes and institutions. Understanding
these processes and institutions is central to the development of policies on adaptive
capacity and adaptation strategies. Local vulnerabilities, capacities and readiness to
deal with potentially highly damaging climate change impacts must be seen through
the lens of the complex interaction between social and ecological systems for policy
to be successful. The next chapter takes this discussion further by examining the
variations between the two study villages with regard to their vulnerabilities to
weather-related stressors.
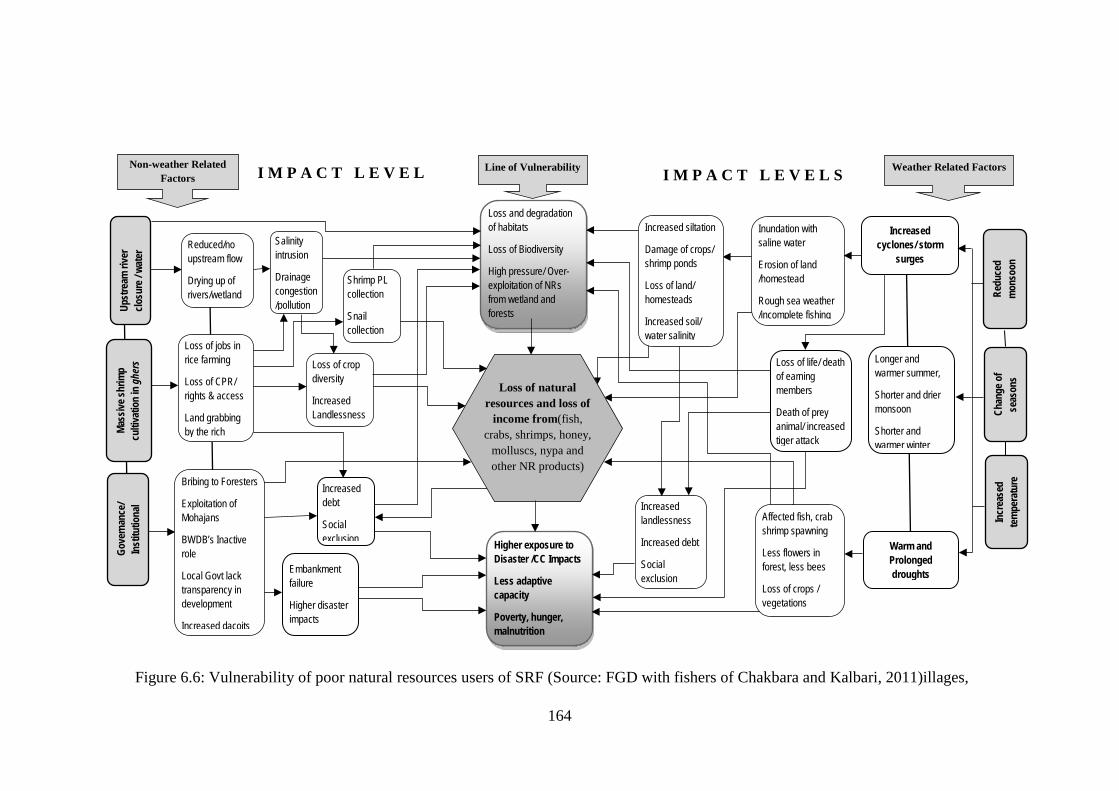
164
Figure 6.6: Vulnerability of poor natural resources users of SRF (Source: FGD with fishers of Chakbara and Kalbari, 2011)illages,
Increased cyclones/ storm
surges
Embankment failure
Higher disaster impacts
Upst
ream
rive
r clo
sure
/ wat
er
Loss of life/ death of earning members
Death of prey animal/ increased tiger attack
Gove
rnan
ce/
Inst
itutio
nal
Increased debt
Social exclusion
Longer and warmer summer,
Shorter and drier monsoon
Shorter and warmer winter
Warm and Prolonged droughts
Weather Related Factors Line of Vulnerability Non-weather Related Factors I M P A C T L E V E L S I M P A C T L E V E L
Bribing to Foresters
Exploitation of Mohajans
BWDB’s Inactive role
Local Govt lack transparency in development
Increased dacoits
Loss of jobs in rice farming
Loss of CPR/ rights & access
Land grabbing by the rich
Loss of crop diversity
Increased Landlessness
Reduced/no upstream flow
Drying up of rivers/wetland
Salinity intrusion
Drainage congestion /pollution
Higher exposure to Disaster /CC Impacts
Less adaptive capacity
Poverty, hunger, malnutrition
Loss and degradation of habitats
Loss of Biodiversity
High pressure/ Over-exploitation of NRs from wetland and forests
Inundation with saline water
Erosion of land /homestead
Rough sea weather /incomplete fishing
Affected fish, crab shrimp spawning
Less flowers in forest, less bees
Loss of crops / vegetations
Increased landlessness
Increased debt
Social exclusion
Increased siltation
Damage of crops/ shrimp ponds
Loss of land/ homesteads
Increased soil/ water salinity
Loss of natural resources and loss of
income from(fish, crabs, shrimps, honey,
molluscs, nypa and other NR products)
Shrimp PL collection
Snail collection
Redu
ced
mon
soon
Mass
ive sh
rimp
culti
vatio
n in
ghe
rs
Chan
ge o
f se
ason
s In
crea
sed
tem
pera
ture
165
Chapter 7: LivelihoodVulnerability of Local Communities
to Weather/Climate Stressors Introduction
This chapter presents the results of livelihood vulnerability assessment conducted in
the two project villages. Its aim is to assess the variations between the villages in
their vulnerability to weather related stressors.The range of indicators used are
aligned to seven sub-components, which measure the vulnerability context of a
system based on the extent of that system’s exposure, sensitivity and adaptive
capacity to cope with hazard events. Types and frequency of natural disasters and
resultant damage experienced by village households are used as indicators of the
“exposure” component of vulnerability while socio-demographic features, livelihood
strategies and social networks and access to safety nets determine the “adaptive
capacity” of village communities. Availability, quality and access to food, water and
health services by the project communities collectively are used to indicate the
“sensitivity” component of vulnerability. Relevant data for livelihood vulnerability
assessment are collected from census and household surveys, conducted in the
project villages including climate data (rainfall and temperature) collected from the
Bangladesh Meteorological Department.
Vulnerability and its Multiple Faces
There are wide variations between the two project villages in terms of their problems
and issues relevant to disaster, livelihoods and vulnerabilities even though they are
located close to each other within a small geographical area of Shyamnagar sub-
district. In the following discussion, the concept of vulnerability used is taken from
the IPCC:
Vulnerability is the degree to which a system is susceptible to, or unable
to cope with, adverse effect of climate change, including climate
variability and extremes. Vulnerability is the function of the character,
magnitude and the rate of climate change and variation to which a system
is exposed, its sensitivity and its adaptive capacity (IPCC, 2001).
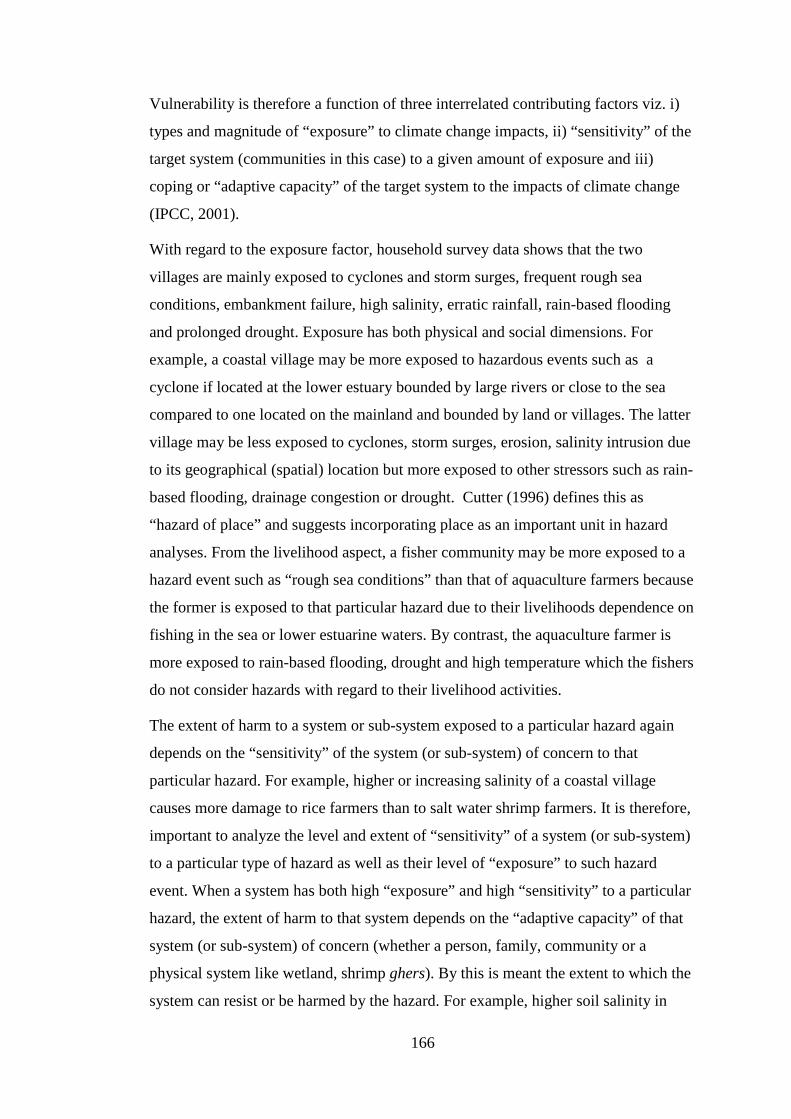
166
Vulnerability is therefore a function of three interrelated contributing factors viz. i)
types and magnitude of “exposure” to climate change impacts, ii) “sensitivity” of the
target system (communities in this case) to a given amount of exposure and iii)
coping or “adaptive capacity” of the target system to the impacts of climate change
(IPCC, 2001).
With regard to the exposure factor, household survey data shows that the two
villages are mainly exposed to cyclones and storm surges, frequent rough sea
conditions, embankment failure, high salinity, erratic rainfall, rain-based flooding
and prolonged drought. Exposure has both physical and social dimensions. For
example, a coastal village may be more exposed to hazardous events such as a
cyclone if located at the lower estuary bounded by large rivers or close to the sea
compared to one located on the mainland and bounded by land or villages. The latter
village may be less exposed to cyclones, storm surges, erosion, salinity intrusion due
to its geographical (spatial) location but more exposed to other stressors such as rain-
based flooding, drainage congestion or drought. Cutter (1996) defines this as
“hazard of place” and suggests incorporating place as an important unit in hazard
analyses. From the livelihood aspect, a fisher community may be more exposed to a
hazard event such as “rough sea conditions” than that of aquaculture farmers because
the former is exposed to that particular hazard due to their livelihoods dependence on
fishing in the sea or lower estuarine waters. By contrast, the aquaculture farmer is
more exposed to rain-based flooding, drought and high temperature which the fishers
do not consider hazards with regard to their livelihood activities.
The extent of harm to a system or sub-system exposed to a particular hazard again
depends on the “sensitivity” of the system (or sub-system) of concern to that
particular hazard. For example, higher or increasing salinity of a coastal village
causes more damage to rice farmers than to salt water shrimp farmers. It is therefore,
important to analyze the level and extent of “sensitivity” of a system (or sub-system)
to a particular type of hazard as well as their level of “exposure” to such hazard
event. When a system has both high “exposure” and high “sensitivity” to a particular
hazard, the extent of harm to that system depends on the “adaptive capacity” of that
system (or sub-system) of concern (whether a person, family, community or a
physical system like wetland, shrimp ghers). By this is meant the extent to which the
system can resist or be harmed by the hazard. For example, higher soil salinity in
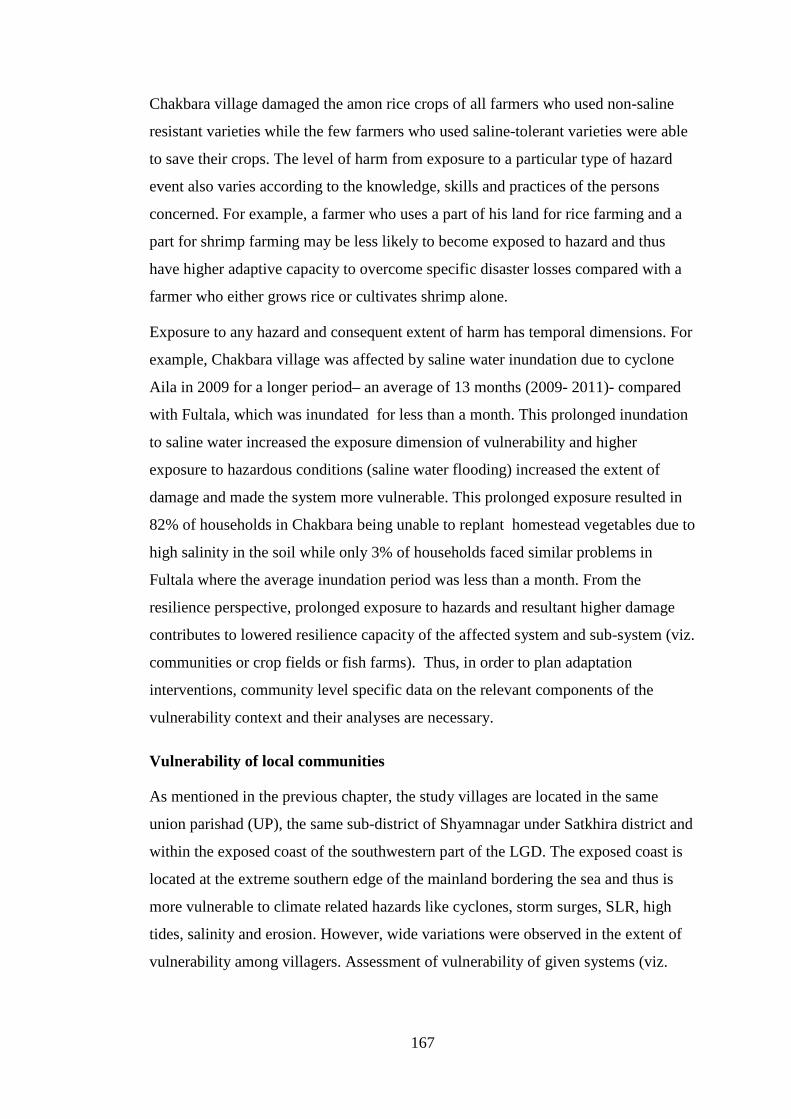
167
Chakbara village damaged the amon rice crops of all farmers who used non-saline
resistant varieties while the few farmers who used saline-tolerant varieties were able
to save their crops. The level of harm from exposure to a particular type of hazard
event also varies according to the knowledge, skills and practices of the persons
concerned. For example, a farmer who uses a part of his land for rice farming and a
part for shrimp farming may be less likely to become exposed to hazard and thus
have higher adaptive capacity to overcome specific disaster losses compared with a
farmer who either grows rice or cultivates shrimp alone.
Exposure to any hazard and consequent extent of harm has temporal dimensions. For
example, Chakbara village was affected by saline water inundation due to cyclone
Aila in 2009 for a longer period– an average of 13 months (2009- 2011)- compared
with Fultala, which was inundated for less than a month. This prolonged inundation
to saline water increased the exposure dimension of vulnerability and higher
exposure to hazardous conditions (saline water flooding) increased the extent of
damage and made the system more vulnerable. This prolonged exposure resulted in
82% of households in Chakbara being unable to replant homestead vegetables due to
high salinity in the soil while only 3% of households faced similar problems in
Fultala where the average inundation period was less than a month. From the
resilience perspective, prolonged exposure to hazards and resultant higher damage
contributes to lowered resilience capacity of the affected system and sub-system (viz.
communities or crop fields or fish farms). Thus, in order to plan adaptation
interventions, community level specific data on the relevant components of the
vulnerability context and their analyses are necessary.
Vulnerability of local communities
As mentioned in the previous chapter, the study villages are located in the same
union parishad (UP), the same sub-district of Shyamnagar under Satkhira district and
within the exposed coast of the southwestern part of the LGD. The exposed coast is
located at the extreme southern edge of the mainland bordering the sea and thus is
more vulnerable to climate related hazards like cyclones, storm surges, SLR, high
tides, salinity and erosion. However, wide variations were observed in the extent of
vulnerability among villagers. Assessment of vulnerability of given systems (viz.
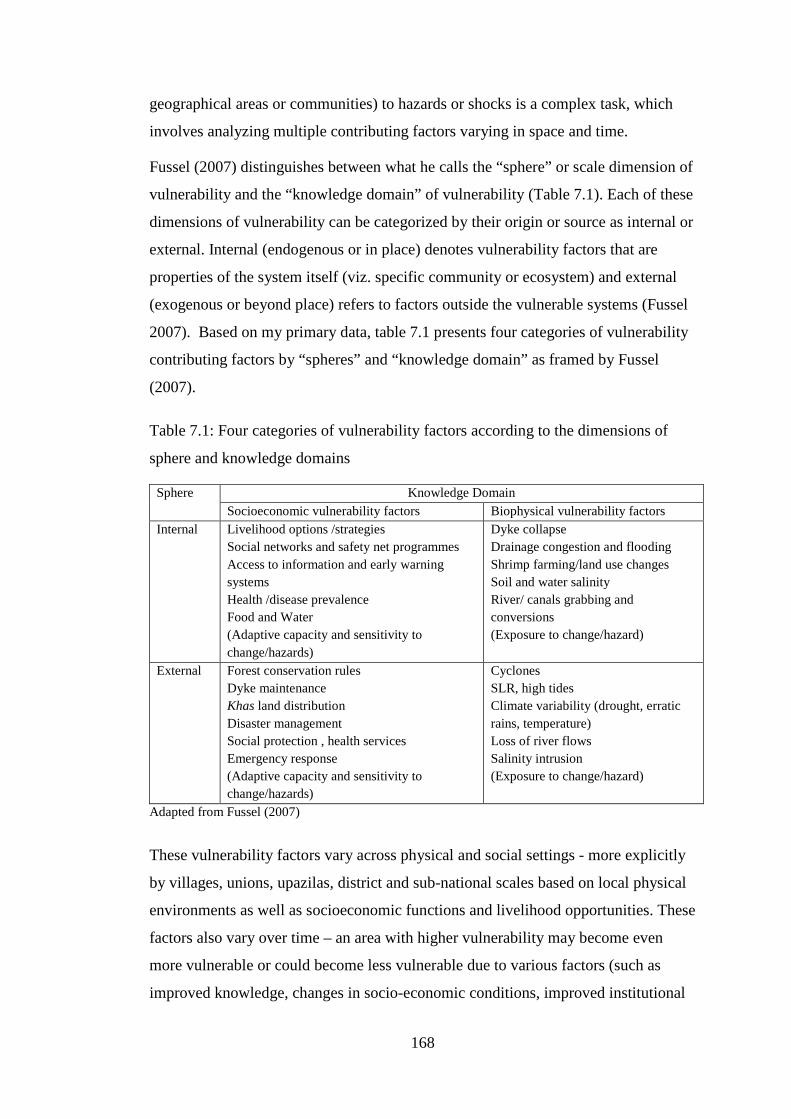
168
geographical areas or communities) to hazards or shocks is a complex task, which
involves analyzing multiple contributing factors varying in space and time.
Fussel (2007) distinguishes between what he calls the “sphere” or scale dimension of
vulnerability and the “knowledge domain” of vulnerability (Table 7.1). Each of these
dimensions of vulnerability can be categorized by their origin or source as internal or
external. Internal (endogenous or in place) denotes vulnerability factors that are
properties of the system itself (viz. specific community or ecosystem) and external
(exogenous or beyond place) refers to factors outside the vulnerable systems (Fussel
2007). Based on my primary data, table 7.1 presents four categories of vulnerability
contributing factors by “spheres” and “knowledge domain” as framed by Fussel
(2007).
Table 7.1: Four categories of vulnerability factors according to the dimensions of
sphere and knowledge domains
Sphere Knowledge Domain Socioeconomic vulnerability factors Biophysical vulnerability factors
Internal Livelihood options /strategies Social networks and safety net programmes Access to information and early warning systems Health /disease prevalence Food and Water (Adaptive capacity and sensitivity to change/hazards)
Dyke collapse Drainage congestion and flooding Shrimp farming/land use changes Soil and water salinity River/ canals grabbing and conversions (Exposure to change/hazard)
External Forest conservation rules Dyke maintenance Khas land distribution Disaster management Social protection , health services Emergency response (Adaptive capacity and sensitivity to change/hazards)
Cyclones SLR, high tides Climate variability (drought, erratic rains, temperature) Loss of river flows Salinity intrusion (Exposure to change/hazard)
Adapted from Fussel (2007)
These vulnerability factors vary across physical and social settings - more explicitly
by villages, unions, upazilas, district and sub-national scales based on local physical
environments as well as socioeconomic functions and livelihood opportunities. These
factors also vary over time – an area with higher vulnerability may become even
more vulnerable or could become less vulnerable due to various factors (such as
improved knowledge, changes in socio-economic conditions, improved institutional

169
capacity, policy, processes and management). However, given these complex
dynamics in the hazard-vulnerability nexus, I intended to assess the livelihood
vulnerability of the two coastal village communities (Fultala and Chakbara) based on
the vulnerability factors (Fussel, 2007) or components as framed by IPCC (2001).
Livelihood Vulnerability Index of Chakbara and Fultala communities
Since the focus of the research is on the social aspects of climate change and climate
variability and community strategies to adapt to changing environments, I have
adopted the Livelihood Vulnerability Index (LVI) tool to assess the vulnerability of
the study villages. The LVI was developed and field tested by Hahn et al. (2009) in
Mozambique. The tool combines a sustainable livelihoods approach with the factors
that make people vulnerable to climate change and climate variability. The approach
has demonstrated effectiveness in assessing vulnerability of communities to the
impacts of climate hazards by collecting and analyzing relevant primary data from
households aligned with the vulnerability factors that collectively determine the
vulnerability of a system (IPCC, 2001). The IPCC vulnerability definition includes
three contributing factors, which are exposure, sensitivity and adaptive capacity to
climate shocks. In developing the LVI for the study villages, I used multiple
indicators related to weather induced threats to assess the exposure of two village
communities. Data on various socio-economic features of the households including
local governments’ functionsin safety net programs were used to analyse the adaptive
capacity component of vulnerability. Other indicators such as water availability,
health issues and food security were used to determine the sensitivity component of
vulnerability. I used most of the indicators in Hahn et al. (2009) that suited local
conditions in addition to some additional indicators. A total of 82 indicators were
used under seven major sub-components of three contributory factors of vulnerability
in determining the LVI (Table 7.2).
The approach involved two broad steps. First, determining the LVI based on
household level primary data including meteorological data on climate parameters
(rainfall and temperature) as part of a composite index comprised of seven major
sub-components. Second, the seven component results were aggregated into three
contributing factors of vulnerability, which were exposure, sensitivity and adaptive
capacity.
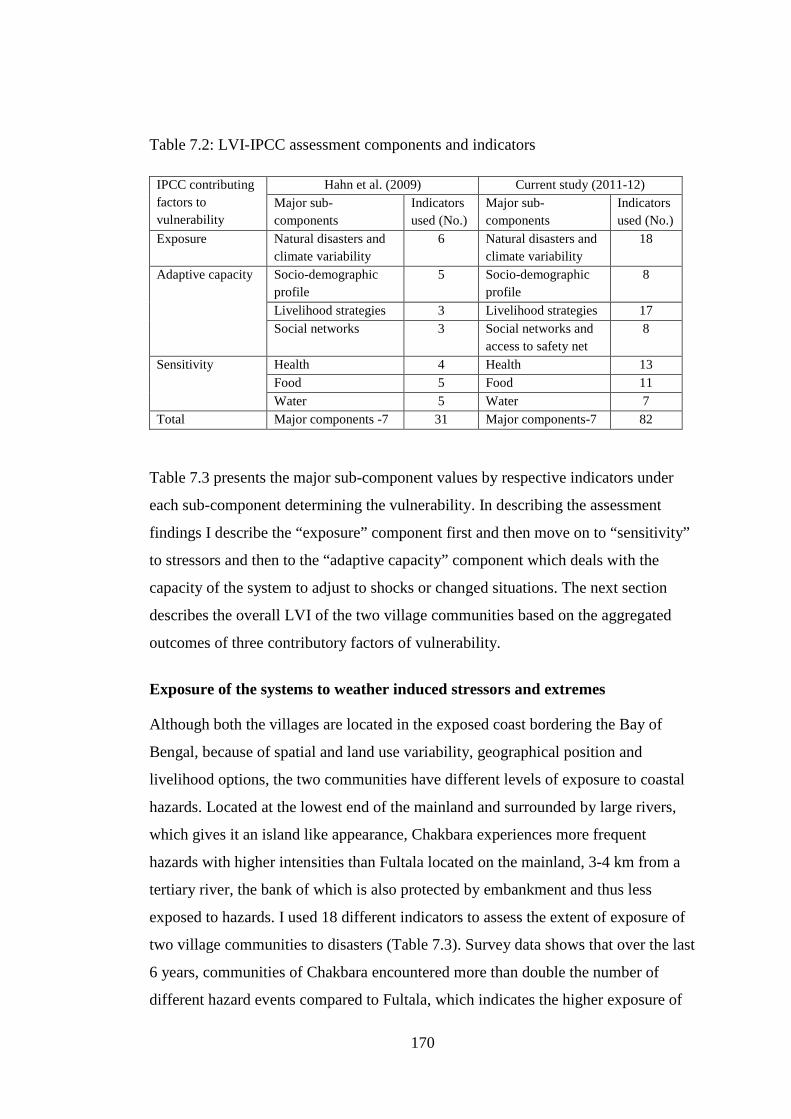
170
Table 7.2: LVI-IPCC assessment components and indicators
IPCC contributing factors to vulnerability
Hahn et al. (2009) Current study (2011-12) Major sub-components
Indicators used (No.)
Major sub-components
Indicators used (No.)
Exposure Natural disasters and climate variability
6 Natural disasters and climate variability
18
Adaptive capacity Socio-demographic profile
5 Socio-demographic profile
8
Livelihood strategies 3 Livelihood strategies 17 Social networks 3 Social networks and
access to safety net 8
Sensitivity Health 4 Health 13 Food 5 Food 11 Water 5 Water 7
Total Major components -7 31 Major components-7 82
Table 7.3 presents the major sub-component values by respective indicators under
each sub-component determining the vulnerability. In describing the assessment
findings I describe the “exposure” component first and then move on to “sensitivity”
to stressors and then to the “adaptive capacity” component which deals with the
capacity of the system to adjust to shocks or changed situations. The next section
describes the overall LVI of the two village communities based on the aggregated
outcomes of three contributory factors of vulnerability.
Exposure of the systems to weather induced stressors and extremes
Although both the villages are located in the exposed coast bordering the Bay of
Bengal, because of spatial and land use variability, geographical position and
livelihood options, the two communities have different levels of exposure to coastal
hazards. Located at the lowest end of the mainland and surrounded by large rivers,
which gives it an island like appearance, Chakbara experiences more frequent
hazards with higher intensities than Fultala located on the mainland, 3-4 km from a
tertiary river, the bank of which is also protected by embankment and thus less
exposed to hazards. I used 18 different indicators to assess the extent of exposure of
two village communities to disasters (Table 7.3). Survey data shows that over the last
6 years, communities of Chakbara encountered more than double the number of
different hazard events compared to Fultala, which indicates the higher exposure of
171
the former. On receiving early warning messages prior to cyclones, between 97%
and 98% of Chakbara households reported having received early warning messages
(EWM) compared with between 57% and 79% of Fultala households prior to the
cyclones Sidr in 2007 and Aila in 2009 respectively (Table 7.3). Over 49% of
Chakbara households reported that they stored drinking water after receiving EWM
compared with 18% of households of Fultala. Almost every household in Chakbara
has multiple water jars of different sizes to store water as the area is high saline
prone and shortage of drinking water is common the year round but severe in the dry
season. Thus, the scarcity of drinking water, higher exposure to saline water flooding
and contamination of drinking water ponds have made the residents of Chakbara
more aware of the need to store drinking water upon receipt of early warning signals
prior to any hazard or disaster. By contrast, Fultala communities are located in an
area less exposed to saline water flooding hazard, which has meant they are less
likely to store drinking water on disaster signals.
Apart from receiving EWM and storing drinking water, Chakbara was severely
affected by cyclone Aila (2009) and 89% households reported leaving their homes
for embankments or other raised places or temporarily migrated for periods from 3
to 18 months compared to only 22% of Fultala households who left their homes for
shorter periods (less than a month). During cyclone Aila, Chakbara was worst hit as
100% of households experienced damage to their homes compared to only 13% of
Fultala households and the homesteads of the affected people remained inundated for
13 months on average in Chakbara compared with less than a month (0.72 month) in
Fultala.
Exposure to disaster also affects employment and occupational patterns in varying
ways. Study data shows that two thirds of the total households in Chakbara were
unable to practice their occupations after cyclone Aila compared with less than one
third of households of Fultala. In terms of other livelihood assets, Chakbara was
worst affected, as 100% households experienced inundation of their fish ponds
compared to 53% in Fultala. The average diversity indices on damage of assets were
much higher in Chakbara than in Fultala both during and after the cyclone Aila
(Table 7.3). Incidents of deaths, injury and conflicts due to cyclone Aila were found
to be negligible in both villages with only one death in Chakbara. Apart from these
indicators of exposure, I also collected local data for the last 60 years (1950-2010) on
172
three weather parameters (average maximum and minimum temperatures and
precipitation - rainfall) from the Dhaka Meteorological Department, which was used
in the LVI assessment. No difference was found between the two villages in terms of
temperatures and rainfall over that period (discussed in previous chapter). This lack
of difference masks differences in their overall exposure rating caused by other
factors.
In addition to its greater distance from the coast, Fultala village is comparatively less
exposed to coastal hazards compared to Chakbara for several other reasons. First, it
is located 3-4 km from a tertiary river with an embankment and the height and
strength of a tidal surge is weaker in small rivers compared with large rivers found
closer to the coast. Second Fultala is bifurcated by a raised paved road which acts as
an embankment and gives double protection from storm surge induced flooding. For
example, one part of the village on the east was protected from flooding due to the
road, which meant that the houses and assets there were saved from coastal flooding
during cyclone Aila. In Chakbara there are no such raised roads. Third, Aila hit in
May when there were no crops in Fultala fields as amon rice cultivation starts from
June-July. In contrast, shrimp ghers and fish ponds (95% of the total cultivable land
in 2009) in Chakbara were stocked with shrimp and white fish which were all
washed away causing considerable financial harm to aquaculture farmers and thereby
increased their vulnerability. Finally, Chakbara remained inundated by cyclone
induced saline water for 12 to18 months compared to less than a month in Fultala,
which contributed to higher damage to Chakbara compared with Fultala and thus
reduced their adaptive capacity (or increased vulnerability).
Besides the spatial dimension, vulnerability to disaster has a temporal dimension. As
noted, cyclone Aila hit in May 2009 which caused severe losses to shrimp farmers as
at that time the shrimp ghers were full of stocked shrimp, which were all washed
away with the surge water. In Fultala the rice farmers did not face such crop losses as
cycloneAila struck before the rice farming cycle. However, exposure and sensitivity
to hazard are not limited to instant direct effect at the time of a hazard event. There is
often varying degrees of residual exposure and sensitivity that even last for several
years.Forexample, after cyclone Aila, Fultala rice farmers incurred losses of amon
rice due to delayed but increased soil and water salinity from the earlier surge water
(cyclone Aila). This affected local agriculture for another two years from the time of

173
the cyclone. In the case of Chakbara, the delayed increase in the salinity of soil and
water had much less impact on Chakbara as over 95% of land were under salt water
shrimp farming, which required a certain level of water salinity for better growth and
survival of shrimp. Only a few Chakbara farmers cultivated rice on less than 5% of
the land area and this land was converted to shrimp ghers in early 2012 due to the
residual effects of salinity induced by cyclone in mid-2009. However, homestead
vegetable production in Chakbara was badly affected by salinity during the post
cyclone years. Thus, temporal and spatial dimensions of hazard impacts are
important factors to be considered as they contribute to differences in the degree and
type of vulnerability for different occupational groups according to temporally
determined impacts even where the affected communities live close to each other
(“hazard of place”).
Sensitivity of the system to weather induced stressors
Sensitivity refers to the responsiveness of a system or systems to climate induced
hazards. IPCC defines sensitivity as the:
… degree to which a system is affected, either adversely or beneficially,
by climate variability or change (IPCC 2001:21). The effect may be
direct (e.g., a change in crop yield in response to a change in the mean,
rangeorvariabilityof temperature) or indirect (e.g., damages caused by
anincrease in the frequency of coastal flooding due to sea level rise).
In this context, I considered three sub-components, which were health related issues,
food security and availability and access to safe water particularly for drinking and
cooking purposes to assess the study village sensitivity factor of vulnerability. In this
vulnerability factor, I first discuss the sensitivity of the local communities to health
issues and then move on to food and water aspects.
Sensitivity related to health issues
I used 13 different health related indicators under this sub-component of sensitivity.
Key indicators included disease prevalence, access to safe latrines, distance, time and
costs to access health facilities, training in health issues, child immunization rate and
skills to prepare oral saline for treating diarrheal cases. Based on the indexed values
it was found that the two villages varied with regard to sensitivity to hazards on
health grounds. For example, in Chakbara, 60 percent of households reported that
174
they had at least one family member who suffered from chronic illness compared
with 55.6 percent of households in Fultala. Households with chronic illness are more
sensitive to hazards, especially when located in a remote setting where emergency
medical facilities are virtually absent, as was the case in Chakbara. Chakbara
households reported a higher proportion (8.9 percent) of children failing to attend
school due to illness compared to 6.7 percent of Fultala households. Regarding safe
latrines (water sealed), only 53.4 percent of Chakbara households had safe latrines
compared with 83.4 percent of Fultala households. Regarding ownership of latrines,
again more households in Chakbara (39%) reported that they do not have any latrine
of their own compared with 2% in Fultala. Use of safe latrines can reduce disease
susceptibility and thereby keep people healthy and fit for work, which is particularly
important for the landless poor as most of them engage in physical work to earn
living. Moreover, reaching health services is costly and time consuming and it also
disrupts daily work routines and can result in a loss of wages. Therefore, lower
susceptibility to illness can positively contribute to reducing sensitivity to increased
vulnerability to shocks. The survey data shows that 37% of Chakbara households
reported at least one of their family members suffered from diarrhea in the survey
year as opposed to only 6% of Fultala households. Although difference is not great,
91% of Chakbara households reported that members had suffered from various
diseases due to cyclone Aila compared with 82% in Fultala.
In the case of access to health emergency services to see a medical doctor or visit a
sub-district hospital, Chakbara residents travelled an average of 24.1km as opposed
to 15.4km for Fultala residents. It took Chakbara residents an average of 138
minutes to reach the sub-district level medical facilities compared to only 42 minutes
for Fultala residents. Similarly, transport costs were higher for Chakbara residents
(BDT23 83.3; US$1.07/per person) compared with Fultala (BDT 30; US $ 0.38/per
person). Education and training in primary health care and family hygiene can
contribute to the reduction in health related problems and reduce the sensitivity of
households to such problems before and after a disaster. More Chakbara households
(73.3%) reported they knew how to prepare oral-saline solutions (for diarrheal
treatment) compared to 64.4% of Fultala households. With regard to the frequency of
23 One US dollar equivalent to Bangladesh Taka (BDT) 78.00 in 2014
175
primary health care training, only 4.4% of households in Chakbara and 2.2 percent of
Fultala households reported that they received such training. However, regarding
immunization of children, the majority of households in both villages (95.6% in
Fultala and 93.3% in Chakbara) reported they immunized their children. Finally, the
frequency of inability to work due to sickness was almost similar (around 45 percent
of households) (see Table 7.3). In summary, Chakbara had an overall health index of
0.478 compared to 0.301 in Fultala which indicates higher sensitivity of the former to
hazards on health related issues compared to the later (Table 7.4). However,
vulnerability is also dependent on the sensitivity to availability of food.
Sensitivity related to Food security
None of the Chakbara households reported growing food (mainly rice) on their farms
as all the crop land of the village had been converted to salt water shrimp farms.
Households were almost entirely dependent on buying rice, except in some small
areas where a few farmers grow amon rice within shrimp ghers during the monsoon
when salinity concentration reduces. In contrast, 40% of households of Fultala relied
on their own farm production for their staple food (amon rice). This can be
considered as an enhancement of their adaptive capacity as these households have
some food security from their land. There is a common saying in rural Bangladesh
that “if we have rice at home, we can make up our meal with salt and chili“,
suggesting that having rice at home is synonymous with food security. Although
agriculture is sensitive to climate variability and change, at the same time it gives
food security. However, having land does not necessarily mean having food security.
This depends on various factors such as size of land holdings, production functions
of the land, and exposure and sensitivity of the land and crops grown to hazard
events. Whether landed farm households or landless, the majority of rural people can
find it difficult to ensure the required amount of food for the family members
consistently throughout the year. The majority of households in the study villages
(Chakbara - 97.8% HHs and Fultala -91.1% HHs) faced difficulties in arranging
adequate food for the family year round. However, periods of hardship varied by
village. Survey data shows that on average the households of Chakbara found it
difficult for 2.5 months to arrange food for their families compared with only 1.9
months for Fultala households. The longer households failed (or found it difficult) to
provide enough food for the family, the more sensitive they were to becoming
176
vulnerable to hazards. The majority of households in Chakbara were dependent on
SRF for their livelihoods and paying bribes and ransom to forest guards and bandits
also increased their vulnerability. Overall, more Chakbara households than Fultala
households were sensitive to physical hazards or disasters.
Rural people usually save a portion of their crops to meet family needs during crisis
periods but this was not possible in Chakbara. Fultala residents also had problems
ensuring a regular saving of rice as they depended on one rice crop a year. As
reported, they found it hard to save crops, apart from a few large farmers (4.4% of
households) who had sufficient farmland that provided sufficient food to be able to
store for lean times. Many small and medium farmers were compelled to sell a part
of their farm crops to meet other family needs, making it impossible to store food
and seeds. This indicates the importance of examining intra-village differences in
assets as part of developing a vulnerability index. The situation was much worse in
Chakbara where 87.8% of households were unable to save seeds compared with only
31.1 percent of Fultala households.
The two villages also differed in terms of provision of daily meals and nutritious
diets. During crisis periods, households of both villages faced difficulty arranging
three meals a day for the family members. Data shows that 62% and 53% households
of Chakbara and Fultala reported that they were unable to provide three meals per
day for their families (Table 7.3). Although the difference is not significant between
the villages, the sensitivity of Chakbara to crisis periods seemed higher compared to
Fultala. Regarding intake of protein-rich food such as fish, chicken, eggs, and milk,
the monthly intake of fish and eggs was higher in Chakbara than Fultala while intake
of chicken and milk was higher in Fultala. The higherconsumption of fish in
Chakbara was a result of its closeness to the river and ocean and the high proportion
of fishing households. The higher consumption of eggs in Chakbara was due to
availability at cheaper price from village households. Chakbara is located far from
local markets so many households sold eggs locally at cheaper prices than in Fultala.
Fultala is located closer to the large market in Munshigonj. Moreover, vegetables
were scarce in Chakbara due to salinity which may have encouraged people to eat
more eggs. However, households in Fultala were able to sell and buy various
products at reasonable price in Munshigonj market.
177
The overall indexed values for the eleven food security indicators show that
Chakbara households were more vulnerable (0.724) than in Fultala (0.545) (Table
7.4). A major reason for this was differences between the two villages in land use
and availability of food. Fultala suffered less from salinity and had a more diverse
economic base consisting of rice farming and vegetable production for sale and
domestic use. In contrast, Chakbara had fewer livelihood opportunities as a
consequence of higher soil salinity. Fultala women said they collected from local
wetland, roadside ditches, pond banks and fallow land near their homes over a dozen
different types of wild plants to be used as vegetables. In Chakbara, few or no such
opportunities existed due to salinity and scarcity of fallow land. The villages also
varied in their sensitivity to water for drinking and cooking.
Sensitivity related to water security
Water for drinking, cooking and other household uses is a perennial problem in the
coastal area as a whole and particularly acute in the study area mainly because of
high salinity. Chakbara residents suffered the most due to shortages of freshwater for
drinking purposes, particularly after Aila. Under normal circumstances, Chakbara
residents would collect drinking water from ponds dug to hold rainwater in the
monsoon and people relied on this water for the entire dry season. During the
monsoon they stored rain water in small to large pots for drinking and cooking
purposes. Cyclone Aila inundated the whole of Chakbara including homesteads,
ponds, roads, and shrimp farms for 18 months resulting in serious freshwater water
problems in the area. Immediately after the cyclone, government and donors working
through NGOs supplied drinking water for every affected household in the village
for more than a year starting, from late May 2009 to the onset of monsoon rains in
June 2010 with the hope that people would be able to revert to their previous practice
of rain water harvesting systems during the monsoon. In 2011 two cyclone affected
ponds were re-habilitated to store freshwater. PSFs (pond sand filters) were set by
NGOs to ensure a supply of safe drinking water to Chakbara. The PSF is a water
purification device and was first demonstrated by DPHE (Department of Public
Health Engineering)/ UNICEF in coastal areas in mid 1980s. Since then many
coastal communities have used PSF water for drinking and cooking purposes
(Ferdoushi & Bolkland, 2000). However, many coastal villages do not have access to
PSFs due to inadequate coverage and services provided by DPHE and NGOs.
178
When I conducted the household survey in mid-2011, 82% of Chakbara households
reported that they did not use PSF water as against only 9% in Fultala. In fact,
cyclone Aila damaged many drinking water ponds in Chakbara for between 12 and
18 months from the end of May 2009 to early 2011. Moreover, 43% of households in
the village reported that they had to drink water directly from open ponds due to the
scarcity of safe water. 29% of Chakbara households reported less regular sources of
safe drinking water compared with 16% of those in Fultala. This reflects differences
between the two villages in levels of soil and water salinity andavailability of
drinking water.
Time required to fetch water is also an important factor in vulnerability and survey
data shows that on average it took 72 to 75 minutes for a Chakbara households to
collect drinking and cooking water compared to 29 to 56 minutes in Fultala (Table
7.3). Part of the reason for this is the settlement pattern in Chakbara, which is lies
alongside the river banks and stretches over a kilometer. Many people considered it
took too long to collect PSF water and preferred to collect water from nearby ponds
without PSF. Many Chakbara households travelled to the SRF for fishing and
collection of crabs, nypa plam, honey and other resources and they often drank water
from ponds inside the SRF dug by the Forest Department for wildlife. This
traditional reliance on pond water may mean that it will take time for the people of
Chakbara to drinking safe water from PSF.
In response to a question regarding use of PSF water, some household members
stated they did not use the pond water from PSF too often as it was time consuming
to pass pond water through the sand filter. One owner of a pond with PSF said people
in the area preferred to collect the water quickly from ponds and to drink pond water
directly without filtering rather than wait for PSF filtering. During my field visit in
2012, I saw the PSF in one pond was out of order for over a month. Local people
were observed collecting pond water directly and said that they did not face much of
a problem drinking pond water without filtering.
Due to salt water shrimp farming, soil and water in Chakbara is more saline than in
Fultala. As a result, 95.6% of Chakbara households reported they were unable to
collect water from their previous sources after cyclone Aila due to saline water
inundation while no Fultala households reported so. Fultala villagers had better
access to drinking water and cyclone Aila did not pollute their drinking water ponds.
179
Moreover, many households in Fultala had small homesteads ponds from which they
obtained water for various household purposes (washing, cooking and bathing).
Fultala residents were better water managers than those in Chakbara. Villagers
reported that whenever their PSFs failed to work, they collectively raised funds and
fixed the problem. Fultala is a mainland village close to a growth center and well
connected to sub-district towns. Village residents are better educated and seemed
more aware of various development issues. The head office of a local NGO called
“Leaders” is located there, which gives the villagers greater exposure to development
issues and assistance compared to Chakbara which is located on an island setting far
from growth centers and the local upazila town. More recently, the people of
Chakbara have become more dependent on relief culture especially after the cyclone
Aila, making them more dependent on government and NGOs.
Another factor contributing to a greater sense of common purpose in Fultala is that
most households are involved in one major occupational activity, namely crop
farming, either as small to medium-size farmers or share croppers or farm labourers,
which helps create a greater mutual reliance on each other to obtain a living. By
contrast, the communities of Chakbara are divided more by occupation with shrimp
farmers, fishers who are further divided between sea-going, river and SRF fishing,
shrimp PL catchers and crab collectors. While both communities are stratified by
income and asset ownership, Chakbara has a higher proportion of poor residents.
These differences came to the fore during cyclone Aila when local people failed to
act collectively to fix the breached embankment. On the water security issue, the
sensitivity of Chakbara households is more than four times higher compared to
Fultala households (Table 7.4).
Adaptive capacity to cope with weather induced stressors
Drawing on Hahn’s work in Mozambique (2009), I used four sub-components in
examining the villages’ adaptive capacity to deal with natural and human-induced
hazards. The first three taken from Hahn were: socio-demographic issues, livelihood
strategies and social networks. The fourth one was access to government’s safety net
programmes which added to the social network component. The social safety net
programmes aimed at supporting the poor to meet crisis consisted of four
components: old /aged allowance from the government; VGD (vulnerable group
180
development) support; VGF (vulnerable group feeding) support and 100-days
activities (launched by the government in lean periods to create jobs for the poor
through cash for work). All these safety net activities are administered at the grass
roots level through the UPs and upazila (sub-district) council, with the UPs
determining which were given priority. These safety net packages played a role in
building the adaptive capacity of poor households to meet family crises by helping
them avoid the debt trap, reducing their need to sell off assets or to rent out land
when work was scarce. However, while official regulations and guidelines existed to
ensure an equitable distribution of assistance, in reality such decisions were often
made informally on political grounds and through local social networks, which
favoured some households over others and generally favoured better-off households
and reduced poor people’s adaptive capacity.
I now turn to the outcomes of related indicators on the socio-demographic sub-
component of adaptive capacity, an important contributory factor in determining the
vulnerability of a system to hazards.
Socio-demographic profile
Under this sub-component, Hahn et al. (2009) considered dependency ratios, percent
of female headed households, average age of the head of female headed households
and percent of households where the head of household never attended school as
indicators of adaptive capacity. These indicators were supplemented by percent of
households with members with no functional education, no functional education for
female members, households with female children aged 10 to19 and households with
members requiring assistance to move or walk. In this sub-component, I used eight
indicators to assess the adaptive capacity of the households in two study villages
(Table 7.3).
Based on these indicators and aggregated sub-component values, Chakbara was
shown to be more vulnerable (0.285) than Fultala (0.227) from a socio-demographic
perspective. More specifically, Chakbara had a higher dependency ratio (65.9) than
Fultala (47.7) and more female-headed households (13.5 percent) than Fultala (4%).
Regarding family educational status, 41% of Chakbara heads of households reported
that they had never attended school compared with 17% in Fultala. In the context of
education of family members (other than household heads), 76% of households in
Chakbara comprised of members with some education compared with 84% in
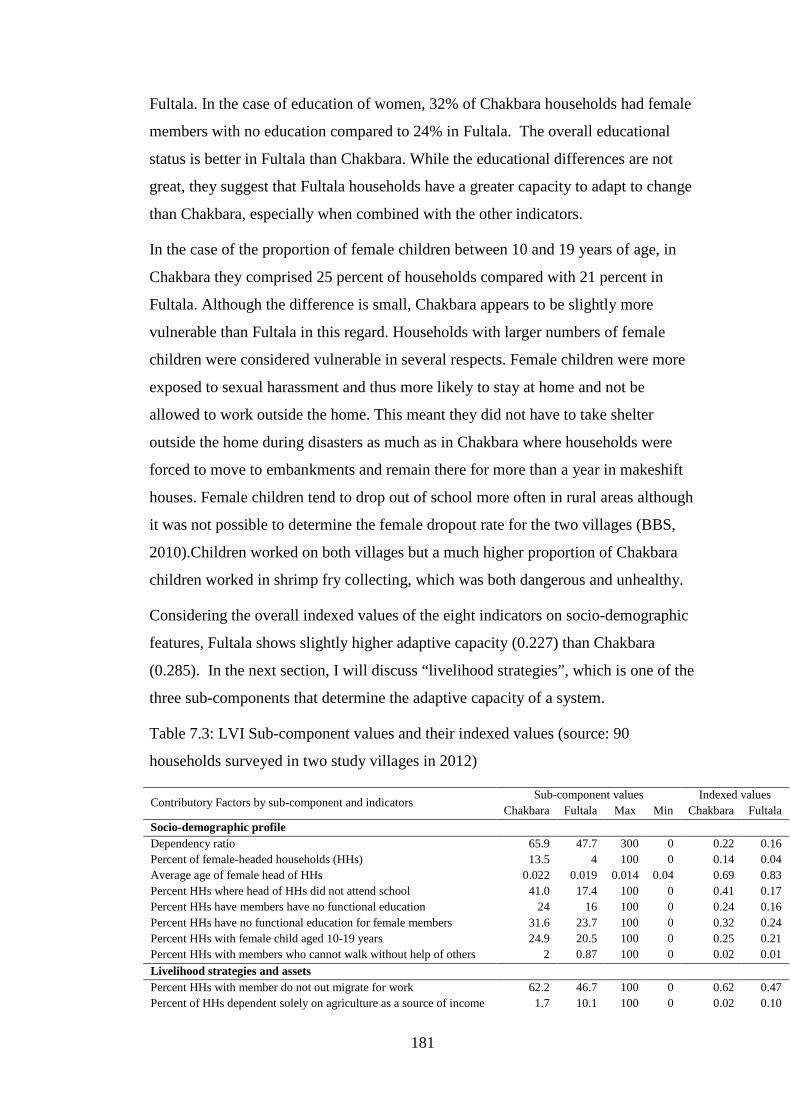
181
Fultala. In the case of education of women, 32% of Chakbara households had female
members with no education compared to 24% in Fultala. The overall educational
status is better in Fultala than Chakbara. While the educational differences are not
great, they suggest that Fultala households have a greater capacity to adapt to change
than Chakbara, especially when combined with the other indicators.
In the case of the proportion of female children between 10 and 19 years of age, in
Chakbara they comprised 25 percent of households compared with 21 percent in
Fultala. Although the difference is small, Chakbara appears to be slightly more
vulnerable than Fultala in this regard. Households with larger numbers of female
children were considered vulnerable in several respects. Female children were more
exposed to sexual harassment and thus more likely to stay at home and not be
allowed to work outside the home. This meant they did not have to take shelter
outside the home during disasters as much as in Chakbara where households were
forced to move to embankments and remain there for more than a year in makeshift
houses. Female children tend to drop out of school more often in rural areas although
it was not possible to determine the female dropout rate for the two villages (BBS,
2010).Children worked on both villages but a much higher proportion of Chakbara
children worked in shrimp fry collecting, which was both dangerous and unhealthy.
Considering the overall indexed values of the eight indicators on socio-demographic
features, Fultala shows slightly higher adaptive capacity (0.227) than Chakbara
(0.285). In the next section, I will discuss “livelihood strategies”, which is one of the
three sub-components that determine the adaptive capacity of a system.
Table 7.3: LVI Sub-component values and their indexed values (source: 90
households surveyed in two study villages in 2012)
Contributory Factors by sub-component and indicators Sub-component values Indexed values Chakbara Fultala Max Min Chakbara Fultala
Socio-demographic profile Dependency ratio 65.9 47.7 300 0 0.22 0.16
Percent of female-headed households (HHs) 13.5 4 100 0 0.14 0.04 Average age of female head of HHs 0.022 0.019 0.014 0.04 0.69 0.83 Percent HHs where head of HHs did not attend school 41.0 17.4 100 0 0.41 0.17 Percent HHs have members have no functional education 24 16 100 0 0.24 0.16 Percent HHs have no functional education for female members 31.6 23.7 100 0 0.32 0.24 Percent HHs with female child aged 10-19 years 24.9 20.5 100 0 0.25 0.21 Percent HHs with members who cannot walk without help of others 2 0.87 100 0 0.02 0.01 Livelihood strategies and assets
Percent HHs with member do not out migrate for work 62.2 46.7 100 0 0.62 0.47 Percent of HHs dependent solely on agriculture as a source of income 1.7 10.1 100 0 0.02 0.10
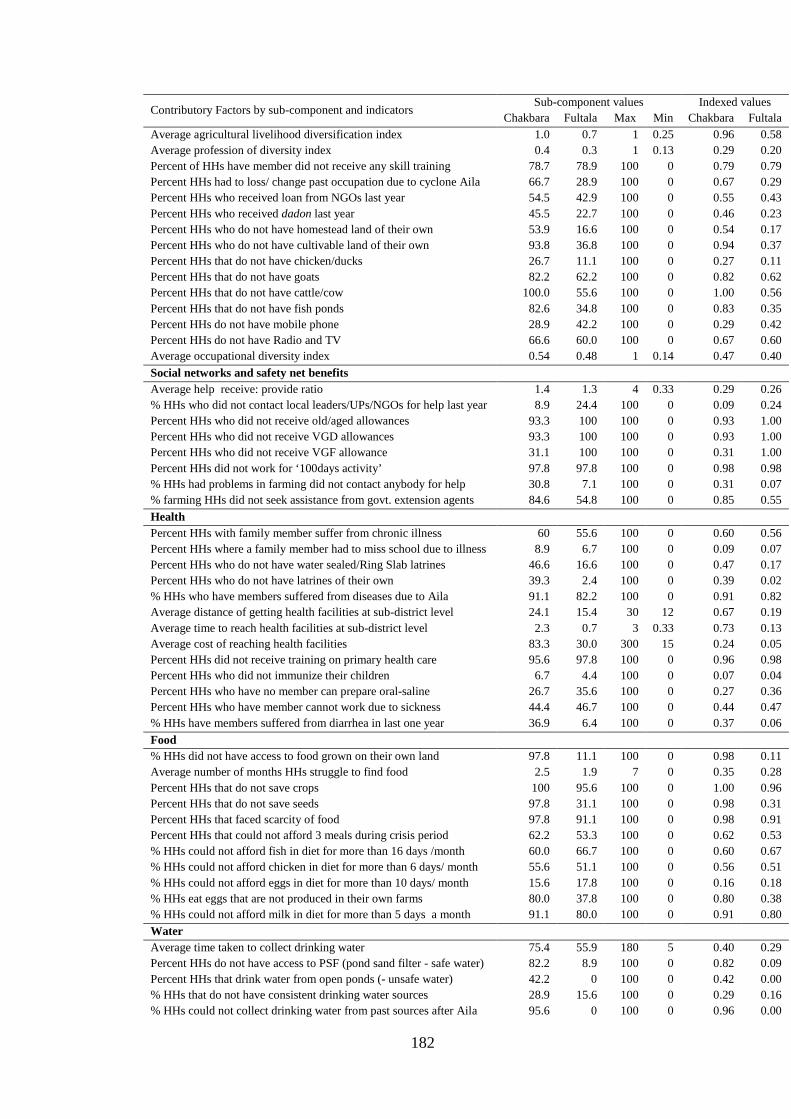
182
Contributory Factors by sub-component and indicators Sub-component values Indexed values
Chakbara Fultala Max Min Chakbara Fultala Average agricultural livelihood diversification index 1.0 0.7 1 0.25 0.96 0.58 Average profession of diversity index 0.4 0.3 1 0.13 0.29 0.20 Percent of HHs have member did not receive any skill training 78.7 78.9 100 0 0.79 0.79 Percent HHs had to loss/ change past occupation due to cyclone Aila 66.7 28.9 100 0 0.67 0.29 Percent HHs who received loan from NGOs last year 54.5 42.9 100 0 0.55 0.43 Percent HHs who received dadon last year 45.5 22.7 100 0 0.46 0.23 Percent HHs who do not have homestead land of their own 53.9 16.6 100 0 0.54 0.17 Percent HHs who do not have cultivable land of their own 93.8 36.8 100 0 0.94 0.37 Percent HHs that do not have chicken/ducks 26.7 11.1 100 0 0.27 0.11 Percent HHs that do not have goats 82.2 62.2 100 0 0.82 0.62 Percent HHs that do not have cattle/cow 100.0 55.6 100 0 1.00 0.56 Percent HHs that do not have fish ponds 82.6 34.8 100 0 0.83 0.35 Percent HHs do not have mobile phone 28.9 42.2 100 0 0.29 0.42 Percent HHs do not have Radio and TV 66.6 60.0 100 0 0.67 0.60 Average occupational diversity index 0.54 0.48 1 0.14 0.47 0.40 Social networks and safety net benefits
Average help receive: provide ratio 1.4 1.3 4 0.33 0.29 0.26 % HHs who did not contact local leaders/UPs/NGOs for help last year 8.9 24.4 100 0 0.09 0.24 Percent HHs who did not receive old/aged allowances 93.3 100 100 0 0.93 1.00 Percent HHs who did not receive VGD allowances 93.3 100 100 0 0.93 1.00 Percent HHs who did not receive VGF allowance 31.1 100 100 0 0.31 1.00 Percent HHs did not work for ‘100days activity’ 97.8 97.8 100 0 0.98 0.98 % HHs had problems in farming did not contact anybody for help 30.8 7.1 100 0 0.31 0.07 % farming HHs did not seek assistance from govt. extension agents 84.6 54.8 100 0 0.85 0.55 Health
Percent HHs with family member suffer from chronic illness 60 55.6 100 0 0.60 0.56 Percent HHs where a family member had to miss school due to illness 8.9 6.7 100 0 0.09 0.07 Percent HHs who do not have water sealed/Ring Slab latrines 46.6 16.6 100 0 0.47 0.17 Percent HHs who do not have latrines of their own 39.3 2.4 100 0 0.39 0.02 % HHs who have members suffered from diseases due to Aila 91.1 82.2 100 0 0.91 0.82 Average distance of getting health facilities at sub-district level 24.1 15.4 30 12 0.67 0.19 Average time to reach health facilities at sub-district level 2.3 0.7 3 0.33 0.73 0.13 Average cost of reaching health facilities 83.3 30.0 300 15 0.24 0.05 Percent HHs did not receive training on primary health care 95.6 97.8 100 0 0.96 0.98 Percent HHs who did not immunize their children 6.7 4.4 100 0 0.07 0.04 Percent HHs who have no member can prepare oral-saline 26.7 35.6 100 0 0.27 0.36 Percent HHs who have member cannot work due to sickness 44.4 46.7 100 0 0.44 0.47 % HHs have members suffered from diarrhea in last one year 36.9 6.4 100 0 0.37 0.06 Food
% HHs did not have access to food grown on their own land 97.8 11.1 100 0 0.98 0.11 Average number of months HHs struggle to find food 2.5 1.9 7 0 0.35 0.28 Percent HHs that do not save crops 100 95.6 100 0 1.00 0.96 Percent HHs that do not save seeds 97.8 31.1 100 0 0.98 0.31 Percent HHs that faced scarcity of food 97.8 91.1 100 0 0.98 0.91 Percent HHs that could not afford 3 meals during crisis period 62.2 53.3 100 0 0.62 0.53 % HHs could not afford fish in diet for more than 16 days /month 60.0 66.7 100 0 0.60 0.67 % HHs could not afford chicken in diet for more than 6 days/ month 55.6 51.1 100 0 0.56 0.51 % HHs could not afford eggs in diet for more than 10 days/ month 15.6 17.8 100 0 0.16 0.18 % HHs eat eggs that are not produced in their own farms 80.0 37.8 100 0 0.80 0.38 % HHs could not afford milk in diet for more than 5 days a month 91.1 80.0 100 0 0.91 0.80 Water
Average time taken to collect drinking water 75.4 55.9 180 5 0.40 0.29 Percent HHs do not have access to PSF (pond sand filter - safe water) 82.2 8.9 100 0 0.82 0.09 Percent HHs that drink water from open ponds (- unsafe water) 42.2 0 100 0 0.42 0.00 % HHs that do not have consistent drinking water sources 28.9 15.6 100 0 0.29 0.16 % HHs could not collect drinking water from past sources after Aila 95.6 0 100 0 0.96 0.00

183
Contributory Factors by sub-component and indicators Sub-component values Indexed values
Chakbara Fultala Max Min Chakbara Fultala Percent HHs do not have access to safe cooking water 86.7 46.6 100 0 0.87 0.47 Average time taken to collect cooking water 72.8 29.4 180 0 0.40 0.15 Natural disasters and climate variability
Average number of disaster events in the past 6 years 0.9 0.4 3 0 0.30 0.12 Percent HHs who did not receive early warning signal on cyclone Sidr 2.8 20.6 100 0 0.03 0.21 Percent HHs who did not receive warning messages on cyclone Aila 1.7 42.5 100 0 0.02 0.43 Percent HHs who had to leave their house due to cyclone Aila 88.9 22.2 100 0 0.89 0.22 Percent HHs who had their homes inundated in last cyclone Aila 100 13.3 100 0 1.00 0.13 Percent HHs who had their fish ponds inundated in last cyclone Aila 100 53 100 0 1.00 0.53 Average months homesteads remained inundated by saline water 13 0.72 18 0.03 0.72 0.04 Percent HHs that had lost previous occupation due to cyclone Aila 66.7 28.9 100 0 0.67 0.29 % HHs who could not re-start vegetable farming after 1 year of Aila 82.1 2.6 100 0 0.82 0.03 Average diversity of damaged assets index during cyclone Aila 8.4 1.9 14 0 0.60 0.14 Average diversity of damaged assets index after cyclone Aila 8.2 4.4 14 0 0.59 0.31 Percentage of HHs with disable or died due to Aila 2.2 0 100 0 0.02 0.00 Average diversity of conflict index due to Aila 0.11 0 1 0 0.11 0.00 % HHs who did not store drinking water after getting cyclone signal 51.10 82.2 100 0 0.51 0.82 % HHs have members did not receive training in disaster management 86.70 93.3 100 0 0.87 0.93 Mean standard deviation of monthly average of average maximum daily temperature (years: 1950–2010) 3.19 3.19 5.04 2.38 0.31 0.31 Mean standard deviation of monthly average of average minimum daily temperature (years: 1950–2010) 5.37 5.37 6.12 4.33 0.58 0.58 Mean standard deviation of monthly av. precipitation (years:1950–2010) 4.82 4.82 7.34 0.18 0.65 0.65
Livelihood strategies
With regard to livelihood assets and strategies, twenty relevant indicators were used
in the analysis (a detailed description of indicators is presented in Table 7.3 and
Table 1 in Appendix 1).Among the twenty indicators, nine relate to livelihood assets
such as households possessing land (homesteads and crop land) of their own, and
owning chickens, ducks, goats, cattle, fish ponds, cell phones, radio /TV and fishing
gears.
Looking first at land holdings, households of Fultala were better off than Chakbara.
Only 17% of Fultala households did not have their own land compared with 54% of
Chakbara households (Table 7.3). Likewise, fewer Chakbara households (6%) had
their own cropland Fultala households (63%). Land ownership is particularly
important in determining a household’s adaptive capacity in that it is not simply a
means to earn a living through farming but also a fungible asset that can be bought,
sold and leased, used as collateral, and underpin social status and influence. The fact
that more people in Chakbara than Fultala have no homestead and crop land of their
own makes them less able to respond to physical and human-induced hazards and
184
shocks. Chakbara’s adaptive capacity is also weakened by its poorer performance
with regard to ownership of chicken, ducks, goats and cattle (Table 7.3).
Fish ponds are another important asset in the coastal zone as pond aquaculture
provides financial and nutritional benefits. In this regard, 83% of Chakbara
households reported they do not have fish ponds compared with 35% in Fultala. In
the case of fishing gear, Chakbara households have slightly greater access (80%)
than Fultala (71%). Chakbara households with fishing gear were more reliant on it as
the majority (64%) fish commercially the year round while over 95% of Fultala
households said they used their ponds for family consumption rather than as a main
source of livelihood. Chakbara are under greater pressure in this regard as there is
evidence of overfishing in the SRF area, upon which thousands of landless poor
depend.
To a greater extent than pond aquaculture, open capture fisheries respond positively
to increased rainfall, flooding, and water flows as they facilitate fish migration and
spawning, larval dispersal and enhance habitat quality and quantity. Current
projections on climate change suggest there could be benefits for local fishers in the
event of increased rainfall. However, such a possibility to result in positive gains for
fishers would require effective policy, management and institutional arrangements
around capture fisheries, something that has often been lacking in the past. It points
to the importance of integrating climate change into improved development planning
at all scalar levels.
People’s lives have improved through the increasing availability of mobile phones
and radio/ TV, especially those living in remote communities. Benefits include better
information and awareness of disaster early warning signals and messages. In this
regard, some 71% of Chakbara households own cell phones compared with 58% in
Fultala. Ownership of radio/ TV does not vary widely between the two villages,
although Fultala has relatively better access to such media assets. It should be added
that access to mobile phones play a central role in cross-village and town
communication and in keeping families in contact with each other in the wider social
sense.
Eleven indicators under this sub-component related to “livelihood functions” which
in conjunction with “livelihood assets”, as discussed above, determine the indexed
185
values for the sub-component of livelihood functions. The relevant key indicators are
households with out-migrating income earners, the degree of dependency on
agriculture for income, the agricultural livelihood diversity index24, skills training,
occupational changes arising out of physical hazards such as cyclones, and ability to
begin vegetable cultivation after a cyclone or other hazard. In the case of the two
villages, more Fultala households (53.3%) reported that members of their households
migrated out to other areas for work than Chakbara (37.8%). Householders
considered that such work was important to sustaining livelihoods when local
opportunities were limited. Fultala residents showed a greater capacity to engage in
diverse income earning opportunities. During lean periods on the land, people from
poor households migrate to other districts to work as brick kiln workers, agricultural
labourers, rickshaw pullers, construction workers and the like. However, there is
debate about the extent to which out-migration in search of work can be considered a
positive adaptive strategy (Barnett and Webber 2010; Farbotko and Lazrus 2012;
Kothari 2013; Tacoli 2009). In so far as out-migrants are able to earn a living
through diversification of their livelihoods and bring back money and skills to the
village, such migration is considered by many local people as of positive value.
However, much depends on how long people stay away, how successful they are in
obtaining jobs, and the extent to which village duties are ignored in the meantime.
Out-migration can contribute to the transmission of HIV-AIDS (Hahn et al., 2009).
While Fultala appears to be less exposed to hazards than Chakbara, a small
percentage (10%) of farming households depended on rice farming for a livelihood.
Potentially this can increase their vulnerability as rice cultivation is highly
susceptible to weather impacts as well as cyclical variations in rainfall and other
weather-related parameters. However, the bulk of Fultala rice farmers reported they
relied on multiple livelihood options, which can be seen as a means of spreading
their risks and so enhancing their resilience, given their more limited land asset base.
Besides, medium and large farmers reported to have better financial resource base
than small farmers that help them cope with crop failure due to weather
perturbations.
24 Calculated as: 1/(Number of agricultural livelihoods) for each household with an average calculated for each village

186
Skill training can enhance the capability of households to improve their livelihood
outcomes. Both villages are similar in the levels of skills training they have received.
Another indicator under this sub-component was consistency in performing the same
occupation or an uninterrupted means of livelihood, which can potentially enhance
adaptive capacity. Data were collected on how many households were able to
continue their previous occupation even after the disruptions caused by cyclone Aila.
67% of Chakbara households had to discontinue their previous livelihood strategies
compared with 29% in Fultala. Therefore, in this respect, Fultala households were
considered to have a higher adaptive capacity than Chakbara. Part of this higher
adaptive capacity arises out of the lower sensitivity of Fultala households to hazards
like cyclones and storm surges.
Another means by which households sustain their livelihoods is through official and
informal credit systems that operate across Bangladesh. Access to loans is stratified
in that the official lending agencies such as banks prefer to lend to asset rich
households, which discriminates against the poor and landless. These latter are often
forced to rely more on loans from NGOs and through the use of credit advances or
dadon from local money lenders called mohajans. Credit provision is a subject of
considerable academic and policy debate as there is a question of whether it simply
helps people to survive rather than to improve their economic situation and make
them more resilient within the existing political economic framework (Hammill et
al., 2008).
There is evidence to support the notion that access to financial capital as and when
required in the form of micro-credit often has positive effects on the livelihoods of
poor households as it assists families to cope with a crisis and reduced the pressure to
sell assets or land. For example, national NGOs such as BRAC, Shushilon, Leaders,
Borsha, and Gonomukhi provide loans with a 25-27% service charge (compounded
rate), which gives the borrower a flexibility to use the loan in making livelihood
decisions, provided that installments are regularly paid back. NGOs also support
borrowers through provision of seeds, disaster relief, health, sanitation and family
planning services and advice about ways to link to government development
projects. However, households that rely on micro-credit or other forms of loan or
dadon indicate their weak asset base and poor economic condition. Thus villages
187
with more households dependent on loans or dadons can be said to have weaker
adaptive capacity to deal with weather and non-weather related hazards and shocks.
NGO conditions regarding interest rates and services charges are generally better
than those provided by local mohajons. The dadon system, though useful for poor
fishers or other resource users without access to NGO micro-credit or other forms of
loans, makes them subject to less flexibility and harsher conditions. Usually, a fisher
takes dadon twice a month for six months of a year under some terms and conditions
that are locally set by the mohajons. The conditions include an interest rate
calculated at 10% per week (for example, if someone borrows Tk. 5,000 (US $
64.10), he/she pays Tk. 500 (US $ 6.41) interest per week plus the capital); dadon
receiving fishers must sell their catch to their respective mohajons; and mohajons
pay less for the fish compared to the prevailing market price. For example, fishers
usually receive anywhere from 5 to 15% less than market prices. A fisher who
catches 280 kg fish per month and who has a dadon loan at 5% interest, loses Tk.
8,400 (US $ 107.69) over a six month period. A final condition is that some
mohajons collect tolaor free fish from the catch, which is around 2 kg of fish from a
fisher per week. This way, a dadon-receiving fisher has to pay around 500% interest
per year plus capital as opposed to only 27% interest on NGO micro-credits.
Mohajons often play a wider patronage role than NGOs by assisting borrowers who
need quick support to meet health costs, lack of food, marriage of daughters (almost
equally for Hindus and Muslims), disaster loss and other social needs. However, this
practice widens the scope of the mohajon’s control over local people, extending into
many areas of the borrower’s social as well as economic life. Thus, compared with
households that are not dependent on such loans, dadon receiving households have a
weaker adaptive capacity to adapt to shocks over the longer term.
When local respondents were asked to compare NGO loans with “mohajany dadon”,
they regarded NGO loans as softer in some regards than dadon payments but that the
rigid weekly installment rules were often difficult to comply with. With dadon,
payment schedules were somewhat more negotiable and could take the form of
payments in kind. However, local respondents considered that they paid back more
than with an NGO loan. Fishers found themselves between the devil and the deep
blue sea as without loans from which ever source, they were unable to organize a 7-
day or 15-day long fishing trip to the SRF and lower estuary. Formal financial
188
institutions such as banks did not provide loans to poor people without collateral,
which increased their dependence on mohajons. NGOs were less willing to take
risks as they were aware that fishing was becoming riskier through fear of theft,
deaths from cyclones and other dangers that made it difficult for fishers to pay back
regularly if at all.
Summarising the relationship between livelihood strategies and adaptive capacity, it
can be concluded that Chakbara households had a lower adaptive capacity (0.569)
than those of Fultala (0.393), making them more vulnerable to the impacts of
hazards. However, within each village, some households were in a better position
than others to deal with any shocks or stresses.
Social network and access to safety nets
Strong social networking and rapport building capacity of households with
neighbours and various public and private institutions can potentially increase the
adaptive capacity of households to absorb shocks from hazards. Households with
strong social networking capacity allows them to get support from friends and
families and increases their access to government safety net programmes, which are
locally administered by the UPs. The two villages differed in terms of the importance
of these social networking capacities. For example, Chakbara households reported
receiving more in kind support from friends and family than from other sources
compared to Fultala with a receive : provide ratio25 of 0.29 compared with 0.26 for
Fultala. With regard to contacts with local government for assistance, 8.9% and
24.4% of households from Chakbara and Fultala respectively said they had not
contacted the UPs in 2010-2011 for assistance. In the case of the extent of receipt of
government safety net support programmes such as old age allowances, VGD
allowances and VGF allowances, no Fultala households received any benefits in
2010-11 compared with 68% of Chakbara households that had received VGF support
from the UP.
25 Receive: provide ratio is calculated for each household as follows: (number of instances of assistance received +1)/(number of instances of assistance provided +1) with an average ratio is calculated

189
Interpreting these findings presents certain difficulties due to the nature of the
political process in Bangladesh, which often lacks transparency, particularly at the
local level. Under a properly functioning governance system, eligible households
would normally receive various kinds of support from the UPs. However, in the
absence of good governance with a weak and unorganized constituency with poor
capacity to claim rights and entitlements, there existed spaces for misappropriation of
state benefits by local politicians for their own use or for the political allies of the UP
Chairmen and members. At the time of the research in the year following cyclone
Aila, some local people suggested that the greater support to Chakbara was a product
of local political affiliations and the public visibility of the plight of Chakbara and
other villages in Gabura union after cyclone Aila. The area had regular visits by
senior government officials, NGOs, donor representatives and media personnel.
Under such circumstances local government representatives (the UP Chairman and
members) were keen to be seen to provide Chakbara residents with their rights and
entitlements. In addition, the sheer magnitude of the disaster made affected people
desperate, and they demanded local government assistance. Whatever the precise
determinants of the distribution of state benefits were at that time, Chakbara
benefitted more than Fultala and government was seen to be responding to local
needs in a proper manner. However, the increase in support to Chakbara by the UP
immediately after the cyclone does not reflect the situation in normal times. Outside
such emergencies, poor people receive little social safety net supports without
bribing or being favoured by allies of the UP Chairman and other local members. In
other words, official assistance is irregular and provides only short term coping
support to Chakbara and other communities. Long-term social and other support,
necessary to assist communities to plan longer term remain scarce or non-existent.
Another aspect of the social network sub-component is the extent to which
households maintain contacts with local government bodies, field level government
agriculture and fisheries extension agents and others in order to lay the groundwork
for assistance when needed. It was found that 31% and 8% of rice farmers in
Chakbara and Fultala respectively did not regularly use such channels when faced
with the need for assistance with their rice crops. When they did seek such help they
went to experienced farmers in the village, agriculture extension agents and fertilizer
dealers. In order of preference, most farmers contacted the local experienced farmers
190
for advice (54% in Chakbara; 50% in Fultala), followed by government agriculture
extension agents (15% in Chakbara; 45% in Fultala) and then to local fertilizer
dealers (8% in Chakbara; 26% in Fultala).
Making contacts and seeking assistance, guidance and technical support has the
potential to improve local livelihoods, farm production functions and social support
networks, which in turn help to increase the capacity to absorb shocks. Often in
remote villages, progressive farmers tend to enhance their farm productivity and
maintain contacts with the local extension agents and seek assistance to solve
problems, enquire about improved seeds, pest management and so forth to improve
farm productivity.
In the overall social networks component, the Chakbara communities (aggregated
indexed value of 0.587) demonstrated slightly higher adaptive capacity compared to
Fultala (indexed value of 0.638). This was mainly due to increased access to safety
net benefits by the Chakbara households compared to that of the Fultala households.
Villagers making contacts with local government officials for assistance was
considered the indicator of social networks and in this sense more households in
Chakbara made such contacts than Fultala. However, Chakbara households were less
able to access technical support through local social networks connecting them to
government services. In contrast, Fultala households used social networks to contact
relevant government officials for technical assistance in farming related problems.
This suggests that in examining adaptive capacity it is insufficient to use crude
measures of social networking such as number of contacts with local government for
services. The type and purpose of such contacts need to be taken into account. Thus,
it can be argued that the Fultala households were likely to benefit more in the longer
term through technical assistance in farming practices than Chakbara households
who relied on government services for short term assistance to cope with
emergencies.
Overall LVI of the villages
Table 7.4 shows that the overall LVI indexed value of major component for
Chakbara is higher (0.528) than that of Fultala (0.356), which indicates that
Chakbara has a relatively greater vulnerability to weather and weather-related
impacts than Fultala (the higher the LVI indexed value, greater the vulnerability or

191
lower the adaptive capacity). The values for all LVI major components are also
presented collectively in a spider diagram (Figure 7.1). The scale of the diagram
ranges from a minimum of 0 (which means least vulnerable) to a maximum of 0.8
(which indicates most vulnerable).
Table 7.4: Indexed major component LVI for Chakbara and Fultala villages (source:
90 households surveyed in 2012)
Major–sub comments Chakbara Fultala Remarks Socio-demographic profile 0.285 0.227 Adaptive capacity Livelihood strategies 0.597 0.392 Adaptive capacity Social networks and access to safety net 0.587 0.638 Adaptive capacity Food 0.731 0.510 Sensitivity Health 0.478 0.301 Sensitivity Water 0.594 0.165 Sensitivity Natural disaster and climate change impacts 0.538
0.318 Exposure
Overall LVI 0.544 0.365
Figure 7.1 shows that both communities were vulnerable to food security issues with
Chakbara more vulnerable. Thus, Chakbara households struggled to ensure a regular
supply of food for an average of 11.8 months a year compared with 4.2 months for
Fultala. Apart from fish, the intake of other protein-rich food such as chicken, eggs
and milk were less available in the diets of the households of Chakbara than in
Fultala (Table 7.3). The higher fish intake in Chakbara was due to the community’s
higher involvement in commercial fishing and their greater ease of access to diverse
fishing places on rivers, canals, water bodies and SRF close to the village. In Fultala,
the nearest fishing grounds had been appropriated for other uses such as rice farming,
construction and private leasing to others. This meant Fultala inhabitants were able to
fish only seasonally in beels and canals for a limited time. However, as Fultala
households were generally better off than those in Chakbara, there is some evidence
to suggest they were able to purchase fish more often than Chakbara.
With regard to water security, Chakbara was nearly four times more sensitive to
weather/ climate induced impacts compared with Fultala, due largely to the absence
of fresh water for drinking. In the case of access to health care, distance, cost and
time to reach health facilities were a greater problem for Chakbara than Fultala. With
regard to livelihood strategy, Fultala households had more land and livestock
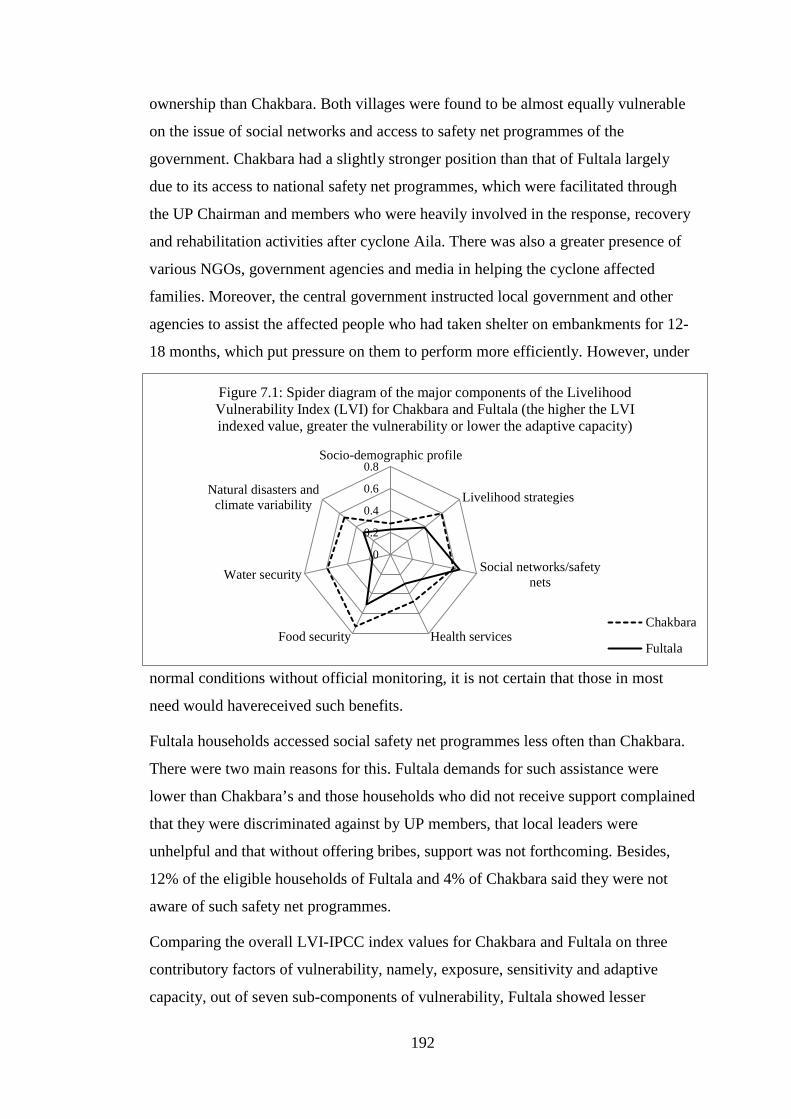
192
ownership than Chakbara. Both villages were found to be almost equally vulnerable
on the issue of social networks and access to safety net programmes of the
government. Chakbara had a slightly stronger position than that of Fultala largely
due to its access to national safety net programmes, which were facilitated through
the UP Chairman and members who were heavily involved in the response, recovery
and rehabilitation activities after cyclone Aila. There was also a greater presence of
various NGOs, government agencies and media in helping the cyclone affected
families. Moreover, the central government instructed local government and other
agencies to assist the affected people who had taken shelter on embankments for 12-
18 months, which put pressure on them to perform more efficiently. However, under
normal conditions without official monitoring, it is not certain that those in most
need would havereceived such benefits.
Fultala households accessed social safety net programmes less often than Chakbara.
There were two main reasons for this. Fultala demands for such assistance were
lower than Chakbara’s and those households who did not receive support complained
that they were discriminated against by UP members, that local leaders were
unhelpful and that without offering bribes, support was not forthcoming. Besides,
12% of the eligible households of Fultala and 4% of Chakbara said they were not
aware of such safety net programmes.
Comparing the overall LVI-IPCC index values for Chakbara and Fultala on three
contributory factors of vulnerability, namely, exposure, sensitivity and adaptive
capacity, out of seven sub-components of vulnerability, Fultala showed lesser
0
0.2
0.4
0.6
0.8Socio-demographic profile
Livelihood strategies
Social networks/safetynets
Health servicesFood security
Water security
Natural disasters andclimate variability
Figure 7.1: Spider diagram of the major components of the Livelihood Vulnerability Index (LVI) for Chakbara and Fultala (the higher the LVI indexed value, greater the vulnerability or lower the adaptive capacity)
Chakbara
Fultala
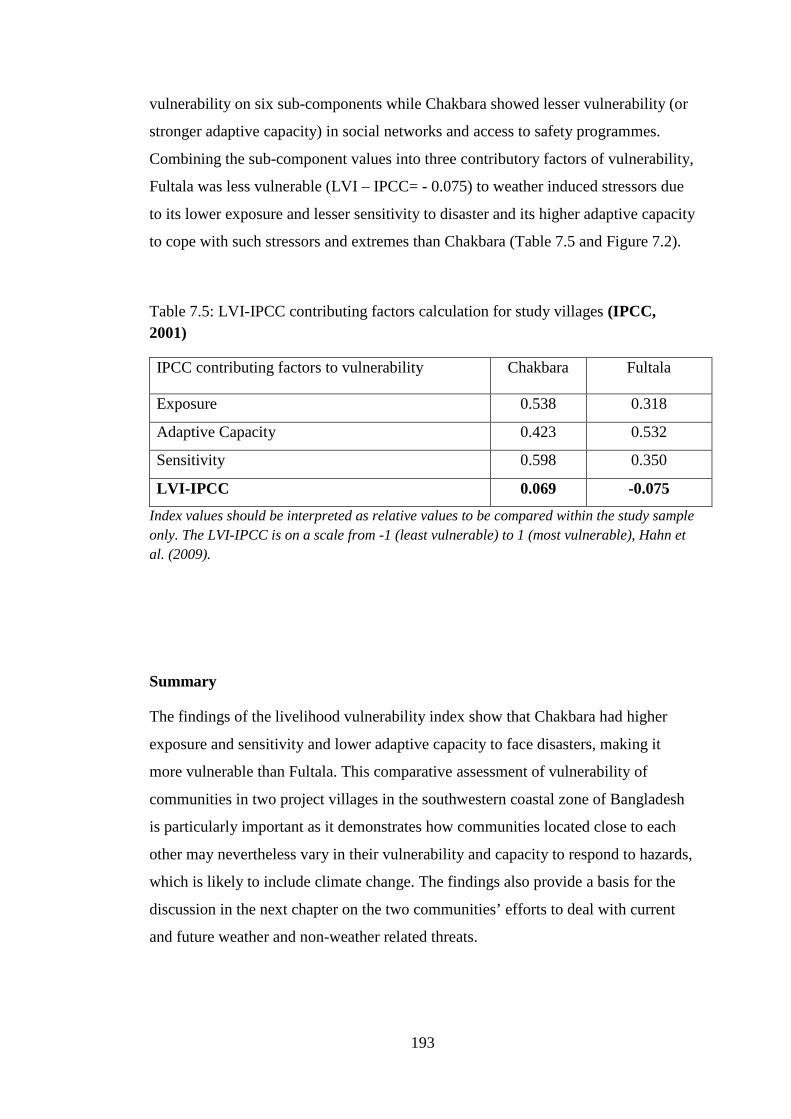
193
vulnerability on six sub-components while Chakbara showed lesser vulnerability (or
stronger adaptive capacity) in social networks and access to safety programmes.
Combining the sub-component values into three contributory factors of vulnerability,
Fultala was less vulnerable (LVI – IPCC= - 0.075) to weather induced stressors due
to its lower exposure and lesser sensitivity to disaster and its higher adaptive capacity
to cope with such stressors and extremes than Chakbara (Table 7.5 and Figure 7.2).
Table 7.5: LVI-IPCC contributing factors calculation for study villages (IPCC, 2001)
IPCC contributing factors to vulnerability Chakbara Fultala
Exposure 0.538 0.318
Adaptive Capacity 0.423 0.532
Sensitivity 0.598 0.350
LVI-IPCC 0.069 -0.075
Index values should be interpreted as relative values to be compared within the study sample only. The LVI-IPCC is on a scale from -1 (least vulnerable) to 1 (most vulnerable), Hahn et al. (2009).
Summary
The findings of the livelihood vulnerability index show that Chakbara had higher
exposure and sensitivity and lower adaptive capacity to face disasters, making it
more vulnerable than Fultala. This comparative assessment of vulnerability of
communities in two project villages in the southwestern coastal zone of Bangladesh
is particularly important as it demonstrates how communities located close to each
other may nevertheless vary in their vulnerability and capacity to respond to hazards,
which is likely to include climate change. The findings also provide a basis for the
discussion in the next chapter on the two communities’ efforts to deal with current
and future weather and non-weather related threats.
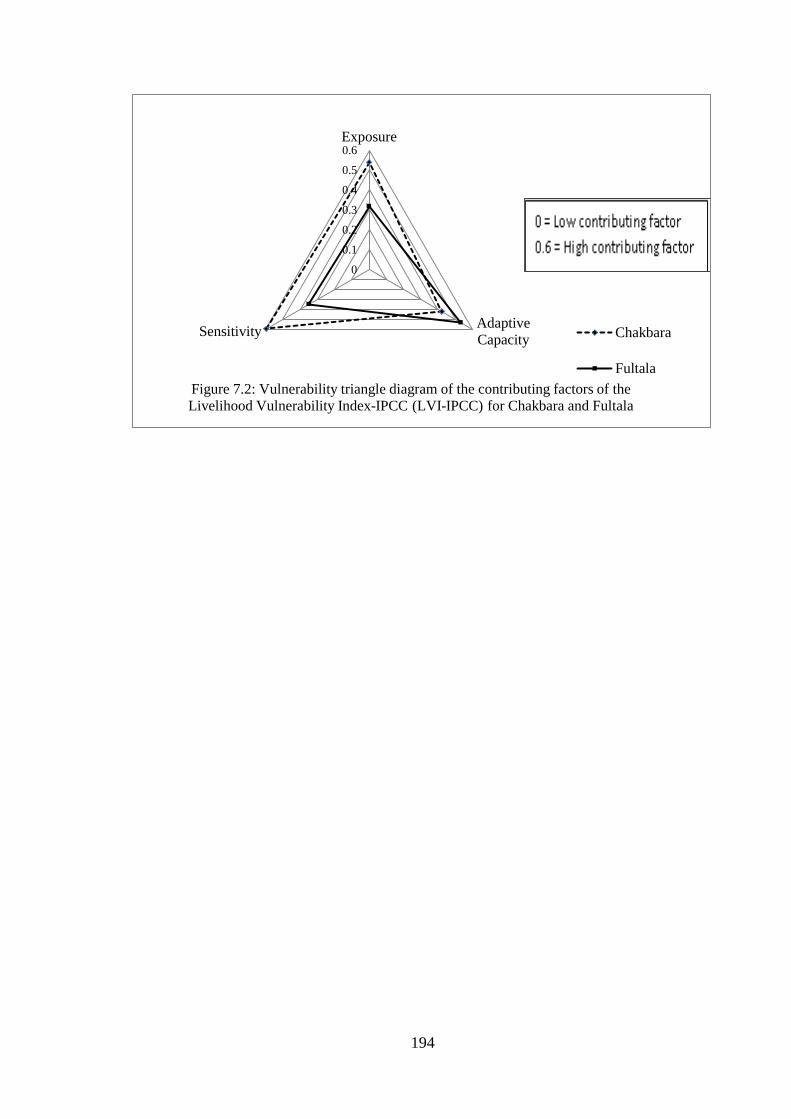
194
0
0.1
0.2
0.3
0.4
0.5
0.6Exposure
AdaptiveCapacitySensitivity
Figure 7.2: Vulnerability triangle diagram of the contributing factors of the Livelihood Vulnerability Index-IPCC (LVI-IPCC) for Chakbara and Fultala
Chakbara
Fultala

195
Chapter 8: Adapting to Weather-induced Local
Environmental Changes
Introduction
This chapter has several objectives. First, it examines the initiatives taken by the
inhabitants of Chakbara and Fultala villages (including case studies in two adjacent
villages) to adjust to local environmental changes due to weather-related causes. It
discusses the efforts made by the local communities, both with and without outside
assistance, to adjust to local changes in fishing, aquaculture, water services,
agriculture and coastal erosion connected with changing weather patterns. Second, it
examines local government annual development schemes for the financial year -
2010-2011 and discusses their relevance to weather and weather-related hazards
within the wider context of climate change concerns. Third, it analyses the activities
of mainstreaming fisheries and agriculture extension agencies in the two unions over
the past five years to determine to what extent there is any link between the
government’s development efforts and climate change adaptation initiatives. Fourth,
an analysis is provided of several local adaptation initiativestaken in the villages.
This analysis draws on the frameworks of community-based adaptation (CBA) and
ecosystem based adaptation (EbA) and seeks to incorporate the ‘resilience to
transformation’adaptation framework developed by Pelling (2011) and the’
incremental to transformative’ framework developed by Kates et al. (2012).
Relevant data were collected through FGD, KII and KAP survey with local
communities, local government representatives, NGO staff and local public agency
officials.
Community efforts to adapt to weather-related threats
Traditionally, the people of the two villages have considered cyclones, storm surges,
salinity and coastal flooding as natural occurrences governed by super-natural forces.
They have responded to such occurrences using a range of measures designed to deal
with particular events such as a cyclone and their longer term consequences. What is
meant here is that local people have operated within a cognitive framework of certain

196
uncertainties so that they know with variable degrees of certainty from year to year
when cyclones or flooding will occur, and develop measures to deal with them. Not
only did they respond to such events, in the past they learned from them, which
allowed them to improve their responses over time. In other words, adaptation was
built into their collective habitus. It should also be noted that their capacity to deal
with naturally occurring events and changes was mediated by the nature of the
society and culture in which they lived, which shaped how, when and why they acted
in the ways they did. . However, it is argued that climate change presents such
communities with new and complex adaptation challenges, which go beyond what
they have previously experienced.
In previous chapters it was shown that in recent years local people in the two study
villages have noticed changes in weather patterns, with uncertainties about what
these changes mean and how they should be responded to them. People have begun
to take their own actions, sometimes assisted by government agencies and NGOs, to
adjust to these changes in weather. Table 8.1 summarises ten community level
adaptation actions taken in response to what people regard as the main weather-
related stressors affecting them. It can be seen from table 8.1 that the weather-
induced changes to which they responded were not entirely new. Rather, they were
an intensification of previously experienced weather patterns combined with greater
irregularity in their occurrence. One consequence of this was that villagers often
drew upon traditional coping strategies rather than making innovative changes.
Household water security: Renovation of cyclone affected ponds
As a result of cyclone Aila, all Chakbara ponds were inundated with saline water and
became unfit for household purposes or for fish/shrimp farming. The western part of
Fultala was also inundated and affected 85 households. I collected data from
households in two study villages and cross checked the data with concerned NGOs
and neighbouring households. The response of 31 Chakbara households was to
renovate their ponds, relying largely on their own resources without any financial
support from outside. The exception was one household, which received BDT 6,250
(US $ 80.13) from an NGO named NG Foundation. The main method used was to
make the ponds over three feet deeper by removing bottom soil and to raise pond
dykes by 2 feet at an average cost of BDT 7,676 (US $ 98.41) per pond. One khas

197
pond was renovated exclusively for drinking water in Chakbara with support from a
large national NGO (BRAC) at a cost of BDT 60,000 (US $ 769.23).
I collected data from two study villagers regarding various adaptation measures they
had undertaken in response cyclones and salinity issues. In Fultala, 54 households
renovated their ponds after the cyclone. Some re-excavated pond bottoms by
deepening ponds by 0.61-2.13m (average 1.07m) while some dewatered the ponds
and sun dried them to free them from contamination with cyclone-borne saline water.
They also raised pond dykes by an average of 0.46m. Out of the 53 households who
renovated, 21 received financial support of from BDT 18,000 (US $ 230.78) to BDT
41,000 (US $ 525.64), depending on the size of ponds, from two NGOs, BRAC-20
and Leaders-1. BRAC, in its disaster rehabilitation package, included the cost of fish
fingerlings and fish feed to re-start aquaculture operations as part of the cyclone
recovery programme. The 32 households that did not receive such assistance spent
an average of BDT 7,658 (US $ 98.18) from their own resources to renovate the
affected ponds. Altogether of the 85 households with contaminated ponds, 53 (62%)
were renovated/re-excavated and 32 were unable to renovate. The main cause of the
contamination was cyclone borne saline water runoff and debris, which affected
freshwater supplies, cooking and other household uses, including fish culture.
Adjustment to gher inundation resulting from cyclones and coastal flooding
From 2007 to 2012, shrimp farmers were affected by coastal flooding and inundation
caused by cyclones, storm surges and intense heavy rainfall. FGD with Chakbara
shrimp farmers revealed that in 2011 almost every shrimp farmer had to repair their
gher dykes at their own cost. The farmers called for a raising of the protective
embankment around the whole union as they argued that simply raising dykes would
be ineffective in the face of another intense cyclone. Such a task was beyond them
and they expected government assistance to accomplish this task. This illustrates that
farmers were thinking ahead, rather than simply responding to a single cyclone, a
combination of autonomous and proto-planned adaptation.
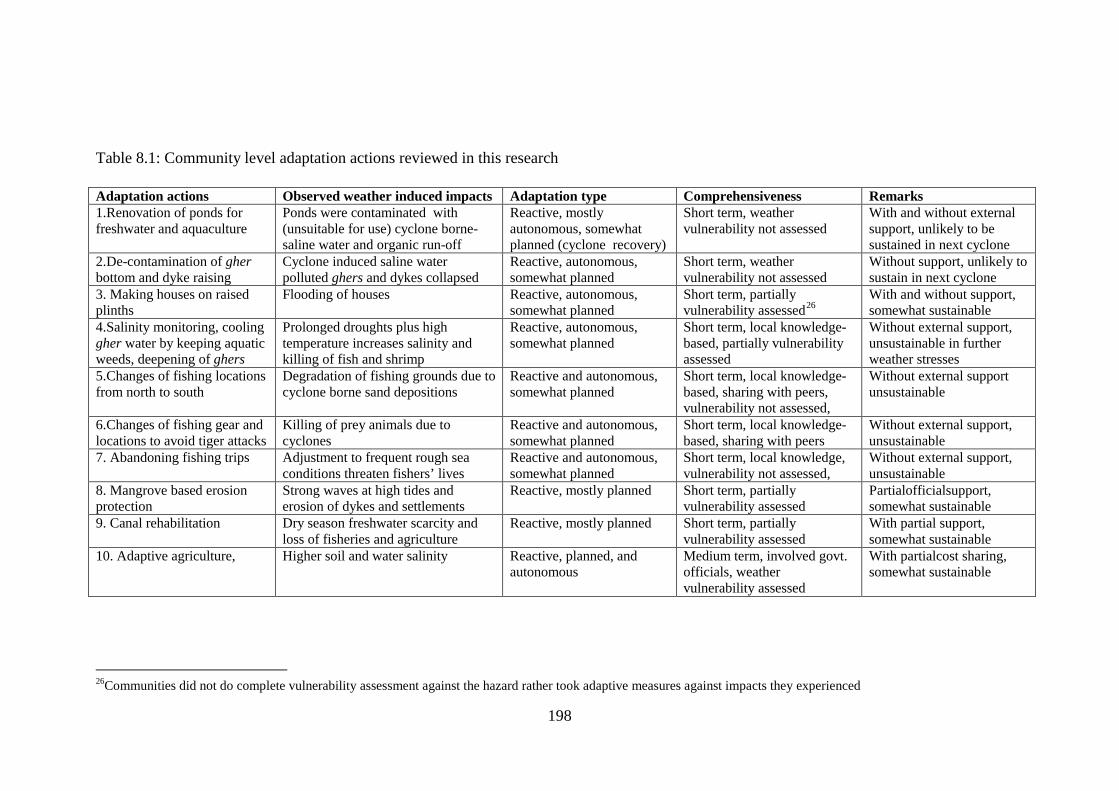
198
Table 8.1: Community level adaptation actions reviewed in this research Adaptation actions Observed weather induced impacts Adaptation type Comprehensiveness Remarks 1.Renovation of ponds for freshwater and aquaculture
Ponds were contaminated with (unsuitable for use) cyclone borne-saline water and organic run-off
Reactive, mostly autonomous, somewhat planned (cyclone recovery)
Short term, weather vulnerability not assessed
With and without external support, unlikely to be sustained in next cyclone
2.De-contamination of gher bottom and dyke raising
Cyclone induced saline water polluted ghers and dykes collapsed
Reactive, autonomous, somewhat planned
Short term, weather vulnerability not assessed
Without support, unlikely to sustain in next cyclone
3. Making houses on raised plinths
Flooding of houses Reactive, autonomous, somewhat planned
Short term, partially vulnerability assessed26
With and without support, somewhat sustainable
4.Salinity monitoring, cooling gher water by keeping aquatic weeds, deepening of ghers
Prolonged droughts plus high temperature increases salinity and killing of fish and shrimp
Reactive, autonomous, somewhat planned
Short term, local knowledge-based, partially vulnerability assessed
Without external support, unsustainable in further weather stresses
5.Changes of fishing locations from north to south
Degradation of fishing grounds due to cyclone borne sand depositions
Reactive and autonomous, somewhat planned
Short term, local knowledge-based, sharing with peers, vulnerability not assessed,
Without external support unsustainable
6.Changes of fishing gear and locations to avoid tiger attacks
Killing of prey animals due to cyclones
Reactive and autonomous, somewhat planned
Short term, local knowledge-based, sharing with peers
Without external support, unsustainable
7. Abandoning fishing trips Adjustment to frequent rough sea conditions threaten fishers’ lives
Reactive and autonomous, somewhat planned
Short term, local knowledge, vulnerability not assessed,
Without external support, unsustainable
8. Mangrove based erosion protection
Strong waves at high tides and erosion of dykes and settlements
Reactive, mostly planned Short term, partially vulnerability assessed
Partialofficialsupport, somewhat sustainable
9. Canal rehabilitation Dry season freshwater scarcity and loss of fisheries and agriculture
Reactive, mostly planned Short term, partially vulnerability assessed
With partial support, somewhat sustainable
10. Adaptive agriculture, Higher soil and water salinity Reactive, planned, and autonomous
Medium term, involved govt. officials, weather vulnerability assessed
With partialcost sharing, somewhat sustainable
26Communities did not do complete vulnerability assessment against the hazard rather took adaptive measures against impacts they experienced

199
While shrimp farmers called for raised embankments, non-shrimp farmers were wary of
them as they were known for making illegal private sluice gates and pipe culverts in the
embankment to facilitate water exchange. Such unauthorized structures weakened the
dykes and contributed to embankment failure and consequent inundation. The situation
was expressed metaphorically by a cyclone affected poor fisher of Chakbara as:
The embankments are our lungs, strong and good ones can save us
from cyclones and storm surges then we can have safe breaths but if
the lungs are perforated we cannot breathe and thus we die. Here the
dykes become perforated due to putting hundreds of pipe culverts by
the shrimp farmers and weakened the dykes and so it gets easily
breached with surge water and inundates us.
Thus, what at first glance appears as an adaptation strategy that benefits both shrimp
farmers and others can be maladaptive for some, such as fishers, whose spatial and
social positioning in society puts them at risk of flooding as a result of culvert
construction. It also suggests that hard engineering solutions to cyclones and flooding
are insufficient to protect some community members.
Adjustment to coastal flooding: Houses on raised plinths
After the cyclone, most households, particularly in Chakbara, had to rebuild their homes.
The majority received monetary support from the government and donors through NGOs
and UPs. Houses were built on raised plinths with the hope that they would avoid severe
inundation (Figure 8.1).
As per my survey data, a total of 83 households in Chakbara rebuilt their houses on
raised plinths with plinth heights ranging from 0.69 to 1.83 meter depending on the land
elevation, previous inundation depth and financial capacity of the households. NGO and
Government financial support covered some but not all the costs of building.
Government support was BDT 21,325 (US $ 273.4) per house. NGOs gave different
amounts: Progoti provided BDT 32,000 (US $ 410.26), Islamic Relief, BDT 60,000 (US
$ 769.23), and Caritas, BDT 110,000 (US $ 1,410.26). No households in Fultala
received housing support as they were considered to have been less affected by the
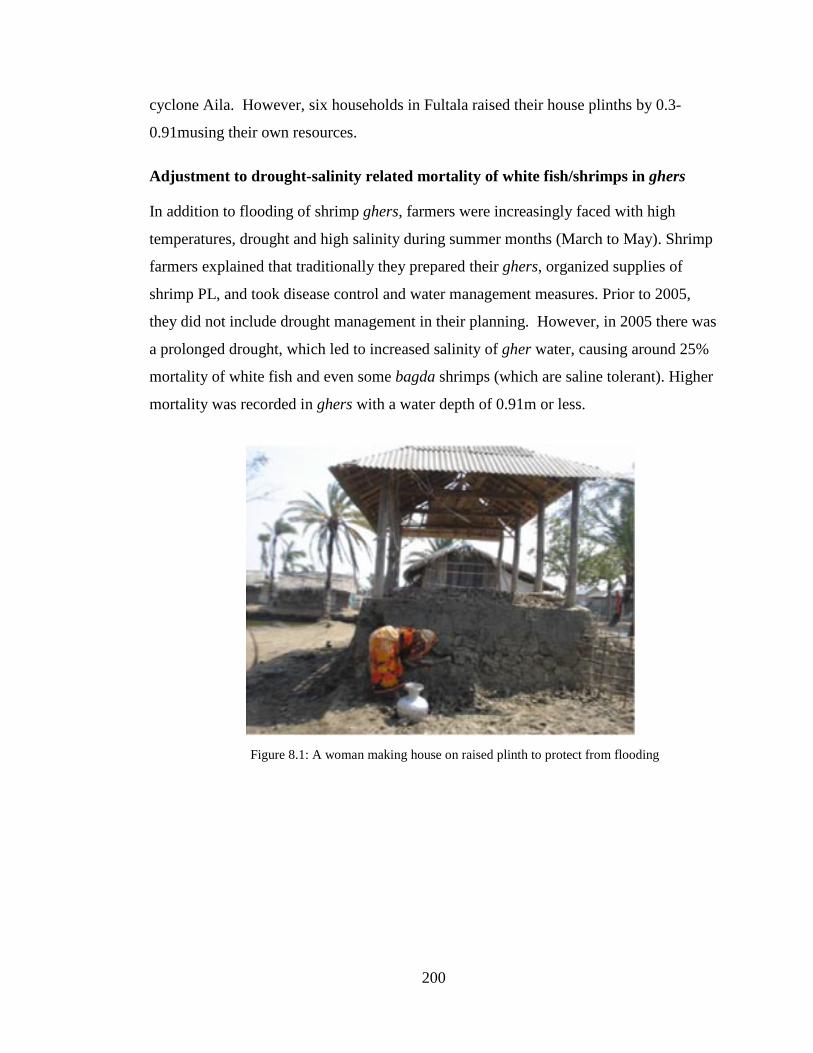
200
cyclone Aila. However, six households in Fultala raised their house plinths by 0.3-
0.91musing their own resources.
Adjustment to drought-salinity related mortality of white fish/shrimps in ghers
In addition to flooding of shrimp ghers, farmers were increasingly faced with high
temperatures, drought and high salinity during summer months (March to May). Shrimp
farmers explained that traditionally they prepared their ghers, organized supplies of
shrimp PL, and took disease control and water management measures. Prior to 2005,
they did not include drought management in their planning. However, in 2005 there was
a prolonged drought, which led to increased salinity of gher water, causing around 25%
mortality of white fish and even some bagda shrimps (which are saline tolerant). Higher
mortality was recorded in ghers with a water depth of 0.91m or less.
Figure 8.1: A woman making house on raised plinth to protect from flooding
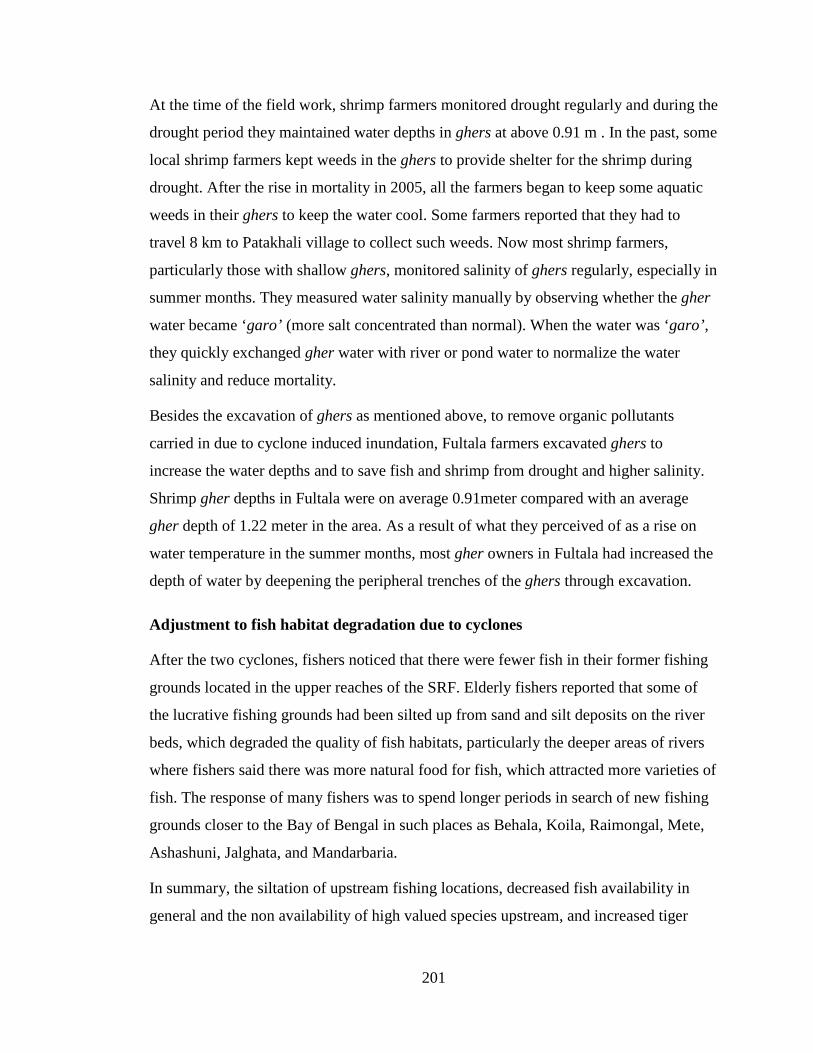
201
At the time of the field work, shrimp farmers monitored drought regularly and during the
drought period they maintained water depths in ghers at above 0.91 m . In the past, some
local shrimp farmers kept weeds in the ghers to provide shelter for the shrimp during
drought. After the rise in mortality in 2005, all the farmers began to keep some aquatic
weeds in their ghers to keep the water cool. Some farmers reported that they had to
travel 8 km to Patakhali village to collect such weeds. Now most shrimp farmers,
particularly those with shallow ghers, monitored salinity of ghers regularly, especially in
summer months. They measured water salinity manually by observing whether the gher
water became ‘garo’ (more salt concentrated than normal). When the water was ‘garo’,
they quickly exchanged gher water with river or pond water to normalize the water
salinity and reduce mortality.
Besides the excavation of ghers as mentioned above, to remove organic pollutants
carried in due to cyclone induced inundation, Fultala farmers excavated ghers to
increase the water depths and to save fish and shrimp from drought and higher salinity.
Shrimp gher depths in Fultala were on average 0.91meter compared with an average
gher depth of 1.22 meter in the area. As a result of what they perceived of as a rise on
water temperature in the summer months, most gher owners in Fultala had increased the
depth of water by deepening the peripheral trenches of the ghers through excavation.
Adjustment to fish habitat degradation due to cyclones
After the two cyclones, fishers noticed that there were fewer fish in their former fishing
grounds located in the upper reaches of the SRF. Elderly fishers reported that some of
the lucrative fishing grounds had been silted up from sand and silt deposits on the river
beds, which degraded the quality of fish habitats, particularly the deeper areas of rivers
where fishers said there was more natural food for fish, which attracted more varieties of
fish. The response of many fishers was to spend longer periods in search of new fishing
grounds closer to the Bay of Bengal in such places as Behala, Koila, Raimongal, Mete,
Ashashuni, Jalghata, and Mandarbaria.
In summary, the siltation of upstream fishing locations, decreased fish availability in
general and the non availability of high valued species upstream, and increased tiger
202
attacks led fishers to change their fishing locations. Thus, fishers were responding to
both the direct and indirect effects of the cyclones.
Adjustment to increased tiger attacks after the recent cyclones
A second weather-related change was an increase in tiger attacks on local villages.
Fishers explained that the attacks were due to the death of large numbers of non-human
prey animals such as deer and boars from the cyclones and the associated flooding.
Fishers and other community members provided three specific reasons why tiger attacks
had increased. First, the tiger population had become concentrated in the upper part of
the SRF as the lower or southern part was heavily damaged by the cyclones and the
tigers were forced to shift to the north of the SRF in search of safety and prey. Second,
the high mortality of deer, boar and other non-human prey animals pushed them to seek
food outside the SRF in villages adjacent to the forest as well as among fishers who
regularly fished along the creeks and streams of the SRF. Thirdly, the damage to shrimp
ghers and rice crops led some local people to seek food and other resources in the SRF
where they were more exposed to tiger attacks. No official assistance was provided to
the local communities so they developed their own strategies of survival.
Over 60 percent of fishers changed the kind of fishing gear they used from char pata
and khal pata jals (small bag nets fixed along the islandor river banks and in canals
inside the SRF) to cast nets and lines. The use of char pata and khal pata jals required
fishers to enter the water to fix the nets and collect fish, which exposed them to tiger
attacks.Using cast nets and lines, they could stay on their boats, which lessened the
physical risk. The 40 percent of fishers who did not switch to new types of nets changed
their fishing locations instead, moving downstream where reported tiger attacks were
lower. Some fishers changed both fishing gear and location.
However, this raised the operational cost of fishing as they were forced to spend more
time and money in rougher weather conditions to catch fish. They received advice from
other fishers from neighbouring villages on new fishing locations.
Fishers’ adaptation response to rough sea conditions

203
Local fishers reported they were much more aware of the effects of cyclones on them
particularly when fishing. Ifthey observed high winds and clouds in the sky (signal 3
conditions: cyclone alert), they took shelter inside the SRF while in the past they tended
to ignore cyclone warning signals 7 or 8 (severe cyclone warning) as they did not fully
understand their significance.The two cyclones had led them to take warnings more
seriously. Although mandatory for estuary fishers to carry radios with them, those who
fished inside the SRF said they did not take them as they feared being robbed by
waterbandits. Instead they relied on observing the sky and clouds and feeling wind speed
as measures of whether they fish or not, take shelter in the SRF or return home.
The fishers had observed increased frequency of rough sea conditions (signal 3) in
recent times; sometimes two to three times in some months compared with one or no
signal a month in the past. If a signal 3 was indicated, many did not go out fishing.
Those already at their fishing grounds either came ashore or took shelter in the SRF.
During rough sea conditions, tidal water currents increased in the rivers and often
netswere damaged. Also, they observed that during storms tree trunks, branches, leaves
and other materials flew at great velocity and damaged nets.
The problem with not fishing when the weather was bad was that although it helped save
lives, it meant they had to take more loans to survive, which reduced their longer term
resilience. Costs could be very high. First, they had to use the money they borrowed
from the mohajans to meet the cost of fishing operations on family expenses (food and
other essentials). Second, they were forced to borrow money from the mohajans for
future family expenses and for the next fishing trip. Thus, they faced the double burden
of income loss and increased debt.
Adjustment to coastal erosion through restoration of mangroves
I conducted a case study on mangrove based adaptation activity undertaken by the
community of Shora village (near to Fultala village), Ramjannagar UP of Shyamnagar
upazila to protect embankments and settlements from tidal waves. The activity was
supported by the national NGO Caritas Bangladesh. Communities planted mangroves
species along a 1.5 km long embankment (over 24.28ha of land) which created a small
green belt that protected the embankment from water intrusion and created a mangrove-
204
based micro ecosystem in the area (Figure 8.2). The FD supplied quality mangrove
saplings and provided technical advice to communities on mangrove management. FD
also signed an agreement with a 7-member village forest management committee
(formed by Caritas) aimed to protect settlements from tidal surges, to motivate local
communities to planting mangroves, to engage in biodiversity conservation and thereby
reduce risks related to weather induced hazards such as cyclones, tidal surges and
erosion.
The FD suggested that the communities plant both mangrove (Bain, Keora, Goran,
Gewa, Kakra) and non-mangrove (Epil Epil, Babla, Akashmoni, Neem) species to
manage salinity and tidal inundation.The initiative was small and cost only some BDT
78,000 (US $ 1,000). Local people were also able to obtain fuel, fish, crabs and to
harvest Keora seeds for making pickle for sale and domestic consumption.
This adaptation scheme improved ecosystem functions and offered ecosystems services
of various kinds. These included provisioning services such as food, fuel, fodder, timber,
etc (as provisioning services); regulatory services such as water flow regulation, erosion
control, disaster risk reduction, and carbon sinks; and services such as soil formation,
photosynthesis, nutrient cycling, natural habitats (for fish, shrimps, crabs) as supporting
Figure 8.2: Mangroves planted to along embankment to protect land from tidal erosion
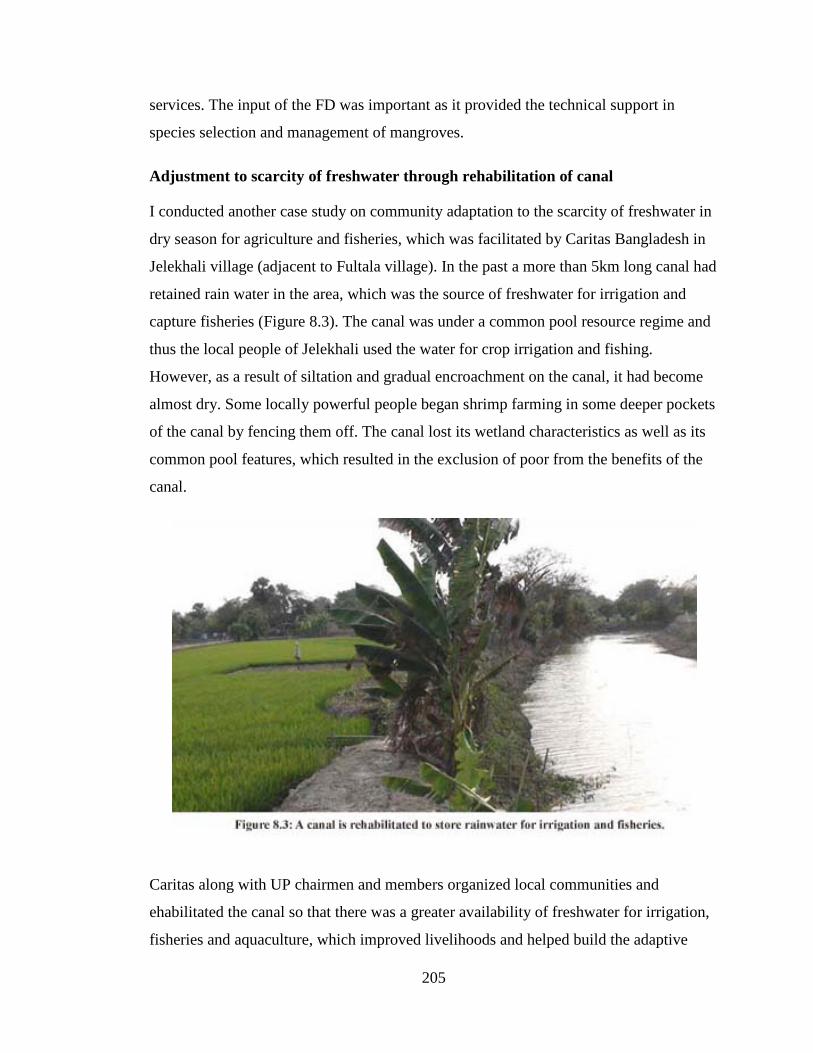
205
services. The input of the FD was important as it provided the technical support in
species selection and management of mangroves.
Adjustment to scarcity of freshwater through rehabilitation of canal
I conducted another case study on community adaptation to the scarcity of freshwater in
dry season for agriculture and fisheries, which was facilitated by Caritas Bangladesh in
Jelekhali village (adjacent to Fultala village). In the past a more than 5km long canal had
retained rain water in the area, which was the source of freshwater for irrigation and
capture fisheries (Figure 8.3). The canal was under a common pool resource regime and
thus the local people of Jelekhali used the water for crop irrigation and fishing.
However, as a result of siltation and gradual encroachment on the canal, it had become
almost dry. Some locally powerful people began shrimp farming in some deeper pockets
of the canal by fencing them off. The canal lost its wetland characteristics as well as its
common pool features, which resulted in the exclusion of poor from the benefits of the
canal.
Caritas along with UP chairmen and members organized local communities and
ehabilitated the canal so that there was a greater availability of freshwater for irrigation,
fisheries and aquaculture, which improved livelihoods and helped build the adaptive
206
capacity of the poor and marginalized communities in the village. Such wetland
rehabilitation can be considered as a ‘no regrets’ adaptation as the restored ecosystems
served the environment and local communities irrespective of changing weather
patterns.
With the active engagement of local communities, local government and local
administrators, Caritas facilitated the rehabilitation of the canal by repossessing the
canal and removing the illegal encroachers (elite capture). Local farmers were able to
double crop rather than rely on a single amon rice crop in the monsoon as the greater
availability of water created the opportunity to grow an extra crop in winter. Besides,
water logging due to drainage congestion in the area was reduced after re-excavation,
which allowed the draining off of excess rainwater from the canal.
A seven member canal management committee formed under the project managed the
scheme on behalf of local people. Some people started duck rearing in the canal, as it
retained water the year round. Rice cultivation ensured the availability of hay (as fodder)
that encouraged people to keep cattle. Integrated rice and fish (mostly golda prawn)
farming added an extra income to many households living along the canal. At a cost of
BDT 620,596 (US$ 7,956.36), the rehabilitated canal was considered a success for the
wider social-ecological benefits it provided.
Adaptive agriculture - an NGO-farmer effort to create a climate resilient farming
system
After cyclone Aila, hundreds of households were supported by government and
international donors through NGOs with seeds to grow rice and vegetables to assist in
the recovery efforts. Rice seeds were given indiscriminately without reference to
whether those receiving had any land or whether the land was under shrimp gher or rice
farming. The support was given mainly to the micro-credit borrowers of NGOs, many of
whom either sold the rice seeds or ate them as puffed rice either because they had no
land or thought it a waste of time to plant because of high salinity. Some farmers tried to
cultivate the land but yields were poor due to high salinity and poor technology adopted
in cultivation.
207
A national NGO named CNRS worked with local farmers in Fultala on agriculture based
adaptation activities through a UNDP-GEF small grants programme titled community
based adaptation (CBA) to climate change. The project began in August 2011
immediately after two weeks of intense heavy rains in early August which damaged
100% of amon rice seedlings and farmers had no choice but to re-seed. CNRS brought
in a late variety of amon seeds and seedlings from the BRRI (Bangladesh Rice Research
Institute) and demonstrated them to farmers. Different technologies of sowing were
demonstrated, which were the direct transplanting of seedlings (normal practice) and
direct sowing of seeds in the crop fields (to cover the delay). Production using both
methods was above average and the rice was harvested earlier than other varieties in the
area.
Several lessons were learned by the demonstration. First, it showed that when there were
heavy rains in the late monsoon, damage to the amon seedbed or newly transplanted
seedlings could be reduced through using late varieties of amon and direct sowing.
Second, prior to the demonstration, farmers in the area were not aware of the late
varieties of amon rice, which indicated a failure of the agriculture extension services and
poor dissemination of the outcomes of the BRRI to farmers. Third, farmers continued to
use the old farming techniques, which gave them low yields whereas with technological
improvements their yields could be easily increased by 15-20%. Fourth, farmers were
keen to adopt the technology and learn more about improved and stress tolerant rice
varieties and how they could access them. Farmers interests was reflected when some
local farmers exchanged the rice with the demonstration farmers at 6kg: 5kg ratio
(interested farmers gave 6kg rice to demo farmers and in exchange received 5 kg rice of
late varieties of rice), which they intended to preserve as seed for the next year. They
considered that the new variety (locally not available) was better adapted to flooding
even when sown late in the season. The example indicates that local farmers sought new
and improved varieties of seeds to adapt to changing or irregular weather, which was a
positive sign in that it promoted agriculture based adaptation in saline and flood prone
areas. This example of farmer interest in innovation parallels the UK’s Overseas
Development Institute’s framework for building adaptive capacity (ODI, 2010).
208
In the following year, CNRS moved to the high salinity prone Chakbara village of
Gabura UP (one of my study villages) where winter rice farming had not been practiced
for the last 25 years due to high salinity resulting from shrimp farming. CNRS selected
three interested farmers with access to sources of freshwater in ponds adjacent to crop
fields. CNRS assisted farmers in the use of a saline tolerant variety of boro (winter) rice
(BRRI dhan 47) in December 2011 (Figure 8.4). CNRS made a digital salinity meter
available at the field level and taught farmers how to monitor the water salinity. It also
provided quality seeds, a salinity moitoring device, and technical support on improved
rice cultivation methods such as advice on fertilizing, weeding and pest management,
watering and salinity management. The farmers were also provided with hands-on
training on how to germinate the seeds, prepare the seedbeds, look after them and
transplant seedlings in a way which maintained required spaces between the rice plants,
including use of granular urea (a nitrogenous fertilizer). After transplantation, CNRS’s
field agronomist paid weekly visits and monitored salinity, pest infestation and growth
and colour of rice plants and suggested actions to deal with any problems. Farmers were
advised to drain water from fields when salinity was high and to re-water with pond
water, which was generally less saline than water in the crop fields.
The CNRS assisted farmers to identify pests and appropriate pesticide use. In this way
the whole four month crop cycle was monitored and when harvesting took place in early
April 2012, yields were 6.5 tonnes/ha which was above the national average of 6
tonnes. This demonstration of winter rice created much enthusiasm among the people of
Chakbara and adjacent villagesas they began to believe that it was possible to grow
winter rice in saline prone areas through the adoption of new varieties and techniques
which they had not had in the past. After harvesting in April, some farmers planned for a
second crop of summer rice (or aus variety) in April to June prior to the next amon rice
(monsoon variety) season in July/August. CNRS supported six farmers to test summer
rice as a second crop. However, pre-monsoon drought in that year (2012) led to all the
rice being burned and damaged except for the field of one farmer who was able to get a
good yield as his pond was deep enough to hold water for the entire dry season. CNRS
organized a farmer’s field day where people from other villages and the upazila and
district level government agriculture officials were present. Crop cutting was done by
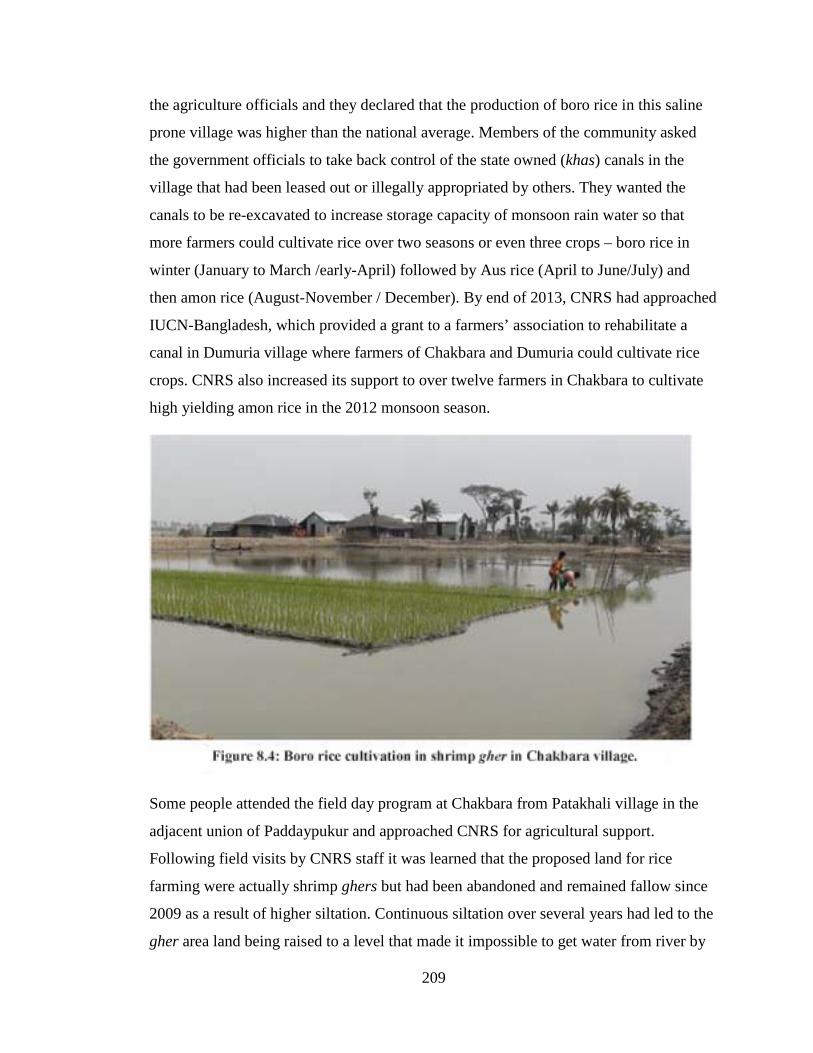
209
the agriculture officials and they declared that the production of boro rice in this saline
prone village was higher than the national average. Members of the community asked
the government officials to take back control of the state owned (khas) canals in the
village that had been leased out or illegally appropriated by others. They wanted the
canals to be re-excavated to increase storage capacity of monsoon rain water so that
more farmers could cultivate rice over two seasons or even three crops – boro rice in
winter (January to March /early-April) followed by Aus rice (April to June/July) and
then amon rice (August-November / December). By end of 2013, CNRS had approached
IUCN-Bangladesh, which provided a grant to a farmers’ association to rehabilitate a
canal in Dumuria village where farmers of Chakbara and Dumuria could cultivate rice
crops. CNRS also increased its support to over twelve farmers in Chakbara to cultivate
high yielding amon rice in the 2012 monsoon season.
Some people attended the field day program at Chakbara from Patakhali village in the
adjacent union of Paddaypukur and approached CNRS for agricultural support.
Following field visits by CNRS staff it was learned that the proposed land for rice
farming were actually shrimp ghers but had been abandoned and remained fallow since
2009 as a result of higher siltation. Continuous siltation over several years had led to the
gher area land being raised to a level that made it impossible to get water from river by
210
gravitational force. On the other hand, the soil salinity of the land was too high to
support rice farming. Seeing the success in rice production in Chakbara, a high saline
village, farmers of Patakhali thus approached CNRS for assistance.
CNRS assisted 13 farmers of Patakhali, which was remote and required land and water
transport to reach it. The village was dominated by shrimp farming and there were no
cows or power-tillers used in rice farming. In order to rice farm, the farmers themselves
tilled the land with shovels and transplanted four different amon rice varieties along with
one local variety in 2012 under the guidance of CNRS and upazila agriculture officials
who were requested by CNRS to assist the affected shrimp farmers to cultivate rice in
their abandoned ghers. At first, rice grew better than expected but was then hit by a pest
infestation, which disheartened the farmers. Repeated application of recommended
pesticides did not work and upon inspection it was found that the local pesticide dealer
had provided the wrong brand and sought to convince the illiterate farmers that the one
he sold them was also for the same purpose. With the advice of upazila agriculture
officials, farmers bought the correct pesticides from the regional town (the CNRS field
agronomist accompanied them) and after being applied good rice yields were obtained
for the first time since shrimp farming began some 25 years before.
During harvesting a mass gathering was organized in late November 2012 to
ceremonially open the harvesting of rice and was attended by the district and upazila
level agriculture officials along with communities from several villages, including the
local government representatives (UP Chairman and members).
What this example showed was that land previously devoted to shrimp farming could be
returned to rice cultivation. While farmers had either forgotten or did not know how to
use the rice cultivation technology, with official and NGO support they were able to re-
learn old techniques. Reforms were needed in the pesticide supply chain and with the
assistance of the government’s Department of Agriculture Extension (DAE), farmers
were able to obtain the appropriate pesticides, which reduced both financial and
environmental costs. A problem faced by rice farmers was the absence of draft animals
and power-tillers, which at the time of the field work was a concern.
211
In response to these issues, the NGO formed two agriculture farmers’ associations, one
in Patakhali and one in Chakbara-Dumuria villages as the farmers of these two villages
shared the same crop fields. CNRS provided one power tiller to the Pathakhali farmers
in late 2012 so that they could start winter rice cultivation and one low lift pump to
Chakbara to irrigate the crop fields as and when required. The upazila agriculture office
of the DAE also provided one good quality low lift pump to the Chakbara-Dumuria
farmers’ association for a nominal rent. CNRS set in train a series of actions to return
khas land to rice farming through contacting the district administration responsible for
approving the leasing of canals. One of the district magistrates visited the village and
met with rice farmers and assured them of his assistance to free the canals from leasing.
The participating farmers based on their two years experience in rice cultivation in
different adverse conditions in three unions of Shyamnagar upazila raised several issues
that affected their farming systems and asked the DAE officials, district administration
(the Magistrate who paid a visit to see rice farming in shrimp gher areas) and NGOs to
take action to resolve the issues to improve and sustain rice farming in the area.
Farmers’ 8-point concerns for adaptive agriculture in the coastal zone
The local farmers who participated in the rice farming demonstration expressed both
their satisfaction and continuing concerns with the previous two years (2011-2012)
experience.In particular, in FGD, the farmers expressed their concerns about eight
specific issues, which they felt needed urgent attention to facilitate adaptive farming in
the weather stressed coastal zone. These issues included water management, erratic
weather factors, enabling markets, pest management, technical backstopping, farm
management, land and water use conflicts and quality seeds and inputs (Figure 8.5).
Water availability issue
A major problem identified was the high soil and water salinity along the coast, which
affected rice farming. Dependence on the availability of freshwater, particularly for
winter (rabi crops) and summer crops (kharip-1) had increased because of erratic rainfall
with intermittent droughts. Amon rice, though a monsoon rain-fed variety, required
some irrigation to cope with droughts during the early-monsoon and monsoon, which
was reported as becoming more common. However, the two main sources of common
212
irrigation water, canals and road side borrow pits, had been taken given over to other
uses. Farmers raised the issue that unless sources of freshwater were made available, any
efforts to adapt agriculture to changing weather conditions would likely be limited to
short term coping strategies. Put another way, extra water and fairer access to it were
required to make the farming system more resilient in the sense of returning it to a time
when more water was available. As it was, the farmers feared a steady decline in their
ability to farm even for basic survival under current conditions.
Addressing issues of uncertain weather patterns
Farmers identified several weather-related factors that affected their capacity to ensure
sustainable livelihoods. They sought, with DAE and NGO assistance, to address
questions of water availability for irrigation, stress tolerant seed varieties able to survive
in saline soil and flooding, and drought conditions. They also said that cyclones and
storm surges and tidal inundation were regular occurrences, which affected coastal
agriculture and they needed outside assistance to deal with them.
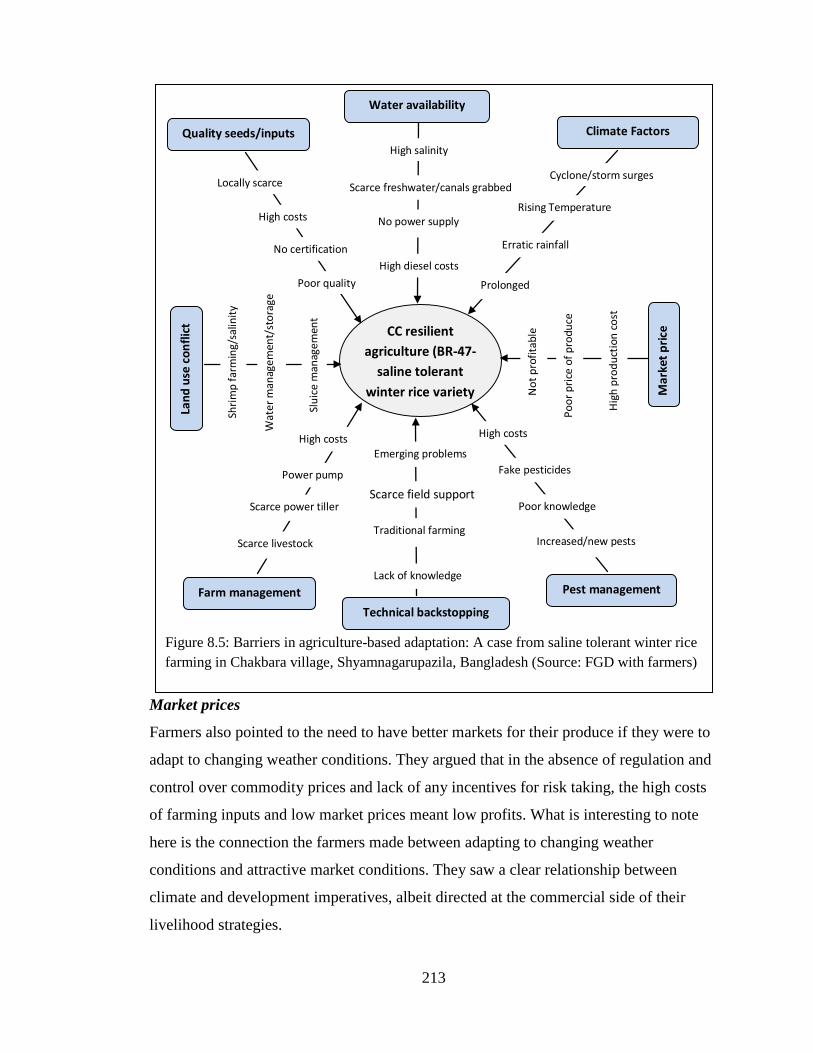
213
Market prices
Farmers also pointed to the need to have better markets for their produce if they were to
adapt to changing weather conditions. They argued that in the absence of regulation and
control over commodity prices and lack of any incentives for risk taking, the high costs
of farming inputs and low market prices meant low profits. What is interesting to note
here is the connection the farmers made between adapting to changing weather
conditions and attractive market conditions. They saw a clear relationship between
climate and development imperatives, albeit directed at the commercial side of their
livelihood strategies.
Figure 8.5: Barriers in agriculture-based adaptation: A case from saline tolerant winter rice farming in Chakbara village, Shyamnagarupazila, Bangladesh (Source: FGD with farmers)
CC resilient agriculture (BR-47-
saline tolerant winter rice variety
Climate Factors
Cyclone/storm surges Locally scarce
Poor quality
High costs
High salinity
Scarce freshwater/canals grabbed
No power supply Rising Temperature
Prolonged
Mar
ket p
rice
Technical backstopping
Water availability
Quality seeds/inputs
High costs
Increased/new pests
Pest management
Emerging problems
Scarce field support
Fake pesticides
Scarce livestock
High costs
Farm management H
igh
prod
uctio
n co
st
Scarce power tiller
Traditional farming
High diesel costs
Land
use
con
flict
Erratic rainfall
Lack of knowledge
Power pump
Poor knowledge
Poor
pric
e of
pro
duce
Shrim
p fa
rmin
g/sa
linity
Wat
er m
anag
emen
t/st
orag
e
Slui
ce m
anag
emen
t
Not
pro
fitab
le
No certification
214
Quality seed and inputs
Fultala farmers continued winter rice farming after the cyclone with a rice variety (BRRI
dhan 28) that was unsuitable for coastal saline areas, and their efforts failed. In Dumuria
village adjacent to Chakbara, villagers tried using the BR 28 rice variety and repeatedly
lost their crops. After the late flooding and damage to full grown amon seed beds, the
Fultala farmers replanted using regular varieties, which gave them lower yields.
Pest management
Farmers reported high pest infestation in rice crops in recent times. Fultala farmers rated
pest infestation as one of the most important problems they faced. The farmers in
Patakhali reported serious pest infestation in their amon rice in 2012, which could not be
controlled even after repeated application of pesticides. Later it was revealed that the
quality of the pesticides was poor and attributed to local pesticide dealers who sold
fake pesticides at high prices in remote areas. Farmers proposed that agriculture
officials should regularly monitor and sanction input dealers if they sold such pesticides.
It is unclear if the rise in pest infestation was related to changing weather patterns or
caused by processes related to cultivation techniques such as planting times, crop
spacing or field sanitation. The three most common insect pests that damage rice crops
in Bangladesh are the stem borer (Dark-headed Borer –Chilo polychyrysus), Leaf Folder
(-Cnaphalocrocis medinalis) and Brown Plant Hopper (BPH–Nilapavata lugens). Of
these, evidence points to an increase in infestations by stem borers and leaf folders in
both amon (monsoon) and boro (winter) seasons while infestations of the brown plant
hopper remain unchanged in amon season for some years but are increasing in boro
season (Haq et al., 2011) .
Recent research suggests that the BPH is susceptible to rising temperatures, which could
mean that other factors than those mentioned are more important (Piyaphongkul et al.,
2012). Chelliah and Heinrichs (1984, 107) have pointed out that increased BPH
populations are a result of new BPH-susceptible rice varieties, excessive use of nitrogen
fertilizers, continuous cropping, staggered planting, and the use of some insecticides.
The BPH is endemic across Asia and rising infestations have been attributed to
excessive use of insecticides. Thus, it may be reduced use of insecticides that can help
215
control the pest. However, another important feature is the loss of beneficial predators
(such as spider, birds, beetles, bugs, dragon flies) due to high salinity, loss of trees and
increased use of pesticides, that naturally control the harmful insect.
Technical backstopping
With the growth of shrimp farming and the decline of rice cultivation in some areas,
particularly Chakbara, there has been a decline in knowledge of the techniques of rice
farming with high yielding varieties (HYV). In Fultala, farmers continue to use
traditional technologies. CNRS’s field agronomist claimed that rice production could
only be increased by improving cultivation practices and technologies in the area.
Farm management
Farmers in Chakbara27 and Patakhali expressed concern that there was a scarcity of draft
animals locally, that power tillers and water pumps were unavailable, and that poor
salinity control was having a negative effect on their ability to farm. Part of the reason
for this was the remoteness of the villages and people had to cross a large river to reach
them. This made it difficult to hire/ arrange power tillers from other areas. The lack of
livestock was due to shrimp farming, which had taken up all former grazing land. In the
first year (2012), the demonstration farmers of Patakhali were able manually to till and
level their rice fields by themselves but they regarded this unsustainable in the long run
(Figure 8.6).
Land and water use conflict
The land and water use conflicts in the local shrimp farming areas were over the
manipulation of sluice gates by the shrimp farmers, shrimp farming and rice farming in
canals converted for such uses, drainage congestion, population settlement, and the
flooding of crop land. Resolving any of these conflicts can only happen through
betterpolicy and legal interventions, which take time and are subject to all the various
obstacles discussed earlier in the study. For example, the rice farmers of Fultala and
Kultali villages who share cropland in the beelareahave been affected by drainage
27 Farmers have land/ghers suitable for rice farming and do farming but are constrained due to lack of facilities/farm machineries such as draft power, pump machines, salinity meters, etc.
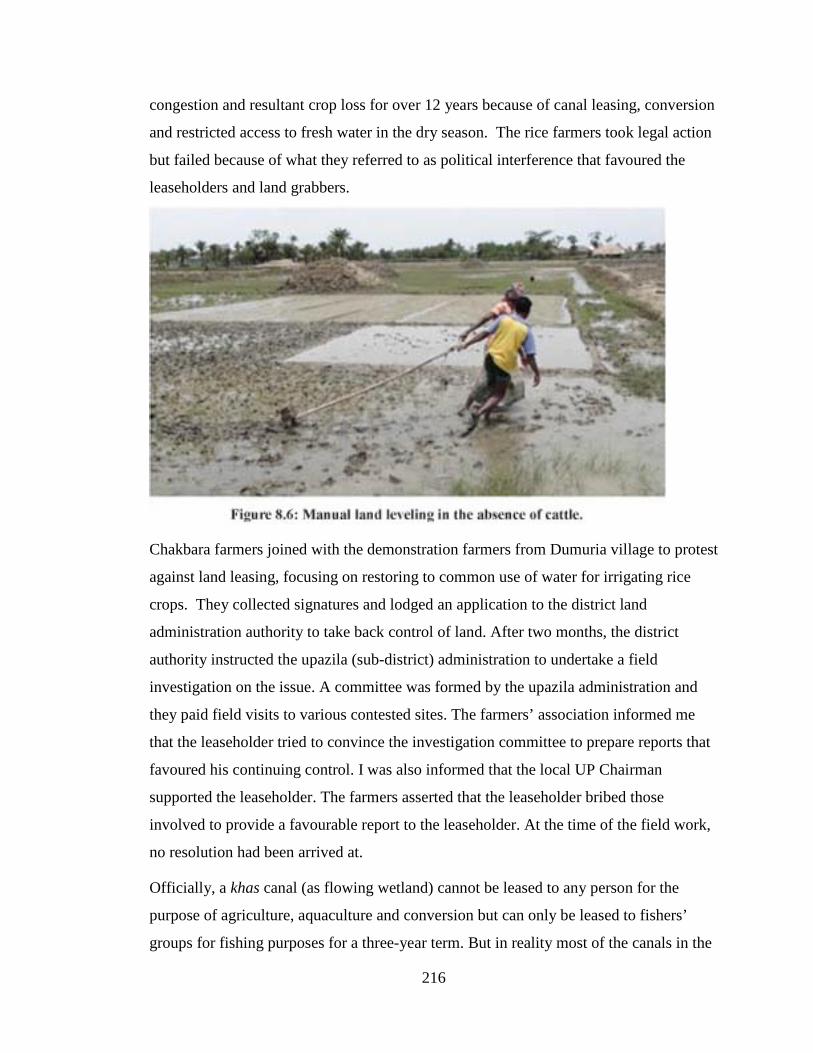
216
congestion and resultant crop loss for over 12 years because of canal leasing, conversion
and restricted access to fresh water in the dry season. The rice farmers took legal action
but failed because of what they referred to as political interference that favoured the
leaseholders and land grabbers.
Chakbara farmers joined with the demonstration farmers from Dumuria village to protest
against land leasing, focusing on restoring to common use of water for irrigating rice
crops. They collected signatures and lodged an application to the district land
administration authority to take back control of land. After two months, the district
authority instructed the upazila (sub-district) administration to undertake a field
investigation on the issue. A committee was formed by the upazila administration and
they paid field visits to various contested sites. The farmers’ association informed me
that the leaseholder tried to convince the investigation committee to prepare reports that
favoured his continuing control. I was also informed that the local UP Chairman
supported the leaseholder. The farmers asserted that the leaseholder bribed those
involved to provide a favourable report to the leaseholder. At the time of the field work,
no resolution had been arrived at.
Officially, a khas canal (as flowing wetland) cannot be leased to any person for the
purpose of agriculture, aquaculture and conversion but can only be leased to fishers’
groups for fishing purposes for a three-year term. But in reality most of the canals in the

217
area were leased to individuals or illegally grabbed, converted and used for private
purposes. The political landscape of canal leasing in the area is complex and multi level
actors are involved in it. The local authority of land leasing lies with upazila land office
and administrator if the size of land/ wetland is less than 8.09ha (20 acres) and with the
district authority if the size is over 8.09ha (20 acres). In the study area, two methods
were used by influential people to obtain canal leases and to appropriate waters bodies.
First, in Fultala, in the name of the landless, local people obtained leases for up to 99
years and then convert canals to crop land or fragmented them for aquaculture or
conversion to settlements. Second, leaseholders converted canal to shrimp ghers, which
is common in Chakbara. In both cases, conflict arose among local people and took two
main forms. First, there was conflict between the leaseholders/ grabbers and poor people
who used to fish in canals for consumption and sale. Second, there was conflict between
grabbers/ leaseholders and rice farmers who used canal water for rice farming. The
other institutional actors such as local leaders, land officials, UPs, upazila and district
authorities were generally aligned with the land takers through manipulation of the
official leasing system. A lack of knowledge of and legal support for local people on
state land leasing policies and processes coupled with the absence of collective action
and poor governance meant that these illegal activities went uncontested. Sometimes,
leaseholders contacted the Ministry of Land (MoL) officials at central government level
using political intermediaries and obtained leases in this way.
Apart from local community/ household level adaptive measures I also reviewed the
annual developed activities of two concerned local government bodies or UPs (Gabura
and Munshigonj) for the fiscal year July 2010 - June 2011 with a view to assessing the
extent to which their activities addressed community vulnerability to weather induced
impacts and building resilience.
UP’s annual development activities
The discussion so far has focused on villager actions in seeking to improve their
livelihoods and protect themselves against both weather and non-weather related events.
It now turns to an assessment of the development practices of the local UPs (Munshigonj
and Gabura) in 2010/2011 in order to determine the extent to which their activities
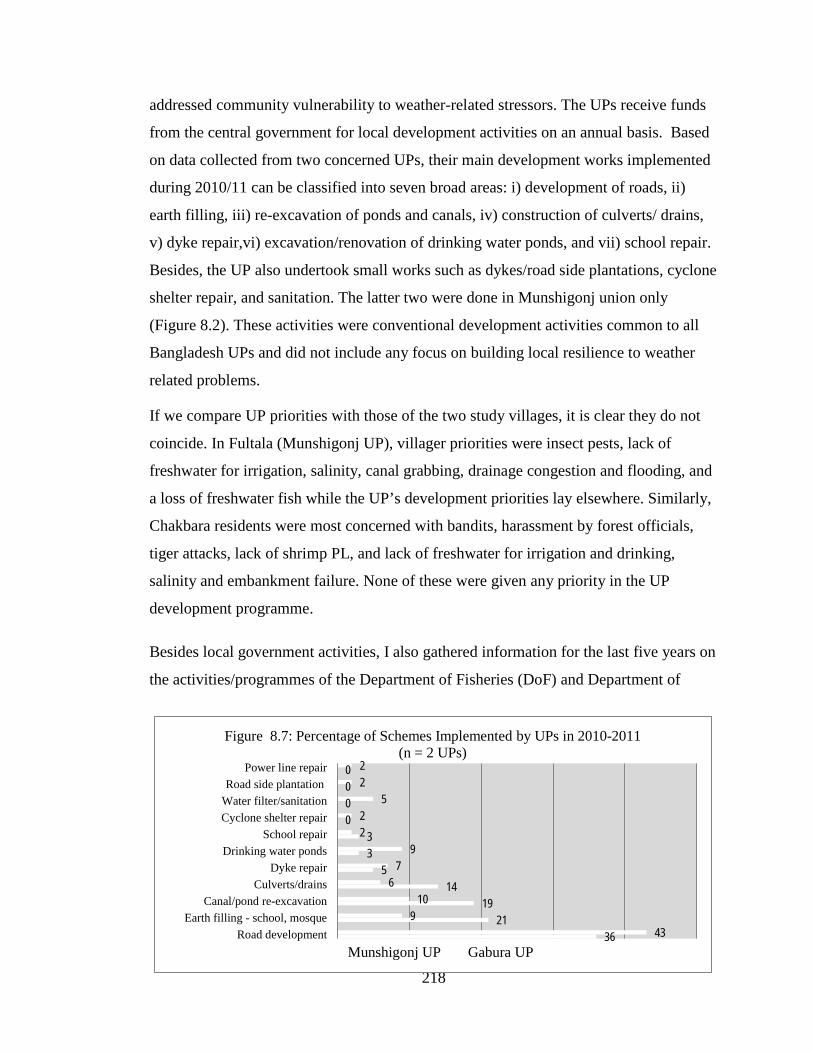
218
addressed community vulnerability to weather-related stressors. The UPs receive funds
from the central government for local development activities on an annual basis. Based
on data collected from two concerned UPs, their main development works implemented
during 2010/11 can be classified into seven broad areas: i) development of roads, ii)
earth filling, iii) re-excavation of ponds and canals, iv) construction of culverts/ drains,
v) dyke repair,vi) excavation/renovation of drinking water ponds, and vii) school repair.
Besides, the UP also undertook small works such as dykes/road side plantations, cyclone
shelter repair, and sanitation. The latter two were done in Munshigonj union only
(Figure 8.2). These activities were conventional development activities common to all
Bangladesh UPs and did not include any focus on building local resilience to weather
related problems.
If we compare UP priorities with those of the two study villages, it is clear they do not
coincide. In Fultala (Munshigonj UP), villager priorities were insect pests, lack of
freshwater for irrigation, salinity, canal grabbing, drainage congestion and flooding, and
a loss of freshwater fish while the UP’s development priorities lay elsewhere. Similarly,
Chakbara residents were most concerned with bandits, harassment by forest officials,
tiger attacks, lack of shrimp PL, and lack of freshwater for irrigation and drinking,
salinity and embankment failure. None of these were given any priority in the UP
development programme.
Besides local government activities, I also gathered information for the last five years on
the activities/programmes of the Department of Fisheries (DoF) and Department of
36 21
19 14
5 3 3
0 0 0 0
43 9
10 6
7 9
2 2
5 2 2
Road developmentEarth filling - school, mosque
Canal/pond re-excavationCulverts/drains
Dyke repairDrinking water ponds
School repairCyclone shelter repairWater filter/sanitationRoad side plantation
Power line repair
Figure 8.7: Percentage of Schemes Implemented by UPs in 2010-2011 (n = 2 UPs)
Munshigonj UP Gabura UP
219
Agriculture Extension (DAE) to ascertain their relevance to adaptation to weather
induced threats at the upazila or sub-district level.
Fisheries and Agriculture Extension services of central government
The Upazila Fisheries Officer (UFO) of Shyamnagar reported theyhad no activities in
Munshigonj and Gabura unions except some training sessions on fish/ shrimp farming
organized by NGOs as resource persons. It indicates that hundreds of shrimp and fish
farmers in the unions received no technical support and related services in aquaculture
from the relevant agency of the central government.
The DAE is the mainstream public agency for agricultural development in the country
with a major focus on extension of improved farming technologies, introduction of new
crop varieties, farmers’ capacity building, dissemination of new knowledge,
technologies and farm mechanization in coordination with other relevant agencies and
institutions. I reviewed the activities of the DAE in Gabura and Munshigonj from
2007/08 to 20011/12 and found that during that time the department established only 36
demonstration plots for boro rice (winter rice) in Munshigonj over a five year period and
only one such plot in Gabura. It also set up 37 amon rice demonstration plots in two
unions and two demonstration plots of aus rice (summer rice). The number of
demonstration activities was very low in comparison with the size of the unions and the
number of farmers wanting to practise and improve rice cultivation.
Besides rice farming, the DAE’s demonstrated other non-rice crops that included their
sensitivity to the salinity problem. However, this activity was very small. Over the last
five years, the DAE made only seven demonstrations of onions (in 2008-09), one sweet
gourd (in 2010) and one on mustard (in 2011), all except one in Munshigonjunion.The
department’s farmer training activities were negligible. They trained 86 farmers over
five years in two unions (Munshigonj- 66 and Gabura-20) in the use of farming
technologies (Munshigonj-13; Gabura-2), farm mechanization (Munshigonj-30, Gabura-
9), and saline tolerant farming systems (Munshigonj-18, Gabura-9).
220
Overall, the development activities of DoF, DAE and UP did not fully coincide with
those of local people, the activities they did engage in were limited, and included very
little that linked development to weather-related concerns.
In the next section, I examine the local adaptation schemes /actions (see table 8.1) in
relation to the four different adaptation frameworks mentioned earlier.
Analysis of local adaptation actions
Ten different adaptation schemes/ actions undertaken by the local communities were
examined in order to assess whether they fell within the principles of i) CBA
(community-based adaptation), ii) EbA (Ecosystems based adaptation), iii) ‘Resilience
to transformational’ adaptation (Pelling, 2011) and iv) ‘Incremental to transformative
adaptation’ (Kates et al., 2012). I begin with the CBA framework.
Adaptation schemes in relation to the CBA framework
Four basic elements of CBA are considered in assessing the nature and extent of local
adaptation actions (Ayers and Forsyth, 2009; Dodman and Mitlin, 2013). These are:
i) Are the strategies generated through participatory processes and do they
operate at local level?;
ii) Do they involve local stakeholders, development and disaster actors
including poor and most vulnerable in planning and actions?;
iii) Are the actions based on local knowledge and site specific climate-induced
threats aimed at building local capacity?;
iv) Do the actions adequately consider local risks and uncertainties including
vulnerabilities
In the case of three schemes on the renovation of saline contaminated fish ponds,
decontamination of shrimp ghers, and the raising of house plinths after cyclone Aila, the
associated saline water flooding was carried out by each household using either its own
resources or with the help of others (NGOs and government). In other words,
community level and organized participatory planning and the development of
adaptation strategies were not the case. Rather, NGOs, as per the direction of donors,
221
prepared the budgets and plans and accordingly supported the selected households while
the communities were mere recipients rather planners. The local UP as local
development and disaster actor was limited to the selection of households. It was not
involved or engaged in planning the schemes through an analysis of the root causes and
the relevance of weather induced current and future risks and uncertainties. These
adaptation schemes aimed at short term coping, rather taking measures to absorb future
weather/ climate-induced shocks and uncertainties over the entire area. In summary, it
can be said that these schemes were not in line with CBA principles.
Another scheme monitor salinity and cool gher water to protect fish and shrimp stocks
from increased temperatures and increased salinity problems was started by individual
farmers and later other farmers followed. This was done on an individual basis and there
was no collective planning to design actions to address the problem.
Three other adaptation schemes involved some collective actions but were limited to
fishers only. The schemes were location of new fishing grounds after old grounds had
been abandoned because of cyclone activity; a shift in fishing gear use and fishing
locations to avoid tiger attacks; and the cessation of fishing trips in rough sea
conditions.
In carrying out these schemes, local fishers shared experience and knowledge among
themselves and developed their own strategies, which conforms to a degree with the
principles of CBA. However, they were short term and designed to deal with current and
more immediate concerns and did not involve other local development and disaster
actors in planning actions towards sustainable adaptation. While they did not fully
conform to CBA principles, there exists the possibility for the further incorporation of
relevant adaptation attributes.
The remaining schemes related to mangrove based erosion protection, canal
rehabilitation, and cooperation between NGOs and farmers in adaptive agriculture
practices. They were based on community level planning (at the village and occupational
level), involved an examination of the root causes of the problems being faced, and the
development of local vulnerability assessments to increase the adaptive capacity of local
communities. They also engaged the services of local development and disaster actors
222
such as the DAE, FD, UPs in planning and execution of schemes and capacity building
and NGOs acting as facilitators.
These examples provide a mixed record of adaptation planning involving autonomous
individual actions, some combined individual and collective action, cooperation with
official agencies and NGOs and a willingness to think beyond immediate concerns. In
the next section I examine adaptation schemes based on the principles of EbA.
Adaptation schemes in relation to EbA framework
As mentioned in chapter 1, four different ecosystem services are considered to be
important in assessing the extent to which local adaptation schemes are consistent with
EbA principles (MEA, 2005). In the analysis that follows, the ten adaptation schemes
are assessed in terms of the facilitation of fourecosystems services:
i) Provisioning services - Food, fuel, fodder, fruits, thatching materials, freshwater
supply, grazing, genetic resources;
ii) Regulating services - Pollution control, regulation of biodiversity, water & air
quality, water flow and flood control, pollination, carbon sequestration;
iii) Cultural services - Ecotourism and recreation, education and research, cultural
heritage, religious values;
iv) Supporting services - Soil formation, photosynthesis, nutrient cycling, natural
habitats, etc.
Of the ten local adaptation schemes considered, five were found to be in line with an
ecosystems based approach to adaptation. These were the renovation of polluted ponds,
the de-contamination of shrimp ghers, mangrove based erosion protection, canal
rehabilitation and adaptive agriculture in saline prone fallow land or shrimp ghers. The
remaining five schemes addressed general livelihoods and adjustments in methods of
accessing resources and did not directly contribute to ecosystem services.
All EbA-related five adaptation schemes contributed to restoring and enhancing
ecosystem components and services for the benefits of local communities and ecosystem
health. For example, pond and gher renovation schemes contributed to restoration of
ecosystems health through improving theavailability of freshwater in ponds and removal

223
of pollutants (from ponds and ghers), which helped to restart fish and shrimp farming
(improved quality of gher ecosystems) and the use of water (ponds) for other productive
purposes. In general, the restoration of wetland (ponds, ghers, canals) and mangroves
facilitated opportunities for improved aquaculture, enhanced water supply for irrigation
(bringing fallow land under crop production in the dry season) and for other uses by the
communities, improved freshwater fish availability in restored canals and better fishing
opportunities for the poor. More mangrove plant resources improved provisioning
services to communitiesthrough supplying fish, shrimp, crabs, mollusks, water, fuel,
fruits and vegetables.
These schemes also provided regulatory and supporting services through photosynthesis
(algae and aquatic vegetations in ponds, ghers and mangrove trees) and the control of air
and water quality, the absorption of pollutants and greater control of flooding by holding
excess rainwater in ponds, ghers and canals. More benthic organisms in wetland and
mangrove areas supported maintaining nutrient cycling and water quality. The
introduction or re-introduction of rice cultivation through adaptive farming schemes in
fallow saline affected land and ghers increased the provisioning services to land and
gher ecosystems through the provision of food, straw and fuel.
The five schemes were small in nature and scope but illustrate how the adoption of an
ecosystem approach together with greater community engagement can contribute to
improved ecosystem service provision and an increase in adaptive capacity.
Adaptation schemes in relation to the ‘resilience to transformation’ framework
I analysed ten local adaptation actions using Pelling’s three-stage adaptation framework
to assess whether these actions contributed to resilience building only or were
(potentially) more transformational (see chapter 1: table 1.1). Table 8.2 elaborates each
of ten adaptation schemes against the indicators of the framework and found that all
schemes to a greater or lesser extent fall under ‘resilience building that is, allowing the
system to bounce back to its previous condition or to maintain functional persistence
after the shocks. The schemes largely had the consequence of maintaining the
functionality of the social-ecological systems rather than move towards Pelling’s
‘transitional’ stage with realization of greater citizen rights within the existing political
224
system or towards the more robust ‘transformational’ stage, which involves changing the
structure, discourses and political economy of development landscapes (see Table 8.2).
However, this was not entirely the case, as the example below illustrates.
In the case of the actions of the NGO-farmer group, they began with a largely resilience
approach based on technical interventions but shifted to questioning and even
challenging the wider legal and institutional framework that was used by more powerful
agents to appropriate land for their own uses. The action started small with a few
farmers of one village who managed to respond successfully to the loss of their amon
rice seed beds because of late monsoon intense heavy rain-based flooding by introducing
late growing varieties. In the following winter rice season, with the support of CNRS
and local agricultural officials, the farmers successfully demonstrated to other farmers
that they could cultivate winter rice (boro) in saline affected ghers at a higher production
rate than the national average. In the following monsoon, some farmers in other villages
approached the project farmers who demonstrated how amon rice farming could be
successful in abandoned shrimp ghers through proper seed bed preparation,
transplantation, fertilizing, pest management, salinity monitoring and water
management. Later, groups of farmers established associations to develop local farming
strategies and plans to identify available sources of freshwater, which could be stored in
canals by making bunds for use in rice farming. Without this action, leaseholders would
have continued to drain water bodies to catch fish using unsustainable methods.
This result was achieved through tripartite negotiations between the local government
representatives, leaseholders of canals, shrimp farmers and rice farmers with NGO
assistance. The Chakbara-Dumuria farmers’ association obtained a low lift pump
machine from the upazila agriculture office, local agriculture extension agents paid field
visits to support farmers and the NGO provided one power tiller and one low lift pump
to two farmers’ associations, which had been formed under the program.
However, the issue of how to transfer the leases of state owned canals from shrimp and
fish farming to rice farming remained unresolved. This was the most serious political
problem facing the farmers as it challenged existing power arrangements in the local

225
area and ultimately the whole system of lease allocation, which traditionally favoured
those with political influence up to the highest levels of government.
Using Pelling’s three fold schema of adaptation, the initial actions of the farmers can be
seen as an attempt to build local resilience by
…seeking only change that can allow existing functions and practices to
persist and in this way not questioning underlying assumptions or power
asymmetries in society (Pelling, 2011:50).
This was followed by attempts to claim what were legitimate legal rights regarding the
use of land and water resources. Pelling refers to this as ‘adaptation as transition’. In this
the farmers challenged the actions of seed dealers, public officials and ultimately the
national government to abide by the law. The farmers were not asking for anything new
but simply the proper application of the law.
The example is complicated by the fact that smallholders and landless labourers did not
always share the same economic interests and there were power asymmetries between
them that shaped their capacity to act. Thus attempts to change land use from private
aquaculture to community based agriculture favoured smallholders and some
sharecroppers without directly assisting the completely landless to take up farming. In
this sense, the challenge by the farmers to the state and its various local agencies to
implement the law fairly constituted ‘…an extension of resilience adaptation to include a
greater focuses on governance…’(Pelling, 2011:68) rather than a failure by farmers to
question the legitimacy of the state in order to transform it.
In summary, most of the schemes were small in nature and mostly undertaken by
individuals and their families rather than involving greater collective or community level
organization and mobilization that extended over wider landscapes or ecosystems.
However, three schemes, of which one was discussed earlier, did have more potential to
graduate from the resilience building stage to the transitional stage of adaptation. In
addition to NGO-farmer adaptive agriculture scheme, these were the canal/ wetland
rehabilitation for freshwater, agriculture and fisheries andthe mangrove restoration for
erosion control, biodiversity and livelihoods.
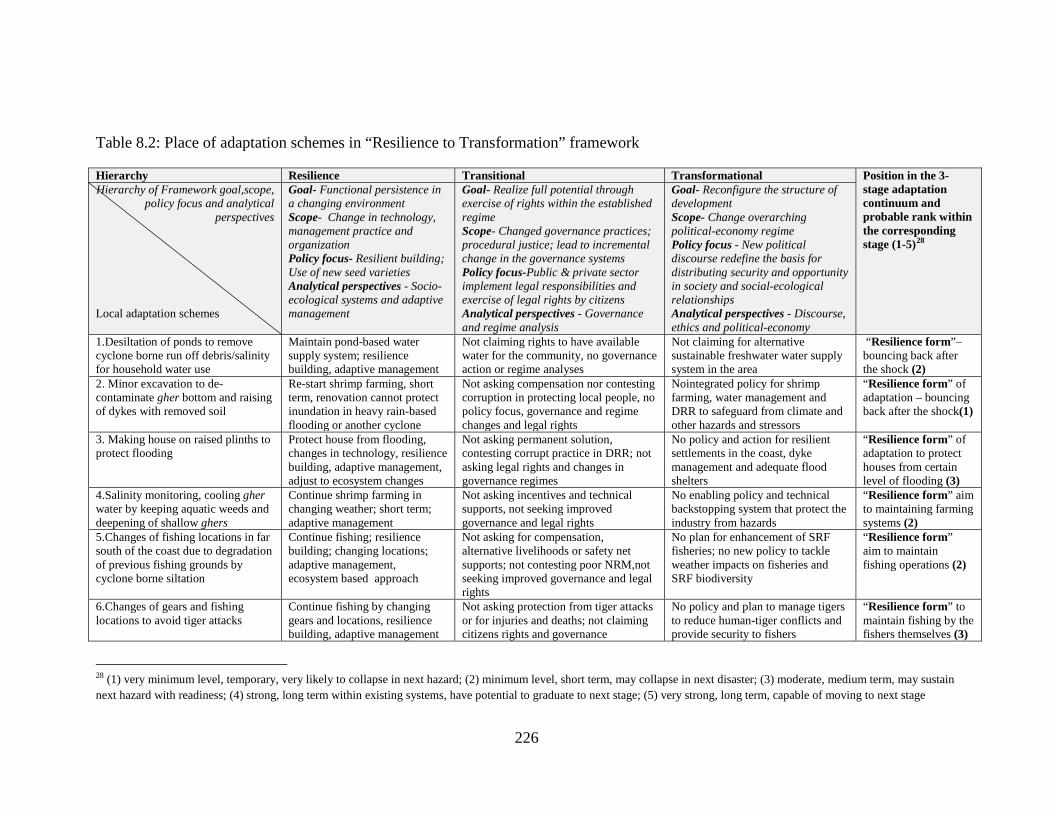
226
Table 8.2: Place of adaptation schemes in “Resilience to Transformation” framework
Hierarchy Resilience Transitional Transformational Position in the 3-stage adaptation continuum and probable rank within the corresponding stage (1-5)28
Hierarchy of Framework goal,scope, policy focus and analytical
perspectives Local adaptation schemes
Goal- Functional persistence in a changing environment Scope- Change in technology, management practice and organization Policy focus- Resilient building; Use of new seed varieties Analytical perspectives - Socio-ecological systems and adaptive management
Goal- Realize full potential through exercise of rights within the established regime Scope- Changed governance practices; procedural justice; lead to incremental change in the governance systems Policy focus-Public & private sector implement legal responsibilities and exercise of legal rights by citizens Analytical perspectives - Governance and regime analysis
Goal- Reconfigure the structure of development Scope- Change overarching political-economy regime Policy focus - New political discourse redefine the basis for distributing security and opportunity in society and social-ecological relationships Analytical perspectives - Discourse, ethics and political-economy
1.Desiltation of ponds to remove cyclone borne run off debris/salinity for household water use
Maintain pond-based water supply system; resilience building, adaptive management
Not claiming rights to have available water for the community, no governance action or regime analyses
Not claiming for alternative sustainable freshwater water supply system in the area
“Resilience form”– bouncing back after the shock (2)
2. Minor excavation to de-contaminate gher bottom and raising of dykes with removed soil
Re-start shrimp farming, short term, renovation cannot protect inundation in heavy rain-based flooding or another cyclone
Not asking compensation nor contesting corruption in protecting local people, no policy focus, governance and regime changes and legal rights
Nointegrated policy for shrimp farming, water management and DRR to safeguard from climate and other hazards and stressors
“Resilience form” of adaptation – bouncing back after the shock(1)
3. Making house on raised plinths to protect flooding
Protect house from flooding, changes in technology, resilience building, adaptive management, adjust to ecosystem changes
Not asking permanent solution, contesting corrupt practice in DRR; not asking legal rights and changes in governance regimes
No policy and action for resilient settlements in the coast, dyke management and adequate flood shelters
“Resilience form” of adaptation to protect houses from certain level of flooding (3)
4.Salinity monitoring, cooling gher water by keeping aquatic weeds and deepening of shallow ghers
Continue shrimp farming in changing weather; short term; adaptive management
Not asking incentives and technical supports, not seeking improved governance and legal rights
No enabling policy and technical backstopping system that protect the industry from hazards
“Resilience form” aim to maintaining farming systems (2)
5.Changes of fishing locations in far south of the coast due to degradation of previous fishing grounds by cyclone borne siltation
Continue fishing; resilience building; changing locations; adaptive management, ecosystem based approach
Not asking for compensation, alternative livelihoods or safety net supports; not contesting poor NRM,not seeking improved governance and legal rights
No plan for enhancement of SRF fisheries; no new policy to tackle weather impacts on fisheries and SRF biodiversity
“Resilience form” aim to maintain fishing operations (2)
6.Changes of gears and fishing locations to avoid tiger attacks
Continue fishing by changing gears and locations, resilience building, adaptive management
Not asking protection from tiger attacks or for injuries and deaths; not claiming citizens rights and governance
No policy and plan to manage tigers to reduce human-tiger conflicts and provide security to fishers
“Resilience form” to maintain fishing by the fishers themselves (3)
28 (1) very minimum level, temporary, very likely to collapse in next hazard; (2) minimum level, short term, may collapse in next disaster; (3) moderate, medium term, may sustain next hazard with readiness; (4) strong, long term within existing systems, have potential to graduate to next stage; (5) very strong, long term, capable of moving to next stage
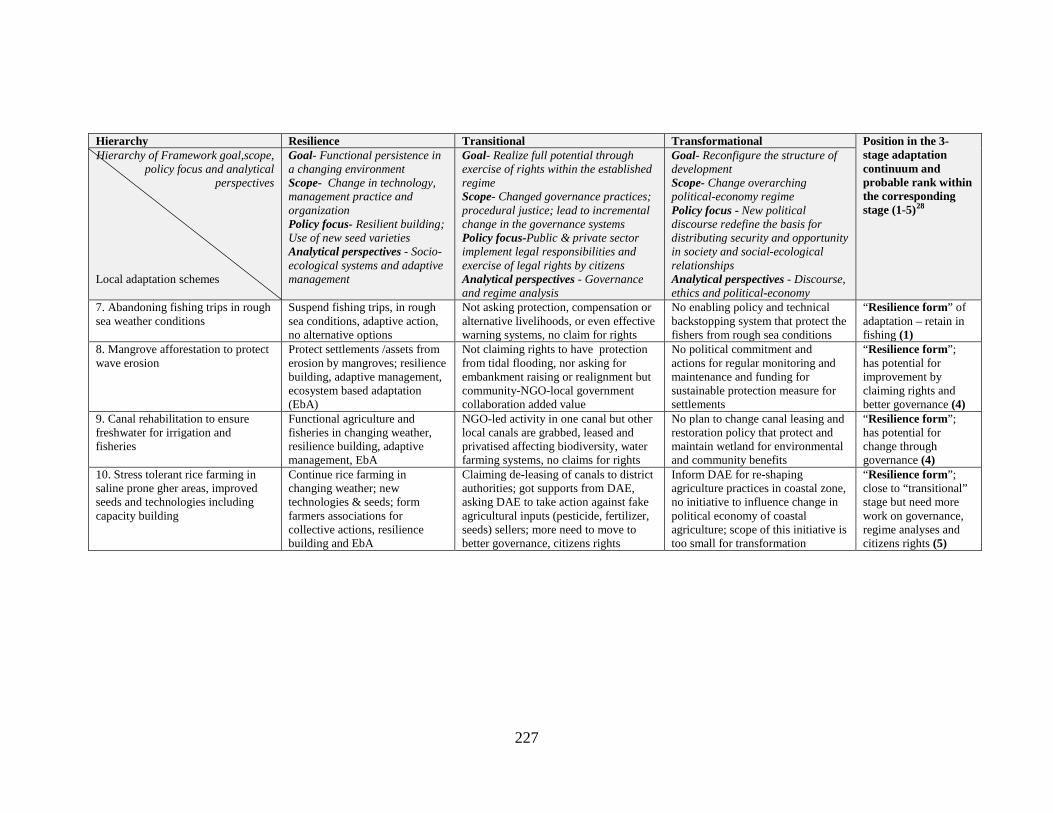
227
Hierarchy Resilience Transitional Transformational Position in the 3-stage adaptation continuum and probable rank within the corresponding stage (1-5)28
Hierarchy of Framework goal,scope, policy focus and analytical
perspectives Local adaptation schemes
Goal- Functional persistence in a changing environment Scope- Change in technology, management practice and organization Policy focus- Resilient building; Use of new seed varieties Analytical perspectives - Socio-ecological systems and adaptive management
Goal- Realize full potential through exercise of rights within the established regime Scope- Changed governance practices; procedural justice; lead to incremental change in the governance systems Policy focus-Public & private sector implement legal responsibilities and exercise of legal rights by citizens Analytical perspectives - Governance and regime analysis
Goal- Reconfigure the structure of development Scope- Change overarching political-economy regime Policy focus - New political discourse redefine the basis for distributing security and opportunity in society and social-ecological relationships Analytical perspectives - Discourse, ethics and political-economy
7. Abandoning fishing trips in rough sea weather conditions
Suspend fishing trips, in rough sea conditions, adaptive action, no alternative options
Not asking protection, compensation or alternative livelihoods, or even effective warning systems, no claim for rights
No enabling policy and technical backstopping system that protect the fishers from rough sea conditions
“Resilience form” of adaptation – retain in fishing (1)
8. Mangrove afforestation to protect wave erosion
Protect settlements /assets from erosion by mangroves; resilience building, adaptive management, ecosystem based adaptation (EbA)
Not claiming rights to have protection from tidal flooding, nor asking for embankment raising or realignment but community-NGO-local government collaboration added value
No political commitment and actions for regular monitoring and maintenance and funding for sustainable protection measure for settlements
“Resilience form”; has potential for improvement by claiming rights and better governance (4)
9. Canal rehabilitation to ensure freshwater for irrigation and fisheries
Functional agriculture and fisheries in changing weather, resilience building, adaptive management, EbA
NGO-led activity in one canal but other local canals are grabbed, leased and privatised affecting biodiversity, water farming systems, no claims for rights
No plan to change canal leasing and restoration policy that protect and maintain wetland for environmental and community benefits
“Resilience form”; has potential for change through governance (4)
10. Stress tolerant rice farming in saline prone gher areas, improved seeds and technologies including capacity building
Continue rice farming in changing weather; new technologies & seeds; form farmers associations for collective actions, resilience building and EbA
Claiming de-leasing of canals to district authorities; got supports from DAE, asking DAE to take action against fake agricultural inputs (pesticide, fertilizer, seeds) sellers; more need to move to better governance, citizens rights
Inform DAE for re-shaping agriculture practices in coastal zone, no initiative to influence change in political economy of coastal agriculture; scope of this initiative is too small for transformation
“Resilience form”; close to “transitional” stage but need more work on governance, regime analyses and citizens rights (5)
228
In addition to Pelling’s framework, Kates and his colleagues (2012) proposed what they
call an incremental to transformative adaptation framework, to understand adaptation
planning. The next section discusses the applicability and usefulness of this approach to
the schemes in the study.
Adaptation schemes in relation to the “incremental to transformative” framework
Kates et al. (2012) argue the need for a new approach to adaptation to climate change
that has much in common with Pelling’s. Most current adaptation strategies they
consider incremental in that they are ‘…extensions of actions and behaviors that already
reduce the losses or enhance the benefits of natural variations in climate and extreme
events’ (Kates et al., 2012: 7156). They call for a shift to transformational adaptation,
which covers three types of adaptation related to increased scale and intensity, degree of
novelty or innovativeness and radically transformative of a place or location.They regard
such adaptation particularly important in places with high levels of vulnerability
andsubject to extreme climate change, such as Bangladesh.
All ten schemes in the study fall within the incremental framework in that they involved
making known and tried adjustments to weather perturbations and extremes. None
manifest any of the six main features of transformative adaptation outlined by Kates et
al. (2012). These are larger scale of action, new to the area, involving large-scale
transformation or shifting of locations (migration), well-planned collective actions,
technology driven and bringing about changes in institutional settings. Table 8.3 shows
that three of the schemes, namely, mangrove restoration, canal rehabilitation and NGO-
farmers adaptive agriculture in the saline-prone coastal zone have the potential to
graduate to a more transformative stage provided that they can obtain larger external
funding, implement more rigorous planning based on detailed analysis of weather
related vulnerabilities, engage local communities and stakeholders in planning, and
integrate climate policies into development planning more attuned to a future with
greater uncertainty in weather and weather-related patterns.
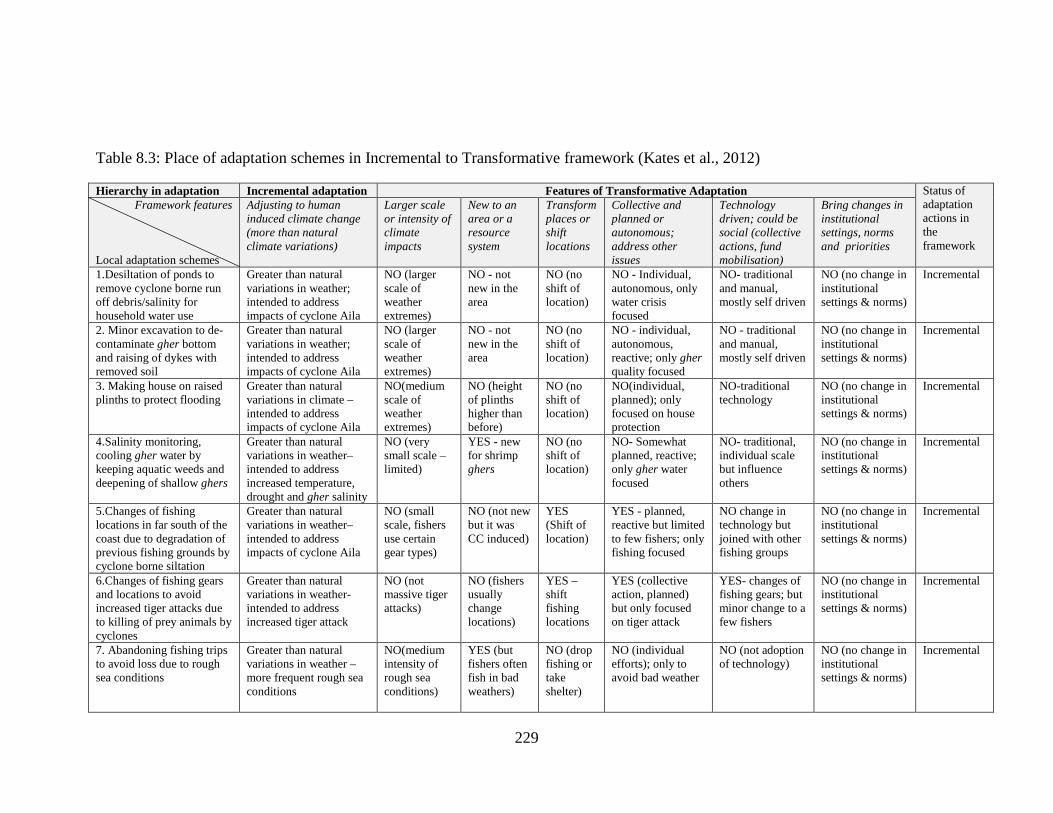
229
Table 8.3: Place of adaptation schemes in Incremental to Transformative framework (Kates et al., 2012)
Hierarchy in adaptation Incremental adaptation Features of Transformative Adaptation Status of adaptation actions in the framework
Framework features Local adaptation schemes
Adjusting to human induced climate change (more than natural climate variations)
Larger scale or intensity of climate impacts
New to an area or a resource system
Transform places or shift locations
Collective and planned or autonomous; address other issues
Technology driven; could be social (collective actions, fund mobilisation)
Bring changes in institutional settings, norms and priorities
1.Desiltation of ponds to remove cyclone borne run off debris/salinity for household water use
Greater than natural variations in weather; intended to address impacts of cyclone Aila
NO (larger scale of weather extremes)
NO - not new in the area
NO (no shift of location)
NO - Individual, autonomous, only water crisis focused
NO- traditional and manual, mostly self driven
NO (no change in institutional settings & norms)
Incremental
2. Minor excavation to de-contaminate gher bottom and raising of dykes with removed soil
Greater than natural variations in weather; intended to address impacts of cyclone Aila
NO (larger scale of weather extremes)
NO - not new in the area
NO (no shift of location)
NO - individual, autonomous, reactive; only gher quality focused
NO - traditional and manual, mostly self driven
NO (no change in institutional settings & norms)
Incremental
3. Making house on raised plinths to protect flooding
Greater than natural variations in climate –intended to address impacts of cyclone Aila
NO(medium scale of weather extremes)
NO (height of plinths higher than before)
NO (no shift of location)
NO(individual, planned); only focused on house protection
NO-traditional technology
NO (no change in institutional settings & norms)
Incremental
4.Salinity monitoring, cooling gher water by keeping aquatic weeds and deepening of shallow ghers
Greater than natural variations in weather–intended to address increased temperature, drought and gher salinity
NO (very small scale – limited)
YES - new for shrimp ghers
NO (no shift of location)
NO- Somewhat planned, reactive; only gher water focused
NO- traditional, individual scale but influence others
NO (no change in institutional settings & norms)
Incremental
5.Changes of fishing locations in far south of the coast due to degradation of previous fishing grounds by cyclone borne siltation
Greater than natural variations in weather–intended to address impacts of cyclone Aila
NO (small scale, fishers use certain gear types)
NO (not new but it was CC induced)
YES (Shift of location)
YES - planned, reactive but limited to few fishers; only fishing focused
NO change in technology but joined with other fishing groups
NO (no change in institutional settings & norms)
Incremental
6.Changes of fishing gears and locations to avoid increased tiger attacks due to killing of prey animals by cyclones
Greater than natural variations in weather- intended to address increased tiger attack
NO (not massive tiger attacks)
NO (fishers usually change locations)
YES – shift fishing locations
YES (collective action, planned) but only focused on tiger attack
YES- changes of fishing gears; but minor change to a few fishers
NO (no change in institutional settings & norms)
Incremental
7. Abandoning fishing trips to avoid loss due to rough sea conditions
Greater than natural variations in weather – more frequent rough sea conditions
NO(medium intensity of rough sea conditions)
YES (but fishers often fish in bad weathers)
NO (drop fishing or take shelter)
NO (individual efforts); only to avoid bad weather
NO (not adoption of technology)
NO (no change in institutional settings & norms)
Incremental
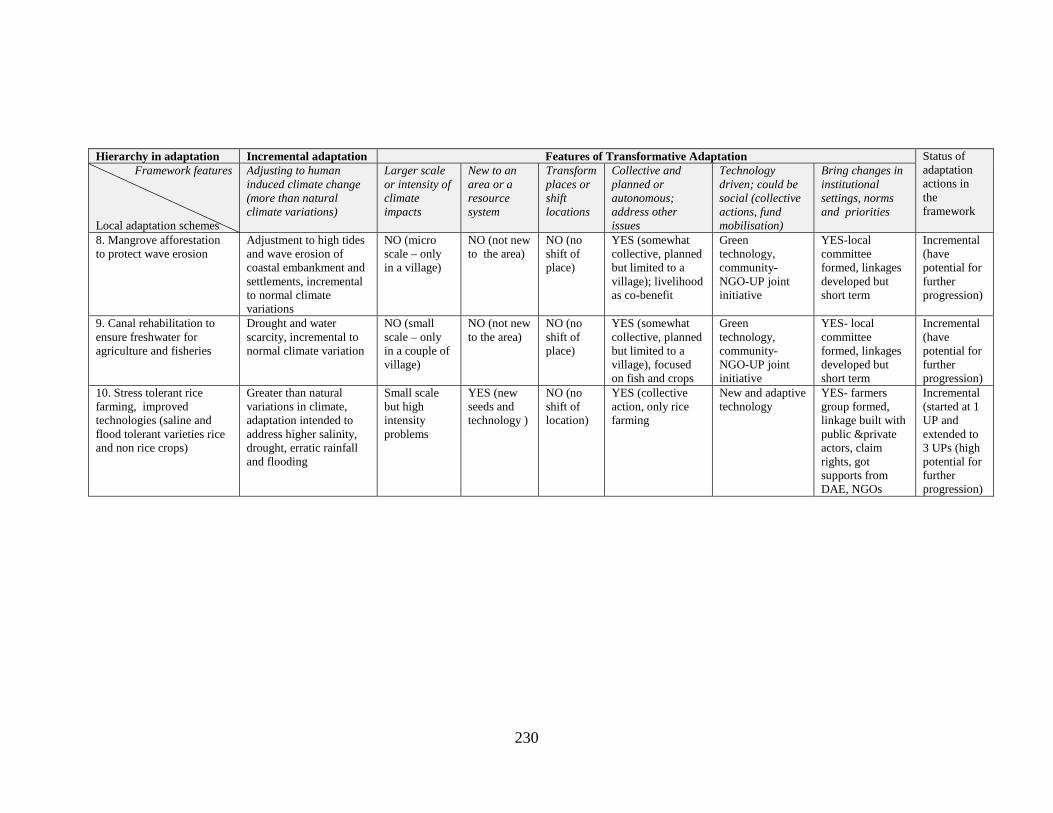
230
Hierarchy in adaptation Incremental adaptation Features of Transformative Adaptation Status of adaptation actions in the framework
Framework features Local adaptation schemes
Adjusting to human induced climate change (more than natural climate variations)
Larger scale or intensity of climate impacts
New to an area or a resource system
Transform places or shift locations
Collective and planned or autonomous; address other issues
Technology driven; could be social (collective actions, fund mobilisation)
Bring changes in institutional settings, norms and priorities
8. Mangrove afforestation to protect wave erosion
Adjustment to high tides and wave erosion of coastal embankment and settlements, incremental to normal climate variations
NO (micro scale – only in a village)
NO (not new to the area)
NO (no shift of place)
YES (somewhat collective, planned but limited to a village); livelihood as co-benefit
Green technology, community-NGO-UP joint initiative
YES-local committee formed, linkages developed but short term
Incremental (have potential for further progression)
9. Canal rehabilitation to ensure freshwater for agriculture and fisheries
Drought and water scarcity, incremental to normal climate variation
NO (small scale – only in a couple of village)
NO (not new to the area)
NO (no shift of place)
YES (somewhat collective, planned but limited to a village), focused on fish and crops
Green technology, community-NGO-UP joint initiative
YES- local committee formed, linkages developed but short term
Incremental (have potential for further progression)
10. Stress tolerant rice farming, improved technologies (saline and flood tolerant varieties rice and non rice crops)
Greater than natural variations in climate, adaptation intended to address higher salinity, drought, erratic rainfall and flooding
Small scale but high intensity problems
YES (new seeds and technology )
NO (no shift of location)
YES (collective action, only rice farming
New and adaptive technology
YES- farmers group formed, linkage built with public &private actors, claim rights, got supports from DAE, NGOs
Incremental (started at 1 UP and extended to 3 UPs (high potential for further progression)
231
Weather or climate related perturbations and extremes are a new generation of threats
in the lexicon of development. The associated risks and vulnerabilities for social
ecological systems at specific spatial and temporal scales are not fully known (Stern,
2006; IPCC, 2012). This inherent uncertainty impairs adaptation planning and
interventions to address site specific problems caused by weather/ climate induced
threats. Key questions have arisen at agency and state levels about how best to
approach the appropriate adaptation strategies to improve longer-term adaptation
outcomes. The most common approach has been one of resilience, in which the aim
is to ensure that systems stressed and shocked by weather-related hazards are able to
bounce back to a previous stage in a modified form. While such resilience building
can strengthen the adaptive capacity of local communities, less attention has been
paid to taking more robust actions that go beyond technical and system-maintaining
solutions along the lines proposed by Pelling (2011) and Kates et al. (2012). Pelling
argues strongly for a political economy approach that focuses on the realization and
stronger institutionalization of citizen’s rights within the established regime (his
transitional phase) followed by a reconfiguration and more radical re-thinking of the
objectives and practices of development. This latter notion of transformational
adaptation seeks a change in the governance of development with a radical
devolution of decision-making to local communities and regions. As Pelling (2011,
63) puts it:
…transformational adaptation describes those actions that can result
in the overturning of established rights systems and the imposition of
new regimes.
Kates et al. (2012) adopt a similar if less directly political approach to what is needed
to provide longer term protection to local communities affected by weather-related
hazards. They define current approaches to adaptation to human induced climate
change as “incremental” as they involved extensions of already existing and
sometimes proven strategies. Their transformative framework focuses on multi-scalar
and more intensive change, new adaptation measures and collective changes in
location or whole-scale shifts of vulnerable populations. They stress the importance
of local leadership and collective action but stop short of the more potentially radical
proposals contained within Pelling’s transformational framework.
232
Summary
This chapter has shown that local communities are trying to adapt to different
weather related adversities and impacts, either on their own initiative or with some
support of outsiders such as government agencies and NGOs in the areas of water,
aquaculture, fisheries, flooding, agriculture and erosion. It was found that most
actions were undertaken at the individual or household level and were largely
reactive, autonomous and incremental (Kates et al., 2012). They were not based on
weather vulnerability assessments and lacked any sustainable community-based
planning. Some schemes such as pond, gher and canal rehabilitation, mangrove
restoration and adaptive agriculture did adopt some aspects of the ecosystems- based
adaptation framework (EbA) and were able to contribute to the enhancement of
ecosystem services and community resilience.
For the most part, local adaptation actions aimed to achieve short term objectives that
at best enhanced levels of resilience and at worst simply allowed individual
households to cope, that is, to rely on known methods of accommodation rather than
more reflexive practices aimed at longer-term transitional or transformational
adaptation (Pelling, 2011). The NGO-farmers joint initiative in adaptive agriculture
suggested the growth of a greater political awareness of the need to challenge
existing political and economic arrangements, but at the time of writing it was
uncertain what the outcomes would be. In contrast, the annual development plans of
local government and the DAE illustrated the poor state of local planning to address
weather related vulnerabilities of local communities compared with other local
concerns. Finally, these findings suggest a lack of readiness among local people and
development actors to take robust steps to adapt to increasing weather induced
threats. This is the subject of the next chapter.

233
Chapter 9: Adaptation Readiness to the Effects of
Changing Weather Patterns
Introduction
It has been argued that research on climate change adaptation and the move towards
more climate-resilient approaches to development policy and planning have been
limited by a focus on building adaptive capacity. This may be seen as the provision
of the institutional and other means to create the potential for taking adaptive action.
What is also required is what has been called ‘adaptation readiness’ or:
...the extent to which policy processes and governance structures
which determine when, how, and if adaptation occurs, are in place
(Ford and King, 2013).
The chapter draws upon this framework to assess the degree of readiness or
preparedness of the two communities to take adaptive action. As indicators of
adaptation readiness, it considers:
i) community understandings and awareness of various government laws and acts that govern the management and utilization of natural resources in the area;
ii) community views on how to adapt to weather related hazards; local and central government programmes and activities designed to enable adaptation strategies;
iii) the availability of common pool resources (CPRs) as a basis for community-based action;
iv) community experiences with the state of safety net and disaster risk reduction services and the governance at local level by the public and private agencies, including the elected local government bodies or UPs; and
v) the quality and experiences of local NGO staff and UPs in working with local people and their views on barriers to adaptation barriers.
The relevant data are derived from KAP survey, case studies, FGD and KII across the two village communities, local government, primary school teachers and local public agencies.
Adaptation, Adaptive Capacity and Adaptation Readiness
234
Several developing countries, including Bangladesh, are moving towards what has
been referred to as climate-resilient development or the mainstreaming of climate
issues into development planning. Bangladesh introduced its national climate change
strategy and action plan (BCCSAP) in 2008 and in 2009 it revised a key aim, to
integrate adaptation planning into the wider development policy framework (MoEF,
2009). Since then two major funds have been established to assist with the
incorporation of climate adaptation into development planning. They are the
Bangladesh Climate Change Resilience Fund (BCCRF) operated by the Bangladesh
government, development partners and the World Bank; and the Bangladesh Climate
Change Trust Fund (BCCTF) financed by the Bangladesh Government.
An example of how development planning can be made more climate-resilient comes
from agriculture. An adaptation programme aimed at coastal agricultural
development involves altering the normal design of such programmes to take into
account current and anticipated future climate related threats, which in the current
study, include erratic rainfall, frequent flooding due to akash bonnaya (intense rain
based flooding), more prolonged pre or monsoon drought (lomba khora) and
increasing temperatures, which in conventional agricultural development
programmes are given less or no priority. A programme would involve the
assessment of local level climate vulnerability (current and projected) to farming
systems and the development of local interventions based on the findings of such an
assessment.
The climate-resilient development planning also recognizes the need for cross
organizational, technical and disciplinary approaches that seek to avoid fragmented
and sector specific interventions. For example, in the Bangladesh case, several
governmental agencies are tasked with addressing salinity and water related issues.
Thus, the DAE (Department of Agriculture Extension) has to collaborate with the
BWDB in relation to dykes, sluice and drainage management issues, with the DoF
manages shrimp farming induced salinity that affects crop agriculture, and with local
government and local administration (including the Ministry of Land - MoL) to deal
with freshwater availability, wetland protection and conflict resolution related to crop
versus shrimp farming, land tenure, salinity and other issues. For improved and
climate and pest resilient rice varieties, the DAE has to collaborate with the
Bangladesh Rice Research Institute (BRRI) and Bangladesh Agricultural Research
235
Institute (BARI), and with private seed companies. For social mobilization,
awareness and capacity building and farmer empowerment, involvement of NGOs is
required.
To make such inter-agency coordination effective at the grass-roots level, local
communities must have a clear understanding of which agency is mandated for
which activities/ services, be aware of the relevant state laws and acts that govern
and facilitate local development initiatives, have sufficient knowledge of the
technical and other requirements of proposed interventions, and possess the political
and social skills and networks to ensure implementation and outcomes that meet
community expectations. In other words, they must possess an overall readiness to
act.
This idea of adaptation readiness is a new concept in the climate change lexicon that
seeks to link adaptive capacity to the political and other realities on the ground that
can hinder or facilitate effective adaptation (O’Brien et al., 2006; Adger and Barnett,
2009; Moser and Ekstrom, 2010). A system, be it a community, region or country,
can be unprepared to adapt to weather induced threats even if it has strong adaptive
capacity. Ford and King (2013:5) define adaptation readiness as
…the extent to which human systems (e.g. nations, regions, business,
communities, etc.) are prepared to adapt, providing an indication or
measure of the likelihood of adaptation taking place.
Adaptation readiness is thus conceptualized as a framework for assessing whether a
system is actually able to implement appropriate strategies of adaptation. It deals
with the translation of policy and planning into actual practices (Ford and King,
2013). (See figure 1.6 in Chapter 1).
Local Adaptation Readiness
Adaptation readiness has cross scale dimensions with local actions nested within
larger organizational, spatial and temporal scales. However, in Bangladesh, key
elements of such readiness are lacking. For example, the DoF has no role in fisheries
management and development within the SRF due to its institutional isolation within
the architecture of current national policy. The FD has the sole authority for the
overall management of all SRF resources, including fisheries, but it has no fisheries
personnel or fisheries unit within its organizational structure. The DoF has the
236
national mandate for the country’s overall fisheries management but is unprepared to
implement, for example, a fisheries focused adaptation programme for the
southwestern region without a major change in overarching policy and a redefinition
of the institutional roles of the respective departments and agencies. In this sense, the
current institutional and policy settings are inadequate to realize what Pelling (2011,
50) refers to as ‘adaptation for resilience’, the most basic and least controversial
aspect of current adaptation thinking.
Another example of the need for greater attention to adaptation readiness is provided
by developments in early 2013 when the IUCN, through its multi-country
programme on Mangroves for Future (MFF), took up a pilot ecosystem based
adaptation project aimed at rehabilitating a khas canal in Gabura union, adjacent to
Chakbara, to reserve rainwater for agriculture and aquaculture. However, all khas
canals in the area were under long term private leasing arrangements given to
individuals by the powerful Ministry of Land (MoL). Leaseholders were unwilling to
allow excavation and community use of the canals even after pressure from local
communities. The MFF project, even though it is in line with Bangladesh’s national
water policy, which focuses on making water available for food production and
community use, clashed with the MoL khas land policy, which is more concerned
with revenue raising than environmental protection.
These examples indicate that even if a system has adequate adaptive capacity or the
institutional potential to act, the actual adaptation may not take place because of a
failure to realize adaptation readiness (Ford and King, 2013). In this context, I
consider six areas which can contribute to building more effective adaptation or
adaptation readiness at the grassroots level.
The first area concerns local understanding of relevant state laws and acts such as the
Embankment Protection Act, Environment Protection Act, and the Fish Conservation
Act, which governs the development activities of the state as well as help to build
effective and empowered constituencies. The second relates to the current functions
of the mainstream public agencies and their institutional integration. These reflect the
state of local governance which cross-cuts all the other areas as without good
governance, adaptation actions are unlikely to be sustainable. The third concerns the
functioning of local government in disaster risk reduction in its relationship to the
UDMC and the fourth relates to community attitudes to climate change adaptation
237
and community adaptation priorities. A fifth area concerns the protection and
management of common pool resources (CPRs). Locally available CPRs such as
wetland, forests, and roadside borrow pits, and char land are all state owned
resources and have high potential for resilience building if they are protected and
managed sustainably in a pro-poor manner. Roadside borrow pits were open to all in
the past and were used by local people, mostly the poor, as CPRs for fishing and
irrigation for winter rice and vegetable production. As such, they allowed people to
earn an income and secure their livelihoods, thus enhancing their resilience. The
sixth area is that of the state of social safety net and emergency disaster response
activities at local (UP) level, which if they function properly and are free from
corruption, have the potential to facilitate and sustain adaptation actions.
Ford and King (2013) highlight six adaptation readiness factors. These are i) political
leadership, ii) institutional organization, iii) adaptation decision making and
stakeholder engagement, iv) availability of usable adaptation science to inform
decision making, v) funding for adaptation, and vi) public support for adaptation,
which are more aligned to policy and institutional capacity levels. Some of these
factors correspond to the six readiness factors considered in this study at local levels.
The first is political leadership as indicated by the role of the UP in disaster and
adaptation, CPR management and political interference in access to and distribution
of adaptation funds. The second is institutional organization, which relates to the
functions of relevant government agencies, the capacity and understanding of
adaptation by institutional actors and the, facilitation of social safety net activities.
Third is stakeholders engagement, which can take the form of community
engagement in local development planning such as dyke management with the
BWDB. The fourth concerns public support for adaptation, which includes
community attitudes to prioritizing adaptation, the absence of usable science to
inform adaptation decision making and awareness building activities.
There is general consensus among adaptation researchers and policy makers that
adaptation works best where relevant institutions work in a collaborative and
transparent manner with local communities to meet mutually agreed upon priority
needs to adapt to the impacts of weather induced adversities (Jones, 2010). Such
institutional capacity across levels of government and between government, NGOs
and local people is regarded as a central aspect of adaptive capacity as it is required
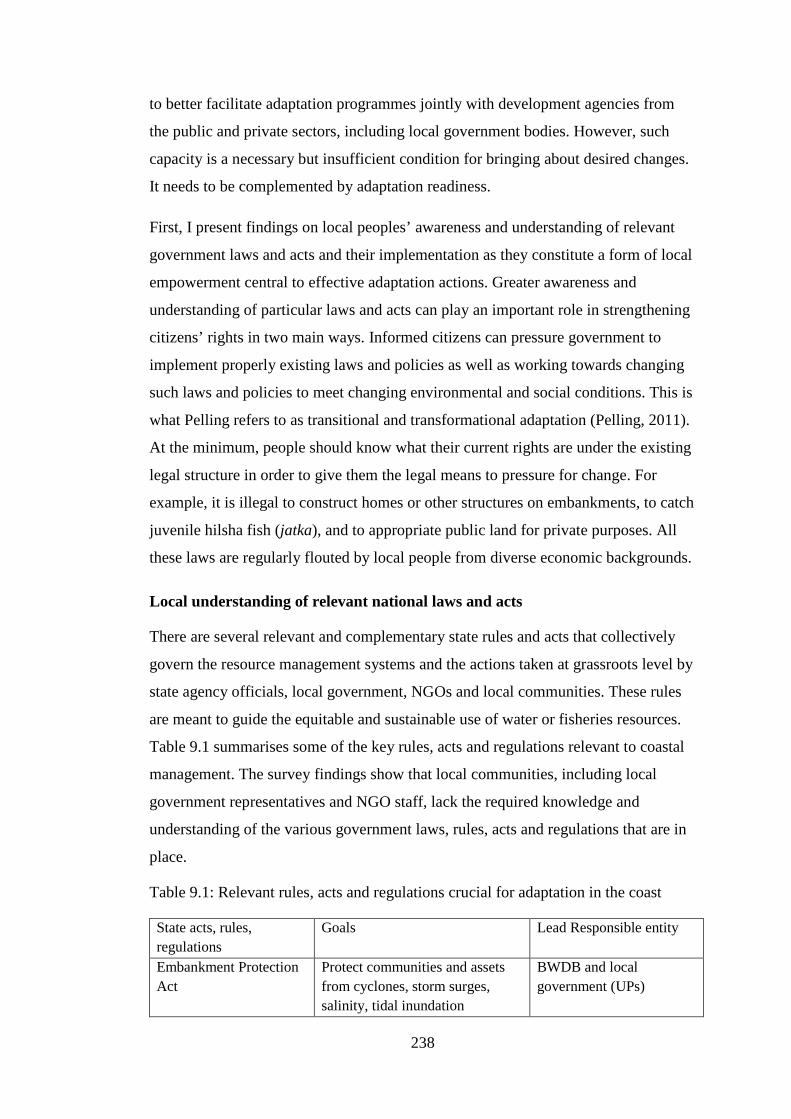
238
to better facilitate adaptation programmes jointly with development agencies from
the public and private sectors, including local government bodies. However, such
capacity is a necessary but insufficient condition for bringing about desired changes.
It needs to be complemented by adaptation readiness.
First, I present findings on local peoples’ awareness and understanding of relevant
government laws and acts and their implementation as they constitute a form of local
empowerment central to effective adaptation actions. Greater awareness and
understanding of particular laws and acts can play an important role in strengthening
citizens’ rights in two main ways. Informed citizens can pressure government to
implement properly existing laws and policies as well as working towards changing
such laws and policies to meet changing environmental and social conditions. This is
what Pelling refers to as transitional and transformational adaptation (Pelling, 2011).
At the minimum, people should know what their current rights are under the existing
legal structure in order to give them the legal means to pressure for change. For
example, it is illegal to construct homes or other structures on embankments, to catch
juvenile hilsha fish (jatka), and to appropriate public land for private purposes. All
these laws are regularly flouted by local people from diverse economic backgrounds.
Local understanding of relevant national laws and acts
There are several relevant and complementary state rules and acts that collectively
govern the resource management systems and the actions taken at grassroots level by
state agency officials, local government, NGOs and local communities. These rules
are meant to guide the equitable and sustainable use of water or fisheries resources.
Table 9.1 summarises some of the key rules, acts and regulations relevant to coastal
management. The survey findings show that local communities, including local
government representatives and NGO staff, lack the required knowledge and
understanding of the various government laws, rules, acts and regulations that are in
place.
Table 9.1: Relevant rules, acts and regulations crucial for adaptation in the coast
State acts, rules, regulations
Goals Lead Responsible entity
Embankment Protection Act
Protect communities and assets from cyclones, storm surges, salinity, tidal inundation
BWDB and local government (UPs)
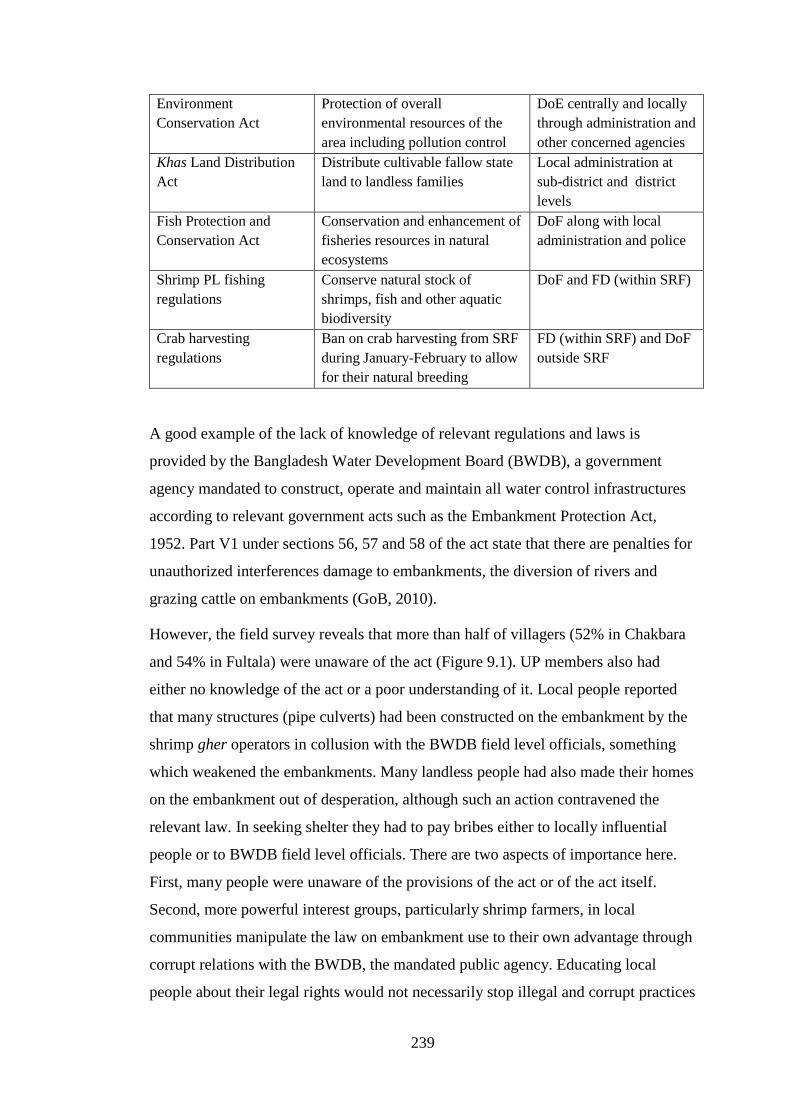
239
Environment Conservation Act
Protection of overall environmental resources of the area including pollution control
DoE centrally and locally through administration and other concerned agencies
Khas Land Distribution Act
Distribute cultivable fallow state land to landless families
Local administration at sub-district and district levels
Fish Protection and Conservation Act
Conservation and enhancement of fisheries resources in natural ecosystems
DoF along with local administration and police
Shrimp PL fishing regulations
Conserve natural stock of shrimps, fish and other aquatic biodiversity
DoF and FD (within SRF)
Crab harvesting regulations
Ban on crab harvesting from SRF during January-February to allow for their natural breeding
FD (within SRF) and DoF outside SRF
A good example of the lack of knowledge of relevant regulations and laws is
provided by the Bangladesh Water Development Board (BWDB), a government
agency mandated to construct, operate and maintain all water control infrastructures
according to relevant government acts such as the Embankment Protection Act,
1952. Part V1 under sections 56, 57 and 58 of the act state that there are penalties for
unauthorized interferences damage to embankments, the diversion of rivers and
grazing cattle on embankments (GoB, 2010).
However, the field survey reveals that more than half of villagers (52% in Chakbara
and 54% in Fultala) were unaware of the act (Figure 9.1). UP members also had
either no knowledge of the act or a poor understanding of it. Local people reported
that many structures (pipe culverts) had been constructed on the embankment by the
shrimp gher operators in collusion with the BWDB field level officials, something
which weakened the embankments. Many landless people had also made their homes
on the embankment out of desperation, although such an action contravened the
relevant law. In seeking shelter they had to pay bribes either to locally influential
people or to BWDB field level officials. There are two aspects of importance here.
First, many people were unaware of the provisions of the act or of the act itself.
Second, more powerful interest groups, particularly shrimp farmers, in local
communities manipulate the law on embankment use to their own advantage through
corrupt relations with the BWDB, the mandated public agency. Educating local
people about their legal rights would not necessarily stop illegal and corrupt practices

240
from continuing, but it would contribute to local people’s understanding of how their
rights were being abused from a legal point of view. Such socially available
knowledge is of great importance in contributing to the building of stronger
collective ties among people with like interests.
The second government act is the Bangladesh Environment Protection Act, 1995.
This act operates across the mandates of almost all public line agencies, which are
expected to comply with the act in designing their respective development
programmes. The survey findings show that two thirds of households in both
villages (67% of Chakbara and 65% of Fultala) reported they were unaware of the
law. Only a few UP members claimed to have some knowledge of the act (8% in
Gabura and 17% in Munshigonj) and the remainder had little to moderate
understanding. This means that without better awareness of the act, people cannot
judge the extent to which it is actually practiced. This is particularly important for
marginal farmers and the landless.
Landlessness is common across the whole of coastal Bangladesh. Many of the
landless engage in resource extraction activities that require access to common land
and water bodies. However, these have diminished considerably in recent decades as
a result of legal and illegal activities. Such common land and water bodies, also
known as khas land, have not been protected and properly distributed to landless
families although the relevant state regulations provide clear directives in this regard.
The study found that 38% and 62% of the villagers of Fultala and Chakbara had no
or little knowledge of the khas land distribution and regulatory system. A majority of
UP members (83% in Gabura and 92% in Munshigonj) also possessed little to
moderate knowledge, although the UP has responsibilities in the management of
such land. Khas land grabbing and conversion often create environmental problems
and the poor become the major victims of such environmental degradation. In
Fultala, there is a history of leasing and illegal grabbing of the state-owned Kultali
Khal, which has affected share croppers and wage labourers the most. Despite the
Land Department being required to maintain the Kultali khal as CPR for the benefit
of landless and marginal farming households for fishing and farming, it has been
leased out to a small number of political well-connected people for private use.
241
Villagers reported no visible activity of the responsible public agencies to protect
khas land in the area (Figure 9.2). They commented that most of the khas land
(canals, land and small rivers) were either leased out to wealthy people or shrimp
farmers or were grabbed by the wealthy and their allies. The majority of UP
members and villagers considered that the relevant government agencies were
ineffective in protecting and distributing khas land according to the requirements of
the relevant act. This mal-distribution of khas land deprived the poor from enhancing
their adaptive capacity through having greater control of such land to produce rice
and vegetables and to engage in fish and shrimp aquaculture or capture fishing. It
also had the indirect and negative consequence of increasing the social and
environmental pressure on the fragile SRF.
The Fish Protection and Conservation Act of 1950 aimed to ensure fisher access to
fish and fishing grounds on rivers, canals, beels and flooded land, the SRF and
coastal wetland. These fishing grounds have been the subject of struggle between the
fishers themselves and powerful state-backed interests before and since that time.
Under the British it was the zamindars and the colonial state itself that controlled
access. Since 1950 it has been the state acting as national landlord and leasing out
access to private interests that has dominated fisheries policy. In 1950, the then East
Pakistan government enacted the Fish Protection and Conservation Act 1950
(amended in 1982) that comprises various regulations aiming to conserve fisheries.
These include bans on catching specific types of undersized fish and on poisoning
water to catch fish, which is very common inside the SRF. This act is administered
by the DoF, in collaboration with sub-district administration, police and local
government bodies.
Some 58% of Chakbara households expressed their ignorance of what the Fish
Conservation Act was supposed to do, even though a majority of them were fishers
(Figure 9.1). In Fultala, 64% of households reported their ignorance of the act’s
purpose and content. One third of UP members in Gabura union reported having no
knowledge of the Act, although they were required to execute the act in their
respective areas.
The fisheries act incorporated a ban on shrimp PL collection from the wild in order
to protect the biodiversity of inland, coastal and marine ecosystems. Shrimp PL
catching from the wild (rivers, canals and within the SRF) with fine mesh nets

242
(locally called mosquito nets or net jals) has been a major political issue in coastal
Bangladesh as it was argued by some environmental groups and shrimp hatchery
owners that such collection destroyed fisheries biodiversity and depleted natural
stocks of shrimp in the coastal waters.
Recent studies reveal that to catch one shrimp PL, as many as 1,666 fry of other
wetland species (including macro zooplankton) are lost as by-catch (Hoq et al., 2001;
Ahmed & Troell, 2010). This by-catch loss is high because the coastal waters,
especially mangroves, are home to a variety of marine and freshwater fish species
where they feed, breed and mature (Iftekhar & Islam, 2004). Local fishers of
Chakbara reported that large fish species like pangus (Pangasius pangasius - large
catfish), med (large estuarine catfish- Arius caelatus), vangra, chaka chingri, datina
2 0
8 0
2 0
17 0
2 0
42 17
0 0
8 0
2 11
25 17
0 2
17 8
18 33
58 33
22 9
42 50
33 7
33 42
20 8
25 50
36 51
58 42
11 13
17 33
27 11
17 42
33 7
17 25
36 7
17 33
18 11
25 42
24 20
17 42
16 18
50 50
52 54
17 25
39 82
17 25
25 84
8 8
58 79
34 8
31 16
0
67 65
17 9
1 2 0 0
4 2
8 0
4 2 0 0
4 2
8 0
7 2 0
7 2
0
Dyke and sluice management rules - Chakbara villagersDyke and sluice management rules- Fultala villagers
Dyke and sluice management rules- UP GaburaDyke and sluice management rules- UP Munshigonj
Regulation on crab harvetsing - Chakbara villagersRegulation on crab harvetsing - Fultala villagers
Regulation on crab harvetsing - UP GaburaRegulation on crab harvetsing - UP Munshogonj
Regulation on shrimp PL fishing - Chakbara villagersRegulation on shrimp PL fishing - Fultala villagers
Regulation on shrimp PL fishing - UP GaburaRegulation on shrimp PL fishing - UP Munshigonj
Fish conservation act - Chakbara villagersFish conservation act - Fultala villagers
Fish conservation act - UP GaburaFish conservation act - UP Munshigonj
Khas distribution rules - Chakbara villagersKhas distribution rules - Fultala villagersKhas land distribution rules - UP Gabura
Khas land distribution rules - UP Munshigonj
Environment conservation act - Chakbara villagersEnvironment conservation act - Fultala villagers
Environment conservation act - UP GaburaEnvironment conservation act - UP Munshigonj
Figure 9.1: Communities' knowldge on development rules and acts: a survey of villagers (n = 90) and UP members (n=24) was
conducted in 2012
Know well (%) Know moderate (%) Know less 9%)Do not know (%) No comment (%)

243
and vetki (Barramundi) which were once commonly found in rivers around the
villages had become very rare. Household survey data shows that 44% of the
households in Chakbara were involved in shrimp PL catching as their primary
occupation and 63% of women headed households survived on shrimp PL catching.
Although illegal since 2000, it has continued unabated along the entire coast of
Bangladesh. Regarding the government’s shrimp PL ban, 7% and 35% of the
households in Chakbara and Fultala respectively reported they had limited
knowledge of the act. UP members had better knowledge, with 59% and 75%
members of Gabura and Munshigonj respectively stating they had a moderate level
of awareness of the act. However, their knowledge of the ban did not prevent them
from allowing PL collection to continue.
Besides fish and shrimps, mud crab (Scylla serrata) has supported the livelihoods of
coastal people. Initially neglected socially as poor man’s work, it has become a big
fishery and both poor and rich are involved in the trade. To sustain the natural crab
stock, the GoB imposed a two month ban in the months of January and February,
which corresponded with the peak breeding time of crabs, in order to sustain the crab
fishery. Accordingly, the FD stopped issuing entry permits for crab collection during
these two months. However, the ban has proved to be ineffective in curbing crab
catching efforts due to a lack of effective monitoring as well as a lack of awareness
by crab collectors of the ban and its purpose. Over 38% and 80% of households in
Chakbara and Fultala respectively expressed their ignorance of the crab ban, which
meant people continued to catch crabs without entry permits. UP members were
better informed but saw it as the responsibility of the FD.
It can be argued that the local ignorance of laws and acts reduces a community’s
capacity or readiness to claim rights and entitlements, which, in turn, hinders the
likelihood of effective adaptation. This is not to say that local people live in
complete ignorance of the law, as many flout regulations that they are aware of
simply because they believe they have little or no choice. In this, they are often aided
and abetted by the better-off traders and locally powerful business people who form
part of the domestic supply chains connecting the resource extractors to local,
regional and national buyers and processors.
Ecosystems and biodiversity in the study area are already impacted due to various
anthropogenic causes (over harvesting of fish, crabs, shrimp PL and habitat
244
degradation and conversion coupled with low freshwater flows form upstream)
affecting the livelihood of local communities. On the top of these, weather /climate
change and variability have exacerbating depletion of natural resources. In this
context, proper awareness and execution of related laws and acts (fisheries and
environmental conservation laws) can protect ecosystems and biodiversity for
environmental and social benefits. However, current policy operates in a punitive
manner with the relevant government agencies (FD, DoF or BDWB) working with
local police to apprehend people breaking laws. Less attention and interest is shown
by these agencies in increasing local awareness of the laws and the reasons why they
exist. A focus on deterrence ignores alternative strategies aimed at generating new
income-generating opportunities so the poor can maintain their livelihoods and
indirectly contribute to building their resilience.
Another component of effective adaptation is the extent to which relevant central
government agencies actually deliver the services they are mandated to do and the
views and reactions of local people to their activities. The next section discusses this.
Functions of development agencies – state of governance
The increasing importance given to mainstreaming climate change into development
planning means that the activities, roles and responsibilities of public agencies
charged with addressing local development issues are central to the climate
adaptation process (Huq and Ayres, 2008). There is increasing interest in
development planning to move away from seeing development and climate change
adaptation as two separate institutional activities, to seeing how they can be
integrated to serve a wider sustainable development agenda (Adger at al., 2007). In
this section, I present my survey findings as to how the relevant government line
agencies provided their mandated services to address local development issues in
their relevant sectors (see Table 9.2). For example, how effective has the BWDB
been in the operation and maintenance of coastal dykes, flood control and
community participation in dyke management? How has the FD managed the fish
sanctuaries inside the SRF and the ban on crab collection during breeding time? How
effective has the DoF been in providing technical support to shrimp farmers and what
has the DAE been able to do to support farming communities sustain crop production
with the extension of saline or stress tolerant farming systems into local areas? How

245
effective have local campaigns and other activities been in raising community
awareness at local level of climate change issues and impacts
0
0
0 0 0 0
0 0 0 0
0 0 0
17
0 0 0 0
0 0 0 0
0 0
8 8
0 0 0
8
0 0 0 0
0 0 0 0
0 0 0 0
2 0 0
17
20 38
8 0
22 36
17 0
22 11 8
0
38 58
67 33
27 27
0 0
42 51
0 0
31 31
8 0
38 27
0 0
54 11
0 0
44 16
8 0
18 27
0 0
42 31
42 17
37 22
0 42
31 36
17 25
29 24
17 8
33 42
17 33
27 18
17 17
20 49
42 33
18 44
8 42
22 38
25 33
16 33
0 17
65 56
25 50
37 31
50 83
40 42
83 58
47 53
75 58
33 18 17
59
38 31
83 67
31 31
75 75
49 20
50 59
42 29
92 58
24 51
75 67
40 51
92 83
15 18
75 33
0 20 40 60 80 100
Maintenace of dykes by BWDB- Villagers, ChakbaraMaintenance of dykes by BWDB- Villagers, Fultala
Maintenance of dykes by BWDB- UP, GaburaMaintenance of dykes by BWDB- UP, Munshigonj
Community participation in dyke mnagement - Villagers, ChakbaraCommunity participation in dyke mnagement - Villagers, Fultala
Community participation in dyke mnagement -UP, GaburaCommunity participation in dyke mnagement -UP, Munshigonj
Govt. activities towards khas land protection -Villagers, ChakbaraGovt. activities towards khas land protection -Villagers, Fultala
Govt. activities towards khas land protection -UP, GaburaGovt. activities towards khas land protection -UP, Munshigonj
Management of sanctuaries inside SRF by FD- Villagers, ChakbaraManagement of sanctuaries inside SRF by FD- Villagers, Fultala
Management of sanctuaries inside SRF by FD- UP, GaburaManagement of sanctuaries inside SRF by FD- UP, Munshigonj
Execution of fish act by the govt agencies - Villagers, ChakbaraExecution of fish act by the govt gaencies - Villagers, Fultala
Execution of fish act by the govt agencies - UP, GaburaExecution of fish act by the govt agencies - UP, Munshigonj
Execution of crab ban period by the govt agencies - Villagers,…Execution of crab ban period by the govt agencies - Villagers, Fultala
Execution of crab ban period by the govt agencies - UP, GaburaExecution of crab ban period by the govt agencies - UP, Munshigonj
Security to fishers in sea and SRF by the govt- Villagers, ChakbaraSecurity to fishers in sea and SRF bythe govt- Villagers, Fultala
Security to fishers in sea and SRF by the govt- UP, GaburaSecurity to fishers in sea and SRF by the govt- UP, Munshigonj
Technical support from govt. to shrimp farmers - Villagers, ChakbaraTechnical support from govt. to shrimp farmers - Villagers, Fultala
Technical support from givt. to shrimp farmers - UP, GaburaTechnical support from govt. to shrimp farmers - UP, Munshigonj
Support from govt for saline tolerant rice farming - Villagers, ChakbaraSupport from govt. for saline tolerant rice farming - Villagers, Fultala
Support grom govt. for saline tolerant rice farming - UP, GaburaSupport from govt. for saline tolerant rice farming - UP, Munshigonj
Support from govt. for drought tolerant rice farming - Villagers,…Support from govt. for drought tolerant rice farming - Villagers, Fultala
Support from govt. for drought tolerant rice farming - UP, GaburaSupport from govt. for drought tolerant rice farming - UP, Munshigonj
Activity to raise awareness of CC impacts- Villagers, ChakbaraActivity to raise awareness of CC impacts- Villagers, Fultala
Activity to raise awareness of CC impacts- UP, GaburaActivity to raise awareness of CC impacts- UP, Munshigonj
Figure 9.2: Current management practices in line of climate change adaptation: perceptions of effectiveness by villagers (n =90 ) and UP
members (n = 24), survey was done in 2012
Most effective (%) Effective (%) No activity/no idea (%)Less effective (%) Not effective (%)

246
The examples given below, which relate largely to a lack of good governance,
largely predate current national concerns and actions over the potential impact of
climate change on local resources both inside and outside the SRF. This strengthens
the argument that any climate change policy must deal with the wider governance
structures of the state within which local people operate.
The role of the BWDB in the proper operation and maintenance (O and M) of coastal
dykes is central in safeguarding communities by reducing their exposure and related
vulnerabilities to hazards. However, the evidence shows that local communities have
limited trust in the BWDB to do its job. When asked to comment on the effectiveness
of BWDB’s current role in dyke management, 31% and 37% respondents of Fultala
and Chakbara respectively stated it was “completely ineffective” and 31% (Fultala)
and 42% (Chakbara) stated it was “less effective”. None were of the opinion that the
DWDB’s work is effective (Figure 9.2). This indicates that current levels of
BWDB’s services are inadequate to protect coastal people from cyclones and tidal
surges. Local UP members (50% from Gabura and 83% from Munshigonj) also
expressed their negative attitude to the performance of BWDB in water management
and flood control (dyke and sluice management) in the area.
With regard to community engagement in dyke management processes, over 40% of
community members responded that their involvement was either ineffective or less
effective and 58% and 83% of UP members in Gabura and Munshigonj were of the
same opinion (Figure 9.2). This suggests that the dykes give local people a false
sense of security as a result of ineffective O & M practices and the disconnectedness
of local communities from dyke management activities. Recent events are testimony
to this lack of trust as it took over 18 months for the BWDB to fix the cyclone-
breached dyke in Gabura union. It also indicates a low readiness of the BWDB to
support community level adaptation. Such weak capacity and non-responsiveness of
the responsible public agency to their mandated responsibilities increases the
exposure of communities to hazards and thus increases their vulnerability.
The problem of poor governance of natural resources in the SRF is illustrated by the
government’s sanctuary policy. The government declared three sanctuaries inside the
SRF in places which are designated as World Heritage sites and banned the
harvesting of any resource from these designated areas. The sanctuaries were chosen
as they had high potential to rejuvenate the health and biodiversity of natural
247
ecosystems both within and outside the spatial boundaries of sanctuaries. However,
survey results revealed a gloomy picture on the management of the sanctuaries. No
UP members had anything positive to say about sanctuary management. The data
shows that 33% and 67% of the UP members of Gabura and Munshigonj respectively
were not aware of any FD activity on sanctuary management and 17% and 59%
respectively regarded current sanctuary management to be ineffective (Figure 9.2).
At the village level, 38% and 58% of Chakbara and Fultala households also stated
they had not seen any activity by the FD with the rest saying the management was
ineffective. Some local fishers said that the sanctuaries were being heavily fished by
fishers in collusion with the field level FD officials. One fisher of Chakbara said:
Quite often the FD field staff asked us to bring more fishers to do fishing
inside the sanctuary areas so that they could get more money from us.
We regularly pay the FD field staff for allowing us to do illegal fishing
inside the sanctuary. The FD field staffs not only allow us to do fishing
inside the sanctuaries but also informed us to leave when the senior FD
officials came to visit the sanctuaries.
The sanctuaries in SRF are thus acting as havens for fishers and foresters, rather for
fish and wildlife. Fishers said that they got more fish in the sanctuary than other
areas, which attracted more people to do fishing inside the sanctuary and the FD field
staff took this opportunity to make money illegally. The size and remoteness of the
SRF provides local FD staff with extra protection in their corrupt practices. Often,
other relevant agencies, including the FD itself, do not have any firsthand
information of how the sanctuaries are being managed. Besides technical
management of SRF, the local poor who used to collect SRF resources are harassed
in many ways by the foresters.
Some SRF users commented that they often found the foresters more dangerous than
tigers and that they were next to God in terms of exercising power over people.
Users pay “additional money” to the FD officials when collecting entry permits and
once inside they continue to harassed by officials who ask for money as “duty fees” ,
meaning that while on duty to watch for illegal fishing, FD staff approach fishers for
money even if they have legal entry permits. A local SRF resource user of Chakbara
said:

248
I tried to stop bribing the FD people but eventually I had to surrender.
The FD officials have enough power, if they wish they could sue case
against anybody at any time for hundreds of reasons. Therefore, I
decided it is better to bribe, keep them happy and harvest resources as
you like.
While fishers and other SRF resource users such as bowalies and mowalies can be
said to share common interests in having fair and equitable access to SRF resources,
this has not led to any organized cooperation among them to challenge the illegal use
of power by foresters in the FD. The users have become used to a system of
clientalism in which they seek entry permits through agents of the FD officials who
operate in local villages. Such a practice works against cooperative action. Apart
from the FD field officials, the poor resource users were harassed by the bandits
inside the SRF.
The adaptive readiness of local people also depends on a secure ‘law and order’
environment in which people can go about their business without threat from thieves
and other criminal elements. However, operating in the SRF and lower estuary has
become riskier due to the actions of local bandits who steal fish, money and take
people hostage for a ransom. While government had attempted to curb such
activities, some villagers who were aware of government actions thought not enough
was being done. Their growing personal insecurity has put greater pressure on local
people to exploit further the resources of the SRF to offset the losses incurred by
paying bandits. Thus, banditry can be seen as an indirect cause of the destruction of
the SRF.
Historically, bandits have operated within the interstices of state power or in
collusion with local power brokers. In the past they targeted wealthier people who
invested in SFR resource collection. However, local people report that almost
everybody, rich or poor, are open to attack by bandits. Shubash Mondal, a poor
bagdi fisher from Kalbari village (adjacent to fish landing centre, Munshigonj), said:
In the past, even before the cyclone Aila in 2009, they were not harassed
by bandits as they are from the very poor and lower class of the society –
bagdi. Bandits used to say “oh! You are the bagdis, just go away”. Now,
they do not care whether we are bagdi or what else, but demand money

249
from us. Sometimes they detain one of our fishing members to ply their
boat for a week or so and also ask for ransom.
Increased attacks have several causes. There are many more users in the SRF than in
the past who are fair game for local bandits. Another factor is the growth of shrimp
farming in the region. Fishers said that the bandit problem had increased over the last
20 years after the start of shrimp farming. Growing unemployment among labourers
and sharecroppers who once worked the rice fields may also have attracted some to
the bandit groups, which they see as a quick and easy source of money compared
with collecting shrimp PL of fishing, which is laborious and risky. Sushanta Mondal,
a fisher from Chandipur village said:
A month back, bandits took me from the boat and asked for ransom of
Tk. 50,000 (US $ 641) and contacted my family for the money. Then my
family contacted a local mohajan and borrowed Tk. 10,000 (US $
128.21) which was then handed over to bandits and I got released after a
week. This not only caused a loss of money but also I lost the fishing
opportunity and associated income for seven days. My family and I had
to suffer a lot from mental anxiety plus increased debt burden…
The fear of kidnap and ransom makes fishers and other SRF resource collectors more
dependent on local mohajans, which increases further their social vulnerability.
Currently, all types of fishers, whether sea going or local, have become potential
targets of bandits. They now include the estimated cost of paying bandits as part of
their operational costs. For example, on each fishing trip, each goisha jal operator
requires some Tk 8,300 (US $ 106.41) as operational costs which they borrow from
mohajons. Usually three people in one boat operate six goisha jals. Estimated costs
of operating a fishing trip in the Bay are given in Table 9.2.
Table 9.2: Operating cost of one trip of fishers operating goisha jal (Interview with a
fish trader in Kolbari Fish Landing Centre)
Items required Costs % of costs
Remarks
BDT US $ Ice 10 blocks 1,300 17 15.66 Each block cost 130 taka Food items and other costs 2,000 26 24.09 For the group FD entry permit costs 1,000 13 12.05 FD also take additional money Paying two bandit groups 2,000 26 24.09 Illegal/ Coercively collected

250
FD office inside SRF (3
locations) 1,500 19 18.07 Illegal collection /bribes
Fish marketing cost 500 6 6.03 Handling, weighing Total: 8,300 106 100
Source: An elderly fisher from Chakbara, Gabura union
It is seen (Table 9.2) that a quarter (24%) of the operating cost was paid to the
bandits and another 20% to FD officials, which is close to a half of the operational
cost. This exploitation of fishers encourages them to fish illegally and to overfish.
They also cut trees in the forest while fishing, which further increases pressure on
forest resources. In summary, banditry combined with corrupt forestry practices
hinder people’s readiness for adaptation and increases their social and physical
vulnerability. Villagers pointed out that the amount of ransom and the release of
hostages was negotiated at different levels. With poor fishers, a small ransom is
demanded and negotiated locally while for more substantial amounts negotiations
escalated to district and even higher levels. The banditry issue is well known to
political leaders and administrators but their effort to control it does not seem to have
been effective.
Another area of government policy is the conservation of fisheries. However, no
local fishers or UP members knew of any steps taken by government to apply the
Fish Conservation Act related to regulations regarding gear and mesh size, taking of
juvenile hilsha fish (jatka), and the ban on poison fishing in canals of the SRF. Local
people made similar observations with regard to the execution of the crab harvesting
ban period in the SRF. A good numbers of villagers (42% - Chakbara 51% - Fultala)
said they had never seen any government action to carry out the crab bans while one-
third said the FD’s effort in this regard were ineffective. The majority (75%) of UP
members said that the application of the FD’s crab ban was “completely ineffective”
(Figure 9.2).
The DoF has a mandate to assist shrimp farmers to reduce their impact on local
social and ecological environments, particularly rice farming. Shrimp farming is
generally more profitable than rice farming but has led to the introduction of two
major problems: viral diseases that can lead to a collapse of shrimp farming and poor
cultivation technologies with low yields. However, local villagers and UP members
251
people expressed serious doubts about the DoF’s capacity and willingness to act.
Their doubts can be grouped into three categories. Between 27% and 38% of
villagers stated that DoF took no action to assist. Between 18 and 44% considered
DoF support to be of limited effectiveness while 29 to 42% stated DoF was
ineffective. No respondents considered DoF support for shrimp farmers was
effective. The majority of UP members (Gabura- 58% and Munshigonj-92%) said
that local farmers did not get technical and material support from local DoF officials
in solving their day to day problems and rated their services as ineffective (Figure
9.2). In fact, over the last 5 years the DoF had virtually no fisheries or aquaculture
development activities in Gabura and Munshigonj unions except attending some
training programmes organized by NGOs.
Another main government agency is the DAE (Department of Agriculture
Extension), which assists agricultural production in the area. The communities
reflected their frustration with the work of the DAE with 37% and 40% rating its
activity as ineffective, 22% and 53% as less effective and 5% and 40% as completely
ineffective. Figure 9.2 shows that 50% and 75% of UP members in the two unions
stated that the DAE’s support to rice farmers was ineffective. Part of the DAE’s brief
is to assist farmers with new salt tolerant strains of rice. Demonstration of saline
tolerant rice varieties (BRRI dhan 47 in winter) at farmers’ plots in Chakbara
(Gabura union) was shown to produce good yields (over 6.5 tonnes per hectare),
which is above the national average (CNRS, 2012). The Bangladesh Rice Research
Institute (BRRI) invented saline tolerant rice varieties suitable for coastal areas but
the evidence shows that the agricultural extension department of the government
(DAE – Department of Agriculture Extension) did not systematically disseminate the
varieties to farmers in high saline affected coastal areas. Over 11% and 54% of the
villagers of Fultala and Chakbara respectively said DAE had done nothing for them
while 24% and 51% said what had been done proved to be ineffective (Figure 9.2).
The majority of UP members (Munshigonj-67% and Gabura-75%) also considered
the DAE work with salt tolerant rice crops was ineffective. Similar experiences were
shared by villagers and UP members in the case of DAE’s support to farmers with
drought tolerant technology on rice farming.
These data show that the extraction and production systems in the area are seriously
neglected and suffering from various technical, managerial and policy related
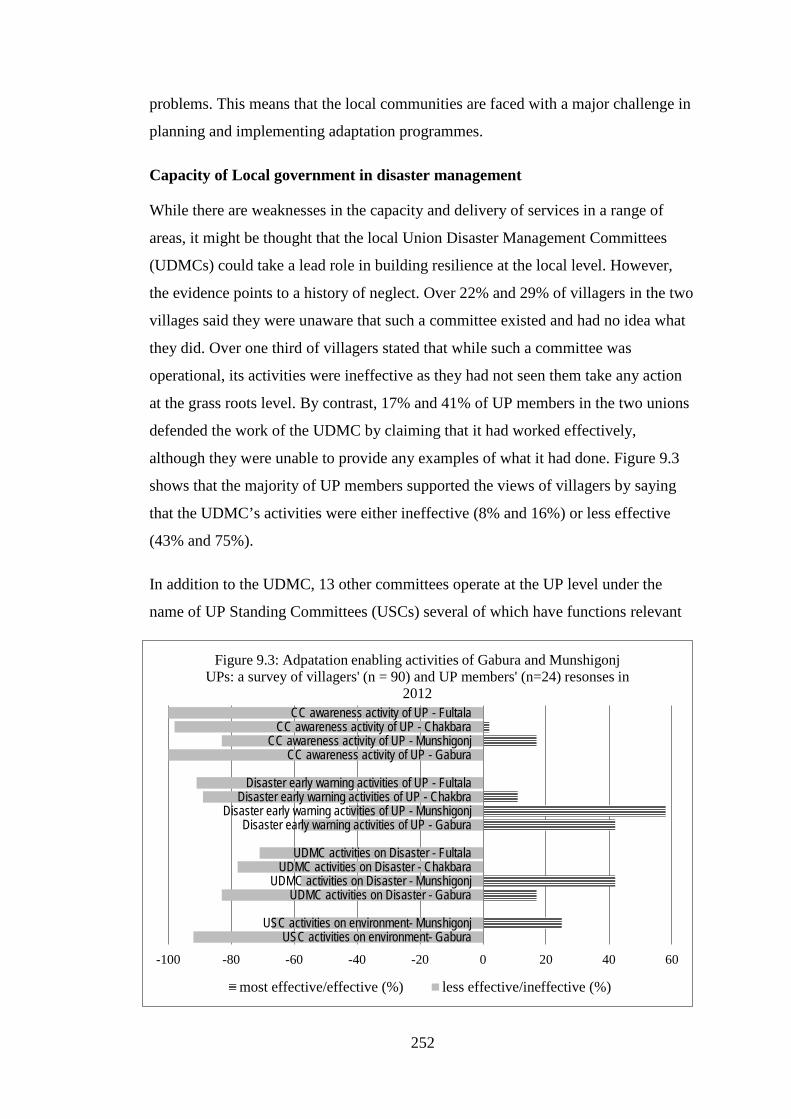
252
problems. This means that the local communities are faced with a major challenge in
planning and implementing adaptation programmes.
Capacity of Local government in disaster management
While there are weaknesses in the capacity and delivery of services in a range of
areas, it might be thought that the local Union Disaster Management Committees
(UDMCs) could take a lead role in building resilience at the local level. However,
the evidence points to a history of neglect. Over 22% and 29% of villagers in the two
villages said they were unaware that such a committee existed and had no idea what
they did. Over one third of villagers stated that while such a committee was
operational, its activities were ineffective as they had not seen them take any action
at the grass roots level. By contrast, 17% and 41% of UP members in the two unions
defended the work of the UDMC by claiming that it had worked effectively,
although they were unable to provide any examples of what it had done. Figure 9.3
shows that the majority of UP members supported the views of villagers by saying
that the UDMC’s activities were either ineffective (8% and 16%) or less effective
(43% and 75%).
In addition to the UDMC, 13 other committees operate at the UP level under the
name of UP Standing Committees (USCs) several of which have functions relevant
-100 -80 -60 -40 -20 0 20 40 60
USC activities on environment- GaburaUSC activities on environment- Munshigonj
UDMC activities on Disaster - GaburaUDMC activities on Disaster - Munshigonj
UDMC activities on Disaster - ChakbaraUDMC activities on Disaster - Fultala
Disaster early warning activities of UP - GaburaDisaster early warning activities of UP - Munshigonj
Disaster early warning activities of UP - ChakbraDisaster early warning activities of UP - Fultala
CC awareness activity of UP - GaburaCC awareness activity of UP - Munshigonj
CC awareness activity of UP - ChakbaraCC awareness activity of UP - Fultala
Figure 9.3: Adpatation enabling activities of Gabura and Munshigonj UPs: a survey of villagers' (n = 90) and UP members' (n=24) resonses in
2012
most effective/effective (%) less effective/ineffective (%)
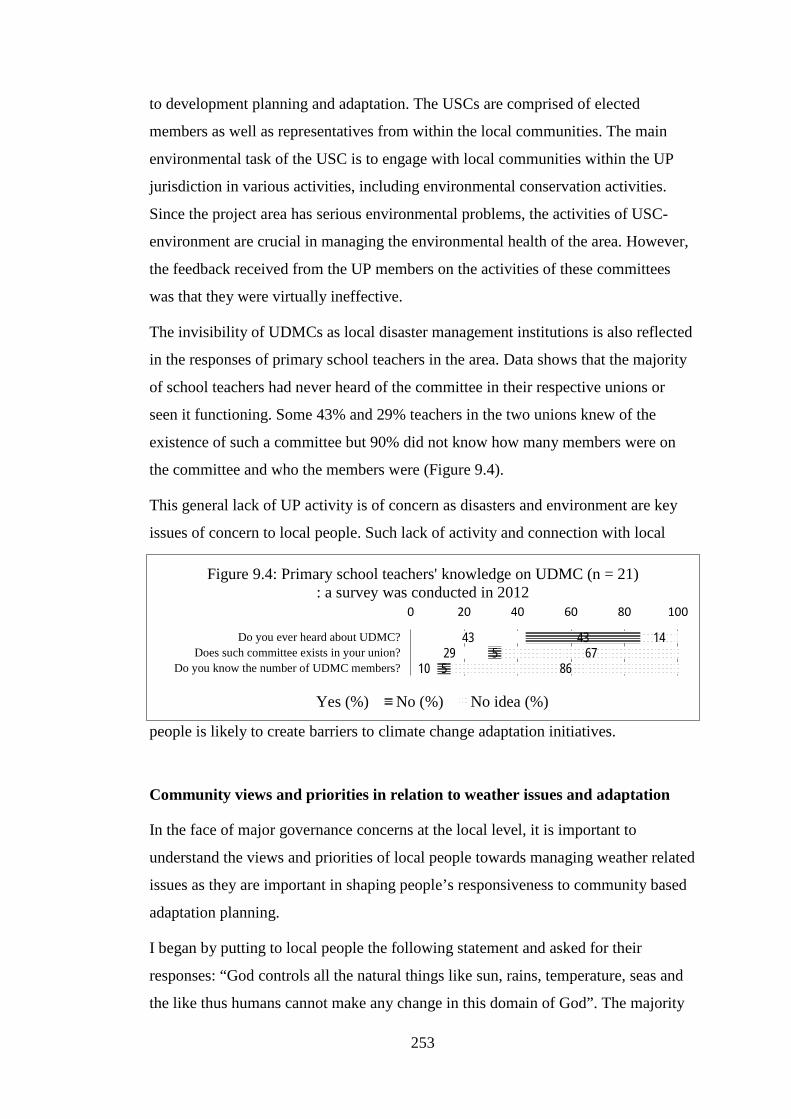
253
to development planning and adaptation. The USCs are comprised of elected
members as well as representatives from within the local communities. The main
environmental task of the USC is to engage with local communities within the UP
jurisdiction in various activities, including environmental conservation activities.
Since the project area has serious environmental problems, the activities of USC-
environment are crucial in managing the environmental health of the area. However,
the feedback received from the UP members on the activities of these committees
was that they were virtually ineffective.
The invisibility of UDMCs as local disaster management institutions is also reflected
in the responses of primary school teachers in the area. Data shows that the majority
of school teachers had never heard of the committee in their respective unions or
seen it functioning. Some 43% and 29% teachers in the two unions knew of the
existence of such a committee but 90% did not know how many members were on
the committee and who the members were (Figure 9.4).
This general lack of UP activity is of concern as disasters and environment are key
issues of concern to local people. Such lack of activity and connection with local
people is likely to create barriers to climate change adaptation initiatives.
Community views and priorities in relation to weather issues and adaptation
In the face of major governance concerns at the local level, it is important to
understand the views and priorities of local people towards managing weather related
issues as they are important in shaping people’s responsiveness to community based
adaptation planning.
I began by putting to local people the following statement and asked for their
responses: “God controls all the natural things like sun, rains, temperature, seas and
the like thus humans cannot make any change in this domain of God”. The majority
43 29
10
43 5
5
14 67
86
0 20 40 60 80 100
Do you ever heard about UDMC?Does such committee exists in your union?
Do you know the number of UDMC members?
Figure 9.4: Primary school teachers' knowledge on UDMC (n = 21) : a survey was conducted in 2012
Yes (%) No (%) No idea (%)
254
of villagers and UP members agreed with this statement. There are several ways of
interpreting this response. The most obvious is that it indicates a fatalism about
human’s capacity to intervene in the natural world, which could restrain some from
taking up proactive measures for adaptation (planned adaptation). It also suggests
that local people lack an understanding of how extensive human intervention has
been in altering climatic conditions. This suggestion received some support from the
next statement when I asked about priority actions to be taken in the area. Local
people were asked which problems should be given greater priority, non-climate
related problems or climate-related ones such as adaptation. Some 73% of Fultala
respondents and 74% of those in Chakbara stated that non-climate concerns should
take priority over climate change adaptation (Figure 9.5). However, most members
of Munshigonj UP disagreed, with 75% stating that climate change programs should
be given priority. Surprisingly, two thirds of the UP members of Gabura union,
which is highly vulnerable to climate change impacts, disagreed with their
Munshigonj counterparts and agreed with the communities that non-climate issues
should be given priority. These responses provide some support for what has been
called the Giddens paradox (Giddens, 2009: 2), which states that because climate
change does not appear obvious or recognizable within the experience and
understandings of local people, they are less likely to support rapid action to deal
with it. Giddens extends this idea when he refers to the idea of ‘future discounting’,
by which he means:
People find it hard to give the same level of reality to the future as
they do to the present (Giddens, 2009: 2).
It suggests that even where local people have an abstract awareness that something
called the climate is changing, the issue is still not experienced or understood enough
within the local context to warrant urgent action through a mobilization of local
resources.
The villagers were asked if there was anything they could do to reduce climate
change impacts. There were mixed responses but the majority agreed that they could
play little role in reducing the impacts of climate change. However, some villagers
(4% in Chakbara and 18% in Fultala) appeared confused by the question and did not
respond. More importantly, 31% and 42% of Fultala and Chakbara villagers
disagreed that there was little they could do and that they did have a role to play in
255
responding to climate change impacts. In addition, a majority of UP members (58%
in Gabura and 75% in Munshigonj) did not agree that they could not do anything and
were positive about the importance of local people becoming more engaged with
climate change concerns. This suggests a degree of institutional and popular support
for action on climate change adaptation.
However, the evidence also shows that tension existed between the UP leadership
and local people over UP’s capacity to deal with climate change adaptation. To this
end, UP members were asked whether their current capacity was adequate to tackle
climate related problems in the area. Figure 9.5 shows that out of a total of 24 UP
members surveyed, the majority (75% and 84% in Gabura and Munshigonj)
considered their current capacity to be inadequate to deal with climate change
problems. They stated there was a need to enhance local capacity to effectively plan,
design and implement climate change adaptation projects in the area. It is also
important to understand how their local constituents judged the capacity of their
elected representatives to assist them in meeting the various hazards that threatened
their well-being. They were asked to respond to the following statement: “I have
trust in UPs that they can tackle climate related problems”. The majority of
community members (69% in Chakbara and 80% in Fultala) disagreed while 11%
and 13% remained non responsive. Interestingly, 75% and 84% of UP members in
Gabura and Munshigonj respectively also agreed about their poor capacity.
The villagers and UP members were then asked how they thought the central
government could contribute to dealing with climate change problems in their
locality. Here again a majority of villagers (64% in Chakbara and 75% in Fultala)
said they did not trust the central government agencies working in the area to help
solve climate related problems. The UP members expressed similar views, with 50%
and 33% from Gabura and Munshigonj respectively agreeing that they did not trust
central government agencies. This indicates that the local people had lost their trust
in and were dissatisfied with the performances of both the local and central
government agencies which affected planning and implementation of effective
adaptation interventions.

256
42 51
75 75
9 0
8 17
67 31
8 67
22 24
0 8
16 16
0 8
71 20
83 75
49 22
8 50
0 17
36 13
0 8
9 2
0 42
9 2
0 8
22 47
25 17
9 11
8 17
29 64
92 33
31 27
25 8
20 29
50 25
11 64
8 17
33 60
58 33
0 0
38 60
67 8
13 4
75 42
16 11 17
58
0 0
0 8
11 29
25 0
4 4
0 0
4 18
17 0
11 7 0
0
7 9
0 0
13 13
25 0
8 0
2 7
8 8
9 13
17 8
11 11
33 0
16 0
0 0
13 11
0 8
0 0 0 0
33 13
0 8
22 18
8 8
7 2
0 0
2 2
0 0
17 0
16 13
0 17
38 22
8 0
42 24
0 8
20 2 0 0
58 49
58 58
0 0 0 0
9 18
58 75
31 31
42 58
4 4
8 8
2 2
8 17
75 83
9 7
25 58
31 58
0 8
22 51 50
25
God controls sun, rains, sea, man can not change these- Villagers ChakbaraGod controls sun, rains, sea, man can not change these- Villagers Fultala
God controls sun, rains, sea, man can not change these- UP, GaburaGod controls sun, rains, sea, man can not change these- UP, Munshigonj
SRF is a vast resource system, CC can not affect it - Villagers ChakbaraSRF is a vast resource system, CC can not affect it - Villagers Fultala
SRF is a vast resource system, CC can not affect it - UP GaburaSRF is a vast resource system, CC can not affect it - UP Munshigonj
Before planning adaptation I need to know more about CC - Villagers ChakbaraBefore planning adaptation I need to know more about CC - Villagers Fultala
Before planning adaptation I need to know more about CC - UP GaburaBefore planning adaptation I need to know more about CC - UP Munshigonj
My villagers and I have nothing to do to reduce CC impacts - Villagers…My villagers and I have nothing to do to reduce CC impacts - Villagers Fultala
My villagers and I have nothing to do to reduce CC impacts - UP GaburaMy villagers and I have nothing to do to reduce CC impacts - UP Munshigonj
Human activity is not causing CC rather it is natural change - Villagers…Human activity is not causing CC rather it is natural change - Villagers Fultala
Human activity is not causing CC rather it is natural change - UP GaburaHuman activity is not causing CC rather it is natural change - UP Munshigonj
SRF is vast, FD alone can not sustainably manage it - Villagers ChakbaraSRF is vast, FD alone can not sustainably manage it - Villagers Fultala
SRF is vast, FD alone can not sustainably manage it - UP GaburaSRF is vast, FD alone can not sustainably manage it - UP Munshigonj
Due to SLR major part of SRF will be damaged in future - Villagers ChakbaraDue to SLR major part of SRF will be damaged in future - Villagers Fultala
Due to SLR major part of SRF will be damaged in future - UP GaburaDue to SLR major part of SRF will be damaged in future - UP Munshigonj
Currently UP has no role to manage/ save SRF resources - UP GaburaCurrently UP has no role to manage/save SRF resources - UP Munshigonj
Priority should be given to other issues than CC problems - Villagers ChakbaraPriority should be given to other issues than CC problems - Villagers Fultala
Priority should be given to other issues than CC problems - UP GaburaPriority should be given to other issues than CC problems - UP Munshigonj
I have trust of UP, they can tackle CC problems - Villagers ChakbaraI have trust of UP, they can tackle CC problems - Villagers Fultala
Currently, UP has no capacity UP to address CC problems - UP GaburaCurrently, UP has no capacity UP to address CC problems - UP Munshigonj
I have trust of central govt. they can tackle CC problems - villagers ChakbaraI have trust of central govt. they can tackle CC problems - villagers Fultala
I have trust of central govt. they can tackle CC problems - UP GaburaI have trust of central govt. they can tackle CC problems - UP Munshigonj
Figure 9.5: Community views on dealing with weather/climate probelms: a survey was conducted of villagers (n = 90) and UP members (n = 24) in
2012
Strongly agree (%) Agree (%) No comment (%) disagree (%) Strongly disagree (%)
257
The focus of attention then changed to community views on current management
practices of SRF by the FD. Local people have a high reliance on SRF resources for
their livelihoods, and their future was of great concern to them in terms of
underpinning their livelihoods and providing protection from cyclones and storm
surges. To this end, I assessed community views of expert opinions that a major part
of the SRF is likely to be damaged by climate induced sea level rise (SLR) in the
future (UNESCO, 2007). The majority of the communities (80%) and UP members
(66-83%) agreed with this statement. I then asked villagers to respond to the
following: The SRF is a vast resource system and climate change cannot affect its
integrity. Here again the majority of the local communities (60-71%) and UP
members (58-66%) disagreed with the statement, meaning they thought that climate
induced SLR will affect the SRF. It should be remembered that these responses were
given with the impact of cyclone Aila fresh in people’s memories and the on-going
and largely negative impacts of natural and human-induced changes on the SRF.
From the resources point of view, the SRF has three dimensions. First, it is a vast
mangrove forest located in the inter-tidal zone of the coast, and a forest resource
base. Second, it is a large fisheries resource base and many varieties of freshwater,
brackish and marine fin fish and shell fish species use this mangrove as their
breeding, nursery and feeding grounds. Third, it is a large wildlife habitat that
provides home for a wide range of wildlife species including migratory birds, sea
turtle nesting sites and one of the largest habitats in the world for the endangered
Bengal tiger. The SRF is thus a multiple resource system upon which multiple
stakeholders are dependent in terms of access and use of various resources and they
often compete among themselves for such access and use.
However, this vast and multiple resource system is being managed by the FD alone,
which is institutionally a department of well-trained foresters with a small wildlife
wing, it is dominated by the foresters with regard to policy, strategy and activities
relevant to SRF management. There is no fisheries wing in the FD and thus virtually
no management of the fisheries of the SRF, except for the issuing of entry permits
and record keeping of fish landings with intermittent checking of fishing boats.
The Government of Bangladesh declared three wildlife sanctuaries within the SRF
with clear boundaries in order to create a haven for fish and other wildlife. However,
during my fieldwork, I was informed by the local fishers that the sanctuaries were
258
not managed properly and were being heavily fished in collusion with the field level
forest officials.
With regard to the community views on improved management of SRF, a majority of
villagers (82% and 84%) and UP members (92%) agreed that the FD alone was
unable to effectively manage the resource. They all favoured multi-stakeholder based
management of SRF rather than the FD-alone system. Currently there is no role for
UPs in the management of SRF and 75% to 83% of UP members expressed the view
that they had no role in its management (Figure 9.5).
The evidence presented suggests that local villagers and UP members have limited
knowledge of weather change issues and impacts. I then asked them to respond to the
following statement: Before planning for adaptation, I need to know more about
weather/ climate change issues. Nearly 100% villagers and UP members emphasized
the necessity of enhancing their knowledge on climate change, suggesting that this
lack of understanding could hamper the implementation of practical adaptation
interventions. Given the fact that the local communities have unclear understanding
and mixed opinions of weather issues in prioritizing local development, I looked at
the status of common pool resource (CPR) systems and their current management
practices which have high potential to support the poor communities in adapting to
environmental shocks.
Common Pool Resources (CPRs) management
CPRs have the capacity to absorb various shocks and stresses associated with
environmental change affecting local livelihoods. For example, wetland and forests
CPRs contribute to ensuring a balance between human needs for food security and
livelihoods and environmental sustainability. The restoration, protection and
management of available CPR bases provide social and ecological benefits (MEA,
2005). Since most CPR bases include ecosystems, there exists high potential for the
adoption of ecosystem-based adaptation approaches that can provide cross-household
benefits and support community-based adaptation initiatives rather than focusing
singularly on individual or household level adaptation schemes (CBD, 2009).
All these CPR bases are owned by the state (khas land). Constitutionally, it is the
responsibility of the concerned government agencies, including local government, to
protect and maintain the CPR bases for the benefit of local ecosystems and their

259
biodiversity which, in turn, provide community livelihoods. However, the current
management of CPR is contrary to the state policy aimed at benefitting the poor and
conserving biodiversity. I asked Fultala villagers to respond to the following
statement: Government is effectively protecting and managing CPR bases in your
area. In response, 75% did not agree with the statement and indicated that
government efforts to protect the CPR bases were ineffective (Figure 9.6).
Physical alteration is one of the main causes of the loss of CPR bases. For example,
wetland are filled or converted to cropland, settlements, roads and infrastructure and
for other uses. With such alternations, CPRs lose their ecosystem functions and
quality and are no longer able to provide ecosystem services and products to local
communities. For the most part, the beneficiaries of altered CPRs are a limited
proportion of the general population. As an example, a major section of the Kultali
Khal (shared between Fultala and Kultali villages) of around 3 km is leased to only
18 people and most of them converted the leased canal to cropland, fish ponds,
settlements. Hundreds of households in three villages were unable to use the khal for
fishing, irrigation, collection of aquatic weeds, and other activities related to the
provision of food, fuel and fodder. Around 80 hectares of crop land that had once
been irrigated with canal water to produce winter rice was denied water once leasing
of the canal began. The majority of Fultala villagers agreed that the quality and types
of CPR should not be altered but be protected and used sustainably for the benefit of
the wider community as they experienced such changes negatively affect the
livelihoods of the poor (Figure 9.6).
Often physical alterations to CPR bases affecting local villagers were localized
disasters that created flooding and drainage congestion. Fultala and Kultali villages
experienced drainage congestion and consequent flooding after physical alterations
to Kultali Khal and their amon rice crops were damaged during monsoon rains
(Figure 9.6).

260
Another major issue of concern to local people and other rural communities in
Bangladesh was the use of CPRs for fishing. Bangladesh has a long history of local
struggles over control of fishing grounds and there is much evidence that the current
leasing system has failed to provide access to local poor, including fishers, to
wetland and has further entrenched asset and income inequalities in rural areas. One
of the key struggles has been over attempts to introduce community based
management of wetland and other CPRs to help the poor make a living. There was
strong support expressed by people in Fultala for the community-based management
of CPR resources. Over 98% of respondents expressed support for the community
management of CPR bases for the greater benefit of the poor (Figure 9.6). Over 95%
also agreed that the planning and management of CPRs should be based on the
opinion and experience of local user communities. Although there is high risk of elite
capture, this problem can be contained if not fully overcome if the overall multiparty
governance structure and system was made functional. There are examples in
Bangladesh where community based organizations (CBOs) formed under co-
management projects were able to establish rights and access to wetland replacing
local elites with the support of DoF, local government agencies and project teams
(Halder and Thompson, 2006).
These sorts of natural resource bases under CPR regimes have a high potential to
help poor communities absorb shocks from climate and non-climate stressors and a
shift to a pro-poor sustainable management of these CPR bases can contribute to
providing a basis for better adaptation options for coastal areas. However, local
readiness for effective adaptation in places such as Fultala is seriously impaired
when CPRs are lost or degraded.
0% 20% 40% 60% 80% 100%
CPR management plans should be based on local knowledge
Pro-poor CPR mangement is better than revenue earning focus
CPR should be under CB-NRM rather giving lease to a few people
CPR alteration increases localized disasters (viz.water logging)
CPR alterations affect biodiversity and livelihoods of the poor
CPRs should not be altered rather protected and used sustainably
Government is effectively protecting and managing CPR bases
Figure 9.6: Community responses on current management of CPRs in Fultala (N = 45): a survey was done in 2013
fully agreed agreed disagreed fully disagreed no comments

261
Overall, many local people thought that most fishing leases had gone to rich and
influential people either directly or through informal channels (30%) and that even
where fishers were in nominal control of a lease, it was wealthier non-fishers who
financed the fishers and were able to use the papers and documents of fisher
cooperatives to obtain leases of wetland. Figure 9.7 shows that 60% of local people
blamed weak governance and political influence as the main barriers to a sustainable
and pro-poor management of CPRs in the area. This problem of elite capture led me
to examine in more detail the workings of local government in the two village areas.
State of safety net and disaster risk reduction activities at local level
The Government of Bangladesh has launched several social safety net programmes
aimed at helping the poor and marginalized households to maintain their livelihoods
during the lean period, when work is scarce, and to protect households with elderly
and disabled people and widows. These programmes include old age allowances, a
VGD programme (vulnerable group development), a VGF or vulnerable group
feeding programme, allowances for widows and a 100-day work programme during
seasonal lean periods. All these initiatives target extreme poor and vulnerable
households and aim to assist them strengthen their capacity to absorb the various
pressures they face. They are implemented through the UPs at village level.
Although designed to help vulnerable households, villagers commented that it was
often very hard for them to access these services because of corruption, inadequate
facilities and nepotism. The household survey data collected from the two study
villages shows that poor people had encountered similar corrupt practices in
30%
10%
60%
Figure 9.7: Percived barriers to pro-poor management of CPRs in Fultala (n = 45) : a survey was done in 2013
Most CPR leases go to richpeopleLack of awareness/ degradation
Weak governance/ politicalinfluence

262
accessing these services from their respective UPs. The data shows that none of the
eligible households got their full entitlements. Chakbara households had access to all
five types of packages in varying degrees but most Fultala households were excluded
from having access to these benefits (Table 9.3). They mentioned several reasons for
their exclusion.
Table 9.3: Extent to which safety net services reached the households: a survey of
villagers done in 2012 (n = 90).
Safety net packages Eligible HHs (Nos.) Benefits actually received (%)
Chakbara Fultala Chakbara Fultala
Old age benefits 6 4 50% 0%
VGD benefits 21 7 14% 0%
VGF benefits 36 4 86% 0%
Widow allowances 4 6 25% 0%
100-day works package 26 18 4% 6%
The top ranked reason for lack of access to all the packages was that villagers were
unable to offer sufficient bribes to local officials and UP elected bodies (Table 9.4).
Some stated that even after paying money for entry on the eligibility list, their names
were excluded to benefit others. They found it difficult to contest such corrupt
practices as they were not organized to take collective action. People also alleged
that the UP Chairman and members failed to provide them with the correct
information on who was eligible and how to seek assistance such that many people
were excluded from benefits. Such exclusion was in some instances a result of
people working away from home. For example, Chakbara has many fishers who
spend two to four weeks at a-time fishing in the sea or lower estuaries. They claimed
that if they had been informed ahead of time about the safety net packages, they
could have re-scheduled their fishing trips to ensure they were enlisted. However, as
they had not been informed many were unable to claim any benefits.
Table 9.4: Governments safety net benefits and governance: a 2012 survey of
villagers (n = 90).
Reasons given by householders why they failed to receive safety net benefits
Percentage distribution of households by reasons for failure to receive different safety net benefits from
UPs
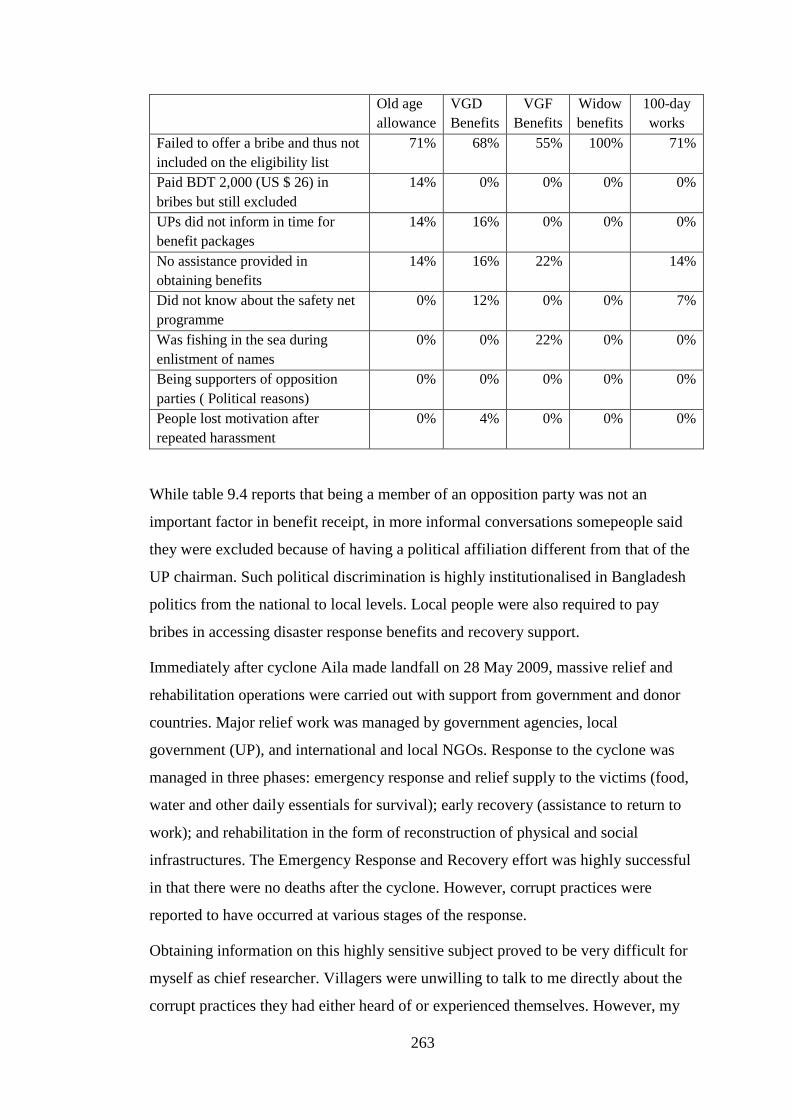
263
Old age allowance
VGD Benefits
VGF Benefits
Widow benefits
100-day works
Failed to offer a bribe and thus not included on the eligibility list
71% 68% 55% 100% 71%
Paid BDT 2,000 (US $ 26) in bribes but still excluded
14% 0% 0% 0% 0%
UPs did not inform in time for benefit packages
14% 16% 0% 0% 0%
No assistance provided in obtaining benefits
14% 16% 22% 14%
Did not know about the safety net programme
0% 12% 0% 0% 7%
Was fishing in the sea during enlistment of names
0% 0% 22% 0% 0%
Being supporters of opposition parties ( Political reasons)
0% 0% 0% 0% 0%
People lost motivation after repeated harassment
0% 4% 0% 0% 0%
While table 9.4 reports that being a member of an opposition party was not an
important factor in benefit receipt, in more informal conversations somepeople said
they were excluded because of having a political affiliation different from that of the
UP chairman. Such political discrimination is highly institutionalised in Bangladesh
politics from the national to local levels. Local people were also required to pay
bribes in accessing disaster response benefits and recovery support.
Immediately after cyclone Aila made landfall on 28 May 2009, massive relief and
rehabilitation operations were carried out with support from government and donor
countries. Major relief work was managed by government agencies, local
government (UP), and international and local NGOs. Response to the cyclone was
managed in three phases: emergency response and relief supply to the victims (food,
water and other daily essentials for survival); early recovery (assistance to return to
work); and rehabilitation in the form of reconstruction of physical and social
infrastructures. The Emergency Response and Recovery effort was highly successful
in that there were no deaths after the cyclone. However, corrupt practices were
reported to have occurred at various stages of the response.
Obtaining information on this highly sensitive subject proved to be very difficult for
myself as chief researcher. Villagers were unwilling to talk to me directly about the
corrupt practices they had either heard of or experienced themselves. However, my

264
research assistants were able to gradually collect some information on corrupt
practices, which confirmed that corruption had indeed taken place. One key obstacle
to people’s willingness to talk about corruption was fear of the local UP Chairman
who was a rich and politically powerful person who had been involved in corrupt
practices. Government agencies and NGO officials also had to follow his guidelines
in implementing relief-rehabilitation activities due to his extensive political
connections with the governing party. One particular way in which the Chairman
was able to act corruptly was by not allowing local people to fix immediately the
cyclone induced breaching points of embankments. Rather, he managed to delay
such action with the intent of letting the breaching points widen in order to claim that
more money was needed from central government, of which he would receive a
larger share. The BWDB did little to fix the embankment immediately after
breaching, silently supporting the intention of the chairman. This deliberate
negligence meant local people suffered prolonged saline water inundation for 18
months and experienced a considerable loss of assets and livelihood opportunities
(See chapter 4 for further discussion of this issue)
Other corrupt practices commented on in relief distribution activities were as
follows. There was corruption in the ways in which relief recipients were selected.
Agents of the UP chairman took bribes from people so they could receive relief
materials. The amount of money paid varied from Tk. 500 to Tk. 7,000 per person
according to the relief packages. The higher the value of the relief package, the more
they paid. The staff of some NGOs, including international NGOs, took bribe money
in enlisting the recipients, saying they had been forced to do so by the UP chairman.
However, several local people claimed that the money went into the pockets of NGO
staff. Second, in some cases, the intended relief materials were not given to the
recipients. Rather, the allocated money was shared between the recipients, NGO staff
and chairman’s agents. Third, money was appropriated by submitting false bills. For
example, if 100 labourers were employed as earth cutters, the official documents
showed that 150 people had been employed, with the extra payments taken by the
agents of the Chairman. Fourth, in some instances payments for earth cutting works
were provided in kind. For example, where a labourer was to receive 5kg rice per
day, they actually received less and the remaining amount was sold in the market.
265
These examples of corrupt practices not only point to a failure of elected local
officials and their allies to carry out their legally required duties. They also highlight
how local people became implicated in the continuation of such practices against
their will. Although there is no evidence to support it, it is likely that some of them
became agents of official distributors of relief materials as a means of enhancing
their livelihood status. The villagers confirmed that corrupt practices were extensive
across a range of officially sanctioned relief agencies and that the local UP Chairman
was directly or indirectly involved in all sorts of misappropriation of assets and
money.
Effective adaptation to weather impacts in a given setting requires an enabling
environment that should facilitate execution of adaptation interventions a good deal
of which are new and additional to conventional development planning depending on
the types and extents of weather induced threats. Apart from the communities’ views
and experience that affect adaptation and adaptation readiness, local staff of several
NGOs recounted their experiences in regard to local planning and provision of
support that have implications for future adaptation planning and implementation.
Views of local NGO staff on barriers to local adaptation readiness
Moser and Ekstrom (2010) have argued that adaptation planning and the
implementation of appropriate strategies are often obstructed, delayed or made
ineffective because of a range of obstacles associated with policy and practice and
multiple scales. However, they suggest that such ‘…obstacles can be overcome with
concerted effort, creative management, change of thinking, prioritization, and related
shifts in resources, land uses, and institutions (Moser and Ekstrom, 2010:22027).
They distinguish between limits and barriers to change, referring to limits as
‘…obstacles that tend to be absolute in a real sense (Moser and Ekstrom, 2010:
22026): they constitute thresholds beyond which existing activities, land uses,
ecosystems, species sustenance , or system states cannot be maintained, not even in a
modified fashion (Gaston, 2009; IPCC, 2007). However, some physical and
ecological limits can be overcome through technological interventions (Moser and
Ekstrom, 2010) while Adger et al. (2009) argued that many social limits can be
overcome with the right mix of political and social support, resources and
development efforts. With this in mind, I investigated local barriers to adaptation in

266
which I discussed with local NGO staff and UPs what they regarded as the main
barriers to adaptation at grassroots level in my study areas.
The field staff of several NGOs working in the area were asked to note the issues that
affected local adaptation and to prioritize them on a five-point scale as a major
problem, a problem, minor problem, not a problem and no idea. Based on this
prioritization, they ranked siltation and grabbing and conversions of rivers and canals
as the top most barriers to adaptation as these led to scarcity of water, drainage
congestion, loss of freshwater fisheries, and loss of agriculture production due to
shortage of water for irrigation (Figure 9.8). In this respect, their experiences
mirrored those of the communities as discussed in the section on CPR. NGO staff
emphasized that without proper water management for the production and extraction
sectors, local level adaptation was difficult. For example, Fultala, being a rice
farming dominated village, needs water management to provide water storage for the
dry season crop and effective drainage of excess water during the monsoon to avoid
flooding and crop loss. The leasing of the canal and subsequent conversions
permanently damaged the water management system that existed in the past. NGO
staff also mentioned increased banditry in the SRF as a barrier to adaptation. Other
than these common areas, they also noted several other barriers to successful
adaptation. These were lack of local awareness on weather issues, knowledge and
skills on adaptation methods and approaches (see also Chapter 5, Chapter 8), poor
prices for farm products, high prices of farm inputs, and the non-availability of
quality crop seeds and fish fingerlings /shrimp PL. Other barriers were lack of
coordination among relevant government agencies, lack of information on weather or
climate change at the local level, and poor coordination among the relevant
institutional actors.
More generally, NGO workers pointed out that development agencies and local
actors had yet to fully grasp the importance of linking weather/ climate change
concerns to development planning. The local UP members also identified barriers to
adaptation from their own perspectives (Figure 9.9). They emphasized lack of
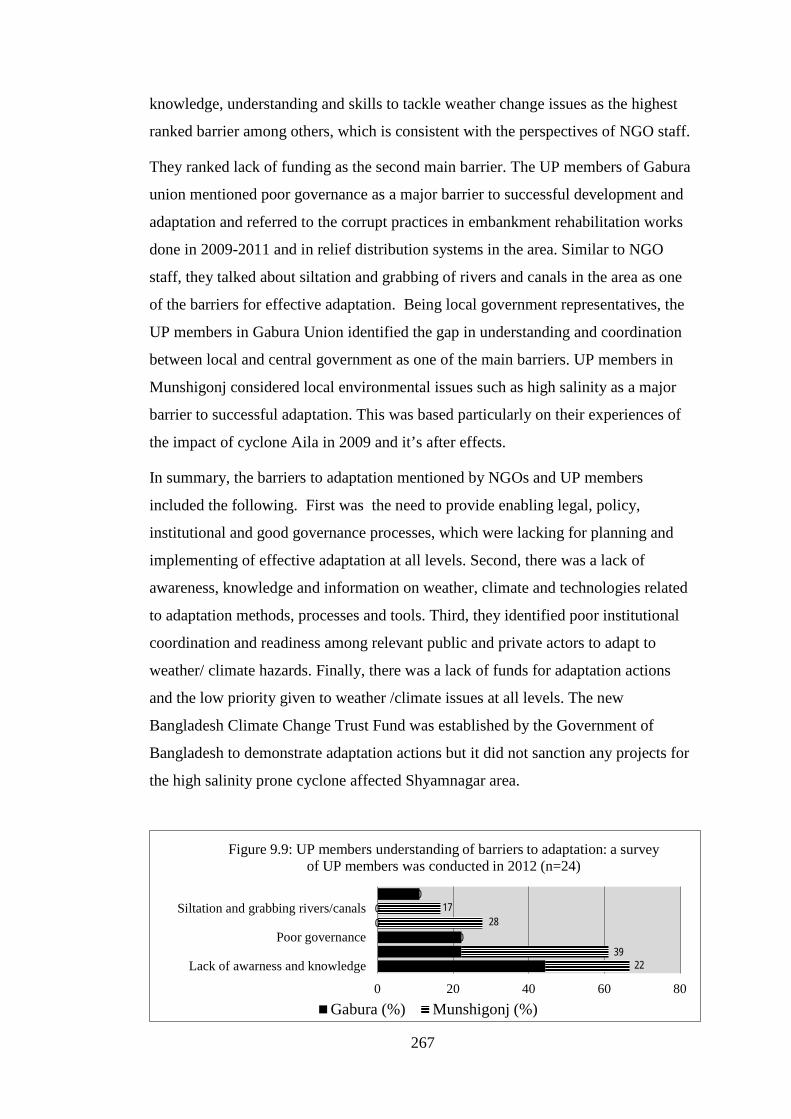
267
knowledge, understanding and skills to tackle weather change issues as the highest
ranked barrier among others, which is consistent with the perspectives of NGO staff.
They ranked lack of funding as the second main barrier. The UP members of Gabura
union mentioned poor governance as a major barrier to successful development and
adaptation and referred to the corrupt practices in embankment rehabilitation works
done in 2009-2011 and in relief distribution systems in the area. Similar to NGO
staff, they talked about siltation and grabbing of rivers and canals in the area as one
of the barriers for effective adaptation. Being local government representatives, the
UP members in Gabura Union identified the gap in understanding and coordination
between local and central government as one of the main barriers. UP members in
Munshigonj considered local environmental issues such as high salinity as a major
barrier to successful adaptation. This was based particularly on their experiences of
the impact of cyclone Aila in 2009 and it’s after effects.
In summary, the barriers to adaptation mentioned by NGOs and UP members
included the following. First was the need to provide enabling legal, policy,
institutional and good governance processes, which were lacking for planning and
implementing of effective adaptation at all levels. Second, there was a lack of
awareness, knowledge and information on weather, climate and technologies related
to adaptation methods, processes and tools. Third, they identified poor institutional
coordination and readiness among relevant public and private actors to adapt to
weather/ climate hazards. Finally, there was a lack of funds for adaptation actions
and the low priority given to weather /climate issues at all levels. The new
Bangladesh Climate Change Trust Fund was established by the Government of
Bangladesh to demonstrate adaptation actions but it did not sanction any projects for
the high salinity prone cyclone affected Shyamnagar area.
44 22 22
0 0
11
22 39
0 28
17 0
0 20 40 60 80
Lack of awarness and knowledge
Poor governance
Siltation and grabbing rivers/canals
Figure 9.9: UP members understanding of barriers to adaptation: a survey of UP members was conducted in 2012 (n=24)
Gabura (%) Munshigonj (%)
268
Using Moser and Ekstrom’s framework (Moser and Ekstrom, 2010), most of these
barriers were related to the actions of local actors such as sub-district level
government officials, UP representatives and NGOs who managed development and
adaptation planning and who brought to their task particular understandings,
priorities, attitudes and practices of adaptation. Some barriers were related to the
wider governance context within which adaptation activities took place. These were
poor compliance with state laws and acts, increased banditry, and the authoritarian
management of SRF by the FD, which excluded other relevant government agencies
and local actors in the governance process. Another set of barriers were related to the
wider socio-ecological context in which adaptation will take place. This context has
been heavily impacted by various exogenous and endogenous interventions described
in detail earlier that have, for the most part, had negative impacts on local social-
ecological systems and compromised future adaptation planning. These include the
widespread conversion of rice paddies to shrimp farms, water diversions from
upstream rivers, land and water grabbing and conversion of rivers, canals and
wetland to new uses (see Chapter 4).
Based on the multiplicity of problems and barriers discussed below is provided an
index to depict the picture on local “adaptation readiness” status for the project area.
Local Adaptation Readiness index
These findings support the argument that the local communities are not ready to take
effective adaptation to changing weather induced environmental changes and that
new approaches are required. To visualize the current status of adaptation readiness,
I developed a readiness index to help judge the status of each of the six local
readiness factors in comparison to others. The index was based on scores given to
sub-factors under each braod factor and expressed as a percentage against the
maximum possible ‘score’ one factor could get (Appendix 2). The scores for each
factor ranged from 0 to 4 where 0 represented the worst status and 4 the best status.
After cumulating the sub-factor scores under each factor, an aggregated score was
obtained which was then expressed as the percentage of the total maximum possible
score one factor could obtain. For example, appendix 2.a shows that the total
aggregated score obtained on the broad factor on “awareness of laws and acts by the
local communities” that influence their livelihoods is 10 which is 41.67% of the
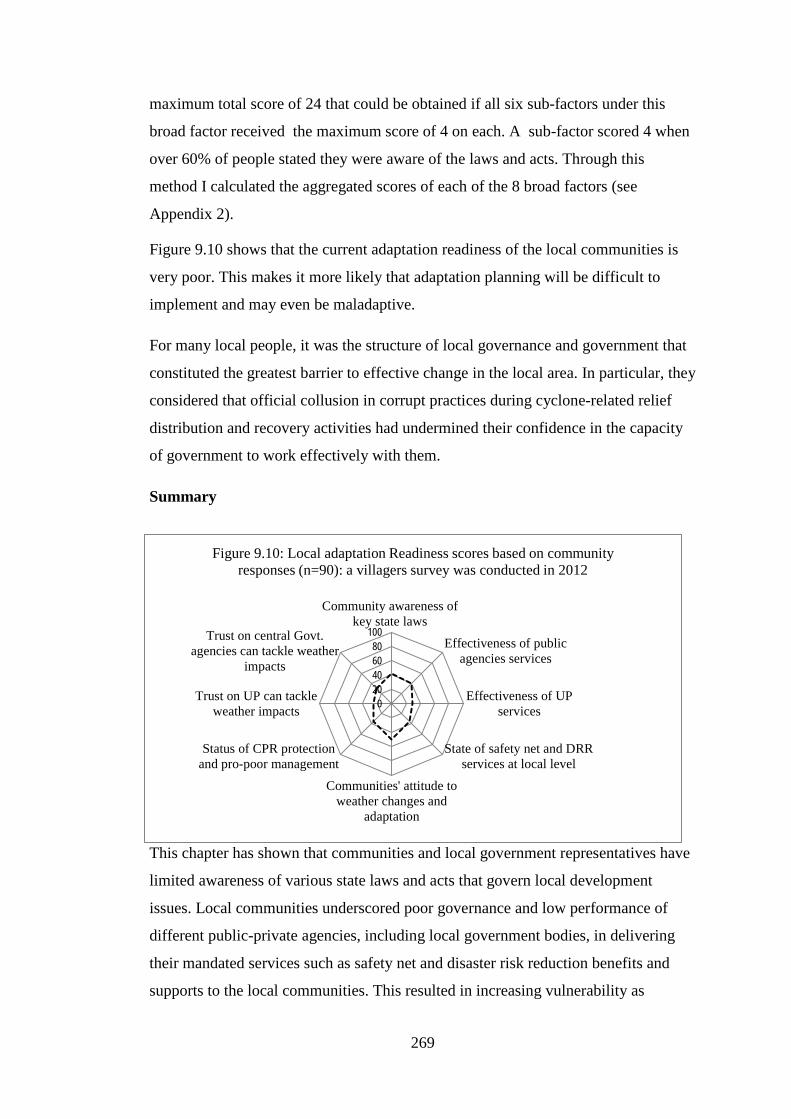
269
maximum total score of 24 that could be obtained if all six sub-factors under this
broad factor received the maximum score of 4 on each. A sub-factor scored 4 when
over 60% of people stated they were aware of the laws and acts. Through this
method I calculated the aggregated scores of each of the 8 broad factors (see
Appendix 2).
Figure 9.10 shows that the current adaptation readiness of the local communities is
very poor. This makes it more likely that adaptation planning will be difficult to
implement and may even be maladaptive.
For many local people, it was the structure of local governance and government that
constituted the greatest barrier to effective change in the local area. In particular, they
considered that official collusion in corrupt practices during cyclone-related relief
distribution and recovery activities had undermined their confidence in the capacity
of government to work effectively with them.
Summary
This chapter has shown that communities and local government representatives have
limited awareness of various state laws and acts that govern local development
issues. Local communities underscored poor governance and low performance of
different public-private agencies, including local government bodies, in delivering
their mandated services such as safety net and disaster risk reduction benefits and
supports to the local communities. This resulted in increasing vulnerability as
020406080
100
Community awareness ofkey state laws
Effectiveness of publicagencies services
Effectiveness of UPservices
State of safety net and DRRservices at local level
Communities' attitude toweather changes and
adaptation
Status of CPR protectionand pro-poor management
Trust on UP can tackleweather impacts
Trust on central Govt.agencies can tackle weather
impacts
Figure 9.10: Local adaptation Readiness scores based on community responses (n=90): a villagers survey was conducted in 2012
270
opposed to building adaptive capacity. Banditry and bribery inside the SRF increased
fisher and resource collector vulnerabilities and led to continuing destruction of the
fragile SRF resources, which, in turn, negatively affecting local social-ecological
resilience.
Local communities did not see tackling the challenges of changing weather patterns
as their main priority, stressing instead the need for action on more pressing non-
climate related local concerns. The local CPR bases had been seriously impacted
due to private leasing, land grabbing and conversions that excluded the poor
communities. They were deprived of access to various ecosystems services and lost
the opportunity of adapting to climate impacts through ecosystem based approaches
to adaptation. Local people stated they had lost their trust in local and central
government agencies and regarded them as corrupt and inefficient.
Community experiences of local barriers to adaptation were similar to those of local
NGO staff and UPs. The majority of NGO staff identified land leasing policy, canal
grabbing, privatisation and conversions as key barriers to adaptation as these
excluded poor people from productive use of these resources, caused a scarcity of
freshwater, increased salinity and drainage congestion, affecting land productivity.
They also mentioned increased banditry inside the SRF as a barrier to ecosystem
based adaptation and which pressured the poor to overharvest SRF resources and
further degrade the forest. Some stated that other barriers to successful adaptation
were the lack of coordination and sense of common purpose among various
government agencies and NGOs,a lack of information on climate change, the non-
availability and high price of production inputs, and a lack of funds. Overall, the
findings support the view that local communities’ lacked “readiness” to adapt to
weather adversities, which impeded prioritization, planning and implementation of
effective adaptation at local level.
The next chapter summarises the study’s main research findings and discusses their
implications for future research and adaptation policy.
271
Chapter 10: Summary and Conclusion
The research examined local understanding and responses to weather/climate
induced threats on local environments and livelihoods in the coastal zone of
Bangladesh. It was argued that such research is important in the light of the
difficulties of identifying the precise effects of weather induced threats in the short
term, and the subsequent importance of prioritizing local adaptation actions under
conditions of climatic uncertainty. It was also argued that weather and weather-
related changes are two factors among many that have shaped the lives and
livelihoods of local people and that such changes have entered their everyday life-
worlds. Attention was also given to the impacts of past development interventions
upon the two villages current socio-ecological conditions. It was shown that local
people’s understanding of weather is grounded largely in their local experiences and
that such experiences consist of a complex interaction between weather- and non-
weather-related events and processes. This fact makes it difficult for both local
people and the researcher to attribute any local changes specifically or precisely to
particular weather events and processes. In addition, weather and non-weather events
and processes have variable impact across and within the two study villages such that
generic adaptation prescriptions may not be realistic to tackle weather induced
threats.
Context Specificity and Local Priorities in an Age of Climate Change
It was argued that when researching the impacts of weather and weather-related
events and processes on the two study villages, it is important to recognize that the
villages have their own socio-ecological histories stretching back over decades and
centuries. Of particular importance in these histories is the impact of post-1950
development interventions on village society and economy, which occurred prior to
official and expert attention being given to the question of climate change adaptation
(elaborated in Chapter 4). These impacts include the construction of roads, polders
and water control structures, the conversion of wetland to other uses, changes in land
and waterscapes and water flow regimes. The impacts of these changes have been
uneven, affecting some groups more than others in both positive and negative ways.

272
In particular, the livelihoods of the poorer members of both villages were shown to
have been negatively affected by reduced freshwater flows, salinity intrusion, land
use change associated with the shift to shrimp farming, and also the appropriation of
land by wealthier and more powerful community members, loss of river navigation,
and reduced biodiversity. These changes have been occurring for decades and even
centuries and the origins of some of them lie outside the present-day borders of the
country.
A particularly serious problem faced by members of the two villages was high
salinity. The causes of high salinity in the southwestern coast were shown to be the
result of a combination of weather (sea level rise, drought) and non-weather
(upstream water diversions, grabbing and conversion of coastal rivers/canals, shrimp
farming, failure of coastal polders) related factors. The introduction and spread of
shrimp farming reduced the share cropping and wage laboring opportunities that
landless workers and marginal farmers had enjoyed under an earlier rice farming
regime. The reduction in such opportunities had a knock-on effect as many became
fishers and scavenged in the SRF, which created extra pressures on fish and forest
resources. The excluded poor who had once been the allies of landed farmers
gradually turn into rivals of shrimp farmers, which manifested itself in various ways,
including the growth of individual and organized opposition to the shrimp farming
regime. Capture fisheries saw a decline in catches and the private leasing and
conversions of khas wetland (rivers, canals and beels) to individuals reduced the
amount of common pool resources available and changed the agro-ecological
character of the region. The permanent loss of wetland (rivers, canals, roadside
borrow pits) resulted in a scarcity of freshwater for fisheries, agriculture, biodiversity
and other community uses in the dry season and caused localized drainage
congestion. For example, in the case of agriculture, land grabbing,conversion and
privatization of canals and road side borrow pits in Fultala village restricted farmers’
use of freshwater for irrigation and thus reduced the dry season farming areas and
yields. This affected food security and livelihoods which, in turn, reduced adaptive
capacity. The study findings confirm that all these changes, which can be linked
directly and indirectly to past exogenous and endogenous development interventions,
collectively disrupted local environments and the social and economic lives of local
people, with negative implications for their local adaptive capacity.
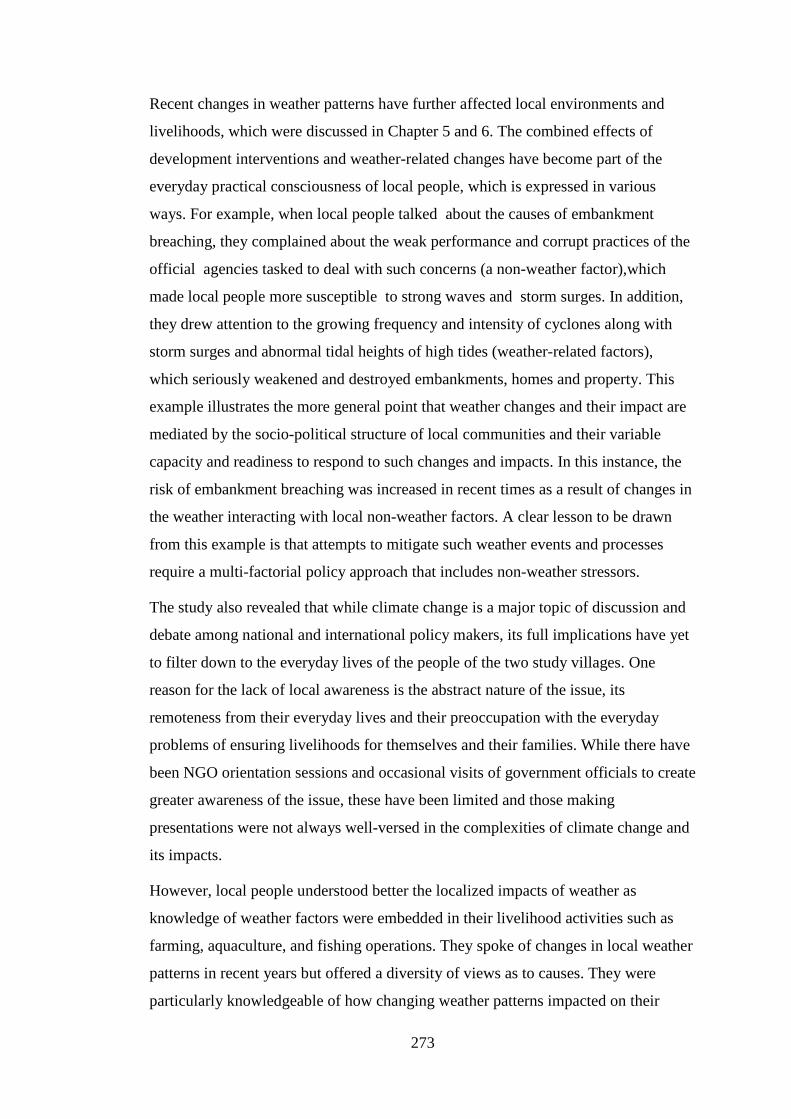
273
Recent changes in weather patterns have further affected local environments and
livelihoods, which were discussed in Chapter 5 and 6. The combined effects of
development interventions and weather-related changes have become part of the
everyday practical consciousness of local people, which is expressed in various
ways. For example, when local people talked about the causes of embankment
breaching, they complained about the weak performance and corrupt practices of the
official agencies tasked to deal with such concerns (a non-weather factor),which
made local people more susceptible to strong waves and storm surges. In addition,
they drew attention to the growing frequency and intensity of cyclones along with
storm surges and abnormal tidal heights of high tides (weather-related factors),
which seriously weakened and destroyed embankments, homes and property. This
example illustrates the more general point that weather changes and their impact are
mediated by the socio-political structure of local communities and their variable
capacity and readiness to respond to such changes and impacts. In this instance, the
risk of embankment breaching was increased in recent times as a result of changes in
the weather interacting with local non-weather factors. A clear lesson to be drawn
from this example is that attempts to mitigate such weather events and processes
require a multi-factorial policy approach that includes non-weather stressors.
The study also revealed that while climate change is a major topic of discussion and
debate among national and international policy makers, its full implications have yet
to filter down to the everyday lives of the people of the two study villages. One
reason for the lack of local awareness is the abstract nature of the issue, its
remoteness from their everyday lives and their preoccupation with the everyday
problems of ensuring livelihoods for themselves and their families. While there have
been NGO orientation sessions and occasional visits of government officials to create
greater awareness of the issue, these have been limited and those making
presentations were not always well-versed in the complexities of climate change and
its impacts.
However, local people understood better the localized impacts of weather as
knowledge of weather factors were embedded in their livelihood activities such as
farming, aquaculture, and fishing operations. They spoke of changes in local weather
patterns in recent years but offered a diversity of views as to causes. They were
particularly knowledgeable of how changing weather patterns impacted on their
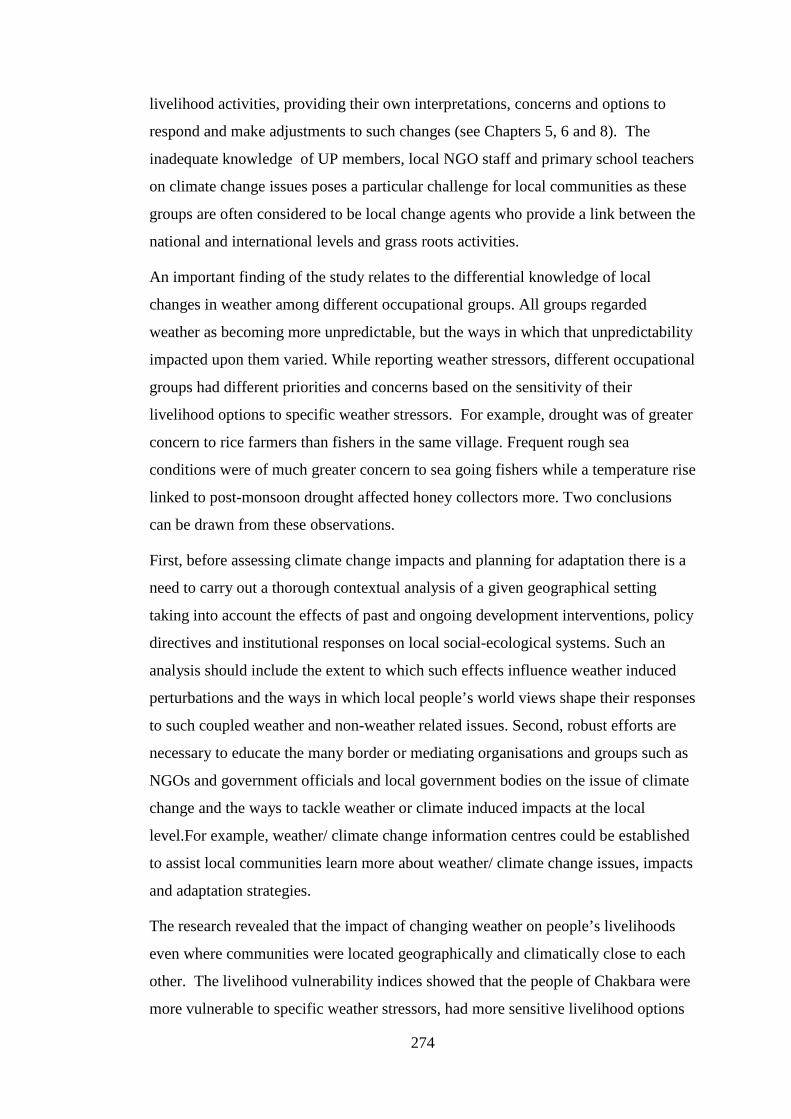
274
livelihood activities, providing their own interpretations, concerns and options to
respond and make adjustments to such changes (see Chapters 5, 6 and 8). The
inadequate knowledge of UP members, local NGO staff and primary school teachers
on climate change issues poses a particular challenge for local communities as these
groups are often considered to be local change agents who provide a link between the
national and international levels and grass roots activities.
An important finding of the study relates to the differential knowledge of local
changes in weather among different occupational groups. All groups regarded
weather as becoming more unpredictable, but the ways in which that unpredictability
impacted upon them varied. While reporting weather stressors, different occupational
groups had different priorities and concerns based on the sensitivity of their
livelihood options to specific weather stressors. For example, drought was of greater
concern to rice farmers than fishers in the same village. Frequent rough sea
conditions were of much greater concern to sea going fishers while a temperature rise
linked to post-monsoon drought affected honey collectors more. Two conclusions
can be drawn from these observations.
First, before assessing climate change impacts and planning for adaptation there is a
need to carry out a thorough contextual analysis of a given geographical setting
taking into account the effects of past and ongoing development interventions, policy
directives and institutional responses on local social-ecological systems. Such an
analysis should include the extent to which such effects influence weather induced
perturbations and the ways in which local people’s world views shape their responses
to such coupled weather and non-weather related issues. Second, robust efforts are
necessary to educate the many border or mediating organisations and groups such as
NGOs and government officials and local government bodies on the issue of climate
change and the ways to tackle weather or climate induced impacts at the local
level.For example, weather/ climate change information centres could be established
to assist local communities learn more about weather/ climate change issues, impacts
and adaptation strategies.
The research revealed that the impact of changing weather on people’s livelihoods
even where communities were located geographically and climatically close to each
other. The livelihood vulnerability indices showed that the people of Chakbara were
more vulnerable to specific weather stressors, had more sensitive livelihood options
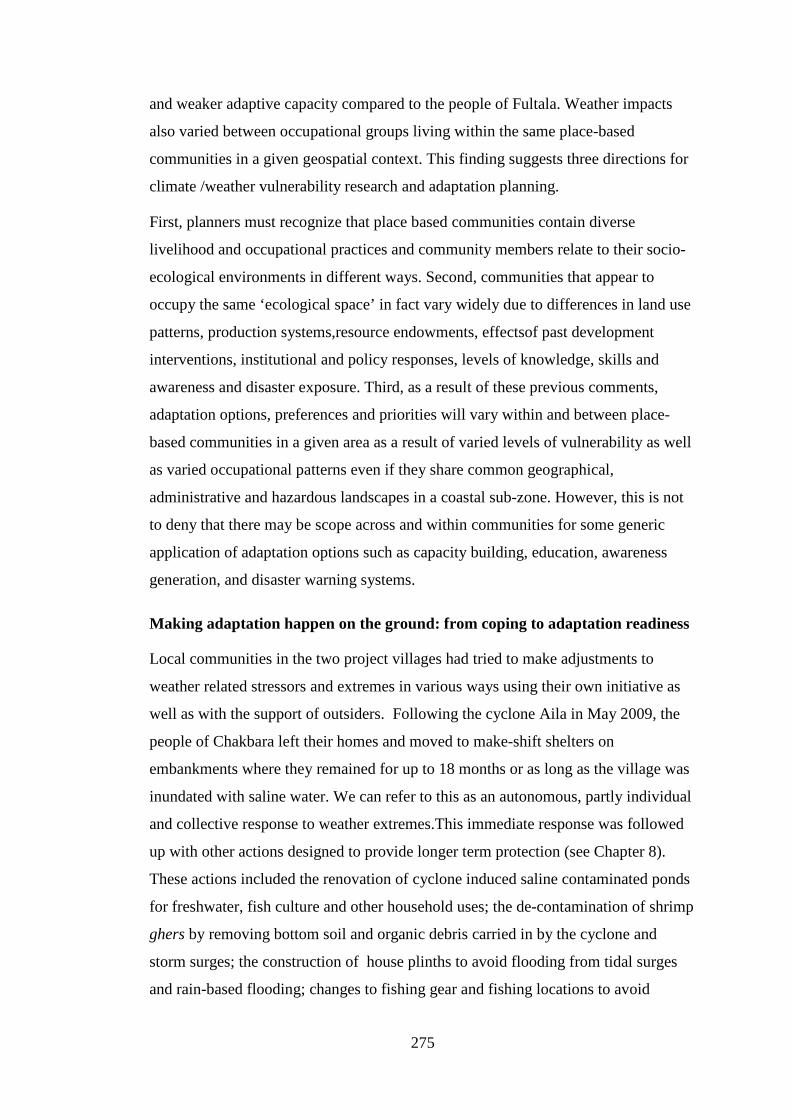
275
and weaker adaptive capacity compared to the people of Fultala. Weather impacts
also varied between occupational groups living within the same place-based
communities in a given geospatial context. This finding suggests three directions for
climate /weather vulnerability research and adaptation planning.
First, planners must recognize that place based communities contain diverse
livelihood and occupational practices and community members relate to their socio-
ecological environments in different ways. Second, communities that appear to
occupy the same ‘ecological space’ in fact vary widely due to differences in land use
patterns, production systems,resource endowments, effectsof past development
interventions, institutional and policy responses, levels of knowledge, skills and
awareness and disaster exposure. Third, as a result of these previous comments,
adaptation options, preferences and priorities will vary within and between place-
based communities in a given area as a result of varied levels of vulnerability as well
as varied occupational patterns even if they share common geographical,
administrative and hazardous landscapes in a coastal sub-zone. However, this is not
to deny that there may be scope across and within communities for some generic
application of adaptation options such as capacity building, education, awareness
generation, and disaster warning systems.
Making adaptation happen on the ground: from coping to adaptation readiness
Local communities in the two project villages had tried to make adjustments to
weather related stressors and extremes in various ways using their own initiative as
well as with the support of outsiders. Following the cyclone Aila in May 2009, the
people of Chakbara left their homes and moved to make-shift shelters on
embankments where they remained for up to 18 months or as long as the village was
inundated with saline water. We can refer to this as an autonomous, partly individual
and collective response to weather extremes.This immediate response was followed
up with other actions designed to provide longer term protection (see Chapter 8).
These actions included the renovation of cyclone induced saline contaminated ponds
for freshwater, fish culture and other household uses; the de-contamination of shrimp
ghers by removing bottom soil and organic debris carried in by the cyclone and
storm surges; the construction of house plinths to avoid flooding from tidal surges
and rain-based flooding; changes to fishing gear and fishing locations to avoid

276
increased tiger attacks inside the SRF resulting from a decline in tiger prey; changes
in fishing locations as the cyclone degraded old fishing grounds through siltation;
the regular monitoring of water salinity of shrimp ghers and the cooling of water
using aquatic vegetation to counter increased water temperatures and salinity levels,
which killed shrimp and fish; and the cultivation of salinity and flood tolerant rice
varieties to adjust to increasing soil salinity and rain based flooding.
These adaptation actions formed part of what can referred to as resilience building
exercises. The adoption of new varieties of rice seeds, improved technologies in rice
farming and shrimp aquaculture such assalinity monitoring, maintenance of higher
water levels in shallow ghers and contacts with government agriculture extension
officials are good examples of what Pelling (2011) calls adaptation as resilience and
what Kates et al. (2012) refers to as incremental adaptation.
The research suggests that while the adaptation measures taken provide some
assistance to local communities in the short term, they lie at the coping end of the
adaptation continuum and are unlikely to provide longer term adaptation benefits.
For example, the renovation of shrimp ghers and ponds will likely be offset if
another cyclone visits the area or the embankment is breached due to high tides. The
poor and sometimes corrupt governance system, as seen in failures to apply national
laws and acts and the uncoordinated performance of different relevant government
agencies, hinder or even subvert effective adaptation on the ground. Currently there
is no programme in place to achieve greater local readiness to facilitate improved
adaptation planning and implementation.
Future adaptation planning for the study area requires consideration of the following
two factors. First, without proper embankment strengthening, the provision of regular
operational and maintenance systems, the funding to underpin such efforts and
greater community engagement, there will be much greater risk of embankment
breaching and consequent flooding, which would outweigh any adaptation benefits.
Likewise the saline and inundation tolerant late varieties of rice alone cannot
guarantee a safe harvest and longer lasting adaptation benefits without the
availability of freshwater, pest management, drainage improvement, access to quality
seeds, agricultural inputs and technologies and enabling markets.

277
Second, the heavy dependence of local people on ecosystem goods and services
means that akey principle of adaptation should be to improve, protect and maintain
such goods and services through the adoption of a more ecosystem-based approach
to adaptation (CBD, 2009; MEA, 2005). As weather stressors affect ecosystems
directly and via the livelihood practices of local people, adaptation planning should
encompass a physical ecosystem or inter-connected ecosystems (cropland-wetland-
mangrove-seascape or a wider landscape) with clearly defined social and ecological
boundaries. Specific adaptation actions need to be designed based on comprehensive
weather vulnerability assessments with the active participation of local communities.
The study also drew attention (see Chapter 9) to the need to assess the local level
‘adaptation readiness’ that would help facilitate adaptation to take place on the
ground (Ford and King, 2013). The effective planning and success of adaptation
actions depend upon certain institutions and processes being in place. These include
relevant and implementable policies and legal mechanisms, local and national actors
able to deliver their mandated services, and community awareness and willingness to
prioritise adaptation. Adaptation readiness also refers to more than being prepared
for weather/climate related hazards and stressors. It means taking an integrated
development-climate approach to encompass both weather and non-weather-related
events and processes.
However, the study showed that most villagers were unaware of, ignored or felt
powerless in the face of the legal framework that governed aspects of land and water
use and the management of coastal natural resources, ecosystem services, sustainable
livelihoods and disaster risk reduction. They expressed considerable frustration with
the activities of some of the relevant government agencies such as BDWB, FD, DoF,
DAE, and the local khas land management authority responsible for overall
management of coastal resourcesand disaster risk reduction. For example, it was
shown that due to the BWDB’s negligence and venality in performing its mandated
duties, local influential shrimp farmers were able to flout the law and act in ways that
subverted local actions aimed at protecting local people from floods and salinity. The
field level land department officials, working with UPs and the local administration,
illegally leased out khas canals to individuals on a long term basis. Such actions
affected local production systems, local food security and reduced people’s
confidence and trust in government.

278
What these comments suggest is that single purpose actions such as introducing salt
tolerant rice varieties, repairing an embankment or building a home on plinths are not
simply technical exercises but are embedded within a political and economic system
that in its current form is not capable of delivering good governance, greater equity
and enhanced local engagement in the task of building resilient communities.
Contributions of the research to theory
In chapter 1 I reviewed relevant theories around multiple aspects of vulnerability and
dimensions of adaptation to moderate climate induced risks. From the theoretical
perspective vulnerability is viewed as ‘susceptibility of a system to harm when
exposed to hazard events’ (UNDRO, 1980; Wisner, 2002; Cutter et al., 2003;
UNISDR, 2004), as ‘potential for change or transformation’ when confronted with a
perturbation rather than the outcome of a perturbation (Gallopin, 2006) and as
‘capacity to be wounded and react adversely’ (Kates, 1985) when exposed to
hazards. Anthropogenic climate variability and change as a new generation of
threatshas influenced theories of vulnerability and given rise to more diverse foci of
analysis in the understanding of the scale and extent of vulnerability in order to
moderate harm. One major shift in vulnerability thinking is broadening of its scope
and scale to accommodate socio-economic aspects of vulnerability in addition to
biophysical ones (Blaikie et al., 1994; Cutter, 1996; Wu et al., 2002;Adger, 2003;
Pelling, 2011).
My research in two place-based communities in remote areas in the southwestern
coastal zone of Bangladesh drew upon the change in ways of assessing livelihood
vulnerability of local communities to weather induced stressors and found them
useful in understanding the core determinants of vulnerability.It also contributed to a
widening of the scope of inquiry to see vulnerability as the product of place-based
and temporal factors as proposed by Cutter (1996). For example, cyclone Aila hit in
the project site in May 2009 and caused severe losses to shrimp farmers as at that
time the shrimp ghers of Chakbara were fully stocked and destroyed by surge water.
While in Fultala the rice farmers were not so severely affected as the cyclone struck
before the rice farming cycle. Thus, temporal and spatial dimensions of hazard
impacts are important phenomena that determine the degree of vulnerability
differently for different occupational groups in different time scales even if they live

279
within the same geographical location. Based on the context of my research area and
hazard-vulnerability-impact nexus, it is necessary to add two more dimensions in the
assessment of vulnerability to weather related stressors, in addition to hazards of
place. These are the time of the hazard, which means when a hazard strikes, and the
corresponding land use of a place at the time of the hazard strike. I have shown these
linkages in Figure 10.1.
On the first issue, the study showed that the temporal dimensions of hazard impacts
need to be refined to capture the processual nature of weather and climate impacts.
Field observations revealed that the level of exposure and sensitivity of a system to
hazard events are not limited to the immediate and direct effect at the time of a
hazardbut can last for years, making people vulnerable on a continuing basis. For
example, after cyclone Aila, rice farmers of Fultala village experienced losses of rice
production due to salinity infestation of soil and water resulting from the residual
effects of saline water inundation from surge water. This lasted for another two years
from the time of the cyclone’s first impact. In the case of Chakbara, the increased
salinity of soil and water post cyclone did not have such harmful effects as over 95%
of land wwas under salt water due to shrimp farming. These findings have
implications for widening the theoretical dimensions of climate vulnerability as well
as climate-induced loss and damage research landscapes.
Another new conceptual dimension relevant to future research and planning is the
concept of local level “adaptation readiness”. A recent pioneering work of Ford and
King (2013) sheds light on the theoretical perspective of “adaptation readiness” at
Land use in place
Extent of damage
Hazard of place
Figure 10.1: Relationship between hazard of place, time of hazards , land use of place and extent of damage (source: based on my study findings)
Time of hazard strike
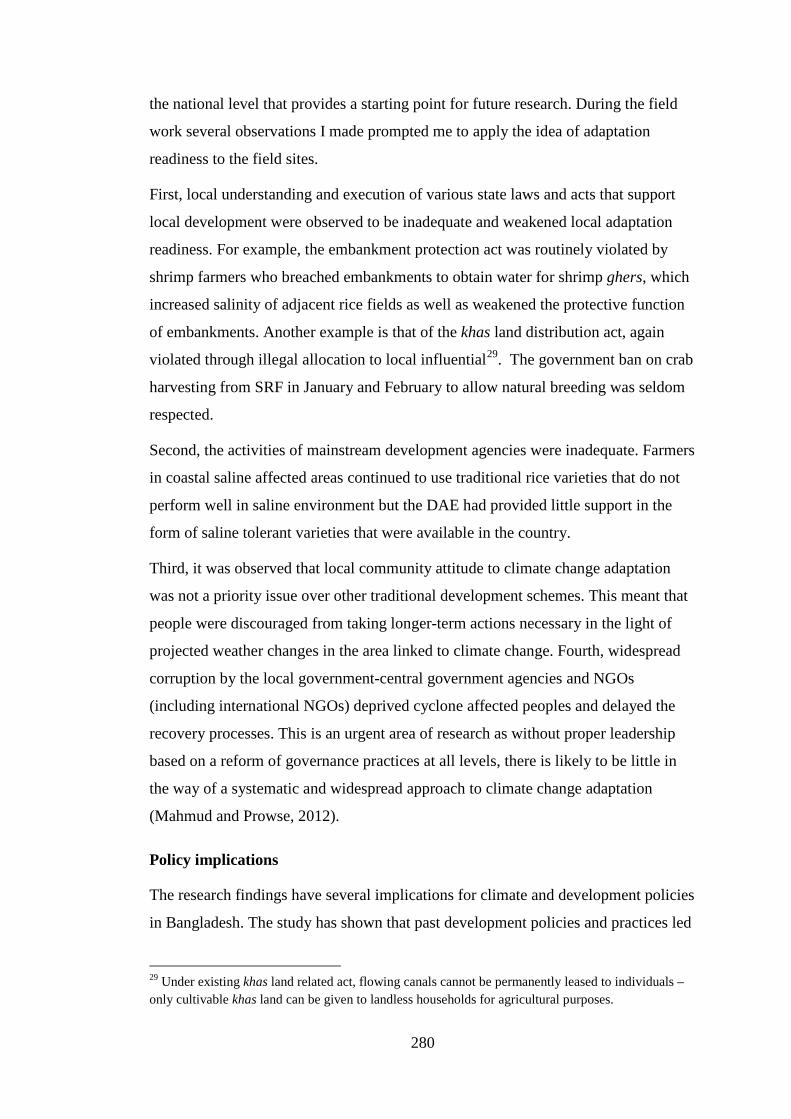
280
the national level that provides a starting point for future research. During the field
work several observations I made prompted me to apply the idea of adaptation
readiness to the field sites.
First, local understanding and execution of various state laws and acts that support
local development were observed to be inadequate and weakened local adaptation
readiness. For example, the embankment protection act was routinely violated by
shrimp farmers who breached embankments to obtain water for shrimp ghers, which
increased salinity of adjacent rice fields as well as weakened the protective function
of embankments. Another example is that of the khas land distribution act, again
violated through illegal allocation to local influential29. The government ban on crab
harvesting from SRF in January and February to allow natural breeding was seldom
respected.
Second, the activities of mainstream development agencies were inadequate. Farmers
in coastal saline affected areas continued to use traditional rice varieties that do not
perform well in saline environment but the DAE had provided little support in the
form of saline tolerant varieties that were available in the country.
Third, it was observed that local community attitude to climate change adaptation
was not a priority issue over other traditional development schemes. This meant that
people were discouraged from taking longer-term actions necessary in the light of
projected weather changes in the area linked to climate change. Fourth, widespread
corruption by the local government-central government agencies and NGOs
(including international NGOs) deprived cyclone affected peoples and delayed the
recovery processes. This is an urgent area of research as without proper leadership
based on a reform of governance practices at all levels, there is likely to be little in
the way of a systematic and widespread approach to climate change adaptation
(Mahmud and Prowse, 2012).
Policy implications
The research findings have several implications for climate and development policies
in Bangladesh. The study has shown that past development policies and practices led
29 Under existing khas land related act, flowing canals cannot be permanently leased to individuals – only cultivable khas land can be given to landless households for agricultural purposes.

281
to increases in the vulnerability of the communities studied and indirectly made it
more difficult for climate adaptation policies to be implemented. An effective
climate adaptation policy requires a reconsideration of past development practices to
make them more compatible with future adaptation strategies. The study findings on
community awareness and understanding of climate change issues, capacity for
planning and implementation of adaptation actions provide empirical grounding for a
more reflexive approach to policy making. For example, the assessment tools used in
the research to assess the climate induced livelihood vulnerabilities of the two
communities have high potential to be used in local, sub-national and national level
climate vulnerability assessments through the design of site specific climate impact
based adaptation strategies and actions. The findings on the lived experiences of
local people in dealing with weather and non-weather stressors can be of value to
mainstream adaptation planners and managers in shaping broader adaptation
assessment methods, strategies and action plans. However, the capacity to adapt and
the means available to do so were more than technical capabilities. They were
embedded within wider social, economic, political and ecological structures and
processes that both set limits upon and provided opportunities to their capacity to act.
Adaptation Readiness
The study sought to assess the ‘adaptation readiness’ at the local level to determine
the degree and type of preparedness of local people, NGOs and government agencies
to take adaptive actions. It argued that adaptive capacity needs to be complemented
by adaptation readiness as a tool for determining to what extent local people and
local development actors are actually ready to take adaptive actions. Such an
approach has the potential to reduce the risk of mal-adaptation.
Common Property Resources, Environmental Spaces and Ecosystems-based
Adaptation
Over the last thirty years most of the Common Property Resources such as khas
wetland, roadside borrow pits, char land and cultivable land have been lost or
privatized, which has deprived poor people of access to basic subsistence resources.
The privatization, conversion and degradation of wetland CPRs and the ecosystems
that underpin them were facilitated by state and local government officials working
directly or indirectly with local politicians and local elites. While many of these
282
CPRs have been lost, there is a need for government to re-think its land and water
tenure policies to help revitalize the remaining CPRs and make available
environmental spaces for community uses and public easementin disaster situations
or other crises. In the coastal region, the availability of freshwater for drinking,
aquaculture, bathing, irrigation, and other household uses has been greatly affected
by increasing salinity such thatthe only usable sources left are canals and private
ponds where access is restricted. Under such circumstances, policy priority should be
given to bringing back wetland CPRs and restoringthem for direct and indirect
community multipurpose uses. The study findings suggest that there have been
opportunities for implementing ecosystems-based adaptation (EbA) to climate
change for wider community benefits in the coastal areas through restoration of
wetland and mangroves involving local communities (Caritas, 2011). The UK DfID
has sought to demonstrate the importance of community access to natural resources
through its climate resilient farming systems programme that facilitates access to
khas land for the extreme poor in the coastal and northeastern haor30 areas of
Bangladesh (Shiree, 2012). Coastal areas have high potential for khas land-based
adaptation programmes to build resilience of the extreme poor if such land are
restored, protected and access arrangements made.
Future Research Directions
Based on the findings of this study, four areas for future research are of particular
importance.
Adaptation governance– political economy of DRR and CCA
While conducting my research several governance issues surfaced related to
planning, operation and management of disaster risk reduction and climate change
adaptation activities at the field level. Of critical importance for future examination
are the institutional coordination among multiple actors, the quality of services
linked to their mandated responsibilities towards the needs of affected communities,
and equitable and pro-poor approaches in responding to disaster vulnerability and
climate change adaptation. The outcomes of this research have potential to inform
30 Vast low lying basins in the northeastern Bangladesh remain under water for 5/6 months of the year during monsoon and a single cropped area (farmers can grown on winter rice in the dry season).

283
and influence policy stakeholders to formulate policy documents and create effective
environments that facilitate greater attention to pro-poor sustainable adaptation
programmes for countries such as Bangladesh where the overall standards of
governance are questionable.
Environment induced migration/displacement
While the research did not examine in detail the role of migration as an adaptation
strategy, it is clear Bangladeshis have historically migrated to domestic and
international locations to meet livelihood needs. In the two villages, people migrated
seasonally when local jobs opportunities were limited. The drivers of migration
includedthe damage to shrimp ghers and rice farms due to cyclone Aila, the decline
in job opportunities in rice farming as a result of shrimp farming, and wider regular
and abnormal flooding events that undermined the capacity of many farmers to
sustain their livelihoods. People also mentioned recent increases in tiger attacks and
bandits inside the SRF, which contributed to pressures to find alternative income
sources outside the local area. In the light of growing international concerns about
future climate-induced migration, more detailed empirical work needs to be done on
the link between climate change, environmental degradation and migrations in highly
vulnerable areas such as the coastal and deltaic parts of Bangladesh. Such work has
the potential to inform policies that seek to establish a balance between planned
migration and the local retention of people in their original homes.
Estimation of loss and damage due to climate change impacts
I witnessed the massive loss and damage to assets and resources as well as disruption
of employment opportunities due to cyclone Aila in two project villages. The loss
and damage was very high in Chakbara where every household was affected and
experienced adverse impacts of cyclone which were manifested as damages to
homestead land, houses, fish ponds, shrimp ghers, crops and vegetables. In addition,
common facilities and resources such as embankments, roads, canals, freshwater
fish, and water sources were severely impacted. In contrast, Fultala, though located
only 11km away from Chakbara, experienced far less damage due to its geographical
location and exposure to hazard events. Local people reported both instant loss and
damage as well as residual effects of disaster that continue to damage crops and
income of people even two to three years after the cyclone.

284
Besides climate extremes such as cyclones and storm surges, local people
experienced loss and damage due to the slow onset of impacts of weather induced
perturbations and stressors such as prolonged drought or lamba khora (loss of crops
and aquaculture), intense rain based flooding or akash bonnaya (crop damage and
loss of fish and shrimp from aquaculture), rough sea conditions or shagor kharap
(loss of fishing efforts in lower estuary and sea) and salinity of new areas (loss of
crops and grazing land).
There remains a lack of comprehensive methodologies for assessing risk of loss and
damage due to both rapid and slow onset weather/ climate induced threats to local
social-ecological systems that impair effective adaptation planning. Such
assessments need to cover various sub-sectors such as settlements, infrastructures,
water resources, agriculture, fisheries aquaculture, natural assets, and biodiversity,
health and income opportunities as well as across organizational geographical,
temporal and other scales
Ecosystems vulnerability to climate change impacts
My research focused on social aspects of climate change and conducted a livelihood
vulnerability assessment for two project communities that revealed the extent to
which the two place-based communities were disproportionately exposed and
sensitive to weather and weather-related impacts and what local capacities they
possessed to deal with them. A high proportion of local people were directly
dependent on the ecosystem services and products of the SRF which is highly
vulnerable to sea level rise as well as to other land-based changes in land and
waterscapes in Bangladesh and in surrounding countries, particularly India. To
protect local ecological systems and the people who depend on them requires a
multi-scalar approach that recognizes that climate change knows no borders and that
the ability of local people to thrive depends as much on actions taken nationally and
internationally as those taken at the local level.
There is an urgent need to reframe current climate change and development research
paradigms in terms of the mutually constitutive nature of social and ecological
systems and to recognize that these relationalities transcend the local. There is only
so much local communities can do to improve their chances of thriving in the face of
globally induced climate change. The research has shown how unprepared local
285
people are for the slow-working and slow-acting impacts of climate change and that
a key reason for this is the slow-working and slow-acting nature of governments, aid
agencies and NGOs.
286
References ADB (1998) Project performance audit report on the Ganges-Kobadak Irrigation rehabilitation project in Bangladesh. Asian Development Bank, PPA BAN 15052.
Adger N (2003) Social capital, collective action, and adaptation to climate change. Econ. Geog., 79, 387-404.
Adger W.N and Vincent K (2004) Uncertainty in adaptive capacity in C.R. Geosciences 337 (2005) 399-410
Adger W.N (2006) “Vulnerability.”Global Environmental Change 16 (3): 268-281.
Adger W.N, S. Agrawala, M.M.Q. Mirza, C. Conde, K. O’Brien, J. Pulhin, R. Pulwarty, B. Smit and K. Takahashi (2007) Assessment of adaptation practices, options, constraints and capacity. Climate Change 2007: Impacts, Adaptation and Vulnerability. Contribution of Working Group II to the Fourth Assessment Report of the Intergovernmental Panel on Climate Change, M.L. Parry, O.F. Canziani, J.P. Palutikof, P.J. van der Linden and C.E. Hanson, Eds., Cambridge University Press, Cambridge, UK, 717-743.
Adger W.N, Barnett J (2009) Four reasons for concern about adaptation to climate change. Environ Plan A 41:2800–2805
Adger W.N, Dessai S, Goulden M, Hulme M, Lorenzoni I, Nelson D.R, Naess, L.O, Wolf J and Wreford A (2009) Are there social limits to adaptation to climate change? Clim Change 93:335–354
Ahmed A.U (2008) Assessment of Vulnerability to climate change and adaptation options for the coastal people of Bangladesh, Practical Action, Bangladesh, Dhaka.
Ahmed N and Troell M (2010) Fishing for Prawn Larvae in Bangladesh: An Important Coastal Livelihood Causing Negative Effects on the Environment. AMBIO DOI 10.1007/s13280-009-0002-y
Ahmed F (2006) Tourism versus Ecotourism: Context Sundarbans. In Badaban, Sundarbans Academy Journal 01/06.
Alam S.M.N, Lin C.K, Yakupitiyage A, Demaine H, Phillips M.J (2005) Compliance of Bangladesh shrimp culture with FAO code of conduct for responsible fisheries: a development challenge. Ocean Coast.Manag. 48, 177-188.
Ali, A (1999) Climate change impacts and adaptation assessment in Bangladesh. Clim Res 12: 109–116, 1999

287
Allen Consulting (2005) Climate change risk and vulnerability. Promoting an efficient adaptation response in Australia. Canberra, Department of the Environment and Heritage, The Australian Greenhouse Office.
Alexander M.J, Rashid M.S, Shamsuddin S.D and Alam M.S (1998) Flood Control, Drainage and Irrigation Projects in Bangladesh and their Impacts on Soils: An empirical Study. Land Degrad. Develop. 9, 233±246 (1998)
Allison M.A, Kham S.R, Goodbred Jr. S. Land Kuehl S.A (2003) Stratigraphic evolution of the late Holocene Ganges-Brahmaputra lower delta plain. Sediment. Geol., 155, 317-342.
Allison E.H, Perry A.L, Badjeck, M-C, Adger W.N, Brown K, Conway D, Halls A.S, Pilling G.M, Reynolds J.D,Andrew N.L &Dulvy N.K (2009) Vulnerability of national economies to the impacts of climate change on fisheries. Fish and Fisheries 10(2):173-196.
Ayers J and Forsyth T (2009) “Community-Based Adaptation to Climate Change: Strengthening Resilience through Development.” Environment.51 (4): 22.
Ayers J (2010) Understanding the Adaptation Paradox: Can Global Climate Change Adaptation Policy be Locally Inclusive? Ph. D Thesis. The London School of Economics and Political Science
BBS (2010) Statistical Yearbook of Bangladesh. Bangladesh Bureau of Statistics, Statistics Division, Ministry of Planning, Dhaka, Bangladesh.
Barnett J and Adger W.N (2007) Climate change, human security and violent conflict, in Political Geography 26 (2007) 639-655
Barnett J and Webber M (2010) Accommodating migration to promote adaptation to climate change. World Bank.
BCAS/RA/Approtech (1994) Vulnerability of Bangladesh to Climate Change and Sea Level Rise: Concepts and Tools for Calculating Risk in Integrated Coastal Zone Management, Bangladesh Centre for Advanced Studies (BCAS), Dhaka, Bangladesh.
Berkes F, Colding J, Folke C (Eds.) (2003) Navigating Social-Ecological Systems: Building Resilience for Complexity and Change.Cambridge University Press, Cambridge.
Blaikie P.M, Cannon T, Davis I and WisnerB (1994) At Risk: Natural Hazards, People’s Vulnerability, and Disasters. Routledge, New York, 320 pp.
Birkmann J (2005) Danger need not spell disaster - but how vulnerable are we? Research Brief, Number I, United Nations University, Tokyo.
Birkmann J (Ed.) (2006) Measuring Vulnerability to Natural Hazards- Towards Disaster-Resilient Societies.UNU Press, Tokyo, New York.
288
Bogdan R.C and Taylor S.J (1975) Introduction to qualitative research methods. New York: JohnWiley and Sons.
Bohle H.G (2001) Vulnerability and Criticality: Perspectives from Social Geography. IHDP Update, 2/01:3–5, 2001.
Brooks N (2003) Vulnerability, risk and adaptation: a conceptual framework. Tyndall Centre Working Paper, No. 38.Norwich, UK, Tyndall Centre for Climate Change Research, University of East Anglia.
Brooks N and Adger N.W (2004) Assessing and Enhancing Adaptive Capacity, Chapter 7. In Lim B and Spanger-Siegfried, E. eds., Adaptation Policy Frameworks for Climate Change: Developing Strategies, Policies and Measures Cambridge: Cambridge University Press. UNDP, 2004
Bryman A (1988) Quantity and quality in social research. London: Unwin Hyman.
Cannon T (2008) Reducing people’s vulnerability to natural hazards: communities and resilience, UNUWIDER Research Paper No. 34
Caritas (2011) Enhancing Coping and Adaptation Capacity of the Coastal Community to Reduce Vulnerability to Climate Change, Process Documentation, Dhaka, Bangladesh
Carvalho and White (1997) Combining the Quantitative and Qualitative Approaches to
Poverty Measurement and Analysis, Technical Paper No. 366, World Bank.
Convention on Biological Diversity (CBD) (2009) Connecting Biodiversity and Climate Change Mitigation and Adaptation: Report of the Second Ad Hoc Technical Expert Group on Biodiversity and Climate Change. Montreal, Technical Series No. 41, 126 pp.
CCC (2009.a) Climate Change, Gender and Vulnerable Groups in Bangladesh. Climate Change Cell, DoE, MoEF; Component 4b, CDMP, MoFDM. Month 2009, Dhaka
CCC (2009.b) Adaptive Crop Agriculture Including Innovative Farming Practices in the Coastal Zone of Bangladesh. Climate Change Cell, DoE, MoEF; Component 4b, CDMP, MoFDM. Month 2009, Dhaka
CEGIS (2006) Impact of Sea Level Rise on Land use Suitability and Adaptation Options; Ministry of Environment and Forests, Government of Bangladesh; Centre for Environment and Geographic Information Services: Dhaka, Bangladesh.
Chapin, FS, T.V. Callaghan,Y. Bergeron,M. Fukuda, J.F. Johnstone, G. Juday and S.A Zimov (2004) Global change and the boreal forest: thresholds, shifting states or gradual change? Ambio, 33, 361-365.
Chelliah, S and E.A Heinrichs (1984) Factors contributing to brown plant hopper resurgence. Proceedings of the FAO/IRRI Workshop on Judicious and Efficient use
289
of Insecticides on Rice, International Rice Research Institute, (JEUIR'84), IRRI, Manila, Philippines, pp: 107-115.
Cheung W.W.L, Lam V.W.Y, Sarmiento J. L, Kearney K, Watson R and Pauly D (2009) Projecting global marine biodiversity impacts under climate change scenarios. Fish and Fisheries, 2009, 10, 235–251
Cheung W.W.L, Lam, V.W.Y, Sarmiento, J. L, Kearney, K, Watson, R, Zeller, D and Pauly D (2010) Large-scale redistribution of maximum fisheries catch potential in the global ocean under climate change. Global Change Biology 16, 24–35.
Chowdhury, M.T.A. and Ashrafi S.A (2008) Environmental factors determining forest resources used in livelihood of the peripheral villages of Sundarbans. J. Innov. Dev.Strategy. 2(2):38-46
CIMC (2012) Report on Climate Change Knowledge, Attitude and Behavioural Practice Survey. Caribbean Institute of Media and Communication. The University of the West Indies, Mona Campus, Kingston 7, Jamaica
Clark G, Moser S, Ratick S, Dow K and 6 others (1998) Assessing the vulnerability of coastal communities to extreme storms: the case of Revere, MA, USA. Mitig Adapt Strat Global Change 3:59–82
CME (2011) Understanding public perceptions of climate change in Combodia. Cambodian Ministry of Environment, 2011, BBC World Service Trust, Combodia
Codjoe S.N.A., Atidoh L.K and Burkett V (2011) Gender and occupational perspectives on adaptation to climate extremes in the Afram Plains of Ghana. Climatic Change, Springer. DOI 10.1007/s10584-011-0237-z.
CNRS (2012) Piloting some Climate Resilient Development Initiatives at Char Kajol, Golachipa, Patuakhali- An Innovative Concept of CBA to CC, Center for Natural Resource Studies. Second Quarterly Report to UNDP, Dhaka
Colls A, Ash N and Ikkala N (2009) Ecosystem-based Adaptation: a natural response to climate change. Gland, Switzerland: IUCN
Curtis S, Gesler W, Smith G and Washburn S (2000) Approaches to sampling and case selection in qualitative research: examples in the geography of health. Social Science & Medicine 50 (2000) 1001-1014. www.elsevier.com/locate/socscimed
Cutter, S.L (1996) ‘Vulnerability to environmental hazards’, Prog. Hum. Geogr.20,529–539.
Cutter S.L, Boruff B.J & Shirley W.L (2003) Social vulnerability to environmental hazards.Social Science Quarterly, 84: 242–261.
Cutter S.L, Barnes L, Berry M, Burton C, Evans, E, Tate E, and Webb J (2008) A
place -based model for understanding community resilience to natural disasters.
Global Environmental Change, 18, 598-606.

290
Cutter S.L, Emrich C.T, Webb J.J and Morath D (2009) Social Vulnerability to Climate Variability Hazards: A Review of the Literature. Final Report to Oxfam America.Department of Geography, University of South Carolina, USA
CZPO (2005) Coastal Zone Policy, Ministry of Water Resources, Government of the People’s Republic of Bangladesh, Dhaka.
Deressa T.T, Hassan M.R and Ringler C (2009) Assessing Household Vulnerability To Climate Change, The Case Of Farmers In The Nile Basin Of Ethiopia. IFPRI Discussion Paper 00935
Dessai S and Holmes M (2007) Assessing the robustness of adaptation decisions to climate change uncertainties: A case study on water resources management in the East of England. Global Environmental Change 17 (1): 59-72
Devisscher T (2010) Ecosystem-based Adaptation in Africa: Rationale, Pathways, and Cost Estimates. Sectoral Report for the Adapt Cost Study. Stockholm Environment Institute.
DMB (2009) “Summary of Cyclonic Storm Aila”, Disaster Management Information Centre, Disaster Management Bureau (DMB), Ministry of Food and Disaster Management, June 11, 2009
DOF (1983) Fishery Statistical Year Book, Bangladesh, Fisheries Resource Survey Systems, Department of Fisheries, Bangladesh
DOF (2009) Fishery Statistical Year Book, Bangladesh, Fisheries Resource Survey Systems, Department of Fisheries, Bangladesh
Dodman D and Mitlin D (2013) Challenges for Community-based Adaptation: The Potential for Transformation. J. Int. Dev. 25 640-659
Easterling, W.E., Aggarwal, P.K., Batima, P. et al. (2007) Food, fibre and forest products. In: Climate Change 2007: Impacts, Adaptation and Vulnerability. Contribution of Working Group II to the Fourth Assessment Report of the Intergovernmental Panel on Climate Change (M.L. Parry, O.F. Canziani, J.P. Palutikof, P.J. van der Linden and C.E. Hanson, eds.). Cambridge University Press, Cambridge, UK, pp. 273–313. Available at: http://www.ipcc.ch/pdf/ assessment-report/ar4/wg2/ar4-wg2-chapter5.pdf.
Engle, N.L (2011) Adaptive capacity and its assessment. Global Environmental Change, 21: 647–656.
EPA (2013) Glossary of Climate Change Terms. United States Environmental Protection Agency. http://www.epa.gov/climatechange/glossary.html
FAO (Food and Agriculture Organization) (1994) Mangrove Forest Management Guidelines, FAO Forestry Paper 117 Rome, FAO.
Fellmann T (2012) The assessment of climate change-related vulnerability in the agricultural sector: reviewing conceptual frameworks. In Meybeck, A., Lankoski,J.,

291
Redfern, S., Azzu, N and Gitz, V. (Eds.), Building Resilience for Adaptation to Climate Change in the Agriculture Sector (pp 37-62). FAO, Rome, Italy
Farbotko C & Lazrus, H (2012) The first climate refugees? Contesting global narratives of climate change in Tuvalu. Global Environmental Change,22 (2), 382-390.
FD (2004) Fact Sheet, Forest Department, Government of Bangladesh, Issue No.4, January 2004.
Ferdoushi Z, Zhang X and Hasan, M.R (2010) Mud crab (Scylla sp.) marketing system in Bangladesh. As. J. Food Ag-Ind. 2010, 3(02), 248-265
Ferdoushi, A.S and Bolkland, W.M (2000) Design Improvement for pond sand filter, World Bank, Dhaka, Bangladesh
Ford J.D and King D (2013) A framework for examining adaptation readiness. Mitg Adapt Strateg Glob Change. http://link.springer.com/article/10.1007.2Fs11027-013-9505-8#page-1
Frankel R.M, & Devers K.J (2000) Study Design in Qualitative Research-1: Developing Questions and Assessing Resource Needs. Education for Health, Vol.13,No.2 2000,251–261
Fussel H.M and Klein R.J.T (2006) Climate Change Vulnerability Assessments: An Evolution of Conceptual Thinking. Climatic Change 75: 301–329
Fussel H.M (2007) Adaptation planning for climate change: concepts, assessment approaches, and key lessons. Sustain Sci DOI 10.1007/s11625-007-0032-y
Gallopin G.C (2006) Linkages between vulnerability, resilience, and adaptive capacity. Global Environmental Change 16 (2006) 293–303
Gaston K.J (2009) Geographic range limits of species. Proc R Soc Lond B Biol Sci 276 :1391–1393.
Giddens A (2009) Politics of Climate Change. Polity Press, Cambridge, UK
GFDRR (2011) Climate Risk and Adaptation Country, Combodia. Global Facility for Disaster Reduction and Recovery. rofilehttp://countryadaptationprofiles.gfdrr.org
Ghazala M and Rao R (2004) “Community-Based and -Driven Development: A Critical Review.” The World Bank Research Observer 19 (1) (April 1): 1–39. doi:10.2307/ 3986491.
GoB (1999) Ecologically Critical Area (ECA) Declaration. Ministry of Environment and Forest. Government of Bangladesh. PBM No/4/7/87/99/245 dated the 19thApril 1999.
GoB (2010) The Embankment Protections Act, 1952 (East Bengal Act No. 10F 1953). Legislative and Parliamentary Affairs Division, Ministry of Law, Justice and Parliamentary Affairs, Government of Bangladesh. Approved by the President of Bangladesh in 1972 (President's Order No. 48 of 1972).
292
Hahn M.B, Riederer A.M and Foster S.O (2009) "The Livelihood Vulnerability Index: A pragmatic approach to assessing risks from climate variability and change - A case study in Mozambique." Global Environmental Change 19(1): 74-88.
Halder, S. and Thompson, P (2006) Community based co-management: a solution to wetland degradation in Bangladesh, MACH Technical Paper 1. Management of Aquatic Ecosystem through Community Husbandry, Winrock International, Dhaka.pp 24.
Halls A.S, Hoggarth D.D and Debnath K (1998) Impacts on flood control schemes on river fish migration and species assemblages in Bangladesh. Journal of Fish Biology (1998) 53 (Supplement A), 358–380
Hammill, A, Richard, M and McCarter, E (2008) Microfinance and Climate Change Adaptation. IDS Bulletin Volume 39 Number 4 September 2008
Haq M, Mia TMA, Rabbi MF and Ali MA (2011) Incidence and severity of rice diseases and insect pests in relation to climate change. Climate Change and Food Security in South Asia (pp. 445 - 457). Berlin: Springer. doi:10.1007/978-90-481-9516-9_27''.
Hewitt K (1997) Regions at Risk: A Geographic Introduction to Disasters (Singapore: Longman).
Hossain M.S (2001) Biological Aspects of the Coastal and Marine Environment of Bangladesh. Ocean & Coastal Management, 44 (3-4): 261-282
Hoq M.E, Islam M.N, Kamal M, Wahab M.A (2001) Abundance and seasonal distribution of Penaeus monodon post larvae in the Sundarbans mangrove, Bangladesh. Hydrobiologia 457, 97–104.
Huq S, A.A Rahman, M Konate, Y. Sokona and H. Reid (2003) Mainstreaming Adaptation to Climate Change in Least Developed Countries (LDCS). International Institute for Environment and Development, London, 57 pp.
Huq S and Reid H (2007) A vital approach to the threat climate change poses to the poor. International Institute for Environment and Development Briefing. Available at - http://onlinelibrary.wiley.com/doi/10.1002/jid.1772/pdf
Huq S and Ayers J (2008) Climate Change Impacts and Responses in Bangladesh, Brussels: Policy Department Economic and Scientific Policy, European Parliament
Iftekhar M.S & Islam M.R (2004) Managing mangroves in Bangladesh: A strategy analysis. Journal of Coastal Conservation 10: 139-146, 2004© EUCC; Opulus Press Uppsala.
IISD (2003) Livelihoods and Climate Change: Combining disaster risk reduction, natural resource management and climate change adaptation in a new approach to the reduction of vulnerability and poverty. International Institute for Sustainable Development, Winnipeg, Canada.http://www.iisd.org/pdf/2003/natres _ livelihoods_cc.pdf

293
IPCC (1995) Second Assessment Report of the IPCC. Intergovernmental Panel on Climate Change Cambridge: Cambridge University Press: Cambridge
IPCC (2001) Climate change 2001: Impacts, Adaptation and Vulnerability. Cambridge: Cambridge University Press: Cambridge
IPCC (2007) Climate Change 2007: Impacts, Adaptation and Vulnerability. Contribution of Working Group II to the Fourth Assessment Report of the Intergovernmental Panel on Climate Change, M.L. Parry, O.F. Canziani, J.P. Palutikof, P.J. van der Linden and C.E. Hanson, Eds., Cambridge University Press, Cambridge, UK, 976pp.
IPCC (2012) Managing the Risks of Extreme Events and Disasters to Advance Climate Change Adaptation. A Special Report of Working Groups I and II of the Intergovernmental Panel on Climate Change [Field, C.B., V. Barros, T.F. Stocker, D. Qin, D.J. Dokken, K.L. Ebi, M.D. Mastrandrea, K.J. Mach, G.-K. Plattner, S.K. Allen, M. Tignor, and P.M. Midgley (eds.)]. Cambridge University Press, Cambridge, UK, and New York, NY, USA, 582 pp.
IPCC (2014) Summary for Policymakers. In: Climate Change 2014: Impacts, Adaptation, and Vulnerability. Part A: Global and Sectoral Aspects. Contribution of Working Group II to the Fifth Assessment Report of the Intergovernmental Panel on Climate Change [Field, C.B., V.R. Barros, D.J. Dokken, K.J. Mach, M.D. Mastrandrea, T.E. Bilir, M. Chatterjee, K.L. Ebi, Y.O. Estrada, R.C. Genova, B. Girma, E.S. Kissel, A.N. Levy, S. MacCracken, P.R. Mastrandrea, and L.L. White (eds.)]. Cambridge University Press, Cambridge, United Kingdom and New York, NY, USA.
Irfanullah H.M, Azad M.A.K, Kamruzzaman M and Wahed M.A (2011) Floating Gardening in Bangladesh: a means to rebuild lives after devastating flood. Indian Journal of Traditional Knowledge. Vol.10 (1), January 2011. Pp.31-38
Islam, M.S (2001) Sea-level Changes in Bangladesh: The Last Ten Thousand Years. Asiatic Society of Bangladesh, Dhaka
Islam M.S, 2009. In search of "white gold": environmental and agrarian changes in rural Bangladesh. Soc. Nat. Resour. 22, 66-78.
Islam S.N (2011) Water salinity investigation in the Sundarbans Rivers in Bangladesh. Int. J. Water, Vol. 6, Nos. 1/2, 2011.pp74-91
Islam M.R (ed.) (2004) Where Land Meets the Sea: A Profile of the Coastal Zone of Bangladesh, The University Press Limited, Dhaka.
Islam S.N and Gnauck A (2008) Mangrove Wetland Ecosystems in Ganges-Brahmaputra delta in Bangladesh. Frontier Earth Sci. China, 2(4):439-448.
Ito, S (2002) From rice to prawns: economic transformation and agrarian structure in rural Bangladesh. J. Peasant Stud. 29, 47-70.
294
IWM (2005) Monitoring of Hydrological and Hydraulic Parameters on Tidal River Management under KJDRP Area, Final report, Bangladesh Water Development Board.
Jalil M.A (2002) Impact of Salinity on the growth of Avicennia officinalis and Aegicerus corniculatum. Thesis submitted to Forestry and Wood Technology Discipline, Khulna University, as partial fulfilment of the 4-years professional B.Sc. (honors) in Forestry, Forestry and Wood Technology Discipline, Khulna University, Khulna, Bangladesh.]
Jennings S and Magrath J (2009) What Happened to the Seasons? Oxfam GB Research Report, October 2009
Jimenez P.R (1985) Participant observation. In Bautista ML, Go SP, editors. Introduction to qualitative research methods. Manila, Philippines: De La Salle University Research Center. p 144 -156.
Jones, L (2010) Overcoming social barriers to adaptation.Background note. Overseas Development Institute, London, UK
Kasperson, J. X. and Kasperson, R. E (2001) ‘International Workshop on Vulnerability and Global Environmental Change’, SEI Risk and Vulnerability Programme Report 2001–01, Stockholm Environment Institute, Stockholm, Sweden.
Kasperson, J.X, Kasperson, R.E, Turner II, B.L, Schiller, A, Hsiel, W.H (2005) Vulnerability to global environmental change. In: Kasperson, J.X., Kasperson, R.E. (Eds.), Social Contours of Risk, vol. II. Earthscan, London, pp. 245–285.
Kates, R (1985) The interaction of climate and society, edited by: Kates, R., Ausubel, J. and Berberian, M., Climate impact assessment, Wiley, New York, 3–36.
Kates R.W, Travis W.R and Wilbanks, T.J (2012) Transformational adaptation when incremental adaptations to climate change are insufficient. PNAS Early Edition, pp.6
Kates R.W (2000) “Cautionary Tales: Adaptation and the Global Poor.” Climatic Change 45 (1): 5-17.
Kelly P.M and Adger W.N (2000) Theory and practice in assessing vulnerability to climate change and facilitating adaptation. Climatic Change 47, 325-352.
Klein, R.J.T., R. Nicholls, F. Thomalla (2004) Resilience to natural hazards: How useful is this concept? Environmental Hazards 5(2003) 35-45.
Kothari U (2013) Political discourses of climate change and migration: resettlement policies in the Maldives. The Geographical Journal.
Kumar K.R, Kumar K.K, Ashrit R.G, Patwardhan S.K, Pant G.B (2002) Climate change in India: Observations and model projections. In Climate Change and India: Issues, Concerns and opportunities; Shukla, P.R., Sharma, S.K., Ramana, P.V., Eds.; Tata McGraw-Hill: New Delhi, India.
295
Levina E and Tirpak D (2006) Adaptation to Climate Change: Key Terms. Paris Cedex: OECD.
Maguire, B and Cartwright, S (2008) Assessing a community’s capacity to manage change: A resilience approach to social assessment. Bureau of Rural Sciences, Australian Government. http://adl.brs.gov.au/brsShop/data/dewha_resilience_ sa_ report_final_4.pdf
Mahmud T and Prowse M (2012) Corruption in cyclone preparedness and relief efforts in coastal Bangladesh: Lessons for climate adaptation? Global Environmental Change 22 (2012) 933–943
Malone, E (2009) Vulnerability and Resilience in the face of Climate Change: Current Research and Needs for population Information. Battelle, Pacific Northwest Division, Richmond, Washington. http://populationaction.org/wp-content/uploads /2009 /08/ Malone_resilience.pdf
Masucci M (2013)Interpreting Qualitative Research Data. KIN 251.San Jose State University, Department of Kinesiology, Qualitative Research Laboratory, USA, http:// www. sjsu.edu/faculty/masucci/InterpretingQualitativeData.pdf.
McGee, R (2000) “Analysis of Poverty Assessment (PPA) and Household Survey, Findings on Poverty Trends in Uganda,” Institute of Development Studies, http://www .ids.ac.uk/ids/aboutids/fellows.htm
McKillip J (1987) Need analysis: Tools for the human services and education. Newbury Park, CA:Sage.
ME (2006) National Adaptation Programme of Action (NAPA). Ministry of Environment, Royal Government of Cambodia, Phnom Penh
MEA (Millennium Ecosystem Assessment) (2005) Ecosystems and Human Well-being: Wetland and Water Synthesis. World Resources Institute, Washington, DC.
Midgley G, Marais S, Mandy Barnett M and Wagsaether, K (2012) Biodiversity, climate change and sustainable development – harnessing synergy and celebrating success, Final Technical Report, South African National Biodiversity Institute, Conservation South Africa and Indigo Development and Change
Miles M.B and Huberman M.A (1994) Qualitative Analysis: An Expanded Sourcebook. (2nd ed.) Thousand Oaks, CA: Sage.
Milliman J.D and Meade R.H (1983) World-wide Delivery of River Sediment to the Oceans.J. of Geol., 91, pp 1-21.
Minkin S.F, Rahman M.M and Halder S (1997) Fish Biodiversity, Human Nutrition andEnvironmental Restoration in Bangladesh. In Open water Fisheries of Bangladesh, eds. Ali, Y and Tsai, C. The University Press Limited. 212pp.
Mirza M.M.Q (1997) Hydrological changes in the Ganges system in Bangladesh in the post-Farakka period, Hydrological Sciences Journal, 42: 5, 613 - 631
296
Mirza M.M.Q and Ericksen N.J (1996) Impact of Water Control Projects on Fisheries Resources in Bangladesh. Environmental Management Vol. 20, No. 4, pp. 523-539
Mirza, M.M.Q. (Ed.) (2004) The Ganges Water Diversion: Environmental Effects and Implications, Kluwer Academic Publisher, Dordrecht.
MoEF (Ministry of Environment and Forests) (1995) National Environment Management Plan.Main Report. Dhaka.
MoEF (1999) Bangladesh Environmental Conservation Act 1995, Ministry of Environment and Forests, People’s Republic of Bangladesh, Dhaka, Bangladesh.pbm-4/7/87/99/245
MoEF (2005) National Adaptation Programme of Action (NAPA), Ministry of Environment andForests, Government of Bangladesh, Dhaka
MoEF (2009) Bangladesh Climate Change Strategy and Action Plan 2009, Ministry of Environment and Forests, People’s Republic of Bangladesh, Bangladesh. xviii + 76pp
Mondal M.S, Jalal M.R, Khan M.S.A, Kumar U, Rahman R and Huq H (2013) Hydro-Meteorological Trends in Southwest Coastal Bangladesh: Perspectives of Climate Change and Human Interventions. American Journal of Climate Change, (http://www. scirp.org/ journal/ajcc)
Morgan, D L (1997) Focus groups as qualitative research (2nd ed.). Thousand Oaks, CA: Sage.
Moser S.C and Ekstrom J.A (2010) A framework to diagnose barriers to climate change adaptation. PNAS 17:22026–22031
Munang R, Thiaw I, Alverson K, Mumba M, Liu, J and Rivington, M (2013) Climate change and Ecosystem-based Adaptation: a new pragmatic approach to buffering climate change impacts. Current Opinion in Environmental Sustainability 2013, 5:xx–yy. www.sciencedirect.com
Nandy P, Ahammad R, Alam M and Islam A (2013) Coastal Ecosystem Based Adaptation: Bangladesh Experience. In R. Shaw et al. (eds.), Climate Change Adaptation Actions in Bangladesh, pp 277-303
Ndathi A.N, Nyangito M.M, Musimba N.K.R and Mitaru B.N (2011)Climate variability and dry season ruminant livestock feeding strategies in Southeastern Kenya. Livestock Research for Rural Development.Volume 23, Article #199.
O’Brien K, Eriksen S, Sygna L, Naess LO (2006) Questioning complacency: climate change impacts, vulnerability, and adaptation in Norway. Ambio 35:50–56
O'Brien, K., S. Eriksen, L.P. Nygaard and A. Schjolden (2007) Why different interpretations of vulnerability matter in climate change discourses‖, Climate Policy, Vol. 7, pp. 73-88.
297
O’Brien K et al. (2008) Disaster Risk Reduction, Climate Change Adaptation and Human Security. Report prepared for the Royal Norwegian Ministry of Foreign Affairs by the Global Environmental Change and Human Security (GECHS) Project, GECHS Report 2008:3.
ODI (2010) Towards a characterisation of adaptive capacity: a framework for analysing adaptive capacity at the local level. Background Note. Overseas Development Institute, UK.
Okamura J (1985) Ethnographic research methods. In Bautista M L, Go SP, editors. Introduction to Qualitative Research Methods. Manila (Philippines): De La Salle University Research Center. p 157 – 172.
Olmos, S (2001) Vulnerability and Adaptation to Climate Change: Concepts, Issues, Assessment Methods. Climate Change Knowledge Network, http://www.cckn.net.
Parvin G.A, Takahashi F and Shaw R (2008) Coastal hazards and community-coping methods in Bangladesh. J. Coast Conserv. Springer Science 12:181-193
Patt A.G, Schröter D, Vega-Leinert A.C. de la, and Klein R.J.T (2009) Vulnerability research and assessment to support adaptation and mitigation: common themes from a diversity of approaches. In: Assessing Vulnerability to Global Environmental Change. Making Research Useful for Adaptation Decision Making and Policy.Earthscan, London, pp. 1-25.
Paul B.G and Vogl C.R (2011) Impacts of shrimp farming in Bangladesh: Challenges and alternatives. Ocean & Coastal Management 54 (2011) 201-211
PDO-ICZMP (2003) Delineation of the Coastal Zone. Working Paper: WP005. Program Development Office for Integrated Coastal Zone Management Plan, Ministry of Water Resources, Dhaka.December 2003.
PDO-ICZMP (2004) Where Land Meets the Sea: A Profile of the Coastal Zone of Bangladesh; and Bangladesh, Bureau of Statistics 2001 Census
Pelling, M (2011) Adaptation to climate change, Routledge, 2 Park Square, Milton Park, Abingdon, Oxon, OX14 4RN
Piran C.L, White J, Godbold A, Solan M, Wiegand J, Holt A (2009) Ecosystem services and policy: a review of coastal wetland ecosystem services and an efficiency-based framework for implementing the ecosystem approach. Issues in Environmental Science and Technology.
Piyaphongkul J, Pritchard, J and Bale, J (2012) Can Tropical Insects Stand the Heat? A Case Study with the Brown Planthopper Nilaparvata lugens (Sta˚l). PLoSONE 7(1): -29409. doi:10.1371/journal.pone.0029409
Pokrant B, Reeves J and McGuire, J (1997) ‘Riparian Rights and the Organisation of Work and Market Relations among the Inland Fishers of Colonial Bengal, c.1793-1950’ in Youssouf Ali and Chu-fa Tsai (eds), Open water Fisheries of Bangladesh

298
(Dhaka:University Press Ltd and Bangladesh Centre for Advanced Studies, 1997), pp. 27-48.
Pouliotte J, Smit B and Westerhoff, L (2009) Adaptation and development: Livelihoods and climate change in Subarnabad, Bangladesh, Climate Change and Development, 1:1, 31-46
Pramanik M.A.H (1983) Remote Sensing Application to Coastal Morphological Investigations in Bangladesh. Ph. D. Thesis. Jahangirnagar University, Bangladesh.
Primavera J.H (2006) Overcoming the impacts of aquaculture on the coastal zone. Ocean Coast Manag 49:531–545
Quasem M.A (2011) Conversion of Agricultural Land to Non-agricultural Uses in Bangladesh: Extent and Determinants, Bangladesh Development Studies Vol. XXXIV, March 2011, No. 1
Rahman A.A, Huq S, Reddy A, Alam M and Kabir S.A (Eds.) (2001) State of Environment Bangladesh 2001.United Nations Environment Programme, Regional Resource Centre for Asia and the Pacific, Bangkok, Thailand, 2001.
Rahman M.M and Biswas S.K (2013) Feasible Solution of Protection and Adaptation Strategy for Coastal Zone of Bangladesh. Pakistan Journal of Meteorology Vol. 8, Issue 15, 9-19 athttp://www.pmd.gov.pk/rnd/rnd_files/vol8_issue15/2
Rahman M.M and Islam A (2013) Adaptation Technologies in Practice and Future Potentials in Bangladesh. In R. Shaw et al. (eds.), Climate Change Adaptation Actions in Bangladesh, pp 305-330
Raihan S.M, Huq M.J, AlstedN.G and Andreasen M.H (2010) Understanding climate change from below, addressing barriers from above: Practical experience and learning from a community-based adaptation project in Bangladesh. Action Aid Bangladesh
Rawlins S.C, Chen A, Rawlins J.M, Chadee D.D and Legall G (2007) A Knowledge, Attitude and Practices Study of the Issues of Climate Change/ Variability Impacts and Public Health in Trinidad and Tobago, and St Kitts and Nevis. West Indian Med J 2007; 56 (2): 115. http:// caribbean.scielo.org/pdf/wimj/v56n2/a03v56n2.pdf.
Reid, H., M. Alam, R. Berger, T. Cannon, S. Huq, and A. Milligan (2009) Community-based adaptation to climate change: an overview. In Participatory Learning and Action, issue 60, pg. 13.
Reynolds TW, Bostrom A, Read D, Morgan MG (2010) Now what do people know about global climate change? Survey studies of educated laypeople. Risk Anal 30 (10):1520–1538.
Roessig J.M, Woodley C.M, Cech J.J. and Hansen L.J (2004) Effects of global climate change on marine and estuarine fishes and fisheries. Reviews in Fish Biology and Fisheries 14, 251–275.

299
Rosenzweig C, Solecki W, DeGaetano A, O'Grady M, Hassol S and Grabhorn, P (Eds.) (2011) Responding to Climate Change in New York State: The ClimAID Integrated Assessment for Effective Climate Change Adaptation. Technical Report. New York State Energy Research and Development Authority (NYSERDA), Albany, New York.
Schimdt, O (1969) East Pakistan Coastal Embankment Project, The Professional Geographer, 21:4, 252-254 (http://dx.doi.org/10-1111/J.0033-0124. 1969.00252.X
Sen H.S (2010) The drying up of River Ganga: an issue of common concern to both India and Bangladesh, Current Science, Vol 99.No.6.
Shampa and Paramanik MIM (2012) Tidal River Management (TRM) for Selected Coastal Area of Bangladesh to Mitigate Drainage Congestion. International Journal of scientific &Technology Research Volume 1, Issue 5, June 2012. ISSN 2277-8616
Shamsuddin, D and Talukder, B (2012) Environmental Impacts of Flood Control Drainage and Irrigation (FCDI) Projects in a Non-Irrigated Area of Bangladesh: A Case Study. The Journal of Transdisciplinary Environmental Studies vol. 11, no. 2, 2012
Shiree (2012) Lesson Learning Report: Innovative Farming as a Tool of Poverty Reduction and Climate Change Adaptation, CNRS. Stimulating Household Improvements Resulting in Economic Empowerment, DFID, Dhaka, Bangladesh. http://www.shiree.org/wp-content/uploads/2012/03/Lesson-Learning-Report-CNRS.pdf
Shiva, V (1995) The damaging social and environment effects of aquaculture. Third World Resurg 59, 22-24.
Sofear S (1999) Qualitative methods: what are they and why use them? Health Services Research, 34, 1101–1118.
Smit B, Burton I, Klein R.J.T and Street R (1999) The Science of Adaptation: A Framework for Assessment” mitigation and Adaptation Strategies for Global Change. 4(3-4) 199-213
Smit B, Burton I, Klein R.J.T and Wandel, J (2000) An Anatomy of Adaptation to Climate Change and Variability. Climate Change 45:223-251
Smit B &Wandel J (2006) Adaptation, adaptive capacity and vulnerability. Global Environmental Change, 16: 282-92.
Smit, B. and Pilifosova, O (2001) ‘Adaptation to climate change in the context of sustainable development and equity’, in McCarthy, J. J., Canziani, O. F., Leary, N. A.,Dokken, D. J., and White, K. S.(eds.), Climate Change 2001: Impacts, Adaptation and Vulnerability (Chapter 18), Cambridge University Press, Cambridge.
Stern N (2006) Stern Review, The Economics of Climate Change: Executive Summary, at http://www.hm-treasury. gov.uk/Stern_review_report.htm
300
Tacoli C (2009) Crisis or adaptation? Migration and climate change in a context of high mobility. Environment and Urbanization, 21(2), 513-525.
Mahmud T and Prowse M (2012) Corruption in cyclone preparedness and relief efforts in coastal Bangladesh: Lessons for climate adaptation? Global Environmental Change 22 (2012) 933–943
Thompson, P.M and Sultana, P (1996) Distributional and Social Impacts of Flood Control in Bangladesh. The Geographical Journal 162 (1), pp. 1-13.
Turner B. L, II, Kasperson R. E, Matson, P. A, McCarthy J. J, Corell R. W, Christensen L, Eckley N, Kasperson J. X, Luers A, Martello M. L, Polsky C, Pulsipher A, and
Schiller A (2003) ‘A framework for vulnerability analysis in sustainability science’, Proc. Natl. Acad. Sci. U.S.A. 100, 8074–8079.
Twigg J (2007) Disaster Reduction Terminology: A Commonsense approach, Humanitarian Practice Network. Issue 38, Available at: http://www. odihpn.org / report. asp?id=2893
United Nations Disaster Relief Organization (UNDRO) (1980) Natural Disasters Vulnerability Analysis. Report of Expert Meeting (9-12 July 1979): Office of the United Nations Disaster Relief Coordinator
UNESCO (2007) Case studies on Climate Change and World Heritage.
UNFCCC (2011) Ecosystem-based approaches to adaptation: compilation of information. Subsidiary Body for Scientific and Technological Advice. FCCC/ SBSTA/ 2011/INF.8
UNISDR (United Nations International Strategy for Disaster Reduction) (2004) Living with Risk: A Global Review of Disaster Reduction Initiatives. Preliminary Version. Geneva, Switzerland: Inter-Agency Secretariat of the International Strategy for Disaster Reduction. 382 pp.
UKCIP (2003) Climate adaptation: Risk, uncertainty and decision-making. Willows R.I. and Connell R.K. (Eds.) UKCIP Technical Report. UKCIP, Oxford.
Walker B, Holling C S, Carpenter S R, and Kinzig, A (2004) Resilience, adaptability and transformability in social–ecological systems. Ecology and Society 9 (2):5.[on line] URL: http://www.ecologyandsociety.org/vol9/iss2/art5
Wisner B, Blaikie P, Cannon T and Davis I (2004) At Risk: Natural Hazards, People’s Vulnerability and Disasters (2nd edition). New York: Routledge.
Wisner B (2002) “Who? What? Where? When? In an Emergency: Notes on Possible Indicators of Vulnerability and Resilience: By Phase of the Disaster Management Cycle and Social Actor” in: Plate, E. (ed.): Environment and Human Security. Contributions to a workshop in Bonn, 23-25 October 2002, Germany, pp.12/7-12/14.
301
World Bank (2000) “Bangladesh: Climate Change and Sustainable Development. Report No. 21104 BD”, Rural Development Unit, South Asia Region, The World Bank, Dhaka.
World Bank (2009) Arable land (hectares per person) in Bangladesh.http://www. tradingeconomics.com/bangladesh/arable-land-hectares-per-person-wb-data.html
Wu S.Y, YarnalB and Fisher A (2002) Vulnerability of coastal communities to sea-level rise: a case study of Cape May County, New Jersey, USA. Climate Res., 224, 255-270.
Zohora, F T (2011) Non-timber Forest Products and Livelihoods in the Sundarbans. Rural Livelihoods and Protected Landscapes: Co-management in the Wetland and Forests of Bangladesh. Nishorgo Network, Dhaka, 99-117.
302
Appendices Appendix 1: Calculating the LVI: composite index approach
Several indicators under each of the seven major vulnerability components are
considered to calculate the LVI of two study villages. The major components are
Socio-Demographic Profile, Livelihood Strategies, Social Networks, Health, Food,
Water and Natural Disasters & Climate Variability of the area. These were developed
based on local situations. Table 1 shows the major components, indicators and
explanation of how each sub-component were quantified, the survey question used to
collect the data. The LVI uses a balanced weighted average approach (Hahn, et al,
2009; Sullivan et al., 2002) where each sub-component contributes equally to the
overall index under each major component that comprises multiple sub-components
as such the LVI formula uses the simple approach of applying equal weights to all
major components. Since each sub-component is measured on a different scale,
standardization was done by using equation adapted from the one used in the Human
Development Index to calculate the life expectancy, which is the ratio of the
difference of the actual life expectancy and a pre-selected minimum, and the range of
predetermined maximum and minimum life expectancy (UNDP, 2007):
𝐼𝐼𝐼𝐼𝐼𝑠𝑣 = 𝑠𝑣−𝑠𝑚𝑚𝑚𝑠𝑚𝑚𝑚−𝑠𝑚𝑚𝑚
……………………………………………………………(1)
Where 𝑠𝑣 is the original sub-component for village v, and 𝑠𝑚𝑚𝑚 and𝑠𝑚𝑚𝑚are the
minimum and maximum values respectively for each sub-component determined
using data from both villages. For example, the ‘average time taken to collect
drinking water’ sub component ranged from 5 to 180 minutes in the two study
villages. These minimum and maximum values were used to transform this indicator
into a standardized index to be integrated into the water component of the LVI. For
variables that measure frequencies such as the ‘% of households drink water from
open ponds (unsafe),’ the minimum value was set at 0 and the maximum at 100.
Some sub-components viz. ‘average agricultural livelihood diversity index’ were
created because an increase in the crude indicator, the number of livelihood activities
undertaken by a HH, was assumed to decrease vulnerability assuming that a HH
who grow rice and do aquaculture is less vulnerable than a household who only grow
rice.
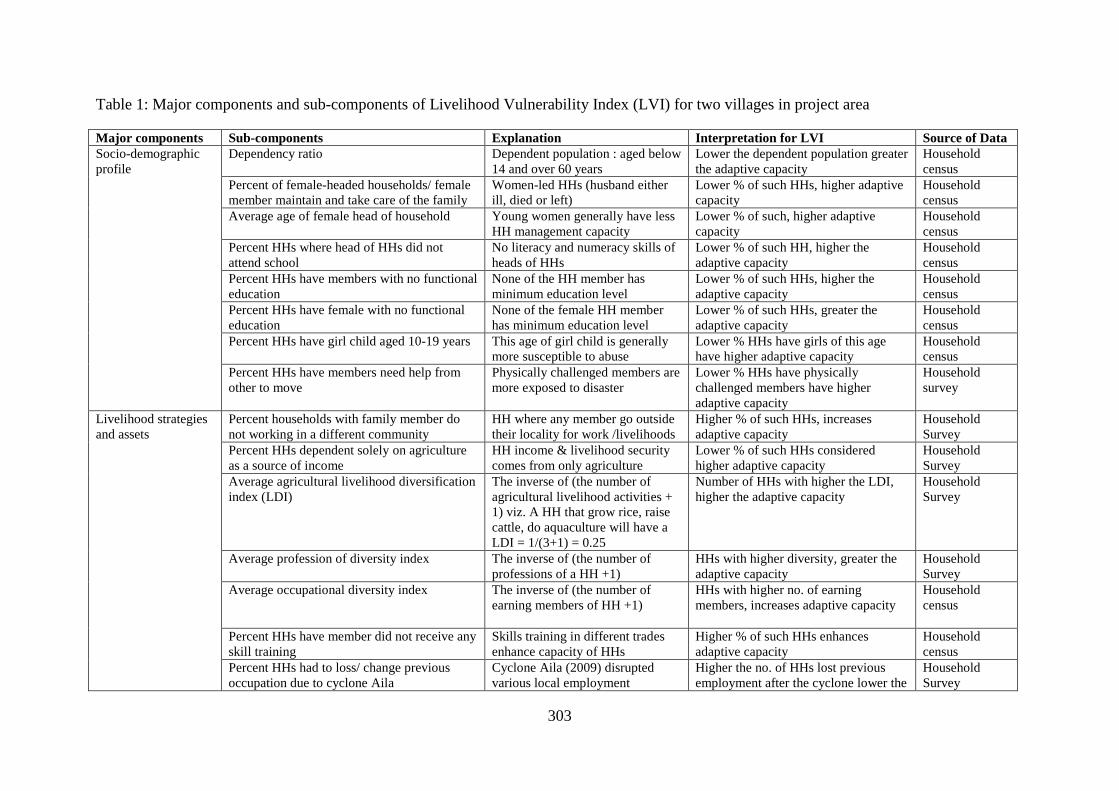
303
Table 1: Major components and sub-components of Livelihood Vulnerability Index (LVI) for two villages in project area
Major components Sub-components Explanation Interpretation for LVI Source of Data Socio-demographic profile
Dependency ratio
Dependent population : aged below 14 and over 60 years
Lower the dependent population greater the adaptive capacity
Household census
Percent of female-headed households/ female member maintain and take care of the family
Women-led HHs (husband either ill, died or left)
Lower % of such HHs, higher adaptive capacity
Household census
Average age of female head of household Young women generally have less HH management capacity
Lower % of such, higher adaptive capacity
Household census
Percent HHs where head of HHs did not attend school
No literacy and numeracy skills of heads of HHs
Lower % of such HH, higher the adaptive capacity
Household census
Percent HHs have members with no functional education
None of the HH member has minimum education level
Lower % of such HHs, higher the adaptive capacity
Household census
Percent HHs have female with no functional education
None of the female HH member has minimum education level
Lower % of such HHs, greater the adaptive capacity
Household census
Percent HHs have girl child aged 10-19 years This age of girl child is generally more susceptible to abuse
Lower % HHs have girls of this age have higher adaptive capacity
Household census
Percent HHs have members need help from other to move
Physically challenged members are more exposed to disaster
Lower % HHs have physically challenged members have higher adaptive capacity
Household survey
Livelihood strategies and assets
Percent households with family member do not working in a different community
HH where any member go outside their locality for work /livelihoods
Higher % of such HHs, increases adaptive capacity
Household Survey
Percent HHs dependent solely on agriculture as a source of income
HH income & livelihood security comes from only agriculture
Lower % of such HHs considered higher adaptive capacity
Household Survey
Average agricultural livelihood diversification index (LDI)
The inverse of (the number of agricultural livelihood activities + 1) viz. A HH that grow rice, raise cattle, do aquaculture will have a LDI = 1/(3+1) = 0.25
Number of HHs with higher the LDI, higher the adaptive capacity
Household Survey
Average profession of diversity index The inverse of (the number of professions of a HH +1)
HHs with higher diversity, greater the adaptive capacity
Household Survey
Average occupational diversity index The inverse of (the number of earning members of HH +1)
HHs with higher no. of earning members, increases adaptive capacity
Household census
Percent HHs have member did not receive any skill training
Skills training in different trades enhance capacity of HHs
Higher % of such HHs enhances adaptive capacity
Household census
Percent HHs had to loss/ change previous occupation due to cyclone Aila
Cyclone Aila (2009) disrupted various local employment
Higher the no. of HHs lost previous employment after the cyclone lower the
Household Survey
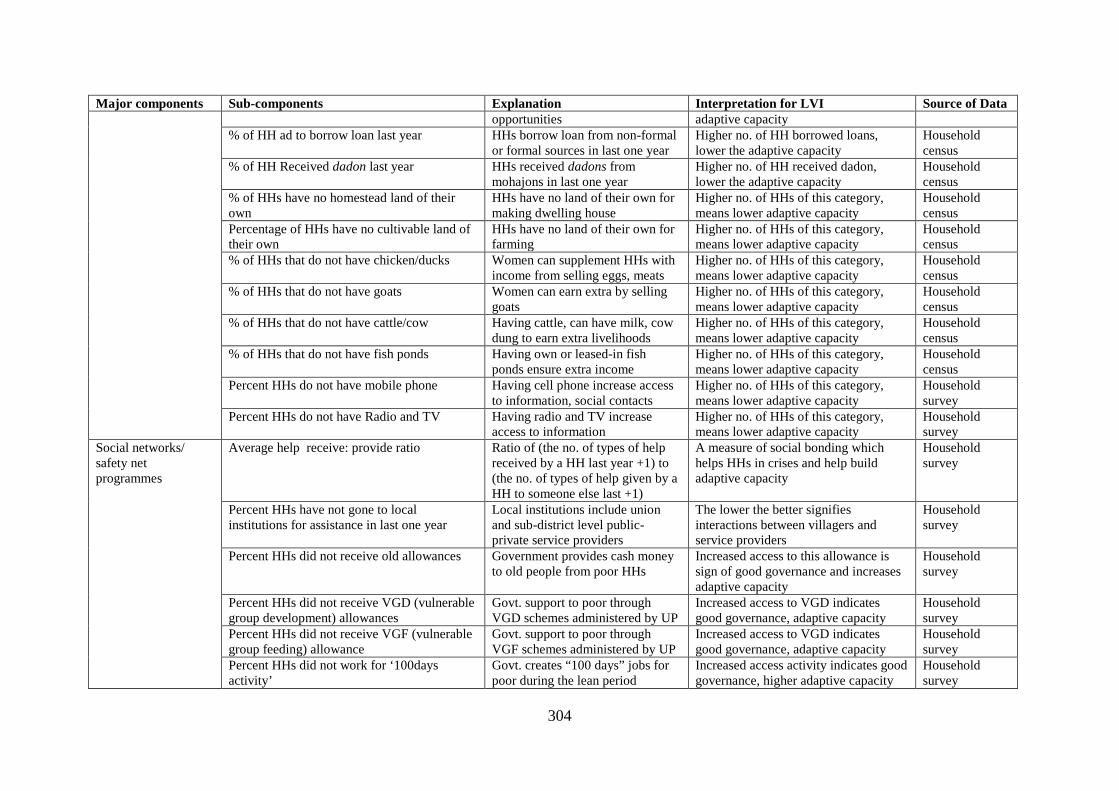
304
Major components Sub-components Explanation Interpretation for LVI Source of Data opportunities adaptive capacity
% of HH ad to borrow loan last year HHs borrow loan from non-formal or formal sources in last one year
Higher no. of HH borrowed loans, lower the adaptive capacity
Household census
% of HH Received dadon last year HHs received dadons from mohajons in last one year
Higher no. of HH received dadon, lower the adaptive capacity
Household census
% of HHs have no homestead land of their own
HHs have no land of their own for making dwelling house
Higher no. of HHs of this category, means lower adaptive capacity
Household census
Percentage of HHs have no cultivable land of their own
HHs have no land of their own for farming
Higher no. of HHs of this category, means lower adaptive capacity
Household census
% of HHs that do not have chicken/ducks Women can supplement HHs with income from selling eggs, meats
Higher no. of HHs of this category, means lower adaptive capacity
Household census
% of HHs that do not have goats Women can earn extra by selling goats
Higher no. of HHs of this category, means lower adaptive capacity
Household census
% of HHs that do not have cattle/cow Having cattle, can have milk, cow dung to earn extra livelihoods
Higher no. of HHs of this category, means lower adaptive capacity
Household census
% of HHs that do not have fish ponds Having own or leased-in fish ponds ensure extra income
Higher no. of HHs of this category, means lower adaptive capacity
Household census
Percent HHs do not have mobile phone Having cell phone increase access to information, social contacts
Higher no. of HHs of this category, means lower adaptive capacity
Household survey
Percent HHs do not have Radio and TV Having radio and TV increase access to information
Higher no. of HHs of this category, means lower adaptive capacity
Household survey
Social networks/ safety net programmes
Average help receive: provide ratio
Ratio of (the no. of types of help received by a HH last year +1) to (the no. of types of help given by a HH to someone else last +1)
A measure of social bonding which helps HHs in crises and help build adaptive capacity
Household survey
Percent HHs have not gone to local institutions for assistance in last one year
Local institutions include union and sub-district level public-private service providers
The lower the better signifies interactions between villagers and service providers
Household survey
Percent HHs did not receive old allowances Government provides cash money to old people from poor HHs
Increased access to this allowance is sign of good governance and increases adaptive capacity
Household survey
Percent HHs did not receive VGD (vulnerable group development) allowances
Govt. support to poor through VGD schemes administered by UP
Increased access to VGD indicates good governance, adaptive capacity
Household survey
Percent HHs did not receive VGF (vulnerable group feeding) allowance
Govt. support to poor through VGF schemes administered by UP
Increased access to VGD indicates good governance, adaptive capacity
Household survey
Percent HHs did not work for ‘100days activity’
Govt. creates “100 days” jobs for poor during the lean period
Increased access activity indicates good governance, higher adaptive capacity
Household survey
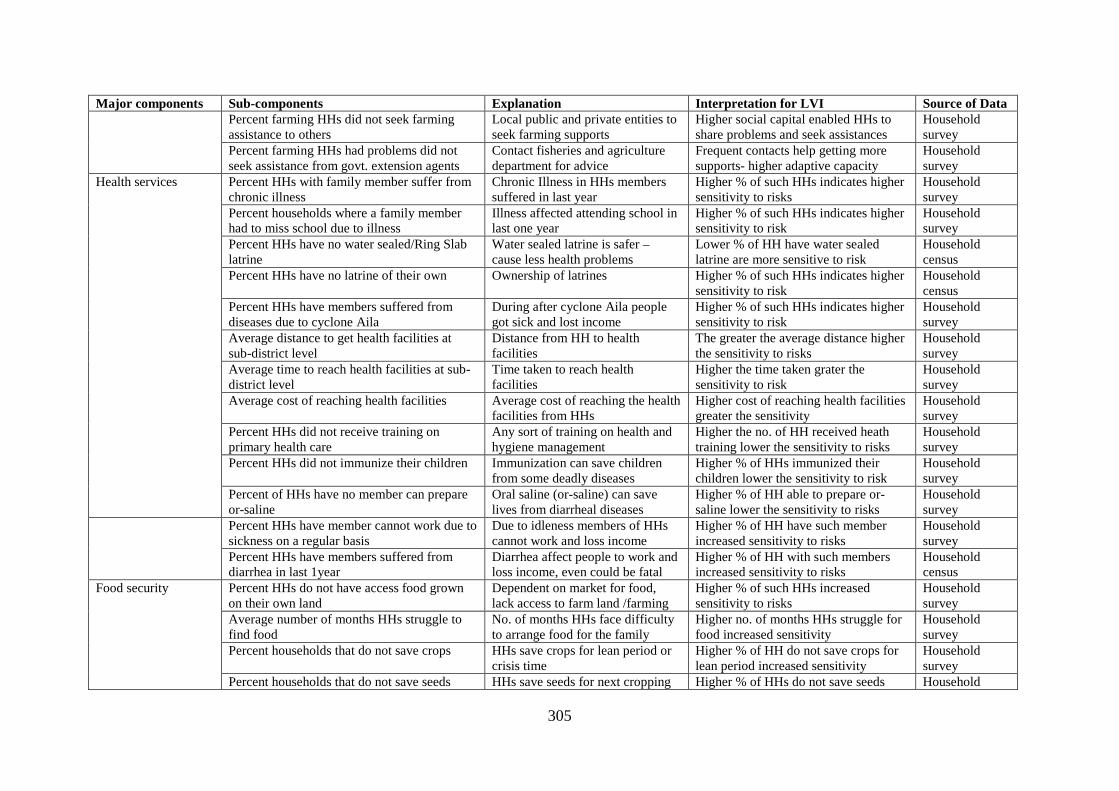
305
Major components Sub-components Explanation Interpretation for LVI Source of Data Percent farming HHs did not seek farming assistance to others
Local public and private entities to seek farming supports
Higher social capital enabled HHs to share problems and seek assistances
Household survey
Percent farming HHs had problems did not seek assistance from govt. extension agents
Contact fisheries and agriculture department for advice
Frequent contacts help getting more supports- higher adaptive capacity
Household survey
Health services Percent HHs with family member suffer from chronic illness
Chronic Illness in HHs members suffered in last year
Higher % of such HHs indicates higher sensitivity to risks
Household survey
Percent households where a family member had to miss school due to illness
Illness affected attending school in last one year
Higher % of such HHs indicates higher sensitivity to risk
Household survey
Percent HHs have no water sealed/Ring Slab latrine
Water sealed latrine is safer – cause less health problems
Lower % of HH have water sealed latrine are more sensitive to risk
Household census
Percent HHs have no latrine of their own Ownership of latrines Higher % of such HHs indicates higher sensitivity to risk
Household census
Percent HHs have members suffered from diseases due to cyclone Aila
During after cyclone Aila people got sick and lost income
Higher % of such HHs indicates higher sensitivity to risk
Household survey
Average distance to get health facilities at sub-district level
Distance from HH to health facilities
The greater the average distance higher the sensitivity to risks
Household survey
Average time to reach health facilities at sub-district level
Time taken to reach health facilities
Higher the time taken grater the sensitivity to risk
Household survey
Average cost of reaching health facilities Average cost of reaching the health facilities from HHs
Higher cost of reaching health facilities greater the sensitivity
Household survey
Percent HHs did not receive training on primary health care
Any sort of training on health and hygiene management
Higher the no. of HH received heath training lower the sensitivity to risks
Household survey
Percent HHs did not immunize their children Immunization can save children from some deadly diseases
Higher % of HHs immunized their children lower the sensitivity to risk
Household survey
Percent of HHs have no member can prepare or-saline
Oral saline (or-saline) can save lives from diarrheal diseases
Higher % of HH able to prepare or-saline lower the sensitivity to risks
Household survey
Percent HHs have member cannot work due to sickness on a regular basis
Due to idleness members of HHs cannot work and loss income
Higher % of HH have such member increased sensitivity to risks
Household survey
Percent HHs have members suffered from diarrhea in last 1year
Diarrhea affect people to work and loss income, even could be fatal
Higher % of HH with such members increased sensitivity to risks
Household census
Food security Percent HHs do not have access food grown on their own land
Dependent on market for food, lack access to farm land /farming
Higher % of such HHs increased sensitivity to risks
Household survey
Average number of months HHs struggle to find food
No. of months HHs face difficulty to arrange food for the family
Higher no. of months HHs struggle for food increased sensitivity
Household survey
Percent households that do not save crops HHs save crops for lean period or crisis time
Higher % of HH do not save crops for lean period increased sensitivity
Household survey
Percent households that do not save seeds HHs save seeds for next cropping Higher % of HHs do not save seeds Household

306
Major components Sub-components Explanation Interpretation for LVI Source of Data seasons increased sensitivity survey
Percent HHs faced scarcity of food HHs face crisis times when unable to arrange food for the family
Higher % of such HHs increased sensitivity to risk
Household survey
Percent HHs could not afford 3 meals a day during crisis period
HHs face crises may not be able to eat 3 meals a day
Higher % of such HHs increased sensitivity to risk
Household survey
Percent HHs could not afford fish in their diet for more than 16 days per month
HHs that failed arrange fish for a single meal in 2 weeks
Higher % of such HHs increased sensitivity to risk
Household survey
Percent HHs could not afford chicken/meat in their diet for more than 6 days per month
HHs that failed arrange chicken for a single meal in 1 week
Higher % of such HHs increased sensitivity to risk
Household survey
Percent HHs could not eat chicken that raised in their own farm
HHs always buy chicken – do not raise chicken at home
Higher % of such HHs increased sensitivity to risk
Household survey
Percent HHs could not afford egg for more than 6-10 days per month
HHs that failed to arrange eggs in their diet at every second day
Higher % of such HHs increased sensitivity to risk
Household survey
Percent HHs could not eat eggs from chicken raised in own farm
HHs always buy eggs– do not raise chicken at home that lay eggs
Higher % of such HHs increased sensitivity to risk
Household survey
Percent HHs could not afford milk in their diet in a month
HHs that failed to arrange milk in their diet in a month
Higher % of such HHs increased sensitivity to risk
Household survey
Water security Average time taken to collect drinking water Average time for HHs to reach drinking water sources
More time taken indicates higher sensitivity
Household survey
Percent HHs do not have access to PSF (pond sand filter/safe water)
PSF provides safe drinking water in the coastal area
Higher % of HHs have access to PSF lower the sensitivity
Household survey
Percent HHs drink water from open ponds (unsafe water)
Where people are to drink water directly from ponds - unsafe
Higher % of HH drink water from open ponds increases sensitivity
Household survey
Percent HHs that do not have consistent drinking water sources - due to cyclone Aila
Cyclone Aila disrupted drinking water sources for varying time
Higher % of lost consistent supply from sources, increases sensitivity
Household survey
Percent HHs could not collect drinking water from previous sources after cyclone Aila
Cyclone water collection from previous sources
Higher % of HH of such category increases sensitivity
Household survey
Percent HHs do not have access to safe cooking water
Safe cooking water is also not readily available in coastal area
Higher % of HHs with poor access, increases sensitivity
Household survey
Average time taken to collect cooking water Average time for HHs to reach safe coking water sources
More time taken to fetch safe cooking indicates higher sensitivity
Household survey
Natural disasters and climate variability
Average number of flood, drought, cyclone events in last 6 years
All types bio-physical hazards communities experience
Higher the hazard events greater the exposure
Household survey
Percent HHs did not receive warning messages on cyclone Sidr
Early warning messages to people to take preparedness measures
Higher % of HHs received warning messages, reduce the exposure
Household census
Percent HHs did not receive warning messages on cyclone Aila
Early warning messages to people to take preparedness measures
Higher % of HHs received warning messages, reduce the exposure
Household census

307
Major components Sub-components Explanation Interpretation for LVI Source of Data Percent HHs had to leave their house due to cyclone Aila
HHs displaced due to cyclone Aila induced saline water inundation
Higher % of HHs had to leave houses, increases the exposure
Household survey
Percent HHs had their homes inundated in last cyclone (Aila)
Houses got inundated due to the cyclone
Higher % of HHs had their houses inundated, increases the exposure
Household survey
Percent HHs had their fish ponds inundated in cyclone Aila
Fish ponds got inundated with saline water due to cyclone
Higher % of HHs had their ponds inundated, increases the exposure
Household survey
Av. months homesteads remained inundated due to cyclone Aila
Extent of inundation of homesteads Higher % of HHs with homesteads inundated, increases the exposure
Household survey
Percent HHs had lost previous occupation due to cyclone Aila
Cyclones disrupted livelihood options for people
Higher % of HHs had lost previous occupation, increases the exposure
Household survey
Average diversity of damaged assets index during cyclone Aila
Average number of assets damaged during cyclone Aila (in 2009)
Higher the damaged assts, greater the exposure
Household survey
Average diversity of damaged assets index after cyclone Aila
Average number of assets damaged after the cyclone Aila (in 2009)
Higher the damaged assts, greater the exposure
Household survey
Percent HHs with disable or died due to Aila Loss of life or disability due to cyclone
Higher % of HH experience dead or disability, greater the exposure
Household survey
Average diversity of conflict index due to Aila Any social conflicts during and after cyclone
More conflicting events increases exposure to disaster risks
Household survey
Percent HHs did not store drinking water after receiving cyclone warning messages
Store drinking water for disaster period
Higher % of HHs store drinking water lessen the exposure
Household survey
Percent HHs could not re-start vegetables production after 1 year of cyclone Aila
Cyclone borne salinity affected vegetables cultivation
Longer the salinity affected period greater the exposure
Household survey
Percent HHs have members did not receive training in disaster management
Training on disaster provide skills of HHs to reduce exposure
Higher % of HHs received reduces exposure to hazards
Household survey
Mean standard deviation of monthly average of average maximum daily temperature (years: 1950–2010)
60 years data of Satkhira (nearest station) was used (Bangladesh Met Department - BMD)
The higher the variability, greater the exposure to climate risk
Meteorological office data
Mean standard deviation of monthly average of average minimum daily temperature (years: 1950–2010)
60 years data of Satkhira was used (collected from BMD)
The higher the variability, greater the exposure to climate risk
Meteorological office data
Mean standard deviation of monthly average precipitation (years: 1950–2010)
60 years data of Satkhira was used (collected BMD)
The higher the variability, greater the exposure to climate risk
Meteorological office data
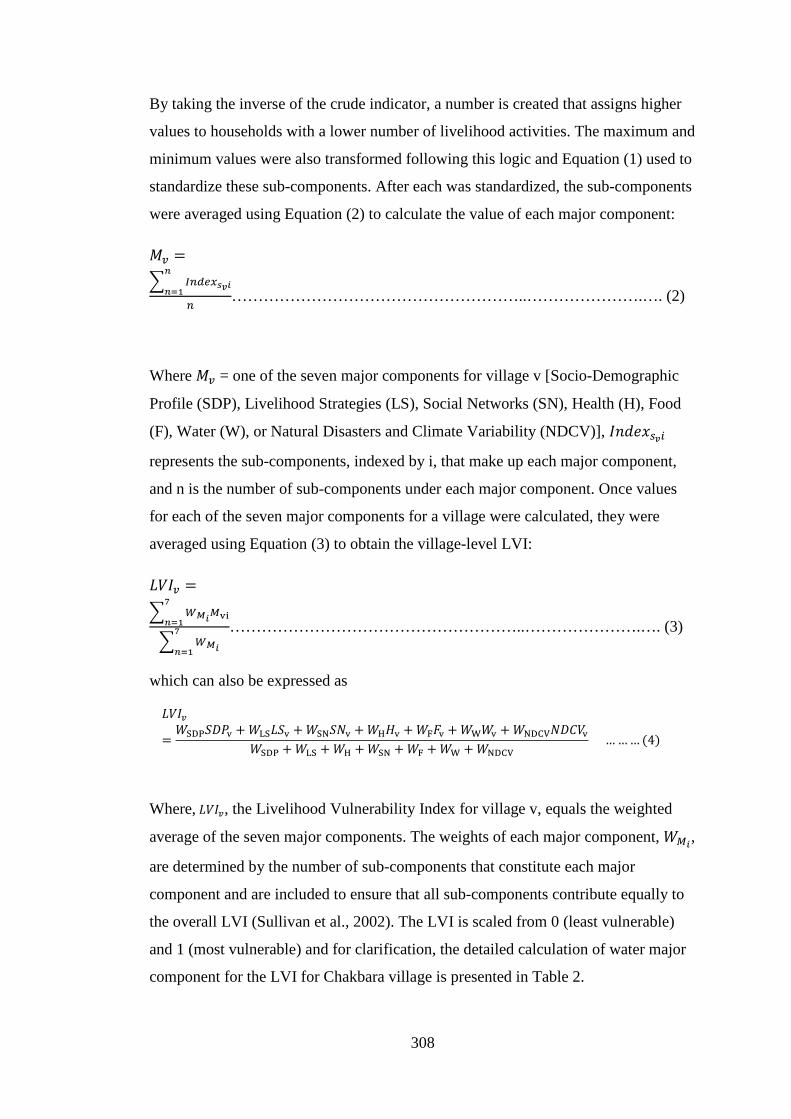
308
By taking the inverse of the crude indicator, a number is created that assigns higher
values to households with a lower number of livelihood activities. The maximum and
minimum values were also transformed following this logic and Equation (1) used to
standardize these sub-components. After each was standardized, the sub-components
were averaged using Equation (2) to calculate the value of each major component:
𝑀𝑣 =� 𝐼𝑚𝐼𝑒𝑚𝑠𝑣𝑚
𝑚
𝑚=1𝑚
………………………………………………..………………….…. (2)
Where 𝑀𝑣 = one of the seven major components for village v [Socio-Demographic
Profile (SDP), Livelihood Strategies (LS), Social Networks (SN), Health (H), Food
(F), Water (W), or Natural Disasters and Climate Variability (NDCV)], 𝐼𝐼𝐼𝐼𝐼𝑠𝑣𝑚
represents the sub-components, indexed by i, that make up each major component,
and n is the number of sub-components under each major component. Once values
for each of the seven major components for a village were calculated, they were
averaged using Equation (3) to obtain the village-level LVI:
𝐿𝐿𝐼𝑣 =� 𝑊𝑀𝑚𝑀vi
7
𝑚=1
� 𝑊𝑀𝑚
7
𝑚=1
………………………………………………..………………….…. (3)
which can also be expressed as
𝐿𝐿𝐼𝑣
=𝑊SDP𝑆𝑆𝑆v + 𝑊LS𝐿𝑆v + 𝑊SN𝑆𝑆v + 𝑊H𝐻v + 𝑊F𝐹v + 𝑊W𝑊v + 𝑊NDCV𝑆𝑆𝑁𝐿v
𝑊SDP + 𝑊LS + 𝑊H + 𝑊SN + 𝑊F + 𝑊W + 𝑊NDCV … … … (4)
Where, 𝐿𝐿𝐼𝑣, the Livelihood Vulnerability Index for village v, equals the weighted
average of the seven major components. The weights of each major component, 𝑊𝑀𝑚,
are determined by the number of sub-components that constitute each major
component and are included to ensure that all sub-components contribute equally to
the overall LVI (Sullivan et al., 2002). The LVI is scaled from 0 (least vulnerable)
and 1 (most vulnerable) and for clarification, the detailed calculation of water major
component for the LVI for Chakbara village is presented in Table 2.

309
Table 2: Calculating the water major component for the LVI for Chakbara
Sub-component values for Chakbara
Max sub-
component
values
Min sub-
component
values
Index value
for Chakbar
a
Water major component values for Chakbara
Average time taken to collect drinking water 75.4 180 5 0.40
0.594
Percent HHs do not have access to PSF (safe) 82.2 100 0 0.82 Percent HHs drink water from open ponds (unsafe) 42.2 100 0 0.42 Percent HHs that do not have consistent drinking water sources 28.9 100 0 0.29 Percent HHs could not collect drinking water from previous sources after cyclone Aila 95.6 100 0 0.96 Percent HHs do not have access to safe cooking water 86.7 100 0 0.87 Average time taken to collect cooking water 72.8 180 2 0.40
Step 1 (repeat for all sub-component indicators):
𝐼𝐼𝐼𝐼𝐼𝑊𝑚𝑊𝑒𝑊1𝐶ℎ𝑚𝑎𝑎𝑚𝑎𝑚(𝑊1𝐶ℎ𝑚𝑎𝑎𝑚𝑊𝑚) = 75.4−5180−5
=0.40
Step 2 (repeat for all major components)
WaterChakbara =� 𝐼𝐼𝐼𝐼𝐼𝑠𝑣𝑚
𝑚
𝑚=1𝐼
=𝑊1𝐶ℎ𝑚𝑎𝑎𝑚𝑊𝑚 + 𝑊2𝐶ℎ𝑚𝑎𝑎𝑚𝑊𝑚 + 𝑊3𝐶ℎ𝑚𝑎𝑎𝑚𝑊𝑚 + 𝑊4𝐶ℎ𝑚𝑎𝑎𝑚𝑊𝑚 + 𝑊5𝐶ℎ𝑚𝑎𝑎𝑚𝑊𝑚 + 𝑊6𝐶ℎ𝑚𝑎𝑎𝑚𝑊𝑚 + 𝑊7𝐶ℎ𝑚𝑎𝑎𝑚𝑊𝑚
7
=0.40 + 0.82 + 0.42 + 0.29 + 0.96 + 0.87 + 0.40
7 = 0.594
Step 3 (repeat for all study areas):
𝐿𝐿𝐼𝐶ℎ𝑚𝑎𝑎𝑚𝑊𝑚 =� 𝑊𝑀𝑚𝑀vi
7
𝑚=1
� 𝑊𝑀𝑚
7
𝑚=1
=8∗0.285+20∗0.586+10∗0.528+13∗0.478+12∗0.701+7∗0.594+17∗0.5218+20+10+13+12+7+17
= 0.539
2.2. Calculating the LVI–IPCC: IPCC framework approach
Hahn et al (2009) developed an alternative method for calculating the LVI that
incorporates the IPCC vulnerability definition. Table 7.2 (main text) shows seven
major components in the LVI–IPCC framework. Exposure of the study population is
measured by the number of natural disasters that have occurred in the past 6 years,
while climate variability is measured by the average standard deviation of the
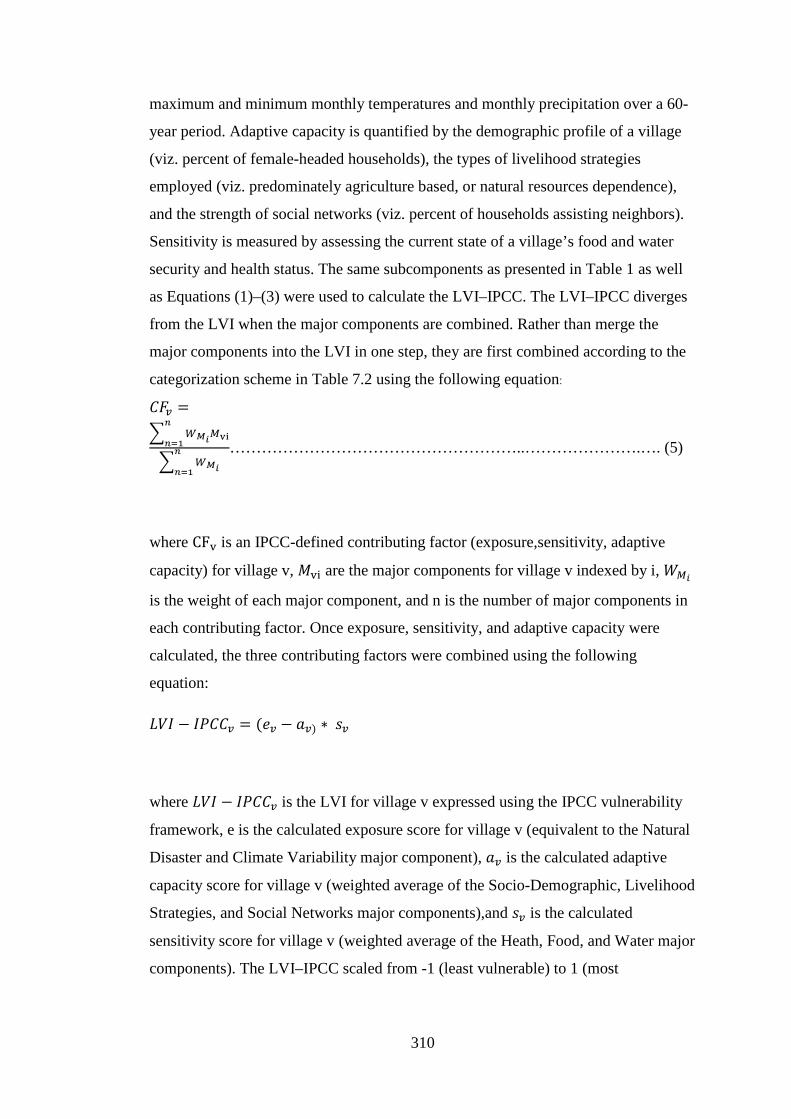
310
maximum and minimum monthly temperatures and monthly precipitation over a 60-
year period. Adaptive capacity is quantified by the demographic profile of a village
(viz. percent of female-headed households), the types of livelihood strategies
employed (viz. predominately agriculture based, or natural resources dependence),
and the strength of social networks (viz. percent of households assisting neighbors).
Sensitivity is measured by assessing the current state of a village’s food and water
security and health status. The same subcomponents as presented in Table 1 as well
as Equations (1)–(3) were used to calculate the LVI–IPCC. The LVI–IPCC diverges
from the LVI when the major components are combined. Rather than merge the
major components into the LVI in one step, they are first combined according to the
categorization scheme in Table 7.2 using the following equation:
𝑁𝐹𝑣 =� 𝑊𝑀𝑚𝑀vi
𝑚
𝑚=1
� 𝑊𝑀𝑚
𝑚
𝑚=1
………………………………………………..………………….…. (5)
where CFv is an IPCC-defined contributing factor (exposure,sensitivity, adaptive
capacity) for village v, 𝑀vi are the major components for village v indexed by i, 𝑊𝑀𝑚
is the weight of each major component, and n is the number of major components in
each contributing factor. Once exposure, sensitivity, and adaptive capacity were
calculated, the three contributing factors were combined using the following
equation:
𝐿𝐿𝐼 − 𝐼𝑆𝑁𝑁𝑣 = (𝐼𝑣 − 𝑎𝑣) ∗ 𝑠𝑣
where 𝐿𝐿𝐼 − 𝐼𝑆𝑁𝑁𝑣 is the LVI for village v expressed using the IPCC vulnerability
framework, e is the calculated exposure score for village v (equivalent to the Natural
Disaster and Climate Variability major component), 𝑎𝑣 is the calculated adaptive
capacity score for village v (weighted average of the Socio-Demographic, Livelihood
Strategies, and Social Networks major components),and 𝑠𝑣 is the calculated
sensitivity score for village v (weighted average of the Heath, Food, and Water major
components). The LVI–IPCC scaled from -1 (least vulnerable) to 1 (most
311
vulnerable). Detailed example of calculating the contributing factors of the LVI–
IPCC for one of the two villages is presented in Table 3.
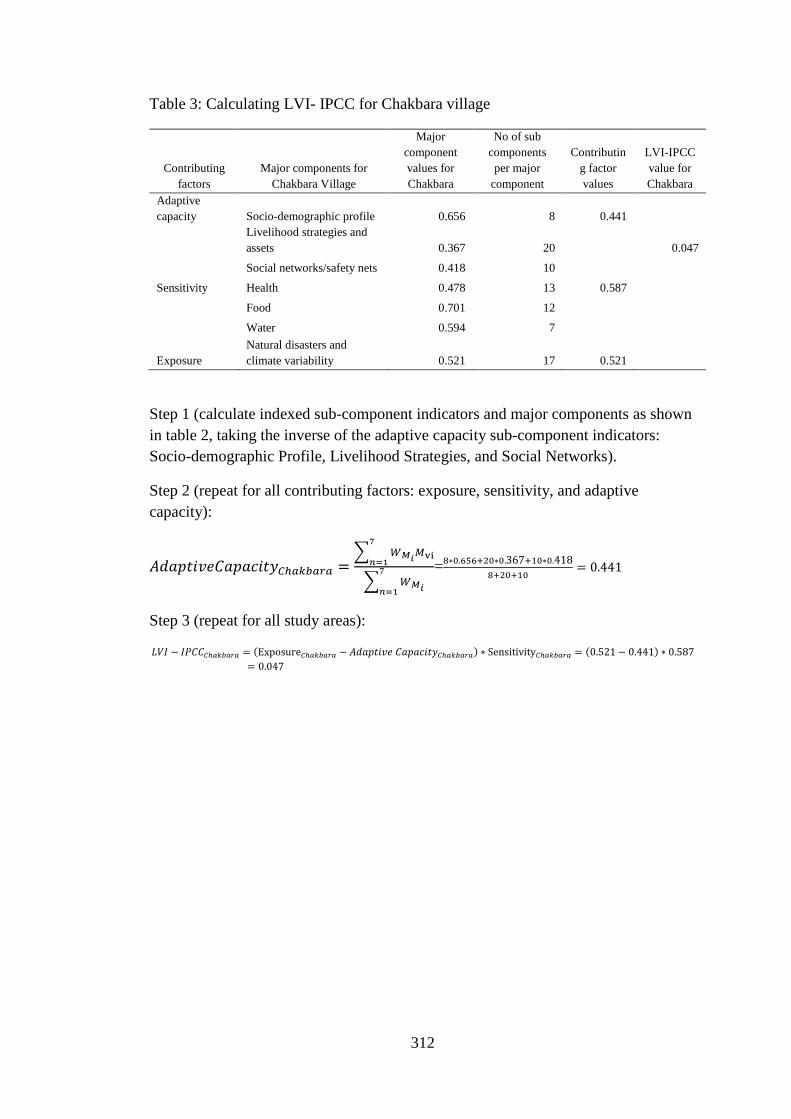
312
Table 3: Calculating LVI- IPCC for Chakbara village
Contributing factors
Major components for Chakbara Village
Major component values for Chakbara
No of sub components per major
component
Contributing factor values
LVI-IPCC value for Chakbara
Adaptive capacity Socio-demographic profile 0.656 8 0.441
Livelihood strategies and assets 0.367 20
0.047
Social networks/safety nets 0.418 10
Sensitivity Health 0.478 13 0.587
Food 0.701 12
Water 0.594 7
Exposure
Natural disasters and climate variability 0.521 17 0.521
Step 1 (calculate indexed sub-component indicators and major components as shown in table 2, taking the inverse of the adaptive capacity sub-component indicators: Socio-demographic Profile, Livelihood Strategies, and Social Networks).
Step 2 (repeat for all contributing factors: exposure, sensitivity, and adaptive capacity):
𝐴𝐼𝑎𝐴𝐴𝐴𝐴𝐼𝑁𝑎𝐴𝑎𝐴𝐴𝐴𝐴𝐶ℎ𝑚𝑎𝑎𝑚𝑊𝑚 =� 𝑊𝑀𝑚𝑀vi
7
𝑚=1
� 𝑊𝑀𝑚
7
𝑚=1
=8∗0.656+20∗0.367+10∗0.4188+20+10
= 0.441
Step 3 (repeat for all study areas):
𝐿𝐿𝐼 − 𝐼𝑆𝑁𝑁𝐶ℎ𝑚𝑎𝑎𝑚𝑊𝑚 = (Exposure𝐶ℎ𝑚𝑎𝑎𝑚𝑊𝑚 − 𝐴𝐼𝑎𝐴𝐴𝐴𝐴𝐼 𝑁𝑎𝐴𝑎𝐴𝐴𝐴𝐴𝐶ℎ𝑚𝑎𝑎𝑚𝑊𝑚) ∗ Sensitivity𝐶ℎ𝑚𝑎𝑎𝑚𝑊𝑚 = (0.521− 0.441) ∗ 0.587= 0.047
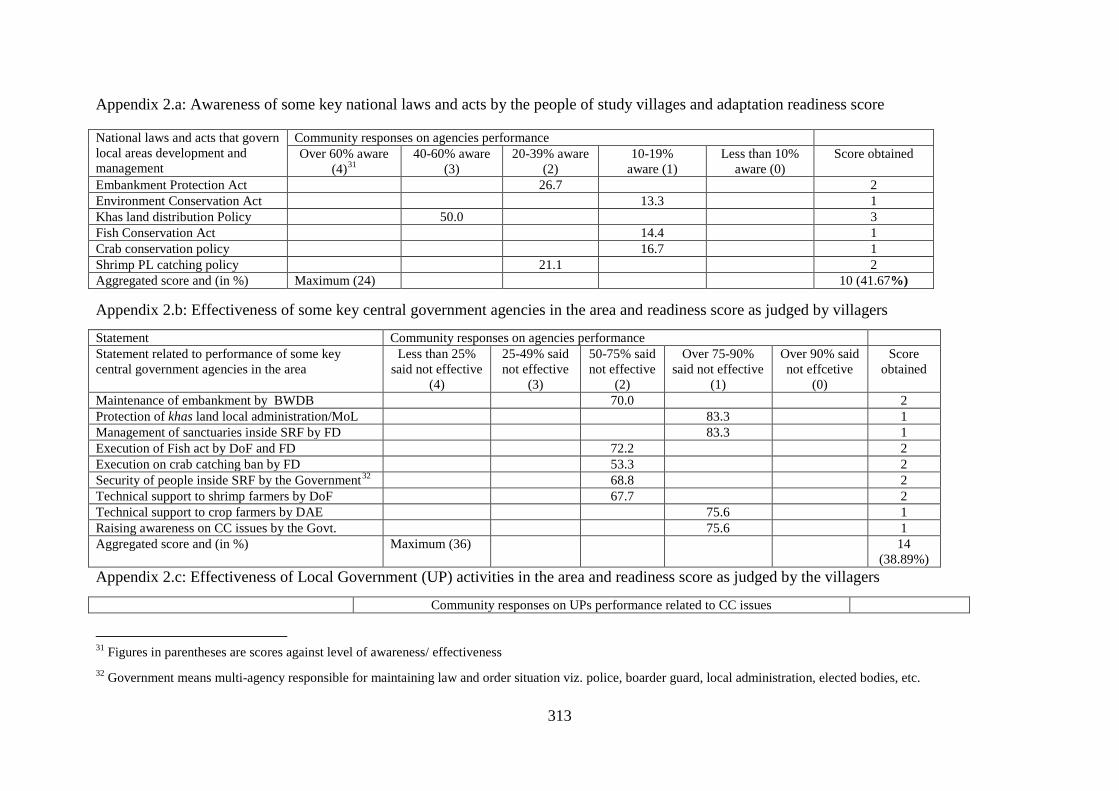
313
Appendix 2.a: Awareness of some key national laws and acts by the people of study villages and adaptation readiness score
National laws and acts that govern local areas development and management
Community responses on agencies performance Over 60% aware
(4)31 40-60% aware
(3) 20-39% aware
(2) 10-19%
aware (1) Less than 10%
aware (0) Score obtained
Embankment Protection Act 26.7 2 Environment Conservation Act 13.3 1 Khas land distribution Policy 50.0 3 Fish Conservation Act 14.4 1 Crab conservation policy 16.7 1 Shrimp PL catching policy 21.1 2 Aggregated score and (in %) Maximum (24) 10 (41.67%)
Appendix 2.b: Effectiveness of some key central government agencies in the area and readiness score as judged by villagers
Statement Community responses on agencies performance Statement related to performance of some key central government agencies in the area
Less than 25% said not effective
(4)
25-49% said not effective
(3)
50-75% said not effective
(2)
Over 75-90% said not effective
(1)
Over 90% said not effcetive
(0)
Score obtained
Maintenance of embankment by BWDB 70.0 2 Protection of khas land local administration/MoL 83.3 1 Management of sanctuaries inside SRF by FD 83.3 1 Execution of Fish act by DoF and FD 72.2 2 Execution on crab catching ban by FD 53.3 2 Security of people inside SRF by the Government32 68.8 2 Technical support to shrimp farmers by DoF 67.7 2 Technical support to crop farmers by DAE 75.6 1 Raising awareness on CC issues by the Govt. 75.6 1 Aggregated score and (in %) Maximum (36) 14
(38.89%) Appendix 2.c: Effectiveness of Local Government (UP) activities in the area and readiness score as judged by the villagers
Community responses on UPs performance related to CC issues
31 Figures in parentheses are scores against level of awareness/ effectiveness 32 Government means multi-agency responsible for maintaining law and order situation viz. police, boarder guard, local administration, elected bodies, etc.
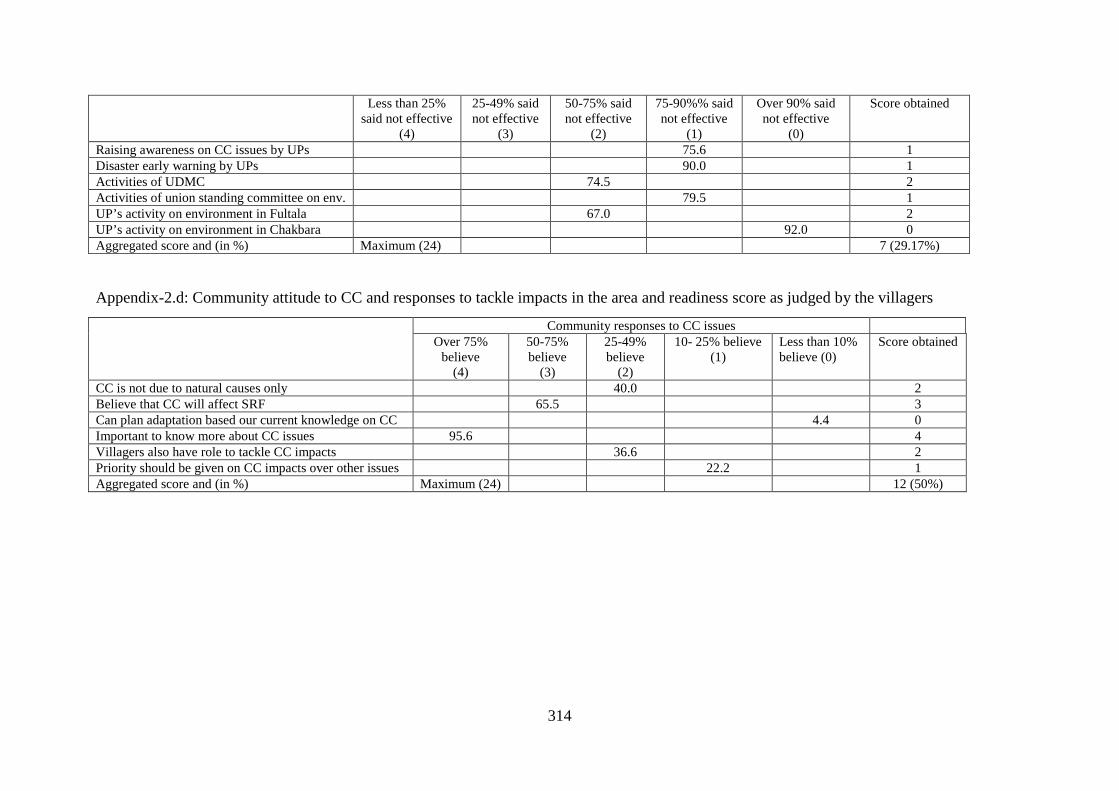
314
Less than 25% said not effective
(4)
25-49% said not effective
(3)
50-75% said not effective
(2)
75-90%% said not effective
(1)
Over 90% said not effective
(0)
Score obtained
Raising awareness on CC issues by UPs 75.6 1 Disaster early warning by UPs 90.0 1 Activities of UDMC 74.5 2 Activities of union standing committee on env. 79.5 1 UP’s activity on environment in Fultala 67.0 2 UP’s activity on environment in Chakbara 92.0 0 Aggregated score and (in %) Maximum (24) 7 (29.17%)
Appendix-2.d: Community attitude to CC and responses to tackle impacts in the area and readiness score as judged by the villagers
Community responses to CC issues Over 75%
believe (4)
50-75% believe
(3)
25-49% believe
(2)
10- 25% believe (1)
Less than 10% believe (0)
Score obtained
CC is not due to natural causes only 40.0 2 Believe that CC will affect SRF 65.5 3 Can plan adaptation based our current knowledge on CC 4.4 0 Important to know more about CC issues 95.6 4 Villagers also have role to tackle CC impacts 36.6 2 Priority should be given on CC impacts over other issues 22.2 1 Aggregated score and (in %) Maximum (24) 12 (50%)

315
Appendix-2.e: Current state of protection and management of CPRs (Common Pool Resources) and readiness score as judged by the villagers
Community responses to CC issues Very good
condition (4) Fair/good
condition (3) Poor/ not too
bad (2) Poor and bad (1)
Very poor/worst (0)
Score obtained
State of protection and management of CPRs X 2 Conversions and degradation of CPRs X 0 Access by the poor to available CPRs X 2 Trend of CPRs and their resources X 1 Any restoration of CPR implemented X 2 State of any CPR under common use X 1 Incident of major conflicts on CPR use X 2 Aggregated score and (in %) Maximum (28) 10 (35.72%)
Appendix-2.f: Current state of safety net and DRR activities in the area and readiness score as judged by the villagers
Community responses to CC issues Very transparent/
no corruption (4)
Transparent /minor
corruption (3)
somewhat transparent/ corruption
(2)
Poorly transparent/major corruption
(1)
Not transparent/
highly corrupt (0)
Score obtained
Transparency in managing sanctuaries in SRF X 0 Harassment of people collect SRF resources X 2 Intention of Bandit control in SRF X 2 Social safety net support to communities X 2 Disaster relief and recovery activities X 2 Community participation in dyke management X 1 Protection of illegal structure in dykes by BWDB X 2 Transparency in Alia affected dyke repairing X 0 Aggregated score and (in %) Maximum (32) 11(34.38%)