hypothalamic regulation of food intake during cancer
TRANSCRIPT

Hypothalamic regulation of
food intake during cancer
Jvalini Dwarkasing
Thesis committee
Promotor
Prof. Dr R.F. WitkampProfessor of Nutrition and PharmacologyWageningen University
Co-promotors
Dr K. van NorrenAssistant professor, Division of Human NutritionWageningen University
Dr M.V. BoekschotenStaff scientist, Division of Human NutritionWageningen University
Other members
Prof. Dr J. Mercer, University of Aberdeen, UKProf. Dr D. Chen, Norwegian university of science and technology, Trondheim, NorwayProf. Dr E. Kampman, Wageningen UniversityProf. Dr J. Keijer, Wageningen University
This research was conducted under the auspices of the Graduate School VLAG (Ad-vanced studies in Food Technology, Agrobiotechnology, Nutrition and Health Sciences).
Hypothalamic regulation of
food intake during cancer
Jvalini Dwarkasing
Thesis
submitted in fulfilment of the requirements for the degree of doctor at Wageningen University
by the authority of the Rector Magnificus Prof. Dr A.P.J. Mol,
in the presence of the Thesis Committee appointed by the Academic Board
to be defended in public on Wednesday 11 November 2015
at 4 p.m. in the Aula.

Jvalini Dwarkasing
Hypothalamic regulation of food intake during cancer148 pages
PhD thesis, Wageningen University, Wageningen, NL (2015)With references, with summaries in Dutch and EnglishISBN 978-94-6257-548-6
Summary
Appetite is often reduced in patients with chronic illness, including cancer. Cancer anorexia, loss of appetite, frequently co-exists with cachexia, and the combined clinical picture is known as anorexia-cachexia syndrome. In patients suffering from this syndrome, anorexia considerably contributes to the progression of cachexia, and strongly impinges on quality of life. Inflammatory processes in the hypothalamus are considered to play a crucial role in the development of disease-related anorexia.
The main aim of this thesis was to further elucidate crucial processes involved in the pathogenesis of anorexia in cancer. To investigate mechanisms specifically involved in cancer anorexia, we used two tumour mouse models with opposing food intake behaviours: a C26-colon adenocarcinoma model with increased food intake and a Lewis lung carcinoma model with decreased food intake. In both models, tumour-induced cachexia (body wasting) was strongly present. The contrast in food intake behaviour between tumour-bearing (TB) mice in response to growth of the two different tumours was used to distinguish processes involved in cachexia from those specifically involved in anorexia.
The hypothalamus was used for transcriptomic analysis (Affymetrix chips). We found expression of genes involved in serotonin signalling in the hypothalamus to be differentially regulated between the two tumour models. Furthermore, transcriptional activity of genes involved in serotonin signalling were inversely associated with food intake behaviour. Surprisingly, we also found a strong increase in gene expression of NPY and AgRP, potent orexigenic neuropeptides, in both models, meaning that their expression did not reflect food intake behaviour. However, NPY has also been described to regulate energy storage. Therefore, we hypothesized that this upregulation of NPY/AgRP corresponded to weight loss, which was severe in both tumour models.
Using hypothalamic cell lines we further explored how serotonin might act on food intake regulatory pathways. We showed that serotonin was able to inhibit neuronal NPY secretion, while not affecting gene expression. Inflammatory markers IL-6 and TNFα were also measured in plasma and it was found that C26 TB mice had a lower inflammatory response than LL TB mice. These differences in inflammatory response could be implicated in the differences in feeding behaviour and serotonin signalling between C26 and LL TB mice. We therefore investigated the direct influence of inflammation on hypothalamic serotonin turnover and its contribution to the development of anorexia. To this end,
different doses of TNF and IL-6 were administered by injection to healthy mice, inducing an acute inflammatory response. The injected cytokine doses were estimated from their corresponding plasma levels measured in tumour bearing (TB) mice. Also in this cytokine induced-anorexia model, where anorexia was exclusively induced by an inflammatory response, serotonin metabolism in the hypothalamus was affected. Both TNF and IL-6 increased hypothalamic serotonin turnover while also inducing anorectic behaviour. Furthermore, the effect of cytokines on increasing serotonin turnover was supported by in vitro experiments with hypothalamic neuronal cell lines.
In conclusion, we identified hypothalamic serotonin signalling to play a major role in the decrease in food intake during cancer. Serotonin signalling itself is modulated by inflammatory mediators. Therefore, hypothalamic inflammation is an important trigger in the failure of hypothalamic food-intake regulation, probably by affecting serotonergic signalling, which acts as an upstream modulator of various orexigenic and anorexigenic systems.
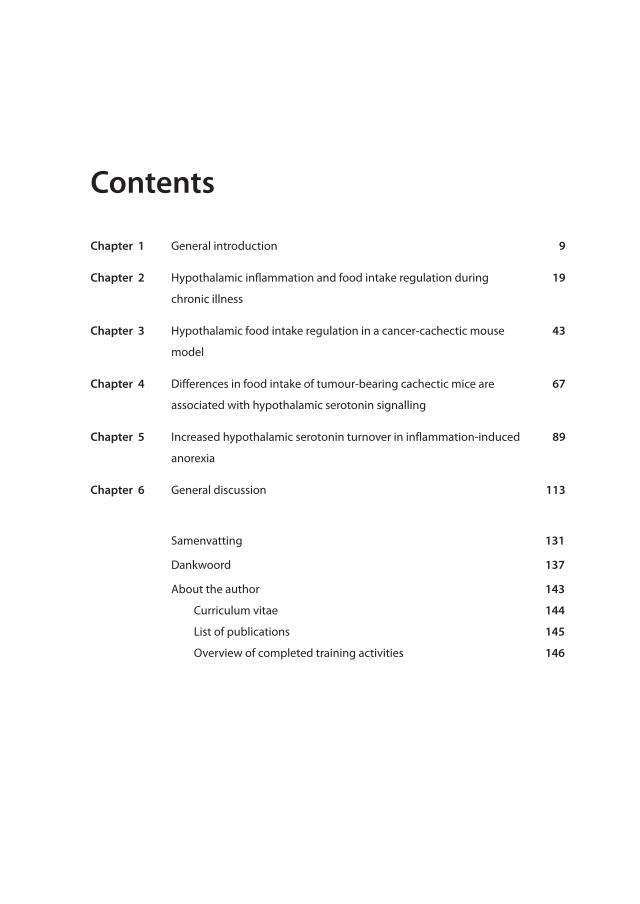
Chapter 1 General introduction 9
Chapter 2 Hypothalamic inflammation and food intake regulation during
chronic illness
19
Chapter 3 Hypothalamic food intake regulation in a cancer-cachectic mouse
model
43
Chapter 4 Differences in food intake of tumour-bearing cachectic mice are
associated with hypothalamic serotonin signalling
67
Chapter 5 Increased hypothalamic serotonin turnover in inflammation-induced
anorexia
89
Chapter 6 General discussion 113
Samenvatting 131
Dankwoord 137
About the author
Curriculum vitae
List of publications
Overview of completed training activities
143
144
145
146
Contents


General introduction
1
10
General introductionChapter 1
Cancer anorexia
Anorexia, literally meaning loss of appetite, in general refers to a condition in which an organism decreases food-intake or even refuses food. Although most people will initially link the term anorexia to the psychological eating disorder anorexia nervosa, it is also considered a common process connected to illness. Anorexia as a consequence of disease is often occuring in patients with cancer.
Different studies indicate an incidence of anorexia in cancer patients from 60-80%, depending on the type and stage of cancer. In these patients, anorexia considerably contributes to the progression of the disease and strongly impinges on quality of life [1-4]. It is still regarded an unmet medical need and current treatments, typically involving corticosteroids and progestagenic steroids, generally improve appetite in less than 30% of the cases [5]. In cancer anorexia, the loss of desire to eat is caused by pathophysiological changes in response to tumour growth and thus also common in patients not receiving chemotherapy [6]. Patients with incurable tumours and near the end of their life, but also newly diagnosed cancer patients often report to experience problems with reduced appetite and involuntary weight loss [3, 7]. Furthermore, anorexia is a strong prognostic factor for reduced survival of cancer patients, even in patients who do not suffer from weight loss [8]. Reports show that cancer patients with a healthy appetite and higher caloric intake have higher survival rates than patients who suffer from anorexia and have a lower energy intake [9, 10]. Anorexia also affects the psychological well-being of the patient. Cancer patients mention anorexia as one of the most prevalent symptoms during disease and often psychologically associate the lack of appetite with disease progression and suffering [11]. On top of that, not eating well and the rejection of food prepared by caring family is a burden for both the patient and his/her family, strongly affecting mental health of both patients as well as their caregivers [12-14].
Anorexia and cachexia: two pathologies, one syndrome?
In a majority of cancer patients, anorexia leads to a reduced food intake [15] and significantly contributes to progression of cachexia [16]. Cachexia is a complex metabolic syndrome associated with underlying illness and is characterized by progressive loss of muscle (muscle wasting) with or without loss of fat mass. This results in weight loss, a reduced quality of life and a shortened survival time [17, 18]. Cachexia is observed in
11
1
Gen
eral
intr
oduc
tion
80% of patients with advanced-stage cancer, and it is estimated to be directly responsible for more than 20% of deaths in cancer [19, 20]. Unfortunately, counteracting body wasting by merely providing nutritional support often fails [21]. At the same time nutritional support can still improve quality of life [22, 23], meaning that nutrition can be a valuable intervention in cancer patients. Cachexia represents an important target in disease management of cancer patients, because it is associated with reduced effectiveness of anti-neoplastic surgery and other anti-cancer treatments, increased risk of therapy-induced side effects, reduced muscle function and physical performance, extended hospital stay, increased postoperative complications and increased infection rates. Most of these complications can be directly correlated to increased morbidity and a reduced quality of life [24-32]. In 2006, anorexia was included as a crucial feature in the framework of factors defining the clinical features of cachexia [33], due to the close entanglement of cachexia and anorexia clinically. Although anorexia and cachexia are likely to be initiated by similar pathologies (underlying illness), it is unclear to what extent anorexia and the metabolic alterations of cachexia affect each other, or to what extent these are distinct entities with their own pathology. Furthermore, food intake is an outcome of various physiological and behavioural processes controlling hunger, satiety and reward systems, making it hard to pinpoint specific causes, as these are highly dependent on the type and stage of the associated disease.
Inflammation is considered to play a pivotal role in the manifestation of both cachexia and anorexia. High concentrations of the prominent pro-inflammatory cytokines IL-1β, IL-6 and TNFα are reported to decrease food intake and to induce features of cachexia [34, 35]. Therefore, the presence of anorexia is not only limited to cancer patients, but also commonly manifested in patients with other chronic illnesses, including acquired immune deficiency syndrome (AIDS) [36], chronic obstructive pulmonary disease (COPD) [37] and chronic heart failure [38].
Role of the hypothalamus in food intake
The hypothalamus is considered to be essential in the integration of metabolic and neuronal signals on energy balance. In cancer, an ongoing elevated inflammatory tone in the hypothalamus is suggested to underlie the onset of anorexia during disease. Here, the hypothalamus appears to be unable to respond adequately to pivotal peripheral signals
12
General introductionChapter 1
involved in appetite regulation [4, 6, 39]. This is particularly relevant when cachexia is also present, which generally demand for an increased energy intake to compensate for increased body weight loss. The hypothalamus displays the highest density of various cytokines receptors in the brain [40], underlying its role in mediating effects of pro-inflammatory cytokines. The hypothalamus contains specific areas that control feeding behaviour with the arcuate nucleus (ARC) being one of the best-characterized regions related to feeding behaviour. This is largely due to its ability to sense peripheral input from its adjacent median eminence. The ARC comprises two neuronal populations with opposing functions on food intake: orexigenic (food intake stimulating) NPY/AgRP, and anorexigenic (food intake inhibiting) POMC/CART neurons [41]. Inflammatory mediators, including TNF and IL-6, cytokines that are commonly elevated in chronic illness, have been shown to interact with neurons dominating these nuclei. Furthermore hypothalamic neurons release various neurotransmitters, including dopamine and serotonin, which are considered to play a role in reward and satiation respectively. Several studies indicate that elevation of hypothalamic serotonin plays a role in the onset of disease-associated anorexia [42-44].
Serotonin in the brain
Serotonin is a common and important mono-amine neurotransmitter and hormone. The body’s largest pool resides in the gut, where it plays a role in regulating gastrointestinal tract functioning. In the CNS, serotonin acts as a neurotransmitter and is involved in several behavioural and physiological processes, including food intake regulation [45]. Serotonin is synthesized from the amino acid tryptophan (TRP). Tryptophan has to compete with other branched-chain amino acids (BCAA) at the blood brain barrier (BBB) in order to enter the hypothalamus. Therefore, the ratio of TRP/BCAA is assumed to reflect brain TRP and ultimately serotonin brain status [46, 47]. In cancer patients, limiting TRP transportation to the brain by supplementation of competing brain chained amino-acids (BCAAs) [48] or inhibiting the activity of serotonin at the 5HT3 receptor has shown to be beneficial for enjoyment of food in anorectic cancer patients [49]. Recent findings on cytokine actions on NPY/AgRP and POMC/CART neurons and their effects on food intake are discussed in chapter 2.
13
1
Gen
eral
intr
oduc
tion
Outline of thesis
The main aim of this research presented in this thesis was to further elucidate crucial processes involved in the pathogenesis of anorexia in cancer. The presence of an elevated inflammatory tone reaching the hypothalamus as an underlying cause for the development of anorexia during cancer was taken as an important starting point.
In chapter 2, we discussed the changes that occur on hypothalamic food-intake regulators and serotonin in chronic inflammation. Cancer has also other consequences besides alteration in food intake, including the development of cachexia. In chapter 3 and 4 we used two different tumour models to investigate mechanisms involved in cancer anorexia. In these models, tumour-induced cachexia (body wasting) was strongly present, but different responses in food intake occurred. This contrast in food intake behaviour was used to distinguish between processes involved in cachexia and mechanisms that might be important in food intake regulation. Using transcriptomics, many genes related to food intake behaviour could be studied. In chapter 2, using transcriptomics analysis, we found serotonin signalling to be among the most significantly altered canonical signalling pathways in the hypothalamus. Therefore, we focused on the role of serotonin in food intake. We reported that differences in food intake are inversely associated with hypothalamic serotonin. We also found that the potent orexigenic regulators NPY and AgRP were among the highest altered genes in both tumour models. However, this expression of NPY and AgRP did not reflect food intake status. In conditions of severe cachexia, it is likely that gene expression of NPY and AgRP responds to cachectic processes that ultimately result in severe body wasting. Furthermore, in chapter 4, we showed that serotonin has an inhibiting action on neuronal NPY release, supporting serotonin’s modulatory role on food intake regulation. To exclude the influences from cachectic processes (e.g. in the muscle and fat tissue) in cancer on the development of anorexia and changes on hypothalamic serotonin and NPY/AgRP regulation, we focused on the specific influence of inflammatory mediators. In chapter 5, we investigated the anorexigenic effects of inflammatory mediators TNF and IL-6 and their effects on serotonin metabolism in the hypothalamus. We showed that systemic inflammation leads to elevated serotonin turnover in the hypothalamus. Finally, chapter 6 presents the general discussion and overall conclusions.
14
General introductionChapter 1
References
1. Maltoni, M., O. Nanni, M. Pirovano, E. Scarpi, M. Indelli, C. Martini, M. Monti, E. Arnoldi, L. Piva, A. Ravaioli, G. Cruciani, R. Labianca, and D. Amadori, Successful validation of the palliative prognostic score in terminally ill cancer patients. Italian Multicenter Study Group on Palliative Care. J Pain Symptom Manage, 1999. 17(4): p. 240-7.
2. Pirovano, M., M. Maltoni, O. Nanni, M. Marinari, M. Indelli, G. Zaninetta, V. Petrella, S. Barni, E. Zecca, E. Scarpi, R. Labianca, D. Amadori, and G. Luporini, A new palliative prognostic score: a first step for the staging of terminally ill cancer patients. Italian Multicenter and Study Group on Palliative Care. J Pain Symptom Manage, 1999. 17(4): p. 231-9.
3. Tranmer, J.E., D. Heyland, D. Dudgeon, D. Groll, M. Squires-Graham, and K. Coulson, Measuring the symptom experience of seriously ill cancer and noncancer hospitalized patients near the end of life with the memorial symptom assessment scale. J Pain Symptom Manage, 2003. 25(5): p. 420-9.
4. Laviano, A., M.M. Meguid, A. Inui, M. Muscaritoli, and F. Rossi-Fanelli, Therapy insight: Cancer anorexia-cachexia syndrome--when all you can eat is yourself. Nat Clin Pract Oncol, 2005. 2(3): p. 158-65.
5. Jatoi, A., Pharmacologic therapy for the cancer anorexia/weight loss syndrome: A data-driven, practical approach. J Support Oncol, 2006. 4(10): p. 499-502.
6. Laviano, A., M.M. Meguid, and F. Rossi-Fanelli, Cancer anorexia: clinical implications, pathogenesis, and therapeutic strategies. Lancet Oncol, 2003. 4(11): p. 686-94.
7. Adams, L.A., N. Shepard, R.A. Caruso, M.J. Norling, H. Belansky, and R.S. Cunningham, Putting evidence into practice: evidence-based interventions to prevent and manage anorexia. Clin J Oncol Nurs, 2009. 13(1): p. 95-102.
8. Lasheen, W. and D. Walsh, The cancer anorexia-cachexia syndrome: myth or reality? Support Care Cancer, 2010. 18(2): p. 265-72.
9. Okusaka, T., S. Okada, H. Ishii, M. Ikeda, H. Kosakamoto, and M. Yoshimori, Prognosis of advanced pancreatic cancer patients with reference to calorie intake. Nutr Cancer, 1998. 32(1): p. 55-8.
10. Tamburini, M., C. Brunelli, S. Rosso, and V. Ventafridda, Prognostic value of quality of life scores in terminal cancer patients. J Pain Symptom Manage, 1996. 11(1): p. 32-41.
11. Donnelly, S., D. Walsh, and L. Rybicki, The symptoms of advanced cancer: identification of clinical and research priorities by assessment of prevalence and severity. J Palliat Care, 1995. 11(1): p. 27-32.
12. Reid, J., H. McKenna, D. Fitzsimons, and T. McCance, Fighting over food: patient and family understanding of cancer cachexia. Oncol Nurs Forum, 2009. 36(4): p. 439-45.
13. Reid, J., H. McKenna, D. Fitzsimons, and T. McCance, The experience of cancer cachexia: a qualitative study of advanced cancer patients and their family members. Int J Nurs Stud, 2009. 46(5): p. 606-16.
15
1
Gen
eral
intr
oduc
tion
14. Reid, J., H. McKenna, D. Fitzsimons, and T. McCance, The experience of cancer cachexia: a qualitative study of advanced cancer patients and their family members. Int J Nurs Stud., 2009. 46(5): p. 606-16. Epub 2008 Dec 10.
15. Sarhill, N., F. Mahmoud, D. Walsh, K.A. Nelson, S. Komurcu, M. Davis, S. LeGrand, O. Abdullah, and L. Rybicki, Evaluation of nutritional status in advanced metastatic cancer. Support Care Cancer, 2003. 11(10): p. 652-9.
16. Muscaritoli, M., S.D. Anker, J. Argiles, Z. Aversa, J.M. Bauer, G. Biolo, Y. Boirie, I. Bosaeus, T. Cederholm, P. Costelli, K.C. Fearon, A. Laviano, M. Maggio, F. Rossi Fanelli, S.M. Schneider, A. Schols, and C.C. Sieber, Consensus definition of sarcopenia, cachexia and pre-cachexia: joint document elaborated by Special Interest Groups (SIG) “cachexia-anorexia in chronic wasting diseases” and “nutrition in geriatrics”. Clin Nutr, 2010. 29(2): p. 154-9.
17. Tisdale, M.J., Mechanisms of cancer cachexia. Physiol Rev., 2009. 89(2): p. 381-410.
18. Evans, W.J., J.E. Morley, J. Argiles, C. Bales, V. Baracos, D. Guttridge, A. Jatoi, K. Kalantar-Zadeh, H. Lochs, G. Mantovani, D. Marks, W.E. Mitch, M. Muscaritoli, A. Najand, P. Ponikowski, F. Rossi Fanelli, M. Schambelan, A. Schols, M. Schuster, D. Thomas, R. Wolfe, and S.D. Anker, Cachexia: a new definition. Clin Nutr, 2008. 27(6): p. 793-9.
19. Mantovani, G., A. Maccio, E. Massa, and C. Madeddu, Managing cancer-related anorexia/cachexia. Drugs, 2001. 61(4): p. 499-514.
20. Martignoni, M.E., P. Kunze, and H. Friess, Cancer cachexia. Mol Cancer, 2003. 2: p. 36.
21. Baldwin, C., Nutritional support for malnourished patients with cancer. Curr Opin Support Palliat Care, 2011. 5(1): p. 29-36.
22. Jatoi, A., K. Rowland, C.L. Loprinzi, J.A. Sloan, S.R. Dakhil, N. MacDonald, B. Gagnon, P.J. Novotny, J.A. Mailliard, T.I. Bushey, S. Nair, B. Christensen, and G. North Central Cancer Treatment, An eicosapentaenoic acid supplement versus megestrol acetate versus both for patients with cancer-associated wasting: a North Central Cancer Treatment Group and National Cancer Institute of Canada collaborative effort. J Clin Oncol, 2004. 22(12): p. 2469-76.
23. Grobbelaar, E.J., S. Owen, A.D. Torrance, and J.A. Wilson, Nutritional challenges in head and neck cancer. Clin Otolaryngol Allied Sci, 2004. 29(4): p. 307-13.
24. Dimitriu, C., M.E. Martignoni, J. Bachmann, B. Frohlich, G. Tintarescu, T. Buliga, I. Lica, G. Constantinescu, M. Beuran, and H. Friess, Clinical impact of cachexia on survival and outcome of cancer patients. Rom J Intern Med., 2005. 43(3-4): p. 173-85.
25. McMillan, D.C., Systemic inflammation, nutritional status and survival in patients with cancer. Curr Opin Clin Nutr Metab Care., 2009. 12(3): p. 223-6.
26. Ovesen, L., J. Hannibal, and E.L. Mortensen, The interrelationship of weight loss, dietary intake, and quality of life in ambulatory patients with cancer of the lung, breast, and ovary. Nutr Cancer, 1993. 19(2): p. 159-67.
27. Taj, M.M., A.D. Pearson, D.B. Mumford, and L. Price, Effect of nutritional status on the incidence of infection in childhood cancer. Pediatr Hematol Oncol, 1993. 10(3): p. 283-7.
16
General introductionChapter 1
28. Deeg, H.J., K. Seidel, B. Bruemmer, M.S. Pepe, and F.R. Appelbaum, Impact of patient weight on non-relapse mortality after marrow transplantation. Bone Marrow Transplant, 1995. 15(3): p. 461-8.
29. van Bokhorst-de van der, S., P.A. van Leeuwen, D.J. Kuik, W.M. Klop, H.P. Sauerwein, G.B. Snow, and J.J. Quak, The impact of nutritional status on the prognoses of patients with advanced head and neck cancer. Cancer, 1999. 86(3): p. 519-27.
30. Edington, J., P.D. Winter, S.J. Coles, C.R. Gale, and C.N. Martyn, Outcomes of undernutrition in patients in the community with cancer or cardiovascular disease. Proc Nutr Soc, 1999. 58(3): p. 655-61.
31. Ross, P.J., S. Ashley, A. Norton, K. Priest, J.S. Waters, T. Eisen, I.E. Smith, and M.E. O’Brien, Do patients with weight loss have a worse outcome when undergoing chemotherapy for lung cancers? Br J Cancer, 2004. 90(10): p. 1905-11.
32. Jagoe, R.T., T.H. Goodship, and G.J. Gibson, The influence of nutritional status on complications after operations for lung cancer. Ann Thorac Surg, 2001. 71(3): p. 936-43.
33. Fearon, K.C., A.C. Voss, D.S. Hustead, and G. Cancer Cachexia Study, Definition of cancer cachexia: effect of weight loss, reduced food intake, and systemic inflammation on functional status and prognosis. Am J Clin Nutr, 2006. 83(6): p. 1345-50.
34. Inui, A., Cancer anorexia-cachexia syndrome: are neuropeptides the key? Cancer Res, 1999. 59(18): p. 4493-501.
35. Sonti, G., S.E. Ilyin, and C.R. Plata-Salaman, Anorexia induced by cytokine interactions at pathophysiological concentrations. Am J Physiol, 1996. 270(6 Pt 2): p. R1394-402.
36. Von Roenn, J.H. and K. Knopf, Anorexia/cachexia in patients with HIV: lessons for the oncologist. Oncology (Williston Park), 1996. 10(7): p. 1049-56; discussion 1062-4, 1067-8.
37. Koehler, F., W. Doehner, S. Hoernig, C. Witt, S.D. Anker, and M. John, Anorexia in chronic obstructive pulmonary disease--association to cachexia and hormonal derangement. Int J Cardiol, 2007. 119(1): p. 83-9.
38. Fudim, M., G. Wagman, R. Altschul, E. Yucel, M. Bloom, and T.J. Vittorio, Pathophysiology and treatment options for cardiac anorexia. Curr Heart Fail Rep, 2011. 8(2): p. 147-53.
39. Laviano, A., M.M. Meguid, and F. Rossi-Fanelli, Improving food intake in anorectic cancer patients. Curr Opin Clin Nutr Metab Care, 2003. 6(4): p. 421-6.
40. Hopkins, S.J. and N.J. Rothwell, Cytokines and the nervous system. I: Expression and recognition. Trends Neurosci, 1995. 18(2): p. 83-8.
41. Sohn, J.W., Network of hypothalamic neurons that control appetite. BMB Rep, 2015. 48(4): p. 229-33.
42. Laviano, A., A. Inui, M.M. Meguid, A. Molfino, C. Conte, and F. Rossi Fanelli, NPY and brain monoamines in the pathogenesis of cancer anorexia. Nutrition, 2008. 24(9): p. 802-5.
17
1
Gen
eral
intr
oduc
tion
43. Meguid, M.M., E.J. Ramos, A. Laviano, M. Varma, T. Sato, C. Chen, Y. Qi, and U.N. Das, Tumor anorexia: effects on neuropeptide Y and monoamines in paraventricular nucleus. Peptides, 2004. 25(2): p. 261-6.
44. Dwarkasing, J.T., M.V. Boekschoten, J.M. Argiles, M. van Dijk, S. Busquets, F. Penna, M. Toledo, A. Laviano, R.F. Witkamp, and K. van Norren, Differences in food intake of tumour-bearing cachectic mice are associated with hypothalamic serotonin signalling. Journal of Cachexia, Sarcopenia and Muscle, 2014, In Press.
45. Gershon, M.D. and J. Tack, The serotonin signaling system: from basic understanding to drug development for functional GI disorders. Gastroenterology, 2007. 132(1): p. 397-414.
46. Wurtman, R.J. and J.J. Wurtman, Do carbohydrates affect food intake via neurotransmitter activity? Appetite, 1988. 11 Suppl 1: p. 42-7.
47. Pratt, O.E., Kinetics of tryptophan transport across the blood-brain barrier. J Neural Transm Suppl, 1979(15): p. 29-42.
48. Cangiano, C., A. Laviano, M.M. Meguid, M. Mulieri, L. Conversano, I. Preziosa, and F. Rossi-Fanelli, Effects of administration of oral branched-chain amino acids on anorexia and caloric intake in cancer patients. J Natl Cancer Inst, 1996. 88(8): p. 550-2.
49. Edelman, M.J., D.R. Gandara, F.J. Meyers, R. Ishii, M. O’Mahony, M. Uhrich, I. Lauder, J. Houston, and D.W. Gietzen, Serotonergic blockade in the treatment of the cancer anorexia-cachexia syndrome. Cancer, 1999. 86(4): p. 684-8.

Peptides 2015
Hypothalamic inflammation and food
intake regulation during chronic illness
J. T. Dwarkasing, D. L. Marks, R. F. Witkamp, K. van Norren
2
20
Hypothalamic inflammation and food intake regulationChapter 2
Abstract
Anorexia is a common symptom in chronic illness. It contributes to malnutrition and strongly affects survival and quality of life. A common denominator of many chronic diseases is an elevated inflammatory status, which is considered to play a pivotal role in the failure of food-intake regulating systems in the hypothalamus. In this review, we summarize findings on the role of hypothalamic inflammation on food intake regulation involving hypothalamic neuropeptide Y (NPY) and pro-opiomelanocortin (POMC). Furthermore, we outline the role of serotonin in the inability of these peptide based food-intake regulating systems to respond and adapt to changes in energy metabolism during chronic disease.
21
2
Hyp
otha
lam
ic in
flam
mat
ion
and
food
inta
ke re
gula
tion
Introduction
In many chronic illnesses including cancer, chronic obstructive pulmonary disease (COPD) and acquired immune deficiency syndrome (AIDS), an ongoing elevated systemic inflammatory status plays a pivotal role in both increased energy expenditure as well as a dysregulation of food intake. As a consequence, increased loss of lean body mass is often accompanied by decreased food intake, ultimately leading to severe malnutrition.
The hypothalamus is important for several metabolic processes including energy homeostasis. It acts as an integrator of metabolic and neuronal signals on energy balance, and regulates the balance between energy expenditure and energy intake. In conditions of increased energy requirements, hypothalamic adaptation generally results in increased food intake, which is for example seen in athletes or persons on incremental exercise training [1, 2] or in individuals residing in a cold environment [1, 3, 4]. However, in conditions where increased energy expenditure is accompanied by the presence of chronic inflammation the hypothalamus is not able to respond adequately to changes in energy balance [5]. Here, this elevated inflammatory status causes loss of body weight, attributed to muscle wasting and increased white adipose tissue lipolysis. On top of that, a loss of appetite beyond a level needed to compensate for increased energy demands is commonly seen, resulting in reduced food intake. This apparent failure of orexigenic (food intake-stimulating) systems of the hypothalamus to respond to peripheral triggers suggests the presence of some form of resistance [5]. This hypothalamic resistance to peripheral neuro-endocrine starvation signals is believed to be directly caused by an increased inflammatory status [5]. Increased plasma levels of pro-inflammatory cytokines are associated with disease progression in a variety of cachectic conditions including cancer [6-8], HIV [9], heart failure [10, 11] and COPD [12].
In experimental models, administration of IL-6, TNFα and IL-1β [13, 14] directly reduces food intake by affecting pivotal food-intake regulating systems in the hypothalamus. At the same time, blocking the action of these cytokines in the presence of underlying disease such as cancer cachexia-anorexia [15-18] or HIV [19] only results in a partial, though significant, reversal of anorexia- cachexia. These studies underline that even though these cytokines are crucial in the pathogenesis of anorexia, their actions and also their interplay with other factors such as anti-inflammatory cytokines [20] are still dependent on the underlying illness via other mechanisms.
22
Hypothalamic inflammation and food intake regulationChapter 2
In this review we will focus on current insights on the role of hypothalamic inflammation in the reduced food intake during inflammatory conditions. In particular, changes which inflammatory mediators can have on two pivotal food intake regulating systems: 1) Neuropeptide Y (NPY)/Agouti-related peptide (AgRP) and 2) pro-opiomelanocortin (POMC)/Cocaine and amphetamine regulated transcript (CART) will be discussed. It is still unknown how cytokines are able to induce alterations in these systems. The role of serotonin will also be studied in this respect, since serotonin is able to modulate food-intake regulatory systems in chronic inflammatory conditions and able to directly influence food intake. In this review, we explored recent literature to investigate the hypothesis that inflammation alters NPY/AgRP-and POMC/CART-regulated food intake via modulation of serotonergic signalling pathways.
Hypothalamic infl ammation
Food intake is an outcome of various physiological and behavioural processes controlling hunger, satiety and reward systems of which many originate in the hypothalamus. The hypothalamus consists of a tightly interconnected network of diverse neuronal populations, among them the arcuate nucleus (ARC) and the paraventricular nucleus (PVN). Even though the exact role of the distinct neuronal populations in the complex network of processes is not entirely clear, the observation of dense neuronal projections from the ARC into the PVN [21, 22], provides anatomical substrate for the ARC-PVN axis. This ARC-PVN axis is widely studied in the regulation of food intake behaviour in response to a negative energy balance [23-25]. In relation to this, the ARC-PVN axis is involved in different physiological processes, while interacting with several other neuronal populations. In the present review, we will primarily focus on this ARC-PVN axis in relation to the effect of neural inflammation and food intake. The hypothesis that the hypothalamus plays a crucial role in both reduced food intake and cachectic body wasting is supported by a combination of findings. Firstly, neuroinflammation and disturbed hypothalamic signalling is present in cachectic chronic diseases such as cancer [5], HIV [26, 27], COPD [28] and heart failure [29, 30]. Secondly, the hypothalamus has the highest density of receptors for these pro-inflammatory cytokines in the brain [31]. This inflammatory response in the hypothalamic area can be a consequence of elevated plasma cytokines entering the brain, as several cytokines are able to cross the BBB including TNFα [32] , IL-6 [33] and IL-1α [34, 35]and IL-1β [36]. In addition,
23
2
Hyp
otha
lam
ic in
flam
mat
ion
and
food
inta
ke re
gula
tion
hypothalamic neurons from the ARC are able to sense systemic circulating factors, including cytokines, and peripheral hormones like leptin and insulin from the adjacent median eminence (ME), which is not protected by the blood-brain barrier. In conditions of food deprivation, permeability and fenestration of microvessels from the ME are increased. This results in an enhanced access of circulating factors entering this region and reaching ARC neurons [37]. In this way ARC neurons might be able to sense peripheral triggers and to project these signals to other neuronal populations including the PVN [38-40]. Subsequently, this response might lead to de novo production of cytokines within the hypothalamus itself. For IL-1β [41], TNFα and Il-6 [42], such de novo synthesis in the hypothalamus has been shown after lipopolysaccharide (LPS) injection in rodents, suggesting that the hypothalamus is both a receiver and an amplifier of the peripheral cytokine signals. Indeed, activation of hypothalamic microglial and astrocyte cells, macrophage-like cells of the central nervous system, appears to be a common phenomenon in chronic inflammatory diseases including myocardial infarction [43], obesity [44] and HIV [45]. Finally, also the vagus nerve is likely to play a role in cytokine signalling to the brain. Vagotomy partially attenuates LPS-induced increases in IL-1β expression in murine hypothalamus, while not affecting elevated IL-1β plasma levels [46]. In summary, inflammatory signals reach the hypothalamus by different routes apparently dependent on the type of inflammatory mediator, the hosts’ specifics and the underlying disease.
Hypothalamic infl ammation: Orexigenic signalling
The arcuate nucleus (ARC) includes two important populations of neurons: orexigenic NPY/AgRP and anorexigenic POMC/CART neurons. NPY and POMC neuronal populations have opposing effects on food intake. Furthermore, they are oppositely regulated by peripheral triggers including insulin [47], gut hormones including glucagon like peptide-1 (GLP-1) [48] and peptide YY (PYY) [49], and leptin [50]. This is for example indicated by the fall in leptin levels during energy deficit, a condition that generally drives an increase of food intake [51-53]. Subsequently, this drop in leptin levels attenuates the activation of POMC neurons and allows the activation of NPY signalling [47], actions both in favour of stimulation of food intake. This stimulation of food intake during energy deficit is also supported by an increase in gut-derived ghrelin [54, 55]. Ghrelin is a potent stimulator of food intake [56] and acts via activation of
24
Hypothalamic inflammation and food intake regulationChapter 2
ARC NPY [57]. Elevated levels of orexigenic ghrelin have been measured in various chronic cachectic conditions including cancer, COPD and chronic heart failure [58-62]. The ability of ghrelin to initiate and stimulate food intake is contradictive to the high occurrence of anorexia in these diseases, suggesting the occurrence of hypothalamic resistance to ghrelin [63, 64]. This elevation of orexigenic ghrelin might be a compensatory response to negative energy balance in these patients. Furthermore it is likely that this elevation of ghrelin is an attempt to suppress inflammation, as ghrelin has strong anti-inflammatory actions by inhibiting pro-inflammatory cytokines, augmenting anti-inflammatory cytokines [65, 66] and reducing hypothalamic glial activation [67]. Furthermore, administration of ghrelin showed to be beneficial in fasting or high-fat diet induced inflammation [68, 69].
Orexigenic neuropeptide AgRP is exclusively located in the ARC [70, 71], while NPY is abundant throughout the entire mammalian brain, with the highest expression of NPY synthesizing neurons located in the ARC [72]. In contrast, NPY release is found to be highest in the PVN [73], supporting the importance of the ARC-PVN axis in NPY and food intake signalling [74].
NPY is strongly activated during states of negative energy balance. In these conditions, it is at least partly responsible for hyperphagia to compensate energy deficits as reported for food restriction [75], food deprivation [76], exercise [77, 78], lactation [79] and insulin-dependent diabetes [80]. Therefore, NPY is considered a crucial sensor of peripheral signals of energy deficit, and in particular decreases in leptin and insulin plasma levels [52, 53] and increased plasma glucocorticoid levels [81]. Subsequently, NPY can regulate energy balance by altering food intake during energy deficit through its release from ARC projections into the PVN, Dorsomedial hypothalamic nucleus (DMH) and Lateral hypothalamus (LHA) [82] (Figure 2.1).
In experimental models for acute inflammation, such as LPS- or TNFα-induced anorexia, hypothalamic NPY expression is decreased (Figure 2.1), corresponding to the observed decrease in food-intake [15, 83, 84]. More importantly, administration of NPY or blocking the induced inflammatory response in these animal models prevents the development of anorexia [15, 85]. These data suggest that NPY release is necessary to adapt food intake to changes in energy expenditure. Paradoxically, hypothalamic NPY gene expression is reported to be increased in animal models for chronic inflammatory diseases that are characterized by the presence of cachexia, such as cancer cachexia
25
2
Hyp
otha
lam
ic in
flam
mat
ion
and
food
inta
ke re
gula
tion
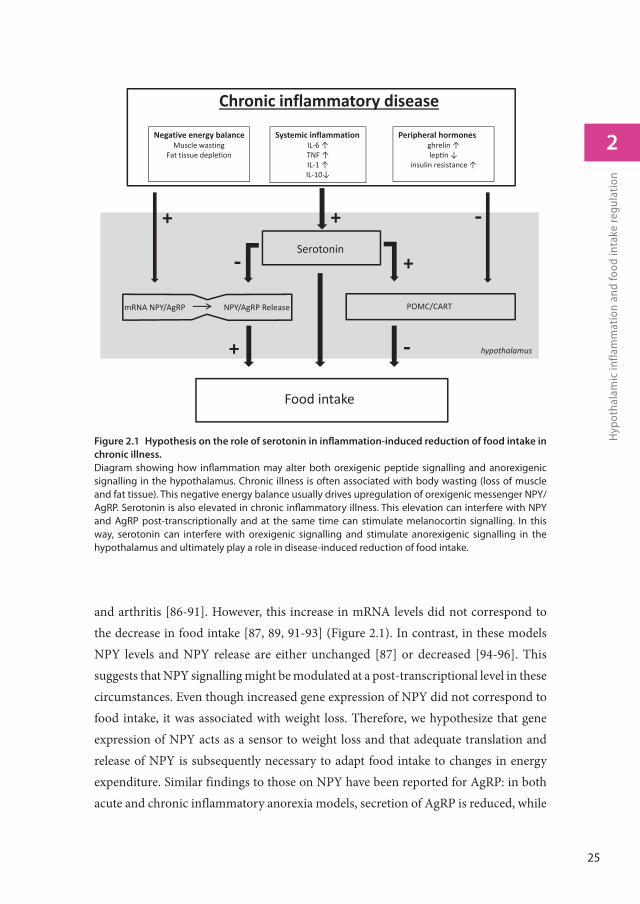
and arthritis [86-91]. However, this increase in mRNA levels did not correspond to the decrease in food intake [87, 89, 91-93] (Figure 2.1). In contrast, in these models NPY levels and NPY release are either unchanged [87] or decreased [94-96]. This suggests that NPY signalling might be modulated at a post-transcriptional level in these circumstances. Even though increased gene expression of NPY did not correspond to food intake, it was associated with weight loss. Therefore, we hypothesize that gene expression of NPY acts as a sensor to weight loss and that adequate translation and release of NPY is subsequently necessary to adapt food intake to changes in energy expenditure. Similar findings to those on NPY have been reported for AgRP: in both acute and chronic inflammatory anorexia models, secretion of AgRP is reduced, while
Figure 2.1 Hypothesis on the role of serotonin in infl ammation-induced reduction of food intake in
chronic illness.
Diagram showing how infl ammation may alter both orexigenic peptide signalling and anorexigenic signalling in the hypothalamus. Chronic illness is often associated with body wasting (loss of muscle and fat tissue). This negative energy balance usually drives upregulation of orexigenic messenger NPY/AgRP. Serotonin is also elevated in chronic infl ammatory illness. This elevation can interfere with NPY and AgRP post-transcriptionally and at the same time can stimulate melanocortin signalling. In this way, serotonin can interfere with orexigenic signalling and stimulate anorexigenic signalling in the hypothalamus and ultimately play a role in disease-induced reduction of food intake.
Food intake
Serotonin
mRNA NPY/AgRP NPY/AgRP Release POMC/CART
+
+
+
Chronic inflammatory disease
Systemic inflammationIL 6TNFIL 1IL 10
Negative energy balanceMuscle wasting
Fat tissue depletion
Peripheral hormonesghrelinlep n
insulin resistance
hypothalamus
+
26
Hypothalamic inflammation and food intake regulationChapter 2
gene expression of AgRP is increased [97] (Figure 2.1). In addition, hypothalamic food-intake regulation in the anx/anx mouse, a genetic model for anorexia showed that comprised signalling of NPY/AgRP is partly due to dysfunctional axonal transport [98]. Similar to NPY, changes on AgRP are associated with weight loss and failure of AgRP signalling is likely to occur post-transcriptionally. Altogether, these data indicate that inflammatory mediators can affect NPY/AgRP gene expression and also act post-transcriptionally, for example via impaired translation, synthesis, packaging or release of NPY, ultimately altering food intake (Figure 2.1).
Hypothalamic infl ammation: Anorexigenic signalling
Two anorexigenic peptides, POMC and CART, are both synthesized in the same ARC neuronal population and are released into the PVN. POMC is a precursor for anorectic alpha-melanocyte stimulating hormone (α-MSH), which is an endogenous agonist of melanocortin receptor 3 and 4 (MC3R and MC4R). Interestingly, AgRP’s orexigenic activity arises from its antagonistic activity on this MC4R receptor [99].
Acute inflammation leads to activation of POMC neurons [100], increased expression of MC4R [101] and increased POMC expression [102, 103] as shown in models of LPS and IL-1β -induced anorexia. Consequently, counteracting the activation of the melanocortin system by MC4R antagonism prevented the development of LPS-induced anorexia [102, 104, 105]. In contrast to an acute immune response, during chronic inflammation such as in cancer, hypothalamic POMC expression is decreased [90, 106]. These opposing differences on POMC expression in acute and chronic inflammation might be explained by changes in leptin plasma levels in these two conditions: LPS administration elevates plasma leptin [107], while in diseases characterized by the presence of cachexia, plasma leptin levels drop [108]. Nonetheless, in chronic inflammatory conditions such as cancer, renal failure and heart failure, the use of AgRP or synthetic MC4R antagonists improved food intake [109-112], but also increased POMC expression and thus possibly αMSH [106]. In contrast, administration of αMSH or synthetic MC4R agonists, have also shown to be beneficial in chronic inflammation including arthritis [113], inflammatory bowel disease [114] and ischemic stroke [115]. This paradox in beneficial effects by both MC4R agonists and antagonists in chronic inflammatory conditions might be explained by another physiological function of the melanocortin systems next to their direct effect on
27
2
Hyp
otha
lam
ic in
flam
mat
ion
and
food
inta
ke re
gula
tion
food intake, namely via their anti-inflammatory actions. Elevation of plasma α-MSH in chronic inflammatory illnesses could suggest an adaptive response in order to control inflammation [116-118]. Both MC4R antagonists [111, 119] and agonists [91, 115, 120, 121] act as anti-inflammatory peptides in experimental models for cancer, rheumatoid arthritis and ischemic stroke either centrally of peripherally [122, 123]. These beneficial suppressive effects of α-MSH on inflammation may occur via increasing circulating anti-inflammatory cytokines [120]. In addition, α-MSH can inhibit pro-inflammatory mediators [91, 115, 121]. In this way α-MSH, via modulation of inflammatory mediators, can attenuate muscle wasting and progression of cachexia [91].
Altogether, it might be that αMSH’s actions on inflammation might be of greater importance on cachexia and anorexia in chronic illness than its direct effects on hypothalamic food-intake regulatory peptides such as POMC and NPY. Of course, the actions of αMSH as a neurotransmitter may be entirely independent of its effects on the immune system. As a consequence, targeting the melanocortin systems is a potential therapeutic approach against cachexia and anorexia induced by inflammation.
Hypothalamic infl ammation: serotonergic signalling
Hypothalamic serotonin is an important mediator in the regulation of satiety and hunger and its levels are inversely associated with food intake [124, 125]. Hypothalamic serotonin is suggested to act as an integrator of peripheral triggers modulating energy balance, as it responds to changes in adipokines [126, 127] and gut-derived hormones [128, 129] and subsequently mediates anorexigenic signalling. Therefore, elevated hypothalamic serotonin levels are suggested to play a crucial role in the development of disease-associated anorexia [5, 93, 95] (Figure 2.1). This increase in serotonin can be caused by activation of proinflammatory cytokines, as these are able to directly affect serotonin metabolism. Central administration of LPS, IL-1α, IL-1β or TNFα [130-132] induces a rise of hypothalamic serotonin, serotonin’s metabolite 5-Hydroxyindoleacetic acid (5-HIAA) and serotonin’s precursor tryptophan (TRP). These effects are likely to be at least partly mediated by IL-1 [131]. Furthermore, blockade of 5HT2a and 5HT2c receptors prevents the development of LPS-induced anorexia [133, 134], suggesting that inflammation-induced anorexia is partly mediated by serotonin. Also during anorexia induced by chronic inflammation, such as tumour-driven anorexia, serotonin in the
28
Hypothalamic inflammation and food intake regulationChapter 2
hypothalamus [95, 135, 136] is elevated, further supporting the importance of serotonin in reduced food intake during both acute and chronic inflammation. In humans, increased levels of TRP, the precursor of serotonin, have been measured in cerebral spinal fluid of anorectic cancer patients [137]. Also, limiting TRP transportation to the brain by supplementation of competing branched chained amino-acids (BCAAs) or antagonizing activity of serotonin at the 5HT3 receptor is beneficial for enjoyment of food in anorectic cancer patients [138]. Serotonergic drugs are extensively investigated for their use in eating disorders in both obesity as well as disease-induced anorexia. Antagonizing serotonin’s activity has been shown to enhance appetite in cancer-cachectic patients [139, 140]. Currently these serotonin antagonists are used to alleviate symptoms of nausea, a symptoms strongly associated with anorexia [141], in cancer patients [142]. At the same time, serotonin agonists are used in treatment of hyperphagia in obesity [124, 140, 141]. Collectively, these observations support the concept that inflammation affects serotonergic activity in the hypothalamus and that serotonin plays an important role in inflammation-induced anorexia.
Serotonin is able to affect food intake via the regulation of several neuronal systems in the ARC. Firstly, serotonin is able to activate the anorexigenic melanocortin system. Serotonergic drugs are used as therapy against obesity. They exert appetite-suppressive effects by increasing the local availability of serotonin or, more specifically, stimulating the 5HT2C receptors [143]. Serotonin’s suppressive effect on food intake is reported to be mediated by 5HT2c and 5HT1b receptors on POMC neurons in the ARC [144-146]. Furthermore, the presence of functional MC4Rs, the downstream target of αMSH, is crucial for this suppressive effect on food intake as well, suggesting a 5HT2c/POMC-MC4R circuit [147]. Secondly, serotonin is able to inhibit the orexigenic activity of ghrelin [129, 148]. This process is likely to be mediated via activation of 5HT2c and 5HT1b receptors on ARC neurons [63, 149]. Vice versa, ghrelin is able to directly inhibit serotonin release [66, 150, 151]. This inhibitory interplay between serotonin and gut-derived ghrelin shows that serotonin may exert its anorectic effects via mechanisms beyond its direct activation of appetite inhibiting neuronal activity [148]. Thirdly, serotonin is able to inhibit orexigenic NPY signalling [95]. Increasing serotonergic activity by the use of serotonin re-uptake inhibitors reduces hypothalamic NPY [152, 153]. In addition, decreasing serotonin concentrations by inhibiting serotonin synthesis results in increased NPY levels [154]. Furthermore, these effects of serotonin on feeding and NPY levels are not apparently accomplished via affecting NPY gene
29
2
Hyp
otha
lam
ic in
flam
mat
ion
and
food
inta
ke re
gula
tion
expression [154, 155]. Also in vitro, serotonin inhibits neuronal NPY secretion, while not affecting NPY gene expression [93]. Therefore, serotonin appears to play an active role in posttranscriptional failure of NPY in anorexia in chronic inflammation.
In summary, several lines of evidence indicate that serotonin mediates food intake by acting as an upstream regulator mediating both anorexigenic and orexigenic signalling. More importantly, serotonin is affected by inflammation and is associated with inflammation-induced anorexia. Consequently, we postulate a neural circuit in which serotonin plays a central role in the failure of food intake regulation taking place during inflammation-induced anorexia (Figure 2.1).
Conclusion
Many chronic illnesses are associated with a pro-inflammatory state in the hypothalamic area. This increased hypothalamic inflammatory status plays a crucial factor in reduced food intake in these conditions, ultimately leading to severe malnutrition and acceleration of disease. Pro-inflammatory cytokines affect both orexigenic NPY/AgRP signalling and anorexigenic melanocortin signalling. Hypothalamic serotonin signalling is elevated in disease-induced anorexia. Furthermore, serotonin is able to activate the melanocortin system, and able to inhibit NPY signalling via post-transcriptional regulation. Therefore, we hypothesize that serotonin-regulated mechanisms are playing a key role in the reduction of food-intake during chronic inflammation. Consequently, targeting serotonin signalling is a promising approach in preventing the development of nutritional disorders in disease.
Acknowledgements
The research leading to these results has received funding from the European Union’s Seventh Framework Programme for research, technological development and demonstration under grant agreement n°266408 (Full4Health).
Confl ict of interest
J. Dwarkasing, D.L Marks and R. Witkamp have nothing to declare. K. van Norren is guest employee at Nutricia Research, a medical nutrition company.
30
Hypothalamic inflammation and food intake regulationChapter 2
References
1. Shorten, A.L., K.E. Wallman, and K.J. Guelfi , Acute eff ect of environmental temperature during exercise on subsequent energy intake in active men. Am J Clin Nutr, 2009. 90(5): p. 1215-21.
2. Whybrow, S., D.A. Hughes, P. Ritz, A.M. Johnstone, G.W. Horgan, N. King, J.E. Blundell, and R.J. Stubbs, The effect of an incremental increase in exercise on appetite, eating behaviour and energy balance in lean men and women feeding ad libitum. Br J Nutr, 2008. 100(5): p. 1109-15.
3. White, L.J., R.H. Dressendorfer, E. Holland, S.C. McCoy, and M.A. Ferguson, Increased caloric intake soon after exercise in cold water. Int J Sport Nutr Exerc Metab, 2005. 15(1): p. 38-47.
4. Westerterp-Plantenga, M.S., W.D. van Marken Lichtenbelt, H. Strobbe, and P. Schrauwen, Energy metabolism in humans at a lowered ambient temperature. Eur J Clin Nutr, 2002. 56(4): p. 288-96.
5. Laviano, A., A. Inui, M.M. Meguid, A. Molfino, C. Conte, and F. Rossi Fanelli, NPY and brain monoamines in the pathogenesis of cancer anorexia. Nutrition, 2008. 24(9): p. 802-5.
6. Michalaki, V., K. Syrigos, P. Charles, and J. Waxman, Serum levels of IL-6 and TNF-alpha correlate with clinicopathological features and patient survival in patients with prostate cancer. Br J Cancer, 2004. 90(12): p. 2312-6.
7. Okada, S., T. Okusaka, H. Ishii, A. Kyogoku, M. Yoshimori, N. Kajimura, K. Yamaguchi, and T. Kakizoe, Elevated serum interleukin-6 levels in patients with pancreatic cancer. Jpn J Clin Oncol, 1998. 28(1): p. 12-5.
8. Andersson, B.A., F. Lewin, J. Lundgren, M. Nilsson, L.E. Rutqvist, S. Lofgren, and N. Laytragoon-Lewin, Plasma tumor necrosis factor-alpha and C-reactive protein as biomarker for survival in head and neck squamous cell carcinoma. J Cancer Res Clin Oncol, 2014. 140(3): p. 515-9.
9. Roberts, L., J.A. Passmore, C. Williamson, F. Little, L.M. Bebell, K. Mlisana, W.A. Burgers, F. van Loggerenberg, G. Walzl, J.F. Djoba Siawaya, Q.A. Karim, and S.S. Karim, Plasma cytokine levels during acute HIV-1 infection predict HIV disease progression. AIDS, 2010. 24(6): p. 819-31.
10. Rauchhaus, M., W. Doehner, D.P. Francis, C. Davos, M. Kemp, C. Liebenthal, J. Niebauer, J. Hooper, H.D. Volk, A.J. Coats, and S.D. Anker, Plasma cytokine parameters and mortality in patients with chronic heart failure. Circulation, 2000. 102(25): p. 3060-7.
11. Pan, J.P., T.Y. Liu, S.C. Chiang, Y.K. Lin, C.Y. Chou, W.L. Chan, and S.T. Lai, The value of plasma levels of tumor necrosis factor-alpha and interleukin-6 in predicting the severity and prognosis in patients with congestive heart failure. J Chin Med Assoc, 2004. 67(5): p. 222-8.
12. Humbert, M., G. Monti, F. Brenot, O. Sitbon, A. Portier, L. Grangeot-Keros, P. Duroux, P. Galanaud, G. Simonneau, and D. Emilie, Increased interleukin-1 and interleukin-6 serum concentrations in severe primary pulmonary hypertension. Am J Respir Crit Care Med, 1995. 151(5): p. 1628-31.
13. Moldawer, L.L., C. Andersson, J. Gelin, and K.G. Lundholm, Regulation of food intake and hepatic protein synthesis by recombinant-derived cytokines. Am J Physiol, 1988. 254(3 Pt 1): p. G450-6.
31
2
Hyp
otha
lam
ic in
flam
mat
ion
and
food
inta
ke re
gula
tion
14. Schobitz, B., G. Pezeshki, T. Pohl, U. Hemmann, P.C. Heinrich, F. Holsboer, and J.M. Reul, Soluble interleukin-6 (IL-6) receptor augments central effects of IL-6 in vivo. FASEB J, 1995. 9(8): p. 659-64.
15. Arruda, A.P., M. Milanski, T. Romanatto, C. Solon, A. Coope, L.C. Alberici, W.T. Festuccia, S.M. Hirabara, E. Ropelle, R. Curi, J.B. Carvalheira, A.E. Vercesi, and L.A. Velloso, Hypothalamic actions of tumor necrosis factor alpha provide the thermogenic core for the wastage syndrome in cachexia. Endocrinology, 2010. 151(2): p. 683-94.
16. Strassmann, G., M. Fong, J.S. Kenney, and C.O. Jacob, Evidence for the involvement of interleukin 6 in experimental cancer cachexia. The Journal of clinical investigation, 1992. 89(5): p. 1681-4.
17. Fujimoto-Ouchi, K., S. Tamura, K. Mori, Y. Tanaka, and H. Ishitsuka, Establishment and characterization of cachexia-inducing and -non-inducing clones of murine colon 26 carcinoma. Int J Cancer, 1995. 61(4): p. 522-8.
18. Gelin, J., L.L. Moldawer, C. Lonnroth, B. Sherry, R. Chizzonite, and K. Lundholm, Role of endogenous tumor necrosis factor alpha and interleukin 1 for experimental tumor growth and the development of cancer cachexia. Cancer Res, 1991. 51(1): p. 415-21.
19. Ting, P.T. and J.Y. Koo, Use of etanercept in human immunodeficiency virus (HIV) and acquired immunodeficiency syndrome (AIDS) patients. Int J Dermatol, 2006. 45(6): p. 689-92.
20. Argiles, J.M., S. Busquets, and F.J. Lopez-Soriano, Anti-inflammatory therapies in cancer cachexia. Eur J Pharmacol, 2011. 668 Suppl 1: p. S81-6.
21. Sawchenko, P.E. and L.W. Swanson, The organization and biochemical specificity of afferent projections to the paraventricular and supraoptic nuclei. Prog Brain Res, 1983. 60: p. 19-29.
22. Baker, R.A. and M. Herkenham, Arcuate nucleus neurons that project to the hypothalamic paraventricular nucleus: neuropeptidergic identity and consequences of adrenalectomy on mRNA levels in the rat. J Comp Neurol, 1995. 358(4): p. 518-30.
23. Kalra, S.P., M.G. Dube, S. Pu, B. Xu, T.L. Horvath, and P.S. Kalra, Interacting appetite-regulating pathways in the hypothalamic regulation of body weight. Endocr Rev, 1999. 20(1): p. 68-100.
24. Porte, D., Jr., R.J. Seeley, S.C. Woods, D.G. Baskin, D.P. Figlewicz, and M.W. Schwartz, Obesity, diabetes and the central nervous system. Diabetologia, 1998. 41(8): p. 863-81.
25. Bell, M.E., S. Bhatnagar, S.F. Akana, S. Choi, and M.F. Dallman, Disruption of arcuate/paraventricular nucleus connections changes body energy balance and response to acute stress. J Neurosci, 2000. 20(17): p. 6707-13.
26. Perrella, O., P.B. Carrieri, D. Guarnaccia, and M. Soscia, Cerebrospinal fluid cytokines in AIDS dementia complex. J Neurol, 1992. 239(7): p. 387-8.
32
Hypothalamic inflammation and food intake regulationChapter 2
27. Heaton, R.K., D.R. Franklin, R.J. Ellis, J.A. McCutchan, S.L. Letendre, S. Leblanc, S.H. Corkran, N.A. Duarte, D.B. Clifford, S.P. Woods, A.C. Collier, C.M. Marra, S. Morgello, M.R. Mindt, M.J. Taylor, T.D. Marcotte, J.H. Atkinson, T. Wolfson, B.B. Gelman, J.C. McArthur, D.M. Simpson, I. Abramson, A. Gamst, C. Fennema-Notestine, T.L. Jernigan, J. Wong, I. Grant, C. Group, and H. Group, HIV-associated neurocognitive disorders before and during the era of combination antiretroviral therapy: differences in rates, nature, and predictors. J Neurovirol, 2011. 17(1): p. 3-16.
28. Cai, C., H.Y. Zhang, J.J. Le, J.C. Dong, Y. Cui, C.Q. Xu, B.J. Liu, J.F. Wu, X.H. Duan, and Y.X. Cao, Inflammatory airway features and hypothalamic-pituitary-adrenal axis function in asthmatic rats combined with chronic obstructive pulmonary disease. Chin Med J (Engl), 2010. 123(13): p. 1720-6.
29. Kang, Y.M., Y. Wang, L.M. Yang, C. Elks, J. Cardinale, X.J. Yu, X.F. Zhao, J. Zhang, L.H. Zhang, Z.M. Yang, and J. Francis, TNF-alpha in hypothalamic paraventricular nucleus contributes to sympathoexcitation in heart failure by modulating AT1 receptor and neurotransmitters. Tohoku J Exp Med, 2010. 222(4): p. 251-63.
30. Kang, Y.M., Z.H. Zhang, R.F. Johnson, Y. Yu, T. Beltz, A.K. Johnson, R.M. Weiss, and R.B. Felder, Novel effect of mineralocorticoid receptor antagonism to reduce proinflammatory cytokines and hypothalamic activation in rats with ischemia-induced heart failure. Circ Res, 2006. 99(7): p. 758-66.
31. Hopkins, S.J. and N.J. Rothwell, Cytokines and the nervous system. I: Expression and recognition. Trends Neurosci, 1995. 18(2): p. 83-8.
32. Gutierrez, E.G., W.A. Banks, and A.J. Kastin, Murine tumor necrosis factor alpha is transported from blood to brain in the mouse. J Neuroimmunol, 1993. 47(2): p. 169-76.
33. Banks, W.A., A.J. Kastin, and E.G. Gutierrez, Penetration of interleukin-6 across the murine blood-brain barrier. Neurosci Lett, 1994. 179(1-2): p. 53-6.
34. Banks, W.A. and A.J. Kastin, Blood to brain transport of interleukin links the immune and central nervous systems. Life Sci, 1991. 48(25): p. PL117-21.
35. Plotkin, S.R., W.A. Banks, and A.J. Kastin, Comparison of saturable transport and extracellular pathways in the passage of interleukin-1 alpha across the blood-brain barrier. J Neuroimmunol, 1996. 67(1): p. 41-7.
36. Banks, W.A., L. Ortiz, S.R. Plotkin, and A.J. Kastin, Human interleukin (IL) 1 alpha, murine IL-1 alpha and murine IL-1 beta are transported from blood to brain in the mouse by a shared saturable mechanism. J Pharmacol Exp Ther, 1991. 259(3): p. 988-96.
37. Langlet, F., B.E. Levin, S. Luquet, M. Mazzone, A. Messina, A.A. Dunn-Meynell, E. Balland, A. Lacombe, D. Mazur, P. Carmeliet, S.G. Bouret, V. Prevot, and B. Dehouck, Tanycytic VEGF-A boosts blood-hypothalamus barrier plasticity and access of metabolic signals to the arcuate nucleus in response to fasting. Cell Metab, 2013. 17(4): p. 607-17.
38. Peruzzo, B., F.E. Pastor, J.L. Blazquez, K. Schobitz, B. Pelaez, P. Amat, and E.M. Rodriguez, A second look at the barriers of the medial basal hypothalamus. Exp Brain Res, 2000. 132(1): p. 10-26.
33
2
Hyp
otha
lam
ic in
flam
mat
ion
and
food
inta
ke re
gula
tion
39. Broadwell, R.D. and M.W. Brightman, Entry of peroxidase into neurons of the central and peripheral nervous systems from extracerebral and cerebral blood. J Comp Neurol, 1976. 166(3): p. 257-83.
40. Krisch, B. and H. Leonhardt, The functional and structural border of the neurohemal region of the median eminence. Cell Tissue Res, 1978. 192(2): p. 327-39.
41. Wong, M.L., P.B. Bongiorno, V. Rettori, S.M. McCann, and J. Licinio, Interleukin (IL) 1beta, IL-1 receptor antagonist, IL-10, and IL-13 gene expression in the central nervous system and anterior pituitary during systemic inflammation: pathophysiological implications. Proc Natl Acad Sci U S A, 1997. 94(1): p. 227-32.
42. Herman, A.P., A. Krawczynska, J. Bochenek, H. Antushevich, A. Herman, and D. Tomaszewska-Zaremba, Peripheral injection of SB203580 inhibits the inflammatory-dependent synthesis of proinflammatory cytokines in the hypothalamus. Biomed Res Int, 2014. 2014: p. 475152.
43. Rana, I., M. Stebbing, A. Kompa, D.J. Kelly, H. Krum, and E. Badoer, Microglia activation in the hypothalamic PVN following myocardial infarction. Brain Res, 2010. 1326: p. 96-104.
44. Thaler, J.P., C.X. Yi, E.A. Schur, S.J. Guyenet, B.H. Hwang, M.O. Dietrich, X. Zhao, D.A. Sarruf, V. Izgur, K.R. Maravilla, H.T. Nguyen, J.D. Fischer, M.E. Matsen, B.E. Wisse, G.J. Morton, T.L. Horvath, D.G. Baskin, M.H. Tschop, and M.W. Schwartz, Obesity is associated with hypothalamic injury in rodents and humans. J Clin Invest, 2012. 122(1): p. 153-62.
45. Ronaldson, P.T. and R. Bendayan, HIV-1 viral envelope glycoprotein gp120 triggers an inflammatory response in cultured rat astrocytes and regulates the functional expression of P-glycoprotein. Mol Pharmacol, 2006. 70(3): p. 1087-98.
46. Laye, S., R.M. Bluthe, S. Kent, C. Combe, C. Medina, P. Parnet, K. Kelley, and R. Dantzer, Subdiaphragmatic vagotomy blocks induction of IL-1 beta mRNA in mice brain in response to peripheral LPS. Am J Physiol, 1995. 268(5 Pt 2): p. R1327-31.
47. Varela, L. and T.L. Horvath, Leptin and insulin pathways in POMC and AgRP neurons that modulate energy balance and glucose homeostasis. EMBO Rep, 2012. 13(12): p. 1079-86.
48. Secher, A., J. Jelsing, A.F. Baquero, J. Hecksher-Sorensen, M.A. Cowley, L.S. Dalboge, G. Hansen, K.L. Grove, C. Pyke, K. Raun, L. Schaffer, M. Tang-Christensen, S. Verma, B.M. Witgen, N. Vrang, and L. Bjerre Knudsen, The arcuate nucleus mediates GLP-1 receptor agonist liraglutide-dependent weight loss. J Clin Invest, 2014. 124(10): p. 4473-88.
49. Batterham, R.L., M.A. Cowley, C.J. Small, H. Herzog, M.A. Cohen, C.L. Dakin, A.M. Wren, A.E. Brynes, M.J. Low, M.A. Ghatei, R.D. Cone, and S.R. Bloom, Gut hormone PYY(3-36) physiologically inhibits food intake. Nature, 2002. 418(6898): p. 650-4.
50. Elias, C.F., C. Aschkenasi, C. Lee, J. Kelly, R.S. Ahima, C. Bjorbaek, J.S. Flier, C.B. Saper, and J.K. Elmquist, Leptin differentially regulates NPY and POMC neurons projecting to the lateral hypothalamic area. Neuron, 1999. 23(4): p. 775-86.
51. Weigle, D.S., P.B. Duell, W.E. Connor, R.A. Steiner, M.R. Soules, and J.L. Kuijper, Effect of fasting, refeeding, and dietary fat restriction on plasma leptin levels. J Clin Endocrinol Metab, 1997. 82(2): p. 561-5.
34
Hypothalamic inflammation and food intake regulationChapter 2
52. Schwartz, M.W., A.J. Sipols, J.L. Marks, G. Sanacora, J.D. White, A. Scheurink, S.E. Kahn, D.G. Baskin, S.C. Woods, D.P. Figlewicz, and et al., Inhibition of hypothalamic neuropeptide Y gene expression by insulin. Endocrinology, 1992. 130(6): p. 3608-16.
53. Wang, J. and K.L. Leibowitz, Central insulin inhibits hypothalamic galanin and neuropeptide Y gene expression and peptide release in intact rats. Brain Res, 1997. 777(1-2): p. 231-6.
54. Muller, A.F., S.W. Lamberts, J.A. Janssen, L.J. Hofland, P.V. Koetsveld, M. Bidlingmaier, C.J. Strasburger, E. Ghigo, and A.J. Van der Lely, Ghrelin drives GH secretion during fasting in man. Eur J Endocrinol, 2002. 146(2): p. 203-7.
55. Tups, A., M. Helwig, R.M. Khorooshi, Z.A. Archer, M. Klingenspor, and J.G. Mercer, Circulating ghrelin levels and central ghrelin receptor expression are elevated in response to food deprivation in a seasonal mammal (Phodopus sungorus). J Neuroendocrinol, 2004. 16(11): p. 922-8.
56. Cummings, D.E., J.Q. Purnell, R.S. Frayo, K. Schmidova, B.E. Wisse, and D.S. Weigle, A preprandial rise in plasma ghrelin levels suggests a role in meal initiation in humans. Diabetes, 2001. 50(8): p. 1714-9.
57. Kohno, D. and T. Yada, Arcuate NPY neurons sense and integrate peripheral metabolic signals to control feeding. Neuropeptides, 2012. 46(6): p. 315-9.
58. Aguilera, A., A. Cirugeda, R. Amair, G. Sansone, L. Alegre, R. Codoceo, M.A. Bajo, G. del Peso, J.J. Diez, J.A. Sanchez-Tomero, and R. Selgas, Ghrelin plasma levels and appetite in peritoneal dialysis patients. Adv Perit Dial, 2004. 20: p. 194-9.
59. Shimizu, Y., N. Nagaya, T. Isobe, M. Imazu, H. Okumura, H. Hosoda, M. Kojima, K. Kangawa, and N. Kohno, Increased plasma ghrelin level in lung cancer cachexia. Clin Cancer Res, 2003. 9(2): p. 774-8.
60. Kerem, M., Z. Ferahkose, U.T. Yilmaz, H. Pasaoglu, E. Ofluoglu, A. Bedirli, B. Salman, T.T. Sahin, and M. Akin, Adipokines and ghrelin in gastric cancer cachexia. World J Gastroenterol, 2008. 14(23): p. 3633-41.
61. Itoh, T., N. Nagaya, M. Yoshikawa, A. Fukuoka, H. Takenaka, Y. Shimizu, Y. Haruta, H. Oya, M. Yamagishi, H. Hosoda, K. Kangawa, and H. Kimura, Elevated plasma ghrelin level in underweight patients with chronic obstructive pulmonary disease. Am J Respir Crit Care Med, 2004. 170(8): p. 879-82.
62. Nagaya, N., M. Uematsu, M. Kojima, Y. Date, M. Nakazato, H. Okumura, H. Hosoda, W. Shimizu, M. Yamagishi, H. Oya, H. Koh, C. Yutani, and K. Kangawa, Elevated circulating level of ghrelin in cachexia associated with chronic heart failure: relationships between ghrelin and anabolic/catabolic factors. Circulation, 2001. 104(17): p. 2034-8.
63. Fujitsuka, N., A. Asakawa, Y. Uezono, K. Minami, T. Yamaguchi, A. Niijima, T. Yada, Y. Maejima, U. Sedbazar, T. Sakai, T. Hattori, Y. Kase, and A. Inui, Potentiation of ghrelin signaling attenuates cancer anorexia-cachexia and prolongs survival. Transl Psychiatry, 2011. 1: p. e23.
64. Akamizu, T. and K. Kangawa, Ghrelin for cachexia. J Cachexia Sarcopenia Muscle, 2010. 1(2): p. 169-176.
35
2
Hyp
otha
lam
ic in
flam
mat
ion
and
food
inta
ke re
gula
tion
65. Waseem, T., M. Duxbury, H. Ito, S.W. Ashley, and M.K. Robinson, Exogenous ghrelin modulates release of pro-inflammatory and anti-inflammatory cytokines in LPS-stimulated macrophages through distinct signaling pathways. Surgery, 2008. 143(3): p. 334-42.
66. Poretti, M.B., M. Rask-Andersen, P. Kumar, S. Rubiales de Barioglio, M. Fiol de Cuneo, H.B. Schioth, and V.P. Carlini, Ghrelin effects expression of several genes associated with depression-like behavior. Prog Neuropsychopharmacol Biol Psychiatry, 2015. 56: p. 227-34.
67. Garcia-Caceres, C., E. Fuente-Martin, F. Diaz, M. Granado, P. Argente-Arizon, L.M. Frago, A. Freire-Regatillo, V. Barrios, J. Argente, and J.A. Chowen, The opposing effects of ghrelin on hypothalamic and systemic inflammatory processes are modulated by its acylation status and food intake in male rats. Endocrinology, 2014. 155(8): p. 2868-80.
68. Barazzoni, R., A. Semolic, M.R. Cattin, M. Zanetti, and G. Guarnieri, Acylated ghrelin limits fat accumulation and improves redox state and inflammation markers in the liver of high-fat-fed rats. Obesity (Silver Spring), 2014. 22(1): p. 170-7.
69. Stevanovic, D., V. Starcevic, U. Vilimanovich, D. Nesic, L. Vucicevic, M. Misirkic, K. Janjetovic, E. Savic, D. Popadic, E. Sudar, D. Micic, M. Sumarac-Dumanovic, and V. Trajkovic, Immunomodulatory actions of central ghrelin in diet-induced energy imbalance. Brain Behav Immun, 2012. 26(1): p. 150-8.
70. Hahn, T.M., J.F. Breininger, D.G. Baskin, and M.W. Schwartz, Coexpression of Agrp and NPY in fasting-activated hypothalamic neurons. Nat Neurosci, 1998. 1(4): p. 271-2.
71. Broberger, C., J. Johansen, C. Johansson, M. Schalling, and T. Hokfelt, The neuropeptide Y/agouti gene-related protein (AGRP) brain circuitry in normal, anorectic, and monosodium glutamate-treated mice. Proc Natl Acad Sci U S A, 1998. 95(25): p. 15043-8.
72. Morris, B.J., Neuronal localisation of neuropeptide Y gene expression in rat brain. J Comp Neurol, 1989. 290(3): p. 358-68.
73. Allen, Y.S., T.E. Adrian, J.M. Allen, K. Tatemoto, T.J. Crow, S.R. Bloom, and J.M. Polak, Neuropeptide Y distribution in the rat brain. Science, 1983. 221(4613): p. 877-9.
74. Dryden, S., L. Pickavance, H.M. Frankish, and G. Williams, Increased neuropeptide Y secretion in the hypothalamic paraventricular nucleus of obese (fa/fa) Zucker rats. Brain Res, 1995. 690(2): p. 185-8.
75. Brady, L.S., M.A. Smith, P.W. Gold, and M. Herkenham, Altered expression of hypothalamic neuropeptide mRNAs in food-restricted and food-deprived rats. Neuroendocrinology, 1990. 52(5): p. 441-7.
76. Yoshimura, M., M. Hagimoto, T. Matsuura, J. Ohkubo, M. Ohno, T. Maruyama, T. Ishikura, H. Hashimoto, T. Kakuma, H. Yoshimatsu, K. Terawaki, Y. Uezono, Y. Toyohira, N. Yanagihara, and Y. Ueta, Effects of food deprivation on the hypothalamic feeding-regulating peptides gene expressions in serotonin depleted rats. J Physiol Sci, 2014. 64(2): p. 97-104.
77. Lewis, D.E., L. Shellard, D.G. Koeslag, D.E. Boer, H.D. McCarthy, P.E. McKibbin, J.C. Russell, and G. Williams, Intense exercise and food restriction cause similar hypothalamic neuropeptide Y increases in rats. Am J Physiol, 1993. 264(2 Pt 1): p. E279-84.
36
Hypothalamic inflammation and food intake regulationChapter 2
78. Kawaguchi, M., K.A. Scott, T.H. Moran, and S. Bi, Dorsomedial hypothalamic corticotropin-releasing factor mediation of exercise-induced anorexia. Am J Physiol Regul Integr Comp Physiol, 2005. 288(6): p. R1800-5.
79. Cui, J.G., G.B. Tang, and D.H. Wang, Hypothalamic neuropeptides, not leptin sensitivity, contributes to the hyperphagia in lactating Brandt’s voles, Lasiopodomys brandtii. J Exp Biol, 2011. 214(Pt 13): p. 2242-7.
80. Sipols, A.J., D.G. Baskin, and M.W. Schwartz, Effect of intracerebroventricular insulin infusion on diabetic hyperphagia and hypothalamic neuropeptide gene expression. Diabetes, 1995. 44(2): p. 147-51.
81. Kim, E., S. Seo, H. Chung, and S. Park, Role of Glucocorticoids in Fasting-induced Changes in Hypothalamic and Pituitary Components of the Growth Hormone (GH)-axis. Korean J Physiol Pharmacol, 2008. 12(5): p. 217-23.
82. King, P.J. and G. Williams, Role of ARC NPY neurons in energy homeostasis. Drug News Perspect, 1998. 11(7): p. 402-10.
83. Iwasa, T., T. Matsuzaki, R. Kinouchi, S. Fujisawa, M. Murakami, M. Kiyokawa, A. Kuwahara, T. Yasui, and M. Irahara, Neonatal LPS injection alters the body weight regulation systems of rats under non-stress and immune stress conditions. Int J Dev Neurosci, 2010. 28(1): p. 119-24.
84. Sergeyev, V., C. Broberger, and T. Hokfelt, Effect of LPS administration on the expression of POMC, NPY, galanin, CART and MCH mRNAs in the rat hypothalamus. Brain Res Mol Brain Res, 2001. 90(2): p. 93-100.
85. Kim, Y.W., K.H. Kim, D.K. Ahn, H.S. Kim, J.Y. Kim, D.C. Lee, and S.Y. Park, Time-course changes of hormones and cytokines by lipopolysaccharide and its relation with anorexia. J Physiol Sci, 2007. 57(3): p. 159-65.
86. Nara-ashizawa, N., T. Tsukada, K. Maruyama, Y. Akiyama, N. Kajimura, K. Nagasaki, T. Iwanaga, and K. Yamaguchi, Hypothalamic appetite-regulating neuropeptide mRNA levels in cachectic nude mice bearing human tumor cells. Metabolism, 2001. 50(10): p. 1213-9.
87. Chance, W.T., C. Xiao, R. Dayal, and S. Sheriff, Alteration of NPY and Y1 receptor in dorsomedial and ventromedial areas of hypothalamus in anorectic tumor-bearing rats. Peptides, 2007. 28(2): p. 295-301.
88. Plata-Salaman, C.R., S.E. Ilyin, and D. Gayle, Brain cytokine mRNAs in anorectic rats bearing prostate adenocarcinoma tumor cells. Am J Physiol, 1998. 275(2 Pt 2): p. R566-73.
89. Nara-ashizawa, N., T. Tsukada, K. Maruyama, Y. Akiyama, N. Kajimura, and K. Yamaguchi, Response of hypothalamic NPY mRNAs to a negative energy balance is less sensitive in cachectic mice bearing human tumor cells. Nutr Cancer, 2001. 41(1-2): p. 111-8.
90. Dwarkasing, J.T., M. van Dijk, F.J. Dijk, M.V. Boekschoten, J. Faber, J.M. Argiles, A. Laviano, M. Muller, R.F. Witkamp, and K. van Norren, Hypothalamic food intake regulation in a cancer-cachectic mouse model. J Cachexia Sarcopenia Muscle, 2013. 5(2): p. 159-69.
37
2
Hyp
otha
lam
ic in
flam
mat
ion
and
food
inta
ke re
gula
tion
91. Gomez-SanMiguel, A.B., A.I. Martin, M.P. Nieto-Bona, C. Fernandez-Galaz, M. Lopez-Menduina, M.A. Villanua, and A. Lopez-Calderon, Systemic alpha-melanocyte-stimulating hormone administration decreases arthritis-induced anorexia and muscle wasting. Am J Physiol Regul Integr Comp Physiol, 2013. 304(10): p. R877-86.
92. Stofkova, A., B. Zelezna, M. Romzova, O. Ulicna, A. Kiss, M. Skurlova, and J. Jurcovicova, Effect of feeding status on adjuvant arthritis severity, cachexia, and insulin sensitivity in male Lewis rats. Mediators Inflamm, 2010. 2010.
93. Dwarkasing, J.T., M.V. Boekschoten, J.M. Argiles, M. van Dijk, S. Busquets, F. Penna, M. Toledo, A. Laviano, R.F. Witkamp, and K. van Norren, Differences in food intake of tumour-bearing cachectic mice are associated with hypothalamic serotonin signalling. Journal of Cachexia, Sarcopenia and Muscle, 2014, In Press.
94. McCarthy, H.D., P.E. McKibbin, A.V. Perkins, E.A. Linton, and G. Williams, Alterations in hypothalamic NPY and CRF in anorexic tumor-bearing rats. Am J Physiol, 1993. 264(4 Pt 1): p. E638-43.
95. Meguid, M.M., E.J. Ramos, A. Laviano, M. Varma, T. Sato, C. Chen, Y. Qi, and U.N. Das, Tumor anorexia: effects on neuropeptide Y and monoamines in paraventricular nucleus. Peptides, 2004. 25(2): p. 261-6.
96. Makarenko, I.G., M.M. Meguid, L. Gatto, C. Chen, and M.V. Ugrumov, Decreased NPY innervation of the hypothalamic nuclei in rats with cancer anorexia. Brain Res, 2003. 961(1): p. 100-8.
97. Scarlett, J.M., X. Zhu, P.J. Enriori, D.D. Bowe, A.K. Batra, P.R. Levasseur, W.F. Grant, M.M. Meguid, M.A. Cowley, and D.L. Marks, Regulation of agouti-related protein messenger ribonucleic acid transcription and peptide secretion by acute and chronic inflammation. Endocrinology, 2008. 149(10): p. 4837-45.
98. Nilsson, I.A., S. Thams, C. Lindfors, A. Bergstrand, S. Cullheim, T. Hokfelt, and J.E. Johansen, Evidence of hypothalamic degeneration in the anorectic anx/anx mouse. Glia, 2011. 59(1): p. 45-57.
99. Ellacott, K.L. and R.D. Cone, The role of the central melanocortin system in the regulation of food intake and energy homeostasis: lessons from mouse models. Philos Trans R Soc Lond B Biol Sci, 2006. 361(1471): p. 1265-74.
100. Scarlett, J.M., E.E. Jobst, P.J. Enriori, D.D. Bowe, A.K. Batra, W.F. Grant, M.A. Cowley, and D.L. Marks, Regulation of central melanocortin signaling by interleukin-1 beta. Endocrinology,
2007. 148(9): p. 4217-25.
101. Borges, B.C., R. Rorato, Y. Avraham, L.E. da Silva, M. Castro, L. Vorobiav, E. Berry, J. Antunes-Rodrigues, and L.L. Elias, Leptin resistance and desensitization of hypophagia during prolonged inflammatory challenge. Am J Physiol Endocrinol Metab, 2011. 300(5): p. E858-69.
102. Jang, P.G., C. Namkoong, G.M. Kang, M.W. Hur, S.W. Kim, G.H. Kim, Y. Kang, M.J. Jeon, E.H. Kim, M.S. Lee, M. Karin, J.H. Baik, J.Y. Park, K.U. Lee, Y.B. Kim, and M.S. Kim, NF-kappaB activation in hypothalamic pro-opiomelanocortin neurons is essential in illness- and leptin-induced anorexia. J Biol Chem, 2010. 285(13): p. 9706-15.
38
Hypothalamic inflammation and food intake regulationChapter 2
103. Endo, M., T. Masaki, M. Seike, and H. Yoshimatsu, Involvement of stomach ghrelin and hypothalamic neuropeptides in tumor necrosis factor-alpha-induced hypophagia in mice. Regul Pept, 2007. 140(1-2): p. 94-100.
104. Sartin, J.L., D.L. Marks, C.D. McMahon, J.A. Daniel, P. Levasseur, C.G. Wagner, B.K. Whitlock, and B.P. Steele, Central role of the melanocortin-4 receptors in appetite regulation after endotoxin. J Anim Sci, 2008. 86(10): p. 2557-67.
105. Huang, Q.H., V.J. Hruby, and J.B. Tatro, Role of central melanocortins in endotoxin-induced anorexia. Am J Physiol, 1999. 276(3 Pt 2): p. R864-71.
106. Wisse, B.E., M.W. Schwartz, and D.E. Cummings, Melanocortin signaling and anorexia in chronic disease states. Ann N Y Acad Sci, 2003. 994: p. 275-81.
107. Grunfeld, C., C. Zhao, J. Fuller, A. Pollack, A. Moser, J. Friedman, and K.R. Feingold, Endotoxin and cytokines induce expression of leptin, the ob gene product, in hamsters. J Clin Invest, 1996. 97(9): p. 2152-7.
108. Lopez-Soriano, J., N. Carbo, L. Tessitore, F.J. Lopez-Soriano, and J.M. Argiles, Leptin and tumor growth in rats. Int J Cancer, 1999. 81(5): p. 726-9.
109. Joppa, M.A., K.R. Gogas, A.C. Foster, and S. Markison, Central infusion of the melanocortin receptor antagonist agouti-related peptide (AgRP(83-132)) prevents cachexia-related symptoms induced by radiation and colon-26 tumors in mice. Peptides, 2007. 28(3): p. 636-42.
110. Weyermann, P., R. Dallmann, J. Magyar, C. Anklin, M. Hufschmid, J. Dubach-Powell, I. Courdier-Fruh, M. Hennebohle, S. Nordhoff, and C. Mondadori, Orally available selective melanocortin-4 receptor antagonists stimulate food intake and reduce cancer-induced cachexia in mice. PLoS One, 2009. 4(3): p. e4774.
111. Cheung, W.W., H.J. Kuo, S. Markison, C. Chen, A.C. Foster, D.L. Marks, and R.H. Mak, Peripheral administration of the melanocortin-4 receptor antagonist NBI-12i ameliorates uremia-associated cachexia in mice. J Am Soc Nephrol, 2007. 18(9): p. 2517-24.
112. Scarlett, J.M., D.D. Bowe, X. Zhu, A.K. Batra, W.F. Grant, and D.L. Marks, Genetic and pharmacologic blockade of central melanocortin signaling attenuates cardiac cachexia in rodent models of heart failure. J Endocrinol, 2010. 206(1): p. 121-30.
113. Ceriani, G., J. Diaz, S. Murphree, A. Catania, and J.M. Lipton, The neuropeptide alpha-melanocyte-stimulating hormone inhibits experimental arthritis in rats. Neuroimmunomodulation, 1994. 1(1): p. 28-32.
114. Rajora, N., G. Boccoli, A. Catania, and J.M. Lipton, alpha-MSH modulates experimental inflammatory bowel disease. Peptides, 1997. 18(3): p. 381-5.
115. Spaccapelo, L., A. Bitto, M. Galantucci, A. Ottani, N. Irrera, L. Minutoli, D. Altavilla, E. Novellino, P. Grieco, D. Zaffe, F. Squadrito, D. Giuliani, and S. Guarini, Melanocortin MC(4) receptor agonists counteract late inflammatory and apoptotic responses and improve neuronal functionality after cerebral ischemia. Eur J Pharmacol, 2011. 670(2-3): p. 479-86.
39
2
Hyp
otha
lam
ic in
flam
mat
ion
and
food
inta
ke re
gula
tion
116. Ghanem, G., J. Verstegen, S. De Rijcke, P. Hanson, A. Van Onderbergen, A. Libert, V. Del Marmol, R. Arnould, A. Vercammen-Grandjean, and F. Lejeune, Studies on factors influencing human plasma alpha-MSH. Anticancer Res, 1989. 9(6): p. 1691-6.
117. Catania, A., L. Airaghi, M.G. Manfredi, M.C. Vivirito, F. Milazzo, J.M. Lipton, and C. Zanussi, Proopiomelanocortin-derived peptides and cytokines: relations in patients with acquired immunodeficiency syndrome. Clin Immunol Immunopathol, 1993. 66(1): p. 73-9.
118. Catania, A., V. Gerloni, S. Procaccia, L. Airaghi, M.G. Manfredi, C. Lomater, L. Grossi, and J.M. Lipton, The anticytokine neuropeptide alpha-melanocyte-stimulating hormone in synovial fluid of patients with rheumatic diseases: comparisons with other anticytokine molecules. Neuroimmunomodulation, 1994. 1(5): p. 321-8.
119. Cheung, W.W. and R.H. Mak, Melanocortin antagonism ameliorates muscle wasting and inflammation in chronic kidney disease. Am J Physiol Renal Physiol, 2012. 303(9): p. F1315-24.
120. Redondo, P., J. Garcia-Foncillas, I. Okroujnov, and E. Bandres, Alpha-MSH regulates interleukin-10 expression by human keratinocytes. Arch Dermatol Res, 1998. 290(8): p. 425-8.
121. Montero-Melendez, T., H.B. Patel, M. Seed, S. Nielsen, T.E. Jonassen, and M. Perretti, The melanocortin agonist AP214 exerts anti-inflammatory and proresolving properties. Am J Pathol, 2011. 179(1): p. 259-69.
122. Macaluso, A., D. McCoy, G. Ceriani, T. Watanabe, J. Biltz, A. Catania, and J.M. Lipton, Antiinflammatory influences of alpha-MSH molecules: central neurogenic and peripheral actions. J Neurosci, 1994. 14(4): p. 2377-82.
123. Ceriani, G., A. Macaluso, A. Catania, and J.M. Lipton, Central neurogenic antiinflammatory action of alpha-MSH: modulation of peripheral inflammation induced by cytokines and other mediators of inflammation. Neuroendocrinology, 1994. 59(2): p. 138-43.
124. Garfield, A.S. and L.K. Heisler, Pharmacological targeting of the serotonergic system for the treatment of obesity. The Journal of physiology, 2009. 587(Pt 1): p. 49-60.
125. Lam, D.D., A.S. Garfield, O.J. Marston, J. Shaw, and L.K. Heisler, Brain serotonin system in the coordination of food intake and body weight. Pharmacol Biochem Behav, 2010. 97(1): p. 84-91.
126. Calapai, G., F. Corica, A. Corsonello, L. Sautebin, M. Di Rosa, G.M. Campo, M. Buemi, V.N. Mauro, and A.P. Caputi, Leptin increases serotonin turnover by inhibition of brain nitric oxide synthesis. J Clin Invest, 1999. 104(7): p. 975-82.
127. Brunetti, L., G. Orlando, C. Ferrante, L. Recinella, S. Leone, A. Chiavaroli, C. Di Nisio, R. Shohreh, F. Manippa, A. Ricciuti, and M. Vacca, Peripheral chemerin administration modulates hypothalamic control of feeding. Peptides, 2014. 51: p. 115-21.
128. Brunetti, L., G. Orlando, L. Recinella, S. Leone, C. Ferrante, A. Chiavaroli, F. Lazzarin, and M. Vacca, Glucagon-like peptide 1 (7-36) amide (GLP-1) and exendin-4 stimulate serotonin release in rat hypothalamus. Peptides, 2008. 29(8): p. 1377-81.
129. Nonogaki, K., K. Ohashi-Nozue, and Y. Oka, A negative feedback system between brain serotonin systems and plasma active ghrelin levels in mice. Biochem Biophys Res Commun, 2006. 341(3): p. 703-7.
40
Hypothalamic inflammation and food intake regulationChapter 2
130. Dunn, A.J., Endotoxin-induced activation of cerebral catecholamine and serotonin metabolism: comparison with interleukin-1. J Pharmacol Exp Ther, 1992. 261(3): p. 964-9.
131. MohanKumar, S.M., P.S. MohanKumar, and S.K. Quadri, Lipopolysaccharide-induced changes in monoamines in specific areas of the brain: blockade by interleukin-1 receptor antagonist. Brain Res, 1999. 824(2): p. 232-7.
132. Nolan, Y., T.J. Connor, J.P. Kelly, and B.E. Leonard, Lipopolysaccharide administration produces time-dependent and region-specific alterations in tryptophan and tyrosine hydroxylase activities in rat brain. J Neural Transm, 2000. 107(12): p. 1393-401.
133. Asarian, L., B.S. Kopf, N. Geary, and W. Langhans, Pharmacological, but not genetic, disruptions in 5-HT(2C) receptor function attenuate LPS anorexia in mice. Pharmacol Biochem Behav, 2007. 86(3): p. 493-8.
134. von Meyenburg, C., W. Langhans, and B.J. Hrupka, Evidence that the anorexia induced by lipopolysaccharide is mediated by the 5-HT2C receptor. Pharmacol Biochem Behav, 2003. 74(2): p. 505-12.
135. Ramos, E.J., S. Suzuki, M.M. Meguid, A. Laviano, T. Sato, C. Chen, and U. Das, Changes in hypothalamic neuropeptide Y and monoaminergic system in tumor-bearing rats: pre- and post-tumor resection and at death. Surgery, 2004. 136(2): p. 270-6.
136. Blaha, V., Z.J. Yang, M.M. Meguid, J.K. Chai, A. Oler, and Z. Zadak, Ventromedial nucleus of hypothalamus is related to the development of cancer-induced anorexia: in vivo microdialysis study. Acta Medica (Hradec Kralove), 1998. 41(1): p. 3-11.
137. Cangiano, C., A. Cascino, F. Ceci, A. Laviano, M. Mulieri, M. Muscaritoli, and F. Rossi-Fanelli, Plasma and CSF tryptophan in cancer anorexia. J Neural Transm Gen Sect, 1990. 81(3): p. 225-33.
138. Cangiano, C., A. Laviano, M.M. Meguid, M. Mulieri, L. Conversano, I. Preziosa, and F. Rossi-Fanelli, Effects of administration of oral branched-chain amino acids on anorexia and caloric intake in cancer patients. J Natl Cancer Inst, 1996. 88(8): p. 550-2.
139. Edelman, M.J., D.R. Gandara, F.J. Meyers, R. Ishii, M. O’Mahony, M. Uhrich, I. Lauder, J. Houston, and D.W. Gietzen, Serotonergic blockade in the treatment of the cancer anorexia-cachexia syndrome. Cancer, 1999. 86(4): p. 684-8.
140. Kardinal, C.G., C.L. Loprinzi, D.J. Schaid, A.C. Hass, A.M. Dose, L.M. Athmann, J.A. Mailliard, G.W. McCormack, J.B. Gerstner, and M.F. Schray, A controlled trial of cyproheptadine in cancer patients with anorexia and/or cachexia. Cancer, 1990. 65(12): p. 2657-62.
141. Ross, D.D. and C.S. Alexander, Management of common symptoms in terminally ill patients: Part I. Fatigue, anorexia, cachexia, nausea and vomiting. Am Fam Physician, 2001. 64(5): p. 807-14.
142. Yang, L.P. and L.J. Scott, Palonosetron: in the prevention of nausea and vomiting. Drugs, 2009. 69(16): p. 2257-78.
143. Witkamp, R.F., Current and future drug targets in weight management. Pharm Res, 2011. 28(8): p. 1792-818.
41
2
Hyp
otha
lam
ic in
flam
mat
ion
and
food
inta
ke re
gula
tion
144. Burke, L.K., B. Doslikova, G. D’Agostino, A.S. Garfield, G. Farooq, D. Burdakov, M.J. Low, M. Rubinstein, M.L. Evans, B. Billups, and L.K. Heisler, 5-HT obesity medication efficacy via POMC activation is maintained during aging. Endocrinology, 2014. 155(10): p. 3732-8.
145. Xu, Y., J.E. Jones, D. Kohno, K.W. Williams, C.E. Lee, M.J. Choi, J.G. Anderson, L.K. Heisler, J.M. Zigman, B.B. Lowell, and J.K. Elmquist, 5-HT2CRs expressed by pro-opiomelanocortin neurons regulate energy homeostasis. Neuron, 2008. 60(4): p. 582-9.
146. Doslikova, B., A.S. Garfield, J. Shaw, M.L. Evans, D. Burdakov, B. Billups, and L.K. Heisler, 5-HT2C receptor agonist anorectic efficacy potentiated by 5-HT1B receptor agonist coapplication: an effect mediated via increased proportion of pro-opiomelanocortin neurons activated. J Neurosci, 2013. 33(23): p. 9800-4.
147. Xu, Y., J.E. Jones, D.A. Lauzon, J.G. Anderson, N. Balthasar, L.K. Heisler, A.R. Zinn, B.B. Lowell, and J.K. Elmquist, A serotonin and melanocortin circuit mediates D-fenfluramine anorexia. J Neurosci, 2010. 30(44): p. 14630-4.
148. Carlini, V.P., R.C. Gaydou, H.B. Schioth, and S.R. de Barioglio, Selective serotonin reuptake inhibitor (fluoxetine) decreases the effects of ghrelin on memory retention and food intake. Regul Pept, 2007. 140(1-2): p. 65-73.
149. Yamada, C., Y. Saegusa, K. Nakagawa, S. Ohnishi, S. Muto, M. Nahata, C. Sadakane, T. Hattori, N. Sakamoto, and H. Takeda, Rikkunshito, a Japanese kampo medicine, ameliorates decreased feeding behavior via ghrelin and serotonin 2B receptor signaling in a novelty stress murine model. Biomed Res Int, 2013. 2013: p. 792940.
150. Brunetti, L., L. Recinella, G. Orlando, B. Michelotto, C. Di Nisio, and M. Vacca, Effects of ghrelin and amylin on dopamine, norepinephrine and serotonin release in the hypothalamus. Eur J Pharmacol, 2002. 454(2-3): p. 189-92.
151. Ghersi, M.S., S.M. Casas, C. Escudero, V.P. Carlini, F. Buteler, R.J. Cabrera, H.B. Schioth, and S.R. de Barioglio, Ghrelin inhibited serotonin release from hippocampal slices. Peptides, 2011. 32(11): p. 2367-71.
152. Shinozaki, T., M. Kimura, M. Hosoyamada, and T. Shibasaki, Fluvoxamine inhibits weight gain and food intake in food restricted hyperphagic Wistar rats. Biol Pharm Bull, 2008. 31(12): p. 2250-4.
153. Dryden, S., H.M. Frankish, Q. Wang, L. Pickavance, and G. Williams, The serotonergic agent fluoxetine reduces neuropeptide Y levels and neuropeptide Y secretion in the hypothalamus of lean and obese rats. Neuroscience, 1996. 72(2): p. 557-66.
154. Dryden, S., H.M. Frankish, Q. Wang, and G. Williams, Increased feeding and neuropeptide Y (NPY) but not NPY mRNA levels in the hypothalamus of the rat following central administration of the serotonin synthesis inhibitor p-chlorophenylalanine. Brain Res, 1996. 724(2): p. 232-7.
155. Moon, Y.W., S.H. Choi, S.B. Yoo, J.H. Lee, and J.W. Jahng, 5-hydroxy-L-tryptophan Suppressed Food Intake in Rats Despite an Increase in the Arcuate NPY Expression. Exp Neurobiol, 2010. 19(3): p. 132-9.

J Cachexia Sarcopenia Muscle, 2014. 5(2): p. 159-69.
Hypothalamic food intake regulation in
a cancer-cachectic mouse model
J. T. Dwarkasing, M. van Dijk, F. J. Dijk, M. V. Boekschoten, J. Faber, J. M. Argilès, A. Laviano, M. Müller, R. F. Witkamp, K. van Norren
3
44
Appetite regulators in a cancer cachectic mouse modelChapter 3
Abstract
Background: Appetite is frequently affected in cancer patients, leading to anorexia and consequently insufficient food intake. In this study, we report on hypothalamic gene expression profile of a cancer cachectic mouse model with increased food intake. In this model, mice bearing C26 tumour have an increased food intake subsequently to the loss of body weight. We hypothesize that in this model, food intake regulating systems in the hypothalamus, which apparently fail in anorexia, are still able to adapt adequately to changes in energy balance. Therefore studying changes that occur on appetite regulators in the hypothalamus might reveal targets for treatment of cancer-induced eating disorders. By applying transcriptomics, many appetite regulating systems in the hypothalamus could be taken into account, providing an overview of changes that occur in the hypothalamus during tumour growth.
Methods: C26-colon adenocarcinoma cells were subcutaneously inoculated in 6 weeks old male CDF1 mice. Body weight and food intake were measured 3 times a week. On day 20, hypothalamus was dissected and used for transcriptomics using Affymetrix chips.
Results: Food intake increased significantly in cachectic tumour-bearing mice (TB), synchronously to the loss of body weight. Hypothalamic gene expression of orexigenic neuropeptides NPY and AgRP was higher, whereas expression of anorexigenic genes CCK and POMC were lower in TB compared to controls. In addition, serotonin and dopamine signalling pathways were found to be significantly altered in TB mice. Serotonin levels in brain showed to be lower in TB mice compared to control mice, while dopamine levels did not change. Moreover, serotonin levels inversely correlated with food intake.
Conclusions: Transcriptomic analysis of the hypothalamus of cachectic TB mice with an increased food intake showed changes in NPY, AgRP and serotonin signalling. Serotonin levels in the brain showed to correlate with changes in food intake. Further research has to reveal whether targeting these systems will be a good strategy to avoid the development of cancer-induced eating disorders.
45
3
App
etit
e re
gula
tors
in a
can
cer c
ache
ctic
mou
se m
odel
Introduction
Anorexia affects 60-80% of all patients with cancer and considerably contributes to disease-related malnutrition and cachexia, which in turn strongly affect patient’s morbidity, mortality and quality of life [1].
Anorexia is often linked to cachexia, a complex metabolic syndrome associated with underlying illness which is characterised by progressive loss of muscle (muscle wasting) with or without loss of fat mass resulting in weight loss [2]. Although anorexia and cachexia are likely to be initiated by similar pathologies, several lines of evidence suggest that both conditions progress via distinct mechanisms. However, the presence of cachexia makes it difficult to disentangle the primary underlying mechanisms of cancer anorexia, since this might be due to tumour growth, cachexia progression or other disease related mechanisms.
Cancer anorexia is generally considered to be a multifactorial condition. Contributing to its complexity is the observation that evolution has developed powerful physiological mechanisms favouring food intake. It has been shown that upon shifting the balance to anorexia, pathways can become redundant when they are not functioning properly. This is for example shown by data obtained from studying knock-out animals for well-known appetite regulators, the NPY knock-out mouse [3], the AgRP knock-out mouse [4], or the ghrelin knock-out mouse [5]. These mice display regular food intake and body weight regulation, despite the loss of a significant key modulator in appetite regulation. The difficulties encountered in studying cancer anorexia, inspired us to approach the problem from a different angle. Cancer-induced anorexia is suggested to be predominantly caused by the inability of the hypothalamus to respond adequately to pivotal peripheral signals involved in appetite regulation [6]. This hypothalamic resistance to peripheral neuro-endocrine signals is believed to be due to the increase in pro-inflammatory cytokines resulting from tumour growth [6]. In this study, we report on hypothalamic gene expression profiles in a cancer cachectic model with increased food intake. In this model, appetite regulating systems, which apparently fail in anorexia, are still able to adapt adequately to changes in energy balance. By applying transcriptomics, many appetite regulating systems in the hypothalamus could be taken into account. Here, we provide an overview of changes that occur in the hypothalamus during tumour growth which could be important in the development of cancer-induced eating disorders.
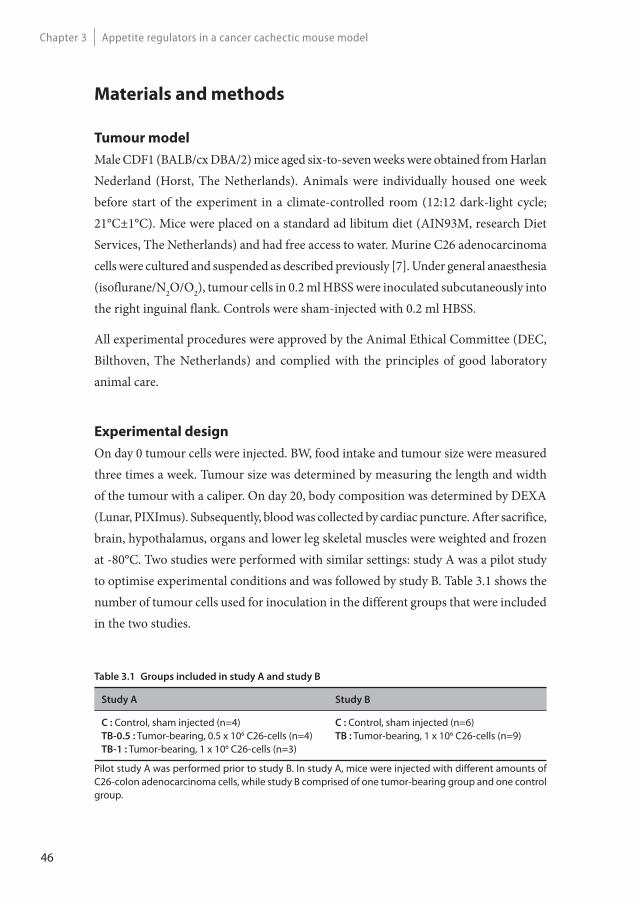
46
Appetite regulators in a cancer cachectic mouse modelChapter 3
Materials and methods
Tumour model
Male CDF1 (BALB/cx DBA/2) mice aged six-to-seven weeks were obtained from Harlan Nederland (Horst, The Netherlands). Animals were individually housed one week before start of the experiment in a climate-controlled room (12:12 dark-light cycle; 21°C±1°C). Mice were placed on a standard ad libitum diet (AIN93M, research Diet Services, The Netherlands) and had free access to water. Murine C26 adenocarcinoma cells were cultured and suspended as described previously [7]. Under general anaesthesia (isoflurane/N2O/O2), tumour cells in 0.2 ml HBSS were inoculated subcutaneously into the right inguinal flank. Controls were sham-injected with 0.2 ml HBSS.
All experimental procedures were approved by the Animal Ethical Committee (DEC, Bilthoven, The Netherlands) and complied with the principles of good laboratory animal care.
Experimental design
On day 0 tumour cells were injected. BW, food intake and tumour size were measured three times a week. Tumour size was determined by measuring the length and width of the tumour with a caliper. On day 20, body composition was determined by DEXA (Lunar, PIXImus). Subsequently, blood was collected by cardiac puncture. After sacrifice, brain, hypothalamus, organs and lower leg skeletal muscles were weighted and frozen at -80°C. Two studies were performed with similar settings: study A was a pilot study to optimise experimental conditions and was followed by study B. Table 3.1 shows the number of tumour cells used for inoculation in the different groups that were included in the two studies.
Table 3.1 Groups included in study A and study B
Study A Study B
C : Control, sham injected (n=4)TB-0.5 : Tumor-bearing, 0.5 x 10⁶ C26-cells (n=4)TB-1 : Tumor-bearing, 1 x 10⁶ C26-cells (n=3)
C : Control, sham injected (n=6)TB : Tumor-bearing, 1 x 10⁶ C26-cells (n=9)
Pilot study A was performed prior to study B. In study A, mice were injected with diff erent amounts of C26-colon adenocarcinoma cells, while study B comprised of one tumor-bearing group and one control group.
47
3
App
etit
e re
gula
tors
in a
can
cer c
ache
ctic
mou
se m
odel
Blood plasma amino acids and cytokines
Amino acids were measured by using HPLC with ortho-phtaldialdehyde as derivatization reagent and L-norvaline as internal standard (Sigma Aldrich). The method was adapted from van Eijk et al. [8].
Cytokines were measured using a mouse cytokine 10-plex bead immunoassay (Bio-source, Etten-Leur, The Netherlands). Prostaglandin E2 was measured using an enzyme-immunoassay kit (Oxford Biomedical Research, Oxford, MI, USA).
Serotonin and dopamine levels
Hypothalamic samples were used for micro array experiments, while remaining brain parts were used to determine serotonin and dopamine levels. Brains were homogenized in 1ml containing 40mM Tris, 1mM EDTA, 5mM EGTA, 0.50% Triton X-100 and PhosSTOP phosphatase inhibitor (Roche Nederland, The Netherlands). Citric acid (1%) was added to prevent serotonin oxidation. Serotonin and dopamine levels were measured using enzyme-immunoassay kits (BAE-5900, BAE-5300, LDN, Nordhorn, Germany).
Statistics
Data was analysed by statistical analysis of variance (ANOVA) followed by a post hoc Tukey’s multiple comparison/Bonferroni test or by a Student’s t test. Differences were considered significant at a two-tailed P<0.05. Statistical analyses were performed using Graphpad Prism 5. For statistical analysis of microarray data see microarray section (below).
Microarray studies
Total RNA from the hypothalamus was isolated by using RNeasy Lipid tissue kit (Qiagen, Venlo, The Netherlands). RNA concentrations were measured by absorbance at 260 nm (Nanodrop). RNA quality was checked using the RNA 6000 Nano assay on the Agilent 2100 Bioanalyzer (Agilent Techologies, Amsterdam, The Netherlands) according to the manufacturer’s protocol. For each mouse, total RNA (100 ng) was labelled using the Ambion WT expression kit (Life Technologies, Bleiswijk, The Netherlands). Micro-array experiments were performed by using Affymetrix Mouse Gene ST 1.0 (study A) and 1.1 (study B).
48
Appetite regulators in a cancer cachectic mouse modelChapter 3
For both study A and B, samples were pooled for each group. Also individual samples from study B were included in a subsequent microarray experiment to confirm the findings on food intake regulators and canonical pathways. In this microarray experiment, 4 control samples and 5 samples from tumour-bearing mice were included in this experiment, however 1 control sample gave various spots on the array and was therefore excluded from analysis.
Array data were analysed using an in-house, on-line system [9]. Shortly, probesets were redefined according to Dai et al. [10] using remapped CDF version 15.1 based on the Entrez Gene database. In total these arrays target 21,225 unique genes. Robust multi-array (RMA) analysis was used to obtain expression values [11, 12]. For study B we only took genes into account that had an intensity >20 on at least 2 arrays, had an interquartile range throughout the samples >0.1 and had at least 7 probes per genes. In total 8,763 genes passed the filter. Genes were considered differentially expressed at P<0.05 after intensity-based moderated t-statistics [13]. Further functional interpretation of the data was performed through the use of IPA (Ingenuity® Systems, www.ingenuity.com). Canonical pathway analysis identified the pathways from the IPA library of canonical pathways that were most significant to the data set. Genes from the data set that met the cut-off of 1.3 fold change and p-value cut-off of 0.05 and were associated with a canonical pathway in the Ingenuity Knowledge Base were considered for the analysis. Array data have been submitted to the Gene Expression Omnibus, accession number GSE44082.
Results
Body weight and food intake
In study A, tumour size and tumour weight did not increase correspondingly to the number of tumour cells injected (Figure 3.1B-3.1C). However, carcass weight, epididymal fat pad weight and skeletal muscle weight decreased proportionally to the number of tumour cells injected, suggesting that body wasting increases with tumour load, despite the weight of the tumour being similar (Supplementary table S3.1). Food intake in all tumour-bearing animals was found to increase after 15 days. At day 19, tumour-bearing (TB) mice in TB-0.5 and TB-1 groups ate approximately 45% more than the controls. An increase of food intake in TB mice was again noticed in subsequent study B (Figure

49
3
App
etit
e re
gula
tors
in a
can
cer c
ache
ctic
mou
se m
odel
3.1A and 3.1D). In this study, food intake of TB mice was 40% higher than controls at day 19. On day 13 after tumour inoculation, TB mice started to lose body weight (BW). Synchronously to the decline in body weight, an increase in food intake in TB mice was measured, suggesting compensatory eating by TB mice, in order to cope with loss of BW. The loss of lean mass, fat mass and skeletal muscle weight in TB mice in study B was comparable with that of study A, showing that the level and severity of cachexia developed in TB animals was similar in both studies (Supplementary table S3.1).
Figure 3.1 Eff ect of tumour inoculation on food intake, tumour size, tumour weight, body weight
and body composition in study A and B.
A) Time-course of change in food intake of TB-mice in study A. B) Time course of change in food intake of TB mice in study B. C) Tumour weight at day 20 in study A. D) Time course of change in body weight in study B. E) Tumour width and length were measured twice a week with a caliper and used to calculate tumour volume. F) Body composition determined by DEXA scan in study B.* Signifi cantly diff erent from C (P<0.05) Data is expressed as mean ± S.E.M. C = sham-injected control, TB-0.5 = injected with 0.5 x 10⁶ tumour cells, TB-1 = injected with 1 x 10⁶ tumour cells and TB = injected with 1 x 10⁶ tumour cells.
c
TB-0.5
TB-10
500
1000
1500
tum
ourw
eigh
t(g)
0 1 6 9 13 15 190
2
4
6
8CTB-0.5TB-1
days after inoculation
Food
Inta
ke(g
)
8 13 15 190
20000
40000
60000
80000CTB-0.5TB-1
days after inoculation
Tum
orvo
lum
e(le
ngth
*wid
th)2
/2(m
m)
C TB0
5
10
15
20
25
30
BMD
lean massfat mass
20 days after tumor inoculation
wei
ght(
g)
0 1 6 13 15 16 19 200
5
10
15
20
25
30CTB
days after inoculation
* *
body
wei
ght(
g)
0 1 6 9 13 15 190
1
2
3
4
5 CTB
*
days after inoculation
Food
Inta
ke(g
)
A
C
E
B
D
F
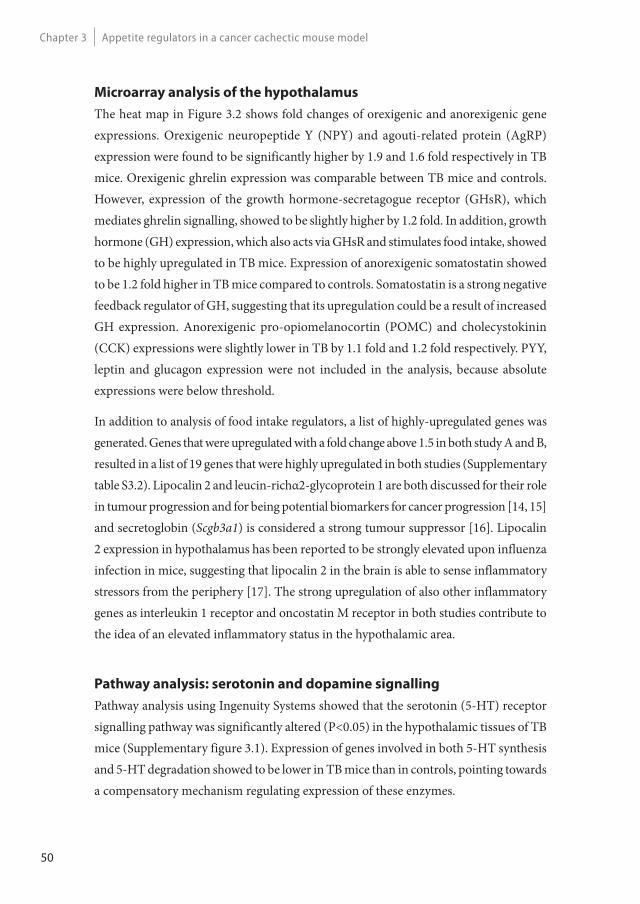
50
Appetite regulators in a cancer cachectic mouse modelChapter 3
Microarray analysis of the hypothalamus
The heat map in Figure 3.2 shows fold changes of orexigenic and anorexigenic gene expressions. Orexigenic neuropeptide Y (NPY) and agouti-related protein (AgRP) expression were found to be significantly higher by 1.9 and 1.6 fold respectively in TB mice. Orexigenic ghrelin expression was comparable between TB mice and controls. However, expression of the growth hormone-secretagogue receptor (GHsR), which mediates ghrelin signalling, showed to be slightly higher by 1.2 fold. In addition, growth hormone (GH) expression, which also acts via GHsR and stimulates food intake, showed to be highly upregulated in TB mice. Expression of anorexigenic somatostatin showed to be 1.2 fold higher in TB mice compared to controls. Somatostatin is a strong negative feedback regulator of GH, suggesting that its upregulation could be a result of increased GH expression. Anorexigenic pro-opiomelanocortin (POMC) and cholecystokinin (CCK) expressions were slightly lower in TB by 1.1 fold and 1.2 fold respectively. PYY, leptin and glucagon expression were not included in the analysis, because absolute expressions were below threshold.
In addition to analysis of food intake regulators, a list of highly-upregulated genes was generated. Genes that were upregulated with a fold change above 1.5 in both study A and B, resulted in a list of 19 genes that were highly upregulated in both studies (Supplementary table S3.2). Lipocalin 2 and leucin-richα2-glycoprotein 1 are both discussed for their role in tumour progression and for being potential biomarkers for cancer progression [14, 15] and secretoglobin (Scgb3a1) is considered a strong tumour suppressor [16]. Lipocalin 2 expression in hypothalamus has been reported to be strongly elevated upon influenza infection in mice, suggesting that lipocalin 2 in the brain is able to sense inflammatory stressors from the periphery [17]. The strong upregulation of also other inflammatory genes as interleukin 1 receptor and oncostatin M receptor in both studies contribute to the idea of an elevated inflammatory status in the hypothalamic area.
Pathway analysis: serotonin and dopamine signalling
Pathway analysis using Ingenuity Systems showed that the serotonin (5-HT) receptor signalling pathway was significantly altered (P<0.05) in the hypothalamic tissues of TB mice (Supplementary figure 3.1). Expression of genes involved in both 5-HT synthesis and 5-HT degradation showed to be lower in TB mice than in controls, pointing towards a compensatory mechanism regulating expression of these enzymes.
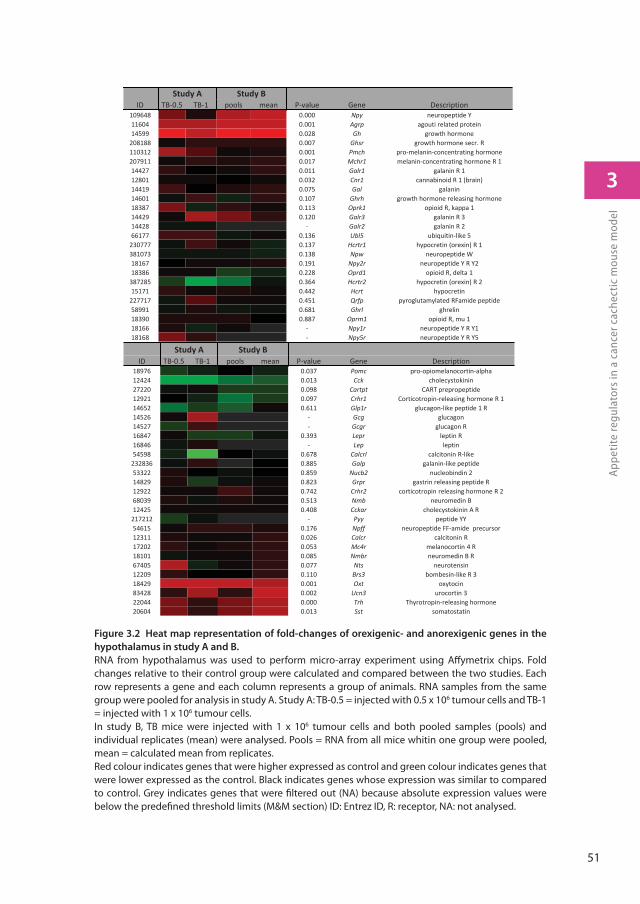
51
3
App
etit
e re
gula
tors
in a
can
cer c
ache
ctic
mou
se m
odel
Figure 3.2 Heat map representation of fold-changes of orexigenic- and anorexigenic genes in the
hypothalamus in study A and B.
RNA from hypothalamus was used to perform micro-array experiment using Aff ymetrix chips. Fold changes relative to their control group were calculated and compared between the two studies. Each row represents a gene and each column represents a group of animals. RNA samples from the same group were pooled for analysis in study A. Study A: TB-0.5 = injected with 0.5 x 10⁶ tumour cells and TB-1 = injected with 1 x 10⁶ tumour cells. In study B, TB mice were injected with 1 x 10⁶ tumour cells and both pooled samples (pools) and individual replicates (mean) were analysed. Pools = RNA from all mice whitin one group were pooled, mean = calculated mean from replicates. Red colour indicates genes that were higher expressed as control and green colour indicates genes that were lower expressed as the control. Black indicates genes whose expression was similar to compared to control. Grey indicates genes that were fi ltered out (NA) because absolute expression values were below the predefi ned threshold limits (M&M section) ID: Entrez ID, R: receptor, NA: not analysed.
Study A Study BID TB 0.5 TB 1 pools mean P value Gene Description
109648 0.000 Npy neuropeptide Y11604 0.001 Agrp agouti related protein14599 0.028 Gh growth hormone
208188 0.007 Ghsr growth hormone secr. R110312 0.001 Pmch pro melanin concentrating hormone207911 0.017 Mchr1 melanin concentrating hormone R 114427 0.011 Galr1 galanin R 112801 0.032 Cnr1 cannabinoid R 1 (brain)14419 0.075 Gal galanin14601 0.107 Ghrh growth hormone releasing hormone18387 0.113 Oprk1 opioid R, kappa 114429 0.120 Galr3 galanin R 314428 Galr2 galanin R 266177 0.136 Ubl5 ubiquitin like 5
230777 0.137 Hcrtr1 hypocretin (orexin) R 1381073 0.138 Npw neuropeptide W18167 0.191 Npy2r neuropeptide Y R Y218386 0.228 Oprd1 opioid R, delta 1
387285 0.364 Hcrtr2 hypocretin (orexin) R 215171 0.442 Hcrt hypocretin
227717 0.451 Qrfp pyroglutamylated RFamide peptide58991 0.681 Ghrl ghrelin18390 0.887 Oprm1 opioid R, mu 118166 Npy1r neuropeptide Y R Y118168 Npy5r neuropeptide Y R Y5
Study A Study BID TB 0.5 TB 1 pools mean P value Gene Description
18976 0.037 Pomc pro opiomelanocortin alpha12424 0.013 Cck cholecystokinin27220 0.098 Cartpt CART prepropeptide12921 0.097 Crhr1 Corticotropin releasing hormone R 114652 0.611 Glp1r glucagon like peptide 1 R14526 Gcg glucagon14527 Gcgr glucagon R16847 0.393 Lepr leptin R16846 Lep leptin54598 0.678 Calcrl calcitonin R like
232836 0.885 Galp galanin like peptide53322 0.859 Nucb2 nucleobindin 214829 0.823 Grpr gastrin releasing peptide R12922 0.742 Crhr2 corticotropin releasing hormone R 268039 0.513 Nmb neuromedin B12425 0.408 Cckar cholecystokinin A R
217212 Pyy peptide YY54615 0.176 Npff neuropeptide FF amide precursor12311 0.026 Calcr calcitonin R17202 0.053 Mc4r melanocortin 4 R18101 0.085 Nmbr neuromedin B R67405 0.077 Nts neurotensin12209 0.110 Brs3 bombesin like R 318429 0.001 Oxt oxytocin83428 0.002 Ucn3 urocortin 322044 0.000 Trh Thyrotropin releasing hormone20604 0.013 Sst somatostatin
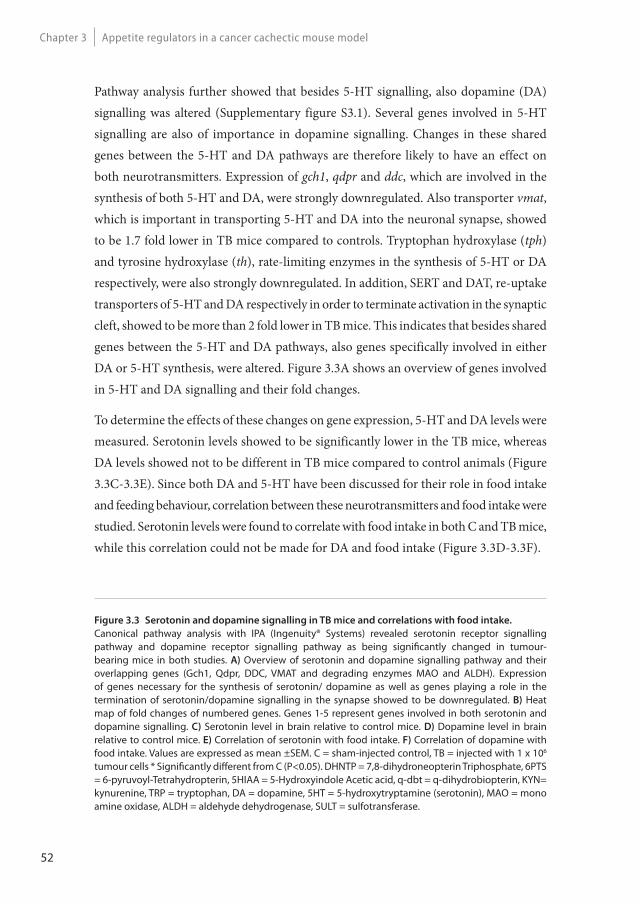
52
Appetite regulators in a cancer cachectic mouse modelChapter 3
Pathway analysis further showed that besides 5-HT signalling, also dopamine (DA) signalling was altered (Supplementary figure S3.1). Several genes involved in 5-HT signalling are also of importance in dopamine signalling. Changes in these shared genes between the 5-HT and DA pathways are therefore likely to have an effect on both neurotransmitters. Expression of gch1, qdpr and ddc, which are involved in the synthesis of both 5-HT and DA, were strongly downregulated. Also transporter vmat, which is important in transporting 5-HT and DA into the neuronal synapse, showed to be 1.7 fold lower in TB mice compared to controls. Tryptophan hydroxylase (tph) and tyrosine hydroxylase (th), rate-limiting enzymes in the synthesis of 5-HT or DA respectively, were also strongly downregulated. In addition, SERT and DAT, re-uptake transporters of 5-HT and DA respectively in order to terminate activation in the synaptic cleft, showed to be more than 2 fold lower in TB mice. This indicates that besides shared genes between the 5-HT and DA pathways, also genes specifically involved in either DA or 5-HT synthesis, were altered. Figure 3.3A shows an overview of genes involved in 5-HT and DA signalling and their fold changes.
To determine the effects of these changes on gene expression, 5-HT and DA levels were measured. Serotonin levels showed to be significantly lower in the TB mice, whereas DA levels showed not to be different in TB mice compared to control animals (Figure 3.3C-3.3E). Since both DA and 5-HT have been discussed for their role in food intake and feeding behaviour, correlation between these neurotransmitters and food intake were studied. Serotonin levels were found to correlate with food intake in both C and TB mice, while this correlation could not be made for DA and food intake (Figure 3.3D-3.3F).
Figure 3.3 Serotonin and dopamine signalling in TB mice and correlations with food intake.
Canonical pathway analysis with IPA (Ingenuity® Systems) revealed serotonin receptor signalling pathway and dopamine receptor signalling pathway as being signifi cantly changed in tumour-bearing mice in both studies. A) Overview of serotonin and dopamine signalling pathway and their overlapping genes (Gch1, Qdpr, DDC, VMAT and degrading enzymes MAO and ALDH). Expression of genes necessary for the synthesis of serotonin/ dopamine as well as genes playing a role in the termination of serotonin/dopamine signalling in the synapse showed to be downregulated. B) Heat map of fold changes of numbered genes. Genes 1-5 represent genes involved in both serotonin and dopamine signalling. C) Serotonin level in brain relative to control mice. D) Dopamine level in brain relative to control mice. E) Correlation of serotonin with food intake. F) Correlation of dopamine with food intake. Values are expressed as mean ±SEM. C = sham-injected control, TB = injected with 1 x 10⁶ tumour cells * Signifi cantly diff erent from C (P<0.05). DHNTP = 7,8-dihydroneopterin Triphosphate, 6PTS = 6-pyruvoyl-Tetrahydropterin, 5HIAA = 5-Hydroxyindole Acetic acid, q-dbt = q-dihydrobiopterin, KYN= kynurenine, TRP = tryptophan, DA = dopamine, 5HT = 5-hydroxytryptamine (serotonin), MAO = mono amine oxidase, ALDH = aldehyde dehydrogenase, SULT = sulfotransferase.
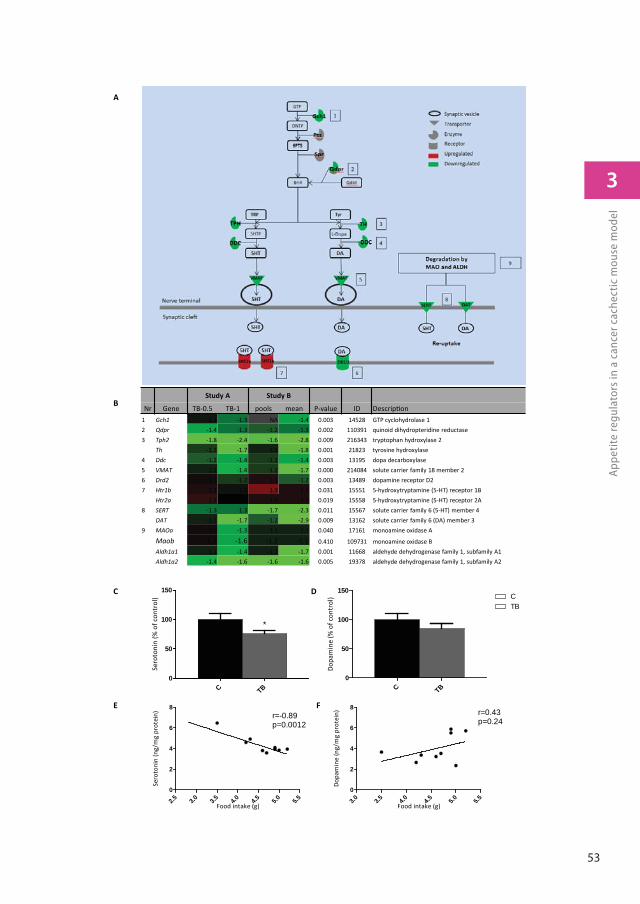
53
3
App
etit
e re
gula
tors
in a
can
cer c
ache
ctic
mou
se m
odel
A
B
C TB0
50
100
150
*
Sero
toni
n (%
of c
ontr
ol)
C TB0
50
100
150CTB
Dopa
min
e (%
of c
ontr
ol)
C D
3.0 3.5 4.0 4.5 5.0 5.50
2
4
6
8r=0.43p=0.24
Food intake (g)
Dopa
min
e (n
g/m
g pr
otei
n)
2.5 3.0 3.5 4.0 4.5 5.0 5.50
2
4
6
8r=-0.89p=0.0012
Food intake (g)
Sero
toni
n (n
g/m
g pr
otei
n)
E F
Study A Study B
Nr Gene TB-0.5 TB-1 pools mean P-value ID Descrip on1 Gch1 -1.1 -1.3 NA -1.4 0.003 14528 GTP cyclohydrolase 12 Qdpr -1.4 -1.3 -1.2 -1.3 0.002 110391 quinoid dihydropteridine reductase3 Tph2 -1.8 -2.4 -1.6 -2.8 0.009 216343 tryptophan hydroxylase 2
Th -1.2 -1.7 -1.1 -1.8 0.001 21823 tyrosine hydroxylase4 Ddc -1.2 -1.4 -1.2 -1.4 0.003 13195 dopa decarboxylase5 VMAT -1.1 -1.4 -1.2 -1.7 0.000 214084 solute carrier family 18 member 26 Drd2 1.1 -1.2 1.1 -1.2 0.003 13489 dopamine receptor D27 Htr1b 1.1 -1.0 1.3 1.1 0.031 15551 5-hydroxytryptamine (5-HT) receptor 1B
Htr2a 1.2 -1.0 1.1 1.1 0.019 15558 5-hydroxytryptamine (5-HT) receptor 2A8 SERT -1.3 -1.3 -1.7 -2.3 0.011 15567 solute carrier family 6 (5-HT) member 4
DAT -1.1 -1.7 -1.2 -2.9 0.009 13162 solute carrier family 6 (DA) member 39 MAOa 1.0 -1.3 -1.1 -1.1 0.040 17161 monoamine oxidase A
Maob -1.2 -1.6 -1.2 -1.1 0.410 109731 monoamine oxidase BAldh1a1 -1.1 -1.4 -1.1 -1.7 0.001 11668 aldehyde dehydrogenase family 1, subfamily A1Aldh1a2 -1.4 -1.6 -1.6 -1.6 0.005 19378 aldehyde dehydrogenase family 1, subfamily A2
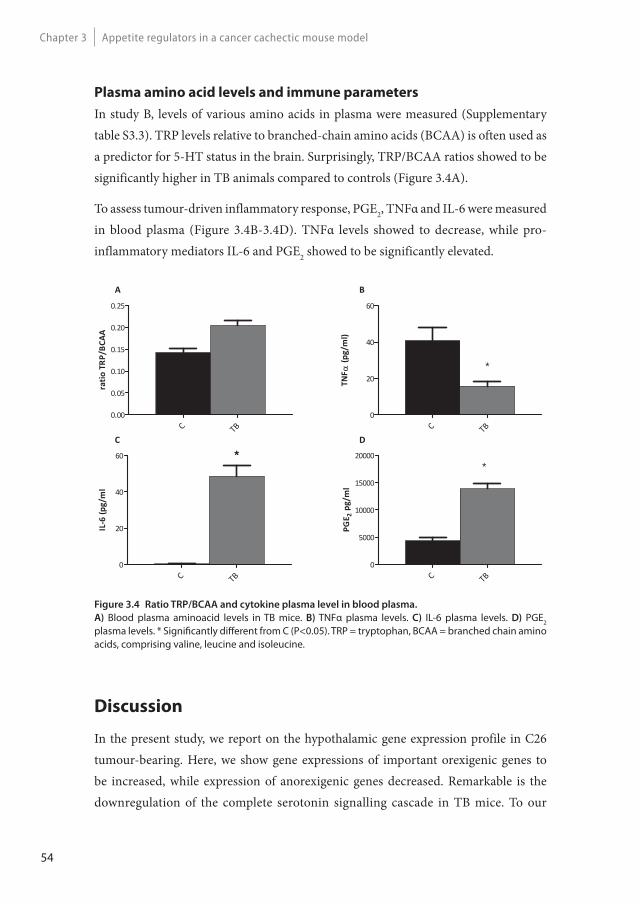
54
Appetite regulators in a cancer cachectic mouse modelChapter 3
Plasma amino acid levels and immune parameters
In study B, levels of various amino acids in plasma were measured (Supplementary table S3.3). TRP levels relative to branched-chain amino acids (BCAA) is often used as a predictor for 5-HT status in the brain. Surprisingly, TRP/BCAA ratios showed to be significantly higher in TB animals compared to controls (Figure 3.4A).
To assess tumour-driven inflammatory response, PGE2, TNFα and IL-6 were measured in blood plasma (Figure 3.4B-3.4D). TNFα levels showed to decrease, while pro-inflammatory mediators IL-6 and PGE2 showed to be significantly elevated.
Figure 3.4 Ratio TRP/BCAA and cytokine plasma level in blood plasma.
A) Blood plasma aminoacid levels in TB mice. B) TNFα plasma levels. C) IL-6 plasma levels. D) PGE2 plasma levels. * Signifi cantly diff erent from C (P<0.05). TRP = tryptophan, BCAA = branched chain amino acids, comprising valine, leucine and isoleucine.
TNF
(pg/
ml)
C TB0
20
40
60
*
IL6
(pg/
ml
C TB0
20
40
60 *
PGE 2
pg/m
l
C TB0
5000
10000
15000
20000*
ratio
TRP/
BCAA
C TB0.00
0.05
0.10
0.15
0.20
0.25
B
DC
A
Discussion
In the present study, we report on the hypothalamic gene expression profile in C26 tumour-bearing. Here, we show gene expressions of important orexigenic genes to be increased, while expression of anorexigenic genes decreased. Remarkable is the downregulation of the complete serotonin signalling cascade in TB mice. To our
55
3
App
etit
e re
gula
tors
in a
can
cer c
ache
ctic
mou
se m
odel
knowledge, this is the first study showing that serotonin synthesis, degradation and synaptic release is affected during tumour growth and subsequent changes on serotonin levels are correlated to changes in food intake.
The observed increase in food intake in these C26 TB mice in both experiments has not yet been reported. The C26 cancer-cachexia mouse model as described in 1990 by Tanaka et al. [18] is often referred to as “the standard” for the C26 model. With this set-up, cachexia develops, which is reflected in a decrease in muscle weight as well as adipose tissue depletion. Our findings on cachexia in the present model correspond to the results found by Tanaka et al. A specific characteristic for this model is that in this particular setting, food intake of TB mice does not change and is not different from that of healthy controls. However, in the meantime various research groups have reported a strong decrease in food intake in mice injected with these C26 cancer cells [19, 20], suggesting that changes in morphology of the cell line, variation in the strain of mice and differences in number of tumour cells used for inoculation might led to these discrepancies in findings on food intake. It has already been reported that C26-induced cachexia and anorexia can vary according to the inoculation site [21] and origin of C26 cells [22], as well as the use of solid tumour fragments or cell suspensions for inoculation can cause variation [23].
Also adaptation of C26 cells to in vitro culture conditions can cause mutations in the cell line leading to changes in cell characteristics, sensitivity to chemotherapy, metastatic potential and tumour-induced cachexia in mice, suggesting that C26 cells can differentiate to different variants and change tumour characteristics despite being derived from the same source [24]. Subsequently, the extent and type of inflammatory response that is induced by tumour growth might play a role in the severity of cachexia and anorexia. Differences in tumour-driven inflammation, might therefore explain differences between various cancer models. To confirm tumour-induced inflammation in our model, various cytokines and PGE2 levels in blood plasma were measured. IL-6 and PGE2 showed to be elevated in TB mice, which also has been reported previously [25]. However, in contrast to previous results, TNFα levels in blood plasma were not elevated in TB mice compared to control mice.
Elevated concentrations of TNFα are reported to decrease food intake [26], suggesting that the absence of TNFα –mediated inflammation might play a role in compensating feeding behaviour in this model. All together, we would like to propose the hypothesis
56
Appetite regulators in a cancer cachectic mouse modelChapter 3
that although the “C26 model” is referred to as such, in fact the model is heterogeneous with many varieties. Small differences in experimental settings and spontaneous mutations in the cell line used might lead to great changes in characteristics of the model.
In the present study, pathway analysis indicates serotonin (5-HT) and dopamine (DA) signalling to be altered in TB mice compared to controls. DA and 5-HT are both important neurotransmitters involved in eating behaviour. The signalling pathways of 5-HT, DA and DA-metabolites norepinephrine and epinephrine are closely linked by shared synthesizing enzymes and transporters. Therefore, it is very likely that changes in these shared genes will propose these comprehensive effects. Since both pathways were predicted to be altered, we measured 5-HT and DA levels in whole brain homogenates. Serotonin levels were found to be significantly lower in TB mice compared to control. This might be caused by decreased TPH and SERT expression, which have been directly correlated to lowered 5-HT levels in other studies [27, 28]. However, DA levels in TB mice showed not to be different from levels in controls, suggesting that effects on expression of shared genes are of greater impact on 5-HT synthesis, than on DA synthesis. In addition, in relation to changes in food intake in TB mice, only 5-HT levels showed to inversely correlate with food intake whereas DA levels did not. A limitation of the present set-up is that gene pathway analysis was based on hypothalamic transcripts whereas analysis of 5-HT and DA levels took place in homogenates of remaining brain material. Therefore, levels of these neurotransmitters reflect an indication and local differences in the various regions of the brain in both DA and 5-HT cannot be ruled-out.
Overall, our results suggest that primarily 5-HT is associated with altered food intake regulation caused by tumour growth. This is consistent with findings reported by other research groups. In MCA tumour-bearing rats which showed clear anorexia, 5-HT levels were elevated in the PVN of the hypothalamus [29]. This elevation of 5-HT showed to be clearly tumour-driven, since it did not occur in the pair-fed controls. In addition, 5-HT levels were restored after tumour resection. On the other hand, also DA levels in the hypothalamus were reported to be decreased in that study. However, this decrease in DA level was also found in the pair-fed control group to a similar extent as observed in TB rats. This suggests that the decrease DA in the hypothalamus was a consequence and not a direct cause of decreased food intake. Dopamine has shown to play a role in mechanisms induced during and after feeding, such as rewarding mechanisms [30]. For example DA levels in the hypothalamus have been shown to increase directly after eating
57
3
App
etit
e re
gula
tors
in a
can
cer c
ache
ctic
mou
se m
odel
and the magnitude of DA response is relative to the size of meal ingested [31]. Our results, together with the existing literature, suggest that DA is not a direct causative factor in the development of cancer anorexia, since it is not induced by tumour growth but decreases subsequent to a reduction in food intake. However, DA is likely to play a role in sustaining cancer anorexia, once this has been manifested. Long-term alterations in DA in the hypothalamus are suggested to affect feeding pattern [32] and treatment with L-dopa, precursor of DA, has been shown to be beneficial in restoring appetite in severely anorectic cancer patients [33]. In addition, an increase in hypothalamic expression of several DA receptors (DRD), including DRD2, during tumour growth in anorectic TB rats, might play a role in sustainment of cancer anorexia [32]. Our results support this finding, as we found a decreased expression of this receptor in TB mice with compensatory feeding behaviour.
In summary, our results suggest that changes in 5-HT signalling and 5-HT levels contribute to compensatory eating during tumour growth. Serotonin is considered an important mediator in the regulation of satiety and hunger [34]. High brain levels induce satiation, whereas lowered levels stimulate food intake. In cancer, elevated brain serotonin has been suggested to play a crucial role in the development of anorexia [6, 29]. On the other hand, lowered serotonin levels and downregulation of SERT are discussed for their role in eating abnormalities and hyperphagia in obesity [35, 36].
Next to changes on 5-HT signalling and 5-HT levels, also tryptophan (TRP) metabolism appeared to change in TB mice. TRP/BCAA ratios in plasma showed to be increased in TB animals. TRP, precursor of 5HT, competes with BCAA at the blood brain barrier. Therefore plasma TRP/BCAA ratio is used as predictor for 5-HT levels in the brain and is often linked to food intake. From this perspective, an elevated TRP/BCAA ratio would result in increased TRP availability for serotonin synthesis in the brain and subsequently higher brain 5-HT levels. However, inconsistencies in this theory have been reported. Several reports show that plasma TRP levels do not predict TRP in brain and consequently brain 5- HT levels [37, 38]. In addition, plasma TRP/BCAA ratio as predictor for changes in food intake [39], appetite [40] and satiety [41] has been reported to fail in several studies. Amino acid profiles in blood reflect skeletal muscle status and total protein metabolism in the body and is dependent on the physical status of the subject [42]. In the case of severe cachexia it could be that large metabolic alterations in muscle [43] and the presence of insulin resistance in the muscle [44] might distort amino acid profiles in blood in order to predict brain 5-HT levels via TRP ratios adequately.
58
Appetite regulators in a cancer cachectic mouse modelChapter 3
In the present study, various food intake regulators were studied for their role in the observed increased food intake in TB mice. AgRP and NPY expressions were highly upregulated in TB mice. Central infusion of AgRP in cachectic C26 tumour-bearing mice results in an increase in food intake [45], which supports our findings. However, increased expression of NPY and its relation to potentiate feeding in this study is more difficult to interpret, as messenger NPY has been reported to not correlate with NPY levels in the hypothalamus in cancer cachectic conditions [46]. Several studies have shown that in cachectic and anorectic TB mice [47] and rats [46], messenger NPY is also elevated. However, translation of messenger NPY or transport of NPY to NPY terminals showed not to correspond to mRNA changes shown by measurements of NPY levels and immunohistochemistry [46]. Serotonin has been discussed to play a role in this imbalance between messenger NPY and NPY signalling in feeding behaviour in cancer anorexia [29]. Inhibition of 5-HT signalling showed to increase NPY levels [48], while induction of 5-HT signalling reduced NPY levels in rats [49]. All together this suggests that 5-HT signalling can interfere with NPY synthesis or transport. Therefore it could be that in the current study, decreased 5-HT levels and lowered 5-HT signalling might preserve NPY signalling.
In this study, we report on the transcriptomic analysis of a cancer-cachectic model with an increased food intake. In this model, food intake regulating systems, of which failure might contribute to anorexia, are able to adapt properly to changes in energy balance. We showed that alterations in NPY, AgRP and serotonin signalling are likely to explain compensatory eating behaviour of mice bearing C26 tumour. Therefore, targeting these systems might offer promising strategies to avoid the development of cancer-induced anorexia.
Acknowledgements
We thank Nicole Buurman, Gerrit de Vrij and Angeline Visscher for their technical support.
The work presented in this manuscript was funded by the European Union Seventh Framework Program (FP7/2007-2013) under grant agreement n°266408 (Full4Health).
The authors confirm that they comply with the principles of ethical publishing in the Journal of Cachexia, Sarcopenia, and Muscle 2010;1:7–8 (von Haehling S, Morley JE, Coats AJ and Anker SD).
59
3
App
etit
e re
gula
tors
in a
can
cer c
ache
ctic
mou
se m
odel
References
1. Argiles, J.M., et al., Optimal management of cancer anorexia-cachexia syndrome. Cancer Manag Res, 2010. 2: p. 27-38.
2. Fearon, K., et al., Defi nition and classifi cation of cancer cachexia: an international consensus. Lancet Oncol, 2011. 12(5): p. 489-95.
3. Erickson, J.C., K.E. Clegg, and R.D. Palmiter, Sensitivity to leptin and susceptibility to seizures of mice lacking neuropeptide Y. Nature, 1996. 381(6581): p. 415-21.
4. Qian, S., et al., Neither agouti-related protein nor neuropeptide Y is critically required for the regulation of energy homeostasis in mice. Molecular and cellular biology, 2002. 22(14): p. 5027-35.
5. Sun, Y., S. Ahmed, and R.G. Smith, Deletion of ghrelin impairs neither growth nor appetite. Mol Cell Biol, 2003. 23(22): p. 7973-81.
6. Laviano, A., et al., NPY and brain monoamines in the pathogenesis of cancer anorexia. Nutrition, 2008. 24(9): p. 802-5.
7. van Norren, K., et al., Dietary supplementation with a specifi c combination of high protein, leucine, and fi sh oil improves muscle function and daily activity in tumour-bearing cachectic mice. Br J Cancer, 2009. 100(5): p. 713-22.
8. van Eijk, H.M., D.R. Rooyakkers, and N.E. Deutz, Rapid routine determination of amino acids in plasma by high-performance liquid chromatography with a 2-3 microns Spherisorb ODS II column. J Chromatogr, 1993. 620(1): p. 143-8.
9. Lin, K., et al., MADMAX - Management and analysis database for multiple ~omics experiments. J Integr Bioinform, 2011. 8(2): p. 160.
10. Dai, M., et al., Evolving gene/transcript defi nitions signifi cantly alter the interpretation of GeneChip data. Nucleic acids research, 2005. 33(20): p. e175.
11. Irizarry, R.A., et al., Summaries of Aff ymetrix GeneChip probe level data. Nucleic acids research, 2003. 31(4): p. e15.
12. Bolstad, B.M., et al., A comparison of normalization methods for high density oligonucleotide array data based on variance and bias. Bioinformatics, 2003. 19(2): p. 185-93.
13. Sartor, M.A., et al., Intensity-based hierarchical Bayes method improves testing for diff erentially expressed genes in microarray experiments. BMC Bioinformatics, 2006. 7: p. 538.
14. Yang, J. and M.A. Moses, Lipocalin 2: a multifaceted modulator of human cancer. Cell cycle, 2009. 8(15): p. 2347-52.
15. Kavathia, N., et al., Serum markers of apoptosis decrease with age and cancer stage. Aging, 2009. 1(7): p. 652-63.
16. Tomita, T. and S. Kimura, Regulation of mouse Scgb3a1 gene expression by NF-Y and association of CpG methylation with its tissue-specifi c expression. BMC Mol Biol, 2008. 9: p. 5.
60
Appetite regulators in a cancer cachectic mouse modelChapter 3
17. Ding, M. and L.A. Toth, mRNA expression in mouse hypothalamus and basal forebrain during infl uenza infection: a novel model for sleep regulation. Physiol Genomics, 2006. 24(3): p. 225-34.
18. Tanaka, Y., et al., Experimental cancer cachexia induced by transplantable colon 26 adenocarcinoma in mice. Cancer Res, 1990. 50(8): p. 2290-5.
19. Iizuka, N., et al., Anticachectic eff ects of the natural herb Coptidis rhizoma and berberine on mice bearing colon 26/clone 20 adenocarcinoma. Int J Cancer, 2002. 99(2): p. 286-91.
20. Soda, K., et al., Manifestations of cancer cachexia induced by colon 26 adenocarcinoma are not fully ascribable to interleukin-6. International journal of cancer. Journal international du cancer, 1995. 62(3): p. 332-6.
21. Matsumoto, T., et al., Tumour inoculation site-dependent induction of cachexia in mice bearing colon 26 carcinoma. Br J Cancer, 1999. 79(5-6): p. 764-9.
22. Murphy, K.T., et al., Importance of functional and metabolic impairments in the characterization of the C-26 murine model of cancer cachexia. Dis Model Mech, 2012.
23. Aulino, P., et al., Molecular, cellular and physiological characterization of the cancer cachexia-inducing C26 colon carcinoma in mouse. BMC Cancer, 2010. 10: p. 363.
24. Sacchi, A., F. Mauro, and G. Zupi, Changes of phenotypic characteristics of variants derived from Lewis lung carcinoma during long-term in vitro growth. Clin Exp Metastasis, 1984. 2(2): p. 171-8.
25. Faber, J., et al., Benefi cial immune modulatory eff ects of a specifi c nutritional combination in a murine model for cancer cachexia. Br J Cancer, 2008. 99(12): p. 2029-36.
26. Sonti, G., S.E. Ilyin, and C.R. Plata-Salaman, Anorexia induced by cytokine interactions at pathophysiological concentrations. Am J Physiol, 1996. 270(6 Pt 2): p. R1394-402.
27. Rothman, R.B., et al., High-dose fenfl uramine administration decreases serotonin transporter binding, but not serotonin transporter protein levels, in rat forebrain. Synapse, 2003. 50(3): p. 233-9.
28. Zhang, X., et al., Tryptophan hydroxylase-2 controls brain serotonin synthesis. Science, 2004. 305(5681): p. 217.
29. Meguid, M.M., et al., Tumor anorexia: eff ects on neuropeptide Y and monoamines in paraventricular nucleus. Peptides, 2004. 25(2): p. 261-6.
30. Salamone, J.D. and M. Correa, Dopamine and Food Addiction: Lexicon Badly Needed. Biol Psychiatry, 2012.
31. Meguid, M.M., Z.J. Yang, and M. Koseki, Eating induced rise in LHA-dopamine correlates with meal size in normal and bulbectomized rats. Brain Res Bull, 1995. 36(5): p. 487-90.
32. Sato, T., et al., Hypothalamic dopaminergic receptor expressions in anorexia of tumor-bearing rats. Am J Physiol Regul Integr Comp Physiol, 2001. 281(6): p. R1907-16.
33. Lozano, R.H. and I.S. Jofre, Novel use of L-dOPA in the treatment of anorexia and asthenia associated with cancer. Palliat Med, 2002. 16(6): p. 548.
61
3
App
etit
e re
gula
tors
in a
can
cer c
ache
ctic
mou
se m
odel
34. Garfi eld, A.S. and L.K. Heisler, Pharmacological targeting of the serotonergic system for the treatment of obesity. Th e Journal of physiology, 2009. 587(Pt 1): p. 49-60.
35. Ratner, C., et al., Cerebral Markers of the Serotonergic System in Rat Models of Obesity and Aft er Roux-en-Y Gastric Bypass. Obesity (Silver Spring), 2012.
36. Wurtman, R.J. and J.J. Wurtman, Brain serotonin, carbohydrate-craving, obesity and depression. Obesity research, 1995. 3 Suppl 4: p. 477S-480S.
37. Madras, B.K., et al., Elevation of serum free tryptophan, but not brain tryptophan, by serum nonesterifi ed fatty acids. Adv Biochem Psychopharmacol, 1974. 11(0): p. 143-51.
38. Molfi no, A., et al., Free tryptophan/large neutral amino acids ratios in blood plasma do not predict cerebral spinal fl uid tryptophan concentrations in interleukin-1-induced anorexia. Pharmacol Biochem Behav, 2008. 89(1): p. 31-5.
39. Sato, T., et al., Involvement of plasma leptin, insulin and free tryptophan in cytokine-induced anorexia. Clin Nutr, 2003. 22(2): p. 139-46.
40. Bossola, M., et al., Anorexia and plasma levels of free tryptophan, branched chain amino acids, and ghrelin in hemodialysis patients. J Ren Nutr, 2009. 19(3): p. 248-55.
41. Koren, M.S., et al., Changes in plasma amino Acid levels do not predict satiety and weight loss on diets with modifi ed macronutrient composition. Ann Nutr Metab, 2007. 51(2): p. 182-7.
42. Newgard, C.B., et al., A branched-chain amino acid-related metabolic signature that diff erentiates obese and lean humans and contributes to insulin resistance. Cell Metab, 2009. 9(4): p. 311-26.
43. Argiles, J.M., et al., Catabolic mediators as targets for cancer cachexia. Drug Discov Today, 2003. 8(18): p. 838-44.
44. Asp, M.L., et al., Evidence for the contribution of insulin resistance to the development of cachexia in tumor-bearing mice. Int J Cancer, 2010. 126(3): p. 756-63.
45. Joppa, M.A., et al., Central infusion of the melanocortin receptor antagonist agouti-related peptide (AgRP(83-132)) prevents cachexia-related symptoms induced by radiation and colon-26 tumors in mice. Peptides, 2007. 28(3): p. 636-42.
46. Chance, W.T., et al., Alteration of NPY and Y1 receptor in dorsomedial and ventromedial areas of hypothalamus in anorectic tumor-bearing rats. Peptides, 2007. 28(2): p. 295-301.
47. Nara-ashizawa, N., et al., Response of hypothalamic NPY mRNAs to a negative energy balance is less sensitive in cachectic mice bearing human tumor cells. Nutr Cancer, 2001. 41(1-2): p. 111-8.
48. Dryden, S., et al., Increased feeding and neuropeptide Y (NPY) but not NPY mRNA levels in the hypothalamus of the rat following central administration of the serotonin synthesis inhibitor p-chlorophenylalanine. Brain Res, 1996. 724(2): p. 232-7.
49. Shinozaki, T., et al., Fluvoxamine inhibits weight gain and food intake in food restricted hyperphagic Wistar rats. Biol Pharm Bull, 2008. 31(12): p. 2250-4.
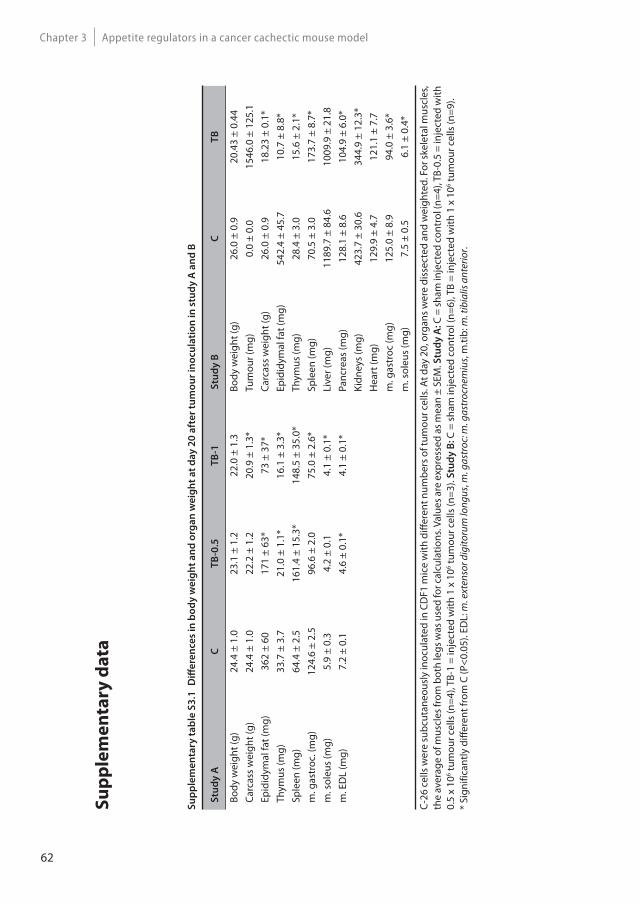
62
Appetite regulators in a cancer cachectic mouse modelChapter 3
Su
pp
lem
en
tary
da
ta
Su
pp
lem
en
tary
ta
ble
S3
.1
Diff
ere
nce
s in
bo
dy
we
igh
t a
nd
org
an
we
igh
t a
t d
ay
20
aft
er
tum
ou
r in
ocu
lati
on
in
stu
dy
A a
nd
B
Stu
dy
AC
T
B-0
.5T
B-1
Stu
dy
BC
T
B
Body
wei
ght (
g)24
.4 ±
1.0
23.1
± 1
.222
.0 ±
1.3
Body
wei
ght (
g)26
.0 ±
0.9
20.4
3 ±
0.44
Carc
ass
wei
ght (
g)24
.4 ±
1.0
22.2
± 1
.220
.9 ±
1.3
*Tu
mou
r (m
g)0.
0 ±
0.0
1546
.0 ±
125
.1Ep
idid
ymal
fat (
mg)
362
± 60
171
± 63
*73
± 3
7*Ca
rcas
s w
eigh
t (g)
26.0
± 0
.918
.23
± 0.
1*Th
ymus
(mg)
33.7
± 3
.721
.0 ±
1.1
*16
.1 ±
3.3
*Ep
idid
ymal
fat (
mg)
542.
4 ±
45.7
10.7
± 8
.8*
Sple
en (m
g)64
.4 ±
2.5
161.
4 ±
15.3
*14
8.5
± 35
.0*
Thym
us (m
g)28
.4 ±
3.0
15.6
± 2
.1*
m. g
astr
oc. (
mg)
124.
6 ±
2.5
96.6
± 2
.075
.0 ±
2.6
*Sp
leen
(mg)
70.5
± 3
.017
3.7
± 8.
7*m
. sol
eus
(mg)
5.9
± 0.
34.
2 ±
0.1
4.1
± 0.
1*Li
ver (
mg)
1189
.7 ±
84.
610
09.9
± 2
1.8
m. E
DL
(mg)
7.2
± 0.
14.
6 ±
0.1*
4.1
± 0.
1*Pa
ncre
as (m
g)12
8.1
± 8.
610
4.9
± 6.
0*Ki
dney
s (m
g)42
3.7
± 30
.634
4.9
± 12
.3*
Hea
rt (m
g)12
9.9
± 4.
712
1.1
± 7.
7m
. gas
troc
(mg)
125.
0 ±
8.9
94.0
± 3
.6*
m. s
oleu
s (m
g)7.
5 ±
0.5
6.1
± 0.
4*
C-26
cel
ls w
ere
subc
utan
eous
ly in
ocul
ated
in C
DF1
mic
e w
ith d
iffer
ent n
umbe
rs o
f tum
our c
ells
. At d
ay 2
0, o
rgan
s wer
e di
ssec
ted
and
wei
ghte
d. F
or sk
elet
al m
uscl
es,
the
aver
age
of m
uscl
es fr
om b
oth
legs
was
use
d fo
r cal
cula
tions
. Val
ues a
re e
xpre
ssed
as m
ean
± SE
M. S
tud
y A
: C =
sham
inje
cted
con
trol
(n=4
), TB
-0.5
= in
ject
ed w
ith
0.5
x 10
6 tum
our c
ells
(n=4
), TB
-1 =
inje
cted
with
1 x
106 tu
mou
r cel
ls (n
=3).
Stu
dy
B: C
= s
ham
inje
cted
con
trol
(n=6
), TB
= in
ject
ed w
ith 1
x 1
06 tum
our c
ells
(n=9
).*
Sign
ifica
ntly
diff
eren
t fro
m C
(P<0
.05)
. ED
L: m
. ext
enso
r dig
itoru
m lo
ngus
, m. g
astr
oc: m
. gas
troc
nem
ius,
m.ti
b: m
. tib
ialis
ant
erio
r.
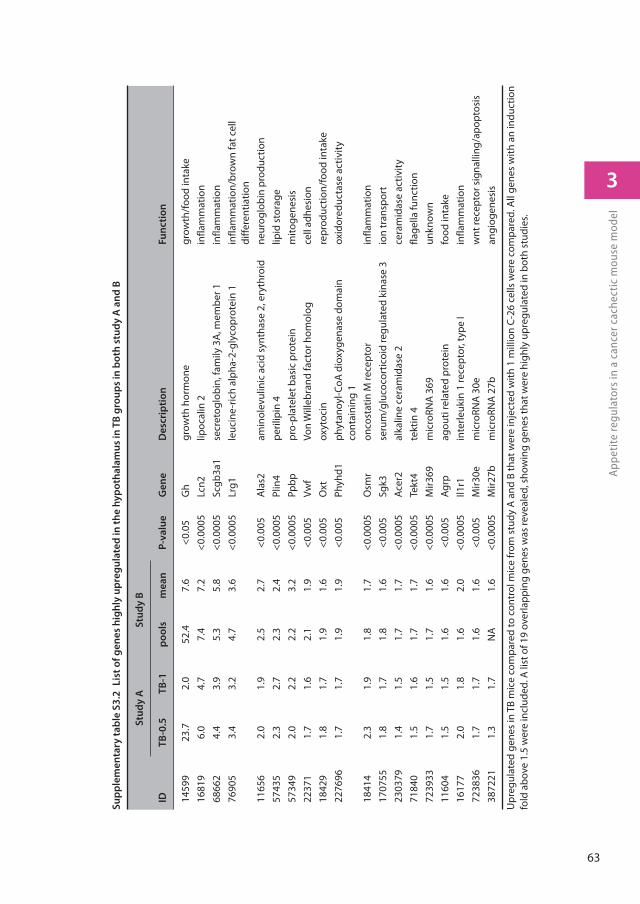
63
3
App
etit
e re
gula
tors
in a
can
cer c
ache
ctic
mou
se m
odel
Su
pp
lem
en
tary
ta
ble
S3
.2
Lis
t o
f g
en
es
hig
hly
up
reg
ula
ted
in
th
e h
yp
oth
ala
mu
s in
TB
gro
up
s in
bo
th s
tud
y A
an
d B
S
tud
y A
Stu
dy
B
IDT
B-0
.5T
B-1
po
ols
me
an
P
-va
lue
Ge
ne
De
scri
pti
on
Fu
nc
tio
n
1459
923
.72.
052
.47.
6<0
.05
Gh
grow
th h
orm
one
grow
th/f
ood
inta
ke16
819
6.0
4.7
7.4
7.2
<0.0
005
Lcn2
lipoc
alin
2in
flam
mat
ion
6866
24.
43.
95.
35.
8<0
.000
5Sc
gb3a
1se
cret
oglo
bin,
fam
ily 3
A, m
embe
r 1in
flam
mat
ion
7690
53.
43.
24.
73.
6<0
.000
5Lr
g1le
ucin
e-ric
h al
pha-
2-gl
ycop
rote
in 1
infla
mm
atio
n/br
own
fat c
ell
diffe
rent
iatio
n11
656
2.0
1.9
2.5
2.7
<0.0
05A
las2
amin
olev
ulin
ic a
cid
synt
hase
2, e
ryth
roid
neur
oglo
bin
prod
uctio
n57
435
2.3
2.7
2.3
2.4
<0.0
005
Plin
4pe
rilip
in 4
lipid
sto
rage
5734
92.
02.
22.
23.
2<0
.000
5Pp
bppr
o-pl
atel
et b
asic
pro
tein
mito
gene
sis
2237
11.
71.
62.
11.
9<0
.005
Vwf
Von
Will
ebra
nd fa
ctor
hom
olog
cell
adhe
sion
1842
91.
81.
71.
91.
6<0
.005
Oxt
oxyt
ocin
repr
oduc
tion/
food
inta
ke22
7696
1.7
1.7
1.9
1.9
<0.0
05Ph
yhd1
phyt
anoy
l-CoA
dio
xyge
nase
dom
ain
cont
aini
ng 1
oxid
ored
ucta
se a
ctiv
ity
1841
42.
31.
91.
81.
7<0
.000
5O
smr
onco
stat
in M
rece
ptor
infla
mm
atio
n17
0755
1.8
1.7
1.8
1.6
<0.0
05Sg
k3se
rum
/glu
coco
rtic
oid
regu
late
d ki
nase
3io
n tr
ansp
ort
2303
791.
41.
51.
71.
7<0
.000
5Ac
er2
alka
line
cera
mid
ase
2ce
ram
idas
e ac
tivity
7184
01.
51.
61.
71.
7<0
.000
5Te
kt4
tekt
in 4
flage
lla fu
nctio
n72
3933
1.7
1.5
1.7
1.6
<0.0
005
Mir3
69m
icro
RNA
369
unkn
own
1160
41.
51.
51.
61.
6<0
.005
Agrp
agou
ti re
late
d pr
otei
nfo
od in
take
1617
72.
01.
81.
62.
0<0
.000
5Il1
r1in
terle
ukin
1 re
cept
or, t
ype
Iin
flam
mat
ion
7238
361.
71.
71.
61.
6<0
.005
Mir3
0em
icro
RNA
30e
wnt
rece
ptor
sig
nalli
ng/a
popt
osis
3872
211.
31.
7N
A1.
6<0
.000
5M
ir27b
mic
roRN
A 2
7ban
giog
enes
is
Upr
egul
ated
gen
es in
TB
mic
e co
mpa
red
to c
ontr
ol m
ice
from
stu
dy A
and
B th
at w
ere
inje
cted
with
1 m
illio
n C-
26 c
ells
wer
e co
mpa
red.
All
gene
s w
ith a
n in
duct
ion
fold
abo
ve 1
.5 w
ere
incl
uded
. A li
st o
f 19
over
lapp
ing
gene
s w
as re
veal
ed, s
how
ing
gene
s th
at w
ere
high
ly u
preg
ulat
ed in
bot
h st
udie
s.
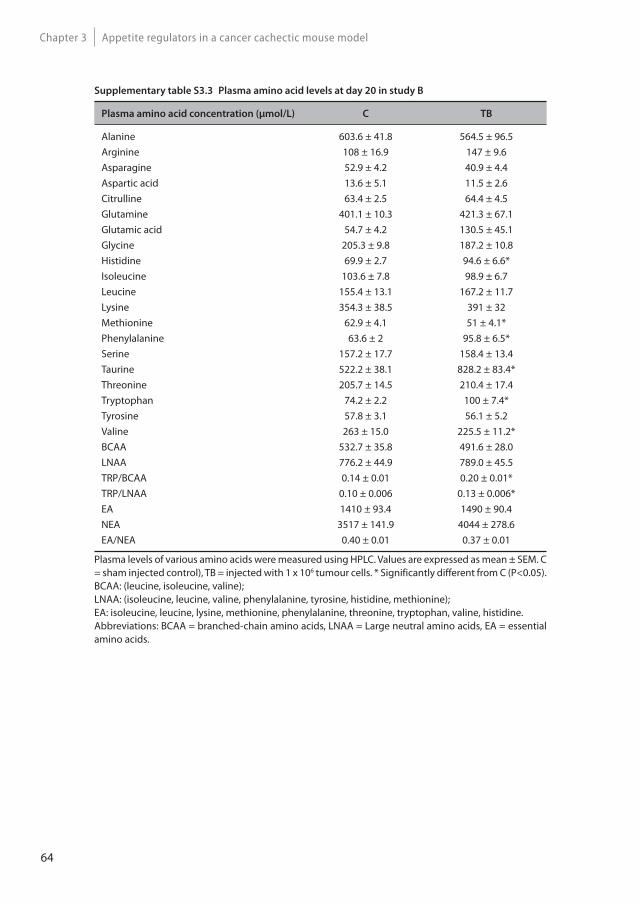
64
Appetite regulators in a cancer cachectic mouse modelChapter 3
Supplementary table S3.3 Plasma amino acid levels at day 20 in study B
Plasma amino acid concentration (μmol/L) C TB
Alanine 603.6 ± 41.8 564.5 ± 96.5Arginine 108 ± 16.9 147 ± 9.6Asparagine 52.9 ± 4.2 40.9 ± 4.4Aspartic acid 13.6 ± 5.1 11.5 ± 2.6Citrulline 63.4 ± 2.5 64.4 ± 4.5Glutamine 401.1 ± 10.3 421.3 ± 67.1Glutamic acid 54.7 ± 4.2 130.5 ± 45.1Glycine 205.3 ± 9.8 187.2 ± 10.8Histidine 69.9 ± 2.7 94.6 ± 6.6*Isoleucine 103.6 ± 7.8 98.9 ± 6.7Leucine 155.4 ± 13.1 167.2 ± 11.7Lysine 354.3 ± 38.5 391 ± 32Methionine 62.9 ± 4.1 51 ± 4.1*Phenylalanine 63.6 ± 2 95.8 ± 6.5*Serine 157.2 ± 17.7 158.4 ± 13.4Taurine 522.2 ± 38.1 828.2 ± 83.4*Threonine 205.7 ± 14.5 210.4 ± 17.4Tryptophan 74.2 ± 2.2 100 ± 7.4*Tyrosine 57.8 ± 3.1 56.1 ± 5.2Valine 263 ± 15.0 225.5 ± 11.2*BCAA 532.7 ± 35.8 491.6 ± 28.0LNAA 776.2 ± 44.9 789.0 ± 45.5TRP/BCAA 0.14 ± 0.01 0.20 ± 0.01*TRP/LNAA 0.10 ± 0.006 0.13 ± 0.006*EA 1410 ± 93.4 1490 ± 90.4NEA 3517 ± 141.9 4044 ± 278.6EA/NEA 0.40 ± 0.01 0.37 ± 0.01
Plasma levels of various amino acids were measured using HPLC. Values are expressed as mean ± SEM. C = sham injected control), TB = injected with 1 x 10⁶ tumour cells. * Significantly different from C (P<0.05). BCAA: (leucine, isoleucine, valine);LNAA: (isoleucine, leucine, valine, phenylalanine, tyrosine, histidine, methionine);EA: isoleucine, leucine, lysine, methionine, phenylalanine, threonine, tryptophan, valine, histidine.Abbreviations: BCAA = branched-chain amino acids, LNAA = Large neutral amino acids, EA = essential amino acids.
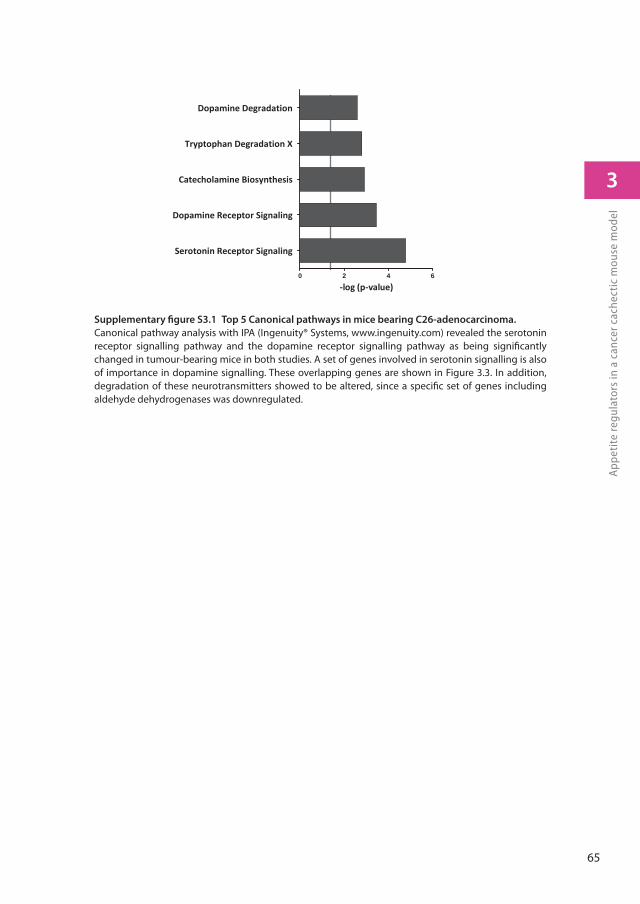
65
3
App
etit
e re
gula
tors
in a
can
cer c
ache
ctic
mou
se m
odel
Supplementary fi gure S3.1 Top 5 Canonical pathways in mice bearing C26-adenocarcinoma.
Canonical pathway analysis with IPA (Ingenuity® Systems, www.ingenuity.com) revealed the serotonin receptor signalling pathway and the dopamine receptor signalling pathway as being signifi cantly changed in tumour-bearing mice in both studies. A set of genes involved in serotonin signalling is also of importance in dopamine signalling. These overlapping genes are shown in Figure 3.3. In addition, degradation of these neurotransmitters showed to be altered, since a specifi c set of genes including aldehyde dehydrogenases was downregulated.
log (p value)0 2 4 6
Serotonin Receptor Signaling
Dopamine Receptor Signaling
Catecholamine Biosynthesis
Tryptophan Degradation X
Dopamine Degradation

J Cachexia Sarcopenia Muscle, 2015. 6(1): p. 84-94.
Differences in food intake of tumour-
bearing cachectic mice are associated with
hypothalamic serotonin signalling
J. T. Dwarkasing, M. V. Boekschoten, J. M. Argilès, M. van Dijk, S. Busquets, F. Penna, M. Toledo, A. Laviano, R. F. Witkamp, K. van Norren
4
68
Serotonin and neuropeptide Y in cancer cachexiaChapter 4
Abstract
Background: Anorexia is a common symptom among cancer patients and contributes to malnutrition and strongly impinges on quality of life. Cancer-induced anorexia is thought to be caused by an inability of food intake-regulating systems in the hypothalamus to respond adequately to negative energy balance during tumour growth. Here, we show that this impaired response of food-intake control is likely to be mediated by altered serotonin signalling and failure in posttranscriptional neuropeptide Y (NPY) regulation.
Methods: Two tumour cachectic mouse models with different food intake behaviours were used: a C26-colon adenocarcinoma model with increased food intake and a Lewis lung carcinoma model with decreased food intake. This contrast in food intake behaviour between tumour-bearing (TB) mice in response to growth of the two different tumours was used to distinguish between processes involved in cachexia and mechanisms that might be important in food intake regulation. The hypothalamus was used for transcriptomics (Affymetrix chips).
Results: In both models, hypothalamic expression of orexigenic neuropeptide NPY was significantly higher compared to controls, suggesting that this change does not directly reflect food intake status, but might be linked to negative energy balance in cachexia. Expression of genes involved in serotonin signalling showed to be different between C26-TB mice and LLC-TB mice and were inversely associated with food intake. In vitro, using hypothalamic cell lines, serotonin repressed neuronal hypothalamic NPY secretion, while not affecting messenger NPY expression, suggesting that serotonin signalling can interfere with NPY synthesis, transport or secretion.
Conclusions: Altered serotonin signalling is associated with changes in food intake behaviour in cachectic tumour-bearing mice. Serotonins’ inhibitory effect on food intake under cancer cachectic conditions is probably via affecting the neuropeptide Y system. Therefore, serotonin regulation might be a therapeutic target to prevent the development of cancer-induced eating disorders.
69
4
Sero
toni
n an
d ne
urop
epti
de Y
in c
ance
r cac
hexi
a
Introduction
Anorexia and consequently a reduced caloric intake [1] affects a majority of all cancer patients [2]. Cancer patients with good appetite and adequate caloric intake have higher survival rates than patients who suffer from anorexia and hence a lower energy intake [3, 4]. Cancer-induced anorexia is considered to be predominantly caused by failure of orexigenic and anorexigenic food intake-regulating systems in the hypothalamus to respond adequately to changes in energy balance [5]. This merits further elucidation of the specific mechanisms involved in this hypothalamic resistance to peripheral neuro-endocrine triggers. Several food intake regulating systems have been mentioned to play a role in the onset of hypothalamic resistance, including the orexigenic triggers neuropeptide Y and ghrelin and anorexigenic melanocortin and CART systems. Cancer anorexia often develops during the progression of cachexia [6], and the combined clinical picture is often called anorexia-cachexia syndrome [7]. Cachexia is a complex metabolic syndrome associated with underlying illness and is characterized by progressive loss of muscle (muscle wasting) with or without loss of fat mass. This results in weight loss, a reduced quality of life and a shortened survival time [6, 8, 9]. Although anorexia is often linked to cachexia and likely to be initiated by similar pathologies (tumour growth), it is unclear to what extent anorexia and the metabolic alterations of cachexia affect each other, or to what extent these are distinct entities with their own pathology. Here, we use two tumour-bearing (TB) mouse models displaying similar development of cachexia. At the same time they show opposite effects on food intake in response to tumour growth. This provides opportunities to disentangle processes involved in anorexia from those causing cachexia. By applying transcriptomics we show that tumour-induced cachexia is associated with several distinct changes in food-intake regulating mediators in the hypothalamus that appear to be independent of food intake status. Furthermore, we found alterations in hypothalamic serotonin signalling and these changes were inversely associated with food intake. In addition, we used hypothalamic cell lines to explore the mechanisms involved in the interaction between serotonin and the NPY-ergic system.
70
Serotonin and neuropeptide Y in cancer cachexiaChapter 4
Materials and methods
Lewis lung tumour model (LLM)
C57Bl/6 male mice (Harlan, Barcelona, Spain), weighing approximately 20 g, were placed on a standard ad libitum diet (Panlab, Barcelona, Spain) and had free access to water. Lewis Lung carcinoma cells were obtained from exponential tumours. Under general anaesthesia, 0.5x10⁶ cells were injected intramuscular in the hind leg. Four groups were included: C, Control mice sacrificed at day 14 (n=6); TB-10, Tumour-bearing mice sacrificed at day 10 (n=6); TB-14 Tumour-bearing mice sacrificed at day 14 (n=8) and TB-17, Tumour-bearing mice sacrificed at day 17 (n=6). Body weight and food intake were measured daily. At the day of sacrifice, mice were anesthetized with a ketamine/xylazine mixture (i.p.; Imalgene® and Rompun® respectively) and blood was collected by cardiac puncture.
C26 colon adenocarcinoma tumour model (C26)
Part of the data (Figure 4.1A) from this experimental arm with C26 TB mice have been published previously [10], but are briefly described again here for easy comparison with Lewis lung TB mice.
Male CDF1 (BALB/cx DBA/2) mice aged six-to-seven weeks (Harlan Nederland, Horst, The Netherlands) were placed on a standard ad libitum diet (AIN93M, Research Diet Services, The Netherlands) and had free access to water. Murine C26 adenocarcinoma cells were cultured and suspended as described previously [11]. Under general anaesthesia (isoflurane/ N2O/O2), 1 x 10⁶ tumour cells in 0.2ml HBSS were inoculated subcutaneously into the right inguinal flank. Controls were sham-injected with 0.2 ml HBSS. Two groups were included: C, Control mice (n=6) and TB, Tumour-bearing (n=9). Body weight and food intake were measured three times a week. At day 19, blood was collected by cardiac puncture under general anaesthesia.
In both tumour models, animals were individually housed one week before start of the experiment in a climate-controlled room (12:12 dark-light cycle; 21°C±1°C).
After sacrifice, brain, hypothalamus, tumour, organs and lower leg skeletal muscles (non-tumour-leg) were weighted and frozen in liquid nitrogen and stored at -80°C. Carcass weight was calculated by body weight at day of section minus tumour weight.
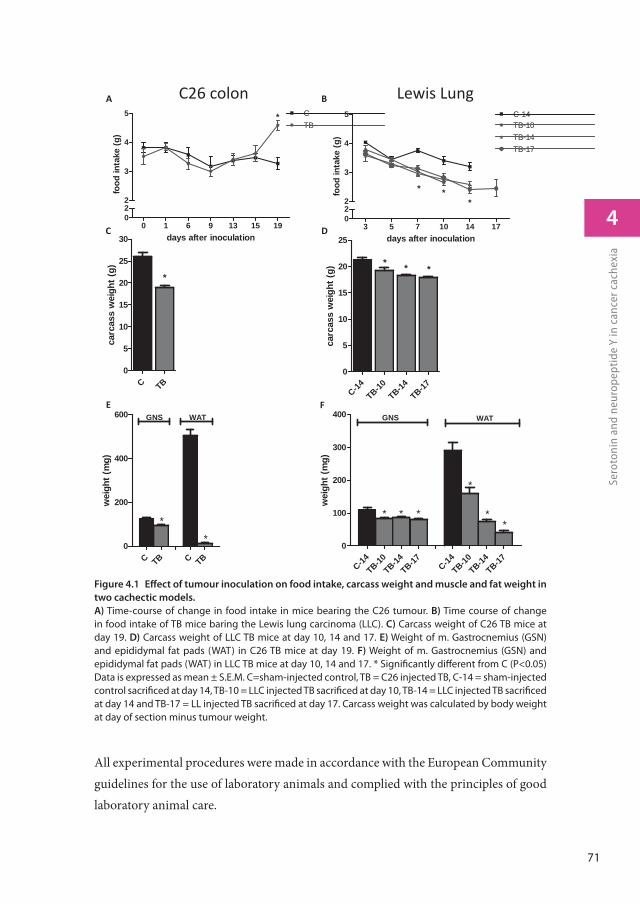
71
4
Sero
toni
n an
d ne
urop
epti
de Y
in c
ance
r cac
hexi
a
All experimental procedures were made in accordance with the European Community guidelines for the use of laboratory animals and complied with the principles of good laboratory animal care.
days after inoculation
food
inta
ke (g
)
0 1 6 9 13 15 19022
3
4
5 CTB
*
carc
ass
wei
ght (
g)
C-14TB-10
TB-14TB-17
0
5
10
15
20
25
* * *
wei
ght (
mg)
C-14TB-10
TB-14TB-17 C-14
TB-10TB-14
TB-170
100
200
300
400 GNS WAT
* **
*
**
carc
ass
wei
ght (
g)
C TB0
5
10
15
20
25
30
*
wei
ght (
mg)
C TB C TB0
200
400
600 GNS WAT
**
A
C
E
B
D
F
C26 colon Lewis Lung
days after inoculation
food
inta
ke (g
)
3 5 7 10 14 17022
3
4
5 C-14TB-10TB-14TB-17
* **
Figure 4.1 Eff ect of tumour inoculation on food intake, carcass weight and muscle and fat weight in
two cachectic models.
A) Time-course of change in food intake in mice bearing the C26 tumour. B) Time course of change in food intake of TB mice baring the Lewis lung carcinoma (LLC). C) Carcass weight of C26 TB mice at day 19. D) Carcass weight of LLC TB mice at day 10, 14 and 17. E) Weight of m. Gastrocnemius (GSN) and epididymal fat pads (WAT) in C26 TB mice at day 19. F) Weight of m. Gastrocnemius (GSN) and epididymal fat pads (WAT) in LLC TB mice at day 10, 14 and 17. * Signifi cantly diff erent from C (P<0.05) Data is expressed as mean ± S.E.M. C=sham-injected control, TB = C26 injected TB, C-14 = sham-injected control sacrifi ced at day 14, TB-10 = LLC injected TB sacrifi ced at day 10, TB-14 = LLC injected TB sacrifi ced at day 14 and TB-17 = LL injected TB sacrifi ced at day 17. Carcass weight was calculated by body weight at day of section minus tumour weight.
72
Serotonin and neuropeptide Y in cancer cachexiaChapter 4
Cell culture and reagents
Murine derived hypothalamic neuronal cell lines hypoE-46 and hypoA2/12 (CELLutions Biosystems Inc. Canada) were grown and maintained in DMEM supplemented with 10% heat-inactivated fetal calf serum, 100 unit/ml penicillin and 100μg/ml streptomycin at 37°C under 5.0% CO2. Cells were grown in monolayers to 90% confluency. Then medium was replaced by serum-free DMEM containing penicillin and streptomycin. After 4 hours, cells were exposed to serotonin (100 μg/ml, 1 μg/ml, 10 ng/ml or 100 pg/ml) for 24 hours or 60mM KCl for 15 minutes. After exposure, supernatant was collected and used for NPY measurements using an enzyme immunoassay (NPY EIA, Phoenix Pharmaceuticals, CA, USA). Cells were homogenized in 40mM Tris, 1mM EDTA, 5mM EGTA and 0.50% Triton X-100. Homogenates were used to measure protein content (Pierce Bicinchoninic acid Rockford, IL, USA). Serotonin cytotoxicity was determined by measuring LDH leakage and effects on cell viability using an XTT conversion assay (Roche Diagnostics, Mannheim, Germany).
Serotonin levels
Hypothalamic samples were used for micro array experiments, while remaining brain parts were used to determine serotonin levels. Brains were homogenized in 1ml containing in 40mM Tris, 1mM EDTA, 5mM EGTA and 0.50% Triton X-100. Serotonin levels were measured using enzyme-immunoassay kits (BAE-5900, LDN, Nordhorn, Germany) and corrected for the amount of protein (Nanodrop spectrophotometer, Thermo Scientific).
Statistics
Data was analysed by statistical analysis of variance (ANOVA) followed by a post hoc Bonferroni test or by a Student’s t test. Differences were considered significant at a two-tailed P<0.05. Statistical analyses were performed using Graphpad Prism 5. For statistical analysis of microarray data see microarray section (below).
Microarray studies
Total RNA from the hypothalamus was isolated by using RNeasy Lipid tissue kit (Qiagen, Venlo, The Netherlands). RNA concentrations were measured by absorbance at 260 nm (Nanodrop). RNA quality was checked using the RNA 6000 Nano assay on the Agilent
73
4
Sero
toni
n an
d ne
urop
epti
de Y
in c
ance
r cac
hexi
a
2100 Bioanalyzer (Agilent Techologies, Amsterdam, The Netherlands) according to the manufacturer’s protocol. For each mouse, total RNA (100ng) was labelled using the Ambion WT expression kit (Life Technologies, Bleiswijk, The Netherlands). Micro-array experiments were performed by using Affymetrix Mouse Gene ST 1.1.
From the C26 model experiment, 4 control samples and 5 samples from tumour-bearing mice were included in this experiment; however 1 control sample gave multiple spots on the array and was therefore excluded from analysis. The Lewis lung experiment included 4 control, 5 TB-10, 7 TB-14 and 6 TB-17 samples.
Array data were analysed using an in-house, on-line system [12]. Briefly, probesets were redefined according to Dai et al. [13] using remapped CDF version 15.1 based on the Entrez Gene database. In total these arrays target 21,225 unique genes. Robust multi-array (RMA) analysis was used to obtain expression values [14, 15]. We only took genes into account that had an intensity >20 on at least 2 arrays, had an interquartile range throughout the samples of >0.1, and at least 7 probes per genes. Genes were considered differentially expressed at P<0.05 after intensity-based moderated t-statistics [16]. Further functional interpretation of the data was performed through the use of IPA (Ingenuity® Systems, www.ingenuity.com). Canonical pathway analysis identified the pathways from the IPA library of canonical pathways that were most significant to the data set. Genes from the data set that met the cut-off of 1.3 fold change and p-value cut-off of 0.05, and were associated with a canonical pathway in the Ingenuity Knowledge Base were considered for the analysis. To list up genes involved in food intake regulation, genes included in GO 0002023, GO 0007631, GO0008343, GO0060259, GO 0042755 (food intake, feeding behaviour and eating behaviour) were analysed (Gene Ontology: tool for the unification of biology. The Gene Ontology Consortium (2000) Nature Genet. 25: 25-29). Also genes POMC (ID 18976), GH ( ID:14599), Sst (ID: 20604) and pro-melanin-concentrating hormone (ID:110312) were additionally looked at, since they also have been described to play a role in food intake behaviour [17]. Array data have been submitted to the Gene Expression Omnibus, accession numbers GSE44082 (C26 tumour) and GSE57190 (Lewis Lung tumour and hypothalamic cell lines). Data set containing the array data on hypothalamic tissues of C26 TB mice has been published previously [10].
74
Serotonin and neuropeptide Y in cancer cachexiaChapter 4
Results
Body weight and food intake
In both tumour models, TB mice showed a lower carcass weight, muscle weight and white adipose fat mass (Figure 4.1) compared to their healthy controls, reflecting that cachexia was present in mice bearing either the C26 or the Lewis Lung tumour. Food intake changes in TB animals were found to differ between the two cachectic models. Mice bearing the C26 tumour were found to increase their food intake synchronously to loss of body weight [10], while mice bearing the Lewis lung carcinoma (LLC) showed a lowered food intake from day 7 after tumour inoculation compared to controls (Figure 4.1 A and D). These opposing changes in food intake in TB mice in response to tumour growth of the two different tumours are used to disentangle shared mechanisms of cachexia from those important for food intake regulation.
Microarray analysis of the hypothalamus: comparison C26 and LLM
Expression of genes involved in food intake was analysed to determine if these could explain the opposing changes in food intake between C26 TB and LLC TB mice. A list of genes involved in food intake was generated by using GO categories involved in food intake regulation (M&M). Fold changes of expression of orexigenic and anorexigenic genes were compared between the two tumour models (Figure 4.2a). Interestingly, changes in gene expression of important mediators of food intake regulation, NPY, AgRP and POMC showed to be similar in C26 TB mice and LLC TB mice compared to their controls even though food intake behaviour was different between the two
Figure 4.2 Heat map representation of gene expressions in the hypothalamus in C26 and LLC TB
mice.
A) Fold changes of orexigenic and anorexigenic genes relative to their control group were calculated and compared between C26 and LLC TB mice. B) Top 30 upregulated genes in C26 TB mice compared to their control and top 30 genes upregulated genes in LLC TB mice compared to their control. 12 genes were overlapping between the C26 and LLC tumour model. Each row represents a gene and each column represents a group of animals. Red colour indicates genes that were higher expressed as control and green colour indicates genes that were lower expressed as the control. Black indicates genes whose expression was similar to compared to control. ID: Entrez ID. C=sham-injected control, TB = C26 injected TB, C-14 = sham-injected control sacrifi ced at day 14, TB-10 = LLC injected TB sacrifi ced at day 10, TB-14 = LLC injected TB sacrifi ced at day 14 and TB-17 = LLC injected TB sacrifi ced at day 17.
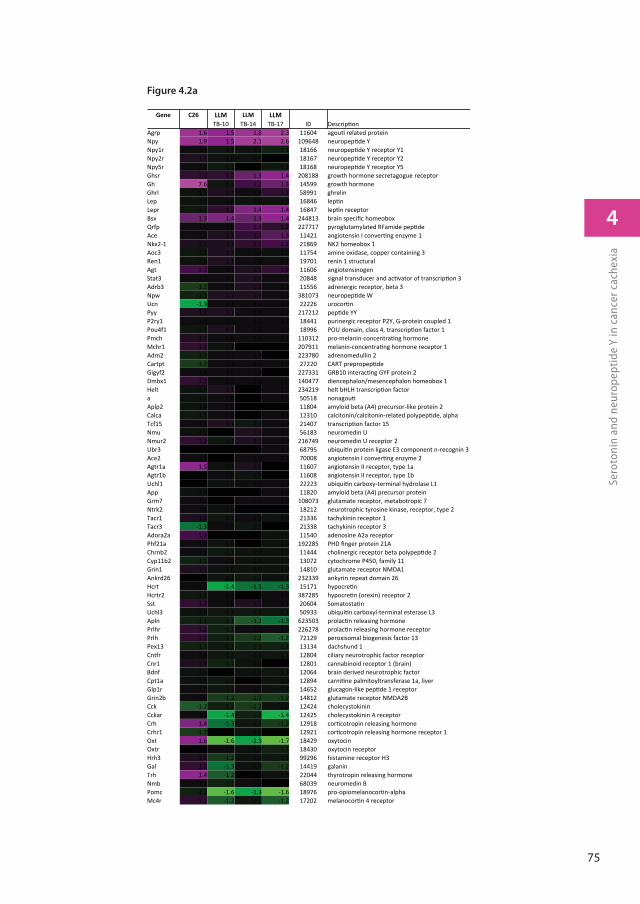
75
4
Sero
toni
n an
d ne
urop
epti
de Y
in c
ance
r cac
hexi
a
Gene C26 LLM LLM LLMTB-10 TB-14 TB-17 ID Descrip on
Agrp 1.6 1.5 1.8 2.3 11604 agou related proteinNpy 1.9 1.5 2.1 2.6 109648 neuropep de YNpy1r 1.1 -1.1 -1.1 -1.1 18166 neuropep de Y receptor Y1Npy2r 1.1 -1.0 -1.1 -1.0 18167 neuropep de Y receptor Y2Npy5r 1.0 -1.1 -1.0 -1.1 18168 neuropep de Y receptor Y5Ghsr 1.2 1.2 1.3 1.4 208188 growth hormone secretagogue receptorGh 7.6 -1.1 1.2 1.3 14599 growth hormoneGhrl -1.0 1.1 1.0 1.2 58991 ghrelinLep -1.0 1.0 -1.0 -1.0 16846 lep nLepr -1.1 1.2 1.4 1.4 16847 lep n receptorBsx 1.3 1.4 1.3 1.4 244813 brain speci c homeoboxQrfp 1.1 1.0 1.2 1.2 227717 pyroglutamylated RFamide pep deAce 1.1 1.1 1.2 1.3 11421 angiotensin I conver ng enzyme 1Nkx2-1 1.1 1.1 1.2 1.2 21869 NK2 homeobox 1Aoc3 -1.1 1.1 1.0 -1.0 11754 amine oxidase, copper containing 3Ren1 -1.0 1.1 1.0 1.1 19701 renin 1 structuralAgt 1.2 1.1 1.1 1.2 11606 angiotensinogen Stat3 1.0 1.1 1.1 1.1 20848 signal transducer and ac vator of transcrip on 3Adrb3 -1.2 1.0 1.1 1.1 11556 adrenergic receptor, beta 3Npw -1.1 1.1 1.1 1.1 381073 neuropep de WUcn -1.3 1.1 1.1 1.0 22226 urocor nPyy 1.1 1.1 1.1 1.1 217212 pep de YYP2ry1 1.0 1.1 1.0 1.1 18441 purinergic receptor P2Y, G-protein coupled 1Pou4f1 -1.1 1.1 1.0 1.0 18996 POU domain, class 4, transcrip on factor 1Pmch 1.1 1.0 1.0 1.1 110312 pro-melanin-concentra ng hormoneMchr1 1.2 -1.1 -1.0 1.0 207911 melanin-concentra ng hormone receptor 1Adm2 -1.1 1.1 1.0 1.0 223780 adrenomedullin 2Cartpt -1.2 1.1 1.0 1.0 27220 CART prepropep deGigyf2 1.1 1.0 1.0 1.0 227331 GRB10 interac ng GYF protein 2Dmbx1 1.2 1.1 1.0 1.0 140477 diencephalon/mesencephalon homeobox 1Helt -1.0 1.1 1.0 1.0 234219 helt bHLH transcrip on factora -1.1 1.0 -1.0 1.0 50518 nonagouAplp2 -1.0 1.0 -1.0 -1.0 11804 amyloid beta (A4) precursor-like protein 2Calca -1.1 1.0 -1.0 1.1 12310 calcitonin/calcitonin-related polypep de, alphaTcf15 1.1 1.1 -1.1 1.0 21407 transcrip on factor 15Nmu -1.0 1.0 1.1 1.1 56183 neuromedin UNmur2 1.2 -1.1 1.1 1.0 216749 neuromedin U receptor 2Ubr3 1.0 1.0 1.0 1.1 68795 ubiqui n protein ligase E3 component n-recognin 3Ace2 1.1 1.0 1.0 1.1 70008 angiotensin I conver ng enzyme 2Agtr1a 1.5 -1.1 1.1 -1.0 11607 angiotensin II receptor, type 1aAgtr1b 1.0 1.0 -1.0 1.0 11608 angiotensin II receptor, type 1bUchl1 -1.0 -1.0 1.0 1.0 22223 ubiqui n carboxy-terminal hydrolase L1App -1.0 -1.0 -1.0 1.0 11820 amyloid beta (A4) precursor proteinGrm7 1.1 1.0 1.0 1.0 108073 glutamate receptor, metabotropic 7Ntrk2 1.1 -1.0 -1.0 1.0 18212 neurotrophic tyrosine kinase, receptor, type 2Tacr1 1.1 -1.1 1.0 -1.0 21336 tachykinin receptor 1Tacr3 -1.3 1.0 -1.1 -1.0 21338 tachykinin receptor 3Adora2a 1.2 1.0 1.0 -1.0 11540 adenosine A2a receptorPhf21a 1.0 -1.0 -1.0 -1.0 192285 PHD nger protein 21AChrnb2 1.0 -1.1 -1.0 -1.0 11444 cholinergic receptor beta polypep de 2Cyp11b2 -1.1 1.0 -1.0 -1.0 13072 cytochrome P450, family 11Grin1 1.1 -1.0 -1.0 -1.0 14810 glutamate receptor NMDA1 Ankrd26 -1.0 -1.1 -1.1 -1.1 232339 ankyrin repeat domain 26Hcrt 1.0 -1.4 -1.3 -1.3 15171 hypocre nHcrtr2 -1.1 1.1 1.0 1.0 387285 hypocre n (orexin) receptor 2Sst 1.2 1.0 1.1 1.1 20604 Somatosta nUchl3 -1.0 -1.1 -1.1 -1.1 50933 ubiqui n carboxyl-terminal esterase L3 Apln -1.1 -1.1 -1.2 -1.3 623503 prolac n releasing hormonePrlhr 1.2 -1.1 1.1 1.0 226278 prolac n releasing hormone receptorPrlh 1.2 -1.1 -1.2 -1.2 72129 peroxisomal biogenesis factor 13Pex13 -1.1 -1.1 -1.1 -1.1 13134 dachshund 1 Cn r 1.0 -1.1 -1.1 -1.1 12804 ciliary neurotrophic factor receptorCnr1 1.1 -1.1 -1.0 -1.0 12801 cannabinoid receptor 1 (brain)Bdnf -1.1 -1.0 -1.0 -1.1 12064 brain derived neurotrophic factorCpt1a -1.0 -1.1 -1.0 -1.0 12894 carni ne palmitoyltransferase 1a, liverGlp1r 1.0 -1.1 1.1 -1.1 14652 glucagon-like pep de 1 receptorGrin2b 1.0 -1.2 -1.2 -1.2 14812 glutamate receptor NMDA2B Cck -1.2 -1.1 -1.2 -1.0 12424 cholecystokininCckar 1.1 -1.4 -1.1 -1.4 12425 cholecystokinin A receptorCrh 1.4 -1.3 -1.1 -1.2 12918 cor cotropin releasing hormoneCrhr1 -1.2 -1.0 -1.0 1.0 12921 cor cotropin releasing hormone receptor 1Oxt 1.6 -1.6 -1.3 -1.7 18429 oxytocinOxtr -1.0 1.0 -1.0 -1.1 18430 oxytocin receptorHrh3 1.1 -1.2 -1.0 -1.1 99296 histamine receptor H3Gal 1.2 -1.3 -1.0 -1.2 14419 galaninTrh 1.4 -1.2 -1.0 -1.0 22044 thyrotropin releasing hormoneNmb 1.1 -1.1 1.0 -1.0 68039 neuromedin BPomc -1.1 -1.6 -1.3 -1.6 18976 pro-opiomelanocor n-alphaMc4r 1.2 -1.2 -1.1 -1.2 17202 melanocor n 4 receptor
Figure 4.2a
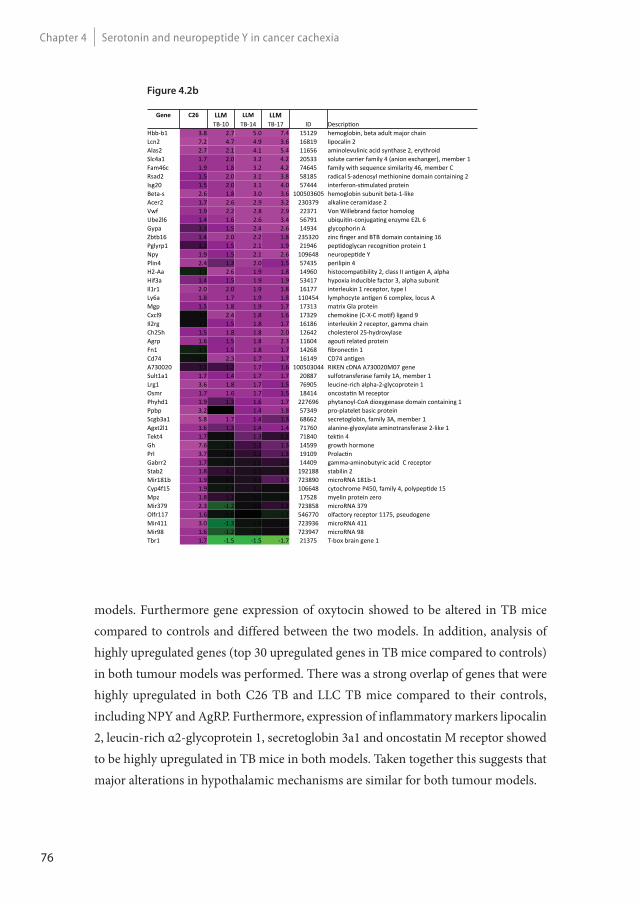
76
Serotonin and neuropeptide Y in cancer cachexiaChapter 4
Gene C26 LLM LLM LLMTB-10 TB-14 TB-17 ID Descrip on
Hbb-b1 3.8 2.7 5.0 7.4 15129 hemoglobin, beta adult major chainLcn2 7.2 4.7 4.9 3.6 16819 lipocalin 2Alas2 2.7 2.1 4.1 5.4 11656 aminolevulinic acid synthase 2, erythroidSlc4a1 1.7 2.0 3.2 4.2 20533 solute carrier family 4 (anion exchanger), member 1Fam46c 1.9 1.8 3.2 4.2 74645 family with sequence similarity 46, member CRsad2 1.5 2.0 3.1 3.8 58185 radical S-adenosyl methionine domain containing 2Isg20 1.5 2.0 3.1 4.0 57444 interferon-s mulated proteinBeta-s 2.6 1.8 3.0 3.6 100503605 hemoglobin subunit beta-1-likeAcer2 1.7 2.6 2.9 3.2 230379 alkaline ceramidase 2Vwf 1.9 2.2 2.8 2.9 22371 Von Willebrand factor homologUbe2l6 1.4 1.6 2.6 3.4 56791 ubiqui n-conjuga ng enzyme E2L 6Gypa 1.3 1.5 2.4 2.6 14934 glycophorin AZbtb16 1.4 2.0 2.2 1.8 235320 zinc nger and BTB domain containing 16Pglyrp1 1.2 1.5 2.1 1.9 21946 pep doglycan recogni on protein 1Npy 1.9 1.5 2.1 2.6 109648 neuropep de YPlin4 2.4 1.3 2.0 1.5 57435 perilipin 4H2-Aa -1.1 2.6 1.9 1.8 14960 histocompa bility 2, class II an gen A, alphaHif3a 1.4 1.5 1.9 1.9 53417 hypoxia inducible factor 3, alpha subunitIl1r1 2.0 2.0 1.9 1.8 16177 interleukin 1 receptor, type ILy6a 1.8 1.7 1.9 1.8 110454 lymphocyte an gen 6 complex, locus AMgp 1.5 1.8 1.9 1.7 17313 matrix Gla proteinCxcl9 1.0 2.4 1.8 1.6 17329 chemokine (C-X-C mo f) ligand 9Il2rg 1.1 1.5 1.8 1.7 16186 interleukin 2 receptor, gamma chainCh25h 1.5 1.8 1.8 2.0 12642 cholesterol 25-hydroxylaseAgrp 1.6 1.5 1.8 2.3 11604 agou related proteinFn1 -1.1 1.5 1.8 1.7 14268 bronec n 1Cd74 -1.0 2.3 1.7 1.7 16149 CD74 an genA730020 1.2 1.2 1.7 1.6 100503044 RIKEN cDNA A730020M07 geneSult1a1 1.7 1.4 1.7 1.7 20887 sulfotransferase family 1A, member 1Lrg1 3.6 1.8 1.7 1.5 76905 leucine-rich alpha-2-glycoprotein 1Osmr 1.7 1.6 1.7 1.5 18414 oncosta n M receptorPhyhd1 1.9 1.3 1.6 1.7 227696 phytanoyl-CoA dioxygenase domain containing 1Ppbp 3.2 -1.0 1.4 1.8 57349 pro-platelet basic proteinScgb3a1 5.8 1.7 1.4 1.3 68662 secretoglobin, family 3A, member 1Agxt2l1 1.6 1.3 1.4 1.4 71760 alanine-glyoxylate aminotransferase 2-like 1Tekt4 1.7 1.1 1.3 1.2 71840 tek n 4Gh 7.6 -1.1 1.2 1.3 14599 growth hormonePrl 3.7 1.0 1.2 1.3 19109 Prolac nGabrr2 1.7 -1.1 1.1 1.2 14409 gamma-aminobutyric acid C receptorStab2 1.8 1.2 1.1 1.1 192188 stabilin 2Mir181b 1.9 1.1 1.1 1.3 723890 microRNA 181b-1Cyp4f15 1.9 -1.1 1.1 1.1 106648 cytochrome P450, family 4, polypep de 15Mpz 1.8 1.2 1.1 -1.0 17528 myelin protein zeroMir379 2.3 -1.2 1.0 1.2 723858 microRNA 379Olfr117 1.6 -1.0 -1.0 -1.1 546770 olfactory receptor 1175, pseudogeneMir411 3.0 -1.3 -1.0 1.0 723936 microRNA 411Mir98 1.6 -1.2 -1.1 1.1 723947 microRNA 98Tbr1 1.7 -1.5 -1.5 -1.7 21375 T-box brain gene 1
models. Furthermore gene expression of oxytocin showed to be altered in TB mice compared to controls and differed between the two models. In addition, analysis of highly upregulated genes (top 30 upregulated genes in TB mice compared to controls) in both tumour models was performed. There was a strong overlap of genes that were highly upregulated in both C26 TB and LLC TB mice compared to their controls, including NPY and AgRP. Furthermore, expression of inflammatory markers lipocalin 2, leucin-rich α2-glycoprotein 1, secretoglobin 3a1 and oncostatin M receptor showed to be highly upregulated in TB mice in both models. Taken together this suggests that major alterations in hypothalamic mechanisms are similar for both tumour models.
Figure 4.2b
77
4
Sero
toni
n an
d ne
urop
epti
de Y
in c
ance
r cac
hexi
a
Microarray analysis of the hypothalamus: serotonin signalling
We hypothesized serotonin to play a crucial role in the opposing food intake behaviour between the C26 tumour and the LLC tumour model. Therefore, expression levels of genes involved in serotonin signalling were compared between the two tumour models. C26 TB mice expressing compensatory eating behaviour in response to weight loss, showed altered serotonin signalling and lower brain serotonin levels compared to their controls. In LLC TB mice, genes involved in serotonin signalling showed a different expression pattern compared to C26 TB mice. Expression of tryptophan hydroxylase (tph) was strongly downregulated in C26 TB mice compared to controls, while expression of this gene was not different from controls in LLC TB mice. Expression of ddc and vmat, genes involved in serotonin synthesis and serotonin release, respectively showed to be downregulated in C26 TB mice, whereas LLC TB mice showed higher expression of these genes (Figure 4.3B). Serotonin brain levels in LLC TB mice showed to be slightly elevated at day 10, just after the onset of anorexia, while levels were lower in C26 TB mice compared to controls (Figure 4.3C).
Hypothalamic cell lines: Eff ect of serotonin on messenger NPY and NPY
secretion
Murine derived hypothalamic cell lines hypoE-46 and hypoA-2/12 were 24 hours exposed to serotonin (100 pg/ml – 100 μg/ml). Serotonin showed to decrease NPY secretion in the hypoE-46 cells, while it did not have any effect on messenger NPY (Figure 4.4). In HypoA- 2/12 cells, serotonin did not have an effect on either NPY secretion or NPY gene expression. Basal expression level of serotonin receptors 5HT1b, 5HT1d, 5HT2a and 5HT2b showed to be significantly different between the two cell lines (Table 4.1). The effect of serotonin on gene expression of 5HT receptors was not different between the two cell lines, except for 5HT2b, which was downregulated in HypoE-46 cells and upregulated in HypoA-2/12 cells after serotonin exposure.
Discussion
Cancer anorexia has been explained by an inability of the hypothalamus to respond adequately to triggers from the periphery during a situation of negative energy balance [18]. Here, we show that this impaired response of food-intake control is associated with
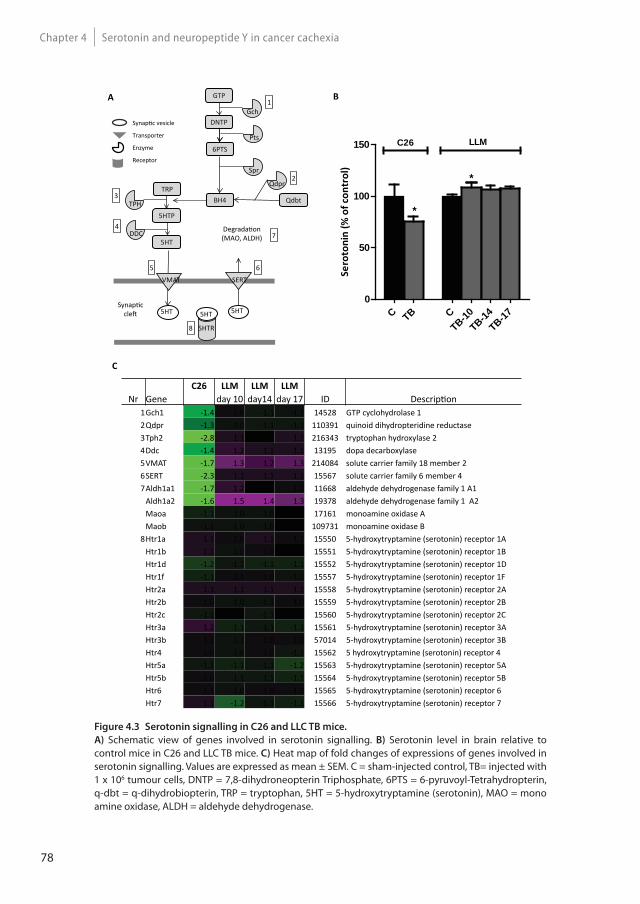
78
Serotonin and neuropeptide Y in cancer cachexiaChapter 4
Figure 4.3 Serotonin signalling in C26 and LLC TB mice.
A) Schematic view of genes involved in serotonin signalling. B) Serotonin level in brain relative to control mice in C26 and LLC TB mice. C) Heat map of fold changes of expressions of genes involved in serotonin signalling. Values are expressed as mean ± SEM. C = sham-injected control, TB= injected with 1 x 10⁶ tumour cells, DNTP = 7,8-dihydroneopterin Triphosphate, 6PTS = 6-pyruvoyl-Tetrahydropterin, q-dbt = q-dihydrobiopterin, TRP = tryptophan, 5HT = 5-hydroxytryptamine (serotonin), MAO = mono amine oxidase, ALDH = aldehyde dehydrogenase.
Synap c vesicle
Transporter
Enzyme
Receptor
GTP
DNTP
6PTS
BH4
Gch
QdbtTRP
5HTP
5HT
VMAT SERT
5HTR
5HT 5HT 5HT
1
Pts
Spr
Qdpr
TPH
DDC
Synap c cle
Degrada on (MAO, ALDH)
2
3
4
5 6
8
7
A
C
Sero
toni
n (%
of c
ontr
ol)
C TB CTB-10
TB-14TB-17
0
50
100
150
*
*
C26 LLM
*
B
C26 LLM LLM LLMNr Gene day 10 day14 day 17 ID Descrip on
1Gch1 -1.4 1.0 -1.1 -1.1 14528 GTP cyclohydrolase 12Qdpr -1.3 -1.0 -1.1 -1.1 110391 quinoid dihydropteridine reductase3Tph2 -2.8 1.1 1.0 1.1 216343 tryptophan hydroxylase 24Ddc -1.4 1.2 1.1 1.1 13195 dopa decarboxylase5VMAT -1.7 1.3 1.2 1.3 214084 solute carrier family 18 member 26SERT -2.3 1.1 1.1 1.1 15567 solute carrier family 6 member 47Aldh1a1 -1.7 1.2 -1.0 1.0 11668 aldehyde dehydrogenase family 1 A1
Aldh1a2 -1.6 1.5 1.4 1.3 19378 aldehyde dehydrogenase family 1 A2Maoa -1.1 -1.0 -1.0 1.0 17161 monoamine oxidase AMaob -1.1 -1.0 -1.0 -1.0 109731 monoamine oxidase B
8Htr1a 1.1 1.0 1.1 1.1 15550 5-hydroxytryptamine (serotonin) receptor 1AHtr1b 1.1 -1.0 1.0 -1.0 15551 5-hydroxytryptamine (serotonin) receptor 1BHtr1d -1.2 -1.1 -1.1 -1.1 15552 5-hydroxytryptamine (serotonin) receptor 1DHtr1f -1.1 1.1 1.0 -1.1 15557 5-hydroxytryptamine (serotonin) receptor 1FHtr2a 1.1 1.1 1.1 1.1 15558 5-hydroxytryptamine (serotonin) receptor 2AHtr2b 1.0 -1.0 -1.1 1.0 15559 5-hydroxytryptamine (serotonin) receptor 2BHtr2c -1.1 -1.0 -1.1 -1.0 15560 5-hydroxytryptamine (serotonin) receptor 2CHtr3a 1.2 -1.1 -1.1 -1.1 15561 5-hydroxytryptamine (serotonin) receptor 3AHtr3b 1.1 -1.1 1.0 1.0 57014 5-hydroxytryptamine (serotonin) receptor 3BHtr4 1.0 -1.0 1.0 -1.1 15562 5 hydroxytryptamine (serotonin) receptor 4Htr5a -1.1 -1.1 -1.1 -1.2 15563 5-hydroxytryptamine (serotonin) receptor 5AHtr5b 1.0 -1.1 -1.1 -1.1 15564 5-hydroxytryptamine (serotonin) receptor 5BHtr6 1.1 -1.0 1.0 1.0 15565 5-hydroxytryptamine (serotonin) receptor 6Htr7 1.1 -1.2 -1.1 -1.1 15566 5-hydroxytryptamine (serotonin) receptor 7
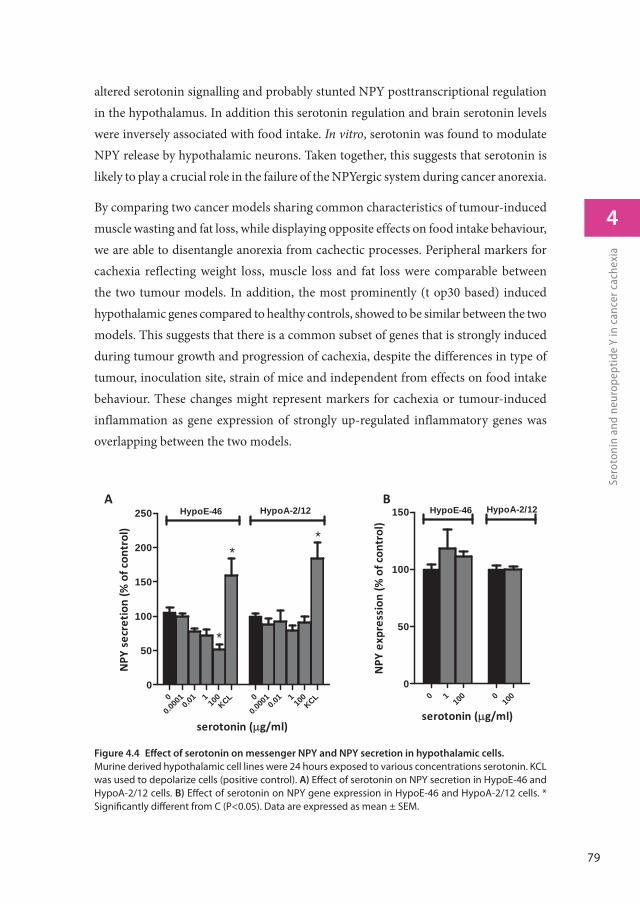
79
4
Sero
toni
n an
d ne
urop
epti
de Y
in c
ance
r cac
hexi
a
altered serotonin signalling and probably stunted NPY posttranscriptional regulation in the hypothalamus. In addition this serotonin regulation and brain serotonin levels were inversely associated with food intake. In vitro, serotonin was found to modulate NPY release by hypothalamic neurons. Taken together, this suggests that serotonin is likely to play a crucial role in the failure of the NPYergic system during cancer anorexia.
By comparing two cancer models sharing common characteristics of tumour-induced muscle wasting and fat loss, while displaying opposite effects on food intake behaviour, we are able to disentangle anorexia from cachectic processes. Peripheral markers for cachexia reflecting weight loss, muscle loss and fat loss were comparable between the two tumour models. In addition, the most prominently (t op30 based) induced hypothalamic genes compared to healthy controls, showed to be similar between the two models. This suggests that there is a common subset of genes that is strongly induced during tumour growth and progression of cachexia, despite the differences in type of tumour, inoculation site, strain of mice and independent from effects on food intake behaviour. These changes might represent markers for cachexia or tumour-induced inflammation as gene expression of strongly up-regulated inflammatory genes was overlapping between the two models.
Figure 4.4 Eff ect of serotonin on messenger NPY and NPY secretion in hypothalamic cells.
Murine derived hypothalamic cell lines were 24 hours exposed to various concentrations serotonin. KCL was used to depolarize cells (positive control). A) Eff ect of serotonin on NPY secretion in HypoE-46 and HypoA-2/12 cells. B) Eff ect of serotonin on NPY gene expression in HypoE-46 and HypoA-2/12 cells. * Signifi cantly diff erent from C (P<0.05). Data are expressed as mean ± SEM.
NPY
expr
essi
on(%
ofco
ntro
l)
0 110
0 010
00
50
100
150 HypoE-46 HypoA-2/12
serotonin ( g/ml)
A B
NPY
secr
etio
n(%
ofco
ntro
l)
0
0.000
10.0
1 110
0KCL 0
0.000
10.0
1 110
0KCL
0
50
100
150
200
250 HypoE-46 HypoA-2/12
serotonin ( g/ml)
*
**
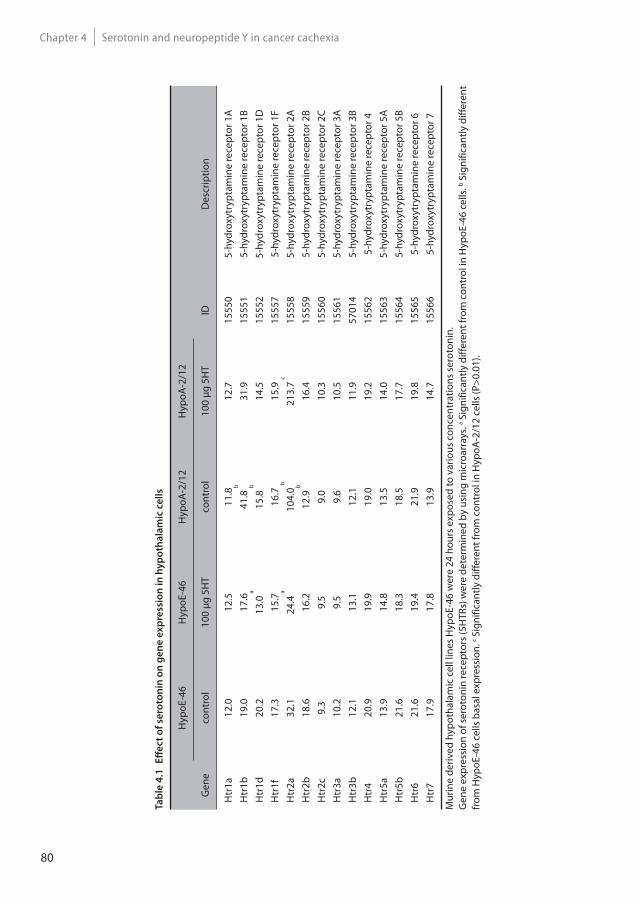
80
Serotonin and neuropeptide Y in cancer cachexiaChapter 4
Ta
ble
4.1
E
ff e
ct
of
sero
ton
in o
n g
en
e e
xp
ress
ion
in
hy
po
tha
lam
ic c
ell
s
Gen
e
Hyp
oE-4
6H
ypoE
-46
Hyp
oA-2
/12
Hyp
oA-2
/12
ID
Des
crip
tion
cont
rol
100
μg 5
HT
cont
rol
100
μg 5
HT
Htr
1a12
.012
.511
.812
.715
550
5-hy
drox
ytry
ptam
ine
rece
ptor
1A
Htr
1b19
.017
.641
.8 b
31.9
1555
15-
hydr
oxyt
rypt
amin
e re
cept
or 1
BH
tr1d
20.2
13.0
a
15.8
b
14.5
1555
25-
hydr
oxyt
rypt
amin
e re
cept
or 1
DH
tr1f
17.3
15.7
16.7
15.9
1555
75-
hydr
oxyt
rypt
amin
e re
cept
or 1
FH
tr2a
32.1
24.4
a
104.
0 b
213.
7 c
1555
85-
hydr
oxyt
rypt
amin
e re
cept
or 2
AH
tr2b
18.6
16.2
12.9
b
16.4
1555
95-
hydr
oxyt
rypt
amin
e re
cept
or 2
BH
tr2c
9.3
9.5
9.0
10.3
1556
05-
hydr
oxyt
rypt
amin
e re
cept
or 2
CH
tr3a
10.2
9.5
9.6
10.5
1556
15-
hydr
oxyt
rypt
amin
e re
cept
or 3
AH
tr3b
12.1
13.1
12.1
11.9
5701
45-
hydr
oxyt
rypt
amin
e re
cept
or 3
BH
tr4
20.9
19.9
19.0
19.2
1556
25-
hydr
oxyt
rypt
amin
e re
cept
or 4
Htr
5a13
.914
.813
.514
.015
563
5-hy
drox
ytry
ptam
ine
rece
ptor
5A
Htr
5b21
.618
.318
.517
.715
564
5-hy
drox
ytry
ptam
ine
rece
ptor
5B
Htr
621
.619
.421
.919
.815
565
5-hy
drox
ytry
ptam
ine
rece
ptor
6H
tr7
17.9
17.8
13.9
14.7
1556
65-
hydr
oxyt
rypt
amin
e re
cept
or 7
Mur
ine
deriv
ed h
ypot
hala
mic
cel
l lin
es H
ypoE
-46
wer
e 24
hou
rs e
xpos
ed to
var
ious
con
cent
ratio
ns s
erot
onin
.G
ene
expr
essi
on o
f ser
oton
in re
cept
ors (
5HTR
s) w
ere
dete
rmin
ed b
y us
ing
mic
roar
rays
. a Sig
nific
antly
diff
eren
t fro
m c
ontr
ol in
Hyp
oE-4
6 ce
lls. b S
igni
fican
tly d
iffer
ent
from
Hyp
oE-4
6 ce
lls b
asal
exp
ress
ion.
c Sig
nific
antly
diff
eren
t fro
m c
ontr
ol in
Hyp
oA-2
/12
cells
(P>0
.01)
.
81
4
Sero
toni
n an
d ne
urop
epti
de Y
in c
ance
r cac
hexi
a
Interestingly, also a majority of genes involved in food intake regulation showed to be similar between the models, even though ultimate effects on food intake were different for the two models. Food intake and drive to eat are the outcomes of numerous metabolic, physiological and behavioural cues including satiety, hunger and reward and learning. Therefore, changes on individual genes are difficult to interpret, as the impact on food intake is not similar between these single genes. Furthermore, it might be that, considering the complexity of food intake regulation, by using GO classification on food intake behaviour, some genes are ignored that might be important as well. Finally, a limitation of the current set-up is that we study expression in the hypothalamus only. Although the hypothalamus is a crucial site of food intake regulation, not all processes involved in food intake are regulated in the hypothalamus [19]. Gene expression of NPY, one of the most potent food stimulating neuropeptides in the hypothalamus [20], showed to increase in both C26 TB and LLC TB mice and was among the strongest induced genes in both models. This suggests that expression of NPY in cachectic TB mice is independent of food intake status. NPY is considered to act as a sensor and regulator of energy balance by altering food intake in energy deficits, which is supported by findings that NPY is stimulated in conditions of negative energy balance like food restriction [21], food deprivation [22, 23], and exercise [24, 25]. Several studies have shown that in cachectic TB rodents, NPY mRNA in the hypothalamus is elevated [26-29]. However, this elevation of mRNA NPY does not reflect food intake behaviour [27, 29] and does not correspond to NPY levels in the hypothalamus [27]. In contrast to these elevated messenger NPY levels, anorectic TB rodents have lower PVN hypothalamic NPY levels [30, 31] and lower NPY immunostaining of fibres innervating various hypothalamic nuclei [32]. On the other hand, mice bearing an A375 tumour that do not suffer from cachexia and weight loss, did not show this elevation of NPY mRNA [26], suggesting that cachexia is an important trigger in stimulation of NPY mRNA. This might explain that in both the C26 model and LLC model, messenger NPY was highly upregulated in TB mice compared to controls, despite their difference in food intake behaviour. Consequently, we hypothesize that failure of the NPY-ergic system taking place at a post-transcriptional level, for example by impaired translation, synthesis, transport or secretion, plays a role in the development of tumour-induced anorexia.
In this study, we also found serotonin signalling to be differently regulated between two types of tumour-induced cachexia models, in addition to their opposed effects on food intake behaviour In C26 TB mice, serotonin signalling was strongly down-regulated
82
Serotonin and neuropeptide Y in cancer cachexiaChapter 4
and inversely associated with an increased food intake. Anorectic Lewis Lung TB mice displayed less pronounced changes in transcript levels of gene involved in serotonin signalling compared to C26 TB mice. Moreover, transcriptional regulation was different from mice bearing C26 tumour. Furthermore, brain serotonin levels were significantly elevated in TB mice at day 10 compared to controls, shortly after the manifestation of anorexia. This effect was less clear at day 14 and day 17, suggesting that effects on serotonin are more prominent during the initial stages of anorexia development. It has been postulated that cancer anorexia develops by waves of brain activation [33], each of them not necessarily mediated by the same mediators. It could be that serotonin might play a role in the initiation of anorexia. Hypothalamic serotonin is an important mediator in the regulation of satiety and hunger [34]. In cancer-induced anorexia, serotonin is considered a key player in the induction of anorexia [35, 36]. In rodents, tumour-driven elevation of hypothalamic serotonin has been associated with reduced food intake [31, 37, 38]. Furthermore, this elevation of serotonin was not present in the pair-fed control group, meaning that reduced food intake itself does not result in an elevation of hypothalamic serotonin. In humans, a practical and non-invasive method to measure site-specific changes on serotonergic activity in the hypothalamus is not yet available, but increased levels of tryptophan, the precursor of serotonin, have been measured in cerebral spinal fluid of cancer anorectic patients [39].
The exact mechanism on how serotonin is able to regulate food intake is not yet under-stood. A cross interaction of serotonin with NPY-ergic system has been discussed [31]. Serotonin signalling is negatively associated with NPY activity [40-42]. Active lowering of serotonin levels results in increased NPY levels [43], while induction of 5-HT signalling showed to reduce NPY levels in rat hypothalamus [44]. More importantly, serotonin is able to repress food intake, despite weight loss-induced elevation of messenger NPY [45], suggesting that serotonin might act as an interfering factor between transcription and NPY secretion. Therefore, we hypothesized that serotonin might interfere with NPY signalling at a post transcriptional level. In this way, it could play a role in post-transcriptional failure of the NPY system during certain forms of cancer.
To determine serotonin’s ability to repress NPY secretion, we used two murine derived hypothalamic cell lines. We showed that serotonin is able to reduce NPY secretion in HypoE-46 cells, a cell line suggested to originate from the PVN [46], without
83
4
Sero
toni
n an
d ne
urop
epti
de Y
in c
ance
r cac
hexi
a
affecting NPY gene expression, supporting the hypothesis that serotonin acts post-transcriptionally. Serotonin did not have an effect on NPY secretion in HypoA- 2/12 cells a cell line suggested to originate from the arcuate nucleus (ARC) or supraoptic nucleus [47]. In lean and obese Zucker rats, increased levels of serotonin, induced by chronic administration of fluoxetine, resulted in reduced food intake and reduced levels of NPY in the PVN, but not in the ARC and other areas of the hypothalamus [40]. This suggests that NPY release by PVN neurons is more sensitive to serotonin and might explain the difference in response to serotonin between the two cell lines.
The two cell lines did not show differences in their general response to serotonin as reflected by expression of genes involved in serotonin signalling. An exception to this was the effect of serotonin on expression of the 5HT2a receptor, which was down-regulated in response to serotonin in the HypoE-46 and up-regulated in the HypoA-2/12 cell line. Moreover, basal expression of 5HT1b and 5HT2a, 5HT2b and 5HT2c differed between the two cell lines. In the ARC nucleus, serotonin has been reported to inhibit NPY release by hyperpolarization of AgRP/NPY neurons via 5HT1b receptors [48]. The role of 5HT2 receptors might be a target for further research on their role in NPY regulation. However, as NPY secretion is via granule exocytosis [49], also a receptor independent process like serotonylation of GTPases might be implicated. Serotonylation is a process, where intracellular serotonin is able to activate small GTPases via transamination. Dependent on the type of GTPases that are activated, several processes dependent on granule exocytosis can be affected, which has been reported for insulin secretion by pancreatic β cells [50] or platelet aggregation [51].
In this study, we provide evidence that cancer anorexia might be due to post transcrip-tional failure of the NPY-ergic system in the hypothalamus to respond to increased energy requirement in cancer cachexia. We show that serotonin is able to affect NPY secretion in vitro. In addition, serotonin signalling is found to be altered in TB mice, suggesting that serotonin might play a crucial role in failure of hypothalamic NPY signalling and subsequently the development or sustainment of cancer anorexia.
Acknowledgements
The research leading to these results has received funding from the European Union’s Seventh Framework Programme for research, technological development and demonstration under grant agreement n°266408 (Full4Health). The authors confirm
84
Serotonin and neuropeptide Y in cancer cachexiaChapter 4
that they comply with the principles of ethical publishing in the Journal of Cachexia, Sarcopenia, and Muscle 2010;1:7-8 (von Haehling S, Morley JE, Coats AJ and Anker SD).
Confl ict of interest
J. Dwarkasing, M. Boekschoten, J. Argilès, S. Busquets, F. Penna, M. Toledo, A. Laviano and R. Witkamp have nothing to declare. M. van Dijk is employee of Nutricia Research, a medical nutrition company. K. van Norren is guest employee of Nutricia Research, a medical nutrition company.
References
1. Sarhill, N., F. Mahmoud, D. Walsh, K.A. Nelson, S. Komurcu, M. Davis, S. LeGrand, O. Abdullah, and L. Rybicki, Evaluation of nutritional status in advanced metastatic cancer. Support Care Cancer, 2003. 11(10): p. 652-9.
2. Argiles, J.M., M. Olivan, S. Busquets, and F.J. Lopez-Soriano, Optimal management of cancer anorexia-cachexia syndrome. Cancer Manag Res, 2010. 2: p. 27-38.
3. Okusaka, T., S. Okada, H. Ishii, M. Ikeda, H. Kosakamoto, and M. Yoshimori, Prognosis of advanced pancreatic cancer patients with reference to calorie intake. Nutr Cancer, 1998. 32(1): p. 55-8.
4. Tamburini, M., C. Brunelli, S. Rosso, and V. Ventafridda, Prognostic value of quality of life scores in terminal cancer patients. J Pain Symptom Manage, 1996. 11(1): p. 32-41.
5. Laviano, A., A. Inui, M.M. Meguid, A. Molfino, C. Conte, and F. Rossi Fanelli, NPY and brain monoamines in the pathogenesis of cancer anorexia. Nutrition, 2008. 24(9): p. 802-5.
6. Fearon, K., F. Strasser, S.D. Anker, I. Bosaeus, E. Bruera, R.L. Fainsinger, A. Jatoi, C. Loprinzi, N. MacDonald, G. Mantovani, M. Davis, M. Muscaritoli, F. Ottery, L. Radbruch, P. Ravasco, D. Walsh, A. Wilcock, S. Kaasa, and V.E. Baracos, Definition and classification of cancer cachexia: an international consensus. Lancet Oncol, 2011. 12(5): p. 489-95.
7. Churm, D., I.M. Andrew, K. Holden, A.J. Hildreth, and C. Hawkins, A questionnaire study of the approach to the anorexia-cachexia syndrome in patients with cancer by staff in a district general hospital. Support Care Cancer, 2009. 17(5): p. 503-7.
8. Argiles, J.M., R. Moore-Carrasco, G. Fuster, S. Busquets, and F.J. Lopez-Soriano, Cancer cachexia: the molecular mechanisms. Int J Biochem Cell Biol, 2003. 35(4): p. 405-9.
9. Tisdale, M.J., Mechanisms of cancer cachexia. Physiol Rev, 2009. 89(2): p. 381-410.
10. Dwarkasing, J.T., M. van Dijk, F.J. Dijk, M.V. Boekschoten, J. Faber, J.M. Argiles, A. Laviano, M. Muller, R.F. Witkamp, and K. van Norren, Hypothalamic food intake regulation in a cancer-cachectic mouse model. J Cachexia Sarcopenia Muscle, 2013. 5(2): p. 159-69.
85
4
Sero
toni
n an
d ne
urop
epti
de Y
in c
ance
r cac
hexi
a
11. van Norren, K., D. Kegler, J.M. Argiles, Y. Luiking, M. Gorselink, A. Laviano, K. Arts, J. Faber, H. Jansen, E.M. van der Beek, and A. van Helvoort, Dietary supplementation with a specific combination of high protein, leucine, and fish oil improves muscle function and daily activity in tumour-bearing cachectic mice. Br J Cancer, 2009. 100(5): p. 713-22.
12. Lin, K., H. Kools, P.J. de Groot, A.K. Gavai, R.K. Basnet, F. Cheng, J. Wu, X. Wang, A. Lommen, G.J. Hooiveld, G. Bonnema, R.G. Visser, M.R. Muller, and J.A. Leunissen, MADMAX - Management and analysis database for multiple ~omics experiments. J Integr Bioinform, 2011. 8(2): p. 160.
13. Dai, M., P. Wang, A.D. Boyd, G. Kostov, B. Athey, E.G. Jones, W.E. Bunney, R.M. Myers, T.P. Speed, H. Akil, S.J. Watson, and F. Meng, Evolving gene/transcript definitions significantly alter the interpretation of GeneChip data. Nucleic acids research, 2005. 33(20): p. e175.
14. Irizarry, R.A., B.M. Bolstad, F. Collin, L.M. Cope, B. Hobbs, and T.P. Speed, Summaries of Affymetrix GeneChip probe level data. Nucleic acids research, 2003. 31(4): p. e15.
15. Bolstad, B.M., R.A. Irizarry, M. Astrand, and T.P. Speed, A comparison of normalization methods for high density oligonucleotide array data based on variance and bias. Bioinformatics, 2003. 19(2): p. 185-93.
16. Sartor, M.A., C.R. Tomlinson, S.C. Wesselkamper, S. Sivaganesan, G.D. Leikauf, and M. Medvedovic, Intensity-based hierarchical Bayes method improves testing for differentially expressed genes in microarray experiments. BMC Bioinformatics, 2006. 7: p. 538.
17. Valassi, E., M. Scacchi, and F. Cavagnini, Neuroendocrine control of food intake. Nutr Metab Cardiovasc Dis, 2008. 18(2): p. 158-68.
18. Laviano, A., M.M. Meguid, A. Inui, M. Muscaritoli, and F. Rossi-Fanelli, Therapy insight: Cancer anorexia-cachexia syndrome--when all you can eat is yourself. Nat Clin Pract Oncol, 2005. 2(3): p. 158-65.
19. Lenard, N.R. and H.R. Berthoud, Central and peripheral regulation of food intake and physical activity: pathways and genes. Obesity (Silver Spring), 2008. 16 Suppl 3: p. S11-22.
20. Edwards, C.M., S. Abusnana, D. Sunter, K.G. Murphy, M.A. Ghatei, and S.R. Bloom, The effect of the orexins on food intake: comparison with neuropeptide Y, melanin-concentrating hormone and galanin. J Endocrinol, 1999. 160(3): p. R7-12.
21. Brady, L.S., M.A. Smith, P.W. Gold, and M. Herkenham, Altered expression of hypothalamic neuropeptide mRNAs in food-restricted and food-deprived rats. Neuroendocrinology, 1990. 52(5): p. 441-7.
22. Kalra, S.P., M.G. Dube, A. Sahu, C.P. Phelps, and P.S. Kalra, Neuropeptide Y secretion increases in the paraventricular nucleus in association with increased appetite for food. Proc Natl Acad Sci U S A, 1991. 88(23): p. 10931-5.
23. Yoshimura, M., M. Hagimoto, T. Matsuura, J. Ohkubo, M. Ohno, T. Maruyama, T. Ishikura, H. Hashimoto, T. Kakuma, H. Yoshimatsu, K. Terawaki, Y. Uezono, Y. Toyohira, N. Yanagihara, and Y. Ueta, Effects of food deprivation on the hypothalamic feeding-regulating peptides gene expressions in serotonin depleted rats. J Physiol Sci, 2014. 64(2): p. 97-104.
86
Serotonin and neuropeptide Y in cancer cachexiaChapter 4
24. Lewis, D.E., L. Shellard, D.G. Koeslag, D.E. Boer, H.D. McCarthy, P.E. McKibbin, J.C. Russell, and G. Williams, Intense exercise and food restriction cause similar hypothalamic neuropeptide Y increases in rats. Am J Physiol, 1993. 264(2 Pt 1): p. E279-84.
25. Kawaguchi, M., K.A. Scott, T.H. Moran, and S. Bi, Dorsomedial hypothalamic corticotropin-releasing factor mediation of exercise-induced anorexia. Am J Physiol Regul Integr Comp Physiol, 2005. 288(6): p. R1800-5.
26. Nara-ashizawa, N., T. Tsukada, K. Maruyama, Y. Akiyama, N. Kajimura, K. Nagasaki, T. Iwanaga, and K. Yamaguchi, Hypothalamic appetite-regulating neuropeptide mRNA levels in cachectic nude mice bearing human tumor cells. Metabolism, 2001. 50(10): p. 1213-9.
27. Chance, W.T., C. Xiao, R. Dayal, and S. Sheriff, Alteration of NPY and Y1 receptor in dorsomedial and ventromedial areas of hypothalamus in anorectic tumor-bearing rats. Peptides, 2007. 28(2): p. 295-301.
28. Plata-Salaman, C.R., S.E. Ilyin, and D. Gayle, Brain cytokine mRNAs in anorectic rats bearing prostate adenocarcinoma tumor cells. Am J Physiol, 1998. 275(2 Pt 2): p. R566-73.
29. Nara-ashizawa, N., T. Tsukada, K. Maruyama, Y. Akiyama, N. Kajimura, and K. Yamaguchi, Response of hypothalamic NPY mRNAs to a negative energy balance is less sensitive in cachectic mice bearing human tumor cells. Nutr Cancer, 2001. 41(1-2): p. 111-8.
30. McCarthy, H.D., P.E. McKibbin, A.V. Perkins, E.A. Linton, and G. Williams, Alterations in hypothalamic NPY and CRF in anorexic tumor-bearing rats. Am J Physiol, 1993. 264(4 Pt 1): p. E638-43.
31. Meguid, M.M., E.J. Ramos, A. Laviano, M. Varma, T. Sato, C. Chen, Y. Qi, and U.N. Das, Tumor anorexia: effects on neuropeptide Y and monoamines in paraventricular nucleus. Peptides, 2004. 25(2): p. 261-6.
32. Makarenko, I.G., M.M. Meguid, L. Gatto, C. Chen, and M.V. Ugrumov, Decreased NPY innervation of the hypothalamic nuclei in rats with cancer anorexia. Brain Res, 2003. 961(1): p. 100-8.
33. Laviano, A., M.M. Meguid, A. Cascino, A. Molfino, and F. Rossi Fanelli, Tryptophan in wasting diseases: at the crossing between immune function and behaviour. Curr Opin Clin Nutr Metab Care, 2009. 12(4): p. 392-7.
34. Lam, D.D., A.S. Garfield, O.J. Marston, J. Shaw, and L.K. Heisler, Brain serotonin system in the coordination of food intake and body weight. Pharmacol Biochem Behav, 2010. 97(1): p. 84-91.
35. Laviano, A., A. Inui, D.L. Marks, M.M. Meguid, C. Pichard, F. Rossi Fanelli, and M. Seelaender, Neural control of the anorexia-cachexia syndrome. Am J Physiol Endocrinol Metab, 2008. 295(5): p. E1000-8.
36. Rossi Fanelli, F. and A. Laviano, Cancer anorexia: a model for the understanding and treatment of secondary anorexia. Int J Cardiol, 2002. 85(1): p. 67-72.
37. Ramos, E.J., S. Suzuki, M.M. Meguid, A. Laviano, T. Sato, C. Chen, and U. Das, Changes in hypothalamic neuropeptide Y and monoaminergic system in tumor-bearing rats: pre- and post-tumor resection and at death. Surgery, 2004. 136(2): p. 270-6.
87
4
Sero
toni
n an
d ne
urop
epti
de Y
in c
ance
r cac
hexi
a
38. Blaha, V., Z.J. Yang, M.M. Meguid, J.K. Chai, A. Oler, and Z. Zadak, Ventromedial nucleus of hypothalamus is related to the development of cancer-induced anorexia: in vivo microdialysis study. Acta Medica (Hradec Kralove), 1998. 41(1): p. 3-11.
39. Cangiano, C., A. Cascino, F. Ceci, A. Laviano, M. Mulieri, M. Muscaritoli, and F. Rossi-Fanelli, Plasma and CSF tryptophan in cancer anorexia. J Neural Transm Gen Sect, 1990. 81(3): p. 225-33.
40. Dryden, S., H.M. Frankish, Q. Wang, L. Pickavance, and G. Williams, The serotonergic agent fluoxetine reduces neuropeptide Y levels and neuropeptide Y secretion in the hypothalamus of lean and obese rats. Neuroscience, 1996. 72(2): p. 557-66.
41. Currie, P.J. and D.V. Coscina, 5-Hydroxytryptaminergic receptor agonists: effects on neuropeptide Y potentiation of feeding and respiratory quotient. Brain Res, 1998. 803(1-2): p. 212-7.
42. Jahng, J.W., T.A. Houpt, S.J. Kim, T.H. Joh, and J.H. Son, Neuropeptide Y mRNA and serotonin innervation in the arcuate nucleus of anorexia mutant mice. Brain Res, 1998. 790(1-2): p. 67-73.
43. Dryden, S., H.M. Frankish, Q. Wang, and G. Williams, Increased feeding and neuropeptide Y (NPY) but not NPY mRNA levels in the hypothalamus of the rat following central administration of the serotonin synthesis inhibitor p-chlorophenylalanine. Brain Res, 1996. 724(2): p. 232-7.
44. Shinozaki, T., M. Kimura, M. Hosoyamada, and T. Shibasaki, Fluvoxamine inhibits weight gain and food intake in food restricted hyperphagic Wistar rats. Biol Pharm Bull, 2008. 31(12): p. 2250-4.
45. Moon, Y.W., S.H. Choi, S.B. Yoo, J.H. Lee, and J.W. Jahng, 5-hydroxy-L-tryptophan Suppressed Food Intake in Rats Despite an Increase in the Arcuate NPY Expression. Exp Neurobiol, 2010. 19(3): p. 132-9.
46. Dhillon, S.S. and D.D. Belsham, Leptin differentially regulates NPY secretion in hypothalamic cell lines through distinct intracellular signal transduction pathways. Regul Pept, 2011. 167(2-3): p. 192-200.
47. Dhillon, S.S. and D.D. Belsham, Estrogen inhibits NPY secretion through membrane-associated estrogen receptor (ER)-alpha in clonal, immortalized hypothalamic neurons. Int J Obes (Lond), 2011. 35(2): p. 198-207.
48. Heisler, L.K., E.E. Jobst, G.M. Sutton, L. Zhou, E. Borok, Z. Thornton-Jones, H.Y. Liu, J.M. Zigman, N. Balthasar, T. Kishi, C.E. Lee, C.J. Aschkenasi, C.Y. Zhang, J. Yu, O. Boss, K.G. Mountjoy, P.G. Clifton, B.B. Lowell, J.M. Friedman, T. Horvath, A.A. Butler, J.K. Elmquist, and M.A. Cowley, Serotonin reciprocally regulates melanocortin neurons to modulate food intake. Neuron, 2006. 51(2): p. 239-49.
49. Ramamoorthy, P., Q. Wang, and M.D. Whim, Cell type-dependent trafficking of neuropeptide Y-containing dense core granules in CNS neurons. J Neurosci, 2011. 31(41): p. 14783-8.
50. Paulmann, N., M. Grohmann, J.P. Voigt, B. Bert, J. Vowinckel, M. Bader, M. Skelin, M. Jevsek, H. Fink, M. Rupnik, and D.J. Walther, Intracellular serotonin modulates insulin secretion from pancreatic beta-cells by protein serotonylation. PLoS Biol, 2009. 7(10): p. e1000229.
51. Walther, D.J., J.U. Peter, S. Winter, M. Holtje, N. Paulmann, M. Grohmann, J. Vowinckel, V. Alamo-Bethencourt, C.S. Wilhelm, G. Ahnert-Hilger, and M. Bader, Serotonylation of small GTPases is a signal transduction pathway that triggers platelet alpha-granule release. Cell, 2003. 115(7): p. 851-62.

Submitted for publication.
Increased hypothalamic serotonin turnover
in inflammation-induced anorexia
J. T. Dwarkasing, R. F. Witkamp, M. V. Boekschoten, M. C. ter Laak, M. S. Heins, K. van Norren
5
90
Serotonin in inflammation-induced anorexiaChapter 5
Abstract
Anorexia can occur as a serious complication of chronic disease. Increasing evidence suggests that inflammation plays a major role, along with a hypothalamic dysregulation characterized by locally elevated serotonin levels. The present study was undertaken to further explore the connections between peripheral inflammation, anorexia and hypothalamic serotonin metabolism and signaling pathways. First, we investigated the response of two hypothalamic neuronal cell lines to TNFα, IL-6 and LPS. Next, we studied transcriptomic changes and serotonergic activity in the hypothalamus of mice after intraperitoneal injection with TNFα, IL-6 or a combination of TNFα and IL-6. In vitro, we showed that hypothalamic neurons responded to inflammatory mediators by releasing cytokines. This inflammatory response was associated with an increased serotonin release. Mice injected with TNFα and IL-6 showed decreased food intake, associated with altered expression of inflammation-related genes in the hypothalamus. In addition, hypothalamic serotonin turnover showed to be elevated in treated mice. Overall, our results underline that peripheral inflammation reaches the hypothalamus where it affects hypothalamic serotoninergic metabolism. These hypothalamic changes in serotonin pathways are associated with decreased food intake, providing evidence for a role of serotonin in inflammation-induced anorexia.
91
5
Sero
toni
n in
infla
mm
atio
n-in
duce
d an
orex
ia
Introduction
Loss of appetite (anorexia) leading to insufficient food intake is often seen in chronic illnesses including cancer, HIV and COPD. A chronically elevated increased inflammatory tone is considered one of the major drivers of anorexia in these diseases. Studies suggest that an ongoing elevated inflammatory tone in the hypothalamus, displaying the highest density of various cytokine receptors in the brain [1], is implicated in these disturbances in food intake. Inflammatory mediators affect important orexigenic and anorexigenic regulators including NPY [2] and POMC [3, 4] peptides in the hypothalamus. Cytokines and other pro-inflammatory signalling molecules from the periphery are able to reach the hypothalamus passing the blood brain barrier (BBB) [5-7]. In addition, de novo synthesis of various cytokines in the hypothalamus has been reported [8]. To trigger these processes, sensing of peripheral signals in the adjacent median eminence [9, 10] and activation of hypothalamic microglial and astrocyte cells [11, 12] might be crucial.
We previously described changes in hypothalamic serotonin signalling in rodent tumour models displaying sever body wasting (cachexia). These changes in serotonin formation were inversely associated with food intake [13]. This is in line with findings in a variety of chronic illnesses, where increased hypothalamic serotonin has been implicated for its role in the development of disease-associated anorexia [14-17]. Hypothalamic serotonin plays an important role in food intake, since it is able to respond to peripheral signals on energy status [18-20] and it is able to modulate anorexigenic and orexigenic signalling in the hypothalamus. Serotonin is able to affect food intake via activation of the anorexigenic melanocortin system involving 5HT2c receptors [21] and by inhibition of the orexigenic NPYergic system [15, 22]. Furthermore, reduction of brain serotonin by reducing availability of its precursor tryptophan (TRP) (Figure 5.1) has been shown to be beneficial in the treatment in anorexia during cancer [23].
In the present study, we investigated the anorexigenic effects of TNFα and IL-6, cytokines that are often elevated during chronic illness, on hypothalamic serotonin signalling. To test physiologically relevant concentrations of TNFα and IL-6 in illness, we included two combinations containing both TNFα and IL-6 that reflected plasma levels measured in C26 adenocarcinoma tumour-bearing mice or Lewis Lung tumour-bearing mice respectively [13, 24]. We show that these cytokines when administered intraperitoneally (ip) induce changes in the hypothalamic transcriptome consistent with changes in inflammatory pathways and serotonin signalling. Furthermore, these
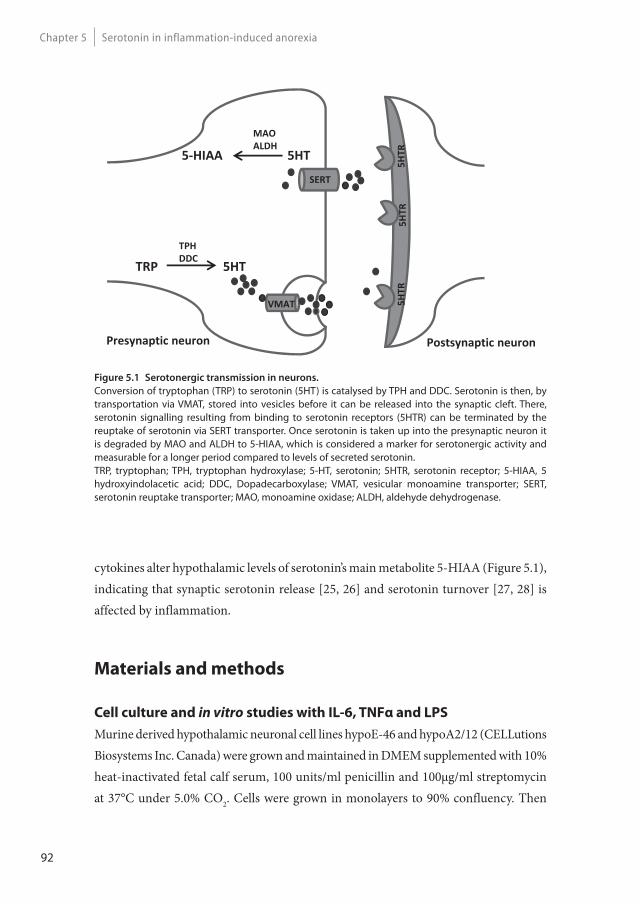
92
Serotonin in inflammation-induced anorexiaChapter 5
cytokines alter hypothalamic levels of serotonin’s main metabolite 5-HIAA (Figure 5.1), indicating that synaptic serotonin release [25, 26] and serotonin turnover [27, 28] is affected by inflammation.
Materials and methods
Cell culture and in vitro studies with IL-6, TNFα and LPS
Murine derived hypothalamic neuronal cell lines hypoE-46 and hypoA2/12 (CELLutions Biosystems Inc. Canada) were grown and maintained in DMEM supplemented with 10% heat-inactivated fetal calf serum, 100 units/ml penicillin and 100μg/ml streptomycin at 37°C under 5.0% CO2. Cells were grown in monolayers to 90% confluency. Then
TRP 5HT
VMAT
TPHDDC
SERT
5 HIAA
MAOALDH
5HT
5HTR
5HTR
5HTR
Presynaptic neuron Postsynaptic neuron
Figure 5.1 Serotonergic transmission in neurons.
Conversion of tryptophan (TRP) to serotonin (5HT) is catalysed by TPH and DDC. Serotonin is then, by transportation via VMAT, stored into vesicles before it can be released into the synaptic cleft. There, serotonin signalling resulting from binding to serotonin receptors (5HTR) can be terminated by the reuptake of serotonin via SERT transporter. Once serotonin is taken up into the presynaptic neuron it is degraded by MAO and ALDH to 5-HIAA, which is considered a marker for serotonergic activity and measurable for a longer period compared to levels of secreted serotonin.TRP, tryptophan; TPH, tryptophan hydroxylase; 5-HT, serotonin; 5HTR, serotonin receptor; 5-HIAA, 5 hydroxyindolacetic acid; DDC, Dopadecarboxylase; VMAT, vesicular monoamine transporter; SERT, serotonin reuptake transporter; MAO, monoamine oxidase; ALDH, aldehyde dehydrogenase.

93
5
Sero
toni
n in
infla
mm
atio
n-in
duce
d an
orex
ia
medium was replaced by serum-free DMEM containing penicillin and streptomycin. After 4 hours, cells were exposed to LPS (1 μg/ml), TNFα (100 pg/ml), IL-6 (100 pg/ml) for 24 hours, or KCl (60 mM) for 15 minutes. After exposure, supernatant was collected to measure levels of serotonin (BAE-5900, LDN, Nordhorn, Germany), IL-6 (DY406, Abingdon, UK), TNFα (DY410, Abingdon, UK) and MCP-1 (DY479, R&D systems, Abingdon, UK) by enzyme-immuno assay. Cells were homogenized in 40mM Tris, 1mM EDTA, 5mM EGTA and 0.50% Triton X-100. Homogenates were used to measure 5-hydroxyindoleacetic acid (5-HIAA) by ELISA (MBS261481, MyBiosource, Breda, The Netherlands) and corrected for total protein content (Pierce Bicinchoninic acid Rockford, IL, USA). Cytotoxicity was determined by measuring LDH leakage and cell viability using an XTT conversion assay (Roche Diagnostics, Mannheim, Germany). All experiments were performed three times in quadruplicate.
Animals
C57BL/6 male mice (Harlan, Horst, The Netherlands), weighing approximately 20 g, were individually housed one week before start of the experiment. Mice were maintained on a 12 hour light:12 hour dark cycle in a climate-controlled room (21°C±1°C). Standard diet was ad libitum available during the entire experiment from one hour prior to dark phase until start of the light phase (Arie Blok B.V, Woerden, and The Netherlands). Water was freely available 24 hours a day. Food intake, water intake and body weight were monitored daily from one week prior to the end of the experiment.
All experimental procedures were made in accordance with the European Community guidelines for the use of laboratory animals and complied with the principles of good laboratory animal care.
Experimental set-up
Mice were injected intraperitoneal (ip) with 50ul of saline vehicle (G-Biosciences, St.Louis, USA), TNFα (Peprotech, London, UK), IL-6 (Peprotech, London, UK), or both TNFα and IL-6. The study included 6 groups: Control, TNFα, IL-6 Low, IL-6 High, TNFα + IL-6 Low and TNFα + IL-6 High (Table 5.1). The rationale to study different doses and combinations of IL-6 was based on our previous observations in mouse tumour models and the generally recognized central role of IL-6 as link between cancer and inflammation [13, 24]. Combinations TNF + IL-6 Low and TNF + IL-6 High
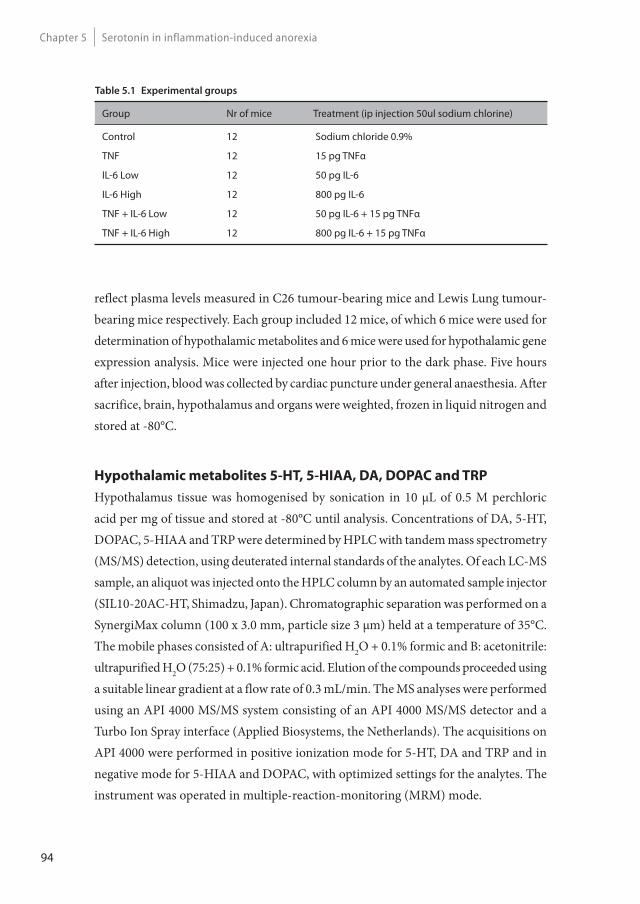
94
Serotonin in inflammation-induced anorexiaChapter 5
reflect plasma levels measured in C26 tumour-bearing mice and Lewis Lung tumour-bearing mice respectively. Each group included 12 mice, of which 6 mice were used for determination of hypothalamic metabolites and 6 mice were used for hypothalamic gene expression analysis. Mice were injected one hour prior to the dark phase. Five hours after injection, blood was collected by cardiac puncture under general anaesthesia. After sacrifice, brain, hypothalamus and organs were weighted, frozen in liquid nitrogen and stored at -80°C.
Hypothalamic metabolites 5-HT, 5-HIAA, DA, DOPAC and TRP
Hypothalamus tissue was homogenised by sonication in 10 μL of 0.5 M perchloric acid per mg of tissue and stored at -80°C until analysis. Concentrations of DA, 5-HT, DOPAC, 5-HIAA and TRP were determined by HPLC with tandem mass spectrometry (MS/MS) detection, using deuterated internal standards of the analytes. Of each LC-MS sample, an aliquot was injected onto the HPLC column by an automated sample injector (SIL10-20AC-HT, Shimadzu, Japan). Chromatographic separation was performed on a SynergiMax column (100 x 3.0 mm, particle size 3 μm) held at a temperature of 35°C. The mobile phases consisted of A: ultrapurified H2O + 0.1% formic and B: acetonitrile: ultrapurified H2O (75:25) + 0.1% formic acid. Elution of the compounds proceeded using a suitable linear gradient at a flow rate of 0.3 mL/min. The MS analyses were performed using an API 4000 MS/MS system consisting of an API 4000 MS/MS detector and a Turbo Ion Spray interface (Applied Biosystems, the Netherlands). The acquisitions on API 4000 were performed in positive ionization mode for 5-HT, DA and TRP and in negative mode for 5-HIAA and DOPAC, with optimized settings for the analytes. The instrument was operated in multiple-reaction-monitoring (MRM) mode.
Table 5.1 Experimental groups
Group Nr of mice Treatment (ip injection 50ul sodium chlorine)
Control 12 Sodium chloride 0.9%
TNF 12 15 pg TNFα
IL-6 Low 12 50 pg IL-6
IL-6 High 12 800 pg IL-6
TNF + IL-6 Low 12 50 pg IL-6 + 15 pg TNFα
TNF + IL-6 High 12 800 pg IL-6 + 15 pg TNFα
95
5
Sero
toni
n in
infla
mm
atio
n-in
duce
d an
orex
ia
Data were calibrated and quantified using the Analyst data system (Applied Biosystems, version 1.6.2, the Netherlands). Concentrations in experimental samples were calculated based on the calibration curve in the corresponding matrix.
Hypothalamic transcriptomics (microarray)
Total RNA from the hypothalamus was isolated by using RNeasy Lipid tissue kit (Qiagen, Venlo, The Netherlands). RNA concentrations were measured by absorbance at 260 nm (Nanodrop). RNA quality was checked using the RNA 6000 Nano assay on the Agilent 2100 Bioanalyzer (Agilent Techologies, Amsterdam, The Netherlands) according to the manufacturer’s protocol. For each mouse, total RNA (100 ng) was labelled using the Ambion WT expression kit (Life Technologies, Bleiswijk, The Netherlands). Micro-array experiments were performed by using Affymetrix Mouse Gene 1.1 ST arrays. In the TNFα treated group, 1 sample gave multiple spots on the array and was therefore excluded from analysis. Array data were analysed using an in-house, on-line system [29]. Briefly, probesets were redefined according to Dai et al. [30] using remapped CDF version 18.0.1 based on the Entrez Gene database. In total these arrays target 21,266 unique genes. Robust multi-array (RMA) analysis was used to obtain expression values [31, 32]. We only took genes into account that had an intensity >20 on at least 3 arrays and at least 7 probes per genes. Genes were considered differentially expressed at P<0.05 after intensity-based moderated t-statistics [33]. Further functional interpretation of the data was performed through the use of IPA (Ingenuity® Systems, www.ingenuity.com). Genes from the data set that met the cut-off of 1.2 fold change and p-value cut-off of 0.05 were considered for the analysis. Upstream regulators were identified by using cut-off values of z-score>1.96 and z-score<-1.96 combined with P<0.05. Furthermore for this upstream regulators analysis, only endogenous metabolites were considered (chemical drugs and compounds were excluded from analysis). Array data have been submitted to the Gene Expression Omnibus (GEO), accession number GSE69151.
Plasma cytokines and gut hormones
Plasma levels of TNF-α, amylin (Active), C-Peptide 2, ghrelin (Active), GIP (Total), GLP-1 (Active), glucagon, IL-6, insulin, leptin, MCP-1, Pancreatic Peptide (PP), PYY and resistin were measured using the 12-plex Mouse Metabolic Hormone Magnetic bead panel (Merck Millipore, Amsterdam, The Netherlands). Serum amyloid was measured
96
Serotonin in inflammation-induced anorexiaChapter 5
in liver homogenates using SAA mouse ELISA kit (Life technologies, Bleiswijk, The Netherlands).
Statistics
Data were analysed by statistical analysis of variance (ANOVA) followed by a post hoc Bonferroni test or by a Dunnet test. Differences were considered significant at a two-tailed P<0.05. Statistical analyses were performed using Graphpad Prism 5.
Results
IL-6, TNFα and LPS increase 5HT and 5-HIAA in hypothalamic cell lines
Exposure of hypothalamic cell lines hypoE-46 and hypoA2/12 to IL-6 (100 pg/ml), TNFα (100 pg/ml) and LPS (1 μg/ml) for 24 hours stimulated serotonin (5HT) release into the medium. Furthermore, levels of intracellular 5-hydroxyindoleacetic acid (5-HIAA) were elevated after exposure to IL-6, TNFα and LPS in both cell lines. Both cell lines produced IL-6 when exposed to IL-6, since levels detected were 4–6 fold higher than exposed levels. In addition, both cell lines produced MCP-1 when exposed to LPS and IL-6. Compared to IL-6 and LPS, TNFα showed to be less potent in inducing the production of MCP-1 and IL-6 (Figure 5.2). No TNFα release was detected (data not shown) after exposure to IL-6, TNFα or LPS.
IL-6 and TNFα reduce food intake in mice
Hourly food intake remained constant in control animals during the entire study period. In cytokine treated mice, food intake curves started to deviate from 2 hours after injection, becoming significantly lower 4 hours after injection in the TNFα, IL-6 high, IL-6 Low + TNFα and IL-6 High + TNFα groups, compared to controls (Figure 5.3). These effects did not differ between cytokine treatments. After 5 hours of injection, food intake between all groups was similar again.
Plasma levels of cytokines and serum amyloid A levels in liver were measured 5 hours after injection. There were three groups with significant changes in plasma TNFα, IL-6 or liver SAA levels: the two combination groups and the IL-6 high group. Plasma TNFα was significantly higher in the two combination groups, while IL-6 was increased in the
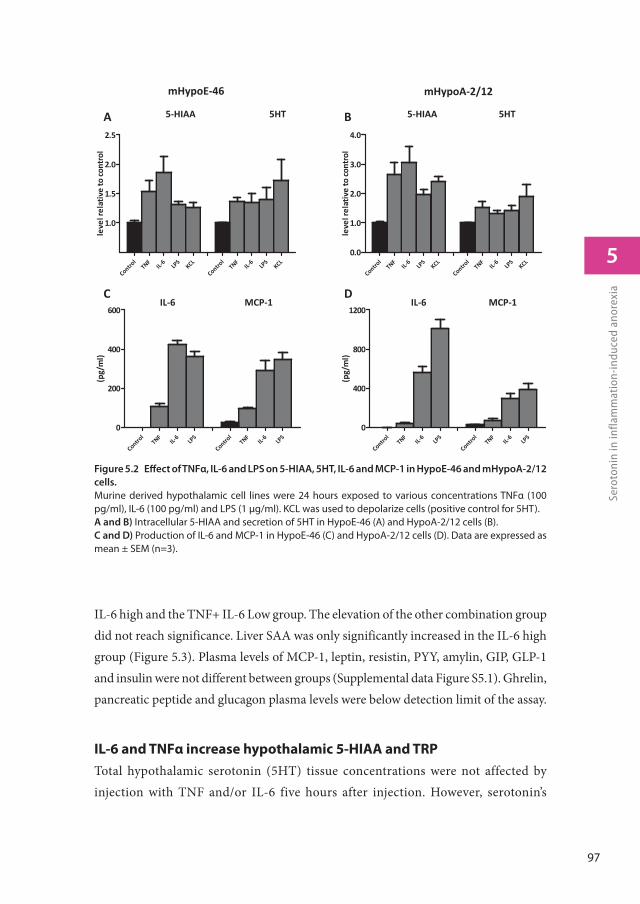
97
5
Sero
toni
n in
infla
mm
atio
n-in
duce
d an
orex
iaIL-6 high and the TNF+ IL-6 Low group. The elevation of the other combination group did not reach significance. Liver SAA was only significantly increased in the IL-6 high group (Figure 5.3). Plasma levels of MCP-1, leptin, resistin, PYY, amylin, GIP, GLP-1 and insulin were not different between groups (Supplemental data Figure S5.1). Ghrelin, pancreatic peptide and glucagon plasma levels were below detection limit of the assay.
IL-6 and TNFα increase hypothalamic 5-HIAA and TRP
Total hypothalamic serotonin (5HT) tissue concentrations were not affected by injection with TNF and/or IL-6 five hours after injection. However, serotonin’s
Figure 5.2 Eff ect of TNFα, IL-6 and LPS on 5-HIAA, 5HT, IL-6 and MCP-1 in HypoE-46 and mHypoA-2/12
cells.
Murine derived hypothalamic cell lines were 24 hours exposed to various concentrations TNFα (100 pg/ml), IL-6 (100 pg/ml) and LPS (1 μg/ml). KCL was used to depolarize cells (positive control for 5HT). A and B) Intracellular 5-HIAA and secretion of 5HT in HypoE-46 (A) and HypoA-2/12 cells (B). C and D) Production of IL-6 and MCP-1 in HypoE-46 (C) and HypoA-2/12 cells (D). Data are expressed as mean ± SEM (n=3).
5 HIAA 5HT
mHypoE 46
5 HIAA 5HT
mHypoA 2/12
Control
TNFIL
6LP
S
Control
TNFIL
6LP
S0
200
400
600
(pg/
ml)
Control
TNFIL
6LP
S
Control
TNFIL
6LP
S0
400
800
1200
(pg/
ml)
IL 6 MCP 1 IL 6 MCP 1
Control
TNFIL
6LP
SKCL
Control
TNFIL
6LP
SKCL
1.0
1.5
2.0
2.5
leve
lrel
ativ
eto
cont
rol
Control
TNFIL
6LP
SKCL
Control
TNFIL
6LP
SKCL
0.0
1.0
2.0
3.0
4.0
leve
lrel
ativ
eto
cont
rol
A B
DC
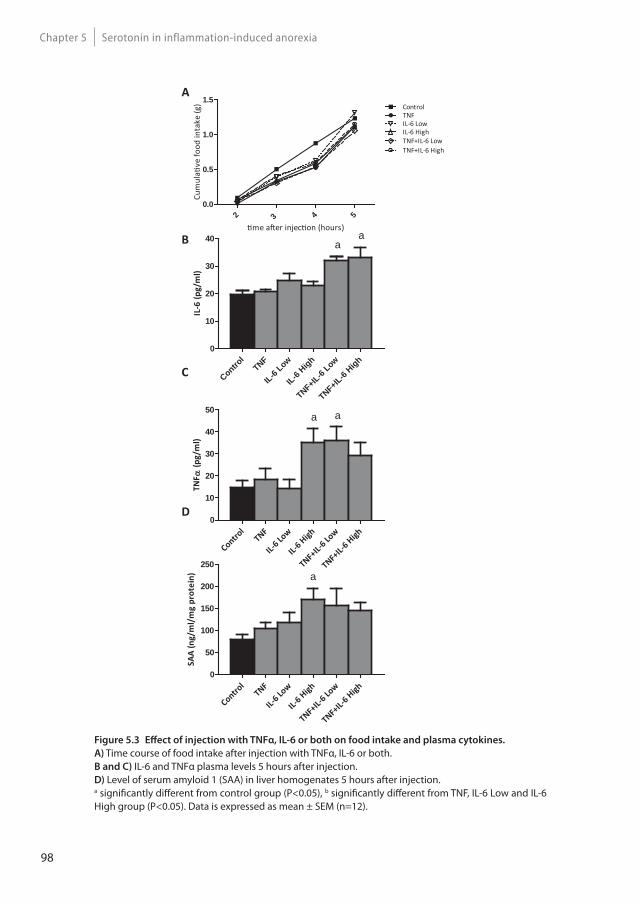
98
Serotonin in inflammation-induced anorexiaChapter 5
Figure 5.3 Eff ect of injection with TNFα, IL-6 or both on food intake and plasma cytokines.
A) Time course of food intake after injection with TNFα, IL-6 or both.B and C) IL-6 and TNFα plasma levels 5 hours after injection.D) Level of serum amyloid 1 (SAA) in liver homogenates 5 hours after injection.a signifi cantly diff erent from control group (P<0.05), b signifi cantly diff erent from TNF, IL-6 Low and IL-6 High group (P<0.05). Data is expressed as mean ± SEM (n=12).
2 3 4 50.0
0.5
1.0
1.5ControlTNF
me a er injec on (hours)
Cum
ula
ve fo
od in
take
(g)
IL-6 LowIL-6 HighTNF+IL-6 LowTNF+IL-6 High
Control
TNF
IL-6 Low
IL-6 High
TNF+IL-6
Low
TNF+IL-6
High0
10
20
30
40
IL-6
(pg/
ml)
aa
Control
TNF
IL-6 Lo
w
IL-6 High
TNF+IL-
6 Low
TNF+IL-
6 High0
10
20
30
40
50
TNF
(pg/
ml)
a a
Control
TNF
IL-6 Lo
w
IL-6 High
TNF+IL-
6 Low
TNF+IL-
6 High0
50
100
150
200
250
SAA
(ng/
ml/
mg
prot
ein) a
A
C
D
B
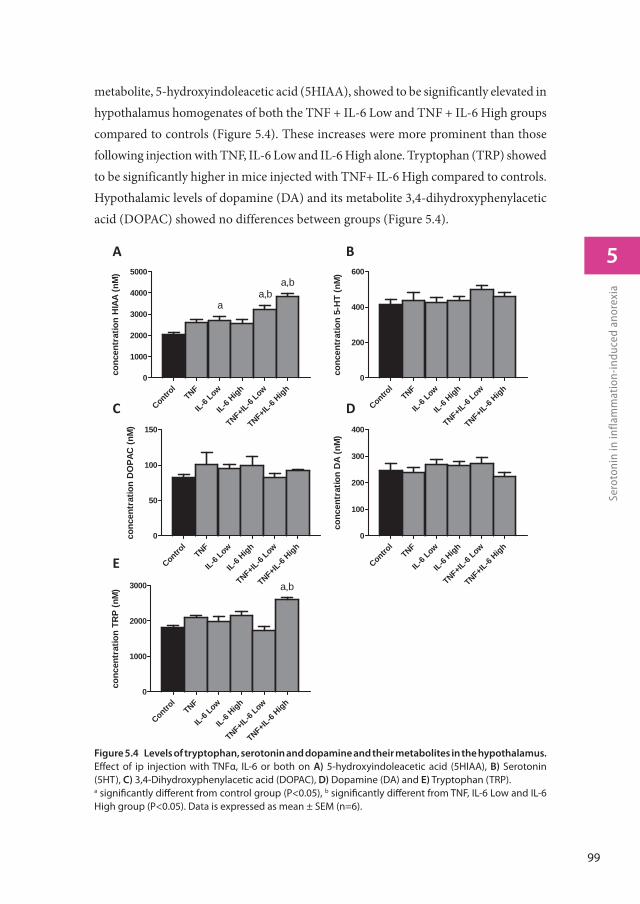
99
5
Sero
toni
n in
infla
mm
atio
n-in
duce
d an
orex
ia
metabolite, 5-hydroxyindoleacetic acid (5HIAA), showed to be significantly elevated in hypothalamus homogenates of both the TNF + IL-6 Low and TNF + IL-6 High groups compared to controls (Figure 5.4). These increases were more prominent than those following injection with TNF, IL-6 Low and IL-6 High alone. Tryptophan (TRP) showed to be significantly higher in mice injected with TNF+ IL-6 High compared to controls. Hypothalamic levels of dopamine (DA) and its metabolite 3,4-dihydroxyphenylacetic acid (DOPAC) showed no differences between groups (Figure 5.4).
Figure 5.4 Levels of tryptophan, serotonin and dopamine and their metabolites in the hypothalamus.
Eff ect of ip injection with TNFα, IL-6 or both on A) 5-hydroxyindoleacetic acid (5HIAA), B) Serotonin (5HT), C) 3,4-Dihydroxyphenylacetic acid (DOPAC), D) Dopamine (DA) and E) Tryptophan (TRP).a signifi cantly diff erent from control group (P<0.05), b signifi cantly diff erent from TNF, IL-6 Low and IL-6 High group (P<0.05). Data is expressed as mean ± SEM (n=6).
Control
TNF
IL-6 Low
IL-6 High
TNF+IL-6
Low
TNF+IL-6
High0
200
400
600
conc
entr
atio
n 5-
HT
(nM
)
Control
TNF
IL-6Low
IL-6 High
TNF+IL-6
Low
TNF+IL-6
High0
50
100
150
conc
entr
atio
n D
OPA
C (n
M)
Control
TNF
IL-6 Low
IL-6 High
TNF+IL-6
Low
TNF+IL-6
High0
1000
2000
3000
conc
entr
atio
n TR
P (n
M) a,b
Control
TNF
IL-6 Low
IL-6 High
TNF+IL-6
Low
TNF+IL-6
High0
100
200
300
400
conc
entr
atio
n D
A (n
M)
Control
TNF
IL-6Low
IL-6 High
TNF+IL-6
Low
TNF+IL-6
High0
1000
2000
3000
4000
5000
conc
entr
atio
n H
IAA
(nM
)
aa,b
a,b
A
E
B
C D
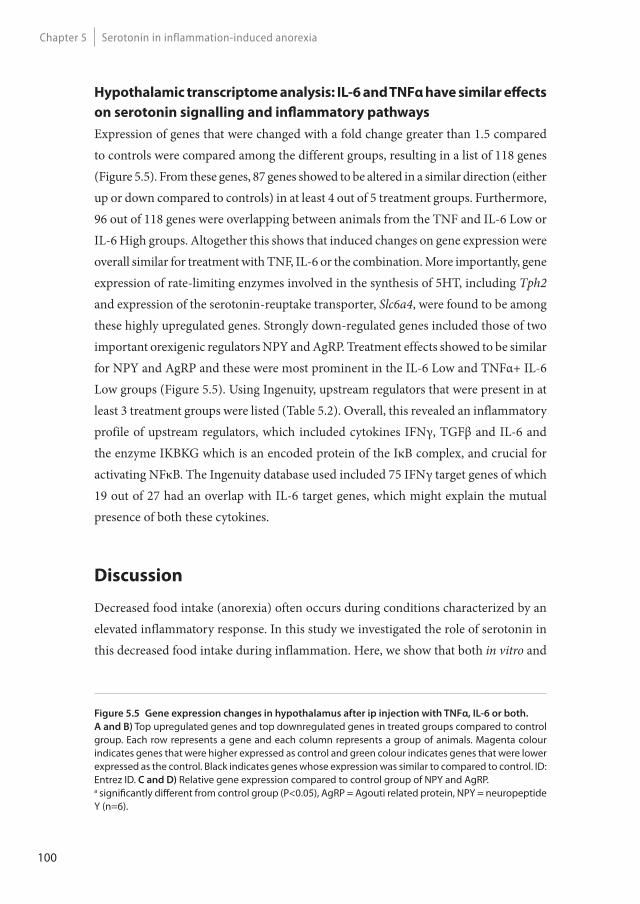
100
Serotonin in inflammation-induced anorexiaChapter 5
Hypothalamic transcriptome analysis: IL-6 and TNFα have similar eff ects
on serotonin signalling and infl ammatory pathways
Expression of genes that were changed with a fold change greater than 1.5 compared to controls were compared among the different groups, resulting in a list of 118 genes (Figure 5.5). From these genes, 87 genes showed to be altered in a similar direction (either up or down compared to controls) in at least 4 out of 5 treatment groups. Furthermore, 96 out of 118 genes were overlapping between animals from the TNF and IL-6 Low or IL-6 High groups. Altogether this shows that induced changes on gene expression were overall similar for treatment with TNF, IL-6 or the combination. More importantly, gene expression of rate-limiting enzymes involved in the synthesis of 5HT, including Tph2 and expression of the serotonin-reuptake transporter, Slc6a4, were found to be among these highly upregulated genes. Strongly down-regulated genes included those of two important orexigenic regulators NPY and AgRP. Treatment effects showed to be similar for NPY and AgRP and these were most prominent in the IL-6 Low and TNFα+ IL-6 Low groups (Figure 5.5). Using Ingenuity, upstream regulators that were present in at least 3 treatment groups were listed (Table 5.2). Overall, this revealed an inflammatory profile of upstream regulators, which included cytokines IFNγ, TGFβ and IL-6 and the enzyme IKBKG which is an encoded protein of the IκB complex, and crucial for activating NFκB. The Ingenuity database used included 75 IFNγ target genes of which 19 out of 27 had an overlap with IL-6 target genes, which might explain the mutual presence of both these cytokines.
Discussion
Decreased food intake (anorexia) often occurs during conditions characterized by an elevated inflammatory response. In this study we investigated the role of serotonin in this decreased food intake during inflammation. Here, we show that both in vitro and
Figure 5.5 Gene expression changes in hypothalamus after ip injection with TNFα, IL-6 or both.
A and B) Top upregulated genes and top downregulated genes in treated groups compared to control group. Each row represents a gene and each column represents a group of animals. Magenta colour indicates genes that were higher expressed as control and green colour indicates genes that were lower expressed as the control. Black indicates genes whose expression was similar to compared to control. ID: Entrez ID. C and D) Relative gene expression compared to control group of NPY and AgRP. a signifi cantly diff erent from control group (P<0.05), AgRP = Agouti related protein, NPY = neuropeptide Y (n=6).
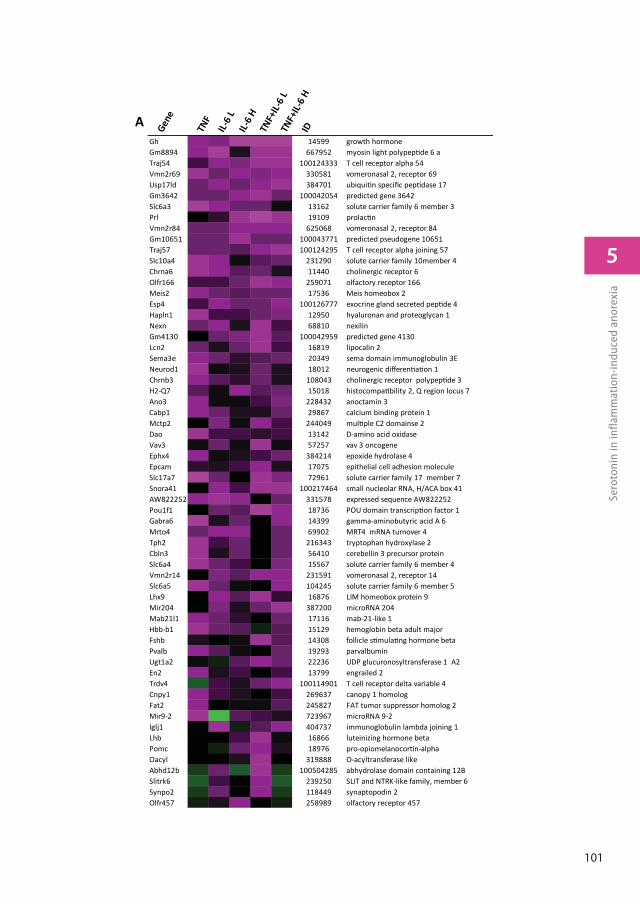
101
5
Sero
toni
n in
infla
mm
atio
n-in
duce
d an
orex
ia
Gene
TNF
IL-6
LIL-
6 H
TNF+
IL-6
LTN
F+IL-
6 H
ID
Gh 14599 growth hormoneGm8894 667952 myosin light polypep de 6 aTraj54 100124333 T cell receptor alpha 54Vmn2r69 330581 vomeronasal 2, receptor 69Usp17ld 384701 ubiqui n speci c pep dase 17Gm3642 100042054 predicted gene 3642Slc6a3 13162 solute carrier family 6 member 3Prl 19109 prolac nVmn2r84 625068 vomeronasal 2, receptor 84Gm10651 100043771 predicted pseudogene 10651Traj57 100124295 T cell receptor alpha joining 57Slc10a4 231290 solute carrier family 10member 4Chrna6 11440 cholinergic receptor 6Olfr166 259071 olfactory receptor 166Meis2 17536 Meis homeobox 2Esp4 100126777 exocrine gland secreted pep de 4Hapln1 12950 hyaluronan and proteoglycan 1Nexn 68810 nexilinGm4130 100042959 predicted gene 4130Lcn2 16819 lipocalin 2Sema3e 20349 sema domain immunoglobulin 3ENeurod1 18012 neurogenic di eren a on 1Chrnb3 108043 cholinergic receptor polypep de 3H2-Q7 15018 histocompa bility 2, Q region locus 7Ano3 228432 anoctamin 3Cabp1 29867 calcium binding protein 1Mctp2 244049 mul ple C2 domainse 2Dao 13142 D-amino acid oxidaseVav3 57257 vav 3 oncogeneEphx4 384214 epoxide hydrolase 4Epcam 17075 epithelial cell adhesion moleculeSlc17a7 72961 solute carrier family 17 member 7Snora41 100217464 small nucleolar RNA, H/ACA box 41AW822252 331578 expressed sequence AW822252Pou1f1 18736 POU domain transcrip on factor 1Gabra6 14399 gamma-aminobutyric acid A 6Mrto4 69902 MRT4 mRNA turnover 4Tph2 216343 tryptophan hydroxylase 2Cbln3 56410 cerebellin 3 precursor proteinSlc6a4 15567 solute carrier family 6 member 4Vmn2r14 231591 vomeronasal 2, receptor 14Slc6a5 104245 solute carrier family 6 member 5Lhx9 16876 LIM homeobox protein 9Mir204 387200 microRNA 204Mab21l1 17116 mab-21-like 1Hbb-b1 15129 hemoglobin beta adult major Fshb 14308 follicle s mula ng hormone betaPvalb 19293 parvalbuminUgt1a2 22236 UDP glucuronosyltransferase 1 A2En2 13799 engrailed 2Trdv4 100114901 T cell receptor delta variable 4Cnpy1 269637 canopy 1 homologFat2 245827 FAT tumor suppressor homolog 2 Mir9-2 723967 microRNA 9-2Iglj1 404737 immunoglobulin lambda joining 1Lhb 16866 luteinizing hormone betaPomc 18976 pro-opiomelanocor n-alphaOacyl 319888 O-acyltransferase likeAbhd12b 100504285 abhydrolase domain containing 12BSlitrk6 239250 SLIT and NTRK-like family, member 6Synpo2 118449 synaptopodin 2Olfr457 258989 olfactory receptor 457
A
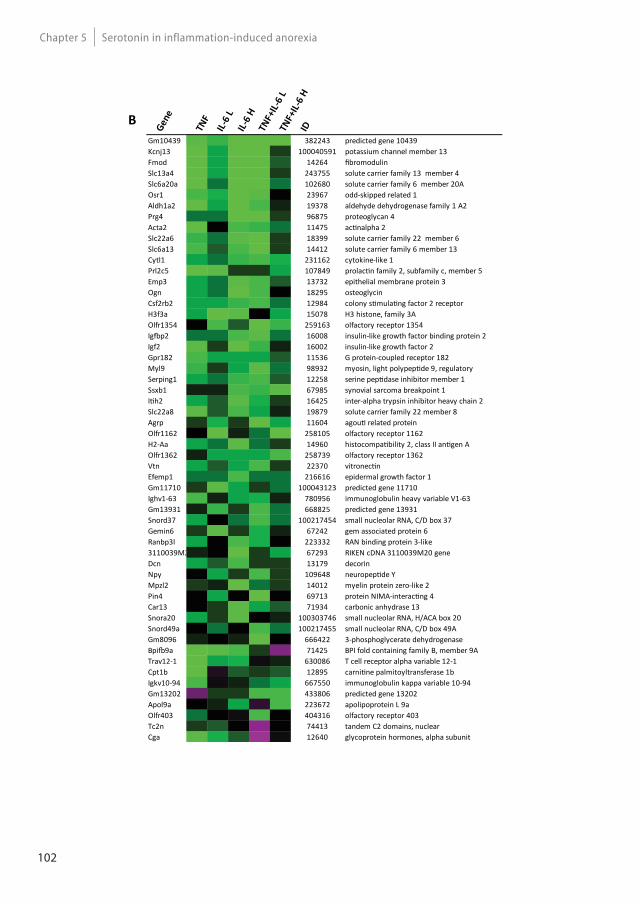
102
Serotonin in inflammation-induced anorexiaChapter 5
Gene
TNF
IL-6
LIL-
6 H
TNF+
IL-6
LTN
F+IL-
6 H
ID
Gm10439 382243 predicted gene 10439Kcnj13 100040591 potassium channel member 13Fmod 14264 bromodulinSlc13a4 243755 solute carrier family 13 member 4Slc6a20a 102680 solute carrier family 6 member 20AOsr1 23967 odd-skipped related 1Aldh1a2 19378 aldehyde dehydrogenase family 1 A2Prg4 96875 proteoglycan 4 Acta2 11475 ac nalpha 2Slc22a6 18399 solute carrier family 22 member 6Slc6a13 14412 solute carrier family 6 member 13Cytl1 231162 cytokine-like 1Prl2c5 107849 prolac n family 2, subfamily c, member 5Emp3 13732 epithelial membrane protein 3Ogn 18295 osteoglycinCsf2rb2 12984 colony s mula ng factor 2 receptor H3f3a 15078 H3 histone, family 3AOlfr1354 259163 olfactory receptor 1354Ig p2 16008 insulin-like growth factor binding protein 2Igf2 16002 insulin-like growth factor 2Gpr182 11536 G protein-coupled receptor 182Myl9 98932 myosin, light polypep de 9, regulatorySerping1 12258 serine pep dase inhibitor member 1Ssxb1 67985 synovial sarcoma breakpoint 1I h2 16425 inter-alpha trypsin inhibitor heavy chain 2Slc22a8 19879 solute carrier family 22 member 8Agrp 11604 agou related proteinOlfr1162 258105 olfactory receptor 1162H2-Aa 14960 histocompa bility 2, class II an gen AOlfr1362 258739 olfactory receptor 1362Vtn 22370 vitronec nEfemp1 216616 epidermal growth factor 1Gm11710 100043123 predicted gene 11710Ighv1-63 780956 immunoglobulin heavy variable V1-63Gm13931 668825 predicted gene 13931Snord37 100217454 small nucleolar RNA, C/D box 37Gemin6 67242 gem associated protein 6Ranbp3l 223332 RAN binding protein 3-like3110039M2 67293 RIKEN cDNA 3110039M20 geneDcn 13179 decorinNpy 109648 neuropep de YMpzl2 14012 myelin protein zero-like 2Pin4 69713 protein NIMA-interac ng 4 Car13 71934 carbonic anhydrase 13Snora20 100303746 small nucleolar RNA, H/ACA box 20Snord49a 100217455 small nucleolar RNA, C/D box 49AGm8096 666422 3-phosphoglycerate dehydrogenaseBpi 9a 71425 BPI fold containing family B, member 9ATrav12-1 630086 T cell receptor alpha variable 12-1Cpt1b 12895 carni ne palmitoyltransferase 1bIgkv10-94 667550 immunoglobulin kappa variable 10-94Gm13202 433806 predicted gene 13202Apol9a 223672 apolipoprotein L 9aOlfr403 404316 olfactory receptor 403Tc2n 74413 tandem C2 domains, nuclearCga 12640 glycoprotein hormones, alpha subunit
B
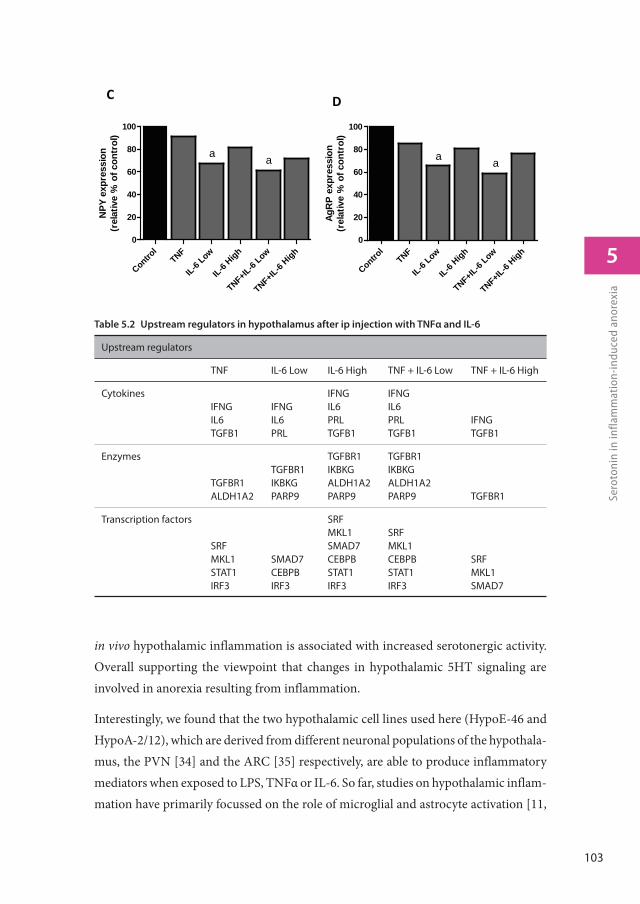
103
5
Sero
toni
n in
infla
mm
atio
n-in
duce
d an
orex
ia
in vivo hypothalamic inflammation is associated with increased serotonergic activity. Overall supporting the viewpoint that changes in hypothalamic 5HT signaling are involved in anorexia resulting from inflammation.
Interestingly, we found that the two hypothalamic cell lines used here (HypoE-46 and HypoA-2/12), which are derived from different neuronal populations of the hypothala-mus, the PVN [34] and the ARC [35] respectively, are able to produce inflammatory mediators when exposed to LPS, TNFα or IL-6. So far, studies on hypothalamic inflam-mation have primarily focussed on the role of microglial and astrocyte activation [11,
C D
AgR
P ex
pres
sion
(rel
ativ
e %
of c
ontr
ol)
Control
TNF
IL-6 Low
IL-6 High
TNF+IL-6
Low
TNF+IL-6
High0
20
40
60
80
100
a a
NPY
exp
ress
ion
(rel
ativ
e %
of c
ontr
ol)
Control
TNF
IL-6 Low
IL-6 High
TNF+IL-6
Low
TNF+IL-6
High0
20
40
60
80
100
a a
Table 5.2 Upstream regulators in hypothalamus after ip injection with TNFα and IL-6
Upstream regulators
TNF IL-6 Low IL-6 High TNF + IL-6 Low TNF + IL-6 High
CytokinesIFNGIL6TGFB1
IFNGIL6PRL
IFNGIL6PRLTGFB1
IFNGIL6PRLTGFB1
IFNGTGFB1
Enzymes
TGFBR1ALDH1A2
TGFBR1IKBKGPARP9
TGFBR1IKBKGALDH1A2PARP9
TGFBR1IKBKGALDH1A2PARP9 TGFBR1
Transcription factors
SRFMKL1STAT1IRF3
SMAD7CEBPBIRF3
SRFMKL1SMAD7CEBPBSTAT1IRF3
SRFMKL1CEBPBSTAT1IRF3
SRFMKL1SMAD7
104
Serotonin in inflammation-induced anorexiaChapter 5
12, 36, 37]. However, it has been shown before that neurons also express high levels of various cytokines [38] and that synthesis of cytokines occurs in response to blood-borne inflammatory mediators [39]. This suggests that neurons may play a significant role in development and sustainment of hypothalamic inflammation. Furthermore, we showed that this inflammatory response in hypothalamic neurons coincided with elevated serotonin secretion and increased intracellular 5-HIAA levels, reflecting an increase in serotonin turnover. In the mice, injection with combinations of TNFα and IL-6 resulted in increased hypothalamic 5-HIAA levels, while tissue serotonin levels did not differ from controls. A possible explanation for this apparent difference could be that in cell experiments, secreted serotonin was measured. However, in total tissue homogenates, intracellular serotonin cannot be distinguished from serotonin released into the synaptic cleft. Therefore, total tissue homogenate levels of serotonin do not properly reflect its release, which has also been reported for other monoamines and catecholamines [40]. However, 5-HIAA, the stable metabolic endproduct of 5HT is considered to be a good reflection for serotonin release [41-43] and therefore widely acknowledged as marker for serotonergic activity [25, 26].
Levels of 5-HIAA are measured in different matrices, models and diseases, including various forms of depression and aggressive behaviour disorders, where measurement of 5-HIAA gives better results than that of serotonin. Alterations on 5-HIAA are more pronounced and long-lasting, while changes on serotonin can be rapidly diminished [27, 44-46].
In the current experimental setting, 5 HT and metabolites were measured 5 hours after cytokine injection and it could be that alterations of serotonin levels had already diminished by then. A similar reasoning might explain why elevated levels of serotonin’s precursor, tryptophan (TRP), were only prominent in mice injected with the combina-tion of the highest dose of IL-6 and TNFα. Tryptophan levels have been reported to rise upon injection with cytokines depending on the type of inflammatory stimulus used. However at the same time, this inflammatory response is associated with increased TRP breakdown by indoleamine 2,3-dioxygenase m (IDO), to synthesize kynurenine [47, 48].
In plasma, levels of TNFα and IL-6 were not elevated in the groups treated with a single cytokine. However, when these cytokines were given in combination, high levels of IL-6 and TNFα were measured. It is likely that clearance of the administered cytokines already occurred within five hours following injection. For both TNFα and IL-6, complete clear-
105
5
Sero
toni
n in
infla
mm
atio
n-in
duce
d an
orex
ia
ance from the circulation has been reported to occur within 6 hours after ip injection [49, 50]. Furthermore levels of these cytokines have different temporal profiles, with TNFα plasma being fast responsive and also more rapidly cleared than IL-6 from the blood, but at the same time being more persistent in hypothalamus than IL-6 [51, 52] .
Food intake showed to decrease in all treated groups and there was no difference be-tween the treatments. It appears that the lowest dose of IL-6 was sufficient to induce an anorexigenic effect and that higher doses produced no additional anorexigenic activity. This is in line with other reports showing that in contrast to other IL-6 effects, there is no clear dose-dependency of IL-6 when it comes to its activity on food-intake [53, 54].
Whole genome gene expression profiles from the hypothalamus and the predicted in-flammatory transcriptional regulators showed a high overlap between TNFα, IL-6 and combination groups, indicating that responses of the different treatments were similar. This might be explained by a production of similar cytokines by the host in response to injection with IL-6 or TNFα. In hypothalamic tissue homogenates, increased levels of IL-6 have been reported after injection with TNFα [55], which suggests that injec-tion with TNFα also leads to activation of IL-6 signalling pathways. The strong down-regulation of expression of two important orexigenic neuropeptide regulators NPY and AgRP also showed to be similar between groups and corresponded to lower food intake in treated groups. This decrease in expression induced by TNFα or IL-6 supports findings that have been reported in a variety of experimental models including hypothalamic injection with TNFα and genetic overexpression of hypothalamic IL-6 [56, 57].
Gene expression of two genes involved in serotonin signalling, showed to be upregulated in mice treated with TNFα and IL-6. Serotonin has been reported to have an inhibiting action on NPY [13, 58, 59], suggesting that the increase in serotonergic activity meas-ured in treated mice, might be responsible for the effects on lower NPY expression in these mice.
In summary, we show that TNFα and IL-6 induce similar inflammatory responses in the hypothalamus and similar effects on food intake. This anorexigenic effect of TNFα and IL-6 showed to coincidence with increased hypothalamic serotonergic activity, providing further evidence for a role for serotonin in inflammation-induced anorexia.
106
Serotonin in inflammation-induced anorexiaChapter 5
Acknowledgements
We would like to thank N. van der Wielen, L. Janssen Duijghuijsen, Y. Wang, S. Keshtkar, S. Rouschop, P. Vinke, L. Strolenberg, W. Blauw and B. Weijers for their technical assistance. The research leading to these results has received funding from the European Union’s Seventh Framework Programme for research, technological development and demonstration under grant agreement n°266408 (Full4Health).
References
1. Hopkins, S.J. and N.J. Rothwell, Cytokines and the nervous system. I: Expression and recognition. Trends Neurosci, 1995. 18(2): p. 83-8.
2. Zhu, C.B., K.M. Lindler, A.W. Owens, L.C. Daws, R.D. Blakely, and W.A. Hewlett, Interleukin-1 receptor activation by systemic lipopolysaccharide induces behavioral despair linked to MAPK regulation of CNS serotonin transporters. Neuropsychopharmacology, 2010. 35(13): p. 2510-20.
3. Endo, M., T. Masaki, M. Seike, and H. Yoshimatsu, Involvement of stomach ghrelin and hypothalamic neuropeptides in tumor necrosis factor-alpha-induced hypophagia in mice. Regul Pept, 2007. 140(1-2): p. 94-100.
4. Jang, P.G., C. Namkoong, G.M. Kang, M.W. Hur, S.W. Kim, G.H. Kim, Y. Kang, M.J. Jeon, E.H. Kim, M.S. Lee, M. Karin, J.H. Baik, J.Y. Park, K.U. Lee, Y.B. Kim, and M.S. Kim, NF-kappaB activation in hypothalamic pro-opiomelanocortin neurons is essential in illness- and leptin-induced anorexia. J Biol Chem, 2010. 285(13): p. 9706-15.
5. Gutierrez, E.G., W.A. Banks, and A.J. Kastin, Murine tumor necrosis factor alpha is transported from blood to brain in the mouse. J Neuroimmunol, 1993. 47(2): p. 169-76.
6. Banks, W.A., A.J. Kastin, and E.G. Gutierrez, Penetration of interleukin-6 across the murine blood-brain barrier. Neurosci Lett, 1994. 179(1-2): p. 53-6.
7. Banks, W.A. and A.J. Kastin, Blood to brain transport of interleukin links the immune and central nervous systems. Life Sci, 1991. 48(25): p. PL117-21.
8. Herman, A.P., A. Krawczynska, J. Bochenek, H. Antushevich, A. Herman, and D. Tomaszewska-Zaremba, Peripheral injection of SB203580 inhibits the inflammatory-dependent synthesis of proinflammatory cytokines in the hypothalamus. Biomed Res Int, 2014. 2014: p. 475152.
9. Peruzzo, B., F.E. Pastor, J.L. Blazquez, K. Schobitz, B. Pelaez, P. Amat, and E.M. Rodriguez, A second look at the barriers of the medial basal hypothalamus. Exp Brain Res, 2000. 132(1): p. 10-26.
10. Krisch, B. and H. Leonhardt, The functional and structural border of the neurohemal region of the median eminence. Cell Tissue Res, 1978. 192(2): p. 327-39.
11. Rana, I., M. Stebbing, A. Kompa, D.J. Kelly, H. Krum, and E. Badoer, Microglia activation in the hypothalamic PVN following myocardial infarction. Brain Res, 2010. 1326: p. 96-104.
107
5
Sero
toni
n in
infla
mm
atio
n-in
duce
d an
orex
ia
12. Ronaldson, P.T. and R. Bendayan, HIV-1 viral envelope glycoprotein gp120 triggers an inflammatory response in cultured rat astrocytes and regulates the functional expression of P-glycoprotein. Mol Pharmacol, 2006. 70(3): p. 1087-98.
13. Dwarkasing, J.T., M.V. Boekschoten, J.M. Argilès, M. van Dijk, S. Busquets, F. Penna, M. Toledo, A. Laviano, R.F. Witkamp, and K. van Norren, Differences in food intake of tumour-bearing cachectic mice are associated with hypothalamic serotonin signalling. Journal of Cachexia, Sarcopenia and Muscle, 2015. 6(1): p. 84-94.
14. Laviano, A., A. Inui, M.M. Meguid, A. Molfino, C. Conte, and F. Rossi Fanelli, NPY and brain monoamines in the pathogenesis of cancer anorexia. Nutrition, 2008. 24(9): p. 802-5.
15. Meguid, M.M., E.J. Ramos, A. Laviano, M. Varma, T. Sato, C. Chen, Y. Qi, and U.N. Das, Tumor anorexia: effects on neuropeptide Y and monoamines in paraventricular nucleus. Peptides, 2004. 25(2): p. 261-6.
16. Delorme, M.L., J. Denis, B. Nordlinger, M. Boschat, and P. Opolon, Relationship between plasma and brain tryptophan in pigs during experimental hepatic coma before and after hemodialysis with selective membranes. J Neurochem, 1981. 36(3): p. 1058-66.
17. Dawson, R. and S. Oparil, Genetic and salt-related alterations in monoamine neurotransmitters in Dahl salt-sensitive and salt-resistant rats. Pharmacology, 1986. 33(6): p. 322-33.
18. Calapai, G., F. Corica, A. Corsonello, L. Sautebin, M. Di Rosa, G.M. Campo, M. Buemi, V.N. Mauro, and A.P. Caputi, Leptin increases serotonin turnover by inhibition of brain nitric oxide synthesis. J Clin Invest, 1999. 104(7): p. 975-82.
19. Brunetti, L., G. Orlando, L. Recinella, S. Leone, C. Ferrante, A. Chiavaroli, F. Lazzarin, and M. Vacca, Glucagon-like peptide 1 (7-36) amide (GLP-1) and exendin-4 stimulate serotonin release in rat hypothalamus. Peptides, 2008. 29(8): p. 1377-81.
20. Nonogaki, K., K. Ohashi-Nozue, and Y. Oka, A negative feedback system between brain serotonin systems and plasma active ghrelin levels in mice. Biochem Biophys Res Commun, 2006. 341(3): p. 703-7.
21. Xu, Y., J.E. Jones, D. Kohno, K.W. Williams, C.E. Lee, M.J. Choi, J.G. Anderson, L.K. Heisler, J.M. Zigman, B.B. Lowell, and J.K. Elmquist, 5-HT2CRs expressed by pro-opiomelanocortin neurons regulate energy homeostasis. Neuron, 2008. 60(4): p. 582-9.
22. Dryden, S., H.M. Frankish, Q. Wang, and G. Williams, Increased feeding and neuropeptide Y (NPY) but not NPY mRNA levels in the hypothalamus of the rat following central administration of the serotonin synthesis inhibitor p-chlorophenylalanine. Brain Res, 1996. 724(2): p. 232-7.
23. Cangiano, C., A. Laviano, M.M. Meguid, M. Mulieri, L. Conversano, I. Preziosa, and F. Rossi-Fanelli, Effects of administration of oral branched-chain amino acids on anorexia and caloric intake in cancer patients. J Natl Cancer Inst, 1996. 88(8): p. 550-2.
24. Dwarkasing, J.T., M. van Dijk, F.J. Dijk, M.V. Boekschoten, J. Faber, J.M. Argiles, A. Laviano, M. Muller, R.F. Witkamp, and K. van Norren, Hypothalamic food intake regulation in a cancer-cachectic mouse model. J Cachexia Sarcopenia Muscle, 2013. 5(2): p. 159-69.
108
Serotonin in inflammation-induced anorexiaChapter 5
25. Matsumoto, M., H. Togashi, M. Yoshioka, M. Hirokami, M. Tochihara, T. Ikeda, C.B. Smith, and H. Saito, Inhibitory effects of clonidine on serotonergic neuronal activity as measured by cerebrospinal fluid serotonin and its metabolite in anesthetized rats. Life Sci, 1993. 53(8): p. 615-20.
26. Shannon, N.J., J.W. Gunnet, and K.E. Moore, A comparison of biochemical indices of 5-hydroxytryptaminergic neuronal activity following electrical stimulation of the dorsal raphe nucleus. J Neurochem, 1986. 47(3): p. 958-65.
27. Winberg, S., A.A. Myrberg, Jr., and G.E. Nilsson, Predator exposure alters brain serotonin metabolism in bicolour damselfish. Neuroreport, 1993. 4(4): p. 399-402.
28. Virkkunen, M. and M. Linnoila, Brain serotonin, type II alcoholism and impulsive violence. J Stud Alcohol Suppl, 1993. 11: p. 163-9.
29. Lin, K., H. Kools, P.J. de Groot, A.K. Gavai, R.K. Basnet, F. Cheng, J. Wu, X. Wang, A. Lommen, G.J. Hooiveld, G. Bonnema, R.G. Visser, M.R. Muller, and J.A. Leunissen, MADMAX - Management and analysis database for multiple ~omics experiments. J Integr Bioinform, 2011. 8(2): p. 160.
30. Dai, M., P. Wang, A.D. Boyd, G. Kostov, B. Athey, E.G. Jones, W.E. Bunney, R.M. Myers, T.P. Speed, H. Akil, S.J. Watson, and F. Meng, Evolving gene/transcript definitions significantly alter the interpretation of GeneChip data. Nucleic acids research, 2005. 33(20): p. e175.
31. Irizarry, R.A., B.M. Bolstad, F. Collin, L.M. Cope, B. Hobbs, and T.P. Speed, Summaries of Affymetrix GeneChip probe level data. Nucleic acids research, 2003. 31(4): p. e15.
32. Bolstad, B.M., R.A. Irizarry, M. Astrand, and T.P. Speed, A comparison of normalization methods for high density oligonucleotide array data based on variance and bias. Bioinformatics, 2003. 19(2): p. 185-93.
33. Sartor, M.A., C.R. Tomlinson, S.C. Wesselkamper, S. Sivaganesan, G.D. Leikauf, and M. Medvedovic, Intensity-based hierarchical Bayes method improves testing for differentially expressed genes in microarray experiments. BMC Bioinformatics, 2006. 7: p. 538.
34. Dhillon, S.S. and D.D. Belsham, Leptin differentially regulates NPY secretion in hypothalamic cell lines through distinct intracellular signal transduction pathways. Regul Pept, 2011. 167(2-3): p. 192-200.
35. Dhillon, S.S. and D.D. Belsham, Estrogen inhibits NPY secretion through membrane-associated estrogen receptor (ER)-alpha in clonal, immortalized hypothalamic neurons. Int J Obes (Lond), 2011. 35(2): p. 198-207.
36. Kalin, S., F.L. Heppner, I. Bechmann, M. Prinz, M.H. Tschop, and C.X. Yi, Hypothalamic innate immune reaction in obesity. Nat Rev Endocrinol, 2015.
37. Thaler, J.P., C.X. Yi, E.A. Schur, S.J. Guyenet, B.H. Hwang, M.O. Dietrich, X. Zhao, D.A. Sarruf, V. Izgur, K.R. Maravilla, H.T. Nguyen, J.D. Fischer, M.E. Matsen, B.E. Wisse, G.J. Morton, T.L. Horvath, D.G. Baskin, M.H. Tschop, and M.W. Schwartz, Obesity is associated with hypothalamic injury in rodents and humans. J Clin Invest, 2012. 122(1): p. 153-62.
109
5
Sero
toni
n in
infla
mm
atio
n-in
duce
d an
orex
ia
38. Acarin, L., B. Gonzalez, and B. Castellano, Neuronal, astroglial and microglial cytokine expression after an excitotoxic lesion in the immature rat brain. Eur J Neurosci, 2000. 12(10): p. 3505-20.
39. Shibata, M., Hypothalamic neuronal responses to cytokines. Yale J Biol Med, 1990. 63(2): p. 147-56.
40. Meeusen, R. and K. De Meirleir, Exercise and brain neurotransmission. Sports Med, 1995. 20(3): p. 160-88.
41. Meeusen, R., K. Thorre, F. Chaouloff, S. Sarre, K. De Meirleir, G. Ebinger, and Y. Michotte, Effects of tryptophan and/or acute running on extracellular 5-HT and 5-HIAA levels in the hippocampus of food-deprived rats. Brain Res, 1996. 740(1-2): p. 245-52.
42. Blomstrand, E., D. Perrett, M. Parry-Billings, and E.A. Newsholme, Effect of sustained exercise on plasma amino acid concentrations and on 5-hydroxytryptamine metabolism in six different brain regions in the rat. Acta Physiol Scand, 1989. 136(3): p. 473-81.
43. Chaouloff, F., D. Laude, and J.L. Elghozi, PHysical exercise: evidence for differential consequences of tryptophan on 5-HT synthesis and metabolism in central serotonergic cell bodies and terminals. J Neural Transm, 1989. 78(2): p. 121-30.
44. Barton, D.A., M.D. Esler, T. Dawood, E.A. Lambert, D. Haikerwal, C. Brenchley, F. Socratous, J. Hastings, L. Guo, G. Wiesner, D.M. Kaye, R. Bayles, M.P. Schlaich, and G.W. Lambert, Elevated brain serotonin turnover in patients with depression: effect of genotype and therapy. Arch Gen Psychiatry, 2008. 65(1): p. 38-46.
45. Vermeiren, Y., D. Van Dam, T. Aerts, S. Engelborghs, and P.P. De Deyn, Monoaminergic neurotransmitter alterations in postmortem brain regions of depressed and aggressive patients with Alzheimer’s disease. Neurobiol Aging, 2014. 35(12): p. 2691-700.
46. Vermeiren, Y., D. Van Dam, T. Aerts, S. Engelborghs, and P.P. De Deyn, Brain region-specific monoaminergic correlates of neuropsychiatric symptoms in Alzheimer’s disease. J Alzheimers Dis, 2014. 41(3): p. 819-33.
47. Dinel, A.L., C. Andre, A. Aubert, G. Ferreira, S. Laye, and N. Castanon, Lipopolysaccharide-induced brain activation of the indoleamine 2,3-dioxygenase and depressive-like behavior are impaired in a mouse model of metabolic syndrome. Psychoneuroendocrinology, 2014. 40: p. 48-59.
48. Sato, T., A. Laviano, M.M. Meguid, C. Chen, F. Rossi-Fanelli, and K. Hatakeyama, Involvement of plasma leptin, insulin and free tryptophan in cytokine-induced anorexia. Clin Nutr, 2003. 22(2): p. 139-46.
49. Dunn, A.J., Stress-related changes in cerebral catecholamine and indoleamine metabolism: lack of effect of adrenalectomy and corticosterone. J Neurochem, 1988. 51(2): p. 406-12.
50. Xiang, B., G. Zhang, L. Guo, X.A. Li, A.J. Morris, A. Daugherty, S.W. Whiteheart, S.S. Smyth, and Z. Li, Platelets protect from septic shock by inhibiting macrophage-dependent inflammation via the cyclooxygenase 1 signalling pathway. Nat Commun, 2013. 4: p. 2657.
110
Serotonin in inflammation-induced anorexiaChapter 5
51. Kim, Y.W., K.H. Kim, D.K. Ahn, H.S. Kim, J.Y. Kim, D.C. Lee, and S.Y. Park, Time-course changes of hormones and cytokines by lipopolysaccharide and its relation with anorexia. J Physiol Sci, 2007. 57(3): p. 159-65.
52. Kakizaki, Y., H. Watanobe, A. Kohsaka, and T. Suda, Temporal profiles of interleukin-1beta, interleukin-6, and tumor necrosis factor-alpha in the plasma and hypothalamic paraventricular nucleus after intravenous or intraperitoneal administration of lipopolysaccharide in the rat: estimation by push-pull perfusion. Endocr J, 1999. 46(4): p. 487-96.
53. Schobitz, B., G. Pezeshki, T. Pohl, U. Hemmann, P.C. Heinrich, F. Holsboer, and J.M. Reul, Soluble interleukin-6 (IL-6) receptor augments central effects of IL-6 in vivo. FASEB J, 1995. 9(8): p. 659-64.
54. Wang, J. and K.L. Leibowitz, Central insulin inhibits hypothalamic galanin and neuropeptide Y gene expression and peptide release in intact rats. Brain Res, 1997. 777(1-2): p. 231-6.
55. Amaral, M.E., R. Barbuio, M. Milanski, T. Romanatto, H.C. Barbosa, W. Nadruz, M.B. Bertolo, A.C. Boschero, M.J. Saad, K.G. Franchini, and L.A. Velloso, Tumor necrosis factor-alpha activates signal transduction in hypothalamus and modulates the expression of pro-inflammatory proteins and orexigenic/anorexigenic neurotransmitters. J Neurochem, 2006. 98(1): p. 203-12.
56. Arruda, A.P., M. Milanski, T. Romanatto, C. Solon, A. Coope, L.C. Alberici, W.T. Festuccia, S.M. Hirabara, E. Ropelle, R. Curi, J.B. Carvalheira, A.E. Vercesi, and L.A. Velloso, Hypothalamic actions of tumor necrosis factor alpha provide the thermogenic core for the wastage syndrome in cachexia. Endocrinology, 2010. 151(2): p. 683-94.
57. Senaris, R.M., M.L. Trujillo, B. Navia, G. Comes, B. Ferrer, M. Giralt, and J. Hidalgo, Interleukin-6 regulates the expression of hypothalamic neuropeptides involved in body weight in a gender-dependent way. J Neuroendocrinol, 2011. 23(8): p. 675-86.
58. Shinozaki, T., M. Kimura, M. Hosoyamada, and T. Shibasaki, Fluvoxamine inhibits weight gain and food intake in food restricted hyperphagic Wistar rats. Biol Pharm Bull, 2008. 31(12): p. 2250-4.
59. Dryden, S., H.M. Frankish, Q. Wang, L. Pickavance, and G. Williams, The serotonergic agent fluoxetine reduces neuropeptide Y levels and neuropeptide Y secretion in the hypothalamus of lean and obese rats. Neuroscience, 1996. 72(2): p. 557-66.
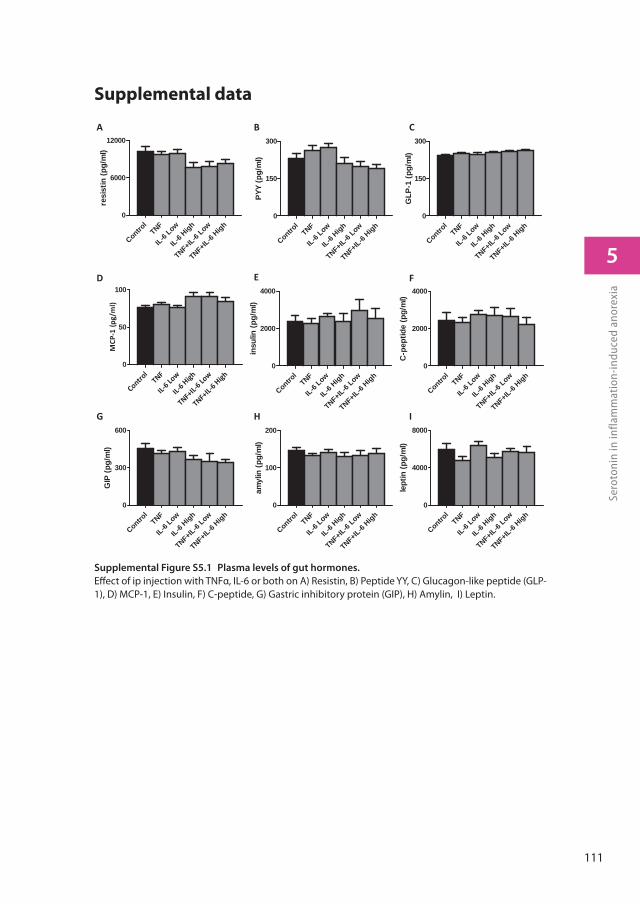
111
5
Sero
toni
n in
infla
mm
atio
n-in
duce
d an
orex
ia
Supplemental data
Supplemental Figure S5.1 Plasma levels of gut hormones.
Eff ect of ip injection with TNFα, IL-6 or both on A) Resistin, B) Peptide YY, C) Glucagon-like peptide (GLP-1), D) MCP-1, E) Insulin, F) C-peptide, G) Gastric inhibitory protein (GIP), H) Amylin, I) Leptin.
Control
TNF
IL6 Lo
w
IL6 High
TNF+IL
6 Low
TNF+IL
6 High0
50
100
MCP
1(p
g/m
l)
Control
TNF
IL-6 Low
IL-6High
TNF+IL-6
Low
TNF+IL-6
High0
100
200
amyl
in (p
g/m
l)
Control
TNF
IL-6 Low
IL-6High
TNF+IL-6
Low
TNF+IL-6
High0
4000
8000
lept
in (p
g/m
l)Contro
lTNF
IL-6 Low
IL-6 High
TNF+IL-6
Low
TNF+IL-6
High0
2000
4000
insu
lin (p
g/m
l)
Control
TNF
IL-6 Low
IL-6High
TNF+IL-6
Low
TNF+IL-6
High0
2000
4000
C-p
eptid
e (p
g/m
l)
Control
TNF
IL-6 Low
IL-6 High
TNF+IL-6
Low
TNF+IL-6
High0
6000
12000
resi
stin
(pg/
ml)
Control
TNF
IL-6Low
IL-6 High
TNF+IL-6
Low
TNF+IL-6
High0
300
600
GIP
(pg/
ml)
Control
TNF
IL-6 Low
IL-6 High
TNF+IL-6
Low
TNF+IL-6
High0
150
300
PYY
(pg/
ml)
Control
TNF
IL-6 Low
IL-6 High
TNF+IL-6
Low
TNF+IL-6
High0
150
300
GLP
-1 (p
g/m
l)
A
G
B
E
H
C
F
I
D


General discussion
6
114
General discussion Chapter 6
The main aim of this thesis was to further unravel crucial processes involved in the pathogenesis of anorexia during cancer. First, two different mouse models were used to investigate the general processes involved in cancer cachexia. In both models, tumour-induced cachexia (body wasting) was indeed strongly present, but opposing responses in food intake occurred. Therefore, these models were taken as a starting point to compare and disentangle processes primarily underlying cachexia and those specifically involved in anorexia. The differences between the models are discussed below (section Tumour mouse models to study human cancer). Furthermore, to determine the contribution of inflammation to the development of anorexia, we used a cytokine-induced anorexia model. Different concentrations of TNFα and IL-6 were injected in healthy mice, thus inducing an acute inflammatory response. The injected cytokine doses were estimated from plasma levels measured in tumour bearing (TB) mice. In this model, cachexia was absent and the acute inflammatory response exclusively induced anorexia. The usefulness and limitations of this acute inflammatory anorectic model to study food intake regulation during chronic illness are also discussed below (section Acute versus chronic inflammation). We identified serotonin signalling to be important in food intake regulation during cancer and showed that serotonin turnover was also modulated by inflammatory mediators. Finally, we used hypothalamic neuronal cell lines to mechanistically study the interactions between inflammation and the serotonin system. Altogether, we show that hypothalamic inflammation as a result of chronic illness is an important trigger in the failure of hypothalamic food intake regulation. Next, we provide evidence for the involvement of serotonergic pathways, acting as an upstream modulator of various orexigenic and anorexigenic systems.
Tumour mouse models to study cancer and their
translation to humans
In chapter 3 and 4, we used two tumour mouse models to study cancer-induced changes in hypothalamic processes involved in food intake. We showed that differences in food intake behaviour were inversely associated with changes in expression of genes involved in serotonin signalling. When using animal tumour models to investigate pathological processes in human diseases it is important to realise that at one hand animal models provide an intermediate step between in vitro and human experiments and that at the other hand their translational value towards humans remains a topic of considerable
115
6
Gen
eral
dis
cuss
ion
controversy. There are several factors that limit the usefulness of animal models in this respect, including the great variety of animal models in use and their lack of predictive value for the highly heterogeneous group of cancers as they occur in human patients. In the following sessions, therefore, specific parts involved in the ability to translate our obtained results to the human situation are discussed.
Heterogeneity of patient population
The population of patients suffering from cancer and the disease itself are highly heterogeneous. Validation or verification of biomarkers identified in smaller patients groups often fails in larger cancer population studies. As a result less than 3% of identified potential cancer biomarkers have found their way to the clinic [1]. Even within a patient group that suffers from a similar cancer type, there are numerous differences, including age, gender, disease state, nutritional status, environmental factors and immune status, that all contribute to course of the disease. Consequently, investigational treatments that show promising effects in smaller subpopulations are often producing disappointing results in larger study groups [2]. At the same time, specific genetic profiling of tumours appear to be a promising approach for treatment of various cancer types [3, 4], underlining the tumour-diversity within specific cancer types.
Another concern is that many intervention treatments have often been performed in patients that suffer from final stage cancer, which often co-occurs with irreversible tissue damage, limiting effectivity of treatment and successful outcomes [2, 5]. Fortunately, nowadays more trials are focused on intervention strategies already at diagnosis [6], increasing chances of success in disease progression.
Heterogeneity of tumour models
In this thesis, two different tumour mouse models, C26 and Lewis Lung (LL) model were used. These models differed in their experimental settings, including nature and origin of tumour cells, number of cells inoculated, duration of tumour growth, and strains of mice. This underlines the differences between the models found in study outcomes, including food intake behaviour and progression of cachexia. Heterogeneity in progression of cachexia and anorexia is a common phenomenon seen with different
116
General discussion Chapter 6
mice models, and even occurs between labs that use the same mouse model. Differences in experimental settings and animal handling, including differences in inoculation site [7], method of administration [8] and strain of mice [9, 10] as well as spontaneous mutations in the cell line used [11] lead to changes in characteristics of the models. These variations can also result in differences between the hosts’ immune response to the tumour, which in turn affects disease progression.
Mice models as representative for human carcinogenesis
Another aspect of the discussion on the use of mice cancer models is their translational value towards humans. Only 8% of cancer treatments showing positive test results in animal models are finally successfully translated to human trials, based on their treatment effectiveness and safety. This generates considerable doubt regarding the usefulness of animal cancer models as suitable models for humans [12]. It appears that this failure in translation from mice to humans is mainly due to disappointing treatment efficacy and safety. Factors underlying this discrepancy include the type of animal model used, differences in size, lifespan [13], drug metabolism [14], functional genes [15] and transcription factor binding sites [16].
Furthermore, psychological changes that affect behaviour in response to tumour growth are complex in humans and difficult to measure in animal models. This is likely to occur in food intake behaviour, since in humans awareness of the disease and its possible consequences will affect mental health and social interactions, which subsequently influences food intake [17-19]. However, even though rodent models possess translational limitations towards humans, they have greatly contributed to our current understanding of molecular and cellular mechanisms in carcinogenesis and their consequences. Furthermore, by using genetic mice models, novel cancer genes have been identified [20, 21]. More importantly, changes in biomarkers that are commonly occurring in cancer patients, including elevated levels of cytokines [22-25], C-reactive protein [26-29], cortisol [30] and muscle-specific markers for cachexia [31] are also found in various animal models used in cancer research. Therefore, similar effects and findings in multiple animal models are likely to be more promising for their efficacy in humans. Vice versa, processes involved in migration of tumour cells through the body and specific characteristics of tumour environment in humans can be mimicked in mice
117
6
Gen
eral
dis
cuss
ion
[32], creating additional research opportunities that are limited in humans. Studies on pathophysiological processes in specific organs in mice are of importance, because of the practical and ethical restrictions of human experiments.
In summary, tumour models in animals are of significant importance to human research, since they provide an intermediate step between in vitro and human experiments. However, limitations on translation from mice to humans, as well as heterogeneity of the cancer patient population should be taken into account.
Chronic infl ammation: low grade and high grade?
An important aspect of anorexia in cancer is chronic inflammation. A chronically elevated inflammatory tone is common to various illnesses, including cancer, COPD, and HIV infection. In LL TB mice we showed that the presence of anorexia during an increased inflammatory status was associated with increased hypothalamic serotonin signalling. In C26 TB mice, displaying an increased food intake, we found that an increased inflammatory status was associated with decreased hypothalamic serotonin signalling. Taken together, this suggests that tumour-induced chronic inflammation can be associated with both elevated and reduced serotonin in the hypothalamus. Contributing to this paradox is the general observation on lowered hypothalamic serotonin concentration or release in obesity [33-37]. Obesity is also considered to be a state characterized by a chronically increased inflammatory tone. Furthermore, targeting the serotonin system using agonists for serotonin receptors 5HT2c, 5HT1b and 5HT6 in the brain is a current treatment in the fight against overeating in obesity [38, 39]. So, an important question that arises is what causes chronic inflammation to be associated with both elevated serotonin and reduced serotonin in the hypothalamus? Inflammation has different manifestations due to its diversity in type, duration, level and origin [40]. In obesity, a low-grade inflammatory process is ongoing, which is characterized by slightly increased cytokine levels in blood. In contrast, in severe illnesses, including progressive cancer and rheumatoid arthritis, the immune system is highly activated, which is reflected by much higher levels of cytokines compared to those seen in obesity [41-47].
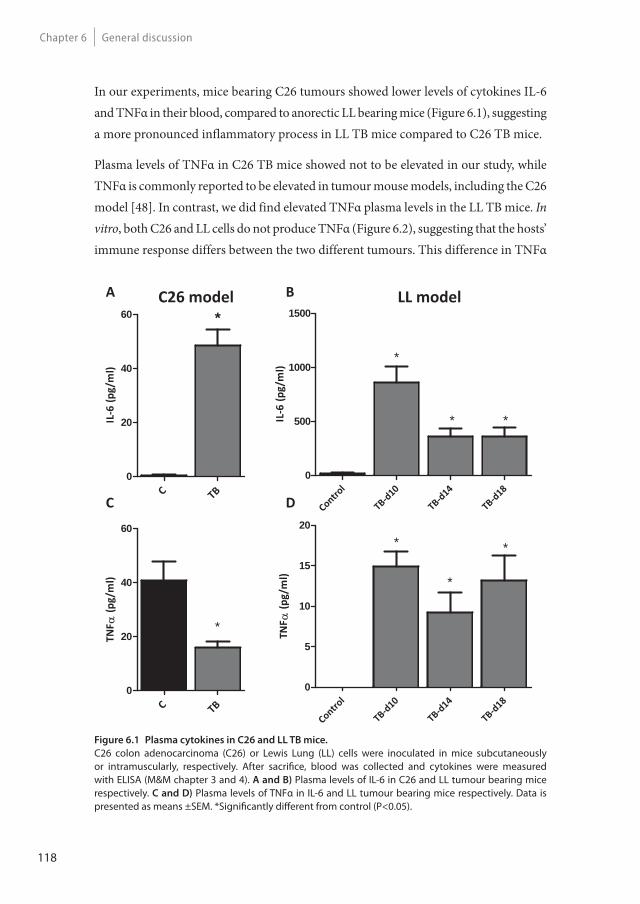
118
General discussion Chapter 6
In our experiments, mice bearing C26 tumours showed lower levels of cytokines IL-6 and TNFα in their blood, compared to anorectic LL bearing mice (Figure 6.1), suggesting a more pronounced inflammatory process in LL TB mice compared to C26 TB mice.
Plasma levels of TNFα in C26 TB mice showed not to be elevated in our study, while TNFα is commonly reported to be elevated in tumour mouse models, including the C26 model [48]. In contrast, we did find elevated TNFα plasma levels in the LL TB mice. In vitro, both C26 and LL cells do not produce TNFα (Figure 6.2), suggesting that the hosts’ immune response differs between the two different tumours. This difference in TNFα
Figure 6.1 Plasma cytokines in C26 and LL TB mice.
C26 colon adenocarcinoma (C26) or Lewis Lung (LL) cells were inoculated in mice subcutaneously or intramuscularly, respectively. After sacrifi ce, blood was collected and cytokines were measured with ELISA (M&M chapter 3 and 4). A and B) Plasma levels of IL-6 in C26 and LL tumour bearing mice respectively. C and D) Plasma levels of TNFα in IL-6 and LL tumour bearing mice respectively. Data is presented as means ±SEM. *Signifi cantly diff erent from control (P<0.05).
Control
TB d10
TB d14
TB d180
500
1000
1500
IL6
(pg/
ml)
*
**IL6
(pg/
ml)
C TB0
20
40
60 *
TNF
(pg/
ml)
C TB0
20
40
60
*
Control
TB d10
TB d14
TB d180
5
10
15
20
TNF
(pg/
ml)
* *
*
C26 model LL modelA B
C D
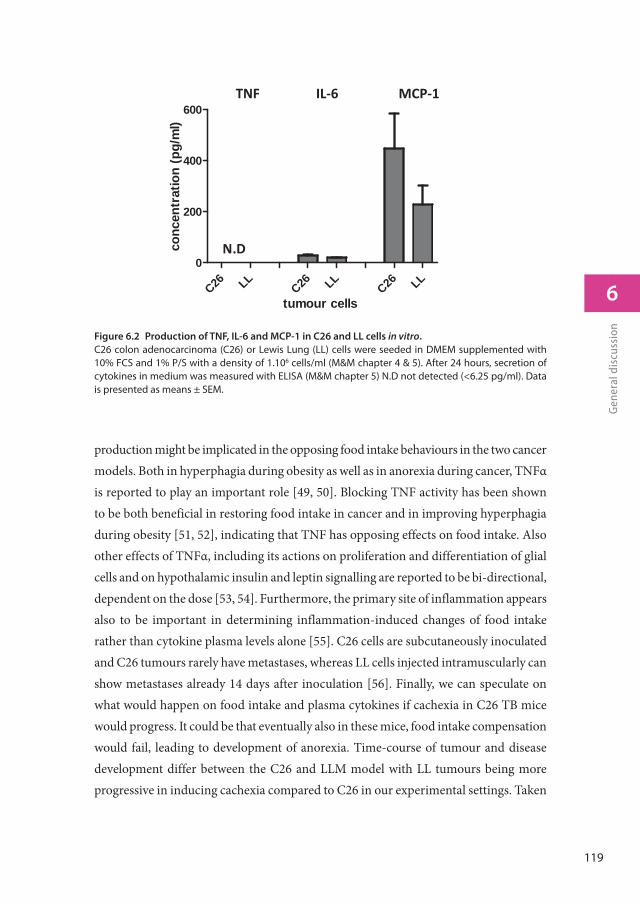
119
6
Gen
eral
dis
cuss
ion
production might be implicated in the opposing food intake behaviours in the two cancer models. Both in hyperphagia during obesity as well as in anorexia during cancer, TNFα is reported to play an important role [49, 50]. Blocking TNF activity has been shown to be both beneficial in restoring food intake in cancer and in improving hyperphagia during obesity [51, 52], indicating that TNF has opposing effects on food intake. Also other effects of TNFα, including its actions on proliferation and differentiation of glial cells and on hypothalamic insulin and leptin signalling are reported to be bi-directional, dependent on the dose [53, 54]. Furthermore, the primary site of inflammation appears also to be important in determining inflammation-induced changes of food intake rather than cytokine plasma levels alone [55]. C26 cells are subcutaneously inoculated and C26 tumours rarely have metastases, whereas LL cells injected intramuscularly can show metastases already 14 days after inoculation [56]. Finally, we can speculate on what would happen on food intake and plasma cytokines if cachexia in C26 TB mice would progress. It could be that eventually also in these mice, food intake compensation would fail, leading to development of anorexia. Time-course of tumour and disease development differ between the C26 and LLM model with LL tumours being more progressive in inducing cachexia compared to C26 in our experimental settings. Taken
Figure 6.2 Production of TNF, IL-6 and MCP-1 in C26 and LL cells in vitro.
C26 colon adenocarcinoma (C26) or Lewis Lung (LL) cells were seeded in DMEM supplemented with 10% FCS and 1% P/S with a density of 1.106 cells/ml (M&M chapter 4 & 5). After 24 hours, secretion of cytokines in medium was measured with ELISA (M&M chapter 5) N.D not detected (<6.25 pg/ml). Data is presented as means ± SEM.
tumour cells
conc
entr
atio
n (p
g/m
l)
C26 LLC26 LL
C26 LL0
200
400
600
N.D
TNF IL 6 MCP 1
120
General discussion Chapter 6
together, it might be that the nature and degree of inflammation induced by the different tumour models underlies their apparently opposing effects on food intake behaviour.
In summary, a variety of chronic inflammatory diseases are accompanied by food intake disturbances. These disturbances have been reported to be associated with altered serotonin signalling. However, whereas food intake appears to be inextricably inversely linked to serotonin status in the hypothalamus, the link between inflammation and alterations in serotonin signalling during disease remains unclear. It appears that the underlying cause of inflammation (e.g. illness) and subsequently differences in degree (e.g. high/low), duration (acute/chronic), origin (tumour/tissue necrosis) and site of origin (e.g. brain, fat) of inflammation play a role in these different findings.
Acute versus chronic infl ammation
The differences in plasma levels of TNF and IL-6 measured in C26 and LL TB mice (Figure 6.2), served as basis to estimate the doses of the cytokines administered to mice described in chapter 5. We found that the different doses of IL-6 injected and the combinations of IL-6 with TNFα had similar effects on food intake and hypothalamic gene expression profiles. This might be due to the fact that these interventions induced secondary inflammatory mediators in a comparable fashion. This experimental set-up induces an acute and short-term inflammatory response, which is in contrast to the chronic elevation of cytokine plasma levels induced by the presence of a tumour. Differences in inflammatory responses between the models used in this thesis and their effect on food intake regulation will be discussed below.
Eff ects of short and chronic anorexia
In chapter 3 and 4 tumour models were used, which are characterized by a chronically elevated inflammatory tone. The resulting elevated cytokine plasma concentrations were considered to be important for the development of anorexia in mice bearing LL tumours. In chapter 5, mice were injected with cytokines aiming to achieve plasma levels comparable to those measured in C26 and LL TB mice. Here, the acute effects of cytokines on food intake were investigated. Table 6.1 summarizes the effects found on food intake and the changes in the hypothalamus of C26 TB, LLM TB, and cytokine-
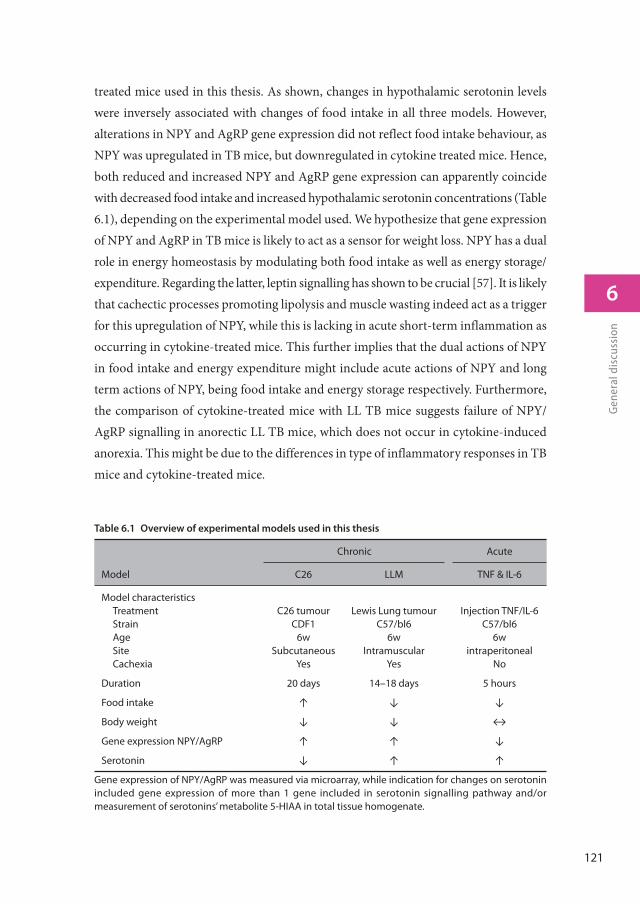
121
6
Gen
eral
dis
cuss
ion
treated mice used in this thesis. As shown, changes in hypothalamic serotonin levels were inversely associated with changes of food intake in all three models. However, alterations in NPY and AgRP gene expression did not reflect food intake behaviour, as NPY was upregulated in TB mice, but downregulated in cytokine treated mice. Hence, both reduced and increased NPY and AgRP gene expression can apparently coincide with decreased food intake and increased hypothalamic serotonin concentrations (Table 6.1), depending on the experimental model used. We hypothesize that gene expression of NPY and AgRP in TB mice is likely to act as a sensor for weight loss. NPY has a dual role in energy homeostasis by modulating both food intake as well as energy storage/expenditure. Regarding the latter, leptin signalling has shown to be crucial [57]. It is likely that cachectic processes promoting lipolysis and muscle wasting indeed act as a trigger for this upregulation of NPY, while this is lacking in acute short-term inflammation as occurring in cytokine-treated mice. This further implies that the dual actions of NPY in food intake and energy expenditure might include acute actions of NPY and long term actions of NPY, being food intake and energy storage respectively. Furthermore, the comparison of cytokine-treated mice with LL TB mice suggests failure of NPY/AgRP signalling in anorectic LL TB mice, which does not occur in cytokine-induced anorexia. This might be due to the differences in type of inflammatory responses in TB mice and cytokine-treated mice.
Table 6.1 Overview of experimental models used in this thesis
Chronic Acute
Model C26 LLM TNF & IL-6
Model characteristicsTreatmentStrainAgeSiteCachexia
C26 tumourCDF1
6wSubcutaneous
Yes
Lewis Lung tumourC57/bl6
6wIntramuscular
Yes
Injection TNF/IL-6C57/bl6
6wintraperitoneal
No
Duration 20 days 14–18 days 5 hours
Food intake ↑ ↓ ↓
Body weight ↓ ↓ ↔
Gene expression NPY/AgRP ↑ ↑ ↓
Serotonin ↓ ↑ ↑
Gene expression of NPY/AgRP was measured via microarray, while indication for changes on serotonin included gene expression of more than 1 gene included in serotonin signalling pathway and/or measurement of serotonins’ metabolite 5-HIAA in total tissue homogenate.
122
General discussion Chapter 6
In both acute and chronic inflammatory diseases, including infections, injury, and cancer, anorexia is commonly occurring. However, the deleterious effects of anorexia in acute and in chronic inflammation are very different, because effects of decreased food intake largely depend on the duration. In chronic inflammatory diseases including cancer, prolonged anorexia contributes to severe malnutrition and body wasting, increasing mortality and impinging on quality of life in these patients. In contrast, short-term anorexia in acute inflammation can be beneficial, since restriction in the intake of macro- and micronutrients will inhibit bacterial growth [58]. Furthermore, anorexia is considered to facilitate fever response, as anorexia in acute inflammation is almost invariably accompanied by fever [59]. During acute illness due to infection, not being hungry would reduce motivation to find food and interaction with others. Subsequently, this would reduce body heat loss (facilitation fever), reduce activity and mobility and reduce exchange of pathogens with others [60]. It has been shown that food deprivation increases survival during bacterial infection [61]. Vice versa, forced-feeding during acute infection increases morbidity and mortality [62]. Together these phenomena suggest a physiological and supportive role of anorexia during acute inflammation. Therefore, the differences in outcome of anorexia between chronic inflammation and acute inflammation might have a functional and evolutionary basis, which in turn underlies that specific processes involved in the development and sustainment of anorexia could be different between the two types of inflammation-induced anorexia. Laviano et al. postulated that anorexia in chronic illness such as cancer anorexia develops by waves of brain activation, each of them not necessarily being mediated by the same mediators [63]. This is supported by the development of tolerance in response to continuous cytokine infusion [64]. However, repetitive administration of cytokines, when the anorexic effect of a previous injection is subsided, induces enhanced development of anorexia [65]. Overall, these data suggests that long-lasting anorexia induced by inflammatory mediators occurs in cycles, while this might not be the case in acute inflammation. Furthermore, compensatory mechanisms in response to chronic malnutrition can occur, which might contribute to the sustainment of anorexia in chronic inflammation, developing a vicious cycle where anorexia and its consequences enhance one another.
123
6
Gen
eral
dis
cuss
ion
Future directions
Severe body wasting due to underlying illnesses like cancer has already been known for centuries and was already described by Hippocrates 400 BC [66]. As of today, many targets have been identified as potentially important for the development and outcome of cachexia. Unfortunately, current treatment options to improve appetite and food intake in patients are still limited. Only 20–30% of patients actually report an improvement in food intake upon medical treatment, which usually involves corticosteroids or progestational agents. Furthermore, these conservative treatments can have severe side-effects, including thrombophlebitis and muscle degradation [67, 68], both deleterious conditions in patients who are often less mobile due to their illness and may already suffer from loss of muscle mass.
The knowledge on the regulatory role of serotonin in food intake regulation, together with indications that serotonin brain levels may be elevated due to an underlying chronic illness and may cause anorexia, triggers the question why still no therapeutics have been developed that alter serotonergic activity in order to improve appetite. This is in particular in contrast to the field of drug development for weight management. Here, targeting the serotonin system is considered an effective strategy to reduce food intake in overweight and obese persons [38]. Several current drugs for weight management possess agonistic activity towards 5HT2C or 5HT1B receptors. Consequently, antagonists for 5HT2C or 5HT1B receptors might be interesting for improving appetite, since the satiating effect of serotonin is reported to occur by concomitant activation of POMC/CART neurons via 2HT2C, and inhibition of NPY/AgRP neurons via 5HT1B receptors [69-71]. It would be interesting to use both C26 and LL TB mouse models to study the effect of serotonin antagonists on food intake.
Another area that demands for further research is the involvement of other organs in food intake regulation, such as stomach and intestines. It appears that stimulation of gastric emptying can be promising in cancer patients. However, mechanisms involved in delayed gastric emptying during disease are not yet entirely clarified, as various factors, including serotonin, influence gastric emptying [72].
Furthermore, since we showed that inflammation directly leads to an increase in serotonin turnover, molecular processes responsible for this increase still need further research, for example by the use of 5HTR-blockade or the use of knock out models.
124
General discussion Chapter 6
It is likely that activation of serotonin signalling leading to anorexia is also involved in modulation of the immune system due to its functions in platelet activation and leukocyte attraction, and this interaction needs to be further elucidated [73, 74].
Final conclusions
In this thesis we investigated changes in inflammatory markers and pathways involved in food intake regulation and eating behaviour using different mouse models. The main objectives were to further elucidate processes involved in the pathogenesis of disease-related anorexia, and to determine the role of inflammation in this process. Taken together, the results presented in this thesis show that hypothalamic inflammation during chronic illness is an important underlying mechanism in the failure of hypothalamic food intake regulation. This is likely to be mediated via effects on serotonergic metabolic and (or) signalling pathways, which act as upstream modulators of hypothalamic orexigenic and anorexigenic neuropeptide systems. The degree (high vs low), duration (acute vs chronic), origin and site of inflammation are important factors influencing hypothalamic inflammation, serotonergic and neuronal NPY/AgRP and POMC/CART systems, and ultimately food intake. The serotonergic regulation of food intake during disease merits further investigation as it may deliver novel therapeutic targets for improving food intake during chronic illness.
References
1. Rhea, J.M. and R.J. Molinaro, Cancer biomarkers: surviving the journey from bench to bedside. MLO Med Lab Obs, 2011. 43(3): p. 10-2, 16, 18; quiz 20, 22.
2. Fearon, K.C., M.D. Barber, A.G. Moses, S.H. Ahmedzai, G.S. Taylor, M.J. Tisdale, and G.D. Murray, Double-blind, placebo-controlled, randomized study of eicosapentaenoic acid diester in patients with cancer cachexia. J Clin Oncol, 2006. 24(21): p. 3401-7.
3. Roberts, M.C. and S.B. Dusetzina, Use and Costs for Tumor Gene Expression Profiling Panels in the Management of Breast Cancer From 2006 to 2012: Implications for Genomic Test Adoption Among Private Payers. J Oncol Pract, 2015.
4. Kim, K.T., H.W. Lee, H.O. Lee, S.C. Kim, Y.J. Seo, W. Chung, H.H. Eum, D.H. Nam, J. Kim, K.M. Joo, and W.Y. Park, Single-cell mRNA sequencing identifies subclonal heterogeneity in anti-cancer drug responses of lung adenocarcinoma cells. Genome Biol, 2015. 16(1): p. 127.
125
6
Gen
eral
dis
cuss
ion
5. Fearon, K., F. Strasser, S.D. Anker, I. Bosaeus, E. Bruera, R.L. Fainsinger, A. Jatoi, C. Loprinzi, N. MacDonald, G. Mantovani, M. Davis, M. Muscaritoli, F. Ottery, L. Radbruch, P. Ravasco, D. Walsh, A. Wilcock, S. Kaasa, and V.E. Baracos, Definition and classification of cancer cachexia: an international consensus. Lancet Oncol, 2011. 12(5): p. 489-95.
6. Baracos, V.E., Clinical trials of cancer cachexia therapy, now and hereafter. J Clin Oncol, 2013. 31(10): p. 1257-8.
7. Matsumoto, T., K. Fujimoto-Ouchi, S. Tamura, Y. Tanaka, and H. Ishitsuka, Tumour inoculation site-dependent induction of cachexia in mice bearing colon 26 carcinoma. Br J Cancer, 1999. 79(5-6): p. 764-9.
8. Aulino, P., E. Berardi, V.M. Cardillo, E. Rizzuto, B. Perniconi, C. Ramina, F. Padula, E.P. Spugnini, A. Baldi, F. Faiola, S. Adamo, and D. Coletti, Molecular, cellular and physiological characterization of the cancer cachexia-inducing C26 colon carcinoma in mouse. BMC Cancer, 2010. 10: p. 363.
9. Soda, K., M. Kawakami, A. Kashii, and M. Miyata, Manifestations of cancer cachexia induced by colon 26 adenocarcinoma are not fully ascribable to interleukin-6. International journal of cancer. Journal international du cancer, 1995. 62(3): p. 332-6.
10. Iizuka, N., S. Hazama, K. Yoshimura, S. Yoshino, A. Tangoku, K. Miyamoto, K. Okita, and M. Oka, Anticachectic effects of the natural herb Coptidis rhizoma and berberine on mice bearing colon 26/clone 20 adenocarcinoma. Int J Cancer, 2002. 99(2): p. 286-91.
11. Sacchi, A., F. Mauro, and G. Zupi, Changes of phenotypic characteristics of variants derived from Lewis lung carcinoma during long-term in vitro growth. Clin Exp Metastasis, 1984. 2(2): p. 171-8.
12. Mak, I.W., N. Evaniew, and M. Ghert, Lost in translation: animal models and clinical trials in cancer treatment. Am J Transl Res, 2014. 6(2): p. 114-8.
13. de Jong, M. and T. Maina, Of mice and humans: are they the same?--Implications in cancer translational research. J Nucl Med, 2010. 51(4): p. 501-4.
14. Martignoni, M., G.M. Groothuis, and R. de Kanter, Species differences between mouse, rat, dog, monkey and human CYP-mediated drug metabolism, inhibition and induction. Expert Opin Drug Metab Toxicol, 2006. 2(6): p. 875-94.
15. Emes, R.D., L. Goodstadt, E.E. Winter, and C.P. Ponting, Comparison of the genomes of human and mouse lays the foundation of genome zoology. Hum Mol Genet, 2003. 12(7): p. 701-9.
16. Odom, D.T., R.D. Dowell, E.S. Jacobsen, W. Gordon, T.W. Danford, K.D. MacIsaac, P.A. Rolfe, C.M. Conboy, D.K. Gifford, and E. Fraenkel, Tissue-specific transcriptional regulation has diverged significantly between human and mouse. Nat Genet, 2007. 39(6): p. 730-2.
17. Schumacher, J.R., M. Palta, N.K. Loconte, A. Trentham-Dietz, W.P. Witt, S.M. Heidrich, and M.A. Smith, Characterizing the psychological distress response before and after a cancer diagnosis. J Behav Med, 2013. 36(6): p. 591-600.
18. Berstein, I.L., Physiological and psychological mechanisms of cancer anorexia. Cancer Res, 1982. 42(2 Suppl): p. 7152-720s.
126
General discussion Chapter 6
19. Holland, J.C., Anorexia and cancer: psychological aspects. CA Cancer J Clin, 1977. 27(6): p. 363-7.
20. Cheon, D.J. and S. Orsulic, Mouse models of cancer. Annu Rev Pathol, 2011. 6: p. 95-119.
21. Mattison, J., L. van der Weyden, T. Hubbard, and D.J. Adams, Cancer gene discovery in mouse and man. Biochim Biophys Acta, 2009. 1796(2): p. 140-61.
22. Okada, S., T. Okusaka, H. Ishii, A. Kyogoku, M. Yoshimori, N. Kajimura, K. Yamaguchi, and T. Kakizoe, Elevated serum interleukin-6 levels in patients with pancreatic cancer. Jpn J Clin Oncol, 1998. 28(1): p. 12-5.
23. Michalaki, V., K. Syrigos, P. Charles, and J. Waxman, Serum levels of IL-6 and TNF-alpha correlate with clinicopathological features and patient survival in patients with prostate cancer. Br J Cancer, 2004. 90(12): p. 2312-6.
24. Rossi, J.F., Z.Y. Lu, M. Jourdan, and B. Klein, Interleukin-6 as a Therapeutic Target. Clin Cancer Res, 2015. 21(6): p. 1248-1257.
25. Strassmann, G., M. Fong, J.S. Kenney, and C.O. Jacob, Evidence for the involvement of interleukin 6 in experimental cancer cachexia. The Journal of clinical investigation, 1992. 89(5): p. 1681-4.
26. Huang, Y., J.F. Feng, J.S. Liu, and Q.X. Chen, Prognostic role of serum C-reactive protein in esophageal cancer: a systematic review and meta-analysis. Ther Clin Risk Manag, 2015. 11: p. 89-94.
27. Zheng, Z., L. Zhou, S. Gao, Z. Yang, J. Yao, and S. Zheng, Prognostic role of C-reactive protein in hepatocellular carcinoma: a systematic review and meta-analysis. Int J Med Sci, 2013. 10(6): p. 653-64.
28. Han, Y., F. Mao, Y. Wu, X. Fu, X. Zhu, S. Zhou, W. Zhang, Q. Sun, and Y. Zhao, Prognostic role of C-reactive protein in breast cancer: a systematic review and meta-analysis. Int J Biol Markers, 2011. 26(4): p. 209-15.
29. Bilir, C., H. Engin, M. Can, Y.B. Temi, and D. Demirtas, The prognostic role of inflammation and hormones in patients with metastatic cancer with cachexia. Med Oncol, 2015. 32(3): p. 56.
30. Fearon, U., D. Clarke, T.J. McKenna, and S.K. Cunningham, Intra-adrenal factors are not involved in the differential control of cortisol and adrenal androgens in human adrenals. Eur J Endocrinol, 1998. 138(5): p. 567-73.
31. Johns, N., N.A. Stephens, and K.C. Fearon, Muscle wasting in cancer. Int J Biochem Cell Biol, 2013. 45(10): p. 2215-29.
32. Chen, H.J., J. Sun, Z. Huang, H. Hou, Jr., M. Arcilla, N. Rakhilin, D.J. Joe, J. Choi, P. Gadamsetty, J. Milsom, G. Nandakumar, R. Longman, X.K. Zhou, R. Edwards, J. Chen, K.Y. Chen, P. Bu, L. Wang, Y. Xu, R. Munroe, C. Abratte, A.D. Miller, Z.H. Gumus, M. Shuler, N. Nishimura, W. Edelmann, X. Shen, and S.M. Lipkin, Comprehensive models of human primary and metastatic colorectal tumors in immunodeficient and immunocompetent mice by chemokine targeting. Nat Biotechnol, 2015.
127
6
Gen
eral
dis
cuss
ion
33. Borgers, A.J., K.E. Koopman, P.H. Bisschop, M.J. Serlie, D.F. Swaab, E. Fliers, S.E. la Fleur, and A. Alkemade, Decreased serotonin transporter immunoreactivity in the human hypothalamic infundibular nucleus of overweight subjects. Front Neurosci, 2014. 8: p. 106.
34. Breisch, S.T., F.P. Zemlan, and B.G. Hoebel, Hyperphagia and obesity following serotonin depletion by intraventricular p-chlorophenylalanine. Science, 1976. 192(4237): p. 382-5.
35. Erritzoe, D., V.G. Frokjaer, M.T. Haahr, J. Kalbitzer, C. Svarer, K.K. Holst, D.L. Hansen, T.L. Jernigan, S. Lehel, and G.M. Knudsen, Cerebral serotonin transporter binding is inversely related to body mass index. Neuroimage, 2010. 52(1): p. 284-9.
36. Wurtman, R.J. and J.J. Wurtman, Brain serotonin, carbohydrate-craving, obesity and depression. Obesity research, 1995. 3 Suppl 4: p. 477S-480S.
37. Hassanain, M. and B.E. Levin, Dysregulation of hypothalamic serotonin turnover in diet-induced obese rats. Brain Res, 2002. 929(2): p. 175-80.
38. Garfield, A.S. and L.K. Heisler, Pharmacological targeting of the serotonergic system for the treatment of obesity. The Journal of physiology, 2009. 587(Pt 1): p. 49-60.
39. Halford, J.C., J.A. Harrold, E.J. Boyland, C.L. Lawton, and J.E. Blundell, Serotonergic drugs : effects on appetite expression and use for the treatment of obesity. Drugs, 2007. 67(1): p. 27-55.
40. Thaler, J.P., S.J. Choi, M.W. Schwartz, and B.E. Wisse, Hypothalamic inflammation and energy homeostasis: resolving the paradox. Front Neuroendocrinol, 2010. 31(1): p. 79-84.
41. Dandona, P., A. Aljada, H. Ghanim, P. Mohanty, C. Tripathy, D. Hofmeyer, and A. Chaudhuri, Increased plasma concentration of macrophage migration inhibitory factor (MIF) and MIF mRNA in mononuclear cells in the obese and the suppressive action of metformin. J Clin Endocrinol Metab, 2004. 89(10): p. 5043-7.
42. Ghanim, H., A. Aljada, D. Hofmeyer, T. Syed, P. Mohanty, and P. Dandona, Circulating mononuclear cells in the obese are in a proinflammatory state. Circulation, 2004. 110(12): p. 1564-71.
43. Kern, M., A. Knigge, J.T. Heiker, J. Kosacka, M. Stumvoll, P. Kovacs, M. Bluher, and N. Kloting, C57BL/6JRj mice are protected against diet induced obesity (DIO). Biochem Biophys Res Commun, 2012. 417(2): p. 717-20.
44. Gonzalez-Gay, M.A., J. Llorca, M.T. Garcia-Unzueta, C. Gonzalez-Juanatey, J.M. De Matias, J. Martin, M. Redelinghuys, A.J. Woodiwiss, G.R. Norton, and P.H. Dessein, High-grade inflammation, circulating adiponectin concentrations and cardiovascular risk factors in severe rheumatoid arthritis. Clin Exp Rheumatol, 2008. 26(4): p. 596-603.
45. Choy, E. and N. Sattar, Interpreting lipid levels in the context of high-grade inflammatory states with a focus on rheumatoid arthritis: a challenge to conventional cardiovascular risk actions. Ann Rheum Dis, 2009. 68(4): p. 460-9.
46. Maccio, A., C. Madeddu, D. Massa, G. Astara, D. Farci, G.B. Melis, and G. Mantovani, Interleukin-6 and leptin as markers of energy metabolic changes in advanced ovarian cancer patients. J Cell Mol Med, 2009. 13(9B): p. 3951-9.

128
General discussion Chapter 6
47. Llorca, J., M.J. Lopez-Diaz, C. Gonzalez-Juanatey, W.E. Ollier, J. Martin, and M.A. Gonzalez-Gay, Persistent chronic inflammation contributes to the development of cancer in patients with rheumatoid arthritis from a defined population of northwestern Spain. Semin Arthritis Rheum, 2007. 37(1): p. 31-8.
48. Faber, J., P. Vos, D. Kegler, K. van Norren, J.M. Argiles, A. Laviano, J. Garssen, and A. van Helvoort, Beneficial immune modulatory effects of a specific nutritional combination in a murine model for cancer cachexia. Br J Cancer, 2008. 99(12): p. 2029-36.
49. Sonti, G., S.E. Ilyin, and C.R. Plata-Salaman, Anorexia induced by cytokine interactions at pathophysiological concentrations. Am J Physiol, 1996. 270(6 Pt 2): p. R1394-402.
50. Amaral, M.E., R. Barbuio, M. Milanski, T. Romanatto, H.C. Barbosa, W. Nadruz, M.B. Bertolo, A.C. Boschero, M.J. Saad, K.G. Franchini, and L.A. Velloso, Tumor necrosis factor-alpha activates signal transduction in hypothalamus and modulates the expression of pro-inflammatory proteins and orexigenic/anorexigenic neurotransmitters. J Neurochem, 2006. 98(1): p. 203-12.
51. De Souza, C.T., E.P. Araujo, S. Bordin, R. Ashimine, R.L. Zollner, A.C. Boschero, M.J. Saad, and L.A. Velloso, Consumption of a fat-rich diet activates a proinflammatory response and induces insulin resistance in the hypothalamus. Endocrinology, 2005. 146(10): p. 4192-9.
52. Argiles, J.M., S. Busquets, and F.J. Lopez-Soriano, Anti-inflammatory therapies in cancer cachexia. Eur J Pharmacol, 2011. 668 Suppl 1: p. S81-6.
53. Tang, X., Y. Wang, S. Zhou, T. Qian, and X. Gu, Signaling pathways regulating dose-dependent dual effects of TNF-alpha on primary cultured Schwann cells. Mol Cell Biochem, 2013. 378(1-2): p. 237-46.
54. Romanatto, T., M. Cesquini, M.E. Amaral, E.A. Roman, J.C. Moraes, M.A. Torsoni, A.P. Cruz-Neto, and L.A. Velloso, TNF-alpha acts in the hypothalamus inhibiting food intake and increasing the respiratory quotient--effects on leptin and insulin signaling pathways. Peptides, 2007. 28(5): p. 1050-8.
55. Tracey, K.J., S. Morgello, B. Koplin, T.J. Fahey, 3rd, J. Fox, A. Aledo, K.R. Manogue, and A. Cerami, Metabolic effects of cachectin/tumor necrosis factor are modified by site of production. Cachectin/tumor necrosis factor-secreting tumor in skeletal muscle induces chronic cachexia, while implantation in brain induces predominantly acute anorexia. J Clin Invest, 1990. 86(6): p. 2014-24.
56. Busquets, S., M. Toledo, M. Orpi, D. Massa, M. Porta, E. Capdevila, N. Padilla, V. Frailis, F.J. Lopez-Soriano, H.Q. Han, and J.M. Argiles, Myostatin blockage using actRIIB antagonism in mice bearing the Lewis lung carcinoma results in the improvement of muscle wasting and physical performance. J Cachexia Sarcopenia Muscle, 2012. 3(1): p. 37-43.
57. Zhang, W., M.A. Cline, and E.R. Gilbert, Hypothalamus-adipose tissue crosstalk: neuropeptide Y and the regulation of energy metabolism. Nutr Metab (Lond), 2014. 11: p. 27.
58. Plata-Salaman, C.R., Anorexia during acute and chronic disease. Nutrition, 1996. 12(2): p. 69-78.
59. Hart, B.L., Biological basis of the behavior of sick animals. Neurosci Biobehav Rev, 1988. 12(2): p. 123-37.
129
6
Gen
eral
dis
cuss
ion
60. Hart, B.L., Behavioral adaptations to pathogens and parasites: five strategies. Neurosci Biobehav Rev, 1990. 14(3): p. 273-94.
61. Wing, E.J. and J.B. Young, Acute starvation protects mice against Listeria monocytogenes. Infect Immun, 1980. 28(3): p. 771-6.
62. Murray, M.J. and A.B. Murray, Anorexia of infection as a mechanism of host defense. Am J Clin Nutr, 1979. 32(3): p. 593-6.
63. Laviano, A., M.M. Meguid, A. Cascino, A. Molfino, and F. Rossi Fanelli, Tryptophan in wasting diseases: at the crossing between immune function and behaviour. Curr Opin Clin Nutr Metab Care, 2009. 12(4): p. 392-7.
64. Langhans, W., D. Savoldelli, and S. Weingarten, Comparison of the feeding responses to bacterial lipopolysaccharide and interleukin-1 beta. Physiol Behav, 1993. 53(4): p. 643-9.
65. Weingarten, S., D. Savoldelli, and W. Langhans, Enhancement or loss of the hypophagic effect of interleukin-1 upon chronic administration. Physiol Behav, 1992. 52(5): p. 831-7.
66. von Haehling, S. and S.D. Anker, Cachexia as major underestimated unmet medical need: facts and numbers. Int J Cardiol, 2012. 161(3): p. 121-3.
67. Jatoi, A., Pharmacologic therapy for the cancer anorexia/weight loss syndrome: A data-driven, practical approach. J Support Oncol, 2006. 4(10): p. 499-502.
68. Hasselgren, P.O., N. Alamdari, Z. Aversa, P. Gonnella, I.J. Smith, and S. Tizio, Corticosteroids and muscle wasting: role of transcription factors, nuclear cofactors, and hyperacetylation. Curr Opin Clin Nutr Metab Care, 2010. 13(4): p. 423-8.
69. Heisler, L.K., E.E. Jobst, G.M. Sutton, L. Zhou, E. Borok, Z. Thornton-Jones, H.Y. Liu, J.M. Zigman, N. Balthasar, T. Kishi, C.E. Lee, C.J. Aschkenasi, C.Y. Zhang, J. Yu, O. Boss, K.G. Mountjoy, P.G. Clifton, B.B. Lowell, J.M. Friedman, T. Horvath, A.A. Butler, J.K. Elmquist, and M.A. Cowley, Serotonin reciprocally regulates melanocortin neurons to modulate food intake. Neuron, 2006. 51(2): p. 239-49.
70. Vickers, S.P., P.G. Clifton, C.T. Dourish, and L.H. Tecott, Reduced satiating effect of d-fenfluramine in serotonin 5-HT(2C) receptor mutant mice. Psychopharmacology (Berl), 1999. 143(3): p. 309-14.
71. Balthasar, N., L.T. Dalgaard, C.E. Lee, J. Yu, H. Funahashi, T. Williams, M. Ferreira, V. Tang, R.A. McGovern, C.D. Kenny, L.M. Christiansen, E. Edelstein, B. Choi, O. Boss, C. Aschkenasi, C.Y. Zhang, K. Mountjoy, T. Kishi, J.K. Elmquist, and B.B. Lowell, Divergence of melanocortin pathways in the control of food intake and energy expenditure. Cell, 2005. 123(3): p. 493-505.
72. van Nieuwenhoven, M.A., S.D. Valks, S. Sobczak, W.J. Riedel, and R.J. Brummer, Acute tryptophan depletion slows gastric emptying in females. Br J Nutr, 2004. 91(3): p. 351-5.
73. Duerschmied, D., M. Canault, D. Lievens, A. Brill, S.M. Cifuni, M. Bader, and D.D. Wagner, Serotonin stimulates platelet receptor shedding by tumor necrosis factor-alpha-converting enzyme (ADAM17). J Thromb Haemost, 2009. 7(7): p. 1163-71.
74. Duerschmied, D., G.L. Suidan, M. Demers, N. Herr, C. Carbo, A. Brill, S.M. Cifuni, M. Mauler, S. Cicko, M. Bader, M. Idzko, C. Bode, and D.D. Wagner, Platelet serotonin promotes the recruitment of neutrophils to sites of acute inflammation in mice. Blood, 2013. 121(6): p. 1008-15.


Nederlandse samenvatting
*
132
Nederlandse samenvatting
Achtergrondinformatie
Bij een groot deel van de kankerpatiënten (60–80%) komt anorexie, oftewel een verlies van eetlust, voor. Deze vorm van anorexie wordt veroorzaakt door de ziekte zelf en staat los van de problemen met eten die veel patiënten ondervinden als gevolg van chemotherapie. Anorexie komt niet alleen voor bij kanker, maar komt ook veelvuldig voor bij andere chronische ziekten zoals HIV, COPD en chronisch hartfalen. Anorexie gaat vaak gepaard met cachexie, een progressief verlopend verlies van vooral spier- maar ook vetmassa. Deze combinatie wordt algemeen aangeduid met de term anorexie-cachexie syndroom. Dit is een levensbedreigende aandoening, waarbij de patiënt ernstig ondervoed raakt en veel spiermassa verliest. Dit heeft onder andere negatieve gevolgen voor de effectiviteit van chemotherapie en het herstel na operaties. Ook nemen de fysieke conditie van de patient en de weerstand tegen infecties af. Deze factoren dragen ertoe bij dat de overlevingskansen en/of de gemiddelde overlevingsduur van de patiënt aanzienlijk afnemen. Belangrijk is daarnaast dat het optreden van anorexie vaak grote psychische gevolgen heeft voor de patiënt en zijn/haar omgeving, omdat verlies aan eetlust in verband wordt gebracht met een slecht ziektebeloop. Helaas zijn er tot op heden nog geen effectieve therapieën ontwikkeld die de ontwikkeling van anorexie tijdens kanker kunnen tegengaan. Dit komt mede doordat er nog niet veel bekend is over de specifieke oorzaken van de ontwikkeling van anorexie tijdens kanker of andere chronische ziekten.
Het doel van het onderzoek beschreven in dit proefschrift was om de mechanismen verder te ontrafelen die betrokken zijn bij de ontwikkeling van anorexie tijdens chronische ziekte. Eerder onderzoek heeft aangetoond dat de hypothalamus, een gebied in de hersenen waar de regulering van voedselinname plaatsvindt, hierin een belangrijke rol speelt. Ons onderzoek heeft zich daarom gericht op het bestuderen van de veranderingen in de hypothalamus tijdens kanker. Verder hebben we veel aandacht besteed aan de rol van ontstekingsreacties die sterk verhoogd zijn tijdens kanker en andere ziekten waarbij anorexie veel voorkomt. Om de gevolgen van tumorgroei op de regulatie van processen in het brein te bestuderen hebben we verschillende muismodellen gebruikt als model voor de mens. Muismodellen worden veelvuldig gebruikt in kankeronderzoek omdat de mogelijkheden tot het bestuderen van tumoren en hun interacties met het lichaam in de mens uiteraard beperkt zijn.
133
*
Ned
erla
ndse
sam
enva
ttin
g
Werkwijze
In dit proefschrift hebben we gebruik gemaakt van drie verschillende muismodellen om de processen die een rol spelen bij anorexie als gevolg van kanker te bestuderen. Hiervan waren er twee tumormodellen, waarbij de muizen worden ingespoten met tumorcellen. Bij het derde model was er geen sprake van tumorgroei. Bij het eerste tumormodel (C26) ontwikkelden de muizen cachexie (gewichtsverlies) tijdens de tumorgroei. Ter compensatie van dit gewichtsverlies gingen de muizen meer eten, om zo het gewichtsverlies te beperken. In het tweede muismodel (LL) droegen de muizen een ander type tumor. In deze muizen ontwikkelde er zich naast het gewichtsverlies ook anorexie (minder eten) naarmate de tumor groeide. Door vervolgens deze twee tumormodellen te vergelijken, kon worden onderzocht welke processen specifiek betrokken zijn bij veranderingen in voedselinname, en welke processen algemeen optreden bij gewichtsafname tijdens tumorgroei.
Het derde muismodel was een model waarbij er geen tumorgroei plaatsvond, maar waarbij de muizen werden ingespoten met bepaalde ontstekingsmediatoren, zogenaamde cytokines. In dit model ontwikkelden de muizen anorexie als gevolg van een ontstekings-reactie zonder dat er sprake was van tumorgroei. Dit werd gedaan om te achterhalen wat de specifieke rol van ontsteking is in de ontwikkeling anorexie. Vervolgens hebben we in deze drie muismodellen de veranderingen die plaatsvinden in de hypothalamus meer in detail bestudeerd en onderling vergeleken. We hebben hiervoor veel gebruikt gemaakt van micro-array-analyse. Bij micro-array-analyse kan de expressie van genen van het gehele genoom tegelijkertijd gemeten worden. Genexpressie is de mate waarmee een gen gekopieerd wordt, zodat het kan worden afgelezen. Dit aflezen is uiteindelijk van belang voor de synthese van het eiwit waarvoor het gen codeert. Omdat het hele genoom geanalyseerd wordt, kunnen veranderingen in veel verschillende biologische processen tegelijk worden opgespoord.
Resultaten en conclusies
Uit onze experimenten is gebleken dat er een aantal sterke veranderingen optreedt in de hypothalamus tijdens de groei van een tumor. Een belangrijke bevinding was het optreden van veranderingen in de vorming van serotonine. Serotonine is een stof die in de hersenen belangrijk is voor de signaaloverdracht tussen neuronen, oftewel de
134
Nederlandse samenvatting
communicatie tussen zenuwcellen in het brein. Serotonine heeft door deze functie een grote invloed op veel gedragsprocessen, waaronder voedselinname. Onze resultaten lijken aan te tonen dat tijdens tumorgroei de afgifte van serotonine in de hypothalamus toeneemt. Deze verhoogde afgifte van serotonine leidt er vervolgens toe dat de processen die normaal gesproken de voedselinname stimuleren worden afgeremd. Hierdoor kan een verhoging in serotonineconcentratie in de hypothalamus leiden tot een afname in eetlust en de ontwikkeling van anorexie. Daarnaast zagen we een verhoging van serotonineconcentratie in de hypothalamus ook in het derde model, waarbij anorexie alleen kon zijn veroorzaakt door ontstekingsreacties en niet door tumorgroei. Dit zou betekenen dat met name de ontstekingsreacties die plaatsvinden tijdens tumorgroei een cruciale rol spelen bij het ontwikkelen van anorexie.
Op basis van dit proefschrift kan worden geconcludeerd dat ontstekingsreacties tijdens chronische ziekten zoals kanker kunnen leiden tot verhoogde afgifte van serotonine in de hypothalamus. Deze verandering is op de lange termijn negatief, omdat ze bijdraagt aan de ontwikkeling van anorexie. Verder onderzoek is nodig om te bestuderen of het verlagen van de serotonineconcentratie of het remmen van de signaaloverdracht via serotonine ook daadwerkelijk effectief is bij de behandeling van anorexie tijdens kanker.

135
*
Ned
erla
ndse
sam
enva
ttin
g


Dankwoord
*
138
Dankwoord
Serotonine is niet alleen betrokken bij eetgedrag, zoals beschreven in dit proefschrift, maar is ook belangrijk voor het ervaren van geluk en plezier. Het gezelschap en de ondersteuning van een aantal mensen heeft sterk bijgedragen aan het ervaren van dit plezier tijdens mijn AIO-tijd. Deze mensen wil ik hier graag bedanken.
Allereerst wil ik mijn co-promotor bedanken. Klaske, ontzettend bedankt voor je vertrouwen in mij, en voor de gegeven kans om een stage te lopen bij Danone, wat vervolgd werd in een promotietraject. Ik bewonder je gedrevenheid en enthousiasme in alles wat je doet. Door je creativiteit heb je me geleerd om vanuit verschillende invalshoeken het onderzoek te benaderen. Je hebt me ontzettend veel geleerd en ik zal onze samenwerking erg missen. Natuurlijk ook bedankt voor de leuke momenten op onze congresreizen: ik had “de beer of het zwijn?”op het pad in Kobe, de lekkere “extra-noir” thee in Lille, “de spook-hotelkamer” in Boston, de “terror-non” aan de Chiemsee, en het maken van mislukte panoramafoto’s op Mount Real absoluut niet willen missen!
Renger, in 2009 kwam ik bij jou aankloppen voor hulp bij het krijgen van een stage via het RIKILT in Suriname. Helaas brandde het lab daar af vanwege het aansluiten van een apparaat op 220V in plaats van 110V . Achteraf gezien is het allemaal goed gekomen, want ik kon via jou direct voor een andere stage bij Danone Research terecht, onder begeleiding van Klaske. Ik waardeer alle moeite die je voor me hebt gedaan bij het helpen bij al mijn carrièrestappen enorm. Ik vond het erg fijn om in jouw groep te werken en dat je me als promotor begeleidde. Ook al was je altijd erg druk, je wist altijd tijd vrij te maken. Ik moet bekennen dat ik de deadlines voor jou altijd vervroegde met een week, maar steeds weer bleek deze extra week overbodig, want je was er altijd wanneer dat nodig was. Ik heb veel geleerd van al je input op onze artikelen en de discussies op de vrijdagochtend, bedankt!
Mark, fijn dat je mijn co-promotor wilde worden en dat ik altijd zo bij je binnen kon lopen voor ondersteuning en vragen over array-analyse. Bedankt voor alles wat je me hebt geleerd over array-analyse en alle Wikipedia kennis die je deelde over allerlei andere dingen tijdens de lunch.
Josèp, thank you for all your scientific contributions and for giving me the opportunity to stay at your lab. I learned a lot from you and from the great people in your group. Josèp, Silvia, Miriam and Fabio, you all made my stay in Barcelona a great experience! Gracias por todo! Alessandro, your always positive energy is great to be around, thank you for sharing your insights and your input on our papers. Daniel, thank you for your efforts

139
*
Dan
kwoo
rd
and your valuable comments on our review. Michael bedankt voor de samenwerking en je input op ons paper! Miriam en Francina, ik waardeer de tijd die jullie namen om me van alles te leren op het lab en over het verwerken van de data en bedankt dat ik jullie altijd om hulp en advies kon vragen.
I would like to thank my committee Julian Mercer, Jaap Keijer, Duen Chen and Ellen Kampman for judgement of the thesis and being present at my defence.
Ex-kamergenootjes Nicole en Anastasia, het was erg wennen zonder jullie. Bedankt voor de gezelligheid en ondersteuning. Milène, Katja, Inge en Nikkie, ook zonder jullie zou het traject een stuk minder gezellig zijn. Ik heb altijd kunnen bouwen op jullie steun zowel in werk als privé en ik zal jullie missen! Milène, jij was de eerste die de aula trotseerde. Je hebt een heerlijk nuchtere persoonlijkheid, en natuurlijk mis ik het dat ik je niet meer kan knuffelen en niet meer kan plagen: jij hapt altijd zo mooi . Katja, jouw humor was een groot gemis in onze kamer na je promoveren. Gelukkig kan ik je buiten werktijd nog steeds om advies vragen. Inge, door jouw sterke sociale intuïtie kan ik altijd bij je terecht, heerlijk om niet alles uit te moeten leggen! Verder ben jij de encyclopedie van onze kamer, je weet echt zoooveel, en als je iets niet weet, dan kom je een paar minuten later alsnog met een uitgebreide uitleg. Nikkie, jij bent altijd zo vrolijk. En als het even niet meezit, dan is chocola bij jou het antwoord (bij wie niet?). Het is heerlijk om je positieve energie om me heen te hebben. Je bent daarnaast ook een fijne sparring-partner in het lab. Neeraj, sorry for all the times I’ve kept you from your work. You’re funny and always calm and it was great to have you sitting next to me. Roomies, ik wens jullie het allerbeste voor de toekomst!
Sheril, Aafke, Lily and Wieneke thanks for the fun times in the lab. Parastoo, Fenni, Antwi, Montserrat, Juri, Sophie, Rogier and Suzanne thanks for all the good times and good luck with your PhD projects! Lonneke and Ya, thanks for all your support during sections, you helped me out when I needed it! All the best for the coming years, you will have great results! Bert, René, Judith en Wilma, erg bedankt voor jullie ondersteuning! Het was erg prettig samenwerken door jullie flexibiliteit en fijne omgang.
Margien, Angeline, Rani, Marlies, Marlous, Lars, Anne en Marjolein, ik vond het leuk om jullie te begeleiden tijdens jullie masterthesis. Bedankt voor jullie harde werk en heel veel succes in jullie verdere carrière! Super dat jullie ook hebben gekozen om een PhD te gaan doen: Margien, Marlies, Anne en Marjolein: veel succes!

140
Dankwoord
Mieke, toen jij me begeleidde op het lab tijdens mijn masterthesis, dacht ik elke keer ‘wanneer gaat ze nou uitbarsten en zeggen dat ik een kluns ben met een pipet?’. Die uitbarsting kwam nooit en mede dankzij jou wilde ik verder op het lab en een PhD gaan doen. Je bent echt ongelofelijk lief en je staat altijd klaar met wijze raad. Jenny, Mechteld, Karin, Shohreh en Carolien, fijn dat ik bij jullie altijd terecht kon voor snelle vragen en ondersteuning. Erg bedankt daarvoor!
Michiel, bedankt voor je kritische blik en alle gezellige gesprekken. Guido, bedankt voor al je input en interesse in het project. Natuurlijk waren de updates over BN’ers en het laatste Bennekomse nieuws ook altijd een fijne afwisseling tijdens de lunches en natuurlijk bedankt voor het snel verwerken van mijn GEO aanvragen! Philip, fijn dat ik bij je terecht kon om over statistiek te discussiëren. Sander bedankt voor de nuttige discussies en natuurlijk de gezelligheid tijdens de lunches. Rinke en Diederik, fijn dat ik bij jullie terecht kon om te discussiëren over écht goede films en leuke Youtubefilmpjes. Die smakeloze grappen erna waren niet altijd nodig... maar goed, het is jullie vergeven. Wilma, ik heb de gesprekken zo vroeg in de ochtend bij het koffieapparaat altijd gezellig en een fijn begin van de dag gevonden! Lydia, bedankt voor je interesse in mijn project en de grappige discussies. Jocelijn, fijn dat ik bij jou mijn masterthesis mocht doen en zo de kans kreeg op een vervolgtraject. Bedankt voor je input op onze resultaten!
Ioannis, bedankt voor de tijd die je voor me hebt uitgetrokken om me te laten zien waar alle verschillende gebieden in de hypothalamus liggen.
Cher, ik ben je dankbaar dat jij de cover op je wilde nemen. Dat je dit hebt ontworpen met alleen het gegeven “kleurrijk en cellen-netwerk”, onderstreept je talent.
Arvind, Mien en Bas, ik heb geluk met jullie als familie. Het is altijd fijn met jullie om me heen en ik weet dat ik altijd op jullie kan rekenen. Arvind, ook al wil je het niet, je bent en blijft mijn kleine broertje en ik hoop dat je me nu misschien wel serieus neemt als ik zeg dat je méér groente en mínder vlees moet eten. Mien, ik ben blij dat je mijn zus bent. Vanaf kinds af aan neem je het altijd voor me op. Sinds je moeder bent, ben je nog zorgzamer geworden. Bas, jij bent een geweldige zwager! Shiyam, je brengt altijd een lach op mijn gezicht. Je groeit zo snel! En lieve Tvesa, welkom in de familie! Moussi is dol op jullie. En opeens kwam ook jij, Sharosh, terecht in onze familie. Je ondersteunt me in alles wat ik doe en waarborgt mijn geluk. Lieverd, ik ben trots op je.

141
*
Dan
kwoo
rd
Lieve mama en papa, jullie zijn de fijnste en beste ouders die iemand zich maar kan wensen! Jullie hebben me altijd geleerd om mijn eigen weg te volgen en als het misgaat, dan zijn jullie er. Er is niemand zo trots op Arvind, Mien en mij, zoals jullie dat zijn en er is niets wat jullie niet zouden doen voor ons geluk. Pa en Ma, zonder jullie was het niet gelukt: dit is ook jullie werk!


About the author
*
144
About the author
Curriculum vitae
Jvalini Dwarkasing was born on the 1st of February, 1986 in Rotterdam, The Netherlands. In 1994, she temporally moved with her family to Paramaribo, Surinam, to return in 1998 and finish secondary school at the Emmauscollege Gymnasium in Rotterdam. In 2004, she started her studies in Nutrition and Health in Wageningen and continued her studies by following two master programmes: Food Safety and Nutrition and Health. In 2009, she did her first master thesis focused on estrogenic activity of soy flavone genistein at the Division of Toxicology under supervision of prof. dr. I. Rietjens. She continued with a 2nd master thesis at Nutrition and Pharmacology guided by dr. J. Meijerink and prof. dr. R. Witkamp, studying the anti-inflammatory effects of cannabinoids. For an internship she went to Danone Research where she worked on the effects of fish oils on NF-κB-mediated HIV replication under supervision of F. Dijk and K. van Norren. Her work was presented at the ESPEN conference and rewarded with a poster prize. In 2010, Jvalini graduated from the master programmes Nutrition and Health and Food Safety. Then, she started a PhD project at the Pharmacology and Nutrition group under guidance of K. van Norren, R. Witkamp, and M. Boekschoten. During her PhD, she closely collaborated with the Muscle, Protein and Metabolism platform from Nutricia Research. She also joined the Cancer Research Group at the University of Barcelona led by prof. J. Argilès to work on a specific cancer model. In 2012, she received a fellowship award by ESPEN and a poster prize from the Society of Sarcopenia and Muscle Wasting. She finished her PhD in 2015. The results of the PhD project “Hypothalamic regulation of food intake during cancer” are described in this thesis.
145
*
Abo
ut th
e au
thor
List of publications
Dwarkasing, J.T., R.F. Witkamp, M.V. Boekschoten, M.C. ter Laak, M.S. Heins, and K. van Norren, Increased hypothalamic serotonin turnover in inflammation-induced anorexia. Submitted for publication.
Dwarkasing, J.T., D.L. Marks, R.F. Witkamp, and K. van Norren, Hypothalamic inflam-mation and food intake regulation during chronic illness. Peptides, 2015.
Dwarkasing, J.T., M. van Dijk, F.J. Dijk, M.V. Boekschoten, J. Faber, J.M. Argiles, A. Laviano, M. Muller, R.F. Witkamp, and K. van Norren, Hypothalamic food intake regulation in a cancer-cachectic mouse model. J Cachexia Sarcopenia Muscle, 2013. 5(2): p. 159-69.
Dwarkasing, J.T., M.V. Boekschoten, J.M. Argilès, M. van Dijk, S. Busquets, F. Penna, M. Toledo, A. Laviano, R.F. Witkamp, and K. van Norren, Differences in food intake of tumour-bearing cachectic mice are associated with hypothalamic serotonin signalling. Journal of Cachexia, Sarcopenia and Muscle, 2015. 6(1): p. 84-94.
Other
Meijerink, J., M. Poland, M.G. Balvers, P. Plastina, C. Lute, J. Dwarkasing, K. van Norren, and R.F. Witkamp, Inhibition of COX-2-mediated eicosanoid production plays a major role in the anti-inflammatory effects of the endocannabinoid N-docosahexaenoylethanolamine (DHEA) in macrophages. Br J Pharmacol, 2015. 172(1): p. 24-37.
van Norren, K., F. Rusli, M. van Dijk, C. Lute, J. Nagel, F.J. Dijk, J. Dwarkasing, M.V. Boekschoten, Y. Luiking, R.F. Witkamp, M. Müller, and W.T. Steegenga, Behavioural changes are a major contributing factor in the reduction of sarcopenia in caloric-restricted ageing mice. Journal of Cachexia, Sarcopenia and Muscle, 2015.
146
About the author
Overview of completed training activities
Discipline specifi c activities
• Pharma-Nutrition Conference (Amsterdam, 2011)• NWO Voedingsdagen (Deurne, The Netherlands, 2011, 2012, 2013, 2014)• Advanced visualization, integration and biological interpretation of –omics data
(Wageningen, The Netherlands, 2011)• NUGO week (Wageningen, The Netherlands, 2011)• Characteristics and implementation Lewis Lung model (Barcelona, Spain, 2012)• Full4Health Project Meetings (Aberdeen, UK, 2011 and Lille, France, 2013)• ESPEN (Barcelona, Spain, 2012)• 1st Cancer Cachexia Conference (Boston, USA, 2012)• Cachexia Conference (Kobe, Japan, 2013)• 2nd Cancer Cachexia Conference (Montreal, Canada, 2014)• Symposium Gut-Nutrient Signalling (Danone Research, Utrecht, The Netherlands,
2013)• Regulation of energy intake: the role of product properties (Wageningen, The
Netherlands, 2012)
General courses
• Implementing and designing experimental models (2011)• Techniques for Writing and Presenting Scientific Papers (2012)• VLAG PhD Week (2011)• PhD Competence test (2011)• Alisson Douglas Summerschool (2013)• Efficient Writing Strategies (2014)
Optional activities
• Preparation Research Proposal (2011)• NMG-Pharma Lab Meetings (weekly, 2011–2015)• Pharma group meetings (weekly, 2011–2015)

147
*
Abo
ut th
e au
thor
Colophon
The research described in this thesis has received funding from the European Union’s Seventh Framework Programme for research, technological development and demonstration under grant agreement n°266408 (Full4Health).
Financial support from Danone Research – Centre for specialised Nutrition and Wageningen University for printing this thesis is gratefully acknowledged.
Design Cher van Tol, Rubixmarketing.nl Layout Renate Siebes, Proefschrift.nuPrinted by Ipskamp Drukkers B.V., Enschede
© Jvalini Dwarkasing, 2015