hypergastrinemia in response to gastric inflammation suppresses somatostatin
TRANSCRIPT

1
Hypergastrinemia in response to gastric inflammation suppresses
somatostatin.
Yana Zavros1, Gabriele Rieder2, Amy Ferguson4, Linda C. Samuelson3 and Juanita L.
Merchant1,2,3
Howard Hughes Medical Institute1 and the Departments of Internal Medicine2,
Physiology3 and Pathology4 University of Michigan, Ann Arbor, MI
Running Title: Suppression of somatostatin by hypergastrinemia.
Corresponding Author
Juanita L. Merchant, M.D., Ph.D.
1150 West Medical Drive
MSRB I, 3510
Ann Arbor, MI 48109-0650
Phone: (734) 647-2944
Fax: (734) 936-1400
email: [email protected]
Abbreviations: wild type mice (G+/+); gastrin-deficient mice (G-/-); G cells (gastrin-
expressing cells); D cells (somatostatin-expressing cells); vehicle treated mice (V);
omeprazole treated mice (OM); antibiotics (Abx); colony forming units (CFU).
Copyright 2001 by the American Physiological Society.
AJP-GI Articles in PresS. Published on October 15, 2001 as DOI 10.1152/ajpgi.00287.2001

2
Key Words: Helicobacter pylori, bacterial overgrowth, omeprazole, gastrin-null mice,
mucosal lymphocytes.

3
Abstract
Background: Hypergastrinemia and a reduction in tissue somatostatin occur in
Helicobacter pylori-infected patients. We investigated whether the D cell may be a direct
target of gastric inflammation and hypergastrinemia. Methods: D cells were quantified
by morphometry and flow cytometry in 16 week old wild type (G+/+) and gastrin-
deficient (G-/-) mice. Hypochlorhydric G-/- mice were treated with either antibiotics for
20 days or infused with gastrin (G-17) for 14 days. G+/+ mice were made
hypochlorhydric by treating mice with omeprazole for 2 months. Results: G-/- mice
showed significant inflammation when compared to the G+/+ mice which resolved after
20 days of antibiotic treatment. D cell numbers were not significantly different between
G-/- and G+/+ mice. After infusing G-17, fundic and antral D cell numbers decreased in
the G-/- mice. G+/+ animals made hypergastrinemic with omeprazole exhibited
decreased D cell numbers. When omeprazole treated mice were treated with antibiotics
alone, elevated plasma gastrin levels returned to baseline and D cell numbers returned to
resting levels despite persistent hypochlorhydria. Conclusion: Hypergastrinemia,
induced by inflammation, results in decreased D cell numbers. Thus, the stomach
responds to the presence of inflammation by reducing somatostatin levels thereby
releasing the inhibition on the G and parietal cells to maximize gastric acid output.

4
Introduction
It has been established that Helicobacter pylori (H. pylori) induces mucosal
inflammation or gastritis and subsequently major cellular and physiologic changes in the
stomach (10). In particular, H. pylori colonization of the stomach correlates with an
increase in gastric G cells, gastrin expression and secretion (10). Basal levels of acid
secretion rise, presumably due to the elevated levels of circulating gastrin. It is assumed
that the high gastric acid levels stimulate the production of somatostatin through putative
chemoreceptors on the D cell. Once the D cell is activated, secreted somatostatin should
inhibit the G cell by paracrine mechanisms (23). Rather, what is observed in H. pylori-
infected patients are reduced numbers of D cells and somatostatin in the face of elevated
gastrin production and acid secretion (12, 24). To explain these findings, a direct
inhibitory effect by inflammatory cytokines on D cells has been proposed (2, 3, 5).
Evidence for the immunoregulation of somatostatin originates from in vitro studies
demonstrating that cytokines such as TNFα and IL-8 inhibit somatostatin release from
isolated rabbit and canine fundic D cells [(2, Beales, 1998 #6168)].
Gastrin null mice created by homologous recombination are hypochlorhydric (11,
13). We have recently studied these mice in greater detail and have found that they also
exhibit significant gastric mucosal inflammation caused by bacterial overgrowth as a
consequence of reduced gastric acidity (30). The present study extends these findings by
measuring changes in tissue somatostatin and D cell numbers in gastrin null mice. As
reviewed above, the levels of tissue somatostatin and the D cell numbers are quite
relevant to understanding the regulation of gastric acid secretion. Thus, it is important to
evaluate the reason for suppressed tissue somatostatin levels during gastritis. Our studies

5
in the gastrin-deficient and omeprazole-treated mice indicate that in the presence of
gastritis, the stomach is stimulated to maximize acid output (30). Thus, it is logical to
propose that at the same time the stomach will act to suppress the inhibitors of gastric
acid secretion. Since somatostatin is a major inhibitor of gastrin secretion and therefore
acid secretion, we hypothesize that during inflammation somatostatin production is
actively inhibited.
Analyzing the D cell population in the gastrin-deficient mice, we observed and
report here that both D cells and somatostatin levels remain elevated despite significant
gastritis. This raised the interesting possibility that gastrin may be the regulator of the D
cell. We tested this hypothesis by infusing gastrin into the gastrin-deficient mice in the
presence of antibiotics to resolve the inflammation. We found that the gastrin infusion
suppressed both fundic and antral D cell populations and tissue somatostatin levels. We
also examined changes in D cells in mice made hypergastrinemic by omeprazole.

6
Material and Methods
Animals: Gastrin deficient (G-/-) mice and strain-matched (C57Bl/6 x
129/Sv) wild type controls (G+/+) were bred by homozygous mating. G+/+ (n=10) and
G-/- (n=12) mice were maintained in individual, sterile microisolator cages in non-barrier
mouse rooms for 16 weeks. All mice were fasted overnight with access to water ad
libitum before analysis. The study was performed with the approval of the University of
Michigan Animal Care and Use Committee which maintains an American Association of
Assessment and Accreditation of Laboratory Animal Care (AAALAC) facility.
Antibiotic treatment: At 13 weeks of age G+/+ and G-/- were treated with
antibiotics by adding 5 mg/kg of streptomycin to their drinking water for 3 weeks. At the
same time, mice were given a subcutaneous injection of 100 mg/kg/day of cefoperazone
(Sigma) (26). Each day their feces were collected, weighed, suspended in 1 ml PBS by
vortexing, then diluted 1:100. One hundred microliters of the suspension were cultured
on Luria broth plates and incubated at 37oC for 24 hr. The colonies on each plate were
counted and the results expressed as CFU/g feces. After 5 days of antibiotic treatment,
the CFU/g feces decreased significantly from 300 x 103 CFU/g feces to 85 x 103 CFU/g
feces. The bacterial count continued to decrease over the next 15 days of treatment (data
not shown) and bacterial counts were undetected in mouse feces by day 20. Therefore we
chose this duration for treatment. Mice were sacrificed after 20 days of antibiotic
treatment and analyzed.
G-17 infusion: G-/- mice were anaesthetized with xyalzine (20 mg/ml) and
ketamine (100 mg/ml) at 8 weeks of age. A midline incision was made in the skin below
the rib cage. Another incision was then made in the abdominal muscle directly under the

7
cutaneous incision. The micro-osmotic pump (Alzet, model 1002), delivering 5µg/kg/hr
of rat non-sulfated gastrin (G-17) (Bachem) was inserted into the peritoneal cavity. The
muscle and skin incisions were then closed by silk sutures. Mice were continuously
infused with G-17 for 14 days prior to sacrifice and analysis.
Omeprazole treatment: Eight week old G+/+ mice were made
hypochlorhydric by treating with a single intraperitoneal injection of omeprazole per day
(400 µmol/kg) for 8 weeks. The stock solution of omeprazole (80 µmol/ml) was
dissolved in DMSO/PEG (4.5/0.5 vol/vol) and stored at –20oC until use. Eight week old
control mice were treated in the same manner with the vehicle alone. All mice were
sacrificed at 16 weeks of age and analyzed. In a separate group, 8 week old G+/+
animals were also treated with omeprazole for 8 weeks, but were treated with the same
antibiotic regimen as described above for 20 days. These animals were also sacrificed at
16 weeks of age.
Quantitative and Qualitative Microbiology: The wet weight of the antral
and fundic tissue was determined. Tissue was homogenized briefly with a polytron PT-
2000 (Kinematica, Cincinnati, OH) in 1 ml saline, and appropriate dilutions were spread
on blood agar plates containing Campylobacter Base Agar (Difco, MI) supplemented
with 5% horse blood (Colorado Serum, Denver) and 2 µg/ml nystatin (Sigma, MO).
Plates were incubated under aerobic, microaerophilic and anaerobic conditions
(CampyPak Plus, GasPak Plus, Anaerobic Systems, BBL) at 37oC for 3-5 days. The
number of colonies were counted and the colony forming units (CFU) per gram of tissue
calculated. Comparisons between groups were based on the log concentrations of
bacteria. For statistical analysis, the total viable count was determined by a total colony

8
count of all bacterial types on aerobic, facultative anaerobic and anaerobic cultures.
Single colonies were used to identify major bacterial species, by the Medical
Microbiology Department at the University of Michigan Hospital, using specific nutrient
culture conditions, biochemical assays and API System for fermenting and non-
fermenting Gram negative bacteria.
To exclude the presence of Helicobacter pylori (H. pylori), an aliquot of the
homogenate was spread on selective blood plates supplemented with 5 µg/ml
vancomycin and 10 µg/ml trimethoprim lactate (Sigma, MO), then incubated for 5 days
at 37oC under microaerophilic conditions. Single colonies from these plates were tested
for urease (using a drop of urea broth:10g urea, 0.5% w/v phenol red, 0.22 g
NaH2PO4.H2O, 0.51 g Na2HPO4, 100 mg NaN3, and 500 ml distilled water at pH 6.2),
catalase (using 3% H2O2 solution), and oxidase (DrySlide, BBL) activity. None of the
tested colonies were positive for any of the three enzyme tests. The quantitative urease
activity was performed on the remaining homogenate to exclude other urease positive
Helicobacter species. Briefly, homogenate was centrifuged for 10 min at 7500 rpm and
the pellet resuspend in 200 µl of urea broth containing phenol red. After incubation at
37oC over-night, the reaction mixture was centrifuged and the supernatants were placed
in microtiter plates. The extent of the phenol red color change was recorded in an
automated ELISA reader at 550 nm against a H. pylori standard curve. All colonies
tested were below the standard curve for H. pylori suggesting an absence of urease
positive Helicobacter spp. In addition, DNA was extracted from stomach tissue of G-/-
and G+/+ mice and a pure culture of H. pylori using a DNeasy Tissue Kit (Qiagen)
according to the manufacturers protocol. Helicobacter primer pairs C97 and C98 and

9
C97 and C05 were used to amplify 16S rRNA amplicons of approximately 400 and 1200
base pairs respectively. The primer sequences were generated according to Fox et al.
(10) and were as follows: C97, 5’-GCT ATG ACG GGT ATC C-3’ (276-291 forward);
C98, 5’-GAT TTT ACC CCT ACA CCA-3’(681-698 reverse) and C05, 5’-ACT TCA
CCC CAG TCG CTG-3’ (1478-1494 reverse). PCR conditions are as previously
published (10). Analysis of the H. pylori DNA samples by PCR with the Helicobacter
genus-specific primers produced the expected 400 base pair and 1200 base pair
amplicons with H. pylori DNA extracted from the stomachs of G+/+ mice infected with
the SS1 strain (16). Neither of the 400 and 1200 base pair amplicons was amplified from
DNA extracted from uninfected G+/+ or G-/- mice, confirming the culture results
demonstrating that there were no Helicobacter spp. present in these mice.
Immunohistochemistry: A longitudinal section of the stomach (spanning
both the fundic and antral regions) was fixed in 4% paraformaldehyde/PBS, paraffin-
embedded and 3 µm sections were prepared. Sections were deparaffinized then
permeabilized in 3% H2O2 and 100% ethanol. Non-specific antigenic sites were blocked
with 20% normal goat serum/PBS, 0.1% Triton X-100 for 30 min before a 2 h incubation
with a 1:200 dilution of rabbit anti-somatostatin (Zymed) antibody. A 1:500 dilution of
the secondary anti-rabbit IgG antibody was added for 30 min and visualized with avidin-
biotin complexes using the Vectastain Elite ABC Kit and diaminobenzidine (DAB) for
substrate (Vector Laboratories, Inc., Burlingame, CA). Sections were also stained with
hematoxylin and eosin (H&E). The morphometric results were expressed as the average
number of cells counted per gland. A total of 10 oriented glands in random fields were

10
counted for each mouse. The results were expressed as the average number of cells
counted per gland.
Sections stained by H&E were graded on the intensity of inflammation and
metaplasia by a pathologist blinded to the treatment and mouse genotypes according to
Eaton et al, a grading system developed for the histologic quantification of gastritis in
mice (9). A score of 0-1 was given to those sections showing no inflammation, 2 for
gastritis (inflammatory infiltrate sufficient to displace glands and 3 for marked
inflammation with metaplasia, where metaplasia is defined as the loss of normal fundic
morphology with replacement of mucous-secreting glands (9). The presence of
metaplasia was confirmed by a PAS/alcian blue stain.
Blood collection: After sacrifice, approximately 1 ml of blood was collected
by cardiac puncture, aliquoted into tubes that were lithium heparinized and centrifuged at
15,000 rpm for 15 min at 4oC. Plasma was collected immediately and stored at –20oC
until assayed.
Peptide extraction: Gastric sections were weighed and added to 500 µl of
boiling double distilled water. After boiling for 5 min the biopsies were compressed
using a glass rod, the tissue was boiled for an additional 5 min, then microfuged at 10,000
rpm for 15 min. The supernatant collected was designated as the water extract containing
gastrin. The pellet was resuspended in 500 µl of boiling 3% acetic acid, boiled for 10
min and microfuged as above. The supernatant collected was the acid extract containing
somatostatin. Extracts were stored at –20oC until assayed by radioimmunoassay.
Somatostatin radioimmunoassay: Somatostatin concentrations in water and
acid biopsy extracts were measured using appropriate volumes and dilutions. Antiserum

11
1001 (CURE, UCLA) was used, which detects both somaotstatin-14 and somatostatin-28
(18). 125I-Tyr-somatostatin-14 was used as the label and somatostatin-14 (50 pmol/L)
was used to generate the standard curve. The ID50 was 8 fmol/ml and the inter- and intra-
assay coefficients of variation were less than 5% and 12% respectively.
Gastrin radioimmunoassay: Plasma and the water and acid tissue extracts were
assayed for gastrin amide (G-17) using appropriate volumes and dilutions (empirically
determined). Samples were incubated in duplicate at 4oC with 125I-15Met human G-17
label and antiserum 1296 (CURE, UCLA). Antiserum 1296 recognizes all carboxy-
terminal fragments larger than the pentapeptide and measures G-17 sulfated and non-
sulfated identically. G-17 (50 pmol/L) was used to generate the standard curve. The ID50
was 1 fmol/ml and inter- and intra-assay coefficients of variation were less than 2% and
11% respectively.
Gastric acid concentrations: The stomachs from G-/- mice infused with
G-17 were opened along the greater curvature and washed with 2 ml normal saline (pH
7.0). All mice were fasted overnight before gastric samples were collected. The
contents were centrifuged at 3,000 rpm for 5 min and the supernatant collected. The
supernatant was titrated using 0.005N NaOH and gastric acidity was expressed in µEq.
Cell preparation and flow cytometry: Lymphocytes and epithelial cells
were isolated from the gastric mucosa according to a previous method (7). Briefly, the
stomach was dissected into 2 mm size pieces. The pieces were first incubated in 20 ml of
Hank's balanced salt solution containing 5% BSA, 1 mM DTT and 1 mM EDTA for 1 h
with vigorous shaking at 37oC to release the epithelial cell population. This first cell
suspension was passed through a filter (50 µm Filcon filter, Dako), collected and washed

12
twice with RPMI medium containing 5% fetal calf serum. The stripped mucosa was then
subjected to enzymatic digestion in 20 ml of RPMI medium containing 1 mg/ml dispase
II (Roche Molecular Biochemicals) for two 30 min incubations at 37oC with vigorous
shaking to remove mucosal lymphocytes. The lymphocytes were collected, washed and
surface labeled for flow cytometry. Isolated T cells, B cells and leukocytes were labeled
with FITC-conjugated anti-mouse CD3 (Pharmingen), CD19 (Pharmingen) and
phycoerythrin-conjugated anti-mouse CD45 (Pharmingen) respectively. D cells were
labeled with a rabbit anti-somatostatin (Vector Labs.) antibody after permeabilization
(29). The total epithelial cell population was quantified using a monoclonal anti-human
cytokeratin-18 (keratin RCK106) antibody (catalogue number 11416, Cappel ICN
Pharmaceuticals). FITC-conjugated anti-mouse and anti-rabbit immunoglobulins
(Cappel ICN Pharmaceuticals) were used to detect the cytokeratin-18 or somatostatin
primary antibodies respectively. Labeled cells were then analyzed by flow cytometry
using a Coulter Elite ESP Cell Sorter (Bechman-Coulter Electronics, Florida). A total of
10,000 cells were analyzed for all cell types. Changes in T and B cells were calculated as
follows:
Cell number in total cell prep x % CD45 + cells x % CD3+ or CD19 + cells
= Number of T or B cells in the mucosa (1). D cells were expressed as a percentage of
the number of cytokeratin-18 positive cells.
Statistical analysis: The results were statistically tested by unpaired t-test or
one-way ANOVA as appropriate, using commercially available software (GraphPad
Prism, GraphPad Software, San Diego, CA). A P<0.05 was considered significant.

13
Results
Mucosal inflammation in gastrin-deficient (G-/-) mice. We examined
mucosal changes by histology and by flow cytometry to quantify T and B cell
populations. Significant inflammation was observed in G-/- (Fig. 1B) compared to the
G+/+ mice (Fig. 1A). The histologic grades for all mice were scored by a pathologist
blinded to the experiment. The mean histologic score for G-/- mice was 3.58 + 0.38
which was significantly greater than that of the G+/+ mice (0.75 + 0.13). To determine if
the presence of bacteria was the cause of the inflammation in the G-/- mice, a group was
treated with antibiotics for 20 days. After antibiotic treatment, the histologic grade
scored in the G-/- mice decreased to normal (0.50 + 0.15). Although the histologic scores
decreased after G-/- mice were infused with G-17 (1.42 + 0.19), this grade was
significantly greater than that for the G+/+ animals. To support the qualitative analysis of
mucosal inflammation, flow cytometry was used to quantify changes in the number of T
and B lymphocytes. Consistent with the histologic grading, there was a significant
increase in T and B cells in G-/- mice that resolved with antibiotics. As observed in the
histologic analysis, G-17 infusion reduced the T and B cell populations (Fig. 2).
However, the lymphocyte population after G-17 infusion did not return completely to
baseline levels.
G-17 infusion reduced bacterial overgrowth in the G-/- mice. Figure 3
illustrates the total number of bacterial counts in the G+/+ mice versus G-/- mice in both
the fundus (Fig. 3A) and antrum (Fig. 3B). After antibiotic treatment and G-17 infusion,
there was a significant reduction in the total number of bacteria in both the fundus and
antrum. However, these numbers were significantly greater than the bacterial counts for

14
the G+/+ mice treated with antibiotics. Overall, the total number of bacteria in the
antrum was significantly greater in the G-/- mice compared to the G+/+ animals.
D cells and tissue somatostatin were suppressed after G-17 infusion. To
evaluate the response to inflammation, changes in D cells and tissue somatostatin
concentrations were measured in G-/- mice. Immunohistochemical staining revealed
positive anti-somatostatin antibodies in both the fundus and antrum of the G-/- mice (Fig.
4A and B). These cells were quantified by morphometric analysis and showed that, after
antibiotic treatment there was no change in the number of D cells in either the fundus or
antrum (Fig. 5B). In contrast to the antibiotic treatment, after G-17 infusion there was a
reduction in the number of D cell staining in both the fundus and antrum (Fig. 4C and D).
After G-17 infusion, there was a significant decrease in D cell numbers in both fundic
and antral regions of the stomach (Fig. 5B). In addition, there was a significant reduction
in both fundic and antral tissue somatostatin concentrations after G-17 infusion (Table 1).
Thus, hypergastrinemia had a greater suppressive effect than inflammation on the D cell
numbers and somatostatin levels. The decrease in somatostatin was consistent with an
increase in circulating gastrin (558 + 114 pmol/l) in the G-/- mice infused with G-17
compared to resting levels in the G+/+ mice (54 + 8 pmol/l) (Table 1). The reduction in
somatostatin during G-17 infusion also correlated with an increase in gastric acidity.
Gastric acidity increased from 0.48 + 0.10 µEq in the untreated G-/- mice to 1.86 + 0.36
µEq in the G-17 infused mice. However, gastric acidity did not reach acid levels
measured in the G+/+ mice (2.71 + 0.31 µEq) (Table 1). This result was similar to the
incomplete recovery of acid secretion observed by Friis-Hansen et al (11). There was no
change in gastric acidity in G-/- mice after antibiotic treatment. Flow cytometry, which

15
evaluated the total number of D cells in the epithelium correlated with the morphometric
analysis (Fig. 5A). Both morphometric and flow cytometric analyses revealed that there
was a trend toward lower D cell numbers in the G-/- mice. This may reflect the modest
inhibitory effect of inflammation on the D cell. Slightly fewer D cells were counted in
the antrum compared to the fundus although there were 3-fold higher tissue somatostatin
levels in the antrum compared to the fundus. Therefore, it appears that the concentration
of somatostatin per cell is highest in the antrum. In addition, there was no significant
difference in somatostatin concentrations between G+/+ and G-/- mice (Table 1).
Hypergastrinemia in omeprazole-treated G+/+ mice suppressed D cells and
tissue somatostatin. Collectively, our results suggest that somatostatin is suppressed by
increasing circulating gastrin concentrations. Furthermore, hypergastrinemia induced by
omeprazole treatment is also associated with decreased somatostatin. Therefore, to
further evaluate the role of hypergastrinemia in the down-regulation of somatostatin,
G+/+ mice were made hypochlorhydric and hypergastrinemic with omeprazole treatment
for 2 months. The circulating gastrin concentrations in these mice were 159 + 11 pmol/l
(Table 2), as reported in other animal models and human subjects (7). Histologic and
flow cytometric evaluation revealed that G+/+ omeprazole-treated mice also showed
significant inflammation (30). After 2 months of omeprazole treatment, D cell numbers
were significantly decreased in both the fundus and antrum compared to untreated
animals (Fig. 6B). This correlated with a significant reduction in tissue somatostatin
concentrations in both the fundus and antrum in the omeprazole-treated mice compared to
controls (Table 2). After antibiotic treatment, the elevated circulating gastrin
concentrations returned to resting levels (34 + 4 pmol/l). Subsequently, we found that

16
resolution of the inflammation correlated with a return of tissue somatostatin levels
(Table 2) and D cell numbers to baseline (Fig. 6B). The flow cytometry was consistent
with the morphometry (Fig. 6A). The return of the D cells to baseline levels occurred in
the presence of hypochlorhydria documented by acid concentrations of 1.62 + 0.59 µEq
in omeprazole-treated mice compared to 5.62 + 0.70 µEq in untreated animals (Table 2).
Figure 7 illustrates the differences between the G-/- and omeprazole-treated
mouse models. G+/+ mice treated with omeprazole become hypochlorhydric and thus
are susceptible to bacterial overgrowth and inflammation. A consequence of the
inflammation is the increase in plasma gastrin (30) (Fig. 7A). When these mice were
treated with antibiotics and the inflammation resolved, plasma gastrin concentrations
normalized despite the stomach remaining hypochlorhydric (Fig. 7B, Table 2).
Examining the fate of the D cell population, we found that D cell numbers were
depressed in the hypergastrinemic state induced by omeprazole (G+/+ mice) (Fig. 6).
Certainly, this is as expected from prior studies suggesting that low acid levels inhibit the
D cell (23). However, we challenged this dogma by administering antibiotics to the
omeprazole-treated mice to eliminate the inflammation-induced hypergastrinemia. With
the reduction in plasma gastrin levels, the D cells returned to baseline resting levels
despite persistent hypochlorydria (Fig. 7B, Table 2). Therefore, we concluded that D
cells are regulated by fluctuations in gastrin and not gastric acid which did not change.
The results in the omeprazole model are supported by studies using G-/- mice. G-
/- mice are hypochlorhydric due to a genetic deficiency of gastrin. These mice exhibit
significant inflammation and increased G cell density (30) despite a lack of gastrin.
Since D cell numbers and somatostatin concentrations were unchanged even after

17
antibiotic treatment, this lead us to propose that gastrin may be the critical factor required
to suppress somatostatin production (Fig. 7C). Confirming our suspicions, it was only
after the infusion of G-17 into the gastrin null mice that we observed a reduction in
somatostatin and D cell density (Fig. 7D). Therefore, these results clearly show that
hypergastrinemia is the major factor modulating the D cell during bacterial infection.

18
Discussion
We have shown that hypochlorhydria, induced either genetically by deletion of
the gastrin gene, or chemically by treatment with omeprazole, causes bacterial
overgrowth that results in gastric inflammation (30). There were slightly lower D cell
numbers in G-/- mice which may reflect an effect of chronic inflammation on
somatostatin in the G-/- mice. While antibiotic treatment of G-/- mice resolved the
inflammation and normalized cell populations such as parietal and G cells (30), we show
here that there was no significant effect on D cells or tissue somatostatin content. When
G-/- mice were infused with G-17, raising circulating gastrin concentrations to levels
observed in hypergastrinemic animals, D cell numbers and tissue somatostatin levels
were suppressed. Similarly, hypergastrinemic omeprazole-treated G+/+ mice also
exhibited reduced D cell numbers and tissue somatostatin concentrations. After
omeprazole mice were treated with antibiotics, plasma gastrin concentrations normalized,
correlating with resolution of the inflammation. Consistent with lower circulating gastrin
levels, D cell numbers returned to baseline. This was also observed in the omeprazole-
treated mice despite persistent hypochlorhydria. Therefore, we conclude from these
studies that the suppression of somatostatin during bacterial infection is due to the
hypergastrinemia induced in response to inflammation and not the hydrogen ion
concentration as previously proposed.
In wild type mice and human subjects, omeprazole induces significant
hypergastrinemia presumably due to the decrease in gastric acid that in turn inhibits D
cell secretion of somatostatin (14, 15). Moreover, in the absence of somatostatin,
inhibition of the G cell is removed allowing serum gastrin levels to rise (6, 21, 22). Since

19
we have shown that omeprazole treatment induces a gastritis and that the inflammation is
a major activator of the G and parietal cell, our model demonstrates that G cell numbers
should increase and serum gastrin levels should rise (30). Indeed, this is what we
observed and is also what has been observed in other models of chemical achlorhydria in
rodents and in human subjects (4, 17, 28). In these prior reports, modulation of the G and
D cell population was postulated to be due to changes in gastric acid. Our model would
support the notion that the regulation of gastrin and somatostatin by gastric acid is
indirect. Rather, the absence of acid permits bacterial overgrowth or microbial
metabolites to induce inflammation. Consistent with this hypothesis, we found that in
normal mice treated with omeprazole and antibiotics to resolve the inflammation, gastrin
levels decreased and D cells returned to their normal resting numbers despite low gastric
acidity. Thus, in the face of low gastric acid due to omeprazole, gastrin levels were
suppressed simply by treating the animals with antibiotics. This in turn released the
inhibition on the D cell. If hypoacidity were the major direct regulator as previously
proposed, then the D cell numbers and tissue somatostatin should have remained low.
Although prior studies have indicated that gastrin stimulates somatostatin release, these
studies were performed on isolated cell populations or in whole animals in the absence of
inflammation, hypochlorhydria or bacterial overgrowth (8, 31). In addition, these studies
examined the effect of acutely administering gastrin. Thus, we emphasize that the results
shown here document an inhibitory effect of gastrin on somatostatin secretion in vivo
when hypergastrinemia is induced by chronic inflammation. Since the studies were
performed in vivo, it is not known under these conditions whether gastrin stimulates the

20
release of other ligands, e.g., HB-EGF, TGFα or trefoil proteins, or acts directly on the D
cell (19, 20, 25, 27). Certainly both possibilities may also occur in concert.
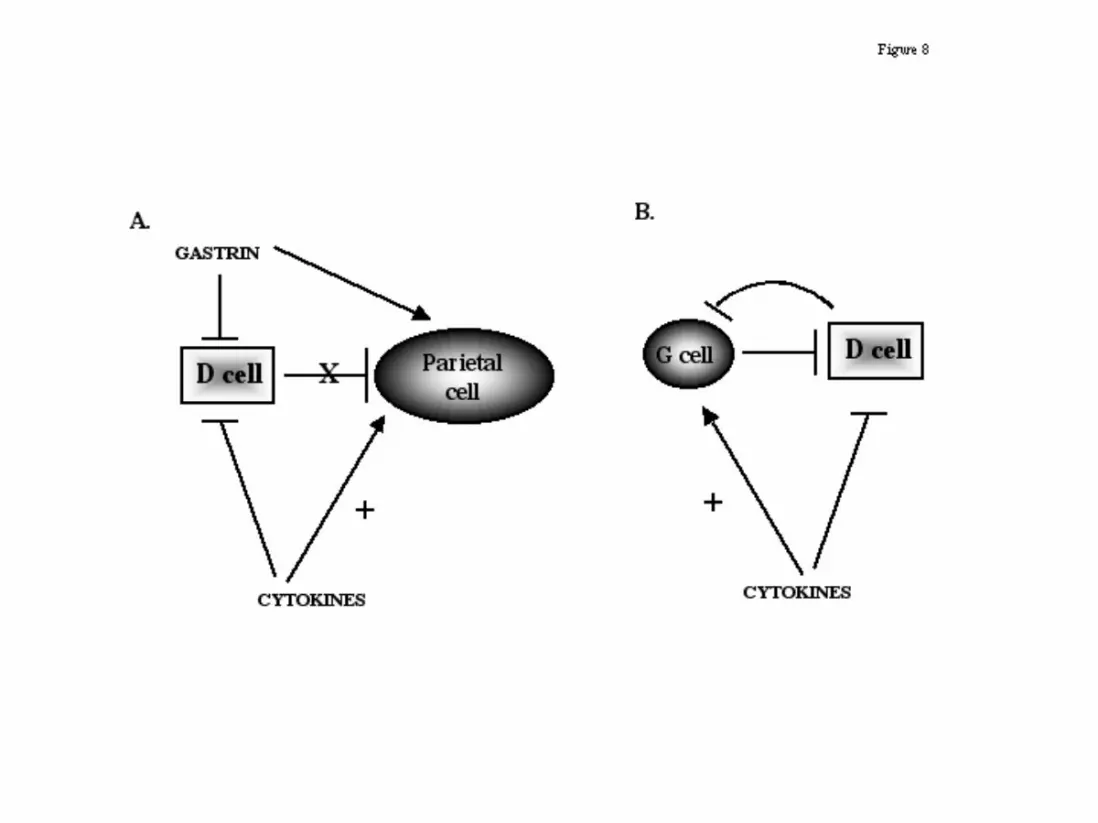
In summary, the findings reported here clearly show that hypergastrinemia,
induced by inflammation, results in decreased D cell numbers. The stomach responds to
the presence of inflammation by increasing gastric acidity, elevating G cell numbers and
gastrin secretion that in turn stimulates parietal cells (30). Coincident with the changes to
increase acid secretion, hypergastrinemia also blocks the somatostatin inhibitory pathway
(Fig. 8). As a result, the stomach is able to maximize its gastric acid output in an attempt
to clear bacterial infection.

21
Acknowledgements
Y.Z. is an associate and J.L.M. is an assistant investigator of the Howard Hughes Medical
Institute. This work was supported in part by Public Health Service grant DK-45729
(J.L.M.) and DK48815 (LCS). We acknowledge the assistance of the flow cytometry core
in the University of Michigan Cancer Center (CA46952) and University of Michigan
Multipurpose Arthritic Center (AR20557) and the assistance of the radioligand core of
the University of Michigan Gastrointestinal Peptide Research Center (DK-34533). We
also acknowledge the use of rabbit gastrin and somatostatin antibodies #1296 and #1001
respectively, from CURE DDRC/RIA Core (DK41301). We thank Chris Dickinson for
synthesizing iodinated somatostatin peptide. We thank Judy Poore for her assistance
with the immunohistochemistry and Mary Van Antwerp and Arthur Tessier for their
technical assistance.

22
Figure Legends
Figure 1: Representative H&E stains from mouse stomach. Representative H&E
stained sections of inflamed stomach from a 16 week old (A) G+/+, (B) G-
/-, (C) G-/- mouse treated with antibiotics or (D) G-/- mouse infused with
G-17. The arrows indicate areas of inflammation. Histologic scores
(mean + SEM) are shown in parentheses. n=10 for the G+/+ group, n=12
for the G-/- groups.
Figure 2: Analysis of T and B lymphocytes by flow cytometry. T and B
lymphocytes isolated from the stomach of G+/+ (open bars), G+/+ mice
treated with antibiotics (shaded bars), G-/- mice (closed bars), G-/- mice
treated with antibiotics (stippled bars) and G-/- mice infused with G-17
(hatched bars) were analyzed by flow cytometry and expressed as the
percent of total cell numbers in prep. *P<0.05 versus G+/+ mice, n=10 for
G+/+ group and n=12 for G-/- group.
Figure 3: Bacterial counts from the stomachs of G+/+ and G-/- mice treated
with either antibiotics or G-17 infusion. Total bacterial counts in the
mouse (A) fundus and (B) antrum represented as the mean + SEM of
CFU/g tissue. Note numbers for G+/+ and G-/- mice treated with
antibiotics previously reported (30).

23
Figure 4: Distribution of D cells in the stomach. D cell distribution in G-/- mouse
(A) fundus, (B) antrum, (C) fundus infused with G-17, (D) antrum infused
with G-17 ad (E) high power of D cell showing cytoplasmic process
connecting with neighboring cell.
Figure 5: Quantitation of D cells. (A) By flow cytometry, the number of
somatostatin positive cells was determined by flow cytometry and is
shown for G+/+ mice (open bars), G+/+ mice with antibiotics (shaded
bars), G-/- mice (closed bars), G-/- mice treated with antibiotics (stippled
bars) and G-/- mice infused with G-17 (hatched bars). Somatostatin
positive cells were normalized to cytokeratin-18 staining to determine %
of D cells in the mucosa. (B) By morphometry, the number of D
cells/gland in G+/+ mice (open bars), G+/+ antibiotic treated mice (shaded
bars), G-/- mice (closed bars), G-/- treated with antibiotics (stippled bars)
and G-/- mice infused with G-17 (hatched bars) were counted. *P<0.05
versus G+/+ mice, n=10 for G+/+ group, n=12 for G-/- group.
Figure 6: Quantitation of D cells . (A) The percent of anti-somatostatin positive
cells per cytokeratin-18 positive cells was determined by flow cytometry
and is shown for controls (open bars), controls plus antibiotics (closed
bars), omeprazole (stippled bars) and omeprazole plus antibiotic (hatched
bars) treated G+/+ mice. (B) The number of D cells/gland in controls
(open bars), controls plus antibiotics (closed bars), omeprazole (stippled

24
bars) and omeprazole plus antibiotic (hatched bars) treated G+/+ mice
were counted. *P<0.05 versus controls, n=8.
Figure 7: Comparison between omeprazole (PPI) treated and G-/- mouse
models. (A) hypergastrinemia during PPI treatment of G+/+ mice results
in elevation of D cell density, (B) after G+/+ mice are treated with
antibiotics plasma gastrin concentrations are normalized and D cells return
to baseline, (C) in the G-/- mice even after antibiotic treatment D cell
numbers are unaltered due to the absence of gastrin, however (D) G-/-
infused with gastrin-17 results in reduction in D cell numbers. Abx:
antibiotic treatment, *models that are comparable.
Figure 8: A proposed model for the down-regulation of somatostatin during
hypergastrinemia as a consequence of inflammation in (A) fundus and
(B) antrum. Inflammation will produce pro-inflammatory cytokines
which in turn may have an inhibitory effect on the D cell and an activating
effect of the G and parietal cells. Moreover, the increase in gastrin has a
direct or indirect inhibitory effect on the D cell. Thus, the overall effect
would be to maximize the acid output in response to gastric bacterial
colonization and inflammation.

25
References
1. Alderuccio, F., B. H. Toh, P. A. Gleeson, and I. R. van Driel. 1995. A novel
method for isolating mononuclear cells from the stomachs of mice with experimental
autoimmune gastritis. Autoimmunity 21:215-21.
2. Beales, I., J. Calam, L. Post, S. Srinivasan, T. Yamada, and J. DelValle. 1997.
Effect of transforming growth factor alpha and interleukin 8 on somatostatin release from
canine fundic D cells. Gastroenterology 112:136-43.
3. Beales, I. L. 2000. Effects of pro-inflammatory cytokines on acid secretion. Dig
Dis Sci 45:289-90.
4. Brand, S. J., and D. Stone. 1988. Reciprocal regulation of antral gastrin and
somatostatin gene expression by omeprazole-induced achlorhydria. J.Clin.Invest.
82:1059-1066.
5. Calam, J. 1998. Helicobacter pylori and somatostatin cells. Eur J Gastroenterol
Hepatol 10:281-3.
6. Chiba, T., S. Kadowaki, T. Taminato, K. Chihara, Y. Seino, S. Matsukura,
and T. Fujita. 1981. Effect of antisomatostatin gamma-globulin on gastrin release in
rats. Gastroenterology 81:321-6.
7. Davies, M. D., and D. M. Parrott. 1981. Cytotoxic T cells in small intestine
epithelial, lamina propria and lung lymphocytes. Immunology 44:367-71.
8. DelValle, J., T. Chiba, J. Park, and T. Yamada. 1993. Distinct receptors for
cholecystokinin and gastrin on canine fundic D-cells. Am J Physiol 264:G811-5.

26
9. Eaton, K. A., S. R. Ringler, and S. J. Danon. 1999. Murine splenocytes induce
severe gastritis and delayed-type hypersensitivity and suppress bacterial colonization in
Helicobacter pylori-infected SCID mice. Infect Immun 67:4594-602.
10. Fox, J. G., F. E. Dewhirst, Z. Shen, Y. Feng, N. S. Taylor, B. J. Paster, R. L.
Ericson, C. N. Lau, P. Correa, J. C. Araya, and I. Roa. 1998. Hepatic Helicobacter
species identified in bile and gallbladder tissue from Chileans with chronic cholecystitis.
Gastroenterology 114:755-63.
11. Friis-Hansen, L., F. Sundler, Y. Li, P. J. Gillespie, T. L. Saunders, J. K.
Greenson, C. Owyang, J. F. Rehfeld, and L. C. Samuelson. 1998. Impaired gastric
acid secretion in gastrin-deficient mice. Am J Physiol 274:G561-8.
12. Graham, D. Y., G. M. Lew, and J. Lechago. 1993. Antral G-cell and D-cell
numbers in Helicobacter pylori infection: Effect of H. pylori eradication.
Gastroenterology 104:1655-1660.
13. Koh, T. J., J. R. Goldenring, S. Ito, I. Mashimo, A. S. Kopin, A. Varro, G. J.
Dockray, and T. C. Wang. 1997. Gastrin deficiency results in altered gastric
differentiation and decreased colonic proliferation in mice. Gastroenterology 113:1015-
1025.
14. Lamberts, R., W. Creutzfeldt, F. Stockmann, U. Jacubaschke, S. Maas, and
G. Brunner. 1988. Long-term omeprazole treatment in man: effects on gastric endocrine
cell populations. Digestion 39:126-35.
15. Lanzon-Miller, S., R. E. Pounder, M. R. Hamilton, S. Ball, N. A. Chronos, F.
Raymond, M. Olausson, and C. Cederberg. 1987. Twenty-four-hour intragastric

27
acidity and plasma gastrin concentration before and during treatment with either
ranitidine or omeprazole. Aliment Pharmacol Ther 1:239-51.
16. Lee, A., J. O'Rourke, M. C. d. Ungria, B. Robertson, G. Daskalopoulos, and
M. F. Dixon. 1997. A standardized mouse model of Helicobacter pylori infection:
Introducing the Sydney Strain. Gastroenterology 112:1386-1397.
17. McCloy, R. F., R. Arnold, K. D. Bardhan, D. Cattan, E. Klinkenberg-Knol,
P. N. Maton, R. H. Riddell, P. Sipponen, and A. Walan. 1995. Pathophysiological
effects of long-term acid suppression in man. Dig Dis Sci 40:96S-120S.
18. McIntosh, C. H., V. Bakich, K. Bokenfohr, D. DiScala-Guenot, Y. N. Kwok,
and J. C. Brown. 1988. Cysteamine-induced reduction in gastrointestinal somatostatin:
evidence for a region-specific loss in immunoreactivity. Regul Pept 21:205-18.
19. Miyazaki, Y., Y. Shinomura, S. Tsutsui, S. Zushi, Y. Higashimoto, S.
Kanayama, S. Higashiyama, N. Taniguchi, and Y. Matsuzawa. 1999. Gastrin induces
heparin-binding epidermal growth factor-like growth factor in rat gastric epithelial cells
transfected with gastrin receptor. Gastroenterology 116:78-89.
20. Plaut, A. G. 1997. Trefoil peptides in the defense of the gastrointestinal tract. N
Eng J Med 336:506-507.
21. Saffouri, B., G. Weir, K. Bitar, and G. Makhlouf. 1979. Stimulation of gastrin
secretion from the perfused rat stomach by somatostatin antiserum. Life Sci 25:1749-53.
22. Saffouri, B., G. C. Weir, K. N. Bitar, and G. M. Makhlouf. 1980. Gastrin and
somatostatin secretion by perfused rat stomach: functional linkage of antral peptides. Am
J Physiol 238:G495-501.

28
23. Schubert, M. L., N. F. Edwards, A. Arimura, and G. M. Makhlouf. 1987.
Paracrine regulation of gastric acid secretion by fundic somatostatin. Am.J.Physiol.
252:G485-G490.
24. Tham, T. C., L. Chen, N. Dennison, C. F. Johnston, J. S. Collins, J. E. Ardill,
and K. D. Buchanan. 1998. Effect of Helicobacter pylori eradication on antral
somatostatin cell density in humans. Eur J Gastroenterol Hepatol 10:289-91.
25. Tsutsui, S., Y. Shinomura, S. Higashiyama, Y. Higashimoto, Y. Miyazaki, S.
Kanayama, S. Hiraoka, T. Minami, S. Kitamura, Y. Murayama, J. Miyagawa, N.
Taniguchi, and Y. Matsuzawa. 1997. Induction of heparin binding epidermal growth
factor-like growth factor and amphiregulin mRNAs by gastrin in the rat stomach.
Biochem Biophys Res Commun 235:520-523.
26. van Ogtrop, M. L., H. F. Guiot, H. Mattie, and R. van Furth. 1991.
Modulation of the intestinal flora of mice by parenteral treatment with broad-spectrum
cephalosporins. Antimicrob Agents Chemother 35:976-82.
27. Wright, N. A. 1993. Trefoil peptides and the gut. Gut 34:577-579.
28. Wu, S. V., A. Giraud, M. Mogard, K. Sumii, and J. H. Walsh. 1990. Effects of
inhibition of gastric secretion on antral gastrin and somatostatin gene expression in rats.
Am.J.Physiol. 258:G788-G793.
29. Zavros, Y., M. V. Antwerp, and J. L. Merchant. 2000. Use of flow cytometry
to quantify mouse gastric epithelial cell populations. Dig Dis Sci 45:1192-1199.
30. Zavros, Y., G. Rieder, A. Ferguson, L. Samuelson, and J. L. Merchant. 2001.
Genetic or Chemical Hypochlorhydria is Associated with Inflammation that Modulates
Parietal and G cell Populations. Gastroenterology IN PRESS.

29
31. Zavros, Y., and A. Shulkes. 1997. Cholecystokinin (CCK) regulates
somatostatin secretion through both the CCK-A and CCK-B/gastrin receptors in sheep. J
Physiol 505:811-21.

30
Table 1: Tissue somatostatin concentrations in the gastric mucosa.
Treatment Tissue somatostatin (pmol/g) Circulating gastrin
(pmol/l)#
Gastric acid
( Eq)#
Fundus Antrum
G+/+
AB
339 + 114
538 + 143
1272 + 301
1608 + 348
54 + 8 2.71 + 0.31
G-/-
AB
G-17
368 + 51
280 + 91
106 + 10*
1156 + 180
1225 + 237
497 + 98*
<2
558 + 114
0.48 + 0.10
1.86 + 0.36
*P<0.05 versus G+/+ group, # previously reported in (30)
Table 2: Tissue somatostatin concentrations in G+/+ omeprazole-treated mice.
Treatment Tissue somatostatin (pmol/g) Circulating gastrin
(pmol/l)#
Gastric acid
( Eq)#
Fundus Antrum
G+/+ V 212 + 30 1783 + 133 34 + 4 5.62 + 0.70
G+/+ V+AB 235 + 42 1621 + 119 44 + 5 5.03 + 0.66
G+/+ OM 186 + 22* 507 + 139* 159 + 11 1.62 + 0.59
G+/+ OM+AB 288 + 76 1496 + 65* 52 + 16 1.90 + 0.86
V: vehicle, AB: antibiotics, OM: omeprazole, *P<0.05 versus G+/+ control group, #
previously reported in (30)