human resources and infrastructure for eye care in india: current status
TRANSCRIPT

128 THE NATIONAL MEDICAL JOURNAL OF INDIA VOL. 17, NO. 3, 2004
Original Articles
Human resources and infrastructure for eye care in India:Current status
G. V. S. MURTHY, SANJEEV K. GUPTA, DAMODAR BACHANI, H. K. TEWARI, NEENA JOHN
ABSTRACT
Background. An ophthalmic workforce and infrastructureplanning survey was undertaken to provide a valid evidence basefor human resource and infrastructure requirements for elimina-tion of avoidable blindness. This is the first time that such anextensive survey has been done in India.
Methods. Pre-tested questionnaires were administered to alldistrict-level blindness officials and ophthalmology training insti-tutions during April 2002–March 2003. Supplementary datasources were used wherever necessary. Data analysis was done inStata 8.0. Projections of the existing ophthalmologists anddedicated eye beds were made for the entire country using themean, median and range for each individual state.
Results. The response rate was 89.3%. More than half theeye care facilities were located in the private sector. Sixty-nineper cent of the ophthalmologists were employed in the privateand non-governmental sectors; 71.5% of all dedicated eye bedswere managed by these two sectors. Five states (Maharashtra,Uttar Pradesh, Karnataka, Andhra Pradesh and Tamil Nadu) hadhalf the practising ophthalmologists in India. There was a widedisparity in access to ophthalmologists and dedicated eye bedsacross the country. Using the median to obtain medium projec-tions, it is estimated that there are 9478 practising ophthalmolo-gists and 59 828 dedicated eye beds in India.
Conclusions. India will be able to meet the requirements fortrained ophthalmologists and dedicated eye beds to achieve thegoals of Vision 2020. Some states will need special attention.Instead of an across-the-board increase in ophthalmologists andeye beds, regions which are deficient will need to be prioritizedand concerted action initiated to achieve an equitable distributionof the available resources.
Natl Med J India 2004;17:128–34
INTRODUCTIONA number of population-based surveys over the past decade have
shown that the prevalence of blindness and visual impairment isa major problem in India.1–4 Cataract, corneal opacities, glaucomaand posterior segment conditions are responsible for a majorproportion of the blindness.1–4 These causes of blindness can onlybe redressed by skilled ophthalmologists in a hospital setting andcannot be managed by other eye care professionals solely in thecommunity. An evidence base is needed to better understand trendsin human resources for health.5 Unfortunately, no regular mecha-nism exists in India for the collection of data on human resourcetrends in the provision of eye care services.6
We carried out an ophthalmic workforce and infrastructureplanning survey for the first time in India to assess the currentsituation and provide information for future human resourceplanning for eye care. The results of the survey will be utilized toidentify gaps and strengthen facilities to achieve the goals of theVision 2020 global initiative.
Vision 2020: The Right to Sight is a global initiative launchedby the World Health Organization in partnership with interna-tional non-governmental organizations (NGOs) and national gov-ernments to attain the goal of elimination of avoidable blindnessby 2020.7 The three essential elements of the global initiativeinclude identification of strategies/targets for disease control,evaluation of human resource needs and their development, andassessing the infrastructure/technology needs and their develop-ment. Cataract, refractive errors, low vision, trachoma, vitamin Adeficiency-related blindness, onchocerciasis and childhood blind-ness are the major thrust areas for Vision 2020.7
The National Programme for Control of Blindness in India waslaunched in 1976 as a completely Central Government-sponsoredscheme. The programme has adapted to the needs of the countryover the past 3 decades and is now geared towards meeting thegoals of Vision 2020. Human resource and infrastructure needshave been identified for India by adopting the recommendations ofthe global taskforce for the implementation of Vision 2020.8
METHODSThis study was conducted in collaboration with the Ophthalmol-ogy Cell, Ministry of Health and Family Welfare, Government ofIndia from April 2002 to March 2003.
A specially designed, semi-open ended questionnaire was pre-tested in 10 districts and mailed to all the districts in the country.The questionnaire had 3 sections:
A. Identification data: District, address, contact details, etc.;B. Eye care infrastructure in the district: Number of eye care
facilities, ophthalmologists and eye beds in all health facilities
Dr Rajendra Prasad Centre for Ophthalmic Sciences, All India Institute ofMedical Sciences, Ansari Nagar, New Delhi 110029, India
G. V. S. MURTHY, SANJEEV K. GUPTA Community OphthalmologyH. K. TEWARI, NEENA JOHNDirectorate General Health Services, Ministry of Health and Family Welfare,
Government of India, Nirman Bhavan, New Delhi 110011, IndiaDAMODAR BACHANI Ophthalmology Section
Correspondence to G. V. S. MURTHY; [email protected]
© The National Medical Journal of India 2004
129MURTHY et al. : HUMAN RESOURCES AND INFRASTRUCTURE FOR EYE CARE
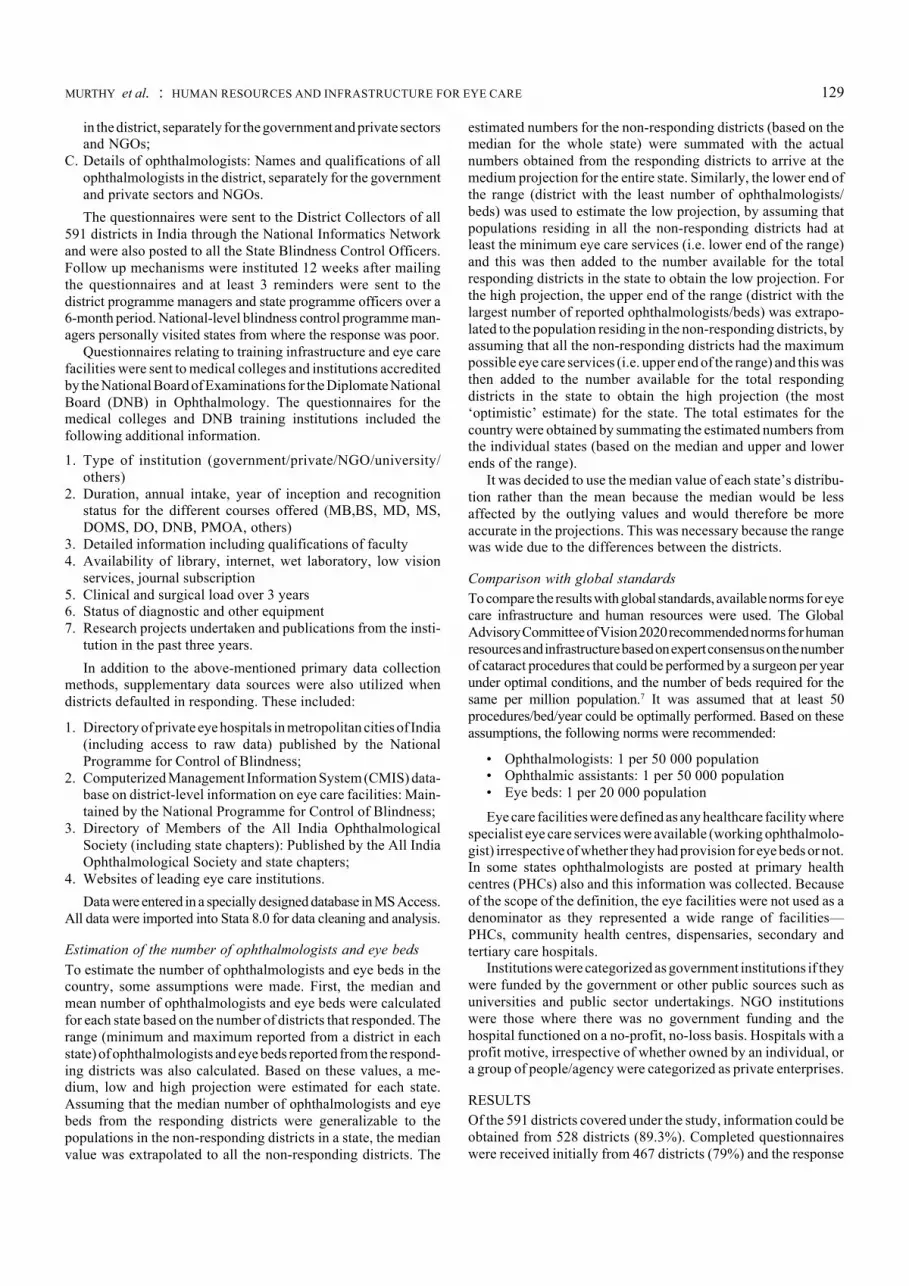
in the district, separately for the government and private sectorsand NGOs;
C. Details of ophthalmologists: Names and qualifications of allophthalmologists in the district, separately for the governmentand private sectors and NGOs.The questionnaires were sent to the District Collectors of all
591 districts in India through the National Informatics Networkand were also posted to all the State Blindness Control Officers.Follow up mechanisms were instituted 12 weeks after mailingthe questionnaires and at least 3 reminders were sent to thedistrict programme managers and state programme officers over a6-month period. National-level blindness control programme man-agers personally visited states from where the response was poor.
Questionnaires relating to training infrastructure and eye carefacilities were sent to medical colleges and institutions accreditedby the National Board of Examinations for the Diplomate NationalBoard (DNB) in Ophthalmology. The questionnaires for themedical colleges and DNB training institutions included thefollowing additional information.
1. Type of institution (government/private/NGO/university/others)
2. Duration, annual intake, year of inception and recognitionstatus for the different courses offered (MB,BS, MD, MS,DOMS, DO, DNB, PMOA, others)
3. Detailed information including qualifications of faculty4. Availability of library, internet, wet laboratory, low vision
services, journal subscription5. Clinical and surgical load over 3 years6. Status of diagnostic and other equipment7. Research projects undertaken and publications from the insti-
tution in the past three years.In addition to the above-mentioned primary data collection
methods, supplementary data sources were also utilized whendistricts defaulted in responding. These included:
1. Directory of private eye hospitals in metropolitan cities of India(including access to raw data) published by the NationalProgramme for Control of Blindness;
2. Computerized Management Information System (CMIS) data-base on district-level information on eye care facilities: Main-tained by the National Programme for Control of Blindness;
3. Directory of Members of the All India OphthalmologicalSociety (including state chapters): Published by the All IndiaOphthalmological Society and state chapters;
4. Websites of leading eye care institutions.Data were entered in a specially designed database in MS Access.
All data were imported into Stata 8.0 for data cleaning and analysis.
Estimation of the number of ophthalmologists and eye bedsTo estimate the number of ophthalmologists and eye beds in thecountry, some assumptions were made. First, the median andmean number of ophthalmologists and eye beds were calculatedfor each state based on the number of districts that responded. Therange (minimum and maximum reported from a district in eachstate) of ophthalmologists and eye beds reported from the respond-ing districts was also calculated. Based on these values, a me-dium, low and high projection were estimated for each state.Assuming that the median number of ophthalmologists and eyebeds from the responding districts were generalizable to thepopulations in the non-responding districts in a state, the medianvalue was extrapolated to all the non-responding districts. The
estimated numbers for the non-responding districts (based on themedian for the whole state) were summated with the actualnumbers obtained from the responding districts to arrive at themedium projection for the entire state. Similarly, the lower end ofthe range (district with the least number of ophthalmologists/beds) was used to estimate the low projection, by assuming thatpopulations residing in all the non-responding districts had atleast the minimum eye care services (i.e. lower end of the range)and this was then added to the number available for the totalresponding districts in the state to obtain the low projection. Forthe high projection, the upper end of the range (district with thelargest number of reported ophthalmologists/beds) was extrapo-lated to the population residing in the non-responding districts, byassuming that all the non-responding districts had the maximumpossible eye care services (i.e. upper end of the range) and this wasthen added to the number available for the total respondingdistricts in the state to obtain the high projection (the most‘optimistic’ estimate) for the state. The total estimates for thecountry were obtained by summating the estimated numbers fromthe individual states (based on the median and upper and lowerends of the range).
It was decided to use the median value of each state’s distribu-tion rather than the mean because the median would be lessaffected by the outlying values and would therefore be moreaccurate in the projections. This was necessary because the rangewas wide due to the differences between the districts.
Comparison with global standardsTo compare the results with global standards, available norms for eyecare infrastructure and human resources were used. The GlobalAdvisory Committee of Vision 2020 recommended norms for humanresources and infrastructure based on expert consensus on the numberof cataract procedures that could be performed by a surgeon per yearunder optimal conditions, and the number of beds required for thesame per million population.7 It was assumed that at least 50procedures/bed/year could be optimally performed. Based on theseassumptions, the following norms were recommended:
• Ophthalmologists: 1 per 50 000 population• Ophthalmic assistants: 1 per 50 000 population• Eye beds: 1 per 20 000 population
Eye care facilities were defined as any healthcare facility wherespecialist eye care services were available (working ophthalmolo-gist) irrespective of whether they had provision for eye beds or not.In some states ophthalmologists are posted at primary healthcentres (PHCs) also and this information was collected. Becauseof the scope of the definition, the eye facilities were not used as adenominator as they represented a wide range of facilities—PHCs, community health centres, dispensaries, secondary andtertiary care hospitals.
Institutions were categorized as government institutions if theywere funded by the government or other public sources such asuniversities and public sector undertakings. NGO institutionswere those where there was no government funding and thehospital functioned on a no-profit, no-loss basis. Hospitals with aprofit motive, irrespective of whether owned by an individual, ora group of people/agency were categorized as private enterprises.
RESULTSOf the 591 districts covered under the study, information could beobtained from 528 districts (89.3%). Completed questionnaireswere received initially from 467 districts (79%) and the response

130 THE NATIONAL MEDICAL JOURNAL OF INDIA VOL. 17, NO. 3, 2004
was improved further by utilizing other data sources and byconstant follow up. This level of response is excellent for extra-polating to the entire country.
A total of 4889 eye care facilities were enumerated in therespondent districts; 52% (2559) were private nursing homes oreye hospitals where patients were admitted for eye surgery.
Another 18% (883) were in the NGO sector. In addition, privatemedical colleges accounted for 1% (56). Overall, 71.5% (3498) offacilities were in the private/NGO sectors. Among all facilities,28.5% (1391) were in the government sector. District hospitalsand mobile ophthalmic units were the commonest types of facili-ties in the government sector (Fig. 1).
FIG 1. Distribution of eye care facilities in India Govt governmentNGO non-governmental organization
FIG 2. Distribution of practising ophthalmologists Govt governmentNGO non-governmental organization CHC/PHC communityhealth centre/primary health centre
TABLE I. Ophthalmologists and eye beds in responding districts
State Ophthalmologists per 100 000 population Eye beds per 100 000 populationMean 95% CI Range Mean 95% CI Range
Andamans 0.6 0.6 0.6–0.6 2.8 2.8 2.8Andhra Pradesh 1.1 0.6–1.5 0.3–5.7 6.1 3.8–8.4 0.7–27.6Assam 0.6 0.3–0.9 0.1–2.6 3.0 1.3–4.6 0 – 12Arunachal Pradesh 0.8 0.1–1.6 0–2.9 3.1 0–9.6 0–28.8Bihar 0.3 0.2–0.4 0–1.1 1.6 0.5–2.8 0–13.7Chandigarh 7.1 7.1 7.1–7.1 15 15 15Chhatisgarh 0.5 0.3–0.7 0.1–1.1 3.5 2.3–4.7 0.5–7.7Delhi 3.8 3.8 3.8 11.6 11.6 11.6Daman and Diu 2.4 0.1–4.8 2.3–2.6 18.5 0–51.4 15.9–21.1Dadra and Nagar Haveli Data not availableGoa 2.2 0–4.8 2.0–2.4 7.9 0–20.6 6.9–8.9Gujarat 1.2 1.0–1.5 0.1–2.9 10.9 7.6–14.2 1.3–28.9Haryana 1.1 0.7–1.4 0.2–2.6 8.2 4.6–11.9 0–22.7Himachal Pradesh 1.0 0.6–1.5 0–2.4 5.6 3.2–8.1 0–11.9Jammu and Kashmir 0.8 0.4–1.2 0.2–1.7 3.5 0.8–6.3 0–9.4Jharkhand 0.3 0.1–0.5 0–1.4 1.1 0.2–2.0 0–4.7Karnataka 1.5 1.0–2.0 0.3–6.7 9.6 6.6–12.6 1.7–36.5Kerala 1.2 0.9–1.5 0.7–2.4 4.8 2.1–7.5 1.5–14.4Lakshadweep 1.6 1.6 1.6 8.3 8.3 8.3Madhya Pradesh 0.7 0.4–0.9 0–3.2 4.5 2.9–6.1 0.5–25.7Manipur 0.5 0–1.2 0–2.0 1.4 0–4.1 0–8.9Maharashtra 1.2 0.6–1.7 0.2–9.4 5.0 3.5–6.5 0.1–17.9Meghalaya 0.4 0–0.9 0.0–0.9 1.4 0–3.4 0.0–3.8Mizoram 0.9 0.1–1.6 0–1.5 3.6 0–7.7 0.0–7.9Nagaland 0.7 0–1.4 0–1.0 2.0 0–5.0 0 – 4Orissa 0.4 0.3–0.6 0–2.1 3.8 2.6–4.9 0–13.1Pondicherry 4.0 0.7–7.3 2.7–7.1 15.8 0–37.2 0–27.1Punjab 1.6 1.0–2.2 0.3–4.4 6.4 4.6–8.3 0.7–12.4Rajasthan 0.6 0.4– 0.7 0.1–1.5 4.1 3.0–5.2 0.5–11.2Sikkim 0.5 0–1.5 0–1.2 2.2 0–8.0 0–7.6Tamil Nadu 1.3 0.8–1.7 0.2–4.0 15.8 9.0–22.5 0.6–70.4Tripura 0.7 0–2.2 0.3–1.4 2.2 0–4.9 1.3–3.4Uttaranchal 0.6 0.4–0.9 0–1.4 5.2 2.9–7.6 0–11.3Uttar Pradesh 0.6 0.4–0.7 0–4.0 4.9 3.2–6.5 0–42.5West Bengal 0.7 0.2–1.3 0.1–4.7 2.9 0.7–5.1 0.3–17.8India 0.9 0.77–0.94 0–9.4 5.4 4.9–6.0 0–70.4
9%
3%
10%
5%
5%
22%
43%
3%
District hospital Mobile unit Govt. medical collageCHC/ PHC Other govt organization NGOPrivate hospital Private medical college
college
10%
7%
2%
10%
18%
52%
1%
District hospital Mobile unitsGovt medical college Other govt organizationNGO Private hospitalPrivate medical college

131MURTHY et al. : HUMAN RESOURCES AND INFRASTRUCTURE FOR EYE CARE
A count of ophthalmologists working in eye care facilitiesshowed that there were an estimated 9031 ophthalmologists in thecountry; 69% (6235) were working in the private and NGOsectors, while 31% (2796) were working in the government sector.The largest concentration of practising ophthalmologists was inthe private sector (Fig. 2). A fair proportion of practising ophthal-mologists (1188) were working in medical colleges (13.1%). Infact, in the government sector there were more ophthalmologistsin medical colleges than in district hospitals.
The different eye care institutions in India reported a total of57 263 eye beds. The largest proportion of beds were in the privateand NGO sectors (71%; 40 648) and 23 972 (41.9%) beds werecontributed solely by the NGO sector (Fig. 3).
Overall, there was nearly 1 ophthalmologist (95% CI: 0.77–0.94) and 5 beds (95% CI: 4.9–6.0) per 100 000 population (TableI). However, there were wide variations across the states. Thesmaller states and union territories had better human resourcesand infrastructure for eye care. FIG 3. Distribution of inpatient facilities (eye beds)
Govt government NGO non-governmental organization
14%
5%
26%
3%
42%
10%
District hospital Govt. medical collegeOther govt organization NGOPrivate hospital Private medical college
TABLE II. Projected number of ophthalmologists and eye beds in India
State Total population Ophthalmologists Eye bedsProjection for total population based on Projection for total population based on
Surveyed No data Reported Mean Median Range Reported Mean Median Rangeavailable (medium Low High (medium Low High
estimate) estimate estimate estimate) estimate estimate
Andamans 356 265 0 2 2 2 2 2 10 10 10 10 10Andhra Pradesh 75 679 541 0 858 858 858 858 858 4743 4743 4743 4743 4743Assam 26 656 325 0 180 180 180 180 180 787 787 787 787 787Arunachal Pradesh 875 482 215 635 7 9 8 7 13 12 19 12 12 74Bihar 62 202 667 18 835 521 171 228 209 171 378 1127 1428 1165 1127 3708Chandigarh 900 914 0 64 64 64 64 64 135 135 135 135 135Chhatisgarh 15 951 911 1 325 235 108 115 115 109 123 689 735 731 696 791Delhi 13 782 976 0 529 529 529 529 529 1601 1601 1601 1601 1601Daman and Diu 158 059 0 4 4 4 4 4 31 31 31 31 31Dadra and Nagar Haveli NA 220 451 NA 0 5 5 6 NA 0 41 35 47Goa 1 343 998 0 29 29 29 29 29 104 104 104 104 104Gujarat 42 735 439 4 545 764 566 621 625 571 698 4373 4868 4828 4432 5687Haryana 15 753 547 5 329 442 165 224 208 176 304 1290 1727 1626 1290 2500Himachal Pradesh 5 322 279 684 969 53 60 60 53 69 310 348 346 310 391Jammu and Kashmir 6 604 088 3 465 829 55 83 83 62 114 221 342 294 221 547Jharkhand 20 315 909 6 593 519 73 93 86 73 165 287 360 287 287 597Karnataka 52 733 958 0 884 884 884 884 884 5003 5003 5003 5003 5003Kerala 27 953 614 3 885 005 374 421 413 401 467 1668 1854 1773 1726 2227Lakshadweep 60 595 0 1 1 1 1 1 5 5 5 5 5Madhya Pradesh 58 121 798 2 263 320 479 495 488 479 551 3035 3137 3103 3046 3617Manipur 2 388 634 0 23 23 23 23 23 80 80 80 80 80Maharashtra 94 565 379 2 186 868 1128 1154 1148 1132 1334 4503 4612 4597 4505 4894Meghalaya 2 014 169 291 900 10 11 11 10 13 39 43 43 39 50Mizoram 767 922 123 136 9 10 10 9 11 41 45 45 41 51Nagaland 1 264779 723 857 8 13 14 8 15 22 36 37 22 51Orissa 36 059 008 647 912 178 181 181 178 192 1336 1361 1359 1336 1421Pondicherry 973 829 0 59 59 59 59 59 223 223 223 223 223Punjab 20 337 324 3 951 972 319 382 378 331 493 1483 1736 1764 1511 1973Rajasthan 56 473 122 0 363 363 363 363 363 2626 2626 2626 2626 2626Sikkim 540 493 0 4 4 4 4 4 13 13 13 13 13Tamil Nadu 53 870 165 8 240 674 740 847 822 756 1070 9673 10975 10497 9722 15474Tripura 1 660 637 1 530 531 11 22 16 16 32 36 70 67 56 88Uttaranchal 8 479 562 0 66 66 66 66 185 567 567 567 567 567Uttar Pradesh 164 027 486 2 025 373 977 989 985 985 1058 9126 9225 9189 9126 9987West Bengal 77 779 347 2 441 824 534 551 546 536 649 2064 2135 2096 2071 2499India 9031 9572 9478 9134 10 940 57263 60 986 59 828 57 539 72 602
Median calculated from surveyed population was extrapolated to population where data were not available to construct medium estimate; district with least reported ophthalmologists/eye beds (lower end of range) was used to extrapolate to population where no data were available to construct low estimate, while district with highest reported ophthalmologists/eyebeds (upper end of range) was used to extrapolate to population where no data were available to construct high estimate. For estimating services available in Dadra and NagarHaveli, rates of Daman were used, as the two are part of the same administrative cluster. NA not available
132 THE NATIONAL MEDICAL JOURNAL OF INDIA VOL. 17, NO. 3, 2004
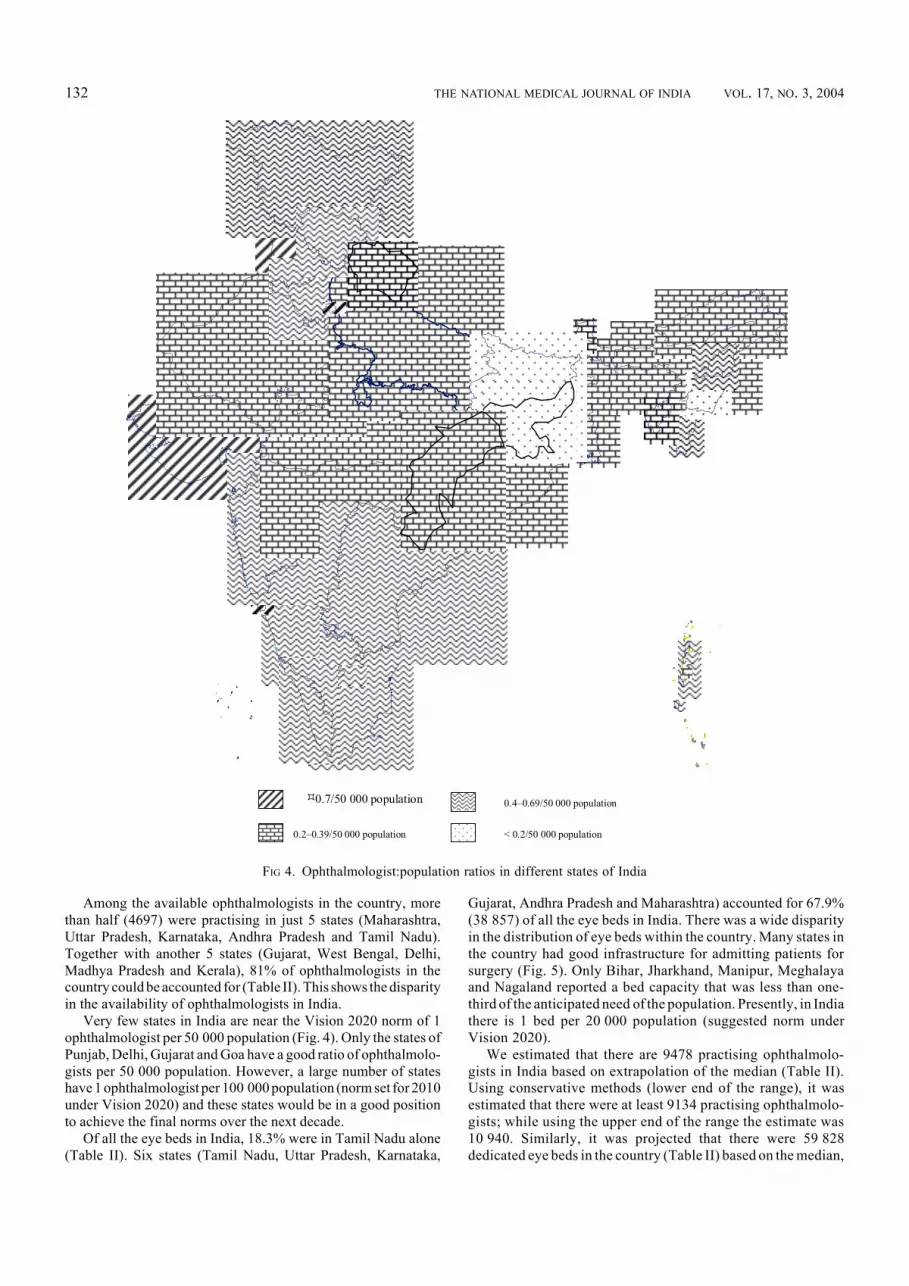
Among the available ophthalmologists in the country, morethan half (4697) were practising in just 5 states (Maharashtra,Uttar Pradesh, Karnataka, Andhra Pradesh and Tamil Nadu).Together with another 5 states (Gujarat, West Bengal, Delhi,Madhya Pradesh and Kerala), 81% of ophthalmologists in thecountry could be accounted for (Table II). This shows the disparityin the availability of ophthalmologists in India.
Very few states in India are near the Vision 2020 norm of 1ophthalmologist per 50 000 population (Fig. 4). Only the states ofPunjab, Delhi, Gujarat and Goa have a good ratio of ophthalmolo-gists per 50 000 population. However, a large number of stateshave 1 ophthalmologist per 100 000 population (norm set for 2010under Vision 2020) and these states would be in a good positionto achieve the final norms over the next decade.
Of all the eye beds in India, 18.3% were in Tamil Nadu alone(Table II). Six states (Tamil Nadu, Uttar Pradesh, Karnataka,
Gujarat, Andhra Pradesh and Maharashtra) accounted for 67.9%(38 857) of all the eye beds in India. There was a wide disparityin the distribution of eye beds within the country. Many states inthe country had good infrastructure for admitting patients forsurgery (Fig. 5). Only Bihar, Jharkhand, Manipur, Meghalayaand Nagaland reported a bed capacity that was less than one-third of the anticipated need of the population. Presently, in Indiathere is 1 bed per 20 000 population (suggested norm underVision 2020).
We estimated that there are 9478 practising ophthalmolo-gists in India based on extrapolation of the median (Table II).Using conservative methods (lower end of the range), it wasestimated that there were at least 9134 practising ophthalmolo-gists; while using the upper end of the range the estimate was10 940. Similarly, it was projected that there were 59 828dedicated eye beds in the country (Table II) based on the median,
FIG 4. Ophthalmologist:population ratios in different states of India
0.7/50 000 population 0.4–0.69/50 000 population
0.2–0.39/50 000 population < 0.2/50 000 population

133MURTHY et al. : HUMAN RESOURCES AND INFRASTRUCTURE FOR EYE CARE
a minimum of 57 539 eye beds based on the lower end of therange, and a maximum of 72 602 eye beds based on the upper endof the range.
DISCUSSIONIncreasing the efficiency of the eye care system in India is depen-dent on the performance of the available ophthalmologists andtheir production and deployment in the country. Both the produc-tion and retention of appropriately skilled ophthalmologists andallied personnel need to be considered for future projections of eyecare resources in India.
It has been estimated that there are 45 million blind and anadditional 135 million visually impaired individuals in the world.7
While 80% of this blindness is avoidable, 90% is in developingcountries.7 Recent studies in India show that the prevalence ofblindness (using a visual acuity cut-off of <6/60 on presenting
FIG 5. Eye beds:population ratios in different states of India
1/20 000 population 0.5–0.99/20 000 population
0.33–0.49/20 000 population <0.33/20t000 population
vision in the better eye) is 1.1% in the general population.9 Amongthe elderly, cataract is responsible for nearly two-thirds of theblindness load in India.1–4 Nearly one-fifth of the blindness is due touncorrected refractive errors.1,3 The other major causes includeglaucoma, age-related macular degeneration, corneal opacities,etc.1,3 It is therefore evident that the elimination of avoidableblindness in India is critically dependent on a pool of well-qualified,efficient and geographically and culturally accessible ophthalmolo-gists and supporting eye care infrastructure. In demographicallylarge but economically underdeveloped regions, the key to blind-ness prevention activities is the effective exploitation of humanresources.10 Unfortunately, there is wide variation in the accessibil-ity to ophthalmic care in India. Previous data show that against anational ophthalmologist:population ratio of 1:107 000, there wereregions in India which had a ratio of 1:9000 while in other regionsthere was only 1 ophthalmologist for 608 000 population.6 Most
134 THE NATIONAL MEDICAL JOURNAL OF INDIA VOL. 17, NO. 3, 2004
ophthalmologists were concentrated in the metropolises while ruralareas had relatively poorer access to eye care facilities.6
Our survey shows that wide disparities still exist, but there hasbeen a scaling up of eye care resources in most states that had ahigh prevalence of blindness in the past. Also, the economicallyand socially ‘developed’ states such as Delhi, Goa, Gujarat,Haryana, Kerala, Mizoram and Punjab have seen a revolution ineye care infrastructure even without any assistance from sourcessuch as the World Bank and DANIDA,9 especially in the privatesector. This augurs well for the future, as it will become increas-ingly difficult for the government to exclusively sustain eye careservices.
The absence of appropriate human resource policies is respon-sible in many countries for a chronic imbalance, with multifacetedeffects on the workforce, including quantitative mismatch, quali-tative disparity, unequal distribution and a lack of coordinationbetween human resource management actions and health policyneeds.11 The quality of health services, their efficacy, efficiency,accessibility and viability depend primarily on the performance ofthose who deliver them and the challenge therefore is to deploypersonnel of adequate quality in sufficient numbers at the righttime and place.11
Norms have been developed for attaining the goals of Vision2020 for disease control, human resources and infrastructure.12 By2020 there should be 20 ophthalmologists and 50 eye beds permillion population, while in the interim there should be 1 ophthal-mologist for 100 000 population by 2010.12 It is evident from thepresent study that India is comfortably placed for attaining thehuman resources (ophthalmologists) and eye care infrastructuregoals of Vision 2020 if the present pace of development continues.One study from India13 have shown that the prevalence of blind-ness is much higher than the national estimates. This study showsthat nearly a 1000 cataracts will need to be operated upon per100 000 population and another 1000 blind persons will need eyecare services. If the human resources and infrastructure continueto expand as envisaged, there is reason to believe that avoidableblindness in India can be eliminated by 2020. Ophthalmolo-gist:population ratios can be used as a conservative guide toforecast ophthalmic manpower requirements and the output ofophthalmologists can be tailored accordingly.14 Our survey hasimmense potential to be used to formulate policies for the trainingand deployment of ophthalmologists in the future.
Similarly, since the availability of eye beds is healthy, there isno need to increase the bed strength further, except in poorlyserved areas. This is important because with the shift towards daycare surgery for cataract, the quantum of beds required for surgerywill decrease over time and therefore spending scarce resources toaugment bed capacity is not warranted, except in poorly servedareas. International non-governmental funding agencies as wellas the national government should exercise caution when institu-tions request support for augmenting bed capacity in existing
hospitals or in new projects in the vicinity of existing eye careset-ups.
A number of sources can be potentially used for humanresource planning in health.5 National workforce planning sur-veys can be effectively used for a variety of purposes such aspractice management, ‘benchmarking’ and health plan adminis-tration.15 The present situational analysis affords an opportunityfor eye care policy-makers in India to take stock of the situationand take appropriate action to bridge the gap between the currentavailability of human resources and eye care infrastructure, andthe needs of the country to attain the goal of Vision 2020: TheRight to Sight. The key to success will depend not merely onincreasing the workforce but on augmenting the skills and effi-ciency of available personnel and eye care infrastructure to renewthe national efforts for elimination of avoidable blindness by 2020.
REFERENCES1 Murthy GVS, Gupta S, Ellwein LB, Munoz SR, Bachani D, Dada VK. A population-
based eye survey of older adults in a rural district of Rajasthan: I. Central visionimpairment, blindness, and cataract surgery. Ophthalmology 2001;108:679–85.
2 Thulasiraj RD, Rahmathulla R, Saraswati A, Selvaraj S, Ellwein LB. The Sivagangaeye survey: I. Blindness and cataract surgery. Ophthalmic Epidemiol 2002;9:299–312.
3 Nirmalan PK, Thulasiraj RD, Maneksha V, Rahmathullah R, Ramakrishnan R,Padmavathi A, et al. A population based eye survey of older adults in Tirunelvelidistrict of south India: Blindness, cataract surgery, and visual outcomes. Br J Ophthalmol2002;86:505–12.
4 Thulasiraj RD, Nirmalan PK, Ramakrishnan R, Krishnadas R, Manimekalai TK,Baburajan NP, et al. Blindness and vision impairment in a rural south Indianpopulation: The Aravind Comprehensive Eye Survey. Ophthalmology 2003;110:1491–8.
5 Diallo K, Zurn P, Gupta N, Dal Poz M. Monitoring and evaluation of human resourcesfor health: An international perspective. Hum Resour Health 2003;1:3.
6 Kumar R. Ophthalmic manpower in India—need for a serious review. Int Ophthalmol1993;17:269–75.
7 Resnikoff S, Pararajasegaram R. Blindness prevention programmes: Past, present, andfuture. Bull World Health Organ 2001;79:222–6.
8 National Programme for Control of Blindness. Achievements under Cataract BlindnessControl Project: 1994–2002. In: NPCB-India: Quarterly Newsletter of NationalProgramme for Control of Blindness and Vision 2020: The Right to Sight Initiative.Directorate General Health Services, Ministry of Health and Family Welfare,Government of India 2002;1:3–6.
9 Dr R.P. Centre for Ophthalmic Sciences, AIIMS. National Survey on Blindness—2001–02: Summary. In: NPCB-India: Quarterly Newsletter of National Programmefor Control of Blindness and Vision 2020: The Right to Sight Initiative. DirectorateGeneral Health Services, Ministry of Health and Family Welfare, Government of India2002:1:6–10.
10 Wei J, Zhao Y, Li X, Ma Y, Liu L, Qu Y. [Research of the exploitation of human resourcesin blindness prevention and primary eye care.] Yan Ke Xue Bao 1995;11:1–4.
11 Dussault G, Dubois CA. Human resources for health policies: A crucial component inhealth policies. Hum Resour Health 2003;1:1.
12 WHO. Global initiative for the elimination of avoidable blindness—Vision 2020:The Right to Sight 1997. WHO/PBL/97.61 Rev 1:1–48.
13 Dandona L, Dandona R, John RK. Estimation of blindness in India from 2000 through2020: Implications for the blindness control policy. Natl Med J India 2000;14:327–34.
14 Trobe JD, Kilpatrick KE. Ophthalmology manpower: Shortfall or windfall. SurvOphthalmol 1983;27:271–5.
15 Jackson CA, Brown MA, Relles DA, Lee PP. Work time estimates for ophthalmicdiagnoses and procedures: Results from the Eye Care Workforce Study. ArchOphthalmol 1998;116:922–8.