hubble space telescope snapshot survey of post‐agb objects
TRANSCRIPT

HUBBLE SPACE TELESCOPE SNAPSHOT SURVEY OF POST-AGB OBJECTS
N. Siodmiak
Space Telescope Science Institute, 3700 San Martin Drive, Baltimore, MD 21218; and N. Copernicus Astronomical Center,
Rabianska 8, 87-100 Torun, Poland; [email protected], [email protected]
M. Meixner
Space Telescope Science Institute, 3700 San Martin Drive, Baltimore, MD 21218; [email protected]
T. Ueta
Department of Physics and Astronomy, University of Denver, 2112 East Wesley Avenue, Denver, CO 80208; [email protected]
B. E. K. Sugerman
Goucher College, 1021 Dulaney Valley Road, Baltimore, MD 21204; [email protected]
G. C. Van de Steene
Royal Observatory of Belgium, Ringlaan 3, 1180 Brussels, Belgium; [email protected]
and
R. Szczerba
N. Copernicus Astronomical Center, Rabianska 8, 87-100 Torun, Poland; [email protected]
Received 2006 November 11; accepted 2008 January 3
ABSTRACT
The results of a Hubble Space Telescope (HST ) snapshot survey of post-AGB objects are shown. The aim of thesurvey is to complement existingHST images of protoplanetary nebulae and to connect various types of nebulositieswith the physical and chemical properties of their central stars. Nebulosities are detected in15 of 33 sources. Imagesand photometric and geometric measurements are presented. For sources with nebulosities we see a morphologicalbifurcation into two groups, DUPLEX and SOLE, as previous studies have found. We find further support for theprevious results, suggesting that this dichotomy is caused by a difference in the optical thickness of the dust shell. Theremaining 18 sources are classified as stellar post-AGB objects, because our observations indicate a lack of nebulosity.We show that some stellar sources may in fact be DUPLEX or SOLE objects based on their infrared colors. The causesof the differences among the groups are investigated. We discuss some evidence suggesting that high progenitor massAGB stars tend to become DUPLEX post-AGB objects and intermediate progenitor mass AGB stars tend to becomeSOLE post-AGB objects. Most of the stellar sources probably have low-mass progenitors and do not seem to developnebulosities during the post-AGB phase; therefore, they do not become planetary nebulae.
Subject headinggs: circumstellar matter — planetary nebulae: general — reflection nebulae —stars: AGB and post-AGB — stars: mass loss
Online material: color figures
1. INTRODUCTION
The post-AGB1 phase is a short period in the evolution oflow- and intermediate-mass stars (0.8Y8 M�) between the as-ymptotic giant branch (AGB) and the planetary nebula (PN)phases. The theoretical evolutionary tracks of the central stars(Blocker 1995) predict that this phase lasts 102Y105 yr, dependingon the core mass, yet an even shorter kinematical age is predictedfor nebulosities, of the order of 103Y104 yr (Sahai et al. 2007). Ashorter kinematical lifetime is obvious from the observational pointof view, since the entire shell (especially an extended cold shellof a post-AGB object) is not necessarily detected at the opticalwavelength.
Many significant changes occur to both the star and the nebuladuring this phase. The superwind (suddenly increased mass lossat the end of the AGB phase) stops, large-amplitude pulsationscease, and the circumstellar envelope slowly expands and cools,
revealing the central star. The post-AGB star evolves at constantluminosity on the Hertzsprung-Russell diagram toward highertemperatures. Themorphology of the expanding envelope changes,resulting in the fascinating shapes of the nebula itself.Despite many efforts, the post-AGB phase is still poorly un-
derstood. In particular, the departure from spherically symmetricAGB circumstellar envelopes (e.g., Olofsson 2001) and the for-mation of diverse, axisymmetric nebulae (e.g., Balick & Frank2002) are of great interest to astronomers. Determining the maincause(s) of the breaking of mass-loss symmetry is an importantissue in understanding the late stages of stellar evolution.Previous morphological studies of post-AGB objects (e.g.,
Sahai et al. 1999; Kwok et al. 2000; Hrivnak et al. 2000a, 2001;Ueta et al. 2000, hereafter UMB00) revealed many asymmet-rical nebulae around central stars, where jets and concentricarcs or rings were not unusual. Furthermore, the ground-basedmid-infrared (8Y21 �m) observations done by Meixner et al.(1999) showed twomorphological classes of extended axisym-metric nebulae among post-AGB objects: ‘‘core/elliptical,’’with unresolved cores and elliptical nebulae, and ‘‘toroidal,’’with limb-brightened peaks that suggest equatorial densityenhancements.
1 The term ‘‘protoplanetary nebulae’’ (PPNs) is also often used to describeobjects in transition between the AGB and PN phases. However, one has to re-member that low-mass objects that evolve very slowly will not be able to ionizethe ejectedmatter and become PNs.Hence, the term ‘‘post-AGB’’ describes awidergroup of evolved objects.
A
382
The Astrophysical Journal, 677:382Y400, 2008 April 10
# 2008. The American Astronomical Society. All rights reserved. Printed in U.S.A.

Optical observations revealed more interesting details ofstructures seen in post-AGB nebulae. UMB00 observed 27 PPNcandidates and divided them into two classes: the Star-ObviousLow-level Elongated (SOLE) nebulae,which showstar-dominatedemission with faint extended nebulosity, and the Dust-ProminentLongitudinally EXtended (DUPLEX) nebulae, which are dust-dominated with a faint or completely obscured central star.
They also noted that those two optical classes correspondedto the mid-infrared ones, i.e., core/elliptical � DUPLEX andtoroidal � SOLE, and that the main difference between SOLEand DUPLEX nebulae was the degree of equatorial enhancement(i.e., DUPLEXes tend to have a higher equator-to-pole density ra-tio than SOLEs) and could not be attributed only to the inclination-angle effects. They also suggested that SOLE nebulae wereoptically thinner than DUPLEX nebulae and that SOLE PPNsevolved from low-mass progenitors and DUPLEX from high-mass progenitors. Later model calculations (Meixner et al. 2002)confirmed the physical differences between those two classes ofobjects. Other high-resolution near-infrared HST observations(e.g., Ueta et al. 2005; Su et al. 2003) also supported the opticalresults. Follow-up studies by, e.g., Ueta et al. (2005) were con-ducted to further investigate the asymmetry of the observed ob-jects. They also found that differences in observed morphologiesare caused (mainly) by optical depth and (to a lesser extent) by theinclination of the objects. All those observations strengthen thehypothesis of an equatorial mass-loss enhancement at the end ofthe AGB (superwind) phase (Meixner et al. 1999) and that mor-phological shaping of nebulae occurs before the post-AGBphase.Moreover, the resulting diverse shapes observed in PPNs, as wellas PNs, may be caused by some properties of the central stars,such as chemical composition, mass, and/or metallicity.
In order to find further support for those results, we have exe-cuted an HST snapshot survey of post-AGB objects by increas-ing the range of masses and chemical composition (C/O ratio) andenlarging the sample of studied objects. The goal of the project isto connect the observed diversity of nebular shapeswith the phys-ical and chemical properties of the central stars. In this paper wepresent the results for post-AGB objects observed recently withHST. Observations and data reduction are summarized in x 2. Theresults and differences between selected groups of objects aregiven in x 3. In x 4 we discuss the obtained results with referencesto the physical and chemical properties of stars. Our conclusionsare given in x 5.
2. OBSERVATIONS
2.1. Sample Selection
Post-AGB stars do not form a homogeneous group. One canfind objects with different masses (including low-mass objectsthat will never become PNs) and chemical composition. How-ever, they are expected to be supergiants of spectral types BYKwith evidence of the circumstellar envelope (e.g., infrared excess)and no large photometric variability (the classification criteria foran object to be a post-AGB star were described in, e.g., Kwok1993; Van Winckel 2003; Waelkens & Waters 2004). In addi-tion, few unique classes of stars like RV Tau objects (Jura 1986),R CrB stars and extreme helium stars (Renzini 1979; Iben et al.1983), or even ‘‘born-again’’ supergiants (Sakurai’s object andFG Sge; e.g., Lawlor & MacDonald 2003) are considered to beevolved objects in the post-AGB phase. All those objects areincluded in the Torun catalog of Galactic post-AGB and relatedobjects (Szczerba et al. 2007).2 From this database we selected
for our snapshot survey3 those sources that were not yet imagedwith HST. Because the exposure time for an object from a snap-shot survey cannot be too long, our sample was biased towardrather bright stars.
The selected post-AGB objects were observed with the HighResolution Channel (HRC) of the Advanced Camera for Surveys(ACS) on board HST (Gonzaga et al. 2005), which has a 2600 ;2900 field of view and a plate scale of 0.02700 pixel�1. Obser-vations for 19 objects from our proposal (program ID 10627,PI: M. Meixner) were done between 2005 July and 2007 January.We also searched for other post-AGB stars (from the Torun cata-log) observed with the ACSHRC. In the HST archive we found17 objects from previous observation cycles.We included 14 post-AGB sources in our reduction and analysis of the images (se-lected objects from program IDs 9463 and 10185, PI: R. Sahai;and 9430, PI: S. Trammell) and excluded 3 objects (the extendedstructures of the Egg Nebula and Frosty Leo are bigger than theimage, which prevents correct measurement, and IRAS 19024+0044 was already carefully analyzed by Sahai et al. [2005]).In total, we have 33 PPNs observed in the broad B (F435W),V (F606W), and I (F814W) filters. Selected candidates differin central star masses, optical and infrared colors, and effectivetemperatures (Stasinska et al. 2006 and references therein). Bydoing this, we increased the number of studied post-AGB objectsand covered the diverse nature of post-AGB stars more exten-sively. The properties of the analyzed post-AGBobjects are shownin Table 1.
2.2. Data Reduction and Measurements
Each source was observed with various exposure times in or-der to increase the dynamic range of the final image. Faint neb-ulaewere revealed in the long exposures, but the central star pixelswere often saturated. The short exposures, free from saturatedpixels, were combined with the longer ones to produce a non-saturated final image. Because each object was observed a coupleof times, we had two or more nonsaturated final images. ThenIRAF STSDAS routines were used for calibration and reduc-tion of images. TheMultiDrizzle package was used to combinemultiple frames of images into a single image (with a plate scaleof 0.02500 pixel�1), remove cosmic rays, and subtract backgroundradiation.
The reduced images were used to measure the photometricand geometric properties of our objects.We adopted the HST pho-tometric calibration of SYNPHOT (ver. 5.0; Laidler et al. 2005) tocalibrate the flux density (Fk in units of erg s�1 cm�2 8�1). Thedefined aperture was big enough to encircle the source togetherwith the diffraction features, while the background emission wascalculated from an up to (depending on the proximity of the otherstars on the images) 10 pixel wide annulus separated from the se-lected aperture by a buffer zone. The sky emission was then sub-tracted from the emission of the entire source. The derived quantity,which was in counts per second, was finally converted into Fkand HSTACS magnitudes (STMAG).
We measured the sizes of the nebulosities around the centralstars. Our motivation was to determine the extension of the neb-ula as a whole, but not the sizes of its particular parts (e.g., eachlobe). For this we needed only two axes of extension. In the caseof the DUPLEX sources, where the central star was not visible
3 Snapshot surveys are designed to fill the observational schedule gaps betweenlarger GO programs, and there is no guarantee that any particular snapshot targetwill be observed. That is why we may expect only part of the selected sample to beobserved.2 Available at http://www.ncac.torun.pl/postagb.
HST IMAGES OF POST-AGB OBJECTS 383

and the lobeswere clearly separated, wemeasured the size of eachlobe separately and, in addition, the extension of thewhole object.The extent of the nebula was defined as the outermost recogniz-able structure in which the emission level was from 1 � up to 14 �(depending on the image quality) above the background level. Themajor and minor axes, as well as the ellipticity of the nebulae,were derived by fitting ellipses to the selected isophotes. We alsomeasured the surface intensity of the nebulae at the edge and com-pared it to the star (or the peak, if the central starwas not visible, asin the DUPLEX sources) surface intensity and got star-to-nebulasurface intensity ratios (Is/In). For objects without nebulae, onlythe peak intensity was measured. The names and coordinates ofall the objects, as well as other derived parameters (Fk,HSTmag-nitudes, Is/In, and extension), are shown in Tables 2, 3, and 4 forSOLE, DUPLEX, and stellar sources, respectively.
Figures 1Y3 show the reduced images. The logarithmic scaleis used to illustrate the contrast between nebulae and central stars.Nevertheless, some faint nebulae are still barely visible. The valueof Is/In ranges from 4 to 3 ; 105 (see Tables 2 and 3). The point-
spread function (PSF) effects are seen on most of the images. Toremove them and make the nebulae more clearly seen we decon-volved our images using the Richardson-Lucy (RL) algorithmwith a stellar PSF created especially for our images by the codeTiny Tim (ver. 6.3; Krist & Hook 2004). As a result, the contrastbetween the nebula and the background emission was improvedin general, but in the case of very faint nebulosities where thenebula emission was comparable to sky emission, the differencebetween reduced and deconvolved images was rather insignifi-cant. There is also one inconvenience in using the RL algorithm,which is known to produce false depressions around unusuallybright pixels. Those ‘‘holes’’ are seen on our deconvolved imagesbut are not considered real structures. The deconvolved imagesare shown together with the reduced ones in Figures 1Y3 in thesame logarithmic scale.
3. RESULTS
We detected nebulosities in 15 out of 33 sources and classifiedthem as SOLE and DUPLEX following UMB00. A SOLE has
TABLE 1
Target Summary for HST ACS HRC Observation of Post-AGB Objects
IRAS ID Other Name Prop. IDa V magb J magb TeAc,d Massd C/Od
01005+7910 ..................... . . . 10627 10.96 10.274 21000 0.55 C
04395+3601 ..................... AFGL 618 9430 . . . 13.510 25000e . . . Ce
06034+1354 ..................... DY Ori 10627 . . . 8.073 5900 <0.55 O
08143�4406 .................... PM 1-39 10627 . . . 9.172 7150 <0.55 C
09256�6324 .................... IW Car 10627 8.33 5.875 6700 <0.55 C
11385�5517� ................... V885 Cen 9436 7.04 5.947 8500 0.55 O
12067�4508 .................... RU Cen 10627 9.13 7.616 6000 <0.55 O
12175�5338 .................... V1024 Cen 10627 9.40 8.326 7350 0.62 O
12222�4652 .................... HD 108015 10627 8.01 6.941 6800 <0.55 O
12538�2611..................... LN Hya 10627 6.82 5.251 6000 <0.55 O
13416�6243 .................... . . . 10627 . . . 10.302 . . . . . . Cf
13428�6232� ................... . . . 9463 . . . 13.176 . . . . . . Cf
15039�4806 .................... HD 133656 10627 7.58 6.680 8000 0.55 O
15469�5311..................... . . . 10627 10.82 7.190 7500 <0.55 O
15553�5230� ................... . . . 10627 . . . 13.380 . . . . . . . . .16206�5956 .................... LS 3591 10627 10.00 9.002 8500 0.66 O
17163�3907 .................... Hen 3-1379 10185 12.45 4.635 . . . . . . . . .
17243�4348 .................... LR Sco 10627 10.49 8.035 6750 0.94 O
17279�1119..................... V340 Ser 10627 9.78 7.845 7300 <0.55 C
17516�2525 .................... . . . 9436 17.76 8.695 . . . . . . Of
17534+2603..................... 89 Her 10627 5.51 4.998 6550 0.61 O
18135�1456 .................... OH 15.7+0.8 9436 16.61 . . . . . . . . . Og
19125+0343..................... BD +03 3950 10627 10.46 7.903 7750 0.58 O
19157�0247 .................... BD �02 4931 10627 10.87 8.872 7750 0.58 O
19306+1407� ................... . . . 9436 . . . 11.286 B . . . Of
19475+3119� .................... HD 331319 9436 9.60 7.773 7750 0.58 O
20000+3239� ................... . . . 9436 . . . 8.021 5500h . . . Cf
20117+1634 ..................... R Sge 10627 9.31 7.818 5000 0.93 O
20547+0247..................... U Equ 9436 . . . 11.561 G . . . Oi
22036+5306� ................... . . . 10185 . . . 11.666 . . . . . . Of
22223+4327� ................... BD +42 4388 9436 10.00 7.812 6500 0.55 C
23304+6147� ................... PM 2-47 9436 . . . 8.501 6750 0.66 C
23541+7031 ..................... M 2-56 9436 . . . 13.857 B . . . Of
Note.—An asterisk indicates that images of the objects were also published in Sahai et al. (2007).a 9430, PI: S. Trammell; 9436 and 10185, PI: R. Sahai; 10627, PI: M. Meixner.b Magnitudes from the GSC2.2 and 2MASS catalogs.c Spectral type is shown if TeA is not known from the model atmosphere analysis.d Data collected by Stasinska et al. (2006), except as noted.e Cernicharo et al. (2001) and references therein.f C/O ratio established by inspection of the ISO spectrum.g Engels (2002) and references therein.h Volk et al. (2002).i Geballe et al. (2005) and references therein.
SIODMIAK ET AL.384 Vol. 677

an optically thin (continuous) envelope, and the star is thereforevery bright at optical and near-infrared wavelengths in comparisonto the nebula (in terms of Is/In, we consider values of >1000).The surface brightness peaks at the central star. Because of multi-axis lobes with different shapes and surface brightness, UMB00divided those objects into subgroups of simple ellipse, multipleellipses, an ellipse with embedded bipolar structure, and an ellipse
with concentric shells. These structures are also present in our ob-jects. In addition, we observe snail-like structures. The PSF effectsare apparent in the images; the faint nebular structures are oftenburied under the PSF of the bright central star. DUPLEXes havean optically thick torus that completely or partially obscures thecentral star. The Is/In values are much below 1000, and the peak ofthe surface brightness is far away from the center of the object.
TABLE 3
Properties of DUPLEX Post-AGB Objects
IRAS ID R.A. (J2000.0) Decl. (J2000.0) ACS Filter Fka HST Mag.b Is/In
c
Size
(arcsec)
(�) ed
04395+3601 .................. 04 42 53.50 +36 06 51.71 F606W 2.54E�15 15.39 . . . 15.40 ; 4.80 (4) 0.67
Eastern lobe . . . 1.98E�15 15.66 124 8.25 ; 4.75 (4) 0.42
Western lobe . . . 5.16E�16 17.12 85 6.20 ; 3.20 (4) 0.48
13428�6232 ................. 13 46 20.96 �62 47 58.10e F606W . . . . . . . . . . . . . . .
F814W 3.86E�16 17.43 4 8.75 ; 6.90 (1) 0.21
15553�5230 ................. 15 59 10.66 �52 38 38.15 F814W 1.90E�17 20.70 . . . 2.50 ; 1.10 (2) 0.56
Eastern lobe . . . 1.21E�17 21.20 10 1.35 ; 1.00 (2) 0.26
Western lobe . . . 6.01E�18 21.95 4 1.20 ; 0.85 (2) 0.29
22036+5306 .................. 22 05 30.35 +53 21 33.97 F606W 1.32E�15 16.10 330 6.75 ; 2.30 (3) 0.66
F814W 2.87E�15 15.26 120 5.60 ; 1.85 (4) 0.67
23541+7031 .................. 23 56 36.31 +70 48 18.39 F606W 5.33E�17 19.58 55 3.75 ; 1.60 (2) 0.57
F814W 4.96E�17 19.66 88 3.30 ; 0.90 (1) 0.73
Note.—Units of right ascension are hours, minutes, and seconds, and units of declination are degrees, arcminutes, and arcseconds.a In units of erg s�1 cm�2 8�1.b HST system magnitudes (STMAG).c Ratio of peak surface intensity Is to nebula surface intensity In.d Ellipticity e ¼ 1� b/a, where a and b are major- and minor-axis lengths, respectively.e The 2MASS counterpart’s coordinates. The only clearly visible part of the nebula was measured on the F814W image (see text).
TABLE 2
Properties of SOLE Post-AGB Objects
IRAS ID R.A. (J2000.0) Decl. (J2000.0) ACS Filter Fka HST Mag.b Is/In
c
Size
(arcsec)
(�) ed
01005+7910 ............. 01 04 45.59 79 26 47.08 F606W 1.23E�13 11.17 26900 3.75 ; 2.20 (2) 0.41
F814W 5.94E�14 11.97 14510 3.65 ; 2.25 (4) 0.38
08143�4406 ............ 08 16 02.98 �44 16 04.88 F606W 5.58E�14 12.03 7500 2.10 ; 1.30 (10) 0.38
F814W 7.61E�14 11.70 3700 2.10 ; 1.35 (4) 0.36
11385�5517............. 11 40 58.82 �55 34 25.52 F435W 8.10E�12 6.63 338000 8.30 ; 6.60 (12) 0.20
F606W 4.47E�12e 7.27e 81500 8.30 ; 6.20 (8) 0.25
12175�5338 ............ 12 20 15.08 �53 55 31.62 F606W 6.46E�13 9.37 76000 5.70 ; 2.50 (7) 0.56
F814W 3.76E�13 9.96 36300 5.60 ; 2.20 (10) 0.61
16206�5956 ............ 16 25 02.61 �60 03 31.35 F606W 3.33E�13 10.09 21500 3.85 ; 2.60 (9) 0.32
F814W 1.87E�13 10.72 21300 3.85 ; 2.55 (6) 0.34
19306+1407 ............. 19 32 55.15 +14 13 36.89 F606W 7.83E�15 14.17 9000 7.70 ; 2.00 (4) 0.74
F814W 1.09E�14 13.81 6400 4.40 ; 2.05 (4) 0.53
19475+3119 ............. 19 49 29.63 +31 27 15.32 F435W 6.91E�13 9.30 190000 10.45 ; 5.10 (3) 0.51
F606W 6.72E�13 9.33 153000 9.95 ; 5.10 (2) 0.49
20000+3239 ............. 20 01 59.56 +32 47 33.71 F606W 3.39E�14 12.57 3800 2.15 ; 1.45 (5) 0.33
F814W 1.02E�13 11.38 2000 2.00 ; 1.20 (7) 0.40
22223+4327 ............. 22 24 31.48 +43 43 10.67 F435W 3.47E�13 10.05 13000 3.40 ; 2.10 (10) 0.38
F606W 5.02E�13 9.65 10000 3.50 ; 2.10 (6) 0.40
23304+6147............. 23 32 44.71 +62 03 48.92 F606W 3.30E�14 12.61 3800 2.25 ; 1.60 (14) 0.29
F814W 8.31E�14 11.60 2100 2.20 ; 1.45 (9) 0.34
Note.—Units of right ascension are hours, minutes, and seconds, and units of declination are degrees, arcminutes, and arcseconds.a In units of erg s�1 cm�2 8�1.b HST system magnitudes (STMAG).c Ratio of star surface intensity Is to nebula surface intensity In.d Ellipticity e ¼ 1� b/a, where a and b are major- and minor-axis lengths, respectively.e Due to a saturation problem, Fk and HST Mag are only the lower limits.
HST IMAGES OF POST-AGB OBJECTS 385No. 1, 2008

The nebula is bipolar, and the (multiple) lobes are seen throughscattered light. The PSF diffraction feature is usually not seen inthe images of DUPLEX objects.
These observational characteristics of the nebulae are consis-tentwith the present understanding of the structure of these shells,in which SOLE and DUPLEX nebulae represent the low and highends, respectively, of the degree of equatorial enhancement for anintrinsically axisymmetric circumstellar shell. In other words, thereis not much of a difference between SOLE and DUPLEX nebulaeas far as the shell structure goes, but the difference is the opticaldepth along the equator due to the difference in the equator-to-poledensity ratio resulting from the different degree of equatorial den-sity enhancement. This is what makes DUPLEX nebulae appearbipolar with a well-defined dust lane, while making SOLE nebu-
lae appear elliptical without a clear dust lane. Because of this, theirshell morphology tends to become less definitive when the opticaldepth along the equator is close to unity (and/or the inclination an-gle of the shell is far from edge-on).We have 10 SOLE objects (IRAS 01005+7910, IRAS 08143�
4406, IRAS 11385�5517, IRAS 12175�5338, IRAS 16206�5956, IRAS 19306+1407, IRAS 19475+3119, IRAS 20000+3239, IRAS22223+4327, and IRAS23304+6147) and 5DUPLEXobjects (IRAS 04395+3601, IRAS 13428�6232, IRAS 15553�5230, IRAS 22036+5306, and IRAS 23541+7031) in our sample.The value of Is/In for our DUPLEXes is at most 330 ( IRAS22036+5306) and for SOLEs reaches a few hundred thousand(e.g., IRAS 11385�5517 or IRAS 19475+3119). The remaining18 sources do not show any nebulosities around them and are
TABLE 4
Properties of Stellar Post-AGB Objects
IRAS ID R.A. (J2000.0) Decl. (J2000.0) ACS Filter Fka HST Mag.b Is
c
12222�4652 .................... 12 24 53.49 �47 09 08.36 F606W 2.27E�12 8.01 1.28E+1
F814W 1.21E�12 8.70 4.48E+0
12538�2611..................... 12 56 30.00 �26 27 36.55 F606W 5.39E�12 7.07 1.21E+1
F814W 4.08E�12 7.37 1.20E+1
13416�6243 .................... 13 45 07.26 �62 58 15.67 F814W 1.77E�15 15.78 6.47E�6
15039�4806 .................... 15 07 27.52 �48 17 53.85 F606W 3.11E�12 7.67 1.27E+1
F814W 1.83E�12 8.25 6.34E+0
17163�3907 .................... 17 19 49.26 �39 10 38.29 F435W 7.93E�16 16.65 6.89E�3
F606W 7.92E�14 11.65 4.38E�1
17279�1119..................... 17 30 46.82 �11 22 08.21 F606W 5.47E�13 9.55 3.59E+0
F814W 4.56E�13 9.75 5.27E+0
17516�2525 .................... 17 54 43.35 �25 26 28.77 F606W 5.35E�16 17.08 3.59E�3
17516�2525ad ................. . . . 4.39E�16 17.29 . . .
17516�2525bd................. . . . 6.12E�17 19.43 . . .
F814W 9.48E�15 13.96 3.24E�2
17516�2525ad ................. . . . 7.90E�15 14.16 . . .
17516�2525bd................. . . . 1.31E�16 18.61 . . .
17534+2603..................... 17 55 25.19 +26 03 01.49 F606W 2.07E�11e 5.61e 1.21E+1
F814W 1.12E�11e 6.28e 1.23E+1
18135�1456 .................... 18 16 25.47 �14 55 16.17 F606W 5.56E�16 17.04 4.23E�3
F814W 6.45E�16 16.88 3.37E�3
20547+0247..................... 20 57 16.29 +02 58 44.47 F606W 3.85E�15e 14.94e 8.32E�3
F814W 8.20E�15 14.12 2.35E�2
RV Tau Stars
06034+1354..................... 06 06 15.04 +13 54 18.95 F606W 7.67E�14 11.69 4.23E�1
F814W 1.10E�13 11.30 3.25E�1
09256�6324 .................... 09 26 53.52 �63 37 48.78 F606W 1.45E�12 8.49 7.80E+0
F814W 1.41E�12 8.53 5.27E+0
12067�4508 .................... 12 09 23.72 �45 25 34.60 F606W 6.02E�13 9.45 2.89E+0
F814W 4.41E�13 9.79 1.93E+0
15469�5311..................... 15 50 43.75 �53 20 42.88 F606W 2.64E�13 10.35 1.37E+0
F814W 3.72E�13 9.97 1.23E+0
17243�4348 .................... 17 27 53.60 �43 50 46.73 F606W 2.46E�13 10.42 1.64E+0
F814W 2.55E�13 10.38 1.07E+0
19125+0343..................... 19 15 01.17 +03 48 43.52 F606W 2.71E�13 10.32 2.39E+0
F814W 2.83E�13 10.27 1.24E+0
19157�0247 .................... 19 18 22.75 �02 42 10.79 F606W 1.93E�13 10.69 1.17E+0
F814W 1.68E�13 10.84 6.11E�1
20117+1634 ..................... 20 14 03.76 +16 43 35.77 F606W 9.79E�13 8.92 5.42E+0
F814W 7.87E�13 9.16 3.04E+0
Note.—Units of right ascension are hours, minutes, and seconds, and units of declination are degrees, arcminutes, and arcseconds.a In units of erg s�1 cm�2 8�1.b HST system magnitudes (STMAG).c Peak intensity (in units of erg s�1 cm�2 8�1 sr�1).d See text for details.e Due to a saturation problem, Fk and HST Mag are only the lower limits.
SIODMIAK ET AL.386 Vol. 677

referred to as stellar objects. Due to a different morphology wemay also expect differences in spectral energy distribution (SED)shapes and position in infrared color-color diagrams. All groupsof sources are discussed separately in the following sections. Im-ages of SOLE, DUPLEX, and stellar objects are shown in Fig-ures 1, 2, and 3, respectively.
3.1. SOLE Objects
IRAS 01005+7910 has a similar-sized nebulosity in both bands(3:7500 ; 2:2000 in V and 3:6500 ; 2:2500 in I ). Its morphology isirregular. It has two lobes of different shapes pointed toward thenorthwest and southeast and an additional small lobe emergingin the southeastern direction visible in the V band. The circular
halo corresponds to the wings of the PSF around the bright cen-tral star.
IRAS 08143�4406 shows an elliptical nebula that is 2.100 longand 1.400 wide. It has two small lobes emerging in the western andeastern directions. The circular PSF halo is also present. The ob-ject looks similar in both bands, with the exception of Is/In, whichis 2 times bigger in the V band than in the I band. This sourceis a carbon-rich object with an overabundance of s-process el-ements (Reyniers et al. 2004) and is similar in appearance toIRAS 07430+1115 from the UMB00 sample, which is also richin s-process elements (e.g., Reddy et al. 1999).
The nebulosity of IRAS 11385�5517 is very asymmetricand looks like a pinwheel. This A-type, oxygen-rich, low-mass
Fig. 1.—Images of SOLE objects (north is up and east is to the left) shown in order of increasing right ascension (see Table 2). The leftmost frames show the IRAS IDand size of the image. The filter types are shown at the bottom of each frame, with ‘‘+RL’’ indicating Richardson-Lucy deconvolution. The images are in logarithmic scaleto illustrate the contrast between the central star and the nebula. [See the electronic edition of the Journal for a color version of this figure.]
HST IMAGES OF POST-AGB OBJECTS 387No. 1, 2008

supergiant was thought to be a binary, but later observationssuggested rather disklike structure and high-velocity bipolar out-flows (e.g., Olofsson & Nyman 1999). It is possible that we seeonly one of these outflows on HST images because of the inclina-tion effect. The snail-like shape of the outflow is quite similar tothe spiral pattern found in C-rich AGB star AFGL 3068 (Mauron& Huggins 2006). The spiral outflow in IRAS 11385�5517 isalso single-armed, and its extension is 8:300 ; 6:600 in the B band.The object is very bright (B ¼ 6:6 and V ¼ 7:3 mag) and lookssimilar in both bands. The value of Is/In is very high in theB band,with �3:4 ; 105 being the highest among SOLE sources.
IRAS 12175�5338 has a very complex morphology. Thenebula is 5.700 long and 2.500 wide. It has at least four lobes, pointedin different directions. The lobes are of very different bright-ness, with the bright ones closer to the central star and the veryfaint more extended structures. They are less clearly visible inthe I band. The circular PSF halo is also seen around the star.The object is quite bright in both bands,�9.5 mag, and is knownto be a metal-deficient pulsating variable (e.g., Van Winckel1997).
IRAS 16206�5956 has a nebulosity very similar to the oneseen in IRAS 11385�5517. It is also asymmetric and has a snail-like shape, but it is much smaller, with an extension of 3:8500 ;2:600. There is also a faint lobe emerging to the southwest with aquite complex structure. There is no visible lobe on the other sideof the objects, but it may be extremely faint and buried under the
PSF of the bright central star. The structures are better resolvedin the V band than in the I band, but Is/In is the same, �21,000,in both bands. IRAS 16206�5956 is also an A-type oxygen-richsupergiant, similar to IRAS 11385�5517, but is more massive,with a core mass of M ¼ 0:66 M� (see Table 1).IRAS 19306+1407 is a B-type oxygen-rich PPN. It has a bright
central star and low surface brightness lobes (Is/In is �9000 and6400 in the V and I band, respectively). The lobes have bipolarstructure, also seen in previous observations (Volk et al. 2004;Sahai 2004). The lobes seem to be smaller in the I band, with anextensionof only 4:400 ; 2:000, in comparison to theV band,wherethey are longer, 7:700 ; 2:000.IRAS 19475+3119 has a quadrupolar nebula and a PSF spher-
ical halo. Similar complex double-elongation structure can beseen in IRAS 04296+3429 from UMB00, except for the differ-ent sizes of the nebula: IRAS 19475+3119 has a much biggernebulosity of 10.4500 long and 5.100 wide.Also, IRAS19475+3119is known to be oxygen-rich (its dust envelope was described indetail by Sarkar & Sahai 2006), whereas IRAS 04296+3429 isa carbon-rich source with s-process overabundances and 21 �memission features (e.g., Volk et al. 1999).IRAS 20000+3239 is a carbon-rich source with s-process el-
ements and a 21 �m feature (e.g., Volk et al. 1999; Van Winckel& Reyniers 2000). It has small lobes emerging to the west andeastwith an extension of 2:1500 ; 1:4500 inV (slightly smaller in theI band) and is very similar to IRAS 08143�4406, described above.
Fig. 1—Continued
SIODMIAK ET AL.388 Vol. 677

IRAS 22223+4327 is also a carbon-rich source with s-processelements and 21 �m features. It is quite bright in the V band(�9.6), and the nebula has a size of 3:400 ; 2:100. There are twopairs of lobes pointed to the north and south, and they are moreclearly visible on the south side. The object is quite similar toIRAS 08143�4406 and IRAS 20000+3239.
IRAS 23304+6147 also belongs to the group of objects with a21 �m feature. Its extension is comparable to the extension ofIRAS 20000+3239 (2:2500 ; 1:600). It has two lobes emerging inthe northern and southern directions and another inner pair oflobes in the western and eastern directions. Those inner lobes arenot so clearly seen even on deconvolved images. The object’sstructure could be similar to that seen in IRAS 06530�0213 fromUMB00. While the appearances of IRAS 20000+3239, IRAS22223+4327, and IRAS 23304+6147 are similar and those threeobjects have the same 21 �m feature, the SOLE morphology isnot characteristic of the whole group with a 21 �m feature, e.g.,DUPLEX source IRAS22574+6609 (UMB00) or theEggNebula(e.g., Sahai et al. 1998).
3.2. DUPLEX Objects
IRAS 04395+3601 (better known as AFGL 618) is a carbon-rich PPN surrounding a B0 central star rapidly evolving to thePN stage. The ACS image shows the bipolar structure of thenebula, with an extent of 15:400 ; 4:800. The eastern lobe is larger(8:2500 ; 4:7500) and brighter (V ¼ 15:7 mag) than the western
one (6:200 ; 3:200 and V ¼ 17:1 mag). The star itself is hidden inthe thick dust torus, and only huge outflows are seen in the optical(Trammell & Goodrich 2002). The structure of the object is verycomplex. The lobes consist of shock-excited gas and dust and arecomposed of several jetlike structures (e.g., Sanchez Contreraset al. 2002). The compact H ii region is present in the central partof the nebula, and the circumstellar envelope contains various mo-lecular species (e.g., Woods et al. 2003a, 2003b).
IRAS 13428�6232 is a very faint object with no optical coun-terpart. The nebula is not visible in the V band, and parts of it arerevealed in the I band. The object is extended in the northeastand southwest directions with a size of more than 2000. However,only its brightest central fragment, with a size of 8:7500 ; 6:900
(extended perpendicularly to the whole object), is above the 1 �level and can bemeasured. This source was studied previously byVan de Steene et al. (2000), who observed the nice bipolar shapeof IRAS 13428�6232 in the near-infrared with an angular size of4:100 ; 12:000 in the N band and 6:000 ; 11:000 in the K band.
IRAS 15553�5230 is a poorly known post-AGB star. ThisIRAS source was observed in the near-infrared by Garcıa-Larioet al. (1997) and Van de Steene et al. (2000), and there was noagreement about the correct counterpart. However, Van de Steeneet al. (2000) noted that the object was elongated. The ISO spec-trum showed no features. Our observations confirmed the coor-dinates indicated by Van de Steene et al. (2000) and revealed thebipolar shape of this small (2:500 ; 1:100) nebula. The object is
Fig. 1—Continued
HST IMAGES OF POST-AGB OBJECTS 389No. 1, 2008

very faint, and the central star is invisible. The lobes differ insize and shape, which may be the effect of the nebula’s orienta-tion toward the observer. A small feature pointing out from theeast lobe may be a faint outflow or a jet.
The extended and complex bipolar nebula of IRAS 22036+5306 was already known from the previous HST observations(proposal ID 9101; Sahai et al. 2003). The size of the object andmagnitudes in the V and I bands determined in this paper areslightly different from the ones given by Sahai and collaborators,but the WFPC2, used in their observations, has a different platescale and response curve than the ACS. The morphology of theobject is very complex, with central ring structures, elongatedlobes, and faint, knotty, jetlike linear structures. The object is
oxygen-rich, with a very characteristic feature in the ISO spectraof water ice absorption at �3.1 �m (e.g., Sahai et al. 2003).IRAS 23541+7031 (also known as M 2-56) is a PPN with
strong shock emission seen in the optical line spectrum. Trammell& Goodrich (1998) discovered its bipolar nature and found weakemission extending up to 1000 from the central bright region. Fromour measurements the nebula is only 3:7500 ; 1:600 in size in theV band and smaller and much fainter in the I band. However,there is very faint emission (below 1 � above the sky level) out-side the measured size, and we were not able to estimate its ex-tent. The central star of IRAS 23541+7031, which is much fainterin the I band, is classified as typeB, but cooler than the central starof AFGL 618.
Fig. 2.—Images of DUPLEX objects shown in order of increasing right ascension (see Table 3). The display scheme is the same as in Fig. 1. [See the electronic editionof the Journal for a color version of this figure.]
SIODMIAK ET AL.390 Vol. 677

3.3. Stellar Objects
Stellar sources are not associated with any obvious nebulos-ities. The objects are both very bright, like IRAS 17534+2603,and very faint, like IRAS 18135�1456. For bright sources thediffraction features are very strong. Various artificial features pro-duced during deconvolution can be seen in Figure 3.
All analyzed RV Tau stars belong to this group. They are coolpost-AGB objects with effective temperatures below 8000 K,usually low-mass central stars and oxygen-rich envelopes (for afew exceptions, see, e.g., Stasinska et al. 2006) with photospheresdepleted in the high-condensation temperature elements as a resultof gas-dust separation (e.g., Gonzalez et al. 1997). Their infraredexcess indicates the presence of warm dust, which should be vis-ible as an extended circumstellar envelope. However, there is noevidence of such an envelope on the analyzed images. This iscaused by properties of both HST and the RV Tau stars. HST issensitive only to nearby, relatively dense circumstellar dust, whileRV Tau stars (because of their long time evolution) have very ex-tended and therefore very low surface brightness envelopes. Hence,RV Tau stars appear as stellar sources.
The rest of the objects in the stellar group are post-AGB starswith infrared excess. IRAS 12538�2611 and IRAS 15039�4806are supergiants with cool dust, while IRAS 12222�4652 andIRAS 17279�1119 show a near-infrared excess which standsfor hot dust (compare the SEDs in Fig. 6, discussed in x 4.3). Itwas suggested by VanWinckel et al. (2000) that all objects withnear-infrared excess are binaries. One of them is IRAS 17534+2603, better known as 89 Her. It is a high-latitude F2 supergiantwith hot dust in a shell, a large CO shell (Fong et al. 2006), and anH� line showing evidence for ongoing mass loss (e.g., Waterset al. 1993). The model constructed for the circumstellar enve-lope also assumed that IRAS 17534+2603 must have evolved asa binary system. Because the stellar objects are not associatedwithany nebulosities, it is astonishing to see a clump of densermaterialin the northwest part of the IRAS 17279�1119 image. It must beconnected with the star, since there are no other objects in the nearvicinity. Itmay be an ejected knot. The object is classified as a stel-lar source, since we do not see any evidence for continuous neb-ulosity around it (as in the case of SOLE objects), but the knotmakes it peculiar.
IRAS 13416�6243 was connected with a highly reddenedG1 supergiant by Hu et al. (1993), but the conclusions from thelow-resolution IRAS spectrum about the 10 and 18 �m silicateabsorption bands were misleading. Instead, the ISO spectrumshows moderate PAH bands and an absorption feature of C2H2
at 13.7 �m, suggesting a carbon-rich, dusty envelope. There isalso a 6.9 �m feature which is seen only in the post-AGB phaseand only in those objects with a 21 �m feature (e.g., Hrivnak et al.
Fig. 2—Continued
Fig. 3.—Exemplary images (reduced and deconvolved) of four stellar objects.The IRAS name, filter, and size of the images are shown. [See the electronic editionof the Journal for a color version of this figure.]
HST IMAGES OF POST-AGB OBJECTS 391No. 1, 2008

2000b). Unfortunately, a 21 �m feature is not seen in this object,and we can only speculate that the feature is quite weak and thatISO resolution was not enough to see it.
IRAS 17516�2525 is known to be an oxygen-rich source withOHmaser emission. It is a very faint star with V � 17:8 mag, butthe analyzed images show that there are indeed two stars veryclose to each other! The separation is 1.4500, and they are resolvedonly on HST images. It is not clear whether the stars are related.IRAS 17516�2525a is redder in the I band than IRAS 17516�2525b, and most likely this is a correct IRAS counterpart.
IRAS 20547+0247 is a peculiar variable star. IRAS 12/25color suggests an optically thin envelope; however, the IRASlow-resolution spectrum shows a 10 �m silicate absorption fea-ture typical for thick dusty envelopes. To explain this contradic-tion Barnbaum et al. (1996) proposed a dusty, thick disk aroundIRAS 20547+0247 but seen edge-on. Its optical spectrum is veryunusual, with strong absorption and emission bands of metal-lic oxides TiO, AlO, and VO, which should not be visible in aG-type star. The infrared spectroscopy revealed hot circum-stellar gas likely located in a disklike structure (Geballe et al.2005). We see no evidence for a disk in the images.
4. DISCUSSION
In this section we describe various properties of the analyzedobjects. Table 5 compares the morphology of the objects withother properties. To get a wider viewwe include in our discussionother post-AGB objects observed withHST and already analyzedby other authors. In total, there are 66 post-AGB objects withHSTimages published in the literature.
4.1. Nebulosities
The morphologies of PPNs are very complex for both SOLEand DUPLEX objects, from optically thin nebulosities to multi-ple dusty outflows with microstructures, as we discussed in x 3.They are different for SOLE and DUPLEX objects, but they allshow some degree of asymmetry. All nebulae are elongated. Thesizes of the nebulae vary from small (e.g., 2:100 ; 1:300 for IRAS08143�4406) to big (e.g., IRAS 04395+3601, with an extent of15:400 ; 4:800), but the physical extension is not known due to alack of known distances to the objects. Small or faint nebulosi-ties can also be buried under the PSF of the bright central star andtherefore hard to see. The surface intensity ratio between the starand the nebula in SOLEobjects is always high, varying from2000to almost 340,000, and the nebula appears faint in comparison tothe central star. DUPLEX sources are all faint (V ¼ 15Y21mag inthis study), and the surface intensity ratio is below 330. Hence,even huge nebulae like AFGL 618 are not easy to detect.
Asmentioned already in this paper, the observational character-istics of the nebulae are consistent with the present understandingof the structure of these shells, in which SOLE and DUPLEXnebulae represent the low and high ends, respectively, of the de-gree of equatorial enhancement for an intrinsically axisymmetriccircumstellar shell. As far as the shell structure goes, there is notmuch of a discrepancy between SOLE and DUPLEX nebulae,but the difference is the optical depth along the equator due tothe variation in the equator-to-pole density ratio resulting fromthe different degree of equatorial density enhancement. Thus,DUPLEX nebulae appear bipolar with a well-defined dust lane,while SOLE nebulae appear elliptical without a clear dust lane.However, their shell morphology tends to become less definitivewhen the optical depth along the equator is close to unity and/orthe inclination angle of the shell is far from edge-on.
Table 5 shows that there is no obvious connection betweenthe morphology and characteristics of the objects in our sample.
Among SOLEs we have a comparable number of carbon- andoxygen-rich objects, which implies that the shapes of the nebu-lae are not necessarily correlated with the chemical compositionof the objects. Good examples are two oxygen-rich supergiants,IRAS 11385�5517 and IRAS 16206�5956, and a carbon-richAGB star, AFGL 3068 (see x 3.1).Also, SOLE objects occupy a wide range of effective temper-
atures (5000 K < TeA < 25;000 K) and masses (0:55 M� <M < 0:91 M�). Therefore, it is unlikely that SOLEmorphologyrepresents a specific evolutionary epoch andmass object. The lackof known chemical compositions andmasses of most DUPLEXesmakes it impossible to connect the morphology with these proper-ties. The range of TeA of DUPLEXes is large (K7YB; see Table 5),and no correlation with morphology can be found. On the otherhand, we find both morphologies among sources with similarchemical and physical properties; e.g., 21 �m sources IRAS20000+3239 and IRAS 22223+4327 are SOLEs, and the EggNebula and IRAS 06176�1036 are DUPLEXes. UMB00 alsodid not find any connections between the shapes of the nebulaeand the properties of the analyzed objects.
4.2. Magnitudes of Analyzed Objects
Derived B, V, and I HST magnitudes are in general consistentwith previously published measurements, although ACS filtersdo not have exact counterparts in other photometric systems (pho-tometric transformations were discussed by Sirianni et al. 2005).However, two DUPLEX objects, IRAS 04395+3601 and IRAS23541+7031, are very bright in the R band in comparison to otheroptical wavelengths (also compare the SEDs in Fig. 5, discussedin x 4.3). AFGL 618 was not measured previously in the V band.Ourmeasurements show it is faint atVACS ¼ 15:39. It is also quitefaint in the near-infrared. However, the object has significant lineemission in H� (e.g., Sanchez Contreras et al. 2002), and thatmay account for the anomalous increase in the R-band bright-ness. Similarly, IRAS 23541+7031 is a bright source in H� (e.g.,Trammell & Goodrich 1998), and its R magnitude is higher thanexpected. The H� line is evidence for ongoing mass loss and canbe found in many post-AGB objects, even RV Tau stars (e.g.,Maas et al. 2005).We do not see as big an increase in brightnessin the R band in any other object in our sample.
4.3. Spectral Energy Distribution
Due to the differences between SOLEs and DUPLEXes, weexpect them to also have different SED shapes, as discussed byUMB00. While SOLEs show both the optical and infrared peaksclearly, DUPLEXes show a prominent infrared peakwith a highlyobscured optical peak. This is consistent with DUPLEXes beingoptically thicker than SOLEs due to their density distribution ofa higher equator-to-pole ratio. SEDs for 33 objects whose imagesare analyzed in this study are shown in Figures 4Y7. Photometricvalues are taken from the GSC2.2, 2MASS, MSX6C, and IRAScatalogs and HST measurements. We adopted the classificationscheme of van der Veen et al. (1989a) and divided the objects intofour groups: I, a flat spectrum between 4 and 25 �m and a steepfalloff toward shorter wavelengths; II, a maximum around 25 �mand a gradual falloff to shorter wavelengths; III, a maximumaround 25 �m and a steep falloff to shorter wavelengths, with aplateau between 1 and 4 �m; and IV, two distinct maxima, onearound 25 �m and the other between 1 and 2 �m (IVa) or below1 �m (IVb).
In SOLE objects, the optical peak due to the central star andthe infrared peak due to dust emission are clearly distinguishable.IRAS 08143�4406, IRAS 20000+3239, and IRAS 23304+6147
SIODMIAK ET AL.392

TABLE 5
Morphology versus Properties of Post-AGB Objects
IRAS ID Prop. ID SED Typea TeAb Mass C/O
b
(deg) References
SOLE Sources
01005+7910..................... 10627 IVb 21000 0.55 C 16.59 13, 32
Z02229+6208 .................. 6364 IVa 5500 0.56 C 1.50 13, 15, 16, 32, 38, 40
04296+3429..................... 6364 IVa 7000 0.55 C �9.05 11, 22, 32, 38, 40, 46
05341+0852..................... 6364 IVa 6500 0.55 C �12.14 13, 16, 32, 38, 46
06530�0213 .................... 6364 IVa 7250 0.56 C �0.14 11, 16, 20, 32, 38, 40
07134+1005..................... 6737 IVb 7250 0.84 C 10.00 12, 13, 15, 18, 32, 38, 40, 46
07430+1115 ..................... 6364 IVa 6000 <0.55 C 17.07 11, 16, 32, 38
08143�4406 .................... 10627 IVa 7150 <0.55 C �5.07 20, 32
11385�5517..................... 9463 IVb 8500 0.55 O 5.94 19, 32
12175�5338 .................... 10627 IVb 7350 0.62 O 8.66 32, 45
16206�5956 .................... 10627 IVb 8500 0.66 O �7.49 7, 32
17436+5003 .................... 6737 IVb 6600 0.91 O 30.87 9, 10, 16, 32, 38
18095+2704..................... 6364 IVa 6600 0.55 O 20.18 9, 16, 32, 38
19114+0002..................... 6737 IVa 6750 0.66 O �4.96 9, 32, 38
19306+1407..................... 9463 IVa B . . . O �2.49 13, 27, 48
19475+3119 ..................... 9463 IVb 7750 0.58 O 2.73 9, 31, 32
20000+3239..................... 9463 IVa 5500 . . . C 1.16 9, 13, 16, 47
20462+3416 ..................... 6364 IVb B1 I . . . O �5.75 9, 38
22223+4327 .................... 9463 IVb 6500 0.55 C �11.56 9, 16, 32, 46
22272+5435..................... 6364 IVa 5750 0.57 C �2.52 9, 32, 38, 39
23304+6147 .................... 9463 IVa 6750 0.66 C 0.59 16, 32, 46
DUPLEX Sources
04395+3601 ..................... 9430 III 25000 . . . C �6.53 3, 30, 37
06176�1036 .................... 7297 III 7500 0.62 C/O �11.76 4, 5, 16, 32
08005�2356 .................... 6364 II F5 . . . C/O 3.58 16, 38
09371+1212 ..................... 9463 IVb K7 II . . . . . . 42.73 16, 25
10197�5750 .................... 6816 II / III A2 I . . . . . . �0.79 24
13428�6232 .................... 9463 III . . . . . . C �0.59 41
15553�5230 .................... 10627 II / III . . . . . . . . . 0.36 41
16342�3814 .................... 6364 III . . . . . . O 5.85 16, 23
16594�4656 .................... 8210 III B7 . . . C �3.29 34, 35, 40, 42, 49
17106�3046 .................... 8210 III . . . . . . . . . 4.70 9, 14, 16, 34
17150�3224 .................... 6364 III G2 . . . O 2.98 16, 35, 38
17245�3951 .................... 8210 III . . . . . . . . . �2.84 9, 16, 34, 35
17423�1755 .................... 6364 II B . . . O 5.78 7, 38
17441�2411..................... 6364 III F5 . . . C? 2.15 16, 33, 35, 38
19024+0044 ..................... 9463 III . . . . . . . . . �2.65 28
19374+2359 ..................... 6364 II F5 . . . O 0.96 11, 16, 38
19477+2401 ..................... 8210 II . . . . . . . . . �1.06 9, 13, 16, 34
20028+3910 ..................... 6364 III G4 . . . C 4.17 9, 16, 34, 38, 48
22036+5306 ..................... 10185 II . . . . . . O �1.84 16, 26, 29
22574+6609 ..................... 8210 II . . . . . . C 5.96 16, 34, 38
23321+6545 ..................... 6364 II / III . . . . . . C 4.32 16, 38
23541+7031 ..................... 9463 II B . . . O 8.42 2, 18
Egg Nebula ...................... 9463 II / III 6500 >0.94 C/O �6.50 21, 32
Stellar Sources
05113+1347 ..................... 6364 IVa 5250 0.60 C �14.29 16, 32, 38
10158�2844 .................... 6364 N/A 7600 0.56 C/O 22.94 5, 16, 32, 38
12222�4652 .................... 10627 N/A 6800 <0.55 O �15.49 5, 32, 45
12538�2611..................... 10627 N/A 6000 <0.55 O 36.40 32, 45
13416�6243 .................... 10627 II . . . . . . C �0.73 36, 41
15039�4806 .................... 10627 N/A 8000 0.55 O 8.65 32, 45
17163�3907 .................... 10185 II . . . . . . . . . �1.12 18
17279�1119..................... 10627 N/A 7300 <0.55 C 12.17 32, 45
17516�2525 .................... 9463 II . . . . . . O 0.06 36, 44
17534+2603 ..................... 10627 N/A 6550 0.61 O 23.19 5, 16, 32, 50
18135�1456 .................... 9463 III . . . . . . O 0.77 6, 43
20136+1309 ..................... 8210 IVa G0 . . . . . . �11.97 34
20547+0247 ..................... 9463 II G . . . O �26.11 1, 8

have an optical maximum above 1 �m, their nebulae are small(compare the sizes in Table 2), and they are of class IVa. Therest of the SOLE sources, except for IRAS 19306+1407, are ofclass IVb, with a peak below 1 �m, and they have extended neb-ulosities. In addition, the SED of IRAS 11385�5517 shows aprominent near-infrared excess that suggests hot dust in circum-stellar material and/or ongoing mass loss. The SED diagram forIRAS 19306+1407 is slightly different from that of other SOLEobjects, with very strong cold dust emission in comparison to thestellar component, but no indication of hot dust which could bestored in the vicinity of the central star. The nebula is rather big,which is characteristic of class IVb, but the optical maximumseems to be above 1 �m, like a class IVa object. It may be a caseof an intermediate optical depth object with a massive circum-stellar envelope that makes its dust peak higher than the stellarcomponent. The lack of other objects with intermediate opticaldepth in our sample is caused by the fast evolution of post-AGBobjects with effective temperatures between 10,000 and 16,000 K(e.g., Schonberner & Blocker 1993); hence, there are a very smallnumber of those objects to observe.
The SEDs for DUPLEX objects are different from those forSOLE sources. The dust maximum is very prominent, and theoptical part is steep or flat without a clear peak. The SEDs are ofclass II (for IRAS 22036+5306 and IRAS 23541+7031) or III (forIRAS 04395+3601 and IRAS 13428�6232), depending on thesteepness of the falloff at shorter wavelengths.We have classifiedIRAS 15553�5230 as type II/III.
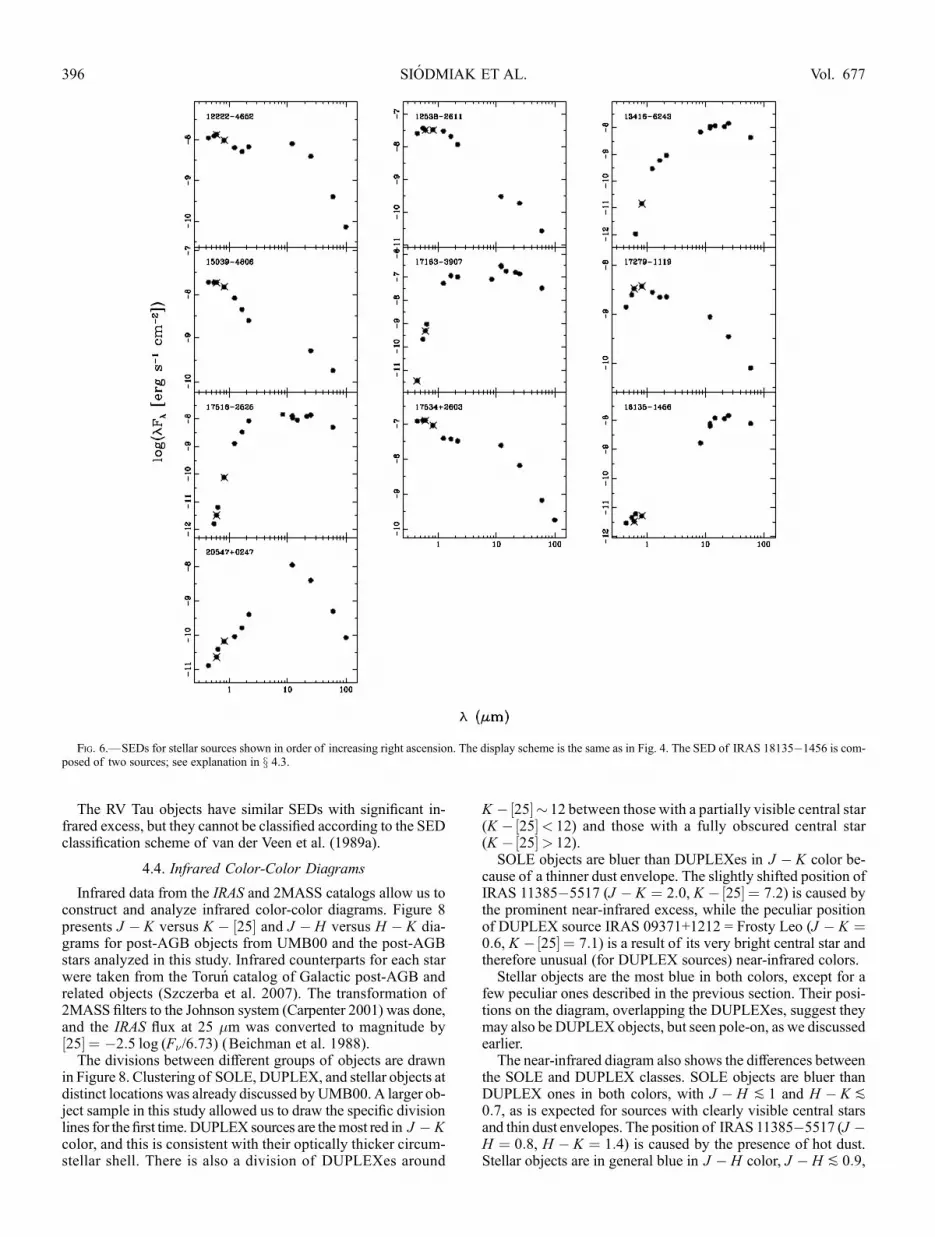
Stellar sources show various kinds of SEDs. The nonYRVTausources can be divided into two groups. IRAS 12222�4652, IRAS12538�2611, IRAS 17279�1119, and IRAS 17534+2603 haverelatively flat optical/near-infrared spectra decreasing in the far-infrared. One may see some resemblance of their SEDs to theSED of SOLE object IRAS 11385�5517. This indicates that thesesources are actually SOLE objects without nebulosities, and hence
are viewed pole-on, are too distant, and/or are too compact for theshell to be resolved. IRAS 15039�4806 may also belong to thiscategory, but its SED is much steeper in the mid-infrared. The sec-ond group consists of IRAS 13416�6243, IRAS 17163�3907,IRAS 17516�2525, and IRAS 20547+0247, with a steep, risingnear/mid-infrared spectrum and prominent but flat far-infraredpart. They look similar to the SEDs of DUPLEXes, which maysuggest that they are indeed DUPLEX sources. However, we donot see any apparent presence of a circumstellar envelope/disk onHST images. The lack of visible nebulositiesmay be caused by anorientation effect, as the sourceswith possible tori around them areviewed almost pole-on. Dust scattering is typically anisotropic,and directions of scattering almost perpendicular to the directionof incident photons are less probable (e.g., Draine 2003). There-fore, pole-on DUPLEX sources may not show obvious nebulosi-ties. Those objects may also be too compact and/or too distant tobe resolved and hence appear as stellar sources. In fact, IRAS13416�6243 is known to have a dusty envelope, and IRAS20547+0247 is suspected to have a dusty thick disk around a central starseen edge-on (see previous sections). The SED of IRAS 17516�2525 is similar to those of the DUPLEX objects, but it is con-structed from the combined magnitudes of two stars unresolved upto now, and the contribution from each star cannot be separated.The SED of IRAS 18135�1458 may also appear similar to
the typical one for DUPLEXes. However, while investigating thisobject we found that two distinct sources separated by �500 wereidentified as this object. One is weakly visible at optical wave-lengths with no infrared counterpart and observedwith HST. Theother is detected only in the far-infrared. The latter is most likelythe correct IRAS source (also confirmed by MSX observations)and genuine post-AGB object. The SED for this object shown inFigure 6 is then the composition of measurements of two differ-ent objects, and further observation should be undertaken to char-acterize the optical property of this post-AGB object.
TABLE 5—Continued
IRAS ID Prop. ID SED Typea TeAb Mass C/O
b
(deg) References
RV Tau Stars
06034+1354................................................ 10627 N/A 5900 <0.55 O �3.42 5, 32
09256�6324 ............................................... 10627 N/A 6700 <0.55 C �9.24 5, 32
12067�4508 ............................................... 10627 N/A 6000 <0.55 O 16.82 5, 32
15469�5311................................................ 10627 N/A 7500 <0.55 O 0.63 5, 32
17243�4348 ............................................... 10627 N/A 6750 0.94 O �4.99 5, 32
19125+0343 ............................................... 10627 N/A 7750 0.58 O �3.49 5, 32
19157�0247 ............................................... 10627 N/A 7750 0.58 O �7.23 5, 32
20117+1634 ................................................ 10627 N/A 5000 0.93 O �9.76 5, 32
R CrB Stars
15465+2818................................................ 6364 N/A 6705 0.66 C 50.98 16, 32, 38
Note.—All objects are included in the Torun catalog of Galactic post-AGB and related objects (Szczerba et al. 2007).a Type of SED according to van der Veen et al. (1989a). SEDs that cannot be classified are marked ‘‘N/A.’’b Spectral type is shown if TeA is not known from the model atmosphere analysis.References.— (1) Barnbaum et al. 1996; (2) Castro-Carrizo et al. 2002; (3) Cernicharo et al. 2001; (4) Cohen et al. 2004; (5) De Ruyter et al. 2006;
(6) Engels 2002; (7) Gauba & Parthasarathy 2004; (8) Geballe et al. 2005; (9) Gledhill et al. 2001; (10) Gledhill & Yates 2003; (11) Gledhill 2005; (12) Honyet al. 2003; (13) Hrivnak et al. 2000b; (14) Kwok et al. 2000; (15) Kwok et al. 2002; (16) Meixner et al. 1999; (17) Meixner et al. 2004; (18) Nyman et al.1998; (19) Olofsson & Nyman 1999; (20) Reyniers et al. 2004; (21) Sahai et al. 1998; (22) Sahai 1999; (23) Sahai et al. 1999a; (24) Sahai et al. 1999b;(25) Sahai et al. 2000; (26) Sahai et al. 2003; (27) Sahai 2004; (28) Sahai et al. 2005; (29) Sahai et al. 2006; (30) Sanchez Contreras et al. 2002; (31) Sarkar &Sahai 2006; (32) Stasinska et al. 2006; (33) Su et al. 1998; (34) Su et al. 2001; (35) Su et al. 2003; (36) Szczerba et al. 2003; (37) Trammell & Goodrich 2002;(38) Ueta et al. 2000; (39) Ueta et al. 2001; (40) Ueta et al. 2005; (41) Van de Steene et al. 2000; (42) Van de Steene & van Hoof 2003; (43) van der Veen et al.1989a; (44) van der Veen et al. 1989b; (45) Van Winckel 1997; (46) VanWinckel & Reyniers 2000; (47) Volk et al. 2002; (48) Volk et al. 2004; (49) Volk et al.2006; (50) Waters et al. 1993.
SIODMIAK ET AL.394

Fig. 4.—SEDs for SOLE objects shown in order of increasing right ascension. Values are taken from theGSC2.2, 2MASS,MSX6C, and IRAS catalogs.MeasuredHSTmagnitudes are shown as crossed symbols.
Fig. 5.—SEDs for DUPLEX objects shown in order of increasing right ascension. The display scheme is the same as in Fig. 4.
The RV Tau objects have similar SEDs with significant in-frared excess, but they cannot be classified according to the SEDclassification scheme of van der Veen et al. (1989a).
4.4. Infrared Color-Color Diagrams
Infrared data from the IRAS and 2MASS catalogs allow us toconstruct and analyze infrared color-color diagrams. Figure 8presents J � K versus K � ½25� and J � H versus H � K dia-grams for post-AGB objects from UMB00 and the post-AGBstars analyzed in this study. Infrared counterparts for each starwere taken from the Torun catalog of Galactic post-AGB andrelated objects (Szczerba et al. 2007). The transformation of2MASS filters to the Johnson system (Carpenter 2001) was done,and the IRAS flux at 25 �m was converted to magnitude by½25� ¼ �2:5 log (F�/6:73) (Beichman et al. 1988).
The divisions between different groups of objects are drawnin Figure 8. Clustering of SOLE, DUPLEX, and stellar objects atdistinct locations was already discussed byUMB00. A larger ob-ject sample in this study allowed us to draw the specific divisionlines for the first time. DUPLEX sources are themost red in J � Kcolor, and this is consistent with their optically thicker circum-stellar shell. There is also a division of DUPLEXes around
K �½25�� 12 between those with a partially visible central star(K �½25�< 12) and those with a fully obscured central star(K �½25�> 12).SOLE objects are bluer than DUPLEXes in J � K color be-
cause of a thinner dust envelope. The slightly shifted position ofIRAS 11385�5517 (J � K ¼ 2:0, K �½25� ¼ 7:2) is caused bythe prominent near-infrared excess, while the peculiar positionof DUPLEX source IRAS 09371+1212 = Frosty Leo (J � K ¼0:6, K �½25� ¼ 7:1) is a result of its very bright central star andtherefore unusual (for DUPLEX sources) near-infrared colors.Stellar objects are the most blue in both colors, except for a
few peculiar ones described in the previous section. Their posi-tions on the diagram, overlapping the DUPLEXes, suggest theymay also be DUPLEX objects, but seen pole-on, as we discussedearlier.The near-infrared diagram also shows the differences between
the SOLE and DUPLEX classes. SOLE objects are bluer thanDUPLEX ones in both colors, with J � H P 1 and H � K P0:7, as is expected for sources with clearly visible central starsand thin dust envelopes. The position of IRAS 11385�5517 (J �H ¼ 0:8, H � K ¼ 1:4) is caused by the presence of hot dust.Stellar objects are in general blue in J � H color, J � H P 0:9,
Fig. 6.—SEDs for stellar sources shown in order of increasing right ascension. The display scheme is the same as in Fig. 4. The SED of IRAS 18135�1456 is com-posed of two sources; see explanation in x 4.3.
SIODMIAK ET AL.396 Vol. 677

similar to SOLE sources, but redder in H � K color, H � K k0:7, more like DUPLEX objects. It may also be a result of hotdust very close to the star, as in the case of 89 Her. Again, fourstellar objects discussed in x 4.3 are found among DUPLEXes,suggesting that they may be DUPLEX objects for which we didnot detect the nebulae because of the orientation effect.
The differences in infrared colors betweenmorphological classesare clearly visible, and our conclusions follow and complement theresults of UMB00. The study of Van de Steene et al. (2000) did not
recognize the infrared color difference; however, there is a littleoverlap between their objects and ours. This is probably causedby selection. Their objects are selected based on IRAS colors.They are bright in the infrared and located close to the Galacticplane, so they are biased toward more massive objects. Some ofthemmay not be post-AGB objects; e.g., IRAS 15154�5258 is a[WR] PN.
We also analyzed the IRAS color-color diagram for the objectsfrom our study. The diagram is presented in Figure 9, and the
Fig. 7.—SEDs for RV Tau objects shown in order of increasing right ascension. The display scheme is the same as in Fig. 4.
Fig. 8.—Infrared color-color diagrams for post-AGB objects from Table 5. Dashed lines separate the parts of the diagrams occupied by different groups of objects.
HST IMAGES OF POST-AGB OBJECTS 397No. 1, 2008

regions defined by van der Veen et al. (1989a) are drawn. The dif-ferences between the morphological classes are also clearly seen.SOLE and DUPLEX objects have similar ½12�� ½25� colors (typ-ical for evolved objects, located in regions IV, V, and redder),but they differ in ½25�� ½60� color, with SOLEs being bluer andDUPLEXes being redder, indicating colder dust in DUPLEXsources. Stellar objects are bluer in both colors and located in re-gions characteristic of less-evolved objects (regions III and VII).Four peculiar stellar objects described in the previous sections aspossible DUPLEX sources but seen pole-on are redder in ½25� �½60� color than other stellar sources and located in regions VIb andIV, which are indeed occupied by DUPLEXes. The position ofSOLE object IRAS 11385�5517 (in regionVIII) is due to its colddust. The F12 for Frosty Leo is not certain (the quality of IRASmeasurement is poor), but regardless, the object is very red in½25�� ½60� color (2.97) and is located outside the presented dia-gram. LargeF60 excessmeans that the object has a detached shellcomposed of cold matter or a reservoir of cold matter around thecentral star.
4.5. Galactic Distribution
The Galactic distribution of all post-AGB objects from Table 5is shown in Figure 10. DUPLEX sources are closer to the Galac-tic plane,while SOLEs are usually further from theGalactic plane.The mean Galactic latitude for DUPLEXes is bDUPLEX ¼ 2:35�
with a standard deviation of 10.03 (however, without the pecu-liar Frosty Leo, bDUPLEX ¼ 1:52� and the standard deviation is4.92�); for SOLEs, it is bSOLE ¼ 2:58� with a standard deviationof 11.23. Previous studies of PNs (Corradi & Schwarz 1995) sug-gested that because of their position close to the Galactic plane,bipolar PNs have evolved from more massive progenitors thanelliptical PNs. Following those findings, UMB00 suggested thatDUPLEX objects have more massive progenitors than SOLE ob-jects and will evolve into bipolar PNs, while SOLEs will form el-liptical PNs. However, the masses of DUPLEX objects and ofsome SOLE objects are not known, and this suggestion cannot
be fully confirmed. The distribution of stellar objects is quite wide,with a mean Galactic latitude of bstellar ¼ 2:94� and a standard de-viation of 18.07. Some of them, like IRAS 13416�6243, lie veryclose to the Galactic plane, again suggesting that theymay in factbe DUPLEX sources. On the other hand, stellar post-AGB ob-jects far from the Galactic plane most likely originate from low-mass progenitors and may not become PNs.
4.6. Do SOLE and DUPLEX SourcesHave Different Progenitors?
Based on previous studies of PNs and findings from observa-tions of PPNs, UMB00 suggested that SOLE and DUPLEX ob-jects have different AGB progenitors with low and high masses,respectively. More massive objects will have more material intheir circumstellar shells, and the starwill be quite obscured, whileit will not be in the case of objects with less material in the en-velope. Sources with dusty shells will therefore be fainter at op-tical wavelengths but brighter in the infrared. This was alreadyshown on the color-color diagrams in Figure 8,with SOLEobjectsbeing bluer than DUPLEX ones. Knowing the masses of post-AGB objects would be the best tool to confirm this dichotomy.Derived physical parameters for 125 PPNs (with references) weregathered from the literature by Stasinska et al. (2006). Unfortu-nately, there is no information for DUPLEX objects because ofthe lack of optical spectra from which those parameters can beobtained. Themeanmass for SOLEs from this study is�0.6M� ,but they can be either very massive (e.g., IRAS 17436+5003 orIRAS 07134+1005 from UMB00, with a mass of M > 0:8M�)or very ‘‘light’’ (e.g., IRAS 08143�4406 from this study, with amass below 0.55M�). One also has to keep in mind the errors onthe derived central star masses due to the uncertainties in effec-tive temperature and gravity with mean values of �TeA ¼ 350 Kand �log g ¼ 0:3 dex (for some objects the uncertainties arelarge, and hence the range of possible masses is big). The stel-lar objects in our sample are mostly of low mass, but there aresome exceptions as well (e.g., IRAS 20117+1634, with a massof �0.9M�). Figure 11 shows the distribution of masses of SOLE
Fig. 9.— IRAS color-color diagram for post-AGB objects from Table 5 withregions defined by van der Veen et al. (1989a).
Fig. 10.—Galactic distribution of post-AGB objects from Table 5.
SIODMIAK ET AL.398 Vol. 677

and stellar objects from Table 5 (the masses of DUPLEXes arenot known and cannot be drawn on the diagram). Masses of stellarobjects are in general lower than masses of SOLEs, especiallywhenwe do not consider RVTau stars (Fig. 11, open histograms).
We also searched for a connection between different morpho-logical groups and the chemistry of PPNs. In the sample of morethan 50 objects from this study and UMB00 we have 12 C-richand 9 O-rich SOLE objects and 7 C-rich and 6 O-rich DUPLEXobjects. We see no obvious correlation between their chemistryand PPN morphology. However, different Galactic distributionsof SOLEs and DUPLEXes and therefore possibly differencesin mass progenitors may also suggest the division of chemicalcomposition. The low-mass objects do not experience the thirddredge-up and evolve all the time as oxygen-rich sources. Moremassive objects experience thermal pulses, and their composi-tion undergoes significant changes, especially in carbon abun-dance, so they are expected to be carbon-rich. If DUPLEXes areindeed more massive, they should be rather C-rich, and SOLEsshould be rather O-rich if they indeed have small masses. How-ever, chemical composition depends on metallicity (e.g., Marigoet al. 1999), and stars of equal masses and different metallicitiescan have different chemical abundances. Therefore, simple chem-ical division in the context of masses of stars is not possible.Since we find both O- and C-rich chemistry in both SOLEs andDUPLEXes in our sample, finding themassiveness of DUPLEXesrelative to SOLEs based on shell chemistry is not possible. How-ever, after examining ISO, IRAS, andVISIR spectra (Szczerba et al.2007)4we do find that all DUPLEXeswith the 9.8�mfeature showit in absorption, while all SOLEs with the 9.8 �m feature show it inemission. This finding may indicate that DUPLEXes tend to beoptically thicker than SOLEs, suggesting the more massive natureof DUPLEXes with respect to SOLEs. While it is an intriguing
trend, it is nevertheless based on small number statistics (onlythree SOLEs: IRAS 11385�5517, IRAS 12175�5338, and IRAS18095+2704; and four DUPLEXes: IRAS 08005�2356, IRAS10197�5750, IRAS 17150�3224, and IRAS 23541+7031).Thus, more observations are needed to verify this. Most of thestellar sources in our sample are oxygen-rich (15 O-rich and5 C-rich), and we see no correlation between their chemicalcomposition and morphology and/or masses. Thus, it cannot besaid that the chemistry of the central star is a key leading to thedifferences between groups of post-AGB objects.
UMB00 found an almost equal number of SOLE andDUPLEXobjects, 11 and 9, respectively (the 10th DUPLEX source in theirsample, IRAS 09452+1330, is an AGB star), while in our samplethere are 9 SOLE and only 4 DUPLEX post-AGBs. The reasonsfor this are the selection criteria. The UMB00 sample focusedmostly on sources for which evidence for spatial extension ex-isted. Our objects were selected to complement the existing im-ages of PPNs and to cover more diverse properties of stars. Mostof them were already studied previously, hence we know theirmagnitudes, temperatures, and chemistry. And usually they arequite bright; there are not many faint objects in our sample. Thisselection was also caused by the requirements of the snapshotsurvey preferring brighter stars with shorter observation times.All this contributed to the lack of DUPLEX objects, which areusually very faint (V � 15:4 in our sample).
5. CONCLUSIONS
We analyzed the HST images of 33 post-AGB objects. Weincreased the number of observed PPNs and covered a wider va-riety of them. Following the previous results of UMB00 we se-lected SOLE and DUPLEX sources based on their morphology.Our results are consistent with UMB00, and therefore strengthenthe validity of the general PPN structure suggested by UMB00,in which an intrinsically axisymmetric shell assumes a differentmorphology mainly due to the varying degree of the equatorialdensity enhancement which determines the presence of the dustlane in DUPLEXes and the absence of it in SOLEs. We selecteda separate group of stellar post-AGB objects without visible neb-ulosities. We searched for connections between the morphologyof the nebulosities and the chemical and physical properties oftheir central stars and did not find any obvious connection. Weconfirmed the results of UMB00 that SOLE objects with thin en-velopes are bluer than dusty DUPLEX sources. We also sug-gested that some of the stellar sources may be objects with anebulosity around the central star, but they are seen pole-on and/orare too faint and distant to be resolved. We also found differencesin the Galactic distribution of different groups, with SOLEs lyingfarther from the Galactic plane than DUPLEXes, which couldsuggest that DUPLEX objects may have more massive progeni-tors. However, we were not able to confirm this suggestion di-rectly because the masses of DUPLEXes and some SOLEs arenot known.
N. S. and M. M. acknowledge support from NASA/NAG5-12595, NASA/STScI GO-10627.01, and NASA/STScI GO-09377.05. N. S. also acknowledges support from grant N2030661 33 of the Science and High EducationMinistry of Poland.T. U. acknowledges support from STScI GO-10627.01. R. S.acknowledges support from grant N203 019 31/2874 of the Sci-ence and High Education Ministry of Poland.
Fig. 11.—Mass histogram for SOLEs and stellar objects from Table 5. Theleftmost bar shows all objects with masses below 0.55M�. In the bottom panel,open histograms correspond to RV Tau and R CrB stars.
4 See also http://www.ncac.torun.pl /postagb and http://archive.eso.org /.
HST IMAGES OF POST-AGB OBJECTS 399No. 1, 2008

REFERENCES
Balick, B., & Frank, A. 2002, ARA&A, 40, 439Barnbaum, C., Omont, A., & Morris, M. 1996, A&A, 310, 259Beichman, C. A., Neugebauer, G., Habing, H. J., Clegg, P. E., & Chester, T. J.1988, Infrared Astronomical Satellite (IRAS ) Catalogs and Atlases, Volume 1:Explanatory Supplement (Pasadena: Caltech)
Blocker, T. 1995, A&A, 299, 755Carpenter, J. M. 2001, AJ, 121, 2851Castro-Carrizo, A., Bujarrabal, V., Sanchez Contreras, C., Alcolea, J., & Neri, R.2002, A&A, 386, 633
Cernicharo, J., Heras, A. M., Tielens, A. G. G. M., Pardo, J. R., Herpin, F.,Guelin, M., & Waters, L. B. F. M. 2001, ApJ, 546, L123
Cohen, M., Van Winckel, H., Bond, H. E., & Gull, T. R. 2004, AJ, 127, 2362Corradi, R. L. M., & Schwarz, H. E. 1995, A&A, 293, 871De Ruyter, S., Van Winckel, H., Maas, T., Lloyd Evans, T., Waters, L. B. F. M.,& Dejonghe, H. 2006, A&A, 448, 641
Draine, B. T. 2003, ApJ, 598, 1017Engels, D. 2002, A&A, 388, 252Fong, D., Meixner, M., Sutton, E. C., Zalucha, A., & Welch, W. J. 2006, ApJ,652, 1626
Garcıa-Lario, P., Manchado, A., Pych, W., & Pottasch, S. R. 1997, A&AS, 126,479
Gauba, G., & Parthasarathy, M. 2004, A&A, 417, 201Geballe, T. R., Barnbaum, C., Noll, K. S., & Morris, M. 2005, ApJ, 624, 983Gledhill, T. M. 2005, MNRAS, 356, 883Gledhill, T. M., Chrysostomou, A., Hough, J. H., & Yates, J. A. 2001, MNRAS,322, 321
Gledhill, T. M., & Yates, J. A. 2003, MNRAS, 343, 880Gonzaga, S., et al. 2005, ACS Instrument Handbook, ver. 6.0 (Baltimore: STScI )Gonzalez, G., Lambert, D. L., & Giridhar, S. 1997, ApJ, 479, 427Hony, S., Tielens, A. G. G. M., Waters, L. B. F. M., & de Koter, A. 2003, A&A,402, 211
Hrivnak, B. J., Kwok, S., & Su, K. Y. L. 2000a, in ASP Conf. Ser. 199,Asymmetrical Planetary Nebulae II: FromOrigins toMicrostructures, ed. J. H.Kastner, N. Soker, & S. Rappaport (San Francisco: ASP), 155
———. 2001, AJ, 121, 2775Hrivnak, B. J., Volk, K., & Kwok, S. 2000b, ApJ, 535, 275Hu, J. Y., Slijkhuis, S., de Jong, T., & Jiang, B. W. 1993, A&AS, 100, 413Iben, I., Jr., Kaler, J. B., Truran, J. W., & Renzini, A. 1983, ApJ, 264, 605Jura, M. 1986, ApJ, 309, 732Krist, J., & Hook, R. 2004, The Tiny Tim User’s Guide, ver. 6.3 (Baltimore:STScI )
Kwok, S. 1993, ARA&A, 31, 63Kwok, S., Hrivnak, B. J., & Su, K. Y. L. 2000, ApJ, 544, L149Kwok, S., Volk, K., & Hrivnak, B. J. 2002, ApJ, 573, 720Laidler, V., et al. 2005, Synphot User’s Guide, ver. 5.0 (Baltimore: STScI )Lawlor, T. M., & MacDonald, J. 2003, ApJ, 583, 913Maas, T., Van Winckel, H., & Lloyd Evans, T. 2005, A&A, 429, 297Marigo, P., Girardi, L., & Bressan, A. 1999, A&A, 344, 123Mauron, N., & Huggins, P. J. 2006, A&A, 452, 257Meixner, M., Ueta, T., Bobrowsky, M., & Speck, A. 2002, ApJ, 571, 936Meixner, M., Zalucha, A., Ueta, T., Fong, D., & Justtanont, K. 2004, ApJ, 614,371
Meixner, M., et al. 1999, ApJS, 122, 221Nyman, L.-8., Hall, P. J., & Olofsson, H. 1998, A&AS, 127, 185Olofsson, H. 2001, in ASP Conf. Ser. 235, Science with the Atacama LargeMillimeter Array, ed. A. Wootten (San Francisco: ASP), 355
Olofsson, H., & Nyman, L.-8. 1999, A&A, 347, 194Reddy, B. E., Bakker, E. J., & Hrivnak, B. J. 1999, ApJ, 524, 831Renzini, A. 1979, in Stars and Star Systems, ed. B. E. Westerlund (Dordrecht:Reidel ), 155
Reyniers, M., Van Winckel, H., Gallino, R., & Straniero, O. 2004, A&A, 417,269
Sahai, R. 1999, ApJ, 524, L125———. 2004, in ASP Conf. Ser. 2004, Asymmetrical Planetary Nebulae III:Winds, Structure and the Thunderbird, ed. M. Meixner et al. (San Francisco:ASP), 141
Sahai, R., Bujarrabal, V., Castro-Carrizo, A., & Zijlstra, A. 2000, A&A, 360,L9
Sahai, R., Morris, M., Sanchez Contreras, C., & Claussen, M. 2007, AJ, 134,2200
Sahai, R., Sanchez Contreras, C., & Morris, M. 2005, ApJ, 620, 948Sahai, R., te Lintel Hekkert, P., Morris, M., Zijlstra, A., & Likkel, L. 1999a,ApJ, 514, L115
Sahai, R., Young, K., Patel, N. A., Sanchez Contreras, C., & Morris, M. 2006,ApJ, 653, 1241
Sahai, R., Zijlstra, A., Bujarrabal, V., & te Lintel Hekkert, P. 1999b, AJ, 117,1408
Sahai, R., Zijlstra, A., Sanchez Contreras, C., & Morris, M. 2003, ApJ, 586,L81
Sahai, R., et al. 1998, ApJ, 493, 301Sanchez Contreras, C., Sahai, R., & Gil de Paz, A. 2002, ApJ, 578, 269Sarkar, G., & Sahai, R. 2006, ApJ, 644, 1171Schonberner, D., & Blocker, T. 1993, in Luminous High-Latitude Stars, ed. D.D. Sasselov (San Francisco: ASP), 337
Sirianni, M., et al. 2005, PASP, 117, 1049Stasinska, G., Szczerba, R., Schmidt, M., & Siodmiak, N. 2006, A&A, 450,701
Su, K. Y. L., Hrivnak, B. J., & Kwok, S. 2001, AJ, 122, 1525Su, K. Y. L., Hrivnak, B. J., Kwok, S., & Sahai, R. 2003, AJ, 126, 848Su, K. Y. L., Volk, K., Kwok, S., & Hrivnak, B. J. 1998, ApJ, 508, 744Szczerba, R., Siodmiak, N., Stasinska, G., & Borkowski, J. 2007, A&A, 469,799
Szczerba, R., Stasinska, G., Siodmiak, N., & Gorny, S. K. 2003, in Exploitingthe ISO Data Archive: Infrared Astronomy in the Internet Age, ed. C. Gry et al.(ESA SP-511; Noordwijk: ESA), 149
Trammell, S. R., & Goodrich, R. W. 1998, BAAS, 30, 1273———. 2002, ApJ, 579, 688Ueta, T., Fong, D., & Meixner, M. 2001, ApJ, 557, L117Ueta, T., Meixner, M., & Bobrowsky, M. 2000, ApJ, 528, 861 (UMB00)Ueta, T., Murakawa, K., & Meixner, M. 2005, AJ, 129, 1625van der Veen, W. E. C. J., Habing, H. J., & Geballe, T. R. 1989a, A&A, 226,108
van der Veen, W. E. C. J., Habing, H. J., van Langevelde, H. J., & Geballe, T. R.1989b, A&A, 216, L1
Van de Steene, G. C., & van Hoof, P. A. M. 2003, A&A, 406, 773Van de Steene, G. C., van Hoof, P. A. M., & Wood, P. R. 2000, A&A, 362, 984Van Winckel, H. 1997, A&A, 319, 561———. 2003, ARA&A, 41, 391Van Winckel, H., & Reyniers, M. 2000, A&A, 354, 135Van Winckel, H., Waelkens, C., & Waters, L. B. F. M. 2000, in IAU Symp. 177,The Carbon Star Phenomenon, ed. R. F. Wing (Dordrecht: Kluwer), 285
Volk, K., Hrivnak, B. J., & Kwok, S. 2004, ApJ, 616, 1181Volk, K., Hrivnak, B. J., Su, K. Y. L., & Kwok, S. 2006, ApJ, 651, 294Volk, K., Kwok, S., & Hrivnak, B. J. 1999, ApJ, 516, L99Volk, K., Kwok, S., Hrivnak, B. J., & Szczerba, R. 2002, ApJ, 567, 412Waelkens, C., & Waters, L. B. M. F. 2004, in Asymptotic Giant Branch Stars,ed. H. J. Habing & H. Olofsson (Berlin: Springer), 519
Waters, L. B. F. M., Waelkens, C., Mayor, M., & Trams, N. R. 1993, A&A,269, 242
Woods, P. M., Millar, T. J., Herbst, E., & Zijlstra, A. A. 2003a, A&A, 402, 189Woods, P. M., Schoier, F. L., Nyman, L.-8., & Olofsson, H. 2003b, A&A, 402,617
SIODMIAK ET AL.400