hubble space telescope snapshot survey of 3cr quasars: the data
TRANSCRIPT

THE ASTROPHYSICAL JOURNAL SUPPLEMENT SERIES, 123 :351È376, 1999 August1999. The American Astronomical Society. All rights reserved. Printed in U.S.A.(
HUBBL E SPACE T EL ESCOPE SNAPSHOT SURVEY OF 3CR QUASARS: THE DATA1MATTHEW D. LEHNERT,2,3 GEORGE K. MILEY,2 WILLIAM B. SPARKS,4 STEFI A. BAUM,4 JOHN BIRETTA,4DANIEL GOLOMBEK,4 SIGRID DE KOFF,2,4 FERDINANDO D. MACCHETTO,4,5 AND PATRICK J. MCCARTHY6
Received 1997 May 5; accepted 1999 March 26
ABSTRACTWe present images taken with the Wide Field Planetary Camera (WFPC-2) on the Hubble Space
Telescope (HST ) of 43 quasars selected from the 3CR radio catalog. The redshift range of the targets isallows us to probe the nature of quasar hosts from about 20% to 80% of thelargeÈ0.3[ z[ 2Èand
age of the universe. These data were taken in the course of a large program that imaged 267 3CR radiogalaxies and quasars using the HST in ““ snapshot ÏÏ mode. Each quasar was centered on the PlanetaryCamera (PC1) and was imaged through the F702W Ðlter (bandpass similar to Cousins R). Typical inte-gration times were 5 and 10 minutes. For each quasar, we attempted to judge the contribution of thehost galaxy to the total light from the quasar in two ways. The Ðrst method was to compare the radiallight distributions of the quasars with that of both model point spread function and an empirical PSFconstructed by summing individual observations of standard stars. Second, to provide morphologicalinformation we attempted to remove the contribution of the quasar nucleus from the extended emissionby subtracting a point spread function constructed from observations of standard stars. This secondmethod proved to be more sensitive in detecting marginally extended emission.
Our analysis suggests that the quasar fuzz contributes from less than 5% to nearly 100% in the mostextreme case (about 20% being typical) of the total light from the quasar, with 16 of the quasars (D40%)being unresolved according to the analysis of their light proÐles (with only 7 being considered unresolveddetermined by PSF subtraction of the quasar images). The magnitudes of the hosts range from about 18to more than 21 in the F702W Ðlter and the sizes are typically 1AÈ2A at a limiting surface brightness of
arcsec~2. Comparisons with the few ground-based images that are available of theseD21È22mF702Wsources suggest good overall morphological agreement with the HST images. The resolution of the0A.1HST PC combination reveals a wide variety of structures in the host galaxies of these quasars. Most ofthe host galaxies show twisted, asymmetric, or distorted isophotes. About 1/4 of the quasar hosts haveclose (within a few arcseconds) companions seen in projection and about 1/10 show obvious signs oftidal interactions with a close companion. Finally, using radio images available from the literature, weÐnd that in many of the resolved sources there is a correspondence between the radio and optical mor-phologies. We Ðnd that these sources exhibit a tendency for the principal axes of the radio and opticalemission to align similar but perhaps weaker than that observed for radio galaxies. This correspondencealso suggests that our methodology for removing the point source contribution from the resolved emis-sion is sound. A more complete analysis of these data and new HST snapshot data will be presented insubsequent papers.Subject headings : galaxies : structure È quasars : general È surveys
1. INTRODUCTION
Observations of radio-loud quasars are important forinvestigating some of the most interesting and fundamentalproblems of contemporary astrophysics. The foremost ofthese is the investigation of causes of the ““ extinction ÏÏ ofluminous quasars. The space density of luminous quasarshas declined by about 3 orders of magnitude from the epochz\ 2È3 to the present (e.g., Hartwick & Schade 1989). Whatprocesses led to the such a dramatic decrease in comovingspace density? Are these processes related to their galacticand/or cluster scale environments? The answers to these
1 Based on observations with the NASA/ESA Hubble Space Telescope,obtained at the Space Telescope Science Institute, which is operated by theAssociation of Universities for Research in Astronomy, Inc., under NASAcontract NAS5-26555.
2 Sterrewacht Leiden, Postbus 9513, 2300 RA Leiden, The Netherlands.3 Current address : Max-Planck-Institut extraterrestrische Physikfu� r
(MPE), Postfach 1603, D-85740 Garching, Germany, mlehnert=mpe.mpg.de.
4 STScI, 3700 San Martin Drive, Baltimore, MD 21218.5 Affiliated with the Space Science Department, ESA.6 Observatories of the Carnegie Institution, Pasadena, CA.
questions will be important in furthering our understandinggalaxy evolution.
Studies of the environments of quasars can also provideinsight into the active galactic nucleus (AGN) phenomenonin general. Of contemporary interest is the relationshipbetween quasars and radio galaxies. A variety of schemeshave been proposed to link quasars and radio galaxiesthrough di†erences in their environments, viewing angle, orevolutionary state (e.g., Norman & Miley 1984 ; Barthel1989 ; Ne† & Hutchings 1990). In particular, the ““ viewingangle ÏÏ scheme of Barthel (in which radio-loud quasars andradio galaxies are drawn from the same parent populationbut viewed preferentially at small or large angles, respec-tively, to the radio axis) predicts that the luminosity andcolor of the quasar fuzz should be identical to those of theradio galaxies at similar radio powers and redshifts (as dosome of the evolutionary uniÐcation schemes). Also, radiogalaxies at high redshifts exhibit the ““ alignment(zZ 0.6)e†ect ÏÏ (McCarthy et al. 1987 ; Chambers, Miley, & vanBreugel 1987), namely that the radio, and the rest-frame UVand optical axes are all roughly colinear. If indeed quasarsand radio galaxies are objects di†erentiated only by viewing
351

352 LEHNERT ET AL.
TABLE 1
OBSERVATION LOG FOR 3CR QUASARS
3CR N Integration Date 3CR N Integration Date(1) (2) (3) (4) (1) (2) (3) (4)
9.0 4 140 1994 May 22 249.1 2 140 1994 Apr 1614.0 2 300 1994 Jun 20 254.0 2 140 1995 Jan 1943.0 2 300 1994 Jul 19 263.0 2 140 1994 Mar 2747.0 2 140 1995 Jan 17 268.4 4 140 1994 Mar 2668.1 2 300 1994 Aug 17 270.1 2 300 1994 Dec 1493.0 2 140 1994 Feb 15 277.1 2 140 1994 Dec 01138.0 1 140 1994 Nov 10 279.0 2 300 1994 Feb 23147.0 2 140 1994 Apr 27 280.1 2 300 1994 May 01154.0 2 140 1994 Mar 18 287.0 4 140 1994 Mar 05175.0 2 140 1995 May 03 288.1 2 140 1994 Apr 06179.0 2 300 1994 Apr 16 298.0 4 140 1994 Jul 15181.0 2 300 1994 Apr 06 309.1 2 140 1994 Jun 21186.0 4 140 1994 Mar 09 334.0 2 140 1995 Jan 23190.0 2 300 1994 Apr 17 343.0 1 300 1995 Jan 11191.0 2 300 1994 Mar 18 351.0 2 140 1994 Jul 25204.0 4 140 1994 Feb 16 380.0 2 140 1994 Sep 14205.0 4 140 1994 Apr 18 418.0 2 300 1994 Jun 20207.0 2 140 1994 Jun 08 432.0 4 140 1994 Jul 21208.0 4 140 1994 Apr 04 454.0 4 140 1994 May 01215.0 2 140 1994 Apr 22 454.3 2 140 1994 Dec 13216.0 2 140 1995 May 11 455.0 1 300 1994 Aug 22220.2 2 300 1994 Dec 17
NOTES.ÈCol. (1) : 3CR source designation. Col. (2) : number of separate exposures each with theexposure time in listed in col. (3). The total integration time is given by multiplying cols. (2) and (3).Col. (3) : integration time in seconds per exposure. Col. (4) : date of observation. The two exposuresfor 3C 179.0 and 3C 279.0 were taken on di†erent dates. For 3C 179.0, the dates of the two exposureswere 1994 April 16 and 1995 May 16, for 3C 279.0, the dates are 1994 February 23 and 1995 May 20.
angle, then quasars might also be expected to exhibit suchan alignment e†ect over the same redshift range as the radiogalaxies.
Investigating the above problems with ground-baseddata has been hampered by the inability of separating mar-ginally extended ““ fuzz ÏÏ from the ““ blinding ÏÏ light of thequasar nucleus. But despite these difficulties, limited infor-mation about the properties of the host galaxies of quasarsspanning a range of redshifts and radio properties has beenobtained (see e.g., Hutchings, Crampton, & Campbell 1984 ;Smith et al. 1986 ; Stockton & MacKenty 1987 ; Veron-Cetty & Woltjer 1990 ; Heckman et al. 1991).
The Hubble Space Telescope (HST ) is well suited forinvestigating quasar host galaxies. Because of its highspatial resolution, imaging with the HST allows us toremove the contribution of the quasar nucleus and investi-gate the properties of the host galaxies on scales of 0.1 to afew kpc, depending on the redshift of the source. This wasone of the reasons that motivated us to undertake a““ snapshot survey ÏÏ of sources in the 3CR catalog. The““ snapshot ÏÏ mode of observing, in which gaps in theprimary HST schedule are Ðlled in with short integrationsof selected targets, greatly enhances the overall efficiency ofthe HST and is well suited to observing large samples ofobjects. The results presented here should be compared andcontrasted with recent HST results by other groups. Imagesof low/modest redshift quasars obtained with the WFPC-2on HST show a wide variety of host galaxy morphologiesincluding elliptical and spiral systems as well as highly dis-turbed, galaxies which may be interacting with and/or acc-reting close companions (Bahcall et al. 1995a, 1995b ;Disney et al. 1995 ; Hutchings & Morris 1995 ; Hooper,Impey, & Foltz 1997).
The 3CR data set allows the properties of matchedsamples of radio-loud quasars and radio galaxies to becompared and should ultimately allow us to investigate theproperties of ““ fuzz ÏÏ over a wide range of redshifts (0.3[
radio luminosities Wz[ 2), (log P178MHz D 1027È1029.3Hz~1) and radio types (e.g., lobe-dominated to core-dominated). Since low-frequency radio emission fromradio-loud AGNs is thought to be emitted isotropically, thelow-frequency selection of the 3CR (178 MHz) implies thatit is relatively unbiased by anisotropic emission (whether itis due to relativistic beaming, emission from an opticallythick accretion disk, or due to an obscuring torus), thus the3CR is particularly well suited for investigating the relation-ship between radio galaxies and quasars. Here we presentand describe the image analysis and data reduction for 43quasars from this ““ 3CR snapshot survey.ÏÏ Other papers inthis series have described the properties of the radio gal-axies (de Ko† et al. 1996 ; Baum et al. 1999 ; McCarthy et al.1997), and future work will compare matched samples ofradio galaxies and quasars over a wide range of redshifts.
2. SAMPLE SELECTION
To select objects for the snapshot survey, we used therevised 3CR sample as deÐned by Bennett (1962a, 1962b),having selection constraints of (i) Ñux density at 178 MHz,S(178)[ 9 Jy, (ii) declination greater than 5¡, and (iii)Galactic latitude, o b o[ 10¡. All of the sources have beenoptically identiÐed and have measured redshifts (Spinrad etal. 1985 ; Djorgovski et al. 1988). In this paper, we report onthe properties of the quasars observed during the snapshotsurvey of a total of 267 3CR sources. The classiÐcation ofthese sources as quasars are based on the compilations ofSpinrad et al. (1985) and Djorgovski et al. (1988). Of the
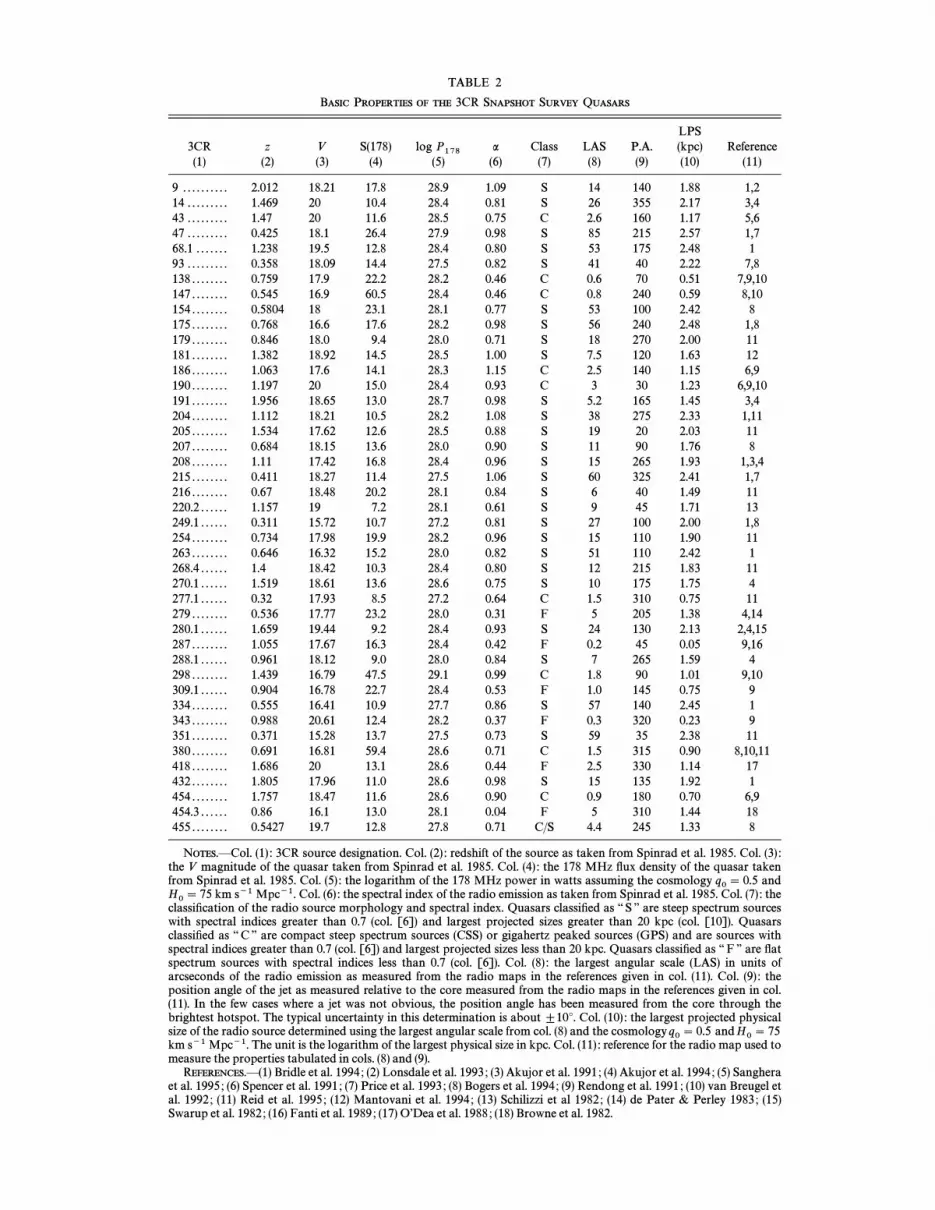
TABLE 2
BASIC PROPERTIES OF THE 3CR SNAPSHOT SURVEY QUASARS
LPS3CR z V S(178) log P178 a Class LAS P.A. (kpc) Reference(1) (2) (3) (4) (5) (6) (7) (8) (9) (10) (11)
9 . . . . . . . . . . 2.012 18.21 17.8 28.9 1.09 S 14 140 1.88 1,214 . . . . . . . . . 1.469 20 10.4 28.4 0.81 S 26 355 2.17 3,443 . . . . . . . . . 1.47 20 11.6 28.5 0.75 C 2.6 160 1.17 5,647 . . . . . . . . . 0.425 18.1 26.4 27.9 0.98 S 85 215 2.57 1,768.1 . . . . . . . 1.238 19.5 12.8 28.4 0.80 S 53 175 2.48 193 . . . . . . . . . 0.358 18.09 14.4 27.5 0.82 S 41 40 2.22 7,8138 . . . . . . . . 0.759 17.9 22.2 28.2 0.46 C 0.6 70 0.51 7,9,10147 . . . . . . . . 0.545 16.9 60.5 28.4 0.46 C 0.8 240 0.59 8,10154 . . . . . . . . 0.5804 18 23.1 28.1 0.77 S 53 100 2.42 8175 . . . . . . . . 0.768 16.6 17.6 28.2 0.98 S 56 240 2.48 1,8179 . . . . . . . . 0.846 18.0 9.4 28.0 0.71 S 18 270 2.00 11181 . . . . . . . . 1.382 18.92 14.5 28.5 1.00 S 7.5 120 1.63 12186 . . . . . . . . 1.063 17.6 14.1 28.3 1.15 C 2.5 140 1.15 6,9190 . . . . . . . . 1.197 20 15.0 28.4 0.93 C 3 30 1.23 6,9,10191 . . . . . . . . 1.956 18.65 13.0 28.7 0.98 S 5.2 165 1.45 3,4204 . . . . . . . . 1.112 18.21 10.5 28.2 1.08 S 38 275 2.33 1,11205 . . . . . . . . 1.534 17.62 12.6 28.5 0.88 S 19 20 2.03 11207 . . . . . . . . 0.684 18.15 13.6 28.0 0.90 S 11 90 1.76 8208 . . . . . . . . 1.11 17.42 16.8 28.4 0.96 S 15 265 1.93 1,3,4215 . . . . . . . . 0.411 18.27 11.4 27.5 1.06 S 60 325 2.41 1,7216 . . . . . . . . 0.67 18.48 20.2 28.1 0.84 S 6 40 1.49 11220.2 . . . . . . 1.157 19 7.2 28.1 0.61 S 9 45 1.71 13249.1 . . . . . . 0.311 15.72 10.7 27.2 0.81 S 27 100 2.00 1,8254 . . . . . . . . 0.734 17.98 19.9 28.2 0.96 S 15 110 1.90 11263 . . . . . . . . 0.646 16.32 15.2 28.0 0.82 S 51 110 2.42 1268.4 . . . . . . 1.4 18.42 10.3 28.4 0.80 S 12 215 1.83 11270.1 . . . . . . 1.519 18.61 13.6 28.6 0.75 S 10 175 1.75 4277.1 . . . . . . 0.32 17.93 8.5 27.2 0.64 C 1.5 310 0.75 11279 . . . . . . . . 0.536 17.77 23.2 28.0 0.31 F 5 205 1.38 4,14280.1 . . . . . . 1.659 19.44 9.2 28.4 0.93 S 24 130 2.13 2,4,15287 . . . . . . . . 1.055 17.67 16.3 28.4 0.42 F 0.2 45 0.05 9,16288.1 . . . . . . 0.961 18.12 9.0 28.0 0.84 S 7 265 1.59 4298 . . . . . . . . 1.439 16.79 47.5 29.1 0.99 C 1.8 90 1.01 9,10309.1 . . . . . . 0.904 16.78 22.7 28.4 0.53 F 1.0 145 0.75 9334 . . . . . . . . 0.555 16.41 10.9 27.7 0.86 S 57 140 2.45 1343 . . . . . . . . 0.988 20.61 12.4 28.2 0.37 F 0.3 320 0.23 9351 . . . . . . . . 0.371 15.28 13.7 27.5 0.73 S 59 35 2.38 11380 . . . . . . . . 0.691 16.81 59.4 28.6 0.71 C 1.5 315 0.90 8,10,11418 . . . . . . . . 1.686 20 13.1 28.6 0.44 F 2.5 330 1.14 17432 . . . . . . . . 1.805 17.96 11.0 28.6 0.98 S 15 135 1.92 1454 . . . . . . . . 1.757 18.47 11.6 28.6 0.90 C 0.9 180 0.70 6,9454.3 . . . . . . 0.86 16.1 13.0 28.1 0.04 F 5 310 1.44 18455 . . . . . . . . 0.5427 19.7 12.8 27.8 0.71 C/S 4.4 245 1.33 8
NOTES.ÈCol. (1) : 3CR source designation. Col. (2) : redshift of the source as taken from Spinrad et al. 1985. Col. (3) :the V magnitude of the quasar taken from Spinrad et al. 1985. Col. (4) : the 178 MHz Ñux density of the quasar takenfrom Spinrad et al. 1985. Col. (5) : the logarithm of the 178 MHz power in watts assuming the cosmology andq0\ 0.5
km s~1 Mpc~1. Col. (6) : the spectral index of the radio emission as taken from Spinrad et al. 1985. Col. (7) : theH0\ 75classiÐcation of the radio source morphology and spectral index. Quasars classiÐed as ““ S ÏÏ are steep spectrum sourceswith spectral indices greater than 0.7 (col. [6]) and largest projected sizes greater than 20 kpc (col. [10]). QuasarsclassiÐed as ““ C ÏÏ are compact steep spectrum sources (CSS) or gigahertz peaked sources (GPS) and are sources withspectral indices greater than 0.7 (col. [6]) and largest projected sizes less than 20 kpc. Quasars classiÐed as ““ F ÏÏ are Ñatspectrum sources with spectral indices less than 0.7 (col. [6]). Col. (8) : the largest angular scale (LAS) in units ofarcseconds of the radio emission as measured from the radio maps in the references given in col. (11). Col. (9) : theposition angle of the jet as measured relative to the core measured from the radio maps in the references given in col.(11). In the few cases where a jet was not obvious, the position angle has been measured from the core through thebrightest hotspot. The typical uncertainty in this determination is about ^10¡. Col. (10) : the largest projected physicalsize of the radio source determined using the largest angular scale from col. (8) and the cosmology andq0\ 0.5 H0\ 75km s~1 Mpc~1. The unit is the logarithm of the largest physical size in kpc. Col. (11) : reference for the radio map used tomeasure the properties tabulated in cols. (8) and (9).
REFERENCES.È(1) Bridle et al. 1994 ; (2) Lonsdale et al. 1993 ; (3) Akujor et al. 1991 ; (4) Akujor et al. 1994 ; (5) Sangheraet al. 1995 ; (6) Spencer et al. 1991 ; (7) Price et al. 1993 ; (8) Bogers et al. 1994 ; (9) Rendong et al. 1991 ; (10) van Breugel etal. 1992 ; (11) Reid et al. 1995 ; (12) Mantovani et al. 1994 ; (13) Schilizzi et al 1982 ; (14) de Pater & Perley 1983 ; (15)Swarup et al. 1982 ; (16) Fanti et al. 1989 ; (17) OÏDea et al. 1988 ; (18) Browne et al. 1982.
0.5 1 1.5 20
1
2
3
4
5
27 28 290
2
4
6
8
10
12
0 1 20
2
4
6
8
354 LEHNERT ET AL. Vol. 123
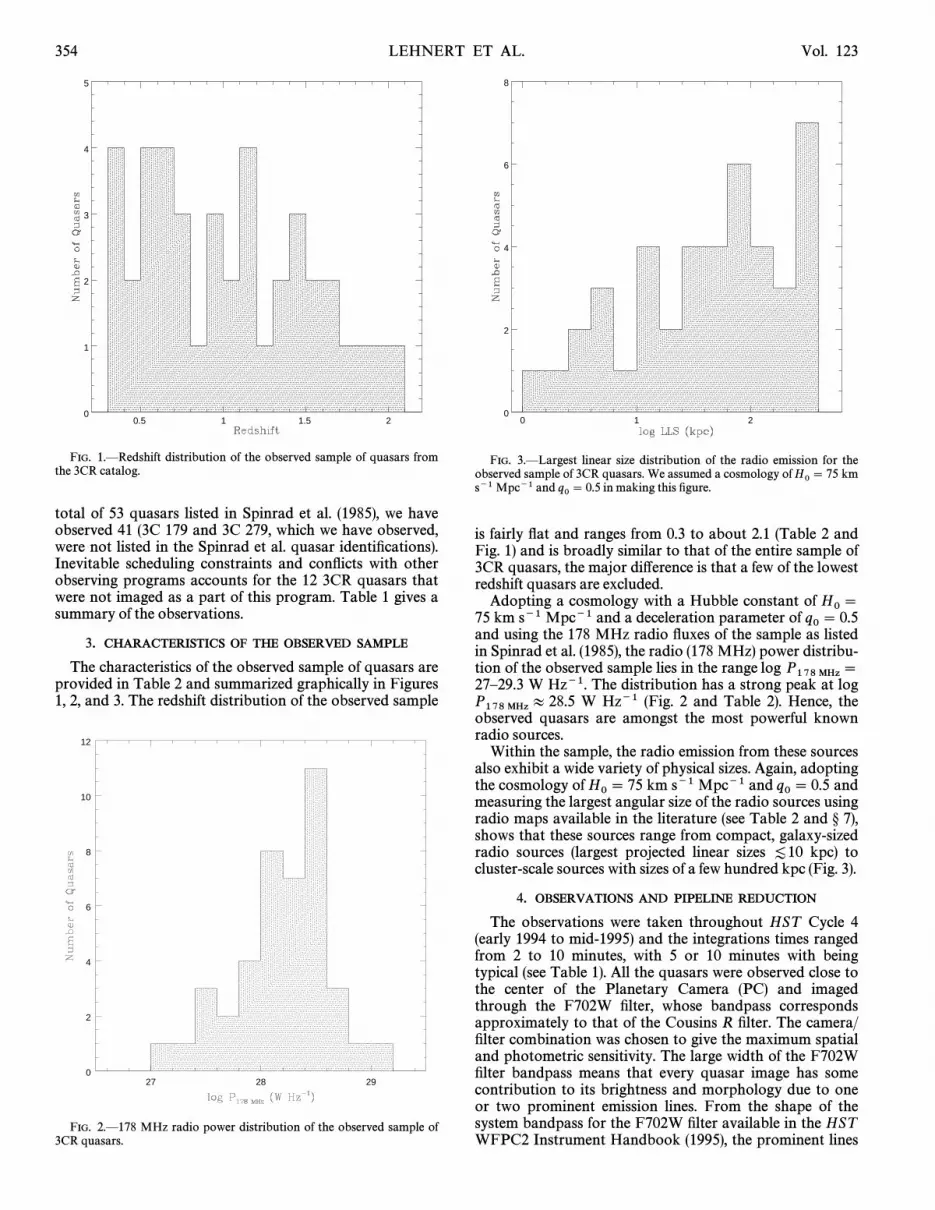
FIG. 1.ÈRedshift distribution of the observed sample of quasars fromthe 3CR catalog.
total of 53 quasars listed in Spinrad et al. (1985), we haveobserved 41 (3C 179 and 3C 279, which we have observed,were not listed in the Spinrad et al. quasar identiÐcations).Inevitable scheduling constraints and conÑicts with otherobserving programs accounts for the 12 3CR quasars thatwere not imaged as a part of this program. Table 1 gives asummary of the observations.
3. CHARACTERISTICS OF THE OBSERVED SAMPLE
The characteristics of the observed sample of quasars areprovided in Table 2 and summarized graphically in Figures1, 2, and 3. The redshift distribution of the observed sample
FIG. 2.È178 MHz radio power distribution of the observed sample of3CR quasars.
FIG. 3.ÈLargest linear size distribution of the radio emission for theobserved sample of 3CR quasars. We assumed a cosmology of kmH0\ 75s~1 Mpc~1 and in making this Ðgure.q0\ 0.5
is fairly Ñat and ranges from 0.3 to about 2.1 (Table 2 andFig. 1) and is broadly similar to that of the entire sample of3CR quasars, the major di†erence is that a few of the lowestredshift quasars are excluded.
Adopting a cosmology with a Hubble constant of H0\75 km s~1 Mpc~1 and a deceleration parameter of q0\ 0.5and using the 178 MHz radio Ñuxes of the sample as listedin Spinrad et al. (1985), the radio (178 MHz) power distribu-tion of the observed sample lies in the range log P178 MHz\27È29.3 W Hz~1. The distribution has a strong peak at log
W Hz~1 (Fig. 2 and Table 2). Hence, theP178 MHzB 28.5observed quasars are amongst the most powerful knownradio sources.
Within the sample, the radio emission from these sourcesalso exhibit a wide variety of physical sizes. Again, adoptingthe cosmology of km s~1 Mpc~1 and andH0\ 75 q0\ 0.5measuring the largest angular size of the radio sources usingradio maps available in the literature (see Table 2 and ° 7),shows that these sources range from compact, galaxy-sizedradio sources (largest projected linear sizes kpc) to[10cluster-scale sources with sizes of a few hundred kpc (Fig. 3).
4. OBSERVATIONS AND PIPELINE REDUCTION
The observations were taken throughout HST Cycle 4(early 1994 to mid-1995) and the integrations times rangedfrom 2 to 10 minutes, with 5 or 10 minutes with beingtypical (see Table 1). All the quasars were observed close tothe center of the Planetary Camera (PC) and imagedthrough the F702W Ðlter, whose bandpass correspondsapproximately to that of the Cousins R Ðlter. The camera/Ðlter combination was chosen to give the maximum spatialand photometric sensitivity. The large width of the F702WÐlter bandpass means that every quasar image has somecontribution to its brightness and morphology due to oneor two prominent emission lines. From the shape of thesystem bandpass for the F702W Ðlter available in the HSTWFPC2 Instrument Handbook (1995), the prominent lines
No. 2, 1999 HST SNAPSHOT SURVEY OF 3CR QUASARS 355
that contribute to the emission within the images and theredshift range over which they contribute are [O III] j5007(0.19\ z\ 0.64), Hb (0.22\ z\ 0.67), [O II] j3727(0.60\ z\ 1.20), Mg II j2798 (1.13\ z\ 1.93). Only 3C 9has a redshift (z\ 2.012) that avoids having prominentemission lines within the bandpass of the F702W Ðlter.
The images were reduced using the standard pipeline (seethe HST Data Handbook 1995). The standard pipelineincludes bias subtraction, dark count correction, Ñat-Ðeldcorrection, and a determination of the absolute sensitivity.For those objects that had two or more individual expo-sures (see Table 1), the separate images were combinedusing the STSDAS task CRREJ. This task constructs anaverage of the input frames and iteratively removes highlydeviant pixels from the average. For those quasars withonly one exposure, we used the IRAF task ““ cosmicrays ÏÏ toremove the e†ects of cosmic rays. This task detects pixelsthat have signiÐcantly di†erent value than the surroundingpixels and replaces the deviant value with the average of thesurrounding pixels. Weak cosmic rays that were missedusing this technique were subsequently removed by Ðttingthe background to the area immediately surrounding thesuspected cosmic ray hit and using this new value as asubstitute for the old value of the counts in the a†ectedpixel.
The data were Ñux-calibrated using the inverse sensitivityfor the F702W Ðlter of 1.834] 10~18 ergs s~1 cm~2 A� ~1dn~1 and a zero point of 22.469 (Whitmore 1995). This putsthe magnitudes on the ““ Vega system.ÏÏ To convert to theSTMAG system, which assumes a Ñat spectral energy dis-tribution and has a zero point of 23.231, 0.762 mag shouldbe subtracted from the magnitudes given here.
5. IMAGE REDUCTION
5.1. PSFs and EEDsOne of the most important steps of the analysis is to
quantify the amount of extended emission from thesequasar images. We have attempted this using two methods.To do this we collected images of the standard stars used tocalibrate the F702W Ðlter that were near the dates of theobservations. Unfortunately, there were only a few expo-sures (5) that were useful. These were then used in two ways.We constructed an empirical point-spread function (PSF)using these observations by adding up the individual expo-sures after they had been aligned to a common center. Thisempirical PSF was then compared with the model PSFconstructed using the PSF modeling program, Tiny Tim.However, as we discuss below, the close agreement islimited to azimuthal averagesÈTiny Tim does not repro-duce the detailed two-dimensional structure of the PSF.Next, we measured the encircled energy diagrams (EEDs),deÐned as the fraction of the Ñux from a point source inte-rior to a radius r, as a function of r. We then intercomparedall the EEDs (including the PSF generated by Tiny Tim)taken through a given Ðlter to determine the reproducibilityof the EED. There was very good agreement between theshape of the EED from the sum of the observations ofstandard stars and that of the Tiny Tim PSF but insufficientdata were available to perform this comparison for individ-ual stars/PSFs taken with the F702W Ðlter. Fortunately, wealso carried out this analysis for another of the WFPC2Ðlters, F555W, in the course of another HST program(Lehnert et al. 1999). For this intercomparison, we used
observations of approximately 20 stars. This inter-comparison implies that we can robustly detect fuzz thatcontributes more than about 5% as much light as thequasar itself (within a radius of about This limit is1A.4).consistent with the known temporal variations in the HSTPSF due to e†ects like the gentle change in focus over time-scales of months and shorter (orbital) timescale variationsdue to the so-called ““ breathing ÏÏ of the telescope (seeWFPC-2 Instrument Handbook). We have restricted our-selves to radii less than about due to the poorly under-1A.5stood large angle scattering, which becomes importantbeyond a radius of about 2A.
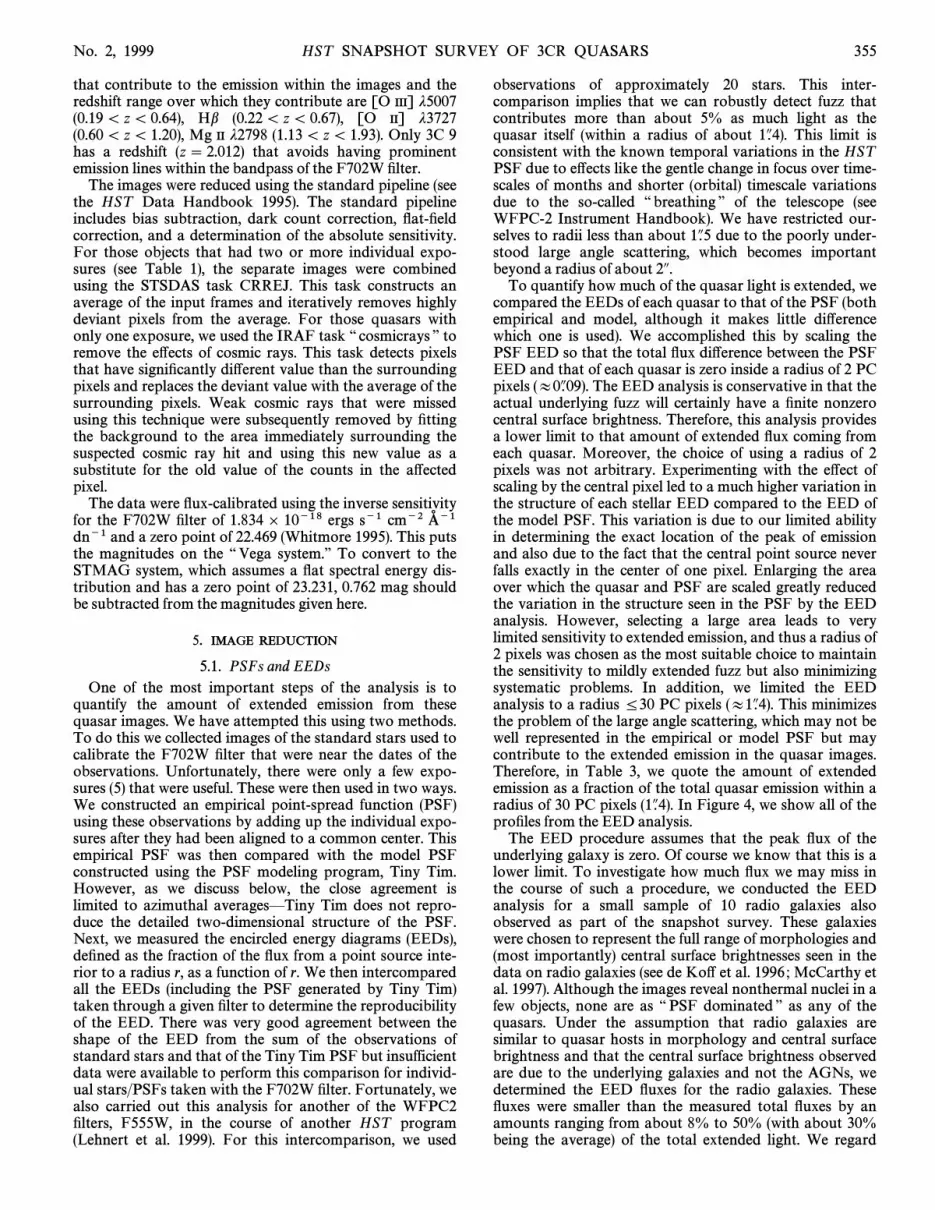
To quantify how much of the quasar light is extended, wecompared the EEDs of each quasar to that of the PSF (bothempirical and model, although it makes little di†erencewhich one is used). We accomplished this by scaling thePSF EED so that the total Ñux di†erence between the PSFEED and that of each quasar is zero inside a radius of 2 PCpixels The EED analysis is conservative in that the(B0A.09).actual underlying fuzz will certainly have a Ðnite nonzerocentral surface brightness. Therefore, this analysis providesa lower limit to that amount of extended Ñux coming fromeach quasar. Moreover, the choice of using a radius of 2pixels was not arbitrary. Experimenting with the e†ect ofscaling by the central pixel led to a much higher variation inthe structure of each stellar EED compared to the EED ofthe model PSF. This variation is due to our limited abilityin determining the exact location of the peak of emissionand also due to the fact that the central point source neverfalls exactly in the center of one pixel. Enlarging the areaover which the quasar and PSF are scaled greatly reducedthe variation in the structure seen in the PSF by the EEDanalysis. However, selecting a large area leads to verylimited sensitivity to extended emission, and thus a radius of2 pixels was chosen as the most suitable choice to maintainthe sensitivity to mildly extended fuzz but also minimizingsystematic problems. In addition, we limited the EEDanalysis to a radius ¹30 PC pixels This minimizes(B1A.4).the problem of the large angle scattering, which may not bewell represented in the empirical or model PSF but maycontribute to the extended emission in the quasar images.Therefore, in Table 3, we quote the amount of extendedemission as a fraction of the total quasar emission within aradius of 30 PC pixels In Figure 4, we show all of the(1A.4).proÐles from the EED analysis.
The EED procedure assumes that the peak Ñux of theunderlying galaxy is zero. Of course we know that this is alower limit. To investigate how much Ñux we may miss inthe course of such a procedure, we conducted the EEDanalysis for a small sample of 10 radio galaxies alsoobserved as part of the snapshot survey. These galaxieswere chosen to represent the full range of morphologies and(most importantly) central surface brightnesses seen in thedata on radio galaxies (see de Ko† et al. 1996 ; McCarthy etal. 1997). Although the images reveal nonthermal nuclei in afew objects, none are as ““ PSF dominated ÏÏ as any of thequasars. Under the assumption that radio galaxies aresimilar to quasar hosts in morphology and central surfacebrightness and that the central surface brightness observedare due to the underlying galaxies and not the AGNs, wedetermined the EED Ñuxes for the radio galaxies. TheseÑuxes were smaller than the measured total Ñuxes by anamounts ranging from about 8% to 50% (with about 30%being the average) of the total extended light. We regard

TABLE 3
HST RESULTS ON 3CR SNAPSHOT SURVEY QUASARS
Resolved/Total Resolved/Total3CR mtotal (EED) (PSF) Rot klim Resolved P.A. O[R Comments(1) (2) (3) (4) (5) (6) (7) (8) (9) (10)
9 . . . . . . . . . . 17.3 \0.05 . . . . . . . . . N . . . ? . . .14 . . . . . . . . . 18.8 0.17 0.40 [65.0 22.3 Y 310 R 543 . . . . . . . . . 20.5 0.17 0.49 [66.7 22.9 Y 170 R? 647 . . . . . . . . . 17.7 0.17 0.38 113.6 22.9 Y 240 R 568.1 . . . . . . . 18.6 \0.05 . . . . . . . . . N . . . ? . . .93 . . . . . . . . . 18.1 0.33 0.56 122.3 22.9 Y 170 R? 5138 . . . . . . . . 18.4 0.14 0.34 [39.0 22.3 Y 105 R 5147 . . . . . . . . 17.2 0.08 0.39 112.5 22.1 Y 250 R 5154 . . . . . . . . 16.9 \0.05 0.17 136.6 22.0 Y? 170 N 6175 . . . . . . . . \16.4 0.05 \0.20 146.6 22.1 Y 230 R 1,3,7179 . . . . . . . . 18.5 0.12 0.38 136.7 22.9 Y 260 R 3,5181 . . . . . . . . 18.3 \0.05 . . . . . . . . . N . . . ? . . .186 . . . . . . . . 17.5 \0.05 0.32 155.8 22.4 Y? 140 R 5190 . . . . . . . . 18.9 0.07 0.28 146.4 22.7 Y 90 R? 6191 . . . . . . . . 17.8 \0.05 0.36 140.7 22.7 Y? 210 N 3,5204 . . . . . . . . 17.8 0.05 0.18 [159.2 22.7 Y 330 N 5205 . . . . . . . . . . . . . . . . . . . . . . . N . . . ? 2207 . . . . . . . . 17.5 \0.05 0.34 153.6 21.9 Y? 90 R 3,5208 . . . . . . . . 18.2 \0.05 . . . . . . . . . N . . . ? . . .215 . . . . . . . . 17.7 0.14 0.40 151.6 21.9 Y 310 R 5216 . . . . . . . . 18.7 0.25 0.59 147.5 22.1 Y 30 R 5220.2 . . . . . . \17.7 \0.05 . . . . . . . . . N . . . ? . . .249.1 . . . . . . \15.8 0.20 \0.73 [173.0 21.7 Y 120 R? 1,3,5254 . . . . . . . . 17.4 \0.05 0.32 [57.1 21.9 Y? 100 R 5263 . . . . . . . . 15.9 0.14 0.11 [146.8 20.6 Y 160 N 3,7268.4 . . . . . . 17.3 \0.05 0.29 [139.6 22.1 Y? 230 R 5270.1 . . . . . . \18.0 \0.05 \0.35 [18.5 22.7 Y? 90 N 1,3,5277.1 . . . . . . 17.6 0.27 0.56 [3.9 22.1 Y 310 R 5279 . . . . . . . . . . . . . . . . . . . . . . . N . . . ? 2280.1 . . . . . . 18.4 0.12 0.41 [150.4 22.9 Y 175 N 3,5287 . . . . . . . . 17.5 \0.05 . . . . . . . . . N . . . ? . . .288.1 . . . . . . 17.4 \0.05 . . . . . . . . . N . . . ? . . .298 . . . . . . . . \16.4 0.10 \0.18 155.4 21.1 Y 135 N 1,6309.1 . . . . . . 17.1 0.07 0.32 [176.6 21.9 Y 120 N 3,5334 . . . . . . . . \16.4 0.13 \0.21 [15.9 21.1 Y 140 R 1,3,6343 . . . . . . . . 20.0 0.81 1.00 4.3 22.7 Y 80 R 5351 . . . . . . . . . . . . . . . . . . . . . . . N . . . ? 2380 . . . . . . . . 16.9 0.05 0.36 148.5 21.9 Y 310 R 3,5418 . . . . . . . . 19.6 0.07 0.43 [98.6 22.9 Y 45 N 6432 . . . . . . . . 17.8 \0.05 0.33 [106.4 22.4 Y? 200 N 3,5454 . . . . . . . . 18.4 0.18 0.49 [50.6 22.3 Y 140 N 4(206),6454.3 . . . . . . . . . . . . . . . . . . . . . N . . . ? 2455 . . . . . . . . 18.8 0.21 0.69 [109.2 21.4 Y 240 R 5
NOTES.ÈCol. (1) : 3CR source designation. Col. (2) : total magnitude within an aperture of radius Col. (3) : the resolved fraction1A.4.of the total emission within a aperture measured using the EED analysis. See text for details. Col. (4) : the resolved fraction of the1A.4total emission within a aperture measured by conducting PSF subtraction. See text for details. For those sources where the nucleus1A.4is saturated, we have given the measured resolved fraction as an upper limit. Col. (5) : angle (in degrees) that the image was rotated tomake north at the top and east to the left in each image. Positive values imply a counterclockwise direction of the rotation. To calculatethe P.A. of the brightest di†raction spike one uses the following formula : if the rotation angle is positive, then one subtracts 45¡ fromthe listed rotation angle. If the rotation angle is negative, then one adds 315¡ to the listed rotation angle. Possible residuals due to thedi†raction spikes are noted in individual source descriptions in ° 7 and in col. (10) of this table. Col. (6) : surface brightness limit of thelowest contour of the plots shown in Figs. 5 and 6 in units of magnitudes per square arcsecond. Col. (7) : is the quasar image resolved?““ Y ÏÏ implies that both the EED and PSF subtraction analyses suggest that the quasar image is resolved. ““ Y? ÏÏ implies that only thePSF subtraction analysis suggests that the quasar image is resolved. ““ N ÏÏ implies that the image is not resolved according to bothanalyses. Col. (8) : position angle of the principal axis of the host galaxy measured north through east. The typical uncertainty is thisdetermination is about ^20¡ (see ° 6 for details). Col. (9) : is there an association between the radio and optical morphologies? A ““ R ÏÏimplies that (i) the principal axis of the radio emission is within 20¡ of the principal axis of the optical emission or (ii) that there is adetailed correspondence between the morphological features seen in both the radio and optical. ““ R? ÏÏ implies that there is somesimilarity in the optical and radio morphologies which may indicate a relationship between the radio and optical emission. ““ N ÏÏimplies that there is little or no correspondence between the radio and optical emission. Col. (10) : comments. A ““ 1 ÏÏ implies that thenucleus is saturated and that PSF subtraction was attempted. A ““ 2 ÏÏ implies that the nucleus was very saturated and that PSFsubtraction was not attempted due to the severe saturation of the nucleus and the large angular scales over which the di†raction spikesare seen due to the nuclear point source. A ““ 3 ÏÏ implies that the image has had a residual of the di†raction spike in the ““]U3 ÏÏdirection removed by Ðtting a surface to the surrounding background (see text for details). A ““ 4 ÏÏ implies that there is a possibleresidual in the displayed image due to the di†raction spike in the ““ ]U3 ÏÏ direction. The number in parentheses after the ““ 4 ÏÏ is theapproximate position angle (measured relative to north through east) of the possible residual. A ““ 5,ÏÏ ““ 6,ÏÏ or ““ 7 ÏÏ is used to characterizethe level of uncertainty in the magnitude of the host galaxy due to the PSF subtraction. A ““ 5 ÏÏ implies that the uncertainty in themagnitude of the host galaxy is about ^0.2 mag. A ““ 6 ÏÏ implies that the uncertainty in the magnitude of the host galaxy is about ^0.4mag. A ““ 7 ÏÏ implies that the uncertainty in the magnitude of the host galaxy is about ^0.7 mag.
356

FIG. 4.ÈRatio of the QSO to PSF EEDs determined as described in the text. Those sources that have extended fractions above 1.05 are consideredresolved. The uncertainties were determined assuming only that photon noise from quasar and PSF light proÐles and sky background contribute to theuncertainties in the ratio (i.e., we neglect possible systematic e†ects).
357

FIG. 4.ÈContinued
358

FIG. 4.ÈContinued
359
FIG. 4.ÈContinued
360
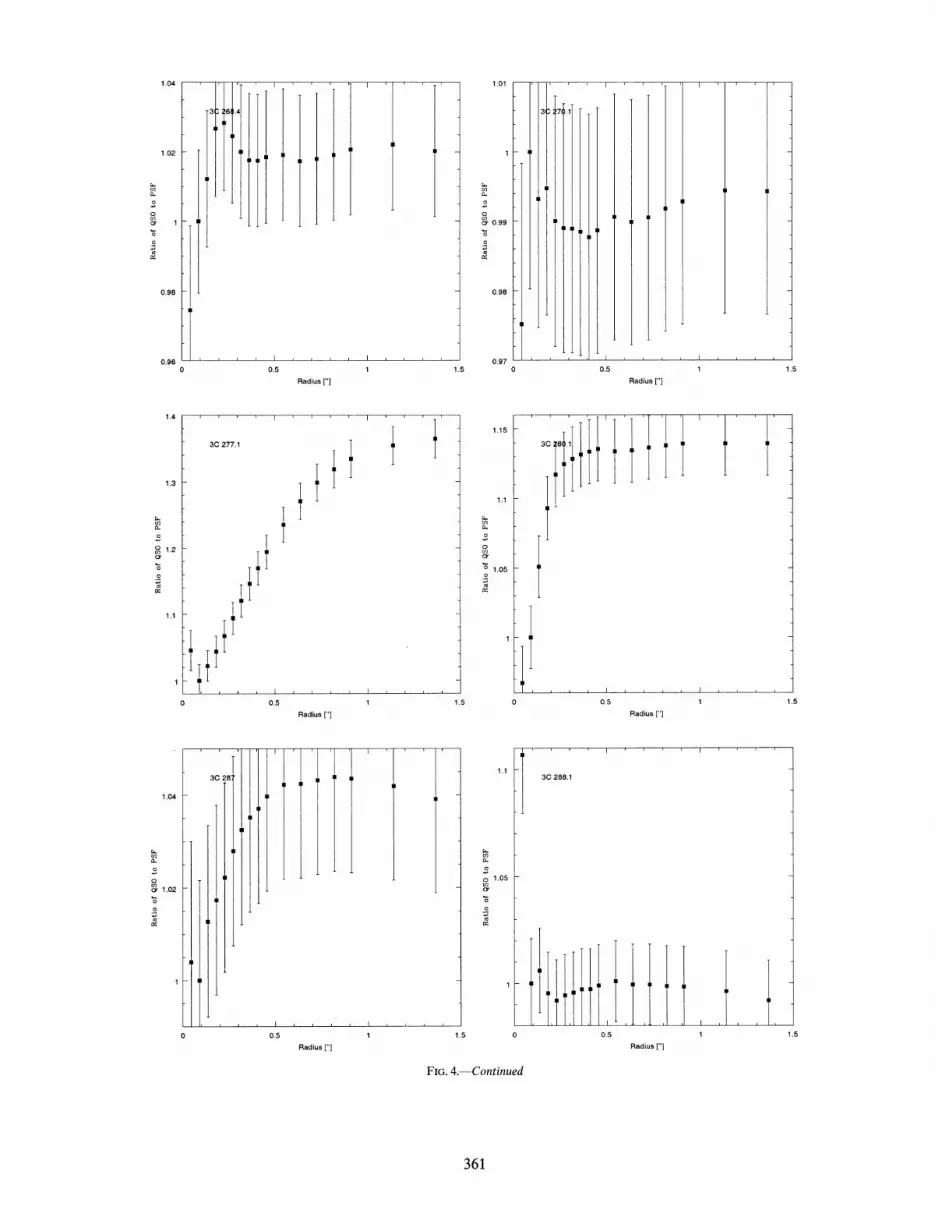
FIG. 4.ÈContinued
361

FIG. 4.ÈContinued

HST SNAPSHOT SURVEY OF 3CR QUASARS 363
FIG. 4.ÈContinued
this as a reasonable underestimate of the quasar Ñuxes bythe EED analysis.
5.2. PSF SubtractionThere are obvious limitations to using the EED analysis
described above. The foremost of these is that it does notprovide information on the morphology of the host galaxy.Also, it in fact only provides a lower limit on the amount ofextended emission since we have assumed that the contribu-tion to the fuzz from the central 0.03 arcsec2 is zero. Tostudy the host galaxy morphology, it is necessary to Ðrstremove the contribution of the quasar nuclei from theimages. Therefore, to provide morphological informationabout the host galaxies, we next attempted subtraction of ascaled PSF from each of the quasar images. We used twodi†erent PSFs, a model of the HST PSF constructed usingTiny Tim and an empirical PSF constructed by averagingseveral images of standard stars. We would have preferredto construct a PSF using exposures of open clusters or ofouter regions of globular clusters but no such images wereavailable from Cycle 4 observations taken through theF702W Ðlter. Also only a limited number of exposures ofstandard stars were available and some of the stellar images
were far (up to about 300 pixels) from the center of the PC.If there were two or more images of the same standardtaken at the same position close in time, the individualexposures were averaged. Images of di†erent standardswere then summed after being aligned to the nearest pixel.The model and empirical PSFs were scaled such that theirpeaks were about 5%È15% of the highest valued pixel in thequasar image and iteratively subtracted until emission dueto the di†raction of the secondary support become negligi-ble or the Ñux in the central pixel of the quasar image wastoo small to be measured. During this procedure we notedthe subtraction level where residual di†raction spikes werejust above the background noise level. Also, we continuedthe subtraction until a negative image of the di†ractionspikes appeared above the level of the noise. This procedureallowed us to estimate the uncertainty in the fraction ofextended emission by observing the values where the dif-fraction spikes in the residual image became negative due tooversubtraction of the PSF or were still present due toundersubtraction.
The relatively subjective method described above allowsus to parameterize the uncertainty in the PSF subtractionprocedure as a function of the total brightness of the quasar.
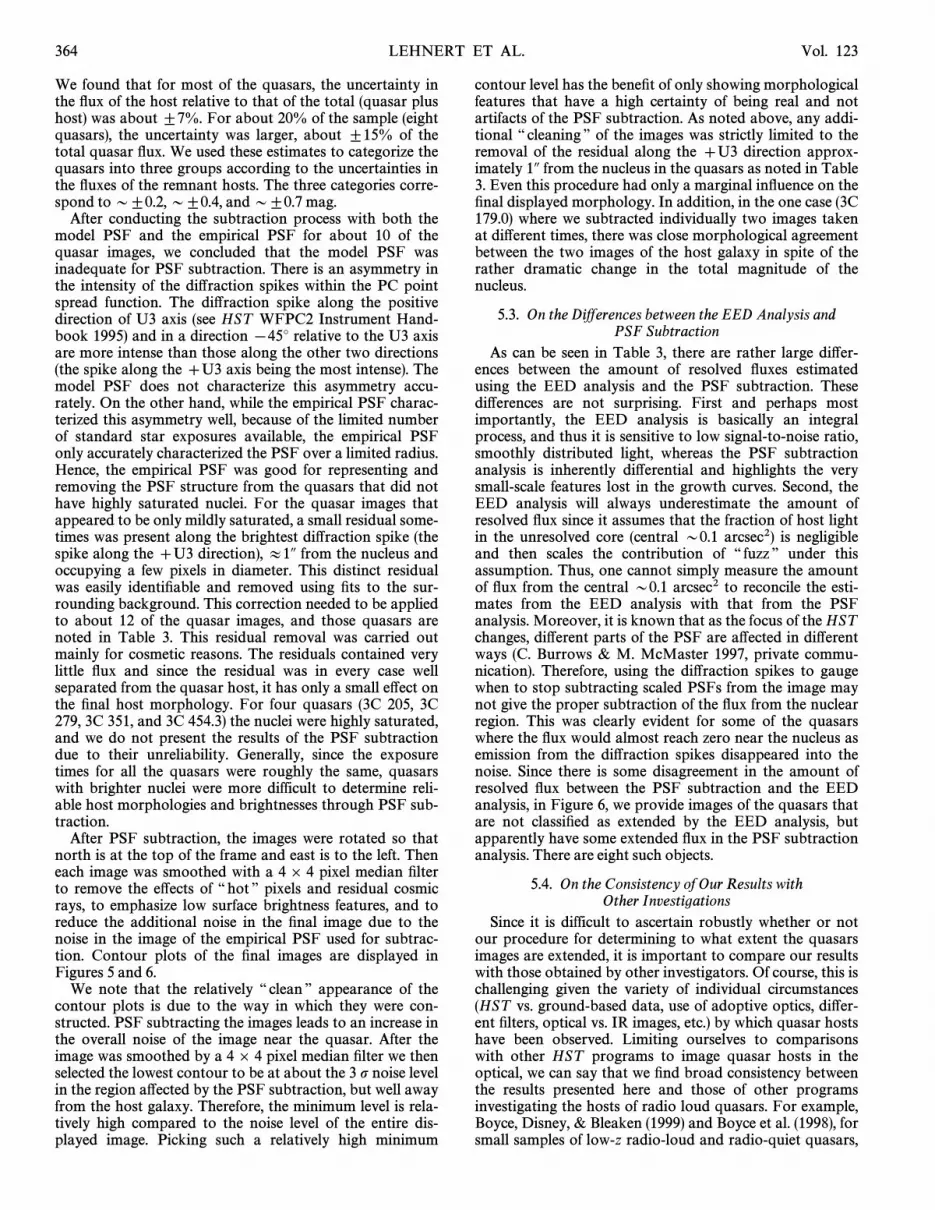
364 LEHNERT ET AL. Vol. 123
We found that for most of the quasars, the uncertainty inthe Ñux of the host relative to that of the total (quasar plushost) was about ^7%. For about 20% of the sample (eightquasars), the uncertainty was larger, about ^15% of thetotal quasar Ñux. We used these estimates to categorize thequasars into three groups according to the uncertainties inthe Ñuxes of the remnant hosts. The three categories corre-spond to D^0.2, D^0.4, and D^0.7 mag.
After conducting the subtraction process with both themodel PSF and the empirical PSF for about 10 of thequasar images, we concluded that the model PSF wasinadequate for PSF subtraction. There is an asymmetry inthe intensity of the di†raction spikes within the PC pointspread function. The di†raction spike along the positivedirection of U3 axis (see HST WFPC2 Instrument Hand-book 1995) and in a direction [45¡ relative to the U3 axisare more intense than those along the other two directions(the spike along the ]U3 axis being the most intense). Themodel PSF does not characterize this asymmetry accu-rately. On the other hand, while the empirical PSF charac-terized this asymmetry well, because of the limited numberof standard star exposures available, the empirical PSFonly accurately characterized the PSF over a limited radius.Hence, the empirical PSF was good for representing andremoving the PSF structure from the quasars that did nothave highly saturated nuclei. For the quasar images thatappeared to be only mildly saturated, a small residual some-times was present along the brightest di†raction spike (thespike along the ]U3 direction), B1A from the nucleus andoccupying a few pixels in diameter. This distinct residualwas easily identiÐable and removed using Ðts to the sur-rounding background. This correction needed to be appliedto about 12 of the quasar images, and those quasars arenoted in Table 3. This residual removal was carried outmainly for cosmetic reasons. The residuals contained verylittle Ñux and since the residual was in every case wellseparated from the quasar host, it has only a small e†ect onthe Ðnal host morphology. For four quasars (3C 205, 3C279, 3C 351, and 3C 454.3) the nuclei were highly saturated,and we do not present the results of the PSF subtractiondue to their unreliability. Generally, since the exposuretimes for all the quasars were roughly the same, quasarswith brighter nuclei were more difficult to determine reli-able host morphologies and brightnesses through PSF sub-traction.
After PSF subtraction, the images were rotated so thatnorth is at the top of the frame and east is to the left. Theneach image was smoothed with a 4] 4 pixel median Ðlterto remove the e†ects of ““ hot ÏÏ pixels and residual cosmicrays, to emphasize low surface brightness features, and toreduce the additional noise in the Ðnal image due to thenoise in the image of the empirical PSF used for subtrac-tion. Contour plots of the Ðnal images are displayed inFigures 5 and 6.
We note that the relatively ““ clean ÏÏ appearance of thecontour plots is due to the way in which they were con-structed. PSF subtracting the images leads to an increase inthe overall noise of the image near the quasar. After theimage was smoothed by a 4 ] 4 pixel median Ðlter we thenselected the lowest contour to be at about the 3 p noise levelin the region a†ected by the PSF subtraction, but well awayfrom the host galaxy. Therefore, the minimum level is rela-tively high compared to the noise level of the entire dis-played image. Picking such a relatively high minimum
contour level has the beneÐt of only showing morphologicalfeatures that have a high certainty of being real and notartifacts of the PSF subtraction. As noted above, any addi-tional ““ cleaning ÏÏ of the images was strictly limited to theremoval of the residual along the ]U3 direction approx-imately 1A from the nucleus in the quasars as noted in Table3. Even this procedure had only a marginal inÑuence on theÐnal displayed morphology. In addition, in the one case (3C179.0) where we subtracted individually two images takenat di†erent times, there was close morphological agreementbetween the two images of the host galaxy in spite of therather dramatic change in the total magnitude of thenucleus.
5.3. On the Di†erences between the EED Analysis andPSF Subtraction
As can be seen in Table 3, there are rather large di†er-ences between the amount of resolved Ñuxes estimatedusing the EED analysis and the PSF subtraction. Thesedi†erences are not surprising. First and perhaps mostimportantly, the EED analysis is basically an integralprocess, and thus it is sensitive to low signal-to-noise ratio,smoothly distributed light, whereas the PSF subtractionanalysis is inherently di†erential and highlights the verysmall-scale features lost in the growth curves. Second, theEED analysis will always underestimate the amount ofresolved Ñux since it assumes that the fraction of host lightin the unresolved core (central D0.1 arcsec2) is negligibleand then scales the contribution of ““ fuzz ÏÏ under thisassumption. Thus, one cannot simply measure the amountof Ñux from the central D0.1 arcsec2 to reconcile the esti-mates from the EED analysis with that from the PSFanalysis. Moreover, it is known that as the focus of the HSTchanges, di†erent parts of the PSF are a†ected in di†erentways (C. Burrows & M. McMaster 1997, private commu-nication). Therefore, using the di†raction spikes to gaugewhen to stop subtracting scaled PSFs from the image maynot give the proper subtraction of the Ñux from the nuclearregion. This was clearly evident for some of the quasarswhere the Ñux would almost reach zero near the nucleus asemission from the di†raction spikes disappeared into thenoise. Since there is some disagreement in the amount ofresolved Ñux between the PSF subtraction and the EEDanalysis, in Figure 6, we provide images of the quasars thatare not classiÐed as extended by the EED analysis, butapparently have some extended Ñux in the PSF subtractionanalysis. There are eight such objects.
5.4. On the Consistency of Our Results withOther Investigations
Since it is difficult to ascertain robustly whether or notour procedure for determining to what extent the quasarsimages are extended, it is important to compare our resultswith those obtained by other investigators. Of course, this ischallenging given the variety of individual circumstances(HST vs. ground-based data, use of adoptive optics, di†er-ent Ðlters, optical vs. IR images, etc.) by which quasar hostshave been observed. Limiting ourselves to comparisonswith other HST programs to image quasar hosts in theoptical, we can say that we Ðnd broad consistency betweenthe results presented here and those of other programsinvestigating the hosts of radio loud quasars. For example,Boyce, Disney, & Bleaken (1999) and Boyce et al. (1998), forsmall samples of low-z radio-loud and radio-quiet quasars,
No. 2, 1999 HST SNAPSHOT SURVEY OF 3CR QUASARS 365
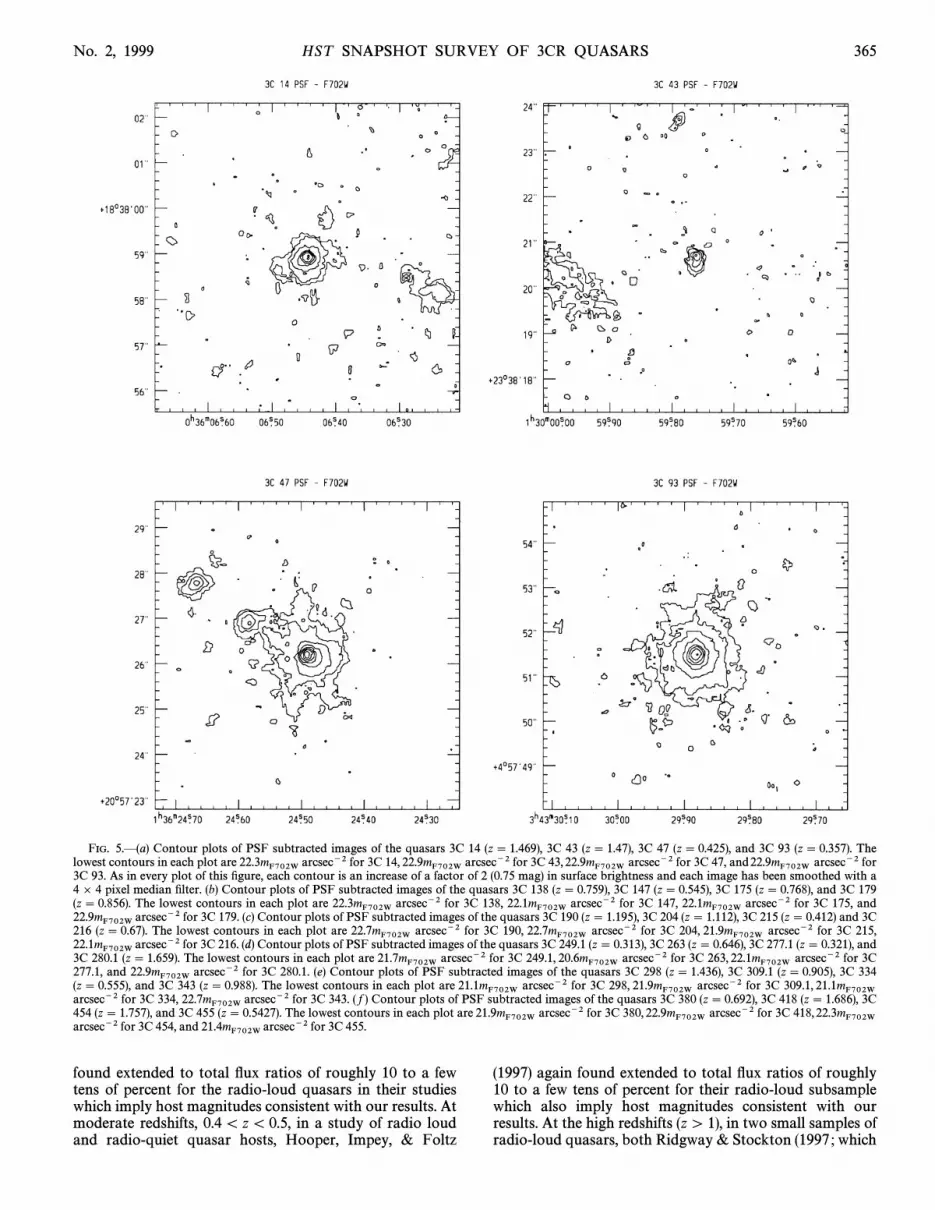
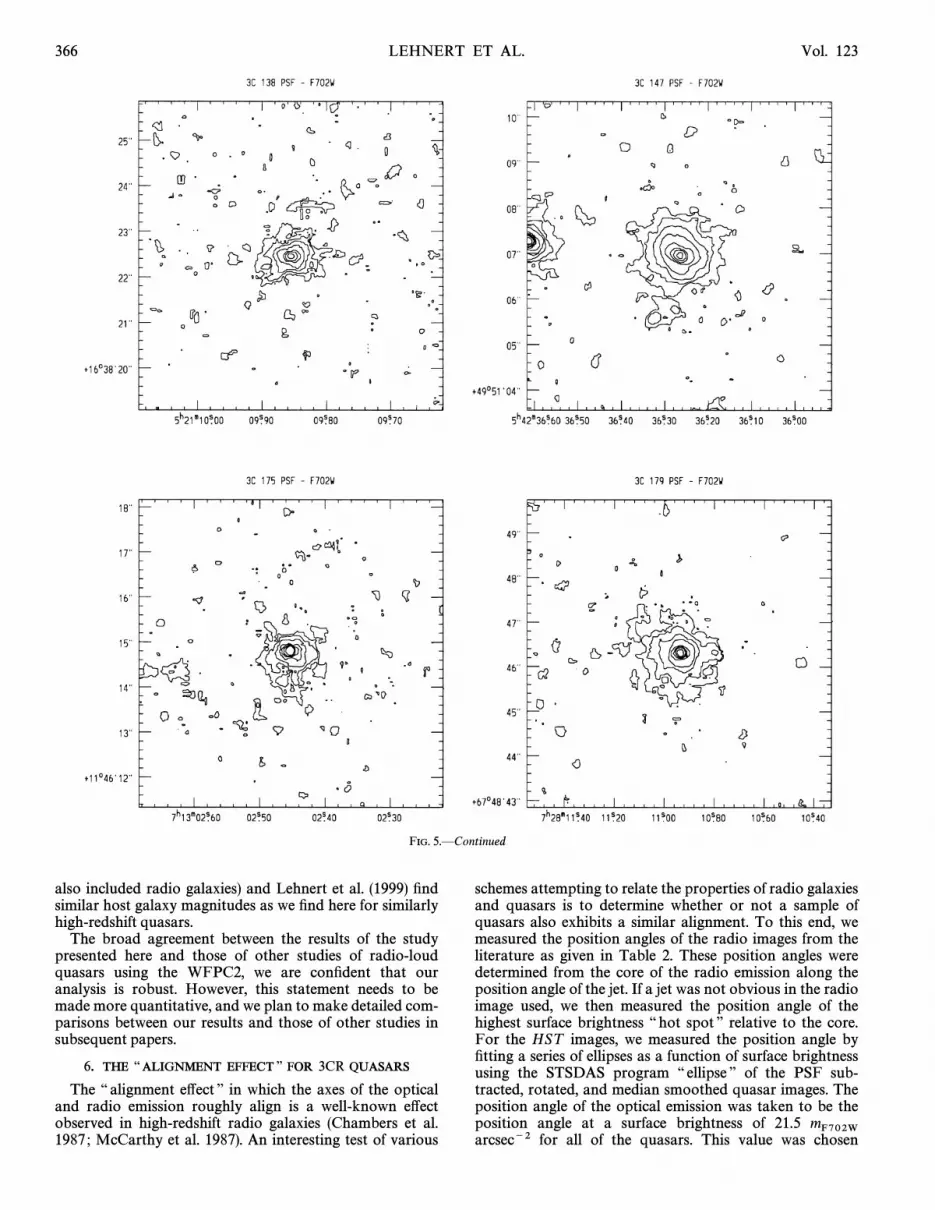
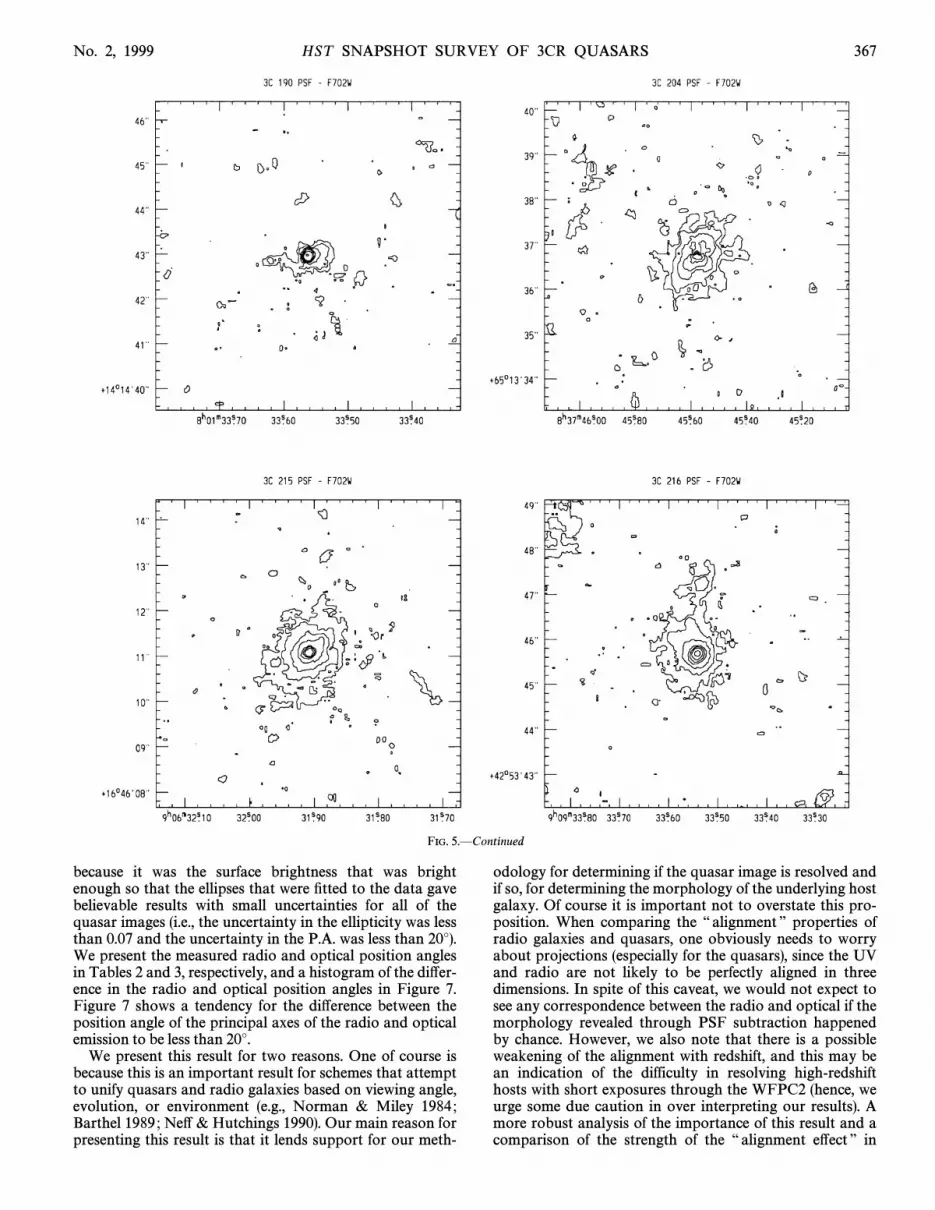
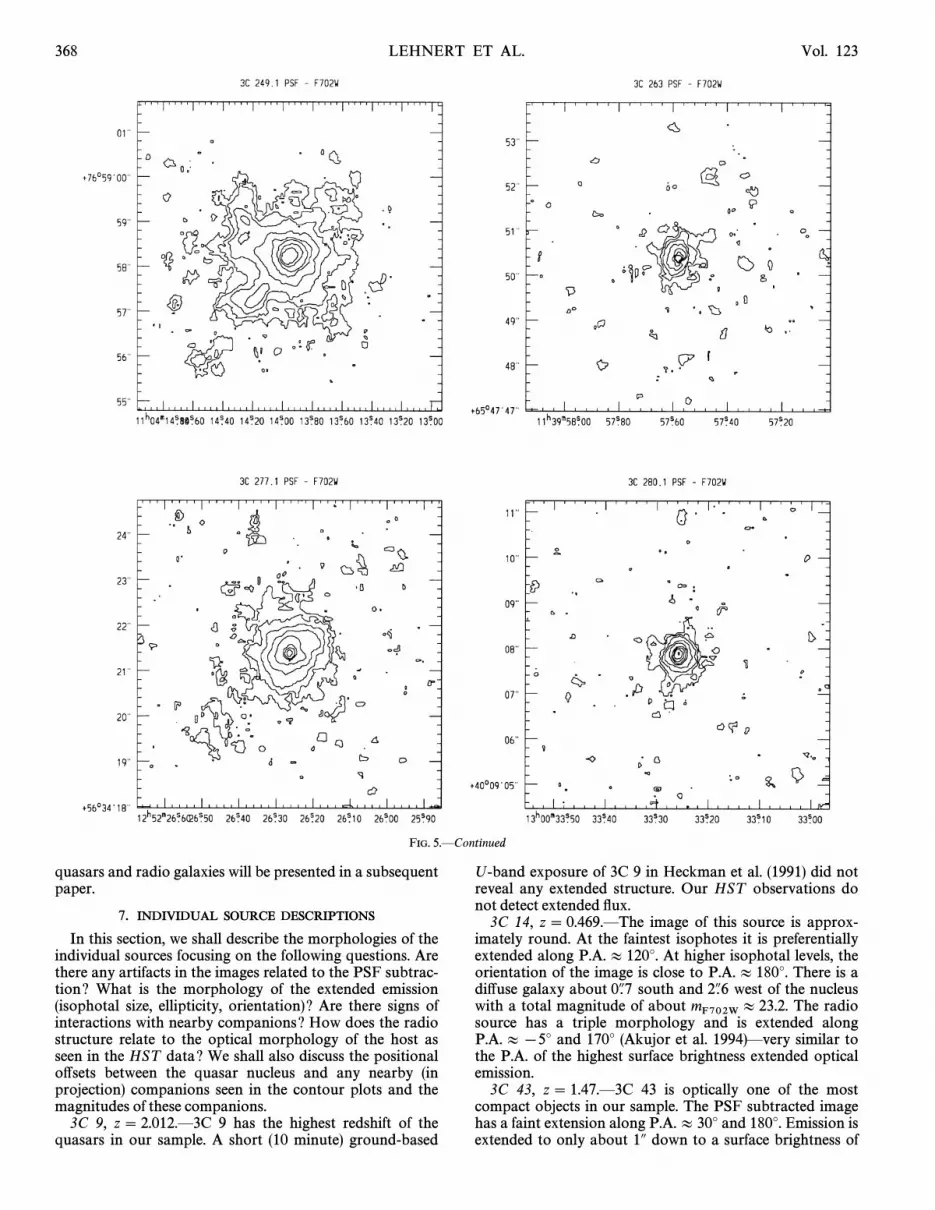
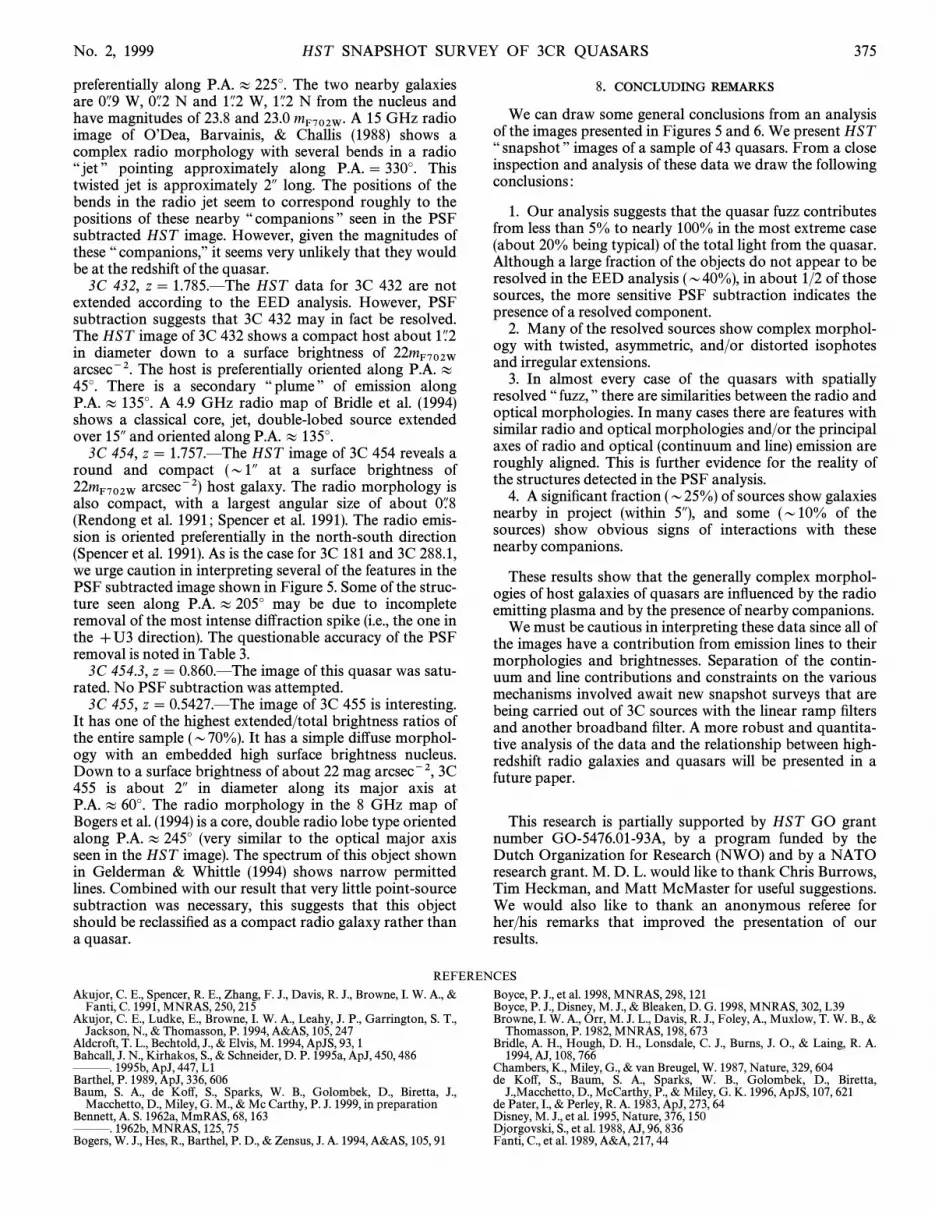
FIG. 5.È(a) Contour plots of PSF subtracted images of the quasars 3C 14 (z\ 1.469), 3C 43 (z\ 1.47), 3C 47 (z\ 0.425), and 3C 93 (z\ 0.357). Thelowest contours in each plot are arcsec~2 for 3C 14, arcsec~2 for 3C 43, arcsec~2 for 3C 47, and arcsec~2 for22.3mF702W 22.9mF702W 22.9mF702W 22.9mF702W3C 93. As in every plot of this Ðgure, each contour is an increase of a factor of 2 (0.75 mag) in surface brightness and each image has been smoothed with a4 ] 4 pixel median Ðlter. (b) Contour plots of PSF subtracted images of the quasars 3C 138 (z\ 0.759), 3C 147 (z\ 0.545), 3C 175 (z\ 0.768), and 3C 179(z\ 0.856). The lowest contours in each plot are arcsec~2 for 3C 138, arcsec~2 for 3C 147, arcsec~2 for 3C 175, and22.3mF702W 22.1mF702W 22.1mF702Warcsec~2 for 3C 179. (c) Contour plots of PSF subtracted images of the quasars 3C 190 (z\ 1.195), 3C 204 (z\ 1.112), 3C 215 (z\ 0.412) and 3C22.9mF702W216 (z\ 0.67). The lowest contours in each plot are arcsec~2 for 3C 190, arcsec~2 for 3C 204, arcsec~2 for 3C 215,22.7mF702W 22.7mF702W 21.9mF702Warcsec~2 for 3C 216. (d) Contour plots of PSF subtracted images of the quasars 3C 249.1 (z\ 0.313), 3C 263 (z\ 0.646), 3C 277.1 (z\ 0.321), and22.1mF702W3C 280.1 (z\ 1.659). The lowest contours in each plot are arcsec~2 for 3C 249.1, arcsec~2 for 3C 263, arcsec~2 for 3C21.7mF702W 20.6mF702W 22.1mF702W277.1, and arcsec~2 for 3C 280.1. (e) Contour plots of PSF subtracted images of the quasars 3C 298 (z\ 1.436), 3C 309.1 (z\ 0.905), 3C 33422.9mF702W(z\ 0.555), and 3C 343 (z\ 0.988). The lowest contours in each plot are arcsec~2 for 3C 298, arcsec~2 for 3C 309.1,21.1mF702W 21.9mF702W 21.1mF702Warcsec~2 for 3C 334, arcsec~2 for 3C 343. ( f ) Contour plots of PSF subtracted images of the quasars 3C 380 (z\ 0.692), 3C 418 (z\ 1.686), 3C22.7mF702W454 (z\ 1.757), and 3C 455 (z\ 0.5427). The lowest contours in each plot are arcsec~2 for 3C 380, arcsec~2 for 3C 418,21.9mF702W 22.9mF702W 22.3mF702Warcsec~2 for 3C 454, and arcsec~2 for 3C 455.21.4mF702W
found extended to total Ñux ratios of roughly 10 to a fewtens of percent for the radio-loud quasars in their studieswhich imply host magnitudes consistent with our results. Atmoderate redshifts, 0.4 \ z\ 0.5, in a study of radio loudand radio-quiet quasar hosts, Hooper, Impey, & Foltz
(1997) again found extended to total Ñux ratios of roughly10 to a few tens of percent for their radio-loud subsamplewhich also imply host magnitudes consistent with ourresults. At the high redshifts (z[ 1), in two small samples ofradio-loud quasars, both Ridgway & Stockton (1997 ; which
366 LEHNERT ET AL. Vol. 123
FIG. 5.ÈContinued
also included radio galaxies) and Lehnert et al. (1999) Ðndsimilar host galaxy magnitudes as we Ðnd here for similarlyhigh-redshift quasars.
The broad agreement between the results of the studypresented here and those of other studies of radio-loudquasars using the WFPC2, we are conÐdent that ouranalysis is robust. However, this statement needs to bemade more quantitative, and we plan to make detailed com-parisons between our results and those of other studies insubsequent papers.
6. THE ““ ALIGNMENT EFFECT ÏÏ FOR 3CR QUASARS
The ““ alignment e†ect ÏÏ in which the axes of the opticaland radio emission roughly align is a well-known e†ectobserved in high-redshift radio galaxies (Chambers et al.1987 ; McCarthy et al. 1987). An interesting test of various
schemes attempting to relate the properties of radio galaxiesand quasars is to determine whether or not a sample ofquasars also exhibits a similar alignment. To this end, wemeasured the position angles of the radio images from theliterature as given in Table 2. These position angles weredetermined from the core of the radio emission along theposition angle of the jet. If a jet was not obvious in the radioimage used, we then measured the position angle of thehighest surface brightness ““ hot spot ÏÏ relative to the core.For the HST images, we measured the position angle byÐtting a series of ellipses as a function of surface brightnessusing the STSDAS program ““ ellipse ÏÏ of the PSF sub-tracted, rotated, and median smoothed quasar images. Theposition angle of the optical emission was taken to be theposition angle at a surface brightness of 21.5 mF702Warcsec~2 for all of the quasars. This value was chosen
No. 2, 1999 HST SNAPSHOT SURVEY OF 3CR QUASARS 367
FIG. 5.ÈContinued
because it was the surface brightness that was brightenough so that the ellipses that were Ðtted to the data gavebelievable results with small uncertainties for all of thequasar images (i.e., the uncertainty in the ellipticity was lessthan 0.07 and the uncertainty in the P.A. was less than 20¡).We present the measured radio and optical position anglesin Tables 2 and 3, respectively, and a histogram of the di†er-ence in the radio and optical position angles in Figure 7.Figure 7 shows a tendency for the di†erence between theposition angle of the principal axes of the radio and opticalemission to be less than 20¡.
We present this result for two reasons. One of course isbecause this is an important result for schemes that attemptto unify quasars and radio galaxies based on viewing angle,evolution, or environment (e.g., Norman & Miley 1984 ;Barthel 1989 ; Ne† & Hutchings 1990). Our main reason forpresenting this result is that it lends support for our meth-
odology for determining if the quasar image is resolved andif so, for determining the morphology of the underlying hostgalaxy. Of course it is important not to overstate this pro-position. When comparing the ““ alignment ÏÏ properties ofradio galaxies and quasars, one obviously needs to worryabout projections (especially for the quasars), since the UVand radio are not likely to be perfectly aligned in threedimensions. In spite of this caveat, we would not expect tosee any correspondence between the radio and optical if themorphology revealed through PSF subtraction happenedby chance. However, we also note that there is a possibleweakening of the alignment with redshift, and this may bean indication of the difficulty in resolving high-redshifthosts with short exposures through the WFPC2 (hence, weurge some due caution in over interpreting our results). Amore robust analysis of the importance of this result and acomparison of the strength of the ““ alignment e†ect ÏÏ in
368 LEHNERT ET AL. Vol. 123
FIG. 5.ÈContinued
quasars and radio galaxies will be presented in a subsequentpaper.
7. INDIVIDUAL SOURCE DESCRIPTIONS
In this section, we shall describe the morphologies of theindividual sources focusing on the following questions. Arethere any artifacts in the images related to the PSF subtrac-tion? What is the morphology of the extended emission(isophotal size, ellipticity, orientation)? Are there signs ofinteractions with nearby companions? How does the radiostructure relate to the optical morphology of the host asseen in the HST data? We shall also discuss the positionalo†sets between the quasar nucleus and any nearby (inprojection) companions seen in the contour plots and themagnitudes of these companions.
3C 9, z\ 2.012.È3C 9 has the highest redshift of thequasars in our sample. A short (10 minute) ground-based
U-band exposure of 3C 9 in Heckman et al. (1991) did notreveal any extended structure. Our HST observations donot detect extended Ñux.
3C 14, z\ 0.469.ÈThe image of this source is approx-imately round. At the faintest isophotes it is preferentiallyextended along P.A.B 120¡. At higher isophotal levels, theorientation of the image is close to P.A.B 180¡. There is adi†use galaxy about south and west of the nucleus0A.7 2A.6with a total magnitude of about The radiomF702W B 23.2.source has a triple morphology and is extended alongP.A.B [5¡ and 170¡ (Akujor et al. 1994)Èvery similar tothe P.A. of the highest surface brightness extended opticalemission.
3C 43, z\ 1.47.È3C 43 is optically one of the mostcompact objects in our sample. The PSF subtracted imagehas a faint extension along P.A.B 30¡ and 180¡. Emission isextended to only about 1A down to a surface brightness of

No. 2, 1999 HST SNAPSHOT SURVEY OF 3CR QUASARS 369
FIG. 5.ÈContinued
22.9 arcsec~2. 3C 43 has a compactmF702W (LASD 2A.6)and complex radio structure (Sanghera et al. 1995 ; Akujoret al. 1991). This complex morphology makes a direct com-parison between the optical and radio emission difficult, butit is interesting to note that the ““ U-like ÏÏ structure seen inthe faintest isophote to the north of the nucleus is roughlymimicked in the radio map of Sanghera et al. (1995). Themost northern component of the complex radio structurehas been identiÐed as the nucleus by Spencer et al. (1991). Ifthis is the case, then the extended optical emission to thesouth of the optical nucleus is roughly aligned with thecurved jet seen in the radio images of 3C 43 (e.g., Sangheraet al. 1995). There is a nearby (in projection) companiongalaxy about 3A north and east of the quasar nucleus0A.2with a total magnitude, There is anothermF702W B 23.5.galaxy just visible on the edge of the contour plot shown inFigure 5, which is almost certainly a foreground galaxy.
3C 47, z\ 0.425.È3C 47 shows signs of interaction witha small galaxy approximately to the northeast of the1A.7nucleus. There is a second galaxy along this same directionapproximately from the nucleus. These galaxies have3A.5total magnitudes of 21.6 and 21.7 respec-mF702W mF702W,tively. The elongated, o†-center (i.e., not centered on thenucleus) isophotes strongly suggest that the host galaxy isinteracting with one or both of the nearby (perhaps only inprojection) galaxies. The 5 GHz radio map of Bridle et al.(1994) show a core, jet, and two lobe morphology. The jet isat P.A.B 210¡, which corresponds closely with a linearfeature seen in the HST image presented in Figure 5.
3C 68.1, z\ 1.238.ÈThe HST data are consistent with apoint source, and thus we do not detect any extended Ñuxaround 3C 68.1.
3C 93, z\ 0.357.È3C 93 possesses a host with a largeangular sizeÈapproximately 3A in diameter (at a surface

370 LEHNERT ET AL. Vol. 123
FIG. 5.ÈContinued
brightness of 22.9 arcsec~2). The isophotes aremF702Wapproximately round, with the brighter isophotes beingextended along the north-south direction and the faintestisophotes oriented along P.A.B 40¡. The 1.5 and 8.4 GHzradio maps of Bogers et al. (1994) show a ““ core ] doublelobe ÏÏ radio source with a relatively large angular size(D41A). The radio source is oriented along P.A.B 45¡ andthus roughly coincident with the principal axis of the outerisophotes. The morphology of the host galaxy agrees wellwith the R-band image of 3C 93 presented in Hes, Barthel,& Fosbury (1996).
3C 138, z\ 0.759.È3C 138 is a Ñattened system orientedpreferentially along P.A.B 130¡. The inner isophotesbecome irregular with extensions along P.A.B 70¡ andalong P.A.B 290¡. 3C 138 is also a so-called compact steepspectrum (CSS) radio source. The high-resolution radio
map of Rendong et al. (1991) shows a compact sourcewhose linear and triplet structure is extended on scales of afew tenths of an arcsecond along P.A.B 70¡. This axis ofemission is similar to the extension of the isophotes onscales of a few tenths of an arcsecond seen in the opticalimage.
3C 147, z\ 0.545.ÈThe isophotes of 3C 147 are fairlyÑat in the high surface brightness regions and becomerounder at fainter isophotal levels. The main axis of theoptical emission is at P.A.B 55¡. The galaxy is about 2Aacross down to about 22 arcsec~2. 3C 147 is also amF702Wwell-known compact steep spectrum radio source whosesize is and has a jetlike structure pointing out from the0A.5nucleus at P.A.B 240¡ (van Breugel et al. 1992). Moreover,there is a blob of emission from the nucleus at0A.4P.A.B 25¡. In the HST image, we also see two blobs of

No. 2, 1999 HST SNAPSHOT SURVEY OF 3CR QUASARS 371
FIG. 6.È(a) Contour plots of PSF subtracted that are not resolved according to the EED analysis (see text for details), but might be resolved as shown byPSF subtraction. The images of the quasars 3C 154 (z\ 0.58), 3C 186 (z\ 1.063), 3C 191 (z\ 1.956), and 3C 207 (z\ 0.684) are shown. The lowest contoursin each plot are arcsec~2 for 3C 154, arcsec~2 for 3C 186, arcsec~2 for 3C 191, and arcsec~2 for 3C 207. As in22.0mF702W 22.4mF702W 22.7mF702W 21.9mF702Wevery plot of this Ðgure, each contour is an increase of a factor of 2 (0.75 mag) in surface brightness and each image has been smoothed with a 4] 4 pixelmedian Ðlter. (b) Contour plots of PSF subtracted images of the quasars 3C 254 (z\ 0.734), 3C 268.4 (z\ 1.4), 3C 270.1 (z\ 1.519) and 3C 432 (z\ 1.785).The lowest contours in each plot are arcsec~2 for 3C 254, arcsec~2 for 3C 268.4, arcsec~2 for 3C 270.1, and21.9mF702W 22.1mF702W 22.7mF702W 22.4mF702Warcsec~2 for 3C 432.
emission about to the south of 3C 147. The total magni-1A.4tude of these two blobs is about 21.7 There is alsomF702W.another bright galaxy visible east of the nucleus. The3A.3total magnitude of this galaxy is 19.4mF702W.
3C 154, z\ 0.580.ÈThe HST data are consistent with apoint source in the EED analysis. However, there is evi-dence for extended emission from the PSF subtraction. InFigure 6, we show the morphology of this extended emis-sion. The F702W image of 3C 154 extended by about at1A.5a level down to a surface brightness of 22 arcsec~2.mF702WRadio maps of 3C 154 show a classical core, double-lobe
morphology (e.g., Bogers et al. 1994). The source is orientedalong P.A.B 100¡ and is large (LASD 53@@ ; Bogers et al.1994). The position angle of the radio source corresponds toa faint extension in the HST image that reaches about 1A.2from the nucleus down to a surface brightness of 22 mF702Warcsec~2.
3C 175, z\ 0.768.ÈThe HST image of 3C 175 is margin-ally resolved. The PSF subtracted image shows a complexmorphology. The inner, brighter isophotes are orientedpreferentially east-west. The fainter isophotes show a““ plume ÏÏ of emission to the southeast and south of the

372 LEHNERT ET AL. Vol. 123
FIG. 6.ÈContinued
nucleus. This ““ plume ÏÏ reaches about 2A from the nucleus(down to 22 arcsec~2). The radio source also has amF702W““ classical ÏÏ radio structure of core and two radio lobes. Thistriple structure is oriented along P.A. B 240¡ ( jet side). Thesize of the radio source is largeÈLAS D 56@@. In the opticalimage there is an extension in the isophotes alongP.A.B 240¡. There is no evidence from ground-basedoptical images of 3C 175 that it is resolved (Malkan 1984 ;Hes et al. 1996).
3C 179, z\ 0.856.ÈThe images of 3C 179 were reducedusing a di†erent method than the rest of the sample. Two300 second images were taken of 3C 179 separated by aperiod of a month. Over that time, 3C 179 increased byabout 0.5 mag in brightness. We therefore PSF subtractedeach image individually and, aligned and rotated bothresidual images and then averaged the two images. The
magnitude and fraction of the extended emission wasobtained by comparing the average quasar brightness withthat of the average host brightness. Of course the fraction ofextended to total Ñux was di†erent in the two images.
The brightest isophotes of the fuzz are oriented prefer-entially in the east-west direction. There is a bright ““ knot ÏÏof emission about from the nucleus along a P.A.B 270¡.0A.8The radio maps of Reid et al. (1995) show a complex mor-phology. The radio maps show a jet along P.A.B 270¡ anda double-lobe morphology.
3C 181, z\ 1.382.ÈThe image of 3C 181 does not appearto be spatially resolved in these HST data.
3C 186, z\ 1.063.ÈThe image of 3C 186 is not resolvedaccording to the EED analysis. However, the PSF subtrac-tion suggests that it might be resolved. We show the pos-sible morphology of the host in Figure 6. The image of 3C

0 20 40 60 80
5
10
3CR Quasars
No. 2, 1999 HST SNAPSHOT SURVEY OF 3CR QUASARS 373
FIG. 7.ÈHistogram of the di†erence between the position angles of theprincipal axis of the radio and optical emission.
186 shows ““ fuzz ÏÏ about across down to a surface1A.8brightness of 22 arcsec~2. There are two signiÐcantmF702Wposition angles of extended emission, P.A.B 30¡ andP.A.B 110¡. There is a nearby (in projection) galaxy about
from the nucleus along P.A.\ 65¡. The total magnitude2A.3of this nearby companion is The radio mor-mF702W \ 22.2.phology is compact and is oriented along P.A.B 140¡(Rendong et al. 1991 ; Spencer et al. 1991).
3C 190, z\ 1.195.ÈThe PSF subtracted image of 3C 190reveals a complex morphology. The principal axis of theoptical emission is along P.A.B 140¡. There is a clump ofemission approximately to the east of the nucleus. The0A.8radio morphology of 3C 190 is compact (LASD 3@@) and islinear having a chain of several hot spots (Spencer et al.1991) along P.A.B 240¡. In the HST image, we see a distor-tion in the isophotes along the P.A. of the radio structure.
3C 191, z\ 1.956.ÈThere is no evidence for a resolvedcomponent in 3C 191 according to the EED analysis, butPSF subtraction analysis suggests that it is resolved. ThePSF subtracted image of 3C 191 reveals a complex mor-phology. The general orientation of the fuzz is alongP.A.B 0¡ and B200¡. There is a ““ plume ÏÏ of emission to thesoutheast of the nucleus along P.A. D 140¡. The radio mor-phology is a core plus double-lobe morphology with a prin-cipal axis of emission along P.A.B 165¡ (Akujor et al. 1991).
3C 204, z\ 1.112.È3C 204 has a relatively high percent-age of extended to total emission (almost 50%). The hostgalaxy is a Ñat system (eD 0.25), and its major axis is orient-ed preferentially along P.A.B 150¡. The radio emission hasa core, jet, double-lobe morphology with the jet orientedalong P.A.B 275¡ (Reid et al. 1995). There appears to be afaint extension of emission along P.A.B 275¡ in the HSTimage of the host galaxy. This ““ Ðnger ÏÏ of emission may berelated to the radio jet seen in the radio image of Reid et al.(1995).
3C 205, z\ 1.534.ÈThe HST image of this quasar wassaturated. No PSF subtraction or EED analysis wasattempted.
3C 207, z\ 0.684.È3C 207 does not appear to be
extended in these HST data.3C 208, z\ 1.110.È3C 208 does not appear to be
extended in these HST data.3C 215, z\ 0.412.ÈThe optical counterpart of 3C 215
appears to have a Ñattened elliptical structure with its majoraxis oriented along P.A.B 135¡. The 5 GHz radio image ofBridle et al. (1994) shows a complex structure with an innerregion consisting of several high surface brightness knots ofemission along an approximately east-west line, engulfed ina large, more di†use emission oriented along P.A.B 150¡.The radio emission is seen over a large scale, LASD 1@. Aground-based V -band image presented by Hes et al. (1996)shows a similar morphology to the image presented here.
3C 216, z\ 0.67.ÈThe HST image of 3C 216 indicatesthat the host galaxy is an interacting system. The faint iso-photes of the quasar fuzz are not centered on the quasarnucleus but are o†set to the northeast along P.A. B 30¡È45¡. The nearby (in projection) galaxy is about to the1A.6north of the nucleus and has a magnitude of 21.9. There isanother brighter galaxy just o† the edge of the contour plotpresented here that is about 4A to the east and north of2A.5the nucleus. The total magnitude of this galaxy is mF702WB20.4. The 1.7 and 5 GHz radio images of Reid et al. (1995)show a compact radio source (LAS D 6@@) oriented alongP.A.B 40¡. Along this P.A. lies a radio ““ hotspot ÏÏ about 1Afrom the nucleus. This hotspot is approximately coincidentwith the ““ plume ÏÏ of optical emission we see in the HSTimage.
3C 220.2, z\ 1.157.È3C 220.2 does not appear to beextended in these HST data.
3C 249.1, z\ 0.313.ÈThe HST image of 3C 249.1 isspectacular. The extended emission comprises about 70% ofthe total light from the quasar. A narrowband HST imagecentered on [O III] j5007 (Sparks, private communication)shows that most of the emission to the east of the nucleus isprobably [O III] emission within the bandpass of theF702W Ðlter (see also Stockton & MacKenty 1987).However, the comparison with the narrowband [O III]image suggests that much of the light from the inner parts ofthe nebula is likely to be continuum emission from the hostgalaxy. A 5 GHz radio image of Bridle et al. (1994) reveals acore, jet, double-lobe morphology oriented preferentiallyalong P.A.B 100¡.
3C 254, z\ 0.734.ÈThe EED analysis of 3C 254 showsno evidence for resolution, but the PSF subtraction indi-cates that it is probably resolved. The HST image of 3C 254has a complex morphology. Its host galaxy is orientedapproximately in the east-west direction. There are““ plumes ÏÏ of emission along P.A.B 45¡ and 285¡. Thesecond of these plumes corresponds to the direction of themost distant radio lobe seen in the 5 GHz radio map ofReid et al. (1995). This radio map reveals that 3C 254 has adouble-lobed radio morphology with a central core.
3C 263, z\ 0.646.ÈThe host galaxy of 3C 263 appears tobe a Ñat system (eD 0.3), with its major axis aligned alongP.A.B 350¡. There is a nearby galaxy in projection alongthe major axis of the galaxy from the nucleus) with a(B1A.9magnitude of 22.2. There is also another nearby galaxyabout south and west of the nucleus. This galaxy has0A.2 1A.5a total magnitude of about 22.3. The 5 GHz radio map inBridle et al. (1994) shows a large-scale (LASD 51@@) core, jet,double-lobe source with the jet have an orientation ofB110¡. The HST image shows a ““ Ðnger ÏÏ of extended emis-sion in the counterjet direction (P.A.D 300¡).

374 LEHNERT ET AL. Vol. 123
3C 268.4, z\ 1.400.ÈThe image of 3C 268.4 does notappear to be extended in the EED analysis. PSF subtractingthe image suggests that 3C 268.4 might be extended. InFigure 6, we show the possible resolved structure of thequasar. The HST image of 3C 268.4 reveals that it isanother source with a complex morphology. The long axis
of the host is approximately along P.A. \ 230¡. In(B1A.5)the faintest isophotes there is also a ““ Ðnger ÏÏ of emissionpointing approximately to the south. In this direction thereis a nearby (in projection) galaxy that is about from the2A.6nucleus and has a total magnitude of 21.1. The 1.4 and 5GHz radio images of Reid et al. (1995) show a core, jet,double-lobe source with a largest angular size of about 12A.The principal axis of the radio emission is approximatelyalong P.A.\ 215¡ and corresponds roughly to the principalaxis of the host galaxy.
3C 270.1, z\ 1.519.ÈAccording to the EED analysis, 3C270.1 does not appear to be extended. However, in Figure 6,we show the morphology of the possible extended emissionobtained by PSF subtraction which suggests that the imageof 3C 270.1 is resolved. The host galaxy of 3C 270.1 isoriented preferentially in the east-west direction(P.A.\ 100¡). There are ““ plumes ÏÏ of emission to the southand to the northwest. The high-resolution radio image ofAkujor et al. (1994) shows a compact (LASD 10@@), ““ bent, ÏÏtriple source (core ] two lobes) along P.A.B 180¡ and320¡.
3C 277.1, z\ 0.321.ÈThe host galaxy of 3C 277.1 is largecompared to those in the rest of the sample (emission is seenover 3A down to 22 arcsec~2). The overall morphol-mF702Wogy of the host is round, but distortions to the inner iso-photes are seen in the directions of P.A. B 170¡ and 310¡.The high-resolution 1.7 and 5 GHz images of Reid et al.(1995) show a compact double oriented along(LASD 1A.5)P.A.B 310¡. The position of the radio ““ hotspot ÏÏ to thenorthwest roughly corresponds to the distortion we see inthe HST image of the host galaxy.
3C 279, z\ 0.538.ÈThe image of this quasar was satu-rated. No PSF subtraction was attempted.
3C 280.1, z\ 1.659.ÈThe host galaxy of 3C 280.1 iscompact and compared to most other hosts in the sample,its surface brightness increases rapidly with decreasing dis-tance from the nucleus. The isophotes are round (eD 0.05)and are oriented along P.A.B 350¡. The 5 GHz radio mapof Swarup, Sinha, & Saikia (1982 ; but see also Lonsdale,Barthel, & Miley 1992 and Akujor et al. 1994) shows a core,two hotspots (one close to the nucleus, D1A to thesoutheast, and a more distant one, about 12A to the west-northwest) and then a wiggly chain of emission to thesoutheast along P.A. B 120¡. This ““ chain ÏÏ of radio emis-sion is seen from about 4A to about 11A from the nucleus.The host galaxy, as seen in our HST image, does have anoutward bending of the isophotes along the direction of andover the region of the southeastern hotspot seen in the radiomaps of Swarup et al. (1982).
3C 287, z\ 1.055.ÈThe HST data are not spatiallyresolved.
3C 288.1, z\ 0.961.ÈThe HST data are not spatiallyresolved.
3C 298, z\ 1.436.ÈThe host galaxy of 3C 298 is domi-nated by two morphological featuresÈan ““ arm ÏÏ of emis-sion that projects from the nucleus to the southwest(P.A.\ 225¡) and then bends around to the east and a““ plume ÏÏ of emission to the north-northeast of the nucleus
(P.A.B 20¡). The radio images of Rendong et al. (1991) andvan Breugel et al. (1992) show a compact triple source
with an east-west orientation.(LASD 1A.8)3C 309.1, z\ 0.905.ÈThe host galaxy of 3C 309.1 is a Ñat
elliptical galaxy. The major axis of the host galaxy is orient-ed along P.A.\ 130¡. The high-resolution radio image ofRedong et al. (1991) shows 3C 309.1 to be a compact source,with a nuclear region oriented along P.A.B 145¡ and a
and a ““ lobe ÏÏ about 1A from the nucleus alongLASD 0A.1P.A.B 95¡. The highest surface brightness isophotes of thehost have an orientation roughly like that of the nuclearradio emission.
3C 334, z\ 0.555.ÈThe HST image of 3C 334 shows ahost galaxy that is distorted, having twisted and o†-centerisophotes. The general orientation of the host is P.A.B 120¡and is across along its major axis (down to a surface1A.5brightness of 21 arcsec~2). The 5 GHz radio imagemF702Wof Bridle et al. (1994) shows a large (LASD 57@@) triple (core,jet, two radio lobes) source. The radio jet emerges from thenucleus at P.A.B 140¡ and curves around to the north. Theorientation of the optical image of the host galaxy isapproximately the same as that of the radio (5 GHz) image.Several ground-based images of 3C 334 show that it isextended and has a morphology similar to that presentedhere. For example, an [O II] j3727 image in Hes et al. (1996)shows that 3C 334 is extended along P.A.B 10¡ and a[O III] j5007 image of Lawrence (1990) shows extended lineemission along P.A.B 150¡. Both results have some mor-phological similarity to the image presented in this study.
3C 343, z\ 0.988.ÈThe image of 3C 343 is most unusualfor the quasars imaged in this sample ; it did not require anyPSF subtraction! It appears to be a Ñat system with a majoraxis of about 2A long oriented along P.A.B 60¡. 3C 343 isanother CSS radio source. The radio map of Rendong et al.(1991) reveals a compact complex radio source.(LASB 0A.3)There is a Ðnger of emission (a jet ?) pointing out alongP.A.B 320¡. From an analysis of an optical spectrum,Aldcroft, Bechtold, & Elvis (1994) suggest that 3C 343 is aSeyfert 2 galaxy (i.e., the galaxy has narrow permitted andforbidden lines). Given the high radio luminosity of thisgalaxy, a more appropriate classiÐcation is as a radiogalaxy. The characteristics of the optical spectrum fromAldcroft et al. supports our imaging data and our conten-tion that 3C 343 does not appear to be a quasar.
3C 351.0, z\ 0.371.ÈThe image of this quasar was satu-rated. No PSF subtraction was attempted.
3C 380, z\ 0.692.È3C 380 appears to be marginallyresolved and is perhaps an interacting system. It has twocompanion galaxies that appear to be immersed in commonisophotes with the host galaxy of 3C 380. These galaxies areapproximately west and north and west and0A.6 0A.5 0A.8 0A.7north of the nucleus, respectively. The total magnitudes ofthese two galaxy are andmF702WB 20.7 mF702W B 21.9.The radio image of van Breugel et al. (1992) at 1.4 GHzshows a very di†use radio morphology that is strikinglysimilar but larger than the optical HST image shown inFigure 5. The interacting companions are engulfed in thisradio emission, and there is a surface brightness enhance-ment of the radio emission over the area of these compan-ions (Reid et al. 1995).
3C 418, z\ 1.686.È3C 418 appears to have a compacthost galaxy with several nearby (in projection) galaxies. Thelong axis of the host is only about across (down to a0A.9surface brightness of 22.9 arcsec~2) and orientedmF702W
No. 2, 1999 HST SNAPSHOT SURVEY OF 3CR QUASARS 375
preferentially along P.A.B 225¡. The two nearby galaxiesare W, N and W, N from the nucleus and0A.9 0A.2 1A.2 1A.2have magnitudes of 23.8 and 23.0 A 15 GHz radiomF702W.image of OÏDea, Barvainis, & Challis (1988) shows acomplex radio morphology with several bends in a radio““ jet ÏÏ pointing approximately along P.A. \ 330¡. Thistwisted jet is approximately 2A long. The positions of thebends in the radio jet seem to correspond roughly to thepositions of these nearby ““ companions ÏÏ seen in the PSFsubtracted HST image. However, given the magnitudes ofthese ““ companions,ÏÏ it seems very unlikely that they wouldbe at the redshift of the quasar.
3C 432, z\ 1.785.ÈThe HST data for 3C 432 are notextended according to the EED analysis. However, PSFsubtraction suggests that 3C 432 may in fact be resolved.The HST image of 3C 432 shows a compact host about 1A.2in diameter down to a surface brightness of 22mF702Warcsec~2. The host is preferentially oriented along P.A.B45¡. There is a secondary ““ plume ÏÏ of emission alongP.A.B 135¡. A 4.9 GHz radio map of Bridle et al. (1994)shows a classical core, jet, double-lobed source extendedover 15A and oriented along P.A.B 135¡.
3C 454, z\ 1.757.ÈThe HST image of 3C 454 reveals around and compact (D1A at a surface brightness of
arcsec~2) host galaxy. The radio morphology is22mF702Walso compact, with a largest angular size of about 0A.8(Rendong et al. 1991 ; Spencer et al. 1991). The radio emis-sion is oriented preferentially in the north-south direction(Spencer et al. 1991). As is the case for 3C 181 and 3C 288.1,we urge caution in interpreting several of the features in thePSF subtracted image shown in Figure 5. Some of the struc-ture seen along P.A.B 205¡ may be due to incompleteremoval of the most intense di†raction spike (i.e., the one inthe ]U3 direction). The questionable accuracy of the PSFremoval is noted in Table 3.
3C 454.3, z\ 0.860.ÈThe image of this quasar was satu-rated. No PSF subtraction was attempted.
3C 455, z\ 0.5427.ÈThe image of 3C 455 is interesting.It has one of the highest extended/total brightness ratios ofthe entire sample (D70%). It has a simple di†use morphol-ogy with an embedded high surface brightness nucleus.Down to a surface brightness of about 22 mag arcsec~2, 3C455 is about 2A in diameter along its major axis atP.A.B 60¡. The radio morphology in the 8 GHz map ofBogers et al. (1994) is a core, double radio lobe type orientedalong P.A.B 245¡ (very similar to the optical major axisseen in the HST image). The spectrum of this object shownin Gelderman & Whittle (1994) shows narrow permittedlines. Combined with our result that very little point-sourcesubtraction was necessary, this suggests that this objectshould be reclassiÐed as a compact radio galaxy rather thana quasar.
8. CONCLUDING REMARKS
We can draw some general conclusions from an analysisof the images presented in Figures 5 and 6. We present HST““ snapshot ÏÏ images of a sample of 43 quasars. From a closeinspection and analysis of these data we draw the followingconclusions :
1. Our analysis suggests that the quasar fuzz contributesfrom less than 5% to nearly 100% in the most extreme case(about 20% being typical) of the total light from the quasar.Although a large fraction of the objects do not appear to beresolved in the EED analysis (D40%), in about 1/2 of thosesources, the more sensitive PSF subtraction indicates thepresence of a resolved component.
2. Many of the resolved sources show complex morphol-ogy with twisted, asymmetric, and/or distorted isophotesand irregular extensions.
3. In almost every case of the quasars with spatiallyresolved ““ fuzz, ÏÏ there are similarities between the radio andoptical morphologies. In many cases there are features withsimilar radio and optical morphologies and/or the principalaxes of radio and optical (continuum and line) emission areroughly aligned. This is further evidence for the reality ofthe structures detected in the PSF analysis.
4. A signiÐcant fraction (D25%) of sources show galaxiesnearby in project (within 5A), and some (D10% of thesources) show obvious signs of interactions with thesenearby companions.
These results show that the generally complex morphol-ogies of host galaxies of quasars are inÑuenced by the radioemitting plasma and by the presence of nearby companions.
We must be cautious in interpreting these data since all ofthe images have a contribution from emission lines to theirmorphologies and brightnesses. Separation of the contin-uum and line contributions and constraints on the variousmechanisms involved await new snapshot surveys that arebeing carried out of 3C sources with the linear ramp Ðltersand another broadband Ðlter. A more robust and quantita-tive analysis of the data and the relationship between high-redshift radio galaxies and quasars will be presented in afuture paper.
This research is partially supported by HST GO grantnumber GO-5476.01-93A, by a program funded by theDutch Organization for Research (NWO) and by a NATOresearch grant. M. D. L. would like to thank Chris Burrows,Tim Heckman, and Matt McMaster for useful suggestions.We would also like to thank an anonymous referee forher/his remarks that improved the presentation of ourresults.
REFERENCES
Akujor, C. E., Spencer, R. E., Zhang, F. J., Davis, R. J., Browne, I. W. A., &Fanti, C. 1991, MNRAS, 250, 215
Akujor, C. E., Ludke, E., Browne, I. W. A., Leahy, J. P., Garrington, S. T.,Jackson, N., & Thomasson, P. 1994, A&AS, 105, 247
Aldcroft, T. L., Bechtold, J., & Elvis, M. 1994, ApJS, 93, 1Bahcall, J. N., Kirhakos, S., & Schneider, D. P. 1995a, ApJ, 450, 486ÈÈÈ. 1995b, ApJ, 447, L1Barthel, P. 1989, ApJ, 336, 606Baum, S. A., de Ko†, S., Sparks, W. B., Golombek, D., Biretta, J.,
Macchetto, D., Miley, G. M., & Mc Carthy, P. J. 1999, in preparationBennett, A. S. 1962a, MmRAS, 68, 163ÈÈÈ. 1962b, MNRAS, 125, 75Bogers, W. J., Hes, R., Barthel, P. D., & Zensus, J. A. 1994, A&AS, 105, 91
Boyce, P. J., et al. 1998, MNRAS, 298, 121Boyce, P. J., Disney, M. J., & Bleaken, D. G. 1998, MNRAS, 302, L39Browne, I. W. A., Orr, M. J. L., Davis, R. J., Foley, A., Muxlow, T. W. B., &
Thomasson, P. 1982, MNRAS, 198, 673Bridle, A. H., Hough, D. H., Lonsdale, C. J., Burns, J. O., & Laing, R. A.
1994, AJ, 108, 766Chambers, K., Miley, G., & van Breugel, W. 1987, Nature, 329, 604de Ko†, S., Baum, S. A., Sparks, W. B., Golombek, D., Biretta,
J.,Macchetto, D., McCarthy, P., & Miley, G. K. 1996, ApJS, 107, 621de Pater, I., & Perley, R. A. 1983, ApJ, 273, 64Disney, M. J., et al. 1995, Nature, 376, 150Djorgovski, S., et al. 1988, AJ, 96, 836Fanti, C., et al. 1989, A&A, 217, 44
376 LEHNERT ET AL.
Gelderman, R., & Whittle, M. 1994, ApJS, 91, 491Hartwick, F., & Schade, D. 1990, ARA&A, 28, 437Heckman, T. M., Lehnert, M. D., van Breugel, W. J. M., & Miley, G. K.
1991, ApJ, 370, 78Hes, R., Barthel, P., & Fosbury, R. 1996, A&A, 313, 423Hooper, E. J., Impey, C. D., & Foltz, C. B. 1997, ApJ, 480, L95HST Data Handbook, Version 2. 1995, ed. C. Leitherer (Baltimore : STScI)Hutchings, J. B., & Morris, S. C. 1995, AJ, 109, 1541Hutchings, J. B., Crampton, D., & Campbell, B. 1984, ApJ, 280, 41Lawrence, C. 1990, in Parsec Scale Radio Jets, ed. J. A. Zensus & T. J.
Pearson (Cambridge : Cambridge Univ. Press), 294Lehnert, M. D., van Breugel, W. J. M., Heckman, T. M., & Miley, G. K.
1999, ApJS, in pressLonsdale, C. J., Barthel, P. D., & Miley, G. K. 1993, ApJS, 87, 63Malkan, M. A. 1984, ApJ, 287, 555McCarthy, P., van Breugel, W., Spinrad, H., & Djorgovski, S. 1987, ApJ,
321, L29McCarthy, P., Miley, G. K., de Ko†, S., Baum, S. A., Sparks, W. B.,
Golombek, D., Biretta, J., & Macchetto, D. 1997, ApJS, 112, 415Mantovani, F., Junor, W., Fanti, R., Padrielli, L., Browne, I. W. A., &
Muxlow, T. W. B. 1992, MNRAS, 257, 353Ne†, S., & Hutchings, J. 1990, AJ, 100, 1441Norman, C., & Miley, G. K. 1984, A&A, 141, 85OÏDea, C. P., Barvainis, R., & Challis, P. M. 1988, AJ, 96, 435
Price, R., Gower, A. C., Hutchings, J. B., Talon, S., Duncan, D., & Ross, G.1993, ApJS, 86, 365
Reid, A., Shone, D. L., Akujor, C. E., Browne, I. W. A., Murphy, D. W.,Pedelty, J., Rudnick, L., & Walsh, D. 1995, A&AS, 110, 213
Rendong, N., Schilizzi, R. T., Fanti, C., & Fanti, R. 1991, A&A, 252, 513Ridgway, S. E., & Stockton, A. 1997, AJ, 114, 511Sanghera, H. S., Saikia, D. J., Ludke, E., Spencer, R. E., Foulsham, P. A.,
Akujor, C. E., & Tzioumis, A. K. 1995, A&A, 295, 629Schilizzi, R. T., Kapahi, V. K., & Ne†, S. G. 1982, JAp&A, 3, 173Smith, E. P., Heckman, T. M., Bothun, G., Romanishin, W., & Balick, B.
1986, ApJ, 306, 64Spencer, R. E., et al. 1991, MNRAS, 250, 225Spinrad, H., Djorgovski, S., Marr, J., & Aguilar, L. 1985, PASP, 97, 932Stockton, A., & MacKenty, J. W. 1987, ApJ, 316, 584Swarup, G., Sinha, R. P., & Saikia, D. J. 1982, MNRAS, 201, 393van Breugel, W. J. M., Fanti, C., Fanti, R., Stanghellini, C., Schilizzi, R. T.,
& Spencer, R. E. 1992, A&A, 256, 56Veron-Cetty, M. -P., & Woltjer, L. 1990, A&A, 236, 69Wide Field and Planetary Camera 2 Instrument Handbook. 1995, ed. C. J.
Burrows (Baltimore : STScI)Whitmore, B. 1995, in Calibrating Hubble Space T elescope : Post Servicing
Mission, ed. A. Koratkar & C. Leitherer (Baltimore : STScI), 269