http authorservices.wiley.com bauthor onlinelibrarytps.asp doi=10.1002 rcm
TRANSCRIPT

Research Article
Received: 23 August 2012 Revised: 12 October 2012 Accepted: 12 October 2012 Published online in Wiley Online Library
Rapid Commun. Mass Spectrom. 2013, 27, 200–206
200
Analysis and quantification of vitamin Dmetabolites in serum byultra-performance liquid chromatography coupled to tandemmass spectrometry and high-resolution mass spectrometry – amethod comparison and validation
Stephen J. Bruce1, BertrandRochat2, Alexandre Béguin1, Benoît Pesse1, Idris Guessous3,4,Olivier Boulat1 and Hugues Henry1*1Clinical Chemistry, University Hospital of Lausanne, CHUV (Centre Hospitalier Universitaire Vaudois), Route du Bugnon 46,1011 Lausanne, Switzerland2Quantitative Mass Spectrometry Facility [qMSF], BH-18-228, CHUV (Centre Hospitalier Universitaire Vaudois), Route duBugnon 46, 1011 Lausanne, Switzerland3Community Prevention Unit, University Institute of Social and Preventive Medicine (IUMSP University Hospital of Lausanne,CHUV (Centre Hospitalier Universitaire Vaudois), Route du Bugnon 46, 1011 Lausanne, Switzerland4Unit of Population Epidemiology, Division of Primary Care Medicine, Department of Community Medicine, Primary Care andEmergency Medicine, Geneva University Hospitals, Rue Gabrielle-Perret-Gentil 4, 1211 Geneva 14, Switzerland
RATIONALE: The aim of the work was to develop and validate a method for the quantification of vitamin D metabolitesin serum using ultra-high-pressure liquid chromatography coupled to mass spectrometry (LC/MS), and to validate ahigh-resolution mass spectrometry (LC/HRMS) approach against a tandem mass spectrometry (LC/MS/MS) approachusing a large clinical sample set.METHODS: A fast, accurate and reliable method for the quantification of the vitamin D metabolites, 25-hydroxyvitaminD2 (25OH-D2) and 25-hydroxyvitamin D3 (25OH-D3), in human serum was developed and validated. The C3 epimer of25OH-D3 (3-epi-25OH-D3) was also separated from 25OH-D3. The samples were rapidly prepared via a protein precipi-tation step followed by solid-phase extraction (SPE) using an HLB melution plate. Quantification was performed usingboth LC/MS/MS and LC/HRMS systems.RESULTS: Recovery, matrix effect, inter- and intra-day reproducibility were assessed. Lower limits of quantification(LLOQs) were determined for both 25OH-D2 and 25OH-D3 for the LC/MS/MS approach (6.2 and 3.4 mg/L, respec-tively) and the LC/HRMS approach (2.1 and 1.7 mg/L, respectively). A Passing & Bablok fit was determined betweenboth approaches for 25OH-D3 on 662 clinical samples (1.11 + 1.06x). It was also shown that results can be affected bythe inclusion of the isomer 3-epi-25OH-D3.CONCLUSIONS: Quantification of the relevant vitamin D metabolites was successfully developed and validated here. Itwas shown that LC/HRMS is an accurate, powerful and easy to use approach for quantification within clinical labora-tories. Finally, the results here suggest that it is important to separate 3-epi-25OH-D3 from 25OH-D3. Copyright© 2012 John Wiley & Sons, Ltd.
(wileyonlinelibrary.com) DOI: 10.1002/rcm.6439
The measurement of metabolites related to the vitamin Dendocrine system continues to be a topic of high interestwithin many clinical laboratories.[1–4] These metabolites,which play a key role in calcium homeostasis, are vital tothe body, mainly linked with controlling skeletal health inhumans.[5] More recently, the vitamin D system has also beenlinked to diabetes, hypertension and cancer.[6,7] Themost usefulmarker for vitamin D status in plasma is generally accepted to
* Correspondence to: H. Henry, Clinical Chemistry, UniversityHospital of Lausanne, CHUV (Centre Hospitalier Universi-taire Vaudois), Route du Bugnon 46, 1011 Lausanne,Switzerland.E-mail: [email protected]
Rapid Commun. Mass Spectrom. 2013, 27, 200–206
be 25-hydroxyvitamin D3 (25OH-D3), which is formed in theliver from its precursor, vitamin D3 (cholecalciferol). Furthermetabolism of 25OH-D3 takes place in the kidney, forming1,25-dihydroxyvitamin D3 (1,25-diOH-D3); however, mostresearchers have previously regarded 1,25-diOH-D3 as amarker of relatively low importance, and it has previously beenshown not to be a good marker for vitamin D status.[8]
Methods for the quantification of vitamin D metabolites,mainly 25OH-D3 and 25OH-D2, are increasingly beingswitched from immunoassays (IAs) and radioimmunoassays(RIAs) to liquid chromatography coupled to tandem massspectrometry (LC/MS/MS).[1,9–17] There have been a numberof studies on vitamin D metabolites which have shown thatLC/MS/MS methods correlate well with results obtainedfrom commercial RIAs.[2,18–21] Many of these RIAs and
Copyright © 2012 John Wiley & Sons, Ltd.

Quantification of vitamin D metabolites in serum
LC/MS/MS approaches fail to separate and account for the3-epi-25OH-D3, which is usually not detectable in most adultserum, but has been reported by Singh et al. to account for asignificant proportion of total circulating 25-hydroxyvitaminD in over 22% of infants (< 1 year old) tested within theirstudy.[22] Other more recently published articles have alsoreported on the presence and importance of measuring3-epi-25OH-D3 in serum.[23–26] This evidence suggests that aroutine clinical method for the quantification of vitamin Dmetabolites in human serum should be one that can separateand detect 3-epi-25OH-D3 from 25OH-D3. There have beenmore recent LC/MS/MS-based methods reported that doaddress the issue of 3-epi-25OH-D3.[22,27,28] All these methodsencompass similar LC/MS/MS approaches, using reversed-phase columns and run times below 20 min, but onlySchleicher et al.[27] and Shah et al.[28] show clear separationof the 3-epi-25OH-D3.Previous mass spectrometry based methods reported for
quantification of vitamin D metabolites have utilized triple-quadrupole mass spectrometers, applying selective reactionmonitoring (SRM) with isotopic dilution for quantification.Here we have also in part employed such an approach, buthave additionally used a potentially more powerful high-resolution orbitrap Exactive Plus system coupled to ultra-high-pressure liquid chromatography (LC/HRMS) on thesame sample set, allowing us to validate and observe thebenefits of employing accurate mass on clinical samples.The relatively recent introduction of bench-top orbitraphigh-resolution mass spectrometry offers the prospect ofperforming routine quantification using accurate mass whilstacquiring potentially important additional information(quantitative/semi-quantitative and qualitative).[29–32] Thereis no need with LC/HRMS to set additional parameters thatcould affect sensitivity and data quality which is a possibilitywith triple-quadrupole instrumentation. High-resolutionaccurate mass technology may potentially have an importantrole in clinical laboratories and beyond for quantitativeanalysis and it is important to test and validate suchtechnology for important routine clinical work such as thatfor vitamin D metabolites.Here we present a robust and efficient method for extraction
and quantification of the vitamin D metabolites 25OH-D2and 25OH-D3, with separation from the potentially interfering3-epi-25OH-D3, for routine clinical analysis of plasma samples,using LC/MS/MS and also LC/HRMS. The same clinicalsamples were run on both systems allowing a direct compari-son of sample data, along with commercially available externalcontrol samples, quality control samples (QCs) and in-housepooled plasma for inter- and intra-day analysis.
20
EXPERIMENTAL
Chemicals
LC/MS grade methanol and formic acid (FA) were purchasedfrom Fluka (Hannover, Germany); ultra-pure water usedthroughout was from a Synergy UV ultra-pure water systemwith a 0.22 mm filter from Millipore (Billerica, MA, USA).The internal standards d3-25OH-D3, d6-25OH-D2 (for matrixeffect determination only) and d6-3-epi-25OH-D3 were pur-chased from Isosciences (King of Prussia, PA, USA) and
Copyright © 2012 JRapid Commun. Mass Spectrom. 2013, 27, 200–206
Toronto Research Chemicals Inc. (Toronto, Canada), respec-tively. Zinc sulfate monohydrate was purchased from Sigma(St. Louis, MO, USA).
Samples, calibrators, QCs, charcoal-stripped serum andpooled serum QCs
The clinical samples measured (n= 662) were from theCentre Hospitalier Universitaire Vaudois (CHUV), Lausanne,Switzerland. The external control serum samples (n = 12) withcombined 25OH-D (all 25OH-vitamin D isomers combined)with given target values previously determined by LC/MS/MSwere from INSTAND e.V. (Düsseldorf, Germany). Thecalibrators and QCs, namely: Multilevel Serum CalibratorSet 25OH-Vitamin D3/D2 (4 point calibrants for 25OH-D2and 25OH-D3) and 25OH-D3/D2 Serum Control Level I,25OH-D3/D2 Serum Control Level II, respectively, wereobtained from ChromSystems (Gräfelfing, Germany). Thepooled serum QC used for inter and intra-day variabilitywas prepared by pooling ten in-house serum samples (CHUV,Lausanne, Switzerland) and preparing aliquots (180 mL) inEppendorf tubes (1.5 mL), which were stored at –80 �C untilrequired. Charcoal-stripped human serum was purchasedfrom Innovative Research (Novi, MI, USA).
Internal standards
Two stock solutions of labeled internal standards (500 mmol/L d3-25OH-D3 and 250 mmol/L d6-3-epi-25OH-D3 in metha-nol) were initially prepared and stored at –80 �C. From thesestocks, a working internal standard (ISTD) solution(1800 nmol/L d3-25OH-D3 and 800 nmol/L d6-epi-25OH-D3)was prepared in methanol, and stored in aliquots at –80 �C. Just prior to sample preparation, one of the workingISTD solution aliquots was diluted with methanol to make30 nmol/L d3-25OH-D3 and 13 nmol/L d6-3-epi-25OH-D3in a final volume of 70 mL (ISTD mix); this solution was goodto comfortably prepare a full 96-well plate of samples.
Sample preparation
Samples were thawed at room temperature, briefly vortexmixed, and placed using a pipette (150 mL) into Eppendorftubes (1.5 mL). To each sample was added 0.2 M ZnSO4 solu-tion (150 mL) followed by the ISTDMix (600 mL) containing thelabeled internal standards. The samples then underwent aquick vortex by hand, and were placed onto an Orbit M60sample shaker (Labnet, NJ, USA) for 10 min to allow fullprecipitation of proteins, after which they underwent centrifu-gation (14000 rpm, 4 �C, 5 min). A SPE Oasis HLB melution96-well plate from Waters (Milford, MA, USA) was preparedby passing through each well: methanol (200 mL) followed byultra-pure water (200 mL) under vacuum. The sample super-natants (750 mL) were removed using a pipette and added toindividual wells on the HLB plate, which were then passedthrough the plate under vacuum. This was followed by twowashing steps: 5% (v/v) methanol solution (200 mL) followedby a 60% (v/v) methanol solution (200 mL). Finally a 96-wellcollection plate containing 34 mL of ultra-pure water in eachwell was placed under the HLB plate, and the analytes wereflushed through the HLB plate under vacuum using methanol(100 mL). The final contents of each well of the collection platewere transferred into LC/MS vials for analysis.
wileyonlinelibrary.com/journal/rcmohn Wiley & Sons, Ltd.
1

S. J. Bruce et al.
202
LC/MS/MS
TheLC/MS/MS system comprised of an autosampler (CTC-PALAnalytics, Switzerland), an ultra-high-pressure transcendpump Janeiro CNS system (Thermo Scientific, Bremen,Germany) run in the high-pressure mode, and a FinniganTSQ Quantum Discovery Max triple-quadrupole mass spec-trometer (Thermo Scientific, Bremen, Germany) operatingwith positive electrospray ionisation (ESI) in the SRM modewith Xcalibur software version 2.1. Samples were injected(20 mL) onto a Zorbax SB-CN 1.8-mm rapid-resolution column(2.1�100mm; Agilent, CA, USA). The flow rate was set to 350mL/min throughout. Themobile phase comprised of A=ultra-pure water with 0.1% formic acid (FA) (v/v), and B=metha-nol with 0.1 % FA (v/v), the starting mobile phase conditionswere A= 34% and B=66%, run with a gradient until 3.0 minwhere A=28% and B= 72%, these conditions were held until6.0 min, at 6.1 min A=0% and B=100% until 7.3 min. Startconditions were re-instated at 8 min and held until 12 min.The flow was directed away from the mass spectrometer forthe first 3 min, to the mass spectrometer for the following5 min, and away again for the final 4 min. The spray voltagewas set at 4500 V, sheath gas pressure=50 (arb), auxillarygas pressure = 20 (arb), capillary temperature=350 �C witha skimmer offset = 10 Vand aQ2 gas pressure=1.5 (arb). A scantime of 0.075 swas used and the SRM transitions used for quan-tification for each analyte were: 401.3! 383.3 (25OH-D3 and 3-epi-25OH-D3), 413.3! 395.3 (25OH-D2), 404.3! 386.3 (d3-25OH-D3) and 407.4! 389.3 (d6-3-epi-25OH-D3). The ISTDd6-3-epi-25OH-D3was validated and used for quantificationof 25OH-D2, the reason being that originally the corre-sponding labeled internal standard for 25OH-D2 (d6-25OH-D2) produced chromatographic and m/z overlapwith 25OH-D3, possibly due to in-source fragmentationwhich created an additional ’precursor ion’ of 401, whichinterfered with the SRM transition for 25OH-D3.
LC/HRMS
The LC/HRMS system consisted of an autosampler (CTC-PALAnalytics, Switzerland), an ultra-high-pressure Accela 1250pump (Thermo Scientific, Bremen, Germany) run in thehigh-pressure mode and an orbitrap Exactive Plus massspectrometer system (Thermo Scientific, Bremen, Germany),run by Xcalibur software version 2.2. The LC method variedslightly from that of the LC/MS/MS method and, althoughthe pump lines were checked/calibrated, the pump pressurereadout when the same column was attached varied to thatof the LC/MS/MS system, and slightly altered the retentiontimes. Separation was achieved for all analytes via bothmethods (LC/MS/MS and LC/HRMS), but due to the slightdifference with the pumps and change to the LC method,the retention times of the analytes varied a little betweenthe two approaches (Fig. 1 and Supplementary Fig. S1,see Supporting Information). The Exactive Plus systemwas run using the Full MS mode, with a scan range set at300–800m/z in the ESI positive mode with a heated ESI probe(H-ESI). The m/z resolution was set at 140 000, AGC Target =1e6, maximum IT= 100 ms, microscans = 1, sheath gas = 40(arb), aux gas = 5 (arb), sweep gas = 0 (arb), spray voltage =4000 V, capillary temperature = 320 �C and the heatertemperature=310 �C. For both the LC/MS/MS and LC/HRMS
wileyonlinelibrary.com/journal/rcm Copyright © 2012 John Wil
methods, including the needle wash and injection sequence,the time between injections was ~13.5 min.
Statistical analysis
Quantification was performed using Xcalibur 2.2 (for both theLC/MS/MS and LC/HRMS results). Final quantificationresults were exported to excel short reports. Further analysisand data comparisons were achieved using Analyse-ITsoftware Ltd. (Leeds, UK) for Microsoft excel.
Method validation
The method validation was based on the recommendationspublished by the Food and Drug Administration (FDA,May 2001).[33] The lower limit of quantification (LLOQ) for25OH-D2 was determined by spiking different concentrationsof 25OH-D2 (16.5, 12.4, 8.3, 6.2, 4.1, 2.1, 0.8, 0.4 and 0 mg/L)into charcoal-stripped serum, with each spiked concentrationprepared in triplicate as described in the section “Samplepreparation”. Analysis of the non-spiked charcoal-strippedserum, despite the ’stripped treatment’ still had significantlevels of 25OH-D3 (but no 25OH-D2 present). Therefore, forthe determination of the LLOQ for 25OH-D3, the multilevelserum calibrator sample point 2 (see section “Samples,calibrators, QCs, charcoal-stripped serum and pooled serumQCs”) was diluted with ultra-pure water to give thefollowing concentrations of 25OH-D3 (6.9, 3.4, 1.7, 0.7, 0.3and 0.2 mg/L); each concentration level was prepared andinjected in triplicate as described in the section “Samplepreparation”. The matrix effects were evaluated by post-spiking pooled serum QCs (n= 5) and blank samples(replacing serumwith ultra-pure water, n = 5) with the labeledstandards d3-25OH-D3 and d6-25OH-D2 to give a finalconcentration of 150 nmol/L for both labeled standards, andcomparing the signal intensities between the serum andblank samples.
RESULTS
A reliable and stable liquid chromatography separation of25OH-D3, 3-epi-25OH-D3 and 25OH-D2 was obtained bysystematic tuning of the LC mobile phase consisting of H2Owith 0.1% (v/v) FA and methanol with 0.1% (v/v) FA (Fig. 1,Supplementary Fig. S1, see Supporting Information).
As part of the assay validation, recovery, matrix effect andlower limits of quantification (LLOQs) were all determined(Table 1). The LLOQs with the LC/MS/MS system for25OH-D2 and 25OH-D3 were 6.2 and 3.4 mg/L, respectively,and with the LC/HRMS system 2.1 and 1.7 mg/L, respec-tively. Inter- and intra-day variability for both the LC/MS/MSand LC/HRMS methods were assessed using both thevitamin D QCs from ChromSystems (QC Level I, targetvalues = 17.4 and 16.7 mg/L for 25OH-D2 and 25OH-D3,respectively, and QC Level II, target values = 38.7 and38.4 mg/L for 25OH-D2 and 25OH-D3, respectively) and thepooled in-house serum QC (QC serum) (see section "Samplepreparation") (Table 2). For the intra-day analysis, six serumQCs were prepared and injected on the same day for eachof the two methods (LC/HRMS and LC/MS/MS); the25OH-D2 levels were not detected (too low/not present
ey & Sons, Ltd. Rapid Commun. Mass Spectrom. 2013, 27, 200–206

25OH-D3
d3-25OH-D3 (ISTD)
25OH-D2 (not present)
d6-3-epi-25OH-D3 (ISTD)
5 ppm mass tolerance (m/z) =
401.33940 – 401.34342
Exact m/z = 401.34141
(B)
25OH-D3
d3-25OH-D3 (ISTD)
25OH-D2 (not present)
d6-3-epi-25OH-D3 (ISTD)
m/z 401.3 383.3
m/z 404.3 386.3
m/z 413.3 395.3
m/z 407.4 389.3
(A)
5 ppm mass tolerance (m/z) =
404.35822 – 404.36226
Exact m/z = 404.36024
5 ppm mass tolerance (m/z) =
413.33934 – 413.34348
Exact m/z = 413.34141
5 ppm mass tolerance (m/z) =
407.37703 – 407.38111
Exact m/z = 407.37907
3-epi-25OH-D3
3-epi-25OH-D3
2.0 2.5 3.0 3.5 4.0 4.5 5.0 5.5 6.0 6.5 7.0 7.5 8.0 8.5 9.0 9.5 10.0
Time (min)
0
20
40
60
80
1000
20
40
60
80
1000
20
40
60
80
1000
20
40
60
80
100
Rel
ativ
e A
bu
nd
ance
2.0 2.5 3.0 3.5 4.0 4.5 5.0 5.5 6.0 6.5 7.0 7.5 8.0 8.5 9.0 9.5 10.0
Time (min)
020
40
60
80
1000
20
40
60
80
1000
20
40
60
80
1000
20
40
60
80
100
Rel
ativ
e A
bu
nd
ance
Figure 1. Patient serum sample chromatograms of 25OH-D, 3-epi-25OH-D3, d3-25OH-D3, 25OH-D2 and d6-3-epi-25OH-D3 with 3-epi-25OH-D3 below the LODfor (A) LC/MS/MS SRM transitions and (B) LC/HRMS with the Xcaliburm/z tol-erance setting at 5 ppm.
Quantification of vitamin D metabolites in serum
20
within QC serum), the 25OH-D3 variability was determinedto be 2.0% for both the LC/MS/MS and LC/HRMS methods.For the inter-day analysis, QC Level I and QC Level IIsamples were prepared and injected in duplicate with everysingle 96-well plate preparation, with ten preparationsassessed here for both the LC/MS/MS and LC/HRMSmethods (n = 10 for both QC Levels I and II); additionally,serum QCs were prepared in triplicate and injected over fiveseparate preparations, i.e. on five different days (for the inter-day validation using the QC serum samples, n=5) for boththe LC/MS/MS and LC/HRMS methods (Table 2). From theintra-day studies, all results described displayed variations<5.0% with the exception of 25OH-D2 within the QC Level IImeasured by the LC/MS/MS which was 6.2% (Table 2).
Copyright © 2012 JRapid Commun. Mass Spectrom. 2013, 27, 200–206
Quantification of 25OH-D2 and 25OH-D3 was performedusing both analytical methods (LC/MS/MS and LC/HRMS)on clinical serum samples (n = 662), prepared once andrun on both systems (the LC/MS/MS system followed byLC/HRMS) and kept at 4 �C between analyses. Data wascollated and subjected to a non-parametric Passing & Bablokfit for method comparison for 25OH-D3 (Fig. 2). Both theLC/MS/MS and LC/HRMS methods displayed goodcorrelation for the measurement of 25OH-D3, with a Passing& Bablok fit = 1.11 + 1.06x (Fig. 2).
The external control serum samples (n = 12, see section“Sample preparation”) were measured and results comparedwith the target values from INSTAND e.V. (also by LC/MS/MS,see section "Sample preparation") using the LC/MS/MS
wileyonlinelibrary.com/journal/rcmohn Wiley & Sons, Ltd.
3

S. J. Bruce et al.
204
approach. Quantification was actually performed via the in-house LC/MS/MS method on solely 25OH-D3, and also on25OH-D3+3-epi-25OH-D3 combined (taking simply the sumof the peak areas of both 25OH-D3 and 3-epi-25OH-D3 to usefor subsequent quantification), therefore allowing an insight intothe significance of separating the metabolites. A clear correlationwas observed between the in-house LC/MS/MS combinedquantification (25OH-D3+3-epi-25OH-D3) and the external con-trol target values via LC/MS/MS from INSTAND e. V. (Passing& Bablok fit =–0.05+0.96x). However, a slightly lower correla-tion was observed for the in-house LC/MS/MS of solely25OH-D3 and the external control target values (Passing &Bablok fit =–0.64+0.88x) (Fig. 3).
DISCUSSION
It is clear that clinical laboratories are moving more towardsmass spectrometry based technology for routine quantitativeanalysis. Isotopic dilution LC/MS/MS-based approachesallow superior selectivity and sensitivity than most availableassays for routine analysis. The increasing demand for vita-min D metabolite analysis in recent years has seen the
Table 1. Recovery values in relation to the sample pre-paration by LC/MS/MS only. Matrix effect and LLOQvalues for both LC/MS/MS and LC/HRMS, all deter-mined for both 25OH-D2 and 25OH-D3 (see Experimentalsection)
Validationparameter
LC/MS/MS LC/HRMS
25OH-D2 25OH-D3 25OH-D2 25OH-D3
Recovery (%) 102.6 104.7 – –Matrix effect (%) –12.7 –5.8 –9.6 –10.9LLOQ (mg/L) 6.2 3.4 2.1 1.7
Table 2. Intra- and inter-day data for 25OH-D2 and 25OH-D3The QCs (QC Level I, target values = 17.4 and 16.7 mg/L for 25values=38.7 and 38.4 mg/L for 25OH-D2 and 25OH-D3, respectivintra- and inter-day analysis. 25OH-D2 was not observed/detecta
Sample
LC/HR
25OH-D2
QC Level I Inter-day (n = 10)Mean (mg/L) 17.9CV (%) 3.4
QC Level II Inter-day (n = 10)Mean (mg/L) 39.3CV (%) 4.9
QC Serum Intra-day (n = 6)Mean (mg/L) n.d.CV (%) n.d.
QC Serum Inter-day (n= 5)Mean (mg/L) n.d.CV (%) n.d.
n.d. = not detected
wileyonlinelibrary.com/journal/rcm Copyright © 2012 John Wil
introduction of many new immunoassay kits and reportedLC/MS-based methods for analysis.[2] Some of these kitsand methods fail to differentiate between different metabo-lites (e.g. 25OH-D2, 25OH-D3 and 3-epi-25OH-D3), and
measured on both the LC/MS/MS and LC/HRMS systems.OH-D2 and 25OH-D3, respectively, and QC Level II, targetely) for inter-day only, and the pooled serum QC for both theble within the QC serum samples
MS LC/MS/MS
25OH-D3 25OH-D2 25OH-D3
16.9 17.6 16.24.7 3.5 4.6
37.8 39.3 38.62.8 6.2 5.0
17.2 n.d. 16.82.0 n.d. 2.0
17.1 n.d. 17.71.0 n.d. 4.5
Figure 2. (A) Passing & Bablok fit for 25OH-D3 in 662 clinicalserum samples prepared and measured on both the LC/MS/MSand LC/HRMS systems. (B) Corresponding residual plot for (A).
ey & Sons, Ltd. Rapid Commun. Mass Spectrom. 2013, 27, 200–206
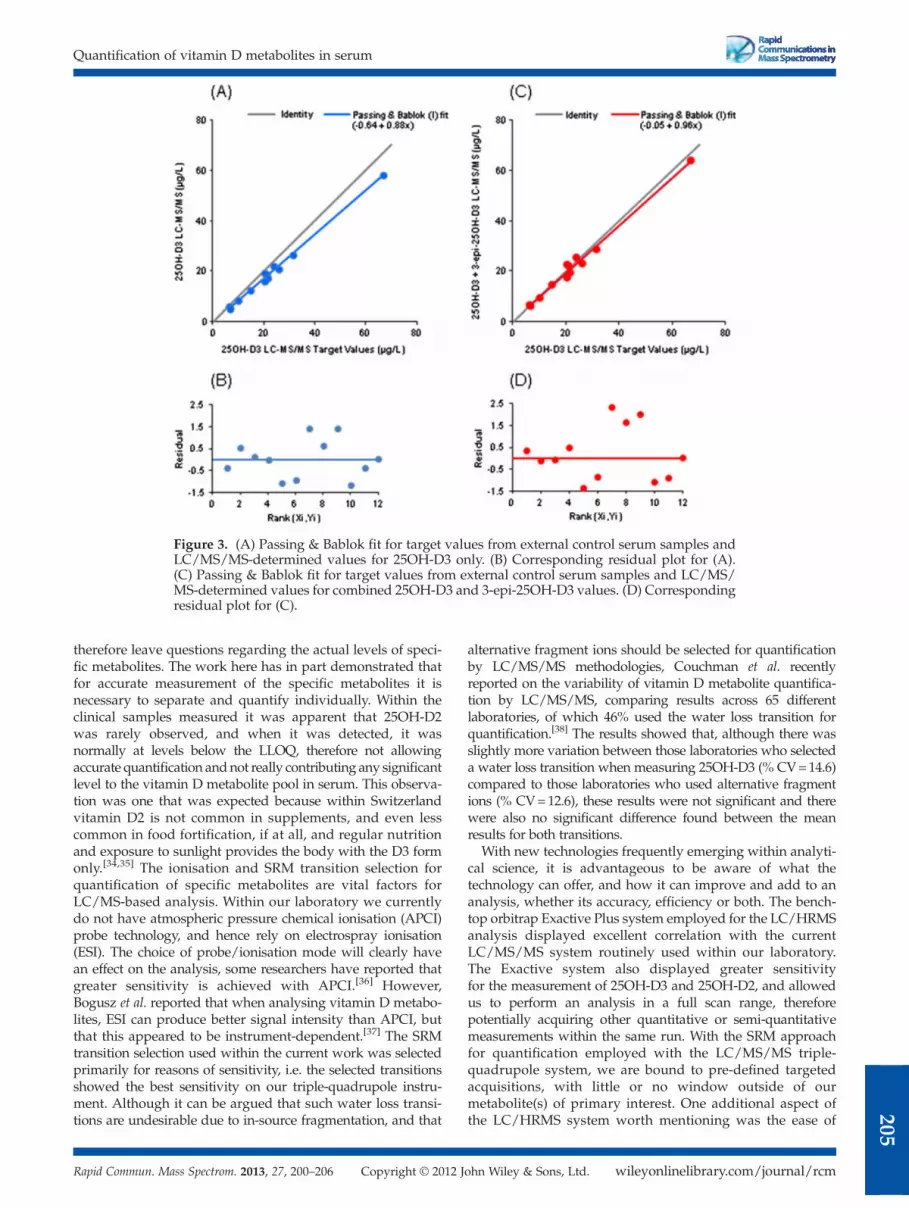
Figure 3. (A) Passing & Bablok fit for target values from external control serum samples andLC/MS/MS-determined values for 25OH-D3 only. (B) Corresponding residual plot for (A).(C) Passing & Bablok fit for target values from external control serum samples and LC/MS/MS-determined values for combined 25OH-D3 and 3-epi-25OH-D3 values. (D) Correspondingresidual plot for (C).
Quantification of vitamin D metabolites in serum
20
therefore leave questions regarding the actual levels of speci-fic metabolites. The work here has in part demonstrated thatfor accurate measurement of the specific metabolites it isnecessary to separate and quantify individually. Within theclinical samples measured it was apparent that 25OH-D2was rarely observed, and when it was detected, it wasnormally at levels below the LLOQ, therefore not allowingaccurate quantification andnot really contributing any significantlevel to the vitamin D metabolite pool in serum. This observa-tion was one that was expected because within Switzerlandvitamin D2 is not common in supplements, and even lesscommon in food fortification, if at all, and regular nutritionand exposure to sunlight provides the body with the D3 formonly.[34,35] The ionisation and SRM transition selection forquantification of specific metabolites are vital factors forLC/MS-based analysis. Within our laboratory we currentlydo not have atmospheric pressure chemical ionisation (APCI)probe technology, and hence rely on electrospray ionisation(ESI). The choice of probe/ionisation mode will clearly havean effect on the analysis, some researchers have reported thatgreater sensitivity is achieved with APCI.[36] However,Bogusz et al. reported that when analysing vitamin D metabo-lites, ESI can produce better signal intensity than APCI, butthat this appeared to be instrument-dependent.[37] The SRMtransition selection used within the current work was selectedprimarily for reasons of sensitivity, i.e. the selected transitionsshowed the best sensitivity on our triple-quadrupole instru-ment. Although it can be argued that such water loss transi-tions are undesirable due to in-source fragmentation, and that
Copyright © 2012 JRapid Commun. Mass Spectrom. 2013, 27, 200–206
alternative fragment ions should be selected for quantificationby LC/MS/MS methodologies, Couchman et al. recentlyreported on the variability of vitamin D metabolite quantifica-tion by LC/MS/MS, comparing results across 65 differentlaboratories, of which 46% used the water loss transition forquantification.[38] The results showed that, although there wasslightly more variation between those laboratories who selecteda water loss transition when measuring 25OH-D3 (% CV=14.6)compared to those laboratories who used alternative fragmentions (% CV=12.6), these results were not significant and therewere also no significant difference found between the meanresults for both transitions.
With new technologies frequently emerging within analyti-cal science, it is advantageous to be aware of what thetechnology can offer, and how it can improve and add to ananalysis, whether its accuracy, efficiency or both. The bench-top orbitrap Exactive Plus system employed for the LC/HRMSanalysis displayed excellent correlation with the currentLC/MS/MS system routinely used within our laboratory.The Exactive system also displayed greater sensitivityfor the measurement of 25OH-D3 and 25OH-D2, and allowedus to perform an analysis in a full scan range, thereforepotentially acquiring other quantitative or semi-quantitativemeasurements within the same run. With the SRM approachfor quantification employed with the LC/MS/MS triple-quadrupole system, we are bound to pre-defined targetedacquisitions, with little or no window outside of ourmetabolite(s) of primary interest. One additional aspect ofthe LC/HRMS system worth mentioning was the ease of
wileyonlinelibrary.com/journal/rcmohn Wiley & Sons, Ltd.
5
S. J. Bruce et al.
206
use; we were able to by-pass all tuning of ions, and believesimilar set-ups can be employed for quantification of othermetabolites using this technology in the future. Thesepoints, coupled with the results shown here, strengthenthe argument that the future of LC/MS-based measure-ments within the clinical laboratory and elsewhere couldlie with high-resolution based mass spectrometry.
CONCLUSIONS
An efficient and accurate method for the quantification of25OH-D2 and 25OH-D3, with additional separation of 3-epi-25OH-D3 in serum for routine clinical analysis, wasvalidated here. Recovery, matrix effect, inter- and intra-dayvariability and LLOQs were all assessed. A large sample setof clinical serum samples (n = 662) was prepared via themethod described here and measured using two differentLC/MS-based approaches (LC/MS/MS and LC/HRMS).The methods displayed excellent correlation (Passing &Bablok fit), and similar LLOQs were obtained, with theLC/HRMS method showing better sensitivity for the 25OH-D3.With the use of external control serum samples, it was alsoshown that separating the 3-epi-25OH-D3 metabolite from25OH-D3 can affect the accuracy of results if the requirementis to quantify each specific metabolite.
SUPPORTING INFORMATION
Additional supporting information may be found in theonline version of this article.
AcknowledgementsThanks to Subodh Nimkar, Maciej Bromirski and colleaguesat Thermo Scientific for help and support with instrumenta-tion, and thanks to Gislinde Gundel and colleagues at Watersfor help and advice with the sample preparation. This studywas funded in part by the Loterie Romande. IG is supportedby an SNF grant (SNF 33CM30-124087/1). Thanks to PeterVollenweider and colleagues from the CoLaus project.
REFERENCES
[1] D. Eyles, C. Anderson, P. Ko, A. Jones, A. Thomas, T. Burne,P. B. Mortensen, B. Norgaard-Pedersen, D. M. Hougaard,J. McGrath. Clin. Chim. Acta 2009, 403, 145.
[2] C. J. Farrell, S. Martin, B. McWhinney, I. Straub, P. Williams,M. Herrmann. Clin. Chem. 2012, 58, 531.
[3] K. S. Jones, I. Schoenmakers, L. J. Bluck, S. Ding, A. Prentice.Br. J. Nutr. 2012, 107, 1128.
[4] E. A. Yetley, C. M. Pfeiffer, R. L. Schleicher, K. W. Phinney,D. A. Lacher, S. Christakos, J. H. Eckfeldt, J. C. Fleet,G. Howard, A. N. Hoofnagle, S. L. Hui, G. L. Lensmeyer,J. Massaro, M. Peacock, B. Rosner, D. Wiebe, R. L. Bailey,P. M. Coates, A. C. Looker, C. Sempos, C. L. Johnson,M F. Picciano, D. R. o. t. N. M. o. S. D. A. C. Vitamin,T. Options for Resolving. J. Nutr. 2010, 140, 2030S.
[5] J. M. Pettifor, A. Prentice. Best Pract. Res. Clin. Endocrinol.Metab. 2011, 25, 573.
[6] W. Janssens, A. Lehouck, C. Carremans, R. Bouillon, C.Mathieu,M. Decramer. Am. J. Respir. Crit. Care Med. 2009, 179, 630.
wileyonlinelibrary.com/journal/rcm Copyright © 2012 John Wil
[7] M. F. Holick. N. Engl. J. Med. 2007, 357, 266.[8] A. S. Dusso, A. J. Brown, E. Slatopolsky. Am. J. Physiol. Renal
Physiol. 2005, 289, F8.[9] M. Vogeser. J. Steroids Biochem. Mol. Biol. 2010, 121, 565.
[10] J. Adamec, A. Jannasch, J. Huang, E. Hohman, J. C. Fleet,M. Peacock, M. G. Ferruzzi, B. Martin, C. M. Weaver.J. Sep. Sci. 2011, 34, 11.
[11] P. A. Aronov, L. M. Hall, K. Dettmer, C. B. Stephensen,B. D. Hammock. Anal. Bioanal. Chem. 2008, 391, 1917.
[12] L. Bilodeau, G. Dufresne, J. Deeks, G. Clément, J. Bertrand,S. Turcotte, A. Robichaud, F. Beraldin, A. Fouquet. J. FoodCompos. Anal. 2011, 24, 441.
[13] G. D. Carter, J. C. Jones. Ann. Clin. Biochem. 2009, 46, 79.[14] S. Ding, I. Schoenmakers, K. Jones, A. Koulman, A. Prentice,
D. A. Volmer. Anal. Bioanal. Chem. 2010, 398, 779.[15] A. K. Saenger, T. J. Laha, D. E. Bremner, S. M. Sadrzadeh.
Am. J. Clin. Pathol. 2006, 125, 914.[16] S. Knox, J. Harris, L. Calton, A. M. Wallace. Ann. Clin.
Biochem. 2009, 46, 226.[17] D. Thibeault, N. Caron, R. Djiana, R. Kremer, D. Blank.
J. Chromatogr. B Analyt. Technol. Biomed. Life Sci. 2012,883-884, 120.
[18] H. Chen, L. F. McCoy, R. L. Schleicher, C. M. Pfeiffer. Clin.Chim. Acta 2008, 391, 6.
[19] J. M. van den Ouweland, A. M. Beijers, P. N. Demacker,H. van Daal. J. Chromatogr. B Analyt. Technol. Biomed LifeSci. 2010, 878, 1163.
[20] A.H. Terry, T. Sandrock,A.W.Meikle.Clin. Chem. 2005, 51, 1565.[21] N. Tsugawa, Y. Suhara, M. Kamao, T. Okano. Anal. Chem.
2005, 77, 3001.[22] R. J. Singh, R. L. Taylor, G. S. Reddy, S. K. Grebe. J. Clin.
Endocrinol. Metab. 2006, 91, 3055.[23] H. C. Stepman, A. Vanderroost, D. Stockl, L. M. Thienpont.
Clin. Chem. Lab. Med. 2011, 49, 253.[24] F. Granado-Lorencio, E. Rubio, I. Blanco-Navarro,
B. Perez-Sacristan, R. Rodriguez-Pena, F. J. Garcia Lopez.Food Chem. Toxicol. 2012, 50, 2106.
[25] F. G. Strathmann, K. Sadilkova, T. J. Laha, S. E. LeSourd,J. A. Bornhorst, A. N. Hoofnagle, R. Jack. Clin. Chim. Acta2012, 413, 203.
[26] G. Lensmeyer, M. Poquette, D. Wiebe, N. Binkley. J. Clin.Endocrinol. Metab. 2012, 97, 163.
[27] R. L. Schleicher, S. E. Encisco,M.Chaudhary-Webb, E. Paliakov,L. F. McCoy, C. M. Pfeiffer. Clin. Chim. Acta 2011, 412, 1594.
[28] I. Shah, R. James, J. Barker, A. Petroczi, D. P. Naughton.Nutr. J. 2011, 10, 46.
[29] J. L. Jiwan, P. Wallemacq, M. F. Herent. Clin. Biochem.2011, 44, 136.
[30] R. Pinhancos, S. Maass, D. M. Ramanathan. J. MassSpectrom. 2011, 46, 1175.
[31] H.Henry,H. R. Sobhi, O. Scheibner,M. Bromirski, S. B.Nimkar,B. Rochat. Rapid Commun. Mass Spectrom. 2012, 26, 499.
[32] M. Oppermann, N. E. Damoc, C. Crone, T. Moehring,H. Muenster, M. Hornshaw.Methods Mol. Biol. 2012, 860, 145.
[33] FDA, 2001. Available: http://www.labcompliance.de/documents/FDA/FDA-Others/Laboratory/f-507-bioanalytical-4252fnl.pdf.
[34] L. A. Houghton, R. Vieth. Am. J. Clin. Nutr. 2006, 84, 694.[35] L. Tripkovic, H. Lambert, K. Hart, C. P. Smith, G. Bucca,
S. Penson, G. Chope, E. Hypponen, J. Berry, R. Vieth,S. Lanham-New. Am. J. Clin. Nutr. 2012, 95, 1357.
[36] S. Baecher, A. Leinenbach, J. A. Wright, S. Pongratz,U. Kobold, R. Thiele. Clin. Biochem. 2012. DOI: 10.1016/j.clinbiochem.2012.06.030.
[37] M. J. Bogusz, E. Al Enazi, M. Tahtamoni, J. A. Jawaad,M. Al Tufail. Clin. Biochem. 2011, 44, 1329.
[38] L. Couchman, C. M. Benton, C. F. Moniz. Clin. Chim. Acta2012, 413, 1239.
ey & Sons, Ltd. Rapid Commun. Mass Spectrom. 2013, 27, 200–206