hrtem and molecular modeling of the mos2–co9s8 interface: understanding the promotion effect in...
TRANSCRIPT

164 Catal. Sci. Technol., 2012, 2, 164–178 This journal is c The Royal Society of Chemistry 2012
Cite this: Catal. Sci. Technol., 2012, 2, 164–178
HRTEM and molecular modeling of the MoS2–Co9S8 interface:
understanding the promotion effect in bulk HDS catalystsw
Manuel Ramos,*ab
Gilles Berhault,*cDomingo A. Ferrer,
dBrenda Torres
aand
Russell R. Chianellia
Received 11th April 2011, Accepted 15th September 2011
DOI: 10.1039/c1cy00126d
As environmental regulations increase, more selective transition metal sulfide (TMS) catalytic
materials for hydrotreating applications are needed. Highly active TMS catalysts become more
and more desirable triggering new interest for unsupported Co-promoted MoS2-based systems
that have high volumetric activity as reported here. Contrary to the common observation for
alumina-supported MoS2-based catalysts, we found in our previous studies with dibenzothiophene
(DBT) hydrodesulfurization (HDS) that the catalytic activity is directly proportional to the
increase of surface area of the sulfide phases (Co9S8 and MoS2) present in Co-promoted MoS2unsupported catalysts. This suggests that activity is directly connected with an increase of the
contact surface area between the two sulfide phases. Understanding of the nature of the possible
interaction between MoS2 and Co9S8 in unsupported catalytic systems is therefore critical in order
to get a more generalized overview of the causes for synergy. This has been achieved herein
through the detailed characterization by XRD, XPS, and HRTEM of the highly active Co9S8/
MoS2 catalyst resulting in a proposed model for a Co9S8/MoS2 interface. This model was then
subjected to a DFT analysis to determine a reasonable description of the surface contact region
between the two bulk phases. Modelling of the interface shows the creation of open latent
vacancy sites on Mo atoms interacting with Co and formation of direct Co–Mo bonds. Strong
electron donation from Co to Mo also occurs through the intermediate sulfur atom bonded to
both metals while an enhanced metallic character is also found. These changes in coordination
and electronic properties are expected to favor a synergetic effect between Co and Mo at the
proposed localized interface region between the two bulk MoS2 and Co9S8 phases.
1. Introduction
Molybdenum sulfide is a key phase of any industrial hydro-
treating catalysts used today. However, MoS2 by itself is only
moderately active for desulfurization purposes. Addition of a
cobalt or nickel promoter is necessary to achieve highly active
catalytic systems for hydrodesulfurization (HDS).1 The
description of the promoted phase has been extensively studied
since the 1970’s leading to different proposals for explaining
the promotion effect from Co or Ni. The first attempt to
describe the promoted phase was formulated by Farragher and
Cossee who considered that Co was localized at octahedral sites
at the periphery of the edge planes of the MoS2 layered phase
in a so-called ‘‘pseudo-intercalation’’ position.2 At the same
time, Delmon and co-workers found that the unsupported
catalysts they prepared that had the MoS2 and Co9S8 phases
present were able to work together by being in close contact.3
This approach offered a good description of the synergy effect
at the macroscopic level by identifying the bulk phases present,
by noting the absence of a ternary bulk promoted phase and
by showing that hydrodesulfurization occurs at the interface
between these two bulk sulfide phases. However, their model
was not able to give insight about how these two bulk phases
interact to produce a synergetic effect. Topsøe et al. were the
first to provide experimental evidence about a specific Co
aMaterials Research Technology Institute, University of Texas at ElPaso, El Paso, TX 79968, USA.E-mail: [email protected]; Fax: +1 915 747 6007;Tel: +1 915 747 8046
bDepartamento de Fısica y Matematicas, Insituto de Ingenerıa yTecnologıa, UACJ, Ave del Charro 610, Ciudad Juarez, Mexico
c Institut de Recherches sur la Catalyse et l’Environnement,IRCELYON, CNRS – Universite de Lyon, Villeurbanne, 69100,France. E-mail: [email protected];Fax: +33 472 44 53 99; Tel: +33 472 44 53 20
dMicroelectronics Research Center, University of Texas at Austin,Austin, TX 78751, USA
w Electronic supplementary information (ESI) available: N2 adsorp-tion–desorption isotherms of the Co/MoS2-H1 catalyst; a TEM imageshowing interaction between edge planes of molybdenum sulfide withCo9S8, a schematic of the procedure used to simulate HRTEMpictures, a fragment of the ‘‘seed’’ from the interface model. SeeDOI: 10.1039/c1cy00126d
CatalysisScience & Technology
Dynamic Article Links
www.rsc.org/catalysis PAPER

This journal is c The Royal Society of Chemistry 2012 Catal. Sci. Technol., 2012, 2, 164–178 165
environment. Small amounts of 57Co introduced into bulk
MoS2 led to the observation of a specific emission Mossbauer
spectroscopy (EMS) signal different from Co9S8 called the
‘‘CoMoS’’ phase.4 Using XAFS, they were also able to show
that the atomic local structure of MoS2 was preserved.5
This model is nowadays generally accepted for supported
CoMo or NiMo systems and has unambiguously demon-
strated the specific interaction of Co or Ni with the edges of
MoS2 slabs (CoMoS ‘‘decoration’’ model). In this respect, in
the last few years, development of quantum computational
calculations by integration of Density Functional Theory
(DFT) has provided a substantial progress in understanding
the localization of Co (or Ni) at the edges of MoS2 layers
assuming the decoration model.6–10
These models are very helpful in providing an explanation
for the cause of the synergetic effect. However, they also suffer
from the absence of a unified description able to explain the
appearance of the synergetic effect when bulk Co9S8 and MoS2phases are present. Also the question of at what level of Co
addition does the Co9S8 phase appear in catalytically stabilized
unsupported catalytic systems is still open.
In a little known paper, Phillips and Fote reported that
promoted systems should be considered as mixtures of two
immiscible phases (Co9S8 and MoS2) that interact by forming
surface phases.11 Fig. 1 illustrates this concept through a
hypothetical phase diagram of Co/Mo/S catalytic systems
participating in a synergetic effect. This description of the
different promoted systems was called ‘‘symmetrical synergy’’
by Chianelli et al. and is composed of three different domains
as Co is added to the system (this approach can be similarly
considered with Ni added to MoS2 or WS2).12 The left-hand
portion of this diagram corresponds to the most accessible
zone (in terms of preparation) for supported systems. In this
region, as Co is added, the promotion effect increases until a
maximum is reached. This maximum occurs typically between
Co/Mo ratios of 0.10–0.30. Co9S8 is not detected in this region
in supported systems and only the Co/Mo/S surface phase is
found. The maximum activity will then correspond to the
optimal accommodation of cobalt at the edges of MoS2 layers
and its exact position will depend on the MoS2 edge area
available (and therefore on its slab size). The Co/Mo/S surface
phase equates with the CoMoS phase.
Further addition of cobalt favors Co9S8 segregation leading
to a region in which both bulk phases coexist. This region can
be described as the ‘‘synergy by contact’’ region dominated by
the two immiscible phases. On the right-hand portion of the
diagram, a Mo/Co/S surface phase exists which is analogous
to the Co/Mo/S surface phase but with Mo promoting Co9S8.
Due to the difficulty to prepare high surface area Co9S8, this
region has not been explored. However, very recent reports
have actually demonstrated that promotion can also be observed
in Co9S8-(or NiSx-) rich regions in the presence of few MoS2(WS2) slabs. Le et al. have observed for unsupported NiW
catalysts that the highest HDS activity per surface area was
achieved on catalysts formed of NiS bulk particles covered
with WS2 slabs.13 Similarly, Olivas et al. have found highly
active unsupported NiW systems presenting molar ratios of
R (R=Ni/(Ni +W)) in the range of 0.8–0.9.14 Finally, Wang
et al. have found unsupported NiMoW catalysts that are very
active in the HDS of 4,6-DMDBT if MoS2 or WS2 slabs are
well dispersed on a Ni7S6 substrate.15
In the presence of both bulk phases (Co9S8 and MoS2), the
HDS activity will then be the resultant of the mixture of the
two surface-enriched phases.12 This symmetrical synergy can
be applied to other promoted systems. Because of the immis-
cibility, surface phases exist in which the bulk crystal phase is
surface enriched with the other metal. The magnitude of this
enrichment and therefore of the synergetic effect will depend
on the surface area of the crystalline phases present. Moreover, it
should be remembered that in any discussion of the synergetic
effect, two questions are still open:
(1) Co9S8 (Ni3S2) can be promoted with Mo or W,
(2) at what concentrations does Co9S8 (Ni3S2) separate from
MoS2 (WS2) in catalytically stabilized materials.
Any description not addressing these points is incomplete.
Furthermore, the nature of the promoting effect is electronic
by nature thanks to the electron donation of Co to Mo
weakening the metal–sulfur bond strength up to values corres-
ponding to optimized HDS performance.16,17
Formation of surface phase Co/Mo/S or Mo/Co/S would
then permit the charge transfer from Co to Mo responsible for
promotion.12 This effect is expected to occur whatever the bulk
crystalline phases present. While the Co/Mo/S surface phase is
well described in the literature, the region where Co9S8 and
MoS2 actually coexist is not completely understood. For
example, Delmon and co-workers reported the presence of
Co9S8 at lower levels that shown in Fig. 1.3 The region where
MoS2 and Co9S8 coexist is very often characterized by a lower
but still existing synergetic effect which could result from an
ineffective use of Co (or Mo) to form the surface phase, part of
Co9S8 or MoS2 not being in contact with each other to form
such a promoted surface phase.
Comprehension of the nature of the possible interaction
between MoS2 and Co9S8 in this region where bulk phases can
coexist is therefore critical in order to get a generalized over-
view of the possible causes for synergy. Comprehension of this
synergetic effect is also important taking into account the high
volumetric activity of unsupported Co/MoS2 catalysts. The
objective of the present study is therefore to provideFig. 1 Hypothetical phase diagram for Co/Mo/S catalytic materials
illustrating the symmetrical synergy model.12

166 Catal. Sci. Technol., 2012, 2, 164–178 This journal is c The Royal Society of Chemistry 2012
information about the local structure of the MoS2/Co9S8interface. For this purpose, unsupported Co-promoted
systems in which Co9S8 and MoS2 phases coexist will be first
evaluated in the hydrodesulfurization (HDS) of dibenzothio-
phene (DBT), a model molecule representative of the refractory
sulfur compounds present in diesel fuels before being carefully
characterized to propose a possible model for the Co9S8/MoS2interface. This model will then be subjected to computational
modeling and DFT calculations in order to determine a
reasonable description of the surface contact region between
the two bulk phases. Consequences in terms of electronic
properties of the formation of such an interface will also be
presented.
2. Experimental
2.1. Preparation of the bimetallic precursors
2.1.1. Preparation of the Co/(NH4)2MoS4 precursor. The
bimetallic precursor was prepared in two steps. In a first step,
ammonium tetrathiomolybdate, (NH4)2MoS4 (ATM), was
prepared according to methods reported elsewhere.18 ATM
was generally prepared by bubbling H2S into an aqueous
solution (30 mL distilled water) of 10 g of ammonium hepta-
molybdate, (NH4)6Mo7O24�6H2O and 100 mL of NH4OH for
about 2 h. In a second step, the molybdenum precursor was
mixed with CoCl2 in aqueous solution; 1.6 g of (NH4)2MoS4 in
20 mL of water was added under stirring at room temperature
to a second solution of 0.47 g of CoCl2�1/2H2O dissolved into
10 mL of water. A black precipitate immediately formed. The
bimetallic precursor is then filtered and dried at room
temperature overnight. This compound was amorphous in nature.
The obtained Co/Mo molar ratio in this bimetallic precursor is
0.3 in agreement with the possible stoichiometric reaction:
3(NH4)2MoS4 + CoCl2 - (NH4)4Co(MoS4)3 + 2NH4Cl.
However, instability in air probably transformed this precursor
into an amorphous polymeric compound of the type
Cox(MoS4)3x keeping a Co/Mo ratio of 0.3.19
2.1.2. Preparation of the Co/(NR4)2MoS4 precursors. For
comparison purposes, some cobalt-containing tetraalkyl-
ammonium thiomolybdate precursors have been considered here
for which carbon does not contribute significantly to the total
surface area. One of these precursors contains a tetramethyl-
ammonium thiomolybdate group (called here Co/TMATM)
while the other one is formed from a tetrapentylammonium
thiomolybdate precursor (called Co/TPenATM). Their preparation
has been detailed elsewhere and does not differ substantially
from the Co/ATM method of preparation.19,20
The (NR4)2MoS4 (R = C1, C5) precursors were first
synthesized at room temperature by simply stirring ATM with
the respective tetraalkylammonium bromide salts in a 1 : 2
molar ratio in the presence of NaOH until formation of a
precipitate:
(NH4)2MoS4 + 2R4NBr + 2NaOH - (NR4)2MoS4+ 2NH4OH + 2NaBr
The precipitate is then filtered in vacuum and dried overnight
at room temperature.
The appropriate amount of (NR4)2MoS4 precursor to yield
1 g of MoS2 (2.3 g of [(CH3)4N]2MoS4 or 5.1 g of
[(C5H11)4N]2MoS4) was then dissolved into 20 mL of water
for [(CH3)4N]2MoS4 or into 50 mL of 1 : 1 ethanol/water
solution for [(C5H11)4N]2MoS4) while stirring. 10 mL of a
0.47 g of CoCl2�1/2H2O aqueous solution was then added.
A black precipitate then formed immediately. The black material
was then filtered and dried overnight at room temperature.
2.2. Preparation of the unsupported Co/MoS2 catalyst
2.2.1. Hydrothermal technique. Co/MoS2 catalysts could
be obtained through decomposition of the bimetallic precursor
under hydrothermal conditions.21 For this purpose, 5 g of the
precursor were added to water and placed inside a 0.5 L high-
pressure batch reactor. The reactor was purged with N2 at
room temperature before increasing temperature and pressure
to 300 1C and 1200 psi (82.7 bars) or 1400 psi (96.5 bars).
Temperature was maintained at 300 1C for 2 h. The desired
pressure was developed autogenously by the appropriate
amount of water addition to the closed system (for instance
50 mL of water for a pressure of 1200 psi). After cooling down
to room temperature, the recovered product was washed with
isopropanol.
2.2.2. In situ technique. Another approach to synthesize
the Co/MoS2 catalysts is to use either ex situ or in situmethods
of activation. The ex situ method consists in decomposing the
precursors under H2/H2S at 400 1C for 4 h. The resulting solid
generally presents very low surface area and will not be
considered here.22 In the in situ approach, the bimetallic
precursors are decomposed in the reaction media during the
HDS of dibenzothiophene (see below). Like for the hydro-
thermal method, the high pressure present in the batch reactor
during the catalytic test favors the formation of high surface
area unsupported Co/MoS2 catalysts.
2.3. Catalytic activity measurements
The hydrodesulfurization (HDS) of dibenzothiophene (DBT)
that has been extensively used as a model of HDS of petroleum
feedstock was carried out in a 2 L Parr model 4522 high-
pressure batch reactor. Approximately 1 g of Co/MoS2catalyst (or the appropriate amount of precursor to yield 1 g
of Co/MoS2 catalyst using the in situ technique), along with
the reactant mixture (6.6 g of DBT in 150 mL of decalin;
[DBT]0 = 0.239 mol L�1), was placed in the reactor, then
pressurized to 490 psi (33.8 bars) with hydrogen, and heated to
350 1C at a rate of 10 1Cmin�1. After the working temperature
was reached, sampling for chromatographic analysis was
taken during the course of each run to determine conversion
versus time dependence. Reaction runs averaged about 5 h.
The reaction products were analyzed using a Perkin–Elmer
model Auto-system chromatograph with a 6 ft long, 1/8 inch
packed column containing OV-3 (phenyl methyl dimethyl silicone
10% phenyl) as a separating phase supplied by Supelco.
2.4. Morphological studies
All morphological studies were performed after a test on a
steady-state stabilized catalyst working in the dibenzothiophene
hydrodesulfurization. Sorption surface analyses were

This journal is c The Royal Society of Chemistry 2012 Catal. Sci. Technol., 2012, 2, 164–178 167
performed on a NOVA 1000 instrument with a Quantachrom
Autosorb-1 model by nitrogen adsorption using the BET
isotherm method. Samples were degassed under Ar flow at
200 1C for 2 h before nitrogen adsorption.
X-Ray Diffraction (XRD) patterns of catalysts were
obtained on a Phillips X Pert MPD diffractometer operating
at 43 kV and 30 mA and equipped with a curved graphite
monochromator using Cu Ka radiation (l= 1.54056 A) in the
2y range of 7–801.
X-Ray photoelectron spectroscopy (XPS) studies were
performed on a Axis Ultra DLD (Kratos Analytical) spectro-
meter equipped with a dual Al/Mg anode. The spectra were
excited using Al Ka radiation (1486.6 eV). The XPS spectra of
Co 2p signals were recorded and their binding energies (BE)
referred to the energy of the Al 2p peak (BE 74.2 eV).
High-resolution transmission electron microscopy
(HRTEM) analysis was performed using a Schottky field
emission electron microscope FEI Tecnai TF20 (200 kV).
The unit is equipped with a STEM unit, high-angle annular
dark-field (HAADF) detector, and X-Twin lenses with a
resolution of B 2 nm. The sample was prepared by adding
0.05 g of catalytic powder in ethanol in a glass vial. The
solution was placed in ultra-sonic bath for particle dispersion.
One drop of the diluted solution was deposited onto a lacey
Cu/C 200 mesh grid. The sample was left to dry at RT for 2 h.
Energy Dispersive X-Ray (EDX) microanalysis was
performed using an EDAX detector with a solid angle of
0.13 sr. Evaluation of slab lengths and stacking degree of
MoS2 particles was performed using SigmaScan Pro5 software.
TEM simulation was carried out using the simulaTEM
software in the Cerius2 analytical 2 molecular package. The
physical meaning and principle of the TEM simulator software is
described in detail by Gomez-Rodrıguez et al.23 Basically, TEM
simulator performs a full dynamical calculation by a multi-slice
method using projected potential f ðUÞ ¼Pn
i¼1 aieð�biU2Þ, where
ai and bi are coefficients to be determined. The variable U =
(u, v, w) is used to represent coordinates in reciprocal space
(Fourier space) quantities (spatial frequencies). f(U) is the atomic
dispersion factor. TEM simulations were calculated at two
defocus conditions with the parameters used for the Tecnai
TF20 (200 kV). The following conditions were used for simulation:
chromatic Cc and spherical Cs aberration coefficients were,
respectively, 1.4 mm and 2.7 mm; the defocus condition was
�485.2 A with a beam spread of 0.3 mrad. The aperture diameter
centered at reciprocal space origin was 0.7 A�1. All calculations
were performed with a 512 � 512 sampling and slide thickness of
20 A. The general procedure used to performHRTEM simulation
is described in Fig. 2.
2.5. Density functional theory calculations
Using information obtained by conventional HRTEM obser-
vations, an interface model was constructed using Cerius2
Package and subjected to validation using projected potential
TEM simulator. Further investigations were carried out on a
selected interface model in order to understand the role of
synergic contact area between MoS2 and Co9S8 bulk species.
Calculations of Total Energy in Band Structure (BS) and
Density of States (DOS) were achieved using CASTEP code,24
as contained in Accelrys Inc. Materials Studio package. To solve
Kohn–Sham equations, a numerical expansion of the k-wave
functions was completed using a plane wave basis (PWB)
set. The exchange–correlation functional was revised by
Perdew–Burke–Ernzerhof (RPBE)25 and ultrasoft pseudo
potentials were used considering the ion-core to be frozen (ion
cores are not involved in chemical bonding). The PWB cutoff
energy was 300 eV with a self-consistent field tolerance of
1 � 10�6 eV per atom for gamma point only in reciprocal space.
The system was relaxed and geometrically optimized during DOS
and BS calculations using a thermal smearing of 0.1 eV. Since the
bulk interface model consisted of more than 100 atoms and to
reduce computational time, just a representative portion called
‘‘seed’’ was subjected to electronic calculations. The ‘‘seed’’ was
treated as a crystal using a supercell with lattice parameters,
a=14.0 A, b=20.0 A and c=6.0 A and a= b= g=901 (P1
non-symmetry) leaving sufficient empty space between adjacent
neighboring atoms to reduce electron interactions in the periodic
structure. The k-point path for band structure calculations was
set as: G(0, 0, 0), F(0, 12,0), Q(0, 1
2, 12) and Z(0, 0, 1
2).
3. Results and discussion
3.1. Unsupported CoMo catalysts: correlation between DBT
HDS activity and specific surface area
The objective of the present study is to develop a reasonable
description of unsupported CoMo catalysts for which the
Fig. 2 Flow chart diagram of the procedure used to build an inter-
face model based on HRTEM simulation.

168 Catal. Sci. Technol., 2012, 2, 164–178 This journal is c The Royal Society of Chemistry 2012
presence of bulk Co9S8 andMoS2 phases is clearly determined.
Therefore, our first objective was to optimize the synthesis of
unsupported CoMo catalysts for which both MoS2 and Co9S8bulk phases coexist and for which a strong synergetic effect
exists. Previous studies made by our research group have been
centered on the preparation of unsupported CoMo catalysts
using several synthesis methods. The different approaches
include (1) the use of carbon-containing thiomolybdate
precursors for which a beneficial role of carbon on the final
HDS activity was confirmed,19,20,26,27 and (2) hydrothermal or
open-flow hot isostatic pressing (OFHIP) techniques providing
high surface area materials.21 The detailed HDS characterization
of these unsupported CoMo catalysts can be found elsewhere
and will therefore not be discussed here extensively.19–21
Unsupported CoMo catalysts prepared from tetraalkyl-
ammonium precursors will only be considered here if carbon
coming from the thiosalts does not contribute significantly to
the total surface area. Therefore, Table 1 lists unsupported
CoMo catalysts prepared by hydrothermal or in situ techniques.
Samples are labeled L (low), M (medium) or H (high) according
to their respective surface areas. Comparison is also provided
with unsupported MoS2 and commercial CoMo/Al2O3
catalyst. The HDS activity values can vary in a large extent
from 7.2 � 10�7 mol s�1 g�1 up to 32.0 � 10�7 mol s�1 g�1.
These values are much higher than those expected for a MoS2sample prepared from ATM (Table 1). Therefore, experi-
mental conditions for the preparation of unsupported CoMo
catalysts appear critical in achieving a high synergetic effect. In
this respect, the pressure applied in the autoclave during the
decomposition of the bimetallic precursor into the unsupported
CoMo catalyst plays a key role in increasing the HDS activity.
The samples prepared under hydrothermal conditions at 1200 psi
(82.7 bars) (Co/MoS2-H1) or 1400 psi (96.5 bars) (Co/MoS2-H2)
present very high activities, respectively, 3.1 and 3.4 times higher
than for the Co/MoS2-L2 catalyst obtained by in situ decom-
position of Co/ATM at 31 bars. Moreover, in all cases, the
increase of the autoclave pressure during the decomposition of
the bimetallic precursor into the final CoMo catalyst also leads to
a very marked increase in the surface area (Table 1). A direct link
between the increase in surface area and the enhancement in
HDS activity is therefore observed as shown in Fig. 3. Since
MoS2 is an anisotropic compound, direct correlation between
surface area and HDS activity is normally unexpected since HDS
active sites are formed only at the edges of MoS2 layers.28 One
possible reason for such a difference in activity could be related
to a higher MoS2 dispersion for high surface area CoMo
catalysts, i.e. a higherMoS2 edge area. However, the determination
by TEM of the MoS2 slab size for Co/MoS2-H1 and for
Co/MoS2-L2 does not sustain this hypothesis. Indeed, while
Co/MoS2-H1 presents an average slab size of 62 A (see Section
3.2.3 for a more detailed TEM characterization), Co/MoS2-L2
exhibits a better MoS2 dispersion with an average slab size of
39 A even if less active in HDS.
Therefore, no direct correlation between the MoS2 edge area
(and the possible degree of accommodation of Co) and the
evolution of the HDS activity can be found. On the other
hand, the fact that the HDS activity correlates with the surface
area of the unsupported CoMo catalyst (then combining the
surface areas of both bulk MoS2 and Co9S8 and not only the
MoS2 edge area) is a stronger argument (even if not a direct
proof) of the necessity to get high surface contact area between
Table 1 Specific surface area, DBT HDS activity and HYD/DDS ratio of unsupported CoMo catalysts formed from either in situ orhydrothermal techniques. Co/MoS2 samples are labelled L (low), M (medium) or H (high) according to their respective surface areas. Comparisonto an unpromoted and unsupported MoS2 catalyst and to a commercial CoMo/Al2O3 is provided
Catalyst Method of preparationSpecific surfacearea/ m2 g�1
Rate constants(10�7 mol s�1 g�1) HYD/DDS ratio
MoS2a ATM precursor (Patm, 400 1C) — 1.7 1.40
Co/MoS2-L1a Co/ATM precursor (prepared at 60 1C) and in situ decomposed
under DBT HDS conditions (31 bars, 350 1C)37 7.2 0.60
Co/MoS2-L2b Co/ATM precursor (prepared at RT) and in situ decomposed
under DBT HDS conditions (31 bars, 350 1C)53 9.4 0.35
Co/MoS2-Ma Co/TMATM precursor (prepared at 60 1C) and in situ
decomposed under DBT HDS conditions (31 bars, 350 1C)117 15.4 0.41
Co/MoS2-H1c Co/ATM precursor decomposed under hydrothermal conditions
(1200 psi (82.7 bars), 300 1C)210 29.0 0.31
Co/MoS2-H2c Co/TPenATM precursor decomposed under hydrothermal conditions
(1400 psi (96.5 bars), 300 1C)250 32.0 0.37
CoMo/Al2O3 Commercial — 15.0 0.40
a From ref. 20. b From ref. 19. c From ref. 21.
Fig. 3 Dibenzothiophene HDS activity vs. specific surface area for
the different unsupported CoMo catalysts listed in Table 1. The
straight line is added only to guide the eye and emphasizes the existing
linear correlation.

This journal is c The Royal Society of Chemistry 2012 Catal. Sci. Technol., 2012, 2, 164–178 169
the two bulk sulfide phases in order to increase the possibility
to form surface Co/Mo and Mo/Co species at the MoS2/Co9S8interface as predicted in the symmetrical synergy model.12
Finally, compared to unpromoted samples, the synergetic
effect can be evaluated not only through comparison of
activity values but also through the examination of the
selectivity variations. Indeed, the HDS of DBT presents two
parallel pathways: (1) the hydrogenating (HYD) pathway
leading to the formation of tetrahydrodibenzothiophene
through hydrogenation of one of the two aromatic rings of
DBT followed by C–S bond breaking and formation of
cyclohexylbenzene, and (2) the direct desulfurization (DDS)
pathway leading to direct C–S bond rupture and formation of
biphenyl. The main effect of the cobalt promotion on MoS2 is
electronic by nature,16,29 and leads to a strong enhancement of
the DDS pathway.30–32 The MoS2 catalyst formed by in situ
decomposition of the ATM precursor under HDS conditions
shows a HYD/DDS ratio of 1.40 that shifts to 0.3–0.6 for the
different Co/MoS2 catalysts (Table 1). A strong DDS selectivity
is then achieved characteristic of a promoting effect of cobalt on
MoS2 whatever the unsupported CoMo samples.
3.2. Characterization by N2 adsorption, XRD, XPS and
(HR)TEM
In the next section of this study, one of the unsupported
CoMo catalysts presenting the most optimized textural and
catalytic properties (Co/MoS2-H1) is characterized to better
determine the morphological characteristics of the MoS2phase and the presence of an eventual Co9S8 phase which
would be susceptible to interact with molybdenum sulfide
through a hypothetic interface. This catalyst was systematically
characterized under HDS steady-state conditions and therefore it
reflects the stabilized catalytic morphology under reaction
conditions.
3.2.1. N2 adsorption–desorption isotherms. The N2
adsorption–desorption isotherms of the Co/MoS2 unsupported
catalyst were recorded before and after the hydrodesulfurization
(HDS) of dibenzothiophene (DBT) (Fig. S1, ESIw).Except for a decrease in the N2 adsorbed volume, the
isotherm curves do not present any real change after the
catalytic test and still present a composite profile closer to
the one expected for a type II than for a type IV solid
suggesting that the catalyst does not present (or presents
poorly) mesoporous organization. The hysteresis loop is also
closer to H3 type confirming that the porosity observed is
mainly due to voids inside aggregates. Therefore, the catalyst
is in fact formed of aggregated particles without any real
mesoporosity, any value of porous volume being due to
intergranular porosity. This aggregated morphology without
any real mesoporosity suggests that the surface area exposed
by the solid only results from the external surface area of the
bulk phases present. This situation differs from unsupported
CoMo catalysts obtained from tetraalkylammonium thiome-
tallates precursors for which mesoporosity was formed
through the decomposition of the organic moieties.33–37
3.2.2. X-Ray diffraction: turbostraticity and bending effects.
The XRD pattern of the Co/MoS2 unsupported catalyst is
reported in Fig. 4. A typical XRD profile characteristic of a
poorly crystalline phase was obtained showing a disordered
MoS2 structure. Molybdenum disulfide is a layered structure
formed of 2D Mo–S–Mo layers stacked in the c direction.38
MoS2 slabs can be maintained stacked but only through weak
Van der Waals interactions. Moreover, this stacking is often
imperfect leading to some rotations of MoS2 layers with
respect to each other, i.e. turbostraticity. MoS2 particles can
also present strong bending curvature effects. All these
features make MoS2 a structure presenting a very disordered
state also called ‘‘rag’’ structure’’.39
Debye–Scherrer equation applied to the full width at half
maximum (FWHM) of the (002) MoS2 diffraction peak
(Fig. 4) provides estimation of the crystalline order along the
[001] direction and thus information about the stacking
degree. A D002 value of 29.2 A was found corresponding to
an average stacking n of 4.6 layers. However, this average
stacking value only gives information about the stacking
degree of MoS2 particles presenting a multiple-layered structure
(n Z 2) since applied to the (002) diffraction peak. Excess
scattering at low angles underneath the (002) peak can also be
noticed in Fig. 4. Previous studies have shown that this excess
scattering is related to the fraction of unstacked layers which is
not taken into account in the calculation of the average stacking
value based on the Debye–Scherrer equation.38,40
The presence of this excess scattering shows that a non-
negligible proportion of unstacked layers is present. Turbo
straticity and bending effects can also influence the morphology
of MoS2-based solids. A slight displacement of the position of
the (002) and (100) reflections is generally related to such
stacking faults.41 Peak displacements are indeed observed here
resulting in a shift of the (002) diffraction peak from 2y =
14.41 (d002 = 6.17 A) to 13.91 (d002 = 6.37 A) and of the (100)
diffraction peak from 2y = 32.71 to 33.61. These peak shifts
can reflect rotation either along the a-axis (basal plane direction)
or along the c-axis (stacking direction). However, while rotation
along the c-axis only results in a shift of the (002) diffraction
peak to lower angle values without any shift of the (100)
diffraction peak, rotation along the a-axis is expected to shift
Fig. 4 X-Ray diffractogram of the Co/MoS2 unsupported catalyst.
The main MoS2 and Co9S8 diffraction peaks are shown on the pattern;
peaks for the Co9S8 phase are shown in italics.

170 Catal. Sci. Technol., 2012, 2, 164–178 This journal is c The Royal Society of Chemistry 2012
the (002) and (100) diffraction peaks, respectively, to lower and
higher angle values.41 Therefore, turbostraticity based on an inter-
layer rotation along the a-axis is observed on the Co/MoS2-H1
catalyst. It is worth noting that the shift of the (002) diffraction peak
can also result from an increase of the interlayer distance. The
turbostratic effect is also responsible for the strong anisotropy of the
(100) MoS2 envelope.42 Previous studies have also shown that
bending of the layers led to higher (110)/(100) intensity ratios than
expected from a perfectly crystalline bulk sample (I(110)/I(100) =
0.52).26,43 The actual I(110)/I(100) ratio (0.60) is slightly higher than
the expected value for highly crystalline bulk MoS2 suggesting that
bending of the layers occurs either from a minor proportion of
very bent slabs or from a large proportion of slabs but with small
bending angles.
Diffraction peaks of the Co9S8 phase (JCPDS: 01-086-2273)
are also observed at 30.41, 48.21, and 52.71 corresponding to
the (311) + (222), (511), and (440) reflections, respectively.
The (331) Co9S8 reflection overlapped with the (103) MoS2diffraction peak around 2y = 401 while the (533) + (622)
Co9S8 reflections give rise to an anisotropy of the (110) MoS2envelope at 2y = 611.
In summary, the X-ray diffraction analysis reveals the
coexistence of both MoS2 and Co9S8 bulk phases. The MoS2phase is poorly organized and is formed of slabs presenting a
high degree of stacking faults and possibly some minor bending
effects. This poorly crystalline and disorganized morphology
hampers the possibility to precisely characterize the eventual
presence of an interface between MoS2 and Co9S8. However,
partly destacked slabs and turbostratic effects are morphological
parameters which might favor the increase of the contact
surface area between the two bulk sulfide phases.
3.2.3. XPS characterization. X-Ray photoelectron spectro-
scopy was used to determine the electronic state of the cobalt
species on the Co/MoS2-H1 unsupported catalyst. After sulfi-
dation, the Co 2p core level spectrum generally reveals the
presence of three distinct phases: surface cobalt(II) oxide, the
mixed so-called ‘‘CoMoS’’ phase where Co is in decoration of
MoS2 edge planes, and Co9S8. XPS can therefore help to
distinguish between ‘‘CoMoS’’ and Co9S8 even if the positions
in binding energy (BE) between these two sulfide Co species
differ only by 0.5 eV which is the experimental resolution
limit.44 Fig. 5 reports the Co 2p core level spectra of Co/MoS2-
H1 before and after HDS reaction. Before HDS reaction, the
Co 2p3/2 signal exhibits a maximum at 778.1 eV with a minor
contribution at 780.5 eV due to Co(II) oxide species (Fig. 5).
The Co 2p3/2 signal for Co9S8 is generally reported to be at
BEs ranging between 777.8 eV and 778.1 eV while the signal
for ‘‘CoMoS’’ is found at 778.6 eV.44,45 Therefore, the Co 2p3/2XPS signature of Co sulfide species is close to the value expected
for Co9S8 suggesting a low proportion of Co atoms in decoration
of MoS2 edges if any. After DBT HDS reaction, the maximum
intensity of the Co 2p3/2 signal slightly shifts (0.3 eV) to lower
BEs (777.8 eV) while the Co(II) oxide contribution remains at
780.5 eV suggesting an even lower proportion of the ‘‘CoMoS’’
phase (if any) after HDS reaction. To confirm this point, the
decomposition of the Co XPS spectrum was performed before
and after the DBT HDS reaction in order to determine the
relative proportion of both CoOx and Co9S8 species and
assuming a third contribution coming from a CoMoS phase.
Results show a very small proportion of the CoMoS phase (r4%) before HDS further reduced to only 2% after HDS.
Therefore, a much lower value than the error uncertainty
commonly observed for the decomposition of XPS spectra
(�10%) is found. Results are reported in Table 2. A CoMoS
phase (if present) should then represent only a negligible amount
insufficient to explain by itself the HDS catalytic properties of
this highly HDS active unsupported CoMo catalyst. Only one
study has previously reported a decomposition of the Co XPS
spectrum of an unsupported CoMo sulfide showing a low
proportion of the CoMoS phase.46 It should however be noted
that even if already low, this proportion was overestimated in this
previous study since the proportion of cobalt present in the CoOx
phase was not taken into account. This confirms that the
synergetic effect observed on this unsupported Co/MoS2 catalyst
cannot be ascribed to cobalt atoms in decoration of MoS2 slabs
as commonly observed for supported catalysts.
3.2.4. TEM characterization. TEM images show the
presence of characteristic fringes of molybdenum disulfide
with the interplanar d002 spacing of about 0.64 nm (Fig. 6).
Samples are formed of bundles of intermingled MoS2 layers
that are fairly stacked. Determination of MoS2 slab dimensions
shows an average length along the basal direction of 6.2 nm with
sizes ranging from 2 to 20 nm. Similarly, an average stacking
degree of 3.7 was found relatively close to the value determined
by XRD.
However, the stacking degree determined by XRD (4.6) was
calculated based on the Debye–Scherrer equation applied to
the (002) diffraction peak and was then overestimated since
neglecting the presence of monolayers. The value found by
Fig. 5 Co 2p XPS core level spectra of the unsupported Co/MoS2-H1
catalyst before and after dibenzothiophene HDS reaction.
Table 2 Results of the decomposition of the Co XPS spectra of theCo/MoS2-H1 unsupported catalyst before and after HDS reactionshowing the different proportions of Co species (the correspondingbinding energy values are given in parentheses)
Co/MoS2-H1 % CoOx % Co9S8 % CoMoS
Before HDS 32 (780.2 eV) 64 (778.0 eV) 4 (778.5 eV)After HDS 41 (780.1 eV) 57 (777.7 eV) 2 (778.5 eV)
This journal is c The Royal Society of Chemistry 2012 Catal. Sci. Technol., 2012, 2, 164–178 171
TEM is therefore closer to the real value even if still probably
overestimated. Quite large stacking distribution was once
again obtained reaching values up to nine stacked slabs.
The composition of the Co/MoS2-H1 unsupported catalyst
was analyzed through EDX analyses of images acquired in the
STEM bright field mode confirming the presence of the Co,
Mo and S elements on large analyzed regions with a 1 : 0.3 : 2.1
Mo :Co : S molar ratio. This ratio is similar to the one
determined by elemental analysis suggesting good homogeneity
of the composition. Examination of TEM pictures show that
slabs often present small bending effects. This confirms that
bending occurs on a large proportion of slabs but with
generally low angles of curvature. Low angles of curvature
are expected since bending of MoS2 layers results in strain
effects along the basal plane leading to unstable structures if
the curvature angle becomes too high.47–49
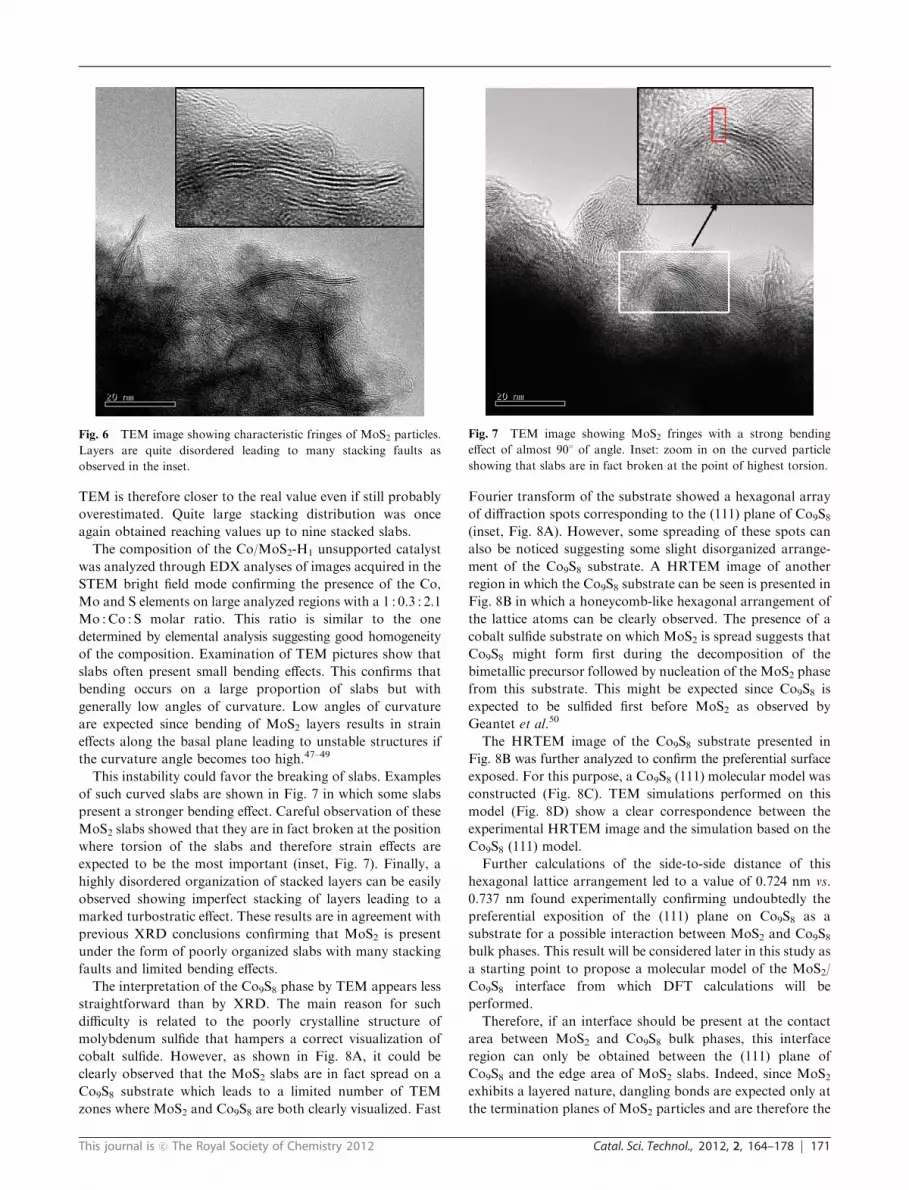
This instability could favor the breaking of slabs. Examples
of such curved slabs are shown in Fig. 7 in which some slabs
present a stronger bending effect. Careful observation of these
MoS2 slabs showed that they are in fact broken at the position
where torsion of the slabs and therefore strain effects are
expected to be the most important (inset, Fig. 7). Finally, a
highly disordered organization of stacked layers can be easily
observed showing imperfect stacking of layers leading to a
marked turbostratic effect. These results are in agreement with
previous XRD conclusions confirming that MoS2 is present
under the form of poorly organized slabs with many stacking
faults and limited bending effects.
The interpretation of the Co9S8 phase by TEM appears less
straightforward than by XRD. The main reason for such
difficulty is related to the poorly crystalline structure of
molybdenum sulfide that hampers a correct visualization of
cobalt sulfide. However, as shown in Fig. 8A, it could be
clearly observed that the MoS2 slabs are in fact spread on a
Co9S8 substrate which leads to a limited number of TEM
zones where MoS2 and Co9S8 are both clearly visualized. Fast
Fourier transform of the substrate showed a hexagonal array
of diffraction spots corresponding to the (111) plane of Co9S8(inset, Fig. 8A). However, some spreading of these spots can
also be noticed suggesting some slight disorganized arrange-
ment of the Co9S8 substrate. A HRTEM image of another
region in which the Co9S8 substrate can be seen is presented in
Fig. 8B in which a honeycomb-like hexagonal arrangement of
the lattice atoms can be clearly observed. The presence of a
cobalt sulfide substrate on which MoS2 is spread suggests that
Co9S8 might form first during the decomposition of the
bimetallic precursor followed by nucleation of the MoS2 phase
from this substrate. This might be expected since Co9S8 is
expected to be sulfided first before MoS2 as observed by
Geantet et al.50
The HRTEM image of the Co9S8 substrate presented in
Fig. 8B was further analyzed to confirm the preferential surface
exposed. For this purpose, a Co9S8 (111) molecular model was
constructed (Fig. 8C). TEM simulations performed on this
model (Fig. 8D) show a clear correspondence between the
experimental HRTEM image and the simulation based on the
Co9S8 (111) model.
Further calculations of the side-to-side distance of this
hexagonal lattice arrangement led to a value of 0.724 nm vs.
0.737 nm found experimentally confirming undoubtedly the
preferential exposition of the (111) plane on Co9S8 as a
substrate for a possible interaction between MoS2 and Co9S8bulk phases. This result will be considered later in this study as
a starting point to propose a molecular model of the MoS2/
Co9S8 interface from which DFT calculations will be
performed.
Therefore, if an interface should be present at the contact
area between MoS2 and Co9S8 bulk phases, this interface
region can only be obtained between the (111) plane of
Co9S8 and the edge area of MoS2 slabs. Indeed, since MoS2exhibits a layered nature, dangling bonds are expected only at
the termination planes of MoS2 particles and are therefore the
Fig. 6 TEM image showing characteristic fringes of MoS2 particles.
Layers are quite disordered leading to many stacking faults as
observed in the inset.
Fig. 7 TEM image showing MoS2 fringes with a strong bending
effect of almost 901 of angle. Inset: zoom in on the curved particle
showing that slabs are in fact broken at the point of highest torsion.

172 Catal. Sci. Technol., 2012, 2, 164–178 This journal is c The Royal Society of Chemistry 2012
preferential region for interaction with cobalt sulfide. As said
before, due to the preferential deposition of MoS2 onto the
Co9S8 substrate, the visualization of both MoS2 and Co9S8 is
however expected to be limited to regions at the periphery of
the aggregated unsupported Co/MoS2 catalyst. Nevertheless,
the situation observed in Fig. 8 is also found on other zones of
visualization of both MoS2 and Co9S8 like in Fig. S2 (ESIw) inwhich MoS2 slabs look like as emerging from the Co9S8substrate from its edges.
3.3. Modeling the MoS2/Co9S8 interface
3.3.1. TEM simulation. The preceding section has shown
that the unsupported Co/MoS2 catalyst is mainly composed of
poorly crystalline MoS2 slabs, slightly bent, and highly stacked
with a strong turbostratic character. This ‘‘rag’’ MoS2 phase is
spread onto a Co9S8 substrate limiting its visualization to the
periphery of the analyzed zones. In the regions where the two
bulk sulfide phases can be observed, Co9S8 seems to preferen-
tially expose (111) planes in close proximity to MoS2. There-
fore, if an interface exists between the two bulk sulfide phases,
it would be found at the contact region between the MoS2 edge
planes and the Co9S8 (111) substrate. This conclusion must be
however considered cautiously due to: (1) the difficulty in
visualizing mixed zones comprising both MoS2 and Co9S8,
(2) the inherent ‘‘local’’ character of a TEM analysis, and (3)
the too low TEM resolution which cannot be used to clearly
visualize the formation of such an interface. Moreover, in the
present case, only initial bulk MoS2 and Co9S8 phases were
considered without taking into account a possible influence of
the ratio of partial pressures between H2 and H2S which would
modify the edge states of MoS2 and/or Co9S8. Therefore, the
procedure developed here should be considered as a first
approach to a more complex catalytic system which would
be more reactive to its environment composed of H2, H2S and
hydrocarbon compounds.
TEM characterization therefore can be used to provide
tracks from direct observations to determine how the two
bulk Co9S8 and MoS2 sulfide phases would interact with each
other but TEM cannot provide definitive conclusion about the
existence of a real interface. To more deeply analyze this
possibility, one must then shift to molecular modeling simulations
to better define the feasibility of such an interface. Therefore, a
model interface was then built between a cleaved (111) Co9S8moiety and the (010) edge plane of MoS2 (Fig. 9). The building
of the interface was a challenging task due to the complexity of
both MoS2 and Co9S8 structures. The positional tensor matrix
sij which indicates each individual atom in the structure has
indeed many coefficient coordinates. However, formation of
an interface between (010) MoS2 and (111) Co9S8 through
modeling simulation was found to be possible by simulating
TEM pictures from tentative models and confronting them to
experimental HRTEM pictures of MoS2 and Co9S8 interacting
with each other as shown in Fig. 10. In a first step, on the
selected experimental TEM image, line profile analysis was
performed to determine the MoS2 interlayer spacing and slab
thickness. The experimental TEM image was also digitalized
before to obtain a molecular representation of the interface
using interface builder from Accelrys which matches the
matrix vector for each crystal plane in a (h, k, l) form to its
parity neighbour crystal making a Ax = B matrix with A the
(010) MoS2 plane, x the (111) Co9S8 plane, and B the interface.
Fig. 8 (A) TEM image of a highly stacked slab presenting some
curving effects and interacting with the Co9S8 substrate. The cobalt
sulfide phase can be clearly visualized as shown for example in the
white-squared zone. Fast Fourier Transform of the square region
(inset) showing a hexagonal arrangement of diffraction spots. (B)
HRTEM image of another region on which MoS2 is spread onto a
Co9S8 substrate. The honeycomb-like arrangement of lattice cobalt
atoms is clearly visualized. (C) Modelling of a Co9S8 (111) plane (blue:
cobalt, yellow: sulfur). (D) Simulated TEM picture of the Co9S8 (111)
model shown in (C) showing the same honeycomb-like arrangement
than found experimentally in (B).
Fig. 9 Schematic representation of the procedure used to build the
model interface between a cleaved (111) Co9S8 moiety and the (010)
edge plane of MoS2.

This journal is c The Royal Society of Chemistry 2012 Catal. Sci. Technol., 2012, 2, 164–178 173
This approach allows us to calculate bonding after building
the interface based on electronic parity between species leading
to a reliable model (Fig. S3, ESIw). A simulated HRTEM
image was then determined with appropriate Scherzer Cs
coefficient and defocus and slide thickness conditions while
keeping similar MoS2 interlayer spacing (Fig. 10). Every data
produced by TEM simulation are then fitted with experimental
TEM results with an accuracy of �0.005%. Finally, a digitalized
image of the simulated picture was generated leading to a
simulated molecular representation using a similar procedure
than for the experimental TEM image. Both models were then
superimposed until a good fit is obtained. A portion of the
interface corresponding to the best fit (Fig. 11) is then chosen
to generate a ‘‘seed’’ interface model for which further analysis
of band structure, density of states and Mulliken calculations
are performed in the following sections.
3.3.2. Description of the MoS2–Co9S8 interface model.
Before describing in detail the local interface structure, it
should be noted at this point that Co9S8 presents a complex
structure. Two types of Co atoms are present: an octahedrally
coordinated Co atom with six S neighbors and a tetrahedrally
coordinated Co atom with (1) 4 nearest S neighbors plus three
other S atoms at a distance only 0.009 A larger and (2) three
Co neighbors forming a cubic array. A close look at the model
interface shows that each MoS2 slab interacts with the cobalt
atoms forming the cubic arrangement (Fig. 11). The interfacial
energy is 1.5 eV/atom. In half of the cobalt cubic clusters
interacting with molybdenum, two Mo atoms interact with Co
atoms. However, while one of the Mo atoms only interacts
with one Co atom, the second Mo atom is connected to two
Co atoms of the cubic array (Fig. 11C). Both Mo atoms are
fivefold coordinated showing the existence of latent vacancy
sites (in bulk MoS2, Mo is six-fold coordinated). These
vacancies may play an important role in HDS providing sites
for coordinating sulfur-containing reactants. For the other
half of the cobalt cubic cluster interacting with molybdenum,
two Mo atoms also form bonds with Co atoms. One of the Mo
atoms is coordinated to only one Co atom of the cubic array
while the other one is coordinated to two Co atoms of the
cubic array but also to one single octahedral Co atom. The
higher coordination number of Mo atoms shows the absence
of latent vacancy sites in this case. Another interesting point of
the proposed interface molecular model is the shift of the
interlayer distance to 6.4 A. This value is identical to the one
observed experimentally by XRD (Fig. 4) and comes from the
shift to lower angles of the (002) diffraction peak. Therefore,
this shift of the (002) diffraction seems to be explained by both
an increase of the interlayer distance between MoS2 slabs due
to the formation of the MoS2/Co9S8 interface and also probably
from rotation of the MoS2 layers from each other about the
a-axis.
3.3.3. Mulliken charge analysis. The presence of direct
Co–Mo bonds is an interesting feature found in our molecular
interface model. The interface model was then further analyzed
to determine the possible modifications of electronic properties
induced by the presence of these Co–Mo bonds and their
influence on the catalytic efficiency in hydrodesulfurization
mainly regarding a possible electron donation from Co to Mo.
The two sets of Mo atoms connected to cobalt cluster arrays
were then analyzed separately through Mulliken population
analysis. For the set of highly coordinated Mo atoms, Mulliken
calculations lead to charges of +0.49 to +0.53 for the Mo
atoms. In bulk MoS2, the Mo charge is +0.61. The direct
bonding between Co and Mo therefore results in a limited
charge donation from cobalt to molybdenum. Inversely,
cobalt atoms of the cubic array that are directly connected
to Mo show much more negative (or less positive) charges
(�0.07 and + 0.03) than those expected for similar Co atoms
in bulk Co9S8 (+0.16). Consequently, one of the first Co
neighbors to these Mo-coordinated Co atoms in the cubic
cluster shows inversely much more positive charge values
ranging from +0.28 to +0.30 while the second first Co
neighbors present more negative values than expected from
the bulk Co9S8 (�0.15 and �0.07). Finally, the Co atoms of
Fig. 10 Comparison between experimental and simulated HRTEM
images of the interface region between the two bulk MoS2 and Co9S8phases. The simulated HRTEM picture is then used as a reference to
build the model interface.
Fig. 11 (A) The resulting model interface between the layered MoS2(010) plane and the Co9S8 (111) plane. The atoms are coloured as
follows: cobalt (blue), sulfur (yellow) and molybdenum (green), (B)
portion of the interface called ‘‘seed’’ (red dashed line) used for DFT
calculations, (C) zoom on a cobalt cubic cluster arrangement con-
nected to Mo atoms, and (D) another view of (B).

174 Catal. Sci. Technol., 2012, 2, 164–178 This journal is c The Royal Society of Chemistry 2012
the cubic cluster located at the farthest atomic positions
compared to Mo present the closest charge values to bulk
cobalt sulfide (+0.14 and +0.16). This result coupled with the
absence of sulfur atoms shared between this cobalt cluster
array and the highly coordinated Mo atoms shows that the
direct electron donation is in this case quite limited. The more
negative charge values of Co connected to Mo combined with
the higher positive charges on some of their first Co neighbors
suggest that donation of electrons (probably induced by a
destabilization effect of Mo) propagates inside the cubic
cluster array resulting in a formal reduction of some Co atoms
and a formal oxidation of some of their Co neighbors. However,
this redistribution of charges inside the cubic cluster only
results in a limited donation from cobalt to molybdenum.
For the set of fivefold-coordinated Mo atoms, the situation
appears different. While for the Mo atom coordinated to two
Co atoms of the cubic cluster, a positive charge value of +0.53
(very similar to the previous case) is obtained suggesting once
again a limited electron donation from Co through direct
Co–Mo bonds, the second Mo atom coordinated to only
one cobalt presents a much lower charge of +0.25 showing
in this case a strong electron donation. This latter Mo atom is
also the only type of molybdenum atoms that possesses
bonding to a sulfur atom connected to the cobalt cluster array
and not only presenting direct Co–Mo bonds (Fig. S4, ESIw).Electron donation from cobalt atoms of the cobalt cluster
array to molybdenum is therefore more effective through
intermediate sulfur shared between the two metallic atoms.
This is also confirmed by the more negative charge value of
this sulfur atom (�0.22) compared to sulfur atoms in similar
crystallographic positions but only connected to cobalt (�0.09and �0.11). The resulting Mo–S bond of this Mo–S–Co entity
is then expected to be particularly weakened and is therefore
the most susceptible to form coordinatively unsaturated sites.
The charges on Co atoms of the cubic array associated to these
fivefold coordinated Mo atoms present a similar situation to
the previous case: a more negative value on the Co atoms
directly connected to Mo and a highly positive value on one of
their first Co neighbors.
Fivefold coordinated Mo atoms engaged in a Mo–S–Co
moiety with the cobalt cubic array therefore not only possess
latent vacancy sites but also are the most susceptible to create
CUS sites through a strong electron donation. It should be
finally noted that similar Mo–S–Co moieties but with octahedral
Co atoms that are not directly bonded to Mo do not result in
an effective electron donation. Therefore, the direct Co–Mo
bond seems necessary to perturb electronically the cobalt cubic
array inducing an electronic donation but only through an
intermediate sulfur atom shared between Mo and Co. These
results confirm that electron donation from Co to Mo is
effective in Co–S–Mo moieties and result into more labile
sulfur atoms.51,52 The presence of latent vacancy sites is also in
full agreement with a recent DFT study by Moses et al.
suggesting that the Co–Mo–S edge in its equilibrium state
under HDS conditions can perform hydrogenation and C–S
bond scission without the necessity to initially create vacancies.53
This result is also in agreement with previous theoretical
calculations showing that to be effective, electron donation
from Co to Mo should occur only when Mo t2g orbitals in a
MoS2 environment lie between the t2g and eg orbitals of Co.
The presence of sulfur bonds between Mo and Co then seems
necessary to shift downward the Co 3d energy bands compared
to Mo 4d t2g levels.16
3.4. Electronic properties
In order to determine the consequences in terms of electronic
properties of the formation of such a MoS2/Co9S8 interface,
band structure and density of states (DOS) calculations were
performed. For comparison purposes, the same procedure was
applied first separately for finite-size MoS2 and Co9S8 samples
to investigate if results are coherent with previous studies
before considering the MoS2/Co9S8 interface. The results
obtained using a PWB set in CASTEP calculations for band
structure calculations of bulk MoS2, Co9S8 and ‘‘seed’’ (MoS2/
Co9S8) indicate a semiconductor behavior for bulk MoS2structure54 as presented in Fig. 12. No irreducible points are
observed in bulk MoS2 due to its strong semiconductor
character. For bulk Co9S8, two Fermi wave vector values kFat B0.17A�1 and B0.43 A�1 were found showing a metallic
character in the first Brillouin zone. For our ‘‘seed’’ interface
model, an interesting metallic character was found with three
Fermi wave vector values kF atB0.37A�1, 0.43 A�1 and 0.56 A�1.
The Fermi wave vector kF value of 0.37 A�1 is in agreement with
Bollinger et al. which obtained a value of 0.39A�1 for a
two-dimensional MoS2 stripe exposing mainly Mo-edges.55 This
characteristic kF value is related to a strong metallic character due
Fig. 12 Band structure calculations for bulk MoS2 (A) and Co9S8 (B)
and for the MoS2/Co9S8 (C) interface model. For each band structure
calculation, the path used for integrating periodic functions of the
wave vector in the Brillouin zone is indicated.

This journal is c The Royal Society of Chemistry 2012 Catal. Sci. Technol., 2012, 2, 164–178 175
to superposition of px orbitals along the edge of MoS2. Similarly,
the kF value at B0.43 A�1 originates from Co9S8 while a new
metallic state is observed at kFE 0.56 A�1. This newmetallic state
results from the formation of the interface and might be related to
the creation of direct Co–Mo bonds. This leads to a conclusion of
mixing states in the interface model due to the superposition of pxorbitals in two parallel sulfur chains along the MoS2 edge which
are in direct contact with Co species.
Fig. 13 reports the DOS for the MoS2 (A) and Co9S8samples (B), and for the MoS2/Co9S8 interface (C). The
DOS found for MoS2 reflects a semiconducting behavior with
a weak band gap of 0.7 eV at the Fermi level (Fig. 13A). This
value is close to the one found previously (0.89 eV) showing
that the DOS for a finite MoS2 system with sulfur-saturated
Mo surface atoms is quite close to the bulk DOS.56,57 In the
layered MoS2 structure, the coordination of the metal atom is
trigonal prismatic. The ligand-field effect on Mo d states
resulting from the covalent Mo d–S p bonding under a
trigonal distortion led to the splitting of t2g orbitals into a
non-degenerate a1g and doubly degenerate eg sets. Therefore,
the Fermi level falls at the upper edge of the a1g band while the
eg complex forms the lowest group of conduction bands.
However, substantial mixing of the Mo 4d character with
the S 3p band occurs.
As previously explained, Co9S8 presents two types of cobalt
atoms: an octahedrally coordinated cobalt atom with six
sulfur neighbors and a tetrahedrally coordinated cobalt atom
forming a cubic array through coordination to three other
cobalt neighbors. Due to the presence of these Co–Co bonds,
the DOS for Co9S8 presents a metallic character (Fig. 13B).
However, the Fermi level (EF) corresponds to an inflection
point showing the presence of lower and upper parts of mainly
the Co 3d band. Hybridization with S 3p s* states is more
expected on the upper part of the Co 3d band above EF.
The DOS for the MoS2/Co9S8 interface presents a metallic
character due to the presence of both Co–Co and Co–Mo
bonds (Fig. 13C). However, due to the Co–Mo interaction, the
distribution of the electronic density of the d bands appears
broader with a lower part going from �10 eV to just
above EF.
Particular attention paid to the DOS profile at EF shows
that the electronic density is however more localized at the
Fermi level for the interface with a higher electron density at
0 eV than for Co9S8 going back to zero for a less positive value
of energy of 0.7 eV versus 1.3 eV for Co9S8.
Therefore, the metallic character is more localized at the
region close to the Fermi level. This effect could be related to
the shift of the unoccupied Mo dyz states below (or close to)
the Fermi level due to their filling by cobalt as previously
stated for the CoMoS decoration model.16 This would suggest
that similarities would exist between CoMoS and the Co9S8/
MoS2 interface in terms of electronic properties confirming
that a similar synergy effect applies in the present case. This is
expected to modify significantly the HDS catalytic properties
of the MoS2/Co9S8 interface increasing its hydrogenating
character but probably less than the formation of latent
vacancy sites on fivefold coordinated Mo atoms of the
interface.
3.5. Comparison to previous results based on DFT, EXAFS,
NMR or organometallic studies
3.5.1. Comparison to previous organometallic studies.
Comparison of the model MoS2/Co9S8 interface is possible
in relation with previous organometallic studies trying to
modelize Co/Mo/S clusters in order to study theHDSmechanism.
Types of reactions exhibited by organometallic compounds in
solution often occur on the surface of heterogeneous catalysts
Fig. 13 Total electronic density of states of (A) MoS2, (B) Co9S8, and
(C) of the ‘‘seed’’ from the MoS2/Co9S8 interface. The inset in (C)
shows a comparison of the densities of states between Co9S8 and the
interface at the Fermi level (after normalization).

176 Catal. Sci. Technol., 2012, 2, 164–178 This journal is c The Royal Society of Chemistry 2012
and can give valuable information about the HDS mechanism.
Co/Mo/S clusters used in the organometallic approach often
present Co–Mo bonds. Examples can be found in studies made
by Curtis and co-workers,58–61 Brenner et al.,62 and by Halbert
et al.63 Curtis et al. found that in the Cp02Mo2Co2S3ðCOÞ4cluster desulfurization reactions can occur on Co sites bonded
to Mo and presenting latent vacancy sites.61 Using the same
organometallic cluster presenting direct Co–Mo bonds with
intermediate S atoms as in the present interface model,
Brenner et al. observed that this cluster led to a much higher
turnover frequency in the HDS of thiophene than a classical
CoMo/Al2O3 catalyst.62 These authors concluded that the
activity was increased by the presence of molecular scale
ensembles containing molybdenum, cobalt and sulfur. Using
XPS, they also observed that the presence of such direct
Co–Mo bonds presenting shared intermediate sulfur atoms
led to a strong donation of electrons from Co to Mo. Halbert
et al. studied the Mo2Co2S4(S2CNEt2)2(CH3CN)2(CO)2 clus-
ter presenting a thiocubane Co2Mo2(m3-S)4 core (Fig. 14).63 In
this cluster, Mo atoms are coordinated to two Co atoms.
When the cobalt fragments bind to the terminal MoQS
groups, open sites on the Mo centers are produced as also
observed in the MoS2/Co9S8 interface. The formation of
Co–Mo bonds in this cluster was suggested to favor the
electronic donation from Co to Mo weakening Mo–S bonds
and making the dz2, dxz, and dyz orbitals of molybdenum more
available as acceptor orbitals.63 This would make ‘‘open’’ sites
analogous to vacancies whose affinity for ligands will be
enhanced by cobalt. This situation can also be expected on
the fivefold coordinatedMo atoms of the interface. Fig. 15 reports
the DOS found for the Mo2Co2S4(S2CNEt2)2(CH3CN)2(CO)2cluster acquired considering only the thiocubane Co2Mo2(m3-S)4core. As expected due to the presence of direct Co–Mo bonds in
this thiocubane cluster, the DOS presents a strong metallic
character which seems even more amplified compared to the
MoS2/Co9S8 interface. As a matter of fact, the DOS profile for
the thiocubane Co2Mo2(m3-S)4 core is essentially similar to the one
observed for the interface model but with a stronger localization
of d orbitals reaching maximum almost at the Fermi level.
This confirms that the formation of direct Co–Mo bonds with
sulfur ligands led to an enhanced hydrogenating character of the
resulting catalyst.
3.5.2. Comparison to previous EXAFS, NMR and DFT
studies. The Co9S8/MoS2 model interface can also be
confronted to previous EXAFS results acquired on CoMo
samples about Co–Mo distances. In this respect, EXAFS
studies have generally reported Co–Mo distances varying
between 2.73 and 2.80 A.64,65 Taking into account all the first
Co neighbors of Mo atoms in the model interface, a value of
2.758 A is found in complete agreement with those determined
by EXAFS. The structural model interface found herein would
lead to similar Co–Mo distances as those obtained experimentally
using X-ray absorption techniques.59Co NMR was rarely envisaged to study Co-promoted
MoS2-based catalysts. Co salt precursors or oxides are generally
paramagnetic and alumina, the most common support used for
CoMo catalysts, impairs the analysis of these solids through 59Co
NMR. Only SiO2-supported CoMo catalysts were studied using
this technique.66 Using 59Co NMR, structural information can
be retrieved from the measurement of the quadrupolar inter-
action related to the symmetry of the local environment. The
local electronic structure is also given by the Knight shift and the
relaxation time. For instance, in a Co9S8 reference, octahedral Co
presents a long longitudinal relaxation time while tetrahedral Co
exhibits a short relaxation time reflecting very different electronic
surroundings with metallic Co neighbors for tetrahedral Co and
only sulfur neighbors for octahedral Co. In CoMo/SiO2, new
distorted tetrahedral Co sites were detected resulting from the
sharing of sulfur atoms between the MoS2 phase and cobalt
atoms engaged in the cubic cluster unit. Such a situation would
favor a higher electron donation from Co to Mo.67 This result is
in agreement with the present conclusions about the inactivity of
octahedral Co atoms and the formation of highly active Co–Mo
entities presenting sulfur ligands and formed with tetrahedral Co
atoms of the cubic clusters of Co9S8 at the interface of the two
sulfide phases.
Fig. 14 Drawing of Co2Mo2(m3-S)4(S2CNEt2)(CO)2�(CH3CN)2cluster. Adapted from ref. 63 (blue: cobalt, green: molybdenum,
yellow: sulfur, red: oxygen, grey: carbon, dark blue: nitrogen, white:
hydrogen).
Fig. 15 Density of states of the thiocubane Co2Mo2(m3-S)4 core of
the Co2Mo2(m3-S)4(S2CNEt2)(CO)2�(CH3CN)2 cluster. Inset: represen-
tation of the thiocubane core (blue: cobalt, green: molybdenum,
yellow: sulfur).

This journal is c The Royal Society of Chemistry 2012 Catal. Sci. Technol., 2012, 2, 164–178 177
The presence of potentially highly active sites on fivefold
coordinated Mo atom directly connected to Co has also to be
compared with previous DFT studies about the localization of
Co onto the edges of MoS2 slabs for supported cobalt-
promoted MoS2 catalysts. In this respect, formation of direct
Co–Mo bonds was already found by DFT calculations modeling
the localization of cobalt on the Me-edge of MoS2 particles.7,68
Under a very large PH2S/PH2
range, formation of these direct
Co–Mo bonds was found to correspond to the most stable
configuration of cobalt on the Me-edge of MoS2. Stable
morphology of CoMo nanocrystallites would correspond to
an equal proportion of 50% of S-edge and 50% of Me-edge.
Co coverage on the S-edge and Me-edge would be, respectively,
100% and 50%. Moreover, Mo atoms on the Co-promoted
Me-edge can exhibit five-fold coordination. Recent DFT
calculations of the localization of cobalt on MoS2 nano-
crystallites have also shown that the maximum in HDS
activity is generally reached at a Co/Mo ratio of 0.3 and
corresponds to the optimum formation of mixed CoMoS sites
with direct Co–Mo bonds.69 These mixed CoMoS sites also
possess intermediate metal–sulfur bond energy corresponding
to the highest HDS activity achievable in the spirit of the
Sabatier principle.16 Therefore, some similarity is observed
here between the model interface that is proposed as occurring
at the interface between bulk MoS2 and Co9S8 phases and the
local Co/Mo/S structure on the Me-edge of MoS2 as deter-
mined by DFT.
3.6. Significance of the present interface model compared to
previous descriptions of the synergy effect on supported systems
Results presented here can be compared to the previous
models of cobalt decoration,4 and of synergy by contact.3 In
agreement with this latter model, our results suggest that
MoS2 and Co9S8 phases are able to interact with each other
in HDS through their interface: the higher hydrogenating
character due to cobalt would enhance the hydrogen supply
to Mo on which sulfur-containing reactants would be preferably
bound. Results are also partly comparable to the more ‘‘nano-
scopic’’ view of the decoration model. As already observed in
Section 3.5.2, similar Co–Mo bonds and five-fold coordination
of Mo would occur on the most stable Co-promoted Me-edge
configuration under typical HDS conditions. Therefore, some
similarity can be expected.
However, some discrepancies should also be noted. First of all,
the formation of the synergetic phase on a support is believed to
occur through migration of cobalt to MoS2 edge planes (which
can be really effective only if cobalt is not sulfided before its
migration to already sulfided Mo). In this case, an intimate
mixing of Co and Mo occurred. In the present case, due to the
fact that Co is expected to be easily sulfided first while Mo must
be reduced from+VI (MoS42�) to +IV (MoS2), MoS2 seems to
‘‘nucleate’’ from the Co9S8 substrate. With respect to the
symmetrical synergism model and its Co/Mo phase diagram, the
segregation of MoS2 from a Co9S8 substrate would correspond to
the second optimum in activity observed on the right side of the
phase diagram (Fig. 1). The proposed model interface would then
correspond to the situation prevailing in the Co-rich regions. It is
also worth noting that the Co/Mo ratio of 0.3 should be considered
cautiously since a large proportion of MoS2 and Co9S8 are
expected not to interact with each other in such a case. This
situation also differs from the one observed on supported systems
for which the optimum on the left side of the phase diagram is
expected to be reached. One characteristic feature of the optimum
observed on the right side of the symmetrical phase diagram is that
the synergetic effect is generally less amplified due to the difficulty
to obtain high surface area Co9S8. This ‘‘surface dependency’’ of
the synergetic effect is clearly observed in this study for Co/MoS2unsupported catalysts in the HDS of DBT. The difficulty to obtain
a highly surface contact with Co9S8 is partly overwhelmed here
through the formation of a very high surface area solid obtained
thanks to an increase of the pressure used during the preparation
and resulting in a high surface contact between reactant and
catalyst. The last point to consider in a future study will be the
influence of the replacement of sulfur by carbide-like entities as
observed in steady-state DBT HDS stabilized catalysts and also to
determine how DBT molecules can interact with these interfacial
sites in order to perform HDS reaction.26,27
4. Conclusion
The present study showed that contrary to the common
assumption observed for supported MoS2-based catalysts,
the HDS activity of Co-promoted MoS2 unsupported catalysts
is directly related to the increase of the respective surface areas
of the pure phases. This suggests that the HDS activity could
be related to the contact area of a possible interface between
bulk MoS2 and Co9S8 phases. This point led us to reinvestigate
carefully highly active unsupported Co/MoS2 catalysts. This
approach helps us to define a model interface between MoS2and Co9S8 in accord with HRTEM experimental observations.
This model was then confronted to a DFT approach to
determine its feasibility as a reasonable description of the
interface region between the two bulk sulfide phases.
Modeling of the interface shows the creation of open latent
vacancy sites on half of the Mo atoms interacting with cobalt
and formation of Co–Mo bonds. Strong electron donation
from Co to Mo occurs through intermediate sulfur atom
bonded to both metals. Calculations of the density of states
for this interface showed an enhanced metallic character at the
region close to the Fermi level consecutively to the
MoS2–Co9S8 interaction. These modifications of coordination
and electronic properties may play a major role in explaining
the synergetic effect present at the interface where Co and Mo
interact with each other. Results particularly confirm the
presence of latent vacancy sites, a higher hydrogenation
character and the weakening of the Mo–S bond strength in
Mo–Co–S entities. These results are in agreement with our
previous work comparing the synergic systems such as MoS2/
Co9S8 with binary transition metal sulfides.12 It confirms that
these synergic systems behave as pseudo-binary sulfides
mimicking the electronic structure of very HDS active noble
metal sulfides.70
Acknowledgements
M. Ramos thanks CONACYT, Mexico doctoral scholarship
program #207997, the MRTI of UTEP, Cotton Trust UTEP,

178 Catal. Sci. Technol., 2012, 2, 164–178 This journal is c The Royal Society of Chemistry 2012
theMicrolectronics Research Lab ofUT-Austin andDepartamento
de Educacion y Cultura of Gobierno del Estado de Chihuahua.
We would like also to thank Dr Marc-Jacques Ledoux for his
strong support and fruitful discussion on this subject. The
authors want to particularly dedicate this paper to the memory
of Dr Edward F. Stiefel because of his contributions to the
field of organometallic catalyst and who, as described in the
text, predicted the inorganic structure of the promoted sites
prior to 1985.
References
1 B. Torres, G. Berhault and R. R. Chianelli, Metal Sulfides inEncyclopedia of Catalysis, Wiley, New York, 2002, DOI: 10.1002/0471227617.
2 A. L. Farragher and P. Cossee, Proceedings of the 5th InternationalCongress on Catalysis, North-Holland, Amsterdam, 1973, p. 1301.
3 G. Hagenbach, P. Courty and B. Delmon, J. Catal., 1973, 31, 264.4 H. Topsøe, B. S. Clausen, R. Candia, C. Wivel and S. Mørup,J. Catal., 1981, 68, 433.
5 R. Candia, B. S. Clausen, J. Bartholdy, N. Y. Topsøe, B. Lengelerand H. Topsøe, Proceedings of the 8th International Congress onCatalysis, Dechema, Frankfurt-an-Main, 1984, vol. 2, p. 375.
6 P. Raybaud, Appl. Catal., A, 2007, 322, 76.7 E. Krebs, A. Daudin and P. Raybaud, Oil Gas Sci. Technol., 2009,64, 707.
8 H. Schweiger, P. Raybaud and H. Toulhoat, J. Catal., 2002,212, 33.
9 M. Sun, A. E. Nelson and J. Adjaye, J. Catal., 2004, 226, 32.10 J. V. Lauritsen, J. Kibsgaard, G. H. Olesen, P. G. Moses,
B. Hinnemann, S. Helveg, J. K. Nørskov, B. S. Clausen, H. Topsøe,E. Lægsgaard and F. Besenbacher, J. Catal., 2007, 249, 220.
11 R. W. Phillips and A. A. Fote, J. Catal., 1976, 41, 168.12 R. R. Chianelli and G. Berhault, Catal. Today, 1999, 53, 357.13 Z. Le, P. Afanasiev, D. Li, X. Long and M. Vrinat, Catal. Today,
2008, 130, 24.14 A. Olivas, G. Alonso and S. Fuentes, Top. Catal., 2006, 39, 175.15 L. Wang, Y. N. Zhang, Y. L. Zhang, Z. Jiang and C. Li,
Chem.–Eur. J., 2009, 15, 12571.16 R. R. Chianelli, G. Berhault, P. Raybaud, S. Kasztelan, J. Hafner
and H. Toulhoat, Appl. Catal., A, 2002, 227, 83.17 M. J. Ledoux, O. Michaux, G. Agostini and P. Panissod, J. Catal.,
1986, 102, 275.18 D. Genuit, P. Afanasiev and M. Vrinat, J. Catal., 2005, 235, 302.19 H. Nava, C. Ornelas, A. Aguilar, G. Berhault, S. Fuentes and
G. Alonso, Catal. Lett., 2003, 86, 257.20 L. Alvarez, J. Espino, C. Ornelas, J. L. Rico, M. T. Cortez,
G. Berhault and G. Alonso, J. Mol. Catal. A: Chem., 2004, 210, 105.21 M. H. Siadati, G. Alonso, B. Torres and R. R. Chianelli, Appl.
Catal., A, 2006, 305, 160.22 J. Espino, L. Alvarez, C. Ornelas, J. L. Rico, S. Fuentes,
G. Berhault and G. Alonso, Catal. Lett., 2003, 90, 71.23 A. Gomez-Rodrıguez, L. M. Beltran del Rıo and R. Herrera-
Becerra, Ultramicroscopy, 2010, 110, 95.24 M. D. Segall, P. J. D. Langan, M. J. Probert, C. J. Pickard,
P. J. Hasnip, S. J. Clark and S. C. Payne, J. Phys.: Condens.Matter, 2002, 14, 2717.
25 J. P. Perdew, K. Burke and M. Ernzerhof, Phys. Rev. Lett., 1996,77, 3865.
26 G. Berhault, A. Mehta, A. Pavel, J. Yang, L. Rendon,M. J. Yacaman, L. Cota, A. Duarte and R. R. Chianelli,J. Catal., 2001, 198, 9.
27 S. P. Kelty, G. Berhault and R. R. Chianelli, Appl. Catal., A, 2007,322, 9.
28 S. J. Tauster, T. A. Pecoraro and R. R. Chianelli, J. Catal., 1980,63, 515.
29 S. Harris and R. R. Chianelli, J. Catal., 1986, 98, 17.30 T. Kabe, A. Ishihara and Q. Zhang, Appl. Catal., A, 1993, 97, 1.31 P. Marchand, J. L. Lemberton and G. Perot, Appl. Catal., A, 1998,
169, 343.32 M. Breysse, G. Berhault, S. Kasztelan, M. Lacroix, F. Mauge and
G. Perot, Catal. Today, 2001, 66, 15.
33 G. Alonso, G. Berhault, F. Paraguay, E. Rivera, S. Fuentes andR. R. Chianelli, Mater. Res. Bull., 2003, 38, 1045.
34 J. A. Lumbreras, R. Huirache-Acuna, E. M. Rivera-Munoz,G. Berhault and G. Alonso, Catal. Lett., 2010, 134, 138.
35 L. Alvarez, G. Berhault and G. Alonso, Catal. Lett., 2008, 125, 35.36 W. Trakarnpruk and B. Seentrakoon, Ind. Eng. Chem. Res., 2007,
46, 1874.37 V. Sundaramurthy, A. K. Dalai and J. Adjaye, J. Mol. Catal. A:
Chem., 2008, 294, 20.38 G. Berhault, M. Perez De la Rosa, A. Mehta, M. J. Yacaman and
R. R. Chianelli, Appl. Catal., A, 2008, 345, 80.39 R. R. Chianelli, E. B. Prestridge, T. A. Pecoraro and
J. P. deNeufville, Science, 1979, 203, 1105.40 M. Perez de la Rosa, S. Texier, G. Berhault, A. Camacho,
M. J. Yacaman, A. Mehta, S. Fuentes, J. A. Montoya,F. Murrieta and R. R. Chianelli, J. Catal., 2004, 225, 288.
41 K. S. Liang, R. R. Chianelli, F. Z. Chien and S. C.Moss, J. Non-Cryst.Solids, 1986, 79, 251.
42 R. R. Chianelli, Int. Rev. Phys. Chem., 1982, 2, 127.43 H. Nava, J. Espino, G. Berhault and G. Alonso, Appl. Catal., A,
2006, 302, 177.44 A. D. Gandubert, E. Krebs, C. Legens, D. Costa, D. Guillaume
and P. Raybaud, Catal. Today, 2008, 130, 149.45 D. G. Castner and P. R. Watson, J. Phys. Chem., 1991, 95, 6617.46 A. F. Lamic, A. Daudin, S. Brunet, C. Legens, C. Bouchy and
E. Devers, Appl. Catal., A, 2008, 344, 198.47 R. R. Chianelli, G. Berhault, P. Santiago, D. Mendoza,
A. Espinosa, J. A. Ascencio and M. J. Yacaman, Mater. Technol.Adv. Perf. Mater., 2000, 15, 54.
48 A. K. Datye, S. Srinivasan, L. F. Allard, C. H. F. Peden,J. R. Brenner and L. T. Thompson, J. Catal., 1996, 158, 205.
49 Y. Iwata, Y. Araki, K. Honna, Y. Miki, K. Sato and H. Shimada,Catal. Today, 2001, 65, 335.
50 C. Geantet, Y. Soldo, C. Glasson, N. Matsubayashi, M. Lacroix,O. Proux, O. Ulrich and J. L. Hazemann, Catal. Lett., 2001, 73, 95.
51 G. Berhault, M. Lacroix, M. Breysse, F. Mauge, J.-C. Lavalley,H. Nie and L. Qu, J. Catal., 1998, 178, 555.
52 F. Bataille, J. L. Lemberton, P. Michaud, G. Perot, M. Vrinat,M. Lemaire, E. Schulz, M. Breysse and S. Kasztelan, J. Catal.,2000, 191, 409.
53 P. G. Moses, B. Hinnemann, H. Topsøe and J. K. Nørskov,J. Catal., 2009, 268, 201.
54 W. Li, J. F. Chen, Q. He and T. Wang, Phys. B, 2010, 405, 2498.55 M. V. Bollinger, J. V. Lauritsen, K. W. Jacobsen, J. K. Nørskov,
S. Helveg and F. Besenbacher, Phys. Rev. Lett., 2001, 87, 196803.56 P. Raybaud, J. Hafner, G. Kresse and H. Toulhoat, Surf. Sci.,
1998, 407, 237.57 P. Raybaud, J. Hafner, G. Kresse and H. Toulhoat, J. Phys.:
Condens. Matter, 1997, 9, 11107.58 M. D. Curtis, J. E. Penner-Hahn, J. Schwank, O. Baralt, D. J.McCabe,
L. Thompson and G. Waldo, Polyhedron, 1981, 7, 2411.59 U. Riaz, O. Curnow and M. D. Curtis, J. Am. Chem. Soc., 1991,
113, 1416.60 U. Riaz, O. Curnow and M. D. Curtis, J. Am. Chem. Soc., 1994,
116, 4357.61 M. D. Curtis and S. H. Druker, J. Am. Chem. Soc., 1997,
119, 1027.62 J. R. Brenner, B. T. Carvill and L. T. Thompson, Appl. Organomet.
Chem., 1992, 6, 463.63 T. R. Halbert, S. A. Cohen and E. I. Stiefel, Organometallics, 1985,
4, 1690.64 B. R. G. Leliveld, J. A. J. van Dillen, J. W. Geus, D. C. Koningsberger
and M. de Boer, J. Phys. Chem. B, 1997, 101, 11160.65 A. J. Dugulan, E. J. M. Hensen and J. A. R. van Veen, Catal.
Today, 2008, 130, 126.66 M. J. Ledoux, O. Michaux, G. Agostini and P. Panissod, J. Catal.,
1985, 96, 189.67 M. J. Ledoux, G. Maire, S. Hantzer and O. Michaux, Proceedings of
the 9th International Congress on Catalysis, Calgary, 1988, vol. 1, p. 74.68 E. Krebs, B. Silvi, A. Daudin and P. Raybaud, J. Catal., 2008,
260, 276.69 K. Marchand, C. Legens, D. Guillaume and P. Raybaud, Oil Gas
Sci. Technol., 2009, 64, 719.70 R. R. Chianelli, T. A. Pecoraro, T. R. Halbert, W. H. Pan and
E. I. Stiefel, J. Catal., 1984, 86, 226.