how shared vision moderates the effects of absorptive capacity and networking on clustered firms’...
TRANSCRIPT

1
How Shared Vision Moderates the Effects of Absorptive Capacity and Networking on Clustered Firms’ Innovation*
Manuel Expósito-Langa Business Administration Department Universitat Politècnica de València
Valencia (Spain) Email: [email protected]
F. Xavier Molina-Morales
Business Administration and Marketing Department Universitat Jaume I
Castelló de la Plana, Spain Email: [email protected]
José-Vicente Tomás-Miquel
Business Administration Department Universitat Politècnica de València
Valencia (Spain) Email: [email protected]
Abstract
This paper will contribute to the line of research that seeks to identify the determinants of firms’ innovation performance. Focusing on the territorial dimension, we investigated the role played by shared vision in the effects of internal resources (absorptive capacity) and external resources (network positioning) on the innovation of firms. To address the research questions, the empirical study drew on a sample of firms belonging to the Valencian textile cluster in Spain. Our findings suggest that networking and firm resources affect performance independently. Furthermore, internal and relational resources are positively active thanks to shared vision. More generally, we aim to contribute to the discussion on the degree to which firms should be involved in the cluster network in order to gain competitive advantages.
Keywords: Cluster, Absorptive Capacity, Shared Vision, Networking
*Financial support provided by the Spanish Ministry of Economy and Competitiveness is gratefully acknowledged (ECO2012-32663) and the Programa de Apoyo a la I+D 2012 para Primeros Proyectos de Investigación PAID-06-12 (SP20120492) of the Universidad Politécnica de Valencia-Vicerrectorado de Investigación.
2
How Shared Vision Moderates the Effects of Absorptive Capacity and Networking on Clustered Firms’ Innovation
1. INTRODUCTION
In the discussion on the determinants of firms’ innovation performance, many relevant
advances have been made by researchers over the last few decades. Specifically, authors
seem to have abandoned once and for all simplistic considerations on the false debate
between internal versus external determining factors, understanding firms as
interconnected organizations (Zaheer and Bell, 2005).
On the one hand, internal capacities are needed to capture, combine and exploit all types
of resources, particularly those related to innovation. It is commonly accepted that
organizations vary widely in their capability to develop, understand, or use knowledge
and innovation (Cohen and Levinthal, 1990). Firms’ absorptive capacity (Cohen and
Levinthal, 1990) is critical to be able to use and benefit from externally acquired
knowledge – particularly new knowledge (Zahra and George, 2002). On the other hand,
in the current economic and entrepreneurial context, complexity and full-scale
innovation requirements move firms forward to interact with external actors. Firms
cannot rely solely on internal sourcing, and thus require knowledge from beyond their
boundaries when developing their innovations (Rigby and Zook, 2002). Recently,
scholars have drawn on the network literature to highlight the importance of the
external resources available to firms through their networks (Gulati, 1999; Gnyawali
and Madhavan, 2001; Bengtsson and Örjan, 2004; McEvily and Marcus, 2005). The
location of the firm within its network of relationships is becoming an increasingly
more important key factor to enhance the value creation of firms.
In sum, the literature is rich in evidence on the relevant role of both internal and
external resources for innovation and also the interactions between them (Cassiman and
Veugelers, 2006).
We start with these considerations and we would like to go further by focusing
specifically on the effects and interactions involved in innovation processes.
Particularly, this paper underlines the relevance of the role played by shared vision in
the effects of internal resources (absorptive capacity) and external resources (network

3
positioning) on the innovation of firms. We understand shared vision as a mechanism
that embodies the collective goals and aspirations of the members of a network and
helps to integrate or to combine resources (Tsai and Ghoshal, 1998). Common values
and a shared vision are the major manifestations of the cognitive dimension of social
capital, and may encourage the development of trusting relationships. Differently,
network positioning refers to the position of the individual actor in the network,
affecting to the relational resources, number of ties, brokerage roles and so on.
In addition we have extended this literature by exploring the territorial dimension of
these processes. Thus, a cluster is identified as a network within a production context in
a geographically defined area (Boschma and Ter Wal, 2007; Parrilli and Sacchetti,
2008). Thanks to geographical proximity, common learning and knowledge flows
between different actors become frequent phenomena. Thus, spaces and the idea of
networks as vehicles of knowledge transfer and diffusion greatly overlap (Boschma and
Ter Wal, 2007).
Firms’ internal resources and network position may independently affect performance,
and we expect firms to benefit further when they possess both a superior set of internal
resources and a beneficial network structure (Zaheer and Bell, 2005). The relational
resources from networking factors and internal resources from absorptive capacity are
expected to be positively activated thanks to shared vision. A shared vision is a bonding
mechanism that helps different parts of an (organizational) network to integrate or to
combine resources. Hence, shared vision acts as facilitator of the absorptive capacity
and network position and could mediate their influence (Upadhyayula and Kumar,
2004) on firms’ outcomes as innovation.
To address the research question, the empirical study draws on a sample of firms
belonging to the textile industrial cluster of Valencia, located in one of the most
important industrial areas in eastern Spain. Findings confirm a relevant role played by
shared vision as a moderating factor between the determinants of the innovation of
clustered firms.
The paper is structured as follows, first the theoretical framework is presented, then the
hypotheses are justified and formulated, the empirical study is described and finally we
discuss conclusions and implications of our findings.
4
2. THEORETICAL FRAMEWORK AND HYPOTHESES
2.1 Social capital and shared vision in clusters
Industrial clusters can be defined as a network of inter-organizational relationships
between different actors, such as customers, competitors, suppliers, support
organizations and local institutions (Piore, 1990). Geographical proximity and a strong
feeling of belonging are primary elements facilitating such relationships, which are in
turn based on norms and values such as trust and reciprocity, among others (Antonelli,
2000).
Recent research on industrial clusters has led researchers to reconsider the main drivers
of cluster innovation, shifting the focus to the role of firms’ internal resources and
capabilities (Hassink, 2008). In this vein, our theoretical proposal recognizes the
cluster’s internal heterogeneity, thus granting a prominent role to the characteristics of
the individual firm (Giuliani, 2005; Boschma and Ter Wal, 2007). Secondly, we assume
the potential relevance of the portfolio of relationships of a clustered firm determining
its network position (Boari et al., 2002; Capaldo, 2007; Coombs et al., 2009; Molina-
Morales and Martinez-Fernandez, 2009, Li et al., 2013). Lastly, we consider the degree
to which members of the network share goals and have similar perceptions of how to act
with others, and the exchange of ideas and resources as an amplification of the positive
effects of both internal and external resources (Inkpen and Tsang, 2005).
Social capital as rooted in relationships has many different attributes. Following
Nahapiet and Ghoshal (1998) is analytically useful to distinguish three highly
interconnected different dimensions: The structural dimension that concerns the density
or dispersion of the network of ties. The nature of the ties is related to the two additional
relational (strength) and cognitive (shared goals and culture) dimensions. Particularly,
we pay attention to the cognitive dimension of the social capital, probably the most
unexploited of them. According to Tsai and Ghoshal (1998), the cognitive dimension is
related to the shared vision among network members, and includes collective objectives
and aspirations. Under these relational conditions members of the network thus have
more opportunities for a free exchange of ideas and resources.

5
The notion of shared vision was used extensively in the organizational field. Shared
vision is related to the traditional concept of goal-oriented implementation and
consensus-building in strategy and leadership literatures (Thompson and Tuden, 1959).
Recent literature on organizational learning has reinvigorated the concept of consensus-
building, and calls for better understanding of shared vision as a transformational
mechanism of a learning organization (Senge, 1990; Sinkula et al., 1997). In this
context, shared vision is defined as the organizational values that promote the overall
active involvement of organizational (network) members in the development,
communication, dissemination, and implementation of organizational goals, contrary to
the traditional top-down approach (Wang and Rafiq, 2009).
As Tsai and Ghoshal (1998) suggested, shared vision and other elements such as shared
goals, culture or shared values are expressions of cognitive social capital that favor
trusting relationships in the strong ties. On the other hand, social interactions play a
critical role in shaping goals and values among the members of the network. Shared
vision represents the degree to which the members of the network share an
understanding of and perspective on the achievement of the network’s activities and
results.
Sharing goals and vision means that network actors have similar perceptions of how to
act with others. In this context, the exchange of ideas and resources may be fostered
(Inkpen and Tsang 2005). On the other hand, common culture refers to the set of
institutionalized rules and norms that govern behavior in the network (Inkpen and Tsang
2005). In this respect, sharing the same entrepreneurial culture implies sharing concepts
such as objectives, concerns, processes, routines, etc. (Rowley 1997). In consequence,
common culture includes many different aspects, such as codes, language, histories,
visions or goals. All these elements permit and improve the understanding between
parties involved in the relationship, thereby facilitating knowledge transmission.
In our case we extended the notion of shared vision to the external interorganizational
relationships. In fact, we assume that to some extent the organization in a network
reproduces single organization conditions. In clusters organizational proximity,
similarity founded in shared vision leads the actors to be connected by sharing the same
reference space and knowledge so that they perceive, interpret and evaluate the world in
a similar way (Presutti et al., 2011). Proximity and interaction intensity, characteristic of

6
districts, play a key role in sharing goals and building common values between network
members. In this way, actors adopt common codes, values and practices through social
interactions (Tsai and Ghoshal 1998). In conclusion, clusters can be described as groups
of firms embedded in a strong local network and sharing a relatively homogenous
system of values and ideas (Barabel et al., 2007; Becattini 1990). In this respect, some
studies observe greater shared culture and values in firms belonging to clusters as
compared with external firms (Parra-Requena et al., 2010). In conclusion, shared vision
can be viewed as a relational mechanism that helps network members to integrate,
exchange resources and obtain relevant knowledge.
2.2 Effects of shared vision and absorptive capacity on clustered firms’ innovation
In accordance with some previous innovation research, we consider firms’ absorptive
capacity as one of the most important determinants (Zahra and George, 2002). The
concept of absorptive capacity has been defined by Cohen and Levinthal (1989, 1990)
as a firm’s ability to identify, assimilate and exploit knowledge from the environment.
Identification of external knowledge refers to the capacity of a company to locate and
acquire external knowledge that is critical for its activity. It can be assimilated to the
notion of competitive scanning (McEvily and Zaheer, 1999), which has been associated
with the innovative capacity of the firm. After identifying potentially useful knowledge,
the firm must transfer that knowledge and put it in a form that the firm can understand
(Zhou and Wu, 2010).
Since innovation is a knowledge-intensive process, we would therefore expect higher
levels of absorptive capacity to be positively related to more effective innovation
outcomes (Stock et al., 2001). Without a doubt, a firm’s capacity to identify, assimilate
and exploit external knowledge is directly associated to its innovative capacity.
Additionally, firms require a solid knowledge base as internal capacity to successfully
absorb the stock of knowledge that it is available in other cluster firms (Giuliani, 2007).
Knowledge base is defined as the “set of information inputs, knowledge and capabilities
that inventors draw on when looking for innovative solutions” (Dosi, 1988), and it
resides in skilled knowledge workers in the firm.
On the other hand, at the organization level several studies have revealed that a shared
vision (or a similar construct, such as goal congruence) may hold a loosely coupled

7
system together and promote the integration of an entire organization (e.g. Orton and
Weick, 1990). We can thus view a shared vision as a bonding mechanism that helps
different parts of an organization or group of organizations to integrate or to combine
resources (Tsai and Ghoshal, 1998). Within the context of regional clusters, proximity
tends to generate shared goals, values and beliefs that relate to high levels of cognitive
cohesion (Bolino et al., 2002). Clusters are associated with high average levels of
cognitive cohesion among firms triggered by close proximity (Trigilia, 2001; Wolfe,
2002; Cooke, 2002), which explain intense knowledge exchanges in the area (Baptista
and Swann, 1998). In clusters, shared vision basically allows clustered firms to receive
a large amount of knowledge and other resources from the other members of the cluster.
The benefits of shared vision can be extended to the cluster level. Shared vision
represents the collective goals between organizations in the cluster. When cluster
members have the same perceptions, they can avoid potential misunderstandings in their
communications and have more opportunities to exchange their ideas or resources. The
common goals or interests clustered firms share have another important benefit. They
help organizations to see the potential value of their exchange and combination of
resources. As a result, cluster members who share a vision will be more likely to
become partners sharing or exchanging their resources.
Shared vision acts more as a prerequisite enabling the access to the external resources
than a direct factor. Shared vision can be viewed as a relational mechanism that helps
network members to integrate, exchange resources and obtain relevant knowledge, and
in consequence enhance innovation. Moreover, shared vision is associated to breaking
barriers and transmission of knowledge then more knowledge exchanges more potential
innovation. For instance, creativity is generated inside the individual organization but
needs to be feed by exchanges and combinations of external knowledge, which is
facilitated by shared vision between organizations in the exchanges.
This line of argument leads to our final prediction. If shared vision among organizations
in clusters facilitates exchanges of knowledge resources among them, then we can
expect shared vision to enhance the positive effect of the absorptive capacity on the
innovation of the firm. The following hypothesis can be formulated:

8
Hypothesis 1. The level of shared vision of a clustered firm would positively moderate
the relation between its absorptive capacity and innovation.
2.3 Effects of shared vision and network position on clustered firms’ innovation
In accordance with some recent networking research, we considered the external
resources available to the firm through its networks to be particularly relevant (McEvily
and Marcus, 2005; Gnyawali and Madhavan, 2001; Gulati, 1999). More and more the
location of the firm within its network of relationships is becoming a key factor to
enhance the value creation of firms.
Clustered firms acquire a large number of knowledge resources from the other members
of the cluster. In this sense, knowledge resources flow rapidly within the cluster, thus
reducing search costs (Maskell, 2001). However, recent cluster literature is increasingly
in agreement with the idea that not all firms in a cluster are equally involved in local
networks (Bathelt et al., 2004; Giuliani, 2007). While geographical proximity can
facilitate connectivity to stable market relationships between cluster companies,
knowledge flows would be restricted to other local communities within the cluster,
identified by their knowledge assets, innovative behavior and economic performance
(Morrison and Rabellotti, 2009).
As suggested by Giuliani (2007), the most valuable knowledge, which concerns
innovation, is unevenly and asymmetrically distributed between cluster companies. In
this sense, the pursuit of such knowledge leads firms to strategically select diverse
partners that can bring them benefits, for instance in terms of solutions to solve
problems, and it is often irrelevant whether they are connected to the business network
or not. Thus, knowledge networks, made up of actors with a similar knowledge base and
knowledge-sharing interests, emerge within the cluster. These networks will present
different characteristics from those of business networks.
In conclusion, the positive association between interorganizational ties and knowledge
acquisition is consistent with the assumptions that learning, particularly that involving
difficult-to-transfer information, is aided by intensive and repeated interactions. Thus,
interactions exert an influence on the capabilities of firms and, hence, constitute a factor
contributing to company innovation.
9
Therefore, relational or social resources have become central in explaining the behavior
and performance of organizations (Nahapiet and Ghoshal, 1998). The fundamental
explanatory tenets of the social network perspective are based on the idea that the
structure of social interactions enhances or constrains access to valued resources (Brass,
1984; Ibarra, 1993; Presutti et al., 2007).
In contrast with this dominant perspective emphasizing the positive effects of the social
capital, it must be mentioned those authors who consider also the negative
consequences. For instance, Anderson and Jack (2002) referring to the nature of the
social capital distinguished between both glue, which forms the structure of networks,
and at the same time a lubricant that facilitates the operation of networks. Moreover, the
association between social capital and innovation can be described as an U-inverted
form, since in the low levels of social capital, increases result on increases of
innovation, but to certain level of social capital, additional increases become neutral or
even negative for innovation (Molina-Morales and Martínez-Fernández 2009).
Holding a great number of ties associated with the existence of a shared vision and a set
of common values, goals and aspirations (Tsai and Ghoshal, 1998) results in advantages
and disadvantages for a firm’s external knowledge acquisition and learning. A
combination of high network centrality values and shared values foster joint action and
common understanding (Portes and Sensenbrenner, 1993; Bolino et al., 2002).
Likewise, it increases the opportunities to access knowledge and ideas freely, and
enhances the effectiveness of the integration and combination of knowledge (Inkpen
and Tsang, 2005).
Clusters are, by definition, associated with the existence of certain shared common
norms and beliefs (Barabel et al., 2007; Becattini, 1990), which explain the generalized
ease and success of knowledge exchanges within the area (Glassmeier, 2011). We
suggest that shared vision would influence the exploitation of the relational advantages
afforded by the firm’s position in the cluster network.
Firms occupying central positions in the cluster network of knowledge relations can
attain benefits from holding direct ties with high levels of shared vision. Ties with high
levels of shared vision imply willingness to take action to benefit partners (Bolino et al.,
2002). In addition, it would enhance the learning potential of the acquisition of diverse

10
and non-redundant knowledge coming from external ties by triggering common
understanding and knowledge integration (Inkpen and Tsang, 2005).
Overall, we suggest that shared vision increases the potential benefits of a high degree
of centrality within a cluster network. Specifically, we anticipate that high degrees of
shared vision would positively moderate the effect exerted by the network positioning
of the firm in the knowledge network. This can be expressed more formally as the
following hypothesis:
Hypothesis 2. The level of shared vision of a clustered firm would positively moderate
the relation between its knowledge network position and innovation.
INSERT FIGURE 1 ABOUT HERE
3. METHODOLOGY
3.1 Research setting
The empirical study is based on the Valencian textile cluster. The textile industry is one
of the most complex manufacturing industries, and is a sector with an enormous number
of possible activities involved, from yarn to fabric or knitwear production. In 2011 the
textile and clothing industry in Spain accounted for 6% of industrial employment, 3% of
GDP and 5.9% of Spanish industrial exports. This industry has traditionally played a
central role in the Spanish pattern of specialization, being one of the most representative
local agglomerations in Spain. In fact, this sector shows the highest degree of
geographical concentration in the country.
Recently in Europe, shifts in international markets, such as international textile trade
liberalization or the introduction of new production technologies, have caused new
developments in this industry, such as a displacement of the internal low added-value
activities to external locations, and consequently there has been a substitution of internal
activities for new ones producing superior and higher added-value products. It should be
noted that the textile sector has been the focus of many researchers in the cluster

11
literature (Guerrieri and Pietrobelli, 2004; Sammarra and Belussi, 2006; Crestanello and
Tattara, 2011).
Facing increasing competition from countries with emerging economies, European
firms have reacted with a variety of strategies, including intense productive
delocalization aimed at reducing production costs, and also policies of repositioning in
higher quality segments of the market, with more added-value products and services.
Within the context of the textile industry two main traditional segments can be
distinguished: clothing and household textiles. However, a third segment has recently
become relevant, the so-called textiles for technical use. This focuses on technological
characteristics, with higher intensity R&D requirements than aesthetical or decorative
requirements, as may be the case of home textiles or clothing. The usual destination for
these products has been industries and markets other than the traditional ones, such as
the automotive industry, building sector, civil engineering, medicine or health and
safety. According to the International Rayon and Synthetic Fibres Committee (CIRFS),
the level of market penetration in this segment is about 25% in contrast with other
traditional segments, which indicates the strong potential market for these products.
In sum, fashion-led industries such as textile-clothing have been primarily affected by
globalization pressures and relocation (Schiattarella, 1999), thus causing a continuous
reduction in production levels and the number of firms. However textiles for technical
use is becoming a market in which Spanish cluster firms can compete, as it is based on
innovative strategies rather than cost reduction. In this sense, textile firms are interested
in increasing the importance of these technical textile products in their product
portfolio, but are limited by their capacity for product diversification (Expósito-Langa
et al., 2011).
3.2 Sample collection and data sources
The empirical study has drawn on the population of firms belonging to the Valencian
textile industrial cluster in Spain. The textile industry in the Valencian region is located
in an industrial cluster in the counties of L’Alcoià, El Comtat and L’Alt Vinalopo in the
province of Alicante and in La Vall d’Albaida in the province of Valencia. According to
IVE (Valencian Institute of Economic Studies), in 2011 about 32,900 people were
employed, with a production value of 4,000 million Euros, accounting for 26% and 27%

12
of the total Spanish sector, respectively. The main products are the so-called home
textiles, although in recent years technical textile production has increased considerably.
The empirical study was carried out in two different phases. Firstly, we drew up a roster
of companies from the SABI1 database including general information about firms in the
textile cluster, such as their location, main activities, income, financial performance
(EBT) and number of employees. As we commented earlier, the textile industry is made
up of a wide range of manufacturing processes involving a large number of primary and
auxiliary activities. Thus, the number of companies in the cluster is large, around 750,
including micro, SMEs and large enterprises. Such a large number of companies cannot,
however, be managed in the roster recall technique.
So, in order to refine the population, from the initial list we selected the companies that
are more representative, based on the opinion of a panel of experts from several
institutions (such as the Polytechnic University of Valencia and the main trade
associations of the textile cluster, such as ATEVAL – Valencia Textile Business
Association and Research Institution – and AETA – Textile Business Association from
Alcoy – together with two main companies from the cluster) and following criteria such
as turnover, number of employees or commercialization of innovative products. After
applying this filter, a final sample of one hundred companies was established, thereby
allowing us to proceed with a representative set of enterprises from the total population
addressed by this research. Although small firms are underrepresented in the sample, a
goodness-of-fit test allowed us to know that the distribution of firms by size classes
does not differ significantly from the size distribution in the population of cluster firms.
The first phase of the study was conducted during the period from May to July 2010.
We applied the roster-recall method (Wasserman and Faust, 1994) since it has been
frequently used in previous research in this particular field (Giuliani and Bell, 2005;
Giuliani, 2007; Morrison and Rabellotti, 2009). This technique consists in sending a
questionnaire to the sample companies and attaching the complete list of these
companies. They are then invited to select those firms from the list with which they
maintain different types of relationships. In our case we followed the procedure
developed in Giuliani (2007) to analyze commercial relationships (business network) 1 SABI is a directory of Spanish and Portuguese companies that collects general information and financial data. In the case of Spain, it covers more than 95% of the companies of the 17 Spanish regions with total yearly revenues over 360,000-420,000 €.

13
and knowledge exchanges (knowledge network). In order to deploy the commercial
relationships we asked the companies with which of the cluster firms mentioned in the
roster they had interacted for business matters. In the same way, in order to construct
the knowledge network we asked firms 2 questions: firstly, to which of the local firms
mentioned in the roster they would turn if they are in a critical situation and need
technical advice; and secondly, which of the firms of the list may have benefited from
their technical support. This procedure followed by Giuliani (2007) analyzes knowledge
relationships based on technical issues. In our case, this procedure is valid since
technical information is predominant in the knowledge exchanges of the Valencian
textile cluster. The process concluded satisfactorily with a total of 79 completed
questionnaires obtained.
In order to complete our analysis, in the second phase of the study we aimed to analyze
the companies that answered the roster in more detail by means of face-to-face
interviews. Finally we obtained semi-structured interviews with company CEOs and
executives, which were conducted during the period from September to November
2010. These interviews allowed us to gain a detailed understanding of company
activities, market strategies, product portfolio, as well as the firm’s orientation towards
innovation process development.
3.3 Variables
Dependent variable
• Innovation, creation of new products
This variable attempts to capture the capacity of a company to create and generate new
products. Within the context of our research we have characterized the development of
new products based on the degree to which they are focused on the technical textiles
segment. We are aware of the difficulties involved in assessing innovation performance
in such specific contexts. Different approaches can be used to measure a firm’s
innovative capacity. For several reasons many companies do not use patents to protect
this knowledge (Grant, 1996), so instead we followed the recommendation of Tushman
and Nadler (1986), who related innovation to new product, service or process creation
in terms of business units. Consequently, in the context of our research we have
associated innovation with the degree to which a firm dedicates its product portfolio to

14
technical textiles, since it can be assumed that this segment implies new products (or a
line of new products) for the textile industrial cluster. Support for the use of this
indicator can be found in previous research on this particular industry (Expósito-Langa
et al., 2011).
To avoid limitations of self-assessment of innovation results by companies we ran a
control of measures by a panel of experts, following the suggestions of Bell (2005). To
do so, in-depth interviews were carried out with a panel of experts from the AETA
Association. During the session we presented the panel of experts with the list of
companies and they were asked to value the innovative output of each of them, in an
attempt to reach a consensus among all participants, which was finally captured on a 1-5
Likert scale. As a result of the meeting with experts, we elaborated a control measure to
assess the innovation of a company. We then computed the bivariant correlation
between experts’ and firms’ perceptions, resulting in a satisfactory correlation at .672
(p < .01). We thereby consider that the measure used in our study captures the
innovation results of the firm in an adequate manner.
Independent variables
• Absorptive Capacity
Despite the increase in literature on absorptive capacity, this capacity has been defined
in multiple ways (Lane et al., 2006; Flatten et al., 2014). As an intangible resource,
absorptive capacity is not an exception and deal with the problem of the measurement.
Absorptive capacity is the ability of the firm to identify and value, assimilate and
exploit external information (Cohen & Levinthal, 1990). Later, Zahra and George
(2002) stated that one of the principal lacunae of this specification of absorptive
capacity is that it does not capture the dynamic nature of the construct, and accordingly
they reconceptualized it. Zahra and George (2002: 186) specified absorptive capacity as
“a set of organizational routines and processes by which firms acquire, assimilate,
transform and exploit knowledge to produce a dynamic organizational capability”. They
further suggested two dimensions of absorptive capacity, Potential (PACAP), which
encompasses knowledge acquisition and assimilation capabilities, and Realized
(RACAP), which includes knowledge transformation and exploitation capabilities. Due
to these difficulties in the measurement and according to the objective of this research,

15
we adapted the measure of the variable to the Potential dimension. This supposes that
absorptive capacity acts as a funnel that emphasizes exploratory learning.
To operationalize absorptive capacity we have proposed a number of items related to
the evaluation of the degree of commitment of the company towards R&D activities.
The first item is defined as the commitment and concern of the management of the
company towards R&D and was formulated following Jansen et al. (2005) and Tu et al.
(2006). In accordance with other contributions, such as Mangematin and Nesta (1999),
Zahra and George (2002) and Jansen et al. (2005), a second item was used to ask
respondents about R&D and the importance of cooperation for knowledge acquisition.
We asked about the company’s participation in R&D programmes (at regional, national
or European levels) during the last three years. In order to contemplate the effect of the
knowledge base in absorptive capacity we asked about the number of technically
qualified personnel in the firm (Giuliani, 2007). Finally, the last item was related to the
percentage spent on R&D in relation to total sales (as innovation effort).
An exploratory factor analysis was run to identify the multi-item scale of the absorptive
capacity construct. A Cronbach’s α value of 0.876 was obtained and the results of the
factor analysis reported by the Barlett test of sphericity were significant (Chi-
square = 199.491; df = 10; sig. = .000). Finally, the value of the Kaiser-Meyer-Olkin
(KMO) measurement was greater than 0.6 (KMO = .799). Therefore, it was appropriate
to proceed with a factor analysis (Coakes and Steed, 2001). A one-factor solution was
obtained with varimax rotation and 67.1% of variance extracted from the overall
variance.
• Shared Vision
To operationalize shared vision we adapted the scale to the particular characteristics of
our study. Following Tsai and Ghoshal (1998), we used a three-item measure to assess
the level of shared vision in the different firms in the industrial cluster which have
relationships. The items were defined as 1) the degree to which a firm shares the same
ambitions and vision with firms or institutions in the textile industry cluster, 2) the
degree to which the firm is enthusiastic about pursuing the collective goals and missions
of its relationships in the cluster, and finally, 3) the degree to which the firm shares
goals and objectives with its contacts in the cluster. We used a 1 to 5 Likert scale.
16
An exploratory factor analysis was run to identify the multi-item scale of the shared
vision construct. A Cronbach’s α value of 0.864 was obtained and the results of the
factor analysis reported by the Barlett test of sphericity were significant (Chi-
square = 127.739; df = 3; sig. = .000). Finally, the KMO measurement was greater than
0.6 (KMO = .678). Therefore, it was appropriate to proceed with a factor analysis
(Coakes and Steed, 2001). A one-factor solution was obtained with varimax rotation
and 80.841% of variance extracted from the overall variance.
• Knowledge/Business Network Position
We have distinguished between two networks in such a way that one of them, the
knowledge network, is the one which represents the sources of knowledge resources for
the clustered firms, rather than the business network, which represents more formal or
merely spatial proximity. Consequently, belonging to the knowledge network can be
expected to be related to innovation of the clustered firms, but not necessarily so for the
case of the business network.
We consider the egonet the result of the links that a certain actor gives and receives in
the network. Thus, the size of the egonet measures the number of connections in the
social network developed by the actor (ego), a social network being considered the set
of actors and the ties among them. In order to make the egonet size variable operational,
we applied social network analysis techniques using the UCINET v.6 software
application (Borgatti et al., 2002). This technique provides a tool to explore the
structural properties of a network, and encompasses theories, models and applications
that are expressed in terms of relational concepts or processes (Wasserman and Faust,
1994).
Two egonet values were obtained for each individual network of each actor in order to
compute its total number of ties with other cluster companies. Particularly, we asked
about the ties of the company concerning both its knowledge and business networks.
Thus, the former was associated to the Knowledge Egonet Size (KES) variable, and the
latter to the Business Egonet Size (BES) variable. Although we used the KES variable
to contrast hypothesis 2, the BES variable was applied to control results.
On the one hand, the knowledge network facilitates the transfer of (mainly tacit)
knowledge related to innovation and technical problems (Giuliani and Bell, 2005;

17
Giuliani, 2007; Morrison and Rabellotti, 2009; Ramírez-Pasillas, 2010), which implies
going one step further than the mere acquisition of information, or explicit knowledge,
that could come in turn from other channels such as trade fairs, Internet, industry
magazines, etc. Thus, companies were asked to select from the list those companies that
had helped them to solve technical problems, provided relevant knowledge or
participated jointly in R&D projects in the last 3 years.
On the other hand, business relationships are established based on business-centred
interaction, such as exchanges of inputs or services, or partnerships based on a common
institutional affiliation (Giuliani, 2007; Ramírez-Pasillas, 2010). Thus, companies were
asked to select from the list the companies with whom they had interacted on business
issues in the last 3 years. In our case we used the business network position of the firm
as a control variable in order to isolate the effect of the knowledge network on
innovation.
• Control (Size)
Size is usually used as a control variable, as described by Kamien and Schwarz (1982).
Thus, larger firms can be expected to invest more resources in obtaining new
knowledge sources. Control variables were measured through the number of employees
and the logarithms of unit sales in order to smooth it, as used by Tsai (2001), among
others.
4. EMPIRICAL RESULTS
4.1 Networks analysis
In order to analyse the relational structure of the participant companies, we used the
social network analysis technique in the software program UCINET v.6 (Borgatti et al.,
2002). This technique has been used in cluster analysis by several authors (Boschma
and Ter Wal, 2007; Giuliani, 2007; Morrisson and Rabellotti, 2009; Ramírez-Pasillas,
2010).
Figures 2 and 3 show the Business and Knowledge networks obtained in the first phase
of our analysis. As can be observed in both networks, there are significant differences in
18
density and structure. On the one hand, the size of the nodes that appear in the figures
was an indicator of their egonet size variable. This value was computed and then
included in the following phase of the study.
INSERT FIGURES 2 AND 3 ABOUT HERE
4.2 Regression models
In Table 1, we present the basic descriptive statistics and the Pearson’s correlation for
all variables.
INSERT TABLE 1 ABOUT HERE
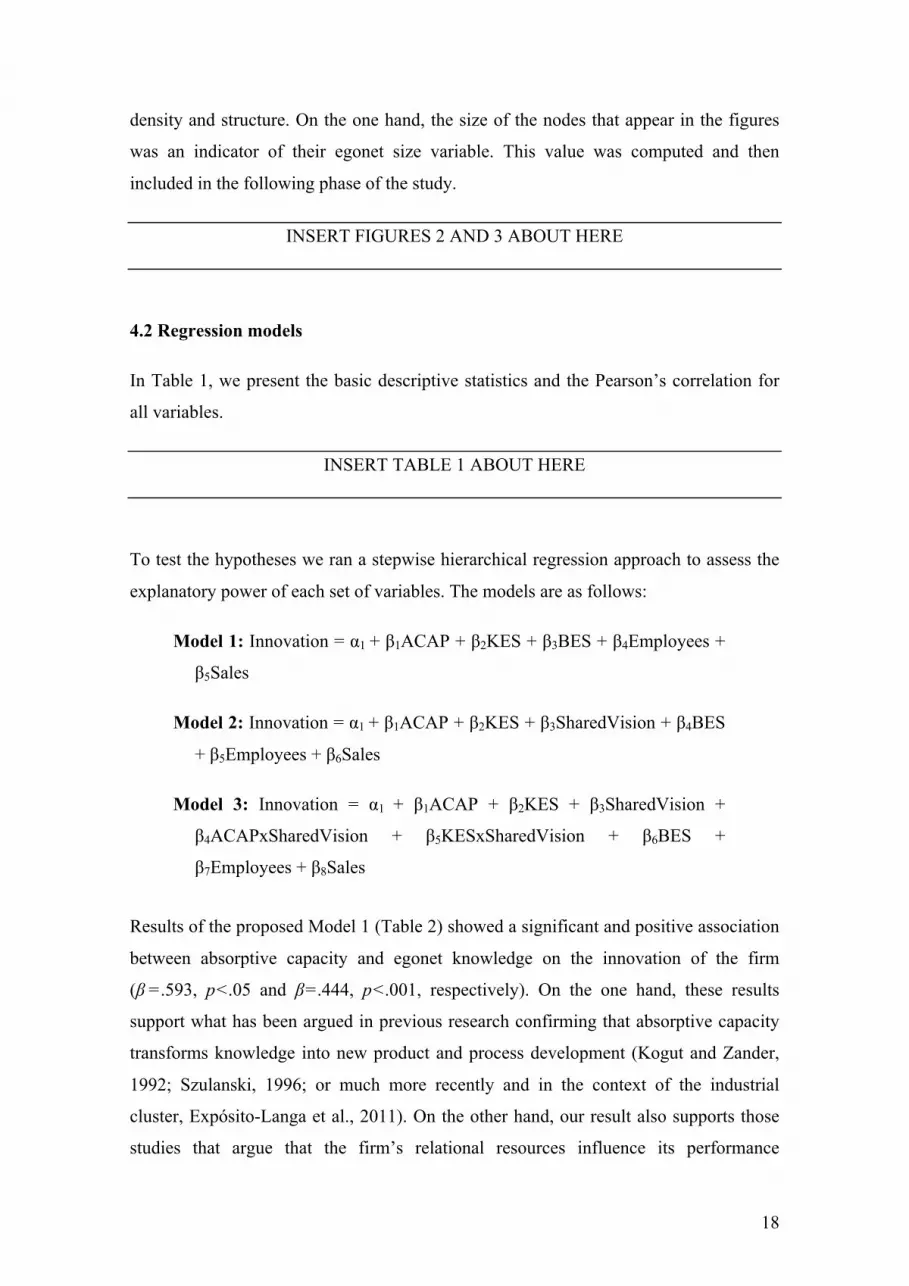
To test the hypotheses we ran a stepwise hierarchical regression approach to assess the
explanatory power of each set of variables. The models are as follows:
Model 1: Innovation = α1 + β1ACAP + β2KES + β3BES + β4Employees +
β5Sales
Model 2: Innovation = α1 + β1ACAP + β2KES + β3SharedVision + β4BES
+ β5Employees + β6Sales
Model 3: Innovation = α1 + β1ACAP + β2KES + β3SharedVision +
β4ACAPxSharedVision + β5KESxSharedVision + β6BES +
β7Employees + β8Sales
Results of the proposed Model 1 (Table 2) showed a significant and positive association
between absorptive capacity and egonet knowledge on the innovation of the firm
(β = .593, p < .05 and β = .444, p < .001, respectively). On the one hand, these results
support what has been argued in previous research confirming that absorptive capacity
transforms knowledge into new product and process development (Kogut and Zander,
1992; Szulanski, 1996; or much more recently and in the context of the industrial
cluster, Expósito-Langa et al., 2011). On the other hand, our result also supports those
studies that argue that the firm’s relational resources influence its performance
19
(Nahapiet and Ghoshal, 1998; Presutti et al., 2007), thereby enhancing or constraining
access to valued resources.
INSERT TABLE 2 ABOUT HERE
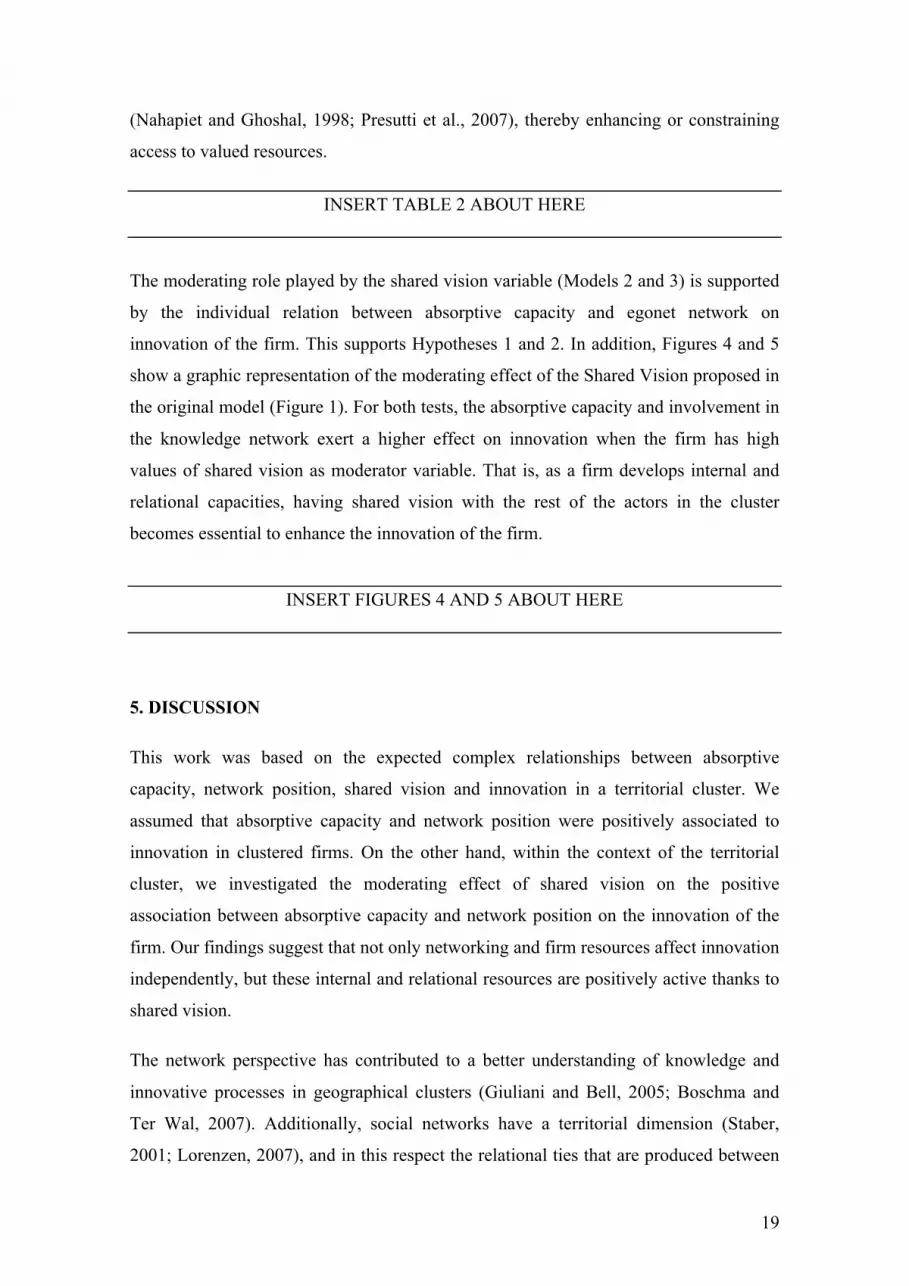
The moderating role played by the shared vision variable (Models 2 and 3) is supported
by the individual relation between absorptive capacity and egonet network on
innovation of the firm. This supports Hypotheses 1 and 2. In addition, Figures 4 and 5
show a graphic representation of the moderating effect of the Shared Vision proposed in
the original model (Figure 1). For both tests, the absorptive capacity and involvement in
the knowledge network exert a higher effect on innovation when the firm has high
values of shared vision as moderator variable. That is, as a firm develops internal and
relational capacities, having shared vision with the rest of the actors in the cluster
becomes essential to enhance the innovation of the firm.
INSERT FIGURES 4 AND 5 ABOUT HERE
5. DISCUSSION
This work was based on the expected complex relationships between absorptive
capacity, network position, shared vision and innovation in a territorial cluster. We
assumed that absorptive capacity and network position were positively associated to
innovation in clustered firms. On the other hand, within the context of the territorial
cluster, we investigated the moderating effect of shared vision on the positive
association between absorptive capacity and network position on the innovation of the
firm. Our findings suggest that not only networking and firm resources affect innovation
independently, but these internal and relational resources are positively active thanks to
shared vision.
The network perspective has contributed to a better understanding of knowledge and
innovative processes in geographical clusters (Giuliani and Bell, 2005; Boschma and
Ter Wal, 2007). Additionally, social networks have a territorial dimension (Staber,
2001; Lorenzen, 2007), and in this respect the relational ties that are produced between

20
close actors are particularly relevant (Malecki, 1995). So, relational dimension, which
occurs in networks, implies the interconnections and interactions between behavioral
actors in the network. However, geographical proximity can lead to relational
dimension, but only when participants develop shared vision and maintain close and
mutually dependent relationships the relevant knowledge flows and transfers (Li et al.,
2013; Rosenkopf and Almeida, 2003).
In our view our paper contributes to the literature in several different ways. On the one
hand, it offers a comprehensive perspective of the innovation process in clustered firms.
In fact, the results obtained balance the importance of each category of knowledge
resources. Hence, while absorptive capacity is important for innovation processes, the
networking intensity of firms to access the firm-external resources must also be
considered. On the other hand, this paper belongs to the group of recent attempts to
clarify key questions in cluster studies through network analysis. Findings confirm
previous literature that has evidenced the relevant role of both internal and external
resources for innovation and also the interactions between them (Cassiman and
Veugelers, 2006).
A firm’s egonet size has provided significant explanatory capacity. Thus, we have
distinguished two different categories of relational structures. One refers to knowledge
exchanges and the other has to do with the business or commercial exchanges. The
significant association between knowledge network and innovation confirms the
importance of knowledge flows in the cluster and, moreover, the importance of the
individual firm’s positioning within the network. In contrast, the fact that the business
network lacks any significant association to innovation may require an additional
comment. One possible explanation for rejection comes from the very definition of
innovation used in our study. Since we considered new product development, and
particularly the relative weight of the textile for technical uses, innovation is related to
technological innovation rather than other forms of non-technological innovations, such
as so-called market innovations. We are convinced that, for the latter category of
innovation, the importance of business networks could have been significantly higher.
The main contribution of the paper is the strong empirical evidence found supporting
the importance of shared vision as an enhancer of the positive effects of internal
resources (absorptive capacity) and external resources (network positioning) on the
21
innovation of the firm. In other words, firms benefit from resources even more when
they have higher levels of shared vision. These findings are in line with some previous
research dealing with an initial consideration of shared vision (Tsai and Ghoshal, 1998).
In a broader sense, the paper claims the cognitive dimension of social networks may
well be of greater relevance (Bengtsson and Sölvell, 2004; Wuyts et al., 2005; Li et al.
2013). Particularly, we seek a more precise and complex relation between this social
dimension and innovation, in line with some relevant precedents. For instance, Nooteboom (1992, 1999) proposed that there is an inverted-U shaped relationship between cognitive distance and innovation performance.
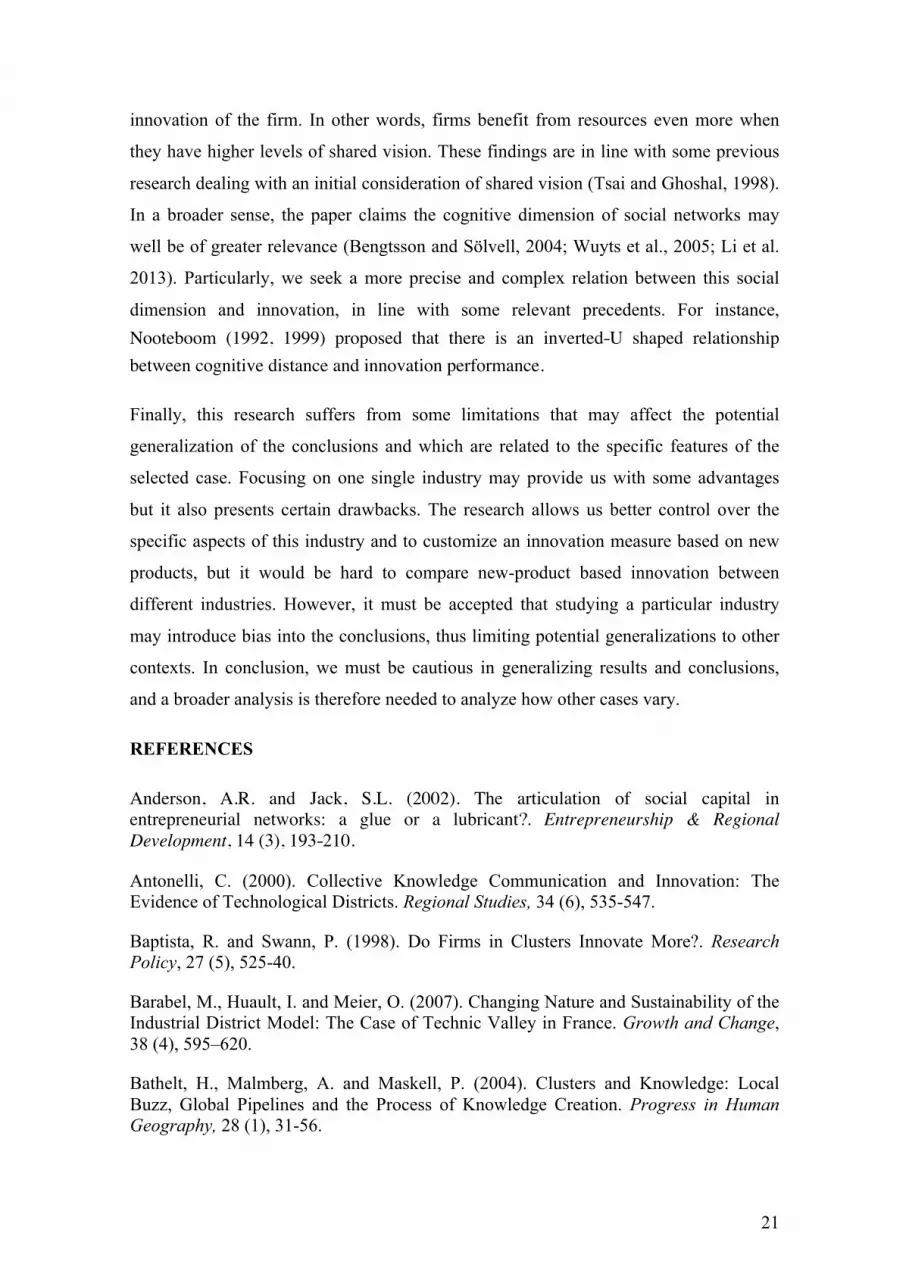
Finally, this research suffers from some limitations that may affect the potential
generalization of the conclusions and which are related to the specific features of the
selected case. Focusing on one single industry may provide us with some advantages
but it also presents certain drawbacks. The research allows us better control over the
specific aspects of this industry and to customize an innovation measure based on new
products, but it would be hard to compare new-product based innovation between
different industries. However, it must be accepted that studying a particular industry
may introduce bias into the conclusions, thus limiting potential generalizations to other
contexts. In conclusion, we must be cautious in generalizing results and conclusions,
and a broader analysis is therefore needed to analyze how other cases vary.
REFERENCES
Anderson, A.R. and Jack, S.L. (2002). The articulation of social capital in entrepreneurial networks: a glue or a lubricant?. Entrepreneurship & Regional Development, 14 (3), 193-210.
Antonelli, C. (2000). Collective Knowledge Communication and Innovation: The Evidence of Technological Districts. Regional Studies, 34 (6), 535-547.
Baptista, R. and Swann, P. (1998). Do Firms in Clusters Innovate More?. Research Policy, 27 (5), 525-40.
Barabel, M., Huault, I. and Meier, O. (2007). Changing Nature and Sustainability of the Industrial District Model: The Case of Technic Valley in France. Growth and Change, 38 (4), 595–620.
Bathelt, H., Malmberg, A. and Maskell, P. (2004). Clusters and Knowledge: Local Buzz, Global Pipelines and the Process of Knowledge Creation. Progress in Human Geography, 28 (1), 31-56.

22
Becattini, G. (1990). The marshallian industrial district as a socio-economic notion. In Pyke, F., Becattini, G. and Sengenberger, W. (Eds.). Industrial districts and local economic regeneration (pp. 37-51). Geneva: International Institute for Labor Studies.
Bell, G.G. (2005). Clusters, Networks, and Firm Innovativeness. Strategic Management Journal, 26 (3), 287-295.
Bengtsson, M. and Sölvell, Ö. (2004). Climate of competition, clusters and innovative performance. Scandinavian Journal of Management, 20, 225-244.
Boari, C., Odorici, V. and Zamarian, M. (2002). Clusters and rivalry: does localization really matter?. Scandinavian Journal of Management, 19, 467-489.
Bolino, M.C., Turnley, W.H., and Bloodgood, J.M. (2002). Citizenship behavior and the creation of social capital in organizations. Academy of Management Review, 27 (4), 505-522.
Borgatti, S.P., Everett, M.G. and Freeman, L.C. (2002). Ucinet for Windows: Software for Social Network Analysis. Analytic Technologies, Harvard.
Boschma, R.A. and Ter Wal, A.L.J. (2007). Knowledge Networks and Innovative Performance in an Industrial District: The Case of a Footwear District in the South of Italy. Industry & Innovation, 14 (2), 77-199.
Brass, D.J. (1984). Being in the right place: a structural analysis of individual influence in an organization. Administrative Science Quarterly, 29, 518-539.
Capaldo, A. (2007). Network structure and innovation: the leveraging of a dual network as a distinctive relational capability. Strategic Management Journal, 28, 585-608.
Cassiman, B. and Veugelers, R. (2006). In search of complementarity in innovation strategy: Internal R&D and external knowledge acquisition. Management Science, 52, 68-82.
Coakes, S. and Steed, I. (2001). SPSS Analysis Without Anguish, Version 10.0. Sidney: John Wiley.
Cohen, W. and Levinthal, D. (1989). Innovation and learning: The two faces of R&D. Economic Journal, 99, 569-596.
Cohen, W. and Levinthal, D. (1990). Absorptive capacity: A new perspective on learning and innovation. Administrative Science Quarterly, 35 (1), 128-152.
Cooke, P. (2002). Knowledge Economies. London: Routledge.
Coombs, J., Deeds, D. and Ireland, R. (2009). Placing the choice between exploration and exploitation in context: a study of geography and new product development, Strategic Entrepreneurship Journal, 3 (3), 261-279.
Crestanello, P. and Tattara, G. (2011). Industrial Clusters and the Governance of the Global Value Chain. The Romania-Veneto Network in Footwear and Clothing. Regional Studies, 45 (2), 187-203.

23
Dosi, G. (1988). Sources, procedures and microeconomic effects of innovation. Journal of Economic Literature, 26, 1120-1171.���
Expósito-Langa, M., Molina-Morales, F.X. and Capó-Vicedo, J. (2011). New Product Development and Absorptive Capacity in Industrial Districts: A Multidimensional Approach. Regional Studies, 45 (3), 319-331.
Flatten, T., Engelen, A., Zahra, S. and Brettel, M. (2011). A measure of absorptive capacity: Scale development and validation. European Management Journal, 29 (2), 98-116.
Giuliani, E. (2005). The Structure of Cluster Knowledge Networks: Uneven and Selective, not Pervasive and Collective. Working paper n.05-11, DRUID.
Giuliani, E. (2007). The selective nature of knowledge networks in clusters: evidence from the wine industry. Journal of Economic Geography, 7, 39–168.
Giuliani, E. and Bell, M. (2005). The micro-determinants of meso-level learning and innovation: evidence from a Chilean wine cluster. Research Policy, 34 (1), 47–68.
Glasmeier, A. (1991). Technological Discontinuities and Flexible Production Networks: The Case of Switzerland and the World Watch Industry. Research Policy, 20 (5), 469-485. Gnyawali D. R. and Madhavan R. (2001). Cooperative Networks and Competitive Dynamics: A Structural Embeddedness Perspective. Academy of Management Review, 26 (3), 431-45.
Grant, R.M. (1996). Prospering in dynamically-competitive environments: Organizational capability as knowledge integration. Organization Science, 7 (4), 375-387.
Guerrieri, P. and Pietrobelli, C. (2004). Industrial districts' evolution and technological regimes: Italy and Taiwan. Technovation, 24, 899-914.
Gulati R. (1999). Network Location and Learning: The Influence of Network Resources and Firm Capabilities on Alliance Formation. Strategic Management Journal, 20 (5), 397-420.
Hassink, R. (2008). Geography locked in decline? On the role of regional lock-ins in old industrial areas. In Boschma, R. and Martin, R. (Eds.), Handbook of Evolutionary Economic Geography (pp.450-468). Cheltenham: Edward Elgar.
Ibarra, H. (1993). Network centrality, power and innovation involvement: Determinants of technical and administrative roles. Academy of Management Journal, 36, 471-501.
Inkpen, A. and E. Tsang (2005). Social capital, networks, and knowledge transfer. Academy of Management Review, 30 (1), 146–165.
Jansen, J., Van Den Bosch, F. and Volberda, H. (2005). Managing potential and realized absorptive capacity: How do organizational antecedents matter?. Academy of Management Journal, 48 (6), 999-1015.

24
Kamien, M.I. and Schwarz, N.L. (1982). Market structure and innovation. Cambridge: Cambridge University Press.
Kogut, B. and Zander, U. (1992). Knowledge of the firm, combinative capabilities, and the replication of technology. Organization Science, 3 (3), 383-397.
Lane, P.J., Koka, B.R. and Pathak, S. (2006). The reification of absorptive capacity: A critical review and rejuvenation of the construct. Academy of Management Review, 31 (4), 833-863.
Li, W., Veliyath, R. and Tan, J. (2013). Network Characteristics and Firm Performance: An Examination of the Relationships in the Context of a Cluster. Journal of Small Business Management, 51 (1), 1-22.
Lorenzen, M. (2007). Social capital and localised learning: proximity and place in technological and institutional dynamics. Urban Studies, 44 (4), 799-817.
Malecki, E. (1995). Culture as mediator of global and local forces. In Van Der Knaap, B. and Le Heron, R. (Eds.). Human Resources and Industrial Spaces: A Perspective on Globalization and Localization (pp. 105-127). Chichester: Wiley.���
Mangematin, V. and Nesta, L. (1999). What kind of knowledge can a firm absorb?. International Journal of Technology Management, 18 (3-4), 149-172.
Maskell, P. (2001). Knowledge creation and diffusion in geographic clusters. International Journal of Innovation Management, 5 (2), 213-225.
McEvily B. and Marcus A. (2005). Embedded Ties and the Acquisition of Competitive Capabilities. Strategic Management Journal, 26 (11), 1033-55.
McEvily, B. and Zaheer, A. (1999). Bridging ties: A source of firm heterogeneity in competitive capabilities. Strategic Management Journal, 20 (12), 1133-1158.
Molina-Morales, F.X. and Martinez-Fernandez, M.T. (2009). Too much love in the neighborhood can hurt: how an excess of intensity and trust in relationships may roduce negative effects on firms. Strategic Management Journal, 30 (9), 013-1023.
Morrison, A. and Rabellotti, R. (2009). Knowledge and Information Networks in an Italian Wine Cluster. European Planning Studies, 17 (7), 983-1006.
Nahapiet, J. and Ghoshal, S. (1998). Social capital, intellectual capital, and the organizational advantage. Academy of Management Review, 23 (2), 242-266.
Nooteboom, B. (1992). Towards a dynamic theory of transactions. Journal of Evolutionary Economics, 2, 281-299.
Nooteboom, B. (1999). Inter-Firm Alliances: Analysis and Design. London: Routledge.
Orton, J.D. and Weick, K.E. (1990). Loosely coupled systems: a reconceptualization. Academy of Management Review, 15 (2), 203–223.
Parra-Requena, G., Molina-Morales, F.X. and García-Villaverde, P.M. (2010). The

25
Mediating Effect of Cognitive Social Capital on Knowledge Acquisition in Clustered Firms. Growth and Change, 41 (1), 59-84.
Parrilli, M.D. and Sacchetti, S. (2008). Linking Learning with Governance in Networks and Clusters: Key Issues for Analysis and Policy. Entrepreneurship and Regional Development, 20 (July), 387–408.
Piore, M.J. (1990). Work, labor and action: Work experience in a system of flexible production, in Pyke, F. Becattini, G. & Sengenberger, W. (Eds), Industrial districts and inter-firm cooperation in Italy. Geneva: International Institute for Labor Studies.
Portes A. and Sensenbrenner J. (1993). Embeddedness and Immigration: Notes on the Social Determinants of Economic Action. American Journal of Sociology, 98 (6), 1320-50.
Presutti, M., Boari, C. and Fratocchi, L. (2007). Knowledge acquisition and the foreign development of high-tech start-ups: A social capital approach. International Business Review, 16, 23-46.
Presutti, M., Boari, C. and Majocchi, A. (2011). The Importance of Proximity for the Start-Ups' Knowledge Acquisition and Exploitation. Journal of Small Business Management, 49 (3), 361-389.
Ramírez-Pasillas M. (2010). International trade fairs as amplifiers of permanent and temporary proximities in clusters. Entrepreneurship & Regional Development, 22 (2), 155-187.
Rigby, D. and Zook, C. (2002). Open-market innovation. Harvard Business Review, 80 (10), 80–89.
Rosenkopf, L. and Almeida, P. (2003). Overcoming local search through alliances and mobility. Management Science, 49 (6), 751-766.
Rowley, T. (1997). Moving beyond dyadic ties: A network theory of stakeholder influences. Academy Management Review, 22 (4), 887-910.
Sammarra, A. and Belussi, F. (2006). Evolution and relocation in fashion-led italian districts: evidence from two case-studies. Entrepreneurship & Regional Development. 18 (6), 543-562.
Schiattarella, R. (1999). La delocalizazzione internazionale: problemi di definizione e delimitazione. Un'analisi per il settore del Made in Italy. Economia e Politica Industriale, 103, 207–239.
Senge P.M. (1990). The fifth discipline: The art and practice of learning orientation. New York: Doubleday.
Sinkula, J.M., Baker, W. and Noordewier, T.G. (1997). A Framework for Market-Based Organizational Learning: Linking Values, Knowledge and Behavior. Journal of the Academy of Marketing Science, 25 (4), 305-318.
Staber, U. (2001). The structure of networks in industrial districts. International Journal

26
of Urban and Regional Research, 25 (3), 537-552.���
Stock, G.N., Greis, N.P. and Fischer, W.A. (2001). Absorptive capacity and new product development. Journal of High Technology Management Research, 12 (1), 77-91.
Szulanski, G. (1996). Exploring internal stickiness: Impediments to the transfer of best practice within the firm. Strategic Management Journal, 17, 27-43. Thompson, J.D., and Tuden, A. (1959). Strategies, structures, and processes of organizational decision. Comparative Studies in Administration, 1, 195-216.
Trigilia, C. (2001). Social capital and local development. European Journal of Social Theory, 4 (4), 427-442.
Tsai, W. (2001). Knowledge transfer in intraorganizational networks: Effects of network position and absorptive capacity on business unit innovation and performance. Academy of Management Journal, 44, 996-1004.
Tsai, W. and Ghoshal, S. (1998). Social capital and value creation: The role of intrafirm networks. Academy of Management Journal, 41 (4), 464-478. Tu, Q., Vonderembse, M., Ragu-Nathan, T.S. and Sharkey, T. (2006). Absorptive capacity: Enhancing the assimilation of time-based manufacturing practices. Journal of Operations Management, 24 (5), 692-710.
Tushman, M.L. and Nadler, D.A. (1986). Organizing for innovation. California Management Review, 28 (3), 74-92.
Upadhyayula, R.S. and Kumar, R. (2004). Social capital as an antecedent of absorptive capacity of firms. Papaer presented in DRUID Conference 2004: Industrial Dynamics, Innovation and Development. Elsinore, Denmark, june 14-16.
Wang, C.L. and Rafiq, M. (2009). Organizational diversity and shared vision: resolving the paradox of exploratory and exploitative learning. European Journal of Innovation Management, 12 (1), 86-101.
Wasserman, S. and Faust, K. (1994). Social Network Analysis. Methods and Applications. Cambridge: Cambridge University Press.
Wolfe, D. (2002). Social capital and cluster development in learning regions, in: Holbrook, J.A. & Wolfe, D. (Eds), Knowledge, clusters and learning regions. Kingston: Queen’s University.
Wuyts, S., Colombo, M.G., Dutta, S. and Nooteboom, B. (2005). Empirical tests of optimal cognitive distance. Journal of Economic Behaviour and Organization, 26 (6), 813-840.
Zaheer, A. and Bell, G.G. (2005). Benefiting from Network Position: Firm Capabilities, Structural Holes, and Performance. Strategic Management Journal, 26, (9), 809-825.
Zahra, S. and George, G. (2002). Absorptive capacity: A review, reconceptualization, and extension. Academy of Management Review, 27 (2), 185-203.

27
Zhou, K.Z. and Wu, F. (2010). Technological capability, strategic flexibility, and product innovation. Strategic Management Journal, 31 (6), 547–561.
Table 1. Descriptive statistics and correlations of the measurements
Variables α Mean S.D. 1 2 3 4 5 6 7
(1) Innovation - 2.13 1.279 1
(2) Absorptive Capacity .876 .362 .824 .671** 1
(3) KES - 2.07 3.21 .224 -.151 1
(4) BES - 8.10 7.27 .091 -.101 .767** 1
(5) Shared Vision .864 2.5 1.337 .217 .090 -.344 -.289 1
(6) Employees - 45.87 30.59 .067 .046 .164 .250 -.016 1
(7) Sales (log. unit sales) - 16.21 .654 .011 .116 .083 .320 -.047 .621** 1 N = 79 ** p < .01
Table 2. Regression results of models Dependent variable: Innovation
M1 M2 M3 Absorptive Capacity (ACAP) .731**
(5.431) .724** (5.889)
.655** (5.778)
Egonet Knowledge (KES) .474* (2.191)
.545** (2.730)
.643* (2.217)
Shared Vision .312 (2.406)
-.014 (-.072)
ACAP x Shared Vision .375* (2.764)
KES x Shared Vision .270* (1.032)
Control (Egonet Business) (BES) -.184 (-.816)
-.135 (-.656)
-.053 (-.278)
Control (Employees) .056 (.330)
.071 (.455)
.042 (.297)
Control (Sales) -.089 (-.491)
-.143 (-.852)
-.186 (-1.198)
Model F 6.699** 7.660** 8.118**
Adjusted R2 .496 .579 .830
Change in R2 .084* .089*
N= 79; **p< .01; *p< .05 Standardized regression estimates (t-values)

28
Absorp've*Capacity*
Knowledge*Egonet*
Innova'on*
H2*
H1*
Shared*Vision*
Figure 1. Proposal model
Figure 2. The Business Network of cluster firms

29
Figure 3. The Knowledge Network of cluster firms
1
1,5
2
2,5
3
3,5
4
4,5
5
Low ACAP High ACAP
Inno
vatio
n
Low Shared Vision
High Shared Vision
Figure 4. Moderating effect of Shared Vision on the relationship between ACAP and Innovation

30
1
1,5
2
2,5
3
3,5
4
4,5
5
Low KES High KES
Inno
vatio
n
Low Shared Vision
High Shared Vision
Figure 5. Moderating effect of Shared Vision on the relationship between KES and Innovation