nonparametric hypothesis testing for clustered survival data
TRANSCRIPT
Nonparametric Hypothesis Testingin Clustered Survival Model

In highly competitive customer subscription-based businesses, companies think of a bunch of ways to attract and to eventually maintain the loyalty of the customers in their products
Usually, they spend to give some premium and/or rewards for existing customers to convince the customers to stay with their subscription or even to prevent them from unsubscribing.
But it would be really expensive if the businesses would give these incentives to all of their subscribers. That is why these incentives are given only to those who would probably churn (unsubscribe).
A way to predict the customer lifetime (length of subscription) is to adopt the methods used in deriving survival functions.
In predicting the lifespan of the customer’s subscription without the use of any intervention, it can also be of further interest if some factors that affects customer churn could be affected by some grouping or clustering factors wherein members of the same cluster will more or less have similar characteristics that affects their churning rate which makes the selection of those who would be given some rewards to avoid churning easier
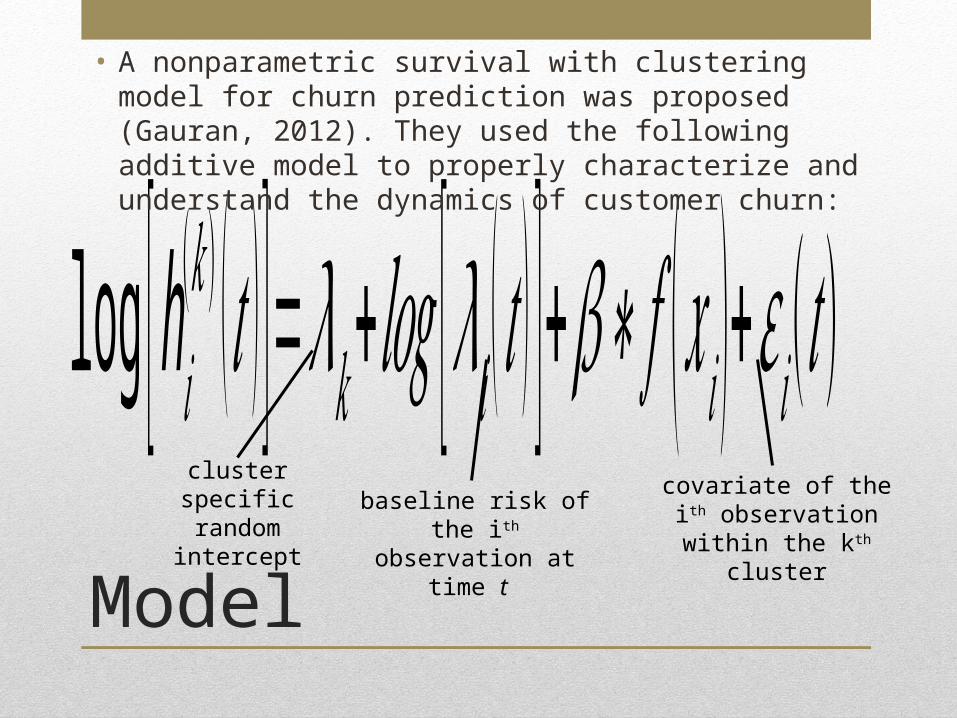
log [h𝑖(𝑘 ) ( 𝑡 )]=𝜆𝑘+ 𝑙𝑜𝑔 [𝜆𝑖 ( 𝑡 ) ]+𝛽∗ 𝑓 ( 𝑥 𝑖 )+𝜀𝑖( 𝑡)cluster specific random
intercept
baseline risk of the ith
observation at time t
covariate of the ith observation within the kth
clusterModel
• A nonparametric survival with clustering model for churn prediction was proposed (Gauran, 2012). They used the following additive model to properly characterize and understand the dynamics of customer churn:
Why this model?
• The literature of survival analysis clearly states that parametric models will not be optimal when the data available is comprised of various clusters.
• Modeling via nonparametric methods is proposed to provide a better characterization for the churning of the observations in a clustered survival data.
Goals of the Study
1.To develop a nonparametric procedure for testing the presence of clustering effect in the nonparametric clustered survival model;
2.To determine the size and power of the proposed testing procedure for a desired level of significance;
3.To establish empirically, the consistency of the bootstrap estimates used in the inference
Inference
•Given the survival data in each cluster, we test the following hypotheses:
•Ho: All cluster have the same churning effect:
•Ha: At least one cluster differs in its churning effect:
Inference
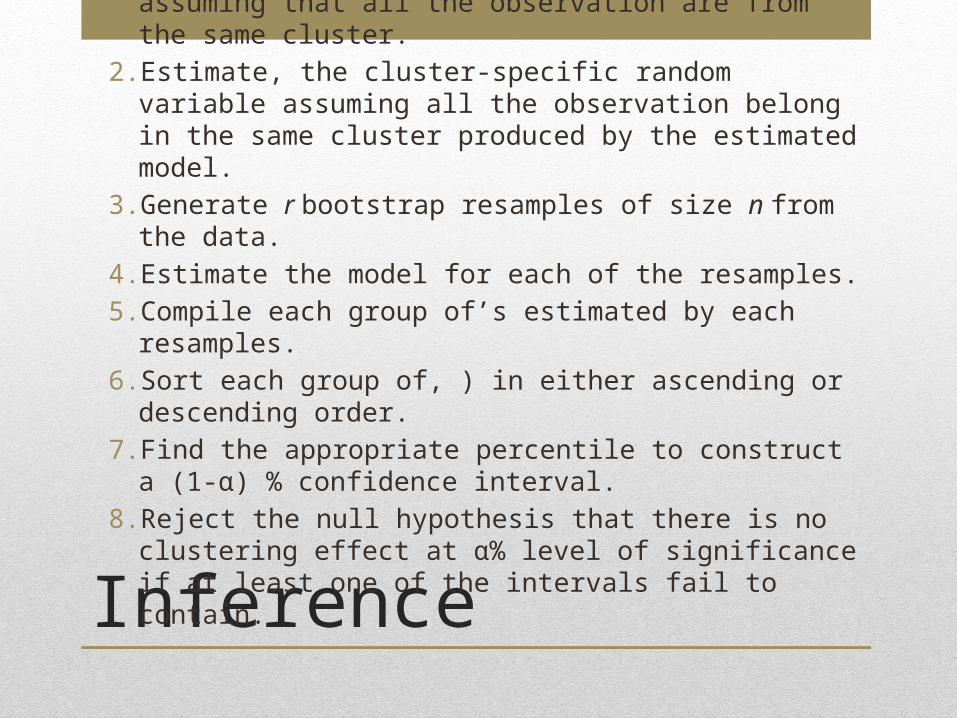
Algorithm:1.Estimate the clustered survival model assuming that all the observation are from the same cluster.
2.Estimate, the cluster-specific random variable assuming all the observation belong in the same cluster produced by the estimated model.
3.Generate r bootstrap resamples of size n from the data.
4.Estimate the model for each of the resamples.5.Compile each group of’s estimated by each resamples.
6.Sort each group of, ) in either ascending or descending order.
7.Find the appropriate percentile to construct a (1-α) % confidence interval.
8.Reject the null hypothesis that there is no clustering effect at α% level of significance if at least one of the intervals fail to contain.

• The procedure makes use of the different survival data for each cluster to represent the variation in terms of the cluster-specific component of the model.
• Resampling the cases allows us to approximate the sampling distribution of the cluster-specific parameter estimator to compare clustering effects across all the observations. This bootstrap method is known to be less sensitive to model misspecification.
Inference
• A simulation study is designed to evaluate the power and size of the proposed testing procedure for clustering effect of the clustered survival model. For each simulation setting, the hypothesis testing procedure is repeated 100 times to determine the reliability of the proposed test.
Simulation
Simulation
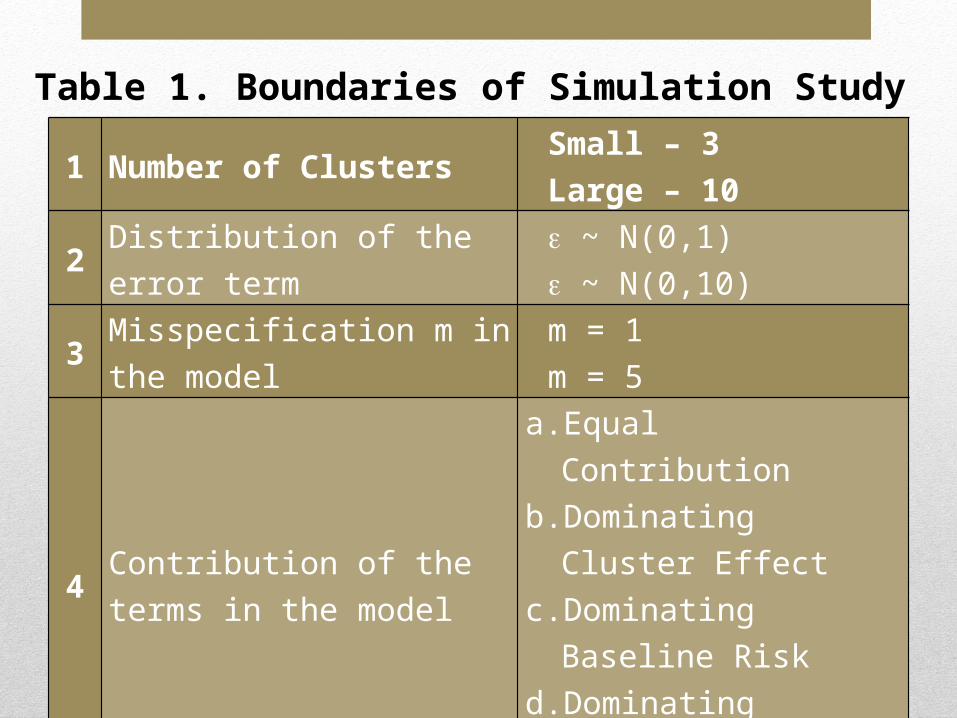
1 Number of Clusters Small – 3Large – 10
2 Distribution of the error term
~ N(0,1) ~ N(0,10)
3 Misspecification m in the model
m = 1m = 5
4 Contribution of the terms in the model
a.Equal Contribution
b.Dominating Cluster Effect
c.Dominating Baseline Risk
d.Dominating Covariate
Table 1. Boundaries of Simulation Study
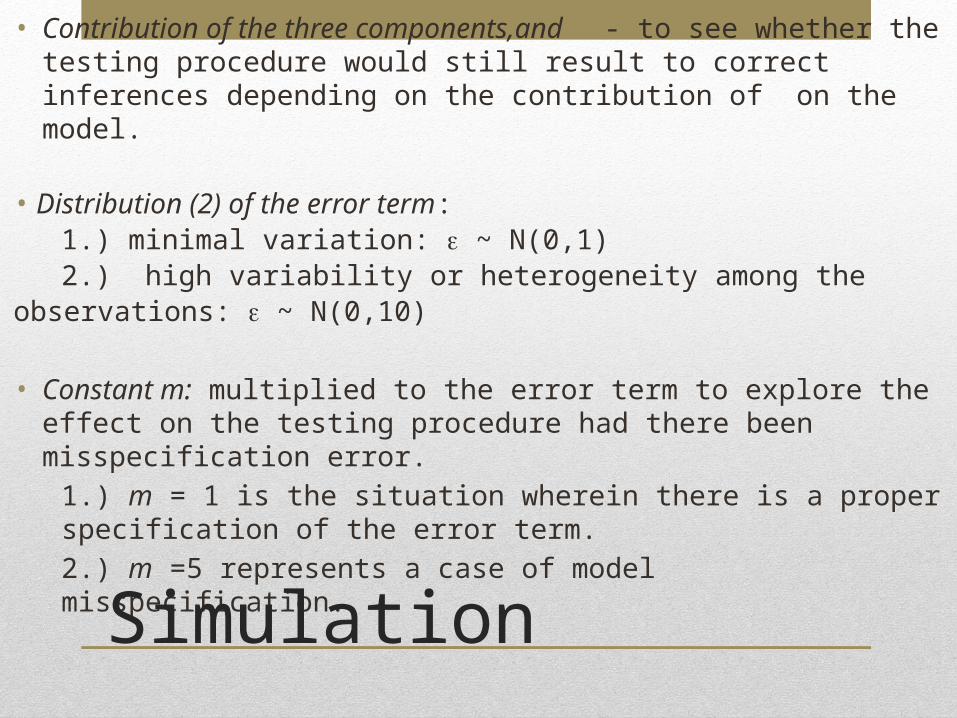
• Contribution of the three components,and - to see whether the testing procedure would still result to correct inferences depending on the contribution of on the model.
• Distribution (2) of the error term: 1.) minimal variation: ~ N(0,1) 2.) high variability or heterogeneity among the
observations: ~ N(0,10)
• Constant m: multiplied to the error term to explore the effect on the testing procedure had there been misspecification error. 1.) m = 1 is the situation wherein there is a proper specification of the error term. 2.) m =5 represents a case of model misspecification.Simulation

The power of the proposed test is computed for the scenarios with small or large number of clusters where all the cluster-specific term comes from the Poisson distribution but have different means. For the computation of the power, the test is conducted for 100 times in every settings where the null hypothesis is indeed false and the proportion of that resulted to the rejection of the null hypothesis is deemed the power of the test for each setting.Results – Power of the Test
Five major scenarios were considered in measuring the power of the test for small number of clusters (k=3). Ranging from those with the distribution of the cluster-specific that have really close means up to those with one cluster having the mean of the cluster-specific term very far away from the mean of the other two clusters.
Results – Small no. of Cluster
Results – Small no. of Clusters
Highly Slightly
different cluster effect
Highly different cluster effect
Two Clusters have the same effect and the other is
slightly different
Distribution of error term e ~ N(0,1)
e ~ N(0,10) e ~
N(0,1)e ~
N(0,10) e ~ N(0,1)
e ~ N(0,10)
Sample size n=10 n=30 n=10 n=30 n=10 n=30 n=10 n=30 n=10 n=30 n=10 n=30
Domina
ting T
erm
Equal mi
sspe
cifica
tion (
m)m = 1
0.92
0.95
0.85
0.89 0.9
80.99
0.97
0.98 0.7
90.79
0.75
0.78
m = 5
0.90
0.94
0.82
0.81 0.9
40.98 0.9 0.9
4 0.75
0.77
0.73
0.75
Cluster Effect
m = 1
0.94
0.94
0.90
0.89 0.9
90.99
0.97
0.98 0.8
30.87
0.78
0.81
m = 5
0.90
0.91
0.88
0.88 0.9
80.99
0.92
0.97 0.7
70.82
0.73
0.75
Baseline Risk
m = 1
0.93
0.94
0.86
0.89 0.9
80.99
0.91
0.97 0.7
70.85
0.74
0.75
m = 5
0.89
0.90
0.85
0.88 0.9
40.98
0.87 0.9 0.7
20.75
0.69
0.71
Covariates
m = 1
0.94
0.94
0.85
0.88 0.9
70.98
0.94
0.95 0.7
80.82
0.73
0.77
m = 5
0.88
0.90
0.82
0.84 0.9
40.97 0.9 0.9
2 0.7 0.77 0.7 0.7
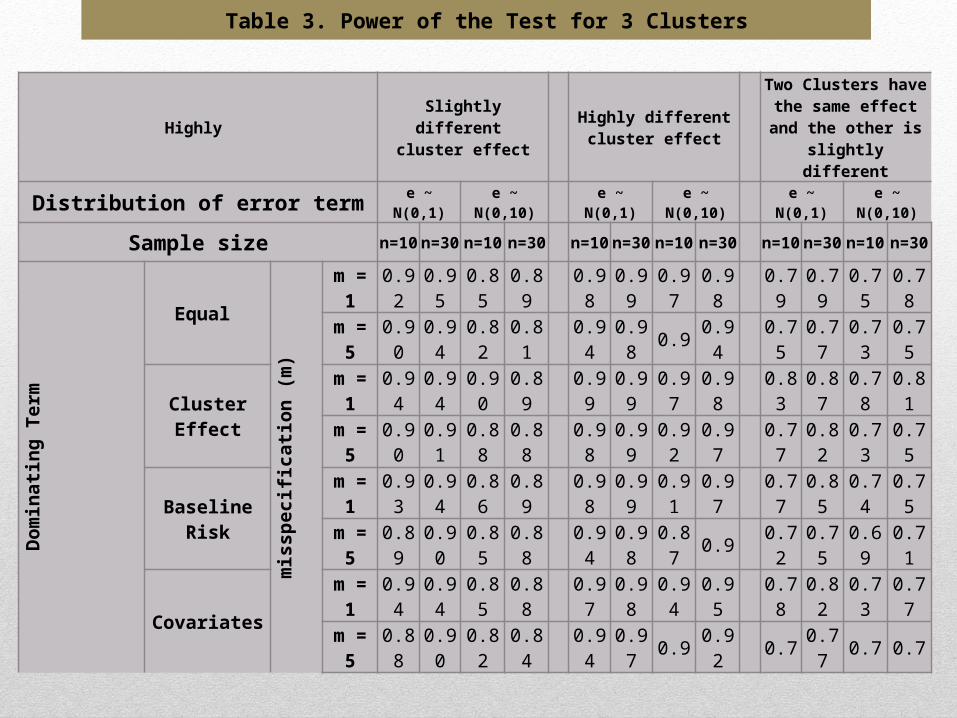
Table 3. Power of the Test for 3 Clusters
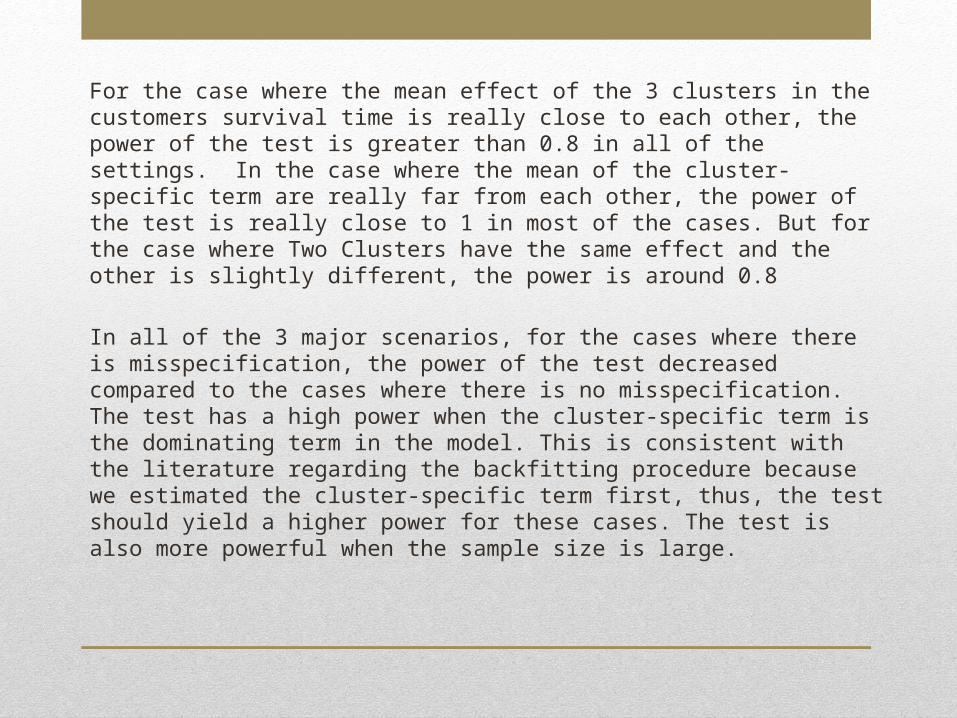
For the case where the mean effect of the 3 clusters in the customers survival time is really close to each other, the power of the test is greater than 0.8 in all of the settings. In the case where the mean of the cluster-specific term are really far from each other, the power of the test is really close to 1 in most of the cases. But for the case where Two Clusters have the same effect and the other is slightly different, the power is around 0.8
In all of the 3 major scenarios, for the cases where there is misspecification, the power of the test decreased compared to the cases where there is no misspecification. The test has a high power when the cluster-specific term is the dominating term in the model. This is consistent with the literature regarding the backfitting procedure because we estimated the cluster-specific term first, thus, the test should yield a higher power for these cases. The test is also more powerful when the sample size is large.
For the scenario with fairly large number of clusters (k=10), 8 major scenarios were considered in determining the power of the test. Ranging from those with the distribution of the cluster-specific term that have really close means, to those with one cluster that has the mean of the cluster-specific term very far away from the mean of the other 9 clusters.
Results – Large no. of Cluster
Results – Large no. of Clusters
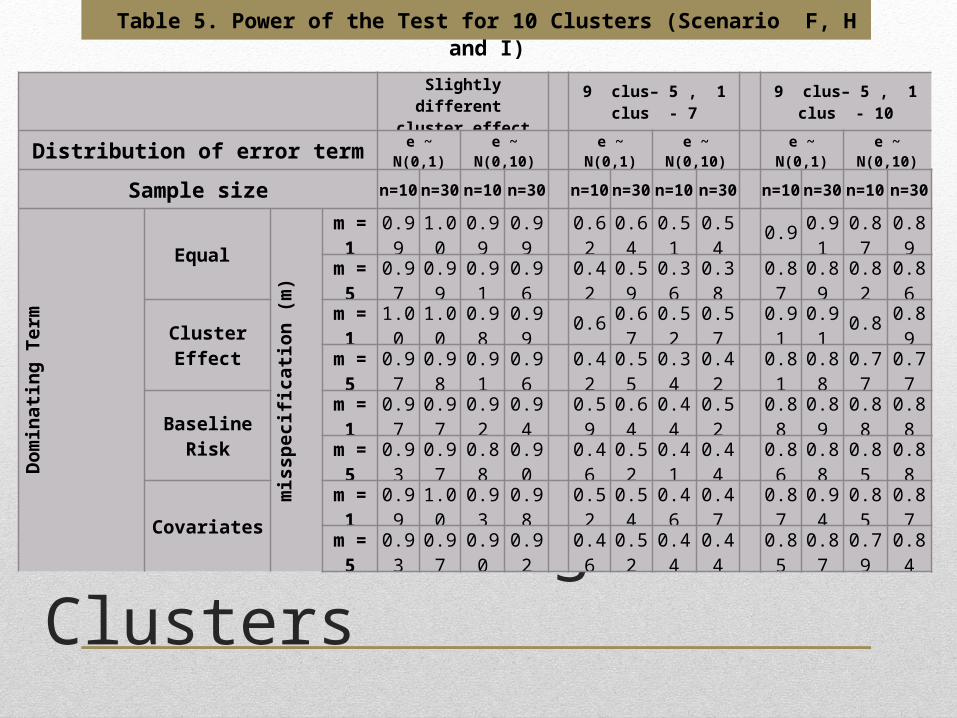
Table 5. Power of the Test for 10 Clusters (Scenario F, H and I)
Slightly different
cluster effect 9 clus– 5 , 1
clus - 7 9 clus– 5 , 1 clus - 10
Distribution of error term e ~ N(0,1)
e ~ N(0,10) e ~
N(0,1)e ~
N(0,10) e ~ N(0,1)
e ~ N(0,10)
Sample size n=10 n=30 n=10 n=30 n=10 n=30 n=10 n=30 n=10 n=30 n=10 n=30
Domina
ting T
erm
Equal mi
sspe
cifica
tion (
m)
m = 1
0.99
1.00
0.99
0.99
0.62
0.64
0.51
0.54
0.9 0.91
0.87
0.89
m = 5
0.97
0.99
0.91
0.96
0.42
0.59
0.36
0.38
0.87
0.89
0.82
0.86
Cluster Effect
m = 1
1.00
1.00
0.98
0.99
0.6 0.67
0.52
0.57
0.91
0.91
0.8 0.89
m = 5
0.97
0.98
0.91
0.96
0.42
0.55
0.34
0.42
0.81
0.88
0.77
0.77
Baseline Risk
m = 1
0.97
0.97
0.92
0.94
0.59
0.64
0.44
0.52
0.88
0.89
0.88
0.88
m = 5
0.93
0.97
0.88
0.90
0.46
0.52
0.41
0.44
0.86
0.88
0.85
0.88
Covariatesm = 1
0.99
1.00
0.93
0.98
0.52
0.54
0.46
0.47
0.87
0.94
0.85
0.87
m = 5
0.93
0.97
0.90
0.92
0.46
0.52
0.44
0.44
0.85
0.87
0.79
0.84
For the case where the mean is higher by one for each succeeding cluster, the power of the test is in between 0.9 to 1 in most of the settings.
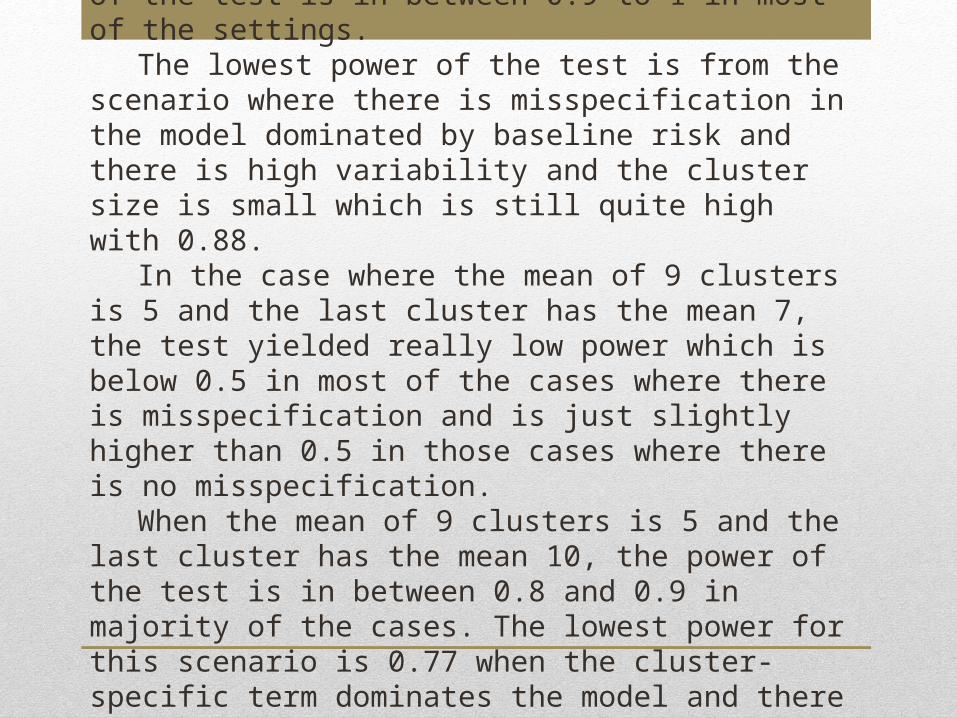
The lowest power of the test is from the scenario where there is misspecification in the model dominated by baseline risk and there is high variability and the cluster size is small which is still quite high with 0.88.
In the case where the mean of 9 clusters is 5 and the last cluster has the mean 7, the test yielded really low power which is below 0.5 in most of the cases where there is misspecification and is just slightly higher than 0.5 in those cases where there is no misspecification.
When the mean of 9 clusters is 5 and the last cluster has the mean 10, the power of the test is in between 0.8 and 0.9 in majority of the cases. The lowest power for this scenario is 0.77 when the cluster-specific term dominates the model and there is both misspecification and high variability.
Results – Large no. of Clusters
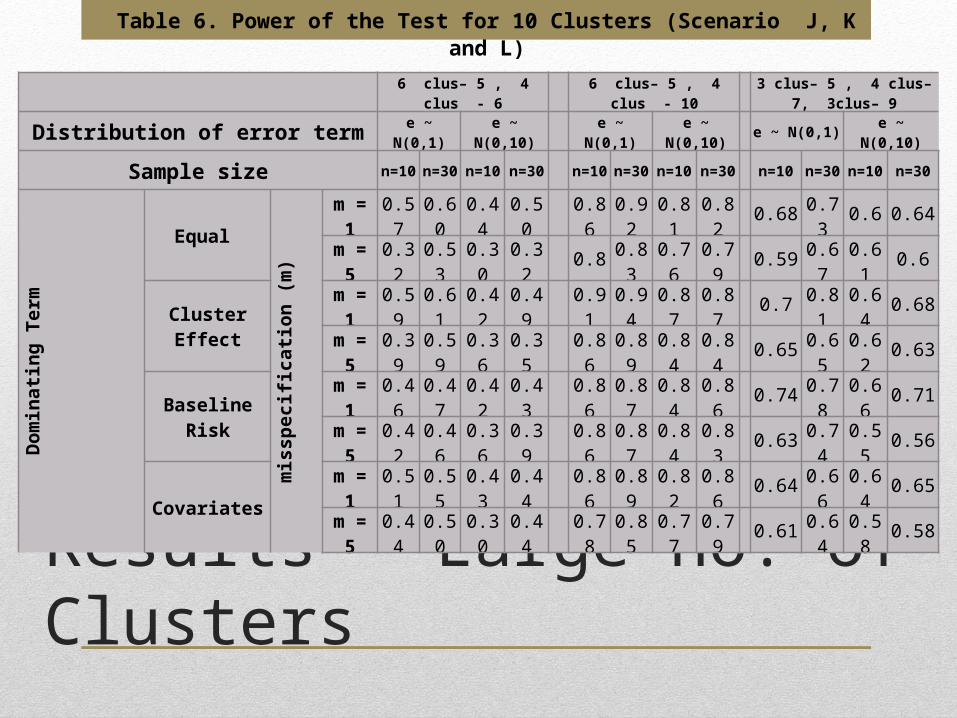
Table 6. Power of the Test for 10 Clusters (Scenario J, K and L)
6 clus– 5 , 4 clus - 6 6 clus– 5 , 4
clus - 10 3 clus– 5 , 4 clus– 7, 3clus– 9
Distribution of error term e ~ N(0,1)
e ~ N(0,10) e ~
N(0,1)e ~
N(0,10) e ~ N(0,1) e ~ N(0,10)
Sample size n=10 n=30 n=10 n=30 n=10 n=30 n=10 n=30 n=10 n=30 n=10 n=30
Domina
ting T
erm
Equal
misspe
cifica
tion (
m)
m = 1
0.57
0.60
0.44
0.50
0.86
0.92
0.81
0.82
0.68 0.73
0.6 0.64m = 5
0.32
0.53
0.30
0.32
0.8 0.83
0.76
0.79
0.59 0.67
0.61
0.6
Cluster Effect
m = 1
0.59
0.61
0.42
0.49
0.91
0.94
0.87
0.87
0.7 0.81
0.64
0.68m = 5
0.39
0.59
0.36
0.35
0.86
0.89
0.84
0.84
0.65 0.65
0.62
0.63
Baseline Risk
m = 1
0.46
0.47
0.42
0.43
0.86
0.87
0.84
0.86
0.74 0.78
0.66
0.71m = 5
0.42
0.46
0.36
0.39
0.86
0.87
0.84
0.83
0.63 0.74
0.55
0.56
Covariatesm = 1
0.51
0.55
0.43
0.44
0.86
0.89
0.82
0.86
0.64 0.66
0.64
0.65m = 5
0.44
0.50
0.30
0.44
0.78
0.85
0.77
0.79
0.61 0.64
0.58
0.58
For the case where 6 clusters have the same mean and the other 4 clusters also have the same mean which 5 and 6 respectively, The power of the test is quite low. The highest power (0.61), is recorded for the case where the cluster-specific term dominates the model with low variability and large cluster size.
When 6 clusters have the same mean and the other 4 clusters also have the same mean which 5 and 10 respectively, because the means are quite far apart, the power of the test is quite high. The highest power (0.94), is recorded for the case where the cluster-specific term dominates the model with low variability and large cluster size and without misspecification. The lowest power is when the terms have equal importance and there is misspecification and the variability is high.
For the case where the clusters groups into 3, the test is least powerful when the covariates dominate the model and there is misspecification and high variability. And still consistent with the results from the other scenarios, the power is high when the cluster-specific term dominates the model and there is no misspecification.
The proposed test is also assessed for its size by using two scenarios, one with small and the other one with large number of clusters where the cluster-specific term all comes from the Poisson distribution with the same means. To check whether the test is correctly-sized, the test is conducted 100 times in each of the settings where the null hypothesis is true, there is no clustering effect. If more than 100* of the results rejected the null hypothesis, the test is considered incorrectly-sized for that setting.Results – Size of the Test
Results – Small no. of Cluster
n=10 n=30 n=10 n=30m = 1
m = 5
m = 1
m = 5
m = 1
m = 5
m = 1
m = 5
Distribution of error term ~ N(0,1) ~ N(0,10)
Dominating Term
Equal
Sam ple size
Cluster EffectBaseline Risk
Covariates misspecification (m)
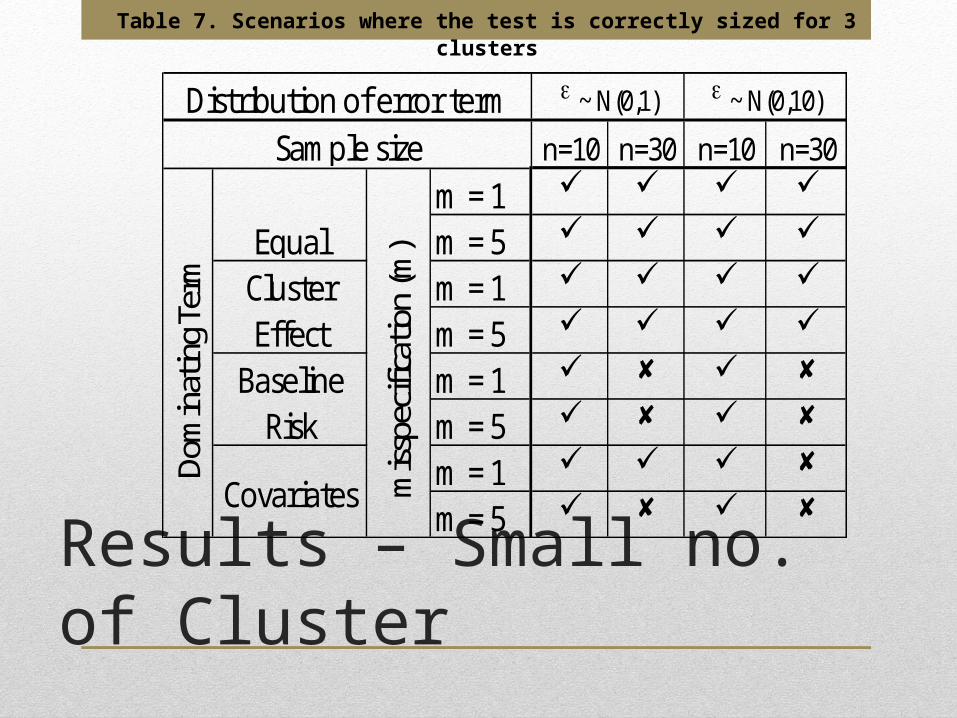
Table 7. Scenarios where the test is correctly sized for 3 clusters
At 5% level of significance, the test is still correctly sized for most of the cases where the cluster –specific term comes from the same distribution for all of the three clusters. The test became incorrectly sized when the baseline risk dominated the model and when the cluster size is small. This may be due to the fact that when there are more observations in a clusters, there would be larger chance of having extreme values on those clusters that would tend to make the test reject the null hypothesis. Also, the test is incorrectly-sized when the covariates have the largest contribution in the model and there is misspecification. This could be attributed to the fact the misspecification have the chance to increase the heterogeneity of the data on hand.
Results – Large no. of Cluster
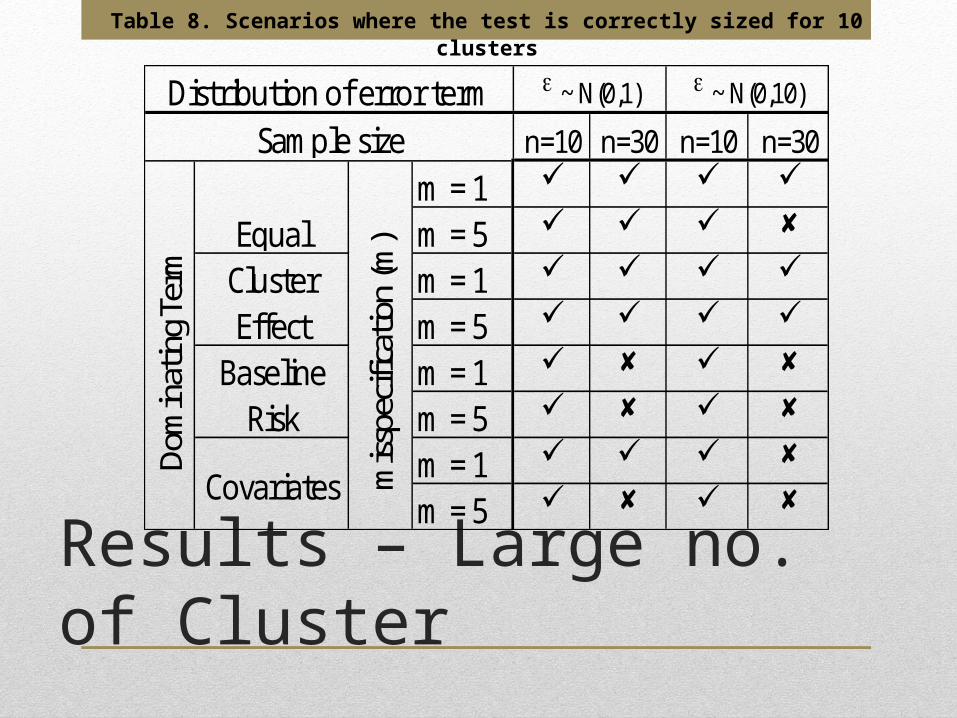
Table 8. Scenarios where the test is correctly sized for 10 clusters
n=10 n=30 n=10 n=30m = 1
m = 5
m = 1
m = 5
m = 1
m = 5
m = 1
m = 5
Distribution of error term ~ N(0,1) ~ N(0,10)
Dominating Term
Equal
Sam ple size
Cluster EffectBaseline Risk
Covariates misspecification (m)
The test is correctly sized when the cluster-specific term dominates the model or the components have equal contribution. For the case where the baseline risk dominates the model the test is incorrectly sized when the cluster size is large at 5% level of significance. Also the same with the results of the other scenarios, the test turns out to be incorrectly-sized when there is misspecification and/or the cluster size is large for the cases where the function of the covariates dominates the model.
Conclusions
The proposed testing procedure can correctly identify the actual behaviour (constant and not constant clustering effect) of the clustering parameters. Simulation studies indicate that the procedure is correctly sized and powerful in a reasonably wide range of data..
Conclusions
The power of the test (proportion of intervals constructed for the alternative parameter value that does not contain the common value) was higher (close to 1 or equal to 1) for distant alternative values, both for small and large number of clusters. The testing procedure for constant cluster effect over time is also robust to model misspecification in most cases. In survival data characterized by large number of clusters, the test is powerful even if the data is highly heterogenous and/or there is misspecification error.