how opposition to immigration is affected by migrants' region
TRANSCRIPT
Acceptable and Unacceptable Migrants: How opposition to immigration is affected by migrants’ region of origin.
CCSR Working Paper 2009-08 Robert Ford [email protected]
Comparative European research has established that public opposition to immigration is widespread and politically important. However, most existing research has suffered from a serious methodological shortcoming: it employs aggregate measures of attitudes to immigrants, which do not distinguish between different migrant groups. This paper corrects this shortcoming by examining disaggregated British attitudes to migration from seven different regions. I find evidence for a consistent hierarchy of preferences between immigrant groups, with white and culturally more proximate immigrant groups less opposed than non-white and culturally more distinct immigrants. The differences in attitudes to different migrant groups are very large, calling into question the reliability of analysis which employs aggregate measures of attitudes to overall immigration. Both total opposition to migration and discrimination between migrant groups decline during the period examined. This is the result of large generational differences in attitudes to immigrants, which are in turn the consequence of cohort differences in education levels, ethnic diversity and in particular value orientations. Younger Britons, who are on average less authoritarian and ethnocentric, oppose immigration less and regard different immigrant groups more equally.
www.ccsr.ac.uk
1
Acceptable and unacceptable immigrants: how opposition to immigration is affected by
migrants’ region of origin
Abstract
Comparative European research has established that public opposition to immigration is widespread and politically important. However, most existing research has suffered from a serious methodological shortcoming: it employs aggregate measures of attitudes to immigrants, which do not distinguish between different migrant groups. This paper corrects this shortcoming by examining disaggregated British attitudes to migration from seven different regions. I find evidence for a consistent hierarchy of preferences between immigrant groups, with white and culturally more proximate immigrant groups less opposed than non-white and culturally more distinct immigrants. The differences in attitudes to different migrant groups are very large, calling into question the reliability of analysis which employs aggregate measures of attitudes to overall immigration. Both total opposition to migration and discrimination between migrant groups decline during the period examined. This is the result of large generational differences in attitudes to immigrants, which are in turn the consequence of cohort differences in education levels, ethnic diversity and in particular value orientations. Younger Britons, who are on average less authoritarian and ethnocentric, oppose immigration less and regard different immigrant groups more equally.
Key words: immigration, discrimination, ethnic hierarchy, Britain, race, value change,
generational change
Word count :
Main text: 7,482
Tables and figures: 656
Total: 8,138
2
Introduction
Immigration has become a hotly debated issue in Europe, as increased international mobility,
population ageing, and political instability in the developing world have all contributed to
unprecedented flows of migrants (Castles and Miller, 2003). Academic research has
documented widespread European hostility to immigrants (Coenders et al, 2004)), and linked
this hostility with increases in support for the extreme right (Van Der Brug et al, 2000; Norris,
2005). However, existing work in this area is limited by current survey data, which has focussed
on attitudes to “immigrants” as an undifferentiated mass, despite strong reasons to believe that
European citizens regard migrants from some regions as more acceptable than others (Crawley,
2005; Sniderman et al, 2004). This article contributes a first analysis of British attitudes to
migrants disaggregated by region of origin, utilising survey data gathered between 1983 and
1996. I show that there are large and consistent differences in attitudes to different migrant
groups, with white migrants preferred to non-whites and a hierarchy of preferences between
groups within each racial category. I also find large generational differences in both opposition
to migration in general and discrimination against less favoured migrant groups, as a result of
education, diversity and, in particular, value change. Younger Britons are much less likely to
hold the authoritarian and ethnocentric values which are strongly correlated with both general
opposition to migration and discriminatory migration preferences.
Why might some immigrants be preferred to others? Theories and evidence
There is now a wide range of survey data on attitudes to immigration in Britain and Europe
(Crawley, 2005; Coenders et al, 2004). Analyses of these data (Sides and Citrin, 2007; McLaren
and Johnson, 2007; Ivarsflaten, 2005) have shown that public opposition to immigration is
3
widespread, and is particularly intense among the less educated, the working classes and those
who feel migrants represent a threat to the national culture (Ivarsflaten, 2005: 42). However, the
data employed in these analyses generally asks only about “immigrants” as an aggregate group,
ignoring the diversity of migration flows. Where some effort is made to be more specific about
origins, the resulting questions often still conflate distinct migrant streams. For example the
Eurobarometer survey has asked about “immigration from outside the EU” while the European
Social Survey asks about “poorer countries in Europe” and “outside Europe”. In the British case,
“immigration from outside the EU” pools together significant migration flows from India,
Pakistan, Bangladesh, the Caribbean, Africa, America and Australia; “poorer countries outside
Europe” would only exclude the last two groups in this list. Even when disaggregated items are
available, researchers often reaggregate them into an overall scale of immigration attitudes,
which is only justifiable if we can accept that these items are just different measures of the same
underlying construct.
When such aggregated items are analyzed, we do not know what kind of immigrants
respondents had in mind when they responded to the survey. This is not a problem if all
immigrants are regarded similarly. Yet there is now a growing body of evidence suggesting that
this is not the case, from two main sources. Sociological research on ethnicity has shown that
strong and robust differences exist in public attitudes towards different ethnic groups. The most
recent studies on public immigration attitudes have also emphasised the role played by
perceived cultural differences between immigrants and native born populations as a key driver
of public resistance to immigration, implying that culturally distinct immigrants will be regarded
as more problematic.
4
A long line of research on ethnic identity, originating in the United States (Bogardus, 1925;
Alba, 1985) but now widely replicated, has shown that there are systematic patterns of
preferences between ethnic groups in diverse societies. These “ethnic hierarchies” are based on
proximity to the majority or dominant group, which is inevitably at the top of the hierarchy. So
in America, the pioneering research of Emile Bogardus (1925) showed that individuals preferred
to socialise and live among ethnic groups most closely associated with the dominant White
Ango-Saxon Protestant group – such as those with British, Dutch or German origin – while
seeking to avoid those groups who were racially, religiously, or linguistically different from the
dominant group – such as African Americans, Latinos or Jews. Similar patterns have been
found in Canada (Berry and Kalin, 1979); Holland (Verkuyten et al, 1996); and the former
Soviet Union (Hagendoorn et al, 1998).
American research has uncovered two longer term trends: a consistency in the overall ranking of
ethnic groups, accompanied by decline in the levels of discrimination between groups. Kleg and
Yamamoto (1998) found that their sample of Americans ranked ethnic groups in almost exactly
the same order as Bogardus’ (1925) respondents did seventy years previously. However, while
the ranking of groups remained consistent, the overall differences in social distance from the
most and least favoured groups fell sharply. While some still discriminate, and do so against the
same groups, contemporary Americans are much more likely than their grandparents to treat
different ethnic groups equally. The emerging field of “whiteness studies” in America has also
provided in depth insights into how new immigrant groups become aware of the ethnic
hierarchy operating in American society, and adapted by adopting behaviours associated with
the dominant group, while distancing themselves from stigmatised groups at the bottom of the
hierarchy (Alba, 1985; Roedinger, 2005).
5
Ethnicity research would therefore lead us to expect that immigrants who are more distinct from
the dominant group on a range of dimensions will receive a more hostile reception. Recent
studies by Sides and Citrin (2007) and Ivarsflaten (2005) have provided indirect evidence in
favour of this hypothesis. Both studies find that a preference for cultural unity is the strongest
predictor of hostility to immigration in a wide range of European societies. A logical implication
of this finding is that immigrants from more distinctive regions, who pose a greater threat to
cultural unity, will be more opposed than immigrants from more similar regions. Research on
British attitudes to asylum seekers has shown how similar arguments, often with an explicitly
racist element, are used by those hostile to their settlement (Lewis, 2004). In a pioneering
experimental study, Sniderman, Hagendoorn and Prior (2004) have demonstrated that Dutch
hostility to immigrants is greatly magnified simply by describing the migrant group in cultural
rather than economic terms. As the ethnicity literature would lead us to expect, these studies all
find that different immigrants are treated differently, with more racially and culturally distinct
migrants attracting more opposition. However, none of the studies has attempted to disaggregate
attitudes to different immigrant groups and directly compare how immigrants’ origins affect
their reception.
Do the British discriminate between immigrant groups? Evidence from public and elite
reactions
Britain has long experience with mass immigration, with large numbers of migrants arriving
from the early 1950s, many years before other European economies, recovering from the
devastation of World War II, began to import labour. From the beginning, migration to Britain
was also a diversified phenomenon, with migrants arriving from a wide range of different
countries, including Ireland, Mediterranean Europe, Australia, the West Indies, South Asia and
6
most recently Eastern Europe. Have the British public has discriminated between these diverse
migrant groups, accepting some while rejecting others? I review evidence from two sources.
Firstly, evidence on the public reactions to different migrant groups, which is limited and
indirect as prior to this study there has been little effort to disaggregate British public opinion
about immigration. Secondly, evidence from studies of elite discourse and policy formulation,
where a larger evidence base exists.
Different migrant groups have excited very different public reactions in Britain, and in particular
that non-white immigration has been far more opposed than white immigration. While
significant early settlements of Polish wartime refugees, and labour flows from Mediterranean
Europe and above all Ireland have sparked little organised public resistance, hostility to
migrants from South Asia and the Caribbean was vociferous from the outset. On a number of
occasions, this hostility spilled over into violent ‘race riots’ in areas where black and Asian
immigrants were concentrated such as: Notting Hill (1958); Toxteth and Brixton (1981);
Bradford and Burnley (2001) (Layton-Henry, 1992; Cantle, 2001). While Irish migrants have
met sporadic hostility, particularly in regions with a history of sectarian tension such as
Glasgow, there have never been riots against white immigrants on this scale. Similarly, the
political focus of both Enoch Powell’s movement against immigration (Schoen, 1977), and far-
right mobilisations by the National Front in the 1970s (Husbands, 1983) and the British National
Party since 1999 (Eatwell and Goodwin, 2009) have been on non-white immigrants.
Some have argued that this hostility to non-white immigration is driven principally by fear that
migrants will compete successfully with native workers for jobs and government resources
(Citrin et al, 1997; Scheve and Slaughter, 2001). Yet no political movement has ever mobilised
in opposition to the settlement of Irish, European, or Australian immigrants, despite their often
7
larger numbers and presumably equal ability to compete for economic resources. Even in the
late 2000s, with East European migrants outnumbering non-white migrants more than three to
one, the main focus of the British National Party’s campaigns remains non-white immigrants
and Muslim minorities, and their electoral support remains concentrated in areas with large
Muslim populations (Ford and Goodwin, 2009). There is thus strong evidence of a racial
division in public attitudes to immigration, with non-white migrants attracting much more
passionate and organised opposition than white migrants. However, the indirect information we
have on public opinion mean we have little idea whether the British citizenry have distinguished
between different migrant groups within racial categories. There is, however, evidence that
British policymakers have done precisely that.
There have been a number of excellent studies of immigration policymaking (for example,
Layton-Henry, 1992; Saggar, 1992; Hansen, 2000; Hampshire, 2005; Somerville, 2007), which
shed considerable light on how and why British political elites have distinguished between
different immigrant groups. From the onset of significant post-war migration to Britain, British
policymakers, like the British public, have shown a preference for white over non-white
immigrants (Hampshire, 2005: ch.2). This preference conflicted with an expansive Imperial
ideology, still strongly held by sections of the post-WWII elite and reflected in the very liberal
and inclusive definition of citizenship laid out in the 1948 British Nationality Act, which
conferred unrestricted British citizenship rights on hundreds of millions of people living in
former British colonies. The link between British citizenship and the former British Empire was
retained in some form for 35 years after this, until finally severed by the passage of the 1983
British Nationality Act. During this whole 35 year period, during which the majority of primary
migration from the Caribbean and South Asia occurred, British policymakers were engaged in a
8
more or less explicit effort to reform this framework so as to restrict migration from non-white
former colonies while retaining migration rights for the citizens of white former colonies.
Policymakers’ preferences were not formed on racial lines alone. There is also evidence that
elites have discriminated between migrant groups within racial categories. Among white
immigrants, the Irish have always held a privileged status, with unrestricted settlement rights.
These were defended throughout all the early rounds of immigration reform, on the grounds of
the “historical, racial and geographical links” between Britain and Ireland (Hampshire, 2005:
27). Immigrants from the white majority former colonies of the “Old Commonwealth” were also
privileged. Indeed, the perceived importance of upholding their migration rights was a principal
reason that the imperial notion of citizenship was not abandoned once public opposition to black
and Asian migration became clear. These special rights were defended because, in the words of
Conservative Home Secretary Reginald Maudling, Old Commonwealth citizens were “kith and
kin” who had an “ancestral connection with the United Kingdom” (Hampshire, 2005: p.40).
Policymakers may also have defended Old Commonwealth migration rights to ensure that
British citizens would continue to enjoy opportunities to emigrate to such countries. Many
people exercised these opportunities - over one million Britons migrated to Australia alone
between 1950 and 1970. This in turn may have fostered more supportive public attitudes to
migrants from these countries, as many British families would know someone who had migrated
in the other direction.
Since the 1970s, the focus of British foreign policy has moved from the Commonwealth to
Brussels. Britain’s accession to the then EEC in 1973 meant granting unrestricted migration
rights to the citizens of other EEC members, even as these same rights were being withdrawn
from black and Asian citizens of former British colonies. It is telling that this massive extension
9
of immigration rights to a range of countries which had never before enjoyed them excited very
little political debate, and is given little attention by the major studies of British immigration
policy. Since accession, there has been a steady flow of migrants from Western Europe to
Britain, which accelerated as Britain’s economic performance improved in the 1990s and 2000s.
By 2008, the population of West European migrants had grown to 850,000 - larger than the
Indian born migrant community (Ellis, 2009). The lack of policymaker and public interest in
West European migrants suggests that they are widely regarded as acceptable in a way that non-
white migrants are not. Free movement within the European Union has also worked in both
directions: Britons have emigrated in large numbers, in particular to France and Spaini. This in
turn may have fostered more positive views of these countries and a greater openness to
accepting their migrants.
While West European migrants have been uncontroversial, recent migration from Eastern
Europe has been contentious. The influx of migrants from the region which followed Britain’s
2004 decision to grant settlement rights to nations from the region on their accession to the EU
far exceeded policymaker expectations. By the end of 2007, over 600,000 Eastern European
migrants were resident in the UK (Ellis, 2009). This wave of arrivals has generated considerably
more public and policymaker attention than any previous influx of white immigrants. Eastern
European arrivals are monitored through a Home Office registration scheme, and have been the
subject of considerable media attention. It is not clear, however, whether this attention is the
result of more negative views about Eastern European migrants, or simply due to the
unprecedented scale of their inflow.
There is also some evidence of differential reactions to non-white migrant groups, at least in the
early debates over migration in the 1950s. Hansen documents evidence of a greater willingness
10
in Whitehall to defend the migration of West Indians whom they regarded as harder working
and more “British” than migrants from South Asia (Hansen, 2000, p.85).4 The references to the
greater “Britishness” of the West Indians in these debates suggest that the greater cultural and
linguistic proximity Caribbean islanders may have contributed to this preference. More recently,
political debate on community cohesion and immigrant integration has focussed on the
religiously and culturally distinct Muslim immigrant minorities, who are thus implicitly or
explicitly regarded as more problematic than other ethnic minority groups (Saggar, 2009). The
belief that Muslims are more “threatening” than Afro-Caribbeans is also seen in analysis of
support for the extreme right British National Party, whose success is strongly correlated with
the presence of large Muslim populations but negatively correlated with the presence of a large
Afro-Caribbean community (Ford and Goodwin, 2010).
The existing literature on Britain thus strongly supports the argument that the British do not
view all immigrants equally. There is a long established preference for white over non-white
immigration, reflected both in the reactions of the British public to migrant settlement and in the
behaviour of elite policymakers since 1948. There is also evidence of preferences among elite
policy makers for more culturally proximate groups within racial categories. Among white
immigrants, the defence of unrestricted Irish migration and efforts to exempt “Old
Commonwealth” countries such as Australia from migration controls suggest these groups are
particularly favoured. Western European migration has also been less politically controversial
than the recent wave of Eastern European settlement. Whitehall policy-makers in the early
period of migration were also more willing to defend migration from the English speaking
Caribbean islands than more culturally and linguistically distinct South Asians, a distinction
which has re-emerged in recent public debates over the alleged failure of South Asian Muslims
to integrate into British society.
11
If there is an “ethnic hierarchy” operating in Britain, what does this research suggest it looks
like? Immigrants from the white, English speaking nations with strong historical links to Britain
– Ireland and the Old Commonwealth –have enjoyed the most favourable treatment from
policymakers. So we can expect them to be at the top. The large flows of migrants to and from
Western Europe over recent decades, which have been accepted with little resistance from the
public or policymakers, suggest that migrants from these countries should also be high up the
hierarchy. However, Eastern Europeans have been the cause of more controversy, suggesting
that migrants from this region are more negatively regarded. Linguistic and cultural similarity
may also encourage acceptance of non-white migrants, in which case Afro-Caribbeans may be
preferred to South Asians.
Explaining discrimination between migrant groups: education, diversity and values
Public attitudes towards immigrants and discrimination between migrant groups are not
monolithic and unchanging phenomena, and can be influenced by a range of factors. I focus on
three major influences which are likely to have an important impact on opposition to
immigration in general and discrimination between migrant groups: education, diversity and
values. The distribution of all of these factors across generations suggests a further hypothesis:
there should be large cohort differences in attitudes to immigrants, with younger generations
more open to immigration and less likely to discriminate between migrant groups.
A range of research shows that more educated people, particularly those with university degrees,
are less likely to express racial prejudice or discriminate against minorities (Vogt, 1997;
Coenders and Scheepers, 2003). I expect such a tolerant viewpoint to extend to immigrants,
12
resulting in a more welcoming attitude to all migrants and less discrimination between migrants
from different regions. Education levels in Britain have risen very rapidly since WWII: the
proportion reporting that they left school with no qualifications at all falls from over two thirds
in the oldest cohorts to around 10% in the youngest, while the proportion who have attended
university more than triples. This massive expansion in education levels may therefore have
prompted a generational shift to more open and tolerant attitudes among the younger, more
educated cohorts.
Social and political values are also strongly associated with attitudes towards immigrants and
ethnic minorities. Two sets of values are particularly important: authoritarianism (Adorno et al,
1950; Altemeyer, 1995) and ethnocentrism (Levinson, D 1949; Kam and Kinder, 2007).
Authoritarians value conformity and homogeneity, and will oppose immigration as it threatens
these. They may also discriminate more between migrant groups, as they may regard more
culturally distinct migrants as the greater threat to the social order they prize. Ethnocentrists
divide the world into an ingroup, with which they identify and seek to support, and various
outgroups, which they oppose as threatening the ingroup (Levinson, 1950; Kam and Kinder,
2007). Such a belief system has obvious implications for immigration attitudes: as immigrants
are an outgroup, ethnocentrists will be more likely to oppose them. They will also be more
likely to discriminate between immigrants, as more culturally distinct migrants will be regarded
as more threatening to the ingroup. Both authoritarianism and ethnocentrism are much less
common among younger cohorts in Britain (Tilley, 2005; Ford, 2008), suggesting that younger
generations may hold values which encourage greater acceptance of immigration.
The growing diversity of British society is also likely to have an impact on attitudes to
immigration. Migrants and the children of migrants should be more open to immigration in
13
general, while those who are from ethnic minority groups which have themselves experienced
discrimination should be less likely to discriminate between immigrant groups solely on the
basis of their origins. Once again, this effect is likely to result in differences between the
generations. In my survey sample, the proportion of non-white respondents nearly quadruples
from less than 2% among those born before 1920 to over 7.5% among those born after 1970.
Data and Methods
The data employed here are from six British Social Attitudes surveys conducted between 1983
and 1996.ii Data from individual surveys are pooled to enable better examination of social
differences in attitudes. During this period respondents were asked whether they though
immigration levels from seven different regions were too high, about right or too low. Few
thought immigration from any region was too low, so binary variables are constructed for
whether a respondent regarded immigration from a particular region as being too high.iii These
regions are: Australia and New Zealand; Western Europe; Eastern Europe; Hong Kong; Africa;
West Indies and South Asia. Eastern Europe and Hong Kong were only asked about in the 1994
and 1996 surveys, while Africa was included in 1996 only.
The great value of these questions is that they represent the only effort to disaggregate British
attitudes to immigration by region of origin. This data provides us with a unique opportunity to
examine how the British public view different migrant groups, and test whether the patterns of
racial and ethnic preference observed in policymaking also obtain among the broader public. As
this is large scale survey data collected over several years, it also enables us to examine
variation across subgroups, over time and between cohorts. The data do suffer from some
limitations. The regions asked about are variable in size – from Hong Kong with a population of
14
less than ten million to South Asia, which encompasses nearly a billion people. The categories
are rather crude, often encompassing large number of distinct nations, and in the case of “South
Asia” encompassing three large nations with distinct streams of migration to Britain. Migration
levels from these regions are also not equal. Although a confounding effect of migration levels
on attitudes is therefore possible, it is unlikely to be large: I find no correlation between group
migration levels and opposition levels, and previous research has shown widespread public
ignorance about migration levels (Saggar and Dreen, 2001).
Authoritarian values are measured using a five item scale developed and validated by Evans and
colleagues in the 1980s (Evans, Heath, and Lalljee, 1996). None of the items in this scale refers
to immigration or identity. Ethnocentrism is measured using an additive scale constructed from
two measures of opposition to social contact with ethnic minorities: opposition to working for a
black or Asian boss, and opposition to a relative marrying someone black or Asian.iv Both of
these scales are standardised, with a mean of zero and a standard deviation of one. Diversity is
measured using dummies for the ethnicity of the respondent. Birth cohort, measured using the
decade a respondent was born in, is also included as a control to test whether cohort differences
in attitudes exist after controlling for these three generationally structured factors. Education is
measured using the highest qualifications achieved. Controls are also included for gender and
for the year the survey was conducted.
I also test the impact of competition for economic resources, frequently offered as an
explanation for hostility to migrants (Bobo, 1983; Esses et al, 2002). Several different economic
factors are controlled for: economic position, economic insecurity and competition for
resources. Economic position is mesaured using the five category Goldthorpe-Heath class
schema (Heath et al, 1985). If economic threat generates opposition to immigration we should
15
expect to see more hostility among the social classes most exposed to immigrant competition:
the unskilled working class and the petty bourgeoisie. A control is also included for
unemployment, as the unemployed may also be more sensitive to immigrant competition.
Subjective economic insecurity is measured using a question asking how well respondents are
managing on their current income. Those who say they find their current circumstances
“difficult” or “very difficult” are considered to be economically insecure. Competition for
government resources is controlled for using residence in government housing and receipt of
social welfare benefits.
Analysis
Levels of opposition to different immigrant groups
Table 1 shows levels of British opposition to immigration from the seven different regions.
There is clear evidence of an “ethnic hierarchy” in public preferences, with large differences in
attitudes to immigration as we move from the less opposed regions on the left of the table to
more opposed regions on the right. Race is clearly a central factor driving preferences: all the
non-white immigrant groups are more opposed than all the white groups, and significant
differences also exist within racial categories. The history of preference shown by elites towards
the Old Commonwealth is also reflected in public attitudes: immigrants from Australia and New
Zealand are least opposed of all migrant groups. Decades of free movement to and from
Western Europe also seem to be reflected in public attitudes: migrants from this region are the
next least opposed. By contrast, the more controversial public reception of Eastern European
migrants is foreshadowed in our data from the 1980s and 1990s: migrants from this region are
the most opposed of all white migrant groups.
16
Britons also distinguish between non-migrant groups. Immigrants from Hong Kong are least
opposed, followed by those from Africa and the West Indies, with migrants from South Asia
most opposed. There are several possible explanations for this pattern of preference. One is that
the preferences reflect the relative prosperity of the regions, with poorer regions attracting
higher opposition. Culture may also play a role: English is the main language in the Caribbean
and is widely spoken in Hong Kong, but is not widely spoken outside the elite in South Asia.
Population size may also play a role – Hong Kong and the Caribbean islands have far fewer
people than South Asia, and respondents may therefore be less worried about immigration from
these regions rising out of control. Finally, actual migration flows from South Asia are higher
than from the other regions, which may increase hostility to this migrant group. While it is not
possible to tease apart these factors adequately with this data, it is clear that there are robust
differences in how immigrant groups are regarded within both the white and non-white racial
categories. This calls into question the wisdom of persistently basing analysis and policy on
views of immigrants as an undifferentiated mass.
The “ethnic hierarchy” in preferences between migrant groups remains consistent in each survey
year, with only one change in the relative position of a group in the whole series, when Hong
Kong immigrants overtake those from Eastern Europe in 1996. While the rank order of groups
remains consistent, the gap in attitudes declines over time. For example, the difference in
opposition to Australian and Indian migrants falls from 44 percentage points in 1983 to 25
points in 1996, while the difference between Western Europeans and West Indians falls from 23
points in 1983 to 11 points in 1996.
(Table 1 about here)
17
Generational change in attitudes to immigrants
Have attitudes towards immigrant groups changed as British society has changed? Table 2 looks
at how attitudes towards immigration from the different regions are structured by birth cohort.
The ethnic hierarchy identified in the previous table holds across all cohorts. Respondents who
grew up in the ethnically homogeneous Britain of the 1930s and 1940s and in the rapidly
diversifying Britain of the 1970s agree on the rank order of immigrants from these seven
regions. In Britain, as in America, the position of different minority groups in the eyes of the
majority remains remarkably consistent between generations.
(Table 2 about here)
While the order of preferences between groups remains the same, opposition to migration from
all regions is lower among younger cohorts, with a particularly sharp difference in attitudes for
cohorts born after 1950, who grew up after mass migration to Britain had commenced. A large
majority of respondents born before 1950 oppose immigration from every non-white region and
from Eastern Europe. The average level of opposition to immigration stands at 56% for this
group. By contrast, average opposition among those born after 1950 is 40%, and only South
Asian migration is opposed by a majority. Cohort differences in attitudes are larger for groups
lower down the ethnic hierarchy, resulting in lower discrimination between groups among the
young. As predicted, both overall opposition to immigration and discrimination between
immigrant groups are lower among the young, as illustrated by figure 1.
(Figure 1 about here)
18
Multivariate analysis
The cross-tabulation analyses have revealed evidence of large differences in opposition to
different immigrant groups, with preferences forming a consistent “ethnic hierarchy”. Table 5
shows the results of logistic regression analysis testing the influence of education, ethnic
diversity, values and economic factors on attitudes to each immigrant group. The generationally
varying factors – education, diversity and values – have a significant effect in all seven models.
Higher education, less authoritarian and ethnocentric values and belonging to an ethnic minority
encourage more open attitudes to all immigrant groups, even after controlling for potentially
confounding factors. These variables generally have a larger impact on opposition to non-white
than white groups, and on opposition to less liked than more liked groups within racial
categories, suggesting they also encourage more equal treatment of different immigrants.
Significant cohort effects remain in several models, with the youngest cohort, born in the 1970s,
expressing significantly less opposition to most migrant groups even after controlling for these
factors.v
The economic controls have virtually no effect on attitudes to white groups, though they have
some impact on attitudes to non-white migrants. Those in working class jobs are more likely to
oppose immigration from South Asia and the West Indies, but are not more opposed to more
numerous migrants from Australia and Europe, who presumably can also compete effectively
for jobs. If perceptions of economic competition are driving opposition to migration, they
therefore do not seem very closely related to actual patterns of competition. Economic
deprivation, however measured, does not seem to encourage more hostile attitudes to
immigrants from any region. In fact, I find that those who live in government housing are
19
significant less opposed to four of the five most opposed immigrant groups. One possible
explanation is social contact: poorer migrants tend to concentrate in or near the deprived areas
where most social housing is located, so native Britons living in such areas are more likely to
have positive social contact with them (McLaren, 2003).
Which factors are most important in driving the large generational differences in immigration
attitudes? To answer this question, I compare the effects of generational differences in each of
the variables on predicted opposition. This is done by changing the values of each variable from
those which hold among the oldest generation – those born before the 1920s – to the values
prevalent among the youngest generation, those born in the 1970s and examine the impact on
predicted levels of opposition to each immigrant group.vivii I focus on the four regions with the
most data: Australian/New Zealand; Western Europe; West Indies and South Asia.
(Figure 2 about here)
As figure 2 shows, the major driver of generational differences in opposition to all immigrant
groups and of discrimination between migrant groups is authoritarian and ethnocentric values.
Shifting scores on the authoritarian value scale from the average for the 1920s cohort to the
average for the 1970s cohort results in a 6 percentage point fall in opposition to Australian
immigration, an 8 point fall in opposition to Western European migrants, and 11 point falls in
opposition to West Indian and South Asian migration. Shifting ethnocentrism scores in a similar
fashion barely changes opposition to Australian migration, reduces opposition to West European
migration by 3.5 points, and opposition to migration from the two non-white regions by 11 and
12 points. The more liberal and less ethnocentric values of young Britons are strongly reflected
in their views about immigration. They accord greater respect to the rights of individuals from
20
across the world to settle in Britain if they choose, and treat immigrants from different regions
more equally, even those from cultures very different to Britain. The other generational changes
to British society – rising education and growing diversity – have similar but less marked
effects. Shifting ethnic diversity from the values prevalent among the oldest to the values
holding in the youngest cohort reduces opposition to white immigration by about one percentage
point, and to non-white immigration by about two points. The rise in educational qualification
levels between oldest and youngest cohorts produces a four point drop in opposition to
European migration and a two point drop in opposition to the other regions.
Discussion
The evidence from this analysis suggests that the current standard practice of treating
immigrants as a single mass is mistaken and likely to produce misleading results. This first
analysis of disaggregated attitudes to different migrant groups has shown very large differences
in British public reactions. British immigration attitudes are racialised: white immigrant groups
are consistently preferred non-white immigrant groups, usually by large margins. They also
discriminate between migrant groups within each racial category, resulting in an “ethnic
hierarchy” of immigrant groups which is consistent across time and between generations. The
overall pattern of preferences within this hierarchy may be the result of several factors, and
needs to be investigated further. I find suggestive evidence that migrants from regions with
stronger economic, cultural and political links to Britain are generally preferred to regions
without such links.
The analysis has confirmed the centrality of race in driving British attitudes to immigrant
groups, a point repeatedly made in historical analyses of British migration. Discrimination
21
against non-white immigrants thus continues well into what Hampshire has described as the
“renegotiation” period of British immigration history, when the first efforts were being made to
promote a more multicultural sense of British identity (Hampshire, 2005: p.18). It is hard to
justify continuing to ask only about “immigrants” in light of this wide and persistent racial
divide. We have no way of knowing whether respondents are thinking of white or non-white
immigrants when they answer, yet this will be very consequential for the answers they give.
This is particularly relevant at a time when both white and non-white immigration are at record
levels, and immigration policy is once again at the heart of political debate. Analyses of
opposition to “immigration” are of little value for determining policy when the public regards
specific immigrant groups so differently. Such analyses may drastically overstate opposition to
some immigrant groups, and understate opposition to others.
The results here also show, however, that discrimination is not simply a matter of black and
white. Respondents also discriminate between different immigrant groups within each racial
category, consistently favouring migrants from regions with stronger cultural and political links
to Britain. This finding underscores the importance of moving beyond race in research of
immigrants and ethnic minorities, towards a more multidimensional understanding of how
attitudes to ethnic groups form, and what factors influence them. For example, the British public
seems more accepting of immigration from regions which have in turn received many British
emigrants, such as Australia and Western Europe, raising the intriguing possibility that
immigration attitudes may have a reciprocal element to them.
While the order of preference between immigrant groups is consistent, the level of
discrimination against less favoured groups is not. As has been found in research on ethnic
hierarchies in America, young Britons discriminate less between immigrant groups. Value
22
change between the generations plays a central role in this shift: younger respondents are much
less authoritarian and ethnocentric than their parents and grandparents. These results
demonstrate how the slow process of intergenerational value change can have powerful policy
implications. Younger Britons, growing up in a more globally mobile and ethnically diverse
society, have much lower allegiance to values which prize authority, homogeneity and
allegiance to the national group. As a result, they are more supportive of immigration, and less
concerned about the origins of immigrants. These large generational differences suggest there
may be a slow, long run rise in the public acceptability of immigration in Britain, as more
liberal, racially tolerant generations replace ageing authoritarian and ethnocentric cohorts.viii
The period under examination here was, however, one when immigration to Britain was
unusually low and stable, and debates over migration were less politically salient than in the
years before or since. The pattern of attitudes and the ranking of migrant groups may change
when immigration rises, particularly if migration from a particular region is persistently very
high, as is presently the case with migration from Eastern Europe. Nonetheless, the consistent
hierarchy in attitudes suggests that we can expect a given number of migrants arriving from a
low rated region to produce a stronger public reaction than the same number from a high rated
region, an expectation borne out by experience since 1996. In the last decade, asylum related
migration, primarily from lower rated African and Middle Eastern countries, has attracted strong
hostile reactions and a restrictionist policy response at levels of 50,000 per annum, while
migration from Western Europe has continued unopposed at twice this level and migration from
Eastern Europe has only generated serious controversy when running at over four times this
level. The recently resurgent far right movement in Britain has focussed its attention on lower
rated ethnic groups, targeting non-white asylum seekers and Muslims from South Asia, the
lowest rated region in this analysis (Goodwin, 2010).
23
The results here also fit with an emerging body of work on migration in Europe which has
argued for the centrality of cultural difference in understanding attitudes towards immigrants
(Sides and Citrin, 2007; Sniderman and Hagendoorn, 2007). Future research needs to shift the
academic and policy focus away from barren discussion of the supposed economic costs or
benefits of immigrants, as economic concerns are not driving public opinion on immigration.
Instead, greater attention should be paid to building more carefully disaggregated measures of
public immigration attitudes, understanding why certain markers of cultural or racial difference
stigmatise some immigrant groups as undesirable and identifying ways to reduce discriminatory
hostility towards such migrants.
24
References
Adorno, T; Frenkel-Brunswick, E; Levinson, D and Sanford, R (1950) (eds) The Authoritarian Personality, New York: Harper and Row Alba, R (1985) Italian Americans: Into the Twilight of Ethnicity, Englewood Cliffs: Prentice-Hall Altemeyer, B (1995) The Authoritarian Specter Cambridge: Harvard University Press Australian Department of Immigration and Multicultural Affairs.(2001) "Immigration: Federation to Century's End 1901–2000” http://www.immi.gov.au/media/publications/statistics/federation/federation.pdf. Retrieved 21/10/2009 Berry and Kalin (1995) Multicultural and ethnic attitudes in Canada: An overview of the 1991 national survey, Canadian Journal of Behavioral Science 27 (1995), pp. 301–320. Bobo, L (1983) “Whites’ Opposition to Busing: Symbolic Racism or Realistic Group Conflict?”, Journal of Personality and Social Psychology, 45: 1196-1210 Bogardus, E (1925) “Social Distance and its Origins”, Journal of Applied Sociology 9: 216-26 Cantle, T (2001) Community Cohesion - A Report of the Independent Review Team London: Home Office. Castles, S and Miller, M (2003) The Age of Migration: International Population Movements in the Modern World (3rd edition) Basingstoke: Palgrave Macmillan Citrin, J; Green; D, Muste, C; and Wong, C (1997) “Public Opinion Toward Immigration Refrom: The Role of Economic Motivations”, Journal of Politics 59(3): 858-81 Coenders, M; Lubbers, M and Scheepers, P (2004) Majority Populations’ Attitudes towards Migrants and Minorities, Report for the European Monitoring Centre on Racism and Xenophobia Coenders, M and Scheepers, P (2003) “The Effect of Education on Nationalism and Ethnic Exclusionism: An International Comparison”, Political Psychology 24(2): 313-43 Delaney, E (2001) Demography, State and Society: Irish Migration to Britain 1921-1971, Liverpool: Liverpool University Press Eatwell, R and Goodwin, M (2009) The New Extremism in 21st Century Britain, Abingdon: Routledge Ellis, A (2009) “UK resident population by country of birth”, Population Trends 135: 20-8
25
Esses, V; Dovidio, J; Jackson, L and Armstrong, T (2002) “The Immigration Dilemma: The Role of Perceived Group Competition, Ethnic Prejudice, and National Identity”, Journal of Social Issues, 57 (3): 389-412 Evans, G; Heath, A and Lalljee; M (1996) “Measuring Left-Right and Libertarian-Authoritarian Values in the British Electorate”, British Journal of Sociology 47 (1) 93-112 Ford, R (2008) “Is racial prejudice declining in Britain?”, British Journal of Sociology 59 (4): 609-36 Ford, R and Goodwin, M (2009) “Angry White Men: Individual and contextual predictors of support for the British National Party”, Political Studies (in press) Hagendoorn, L; Drogendijk, R; Tumanov, S and Hraba, J (1998) “Inter-ethnic preferences and ethnic hierarchies in the former Soviet Union”, International Journal of Intercultural Relations, 22 (4): 483-503 Hampshire, S (2005) Citizenship and Belonging: Immigration and the Politics of Democratic Governance in Postwar Britain, Basingstoke: Palgrave Macmillan Hansen, R (2000) Citizenship and Immigration in Post-war Britain, Oxford: Oxford University Press” Heath, A; Jowell, R and Curtice, J (1985) How Britain Votes, Oxford: Pergammon Press Husbands, C (1983) Racial exclusionism and the city: the urban support for the National Front, London: Allen & Unwin Ivarsflaten, E (2005), "Threatened by Diversity: Why Restrictive Asylum and Immigration Policies Appeal to Western Europeans," Journal of Elections, Public Opinion and Parties 15(1):21-45. Jowell, R., Curtice, J., Park, A., Brook, L., Ahrendt, D (1995) British Social Attitudes: the 12th Report, Aldershot: Dartmouth. Kam, C and Kinder, D (2007) “Terror and Ethnocentrism: Foundations of American Support for the War on Terrorism”, Journal of Politics, 69: 320-338 Kleg, M and Yamamoto, K (1998) “As the World Turns: Ethno-Racial Distances After 70 Years”, The Social Science Journal, 35 (2): 183-90 Layton-Henry, Z (1992) The Politics of Immigration: Immigration, 'Race' and 'Race' Relations in Post-War Britain, Oxford: Blackwell Levinson, D (1949) “An approach to the theory and measurement of ethnocentric ideology”, Journal of Psychology 28:19-39 Lewis, M (2004) Asylum: Understanding Public Attitudes, London: IPPR
26
McLaren, L (2003) “Anti-Immigrant Prejudice in Europe: Contact, Threat Perception, and Preferences for the Exclusion of Migrants”, Social Forces 81(3): 909-36 McLaren, L and Johnson, M (2007) “Resources, Group Conflict and Symbols:Explaining Anti-Immigration Hostility in Britain”, Political Studies 55: 709-32 Norris, P (2005) Radical Right: Voters and Parties in the Electoral Market, Cambridge: Cambridge University Press Office for National Statistics (2008) “International Migration Statistics”, available at: www.statistics.gov.uk Roedinger, D (2005) Working Toward Whiteness: How America’s Immigrants Became White, New York: Basic Books Saggar, S (1992) Race and Politics in Britain, London: Harvester-Wheatsheaf Saggar, S (2009) Pariah Politics: Understanding Western radical Islamism and what should be done, Oxford: Oxford University Press Saggar, S and Drean, J (2001) British Public Attitudes and Ethnic Minorities, London: Cabinet Office Performance and Innovation Unit Scheve and Slaughter (2001) “Labour Market Competition and Individual Preferences Over Immigration Policy”, Review of Economics and Statistics 83(1): 133-45 Schoen, D (1977) Enoch Powell and the Powellites, Basingstoke: Macmillan Sides, J and Citrin, J (2007) “European Opinion About Immigration: The Role of Identities, Interests and Information”, British Journal of Political Science 37: 477-504 Somerville, W (2007) Immigration Under New Labour, London: Policy Press Sniderman,P Hagendoorn, L and Prior, M (2004) “Predisposing Factors and Situational Triggers: Exclusionary Reactions to Immigrant Minorities”, American Political Science Review 98(1): 35-49 Tilley, J (2005) “Libertarian-authoritarian value change in Britain, 1974-2001”, Political Studies 53: 442-453 Tomz, M; Wittenberg, J and King, G (2001) CLARIFY: Software for Interpreting and Presenting Statistical Results, Version 2.0 Cambridge, MA: Harvard University, http://gking.harvard.edu Van Der Brug, W; Fennema, M and Tillie, J (2000) “Anti-immigrant parties in Europe: Ideological or Protest Vote?”, European Journal of Political Research 27(1): 77-102 Verkuyten, M; Hagendoorn, L and Masson, K (1996) “The ethnic hierarchy among majority and minority youth in the Netherlands”, Journal of Applied Social Psychology 26(12):1104-1118
27
Vogt, P (1997) Tolerance and Education, Thousand Oaks: Sage Notes i Around 100,000 Britons emigrated annually to the EU throughout the 1990s and 2000s, with France and Spain accepting the majority. ii The British Social Attitudes surveys are fielded to a stratified random sample of the British population. Sample sizes are between 1,750 and 3,500. Response rates range between 60 and 70%. Further technical details can be found in Jowell et al (1995). iii Ranging from 2% for Asian immigration to 11% for Australian immigration. An ordered logistic regression analysis using all three response categores produced very similar results to those presented. iv Ethnocentrism questions were not asked to non-white respondents, so it is not possible to control for ethnocentrism and ethnic diversity at the same time. The reported diversity coefficients were therefore generated in separate models which excluded ethnocentrism. v These differences could also be lifecycle effects, related to the age of respondents. However, as I am not aware of any strong theoretical reason to expect young people to be less concerned about immigration than older people, I have interpreted these differences in terms of cohort effects. vi Calculated using the Clarify programme (Tomz et al, 2001) vii For education, the change is from the levels of the pre-1920s generation to the levels of the most highly educated cohort (1950s). The levels of education in subsequent cohorts are artificially depressed as many respondents were still in education when interviewed. We make the conservative assumption that the youngest cohort would end up at least as educated as its predecessors. viii Tilley (2005) finds evidence that the decline in authoritarian values decelerates among cohorts coming of age in the 1970s and 1980s. However, the differences in values between older and younger generations that an aggregate shift towards lower authoritarianism is still likely to continue for decades.
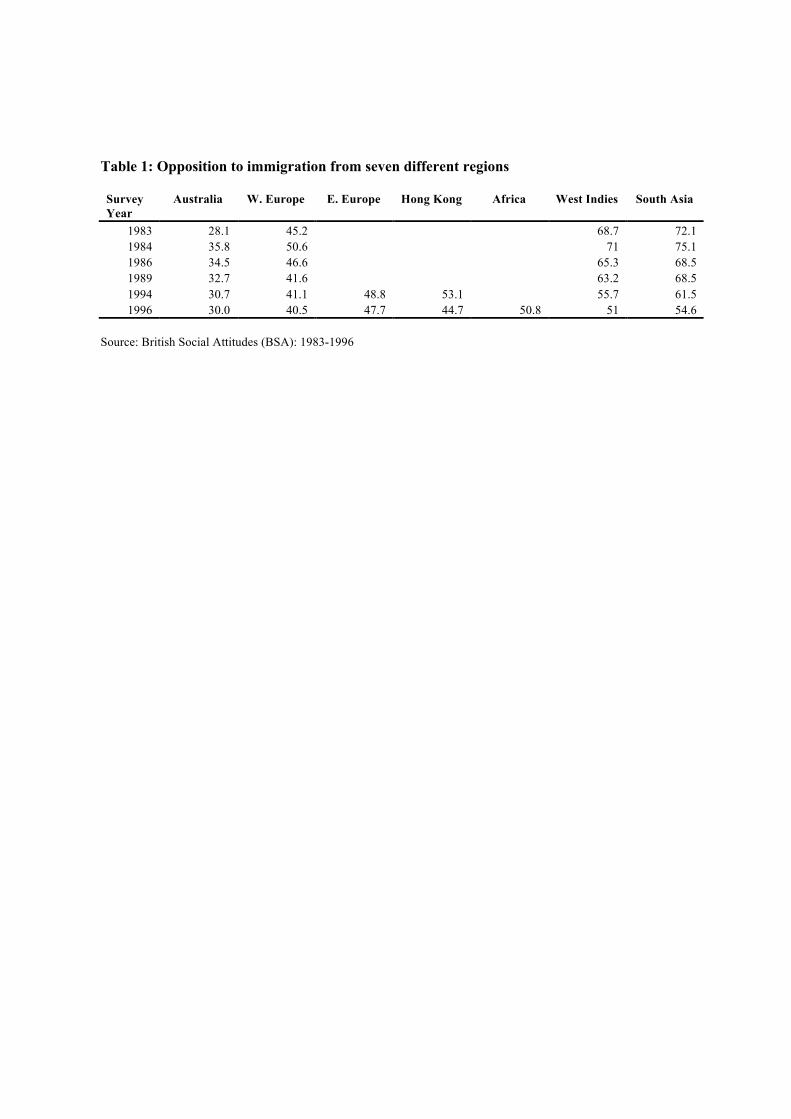
Table 1: Opposition to immigration from seven different regions
SurveyYear
Australia
W. Europe
E. Europe
Hong Kong
Africa
West Indies
South Asia
1983 28.1 45.2 68.7 72.1 1984 35.8 50.6 71 75.1 1986 34.5 46.6 65.3 68.5 1989 32.7 41.6 63.2 68.5 1994 30.7 41.1 48.8 53.1 55.7 61.5 1996 30.0 40.5 47.7 44.7 50.8 51 54.6
Source: British Social Attitudes (BSA): 1983-1996
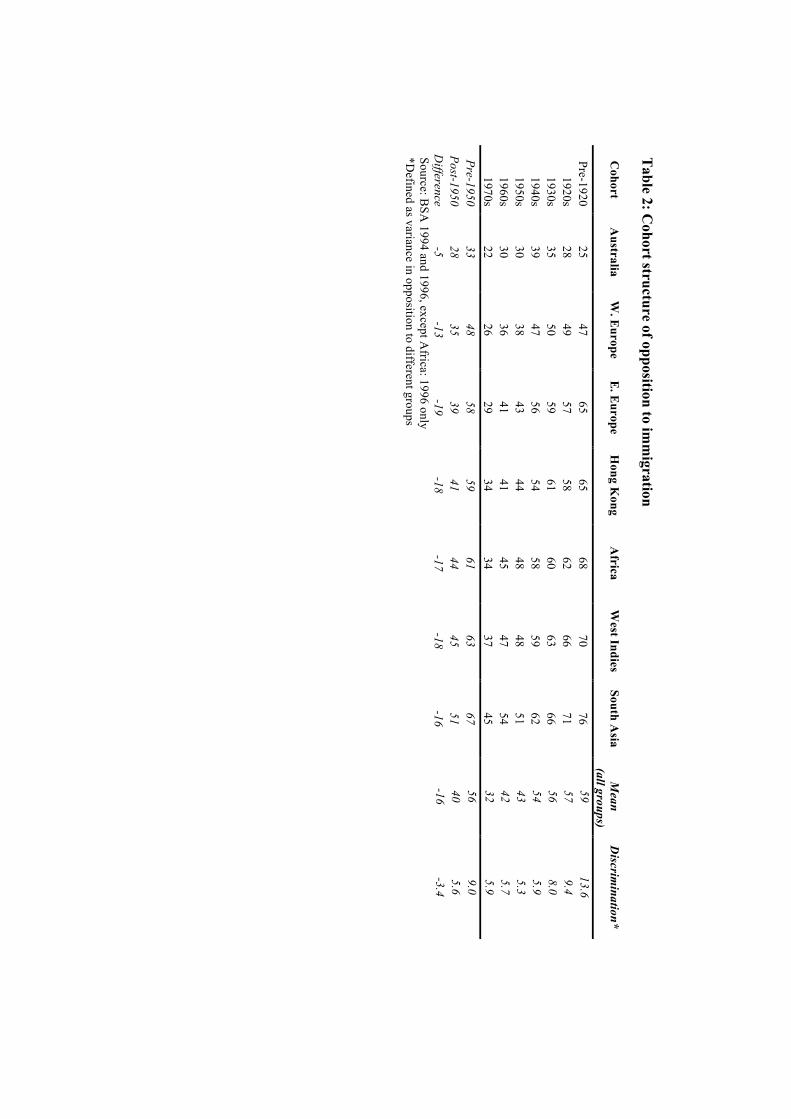
Table 2: C
ohort structure of opposition to imm
igration
Cohort
A
ustralia
W. E
urope
E. E
urope
Hong K
ong
Africa
W
est Indies
South Asia
M
ean (all groups)
Discrim
ination*
Pre-1920 25
47 65
65 68
70 76
59 13.6
1920s 28
49 57
58 62
66 71
57 9.4
1930s 35
50 59
61 60
63 66
56 8.0
1940s 39
47 56
54 58
59 62
54 5.9
1950s 30
38 43
44 48
48 51
43 5.3
1960s 30
36 41
41 45
47 54
42 5.7
1970s 22
26 29
34 34
37 45
32 5.9
Pre-1950 33
48 58
59 61
63 67
56 9.0
Post-1950 28
35 39
41 44
45 51
40 5.6
Difference
-5 -13
-19 -18
-17 -18
-16 -16
-3.4 Source: B
SA 1994 and 1996, except A
frica: 1996 only *D
efined as variance in opposition to different groups
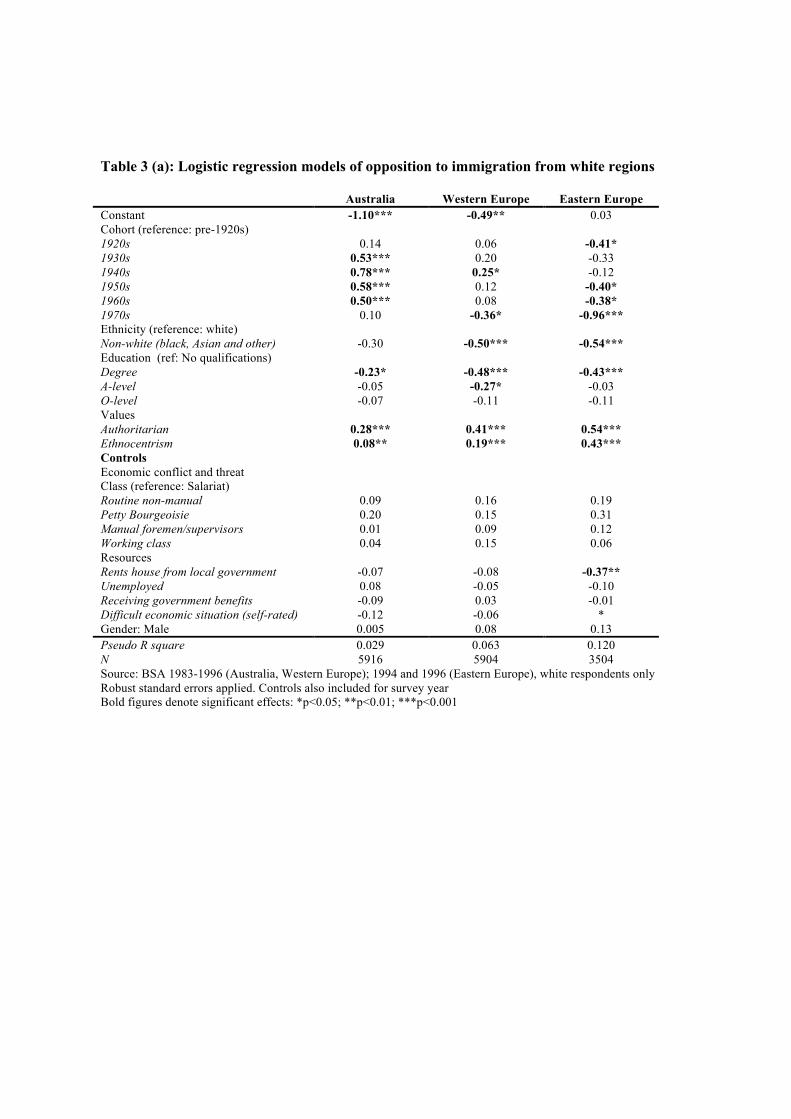
Table 3 (a): Logistic regression models of opposition to immigration from white regions
Australia Western Europe Eastern Europe Constant -1.10*** -0.49** 0.03 Cohort (reference: pre-1920s) 1920s 0.14 0.06 -0.41* 1930s 0.53*** 0.20 -0.33 1940s 0.78*** 0.25* -0.12 1950s 0.58*** 0.12 -0.40* 1960s 0.50*** 0.08 -0.38* 1970s 0.10 -0.36* -0.96*** Ethnicity (reference: white) Non-white (black, Asian and other) -0.30 -0.50*** -0.54*** Education (ref: No qualifications) Degree -0.23* -0.48*** -0.43*** A-level -0.05 -0.27* -0.03 O-level -0.07 -0.11 -0.11 Values Authoritarian 0.28*** 0.41*** 0.54*** Ethnocentrism 0.08** 0.19*** 0.43*** Controls Economic conflict and threat Class (reference: Salariat) Routine non-manual 0.09 0.16 0.19 Petty Bourgeoisie 0.20 0.15 0.31 Manual foremen/supervisors 0.01 0.09 0.12 Working class 0.04 0.15 0.06 Resources Rents house from local government -0.07 -0.08 -0.37** Unemployed 0.08 -0.05 -0.10 Receiving government benefits -0.09 0.03 -0.01 Difficult economic situation (self-rated) -0.12 -0.06 * Gender: Male 0.005 0.08 0.13 Pseudo R square 0.029 0.063 0.120 N 5916 5904 3504 Source: BSA 1983-1996 (Australia, Western Europe); 1994 and 1996 (Eastern Europe), white respondents only Robust standard errors applied. Controls also included for survey year Bold figures denote significant effects: *p<0.05; **p<0.01; ***p<0.001
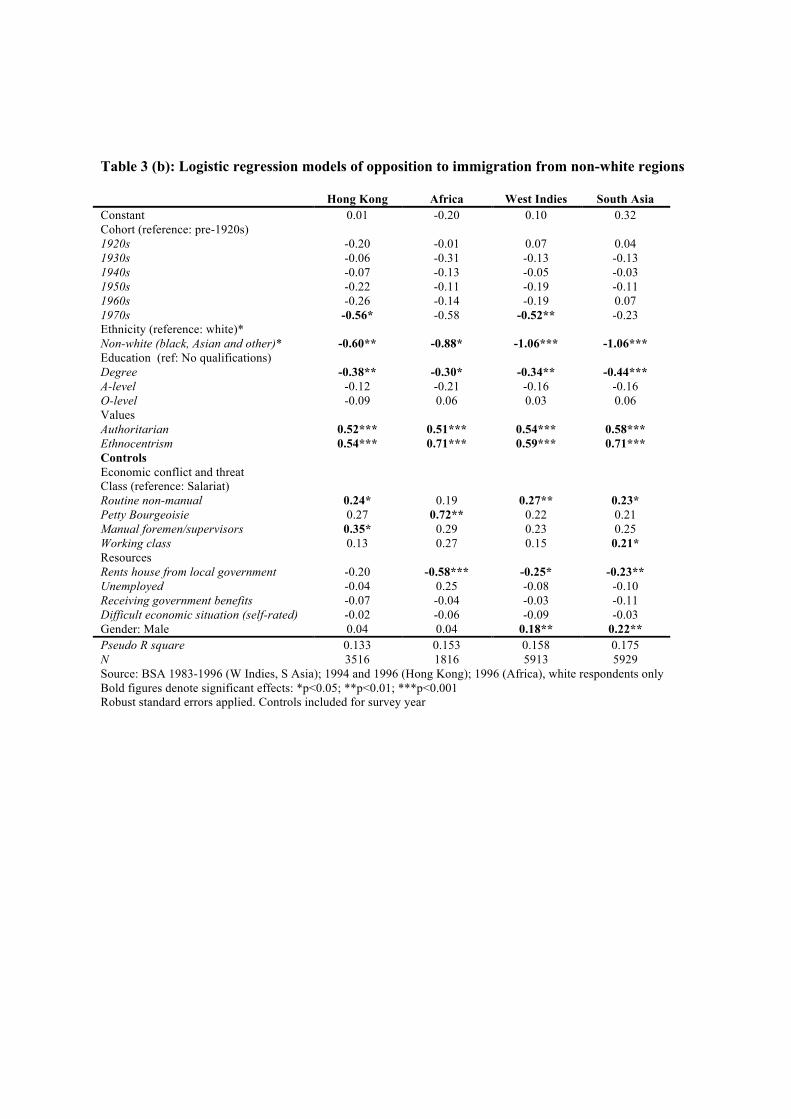
Table 3 (b): Logistic regression models of opposition to immigration from non-white regions
Hong Kong Africa West Indies South Asia Constant 0.01 -0.20 0.10 0.32 Cohort (reference: pre-1920s) 1920s -0.20 -0.01 0.07 0.04 1930s -0.06 -0.31 -0.13 -0.13 1940s -0.07 -0.13 -0.05 -0.03 1950s -0.22 -0.11 -0.19 -0.11 1960s -0.26 -0.14 -0.19 0.07 1970s -0.56* -0.58 -0.52** -0.23 Ethnicity (reference: white)* Non-white (black, Asian and other)* -0.60** -0.88* -1.06*** -1.06*** Education (ref: No qualifications) Degree -0.38** -0.30* -0.34** -0.44*** A-level -0.12 -0.21 -0.16 -0.16 O-level -0.09 0.06 0.03 0.06 Values Authoritarian 0.52*** 0.51*** 0.54*** 0.58*** Ethnocentrism 0.54*** 0.71*** 0.59*** 0.71*** Controls Economic conflict and threat Class (reference: Salariat) Routine non-manual 0.24* 0.19 0.27** 0.23* Petty Bourgeoisie 0.27 0.72** 0.22 0.21 Manual foremen/supervisors 0.35* 0.29 0.23 0.25 Working class 0.13 0.27 0.15 0.21* Resources Rents house from local government -0.20 -0.58*** -0.25* -0.23** Unemployed -0.04 0.25 -0.08 -0.10 Receiving government benefits -0.07 -0.04 -0.03 -0.11 Difficult economic situation (self-rated) -0.02 -0.06 -0.09 -0.03 Gender: Male 0.04 0.04 0.18** 0.22** Pseudo R square 0.133 0.153 0.158 0.175 N 3516 1816 5913 5929 Source: BSA 1983-1996 (W Indies, S Asia); 1994 and 1996 (Hong Kong); 1996 (Africa), white respondents only Bold figures denote significant effects: *p<0.05; **p<0.01; ***p<0.001 Robust standard errors applied. Controls included for survey year
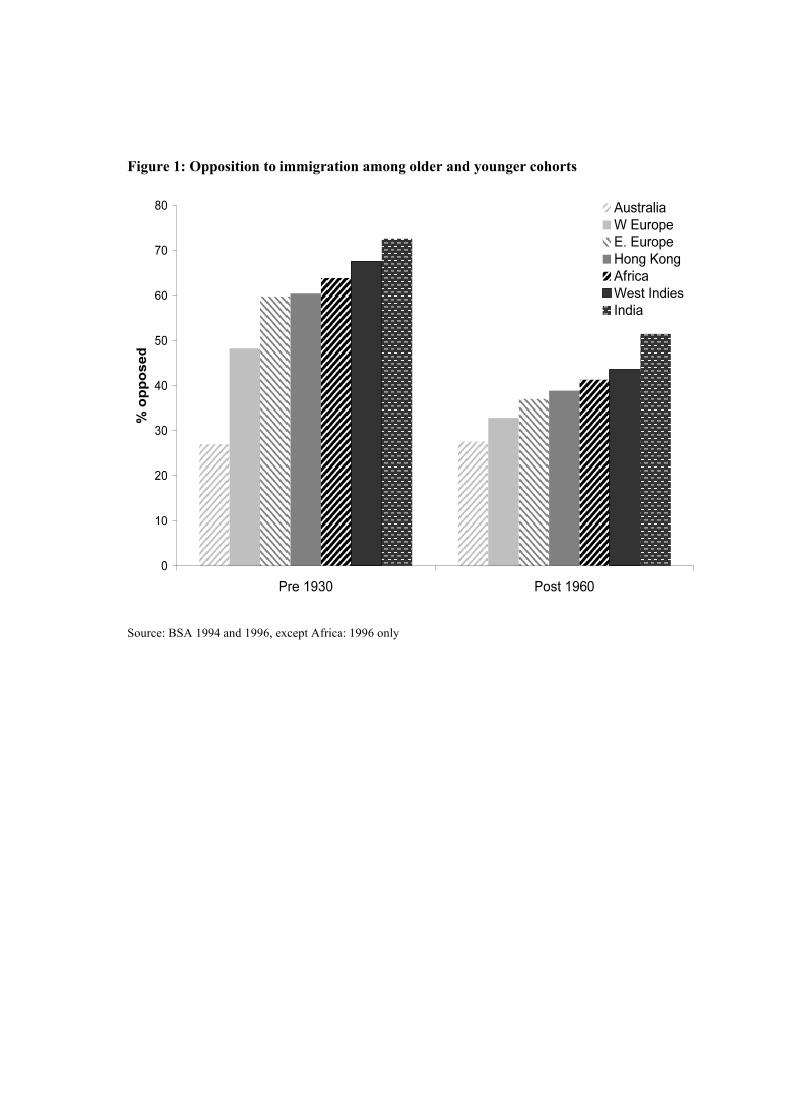
Figure 1: Opposition to immigration among older and younger cohorts
Source: BSA 1994 and 1996, except Africa: 1996 only
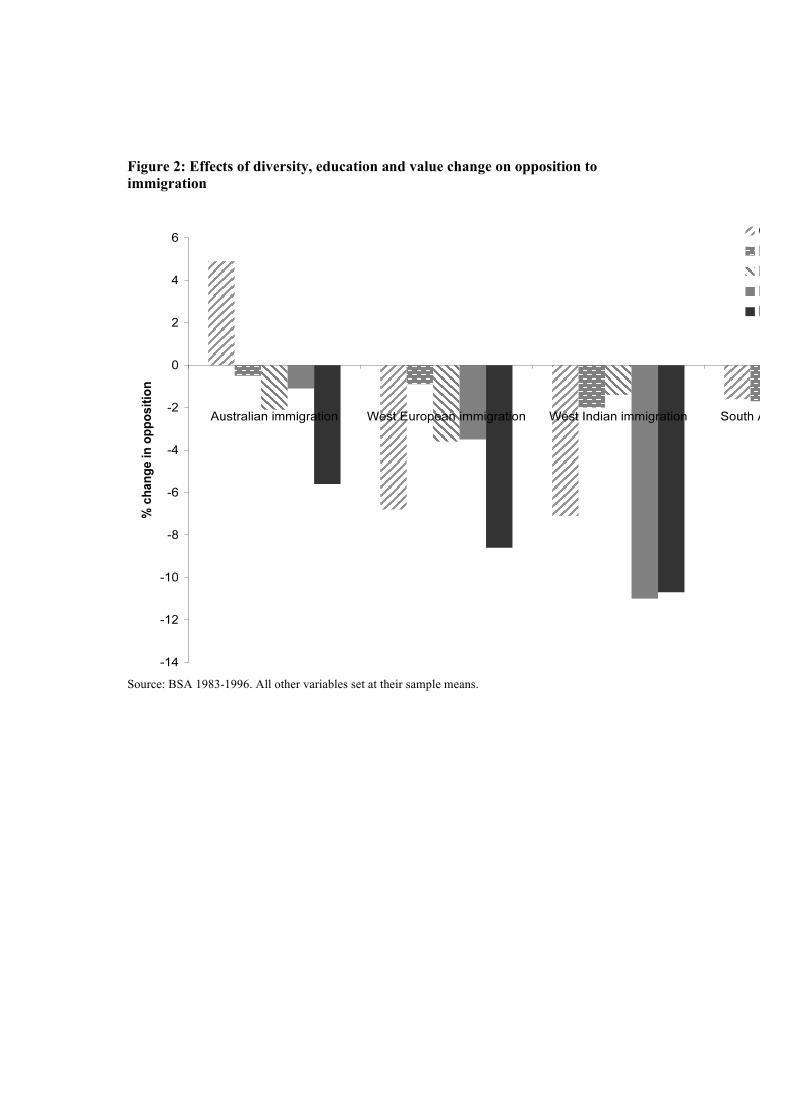
Figure 2: Effects of diversity, education and value change on opposition to immigration
Source: BSA 1983-1996. All other variables set at their sample means.