how do common investors behave? information search and portfolio choice among bank customers and...
TRANSCRIPT

How do common investors behave? Information searchand portfolio choice among bank customersand university students
Marco Monti • Riccardo Boero • Nathan Berg •
Gerd Gigerenzer • Laura Martignon
Received: 16 April 2012 / Accepted: 11 June 2012 / Published online: 10 July 2012
� Springer-Verlag 2012
Abstract Bank customers are not financial experts, and yet they make high-stakes
decisions that can substantively affect personal wealth. Sooner or later, every
individual has to take relevant investment decisions. Using data collected from
financial advisors, bank customers and university students in Italy, this paper aims
to reveal new insights about the decision processes of average non-expert investors:
their investment goals, the information sets they consider, and the factors that
ultimately influence decisions about investment products. Using four portfolio
choice tasks based on data collected directly from financial advisors and their
clients, we find that most subjects used a limited set of information, ignoring factors
that conventional economic models usually assume drive investor behavior. Fur-
thermore, we suggest that non-compensatory decision-tree models, which make no
trade-offs among investment features, are parsimonious descriptions of investor
M. Monti � G. Gigerenzer
Max Planck Institute for Human Development-Berlin, Lentzeallee 94, 14195 Berlin, Germany
e-mail: [email protected]
G. Gigerenzer
e-mail: [email protected]
R. Boero (&)
Department of Economics and Public Finance, University of Torino,
C.so Unione Sovietica 218/bis, 10134 Turin, Italy
e-mail: [email protected]
N. Berg
School of Economic, Political and Policy Sciences, University of Texas-Dallas,
800 West Campbell Road, GR 31, Richardson, TX 75080-3021, USA
e-mail: [email protected]
L. Martignon
Institut fur Mathematik und Informatik, University of Education-Ludwigsburg,
Reuteallee 46, 71634 Ludwigsburg, Germany
e-mail: [email protected]
123
Mind Soc (2012) 11:203–233
DOI 10.1007/s11299-012-0109-x
behavior useful for improving the organization of financial institutions and in policy
contexts alike.
Keywords Behavioral finance � Investment decision � Portfolio composition �Non-compensatory heuristic � Recognition heuristic � Ecological rationality
1 Introduction
This study seeks to describe the decision-making processes of bank consumers who
make portfolio decisions in consultation with financial advisors employed by banks
and to compare their choices with the ones of completely inexperienced investors
such as undergraduate students. In a first, hypothesis-finding step, we collected
qualitative and quantitative data using in-depth interviews with both financial
advisors and their clients concerning the typical range of investment alternatives
presented to consumer investors. Interviews and survey data also provided
quantitative descriptions of the typical number of items in investors’ consideration
sets and the investment features (i.e., information) that investors typically ask for
and are supplied with by investment advisors. In a second, hypothesis-testing step,
we used the results of the interview and survey data to construct a laboratory-type
experiment consisting of four portfolio choice tasks designed to match the
investment environment that actual bank customers face.
Thanks to an unusually cooperative experimental partner, a chain of regional
banks in Italy in the suburbs of Trento, we were able to conduct these investment
task experiments using random samples of actual bank customers and conduct them
on-site inside the banks at which these same customers have investment accounts.
We think this provides an unusually high degree of match between the subject
population and laboratory environment, on the one hand, and the real-world
investment behavior of primary scientific interest on the other.
Furthermore, we replicated the experiment in a university computer lab with
random samples of undergraduate students: in this way we test the results obtained
so far on non-experts’ investment choices and we investigate the potential role of
experience.
There are five main questions we seek to address: (1) What information do
common investors need before making high-stakes investment decisions? (2) Given
a large field of information about different investment alternatives and their
features, how do common investors search for information? (3) Even when the size
of the choice set is modest, can we describe patterns of information search and
information usage to reveal how consumers eliminate investments from consider-
ation? (4) Is there confirmatory evidence of pairwise comparison of common
investment features consistent with the widespread assumption that consumers rank
items in their choice sets by product features? (5) If not, can we specify a descriptive
model informed by empirical data that better reveals patterns of information search
and the decision processes actually used by investors?
In conclusion, answering the questions we are proposing has some important
consequences for both financial institutions and investors, opening the possibility to
204 M. Monti et al.
123

improve the resilience of the economy towards recurrent shocks. In fact, it is our strong
belief that hypotheses which identify cycles of over and under risk-exposure and
confidence of economic actors as relevant causes of recurrent crisis in financial markets
are rightly focused. In particular we claim that, although not the only cause of those
phenomena, the imperfect match of investors’ preferences in financial markets strongly
diminishes the capability of the system to adapt and learn. As a logical consequence of
this claim, we believe that misunderstandings about investors’ decision making lead
not only to poor customers’ satisfaction and inefficient organization of financial
institutions but also to endemic financial instability.
Yee et al. (2007) show that consumer choice is sometimes better described and
predicted by lexicographic, or non-compensatory, decision tree models rather than
linear models (conjoint analysis) which are standard in marketing research and
economics. We use this insight as motivation to fit non-compensatory decision trees
and compensatory tallying rules to portfolio choice data, comparing their predictive
accuracy with larger linear models that simultaneously apply weights to all
investment features to predict investor behavior.1 We also borrow the technique of
process tracing from psychology to filter the data in greater detail in hopes of
revealing more about investors’ decision process.
One motivation for the approach taken in this study is that improved veridical
descriptions of decision-making process which go beyond the as-if methodological goal
of predicting decision outcomes would be a substantive advance for descriptive
behavioral science. Perhaps just as compelling, especially in light of the institutional
failures surrounding recent financial market crises whose consequences continue to play
out as we write, these descriptions of decision-making process should facilitate the
design of improved institutions that are better matched to the decision-making processes
commonly found among bank consumers. Because firms may have incentives to offer
smaller ranges of choices to retail (versus online) customers (Lynch and Ariely 2000),
this study’s rich data, drawing on retail branch bank customer decisions and information
collected from those bank employees who dispense investment advice, provides a
unique view into retail banking as experienced by consumers.
We would contend that mistaken models of the investor’s mind underlie a wide
variety of real-world problems, from faulty risk models used by ratings agencies on
mortgage-backed securities to misguided marketing campaigns that fail to
successfully launch new investment products to consumers. Being well informed
about decision process—not merely decision outcomes—matters greatly.
A growing literature in economics and psychology shows that decision makers
often do not incorporate all available information into their decisions, even when
1 Linear models of investor behavior, such as those derived from expected utility maximization with a
mean–variance expected utility function, assume that all features of each investment alternative are
weighted and summed (and possibly transformed by a monotonic function). In contrast, non-
compensatory models have a fixed hierarchy of investment features. One investment feature (e.g., high
risk) can be enough to entirely discard an alternative from the investor’s consideration set, without the
possibility of compensation (e.g., standard models typically assume that, no matter how high the risk, this
negative can be compensated with sufficiently large positives such as high expected return). Just as Yee
et al. (2007) found that consumers can effectively manage large choice sets by quickly shrinking the items
in consideration using a single product feature, we consider models which allow data to reveal this kind of
fast reduction of choice sets by lexicographically ruling out alternatives based on one undesirable feature.
How do common investors behave? 205
123

information is statistically valid, non-redundant (i.e., non-collinear with other
predictors), and costless to acquire (Balzer et al. 1989; Chewning and Harrell 1990;
Lee and Lee 2004; Berg and Hoffrage 2008). Loewenstein (2006) illustrates the
more general point about mismatch between models and underlying behavioral
processes that, paradoxically, can get worse when modelers try to introduce new
aspects of realism to their models.
We try to demonstrate a technique, implemented in the case study presented here
of Italian bank customers (who are typical in that they possess no expert credentials
or specialized academic training in finance) and undergraduate students (who do not
possess experience in investments but who have received a basic training in
finance), to reveal how average investors search for information and map that
information into portfolio decisions.
If information search is limited rather than exhaustive, how are pieces of
information that are considered mapped into actual decisions? Gigerenzer et al.
(1999) put forward a positive theory regarding simple and information-frugal
decision rules that have attractive properties (e.g., accuracy in prediction tasks, as in
Gigerenzer and Brighton 2009; Martignon and Laskey 1999, and Gigerenzer and
Goldstein 1996) and solid empirical support based on lab experiments.
Fast-and-frugal heuristics can make accurate predictions in a variety of domains
(Gigerenzer et al. 1999). Information-frugal models classify and infer with only
limited knowledge and computational effort, using a strict subset of the available
information. Some of the heuristics we consider, as in Yee et al. (2007), make no
trade-offs between investment features. Instead, they process sequentially and
lexicographically one investment feature at a time. Under certain circumstances,
such heuristics can be as accurate as models based on standard definitions of
‘‘rational choice’’ in economics (e.g., weighted linear models and Bayesian
approaches that take all features and their entire correlation structure into account,
assuming that decision makers somehow have access to all the relevant parame-
ters—see Martignon and Laskey 1999, and Gigerenzer et al. 1999).
The paper proceeds as follows. Section 2 describes the experimental design, the
samples from which the data were collected, and details of the four experimental
tasks tailored to match Italian bank customers’ investment environment. Sections 3
and 4 present the empirical results, describing a number of patterns in subjects’
search for information and prediction models for consumers’ ranking of investments
and portfolio choice. Moreover, Sects. 3 and 4 fit Markov transition matrices for
information search, response-time data, process tracing, non-compensatory heuristic
models of investment choice, and linear models that attempt prediction of consumer’s
choice of investment products actually offered to them by banks. Finally, Sect. 5
concludes with a discussion and interpretation of the empirical results.
2 Methods
The research project was developed in three phases. We first collected interviews
from 20 professional financial advisors and then from 80 customers of an Italian
mutual bank. The interviews focused on interactions between advisors and their
206 M. Monti et al.
123

clients with active investment accounts. An important focus was the investors’
experiences communicating with advisors about risk, and the information they
valued (or not) when allocating investment funds to different investment products.
Fifteen customers from the sample were also invited to participate in four
investment choice tasks. The same tasks were then presented to undergraduate
students. We analyze this experimental data at the aggregate level comparing the
two subjects’ samples and then investigate within-subject treatment effects across
the four investment tasks. The four investment tasks systematically modify and test
one real-world aspect of advisor-client communication.
2.1 Participants
Subjects were customers of an Italian mutual bank and students attending the
courses of an undergraduate program in Business Administration at the University
of Torino, Cuneo campus. Fifteen bank customers and 56 undergraduate students
participated in a sequence of four experimental computer-interactive tasks,
implemented using an original computer interface.
A mutual bank is a nonprofit financial institution whose aim is to support the
economic well-being of the people living in a specific region. We selected this type of
bank because its financial advisors do not earn commissions and face little or no pressure
to sell investment products. Given that their incentives are likely much more closely
aligned with investors’ interests than those in other institutional arrangements, the
mutual bank offers what is perhaps the most conducive environment one might hope for
in terms of clear and effective communication between financial advisors and their
clients. This environment, we hope, provides a best-case scenario for learning about the
information consumers want and use, and which elements of financial communication
work and do not work from the consumer perspective, without the confounding
influence of possibly adversarial incentives.
Customers were randomly selected from the bank database, which contains all
active customers. When randomly drawing customer/subjects, we imposed a
minimum deposit threshold of 40,000 Euros to help ensure that investment decisions
we observed were relatively high stakes.
Students were mainly in the second year (94.6 %, 3 subjects were at the third
year) of their program and all regularly attended obligatory lectures, in particular
‘‘Finance for business management’’ and ‘‘Macroeconomics,’’ where they received
basic training in concepts such as bonds, stocks, and investment funds and on how
to compute their return rates. Students were, at the time of experiment (in May
2010; average age: 21.1), inexperienced in investments, having never made
investment choices (100 %) but experienced in using a bank current account for
managing their liquidity (100 %). Finally, 34 of the participating students were male
(61 %) and 22 female (39 %).
2.2 Design overview
We designed four hypothetical investment tasks to keep track of financial
consumers’ information search and actual decision making in the field. The bank
How do common investors behave? 207
123
customers did not receive rewards for completing the task, while the undergraduate
students did. We discuss the rationale for this approach below.
To make the tasks as close to a real investment environment as possible, the
information setup of the investment tasks relied partially on the investment features
that financial advisors commonly present to their customers, as pointed out during
the interviews we conducted. We used information collected from the financial
advisors to calibrate investment features presented in the experiments that
realistically match the features of investment options commonly presented to
customers.
We investigated subjects’ decision strategies according to three main character-
istics: (1) the amount of information subjects use when making financial decisions,
(2) the type of information (features or cues) they consider before choosing their
investments, and (3) the decision process they follow when making decisions.
Computer-administered investment tasks were carried out with bank customers at
different bank branches in and around Trento, Italy. An experimenter read the
instructions to each participant out loud. Each session was run with a single bank
customer. The average session lasted 60 min for the experimental tasks and 15 min
for a post-experiment interview. Investors participated voluntarily in the experi-
ments and were not remunerated. Most subjects showed great enthusiasm and gave
statements indicating that they viewed their participation as a contribution
improving the quality of service at their mutual bank.
Investment tasks were conducted on a touch-screen-based interface programmed
in Java. We designed this computer interface specifically to facilitate interaction of
a wide range of consumers with different demographic characteristics. In particular,
we wanted an experimental interface with large, easy-to-read, icons that would work
well for older investors. Each subject was placed in front of the touch-screen and
trained extensively in a one-on-one teaching format on how to operate the computer
and the details of all tasks. All experimental decisions were recorded automatically
by a PC running a Java Virtual Machine, and interviews were recorded as digital
audio files that were later transcribed.
Each experiment was composed of four different tasks. In Task 1, subjects were
asked to choose between two investments based on risk, the availability of a fixed
return rate, investment time horizons, management fees, liquidity, and costs for their
redemption. In Task 2, the number of investments was expanded to six, and we
observed the information subjects chose to look up, their sequence of information
search, and their most preferred investment choice. In Task 3, instead of choosing
from a stated menu of investment choices, subjects were asked to design their
preferred investment portfolio based on investment labels indicating general
categories of asset classes (e.g., equity, treasury bills, other fixed income, real
estate). Labels such as ‘‘treasury bills’’ are typically used by investment advisors as
benchmarks when discussing risk, serving as the closest real-world analog to the
risk-free returns that appear in many theoretical models of portfolio choice such as
CAPM. We used these labels to better understand their effects, given that they are
commonly used by investment advisors in consultations with bank customers. In
Task 4, individuals were asked to repeat the asset allocation decision from Task 3,
this time using only individual investment features but no labels for asset categories.
208 M. Monti et al.
123

This design allows for within-person analysis of the effect of labels on portfolio
choice. In all experiments, we randomized the order in which investment features
were presented. The goal was to avoid influencing information search by presenting
information in a fixed order.
For conducting the experiment with university students, we implemented the
interface outlined above in z-Tree (Fischbacher 2007) and ran the experiment
simultaneously in two rooms of a computer lab of the University of Torino, Italy,
controlling for a complete absence of communication between subjects.
All the investment features we presented to our subjects, both bank customers
and university students, were according to six ‘‘investment models’’ we observed in
the field. These were chosen based on different data collected about representative
menus facing bank customers at the banks we studied. All six investment
alternatives are those that are typically available in banks: bank accounts, bonds
issued by the bank, bonds issued by the government (i.e., the Italian equivalent of
US treasury bills), insurance products, balanced mutual funds (with a roughly 50–50
portfolio in corporate bonds and blue chip stock equities), and stocks (a value-
weighted index of Italy’s largest 40 publically traded companies trading in markets
with euro-dominated shares). According to the actual characteristics of those
investments we assigned values to the features of our ‘‘investment models’’ (e.g.,
stocks have a high risk value, governments bonds have low risk, etc.; see Fig. 3 for
full details). Throughout the experiment, we presented combinations of these
features.
The following four sub-sections describe each task presented to bank customers,
and last one presents the modifications we implemented to the experimental design
in order to obtain comparable results with undergraduate students, that is, the
incentive mechanism we adopted.
2.3 Task 1: Binary investment choice
When asked to choose between two investments, subjects were invited to search for
information presented in a 2 9 6 matrix. Each of the two rows represented one of
the two investment alternatives. Each of the six columns contained information
about one of the following investment features—risk, time horizon, management
costs (intermediary fees), liquidity, costs for redeeming the invested capital before
the investment natural end, and coupon rate (Fig. 1). The investment features, about
which each column provided information, were labeled, but the information in those
information matrix cells was hidden, allowing us to measure which information
cells were ‘‘looked up’’ by subjects and in which order.2 Bank customers did not
face monetary costs of information. The experimental design does, however, impose
a limit of six as the maximum number of investment features that can be looked up
(out of 12 that could be looked up in the absence of any limit) to generate
2 These terms are translations of the Italian terms used by the banks’ financial advisors. Their imprecision
would likely make any student of financial economics blush or, better still, demand more specificity.
What, for example, does ‘‘risk’’ mean? Nevertheless, our goal was to calibrate all experimental details to
the actual investment environment faced by the consumers who served as subjects. Thus, the terms are
regrettably vague: rischio, durata, costo, liquidabilita, spese di uscita and interessi.
How do common investors behave? 209
123

meaningful opportunity costs associated with each investment feature that is looked
up.3
Each task began by presenting a black matrix on the screen, initially hiding all
information about investment features. Each subject was asked to explore those
features that they considered helpful for identifying their preferred investment.
Figure 1 shows a typical screen for Task 1 after six pieces of information about four
investment features have been looked up. A decision is about to be made.
2.4 Task 2: Extended information search
Task 2 forces the same subjects to confront an investment environment with a larger
choice set and considerably more information that could be looked up. The
investor’s choice set now contains all six alternatives.
Figure 2 depicts this larger information field, consisting of six investment
alternatives. The order in which investment features were presented to subjects was
randomized in each trial. Therefore, the order of the columns of Fig. 2 differed for
each subject.
The screenshot in Fig. 2 shows a subject who has already looked up 14 out of the
36 available pieces of information. Subjects were asked to look up only the
information they considered necessary for choosing their most preferred investment
portfolio. Once again, the task began by presenting an information matrix in which
all investment features were initially blacked out. No restrictions on the number of
investment features that could be looked up were imposed.
Fig. 1 Task 1, choosing between two investments
3 The maximum number of six investment features that can be looked up actually comes from
information collected from investment advisors. They told us that, due to time constraints and limitations
of customers’ understanding of and capacity to absorb investment information, they commonly consider
the upper limit to be six pieces of information.
210 M. Monti et al.
123

2.5 Task 3: Portfolio choice with asset class labels
Unlike Tasks 1 and 2, subjects in Task 3 were provided with the full information
matrix revealing all investment features from the beginning. Their task was to
choose an investment portfolio by writing down portfolio weights (i.e., a list of six
numbers summing to 100 that represent the percentages of the investor’s wealth
allocated to the six investment categories in the rows of Fig. 2).
Figure 3 illustrates the screen that elicits subjects’ portfolio weights. The first
column contains the name (i.e., label) of each investment. The white boxes show the
investment features. The last column contains the investors’ portfolio weights
(sometimes referred to as allocation decisions). Buttons on the boxes where subjects
entered portfolio weights adjusted in 5 percentage-point increments. The heading of
the last column dynamically displays the percentages of investor wealth allocated to
each row, which corresponds to an investment or investment class serving as one
element in the investor’s portfolio. The screen shot shown in Fig. 3 depicts an
investor’s portfolio choice in mid process. Only 70 % of the investor’s wealth has
been allocated so far. The investor then continues adjusting the portfolio weights
until a full 100 % has been allocated across the six rows show in the final column.
2.6 Task 4: Zero information portfolio choice
Task 4 was identical to Task 3 except for the first column. The first column
displayed asset class labels in Task 3. In Task 4, those labels are hidden, as shown in
Fig. 4. No other changes were introduced apart from a random reshuffle in columns
Fig. 2 Task 2, extended information search
How do common investors behave? 211
123

to re-order investment features. Investors were asked to state their decision
processes aloud while the experimenter kept a written protocol; we digitally
recorded the descriptions subjects reported while performing the tasks and then
summarized them into summary schemes.
2.7 Changes in experimental design introduced for university students
As mentioned before, the sample of bank customers received no monetary
incentives in the experiment, the hypothetical investment choice being a familiar
one to them. For the sample of university students that approach could not be
followed for obvious reasons: lacking experience in the field, they were absolutely
unfamiliar with making investment choices.
Fig. 3 Task 3, investment portfolio selection
Fig. 4 Task 4, ‘‘Blind’’ portfolio choice
212 M. Monti et al.
123

Thus we introduced an incentive mechanism by modeling a financial market
where the different kinds of investments generated different returns relying on
stochastic procedures. The details of the modeling of the considered financial
investments are presented in the appendix to this paper, but here it is worth stressing
its underlying principles.
In addition to the features of each investment choice explained above, three
important features of financial investments needed to be modeled: how investment
features translate into monetary earnings, the uncertainty of future events, and the
cost of information search.
Taking this into consideration, the rationale of the design is to replicate actual
financial investments, and thus different parameters for costs, coupon, etc. are
introduced. These parameters are used to compute a payoff function for each
investment chosen by subjects. However, with investment choices being subject to
uncertainty, two stochastic processes are modeled in the payoff function in order to
capture the ‘‘risk’’ and ‘‘time horizon’’ features of investments.
In summary, our undergraduate students knew that the investments they were
going to choose led to realistic outcomes subject to uncertain future events. We did
not provide the full description of the payoff function we implemented as explained
in the Appendix, but we explained the meaning of all investment features and their
possible consequences on the payoff.
Finally, taking into consideration the analytic focus on information search (which
is investigated in Task 1 and 2), we introduced a cost for information exploration of
6 ECUs (i.e., experimental currency unit) for each piece of uncovered information
in Task 1 and of 2 ECUs for each piece of information uncovered in Task 2. In order
to avoid confusion about the cost of unveiling information in the two tasks, such
information was clearly written in the interface of each task.
The differences in cost between Task 1 and Task 2 were made because of the
different availability of pieces of information and of investments on offer. In Task 1
there are only two possible investments and 12 unrevealed features, while in Task 2
these numbers are three times larger; thus we chose to make exploration cost three
times less expensive.
Moreover, the exchange rate between ECU and euro was communicated to
subjects at the beginning of the experiment and it was set at 1 ECU = 1 Euro cent.
At the end of the short experiment (it lasted about 20 min, including the time for
payment), besides paying to subjects a show-up fee of 5 Euros each, the monetary
earnings of subjects (i.e., the number of ECUs gained in the experiment and
converted at the fixed and known exchange rate) were rounded and subjects
received on average 4.50 Euros, with a minimum of 3 and a maximum of 6.5 Euros.
The total payoff obtained by students on the basis of their choices was presented at
the end of the experiment.
Furthermore, having divided the students’ sample into two separate rooms, we
took advantage of the possibility to control for the existence of possible sequence
effects between Tasks 3 and 4. Thus, half of the students took the experiment in the
order Task 1, 2, 3, and 4, and half in the order Task 1, 2, 4 and 3. The results
presented in this paper for this sample thus randomize the sequence of the two last
How do common investors behave? 213
123
tasks. Moreover, as for the bank customers, we randomized the order of investment
features (i.e., liquidity, cost, coupon, etc.) that students faced.
Finally, while the sample of bank customers was smaller (15 subjects) and Task 1
was repeated on average 4 times by each subject, the sample of students was larger
(56 subjects) and Task 1 was repeated three times by each. The remaining tasks (2, 3
and 4) were performed only once by both bank customers and university students.
3 Results on information search
The results are presented in two sections, one concerning the descriptive analysis of
subjects’ information search behavior and the other concerning the modeling of
decision strategies.
In examining the approach followed by investors in searching for financial
information, we first considered how much information an investor needed in order to
arrive at an investment decision. We investigated the information search processes
occurring in both Task 1 (pair-wise investments comparison) and Task 2 (extended
information search with an expanded choice set and list of investment features).
In Task 1, 86 % of customers looked at all six pieces of information. In Task 2,
customers considered, on average, less than half of the available information
(45 %), revealing a preference for partial rather than full information to act upon.
This preference was confirmed by students: in Task 1, 26 % of university students
explored 6 or more pieces of information (the mean of explored cues is 4.1, that is to
say the 34.5 % of available information), and in Task 2, they explored on average
12.8 cues, that is to say the 35.6 % of available information.
3.1 Quantity of look-ups and types of information searched
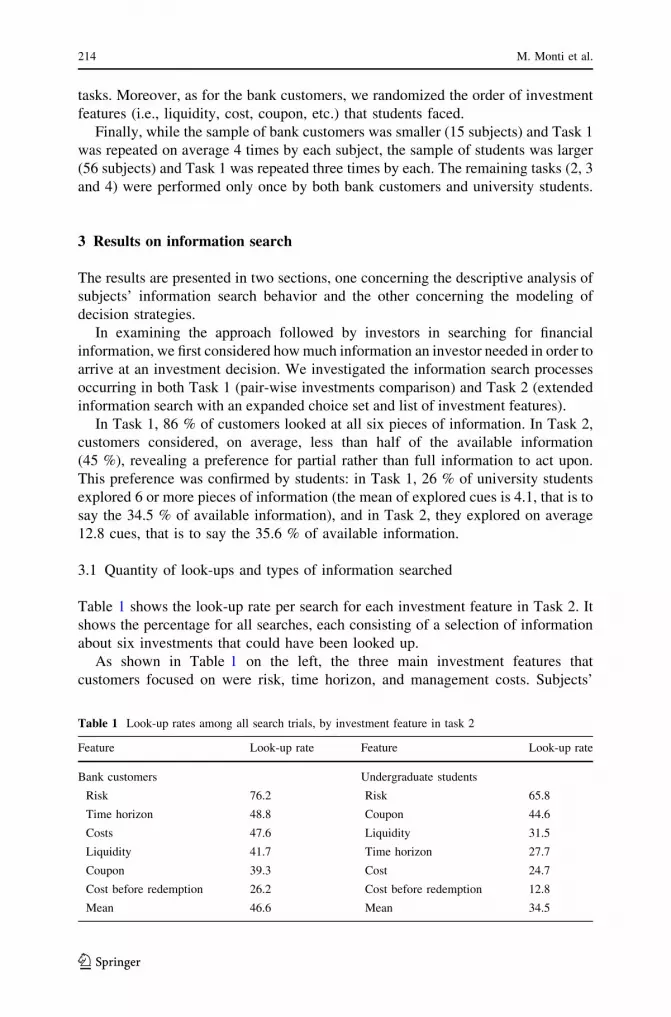
Table 1 shows the look-up rate per search for each investment feature in Task 2. It
shows the percentage for all searches, each consisting of a selection of information
about six investments that could have been looked up.
As shown in Table 1 on the left, the three main investment features that
customers focused on were risk, time horizon, and management costs. Subjects’
Table 1 Look-up rates among all search trials, by investment feature in task 2
Feature Look-up rate Feature Look-up rate
Bank customers Undergraduate students
Risk 76.2 Risk 65.8
Time horizon 48.8 Coupon 44.6
Costs 47.6 Liquidity 31.5
Liquidity 41.7 Time horizon 27.7
Coupon 39.3 Cost 24.7
Cost before redemption 26.2 Cost before redemption 12.8
Mean 46.6 Mean 34.5
214 M. Monti et al.
123

demand for information about the risk feature dominated all other investment
features by a sizable margin. In 65 trials, subjects looked up information about risk
on more than 75 % of searches, whereas the look-up rate for all other investment
features was less than 50 %.
Student data largely confirm that for the bank customers. In fact students focused
significantly more on the risk feature. The only difference emerging in comparison
with customers is the attention to the coupon feature. Students seemed to be more
interested in the availability of a predetermined and guaranteed gain. Such a
peculiarity is confirmed by the analyses we present throughout this paper but for
now it is important to underline that is the only relevant difference we found in the
two samples, and that the experiment as a whole confirms that information about
risk is searched for in more than 50 % of the cases, while other information features
are investigated much less frequently.
3.2 Temporal analysis of information search
In Task 1, bank customers sequentially searched for at most 6 different pieces of
information while students could search the information space as much as they
liked. Table 2 presents the empirical distribution of information look-ups at each of
the first search steps, denoted as t1, …, t8. This sequential analysis yields results
consistent with Table 1 while providing more details about the sequence of search.
Risk, time horizon, and management costs tended to be looked up first in the sample
of bank customers. Similarly, and consistent with what has been presented before,
students look up risk, coupon, and management costs first.
Table 2 Percentage of total look-ups (highest in bold) allocated to various investment features in task 1
Feature Time t1 t2 t3 t4 t5 t6
Bank customers
Risk 89.2 41.5 1.5 24.6 3.1 3.1
Time horizon 6.2 40.0 26.2 12.3 6.2 6.2
Cost 0.0 4.6 35.4 13.8 23.1 20.0
Liquidity 0.0 6.2 12.3 29.2 21.5 16.9
Cost before redemption 1.5 3.1 7.7 10.8 32.3 16.9
Coupon 3.1 4.6 16.9 9.2 10.8 30.8
Feature Time t1 t2 t3 t4 t5 t6 t7 t8
Undergraduate students
Risk 50.3 39.2 27.1 21.6 18.0 15.9 5.0 0.0
Coupon 14.4 15.0 27.1 36.3 24.6 25.0 15.0 9.1
Cost 7.2 9.8 11.3 8.8 23.0 25.0 15.0 9.1
Time horizon 10.8 13.7 14.3 15.7 6.6 11.4 30.0 36.4
Cost before redemption 3.6 5.2 6.8 2.9 9.8 6.8 20.0 18.2
Liquidity 13.8 17.0 13.5 14.7 18.0 15.9 15.0 27.3
How do common investors behave? 215
123

To make Table 2 clearer, it reveals that at the first opportunity to look up an
investment feature (t1), bank customers looked up risk in 89.2 % of all trials. At t2,
risk was looked up in 41.5 % of all cases, and time horizon 40 %. At t3, cost was
looked up in 35.4 % of all cases and time horizon 26.2 %. These per-period
empirical distributions of information search reveal that, at t1 and t2, risk and time
horizon are the most frequently looked up investment features by customers. From
t4 onwards, the empirical distribution of look-ups is more evenly distributed over
features. It is especially interesting that a predetermined regular gain (i.e., coupon),
rather than appearing as the highest priority investment feature for experienced bank
customers, is the most frequently looked up feature only in the very last time period,
while university students look it up just after risk.
Table 3 presents an estimated Markov transition matrix comprised of the
empirical probabilities of moving from one investment feature to another in the
bank customers’ six-step information search process and in the students’
unbounded but expensive information search process. For bank customers at the
beginning (start position), the feature most likely to be looked up first is risk
(89 % of all first lookups). The feature most frequently looked up following risk
is either time horizon (35 % of look-ups following risk) or risk once again (23 %
of look-ups following risk). The most frequent look-up after time horizon is
either cost (46 % of look-ups after time horizon) or time horizon once more
(16 %).
For students, we observe that risk is the first to be looked up (50 % of all first
look-ups at the beginning), followed by cost, coupon, time horizon, and liquidity.
Again, what seems to be relevantly different is the focus on coupon, which,
however, in the transition matrix appears to happen with highest probability after
the exploration of costs.
3.3 Process tracing of information search
Following the approach to describing patterns in information search proposed by
Payne et al. (2004), we looked at two types of search paths: feature-wise and
investment-wise. A feature-wise path corresponds to an investor focusing on just
one feature and looking up that same feature across investments. An investment-
wise path corresponds to an investor looking up features belonging to just one
investment at a time.
For the 14 bank customers, data collected in Task 2 show that 8 of them (57 %)
adopted an investment-wise approach calculated according to Payne’s measure.
Subjects tended to focus their attention on information pertaining to a single
investment at a time. The simultaneous protocol analysis revealed that most
customers began searching for information about the investments they already
owned in real life (e.g., government bonds [treasury bills] for subject 9, mutual
bank bonds for subject 7, etc.). The other customers searched the available
information by adopting mixed strategies: Some of them searched exhaustively for
information dealing with risk by adopting a cue-wise approach, while others
gathered information across all investments without revealing a predominant
approach.
216 M. Monti et al.
123

Ta
ble
3T
ran
siti
on
pro
bab
ilit
ies
(hig
hes
tin
bo
ld)
bet
wee
nin
ves
tmen
tfe
atu
res
inin
div
idu
alin
form
atio
nse
arch
inta
sk1
Tra
nsi
tio
np
rob
abil
itie
s
fro
mfe
atu
reto
feat
ure
Sta
rtR
isk
Tim
eh
ori
zon
Cost
Liq
uid
ity
Cost
bef
ore
redem
pti
on
Co
up
on
En
d
Ban
kcu
sto
mer
s
Sta
rt0
89
60
02
30
Ris
k0
23
35
11
14
41
12
Tim
eh
ori
zon
01
41
64
66
10
26
Cost
05
51
43
31
11
02
2
Liq
uid
ity
05
77
11
32
16
21
Cost
bef
ore
redem
pti
on
06
61
14
17
30
26
Cou
po
n0
12
48
16
61
04
3
En
d0
00
00
00
0
Tra
nsi
tio
np
rob
abil
itie
s
fro
mfe
atu
reto
feat
ure
Sta
rtR
isk
Cost
Cou
po
nT
ime
ho
rizo
nL
iqu
idit
yC
ost
bef
ore
red
empti
on
En
d
Un
der
gra
du
ate
stud
ents
Sta
rt0
50
14
11
14
74
1
Ris
k0
32
20
81
36
61
6
Cost
01
42
77
10
74
30
Cou
po
n0
15
16
28
61
42
18
Tim
eh
ori
zon
01
69
92
01
03
32
Liq
uid
ity
01
21
11
11
22
22
30
Cost
bef
ore
redem
pti
on
21
21
62
71
22
62
3
En
d0
00
00
00
0
How do common investors behave? 217
123

3.4 Overlapping information index and order preservation index
We investigated subjects’ information search to answer the following questions:
Did customers look at identical information for both investments? And did they
search for investment features by following a stable ordering of investment
features?
We adopted a within-subject approach by introducing two indices characterizing
customers’ information search. We noticed that in our experiments, customers did
not necessarily collect overlapping information on different investments before
making choices. In other words, when considering investments A and B (Task 1),
customers did not check the same features for A and B respectively before choosing.
Such measures of systematic search, as the two indices we introduced, are not
commonly mentioned in the experimental psychology literature, although they are
certainly relevant for describing information usage and decision processes which
provide an indication of whether neoclassical or heuristic models better describe
how customers choose investments.
The two specific measures used here for each participant are: The Overlapping
Information Index (OII) and the Order Preservation Index (OPI). We defined the
OII as the percentage of identical features looked up for both investments across
customers. OPI indicates the percentage of overlapping features searched in
identical order. Let us look at two examples. Suppose that a subject explores
features of different investment options in the following order: risk, liquidity,
then cost, for investment 1, and cost, risk, then liquidity, for investment 2. As an
alternative example, another subject might search in the following order: risk,
cost, and liquidity for investment 1, and risk, liquidity, and cost, for investment
2. In both examples the OII is 100 %, since three out of the three features are
looked up for both investments, and for both examples the OPI is 66.6 %,
because two out of the three overlapping features are looked up in the same
order.
Following from above, we classified customers according to OII. We chose a
threshold of 50 % to split the sample into low- and high-OII groups:
• High Overlapping Information Index Group (HOI); customers show an OII
greater or equal to 50 %;
• Low Overlapping Information Index Group (LOI); customers show an OII lower
than 50 %.
OPI and OII are highly correlated, which means that customers belonging to the
HOI group preserve their search order across different searches and focus their
attention on a smaller set of financial features (the correlation coefficient between
OPI and OII is 0.98 in both subjects’ samples). This fact suggests that the selection
of the considered information set is strongly linked to individual search processes
and with the investment representation space and, thus, with the decision
mechanism. By looking at individual values, the aggregate values of which are
presented in Table 4, we deduce that a part of our sample looked for coincident
information for both investments and followed the same sequential order across
cues.
218 M. Monti et al.
123

4 Results on decision strategies
4.1 Heuristic model
This section is devoted to the description of a simple heuristic that describes quite
well how bank customers and university students made their decisions. Let us begin
by establishing certain notations and introducing some important concepts. We
define the cue profile of an investment as a binary vector of 1 s and 0 s according to
whether cue values are ‘‘positive’’ or not, ordered according to the sequence: risk,
time horizon, liquidity, costs (intermediary fees), costs for redeeming the invested
capital before the investment natural end, and coupon. Based on the model of take-
the-best (Gigerenzer and Goldstein 1996), investment features are all transformed to
binary values to simplify their comparison. The convention for assigning the values
1 or 0 to a cue reflects the preferences revealed by customers in their interviews. If
for instance, risk is medium or low, it is assigned the value 1, and 0 otherwise (i.e.,
when risk is unveiled or when its value is high). Similarly, if time horizon is
medium or short, its value is 1, and if cost and liquidity are medium or low, they are
also assigned the value 1. If the investment has no cost before redemption this cue is
assigned a 1, otherwise 0, and if there are ‘‘returns during the holding time’’ then
this cue is assigned a 1, otherwise 0.
Based on interviews with financial advisors combined with experimental data on
customers’ information search, we identified a heuristic that is a hybrid between
lexicographic and tallying rules. This hybrid heuristic first examines the one cue that
was searched most, namely risk, which lexicographically over-rules all other
investment features. For a pair of investments considered to have similar risk, the
heuristic ranks the investments by means of a tallying rule depicted in Fig. 5.
Tallying is a heuristic that can be described by a linear model with weights equal
to one for each investment feature. In this context, tallying means counting the
number of 1’s for both investments and choosing the investment with a higher score.
For instance, if Investment A has a cue profile, (011111) and B has a cue profile
(100000), then B is preferred because the first cue is treated lexicographically. As an
example, if A is an investment with a cue profile (100101) and B is an investment
Table 4 Overlapping information index and order preservation index calculated in task 1
Group Percentage Overlapping information
index (in %)
Mean number of cue
look-ups
Order preservation
index (in %)
Bank customers
HOI group mean 53 74.7 3.7 71.8
LOI group mean 47 28.1 5.0 19.2
Sample mean 53.0 4.3 47.3
Undergraduate students
HOI group mean 52 76.0 5.1 72.5
LOI group mean 48 17.1 3.2 16.9
Sample mean 47.6 4.1 45.7
How do common investors behave? 219
123
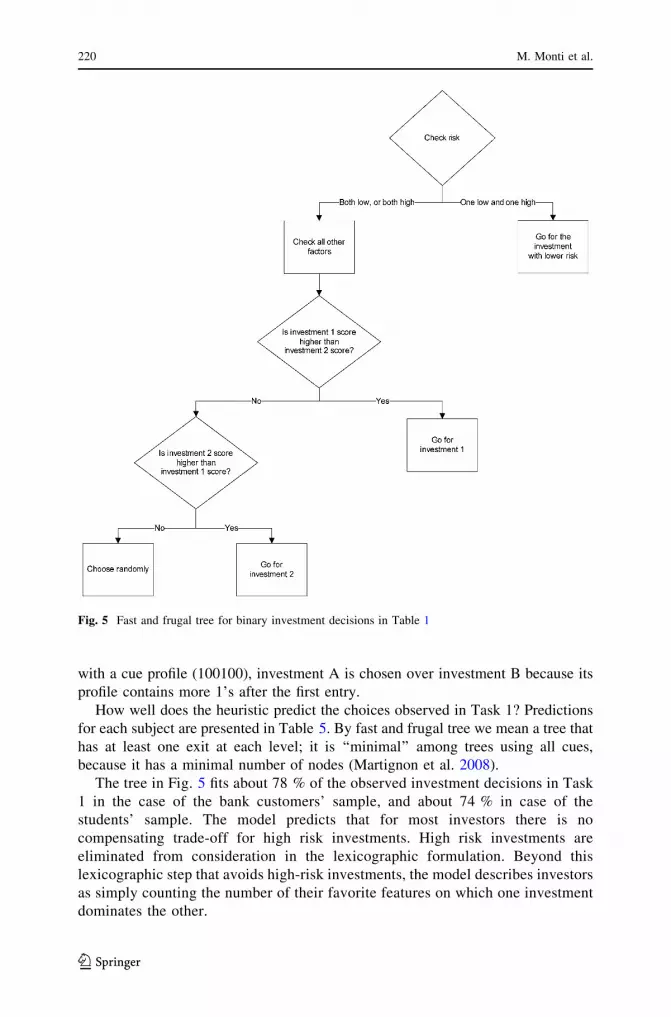
with a cue profile (100100), investment A is chosen over investment B because its
profile contains more 1’s after the first entry.
How well does the heuristic predict the choices observed in Task 1? Predictions
for each subject are presented in Table 5. By fast and frugal tree we mean a tree that
has at least one exit at each level; it is ‘‘minimal’’ among trees using all cues,
because it has a minimal number of nodes (Martignon et al. 2008).
The tree in Fig. 5 fits about 78 % of the observed investment decisions in Task
1 in the case of the bank customers’ sample, and about 74 % in case of the
students’ sample. The model predicts that for most investors there is no
compensating trade-off for high risk investments. High risk investments are
eliminated from consideration in the lexicographic formulation. Beyond this
lexicographic step that avoids high-risk investments, the model describes investors
as simply counting the number of their favorite features on which one investment
dominates the other.
Fig. 5 Fast and frugal tree for binary investment decisions in Table 1
220 M. Monti et al.
123

4.2 Logit model
In order to evaluate the heuristic model described above it is possible to refer to two
different approaches. The first one is to compare it to models that have a strong
theoretical support, in particular those based upon what is usually labeled ‘‘rational
choice’’. The second approach is to compare its predictive power with the one of
econometric models.
Both approaches do not allow to precisely evaluate the analytic power of the
considered model. In other words, often the goodness of a behavioral model can not
be evaluated relying only on its predictive accuracy as its capability to capture the
reasons and conditions for a specific behavior is extremely important too. However,
we leave this latter subtle task to the discussion throughout the paper and to the
readers, while in this section we focus on predictive accuracy.
In particular, passing to the comparison of the predictive accuracy of the heuristic
model with rational choice models, we can not specify rational choice predictions
for the sample of investors: in that case in fact the loose definition of investment
choices and the lack of a specific incentive mechanism do not allow the computation
of expected returns for each investment choice. On the contrary, in the case of
students we can compute expected returns and see how much rational choice
predicts the observed data. The maximization of expected returns leads to a correct
prediction of the 51.8 % of participants’ binary choices, that is a significantly lower
rate than the heuristic model and a value similar, in terms of predictive accuracy, to
a complete random choice (i.e., 50 %).
Among the many econometric techniques, we chose logit regression models as
the most appropriate to study the problem we are considering here. The multinomial
logit model linearly integrates effects of all investment features by taking a
weighted average and then transforming (non-linearly) to estimated probabilities.
We fit the logit model as a representative of standard linear prediction models as a
benchmark against which to compare the fitting accuracy of the heuristic model
(Train 2003).
The logit model is widely known and used in countless applications. It assumes
that individuals can assign random utility scores to different objects according to the
equation ui ¼ vi þ ei, composed of an observable component of utility vi and an
unobservable (random) utility component ei. The assumed decision mechanism is
that the individual chooses the object with the highest utility. Hence, under the
assumption that ei is identically and independently distributed, drawn from the
Table 5 Decision heuristic
predictionsScores (%)
Bank customers
Mean 78.3
SD 21.8
Undergraduate students
Mean 73.8
SD 37.9
How do common investors behave? 221
123
Gumbel distribution, the probability of choosing an object is specified by the
following functional form: pi ¼ exp við Þ.P
j exp vj
� �, where j indexes all the objects
in the choice set (which, in its present application, only includes two objects), and irepresents one object of special interest to the modeler in the choice set. As is
common practice, we also assume that observable utility is the summation of
weighted cue utilities: that is, vi ¼P
k bkxik. The symbol xik represents the kth cue
of object i, and bk is the weight parameter that we external observers seek to
estimate.
We discretized all cue values in order to normalize the utility value of investment
features that were not looked up, even for free, to zero. For example, because the
risk feature takes on three levels (low, medium, high), the utility specification coded
this information as three dichotomous variables are used, rl, rm, and rh. When the
risk feature is not looked up, all these variables take on the value zero. When the
risk feature is looked up and its value is revealed to be low, then the three risk
variables are coded as rl = 1, rm = 0, and rh = 0. Similarly for rm or rh. When risk
information is looked up, only one of the three risk variables turns on to indicate a
value of 1. As a consequence of this flexible coding that allows for any pattern of
marginal utility effects conditional on low, medium, high risk, or no risk
information at all, there are three parameters for risk, brl, brm, and brh.
We chose to infer the model on the bank customers’ dataset and in order to
avoid as much as possible the problem of non-representative sample due to small
sample size, we used a cross validation method. We divided the bank customers’
dataset by randomly drawing a 75 % of the sample into the sub-sample for data
fitting and a 25 % sub-sample for validation. This procedure was repeated 100
times. Each time, the model was estimated on the fitting sample and validated on
the validation sample. After that we also tested the estimated model with students’
data.
Table 6 presents average realized values of the estimated coefficients in the
linear utility model and counts on the number (out of these 100 prediction trials) in
which a particular estimated coefficient was statistically significant. The results
provide some evidence about which kinds of information are more important than
others, at least in linear prediction. In Table 6, the four most robust cues seem to be
high risk, high liquidity, unavailability of cost before redemption, and presence of
regular coupon payments. High risk seems to have the largest magnitude impact on
utility, which is negative. This is also, of course, consistent with the heuristic model
introduced above. The positive sign on the other coefficients suggest that, all else
equal, investments with high liquidity, no cost before redemption, and regular
coupon payments are preferred, but it is important to note also that several
information cues are not relevant for decisions making (i.e., it was impossible to
estimate a significant parameter value).
The average percentage of correct hits for the fitting data on bank customers is
84.5 %; it is 80.4 % for the validation data, which should be compared with the
78.3 % obtained by the heuristic model. This suggests the full linear model could
have over-fitted the data, pointing to another advantage of simpler heuristic models
in out-of-sample prediction that has been commented on extensively elsewhere.
222 M. Monti et al.
123

Such a suggestion is confirmed by applying the estimated model to the students’
sample: the model fits the 76 % of data, a much lower value than the one obtained
with customers’ data which is the one on which the estimation has been done.
Furthermore, the logit model predictions on the students’ sample do not show
statistically significant differences with the ones obtained on this sample by the
heuristic model (74 %).
4.3 Role of recognition in portfolio choice
We now present the role of the investment labels on subjects’ choice of portfolio
weights in order to investigate the eventual role of familiarity. We collected data on
subjects’ performance in reproducing the same investments allocation task they
performed in Task 3 and 4; the only difference introduced in Task 4 is that we did
not provide them with the investment names or labels—just the technical features of
the investments. Therefore, financial consumers were still exposed to the same 6
types of investments they encountered in Task 3; namely, stocks, mutual balanced
funds, government bonds (treasury bills), savings accounts, mutual bank bonds and
insurance with guaranteed capital. The idea was to test how consistent their choices
remained when provided with just the investment features and not with their names.
The first result was that for both bank customers and students the availability of
labels strongly impacted on portfolio allocations. Given that they paid most
attention to risk in the exploration phase, they should have split investments in two
Table 6 Estimation results of
the logit model regressed on
bank customers data
Mean hit rate for fitting: 84.5 %
Mean hit rate in out-of-sample
prediction: 80.4 %
Mean hit rate in the university
students’ sample prediction:
76.2 %
Parameter Number of
significant
in 100 trials
Average coefficient
value in the linear
utility model
brl : low risk 20 1.3
brm: medium risk 8 2.7
brh: high risk 72 -3.3
bds: short time horizon 16 2.7
bdm: medium time horizon 4 2.9
bdl: long time horizon 0 n/a
bcl: low cost 28 1.8
bcm: medium cost 0 n/a
bch: high cost 0 n/a
bll: low liquidity 0 n/a
blm: medium liquidity 0 n/a
blh: high liquidity 100 2.1
bbu: cost before redemption
unavailable
48 1.7
bba: cost before redemption
available
0 n/a
biu: coupon unavailable 4 -2.2
bia: coupon available 54 2.4
How do common investors behave? 223
123

different categories, namely, high-risk investments versus medium- and low-risk
investments, even when investment labels were absent. The empirical evidence shows
us that 9 out of 15 bank customers (60 %) made significant inconsistencies, that is, they
invested in much riskier portfolios than before and with asset allocations that deviated
from the original ones, on average by 69 % (calculated on the amount of the originally
invested money). These results give us a perspective on how people perceive,
represent, and act upon financial information and reveal a delicate aspect for potential
manipulation of decisions through branding, for better or for worse. The inconsistency
may have to do with some customers relying on the recognition heuristic in Task 3,
while this was not possible in Task 4. The results confirm the role of the recognition
heuristic: when it is not applicable, customers perform differently.4
Students’ data confirm such conclusion although they recognized different
investments: the weight on risky assets in this case increases when labels are
provided, as shown by average values in Table 7. Similarly, the average percentage
change in portfolio composition when labels are removed is 30 %, much lower than
the 69 % observed in the bank customers sample. The reason for such differences
across samples and for the different allocation across treatments in both subjects’
samples is due to the familiarity with labels and to the recognition heuristic. In fact
we know that students are only used to bank accounts, exploited for liquidity
management, and presumably know that high gains can be obtained by stocks.
When labels are at disposal, students thus move investments from bank accounts,
which if labeled seem less attractive, to stocks. But students are less familiar with
the proposed investments, and thus the average impact of labels is lower.
5 Discussion
The aim of this research was to investigate how average investors make financial
decisions. We focused on two components of investor behavior: information search
Table 7 Comparison between
portfolio choice across
treatments
Weight on risky
assets chosen with
labels
Weight on risky
assets chosen
without labels
Within-subject
percentage
change
Bank customers
Mean 21.0 27.0 41.4
SD 19.0 21.4
Undergraduate students
Mean 17.6 11.3 35.5
SD 14.3 15.7
4 By recognition heuristic, we mean a simple strategy that allows individuals to infer, for example, which
of two objects has a higher value on some numerical criterion, based on the fact that one is recognized and
the other is not (e.g., predicting which investment has a higher expected return based on whether one
recognizes the name of one of the shares). The recognition heuristic for such tasks is simply stated: If one
of the two objects is recognized and the other is not, then infer that the recognized object has the higher
value (Goldstein and Gigerenzer 2002).
224 M. Monti et al.
123

and decision process. We interviewed 80 customers of an Italian mutual bank, and
we invited 15 of them to participate in an interactive experiment with four
investment tasks. We designed the experimental setup to reflect as realistically as
possible the actual decisions that take place in transactions between financial
advisors and their customers. To a large extent, we succeeded in presenting
information to customers that matched the information they typically encounter
when making real financial decisions. We then applied the same experimental
design to 56 young university students in order to test whether the results we
obtained with bank customers replicate and to start to evaluate the possible role
played by experience in investment choices.
In Task 1, we asked our subjects to choose between two investments while facing
a strict information budget that limited information look-ups. In Task 2, subjects
faced more investment possibilities and information space. We observed in Task 2
that subjects looked up less than half of the available investment features even when
they were free to have more information and could have accessed all of it within a
few additional seconds of search. More than half the bank customers subjects
(57 %) looked up only a small set of non-overlapping features even when they were
free to access the entire information set and it was feasible to do so with very
modest time costs.
Although one of the samples size is small (in part, due to our bank partner’s
indication that our data collection had continued long enough), the rich combination
of qualitative interview data from 80 respondents, information search data, and
investment decision data reveal new empirical insight into information search and
investment decision processes among real investors. Moreover the use of a larger
sample of inexperienced investors further strengthens our results.
The evidence we presented suggests that investors usually consider only a strict
subset of available information about the set of investment alternatives from which
they choose, even when the universe of investments and related information sets is
relatively small and search costs minimal. In this sense, investors appear to follow a
heuristic search intuition that one finds as a key feature in a number of investment
heuristics recently appearing in the behavioral finance literature (DeMiguel et al.
2009; Gigerenzer 2008).
Of particular interest was how infrequently subjects undertook pairwise
comparisons that we commonly assume take place in order to completely rank
one’s choice set (e.g., the expected return of investment A and the expected return
of investment B). Pairwise comparison of product features is the essential
behavioral assumption underlying the rational choice model in economics and the
preponderance of consumer choice models used in marketing research. And yet our
evidence directly contradicts this fundamental assumption about consumers’
decision process. Investors thus neither look at all available information neither
they fully compare the available choices, and that is true for both experienced but
non expert investors such as our bank customers and for completely inexperienced
investors such as our university students.
Relying on the analysis of the behavior we observed, we modeled binary
investment choice with a lexicographic decision tree that predicts 78 % of choices
correctly in the case of bank customers, and 74 % of choices when university
How do common investors behave? 225
123

students are considered. The decision tree orders risk first among various investment
features. That means that risk is more important that all other features combined.
The decision tree model then uses a tallying rule on the remaining investment
features.
Tallying is cognitively less demanding than weighted additive models, because it
depends only on counting up pros and cons rather than computing weighted sums. We
compared the predictive performance of these models against a competing linear model
based on full-information utility maximization. The performance of the regression
model predicts the choice data slightly better than simpler models, with 80 versus 78 %
predictive accuracy when analyzing bank customers data, but it looses its better
accuracy when considering our second sample of university students. Moreover, in
terms of model complexity, it costs many more parameters, which implies a large risk
of overfitting. Finally, the regressed model ignores several information pieces and
gives more weight on the information we selected as more relevant in the heuristic
model. We also tried to compare the predictive accuracy of rational choice models
although our experimental design does not allow an extensive comparison: the poor
results we obtained strengthen our doubts about the possibility to accept rational choice
models as empirically valid in investment decisions.
The second part of our experiment focused on portfolio choice. We discovered in
Task 3 and 4 that when labels are missing, bank customers tend to select a riskier
mix of investments than was selected when investment labels were available. On the
contrary, undergraduate students showed smaller changes in portfolio composition
and towards less risky investments, probably due to their different familiarity with
investment labels. This suggests that seemingly superficial differences in the naming
of two financial products with identical mean and variance could play a significant
role in investment decisions. The recognition heuristic theory suggests how label-
versus no-label tasks generated differences in observed choice behavior, although
the informative role of investment names still needs more attention in future
research as well as the impact of experience in investments does.
Financial products are presented to potential investors in the real world with a
rapidly proliferating array of such labels. The names of things in the real-world
investing environment very likely influence investor behavior, even though it should
not according to standard portfolio choice theory. According to that theory, so long
as the mean and standard deviation of all risky returns (including correlations, and
possibly all higher moments for risk preference specifications more complicated
than mean–variance preferences) are presented to the investor, his or her decisions
should not be influenced by the order of presentation or names and labels applied to
investment features. Behavior should be especially invariant to labeling changes
that do not affect the first and second moments of random returns.
The heuristic model we tested suggests that subjects in our study rely on simple
decision trees in which risk is, by far, the most important investment feature and
non-compensatory. Furthermore, normative assessment of the performance of real
bank customers’ decision processes (relative to the neoclassical benchmark)
indicates heuristic strategies appear to serve investors reasonably well. Whereas the
biases and heuristics literature frequently assigns an automatic negative normative
value to any decision procedure that deviates from the neoclassical ideal, we identify
226 M. Monti et al.
123

attractive normative properties of the heuristic approach (similar to the normative
assessments in Magni 2009). Similar lexicographic decision-tree heuristics such as
Gigerenzer and Goldstein’s (1996) take-the-best heuristic consider the features of
investments sequentially in a ranking determined by some measure of pairwise
correlation or univariate predictive accuracy (rather than considering all their inter-
correlatedness with other regressors in the model as, for example, partial
correlations do). This helps reduce the cognitive processing required to execute
heuristics and can improve robustness and accuracy of predictions (Gigerenzer and
Brighton 2009).
Although it remains an open question as to what extent bank customers are able
to judge the quality of their decisions in terms of outcomes and of processes, we
noticed that our subjects clearly tended to consider specific combinations of
investment features, and use these combinations according to predictable rules, even
though they lacked theories on causal links between features and decision criteria.
This evidence is made sound by its confirmation in the choices of completely
inexperienced investors, although we do not know yet the reasons for such a
pervasive behavior.
The tasks that subjects faced required them to, in some treatments, search freely for
information, unlike most experimental economics tasks of financial decisions in which
subjects are provided with a complete set of summary statistics (namely, expected
values, variances, and covariances), which are required by standard models such as
CAPM. The subjects in this study could decide how much information they wanted to
look at. Most chose to look up some quantity of information less than the maximum of
all that was available. And a significant proportion explored only a very small subset
of overlapping investment features (i.e., looking up the same piece of information
more than once). Subjects exhibited remarkably similar information search behavior
across trials and samples, and their subjective reports about their search behavior
coincided remarkably in that nearly all reported spending very little time in
deliberation (and never calculation) in choosing portfolio weights. Moreover, subjects
indicated that, although they were handling meaningful amounts of money, they
nevertheless made investment decisions with relatively little cognitive effort in both
lab experiments and in actual investment decision making. Information search was
characterized by frugality and simplicity.
Given the crisis we are living through at the time of writing, and the
accumulating evidence of mismatch between models of omniscient investors and
the badly designed institutions that result from those models, we believe that
behavioral research can play an important and positive role in improving risk
communication and deepening the relationship between firms selling investment
advice and their customers. We hope that improvements in descriptive models of
investors’ use of information and decision processes will, in turn, improve both the
investment environment that average financial consumers face and the organization
of financial institutions. Insofar as researchers discover better descriptive informa-
tion about consumers’ information needs and decisions processes, advancement
toward satisfaction with the investment experience and with firms’ and policy
makers’ ability to predict consumer behavior becomes more likely. Far from a zero-
sum game, there appears to be room for substantial improvements, from the vantage
How do common investors behave? 227
123
points of all parties, in the processes by which consumer-level financial transactions
take place.
Acknowledgments We thank John Payne for very helpful comments and Michela Balconi for her ideas
regarding data analysis. We also thank Davide Donati, general director of the Cassa Rurale Giudicarie
Valsabbia Paganella, and all the Board of Executives, for their full support in conducting on-site research
at their banks. We likewise thank Marcel Jentsch for valuable help programming and designing
interactive interfaces. Riccardo Boero acknowledges financial support from Regione Piemonte
[IIINBEMA Research Project].
Appendix A
The experimental design is driven by the principle of preserving the comparability
with results obtained with bank customers creating a realistic investment
environment.
It relies on the computation of payoffs for each choice made by subjects through
the modeling of the outcome of each investment in a virtual financial market with
realistic economic incentives and uncertainty.
Economic earnings are computed using experimental currency units (ECU)
which are then converted in euro according to a fixed conversion rate that is
explained above in the paper. In other words, in the following we talk about
earnings in ECU but they correspond to actual money.
The payoff structure we develop is built as a unique payoff function which works
for every investment because every single different feature of investments is
represented by different parameters in the function. Below each element of the
payoff function is singularly discussed, and finally some examples of the aggregated
payoff function are presented.
The portfolio duration
Due to the aim of modeling the intrinsic uncertainty of investment decisions we rely
on the happening of probabilistic events. In particular after each investment decision
a time of duration of the portfolio (in Task 1 and 2 is the duration of the single
investment that has been chosen because the investment portfolio collapses in the
choice of a single investment) is randomly chosen, with a uniform probability
distribution, among the five possible ones (i.e., immediate, short, medium and long,
and very long that is to say, in numbers, 0, 1, 2, 3, and 4). The reason for considering
the possibility of very short (i.e., ‘‘immediate’’) duration of investment decisions is
to make even short duration investments subjects to some uncertainty as it will be
better detailed below. Thus, the portfolio duration is a discrete random variable as
follows:
PDt ¼ n 2 0; 1; 2; 3; 4f g;
where PDt, the duration of the portfolio choice, is a random variable uniformly draw
from the set of integers ranging from 0 to 4 (i.e., from very short to long).
The portfolio duration can be conceived as the time when the investor is asked to
dismiss her portfolio due to an external shock (e.g., the need for liquidity for
228 M. Monti et al.
123

relocating, for medical care, etc.…). It is an uncertain and random event that every
investor knows to potentially face and that in our design models the uncertain
lasting of investment decisions made by subjects.
A portfolio duration is, during the experiment, randomly drawn for each
investment choice made by each subject: that is to say that it is randomly chosen for
each subject on every repetition of each single task of the experiment and,
obviously, it is not known by subjects before the choice.
The payoff function
The payoff function consider all the six characteristics differentiating investment
decisions and the values each feature can take. In this paragraph we consider each
feature and transform it to an ECUs value. The payoff function will then be just the
sum of the ECUs obtained by each feature.
The characteristics of investment decisions that subjects face in the
different experiment tasks are six and each one has a different set of possible
values, as follows (the possible values of each feature are presented between
brackets):
1. liquidity (easy, difficult);
2. coupon (no, yes);
3. cost before redemption (no, yes);
4. risk (low, medium, high);
5. time horizon (short, medium, long);
6. cost (low, medium, high).
The same list, represented in formal means is as follows (where ‘‘i’’ stands for
each investment):
1. liqi 2 0; 1f g;2. coui 2 0; 1f g;3. cbri 2 0; 1f g;4. riski 2 0; 1; 2f g;5. tihi 2 0; 1; 2f g;6. costi 2 0; 1; 2f g:
Liquidity The lack of liquidity of an investment can be a cost if the investor has to
dismiss the investment before its natural end. Thus, such a cost emerges if and only
if the chosen investment has ‘‘difficult’’ value of liquidity and the portfolio duration
is shorter than the investment time horizon. In mathematical language liquidity
contributes to the payoff with �urgencyti � liqi � kliquidity,
where urgencyit ¼0; when tihi\PDt
1; when tihi�PDt
�, and that is to say that the contribu-
tion of the liquidity feature is a cost (a negative impact of the parameter kliquidity)
that happens only if the liquidity is difficult and the duration of the portfolio (PDt) is
shorter than the time horizon of the investment (tihi).
How do common investors behave? 229
123

Coupon The presence of coupons increases the return of an investment. Obviously
it also depends on the time an investment is kept, and thus the amount of
earnings deriving from coupons depends on the portfolio duration. In a formal way
it is PDt � coui � kcoupon, meaning that coupons (if present) increase the return of
an investment by a constant value (kcoupon) multiplied for the portfolio duration
(PDt).
Cost before redemption The cost before redemption negatively modifies the return
of an investment if and only if that feature characterizes the investment and if the
portfolio duration is shorter than the investment time horizon (i.e., the urgencyti
value computed as above equals 1): �urgencyti � cbri � kcostBeforeRedemption:
Risk Risk is the main component of an investment return. If risk is higher, profits
can be higher but also more uncertain. We combine different risk values
(probabilities) and different returns promised by the investment. We thus extract a
new, continuous and uniform, random variable ‘‘risk probability’’ RPti ¼ n 23¼riski
3; 1þ riski
� �and multiply it for the parameter value krisk.
The mathematical expression of the positive return coming from investments is
thus RPti�krisk which implies, according to riski values, the following maximum,
average and minimum yields (Table 8).
As the table points out, riskier investments on average yield higher profits, but
there is also the chance of gaining much less profits.
Time horizon The time horizon of the investment does not imply a cost per se but
it affects other cost elements (i.e., liquidity and cost before redemption) impacting
on the conditional variable called urgencyti.
Cost The cost for buying an investment can vary and it represents a value
decreasing the payoff of each investment. It is computed as �ðcosti þ 1Þ � kcost, that
is to say that the cost increases proportionally to the value of costi and to the
parameter kcost.
The payoff function Putting together the elements just introduced, the payoff
function of an investment i at time t takes the following form:
pit ¼ RPit � krisk þ PDt � coui � kcoupon � urgencyti � liqi � kliquidity � urgencyti � cbri
� kcostBeforeRedemption � costt þ 1ð Þ � kcost
where PDt ¼ n 2 0; 1; 2; 3; 4f g, urgencyit ¼0;when tihi\PDt
1;when tihi�PDt
�, and
RPti ¼ n 2 3¼riski
3; 1þ riski
� �.
Examples Just as an example to make the payoff computation clearer, it is possible
to specify parameters values and to report some investment profits.
230 M. Monti et al.
123
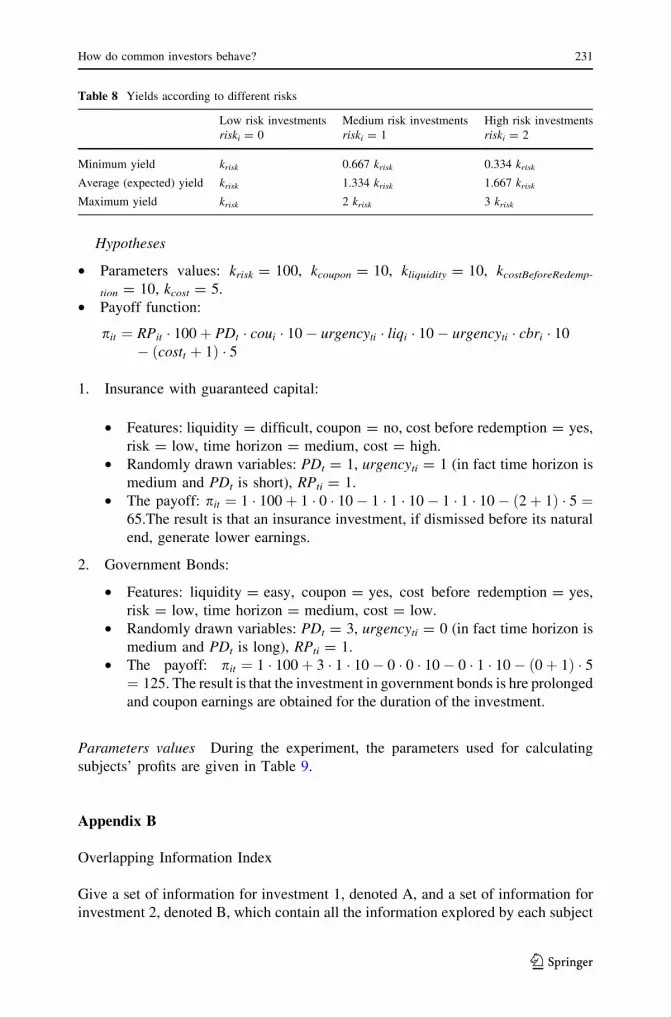
Hypotheses
• Parameters values: krisk = 100, kcoupon = 10, kliquidity = 10, kcostBeforeRedemp-
tion = 10, kcost = 5.
• Payoff function:
pit ¼ RPit � 100þ PDt � coui � 10� urgencyti � liqi � 10� urgencyti � cbri � 10
� costt þ 1ð Þ � 5
1. Insurance with guaranteed capital:
• Features: liquidity = difficult, coupon = no, cost before redemption = yes,
risk = low, time horizon = medium, cost = high.
• Randomly drawn variables: PDt = 1, urgencyti = 1 (in fact time horizon is
medium and PDt is short), RPti = 1.
• The payoff: pit ¼ 1 � 100þ 1 � 0 � 10� 1 � 1 � 10� 1 � 1 � 10� 2þ 1ð Þ � 5 ¼65.The result is that an insurance investment, if dismissed before its natural
end, generate lower earnings.
2. Government Bonds:
• Features: liquidity = easy, coupon = yes, cost before redemption = yes,
risk = low, time horizon = medium, cost = low.
• Randomly drawn variables: PDt = 3, urgencyti = 0 (in fact time horizon is
medium and PDt is long), RPti = 1.
• The payoff: pit ¼ 1 � 100þ 3 � 1 � 10� 0 � 0 � 10� 0 � 1 � 10� 0þ 1ð Þ � 5¼ 125. The result is that the investment in government bonds is hre prolonged
and coupon earnings are obtained for the duration of the investment.
Parameters values During the experiment, the parameters used for calculating
subjects’ profits are given in Table 9.
Appendix B
Overlapping Information Index
Give a set of information for investment 1, denoted A, and a set of information for
investment 2, denoted B, which contain all the information explored by each subject
Table 8 Yields according to different risks
Low risk investments
riski = 0
Medium risk investments
riski = 1
High risk investments
riski = 2
Minimum yield krisk 0.667 krisk 0.334 krisk
Average (expected) yield krisk 1.334 krisk 1.667 krisk
Maximum yield krisk 2 krisk 3 krisk
How do common investors behave? 231
123

for each investment choice, the OII measure of overlapping information (introduced
in the body of this paper) is simply the cardinality of the intersection of these two
sets for each participant:
OII ¼ A \ Bj j ðB:1Þ
Order Preservation Index
The Order Preserving Index takes not of the order in which the elements of the
information sets A and B were generated by subjects’ search behavior. We write the
elements of the set A as a vector that records this sequence: a = [a1, a2, …, an],
where n denotes the number of items searched for or looked up by a particular
subject. The index of subjects’ identities is suppressed here for expositional clarity
in describing the information indexes used in the paper’s section on process tracing.
Thus, ai was looked up before aj if and only if i \ j. Similarly, a vectorized version
of the set B that records the order in which information was looked up is denoted as
b = [b1, b2, …, bn].
The (n ? 1) 9 (m ? 1) matrix referred to as the so-called F matrix (see Payne
et al. 2004) plays a key role in process tracing. The first column and first row of the
matrix F are initialized as 0. In MATLAB command language, this is expressed as
F(1,1:m ? 1) = 0 and F(1:n ? 1,1) = 0.
The rest of the matrix is computed according to a recurrence relation, the
Needleman-Wunsch algorithm. The order of the steps follow from the sequence
given by vectors a and b.
F i; jð Þ ¼ max
F i� 1; j� 1ð Þ þ sðai�1; bj�1ÞFði� 1; jÞFði; j� 1Þ
8<: ðB:2Þ
where
s ai; bj
� �¼ 1; if ai ¼ bj
0; otherwise
�ðB:3Þ
Finally, the OPI is computed as:
OPI ¼ 100Fðnþ 1;mþ 1Þ
maxðn;mÞ
� �� �% ðB:4Þ
Table 9 Parameters used in the
experiment
k parameters are the ones just
described while Exploration costis the cost of unveiling the value
of an investment feature
Parameter Value (in ECU)
Exploration cost 6 in Task 1, 2 in Task 2
krisk 100
kcoupon 5
kliquidity 10
kcostBeforeRedemption 10
kcost 20
232 M. Monti et al.
123
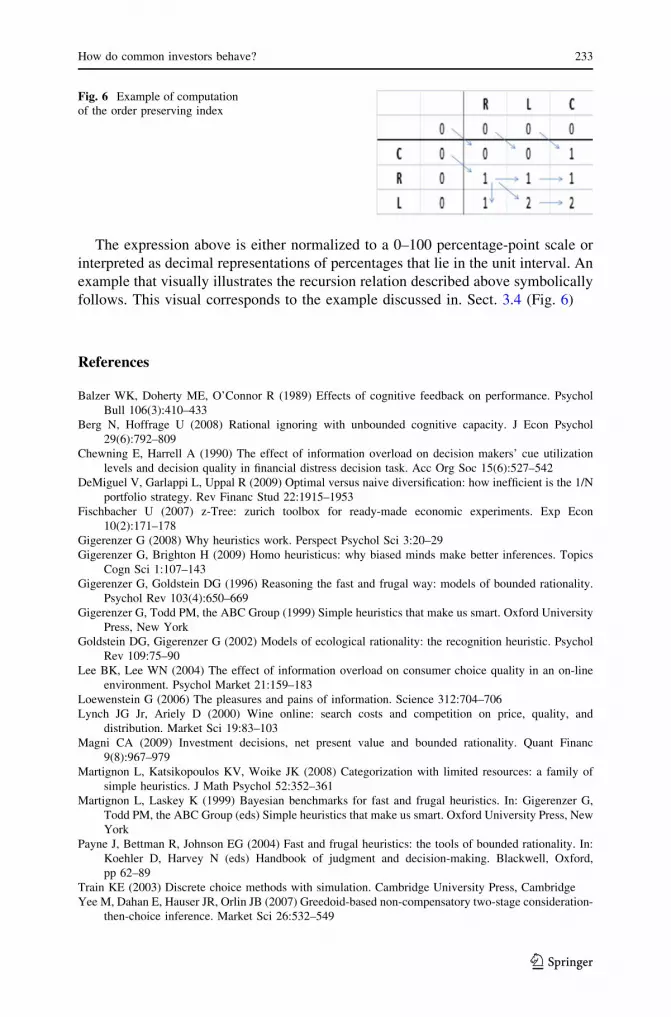
The expression above is either normalized to a 0–100 percentage-point scale or
interpreted as decimal representations of percentages that lie in the unit interval. An
example that visually illustrates the recursion relation described above symbolically
follows. This visual corresponds to the example discussed in. Sect. 3.4 (Fig. 6)
References
Balzer WK, Doherty ME, O’Connor R (1989) Effects of cognitive feedback on performance. Psychol
Bull 106(3):410–433
Berg N, Hoffrage U (2008) Rational ignoring with unbounded cognitive capacity. J Econ Psychol
29(6):792–809
Chewning E, Harrell A (1990) The effect of information overload on decision makers’ cue utilization
levels and decision quality in financial distress decision task. Acc Org Soc 15(6):527–542
DeMiguel V, Garlappi L, Uppal R (2009) Optimal versus naive diversification: how inefficient is the 1/N
portfolio strategy. Rev Financ Stud 22:1915–1953
Fischbacher U (2007) z-Tree: zurich toolbox for ready-made economic experiments. Exp Econ
10(2):171–178
Gigerenzer G (2008) Why heuristics work. Perspect Psychol Sci 3:20–29
Gigerenzer G, Brighton H (2009) Homo heuristicus: why biased minds make better inferences. Topics
Cogn Sci 1:107–143
Gigerenzer G, Goldstein DG (1996) Reasoning the fast and frugal way: models of bounded rationality.
Psychol Rev 103(4):650–669
Gigerenzer G, Todd PM, the ABC Group (1999) Simple heuristics that make us smart. Oxford University
Press, New York
Goldstein DG, Gigerenzer G (2002) Models of ecological rationality: the recognition heuristic. Psychol
Rev 109:75–90
Lee BK, Lee WN (2004) The effect of information overload on consumer choice quality in an on-line
environment. Psychol Market 21:159–183
Loewenstein G (2006) The pleasures and pains of information. Science 312:704–706
Lynch JG Jr, Ariely D (2000) Wine online: search costs and competition on price, quality, and
distribution. Market Sci 19:83–103
Magni CA (2009) Investment decisions, net present value and bounded rationality. Quant Financ
9(8):967–979
Martignon L, Katsikopoulos KV, Woike JK (2008) Categorization with limited resources: a family of
simple heuristics. J Math Psychol 52:352–361
Martignon L, Laskey K (1999) Bayesian benchmarks for fast and frugal heuristics. In: Gigerenzer G,
Todd PM, the ABC Group (eds) Simple heuristics that make us smart. Oxford University Press, New
York
Payne J, Bettman R, Johnson EG (2004) Fast and frugal heuristics: the tools of bounded rationality. In:
Koehler D, Harvey N (eds) Handbook of judgment and decision-making. Blackwell, Oxford,
pp 62–89
Train KE (2003) Discrete choice methods with simulation. Cambridge University Press, Cambridge
Yee M, Dahan E, Hauser JR, Orlin JB (2007) Greedoid-based non-compensatory two-stage consideration-
then-choice inference. Market Sci 26:532–549
Fig. 6 Example of computationof the order preserving index
How do common investors behave? 233
123