form 10-k - investors
TRANSCRIPT
Form 10-K
NRG
Energy, Inc. | 2019 Form 10-K
NRG Energy, Inc.
804 Carnegie Center Princeton, NJ 08540-6213
t: 609.524.4500 f: 609.524.4501
nrg.com
NRG and the plus signs are registered servicemarks of NRG Energy, Inc. NRG is a registered trademark of NRG Energy, Inc. © 2020 NRG Energy, Inc. All rights reserved. 421558534
910 Louisiana St. Houston, TX 77002-6929
t: 713.537.3000
Stockholder information
STOCK TRANSFER AGENT AND REGISTRAR Shareholder correspondence should be mailed to: Computershare P.O. BOX 505000 Louisville, KY 40233-5000
STOCKHOLDER INQUIRIES Overnight correspondence should be sent to: Computershare 462 South 4th Street, Suite 1600 Louisville, KY 40202
1.866.214.2213
Email: [email protected]
Online inquires: https://www-us.computershare.com/investor/Contact
Website: www.computershare.com/investor
Send certificates for transfer and address changes to: Computershare P.O. BOX 505000 Louisville, KY 40233-5000
STOCK LISTING NRG’s common stock is listed on the New York Stock Exchange under the ticker symbol NRG.
FINANCIAL INFORMATION NRG’s Annual Report on Form 10-K, Proxy Statement and other SEC Filings are available at www.nrg.com under the Investors section.
UNITED STATES SECURITIES AND EXCHANGE COMMISSIONWashington, D.C. 20549
Form 10-K☒ ANNUAL REPORT PURSUANT TO SECTION 13 OR 15(d) OF THE SECURITIES EXCHANGE ACT OF 1934
For the Fiscal Year ended December 31, 2019.
☐ TRANSITION REPORT PURSUANT TO SECTION 13 OR 15(d) OF THE SECURITIES EXCHANGE ACT OF 1934For the Transition period from to .
Commission file No. 001-15891
NRG Energy, Inc.(Exact name of registrant as specified in its charter)
Delaware(State or other jurisdiction of incorporation or organization)
41-1724239(I.R.S. Employer Identification No.)
804 Carnegie Center , Princeton , New Jersey(Address of principal executive offices)
08540(Zip Code)
(609) 524-4500(Registrant's telephone number, including area code)
Securities registered pursuant to Section 12(b) of the Act:Title of Each Class Trading Symbol(s) Name of Exchange on Which Registered
Common Stock, par value $0.01 NRG New York Stock Exchange
Securities registered pursuant to Section 12(g) of the Act:None
Indicate by check mark if the registrant is a well-known seasoned issuer, as defined in Rule 405 of the Securities Act. Yes ☒ No ☐
Indicate by check mark if the registrant is not required to file reports pursuant to Section 13 or Section 15(d) of the Exchange Act. Yes ☐ No ☒
Indicate by check mark whether the registrant (1) has filed all reports to be filed by Section 13 or 15(d) of the Securities Exchange Act of 1934 during thepreceding 12 months (or for such shorter period that the registrant was required to file such reports), and (2) has been subject to such filing requirements for thepast 90 days. Yes ☒ No ☐
Indicate by check mark whether the registrant has submitted electronically every Interactive Data File required to be submitted pursuant to Rule 405 ofRegulation S-T (§232.405 of this chapter) during the preceding 12 months (or for such shorter period that the registrant was required to submit suchfiles). Yes ☒ No ☐
Indicate by check mark whether the registrant is a large accelerated filer, an accelerated filer, a non-accelerated filer, a smaller reporting company, or emerginggrowth company. See the definitions of "large accelerated filer," "accelerated filer," "smaller reporting company," and "emerging growth company" in Rule 12b-2of the Exchange Act.
Large Accelerated Filer ☒ Accelerated filer ☐ Non-accelerated filer ☐ Smaller reporting company ☐
Emerging growth company ☐
If an emerging growth company, indicate by check mark if the registrant has elected not to use the extended transition period for complying with anynew or revised financial accounting standards provided pursuant to Section 13(a) of the Exchange Act. ☐
Indicate by check mark whether the registrant is a shell company (as defined in Rule 12b-2 of the Act). Yes ☐ No ☒As of the last business day of the most recently completed second fiscal quarter, the aggregate market value of the common stock of the registrant
held by non-affiliates was approximately $7,893,678,070 based on the closing sale price of $35.12 as reported on the New York Stock Exchange.Indicate the number of shares outstanding of each of the registrant's classes of common stock as of the latest practicable date.
Class Outstanding at February 27, 2020Common Stock, par value $0.01 per share 247,656,747
Documents Incorporated by Reference:Portions of the Registrant's definitive Proxy Statement relating to its 2020 Annual Meeting of Stockholders
are incorporated by reference into Part III of this Annual Report on Form 10-K
1
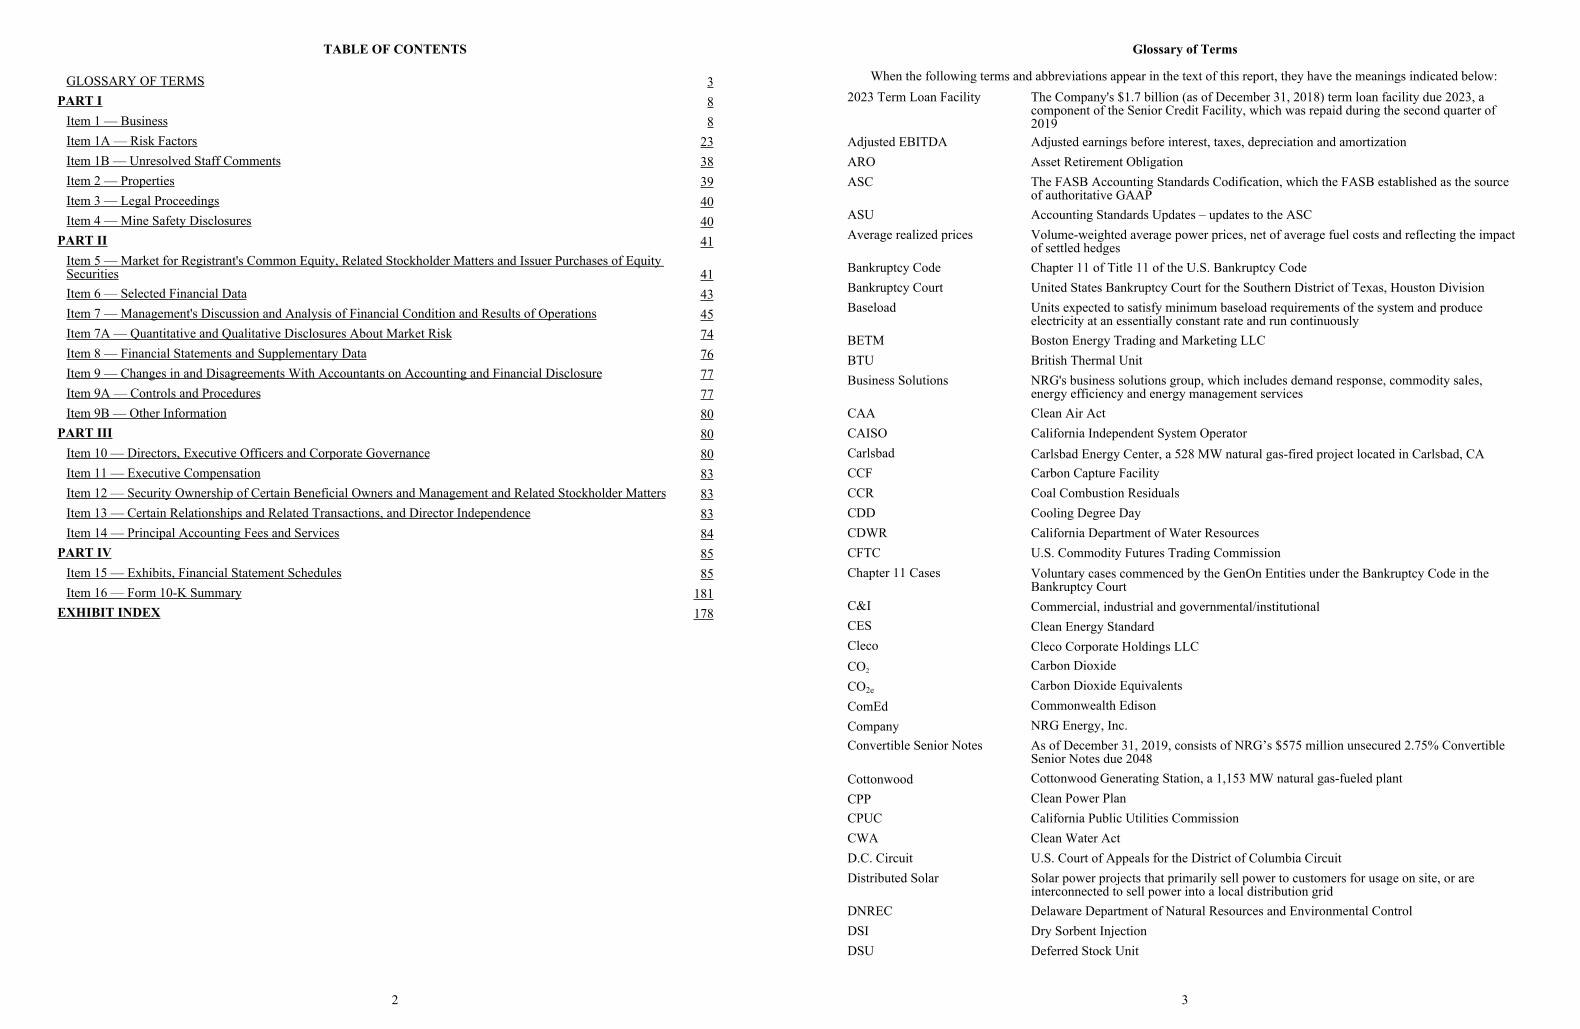
TABLE OF CONTENTS
GLOSSARY OF TERMS 3PART I 8
Item 1 — Business 8Item 1A — Risk Factors 23Item 1B — Unresolved Staff Comments 38Item 2 — Properties 39Item 3 — Legal Proceedings 40Item 4 — Mine Safety Disclosures 40
PART II 41Item 5 — Market for Registrant's Common Equity, Related Stockholder Matters and Issuer Purchases of Equity Securities 41Item 6 — Selected Financial Data 43Item 7 — Management's Discussion and Analysis of Financial Condition and Results of Operations 45Item 7A — Quantitative and Qualitative Disclosures About Market Risk 74Item 8 — Financial Statements and Supplementary Data 76Item 9 — Changes in and Disagreements With Accountants on Accounting and Financial Disclosure 77Item 9A — Controls and Procedures 77Item 9B — Other Information 80
PART III 80Item 10 — Directors, Executive Officers and Corporate Governance 80Item 11 — Executive Compensation 83Item 12 — Security Ownership of Certain Beneficial Owners and Management and Related Stockholder Matters 83Item 13 — Certain Relationships and Related Transactions, and Director Independence 83Item 14 — Principal Accounting Fees and Services 84
PART IV 85Item 15 — Exhibits, Financial Statement Schedules 85Item 16 — Form 10-K Summary 181
EXHIBIT INDEX 178
2
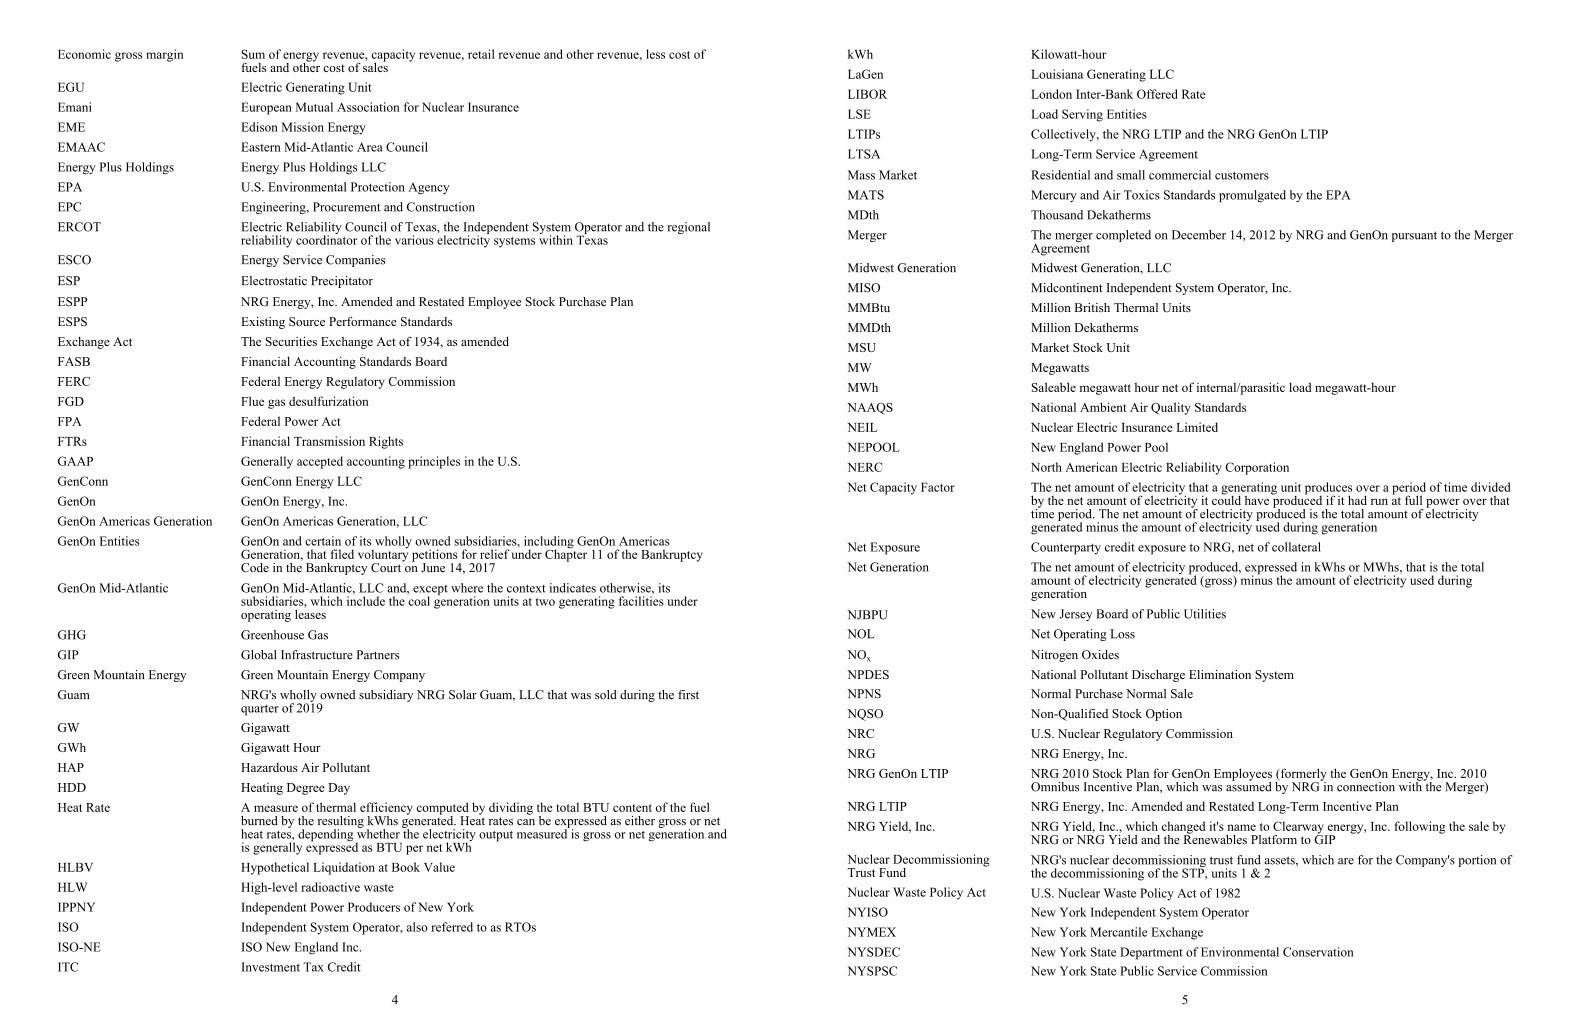
Glossary of Terms
When the following terms and abbreviations appear in the text of this report, they have the meanings indicated below:2023 Term Loan Facility The Company's $1.7 billion (as of December 31, 2018) term loan facility due 2023, a
component of the Senior Credit Facility, which was repaid during the second quarter of 2019
Adjusted EBITDA Adjusted earnings before interest, taxes, depreciation and amortizationARO Asset Retirement ObligationASC The FASB Accounting Standards Codification, which the FASB established as the source
of authoritative GAAPASU Accounting Standards Updates – updates to the ASCAverage realized prices Volume-weighted average power prices, net of average fuel costs and reflecting the impact
of settled hedgesBankruptcy Code Chapter 11 of Title 11 of the U.S. Bankruptcy CodeBankruptcy Court United States Bankruptcy Court for the Southern District of Texas, Houston DivisionBaseload Units expected to satisfy minimum baseload requirements of the system and produce
electricity at an essentially constant rate and run continuouslyBETM Boston Energy Trading and Marketing LLCBTU British Thermal UnitBusiness Solutions NRG's business solutions group, which includes demand response, commodity sales,
energy efficiency and energy management servicesCAA Clean Air ActCAISO California Independent System OperatorCarlsbad Carlsbad Energy Center, a 528 MW natural gas-fired project located in Carlsbad, CACCF Carbon Capture FacilityCCR Coal Combustion ResidualsCDD Cooling Degree DayCDWR California Department of Water ResourcesCFTC U.S. Commodity Futures Trading CommissionChapter 11 Cases Voluntary cases commenced by the GenOn Entities under the Bankruptcy Code in the
Bankruptcy CourtC&I Commercial, industrial and governmental/institutionalCES Clean Energy StandardCleco Cleco Corporate Holdings LLCCO2 Carbon DioxideCO2e Carbon Dioxide EquivalentsComEd Commonwealth EdisonCompany NRG Energy, Inc.Convertible Senior Notes As of December 31, 2019, consists of NRG’s $575 million unsecured 2.75% Convertible
Senior Notes due 2048Cottonwood Cottonwood Generating Station, a 1,153 MW natural gas-fueled plantCPP Clean Power PlanCPUC California Public Utilities CommissionCWA Clean Water ActD.C. Circuit U.S. Court of Appeals for the District of Columbia CircuitDistributed Solar Solar power projects that primarily sell power to customers for usage on site, or are
interconnected to sell power into a local distribution gridDNREC Delaware Department of Natural Resources and Environmental ControlDSI Dry Sorbent Injection DSU Deferred Stock Unit
3
Economic gross margin Sum of energy revenue, capacity revenue, retail revenue and other revenue, less cost of fuels and other cost of sales
EGU Electric Generating UnitEmani European Mutual Association for Nuclear InsuranceEME Edison Mission EnergyEMAAC Eastern Mid-Atlantic Area CouncilEnergy Plus Holdings Energy Plus Holdings LLCEPA U.S. Environmental Protection AgencyEPC Engineering, Procurement and ConstructionERCOT Electric Reliability Council of Texas, the Independent System Operator and the regional
reliability coordinator of the various electricity systems within TexasESCO Energy Service CompaniesESP Electrostatic PrecipitatorESPP NRG Energy, Inc. Amended and Restated Employee Stock Purchase PlanESPS Existing Source Performance StandardsExchange Act The Securities Exchange Act of 1934, as amendedFASB Financial Accounting Standards BoardFERC Federal Energy Regulatory CommissionFGD Flue gas desulfurizationFPA Federal Power ActFTRs Financial Transmission RightsGAAP Generally accepted accounting principles in the U.S.GenConn GenConn Energy LLCGenOn GenOn Energy, Inc.GenOn Americas Generation GenOn Americas Generation, LLCGenOn Entities GenOn and certain of its wholly owned subsidiaries, including GenOn Americas
Generation, that filed voluntary petitions for relief under Chapter 11 of the Bankruptcy Code in the Bankruptcy Court on June 14, 2017
GenOn Mid-Atlantic GenOn Mid-Atlantic, LLC and, except where the context indicates otherwise, its subsidiaries, which include the coal generation units at two generating facilities under operating leases
GHG Greenhouse GasGIP Global Infrastructure PartnersGreen Mountain Energy Green Mountain Energy CompanyGuam NRG's wholly owned subsidiary NRG Solar Guam, LLC that was sold during the first
quarter of 2019GW GigawattGWh Gigawatt HourHAP Hazardous Air PollutantHDD Heating Degree DayHeat Rate A measure of thermal efficiency computed by dividing the total BTU content of the fuel
burned by the resulting kWhs generated. Heat rates can be expressed as either gross or net heat rates, depending whether the electricity output measured is gross or net generation and is generally expressed as BTU per net kWh
HLBV Hypothetical Liquidation at Book ValueHLW High-level radioactive wasteIPPNY Independent Power Producers of New YorkISO Independent System Operator, also referred to as RTOsISO-NE ISO New England Inc.ITC Investment Tax Credit
4
kWh Kilowatt-hourLaGen Louisiana Generating LLCLIBOR London Inter-Bank Offered RateLSE Load Serving EntitiesLTIPs Collectively, the NRG LTIP and the NRG GenOn LTIPLTSA Long-Term Service AgreementMass Market Residential and small commercial customersMATS Mercury and Air Toxics Standards promulgated by the EPAMDth Thousand DekathermsMerger The merger completed on December 14, 2012 by NRG and GenOn pursuant to the Merger
AgreementMidwest Generation Midwest Generation, LLCMISO Midcontinent Independent System Operator, Inc.MMBtu Million British Thermal UnitsMMDth Million DekathermsMSU Market Stock UnitMW MegawattsMWh Saleable megawatt hour net of internal/parasitic load megawatt-hourNAAQS National Ambient Air Quality StandardsNEIL Nuclear Electric Insurance LimitedNEPOOL New England Power PoolNERC North American Electric Reliability CorporationNet Capacity Factor The net amount of electricity that a generating unit produces over a period of time divided
by the net amount of electricity it could have produced if it had run at full power over that time period. The net amount of electricity produced is the total amount of electricity generated minus the amount of electricity used during generation
Net Exposure Counterparty credit exposure to NRG, net of collateralNet Generation The net amount of electricity produced, expressed in kWhs or MWhs, that is the total
amount of electricity generated (gross) minus the amount of electricity used during generation
NJBPU New Jersey Board of Public UtilitiesNOL Net Operating LossNOx Nitrogen OxidesNPDES National Pollutant Discharge Elimination SystemNPNS Normal Purchase Normal SaleNQSO Non-Qualified Stock OptionNRC U.S. Nuclear Regulatory CommissionNRG NRG Energy, Inc.NRG GenOn LTIP NRG 2010 Stock Plan for GenOn Employees (formerly the GenOn Energy, Inc. 2010
Omnibus Incentive Plan, which was assumed by NRG in connection with the Merger)NRG LTIP NRG Energy, Inc. Amended and Restated Long-Term Incentive PlanNRG Yield, Inc. NRG Yield, Inc., which changed it's name to Clearway energy, Inc. following the sale by
NRG or NRG Yield and the Renewables Platform to GIPNuclear Decommissioning Trust Fund
NRG's nuclear decommissioning trust fund assets, which are for the Company's portion of the decommissioning of the STP, units 1 & 2
Nuclear Waste Policy Act U.S. Nuclear Waste Policy Act of 1982NYISO New York Independent System OperatorNYMEX New York Mercantile ExchangeNYSDEC New York State Department of Environmental ConservationNYSPSC New York State Public Service Commission
5
OCI/OCL Other Comprehensive Income/(Loss)ORDC Operating Reserve Demand Curve Peaking Units expected to satisfy demand requirements during the periods of greatest or peak load
on the systemPER Peak Energy RentPG&E PG&E Corporation (NYSE: PCG) and its primary operating subsidiary, Pacific Gas and
Electric CompanyPipeline Projects that range from identified lead to shortlisted with an offtake, and represents a lower
level of execution certaintyPJM PJM Interconnection, LLCPM2.5 Particulate Matter that has a diameter of less than 2.5 micrometersPPA Power Purchase AgreementPPM Parts per millionPSU Performance Stock UnitPTC Production Tax CreditPUCT Public Utility Commission of TexasRCE Residential Customer Equivalent, a single RCE represents 10,000 kWh of electricityRCRA Resource Conservation and Recovery Act of 1976RECs Renewable Energy CertificatesReliant Energy Reliant Energy Retail Services, LLCREMA NRG REMA LLC, which leases a 100% interest in the Shawville generating facility and
16.7% and 16.5% interests in the Keystone and Conemaugh generating facilities, respectively
Renewables Consist of the following projects retained by NRG: Agua, Ivanpah, NFL stadiumsRenewables Platform The renewable operating and development platform sold to GIP with NRG's interest in
NRG Yield.Restructuring Support Agreement
Restructuring Support and Lock-Up Agreement, dated as of June 12, 2017 and as amended on October 2, 2017, by and among GenOn Energy, Inc., GenOn Americas Generation, LLC, and subsidiaries signatory thereto, NRG Energy, Inc. and the noteholders signatory thereto
Retail Reporting segment that includes NRG's retail residential, commercial and industrial businesses
Revolving Credit Facility The Company's $2.6 billion revolving credit facility, a component of the Senior Credit Facility, due 2024 was amended on May 28, 2019
RGGI Regional Greenhouse Gas InitiativeRMR Reliability Must-RunROFO Right of First OfferROFO Agreement Second Amended and Restated Right of First Offer Agreement by and between NRG
Energy, Inc. and NRG Yield, Inc.RPM Reliability Pricing ModelRPS Renewable Portfolio StandardsRPSU Relative Performance Stock UnitRSU Restricted Stock UnitRTO Regional Transmission OrganizationSCE Southern California Edison CompanySCR Selective Catalytic Reduction Control SystemSDG&E San Diego Gas & ElectricSEC U.S. Securities and Exchange CommissionSecurities Act The Securities Act of 1933, as amendedSenior Credit Facility NRG's senior secured credit facility, comprised of the Revolving Credit Facility and the
2023 Term Loan Facility. The 2023 Term Loan Facility was repaid in the second quarter of 2019
6
Senior Notes As of December 31, 2019, NRG's $3.8 billion outstanding unsecured senior notes consisting of $1.0 billion of the 7.25% senior notes due 2026, $1.23 billion of the 6.625% senior notes due 2027, $821 million of 5.75% senior notes due 2028 and $733 million of the 5.25% senior notes due 2029
Senior Secured Notes As of December 31, 2019, NRG’s $1.1 billion outstanding Senior Secured First Lien Notes consists of $600 million of the 3.75% Senior Secured First Lien Notes due 2024 and $500 million of the 4.45% Senior Secured First Lien Notes due 2029
Services Agreement NRG provided GenOn with various management, personnel and other services, which include human resources, regulatory and public affairs, accounting, tax, legal, information systems, treasury, risk management, commercial operations, and asset management, as set forth in the services agreement with GenOn
Settlement Agreement A settlement agreement and any other documents necessary to effectuate the settlement among NRG, GenOn, and certain holders of senior unsecured notes of GenOn Americas Generations and GenOn, and certain of GenOn's direct and indirect subsidiaries
SNF Spent Nuclear FuelSO2 Sulfur DioxideSouth Central Portfolio NRG's South Central Portfolio, which owned and operated a portfolio of generation assets
consisting of Bayou Cove, Big Cajun-I, Big Cajun-II, Cottonwood and Sterlington, was sold on February 4, 2019. NRG is leasing back the Cottonwood facility through May 2025
SPP Solar Power PartnersS&P Standard & Poor'sSTP South Texas Project — nuclear generating facility located near Bay City, Texas in which
NRG owns a 44% interestSTPNOC South Texas Project Nuclear Operating CompanyTax Act The Tax Cuts and Jobs Act of 2017Texas Genco Texas Genco LLCTSA Transportation Services AgreementTSR Total Shareholder ReturnTWCC Texas Westmoreland Coal Co.TWh Terawatt HourUPMC University of Pittsburgh Medical CenterU.S. United States of AmericaU.S. DOE U.S. Department of EnergyUtility-Scale Solar Solar power projects, typically 20 MW or greater in size (on an alternating current basis),
that are interconnected into the transmission or distribution grid to sell power at a wholesale level
VaR Value at RiskVIE Variable Interest EntityWECC Western Electricity Coordinating CouncilZECs Zero Emissions Credits
7
PART I
Item 1 — Business
General
NRG Energy, Inc., or NRG or the Company, is an integrated power company built on dynamic retail brands with diversegeneration assets. NRG brings the power of energy to customers by producing and selling electricity and related products andservices in major competitive power markets in the U.S. and Canada in a manner that delivers value to all of NRG'sstakeholders. NRG is a customer-driven business focused on perfecting the integrated model by balancing retail load withgeneration supply within its deregulated markets. The Company sells energy, services, and innovative, sustainable products andservices directly to retail customers under the brand names NRG, Reliant, Green Mountain Energy, Stream, and XOOMEnergy, as well as other brand names owned by NRG, supported by approximately 23,000 MW of generation as of December31, 2019. NRG was incorporated as a Delaware corporation on May 29, 1992.
NRG divested non-core businesses including, among others: (i) NRG Yield, Inc. and the Renewables Platform during2018; and (ii) the South Central Portfolio during 2019.
The Company previously owned GenOn Energy, Inc. which filed for bankruptcy on June 14, 2017. As a result of thebankruptcy filing, NRG determined it no longer controlled GenOn and deconsolidated GenOn and its subsidiaries for financialreporting purposes. On December 14, 2018, GenOn emerged from bankruptcy as a standalone company no longer owned byNRG.
Since 2017, the Company has been executing its three-year Transformation Plan, which includes targets related tooperations and cost excellence, portfolio optimization, and capital structure and allocation enhancement. See Item 7 –Management’s Discussion and Analysis of Financial Conditions and Results of Operations for further discussion.
Strategy
NRG's strategy is to maximize stockholder value through the safe production and sale of reliable power to its customers inthe markets it serves, while positioning the Company to provide innovative solutions to the end-use energy customer. Thisstrategy is intended to enable the Company to optimize its integrated model to generate stable and predictable cash flow,significantly strengthen earnings and cost competitiveness, and lower risk and volatility.
To effectuate the Company’s strategy, NRG is focused on: (i) serving the energy needs of end-use residential, commercialand industrial customers in competitive markets through multiple brands and channels with a variety of retail energy productsand services differentiated by innovative features, premium service, sustainability, and loyalty/affinity programs; (ii) offeringinnovative and renewable energy solutions for customers; (iii) excellence in operating performance of its existing assets; (iv)optimal hedging of NRG's net retail and generation positions; and (v) engaging in disciplined and transparent capital allocation.
Sustainability is an integral piece of NRG's strategy and ties directly to business success, reduced risks and brand value.On September 24, 2019, NRG announced the acceleration of its science-based GHG emissions reduction goals to align withprevailing climate science, limiting warming to a 1.5 degree Celsius scenario. Under its new GHG emissions reduction timeline,NRG is targeting to achieve a 50% reduction by 2025 and net-zero emissions by 2050, from a 2014 baseline.
Business Overview
The Company’s core business is the sale of electricity and natural gas to residential, commercial and industrial customers,supported by the Company's wholesale generation.
Beginning in 2020, the Company is managing its integrated model based on the combined results of the retail andwholesale generation businesses. The Company’s integrated model consists of three core functions: Customer Operations,Market Operations and Plant Operations, which directly support each other in each geographic region. The Company’sintegrated model provides the advantage of being able to supply the Company’s retail customers with electricity from theCompany’s assets, which reduces the need to sell power to and buy power from other institutions and intermediaries, resultingin stable earnings and cash flows, lower transaction costs and less credit exposure. The integrated model also results in areduction in actual and contingent collateral through offsetting transactions, thereby minimizing transactions with third parties.
NRG provides energy and related services to residential, industrial and commercial customers at either fixed, indexed orvariable prices through various brands and sales channels across the U.S. and Canada. Residential and small commercial (Massmarket) customers typically contract for terms ranging from one month to five years, while industrial and large commercial(C&I) contracts are often between one year and five years in length. NRG sold approximately 69 TWhs of electricity and 23MMDth of natural gas in 2019 and served approximately 3.7 million customers as of December 31, 2019, making it one of thelargest competitive energy retailers in the U.S. In any given year, the quantity of TWhs and MMDth sold can be affected byweather, economic conditions and competition. As of the end of 2019, NRG had recurring electricity and/or natural gas sales in
8
19 U.S. states, the District of Columbia, and 2 provinces in Canada. NRG's retail brands, collectively, have the largest share ofcompetitively served residential electric customers in Texas and nationwide.
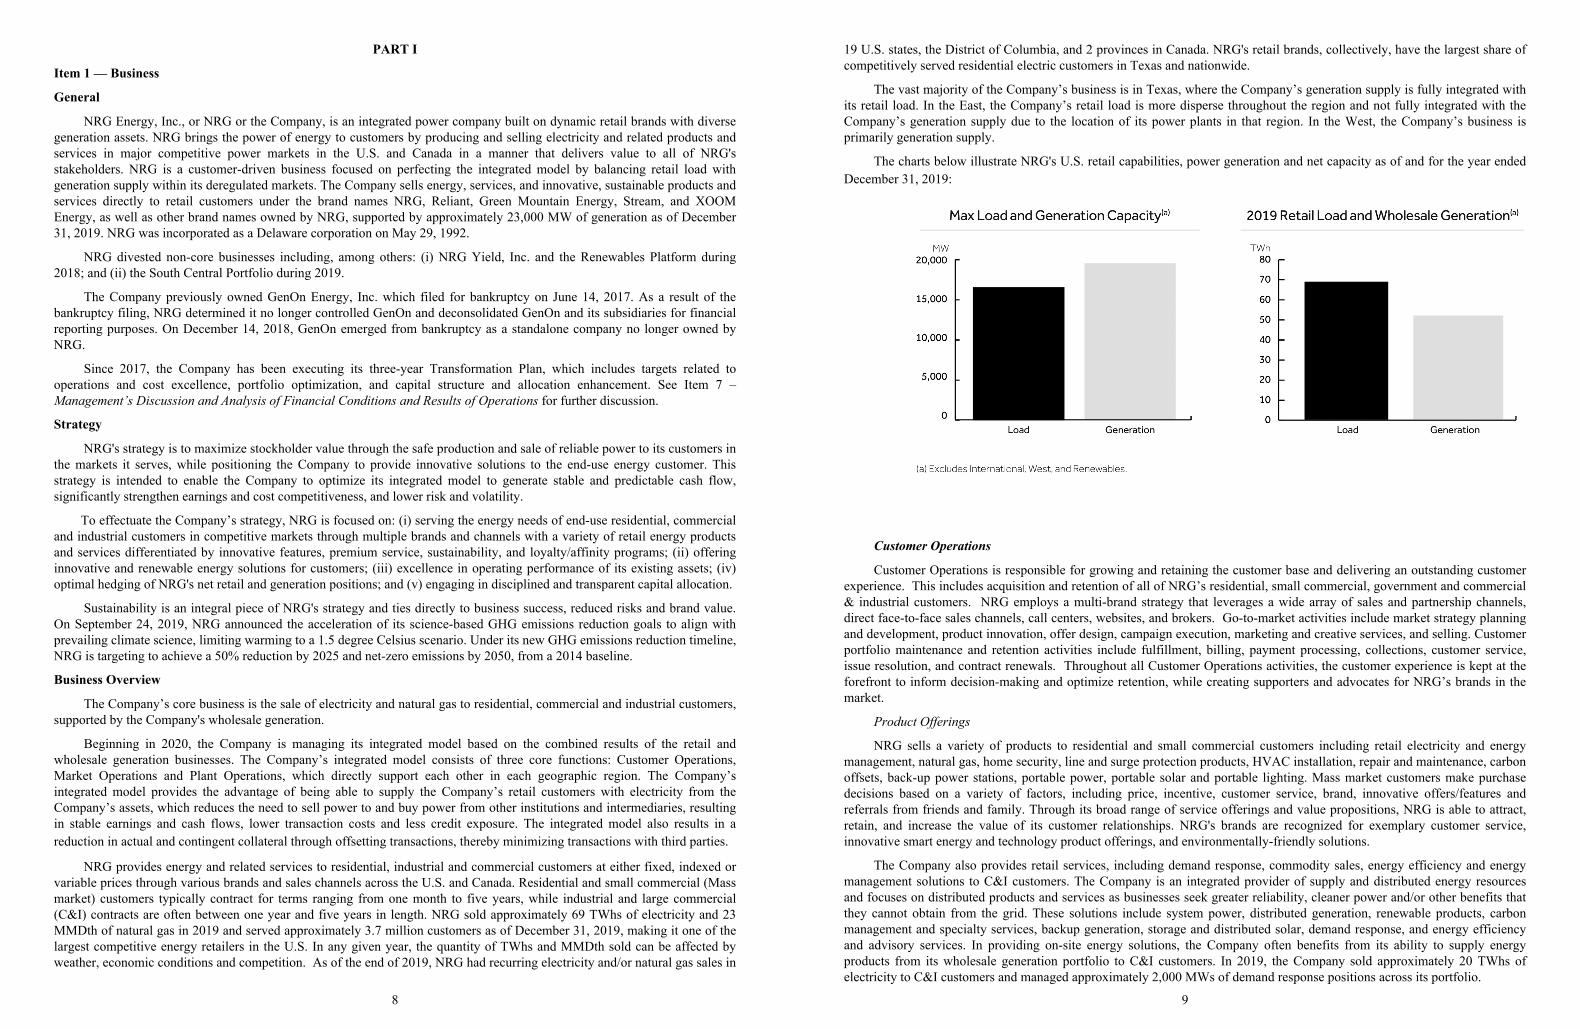
The vast majority of the Company’s business is in Texas, where the Company’s generation supply is fully integrated withits retail load. In the East, the Company’s retail load is more disperse throughout the region and not fully integrated with theCompany’s generation supply due to the location of its power plants in that region. In the West, the Company’s business isprimarily generation supply.
The charts below illustrate NRG's U.S. retail capabilities, power generation and net capacity as of and for the year endedDecember 31, 2019:
Customer Operations
Customer Operations is responsible for growing and retaining the customer base and delivering an outstanding customerexperience. This includes acquisition and retention of all of NRG’s residential, small commercial, government and commercial& industrial customers. NRG employs a multi-brand strategy that leverages a wide array of sales and partnership channels,direct face-to-face sales channels, call centers, websites, and brokers. Go-to-market activities include market strategy planningand development, product innovation, offer design, campaign execution, marketing and creative services, and selling. Customerportfolio maintenance and retention activities include fulfillment, billing, payment processing, collections, customer service,issue resolution, and contract renewals. Throughout all Customer Operations activities, the customer experience is kept at theforefront to inform decision-making and optimize retention, while creating supporters and advocates for NRG’s brands in themarket.
Product Offerings
NRG sells a variety of products to residential and small commercial customers including retail electricity and energymanagement, natural gas, home security, line and surge protection products, HVAC installation, repair and maintenance, carbonoffsets, back-up power stations, portable power, portable solar and portable lighting. Mass market customers make purchasedecisions based on a variety of factors, including price, incentive, customer service, brand, innovative offers/features andreferrals from friends and family. Through its broad range of service offerings and value propositions, NRG is able to attract,retain, and increase the value of its customer relationships. NRG's brands are recognized for exemplary customer service,innovative smart energy and technology product offerings, and environmentally-friendly solutions.
The Company also provides retail services, including demand response, commodity sales, energy efficiency and energymanagement solutions to C&I customers. The Company is an integrated provider of supply and distributed energy resourcesand focuses on distributed products and services as businesses seek greater reliability, cleaner power and/or other benefits thatthey cannot obtain from the grid. These solutions include system power, distributed generation, renewable products, carbonmanagement and specialty services, backup generation, storage and distributed solar, demand response, and energy efficiencyand advisory services. In providing on-site energy solutions, the Company often benefits from its ability to supply energyproducts from its wholesale generation portfolio to C&I customers. In 2019, the Company sold approximately 20 TWhs ofelectricity to C&I customers and managed approximately 2,000 MWs of demand response positions across its portfolio.
9
Market Operations
Market Operations has two primary objectives: (i) to supply load to our customers in the most cost-efficient manner; and(ii) to maximize the value of any excess generation after satisfying the Company’s customer load requirements. Theseobjectives are intended to reduce supply costs and maximize earnings with predictable cash flows.
To meet these objectives, NRG enters into supply, power sales and hedging arrangements via a wide range of productsand contracts, including (i) renewable PPAs, (ii) capacity auctions and other contracted revenue sources, (iii) fuel supply andtransportation contracts, and (iv) natural gas derivative instruments and other financial instruments.
In addition, because changes in power prices in the markets where NRG operates are generally correlated to changes innatural gas prices, NRG uses hedging strategies that may include power and natural gas forward purchases and sales contractsto manage the commodity price risk.
Renewable PPAs
During 2019, NRG began procuring mid to long-term renewable generation through power purchase agreements. As ofDecember 31, 2019, NRG has entered into PPAs in Texas totaling approximately 1,600 MWs with third-party projectdevelopers and other counterparties. The average tenor of these agreements is ten years. The Company expects to continueevaluating and executing agreements, such as these, that support the needs of the business.
Capacity and Other Contracted Revenue Sources
NRG's revenues and cash flows, primarily in the East and West, benefit from capacity/demand payments and othercontracted revenue sources, originating from market clearing capacity prices, resource adequacy contracts, tolling arrangementsand other long-term contractual arrangements.
The Company's largest sources of capacity revenues are capacity auctions in PJM, ISO-NE and NYISO. Both PJM andISO-NE operate a pay-for-performance model where capacity payments are modified based on real-time performance andNRG's actual revenues will be the combination of revenues based on the cleared auction MWs plus the net of any over- andunder-performance of NRG's respective generation assets. The Company primarily sells physical capacity forward throughbilateral contracts for our New York assets. To the extent NRG is not able to enter into a physical bilateral contract, NRG willsell the remaining capacity into the NYISO six month strip, monthly or spot auctions
◦ 2023/2024 ISO-NE Auction Results - On February 5, 2020 ISO-NE announced the results of its 2023/2024 forwardcapacity auction. NRG cleared 784 MW of capacity. NRG's expected capacity revenues from the auction for the2023/2024 delivery year are approximately $18 million.
◦ PJM Auction Results— PJM announced during 2019 it was suspending all auction deadlines relating to Base ResidualAuctions for 2022/2023 and 2023/2024 delivery year, consistent with FERC’s July 25, 2019 Order. Refer to theCapacity Market Reforms Filing discussion within the Regional Regulatory Developments section below for furtherdiscussion.
In California, there is a resource adequacy requirement that is primarily satisfied through bilateral contracts. Such bilateralcontracts are typically short-term resource adequacy contracts. When bilateral contracting does not satisfy the resourceadequacy need, such shortfalls can be addressed through procurement tools administered by the CAISO, including the capacityprocurement mechanism or reliability must-run contracts.
Fuel Supply and Transportation
NRG's fuel requirements consist of various forms of fossil fuel and nuclear fuel. The prices of fossil fuels can be volatile.The Company obtains its fossil fuels from multiple suppliers and through multiple transporters. Although availability isgenerally not an issue, localized shortages, transportation availability, delays arising from extreme weather conditions andsupplier financial stability issues can and do occur. The preceding factors related to the sources and availability of raw materialsare fairly uniform across the Company's business and fuel products used. NRG's primary fuel requirements consist of thefollowing:
Natural Gas — NRG operates a fleet of mid-merit and peaking natural gas plants across all its U.S. wholesale regions.Fuel needs are managed on a spot basis, especially for peaking assets, as the Company does not believe it is prudent to forwardpurchase natural gas for these types of units as the dispatch is highly unpredictable. The Company contracts for natural gasstorage services, as well as natural gas transportation services to deliver natural gas when needed.
10
Coal — The Company believes it is adequately hedged, using forward coal supply agreements, for its domestic coalconsumption for 2020. NRG actively manages its coal requirements based on forecasted generation, market volatility and itsinventory on site. As of December 31, 2019, NRG had purchased forward contracts to provide fuel for approximately 58% ofthe Company's expected requirements for 2020 and 2021 per the table below. NRG purchased approximately 17 million tons ofcoal in 2019, almost all of which was Powder River Basin coal. For fuel transport, NRG has entered into various railtransportation and rail car lease agreements with varying tenures that will provide for most of the Company's transportationrequirements of Powder River Basin coal for the next 2 years.
The following table shows the percentage of the Company's coal requirements for 2020 and 2021 that have beenpurchased forward as of December 31, 2019:
Percentage ofCompany's
Requirement
2020 . . . . . . . . . . . . . . . . . . . . . . . . . . . . . . . . . . . . . . . . . . . . . . . . . . . . . . . . . . . . . . . . . . . . . . . . . . . . . . . . . . . . . . . . . . 100 %2021 . . . . . . . . . . . . . . . . . . . . . . . . . . . . . . . . . . . . . . . . . . . . . . . . . . . . . . . . . . . . . . . . . . . . . . . . . . . . . . . . . . . . . . . . . . 16 %
Nuclear Fuel — STP's owners satisfy their fuel supply requirements by: (i) acquiring uranium concentrates andcontracting for conversion of the uranium concentrates into uranium hexafluoride; (ii) contracting for enrichment of uraniumhexafluoride; and (iii) contracting for fabrication of nuclear fuel assemblies. Through its proportionate participation inSTPNOC, which is the NRC-licensed operator of STP that is responsible for all aspects of fuel procurement, NRG is party to anumber of long-term forward purchase contracts with many of the world's largest suppliers covering STP's requirements foruranium concentrates with only approximately 25% of STP's requirements outstanding for the duration of the original operatinglicense. Similarly, NRG is party to long-term contracts to procure STP's requirements for conversion and enrichment servicesand fuel fabrication for the life of the operating license. Since the operating license was renewed for another 20 years in 2017,STPNOC has begun to review a second phase of fuel purchasing.
Natural Gas Derivative Instruments and Other Financial Instruments
NRG also trades electric power, natural gas and related commodity and financial products, including forwards, futures,options and swaps.
Plant Operations
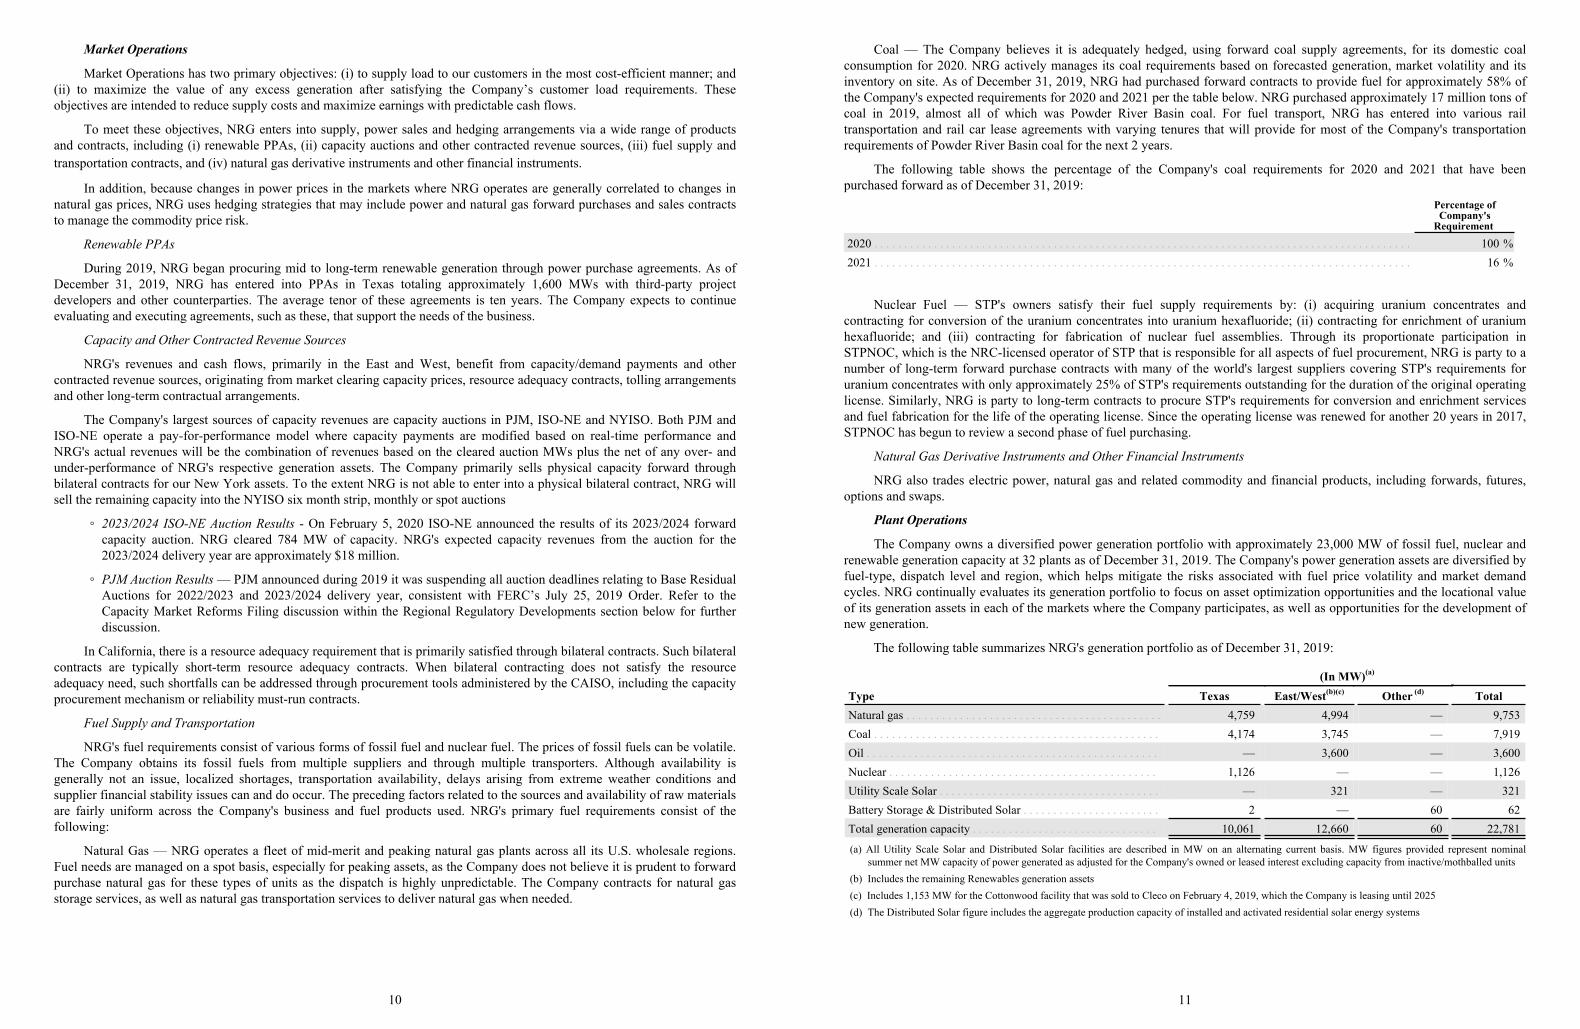
The Company owns a diversified power generation portfolio with approximately 23,000 MW of fossil fuel, nuclear andrenewable generation capacity at 32 plants as of December 31, 2019. The Company's power generation assets are diversified byfuel-type, dispatch level and region, which helps mitigate the risks associated with fuel price volatility and market demandcycles. NRG continually evaluates its generation portfolio to focus on asset optimization opportunities and the locational valueof its generation assets in each of the markets where the Company participates, as well as opportunities for the development ofnew generation.
The following table summarizes NRG's generation portfolio as of December 31, 2019:
(In MW)(a)
Type Texas East/West(b)(c) Other (d) TotalNatural gas . . . . . . . . . . . . . . . . . . . . . . . . . . . . . . . . . . . . . . . . . . . 4,759 4,994 — 9,753Coal . . . . . . . . . . . . . . . . . . . . . . . . . . . . . . . . . . . . . . . . . . . . . . . . 4,174 3,745 — 7,919Oil . . . . . . . . . . . . . . . . . . . . . . . . . . . . . . . . . . . . . . . . . . . . . . . . . — 3,600 — 3,600Nuclear . . . . . . . . . . . . . . . . . . . . . . . . . . . . . . . . . . . . . . . . . . . . . 1,126 — — 1,126Utility Scale Solar . . . . . . . . . . . . . . . . . . . . . . . . . . . . . . . . . . . . . — 321 — 321Battery Storage & Distributed Solar . . . . . . . . . . . . . . . . . . . . . . . 2 — 60 62Total generation capacity . . . . . . . . . . . . . . . . . . . . . . . . . . . . . . . 10,061 12,660 60 22,781
(a) All Utility Scale Solar and Distributed Solar facilities are described in MW on an alternating current basis. MW figures provided represent nominalsummer net MW capacity of power generated as adjusted for the Company's owned or leased interest excluding capacity from inactive/mothballed units
(b) Includes the remaining Renewables generation assets(c) Includes 1,153 MW for the Cottonwood facility that was sold to Cleco on February 4, 2019, which the Company is leasing until 2025(d) The Distributed Solar figure includes the aggregate production capacity of installed and activated residential solar energy systems
11
Plant Operations is responsible for operating the Company's generation facilities at the highest standards of safety andreliability, and includes (i) operations and maintenance, (ii) asset management, and (iii) development, engineering andconstruction.
Operations & Maintenance
NRG operates and maintains its generation portfolio, as well as approximately 8,100 MW of additional coal and natural gasgeneration capacity at 17 plants operated on behalf of third parties as of December 31, 2019 using prudent industry practices forthe safe, reliable and economic generation of electricity in compliance with all local, state and federal requirements. TheCompany follows a consistent set of operating requirements, including a solid base of training, required adherence to specificsafety and environmental limits, procedure and checklist usage, and the implementation of continuous process improvementthrough incident investigations.
NRG uses best-in-class maintenance practices for preventive, predictive, and corrective maintenance planning. TheCompany’s strategic planning process evaluates equipment condition, performance, and obsolescence to support thedevelopment of a comprehensive work scope and schedule for long-term performance.
Asset Management
NRG manages all aspects of its generation portfolio to optimize the lifecycle value of the assets, consistent with theCompany’s goals. The Company evaluates capital projects required for continued operation and strategic enhancement of theassets, provides quality assurance on capital outlays, and assesses the impact of rules, regulations, and laws on businessprofitability. In addition, the Company manages its long-term contracts, power purchase agreements, and real estate holdingsand provides third party asset management services.
Development, Engineering & Construction
NRG develops, engineers and executes major plant modifications, “new build” generation and energy storage projects thatenhance the value of its generation portfolio and provide options to meet generation growth needs in the retail markets weserve, in accordance with the Company’s strategic goals. Projects have included gas-fired generation development andconstruction, coal to gas conversions, grid scale energy storage development, grid scale renewable construction, and assetdemolition, remediation and reclamation work.
12
Operational Statistics
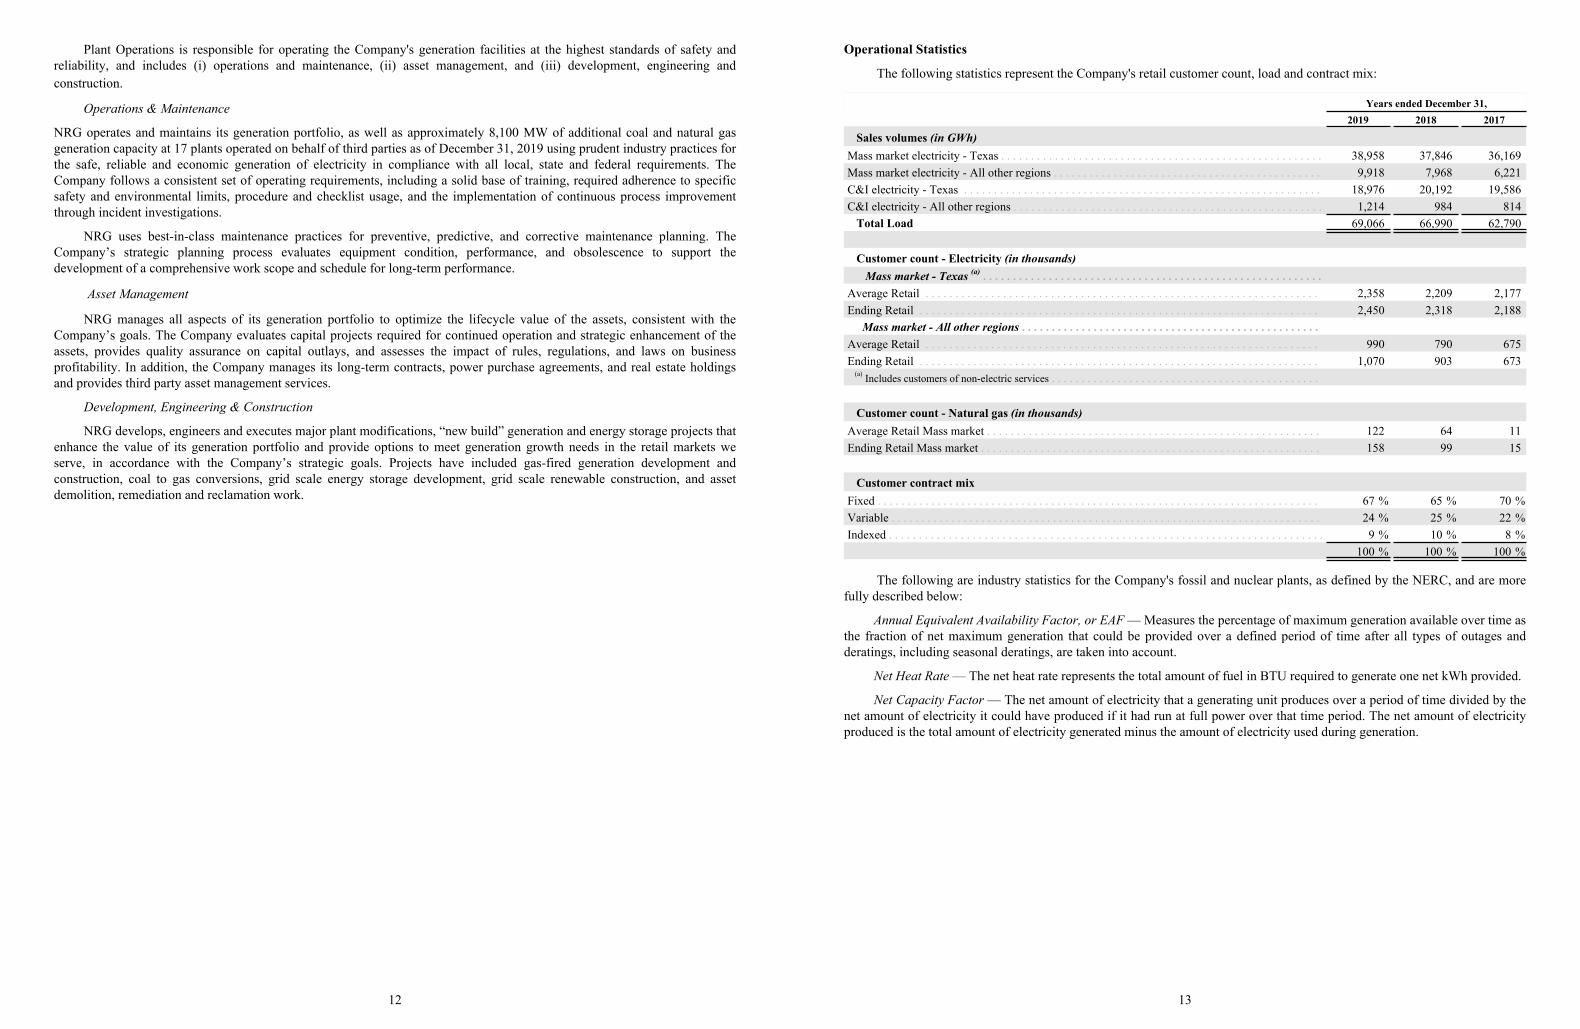
The following statistics represent the Company's retail customer count, load and contract mix:
Years ended December 31,2019 2018 2017
Sales volumes (in GWh)Mass market electricity - Texas . . . . . . . . . . . . . . . . . . . . . . . . . . . . . . . . . . . . . . . . . . . . . . . . . . . . . . 38,958 37,846 36,169Mass market electricity - All other regions . . . . . . . . . . . . . . . . . . . . . . . . . . . . . . . . . . . . . . . . . . . . . 9,918 7,968 6,221C&I electricity - Texas . . . . . . . . . . . . . . . . . . . . . . . . . . . . . . . . . . . . . . . . . . . . . . . . . . . . . . . . . . . . 18,976 20,192 19,586C&I electricity - All other regions . . . . . . . . . . . . . . . . . . . . . . . . . . . . . . . . . . . . . . . . . . . . . . . . . . . . 1,214 984 814
Total Load 69,066 66,990 62,790
Customer count - Electricity (in thousands) Mass market - Texas (a) . . . . . . . . . . . . . . . . . . . . . . . . . . . . . . . . . . . . . . . . . . . . . . . . . . . . . . . . .Average Retail . . . . . . . . . . . . . . . . . . . . . . . . . . . . . . . . . . . . . . . . . . . . . . . . . . . . . . . . . . . . . . . . . . 2,358 2,209 2,177Ending Retail . . . . . . . . . . . . . . . . . . . . . . . . . . . . . . . . . . . . . . . . . . . . . . . . . . . . . . . . . . . . . . . . . . . 2,450 2,318 2,188 Mass market - All other regions . . . . . . . . . . . . . . . . . . . . . . . . . . . . . . . . . . . . . . . . . . . . . . . . . . Average Retail . . . . . . . . . . . . . . . . . . . . . . . . . . . . . . . . . . . . . . . . . . . . . . . . . . . . . . . . . . . . . . . . . . 990 790 675Ending Retail . . . . . . . . . . . . . . . . . . . . . . . . . . . . . . . . . . . . . . . . . . . . . . . . . . . . . . . . . . . . . . . . . . . 1,070 903 673
(a) Includes customers of non-electric services . . . . . . . . . . . . . . . . . . . . . . . . . . . . . . . . . . . . . . . . . . . . .
Customer count - Natural gas (in thousands)Average Retail Mass market . . . . . . . . . . . . . . . . . . . . . . . . . . . . . . . . . . . . . . . . . . . . . . . . . . . . . . . . 122 64 11Ending Retail Mass market . . . . . . . . . . . . . . . . . . . . . . . . . . . . . . . . . . . . . . . . . . . . . . . . . . . . . . . . . 158 99 15
Customer contract mixFixed . . . . . . . . . . . . . . . . . . . . . . . . . . . . . . . . . . . . . . . . . . . . . . . . . . . . . . . . . . . . . . . . . . . . . . . . . . 67 % 65 % 70 %Variable . . . . . . . . . . . . . . . . . . . . . . . . . . . . . . . . . . . . . . . . . . . . . . . . . . . . . . . . . . . . . . . . . . . . . . . . 24 % 25 % 22 %Indexed . . . . . . . . . . . . . . . . . . . . . . . . . . . . . . . . . . . . . . . . . . . . . . . . . . . . . . . . . . . . . . . . . . . . . . . . . 9 % 10 % 8 %
100 % 100 % 100 %
The following are industry statistics for the Company's fossil and nuclear plants, as defined by the NERC, and are morefully described below:
Annual Equivalent Availability Factor, or EAF — Measures the percentage of maximum generation available over time asthe fraction of net maximum generation that could be provided over a defined period of time after all types of outages andderatings, including seasonal deratings, are taken into account.
Net Heat Rate — The net heat rate represents the total amount of fuel in BTU required to generate one net kWh provided.
Net Capacity Factor — The net amount of electricity that a generating unit produces over a period of time divided by thenet amount of electricity it could have produced if it had run at full power over that time period. The net amount of electricityproduced is the total amount of electricity generated minus the amount of electricity used during generation.
13
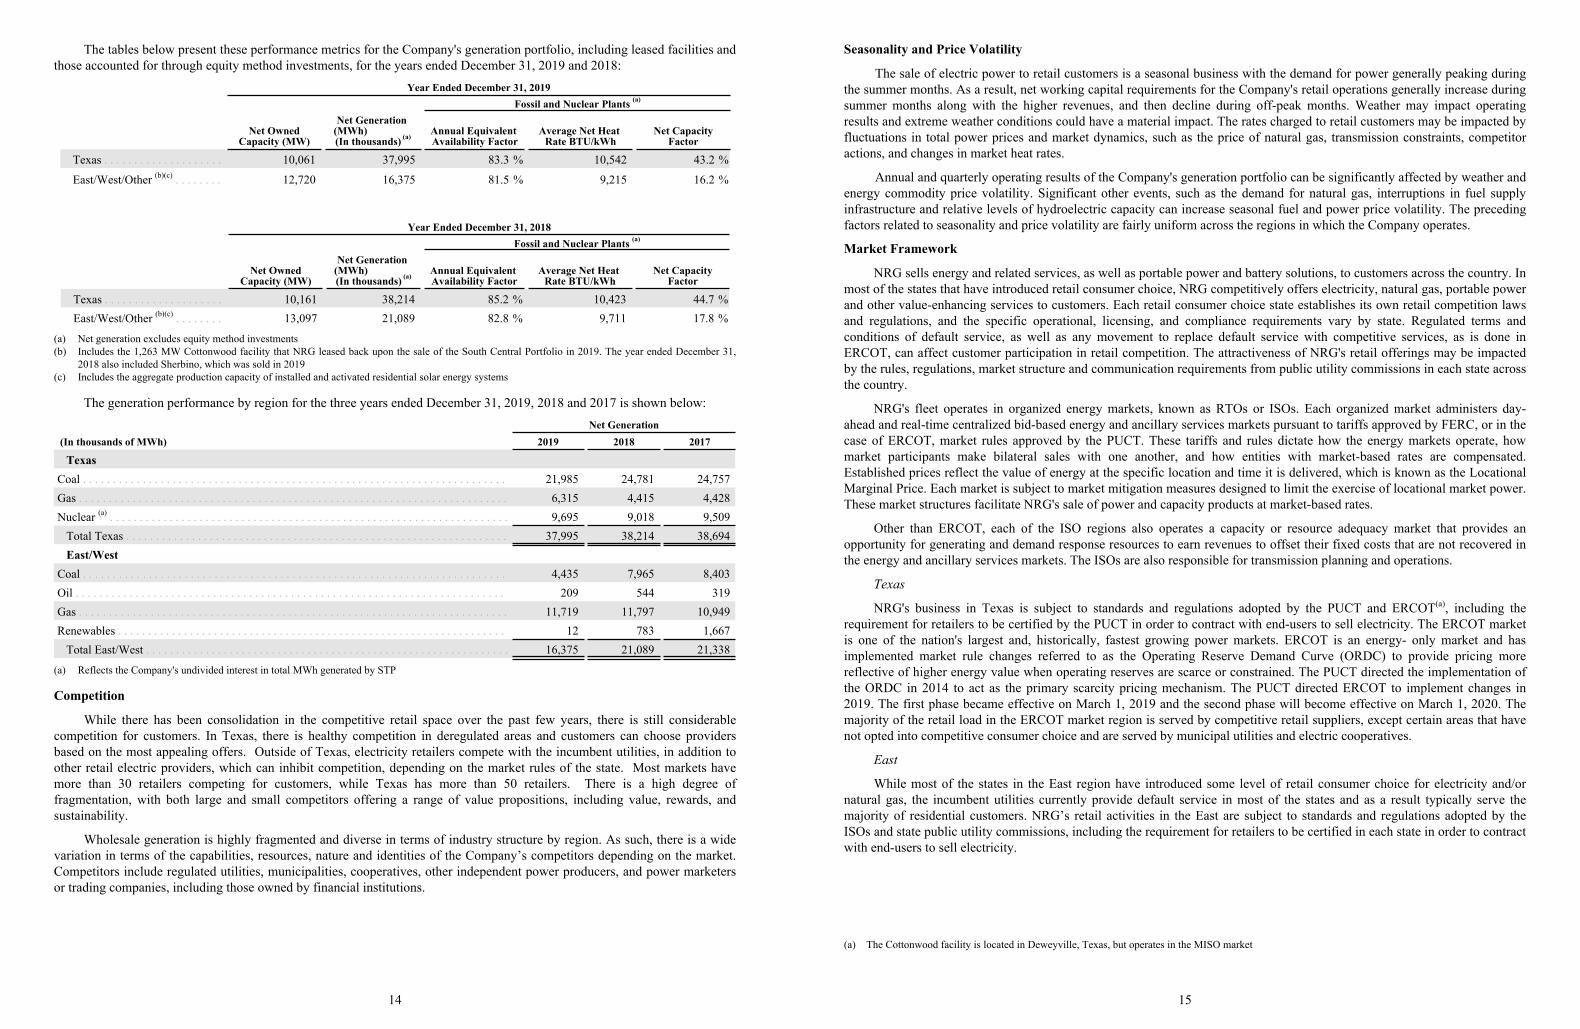
The tables below present these performance metrics for the Company's generation portfolio, including leased facilities andthose accounted for through equity method investments, for the years ended December 31, 2019 and 2018:
Year Ended December 31, 2019Fossil and Nuclear Plants (a)
Net OwnedCapacity (MW)
Net Generation (MWh) (In thousands) (a)
Annual Equivalent Availability Factor
Average Net Heat Rate BTU/kWh
Net CapacityFactor
Texas . . . . . . . . . . . . . . . . . . . . 10,061 37,995 83.3 % 10,542 43.2 %
East/West/Other (b)(c) . . . . . . . . 12,720 16,375 81.5 % 9,215 16.2 %
Year Ended December 31, 2018Fossil and Nuclear Plants (a)
Net OwnedCapacity (MW)
Net Generation (MWh) (In thousands) (a)
Annual Equivalent Availability Factor
Average Net Heat Rate BTU/kWh
Net CapacityFactor
Texas . . . . . . . . . . . . . . . . . . . . 10,161 38,214 85.2 % 10,423 44.7 %East/West/Other (b)(c) . . . . . . . . 13,097 21,089 82.8 % 9,711 17.8 %
(a) Net generation excludes equity method investments(b) Includes the 1,263 MW Cottonwood facility that NRG leased back upon the sale of the South Central Portfolio in 2019. The year ended December 31,
2018 also included Sherbino, which was sold in 2019(c) Includes the aggregate production capacity of installed and activated residential solar energy systems
The generation performance by region for the three years ended December 31, 2019, 2018 and 2017 is shown below:Net Generation
(In thousands of MWh) 2019 2018 2017
TexasCoal . . . . . . . . . . . . . . . . . . . . . . . . . . . . . . . . . . . . . . . . . . . . . . . . . . . . . . . . . . . . . . . . . . . . . . . 21,985 24,781 24,757Gas . . . . . . . . . . . . . . . . . . . . . . . . . . . . . . . . . . . . . . . . . . . . . . . . . . . . . . . . . . . . . . . . . . . . . . . . 6,315 4,415 4,428Nuclear (a) . . . . . . . . . . . . . . . . . . . . . . . . . . . . . . . . . . . . . . . . . . . . . . . . . . . . . . . . . . . . . . . . . . . 9,695 9,018 9,509
Total Texas . . . . . . . . . . . . . . . . . . . . . . . . . . . . . . . . . . . . . . . . . . . . . . . . . . . . . . . . . . . . . . . . 37,995 38,214 38,694East/West
Coal . . . . . . . . . . . . . . . . . . . . . . . . . . . . . . . . . . . . . . . . . . . . . . . . . . . . . . . . . . . . . . . . . . . . . . . 4,435 7,965 8,403Oil . . . . . . . . . . . . . . . . . . . . . . . . . . . . . . . . . . . . . . . . . . . . . . . . . . . . . . . . . . . . . . . . . . . . . . . . 209 544 319Gas . . . . . . . . . . . . . . . . . . . . . . . . . . . . . . . . . . . . . . . . . . . . . . . . . . . . . . . . . . . . . . . . . . . . . . . . 11,719 11,797 10,949Renewables . . . . . . . . . . . . . . . . . . . . . . . . . . . . . . . . . . . . . . . . . . . . . . . . . . . . . . . . . . . . . . . . . 12 783 1,667
Total East/West . . . . . . . . . . . . . . . . . . . . . . . . . . . . . . . . . . . . . . . . . . . . . . . . . . . . . . . . . . . . . 16,375 21,089 21,338
(a) Reflects the Company's undivided interest in total MWh generated by STP
Competition
While there has been consolidation in the competitive retail space over the past few years, there is still considerablecompetition for customers. In Texas, there is healthy competition in deregulated areas and customers can choose providersbased on the most appealing offers. Outside of Texas, electricity retailers compete with the incumbent utilities, in addition toother retail electric providers, which can inhibit competition, depending on the market rules of the state. Most markets havemore than 30 retailers competing for customers, while Texas has more than 50 retailers. There is a high degree offragmentation, with both large and small competitors offering a range of value propositions, including value, rewards, andsustainability.
Wholesale generation is highly fragmented and diverse in terms of industry structure by region. As such, there is a widevariation in terms of the capabilities, resources, nature and identities of the Company’s competitors depending on the market.Competitors include regulated utilities, municipalities, cooperatives, other independent power producers, and power marketersor trading companies, including those owned by financial institutions.
14
Seasonality and Price Volatility
The sale of electric power to retail customers is a seasonal business with the demand for power generally peaking duringthe summer months. As a result, net working capital requirements for the Company's retail operations generally increase duringsummer months along with the higher revenues, and then decline during off-peak months. Weather may impact operatingresults and extreme weather conditions could have a material impact. The rates charged to retail customers may be impacted byfluctuations in total power prices and market dynamics, such as the price of natural gas, transmission constraints, competitoractions, and changes in market heat rates.
Annual and quarterly operating results of the Company's generation portfolio can be significantly affected by weather andenergy commodity price volatility. Significant other events, such as the demand for natural gas, interruptions in fuel supplyinfrastructure and relative levels of hydroelectric capacity can increase seasonal fuel and power price volatility. The precedingfactors related to seasonality and price volatility are fairly uniform across the regions in which the Company operates.
Market Framework
NRG sells energy and related services, as well as portable power and battery solutions, to customers across the country. Inmost of the states that have introduced retail consumer choice, NRG competitively offers electricity, natural gas, portable powerand other value-enhancing services to customers. Each retail consumer choice state establishes its own retail competition lawsand regulations, and the specific operational, licensing, and compliance requirements vary by state. Regulated terms andconditions of default service, as well as any movement to replace default service with competitive services, as is done inERCOT, can affect customer participation in retail competition. The attractiveness of NRG's retail offerings may be impactedby the rules, regulations, market structure and communication requirements from public utility commissions in each state acrossthe country.
NRG's fleet operates in organized energy markets, known as RTOs or ISOs. Each organized market administers day-ahead and real-time centralized bid-based energy and ancillary services markets pursuant to tariffs approved by FERC, or in thecase of ERCOT, market rules approved by the PUCT. These tariffs and rules dictate how the energy markets operate, howmarket participants make bilateral sales with one another, and how entities with market-based rates are compensated.Established prices reflect the value of energy at the specific location and time it is delivered, which is known as the LocationalMarginal Price. Each market is subject to market mitigation measures designed to limit the exercise of locational market power.These market structures facilitate NRG's sale of power and capacity products at market-based rates.
Other than ERCOT, each of the ISO regions also operates a capacity or resource adequacy market that provides anopportunity for generating and demand response resources to earn revenues to offset their fixed costs that are not recovered inthe energy and ancillary services markets. The ISOs are also responsible for transmission planning and operations.
Texas
NRG's business in Texas is subject to standards and regulations adopted by the PUCT and ERCOT(a), including therequirement for retailers to be certified by the PUCT in order to contract with end-users to sell electricity. The ERCOT marketis one of the nation's largest and, historically, fastest growing power markets. ERCOT is an energy- only market and hasimplemented market rule changes referred to as the Operating Reserve Demand Curve (ORDC) to provide pricing morereflective of higher energy value when operating reserves are scarce or constrained. The PUCT directed the implementation ofthe ORDC in 2014 to act as the primary scarcity pricing mechanism. The PUCT directed ERCOT to implement changes in2019. The first phase became effective on March 1, 2019 and the second phase will become effective on March 1, 2020. Themajority of the retail load in the ERCOT market region is served by competitive retail suppliers, except certain areas that havenot opted into competitive consumer choice and are served by municipal utilities and electric cooperatives.
East
While most of the states in the East region have introduced some level of retail consumer choice for electricity and/ornatural gas, the incumbent utilities currently provide default service in most of the states and as a result typically serve themajority of residential customers. NRG’s retail activities in the East are subject to standards and regulations adopted by theISOs and state public utility commissions, including the requirement for retailers to be certified in each state in order to contractwith end-users to sell electricity.
(a) The Cottonwood facility is located in Deweyville, Texas, but operates in the MISO market
15
NRG's power plants and demand response assets located in the East region of the U.S. are within the control areas of ISO-NE, MISO, NYISO and PJM. Each of the market regions in the East region provides for robust competition in the day-aheadand real-time energy and ancillary services markets. Additionally, the East region receives a significant portion of its revenuesfrom capacity markets. PJM and ISO-NE use a three-year forward capacity auction, while NYISO uses a month-ahead capacityauction. MISO has an annual auction, known as the Planning Resource Auction. Capacity market prices are sensitive to designparameters, as well as additions of new capacity. Both ISO-NE and PJM operate a pay-for-performance model where capacitypayments are modified based on real-time generator performance. In such markets, NRG’s actual capacity revenues will be thecombination of cleared auction prices times the quantity of MWs cleared, plus the net of any over-performance "bonuspayments" and any under-performance charges. Additionally, bidding rules allow for the incorporation of a risk premium intogenerator bids.
West
In the West region of the U.S., NRG operates a fleet of natural gas-fired power plants located entirely within the CAISOfootprint. The CAISO operates day-ahead and real-time locational markets for energy and ancillary services, while managingcongestion primarily through nodal prices. The CAISO system facilitates NRG's sale of power, ancillary services and capacityproducts at market-based rates, either within the CAISO's centralized energy and ancillary service markets or bilaterallypursuant to tolling arrangements or other capacity sales with California's LSEs. The CPUC also determines capacityrequirements for LSEs and for specified local areas utilizing inputs from the CAISO. Both the CAISO and CPUC rules requireLSEs to contract with sufficient generation resources in order to maintain minimum levels of generation within defined localareas. Additionally, the CAISO has independent authority to contract with needed resources under certain circumstances,typically either when LSEs have failed to procure sufficient resources, or system conditions change unexpectedly.
The Company’s Agua Caliente and Ivanpah projects are party to PPAs with PG&E. Both projects have project financingwith the U.S. DOE. Agua Caliente Borrower 1 LLC, along with Agua Caliente Borrower 2 LLC, which is owned by ClearwayEnergy Inc., were party to a back-leverage financing related to the Agua Caliente project, which was repaid in 2019. OnJanuary 29, 2019, PG&E Corp. and subsidiary utility PG&E filed for Chapter 11 bankruptcy protection. For further discussionsee Energy Regulatory Matters, Item 15 — Note 13, Debt and Finance Leases, and Item 15 — Note 17, Investments Accountedfor by the Equity Method and Variable Interest Entities, to the Consolidated Financial Statements.
Regulatory Matters
As participants in wholesale and retail energy markets and owners of power plants, certain NRG entities are subject toregulation by various federal and state government agencies. These include the CFTC, FERC, NRC and the PUCT, as well asother public utility commissions in certain states where NRG's generation or distributed generation assets are located. Inaddition, NRG is subject to the market rules, procedures and protocols of the various ISO and RTO markets in which itparticipates. Likewise, certain NRG entities participating in the retail markets are subject to rules and regulations established bythe states in which NRG entities are licensed to sell at retail. NRG must also comply with the mandatory reliabilityrequirements imposed by NERC and the regional reliability entities in the regions where NRG operates.
NRG's operations within the ERCOT footprint are not subject to rate regulation by FERC, as they are deemed to operatesolely within the ERCOT market and not in interstate commerce. These operations are subject to regulation by the PUCT, aswell as to regulation by the NRC with respect to NRG's ownership interest in STP.
Federal Energy Regulation
PG&E Corporation Bankruptcy Filing — On January 18, 2019, NextEra Energy, Inc., filed a petition for declaratoryorder requesting that FERC assert its jurisdiction over PG&E's wholesale contracts prior to PG&E's formal bankruptcy filing.Exelon Corporation and EDF Renewables filed similar complaints. On January 25, 2019, FERC found that it and thebankruptcy courts have concurrent jurisdiction to review and address the disposition of wholesale power contracts. Separately,the PG&E bankruptcy court ruled on June 7, 2019 that it does not share concurrent jurisdiction with FERC and has unilateraldiscretion to address the disposition of wholesale power contracts, which ruling was appealed by FERC and variouscounterparties to such contracts. On June 26, 2019, PG&E appealed the FERC order that was issued on January 25, 2019. Bothsets of appeals are currently pending before the Court of Appeals for the Ninth Circuit and the issue of jurisdiction overwholesale power contracts remains in litigation.
On September 9, 2019, PG&E filed a plan of reorganization that would assume all power purchase agreements, includingthose held by the Agua Caliente project and two of the Ivanpah units. On October 17, 2019, a group of unsecured noteholdersfiled a competing plan of reorganization that would also assume all power purchase agreements, including those held by theAgua Caliente project and the two Ivanpah units.
16
On January 22, 2020, PG&E announced that it had reached an agreement with certain noteholder plan proponents and, onJanuary 31, 2020, the PG&E plan was amended to provide for the eventual implementation of such settlement. On February 4,2020, the Bankruptcy Court approved such settlement, and the noteholders have accordingly agreed to support the PG&E plan.On February 5, 2020, the noteholders caused the noteholder plan to be withdrawn. There are many conditions that must besatisfied before the PG&E plan and assumption of the power purchase agreements can become effective, including, but notlimited to, approvals by various classes of creditors, the Bankruptcy Court, and the CPUC. A hearing before the BankruptcyCourt to consider whether the PG&E plan will be approved and confirmed is currently expected to occur on May 29, 2020.
State Energy Regulation
State Out-Of-Market Subsidy Proposals — NRG has opposed efforts to provide out-of-market subsidies for nucleargenerators and intends to continue opposing them in the future. Nuclear subsidy programs have either been implemented, are inthe process of being implemented, or have been introduced for discussion in Connecticut, Illinois, New Jersey, New York, Ohioand Pennsylvania. NRG and others were unsuccessful in challenging the legality of the subsidies in Illinois and New York, andthe U.S. Supreme Court has declined to review the lower court decisions. Through our PJM trade organization, NRG is alsocurrently participating in an appeal of NJBPU's Order regarding ZECs.
Illinois Legislature Considers Changes to the Generator Business Model — In Illinois, in addition to legislation toprovide more subsidies to nuclear power plants in the state, the Legislature is also considering several bills that may affectNRG’s wholesale and retail revenues, including a bill that would replace the PJM capacity market with a state-run capacitymarket. NRG continues to oppose the ongoing legislative effort and supports a competitive clean energy market design thatwould competitively reduce greenhouse gas emission through the procurement of clean energy resources without sacrificing theconsumer benefits of the competitive PJM market design.
New York State Climate Leadership and Community Protection Act — The New York State Legislature enacted climatechange legislation establishing by 2030, 70 percent of the state's energy will be generated by renewables and by 2040, thestate's entire electric system must be zero-emitting. The law includes a provision that the NYSPSC may temporarily suspend ormodify the obligations under its program if it finds that the program impedes safe and adequate electric service, likely impairs"existing obligations and agreements," and/or increases consumer late payments or service disconnections. The legislationincludes provision for offsets, including carbon capture and sequestration, but electric generation sources are not eligible toparticipate in the offsets mechanism.
Regional Regulatory Developments
NRG is affected by rule/tariff changes that occur in the ISO regions. For further discussion on regulatory developmentssee Item 15 — Note 24, Regulatory Matters, to the Consolidated Financial Statements.
East/West
PJM
Capacity Market Reforms Filing— On December 19, 2019, FERC issued an order on the pending proposals to reform thePJM market to mitigate subsidized resources in the capacity market. FERC directed PJM to apply the Minimum Offer PriceRule, or MOPR, to new and existing resources receiving state subsidies and subject them to default offer floor prices in theircapacity bids. The Order provided for various category specific exemptions to the MOPR, as well as a unit specific exemption,which permits any resource that can justify an offer lower than the default offer price floor to submit such capacity bids to PJMfor review. As part of the December 19, 2019 FERC Order, FERC gave PJM 90 days to make a compliance filing and submittariff language to reflect the requirements of the Order and directed PJM to include in this filing a timetable for when itproposes to hold the previously postponed Base Residual Auctions for the 2022/2023 and 2023/2024 delivery years. Multipleparties filed for rehearing. Subjecting subsidized resources to default offer floors in the capacity market should protect themarket from further price suppression. The impact of these changes on capacity markets outcomes is dependent on, amongother factors, bidding behavior, load forecast changes, new resource entry, and existing resource exit.
PJM's Operating ORDC Filing — On March 29, 2019, PJM proposed energy and reserve market reforms to enhanceprice formation in reserve markets, which includes modifying its ORDC and aligning market-based reserve products in Day-Ahead and Real-Time markets. The matter is pending at FERC. If the proposal were approved as filed, energy and reservemarket prices could increase.
Independent Market Monitor Market Seller Offer Cap Complaint — On February 21, 2019, the Independent MarketMonitor filed a complaint alleging that the current Market Seller Offer Cap is too high. On April 9, 2019, PJM filed its answerarguing that as a threshold matter the Independent Market Monitor is not authorized to file a complaint against PJM and amongother things, that the Market Monitor failed to support its claim that the expected number of performance assessment hours usedto calculate the cap is overstated. The Company’s trade organization filed a protest in the docket echoing PJM’s concerns. The
17
Market Monitor subsequently filed answers in the docket and the docket remains pending. If the request is granted, defaultmarket offer caps could be lower.
PJM’s Fast Start Pricing Filing — On April 19, 2019, FERC ordered PJM to implement fast start pricing because itfound that the existing fast start pricing practices are unjust and unreasonable because they do not allow prices to reflect themarginal cost of serving load. PJM made its compliance filing on August 30, 2019. On January 23, 2020, FERC issued an orderholding the proceeding in abeyance until July 31, 2020, to allow PJM to consider changes to address FERC's concern about amismatch between dispatch and pricing. The changes could provide more accurate pricing to reflect the marginal cost of servingload.
New England
ISO-NE Retention of Mystic Units — ISO-NE is currently engaged in a proceeding at FERC regarding how to ensuresystem reliability in a gas-constrained system. In particular, FERC has approved ISO-NE's proposal to retain units at the Mysticgenerating station, which utilizes liquefied natural gas for fuel security. Among other things, FERC specifically will allowresources retained for fuel security to enter a zero bid in the Forward Capacity Auction, and also ordered ISO-NE to provide along-term market-based solution for fuel security. On January 2, 2019, multiple parties filed for rehearing. The motions forrehearing are pending at FERC. On January 10, 2020, FERC rejected Exelon's request to have the option to terminate thesecond year of its two-year cost of service agreement for Mystic units 8 and 9. The outcome of this matter may affect futurecapacity market prices.
ISO-NE Inventoried Energy Compensation Proposal — On March 25, 2019, ISO-NE proposed an interim measure toaddress near-term fuel security concerns. The proposal would provide payment for inventoried energy during winter months.NRG protested, among other things, the payment rate proposed by the ISO for inventoried energy. After ISO-NE supplementedits filings due to a deficiency notice from FERC, NRG filed comments to ISO-NE's response on June 27, 2019. On August 6,2019, FERC issued a notice stating that due to lack of quorum, ISO-NE's proposal became effective by operation of law.Multiple parties filed for rehearing. Those rehearings were denied. Subsequently, multiple parties filed an appeal of FERC'sOrder to the Court of Appeals for the D.C. Circuit. The case is pending. ISO-NE's proposal will affect future capacity marketprices and the compensation fuel secure units receive.
Connecticut Department of Energy and Environmental Protection Integrated Resource Plan Proceeding — InConnecticut's ongoing proceeding related to its Integrated Resource Plan, the Connecticut Department of Energy andEnvironmental Protection issued a notice of technical meeting and opportunity for public comment on January 8, 2020 seekingcomment on two issues: (1) the compatibility of state goals and those of ISO-NE and (2) the possibility of alternative marketdesigns that would be more in line with the state's goals. On January 22, 2020, NRG presented its thoughts and on February 5,2020, NRG filed comments advocating for competitive markets and proposed its competitive clean energy market design. OnFebruary 28, 2020, the Connecticut Departments of Energy and Environmental Protection will hold a second technical meeting.
New York
New York State Public Service Commission Retail Energy Market Proceedings — On February 23, 2016, the NYSPSCissued an order referred to as the Retail Reset Order. Among other things, the Retail Reset Order placed a price cap on energysupply offers and imposed burdensome new regulations on customers. Various parties have challenged the NYSPSC's authorityto regulate prices charged by competitive suppliers. On May 9, 2019 the New York Court of Appeals, the state’s highesttribunal, issued a decision affirming the NYSPSC’s authority to regulate ESCO’s prices as a condition of access to the utilities’infrastructure. In conjunction with the court challenge, the NYSPSC also noticed an evidentiary proceeding. On December 12,2019, the NYSPSC issued an order adopting changes to the retail access energy market based on the record in the evidentiaryproceeding. The Order limits ESCO offers to three compliant products: guaranteed savings from the utility default rate, a fixedterm capped at 5% of the rolling 12-month average utility default rate, or NY-sourced renewable energy that is at least 50%greater than the prevailing NY Renewable Energy Standard for load serving entities. The Order also establishes new ESCOeligibility criteria and certification process, as well as re-certification of current ESCOs. The NYSPSC ordered complianceeffective February 10, 2020. On January 13, 2020, multiple parties filed motions for rehearing and a stay of the Order. OnJanuary 17, 2020, NRG filed a request for a 90-day extension of the February 10, 2020 effective date, and, on January 22, 2020,the NYSPSC granted an extension for compliance to May 11, 2020. The limited offerings imposed by the Order, as issued, maynegatively impact the retail business.
New York State Public Service Commission Resource Adequacy Proceeding — On August 8, 2019, the NYSPSCestablished an investigation into New York's resource adequacy market design. On November 8, 2019, NRG filed commentsand recommendations, specifically putting forth NRG's Forward Clean Energy Market Proposal, that would allow New York tomaintain a reliable system while advancing its environmental goals. The proceeding is pending. Any actions taken by theNYSPSC could affect market design and market prices in New York.
18
Independent Power Producers of New York (IPPNY) Complaint — On February 20, 2020, FERC rejected a rehearingrequest asking FERC to direct NYISO to require that capacity from existing generation resources that would have exited themarket but for out-of-market payments be mitigated and found that NYISO complied with the initial order to establish astakeholder process to consider whether buyer side mitigation measures are needed to address these agreements. On January 9,2017, EPSA requested FERC to promptly direct NYISO to file tariff provisions to address pending market concerns related toout-of-market payments to existing generation in NYISO. On April 5, 2018, EPSA filed a motion for renewed request forexpedited action on the MOPR. Failure to implement buyer-side mitigation measures could result in uneconomic entry, whichartificially decreases capacity prices below competitive market levels.
New York Buyer Side Mitigation Proceedings — On February 20, 2020, FERC issued multiple orders pertaining to theNYISO capacity market. The orders narrowed certain exemptions to buyer side mitigation measures. Specifically, FERC statedthat certain renewable and self-supply resources would be exempt from offer floor mitigation but rejected NYISO’s proposal ofa 1,000 MW cap on renewable resources that could qualify for the exemption. FERC ordered NYISO to make a compliancefiling narrowly tailoring its cap. FERC also rejected a complaint to exempt new electric storage resources. It also rejected ablanket exemption to demand response providers currently subject to mitigation but granted a request for new demand responseto receive a blanket exemption from the buyer side mitigation measures. Implementation of buyer-side mitigation measures toaddress price suppression provides more accurate capacity price signals in the competitive market.
Texas
ORDC Reforms — In January 2019, the PUCT directed ERCOT to implement changes to its scarcity pricing structure,known as the ORDC, which is designed to increase the likelihood of scarcity pricing to support existing generation and newinvestment. The PUCT directed ORDC reforms to be implemented in two phases of gradually increasing magnitude. The firstphase became effective on March 1, 2019 and the second phase will become effective on March 1, 2020. To date, the ORDCreforms have produced a noticeable improvement in scarcity pricing.
Environmental Regulatory Matters
NRG is subject to numerous environmental laws in the development, construction, ownership and operation of powerplants. These laws generally require that governmental permits and approvals be obtained before construction and duringoperation of power plants. Federal and state environmental laws historically have become more stringent over time. Future lawsmay require the addition of emissions controls or other environmental controls or impose restrictions on the Company'soperations. Complying with environmental laws often involves significant capital and operating expenses, as well asoccasionally curtailing operations. NRG decides to invest capital for environmental controls based on the relative certainty ofthe requirements, an evaluation of compliance options, and the expected economic returns on capital.
A number of regulations that may affect the Company are under review by the EPA, including ash storage and disposalrequirements, NAAQS revisions and implementation and effluent limitation guidelines. NRG will evaluate the impact of theseregulations as they are revised but cannot fully predict the impact of each until anticipated revisions and legal challenges areresolved.
Air
The CAA and the resulting regulations (as well as similar state and local requirements) have the potential to affect airemissions, operating practices and pollution control equipment required at power plants. Under the CAA, the EPA sets NAAQSfor certain pollutants including SO2, ozone, and PM2.5. Many of the Company's facilities are located in or near areas that areclassified by the EPA as not achieving certain NAAQS (non-attainment areas). The relevant NAAQS have become morestringent. The Company maintains a comprehensive compliance strategy to address continuing and new requirements.Complying with increasingly stringent air regulations could require the installation of additional emissions control equipment atsome NRG facilities or retiring of units if installing such controls is not economic. Significant changes to air regulatoryprograms affecting the Company are described below.
Clean Power Plan — The attention in recent years on GHG emissions has resulted in federal regulations and statelegislative and regulatory action. In October 2015, the EPA finalized the CPP, addressing GHG emissions from existing EGUs.On February 9, 2016, the U.S. Supreme Court stayed the CPP. In July 2019, EPA promulgated the ACE rule, which rescindedthe CPP, which sought to broadly regulate CO2 emissions from the power sector. The ACE rule requires states that have coal-fired EGUs to develop plans to seek heat rate improvements from coal-fired EGUs. Texas, Illiniois and Delaware have startedworking on plans to comply with the ACE rule. Numerous parties have challenged the ACE rule in the D.C. Circuit andnumerous parties have filed petitions for reconsideration with the EPA.
19
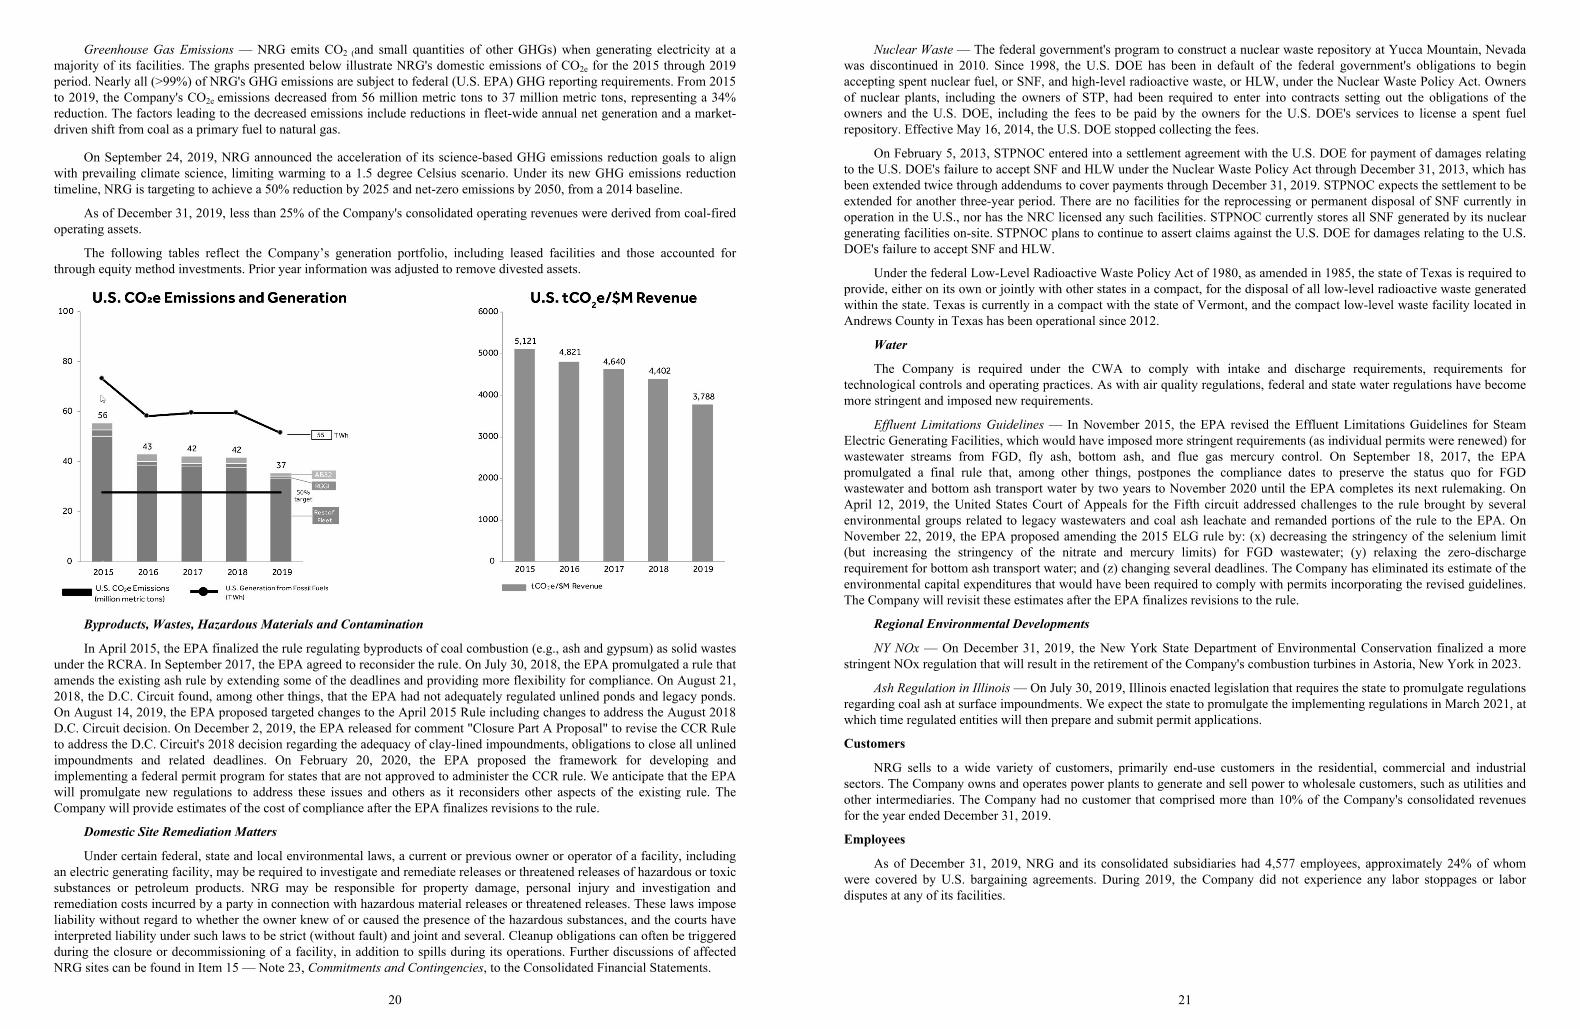
Greenhouse Gas Emissions — NRG emits CO2 (and small quantities of other GHGs) when generating electricity at amajority of its facilities. The graphs presented below illustrate NRG's domestic emissions of CO2e for the 2015 through 2019period. Nearly all (>99%) of NRG's GHG emissions are subject to federal (U.S. EPA) GHG reporting requirements. From 2015to 2019, the Company's CO2e emissions decreased from 56 million metric tons to 37 million metric tons, representing a 34%reduction. The factors leading to the decreased emissions include reductions in fleet-wide annual net generation and a market-driven shift from coal as a primary fuel to natural gas.
On September 24, 2019, NRG announced the acceleration of its science-based GHG emissions reduction goals to alignwith prevailing climate science, limiting warming to a 1.5 degree Celsius scenario. Under its new GHG emissions reductiontimeline, NRG is targeting to achieve a 50% reduction by 2025 and net-zero emissions by 2050, from a 2014 baseline.
As of December 31, 2019, less than 25% of the Company's consolidated operating revenues were derived from coal-firedoperating assets.
The following tables reflect the Company’s generation portfolio, including leased facilities and those accounted forthrough equity method investments. Prior year information was adjusted to remove divested assets.
Byproducts, Wastes, Hazardous Materials and Contamination
In April 2015, the EPA finalized the rule regulating byproducts of coal combustion (e.g., ash and gypsum) as solid wastesunder the RCRA. In September 2017, the EPA agreed to reconsider the rule. On July 30, 2018, the EPA promulgated a rule thatamends the existing ash rule by extending some of the deadlines and providing more flexibility for compliance. On August 21,2018, the D.C. Circuit found, among other things, that the EPA had not adequately regulated unlined ponds and legacy ponds.On August 14, 2019, the EPA proposed targeted changes to the April 2015 Rule including changes to address the August 2018D.C. Circuit decision. On December 2, 2019, the EPA released for comment "Closure Part A Proposal" to revise the CCR Ruleto address the D.C. Circuit's 2018 decision regarding the adequacy of clay-lined impoundments, obligations to close all unlinedimpoundments and related deadlines. On February 20, 2020, the EPA proposed the framework for developing andimplementing a federal permit program for states that are not approved to administer the CCR rule. We anticipate that the EPAwill promulgate new regulations to address these issues and others as it reconsiders other aspects of the existing rule. TheCompany will provide estimates of the cost of compliance after the EPA finalizes revisions to the rule.
Domestic Site Remediation Matters
Under certain federal, state and local environmental laws, a current or previous owner or operator of a facility, includingan electric generating facility, may be required to investigate and remediate releases or threatened releases of hazardous or toxicsubstances or petroleum products. NRG may be responsible for property damage, personal injury and investigation andremediation costs incurred by a party in connection with hazardous material releases or threatened releases. These laws imposeliability without regard to whether the owner knew of or caused the presence of the hazardous substances, and the courts haveinterpreted liability under such laws to be strict (without fault) and joint and several. Cleanup obligations can often be triggeredduring the closure or decommissioning of a facility, in addition to spills during its operations. Further discussions of affectedNRG sites can be found in Item 15 — Note 23, Commitments and Contingencies, to the Consolidated Financial Statements.
20
Nuclear Waste — The federal government's program to construct a nuclear waste repository at Yucca Mountain, Nevadawas discontinued in 2010. Since 1998, the U.S. DOE has been in default of the federal government's obligations to beginaccepting spent nuclear fuel, or SNF, and high-level radioactive waste, or HLW, under the Nuclear Waste Policy Act. Ownersof nuclear plants, including the owners of STP, had been required to enter into contracts setting out the obligations of theowners and the U.S. DOE, including the fees to be paid by the owners for the U.S. DOE's services to license a spent fuelrepository. Effective May 16, 2014, the U.S. DOE stopped collecting the fees.
On February 5, 2013, STPNOC entered into a settlement agreement with the U.S. DOE for payment of damages relatingto the U.S. DOE's failure to accept SNF and HLW under the Nuclear Waste Policy Act through December 31, 2013, which hasbeen extended twice through addendums to cover payments through December 31, 2019. STPNOC expects the settlement to beextended for another three-year period. There are no facilities for the reprocessing or permanent disposal of SNF currently inoperation in the U.S., nor has the NRC licensed any such facilities. STPNOC currently stores all SNF generated by its nucleargenerating facilities on-site. STPNOC plans to continue to assert claims against the U.S. DOE for damages relating to the U.S.DOE's failure to accept SNF and HLW.
Under the federal Low-Level Radioactive Waste Policy Act of 1980, as amended in 1985, the state of Texas is required toprovide, either on its own or jointly with other states in a compact, for the disposal of all low-level radioactive waste generatedwithin the state. Texas is currently in a compact with the state of Vermont, and the compact low-level waste facility located inAndrews County in Texas has been operational since 2012.
Water
The Company is required under the CWA to comply with intake and discharge requirements, requirements fortechnological controls and operating practices. As with air quality regulations, federal and state water regulations have becomemore stringent and imposed new requirements.
Effluent Limitations Guidelines — In November 2015, the EPA revised the Effluent Limitations Guidelines for SteamElectric Generating Facilities, which would have imposed more stringent requirements (as individual permits were renewed) forwastewater streams from FGD, fly ash, bottom ash, and flue gas mercury control. On September 18, 2017, the EPApromulgated a final rule that, among other things, postpones the compliance dates to preserve the status quo for FGDwastewater and bottom ash transport water by two years to November 2020 until the EPA completes its next rulemaking. OnApril 12, 2019, the United States Court of Appeals for the Fifth circuit addressed challenges to the rule brought by severalenvironmental groups related to legacy wastewaters and coal ash leachate and remanded portions of the rule to the EPA. OnNovember 22, 2019, the EPA proposed amending the 2015 ELG rule by: (x) decreasing the stringency of the selenium limit(but increasing the stringency of the nitrate and mercury limits) for FGD wastewater; (y) relaxing the zero-dischargerequirement for bottom ash transport water; and (z) changing several deadlines. The Company has eliminated its estimate of theenvironmental capital expenditures that would have been required to comply with permits incorporating the revised guidelines.The Company will revisit these estimates after the EPA finalizes revisions to the rule.
Regional Environmental Developments
NY NOx — On December 31, 2019, the New York State Department of Environmental Conservation finalized a morestringent NOx regulation that will result in the retirement of the Company's combustion turbines in Astoria, New York in 2023.
Ash Regulation in Illinois— On July 30, 2019, Illinois enacted legislation that requires the state to promulgate regulationsregarding coal ash at surface impoundments. We expect the state to promulgate the implementing regulations in March 2021, atwhich time regulated entities will then prepare and submit permit applications.
Customers
NRG sells to a wide variety of customers, primarily end-use customers in the residential, commercial and industrialsectors. The Company owns and operates power plants to generate and sell power to wholesale customers, such as utilities andother intermediaries. The Company had no customer that comprised more than 10% of the Company's consolidated revenuesfor the year ended December 31, 2019.
Employees
As of December 31, 2019, NRG and its consolidated subsidiaries had 4,577 employees, approximately 24% of whomwere covered by U.S. bargaining agreements. During 2019, the Company did not experience any labor stoppages or labordisputes at any of its facilities.
21
Available Information
NRG's annual reports on Form 10-K, quarterly reports on Form 10-Q, current reports on Form 8-K, and amendments tothose reports filed or furnished pursuant to section 13(a) or 15(d) of the Exchange Act are available free of charge through theSEC's website, www.sec.gov, and through the Company's website, www.nrg.com, as soon as reasonably practicable after theyare electronically filed with, or furnished to, the SEC. The Company also routinely posts press releases, presentations, webcasts,sustainability reports and other information regarding the Company on the Company's website. The information posted on theCompany's website is not a part of this report.
22
Item 1A — Risk Factors
Risks Related to the Operation of NRG's Business
NRG's financial performance may be impacted by price fluctuations in the retail and wholesale power and natural gasmarkets, as well as fluctuations in coal and oil markets and other market factors that are beyond the Company's control.
Market prices for power, capacity, ancillary services, natural gas, coal and oil are unpredictable and tend to fluctuatesubstantially. Unlike most other commodities, electric power can only be stored on a very limited basis and generally must beproduced concurrently with its use. As a result, power prices are subject to significant volatility due to supply and demandimbalances, especially in the day-ahead and spot markets. Long- and short-term power prices may also fluctuate substantiallydue to other factors outside of the Company's control, including:
• changes in generation capacity in the Company’s markets, including the addition of new supplies of power as a result of the development of new plants, expansion of existing plants, the continued operation of uneconomic power plants due to state subsidies, or additional transmission capacity;
• environmental regulations and legislation;• electric supply disruptions, including plant outages and transmission disruptions;• changes in power transmission infrastructure;• fuel transportation capacity constraints or inefficiencies;• changes in law, including judicial decisions;• weather conditions, including extreme weather conditions and seasonal fluctuations, including the effects of climate
change;• changes in commodity prices and the supply of commodities, including but not limited to natural gas, coal and oil;• changes in the demand for power or in patterns of power usage, including the potential development of demand-side
management tools and practices, distributed generation, and more efficient end-use technologies;• development of new fuels, new technologies and new forms of competition for the production of power;• fuel price volatility;• economic and political conditions;• regulations and actions of the ISOs and RTOs; • federal and state power regulations and legislation;• changes in prices related to RECs; and• changes in capacity prices and capacity markets.
While retail rates are generally designed to allow retail sellers of electricity and natural gas to pass through pricefluctuations, the Company may not be able to pass through all such fluctuations to customers. For example, the Companyengages in some sales of power at fixed prices. Additionally, increases in wholesale costs to retail customers may causeadditional customer defaults or increased customer attrition, or may be limited by regulatory rules.
Such factors and the associated fluctuations in power prices have affected the Company's wholesale and retail profitabilityin the past and will continue to do so in the future.
Volatile power supply costs and demand for power could adversely affect the financial performance of NRG's retailbusinesses.
Although NRG is the primary provider of its retail businesses' wholesale electricity supply requirements, the retailbusinesses purchase a significant portion of their supply requirements from third parties. As a result, financial performancedepends on the ability to obtain adequate supplies of electric generation from third parties at prices below the prices it chargesits customers. Consequently, the Company's earnings and cash flows could be adversely affected in any period in which theretail businesses' wholesale electricity supply costs rise at a greater rate than the rates it charges to customers. The price ofwholesale electricity supply purchases associated with the retail businesses' energy commitments can be different than thatreflected in the rates charged to customers due to, among other factors:
• varying supply procurement contracts used and the timing of entering into related contracts;• subsequent changes in the overall price of natural gas;• daily, monthly or seasonal fluctuations in the price of natural gas relative to the 12-month forward prices;• transmission constraints and the Company's ability to move power to its customers; and• changes in market heat rate (i.e., the relationship between power and natural gas prices).
23
The retail businesses' earnings and cash flows could also be adversely affected in any period in which its customers' actualusage of electricity significantly varies from the forecasted usage, which could occur due to, among other factors, weatherevents, changes in usage patterns, competition and economic conditions.
Some of NRG's businesses operate, wholly or partially, without long-term power sale agreements.
Some of NRG's businesses operate without long-term contracts. Many of NRG’s retail customers are contracted for aperiod of one year or less, and NRG may or may not hedge its retail power sales exposure, or may hedge in a manner that is noteffective at managing quantity or price risk in the retail market. Many of NRG’s generation facilities operate as "merchant"facilities without long-term power sales agreements for some or all of their generating capacity and output and therefore areexposed to market fluctuations. Without the benefit of long-term power sales or purchase agreements, and without long-termload obligations, NRG cannot be sure that it will be able to sell or purchase power at commercially attractive rates or that itsgeneration facilities will be able to operate profitably. This could lead to future impairments of the Company's property, plantand equipment, the closing of certain of its facilities or the loss of retail customers, which could have a material adverse effecton the Company's results of operations, financial condition or cash flows.
The Company's retail businesses may lose a significant number of retail customers or acquire less customers thanforecasted due to competitive marketing activity by other retail electricity providers or competition with or disruptions to oursales partners, which could adversely affect the financial performance of the Company's retail businesses.
The Company's retail businesses face competition for customers. Competitors may offer different products, lower prices,and other incentives, which may attract customers away from NRG's retail businesses. In some retail electricity markets, theprincipal competitor may be the incumbent utility. The incumbent utility has the advantage of long-standing relationships withits customers and strong brand recognition. Furthermore, NRG's retail businesses may face competition from a number of otherenergy service providers, other energy industry participants, or nationally branded providers of consumer products and services,who may develop businesses that will compete with NRG and its retail businesses.
NRG's costs, results of operations, financial condition and cash flows could be adversely impacted by disruption of its fuelsupplies.
NRG relies on natural gas, coal and oil to fuel a majority of its power generation facilities. Its retail operations canlikewise be affected by changes in commodity costs. Grid operations depend on the continuing financial viability of contractualcounterparties, as well as the infrastructure (including rail lines, rail cars, barge facilities, roadways, riverways and natural gaspipelines) available to serve generation facilities and to ensure that there is sufficient power produced to meet retail demand. Asa result, the Company’s wholesale generation facilities are subject to the risks of disruptions or curtailments in the production ofpower at its generation facilities if no fuel is available at any price, if a counterparty fails to perform or if there is a disruption inthe fuel delivery infrastructure. The Company’s retail operations are likewise subject to many of the same constraints.
NRG routinely hedges both its wholesale sales and purchases to support its retail load obligations. In order to hedge theseobligations, the Company may enter into long-term and short-term contracts for the purchase and delivery of fuel. Many of theforward power sales contracts do not allow the Company to pass through changes in fuel costs or discharge the power saleobligations in the case of a disruption in fuel supply due to force majeure events or the default of a fuel supplier or transporter.Disruptions in the Company's fuel supplies or power supply arrangements may therefore require it to find alternative fuelsources at higher costs, to find other sources of power to deliver to retail customers or other counterparties at a higher cost, or topay damages to counterparties for failure to deliver power or sell electricity or natural gas as contracted. Any such event couldhave a material adverse effect on the Company's financial performance.
24
NRG also buys significant quantities of electricity and fuel on a short-term or spot market basis. Prices sometimes rise orfall significantly over a relatively short period of time. The price NRG can obtain for the sale of energy may not rise at the samerate, or may not rise at all, to match a rise in fuel or delivery costs. Retail rates may also not rise at the same rate or may not riseat all. This may have a material adverse effect on the Company's financial performance. Changes in market prices forelectricity, natural gas, coal and oil may result from the following:
• weather conditions;• seasonality;• demand for energy commodities and general economic conditions;• disruption or other constraints or inefficiencies of electricity, gas or coal transmission or transportation;• additional generating capacity;• availability and levels of storage and inventory for fuel stocks;• natural gas, crude oil, refined products and coal production levels;• changes in market liquidity;• federal, state and foreign governmental regulation and legislation; and• the creditworthiness and liquidity and willingness of fuel suppliers/transporters to do business with the Company.
NRG's plant operating characteristics and equipment, particularly at its coal-fired plants, often dictate the specific fuelquality to be combusted. The availability and price of specific fuel qualities may vary due to supplier financial or operationaldisruptions, transportation disruptions and force majeure. At times, coal of specific quality may not be available at any price orthe Company may not be able to transport such coal to its facilities on a timely basis. In this case, the Company may not be ableto run the coal facility even if it would be profitable. Operating a coal facility with different quality coal can lead to emission oroperating problems. If the Company had sold forward the power from such a coal facility, it could be required to supply orpurchase power from alternate sources, perhaps at a loss. This could have a material adverse impact on the financial results ofspecific plants and on the Company's results of operations.
Changes in the price of coal and natural gas could cause the Company to hold excess coal inventories and incur contracttermination costs.
Low natural gas prices can cause natural gas to be the more cost-competitive fuel compared to coal for generatingelectricity. Because the Company enters into guaranteed supply contracts to provide for the amount of coal needed to operate itsbase load coal-fired generating facilities, the Company may experience periods where it holds excess amounts of coal if fuelpricing results in the Company reducing or idling coal-fired generating facilities. In addition, the Company may incur costs toterminate supply contracts for coal in excess of its generating requirements.
NRG's trading operations and use of hedging agreements could result in financial losses that negatively impact its results ofoperations.
The Company typically enters into hedging agreements, including contracts to purchase or sell commodities at futuredates and at fixed prices, to manage the commodity price risks inherent in its power generation and retail operations. TheCompany’s risk management policies and hedging procedures may not mitigate risk as planned, and the Company may fail tofully or effectively hedge its commodity supply and price risk. In addition, these activities, although intended to mitigate pricevolatility, expose the Company to other risks. When the Company sells or buys power forward, it gives up the opportunity tobuy or sell power at the future price, which not only may result in lost opportunity costs but also may require the Company topost significant amounts of cash collateral or other credit support to its counterparties. The Company also relies on counterpartyperformance under its hedging agreements and is exposed to the credit quality of its counterparties under those agreements.Further, if the values of the financial contracts change in a manner that the Company does not anticipate, or if a counterpartyfails to perform under a contract, it could harm the Company's business, operating results or financial position.
NRG does not typically hedge the entire exposure of its operations against commodity price volatility. To the extent itdoes not hedge against commodity price volatility, the Company's results of operations and financial position may be improvedor diminished based upon movement in commodity prices.
NRG may engage in trading activities, including the trading of power, fuel and emissions allowances that are not directlyrelated to the operation of the Company's generation facilities or the management of related risks. These trading activities takeplace in volatile markets and some of these trades could be characterized as speculative. The Company would expect to settlethese trades financially rather than through the production of power or the delivery of fuel. This trading activity may expose theCompany to the risk of significant financial losses which could have a material adverse effect on its business and financialcondition.
25
There may be periods when NRG will not be able to meet its commitments under forward sale or purchase obligations at areasonable cost or at all.
The Company may sell fixed price gas as a proxy for power. Because the obligations under most of the Company'sforward sale agreements are not contingent on a unit being available to generate power, NRG is generally required to deliverpower to the buyer, even in the event of a plant outage, fuel supply disruption or a reduction in the available capacity of theunit. To the extent that the Company does not have sufficient lower-cost capacity to meet its commitments under its forwardsale obligations, the Company would be required to supply replacement power either by running its other, higher cost powerplants or by obtaining power from third-party sources at market prices that could substantially exceed the contract price. IfNRG fails to deliver the contracted power, it would be required to pay the difference between the market price at the deliverypoint and the contract price, and the amount of such payments could be substantial.
NRG may not have sufficient liquidity to hedge market risks effectively.
The Company is exposed to market risks through its retail and wholesale operations, which involve the purchase ofelectricity for resale, the sale of energy, capacity and related products, and the purchase and sale of fuel, transmission servicesand emission allowances. These market risks include, among other risks, volatility arising from location and timing differencesthat may be associated with buying and transporting fuel, converting fuel into energy and delivering energy to a buyer.
NRG undertakes these market activities through agreements with various counterparties. Many of the Company'sagreements with counterparties include provisions that require the Company to provide guarantees, offset or nettingarrangements, letters of credit, a first lien on assets and/or cash collateral to protect the counterparties against the risk of theCompany's default or insolvency. The amount of such credit support that must be provided typically is based on the differencebetween the price of the commodity in a given contract and the market price of the commodity. Significant movements inmarket prices can result in the Company being required to provide cash collateral and letters of credit in very large amounts.The effectiveness of the Company's strategy may depend on the amount of collateral available to enter into or maintain thesecontracts, and liquidity requirements may be greater than the Company anticipates or will be able to meet. Without a sufficientamount of working capital to post as collateral in support of performance guarantees or as a cash margin, the Company may notbe able to manage price volatility effectively or to implement its strategy. An increase in the amount of letters of credit or cashcollateral required to be provided to the Company's counterparties may negatively affect the Company's liquidity and financialcondition.
Further, if any of NRG's facilities experience unplanned outages or if retail customers use more power than expected, theCompany may be required to procure additional power at spot market prices to fulfill contractual commitments. Withoutadequate liquidity to meet margin and collateral requirements, the Company may be exposed to significant losses, may misssignificant opportunities, and may have increased exposure to the volatility of spot markets.
The accounting for NRG's hedging activities may increase the volatility in the Company's quarterly and annual financialresults.
NRG engages in commodity-related marketing and price-risk management activities in order to financially hedge itsexposure to market risk with respect to electricity sales from its generation assets, fuel utilized by those assets and emissionallowances, as well as retail sales of electricity.
NRG generally attempts to balance its fixed-price physical and financial purchases and sales commitments in terms ofcontract volumes and the timing of performance and delivery obligations through the use of financial and physical derivativecontracts. These derivatives are accounted for in accordance with the FASB ASC 815, Derivatives and Hedging, or ASC 815,which requires the Company to record all derivatives on the balance sheet at fair value with changes in the fair value resultingfrom fluctuations in the underlying commodity prices immediately recognized in earnings, unless the derivative qualifies forcash flow hedge accounting treatment. Whether a derivative qualifies for cash flow hedge accounting treatment depends upon itmeeting specific criteria used to determine if the cash flow hedge is and will remain appropriate for the term of the derivative.All economic hedges may not necessarily qualify for cash flow hedge accounting treatment. As a result, the Company'squarterly and annual results are subject to significant fluctuations caused by changes in market prices.
Competition in power markets may have a material adverse effect on NRG's results of operations, cash flows and the marketvalue of its assets.
NRG has numerous competitors in all aspects of its business, and additional competitors may enter the industry. Newparties may offer retail electricity bundled with other products or at prices that are below the Company’s rates.
Because many of the Company's facilities are older, newer plants owned by the Company's competitors are often moreefficient than NRG's aging plants, which may put some of the Company's plants at a competitive disadvantage to the extent theCompany's competitors are able to consume the same or less fuel as the Company's plants consume. Over time, the Company'splants may be squeezed out of their markets or may be unable to compete with these more efficient plants.
26
Other companies with which NRG competes may have greater liquidity, greater access to credit and other financialresources, lower cost structures, more effective risk management policies and procedures, greater ability to incur losses, longer-standing relationships with customers, greater potential for profitability from retail sales or greater flexibility in the timing oftheir sale of generation capacity and ancillary services than NRG does. Competitors may also have better access to subsidies orother out-of-market payments that put NRG at a competitive disadvantage.
NRG's competitors may be able to respond more quickly to new laws or regulations or emerging technologies, or todevote greater resources to marketing of retail power than NRG can. In addition, current and potential competitors may makestrategic acquisitions or establish cooperative relationships among themselves or with third parties. Accordingly, it is possiblethat new competitors or alliances among current and new competitors may emerge and rapidly gain significant market share.There can be no assurance that NRG will be able to compete successfully against current and future competitors, and any failureto do so would have a material adverse effect on the Company's business, financial condition, results of operations and cashflow.
Operation of power generation facilities involves significant risks and hazards customary to the power industry that couldhave a material adverse effect on NRG's revenues and results of operations, and NRG may not have adequate insurance tocover these risks and hazards.
The ongoing operation of NRG's facilities involves risks that include the breakdown or failure of equipment or processes,performance below expected levels of output or efficiency and the inability to transport the Company's product to its customersin an efficient manner due to a lack of transmission capacity. Unplanned outages of generating units, including extensions ofscheduled outages due to mechanical failures or other problems occur from time to time and are an inherent risk of theCompany's business. Unplanned outages typically increase the Company's operation and maintenance expenses and may reducethe Company's revenues as a result of selling fewer MWh or non-performance penalties or require NRG to incur significantcosts as a result of running one of its higher cost units or obtaining replacement power from third parties in the open market tosatisfy the Company's forward power sales obligations. NRG's inability to operate the Company's plants efficiently, managecapital expenditures and costs, and generate earnings and cash flow from the Company's asset-based businesses could have amaterial adverse effect on the Company's results of operations, financial condition or cash flows. While NRG maintainsinsurance, obtains warranties from vendors and obligates contractors to meet certain performance levels, the proceeds of suchinsurance, warranties or performance guarantees may not be adequate to cover the Company's lost revenues, increased expensesor liquidated damages payments should the Company experience equipment breakdown or non-performance by contractors orvendors.
In addition, NRG provides plant operations and commercial services to a variety of third-parties. There is a risk thatmistakes, mis-operations, or actions taken by these third-parties could be attributed to NRG, including the risk of investigationor penalties being assessed to NRG in connection with the services it offers, or that regulators could question whether NRG hadthe appropriate safeguards in place.
Power generation involves hazardous activities, including acquiring, transporting and unloading fuel, operating largepieces of rotating equipment and delivering electricity to transmission and distribution systems. In addition to natural risks suchas earthquake, flood, lightning, hurricane and wind, other hazards, such as fire, explosion, structural collapse and machineryfailure are inherent risks in the Company's operations. These and other hazards can cause significant personal injury or loss oflife, severe damage to and destruction of property, plant and equipment, contamination of, or damage to, the environment andsuspension of operations. The occurrence of any one of these events may result in NRG being named as a defendant in lawsuitsasserting claims for substantial damages, including for environmental cleanup costs, personal injury and property damage andfines and/or penalties. NRG maintains an amount of insurance protection that it considers adequate, but the Company cannotprovide any assurance that its insurance will be sufficient or effective under all circumstances and against all hazards orliabilities to which it may be subject. A successful claim for which the Company is not fully insured could hurt its financialresults and materially harm NRG's financial condition. NRG cannot provide any assurance that its insurance coverage willcontinue to be available at all or at rates or on terms similar to those presently available. Any losses not covered by insurancecould have a material adverse effect on the Company's financial condition, results of operations or cash flows.
Maintenance, expansion and refurbishment of power generation facilities involve significant risks that could result inunplanned power outages or reduced output and could have a material adverse effect on NRG's results of operations, cashflows and financial condition.
Many of NRG's facilities require periodic maintenance and repair. Any unexpected failure, including failure associatedwith breakdowns, forced outages or any unanticipated capital expenditures could result in reduced profitability.
NRG cannot be certain of the level of capital expenditures that will be required due to changing environmental and safetylaws (including changes in the interpretation or enforcement thereof), needed facility repairs and unexpected events (such asnatural disasters or terrorist attacks). The unexpected requirement of large capital expenditures could have a material adverseeffect on the Company's liquidity and financial condition.
27
If NRG significantly modifies a unit, the Company may be required to install the best available control technology or toachieve the lowest achievable emission rates as such terms are defined under the new source review provisions of the CAA,which would likely result in substantial additional capital expenditures.
NRG and its subsidiaries have guaranteed the performance of third parties, which may result in substantial costs in theevent of non-performance.
NRG and its subsidiaries have issued certain guarantees of the performance of others, which obligate NRG and itssubsidiaries to perform in the event that the third parties do not perform. In the event of non-performance by the third parties,NRG could incur substantial cost to fulfill their obligations under these guarantees. Such performance guarantees could have amaterial impact on the operating results, financial condition, or cash flows of the Company.
Supplier and/or customer concentration at certain of NRG's facilities may expose the Company to significant financialcredit or performance risks.
NRG often relies on a single contracted supplier or a small number of suppliers for the provision of fuel, transportation offuel, chemicals and other services required for the operation of certain of its facilities. If these suppliers cannot perform, theCompany utilizes the marketplace to provide these services. There can be no assurance that the marketplace can provide theseservices as, when and where required or at comparable prices.
At times, NRG may rely on a single customer or a few customers to purchase all or a significant portion of a facility'soutput, in some cases under long-term agreements that account for a substantial percentage of the anticipated revenue from agiven facility. The Company has also hedged a portion of its exposure to power price fluctuations through forward fixed pricepower sales and natural gas price swap agreements. Counterparties to these agreements may breach or may be unable toperform their obligations. NRG may not be able to enter into replacement agreements on terms as favorable as its existingagreements, or at all. If the Company was unable to enter into replacement PPAs, the Company would sell its plants' power atmarket prices. If the Company is unable to enter into replacement fuel or fuel transportation purchase agreements, NRG wouldseek to purchase the Company's fuel requirements at market prices, exposing the Company to market price volatility and therisk that fuel and transportation may not be available during certain periods at any price.
The failure of any supplier or customer to fulfill its contractual obligations to NRG could have a material adverse effect onthe Company's financial results. Consequently, the financial performance of the Company's facilities is dependent on the creditquality of, and continued performance by, suppliers and customers.
Reliance on power purchase agreements for renewable generation may expose the Company to significant financial andperformance risks.
NRG may rely on a few counterparties, in some cases under mid to long-term agreements, to purchase all or a significantportion of the Company's renewable power requirements. In many cases, these purchases are specific to a facility, which attimes may be in the early stages of development. Counterparties to these agreements may breach or be unable to perform theirobligations and may be subject to additional risks, such as a facility development and transmission risks, unfavorable weatherand atmospheric conditions, and mechanical or operational failures. NRG may not be able to enter into replacement agreementsor replace expected generation on terms as favorable as its existing agreements, or at all.
NRG relies on power transmission and distribution facilities that it does not own or control and that are subject totransmission constraints within a number of the Company's core regions.
NRG depends on transmission and distribution facilities owned and operated by others to deliver power to its customers.If transmission or distribution is disrupted, including by force majeure events, or if the transmission or distributioninfrastructure is inadequate, NRG's ability to deliver power may be adversely impacted. The Company also cannot predictwhether transmission or distribution facilities will be expanded in specific markets to accommodate competitive access to thosemarkets.
In addition, in certain of the markets in which NRG operates, energy transmission congestion may occur and theCompany may be deemed responsible for congestion costs associated with power sales or purchases, or retail sales, particularlywhere the Company’s load is not co-located with its retail sales obligations. If NRG were liable for such congestion costs, theCompany's financial results could be adversely affected.
28
NRG adopted and substantially completed the Transformation Plan. If the Transformation Plan does not achieve itsexpected benefits, there could be negative impacts to NRG’s business, results of operations and financial condition.
NRG adopted the Transformation Plan in 2017, designed to significantly strengthen earnings and cost competitiveness,lower risk and volatility, and create significant shareholder value. The three-part, three-year plan is comprised of the followingcomponents: (i) operations and cost excellence; (ii) portfolio optimization; and (iii) capital structure and allocationenhancements. NRG has substantially completed the Transformation Plan, with the exception of the margin enhancementactivities that are ongoing in 2020.
NRG may be unable to fully implement the remaining margin enhancement activities under the Transformation Plan, inwhich case, NRG would not realize the full anticipated benefits. Alternatively, components of the Transformation Plan alreadyimplemented may not result in the anticipated benefits to NRG’s business, results of operations and financial condition in atimely manner if at all. Further, NRG could experience unexpected delays, business disruptions resulting from supporting theseinitiatives during and following completion of these activities, decreased productivity, adverse effects on employee morale andemployee turnover as a result of such initiatives, any of which may impair NRG’s ability to achieve anticipated results orotherwise harm NRG’s business, results of operations and financial condition.
Because NRG owns less than a majority of the ownership interests of some of its project investments, the Company cannotexercise complete control over their operations.
NRG has limited control over the operation of some project investments and joint ventures because the Company'sinvestments are in projects where it beneficially owns less than a majority of the ownership interests. NRG seeks to exert adegree of influence with respect to the management and operation of projects in which it owns less than a majority of theownership interests by negotiating to obtain positions on management committees or to receive certain limited governancerights, such as rights to veto significant actions. However, the Company may not always succeed in such negotiations. NRGmay be dependent on its co-venturers to operate such projects. The Company's co-venturers may not have the level ofexperience, technical expertise, human resources management and other attributes necessary to operate these projects optimally.The approval of co-venturers also may be required for NRG to receive distributions of funds from projects or to transfer theCompany's interest in projects.
NRG may be unable to integrate the operations of acquired entities in the manner expected.
NRG enters into acquisitions that result in various benefits, including, among other things, cost savings and operatingefficiencies. Achieving the anticipated benefits of these acquisitions depends on whether the businesses can be integrated intoNRG in an efficient and effective manner. The integration process could take longer than anticipated and could result in the lossof valuable employees, the disruption of NRG's businesses, processes and systems or inconsistencies in standards, controls,procedures, practices, policies and compensation arrangements, any of which could adversely affect the Company's ability toachieve the anticipated benefits of the acquisitions. NRG may have difficulty addressing possible differences in corporatecultures and management philosophies. Failure to achieve these anticipated benefits could result in increased costs or decreasesin the amount of expected revenues and could adversely affect NRG's future business, financial condition, operating results andprospects.
Future acquisition or disposition activities could involve unknown risks and may have materially adverse effects and NRGmay be subject to trailing liabilities from businesses that it disposes of or that are inactive.
NRG may in the future make acquisitions or dispositions of businesses or assets, acquire or sell books of retail customers,or pursue other business activities, directly or indirectly through subsidiaries, that involve a number of risks. The acquisition ofcompanies and assets is subject to substantial risks, including the failure to identify material problems during due diligence, therisk of over-paying for assets or customers, the ability to retain customers and the inability to arrange financing for anacquisition as may be required or desired. Further, the integration and consolidation of acquisitions requires substantial human,financial and other resources and, ultimately, the Company's acquisitions may not be successfully integrated. In the case ofdispositions, such risks may relate to employment matters, counterparties, regulators and other stakeholders in the disposedbusiness, risks relating to separating the disposed assets from NRG’s business, risks related to the management of NRG’songoing business, risks unknown to NRG at the time, and other financial, legal and operational risks related to such disposition.In addition, NRG may be subject to material trailing liabilities from disposed businesses such as NRG Yield, Inc., and itsRenewables Platform. Any such risk may result in one or more costly disputes or litigation. There can be no assurances that anyfuture acquisitions will perform as expected or that the returns from such acquisitions will support the indebtedness incurred toacquire them or the capital expenditures needed to develop them. There can also be no assurances that NRG will realize theanticipated benefits from any such dispositions. The failure to realize the anticipated returns or benefits from an acquisition ordisposition could adversely affect NRG's results of operations, cash flows and financial condition.
29
NRG's business, financial condition and results of operations could be adversely impacted by strikes or work stoppages by itsunionized employees or inability to replace employees as they retire.
As of December 31, 2019, approximately 24% of NRG's employees were covered by collective bargaining agreements. Inthe event that the Company's union employees strike, participate in a work stoppage or slowdown or engage in other forms oflabor strife or disruption, NRG would be responsible for procuring replacement labor or the Company could experience reducedpower generation or outages. Although NRG's ability to procure such labor is uncertain, contingency staffing planning iscompleted as part of each respective contract negotiations. Strikes, work stoppages or the inability to negotiate future collectivebargaining agreements on favorable terms could have a material adverse effect on the Company's business, financial condition,results of operations and cash flows. In addition, a number of the Company's employees at NRG's plants are close to retirement.The Company's inability to replace retiring workers could create potential knowledge and expertise gaps as such workers retire.
Changes in technology may impair the value of NRG's power plants and the attractiveness of its retail products.
Research and development activities are ongoing in the industry to provide alternative and more efficient technologies toproduce power, including wind, photovoltaic (solar) cells, energy storage, and improvements in traditional technologies andequipment, such as more efficient gas turbines. Advances in these or other technologies could reduce the costs of powerproduction to a level below what the Company has currently forecasted, which could adversely affect its cash flows, results ofoperations or competitive position. Technology, including distributed technology or changes in retail rate structures, may alsohave a material impact on the Company’s ability to retain retail customers.
The Company may potentially be affected by emerging technologies that may over time affect change in capacity marketsand the energy industry overall with the inclusion of distributed generation and clean technology.
Some emerging technologies like distributed renewable energy technologies, broad consumer adoption of electric vehiclesand energy storage devices could affect the price of energy. These emerging technologies may affect the financial viability ofutility counterparties and could have significant impacts on wholesale market prices, which could ultimately have a materialadverse effect on NRG's financial condition, results of operations and cash flows.
Risks that are beyond NRG's control, including but not limited to acts of terrorism or related acts of war, natural disaster,hostile cyber intrusions or other catastrophic events could have a material adverse effect on NRG's financial condition,results of operations and cash flows.
NRG's generation facilities and the facilities of third parties on which they rely may be targets of terrorist activities, aswell as events occurring in response to or in connection with such activities, all of which could cause environmentalrepercussions and/or result in full or partial disruption of the facilities ability to generate, transmit, transport or distributeelectricity or natural gas. Strategic targets, such as energy-related facilities, may be at greater risk of future terrorist activitiesthan other domestic targets. Hostile cyber intrusions, including those targeting information systems, as well as electroniccontrol systems used at the generation facilities and for the distribution systems, could severely disrupt business operations andresult in loss of service to customers, as well as significant expense to repair security breaches or system damage. Any suchenvironmental repercussions or disruption could result in a significant decrease in revenues or significant reconstruction orremediation costs beyond what could be recovered through insurance policies, which could have a material adverse effect onthe Company's financial condition, results of operations and cash flows. In addition, significant weather events or terroristactions could damage or shut down the power transmission and distribution facilities upon which the Company is dependent,which may reduce retail volume for extended periods of time. Power supply may be sold at a loss if these events cause asignificant loss of retail customer load.
The operation of NRG’s businesses is subject to cyber-based security and integrity risk.
Numerous functions affecting the efficient operation of NRG’s businesses depend on the secure and reliable storage,processing and communication of electronic data and the use of sophisticated computer hardware and software systems. Theoperation of NRG’s generation plants, including STP, and of NRG's energy and fuel trading businesses rely on cyber-basedtechnologies and, therefore, are subject to the risk that such systems could be the target of disruptive actions, particularlythrough cyber attack or cyber intrusion, including by computer hackers, foreign governments and cyber terrorists, or otherwisebe compromised by unintentional events. As a result, operations could be interrupted, property could be damaged and sensitivecustomer information could be lost or stolen, causing NRG to incur significant losses of revenues, other substantial liabilitiesand damages, costs to replace or repair damaged equipment and damage to NRG's reputation. In addition, NRG may experienceincreased capital and operating costs to implement increased security for its cyber systems and plants.
30
The Company's businesses are subject to the risk that sensitive data may be compromised, which could result in an adverseimpact to the Company's reputation and/or its results of operations.
The Company requires access to sensitive data in the ordinary course of business. Examples of sensitive data are names,addresses, account information, historical electricity usage, expected patterns of use, payment history, credit bureau data, creditand debit card account numbers, driver's license numbers, social security numbers and bank account information. NRG mayneed to provide sensitive data to vendors and service providers, who require access to this information in order to provideservices to NRG, such as call center operations. If a significant breach occurred or if sensitive data that was entrusted to theCompany was mishandled, the reputation of NRG and its businesses may be adversely affected, customer confidence may bediminished, or NRG and its retail businesses may be subject to legal claims, any of which may contribute to the loss ofcustomers and have a negative impact on the business and/or results of operations.
Risks Related to Governmental Regulation and Laws
NRG's business is subject to substantial energy regulation and may be adversely affected by legislative or regulatorychanges, as well as liability under, or any future inability to comply with, existing or future energy regulations orrequirements.
NRG's business is subject to extensive U.S. federal, state and local laws and foreign laws. Compliance with, or changes to,the requirements under these legal and regulatory regimes may cause the Company to incur significant additional costs, reducethe Company's ability to hedge exposure or to sell retail power within certain states or to certain classes of retail customers; orrestrict the Company’s marketing practices, its ability to pass through costs to retail customers, or its ability to compete onfavorable terms with competitors, including the incumbent utility. Retail competition is regulated on a state-by-state level and ishighly dependent on state laws, regulations and policies, which could change at any moment.
Failure to comply with such requirements could result in the shutdown of a non-complying facility, the imposition ofliens, fines, and/or civil or criminal liability.
Public utilities under the FPA are required to obtain FERC acceptance of their rate schedules for wholesale sales ofelectricity. Except for ERCOT generation facilities and power marketers, all of NRG's non-qualifying facility generatingcompanies and power marketing affiliates in the U.S. make sales of electricity in interstate commerce and are public utilities forpurposes of the FPA. FERC has granted each of NRG's generating and power marketing companies that make sales ofelectricity outside of ERCOT the authority to sell electricity at market-based rates. FERC's orders that grant NRG's generatingand power marketing companies market-based rate authority reserve the right to revoke or revise that authority if FERCsubsequently determines that NRG can exercise market power in transmission or generation, create barriers to entry, or engagein abusive affiliate transactions. In addition, NRG's market-based sales are subject to certain market behavior rules, and if anyof NRG's generating and power marketing companies were deemed to have violated those rules, they are subject to potentialdisgorgement of profits associated with the violation and/or suspension or revocation of their market-based rate authority. IfNRG's generating and power marketing companies were to lose their market-based rate authority, such companies would berequired to obtain FERC's acceptance of a cost-of-service rate schedule and could become subject to the accounting, record-keeping, and reporting requirements that are imposed on utilities with cost-based rate schedules. This could have a materialadverse effect on the rates NRG charges for power from its facilities.
Substantially all of the Company's generation assets are also subject to the reliability standards promulgated by thedesignated Electric Reliability Organization (currently NERC) and approved by FERC. If NRG fails to comply with themandatory reliability standards, NRG could be subject to sanctions, including substantial monetary penalties and increasedcompliance obligations. NRG is also affected by legislative and regulatory changes, as well as changes to market design, marketrules, tariffs, cost allocations, and bidding rules that occur in the existing ISOs. The ISOs that oversee most of the wholesalepower markets impose, and in the future may continue to impose, mitigation, including price limitations, offer caps, non-performance penalties and other mechanisms to address some of the volatility and the potential exercise of market power inthese markets. These types of price limitations and other regulatory mechanisms may have a material adverse effect on theprofitability of NRG's generation facilities that sell energy and capacity into the wholesale power markets.
31
The regulatory environment has undergone significant changes in the last several years due to state and federal policiesaffecting wholesale and retail competition and the creation of incentives for the addition of large amounts of new renewablegeneration and, in some cases, transmission. These changes are ongoing, and the Company cannot predict the future design ofthe wholesale power markets or the ultimate effect that the changing regulatory environment will have on NRG's business. Inaddition, in some of these markets, interested parties have proposed material market design changes, including the eliminationof a single clearing price mechanism, as well as proposals to reinstate the vertical monopoly utility of the markets or requiredivestiture by generating companies to reduce their market share. If competitive restructuring of the electric power markets isreversed, discontinued, or delayed, the Company's business prospects and financial results could be negatively impacted. Inaddition, since 2010, there have been a number of reforms to the regulation of the derivatives markets, both in the United Statesand internationally. These regulations, and any further changes thereto, or adoption of additional regulations, including anyregulations relating to position limits on futures and other derivatives or margin for derivatives, could negatively impact NRG’sability to hedge its portfolio in an efficient, cost-effective manner by, among other things, potentially decreasing liquidity in theforward commodity and derivatives markets or limiting NRG’s ability to utilize non-cash collateral for derivatives transactions.
NRG’s business may be affected by state interference in the competitive wholesale marketplace.
NRG’s generation and competitive retail businesses rely on a competitive wholesale marketplace. The competitivewholesale marketplace may be impacted by out-of-market subsidies provided by states or state entities, including bailouts ofuneconomic nuclear plants, imports of power from Canada, renewable mandates or subsidies, mandates to sell power below itscost of acquisition and associated costs, as well as out-of-market payments to new or existing generators. These out-of-marketsubsidies to existing or new generation undermine the competitive wholesale marketplace, which can lead to prematureretirement of existing facilities, including those owned by the Company. If these measures continue, capacity and energy pricesmay be suppressed, and the Company may not be successful in its efforts to insulate the competitive market from thisinterference. The Company's retail businesses may be materially impacted by rules or regulations that allow regulated utilitiesto participate in competitive retail markets or own and operate facilities that could be provided by competitive marketparticipants.
The integration of the Capacity Performance product into the PJM market and the Pay-for-Performance mechanism inISO-NE could lead to substantial changes in capacity income and non-performance penalties, which could have a materialadverse effect on NRG’s results of operations, financial condition and cash flows.
Both ISO-NE and PJM operate a pay-for-performance model where capacity payments are modified based on real-timegenerator performance. Capacity market prices are sensitive to design parameters, as well as additions of new capacity. NRGmay experience substantial changes in capacity income and non-performance penalties, which could have a material adverseeffect on NRG’s results of operations, financial condition and cash flows.
NRG's ownership interest in a nuclear power facility subjects the Company to regulations, costs and liabilities uniquelyassociated with these types of facilities.
Under the Atomic Energy Act of 1954, as amended, or AEA, ownership and operation of STP, of which NRG indirectlyowns a 44% interest, is subject to regulation by the NRC. Such regulation includes licensing, inspection, enforcement, testing,evaluation and modification of all aspects of nuclear reactor power plant design and operation, environmental and safetyperformance, technical and financial qualifications, decommissioning funding assurance and transfer and foreign ownershiprestrictions. The current facility operating licenses for STP expire on August 20, 2047 (Unit 1) and December 15, 2048 (Unit 2).
32
There are unique risks to owning and operating a nuclear power facility. These include liabilities related to the handling,treatment, storage, disposal, transport, release and use of radioactive materials, particularly with respect to spent nuclear fuel,and uncertainties regarding the ultimate, and potential exposure to, technical and financial risks associated with modifying ordecommissioning a nuclear facility. The NRC could require the shutdown of the plant for safety reasons or refuse to permitrestart of the unit after unplanned or planned outages. New or amended NRC safety and regulatory requirements may give riseto additional operation and maintenance costs and capital expenditures. Additionally, aging equipment may require more capitalexpenditures to keep each of these nuclear power plants operating efficiently. This equipment is also likely to require periodicupgrading and improvement. Any unexpected failure, including failure associated with breakdowns, forced outages, or anyunanticipated capital expenditures, could result in reduced profitability. STP will be obligated to continue storing spent nuclearfuel if the U.S. DOE continues to fail to meet its contractual obligations to STP made pursuant to the U.S. Nuclear Waste PolicyAct of 1982 to accept and dispose of STP's spent nuclear fuel. See also Item 1 — Regulatory Matters — Nuclear Operations - Decommissioning Trusts and Item 1 — Environmental Matters — Federal Environmental Initiatives — Nuclear Waste forfurther discussion. Costs associated with these risks could be substantial and could have a material adverse effect on NRG'sresults of operations, financial condition or cash flow to the extent not covered by the Decommissioning Trusts or recoveredfrom ratepayers. In addition, to the extent that all or a part of STP is required by the NRC to permanently or temporarily shutdown or modify its operations, or is otherwise subject to a forced outage, NRG may incur additional costs to the extent it isobligated to provide power from more expensive alternative sources — either NRG's own plants, third party generators or theERCOT — to cover the Company's then existing forward sale obligations. Such shutdown or modification could also lead tosubstantial costs related to the storage and disposal of radioactive materials and spent nuclear fuel.
While STP maintains property and liability insurance for losses related to nuclear operations, there may be limitations onthe amounts and types of insurance commercially available. See also Item 15 — Note 23, Commitments and Contingencies,Nuclear Insurance. An accident at STP or another nuclear facility could have a material adverse effect on NRG's financialcondition, its operational results, or liquidity as losses may exceed the insurance coverage available and/or may result in theobligation to pay retrospective premium obligations.
NRG is subject to environmental laws that impose extensive and increasingly stringent requirements on the Company'songoing operations, as well as potentially substantial liabilities arising out of environmental contamination. Theseenvironmental requirements and liabilities could adversely impact NRG's results of operations, financial condition and cashflows.
NRG is subject to the environmental laws of foreign and U.S., federal, state and local authorities. The Company mustcomply with numerous environmental laws and obtain numerous governmental permits and approvals to build and operate theCompany's plants. Federal and state environmental laws generally have become more stringent over time. Should NRG fail tocomply with any environmental requirements that apply to its operations, the Company could be subject to administrative, civiland/or criminal liability and fines, and regulatory agencies could take other actions seeking to curtail the Company's operations.In addition, when new requirements take effect or when existing environmental requirements are revised, reinterpreted orsubject to changing enforcement policies, NRG's business, results of operations, financial condition and cash flows could beadversely affected.
NRG's businesses are subject to physical, market and economic risks relating to potential effects of climate change.
Fluctuations in weather and other environmental conditions, including temperature and precipitation levels, may affectconsumer demand for electricity. In addition, the potential physical effects of climate change, such as increased frequency andseverity of storms, floods and other climatic events, could disrupt NRG's operations and supply chain, and cause them to incursignificant costs in preparing for or responding to these effects. These or other meteorological changes could lead to increasedoperating costs, capital expenses or power purchase costs. NRG's commercial and residential customers may also experiencethe potential physical impacts of climate change and may incur significant costs in preparing for or responding to these efforts,including increasing the mix and resiliency of their energy solutions and supply.
Hazards customary to the power production industry include the potential for unusual weather conditions, which couldaffect fuel pricing and availability, the Company's route to market or access to customers, i.e., transmission and distributionlines, or critical plant assets. The contribution of climate change to the frequency or intensity of weather-related events couldaffect NRG's operations and planning process.
Climate change could also affect the availability of a secure and economical supply of water in some locations, which isessential for the continued operation of NRG's generation plants. NRG monitors water risk carefully. If it is determined that awater supply risk exists that could impact projected generation levels at any plant risk mitigation efforts are identified andevaluated for implementation.
Also, demand for NRG's energy-related services could be similarly impacted by consumers’ preferences or market factorsfavoring energy efficiency, low-carbon power sources or reduced electricity usage.
33
Policies at the national, regional and state levels to regulate GHG emissions and mitigate climate change could adverselyimpact NRG's results of operations, financial condition and cash flows.
NRG's GHG emissions for 2019 can be found in Item 1, Business —Environmental Regulatory Matters. GHG regulationcould increase the cost of electricity generated by fossil fuels, and such increases could reduce demand for the power NRGgenerates and markets. In 2015, the EPA promulgated the final GHG emissions rules for new and existing fossil-fuel-firedelectric generating units, which have been stayed by the U.S. Supreme Court and the EPA has proposed repealing.
The Company operates generating units in Connecticut, Delaware, Maryland, and New York which are subject to RGGI,which is a regional cap and trade system for CO2. In 2013, each of these states finalized a rule that reduced and will continue toreduce the number of allowances through 2020. The nine RGGI states re-evaluated the program and published a model rule tofurther reduce the number of allowances. The revisions being currently contemplated could adversely impact NRG's results ofoperations, financial condition and cash flows.
California has a CO2 cap and trade program for electric generating units greater than 25 MW. The impact on the Companydepends on the cost of the related allowances and the ability to pass these costs through to customers.
NRG's retail businesses are subject to changing state rules and regulations that could have a material impact on theprofitability of its business lines.
The competitiveness of NRG's retail businesses partially depends on state regulatory policies that establish the structure,rules, terms and conditions on which services are offered to retail customers. These state policies, which can include controls onthe retail rates NRG's retail businesses can charge, the imposition of additional costs on sales, restrictions on the Company'sability to obtain new customers through various marketing channels and disclosure requirements, which can affect thecompetitiveness of NRG's retail businesses. The Company's retail businesses may be materially impacted by rules orregulations that allow regulated utilities to participate in competitive retail markets or own and operate facilities that could beprovided by competitive market participants. Additionally, state or federal imposition of net metering or RPS programs canmake it more or less expensive for retail customers to supplement or replace their reliance on grid power. NRG's retailbusinesses have limited ability to influence development of these policies, and its business model may be more or less effective,depending on changes to the regulatory environment.
The Company's international operations are exposed to political and economic risks, commercial instability and eventsbeyond the Company's control in the countries in which it operates, which risks may negatively impact the Company'sbusiness.
The Company's international operations depend on products manufactured, purchased and sold in the U.S. andinternationally, including in countries with political and economic instability. In some cases, these countries have greaterpolitical and economic volatility and greater vulnerability to infrastructure and labor disruptions than in NRG's other markets.Operating and seeking to expand business in a number of different regions and countries exposes the Company to a number ofrisks, including:
• multiple and potentially conflicting laws, regulations and policies that are subject to change;• imposition of currency restrictions on repatriation of earnings or other restraints;• imposition of burdensome tariffs or quotas;• national and international conflict, including terrorist acts; and• political and economic instability or civil unrest that may severely disrupt economic activity in affected countries.
The occurrence of one or more of these events may negatively impact the Company's business, results of operations andfinancial condition.
34
Risks Related to Economic and Financial Market Conditions
NRG's level of indebtedness could adversely affect its ability to raise additional capital to fund its operations or returncapital to stockholders. It could also expose it to the risk of increased interest rates and limit its ability to react to changes inthe economy or its industry.
NRG's substantial debt could have negative consequences, including:
• increasing NRG's vulnerability to general economic and industry conditions;• requiring a substantial portion of NRG's cash flow from operations to be dedicated to the payment of principal and
interest on its indebtedness, therefore reducing NRG's ability to pay dividends to holders of its preferred or common stock or to use its cash flow to fund its operations, capital expenditures and future business opportunities;
• limiting NRG's ability to enter into long-term power sales or fuel purchases which require credit support;• exposing NRG to the risk of increased interest rates because certain of its borrowings, including borrowings under its
Senior Credit Facility are at variable rates of interest;• limiting NRG's ability to obtain additional financing for working capital including collateral postings, capital
expenditures, debt service requirements, acquisitions and general corporate or other purposes; and• limiting NRG's ability to adjust to changing market conditions and placing it at a competitive disadvantage compared
to its competitors who have less debt.
The indentures for NRG's Senior Notes, Senior Secured Notes and Senior Credit Facility contain financial and otherrestrictive covenants that may limit the Company's ability to return capital to stockholders or otherwise engage in activities thatmay be in its long-term best interests. Furthermore, financial and other restrictive covenants contained in any project levelsubsidiary debt may limit the ability of NRG to receive distributions from such subsidiary. NRG's failure to comply with thosecovenants could result in an event of default which, if not cured or waived, could result in the acceleration of all of theCompany's indebtedness.
In addition, NRG's ability to arrange financing, either at the corporate level, a non-recourse project-level subsidiary orotherwise, and the costs of such capital, are dependent on numerous factors, including:
• general economic and capital market conditions;• credit availability from banks and other financial institutions;• investor confidence in NRG, its partners and the regional wholesale power markets;• NRG's financial performance and the financial performance of its subsidiaries;• NRG's level of indebtedness and compliance with covenants in debt agreements;• maintenance of acceptable credit ratings;• cash flow; and• provisions of tax and securities laws that may impact raising capital.
NRG may not be successful in obtaining additional capital for these or other reasons. The failure to obtain additionalcapital from time to time may have a material adverse effect on its business and operations.
Adverse economic conditions could adversely affect NRG’s business, financial condition, results of operations and cashflows.
Adverse economic conditions and declines in wholesale energy prices, partially resulting from adverse economicconditions, may impact NRG's results of operations. The breadth and depth of negative economic conditions may have a wide-ranging impact on the U.S. business environment, including NRG’s businesses. In addition, adverse economic conditions alsoreduce the demand for energy commodities. Reduced demand from negative economic conditions continues to impact the keydomestic wholesale energy markets NRG serves. The combination of lower demand for power and increased supply of naturalgas has put downward price pressure on wholesale energy markets in general, further impacting NRG’s energy marketingresults. In general, economic and commodity market conditions will continue to impact NRG’s unhedged future energymargins, liquidity, earnings growth and overall financial condition. In addition, adverse economic conditions, declines inwholesale energy prices, reduced demand for power and other factors may negatively impact the trading price of NRG’scommon stock and impact forecasted cash flows, which may require NRG to evaluate its goodwill and other long-lived assetsfor impairment. Any such impairment could have a material impact on NRG’s financial statements.
35
Goodwill and other intangible assets that NRG has recorded in connection with its acquisitions are subject to impairmentevaluations and, as a result, the Company could be required to write off some or all of this goodwill and other intangibleassets, which may adversely affect the Company's financial condition and results of operations.
Goodwill is not amortized but is reviewed annually or more frequently for impairment. Other intangibles are alsoreviewed at least annually or more frequently, if certain conditions exist, and are amortized. Any reduction in or impairment ofthe value of goodwill or other intangible assets will result in a charge against earnings, which could materially adversely affectNRG's reported results of operations and financial position in future periods.
The Company has made investments, and may continue to make investments, in new business initiatives predominantlyfocused on consumer products and in markets that may not be successful, may not achieve the intended financial results ormay result in product liability and reputational risk that could adversely affect the Company.
NRG continues to pursue growth in its existing businesses and markets and further diversification across the competitiveenergy value chain. NRG is continuing to pursue investment opportunities in renewables, consumer products and distributedgeneration. Such initiatives may involve significant risks and uncertainties, including distraction of management from currentoperations, inadequate return on capital, and unidentified issues not discovered in the diligence performed prior to launching aninitiative or entering a market.
As part of these initiatives, the Company may be liable to customers for any damage caused to customers’ homes,facilities, belongings or property during the installation of Company products and systems, such as residential solar systems andmass market back-up generators. In addition, shortages of skilled labor for Company projects could significantly delay a projector otherwise increase its costs. The products that the Company sells or manufactures may expose the Company to productliability claims relating to personal injury, death, or environmental or property damage, and may require product recalls or otheractions. Although the Company maintains liability insurance, the Company cannot be certain that its coverage will be adequatefor liabilities actually incurred or that insurance will continue to be available to the Company on economically reasonableterms, or at all. Further, any product liability claim or damage caused by the Company could significantly impair theCompany’s brand and reputation, which may result in a failure to maintain customers and achieve the Company’s desiredgrowth initiatives in these new businesses.
36
CAUTIONARY STATEMENT REGARDING FORWARD-LOOKING INFORMATION
This Annual Report on Form 10-K of NRG Energy, Inc., or NRG or the Company, includes forward-looking statementswithin the meaning of Section 27A of the Securities Act of 1933, as amended, or Securities Act, and Section 21E of theSecurities Exchange Act of 1934, as amended, or Exchange Act. The words "believes," "projects," "anticipates," "plans,""expects," "intends," "estimates" and similar expressions are intended to identify forward-looking statements. These forward-looking statements involve known and unknown risks, uncertainties and other factors that may cause NRG's actual results,performance and achievements, or industry results, to be materially different from any future results, performance orachievements expressed or implied by such forward-looking statements. These factors, risks and uncertainties include thefactors described under Item 1A — Risk Factors and the following:
• NRG's ability to obtain and maintain retail market share;• NRG's ability to engage in successful sales and divestitures, as well as mergers and acquisitions activity;• NRG's ability to achieve the expected benefits of its Transformation Plan;• General economic conditions, changes in the wholesale power markets and fluctuations in the cost of fuel;• Volatile power supply costs and demand for power;• Changes in law, including judicial decisions;• Hazards customary to the power production industry and power generation operations, such as fuel and electricity
price volatility, unusual weather conditions, catastrophic weather-related or other damage to facilities, unscheduledgeneration outages, maintenance or repairs, unanticipated changes to fuel supply costs or availability due to higherdemand, shortages, transportation problems or other developments, environmental incidents, or electric transmission orgas pipeline system constraints and the possibility that NRG may not have adequate insurance to cover losses as aresult of such hazards;
• The effectiveness of NRG's risk management policies and procedures and the ability of NRG's counterparties to satisfytheir financial commitments;
• Counterparties' collateral demands and other factors affecting NRG's liquidity position and financial condition;• NRG's ability to operate its businesses efficiently and generate earnings and cash flows from its asset-based businesses
in relation to its debt and other obligations;• NRG's ability to enter into contracts to sell power and procure fuel on acceptable terms and prices;• The liquidity and competitiveness of wholesale markets for energy commodities;• Government regulation, including changes in market rules, rates, tariffs and environmental laws;• Price mitigation strategies and other market structures employed by ISOs or RTOs that result in a failure to adequately
and fairly compensate NRG's generation units;• NRG's ability to mitigate forced outage risk for units subject to capacity performance requirements in PJM,
performance incentives in ISO-NE, and scarcity pricing in ERCOT;• NRG's ability to borrow funds and access capital markets, as well as NRG's substantial indebtedness and the
possibility that NRG may incur additional indebtedness in the future;• Operating and financial restrictions placed on NRG and its subsidiaries that are contained in the indentures governing
NRG's Senior Notes, Senior Secured Notes, and Senior Credit Facility, and in debt and other agreements of certain ofNRG subsidiaries and project affiliates generally;
• Cyber terrorism and inadequate cybersecurity, or the occurrence of a catastrophic loss and the possibility that NRGmay not have adequate insurance to cover losses resulting from such hazards or the inability of NRG's insurers toprovide coverage;
• NRG's ability to develop and build new power generation facilities;• NRG's ability to develop and innovate new products, as retail and wholesale markets continue to change and evolve;• NRG's ability to implement its strategy of finding ways to meet the challenges of climate change, clean air and
protecting natural resources, while taking advantage of business opportunities;• NRG's ability to increase cash from operations through operational and commercial initiatives, corporate efficiencies,
asset strategy, and a range of other programs throughout NRG to reduce costs or generate revenues;• NRG's ability to successfully evaluate investments and achieve intended financial results in new business and growth
initiatives;• NRG's ability to successfully integrate, realize cost savings and manage any acquired businesses; and• NRG's ability to develop and maintain successful partnering relationships as needed.
37
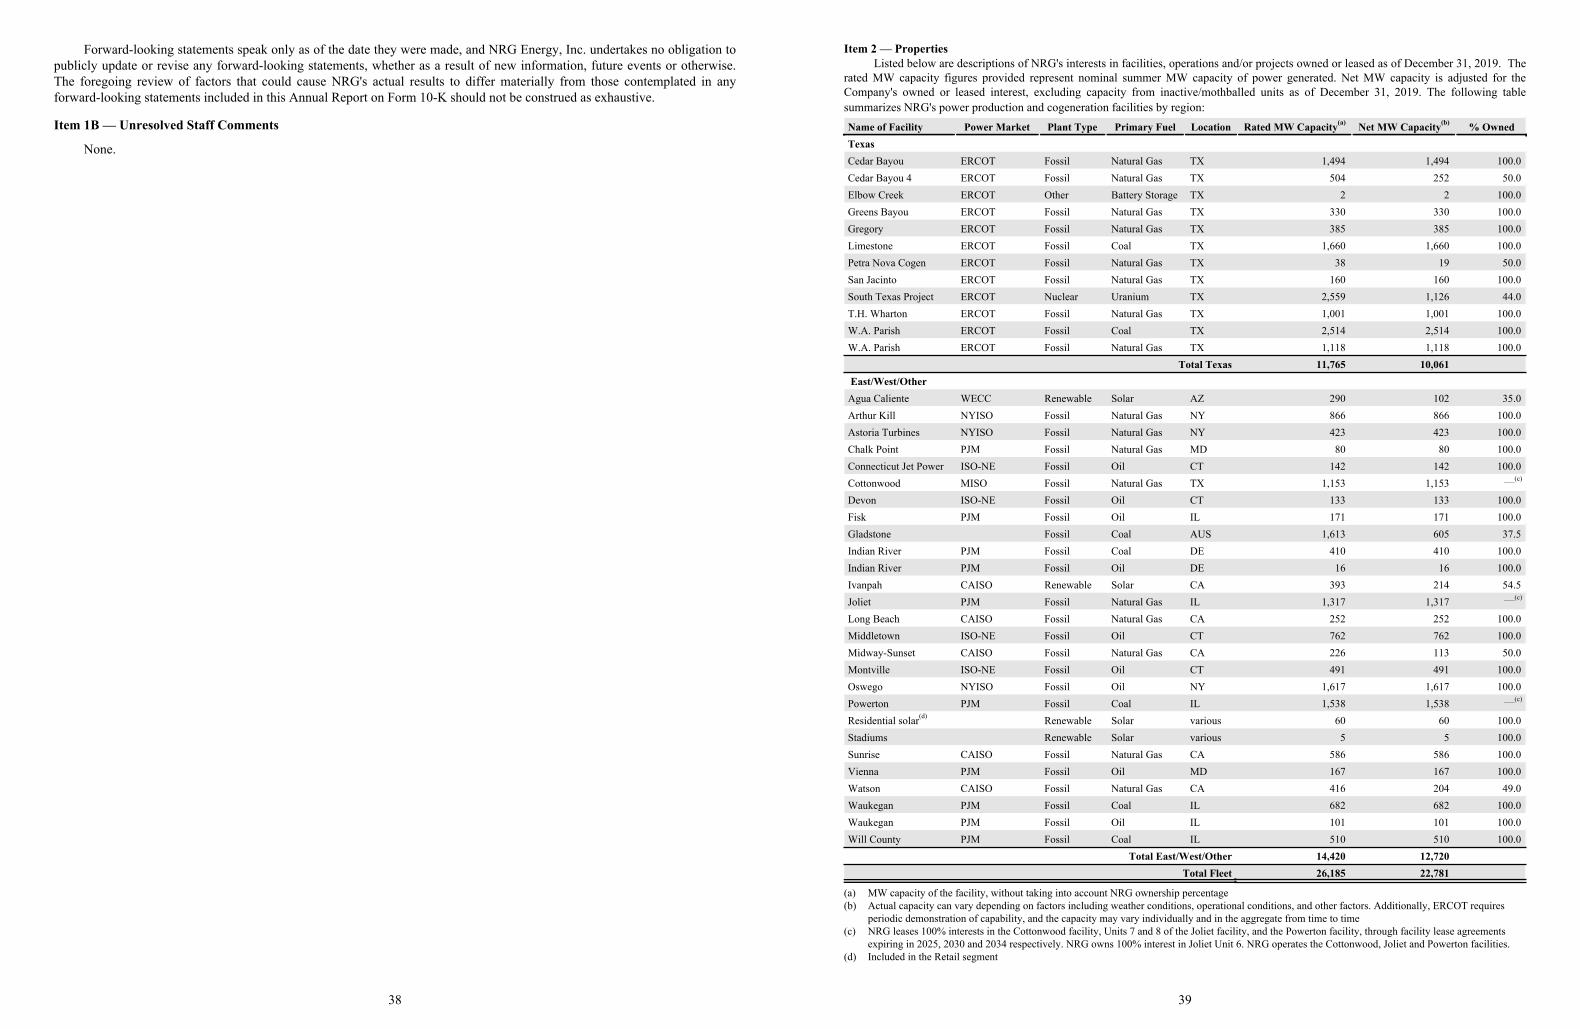
Forward-looking statements speak only as of the date they were made, and NRG Energy, Inc. undertakes no obligation topublicly update or revise any forward-looking statements, whether as a result of new information, future events or otherwise.The foregoing review of factors that could cause NRG's actual results to differ materially from those contemplated in anyforward-looking statements included in this Annual Report on Form 10-K should not be construed as exhaustive.
Item 1B — Unresolved Staff Comments
None.
38
Item 2 — PropertiesListed below are descriptions of NRG's interests in facilities, operations and/or projects owned or leased as of December 31, 2019. The
rated MW capacity figures provided represent nominal summer MW capacity of power generated. Net MW capacity is adjusted for theCompany's owned or leased interest, excluding capacity from inactive/mothballed units as of December 31, 2019. The following tablesummarizes NRG's power production and cogeneration facilities by region:Name of Facility Power Market Plant Type Primary Fuel Location Rated MW Capacity(a) Net MW Capacity(b) % OwnedTexasCedar Bayou ERCOT Fossil Natural Gas TX 1,494 1,494 100.0Cedar Bayou 4 ERCOT Fossil Natural Gas TX 504 252 50.0Elbow Creek ERCOT Other Battery Storage TX 2 2 100.0Greens Bayou ERCOT Fossil Natural Gas TX 330 330 100.0Gregory ERCOT Fossil Natural Gas TX 385 385 100.0Limestone ERCOT Fossil Coal TX 1,660 1,660 100.0Petra Nova Cogen ERCOT Fossil Natural Gas TX 38 19 50.0San Jacinto ERCOT Fossil Natural Gas TX 160 160 100.0South Texas Project ERCOT Nuclear Uranium TX 2,559 1,126 44.0T.H. Wharton ERCOT Fossil Natural Gas TX 1,001 1,001 100.0W.A. Parish ERCOT Fossil Coal TX 2,514 2,514 100.0W.A. Parish ERCOT Fossil Natural Gas TX 1,118 1,118 100.0
Total Texas 11,765 10,061 East/West/OtherAgua Caliente WECC Renewable Solar AZ 290 102 35.0Arthur Kill NYISO Fossil Natural Gas NY 866 866 100.0Astoria Turbines NYISO Fossil Natural Gas NY 423 423 100.0Chalk Point PJM Fossil Natural Gas MD 80 80 100.0Connecticut Jet Power ISO-NE Fossil Oil CT 142 142 100.0Cottonwood MISO Fossil Natural Gas TX 1,153 1,153 ___(c)
Devon ISO-NE Fossil Oil CT 133 133 100.0Fisk PJM Fossil Oil IL 171 171 100.0Gladstone Fossil Coal AUS 1,613 605 37.5Indian River PJM Fossil Coal DE 410 410 100.0Indian River PJM Fossil Oil DE 16 16 100.0Ivanpah CAISO Renewable Solar CA 393 214 54.5Joliet PJM Fossil Natural Gas IL 1,317 1,317 ___(c)
Long Beach CAISO Fossil Natural Gas CA 252 252 100.0Middletown ISO-NE Fossil Oil CT 762 762 100.0Midway-Sunset CAISO Fossil Natural Gas CA 226 113 50.0Montville ISO-NE Fossil Oil CT 491 491 100.0Oswego NYISO Fossil Oil NY 1,617 1,617 100.0Powerton PJM Fossil Coal IL 1,538 1,538 ___(c)
Residential solar(d) Renewable Solar various 60 60 100.0Stadiums Renewable Solar various 5 5 100.0Sunrise CAISO Fossil Natural Gas CA 586 586 100.0Vienna PJM Fossil Oil MD 167 167 100.0Watson CAISO Fossil Natural Gas CA 416 204 49.0Waukegan PJM Fossil Coal IL 682 682 100.0Waukegan PJM Fossil Oil IL 101 101 100.0Will County PJM Fossil Coal IL 510 510 100.0
Total East/West/Other 14,420 12,720Total Fleet 26,185 22,781
(a) MW capacity of the facility, without taking into account NRG ownership percentage(b) Actual capacity can vary depending on factors including weather conditions, operational conditions, and other factors. Additionally, ERCOT requires
periodic demonstration of capability, and the capacity may vary individually and in the aggregate from time to time(c) NRG leases 100% interests in the Cottonwood facility, Units 7 and 8 of the Joliet facility, and the Powerton facility, through facility lease agreements
expiring in 2025, 2030 and 2034 respectively. NRG owns 100% interest in Joliet Unit 6. NRG operates the Cottonwood, Joliet and Powerton facilities.(d) Included in the Retail segment
39
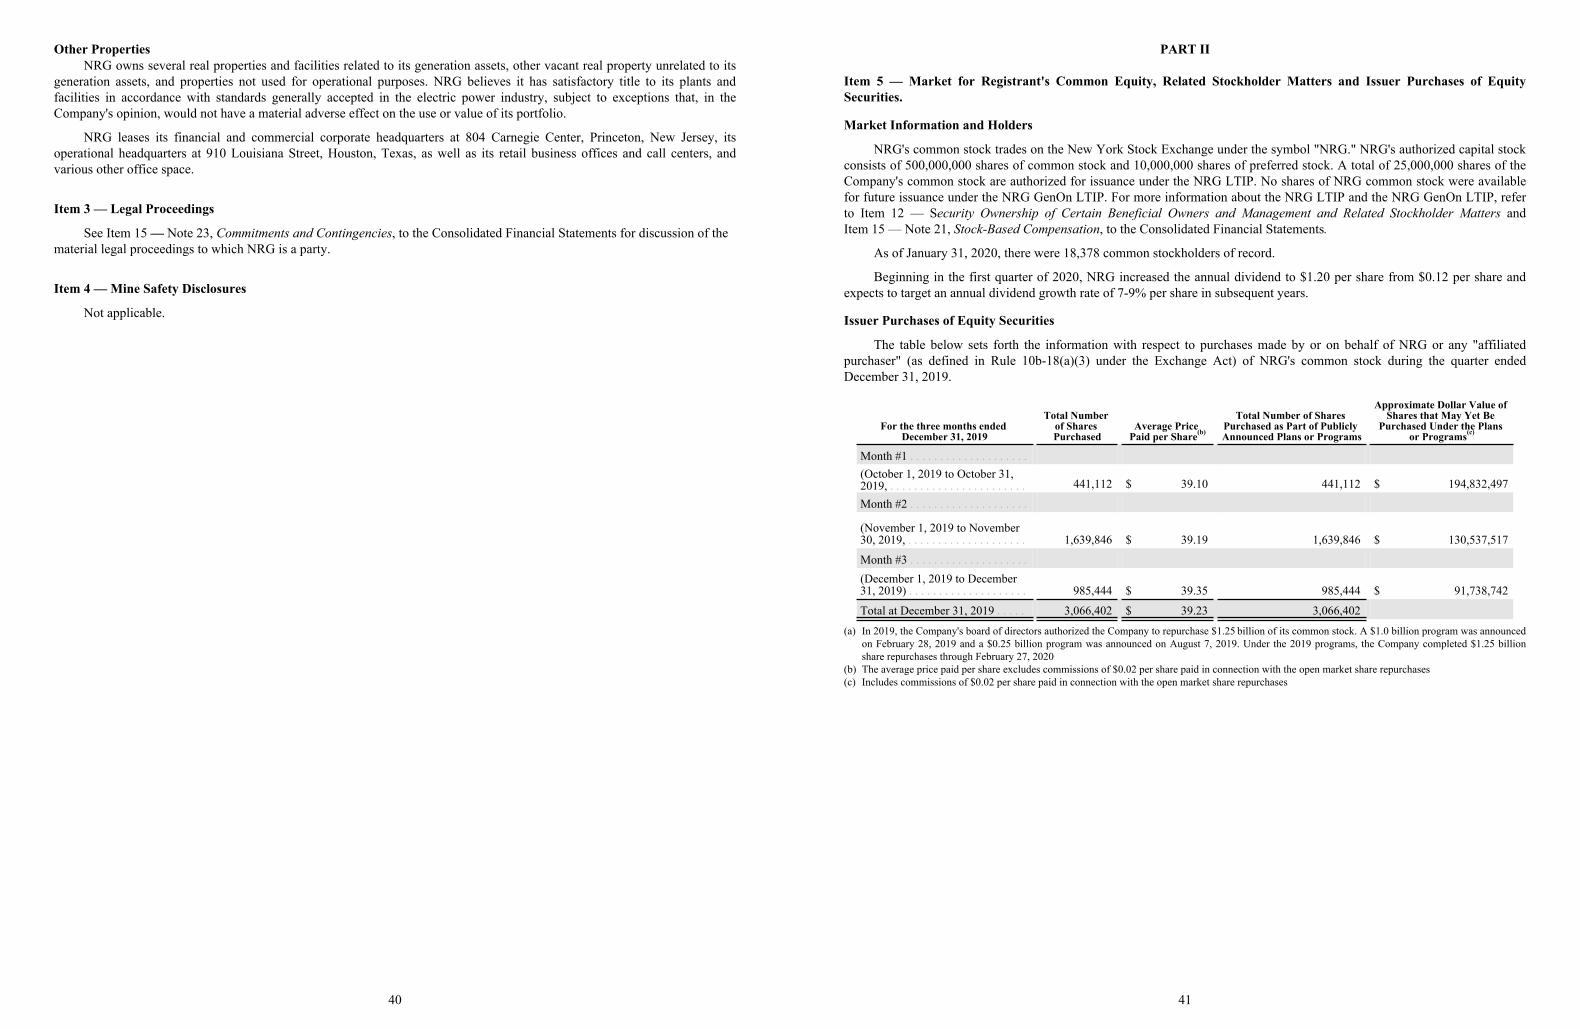
Other PropertiesNRG owns several real properties and facilities related to its generation assets, other vacant real property unrelated to its
generation assets, and properties not used for operational purposes. NRG believes it has satisfactory title to its plants andfacilities in accordance with standards generally accepted in the electric power industry, subject to exceptions that, in theCompany's opinion, would not have a material adverse effect on the use or value of its portfolio.
NRG leases its financial and commercial corporate headquarters at 804 Carnegie Center, Princeton, New Jersey, itsoperational headquarters at 910 Louisiana Street, Houston, Texas, as well as its retail business offices and call centers, andvarious other office space.
Item 3 — Legal Proceedings
See Item 15 — Note 23, Commitments and Contingencies, to the Consolidated Financial Statements for discussion of the material legal proceedings to which NRG is a party.
Item 4 — Mine Safety Disclosures
Not applicable.
40
PART II
Item 5 — Market for Registrant's Common Equity, Related Stockholder Matters and Issuer Purchases of EquitySecurities.
Market Information and Holders
NRG's common stock trades on the New York Stock Exchange under the symbol "NRG." NRG's authorized capital stockconsists of 500,000,000 shares of common stock and 10,000,000 shares of preferred stock. A total of 25,000,000 shares of theCompany's common stock are authorized for issuance under the NRG LTIP. No shares of NRG common stock were availablefor future issuance under the NRG GenOn LTIP. For more information about the NRG LTIP and the NRG GenOn LTIP, referto Item 12 — Security Ownership of Certain Beneficial Owners and Management and Related Stockholder Matters andItem 15 — Note 21, Stock-Based Compensation, to the Consolidated Financial Statements.
As of January 31, 2020, there were 18,378 common stockholders of record.
Beginning in the first quarter of 2020, NRG increased the annual dividend to $1.20 per share from $0.12 per share andexpects to target an annual dividend growth rate of 7-9% per share in subsequent years.
Issuer Purchases of Equity Securities
The table below sets forth the information with respect to purchases made by or on behalf of NRG or any "affiliatedpurchaser" (as defined in Rule 10b-18(a)(3) under the Exchange Act) of NRG's common stock during the quarter endedDecember 31, 2019.
For the three months ended December 31, 2019
Total Number of Shares Purchased
Average Price Paid per Share(b)
Total Number of Shares Purchased as Part of Publicly Announced Plans or Programs
Approximate Dollar Value of Shares that May Yet Be
Purchased Under the Plans or Programs(c)
Month #1 . . . . . . . . . . . . . . . . . . . .(October 1, 2019 to October 31, 2019, . . . . . . . . . . . . . . . . . . . . . . . 441,112 $ 39.10 441,112 $ 194,832,497
Month #2 . . . . . . . . . . . . . . . . . . . .
(November 1, 2019 to November 30, 2019, . . . . . . . . . . . . . . . . . . . . 1,639,846 $ 39.19 1,639,846 $ 130,537,517
Month #3 . . . . . . . . . . . . . . . . . . . .(December 1, 2019 to December 31, 2019) . . . . . . . . . . . . . . . . . . . . 985,444 $ 39.35 985,444 $ 91,738,742
Total at December 31, 2019 . . . . . 3,066,402 $ 39.23 3,066,402
(a) In 2019, the Company's board of directors authorized the Company to repurchase $1.25 billion of its common stock. A $1.0 billion program was announcedon February 28, 2019 and a $0.25 billion program was announced on August 7, 2019. Under the 2019 programs, the Company completed $1.25 billionshare repurchases through February 27, 2020
(b) The average price paid per share excludes commissions of $0.02 per share paid in connection with the open market share repurchases(c) Includes commissions of $0.02 per share paid in connection with the open market share repurchases
41
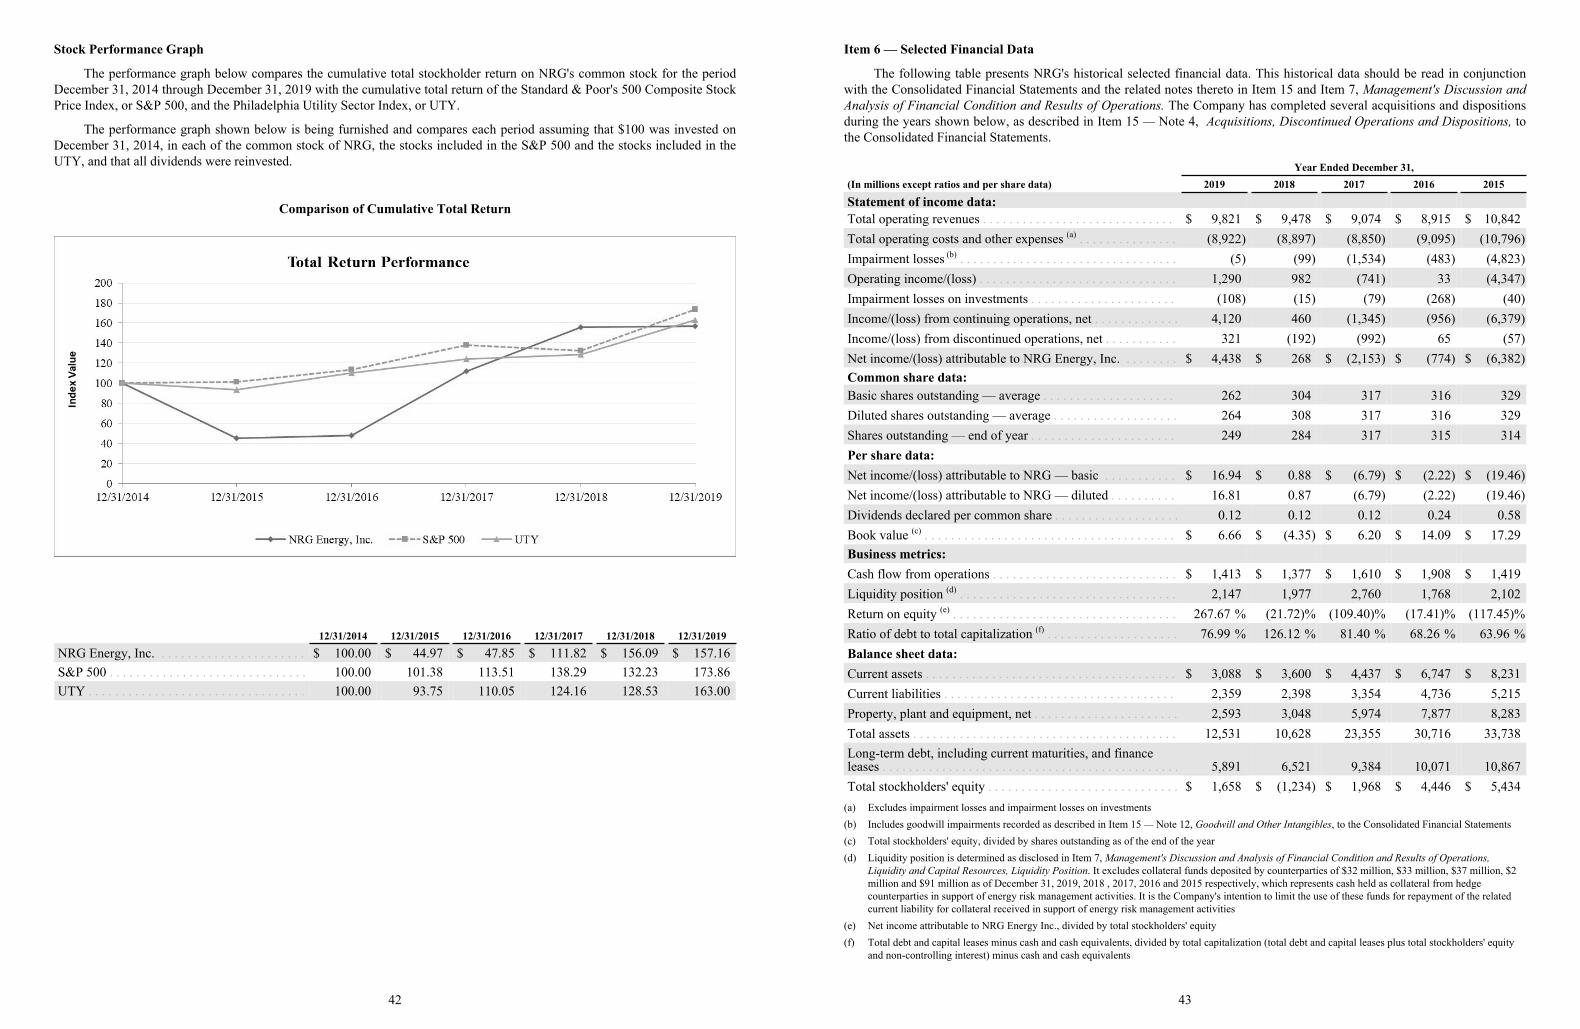
Stock Performance Graph
The performance graph below compares the cumulative total stockholder return on NRG's common stock for the periodDecember 31, 2014 through December 31, 2019 with the cumulative total return of the Standard & Poor's 500 Composite StockPrice Index, or S&P 500, and the Philadelphia Utility Sector Index, or UTY.
The performance graph shown below is being furnished and compares each period assuming that $100 was invested onDecember 31, 2014, in each of the common stock of NRG, the stocks included in the S&P 500 and the stocks included in theUTY, and that all dividends were reinvested.
Comparison of Cumulative Total Return
12/31/2014 12/31/2015 12/31/2016 12/31/2017 12/31/2018 12/31/2019
NRG Energy, Inc. . . . . . . . . . . . . . . . . . . . . . . $ 100.00 $ 44.97 $ 47.85 $ 111.82 $ 156.09 $ 157.16S&P 500 . . . . . . . . . . . . . . . . . . . . . . . . . . . . . . 100.00 101.38 113.51 138.29 132.23 173.86UTY . . . . . . . . . . . . . . . . . . . . . . . . . . . . . . . . . 100.00 93.75 110.05 124.16 128.53 163.00
42
Item 6 — Selected Financial Data
The following table presents NRG's historical selected financial data. This historical data should be read in conjunctionwith the Consolidated Financial Statements and the related notes thereto in Item 15 and Item 7, Management's Discussion andAnalysis of Financial Condition and Results of Operations. The Company has completed several acquisitions and dispositionsduring the years shown below, as described in Item 15 — Note 4, Acquisitions, Discontinued Operations and Dispositions, tothe Consolidated Financial Statements.
Year Ended December 31,(In millions except ratios and per share data) 2019 2018 2017 2016 2015
Statement of income data:Total operating revenues . . . . . . . . . . . . . . . . . . . . . . . . . . . . . $ 9,821 $ 9,478 $ 9,074 $ 8,915 $ 10,842Total operating costs and other expenses (a) . . . . . . . . . . . . . . . (8,922) (8,897) (8,850) (9,095) (10,796)Impairment losses (b) . . . . . . . . . . . . . . . . . . . . . . . . . . . . . . . . . (5) (99) (1,534) (483) (4,823)Operating income/(loss) . . . . . . . . . . . . . . . . . . . . . . . . . . . . . . 1,290 982 (741) 33 (4,347)Impairment losses on investments . . . . . . . . . . . . . . . . . . . . . . (108) (15) (79) (268) (40)Income/(loss) from continuing operations, net . . . . . . . . . . . . . 4,120 460 (1,345) (956) (6,379)Income/(loss) from discontinued operations, net . . . . . . . . . . . 321 (192) (992) 65 (57)Net income/(loss) attributable to NRG Energy, Inc. . . . . . . . . $ 4,438 $ 268 $ (2,153) $ (774) $ (6,382)Common share data:Basic shares outstanding — average . . . . . . . . . . . . . . . . . . . . 262 304 317 316 329Diluted shares outstanding — average . . . . . . . . . . . . . . . . . . . 264 308 317 316 329Shares outstanding — end of year . . . . . . . . . . . . . . . . . . . . . . 249 284 317 315 314Per share data:Net income/(loss) attributable to NRG — basic . . . . . . . . . . . $ 16.94 $ 0.88 $ (6.79) $ (2.22) $ (19.46)Net income/(loss) attributable to NRG — diluted . . . . . . . . . . 16.81 0.87 (6.79) (2.22) (19.46)Dividends declared per common share . . . . . . . . . . . . . . . . . . . 0.12 0.12 0.12 0.24 0.58Book value (c) . . . . . . . . . . . . . . . . . . . . . . . . . . . . . . . . . . . . . . $ 6.66 $ (4.35) $ 6.20 $ 14.09 $ 17.29Business metrics:Cash flow from operations . . . . . . . . . . . . . . . . . . . . . . . . . . . . $ 1,413 $ 1,377 $ 1,610 $ 1,908 $ 1,419Liquidity position (d) . . . . . . . . . . . . . . . . . . . . . . . . . . . . . . . . . 2,147 1,977 2,760 1,768 2,102Return on equity (e) . . . . . . . . . . . . . . . . . . . . . . . . . . . . . . . . . . 267.67 % (21.72)% (109.40)% (17.41)% (117.45)%Ratio of debt to total capitalization (f) . . . . . . . . . . . . . . . . . . . . 76.99 % 126.12 % 81.40 % 68.26 % 63.96 %Balance sheet data:Current assets . . . . . . . . . . . . . . . . . . . . . . . . . . . . . . . . . . . . . . $ 3,088 $ 3,600 $ 4,437 $ 6,747 $ 8,231Current liabilities . . . . . . . . . . . . . . . . . . . . . . . . . . . . . . . . . . . 2,359 2,398 3,354 4,736 5,215Property, plant and equipment, net . . . . . . . . . . . . . . . . . . . . . . 2,593 3,048 5,974 7,877 8,283Total assets . . . . . . . . . . . . . . . . . . . . . . . . . . . . . . . . . . . . . . . . 12,531 10,628 23,355 30,716 33,738Long-term debt, including current maturities, and finance leases . . . . . . . . . . . . . . . . . . . . . . . . . . . . . . . . . . . . . . . . . . . . . 5,891 6,521 9,384 10,071 10,867Total stockholders' equity . . . . . . . . . . . . . . . . . . . . . . . . . . . . . $ 1,658 $ (1,234) $ 1,968 $ 4,446 $ 5,434
(a) Excludes impairment losses and impairment losses on investments(b) Includes goodwill impairments recorded as described in Item 15 — Note 12, Goodwill and Other Intangibles, to the Consolidated Financial Statements(c) Total stockholders' equity, divided by shares outstanding as of the end of the year(d) Liquidity position is determined as disclosed in Item 7, Management's Discussion and Analysis of Financial Condition and Results of Operations,
Liquidity and Capital Resources, Liquidity Position. It excludes collateral funds deposited by counterparties of $32 million, $33 million, $37 million, $2 million and $91 million as of December 31, 2019, 2018 , 2017, 2016 and 2015 respectively, which represents cash held as collateral from hedge counterparties in support of energy risk management activities. It is the Company's intention to limit the use of these funds for repayment of the related current liability for collateral received in support of energy risk management activities
(e) Net income attributable to NRG Energy Inc., divided by total stockholders' equity(f) Total debt and capital leases minus cash and cash equivalents, divided by total capitalization (total debt and capital leases plus total stockholders' equity
and non-controlling interest) minus cash and cash equivalents
43
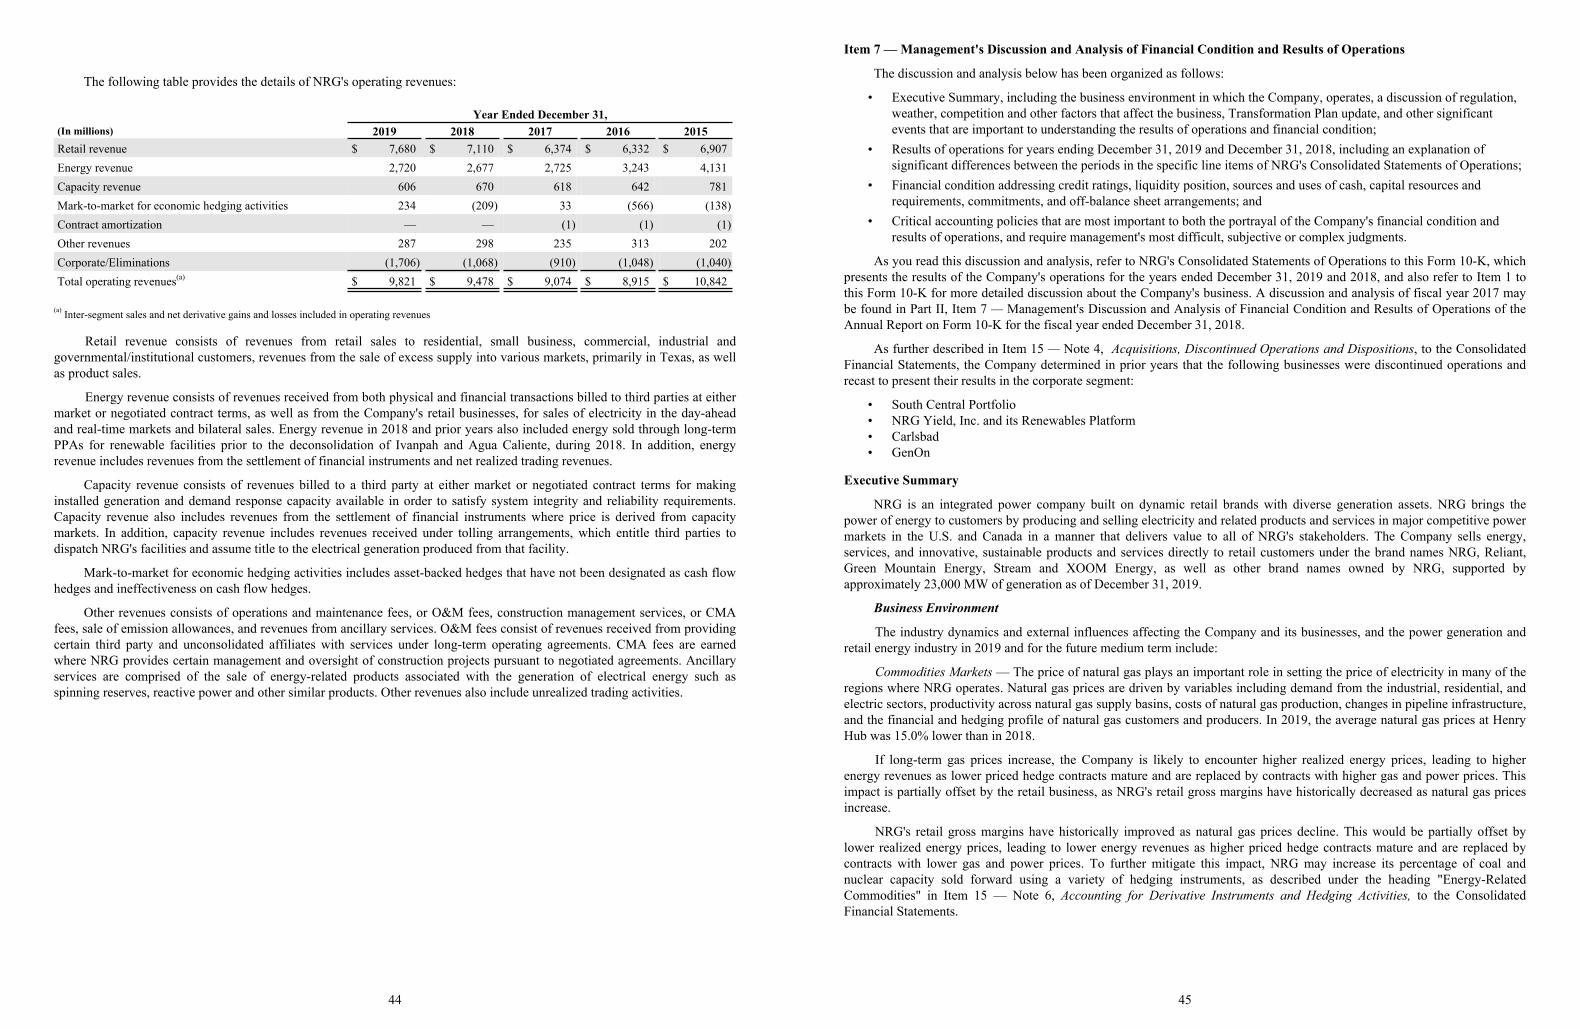
The following table provides the details of NRG's operating revenues:
Year Ended December 31,(In millions) 2019 2018 2017 2016 2015Retail revenue $ 7,680 $ 7,110 $ 6,374 $ 6,332 $ 6,907Energy revenue 2,720 2,677 2,725 3,243 4,131Capacity revenue 606 670 618 642 781Mark-to-market for economic hedging activities 234 (209) 33 (566) (138)Contract amortization — — (1) (1) (1)Other revenues 287 298 235 313 202Corporate/Eliminations (1,706) (1,068) (910) (1,048) (1,040)Total operating revenues(a) $ 9,821 $ 9,478 $ 9,074 $ 8,915 $ 10,842
(a) Inter-segment sales and net derivative gains and losses included in operating revenues
Retail revenue consists of revenues from retail sales to residential, small business, commercial, industrial andgovernmental/institutional customers, revenues from the sale of excess supply into various markets, primarily in Texas, as wellas product sales.
Energy revenue consists of revenues received from both physical and financial transactions billed to third parties at eithermarket or negotiated contract terms, as well as from the Company's retail businesses, for sales of electricity in the day-aheadand real-time markets and bilateral sales. Energy revenue in 2018 and prior years also included energy sold through long-termPPAs for renewable facilities prior to the deconsolidation of Ivanpah and Agua Caliente, during 2018. In addition, energyrevenue includes revenues from the settlement of financial instruments and net realized trading revenues.
Capacity revenue consists of revenues billed to a third party at either market or negotiated contract terms for makinginstalled generation and demand response capacity available in order to satisfy system integrity and reliability requirements.Capacity revenue also includes revenues from the settlement of financial instruments where price is derived from capacitymarkets. In addition, capacity revenue includes revenues received under tolling arrangements, which entitle third parties todispatch NRG's facilities and assume title to the electrical generation produced from that facility.
Mark-to-market for economic hedging activities includes asset-backed hedges that have not been designated as cash flowhedges and ineffectiveness on cash flow hedges.
Other revenues consists of operations and maintenance fees, or O&M fees, construction management services, or CMAfees, sale of emission allowances, and revenues from ancillary services. O&M fees consist of revenues received from providingcertain third party and unconsolidated affiliates with services under long-term operating agreements. CMA fees are earnedwhere NRG provides certain management and oversight of construction projects pursuant to negotiated agreements. Ancillaryservices are comprised of the sale of energy-related products associated with the generation of electrical energy such asspinning reserves, reactive power and other similar products. Other revenues also include unrealized trading activities.
44
Item 7 — Management's Discussion and Analysis of Financial Condition and Results of Operations
The discussion and analysis below has been organized as follows:
• Executive Summary, including the business environment in which the Company, operates, a discussion of regulation, weather, competition and other factors that affect the business, Transformation Plan update, and other significant events that are important to understanding the results of operations and financial condition;
• Results of operations for years ending December 31, 2019 and December 31, 2018, including an explanation of significant differences between the periods in the specific line items of NRG's Consolidated Statements of Operations;
• Financial condition addressing credit ratings, liquidity position, sources and uses of cash, capital resources and requirements, commitments, and off-balance sheet arrangements; and
• Critical accounting policies that are most important to both the portrayal of the Company's financial condition and results of operations, and require management's most difficult, subjective or complex judgments.
As you read this discussion and analysis, refer to NRG's Consolidated Statements of Operations to this Form 10-K, whichpresents the results of the Company's operations for the years ended December 31, 2019 and 2018, and also refer to Item 1 tothis Form 10-K for more detailed discussion about the Company's business. A discussion and analysis of fiscal year 2017 maybe found in Part II, Item 7 — Management's Discussion and Analysis of Financial Condition and Results of Operations of theAnnual Report on Form 10-K for the fiscal year ended December 31, 2018.
As further described in Item 15 — Note 4, Acquisitions, Discontinued Operations and Dispositions, to the ConsolidatedFinancial Statements, the Company determined in prior years that the following businesses were discontinued operations andrecast to present their results in the corporate segment:
• South Central Portfolio• NRG Yield, Inc. and its Renewables Platform• Carlsbad• GenOn
Executive Summary
NRG is an integrated power company built on dynamic retail brands with diverse generation assets. NRG brings thepower of energy to customers by producing and selling electricity and related products and services in major competitive powermarkets in the U.S. and Canada in a manner that delivers value to all of NRG's stakeholders. The Company sells energy,services, and innovative, sustainable products and services directly to retail customers under the brand names NRG, Reliant,Green Mountain Energy, Stream and XOOM Energy, as well as other brand names owned by NRG, supported byapproximately 23,000 MW of generation as of December 31, 2019.
Business Environment
The industry dynamics and external influences affecting the Company and its businesses, and the power generation andretail energy industry in 2019 and for the future medium term include:
Commodities Markets — The price of natural gas plays an important role in setting the price of electricity in many of theregions where NRG operates. Natural gas prices are driven by variables including demand from the industrial, residential, andelectric sectors, productivity across natural gas supply basins, costs of natural gas production, changes in pipeline infrastructure,and the financial and hedging profile of natural gas customers and producers. In 2019, the average natural gas prices at HenryHub was 15.0% lower than in 2018.
If long-term gas prices increase, the Company is likely to encounter higher realized energy prices, leading to higherenergy revenues as lower priced hedge contracts mature and are replaced by contracts with higher gas and power prices. Thisimpact is partially offset by the retail business, as NRG's retail gross margins have historically decreased as natural gas pricesincrease.
NRG's retail gross margins have historically improved as natural gas prices decline. This would be partially offset bylower realized energy prices, leading to lower energy revenues as higher priced hedge contracts mature and are replaced bycontracts with lower gas and power prices. To further mitigate this impact, NRG may increase its percentage of coal andnuclear capacity sold forward using a variety of hedging instruments, as described under the heading "Energy-RelatedCommodities" in Item 15 — Note 6, Accounting for Derivative Instruments and Hedging Activities, to the ConsolidatedFinancial Statements.
45
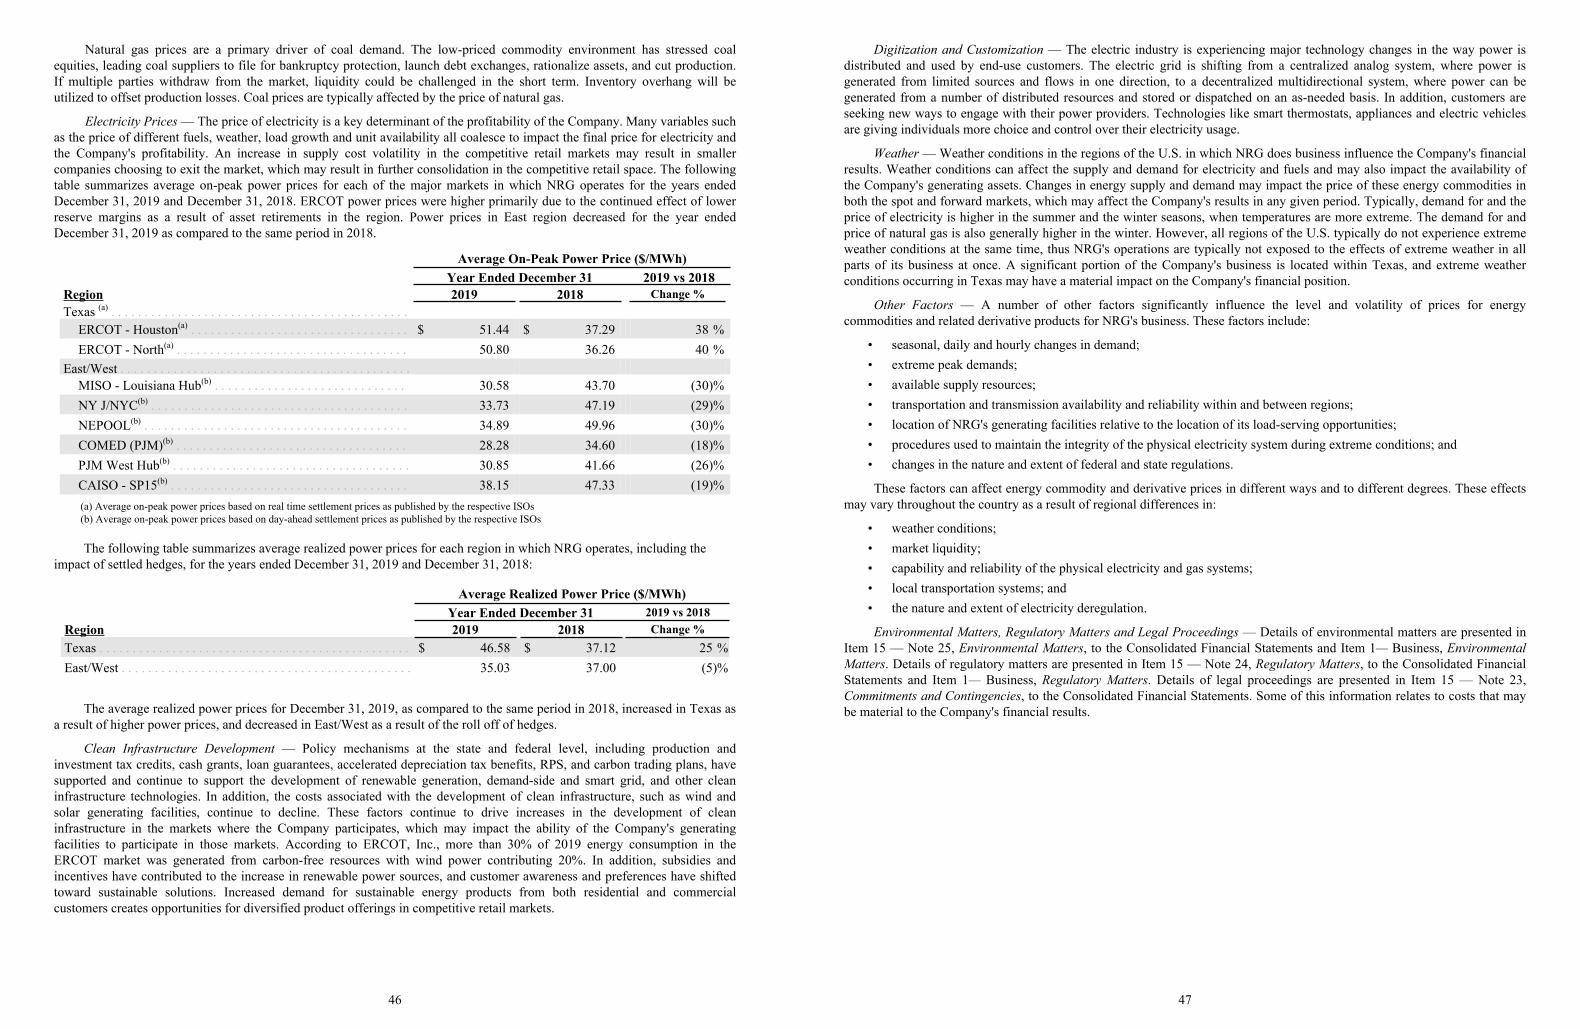
Natural gas prices are a primary driver of coal demand. The low-priced commodity environment has stressed coalequities, leading coal suppliers to file for bankruptcy protection, launch debt exchanges, rationalize assets, and cut production.If multiple parties withdraw from the market, liquidity could be challenged in the short term. Inventory overhang will beutilized to offset production losses. Coal prices are typically affected by the price of natural gas.
Electricity Prices — The price of electricity is a key determinant of the profitability of the Company. Many variables suchas the price of different fuels, weather, load growth and unit availability all coalesce to impact the final price for electricity andthe Company's profitability. An increase in supply cost volatility in the competitive retail markets may result in smallercompanies choosing to exit the market, which may result in further consolidation in the competitive retail space. The followingtable summarizes average on-peak power prices for each of the major markets in which NRG operates for the years endedDecember 31, 2019 and December 31, 2018. ERCOT power prices were higher primarily due to the continued effect of lowerreserve margins as a result of asset retirements in the region. Power prices in East region decreased for the year endedDecember 31, 2019 as compared to the same period in 2018.
Average On-Peak Power Price ($/MWh)Year Ended December 31 2019 vs 2018
Region 2019 2018 Change %Texas (a) . . . . . . . . . . . . . . . . . . . . . . . . . . . . . . . . . . . . . . . . . . . . .
ERCOT - Houston(a) . . . . . . . . . . . . . . . . . . . . . . . . . . . . . . . . . $ 51.44 $ 37.29 38 %ERCOT - North(a) . . . . . . . . . . . . . . . . . . . . . . . . . . . . . . . . . . . 50.80 36.26 40 %
East/West . . . . . . . . . . . . . . . . . . . . . . . . . . . . . . . . . . . . . . . . . . . .MISO - Louisiana Hub(b) . . . . . . . . . . . . . . . . . . . . . . . . . . . . . 30.58 43.70 (30)%NY J/NYC(b) . . . . . . . . . . . . . . . . . . . . . . . . . . . . . . . . . . . . . . . 33.73 47.19 (29)%NEPOOL(b) . . . . . . . . . . . . . . . . . . . . . . . . . . . . . . . . . . . . . . . . 34.89 49.96 (30)%COMED (PJM)(b) . . . . . . . . . . . . . . . . . . . . . . . . . . . . . . . . . . . 28.28 34.60 (18)%PJM West Hub(b) . . . . . . . . . . . . . . . . . . . . . . . . . . . . . . . . . . . . 30.85 41.66 (26)%CAISO - SP15(b) . . . . . . . . . . . . . . . . . . . . . . . . . . . . . . . . . . . . 38.15 47.33 (19)%
(a) Average on-peak power prices based on real time settlement prices as published by the respective ISOs (b) Average on-peak power prices based on day-ahead settlement prices as published by the respective ISOs
The following table summarizes average realized power prices for each region in which NRG operates, including the impact of settled hedges, for the years ended December 31, 2019 and December 31, 2018:
Average Realized Power Price ($/MWh)Year Ended December 31 2019 vs 2018
Region 2019 2018 Change %Texas . . . . . . . . . . . . . . . . . . . . . . . . . . . . . . . . . . . . . . . . . . . . . . . $ 46.58 $ 37.12 25 %East/West . . . . . . . . . . . . . . . . . . . . . . . . . . . . . . . . . . . . . . . . . . . . 35.03 37.00 (5)%
The average realized power prices for December 31, 2019, as compared to the same period in 2018, increased in Texas asa result of higher power prices, and decreased in East/West as a result of the roll off of hedges.
Clean Infrastructure Development — Policy mechanisms at the state and federal level, including production andinvestment tax credits, cash grants, loan guarantees, accelerated depreciation tax benefits, RPS, and carbon trading plans, havesupported and continue to support the development of renewable generation, demand-side and smart grid, and other cleaninfrastructure technologies. In addition, the costs associated with the development of clean infrastructure, such as wind andsolar generating facilities, continue to decline. These factors continue to drive increases in the development of cleaninfrastructure in the markets where the Company participates, which may impact the ability of the Company's generatingfacilities to participate in those markets. According to ERCOT, Inc., more than 30% of 2019 energy consumption in theERCOT market was generated from carbon-free resources with wind power contributing 20%. In addition, subsidies andincentives have contributed to the increase in renewable power sources, and customer awareness and preferences have shiftedtoward sustainable solutions. Increased demand for sustainable energy products from both residential and commercialcustomers creates opportunities for diversified product offerings in competitive retail markets.
46
Digitization and Customization — The electric industry is experiencing major technology changes in the way power isdistributed and used by end-use customers. The electric grid is shifting from a centralized analog system, where power isgenerated from limited sources and flows in one direction, to a decentralized multidirectional system, where power can begenerated from a number of distributed resources and stored or dispatched on an as-needed basis. In addition, customers areseeking new ways to engage with their power providers. Technologies like smart thermostats, appliances and electric vehiclesare giving individuals more choice and control over their electricity usage.
Weather — Weather conditions in the regions of the U.S. in which NRG does business influence the Company's financialresults. Weather conditions can affect the supply and demand for electricity and fuels and may also impact the availability ofthe Company's generating assets. Changes in energy supply and demand may impact the price of these energy commodities inboth the spot and forward markets, which may affect the Company's results in any given period. Typically, demand for and theprice of electricity is higher in the summer and the winter seasons, when temperatures are more extreme. The demand for andprice of natural gas is also generally higher in the winter. However, all regions of the U.S. typically do not experience extremeweather conditions at the same time, thus NRG's operations are typically not exposed to the effects of extreme weather in allparts of its business at once. A significant portion of the Company's business is located within Texas, and extreme weatherconditions occurring in Texas may have a material impact on the Company's financial position.
Other Factors — A number of other factors significantly influence the level and volatility of prices for energycommodities and related derivative products for NRG's business. These factors include:
• seasonal, daily and hourly changes in demand;• extreme peak demands;• available supply resources;• transportation and transmission availability and reliability within and between regions;• location of NRG's generating facilities relative to the location of its load-serving opportunities;• procedures used to maintain the integrity of the physical electricity system during extreme conditions; and• changes in the nature and extent of federal and state regulations.
These factors can affect energy commodity and derivative prices in different ways and to different degrees. These effectsmay vary throughout the country as a result of regional differences in:
• weather conditions;• market liquidity;• capability and reliability of the physical electricity and gas systems;• local transportation systems; and• the nature and extent of electricity deregulation.
Environmental Matters, Regulatory Matters and Legal Proceedings — Details of environmental matters are presented inItem 15 — Note 25, Environmental Matters, to the Consolidated Financial Statements and Item 1— Business, EnvironmentalMatters. Details of regulatory matters are presented in Item 15 — Note 24, Regulatory Matters, to the Consolidated FinancialStatements and Item 1— Business, Regulatory Matters. Details of legal proceedings are presented in Item 15 — Note 23,Commitments and Contingencies, to the Consolidated Financial Statements. Some of this information relates to costs that maybe material to the Company's financial results.
47
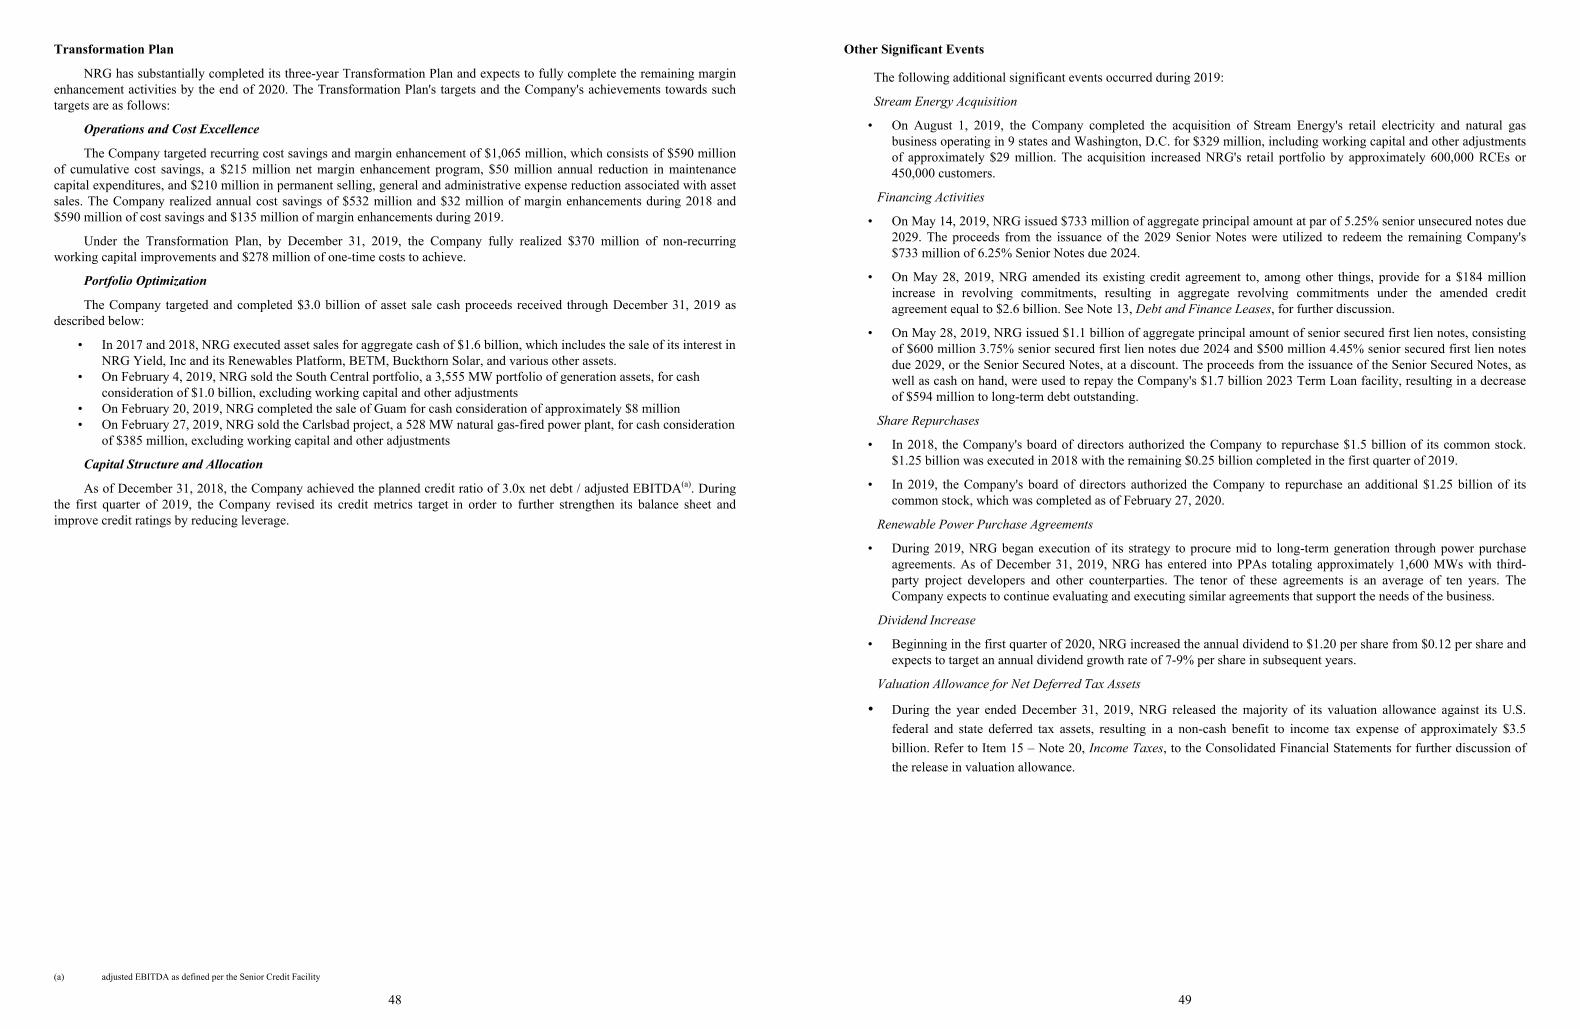
Transformation Plan
NRG has substantially completed its three-year Transformation Plan and expects to fully complete the remaining marginenhancement activities by the end of 2020. The Transformation Plan's targets and the Company's achievements towards suchtargets are as follows:
Operations and Cost Excellence
The Company targeted recurring cost savings and margin enhancement of $1,065 million, which consists of $590 millionof cumulative cost savings, a $215 million net margin enhancement program, $50 million annual reduction in maintenancecapital expenditures, and $210 million in permanent selling, general and administrative expense reduction associated with assetsales. The Company realized annual cost savings of $532 million and $32 million of margin enhancements during 2018 and$590 million of cost savings and $135 million of margin enhancements during 2019.
Under the Transformation Plan, by December 31, 2019, the Company fully realized $370 million of non-recurringworking capital improvements and $278 million of one-time costs to achieve.
Portfolio Optimization
The Company targeted and completed $3.0 billion of asset sale cash proceeds received through December 31, 2019 asdescribed below:
• In 2017 and 2018, NRG executed asset sales for aggregate cash of $1.6 billion, which includes the sale of its interest in NRG Yield, Inc and its Renewables Platform, BETM, Buckthorn Solar, and various other assets.
• On February 4, 2019, NRG sold the South Central portfolio, a 3,555 MW portfolio of generation assets, for cash consideration of $1.0 billion, excluding working capital and other adjustments
• On February 20, 2019, NRG completed the sale of Guam for cash consideration of approximately $8 million • On February 27, 2019, NRG sold the Carlsbad project, a 528 MW natural gas-fired power plant, for cash consideration
of $385 million, excluding working capital and other adjustments
Capital Structure and Allocation
As of December 31, 2018, the Company achieved the planned credit ratio of 3.0x net debt / adjusted EBITDA(a). Duringthe first quarter of 2019, the Company revised its credit metrics target in order to further strengthen its balance sheet andimprove credit ratings by reducing leverage.
(a) adjusted EBITDA as defined per the Senior Credit Facility
48
Other Significant Events
The following additional significant events occurred during 2019:
Stream Energy Acquisition
• On August 1, 2019, the Company completed the acquisition of Stream Energy's retail electricity and natural gasbusiness operating in 9 states and Washington, D.C. for $329 million, including working capital and other adjustmentsof approximately $29 million. The acquisition increased NRG's retail portfolio by approximately 600,000 RCEs or450,000 customers.
Financing Activities
• On May 14, 2019, NRG issued $733 million of aggregate principal amount at par of 5.25% senior unsecured notes due2029. The proceeds from the issuance of the 2029 Senior Notes were utilized to redeem the remaining Company's$733 million of 6.25% Senior Notes due 2024.
• On May 28, 2019, NRG amended its existing credit agreement to, among other things, provide for a $184 millionincrease in revolving commitments, resulting in aggregate revolving commitments under the amended creditagreement equal to $2.6 billion. See Note 13, Debt and Finance Leases, for further discussion.
• On May 28, 2019, NRG issued $1.1 billion of aggregate principal amount of senior secured first lien notes, consistingof $600 million 3.75% senior secured first lien notes due 2024 and $500 million 4.45% senior secured first lien notesdue 2029, or the Senior Secured Notes, at a discount. The proceeds from the issuance of the Senior Secured Notes, aswell as cash on hand, were used to repay the Company's $1.7 billion 2023 Term Loan facility, resulting in a decreaseof $594 million to long-term debt outstanding.
Share Repurchases
• In 2018, the Company's board of directors authorized the Company to repurchase $1.5 billion of its common stock.$1.25 billion was executed in 2018 with the remaining $0.25 billion completed in the first quarter of 2019.
• In 2019, the Company's board of directors authorized the Company to repurchase an additional $1.25 billion of itscommon stock, which was completed as of February 27, 2020.
Renewable Power Purchase Agreements
• During 2019, NRG began execution of its strategy to procure mid to long-term generation through power purchaseagreements. As of December 31, 2019, NRG has entered into PPAs totaling approximately 1,600 MWs with third-party project developers and other counterparties. The tenor of these agreements is an average of ten years. TheCompany expects to continue evaluating and executing similar agreements that support the needs of the business.
Dividend Increase
• Beginning in the first quarter of 2020, NRG increased the annual dividend to $1.20 per share from $0.12 per share andexpects to target an annual dividend growth rate of 7-9% per share in subsequent years.
Valuation Allowance for Net Deferred Tax Assets
• During the year ended December 31, 2019, NRG released the majority of its valuation allowance against its U.S.federal and state deferred tax assets, resulting in a non-cash benefit to income tax expense of approximately $3.5billion. Refer to Item 15 – Note 20, Income Taxes, to the Consolidated Financial Statements for further discussion ofthe release in valuation allowance.
49
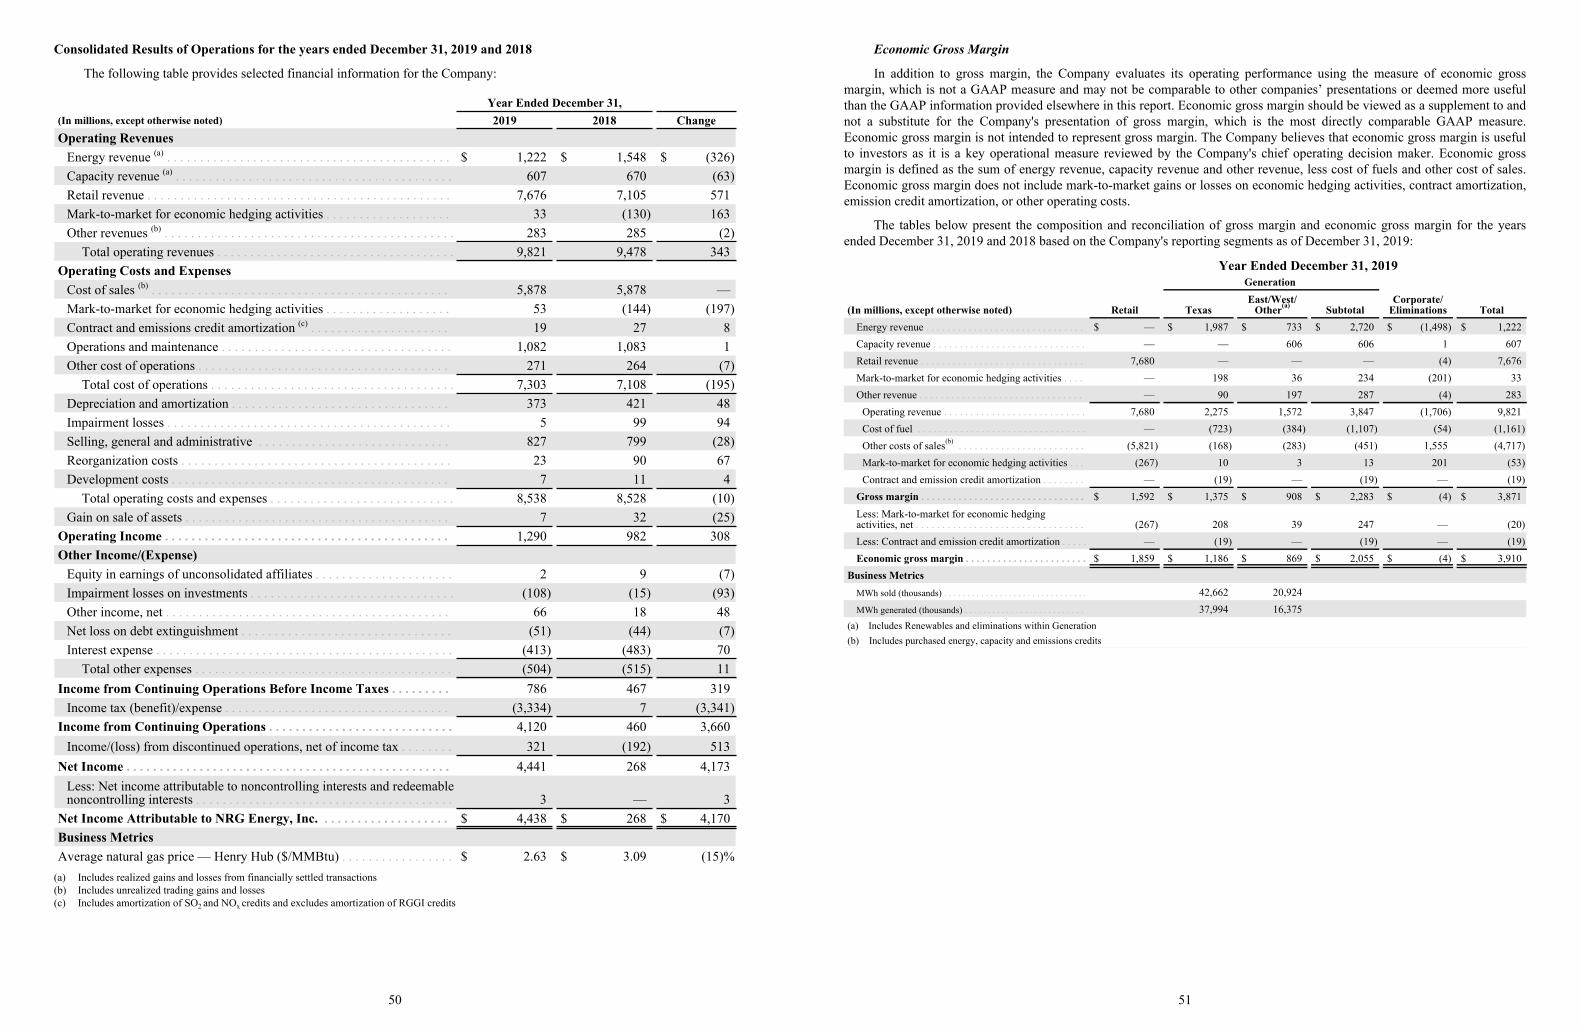
Consolidated Results of Operations for the years ended December 31, 2019 and 2018
The following table provides selected financial information for the Company:
Year Ended December 31,(In millions, except otherwise noted) 2019 2018 ChangeOperating Revenues
Energy revenue (a) . . . . . . . . . . . . . . . . . . . . . . . . . . . . . . . . . . . . . . . . . . . $ 1,222 $ 1,548 $ (326)Capacity revenue (a) . . . . . . . . . . . . . . . . . . . . . . . . . . . . . . . . . . . . . . . . . . 607 670 (63)Retail revenue . . . . . . . . . . . . . . . . . . . . . . . . . . . . . . . . . . . . . . . . . . . . . . 7,676 7,105 571Mark-to-market for economic hedging activities . . . . . . . . . . . . . . . . . . . 33 (130) 163Other revenues (b) . . . . . . . . . . . . . . . . . . . . . . . . . . . . . . . . . . . . . . . . . . . . 283 285 (2)
Total operating revenues . . . . . . . . . . . . . . . . . . . . . . . . . . . . . . . . . . . . 9,821 9,478 343Operating Costs and Expenses
Cost of sales (b) . . . . . . . . . . . . . . . . . . . . . . . . . . . . . . . . . . . . . . . . . . . . . 5,878 5,878 —Mark-to-market for economic hedging activities . . . . . . . . . . . . . . . . . . . 53 (144) (197)Contract and emissions credit amortization (c) . . . . . . . . . . . . . . . . . . . . . 19 27 8Operations and maintenance . . . . . . . . . . . . . . . . . . . . . . . . . . . . . . . . . . . 1,082 1,083 1Other cost of operations . . . . . . . . . . . . . . . . . . . . . . . . . . . . . . . . . . . . . . 271 264 (7)
Total cost of operations . . . . . . . . . . . . . . . . . . . . . . . . . . . . . . . . . . . . . 7,303 7,108 (195)Depreciation and amortization . . . . . . . . . . . . . . . . . . . . . . . . . . . . . . . . . 373 421 48Impairment losses . . . . . . . . . . . . . . . . . . . . . . . . . . . . . . . . . . . . . . . . . . . 5 99 94Selling, general and administrative . . . . . . . . . . . . . . . . . . . . . . . . . . . . . 827 799 (28)Reorganization costs . . . . . . . . . . . . . . . . . . . . . . . . . . . . . . . . . . . . . . . . . 23 90 67Development costs . . . . . . . . . . . . . . . . . . . . . . . . . . . . . . . . . . . . . . . . . . 7 11 4
Total operating costs and expenses . . . . . . . . . . . . . . . . . . . . . . . . . . . . 8,538 8,528 (10)Gain on sale of assets . . . . . . . . . . . . . . . . . . . . . . . . . . . . . . . . . . . . . . . . 7 32 (25)
Operating Income . . . . . . . . . . . . . . . . . . . . . . . . . . . . . . . . . . . . . . . . . . . 1,290 982 308Other Income/(Expense)
Equity in earnings of unconsolidated affiliates . . . . . . . . . . . . . . . . . . . . . 2 9 (7)Impairment losses on investments . . . . . . . . . . . . . . . . . . . . . . . . . . . . . . . (108) (15) (93)Other income, net . . . . . . . . . . . . . . . . . . . . . . . . . . . . . . . . . . . . . . . . . . . 66 18 48Net loss on debt extinguishment . . . . . . . . . . . . . . . . . . . . . . . . . . . . . . . . (51) (44) (7)Interest expense . . . . . . . . . . . . . . . . . . . . . . . . . . . . . . . . . . . . . . . . . . . . . (413) (483) 70
Total other expenses . . . . . . . . . . . . . . . . . . . . . . . . . . . . . . . . . . . . . . . (504) (515) 11Income from Continuing Operations Before Income Taxes . . . . . . . . . 786 467 319
Income tax (benefit)/expense . . . . . . . . . . . . . . . . . . . . . . . . . . . . . . . . . . (3,334) 7 (3,341)Income from Continuing Operations . . . . . . . . . . . . . . . . . . . . . . . . . . . . 4,120 460 3,660
Income/(loss) from discontinued operations, net of income tax . . . . . . . . 321 (192) 513Net Income . . . . . . . . . . . . . . . . . . . . . . . . . . . . . . . . . . . . . . . . . . . . . . . . . 4,441 268 4,173
Less: Net income attributable to noncontrolling interests and redeemable noncontrolling interests . . . . . . . . . . . . . . . . . . . . . . . . . . . . . . . . . . . . . . . 3 — 3
Net Income Attributable to NRG Energy, Inc. . . . . . . . . . . . . . . . . . . . $ 4,438 $ 268 $ 4,170Business MetricsAverage natural gas price — Henry Hub ($/MMBtu) . . . . . . . . . . . . . . . . . $ 2.63 $ 3.09 (15)%
(a) Includes realized gains and losses from financially settled transactions(b) Includes unrealized trading gains and losses(c) Includes amortization of SO2 and NOx credits and excludes amortization of RGGI credits
50
Economic Gross Margin
In addition to gross margin, the Company evaluates its operating performance using the measure of economic grossmargin, which is not a GAAP measure and may not be comparable to other companies’ presentations or deemed more usefulthan the GAAP information provided elsewhere in this report. Economic gross margin should be viewed as a supplement to andnot a substitute for the Company's presentation of gross margin, which is the most directly comparable GAAP measure.Economic gross margin is not intended to represent gross margin. The Company believes that economic gross margin is usefulto investors as it is a key operational measure reviewed by the Company's chief operating decision maker. Economic grossmargin is defined as the sum of energy revenue, capacity revenue and other revenue, less cost of fuels and other cost of sales.Economic gross margin does not include mark-to-market gains or losses on economic hedging activities, contract amortization,emission credit amortization, or other operating costs.
The tables below present the composition and reconciliation of gross margin and economic gross margin for the yearsended December 31, 2019 and 2018 based on the Company's reporting segments as of December 31, 2019:
Year Ended December 31, 2019Generation
(In millions, except otherwise noted) Retail TexasEast/West/
Other(a) SubtotalCorporate/
Eliminations TotalEnergy revenue . . . . . . . . . . . . . . . . . . . . . . . . . . . . . . $ — $ 1,987 $ 733 $ 2,720 $ (1,498) $ 1,222Capacity revenue . . . . . . . . . . . . . . . . . . . . . . . . . . . . . — — 606 606 1 607Retail revenue . . . . . . . . . . . . . . . . . . . . . . . . . . . . . . . 7,680 — — — (4) 7,676Mark-to-market for economic hedging activities . . . . — 198 36 234 (201) 33Other revenue . . . . . . . . . . . . . . . . . . . . . . . . . . . . . . . — 90 197 287 (4) 283
Operating revenue . . . . . . . . . . . . . . . . . . . . . . . . . . . 7,680 2,275 1,572 3,847 (1,706) 9,821Cost of fuel . . . . . . . . . . . . . . . . . . . . . . . . . . . . . . . . — (723) (384) (1,107) (54) (1,161)Other costs of sales(b) . . . . . . . . . . . . . . . . . . . . . . . . (5,821) (168) (283) (451) 1,555 (4,717)Mark-to-market for economic hedging activities . . . (267) 10 3 13 201 (53)Contract and emission credit amortization . . . . . . . . — (19) — (19) — (19)
Gross margin . . . . . . . . . . . . . . . . . . . . . . . . . . . . . . . $ 1,592 $ 1,375 $ 908 $ 2,283 $ (4) $ 3,871Less: Mark-to-market for economic hedging activities, net . . . . . . . . . . . . . . . . . . . . . . . . . . . . . . . . (267) 208 39 247 — (20)Less: Contract and emission credit amortization . . . . . — (19) — (19) — (19)Economic gross margin . . . . . . . . . . . . . . . . . . . . . . . $ 1,859 $ 1,186 $ 869 $ 2,055 $ (4) $ 3,910
Business MetricsMWh sold (thousands) . . . . . . . . . . . . . . . . . . . . . . . . . . . . . . . 42,662 20,924MWh generated (thousands) . . . . . . . . . . . . . . . . . . . . . . . . . . 37,994 16,375
(a) Includes Renewables and eliminations within Generation(b) Includes purchased energy, capacity and emissions credits
51
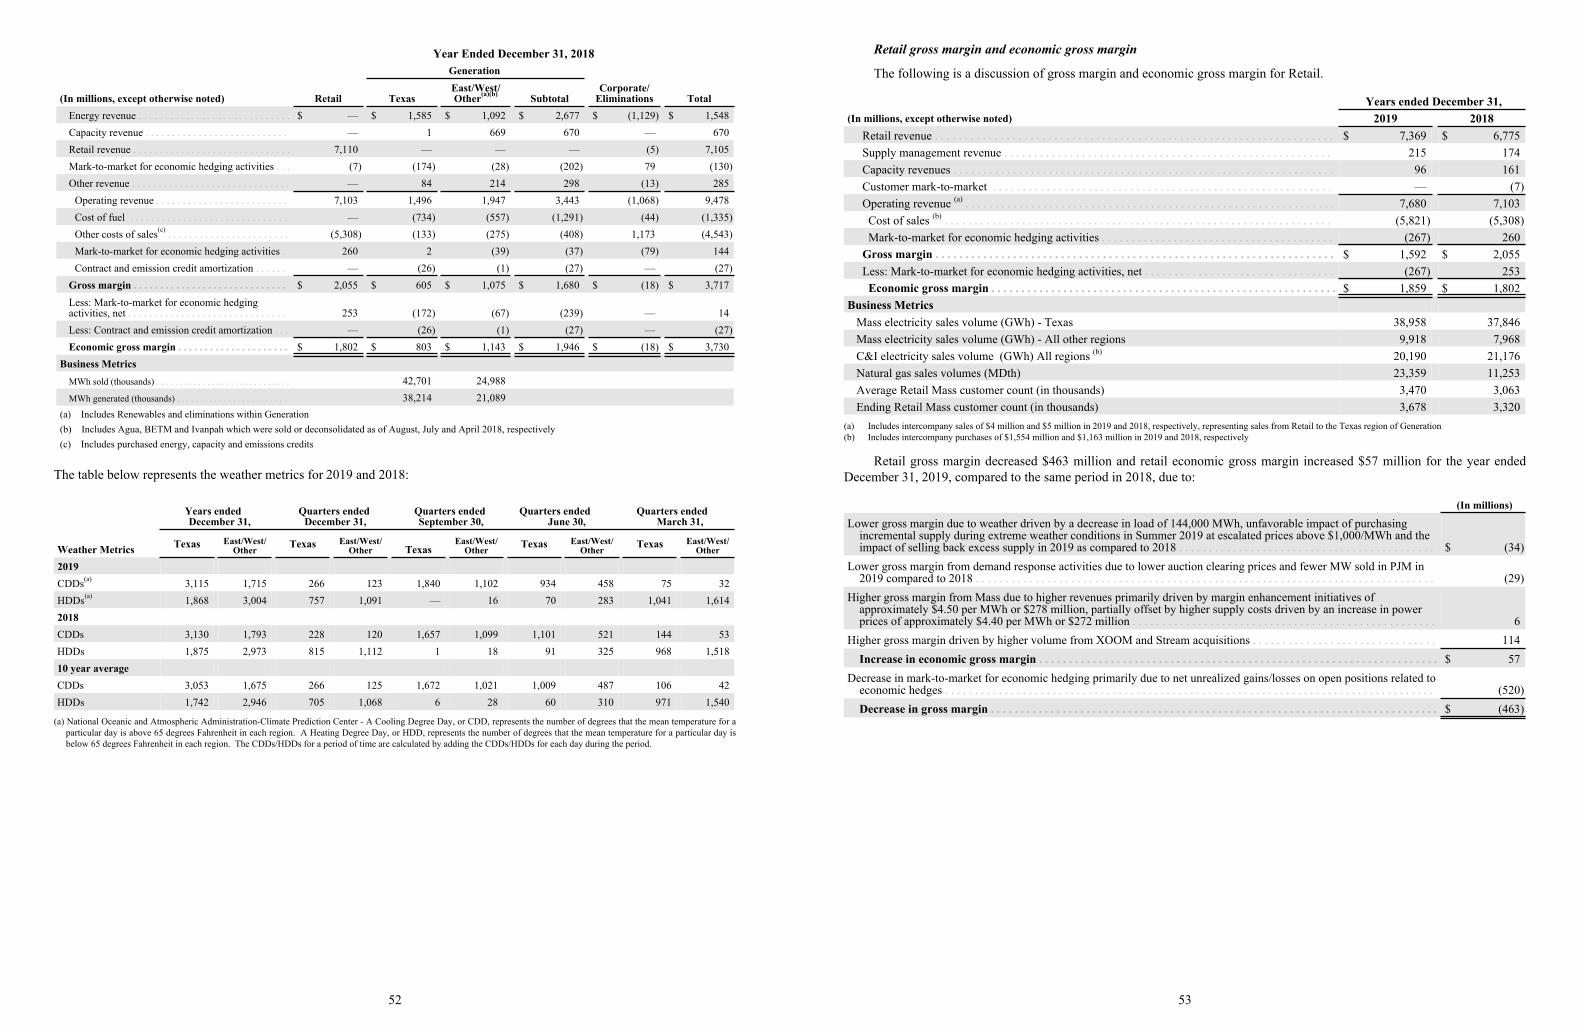
Year Ended December 31, 2018Generation
(In millions, except otherwise noted) Retail TexasEast/West/Other(a)(b) Subtotal
Corporate/Eliminations Total
Energy revenue . . . . . . . . . . . . . . . . . . . . . . . . . . . . . $ — $ 1,585 $ 1,092 $ 2,677 $ (1,129) $ 1,548Capacity revenue . . . . . . . . . . . . . . . . . . . . . . . . . . . — 1 669 670 — 670Retail revenue . . . . . . . . . . . . . . . . . . . . . . . . . . . . . . 7,110 — — — (5) 7,105Mark-to-market for economic hedging activities . . . (7) (174) (28) (202) 79 (130)Other revenue . . . . . . . . . . . . . . . . . . . . . . . . . . . . . . — 84 214 298 (13) 285
Operating revenue . . . . . . . . . . . . . . . . . . . . . . . . . 7,103 1,496 1,947 3,443 (1,068) 9,478Cost of fuel . . . . . . . . . . . . . . . . . . . . . . . . . . . . . . — (734) (557) (1,291) (44) (1,335)Other costs of sales(c) . . . . . . . . . . . . . . . . . . . . . . . (5,308) (133) (275) (408) 1,173 (4,543)Mark-to-market for economic hedging activities . 260 2 (39) (37) (79) 144Contract and emission credit amortization . . . . . . — (26) (1) (27) — (27)
Gross margin . . . . . . . . . . . . . . . . . . . . . . . . . . . . . $ 2,055 $ 605 $ 1,075 $ 1,680 $ (18) $ 3,717Less: Mark-to-market for economic hedging activities, net . . . . . . . . . . . . . . . . . . . . . . . . . . . . . . 253 (172) (67) (239) — 14Less: Contract and emission credit amortization . . . — (26) (1) (27) — (27)Economic gross margin . . . . . . . . . . . . . . . . . . . . . $ 1,802 $ 803 $ 1,143 $ 1,946 $ (18) $ 3,730
Business MetricsMWh sold (thousands) . . . . . . . . . . . . . . . . . . . . . . . . . . . . . 42,701 24,988MWh generated (thousands) . . . . . . . . . . . . . . . . . . . . . . . . 38,214 21,089
(a) Includes Renewables and eliminations within Generation (b) Includes Agua, BETM and Ivanpah which were sold or deconsolidated as of August, July and April 2018, respectively(c) Includes purchased energy, capacity and emissions credits
The table below represents the weather metrics for 2019 and 2018:
Years ended December 31,
Quarters ended December 31,
Quarters ended September 30,
Quarters ended June 30,
Quarters ended March 31,
Weather Metrics Texas East/West/Other Texas East/West/
Other TexasEast/West/
Other Texas East/West/Other Texas East/West/
Other
2019CDDs(a) 3,115 1,715 266 123 1,840 1,102 934 458 75 32HDDs(a) 1,868 3,004 757 1,091 — 16 70 283 1,041 1,6142018CDDs 3,130 1,793 228 120 1,657 1,099 1,101 521 144 53HDDs 1,875 2,973 815 1,112 1 18 91 325 968 1,51810 year averageCDDs 3,053 1,675 266 125 1,672 1,021 1,009 487 106 42HDDs 1,742 2,946 705 1,068 6 28 60 310 971 1,540
(a) National Oceanic and Atmospheric Administration-Climate Prediction Center - A Cooling Degree Day, or CDD, represents the number of degrees that the mean temperature for aparticular day is above 65 degrees Fahrenheit in each region. A Heating Degree Day, or HDD, represents the number of degrees that the mean temperature for a particular day isbelow 65 degrees Fahrenheit in each region. The CDDs/HDDs for a period of time are calculated by adding the CDDs/HDDs for each day during the period.
52
Retail gross margin and economic gross margin
The following is a discussion of gross margin and economic gross margin for Retail.
Years ended December 31,(In millions, except otherwise noted) 2019 2018
Retail revenue . . . . . . . . . . . . . . . . . . . . . . . . . . . . . . . . . . . . . . . . . . . . . . . . . . . . . . . . . . . . . . . . . . . $ 7,369 $ 6,775Supply management revenue . . . . . . . . . . . . . . . . . . . . . . . . . . . . . . . . . . . . . . . . . . . . . . . . . . . . . . . 215 174Capacity revenues . . . . . . . . . . . . . . . . . . . . . . . . . . . . . . . . . . . . . . . . . . . . . . . . . . . . . . . . . . . . . . . . 96 161Customer mark-to-market . . . . . . . . . . . . . . . . . . . . . . . . . . . . . . . . . . . . . . . . . . . . . . . . . . . . . . . . . — (7)Operating revenue (a) . . . . . . . . . . . . . . . . . . . . . . . . . . . . . . . . . . . . . . . . . . . . . . . . . . . . . . . . . . . . . . 7,680 7,103
Cost of sales (b) . . . . . . . . . . . . . . . . . . . . . . . . . . . . . . . . . . . . . . . . . . . . . . . . . . . . . . . . . . . . . . . . . (5,821) (5,308)Mark-to-market for economic hedging activities . . . . . . . . . . . . . . . . . . . . . . . . . . . . . . . . . . . . . . . (267) 260
Gross margin . . . . . . . . . . . . . . . . . . . . . . . . . . . . . . . . . . . . . . . . . . . . . . . . . . . . . . . . . . . . . . . . . . . $ 1,592 $ 2,055Less: Mark-to-market for economic hedging activities, net . . . . . . . . . . . . . . . . . . . . . . . . . . . . . . . . (267) 253Economic gross margin . . . . . . . . . . . . . . . . . . . . . . . . . . . . . . . . . . . . . . . . . . . . . . . . . . . . . . . . . . $ 1,859 $ 1,802
Business MetricsMass electricity sales volume (GWh) - Texas 38,958 37,846Mass electricity sales volume (GWh) - All other regions 9,918 7,968C&I electricity sales volume (GWh) All regions (b) 20,190 21,176Natural gas sales volumes (MDth) 23,359 11,253Average Retail Mass customer count (in thousands) 3,470 3,063Ending Retail Mass customer count (in thousands) 3,678 3,320
(a) Includes intercompany sales of $4 million and $5 million in 2019 and 2018, respectively, representing sales from Retail to the Texas region of Generation(b) Includes intercompany purchases of $1,554 million and $1,163 million in 2019 and 2018, respectively
Retail gross margin decreased $463 million and retail economic gross margin increased $57 million for the year endedDecember 31, 2019, compared to the same period in 2018, due to:
(In millions)
Lower gross margin due to weather driven by a decrease in load of 144,000 MWh, unfavorable impact of purchasing incremental supply during extreme weather conditions in Summer 2019 at escalated prices above $1,000/MWh and the impact of selling back excess supply in 2019 as compared to 2018 . . . . . . . . . . . . . . . . . . . . . . . . . . . . . . . . . . . . . . . . . . . $ (34)
Lower gross margin from demand response activities due to lower auction clearing prices and fewer MW sold in PJM in 2019 compared to 2018 . . . . . . . . . . . . . . . . . . . . . . . . . . . . . . . . . . . . . . . . . . . . . . . . . . . . . . . . . . . . . . . . . . . . . . . . . . . . . (29)
Higher gross margin from Mass due to higher revenues primarily driven by margin enhancement initiatives of approximately $4.50 per MWh or $278 million, partially offset by higher supply costs driven by an increase in power prices of approximately $4.40 per MWh or $272 million . . . . . . . . . . . . . . . . . . . . . . . . . . . . . . . . . . . . . . . . . . . . . . . . . . . 6
Higher gross margin driven by higher volume from XOOM and Stream acquisitions . . . . . . . . . . . . . . . . . . . . . . . . . . . . . . . 114Increase in economic gross margin . . . . . . . . . . . . . . . . . . . . . . . . . . . . . . . . . . . . . . . . . . . . . . . . . . . . . . . . . . . . . . . . . . . $ 57
Decrease in mark-to-market for economic hedging primarily due to net unrealized gains/losses on open positions related to economic hedges . . . . . . . . . . . . . . . . . . . . . . . . . . . . . . . . . . . . . . . . . . . . . . . . . . . . . . . . . . . . . . . . . . . . . . . . . . . . . . . . . . (520)Decrease in gross margin . . . . . . . . . . . . . . . . . . . . . . . . . . . . . . . . . . . . . . . . . . . . . . . . . . . . . . . . . . . . . . . . . . . . . . . . . . . $ (463)
53
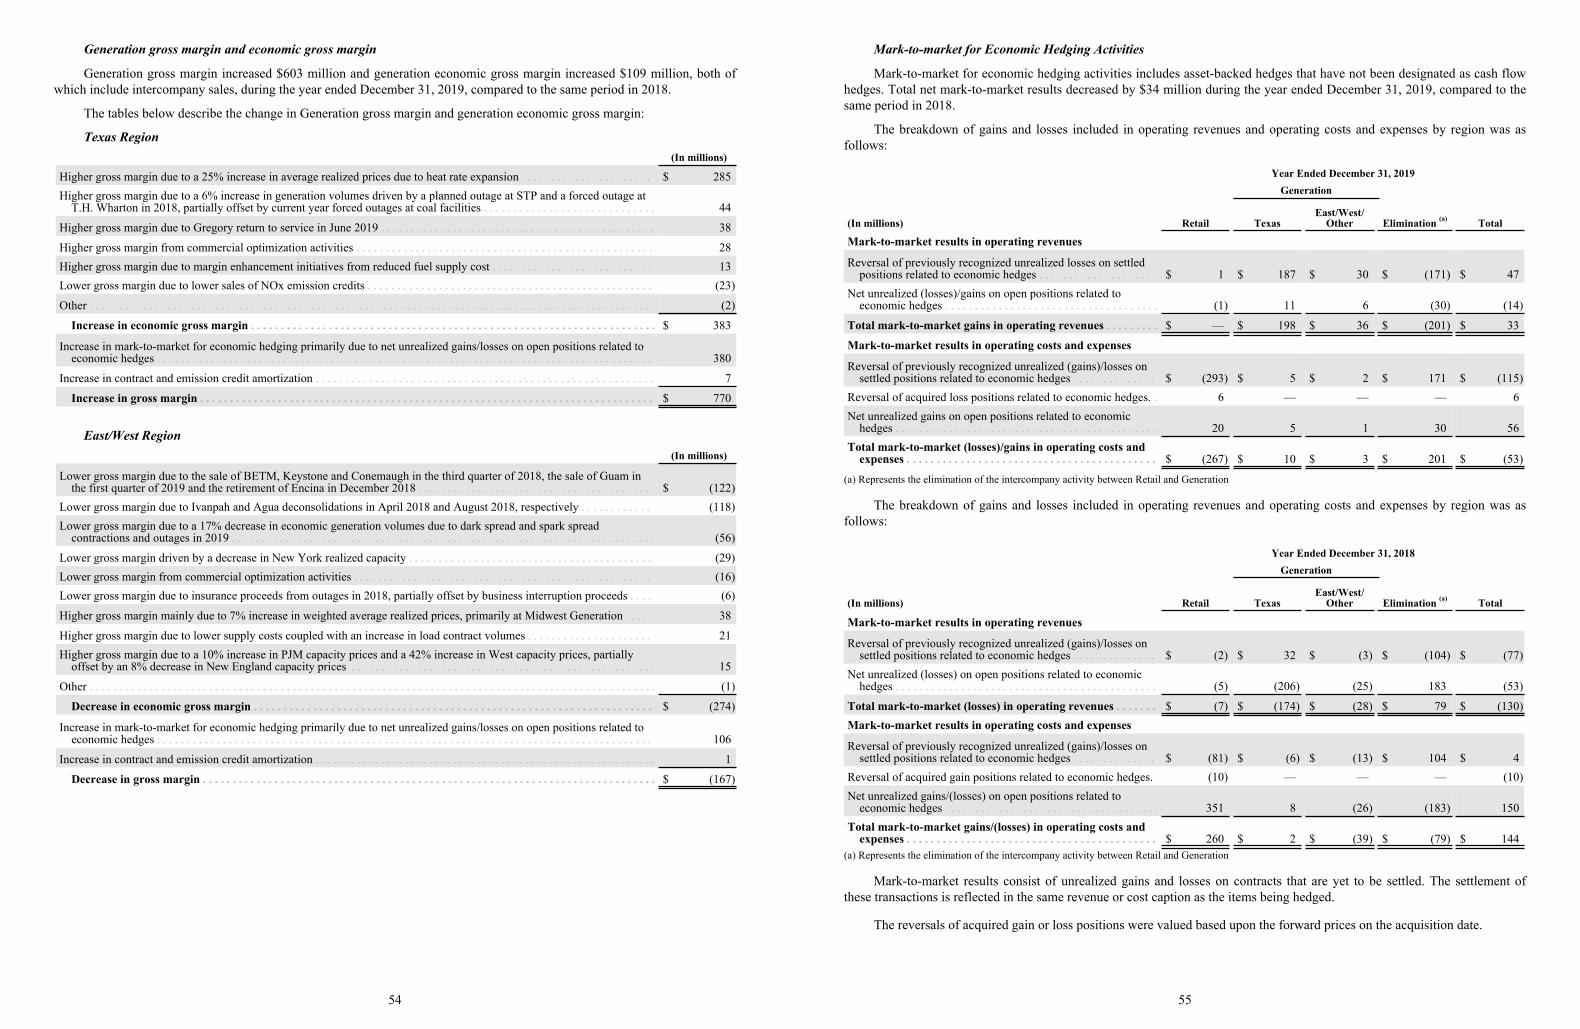
Generation gross margin and economic gross margin
Generation gross margin increased $603 million and generation economic gross margin increased $109 million, both ofwhich include intercompany sales, during the year ended December 31, 2019, compared to the same period in 2018.
The tables below describe the change in Generation gross margin and generation economic gross margin:
Texas Region(In millions)
Higher gross margin due to a 25% increase in average realized prices due to heat rate expansion . . . . . . . . . . . . . . . . . . . . . . $ 285Higher gross margin due to a 6% increase in generation volumes driven by a planned outage at STP and a forced outage at
T.H. Wharton in 2018, partially offset by current year forced outages at coal facilities . . . . . . . . . . . . . . . . . . . . . . . . . . . . . 44
Higher gross margin due to Gregory return to service in June 2019 . . . . . . . . . . . . . . . . . . . . . . . . . . . . . . . . . . . . . . . . . . . . . . 38
Higher gross margin from commercial optimization activities . . . . . . . . . . . . . . . . . . . . . . . . . . . . . . . . . . . . . . . . . . . . . . . . . . 28Higher gross margin due to margin enhancement initiatives from reduced fuel supply cost . . . . . . . . . . . . . . . . . . . . . . . . . . . 13Lower gross margin due to lower sales of NOx emission credits . . . . . . . . . . . . . . . . . . . . . . . . . . . . . . . . . . . . . . . . . . . . . . . . (23)
Other . . . . . . . . . . . . . . . . . . . . . . . . . . . . . . . . . . . . . . . . . . . . . . . . . . . . . . . . . . . . . . . . . . . . . . . . . . . . . . . . . . . . . . . . . . . . . . . (2)
Increase in economic gross margin . . . . . . . . . . . . . . . . . . . . . . . . . . . . . . . . . . . . . . . . . . . . . . . . . . . . . . . . . . . . . . . . . . . . $ 383
Increase in mark-to-market for economic hedging primarily due to net unrealized gains/losses on open positions related to economic hedges . . . . . . . . . . . . . . . . . . . . . . . . . . . . . . . . . . . . . . . . . . . . . . . . . . . . . . . . . . . . . . . . . . . . . . . . . . . . . . . . . . . 380
Increase in contract and emission credit amortization . . . . . . . . . . . . . . . . . . . . . . . . . . . . . . . . . . . . . . . . . . . . . . . . . . . . . . . . . 7
Increase in gross margin . . . . . . . . . . . . . . . . . . . . . . . . . . . . . . . . . . . . . . . . . . . . . . . . . . . . . . . . . . . . . . . . . . . . . . . . . . . . $ 770
East/West Region(In millions)
Lower gross margin due to the sale of BETM, Keystone and Conemaugh in the third quarter of 2018, the sale of Guam in the first quarter of 2019 and the retirement of Encina in December 2018 . . . . . . . . . . . . . . . . . . . . . . . . . . . . . . . . . . . . . . . . $ (122)
Lower gross margin due to Ivanpah and Agua deconsolidations in April 2018 and August 2018, respectively . . . . . . . . . . . . (118)Lower gross margin due to a 17% decrease in economic generation volumes due to dark spread and spark spread
contractions and outages in 2019 . . . . . . . . . . . . . . . . . . . . . . . . . . . . . . . . . . . . . . . . . . . . . . . . . . . . . . . . . . . . . . . . . . . . . . . (56)
Lower gross margin driven by a decrease in New York realized capacity . . . . . . . . . . . . . . . . . . . . . . . . . . . . . . . . . . . . . . . . . (29)Lower gross margin from commercial optimization activities . . . . . . . . . . . . . . . . . . . . . . . . . . . . . . . . . . . . . . . . . . . . . . . . . . (16)Lower gross margin due to insurance proceeds from outages in 2018, partially offset by business interruption proceeds . . . . (6)
Higher gross margin mainly due to 7% increase in weighted average realized prices, primarily at Midwest Generation . . . . . 38
Higher gross margin due to lower supply costs coupled with an increase in load contract volumes . . . . . . . . . . . . . . . . . . . . . 21Higher gross margin due to a 10% increase in PJM capacity prices and a 42% increase in West capacity prices, partially
offset by an 8% decrease in New England capacity prices . . . . . . . . . . . . . . . . . . . . . . . . . . . . . . . . . . . . . . . . . . . . . . . . . . . 15
Other . . . . . . . . . . . . . . . . . . . . . . . . . . . . . . . . . . . . . . . . . . . . . . . . . . . . . . . . . . . . . . . . . . . . . . . . . . . . . . . . . . . . . . . . . . . . . . . (1)
Decrease in economic gross margin . . . . . . . . . . . . . . . . . . . . . . . . . . . . . . . . . . . . . . . . . . . . . . . . . . . . . . . . . . . . . . . . . . . $ (274)
Increase in mark-to-market for economic hedging primarily due to net unrealized gains/losses on open positions related to economic hedges . . . . . . . . . . . . . . . . . . . . . . . . . . . . . . . . . . . . . . . . . . . . . . . . . . . . . . . . . . . . . . . . . . . . . . . . . . . . . . . . . . . 106
Increase in contract and emission credit amortization . . . . . . . . . . . . . . . . . . . . . . . . . . . . . . . . . . . . . . . . . . . . . . . . . . . . . . . . . 1
Decrease in gross margin . . . . . . . . . . . . . . . . . . . . . . . . . . . . . . . . . . . . . . . . . . . . . . . . . . . . . . . . . . . . . . . . . . . . . . . . . . . . $ (167)
54
Mark-to-market for Economic Hedging Activities
Mark-to-market for economic hedging activities includes asset-backed hedges that have not been designated as cash flowhedges. Total net mark-to-market results decreased by $34 million during the year ended December 31, 2019, compared to thesame period in 2018.
The breakdown of gains and losses included in operating revenues and operating costs and expenses by region was asfollows:
Year Ended December 31, 2019Generation
(In millions) Retail TexasEast/West/
Other Elimination (a) Total
Mark-to-market results in operating revenues
Reversal of previously recognized unrealized losses on settled positions related to economic hedges . . . . . . . . . . . . . . . . . . . . $ 1 $ 187 $ 30 $ (171) $ 47
Net unrealized (losses)/gains on open positions related to economic hedges . . . . . . . . . . . . . . . . . . . . . . . . . . . . . . . . . . . . (1) 11 6 (30) (14)
Total mark-to-market gains in operating revenues . . . . . . . . . $ — $ 198 $ 36 $ (201) $ 33
Mark-to-market results in operating costs and expenses
Reversal of previously recognized unrealized (gains)/losses on settled positions related to economic hedges . . . . . . . . . . . . . . $ (293) $ 5 $ 2 $ 171 $ (115)
Reversal of acquired loss positions related to economic hedges. . 6 — — — 6Net unrealized gains on open positions related to economic
hedges . . . . . . . . . . . . . . . . . . . . . . . . . . . . . . . . . . . . . . . . . . . . 20 5 1 30 56Total mark-to-market (losses)/gains in operating costs and
expenses . . . . . . . . . . . . . . . . . . . . . . . . . . . . . . . . . . . . . . . . . . $ (267) $ 10 $ 3 $ 201 $ (53)
(a) Represents the elimination of the intercompany activity between Retail and Generation
The breakdown of gains and losses included in operating revenues and operating costs and expenses by region was asfollows:
Year Ended December 31, 2018Generation
(In millions) Retail TexasEast/West/
Other Elimination (a) Total
Mark-to-market results in operating revenues
Reversal of previously recognized unrealized (gains)/losses on settled positions related to economic hedges . . . . . . . . . . . . . . $ (2) $ 32 $ (3) $ (104) $ (77)
Net unrealized (losses) on open positions related to economic hedges . . . . . . . . . . . . . . . . . . . . . . . . . . . . . . . . . . . . . . . . . . . . (5) (206) (25) 183 (53)
Total mark-to-market (losses) in operating revenues . . . . . . . $ (7) $ (174) $ (28) $ 79 $ (130)Mark-to-market results in operating costs and expenses
Reversal of previously recognized unrealized (gains)/losses on settled positions related to economic hedges . . . . . . . . . . . . . . $ (81) $ (6) $ (13) $ 104 $ 4
Reversal of acquired gain positions related to economic hedges. (10) — — — (10)Net unrealized gains/(losses) on open positions related to
economic hedges . . . . . . . . . . . . . . . . . . . . . . . . . . . . . . . . . . . . 351 8 (26) (183) 150Total mark-to-market gains/(losses) in operating costs and
expenses . . . . . . . . . . . . . . . . . . . . . . . . . . . . . . . . . . . . . . . . . . $ 260 $ 2 $ (39) $ (79) $ 144(a) Represents the elimination of the intercompany activity between Retail and Generation
Mark-to-market results consist of unrealized gains and losses on contracts that are yet to be settled. The settlement ofthese transactions is reflected in the same revenue or cost caption as the items being hedged.
The reversals of acquired gain or loss positions were valued based upon the forward prices on the acquisition date.
55
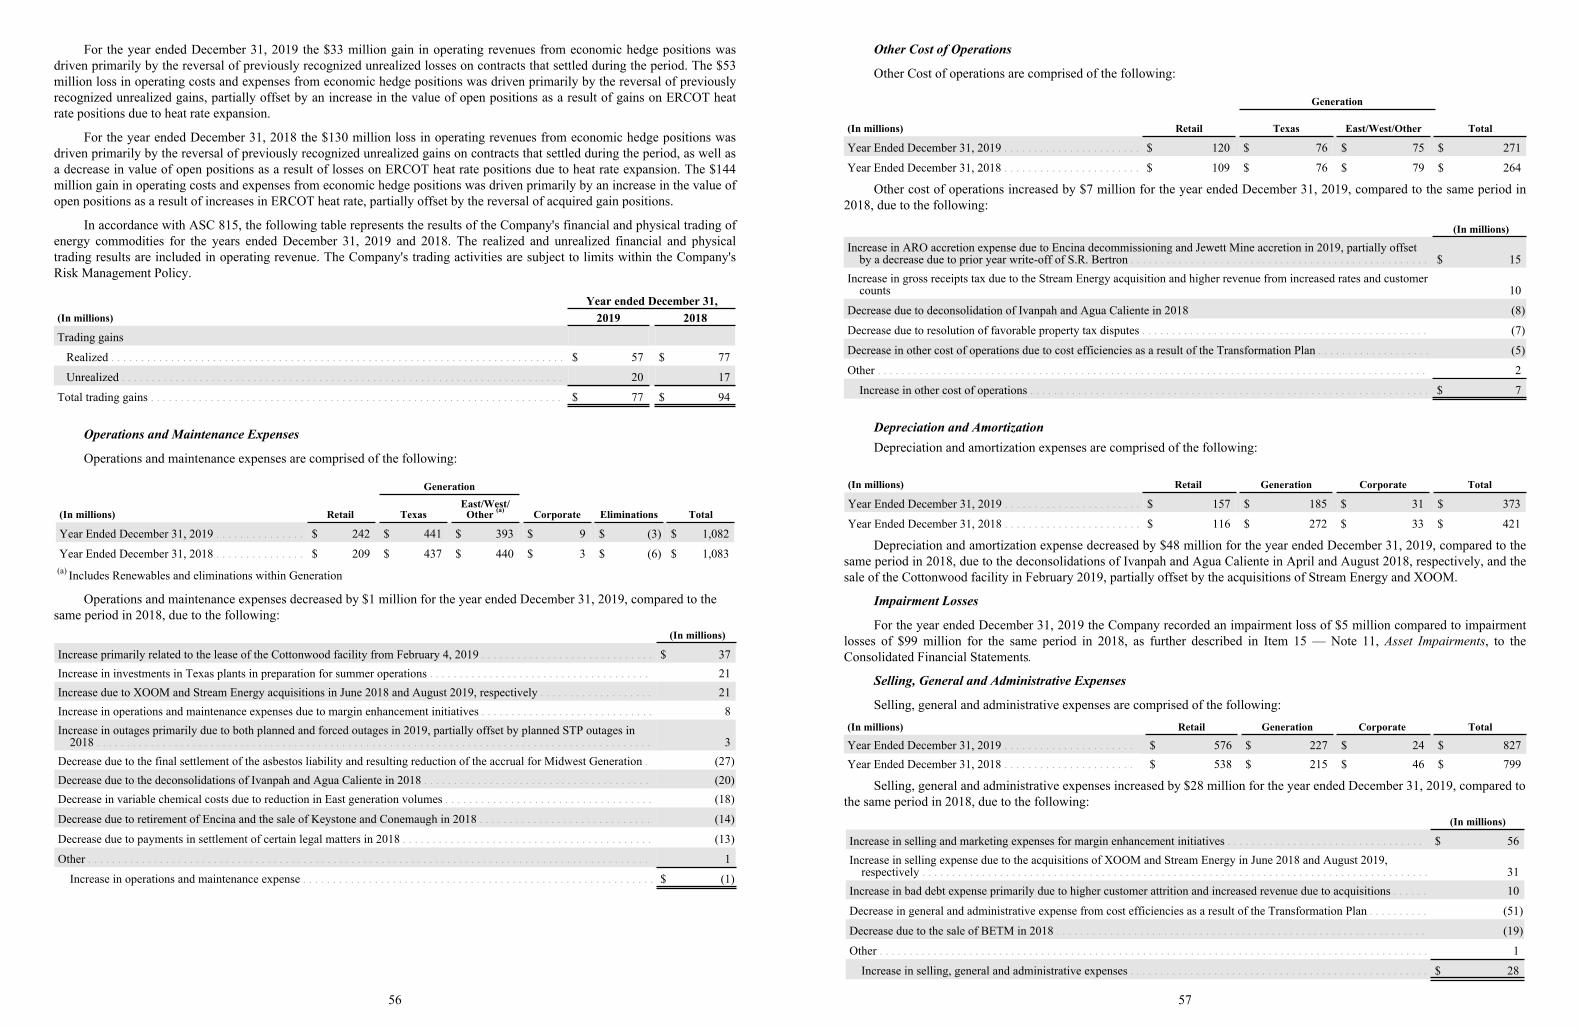
For the year ended December 31, 2019 the $33 million gain in operating revenues from economic hedge positions wasdriven primarily by the reversal of previously recognized unrealized losses on contracts that settled during the period. The $53million loss in operating costs and expenses from economic hedge positions was driven primarily by the reversal of previouslyrecognized unrealized gains, partially offset by an increase in the value of open positions as a result of gains on ERCOT heatrate positions due to heat rate expansion.
For the year ended December 31, 2018 the $130 million loss in operating revenues from economic hedge positions wasdriven primarily by the reversal of previously recognized unrealized gains on contracts that settled during the period, as well asa decrease in value of open positions as a result of losses on ERCOT heat rate positions due to heat rate expansion. The $144million gain in operating costs and expenses from economic hedge positions was driven primarily by an increase in the value ofopen positions as a result of increases in ERCOT heat rate, partially offset by the reversal of acquired gain positions.
In accordance with ASC 815, the following table represents the results of the Company's financial and physical trading ofenergy commodities for the years ended December 31, 2019 and 2018. The realized and unrealized financial and physicaltrading results are included in operating revenue. The Company's trading activities are subject to limits within the Company'sRisk Management Policy.
Year ended December 31,(In millions) 2019 2018Trading gains
Realized . . . . . . . . . . . . . . . . . . . . . . . . . . . . . . . . . . . . . . . . . . . . . . . . . . . . . . . . . . . . . . . . . . . . . . . . . . . . $ 57 $ 77
Unrealized . . . . . . . . . . . . . . . . . . . . . . . . . . . . . . . . . . . . . . . . . . . . . . . . . . . . . . . . . . . . . . . . . . . . . . . . . . 20 17
Total trading gains . . . . . . . . . . . . . . . . . . . . . . . . . . . . . . . . . . . . . . . . . . . . . . . . . . . . . . . . . . . . . . . . . . . . . $ 77 $ 94
Operations and Maintenance Expenses
Operations and maintenance expenses are comprised of the following:
Generation
Corporate Eliminations(In millions) Retail TexasEast/West/
Other (a) Total
Year Ended December 31, 2019 . . . . . . . . . . . . . . . $ 242 $ 441 $ 393 $ 9 $ (3) $ 1,082
Year Ended December 31, 2018 . . . . . . . . . . . . . . . $ 209 $ 437 $ 440 $ 3 $ (6) $ 1,083(a) Includes Renewables and eliminations within Generation
Operations and maintenance expenses decreased by $1 million for the year ended December 31, 2019, compared to the same period in 2018, due to the following:
(In millions)
Increase primarily related to the lease of the Cottonwood facility from February 4, 2019 . . . . . . . . . . . . . . . . . . . . . . . . . . . . . $ 37Increase in investments in Texas plants in preparation for summer operations . . . . . . . . . . . . . . . . . . . . . . . . . . . . . . . . . . . . . 21Increase due to XOOM and Stream Energy acquisitions in June 2018 and August 2019, respectively . . . . . . . . . . . . . . . . . . . 21Increase in operations and maintenance expenses due to margin enhancement initiatives . . . . . . . . . . . . . . . . . . . . . . . . . . . . . 8Increase in outages primarily due to both planned and forced outages in 2019, partially offset by planned STP outages in
2018 . . . . . . . . . . . . . . . . . . . . . . . . . . . . . . . . . . . . . . . . . . . . . . . . . . . . . . . . . . . . . . . . . . . . . . . . . . . . . . . . . . . . . . . . . . . . . 3Decrease due to the final settlement of the asbestos liability and resulting reduction of the accrual for Midwest Generation . (27)Decrease due to the deconsolidations of Ivanpah and Agua Caliente in 2018 . . . . . . . . . . . . . . . . . . . . . . . . . . . . . . . . . . . . . . (20)Decrease in variable chemical costs due to reduction in East generation volumes . . . . . . . . . . . . . . . . . . . . . . . . . . . . . . . . . . . (18)
Decrease due to retirement of Encina and the sale of Keystone and Conemaugh in 2018 . . . . . . . . . . . . . . . . . . . . . . . . . . . . . (14)
Decrease due to payments in settlement of certain legal matters in 2018 . . . . . . . . . . . . . . . . . . . . . . . . . . . . . . . . . . . . . . . . . . (13)
Other . . . . . . . . . . . . . . . . . . . . . . . . . . . . . . . . . . . . . . . . . . . . . . . . . . . . . . . . . . . . . . . . . . . . . . . . . . . . . . . . . . . . . . . . . . . . . . 1
Increase in operations and maintenance expense . . . . . . . . . . . . . . . . . . . . . . . . . . . . . . . . . . . . . . . . . . . . . . . . . . . . . . . . . . . $ (1)
56
Other Cost of Operations
Other Cost of operations are comprised of the following:
Generation
(In millions) Retail Texas East/West/Other Total
Year Ended December 31, 2019 . . . . . . . . . . . . . . . . . . . . . . . $ 120 $ 76 $ 75 $ 271
Year Ended December 31, 2018 . . . . . . . . . . . . . . . . . . . . . . . $ 109 $ 76 $ 79 $ 264
Other cost of operations increased by $7 million for the year ended December 31, 2019, compared to the same period in2018, due to the following:
(In millions)
Increase in ARO accretion expense due to Encina decommissioning and Jewett Mine accretion in 2019, partially offset by a decrease due to prior year write-off of S.R. Bertron . . . . . . . . . . . . . . . . . . . . . . . . . . . . . . . . . . . . . . . . . . . . . . . . . . $ 15
Increase in gross receipts tax due to the Stream Energy acquisition and higher revenue from increased rates and customer counts 10
Decrease due to deconsolidation of Ivanpah and Agua Caliente in 2018 (8)
Decrease due to resolution of favorable property tax disputes . . . . . . . . . . . . . . . . . . . . . . . . . . . . . . . . . . . . . . . . . . . . . . . . (7)
Decrease in other cost of operations due to cost efficiencies as a result of the Transformation Plan . . . . . . . . . . . . . . . . . . . (5)
Other . . . . . . . . . . . . . . . . . . . . . . . . . . . . . . . . . . . . . . . . . . . . . . . . . . . . . . . . . . . . . . . . . . . . . . . . . . . . . . . . . . . . . . . . . . . . 2
Increase in other cost of operations . . . . . . . . . . . . . . . . . . . . . . . . . . . . . . . . . . . . . . . . . . . . . . . . . . . . . . . . . . . . . . . . . . . $ 7
Depreciation and AmortizationDepreciation and amortization expenses are comprised of the following:
Generation Corporate(In millions) Retail Total
Year Ended December 31, 2019 . . . . . . . . . . . . . . . . . . . . . . . $ 157 $ 185 $ 31 $ 373
Year Ended December 31, 2018 . . . . . . . . . . . . . . . . . . . . . . . $ 116 $ 272 $ 33 $ 421
Depreciation and amortization expense decreased by $48 million for the year ended December 31, 2019, compared to thesame period in 2018, due to the deconsolidations of Ivanpah and Agua Caliente in April and August 2018, respectively, and thesale of the Cottonwood facility in February 2019, partially offset by the acquisitions of Stream Energy and XOOM.
Impairment Losses
For the year ended December 31, 2019 the Company recorded an impairment loss of $5 million compared to impairmentlosses of $99 million for the same period in 2018, as further described in Item 15 — Note 11, Asset Impairments, to theConsolidated Financial Statements.
Selling, General and Administrative Expenses
Selling, general and administrative expenses are comprised of the following:(In millions) Retail Generation Corporate Total
Year Ended December 31, 2019 . . . . . . . . . . . . . . . . . . . . . . $ 576 $ 227 $ 24 $ 827Year Ended December 31, 2018 . . . . . . . . . . . . . . . . . . . . . . $ 538 $ 215 $ 46 $ 799
Selling, general and administrative expenses increased by $28 million for the year ended December 31, 2019, compared to the same period in 2018, due to the following:
(In millions)
Increase in selling and marketing expenses for margin enhancement initiatives . . . . . . . . . . . . . . . . . . . . . . . . . . . . . . . . . $ 56Increase in selling expense due to the acquisitions of XOOM and Stream Energy in June 2018 and August 2019,
respectively . . . . . . . . . . . . . . . . . . . . . . . . . . . . . . . . . . . . . . . . . . . . . . . . . . . . . . . . . . . . . . . . . . . . . . . . . . . . . . . . . . . . . 31Increase in bad debt expense primarily due to higher customer attrition and increased revenue due to acquisitions . . . . . . 10
Decrease in general and administrative expense from cost efficiencies as a result of the Transformation Plan . . . . . . . . . . (51)
Decrease due to the sale of BETM in 2018 . . . . . . . . . . . . . . . . . . . . . . . . . . . . . . . . . . . . . . . . . . . . . . . . . . . . . . . . . . . . . . (19)
Other . . . . . . . . . . . . . . . . . . . . . . . . . . . . . . . . . . . . . . . . . . . . . . . . . . . . . . . . . . . . . . . . . . . . . . . . . . . . . . . . . . . . . . . . . . . . 1
Increase in selling, general and administrative expenses . . . . . . . . . . . . . . . . . . . . . . . . . . . . . . . . . . . . . . . . . . . . . . . . . . $ 28
57
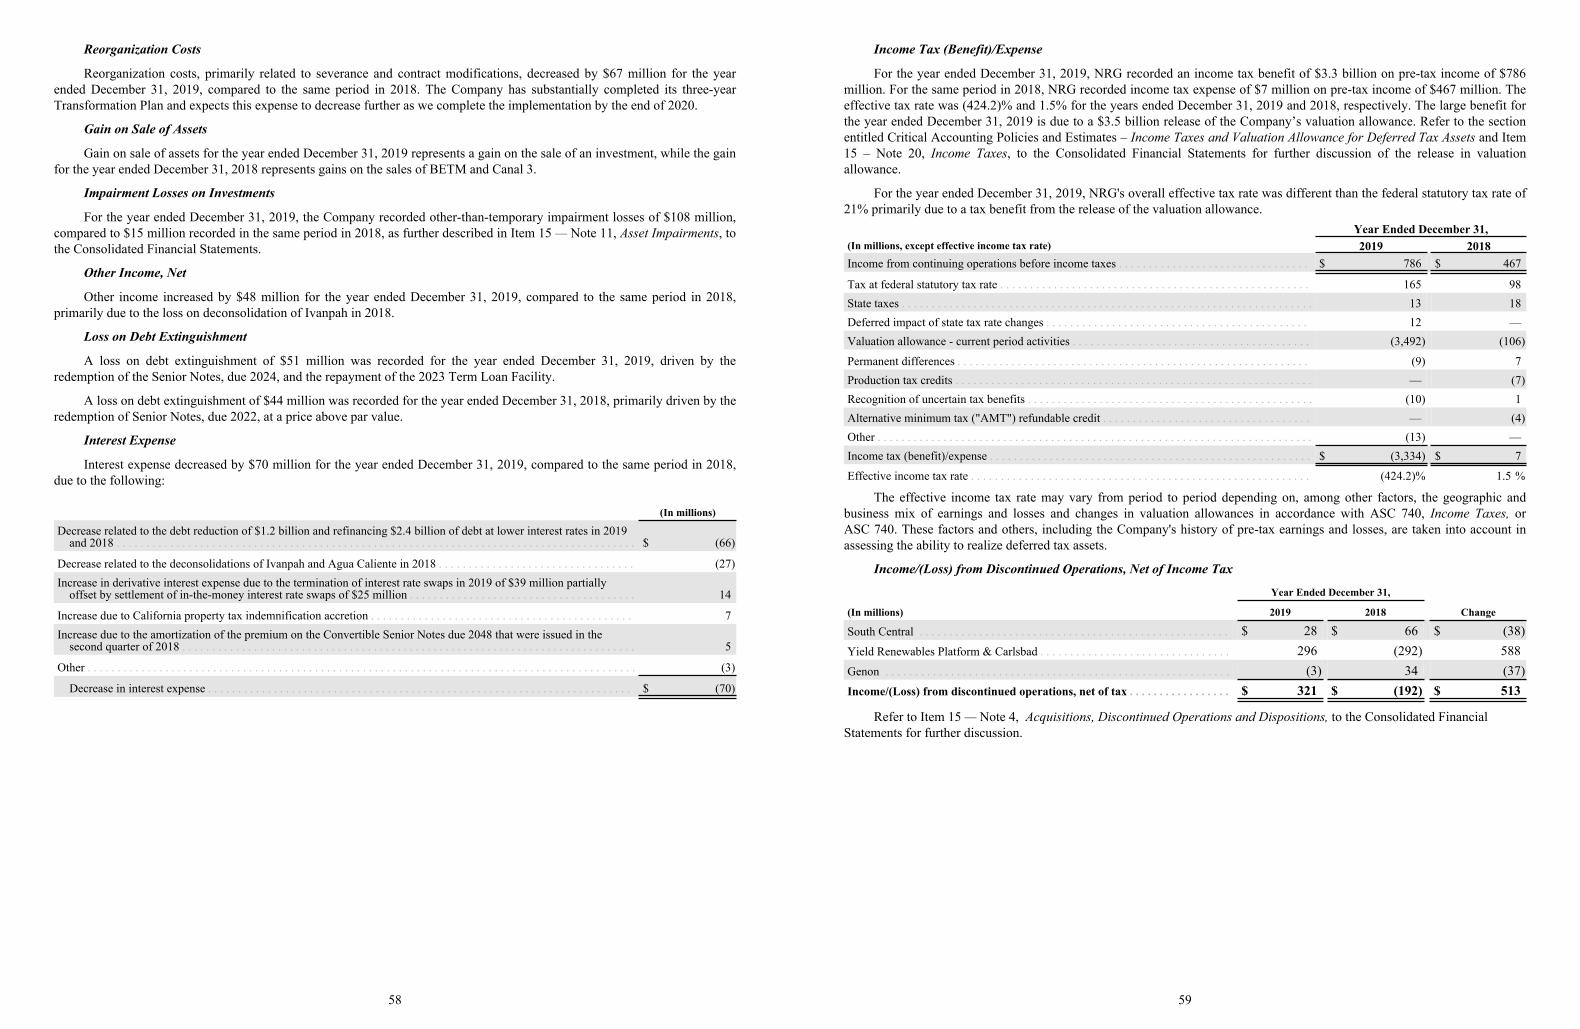
Reorganization Costs
Reorganization costs, primarily related to severance and contract modifications, decreased by $67 million for the yearended December 31, 2019, compared to the same period in 2018. The Company has substantially completed its three-yearTransformation Plan and expects this expense to decrease further as we complete the implementation by the end of 2020.
Gain on Sale of Assets
Gain on sale of assets for the year ended December 31, 2019 represents a gain on the sale of an investment, while the gainfor the year ended December 31, 2018 represents gains on the sales of BETM and Canal 3.
Impairment Losses on Investments
For the year ended December 31, 2019, the Company recorded other-than-temporary impairment losses of $108 million,compared to $15 million recorded in the same period in 2018, as further described in Item 15— Note 11, Asset Impairments, tothe Consolidated Financial Statements.
Other Income, Net
Other income increased by $48 million for the year ended December 31, 2019, compared to the same period in 2018,primarily due to the loss on deconsolidation of Ivanpah in 2018.
Loss on Debt Extinguishment
A loss on debt extinguishment of $51 million was recorded for the year ended December 31, 2019, driven by theredemption of the Senior Notes, due 2024, and the repayment of the 2023 Term Loan Facility.
A loss on debt extinguishment of $44 million was recorded for the year ended December 31, 2018, primarily driven by theredemption of Senior Notes, due 2022, at a price above par value.
Interest Expense
Interest expense decreased by $70 million for the year ended December 31, 2019, compared to the same period in 2018,due to the following:
(In millions)
Decrease related to the debt reduction of $1.2 billion and refinancing $2.4 billion of debt at lower interest rates in 2019 and 2018 . . . . . . . . . . . . . . . . . . . . . . . . . . . . . . . . . . . . . . . . . . . . . . . . . . . . . . . . . . . . . . . . . . . . . . . . . . . . . . . . . . . . . . . $ (66)
Decrease related to the deconsolidations of Ivanpah and Agua Caliente in 2018 . . . . . . . . . . . . . . . . . . . . . . . . . . . . . . . . . (27)Increase in derivative interest expense due to the termination of interest rate swaps in 2019 of $39 million partially
offset by settlement of in-the-money interest rate swaps of $25 million . . . . . . . . . . . . . . . . . . . . . . . . . . . . . . . . . . . . . . 14
Increase due to California property tax indemnification accretion . . . . . . . . . . . . . . . . . . . . . . . . . . . . . . . . . . . . . . . . . . . . 7Increase due to the amortization of the premium on the Convertible Senior Notes due 2048 that were issued in the
second quarter of 2018 . . . . . . . . . . . . . . . . . . . . . . . . . . . . . . . . . . . . . . . . . . . . . . . . . . . . . . . . . . . . . . . . . . . . . . . . . . . . 5
Other . . . . . . . . . . . . . . . . . . . . . . . . . . . . . . . . . . . . . . . . . . . . . . . . . . . . . . . . . . . . . . . . . . . . . . . . . . . . . . . . . . . . . . . . . . . . (3)
Decrease in interest expense . . . . . . . . . . . . . . . . . . . . . . . . . . . . . . . . . . . . . . . . . . . . . . . . . . . . . . . . . . . . . . . . . . . . . . . $ (70)
58
Income Tax (Benefit)/Expense
For the year ended December 31, 2019, NRG recorded an income tax benefit of $3.3 billion on pre-tax income of $786million. For the same period in 2018, NRG recorded income tax expense of $7 million on pre-tax income of $467 million. Theeffective tax rate was (424.2)% and 1.5% for the years ended December 31, 2019 and 2018, respectively. The large benefit forthe year ended December 31, 2019 is due to a $3.5 billion release of the Company’s valuation allowance. Refer to the sectionentitled Critical Accounting Policies and Estimates – Income Taxes and Valuation Allowance for Deferred Tax Assets and Item15 – Note 20, Income Taxes, to the Consolidated Financial Statements for further discussion of the release in valuationallowance.
For the year ended December 31, 2019, NRG's overall effective tax rate was different than the federal statutory tax rate of21% primarily due to a tax benefit from the release of the valuation allowance.
Year Ended December 31,(In millions, except effective income tax rate) 2019 2018Income from continuing operations before income taxes . . . . . . . . . . . . . . . . . . . . . . . . . . . . . . . . $ 786 $ 467
Tax at federal statutory tax rate . . . . . . . . . . . . . . . . . . . . . . . . . . . . . . . . . . . . . . . . . . . . . . . . . . . . 165 98State taxes . . . . . . . . . . . . . . . . . . . . . . . . . . . . . . . . . . . . . . . . . . . . . . . . . . . . . . . . . . . . . . . . . . . . . 13 18Deferred impact of state tax rate changes . . . . . . . . . . . . . . . . . . . . . . . . . . . . . . . . . . . . . . . . . . . . 12 —Valuation allowance - current period activities . . . . . . . . . . . . . . . . . . . . . . . . . . . . . . . . . . . . . . . . (3,492) (106)
Permanent differences . . . . . . . . . . . . . . . . . . . . . . . . . . . . . . . . . . . . . . . . . . . . . . . . . . . . . . . . . . . (9) 7Production tax credits . . . . . . . . . . . . . . . . . . . . . . . . . . . . . . . . . . . . . . . . . . . . . . . . . . . . . . . . . . . . — (7)Recognition of uncertain tax benefits . . . . . . . . . . . . . . . . . . . . . . . . . . . . . . . . . . . . . . . . . . . . . . . . (10) 1Alternative minimum tax ("AMT") refundable credit . . . . . . . . . . . . . . . . . . . . . . . . . . . . . . . . . . . — (4)Other . . . . . . . . . . . . . . . . . . . . . . . . . . . . . . . . . . . . . . . . . . . . . . . . . . . . . . . . . . . . . . . . . . . . . . . . . (13) —Income tax (benefit)/expense . . . . . . . . . . . . . . . . . . . . . . . . . . . . . . . . . . . . . . . . . . . . . . . . . . . . . . $ (3,334) $ 7
Effective income tax rate . . . . . . . . . . . . . . . . . . . . . . . . . . . . . . . . . . . . . . . . . . . . . . . . . . . . . . . . . (424.2)% 1.5 %
The effective income tax rate may vary from period to period depending on, among other factors, the geographic andbusiness mix of earnings and losses and changes in valuation allowances in accordance with ASC 740, Income Taxes, orASC 740. These factors and others, including the Company's history of pre-tax earnings and losses, are taken into account inassessing the ability to realize deferred tax assets.
Income/(Loss) from Discontinued Operations, Net of Income Tax
Year Ended December 31,
(In millions) 2019 2018 Change
South Central . . . . . . . . . . . . . . . . . . . . . . . . . . . . . . . . . . . . . . . . . . . . . . . . . . . . $ 28 $ 66 $ (38)Yield Renewables Platform & Carlsbad . . . . . . . . . . . . . . . . . . . . . . . . . . . . . . . . 296 (292) 588Genon . . . . . . . . . . . . . . . . . . . . . . . . . . . . . . . . . . . . . . . . . . . . . . . . . . . . . . . . . . (3) 34 (37)Income/(Loss) from discontinued operations, net of tax . . . . . . . . . . . . . . . . . $ 321 $ (192) $ 513
Refer to Item 15 — Note 4, Acquisitions, Discontinued Operations and Dispositions, to the Consolidated Financial Statements for further discussion.
59
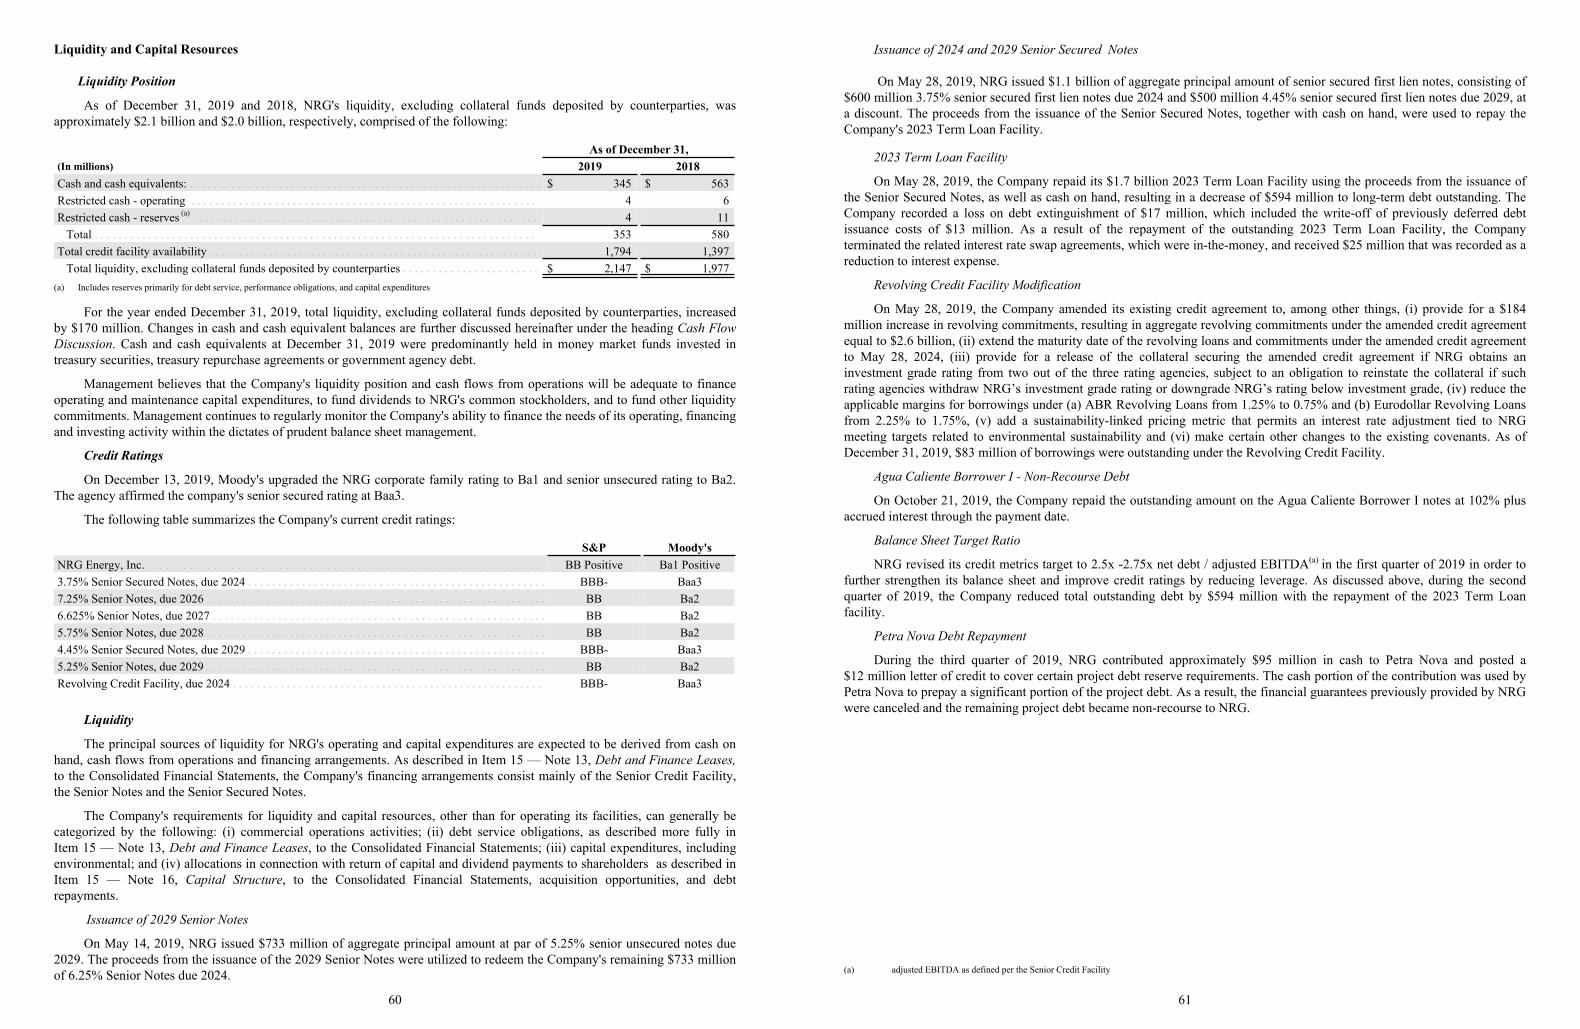
Liquidity and Capital Resources
Liquidity Position
As of December 31, 2019 and 2018, NRG's liquidity, excluding collateral funds deposited by counterparties, wasapproximately $2.1 billion and $2.0 billion, respectively, comprised of the following:
As of December 31,(In millions) 2019 2018Cash and cash equivalents: . . . . . . . . . . . . . . . . . . . . . . . . . . . . . . . . . . . . . . . . . . . . . . . . . . . . . . . . . . . $ 345 $ 563Restricted cash - operating . . . . . . . . . . . . . . . . . . . . . . . . . . . . . . . . . . . . . . . . . . . . . . . . . . . . . . . . . . 4 6Restricted cash - reserves (a) . . . . . . . . . . . . . . . . . . . . . . . . . . . . . . . . . . . . . . . . . . . . . . . . . . . . . . . . . . 4 11
Total . . . . . . . . . . . . . . . . . . . . . . . . . . . . . . . . . . . . . . . . . . . . . . . . . . . . . . . . . . . . . . . . . . . . . . . . . . 353 580Total credit facility availability . . . . . . . . . . . . . . . . . . . . . . . . . . . . . . . . . . . . . . . . . . . . . . . . . . . . . . . 1,794 1,397
Total liquidity, excluding collateral funds deposited by counterparties . . . . . . . . . . . . . . . . . . . . . . . $ 2,147 $ 1,977(a) Includes reserves primarily for debt service, performance obligations, and capital expenditures
For the year ended December 31, 2019, total liquidity, excluding collateral funds deposited by counterparties, increasedby $170 million. Changes in cash and cash equivalent balances are further discussed hereinafter under the heading Cash FlowDiscussion. Cash and cash equivalents at December 31, 2019 were predominantly held in money market funds invested intreasury securities, treasury repurchase agreements or government agency debt.
Management believes that the Company's liquidity position and cash flows from operations will be adequate to financeoperating and maintenance capital expenditures, to fund dividends to NRG's common stockholders, and to fund other liquiditycommitments. Management continues to regularly monitor the Company's ability to finance the needs of its operating, financingand investing activity within the dictates of prudent balance sheet management.
Credit Ratings
On December 13, 2019, Moody's upgraded the NRG corporate family rating to Ba1 and senior unsecured rating to Ba2.The agency affirmed the company's senior secured rating at Baa3.
The following table summarizes the Company's current credit ratings:
S&P Moody'sNRG Energy, Inc. . . . . . . . . . . . . . . . . . . . . . . . . . . . . . . . . . . . . . . . . . . . . . . . . . . . . . . . . . . . . . . . . . . BB Positive Ba1 Positive3.75% Senior Secured Notes, due 2024 . . . . . . . . . . . . . . . . . . . . . . . . . . . . . . . . . . . . . . . . . . . . . . . . . . BBB- Baa37.25% Senior Notes, due 2026 . . . . . . . . . . . . . . . . . . . . . . . . . . . . . . . . . . . . . . . . . . . . . . . . . . . . . . . . . BB Ba26.625% Senior Notes, due 2027 . . . . . . . . . . . . . . . . . . . . . . . . . . . . . . . . . . . . . . . . . . . . . . . . . . . . . . . . BB Ba25.75% Senior Notes, due 2028 . . . . . . . . . . . . . . . . . . . . . . . . . . . . . . . . . . . . . . . . . . . . . . . . . . . . . . . . . BB Ba24.45% Senior Secured Notes, due 2029 . . . . . . . . . . . . . . . . . . . . . . . . . . . . . . . . . . . . . . . . . . . . . . . . . . BBB- Baa35.25% Senior Notes, due 2029 . . . . . . . . . . . . . . . . . . . . . . . . . . . . . . . . . . . . . . . . . . . . . . . . . . . . . . . . . BB Ba2Revolving Credit Facility, due 2024 . . . . . . . . . . . . . . . . . . . . . . . . . . . . . . . . . . . . . . . . . . . . . . . . . . . . BBB- Baa3
Liquidity
The principal sources of liquidity for NRG's operating and capital expenditures are expected to be derived from cash onhand, cash flows from operations and financing arrangements. As described in Item 15 — Note 13, Debt and Finance Leases,to the Consolidated Financial Statements, the Company's financing arrangements consist mainly of the Senior Credit Facility,the Senior Notes and the Senior Secured Notes.
The Company's requirements for liquidity and capital resources, other than for operating its facilities, can generally becategorized by the following: (i) commercial operations activities; (ii) debt service obligations, as described more fully inItem 15 — Note 13, Debt and Finance Leases, to the Consolidated Financial Statements; (iii) capital expenditures, includingenvironmental; and (iv) allocations in connection with return of capital and dividend payments to shareholders as described inItem 15 — Note 16, Capital Structure, to the Consolidated Financial Statements, acquisition opportunities, and debtrepayments.
Issuance of 2029 Senior Notes
On May 14, 2019, NRG issued $733 million of aggregate principal amount at par of 5.25% senior unsecured notes due2029. The proceeds from the issuance of the 2029 Senior Notes were utilized to redeem the Company's remaining $733 millionof 6.25% Senior Notes due 2024.
60
Issuance of 2024 and 2029 Senior Secured Notes
On May 28, 2019, NRG issued $1.1 billion of aggregate principal amount of senior secured first lien notes, consisting of$600 million 3.75% senior secured first lien notes due 2024 and $500 million 4.45% senior secured first lien notes due 2029, ata discount. The proceeds from the issuance of the Senior Secured Notes, together with cash on hand, were used to repay theCompany's 2023 Term Loan Facility.
2023 Term Loan Facility
On May 28, 2019, the Company repaid its $1.7 billion 2023 Term Loan Facility using the proceeds from the issuance ofthe Senior Secured Notes, as well as cash on hand, resulting in a decrease of $594 million to long-term debt outstanding. TheCompany recorded a loss on debt extinguishment of $17 million, which included the write-off of previously deferred debtissuance costs of $13 million. As a result of the repayment of the outstanding 2023 Term Loan Facility, the Companyterminated the related interest rate swap agreements, which were in-the-money, and received $25 million that was recorded as areduction to interest expense.
Revolving Credit Facility Modification
On May 28, 2019, the Company amended its existing credit agreement to, among other things, (i) provide for a $184million increase in revolving commitments, resulting in aggregate revolving commitments under the amended credit agreementequal to $2.6 billion, (ii) extend the maturity date of the revolving loans and commitments under the amended credit agreementto May 28, 2024, (iii) provide for a release of the collateral securing the amended credit agreement if NRG obtains aninvestment grade rating from two out of the three rating agencies, subject to an obligation to reinstate the collateral if suchrating agencies withdraw NRG’s investment grade rating or downgrade NRG’s rating below investment grade, (iv) reduce theapplicable margins for borrowings under (a) ABR Revolving Loans from 1.25% to 0.75% and (b) Eurodollar Revolving Loansfrom 2.25% to 1.75%, (v) add a sustainability-linked pricing metric that permits an interest rate adjustment tied to NRGmeeting targets related to environmental sustainability and (vi) make certain other changes to the existing covenants. As ofDecember 31, 2019, $83 million of borrowings were outstanding under the Revolving Credit Facility.
Agua Caliente Borrower I - Non-Recourse Debt
On October 21, 2019, the Company repaid the outstanding amount on the Agua Caliente Borrower I notes at 102% plusaccrued interest through the payment date.
Balance Sheet Target Ratio
NRG revised its credit metrics target to 2.5x -2.75x net debt / adjusted EBITDA(a) in the first quarter of 2019 in order tofurther strengthen its balance sheet and improve credit ratings by reducing leverage. As discussed above, during the secondquarter of 2019, the Company reduced total outstanding debt by $594 million with the repayment of the 2023 Term Loanfacility.
Petra Nova Debt Repayment
During the third quarter of 2019, NRG contributed approximately $95 million in cash to Petra Nova and posted a$12 million letter of credit to cover certain project debt reserve requirements. The cash portion of the contribution was used byPetra Nova to prepay a significant portion of the project debt. As a result, the financial guarantees previously provided by NRGwere canceled and the remaining project debt became non-recourse to NRG.
(a) adjusted EBITDA as defined per the Senior Credit Facility
61
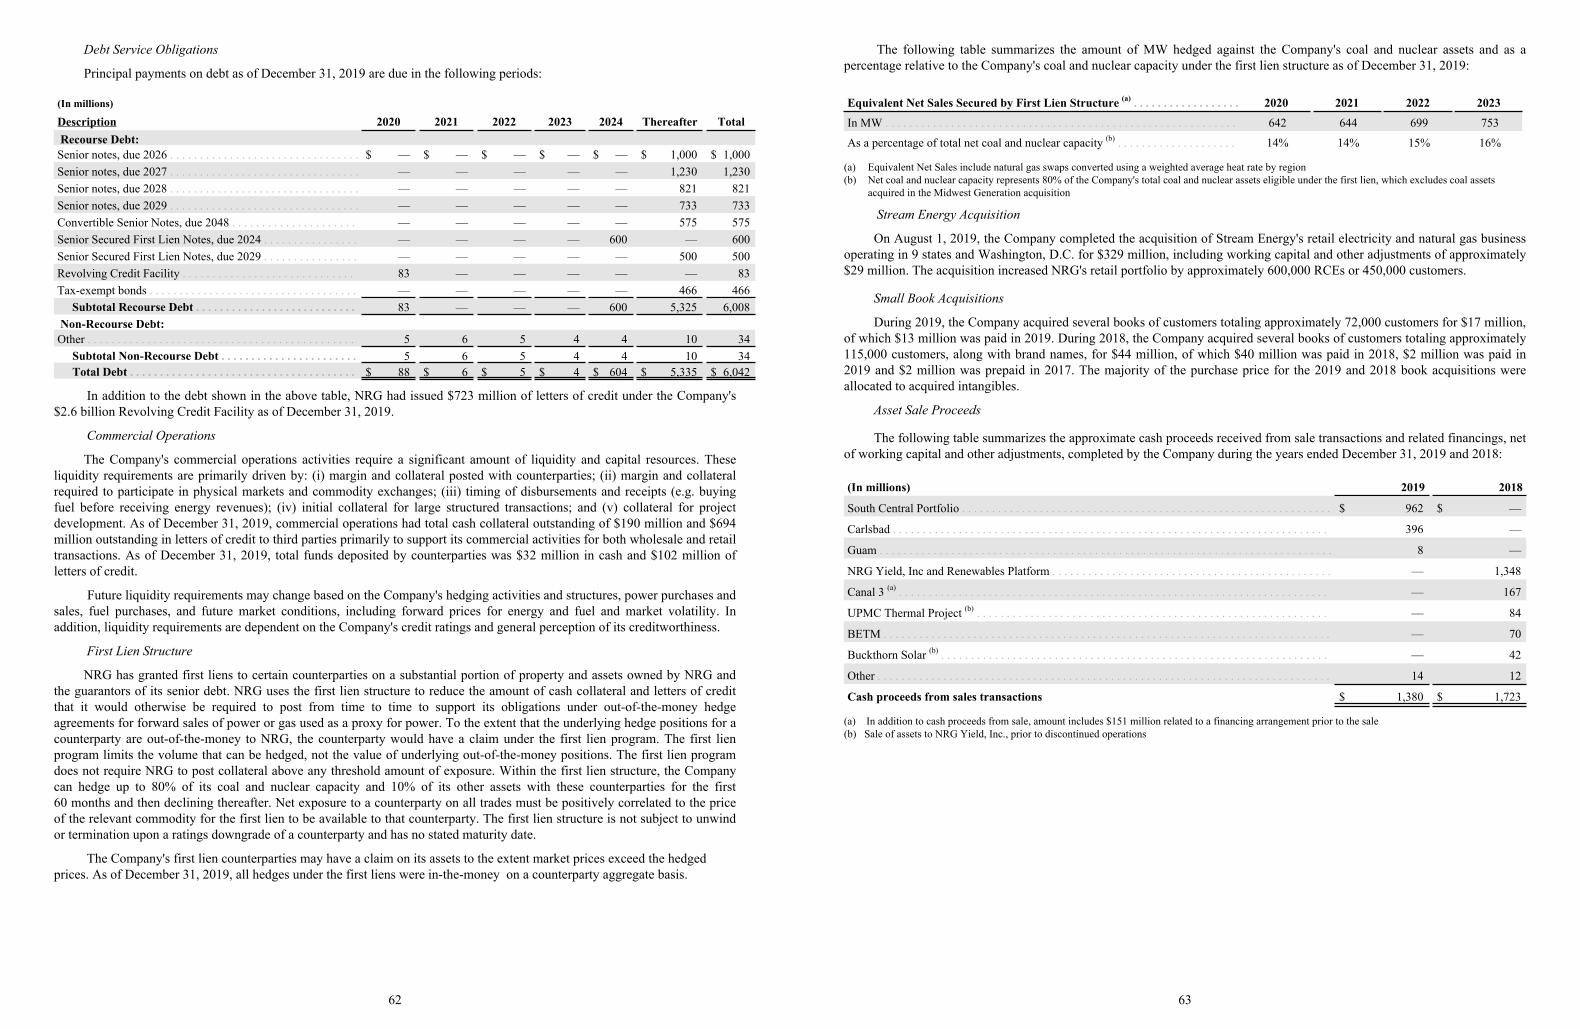
Debt Service Obligations
Principal payments on debt as of December 31, 2019 are due in the following periods:
(In millions)
Description 2020 2021 2022 2023 2024 Thereafter Total Recourse Debt:Senior notes, due 2026 . . . . . . . . . . . . . . . . . . . . . . . . . . . . . . . . $ — $ — $ — $ — $ — $ 1,000 $ 1,000Senior notes, due 2027 . . . . . . . . . . . . . . . . . . . . . . . . . . . . . . . . — — — — — 1,230 1,230Senior notes, due 2028 . . . . . . . . . . . . . . . . . . . . . . . . . . . . . . . . — — — — — 821 821Senior notes, due 2029 . . . . . . . . . . . . . . . . . . . . . . . . . . . . . . . . — — — — — 733 733Convertible Senior Notes, due 2048 . . . . . . . . . . . . . . . . . . . . . — — — — — 575 575Senior Secured First Lien Notes, due 2024 . . . . . . . . . . . . . . . . — — — — 600 — 600Senior Secured First Lien Notes, due 2029 . . . . . . . . . . . . . . . . — — — — — 500 500Revolving Credit Facility . . . . . . . . . . . . . . . . . . . . . . . . . . . . . 83 — — — — — 83Tax-exempt bonds . . . . . . . . . . . . . . . . . . . . . . . . . . . . . . . . . . . — — — — — 466 466
Subtotal Recourse Debt . . . . . . . . . . . . . . . . . . . . . . . . . . . 83 — — — 600 5,325 6,008 Non-Recourse Debt:Other . . . . . . . . . . . . . . . . . . . . . . . . . . . . . . . . . . . . . . . . . . . . . 5 6 5 4 4 10 34
Subtotal Non-Recourse Debt . . . . . . . . . . . . . . . . . . . . . . . 5 6 5 4 4 10 34Total Debt . . . . . . . . . . . . . . . . . . . . . . . . . . . . . . . . . . . . . . $ 88 $ 6 $ 5 $ 4 $ 604 $ 5,335 $ 6,0425,335 6,042
In addition to the debt shown in the above table, NRG had issued $723 million of letters of credit under the Company's$2.6 billion Revolving Credit Facility as of December 31, 2019.
Commercial Operations
The Company's commercial operations activities require a significant amount of liquidity and capital resources. Theseliquidity requirements are primarily driven by: (i) margin and collateral posted with counterparties; (ii) margin and collateralrequired to participate in physical markets and commodity exchanges; (iii) timing of disbursements and receipts (e.g. buyingfuel before receiving energy revenues); (iv) initial collateral for large structured transactions; and (v) collateral for projectdevelopment. As of December 31, 2019, commercial operations had total cash collateral outstanding of $190 million and $694million outstanding in letters of credit to third parties primarily to support its commercial activities for both wholesale and retailtransactions. As of December 31, 2019, total funds deposited by counterparties was $32 million in cash and $102 million ofletters of credit.
Future liquidity requirements may change based on the Company's hedging activities and structures, power purchases andsales, fuel purchases, and future market conditions, including forward prices for energy and fuel and market volatility. Inaddition, liquidity requirements are dependent on the Company's credit ratings and general perception of its creditworthiness.
First Lien Structure
NRG has granted first liens to certain counterparties on a substantial portion of property and assets owned by NRG andthe guarantors of its senior debt. NRG uses the first lien structure to reduce the amount of cash collateral and letters of creditthat it would otherwise be required to post from time to time to support its obligations under out-of-the-money hedgeagreements for forward sales of power or gas used as a proxy for power. To the extent that the underlying hedge positions for acounterparty are out-of-the-money to NRG, the counterparty would have a claim under the first lien program. The first lienprogram limits the volume that can be hedged, not the value of underlying out-of-the-money positions. The first lien programdoes not require NRG to post collateral above any threshold amount of exposure. Within the first lien structure, the Companycan hedge up to 80% of its coal and nuclear capacity and 10% of its other assets with these counterparties for the first60 months and then declining thereafter. Net exposure to a counterparty on all trades must be positively correlated to the priceof the relevant commodity for the first lien to be available to that counterparty. The first lien structure is not subject to unwindor termination upon a ratings downgrade of a counterparty and has no stated maturity date.
The Company's first lien counterparties may have a claim on its assets to the extent market prices exceed the hedged prices. As of December 31, 2019, all hedges under the first liens were in-the-money on a counterparty aggregate basis.
62
The following table summarizes the amount of MW hedged against the Company's coal and nuclear assets and as apercentage relative to the Company's coal and nuclear capacity under the first lien structure as of December 31, 2019:
Equivalent Net Sales Secured by First Lien Structure (a) . . . . . . . . . . . . . . . . . . 2020 2021 2022 2023
In MW . . . . . . . . . . . . . . . . . . . . . . . . . . . . . . . . . . . . . . . . . . . . . . . . . . . . . . . . . . . 642 644 699 753
As a percentage of total net coal and nuclear capacity (b) . . . . . . . . . . . . . . . . . . . . 14% 14% 15% 16%
(a) Equivalent Net Sales include natural gas swaps converted using a weighted average heat rate by region(b) Net coal and nuclear capacity represents 80% of the Company's total coal and nuclear assets eligible under the first lien, which excludes coal assets
acquired in the Midwest Generation acquisition
Stream Energy Acquisition
On August 1, 2019, the Company completed the acquisition of Stream Energy's retail electricity and natural gas businessoperating in 9 states and Washington, D.C. for $329 million, including working capital and other adjustments of approximately$29 million. The acquisition increased NRG's retail portfolio by approximately 600,000 RCEs or 450,000 customers.
Small Book Acquisitions
During 2019, the Company acquired several books of customers totaling approximately 72,000 customers for $17 million,of which $13 million was paid in 2019. During 2018, the Company acquired several books of customers totaling approximately115,000 customers, along with brand names, for $44 million, of which $40 million was paid in 2018, $2 million was paid in2019 and $2 million was prepaid in 2017. The majority of the purchase price for the 2019 and 2018 book acquisitions wereallocated to acquired intangibles.
Asset Sale Proceeds
The following table summarizes the approximate cash proceeds received from sale transactions and related financings, netof working capital and other adjustments, completed by the Company during the years ended December 31, 2019 and 2018:
(In millions) 2019 2018
South Central Portfolio . . . . . . . . . . . . . . . . . . . . . . . . . . . . . . . . . . . . . . . . . . . . . . . . . . . . . . . . . . . . . . $ 962 $ —
Carlsbad . . . . . . . . . . . . . . . . . . . . . . . . . . . . . . . . . . . . . . . . . . . . . . . . . . . . . . . . . . . . . . . . . . . . . . . . . 396 —
Guam . . . . . . . . . . . . . . . . . . . . . . . . . . . . . . . . . . . . . . . . . . . . . . . . . . . . . . . . . . . . . . . . . . . . . . . . . . . . 8 —
NRG Yield, Inc and Renewables Platform . . . . . . . . . . . . . . . . . . . . . . . . . . . . . . . . . . . . . . . . . . . . . . . — 1,348
Canal 3 (a) . . . . . . . . . . . . . . . . . . . . . . . . . . . . . . . . . . . . . . . . . . . . . . . . . . . . . . . . . . . . . . . . . . . . . . . . — 167
UPMC Thermal Project (b) . . . . . . . . . . . . . . . . . . . . . . . . . . . . . . . . . . . . . . . . . . . . . . . . . . . . . . . . . . . — 84
BETM . . . . . . . . . . . . . . . . . . . . . . . . . . . . . . . . . . . . . . . . . . . . . . . . . . . . . . . . . . . . . . . . . . . . . . . . . . . — 70
Buckthorn Solar (b) . . . . . . . . . . . . . . . . . . . . . . . . . . . . . . . . . . . . . . . . . . . . . . . . . . . . . . . . . . . . . . . . . — 42
Other . . . . . . . . . . . . . . . . . . . . . . . . . . . . . . . . . . . . . . . . . . . . . . . . . . . . . . . . . . . . . . . . . . . . . . . . . . . . 14 12
Cash proceeds from sales transactions $ 1,380 $ 1,723
(a) In addition to cash proceeds from sale, amount includes $151 million related to a financing arrangement prior to the sale(b) Sale of assets to NRG Yield, Inc., prior to discontinued operations
63
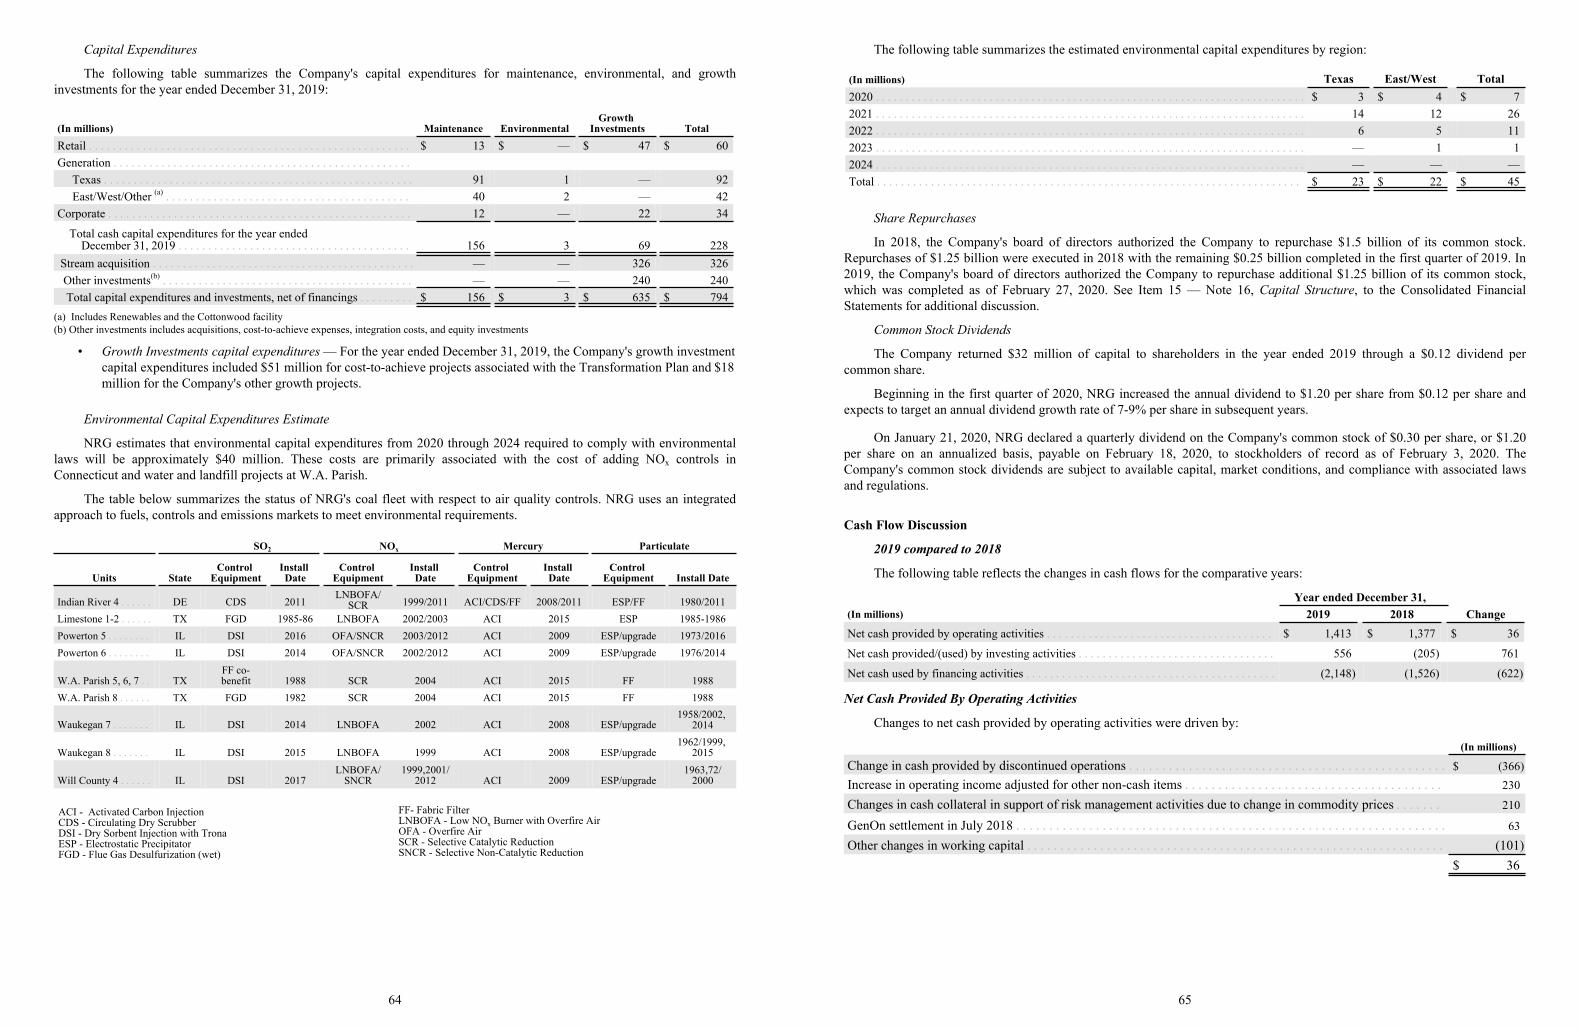
Capital Expenditures
The following table summarizes the Company's capital expenditures for maintenance, environmental, and growthinvestments for the year ended December 31, 2019:
(In millions) Maintenance EnvironmentalGrowth
Investments TotalRetail . . . . . . . . . . . . . . . . . . . . . . . . . . . . . . . . . . . . . . . . . . . . . . . . . . . . . . $ 13 $ — $ 47 $ 60Generation . . . . . . . . . . . . . . . . . . . . . . . . . . . . . . . . . . . . . . . . . . . . . . . . . .
Texas . . . . . . . . . . . . . . . . . . . . . . . . . . . . . . . . . . . . . . . . . . . . . . . . . . . . 91 1 — 92East/West/Other (a) . . . . . . . . . . . . . . . . . . . . . . . . . . . . . . . . . . . . . . . . . 40 2 — 42
Corporate . . . . . . . . . . . . . . . . . . . . . . . . . . . . . . . . . . . . . . . . . . . . . . . . . . . 12 — 22 34
Total cash capital expenditures for the year ended December 31, 2019 . . . . . . . . . . . . . . . . . . . . . . . . . . . . . . . . . . . . . . . 156 3 69 228
Stream acquisition . . . . . . . . . . . . . . . . . . . . . . . . . . . . . . . . . . . . . . . . . . . . — — 326 326 Other investments(b) . . . . . . . . . . . . . . . . . . . . . . . . . . . . . . . . . . . . . . . . . . — — 240 240
Total capital expenditures and investments, net of financings . . . . . . . . . $ 156 $ 3 $ 635 $ 794(a) Includes Renewables and the Cottonwood facility(b) Other investments includes acquisitions, cost-to-achieve expenses, integration costs, and equity investments
• Growth Investments capital expenditures — For the year ended December 31, 2019, the Company's growth investment capital expenditures included $51 million for cost-to-achieve projects associated with the Transformation Plan and $18 million for the Company's other growth projects.
Environmental Capital Expenditures Estimate
NRG estimates that environmental capital expenditures from 2020 through 2024 required to comply with environmentallaws will be approximately $40 million. These costs are primarily associated with the cost of adding NOx controls inConnecticut and water and landfill projects at W.A. Parish.
The table below summarizes the status of NRG's coal fleet with respect to air quality controls. NRG uses an integratedapproach to fuels, controls and emissions markets to meet environmental requirements.
SO2 NOx Mercury Particulate
Units StateControl
EquipmentInstall Date
Control Equipment
Install Date
Control Equipment
Install Date
Control Equipment Install Date
Indian River 4 . . . . . . DE CDS 2011LNBOFA/
SCR 1999/2011 ACI/CDS/FF 2008/2011 ESP/FF 1980/2011Limestone 1-2 . . . . . . TX FGD 1985-86 LNBOFA 2002/2003 ACI 2015 ESP 1985-1986Powerton 5 . . . . . . . . IL DSI 2016 OFA/SNCR 2003/2012 ACI 2009 ESP/upgrade 1973/2016Powerton 6 . . . . . . . . IL DSI 2014 OFA/SNCR 2002/2012 ACI 2009 ESP/upgrade 1976/2014
W.A. Parish 5, 6, 7 . . TXFF co-benefit 1988 SCR 2004 ACI 2015 FF 1988
W.A. Parish 8 . . . . . . TX FGD 1982 SCR 2004 ACI 2015 FF 1988
Waukegan 7 . . . . . . . IL DSI 2014 LNBOFA 2002 ACI 2008 ESP/upgrade1958/2002,
2014
Waukegan 8 . . . . . . . IL DSI 2015 LNBOFA 1999 ACI 2008 ESP/upgrade1962/1999,
2015
Will County 4 . . . . . . IL DSI 2017LNBOFA/
SNCR1999,2001/
2012 ACI 2009 ESP/upgrade1963,72/
2000
ACI - Activated Carbon InjectionCDS - Circulating Dry ScrubberDSI - Dry Sorbent Injection with TronaESP - Electrostatic PrecipitatorFGD - Flue Gas Desulfurization (wet)
FF- Fabric FilterLNBOFA - Low NOx Burner with Overfire AirOFA - Overfire AirSCR - Selective Catalytic ReductionSNCR - Selective Non-Catalytic Reduction
64
The following table summarizes the estimated environmental capital expenditures by region:
(In millions) Texas East/West Total2020 . . . . . . . . . . . . . . . . . . . . . . . . . . . . . . . . . . . . . . . . . . . . . . . . . . . . . . . . . . . . . . . . . . . . . . . . $ 3 $ 4 $ 72021 . . . . . . . . . . . . . . . . . . . . . . . . . . . . . . . . . . . . . . . . . . . . . . . . . . . . . . . . . . . . . . . . . . . . . . . . 14 12 262022 . . . . . . . . . . . . . . . . . . . . . . . . . . . . . . . . . . . . . . . . . . . . . . . . . . . . . . . . . . . . . . . . . . . . . . . . 6 5 112023 . . . . . . . . . . . . . . . . . . . . . . . . . . . . . . . . . . . . . . . . . . . . . . . . . . . . . . . . . . . . . . . . . . . . . . . . — 1 12024 . . . . . . . . . . . . . . . . . . . . . . . . . . . . . . . . . . . . . . . . . . . . . . . . . . . . . . . . . . . . . . . . . . . . . . . . — — —Total . . . . . . . . . . . . . . . . . . . . . . . . . . . . . . . . . . . . . . . . . . . . . . . . . . . . . . . . . . . . . . . . . . . . . . . $ 23 $ 22 $ 45
Share Repurchases
In 2018, the Company's board of directors authorized the Company to repurchase $1.5 billion of its common stock.Repurchases of $1.25 billion were executed in 2018 with the remaining $0.25 billion completed in the first quarter of 2019. In2019, the Company's board of directors authorized the Company to repurchase additional $1.25 billion of its common stock,which was completed as of February 27, 2020. See Item 15 — Note 16, Capital Structure, to the Consolidated FinancialStatements for additional discussion.
Common Stock Dividends
The Company returned $32 million of capital to shareholders in the year ended 2019 through a $0.12 dividend percommon share.
Beginning in the first quarter of 2020, NRG increased the annual dividend to $1.20 per share from $0.12 per share andexpects to target an annual dividend growth rate of 7-9% per share in subsequent years.
On January 21, 2020, NRG declared a quarterly dividend on the Company's common stock of $0.30 per share, or $1.20per share on an annualized basis, payable on February 18, 2020, to stockholders of record as of February 3, 2020. TheCompany's common stock dividends are subject to available capital, market conditions, and compliance with associated lawsand regulations.
Cash Flow Discussion
2019 compared to 2018
The following table reflects the changes in cash flows for the comparative years:
Year ended December 31,(In millions) 2019 2018 ChangeNet cash provided by operating activities . . . . . . . . . . . . . . . . . . . . . . . . . . . . . . . . . . . . . . $ 1,413 $ 1,377 $ 36
Net cash provided/(used) by investing activities . . . . . . . . . . . . . . . . . . . . . . . . . . . . . . . . . 556 (205) 761
Net cash used by financing activities . . . . . . . . . . . . . . . . . . . . . . . . . . . . . . . . . . . . . . . . . . (2,148) (1,526) (622)
Net Cash Provided By Operating Activities
Changes to net cash provided by operating activities were driven by:
(In millions)
Change in cash provided by discontinued operations . . . . . . . . . . . . . . . . . . . . . . . . . . . . . . . . . . . . . . . . . . . . . . . . $ (366)Increase in operating income adjusted for other non-cash items . . . . . . . . . . . . . . . . . . . . . . . . . . . . . . . . . . . . . . . 230
Changes in cash collateral in support of risk management activities due to change in commodity prices . . . . . . . 210
GenOn settlement in July 2018 . . . . . . . . . . . . . . . . . . . . . . . . . . . . . . . . . . . . . . . . . . . . . . . . . . . . . . . . . . . . . . . . . 63
Other changes in working capital . . . . . . . . . . . . . . . . . . . . . . . . . . . . . . . . . . . . . . . . . . . . . . . . . . . . . . . . . . . . . . . (101)$ 36
65
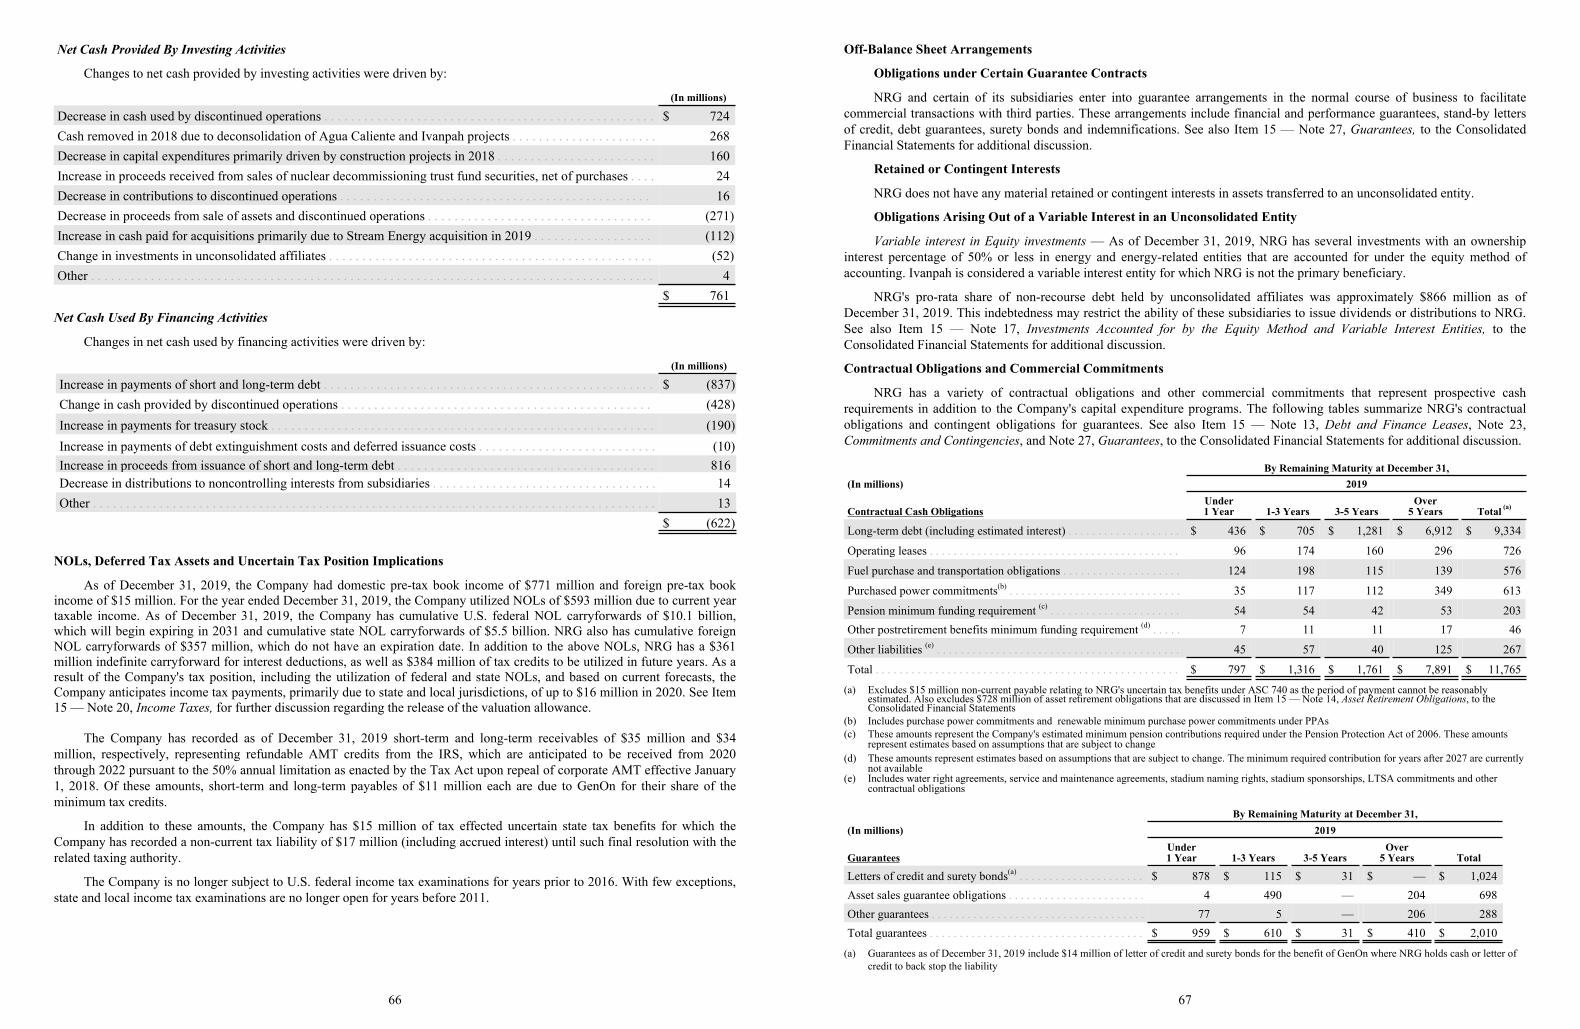
Net Cash Provided By Investing Activities
Changes to net cash provided by investing activities were driven by:
(In millions)
Decrease in cash used by discontinued operations . . . . . . . . . . . . . . . . . . . . . . . . . . . . . . . . . . . . . . . . . . . . . . . . . . $ 724Cash removed in 2018 due to deconsolidation of Agua Caliente and Ivanpah projects . . . . . . . . . . . . . . . . . . . . . . 268Decrease in capital expenditures primarily driven by construction projects in 2018 . . . . . . . . . . . . . . . . . . . . . . . . 160Increase in proceeds received from sales of nuclear decommissioning trust fund securities, net of purchases . . . . 24Decrease in contributions to discontinued operations . . . . . . . . . . . . . . . . . . . . . . . . . . . . . . . . . . . . . . . . . . . . . . . 16Decrease in proceeds from sale of assets and discontinued operations . . . . . . . . . . . . . . . . . . . . . . . . . . . . . . . . . . (271)Increase in cash paid for acquisitions primarily due to Stream Energy acquisition in 2019 . . . . . . . . . . . . . . . . . . (112)Change in investments in unconsolidated affiliates . . . . . . . . . . . . . . . . . . . . . . . . . . . . . . . . . . . . . . . . . . . . . . . . . (52)Other . . . . . . . . . . . . . . . . . . . . . . . . . . . . . . . . . . . . . . . . . . . . . . . . . . . . . . . . . . . . . . . . . . . . . . . . . . . . . . . . . . . . . 4
$ 761Net Cash Used By Financing Activities
Changes in net cash used by financing activities were driven by:
(In millions)
Increase in payments of short and long-term debt . . . . . . . . . . . . . . . . . . . . . . . . . . . . . . . . . . . . . . . . . . . . . . . . . . $ (837)Change in cash provided by discontinued operations . . . . . . . . . . . . . . . . . . . . . . . . . . . . . . . . . . . . . . . . . . . . . . . (428)Increase in payments for treasury stock . . . . . . . . . . . . . . . . . . . . . . . . . . . . . . . . . . . . . . . . . . . . . . . . . . . . . . . . . . (190)Increase in payments of debt extinguishment costs and deferred issuance costs . . . . . . . . . . . . . . . . . . . . . . . . . . . (10)Increase in proceeds from issuance of short and long-term debt . . . . . . . . . . . . . . . . . . . . . . . . . . . . . . . . . . . . . . . 816Decrease in distributions to noncontrolling interests from subsidiaries . . . . . . . . . . . . . . . . . . . . . . . . . . . . . . . . . . 14Other . . . . . . . . . . . . . . . . . . . . . . . . . . . . . . . . . . . . . . . . . . . . . . . . . . . . . . . . . . . . . . . . . . . . . . . . . . . . . . . . . . . . . 13
$ (622)
NOLs, Deferred Tax Assets and Uncertain Tax Position Implications
As of December 31, 2019, the Company had domestic pre-tax book income of $771 million and foreign pre-tax bookincome of $15 million. For the year ended December 31, 2019, the Company utilized NOLs of $593 million due to current yeartaxable income. As of December 31, 2019, the Company has cumulative U.S. federal NOL carryforwards of $10.1 billion,which will begin expiring in 2031 and cumulative state NOL carryforwards of $5.5 billion. NRG also has cumulative foreignNOL carryforwards of $357 million, which do not have an expiration date. In addition to the above NOLs, NRG has a $361million indefinite carryforward for interest deductions, as well as $384 million of tax credits to be utilized in future years. As aresult of the Company's tax position, including the utilization of federal and state NOLs, and based on current forecasts, theCompany anticipates income tax payments, primarily due to state and local jurisdictions, of up to $16 million in 2020. See Item15 — Note 20, Income Taxes, for further discussion regarding the release of the valuation allowance.
The Company has recorded as of December 31, 2019 short-term and long-term receivables of $35 million and $34million, respectively, representing refundable AMT credits from the IRS, which are anticipated to be received from 2020through 2022 pursuant to the 50% annual limitation as enacted by the Tax Act upon repeal of corporate AMT effective January1, 2018. Of these amounts, short-term and long-term payables of $11 million each are due to GenOn for their share of theminimum tax credits.
In addition to these amounts, the Company has $15 million of tax effected uncertain state tax benefits for which theCompany has recorded a non-current tax liability of $17 million (including accrued interest) until such final resolution with therelated taxing authority.
The Company is no longer subject to U.S. federal income tax examinations for years prior to 2016. With few exceptions,state and local income tax examinations are no longer open for years before 2011.
66
Off-Balance Sheet Arrangements
Obligations under Certain Guarantee Contracts
NRG and certain of its subsidiaries enter into guarantee arrangements in the normal course of business to facilitatecommercial transactions with third parties. These arrangements include financial and performance guarantees, stand-by lettersof credit, debt guarantees, surety bonds and indemnifications. See also Item 15 — Note 27, Guarantees, to the ConsolidatedFinancial Statements for additional discussion.
Retained or Contingent Interests
NRG does not have any material retained or contingent interests in assets transferred to an unconsolidated entity.
Obligations Arising Out of a Variable Interest in an Unconsolidated Entity
Variable interest in Equity investments — As of December 31, 2019, NRG has several investments with an ownershipinterest percentage of 50% or less in energy and energy-related entities that are accounted for under the equity method ofaccounting. Ivanpah is considered a variable interest entity for which NRG is not the primary beneficiary.
NRG's pro-rata share of non-recourse debt held by unconsolidated affiliates was approximately $866 million as ofDecember 31, 2019. This indebtedness may restrict the ability of these subsidiaries to issue dividends or distributions to NRG.See also Item 15 — Note 17, Investments Accounted for by the Equity Method and Variable Interest Entities, to theConsolidated Financial Statements for additional discussion.
Contractual Obligations and Commercial Commitments
NRG has a variety of contractual obligations and other commercial commitments that represent prospective cashrequirements in addition to the Company's capital expenditure programs. The following tables summarize NRG's contractualobligations and contingent obligations for guarantees. See also Item 15 — Note 13, Debt and Finance Leases, Note 23,Commitments and Contingencies, and Note 27, Guarantees, to the Consolidated Financial Statements for additional discussion.
By Remaining Maturity at December 31,(In millions) 2019
Contractual Cash ObligationsUnder1 Year 1-3 Years 3-5 Years
Over5 Years Total (a)
Long-term debt (including estimated interest) . . . . . . . . . . . . . . . . . . . $ 436 $ 705 $ 1,281 $ 6,912 $ 9,334
Operating leases . . . . . . . . . . . . . . . . . . . . . . . . . . . . . . . . . . . . . . . . . . 96 174 160 296 726
Fuel purchase and transportation obligations . . . . . . . . . . . . . . . . . . . . 124 198 115 139 576
Purchased power commitments(b) . . . . . . . . . . . . . . . . . . . . . . . . . . . . . 35 117 112 349 613
Pension minimum funding requirement (c) . . . . . . . . . . . . . . . . . . . . . . 54 54 42 53 203Other postretirement benefits minimum funding requirement (d) . . . . . 7 11 11 17 46
Other liabilities (e) . . . . . . . . . . . . . . . . . . . . . . . . . . . . . . . . . . . . . . . . . 45 57 40 125 267
Total . . . . . . . . . . . . . . . . . . . . . . . . . . . . . . . . . . . . . . . . . . . . . . . . . . . $ 797 $ 1,316 $ 1,761 $ 7,891 $ 11,765
(a) Excludes $15 million non-current payable relating to NRG's uncertain tax benefits under ASC 740 as the period of payment cannot be reasonably estimated. Also excludes $728 million of asset retirement obligations that are discussed in Item 15 — Note 14, Asset Retirement Obligations, to the Consolidated Financial Statements
(b) Includes purchase power commitments and renewable minimum purchase power commitments under PPAs (c) These amounts represent the Company's estimated minimum pension contributions required under the Pension Protection Act of 2006. These amounts
represent estimates based on assumptions that are subject to change(d) These amounts represent estimates based on assumptions that are subject to change. The minimum required contribution for years after 2027 are currently
not available(e) Includes water right agreements, service and maintenance agreements, stadium naming rights, stadium sponsorships, LTSA commitments and other
contractual obligations
By Remaining Maturity at December 31,(In millions) 2019
GuaranteesUnder1 Year 1-3 Years 3-5 Years
Over5 Years Total
Letters of credit and surety bonds(a) . . . . . . . . . . . . . . . . . . . . . $ 878 $ 115 $ 31 $ — $ 1,024Asset sales guarantee obligations . . . . . . . . . . . . . . . . . . . . . . . 4 490 — 204 698Other guarantees . . . . . . . . . . . . . . . . . . . . . . . . . . . . . . . . . . . . 77 5 — 206 288Total guarantees . . . . . . . . . . . . . . . . . . . . . . . . . . . . . . . . . . . . $ 959 $ 610 $ 31 $ 410 $ 2,010
(a) Guarantees as of December 31, 2019 include $14 million of letter of credit and surety bonds for the benefit of GenOn where NRG holds cash or letter of credit to back stop the liability
67
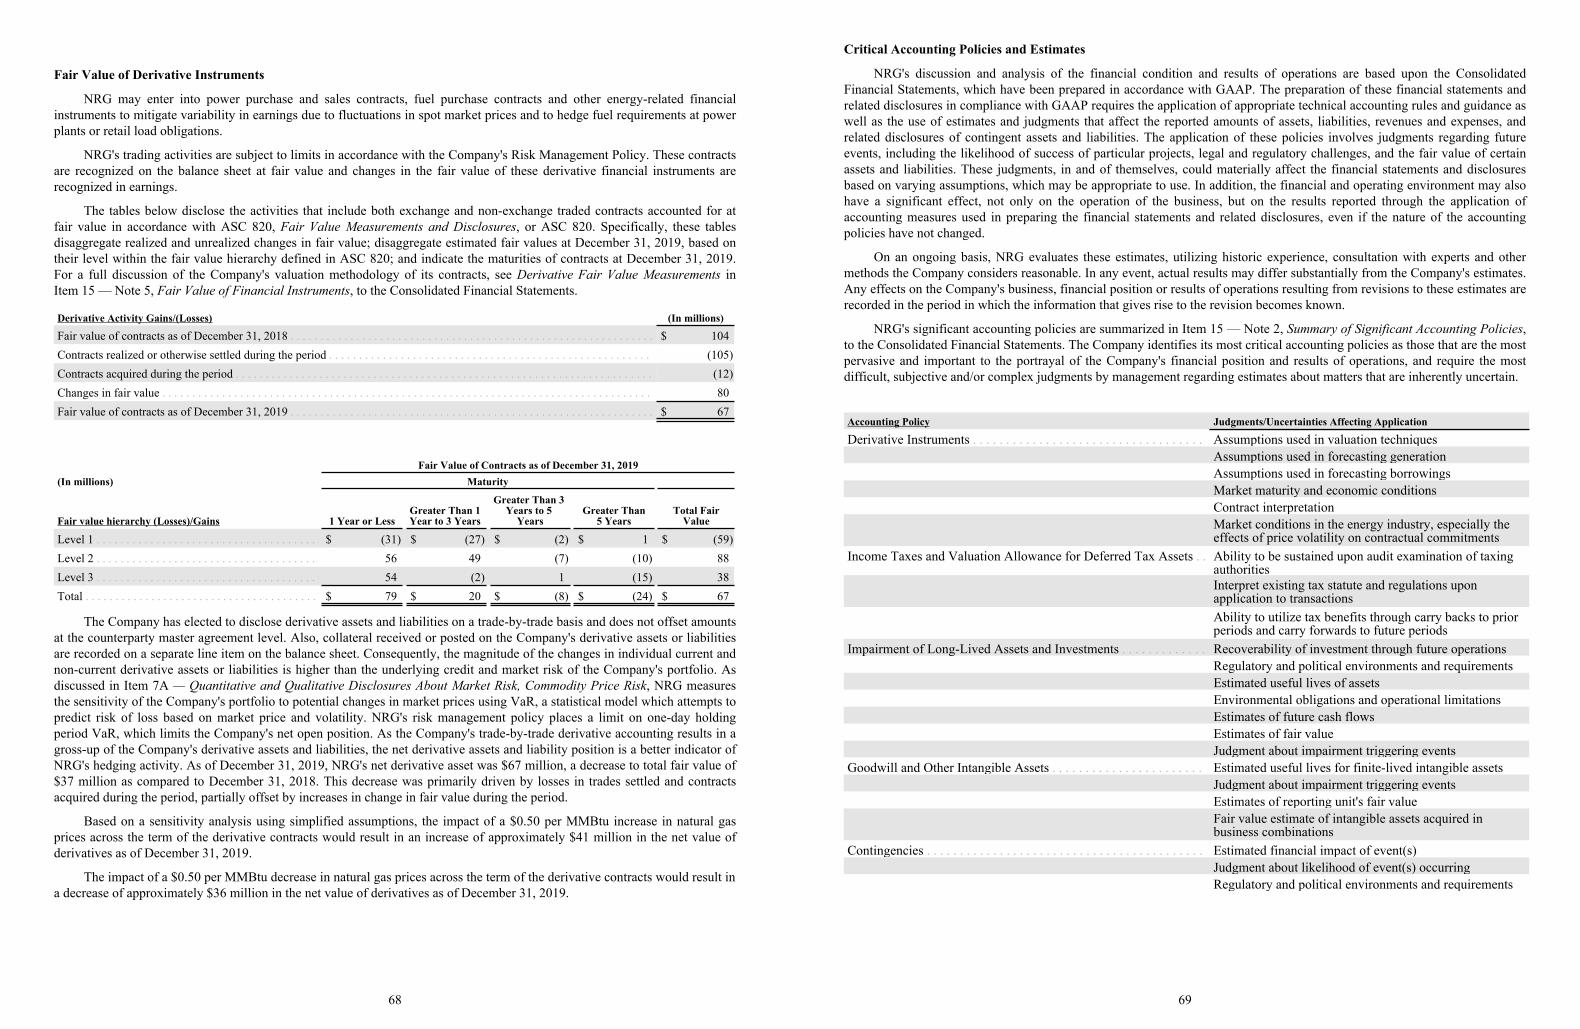
Fair Value of Derivative Instruments
NRG may enter into power purchase and sales contracts, fuel purchase contracts and other energy-related financialinstruments to mitigate variability in earnings due to fluctuations in spot market prices and to hedge fuel requirements at powerplants or retail load obligations.
NRG's trading activities are subject to limits in accordance with the Company's Risk Management Policy. These contractsare recognized on the balance sheet at fair value and changes in the fair value of these derivative financial instruments arerecognized in earnings.
The tables below disclose the activities that include both exchange and non-exchange traded contracts accounted for atfair value in accordance with ASC 820, Fair Value Measurements and Disclosures, or ASC 820. Specifically, these tablesdisaggregate realized and unrealized changes in fair value; disaggregate estimated fair values at December 31, 2019, based ontheir level within the fair value hierarchy defined in ASC 820; and indicate the maturities of contracts at December 31, 2019.For a full discussion of the Company's valuation methodology of its contracts, see Derivative Fair Value Measurements inItem 15 — Note 5, Fair Value of Financial Instruments, to the Consolidated Financial Statements.
Derivative Activity Gains/(Losses) (In millions)
Fair value of contracts as of December 31, 2018 . . . . . . . . . . . . . . . . . . . . . . . . . . . . . . . . . . . . . . . . . . . . . . . . . . . . . . . . . . . . . $ 104Contracts realized or otherwise settled during the period . . . . . . . . . . . . . . . . . . . . . . . . . . . . . . . . . . . . . . . . . . . . . . . . . . . . . . (105)Contracts acquired during the period . . . . . . . . . . . . . . . . . . . . . . . . . . . . . . . . . . . . . . . . . . . . . . . . . . . . . . . . . . . . . . . . . . . . . . (12)Changes in fair value . . . . . . . . . . . . . . . . . . . . . . . . . . . . . . . . . . . . . . . . . . . . . . . . . . . . . . . . . . . . . . . . . . . . . . . . . . . . . . . . . . 80Fair value of contracts as of December 31, 2019 . . . . . . . . . . . . . . . . . . . . . . . . . . . . . . . . . . . . . . . . . . . . . . . . . . . . . . . . . . . . . $ 67
Fair Value of Contracts as of December 31, 2019(In millions) Maturity
Fair value hierarchy (Losses)/Gains 1 Year or LessGreater Than 1 Year to 3 Years
Greater Than 3 Years to 5
YearsGreater Than
5 YearsTotal Fair
Value
Level 1 . . . . . . . . . . . . . . . . . . . . . . . . . . . . . . . . . . . . . $ (31) $ (27) $ (2) $ 1 $ (59)Level 2 . . . . . . . . . . . . . . . . . . . . . . . . . . . . . . . . . . . . . 56 49 (7) (10) 88Level 3 . . . . . . . . . . . . . . . . . . . . . . . . . . . . . . . . . . . . . 54 (2) 1 (15) 38Total . . . . . . . . . . . . . . . . . . . . . . . . . . . . . . . . . . . . . . . $ 79 $ 20 $ (8) $ (24) $ 67
The Company has elected to disclose derivative assets and liabilities on a trade-by-trade basis and does not offset amountsat the counterparty master agreement level. Also, collateral received or posted on the Company's derivative assets or liabilitiesare recorded on a separate line item on the balance sheet. Consequently, the magnitude of the changes in individual current andnon-current derivative assets or liabilities is higher than the underlying credit and market risk of the Company's portfolio. Asdiscussed in Item 7A — Quantitative and Qualitative Disclosures About Market Risk, Commodity Price Risk, NRG measuresthe sensitivity of the Company's portfolio to potential changes in market prices using VaR, a statistical model which attempts topredict risk of loss based on market price and volatility. NRG's risk management policy places a limit on one-day holdingperiod VaR, which limits the Company's net open position. As the Company's trade-by-trade derivative accounting results in agross-up of the Company's derivative assets and liabilities, the net derivative assets and liability position is a better indicator ofNRG's hedging activity. As of December 31, 2019, NRG's net derivative asset was $67 million, a decrease to total fair value of$37 million as compared to December 31, 2018. This decrease was primarily driven by losses in trades settled and contractsacquired during the period, partially offset by increases in change in fair value during the period.
Based on a sensitivity analysis using simplified assumptions, the impact of a $0.50 per MMBtu increase in natural gasprices across the term of the derivative contracts would result in an increase of approximately $41 million in the net value ofderivatives as of December 31, 2019.
The impact of a $0.50 per MMBtu decrease in natural gas prices across the term of the derivative contracts would result in a decrease of approximately $36 million in the net value of derivatives as of December 31, 2019.
68
Critical Accounting Policies and Estimates
NRG's discussion and analysis of the financial condition and results of operations are based upon the ConsolidatedFinancial Statements, which have been prepared in accordance with GAAP. The preparation of these financial statements andrelated disclosures in compliance with GAAP requires the application of appropriate technical accounting rules and guidance aswell as the use of estimates and judgments that affect the reported amounts of assets, liabilities, revenues and expenses, andrelated disclosures of contingent assets and liabilities. The application of these policies involves judgments regarding futureevents, including the likelihood of success of particular projects, legal and regulatory challenges, and the fair value of certainassets and liabilities. These judgments, in and of themselves, could materially affect the financial statements and disclosuresbased on varying assumptions, which may be appropriate to use. In addition, the financial and operating environment may alsohave a significant effect, not only on the operation of the business, but on the results reported through the application ofaccounting measures used in preparing the financial statements and related disclosures, even if the nature of the accountingpolicies have not changed.
On an ongoing basis, NRG evaluates these estimates, utilizing historic experience, consultation with experts and othermethods the Company considers reasonable. In any event, actual results may differ substantially from the Company's estimates.Any effects on the Company's business, financial position or results of operations resulting from revisions to these estimates arerecorded in the period in which the information that gives rise to the revision becomes known.
NRG's significant accounting policies are summarized in Item 15 — Note 2, Summary of Significant Accounting Policies,to the Consolidated Financial Statements. The Company identifies its most critical accounting policies as those that are the mostpervasive and important to the portrayal of the Company's financial position and results of operations, and require the mostdifficult, subjective and/or complex judgments by management regarding estimates about matters that are inherently uncertain.
Accounting Policy Judgments/Uncertainties Affecting Application
Derivative Instruments . . . . . . . . . . . . . . . . . . . . . . . . . . . . . . . . . . . Assumptions used in valuation techniquesAssumptions used in forecasting generationAssumptions used in forecasting borrowingsMarket maturity and economic conditionsContract interpretationMarket conditions in the energy industry, especially the effects of price volatility on contractual commitments
Income Taxes and Valuation Allowance for Deferred Tax Assets . . Ability to be sustained upon audit examination of taxing authoritiesInterpret existing tax statute and regulations upon application to transactionsAbility to utilize tax benefits through carry backs to prior periods and carry forwards to future periods
Impairment of Long-Lived Assets and Investments . . . . . . . . . . . . . Recoverability of investment through future operationsRegulatory and political environments and requirementsEstimated useful lives of assetsEnvironmental obligations and operational limitationsEstimates of future cash flowsEstimates of fair valueJudgment about impairment triggering events
Goodwill and Other Intangible Assets . . . . . . . . . . . . . . . . . . . . . . . Estimated useful lives for finite-lived intangible assetsJudgment about impairment triggering eventsEstimates of reporting unit's fair valueFair value estimate of intangible assets acquired in business combinations
Contingencies . . . . . . . . . . . . . . . . . . . . . . . . . . . . . . . . . . . . . . . . . . Estimated financial impact of event(s)Judgment about likelihood of event(s) occurringRegulatory and political environments and requirements
69
Derivative Instruments
The Company follows the guidance of ASC 815 to account for derivative instruments. ASC 815 requires the Company tomark-to-market all derivative instruments on the balance sheet and recognize changes in the fair value of non-hedge derivativeinstruments immediately in earnings. In certain cases, NRG may apply hedge accounting to the Company's derivativeinstruments. The criteria used to determine if hedge accounting treatment is appropriate are: (i) the designation of the hedge toan underlying exposure; (ii) whether the overall risk is being reduced; and (iii) if there is a correlation between the changes infair value of the derivative instrument and the underlying hedged item. Changes in the fair value of derivatives instrumentsaccounted for as hedges are deferred and recorded as a component of OCI and subsequently recognized in earnings when thehedged transactions occur.
For purposes of measuring the fair value of derivative instruments, NRG uses quoted exchange prices and broker quotes.When external prices are not available, NRG uses internal models to determine the fair value. These internal models includeassumptions of the future prices of energy commodities based on the specific market in which the energy commodity is beingpurchased or sold, using externally available forward market pricing curves for all periods possible under the pricing model.These estimations are considered to be critical accounting estimates.
Upon repayment of the Term Loan in 2019, all of the Company's interest rate swaps were terminated. In order to qualifythe derivative instruments for hedged transactions prior to termination, NRG estimated the forecasted borrowings for interestrate swaps occurring within a specified time period. Judgments related to the probability of forecasted borrowings were basedon the estimated timing of project construction, which can vary based on various factors. The probability that forecastedborrowings will occur by the end of a specified time period could change the results of operations by requiring amountscurrently classified in OCI to be reclassified into earnings, creating increased variability in the Company's earnings.
Certain derivative instruments that meet the criteria for derivative accounting treatment also qualify for a scope exceptionto derivative accounting, as they are considered to be NPNS. The availability of this exception is based upon the assumptionthat NRG has the ability and it is probable to deliver or take delivery of the underlying item. These assumptions are based onexpected load requirements, available baseload capacity, internal forecasts of sales and generation and historical physicaldelivery on contracts. Derivatives that are considered to be NPNS are exempt from derivative accounting treatment and areaccounted for under accrual accounting. If it is determined that a transaction designated as NPNS no longer meets the scopeexception due to changes in estimates, the related contract would be recorded on the balance sheet at fair value combined withthe immediate recognition through earnings.
Income Taxes and Valuation Allowance for Deferred Tax Assets
As of December 31, 2019, NRG’s deferred tax assets were primarily the result of U.S. federal and state NOLs, thedifference between book and tax basis in property, plant, and equipment, and tax credit carryforwards. The realization ofdeferred tax assets is dependent upon the Company's ability to generate sufficient future taxable income during the periods inwhich those temporary differences become deductible, prior to the expiration of the tax attributes. The evaluation of deferredtax assets requires judgment in assessing the likely future tax consequences of events that have been recognized in theCompany's financial statements or tax returns and forecasting future profitability by tax jurisdiction.
A valuation allowance of $242 million and $3.8 billion was recorded against NRG’s gross deferred tax asset balance as ofDecember 31, 2019, and December 31, 2018, respectively. During the year ended December 31, 2019, NRG released themajority of its valuation allowance against its U.S. federal and state deferred tax assets, resulting in a non-cash benefit toincome tax expense of approximately $3.5 billion.
The Company evaluates its deferred tax assets quarterly on a jurisdictional basis to determine whether adjustments to thevaluation allowance are appropriate considering changes in facts or circumstances. As of each reporting date, managementconsiders new evidence, both positive and negative, when determining the future realization of the Company’s deferred taxassets. In making the determination to release the majority of the valuation allowance as of December 31, 2019, the Companyevaluated a number of factors, including its recent history of pre-tax earnings, utilization of $593 million of NOLs in 2019, aswell as its forecasted future pre-tax earnings. Based on this evaluation, the Company determined that its future U.S. federal taxbenefits are more-likely-than-not to be realized. Given the Company’s current level of pre-tax earnings and forecasted futurepre-tax earnings, the Company expects to generate income before taxes in the U.S. in future periods at a level that would fullyutilize its U.S. federal NOL carryforwards and the majority of its state NOL carryforwards prior to their expiration.
NRG continues to maintain a valuation allowance of approximately $242 million as of December 31, 2019 against netdeferred tax assets consisting of state net operating losses and foreign NOL carryforwards in jurisdictions where the Companydoes not currently believe that the realization of its deferred tax assets is more likely than not.
NRG continues to be under audit for multiple years by taxing authorities in other jurisdictions. Considerable judgment isrequired to determine the tax treatment of a particular item that involves interpretations of complex tax laws, including the
70
impact of the Tax Act effective December 22, 2017. NRG is subject to examination by taxing authorities for income tax returnsfiled in the U.S. federal jurisdiction and various state and foreign jurisdictions, including operations located in Australia.
The Company is no longer subject to U.S. federal income tax examinations for years prior to 2016. With few exceptions,state and local income tax examinations are no longer open for years before 2011.
Evaluation of Assets for Impairment and Other-Than-Temporary Decline in Value
In accordance with ASC 360, Property, Plant, and Equipment, or ASC 360, NRG evaluates property, plant and equipmentand certain intangible assets for impairment whenever indicators of impairment exist. Examples of such indicators or eventsare:
• Significant decrease in the market price of a long-lived asset;• Significant adverse change in the manner an asset is being used or its physical condition;• Adverse business climate;• Accumulation of costs significantly in excess of the amount originally expected for the construction or acquisition of
an asset;• Current period loss combined with a history of losses or the projection of future losses; and• Change in the Company's intent about an asset from an intent to hold to a greater than 50% likelihood that an asset will
be sold, or disposed of before the end of its previously estimated useful life.
Recoverability of assets to be held and used is measured by a comparison of the carrying amount of the assets to the futurenet cash flows expected to be generated by the asset, through considering project specific assumptions for long-term powerprices, escalated future project operating costs and expected plant operations. If such assets are considered to be impaired, theimpairment to be recognized is measured by the amount by which the carrying amount of the assets exceeds the fair value of theassets by factoring in the different courses of action available to the Company. Generally, fair value will be determined usingvaluation techniques, such as the present value of expected future cash flows. NRG uses its best estimates in making theseevaluations and considers various factors, including forward price curves for energy, fuel and operating costs. However, actualfuture market prices and project costs could vary from the assumptions used in the Company's estimates and the impact of suchvariations could be material.
For assets to be held and used, if the Company determines that the undiscounted cash flows from the asset are less thanthe carrying amount of the asset, NRG must estimate fair value to determine the amount of any impairment loss. Assets held-for-sale are reported at the lower of the carrying amount or fair value less the cost to sell. The estimation of fair value, whetherin conjunction with an asset to be held and used or with an asset held-for-sale, and the evaluation of asset impairment are, bytheir nature, subjective. NRG considers quoted market prices in active markets to the extent they are available. In the absence ofsuch information, the Company may consider prices of similar assets, consult with brokers, or employ other valuationtechniques. NRG will also discount the estimated future cash flows associated with the asset using a single interest raterepresentative of the risk involved with such an investment or employ an expected present value method that probability-weights a range of possible outcomes. The use of these methods involves the same inherent uncertainty of future cash flows aspreviously discussed with respect to undiscounted cash flows. Actual future market prices and project costs could vary fromthose used in the Company's estimates and the impact of such variations could be material.
Annually, during the fourth quarter, the Company revises its views of power and fuel prices including the Company'sfundamental view for long-term prices, forecasted generation and operating and capital expenditures, in connection with thepreparation of its annual budget. Changes to the Company's views of long-term power and fuel prices impact the Company’sprojections of profitability, based on management's estimate of supply and demand within the sub-markets for its operations andthe physical and economic characteristics of each of its businesses.
As of December 31, 2019, the Company recorded impairment losses of approximately $5 million, excluding impairmentlosses on equity and cost method investments discussed below. These impairment losses were primarily to record the value ofcertain long-lived assets, including property, plant and equipment and intangible assets, at fair market value in connection withan impairment indicator.
Equity and Cost Method Investments
NRG is also required to evaluate its equity method and cost method investments to determine whether or not they areimpaired in accordance with ASC 323, Investments - Equity Method and Joint Ventures, or ASC 323. The standard fordetermining whether an impairment must be recorded under ASC 323 is whether a decline in the value is considered an other-than-temporary decline in value. The evaluation and measurement of impairments under ASC 323 involves the sameuncertainties as described for long-lived assets that the Company owns directly and accounts for in accordance with ASC 360.
71
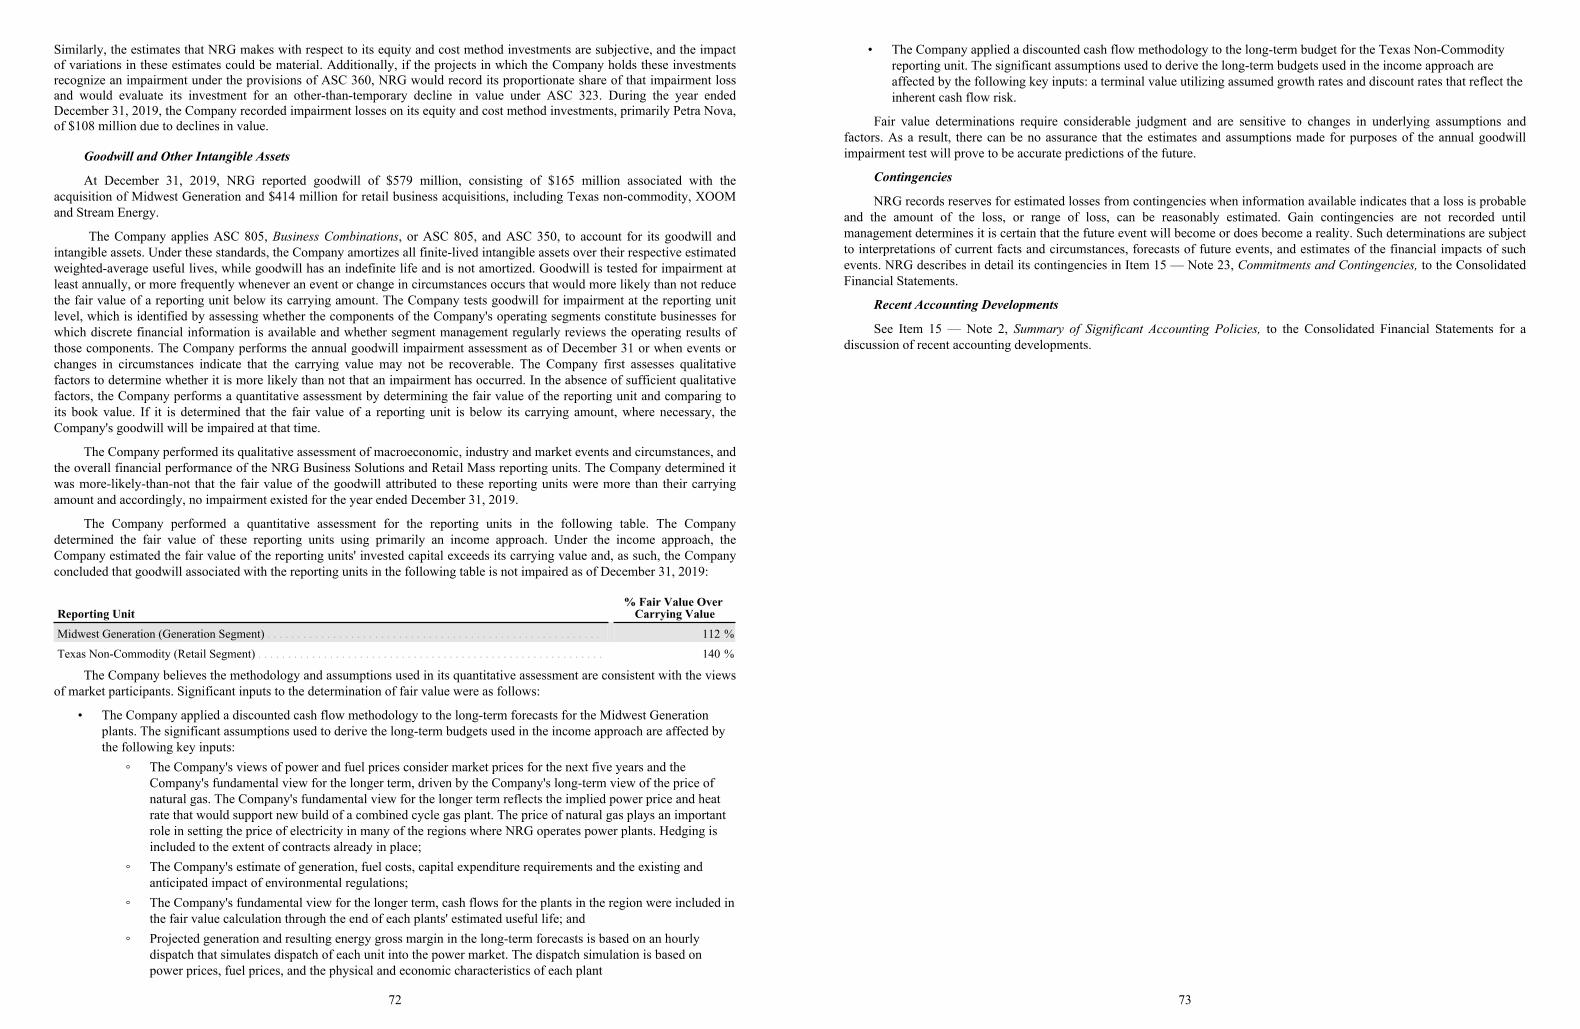
Similarly, the estimates that NRG makes with respect to its equity and cost method investments are subjective, and the impactof variations in these estimates could be material. Additionally, if the projects in which the Company holds these investmentsrecognize an impairment under the provisions of ASC 360, NRG would record its proportionate share of that impairment lossand would evaluate its investment for an other-than-temporary decline in value under ASC 323. During the year endedDecember 31, 2019, the Company recorded impairment losses on its equity and cost method investments, primarily Petra Nova,of $108 million due to declines in value.
Goodwill and Other Intangible Assets
At December 31, 2019, NRG reported goodwill of $579 million, consisting of $165 million associated with theacquisition of Midwest Generation and $414 million for retail business acquisitions, including Texas non-commodity, XOOMand Stream Energy.
The Company applies ASC 805, Business Combinations, or ASC 805, and ASC 350, to account for its goodwill andintangible assets. Under these standards, the Company amortizes all finite-lived intangible assets over their respective estimatedweighted-average useful lives, while goodwill has an indefinite life and is not amortized. Goodwill is tested for impairment atleast annually, or more frequently whenever an event or change in circumstances occurs that would more likely than not reducethe fair value of a reporting unit below its carrying amount. The Company tests goodwill for impairment at the reporting unitlevel, which is identified by assessing whether the components of the Company's operating segments constitute businesses forwhich discrete financial information is available and whether segment management regularly reviews the operating results ofthose components. The Company performs the annual goodwill impairment assessment as of December 31 or when events orchanges in circumstances indicate that the carrying value may not be recoverable. The Company first assesses qualitativefactors to determine whether it is more likely than not that an impairment has occurred. In the absence of sufficient qualitativefactors, the Company performs a quantitative assessment by determining the fair value of the reporting unit and comparing toits book value. If it is determined that the fair value of a reporting unit is below its carrying amount, where necessary, theCompany's goodwill will be impaired at that time.
The Company performed its qualitative assessment of macroeconomic, industry and market events and circumstances, andthe overall financial performance of the NRG Business Solutions and Retail Mass reporting units. The Company determined itwas more-likely-than-not that the fair value of the goodwill attributed to these reporting units were more than their carryingamount and accordingly, no impairment existed for the year ended December 31, 2019.
The Company performed a quantitative assessment for the reporting units in the following table. The Companydetermined the fair value of these reporting units using primarily an income approach. Under the income approach, theCompany estimated the fair value of the reporting units' invested capital exceeds its carrying value and, as such, the Companyconcluded that goodwill associated with the reporting units in the following table is not impaired as of December 31, 2019:
Reporting Unit% Fair Value Over
Carrying Value
Midwest Generation (Generation Segment) . . . . . . . . . . . . . . . . . . . . . . . . . . . . . . . . . . . . . . . . . . . . . . . . . . . . . . . . 112 %
Texas Non-Commodity (Retail Segment) . . . . . . . . . . . . . . . . . . . . . . . . . . . . . . . . . . . . . . . . . . . . . . . . . . . . . . . . . . 140 %
The Company believes the methodology and assumptions used in its quantitative assessment are consistent with the viewsof market participants. Significant inputs to the determination of fair value were as follows:
• The Company applied a discounted cash flow methodology to the long-term forecasts for the Midwest Generation plants. The significant assumptions used to derive the long-term budgets used in the income approach are affected by the following key inputs:
◦ The Company's views of power and fuel prices consider market prices for the next five years and the Company's fundamental view for the longer term, driven by the Company's long-term view of the price of natural gas. The Company's fundamental view for the longer term reflects the implied power price and heat rate that would support new build of a combined cycle gas plant. The price of natural gas plays an important role in setting the price of electricity in many of the regions where NRG operates power plants. Hedging is included to the extent of contracts already in place;
◦ The Company's estimate of generation, fuel costs, capital expenditure requirements and the existing and anticipated impact of environmental regulations;
◦ The Company's fundamental view for the longer term, cash flows for the plants in the region were included in the fair value calculation through the end of each plants' estimated useful life; and
◦ Projected generation and resulting energy gross margin in the long-term forecasts is based on an hourly dispatch that simulates dispatch of each unit into the power market. The dispatch simulation is based on power prices, fuel prices, and the physical and economic characteristics of each plant
72
• The Company applied a discounted cash flow methodology to the long-term budget for the Texas Non-Commodity reporting unit. The significant assumptions used to derive the long-term budgets used in the income approach are affected by the following key inputs: a terminal value utilizing assumed growth rates and discount rates that reflect the inherent cash flow risk.
Fair value determinations require considerable judgment and are sensitive to changes in underlying assumptions andfactors. As a result, there can be no assurance that the estimates and assumptions made for purposes of the annual goodwillimpairment test will prove to be accurate predictions of the future.
Contingencies
NRG records reserves for estimated losses from contingencies when information available indicates that a loss is probableand the amount of the loss, or range of loss, can be reasonably estimated. Gain contingencies are not recorded untilmanagement determines it is certain that the future event will become or does become a reality. Such determinations are subjectto interpretations of current facts and circumstances, forecasts of future events, and estimates of the financial impacts of suchevents. NRG describes in detail its contingencies in Item 15 — Note 23, Commitments and Contingencies, to the ConsolidatedFinancial Statements.
Recent Accounting Developments
See Item 15 — Note 2, Summary of Significant Accounting Policies, to the Consolidated Financial Statements for adiscussion of recent accounting developments.
73
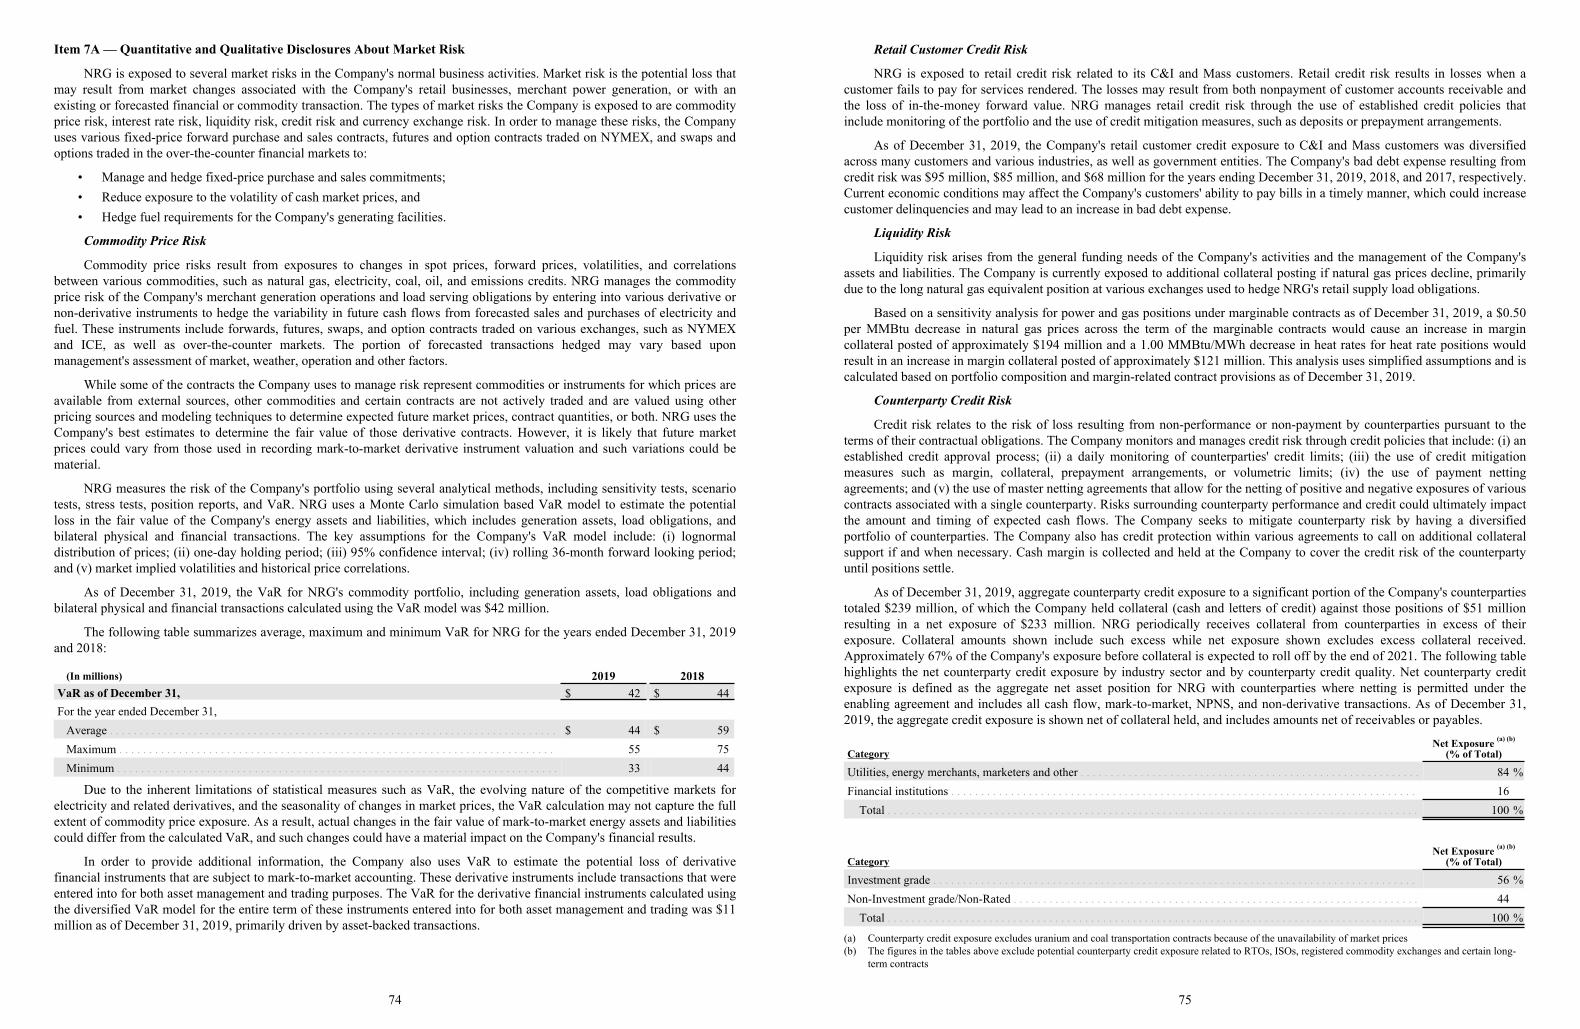
Item 7A — Quantitative and Qualitative Disclosures About Market Risk
NRG is exposed to several market risks in the Company's normal business activities. Market risk is the potential loss thatmay result from market changes associated with the Company's retail businesses, merchant power generation, or with anexisting or forecasted financial or commodity transaction. The types of market risks the Company is exposed to are commodityprice risk, interest rate risk, liquidity risk, credit risk and currency exchange risk. In order to manage these risks, the Companyuses various fixed-price forward purchase and sales contracts, futures and option contracts traded on NYMEX, and swaps andoptions traded in the over-the-counter financial markets to:
• Manage and hedge fixed-price purchase and sales commitments;• Reduce exposure to the volatility of cash market prices, and• Hedge fuel requirements for the Company's generating facilities.
Commodity Price Risk
Commodity price risks result from exposures to changes in spot prices, forward prices, volatilities, and correlationsbetween various commodities, such as natural gas, electricity, coal, oil, and emissions credits. NRG manages the commodityprice risk of the Company's merchant generation operations and load serving obligations by entering into various derivative ornon-derivative instruments to hedge the variability in future cash flows from forecasted sales and purchases of electricity andfuel. These instruments include forwards, futures, swaps, and option contracts traded on various exchanges, such as NYMEXand ICE, as well as over-the-counter markets. The portion of forecasted transactions hedged may vary based uponmanagement's assessment of market, weather, operation and other factors.
While some of the contracts the Company uses to manage risk represent commodities or instruments for which prices areavailable from external sources, other commodities and certain contracts are not actively traded and are valued using otherpricing sources and modeling techniques to determine expected future market prices, contract quantities, or both. NRG uses theCompany's best estimates to determine the fair value of those derivative contracts. However, it is likely that future marketprices could vary from those used in recording mark-to-market derivative instrument valuation and such variations could bematerial.
NRG measures the risk of the Company's portfolio using several analytical methods, including sensitivity tests, scenariotests, stress tests, position reports, and VaR. NRG uses a Monte Carlo simulation based VaR model to estimate the potentialloss in the fair value of the Company's energy assets and liabilities, which includes generation assets, load obligations, andbilateral physical and financial transactions. The key assumptions for the Company's VaR model include: (i) lognormaldistribution of prices; (ii) one-day holding period; (iii) 95% confidence interval; (iv) rolling 36-month forward looking period;and (v) market implied volatilities and historical price correlations.
As of December 31, 2019, the VaR for NRG's commodity portfolio, including generation assets, load obligations andbilateral physical and financial transactions calculated using the VaR model was $42 million.
The following table summarizes average, maximum and minimum VaR for NRG for the years ended December 31, 2019and 2018:
(In millions) 2019 2018VaR as of December 31, $ 42 $ 44For the year ended December 31,
Average . . . . . . . . . . . . . . . . . . . . . . . . . . . . . . . . . . . . . . . . . . . . . . . . . . . . . . . . . . . . . . . . . . . . . . . . . . . $ 44 $ 59Maximum . . . . . . . . . . . . . . . . . . . . . . . . . . . . . . . . . . . . . . . . . . . . . . . . . . . . . . . . . . . . . . . . . . . . . . . . . 55 75Minimum . . . . . . . . . . . . . . . . . . . . . . . . . . . . . . . . . . . . . . . . . . . . . . . . . . . . . . . . . . . . . . . . . . . . . . . . . . 33 44
Due to the inherent limitations of statistical measures such as VaR, the evolving nature of the competitive markets forelectricity and related derivatives, and the seasonality of changes in market prices, the VaR calculation may not capture the fullextent of commodity price exposure. As a result, actual changes in the fair value of mark-to-market energy assets and liabilitiescould differ from the calculated VaR, and such changes could have a material impact on the Company's financial results.
In order to provide additional information, the Company also uses VaR to estimate the potential loss of derivativefinancial instruments that are subject to mark-to-market accounting. These derivative instruments include transactions that wereentered into for both asset management and trading purposes. The VaR for the derivative financial instruments calculated usingthe diversified VaR model for the entire term of these instruments entered into for both asset management and trading was $11million as of December 31, 2019, primarily driven by asset-backed transactions.
74
Retail Customer Credit Risk
NRG is exposed to retail credit risk related to its C&I and Mass customers. Retail credit risk results in losses when acustomer fails to pay for services rendered. The losses may result from both nonpayment of customer accounts receivable andthe loss of in-the-money forward value. NRG manages retail credit risk through the use of established credit policies thatinclude monitoring of the portfolio and the use of credit mitigation measures, such as deposits or prepayment arrangements.
As of December 31, 2019, the Company's retail customer credit exposure to C&I and Mass customers was diversifiedacross many customers and various industries, as well as government entities. The Company's bad debt expense resulting fromcredit risk was $95 million, $85 million, and $68 million for the years ending December 31, 2019, 2018, and 2017, respectively.Current economic conditions may affect the Company's customers' ability to pay bills in a timely manner, which could increasecustomer delinquencies and may lead to an increase in bad debt expense.
Liquidity Risk
Liquidity risk arises from the general funding needs of the Company's activities and the management of the Company'sassets and liabilities. The Company is currently exposed to additional collateral posting if natural gas prices decline, primarilydue to the long natural gas equivalent position at various exchanges used to hedge NRG's retail supply load obligations.
Based on a sensitivity analysis for power and gas positions under marginable contracts as of December 31, 2019, a $0.50per MMBtu decrease in natural gas prices across the term of the marginable contracts would cause an increase in margincollateral posted of approximately $194 million and a 1.00 MMBtu/MWh decrease in heat rates for heat rate positions wouldresult in an increase in margin collateral posted of approximately $121 million. This analysis uses simplified assumptions and iscalculated based on portfolio composition and margin-related contract provisions as of December 31, 2019.
Counterparty Credit Risk
Credit risk relates to the risk of loss resulting from non-performance or non-payment by counterparties pursuant to theterms of their contractual obligations. The Company monitors and manages credit risk through credit policies that include: (i) anestablished credit approval process; (ii) a daily monitoring of counterparties' credit limits; (iii) the use of credit mitigationmeasures such as margin, collateral, prepayment arrangements, or volumetric limits; (iv) the use of payment nettingagreements; and (v) the use of master netting agreements that allow for the netting of positive and negative exposures of variouscontracts associated with a single counterparty. Risks surrounding counterparty performance and credit could ultimately impactthe amount and timing of expected cash flows. The Company seeks to mitigate counterparty risk by having a diversifiedportfolio of counterparties. The Company also has credit protection within various agreements to call on additional collateralsupport if and when necessary. Cash margin is collected and held at the Company to cover the credit risk of the counterpartyuntil positions settle.
As of December 31, 2019, aggregate counterparty credit exposure to a significant portion of the Company's counterpartiestotaled $239 million, of which the Company held collateral (cash and letters of credit) against those positions of $51 millionresulting in a net exposure of $233 million. NRG periodically receives collateral from counterparties in excess of theirexposure. Collateral amounts shown include such excess while net exposure shown excludes excess collateral received.Approximately 67% of the Company's exposure before collateral is expected to roll off by the end of 2021. The following tablehighlights the net counterparty credit exposure by industry sector and by counterparty credit quality. Net counterparty creditexposure is defined as the aggregate net asset position for NRG with counterparties where netting is permitted under theenabling agreement and includes all cash flow, mark-to-market, NPNS, and non-derivative transactions. As of December 31,2019, the aggregate credit exposure is shown net of collateral held, and includes amounts net of receivables or payables.
CategoryNet Exposure (a) (b)
(% of Total)
Utilities, energy merchants, marketers and other . . . . . . . . . . . . . . . . . . . . . . . . . . . . . . . . . . . . . . . . . . . . . . . . . . . . . . . . . 84 %Financial institutions . . . . . . . . . . . . . . . . . . . . . . . . . . . . . . . . . . . . . . . . . . . . . . . . . . . . . . . . . . . . . . . . . . . . . . . . . . . . . . 16
Total . . . . . . . . . . . . . . . . . . . . . . . . . . . . . . . . . . . . . . . . . . . . . . . . . . . . . . . . . . . . . . . . . . . . . . . . . . . . . . . . . . . . . . . . . 100 %
CategoryNet Exposure (a) (b)
(% of Total)
Investment grade . . . . . . . . . . . . . . . . . . . . . . . . . . . . . . . . . . . . . . . . . . . . . . . . . . . . . . . . . . . . . . . . . . . . . . . . . . . . . . . . . 56 %Non-Investment grade/Non-Rated . . . . . . . . . . . . . . . . . . . . . . . . . . . . . . . . . . . . . . . . . . . . . . . . . . . . . . . . . . . . . . . . . . . . 44
Total . . . . . . . . . . . . . . . . . . . . . . . . . . . . . . . . . . . . . . . . . . . . . . . . . . . . . . . . . . . . . . . . . . . . . . . . . . . . . . . . . . . . . . . . . 100 %
(a) Counterparty credit exposure excludes uranium and coal transportation contracts because of the unavailability of market prices(b) The figures in the tables above exclude potential counterparty credit exposure related to RTOs, ISOs, registered commodity exchanges and certain long-
term contracts
75
The Company has $33 million of exposure to one wholesale counterparty in excess of 10% of the total net exposurediscussed above as of December 31, 2019. Changes in hedge positions and market prices will affect credit exposure andcounterparty concentration. Given the credit quality, diversification and term of the exposure in the portfolio, the Companydoes not anticipate a material impact on its financial position or results of operations from nonperformance by any counterparty.
RTOs and ISOs
The Company participates in the organized markets of CAISO, ERCOT, ISO-NE, MISO, NYISO and PJM, known asRTOs or ISOs. Trading in these markets is approved by FERC, or in the case of ERCOT, approved by the PUCT and includecredit policies that, under certain circumstances, require that losses arising from the default of one member on spot markettransactions be shared by the remaining participants. As a result, the counterparty credit risk to these markets is limited toNRG’s applicable share of the overall market and are excluded from the above exposures.
Exchange Traded Transactions
The Company enters into commodity transactions on registered exchanges, notably ICE, NYMEX and Nodal. Theseclearinghouses act as the counterparty and transactions are subject to extensive collateral and margining requirements. As aresult, these commodity transactions have limited counterparty credit risk.
Long-Term Contracts
Counterparty credit exposure described above excludes credit risk exposure under certain long-term contracts, primarilysolar PPAs. As external sources or observable market quotes are not available to estimate such exposure, the Company valuesthese contracts based on various techniques including, but not limited to, internal models based on a fundamental analysis of themarket and extrapolation of observable market data with similar characteristics. Based on these valuation techniques, as ofDecember 31, 2019, aggregate credit risk exposure managed by NRG to these counterparties was approximately $548 millionfor the next five years, including exposure to PG&E through its unconsolidated affiliates Ivanpah and Agua Caliente.
Interest Rate Risk
NRG was previously exposed to fluctuations in interest rates through its issuance of variable rate debt. Exposures tointerest rate fluctuations may be mitigated by entering into derivative instruments known as interest rate swaps, caps, collarsand put or call options. These contracts reduce exposure to interest rate volatility and result in primarily fixed rate debtobligations when taking into account the combination of the variable rate debt and the interest rate derivative instrument. NRG'srisk management policies allow the Company to reduce interest rate exposure from variable rate debt obligations.
The Company previously entered into interest rate swaps. As of December 31, 2019, NRG had no interest rate derivativeinstruments, as a result of the early termination of such contracts in connection with the repayment of the 2023 Term LoanFacility during the second quarter of 2019. See Item 15 — Note 13, Debt and Finance Leases, to the Consolidated FinancialStatements for further discussion.
As of December 31, 2019, the Company's debt fair value was $6.5 billion and carrying value was $6.0 billion. NRGestimates that a 1% decrease in market interest rates would have increased the fair value of the Company's long-term debt by$560 million.
Credit Risk Related Contingent Features
Certain of the Company's hedging agreements contain provisions that require the Company to post additional collateral ifthe counterparty determines that there has been deterioration in credit quality, generally termed "adequate assurance" under theagreements, or require the Company to post additional collateral if there were a one notch downgrade in the Company's creditrating. The collateral required for contracts that have adequate assurance clauses that are in a net liability position as ofDecember 31, 2019, was $14 million. The collateral required for contracts with credit rating contingent features that are in a netliability position as of December 31, 2019 was $24 million. The Company is also a party to certain marginable agreementsunder which it has a net liability position, but the counterparty has not called for the collateral due, which was approximately $3million as of December 31, 2019.
Currency Exchange Risk
NRG's foreign earnings and investments may be subject to foreign currency exchange risk, which NRG generally does nothedge. As these earnings and investments are not material to NRG's consolidated results, the Company's foreign currencyexposure is limited.
Item 8 — Financial Statements and Supplementary Data
The financial statements and schedules are included in Part IV, Item 15 of this Form 10-K.
76
Item 9 — Changes in and Disagreements With Accountants on Accounting and Financial Disclosure
None.
Item 9A — Controls and Procedures
Conclusion Regarding the Effectiveness of Disclosure Controls and Procedures and Internal Control Over FinancialReporting
Under the supervision and with the participation of NRG's management, including its principal executive officer, principalfinancial officer and principal accounting officer, NRG conducted an evaluation of the effectiveness of the design and operationof its disclosure controls and procedures, as such term is defined in Rules 13a-15(e) or 15d-15(e) of the Exchange Act. Basedon this evaluation, the Company's principal executive officer, principal financial officer and principal accounting officerconcluded that the disclosure controls and procedures were effective as of the end of the period covered by this Annual Reporton Form 10-K. Management's report on the Company's internal control over financial reporting and the report of the Company'sindependent registered public accounting firm are incorporated under the caption "Management's Report on Internal Controlover Financial Reporting" and under the caption "Report of Independent Registered Public Accounting Firm" in this AnnualReport on Form 10-K for the fiscal year ended December 31, 2019.
Changes in Internal Control over Financial Reporting
There were no changes in NRG’s internal control over financial reporting (as such term is defined in Rule 13a-15(f) underthe Exchange Act) that occurred in the fourth quarter of 2019 that materially affected, or are reasonably likely to materiallyaffect, NRG’s internal control over financial reporting.
Inherent Limitations over Internal Controls
NRG's internal control over financial reporting is designed to provide reasonable assurance regarding the reliability offinancial reporting and the preparation of consolidated financial statements for external purposes in accordance with GAAP.The Company's internal control over financial reporting includes those policies and procedures that:
1. Pertain to the maintenance of records that, in reasonable detail, accurately and fairly reflect the transactions and dispositions of the Company's assets;
2. Provide reasonable assurance that transactions are recorded as necessary to permit preparation of consolidated financial statements in accordance with GAAP, and that the Company's receipts and expenditures are being made only in accordance with authorizations of its management and directors; and
3. Provide reasonable assurance regarding prevention or timely detection of unauthorized acquisition, use or disposition of the Company's assets that could have a material effect on the consolidated financial statements.
Internal control over financial reporting cannot provide absolute assurance of achieving financial reporting objectivesbecause of its inherent limitations, including the possibility of human error and circumvention by collusion or overriding ofcontrols. Accordingly, even an effective internal control system may not prevent or detect material misstatements on a timelybasis. Also, projections of any evaluation of effectiveness to future periods are subject to the risk that controls may becomeinadequate because of changes in conditions or that the degree of compliance with the policies or procedures may deteriorate.
Management's Report on Internal Control over Financial Reporting
The Company's management is responsible for establishing and maintaining adequate internal control over financialreporting, as such term is defined in Exchange Act Rule 13a-15(f). Under the supervision and with the participation of theCompany's management, including its principal executive officer, principal financial officer and principal accounting officer,the Company conducted an evaluation of the effectiveness of its internal control over financial reporting based on theframework in Internal Control — Integrated Framework (2013) issued by the Committee of Sponsoring Organizations of theTreadway Commission. Based on the Company's evaluation under the framework in Internal Control — Integrated Framework(2013), the Company's management concluded that its internal control over financial reporting was effective as ofDecember 31, 2019.
On August 1, 2019, we acquired Stream Energy, as further described in Note 4, Acquisitions, Discontinued Operationsand Dispositions. Stream Energy comprised approximately 2.8% of the Company's total assets as of December 31, 2019 andapproximately 3.2% of the Company's total revenues for the year ended December 31, 2019. As of December 31, 2019, we arein the process of evaluating the internal controls of the acquired business and integrating it into our existing operations. Theacquired business has, therefore, been excluded from management's assessment of internal control over financial reporting forthe year ended December 31, 2019.
77
The effectiveness of the Company's internal control over financial reporting as of December 31, 2019 has been audited byKPMG LLP, the Company's independent registered public accounting firm, as stated in its report which is included in thisAnnual Report on Form 10-K.
78
REPORT OF INDEPENDENT REGISTERED PUBLIC ACCOUNTING FIRM
To the Board of Directors and StockholdersNRG Energy, Inc.:
Opinion on Internal Control Over Financial Reporting
We have audited NRG Energy, Inc. and subsidiaries' (the Company) internal control over financial reporting as ofDecember 31, 2019, based on criteria established in Internal Control — Integrated Framework (2013) issued by the Committeeof Sponsoring Organizations of the Treadway Commission. In our opinion, the Company maintained, in all material respects,effective internal control over financial reporting as of December 31, 2019, based on criteria established in Internal Control —Integrated Framework (2013) issued by the Committee of Sponsoring Organizations of the Treadway Commission.
We also have audited, in accordance with the standards of the Public Company Accounting Oversight Board (United States)(PCAOB), the consolidated balance sheets of the Company as of December 31, 2019 and 2018, and the related consolidatedstatements of operations, comprehensive income/(loss), stockholders’ equity, and cash flows for each of the years in the three-year period ended December 31, 2019, and the related notes and financial statement schedule II (collectively, the consolidatedfinancial statements), and our report dated February 27, 2020 expressed an unqualified opinion on those consolidated financialstatements.
Management excluded Stream Energy (Stream), acquired by the Company during 2019, from their assessment of theeffectiveness of the Company's internal control over financial reporting as of December 31, 2019. Stream's assets comprisedapproximately 2.8% of the Company's total assets as of December 31, 2019 and Stream's revenues comprised approximately3.2% of the Company's total revenues for the year ended December 31, 2019. Our audit of the Company's internal control overfinancial reporting also excluded Stream.
Basis for Opinion
The Company's management is responsible for maintaining effective internal control over financial reporting and for itsassessment of the effectiveness of internal control over financial reporting, included in the accompanying Management’s Reporton Internal Control over Financial Reporting. Our responsibility is to express an opinion on the Company’s internal controlover financial reporting based on our audit. We are a public accounting firm registered with the PCAOB and are required to beindependent with respect to the Company in accordance with the U.S. federal securities laws and the applicable rules andregulations of the Securities and Exchange Commission and the PCAOB.
We conducted our audit in accordance with the standards of the PCAOB. Those standards require that we plan and perform theaudit to obtain reasonable assurance about whether effective internal control over financial reporting was maintained in allmaterial respects. Our audit of internal control over financial reporting included obtaining an understanding of internal controlover financial reporting, assessing the risk that a material weakness exists, and testing and evaluating the design and operatingeffectiveness of internal control based on the assessed risk. Our audit also included performing such other procedures as weconsidered necessary in the circumstances. We believe that our audit provides a reasonable basis for our opinion.
Definition and Limitations of Internal Control Over Financial Reporting
A company’s internal control over financial reporting is a process designed to provide reasonable assurance regarding thereliability of financial reporting and the preparation of financial statements for external purposes in accordance with generallyaccepted accounting principles. A company’s internal control over financial reporting includes those policies and proceduresthat (1) pertain to the maintenance of records that, in reasonable detail, accurately and fairly reflect the transactions anddispositions of the assets of the company; (2) provide reasonable assurance that transactions are recorded as necessary to permitpreparation of financial statements in accordance with generally accepted accounting principles, and that receipts andexpenditures of the company are being made only in accordance with authorizations of management and directors of thecompany; and (3) provide reasonable assurance regarding prevention or timely detection of unauthorized acquisition, use, ordisposition of the company’s assets that could have a material effect on the financial statements.
Because of its inherent limitations, internal control over financial reporting may not prevent or detect misstatements. Also,projections of any evaluation of effectiveness to future periods are subject to the risk that controls may become inadequatebecause of changes in conditions, or that the degree of compliance with the policies or procedures may deteriorate.
/s/ KPMG LLP
Philadelphia, PennsylvaniaFebruary 27, 2020
79
Item 9B — Other Information
None.PART III
Item 10 — Directors, Executive Officers and Corporate Governance
Directors
E. Spencer Abraham has been a director of NRG since December 2012. Previously, he served as a director of GenOnEnergy, Inc. from January 2012 to December 2012. He is Chairman and Chief Executive Officer of The Abraham Group, aninternational strategic consulting firm based in Washington, D.C. which he founded in 2005. Prior to that, Secretary Abrahamserved as Secretary of Energy under President George W. Bush from 2001 through January 2005 and was a U.S. Senator for theState of Michigan from 1995 to 2001. Secretary Abraham serves on the boards of the following public companies: OccidentalPetroleum Corporation, PBF Energy and Two Harbors Investment Corp., as well as chairman of the board of Uranium EnergyCorp. Secretary Abraham previously served as the non-executive chairman of AREVA, Inc., the U.S. subsidiary of the French-owned nuclear company, and as a director of Deepwater Wind LLC, International Battery, C3 IoT, Green Rock Energy, ICxTechnologies, PetroTiger and Sindicatum Sustainable Resources. He also previously served on the advisory board orcommittees of Midas Medici (Utilipoint), Millennium Private Equity, Sunovia and Wetherly Capital.
Antonio Carrillo has been a director of NRG since October 2019. Mr. Carrillo currently serves as Arcosa Inc.’s Presidentand Chief Executive Officer since November 2018 and is a member of its Board of Directors. From April 2018 to November2018, Mr. Carrillo served as Senior Vice President and Group President of Construction, Energy, Marine and Components ofTrinity Industries, Inc. (Trinity). From 2012 to February 2018, Mr. Carrillo served as the Chief Executive Officer of OrbiaAdvance Corporation (formerly known as Mexichem S.A.B. de C.V.) (Orbia), a publicly-traded global specialty chemicalcompany. Prior to joining Orbia, Mr. Carrillo spent 16 years at Trinity where he served as Senior Vice President and GroupPresident of Trinity’s Energy Equipment Group and was responsible for Trinity’s Mexico operations. Mr. Carrillo previouslyserved as a director of Trinity from 2014 until November 2018 and a director of Dr Pepper Snapple Group, Inc. from 2015 to2018.
Matthew Carter, Jr. has been a director of NRG since March 2018. Mr. Carter currently serves as Chief Executive Officerof Aryaka Networks, Inc. Mr. Carter served as President and Chief Executive Officer and a director of Inteliquent, Inc., apublicly traded provider of voice telecommunications services, from June 2015 until February 2017 when Inteliquent, Inc. wasacquired. He served as President of the Sprint Enterprise Solutions business unit of Sprint Corporation, a publicly tradedtelecommunications company, from September 2013 until January 2015 and, previous to that position, served as President,Sprint Global Wholesale & Emerging Solutions at Sprint Nextel Corporation. Mr. Carter also serves as a director of Jones LangLasalle Incorporated. He previously served as a director of USG Corporation from 2012 to 2018, Apollo Education Group, Inc.from 2012 to 2017 and Inteliquent, Inc. from June 2015 to February 2017 and has significant marketing, technology andinternational experience, including previous management oversight for all of Inteliquent, Inc.’s operations.
Lawrence S. Coben has served as Chairman of the Board since February 2017, and has been a director of NRG sinceDecember 2003. He was Chairman and Chief Executive Officer of Tremisis Energy Corporation LLC until December 2017. Dr.Coben was Chairman and Chief Executive Officer of both Tremisis Energy Acquisition Corporation II, a publicly heldcompany, from July 2007 through March 2009 and of Tremisis Energy Acquisition Corporation from February 2004 to May2006. From January 2001 to January 2004, he was a Senior Principal of Sunrise Capital Partners L.P., a private equity firm.From 1997 to January 2001, Dr. Coben was an independent consultant. From 1994 to 1996, Dr. Coben was Chief ExecutiveOfficer of Bolivian Power Company. Dr. Coben serves on the board of Freshpet, Inc. and served on the advisory board ofMorgan Stanley Infrastructure II, L.P. from September 2014 through December 2016. Dr. Coben is also Executive Director ofthe Sustainable Preservation Initiative and a Consulting Scholar at the University of Pennsylvania Museum of Archaeology andAnthropology.
Heather Cox has been a director of NRG since March 2018. Ms. Cox currently serves as Chief Digital Health andAnalytics Officer at Humana Inc. Ms. Cox was Executive Vice President, Chief Technology & Digital Officer of UnitedServices Automobile Association, Inc. from October 2016 to March 2018. Ms. Cox served as Chief Executive Officer,Financial Technology Division and Head of Citi FinTech of Citigroup, Inc. from November 2015 to September 2016, and asChief Client Experience, Digital and Marketing Officer, Global Consumer Bank of Citigroup, Inc. from April 2014 toNovember 2015. Prior to that, Ms. Cox served at Capital One Financial Corporation for six years, most recently as ExecutiveVice President, US Card Operations, Capital One from August 2011 to August 2014. Ms. Cox also served in variousmanagerial and executive roles at E*Trade Bank for ten years.
Terry G. Dallas has been a director of NRG since December 2012. Previously, he served as a director of GenOn Energy,Inc. from December 2010 to December 2012. Mr. Dallas served as a director of Mirant Corporation from 2006 until December2010. Mr. Dallas was also the former Executive Vice President and Chief Financial Officer of Unocal Corporation, an oil and
80
gas exploration and production company prior to its merger with Chevron Corporation, from 2000 to 2005. Prior to that, Mr.Dallas held various executive finance positions in his 21-year career with Atlantic Richfield Corporation, an oil and gascompany with major operations in the United States, Latin America, Asia, Europe and the Middle East. Mr. Dallas is an “auditcommittee financial expert” as defined by the SEC rules.
Mauricio Gutierrez has served as President and Chief Executive Officer of NRG since December 2015 and as a directorof NRG since January 2016. Prior to December 2015, Mr. Gutierrez was the Executive Vice President and Chief OperatingOfficer of NRG from July 2010 to December 2015. Mr. Gutierrez also served as the Interim President and Chief ExecutiveOfficer of Clearway Energy, Inc. from December 2015 to May 2016 and Executive Vice President and Chief Operating Officerof Clearway Energy, Inc. from December 2012 to December 2015. Mr. Gutierrez has also served on the board of ClearwayEnergy, Inc. from December 2012 until August 2018. Mr. Gutierrez has been with NRG since August 2004 and served inmultiple executive positions within NRG including Executive Vice President - Commercial Operations from January 2009 toJuly 2010 and Senior Vice President - Commercial Operations from March 2008 to January 2009. Prior to joining NRG inAugust 2004, Mr. Gutierrez held various commercial positions within Dynegy, Inc.
Paul W. Hobby has been a director of NRG since March 2006. Mr. Hobby is the Managing Partner of Genesis Park, L.P.,a Houston-based private equity business specializing in technology and communications investments which he founded in1999. Mr. Hobby routinely provides management and governance services to Genesis Park portfolio companies. He previouslyserved as the Chief Executive Officer of Alpheus Communications, Inc., a Texas wholesale telecommunications provider from2004 to 2011, and as Former Chairman of CapRock Services Corp., the largest provider of satellite services to the global energybusiness from 2002 to 2006. From November 1992 until January 2001, he served as Chairman and Chief Executive Officer ofHobby Media Services and was Chairman of Columbine JDS Systems, Inc. from 1995 until 1997. Mr. Hobby currently serveson the board of directors of Flotek Industries Inc. Mr. Hobby is former Chairman of the Houston Branch of the Federal ReserveBank of Dallas and the Greater Houston Partnership and is former Chairman of the Texas Ethics Commission. He was anAssistant U.S. Attorney for the Southern District of Texas from 1989 to 1992, Chief of Staff to the Lieutenant Governor ofTexas, Bob Bullock and an Associate at Fulbright & Jaworski from 1986 to 1989.
Alexandra Pruner has been a director of NRG since October 2019. Ms. Pruner is a Senior Advisor of Perella WeinbergPartners, a global independent advisory firm providing strategic and financial advice and asset-management services, and itsenergy division, Tudor, Pickering, Holt & Co., since December 2018. She previously served as Partner and Chief FinancialOfficer of Perella Weinberg Partners from December 201 through November 2018. She served as Chief Financial Officer and amember of the Management Committee at Tudor, Pickering, Holt & Co. from the firm's founding in 2007 until its combinationwith Perella Weinberg in 2016. Ms. Pruner serves on the Board of Directors and as a member of the audit committees of PlainsAll American Pipeline, L.P. and its general partner PAA GP Holdings LLC, and served on the Anadarko Petroleum CorporationBoard until its merger with Occidental Petroleum. She is the founder and a Board member of Women's Global LeadershipConference in Energy & Technology, is an Emeritus Director of the Amegy Bank Development Board, and is the Chair ofBrown University's President's Advisory Council on the Economics Department. Ms. Pruner is chair of the audit committee andmember of the executive committee of the United Way of Greater Houston, on the Board of the Houston Zoo and serves on theHouston advisory Board of The Nature Conservancy, among other volunteer efforts.
Anne C. Schaumburg has been a director of NRG since April 2005. From 1984 until her retirement in January 2002, shewas Managing Director of Credit Suisse First Boston and a senior banker in the Global Energy Group. Ms. Schaumburg hasworked in the Investment Banking industry for 28 years specializing in the power sector. She ran Credit Suisse's Power Groupfrom 1994 - 1999, prior to its consolidation with Natural Resources and Project Finance, where she was responsible forassisting clients on advisory and finance assignments. Her transaction expertise, across the spectrum of utility and unregulatedpower, includes mergers and acquisitions, debt and equity capital market financings, project finance and leasing, utilitydisaggregation and privatizations. Ms. Schaumburg is also a director of Brookfield Infrastructure Partners since 2008 and chairof their audit committee. Ms. Schaumburg is an "audit committee financial expert" as defined by the SEC rules.
Thomas H. Weidemeyer has been a director of NRG since December 2003. Until his retirement in December 2003, Mr.Weidemeyer served as Director, Senior Vice President and Chief Operating Officer of United Parcel Service, Inc., the world'slargest transportation company and President of UPS Airlines. Mr. Weidemeyer became Manager of the Americas InternationalOperation in 1989, and in that capacity directed the development of the UPS delivery network throughout Central and SouthAmerica. In 1990, Mr. Weidemeyer became Vice President and Airline Manager of UPS Airlines and, in 1994, was elected itsPresident and Chief Operating Officer. Mr. Weidemeyer became Senior Vice President and a member of the ManagementCommittee of United Parcel Service, Inc. that same year, and he became Chief Operating Officer of United Parcel Service, Inc.in January 2001. Mr. Weidemeyer also serves as a director of The Goodyear Tire & Rubber Co., Waste Management, Inc. andAmsted Industries Incorporated.
81
Executive Officers
Mauricio Gutierrez has served as President and Chief Executive Officer of NRG since December 2015 and as a directorof NRG since January 2016. For additional biographical information for Mr. Gutierrez, see above under "Directors."
Kirkland Andrews has served as Executive Vice President and Chief Financial Officer of NRG Energy since September2011. Mr. Andrews also served as Executive Vice President, Chief Financial Officer of Clearway Energy, Inc. from December2012 to November 2016. Prior to joining NRG, he served as Managing Director and Co-Head Investment Banking, Power andUtilities - Americas at Deutsche Bank Securities from June 2009 to September 2011. Prior to this, he served in severalcapacities at Citigroup Global Markets Inc., including Managing Director, Group Head, North American Power fromNovember 2007 to June 2009, and Head of Power M&A, Mergers and Acquisitions from July 2005 to November 2007. Mr.Andrews serves on the board of RPM International Inc. and previously served on the board of Clearway Energy, Inc. fromDecember 2012 until August 2018. In his banking career, Mr. Andrews led multiple large and innovative strategic, debt, equityand commodities transactions.
David Callen has served as Senior Vice President and Chief Accounting Officer since February 2016 and Vice Presidentand Chief Accounting Officer from March 2015 to February 2016. In this capacity, Mr. Callen is responsible for directingNRG's financial accounting and reporting activities. Mr. Callen also has served as Vice President and Chief Accounting Officerof Clearway Energy, Inc. since March 2015. Prior to this, Mr. Callen served as the Company's Vice President, FinancialPlanning & Analysis from November 2010 to March 2015. He previously served as Director, Finance from October 2007through October 2010, Director, Financial Reporting from February 2006 through October 2007, and Manager, AccountingResearch from September 2004 through February 2006. Prior to NRG, Mr. Callen was an auditor for KPMG LLP in both NewYork City and Tel Aviv Israel from October 1996 through April 2001.
Brian Curci has served as Senior Vice President, General Counsel of NRG since March 2018. Prior to March 2018, Mr.Curci served as Deputy General Counsel and has served in various roles in over ten years with NRG, including as CorporateSecretary from October 2011 to July 2018. Prior to NRG, Mr. Curci was a corporate associate with the law firm Saul EwingLLP in Philadelphia.
Robert Gaudette has served as Senior Vice President, Business Solutions of NRG since December 2013. In this role, Mr.Gaudette oversees NRG's broad portfolio of products and services for the commercial and industrial customers. Prior toDecember 2013, Mr. Gaudette was Senior Vice President C&I and Origination, starting in August 2013, and Senior VicePresident - Product Development & Origination following the acquisition of GenOn in December 2012. Mr. Gaudette served asSenior Vice President and Chief Commercial Officer at GenOn from December 2010 to December 2012 and served as VicePresident of Mirant's Mid-Atlantic business unit from August 2009 to December 2010. During his career at Mirant, whichbegan in 2001, Mr. Gaudette worked in various other capacities including Director of West Power, Director of NYMEXTrading, Assistant to the Chief Operating Officer and NYMEX natural gas trader.
Elizabeth Killinger has served as Executive Vice President and President, NRG Retail and Reliant of NRG since February2016. Ms. Killinger was Senior Vice President and President, NRG Retail from June 2015 to February 2016 and Senior VicePresident and President, NRG Texas Retail from January 2013 to June 2015. Ms. Killinger has also served as President ofReliant, a subsidiary of NRG, since October 2012. Prior to that, Ms. Killinger was Senior Vice President of Retail Operationsand Reliant Residential from January 2011 to October 2012. Ms. Killinger has been with the Company and its predecessorssince 2002 and has held various operational and business leadership positions within the retail organization. Prior to joining theCompany, Ms. Killinger spent a decade providing strategy, management and systems consulting to energy, oilfield services andretail distribution companies across the U.S. and in Europe.
Christopher Moser has served as Executive Vice President, Operations of NRG since January 2018. Mr. Moser previouslyserved as Senior Vice President, Operations of NRG, with responsibility for Plant Operations, Commercial Operations,Business Operations and Engineering and Construction, beginning in March 2016. From June 2010 to March 2016, Mr. Moserserved as Senior Vice President, Commercial Operations. In this capacity, he was responsible for the optimization of theCompany's wholesale generation fleet.
82
Code of Ethics
NRG has adopted a code of ethics entitled "NRG Code of Conduct" that applies to directors, officers and employees, including the chief executive officer and senior financial officers of NRG. It may be accessed through the "Governance" section of the Company's website at www.nrg.com. NRG also elects to disclose the information required by Form 8-K, Item 5.05, "Amendments to the Registrant's Code of Ethics, or Waiver of a Provision of the Code of Ethics," through the Company's website, and such information will remain available on this website for at least a 12-month period. A copy of the "NRG Code of Conduct" is available in print to any stockholder who requests it.
Other information required by this Item will be incorporated by reference to the similarly named section of NRG's DefinitiveProxy Statement for its 2020 Annual Meeting of Stockholders.
Item 11 — Executive Compensation
Information required by this Item will be incorporated by reference to the similarly named section of NRG's DefinitiveProxy Statement for its 2020 Annual Meeting of Stockholders.
Item 12 — Security Ownership of Certain Beneficial Owners and Management and Related Stockholder Matters
Securities Authorized for Issuance under Equity Compensation Plans
Plan Category
(a)Number of Securities
to be Issued UponExercise of
Outstanding Options,Warrants and Rights
(b)Weighted-Average
ExercisePrice of Outstanding
Options, Warrants andRights
(c)Number of SecuritiesRemaining Availablefor Future Issuance
Under Equity Compensation
Plans (ExcludingSecurities Reflected
in Column (a)
Equity compensation plans approved by security holders . . . . . . . . . . . . . . . . . . . . . . . . . . . . . . . . . . . 1,166,785 (1) $ 20.91 12,820,810
Equity compensation plans not approved by security holders . . . . . . . . . . . . . . . . . . . . . . . . . . . . . . . . . . . 319,264 (2) 26.21 — (4)
Total . . . . . . . . . . . . . . . . . . . . . . . . . . . . . . . . . . . . . . . . 1,486,049 $ 24.06 12,820,810 (3)
(1) Consists of shares issuable under the NRG LTIP and the ESPP. The NRG LTIP became effective upon the Company's emergence from bankruptcy. OnApril 27, 2017, the NRG LTIP was amended and restated to increase the number of shares available for issuance to 25,000,000. The ESPP, as amendedand restated, was approved by the Company's stockholders on April 27, 2017, and became effective April 28, 2017. As of December 31, 2019, there were2,885,060 shares reserved from the Company's treasury shares for the ESPP
(2) Consists of shares issuable under the NRG GenOn LTIP. The plans is listed as “not approved” because it was not subject to separate line item approvalby NRG's stockholders when the Merger was approved.See Item 15 — Note 21, Stock-Based Compensation, to Consolidated Financial Statements for adiscussion of the NRG GenOn LTIP
(3) Consists of 9,935,750 shares of common stock under NRG's LTIP and 2,885,060 shares of treasury stock reserved for issuance under the ESPP.
(4) Upon adoption of the NRG Amended and Restated LTIP effective April 27, 2017, no securities remain available for future issuance under the NRGGenOn LTIP. See Note 21, Stock-Based Compensation, for additional information
NRG LTIP currently provides for grants of restricted stock units, relative performance stock units, deferred stock unitsand dividend equivalent rights. NRG's directors, officers and employees, as well as other individuals performing services for, orto whom an offer of employment has been extended by the Company, are eligible to receive grants under the NRG LTIP. Thepurpose of the NRG LTIP is to promote the Company's long-term growth and profitability by providing these individuals withincentives to maximize stockholder value and otherwise contribute to the Company's success and to enable the Company toattract, retain and reward the best available persons for positions of responsibility. The Compensation Committee of the Boardof Directors administers the NRG LTIP.
Other information required by this Item will be incorporated by reference to the similarly named section of NRG'sDefinitive Proxy Statement for its 2020 Annual Meeting of Stockholders.
Item 13 — Certain Relationships and Related Transactions, and Director Independence
Information required by this Item will be incorporated by reference to the similarly named section of NRG's DefinitiveProxy Statement for its 2020 Annual Meeting of Stockholders.
83
Item 14 — Principal Accounting Fees and Services
Information required by this Item will be incorporated by reference to the similarly named section of NRG's DefinitiveProxy Statement for its 2020 Annual Meeting of Stockholders.
84
PART IV
Item 15 — Exhibits, Financial Statement Schedules
(a)(1) Financial Statements
The following consolidated financial statements of NRG Energy, Inc. and related notes thereto, together with thereports thereon of KPMG LLP, are included herein:
Consolidated Statements of Operations — Years ended December 31, 2019, 2018, and 2017
Consolidated Statements of Comprehensive Income/(Loss) — Years ended December 31, 2019, 2018, and 2017
Consolidated Balance Sheets — As of December 31, 2019 and 2018
Consolidated Statements of Cash Flows — Years ended December 31, 2019, 2018, and 2017
Consolidated Statements of Stockholders' Equity — Years ended December 31, 2019, 2018, and 2017
Notes to Consolidated Financial Statements
(a)(2) Financial Statement Schedule
The following Consolidated Financial Statement Schedule of NRG Energy, Inc. is filed as part of Item 15 of thisreport and should be read in conjunction with the Consolidated Financial Statements.
Schedule II — Valuation and Qualifying Accounts
All other schedules for which provision is made in the applicable accounting regulation of the Securities andExchange Commission are not required under the related instructions or are inapplicable, and therefore, have beenomitted.
(a)(3) Exhibits: See Exhibit Index submitted as a separate section of this report.
(b) Exhibits
See Exhibit Index submitted as a separate section of this report.
(c) Not applicable
85
REPORT OF INDEPENDENT REGISTERED PUBLIC ACCOUNTING FIRM
To the Board of Directors and Stockholders NRG Energy, Inc.:
Opinion on the Consolidated Financial Statements
We have audited the accompanying consolidated balance sheets of NRG Energy, Inc. and subsidiaries (the Company) as ofDecember 31, 2019 and 2018, the related consolidated statements of operations, comprehensive income/(loss), stockholders'equity, and cash flows for each of the years in the three-year period ended December 31, 2019, and the related notes andfinancial statement schedule II (collectively, the consolidated financial statements). In our opinion, the consolidated financialstatements present fairly, in all material respects, the financial position of the Company as of December 31, 2019 and 2018, andthe results of its operations and its cash flows for each of the years in the three-year period ended December 31, 2019, inconformity with U.S. generally accepted accounting principles.
We also have audited, in accordance with the standards of the Public Company Accounting Oversight Board (United States)(PCAOB), the Company's internal control over financial reporting as of December 31, 2019, based on criteria established inInternal Control - Integrated Framework (2013) issued by the Committee of Sponsoring Organizations of the TreadwayCommission, and our report dated February 27, 2020 expressed an unqualified opinion on the effectiveness of the Company'sinternal control over financial reporting.
Changes in Accounting Principle
As discussed in Note 2 to the consolidated financial statements, effective January 1, 2019, the Company adopted FinancialAccounting Standard Board (FASB) Accounting Standards Codification (ASC) Topic 842, Leases, and related amendments. Asdiscussed in Note 3 to the consolidated financial statements, effective January 1, 2018, the Company adopted FASB ASC Topic606, Revenue from Contracts with Customers, and related amendments.
Basis for Opinion
These consolidated financial statements are the responsibility of the Company's management. Our responsibility is to express anopinion on these consolidated financial statements based on our audits. We are a public accounting firm registered with thePCAOB and are required to be independent with respect to the Company in accordance with the U.S. federal securities laws andthe applicable rules and regulations of the Securities and Exchange Commission and the PCAOB.
We conducted our audits in accordance with the standards of the PCAOB. Those standards require that we plan and perform theaudit to obtain reasonable assurance about whether the consolidated financial statements are free of material misstatement,whether due to error or fraud. Our audits included performing procedures to assess the risks of material misstatement of theconsolidated financial statements, whether due to error or fraud, and performing procedures that respond to those risks. Suchprocedures included examining, on a test basis, evidence regarding the amounts and disclosures in the consolidated financialstatements. Our audits also included evaluating the accounting principles used and significant estimates made by management,as well as evaluating the overall presentation of the consolidated financial statements. We believe that our audits provide areasonable basis for our opinion.
Critical Audit Matters
The critical audit matters communicated below are matters arising from the current period audit of the consolidated financialstatements that were communicated or required to be communicated to the audit committee and that: (1) relate to accounts ordisclosures that are material to the consolidated financial statements and (2) involved our especially challenging, subjective, orcomplex judgments. The communication of critical audit matters does not alter in any way our opinion on the consolidatedfinancial statements, taken as a whole, and we are not, by communicating the critical audit matters below, providing separateopinions on the critical audit matters or on the accounts or disclosures to which they relate.
Evaluation of the sufficiency of audit evidence obtained over operating revenues
As discussed in Note 3 to the consolidated financial statements, the Company had $9,821 million of operatingrevenues. Operating revenue is derived from various revenue streams in different geographic markets and theCompany’s processes and related information technology (IT) systems used to record revenue differ for each of theserevenue streams.
86
We identified the evaluation of the sufficiency of audit evidence over operating revenues as a critical audit matterwhich required a high degree of auditor judgment due to the number of revenue streams and IT systems involved in therevenue recognition process. This included determining the revenue streams over which procedures were to beperformed and evaluating the nature and extent of evidence obtained over the individual revenue streams as well asoperating revenue in the aggregate. It also included the involvement of IT professionals with specialized skills andknowledge to assist in the performance of certain procedures.
We, with the assistance of IT professionals, applied auditor judgment to determine the revenue streams over whichprocedures were performed as well as the nature and extent of such procedures. For each revenue stream over whichprocedures were performed, we tested certain internal controls over the Company’s revenue recognition processes;involved IT professionals, who assisted in testing certain IT applications used by the Company in its revenuerecognition processes; and assessed the recorded revenue by selecting transactions and comparing the amountsrecognized to underlying documentation, including contracts with customers. In addition, we evaluated the overallsufficiency of audit evidence obtained over operating revenues.
Evaluation of the realizability of deferred tax assets related to net operating loss carryforwards
As discussed in Notes 2 and 20 to the consolidated financial statements, the Company decreased its valuationallowance by $3.5 billion during the year ended December 31, 2019 resulting in $3.3 billion of net deferred tax assetsas of December 31, 2019. The Company records a valuation allowance to reduce its deferred tax assets to an amountthat is more than 50% likely of being realized. The Company considers both positive and negative evidence inevaluating the need for a valuation allowance, including cumulative pre-tax earnings or losses and forecasted futuretaxable income in each tax jurisdiction.
We identified the evaluation of the realizability of deferred tax assets related to net operating loss carryforwards as acritical audit matter. A high degree of auditor judgment was necessary to assess the consideration of positive andnegative evidence, specifically the Company’s cumulative losses in recent years and the relevance of such losses toforecasted future taxable income. In addition, specialized skills were required to evaluate the Company’s interpretationof income tax regulations.
The primary procedures we performed to address this critical audit matter included the following. We tested certaininternal controls over the Company’s income tax process, including controls related to the application of income taxregulations and the Company's consideration of positive and negative evidence. We assessed the utilization of netoperating loss carryforwards in each tax jurisdiction before their scheduled expiration. We involved income taxprofessionals with specialized skills and knowledge, who assisted in evaluating the Company's interpretation ofincome tax regulations applied in its realizability analysis. We evaluated the Company’s consideration of positive andnegative evidence in determining whether net deferred tax assets were more than 50% likely of being realized. Thisevaluation included considering the cumulative losses in recent years and evaluating the likelihood that those losseswould reoccur and impact forecasted future taxable income.
/s/ KPMG LLP
We have served as the Company's auditor since 2004.
Philadelphia, PennsylvaniaFebruary 27, 2020
87
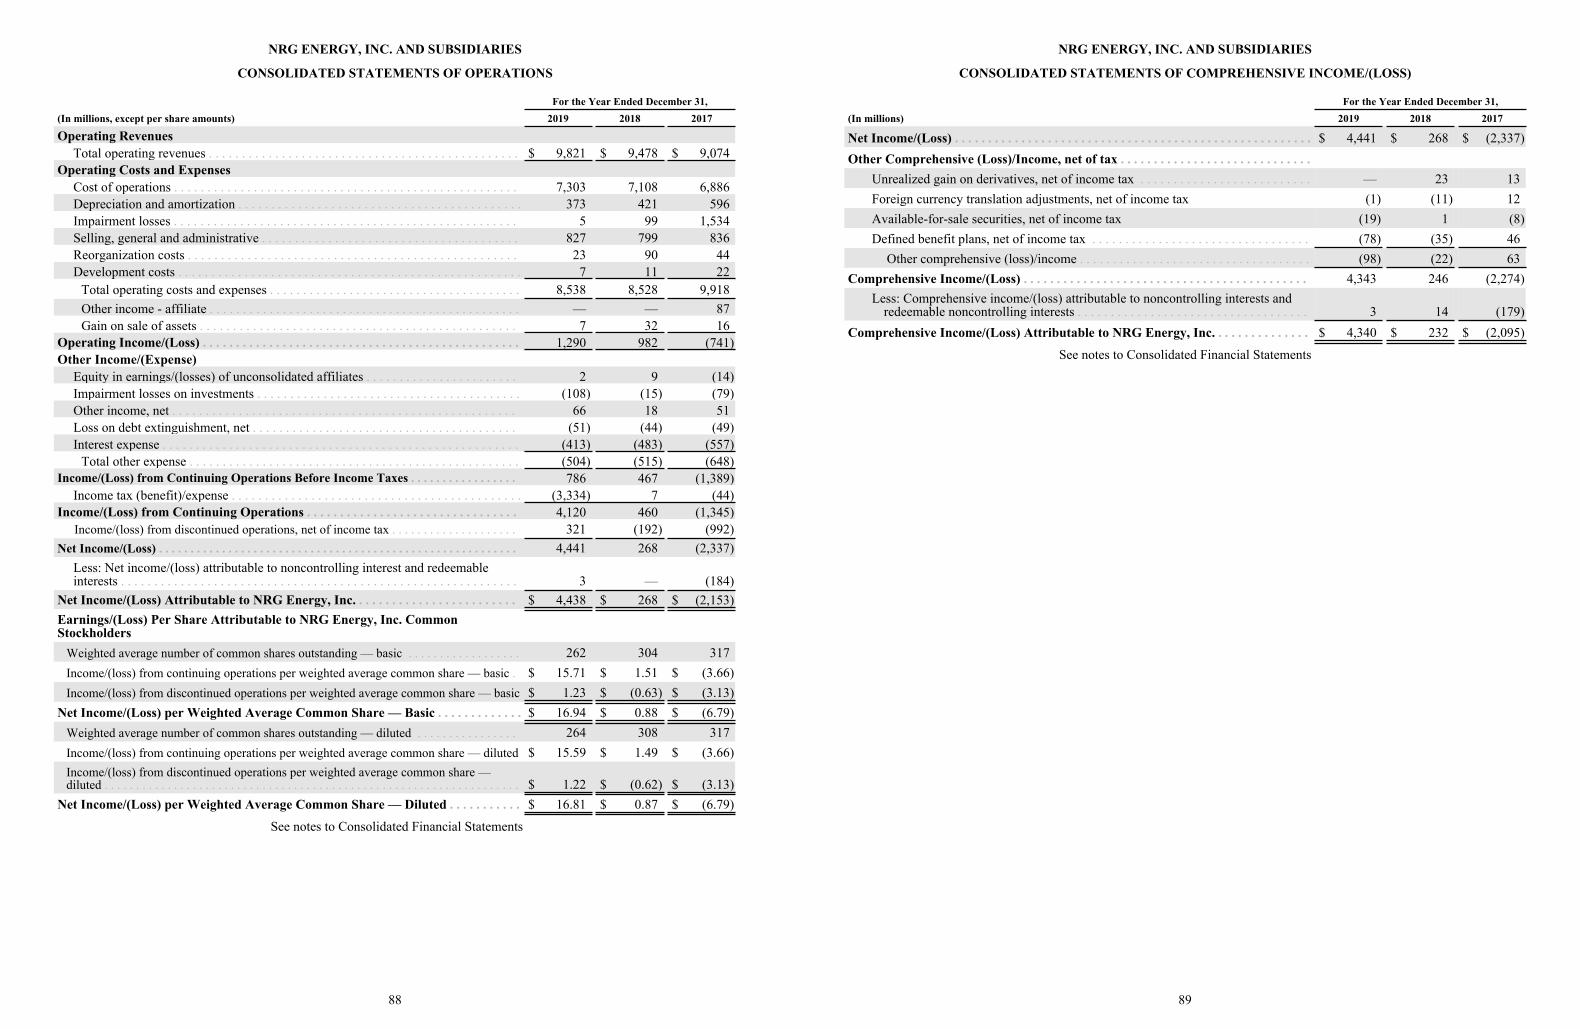
NRG ENERGY, INC. AND SUBSIDIARIES
CONSOLIDATED STATEMENTS OF OPERATIONS
For the Year Ended December 31,(In millions, except per share amounts) 2019 2018 2017
Operating RevenuesTotal operating revenues . . . . . . . . . . . . . . . . . . . . . . . . . . . . . . . . . . . . . . . . . . . . . . . $ 9,821 $ 9,478 $ 9,074
Operating Costs and ExpensesCost of operations . . . . . . . . . . . . . . . . . . . . . . . . . . . . . . . . . . . . . . . . . . . . . . . . . . . . 7,303 7,108 6,886Depreciation and amortization . . . . . . . . . . . . . . . . . . . . . . . . . . . . . . . . . . . . . . . . . . . 373 421 596Impairment losses . . . . . . . . . . . . . . . . . . . . . . . . . . . . . . . . . . . . . . . . . . . . . . . . . . . . 5 99 1,534Selling, general and administrative . . . . . . . . . . . . . . . . . . . . . . . . . . . . . . . . . . . . . . . 827 799 836Reorganization costs . . . . . . . . . . . . . . . . . . . . . . . . . . . . . . . . . . . . . . . . . . . . . . . . . . 23 90 44Development costs . . . . . . . . . . . . . . . . . . . . . . . . . . . . . . . . . . . . . . . . . . . . . . . . . . . . 7 11 22
Total operating costs and expenses . . . . . . . . . . . . . . . . . . . . . . . . . . . . . . . . . . . . . . 8,538 8,528 9,918Other income - affiliate . . . . . . . . . . . . . . . . . . . . . . . . . . . . . . . . . . . . . . . . . . . . . . . — — 87Gain on sale of assets . . . . . . . . . . . . . . . . . . . . . . . . . . . . . . . . . . . . . . . . . . . . . . . . 7 32 16
Operating Income/(Loss) . . . . . . . . . . . . . . . . . . . . . . . . . . . . . . . . . . . . . . . . . . . . . . . . 1,290 982 (741)Other Income/(Expense)
Equity in earnings/(losses) of unconsolidated affiliates . . . . . . . . . . . . . . . . . . . . . . . 2 9 (14)Impairment losses on investments . . . . . . . . . . . . . . . . . . . . . . . . . . . . . . . . . . . . . . . . (108) (15) (79)Other income, net . . . . . . . . . . . . . . . . . . . . . . . . . . . . . . . . . . . . . . . . . . . . . . . . . . . . 66 18 51Loss on debt extinguishment, net . . . . . . . . . . . . . . . . . . . . . . . . . . . . . . . . . . . . . . . . (51) (44) (49)Interest expense . . . . . . . . . . . . . . . . . . . . . . . . . . . . . . . . . . . . . . . . . . . . . . . . . . . . . . (413) (483) (557)
Total other expense . . . . . . . . . . . . . . . . . . . . . . . . . . . . . . . . . . . . . . . . . . . . . . . . . . (504) (515) (648)Income/(Loss) from Continuing Operations Before Income Taxes . . . . . . . . . . . . . . . . . 786 467 (1,389)
Income tax (benefit)/expense . . . . . . . . . . . . . . . . . . . . . . . . . . . . . . . . . . . . . . . . . . . . (3,334) 7 (44)Income/(Loss) from Continuing Operations . . . . . . . . . . . . . . . . . . . . . . . . . . . . . . . . 4,120 460 (1,345)
Income/(loss) from discontinued operations, net of income tax . . . . . . . . . . . . . . . . . . . . 321 (192) (992)Net Income/(Loss) . . . . . . . . . . . . . . . . . . . . . . . . . . . . . . . . . . . . . . . . . . . . . . . . . . . . . . . . . 4,441 268 (2,337)
Less: Net income/(loss) attributable to noncontrolling interest and redeemable interests . . . . . . . . . . . . . . . . . . . . . . . . . . . . . . . . . . . . . . . . . . . . . . . . . . . . . . . . . . . . 3 — (184)
Net Income/(Loss) Attributable to NRG Energy, Inc. . . . . . . . . . . . . . . . . . . . . . . . . $ 4,438 $ 268 $ (2,153)Earnings/(Loss) Per Share Attributable to NRG Energy, Inc. Common Stockholders
Weighted average number of common shares outstanding — basic . . . . . . . . . . . . . . . . . . 262 304 317Income/(loss) from continuing operations per weighted average common share — basic . $ 15.71 $ 1.51 $ (3.66)Income/(loss) from discontinued operations per weighted average common share — basic $ 1.23 $ (0.63) $ (3.13)
Net Income/(Loss) per Weighted Average Common Share — Basic . . . . . . . . . . . . . $ 16.94 $ 0.88 $ (6.79)Weighted average number of common shares outstanding — diluted . . . . . . . . . . . . . . . . 264 308 317Income/(loss) from continuing operations per weighted average common share — diluted $ 15.59 $ 1.49 $ (3.66)Income/(loss) from discontinued operations per weighted average common share — diluted . . . . . . . . . . . . . . . . . . . . . . . . . . . . . . . . . . . . . . . . . . . . . . . . . . . . . . . . . . . . . . . . . . $ 1.22 $ (0.62) $ (3.13)
Net Income/(Loss) per Weighted Average Common Share — Diluted . . . . . . . . . . . $ 16.81 $ 0.87 $ (6.79)
(741)
(413) (483) (557)(504) (515) (648)
(3,334) (44)
See notes to Consolidated Financial Statements
88
NRG ENERGY, INC. AND SUBSIDIARIES
CONSOLIDATED STATEMENTS OF COMPREHENSIVE INCOME/(LOSS)
For the Year Ended December 31,(In millions) 2019 2018 2017
Net Income/(Loss) . . . . . . . . . . . . . . . . . . . . . . . . . . . . . . . . . . . . . . . . . . . . . . . . . . . . . . $ 4,441 $ 268 $ (2,337)Other Comprehensive (Loss)/Income, net of tax . . . . . . . . . . . . . . . . . . . . . . . . . . . . .
Unrealized gain on derivatives, net of income tax . . . . . . . . . . . . . . . . . . . . . . . . . . — 23 13Foreign currency translation adjustments, net of income tax (1) (11) 12Available-for-sale securities, net of income tax (19) 1 (8)Defined benefit plans, net of income tax . . . . . . . . . . . . . . . . . . . . . . . . . . . . . . . . . (78) (35) 46
Other comprehensive (loss)/income . . . . . . . . . . . . . . . . . . . . . . . . . . . . . . . . . . . (98) (22) 63Comprehensive Income/(Loss) . . . . . . . . . . . . . . . . . . . . . . . . . . . . . . . . . . . . . . . . . . . 4,343 246 (2,274)
Less: Comprehensive income/(loss) attributable to noncontrolling interests and redeemable noncontrolling interests . . . . . . . . . . . . . . . . . . . . . . . . . . . . . . . . . . . 3 14 (179)
Comprehensive Income/(Loss) Attributable to NRG Energy, Inc. . . . . . . . . . . . . . . $ 4,340 $ 232 $ (2,095)
See notes to Consolidated Financial Statements
89
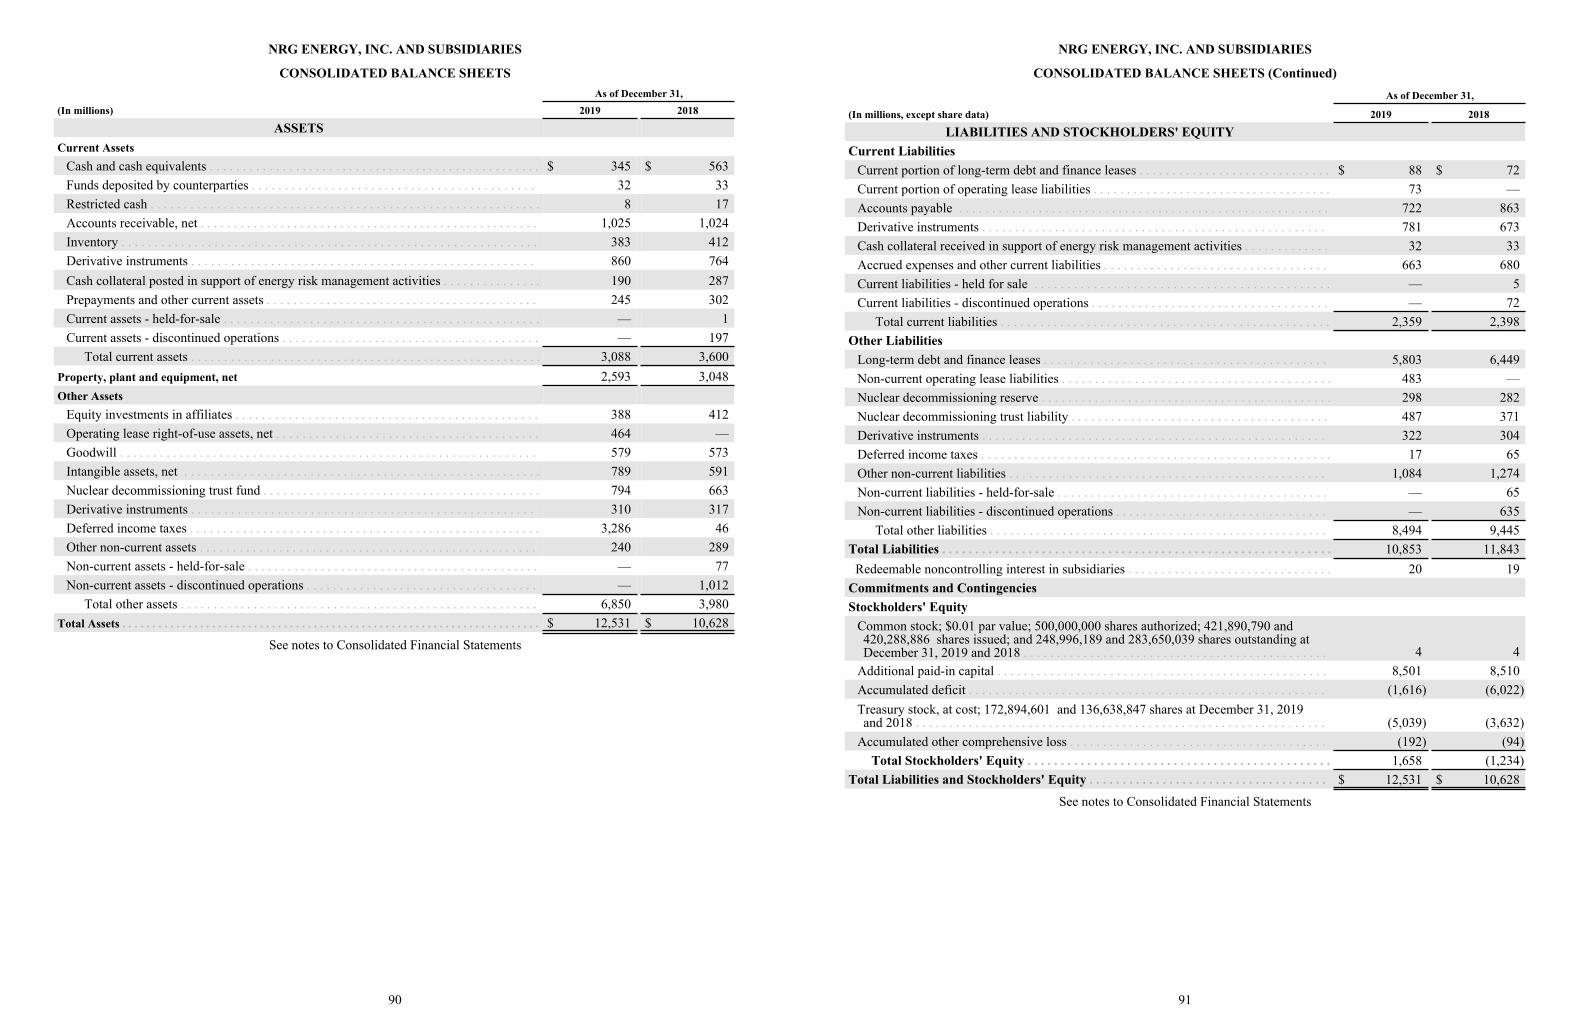
NRG ENERGY, INC. AND SUBSIDIARIES
CONSOLIDATED BALANCE SHEETSAs of December 31,
(In millions) 2019 2018
ASSETSCurrent Assets
Cash and cash equivalents . . . . . . . . . . . . . . . . . . . . . . . . . . . . . . . . . . . . . . . . . . . . . . . . . . $ 345 $ 563Funds deposited by counterparties . . . . . . . . . . . . . . . . . . . . . . . . . . . . . . . . . . . . . . . . . . . 32 33Restricted cash . . . . . . . . . . . . . . . . . . . . . . . . . . . . . . . . . . . . . . . . . . . . . . . . . . . . . . . . . . . 8 17Accounts receivable, net . . . . . . . . . . . . . . . . . . . . . . . . . . . . . . . . . . . . . . . . . . . . . . . . . . . 1,025 1,024Inventory . . . . . . . . . . . . . . . . . . . . . . . . . . . . . . . . . . . . . . . . . . . . . . . . . . . . . . . . . . . . . . . 383 412Derivative instruments . . . . . . . . . . . . . . . . . . . . . . . . . . . . . . . . . . . . . . . . . . . . . . . . . . . . 860 764Cash collateral posted in support of energy risk management activities . . . . . . . . . . . . . . . 190 287Prepayments and other current assets . . . . . . . . . . . . . . . . . . . . . . . . . . . . . . . . . . . . . . . . . 245 302Current assets - held-for-sale . . . . . . . . . . . . . . . . . . . . . . . . . . . . . . . . . . . . . . . . . . . . . . . . — 1Current assets - discontinued operations . . . . . . . . . . . . . . . . . . . . . . . . . . . . . . . . . . . . . . . — 197
Total current assets . . . . . . . . . . . . . . . . . . . . . . . . . . . . . . . . . . . . . . . . . . . . . . . . . . . . . 3,088 3,600Property, plant and equipment, net 2,593 3,048Other Assets
Equity investments in affiliates . . . . . . . . . . . . . . . . . . . . . . . . . . . . . . . . . . . . . . . . . . . . . . 388 412Operating lease right-of-use assets, net . . . . . . . . . . . . . . . . . . . . . . . . . . . . . . . . . . . . . . . . 464 —Goodwill . . . . . . . . . . . . . . . . . . . . . . . . . . . . . . . . . . . . . . . . . . . . . . . . . . . . . . . . . . . . . . . 579 573Intangible assets, net . . . . . . . . . . . . . . . . . . . . . . . . . . . . . . . . . . . . . . . . . . . . . . . . . . . . . . 789 591Nuclear decommissioning trust fund . . . . . . . . . . . . . . . . . . . . . . . . . . . . . . . . . . . . . . . . . . 794 663Derivative instruments . . . . . . . . . . . . . . . . . . . . . . . . . . . . . . . . . . . . . . . . . . . . . . . . . . . . 310 317Deferred income taxes . . . . . . . . . . . . . . . . . . . . . . . . . . . . . . . . . . . . . . . . . . . . . . . . . . . . . 3,286 46Other non-current assets . . . . . . . . . . . . . . . . . . . . . . . . . . . . . . . . . . . . . . . . . . . . . . . . . . . 240 289Non-current assets - held-for-sale . . . . . . . . . . . . . . . . . . . . . . . . . . . . . . . . . . . . . . . . . . . . — 77Non-current assets - discontinued operations . . . . . . . . . . . . . . . . . . . . . . . . . . . . . . . . . . . — 1,012
Total other assets . . . . . . . . . . . . . . . . . . . . . . . . . . . . . . . . . . . . . . . . . . . . . . . . . . . . . . 6,850 3,980Total Assets . . . . . . . . . . . . . . . . . . . . . . . . . . . . . . . . . . . . . . . . . . . . . . . . . . . . . . . . . . . . . . . . . . . . . . $ 12,531 $ 10,628
See notes to Consolidated Financial Statements
90
NRG ENERGY, INC. AND SUBSIDIARIES
CONSOLIDATED BALANCE SHEETS (Continued)As of December 31,
(In millions, except share data) 2019 2018
LIABILITIES AND STOCKHOLDERS' EQUITYCurrent Liabilities
Current portion of long-term debt and finance leases . . . . . . . . . . . . . . . . . . . . . . . . . . . . . $ 88 $ 72Current portion of operating lease liabilities . . . . . . . . . . . . . . . . . . . . . . . . . . . . . . . . . . . . 73 —Accounts payable . . . . . . . . . . . . . . . . . . . . . . . . . . . . . . . . . . . . . . . . . . . . . . . . . . . . . . . . 722 863Derivative instruments . . . . . . . . . . . . . . . . . . . . . . . . . . . . . . . . . . . . . . . . . . . . . . . . . . . . 781 673Cash collateral received in support of energy risk management activities . . . . . . . . . . . . . 32 33Accrued expenses and other current liabilities . . . . . . . . . . . . . . . . . . . . . . . . . . . . . . . . . . 663 680Current liabilities - held for sale . . . . . . . . . . . . . . . . . . . . . . . . . . . . . . . . . . . . . . . . . . . . . — 5Current liabilities - discontinued operations . . . . . . . . . . . . . . . . . . . . . . . . . . . . . . . . . . . . — 72
Total current liabilities . . . . . . . . . . . . . . . . . . . . . . . . . . . . . . . . . . . . . . . . . . . . . . . . . . 2,359 2,398Other Liabilities
Long-term debt and finance leases . . . . . . . . . . . . . . . . . . . . . . . . . . . . . . . . . . . . . . . . . . . 5,803 6,449Non-current operating lease liabilities . . . . . . . . . . . . . . . . . . . . . . . . . . . . . . . . . . . . . . . . . 483 —Nuclear decommissioning reserve . . . . . . . . . . . . . . . . . . . . . . . . . . . . . . . . . . . . . . . . . . . . 298 282Nuclear decommissioning trust liability . . . . . . . . . . . . . . . . . . . . . . . . . . . . . . . . . . . . . . . 487 371Derivative instruments . . . . . . . . . . . . . . . . . . . . . . . . . . . . . . . . . . . . . . . . . . . . . . . . . . . . 322 304Deferred income taxes . . . . . . . . . . . . . . . . . . . . . . . . . . . . . . . . . . . . . . . . . . . . . . . . . . . . . 17 65Other non-current liabilities . . . . . . . . . . . . . . . . . . . . . . . . . . . . . . . . . . . . . . . . . . . . . . . . 1,084 1,274Non-current liabilities - held-for-sale . . . . . . . . . . . . . . . . . . . . . . . . . . . . . . . . . . . . . . . . . — 65Non-current liabilities - discontinued operations . . . . . . . . . . . . . . . . . . . . . . . . . . . . . . . . — 635
Total other liabilities . . . . . . . . . . . . . . . . . . . . . . . . . . . . . . . . . . . . . . . . . . . . . . . . . . . 8,494 9,445Total Liabilities . . . . . . . . . . . . . . . . . . . . . . . . . . . . . . . . . . . . . . . . . . . . . . . . . . . . . . . . . . . 10,853 11,843
Redeemable noncontrolling interest in subsidiaries . . . . . . . . . . . . . . . . . . . . . . . . . . . . . . . 20 19Commitments and ContingenciesStockholders' Equity
Common stock; $0.01 par value; 500,000,000 shares authorized; 421,890,790 and 420,288,886 shares issued; and 248,996,189 and 283,650,039 shares outstanding at December 31, 2019 and 2018 . . . . . . . . . . . . . . . . . . . . . . . . . . . . . . . . . . . . . . . . . . . . . . 4 4
Additional paid-in capital . . . . . . . . . . . . . . . . . . . . . . . . . . . . . . . . . . . . . . . . . . . . . . . . . . 8,501 8,510Accumulated deficit . . . . . . . . . . . . . . . . . . . . . . . . . . . . . . . . . . . . . . . . . . . . . . . . . . . . . . (1,616) (6,022)Treasury stock, at cost; 172,894,601 and 136,638,847 shares at December 31, 2019 and 2018 . . . . . . . . . . . . . . . . . . . . . . . . . . . . . . . . . . . . . . . . . . . . . . . . . . . . . . . . . . . . . . (5,039) (3,632)
Accumulated other comprehensive loss . . . . . . . . . . . . . . . . . . . . . . . . . . . . . . . . . . . . . . . (192) (94)Total Stockholders' Equity . . . . . . . . . . . . . . . . . . . . . . . . . . . . . . . . . . . . . . . . . . . . . . 1,658 (1,234)
Total Liabilities and Stockholders' Equity . . . . . . . . . . . . . . . . . . . . . . . . . . . . . . . . . . . . $ 12,531 $ 10,628
See notes to Consolidated Financial Statements
91
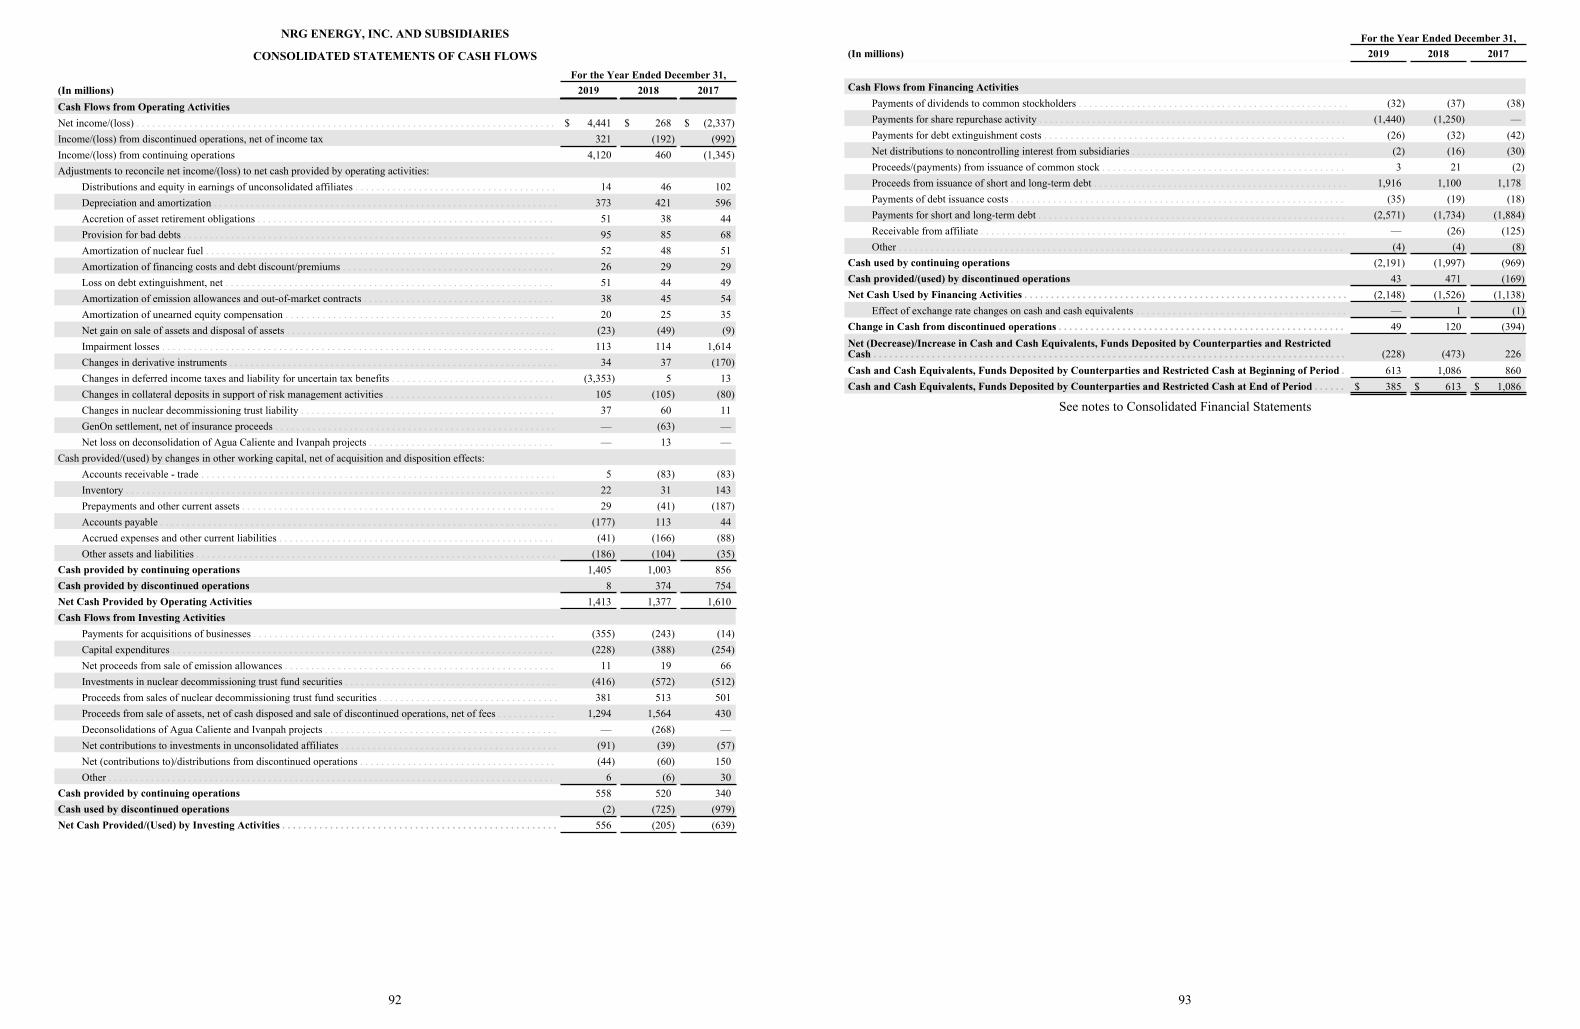
NRG ENERGY, INC. AND SUBSIDIARIES
CONSOLIDATED STATEMENTS OF CASH FLOWSFor the Year Ended December 31,
(In millions) 2019 2018 2017Cash Flows from Operating ActivitiesNet income/(loss) . . . . . . . . . . . . . . . . . . . . . . . . . . . . . . . . . . . . . . . . . . . . . . . . . . . . . . . . . . . . . . . . . . . . . . . . . . . . . . . $ 4,441 $ 268 $ (2,337)Income/(loss) from discontinued operations, net of income tax 321 (192) (992)Income/(loss) from continuing operations 4,120 460 (1,345)Adjustments to reconcile net income/(loss) to net cash provided by operating activities:
Distributions and equity in earnings of unconsolidated affiliates . . . . . . . . . . . . . . . . . . . . . . . . . . . . . . . . . . . . . . 14 46 102Depreciation and amortization . . . . . . . . . . . . . . . . . . . . . . . . . . . . . . . . . . . . . . . . . . . . . . . . . . . . . . . . . . . . . . . . . 373 421 596Accretion of asset retirement obligations . . . . . . . . . . . . . . . . . . . . . . . . . . . . . . . . . . . . . . . . . . . . . . . . . . . . . . . . 51 38 44Provision for bad debts . . . . . . . . . . . . . . . . . . . . . . . . . . . . . . . . . . . . . . . . . . . . . . . . . . . . . . . . . . . . . . . . . . . . . . 95 85 68Amortization of nuclear fuel . . . . . . . . . . . . . . . . . . . . . . . . . . . . . . . . . . . . . . . . . . . . . . . . . . . . . . . . . . . . . . . . . . 52 48 51Amortization of financing costs and debt discount/premiums . . . . . . . . . . . . . . . . . . . . . . . . . . . . . . . . . . . . . . . . 26 29 29Loss on debt extinguishment, net . . . . . . . . . . . . . . . . . . . . . . . . . . . . . . . . . . . . . . . . . . . . . . . . . . . . . . . . . . . . . . 51 44 49Amortization of emission allowances and out-of-market contracts . . . . . . . . . . . . . . . . . . . . . . . . . . . . . . . . . . . . 38 45 54Amortization of unearned equity compensation . . . . . . . . . . . . . . . . . . . . . . . . . . . . . . . . . . . . . . . . . . . . . . . . . . . 20 25 35Net gain on sale of assets and disposal of assets . . . . . . . . . . . . . . . . . . . . . . . . . . . . . . . . . . . . . . . . . . . . . . . . . . . (23) (49) (9)Impairment losses . . . . . . . . . . . . . . . . . . . . . . . . . . . . . . . . . . . . . . . . . . . . . . . . . . . . . . . . . . . . . . . . . . . . . . . . . . 113 114 1,614Changes in derivative instruments . . . . . . . . . . . . . . . . . . . . . . . . . . . . . . . . . . . . . . . . . . . . . . . . . . . . . . . . . . . . . . 34 37 (170)Changes in deferred income taxes and liability for uncertain tax benefits . . . . . . . . . . . . . . . . . . . . . . . . . . . . . . . (3,353) 5 13Changes in collateral deposits in support of risk management activities . . . . . . . . . . . . . . . . . . . . . . . . . . . . . . . . 105 (105) (80)Changes in nuclear decommissioning trust liability . . . . . . . . . . . . . . . . . . . . . . . . . . . . . . . . . . . . . . . . . . . . . . . . 37 60 11GenOn settlement, net of insurance proceeds . . . . . . . . . . . . . . . . . . . . . . . . . . . . . . . . . . . . . . . . . . . . . . . . . . . . . — (63) —Net loss on deconsolidation of Agua Caliente and Ivanpah projects . . . . . . . . . . . . . . . . . . . . . . . . . . . . . . . . . . . — 13 —
Cash provided/(used) by changes in other working capital, net of acquisition and disposition effects:Accounts receivable - trade . . . . . . . . . . . . . . . . . . . . . . . . . . . . . . . . . . . . . . . . . . . . . . . . . . . . . . . . . . . . . . . . . . . 5 (83) (83)Inventory . . . . . . . . . . . . . . . . . . . . . . . . . . . . . . . . . . . . . . . . . . . . . . . . . . . . . . . . . . . . . . . . . . . . . . . . . . . . . . . . . 22 31 143Prepayments and other current assets . . . . . . . . . . . . . . . . . . . . . . . . . . . . . . . . . . . . . . . . . . . . . . . . . . . . . . . . . . . 29 (41) (187)Accounts payable . . . . . . . . . . . . . . . . . . . . . . . . . . . . . . . . . . . . . . . . . . . . . . . . . . . . . . . . . . . . . . . . . . . . . . . . . . . (177) 113 44Accrued expenses and other current liabilities . . . . . . . . . . . . . . . . . . . . . . . . . . . . . . . . . . . . . . . . . . . . . . . . . . . . (41) (166) (88)Other assets and liabilities . . . . . . . . . . . . . . . . . . . . . . . . . . . . . . . . . . . . . . . . . . . . . . . . . . . . . . . . . . . . . . . . . . . . (186) (104) (35)
Cash provided by continuing operations 1,405 1,003 856Cash provided by discontinued operations 8 374 754Net Cash Provided by Operating Activities 1,413 1,377 1,610Cash Flows from Investing Activities
Payments for acquisitions of businesses . . . . . . . . . . . . . . . . . . . . . . . . . . . . . . . . . . . . . . . . . . . . . . . . . . . . . . . . . (355) (243) (14)Capital expenditures . . . . . . . . . . . . . . . . . . . . . . . . . . . . . . . . . . . . . . . . . . . . . . . . . . . . . . . . . . . . . . . . . . . . . . . . (228) (388) (254)Net proceeds from sale of emission allowances . . . . . . . . . . . . . . . . . . . . . . . . . . . . . . . . . . . . . . . . . . . . . . . . . . . 11 19 66Investments in nuclear decommissioning trust fund securities . . . . . . . . . . . . . . . . . . . . . . . . . . . . . . . . . . . . . . . . (416) (572) (512)Proceeds from sales of nuclear decommissioning trust fund securities . . . . . . . . . . . . . . . . . . . . . . . . . . . . . . . . . . 381 513 501Proceeds from sale of assets, net of cash disposed and sale of discontinued operations, net of fees . . . . . . . . . . . 1,294 1,564 430Deconsolidations of Agua Caliente and Ivanpah projects . . . . . . . . . . . . . . . . . . . . . . . . . . . . . . . . . . . . . . . . . . . . — (268) —Net contributions to investments in unconsolidated affiliates . . . . . . . . . . . . . . . . . . . . . . . . . . . . . . . . . . . . . . . . . (91) (39) (57)Net (contributions to)/distributions from discontinued operations . . . . . . . . . . . . . . . . . . . . . . . . . . . . . . . . . . . . . (44) (60) 150Other . . . . . . . . . . . . . . . . . . . . . . . . . . . . . . . . . . . . . . . . . . . . . . . . . . . . . . . . . . . . . . . . . . . . . . . . . . . . . . . . . . . . 6 (6) 30
Cash provided by continuing operations 558 520 340Cash used by discontinued operations (2) (725) (979)Net Cash Provided/(Used) by Investing Activities . . . . . . . . . . . . . . . . . . . . . . . . . . . . . . . . . . . . . . . . . . . . . . . . . . . . 556 (205) (639)
92
For the Year Ended December 31,(In millions) 2019 2018 2017
Cash Flows from Financing ActivitiesPayments of dividends to common stockholders . . . . . . . . . . . . . . . . . . . . . . . . . . . . . . . . . . . . . . . . . . . . . . . . . . . (32) (37) (38)Payments for share repurchase activity . . . . . . . . . . . . . . . . . . . . . . . . . . . . . . . . . . . . . . . . . . . . . . . . . . . . . . . . . . (1,440) (1,250) —Payments for debt extinguishment costs . . . . . . . . . . . . . . . . . . . . . . . . . . . . . . . . . . . . . . . . . . . . . . . . . . . . . . . . . (26) (32) (42)Net distributions to noncontrolling interest from subsidiaries . . . . . . . . . . . . . . . . . . . . . . . . . . . . . . . . . . . . . . . . . (2) (16) (30)Proceeds/(payments) from issuance of common stock . . . . . . . . . . . . . . . . . . . . . . . . . . . . . . . . . . . . . . . . . . . . . . 3 21 (2)Proceeds from issuance of short and long-term debt . . . . . . . . . . . . . . . . . . . . . . . . . . . . . . . . . . . . . . . . . . . . . . . . 1,916 1,100 1,178Payments of debt issuance costs . . . . . . . . . . . . . . . . . . . . . . . . . . . . . . . . . . . . . . . . . . . . . . . . . . . . . . . . . . . . . . . (35) (19) (18)Payments for short and long-term debt . . . . . . . . . . . . . . . . . . . . . . . . . . . . . . . . . . . . . . . . . . . . . . . . . . . . . . . . . . (2,571) (1,734) (1,884)Receivable from affiliate . . . . . . . . . . . . . . . . . . . . . . . . . . . . . . . . . . . . . . . . . . . . . . . . . . . . . . . . . . . . . . . . . . . . . — (26) (125)Other . . . . . . . . . . . . . . . . . . . . . . . . . . . . . . . . . . . . . . . . . . . . . . . . . . . . . . . . . . . . . . . . . . . . . . . . . . . . . . . . . . . . (4) (4) (8)
Cash used by continuing operations (2,191) (1,997) (969)Cash provided/(used) by discontinued operations 43 471 (169)Net Cash Used by Financing Activities . . . . . . . . . . . . . . . . . . . . . . . . . . . . . . . . . . . . . . . . . . . . . . . . . . . . . . . . . . . . . (2,148) (1,526) (1,138)
Effect of exchange rate changes on cash and cash equivalents . . . . . . . . . . . . . . . . . . . . . . . . . . . . . . . . . . . . . . . . — 1 (1)Change in Cash from discontinued operations . . . . . . . . . . . . . . . . . . . . . . . . . . . . . . . . . . . . . . . . . . . . . . . . . . . . . . 49 120 (394)Net (Decrease)/Increase in Cash and Cash Equivalents, Funds Deposited by Counterparties and Restricted Cash . . . . . . . . . . . . . . . . . . . . . . . . . . . . . . . . . . . . . . . . . . . . . . . . . . . . . . . . . . . . . . . . . . . . . . . . . . . . . . . . . . . . . . . . . (228) (473) 226Cash and Cash Equivalents, Funds Deposited by Counterparties and Restricted Cash at Beginning of Period . 613 1,086 860Cash and Cash Equivalents, Funds Deposited by Counterparties and Restricted Cash at End of Period . . . . . . $ 385 $ 613 $ 1,086
See notes to Consolidated Financial Statements
93
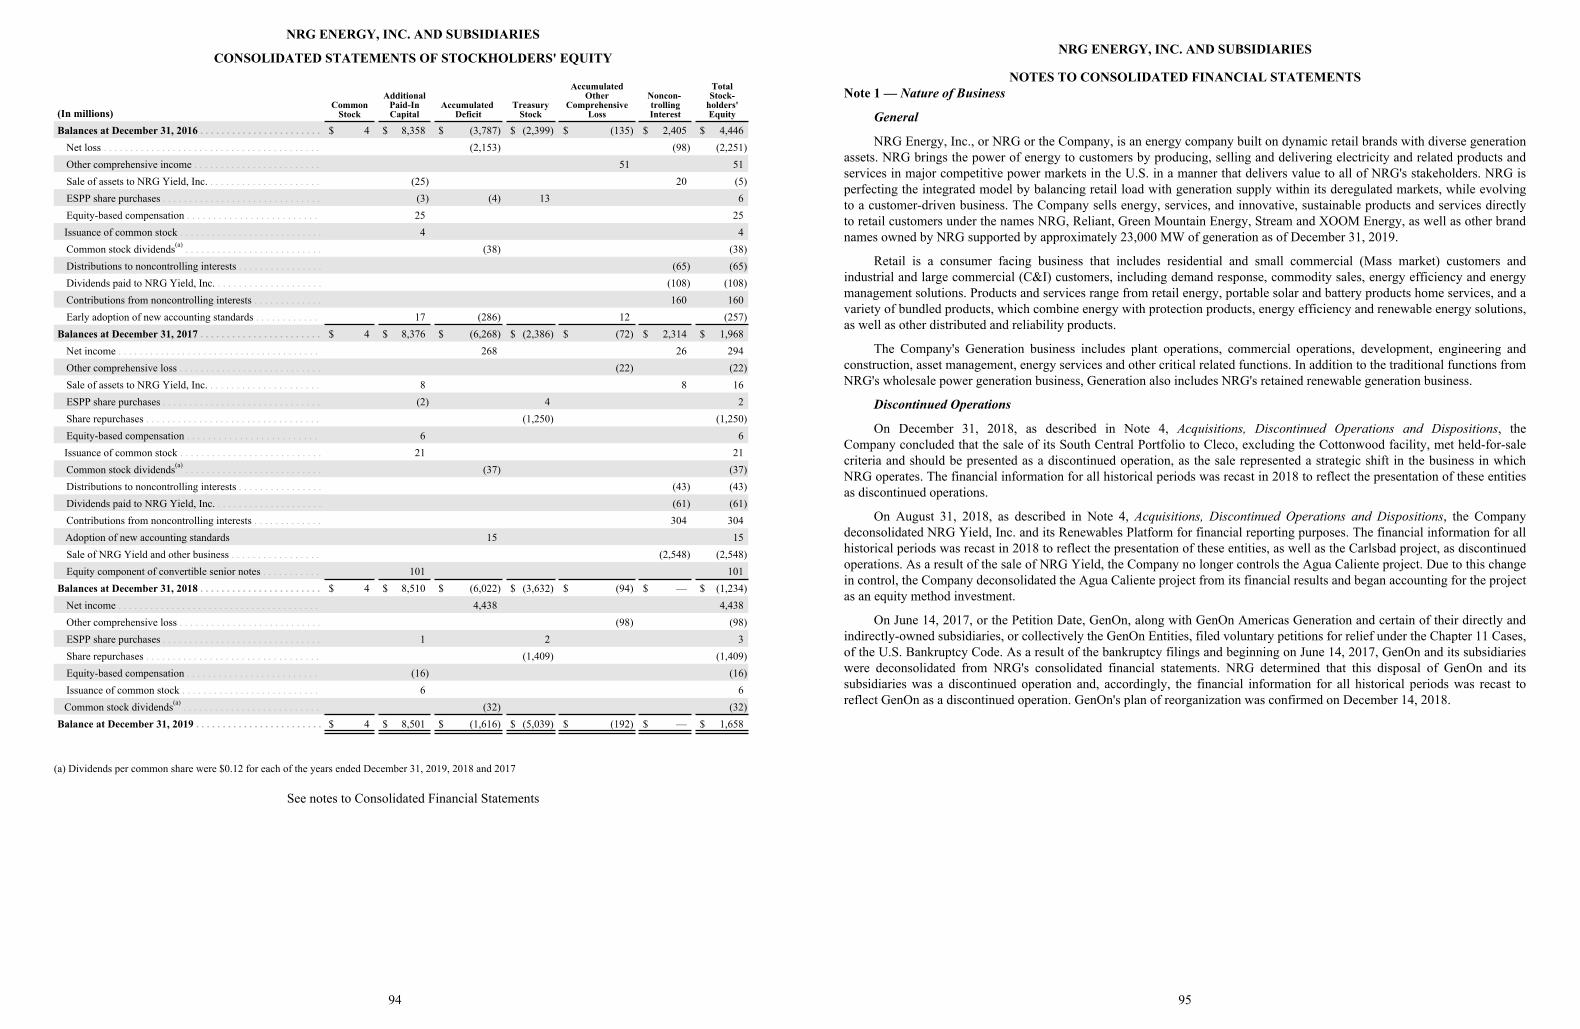
NRG ENERGY, INC. AND SUBSIDIARIES
CONSOLIDATED STATEMENTS OF STOCKHOLDERS' EQUITY
(In millions)Common
Stock
AdditionalPaid-InCapital
Accumulated Deficit
TreasuryStock
AccumulatedOther
ComprehensiveLoss
Noncon- trollingInterest
TotalStock-
holders'Equity
Balances at December 31, 2016 . . . . . . . . . . . . . . . . . . . . . . . $ 4 $ 8,358 $ (3,787) $ (2,399) $ (135) $ 2,405 $ 4,446Net loss . . . . . . . . . . . . . . . . . . . . . . . . . . . . . . . . . . . . . . . . . (2,153) (98) (2,251)Other comprehensive income . . . . . . . . . . . . . . . . . . . . . . . . 51 51Sale of assets to NRG Yield, Inc. . . . . . . . . . . . . . . . . . . . . . (25) 20 (5)ESPP share purchases . . . . . . . . . . . . . . . . . . . . . . . . . . . . . . (3) (4) 13 6Equity-based compensation . . . . . . . . . . . . . . . . . . . . . . . . . 25 25Issuance of common stock . . . . . . . . . . . . . . . . . . . . . . . . . . . 4 4Common stock dividends(a) . . . . . . . . . . . . . . . . . . . . . . . . . . (38) (38)Distributions to noncontrolling interests . . . . . . . . . . . . . . . . (65) (65)Dividends paid to NRG Yield, Inc. . . . . . . . . . . . . . . . . . . . . (108) (108)Contributions from noncontrolling interests . . . . . . . . . . . . . 160 160Early adoption of new accounting standards . . . . . . . . . . . . 17 (286) 12 (257)
Balances at December 31, 2017 . . . . . . . . . . . . . . . . . . . . . . . $ 4 $ 8,376 $ (6,268) $ (2,386) $ (72) $ 2,314 $ 1,968Net income . . . . . . . . . . . . . . . . . . . . . . . . . . . . . . . . . . . . . . 268 26 294Other comprehensive loss . . . . . . . . . . . . . . . . . . . . . . . . . . . (22) (22)Sale of assets to NRG Yield, Inc. . . . . . . . . . . . . . . . . . . . . . 8 8 16ESPP share purchases . . . . . . . . . . . . . . . . . . . . . . . . . . . . . . (2) 4 2Share repurchases . . . . . . . . . . . . . . . . . . . . . . . . . . . . . . . . . (1,250) (1,250)Equity-based compensation . . . . . . . . . . . . . . . . . . . . . . . . . 6 6Issuance of common stock . . . . . . . . . . . . . . . . . . . . . . . . . . . 21 21Common stock dividends(a) . . . . . . . . . . . . . . . . . . . . . . . . . . (37) (37)Distributions to noncontrolling interests . . . . . . . . . . . . . . . . (43) (43)Dividends paid to NRG Yield, Inc. . . . . . . . . . . . . . . . . . . . . (61) (61)Contributions from noncontrolling interests . . . . . . . . . . . . . 304 304
Adoption of new accounting standards 15 15Sale of NRG Yield and other business . . . . . . . . . . . . . . . . . (2,548) (2,548)Equity component of convertible senior notes . . . . . . . . . . . 101 101
Balances at December 31, 2018 . . . . . . . . . . . . . . . . . . . . . . . $ 4 $ 8,510 $ (6,022) $ (3,632) $ (94) $ — $ (1,234)Net income . . . . . . . . . . . . . . . . . . . . . . . . . . . . . . . . . . . . . . 4,438 4,438Other comprehensive loss . . . . . . . . . . . . . . . . . . . . . . . . . . . (98) (98)ESPP share purchases . . . . . . . . . . . . . . . . . . . . . . . . . . . . . . 1 2 3Share repurchases . . . . . . . . . . . . . . . . . . . . . . . . . . . . . . . . . (1,409) (1,409)Equity-based compensation . . . . . . . . . . . . . . . . . . . . . . . . . (16) (16)Issuance of common stock . . . . . . . . . . . . . . . . . . . . . . . . . . 6 6Common stock dividends(a) . . . . . . . . . . . . . . . . . . . . . . . . . . (32) (32)
Balance at December 31, 2019 . . . . . . . . . . . . . . . . . . . . . . . . $ 4 $ 8,501 $ (1,616) $ (5,039) $ (192) $ — $ 1,658
(a) Dividends per common share were $0.12 for each of the years ended December 31, 2019, 2018 and 2017
See notes to Consolidated Financial Statements
94
NRG ENERGY, INC. AND SUBSIDIARIES
NOTES TO CONSOLIDATED FINANCIAL STATEMENTSNote 1 — Nature of Business
General
NRG Energy, Inc., or NRG or the Company, is an energy company built on dynamic retail brands with diverse generationassets. NRG brings the power of energy to customers by producing, selling and delivering electricity and related products andservices in major competitive power markets in the U.S. in a manner that delivers value to all of NRG's stakeholders. NRG isperfecting the integrated model by balancing retail load with generation supply within its deregulated markets, while evolvingto a customer-driven business. The Company sells energy, services, and innovative, sustainable products and services directlyto retail customers under the names NRG, Reliant, Green Mountain Energy, Stream and XOOM Energy, as well as other brandnames owned by NRG supported by approximately 23,000 MW of generation as of December 31, 2019.
Retail is a consumer facing business that includes residential and small commercial (Mass market) customers andindustrial and large commercial (C&I) customers, including demand response, commodity sales, energy efficiency and energymanagement solutions. Products and services range from retail energy, portable solar and battery products home services, and avariety of bundled products, which combine energy with protection products, energy efficiency and renewable energy solutions,as well as other distributed and reliability products.
The Company's Generation business includes plant operations, commercial operations, development, engineering andconstruction, asset management, energy services and other critical related functions. In addition to the traditional functions fromNRG's wholesale power generation business, Generation also includes NRG's retained renewable generation business.
Discontinued Operations
On December 31, 2018, as described in Note 4, Acquisitions, Discontinued Operations and Dispositions, theCompany concluded that the sale of its South Central Portfolio to Cleco, excluding the Cottonwood facility, met held-for-salecriteria and should be presented as a discontinued operation, as the sale represented a strategic shift in the business in whichNRG operates. The financial information for all historical periods was recast in 2018 to reflect the presentation of these entitiesas discontinued operations.
On August 31, 2018, as described in Note 4, Acquisitions, Discontinued Operations and Dispositions, the Companydeconsolidated NRG Yield, Inc. and its Renewables Platform for financial reporting purposes. The financial information for allhistorical periods was recast in 2018 to reflect the presentation of these entities, as well as the Carlsbad project, as discontinuedoperations. As a result of the sale of NRG Yield, the Company no longer controls the Agua Caliente project. Due to this changein control, the Company deconsolidated the Agua Caliente project from its financial results and began accounting for the projectas an equity method investment.
On June 14, 2017, or the Petition Date, GenOn, along with GenOn Americas Generation and certain of their directly andindirectly-owned subsidiaries, or collectively the GenOn Entities, filed voluntary petitions for relief under the Chapter 11 Cases,of the U.S. Bankruptcy Code. As a result of the bankruptcy filings and beginning on June 14, 2017, GenOn and its subsidiarieswere deconsolidated from NRG's consolidated financial statements. NRG determined that this disposal of GenOn and itssubsidiaries was a discontinued operation and, accordingly, the financial information for all historical periods was recast toreflect GenOn as a discontinued operation. GenOn's plan of reorganization was confirmed on December 14, 2018.
95
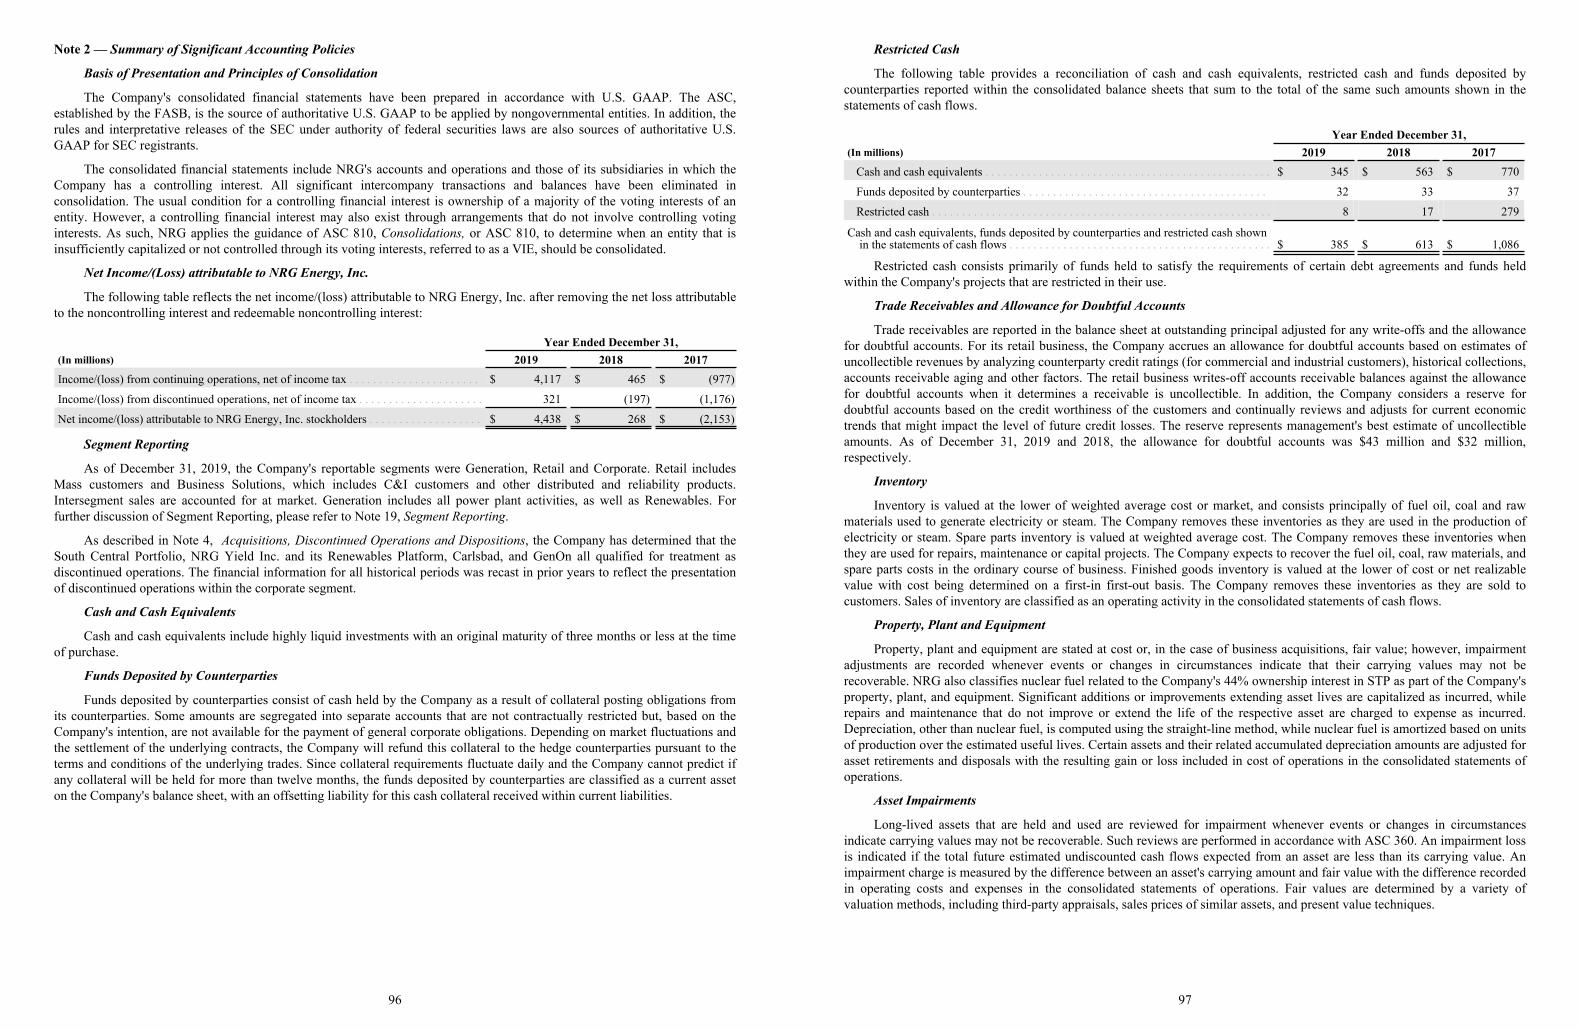
Note 2 — Summary of Significant Accounting Policies
Basis of Presentation and Principles of Consolidation
The Company's consolidated financial statements have been prepared in accordance with U.S. GAAP. The ASC,established by the FASB, is the source of authoritative U.S. GAAP to be applied by nongovernmental entities. In addition, therules and interpretative releases of the SEC under authority of federal securities laws are also sources of authoritative U.S.GAAP for SEC registrants.
The consolidated financial statements include NRG's accounts and operations and those of its subsidiaries in which theCompany has a controlling interest. All significant intercompany transactions and balances have been eliminated inconsolidation. The usual condition for a controlling financial interest is ownership of a majority of the voting interests of anentity. However, a controlling financial interest may also exist through arrangements that do not involve controlling votinginterests. As such, NRG applies the guidance of ASC 810, Consolidations, or ASC 810, to determine when an entity that isinsufficiently capitalized or not controlled through its voting interests, referred to as a VIE, should be consolidated.
Net Income/(Loss) attributable to NRG Energy, Inc.
The following table reflects the net income/(loss) attributable to NRG Energy, Inc. after removing the net loss attributableto the noncontrolling interest and redeemable noncontrolling interest:
Year Ended December 31,(In millions) 2019 2018 2017Income/(loss) from continuing operations, net of income tax . . . . . . . . . . . . . . . . . . . . . . $ 4,117 $ 465 $ (977)
Income/(loss) from discontinued operations, net of income tax . . . . . . . . . . . . . . . . . . . . . 321 (197) (1,176)
Net income/(loss) attributable to NRG Energy, Inc. stockholders . . . . . . . . . . . . . . . . . . . $ 4,438 $ 268 $ (2,153)
Segment Reporting
As of December 31, 2019, the Company's reportable segments were Generation, Retail and Corporate. Retail includesMass customers and Business Solutions, which includes C&I customers and other distributed and reliability products.Intersegment sales are accounted for at market. Generation includes all power plant activities, as well as Renewables. Forfurther discussion of Segment Reporting, please refer to Note 19, Segment Reporting.
As described in Note 4, Acquisitions, Discontinued Operations and Dispositions, the Company has determined that theSouth Central Portfolio, NRG Yield Inc. and its Renewables Platform, Carlsbad, and GenOn all qualified for treatment asdiscontinued operations. The financial information for all historical periods was recast in prior years to reflect the presentationof discontinued operations within the corporate segment.
Cash and Cash Equivalents
Cash and cash equivalents include highly liquid investments with an original maturity of three months or less at the timeof purchase.
Funds Deposited by Counterparties
Funds deposited by counterparties consist of cash held by the Company as a result of collateral posting obligations fromits counterparties. Some amounts are segregated into separate accounts that are not contractually restricted but, based on theCompany's intention, are not available for the payment of general corporate obligations. Depending on market fluctuations andthe settlement of the underlying contracts, the Company will refund this collateral to the hedge counterparties pursuant to theterms and conditions of the underlying trades. Since collateral requirements fluctuate daily and the Company cannot predict ifany collateral will be held for more than twelve months, the funds deposited by counterparties are classified as a current asseton the Company's balance sheet, with an offsetting liability for this cash collateral received within current liabilities.
96
Restricted Cash
The following table provides a reconciliation of cash and cash equivalents, restricted cash and funds deposited bycounterparties reported within the consolidated balance sheets that sum to the total of the same such amounts shown in thestatements of cash flows.
Year Ended December 31,(In millions) 2019 2018 2017
Cash and cash equivalents . . . . . . . . . . . . . . . . . . . . . . . . . . . . . . . . . . . . . . . . . . . . . . . . $ 345 $ 563 $ 770
Funds deposited by counterparties . . . . . . . . . . . . . . . . . . . . . . . . . . . . . . . . . . . . . . . . . 32 33 37
Restricted cash . . . . . . . . . . . . . . . . . . . . . . . . . . . . . . . . . . . . . . . . . . . . . . . . . . . . . . . . . 8 17 279
Cash and cash equivalents, funds deposited by counterparties and restricted cash shown in the statements of cash flows . . . . . . . . . . . . . . . . . . . . . . . . . . . . . . . . . . . . . . . . . . . . $ 385 $ 613 $ 1,086
Restricted cash consists primarily of funds held to satisfy the requirements of certain debt agreements and funds heldwithin the Company's projects that are restricted in their use.
Trade Receivables and Allowance for Doubtful Accounts
Trade receivables are reported in the balance sheet at outstanding principal adjusted for any write-offs and the allowancefor doubtful accounts. For its retail business, the Company accrues an allowance for doubtful accounts based on estimates ofuncollectible revenues by analyzing counterparty credit ratings (for commercial and industrial customers), historical collections,accounts receivable aging and other factors. The retail business writes-off accounts receivable balances against the allowancefor doubtful accounts when it determines a receivable is uncollectible. In addition, the Company considers a reserve fordoubtful accounts based on the credit worthiness of the customers and continually reviews and adjusts for current economictrends that might impact the level of future credit losses. The reserve represents management's best estimate of uncollectibleamounts. As of December 31, 2019 and 2018, the allowance for doubtful accounts was $43 million and $32 million,respectively.
Inventory
Inventory is valued at the lower of weighted average cost or market, and consists principally of fuel oil, coal and rawmaterials used to generate electricity or steam. The Company removes these inventories as they are used in the production ofelectricity or steam. Spare parts inventory is valued at weighted average cost. The Company removes these inventories whenthey are used for repairs, maintenance or capital projects. The Company expects to recover the fuel oil, coal, raw materials, andspare parts costs in the ordinary course of business. Finished goods inventory is valued at the lower of cost or net realizablevalue with cost being determined on a first-in first-out basis. The Company removes these inventories as they are sold tocustomers. Sales of inventory are classified as an operating activity in the consolidated statements of cash flows.
Property, Plant and Equipment
Property, plant and equipment are stated at cost or, in the case of business acquisitions, fair value; however, impairmentadjustments are recorded whenever events or changes in circumstances indicate that their carrying values may not berecoverable. NRG also classifies nuclear fuel related to the Company's 44% ownership interest in STP as part of the Company'sproperty, plant, and equipment. Significant additions or improvements extending asset lives are capitalized as incurred, whilerepairs and maintenance that do not improve or extend the life of the respective asset are charged to expense as incurred.Depreciation, other than nuclear fuel, is computed using the straight-line method, while nuclear fuel is amortized based on unitsof production over the estimated useful lives. Certain assets and their related accumulated depreciation amounts are adjusted forasset retirements and disposals with the resulting gain or loss included in cost of operations in the consolidated statements ofoperations.
Asset Impairments
Long-lived assets that are held and used are reviewed for impairment whenever events or changes in circumstancesindicate carrying values may not be recoverable. Such reviews are performed in accordance with ASC 360. An impairment lossis indicated if the total future estimated undiscounted cash flows expected from an asset are less than its carrying value. Animpairment charge is measured by the difference between an asset's carrying amount and fair value with the difference recordedin operating costs and expenses in the consolidated statements of operations. Fair values are determined by a variety ofvaluation methods, including third-party appraisals, sales prices of similar assets, and present value techniques.
97
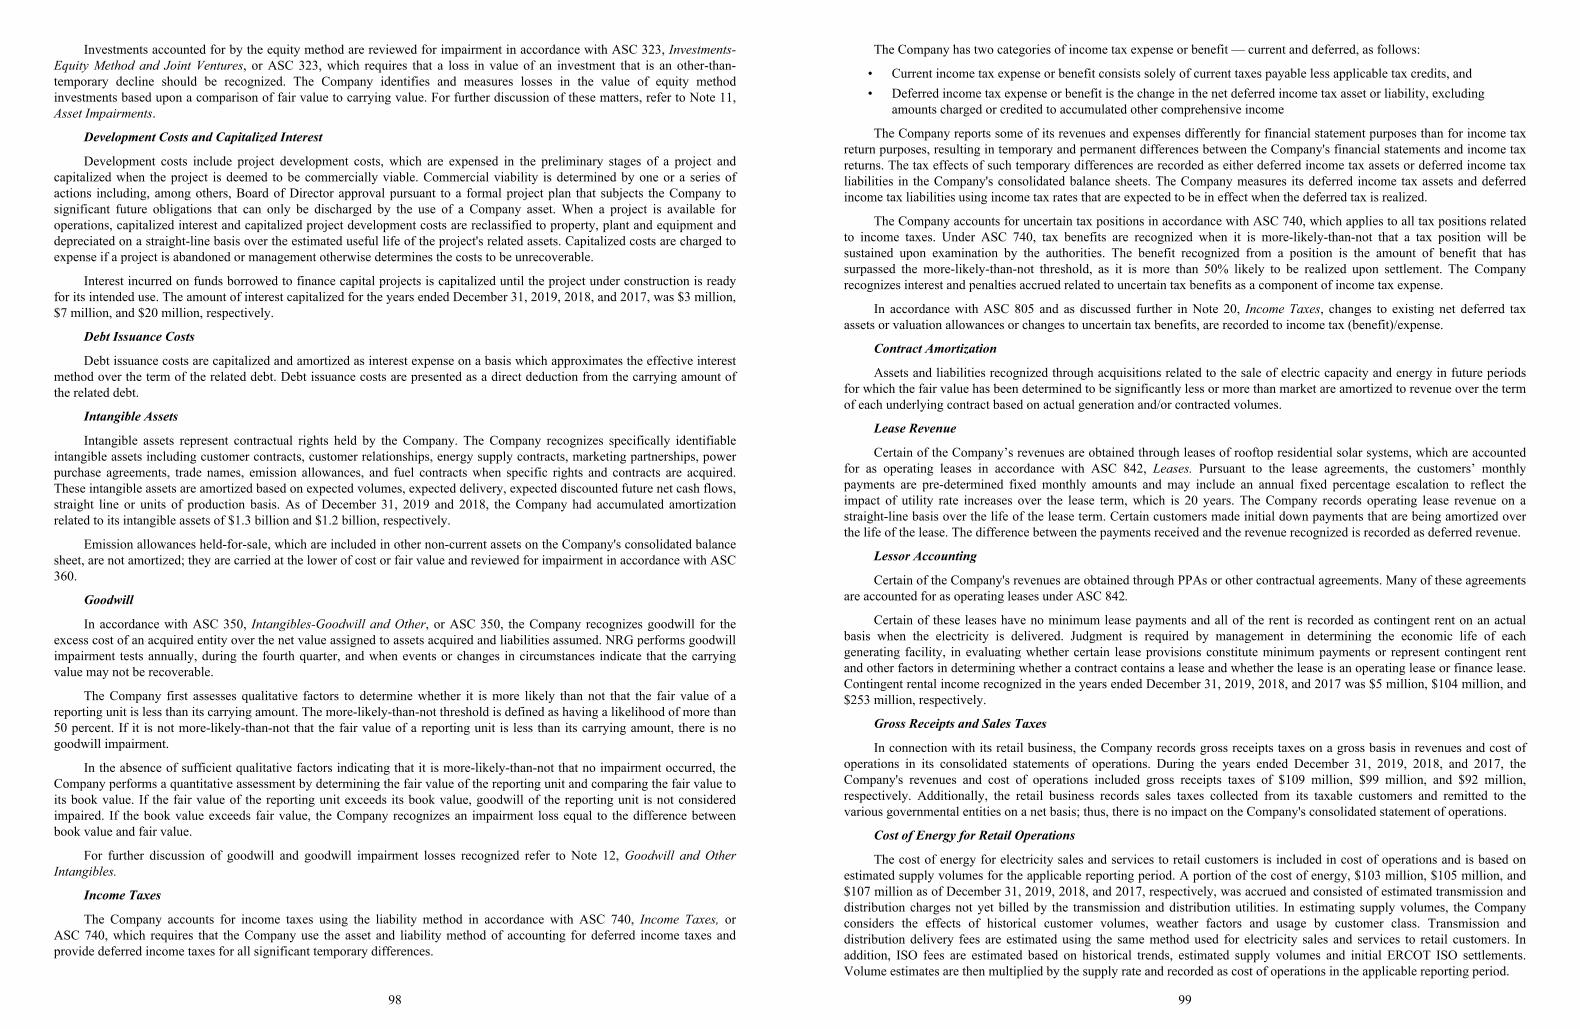
Investments accounted for by the equity method are reviewed for impairment in accordance with ASC 323, Investments-Equity Method and Joint Ventures, or ASC 323, which requires that a loss in value of an investment that is an other-than-temporary decline should be recognized. The Company identifies and measures losses in the value of equity methodinvestments based upon a comparison of fair value to carrying value. For further discussion of these matters, refer to Note 11,Asset Impairments.
Development Costs and Capitalized Interest
Development costs include project development costs, which are expensed in the preliminary stages of a project andcapitalized when the project is deemed to be commercially viable. Commercial viability is determined by one or a series ofactions including, among others, Board of Director approval pursuant to a formal project plan that subjects the Company tosignificant future obligations that can only be discharged by the use of a Company asset. When a project is available foroperations, capitalized interest and capitalized project development costs are reclassified to property, plant and equipment anddepreciated on a straight-line basis over the estimated useful life of the project's related assets. Capitalized costs are charged toexpense if a project is abandoned or management otherwise determines the costs to be unrecoverable.
Interest incurred on funds borrowed to finance capital projects is capitalized until the project under construction is readyfor its intended use. The amount of interest capitalized for the years ended December 31, 2019, 2018, and 2017, was $3 million,$7 million, and $20 million, respectively.
Debt Issuance Costs
Debt issuance costs are capitalized and amortized as interest expense on a basis which approximates the effective interestmethod over the term of the related debt. Debt issuance costs are presented as a direct deduction from the carrying amount ofthe related debt.
Intangible Assets
Intangible assets represent contractual rights held by the Company. The Company recognizes specifically identifiableintangible assets including customer contracts, customer relationships, energy supply contracts, marketing partnerships, powerpurchase agreements, trade names, emission allowances, and fuel contracts when specific rights and contracts are acquired.These intangible assets are amortized based on expected volumes, expected delivery, expected discounted future net cash flows,straight line or units of production basis. As of December 31, 2019 and 2018, the Company had accumulated amortizationrelated to its intangible assets of $1.3 billion and $1.2 billion, respectively.
Emission allowances held-for-sale, which are included in other non-current assets on the Company's consolidated balancesheet, are not amortized; they are carried at the lower of cost or fair value and reviewed for impairment in accordance with ASC360.
Goodwill
In accordance with ASC 350, Intangibles-Goodwill and Other, or ASC 350, the Company recognizes goodwill for theexcess cost of an acquired entity over the net value assigned to assets acquired and liabilities assumed. NRG performs goodwillimpairment tests annually, during the fourth quarter, and when events or changes in circumstances indicate that the carryingvalue may not be recoverable.
The Company first assesses qualitative factors to determine whether it is more likely than not that the fair value of areporting unit is less than its carrying amount. The more-likely-than-not threshold is defined as having a likelihood of more than50 percent. If it is not more-likely-than-not that the fair value of a reporting unit is less than its carrying amount, there is nogoodwill impairment.
In the absence of sufficient qualitative factors indicating that it is more-likely-than-not that no impairment occurred, theCompany performs a quantitative assessment by determining the fair value of the reporting unit and comparing the fair value toits book value. If the fair value of the reporting unit exceeds its book value, goodwill of the reporting unit is not consideredimpaired. If the book value exceeds fair value, the Company recognizes an impairment loss equal to the difference betweenbook value and fair value.
For further discussion of goodwill and goodwill impairment losses recognized refer to Note 12, Goodwill and OtherIntangibles.
Income Taxes
The Company accounts for income taxes using the liability method in accordance with ASC 740, Income Taxes, orASC 740, which requires that the Company use the asset and liability method of accounting for deferred income taxes andprovide deferred income taxes for all significant temporary differences.
98
The Company has two categories of income tax expense or benefit — current and deferred, as follows:
• Current income tax expense or benefit consists solely of current taxes payable less applicable tax credits, and• Deferred income tax expense or benefit is the change in the net deferred income tax asset or liability, excluding
amounts charged or credited to accumulated other comprehensive income
The Company reports some of its revenues and expenses differently for financial statement purposes than for income taxreturn purposes, resulting in temporary and permanent differences between the Company's financial statements and income taxreturns. The tax effects of such temporary differences are recorded as either deferred income tax assets or deferred income taxliabilities in the Company's consolidated balance sheets. The Company measures its deferred income tax assets and deferredincome tax liabilities using income tax rates that are expected to be in effect when the deferred tax is realized.
The Company accounts for uncertain tax positions in accordance with ASC 740, which applies to all tax positions relatedto income taxes. Under ASC 740, tax benefits are recognized when it is more-likely-than-not that a tax position will besustained upon examination by the authorities. The benefit recognized from a position is the amount of benefit that hassurpassed the more-likely-than-not threshold, as it is more than 50% likely to be realized upon settlement. The Companyrecognizes interest and penalties accrued related to uncertain tax benefits as a component of income tax expense.
In accordance with ASC 805 and as discussed further in Note 20, Income Taxes, changes to existing net deferred taxassets or valuation allowances or changes to uncertain tax benefits, are recorded to income tax (benefit)/expense.
Contract Amortization
Assets and liabilities recognized through acquisitions related to the sale of electric capacity and energy in future periodsfor which the fair value has been determined to be significantly less or more than market are amortized to revenue over the termof each underlying contract based on actual generation and/or contracted volumes.
Lease Revenue
Certain of the Company’s revenues are obtained through leases of rooftop residential solar systems, which are accountedfor as operating leases in accordance with ASC 842, Leases. Pursuant to the lease agreements, the customers’ monthlypayments are pre-determined fixed monthly amounts and may include an annual fixed percentage escalation to reflect theimpact of utility rate increases over the lease term, which is 20 years. The Company records operating lease revenue on astraight-line basis over the life of the lease term. Certain customers made initial down payments that are being amortized overthe life of the lease. The difference between the payments received and the revenue recognized is recorded as deferred revenue.
Lessor Accounting
Certain of the Company's revenues are obtained through PPAs or other contractual agreements. Many of these agreementsare accounted for as operating leases under ASC 842.
Certain of these leases have no minimum lease payments and all of the rent is recorded as contingent rent on an actualbasis when the electricity is delivered. Judgment is required by management in determining the economic life of eachgenerating facility, in evaluating whether certain lease provisions constitute minimum payments or represent contingent rentand other factors in determining whether a contract contains a lease and whether the lease is an operating lease or finance lease.Contingent rental income recognized in the years ended December 31, 2019, 2018, and 2017 was $5 million, $104 million, and$253 million, respectively.
Gross Receipts and Sales Taxes
In connection with its retail business, the Company records gross receipts taxes on a gross basis in revenues and cost ofoperations in its consolidated statements of operations. During the years ended December 31, 2019, 2018, and 2017, theCompany's revenues and cost of operations included gross receipts taxes of $109 million, $99 million, and $92 million,respectively. Additionally, the retail business records sales taxes collected from its taxable customers and remitted to thevarious governmental entities on a net basis; thus, there is no impact on the Company's consolidated statement of operations.
Cost of Energy for Retail Operations
The cost of energy for electricity sales and services to retail customers is included in cost of operations and is based onestimated supply volumes for the applicable reporting period. A portion of the cost of energy, $103 million, $105 million, and$107 million as of December 31, 2019, 2018, and 2017, respectively, was accrued and consisted of estimated transmission anddistribution charges not yet billed by the transmission and distribution utilities. In estimating supply volumes, the Companyconsiders the effects of historical customer volumes, weather factors and usage by customer class. Transmission anddistribution delivery fees are estimated using the same method used for electricity sales and services to retail customers. Inaddition, ISO fees are estimated based on historical trends, estimated supply volumes and initial ERCOT ISO settlements.Volume estimates are then multiplied by the supply rate and recorded as cost of operations in the applicable reporting period.
99
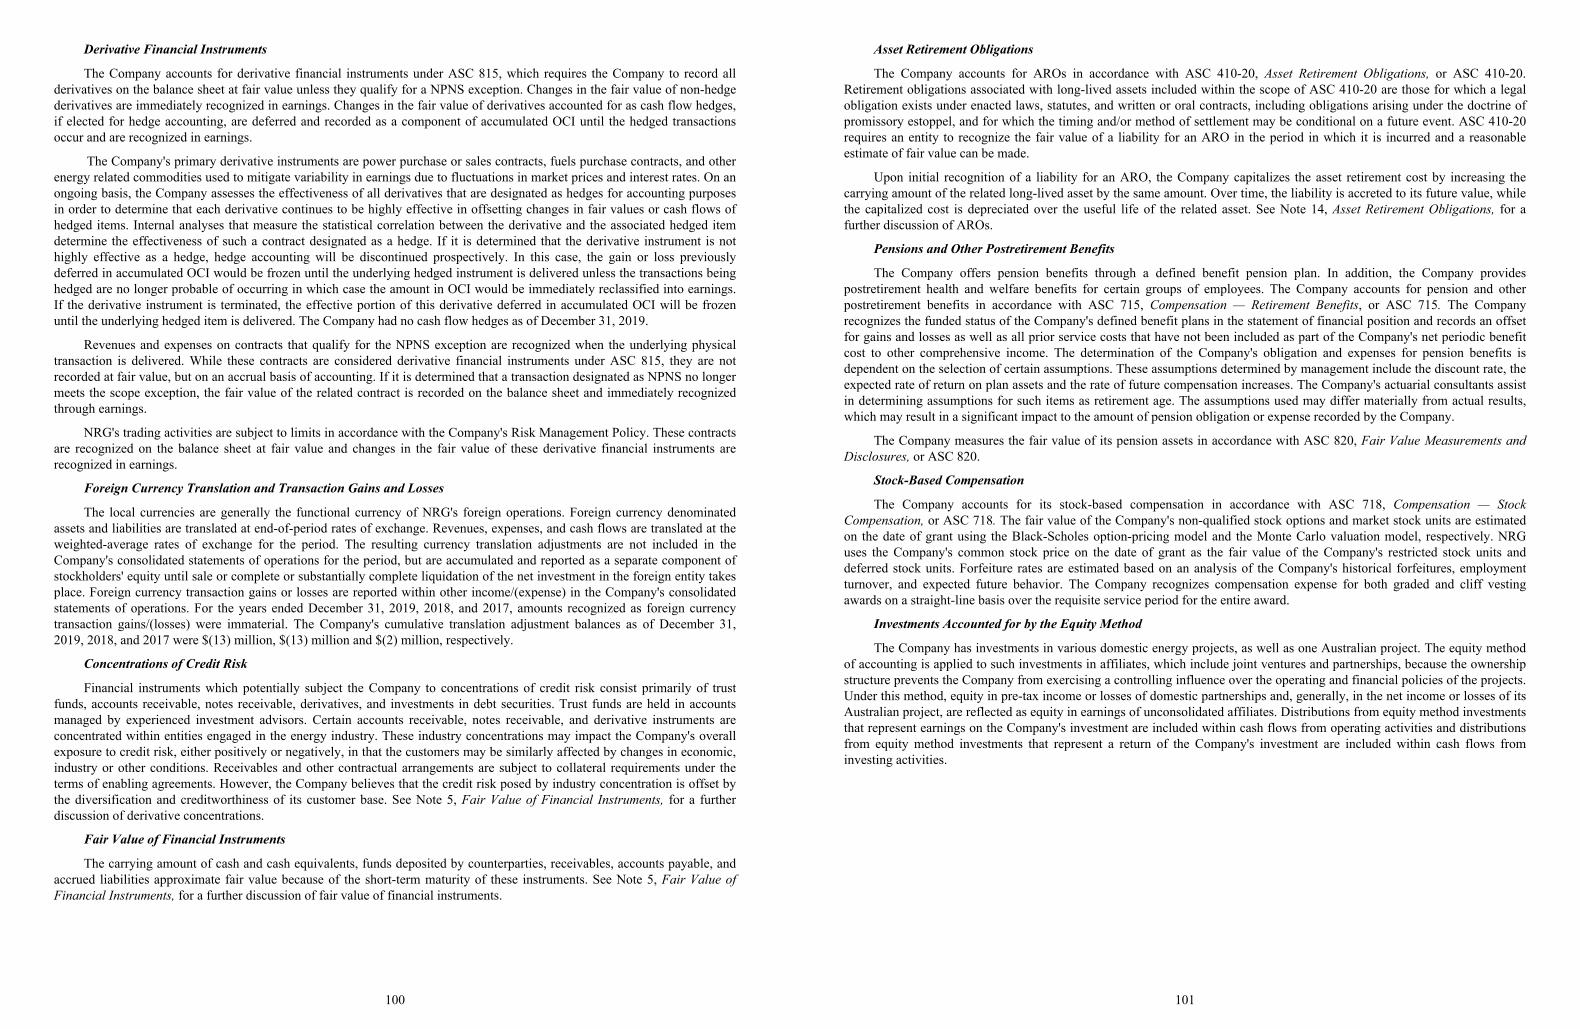
Derivative Financial Instruments
The Company accounts for derivative financial instruments under ASC 815, which requires the Company to record allderivatives on the balance sheet at fair value unless they qualify for a NPNS exception. Changes in the fair value of non-hedgederivatives are immediately recognized in earnings. Changes in the fair value of derivatives accounted for as cash flow hedges,if elected for hedge accounting, are deferred and recorded as a component of accumulated OCI until the hedged transactionsoccur and are recognized in earnings.
The Company's primary derivative instruments are power purchase or sales contracts, fuels purchase contracts, and otherenergy related commodities used to mitigate variability in earnings due to fluctuations in market prices and interest rates. On anongoing basis, the Company assesses the effectiveness of all derivatives that are designated as hedges for accounting purposesin order to determine that each derivative continues to be highly effective in offsetting changes in fair values or cash flows ofhedged items. Internal analyses that measure the statistical correlation between the derivative and the associated hedged itemdetermine the effectiveness of such a contract designated as a hedge. If it is determined that the derivative instrument is nothighly effective as a hedge, hedge accounting will be discontinued prospectively. In this case, the gain or loss previouslydeferred in accumulated OCI would be frozen until the underlying hedged instrument is delivered unless the transactions beinghedged are no longer probable of occurring in which case the amount in OCI would be immediately reclassified into earnings.If the derivative instrument is terminated, the effective portion of this derivative deferred in accumulated OCI will be frozenuntil the underlying hedged item is delivered. The Company had no cash flow hedges as of December 31, 2019.
Revenues and expenses on contracts that qualify for the NPNS exception are recognized when the underlying physicaltransaction is delivered. While these contracts are considered derivative financial instruments under ASC 815, they are notrecorded at fair value, but on an accrual basis of accounting. If it is determined that a transaction designated as NPNS no longermeets the scope exception, the fair value of the related contract is recorded on the balance sheet and immediately recognizedthrough earnings.
NRG's trading activities are subject to limits in accordance with the Company's Risk Management Policy. These contractsare recognized on the balance sheet at fair value and changes in the fair value of these derivative financial instruments arerecognized in earnings.
Foreign Currency Translation and Transaction Gains and Losses
The local currencies are generally the functional currency of NRG's foreign operations. Foreign currency denominatedassets and liabilities are translated at end-of-period rates of exchange. Revenues, expenses, and cash flows are translated at theweighted-average rates of exchange for the period. The resulting currency translation adjustments are not included in theCompany's consolidated statements of operations for the period, but are accumulated and reported as a separate component ofstockholders' equity until sale or complete or substantially complete liquidation of the net investment in the foreign entity takesplace. Foreign currency transaction gains or losses are reported within other income/(expense) in the Company's consolidatedstatements of operations. For the years ended December 31, 2019, 2018, and 2017, amounts recognized as foreign currencytransaction gains/(losses) were immaterial. The Company's cumulative translation adjustment balances as of December 31,2019, 2018, and 2017 were $(13) million, $(13) million and $(2) million, respectively.
Concentrations of Credit Risk
Financial instruments which potentially subject the Company to concentrations of credit risk consist primarily of trustfunds, accounts receivable, notes receivable, derivatives, and investments in debt securities. Trust funds are held in accountsmanaged by experienced investment advisors. Certain accounts receivable, notes receivable, and derivative instruments areconcentrated within entities engaged in the energy industry. These industry concentrations may impact the Company's overallexposure to credit risk, either positively or negatively, in that the customers may be similarly affected by changes in economic,industry or other conditions. Receivables and other contractual arrangements are subject to collateral requirements under theterms of enabling agreements. However, the Company believes that the credit risk posed by industry concentration is offset bythe diversification and creditworthiness of its customer base. See Note 5, Fair Value of Financial Instruments, for a furtherdiscussion of derivative concentrations.
Fair Value of Financial Instruments
The carrying amount of cash and cash equivalents, funds deposited by counterparties, receivables, accounts payable, andaccrued liabilities approximate fair value because of the short-term maturity of these instruments. See Note 5, Fair Value ofFinancial Instruments, for a further discussion of fair value of financial instruments.
100
Asset Retirement Obligations
The Company accounts for AROs in accordance with ASC 410-20, Asset Retirement Obligations, or ASC 410-20.Retirement obligations associated with long-lived assets included within the scope of ASC 410-20 are those for which a legalobligation exists under enacted laws, statutes, and written or oral contracts, including obligations arising under the doctrine ofpromissory estoppel, and for which the timing and/or method of settlement may be conditional on a future event. ASC 410-20requires an entity to recognize the fair value of a liability for an ARO in the period in which it is incurred and a reasonableestimate of fair value can be made.
Upon initial recognition of a liability for an ARO, the Company capitalizes the asset retirement cost by increasing thecarrying amount of the related long-lived asset by the same amount. Over time, the liability is accreted to its future value, whilethe capitalized cost is depreciated over the useful life of the related asset. See Note 14, Asset Retirement Obligations, for afurther discussion of AROs.
Pensions and Other Postretirement Benefits
The Company offers pension benefits through a defined benefit pension plan. In addition, the Company providespostretirement health and welfare benefits for certain groups of employees. The Company accounts for pension and otherpostretirement benefits in accordance with ASC 715, Compensation — Retirement Benefits, or ASC 715. The Companyrecognizes the funded status of the Company's defined benefit plans in the statement of financial position and records an offsetfor gains and losses as well as all prior service costs that have not been included as part of the Company's net periodic benefitcost to other comprehensive income. The determination of the Company's obligation and expenses for pension benefits isdependent on the selection of certain assumptions. These assumptions determined by management include the discount rate, theexpected rate of return on plan assets and the rate of future compensation increases. The Company's actuarial consultants assistin determining assumptions for such items as retirement age. The assumptions used may differ materially from actual results,which may result in a significant impact to the amount of pension obligation or expense recorded by the Company.
The Company measures the fair value of its pension assets in accordance with ASC 820, Fair Value Measurements andDisclosures, or ASC 820.
Stock-Based Compensation
The Company accounts for its stock-based compensation in accordance with ASC 718, Compensation — StockCompensation, or ASC 718. The fair value of the Company's non-qualified stock options and market stock units are estimatedon the date of grant using the Black-Scholes option-pricing model and the Monte Carlo valuation model, respectively. NRGuses the Company's common stock price on the date of grant as the fair value of the Company's restricted stock units anddeferred stock units. Forfeiture rates are estimated based on an analysis of the Company's historical forfeitures, employmentturnover, and expected future behavior. The Company recognizes compensation expense for both graded and cliff vestingawards on a straight-line basis over the requisite service period for the entire award.
Investments Accounted for by the Equity Method
The Company has investments in various domestic energy projects, as well as one Australian project. The equity methodof accounting is applied to such investments in affiliates, which include joint ventures and partnerships, because the ownershipstructure prevents the Company from exercising a controlling influence over the operating and financial policies of the projects.Under this method, equity in pre-tax income or losses of domestic partnerships and, generally, in the net income or losses of itsAustralian project, are reflected as equity in earnings of unconsolidated affiliates. Distributions from equity method investmentsthat represent earnings on the Company's investment are included within cash flows from operating activities and distributionsfrom equity method investments that represent a return of the Company's investment are included within cash flows frominvesting activities.
101
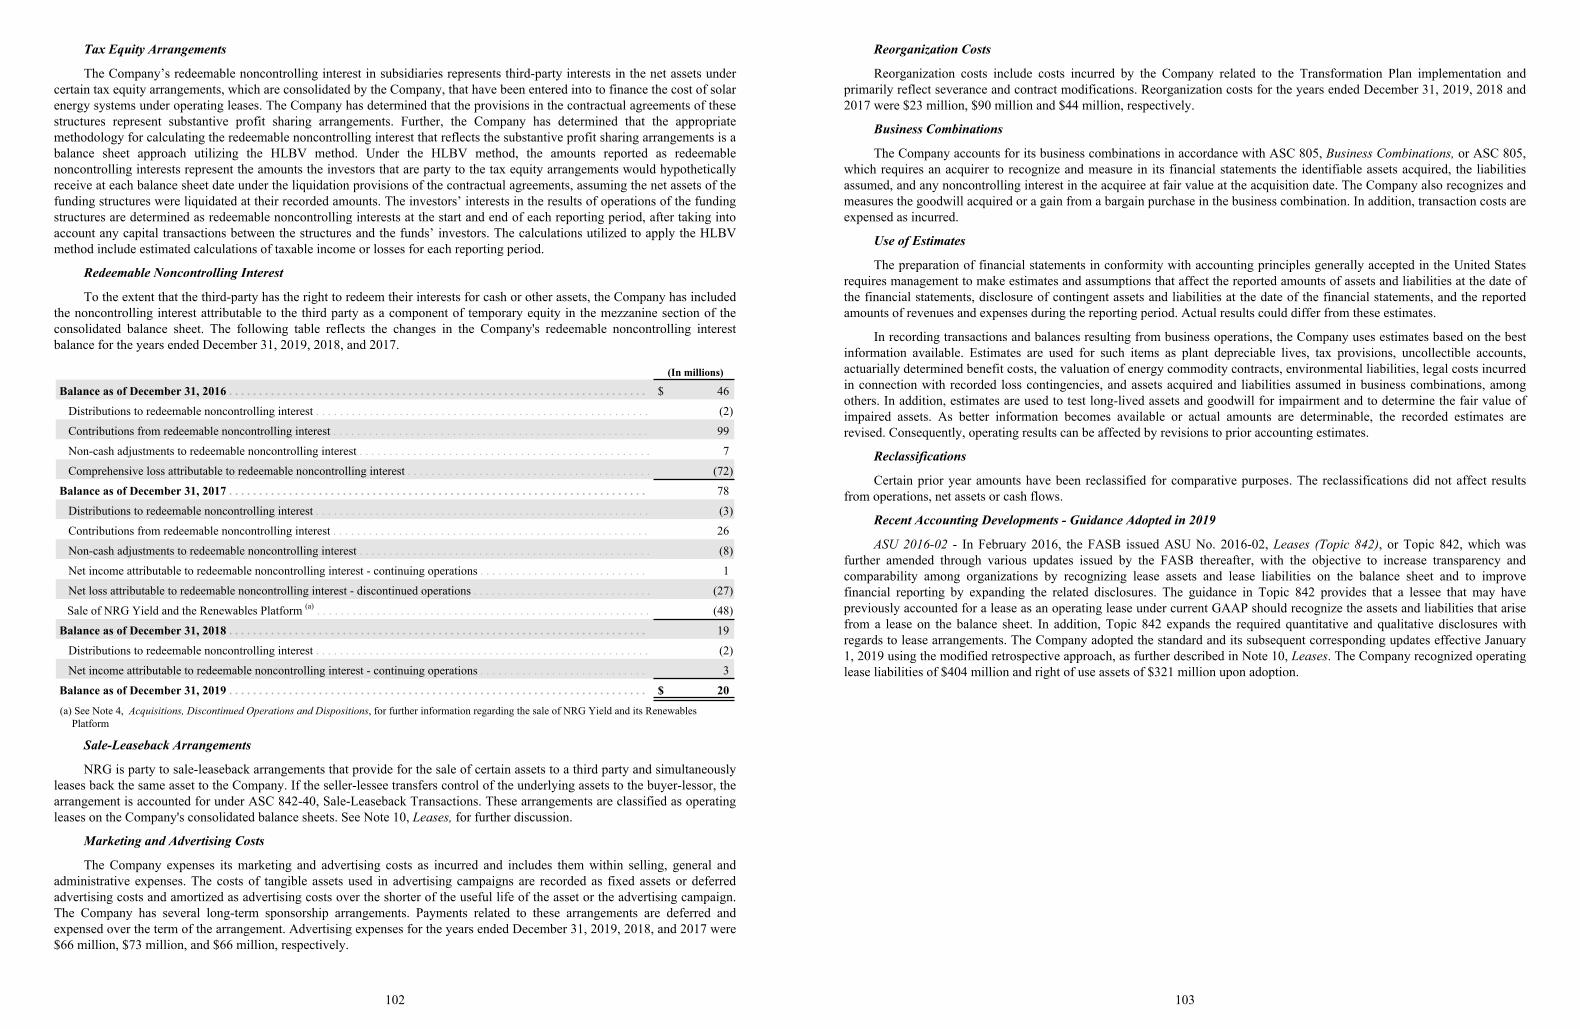
Tax Equity Arrangements
The Company’s redeemable noncontrolling interest in subsidiaries represents third-party interests in the net assets undercertain tax equity arrangements, which are consolidated by the Company, that have been entered into to finance the cost of solarenergy systems under operating leases. The Company has determined that the provisions in the contractual agreements of thesestructures represent substantive profit sharing arrangements. Further, the Company has determined that the appropriatemethodology for calculating the redeemable noncontrolling interest that reflects the substantive profit sharing arrangements is abalance sheet approach utilizing the HLBV method. Under the HLBV method, the amounts reported as redeemablenoncontrolling interests represent the amounts the investors that are party to the tax equity arrangements would hypotheticallyreceive at each balance sheet date under the liquidation provisions of the contractual agreements, assuming the net assets of thefunding structures were liquidated at their recorded amounts. The investors’ interests in the results of operations of the fundingstructures are determined as redeemable noncontrolling interests at the start and end of each reporting period, after taking intoaccount any capital transactions between the structures and the funds’ investors. The calculations utilized to apply the HLBVmethod include estimated calculations of taxable income or losses for each reporting period.
Redeemable Noncontrolling Interest
To the extent that the third-party has the right to redeem their interests for cash or other assets, the Company has includedthe noncontrolling interest attributable to the third party as a component of temporary equity in the mezzanine section of theconsolidated balance sheet. The following table reflects the changes in the Company's redeemable noncontrolling interestbalance for the years ended December 31, 2019, 2018, and 2017.
(In millions)
Balance as of December 31, 2016 . . . . . . . . . . . . . . . . . . . . . . . . . . . . . . . . . . . . . . . . . . . . . . . . . . . . . . . . . . . . . . . . . . . . . . $ 46
Distributions to redeemable noncontrolling interest . . . . . . . . . . . . . . . . . . . . . . . . . . . . . . . . . . . . . . . . . . . . . . . . . . . . . . . . (2)
Contributions from redeemable noncontrolling interest . . . . . . . . . . . . . . . . . . . . . . . . . . . . . . . . . . . . . . . . . . . . . . . . . . . . . 99
Non-cash adjustments to redeemable noncontrolling interest . . . . . . . . . . . . . . . . . . . . . . . . . . . . . . . . . . . . . . . . . . . . . . . . . 7
Comprehensive loss attributable to redeemable noncontrolling interest . . . . . . . . . . . . . . . . . . . . . . . . . . . . . . . . . . . . . . . . . (72)
Balance as of December 31, 2017 . . . . . . . . . . . . . . . . . . . . . . . . . . . . . . . . . . . . . . . . . . . . . . . . . . . . . . . . . . . . . . . . . . . . . . 78
Distributions to redeemable noncontrolling interest . . . . . . . . . . . . . . . . . . . . . . . . . . . . . . . . . . . . . . . . . . . . . . . . . . . . . . . . (3)
Contributions from redeemable noncontrolling interest . . . . . . . . . . . . . . . . . . . . . . . . . . . . . . . . . . . . . . . . . . . . . . . . . . . . . 26
Non-cash adjustments to redeemable noncontrolling interest . . . . . . . . . . . . . . . . . . . . . . . . . . . . . . . . . . . . . . . . . . . . . . . . . (8)
Net income attributable to redeemable noncontrolling interest - continuing operations . . . . . . . . . . . . . . . . . . . . . . . . . . . . 1
Net loss attributable to redeemable noncontrolling interest - discontinued operations . . . . . . . . . . . . . . . . . . . . . . . . . . . . . . (27)
Sale of NRG Yield and the Renewables Platform (a) . . . . . . . . . . . . . . . . . . . . . . . . . . . . . . . . . . . . . . . . . . . . . . . . . . . . . . . . (48)
Balance as of December 31, 2018 . . . . . . . . . . . . . . . . . . . . . . . . . . . . . . . . . . . . . . . . . . . . . . . . . . . . . . . . . . . . . . . . . . . . . . 19
Distributions to redeemable noncontrolling interest . . . . . . . . . . . . . . . . . . . . . . . . . . . . . . . . . . . . . . . . . . . . . . . . . . . . . . . . (2)
Net income attributable to redeemable noncontrolling interest - continuing operations . . . . . . . . . . . . . . . . . . . . . . . . . . . . 3
Balance as of December 31, 2019 . . . . . . . . . . . . . . . . . . . . . . . . . . . . . . . . . . . . . . . . . . . . . . . . . . . . . . . . . . . . . . . . . . . . . . $ 20
(a) See Note 4, Acquisitions, Discontinued Operations and Dispositions, for further information regarding the sale of NRG Yield and its Renewables Platform
Sale-Leaseback Arrangements
NRG is party to sale-leaseback arrangements that provide for the sale of certain assets to a third party and simultaneouslyleases back the same asset to the Company. If the seller-lessee transfers control of the underlying assets to the buyer-lessor, thearrangement is accounted for under ASC 842-40, Sale-Leaseback Transactions. These arrangements are classified as operatingleases on the Company's consolidated balance sheets. See Note 10, Leases, for further discussion.
Marketing and Advertising Costs
The Company expenses its marketing and advertising costs as incurred and includes them within selling, general andadministrative expenses. The costs of tangible assets used in advertising campaigns are recorded as fixed assets or deferredadvertising costs and amortized as advertising costs over the shorter of the useful life of the asset or the advertising campaign.The Company has several long-term sponsorship arrangements. Payments related to these arrangements are deferred andexpensed over the term of the arrangement. Advertising expenses for the years ended December 31, 2019, 2018, and 2017 were$66 million, $73 million, and $66 million, respectively.
102
Reorganization Costs
Reorganization costs include costs incurred by the Company related to the Transformation Plan implementation andprimarily reflect severance and contract modifications. Reorganization costs for the years ended December 31, 2019, 2018 and2017 were $23 million, $90 million and $44 million, respectively.
Business Combinations
The Company accounts for its business combinations in accordance with ASC 805, Business Combinations, or ASC 805,which requires an acquirer to recognize and measure in its financial statements the identifiable assets acquired, the liabilitiesassumed, and any noncontrolling interest in the acquiree at fair value at the acquisition date. The Company also recognizes andmeasures the goodwill acquired or a gain from a bargain purchase in the business combination. In addition, transaction costs areexpensed as incurred.
Use of Estimates
The preparation of financial statements in conformity with accounting principles generally accepted in the United Statesrequires management to make estimates and assumptions that affect the reported amounts of assets and liabilities at the date ofthe financial statements, disclosure of contingent assets and liabilities at the date of the financial statements, and the reportedamounts of revenues and expenses during the reporting period. Actual results could differ from these estimates.
In recording transactions and balances resulting from business operations, the Company uses estimates based on the bestinformation available. Estimates are used for such items as plant depreciable lives, tax provisions, uncollectible accounts,actuarially determined benefit costs, the valuation of energy commodity contracts, environmental liabilities, legal costs incurredin connection with recorded loss contingencies, and assets acquired and liabilities assumed in business combinations, amongothers. In addition, estimates are used to test long-lived assets and goodwill for impairment and to determine the fair value ofimpaired assets. As better information becomes available or actual amounts are determinable, the recorded estimates arerevised. Consequently, operating results can be affected by revisions to prior accounting estimates.
Reclassifications
Certain prior year amounts have been reclassified for comparative purposes. The reclassifications did not affect resultsfrom operations, net assets or cash flows.
Recent Accounting Developments - Guidance Adopted in 2019
ASU 2016-02 - In February 2016, the FASB issued ASU No. 2016-02, Leases (Topic 842), or Topic 842, which wasfurther amended through various updates issued by the FASB thereafter, with the objective to increase transparency andcomparability among organizations by recognizing lease assets and lease liabilities on the balance sheet and to improvefinancial reporting by expanding the related disclosures. The guidance in Topic 842 provides that a lessee that may havepreviously accounted for a lease as an operating lease under current GAAP should recognize the assets and liabilities that arisefrom a lease on the balance sheet. In addition, Topic 842 expands the required quantitative and qualitative disclosures withregards to lease arrangements. The Company adopted the standard and its subsequent corresponding updates effective January1, 2019 using the modified retrospective approach, as further described in Note 10, Leases. The Company recognized operatinglease liabilities of $404 million and right of use assets of $321 million upon adoption.
103
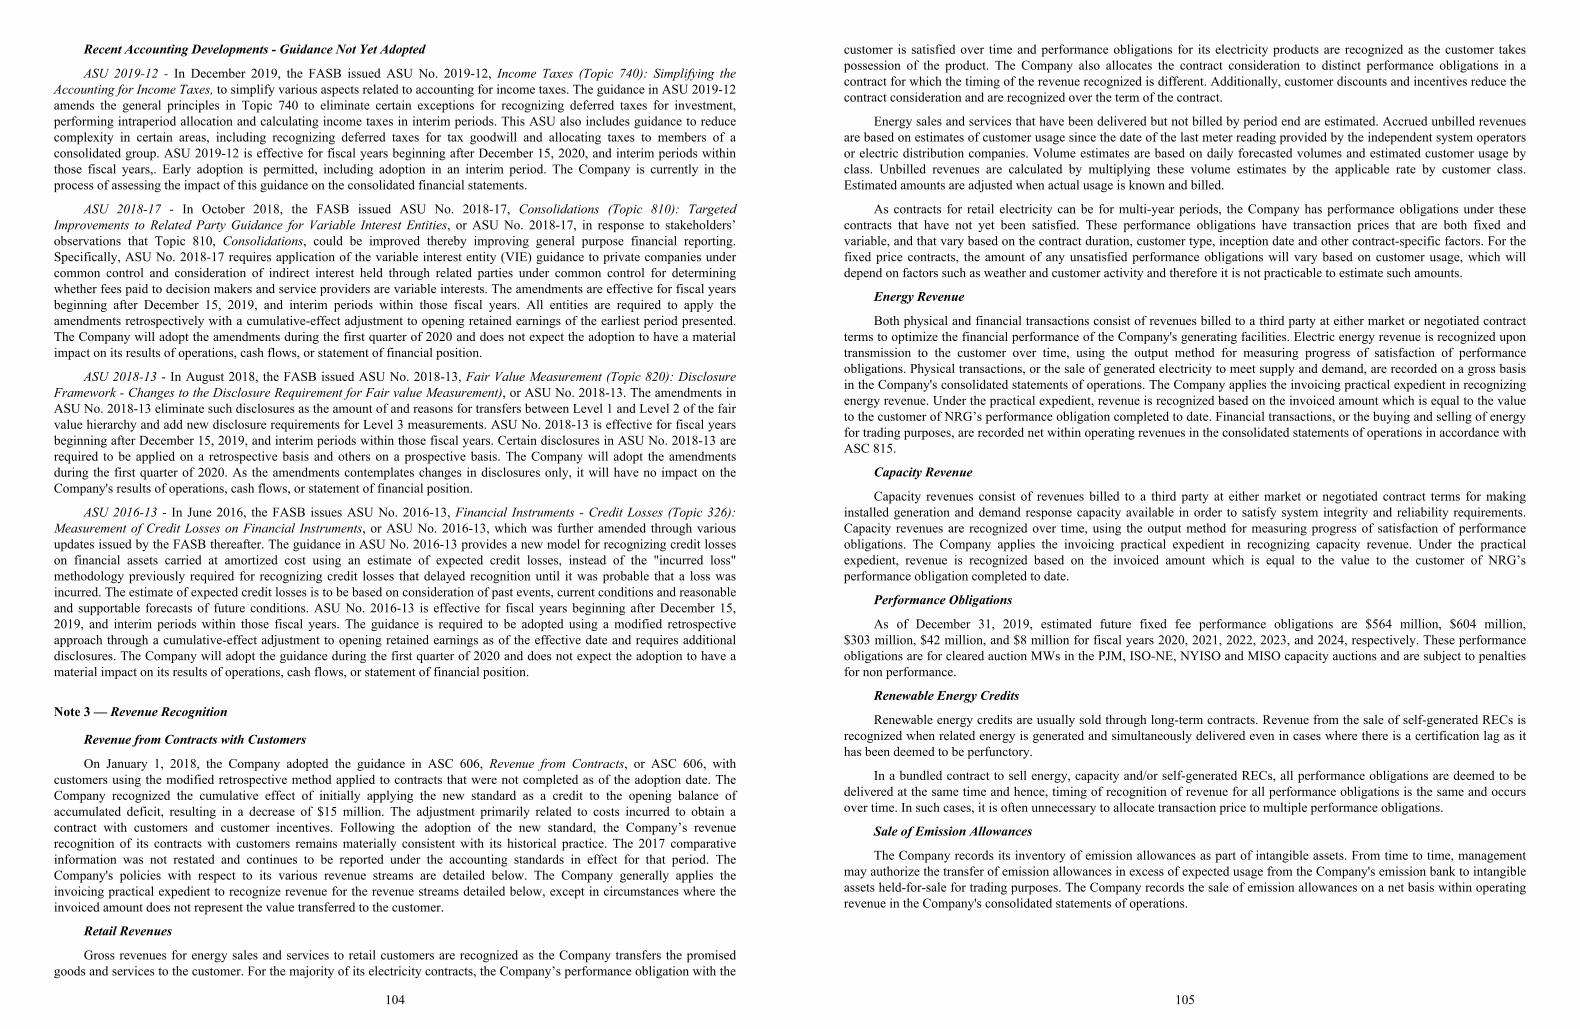
Recent Accounting Developments - Guidance Not Yet Adopted
ASU 2019-12 - In December 2019, the FASB issued ASU No. 2019-12, Income Taxes (Topic 740): Simplifying theAccounting for Income Taxes, to simplify various aspects related to accounting for income taxes. The guidance in ASU 2019-12amends the general principles in Topic 740 to eliminate certain exceptions for recognizing deferred taxes for investment,performing intraperiod allocation and calculating income taxes in interim periods. This ASU also includes guidance to reducecomplexity in certain areas, including recognizing deferred taxes for tax goodwill and allocating taxes to members of aconsolidated group. ASU 2019-12 is effective for fiscal years beginning after December 15, 2020, and interim periods withinthose fiscal years,. Early adoption is permitted, including adoption in an interim period. The Company is currently in theprocess of assessing the impact of this guidance on the consolidated financial statements.
ASU 2018-17 - In October 2018, the FASB issued ASU No. 2018-17, Consolidations (Topic 810): TargetedImprovements to Related Party Guidance for Variable Interest Entities, or ASU No. 2018-17, in response to stakeholders’observations that Topic 810, Consolidations, could be improved thereby improving general purpose financial reporting.Specifically, ASU No. 2018-17 requires application of the variable interest entity (VIE) guidance to private companies undercommon control and consideration of indirect interest held through related parties under common control for determiningwhether fees paid to decision makers and service providers are variable interests. The amendments are effective for fiscal yearsbeginning after December 15, 2019, and interim periods within those fiscal years. All entities are required to apply theamendments retrospectively with a cumulative-effect adjustment to opening retained earnings of the earliest period presented.The Company will adopt the amendments during the first quarter of 2020 and does not expect the adoption to have a materialimpact on its results of operations, cash flows, or statement of financial position.
ASU 2018-13 - In August 2018, the FASB issued ASU No. 2018-13, Fair Value Measurement (Topic 820): DisclosureFramework - Changes to the Disclosure Requirement for Fair value Measurement), or ASU No. 2018-13. The amendments inASU No. 2018-13 eliminate such disclosures as the amount of and reasons for transfers between Level 1 and Level 2 of the fairvalue hierarchy and add new disclosure requirements for Level 3 measurements. ASU No. 2018-13 is effective for fiscal yearsbeginning after December 15, 2019, and interim periods within those fiscal years. Certain disclosures in ASU No. 2018-13 arerequired to be applied on a retrospective basis and others on a prospective basis. The Company will adopt the amendmentsduring the first quarter of 2020. As the amendments contemplates changes in disclosures only, it will have no impact on theCompany's results of operations, cash flows, or statement of financial position.
ASU 2016-13 - In June 2016, the FASB issues ASU No. 2016-13, Financial Instruments - Credit Losses (Topic 326):Measurement of Credit Losses on Financial Instruments, or ASU No. 2016-13, which was further amended through variousupdates issued by the FASB thereafter. The guidance in ASU No. 2016-13 provides a new model for recognizing credit losseson financial assets carried at amortized cost using an estimate of expected credit losses, instead of the "incurred loss"methodology previously required for recognizing credit losses that delayed recognition until it was probable that a loss wasincurred. The estimate of expected credit losses is to be based on consideration of past events, current conditions and reasonableand supportable forecasts of future conditions. ASU No. 2016-13 is effective for fiscal years beginning after December 15,2019, and interim periods within those fiscal years. The guidance is required to be adopted using a modified retrospectiveapproach through a cumulative-effect adjustment to opening retained earnings as of the effective date and requires additionaldisclosures. The Company will adopt the guidance during the first quarter of 2020 and does not expect the adoption to have amaterial impact on its results of operations, cash flows, or statement of financial position.
Note 3 — Revenue Recognition
Revenue from Contracts with Customers
On January 1, 2018, the Company adopted the guidance in ASC 606, Revenue from Contracts, or ASC 606, withcustomers using the modified retrospective method applied to contracts that were not completed as of the adoption date. TheCompany recognized the cumulative effect of initially applying the new standard as a credit to the opening balance ofaccumulated deficit, resulting in a decrease of $15 million. The adjustment primarily related to costs incurred to obtain acontract with customers and customer incentives. Following the adoption of the new standard, the Company’s revenuerecognition of its contracts with customers remains materially consistent with its historical practice. The 2017 comparativeinformation was not restated and continues to be reported under the accounting standards in effect for that period. TheCompany's policies with respect to its various revenue streams are detailed below. The Company generally applies theinvoicing practical expedient to recognize revenue for the revenue streams detailed below, except in circumstances where theinvoiced amount does not represent the value transferred to the customer.
Retail Revenues
Gross revenues for energy sales and services to retail customers are recognized as the Company transfers the promisedgoods and services to the customer. For the majority of its electricity contracts, the Company’s performance obligation with the
104
customer is satisfied over time and performance obligations for its electricity products are recognized as the customer takespossession of the product. The Company also allocates the contract consideration to distinct performance obligations in acontract for which the timing of the revenue recognized is different. Additionally, customer discounts and incentives reduce thecontract consideration and are recognized over the term of the contract.
Energy sales and services that have been delivered but not billed by period end are estimated. Accrued unbilled revenuesare based on estimates of customer usage since the date of the last meter reading provided by the independent system operatorsor electric distribution companies. Volume estimates are based on daily forecasted volumes and estimated customer usage byclass. Unbilled revenues are calculated by multiplying these volume estimates by the applicable rate by customer class.Estimated amounts are adjusted when actual usage is known and billed.
As contracts for retail electricity can be for multi-year periods, the Company has performance obligations under thesecontracts that have not yet been satisfied. These performance obligations have transaction prices that are both fixed andvariable, and that vary based on the contract duration, customer type, inception date and other contract-specific factors. For thefixed price contracts, the amount of any unsatisfied performance obligations will vary based on customer usage, which willdepend on factors such as weather and customer activity and therefore it is not practicable to estimate such amounts.
Energy Revenue
Both physical and financial transactions consist of revenues billed to a third party at either market or negotiated contractterms to optimize the financial performance of the Company's generating facilities. Electric energy revenue is recognized upontransmission to the customer over time, using the output method for measuring progress of satisfaction of performanceobligations. Physical transactions, or the sale of generated electricity to meet supply and demand, are recorded on a gross basisin the Company's consolidated statements of operations. The Company applies the invoicing practical expedient in recognizingenergy revenue. Under the practical expedient, revenue is recognized based on the invoiced amount which is equal to the valueto the customer of NRG’s performance obligation completed to date. Financial transactions, or the buying and selling of energyfor trading purposes, are recorded net within operating revenues in the consolidated statements of operations in accordance withASC 815.
Capacity Revenue
Capacity revenues consist of revenues billed to a third party at either market or negotiated contract terms for makinginstalled generation and demand response capacity available in order to satisfy system integrity and reliability requirements.Capacity revenues are recognized over time, using the output method for measuring progress of satisfaction of performanceobligations. The Company applies the invoicing practical expedient in recognizing capacity revenue. Under the practicalexpedient, revenue is recognized based on the invoiced amount which is equal to the value to the customer of NRG’sperformance obligation completed to date.
Performance Obligations
As of December 31, 2019, estimated future fixed fee performance obligations are $564 million, $604 million,$303 million, $42 million, and $8 million for fiscal years 2020, 2021, 2022, 2023, and 2024, respectively. These performanceobligations are for cleared auction MWs in the PJM, ISO-NE, NYISO and MISO capacity auctions and are subject to penaltiesfor non performance.
Renewable Energy Credits
Renewable energy credits are usually sold through long-term contracts. Revenue from the sale of self-generated RECs isrecognized when related energy is generated and simultaneously delivered even in cases where there is a certification lag as ithas been deemed to be perfunctory.
In a bundled contract to sell energy, capacity and/or self-generated RECs, all performance obligations are deemed to bedelivered at the same time and hence, timing of recognition of revenue for all performance obligations is the same and occursover time. In such cases, it is often unnecessary to allocate transaction price to multiple performance obligations.
Sale of Emission Allowances
The Company records its inventory of emission allowances as part of intangible assets. From time to time, managementmay authorize the transfer of emission allowances in excess of expected usage from the Company's emission bank to intangibleassets held-for-sale for trading purposes. The Company records the sale of emission allowances on a net basis within operatingrevenue in the Company's consolidated statements of operations.
105
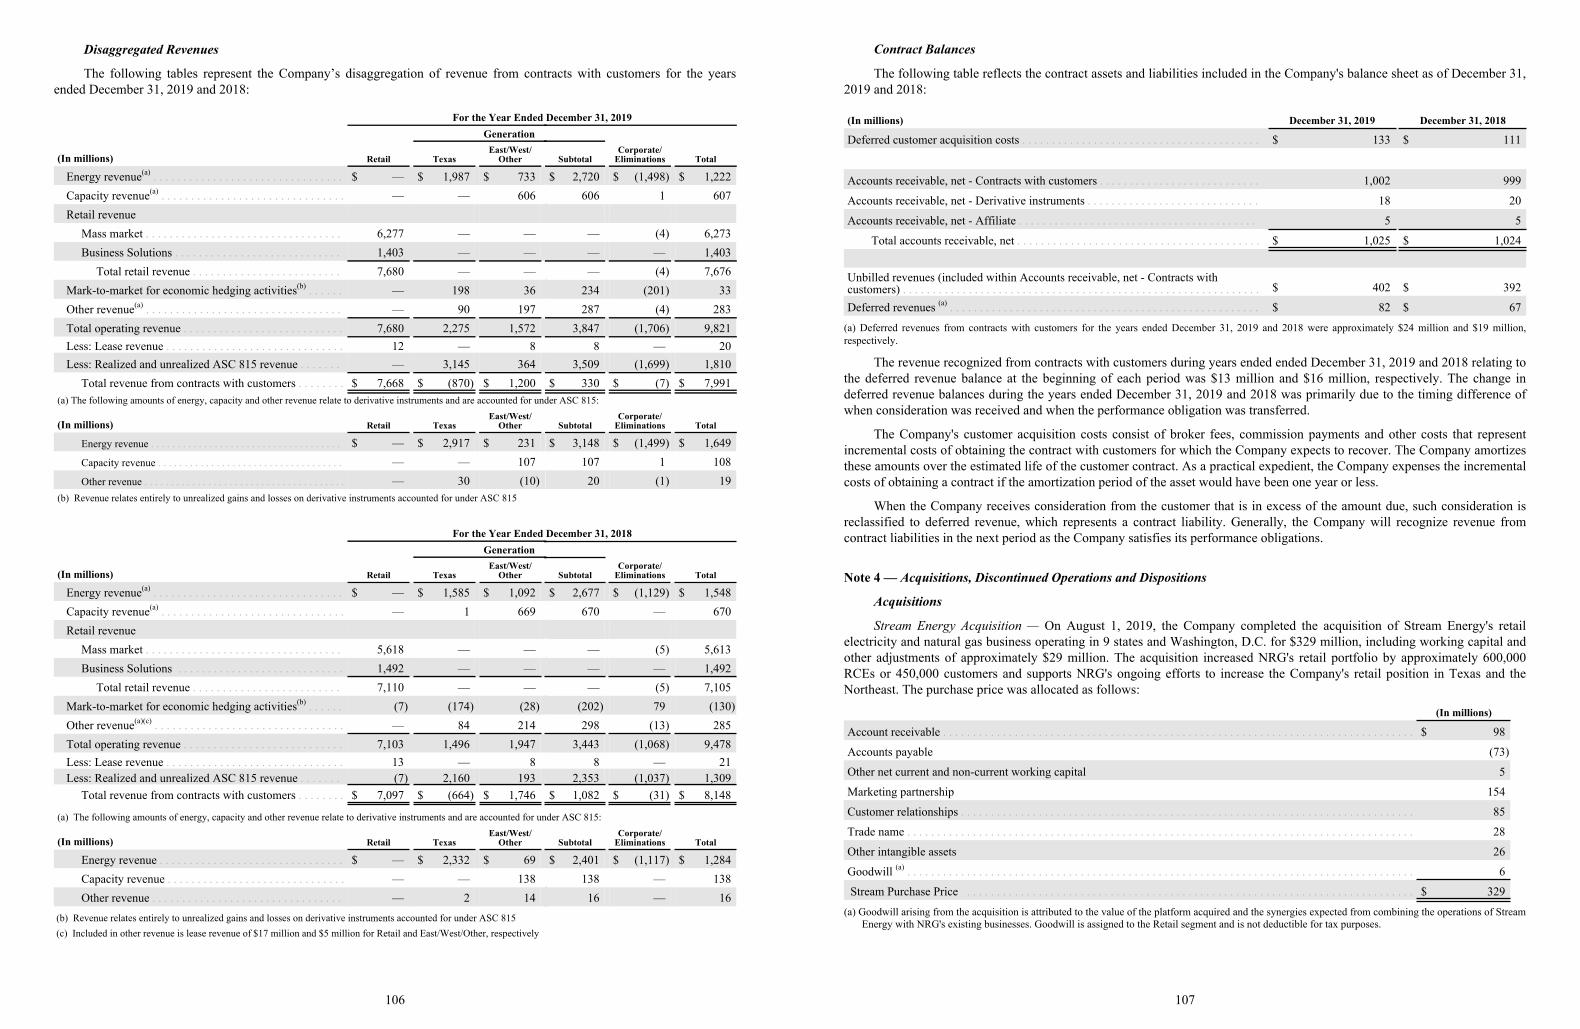
Disaggregated Revenues
The following tables represent the Company’s disaggregation of revenue from contracts with customers for the yearsended December 31, 2019 and 2018:
For the Year Ended December 31, 2019Generation
(In millions) Retail TexasEast/West/
Other SubtotalCorporate/
Eliminations Total
Energy revenue(a) . . . . . . . . . . . . . . . . . . . . . . . . . . . . . . . . $ — $ 1,987 $ 733 $ 2,720 $ (1,498) $ 1,222Capacity revenue(a) . . . . . . . . . . . . . . . . . . . . . . . . . . . . . . . — — 606 606 1 607Retail revenue
Mass market . . . . . . . . . . . . . . . . . . . . . . . . . . . . . . . . . 6,277 — — — (4) 6,273Business Solutions . . . . . . . . . . . . . . . . . . . . . . . . . . . . 1,403 — — — — 1,403
Total retail revenue . . . . . . . . . . . . . . . . . . . . . . . . . 7,680 — — — (4) 7,676Mark-to-market for economic hedging activities(b) . . . . . . — 198 36 234 (201) 33Other revenue(a) . . . . . . . . . . . . . . . . . . . . . . . . . . . . . . . . . — 90 197 287 (4) 283Total operating revenue . . . . . . . . . . . . . . . . . . . . . . . . . . . 7,680 2,275 1,572 3,847 (1,706) 9,821Less: Lease revenue . . . . . . . . . . . . . . . . . . . . . . . . . . . . . . 12 — 8 8 — 20Less: Realized and unrealized ASC 815 revenue . . . . . . . — 3,145 364 3,509 (1,699) 1,810
Total revenue from contracts with customers . . . . . . . . $ 7,668 $ (870) $ 1,200 $ 330 $ (7) $ 7,991(a) The following amounts of energy, capacity and other revenue relate to derivative instruments and are accounted for under ASC 815:
(In millions) Retail TexasEast/West/
Other SubtotalCorporate/
Eliminations Total
Energy revenue . . . . . . . . . . . . . . . . . . . . . . . . . . . . . . . . . . . . $ — $ 2,917 $ 231 $ 3,148 $ (1,499) $ 1,649Capacity revenue . . . . . . . . . . . . . . . . . . . . . . . . . . . . . . . . . . . — — 107 107 1 108Other revenue . . . . . . . . . . . . . . . . . . . . . . . . . . . . . . . . . . . . . . — 30 (10) 20 (1) 19
(b) Revenue relates entirely to unrealized gains and losses on derivative instruments accounted for under ASC 815
For the Year Ended December 31, 2018Generation
(In millions) Retail TexasEast/West/
Other SubtotalCorporate/
Eliminations Total
Energy revenue(a) . . . . . . . . . . . . . . . . . . . . . . . . . . . . . . . . $ — $ 1,585 $ 1,092 $ 2,677 $ (1,129) $ 1,548Capacity revenue(a) . . . . . . . . . . . . . . . . . . . . . . . . . . . . . . . — 1 669 670 — 670Retail revenue
Mass market . . . . . . . . . . . . . . . . . . . . . . . . . . . . . . . . . 5,618 — — — (5) 5,613Business Solutions . . . . . . . . . . . . . . . . . . . . . . . . . . . . 1,492 — — — — 1,492
Total retail revenue . . . . . . . . . . . . . . . . . . . . . . . . . 7,110 — — — (5) 7,105Mark-to-market for economic hedging activities(b) . . . . . . (7) (174) (28) (202) 79 (130)Other revenue(a)(c) . . . . . . . . . . . . . . . . . . . . . . . . . . . . . . . . — 84 214 298 (13) 285Total operating revenue . . . . . . . . . . . . . . . . . . . . . . . . . . . 7,103 1,496 1,947 3,443 (1,068) 9,478Less: Lease revenue . . . . . . . . . . . . . . . . . . . . . . . . . . . . . . 13 — 8 8 — 21Less: Realized and unrealized ASC 815 revenue . . . . . . . (7) 2,160 193 2,353 (1,037) 1,309
Total revenue from contracts with customers . . . . . . . . $ 7,097 $ (664) $ 1,746 $ 1,082 $ (31) $ 8,148
(a) The following amounts of energy, capacity and other revenue relate to derivative instruments and are accounted for under ASC 815:
(In millions) Retail TexasEast/West/
Other SubtotalCorporate/
Eliminations Total
Energy revenue . . . . . . . . . . . . . . . . . . . . . . . . . . . . . . . $ — $ 2,332 $ 69 $ 2,401 $ (1,117) $ 1,284Capacity revenue . . . . . . . . . . . . . . . . . . . . . . . . . . . . . . — — 138 138 — 138Other revenue . . . . . . . . . . . . . . . . . . . . . . . . . . . . . . . . — 2 14 16 — 16
(b) Revenue relates entirely to unrealized gains and losses on derivative instruments accounted for under ASC 815 (c) Included in other revenue is lease revenue of $17 million and $5 million for Retail and East/West/Other, respectively
106
Contract Balances
The following table reflects the contract assets and liabilities included in the Company's balance sheet as of December 31,2019 and 2018:
(In millions) December 31, 2019 December 31, 2018
Deferred customer acquisition costs . . . . . . . . . . . . . . . . . . . . . . . . . . . . . . . . . . . . . . . . $ 133 $ 111
Accounts receivable, net - Contracts with customers . . . . . . . . . . . . . . . . . . . . . . . . . . . 1,002 999
Accounts receivable, net - Derivative instruments . . . . . . . . . . . . . . . . . . . . . . . . . . . . . 18 20
Accounts receivable, net - Affiliate . . . . . . . . . . . . . . . . . . . . . . . . . . . . . . . . . . . . . . . . 5 5
Total accounts receivable, net . . . . . . . . . . . . . . . . . . . . . . . . . . . . . . . . . . . . . . . . . $ 1,025 $ 1,024
Unbilled revenues (included within Accounts receivable, net - Contracts with customers) . . . . . . . . . . . . . . . . . . . . . . . . . . . . . . . . . . . . . . . . . . . . . . . . . . . . . . . . . . . . $ 402 $ 392
Deferred revenues (a) . . . . . . . . . . . . . . . . . . . . . . . . . . . . . . . . . . . . . . . . . . . . . . . . . . . . $ 82 $ 67
(a) Deferred revenues from contracts with customers for the years ended December 31, 2019 and 2018 were approximately $24 million and $19 million,respectively.
The revenue recognized from contracts with customers during years ended ended December 31, 2019 and 2018 relating tothe deferred revenue balance at the beginning of each period was $13 million and $16 million, respectively. The change indeferred revenue balances during the years ended December 31, 2019 and 2018 was primarily due to the timing difference ofwhen consideration was received and when the performance obligation was transferred.
The Company's customer acquisition costs consist of broker fees, commission payments and other costs that representincremental costs of obtaining the contract with customers for which the Company expects to recover. The Company amortizesthese amounts over the estimated life of the customer contract. As a practical expedient, the Company expenses the incrementalcosts of obtaining a contract if the amortization period of the asset would have been one year or less.
When the Company receives consideration from the customer that is in excess of the amount due, such consideration isreclassified to deferred revenue, which represents a contract liability. Generally, the Company will recognize revenue fromcontract liabilities in the next period as the Company satisfies its performance obligations.
Note 4 — Acquisitions, Discontinued Operations and Dispositions
Acquisitions
Stream Energy Acquisition — On August 1, 2019, the Company completed the acquisition of Stream Energy's retailelectricity and natural gas business operating in 9 states and Washington, D.C. for $329 million, including working capital andother adjustments of approximately $29 million. The acquisition increased NRG's retail portfolio by approximately 600,000RCEs or 450,000 customers and supports NRG's ongoing efforts to increase the Company's retail position in Texas and theNortheast. The purchase price was allocated as follows:
(In millions)
Account receivable . . . . . . . . . . . . . . . . . . . . . . . . . . . . . . . . . . . . . . . . . . . . . . . . . . . . . . . . . . . . . . . . . . . . . . . . . . . . . . . $ 98
Accounts payable (73)
Other net current and non-current working capital 5
Marketing partnership 154
Customer relationships . . . . . . . . . . . . . . . . . . . . . . . . . . . . . . . . . . . . . . . . . . . . . . . . . . . . . . . . . . . . . . . . . . . . . . . . . . . . 85
Trade name . . . . . . . . . . . . . . . . . . . . . . . . . . . . . . . . . . . . . . . . . . . . . . . . . . . . . . . . . . . . . . . . . . . . . . . . . . . . . . . . . . . . . 28
Other intangible assets 26
Goodwill (a) . . . . . . . . . . . . . . . . . . . . . . . . . . . . . . . . . . . . . . . . . . . . . . . . . . . . . . . . . . . . . . . . . . . . . . . . . . . . . . . . . . . . . 6
Stream Purchase Price . . . . . . . . . . . . . . . . . . . . . . . . . . . . . . . . . . . . . . . . . . . . . . . . . . . . . . . . . . . . . . . . . . . . . . . . . . . $ 329
(a) Goodwill arising from the acquisition is attributed to the value of the platform acquired and the synergies expected from combining the operations of StreamEnergy with NRG's existing businesses. Goodwill is assigned to the Retail segment and is not deductible for tax purposes.
107
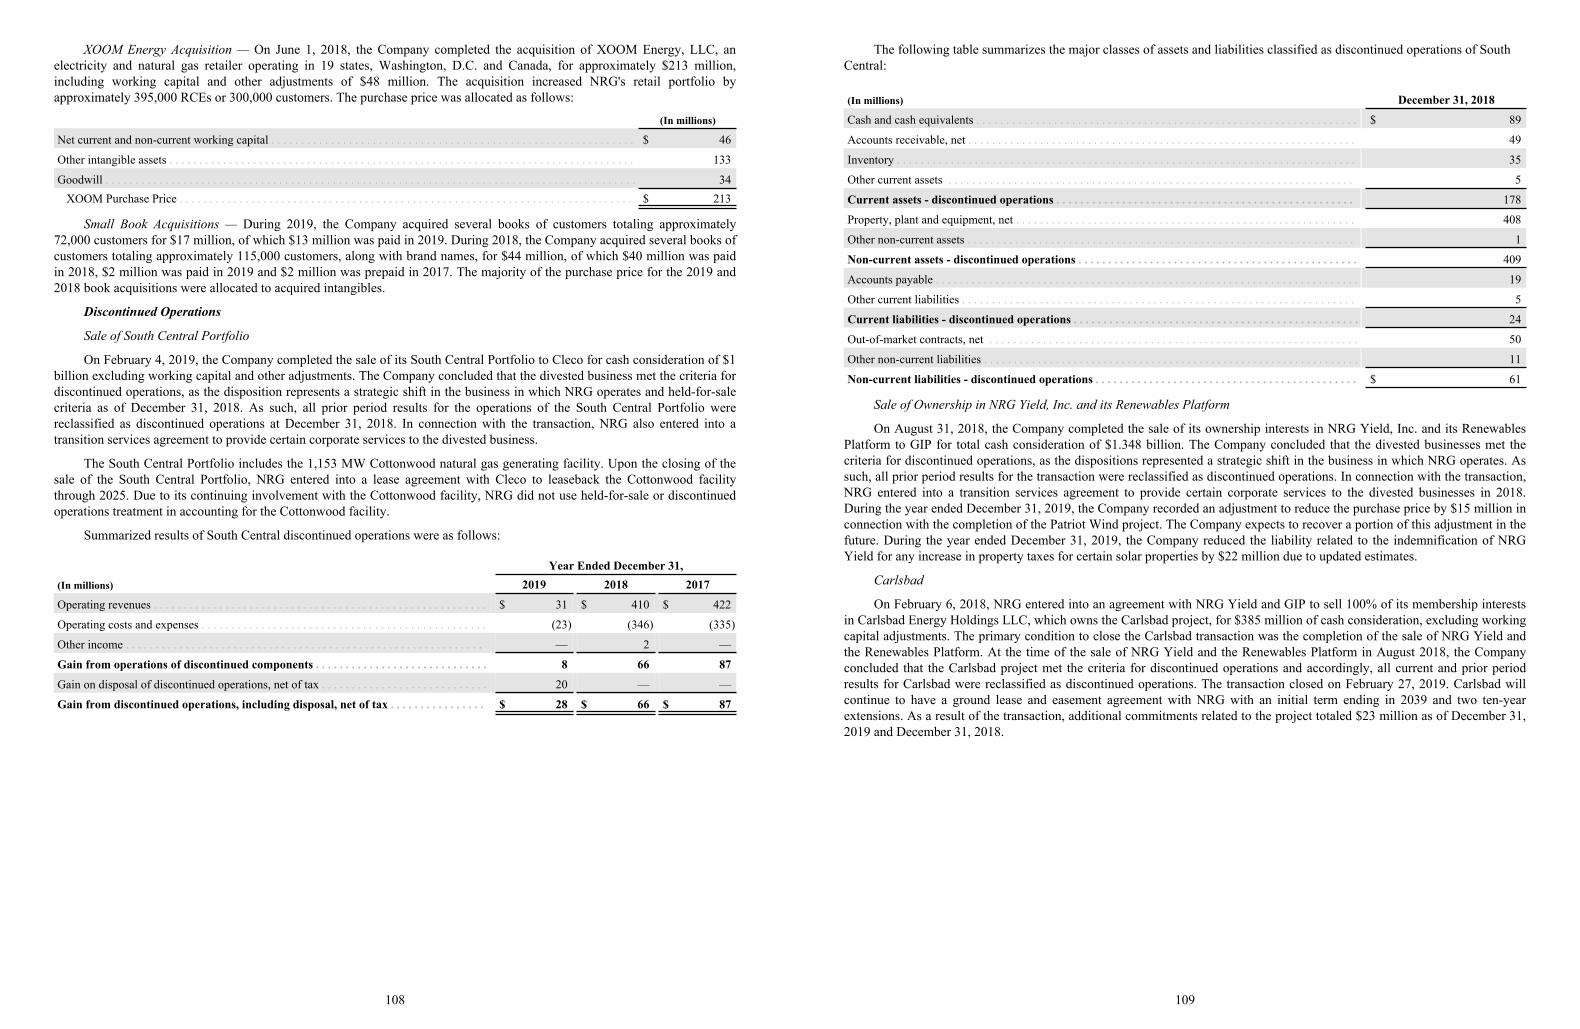
XOOM Energy Acquisition — On June 1, 2018, the Company completed the acquisition of XOOM Energy, LLC, anelectricity and natural gas retailer operating in 19 states, Washington, D.C. and Canada, for approximately $213 million,including working capital and other adjustments of $48 million. The acquisition increased NRG's retail portfolio byapproximately 395,000 RCEs or 300,000 customers. The purchase price was allocated as follows:
(In millions)
Net current and non-current working capital . . . . . . . . . . . . . . . . . . . . . . . . . . . . . . . . . . . . . . . . . . . . . . . . . . . . . . . . . . . . . $ 46
Other intangible assets . . . . . . . . . . . . . . . . . . . . . . . . . . . . . . . . . . . . . . . . . . . . . . . . . . . . . . . . . . . . . . . . . . . . . . . . . . . . . . 133
Goodwill . . . . . . . . . . . . . . . . . . . . . . . . . . . . . . . . . . . . . . . . . . . . . . . . . . . . . . . . . . . . . . . . . . . . . . . . . . . . . . . . . . . . . . . . . 34XOOM Purchase Price . . . . . . . . . . . . . . . . . . . . . . . . . . . . . . . . . . . . . . . . . . . . . . . . . . . . . . . . . . . . . . . . . . . . . . . . . . . . $ 213
Small Book Acquisitions — During 2019, the Company acquired several books of customers totaling approximately72,000 customers for $17 million, of which $13 million was paid in 2019. During 2018, the Company acquired several books ofcustomers totaling approximately 115,000 customers, along with brand names, for $44 million, of which $40 million was paidin 2018, $2 million was paid in 2019 and $2 million was prepaid in 2017. The majority of the purchase price for the 2019 and2018 book acquisitions were allocated to acquired intangibles.
Discontinued Operations
Sale of South Central Portfolio
On February 4, 2019, the Company completed the sale of its South Central Portfolio to Cleco for cash consideration of $1billion excluding working capital and other adjustments. The Company concluded that the divested business met the criteria fordiscontinued operations, as the disposition represents a strategic shift in the business in which NRG operates and held-for-salecriteria as of December 31, 2018. As such, all prior period results for the operations of the South Central Portfolio werereclassified as discontinued operations at December 31, 2018. In connection with the transaction, NRG also entered into atransition services agreement to provide certain corporate services to the divested business.
The South Central Portfolio includes the 1,153 MW Cottonwood natural gas generating facility. Upon the closing of thesale of the South Central Portfolio, NRG entered into a lease agreement with Cleco to leaseback the Cottonwood facilitythrough 2025. Due to its continuing involvement with the Cottonwood facility, NRG did not use held-for-sale or discontinuedoperations treatment in accounting for the Cottonwood facility.
Summarized results of South Central discontinued operations were as follows:
Year Ended December 31,(In millions) 2019 2018 2017
Operating revenues . . . . . . . . . . . . . . . . . . . . . . . . . . . . . . . . . . . . . . . . . . . . . . . . . . . . . . . . $ 31 $ 410 $ 422
Operating costs and expenses . . . . . . . . . . . . . . . . . . . . . . . . . . . . . . . . . . . . . . . . . . . . . . . . (23) (346) (335)
Other income . . . . . . . . . . . . . . . . . . . . . . . . . . . . . . . . . . . . . . . . . . . . . . . . . . . . . . . . . . . . — 2 —
Gain from operations of discontinued components . . . . . . . . . . . . . . . . . . . . . . . . . . . . . 8 66 87
Gain on disposal of discontinued operations, net of tax . . . . . . . . . . . . . . . . . . . . . . . . . . . . 20 — —
Gain from discontinued operations, including disposal, net of tax . . . . . . . . . . . . . . . . $ 28 $ 66 $ 87
108
The following table summarizes the major classes of assets and liabilities classified as discontinued operations of South Central:
(In millions) December 31, 2018
Cash and cash equivalents . . . . . . . . . . . . . . . . . . . . . . . . . . . . . . . . . . . . . . . . . . . . . . . . . . . . . . . . . . . . . . . . $ 89
Accounts receivable, net . . . . . . . . . . . . . . . . . . . . . . . . . . . . . . . . . . . . . . . . . . . . . . . . . . . . . . . . . . . . . . . . . 49
Inventory . . . . . . . . . . . . . . . . . . . . . . . . . . . . . . . . . . . . . . . . . . . . . . . . . . . . . . . . . . . . . . . . . . . . . . . . . . . . . 35
Other current assets . . . . . . . . . . . . . . . . . . . . . . . . . . . . . . . . . . . . . . . . . . . . . . . . . . . . . . . . . . . . . . . . . . . . 5
Current assets - discontinued operations . . . . . . . . . . . . . . . . . . . . . . . . . . . . . . . . . . . . . . . . . . . . . . . . . . 178
Property, plant and equipment, net . . . . . . . . . . . . . . . . . . . . . . . . . . . . . . . . . . . . . . . . . . . . . . . . . . . . . . . . . 408
Other non-current assets . . . . . . . . . . . . . . . . . . . . . . . . . . . . . . . . . . . . . . . . . . . . . . . . . . . . . . . . . . . . . . . . . 1
Non-current assets - discontinued operations . . . . . . . . . . . . . . . . . . . . . . . . . . . . . . . . . . . . . . . . . . . . . . . 409
Accounts payable . . . . . . . . . . . . . . . . . . . . . . . . . . . . . . . . . . . . . . . . . . . . . . . . . . . . . . . . . . . . . . . . . . . . . . . 19
Other current liabilities . . . . . . . . . . . . . . . . . . . . . . . . . . . . . . . . . . . . . . . . . . . . . . . . . . . . . . . . . . . . . . . . . . 5
Current liabilities - discontinued operations . . . . . . . . . . . . . . . . . . . . . . . . . . . . . . . . . . . . . . . . . . . . . . . . 24
Out-of-market contracts, net . . . . . . . . . . . . . . . . . . . . . . . . . . . . . . . . . . . . . . . . . . . . . . . . . . . . . . . . . . . . . . 50
Other non-current liabilities . . . . . . . . . . . . . . . . . . . . . . . . . . . . . . . . . . . . . . . . . . . . . . . . . . . . . . . . . . . . . . . 11
Non-current liabilities - discontinued operations . . . . . . . . . . . . . . . . . . . . . . . . . . . . . . . . . . . . . . . . . . . . $ 61
Sale of Ownership in NRG Yield, Inc. and its Renewables Platform
On August 31, 2018, the Company completed the sale of its ownership interests in NRG Yield, Inc. and its RenewablesPlatform to GIP for total cash consideration of $1.348 billion. The Company concluded that the divested businesses met thecriteria for discontinued operations, as the dispositions represented a strategic shift in the business in which NRG operates. Assuch, all prior period results for the transaction were reclassified as discontinued operations. In connection with the transaction,NRG entered into a transition services agreement to provide certain corporate services to the divested businesses in 2018.During the year ended December 31, 2019, the Company recorded an adjustment to reduce the purchase price by $15 million inconnection with the completion of the Patriot Wind project. The Company expects to recover a portion of this adjustment in thefuture. During the year ended December 31, 2019, the Company reduced the liability related to the indemnification of NRGYield for any increase in property taxes for certain solar properties by $22 million due to updated estimates.
Carlsbad
On February 6, 2018, NRG entered into an agreement with NRG Yield and GIP to sell 100% of its membership interestsin Carlsbad Energy Holdings LLC, which owns the Carlsbad project, for $385 million of cash consideration, excluding workingcapital adjustments. The primary condition to close the Carlsbad transaction was the completion of the sale of NRG Yield andthe Renewables Platform. At the time of the sale of NRG Yield and the Renewables Platform in August 2018, the Companyconcluded that the Carlsbad project met the criteria for discontinued operations and accordingly, all current and prior periodresults for Carlsbad were reclassified as discontinued operations. The transaction closed on February 27, 2019. Carlsbad willcontinue to have a ground lease and easement agreement with NRG with an initial term ending in 2039 and two ten-yearextensions. As a result of the transaction, additional commitments related to the project totaled $23 million as of December 31,2019 and December 31, 2018.
109
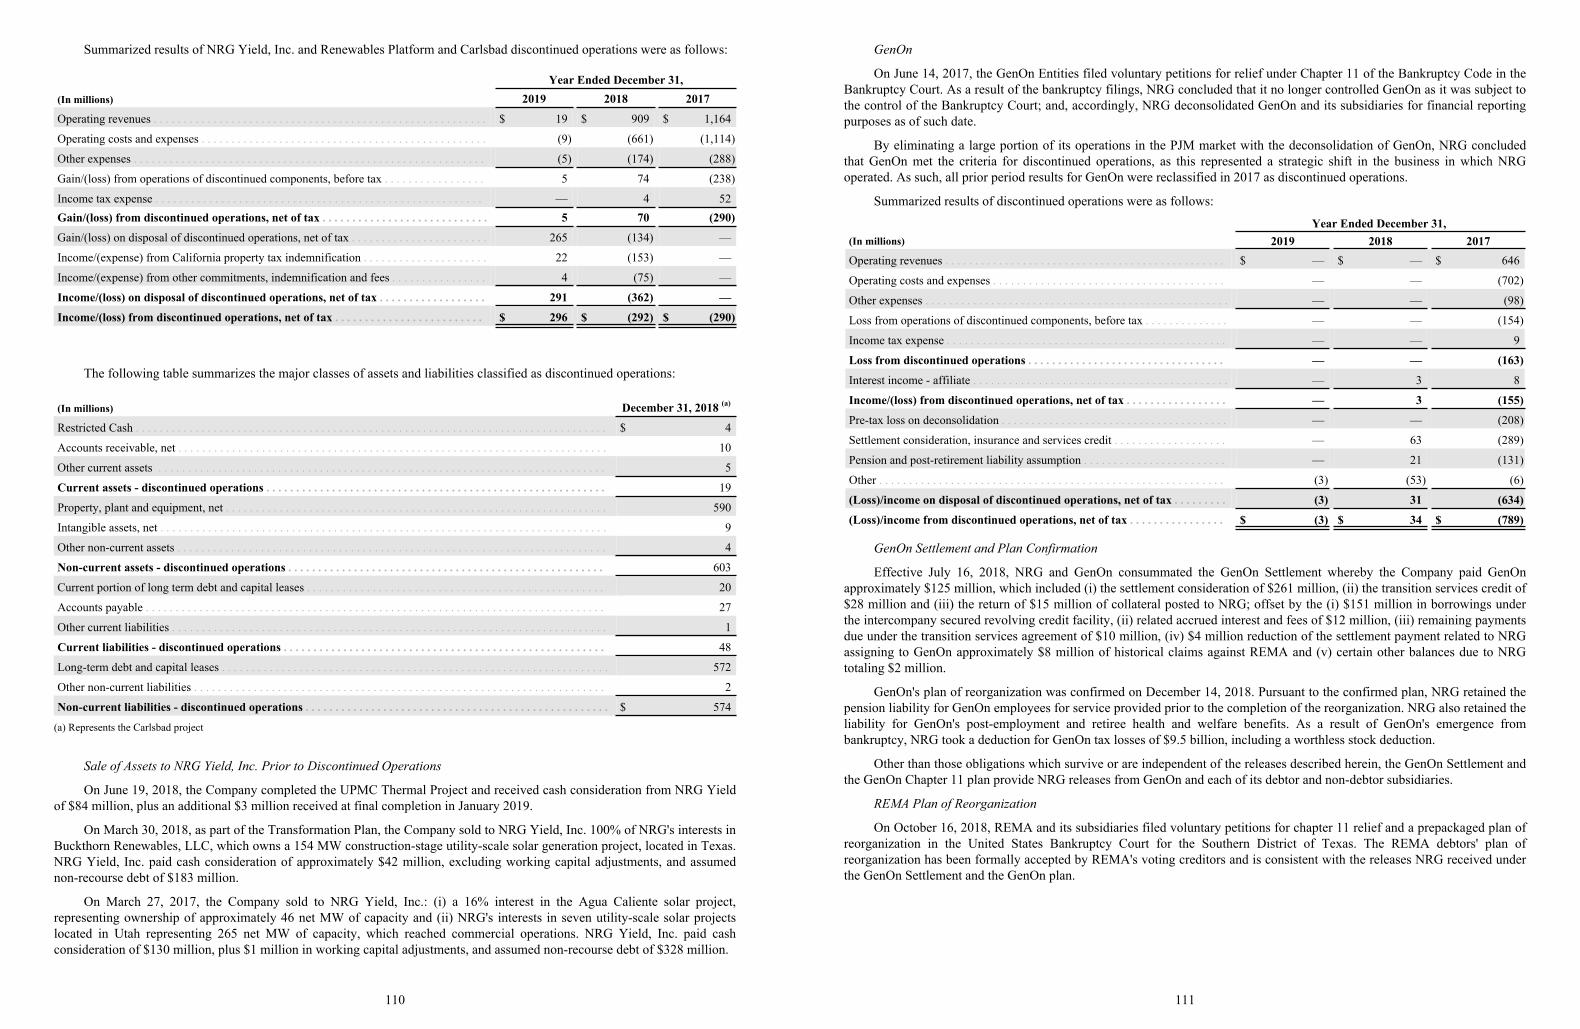
Summarized results of NRG Yield, Inc. and Renewables Platform and Carlsbad discontinued operations were as follows:
Year Ended December 31,(In millions) 2019 2018 2017
Operating revenues . . . . . . . . . . . . . . . . . . . . . . . . . . . . . . . . . . . . . . . . . . . . . . . . . . . . . . . . $ 19 $ 909 $ 1,164
Operating costs and expenses . . . . . . . . . . . . . . . . . . . . . . . . . . . . . . . . . . . . . . . . . . . . . . . . (9) (661) (1,114)
Other expenses . . . . . . . . . . . . . . . . . . . . . . . . . . . . . . . . . . . . . . . . . . . . . . . . . . . . . . . . . . . (5) (174) (288)
Gain/(loss) from operations of discontinued components, before tax . . . . . . . . . . . . . . . . . 5 74 (238)
Income tax expense . . . . . . . . . . . . . . . . . . . . . . . . . . . . . . . . . . . . . . . . . . . . . . . . . . . . . . . — 4 52Gain/(loss) from discontinued operations, net of tax . . . . . . . . . . . . . . . . . . . . . . . . . . . . 5 70 (290)
Gain/(loss) on disposal of discontinued operations, net of tax . . . . . . . . . . . . . . . . . . . . . . . 265 (134) —
Income/(expense) from California property tax indemnification . . . . . . . . . . . . . . . . . . . . . 22 (153) —
Income/(expense) from other commitments, indemnification and fees . . . . . . . . . . . . . . . . 4 (75) —
Income/(loss) on disposal of discontinued operations, net of tax . . . . . . . . . . . . . . . . . . 291 (362) —
Income/(loss) from discontinued operations, net of tax . . . . . . . . . . . . . . . . . . . . . . . . . $ 296 $ (292) $ (290)
The following table summarizes the major classes of assets and liabilities classified as discontinued operations:
(In millions) December 31, 2018 (a)
Restricted Cash . . . . . . . . . . . . . . . . . . . . . . . . . . . . . . . . . . . . . . . . . . . . . . . . . . . . . . . . . . . . . . . . . . . . . . . . . . . . . . . $ 4
Accounts receivable, net . . . . . . . . . . . . . . . . . . . . . . . . . . . . . . . . . . . . . . . . . . . . . . . . . . . . . . . . . . . . . . . . . . . . . . . . 10
Other current assets . . . . . . . . . . . . . . . . . . . . . . . . . . . . . . . . . . . . . . . . . . . . . . . . . . . . . . . . . . . . . . . . . . . . . . . . . . . 5
Current assets - discontinued operations . . . . . . . . . . . . . . . . . . . . . . . . . . . . . . . . . . . . . . . . . . . . . . . . . . . . . . . . . 19
Property, plant and equipment, net . . . . . . . . . . . . . . . . . . . . . . . . . . . . . . . . . . . . . . . . . . . . . . . . . . . . . . . . . . . . . . . . 590
Intangible assets, net . . . . . . . . . . . . . . . . . . . . . . . . . . . . . . . . . . . . . . . . . . . . . . . . . . . . . . . . . . . . . . . . . . . . . . . . . . . 9
Other non-current assets . . . . . . . . . . . . . . . . . . . . . . . . . . . . . . . . . . . . . . . . . . . . . . . . . . . . . . . . . . . . . . . . . . . . . . . . 4
Non-current assets - discontinued operations . . . . . . . . . . . . . . . . . . . . . . . . . . . . . . . . . . . . . . . . . . . . . . . . . . . . . 603
Current portion of long term debt and capital leases . . . . . . . . . . . . . . . . . . . . . . . . . . . . . . . . . . . . . . . . . . . . . . . . . . 20
Accounts payable . . . . . . . . . . . . . . . . . . . . . . . . . . . . . . . . . . . . . . . . . . . . . . . . . . . . . . . . . . . . . . . . . . . . . . . . . . . . . 27
Other current liabilities . . . . . . . . . . . . . . . . . . . . . . . . . . . . . . . . . . . . . . . . . . . . . . . . . . . . . . . . . . . . . . . . . . . . . . . . . 1
Current liabilities - discontinued operations . . . . . . . . . . . . . . . . . . . . . . . . . . . . . . . . . . . . . . . . . . . . . . . . . . . . . . 48
Long-term debt and capital leases . . . . . . . . . . . . . . . . . . . . . . . . . . . . . . . . . . . . . . . . . . . . . . . . . . . . . . . . . . . . . . . . . 572
Other non-current liabilities . . . . . . . . . . . . . . . . . . . . . . . . . . . . . . . . . . . . . . . . . . . . . . . . . . . . . . . . . . . . . . . . . . . . . 2
Non-current liabilities - discontinued operations . . . . . . . . . . . . . . . . . . . . . . . . . . . . . . . . . . . . . . . . . . . . . . . . . . . $ 574
(a) Represents the Carlsbad project
Sale of Assets to NRG Yield, Inc. Prior to Discontinued Operations
On June 19, 2018, the Company completed the UPMC Thermal Project and received cash consideration from NRG Yieldof $84 million, plus an additional $3 million received at final completion in January 2019.
On March 30, 2018, as part of the Transformation Plan, the Company sold to NRG Yield, Inc. 100% of NRG's interests inBuckthorn Renewables, LLC, which owns a 154 MW construction-stage utility-scale solar generation project, located in Texas.NRG Yield, Inc. paid cash consideration of approximately $42 million, excluding working capital adjustments, and assumednon-recourse debt of $183 million.
On March 27, 2017, the Company sold to NRG Yield, Inc.: (i) a 16% interest in the Agua Caliente solar project,representing ownership of approximately 46 net MW of capacity and (ii) NRG's interests in seven utility-scale solar projectslocated in Utah representing 265 net MW of capacity, which reached commercial operations. NRG Yield, Inc. paid cashconsideration of $130 million, plus $1 million in working capital adjustments, and assumed non-recourse debt of $328 million.
110
GenOn
On June 14, 2017, the GenOn Entities filed voluntary petitions for relief under Chapter 11 of the Bankruptcy Code in theBankruptcy Court. As a result of the bankruptcy filings, NRG concluded that it no longer controlled GenOn as it was subject tothe control of the Bankruptcy Court; and, accordingly, NRG deconsolidated GenOn and its subsidiaries for financial reportingpurposes as of such date.
By eliminating a large portion of its operations in the PJM market with the deconsolidation of GenOn, NRG concludedthat GenOn met the criteria for discontinued operations, as this represented a strategic shift in the business in which NRGoperated. As such, all prior period results for GenOn were reclassified in 2017 as discontinued operations.
Summarized results of discontinued operations were as follows:
Year Ended December 31, (In millions) 2019 2018 2017Operating revenues . . . . . . . . . . . . . . . . . . . . . . . . . . . . . . . . . . . . . . . . . . . . . . . $ — $ — $ 646
Operating costs and expenses . . . . . . . . . . . . . . . . . . . . . . . . . . . . . . . . . . . . . . . — — (702)
Other expenses . . . . . . . . . . . . . . . . . . . . . . . . . . . . . . . . . . . . . . . . . . . . . . . . . . . — — (98)
Loss from operations of discontinued components, before tax . . . . . . . . . . . . . . — — (154)
Income tax expense . . . . . . . . . . . . . . . . . . . . . . . . . . . . . . . . . . . . . . . . . . . . . . . — — 9
Loss from discontinued operations . . . . . . . . . . . . . . . . . . . . . . . . . . . . . . . . . — — (163)
Interest income - affiliate . . . . . . . . . . . . . . . . . . . . . . . . . . . . . . . . . . . . . . . . . . . — 3 8
Income/(loss) from discontinued operations, net of tax . . . . . . . . . . . . . . . . . — 3 (155)
Pre-tax loss on deconsolidation . . . . . . . . . . . . . . . . . . . . . . . . . . . . . . . . . . . . . . — — (208)
Settlement consideration, insurance and services credit . . . . . . . . . . . . . . . . . . . — 63 (289)
Pension and post-retirement liability assumption . . . . . . . . . . . . . . . . . . . . . . . . — 21 (131)
Other . . . . . . . . . . . . . . . . . . . . . . . . . . . . . . . . . . . . . . . . . . . . . . . . . . . . . . . . . . (3) (53) (6)
(Loss)/income on disposal of discontinued operations, net of tax . . . . . . . . . (3) 31 (634)
(Loss)/income from discontinued operations, net of tax . . . . . . . . . . . . . . . . $ (3) $ 34 $ (789)
GenOn Settlement and Plan Confirmation
Effective July 16, 2018, NRG and GenOn consummated the GenOn Settlement whereby the Company paid GenOnapproximately $125 million, which included (i) the settlement consideration of $261 million, (ii) the transition services credit of$28 million and (iii) the return of $15 million of collateral posted to NRG; offset by the (i) $151 million in borrowings underthe intercompany secured revolving credit facility, (ii) related accrued interest and fees of $12 million, (iii) remaining paymentsdue under the transition services agreement of $10 million, (iv) $4 million reduction of the settlement payment related to NRGassigning to GenOn approximately $8 million of historical claims against REMA and (v) certain other balances due to NRGtotaling $2 million.
GenOn's plan of reorganization was confirmed on December 14, 2018. Pursuant to the confirmed plan, NRG retained thepension liability for GenOn employees for service provided prior to the completion of the reorganization. NRG also retained theliability for GenOn's post-employment and retiree health and welfare benefits. As a result of GenOn's emergence frombankruptcy, NRG took a deduction for GenOn tax losses of $9.5 billion, including a worthless stock deduction.
Other than those obligations which survive or are independent of the releases described herein, the GenOn Settlement andthe GenOn Chapter 11 plan provide NRG releases from GenOn and each of its debtor and non-debtor subsidiaries.
REMA Plan of Reorganization
On October 16, 2018, REMA and its subsidiaries filed voluntary petitions for chapter 11 relief and a prepackaged plan ofreorganization in the United States Bankruptcy Court for the Southern District of Texas. The REMA debtors' plan ofreorganization has been formally accepted by REMA's voting creditors and is consistent with the releases NRG received underthe GenOn Settlement and the GenOn plan.
111
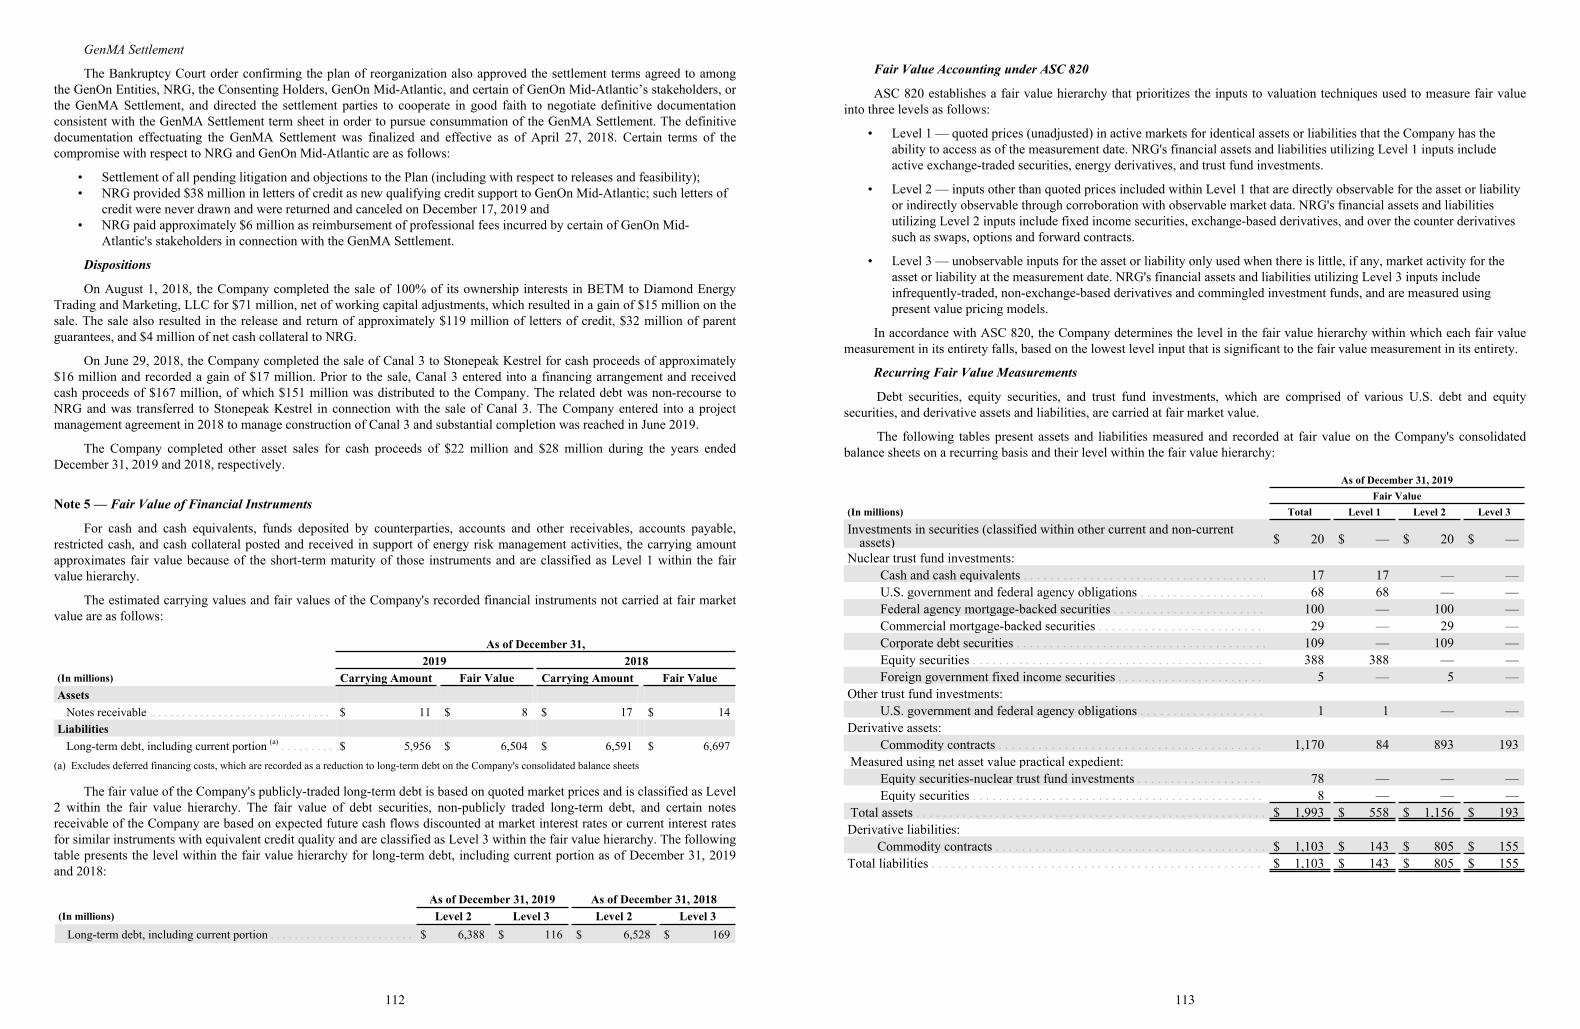
GenMA Settlement
The Bankruptcy Court order confirming the plan of reorganization also approved the settlement terms agreed to amongthe GenOn Entities, NRG, the Consenting Holders, GenOn Mid-Atlantic, and certain of GenOn Mid-Atlantic’s stakeholders, orthe GenMA Settlement, and directed the settlement parties to cooperate in good faith to negotiate definitive documentationconsistent with the GenMA Settlement term sheet in order to pursue consummation of the GenMA Settlement. The definitivedocumentation effectuating the GenMA Settlement was finalized and effective as of April 27, 2018. Certain terms of thecompromise with respect to NRG and GenOn Mid-Atlantic are as follows:
• Settlement of all pending litigation and objections to the Plan (including with respect to releases and feasibility);• NRG provided $38 million in letters of credit as new qualifying credit support to GenOn Mid-Atlantic; such letters of
credit were never drawn and were returned and canceled on December 17, 2019 and• NRG paid approximately $6 million as reimbursement of professional fees incurred by certain of GenOn Mid-
Atlantic's stakeholders in connection with the GenMA Settlement.
Dispositions
On August 1, 2018, the Company completed the sale of 100% of its ownership interests in BETM to Diamond EnergyTrading and Marketing, LLC for $71 million, net of working capital adjustments, which resulted in a gain of $15 million on thesale. The sale also resulted in the release and return of approximately $119 million of letters of credit, $32 million of parentguarantees, and $4 million of net cash collateral to NRG.
On June 29, 2018, the Company completed the sale of Canal 3 to Stonepeak Kestrel for cash proceeds of approximately$16 million and recorded a gain of $17 million. Prior to the sale, Canal 3 entered into a financing arrangement and receivedcash proceeds of $167 million, of which $151 million was distributed to the Company. The related debt was non-recourse toNRG and was transferred to Stonepeak Kestrel in connection with the sale of Canal 3. The Company entered into a projectmanagement agreement in 2018 to manage construction of Canal 3 and substantial completion was reached in June 2019.
The Company completed other asset sales for cash proceeds of $22 million and $28 million during the years endedDecember 31, 2019 and 2018, respectively.
Note 5 — Fair Value of Financial Instruments
For cash and cash equivalents, funds deposited by counterparties, accounts and other receivables, accounts payable,restricted cash, and cash collateral posted and received in support of energy risk management activities, the carrying amountapproximates fair value because of the short-term maturity of those instruments and are classified as Level 1 within the fairvalue hierarchy.
The estimated carrying values and fair values of the Company's recorded financial instruments not carried at fair marketvalue are as follows:
As of December 31,2019 2018
(In millions) Carrying Amount Fair Value Carrying Amount Fair ValueAssets
Notes receivable . . . . . . . . . . . . . . . . . . . . . . . . . . . . . . $ 11 $ 8 $ 17 $ 14Liabilities
Long-term debt, including current portion (a) . . . . . . . . . $ 5,956 $ 6,504 $ 6,591 $ 6,697(a) Excludes deferred financing costs, which are recorded as a reduction to long-term debt on the Company's consolidated balance sheets
The fair value of the Company's publicly-traded long-term debt is based on quoted market prices and is classified as Level2 within the fair value hierarchy. The fair value of debt securities, non-publicly traded long-term debt, and certain notesreceivable of the Company are based on expected future cash flows discounted at market interest rates or current interest ratesfor similar instruments with equivalent credit quality and are classified as Level 3 within the fair value hierarchy. The followingtable presents the level within the fair value hierarchy for long-term debt, including current portion as of December 31, 2019and 2018:
As of December 31, 2019 As of December 31, 2018(In millions) Level 2 Level 3 Level 2 Level 3
Long-term debt, including current portion . . . . . . . . . . . . . . . . . . . . . . . . $ 6,388 $ 116 $ 6,528 $ 169
112
Fair Value Accounting under ASC 820
ASC 820 establishes a fair value hierarchy that prioritizes the inputs to valuation techniques used to measure fair valueinto three levels as follows:
• Level 1 — quoted prices (unadjusted) in active markets for identical assets or liabilities that the Company has the ability to access as of the measurement date. NRG's financial assets and liabilities utilizing Level 1 inputs include active exchange-traded securities, energy derivatives, and trust fund investments.
• Level 2 — inputs other than quoted prices included within Level 1 that are directly observable for the asset or liability or indirectly observable through corroboration with observable market data. NRG's financial assets and liabilities utilizing Level 2 inputs include fixed income securities, exchange-based derivatives, and over the counter derivatives such as swaps, options and forward contracts.
• Level 3 — unobservable inputs for the asset or liability only used when there is little, if any, market activity for the asset or liability at the measurement date. NRG's financial assets and liabilities utilizing Level 3 inputs include infrequently-traded, non-exchange-based derivatives and commingled investment funds, and are measured using present value pricing models.
In accordance with ASC 820, the Company determines the level in the fair value hierarchy within which each fair valuemeasurement in its entirety falls, based on the lowest level input that is significant to the fair value measurement in its entirety.
Recurring Fair Value Measurements
Debt securities, equity securities, and trust fund investments, which are comprised of various U.S. debt and equitysecurities, and derivative assets and liabilities, are carried at fair market value.
The following tables present assets and liabilities measured and recorded at fair value on the Company's consolidatedbalance sheets on a recurring basis and their level within the fair value hierarchy:
As of December 31, 2019Fair Value
(In millions) Total Level 1 Level 2 Level 3
Investments in securities (classified within other current and non-current assets) $ 20 $ — $ 20 $ —
Nuclear trust fund investments:Cash and cash equivalents . . . . . . . . . . . . . . . . . . . . . . . . . . . . . . . . . . . . . 17 17 — —U.S. government and federal agency obligations . . . . . . . . . . . . . . . . . . . 68 68 — —Federal agency mortgage-backed securities . . . . . . . . . . . . . . . . . . . . . . . 100 — 100 —Commercial mortgage-backed securities . . . . . . . . . . . . . . . . . . . . . . . . . 29 — 29 —Corporate debt securities . . . . . . . . . . . . . . . . . . . . . . . . . . . . . . . . . . . . . . 109 — 109 —Equity securities . . . . . . . . . . . . . . . . . . . . . . . . . . . . . . . . . . . . . . . . . . . . 388 388 — —Foreign government fixed income securities . . . . . . . . . . . . . . . . . . . . . . 5 — 5 —
Other trust fund investments:U.S. government and federal agency obligations . . . . . . . . . . . . . . . . . . . 1 1 — —
Derivative assets:Commodity contracts . . . . . . . . . . . . . . . . . . . . . . . . . . . . . . . . . . . . . . . . 1,170 84 893 193
Measured using net asset value practical expedient:Equity securities-nuclear trust fund investments . . . . . . . . . . . . . . . . . . . 78 — — —Equity securities . . . . . . . . . . . . . . . . . . . . . . . . . . . . . . . . . . . . . . . . . . . . 8 — — —
Total assets . . . . . . . . . . . . . . . . . . . . . . . . . . . . . . . . . . . . . . . . . . . . . . . . . . . . . $ 1,993 $ 558 $ 1,156 $ 193Derivative liabilities:
Commodity contracts . . . . . . . . . . . . . . . . . . . . . . . . . . . . . . . . . . . . . . . . . $ 1,103 $ 143 $ 805 $ 155Total liabilities . . . . . . . . . . . . . . . . . . . . . . . . . . . . . . . . . . . . . . . . . . . . . . . . . . $ 1,103 $ 143 $ 805 $ 155
1,993 1,156
113
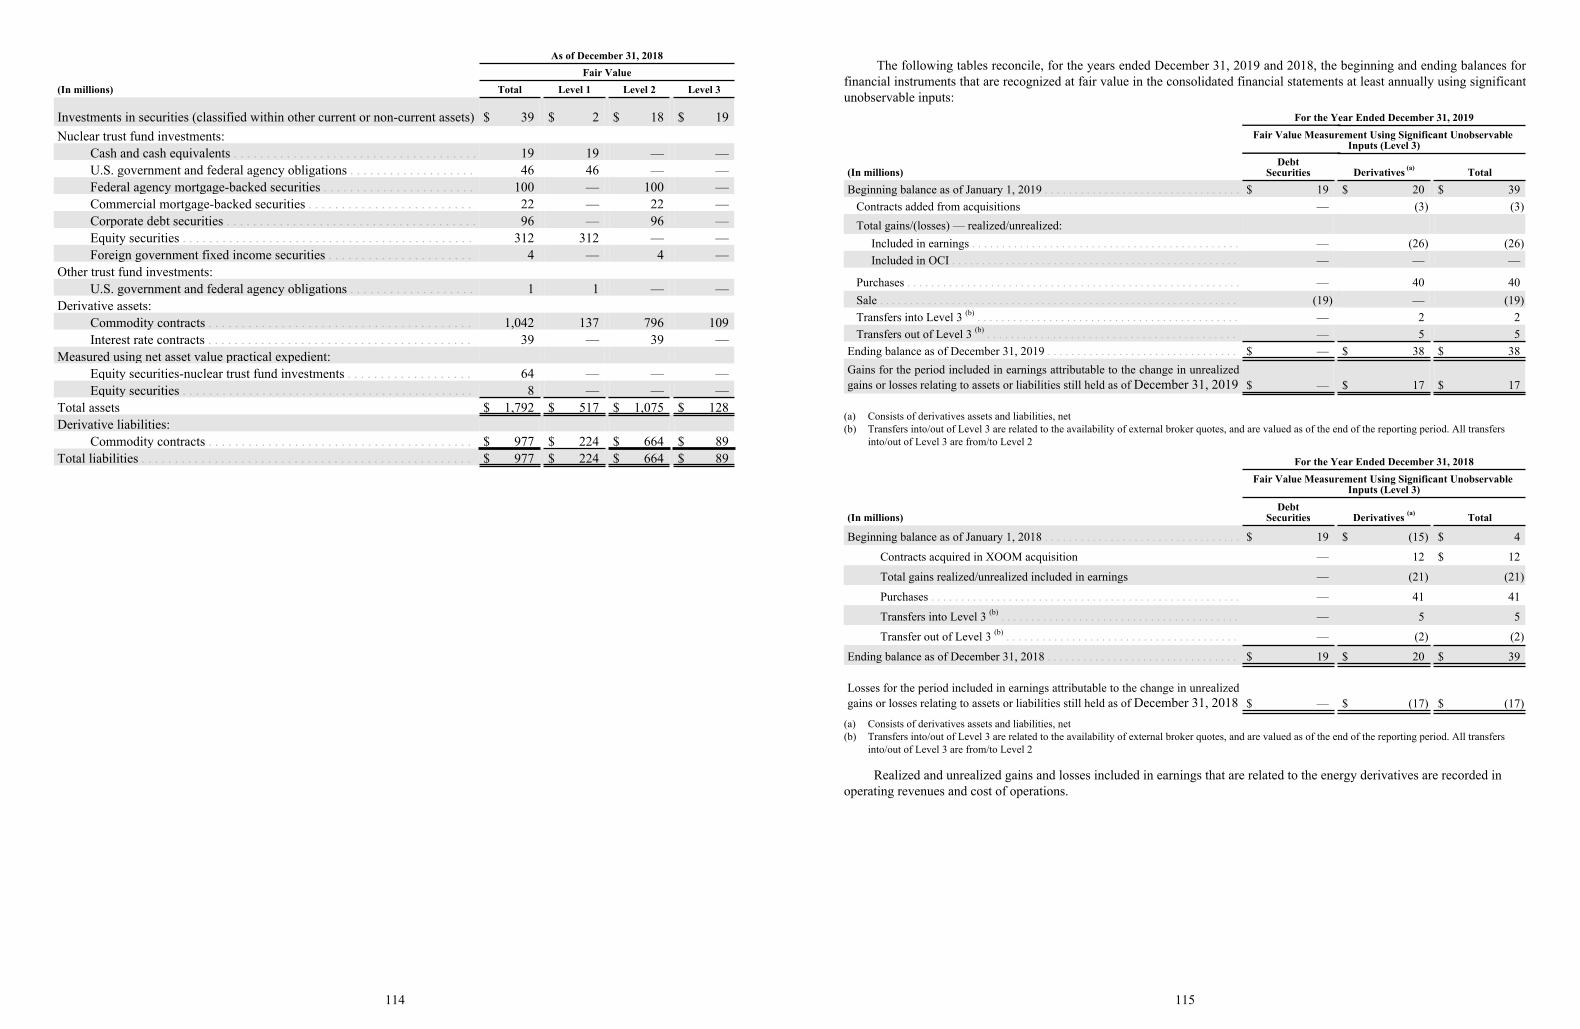
As of December 31, 2018Fair Value
(In millions) Total Level 1 Level 2 Level 3
Investments in securities (classified within other current or non-current assets) $ 39 $ 2 $ 18 $ 19Nuclear trust fund investments:
Cash and cash equivalents . . . . . . . . . . . . . . . . . . . . . . . . . . . . . . . . . . . . . 19 19 — —U.S. government and federal agency obligations . . . . . . . . . . . . . . . . . . . 46 46 — —Federal agency mortgage-backed securities . . . . . . . . . . . . . . . . . . . . . . . 100 — 100 —Commercial mortgage-backed securities . . . . . . . . . . . . . . . . . . . . . . . . . 22 — 22 —Corporate debt securities . . . . . . . . . . . . . . . . . . . . . . . . . . . . . . . . . . . . . . 96 — 96 —Equity securities . . . . . . . . . . . . . . . . . . . . . . . . . . . . . . . . . . . . . . . . . . . . 312 312 — —Foreign government fixed income securities . . . . . . . . . . . . . . . . . . . . . . 4 — 4 —
Other trust fund investments:U.S. government and federal agency obligations . . . . . . . . . . . . . . . . . . . 1 1 — —
Derivative assets:Commodity contracts . . . . . . . . . . . . . . . . . . . . . . . . . . . . . . . . . . . . . . . . 1,042 137 796 109Interest rate contracts . . . . . . . . . . . . . . . . . . . . . . . . . . . . . . . . . . . . . . . . 39 — 39 —
Measured using net asset value practical expedient:Equity securities-nuclear trust fund investments . . . . . . . . . . . . . . . . . . . 64 — — —Equity securities . . . . . . . . . . . . . . . . . . . . . . . . . . . . . . . . . . . . . . . . . . . . 8 — — —
Total assets $ 1,792 $ 517 $ 1,075 $ 128Derivative liabilities:
Commodity contracts . . . . . . . . . . . . . . . . . . . . . . . . . . . . . . . . . . . . . . . . $ 977 $ 224 $ 664 $ 89Total liabilities . . . . . . . . . . . . . . . . . . . . . . . . . . . . . . . . . . . . . . . . . . . . . . . . . . $ 977 $ 224 $ 664 $ 89
1,792 1,075
114
The following tables reconcile, for the years ended December 31, 2019 and 2018, the beginning and ending balances forfinancial instruments that are recognized at fair value in the consolidated financial statements at least annually using significantunobservable inputs:
For the Year Ended December 31, 2019Fair Value Measurement Using Significant Unobservable
Inputs (Level 3)
(In millions)Debt
Securities Derivatives (a) TotalBeginning balance as of January 1, 2019 . . . . . . . . . . . . . . . . . . . . . . . . . . . . . . . . . $ 19 $ 20 $ 39
Contracts added from acquisitions — (3) (3)Total gains/(losses) — realized/unrealized:
Included in earnings . . . . . . . . . . . . . . . . . . . . . . . . . . . . . . . . . . . . . . . . . . . . . — (26) (26)Included in OCI . . . . . . . . . . . . . . . . . . . . . . . . . . . . . . . . . . . . . . . . . . . . . . . . — — —
Purchases . . . . . . . . . . . . . . . . . . . . . . . . . . . . . . . . . . . . . . . . . . . . . . . . . . . . . . . . — 40 40Sale . . . . . . . . . . . . . . . . . . . . . . . . . . . . . . . . . . . . . . . . . . . . . . . . . . . . . . . . . . . . (19) — (19)Transfers into Level 3 (b) . . . . . . . . . . . . . . . . . . . . . . . . . . . . . . . . . . . . . . . . . . . . — 2 2Transfers out of Level 3 (b) . . . . . . . . . . . . . . . . . . . . . . . . . . . . . . . . . . . . . . . . . . — 5 5
Ending balance as of December 31, 2019 . . . . . . . . . . . . . . . . . . . . . . . . . . . . . . . . $ — $ 38 $ 38Gains for the period included in earnings attributable to the change in unrealizedgains or losses relating to assets or liabilities still held as of December 31, 2019 $ — $ 17 $ 17
(a) Consists of derivatives assets and liabilities, net(b) Transfers into/out of Level 3 are related to the availability of external broker quotes, and are valued as of the end of the reporting period. All transfers
into/out of Level 3 are from/to Level 2
For the Year Ended December 31, 2018Fair Value Measurement Using Significant Unobservable
Inputs (Level 3)
(In millions)Debt
Securities Derivatives (a) Total
Beginning balance as of January 1, 2018 . . . . . . . . . . . . . . . . . . . . . . . . . . . . . . . . . $ 19 $ (15) $ 4
Contracts acquired in XOOM acquisition — 12 $ 12
Total gains realized/unrealized included in earnings — (21) (21)
Purchases . . . . . . . . . . . . . . . . . . . . . . . . . . . . . . . . . . . . . . . . . . . . . . . . . . . . — 41 41
Transfers into Level 3 (b) . . . . . . . . . . . . . . . . . . . . . . . . . . . . . . . . . . . . . . . . — 5 5
Transfer out of Level 3 (b) . . . . . . . . . . . . . . . . . . . . . . . . . . . . . . . . . . . . . . . — (2) (2)
Ending balance as of December 31, 2018 . . . . . . . . . . . . . . . . . . . . . . . . . . . . . . . . $ 19 $ 20 $ 39
Losses for the period included in earnings attributable to the change in unrealizedgains or losses relating to assets or liabilities still held as of December 31, 2018 $ — $ (17) $ (17)
(a) Consists of derivatives assets and liabilities, net(b) Transfers into/out of Level 3 are related to the availability of external broker quotes, and are valued as of the end of the reporting period. All transfers
into/out of Level 3 are from/to Level 2
Realized and unrealized gains and losses included in earnings that are related to the energy derivatives are recorded in operating revenues and cost of operations.
115
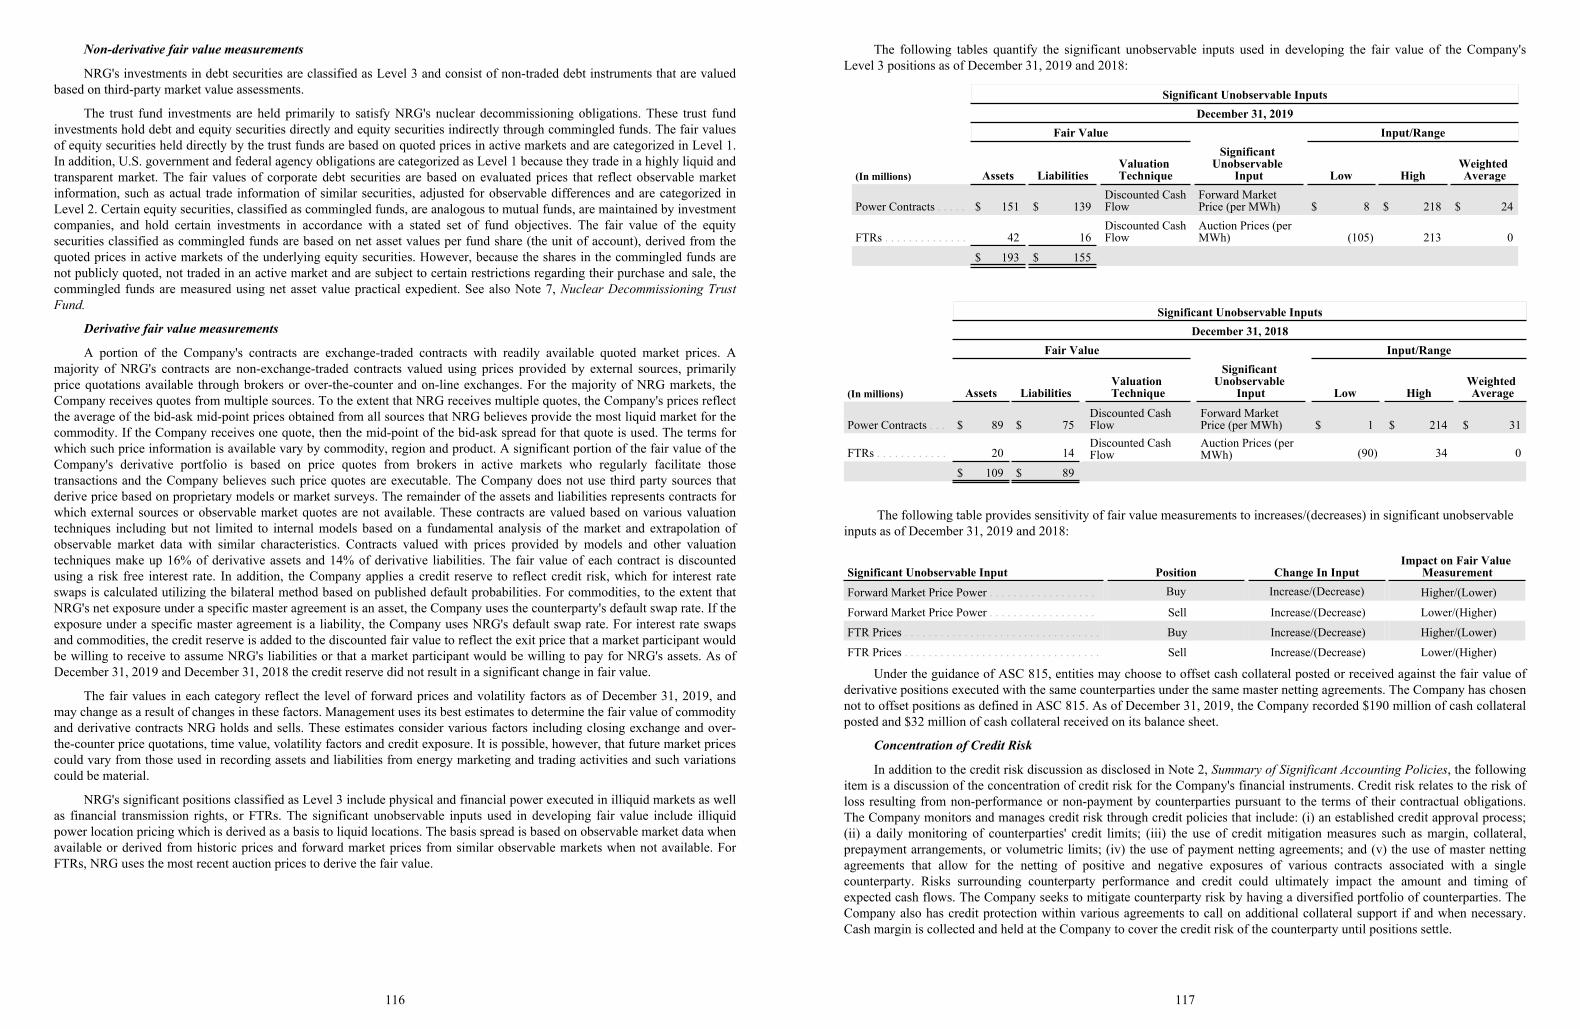
Non-derivative fair value measurements
NRG's investments in debt securities are classified as Level 3 and consist of non-traded debt instruments that are valuedbased on third-party market value assessments.
The trust fund investments are held primarily to satisfy NRG's nuclear decommissioning obligations. These trust fundinvestments hold debt and equity securities directly and equity securities indirectly through commingled funds. The fair valuesof equity securities held directly by the trust funds are based on quoted prices in active markets and are categorized in Level 1.In addition, U.S. government and federal agency obligations are categorized as Level 1 because they trade in a highly liquid andtransparent market. The fair values of corporate debt securities are based on evaluated prices that reflect observable marketinformation, such as actual trade information of similar securities, adjusted for observable differences and are categorized inLevel 2. Certain equity securities, classified as commingled funds, are analogous to mutual funds, are maintained by investmentcompanies, and hold certain investments in accordance with a stated set of fund objectives. The fair value of the equitysecurities classified as commingled funds are based on net asset values per fund share (the unit of account), derived from thequoted prices in active markets of the underlying equity securities. However, because the shares in the commingled funds arenot publicly quoted, not traded in an active market and are subject to certain restrictions regarding their purchase and sale, thecommingled funds are measured using net asset value practical expedient. See also Note 7, Nuclear Decommissioning TrustFund.
Derivative fair value measurements
A portion of the Company's contracts are exchange-traded contracts with readily available quoted market prices. Amajority of NRG's contracts are non-exchange-traded contracts valued using prices provided by external sources, primarilyprice quotations available through brokers or over-the-counter and on-line exchanges. For the majority of NRG markets, theCompany receives quotes from multiple sources. To the extent that NRG receives multiple quotes, the Company's prices reflectthe average of the bid-ask mid-point prices obtained from all sources that NRG believes provide the most liquid market for thecommodity. If the Company receives one quote, then the mid-point of the bid-ask spread for that quote is used. The terms forwhich such price information is available vary by commodity, region and product. A significant portion of the fair value of theCompany's derivative portfolio is based on price quotes from brokers in active markets who regularly facilitate thosetransactions and the Company believes such price quotes are executable. The Company does not use third party sources thatderive price based on proprietary models or market surveys. The remainder of the assets and liabilities represents contracts forwhich external sources or observable market quotes are not available. These contracts are valued based on various valuationtechniques including but not limited to internal models based on a fundamental analysis of the market and extrapolation ofobservable market data with similar characteristics. Contracts valued with prices provided by models and other valuationtechniques make up 16% of derivative assets and 14% of derivative liabilities. The fair value of each contract is discountedusing a risk free interest rate. In addition, the Company applies a credit reserve to reflect credit risk, which for interest rateswaps is calculated utilizing the bilateral method based on published default probabilities. For commodities, to the extent thatNRG's net exposure under a specific master agreement is an asset, the Company uses the counterparty's default swap rate. If theexposure under a specific master agreement is a liability, the Company uses NRG's default swap rate. For interest rate swapsand commodities, the credit reserve is added to the discounted fair value to reflect the exit price that a market participant wouldbe willing to receive to assume NRG's liabilities or that a market participant would be willing to pay for NRG's assets. As ofDecember 31, 2019 and December 31, 2018 the credit reserve did not result in a significant change in fair value.
The fair values in each category reflect the level of forward prices and volatility factors as of December 31, 2019, andmay change as a result of changes in these factors. Management uses its best estimates to determine the fair value of commodityand derivative contracts NRG holds and sells. These estimates consider various factors including closing exchange and over-the-counter price quotations, time value, volatility factors and credit exposure. It is possible, however, that future market pricescould vary from those used in recording assets and liabilities from energy marketing and trading activities and such variationscould be material.
NRG's significant positions classified as Level 3 include physical and financial power executed in illiquid markets as wellas financial transmission rights, or FTRs. The significant unobservable inputs used in developing fair value include illiquidpower location pricing which is derived as a basis to liquid locations. The basis spread is based on observable market data whenavailable or derived from historic prices and forward market prices from similar observable markets when not available. ForFTRs, NRG uses the most recent auction prices to derive the fair value.
116
The following tables quantify the significant unobservable inputs used in developing the fair value of the Company'sLevel 3 positions as of December 31, 2019 and 2018:
Significant Unobservable InputsDecember 31, 2019
Fair Value Input/Range
(In millions) Assets LiabilitiesValuation Technique
Significant Unobservable
Input Low HighWeighted Average
Power Contracts . . . . . $ 151 $ 139Discounted Cash Flow
Forward Market Price (per MWh) $ 8 $ 218 $ 24
FTRs . . . . . . . . . . . . . . 42 16Discounted Cash Flow
Auction Prices (per MWh) (105) 213 0
$ 193 $ 155
Significant Unobservable InputsDecember 31, 2018
Fair Value Input/Range
(In millions) Assets LiabilitiesValuation Technique
Significant Unobservable
Input Low HighWeighted Average
Power Contracts . . . $ 89 $ 75Discounted Cash Flow
Forward Market Price (per MWh) $ 1 $ 214 $ 31
FTRs . . . . . . . . . . . . 20 14Discounted Cash Flow
Auction Prices (per MWh) (90) 34 0
$ 109 $ 89
The following table provides sensitivity of fair value measurements to increases/(decreases) in significant unobservable inputs as of December 31, 2019 and 2018:
Significant Unobservable Input Position Change In InputImpact on Fair Value
Measurement
Forward Market Price Power . . . . . . . . . . . . . . . . . . Buy Increase/(Decrease) Higher/(Lower)
Forward Market Price Power . . . . . . . . . . . . . . . . . . Sell Increase/(Decrease) Lower/(Higher)
FTR Prices . . . . . . . . . . . . . . . . . . . . . . . . . . . . . . . . . Buy Increase/(Decrease) Higher/(Lower)
FTR Prices . . . . . . . . . . . . . . . . . . . . . . . . . . . . . . . . . Sell Increase/(Decrease) Lower/(Higher)
Under the guidance of ASC 815, entities may choose to offset cash collateral posted or received against the fair value ofderivative positions executed with the same counterparties under the same master netting agreements. The Company has chosennot to offset positions as defined in ASC 815. As of December 31, 2019, the Company recorded $190 million of cash collateralposted and $32 million of cash collateral received on its balance sheet.
Concentration of Credit Risk
In addition to the credit risk discussion as disclosed in Note 2, Summary of Significant Accounting Policies, the followingitem is a discussion of the concentration of credit risk for the Company's financial instruments. Credit risk relates to the risk ofloss resulting from non-performance or non-payment by counterparties pursuant to the terms of their contractual obligations.The Company monitors and manages credit risk through credit policies that include: (i) an established credit approval process;(ii) a daily monitoring of counterparties' credit limits; (iii) the use of credit mitigation measures such as margin, collateral,prepayment arrangements, or volumetric limits; (iv) the use of payment netting agreements; and (v) the use of master nettingagreements that allow for the netting of positive and negative exposures of various contracts associated with a singlecounterparty. Risks surrounding counterparty performance and credit could ultimately impact the amount and timing ofexpected cash flows. The Company seeks to mitigate counterparty risk by having a diversified portfolio of counterparties. TheCompany also has credit protection within various agreements to call on additional collateral support if and when necessary.Cash margin is collected and held at the Company to cover the credit risk of the counterparty until positions settle.
117
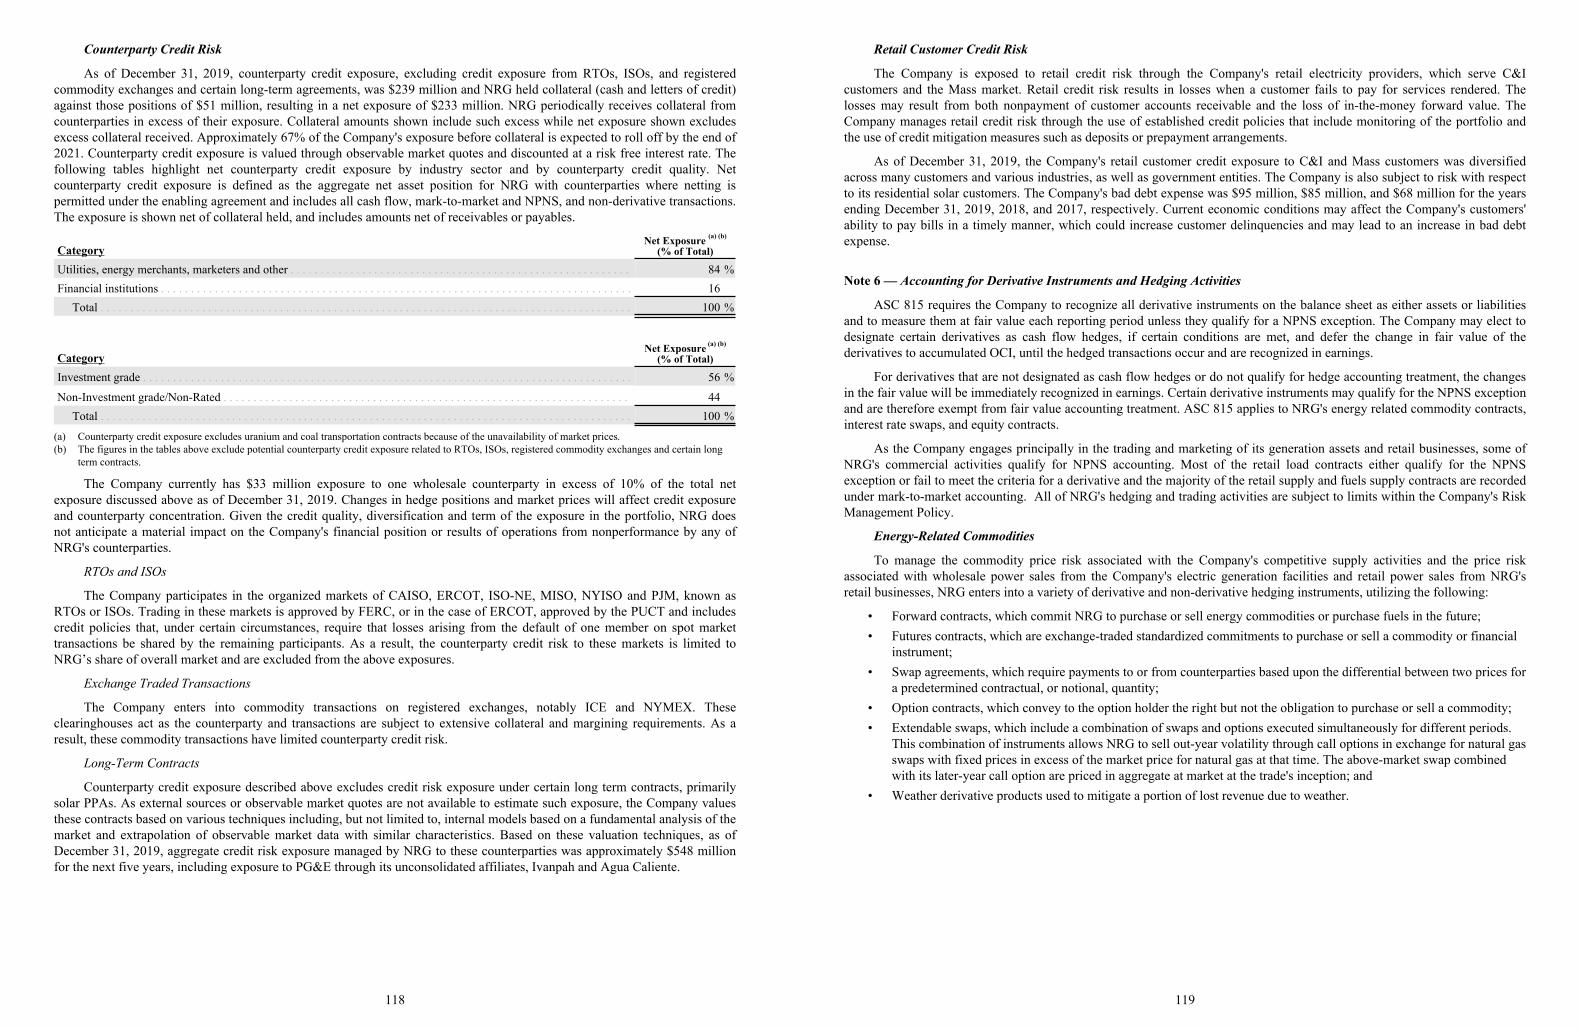
Counterparty Credit Risk
As of December 31, 2019, counterparty credit exposure, excluding credit exposure from RTOs, ISOs, and registeredcommodity exchanges and certain long-term agreements, was $239 million and NRG held collateral (cash and letters of credit)against those positions of $51 million, resulting in a net exposure of $233 million. NRG periodically receives collateral fromcounterparties in excess of their exposure. Collateral amounts shown include such excess while net exposure shown excludesexcess collateral received. Approximately 67% of the Company's exposure before collateral is expected to roll off by the end of2021. Counterparty credit exposure is valued through observable market quotes and discounted at a risk free interest rate. Thefollowing tables highlight net counterparty credit exposure by industry sector and by counterparty credit quality. Netcounterparty credit exposure is defined as the aggregate net asset position for NRG with counterparties where netting ispermitted under the enabling agreement and includes all cash flow, mark-to-market and NPNS, and non-derivative transactions.The exposure is shown net of collateral held, and includes amounts net of receivables or payables.
CategoryNet Exposure (a) (b)
(% of Total)
Utilities, energy merchants, marketers and other . . . . . . . . . . . . . . . . . . . . . . . . . . . . . . . . . . . . . . . . . . . . . . . . . . . . . . . . . 84 %Financial institutions . . . . . . . . . . . . . . . . . . . . . . . . . . . . . . . . . . . . . . . . . . . . . . . . . . . . . . . . . . . . . . . . . . . . . . . . . . . . . . . 16
Total . . . . . . . . . . . . . . . . . . . . . . . . . . . . . . . . . . . . . . . . . . . . . . . . . . . . . . . . . . . . . . . . . . . . . . . . . . . . . . . . . . . . . . . . . 100 %
CategoryNet Exposure (a) (b)
(% of Total)
Investment grade . . . . . . . . . . . . . . . . . . . . . . . . . . . . . . . . . . . . . . . . . . . . . . . . . . . . . . . . . . . . . . . . . . . . . . . . . . . . . . . . . . 56 %
Non-Investment grade/Non-Rated . . . . . . . . . . . . . . . . . . . . . . . . . . . . . . . . . . . . . . . . . . . . . . . . . . . . . . . . . . . . . . . . . . . . 44Total . . . . . . . . . . . . . . . . . . . . . . . . . . . . . . . . . . . . . . . . . . . . . . . . . . . . . . . . . . . . . . . . . . . . . . . . . . . . . . . . . . . . . . . . . 100 %
(a) Counterparty credit exposure excludes uranium and coal transportation contracts because of the unavailability of market prices.(b) The figures in the tables above exclude potential counterparty credit exposure related to RTOs, ISOs, registered commodity exchanges and certain long
term contracts.
The Company currently has $33 million exposure to one wholesale counterparty in excess of 10% of the total netexposure discussed above as of December 31, 2019. Changes in hedge positions and market prices will affect credit exposureand counterparty concentration. Given the credit quality, diversification and term of the exposure in the portfolio, NRG doesnot anticipate a material impact on the Company's financial position or results of operations from nonperformance by any ofNRG's counterparties.
RTOs and ISOs
The Company participates in the organized markets of CAISO, ERCOT, ISO-NE, MISO, NYISO and PJM, known asRTOs or ISOs. Trading in these markets is approved by FERC, or in the case of ERCOT, approved by the PUCT and includescredit policies that, under certain circumstances, require that losses arising from the default of one member on spot markettransactions be shared by the remaining participants. As a result, the counterparty credit risk to these markets is limited toNRG’s share of overall market and are excluded from the above exposures.
Exchange Traded Transactions
The Company enters into commodity transactions on registered exchanges, notably ICE and NYMEX. Theseclearinghouses act as the counterparty and transactions are subject to extensive collateral and margining requirements. As aresult, these commodity transactions have limited counterparty credit risk.
Long-Term Contracts
Counterparty credit exposure described above excludes credit risk exposure under certain long term contracts, primarilysolar PPAs. As external sources or observable market quotes are not available to estimate such exposure, the Company valuesthese contracts based on various techniques including, but not limited to, internal models based on a fundamental analysis of themarket and extrapolation of observable market data with similar characteristics. Based on these valuation techniques, as ofDecember 31, 2019, aggregate credit risk exposure managed by NRG to these counterparties was approximately $548 millionfor the next five years, including exposure to PG&E through its unconsolidated affiliates, Ivanpah and Agua Caliente.
118
Retail Customer Credit Risk
The Company is exposed to retail credit risk through the Company's retail electricity providers, which serve C&Icustomers and the Mass market. Retail credit risk results in losses when a customer fails to pay for services rendered. Thelosses may result from both nonpayment of customer accounts receivable and the loss of in-the-money forward value. TheCompany manages retail credit risk through the use of established credit policies that include monitoring of the portfolio andthe use of credit mitigation measures such as deposits or prepayment arrangements.
As of December 31, 2019, the Company's retail customer credit exposure to C&I and Mass customers was diversifiedacross many customers and various industries, as well as government entities. The Company is also subject to risk with respectto its residential solar customers. The Company's bad debt expense was $95 million, $85 million, and $68 million for the yearsending December 31, 2019, 2018, and 2017, respectively. Current economic conditions may affect the Company's customers'ability to pay bills in a timely manner, which could increase customer delinquencies and may lead to an increase in bad debtexpense.
Note 6 — Accounting for Derivative Instruments and Hedging Activities
ASC 815 requires the Company to recognize all derivative instruments on the balance sheet as either assets or liabilitiesand to measure them at fair value each reporting period unless they qualify for a NPNS exception. The Company may elect todesignate certain derivatives as cash flow hedges, if certain conditions are met, and defer the change in fair value of thederivatives to accumulated OCI, until the hedged transactions occur and are recognized in earnings.
For derivatives that are not designated as cash flow hedges or do not qualify for hedge accounting treatment, the changesin the fair value will be immediately recognized in earnings. Certain derivative instruments may qualify for the NPNS exceptionand are therefore exempt from fair value accounting treatment. ASC 815 applies to NRG's energy related commodity contracts,interest rate swaps, and equity contracts.
As the Company engages principally in the trading and marketing of its generation assets and retail businesses, some ofNRG's commercial activities qualify for NPNS accounting. Most of the retail load contracts either qualify for the NPNSexception or fail to meet the criteria for a derivative and the majority of the retail supply and fuels supply contracts are recordedunder mark-to-market accounting. All of NRG's hedging and trading activities are subject to limits within the Company's RiskManagement Policy.
Energy-Related Commodities
To manage the commodity price risk associated with the Company's competitive supply activities and the price riskassociated with wholesale power sales from the Company's electric generation facilities and retail power sales from NRG'sretail businesses, NRG enters into a variety of derivative and non-derivative hedging instruments, utilizing the following:
• Forward contracts, which commit NRG to purchase or sell energy commodities or purchase fuels in the future;• Futures contracts, which are exchange-traded standardized commitments to purchase or sell a commodity or financial
instrument;• Swap agreements, which require payments to or from counterparties based upon the differential between two prices for
a predetermined contractual, or notional, quantity;• Option contracts, which convey to the option holder the right but not the obligation to purchase or sell a commodity;• Extendable swaps, which include a combination of swaps and options executed simultaneously for different periods.
This combination of instruments allows NRG to sell out-year volatility through call options in exchange for natural gas swaps with fixed prices in excess of the market price for natural gas at that time. The above-market swap combined with its later-year call option are priced in aggregate at market at the trade's inception; and
• Weather derivative products used to mitigate a portion of lost revenue due to weather.
119
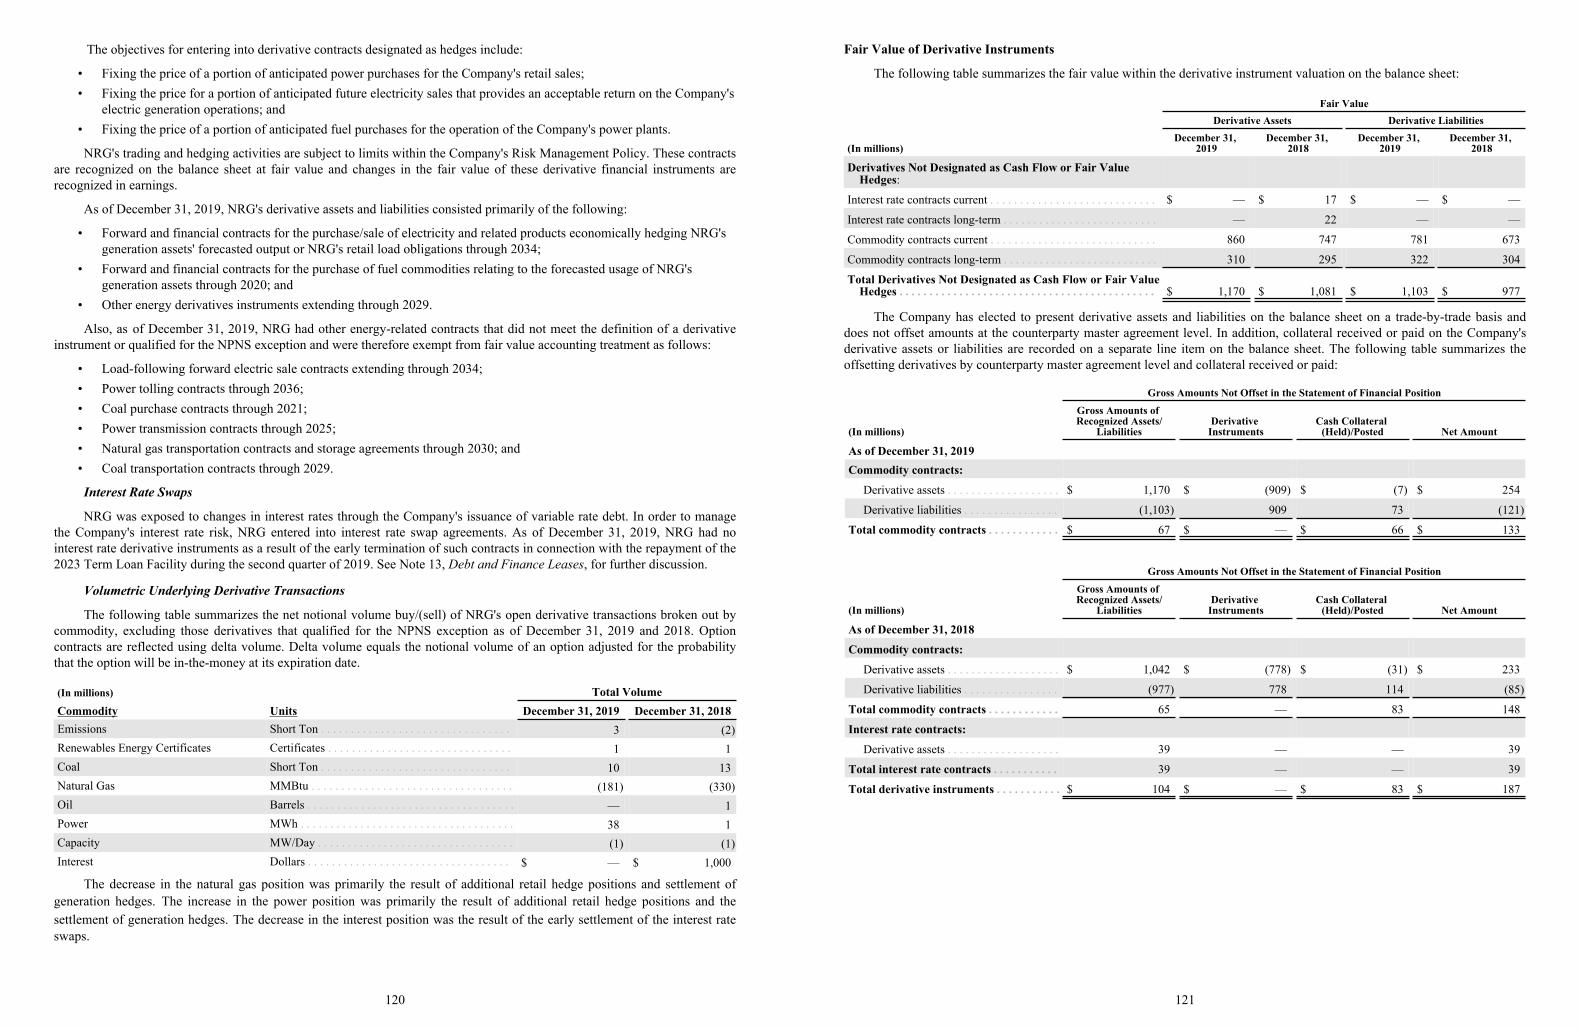
The objectives for entering into derivative contracts designated as hedges include:
• Fixing the price of a portion of anticipated power purchases for the Company's retail sales;• Fixing the price for a portion of anticipated future electricity sales that provides an acceptable return on the Company's
electric generation operations; and• Fixing the price of a portion of anticipated fuel purchases for the operation of the Company's power plants.
NRG's trading and hedging activities are subject to limits within the Company's Risk Management Policy. These contractsare recognized on the balance sheet at fair value and changes in the fair value of these derivative financial instruments arerecognized in earnings.
As of December 31, 2019, NRG's derivative assets and liabilities consisted primarily of the following:
• Forward and financial contracts for the purchase/sale of electricity and related products economically hedging NRG's generation assets' forecasted output or NRG's retail load obligations through 2034;
• Forward and financial contracts for the purchase of fuel commodities relating to the forecasted usage of NRG's generation assets through 2020; and
• Other energy derivatives instruments extending through 2029.
Also, as of December 31, 2019, NRG had other energy-related contracts that did not meet the definition of a derivativeinstrument or qualified for the NPNS exception and were therefore exempt from fair value accounting treatment as follows:
• Load-following forward electric sale contracts extending through 2034;• Power tolling contracts through 2036;• Coal purchase contracts through 2021;• Power transmission contracts through 2025;• Natural gas transportation contracts and storage agreements through 2030; and• Coal transportation contracts through 2029.
Interest Rate Swaps
NRG was exposed to changes in interest rates through the Company's issuance of variable rate debt. In order to managethe Company's interest rate risk, NRG entered into interest rate swap agreements. As of December 31, 2019, NRG had nointerest rate derivative instruments as a result of the early termination of such contracts in connection with the repayment of the2023 Term Loan Facility during the second quarter of 2019. See Note 13, Debt and Finance Leases, for further discussion.
Volumetric Underlying Derivative Transactions
The following table summarizes the net notional volume buy/(sell) of NRG's open derivative transactions broken out bycommodity, excluding those derivatives that qualified for the NPNS exception as of December 31, 2019 and 2018. Optioncontracts are reflected using delta volume. Delta volume equals the notional volume of an option adjusted for the probabilitythat the option will be in-the-money at its expiration date.
(In millions) Total VolumeCommodity Units December 31, 2019 December 31, 2018Emissions Short Ton . . . . . . . . . . . . . . . . . . . . . . . . . . . . . . . . 3 (2)Renewables Energy Certificates Certificates . . . . . . . . . . . . . . . . . . . . . . . . . . . . . . . 1 1Coal Short Ton . . . . . . . . . . . . . . . . . . . . . . . . . . . . . . . . 10 13Natural Gas MMBtu . . . . . . . . . . . . . . . . . . . . . . . . . . . . . . . . . . (181) (330)Oil Barrels . . . . . . . . . . . . . . . . . . . . . . . . . . . . . . . . . . . — 1Power MWh . . . . . . . . . . . . . . . . . . . . . . . . . . . . . . . . . . . . 38 1Capacity MW/Day . . . . . . . . . . . . . . . . . . . . . . . . . . . . . . . . . (1) (1)Interest Dollars . . . . . . . . . . . . . . . . . . . . . . . . . . . . . . . . . . $ — $ 1,000
The decrease in the natural gas position was primarily the result of additional retail hedge positions and settlement ofgeneration hedges. The increase in the power position was primarily the result of additional retail hedge positions and thesettlement of generation hedges. The decrease in the interest position was the result of the early settlement of the interest rateswaps.
120
Fair Value of Derivative Instruments
The following table summarizes the fair value within the derivative instrument valuation on the balance sheet:
Fair ValueDerivative Assets Derivative Liabilities
(In millions)December 31,
2019December 31,
2018December 31,
2019December 31,
2018
Derivatives Not Designated as Cash Flow or Fair Value Hedges:
Interest rate contracts current . . . . . . . . . . . . . . . . . . . . . . . . . . . . $ — $ 17 $ — $ —
Interest rate contracts long-term . . . . . . . . . . . . . . . . . . . . . . . . . . — 22 — —
Commodity contracts current . . . . . . . . . . . . . . . . . . . . . . . . . . . . 860 747 781 673
Commodity contracts long-term . . . . . . . . . . . . . . . . . . . . . . . . . . 310 295 322 304
Total Derivatives Not Designated as Cash Flow or Fair Value Hedges . . . . . . . . . . . . . . . . . . . . . . . . . . . . . . . . . . . . . . . . . . . $ 1,170 $ 1,081 $ 1,103 $ 977
The Company has elected to present derivative assets and liabilities on the balance sheet on a trade-by-trade basis anddoes not offset amounts at the counterparty master agreement level. In addition, collateral received or paid on the Company'sderivative assets or liabilities are recorded on a separate line item on the balance sheet. The following table summarizes theoffsetting derivatives by counterparty master agreement level and collateral received or paid:
Gross Amounts Not Offset in the Statement of Financial Position
(In millions)
Gross Amounts of Recognized Assets/
LiabilitiesDerivative
InstrumentsCash Collateral
(Held)/Posted Net Amount
As of December 31, 2019Commodity contracts:
Derivative assets . . . . . . . . . . . . . . . . . . . $ 1,170 $ (909) $ (7) $ 254
Derivative liabilities . . . . . . . . . . . . . . . . (1,103) 909 73 (121)
Total commodity contracts . . . . . . . . . . . . $ 67 $ — $ 66 $ 133
Gross Amounts Not Offset in the Statement of Financial Position
(In millions)
Gross Amounts of Recognized Assets/
LiabilitiesDerivative
InstrumentsCash Collateral
(Held)/Posted Net Amount
As of December 31, 2018
Commodity contracts:
Derivative assets . . . . . . . . . . . . . . . . . . . $ 1,042 $ (778) $ (31) $ 233
Derivative liabilities . . . . . . . . . . . . . . . . (977) 778 114 (85)
Total commodity contracts . . . . . . . . . . . . 65 — 83 148
Interest rate contracts:
Derivative assets . . . . . . . . . . . . . . . . . . . 39 — — 39
Total interest rate contracts . . . . . . . . . . . 39 — — 39
Total derivative instruments . . . . . . . . . . . $ 104 $ — $ 83 $ 187
121
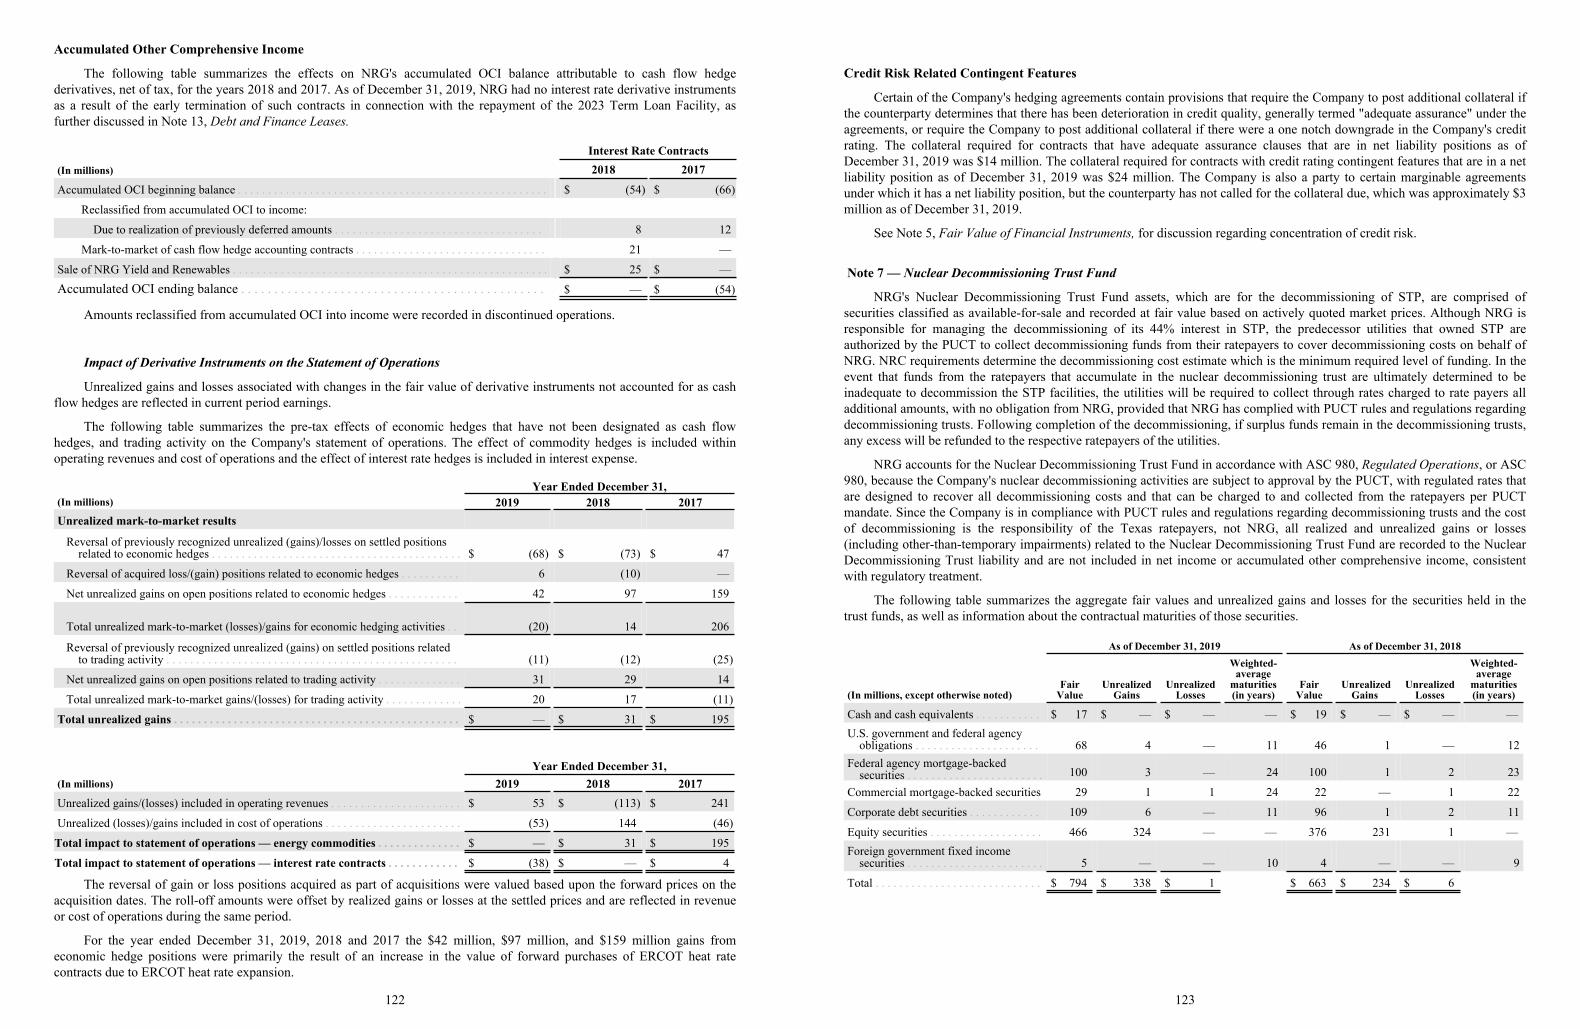
Accumulated Other Comprehensive Income
The following table summarizes the effects on NRG's accumulated OCI balance attributable to cash flow hedgederivatives, net of tax, for the years 2018 and 2017. As of December 31, 2019, NRG had no interest rate derivative instrumentsas a result of the early termination of such contracts in connection with the repayment of the 2023 Term Loan Facility, asfurther discussed in Note 13, Debt and Finance Leases.
Interest Rate Contracts(In millions) 2018 2017
Accumulated OCI beginning balance . . . . . . . . . . . . . . . . . . . . . . . . . . . . . . . . . . . . . . . . . . . . . . . . . . . . $ (54) $ (66)
Reclassified from accumulated OCI to income:
Due to realization of previously deferred amounts . . . . . . . . . . . . . . . . . . . . . . . . . . . . . . . . . . . 8 12
Mark-to-market of cash flow hedge accounting contracts . . . . . . . . . . . . . . . . . . . . . . . . . . . . . . . . 21 —
Sale of NRG Yield and Renewables . . . . . . . . . . . . . . . . . . . . . . . . . . . . . . . . . . . . . . . . . . . . . . . . . . . . . $ 25 $ —Accumulated OCI ending balance . . . . . . . . . . . . . . . . . . . . . . . . . . . . . . . . . . . . . . . . . . . . . . $ — $ (54)
Amounts reclassified from accumulated OCI into income were recorded in discontinued operations.
Impact of Derivative Instruments on the Statement of Operations
Unrealized gains and losses associated with changes in the fair value of derivative instruments not accounted for as cashflow hedges are reflected in current period earnings.
The following table summarizes the pre-tax effects of economic hedges that have not been designated as cash flowhedges, and trading activity on the Company's statement of operations. The effect of commodity hedges is included withinoperating revenues and cost of operations and the effect of interest rate hedges is included in interest expense.
Year Ended December 31,(In millions) 2019 2018 2017Unrealized mark-to-market results
Reversal of previously recognized unrealized (gains)/losses on settled positions related to economic hedges . . . . . . . . . . . . . . . . . . . . . . . . . . . . . . . . . . . . . . . . . . $ (68) $ (73) $ 47
Reversal of acquired loss/(gain) positions related to economic hedges . . . . . . . . . . 6 (10) —
Net unrealized gains on open positions related to economic hedges . . . . . . . . . . . . 42 97 159
Total unrealized mark-to-market (losses)/gains for economic hedging activities . . (20) 14 206
Reversal of previously recognized unrealized (gains) on settled positions related to trading activity . . . . . . . . . . . . . . . . . . . . . . . . . . . . . . . . . . . . . . . . . . . . . . . . . (11) (12) (25)
Net unrealized gains on open positions related to trading activity . . . . . . . . . . . . . . 31 29 14
Total unrealized mark-to-market gains/(losses) for trading activity . . . . . . . . . . . . . 20 17 (11)
Total unrealized gains . . . . . . . . . . . . . . . . . . . . . . . . . . . . . . . . . . . . . . . . . . . . . . . . $ — $ 31 $ 195
Year Ended December 31,(In millions) 2019 2018 2017Unrealized gains/(losses) included in operating revenues . . . . . . . . . . . . . . . . . . . . . . $ 53 $ (113) $ 241
Unrealized (losses)/gains included in cost of operations . . . . . . . . . . . . . . . . . . . . . . . (53) 144 (46)
Total impact to statement of operations — energy commodities . . . . . . . . . . . . . . $ — $ 31 $ 195
Total impact to statement of operations — interest rate contracts . . . . . . . . . . . . $ (38) $ — $ 4
The reversal of gain or loss positions acquired as part of acquisitions were valued based upon the forward prices on theacquisition dates. The roll-off amounts were offset by realized gains or losses at the settled prices and are reflected in revenueor cost of operations during the same period.
For the year ended December 31, 2019, 2018 and 2017 the $42 million, $97 million, and $159 million gains fromeconomic hedge positions were primarily the result of an increase in the value of forward purchases of ERCOT heat ratecontracts due to ERCOT heat rate expansion.
122
Credit Risk Related Contingent Features
Certain of the Company's hedging agreements contain provisions that require the Company to post additional collateral ifthe counterparty determines that there has been deterioration in credit quality, generally termed "adequate assurance" under theagreements, or require the Company to post additional collateral if there were a one notch downgrade in the Company's creditrating. The collateral required for contracts that have adequate assurance clauses that are in net liability positions as ofDecember 31, 2019 was $14 million. The collateral required for contracts with credit rating contingent features that are in a netliability position as of December 31, 2019 was $24 million. The Company is also a party to certain marginable agreementsunder which it has a net liability position, but the counterparty has not called for the collateral due, which was approximately $3million as of December 31, 2019.
See Note 5, Fair Value of Financial Instruments, for discussion regarding concentration of credit risk.
Note 7 — Nuclear Decommissioning Trust Fund
NRG's Nuclear Decommissioning Trust Fund assets, which are for the decommissioning of STP, are comprised ofsecurities classified as available-for-sale and recorded at fair value based on actively quoted market prices. Although NRG isresponsible for managing the decommissioning of its 44% interest in STP, the predecessor utilities that owned STP areauthorized by the PUCT to collect decommissioning funds from their ratepayers to cover decommissioning costs on behalf ofNRG. NRC requirements determine the decommissioning cost estimate which is the minimum required level of funding. In theevent that funds from the ratepayers that accumulate in the nuclear decommissioning trust are ultimately determined to beinadequate to decommission the STP facilities, the utilities will be required to collect through rates charged to rate payers alladditional amounts, with no obligation from NRG, provided that NRG has complied with PUCT rules and regulations regardingdecommissioning trusts. Following completion of the decommissioning, if surplus funds remain in the decommissioning trusts,any excess will be refunded to the respective ratepayers of the utilities.
NRG accounts for the Nuclear Decommissioning Trust Fund in accordance with ASC 980, Regulated Operations, or ASC980, because the Company's nuclear decommissioning activities are subject to approval by the PUCT, with regulated rates thatare designed to recover all decommissioning costs and that can be charged to and collected from the ratepayers per PUCTmandate. Since the Company is in compliance with PUCT rules and regulations regarding decommissioning trusts and the costof decommissioning is the responsibility of the Texas ratepayers, not NRG, all realized and unrealized gains or losses(including other-than-temporary impairments) related to the Nuclear Decommissioning Trust Fund are recorded to the NuclearDecommissioning Trust liability and are not included in net income or accumulated other comprehensive income, consistentwith regulatory treatment.
The following table summarizes the aggregate fair values and unrealized gains and losses for the securities held in thetrust funds, as well as information about the contractual maturities of those securities.
As of December 31, 2019 As of December 31, 2018
(In millions, except otherwise noted)Fair
ValueUnrealized
GainsUnrealized
Losses
Weighted-average
maturities(in years)
FairValue
UnrealizedGains
UnrealizedLosses
Weighted-average
maturities(in years)
Cash and cash equivalents . . . . . . . . . . . $ 17 $ — $ — — $ 19 $ — $ — —U.S. government and federal agency
obligations . . . . . . . . . . . . . . . . . . . . . 68 4 — 11 46 1 — 12Federal agency mortgage-backed
securities . . . . . . . . . . . . . . . . . . . . . . . 100 3 — 24 100 1 2 23
Commercial mortgage-backed securities 29 1 1 24 22 — 1 22
Corporate debt securities . . . . . . . . . . . . 109 6 — 11 96 1 2 11
Equity securities . . . . . . . . . . . . . . . . . . . 466 324 — — 376 231 1 —Foreign government fixed income
securities . . . . . . . . . . . . . . . . . . . . . . . 5 — — 10 4 — — 9
Total . . . . . . . . . . . . . . . . . . . . . . . . . . . . $ 794 $ 338 $ 1 $ 663 $ 234 $ 6
123
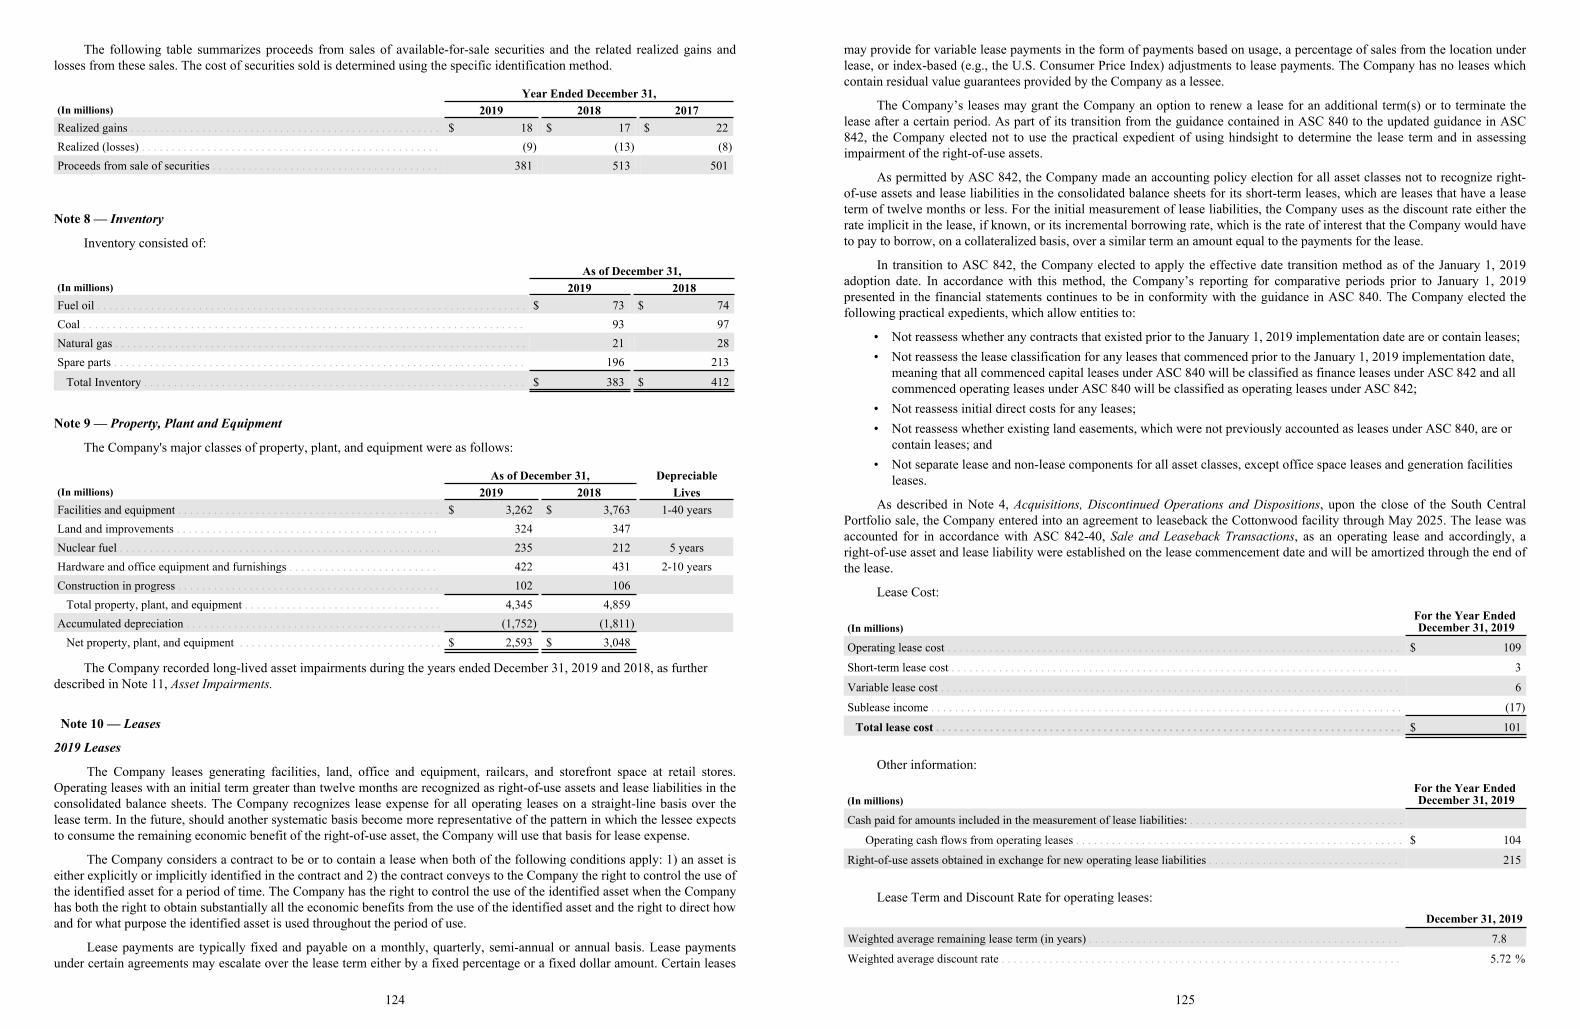
The following table summarizes proceeds from sales of available-for-sale securities and the related realized gains andlosses from these sales. The cost of securities sold is determined using the specific identification method.
Year Ended December 31,(In millions) 2019 2018 2017Realized gains . . . . . . . . . . . . . . . . . . . . . . . . . . . . . . . . . . . . . . . . . . . . . . . . . . . . $ 18 $ 17 $ 22Realized (losses) . . . . . . . . . . . . . . . . . . . . . . . . . . . . . . . . . . . . . . . . . . . . . . . . . . (9) (13) (8)Proceeds from sale of securities . . . . . . . . . . . . . . . . . . . . . . . . . . . . . . . . . . . . . . 381 513 501
Note 8 — Inventory
Inventory consisted of:
As of December 31,(In millions) 2019 2018Fuel oil . . . . . . . . . . . . . . . . . . . . . . . . . . . . . . . . . . . . . . . . . . . . . . . . . . . . . . . . . . . . . . . . . . . . . . . . $ 73 $ 74Coal . . . . . . . . . . . . . . . . . . . . . . . . . . . . . . . . . . . . . . . . . . . . . . . . . . . . . . . . . . . . . . . . . . . . . . . . . . 93 97Natural gas . . . . . . . . . . . . . . . . . . . . . . . . . . . . . . . . . . . . . . . . . . . . . . . . . . . . . . . . . . . . . . . . . . . . . 21 28Spare parts . . . . . . . . . . . . . . . . . . . . . . . . . . . . . . . . . . . . . . . . . . . . . . . . . . . . . . . . . . . . . . . . . . . . . 196 213
Total Inventory . . . . . . . . . . . . . . . . . . . . . . . . . . . . . . . . . . . . . . . . . . . . . . . . . . . . . . . . . . . . . . . . $ 383 $ 412
Note 9 — Property, Plant and Equipment
The Company's major classes of property, plant, and equipment were as follows:
As of December 31, Depreciable(In millions) 2019 2018 LivesFacilities and equipment . . . . . . . . . . . . . . . . . . . . . . . . . . . . . . . . . . . . . . . . . . . . $ 3,262 $ 3,763 1-40 yearsLand and improvements . . . . . . . . . . . . . . . . . . . . . . . . . . . . . . . . . . . . . . . . . . . . 324 347Nuclear fuel . . . . . . . . . . . . . . . . . . . . . . . . . . . . . . . . . . . . . . . . . . . . . . . . . . . . . . 235 212 5 yearsHardware and office equipment and furnishings . . . . . . . . . . . . . . . . . . . . . . . . . 422 431 2-10 yearsConstruction in progress . . . . . . . . . . . . . . . . . . . . . . . . . . . . . . . . . . . . . . . . . . . . 102 106
Total property, plant, and equipment . . . . . . . . . . . . . . . . . . . . . . . . . . . . . . . . . 4,345 4,859Accumulated depreciation . . . . . . . . . . . . . . . . . . . . . . . . . . . . . . . . . . . . . . . . . . . (1,752) (1,811)
Net property, plant, and equipment . . . . . . . . . . . . . . . . . . . . . . . . . . . . . . . . . . $ 2,593 $ 3,048
The Company recorded long-lived asset impairments during the years ended December 31, 2019 and 2018, as further described in Note 11, Asset Impairments.
Note 10 — Leases
2019 Leases
The Company leases generating facilities, land, office and equipment, railcars, and storefront space at retail stores.Operating leases with an initial term greater than twelve months are recognized as right-of-use assets and lease liabilities in theconsolidated balance sheets. The Company recognizes lease expense for all operating leases on a straight-line basis over thelease term. In the future, should another systematic basis become more representative of the pattern in which the lessee expectsto consume the remaining economic benefit of the right-of-use asset, the Company will use that basis for lease expense.
The Company considers a contract to be or to contain a lease when both of the following conditions apply: 1) an asset iseither explicitly or implicitly identified in the contract and 2) the contract conveys to the Company the right to control the use ofthe identified asset for a period of time. The Company has the right to control the use of the identified asset when the Companyhas both the right to obtain substantially all the economic benefits from the use of the identified asset and the right to direct howand for what purpose the identified asset is used throughout the period of use.
Lease payments are typically fixed and payable on a monthly, quarterly, semi-annual or annual basis. Lease paymentsunder certain agreements may escalate over the lease term either by a fixed percentage or a fixed dollar amount. Certain leases
124
may provide for variable lease payments in the form of payments based on usage, a percentage of sales from the location underlease, or index-based (e.g., the U.S. Consumer Price Index) adjustments to lease payments. The Company has no leases whichcontain residual value guarantees provided by the Company as a lessee.
The Company’s leases may grant the Company an option to renew a lease for an additional term(s) or to terminate thelease after a certain period. As part of its transition from the guidance contained in ASC 840 to the updated guidance in ASC842, the Company elected not to use the practical expedient of using hindsight to determine the lease term and in assessingimpairment of the right-of-use assets.
As permitted by ASC 842, the Company made an accounting policy election for all asset classes not to recognize right-of-use assets and lease liabilities in the consolidated balance sheets for its short-term leases, which are leases that have a leaseterm of twelve months or less. For the initial measurement of lease liabilities, the Company uses as the discount rate either therate implicit in the lease, if known, or its incremental borrowing rate, which is the rate of interest that the Company would haveto pay to borrow, on a collateralized basis, over a similar term an amount equal to the payments for the lease.
In transition to ASC 842, the Company elected to apply the effective date transition method as of the January 1, 2019adoption date. In accordance with this method, the Company’s reporting for comparative periods prior to January 1, 2019presented in the financial statements continues to be in conformity with the guidance in ASC 840. The Company elected thefollowing practical expedients, which allow entities to:
• Not reassess whether any contracts that existed prior to the January 1, 2019 implementation date are or contain leases;• Not reassess the lease classification for any leases that commenced prior to the January 1, 2019 implementation date,
meaning that all commenced capital leases under ASC 840 will be classified as finance leases under ASC 842 and all commenced operating leases under ASC 840 will be classified as operating leases under ASC 842;
• Not reassess initial direct costs for any leases;• Not reassess whether existing land easements, which were not previously accounted as leases under ASC 840, are or
contain leases; and• Not separate lease and non-lease components for all asset classes, except office space leases and generation facilities
leases.
As described in Note 4, Acquisitions, Discontinued Operations and Dispositions, upon the close of the South CentralPortfolio sale, the Company entered into an agreement to leaseback the Cottonwood facility through May 2025. The lease wasaccounted for in accordance with ASC 842-40, Sale and Leaseback Transactions, as an operating lease and accordingly, aright-of-use asset and lease liability were established on the lease commencement date and will be amortized through the end ofthe lease.
Lease Cost:
(In millions)For the Year Ended December 31, 2019
Operating lease cost . . . . . . . . . . . . . . . . . . . . . . . . . . . . . . . . . . . . . . . . . . . . . . . . . . . . . . . . . . . . . . . . . . . . . . . . . . . . $ 109
Short-term lease cost . . . . . . . . . . . . . . . . . . . . . . . . . . . . . . . . . . . . . . . . . . . . . . . . . . . . . . . . . . . . . . . . . . . . . . . . . . . 3
Variable lease cost . . . . . . . . . . . . . . . . . . . . . . . . . . . . . . . . . . . . . . . . . . . . . . . . . . . . . . . . . . . . . . . . . . . . . . . . . . . . . 6
Sublease income . . . . . . . . . . . . . . . . . . . . . . . . . . . . . . . . . . . . . . . . . . . . . . . . . . . . . . . . . . . . . . . . . . . . . . . . . . . . . . . (17)
Total lease cost . . . . . . . . . . . . . . . . . . . . . . . . . . . . . . . . . . . . . . . . . . . . . . . . . . . . . . . . . . . . . . . . . . . . . . . . . . . . . . $ 101
Other information:
(In millions) For the Year Ended December 31, 2019
Cash paid for amounts included in the measurement of lease liabilities: . . . . . . . . . . . . . . . . . . . . . . . . . . . . . . . . . . . .
Operating cash flows from operating leases . . . . . . . . . . . . . . . . . . . . . . . . . . . . . . . . . . . . . . . . . . . . . . . . . . . . . . . $ 104
Right-of-use assets obtained in exchange for new operating lease liabilities . . . . . . . . . . . . . . . . . . . . . . . . . . . . . . . . 215
Lease Term and Discount Rate for operating leases:December 31, 2019
Weighted average remaining lease term (in years) . . . . . . . . . . . . . . . . . . . . . . . . . . . . . . . . . . . . . . . . . . . . . . . . . . . . 7.8
Weighted average discount rate . . . . . . . . . . . . . . . . . . . . . . . . . . . . . . . . . . . . . . . . . . . . . . . . . . . . . . . . . . . . . . . . . . . 5.72 %
125
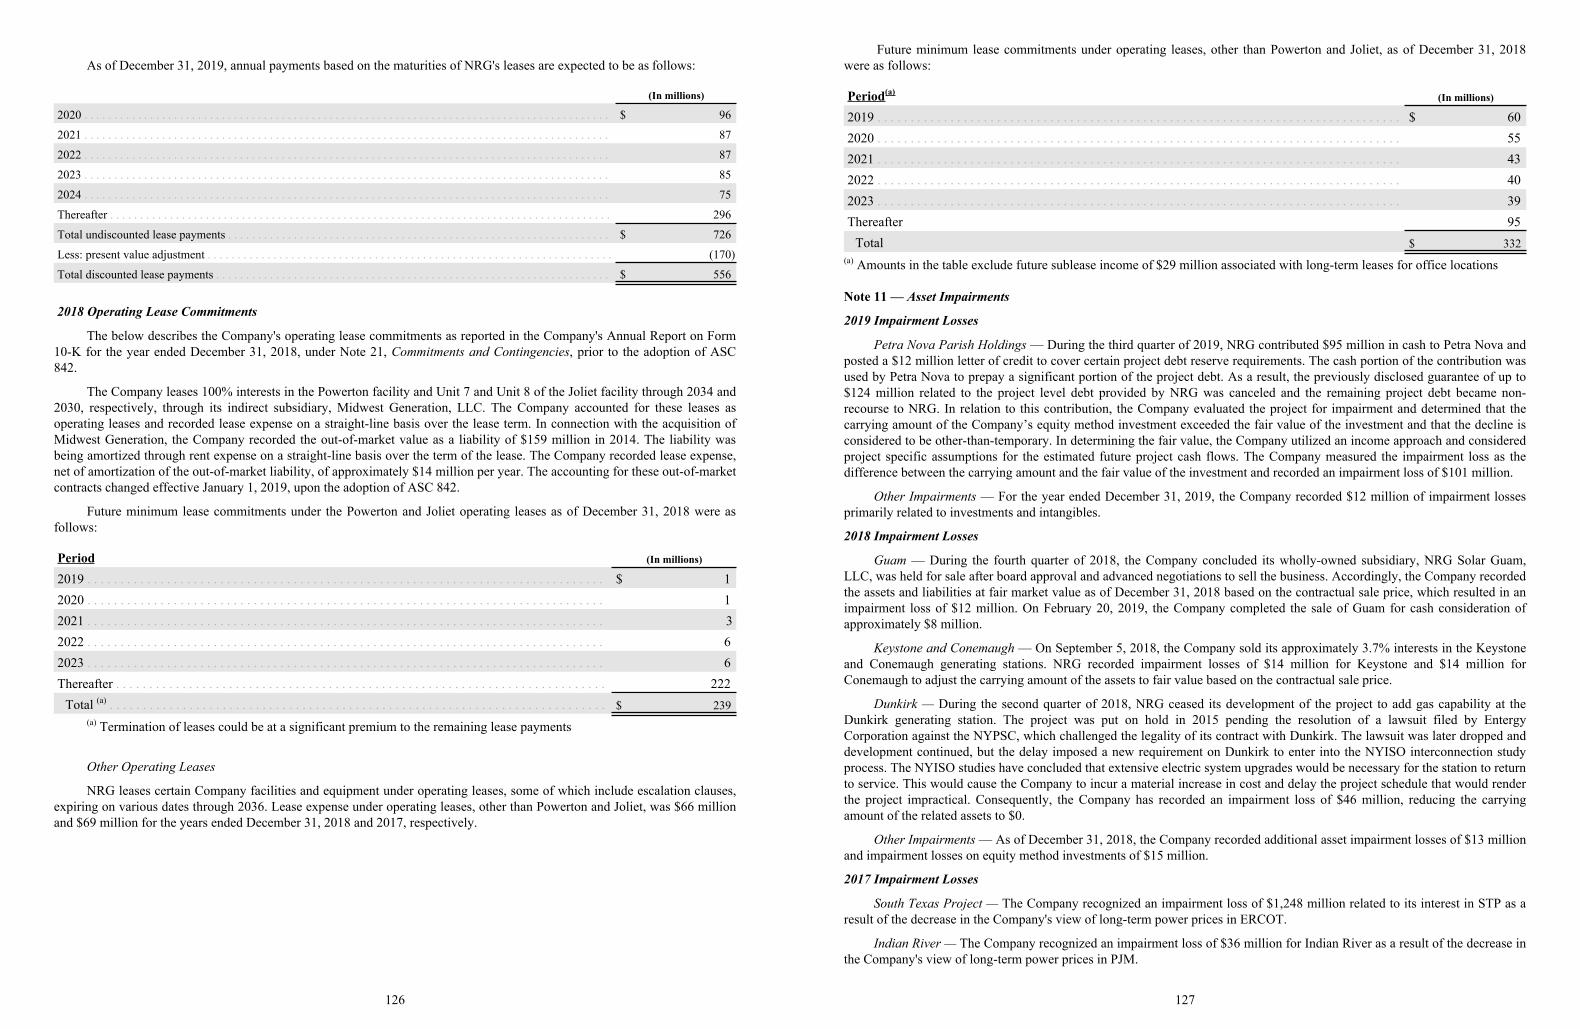
As of December 31, 2019, annual payments based on the maturities of NRG's leases are expected to be as follows:
(In millions)
2020 . . . . . . . . . . . . . . . . . . . . . . . . . . . . . . . . . . . . . . . . . . . . . . . . . . . . . . . . . . . . . . . . . . . . . . . . . . . . . . . . . . . . . . . . $ 96
2021 . . . . . . . . . . . . . . . . . . . . . . . . . . . . . . . . . . . . . . . . . . . . . . . . . . . . . . . . . . . . . . . . . . . . . . . . . . . . . . . . . . . . . . . . 87
2022 . . . . . . . . . . . . . . . . . . . . . . . . . . . . . . . . . . . . . . . . . . . . . . . . . . . . . . . . . . . . . . . . . . . . . . . . . . . . . . . . . . . . . . . . 87
2023 . . . . . . . . . . . . . . . . . . . . . . . . . . . . . . . . . . . . . . . . . . . . . . . . . . . . . . . . . . . . . . . . . . . . . . . . . . . . . . . . . . . . . . . . 85
2024 . . . . . . . . . . . . . . . . . . . . . . . . . . . . . . . . . . . . . . . . . . . . . . . . . . . . . . . . . . . . . . . . . . . . . . . . . . . . . . . . . . . . . . . . 75
Thereafter . . . . . . . . . . . . . . . . . . . . . . . . . . . . . . . . . . . . . . . . . . . . . . . . . . . . . . . . . . . . . . . . . . . . . . . . . . . . . . . . . . . . 296
Total undiscounted lease payments . . . . . . . . . . . . . . . . . . . . . . . . . . . . . . . . . . . . . . . . . . . . . . . . . . . . . . . . . . . . . . . . $ 726
Less: present value adjustment . . . . . . . . . . . . . . . . . . . . . . . . . . . . . . . . . . . . . . . . . . . . . . . . . . . . . . . . . . . . . . . . . . . . (170)
Total discounted lease payments . . . . . . . . . . . . . . . . . . . . . . . . . . . . . . . . . . . . . . . . . . . . . . . . . . . . . . . . . . . . . . . . . . $ 556
2018 Operating Lease Commitments
The below describes the Company's operating lease commitments as reported in the Company's Annual Report on Form10-K for the year ended December 31, 2018, under Note 21, Commitments and Contingencies, prior to the adoption of ASC842.
The Company leases 100% interests in the Powerton facility and Unit 7 and Unit 8 of the Joliet facility through 2034 and2030, respectively, through its indirect subsidiary, Midwest Generation, LLC. The Company accounted for these leases asoperating leases and recorded lease expense on a straight-line basis over the lease term. In connection with the acquisition ofMidwest Generation, the Company recorded the out-of-market value as a liability of $159 million in 2014. The liability wasbeing amortized through rent expense on a straight-line basis over the term of the lease. The Company recorded lease expense,net of amortization of the out-of-market liability, of approximately $14 million per year. The accounting for these out-of-marketcontracts changed effective January 1, 2019, upon the adoption of ASC 842.
Future minimum lease commitments under the Powerton and Joliet operating leases as of December 31, 2018 were asfollows:
Period (In millions)
2019 . . . . . . . . . . . . . . . . . . . . . . . . . . . . . . . . . . . . . . . . . . . . . . . . . . . . . . . . . . . . . . . . . . . . . . . . . . . . . . $ 12020 . . . . . . . . . . . . . . . . . . . . . . . . . . . . . . . . . . . . . . . . . . . . . . . . . . . . . . . . . . . . . . . . . . . . . . . . . . . . . . 12021 . . . . . . . . . . . . . . . . . . . . . . . . . . . . . . . . . . . . . . . . . . . . . . . . . . . . . . . . . . . . . . . . . . . . . . . . . . . . . . 32022 . . . . . . . . . . . . . . . . . . . . . . . . . . . . . . . . . . . . . . . . . . . . . . . . . . . . . . . . . . . . . . . . . . . . . . . . . . . . . . 62023 . . . . . . . . . . . . . . . . . . . . . . . . . . . . . . . . . . . . . . . . . . . . . . . . . . . . . . . . . . . . . . . . . . . . . . . . . . . . . . 6Thereafter . . . . . . . . . . . . . . . . . . . . . . . . . . . . . . . . . . . . . . . . . . . . . . . . . . . . . . . . . . . . . . . . . . . . . . . . . . 222
Total (a) . . . . . . . . . . . . . . . . . . . . . . . . . . . . . . . . . . . . . . . . . . . . . . . . . . . . . . . . . . . . . . . . . . . . . . . . . . . $ 239(a) Termination of leases could be at a significant premium to the remaining lease payments
Other Operating Leases
NRG leases certain Company facilities and equipment under operating leases, some of which include escalation clauses,expiring on various dates through 2036. Lease expense under operating leases, other than Powerton and Joliet, was $66 millionand $69 million for the years ended December 31, 2018 and 2017, respectively.
126
Future minimum lease commitments under operating leases, other than Powerton and Joliet, as of December 31, 2018were as follows:
Period(a) (In millions)
2019 . . . . . . . . . . . . . . . . . . . . . . . . . . . . . . . . . . . . . . . . . . . . . . . . . . . . . . . . . . . . . . . . . . . . . . . . . . . . . . . $ 602020 . . . . . . . . . . . . . . . . . . . . . . . . . . . . . . . . . . . . . . . . . . . . . . . . . . . . . . . . . . . . . . . . . . . . . . . . . . . . . . . 552021 . . . . . . . . . . . . . . . . . . . . . . . . . . . . . . . . . . . . . . . . . . . . . . . . . . . . . . . . . . . . . . . . . . . . . . . . . . . . . . . 432022 . . . . . . . . . . . . . . . . . . . . . . . . . . . . . . . . . . . . . . . . . . . . . . . . . . . . . . . . . . . . . . . . . . . . . . . . . . . . . . . 402023 . . . . . . . . . . . . . . . . . . . . . . . . . . . . . . . . . . . . . . . . . . . . . . . . . . . . . . . . . . . . . . . . . . . . . . . . . . . . . . . 39Thereafter 95
Total $ 332(a) Amounts in the table exclude future sublease income of $29 million associated with long-term leases for office locations
Note 11 — Asset Impairments
2019 Impairment Losses
Petra Nova Parish Holdings — During the third quarter of 2019, NRG contributed $95 million in cash to Petra Nova andposted a $12 million letter of credit to cover certain project debt reserve requirements. The cash portion of the contribution wasused by Petra Nova to prepay a significant portion of the project debt. As a result, the previously disclosed guarantee of up to$124 million related to the project level debt provided by NRG was canceled and the remaining project debt became non-recourse to NRG. In relation to this contribution, the Company evaluated the project for impairment and determined that thecarrying amount of the Company’s equity method investment exceeded the fair value of the investment and that the decline isconsidered to be other-than-temporary. In determining the fair value, the Company utilized an income approach and consideredproject specific assumptions for the estimated future project cash flows. The Company measured the impairment loss as thedifference between the carrying amount and the fair value of the investment and recorded an impairment loss of $101 million.
Other Impairments — For the year ended December 31, 2019, the Company recorded $12 million of impairment lossesprimarily related to investments and intangibles.
2018 Impairment Losses
Guam — During the fourth quarter of 2018, the Company concluded its wholly-owned subsidiary, NRG Solar Guam,LLC, was held for sale after board approval and advanced negotiations to sell the business. Accordingly, the Company recordedthe assets and liabilities at fair market value as of December 31, 2018 based on the contractual sale price, which resulted in animpairment loss of $12 million. On February 20, 2019, the Company completed the sale of Guam for cash consideration ofapproximately $8 million.
Keystone and Conemaugh — On September 5, 2018, the Company sold its approximately 3.7% interests in the Keystoneand Conemaugh generating stations. NRG recorded impairment losses of $14 million for Keystone and $14 million forConemaugh to adjust the carrying amount of the assets to fair value based on the contractual sale price.
Dunkirk — During the second quarter of 2018, NRG ceased its development of the project to add gas capability at theDunkirk generating station. The project was put on hold in 2015 pending the resolution of a lawsuit filed by EntergyCorporation against the NYPSC, which challenged the legality of its contract with Dunkirk. The lawsuit was later dropped anddevelopment continued, but the delay imposed a new requirement on Dunkirk to enter into the NYISO interconnection studyprocess. The NYISO studies have concluded that extensive electric system upgrades would be necessary for the station to returnto service. This would cause the Company to incur a material increase in cost and delay the project schedule that would renderthe project impractical. Consequently, the Company has recorded an impairment loss of $46 million, reducing the carryingamount of the related assets to $0.
Other Impairments— As of December 31, 2018, the Company recorded additional asset impairment losses of $13 millionand impairment losses on equity method investments of $15 million.
2017 Impairment Losses
South Texas Project — The Company recognized an impairment loss of $1,248 million related to its interest in STP as aresult of the decrease in the Company's view of long-term power prices in ERCOT.
Indian River — The Company recognized an impairment loss of $36 million for Indian River as a result of the decrease inthe Company's view of long-term power prices in PJM.
127
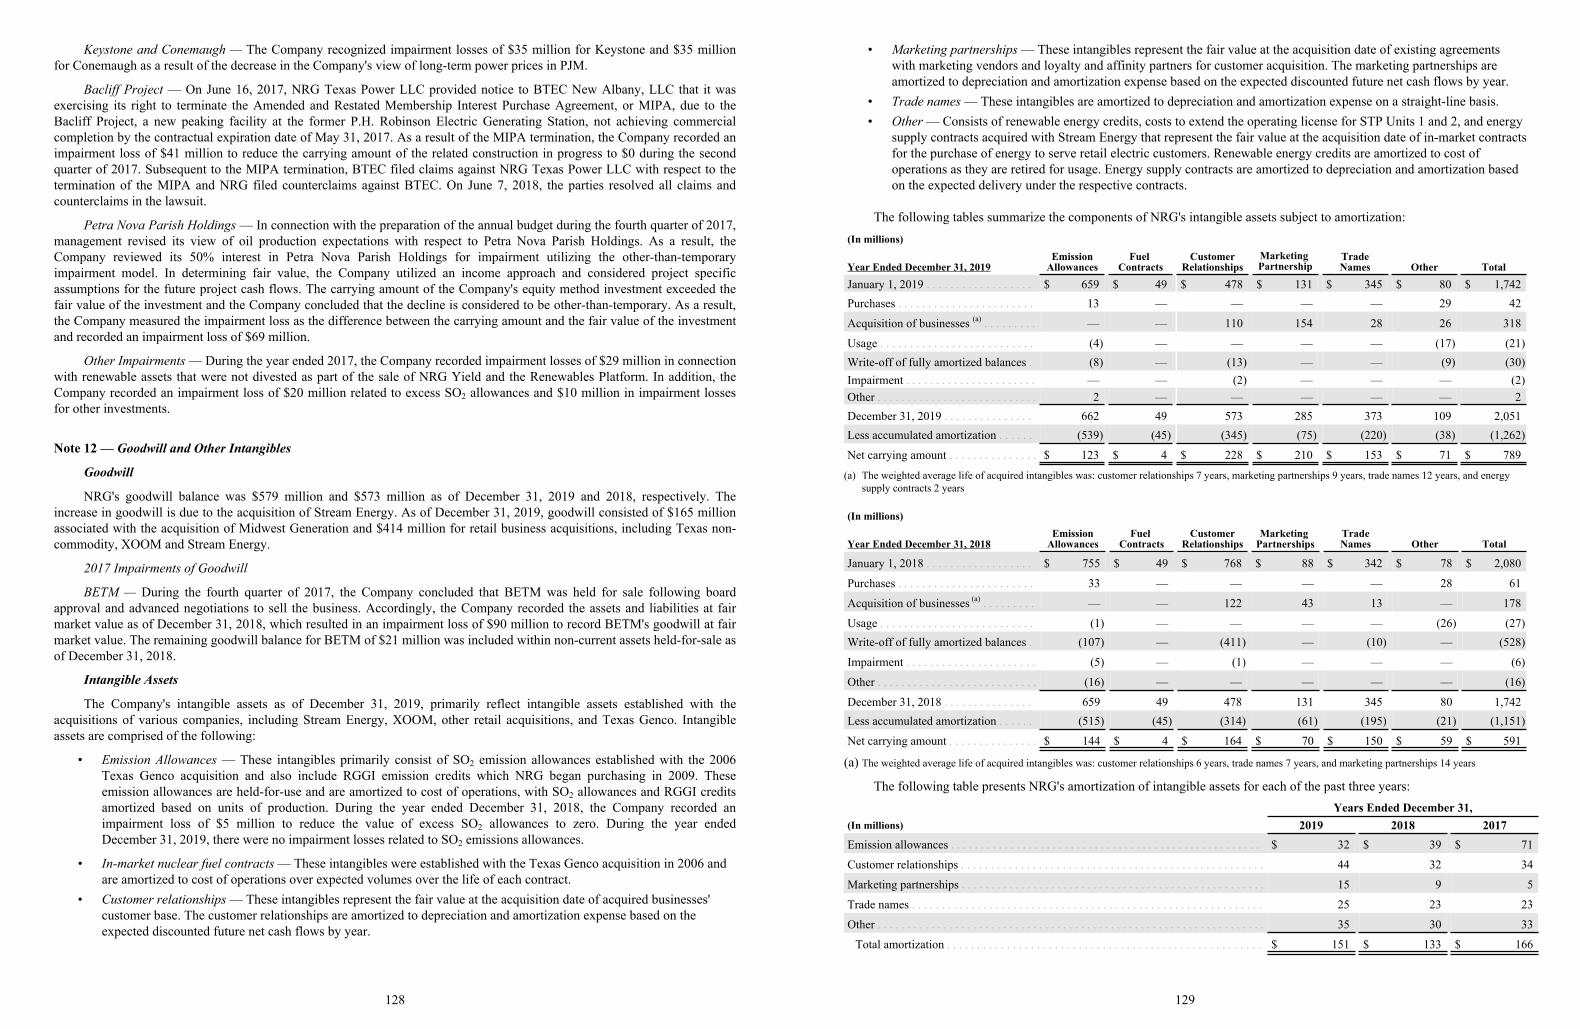
Keystone and Conemaugh — The Company recognized impairment losses of $35 million for Keystone and $35 millionfor Conemaugh as a result of the decrease in the Company's view of long-term power prices in PJM.
Bacliff Project — On June 16, 2017, NRG Texas Power LLC provided notice to BTEC New Albany, LLC that it wasexercising its right to terminate the Amended and Restated Membership Interest Purchase Agreement, or MIPA, due to theBacliff Project, a new peaking facility at the former P.H. Robinson Electric Generating Station, not achieving commercialcompletion by the contractual expiration date of May 31, 2017. As a result of the MIPA termination, the Company recorded animpairment loss of $41 million to reduce the carrying amount of the related construction in progress to $0 during the secondquarter of 2017. Subsequent to the MIPA termination, BTEC filed claims against NRG Texas Power LLC with respect to thetermination of the MIPA and NRG filed counterclaims against BTEC. On June 7, 2018, the parties resolved all claims andcounterclaims in the lawsuit.
Petra Nova Parish Holdings — In connection with the preparation of the annual budget during the fourth quarter of 2017,management revised its view of oil production expectations with respect to Petra Nova Parish Holdings. As a result, theCompany reviewed its 50% interest in Petra Nova Parish Holdings for impairment utilizing the other-than-temporaryimpairment model. In determining fair value, the Company utilized an income approach and considered project specificassumptions for the future project cash flows. The carrying amount of the Company's equity method investment exceeded thefair value of the investment and the Company concluded that the decline is considered to be other-than-temporary. As a result,the Company measured the impairment loss as the difference between the carrying amount and the fair value of the investmentand recorded an impairment loss of $69 million.
Other Impairments — During the year ended 2017, the Company recorded impairment losses of $29 million in connectionwith renewable assets that were not divested as part of the sale of NRG Yield and the Renewables Platform. In addition, theCompany recorded an impairment loss of $20 million related to excess SO2 allowances and $10 million in impairment lossesfor other investments.
Note 12 — Goodwill and Other Intangibles
Goodwill
NRG's goodwill balance was $579 million and $573 million as of December 31, 2019 and 2018, respectively. Theincrease in goodwill is due to the acquisition of Stream Energy. As of December 31, 2019, goodwill consisted of $165 millionassociated with the acquisition of Midwest Generation and $414 million for retail business acquisitions, including Texas non-commodity, XOOM and Stream Energy.
2017 Impairments of Goodwill
BETM — During the fourth quarter of 2017, the Company concluded that BETM was held for sale following boardapproval and advanced negotiations to sell the business. Accordingly, the Company recorded the assets and liabilities at fairmarket value as of December 31, 2018, which resulted in an impairment loss of $90 million to record BETM's goodwill at fairmarket value. The remaining goodwill balance for BETM of $21 million was included within non-current assets held-for-sale asof December 31, 2018.
Intangible Assets
The Company's intangible assets as of December 31, 2019, primarily reflect intangible assets established with theacquisitions of various companies, including Stream Energy, XOOM, other retail acquisitions, and Texas Genco. Intangibleassets are comprised of the following:
• Emission Allowances — These intangibles primarily consist of SO2 emission allowances established with the 2006Texas Genco acquisition and also include RGGI emission credits which NRG began purchasing in 2009. Theseemission allowances are held-for-use and are amortized to cost of operations, with SO2 allowances and RGGI creditsamortized based on units of production. During the year ended December 31, 2018, the Company recorded animpairment loss of $5 million to reduce the value of excess SO2 allowances to zero. During the year endedDecember 31, 2019, there were no impairment losses related to SO2 emissions allowances.
• In-market nuclear fuel contracts — These intangibles were established with the Texas Genco acquisition in 2006 and are amortized to cost of operations over expected volumes over the life of each contract.
• Customer relationships — These intangibles represent the fair value at the acquisition date of acquired businesses' customer base. The customer relationships are amortized to depreciation and amortization expense based on the expected discounted future net cash flows by year.
128
• Marketing partnerships — These intangibles represent the fair value at the acquisition date of existing agreements with marketing vendors and loyalty and affinity partners for customer acquisition. The marketing partnerships are amortized to depreciation and amortization expense based on the expected discounted future net cash flows by year.
• Trade names — These intangibles are amortized to depreciation and amortization expense on a straight-line basis.• Other — Consists of renewable energy credits, costs to extend the operating license for STP Units 1 and 2, and energy
supply contracts acquired with Stream Energy that represent the fair value at the acquisition date of in-market contracts for the purchase of energy to serve retail electric customers. Renewable energy credits are amortized to cost of operations as they are retired for usage. Energy supply contracts are amortized to depreciation and amortization based on the expected delivery under the respective contracts.
The following tables summarize the components of NRG's intangible assets subject to amortization:(In millions)
Year Ended December 31, 2019Emission
AllowancesFuel
ContractsCustomer
RelationshipsMarketing Partnership
s
TradeNames Other Total
January 1, 2019 . . . . . . . . . . . . . . . . . . $ 659 $ 49 $ 478 $ 131 $ 345 $ 80 $ 1,742Purchases . . . . . . . . . . . . . . . . . . . . . . . 13 — — — — 29 42
Acquisition of businesses (a) . . . . . . . . . — — 110 154 28 26 318
Usage . . . . . . . . . . . . . . . . . . . . . . . . . . (4) — — — — (17) (21)Write-off of fully amortized balances . (8) — (13) — — (9) (30)Impairment . . . . . . . . . . . . . . . . . . . . . . — — (2) — — — (2)Other . . . . . . . . . . . . . . . . . . . . . . . . . . . 2 — — — — — 2December 31, 2019 . . . . . . . . . . . . . . . 662 49 573 285 373 109 2,051Less accumulated amortization . . . . . . (539) (45) (345) (75) (220) (38) (1,262)
Net carrying amount . . . . . . . . . . . . . . . $ 123 $ 4 $ 228 $ 210 $ 153 $ 71 $ 789
(a) The weighted average life of acquired intangibles was: customer relationships 7 years, marketing partnerships 9 years, trade names 12 years, and energy supply contracts 2 years
(In millions)
Year Ended December 31, 2018Emission
AllowancesFuel
ContractsCustomer
RelationshipsMarketing
PartnershipsTradeNames Other Total
January 1, 2018 . . . . . . . . . . . . . . . . . . $ 755 $ 49 $ 768 $ 88 $ 342 $ 78 $ 2,080
Purchases . . . . . . . . . . . . . . . . . . . . . . . 33 — — — — 28 61
Acquisition of businesses (a) . . . . . . . . . — — 122 43 13 — 178
Usage . . . . . . . . . . . . . . . . . . . . . . . . . . (1) — — — — (26) (27)Write-off of fully amortized balances . (107) — (411) — (10) — (528)
Impairment . . . . . . . . . . . . . . . . . . . . . . (5) — (1) — — — (6)
Other . . . . . . . . . . . . . . . . . . . . . . . . . . . (16) — — — — — (16)
December 31, 2018 . . . . . . . . . . . . . . . 659 49 478 131 345 80 1,742Less accumulated amortization . . . . . . (515) (45) (314) (61) (195) (21) (1,151)
Net carrying amount . . . . . . . . . . . . . . . $ 144 $ 4 $ 164 $ 70 $ 150 $ 59 $ 591
(a) The weighted average life of acquired intangibles was: customer relationships 6 years, trade names 7 years, and marketing partnerships 14 years
The following table presents NRG's amortization of intangible assets for each of the past three years:Years Ended December 31,
(In millions) 2019 2018 2017Emission allowances . . . . . . . . . . . . . . . . . . . . . . . . . . . . . . . . . . . . . . . . . . . . . . . . . . . . $ 32 $ 39 $ 71
Customer relationships . . . . . . . . . . . . . . . . . . . . . . . . . . . . . . . . . . . . . . . . . . . . . . . . . . . 44 32 34
Marketing partnerships . . . . . . . . . . . . . . . . . . . . . . . . . . . . . . . . . . . . . . . . . . . . . . . . . . . 15 9 5
Trade names . . . . . . . . . . . . . . . . . . . . . . . . . . . . . . . . . . . . . . . . . . . . . . . . . . . . . . . . . . . 25 23 23
Other . . . . . . . . . . . . . . . . . . . . . . . . . . . . . . . . . . . . . . . . . . . . . . . . . . . . . . . . . . . . . . . . . 35 30 33
Total amortization . . . . . . . . . . . . . . . . . . . . . . . . . . . . . . . . . . . . . . . . . . . . . . . . . . . . . $ 151 $ 133 $ 166
129
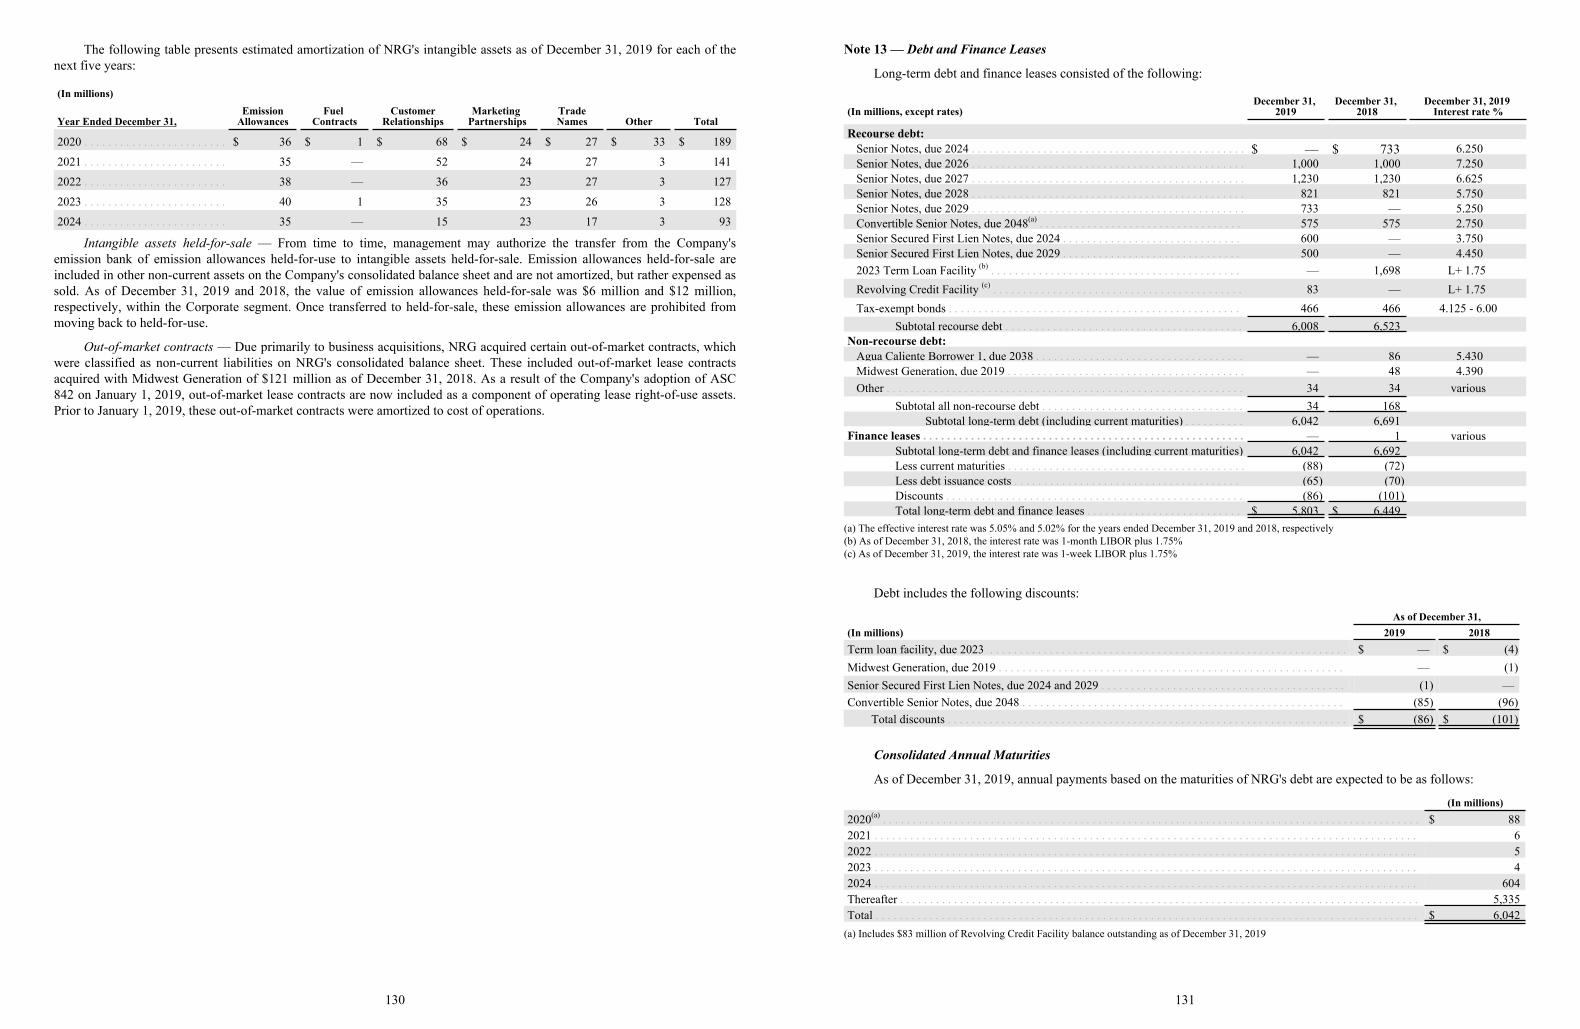
The following table presents estimated amortization of NRG's intangible assets as of December 31, 2019 for each of thenext five years:
(In millions)
Year Ended December 31,Emission
AllowancesFuel
ContractsCustomer
RelationshipsMarketing
PartnershipsTradeNames Other Total
2020 . . . . . . . . . . . . . . . . . . . . . . . . $ 36 $ 1 $ 68 $ 24 $ 27 $ 33 $ 189
2021 . . . . . . . . . . . . . . . . . . . . . . . . 35 — 52 24 27 3 141
2022 . . . . . . . . . . . . . . . . . . . . . . . . 38 — 36 23 27 3 127
2023 . . . . . . . . . . . . . . . . . . . . . . . . 40 1 35 23 26 3 128
2024 . . . . . . . . . . . . . . . . . . . . . . . . 35 — 15 23 17 3 93
Intangible assets held-for-sale — From time to time, management may authorize the transfer from the Company'semission bank of emission allowances held-for-use to intangible assets held-for-sale. Emission allowances held-for-sale areincluded in other non-current assets on the Company's consolidated balance sheet and are not amortized, but rather expensed assold. As of December 31, 2019 and 2018, the value of emission allowances held-for-sale was $6 million and $12 million,respectively, within the Corporate segment. Once transferred to held-for-sale, these emission allowances are prohibited frommoving back to held-for-use.
Out-of-market contracts — Due primarily to business acquisitions, NRG acquired certain out-of-market contracts, whichwere classified as non-current liabilities on NRG's consolidated balance sheet. These included out-of-market lease contractsacquired with Midwest Generation of $121 million as of December 31, 2018. As a result of the Company's adoption of ASC842 on January 1, 2019, out-of-market lease contracts are now included as a component of operating lease right-of-use assets.Prior to January 1, 2019, these out-of-market contracts were amortized to cost of operations.
130
Note 13 — Debt and Finance Leases
Long-term debt and finance leases consisted of the following:
(In millions, except rates)December 31,
2019December 31,
2018December 31, 2019
Interest rate %
Recourse debt:Senior Notes, due 2024 . . . . . . . . . . . . . . . . . . . . . . . . . . . . . . . . . . . . . . . . . . . . . . $ — $ 733 6.250Senior Notes, due 2026 . . . . . . . . . . . . . . . . . . . . . . . . . . . . . . . . . . . . . . . . . . . . . . 1,000 1,000 7.250Senior Notes, due 2027 . . . . . . . . . . . . . . . . . . . . . . . . . . . . . . . . . . . . . . . . . . . . . . 1,230 1,230 6.625Senior Notes, due 2028 . . . . . . . . . . . . . . . . . . . . . . . . . . . . . . . . . . . . . . . . . . . . . . 821 821 5.750Senior Notes, due 2029 . . . . . . . . . . . . . . . . . . . . . . . . . . . . . . . . . . . . . . . . . . . . . . 733 — 5.250Convertible Senior Notes, due 2048(a) . . . . . . . . . . . . . . . . . . . . . . . . . . . . . . . . . . 575 575 2.750Senior Secured First Lien Notes, due 2024 . . . . . . . . . . . . . . . . . . . . . . . . . . . . . . 600 — 3.750Senior Secured First Lien Notes, due 2029 . . . . . . . . . . . . . . . . . . . . . . . . . . . . . . 500 — 4.4502023 Term Loan Facility (b) . . . . . . . . . . . . . . . . . . . . . . . . . . . . . . . . . . . . . . . . . . — 1,698 L+ 1.75Revolving Credit Facility (c) . . . . . . . . . . . . . . . . . . . . . . . . . . . . . . . . . . . . . . . . . . 83 — L+ 1.75Tax-exempt bonds . . . . . . . . . . . . . . . . . . . . . . . . . . . . . . . . . . . . . . . . . . . . . . . . . 466 466 4.125 - 6.00
Subtotal recourse debt . . . . . . . . . . . . . . . . . . . . . . . . . . . . . . . . . . . . . . . . 6,008 6,523Non-recourse debt:
Agua Caliente Borrower 1, due 2038 . . . . . . . . . . . . . . . . . . . . . . . . . . . . . . . . . . . — 86 5.430Midwest Generation, due 2019 . . . . . . . . . . . . . . . . . . . . . . . . . . . . . . . . . . . . . . . . — 48 4.390Other . . . . . . . . . . . . . . . . . . . . . . . . . . . . . . . . . . . . . . . . . . . . . . . . . . . . . . . . . . . . 34 34 various
Subtotal all non-recourse debt . . . . . . . . . . . . . . . . . . . . . . . . . . . . . . . . . . 34 168Subtotal long-term debt (including current maturities) . . . . . . . . . . 6,042 6,691
Finance leases . . . . . . . . . . . . . . . . . . . . . . . . . . . . . . . . . . . . . . . . . . . . . . . . . . . . . . — 1 variousSubtotal long-term debt and finance leases (including current maturities) 6,042 6,692Less current maturities . . . . . . . . . . . . . . . . . . . . . . . . . . . . . . . . . . . . . . . . (88) (72)Less debt issuance costs . . . . . . . . . . . . . . . . . . . . . . . . . . . . . . . . . . . . . . (65) (70)Discounts . . . . . . . . . . . . . . . . . . . . . . . . . . . . . . . . . . . . . . . . . . . . . . . . . . (86) (101)Total long-term debt and finance leases . . . . . . . . . . . . . . . . . . . . . . . . . . $ 5,803 $ 6,449
6,008 6,523
6,042 6,692
(86) (101)$ 5,803 $ 6,449
(a) The effective interest rate was 5.05% and 5.02% for the years ended December 31, 2019 and 2018, respectively(b) As of December 31, 2018, the interest rate was 1-month LIBOR plus 1.75%(c) As of December 31, 2019, the interest rate was 1-week LIBOR plus 1.75%
Debt includes the following discounts:
As of December 31,(In millions) 2019 2018Term loan facility, due 2023 . . . . . . . . . . . . . . . . . . . . . . . . . . . . . . . . . . . . . . . . . . . . . . . . . . . . . . . . . . . . $ — $ (4)Midwest Generation, due 2019 . . . . . . . . . . . . . . . . . . . . . . . . . . . . . . . . . . . . . . . . . . . . . . . . . . . . . . . . . . — (1)Senior Secured First Lien Notes, due 2024 and 2029 . . . . . . . . . . . . . . . . . . . . . . . . . . . . . . . . . . . . . . . . . (1) —Convertible Senior Notes, due 2048 . . . . . . . . . . . . . . . . . . . . . . . . . . . . . . . . . . . . . . . . . . . . . . . . . . . . . . (85) (96)
Total discounts . . . . . . . . . . . . . . . . . . . . . . . . . . . . . . . . . . . . . . . . . . . . . . . . . . . . . . . . . . . . . . . . . . . $ (86) $ (101)(86) (101)
Consolidated Annual Maturities
As of December 31, 2019, annual payments based on the maturities of NRG's debt are expected to be as follows:
(In millions)2020(a) . . . . . . . . . . . . . . . . . . . . . . . . . . . . . . . . . . . . . . . . . . . . . . . . . . . . . . . . . . . . . . . . . . . . . . . . . . . . . . . . . . . . . . . . . . $ 882021 . . . . . . . . . . . . . . . . . . . . . . . . . . . . . . . . . . . . . . . . . . . . . . . . . . . . . . . . . . . . . . . . . . . . . . . . . . . . . . . . . . . . . . . . . . . 62022 . . . . . . . . . . . . . . . . . . . . . . . . . . . . . . . . . . . . . . . . . . . . . . . . . . . . . . . . . . . . . . . . . . . . . . . . . . . . . . . . . . . . . . . . . . . 52023 . . . . . . . . . . . . . . . . . . . . . . . . . . . . . . . . . . . . . . . . . . . . . . . . . . . . . . . . . . . . . . . . . . . . . . . . . . . . . . . . . . . . . . . . . . . 42024 . . . . . . . . . . . . . . . . . . . . . . . . . . . . . . . . . . . . . . . . . . . . . . . . . . . . . . . . . . . . . . . . . . . . . . . . . . . . . . . . . . . . . . . . . . . 604Thereafter . . . . . . . . . . . . . . . . . . . . . . . . . . . . . . . . . . . . . . . . . . . . . . . . . . . . . . . . . . . . . . . . . . . . . . . . . . . . . . . . . . . . . . . 5,335Total . . . . . . . . . . . . . . . . . . . . . . . . . . . . . . . . . . . . . . . . . . . . . . . . . . . . . . . . . . . . . . . . . . . . . . . . . . . . . . . . . . . . . . . . . . . $ 6,0426,042
(a) Includes $83 million of Revolving Credit Facility balance outstanding as of December 31, 2019
131
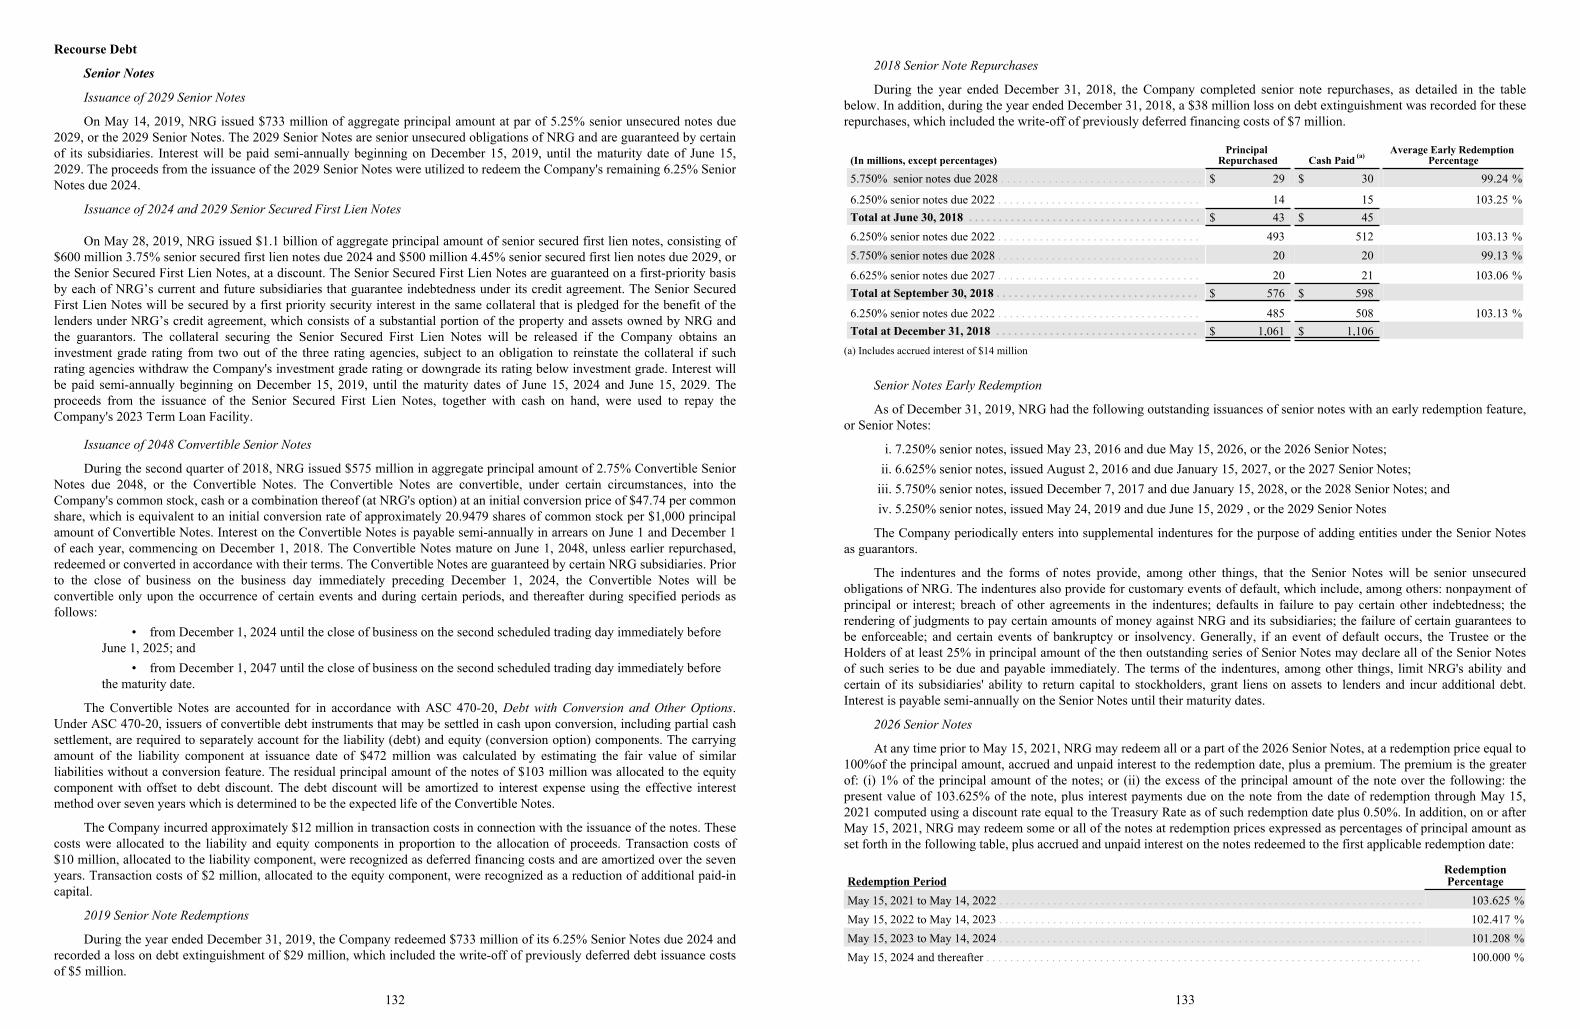
Recourse Debt
Senior Notes
Issuance of 2029 Senior Notes
On May 14, 2019, NRG issued $733 million of aggregate principal amount at par of 5.25% senior unsecured notes due2029, or the 2029 Senior Notes. The 2029 Senior Notes are senior unsecured obligations of NRG and are guaranteed by certainof its subsidiaries. Interest will be paid semi-annually beginning on December 15, 2019, until the maturity date of June 15,2029. The proceeds from the issuance of the 2029 Senior Notes were utilized to redeem the Company's remaining 6.25% SeniorNotes due 2024.
Issuance of 2024 and 2029 Senior Secured First Lien Notes
On May 28, 2019, NRG issued $1.1 billion of aggregate principal amount of senior secured first lien notes, consisting of$600 million 3.75% senior secured first lien notes due 2024 and $500 million 4.45% senior secured first lien notes due 2029, orthe Senior Secured First Lien Notes, at a discount. The Senior Secured First Lien Notes are guaranteed on a first-priority basisby each of NRG’s current and future subsidiaries that guarantee indebtedness under its credit agreement. The Senior SecuredFirst Lien Notes will be secured by a first priority security interest in the same collateral that is pledged for the benefit of thelenders under NRG’s credit agreement, which consists of a substantial portion of the property and assets owned by NRG andthe guarantors. The collateral securing the Senior Secured First Lien Notes will be released if the Company obtains aninvestment grade rating from two out of the three rating agencies, subject to an obligation to reinstate the collateral if suchrating agencies withdraw the Company's investment grade rating or downgrade its rating below investment grade. Interest willbe paid semi-annually beginning on December 15, 2019, until the maturity dates of June 15, 2024 and June 15, 2029. Theproceeds from the issuance of the Senior Secured First Lien Notes, together with cash on hand, were used to repay theCompany's 2023 Term Loan Facility.
Issuance of 2048 Convertible Senior Notes
During the second quarter of 2018, NRG issued $575 million in aggregate principal amount of 2.75% Convertible SeniorNotes due 2048, or the Convertible Notes. The Convertible Notes are convertible, under certain circumstances, into theCompany's common stock, cash or a combination thereof (at NRG's option) at an initial conversion price of $47.74 per commonshare, which is equivalent to an initial conversion rate of approximately 20.9479 shares of common stock per $1,000 principalamount of Convertible Notes. Interest on the Convertible Notes is payable semi-annually in arrears on June 1 and December 1of each year, commencing on December 1, 2018. The Convertible Notes mature on June 1, 2048, unless earlier repurchased,redeemed or converted in accordance with their terms. The Convertible Notes are guaranteed by certain NRG subsidiaries. Priorto the close of business on the business day immediately preceding December 1, 2024, the Convertible Notes will beconvertible only upon the occurrence of certain events and during certain periods, and thereafter during specified periods asfollows:
• from December 1, 2024 until the close of business on the second scheduled trading day immediately before June 1, 2025; and
• from December 1, 2047 until the close of business on the second scheduled trading day immediately before the maturity date.
The Convertible Notes are accounted for in accordance with ASC 470-20, Debt with Conversion and Other Options.Under ASC 470-20, issuers of convertible debt instruments that may be settled in cash upon conversion, including partial cashsettlement, are required to separately account for the liability (debt) and equity (conversion option) components. The carryingamount of the liability component at issuance date of $472 million was calculated by estimating the fair value of similarliabilities without a conversion feature. The residual principal amount of the notes of $103 million was allocated to the equitycomponent with offset to debt discount. The debt discount will be amortized to interest expense using the effective interestmethod over seven years which is determined to be the expected life of the Convertible Notes.
The Company incurred approximately $12 million in transaction costs in connection with the issuance of the notes. Thesecosts were allocated to the liability and equity components in proportion to the allocation of proceeds. Transaction costs of$10 million, allocated to the liability component, were recognized as deferred financing costs and are amortized over the sevenyears. Transaction costs of $2 million, allocated to the equity component, were recognized as a reduction of additional paid-incapital.
2019 Senior Note Redemptions
During the year ended December 31, 2019, the Company redeemed $733 million of its 6.25% Senior Notes due 2024 andrecorded a loss on debt extinguishment of $29 million, which included the write-off of previously deferred debt issuance costsof $5 million.
132
2018 Senior Note Repurchases
During the year ended December 31, 2018, the Company completed senior note repurchases, as detailed in the tablebelow. In addition, during the year ended December 31, 2018, a $38 million loss on debt extinguishment was recorded for theserepurchases, which included the write-off of previously deferred financing costs of $7 million.
(In millions, except percentages)Principal
Repurchased Cash Paid (a)Average Early Redemption
Percentage
5.750% senior notes due 2028 . . . . . . . . . . . . . . . . . . . . . . . . . . . . . . . . . . $ 29 $ 30 99.24 %
6.250% senior notes due 2022 . . . . . . . . . . . . . . . . . . . . . . . . . . . . . . . . . . 14 15 103.25 %Total at June 30, 2018 . . . . . . . . . . . . . . . . . . . . . . . . . . . . . . . . . . . . . . . $ 43 $ 456.250% senior notes due 2022 . . . . . . . . . . . . . . . . . . . . . . . . . . . . . . . . . . 493 512 103.13 %5.750% senior notes due 2028 . . . . . . . . . . . . . . . . . . . . . . . . . . . . . . . . . . 20 20 99.13 %
6.625% senior notes due 2027 . . . . . . . . . . . . . . . . . . . . . . . . . . . . . . . . . . 20 21 103.06 %Total at September 30, 2018 . . . . . . . . . . . . . . . . . . . . . . . . . . . . . . . . . . $ 576 $ 598
6.250% senior notes due 2022 . . . . . . . . . . . . . . . . . . . . . . . . . . . . . . . . . . 485 508 103.13 %Total at December 31, 2018 . . . . . . . . . . . . . . . . . . . . . . . . . . . . . . . . . . $ 1,061 $ 1,106
(a) Includes accrued interest of $14 million
Senior Notes Early Redemption
As of December 31, 2019, NRG had the following outstanding issuances of senior notes with an early redemption feature,or Senior Notes:
i. 7.250% senior notes, issued May 23, 2016 and due May 15, 2026, or the 2026 Senior Notes;ii. 6.625% senior notes, issued August 2, 2016 and due January 15, 2027, or the 2027 Senior Notes;
iii. 5.750% senior notes, issued December 7, 2017 and due January 15, 2028, or the 2028 Senior Notes; andiv. 5.250% senior notes, issued May 24, 2019 and due June 15, 2029 , or the 2029 Senior Notes
The Company periodically enters into supplemental indentures for the purpose of adding entities under the Senior Notesas guarantors.
The indentures and the forms of notes provide, among other things, that the Senior Notes will be senior unsecuredobligations of NRG. The indentures also provide for customary events of default, which include, among others: nonpayment ofprincipal or interest; breach of other agreements in the indentures; defaults in failure to pay certain other indebtedness; therendering of judgments to pay certain amounts of money against NRG and its subsidiaries; the failure of certain guarantees tobe enforceable; and certain events of bankruptcy or insolvency. Generally, if an event of default occurs, the Trustee or theHolders of at least 25% in principal amount of the then outstanding series of Senior Notes may declare all of the Senior Notesof such series to be due and payable immediately. The terms of the indentures, among other things, limit NRG's ability andcertain of its subsidiaries' ability to return capital to stockholders, grant liens on assets to lenders and incur additional debt.Interest is payable semi-annually on the Senior Notes until their maturity dates.
2026 Senior Notes
At any time prior to May 15, 2021, NRG may redeem all or a part of the 2026 Senior Notes, at a redemption price equal to100%of the principal amount, accrued and unpaid interest to the redemption date, plus a premium. The premium is the greaterof: (i) 1% of the principal amount of the notes; or (ii) the excess of the principal amount of the note over the following: thepresent value of 103.625% of the note, plus interest payments due on the note from the date of redemption through May 15,2021 computed using a discount rate equal to the Treasury Rate as of such redemption date plus 0.50%. In addition, on or afterMay 15, 2021, NRG may redeem some or all of the notes at redemption prices expressed as percentages of principal amount asset forth in the following table, plus accrued and unpaid interest on the notes redeemed to the first applicable redemption date:
Redemption PeriodRedemptionPercentage
May 15, 2021 to May 14, 2022 . . . . . . . . . . . . . . . . . . . . . . . . . . . . . . . . . . . . . . . . . . . . . . . . . . . . . . . . . . . . . . . . . . . . . . . 103.625 %May 15, 2022 to May 14, 2023 . . . . . . . . . . . . . . . . . . . . . . . . . . . . . . . . . . . . . . . . . . . . . . . . . . . . . . . . . . . . . . . . . . . . . . . 102.417 %May 15, 2023 to May 14, 2024 . . . . . . . . . . . . . . . . . . . . . . . . . . . . . . . . . . . . . . . . . . . . . . . . . . . . . . . . . . . . . . . . . . . . . . . 101.208 %May 15, 2024 and thereafter . . . . . . . . . . . . . . . . . . . . . . . . . . . . . . . . . . . . . . . . . . . . . . . . . . . . . . . . . . . . . . . . . . . . . . . . . 100.000 %
133
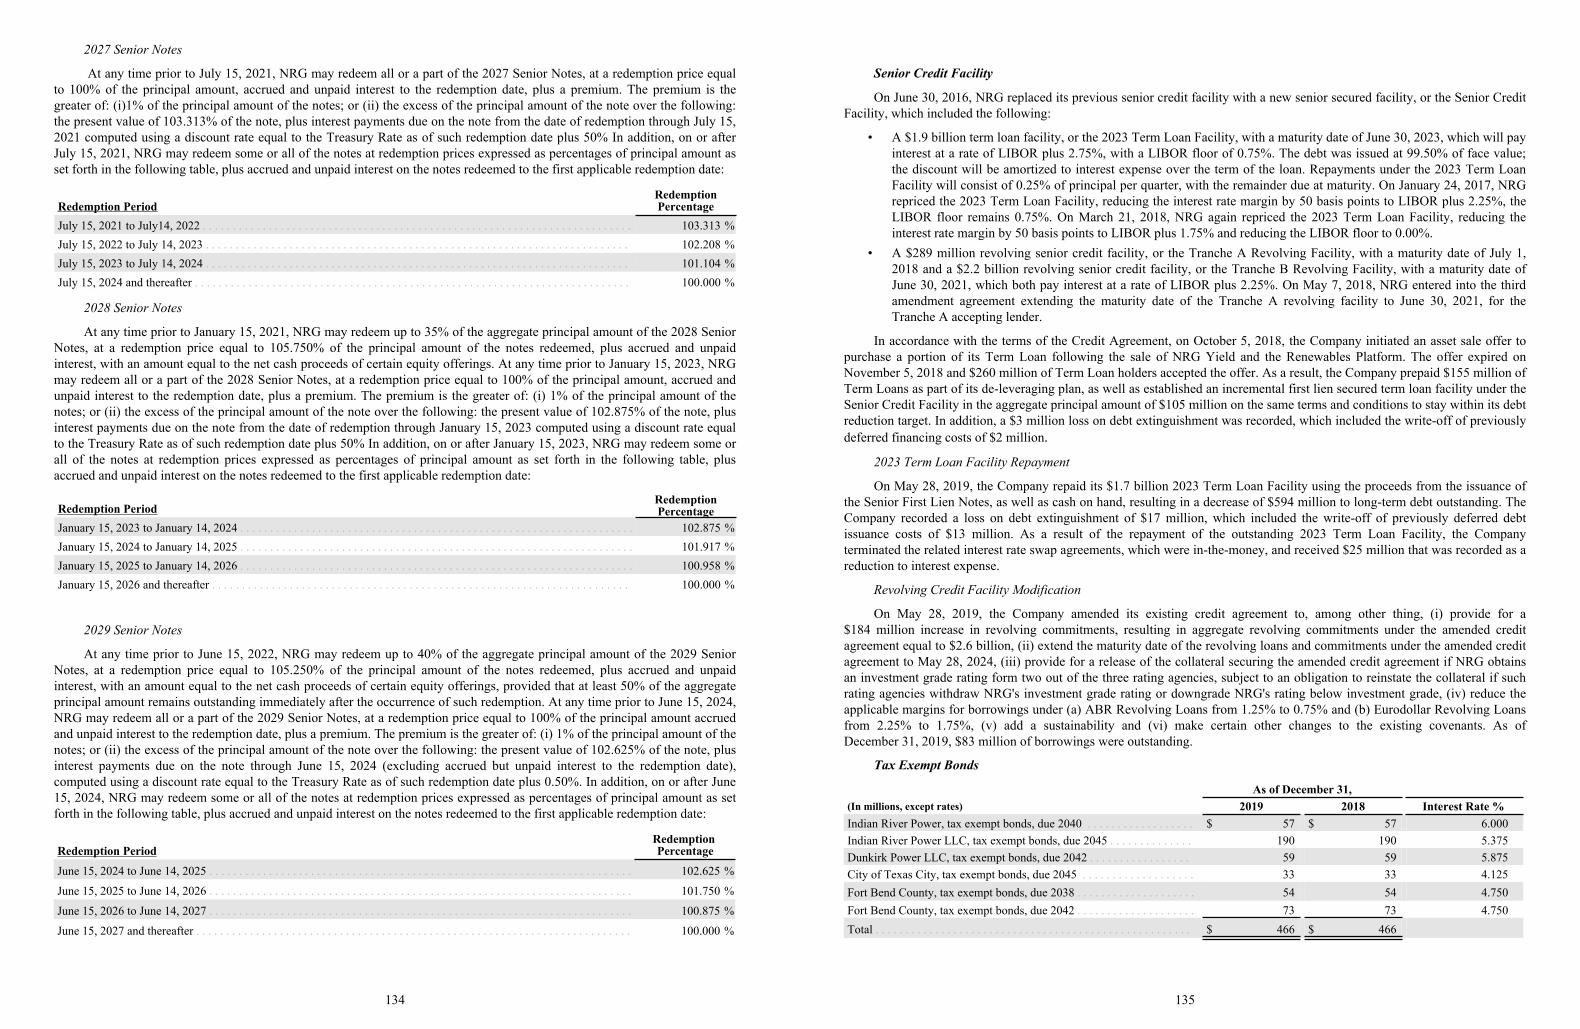
2027 Senior Notes
At any time prior to July 15, 2021, NRG may redeem all or a part of the 2027 Senior Notes, at a redemption price equalto 100% of the principal amount, accrued and unpaid interest to the redemption date, plus a premium. The premium is thegreater of: (i)1% of the principal amount of the notes; or (ii) the excess of the principal amount of the note over the following:the present value of 103.313% of the note, plus interest payments due on the note from the date of redemption through July 15,2021 computed using a discount rate equal to the Treasury Rate as of such redemption date plus 50% In addition, on or afterJuly 15, 2021, NRG may redeem some or all of the notes at redemption prices expressed as percentages of principal amount asset forth in the following table, plus accrued and unpaid interest on the notes redeemed to the first applicable redemption date:
Redemption PeriodRedemptionPercentage
July 15, 2021 to July14, 2022 . . . . . . . . . . . . . . . . . . . . . . . . . . . . . . . . . . . . . . . . . . . . . . . . . . . . . . . . . . . . . . . . . . . . . . . . 103.313 %July 15, 2022 to July 14, 2023 . . . . . . . . . . . . . . . . . . . . . . . . . . . . . . . . . . . . . . . . . . . . . . . . . . . . . . . . . . . . . . . . . . . . . . . 102.208 %July 15, 2023 to July 14, 2024 . . . . . . . . . . . . . . . . . . . . . . . . . . . . . . . . . . . . . . . . . . . . . . . . . . . . . . . . . . . . . . . . . . . . . . . 101.104 %July 15, 2024 and thereafter . . . . . . . . . . . . . . . . . . . . . . . . . . . . . . . . . . . . . . . . . . . . . . . . . . . . . . . . . . . . . . . . . . . . . . . . . 100.000 %
2028 Senior Notes
At any time prior to January 15, 2021, NRG may redeem up to 35% of the aggregate principal amount of the 2028 SeniorNotes, at a redemption price equal to 105.750% of the principal amount of the notes redeemed, plus accrued and unpaidinterest, with an amount equal to the net cash proceeds of certain equity offerings. At any time prior to January 15, 2023, NRGmay redeem all or a part of the 2028 Senior Notes, at a redemption price equal to 100% of the principal amount, accrued andunpaid interest to the redemption date, plus a premium. The premium is the greater of: (i) 1% of the principal amount of thenotes; or (ii) the excess of the principal amount of the note over the following: the present value of 102.875% of the note, plusinterest payments due on the note from the date of redemption through January 15, 2023 computed using a discount rate equalto the Treasury Rate as of such redemption date plus 50% In addition, on or after January 15, 2023, NRG may redeem some orall of the notes at redemption prices expressed as percentages of principal amount as set forth in the following table, plusaccrued and unpaid interest on the notes redeemed to the first applicable redemption date:
Redemption PeriodRedemptionPercentage
January 15, 2023 to January 14, 2024 . . . . . . . . . . . . . . . . . . . . . . . . . . . . . . . . . . . . . . . . . . . . . . . . . . . . . . . . . . . . . . . . . . 102.875 %January 15, 2024 to January 14, 2025 . . . . . . . . . . . . . . . . . . . . . . . . . . . . . . . . . . . . . . . . . . . . . . . . . . . . . . . . . . . . . . . . . . 101.917 %January 15, 2025 to January 14, 2026 . . . . . . . . . . . . . . . . . . . . . . . . . . . . . . . . . . . . . . . . . . . . . . . . . . . . . . . . . . . . . . . . . . 100.958 %January 15, 2026 and thereafter . . . . . . . . . . . . . . . . . . . . . . . . . . . . . . . . . . . . . . . . . . . . . . . . . . . . . . . . . . . . . . . . . . . . . . 100.000 %
Percentage
2029 Senior Notes
At any time prior to June 15, 2022, NRG may redeem up to 40% of the aggregate principal amount of the 2029 SeniorNotes, at a redemption price equal to 105.250% of the principal amount of the notes redeemed, plus accrued and unpaidinterest, with an amount equal to the net cash proceeds of certain equity offerings, provided that at least 50% of the aggregateprincipal amount remains outstanding immediately after the occurrence of such redemption. At any time prior to June 15, 2024,NRG may redeem all or a part of the 2029 Senior Notes, at a redemption price equal to 100% of the principal amount accruedand unpaid interest to the redemption date, plus a premium. The premium is the greater of: (i) 1% of the principal amount of thenotes; or (ii) the excess of the principal amount of the note over the following: the present value of 102.625% of the note, plusinterest payments due on the note through June 15, 2024 (excluding accrued but unpaid interest to the redemption date),computed using a discount rate equal to the Treasury Rate as of such redemption date plus 0.50%. In addition, on or after June15, 2024, NRG may redeem some or all of the notes at redemption prices expressed as percentages of principal amount as setforth in the following table, plus accrued and unpaid interest on the notes redeemed to the first applicable redemption date:
Redemption PeriodRedemption Percentage
June 15, 2024 to June 14, 2025 . . . . . . . . . . . . . . . . . . . . . . . . . . . . . . . . . . . . . . . . . . . . . . . . . . . . . . . . . . . . . . . . . . . . . . . 102.625 %
June 15, 2025 to June 14, 2026 . . . . . . . . . . . . . . . . . . . . . . . . . . . . . . . . . . . . . . . . . . . . . . . . . . . . . . . . . . . . . . . . . . . . . . . 101.750 %
June 15, 2026 to June 14, 2027 . . . . . . . . . . . . . . . . . . . . . . . . . . . . . . . . . . . . . . . . . . . . . . . . . . . . . . . . . . . . . . . . . . . . . . . 100.875 %
June 15, 2027 and thereafter . . . . . . . . . . . . . . . . . . . . . . . . . . . . . . . . . . . . . . . . . . . . . . . . . . . . . . . . . . . . . . . . . . . . . . . . . 100.000 %
134
Senior Credit Facility
On June 30, 2016, NRG replaced its previous senior credit facility with a new senior secured facility, or the Senior CreditFacility, which included the following:
• A $1.9 billion term loan facility, or the 2023 Term Loan Facility, with a maturity date of June 30, 2023, which will payinterest at a rate of LIBOR plus 2.75%, with a LIBOR floor of 0.75%. The debt was issued at 99.50% of face value;the discount will be amortized to interest expense over the term of the loan. Repayments under the 2023 Term LoanFacility will consist of 0.25% of principal per quarter, with the remainder due at maturity. On January 24, 2017, NRGrepriced the 2023 Term Loan Facility, reducing the interest rate margin by 50 basis points to LIBOR plus 2.25%, theLIBOR floor remains 0.75%. On March 21, 2018, NRG again repriced the 2023 Term Loan Facility, reducing theinterest rate margin by 50 basis points to LIBOR plus 1.75% and reducing the LIBOR floor to 0.00%.
• A $289 million revolving senior credit facility, or the Tranche A Revolving Facility, with a maturity date of July 1,2018 and a $2.2 billion revolving senior credit facility, or the Tranche B Revolving Facility, with a maturity date ofJune 30, 2021, which both pay interest at a rate of LIBOR plus 2.25%. On May 7, 2018, NRG entered into the thirdamendment agreement extending the maturity date of the Tranche A revolving facility to June 30, 2021, for theTranche A accepting lender.
In accordance with the terms of the Credit Agreement, on October 5, 2018, the Company initiated an asset sale offer topurchase a portion of its Term Loan following the sale of NRG Yield and the Renewables Platform. The offer expired onNovember 5, 2018 and $260 million of Term Loan holders accepted the offer. As a result, the Company prepaid $155 million ofTerm Loans as part of its de-leveraging plan, as well as established an incremental first lien secured term loan facility under theSenior Credit Facility in the aggregate principal amount of $105 million on the same terms and conditions to stay within its debtreduction target. In addition, a $3 million loss on debt extinguishment was recorded, which included the write-off of previouslydeferred financing costs of $2 million.
2023 Term Loan Facility Repayment
On May 28, 2019, the Company repaid its $1.7 billion 2023 Term Loan Facility using the proceeds from the issuance ofthe Senior First Lien Notes, as well as cash on hand, resulting in a decrease of $594 million to long-term debt outstanding. TheCompany recorded a loss on debt extinguishment of $17 million, which included the write-off of previously deferred debtissuance costs of $13 million. As a result of the repayment of the outstanding 2023 Term Loan Facility, the Companyterminated the related interest rate swap agreements, which were in-the-money, and received $25 million that was recorded as areduction to interest expense.
Revolving Credit Facility Modification
On May 28, 2019, the Company amended its existing credit agreement to, among other thing, (i) provide for a$184 million increase in revolving commitments, resulting in aggregate revolving commitments under the amended creditagreement equal to $2.6 billion, (ii) extend the maturity date of the revolving loans and commitments under the amended creditagreement to May 28, 2024, (iii) provide for a release of the collateral securing the amended credit agreement if NRG obtainsan investment grade rating form two out of the three rating agencies, subject to an obligation to reinstate the collateral if suchrating agencies withdraw NRG's investment grade rating or downgrade NRG's rating below investment grade, (iv) reduce theapplicable margins for borrowings under (a) ABR Revolving Loans from 1.25% to 0.75% and (b) Eurodollar Revolving Loansfrom 2.25% to 1.75%, (v) add a sustainability and (vi) make certain other changes to the existing covenants. As ofDecember 31, 2019, $83 million of borrowings were outstanding.
Tax Exempt Bonds
As of December 31,(In millions, except rates) 2019 2018 Interest Rate % Indian River Power, tax exempt bonds, due 2040 . . . . . . . . . . . . . . . . . . $ 57 $ 57 6.000Indian River Power LLC, tax exempt bonds, due 2045 . . . . . . . . . . . . . . 190 190 5.375Dunkirk Power LLC, tax exempt bonds, due 2042 . . . . . . . . . . . . . . . . . 59 59 5.875City of Texas City, tax exempt bonds, due 2045 . . . . . . . . . . . . . . . . . . . 33 33 4.125Fort Bend County, tax exempt bonds, due 2038 . . . . . . . . . . . . . . . . . . . . 54 54 4.750Fort Bend County, tax exempt bonds, due 2042 . . . . . . . . . . . . . . . . . . . . 73 73 4.750Total . . . . . . . . . . . . . . . . . . . . . . . . . . . . . . . . . . . . . . . . . . . . . . . . . . . . . $ 466 $ 466
135
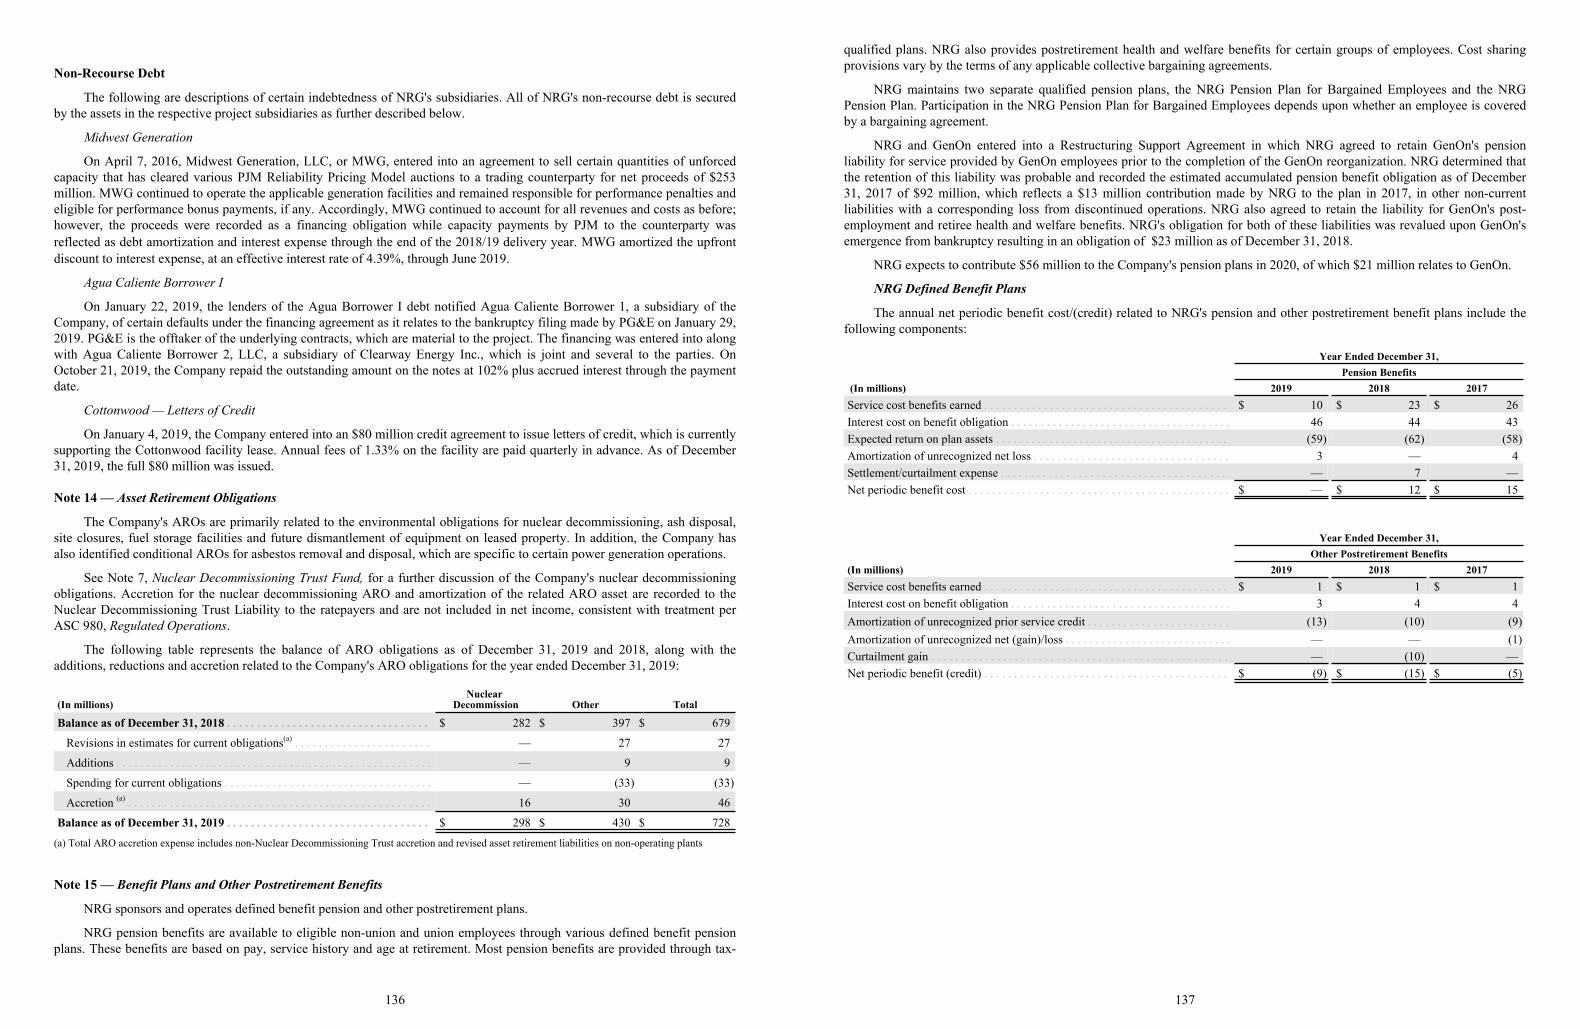
Non-Recourse Debt
The following are descriptions of certain indebtedness of NRG's subsidiaries. All of NRG's non-recourse debt is securedby the assets in the respective project subsidiaries as further described below.
Midwest Generation
On April 7, 2016, Midwest Generation, LLC, or MWG, entered into an agreement to sell certain quantities of unforcedcapacity that has cleared various PJM Reliability Pricing Model auctions to a trading counterparty for net proceeds of $253million. MWG continued to operate the applicable generation facilities and remained responsible for performance penalties andeligible for performance bonus payments, if any. Accordingly, MWG continued to account for all revenues and costs as before;however, the proceeds were recorded as a financing obligation while capacity payments by PJM to the counterparty wasreflected as debt amortization and interest expense through the end of the 2018/19 delivery year. MWG amortized the upfrontdiscount to interest expense, at an effective interest rate of 4.39%, through June 2019.
Agua Caliente Borrower I
On January 22, 2019, the lenders of the Agua Borrower I debt notified Agua Caliente Borrower 1, a subsidiary of theCompany, of certain defaults under the financing agreement as it relates to the bankruptcy filing made by PG&E on January 29,2019. PG&E is the offtaker of the underlying contracts, which are material to the project. The financing was entered into alongwith Agua Caliente Borrower 2, LLC, a subsidiary of Clearway Energy Inc., which is joint and several to the parties. OnOctober 21, 2019, the Company repaid the outstanding amount on the notes at 102% plus accrued interest through the paymentdate.
Cottonwood — Letters of Credit
On January 4, 2019, the Company entered into an $80 million credit agreement to issue letters of credit, which is currentlysupporting the Cottonwood facility lease. Annual fees of 1.33% on the facility are paid quarterly in advance. As of December31, 2019, the full $80 million was issued.
Note 14 — Asset Retirement Obligations
The Company's AROs are primarily related to the environmental obligations for nuclear decommissioning, ash disposal,site closures, fuel storage facilities and future dismantlement of equipment on leased property. In addition, the Company hasalso identified conditional AROs for asbestos removal and disposal, which are specific to certain power generation operations.
See Note 7, Nuclear Decommissioning Trust Fund, for a further discussion of the Company's nuclear decommissioningobligations. Accretion for the nuclear decommissioning ARO and amortization of the related ARO asset are recorded to theNuclear Decommissioning Trust Liability to the ratepayers and are not included in net income, consistent with treatment perASC 980, Regulated Operations.
The following table represents the balance of ARO obligations as of December 31, 2019 and 2018, along with theadditions, reductions and accretion related to the Company's ARO obligations for the year ended December 31, 2019:
(In millions)Nuclear
Decommission Other Total
Balance as of December 31, 2018 . . . . . . . . . . . . . . . . . . . . . . . . . . . . . . . . . . $ 282 $ 397 $ 679
Revisions in estimates for current obligations(a) . . . . . . . . . . . . . . . . . . . . . . . — 27 27
Additions . . . . . . . . . . . . . . . . . . . . . . . . . . . . . . . . . . . . . . . . . . . . . . . . . . . . . — 9 9
Spending for current obligations . . . . . . . . . . . . . . . . . . . . . . . . . . . . . . . . . . . — (33) (33)
Accretion (a) . . . . . . . . . . . . . . . . . . . . . . . . . . . . . . . . . . . . . . . . . . . . . . . . . . . 16 30 46
Balance as of December 31, 2019 . . . . . . . . . . . . . . . . . . . . . . . . . . . . . . . . . . $ 298 $ 430 $ 728
(a) Total ARO accretion expense includes non-Nuclear Decommissioning Trust accretion and revised asset retirement liabilities on non-operating plants
Note 15 — Benefit Plans and Other Postretirement Benefits
NRG sponsors and operates defined benefit pension and other postretirement plans.
NRG pension benefits are available to eligible non-union and union employees through various defined benefit pensionplans. These benefits are based on pay, service history and age at retirement. Most pension benefits are provided through tax-
136
qualified plans. NRG also provides postretirement health and welfare benefits for certain groups of employees. Cost sharingprovisions vary by the terms of any applicable collective bargaining agreements.
NRG maintains two separate qualified pension plans, the NRG Pension Plan for Bargained Employees and the NRGPension Plan. Participation in the NRG Pension Plan for Bargained Employees depends upon whether an employee is coveredby a bargaining agreement.
NRG and GenOn entered into a Restructuring Support Agreement in which NRG agreed to retain GenOn's pensionliability for service provided by GenOn employees prior to the completion of the GenOn reorganization. NRG determined thatthe retention of this liability was probable and recorded the estimated accumulated pension benefit obligation as of December31, 2017 of $92 million, which reflects a $13 million contribution made by NRG to the plan in 2017, in other non-currentliabilities with a corresponding loss from discontinued operations. NRG also agreed to retain the liability for GenOn's post-employment and retiree health and welfare benefits. NRG's obligation for both of these liabilities was revalued upon GenOn'semergence from bankruptcy resulting in an obligation of $23 million as of December 31, 2018.
NRG expects to contribute $56 million to the Company's pension plans in 2020, of which $21 million relates to GenOn.
NRG Defined Benefit Plans
The annual net periodic benefit cost/(credit) related to NRG's pension and other postretirement benefit plans include thefollowing components:
Year Ended December 31,Pension Benefits
(In millions) 2019 2018 2017Service cost benefits earned . . . . . . . . . . . . . . . . . . . . . . . . . . . . . . . . . . . . . . . . . $ 10 $ 23 $ 26Interest cost on benefit obligation . . . . . . . . . . . . . . . . . . . . . . . . . . . . . . . . . . . . . 46 44 43Expected return on plan assets . . . . . . . . . . . . . . . . . . . . . . . . . . . . . . . . . . . . . . . (59) (62) (58)Amortization of unrecognized net loss . . . . . . . . . . . . . . . . . . . . . . . . . . . . . . . . . 3 — 4Settlement/curtailment expense . . . . . . . . . . . . . . . . . . . . . . . . . . . . . . . . . . . . . . . — 7 —Net periodic benefit cost . . . . . . . . . . . . . . . . . . . . . . . . . . . . . . . . . . . . . . . . . . . . $ — $ 12 $ 15
Year Ended December 31,Other Postretirement Benefits
(In millions) 2019 2018 2017Service cost benefits earned . . . . . . . . . . . . . . . . . . . . . . . . . . . . . . . . . . . . . . . . . $ 1 $ 1 $ 1Interest cost on benefit obligation . . . . . . . . . . . . . . . . . . . . . . . . . . . . . . . . . . . . . 3 4 4Amortization of unrecognized prior service credit . . . . . . . . . . . . . . . . . . . . . . . . (13) (10) (9)Amortization of unrecognized net (gain)/loss . . . . . . . . . . . . . . . . . . . . . . . . . . . . — — (1)Curtailment gain . . . . . . . . . . . . . . . . . . . . . . . . . . . . . . . . . . . . . . . . . . . . . . . . . . — (10) —Net periodic benefit (credit) . . . . . . . . . . . . . . . . . . . . . . . . . . . . . . . . . . . . . . . . . $ (9) $ (15) $ (5)(9) (15) (5)
137
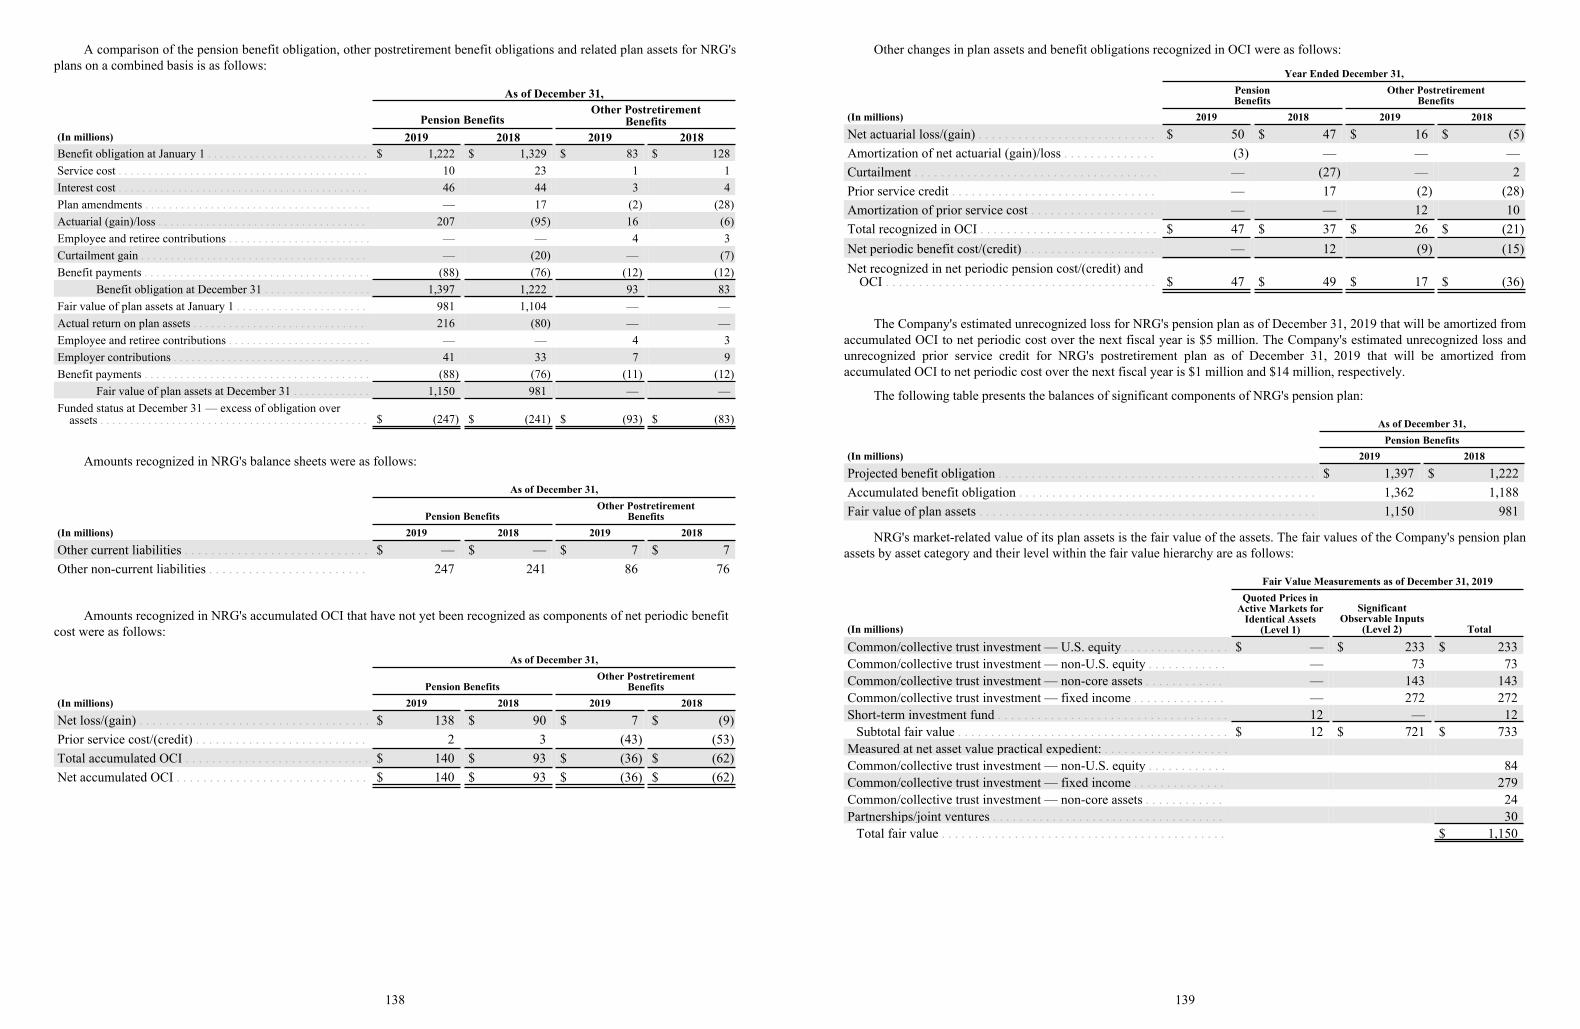
A comparison of the pension benefit obligation, other postretirement benefit obligations and related plan assets for NRG'splans on a combined basis is as follows:
As of December 31,
Pension BenefitsOther Postretirement
Benefits(In millions) 2019 2018 2019 2018Benefit obligation at January 1 . . . . . . . . . . . . . . . . . . . . . . . . . . . $ 1,222 $ 1,329 $ 83 $ 128Service cost . . . . . . . . . . . . . . . . . . . . . . . . . . . . . . . . . . . . . . . . . . 10 23 1 1Interest cost . . . . . . . . . . . . . . . . . . . . . . . . . . . . . . . . . . . . . . . . . . 46 44 3 4Plan amendments . . . . . . . . . . . . . . . . . . . . . . . . . . . . . . . . . . . . . . — 17 (2) (28)Actuarial (gain)/loss . . . . . . . . . . . . . . . . . . . . . . . . . . . . . . . . . . . 207 (95) 16 (6)Employee and retiree contributions . . . . . . . . . . . . . . . . . . . . . . . . — — 4 3Curtailment gain . . . . . . . . . . . . . . . . . . . . . . . . . . . . . . . . . . . . . . — (20) — (7)Benefit payments . . . . . . . . . . . . . . . . . . . . . . . . . . . . . . . . . . . . . . (88) (76) (12) (12)
Benefit obligation at December 31 . . . . . . . . . . . . . . . . . . 1,397 1,222 93 83Fair value of plan assets at January 1 . . . . . . . . . . . . . . . . . . . . . . 981 1,104 — —Actual return on plan assets . . . . . . . . . . . . . . . . . . . . . . . . . . . . . 216 (80) — —Employee and retiree contributions . . . . . . . . . . . . . . . . . . . . . . . . — — 4 3Employer contributions . . . . . . . . . . . . . . . . . . . . . . . . . . . . . . . . . 41 33 7 9Benefit payments . . . . . . . . . . . . . . . . . . . . . . . . . . . . . . . . . . . . . . (88) (76) (11) (12)
Fair value of plan assets at December 31 . . . . . . . . . . . . . 1,150 981 — —Funded status at December 31 — excess of obligation over
assets . . . . . . . . . . . . . . . . . . . . . . . . . . . . . . . . . . . . . . . . . . . . . $ (247) $ (241) $ (93) $ (83)
Amounts recognized in NRG's balance sheets were as follows:
As of December 31,
Pension BenefitsOther Postretirement
Benefits(In millions) 2019 2018 2019 2018
Other current liabilities . . . . . . . . . . . . . . . . . . . . . . . . . . . . $ — $ — $ 7 $ 7Other non-current liabilities . . . . . . . . . . . . . . . . . . . . . . . . 247 241 86 76
Amounts recognized in NRG's accumulated OCI that have not yet been recognized as components of net periodic benefit cost were as follows:
As of December 31,
Pension BenefitsOther Postretirement
Benefits(In millions) 2019 2018 2019 2018
Net loss/(gain) . . . . . . . . . . . . . . . . . . . . . . . . . . . . . . . . . . . $ 138 $ 90 $ 7 $ (9)Prior service cost/(credit) . . . . . . . . . . . . . . . . . . . . . . . . . . 2 3 (43) (53)Total accumulated OCI . . . . . . . . . . . . . . . . . . . . . . . . . . . . $ 140 $ 93 $ (36) $ (62)Net accumulated OCI . . . . . . . . . . . . . . . . . . . . . . . . . . . . . $ 140 $ 93 $ (36) $ (62)
138
Other changes in plan assets and benefit obligations recognized in OCI were as follows:
Year Ended December 31,PensionBenefits
Other PostretirementBenefits
(In millions) 2019 2018 2019 2018
Net actuarial loss/(gain) . . . . . . . . . . . . . . . . . . . . . . . . . . . $ 50 $ 47 $ 16 $ (5)Amortization of net actuarial (gain)/loss . . . . . . . . . . . . . . (3) — — —Curtailment . . . . . . . . . . . . . . . . . . . . . . . . . . . . . . . . . . . . . — (27) — 2Prior service credit . . . . . . . . . . . . . . . . . . . . . . . . . . . . . . . — 17 (2) (28)Amortization of prior service cost . . . . . . . . . . . . . . . . . . . — — 12 10Total recognized in OCI . . . . . . . . . . . . . . . . . . . . . . . . . . . $ 47 $ 37 $ 26 $ (21)Net periodic benefit cost/(credit) . . . . . . . . . . . . . . . . . . . . — 12 (9) (15)Net recognized in net periodic pension cost/(credit) and
OCI . . . . . . . . . . . . . . . . . . . . . . . . . . . . . . . . . . . . . . . . . $ 47 $ 49 $ 17 $ (36)
The Company's estimated unrecognized loss for NRG's pension plan as of December 31, 2019 that will be amortized fromaccumulated OCI to net periodic cost over the next fiscal year is $5 million. The Company's estimated unrecognized loss andunrecognized prior service credit for NRG's postretirement plan as of December 31, 2019 that will be amortized fromaccumulated OCI to net periodic cost over the next fiscal year is $1 million and $14 million, respectively.
The following table presents the balances of significant components of NRG's pension plan:
As of December 31,Pension Benefits
(In millions) 2019 2018
Projected benefit obligation . . . . . . . . . . . . . . . . . . . . . . . . . . . . . . . . . . . . . . . . . . . . . . . . $ 1,397 $ 1,222Accumulated benefit obligation . . . . . . . . . . . . . . . . . . . . . . . . . . . . . . . . . . . . . . . . . . . . . 1,362 1,188Fair value of plan assets . . . . . . . . . . . . . . . . . . . . . . . . . . . . . . . . . . . . . . . . . . . . . . . . . . . 1,150 981
NRG's market-related value of its plan assets is the fair value of the assets. The fair values of the Company's pension planassets by asset category and their level within the fair value hierarchy are as follows:
Fair Value Measurements as of December 31, 2019
(In millions)
Quoted Prices inActive Markets for
Identical Assets(Level 1)
SignificantObservable Inputs
(Level 2) Total
Common/collective trust investment — U.S. equity . . . . . . . . . . . . . . . . $ — $ 233 $ 233Common/collective trust investment — non-U.S. equity . . . . . . . . . . . . — 73 73Common/collective trust investment — non-core assets . . . . . . . . . . . . — 143 143Common/collective trust investment — fixed income . . . . . . . . . . . . . . — 272 272Short-term investment fund . . . . . . . . . . . . . . . . . . . . . . . . . . . . . . . . . . . 12 — 12
Subtotal fair value . . . . . . . . . . . . . . . . . . . . . . . . . . . . . . . . . . . . . . . . . $ 12 $ 721 $ 733Measured at net asset value practical expedient: . . . . . . . . . . . . . . . . . . .Common/collective trust investment — non-U.S. equity . . . . . . . . . . . . 84Common/collective trust investment — fixed income . . . . . . . . . . . . . . 279Common/collective trust investment — non-core assets . . . . . . . . . . . . 24Partnerships/joint ventures . . . . . . . . . . . . . . . . . . . . . . . . . . . . . . . . . . . 30
Total fair value . . . . . . . . . . . . . . . . . . . . . . . . . . . . . . . . . . . . . . . . . . . $ 1,1501,150
139
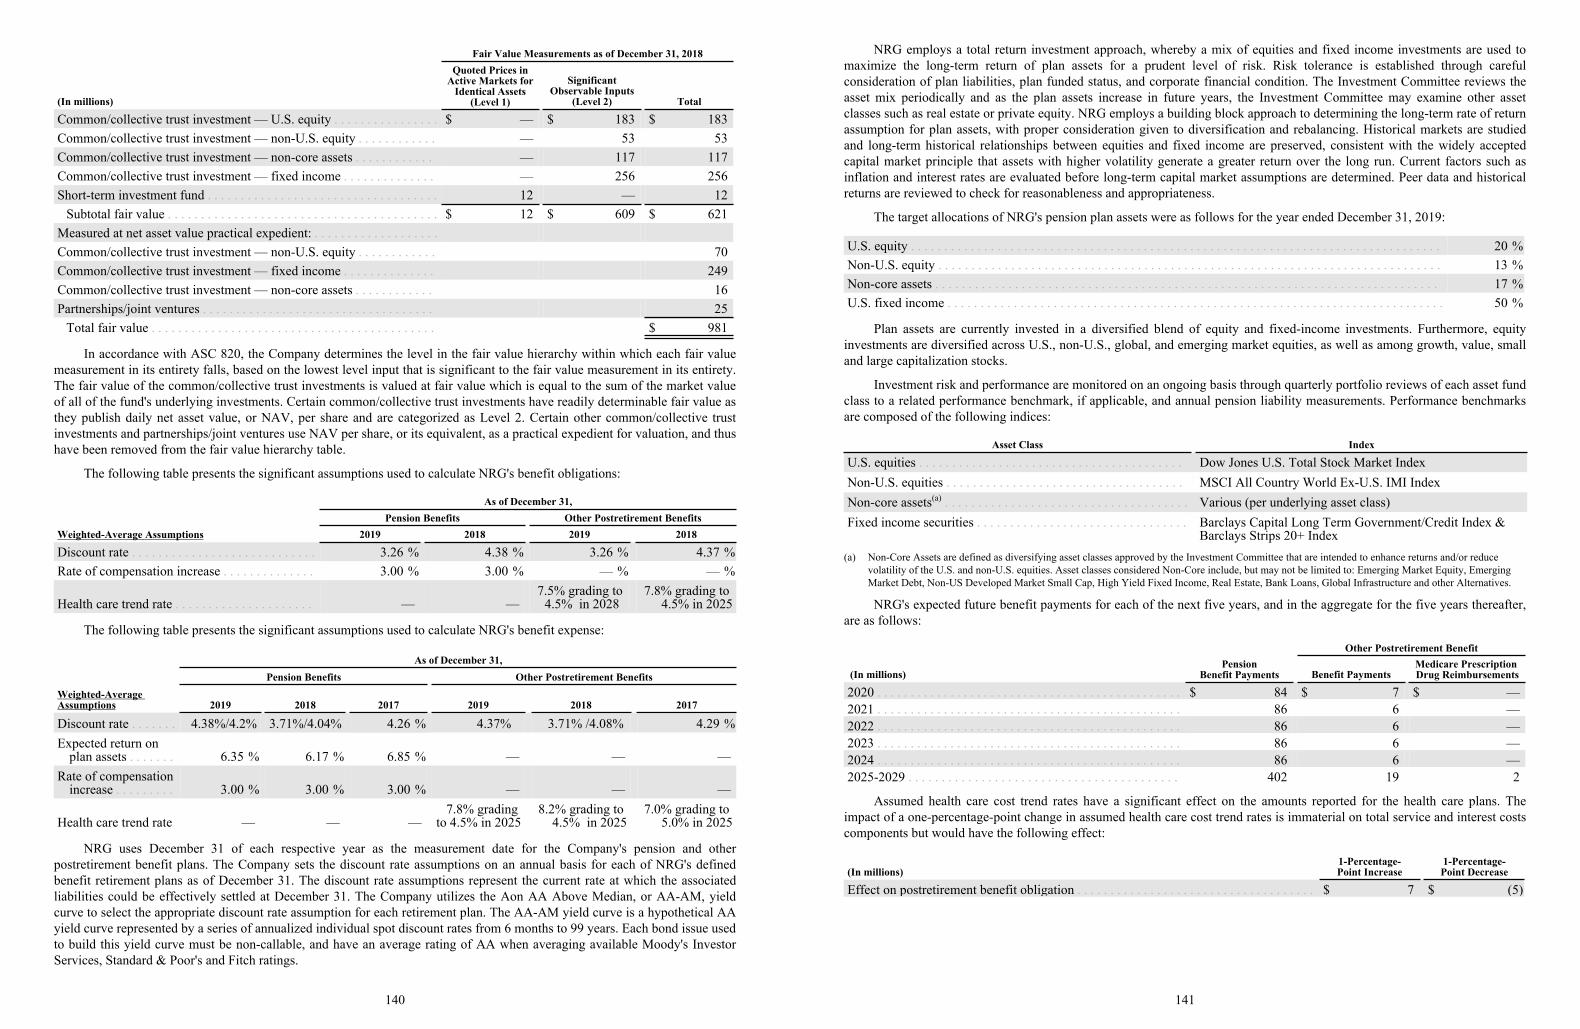
Fair Value Measurements as of December 31, 2018
(In millions)
Quoted Prices inActive Markets for
Identical Assets(Level 1)
SignificantObservable Inputs
(Level 2) Total
Common/collective trust investment — U.S. equity . . . . . . . . . . . . . . . . $ — $ 183 $ 183Common/collective trust investment — non-U.S. equity . . . . . . . . . . . . — 53 53Common/collective trust investment — non-core assets . . . . . . . . . . . . — 117 117Common/collective trust investment — fixed income . . . . . . . . . . . . . . — 256 256Short-term investment fund . . . . . . . . . . . . . . . . . . . . . . . . . . . . . . . . . . . 12 — 12
Subtotal fair value . . . . . . . . . . . . . . . . . . . . . . . . . . . . . . . . . . . . . . . . . $ 12 $ 609 $ 621Measured at net asset value practical expedient: . . . . . . . . . . . . . . . . . . .Common/collective trust investment — non-U.S. equity . . . . . . . . . . . . 70Common/collective trust investment — fixed income . . . . . . . . . . . . . . 249Common/collective trust investment — non-core assets . . . . . . . . . . . . 16Partnerships/joint ventures . . . . . . . . . . . . . . . . . . . . . . . . . . . . . . . . . . . 25
Total fair value . . . . . . . . . . . . . . . . . . . . . . . . . . . . . . . . . . . . . . . . . . . $ 981
In accordance with ASC 820, the Company determines the level in the fair value hierarchy within which each fair valuemeasurement in its entirety falls, based on the lowest level input that is significant to the fair value measurement in its entirety.The fair value of the common/collective trust investments is valued at fair value which is equal to the sum of the market valueof all of the fund's underlying investments. Certain common/collective trust investments have readily determinable fair value asthey publish daily net asset value, or NAV, per share and are categorized as Level 2. Certain other common/collective trustinvestments and partnerships/joint ventures use NAV per share, or its equivalent, as a practical expedient for valuation, and thushave been removed from the fair value hierarchy table.
The following table presents the significant assumptions used to calculate NRG's benefit obligations:
As of December 31,Pension Benefits Other Postretirement Benefits
Weighted-Average Assumptions 2019 2018 2019 2018
Discount rate . . . . . . . . . . . . . . . . . . . . . . . . . . . . 3.26 % 4.38 % 3.26 % 4.37 %Rate of compensation increase . . . . . . . . . . . . . . 3.00 % 3.00 % — % — %
Health care trend rate . . . . . . . . . . . . . . . . . . . . . — —7.5% grading to
4.5% in 2028 7.8% grading to
4.5% in 2025
The following table presents the significant assumptions used to calculate NRG's benefit expense:
As of December 31,Pension Benefits Other Postretirement Benefits
Weighted-Average Assumptions 2019 2018 2017 2019 2018 2017
Discount rate . . . . . . . 4.38%/4.2% 3.71%/4.04% 4.26 % 4.37% 3.71% /4.08% 4.29 %Expected return on
plan assets . . . . . . . 6.35 % 6.17 % 6.85 % — — —Rate of compensation
increase . . . . . . . . . 3.00 % 3.00 % 3.00 % — — —
Health care trend rate — — —7.8% grading
to 4.5% in 20258.2% grading to
4.5% in 20257.0% grading to
5.0% in 2025
NRG uses December 31 of each respective year as the measurement date for the Company's pension and otherpostretirement benefit plans. The Company sets the discount rate assumptions on an annual basis for each of NRG's definedbenefit retirement plans as of December 31. The discount rate assumptions represent the current rate at which the associatedliabilities could be effectively settled at December 31. The Company utilizes the Aon AA Above Median, or AA-AM, yieldcurve to select the appropriate discount rate assumption for each retirement plan. The AA-AM yield curve is a hypothetical AAyield curve represented by a series of annualized individual spot discount rates from 6 months to 99 years. Each bond issue usedto build this yield curve must be non-callable, and have an average rating of AA when averaging available Moody's InvestorServices, Standard & Poor's and Fitch ratings.
140
NRG employs a total return investment approach, whereby a mix of equities and fixed income investments are used tomaximize the long-term return of plan assets for a prudent level of risk. Risk tolerance is established through carefulconsideration of plan liabilities, plan funded status, and corporate financial condition. The Investment Committee reviews theasset mix periodically and as the plan assets increase in future years, the Investment Committee may examine other assetclasses such as real estate or private equity. NRG employs a building block approach to determining the long-term rate of returnassumption for plan assets, with proper consideration given to diversification and rebalancing. Historical markets are studiedand long-term historical relationships between equities and fixed income are preserved, consistent with the widely acceptedcapital market principle that assets with higher volatility generate a greater return over the long run. Current factors such asinflation and interest rates are evaluated before long-term capital market assumptions are determined. Peer data and historicalreturns are reviewed to check for reasonableness and appropriateness.
The target allocations of NRG's pension plan assets were as follows for the year ended December 31, 2019:
U.S. equity . . . . . . . . . . . . . . . . . . . . . . . . . . . . . . . . . . . . . . . . . . . . . . . . . . . . . . . . . . . . . . . . . . . . . . . . . . . . . . . . 20 %Non-U.S. equity . . . . . . . . . . . . . . . . . . . . . . . . . . . . . . . . . . . . . . . . . . . . . . . . . . . . . . . . . . . . . . . . . . . . . . . . . . . . 13 %Non-core assets . . . . . . . . . . . . . . . . . . . . . . . . . . . . . . . . . . . . . . . . . . . . . . . . . . . . . . . . . . . . . . . . . . . . . . . . . . . . 17 %U.S. fixed income . . . . . . . . . . . . . . . . . . . . . . . . . . . . . . . . . . . . . . . . . . . . . . . . . . . . . . . . . . . . . . . . . . . . . . . . . . . 50 %
Plan assets are currently invested in a diversified blend of equity and fixed-income investments. Furthermore, equityinvestments are diversified across U.S., non-U.S., global, and emerging market equities, as well as among growth, value, smalland large capitalization stocks.
Investment risk and performance are monitored on an ongoing basis through quarterly portfolio reviews of each asset fundclass to a related performance benchmark, if applicable, and annual pension liability measurements. Performance benchmarksare composed of the following indices:
Asset Class Index
U.S. equities . . . . . . . . . . . . . . . . . . . . . . . . . . . . . . . . . . . . . . . . Dow Jones U.S. Total Stock Market IndexNon-U.S. equities . . . . . . . . . . . . . . . . . . . . . . . . . . . . . . . . . . . . MSCI All Country World Ex-U.S. IMI IndexNon-core assets(a) . . . . . . . . . . . . . . . . . . . . . . . . . . . . . . . . . . . . . Various (per underlying asset class)Fixed income securities . . . . . . . . . . . . . . . . . . . . . . . . . . . . . . . . Barclays Capital Long Term Government/Credit Index &
Barclays Strips 20+ Index(a) Non-Core Assets are defined as diversifying asset classes approved by the Investment Committee that are intended to enhance returns and/or reduce
volatility of the U.S. and non-U.S. equities. Asset classes considered Non-Core include, but may not be limited to: Emerging Market Equity, Emerging Market Debt, Non-US Developed Market Small Cap, High Yield Fixed Income, Real Estate, Bank Loans, Global Infrastructure and other Alternatives.
NRG's expected future benefit payments for each of the next five years, and in the aggregate for the five years thereafter,are as follows:
Other Postretirement Benefit
(In millions)Pension
Benefit Payments Benefit PaymentsMedicare Prescription Drug Reimbursements
2020 . . . . . . . . . . . . . . . . . . . . . . . . . . . . . . . . . . . . . . . . . . . . . . $ 84 $ 7 $ —2021 . . . . . . . . . . . . . . . . . . . . . . . . . . . . . . . . . . . . . . . . . . . . . . 86 6 —2022 . . . . . . . . . . . . . . . . . . . . . . . . . . . . . . . . . . . . . . . . . . . . . . 86 6 —2023 . . . . . . . . . . . . . . . . . . . . . . . . . . . . . . . . . . . . . . . . . . . . . . 86 6 —2024 . . . . . . . . . . . . . . . . . . . . . . . . . . . . . . . . . . . . . . . . . . . . . . 86 6 —2025-2029 . . . . . . . . . . . . . . . . . . . . . . . . . . . . . . . . . . . . . . . . . 402 19 2
Assumed health care cost trend rates have a significant effect on the amounts reported for the health care plans. Theimpact of a one-percentage-point change in assumed health care cost trend rates is immaterial on total service and interest costscomponents but would have the following effect:
(In millions)1-Percentage-Point Increase
1-Percentage-Point Decrease
Effect on postretirement benefit obligation . . . . . . . . . . . . . . . . . . . . . . . . . . . . . . . . . . . . $ 7 $ (5)
141
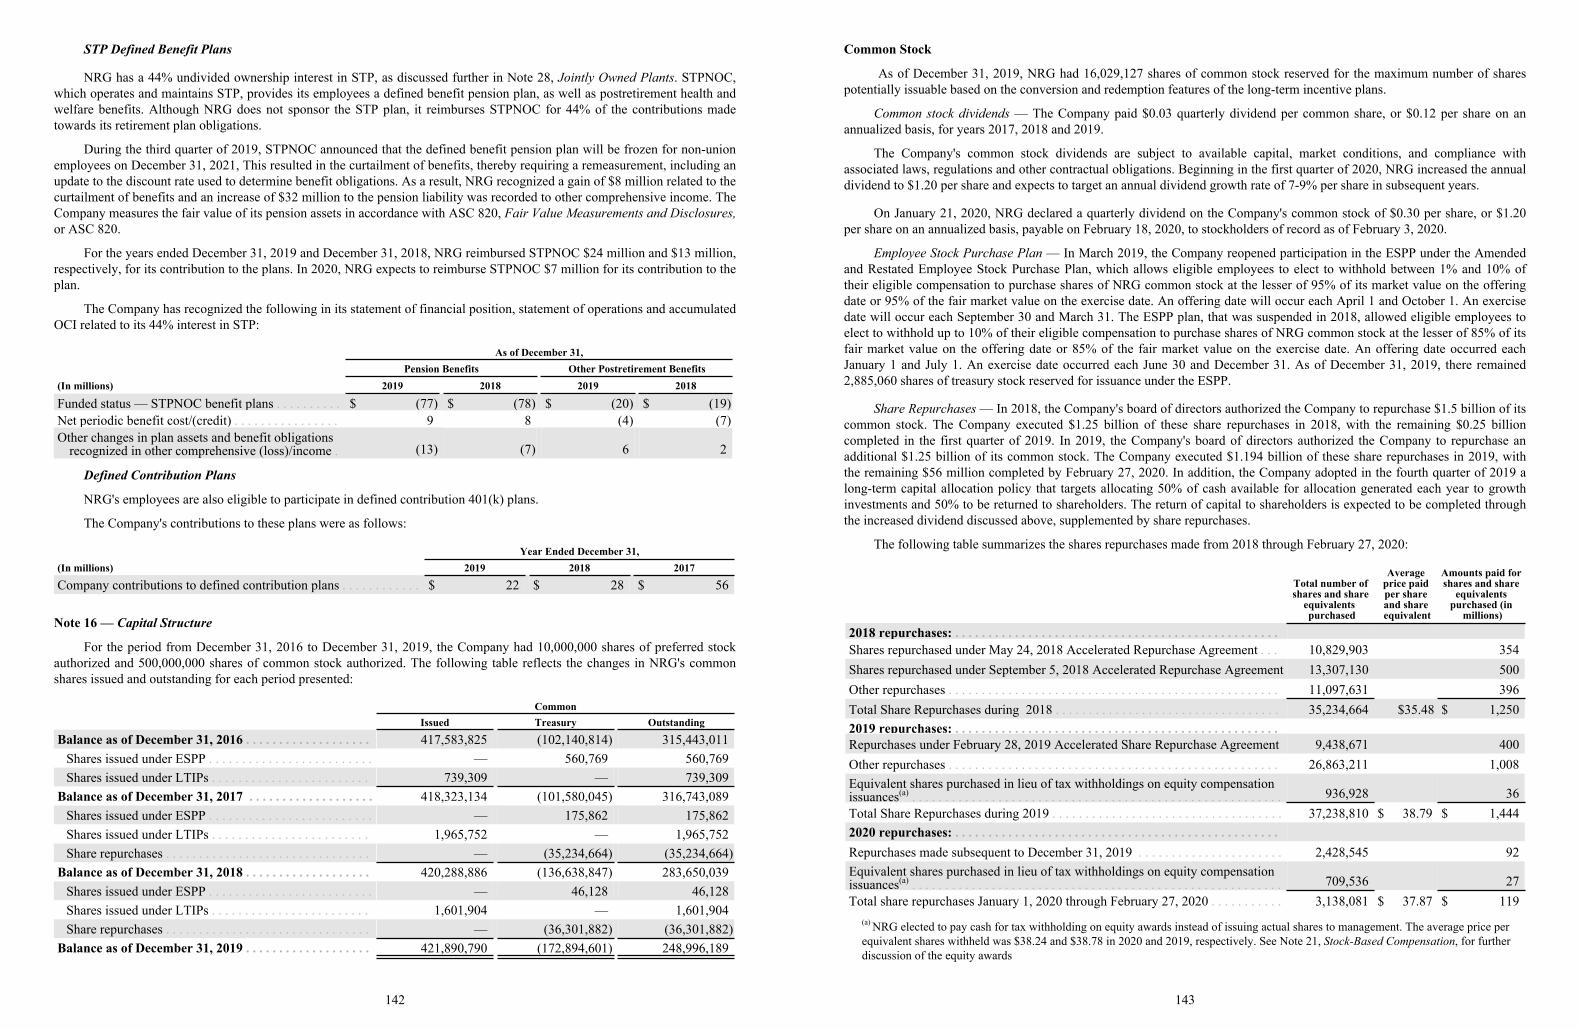
STP Defined Benefit Plans
NRG has a 44% undivided ownership interest in STP, as discussed further in Note 28, Jointly Owned Plants. STPNOC,which operates and maintains STP, provides its employees a defined benefit pension plan, as well as postretirement health andwelfare benefits. Although NRG does not sponsor the STP plan, it reimburses STPNOC for 44% of the contributions madetowards its retirement plan obligations.
During the third quarter of 2019, STPNOC announced that the defined benefit pension plan will be frozen for non-unionemployees on December 31, 2021, This resulted in the curtailment of benefits, thereby requiring a remeasurement, including anupdate to the discount rate used to determine benefit obligations. As a result, NRG recognized a gain of $8 million related to thecurtailment of benefits and an increase of $32 million to the pension liability was recorded to other comprehensive income. TheCompany measures the fair value of its pension assets in accordance with ASC 820, Fair Value Measurements and Disclosures,or ASC 820.
For the years ended December 31, 2019 and December 31, 2018, NRG reimbursed STPNOC $24 million and $13 million,respectively, for its contribution to the plans. In 2020, NRG expects to reimburse STPNOC $7 million for its contribution to theplan.
The Company has recognized the following in its statement of financial position, statement of operations and accumulatedOCI related to its 44% interest in STP:
As of December 31,Pension Benefits Other Postretirement Benefits
(In millions) 2019 2018 2019 2018
Funded status — STPNOC benefit plans . . . . . . . . . . $ (77) $ (78) $ (20) $ (19)Net periodic benefit cost/(credit) . . . . . . . . . . . . . . . . 9 8 (4) (7)Other changes in plan assets and benefit obligations
recognized in other comprehensive (loss)/income . (13) (7) 6 2
Defined Contribution Plans
NRG's employees are also eligible to participate in defined contribution 401(k) plans.
The Company's contributions to these plans were as follows:
Year Ended December 31,(In millions) 2019 2018 2017
Company contributions to defined contribution plans . . . . . . . . . . . . $ 22 $ 28 $ 56
Note 16 — Capital Structure
For the period from December 31, 2016 to December 31, 2019, the Company had 10,000,000 shares of preferred stockauthorized and 500,000,000 shares of common stock authorized. The following table reflects the changes in NRG's commonshares issued and outstanding for each period presented:
CommonIssued Treasury Outstanding
Balance as of December 31, 2016 . . . . . . . . . . . . . . . . . . . 417,583,825 (102,140,814) 315,443,011Shares issued under ESPP . . . . . . . . . . . . . . . . . . . . . . . . . — 560,769 560,769Shares issued under LTIPs . . . . . . . . . . . . . . . . . . . . . . . . 739,309 — 739,309
Balance as of December 31, 2017 . . . . . . . . . . . . . . . . . . . 418,323,134 (101,580,045) 316,743,089Shares issued under ESPP . . . . . . . . . . . . . . . . . . . . . . . . . — 175,862 175,862Shares issued under LTIPs . . . . . . . . . . . . . . . . . . . . . . . . 1,965,752 — 1,965,752Share repurchases . . . . . . . . . . . . . . . . . . . . . . . . . . . . . . . — (35,234,664) (35,234,664)
Balance as of December 31, 2018 . . . . . . . . . . . . . . . . . . . 420,288,886 (136,638,847) 283,650,039Shares issued under ESPP . . . . . . . . . . . . . . . . . . . . . . . . . — 46,128 46,128Shares issued under LTIPs . . . . . . . . . . . . . . . . . . . . . . . . 1,601,904 — 1,601,904Share repurchases . . . . . . . . . . . . . . . . . . . . . . . . . . . . . . . — (36,301,882) (36,301,882)
Balance as of December 31, 2019 . . . . . . . . . . . . . . . . . . . 421,890,790 (172,894,601) 248,996,189
142
Common Stock
As of December 31, 2019, NRG had 16,029,127 shares of common stock reserved for the maximum number of sharespotentially issuable based on the conversion and redemption features of the long-term incentive plans.
Common stock dividends — The Company paid $0.03 quarterly dividend per common share, or $0.12 per share on anannualized basis, for years 2017, 2018 and 2019.
The Company's common stock dividends are subject to available capital, market conditions, and compliance withassociated laws, regulations and other contractual obligations. Beginning in the first quarter of 2020, NRG increased the annualdividend to $1.20 per share and expects to target an annual dividend growth rate of 7-9% per share in subsequent years.
On January 21, 2020, NRG declared a quarterly dividend on the Company's common stock of $0.30 per share, or $1.20per share on an annualized basis, payable on February 18, 2020, to stockholders of record as of February 3, 2020.
Employee Stock Purchase Plan — In March 2019, the Company reopened participation in the ESPP under the Amendedand Restated Employee Stock Purchase Plan, which allows eligible employees to elect to withhold between 1% and 10% oftheir eligible compensation to purchase shares of NRG common stock at the lesser of 95% of its market value on the offeringdate or 95% of the fair market value on the exercise date. An offering date will occur each April 1 and October 1. An exercisedate will occur each September 30 and March 31. The ESPP plan, that was suspended in 2018, allowed eligible employees toelect to withhold up to 10% of their eligible compensation to purchase shares of NRG common stock at the lesser of 85% of itsfair market value on the offering date or 85% of the fair market value on the exercise date. An offering date occurred eachJanuary 1 and July 1. An exercise date occurred each June 30 and December 31. As of December 31, 2019, there remained2,885,060 shares of treasury stock reserved for issuance under the ESPP.
Share Repurchases — In 2018, the Company's board of directors authorized the Company to repurchase $1.5 billion of itscommon stock. The Company executed $1.25 billion of these share repurchases in 2018, with the remaining $0.25 billioncompleted in the first quarter of 2019. In 2019, the Company's board of directors authorized the Company to repurchase anadditional $1.25 billion of its common stock. The Company executed $1.194 billion of these share repurchases in 2019, withthe remaining $56 million completed by February 27, 2020. In addition, the Company adopted in the fourth quarter of 2019 along-term capital allocation policy that targets allocating 50% of cash available for allocation generated each year to growthinvestments and 50% to be returned to shareholders. The return of capital to shareholders is expected to be completed throughthe increased dividend discussed above, supplemented by share repurchases.
The following table summarizes the shares repurchases made from 2018 through February 27, 2020:
Total number of shares and share
equivalents purchased
Average price paid per share and share equivalent
Amounts paid for shares and share
equivalents purchased (in
millions)
2018 repurchases: . . . . . . . . . . . . . . . . . . . . . . . . . . . . . . . . . . . . . . . . . . . . . . . . . Shares repurchased under May 24, 2018 Accelerated Repurchase Agreement . . . 10,829,903 354Shares repurchased under September 5, 2018 Accelerated Repurchase Agreement 13,307,130 500Other repurchases . . . . . . . . . . . . . . . . . . . . . . . . . . . . . . . . . . . . . . . . . . . . . . . . . . 11,097,631 396Total Share Repurchases during 2018 . . . . . . . . . . . . . . . . . . . . . . . . . . . . . . . . . . 35,234,664 $35.48 $ 1,2502019 repurchases: . . . . . . . . . . . . . . . . . . . . . . . . . . . . . . . . . . . . . . . . . . . . . . . . . Repurchases under February 28, 2019 Accelerated Share Repurchase Agreement 9,438,671 400Other repurchases . . . . . . . . . . . . . . . . . . . . . . . . . . . . . . . . . . . . . . . . . . . . . . . . . . 26,863,211 1,008Equivalent shares purchased in lieu of tax withholdings on equity compensation issuances(a) . . . . . . . . . . . . . . . . . . . . . . . . . . . . . . . . . . . . . . . . . . . . . . . . . . . . . . . . 936,928 36Total Share Repurchases during 2019 . . . . . . . . . . . . . . . . . . . . . . . . . . . . . . . . . . . 37,238,810 $ 38.79 $ 1,4442020 repurchases: . . . . . . . . . . . . . . . . . . . . . . . . . . . . . . . . . . . . . . . . . . . . . . . . . Repurchases made subsequent to December 31, 2019 . . . . . . . . . . . . . . . . . . . . . . 2,428,545 92Equivalent shares purchased in lieu of tax withholdings on equity compensation issuances(a) . . . . . . . . . . . . . . . . . . . . . . . . . . . . . . . . . . . . . . . . . . . . . . . . . . . . . . . . 709,536 27Total share repurchases January 1, 2020 through February 27, 2020 . . . . . . . . . . . 3,138,081 $ 37.87 $ 119
(a) NRG elected to pay cash for tax withholding on equity awards instead of issuing actual shares to management. The average price per equivalent shares withheld was $38.24 and $38.78 in 2020 and 2019, respectively. See Note 21, Stock-Based Compensation, for further discussion of the equity awards
143
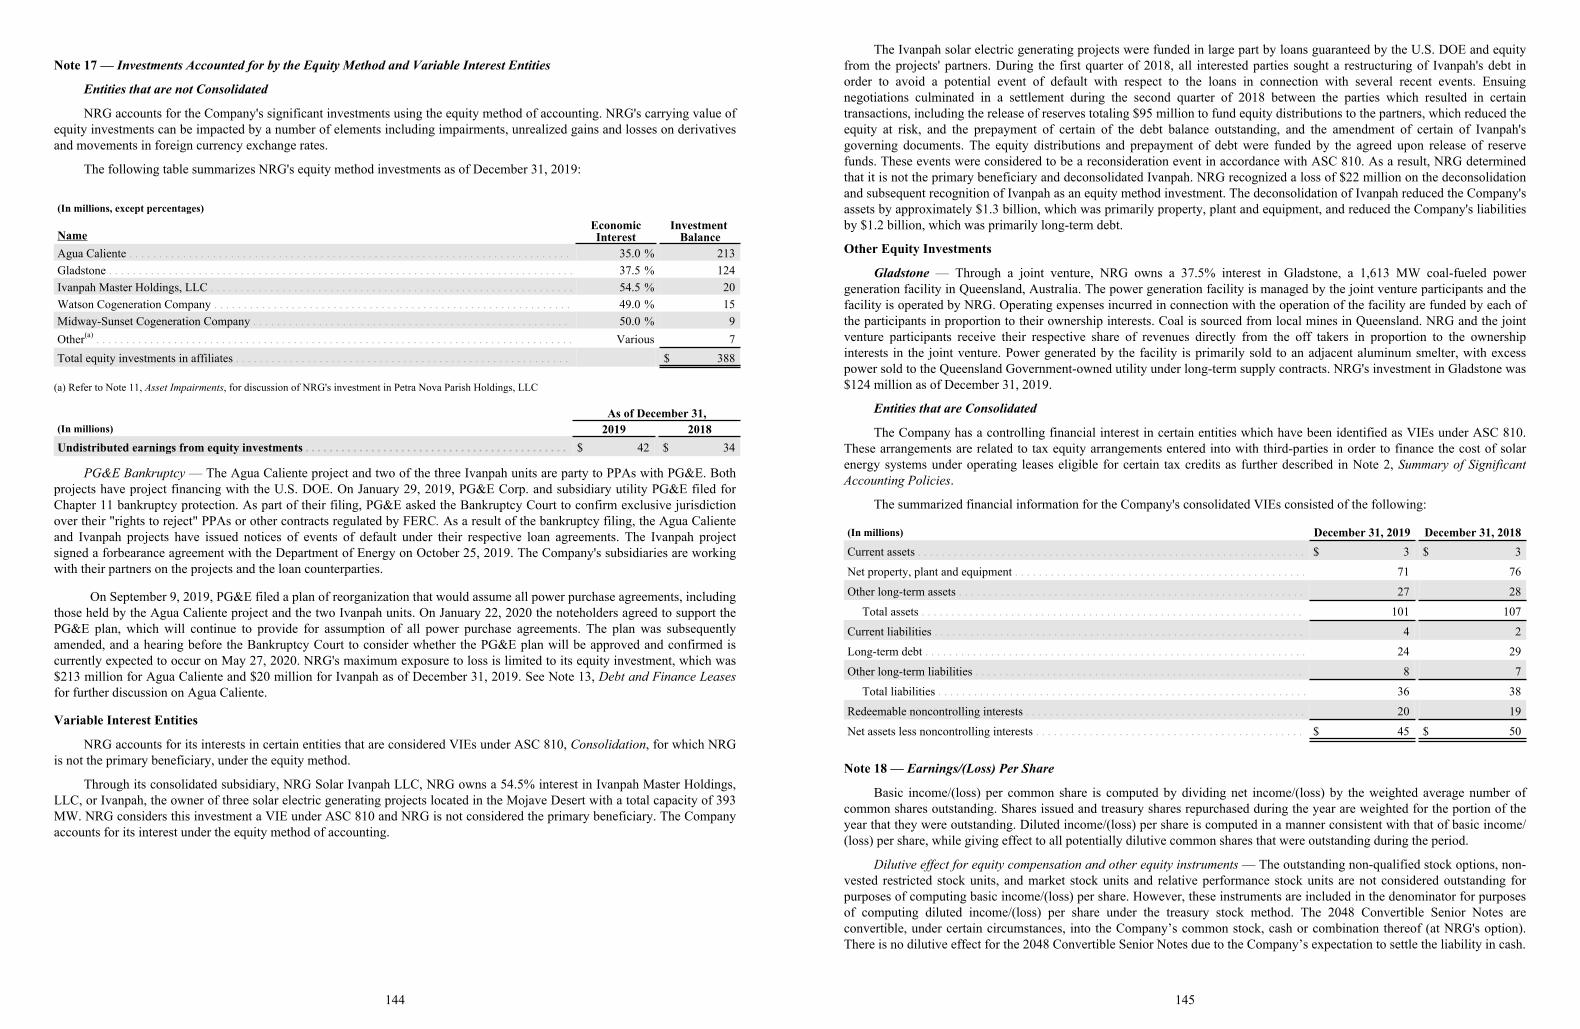
Note 17 — Investments Accounted for by the Equity Method and Variable Interest Entities
Entities that are not Consolidated
NRG accounts for the Company's significant investments using the equity method of accounting. NRG's carrying value ofequity investments can be impacted by a number of elements including impairments, unrealized gains and losses on derivativesand movements in foreign currency exchange rates.
The following table summarizes NRG's equity method investments as of December 31, 2019:
(In millions, except percentages)
NameEconomicInterest
Investment Balance
Agua Caliente . . . . . . . . . . . . . . . . . . . . . . . . . . . . . . . . . . . . . . . . . . . . . . . . . . . . . . . . . . . . . . . . . . . . . . . . . . 35.0 % 213Gladstone . . . . . . . . . . . . . . . . . . . . . . . . . . . . . . . . . . . . . . . . . . . . . . . . . . . . . . . . . . . . . . . . . . . . . . . . . . . . . . 37.5 % 124Ivanpah Master Holdings, LLC . . . . . . . . . . . . . . . . . . . . . . . . . . . . . . . . . . . . . . . . . . . . . . . . . . . . . . . . . . . . . 54.5 % 20Watson Cogeneration Company . . . . . . . . . . . . . . . . . . . . . . . . . . . . . . . . . . . . . . . . . . . . . . . . . . . . . . . . . . . . 49.0 % 15Midway-Sunset Cogeneration Company . . . . . . . . . . . . . . . . . . . . . . . . . . . . . . . . . . . . . . . . . . . . . . . . . . . . . 50.0 % 9Other(a) . . . . . . . . . . . . . . . . . . . . . . . . . . . . . . . . . . . . . . . . . . . . . . . . . . . . . . . . . . . . . . . . . . . . . . . . . . . . . . . . Various 7Total equity investments in affiliates . . . . . . . . . . . . . . . . . . . . . . . . . . . . . . . . . . . . . . . . . . . . . . . . . . . . . . . . $ 388
(a) Refer to Note 11, Asset Impairments, for discussion of NRG's investment in Petra Nova Parish Holdings, LLC
As of December 31,(In millions) 2019 2018Undistributed earnings from equity investments . . . . . . . . . . . . . . . . . . . . . . . . . . . . . . . . . . . . . . . . . . . . $ 42 $ 34
PG&E Bankruptcy — The Agua Caliente project and two of the three Ivanpah units are party to PPAs with PG&E. Bothprojects have project financing with the U.S. DOE. On January 29, 2019, PG&E Corp. and subsidiary utility PG&E filed forChapter 11 bankruptcy protection. As part of their filing, PG&E asked the Bankruptcy Court to confirm exclusive jurisdictionover their "rights to reject" PPAs or other contracts regulated by FERC. As a result of the bankruptcy filing, the Agua Calienteand Ivanpah projects have issued notices of events of default under their respective loan agreements. The Ivanpah projectsigned a forbearance agreement with the Department of Energy on October 25, 2019. The Company's subsidiaries are workingwith their partners on the projects and the loan counterparties.
On September 9, 2019, PG&E filed a plan of reorganization that would assume all power purchase agreements, includingthose held by the Agua Caliente project and the two Ivanpah units. On January 22, 2020 the noteholders agreed to support thePG&E plan, which will continue to provide for assumption of all power purchase agreements. The plan was subsequentlyamended, and a hearing before the Bankruptcy Court to consider whether the PG&E plan will be approved and confirmed iscurrently expected to occur on May 27, 2020. NRG's maximum exposure to loss is limited to its equity investment, which was$213 million for Agua Caliente and $20 million for Ivanpah as of December 31, 2019. See Note 13, Debt and Finance Leasesfor further discussion on Agua Caliente.
Variable Interest Entities
NRG accounts for its interests in certain entities that are considered VIEs under ASC 810, Consolidation, for which NRGis not the primary beneficiary, under the equity method.
Through its consolidated subsidiary, NRG Solar Ivanpah LLC, NRG owns a 54.5% interest in Ivanpah Master Holdings,LLC, or Ivanpah, the owner of three solar electric generating projects located in the Mojave Desert with a total capacity of 393MW. NRG considers this investment a VIE under ASC 810 and NRG is not considered the primary beneficiary. The Companyaccounts for its interest under the equity method of accounting.
144
The Ivanpah solar electric generating projects were funded in large part by loans guaranteed by the U.S. DOE and equityfrom the projects' partners. During the first quarter of 2018, all interested parties sought a restructuring of Ivanpah's debt inorder to avoid a potential event of default with respect to the loans in connection with several recent events. Ensuingnegotiations culminated in a settlement during the second quarter of 2018 between the parties which resulted in certaintransactions, including the release of reserves totaling $95 million to fund equity distributions to the partners, which reduced theequity at risk, and the prepayment of certain of the debt balance outstanding, and the amendment of certain of Ivanpah'sgoverning documents. The equity distributions and prepayment of debt were funded by the agreed upon release of reservefunds. These events were considered to be a reconsideration event in accordance with ASC 810. As a result, NRG determinedthat it is not the primary beneficiary and deconsolidated Ivanpah. NRG recognized a loss of $22 million on the deconsolidationand subsequent recognition of Ivanpah as an equity method investment. The deconsolidation of Ivanpah reduced the Company'sassets by approximately $1.3 billion, which was primarily property, plant and equipment, and reduced the Company's liabilitiesby $1.2 billion, which was primarily long-term debt.
Other Equity Investments
Gladstone — Through a joint venture, NRG owns a 37.5% interest in Gladstone, a 1,613 MW coal-fueled powergeneration facility in Queensland, Australia. The power generation facility is managed by the joint venture participants and thefacility is operated by NRG. Operating expenses incurred in connection with the operation of the facility are funded by each ofthe participants in proportion to their ownership interests. Coal is sourced from local mines in Queensland. NRG and the jointventure participants receive their respective share of revenues directly from the off takers in proportion to the ownershipinterests in the joint venture. Power generated by the facility is primarily sold to an adjacent aluminum smelter, with excesspower sold to the Queensland Government-owned utility under long-term supply contracts. NRG's investment in Gladstone was$124 million as of December 31, 2019.
Entities that are Consolidated
The Company has a controlling financial interest in certain entities which have been identified as VIEs under ASC 810.These arrangements are related to tax equity arrangements entered into with third-parties in order to finance the cost of solarenergy systems under operating leases eligible for certain tax credits as further described in Note 2, Summary of SignificantAccounting Policies.
The summarized financial information for the Company's consolidated VIEs consisted of the following:
(In millions) December 31, 2019 December 31, 2018Current assets . . . . . . . . . . . . . . . . . . . . . . . . . . . . . . . . . . . . . . . . . . . . . . . . . . . . . . . . . . . . . . . . . $ 3 $ 3
Net property, plant and equipment . . . . . . . . . . . . . . . . . . . . . . . . . . . . . . . . . . . . . . . . . . . . . . . . . 71 76
Other long-term assets . . . . . . . . . . . . . . . . . . . . . . . . . . . . . . . . . . . . . . . . . . . . . . . . . . . . . . . . . . 27 28
Total assets . . . . . . . . . . . . . . . . . . . . . . . . . . . . . . . . . . . . . . . . . . . . . . . . . . . . . . . . . . . . . . . . 101 107
Current liabilities . . . . . . . . . . . . . . . . . . . . . . . . . . . . . . . . . . . . . . . . . . . . . . . . . . . . . . . . . . . . . . 4 2
Long-term debt . . . . . . . . . . . . . . . . . . . . . . . . . . . . . . . . . . . . . . . . . . . . . . . . . . . . . . . . . . . . . . . . 24 29
Other long-term liabilities . . . . . . . . . . . . . . . . . . . . . . . . . . . . . . . . . . . . . . . . . . . . . . . . . . . . . . . 8 7
Total liabilities . . . . . . . . . . . . . . . . . . . . . . . . . . . . . . . . . . . . . . . . . . . . . . . . . . . . . . . . . . . . . . 36 38
Redeemable noncontrolling interests . . . . . . . . . . . . . . . . . . . . . . . . . . . . . . . . . . . . . . . . . . . . . . . 20 19
Net assets less noncontrolling interests . . . . . . . . . . . . . . . . . . . . . . . . . . . . . . . . . . . . . . . . . . . . . $ 45 $ 50
Note 18 — Earnings/(Loss) Per Share
Basic income/(loss) per common share is computed by dividing net income/(loss) by the weighted average number ofcommon shares outstanding. Shares issued and treasury shares repurchased during the year are weighted for the portion of theyear that they were outstanding. Diluted income/(loss) per share is computed in a manner consistent with that of basic income/(loss) per share, while giving effect to all potentially dilutive common shares that were outstanding during the period.
Dilutive effect for equity compensation and other equity instruments— The outstanding non-qualified stock options, non-vested restricted stock units, and market stock units and relative performance stock units are not considered outstanding forpurposes of computing basic income/(loss) per share. However, these instruments are included in the denominator for purposesof computing diluted income/(loss) per share under the treasury stock method. The 2048 Convertible Senior Notes areconvertible, under certain circumstances, into the Company’s common stock, cash or combination thereof (at NRG's option).There is no dilutive effect for the 2048 Convertible Senior Notes due to the Company’s expectation to settle the liability in cash.
145
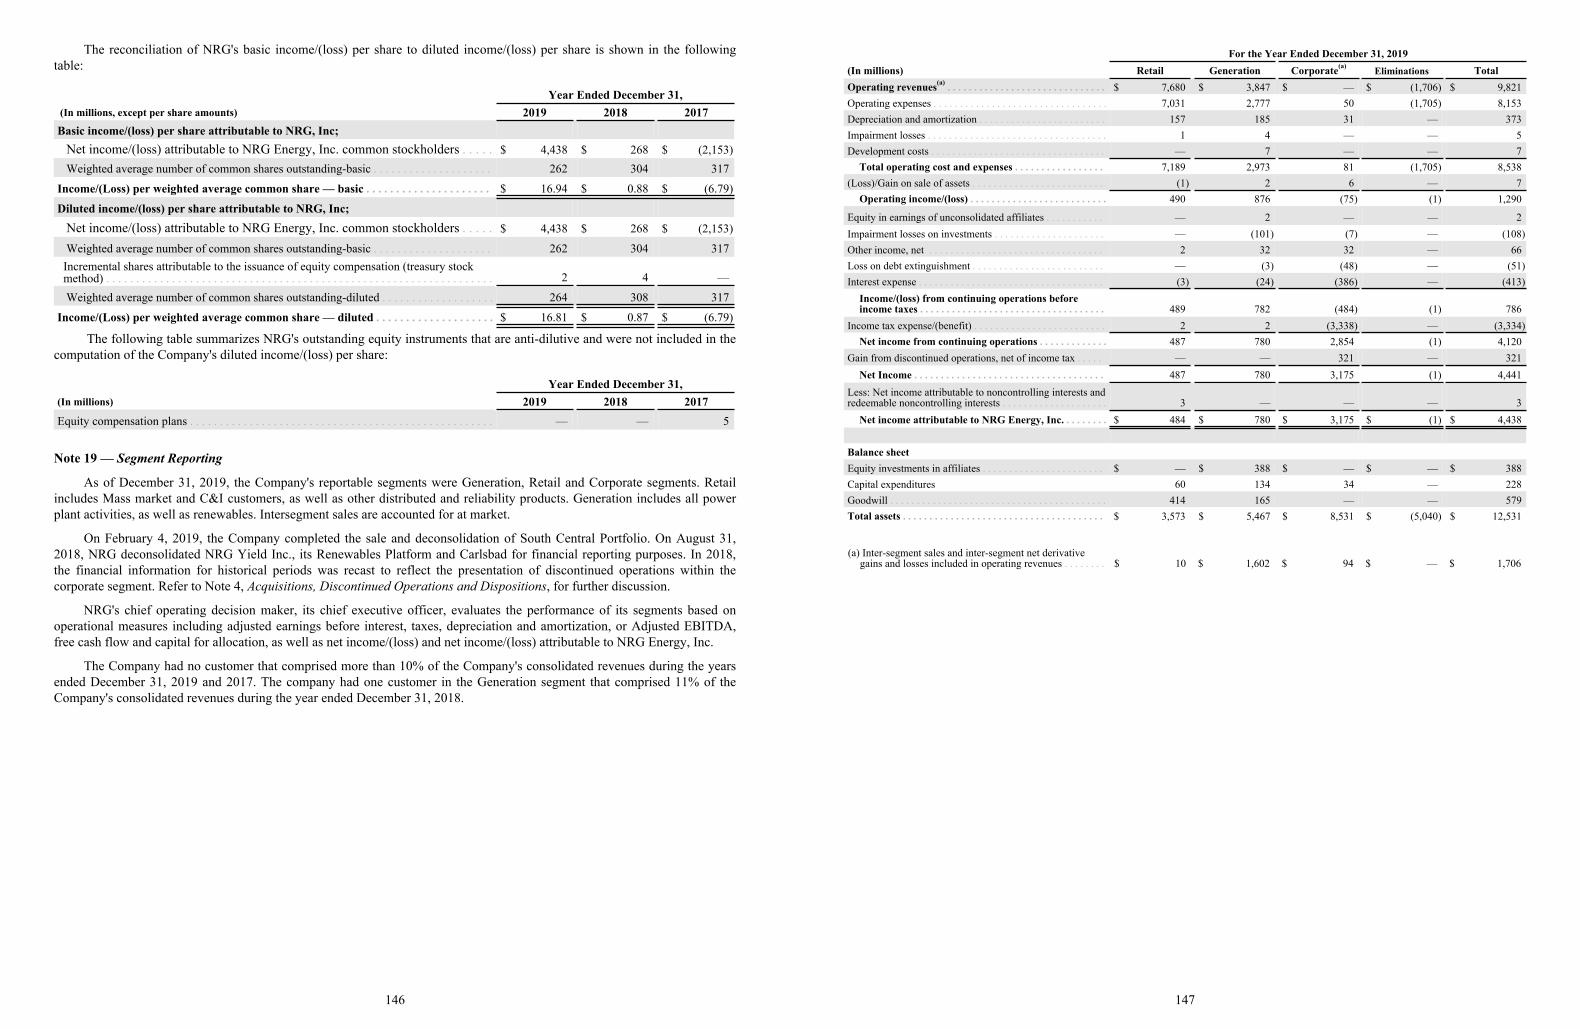
The reconciliation of NRG's basic income/(loss) per share to diluted income/(loss) per share is shown in the followingtable:
Year Ended December 31, (In millions, except per share amounts) 2019 2018 2017Basic income/(loss) per share attributable to NRG, Inc;
Net income/(loss) attributable to NRG Energy, Inc. common stockholders . . . . . $ 4,438 $ 268 $ (2,153)Weighted average number of common shares outstanding-basic . . . . . . . . . . . . . . . . . . . . 262 304 317
Income/(Loss) per weighted average common share — basic . . . . . . . . . . . . . . . . . . . . . $ 16.94 $ 0.88 $ (6.79)
Diluted income/(loss) per share attributable to NRG, Inc; Net income/(loss) attributable to NRG Energy, Inc. common stockholders . . . . . $ 4,438 $ 268 $ (2,153)
Weighted average number of common shares outstanding-basic . . . . . . . . . . . . . . . . . . . . 262 304 317 Incremental shares attributable to the issuance of equity compensation (treasury stock
method) . . . . . . . . . . . . . . . . . . . . . . . . . . . . . . . . . . . . . . . . . . . . . . . . . . . . . . . . . . . . . . . . . 2 4 —
Weighted average number of common shares outstanding-diluted . . . . . . . . . . . . . . . . . . . 264 308 317
Income/(Loss) per weighted average common share — diluted . . . . . . . . . . . . . . . . . . . . $ 16.81 $ 0.87 $ (6.79)
The following table summarizes NRG's outstanding equity instruments that are anti-dilutive and were not included in thecomputation of the Company's diluted income/(loss) per share:
Year Ended December 31,(In millions) 2019 2018 2017Equity compensation plans . . . . . . . . . . . . . . . . . . . . . . . . . . . . . . . . . . . . . . . . . . . . . . . . . . . — — 5
Note 19 — Segment Reporting
As of December 31, 2019, the Company's reportable segments were Generation, Retail and Corporate segments. Retailincludes Mass market and C&I customers, as well as other distributed and reliability products. Generation includes all powerplant activities, as well as renewables. Intersegment sales are accounted for at market.
On February 4, 2019, the Company completed the sale and deconsolidation of South Central Portfolio. On August 31,2018, NRG deconsolidated NRG Yield Inc., its Renewables Platform and Carlsbad for financial reporting purposes. In 2018,the financial information for historical periods was recast to reflect the presentation of discontinued operations within thecorporate segment. Refer to Note 4, Acquisitions, Discontinued Operations and Dispositions, for further discussion.
NRG's chief operating decision maker, its chief executive officer, evaluates the performance of its segments based onoperational measures including adjusted earnings before interest, taxes, depreciation and amortization, or Adjusted EBITDA,free cash flow and capital for allocation, as well as net income/(loss) and net income/(loss) attributable to NRG Energy, Inc.
The Company had no customer that comprised more than 10% of the Company's consolidated revenues during the yearsended December 31, 2019 and 2017. The company had one customer in the Generation segment that comprised 11% of theCompany's consolidated revenues during the year ended December 31, 2018.
146
For the Year Ended December 31, 2019(In millions) Retail Generation Corporate(a) Eliminations TotalOperating revenues(a) . . . . . . . . . . . . . . . . . . . . . . . . . . . . . . $ 7,680 $ 3,847 $ — $ (1,706) $ 9,821Operating expenses . . . . . . . . . . . . . . . . . . . . . . . . . . . . . . . . . 7,031 2,777 50 (1,705) 8,153Depreciation and amortization . . . . . . . . . . . . . . . . . . . . . . . . 157 185 31 — 373Impairment losses . . . . . . . . . . . . . . . . . . . . . . . . . . . . . . . . . . 1 4 — — 5Development costs . . . . . . . . . . . . . . . . . . . . . . . . . . . . . . . . . — 7 — — 7
Total operating cost and expenses . . . . . . . . . . . . . . . . . 7,189 2,973 81 (1,705) 8,538(Loss)/Gain on sale of assets . . . . . . . . . . . . . . . . . . . . . . . . . (1) 2 6 — 7
Operating income/(loss) . . . . . . . . . . . . . . . . . . . . . . . . . . 490 876 (75) (1) 1,290
Equity in earnings of unconsolidated affiliates . . . . . . . . . . . — 2 — — 2Impairment losses on investments . . . . . . . . . . . . . . . . . . . . . — (101) (7) — (108)Other income, net . . . . . . . . . . . . . . . . . . . . . . . . . . . . . . . . . 2 32 32 — 66Loss on debt extinguishment . . . . . . . . . . . . . . . . . . . . . . . . . — (3) (48) — (51)Interest expense . . . . . . . . . . . . . . . . . . . . . . . . . . . . . . . . . . . (3) (24) (386) — (413)
Income/(loss) from continuing operations before income taxes . . . . . . . . . . . . . . . . . . . . . . . . . . . . . . . . . . . 489 782 (484) (1) 786
Income tax expense/(benefit) . . . . . . . . . . . . . . . . . . . . . . . . . 2 2 (3,338) — (3,334)Net income from continuing operations . . . . . . . . . . . . . 487 780 2,854 (1) 4,120
Gain from discontinued operations, net of income tax . . . . . — — 321 — 321Net Income . . . . . . . . . . . . . . . . . . . . . . . . . . . . . . . . . . . . 487 780 3,175 (1) 4,441
Less: Net income attributable to noncontrolling interests and redeemable noncontrolling interests . . . . . . . . . . . . . . . . . . . . 3 — — — 3
Net income attributable to NRG Energy, Inc. . . . . . . . . $ 484 $ 780 $ 3,175 $ (1) $ 4,438
Balance sheetEquity investments in affiliates . . . . . . . . . . . . . . . . . . . . . . . $ — $ 388 $ — $ — $ 388Capital expenditures 60 134 34 — 228Goodwill . . . . . . . . . . . . . . . . . . . . . . . . . . . . . . . . . . . . . . . . . 414 165 — — 579Total assets . . . . . . . . . . . . . . . . . . . . . . . . . . . . . . . . . . . . . . $ 3,573 $ 5,467 $ 8,531 $ (5,040) $ 12,531
(a) Inter-segment sales and inter-segment net derivative gains and losses included in operating revenues . . . . . . . . $ 10 $ 1,602 $ 94 $ — $ 1,706
147
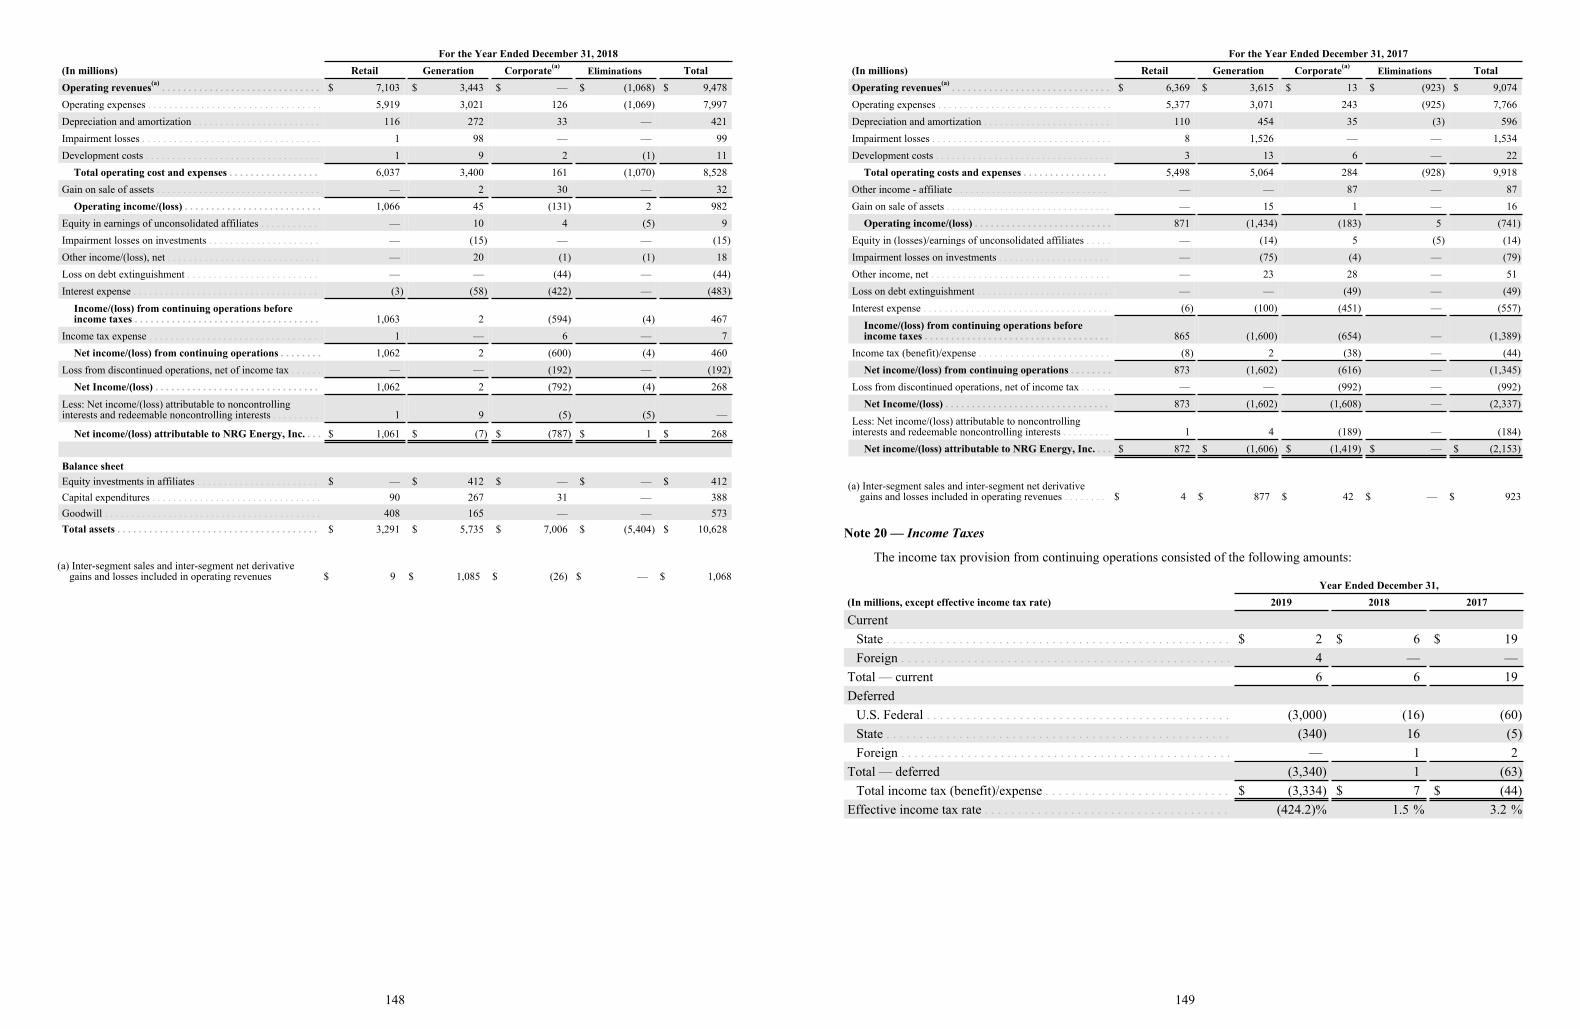
For the Year Ended December 31, 2018(In millions) Retail Generation Corporate(a) Eliminations TotalOperating revenues(a) . . . . . . . . . . . . . . . . . . . . . . . . . . . . . . $ 7,103 $ 3,443 $ — $ (1,068) $ 9,478Operating expenses . . . . . . . . . . . . . . . . . . . . . . . . . . . . . . . . . 5,919 3,021 126 (1,069) 7,997Depreciation and amortization . . . . . . . . . . . . . . . . . . . . . . . . 116 272 33 — 421Impairment losses . . . . . . . . . . . . . . . . . . . . . . . . . . . . . . . . . . 1 98 — — 99Development costs . . . . . . . . . . . . . . . . . . . . . . . . . . . . . . . . . 1 9 2 (1) 11
Total operating cost and expenses . . . . . . . . . . . . . . . . . 6,037 3,400 161 (1,070) 8,528Gain on sale of assets . . . . . . . . . . . . . . . . . . . . . . . . . . . . . . . — 2 30 — 32
Operating income/(loss) . . . . . . . . . . . . . . . . . . . . . . . . . . 1,066 45 (131) 2 982Equity in earnings of unconsolidated affiliates . . . . . . . . . . . — 10 4 (5) 9Impairment losses on investments . . . . . . . . . . . . . . . . . . . . . — (15) — — (15)Other income/(loss), net . . . . . . . . . . . . . . . . . . . . . . . . . . . . . — 20 (1) (1) 18Loss on debt extinguishment . . . . . . . . . . . . . . . . . . . . . . . . . — — (44) — (44)Interest expense . . . . . . . . . . . . . . . . . . . . . . . . . . . . . . . . . . . (3) (58) (422) — (483)
Income/(loss) from continuing operations before income taxes . . . . . . . . . . . . . . . . . . . . . . . . . . . . . . . . . . . 1,063 2 (594) (4) 467
Income tax expense . . . . . . . . . . . . . . . . . . . . . . . . . . . . . . . . 1 — 6 — 7Net income/(loss) from continuing operations . . . . . . . . 1,062 2 (600) (4) 460
Loss from discontinued operations, net of income tax . . . . . . — — (192) — (192)Net Income/(loss) . . . . . . . . . . . . . . . . . . . . . . . . . . . . . . . 1,062 2 (792) (4) 268
Less: Net income/(loss) attributable to noncontrolling interests and redeemable noncontrolling interests . . . . . . . . . 1 9 (5) (5) —
Net income/(loss) attributable to NRG Energy, Inc. . . . $ 1,061 $ (7) $ (787) $ 1 $ 268
Balance sheetEquity investments in affiliates . . . . . . . . . . . . . . . . . . . . . . . $ — $ 412 $ — $ — $ 412Capital expenditures . . . . . . . . . . . . . . . . . . . . . . . . . . . . . . . . 90 267 31 — 388Goodwill . . . . . . . . . . . . . . . . . . . . . . . . . . . . . . . . . . . . . . . . . 408 165 — — 573Total assets . . . . . . . . . . . . . . . . . . . . . . . . . . . . . . . . . . . . . . $ 3,291 $ 5,735 $ 7,006 $ (5,404) $ 10,628
(a) Inter-segment sales and inter-segment net derivative gains and losses included in operating revenues $ 9 $ 1,085 $ (26) $ — $ 1,068
148
For the Year Ended December 31, 2017(In millions) Retail Generation Corporate(a) Eliminations TotalOperating revenues(a) . . . . . . . . . . . . . . . . . . . . . . . . . . . . . . $ 6,369 $ 3,615 $ 13 $ (923) $ 9,074Operating expenses . . . . . . . . . . . . . . . . . . . . . . . . . . . . . . . . . 5,377 3,071 243 (925) 7,766Depreciation and amortization . . . . . . . . . . . . . . . . . . . . . . . . 110 454 35 (3) 596Impairment losses . . . . . . . . . . . . . . . . . . . . . . . . . . . . . . . . . . 8 1,526 — — 1,534Development costs . . . . . . . . . . . . . . . . . . . . . . . . . . . . . . . . . 3 13 6 — 22
Total operating costs and expenses . . . . . . . . . . . . . . . . 5,498 5,064 284 (928) 9,918Other income - affiliate . . . . . . . . . . . . . . . . . . . . . . . . . . . . . — — 87 — 87Gain on sale of assets . . . . . . . . . . . . . . . . . . . . . . . . . . . . . . . — 15 1 — 16
Operating income/(loss) . . . . . . . . . . . . . . . . . . . . . . . . . . 871 (1,434) (183) 5 (741)Equity in (losses)/earnings of unconsolidated affiliates . . . . . — (14) 5 (5) (14)Impairment losses on investments . . . . . . . . . . . . . . . . . . . . . — (75) (4) — (79)Other income, net . . . . . . . . . . . . . . . . . . . . . . . . . . . . . . . . . . — 23 28 — 51Loss on debt extinguishment . . . . . . . . . . . . . . . . . . . . . . . . . — — (49) — (49)Interest expense . . . . . . . . . . . . . . . . . . . . . . . . . . . . . . . . . . . (6) (100) (451) — (557)
Income/(loss) from continuing operations before income taxes . . . . . . . . . . . . . . . . . . . . . . . . . . . . . . . . . . . 865 (1,600) (654) — (1,389)
Income tax (benefit)/expense . . . . . . . . . . . . . . . . . . . . . . . . . (8) 2 (38) — (44)Net income/(loss) from continuing operations . . . . . . . . 873 (1,602) (616) — (1,345)
Loss from discontinued operations, net of income tax . . . . . . — — (992) — (992)Net Income/(loss) . . . . . . . . . . . . . . . . . . . . . . . . . . . . . . . 873 (1,602) (1,608) — (2,337)
Less: Net income/(loss) attributable to noncontrolling interests and redeemable noncontrolling interests . . . . . . . . . 1 4 (189) — (184)
Net income/(loss) attributable to NRG Energy, Inc. . . . $ 872 $ (1,606) $ (1,419) $ — $ (2,153)
(a) Inter-segment sales and inter-segment net derivative gains and losses included in operating revenues . . . . . . . . $ 4 $ 877 $ 42 $ — $ 923
Note 20 — Income Taxes
The income tax provision from continuing operations consisted of the following amounts:
Year Ended December 31,(In millions, except effective income tax rate) 2019 2018 2017
CurrentState . . . . . . . . . . . . . . . . . . . . . . . . . . . . . . . . . . . . . . . . . . . . . . . . . . . . $ 2 $ 6 $ 19Foreign . . . . . . . . . . . . . . . . . . . . . . . . . . . . . . . . . . . . . . . . . . . . . . . . . . 4 — —
Total — current 6 6 19Deferred
U.S. Federal . . . . . . . . . . . . . . . . . . . . . . . . . . . . . . . . . . . . . . . . . . . . . . (3,000) (16) (60)State . . . . . . . . . . . . . . . . . . . . . . . . . . . . . . . . . . . . . . . . . . . . . . . . . . . . (340) 16 (5)Foreign . . . . . . . . . . . . . . . . . . . . . . . . . . . . . . . . . . . . . . . . . . . . . . . . . . — 1 2
Total — deferred (3,340) 1 (63)Total income tax (benefit)/expense . . . . . . . . . . . . . . . . . . . . . . . . . . . . $ (3,334) $ 7 $ (44)
Effective income tax rate . . . . . . . . . . . . . . . . . . . . . . . . . . . . . . . . . . . . . (424.2)% 1.5 % 3.2 %
149
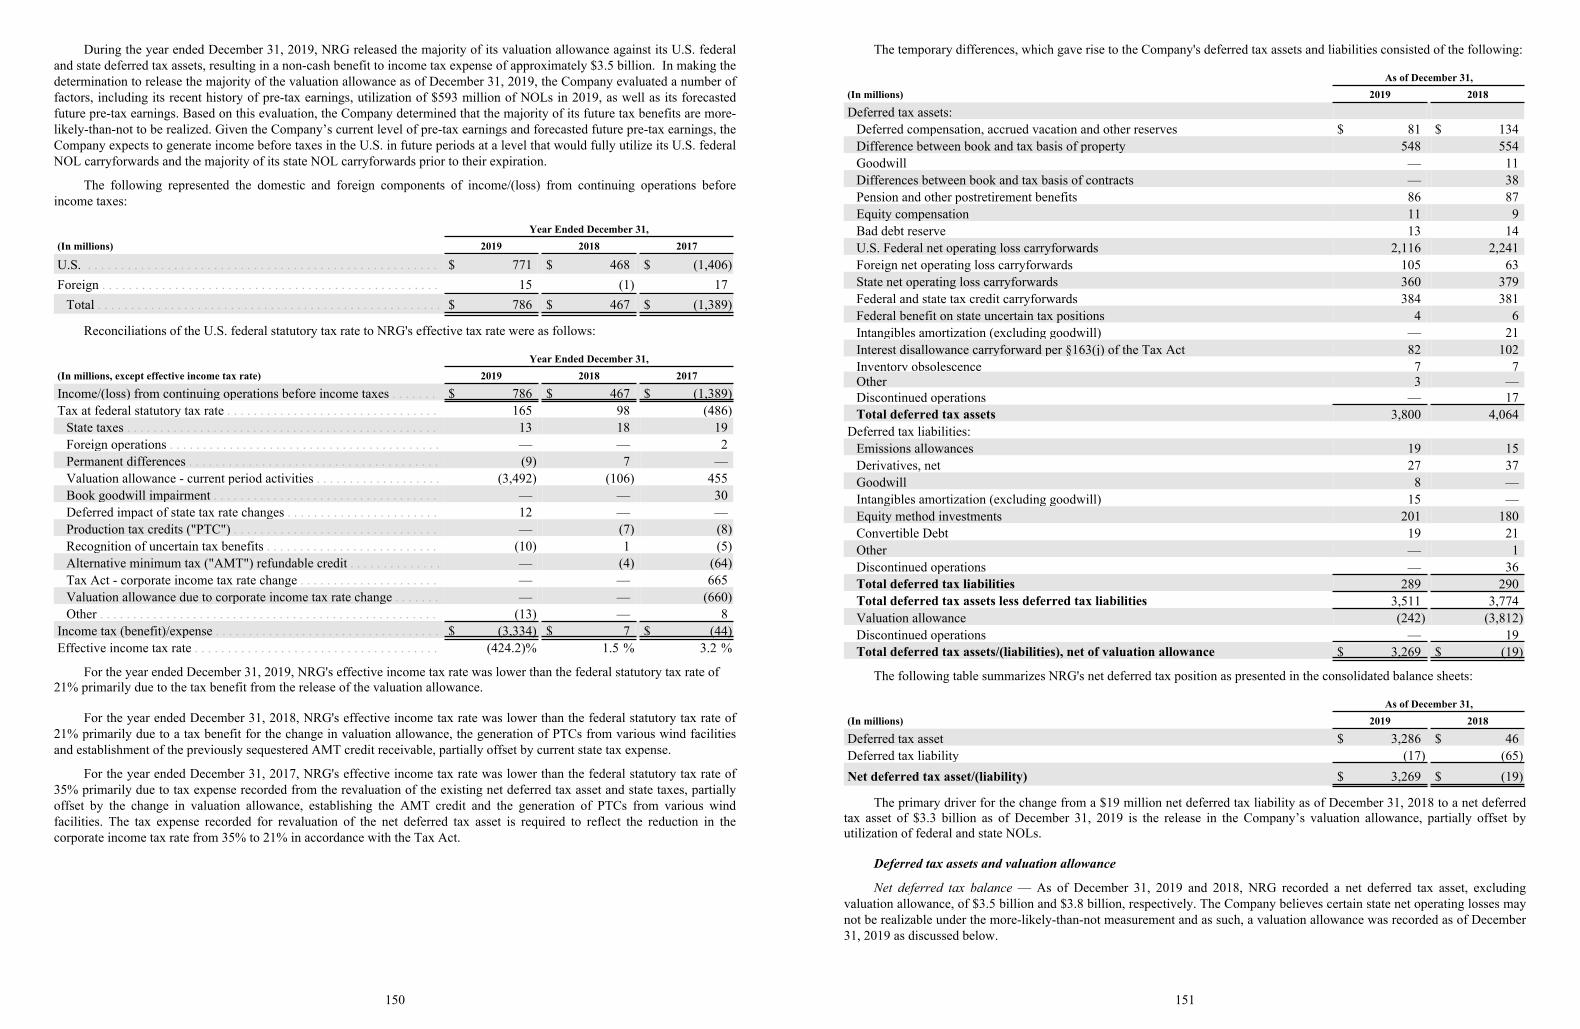
During the year ended December 31, 2019, NRG released the majority of its valuation allowance against its U.S. federaland state deferred tax assets, resulting in a non-cash benefit to income tax expense of approximately $3.5 billion. In making thedetermination to release the majority of the valuation allowance as of December 31, 2019, the Company evaluated a number offactors, including its recent history of pre-tax earnings, utilization of $593 million of NOLs in 2019, as well as its forecastedfuture pre-tax earnings. Based on this evaluation, the Company determined that the majority of its future tax benefits are more-likely-than-not to be realized. Given the Company’s current level of pre-tax earnings and forecasted future pre-tax earnings, theCompany expects to generate income before taxes in the U.S. in future periods at a level that would fully utilize its U.S. federalNOL carryforwards and the majority of its state NOL carryforwards prior to their expiration.
The following represented the domestic and foreign components of income/(loss) from continuing operations beforeincome taxes:
Year Ended December 31,(In millions) 2019 2018 2017
U.S. . . . . . . . . . . . . . . . . . . . . . . . . . . . . . . . . . . . . . . . . . . . . . . . . . . . . . $ 771 $ 468 $ (1,406)Foreign . . . . . . . . . . . . . . . . . . . . . . . . . . . . . . . . . . . . . . . . . . . . . . . . . . . 15 (1) 17
Total . . . . . . . . . . . . . . . . . . . . . . . . . . . . . . . . . . . . . . . . . . . . . . . . . . . . $ 786 $ 467 $ (1,389)
Reconciliations of the U.S. federal statutory tax rate to NRG's effective tax rate were as follows:
Year Ended December 31,(In millions, except effective income tax rate) 2019 2018 2017
Income/(loss) from continuing operations before income taxes . . . . . . . $ 786 $ 467 $ (1,389)Tax at federal statutory tax rate . . . . . . . . . . . . . . . . . . . . . . . . . . . . . . . . 165 98 (486)
State taxes . . . . . . . . . . . . . . . . . . . . . . . . . . . . . . . . . . . . . . . . . . . . . . . 13 18 19Foreign operations . . . . . . . . . . . . . . . . . . . . . . . . . . . . . . . . . . . . . . . . . — — 2Permanent differences . . . . . . . . . . . . . . . . . . . . . . . . . . . . . . . . . . . . . . (9) 7 —Valuation allowance - current period activities . . . . . . . . . . . . . . . . . . . (3,492) (106) 455Book goodwill impairment . . . . . . . . . . . . . . . . . . . . . . . . . . . . . . . . . . — — 30Deferred impact of state tax rate changes . . . . . . . . . . . . . . . . . . . . . . . 12 — —Production tax credits ("PTC") . . . . . . . . . . . . . . . . . . . . . . . . . . . . . . . — (7) (8)Recognition of uncertain tax benefits . . . . . . . . . . . . . . . . . . . . . . . . . . (10) 1 (5)Alternative minimum tax ("AMT") refundable credit . . . . . . . . . . . . . . — (4) (64)Tax Act - corporate income tax rate change . . . . . . . . . . . . . . . . . . . . . — — 665Valuation allowance due to corporate income tax rate change . . . . . . . — — (660)Other . . . . . . . . . . . . . . . . . . . . . . . . . . . . . . . . . . . . . . . . . . . . . . . . . . . (13) — 8
Income tax (benefit)/expense . . . . . . . . . . . . . . . . . . . . . . . . . . . . . . . . . . $ (3,334) $ 7 $ (44)Effective income tax rate . . . . . . . . . . . . . . . . . . . . . . . . . . . . . . . . . . . . . (424.2)% 1.5 % 3.2 %
(1,389)
(13)(3,334) (44)
For the year ended December 31, 2019, NRG's effective income tax rate was lower than the federal statutory tax rate of 21% primarily due to the tax benefit from the release of the valuation allowance.
For the year ended December 31, 2018, NRG's effective income tax rate was lower than the federal statutory tax rate of21% primarily due to a tax benefit for the change in valuation allowance, the generation of PTCs from various wind facilitiesand establishment of the previously sequestered AMT credit receivable, partially offset by current state tax expense.
For the year ended December 31, 2017, NRG's effective income tax rate was lower than the federal statutory tax rate of35% primarily due to tax expense recorded from the revaluation of the existing net deferred tax asset and state taxes, partiallyoffset by the change in valuation allowance, establishing the AMT credit and the generation of PTCs from various windfacilities. The tax expense recorded for revaluation of the net deferred tax asset is required to reflect the reduction in thecorporate income tax rate from 35% to 21% in accordance with the Tax Act.
150
The temporary differences, which gave rise to the Company's deferred tax assets and liabilities consisted of the following:
As of December 31,(In millions) 2019 2018
Deferred tax assets:Deferred compensation, accrued vacation and other reserves $ 81 $ 134Difference between book and tax basis of property 548 554Goodwill — 11Differences between book and tax basis of contracts — 38Pension and other postretirement benefits 86 87Equity compensation 11 9Bad debt reserve 13 14U.S. Federal net operating loss carryforwards 2,116 2,241Foreign net operating loss carryforwards 105 63State net operating loss carryforwards 360 379Federal and state tax credit carryforwards 384 381Federal benefit on state uncertain tax positions 4 6Intangibles amortization (excluding goodwill) — 21Interest disallowance carryforward per §163(j) of the Tax Act 82 102Inventory obsolescence 7 7Other 3 —Discontinued operations — 17Total deferred tax assets 3,800 4,064
Deferred tax liabilities:Emissions allowances 19 15Derivatives, net 27 37Goodwill 8 —Intangibles amortization (excluding goodwill) 15 —Equity method investments 201 180Convertible Debt 19 21Other — 1Discontinued operations — 36Total deferred tax liabilities 289 290Total deferred tax assets less deferred tax liabilities 3,511 3,774Valuation allowance (242) (3,812)Discontinued operations — 19Total deferred tax assets/(liabilities), net of valuation allowance $ 3,269 $ (19)3,269 (19)
The following table summarizes NRG's net deferred tax position as presented in the consolidated balance sheets:
As of December 31,(In millions) 2019 2018
Deferred tax asset $ 3,286 $ 46Deferred tax liability (17) (65)Net deferred tax asset/(liability) $ 3,269 $ (19)
(17) (65)
The primary driver for the change from a $19 million net deferred tax liability as of December 31, 2018 to a net deferredtax asset of $3.3 billion as of December 31, 2019 is the release in the Company’s valuation allowance, partially offset byutilization of federal and state NOLs.
Deferred tax assets and valuation allowance
Net deferred tax balance — As of December 31, 2019 and 2018, NRG recorded a net deferred tax asset, excludingvaluation allowance, of $3.5 billion and $3.8 billion, respectively. The Company believes certain state net operating losses maynot be realizable under the more-likely-than-not measurement and as such, a valuation allowance was recorded as of December31, 2019 as discussed below.
151
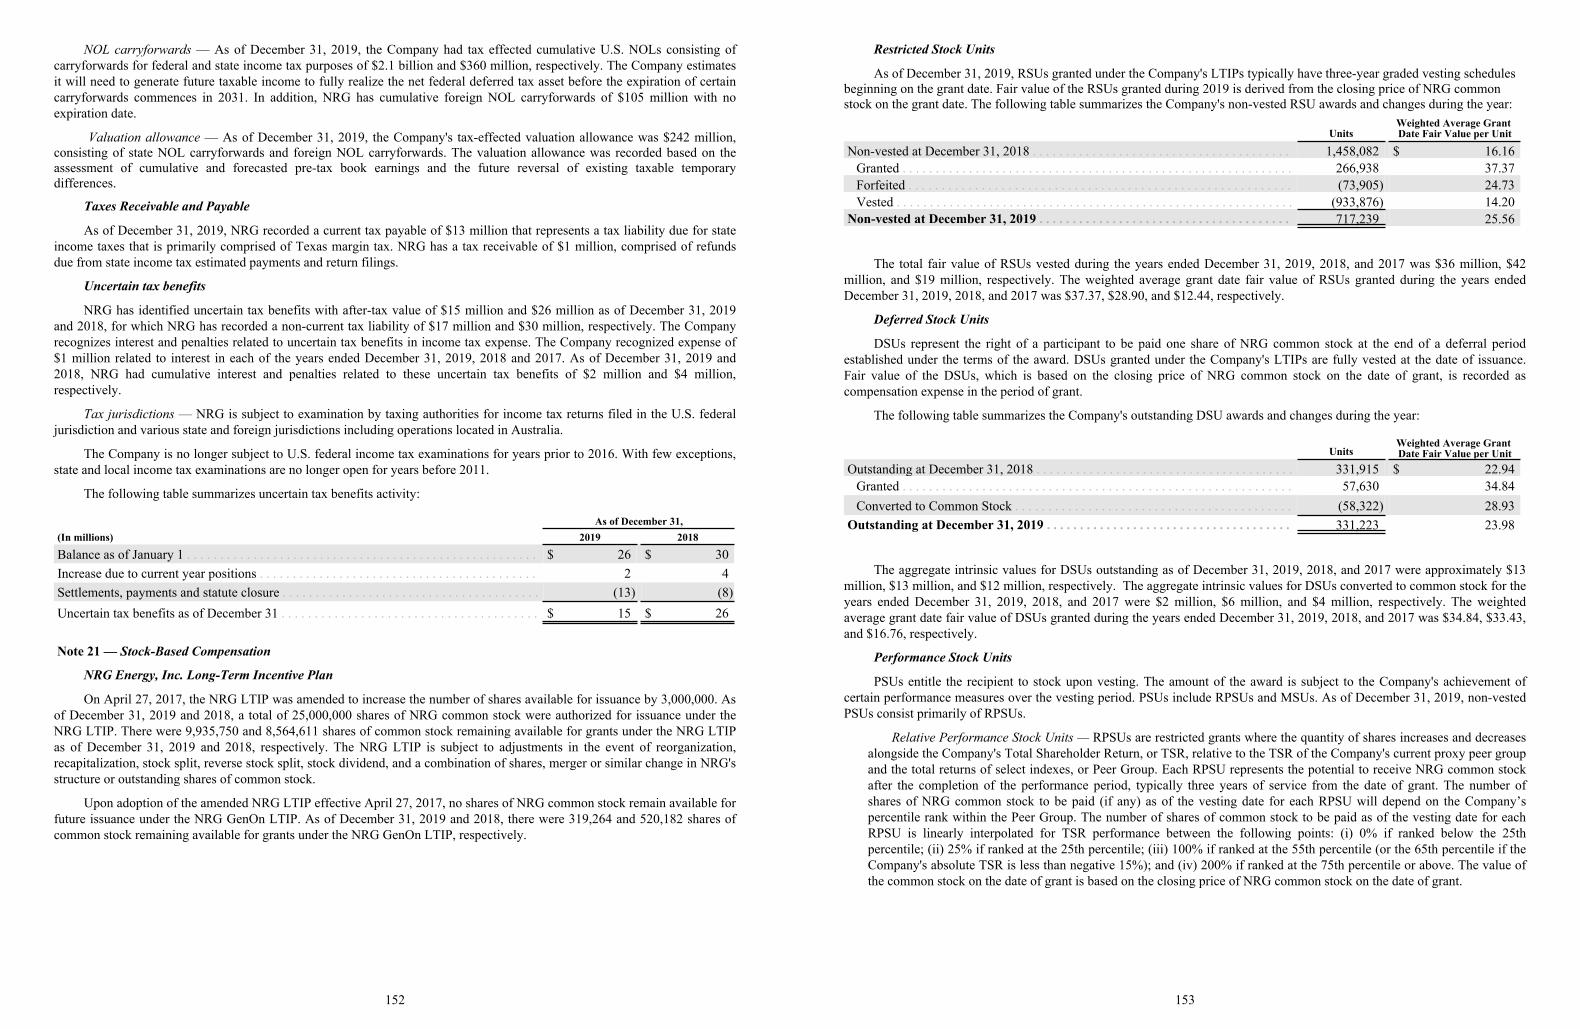
NOL carryforwards — As of December 31, 2019, the Company had tax effected cumulative U.S. NOLs consisting ofcarryforwards for federal and state income tax purposes of $2.1 billion and $360 million, respectively. The Company estimatesit will need to generate future taxable income to fully realize the net federal deferred tax asset before the expiration of certaincarryforwards commences in 2031. In addition, NRG has cumulative foreign NOL carryforwards of $105 million with noexpiration date.
Valuation allowance — As of December 31, 2019, the Company's tax-effected valuation allowance was $242 million,consisting of state NOL carryforwards and foreign NOL carryforwards. The valuation allowance was recorded based on theassessment of cumulative and forecasted pre-tax book earnings and the future reversal of existing taxable temporarydifferences.
Taxes Receivable and Payable
As of December 31, 2019, NRG recorded a current tax payable of $13 million that represents a tax liability due for stateincome taxes that is primarily comprised of Texas margin tax. NRG has a tax receivable of $1 million, comprised of refundsdue from state income tax estimated payments and return filings.
Uncertain tax benefits
NRG has identified uncertain tax benefits with after-tax value of $15 million and $26 million as of December 31, 2019and 2018, for which NRG has recorded a non-current tax liability of $17 million and $30 million, respectively. The Companyrecognizes interest and penalties related to uncertain tax benefits in income tax expense. The Company recognized expense of$1 million related to interest in each of the years ended December 31, 2019, 2018 and 2017. As of December 31, 2019 and2018, NRG had cumulative interest and penalties related to these uncertain tax benefits of $2 million and $4 million,respectively.
Tax jurisdictions — NRG is subject to examination by taxing authorities for income tax returns filed in the U.S. federaljurisdiction and various state and foreign jurisdictions including operations located in Australia.
The Company is no longer subject to U.S. federal income tax examinations for years prior to 2016. With few exceptions,state and local income tax examinations are no longer open for years before 2011.
The following table summarizes uncertain tax benefits activity:
As of December 31,(In millions) 2019 2018
Balance as of January 1 . . . . . . . . . . . . . . . . . . . . . . . . . . . . . . . . . . . . . . . . . . . . . . . . . . . . . $ 26 $ 30Increase due to current year positions . . . . . . . . . . . . . . . . . . . . . . . . . . . . . . . . . . . . . . . . . . 2 4Settlements, payments and statute closure . . . . . . . . . . . . . . . . . . . . . . . . . . . . . . . . . . . . . . . (13) (8)Uncertain tax benefits as of December 31 . . . . . . . . . . . . . . . . . . . . . . . . . . . . . . . . . . . . . . . $ 15 $ 26
Note 21 — Stock-Based Compensation
NRG Energy, Inc. Long-Term Incentive Plan
On April 27, 2017, the NRG LTIP was amended to increase the number of shares available for issuance by 3,000,000. Asof December 31, 2019 and 2018, a total of 25,000,000 shares of NRG common stock were authorized for issuance under theNRG LTIP. There were 9,935,750 and 8,564,611 shares of common stock remaining available for grants under the NRG LTIPas of December 31, 2019 and 2018, respectively. The NRG LTIP is subject to adjustments in the event of reorganization,recapitalization, stock split, reverse stock split, stock dividend, and a combination of shares, merger or similar change in NRG'sstructure or outstanding shares of common stock.
Upon adoption of the amended NRG LTIP effective April 27, 2017, no shares of NRG common stock remain available forfuture issuance under the NRG GenOn LTIP. As of December 31, 2019 and 2018, there were 319,264 and 520,182 shares ofcommon stock remaining available for grants under the NRG GenOn LTIP, respectively.
152
Restricted Stock Units
As of December 31, 2019, RSUs granted under the Company's LTIPs typically have three-year graded vesting schedules beginning on the grant date. Fair value of the RSUs granted during 2019 is derived from the closing price of NRG common stock on the grant date. The following table summarizes the Company's non-vested RSU awards and changes during the year:
UnitsWeighted Average Grant Date Fair Value per Unit
Non-vested at December 31, 2018 . . . . . . . . . . . . . . . . . . . . . . . . . . . . . . . . . . . . . . . 1,458,082 $ 16.16Granted . . . . . . . . . . . . . . . . . . . . . . . . . . . . . . . . . . . . . . . . . . . . . . . . . . . . . . . . . . . 266,938 37.37Forfeited . . . . . . . . . . . . . . . . . . . . . . . . . . . . . . . . . . . . . . . . . . . . . . . . . . . . . . . . . . (73,905) 24.73Vested . . . . . . . . . . . . . . . . . . . . . . . . . . . . . . . . . . . . . . . . . . . . . . . . . . . . . . . . . . . . (933,876) 14.20
Non-vested at December 31, 2019 . . . . . . . . . . . . . . . . . . . . . . . . . . . . . . . . . . . . . . 717,239 25.56(933,876)717,239
The total fair value of RSUs vested during the years ended December 31, 2019, 2018, and 2017 was $36 million, $42million, and $19 million, respectively. The weighted average grant date fair value of RSUs granted during the years endedDecember 31, 2019, 2018, and 2017 was $37.37, $28.90, and $12.44, respectively.
Deferred Stock Units
DSUs represent the right of a participant to be paid one share of NRG common stock at the end of a deferral periodestablished under the terms of the award. DSUs granted under the Company's LTIPs are fully vested at the date of issuance.Fair value of the DSUs, which is based on the closing price of NRG common stock on the date of grant, is recorded ascompensation expense in the period of grant.
The following table summarizes the Company's outstanding DSU awards and changes during the year:
UnitsWeighted Average Grant Date Fair Value per Unit
Outstanding at December 31, 2018 . . . . . . . . . . . . . . . . . . . . . . . . . . . . . . . . . . . . . . . 331,915 $ 22.94Granted . . . . . . . . . . . . . . . . . . . . . . . . . . . . . . . . . . . . . . . . . . . . . . . . . . . . . . . . . . . 57,630 34.84Converted to Common Stock . . . . . . . . . . . . . . . . . . . . . . . . . . . . . . . . . . . . . . . . . . (58,322) 28.93
Outstanding at December 31, 2019 . . . . . . . . . . . . . . . . . . . . . . . . . . . . . . . . . . . . . 331,223 23.98
Date Fair Value per Unit
331,223
The aggregate intrinsic values for DSUs outstanding as of December 31, 2019, 2018, and 2017 were approximately $13million, $13 million, and $12 million, respectively. The aggregate intrinsic values for DSUs converted to common stock for theyears ended December 31, 2019, 2018, and 2017 were $2 million, $6 million, and $4 million, respectively. The weightedaverage grant date fair value of DSUs granted during the years ended December 31, 2019, 2018, and 2017 was $34.84, $33.43,and $16.76, respectively.
Performance Stock Units
PSUs entitle the recipient to stock upon vesting. The amount of the award is subject to the Company's achievement ofcertain performance measures over the vesting period. PSUs include RPSUs and MSUs. As of December 31, 2019, non-vestedPSUs consist primarily of RPSUs.
Relative Performance Stock Units — RPSUs are restricted grants where the quantity of shares increases and decreasesalongside the Company's Total Shareholder Return, or TSR, relative to the TSR of the Company's current proxy peer groupand the total returns of select indexes, or Peer Group. Each RPSU represents the potential to receive NRG common stockafter the completion of the performance period, typically three years of service from the date of grant. The number ofshares of NRG common stock to be paid (if any) as of the vesting date for each RPSU will depend on the Company’spercentile rank within the Peer Group. The number of shares of common stock to be paid as of the vesting date for eachRPSU is linearly interpolated for TSR performance between the following points: (i) 0% if ranked below the 25thpercentile; (ii) 25% if ranked at the 25th percentile; (iii) 100% if ranked at the 55th percentile (or the 65th percentile if theCompany's absolute TSR is less than negative 15%); and (iv) 200% if ranked at the 75th percentile or above. The value ofthe common stock on the date of grant is based on the closing price of NRG common stock on the date of grant.
153
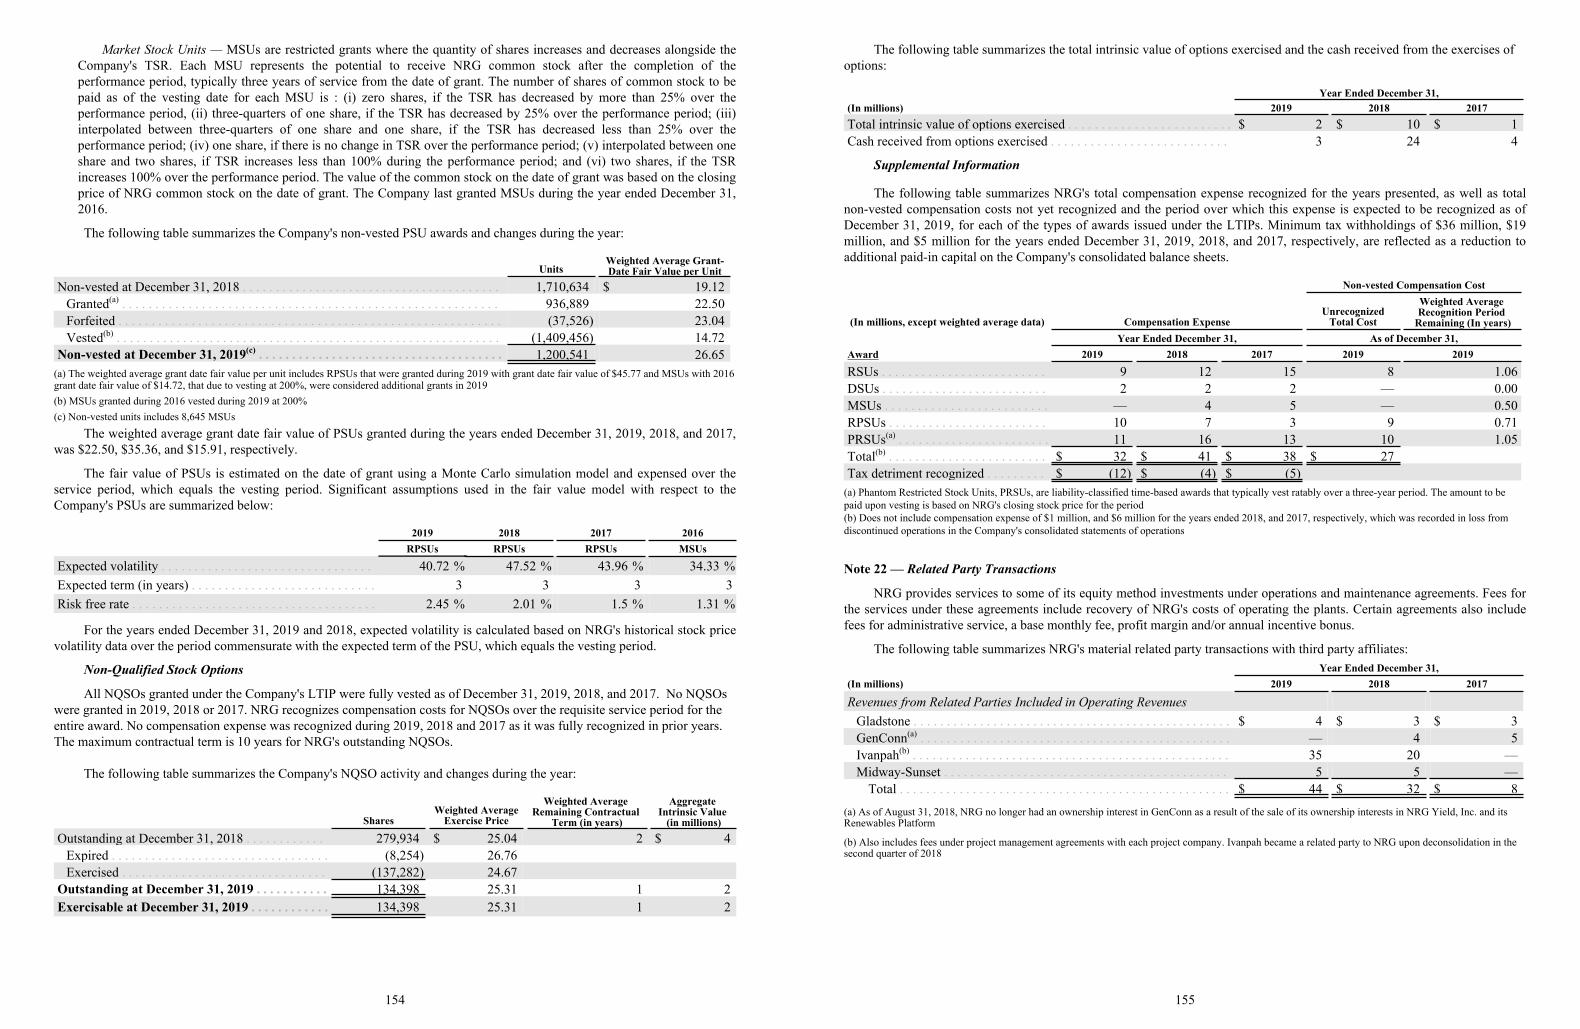
Market Stock Units — MSUs are restricted grants where the quantity of shares increases and decreases alongside theCompany's TSR. Each MSU represents the potential to receive NRG common stock after the completion of theperformance period, typically three years of service from the date of grant. The number of shares of common stock to bepaid as of the vesting date for each MSU is : (i) zero shares, if the TSR has decreased by more than 25% over theperformance period, (ii) three-quarters of one share, if the TSR has decreased by 25% over the performance period; (iii)interpolated between three-quarters of one share and one share, if the TSR has decreased less than 25% over theperformance period; (iv) one share, if there is no change in TSR over the performance period; (v) interpolated between oneshare and two shares, if TSR increases less than 100% during the performance period; and (vi) two shares, if the TSRincreases 100% over the performance period. The value of the common stock on the date of grant was based on the closingprice of NRG common stock on the date of grant. The Company last granted MSUs during the year ended December 31,2016.
The following table summarizes the Company's non-vested PSU awards and changes during the year:
UnitsWeighted Average Grant-Date Fair Value per Unit
Non-vested at December 31, 2018 . . . . . . . . . . . . . . . . . . . . . . . . . . . . . . . . . . . . . . . 1,710,634 $ 19.12Granted(a) . . . . . . . . . . . . . . . . . . . . . . . . . . . . . . . . . . . . . . . . . . . . . . . . . . . . . . . . . 936,889 22.50Forfeited . . . . . . . . . . . . . . . . . . . . . . . . . . . . . . . . . . . . . . . . . . . . . . . . . . . . . . . . . . (37,526) 23.04Vested(b) . . . . . . . . . . . . . . . . . . . . . . . . . . . . . . . . . . . . . . . . . . . . . . . . . . . . . . . . . . (1,409,456) 14.72
Non-vested at December 31, 2019(c) . . . . . . . . . . . . . . . . . . . . . . . . . . . . . . . . . . . . . 1,200,541 26.65
Date Fair Value per Unit
(1,409,456)1,200,541
(a) The weighted average grant date fair value per unit includes RPSUs that were granted during 2019 with grant date fair value of $45.77 and MSUs with 2016 grant date fair value of $14.72, that due to vesting at 200%, were considered additional grants in 2019(b) MSUs granted during 2016 vested during 2019 at 200%(c) Non-vested units includes 8,645 MSUs
The weighted average grant date fair value of PSUs granted during the years ended December 31, 2019, 2018, and 2017,was $22.50, $35.36, and $15.91, respectively.
The fair value of PSUs is estimated on the date of grant using a Monte Carlo simulation model and expensed over theservice period, which equals the vesting period. Significant assumptions used in the fair value model with respect to theCompany's PSUs are summarized below:
2019 2018 2017 2016RPSUs RPSUs RPSUs MSUs
Expected volatility . . . . . . . . . . . . . . . . . . . . . . . . . . . . . . . . 40.72 % 47.52 % 43.96 % 34.33 %Expected term (in years) . . . . . . . . . . . . . . . . . . . . . . . . . . . . 3 3 3 3Risk free rate . . . . . . . . . . . . . . . . . . . . . . . . . . . . . . . . . . . . . 2.45 % 2.01 % 1.5 % 1.31 %
For the years ended December 31, 2019 and 2018, expected volatility is calculated based on NRG's historical stock pricevolatility data over the period commensurate with the expected term of the PSU, which equals the vesting period.
Non-Qualified Stock Options
All NQSOs granted under the Company's LTIP were fully vested as of December 31, 2019, 2018, and 2017. No NQSOs were granted in 2019, 2018 or 2017. NRG recognizes compensation costs for NQSOs over the requisite service period for the entire award. No compensation expense was recognized during 2019, 2018 and 2017 as it was fully recognized in prior years. The maximum contractual term is 10 years for NRG's outstanding NQSOs.
The following table summarizes the Company's NQSO activity and changes during the year:
SharesWeighted Average
Exercise Price
Weighted Average Remaining Contractual
Term (in years)
Aggregate Intrinsic Value
(in millions)Outstanding at December 31, 2018 . . . . . . . . . . . . 279,934 $ 25.04 2 $ 4
Expired . . . . . . . . . . . . . . . . . . . . . . . . . . . . . . . . . (8,254) 26.76Exercised . . . . . . . . . . . . . . . . . . . . . . . . . . . . . . . (137,282) 24.67
Outstanding at December 31, 2019 . . . . . . . . . . . 134,398 25.31 1 2Exercisable at December 31, 2019 . . . . . . . . . . . . 134,398 25.31 1 2
(137,282)134,398
154
The following table summarizes the total intrinsic value of options exercised and the cash received from the exercises of options:
Year Ended December 31,(In millions) 2019 2018 2017Total intrinsic value of options exercised . . . . . . . . . . . . . . . . . . . . . . . . . $ 2 $ 10 $ 1Cash received from options exercised . . . . . . . . . . . . . . . . . . . . . . . . . . . 3 24 4
Supplemental Information
The following table summarizes NRG's total compensation expense recognized for the years presented, as well as totalnon-vested compensation costs not yet recognized and the period over which this expense is expected to be recognized as ofDecember 31, 2019, for each of the types of awards issued under the LTIPs. Minimum tax withholdings of $36 million, $19million, and $5 million for the years ended December 31, 2019, 2018, and 2017, respectively, are reflected as a reduction toadditional paid-in capital on the Company's consolidated balance sheets.
Non-vested Compensation Cost
(In millions, except weighted average data) Compensation ExpenseUnrecognized
Total Cost
Weighted Average Recognition Period
Remaining (In years)Year Ended December 31, As of December 31,
Award 2019 2018 2017 2019 2019
RSUs . . . . . . . . . . . . . . . . . . . . . . . . . 9 12 15 8 1.06DSUs . . . . . . . . . . . . . . . . . . . . . . . . . 2 2 2 — 0.00MSUs . . . . . . . . . . . . . . . . . . . . . . . . . — 4 5 — 0.50RPSUs . . . . . . . . . . . . . . . . . . . . . . . . 10 7 3 9 0.71PRSUs(a) . . . . . . . . . . . . . . . . . . . . . . . 11 16 13 10 1.05Total(b) . . . . . . . . . . . . . . . . . . . . . . . . $ 32 $ 41 $ 38 $ 27Tax detriment recognized . . . . . . . . . $ (12) $ (4) $ (5)(12) (4) (5)
(a) Phantom Restricted Stock Units, PRSUs, are liability-classified time-based awards that typically vest ratably over a three-year period. The amount to be paid upon vesting is based on NRG's closing stock price for the period (b) Does not include compensation expense of $1 million, and $6 million for the years ended 2018, and 2017, respectively, which was recorded in loss from discontinued operations in the Company's consolidated statements of operations
Note 22 — Related Party Transactions
NRG provides services to some of its equity method investments under operations and maintenance agreements. Fees forthe services under these agreements include recovery of NRG's costs of operating the plants. Certain agreements also includefees for administrative service, a base monthly fee, profit margin and/or annual incentive bonus.
The following table summarizes NRG's material related party transactions with third party affiliates:Year Ended December 31,
(In millions) 2019 2018 2017
Revenues from Related Parties Included in Operating RevenuesGladstone . . . . . . . . . . . . . . . . . . . . . . . . . . . . . . . . . . . . . . . . . . . . . . . . $ 4 $ 3 $ 3GenConn(a) . . . . . . . . . . . . . . . . . . . . . . . . . . . . . . . . . . . . . . . . . . . . . . . — 4 5Ivanpah(b) . . . . . . . . . . . . . . . . . . . . . . . . . . . . . . . . . . . . . . . . . . . . . . . . 35 20 —Midway-Sunset . . . . . . . . . . . . . . . . . . . . . . . . . . . . . . . . . . . . . . . . . . . 5 5 —
Total . . . . . . . . . . . . . . . . . . . . . . . . . . . . . . . . . . . . . . . . . . . . . . . . . . $ 44 $ 32 $ 8
(a) As of August 31, 2018, NRG no longer had an ownership interest in GenConn as a result of the sale of its ownership interests in NRG Yield, Inc. and its Renewables Platform
(b) Also includes fees under project management agreements with each project company. Ivanpah became a related party to NRG upon deconsolidation in the second quarter of 2018
155
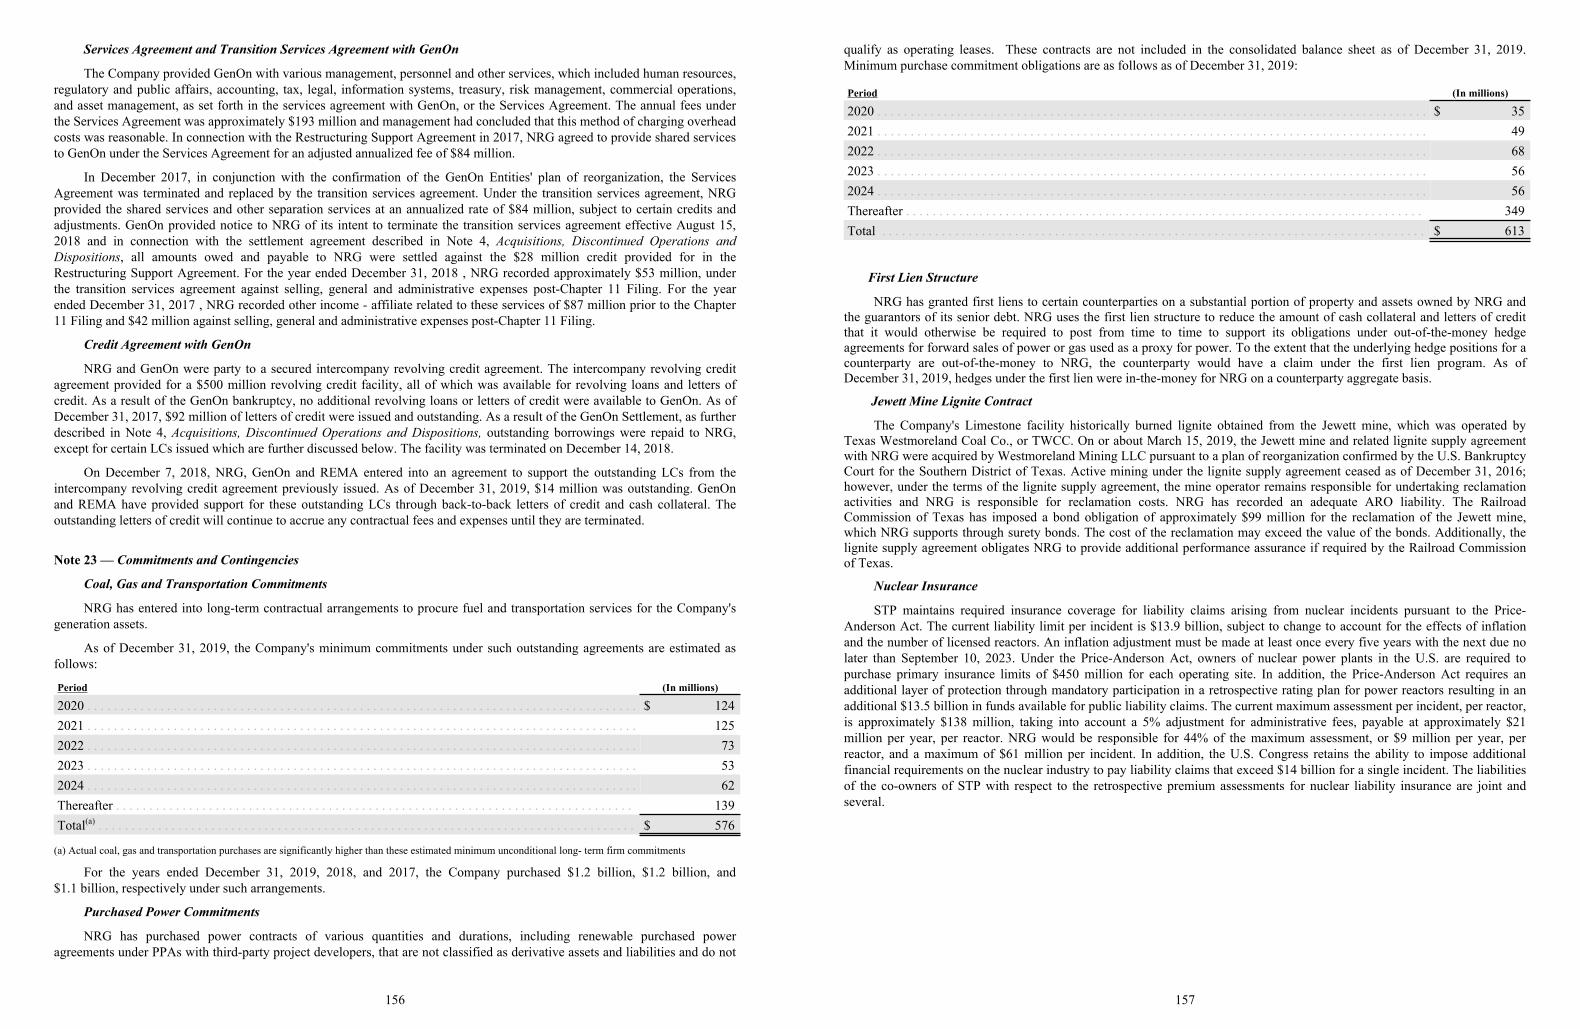
Services Agreement and Transition Services Agreement with GenOn
The Company provided GenOn with various management, personnel and other services, which included human resources,regulatory and public affairs, accounting, tax, legal, information systems, treasury, risk management, commercial operations,and asset management, as set forth in the services agreement with GenOn, or the Services Agreement. The annual fees underthe Services Agreement was approximately $193 million and management had concluded that this method of charging overheadcosts was reasonable. In connection with the Restructuring Support Agreement in 2017, NRG agreed to provide shared servicesto GenOn under the Services Agreement for an adjusted annualized fee of $84 million.
In December 2017, in conjunction with the confirmation of the GenOn Entities' plan of reorganization, the ServicesAgreement was terminated and replaced by the transition services agreement. Under the transition services agreement, NRGprovided the shared services and other separation services at an annualized rate of $84 million, subject to certain credits andadjustments. GenOn provided notice to NRG of its intent to terminate the transition services agreement effective August 15,2018 and in connection with the settlement agreement described in Note 4, Acquisitions, Discontinued Operations andDispositions, all amounts owed and payable to NRG were settled against the $28 million credit provided for in theRestructuring Support Agreement. For the year ended December 31, 2018 , NRG recorded approximately $53 million, underthe transition services agreement against selling, general and administrative expenses post-Chapter 11 Filing. For the yearended December 31, 2017 , NRG recorded other income - affiliate related to these services of $87 million prior to the Chapter11 Filing and $42 million against selling, general and administrative expenses post-Chapter 11 Filing.
Credit Agreement with GenOn
NRG and GenOn were party to a secured intercompany revolving credit agreement. The intercompany revolving creditagreement provided for a $500 million revolving credit facility, all of which was available for revolving loans and letters ofcredit. As a result of the GenOn bankruptcy, no additional revolving loans or letters of credit were available to GenOn. As ofDecember 31, 2017, $92 million of letters of credit were issued and outstanding. As a result of the GenOn Settlement, as furtherdescribed in Note 4, Acquisitions, Discontinued Operations and Dispositions, outstanding borrowings were repaid to NRG,except for certain LCs issued which are further discussed below. The facility was terminated on December 14, 2018.
On December 7, 2018, NRG, GenOn and REMA entered into an agreement to support the outstanding LCs from theintercompany revolving credit agreement previously issued. As of December 31, 2019, $14 million was outstanding. GenOnand REMA have provided support for these outstanding LCs through back-to-back letters of credit and cash collateral. Theoutstanding letters of credit will continue to accrue any contractual fees and expenses until they are terminated.
Note 23 — Commitments and Contingencies
Coal, Gas and Transportation Commitments
NRG has entered into long-term contractual arrangements to procure fuel and transportation services for the Company'sgeneration assets.
As of December 31, 2019, the Company's minimum commitments under such outstanding agreements are estimated asfollows:
Period (In millions)
2020 . . . . . . . . . . . . . . . . . . . . . . . . . . . . . . . . . . . . . . . . . . . . . . . . . . . . . . . . . . . . . . . . . . . . . . . . . . . . . . . . . . . $ 1242021 . . . . . . . . . . . . . . . . . . . . . . . . . . . . . . . . . . . . . . . . . . . . . . . . . . . . . . . . . . . . . . . . . . . . . . . . . . . . . . . . . . . 1252022 . . . . . . . . . . . . . . . . . . . . . . . . . . . . . . . . . . . . . . . . . . . . . . . . . . . . . . . . . . . . . . . . . . . . . . . . . . . . . . . . . . . 732023 . . . . . . . . . . . . . . . . . . . . . . . . . . . . . . . . . . . . . . . . . . . . . . . . . . . . . . . . . . . . . . . . . . . . . . . . . . . . . . . . . . . 532024 . . . . . . . . . . . . . . . . . . . . . . . . . . . . . . . . . . . . . . . . . . . . . . . . . . . . . . . . . . . . . . . . . . . . . . . . . . . . . . . . . . . 62Thereafter . . . . . . . . . . . . . . . . . . . . . . . . . . . . . . . . . . . . . . . . . . . . . . . . . . . . . . . . . . . . . . . . . . . . . . . . . . . . . . 139Total(a) . . . . . . . . . . . . . . . . . . . . . . . . . . . . . . . . . . . . . . . . . . . . . . . . . . . . . . . . . . . . . . . . . . . . . . . . . . . . . . . . . $ 576
(a) Actual coal, gas and transportation purchases are significantly higher than these estimated minimum unconditional long- term firm commitments
For the years ended December 31, 2019, 2018, and 2017, the Company purchased $1.2 billion, $1.2 billion, and$1.1 billion, respectively under such arrangements.
Purchased Power Commitments
NRG has purchased power contracts of various quantities and durations, including renewable purchased poweragreements under PPAs with third-party project developers, that are not classified as derivative assets and liabilities and do not
156
qualify as operating leases. These contracts are not included in the consolidated balance sheet as of December 31, 2019.Minimum purchase commitment obligations are as follows as of December 31, 2019:
Period (In millions)
2020 . . . . . . . . . . . . . . . . . . . . . . . . . . . . . . . . . . . . . . . . . . . . . . . . . . . . . . . . . . . . . . . . . . . . . . . . . . . . . . . . . . . $ 352021 . . . . . . . . . . . . . . . . . . . . . . . . . . . . . . . . . . . . . . . . . . . . . . . . . . . . . . . . . . . . . . . . . . . . . . . . . . . . . . . . . . . 492022 . . . . . . . . . . . . . . . . . . . . . . . . . . . . . . . . . . . . . . . . . . . . . . . . . . . . . . . . . . . . . . . . . . . . . . . . . . . . . . . . . . . 682023 . . . . . . . . . . . . . . . . . . . . . . . . . . . . . . . . . . . . . . . . . . . . . . . . . . . . . . . . . . . . . . . . . . . . . . . . . . . . . . . . . . . 562024 . . . . . . . . . . . . . . . . . . . . . . . . . . . . . . . . . . . . . . . . . . . . . . . . . . . . . . . . . . . . . . . . . . . . . . . . . . . . . . . . . . . 56Thereafter . . . . . . . . . . . . . . . . . . . . . . . . . . . . . . . . . . . . . . . . . . . . . . . . . . . . . . . . . . . . . . . . . . . . . . . . . . . . . . 349Total . . . . . . . . . . . . . . . . . . . . . . . . . . . . . . . . . . . . . . . . . . . . . . . . . . . . . . . . . . . . . . . . . . . . . . . . . . . . . . . . . . $ 613
First Lien Structure
NRG has granted first liens to certain counterparties on a substantial portion of property and assets owned by NRG andthe guarantors of its senior debt. NRG uses the first lien structure to reduce the amount of cash collateral and letters of creditthat it would otherwise be required to post from time to time to support its obligations under out-of-the-money hedgeagreements for forward sales of power or gas used as a proxy for power. To the extent that the underlying hedge positions for acounterparty are out-of-the-money to NRG, the counterparty would have a claim under the first lien program. As ofDecember 31, 2019, hedges under the first lien were in-the-money for NRG on a counterparty aggregate basis.
Jewett Mine Lignite Contract
The Company's Limestone facility historically burned lignite obtained from the Jewett mine, which was operated byTexas Westmoreland Coal Co., or TWCC. On or about March 15, 2019, the Jewett mine and related lignite supply agreementwith NRG were acquired by Westmoreland Mining LLC pursuant to a plan of reorganization confirmed by the U.S. BankruptcyCourt for the Southern District of Texas. Active mining under the lignite supply agreement ceased as of December 31, 2016;however, under the terms of the lignite supply agreement, the mine operator remains responsible for undertaking reclamationactivities and NRG is responsible for reclamation costs. NRG has recorded an adequate ARO liability. The RailroadCommission of Texas has imposed a bond obligation of approximately $99 million for the reclamation of the Jewett mine,which NRG supports through surety bonds. The cost of the reclamation may exceed the value of the bonds. Additionally, thelignite supply agreement obligates NRG to provide additional performance assurance if required by the Railroad Commissionof Texas.
Nuclear Insurance
STP maintains required insurance coverage for liability claims arising from nuclear incidents pursuant to the Price-Anderson Act. The current liability limit per incident is $13.9 billion, subject to change to account for the effects of inflationand the number of licensed reactors. An inflation adjustment must be made at least once every five years with the next due nolater than September 10, 2023. Under the Price-Anderson Act, owners of nuclear power plants in the U.S. are required topurchase primary insurance limits of $450 million for each operating site. In addition, the Price-Anderson Act requires anadditional layer of protection through mandatory participation in a retrospective rating plan for power reactors resulting in anadditional $13.5 billion in funds available for public liability claims. The current maximum assessment per incident, per reactor,is approximately $138 million, taking into account a 5% adjustment for administrative fees, payable at approximately $21million per year, per reactor. NRG would be responsible for 44% of the maximum assessment, or $9 million per year, perreactor, and a maximum of $61 million per incident. In addition, the U.S. Congress retains the ability to impose additionalfinancial requirements on the nuclear industry to pay liability claims that exceed $14 billion for a single incident. The liabilitiesof the co-owners of STP with respect to the retrospective premium assessments for nuclear liability insurance are joint andseveral.
157
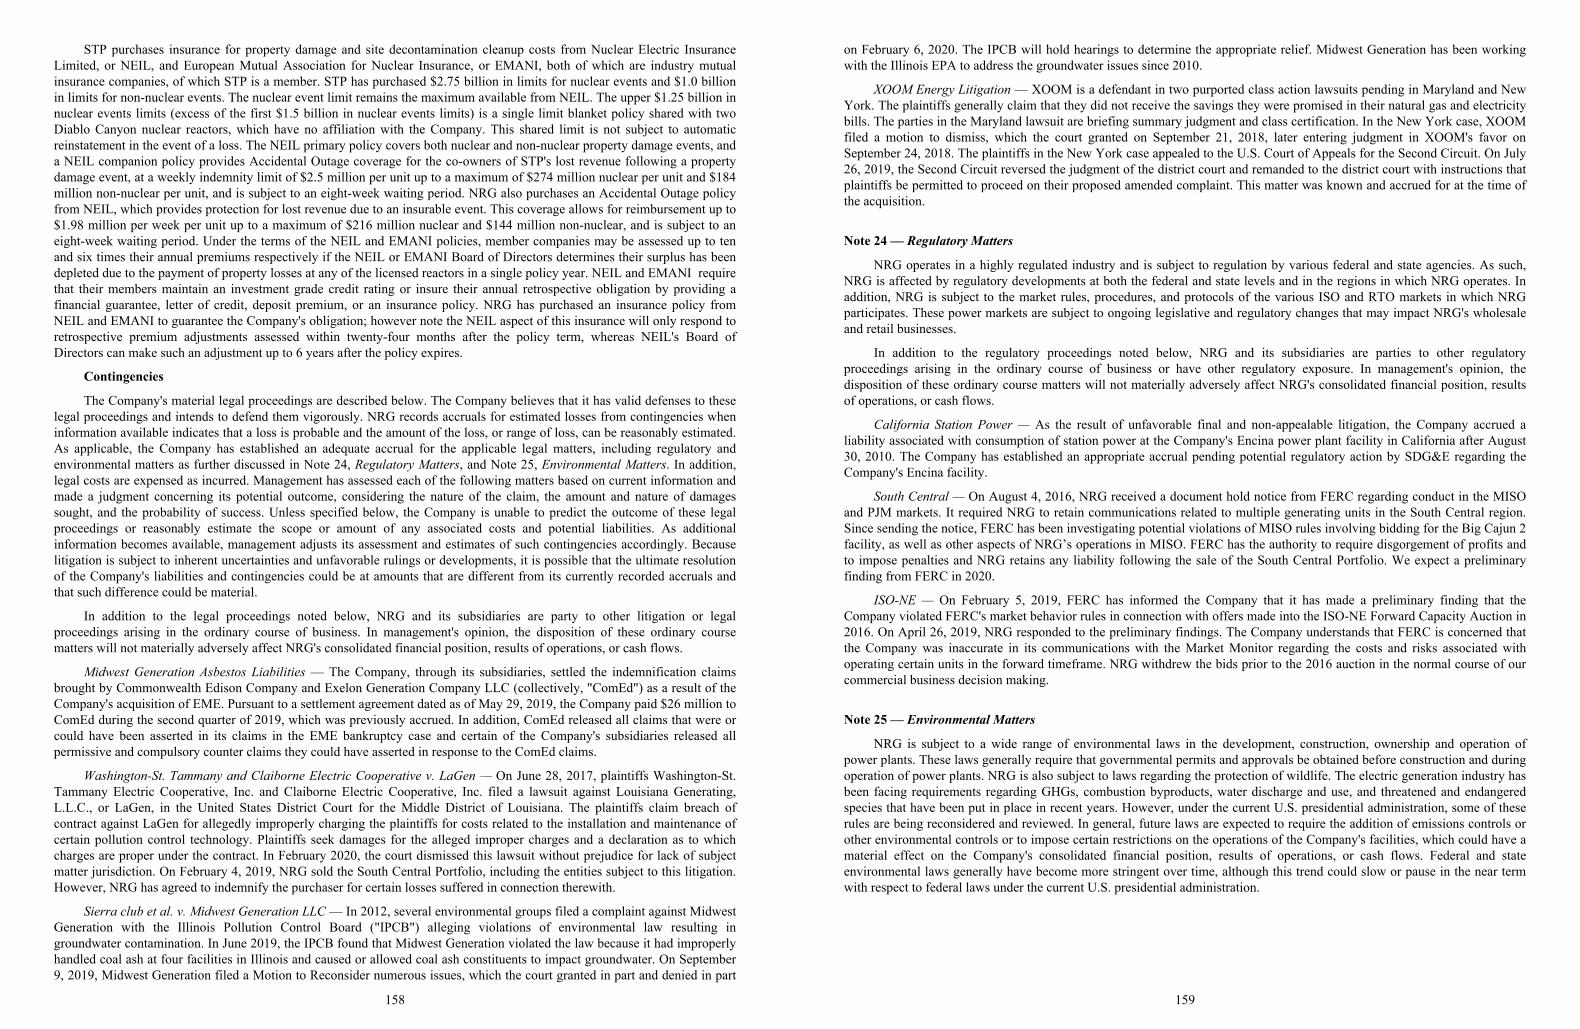
STP purchases insurance for property damage and site decontamination cleanup costs from Nuclear Electric InsuranceLimited, or NEIL, and European Mutual Association for Nuclear Insurance, or EMANI, both of which are industry mutualinsurance companies, of which STP is a member. STP has purchased $2.75 billion in limits for nuclear events and $1.0 billionin limits for non-nuclear events. The nuclear event limit remains the maximum available from NEIL. The upper $1.25 billion innuclear events limits (excess of the first $1.5 billion in nuclear events limits) is a single limit blanket policy shared with twoDiablo Canyon nuclear reactors, which have no affiliation with the Company. This shared limit is not subject to automaticreinstatement in the event of a loss. The NEIL primary policy covers both nuclear and non-nuclear property damage events, anda NEIL companion policy provides Accidental Outage coverage for the co-owners of STP's lost revenue following a propertydamage event, at a weekly indemnity limit of $2.5 million per unit up to a maximum of $274 million nuclear per unit and $184million non-nuclear per unit, and is subject to an eight-week waiting period. NRG also purchases an Accidental Outage policyfrom NEIL, which provides protection for lost revenue due to an insurable event. This coverage allows for reimbursement up to$1.98 million per week per unit up to a maximum of $216 million nuclear and $144 million non-nuclear, and is subject to aneight-week waiting period. Under the terms of the NEIL and EMANI policies, member companies may be assessed up to tenand six times their annual premiums respectively if the NEIL or EMANI Board of Directors determines their surplus has beendepleted due to the payment of property losses at any of the licensed reactors in a single policy year. NEIL and EMANI requirethat their members maintain an investment grade credit rating or insure their annual retrospective obligation by providing afinancial guarantee, letter of credit, deposit premium, or an insurance policy. NRG has purchased an insurance policy fromNEIL and EMANI to guarantee the Company's obligation; however note the NEIL aspect of this insurance will only respond toretrospective premium adjustments assessed within twenty-four months after the policy term, whereas NEIL's Board ofDirectors can make such an adjustment up to 6 years after the policy expires.
Contingencies
The Company's material legal proceedings are described below. The Company believes that it has valid defenses to theselegal proceedings and intends to defend them vigorously. NRG records accruals for estimated losses from contingencies wheninformation available indicates that a loss is probable and the amount of the loss, or range of loss, can be reasonably estimated.As applicable, the Company has established an adequate accrual for the applicable legal matters, including regulatory andenvironmental matters as further discussed in Note 24, Regulatory Matters, and Note 25, Environmental Matters. In addition,legal costs are expensed as incurred. Management has assessed each of the following matters based on current information andmade a judgment concerning its potential outcome, considering the nature of the claim, the amount and nature of damagessought, and the probability of success. Unless specified below, the Company is unable to predict the outcome of these legalproceedings or reasonably estimate the scope or amount of any associated costs and potential liabilities. As additionalinformation becomes available, management adjusts its assessment and estimates of such contingencies accordingly. Becauselitigation is subject to inherent uncertainties and unfavorable rulings or developments, it is possible that the ultimate resolutionof the Company's liabilities and contingencies could be at amounts that are different from its currently recorded accruals andthat such difference could be material.
In addition to the legal proceedings noted below, NRG and its subsidiaries are party to other litigation or legalproceedings arising in the ordinary course of business. In management's opinion, the disposition of these ordinary coursematters will not materially adversely affect NRG's consolidated financial position, results of operations, or cash flows.
Midwest Generation Asbestos Liabilities — The Company, through its subsidiaries, settled the indemnification claimsbrought by Commonwealth Edison Company and Exelon Generation Company LLC (collectively, "ComEd") as a result of theCompany's acquisition of EME. Pursuant to a settlement agreement dated as of May 29, 2019, the Company paid $26 million toComEd during the second quarter of 2019, which was previously accrued. In addition, ComEd released all claims that were orcould have been asserted in its claims in the EME bankruptcy case and certain of the Company's subsidiaries released allpermissive and compulsory counter claims they could have asserted in response to the ComEd claims.
Washington-St. Tammany and Claiborne Electric Cooperative v. LaGen — On June 28, 2017, plaintiffs Washington-St.Tammany Electric Cooperative, Inc. and Claiborne Electric Cooperative, Inc. filed a lawsuit against Louisiana Generating,L.L.C., or LaGen, in the United States District Court for the Middle District of Louisiana. The plaintiffs claim breach ofcontract against LaGen for allegedly improperly charging the plaintiffs for costs related to the installation and maintenance ofcertain pollution control technology. Plaintiffs seek damages for the alleged improper charges and a declaration as to whichcharges are proper under the contract. In February 2020, the court dismissed this lawsuit without prejudice for lack of subjectmatter jurisdiction. On February 4, 2019, NRG sold the South Central Portfolio, including the entities subject to this litigation.However, NRG has agreed to indemnify the purchaser for certain losses suffered in connection therewith.
Sierra club et al. v. Midwest Generation LLC— In 2012, several environmental groups filed a complaint against MidwestGeneration with the Illinois Pollution Control Board ("IPCB") alleging violations of environmental law resulting ingroundwater contamination. In June 2019, the IPCB found that Midwest Generation violated the law because it had improperlyhandled coal ash at four facilities in Illinois and caused or allowed coal ash constituents to impact groundwater. On September9, 2019, Midwest Generation filed a Motion to Reconsider numerous issues, which the court granted in part and denied in part
158
on February 6, 2020. The IPCB will hold hearings to determine the appropriate relief. Midwest Generation has been workingwith the Illinois EPA to address the groundwater issues since 2010.
XOOM Energy Litigation — XOOM is a defendant in two purported class action lawsuits pending in Maryland and NewYork. The plaintiffs generally claim that they did not receive the savings they were promised in their natural gas and electricitybills. The parties in the Maryland lawsuit are briefing summary judgment and class certification. In the New York case, XOOMfiled a motion to dismiss, which the court granted on September 21, 2018, later entering judgment in XOOM's favor onSeptember 24, 2018. The plaintiffs in the New York case appealed to the U.S. Court of Appeals for the Second Circuit. On July26, 2019, the Second Circuit reversed the judgment of the district court and remanded to the district court with instructions thatplaintiffs be permitted to proceed on their proposed amended complaint. This matter was known and accrued for at the time ofthe acquisition.
Note 24 — Regulatory Matters
NRG operates in a highly regulated industry and is subject to regulation by various federal and state agencies. As such,NRG is affected by regulatory developments at both the federal and state levels and in the regions in which NRG operates. Inaddition, NRG is subject to the market rules, procedures, and protocols of the various ISO and RTO markets in which NRGparticipates. These power markets are subject to ongoing legislative and regulatory changes that may impact NRG's wholesaleand retail businesses.
In addition to the regulatory proceedings noted below, NRG and its subsidiaries are parties to other regulatoryproceedings arising in the ordinary course of business or have other regulatory exposure. In management's opinion, thedisposition of these ordinary course matters will not materially adversely affect NRG's consolidated financial position, resultsof operations, or cash flows.
California Station Power — As the result of unfavorable final and non-appealable litigation, the Company accrued aliability associated with consumption of station power at the Company's Encina power plant facility in California after August30, 2010. The Company has established an appropriate accrual pending potential regulatory action by SDG&E regarding theCompany's Encina facility.
South Central — On August 4, 2016, NRG received a document hold notice from FERC regarding conduct in the MISOand PJM markets. It required NRG to retain communications related to multiple generating units in the South Central region.Since sending the notice, FERC has been investigating potential violations of MISO rules involving bidding for the Big Cajun 2facility, as well as other aspects of NRG’s operations in MISO. FERC has the authority to require disgorgement of profits andto impose penalties and NRG retains any liability following the sale of the South Central Portfolio. We expect a preliminaryfinding from FERC in 2020.
ISO-NE — On February 5, 2019, FERC has informed the Company that it has made a preliminary finding that theCompany violated FERC's market behavior rules in connection with offers made into the ISO-NE Forward Capacity Auction in2016. On April 26, 2019, NRG responded to the preliminary findings. The Company understands that FERC is concerned thatthe Company was inaccurate in its communications with the Market Monitor regarding the costs and risks associated withoperating certain units in the forward timeframe. NRG withdrew the bids prior to the 2016 auction in the normal course of ourcommercial business decision making.
Note 25 — Environmental Matters
NRG is subject to a wide range of environmental laws in the development, construction, ownership and operation ofpower plants. These laws generally require that governmental permits and approvals be obtained before construction and duringoperation of power plants. NRG is also subject to laws regarding the protection of wildlife. The electric generation industry hasbeen facing requirements regarding GHGs, combustion byproducts, water discharge and use, and threatened and endangeredspecies that have been put in place in recent years. However, under the current U.S. presidential administration, some of theserules are being reconsidered and reviewed. In general, future laws are expected to require the addition of emissions controls orother environmental controls or to impose certain restrictions on the operations of the Company's facilities, which could have amaterial effect on the Company's consolidated financial position, results of operations, or cash flows. Federal and stateenvironmental laws generally have become more stringent over time, although this trend could slow or pause in the near termwith respect to federal laws under the current U.S. presidential administration.
159
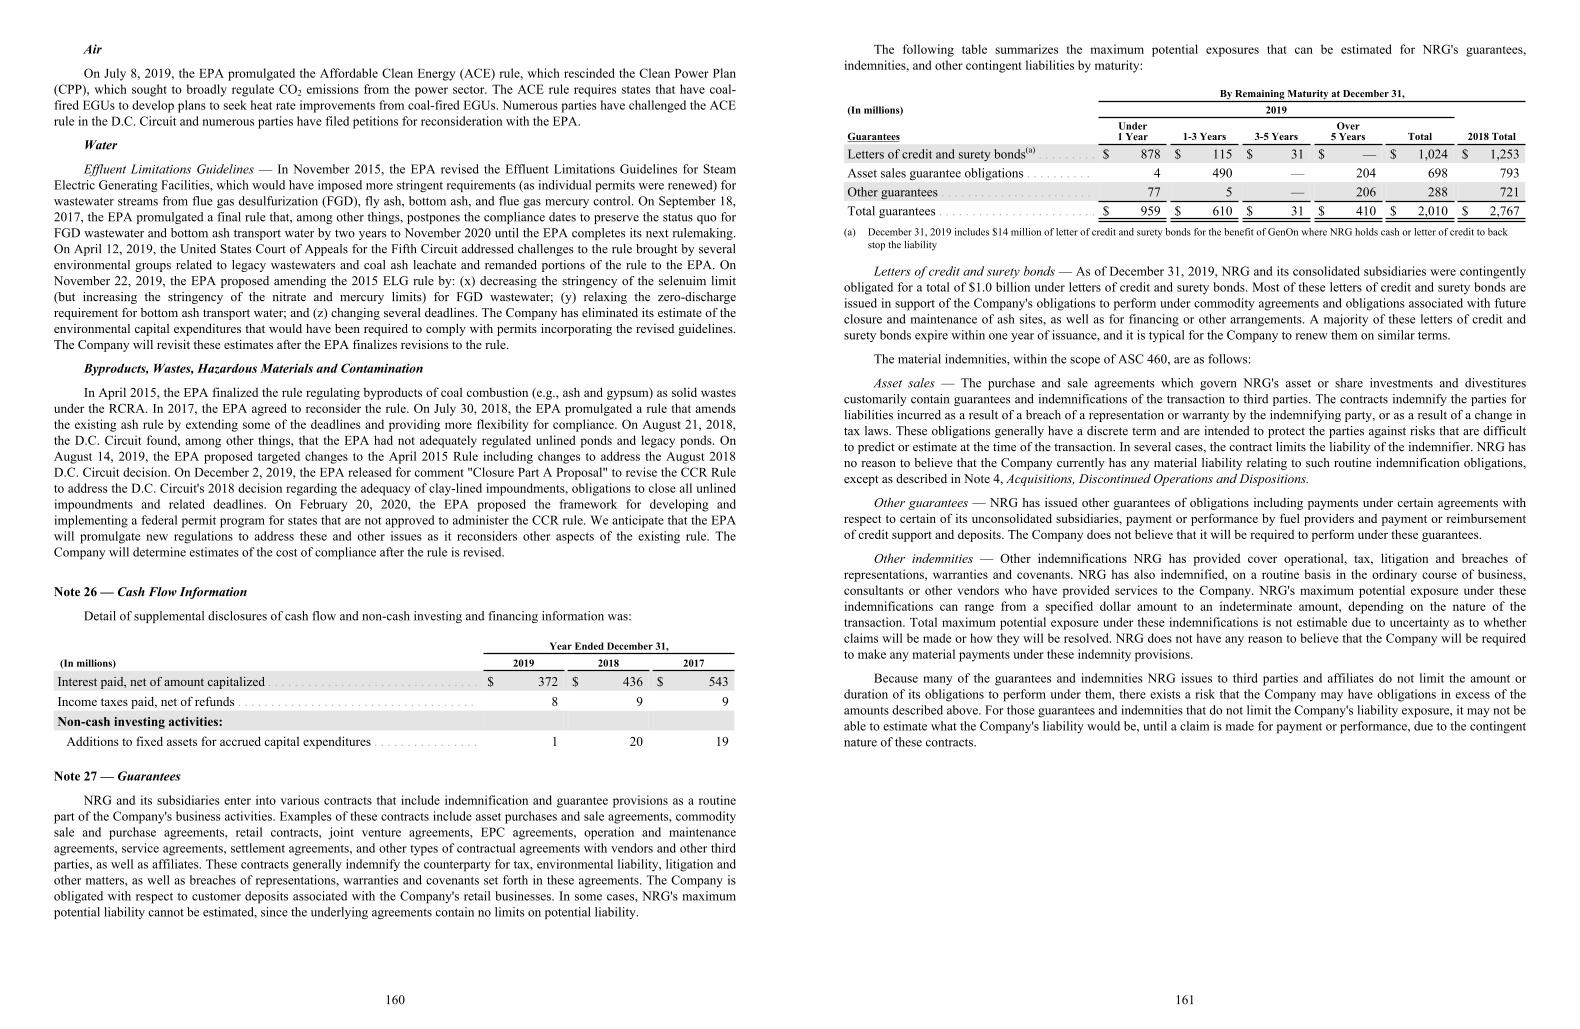
Air
On July 8, 2019, the EPA promulgated the Affordable Clean Energy (ACE) rule, which rescinded the Clean Power Plan(CPP), which sought to broadly regulate CO2 emissions from the power sector. The ACE rule requires states that have coal-fired EGUs to develop plans to seek heat rate improvements from coal-fired EGUs. Numerous parties have challenged the ACErule in the D.C. Circuit and numerous parties have filed petitions for reconsideration with the EPA.
Water
Effluent Limitations Guidelines — In November 2015, the EPA revised the Effluent Limitations Guidelines for SteamElectric Generating Facilities, which would have imposed more stringent requirements (as individual permits were renewed) forwastewater streams from flue gas desulfurization (FGD), fly ash, bottom ash, and flue gas mercury control. On September 18,2017, the EPA promulgated a final rule that, among other things, postpones the compliance dates to preserve the status quo forFGD wastewater and bottom ash transport water by two years to November 2020 until the EPA completes its next rulemaking.On April 12, 2019, the United States Court of Appeals for the Fifth Circuit addressed challenges to the rule brought by severalenvironmental groups related to legacy wastewaters and coal ash leachate and remanded portions of the rule to the EPA. OnNovember 22, 2019, the EPA proposed amending the 2015 ELG rule by: (x) decreasing the stringency of the selenuim limit(but increasing the stringency of the nitrate and mercury limits) for FGD wastewater; (y) relaxing the zero-dischargerequirement for bottom ash transport water; and (z) changing several deadlines. The Company has eliminated its estimate of theenvironmental capital expenditures that would have been required to comply with permits incorporating the revised guidelines.The Company will revisit these estimates after the EPA finalizes revisions to the rule.
Byproducts, Wastes, Hazardous Materials and Contamination
In April 2015, the EPA finalized the rule regulating byproducts of coal combustion (e.g., ash and gypsum) as solid wastesunder the RCRA. In 2017, the EPA agreed to reconsider the rule. On July 30, 2018, the EPA promulgated a rule that amendsthe existing ash rule by extending some of the deadlines and providing more flexibility for compliance. On August 21, 2018,the D.C. Circuit found, among other things, that the EPA had not adequately regulated unlined ponds and legacy ponds. OnAugust 14, 2019, the EPA proposed targeted changes to the April 2015 Rule including changes to address the August 2018D.C. Circuit decision. On December 2, 2019, the EPA released for comment "Closure Part A Proposal" to revise the CCR Ruleto address the D.C. Circuit's 2018 decision regarding the adequacy of clay-lined impoundments, obligations to close all unlinedimpoundments and related deadlines. On February 20, 2020, the EPA proposed the framework for developing andimplementing a federal permit program for states that are not approved to administer the CCR rule. We anticipate that the EPAwill promulgate new regulations to address these and other issues as it reconsiders other aspects of the existing rule. TheCompany will determine estimates of the cost of compliance after the rule is revised.
Note 26 — Cash Flow Information
Detail of supplemental disclosures of cash flow and non-cash investing and financing information was:
Year Ended December 31, (In millions) 2019 2018 2017
Interest paid, net of amount capitalized . . . . . . . . . . . . . . . . . . . . . . . . . . . . . . . . $ 372 $ 436 $ 543Income taxes paid, net of refunds . . . . . . . . . . . . . . . . . . . . . . . . . . . . . . . . . . . . 8 9 9Non-cash investing activities:
Additions to fixed assets for accrued capital expenditures . . . . . . . . . . . . . . . . 1 20 19
Note 27 — Guarantees
NRG and its subsidiaries enter into various contracts that include indemnification and guarantee provisions as a routinepart of the Company's business activities. Examples of these contracts include asset purchases and sale agreements, commoditysale and purchase agreements, retail contracts, joint venture agreements, EPC agreements, operation and maintenanceagreements, service agreements, settlement agreements, and other types of contractual agreements with vendors and other thirdparties, as well as affiliates. These contracts generally indemnify the counterparty for tax, environmental liability, litigation andother matters, as well as breaches of representations, warranties and covenants set forth in these agreements. The Company isobligated with respect to customer deposits associated with the Company's retail businesses. In some cases, NRG's maximumpotential liability cannot be estimated, since the underlying agreements contain no limits on potential liability.
160
The following table summarizes the maximum potential exposures that can be estimated for NRG's guarantees,indemnities, and other contingent liabilities by maturity:
By Remaining Maturity at December 31,(In millions) 2019
GuaranteesUnder1 Year 1-3 Years 3-5 Years
Over5 Years Total 2018 Total
Letters of credit and surety bonds(a) . . . . . . . . . $ 878 $ 115 $ 31 $ — $ 1,024 $ 1,253Asset sales guarantee obligations . . . . . . . . . . 4 490 — 204 698 793Other guarantees . . . . . . . . . . . . . . . . . . . . . . . 77 5 — 206 288 721Total guarantees . . . . . . . . . . . . . . . . . . . . . . . . $ 959 $ 610 $ 31 $ 410 $ 2,010 $ 2,767
(a) December 31, 2019 includes $14 million of letter of credit and surety bonds for the benefit of GenOn where NRG holds cash or letter of credit to back stop the liability
Letters of credit and surety bonds — As of December 31, 2019, NRG and its consolidated subsidiaries were contingentlyobligated for a total of $1.0 billion under letters of credit and surety bonds. Most of these letters of credit and surety bonds areissued in support of the Company's obligations to perform under commodity agreements and obligations associated with futureclosure and maintenance of ash sites, as well as for financing or other arrangements. A majority of these letters of credit andsurety bonds expire within one year of issuance, and it is typical for the Company to renew them on similar terms.
The material indemnities, within the scope of ASC 460, are as follows:
Asset sales — The purchase and sale agreements which govern NRG's asset or share investments and divestiturescustomarily contain guarantees and indemnifications of the transaction to third parties. The contracts indemnify the parties forliabilities incurred as a result of a breach of a representation or warranty by the indemnifying party, or as a result of a change intax laws. These obligations generally have a discrete term and are intended to protect the parties against risks that are difficultto predict or estimate at the time of the transaction. In several cases, the contract limits the liability of the indemnifier. NRG hasno reason to believe that the Company currently has any material liability relating to such routine indemnification obligations,except as described in Note 4, Acquisitions, Discontinued Operations and Dispositions.
Other guarantees — NRG has issued other guarantees of obligations including payments under certain agreements withrespect to certain of its unconsolidated subsidiaries, payment or performance by fuel providers and payment or reimbursementof credit support and deposits. The Company does not believe that it will be required to perform under these guarantees.
Other indemnities — Other indemnifications NRG has provided cover operational, tax, litigation and breaches ofrepresentations, warranties and covenants. NRG has also indemnified, on a routine basis in the ordinary course of business,consultants or other vendors who have provided services to the Company. NRG's maximum potential exposure under theseindemnifications can range from a specified dollar amount to an indeterminate amount, depending on the nature of thetransaction. Total maximum potential exposure under these indemnifications is not estimable due to uncertainty as to whetherclaims will be made or how they will be resolved. NRG does not have any reason to believe that the Company will be requiredto make any material payments under these indemnity provisions.
Because many of the guarantees and indemnities NRG issues to third parties and affiliates do not limit the amount orduration of its obligations to perform under them, there exists a risk that the Company may have obligations in excess of theamounts described above. For those guarantees and indemnities that do not limit the Company's liability exposure, it may not beable to estimate what the Company's liability would be, until a claim is made for payment or performance, due to the contingentnature of these contracts.
161
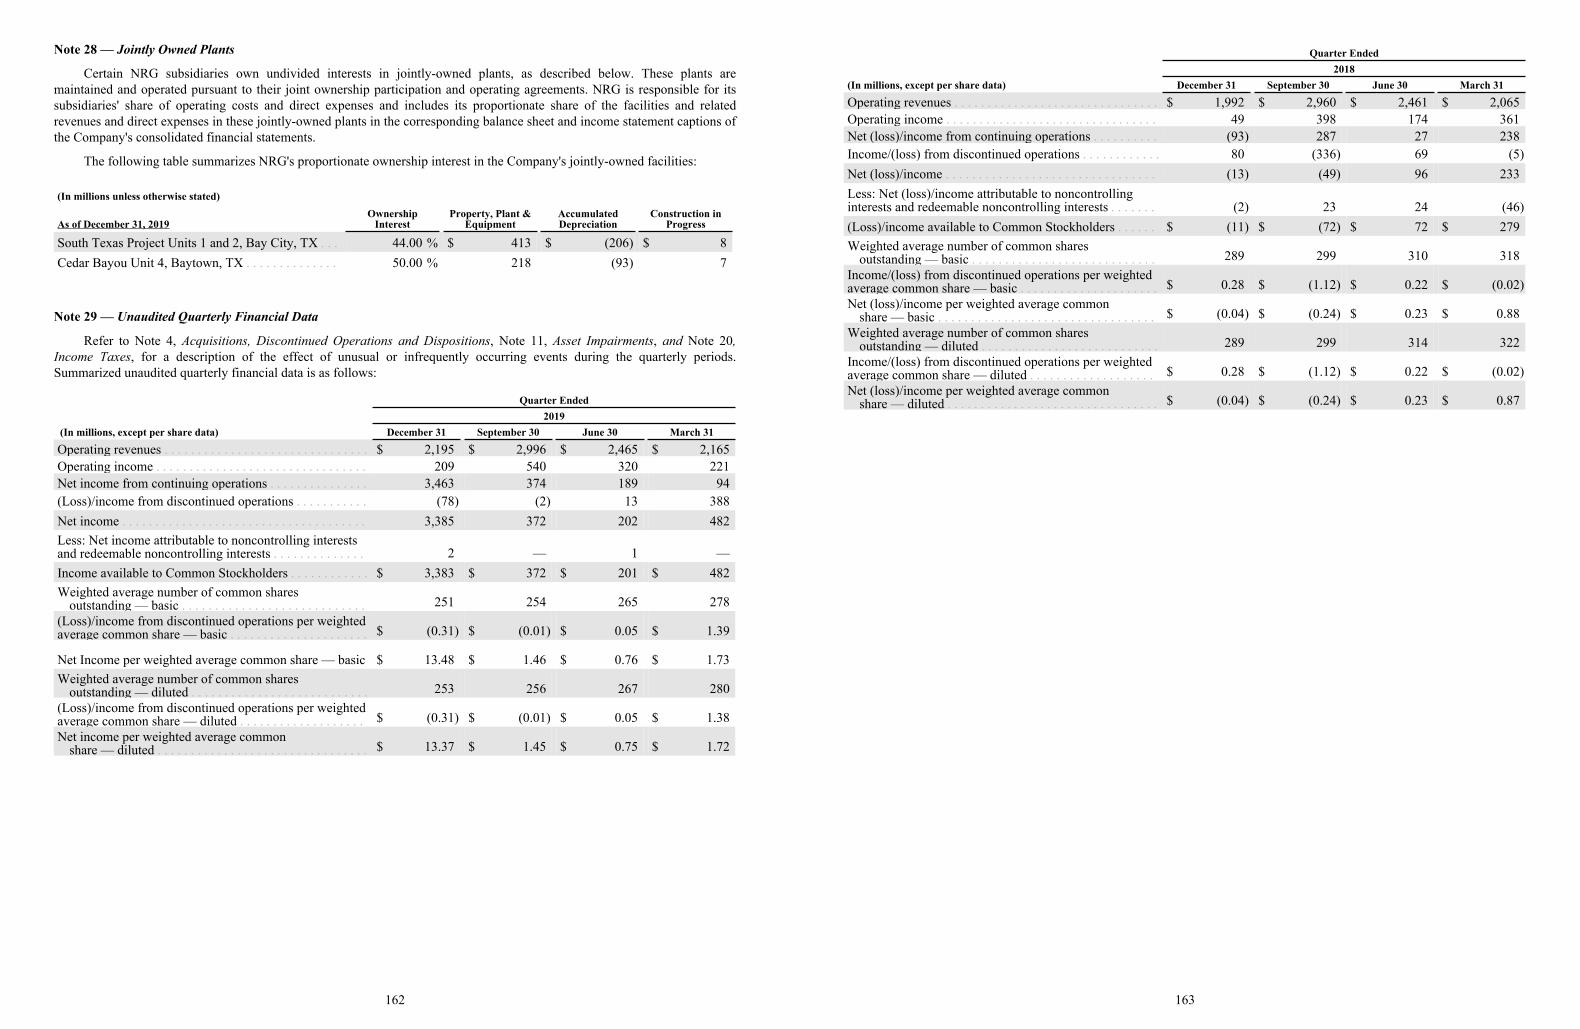
Note 28 — Jointly Owned Plants
Certain NRG subsidiaries own undivided interests in jointly-owned plants, as described below. These plants aremaintained and operated pursuant to their joint ownership participation and operating agreements. NRG is responsible for itssubsidiaries' share of operating costs and direct expenses and includes its proportionate share of the facilities and relatedrevenues and direct expenses in these jointly-owned plants in the corresponding balance sheet and income statement captions ofthe Company's consolidated financial statements.
The following table summarizes NRG's proportionate ownership interest in the Company's jointly-owned facilities:
(In millions unless otherwise stated)
As of December 31, 2019Ownership
InterestProperty, Plant &
EquipmentAccumulatedDepreciation
Construction inProgress
South Texas Project Units 1 and 2, Bay City, TX . . . 44.00 % $ 413 $ (206) $ 8Cedar Bayou Unit 4, Baytown, TX . . . . . . . . . . . . . . 50.00 % 218 (93) 7
Note 29 — Unaudited Quarterly Financial Data
Refer to Note 4, Acquisitions, Discontinued Operations and Dispositions, Note 11, Asset Impairments, and Note 20,Income Taxes, for a description of the effect of unusual or infrequently occurring events during the quarterly periods.Summarized unaudited quarterly financial data is as follows:
Quarter Ended2019
(In millions, except per share data) December 31 September 30 June 30 March 31
Operating revenues . . . . . . . . . . . . . . . . . . . . . . . . . . . . . . . $ 2,195 $ 2,996 $ 2,465 $ 2,165Operating income . . . . . . . . . . . . . . . . . . . . . . . . . . . . . . . . 209 540 320 221Net income from continuing operations . . . . . . . . . . . . . . . 3,463 374 189 94(Loss)/income from discontinued operations . . . . . . . . . . . (78) (2) 13 388Net income . . . . . . . . . . . . . . . . . . . . . . . . . . . . . . . . . . . . . 3,385 372 202 482Less: Net income attributable to noncontrolling interests and redeemable noncontrolling interests . . . . . . . . . . . . . . 2 — 1 —Income available to Common Stockholders . . . . . . . . . . . . $ 3,383 $ 372 $ 201 $ 482Weighted average number of common shares
outstanding — basic . . . . . . . . . . . . . . . . . . . . . . . . . . . . 251 254 265 278(Loss)/income from discontinued operations per weighted average common share — basic . . . . . . . . . . . . . . . . . . . . . $ (0.31) $ (0.01) $ 0.05 $ 1.39
Net Income per weighted average common share — basic $ 13.48 $ 1.46 $ 0.76 $ 1.73Weighted average number of common shares
outstanding — diluted . . . . . . . . . . . . . . . . . . . . . . . . . . . 253 256 267 280(Loss)/income from discontinued operations per weighted average common share — diluted . . . . . . . . . . . . . . . . . . . $ (0.31) $ (0.01) $ 0.05 $ 1.38Net income per weighted average common
share — diluted . . . . . . . . . . . . . . . . . . . . . . . . . . . . . . . . $ 13.37 $ 1.45 $ 0.75 $ 1.72
162
Quarter Ended2018
(In millions, except per share data) December 31 September 30 June 30 March 31
Operating revenues . . . . . . . . . . . . . . . . . . . . . . . . . . . . . . . $ 1,992 $ 2,960 $ 2,461 $ 2,065Operating income . . . . . . . . . . . . . . . . . . . . . . . . . . . . . . . . 49 398 174 361Net (loss)/income from continuing operations . . . . . . . . . . (93) 287 27 238Income/(loss) from discontinued operations . . . . . . . . . . . . 80 (336) 69 (5)Net (loss)/income . . . . . . . . . . . . . . . . . . . . . . . . . . . . . . . . (13) (49) 96 233Less: Net (loss)/income attributable to noncontrolling interests and redeemable noncontrolling interests . . . . . . . (2) 23 24 (46)(Loss)/income available to Common Stockholders . . . . . . $ (11) $ (72) $ 72 $ 279Weighted average number of common shares
outstanding — basic . . . . . . . . . . . . . . . . . . . . . . . . . . . . 289 299 310 318Income/(loss) from discontinued operations per weighted average common share — basic . . . . . . . . . . . . . . . . . . . . . $ 0.28 $ (1.12) $ 0.22 $ (0.02)Net (loss)/income per weighted average common
share — basic . . . . . . . . . . . . . . . . . . . . . . . . . . . . . . . . . $ (0.04) $ (0.24) $ 0.23 $ 0.88Weighted average number of common shares
outstanding — diluted . . . . . . . . . . . . . . . . . . . . . . . . . . . 289 299 314 322Income/(loss) from discontinued operations per weighted average common share — diluted . . . . . . . . . . . . . . . . . . . $ 0.28 $ (1.12) $ 0.22 $ (0.02)Net (loss)/income per weighted average common
share — diluted . . . . . . . . . . . . . . . . . . . . . . . . . . . . . . . . $ (0.04) $ (0.24) $ 0.23 $ 0.87
163
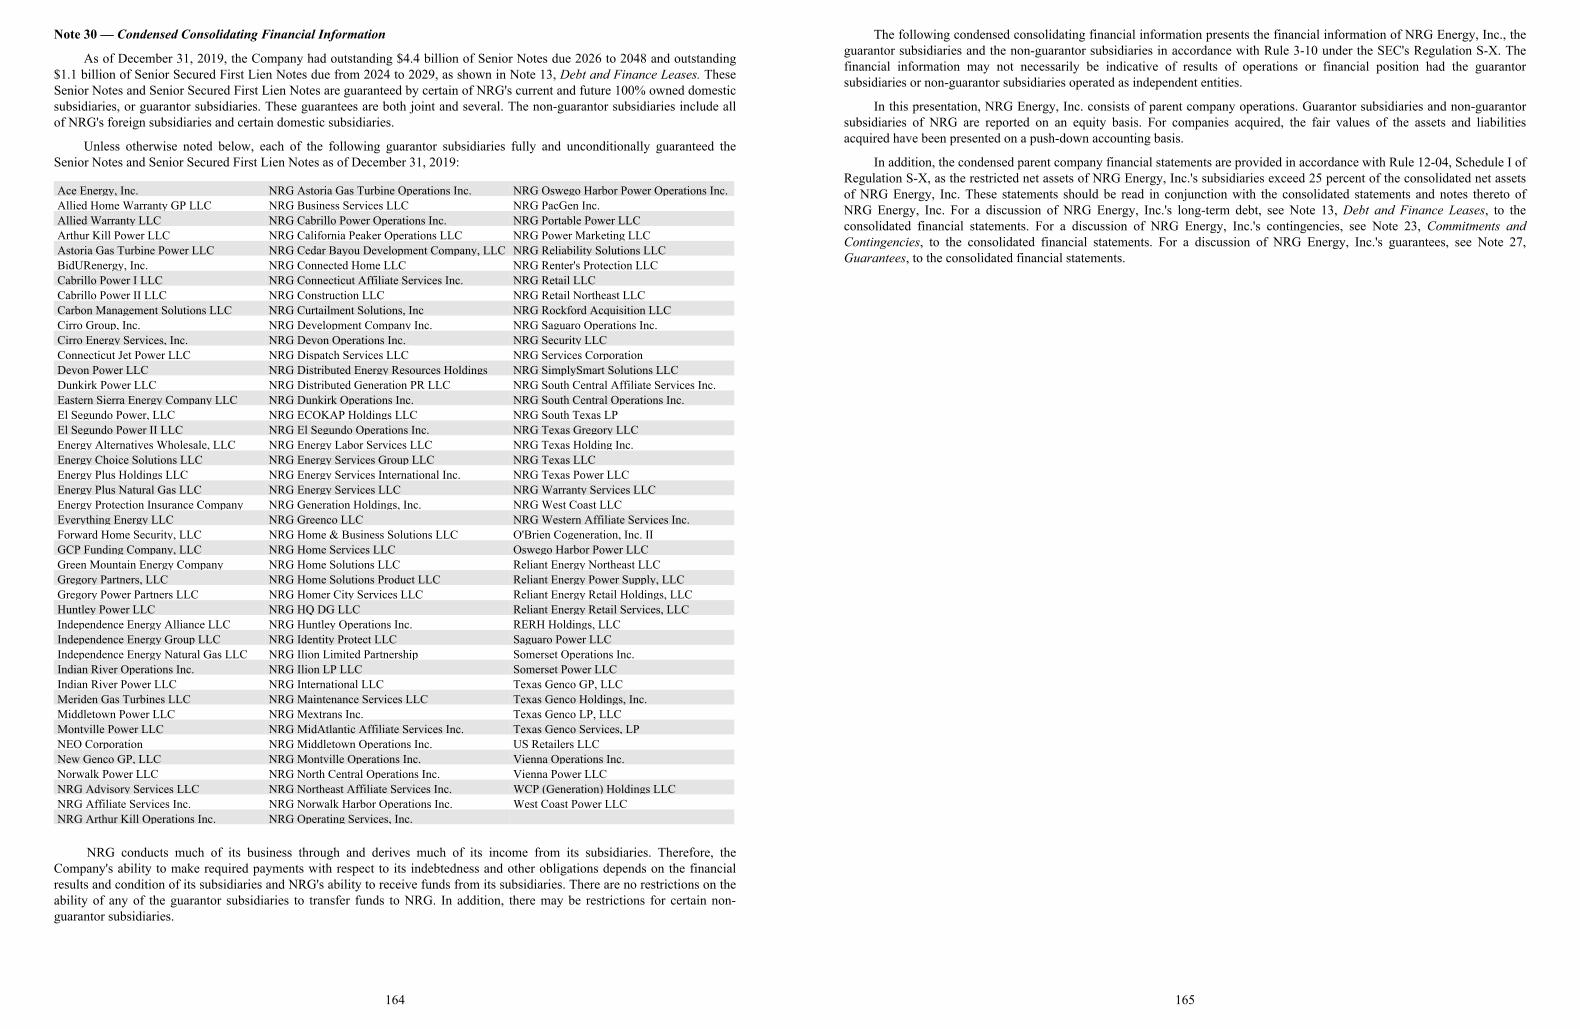
Note 30 — Condensed Consolidating Financial Information
As of December 31, 2019, the Company had outstanding $4.4 billion of Senior Notes due 2026 to 2048 and outstanding$1.1 billion of Senior Secured First Lien Notes due from 2024 to 2029, as shown in Note 13, Debt and Finance Leases. TheseSenior Notes and Senior Secured First Lien Notes are guaranteed by certain of NRG's current and future 100% owned domesticsubsidiaries, or guarantor subsidiaries. These guarantees are both joint and several. The non-guarantor subsidiaries include allof NRG's foreign subsidiaries and certain domestic subsidiaries.
Unless otherwise noted below, each of the following guarantor subsidiaries fully and unconditionally guaranteed theSenior Notes and Senior Secured First Lien Notes as of December 31, 2019:
Ace Energy, Inc. NRG Astoria Gas Turbine Operations Inc. NRG Oswego Harbor Power Operations Inc.Allied Home Warranty GP LLC NRG Business Services LLC NRG PacGen Inc.Allied Warranty LLC NRG Cabrillo Power Operations Inc. NRG Portable Power LLCArthur Kill Power LLC NRG California Peaker Operations LLC NRG Power Marketing LLCAstoria Gas Turbine Power LLC NRG Cedar Bayou Development Company, LLC NRG Reliability Solutions LLCBidURenergy, Inc. NRG Connected Home LLC NRG Renter's Protection LLCCabrillo Power I LLC NRG Connecticut Affiliate Services Inc. NRG Retail LLCCabrillo Power II LLC NRG Construction LLC NRG Retail Northeast LLCCarbon Management Solutions LLC NRG Curtailment Solutions, Inc NRG Rockford Acquisition LLCCirro Group, Inc. NRG Development Company Inc. NRG Saguaro Operations Inc.Cirro Energy Services, Inc. NRG Devon Operations Inc. NRG Security LLCConnecticut Jet Power LLC NRG Dispatch Services LLC NRG Services CorporationDevon Power LLC NRG Distributed Energy Resources Holdings NRG SimplySmart Solutions LLCDunkirk Power LLC NRG Distributed Generation PR LLC NRG South Central Affiliate Services Inc.Eastern Sierra Energy Company LLC NRG Dunkirk Operations Inc. NRG South Central Operations Inc.El Segundo Power, LLC NRG ECOKAP Holdings LLC NRG South Texas LPEl Segundo Power II LLC NRG El Segundo Operations Inc. NRG Texas Gregory LLCEnergy Alternatives Wholesale, LLC NRG Energy Labor Services LLC NRG Texas Holding Inc.Energy Choice Solutions LLC NRG Energy Services Group LLC NRG Texas LLCEnergy Plus Holdings LLC NRG Energy Services International Inc. NRG Texas Power LLCEnergy Plus Natural Gas LLC NRG Energy Services LLC NRG Warranty Services LLCEnergy Protection Insurance Company NRG Generation Holdings, Inc. NRG West Coast LLCEverything Energy LLC NRG Greenco LLC NRG Western Affiliate Services Inc.Forward Home Security, LLC NRG Home & Business Solutions LLC O'Brien Cogeneration, Inc. IIGCP Funding Company, LLC NRG Home Services LLC Oswego Harbor Power LLCGreen Mountain Energy Company NRG Home Solutions LLC Reliant Energy Northeast LLCGregory Partners, LLC NRG Home Solutions Product LLC Reliant Energy Power Supply, LLCGregory Power Partners LLC NRG Homer City Services LLC Reliant Energy Retail Holdings, LLCHuntley Power LLC NRG HQ DG LLC Reliant Energy Retail Services, LLCIndependence Energy Alliance LLC NRG Huntley Operations Inc. RERH Holdings, LLCIndependence Energy Group LLC NRG Identity Protect LLC Saguaro Power LLCIndependence Energy Natural Gas LLC NRG Ilion Limited Partnership Somerset Operations Inc.Indian River Operations Inc. NRG Ilion LP LLC Somerset Power LLCIndian River Power LLC NRG International LLC Texas Genco GP, LLCMeriden Gas Turbines LLC NRG Maintenance Services LLC Texas Genco Holdings, Inc.Middletown Power LLC NRG Mextrans Inc. Texas Genco LP, LLCMontville Power LLC NRG MidAtlantic Affiliate Services Inc. Texas Genco Services, LPNEO Corporation NRG Middletown Operations Inc. US Retailers LLCNew Genco GP, LLC NRG Montville Operations Inc. Vienna Operations Inc.Norwalk Power LLC NRG North Central Operations Inc. Vienna Power LLCNRG Advisory Services LLC NRG Northeast Affiliate Services Inc. WCP (Generation) Holdings LLCNRG Affiliate Services Inc. NRG Norwalk Harbor Operations Inc. West Coast Power LLCNRG Arthur Kill Operations Inc. NRG Operating Services, Inc.
NRG conducts much of its business through and derives much of its income from its subsidiaries. Therefore, theCompany's ability to make required payments with respect to its indebtedness and other obligations depends on the financialresults and condition of its subsidiaries and NRG's ability to receive funds from its subsidiaries. There are no restrictions on theability of any of the guarantor subsidiaries to transfer funds to NRG. In addition, there may be restrictions for certain non-guarantor subsidiaries.
164
The following condensed consolidating financial information presents the financial information of NRG Energy, Inc., theguarantor subsidiaries and the non-guarantor subsidiaries in accordance with Rule 3-10 under the SEC's Regulation S-X. Thefinancial information may not necessarily be indicative of results of operations or financial position had the guarantorsubsidiaries or non-guarantor subsidiaries operated as independent entities.
In this presentation, NRG Energy, Inc. consists of parent company operations. Guarantor subsidiaries and non-guarantorsubsidiaries of NRG are reported on an equity basis. For companies acquired, the fair values of the assets and liabilitiesacquired have been presented on a push-down accounting basis.
In addition, the condensed parent company financial statements are provided in accordance with Rule 12-04, Schedule I ofRegulation S-X, as the restricted net assets of NRG Energy, Inc.'s subsidiaries exceed 25 percent of the consolidated net assetsof NRG Energy, Inc. These statements should be read in conjunction with the consolidated statements and notes thereto ofNRG Energy, Inc. For a discussion of NRG Energy, Inc.'s long-term debt, see Note 13, Debt and Finance Leases, to theconsolidated financial statements. For a discussion of NRG Energy, Inc.'s contingencies, see Note 23, Commitments andContingencies, to the consolidated financial statements. For a discussion of NRG Energy, Inc.'s guarantees, see Note 27,Guarantees, to the consolidated financial statements.
165
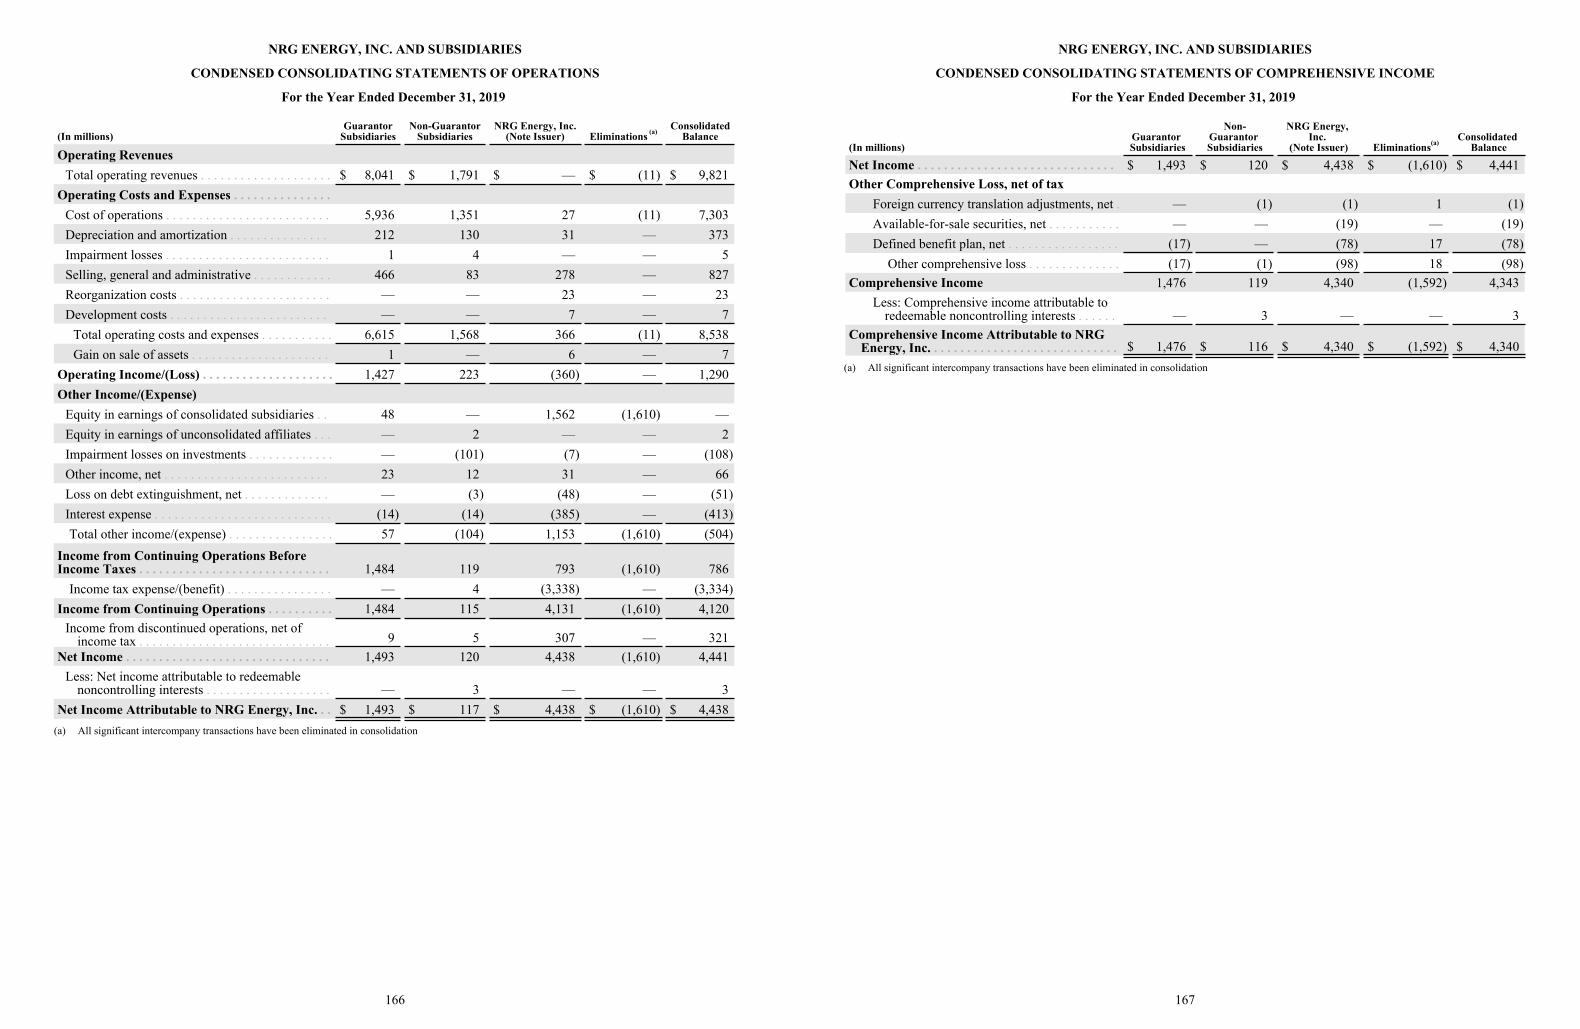
NRG ENERGY, INC. AND SUBSIDIARIES
CONDENSED CONSOLIDATING STATEMENTS OF OPERATIONS
For the Year Ended December 31, 2019
(In millions)Guarantor
SubsidiariesNon-Guarantor
SubsidiariesNRG Energy, Inc.
(Note Issuer) Eliminations (a)Consolidated
Balance
Operating RevenuesTotal operating revenues . . . . . . . . . . . . . . . . . . . . $ 8,041 $ 1,791 $ — $ (11) $ 9,821
Operating Costs and Expenses . . . . . . . . . . . . . . .Cost of operations . . . . . . . . . . . . . . . . . . . . . . . . . 5,936 1,351 27 (11) 7,303Depreciation and amortization . . . . . . . . . . . . . . . 212 130 31 — 373Impairment losses . . . . . . . . . . . . . . . . . . . . . . . . . 1 4 — — 5Selling, general and administrative . . . . . . . . . . . . 466 83 278 — 827Reorganization costs . . . . . . . . . . . . . . . . . . . . . . . — — 23 — 23Development costs . . . . . . . . . . . . . . . . . . . . . . . . — — 7 — 7
Total operating costs and expenses . . . . . . . . . . . 6,615 1,568 366 (11) 8,538Gain on sale of assets . . . . . . . . . . . . . . . . . . . . . 1 — 6 — 7
Operating Income/(Loss) . . . . . . . . . . . . . . . . . . . . 1,427 223 (360) — 1,290Other Income/(Expense)
Equity in earnings of consolidated subsidiaries . . 48 — 1,562 (1,610) —Equity in earnings of unconsolidated affiliates . . . — 2 — — 2Impairment losses on investments . . . . . . . . . . . . . — (101) (7) — (108)Other income, net . . . . . . . . . . . . . . . . . . . . . . . . . 23 12 31 — 66Loss on debt extinguishment, net . . . . . . . . . . . . . — (3) (48) — (51)Interest expense . . . . . . . . . . . . . . . . . . . . . . . . . . . (14) (14) (385) — (413)Total other income/(expense) . . . . . . . . . . . . . . . . 57 (104) 1,153 (1,610) (504)
Income from Continuing Operations Before Income Taxes . . . . . . . . . . . . . . . . . . . . . . . . . . . . . 1,484 119 793 (1,610) 786
Income tax expense/(benefit) . . . . . . . . . . . . . . . . — 4 (3,338) — (3,334)Income from Continuing Operations . . . . . . . . . . 1,484 115 4,131 (1,610) 4,120
Income from discontinued operations, net of income tax . . . . . . . . . . . . . . . . . . . . . . . . . . . . . 9 5 307 — 321
Net Income . . . . . . . . . . . . . . . . . . . . . . . . . . . . . . . 1,493 120 4,438 (1,610) 4,441Less: Net income attributable to redeemable
noncontrolling interests . . . . . . . . . . . . . . . . . . . — 3 — — 3Net Income Attributable to NRG Energy, Inc. . . $ 1,493 $ 117 $ 4,438 $ (1,610) $ 4,438
(a) All significant intercompany transactions have been eliminated in consolidation
166
NRG ENERGY, INC. AND SUBSIDIARIES
CONDENSED CONSOLIDATING STATEMENTS OF COMPREHENSIVE INCOME
For the Year Ended December 31, 2019
(In millions)Guarantor Subsidiaries
Non-Guarantor Subsidiaries
NRG Energy, Inc.
(Note Issuer) Eliminations(a)Consolidated
Balance
Net Income . . . . . . . . . . . . . . . . . . . . . . . . . . . . . . $ 1,493 $ 120 $ 4,438 $ (1,610) $ 4,441Other Comprehensive Loss, net of tax
Foreign currency translation adjustments, net . — (1) (1) 1 (1)Available-for-sale securities, net . . . . . . . . . . . — — (19) — (19)Defined benefit plan, net . . . . . . . . . . . . . . . . . (17) — (78) 17 (78)
Other comprehensive loss . . . . . . . . . . . . . . (17) (1) (98) 18 (98)Comprehensive Income 1,476 119 4,340 (1,592) 4,343
Less: Comprehensive income attributable to redeemable noncontrolling interests . . . . . . — 3 — — 3
Comprehensive Income Attributable to NRG Energy, Inc. . . . . . . . . . . . . . . . . . . . . . . . . . . . . $ 1,476 $ 116 $ 4,340 $ (1,592) $ 4,340
(a) All significant intercompany transactions have been eliminated in consolidation
167
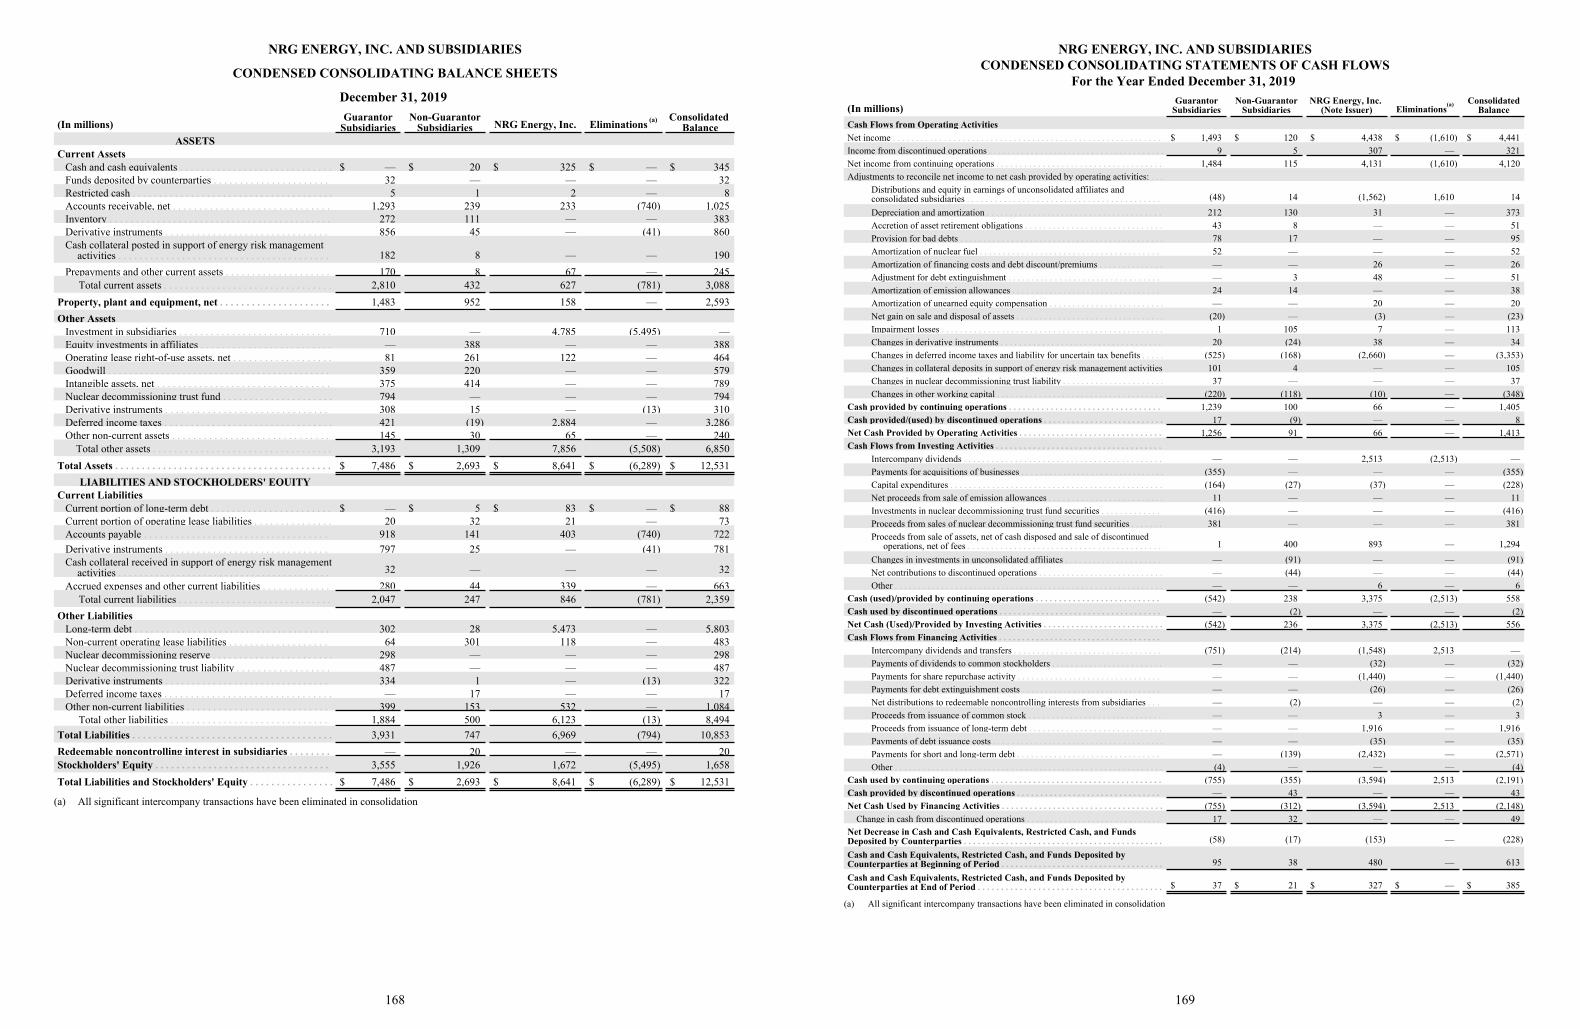
NRG ENERGY, INC. AND SUBSIDIARIES
CONDENSED CONSOLIDATING BALANCE SHEETS
December 31, 2019
(In millions)Guarantor
SubsidiariesNon-Guarantor
Subsidiaries NRG Energy, Inc. Eliminations (a) Consolidated Balance
ASSETSCurrent Assets
Cash and cash equivalents . . . . . . . . . . . . . . . . . . . . . . . . . . . . . $ — $ 20 $ 325 $ — $ 345Funds deposited by counterparties . . . . . . . . . . . . . . . . . . . . . . 32 — — — 32Restricted cash . . . . . . . . . . . . . . . . . . . . . . . . . . . . . . . . . . . . . . 5 1 2 — 8Accounts receivable, net . . . . . . . . . . . . . . . . . . . . . . . . . . . . . . 1,293 239 233 (740) 1,025Inventory . . . . . . . . . . . . . . . . . . . . . . . . . . . . . . . . . . . . . . . . . . 272 111 — — 383Derivative instruments . . . . . . . . . . . . . . . . . . . . . . . . . . . . . . . 856 45 — (41) 860Cash collateral posted in support of energy risk management
activities . . . . . . . . . . . . . . . . . . . . . . . . . . . . . . . . . . . . . . . . 182 8 — — 190Prepayments and other current assets . . . . . . . . . . . . . . . . . . . . 170 8 67 — 245 Total current assets . . . . . . . . . . . . . . . . . . . . . . . . . . . . . . . . 2,810 432 627 (781) 3,088
Property, plant and equipment, net . . . . . . . . . . . . . . . . . . . . . 1,483 952 158 — 2,593Other Assets
Investment in subsidiaries . . . . . . . . . . . . . . . . . . . . . . . . . . . . . 710 — 4,785 (5,495) —Equity investments in affiliates . . . . . . . . . . . . . . . . . . . . . . . . . — 388 — — 388Operating lease right-of-use assets, net . . . . . . . . . . . . . . . . . . . 81 261 122 — 464Goodwill . . . . . . . . . . . . . . . . . . . . . . . . . . . . . . . . . . . . . . . . . . 359 220 — — 579Intangible assets, net . . . . . . . . . . . . . . . . . . . . . . . . . . . . . . . . . 375 414 — — 789Nuclear decommissioning trust fund . . . . . . . . . . . . . . . . . . . . . 794 — — — 794Derivative instruments . . . . . . . . . . . . . . . . . . . . . . . . . . . . . . . 308 15 — (13) 310Deferred income taxes . . . . . . . . . . . . . . . . . . . . . . . . . . . . . . . . 421 (19) 2,884 — 3,286Other non-current assets . . . . . . . . . . . . . . . . . . . . . . . . . . . . . . 145 30 65 — 240 Total other assets . . . . . . . . . . . . . . . . . . . . . . . . . . . . . . . . . . 3,193 1,309 7,856 (5,508) 6,850
Total Assets . . . . . . . . . . . . . . . . . . . . . . . . . . . . . . . . . . . . . . . . . $ 7,486 $ 2,693 $ 8,641 $ (6,289) $ 12,531LIABILITIES AND STOCKHOLDERS' EQUITY
Current LiabilitiesCurrent portion of long-term debt . . . . . . . . . . . . . . . . . . . . . . . $ — $ 5 $ 83 $ — $ 88Current portion of operating lease liabilities . . . . . . . . . . . . . . . 20 32 21 — 73Accounts payable . . . . . . . . . . . . . . . . . . . . . . . . . . . . . . . . . . . 918 141 403 (740) 722Derivative instruments . . . . . . . . . . . . . . . . . . . . . . . . . . . . . . . 797 25 — (41) 781Cash collateral received in support of energy risk management
activities . . . . . . . . . . . . . . . . . . . . . . . . . . . . . . . . . . . . . . . . 32 — — — 32Accrued expenses and other current liabilities . . . . . . . . . . . . . 280 44 339 — 663 Total current liabilities . . . . . . . . . . . . . . . . . . . . . . . . . . . . . 2,047 247 846 (781) 2,359
Other LiabilitiesLong-term debt . . . . . . . . . . . . . . . . . . . . . . . . . . . . . . . . . . . . . 302 28 5,473 — 5,803Non-current operating lease liabilities . . . . . . . . . . . . . . . . . . . 64 301 118 — 483Nuclear decommissioning reserve . . . . . . . . . . . . . . . . . . . . . . . 298 — — — 298Nuclear decommissioning trust liability . . . . . . . . . . . . . . . . . . 487 — — — 487Derivative instruments . . . . . . . . . . . . . . . . . . . . . . . . . . . . . . . 334 1 — (13) 322Deferred income taxes . . . . . . . . . . . . . . . . . . . . . . . . . . . . . . . . — 17 — — 17Other non-current liabilities . . . . . . . . . . . . . . . . . . . . . . . . . . . 399 153 532 — 1,084 Total other liabilities . . . . . . . . . . . . . . . . . . . . . . . . . . . . . . 1,884 500 6,123 (13) 8,494
Total Liabilities . . . . . . . . . . . . . . . . . . . . . . . . . . . . . . . . . . . . . . 3,931 747 6,969 (794) 10,853Redeemable noncontrolling interest in subsidiaries . . . . . . . . — 20 — — 20Stockholders' Equity . . . . . . . . . . . . . . . . . . . . . . . . . . . . . . . . . 3,555 1,926 1,672 (5,495) 1,658Total Liabilities and Stockholders' Equity . . . . . . . . . . . . . . . . $ 7,486 $ 2,693 $ 8,641 $ (6,289) $ 12,531
1,084
(a) All significant intercompany transactions have been eliminated in consolidation
168
NRG ENERGY, INC. AND SUBSIDIARIESCONDENSED CONSOLIDATING STATEMENTS OF CASH FLOWS
For the Year Ended December 31, 2019
(In millions)Guarantor
SubsidiariesNon-Guarantor
SubsidiariesNRG Energy, Inc.
(Note Issuer) Eliminations(a) ConsolidatedBalance
Cash Flows from Operating ActivitiesNet income . . . . . . . . . . . . . . . . . . . . . . . . . . . . . . . . . . . . . . . . . . . . . . . . . . . . . . . . . . $ 1,493 $ 120 $ 4,438 $ (1,610) $ 4,441Income from discontinued operations . . . . . . . . . . . . . . . . . . . . . . . . . . . . . . . . . . . . . . 9 5 307 — 321Net income from continuing operations . . . . . . . . . . . . . . . . . . . . . . . . . . . . . . . . . . . . 1,484 115 4,131 (1,610) 4,120Adjustments to reconcile net income to net cash provided by operating activities: . . .
Distributions and equity in earnings of unconsolidated affiliates and consolidated subsidiaries . . . . . . . . . . . . . . . . . . . . . . . . . . . . . . . . . . . . . . . . . . (48) 14 (1,562) 1,610 14
Depreciation and amortization . . . . . . . . . . . . . . . . . . . . . . . . . . . . . . . . . . . . . . 212 130 31 — 373Accretion of asset retirement obligations . . . . . . . . . . . . . . . . . . . . . . . . . . . . . . 43 8 — — 51Provision for bad debts . . . . . . . . . . . . . . . . . . . . . . . . . . . . . . . . . . . . . . . . . . . . 78 17 — — 95Amortization of nuclear fuel . . . . . . . . . . . . . . . . . . . . . . . . . . . . . . . . . . . . . . . 52 — — — 52Amortization of financing costs and debt discount/premiums . . . . . . . . . . . . . . — — 26 — 26Adjustment for debt extinguishment . . . . . . . . . . . . . . . . . . . . . . . . . . . . . . . . . — 3 48 — 51Amortization of emission allowances . . . . . . . . . . . . . . . . . . . . . . . . . . . . . . . . 24 14 — — 38Amortization of unearned equity compensation . . . . . . . . . . . . . . . . . . . . . . . . . — — 20 — 20Net gain on sale and disposal of assets . . . . . . . . . . . . . . . . . . . . . . . . . . . . . . . . (20) — (3) — (23)Impairment losses . . . . . . . . . . . . . . . . . . . . . . . . . . . . . . . . . . . . . . . . . . . . . . . . 1 105 7 — 113Changes in derivative instruments . . . . . . . . . . . . . . . . . . . . . . . . . . . . . . . . . . . 20 (24) 38 — 34Changes in deferred income taxes and liability for uncertain tax benefits . . . . . (525) (168) (2,660) — (3,353)Changes in collateral deposits in support of energy risk management activities 101 4 — — 105Changes in nuclear decommissioning trust liability . . . . . . . . . . . . . . . . . . . . . . 37 — — — 37Changes in other working capital . . . . . . . . . . . . . . . . . . . . . . . . . . . . . . . . . . . . (220) (118) (10) — (348)
Cash provided by continuing operations . . . . . . . . . . . . . . . . . . . . . . . . . . . . . . . . . 1,239 100 66 — 1,405Cash provided/(used) by discontinued operations . . . . . . . . . . . . . . . . . . . . . . . . . . 17 (9) — — 8Net Cash Provided by Operating Activities . . . . . . . . . . . . . . . . . . . . . . . . . . . . . . . 1,256 91 66 — 1,413Cash Flows from Investing Activities . . . . . . . . . . . . . . . . . . . . . . . . . . . . . . . . . . . .
Intercompany dividends . . . . . . . . . . . . . . . . . . . . . . . . . . . . . . . . . . . . . . . . . . . — — 2,513 (2,513) —Payments for acquisitions of businesses . . . . . . . . . . . . . . . . . . . . . . . . . . . . . . . (355) — — — (355)Capital expenditures . . . . . . . . . . . . . . . . . . . . . . . . . . . . . . . . . . . . . . . . . . . . . . (164) (27) (37) — (228)Net proceeds from sale of emission allowances . . . . . . . . . . . . . . . . . . . . . . . . . 11 — — — 11Investments in nuclear decommissioning trust fund securities . . . . . . . . . . . . . (416) — — — (416)Proceeds from sales of nuclear decommissioning trust fund securities . . . . . . . 381 — — — 381Proceeds from sale of assets, net of cash disposed and sale of discontinued
operations, net of fees . . . . . . . . . . . . . . . . . . . . . . . . . . . . . . . . . . . . . . . . . . 1 400 893 — 1,294
Changes in investments in unconsolidated affiliates . . . . . . . . . . . . . . . . . . . . . — (91) — — (91)Net contributions to discontinued operations . . . . . . . . . . . . . . . . . . . . . . . . . . . — (44) — — (44)Other . . . . . . . . . . . . . . . . . . . . . . . . . . . . . . . . . . . . . . . . . . . . . . . . . . . . . . . . . . — — 6 — 6
Cash (used)/provided by continuing operations . . . . . . . . . . . . . . . . . . . . . . . . . . . (542) 238 3,375 (2,513) 558Cash used by discontinued operations . . . . . . . . . . . . . . . . . . . . . . . . . . . . . . . . . . . — (2) — — (2)Net Cash (Used)/Provided by Investing Activities . . . . . . . . . . . . . . . . . . . . . . . . . . (542) 236 3,375 (2,513) 556Cash Flows from Financing Activities . . . . . . . . . . . . . . . . . . . . . . . . . . . . . . . . . . .
Intercompany dividends and transfers . . . . . . . . . . . . . . . . . . . . . . . . . . . . . . . . (751) (214) (1,548) 2,513 —Payments of dividends to common stockholders . . . . . . . . . . . . . . . . . . . . . . . . — — (32) — (32)Payments for share repurchase activity . . . . . . . . . . . . . . . . . . . . . . . . . . . . . . . — — (1,440) — (1,440)Payments for debt extinguishment costs . . . . . . . . . . . . . . . . . . . . . . . . . . . . . . — — (26) — (26)Net distributions to redeemable noncontrolling interests from subsidiaries . . . — (2) — — (2)Proceeds from issuance of common stock . . . . . . . . . . . . . . . . . . . . . . . . . . . . . — — 3 — 3Proceeds from issuance of long-term debt . . . . . . . . . . . . . . . . . . . . . . . . . . . . . — — 1,916 — 1,916Payments of debt issuance costs . . . . . . . . . . . . . . . . . . . . . . . . . . . . . . . . . . . . . — — (35) — (35)Payments for short and long-term debt . . . . . . . . . . . . . . . . . . . . . . . . . . . . . . . — (139) (2,432) — (2,571)Other . . . . . . . . . . . . . . . . . . . . . . . . . . . . . . . . . . . . . . . . . . . . . . . . . . . . . . . . . . (4) — — — (4)
Cash used by continuing operations . . . . . . . . . . . . . . . . . . . . . . . . . . . . . . . . . . . . . (755) (355) (3,594) 2,513 (2,191)Cash provided by discontinued operations . . . . . . . . . . . . . . . . . . . . . . . . . . . . . . . — 43 — — 43Net Cash Used by Financing Activities . . . . . . . . . . . . . . . . . . . . . . . . . . . . . . . . . . . (755) (312) (3,594) 2,513 (2,148)
Change in cash from discontinued operations . . . . . . . . . . . . . . . . . . . . . . . . . . . . . 17 32 — — 49Net Decrease in Cash and Cash Equivalents, Restricted Cash, and Funds Deposited by Counterparties . . . . . . . . . . . . . . . . . . . . . . . . . . . . . . . . . . . . . . . . . . . (58) (17) (153) — (228)
Cash and Cash Equivalents, Restricted Cash, and Funds Deposited by Counterparties at Beginning of Period . . . . . . . . . . . . . . . . . . . . . . . . . . . . . . . . . . . 95 38 480 — 613
Cash and Cash Equivalents, Restricted Cash, and Funds Deposited by Counterparties at End of Period . . . . . . . . . . . . . . . . . . . . . . . . . . . . . . . . . . . . . . . . $ 37 $ 21 $ 327 $ — $ 385
(220) (118) (10) (348)
(9)1,256 1,413
(2) (2)(542) 3,375 (2,513)
(4) (4)
(755) (312) (3,594) 2,513 (2,148)
(a) All significant intercompany transactions have been eliminated in consolidation
169
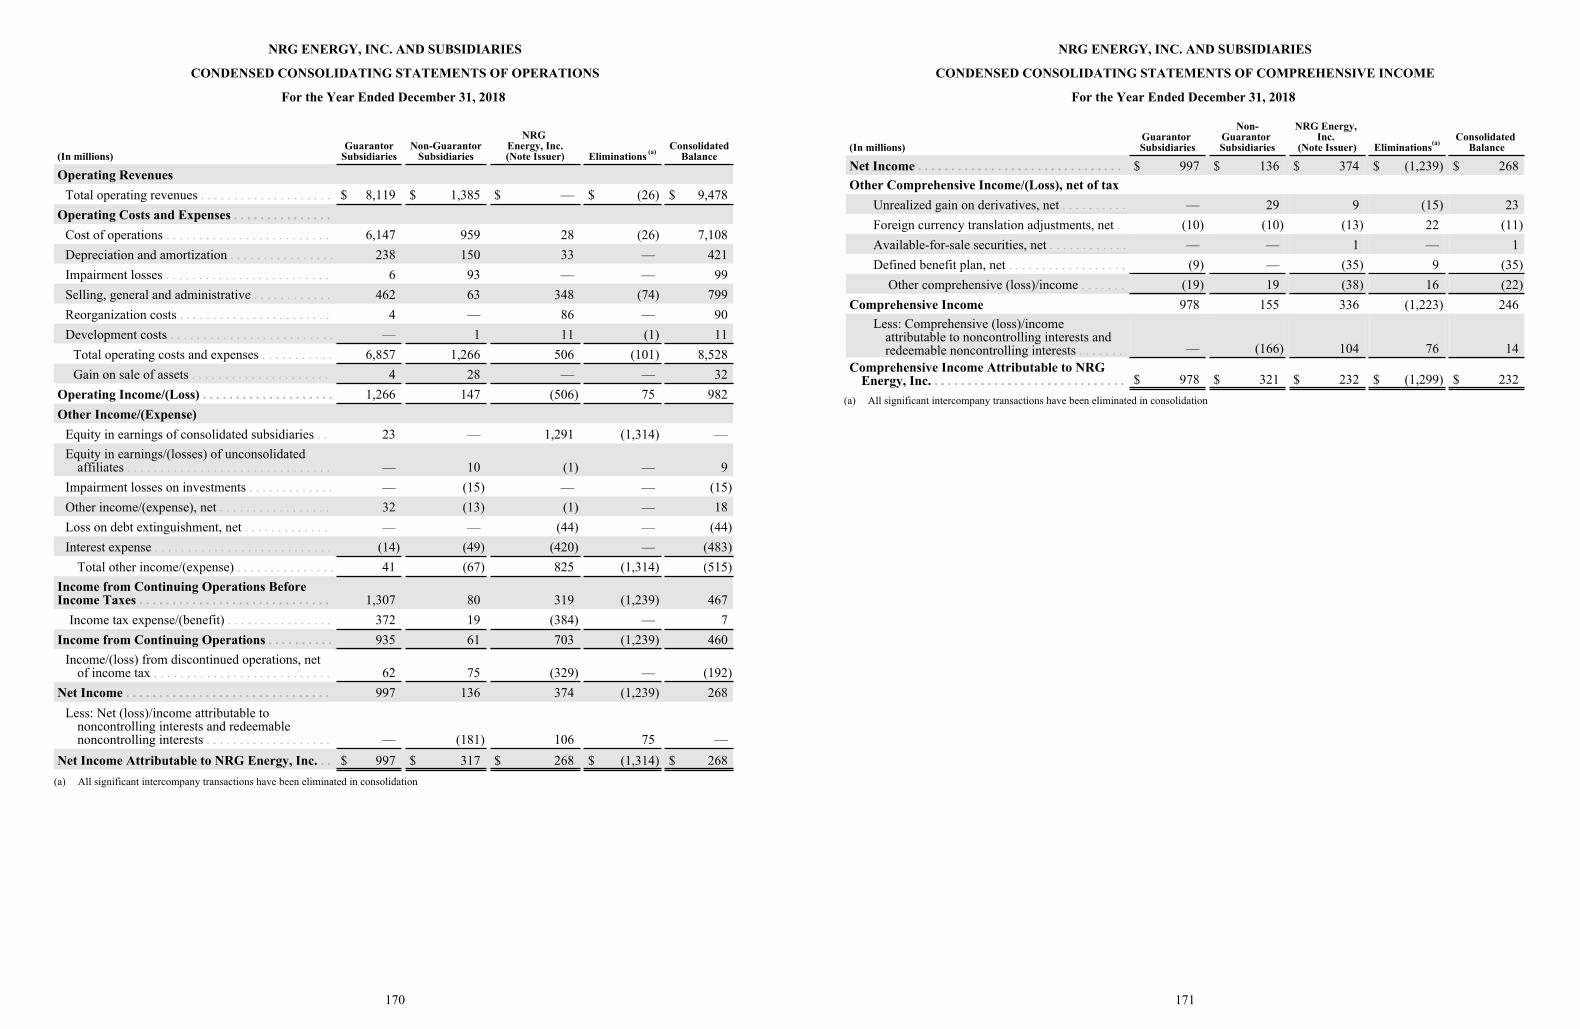
NRG ENERGY, INC. AND SUBSIDIARIES
CONDENSED CONSOLIDATING STATEMENTS OF OPERATIONS
For the Year Ended December 31, 2018
(In millions)Guarantor
SubsidiariesNon-Guarantor
Subsidiaries
NRG Energy, Inc.(Note Issuer) Eliminations (a)
ConsolidatedBalance
Operating RevenuesTotal operating revenues . . . . . . . . . . . . . . . . . . . . $ 8,119 $ 1,385 $ — $ (26) $ 9,478
Operating Costs and Expenses . . . . . . . . . . . . . . . Cost of operations . . . . . . . . . . . . . . . . . . . . . . . . . 6,147 959 28 (26) 7,108Depreciation and amortization . . . . . . . . . . . . . . . . 238 150 33 — 421Impairment losses . . . . . . . . . . . . . . . . . . . . . . . . . 6 93 — — 99Selling, general and administrative . . . . . . . . . . . . 462 63 348 (74) 799Reorganization costs . . . . . . . . . . . . . . . . . . . . . . . 4 — 86 — 90Development costs . . . . . . . . . . . . . . . . . . . . . . . . . — 1 11 (1) 11
Total operating costs and expenses . . . . . . . . . . . 6,857 1,266 506 (101) 8,528Gain on sale of assets . . . . . . . . . . . . . . . . . . . . . 4 28 — — 32
Operating Income/(Loss) . . . . . . . . . . . . . . . . . . . . 1,266 147 (506) 75 982Other Income/(Expense)
Equity in earnings of consolidated subsidiaries . . 23 — 1,291 (1,314) —Equity in earnings/(losses) of unconsolidated
affiliates . . . . . . . . . . . . . . . . . . . . . . . . . . . . . . . — 10 (1) — 9Impairment losses on investments . . . . . . . . . . . . . — (15) — — (15)Other income/(expense), net . . . . . . . . . . . . . . . . . 32 (13) (1) — 18Loss on debt extinguishment, net . . . . . . . . . . . . . — — (44) — (44)Interest expense . . . . . . . . . . . . . . . . . . . . . . . . . . . (14) (49) (420) — (483)
Total other income/(expense) . . . . . . . . . . . . . . . 41 (67) 825 (1,314) (515)Income from Continuing Operations Before Income Taxes . . . . . . . . . . . . . . . . . . . . . . . . . . . . . 1,307 80 319 (1,239) 467
Income tax expense/(benefit) . . . . . . . . . . . . . . . . 372 19 (384) — 7Income from Continuing Operations . . . . . . . . . . 935 61 703 (1,239) 460
Income/(loss) from discontinued operations, net of income tax . . . . . . . . . . . . . . . . . . . . . . . . . . . 62 75 (329) — (192)
Net Income . . . . . . . . . . . . . . . . . . . . . . . . . . . . . . . 997 136 374 (1,239) 268Less: Net (loss)/income attributable to
noncontrolling interests and redeemable noncontrolling interests . . . . . . . . . . . . . . . . . . . — (181) 106 75 —
Net Income Attributable to NRG Energy, Inc. . . $ 997 $ 317 $ 268 $ (1,314) $ 268(a) All significant intercompany transactions have been eliminated in consolidation
170
NRG ENERGY, INC. AND SUBSIDIARIES
CONDENSED CONSOLIDATING STATEMENTS OF COMPREHENSIVE INCOME
For the Year Ended December 31, 2018
(In millions)Guarantor Subsidiaries
Non-Guarantor Subsidiaries
NRG Energy, Inc.
(Note Issuer) Eliminations(a)Consolidated
Balance
Net Income . . . . . . . . . . . . . . . . . . . . . . . . . . . . . . . $ 997 $ 136 $ 374 $ (1,239) $ 268Other Comprehensive Income/(Loss), net of tax
Unrealized gain on derivatives, net . . . . . . . . . . — 29 9 (15) 23Foreign currency translation adjustments, net . (10) (10) (13) 22 (11)Available-for-sale securities, net . . . . . . . . . . . . — — 1 — 1Defined benefit plan, net . . . . . . . . . . . . . . . . . . (9) — (35) 9 (35)
Other comprehensive (loss)/income . . . . . . . (19) 19 (38) 16 (22)Comprehensive Income 978 155 336 (1,223) 246
Less: Comprehensive (loss)/income attributable to noncontrolling interests and redeemable noncontrolling interests . . . . . . . — (166) 104 76 14
Comprehensive Income Attributable to NRG Energy, Inc. . . . . . . . . . . . . . . . . . . . . . . . . . . . . . $ 978 $ 321 $ 232 $ (1,299) $ 232
(a) All significant intercompany transactions have been eliminated in consolidation
171
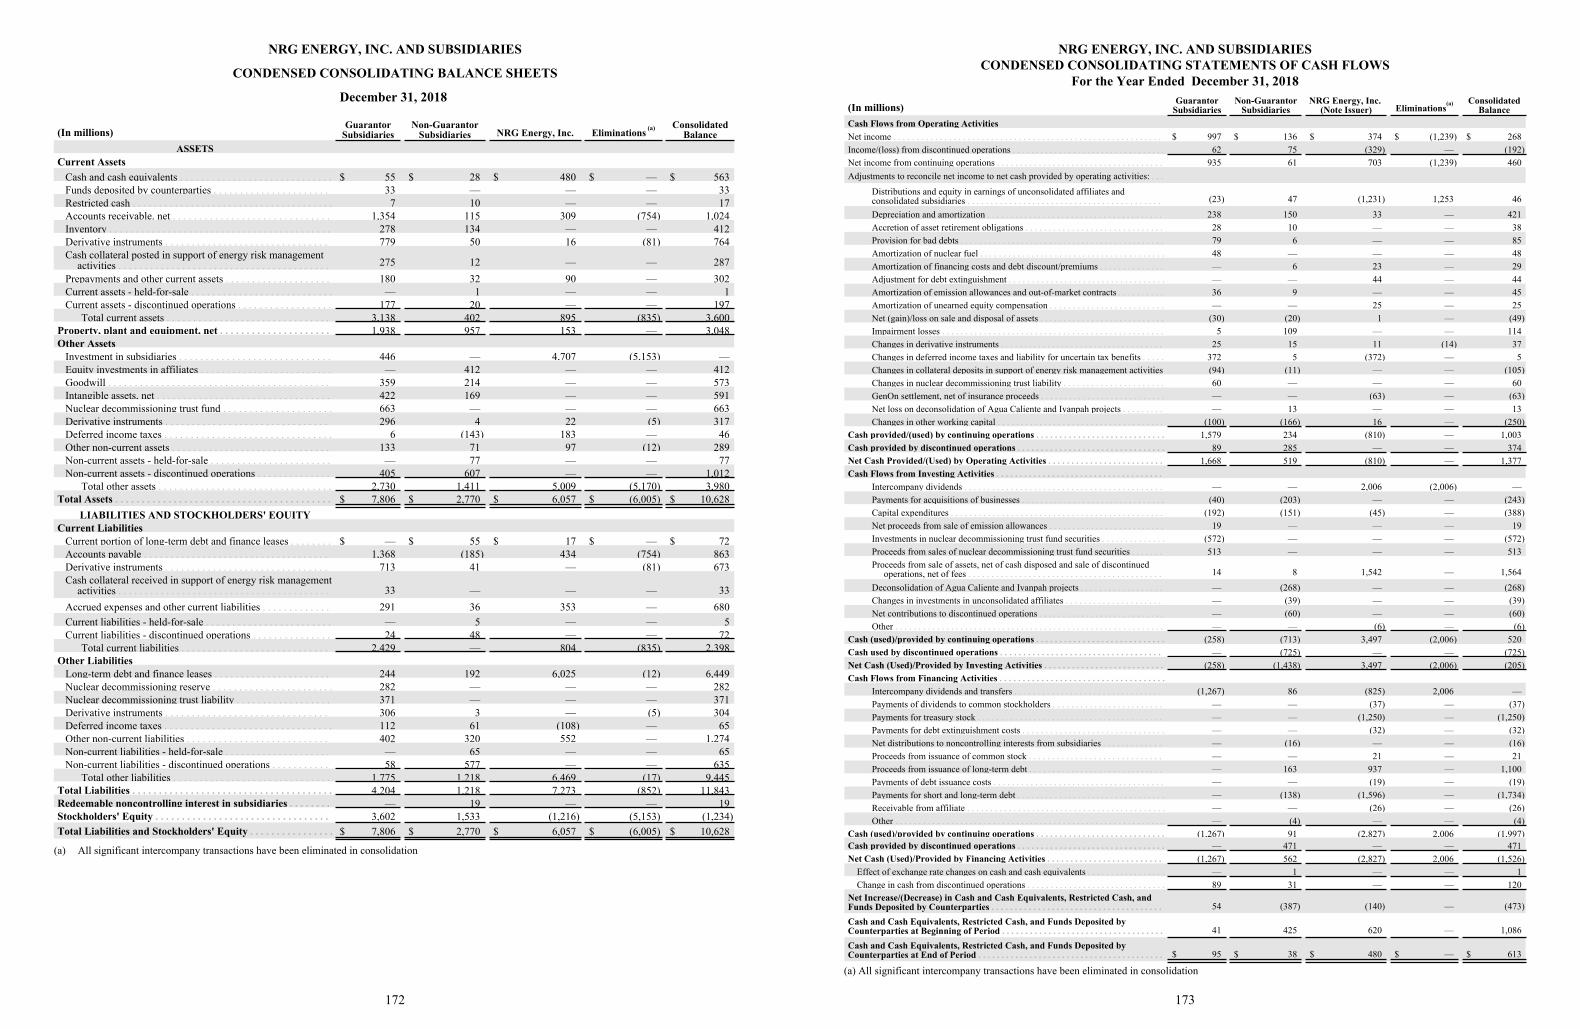
NRG ENERGY, INC. AND SUBSIDIARIES
CONDENSED CONSOLIDATING BALANCE SHEETS
December 31, 2018
(In millions)Guarantor
SubsidiariesNon-Guarantor
Subsidiaries NRG Energy, Inc. Eliminations (a) ConsolidatedBalance
ASSETSCurrent Assets
Cash and cash equivalents . . . . . . . . . . . . . . . . . . . . . . . . . . . . . $ 55 $ 28 $ 480 $ — $ 563Funds deposited by counterparties . . . . . . . . . . . . . . . . . . . . . . 33 — — — 33Restricted cash . . . . . . . . . . . . . . . . . . . . . . . . . . . . . . . . . . . . . . 7 10 — — 17Accounts receivable. net . . . . . . . . . . . . . . . . . . . . . . . . . . . . . . 1,354 115 309 (754) 1,024Inventory . . . . . . . . . . . . . . . . . . . . . . . . . . . . . . . . . . . . . . . . . . 278 134 — — 412Derivative instruments . . . . . . . . . . . . . . . . . . . . . . . . . . . . . . . 779 50 16 (81) 764Cash collateral posted in support of energy risk management
activities . . . . . . . . . . . . . . . . . . . . . . . . . . . . . . . . . . . . . . . . 275 12 — — 287Prepayments and other current assets . . . . . . . . . . . . . . . . . . . . 180 32 90 — 302Current assets - held-for-sale . . . . . . . . . . . . . . . . . . . . . . . . . . . — 1 — — 1Current assets - discontinued operations . . . . . . . . . . . . . . . . . . 177 20 — — 197
Total current assets . . . . . . . . . . . . . . . . . . . . . . . . . . . . . . . 3,138 402 895 (835) 3,600Property, plant and equipment, net . . . . . . . . . . . . . . . . . . . . . 1,938 957 153 — 3,048Other Assets
Investment in subsidiaries . . . . . . . . . . . . . . . . . . . . . . . . . . . . . 446 — 4,707 (5,153) —Equity investments in affiliates . . . . . . . . . . . . . . . . . . . . . . . . . — 412 — — 412Goodwill . . . . . . . . . . . . . . . . . . . . . . . . . . . . . . . . . . . . . . . . . . 359 214 — — 573Intangible assets, net . . . . . . . . . . . . . . . . . . . . . . . . . . . . . . . . . 422 169 — — 591Nuclear decommissioning trust fund . . . . . . . . . . . . . . . . . . . . . 663 — — — 663Derivative instruments . . . . . . . . . . . . . . . . . . . . . . . . . . . . . . . 296 4 22 (5) 317Deferred income taxes . . . . . . . . . . . . . . . . . . . . . . . . . . . . . . . . 6 (143) 183 — 46Other non-current assets . . . . . . . . . . . . . . . . . . . . . . . . . . . . . . 133 71 97 (12) 289Non-current assets - held-for-sale . . . . . . . . . . . . . . . . . . . . . . . — 77 — — 77Non-current assets - discontinued operations . . . . . . . . . . . . . . 405 607 — — 1,012
Total other assets . . . . . . . . . . . . . . . . . . . . . . . . . . . . . . . . . 2,730 1,411 5,009 (5,170) 3,980Total Assets . . . . . . . . . . . . . . . . . . . . . . . . . . . . . . . . . . . . . . . . . $ 7,806 $ 2,770 $ 6,057 $ (6,005) $ 10,628
LIABILITIES AND STOCKHOLDERS' EQUITYCurrent Liabilities
Current portion of long-term debt and finance leases . . . . . . . . $ — $ 55 $ 17 $ — $ 72Accounts payable . . . . . . . . . . . . . . . . . . . . . . . . . . . . . . . . . . . 1,368 (185) 434 (754) 863Derivative instruments . . . . . . . . . . . . . . . . . . . . . . . . . . . . . . . 713 41 — (81) 673Cash collateral received in support of energy risk management
activities . . . . . . . . . . . . . . . . . . . . . . . . . . . . . . . . . . . . . . . . 33 — — — 33Accrued expenses and other current liabilities . . . . . . . . . . . . . 291 36 353 — 680Current liabilities - held-for-sale . . . . . . . . . . . . . . . . . . . . . . . . — 5 — — 5Current liabilities - discontinued operations . . . . . . . . . . . . . . . 24 48 — — 72
Total current liabilities . . . . . . . . . . . . . . . . . . . . . . . . . . . . 2,429 — 804 (835) 2,398Other Liabilities
Long-term debt and finance leases . . . . . . . . . . . . . . . . . . . . . . 244 192 6,025 (12) 6,449Nuclear decommissioning reserve . . . . . . . . . . . . . . . . . . . . . . . 282 — — — 282Nuclear decommissioning trust liability . . . . . . . . . . . . . . . . . . 371 — — — 371Derivative instruments . . . . . . . . . . . . . . . . . . . . . . . . . . . . . . . 306 3 — (5) 304Deferred income taxes . . . . . . . . . . . . . . . . . . . . . . . . . . . . . . . . 112 61 (108) — 65Other non-current liabilities . . . . . . . . . . . . . . . . . . . . . . . . . . . 402 320 552 — 1,274Non-current liabilities - held-for-sale . . . . . . . . . . . . . . . . . . . . — 65 — — 65Non-current liabilities - discontinued operations . . . . . . . . . . . 58 577 — — 635
Total other liabilities . . . . . . . . . . . . . . . . . . . . . . . . . . . . . . 1,775 1,218 6,469 (17) 9,445Total Liabilities . . . . . . . . . . . . . . . . . . . . . . . . . . . . . . . . . . . . . . 4,204 1,218 7,273 (852) 11,843Redeemable noncontrolling interest in subsidiaries . . . . . . . . — 19 — — 19Stockholders' Equity . . . . . . . . . . . . . . . . . . . . . . . . . . . . . . . . . 3,602 1,533 (1,216) (5,153) (1,234)Total Liabilities and Stockholders' Equity . . . . . . . . . . . . . . . . $ 7,806 $ 2,770 $ 6,057 $ (6,005) $ 10,628
3,138 (835) 3,6001,938 3,048
1,0122,730 1,411 5,009 (5,170) 3,980
2,429 (835) 2,398
1,775 1,218 6,469 (17) 9,4454,204 1,218 7,273 (852) 11,843
(a) All significant intercompany transactions have been eliminated in consolidation
172
NRG ENERGY, INC. AND SUBSIDIARIESCONDENSED CONSOLIDATING STATEMENTS OF CASH FLOWS
For the Year Ended December 31, 2018
(In millions)Guarantor
SubsidiariesNon-Guarantor
SubsidiariesNRG Energy, Inc.
(Note Issuer) Eliminations(a) ConsolidatedBalance
Cash Flows from Operating ActivitiesNet income . . . . . . . . . . . . . . . . . . . . . . . . . . . . . . . . . . . . . . . . . . . . . . . . . . . . . . . . . . $ 997 $ 136 $ 374 $ (1,239) $ 268Income/(loss) from discontinued operations . . . . . . . . . . . . . . . . . . . . . . . . . . . . . . . . . 62 75 (329) — (192)Net income from continuing operations . . . . . . . . . . . . . . . . . . . . . . . . . . . . . . . . . . . . 935 61 703 (1,239) 460Adjustments to reconcile net income to net cash provided by operating activities: . . .
Distributions and equity in earnings of unconsolidated affiliates and consolidated subsidiaries . . . . . . . . . . . . . . . . . . . . . . . . . . . . . . . . . . . . . . . . . . (23) 47 (1,231) 1,253 46
Depreciation and amortization . . . . . . . . . . . . . . . . . . . . . . . . . . . . . . . . . . . . . . 238 150 33 — 421Accretion of asset retirement obligations . . . . . . . . . . . . . . . . . . . . . . . . . . . . . . 28 10 — — 38Provision for bad debts . . . . . . . . . . . . . . . . . . . . . . . . . . . . . . . . . . . . . . . . . . . . 79 6 — — 85Amortization of nuclear fuel . . . . . . . . . . . . . . . . . . . . . . . . . . . . . . . . . . . . . . . . 48 — — — 48Amortization of financing costs and debt discount/premiums . . . . . . . . . . . . . . — 6 23 — 29Adjustment for debt extinguishment . . . . . . . . . . . . . . . . . . . . . . . . . . . . . . . . . . — — 44 — 44Amortization of emission allowances and out-of-market contracts . . . . . . . . . . 36 9 — — 45Amortization of unearned equity compensation . . . . . . . . . . . . . . . . . . . . . . . . . — — 25 — 25Net (gain)/loss on sale and disposal of assets . . . . . . . . . . . . . . . . . . . . . . . . . . . (30) (20) 1 — (49)Impairment losses . . . . . . . . . . . . . . . . . . . . . . . . . . . . . . . . . . . . . . . . . . . . . . . . 5 109 — — 114Changes in derivative instruments . . . . . . . . . . . . . . . . . . . . . . . . . . . . . . . . . . . 25 15 11 (14) 37Changes in deferred income taxes and liability for uncertain tax benefits . . . . . 372 5 (372) — 5Changes in collateral deposits in support of energy risk management activities (94) (11) — — (105)Changes in nuclear decommissioning trust liability . . . . . . . . . . . . . . . . . . . . . . 60 — — — 60GenOn settlement, net of insurance proceeds . . . . . . . . . . . . . . . . . . . . . . . . . . . — — (63) — (63)Net loss on deconsolidation of Agua Caliente and Ivanpah projects . . . . . . . . . — 13 — — 13Changes in other working capital . . . . . . . . . . . . . . . . . . . . . . . . . . . . . . . . . . . . (100) (166) 16 — (250)
Cash provided/(used) by continuing operations . . . . . . . . . . . . . . . . . . . . . . . . . . . . 1,579 234 (810) — 1,003Cash provided by discontinued operations . . . . . . . . . . . . . . . . . . . . . . . . . . . . . . . . 89 285 — — 374Net Cash Provided/(Used) by Operating Activities . . . . . . . . . . . . . . . . . . . . . . . . . 1,668 519 (810) — 1,377Cash Flows from Investing Activities . . . . . . . . . . . . . . . . . . . . . . . . . . . . . . . . . . . .
Intercompany dividends . . . . . . . . . . . . . . . . . . . . . . . . . . . . . . . . . . . . . . . . . . . — — 2,006 (2,006) —Payments for acquisitions of businesses . . . . . . . . . . . . . . . . . . . . . . . . . . . . . . . (40) (203) — — (243)Capital expenditures . . . . . . . . . . . . . . . . . . . . . . . . . . . . . . . . . . . . . . . . . . . . . . (192) (151) (45) — (388)Net proceeds from sale of emission allowances . . . . . . . . . . . . . . . . . . . . . . . . . 19 — — — 19Investments in nuclear decommissioning trust fund securities . . . . . . . . . . . . . . (572) — — — (572)Proceeds from sales of nuclear decommissioning trust fund securities . . . . . . . 513 — — — 513Proceeds from sale of assets, net of cash disposed and sale of discontinued
operations, net of fees . . . . . . . . . . . . . . . . . . . . . . . . . . . . . . . . . . . . . . . . . . 14 8 1,542 — 1,564
Deconsolidation of Agua Caliente and Ivanpah projects . . . . . . . . . . . . . . . . . . — (268) — — (268)Changes in investments in unconsolidated affiliates . . . . . . . . . . . . . . . . . . . . . — (39) — — (39)Net contributions to discontinued operations . . . . . . . . . . . . . . . . . . . . . . . . . . . — (60) — — (60)Other . . . . . . . . . . . . . . . . . . . . . . . . . . . . . . . . . . . . . . . . . . . . . . . . . . . . . . . . . . — — (6) — (6)
Cash (used)/provided by continuing operations . . . . . . . . . . . . . . . . . . . . . . . . . . . . (258) (713) 3,497 (2,006) 520Cash used by discontinued operations . . . . . . . . . . . . . . . . . . . . . . . . . . . . . . . . . . . — (725) — — (725)Net Cash (Used)/Provided by Investing Activities . . . . . . . . . . . . . . . . . . . . . . . . . . (258) (1,438) 3,497 (2,006) (205)Cash Flows from Financing Activities . . . . . . . . . . . . . . . . . . . . . . . . . . . . . . . . . . . .
Intercompany dividends and transfers . . . . . . . . . . . . . . . . . . . . . . . . . . . . . . . . (1,267) 86 (825) 2,006 —Payments of dividends to common stockholders . . . . . . . . . . . . . . . . . . . . . . . . — — (37) — (37)Payments for treasury stock . . . . . . . . . . . . . . . . . . . . . . . . . . . . . . . . . . . . . . . . — — (1,250) — (1,250)Payments for debt extinguishment costs . . . . . . . . . . . . . . . . . . . . . . . . . . . . . . . — — (32) — (32)Net distributions to noncontrolling interests from subsidiaries . . . . . . . . . . . . . — (16) — — (16)Proceeds from issuance of common stock . . . . . . . . . . . . . . . . . . . . . . . . . . . . . — — 21 — 21Proceeds from issuance of long-term debt . . . . . . . . . . . . . . . . . . . . . . . . . . . . . — 163 937 — 1,100Payments of debt issuance costs . . . . . . . . . . . . . . . . . . . . . . . . . . . . . . . . . . . . . — — (19) — (19)Payments for short and long-term debt . . . . . . . . . . . . . . . . . . . . . . . . . . . . . . . . — (138) (1,596) — (1,734)Receivable from affiliate . . . . . . . . . . . . . . . . . . . . . . . . . . . . . . . . . . . . . . . . . . . — — (26) — (26)Other . . . . . . . . . . . . . . . . . . . . . . . . . . . . . . . . . . . . . . . . . . . . . . . . . . . . . . . . . . — (4) — — (4)
Cash (used)/provided by continuing operations . . . . . . . . . . . . . . . . . . . . . . . . . . . . (1,267) 91 (2,827) 2,006 (1,997)Cash provided by discontinued operations . . . . . . . . . . . . . . . . . . . . . . . . . . . . . . . . — 471 — — 471Net Cash (Used)/Provided by Financing Activities . . . . . . . . . . . . . . . . . . . . . . . . . (1,267) 562 (2,827) 2,006 (1,526)
Effect of exchange rate changes on cash and cash equivalents . . . . . . . . . . . . . . . . . — 1 — — 1Change in cash from discontinued operations . . . . . . . . . . . . . . . . . . . . . . . . . . . . . . 89 31 — — 120
Net Increase/(Decrease) in Cash and Cash Equivalents, Restricted Cash, and Funds Deposited by Counterparties . . . . . . . . . . . . . . . . . . . . . . . . . . . . . . . . . . . . . 54 (387) (140) — (473)
Cash and Cash Equivalents, Restricted Cash, and Funds Deposited by Counterparties at Beginning of Period . . . . . . . . . . . . . . . . . . . . . . . . . . . . . . . . . . . 41 425 620 — 1,086
Cash and Cash Equivalents, Restricted Cash, and Funds Deposited by Counterparties at End of Period . . . . . . . . . . . . . . . . . . . . . . . . . . . . . . . . . . . . . . . . $ 95 $ 38 $ 480 $ — $ 613
(329) (192)
(100) (166) (250)
1,668 (810) 1,377
(6) (6)
(725) (725)(258) (1,438) 3,497 (2,006) (205)
(4) (4)
(1,267) (2,827) 2,006 (1,526)
(a) All significant intercompany transactions have been eliminated in consolidation
173
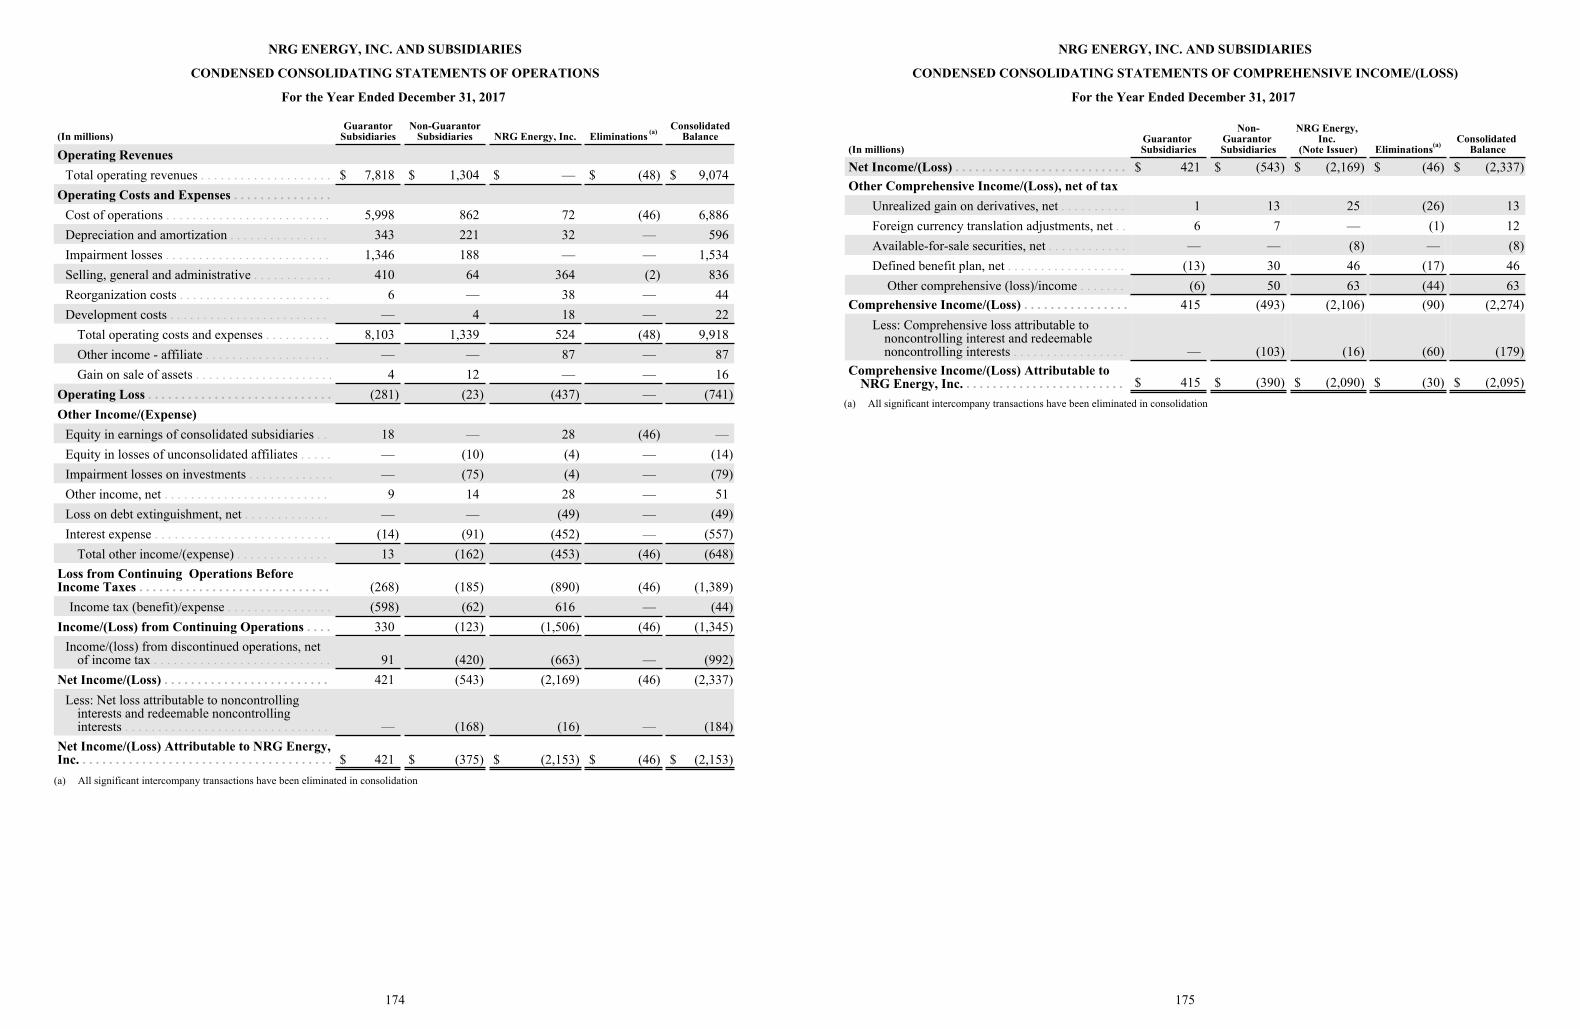
NRG ENERGY, INC. AND SUBSIDIARIES
CONDENSED CONSOLIDATING STATEMENTS OF OPERATIONS
For the Year Ended December 31, 2017
(In millions)Guarantor
SubsidiariesNon-Guarantor
Subsidiaries NRG Energy, Inc. Eliminations (a)Consolidated
Balance
Operating RevenuesTotal operating revenues . . . . . . . . . . . . . . . . . . . . $ 7,818 $ 1,304 $ — $ (48) $ 9,074
Operating Costs and Expenses . . . . . . . . . . . . . . .Cost of operations . . . . . . . . . . . . . . . . . . . . . . . . . 5,998 862 72 (46) 6,886Depreciation and amortization . . . . . . . . . . . . . . . 343 221 32 — 596Impairment losses . . . . . . . . . . . . . . . . . . . . . . . . . 1,346 188 — — 1,534Selling, general and administrative . . . . . . . . . . . . 410 64 364 (2) 836Reorganization costs . . . . . . . . . . . . . . . . . . . . . . . 6 — 38 — 44Development costs . . . . . . . . . . . . . . . . . . . . . . . . — 4 18 — 22
Total operating costs and expenses . . . . . . . . . . 8,103 1,339 524 (48) 9,918Other income - affiliate . . . . . . . . . . . . . . . . . . . — — 87 — 87Gain on sale of assets . . . . . . . . . . . . . . . . . . . . . 4 12 — — 16
Operating Loss . . . . . . . . . . . . . . . . . . . . . . . . . . . . (281) (23) (437) — (741)Other Income/(Expense)
Equity in earnings of consolidated subsidiaries . . 18 — 28 (46) —Equity in losses of unconsolidated affiliates . . . . . — (10) (4) — (14)Impairment losses on investments . . . . . . . . . . . . . — (75) (4) — (79)Other income, net . . . . . . . . . . . . . . . . . . . . . . . . . 9 14 28 — 51Loss on debt extinguishment, net . . . . . . . . . . . . . — — (49) — (49)Interest expense . . . . . . . . . . . . . . . . . . . . . . . . . . . (14) (91) (452) — (557)
Total other income/(expense) . . . . . . . . . . . . . . 13 (162) (453) (46) (648)Loss from Continuing Operations Before Income Taxes . . . . . . . . . . . . . . . . . . . . . . . . . . . . . (268) (185) (890) (46) (1,389)
Income tax (benefit)/expense . . . . . . . . . . . . . . . . (598) (62) 616 — (44)Income/(Loss) from Continuing Operations . . . . 330 (123) (1,506) (46) (1,345)
Income/(loss) from discontinued operations, net of income tax . . . . . . . . . . . . . . . . . . . . . . . . . . . 91 (420) (663) — (992)
Net Income/(Loss) . . . . . . . . . . . . . . . . . . . . . . . . . 421 (543) (2,169) (46) (2,337)Less: Net loss attributable to noncontrolling
interests and redeemable noncontrolling interests . . . . . . . . . . . . . . . . . . . . . . . . . . . . . . . — (168) (16) — (184)
Net Income/(Loss) Attributable to NRG Energy, Inc. . . . . . . . . . . . . . . . . . . . . . . . . . . . . . . . . . . . . . . $ 421 $ (375) $ (2,153) $ (46) $ (2,153)
(a) All significant intercompany transactions have been eliminated in consolidation
174
NRG ENERGY, INC. AND SUBSIDIARIES
CONDENSED CONSOLIDATING STATEMENTS OF COMPREHENSIVE INCOME/(LOSS)
For the Year Ended December 31, 2017
(In millions)Guarantor Subsidiaries
Non-Guarantor Subsidiaries
NRG Energy, Inc.
(Note Issuer) Eliminations(a)Consolidated
Balance
Net Income/(Loss) . . . . . . . . . . . . . . . . . . . . . . . . . . $ 421 $ (543) $ (2,169) $ (46) $ (2,337)Other Comprehensive Income/(Loss), net of tax
Unrealized gain on derivatives, net . . . . . . . . . . 1 13 25 (26) 13Foreign currency translation adjustments, net . . 6 7 — (1) 12Available-for-sale securities, net . . . . . . . . . . . . — — (8) — (8)Defined benefit plan, net . . . . . . . . . . . . . . . . . . (13) 30 46 (17) 46
Other comprehensive (loss)/income . . . . . . . (6) 50 63 (44) 63Comprehensive Income/(Loss) . . . . . . . . . . . . . . . . 415 (493) (2,106) (90) (2,274)
Less: Comprehensive loss attributable to noncontrolling interest and redeemable noncontrolling interests . . . . . . . . . . . . . . . . . — (103) (16) (60) (179)
Comprehensive Income/(Loss) Attributable to NRG Energy, Inc. . . . . . . . . . . . . . . . . . . . . . . . . $ 415 $ (390) $ (2,090) $ (30) $ (2,095)
(a) All significant intercompany transactions have been eliminated in consolidation
175
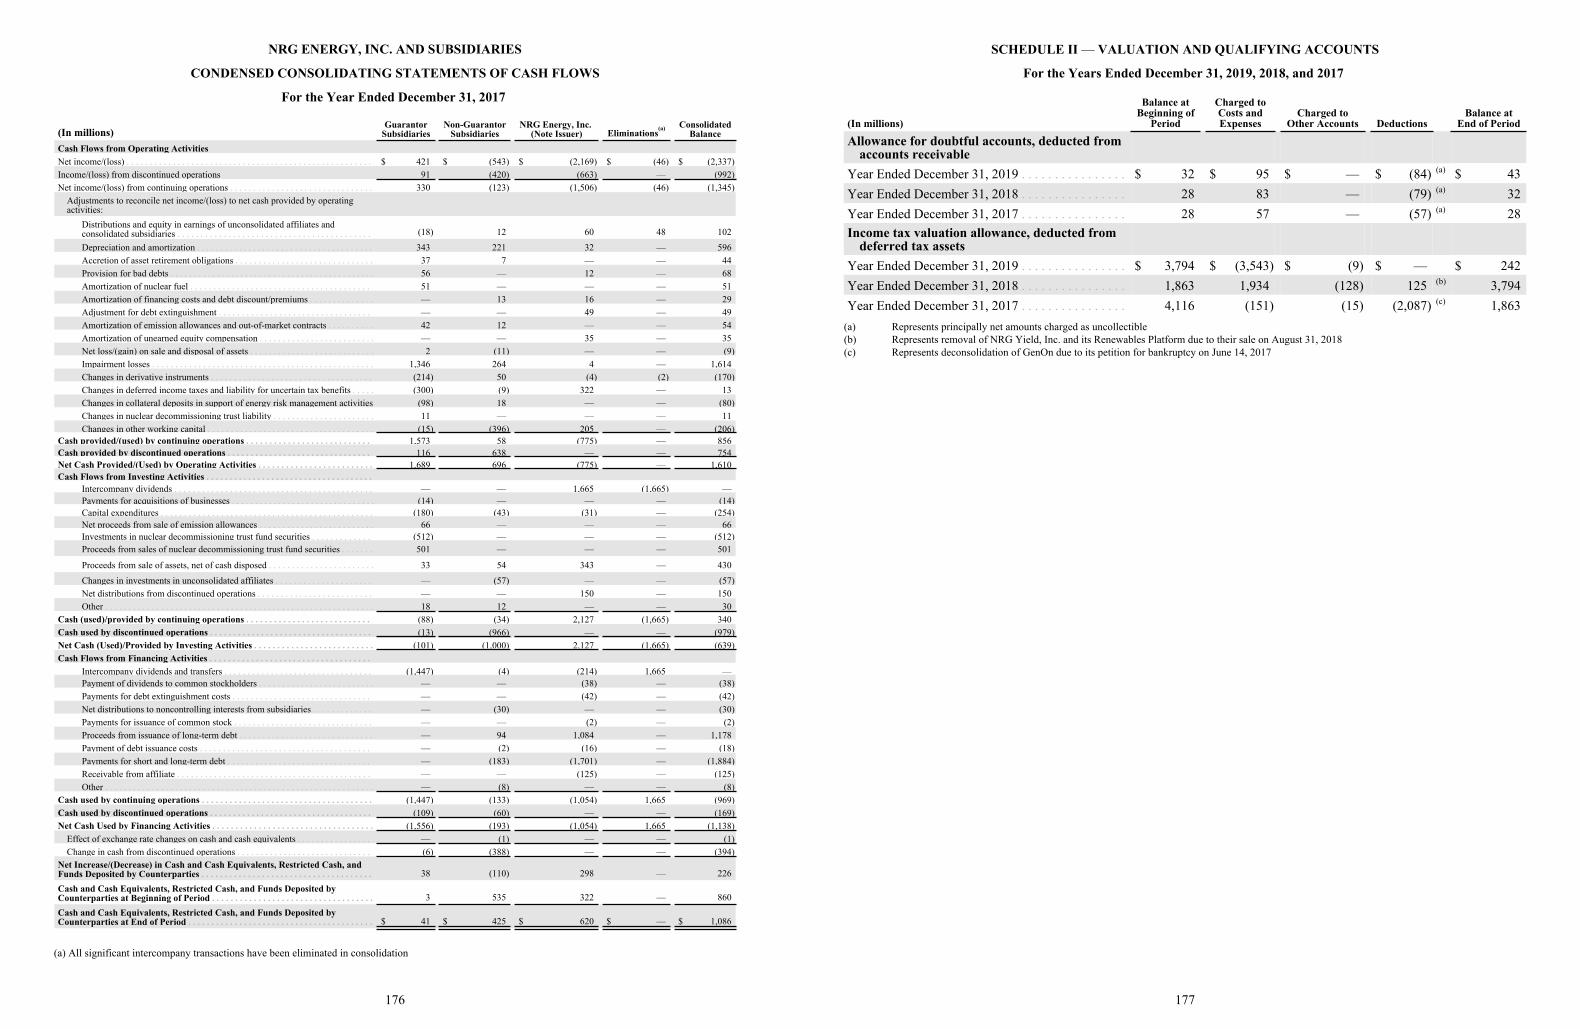
NRG ENERGY, INC. AND SUBSIDIARIES
CONDENSED CONSOLIDATING STATEMENTS OF CASH FLOWS
For the Year Ended December 31, 2017
(In millions)Guarantor
SubsidiariesNon-Guarantor
SubsidiariesNRG Energy, Inc.
(Note Issuer) Eliminations(a) ConsolidatedBalance
Cash Flows from Operating ActivitiesNet income/(loss) . . . . . . . . . . . . . . . . . . . . . . . . . . . . . . . . . . . . . . . . . . . . . . . . . . . . . $ 421 $ (543) $ (2,169) $ (46) $ (2,337)Income/(loss) from discontinued operations 91 (420) (663) — (992)Net income/(loss) from continuing operations . . . . . . . . . . . . . . . . . . . . . . . . . . . . . . . 330 (123) (1,506) (46) (1,345)
Adjustments to reconcile net income/(loss) to net cash provided by operating activities:
Distributions and equity in earnings of unconsolidated affiliates and consolidated subsidiaries . . . . . . . . . . . . . . . . . . . . . . . . . . . . . . . . . . . . . . . . . . (18) 12 60 48 102
Depreciation and amortization . . . . . . . . . . . . . . . . . . . . . . . . . . . . . . . . . . . . . . 343 221 32 — 596Accretion of asset retirement obligations . . . . . . . . . . . . . . . . . . . . . . . . . . . . . . 37 7 — — 44Provision for bad debts . . . . . . . . . . . . . . . . . . . . . . . . . . . . . . . . . . . . . . . . . . . . 56 — 12 — 68Amortization of nuclear fuel . . . . . . . . . . . . . . . . . . . . . . . . . . . . . . . . . . . . . . . 51 — — — 51Amortization of financing costs and debt discount/premiums . . . . . . . . . . . . . . — 13 16 — 29Adjustment for debt extinguishment . . . . . . . . . . . . . . . . . . . . . . . . . . . . . . . . . — — 49 — 49Amortization of emission allowances and out-of-market contracts . . . . . . . . . . 42 12 — — 54Amortization of unearned equity compensation . . . . . . . . . . . . . . . . . . . . . . . . . — — 35 — 35Net loss/(gain) on sale and disposal of assets . . . . . . . . . . . . . . . . . . . . . . . . . . . 2 (11) — — (9)Impairment losses . . . . . . . . . . . . . . . . . . . . . . . . . . . . . . . . . . . . . . . . . . . . . . . . 1,346 264 4 — 1,614Changes in derivative instruments . . . . . . . . . . . . . . . . . . . . . . . . . . . . . . . . . . . (214) 50 (4) (2) (170)Changes in deferred income taxes and liability for uncertain tax benefits . . . . . (300) (9) 322 — 13Changes in collateral deposits in support of energy risk management activities (98) 18 — — (80)Changes in nuclear decommissioning trust liability . . . . . . . . . . . . . . . . . . . . . . 11 — — — 11Changes in other working capital . . . . . . . . . . . . . . . . . . . . . . . . . . . . . . . . . . . . (15) (396) 205 — (206)
Cash provided/(used) by continuing operations . . . . . . . . . . . . . . . . . . . . . . . . . . . 1,573 58 (775) — 856Cash provided by discontinued operations . . . . . . . . . . . . . . . . . . . . . . . . . . . . . . . 116 638 — — 754Net Cash Provided/(Used) by Operating Activities . . . . . . . . . . . . . . . . . . . . . . . . . 1,689 696 (775) — 1,610Cash Flows from Investing Activities . . . . . . . . . . . . . . . . . . . . . . . . . . . . . . . . . . . .
Intercompany dividends . . . . . . . . . . . . . . . . . . . . . . . . . . . . . . . . . . . . . . . . . . . — — 1,665 (1,665) —Payments for acquisitions of businesses . . . . . . . . . . . . . . . . . . . . . . . . . . . . . . . (14) — — — (14)Capital expenditures . . . . . . . . . . . . . . . . . . . . . . . . . . . . . . . . . . . . . . . . . . . . . . (180) (43) (31) — (254)Net proceeds from sale of emission allowances . . . . . . . . . . . . . . . . . . . . . . . . . 66 — — — 66Investments in nuclear decommissioning trust fund securities . . . . . . . . . . . . . (512) — — — (512)Proceeds from sales of nuclear decommissioning trust fund securities . . . . . . . 501 — — — 501
Proceeds from sale of assets, net of cash disposed . . . . . . . . . . . . . . . . . . . . . . . 33 54 343 — 430
Changes in investments in unconsolidated affiliates . . . . . . . . . . . . . . . . . . . . . — (57) — — (57)Net distributions from discontinued operations . . . . . . . . . . . . . . . . . . . . . . . . . — — 150 — 150Other . . . . . . . . . . . . . . . . . . . . . . . . . . . . . . . . . . . . . . . . . . . . . . . . . . . . . . . . . . 18 12 — — 30
Cash (used)/provided by continuing operations . . . . . . . . . . . . . . . . . . . . . . . . . . . (88) (34) 2,127 (1,665) 340Cash used by discontinued operations . . . . . . . . . . . . . . . . . . . . . . . . . . . . . . . . . . . (13) (966) — — (979)Net Cash (Used)/Provided by Investing Activities . . . . . . . . . . . . . . . . . . . . . . . . . . (101) (1,000) 2,127 (1,665) (639)Cash Flows from Financing Activities . . . . . . . . . . . . . . . . . . . . . . . . . . . . . . . . . . .
Intercompany dividends and transfers . . . . . . . . . . . . . . . . . . . . . . . . . . . . . . . . (1,447) (4) (214) 1,665 —Payment of dividends to common stockholders . . . . . . . . . . . . . . . . . . . . . . . . . — — (38) — (38)Payments for debt extinguishment costs . . . . . . . . . . . . . . . . . . . . . . . . . . . . . . — — (42) — (42)Net distributions to noncontrolling interests from subsidiaries . . . . . . . . . . . . . — (30) — — (30)Payments for issuance of common stock . . . . . . . . . . . . . . . . . . . . . . . . . . . . . . — — (2) — (2)Proceeds from issuance of long-term debt . . . . . . . . . . . . . . . . . . . . . . . . . . . . . — 94 1,084 — 1,178Payment of debt issuance costs . . . . . . . . . . . . . . . . . . . . . . . . . . . . . . . . . . . . . — (2) (16) — (18)Payments for short and long-term debt . . . . . . . . . . . . . . . . . . . . . . . . . . . . . . . — (183) (1,701) — (1,884)Receivable from affiliate . . . . . . . . . . . . . . . . . . . . . . . . . . . . . . . . . . . . . . . . . . — — (125) — (125)Other . . . . . . . . . . . . . . . . . . . . . . . . . . . . . . . . . . . . . . . . . . . . . . . . . . . . . . . . . . — (8) — — (8)
Cash used by continuing operations . . . . . . . . . . . . . . . . . . . . . . . . . . . . . . . . . . . . . (1,447) (133) (1,054) 1,665 (969)Cash used by discontinued operations . . . . . . . . . . . . . . . . . . . . . . . . . . . . . . . . . . . (109) (60) — — (169)Net Cash Used by Financing Activities . . . . . . . . . . . . . . . . . . . . . . . . . . . . . . . . . . . (1,556) (193) (1,054) 1,665 (1,138)
Effect of exchange rate changes on cash and cash equivalents . . . . . . . . . . . . . . . . — (1) — — (1)Change in cash from discontinued operations . . . . . . . . . . . . . . . . . . . . . . . . . . . . . (6) (388) — — (394)
Net Increase/(Decrease) in Cash and Cash Equivalents, Restricted Cash, and Funds Deposited by Counterparties . . . . . . . . . . . . . . . . . . . . . . . . . . . . . . . . . . . . . 38 (110) 298 — 226
Cash and Cash Equivalents, Restricted Cash, and Funds Deposited by Counterparties at Beginning of Period . . . . . . . . . . . . . . . . . . . . . . . . . . . . . . . . . . . 3 535 322 — 860
Cash and Cash Equivalents, Restricted Cash, and Funds Deposited by Counterparties at End of Period . . . . . . . . . . . . . . . . . . . . . . . . . . . . . . . . . . . . . . . . $ 41 $ 425 $ 620 $ — $ 1,086
(420) (663) (992)
(15) (396) (206)
1,689 (775) 1,610
(13) (966) (979)(101) (1,000) 2,127 (1,665) (639)
(8) (8)
(109) (60) (169)(1,556) (193) (1,054) 1,665 (1,138)
(1) (1)(6) (388) (394)
(a) All significant intercompany transactions have been eliminated in consolidation
176
SCHEDULE II — VALUATION AND QUALIFYING ACCOUNTS
For the Years Ended December 31, 2019, 2018, and 2017
(In millions)
Balance atBeginning of
Period
Charged toCosts andExpenses
Charged toOther Accounts Deductions
Balance atEnd of Period
Allowance for doubtful accounts, deducted from accounts receivable
Year Ended December 31, 2019 . . . . . . . . . . . . . . . . $ 32 $ 95 $ — $ (84) (a) $ 43Year Ended December 31, 2018 . . . . . . . . . . . . . . . . 28 83 — (79) (a) 32Year Ended December 31, 2017 . . . . . . . . . . . . . . . . 28 57 — (57) (a) 28Income tax valuation allowance, deducted from
deferred tax assetsYear Ended December 31, 2019 . . . . . . . . . . . . . . . . $ 3,794 $ (3,543) $ (9) $ — $ 242Year Ended December 31, 2018 . . . . . . . . . . . . . . . . 1,863 1,934 (128) 125 (b) 3,794Year Ended December 31, 2017 . . . . . . . . . . . . . . . . 4,116 (151) (15) (2,087) (c) 1,863
(a) Represents principally net amounts charged as uncollectible(b) Represents removal of NRG Yield, Inc. and its Renewables Platform due to their sale on August 31, 2018(c) Represents deconsolidation of GenOn due to its petition for bankruptcy on June 14, 2017
177
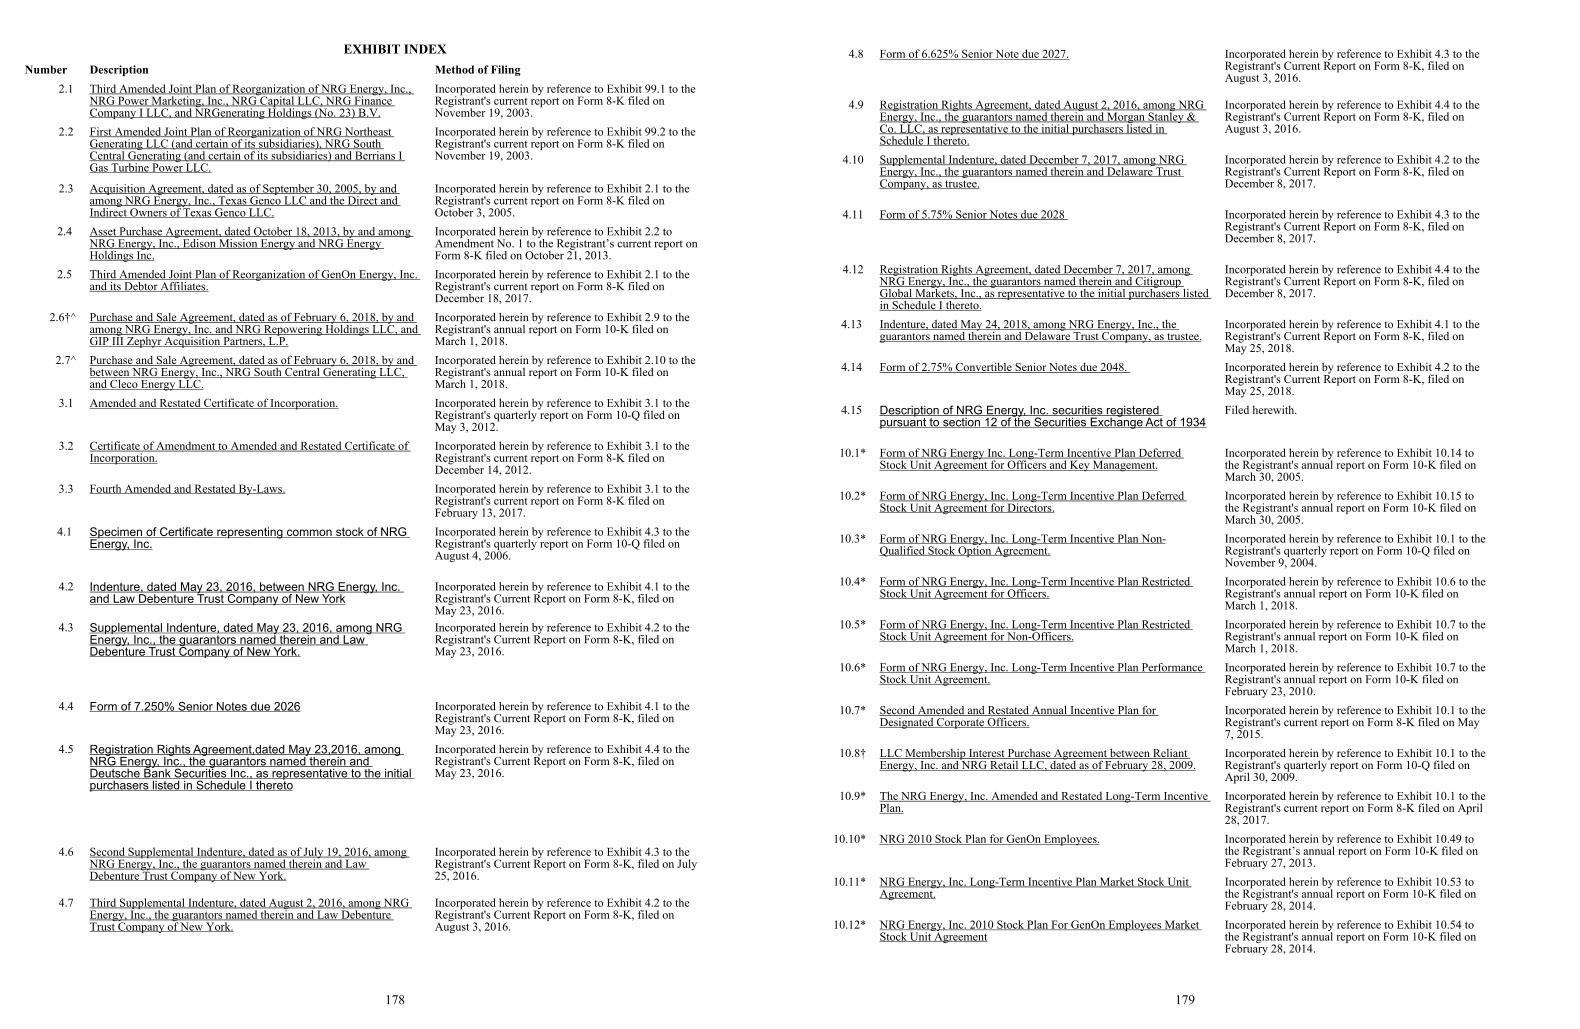
EXHIBIT INDEXNumber Description Method of Filing
2.1 Third Amended Joint Plan of Reorganization of NRG Energy, Inc., NRG Power Marketing, Inc., NRG Capital LLC, NRG Finance Company I LLC, and NRGenerating Holdings (No. 23) B.V.
Incorporated herein by reference to Exhibit 99.1 to the Registrant's current report on Form 8-K filed on November 19, 2003.
2.2 First Amended Joint Plan of Reorganization of NRG Northeast Generating LLC (and certain of its subsidiaries), NRG South Central Generating (and certain of its subsidiaries) and Berrians I Gas Turbine Power LLC.
Incorporated herein by reference to Exhibit 99.2 to the Registrant's current report on Form 8-K filed on November 19, 2003.
2.3 Acquisition Agreement, dated as of September 30, 2005, by and among NRG Energy, Inc., Texas Genco LLC and the Direct and Indirect Owners of Texas Genco LLC.
Incorporated herein by reference to Exhibit 2.1 to the Registrant's current report on Form 8-K filed on October 3, 2005.
2.4 Asset Purchase Agreement, dated October 18, 2013, by and among NRG Energy, Inc., Edison Mission Energy and NRG Energy Holdings Inc.
Incorporated herein by reference to Exhibit 2.2 to Amendment No. 1 to the Registrant’s current report on Form 8-K filed on October 21, 2013.
2.5 Third Amended Joint Plan of Reorganization of GenOn Energy, Inc. and its Debtor Affiliates.
Incorporated herein by reference to Exhibit 2.1 to the Registrant's current report on Form 8-K filed on December 18, 2017.
2.6†^ Purchase and Sale Agreement, dated as of February 6, 2018, by and among NRG Energy, Inc. and NRG Repowering Holdings LLC, and GIP III Zephyr Acquisition Partners, L.P.
Incorporated herein by reference to Exhibit 2.9 to the Registrant's annual report on Form 10-K filed on March 1, 2018.
2.7^ Purchase and Sale Agreement, dated as of February 6, 2018, by and between NRG Energy, Inc., NRG South Central Generating LLC, and Cleco Energy LLC.
Incorporated herein by reference to Exhibit 2.10 to the Registrant's annual report on Form 10-K filed on March 1, 2018.
3.1 Amended and Restated Certificate of Incorporation. Incorporated herein by reference to Exhibit 3.1 to the Registrant's quarterly report on Form 10-Q filed on May 3, 2012.
3.2 Certificate of Amendment to Amended and Restated Certificate of Incorporation.
Incorporated herein by reference to Exhibit 3.1 to the Registrant's current report on Form 8-K filed on December 14, 2012.
3.3 Fourth Amended and Restated By-Laws. Incorporated herein by reference to Exhibit 3.1 to the Registrant's current report on Form 8-K filed on February 13, 2017.
4.1 Specimen of Certificate representing common stock of NRG Energy, Inc.
Incorporated herein by reference to Exhibit 4.3 to the Registrant's quarterly report on Form 10-Q filed on August 4, 2006.
4.2 Indenture, dated May 23, 2016, between NRG Energy, Inc. and Law Debenture Trust Company of New York
Incorporated herein by reference to Exhibit 4.1 to the Registrant's Current Report on Form 8-K, filed on May 23, 2016.
4.3 Supplemental Indenture, dated May 23, 2016, among NRG Energy, Inc., the guarantors named therein and Law Debenture Trust Company of New York.
Incorporated herein by reference to Exhibit 4.2 to the Registrant's Current Report on Form 8-K, filed on May 23, 2016.
4.4 Form of 7.250% Senior Notes due 2026 Incorporated herein by reference to Exhibit 4.1 to the Registrant's Current Report on Form 8-K, filed on May 23, 2016.
4.5 Registration Rights Agreement,dated May 23,2016, among NRG Energy, Inc., the guarantors named therein and Deutsche Bank Securities Inc., as representative to the initial purchasers listed in Schedule I thereto
Incorporated herein by reference to Exhibit 4.4 to the Registrant's Current Report on Form 8-K, filed on May 23, 2016.
4.6 Second Supplemental Indenture, dated as of July 19, 2016, among NRG Energy, Inc., the guarantors named therein and Law Debenture Trust Company of New York.
Incorporated herein by reference to Exhibit 4.3 to the Registrant's Current Report on Form 8-K, filed on July 25, 2016.
4.7 Third Supplemental Indenture, dated August 2, 2016, among NRG Energy, Inc., the guarantors named therein and Law Debenture Trust Company of New York.
Incorporated herein by reference to Exhibit 4.2 to the Registrant's Current Report on Form 8-K, filed on August 3, 2016.
178
4.8 Form of 6.625% Senior Note due 2027. Incorporated herein by reference to Exhibit 4.3 to the Registrant's Current Report on Form 8-K, filed on August 3, 2016.
4.9 Registration Rights Agreement, dated August 2, 2016, among NRG Energy, Inc., the guarantors named therein and Morgan Stanley & Co. LLC, as representative to the initial purchasers listed in Schedule I thereto.
Incorporated herein by reference to Exhibit 4.4 to the Registrant's Current Report on Form 8-K, filed on August 3, 2016.
4.10 Supplemental Indenture, dated December 7, 2017, among NRG Energy, Inc., the guarantors named therein and Delaware Trust Company, as trustee.
Incorporated herein by reference to Exhibit 4.2 to the Registrant's Current Report on Form 8-K, filed on December 8, 2017.
4.11 Form of 5.75% Senior Notes due 2028 Incorporated herein by reference to Exhibit 4.3 to the Registrant's Current Report on Form 8-K, filed on December 8, 2017.
4.12 Registration Rights Agreement, dated December 7, 2017, among NRG Energy, Inc., the guarantors named therein and Citigroup Global Markets, Inc., as representative to the initial purchasers listed in Schedule I thereto.
Incorporated herein by reference to Exhibit 4.4 to the Registrant's Current Report on Form 8-K, filed on December 8, 2017.
4.13 Indenture, dated May 24, 2018, among NRG Energy, Inc., the guarantors named therein and Delaware Trust Company, as trustee.
Incorporated herein by reference to Exhibit 4.1 to the Registrant's Current Report on Form 8-K, filed on May 25, 2018.
4.14 Form of 2.75% Convertible Senior Notes due 2048. Incorporated herein by reference to Exhibit 4.2 to the Registrant's Current Report on Form 8-K, filed on May 25, 2018.
4.15 Description of NRG Energy, Inc. securities registered pursuant to section 12 of the Securities Exchange Act of 1934
Filed herewith.
10.1* Form of NRG Energy Inc. Long-Term Incentive Plan Deferred Stock Unit Agreement for Officers and Key Management.
Incorporated herein by reference to Exhibit 10.14 to the Registrant's annual report on Form 10-K filed on March 30, 2005.
10.2* Form of NRG Energy, Inc. Long-Term Incentive Plan Deferred Stock Unit Agreement for Directors.
Incorporated herein by reference to Exhibit 10.15 to the Registrant's annual report on Form 10-K filed on March 30, 2005.
10.3* Form of NRG Energy, Inc. Long-Term Incentive Plan Non-Qualified Stock Option Agreement.
Incorporated herein by reference to Exhibit 10.1 to the Registrant's quarterly report on Form 10-Q filed on November 9, 2004.
10.4* Form of NRG Energy, Inc. Long-Term Incentive Plan Restricted Stock Unit Agreement for Officers.
Incorporated herein by reference to Exhibit 10.6 to the Registrant's annual report on Form 10-K filed on March 1, 2018.
10.5* Form of NRG Energy, Inc. Long-Term Incentive Plan Restricted Stock Unit Agreement for Non-Officers.
Incorporated herein by reference to Exhibit 10.7 to the Registrant's annual report on Form 10-K filed on March 1, 2018.
10.6* Form of NRG Energy, Inc. Long-Term Incentive Plan Performance Stock Unit Agreement.
Incorporated herein by reference to Exhibit 10.7 to the Registrant's annual report on Form 10-K filed on February 23, 2010.
10.7* Second Amended and Restated Annual Incentive Plan for Designated Corporate Officers.
Incorporated herein by reference to Exhibit 10.1 to the Registrant's current report on Form 8-K filed on May 7, 2015.
10.8† LLC Membership Interest Purchase Agreement between Reliant Energy, Inc. and NRG Retail LLC, dated as of February 28, 2009.
Incorporated herein by reference to Exhibit 10.1 to the Registrant's quarterly report on Form 10-Q filed on April 30, 2009.
10.9* The NRG Energy, Inc. Amended and Restated Long-Term Incentive Plan.
Incorporated herein by reference to Exhibit 10.1 to the Registrant's current report on Form 8-K filed on April 28, 2017.
10.10* NRG 2010 Stock Plan for GenOn Employees. Incorporated herein by reference to Exhibit 10.49 to the Registrant’s annual report on Form 10-K filed on February 27, 2013.
10.11* NRG Energy, Inc. Long-Term Incentive Plan Market Stock Unit Agreement.
Incorporated herein by reference to Exhibit 10.53 to the Registrant's annual report on Form 10-K filed on February 28, 2014.
10.12* NRG Energy, Inc. 2010 Stock Plan For GenOn Employees Market Stock Unit Agreement
Incorporated herein by reference to Exhibit 10.54 to the Registrant's annual report on Form 10-K filed on February 28, 2014.
179
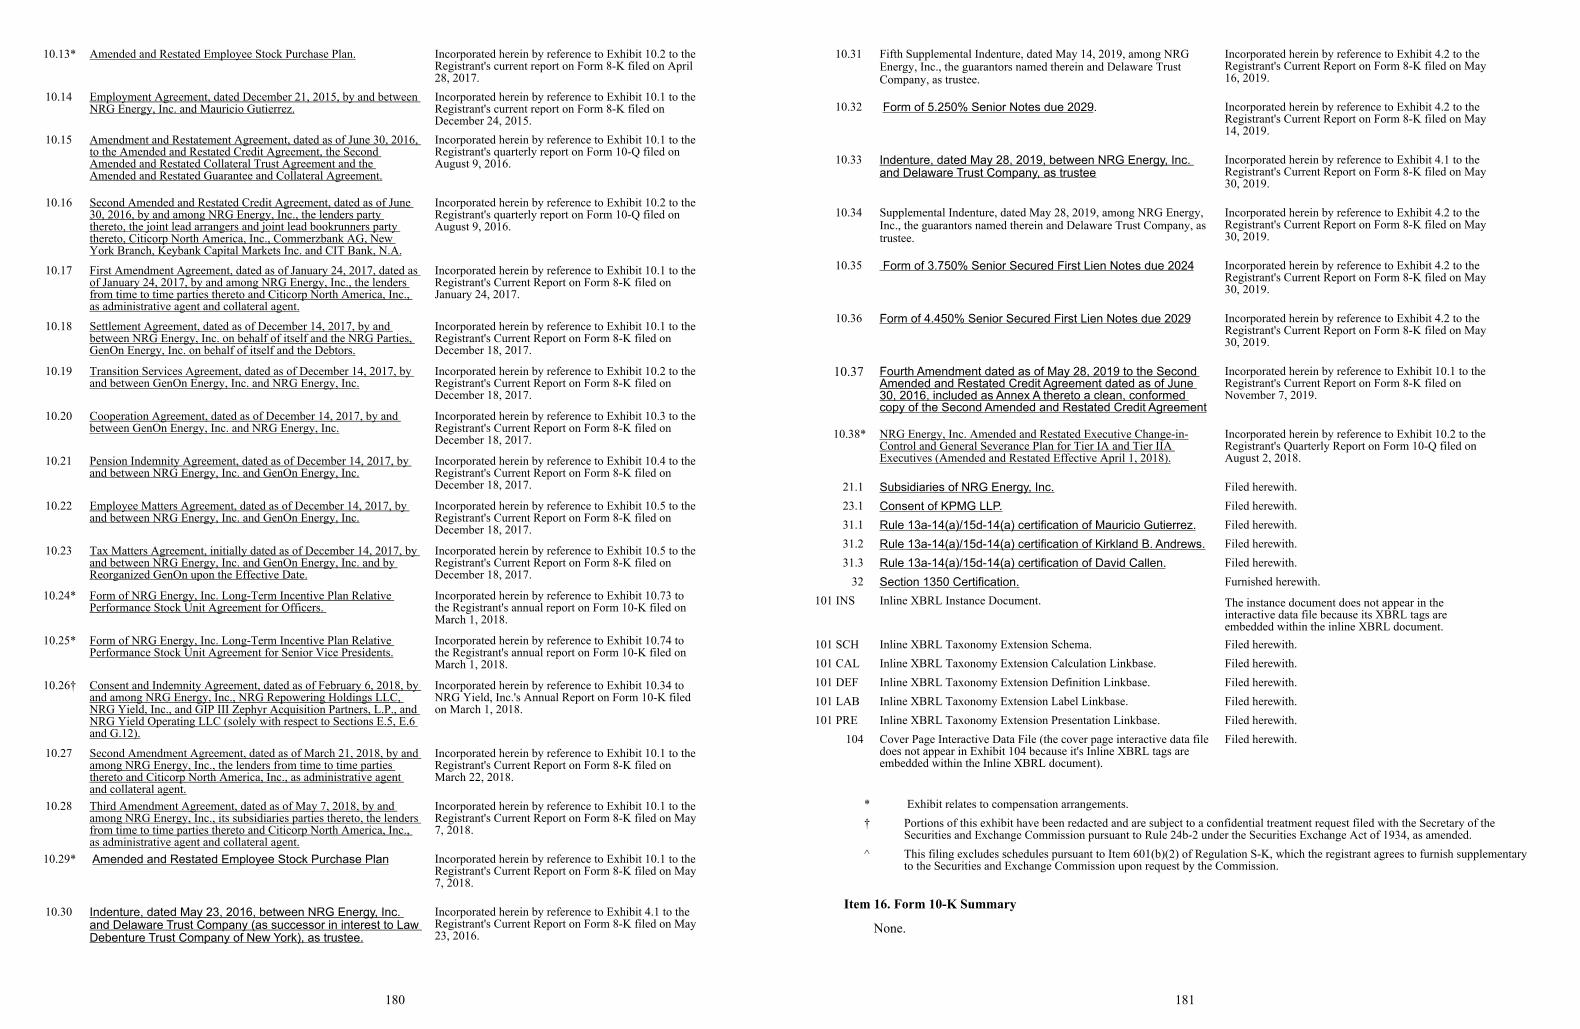
10.13* Amended and Restated Employee Stock Purchase Plan. Incorporated herein by reference to Exhibit 10.2 to the Registrant's current report on Form 8-K filed on April 28, 2017.
10.14 Employment Agreement, dated December 21, 2015, by and between NRG Energy, Inc. and Mauricio Gutierrez.
Incorporated herein by reference to Exhibit 10.1 to the Registrant's current report on Form 8-K filed on December 24, 2015.
10.15 Amendment and Restatement Agreement, dated as of June 30, 2016, to the Amended and Restated Credit Agreement, the Second Amended and Restated Collateral Trust Agreement and the Amended and Restated Guarantee and Collateral Agreement.
Incorporated herein by reference to Exhibit 10.1 to the Registrant's quarterly report on Form 10-Q filed on August 9, 2016.
10.16 Second Amended and Restated Credit Agreement, dated as of June 30, 2016, by and among NRG Energy, Inc., the lenders party thereto, the joint lead arrangers and joint lead bookrunners party thereto, Citicorp North America, Inc., Commerzbank AG, New York Branch, Keybank Capital Markets Inc. and CIT Bank, N.A.
Incorporated herein by reference to Exhibit 10.2 to the Registrant's quarterly report on Form 10-Q filed on August 9, 2016.
10.17 First Amendment Agreement, dated as of January 24, 2017, dated as of January 24, 2017, by and among NRG Energy, Inc., the lenders from time to time parties thereto and Citicorp North America, Inc., as administrative agent and collateral agent.
Incorporated herein by reference to Exhibit 10.1 to the Registrant's Current Report on Form 8-K filed on January 24, 2017.
10.18 Settlement Agreement, dated as of December 14, 2017, by and between NRG Energy, Inc. on behalf of itself and the NRG Parties, GenOn Energy, Inc. on behalf of itself and the Debtors.
Incorporated herein by reference to Exhibit 10.1 to the Registrant's Current Report on Form 8-K filed on December 18, 2017.
10.19 Transition Services Agreement, dated as of December 14, 2017, by and between GenOn Energy, Inc. and NRG Energy, Inc.
Incorporated herein by reference to Exhibit 10.2 to the Registrant's Current Report on Form 8-K filed on December 18, 2017.
10.20 Cooperation Agreement, dated as of December 14, 2017, by and between GenOn Energy, Inc. and NRG Energy, Inc.
Incorporated herein by reference to Exhibit 10.3 to the Registrant's Current Report on Form 8-K filed on December 18, 2017.
10.21 Pension Indemnity Agreement, dated as of December 14, 2017, by and between NRG Energy, Inc. and GenOn Energy, Inc.
Incorporated herein by reference to Exhibit 10.4 to the Registrant's Current Report on Form 8-K filed on December 18, 2017.
10.22 Employee Matters Agreement, dated as of December 14, 2017, by and between NRG Energy, Inc. and GenOn Energy, Inc.
Incorporated herein by reference to Exhibit 10.5 to the Registrant's Current Report on Form 8-K filed on December 18, 2017.
10.23 Tax Matters Agreement, initially dated as of December 14, 2017, by and between NRG Energy, Inc. and GenOn Energy, Inc. and by Reorganized GenOn upon the Effective Date.
Incorporated herein by reference to Exhibit 10.5 to the Registrant's Current Report on Form 8-K filed on December 18, 2017.
10.24* Form of NRG Energy, Inc. Long-Term Incentive Plan Relative Performance Stock Unit Agreement for Officers.
Incorporated herein by reference to Exhibit 10.73 to the Registrant's annual report on Form 10-K filed on March 1, 2018.
10.25* Form of NRG Energy, Inc. Long-Term Incentive Plan Relative Performance Stock Unit Agreement for Senior Vice Presidents.
Incorporated herein by reference to Exhibit 10.74 to the Registrant's annual report on Form 10-K filed on March 1, 2018.
10.26† Consent and Indemnity Agreement, dated as of February 6, 2018, by and among NRG Energy, Inc., NRG Repowering Holdings LLC, NRG Yield, Inc., and GIP III Zephyr Acquisition Partners, L.P., and NRG Yield Operating LLC (solely with respect to Sections E.5, E.6 and G.12).
Incorporated herein by reference to Exhibit 10.34 to NRG Yield, Inc.'s Annual Report on Form 10-K filed on March 1, 2018.
10.27 Second Amendment Agreement, dated as of March 21, 2018, by and among NRG Energy, Inc., the lenders from time to time parties thereto and Citicorp North America, Inc., as administrative agent and collateral agent.
Incorporated herein by reference to Exhibit 10.1 to the Registrant's Current Report on Form 8-K filed on March 22, 2018.
10.28 Third Amendment Agreement, dated as of May 7, 2018, by and among NRG Energy, Inc., its subsidiaries parties thereto, the lenders from time to time parties thereto and Citicorp North America, Inc., as administrative agent and collateral agent.
Incorporated herein by reference to Exhibit 10.1 to the Registrant's Current Report on Form 8-K filed on May 7, 2018.
10.29* Amended and Restated Employee Stock Purchase Plan Incorporated herein by reference to Exhibit 10.1 to the Registrant's Current Report on Form 8-K filed on May 7, 2018.
10.30 Indenture, dated May 23, 2016, between NRG Energy, Inc. and Delaware Trust Company (as successor in interest to Law Debenture Trust Company of New York), as trustee.
Incorporated herein by reference to Exhibit 4.1 to the Registrant's Current Report on Form 8-K filed on May 23, 2016.
180
10.31 Fifth Supplemental Indenture, dated May 14, 2019, among NRG Energy, Inc., the guarantors named therein and Delaware Trust Company, as trustee.
Incorporated herein by reference to Exhibit 4.2 to the Registrant's Current Report on Form 8-K filed on May 16, 2019.
10.32 Form of 5.250% Senior Notes due 2029. Incorporated herein by reference to Exhibit 4.2 to the Registrant's Current Report on Form 8-K filed on May 14, 2019.
10.33 Indenture, dated May 28, 2019, between NRG Energy, Inc. and Delaware Trust Company, as trustee
Incorporated herein by reference to Exhibit 4.1 to the Registrant's Current Report on Form 8-K filed on May 30, 2019.
10.34 Supplemental Indenture, dated May 28, 2019, among NRG Energy, Inc., the guarantors named therein and Delaware Trust Company, as trustee.
Incorporated herein by reference to Exhibit 4.2 to the Registrant's Current Report on Form 8-K filed on May 30, 2019.
10.35 Form of 3.750% Senior Secured First Lien Notes due 2024 Incorporated herein by reference to Exhibit 4.2 to the Registrant's Current Report on Form 8-K filed on May 30, 2019.
10.36 Form of 4.450% Senior Secured First Lien Notes due 2029 Incorporated herein by reference to Exhibit 4.2 to the Registrant's Current Report on Form 8-K filed on May 30, 2019.
10.37 Fourth Amendment dated as of May 28, 2019 to the Second Amended and Restated Credit Agreement dated as of June 30, 2016, included as Annex A thereto a clean, conformed copy of the Second Amended and Restated Credit Agreement
Incorporated herein by reference to Exhibit 10.1 to the Registrant's Current Report on Form 8-K filed on November 7, 2019.
10.38* NRG Energy, Inc. Amended and Restated Executive Change-in-Control and General Severance Plan for Tier IA and Tier IIA Executives (Amended and Restated Effective April 1, 2018).
Incorporated herein by reference to Exhibit 10.2 to the Registrant's Quarterly Report on Form 10-Q filed on August 2, 2018.
21.1 Subsidiaries of NRG Energy, Inc. Filed herewith.23.1 Consent of KPMG LLP. Filed herewith.31.1 Rule 13a-14(a)/15d-14(a) certification of Mauricio Gutierrez. Filed herewith.31.2 Rule 13a-14(a)/15d-14(a) certification of Kirkland B. Andrews. Filed herewith.31.3 Rule 13a-14(a)/15d-14(a) certification of David Callen. Filed herewith.
32 Section 1350 Certification. Furnished herewith.101 INS Inline XBRL Instance Document. The instance document does not appear in the
interactive data file because its XBRL tags are embedded within the inline XBRL document.
101 SCH Inline XBRL Taxonomy Extension Schema. Filed herewith.101 CAL Inline XBRL Taxonomy Extension Calculation Linkbase. Filed herewith.101 DEF Inline XBRL Taxonomy Extension Definition Linkbase. Filed herewith.101 LAB Inline XBRL Taxonomy Extension Label Linkbase. Filed herewith.101 PRE Inline XBRL Taxonomy Extension Presentation Linkbase. Filed herewith.
104 Cover Page Interactive Data File (the cover page interactive data file does not appear in Exhibit 104 because it's Inline XBRL tags are embedded within the Inline XBRL document).
Filed herewith.
* Exhibit relates to compensation arrangements.† Portions of this exhibit have been redacted and are subject to a confidential treatment request filed with the Secretary of the
Securities and Exchange Commission pursuant to Rule 24b-2 under the Securities Exchange Act of 1934, as amended.^ This filing excludes schedules pursuant to Item 601(b)(2) of Regulation S-K, which the registrant agrees to furnish supplementary
to the Securities and Exchange Commission upon request by the Commission.
Item 16. Form 10-K Summary
None.
181
SIGNATURES
Pursuant to the requirements of Section 13 or 15(d) of the Securities Exchange Act of 1934, the registrant has duly causedthis report to be signed on its behalf by the undersigned thereunto duly authorized.
NRG ENERGY, INC.(Registrant)
By: /s/ MAURICIO GUTIERREZ
Mauricio GutierrezChief Executive Officer
Date: February 27, 2020
182
POWER OF ATTORNEY
Each person whose signature appears below constitutes and appoints Brian E. Curci and Christine A. Zoino, each or anyof them, such person's true and lawful attorney-in-fact and agent with full power of substitution and resubstitution for suchperson and in such person's name, place and stead, in any and all capacities, to sign any and all amendments to this report onForm 10-K, and to file the same with all exhibits thereto, and other documents in connection therewith, with the Securities andExchange Commission, granting unto said attorneys-in-fact and agents, and each of them, full power and authority to do andperform each and every act and thing necessary or desirable to be done in and about the premises, as fully to all intents andpurposes as such person, hereby ratifying and confirming all that said attorneys-in-fact and agents, or any of them or his or theirsubstitute or substitutes, may lawfully do or cause to be done by virtue hereof.
In accordance with the Exchange Act, this report has been signed by the following persons on behalf of the registrant inthe capacities indicated on February 27, 2020.
Signature Title Date/s/ MAURICIO GUTIERREZ President, Chief Executive Officer and
February 27, 2020Mauricio Gutierrez Director (Principal Executive Officer)
/s/ KIRKLAND B. ANDREWS Chief Financial OfficerFebruary 27, 2020
Kirkland B. Andrews (Principal Financial Officer)/s/ DAVID CALLEN Chief Accounting Officer
February 27, 2020David Callen (Principal Accounting Officer)
/s/ LAWRENCE S. COBEN Chairman of the Board February 27, 2020
Lawrence S. Coben/s/ E. SPENCER ABRAHAM
Director February 27, 2020E. Spencer Abraham
/s/ ANTONIO CARRILLODirector February 27, 2020
Antonio Carrillo/s/ MATTHEW CARTER, JR.
Director February 27, 2020Matthew Carter, Jr./s/ HEATHER COX
Director February 27, 2020Heather Cox
/s/ TERRY G. DALLASDirector February 27, 2020
Terry G. Dallas/s/ PAUL W. HOBBY
Director February 27, 2020Paul W. Hobby
/s/ ALEXANDRA PRUNERDirector February 27, 2020
Alexandra Pruner/s/ ANNE C. SCHAUMBURG
Director February 27, 2020Anne C. Schaumburg
/s/ THOMAS H. WEIDEMEYER Director February 27, 2020
Thomas H. Weidemeyer
183

(This page intentionally left blank)
Stockholder information
STOCK TRANSFER AGENT AND REGISTRAR Shareholder correspondence should be mailed to: Computershare P.O. BOX 505000 Louisville, KY 40233-5000
STOCKHOLDER INQUIRIES Overnight correspondence should be sent to: Computershare 462 South 4th Street, Suite 1600 Louisville, KY 40202
1.866.214.2213
Email: [email protected]
Online inquires: https://www-us.computershare.com/investor/Contact
Website: www.computershare.com/investor
Send certificates for transfer and address changes to: Computershare P.O. BOX 505000 Louisville, KY 40233-5000
STOCK LISTING NRG’s common stock is listed on the New York Stock Exchange under the ticker symbol NRG.
FINANCIAL INFORMATION NRG’s Annual Report on Form 10-K, Proxy Statement and other SEC Filings are available at www.nrg.com under the Investors section.
Form 10-K
NRG
Energy, Inc. | 2019 Form 10-K
NRG Energy, Inc.
804 Carnegie Center Princeton, NJ 08540-6213
t: 609.524.4500 f: 609.524.4501
nrg.com
NRG and the plus signs are registered servicemarks of NRG Energy, Inc. NRG is a registered trademark of NRG Energy, Inc. © 2020 NRG Energy, Inc. All rights reserved. 421558534
910 Louisiana St. Houston, TX 77002-6929
t: 713.537.3000