household welfare and vietnam's transition
TRANSCRIPT
Household Welfare and Vietnam's Transition
Household Welfare and Vietnam's TransitionEDITED BYDAVID DOLLARPAUL GLEWWEJENNIE LITVACK
The World BankWashington, D.C.
(c) 1998 The International Bank for Reconstructionand Development/The World Bank1818 H Street, N.W., Washington, D.C.20433
All rights reservedManufactured in the United States of AmericaFirst printing May 1998
The World Bank Regional and Sectoral Studies series provides an outlet for work that is relatively focused in itssubject matter or geographic coverage and that contributes to the intellectual foundations of development operations and policy formulation. Some sources cited in this publication may beinformal documents that are not readily available.
The findings, interpretations, and conclusions expressed in this publication are those of the author and should notbe attributed in any manner to the World Bank, to its affiliated organizations, or to the members of its Board ofExecutive Directors or the countries they represent.
The material in this publication is copyrighted. Requests for permission to reproduce portions of it should be sentto the Office of the Publisher at the address shown in the copyright notice above. The World Bank encouragesdissemination of its work and will normally give permission promptly and, when the reproduction is fornoncommercial purposes, without asking a fee. Permission to copy portions for classroom use is granted throughthe Copyright Clearance Center, Inc., Suite 910,222 Rosewood Dr., Danvers, Massachusetts 01923, U.S.A.
All of the editors work at the World Bank. David Dollar is research manager in the Development Research Group,Development Economics Department. Paul Glewwe is a senior economist in the Development Research Group.Jennie Litvack is an economist in the Public Sector Management Division of the Poverty Reduction andEconomic Management Network.
Cover design by Sam Ferro and Sherry Holmberg. Cover photo by Jennie Litvack.
Library of Congress Cataloging−in−Publication Data
Household welfare and Vietnam's transition /edited by David Dollar, Paul Glewwe, Jennie Litvack. p.cm.−(World Bank regional and sectoral studies)Includes bibliographical references(p.).ISBN 0−8213−4162−61. Households−Economic aspects−Vietnam. 2. Vietnam−Economicpolicy. 3. Vietnam−Economic conditions. 4. Poverty−Vietnam.
Household Welfare and Vietnam's Transition
Household Welfare and Vietnam's Transition 1
I. Dollar, David. II. Glewwe, Paul, 1958−. III. Litvack, Jennie I. (Jennie, Ilene),1963− . IV. Series.HC444.H68 1998338.9597−dc21 97−46963 CIP
Contents
Foreword link
Contributors link
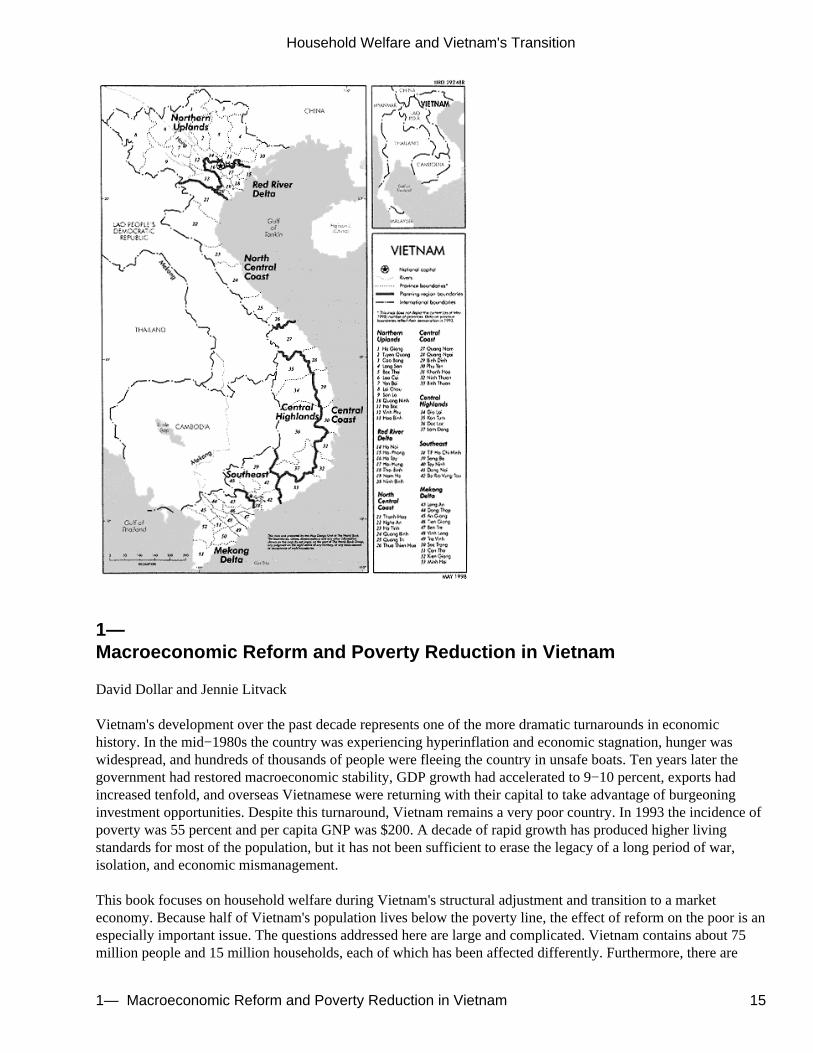
Map link
1. Macroeconomic Reform and Poverty Reduction in Vietnam
David Dollar and Jennie Litvack
link
Economic Reform and Macroeconomic Performance, 1985−95link
A Weak Macroeconomy link
Reform of Agriculture and the Private Sector link
Reform of the Macroeconomy link
A Successful Structural Adjustment link
Widespread Benefits link
Lurking Challenges link
The Impact of Economic Growth on Poverty Reduction link
Income Distribution in Other Transition Economies link
Estimates of Poverty Incidence link
Projections of Future Poverty Incidence link
A Poverty Alleviation Strategy for Vietnam link
The Role of Government in a Market Economy link
Lessons Learned link
Notes link
References link
2. Poverty and Inequality in the Early Reform Period
David Dollar and Paul Glewwe
link
Data Available for Examining Poverty and Inequality in Vietnamlink
Household Characteristics and Household Welfare in Vietnamlink
Characteristics of Vietnamese Households link
link
Household Welfare and Vietnam's Transition
Contents 2
Measuring Household Welfare Using per Capita ConsumptionExpenditures
Welfare Levels among Different Vietnamese Households link
Inequality in Vietnam link
Measurement of Inequality link
Factors Associated with Inequality in Vietnam link
Poverty in Vietnam link
Measuring Poverty link
Choosing a Poverty Line link
Analysis of Poverty in Vietnam link
A Closer Examination of Regional Variation link
Appendix: Calculation of Total Household Expenditures link
Food Expenditures link
Nonfood Expenditures link
Notes link
References link
3. Agriculture and Rural Poverty in Vietnam
Thomas B. Wiens
link
Reforming Institutions in Rural Vietnam link
Characterizing Rural Poverty link
Location and Economic Environment link
Land Quality and Tenure link
Labor and Dependents link
Infrastructure link
Farm Production link
Net Rural Income link
Credit and Poverty link
Promoting Crop Production link
The Paddy Rice Supply Function link
Labor link
Land and Irrigation link
Fertilizer and Agrochemicals link
Capital Services link
Prices of Competing Crops link
Household Welfare and Vietnam's Transition
Contents 3

Nonfarm Employment link
Infrastructure link
Health and Education link
Extension link
Farm Size link
Regional Differences link
Net Value of Crop Output link
The Cash Farm Economy link
Conclusion link
Notes link
References link
4. Infrastructure and Poverty in Vietnam
Dominique van de Walle
link
Poverty and Infrastructure in Vietnam, 1992−93 link
Availability of Physical Infrastructure in Rural Vietnam link
Drinking Water link
Sewerage and Sanitation link
Access to Irrigation link
Sources of Energy link
Transportation link
Summary link
Explaining Crop Income link
Determinants of Crop Income link
The Benefits from Irrigation: Policy Simulations link
Household Labor Costs link
The Cost of Expanding Irrigation link
Conclusion link
Notes link
References link
5. Nonfarm Household Enterprises in Vietnam
Wim P. M. Vijverberg
link
The Current Business Environment link
Nonfarm Self−employment in the Context of Labor MarketActivities
link
Household Welfare and Vietnam's Transition
Contents 4
Descriptive Analysis link
Multivariate Probit Model link
Nonfarm Self−employment and the Incidence of Poverty link
Characteristics of Nonfarm Enterprises link
Labor Force link
Capital Stocks link
Taxation link
Profitability link
Enterprise Performance and Household Poverty link
Determinants of Nonfarm Enterprise Income link
Defining the Model link
Estimating the Model link
Considerations for Public Policy link
Notes link
References link
6. Private Transfers in Vietnam
Donald Cox, James Fetzer, and Emmanuel Jimenez
link
Description of the Data Set link
Descriptive Evidence link
Scope and Magnitude of Transfers link
Transfer Patterns link
Multivariate Analysis link
Specification of Transfer Functions link
Multivariate Results link
Private Transfer Effects of Employment Loss link
Conclusion link
Appendix: Sample Selection Criteria link
Notes link
References link
7. School Enrollment and Completion in Vietnam: AnInvestigation of Recent Trends
Paul Glewwe and Hanan Jacoby
link
An Overview of the Current Education System link
Recent Trends in Education link
Household Welfare and Vietnam's Transition
Contents 5
Descriptive Analysis link
Changes over Time in School Enrollment and Labor ForceParticipation
link
Regional Variation in School Enrollment, Fees, and Quality link
Summary link
Regression Analysis link
An Empirical Model of School Continuation Decisions link
Results link
Conclusion link
Appendix link
Notes link
References link
8. Access to Health Care during Transition: The Role of thePrivate Sector in Vietnam
Paul Gertler and Jennie Litvack
link
Structure and Performance of the Health Sector link
Access to Health Care link
Policy Reform link
Targeting Public Expenditure to the Poor link
Reforming Drug Policy link
Summary and Conclusion link
Appendix link
Notes link
References link
9. Will Vietnam Grow Out of Malnutrition?
Ninez Ponce, Paul Gertler, and Paul Glewwe
link
Institutional Changes in Vietnam link
Nutritional Status in Vietnam link
Measuring Nutritional Status link
Malnutrition in Vietnam, 1992−93 link
The Relationship between Income and Nutritional Status inVietnam
link
Descriptive Analysis link
Multivariate Analysis link
Household Welfare and Vietnam's Transition
Contents 6
Economic Growth and Child Growth: Future Prospects link
Conclusion link
Notes link
References link
10. Poverty and Fertility in Vietnam
Jaikishan Desai
link
Data and Descriptive Information link
Sample Bias link
Fertility Patterns and Trends link
Sample Selection and Socioeconomic Differences in MaritalFertility
link
Do the Poor Have More Children? link
Theoretical Background link
Selection of Variables link
Regression Results link
Conclusion and Policy Directions link
Appendix link
Notes link
References link
Appendix Description of the Vietnam Living Standards Survey(VNLSS)
link
Figures
1.1 Annual per Capita Foodgrain Production, Vietnam, 1979−95link
1.2 Growth in Domestic Credit and Its Components, Vietnam,1987−95
link
1.3 Government Revenue, Expenditure, and Fiscal Balance,Vietnam, 1985−95
link
1.4 Savings and Investment, Vietnam, 1985−95 link
3.1 Irrigated Area and Fertilizer Use in Vietnam link
3.2 Crop Revenues and Input Costs in Vietnam, by IncomeQuintile
link
3.3 Crop Production in Vietnam by Use, by Region link
3.4 Sources of Income for Farm Households in Vietnam, byIncome Quintile
link
4.1 Sources of Drinking Water in Rural Vietnam, 1992−93 link
4.2 Sources of Drinking Water in Vietnam, 1992−93 link
Household Welfare and Vietnam's Transition
Contents 7
4.3 Sanitation Facilities Used in Rural Vietnam, 1992−93 link
4.4 Sanitation Facilities Used in Urban Vietnam, 1992−93 link
4.5 Distribution of Total Land and Irrigated Annual Cropland inVietnam, 1992−93
link
5.1 Frequency Distribution of Family Enterprise Start−up Dates,Vietnam, 1992−93
link
5.2 Distribution of Hours of Family Labor, Total CapitalResources, and Annual Enterprise Income, Vietnam, 1992−93
link
6.1 Vietnamese Households Receiving Private Transfers, byRegion
link
6.2 Vietnamese Households Giving Private Transfers, by Regionlink
6.3 Sources of Private Transfers in Urban VietnameseHouseholds
link
6.4 Sources of Private Transfers in Rural Vietnamese Householdslink
6.5 Probability of Receiving Net Transfers, as a Function ofHousehold Head's Age
link
7.1 School Enrollment and Labor Force Participation amongChildren Aged 6−11 and 12−17 in Vietnam, 1980−92
link
7.2 School Enrollment and Labor Force Participation amongChildren Aged 12−17 in Urban and Rural Vietnam, 1980−92
link
7.3 School Enrollment Rate among Children Aged 12−17 inNorthern Regions of Vietnam, 1980−92
link
7.4 School Enrollment Rate among Children Aged 12−17 inSouthern Regions of Vietnam, 1980−92
link
7.5 Labor Force Participation among Children Aged 12−17 inVietnam, by Region, 1980−92
link
7.6 School Leavers by Last Grade Attained, Vietnam, 1985−92link
7.7 School Enrollment Rate among Children Aged 12−17 inVietnam, by Income Quintile, 1980−92
link
8.1 Utilization of Public Sector Health Services in Vietnam,1987−93
link
8.2 Contact Rate with the Health Care System in Vietnam, 1993link
8.3 Utilization Rates of the Public Sector Health Care System inVietnam, 1993
link
8.4 Health Facilities and Personnel in Rural Communes inVietnam, 1993
link
9.1 Incidence of Child Malnutrition In Vietnam, Based on ThreeIndicators, 1992−93
link
9.2 Median Child Height in the U.S. National Center for HealthStatistics and Vietnam Living Standards Survey Samples
link
Household Welfare and Vietnam's Transition
Contents 8
9.3 Income, Child Malnutrition, and Public Health Investments in12 Developing Countries, 1989−92
link
9.4 GDP per Capita and Child Malnutrition in Vietnam, 1982−93link
9.5 Mean per Capita Household Expenditure and ChildMalnutrition in Vietnam, by Region, 1992−93
link
9.6 Change in Prevalence of Child Malnutrition and EconomicGrowth in Vietnam, by Region
link
9.7 Projected Child Malnutrition Rates in Vietnam Based onThree Economic Growth Rates, 1993−2013
link
10.1 Age Distribution of All Women Aged 15−49 in the SampledHouseholds and in the Fertility Sample
link
10.2 Age−specific Fertility Rates of Women Aged 15−49,1986−87 and 1991−92
link
10.3 Life−cycle Variation in Different Household ExpenditureMeasures
link
Tables
1.1 National Poverty Incidence in Vietnam under DifferentDistributional Scenarios, Selected Years
link
1.2 Poverty Incidence (Headcount Index) and Growth Rate inVietnam, by Region, 1993−94
link
1.3 Effect on Poverty Incidence (Headcount Index) of DifferentGrowth Scenarios in Vietnam, 1993−94
link
2.1 Characteristics of Vietnamese Households, by Region link
2.2 Characteristics of Vietnamese Households, by ExpenditureQuintile
link
2.3 Nonincome Indicators of Living Standards in Vietnam link
2.4 Expenditure Inequality in Vietnam and Other DevelopingCountries
link
2.5 Inequality in Vietnam, 1992−93 link
2.6 Urban and Rural Poverty Lines in Vietnam, by Region link
2.7 Poverty Indexes in Vietnam, 1992−93 link
2.8 Expenditure Levels and Poverty in Rural Areas of Vietnam,by Region
link
2.9 Determinants of Log per Capita Expenditure in Rural Areas ofVietnam
link
2.10 Selected Characteristics of Rural Areas in Vietnam, byRegion, 1992−93
link
3.1 Rural Poverty's Link to Geography in Vietnam, 1992−93 link
3.2 Paddy Rice Supply Function Estimates link
Household Welfare and Vietnam's Transition
Contents 9
3.3 Supply Function for Net Value of Crop Output link
4.1 Rural Poor and Nonpoor with Access to Infrastructure inVietnam, 1992−93
link
4.2 Rural Poor and Nonpoor with Access to Infrastructure inNorth and South Vietnam, 1992−93
link
4.3 Sources of Drinking Water in Rural and Urban Vietnam,1992−93
link
4.4 Sources of Drinking Water in Rural and Urban Vietnam, byRegion, 1992−93
link
4.5 Toilet Facilities in Rural and Urban Vietnam, 1992−93 link
4.6 Toilet Facilities in Rural and Urban Vietnam, by Region,1992−93
link
4.7 Average Area of Land per Capita in Rural Vietnam, 1992−93link
4.8 Average Area of Land per Capita in Rural Vietnam, byRegion, 1992−93
link
4.9 Sources of Lighting in Rural and Urban Vietnam, 1992−93link
4.10 Cooking Fuel in Rural and Urban Vietnam, 1992−93 link
4.11 Marginal Effect on Net Crop Income, Allowing forInteraction Effects
link
4.12 National Distribution of Impacts of Irrigation Expansionunder Four Scenarios
link
4.13 Distribution of per Capita Impacts under Simulation 1, byExpenditure Group and Region
link
4.14 Distribution of per Capita Impacts under Simulation 2, byExpenditure Group and Region
link
4.15 Distribution of per Capita Impacts under Simulation 3, byExpenditure Group and Region
link
4.16 Distribution of per Capita Impacts under Simulation 4, byExpenditure Group and Region
link
5.1a Labor Market Participation in Vietnam, by Rural or UrbanResidence and by Gender, 1992−93
link
5.1b Labor Market Participation in Vietnam, by Region, 1992−93link
5.1c Labor Market Participation in Vietnam, by Ethnic Group,1992−93
link
5.1d Labor Market Participation in Vietnam, by Age and Gender,1992−93
link
5.1e Labor Market Participation in Vietnam, by Years ofSchooling, 1992−93
link
5.2 Probit Estimates of Whether a Household Operates a NonfarmEnterprise
link
Household Welfare and Vietnam's Transition
Contents 10
5.3 Labor Market Activity and the Standard of Living in Vietnam,by per Capita Expenditure Quintile, 1992−93
link
5.4 Characteristics of Nonfarm Family Enterprises in Vietnam,1992−93
link
5.5 Family Enterprise Characteristics in Vietnam, by Quintile,1992−93
link
5.6 Income from Nonfarm Family Enterprises as a Share ofHousehold Expenditure
link
5.7 Income from Nonfarm Enterprises and HouseholdWell−being in Vietnam, 1992−93
link
5.8 Determinants of Hourly Enterprise Income, Vietnam,1992−93
link
5.9 Determinants of Monthly Enterprise Income in Vietnam,1992−93
link
6.1 Characteristics of Households in Vietnam, by Private TransferStatus
link
6.2 Effects of Public and Private Transfers on the Distribution ofIncome in Vietnam
link
6.3 Transfers over the Life Cycle in Vietnam link
6.4 Transfers among Rural and Urban Households in Vietnamlink
6.5 Probit and Ordinary Least Squares Estimates: TransfersReceived
| link
6A.1 Selection Criteria link
7.1 School Quality Indicators for Rural Areas of Vietnam,1992−93
link
7.2 School Enrollment in Vietnam in Selected Years, 1980−94link
7.3 Effect of Years of Schooling on Wages in Vietnam, 1992−93link
7.4 School Enrollment Rates in Vietnam, by Quintile and Region,1992−93
link
7.5 Share of Schools for Which Quality Problems Cited in RuralVietnam, by Region, 1992−93
link
7.6 Expenses and School Fees at Public Schools in Vietnam, byRegion, 1992−93
link
7.7 Descriptive Statistics of Explanatory Variables link
7.8 Determinants of Enrollment in and Completion of PrimarySchool
link
7.9 Determinants of Enrollment in and Completion of LowerSecondary School
link
7A.1 First−Stage Estimates for Primary Enrollment Regressionlink
Household Welfare and Vietnam's Transition
Contents 11
7A.2 First−Stage Estimates for Primary Completion and forSecondary Enrollment and Completion Regressions
link
8.1 Health Status Indicators in Selected Asian Countries, 1960and 1990
link
8.2 Health Care Infrastructure in Selected Asian Countries, 1991link
8.3 Annual Health Care Expenditures in Selected AsianCountries, 1991
link
8.4 Uses and Sources of Health Sector Funds in Vietnam, 1993link
8.5 Estimated Income Elasticities of the Demand for MedicalCare
link
8A.1 Two−Part Models of the Demand for Public Hospital Carelink
8A.2 Two−Part Models of the Demand for Commune HealthCenter Care
link
8A.3 Two−Part Models of the Demand for Private Provider Carelink
8A.4 Two−Part Models of the Demand for Private Drugs link
9.1 Multivariate Regression Results link
9.2 Description of Variables link
10.1 Age Distribution of All Women Aged 15−49 in the SampledHouseholds and in the Fertility Sample
link
10.2 Demographic Characteristics of Women Selected for theFertility Section of the 1992−93 Vietnam Living StandardsSurvey, by Age Cohort
link
10.3 Statistics for the Fertility Process, by Age Cohort link
10.4 Age−specific Fertility Rates and Total Fertility Rate link
10.5 Mean Number of Children Ever Born to Married WomenAged 20−39 in Rural Vietnam, by Women's Age Cohort andSocioeconomic Characteristics
link
10.6 Means and Standard Deviations of Dependent andIndependent Variables for Fertility Regression Models forMarried Women Aged 25−39 in Rural Vietnam
link
10.7 Regression Results for Children Ever Born to Ever−marriedWomen Aged 25−39 in Rural Vietnam
link
10.8 Regression Results for Children Ever Born to Ever−marriedWomen Aged 25−39 in Rural Vietnam, Taking into AccountEffects of Commune Characteristics
link
10.9 Regression Results for Children Ever Born to Ever−marriedWomen Aged 25−39 Who Have Begun Childbearing in RuralVietnam: Commune Fixed Effects Specification
link
10.10 Regression Results for Children Ever Born to MarriedWomen Aged 25−39 in Urban Vietnam
link
Household Welfare and Vietnam's Transition
Contents 12
10A.1 Instrumenting Regressions for Log of Real HouseholdExpenditure per Adult in Rural Areas
link
10A.2 Instrumenting Regressions for Log of Real HouseholdExpenditure per Adult in Urban Areas
link
Foreword
Vietnam's development since 1985 provides important lessons for economic and social policy. Among the world's40 poorest countries in 1985, Vietnam has since had−by far−the fastest growth rate. This rapid growth hastransformed the country, reducing poverty from about 75 percent of the population to about 50 percent. At thesame time, the transition from a planned to a market economy has created new challenges for public policy in awide range of areas.
This volume examines various aspects of Vietnam's transition. Which macroeconomic and structural reforms ledto growth? What effect has reform had on the household economy−both small businesses in urban areas and farmhouseholds in rural areas? How has the transition affected education, health, fertility, and child nutrition−crucialfactors for the emergence of a healthy and highly skilled population? These are some of the questions addressedby a group of researchers from inside and outside the World Bank.
The research presented in the volume developed from a collaborative effort of the Vietnamese government, theWorld Bank, the United Nations Development Programme, and the Swedish International Development Agency.In 1992−93 these agencies collaborated on the design and implementation of Vietnam's first nationallyrepresentative household survey. The wealth of information generated by this Living Standards Survey has beenused by the government and scholars to analyze poverty and inequality in Vietnam. This kind of effort−producinghigh−quality information that can be used to inform policymaking−is one of the most important contributions ofthe World Bank and development cooperation more broadly.
Following up on this initial success, the same agencies are now collaborating on a new survey that will comeabout five years after the first one.
This second Living Standards Survey will return to most of the original 4,800 households (creating a unique paneldata set) and add 2,000 more, producing a data set that will be representative of Vietnam in 1998.
This volume provides a wealth of information on Vietnam in 1992−93 and an analysis of economic and socialpolicy. It shows how micro−level data can be used to analyze the likely effect of different governmentexpenditures and activities. It focuses in particular on the effect different policies have on the poor, and in sodoing it challenges stereotypes about poverty−focused expenditures. Some social services, for example, hardlyreach the poor, while others are highly pro−poor. Given that Vietnam has good human capital but many otherdeficiencies, certain investments in infrastructure−such as rural roads or irrigation−may have a dramatic effect onthe incomes of poor households. These findings have already influenced policies in Vietnam and the WorldBank's assistance strategy for the country.
The studies in this volume should be of interest to anyone interested in Vietnam and anyone who wants to learnhow this low−income country has managed to make impressive strides since 1985.
JOSEPH E. STIGLITZCHIEF ECONOMIST AND SENIOR VICE PRESIDENTTHE WORLD BANK
Household Welfare and Vietnam's Transition
Foreword 13
Contributors
Donald Cox is professor of economics at Boston College.
Jaikishan R. Desai is a consultant in Macroeconomics 1 of the Africa Economic Management and Social PolicyUnit at the World Bank.
David Dollar is research manager in the Development Research Group at the World Bank.
James Fetzer is assistant professor of economics at Suffolk University.
Paul J. Gertler is professor of economics, finance, and public policy at the University of California at Berkeley,where he holds joint appointments in the Haas School of Business and School of Public Health.
Paul Glewwe is senior economist in the Development Research Group at the World Bank.
Hanan G. Jacoby is a consultant in the Development Research Group at the World Bank.
Emmanuel Jimenez is research manager in the Development Research Group at the World Bank.
Jennie I. Litvack is economist in the Poverty Reduction and Economic Management Network at the World Bank.
Ninez A. Ponce is health services research fellow in the Department of Health Services at the University ofCalifornia at Los Angeles.
Dominique van de Walle is senior economist in the Development Research Group at the World Bank.
Wim P. M. Vijverberg is professor of economics and political science at the University of Texas at Dallas.
Thomas Wiens is lead rural specialist in the Environmentally and Socially Sustainable Development Departmentof the Latin America and Caribbean Region at the World Bank.
Household Welfare and Vietnam's Transition
Contributors 14
1—Macroeconomic Reform and Poverty Reduction in Vietnam
David Dollar and Jennie Litvack
Vietnam's development over the past decade represents one of the more dramatic turnarounds in economichistory. In the mid−1980s the country was experiencing hyperinflation and economic stagnation, hunger waswidespread, and hundreds of thousands of people were fleeing the country in unsafe boats. Ten years later thegovernment had restored macroeconomic stability, GDP growth had accelerated to 9−10 percent, exports hadincreased tenfold, and overseas Vietnamese were returning with their capital to take advantage of burgeoninginvestment opportunities. Despite this turnaround, Vietnam remains a very poor country. In 1993 the incidence ofpoverty was 55 percent and per capita GNP was $200. A decade of rapid growth has produced higher livingstandards for most of the population, but it has not been sufficient to erase the legacy of a long period of war,isolation, and economic mismanagement.
This book focuses on household welfare during Vietnam's structural adjustment and transition to a marketeconomy. Because half of Vietnam's population lives below the poverty line, the effect of reform on the poor is anespecially important issue. The questions addressed here are large and complicated. Vietnam contains about 75million people and 15 million households, each of which has been affected differently. Furthermore, there are
Household Welfare and Vietnam's Transition
1— Macroeconomic Reform and Poverty Reduction in Vietnam 15
many different dimensions to economic welfare. Even with vast amounts of data, analyzing the impact of reformon household welfare is a difficult task. In the case of Vietnam the task is compounded by the lack of useful data.This book draws heavily on a nationally representative household survey, the Vietnam Living Standards Survey,carried out during 1992−93−the first such survey ever conducted in Vietnam. These data provide a thoroughassessment of the situation at that time. We cannot draw firm conclusions about the impact of Vietnam's transitionon household
welfare using only the 1992−93 Living Standards Survey because the data are from only one point in time. Thuswe will draw on other data, both macroeconomic and microeconomic, so that we will be able to make sometentative judgments about the changes in household welfare between 1985 and 1993.
Despite the remarkable changes that have occurred in Vietnam, the country is still at an early stage in its transitionto a market economy. That transition will continue for at least another decade. As additional representativehousehold surveys are conducted during that time, it will be possible to monitor progress in poverty alleviationand, more broadly, changes in household welfare. Thus in this book we lay the foundation for future work onhousehold welfare in Vietnam.
Finally, the book is intended to aid policymaking. The effect of growth on poverty reduction in Vietnam over thenext decade will be influenced by household behavior and by a host of government policies and expenditures. Inaddition, the book estimates the possible effects of different interventions and makes recommendationsconcerning an efficient poverty alleviation strategy.
This first chapter sets the stage for the remaining chapters. It reviews the main features of Vietnam's reformprogram and the country's macroeconomic performance from 1985 to 1995. The second section of the chapterthen estimates the impact of growth on poverty for 1985−94 under a variety of assumptions about the distributionof the benefits from growth. The estimated decline in poverty since the mid−1980s has been remarkable: fromabout 75 percent of the population in 1984 to 55 percent in 1993. This reduction is comparable to that achieved byother highgrowth East Asian economies in the early stages of their stunning economic performance. Critics ofstructural adjustment often contend that it hurts the poor.1 The outcome in Vietnam was exactly the opposite:structural adjustment ushered in an era of rapid growth that led to a sharp decline in poverty.
The second section also examines the likely impact of continued rapid growth on poverty between 1994 and 2000,again using a variety of assumptions about changes in the distribution of income. If rapid growth is sustained,poverty incidence could fall to 35 percent−or even lower−by 2000. The extent of this reduction will depend notonly on the rate of growth but also on how broadly based growth is, in particular on how well it reacheshouseholds at the lower end of the income distribution.
The third section of this chapter considers the most important factors−including government policy andexpenditures−that will influence the extent to which the benefits of growth are widely diffused. We discuss theprincipal reasons for government intervention: efficiency (correcting discrepancies between social and privatecosts and benefits) and equity (changing the distribution of household welfare that is set by purely marketactivities). The discussion highlights the need to select policies that can
achieve distributional objectives as efficiently as possible. The last section previews the issues that will be takenup in later chapters and highlights some of the key findings. It also addresses some general methodological issuesconcerning the use of cross−sectional data to estimate the impact of different policy options.
While the focus of the book is Vietnam, the findings will be relevant to anyone interested in growth and povertyreduction in the least developed countries. The World Bank (1996) reports that there were 40 countries, totaling
Household Welfare and Vietnam's Transition
1— Macroeconomic Reform and Poverty Reduction in Vietnam 16
1.7 billion people, with per capita GNP below $520 in 1994. Vietnam is part of this least developed group and infact is near the bottom in terms of per capita GNP. Of these countries, one−half had average per capita GNPgrowth rates that were negative in 1985−94, and the highest growth rate, excluding that of Vietnam, was about 3percent. Vietnam's growth rate of nearly 5 percent per capita over 1986−95 makes it highly unusual among verypoor countries. Which key factors have enabled Vietnam to stand out among the least developed countries? Howhave structural adjustment and reform affected poverty and household welfare? Which policies and publicexpenditures will sustain a high rate of poverty reduction? The answers to these questions will be pertinent topeople interested in economic development.
Economic Reform and Macroeconomic Performance, 1985−95
During 1986−95 Vietnam's economic system went through a remarkable transformation. The impetus for thisreform can be found in the economy's poor performance in the mid−1980s, a period of high inflation and slowgrowth. The government's attempt to develop the economy on the basis of collectivized agriculture and subsidizedstate industries yielded very poor results. This disappointing performance led to an era of stabilization andstructural reforms that were aimed at transforming the centrally planned system into a market economy.
A Weak Macroeconomy
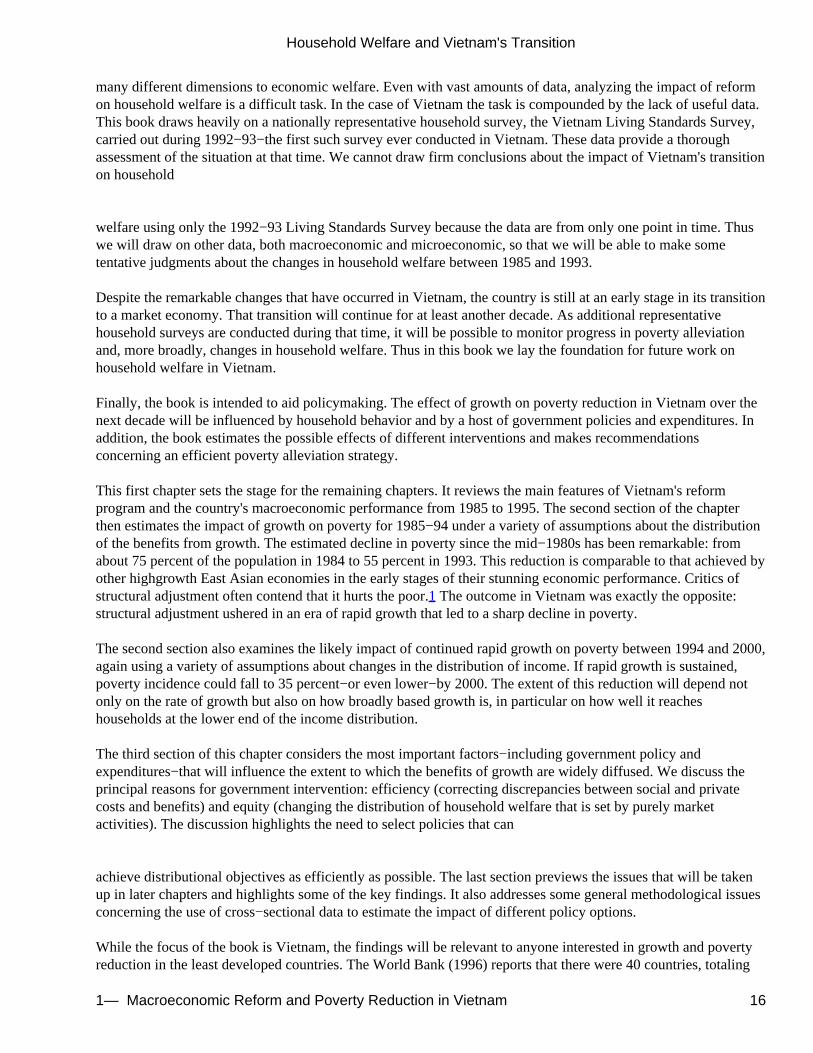
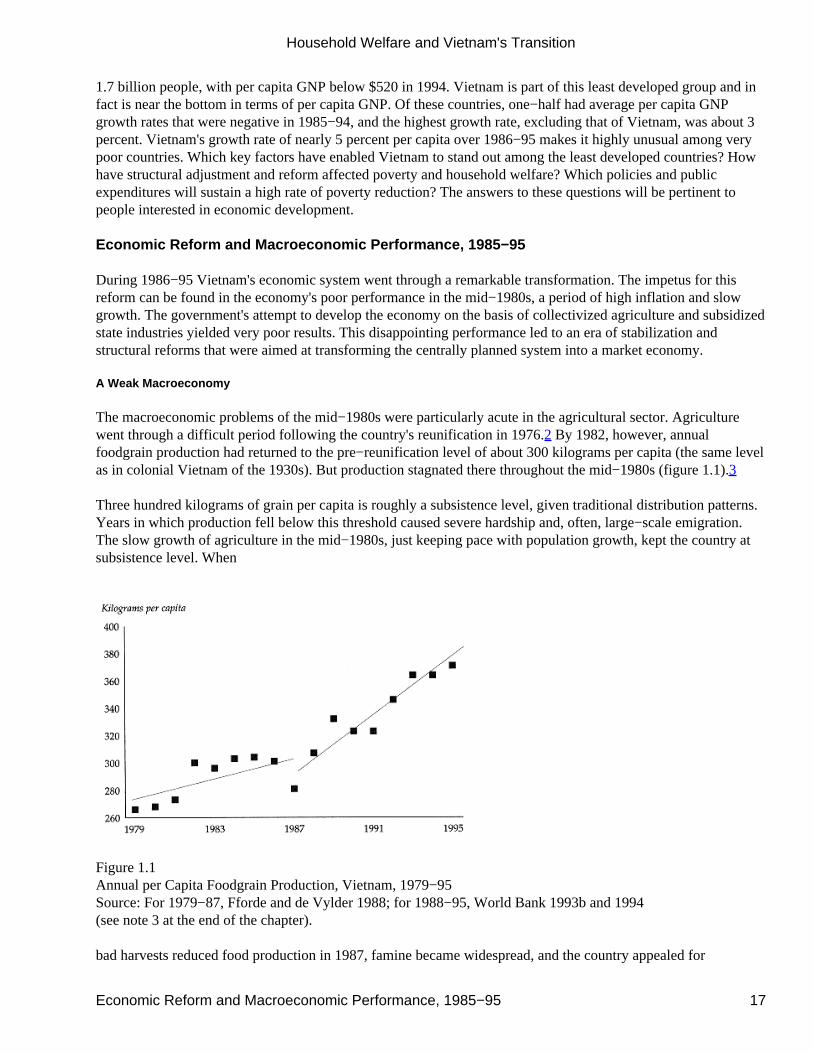
The macroeconomic problems of the mid−1980s were particularly acute in the agricultural sector. Agriculturewent through a difficult period following the country's reunification in 1976.2 By 1982, however, annualfoodgrain production had returned to the pre−reunification level of about 300 kilograms per capita (the same levelas in colonial Vietnam of the 1930s). But production stagnated there throughout the mid−1980s (figure 1.1).3
Three hundred kilograms of grain per capita is roughly a subsistence level, given traditional distribution patterns.Years in which production fell below this threshold caused severe hardship and, often, large−scale emigration.The slow growth of agriculture in the mid−1980s, just keeping pace with population growth, kept the country atsubsistence level. When
Figure 1.1Annual per Capita Foodgrain Production, Vietnam, 1979−95Source: For 1979−87, Fforde and de Vylder 1988; for 1988−95, World Bank 1993b and 1994(see note 3 at the end of the chapter).
bad harvests reduced food production in 1987, famine became widespread, and the country appealed for
Household Welfare and Vietnam's Transition
Economic Reform and Macroeconomic Performance, 1985−95 17
international food aid. The weak performance in agriculture−and the related concern that there would not beenough food for a growing population−was one of the important factors pushing the government to change itsdevelopment strategy.
Weak performance was visible in other sectors of the economy as well. Overall GDP growth was 2.3 percent in1986, about the same as population growth, and fell to 0.7 percent in 1987.4 Vietnam was receiving significantaid from the Soviet Union at the time, but this assistance was not effectively channeled into investment. Nationalaccounts data from this period are of doubtful quality, but still provide a broad picture of macroeconomic trends.The investment rate in the mid−1980s was very low−5−8 percent of GDP. The current account deficit, whichmeasures the net inflow of foreign savings, was greater, around 10 percent of GDP. Thus domestic savings werenegative throughout this period. The large external deficit was financed by Soviet aid. Much of this aid came inthe form of intermediate goods−petroleum, fertilizer, and steel−that were passed on to producers, and ultimatelyconsumers, at subsidized prices. Thus Soviet aid financed consumption rather than investment.
Government revenue was also used to subsidize both producers and consumers, resulting in a fiscal deficit thatcould not be easily financed. The fiscal deficit fluctuated between 5 percent and 10 percent of GDP in themid−1980s. In principle, a deficit of this magnitude could have been
financed by Soviet aid. In practice, however, the commodities imported from the Soviet Union were passed on toenterprises and agricultural collectives at low prices and did not generate sufficient revenue to finance the budgetdeficit. The government instead relied on credit from the state bank. The ensuing credit growth was a primarysource of high inflation. In 1987 credit to the government increased by about 300 percent, to state enterprises byabout 200 percent, and overall by about 250 percent. This expansion generated inflation of nearly 400 percent ayear in 1986−87. The economy was allegedly a planned system with fixed prices at that time, but ''fixed" priceswere being revised several times per month.
It is difficult to exaggerate the disastrous condition of the economy in this period. It may seem inconsistent toreport that Vietnam has grown well for about a decade but that its per capita GNP was still only $200 in 1994.There is no inconsistency, however, because in the mid−1980s Vietnam was one of the world's poorest countries.Per capita growth was negative, famine was widespread, people were leaving the country in large numbers,hyperinflation had set in, domestic savings were negative, investment was low, and the country was dependent onSoviet aid equal to about 10 percent of GDP. Furthermore, by 1987 it was clear that Soviet aid would begin towane, given the country's economic problems. The Communist Party had already decided at an important partycongress in December 1986 to initiate some fundamental economic changes. Little changed during 1987, but theworsening economic crisis that year spurred the government to introduce some radical reforms beginning in 1988.
Reform of Agriculture and the Private Sector
Vietnam's program of doi moi (renovation) began in the agricultural sector.5 Collectives were dismantled in 1988and land was distributed among peasant households. Initially, the property rights to land were left vague. But in1993 a new land law clarified that peasants had the right to use the land distributed to them for 20 years and thatthis right could be renewed. Further, peasants could sell or mortgage the right to use their land (see World Bank1993b, chapter 2). Just as important as the reform of property rights was the reform of prices introduced early in1989. Controlled prices for most goods and services were abolished. For several years the country had beenfunctioning with a system of dual pricing, in which most output (both agricultural and industrial) had to be sold tothe state at official prices, and the balance could be sold at market prices. The abolition of these controlled pricesand the system of state procurement in 1989 strengthened the incentive to produce.
In the case of rice, for example, the official price in 1988 was about onetenth the free market price. Paddyproduction responded quickly to the improved incentives, with large increases in per capita output in 1988 and
Household Welfare and Vietnam's Transition
Reform of Agriculture and the Private Sector 18
1989 (see figure 1.1). Production stagnated in 1990 and 1991 because of problems with weather and with thesupply of fertilizer, owing to the collapse of trade and aid relations with the Soviet Union. By 1992 a commercialmarket for imported fertilizer had replaced the previous system of state distribution. In 1992, 1993, and 1995paddy production reached new historical highs. Per capita production in 1995 (nearly 375 kilograms) was about25 percent higher than the subsistence level that characterized the mid−1980s.
Reforms in agriculture were particularly important because it was the largest sector of the economy, accounting in1989 for 40 percent of GDP at market prices. But there were analogous reforms in other sectors as well. For years,private production of goods and services had been tightly restricted. Official policy changed in the late 1980s toincreasingly tolerate and even encourage the private sector. Price liberalization in 1989 gave major impetus to thistrend. In 1989 overall GDP growth accelerated to 8 percent. There was rapid growth in agriculture, services, andconstruction, all areas in which the private sector was able to respond quickly to strengthened incentives. On theother hand, industry−which remained largely under state control−showed negative growth for the year.
Reform of the Macroeconomy
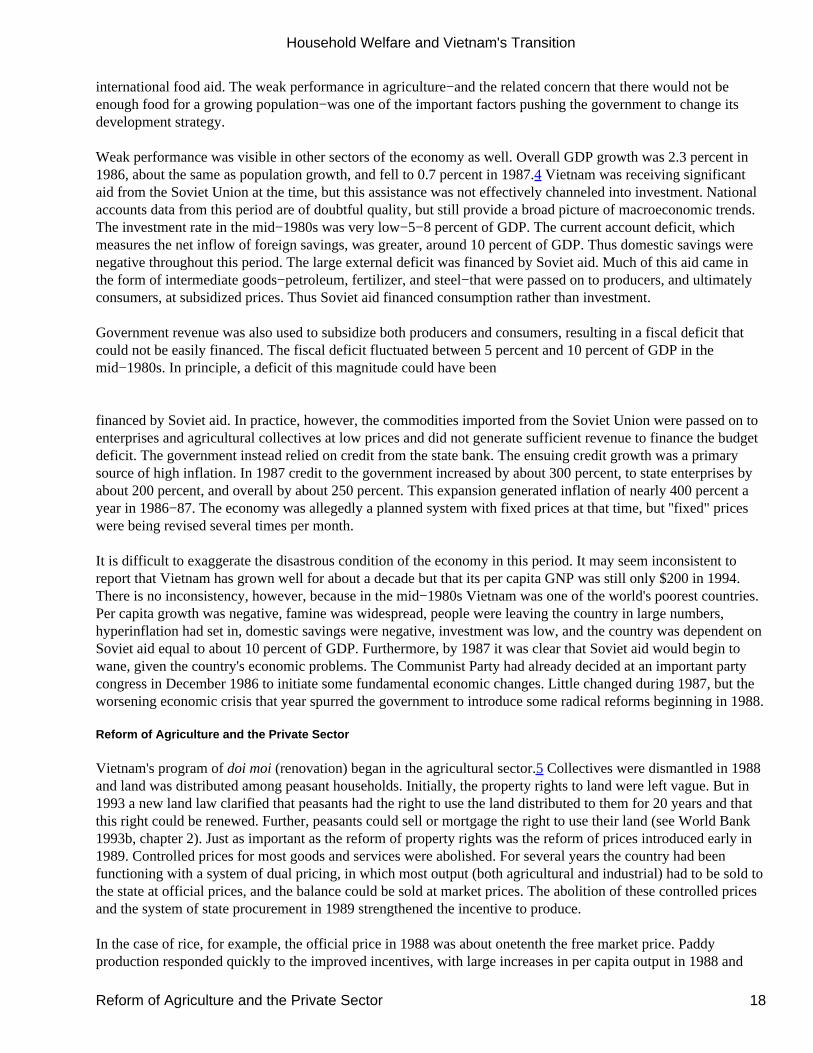
At the same time that the government was introducing these structural reforms, it was trying to cope with seriousmacroeconomic problems, including high inflation and the impending cutoff of Soviet aid. The fundamentalproblem was that the government and state enterprises were spending too much and this excess was beingfinanced by Soviet aid and central bank credit. Strong measures to deal with this situation were introduced in1989. Production and consumption subsidies were eliminated from the budget. At the same time, interest rates onloans to state firms were raised above the level of inflation (that is, to 9 percent per month in the spring of 1989,when inflation was about 7 percent per month). The state bank made a serious effort to control the growth ofcredit during the first half of 1989. This policy, combined with the strong output response in the agriculturalsector, sharply reduced inflation by mid−1989. The policy, however, also created severe hardships for stateenterprises. Thus there was strong pressure on the state bank to ease up on its credit and interest rate policies,once some initial success with disinflation had been achieved. Interest rates were lowered and credit growthexpanded in the second half of 1989. Inflation resumed at a moderate rate. Overall, 1989 was a year of modestrestraint. Domestic credit grew by about 150 percent, down from 400 percent in 1988 (figure 1.2).
In 1990−92 the government took additional steps to control the growth of credit and hence inflation.6 Credit wasno longer used to finance the budget by 1991. Loans to state enterprises were also controlled more carefully andpriced appropriately. This hardening of the budget constraint led
Household Welfare and Vietnam's Transition
Reform of the Macroeconomy 19
Figure 1.2Growth in Domestic Credit and Its Components, Vietnam, 1987−95Source: State Bank of Vietnam.
to a major restructuring of the sector. Between 1988 and 1992 about 800,000 workers−one−third of the 1988state−enterprise labor force−left the sector, and the number of firms declined from 12,000 to 7,000. These policiesgradually brought the expansion of credit under control. In 1995 domestic credit increased 20.3 percent, none ofwhich went toward the budget, credit to state firms increased 16.7 percent, and credit to the private sectorincreased 37.2 percent. The restrained monetary policy succeeded in bringing inflation down to about 10 percentper year during 1993−95.
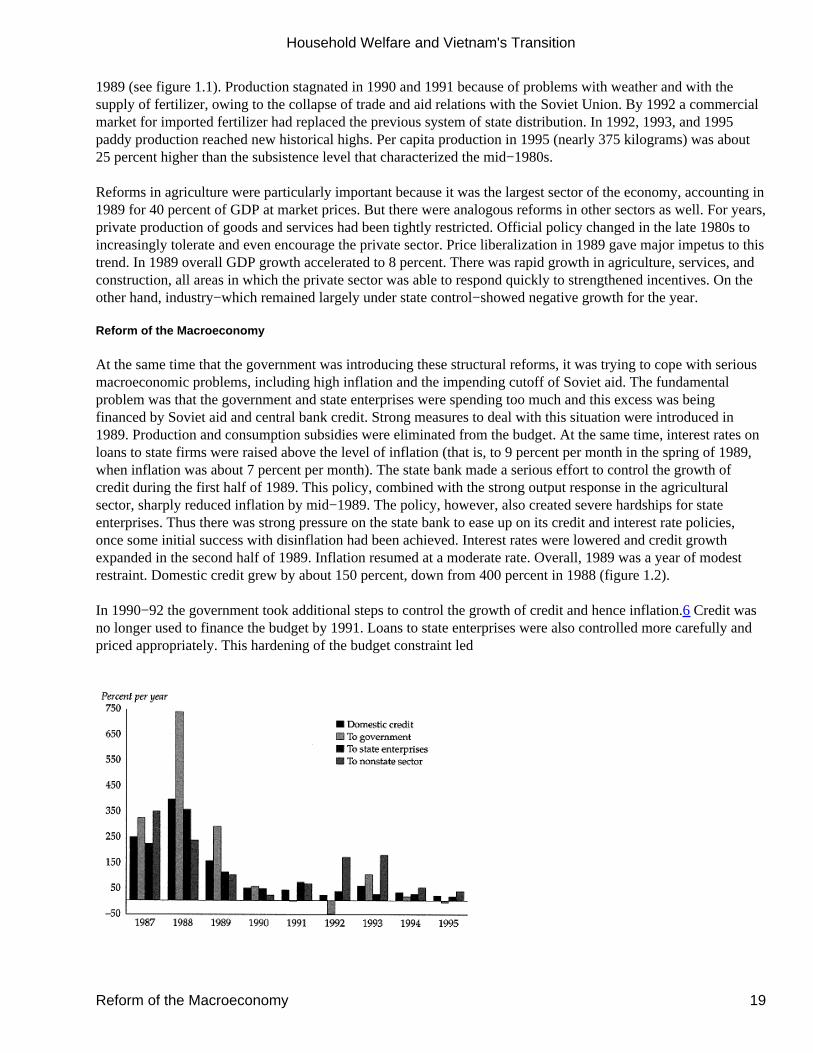
The disinflation program required imposing discipline on state enterprises and on the budget. During 1985−89 thefiscal deficit ranged between 5 percent and 10 percent of GDP and had been financed largely by bank credit. Thetight credit policies in 1990−92 necessitated a large fiscal adjustment. Revenue as a share of GDP was fairlystable during this period, so that the brunt of adjustment fell on the expenditure side of the budget. Totalgovernment spending was reduced by 6 percentage points of GDP between 1989 and 1991 (figure 1.3). Part of thesavings came from a military demobilization that returned about half a million soldiers to the civilian labor force.In addition, the government cut back sharply on its investment program. Furthermore, wage increases for civilservants lagged behind the ongoing, moderate inflation. Salaries for teachers and health workers had fallen so lowby 1991 that it was difficult for communities to get them to perform their duties without additional stipends(World Bank 1993b, chapter 7).
Figure 1.3Government Revenue, Expenditure, and Fiscal Balance, Vietnam, 1985−95Source: State Bank of Vietnam.
A Successful Structural Adjustment
The monetary and fiscal tightening in the early 1990s represents a classic structural adjustment to bring inflationand the fiscal deficit under control. Vietnam was unusual in that it did not receive any financial support from theInternational Monetary Fund (IMF) or the World Bank during this adjustment period, owing to the opposition ofmajor shareholders. However, these institutions did offer policy advice and technical assistance. Vietnam'sexperience with disinflation was also unusual in that it was not accompanied by a recession. GDP growthdecelerated to 5−6 percent during 1990−91, but that was still a healthy rate of growth. Once stabilization wasachieved, growth accelerated, averaging 9 percent for 1992−95. Because of this high growth and initial reforms ofthe tax system, government revenue increased rapidly after 1991, and the government was able to restore the
Household Welfare and Vietnam's Transition
A Successful Structural Adjustment 20
investment and social expenditures cut during the austerity period. Thus government expenditures as a share ofGDP were higher in 1994 than in 1989, at the beginning of the fiscal adjustment (figure 1.3). Furthermore,because per capita GDP had increased substantially during this period, real per capita government expenditureswere nearly twice as high in 1994 as in 1989.
Structural adjustment is usually associated with cutbacks in government services. But Vietnam's experience wasthat successful adjustment combined with several good years of high growth enabled the government to providemore services than it had previously. The government of
Vietnam also improved its allocation of resources: it reduced expenditures that did not promote development (thatis, those for the military or to subsidize production) relative to development spending for infrastructure, health,and education.
The importance of a dualistic economy. The fact that Vietnam was able to halt high inflation without suffering arecession can be attributed to the dualistic nature of the economy at the beginning of 1989. As noted, agriculturalland had been distributed to peasant families, a relatively easy reform that could be carried out quickly.Furthermore, Vietnam's private sector was large compared with other socialist economies. This sector had beenoperating largely underground until 1988.
Stabilization is normally a shock to the economy because interest rates are raised, government subsidies are cut,and devaluation makes imported inputs more expensive. Vietnam's stabilization had the predictable effect on thestate sector of the economy, which showed negative growth in 1989. What distinguished Vietnam from mosttransition economies was that, alongside the state sector, it had large agricultural and private service andmanufacturing sectors, in total producing about 60 percent of GDP and employing 85 percent of the labor force.These producers were not receiving credit from the formal sector or subsidies from the government. Thus, forthem, 1989 was a year in which inflation fell and prices were liberalized, creating a good environment forexpansion. That interest rates were much higher and subsidies were lower did not matter to agriculturalhouseholds and small private firms, since they were not getting any of the formal credit or budget subsidies tobegin with.7
International interventions. Two other aspects of Vietnam's reform may help explain the outstanding results: itsthorough opening to international markets and the timing of foreign assistance to support its reform. Vietnam'sinitial conditions were very similar to those of other low−income countries, many of which have carried outmacroeconomic policy reform supported by the IMF and the World Bank, but without Vietnam's spectacularresults.
Opening itself to international markets included the unification of its multiple exchange rates in 1989. At the sametime the official rate was devalued from 900 dong per dollar to 5,000 dong per dollar, the rate prevailing in theblack market. The central bank has subsequently kept the official rate very close to the parallel rate. This bolddevaluation in 1989 greatly strengthened incentives to export. At the same time administrative controls on exportsand imports were relaxed. As a result exports have been a leading growth sector throughout the reform period,with real export growth averaging more than 25 percent per year. Rice exports were a major part of this success in1989, crude petroleum exports (not part of the reform program) contributed in 1990 and 1991, and a wide range ofexports have been
on the rise in the past few years, including cash crops (rubber, cashews, coffee), labor−intensive manufactures,and tourist services.8
Household Welfare and Vietnam's Transition
A Successful Structural Adjustment 21
Desai (1998) finds Vietnam to be one of the transition economies most open to foreign trade and investment. By1995 net exports relative to GNP had reached 79 percent in Vietnam, a high figure for a populous country. Thecomparable figure for Thailand−well known as an open economy−was 70 percent; Egypt, a large closed economy,had net exports totaling 32 percent of GNP. A number of studies have found that open economies grow morerapidly. Sachs and Warner (1995), for example, estimated that a shift from a closed to an open trade regime addsmore than two percentage points to growth. They also identified 35 developing countries that were still closed asof 1994. Vietnam's experience provides additional evidence of the value of trade liberalization. Combined with alarge devaluation, it spurred production at a time when fiscal and monetary restraint were contracting aggregatedemand. Vietnam's export surge was important not only because it spurred production, but also because itfinanced the economy's growing import demand. As anticipated, Soviet aid declined very rapidly after 1988, andthis was not replaced by financing from other sources.
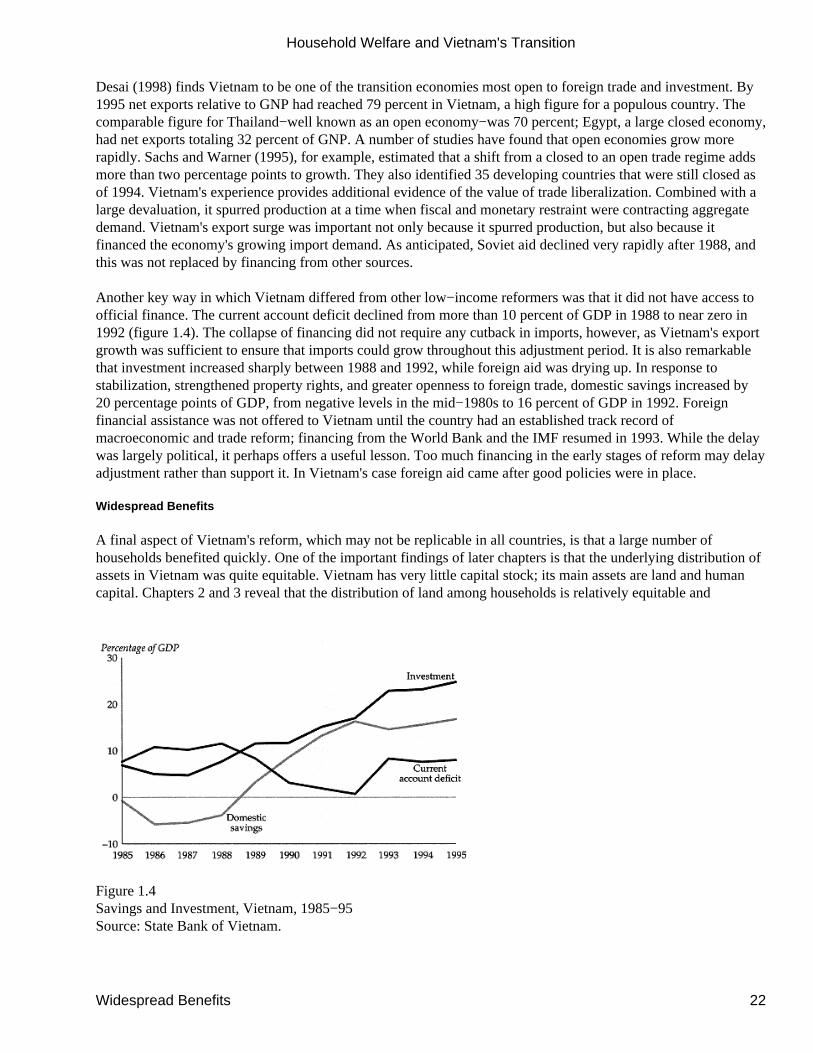
Another key way in which Vietnam differed from other low−income reformers was that it did not have access toofficial finance. The current account deficit declined from more than 10 percent of GDP in 1988 to near zero in1992 (figure 1.4). The collapse of financing did not require any cutback in imports, however, as Vietnam's exportgrowth was sufficient to ensure that imports could grow throughout this adjustment period. It is also remarkablethat investment increased sharply between 1988 and 1992, while foreign aid was drying up. In response tostabilization, strengthened property rights, and greater openness to foreign trade, domestic savings increased by20 percentage points of GDP, from negative levels in the mid−1980s to 16 percent of GDP in 1992. Foreignfinancial assistance was not offered to Vietnam until the country had an established track record ofmacroeconomic and trade reform; financing from the World Bank and the IMF resumed in 1993. While the delaywas largely political, it perhaps offers a useful lesson. Too much financing in the early stages of reform may delayadjustment rather than support it. In Vietnam's case foreign aid came after good policies were in place.
Widespread Benefits
A final aspect of Vietnam's reform, which may not be replicable in all countries, is that a large number ofhouseholds benefited quickly. One of the important findings of later chapters is that the underlying distribution ofassets in Vietnam was quite equitable. Vietnam has very little capital stock; its main assets are land and humancapital. Chapters 2 and 3 reveal that the distribution of land among households is relatively equitable and
Figure 1.4Savings and Investment, Vietnam, 1985−95Source: State Bank of Vietnam.
Household Welfare and Vietnam's Transition
Widespread Benefits 22
that basic education and literacy are widespread. The vast majority of households were thus able to benefitquickly from market reforms and the opening of the economy to international trade. Put simply, the reforms raisedthe relative price of rice and other agricultural products, and most households had the land and knowledge torespond to the improved incentives. Higher incomes generated demand for other goods and services, some ofwhich could be met by the private sector. In this way a positive dynamic was established. And since mosthouseholds benefited right away, the reform was popular and possible to sustain politically.
Lurking Challenges
In summary, Vietnam's macroeconomic performance has been very good since 1989. The country has reducedinflation from 400 percent to single digits. The root problem was a large and inefficient public sector. Withmilitary demobilization, layoffs from state enterprises, and reductions in the civil service, about 1.5 million peoplehave left the public sector since 1988, reducing its weight in the labor force from 15 percent to 10 percent. Thisadjustment was accomplished without a recession because private producers, particularly in agriculture and theservice sector, responded quickly to strengthened property rights and price reforms. A growing economy madeadjustment easier. The Ministry of Labor found in its surveys that most workers laid off from the public sectorwere absorbed by the rapidly growing private sector within one year (World Bank 1993b, chapter 3). Robustgrowth has also raised government revenue, with the
result that public expenditures on infrastructure, education, and health are much higher now than at the beginningof adjustment.
Vietnam still faces serious challenges. It is too early to conclude that its shift onto a higher growth path ispermanent and not simply a boom. Vietnam's low per capita GNP indicates that it has a large amount of laborrelative to other factors of production, such as physical capital (including infrastructure), land, and naturalresources. While the distribution of land among households is equitable, the population density on the country'sarable land is extreme−1,000 people per square kilometer of agricultural land, one of the highest concentrations inthe developing world. Furthermore, population growth remains high.
Absorbing the workers laid off from the public sector may have seemed to many observers to be a daunting task.But it was minor compared with the challenge of employing the new entrants to the labor force. Retrenchmentreleased 1.5 million public sector employees over five years; new workers total about 1 million people per year.Population growth has begun to decelerate; however, rapid population growth in the range of 2−3 percent per yearduring 1975−90 will result in the ongoing expansion of the labor force for some years. The 9 percent GDP growthseen in recent years is necessary to absorb this expanding pool of workers; any slippage from that rate will resultin mounting unemployment.
Absorbing the large number of underutilized workers is both a challenge and an opportunity. Vietnam has theopportunity to follow the same kind of labor−intensive development strategy that has been successful in otherEast Asian economies. The common features of this strategy have been macroeconomic stability, reliance on theprivate sector to finance most investment, a strong focus on human resource development, and relative opennessto foreign trade and investment (World Bank 1993a).
Vietnam has made substantial progress in each of these areas. Nevertheless, the state sector is still large andsignificant impediments to foreign trade and investment remain. Progress with structural reforms is thus one ofthe factors that will influence the country's growth. Divesting state enterprises, improving the environment forprivate investment, and lowering trade barriers are all structural reforms that will help sustain the 9 percentgrowth of recent years. It will be easier for the government if it moves on all of these policy fronts at once: if thegovernment retains a large number of commercial enterprises, it will be more difficult to promote privateinvestment or to reduce protection of inefficient industries.
Household Welfare and Vietnam's Transition
Lurking Challenges 23
Looking to the future, then, one important issue is whether the reform program will continue to generate robustgrowth. A growing literature analyzes macroeconomic policies in Vietnam and the priorities for further reform(see, for example, Dapice, Haughton, and Perkins 1996; Dollar 1996; Riedel 1992). It is not the purpose of thisbook to contribute to that literature. Rather, we take macroeconomic policies as given and address
the question of how the benefits of growth are distributed among the population. Vietnam began its transition withwell over half its population living below a widely accepted international poverty line. Rapid growth can reducepoverty quickly, but only if growth involves the bulk of the population. The initial reforms in 1988 and 1989 didreach a large number of households. But during 1993−95 growth has been more narrowly concentrated in theurban areas around Ho Chi Minh City and Hanoi.
The Impact of Economic Growth on Poverty Reduction
Vietnam's economic growth has accelerated over the past decade. By the end of the 1980s per capita incomegrowth had climbed to almost 6 percent per year. This strong rate continued through the first half of the 1990s.This growth has probably reduced poverty somewhat. But by how much? The answer depends on the extent towhich the poor have shared in the growth process. We cannot know this definitively though, owing to a lack ofhistorical data with which to track the distribution of household living standards. We can, however, combine dataon income distribution in 1993 and growth rates from 1984−93 with a set of plausible assumptions about changesin the income distribution, in order to identify a range of estimates for the poverty rate in 1984. In the second halfof this section we use a similar methodology to project forward the likely effect of growth on poverty reductionduring the rest of the decade.
Income Distribution in Other Transition Economies
The Living Standards Survey revealed that in 1993 the distribution of income in Vietnam was relatively evencompared with other developing countries. The Gini coefficient, which measures inequality in the distribution ofindividual consumption, was 0.34. Recent figures for some nearby countries are 0.32 for Indonesia, 0.38 forChina, 0.41 for the Philippines, 0.46 for Thailand, and 0.48 for Malaysia (World Bank 1996, table 5). In order toestimate the impact of growth on poverty reduction during the past decade in Vietnam, we need to make someassumptions about what happened to the distribution of income during that period. Kuznets's wellknowninverted−U theory−inequality rises during the early phase of industrialization and then falls−launched a lengthydebate in the field of development economics regarding the likely trends in income distribution as a countrygrows. Subsequent research has cast doubt on the universality of this pattern of growth (Anand and Kanbur 1993).Indeed, experiences in East Asia have illustrated that economies need not suffer from rising inequality duringinitial stages of development. Taiwan (China) and the Republic of Korea are two notable examples. There,country circumstances and policy decisions led to widespread participation in rapid growth and, as a result,dramatic levels of poverty reduction. More generally, Bruno,
Ravallion, and Squire (1995) demonstrate that there is no systematic relationship between growth and inequalityover time.
On the other hand, countries undergoing the transition from a socialist to a market economy have shown atendency toward greater inequality. This tendency has been particularly strong in the heavily industrializedcountries of Central and Eastern Europe. China's experience demonstrates a different path, which may beparticularly relevant for Vietnam given its initial agrarian character. Income distribution improved during theearly years of China's reforms (1978−83), when changes in agricultural policies led to dramatic increases in ruralincome. Distribution became more unequal in subsequent years with the increasing importance of rural enterprisesand industry. Gini coefficients are estimated to have declined from 0.28 in 1978 to 0.22 in 1983 and then to have
Household Welfare and Vietnam's Transition
The Impact of Economic Growth on Poverty Reduction 24
risen to 0.31 in 1989 (World Bank 1992).
China's experience is also noteworthy because of recent analysis indicating that while the proportion of thepopulation living below the poverty line declined throughout the 1980s, the depth and severity of povertyworsened (Ravallion and Chen 1994). The growth process was leaving some of the poorest people in Chinabehind. These findings highlight the need to examine not only the rate of poverty (that is, the headcount index),but also higher−order poverty measures (that is, the poverty gap and the Foster−Greer−Thorbecke index).
Estimates of Poverty Incidence
We can only speculate on how income distribution has changed in Vietnam since before doi moi. Many believethat economic reforms have not only led to higher household living standards, but also to greater inequalityamong households. Yet Vietnam's response to market reform was driven largely by the agricultural sector in theearly years of reform, 1988−91, followed by rapid expansion of industry since 1992. It is possible that Vietnam,like China, experienced an initial improvement in distribution followed by a recent worsening. Thus in estimatingthe likely impact of growth on poverty, we examine several different scenarios, the most plausible of which is thatincome distribution has become more unequal since the mid−1980s and will continue to become more unequal. InChina the Gini coefficient increased at about 1.6 percent per year in 1985−90, once the initial impact of agrarianreform had been absorbed. In our scenarios, a Gini of 0.30 in 1984 increasing to 0.38 by 2000 would be verysimilar to the Chinese experience. Because of the impact of Vietnam's agrarian reform, the deterioration may nothave been quite so sharp between 1984 and 1993, but we believe that this is a reasonable estimate.
We look at other scenarios as well, including one in which the Gini coefficient increases from 0.24 in 1984 to0.34 in 1993. Such a shift is very large relative to the historical experience of other countries and can thus betaken as a plausible outer bound of an increase in inequality.
Completing our analysis are scenarios in which the Gini declined from 0.38 in 1984 and in which it remainedconstant at 0.34. The four possibilities provide a range of estimates for the change in poverty incidence between1984 and 1993.
Specifically, we estimate the impact of growth on poverty alleviation using the following data and specifications:
Four different Lorenz curves representing different distribution scenarios (with Gini coefficients of 0.24, 0.30,0.34, and 0.38).9
A poverty line constructed using the ''cost of basic needs "methodology" (see Ravallion 1994 for themethodology and chapter 2 of this book for details on calculating Vietnam's poverty line).
Per capita consumption estimates based on actual growth rates of 1984−94 and on projected annual per capitagrowth of 6 percent from 1994 onward.10
Projections of poverty incidence are based on the structure of the parameterized Lorenz curve that best fits thedata and is selected as described in Chen, Datt, and Ravallion (1994).11 Ravallion and Datt (1992) used a similarmethod to assess the importance of growth and distributional changes on poverty reduction in India and Brazilduring the 1980s. Here, actual poverty is unknown for all years except 1993; so we estimate poverty rates usingknown growth rates and several possible income distributions.
Results indicate that there was a dramatic decrease in poverty during 1984−93, regardless of which assumptionabout the change in income distribution is used (table 1.1). Poverty was extremely prevalent prior to reform, andhas declined rapidly since. The estimated poverty rate in 1984 ranges from 74 percent to 77 percent under the
Household Welfare and Vietnam's Transition
Estimates of Poverty Incidence 25
different distributional assumptions. Estimated higher−order poverty measures−the poverty gap and squaredpoverty gap indexes−also indicate that the severity of poverty decreased under all distributional scenarios. Thismagnitude of poverty reduction is similar to that experienced by other developing economies that have grownrapidly, such as Korea and Indonesia between 1970 and 1990 (Johanson 1993).
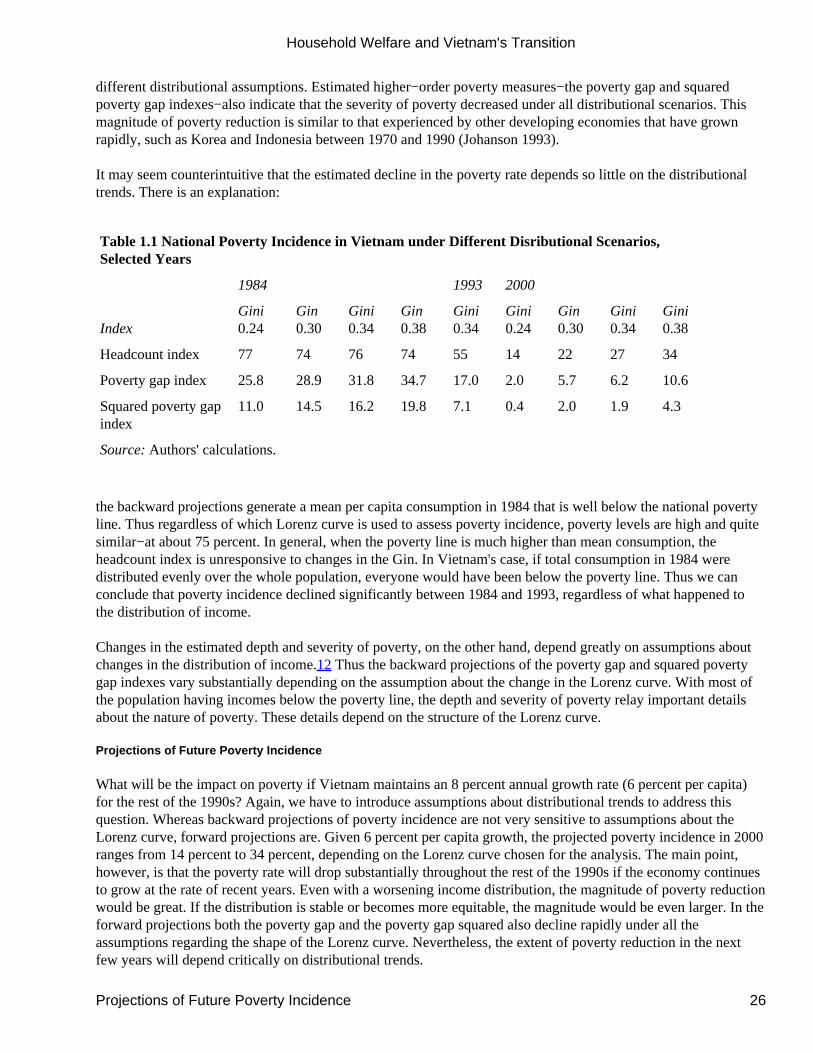
It may seem counterintuitive that the estimated decline in the poverty rate depends so little on the distributionaltrends. There is an explanation:
Table 1.1 National Poverty Incidence in Vietnam under Different Disributional Scenarios,Selected Years
1984 1993 2000
IndexGini0.24
Gin0.30
Gini0.34
Gin0.38
Gini0.34
Gini0.24
Gin0.30
Gini0.34
Gini0.38
Headcount index 77 74 76 74 55 14 22 27 34
Poverty gap index 25.8 28.9 31.8 34.7 17.0 2.0 5.7 6.2 10.6
Squared poverty gapindex
11.0 14.5 16.2 19.8 7.1 0.4 2.0 1.9 4.3
Source: Authors' calculations.
the backward projections generate a mean per capita consumption in 1984 that is well below the national povertyline. Thus regardless of which Lorenz curve is used to assess poverty incidence, poverty levels are high and quitesimilar−at about 75 percent. In general, when the poverty line is much higher than mean consumption, theheadcount index is unresponsive to changes in the Gin. In Vietnam's case, if total consumption in 1984 weredistributed evenly over the whole population, everyone would have been below the poverty line. Thus we canconclude that poverty incidence declined significantly between 1984 and 1993, regardless of what happened tothe distribution of income.
Changes in the estimated depth and severity of poverty, on the other hand, depend greatly on assumptions aboutchanges in the distribution of income.12 Thus the backward projections of the poverty gap and squared povertygap indexes vary substantially depending on the assumption about the change in the Lorenz curve. With most ofthe population having incomes below the poverty line, the depth and severity of poverty relay important detailsabout the nature of poverty. These details depend on the structure of the Lorenz curve.
Projections of Future Poverty Incidence
What will be the impact on poverty if Vietnam maintains an 8 percent annual growth rate (6 percent per capita)for the rest of the 1990s? Again, we have to introduce assumptions about distributional trends to address thisquestion. Whereas backward projections of poverty incidence are not very sensitive to assumptions about theLorenz curve, forward projections are. Given 6 percent per capita growth, the projected poverty incidence in 2000ranges from 14 percent to 34 percent, depending on the Lorenz curve chosen for the analysis. The main point,however, is that the poverty rate will drop substantially throughout the rest of the 1990s if the economy continuesto grow at the rate of recent years. Even with a worsening income distribution, the magnitude of poverty reductionwould be great. If the distribution is stable or becomes more equitable, the magnitude would be even larger. In theforward projections both the poverty gap and the poverty gap squared also decline rapidly under all theassumptions regarding the shape of the Lorenz curve. Nevertheless, the extent of poverty reduction in the nextfew years will depend critically on distributional trends.
Household Welfare and Vietnam's Transition
Projections of Future Poverty Incidence 26
The main point illustrated here is that, for a country with most of its people living below the poverty line (as inVietnam in 1984), rapid growth will reduce poverty regardless of changes in the distribution of income. Aspoverty incidence declines, however, further reductions in poverty will depend increasingly on distributionalissues. In Vietnam the speed of poverty reduction in the next decade will depend on the extent to which growth isspread among the population.
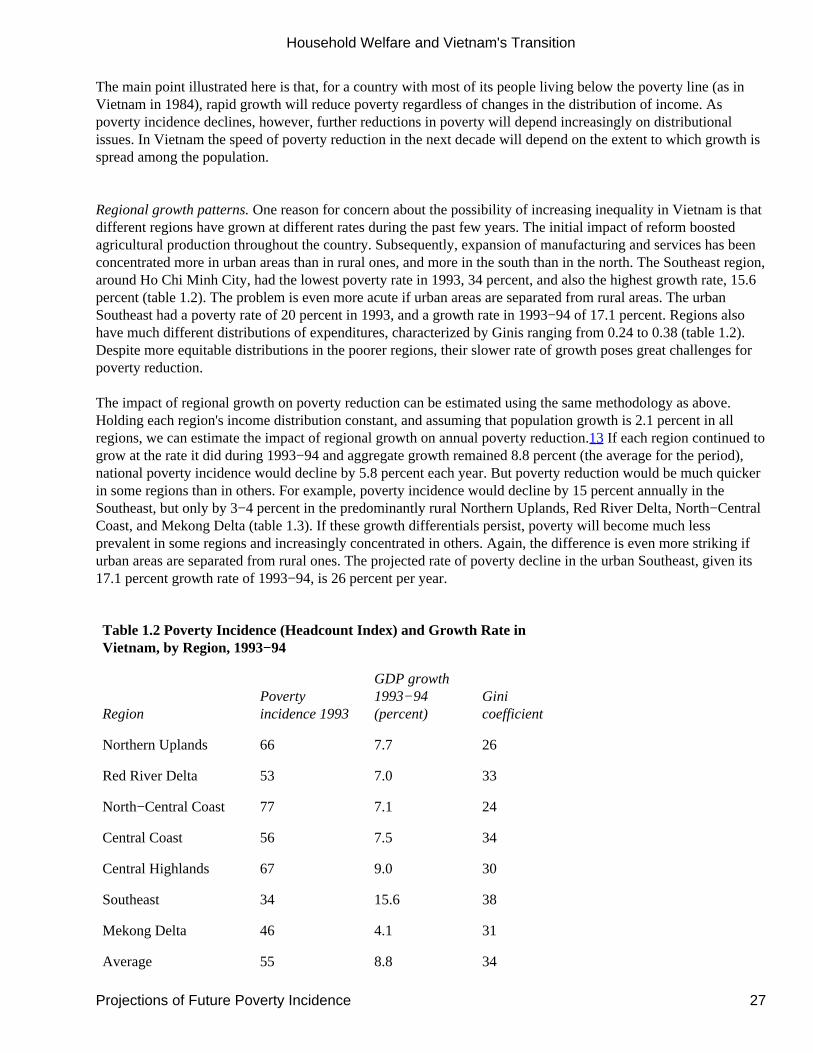
Regional growth patterns. One reason for concern about the possibility of increasing inequality in Vietnam is thatdifferent regions have grown at different rates during the past few years. The initial impact of reform boostedagricultural production throughout the country. Subsequently, expansion of manufacturing and services has beenconcentrated more in urban areas than in rural ones, and more in the south than in the north. The Southeast region,around Ho Chi Minh City, had the lowest poverty rate in 1993, 34 percent, and also the highest growth rate, 15.6percent (table 1.2). The problem is even more acute if urban areas are separated from rural areas. The urbanSoutheast had a poverty rate of 20 percent in 1993, and a growth rate in 1993−94 of 17.1 percent. Regions alsohave much different distributions of expenditures, characterized by Ginis ranging from 0.24 to 0.38 (table 1.2).Despite more equitable distributions in the poorer regions, their slower rate of growth poses great challenges forpoverty reduction.
The impact of regional growth on poverty reduction can be estimated using the same methodology as above.Holding each region's income distribution constant, and assuming that population growth is 2.1 percent in allregions, we can estimate the impact of regional growth on annual poverty reduction.13 If each region continued togrow at the rate it did during 1993−94 and aggregate growth remained 8.8 percent (the average for the period),national poverty incidence would decline by 5.8 percent each year. But poverty reduction would be much quickerin some regions than in others. For example, poverty incidence would decline by 15 percent annually in theSoutheast, but only by 3−4 percent in the predominantly rural Northern Uplands, Red River Delta, North−CentralCoast, and Mekong Delta (table 1.3). If these growth differentials persist, poverty will become much lessprevalent in some regions and increasingly concentrated in others. Again, the difference is even more striking ifurban areas are separated from rural ones. The projected rate of poverty decline in the urban Southeast, given its17.1 percent growth rate of 1993−94, is 26 percent per year.
Table 1.2 Poverty Incidence (Headcount Index) and Growth Rate inVietnam, by Region, 1993−94
RegionPovertyincidence 1993
GDP growth1993−94(percent)
Ginicoefficient
Northern Uplands 66 7.7 26
Red River Delta 53 7.0 33
North−Central Coast 77 7.1 24
Central Coast 56 7.5 34
Central Highlands 67 9.0 30
Southeast 34 15.6 38
Mekong Delta 46 4.1 31
Average 55 8.8 34
Household Welfare and Vietnam's Transition
Projections of Future Poverty Incidence 27
Source: 1992−93 Vietnam Living Standards Survey; Vietnam Ministry ofPlanning and Investment.
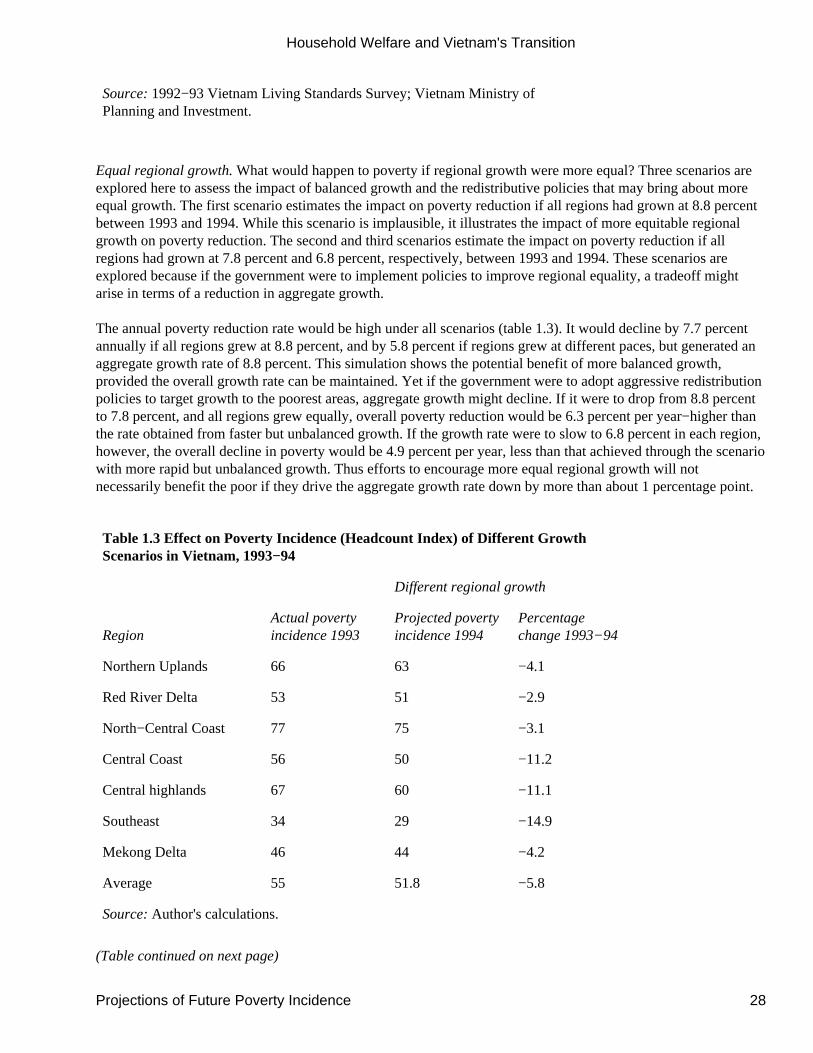
Equal regional growth. What would happen to poverty if regional growth were more equal? Three scenarios areexplored here to assess the impact of balanced growth and the redistributive policies that may bring about moreequal growth. The first scenario estimates the impact on poverty reduction if all regions had grown at 8.8 percentbetween 1993 and 1994. While this scenario is implausible, it illustrates the impact of more equitable regionalgrowth on poverty reduction. The second and third scenarios estimate the impact on poverty reduction if allregions had grown at 7.8 percent and 6.8 percent, respectively, between 1993 and 1994. These scenarios areexplored because if the government were to implement policies to improve regional equality, a tradeoff mightarise in terms of a reduction in aggregate growth.
The annual poverty reduction rate would be high under all scenarios (table 1.3). It would decline by 7.7 percentannually if all regions grew at 8.8 percent, and by 5.8 percent if regions grew at different paces, but generated anaggregate growth rate of 8.8 percent. This simulation shows the potential benefit of more balanced growth,provided the overall growth rate can be maintained. Yet if the government were to adopt aggressive redistributionpolicies to target growth to the poorest areas, aggregate growth might decline. If it were to drop from 8.8 percentto 7.8 percent, and all regions grew equally, overall poverty reduction would be 6.3 percent per year−higher thanthe rate obtained from faster but unbalanced growth. If the growth rate were to slow to 6.8 percent in each region,however, the overall decline in poverty would be 4.9 percent per year, less than that achieved through the scenariowith more rapid but unbalanced growth. Thus efforts to encourage more equal regional growth will notnecessarily benefit the poor if they drive the aggregate growth rate down by more than about 1 percentage point.
Table 1.3 Effect on Poverty Incidence (Headcount Index) of Different GrowthScenarios in Vietnam, 1993−94
Different regional growth
RegionActual povertyincidence 1993
Projected povertyincidence 1994
Percentagechange 1993−94
Northern Uplands 66 63 −4.1
Red River Delta 53 51 −2.9
North−Central Coast 77 75 −3.1
Central Coast 56 50 −11.2
Central highlands 67 60 −11.1
Southeast 34 29 −14.9
Mekong Delta 46 44 −4.2
Average 55 51.8 −5.8
Source: Author's calculations.
(Table continued on next page)
Household Welfare and Vietnam's Transition
Projections of Future Poverty Incidence 28
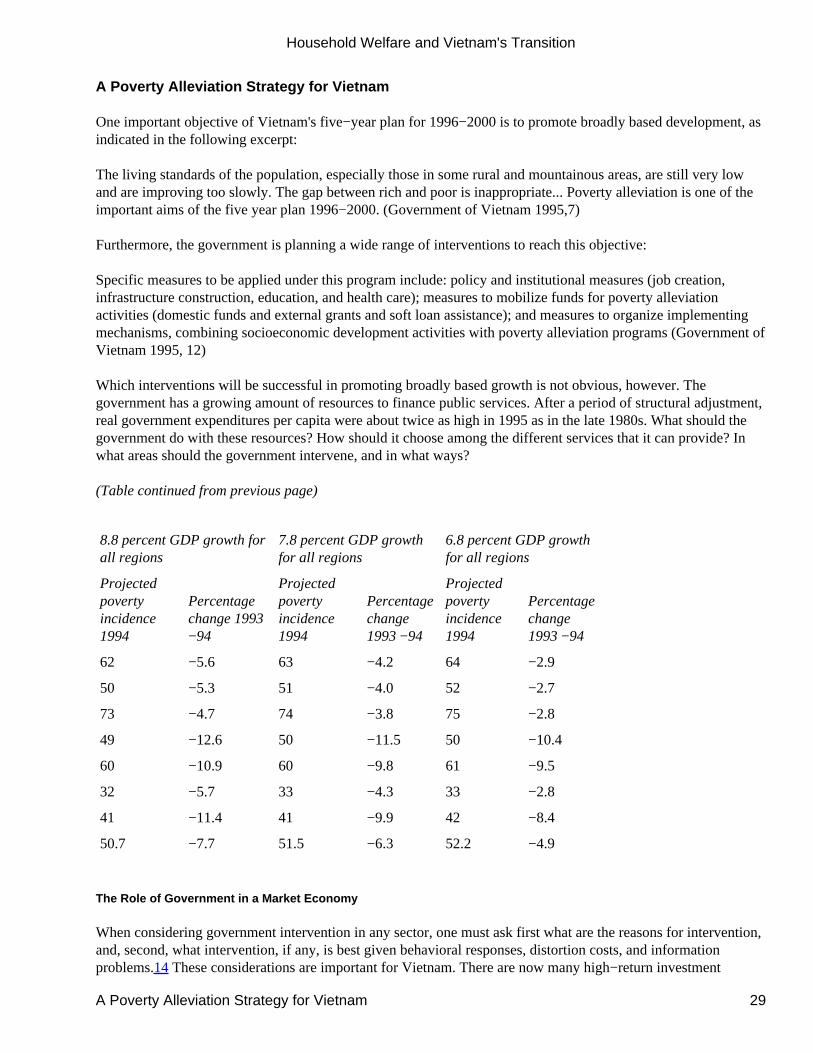
A Poverty Alleviation Strategy for Vietnam
One important objective of Vietnam's five−year plan for 1996−2000 is to promote broadly based development, asindicated in the following excerpt:
The living standards of the population, especially those in some rural and mountainous areas, are still very lowand are improving too slowly. The gap between rich and poor is inappropriate... Poverty alleviation is one of theimportant aims of the five year plan 1996−2000. (Government of Vietnam 1995,7)
Furthermore, the government is planning a wide range of interventions to reach this objective:
Specific measures to be applied under this program include: policy and institutional measures (job creation,infrastructure construction, education, and health care); measures to mobilize funds for poverty alleviationactivities (domestic funds and external grants and soft loan assistance); and measures to organize implementingmechanisms, combining socioeconomic development activities with poverty alleviation programs (Government ofVietnam 1995, 12)
Which interventions will be successful in promoting broadly based growth is not obvious, however. Thegovernment has a growing amount of resources to finance public services. After a period of structural adjustment,real government expenditures per capita were about twice as high in 1995 as in the late 1980s. What should thegovernment do with these resources? How should it choose among the different services that it can provide? Inwhat areas should the government intervene, and in what ways?
(Table continued from previous page)
8.8 percent GDP growth forall regions
7.8 percent GDP growthfor all regions
6.8 percent GDP growthfor all regions
Projectedpovertyincidence1994
Percentagechange 1993−94
Projectedpovertyincidence1994
Percentagechange1993 −94
Projectedpovertyincidence1994
Percentagechange1993 −94
62 −5.6 63 −4.2 64 −2.9
50 −5.3 51 −4.0 52 −2.7
73 −4.7 74 −3.8 75 −2.8
49 −12.6 50 −11.5 50 −10.4
60 −10.9 60 −9.8 61 −9.5
32 −5.7 33 −4.3 33 −2.8
41 −11.4 41 −9.9 42 −8.4
50.7 −7.7 51.5 −6.3 52.2 −4.9
The Role of Government in a Market Economy
When considering government intervention in any sector, one must ask first what are the reasons for intervention,and, second, what intervention, if any, is best given behavioral responses, distortion costs, and informationproblems.14 These considerations are important for Vietnam. There are now many high−return investment
Household Welfare and Vietnam's Transition
A Poverty Alleviation Strategy for Vietnam 29
opportunities, most of which can eventually be undertaken by the private sector. In the short term the governmenthas a role in facilitating private sector investment. Beyond that, the government's role is to intervene where thereare large discrepancies between the social return to investment and the private return (such interventions willimprove the efficiency of the market economy) and to ensure that distributional goals are met. Finding the rightbalance between distributional and efficiency objectives is perhaps the most difficult challenge for Vietnamesepolicymakers.
In choosing among redistributive policies, it will be important to pick those that help the poor in the most efficientway. One means of explicitly considering both efficiency and equity tradeoffs is by creating an efficiency policyhierarchy (Knowles and others 1996). This involves ranking possible policy options (those that enhanceefficiency by addressing externalities and market failures) according to their direct and indirect (distortionary)costs, and then selecting the option that will achieve distributional objectives at the least cost. A solidunderstanding of household behavior is essential for developing such a hierarchy. The other chapters in this bookfocus on the analysis of household data.
When considering household behavior in a range of sectors, there are generally good prospects for publicinterventions that improve efficiency and promote equity, such as infrastructure investment, agricultural supportservices, human capital accumulation, and safety nets. Together, these areas make up an effective povertyalleviation strategy. The particular interventions selected in each sector should be assessed considering both thedirect and indirect (distortionary) costs of alternatives. Vietnam has a history of quantitative restrictions andinterventions, which tend to be more distortionary than price−based (taxes, subsidies) approaches. Thus in theVietnamese context it is important to focus on the costs of different types of interventions−whether designed topromote efficiency or increase equity. The analyses in the book are designed to provide information that will helppolicy makers identify the most effective interventions.
One of the main lessons of this work is that household survey data can be useful for identifying interventions thatwill promote growth and poverty reduction. Ideally, policy makers want to work with panel data that trace howhousehold welfare changes over time as policies and other variables change. But Vietnamese policymakers do nothave panel data on household behavior. This situation is common in the developing world.
Even in countries in which several household surveys have been carried out over time, there are rarely panel datawith observations over time on the same households. Furthermore, survey questionnaires change, making evenbasic comparisons over time difficult.
The authors of this book attempt to draw lessons from cross−sectional data on household behavior. This approachis risky, as results can be affected by omitted variables or household−specific effects that cannot be controlled for.While cross−sectional data can reveal associations, they cannot as easily determine causation. The basicmethodological approach used throughout the book is to combine the cross−sectional survey data with otherinformation in order to draw inferences−cautiously. Developing panel data sets should be a high priority forVietnam and any country interested in monitoring the impact of policies. The approaches used throughout thisbook should be relevant to the wide range of policymakers in the developing world who have to work withless−than−ideal data. Vietnam's policymakers are not going to wait until they have a perfect dataset to beginpolicy analysis. We show how the cross−sectional data can be used to make informed judgments about the likelyeffect of different interventions.
Lessons Learned
What are some of the key lessons from this analysis? The chapters that focus on the household economy (3−5)provide useful guidance on the kinds of interventions that are likely to increase the incomes of the poor. While thecross−sectional estimates must be treated with caution, they indicate that the returns to infrastructure and capital
Household Welfare and Vietnam's Transition
Lessons Learned 30
are quite high in agricultural and nonagricultural household production. Deficiencies in power, transport, andwater management are clearly serious problems for Vietnam. The main urban industrial areas there needinfrastructure investment. At the same time, rural infrastructure is one of the important determinants of economicdevelopment in some regions. All of the provinces of Vietnam are looking to the central government to financeinfrastructure projects that will benefit their areas. Chapters 3−5 indicate that these types of investments couldspur growth and alleviate poverty by raising productivity.
Industrialization and urbanization. Vietnam is a labor−rich country whose rapid growth will certainly beaccompanied by industrialization and urbanization. As the country industrializes, the pace of urbanization will bean important issue. If people move into the cities too quickly, it will be more difficult to develop an urbaninfrastructure base in a manner conducive to long−term growth. A recent survey of migrants to the Hanoi areaindicates that more than half moved for economic reasons (UNDP 1997). Given that per capita income in ruralareas of the Red River Delta is more
than five times lower than that in neighboring Hanoi, this movement is hardly surprising. Investments andprograms to promote rural and agricultural development can reduce the relative attraction of urban life and slowthe pace of urbanization.
Equality and efficiency. One of the interesting findings highlighted in chapters 2 and 3 is that the distribution ofland among agricultural households is quite equitable within regions of Vietnam−there are few landless ruralhouseholds. Still, 61 percent of rural households are poor, primarily because of the extreme population densityand the failure to generate the maximum value from agricultural land. Diversification into nonagriculturalactivities is the only solution to the first problem. The second problem can be addressed through investments intransport and irrigation, and improvements in agricultural extension services.
An important message in chapters 3−5 is that there are interventions that can achieve both efficiency and equityobjectives. They would have a high rate of return and a strong direct impact on rural poverty. Simulations inchapter 4, for example, demonstrate that irrigation investments should have high rates of return−in the 20−35percent range. These benefits will be pro−poor in general but even more so if the irrigation expansion is targetedto households with low per capita holdings. The government has indicated its intention of increasinginfrastructure investment in rural and remote areas. These investments must be chosen carefully. Infrastructureinvestments with a low rate of return are not going to help the poor in the long run. Our analysis indicates thatthere are high−return rural investments, and that these are the kinds of "win−win" projects (since they promotegrowth and reduce poverty) that the government should target. In regions where infrastructure investments havelow returns, out−migration will have to be an important part of the solution to widespread poverty.
Private sector development. Chapters 3 and 5 paint a vibrant picture of a small−scale private sector both inagricultural and nonagricultural activities. The estimated return to capital for both of these activities is high, wellabove prevailing interest rates (which themselves are high in real terms). This finding implies that the expansionof credit at market interest rates would benefit private producers. The government has developed a bank for thepoor that lends money to poor households at subsidized interest rates. The amount of subsidized credit will alwaysbe constrained by the government budget, and there are questions as to how well this credit can be targeted topoor households. Our analysis suggests that distributional objectives could be achieved more efficiently throughother approaches with lower direct and, especially, indirect costs. For example, measures that promote theexpansion of commercial banking (such as regulatory and tax reform, training of bankers, and outreach offinancial services to
remote areas) can help private producers, taking the place of ongoing subsidies.
Household Welfare and Vietnam's Transition
Lessons Learned 31

Investment in human capital. Human capital development is critical to ensure that growth is broadly based andinvolves most households. Several chapters of this book focus on different aspects of human capital accumulation,including education, health, nutrition, and fertility. The common theme running through these chapters is the wayin which poverty today breeds poverty in the future by hampering the development of human capital. Thisresearch examines the determinants of educational enrollments, health and nutrition status, and fertility and offersinsights into which kinds of interventions are likely to be successful in building up the human capital of poorhouseholds.
We find that education, as currently provided in Vietnam, may or may not affect living standards. Primaryeducation is strongly associated with farm income and with wages in urban areas. Secondary education increasesthe productivity of nonfarm activities. But education is not always associated with higher incomes. Secondaryeducation has little additional impact on farm incomes and no effect on wages in rural areas, and primaryeducation has little effect on nonfarm self−employment activities.
When returns to education are low, households begin to remove their children from school. For example, manyrural households took their children out of lower secondary school when the market reforms began. Our analysissuggests that this choice was influenced by the poor quality of education and by expanded income−earningopportunities for the 12−17−year−old cohort. The government must understand that a program to expandsecondary education by building additional school buildings is not likely to have much impact. Keeping more ofthe 12−17−year−old group in school will require an increase in the return to this investment. At the school level,school quality could be improved and the curriculum altered. At the macroeconomic level, policies that promotelabor−intensive growth and expansion of the private sector will also be critical.
Although private returns to education vary among regions, the social returns to education appear quite strongthroughout. In Vietnam there is little evidence that poverty−that is, lack of income−is associated with malnutritionor high fertility. Education and information, however, do play key roles. For example, the educational status ofwomen, and that of their husbands, is a key determinant of fertility. Furthermore, child malnutrition is prevalentamong all income groups in Vietnam, even the richest, indicating that low incomes are not the cause. Improvinginformation must be a key part of a successful strategy to alleviate malnutrition. Simply put, income growth aloneis unlikely to solve the problems of malnutrition and rapid population growth; yet high fertility and malnutritionare likely to be sources of future poverty. The evidence supports the view that education and knowledge are keysto reducing fertility and malnutri−
tion today, which will strengthen households' income−earning ability in the future.
Household choices. One of the important implicit messages in this book is that the government needs tounderstand how households make decisions and factor this into its interventions. The applied microeconomicresearch in the book should enable policymakers to better appreciate the factors that influence household choices.For example, evidence presented in chapter 6 shows that most households are involved in private transfers. Thetransfers tend to go to the elderly for income support and to the young to build up human and physical capital.Households either receive or give transfers to other households, and for some groups these transfers make up asubstantial portion of household income.
Transfers tend to be allocated to vulnerable households, such as those containing the elderly or the disabled, orlow−income households, and thus serve as a form of insurance. In addition, private transfers help equalize thedistribution of income. They provide a larger boost to the resources of very poor households than do publictransfers. Yet while private transfers fill an important insurance role for all households and help raise theconsumption of the poorest, they do not obviate the need for public safety nets. The private transfers received bythe poorest are not nearly sufficient to lift them out of poverty, and some of the poor do not receive any privatetransfers. Moreover, such transfers are likely to perform inadequately in the face of community covariate shock.
Household Welfare and Vietnam's Transition
Lessons Learned 32
Public safety nets have several advantages over private ones. For example, they widen the risk−sharing pool,helping to insure against widespread disasters that might impoverish entire private networks. Still, policymakersshould recognize that expanding the public safety net might well diminish the private safety net. The governmentcan learn about household vulnerability by studying private transfers and can try to target public safety nets whereprivate ones are unlikely to be sufficient. This is particularly important in Vietnam, since the government haslimited fiscal ability to finance a public safety net. Much of Vietnam's current safety net spending benefitshouseholds that are not very poor (World Bank 1995). These public transfers may crowd out private ones, andwould be much better used if they were effectively targeted to the poorest households.
In sum, the key to maintaining a high rate of poverty reduction in Vietnam is sustaining rapid, broadly basedgrowth for at least another one or two decades. In some cases there may be tradeoffs between short−term growthand redistributive policies that have an immediate impact on poverty. But the extent of the tradeoff is probably notgreat. Vietnam's current transfer programs are not effectively reaching the poor. If some of these resources wereredirected to basic education or to carefully chosen rural infrastructure investments, the likely impact would beboth an
immediate improvement in conditions for the poor and an acceleration of medium−term growth.
With good policies and a well−designed program of infrastructure investment, industrial and commercialactivities should expand in several locations around the country. The inevitable rural−urban migration canproceed without disruption if it is supported by programs that build up rural infrastructure and human capital. Onthe one hand, this will ensure a supply of healthy, literate workers to the expanding cities; on the other, theseactivities will raise the productivity and incomes of those who remain in rural areas. Thus policies andinvestments that promote growth in different regions of Vietnam can be both an effective long−term growthstrategy and the best poverty alleviation strategy.
Notes
The authors gratefully acknowledge excellent research assistance from Ky Viet Tran; helpful comments fromPaul Glewwe, Martin Ravallion, Dominique van de Walle, and an anonymous referee; and financial support fromthe World Bank's Research Support Budget (RPO 678−83).
1. A good example of this criticism is the nongovernmental organization (NGO) declaration at the United NationsConference on Women, held in Beijing in 1995: ''The global economy governed by international financialinstitutions, the World Trade Organization, and multinational corporations proposes structural adjustmentprograms for countries in the South in the name of fiscal health. The result is increasing poverty, debt, andunemployment."
2. See Fforde and de Vylder (1988) for a description and analysis of Vietnam's development strategy during theearly and mid−1980s.
3. The data are from Vietnam's General Statistical Office. Data for 1979−87 are cited in Fforde and de Vylder(1988, 88). All of the data in this chapter for 1988 and later are from official sources and are reported in theappendix tables to World Bank (1993b) and World Bank (1994).
Household Welfare and Vietnam's Transition
Notes 33
4. Before 1988, national accounts were calculated using the Net Material Product System (MPS). Vietnamsubsequently adopted the System of National Accounts (SNA) used by most countries and has calculated GDP in1989 market prices beginning with data for 1988. The MPS data for the pre−1998 period exclude some servicescounted as part of GDP in the SNA. More important in the case of Vietnam, production data were aggregatedusing the rather arbitrary fixed plan prices of 1982. We have made our own estimates of pre−1988 GDP bycombining the sectoral growth rates calculated using the MPS with the sectoral weights calculated using the SNA.This approach corrects for the main distortion in the 1982 fixed prices, which undervalued agricultural outputrelative to industrial output.
5. See Ljunggren (1993) for a discussion of the political and economic factors that led to doi moi, as well as adetailed description of the measures introduced during 1988−90.
6. Dollar (1994) analyzes the stabilization measures and the factors that led to their success.
7. Ronnas (1992) used survey data to demonstrate the extent to which the private sector in services andmanufacturing was cut off from formal credit channels in this period.
8. Dollar and Ljunggren (1998) provide details on trade reform measures and on the response of exports, imports,and foreign investment.
9. To get a reasonable estimate of national inequality in 1984, we examined the range of inequality among thedifferent regions in 1993. Gini coefficients for the different regions ranged from 0.24 to 0.38. We chose Lorenzcurves corresponding to Ginis of 0.24 (North−Central Coast), 0.30 (Central Highlands), 0.34 (national), and 0.38(Southeast).
10. Consumption is used as a proxy for income, which itself is used as an indicator of individual living standards.Experience with household surveys in lowincome countries has indicated that consumption data can be collectedmore accurately than income data.
11. We tried two different specifications of the Lorenz curve−the general quadratic Lorenz curve (Villasenor andArnold 1984) and the Beta, Lorenz curve (Kakwani 1980). These are described in Ravallion and Datt (1992). Thecurves are constructed using the software program POVCAL (Chen, Datt, and Ravallion 1992).
12. We repeated this analysis using a lower poverty line of 800,000 dong (rather than the national average of 1.2million) to provide more sensitivity when examining the 1984 poverty rates. Using this lower line, the povertyrate was estimated at 30 percent of the population in 1993. The backward projections with different Ginis lead togreater dispersions in poverty rates in 1984 (ranging from 58 to 66 percent). Nevertheless, the difference stillappears modest.
13. These regional projections are based on the simplifying assumptions that income distribution within eachregion remains constant and that the population growth rate is the same in all regions.
Household Welfare and Vietnam's Transition
Notes 34
14. For a more complete discussion of the role of government (particularly in developing countries), see WorldBank (1997).
References
Anand, Sudhir, and Ravi S. M. Kanbur. 1993. "Inequality and Development: A Critique." Journal of DevelopmentEconomics 41(1): 19−43.
Bruno, Michael, Martin Ravallion, and Lyn Squire. 1995. "Equity and Growth in Developing Countries: Old andNew Perspectives on the Policy Issues." World Bank, Policy Research Department, Washington, D.C.
Chen, Shaohua, Gaurav Datt, and Martin Ravallion. 1992. "POVCAL." World Bank, Policy ResearchDepartment, Washington, D.C.
_____. 1994. "Is Poverty Increasing in the Developing World?" World Bank, Policy Research Department,Washington, D.C.
Dapice, David, Jonathan Haughton, and Dwight Perkins, eds. 1996. In Search of the
Dragon's Tail: Economic Reform in Vietnam. Cambridge, Mass.: Harvard University Press.
Desai, Padma, ed. 1998. Going Global: Transition from Plan to Market in the World Economy. Cambridge,Mass.: MIT Press.
Dollar, David. 1994. "Macroeconomic Management and the Transition to the Market in Vietnam." Journal ofComparative Economics 18: 357−75.
______. 1996. "Economic Reform, Openness and Vietnam's Entry into ASEAN." ASEAN Economic Bulletin 13:169−84.
Dollar, David, and Börje Ljunggren. 1998. "Macroeconomic Adjustment and Structural Reform in an OpenTransition Economy: The Case of Vietnam." In Padma Desai, ed., Going Global: Transition from Plan to Marketin the World Economy. Cambridge, Mass.: MIT Press.
Fforde, Adam, and Stefan de Vylder. 1988. Vietnam: An Economy in Transition. Stockholm: SwedishInternational Development Authority.
Johanson, Frida. 1993. Poverty Reduction in East Asia: The Silent Revolution. World Bank Discussion Paper 203.Washington, D.C.
Kakwani, Nanak. 1980. Income Inequality and Poverty: Methods of Estimation and Policy Applications. Oxford:Oxford University Press.
Knowles, James, Jere Behrman, Benjamin Diokono, and Keith Mclnnes. 1996. "Key Issues in the Financing ofVietnam's Social Services." Report prepared for the government of Vietnam and the Asian Development Bank.Abt Associates, Bethesda, Md.
Kuznets, Simon. 1965. Economic Growth and Structure. New York: Norton.
Ljunggren, Börje, ed. 1993. The Challenge of Reform in Indochina. Cambridge, Mass.: Harvard University Press.
Household Welfare and Vietnam's Transition
References 35
Ravallion, Martin. 1994. "Poverty Comparisons." Fundamentals of Pure and Applied Economics 56. Chur,Switzerland: Harwood Academic Press.
Ravallion, Martin, and Shaohua Chen. 1994. "An Update on Rural Poverty in China." World Bank, PolicyResearch Department, Washington, D.C.
Ravallion, Martin, and Gaurav Datt. 1992. "Growth and Redistribution Components of Changes in PovertyMeasures: A Decomposition with Applications to Brazil and India in the 1980s." Journal of DevelopmentEconomics 38: 275−95.
Riedel, James. 1992. "Vietnam: On the Trail of the Tigers." Working paper. Johns Hopkins Univ., School forAdvanced International Studies, Washington, D.C.
Ronnas, Per. 1992. Employment Generation through Private Entrepreneurship in Vietnam. Geneva: InternationalLabour Office.
Sachs, Jeffrey, and Andrew Warner. 1995. "Economic Reform and the Process of Global Integration." BrookingsPapers on Economic Activity 1. Brookings Institution, Washington, D.C.
UNDP (United Nations Development Programme). 1997. "Report on Spontaneous Migration Survey in Hanoi."VIE/95/004. Center for Population and Human Resources, New York.
Vietnam, Government of. 1995. Socio−Economic Development and Investment Requirements for the Five Years1996−2000. Hanoi.
Villasenor, J., and B. C. Arnold. 1984. "The General Quadratic Lorenz Curve." Technical report. Colegio dePostgraduados, Mexico City.
World Bank. 1992. China: Strategies for Reducing Poverty in the 1990s. Washington, D.C.
_____. 1993a. The East Asian Miracle: Economic Growth and Public Policy. New York: Oxford UniversityPress.
_____. 1993b. "Vietnam: Transition to the Market." Report 11902−VN. East Asia and Pacific Region,Washington, D.C.
_____. 1994. "Vietnam: Public Sector Management and Private Sector Incentives." Report 13143−VN. East Asiaand Pacific Region, Washington, D.C.
_____. 1995. "Vietnam: Poverty Assessment and Strategy." Report 13442−VN. East Asia and Pacific Region,Washington, D.C.
_____. 1996. World Development Report 1996: From Plan to Market. New York: Oxford University Press.
_____. 1997. World Development Report: The State in a Changing World. New York: Oxford University Press.
Household Welfare and Vietnam's Transition
References 36
2—Poverty and Inequality in the Early Reform Period
David Dollar and Paul Glewwe
Despite impressive economic growth in the past few years, as documented in chapter 1, Vietnam remains one ofthe poorest countries in the world. While lack of data precludes a detailed analysis of poverty and inequality inVietnam in the 1980s and earlier, the 1992−93 Vietnam Living Standards Survey (VNLSS) offers a wealth of datawith which to investigate household welfare at an early point in Vietnam's reform. This chapter provides a broaddescriptive analysis of poverty and inequality in Vietnam based on those data. The information presented hereestablishes a context for more detailed analyses of specific aspects of household welfare in Vietnam in laterchapters.
Data Available for Examining Poverty and Inequality in Vietnam
To analyze poverty and inequality, data are needed from a sample of individual households, since average levelsof income provide no information about the distribution of income across households and, consequently, areconsistent with a wide range of possible levels of poverty. Until the early 1990s data collection in Vietnam closelyfollowed the system developed in the former Soviet Union. At the national level this means that estimates ofeconomic production were based on the Net Material Product System, as opposed to the System of NationalAccounts (see chapter 1, note 4). Vietnam's use of the Soviet system of household data collection in the 1980s andearlier emphasized separate surveys for different kinds of workers, such as factory workers and farmers. Thisapproach leads to problems for analysis for two reasons: families that have several types of workers may beovercounted when separate surveys are combined, and families with nonworking members (unemployed, retired)are excluded from all
such surveys. An additional problem arose in the 1980s because financial constraints in Vietnam's GeneralStatistical Office led to substantial reductions in the number of households sampled; in any given year only a fewprovinces were surveyed (out of a total of 52 provinces in Vietnam). Yet another problem is due to a major switchin the method of collecting expenditure data−in the 1970s household expenditure diaries were replaced by directquestions asked by interviewers. Such a fundamental change in survey design complicates attempts to assesschanges in household welfare as measured by consumption expenditures.
In general, because of these problems and others it is difficult, if not impossible, to use data from past householdsurveys to analyze changes in poverty and inequality before the early 1990s. Fortunately, this dearth ofinformation ended upon the successful completion of the 1992−93 VNLSS, jointly conducted by the StatePlanning Committee and the General Statistical Office. This multitopic household survey covered 4,800Vietnamese households from all regions of Vietnam. The data were collected between October 1992 and October1993. The survey is patterned after the World Bank's Living Standards Measurement Study (LSMS) householdsurveys.1 The VNLSS is the first nationally representative general−purpose household survey (in the sense ofcollecting income and expenditure data) ever conducted in Vietnam. Preparations are currently under way for anew survey in 1998.
A brief description of the data collected gives a general idea of the wealth of information available from theVNLSS (see the appendix at the end of this book for a detailed description). The household questionnaire collectsdetailed data on household composition, education, health, employment, migration, housing, fertility, agriculturalactivities, nonfarm self−employment, food and nonfood expenditures, income, credit and savings, andanthropometric measurements (height, weight, and upper arm circumference). In addition, a communityquestionnaire was completed in all rural areas (80 percent of the households surveyed) that collected data on
Household Welfare and Vietnam's Transition
2— Poverty and Inequality in the Early Reform Period 37
demographic structure, economic activities, infrastructure, schools, health facilities, and agricultural activities(including local wage rates). Finally, price data were collected from all sampling areas. For rural areas a separateprice questionnaire was completed, while in urban areas comparable price data already collected by Vietnam'sGeneral Statistical Office were used.
Household Characteristics and Household Welfare in Vietnam
Before directly analyzing inequality and poverty in Vietnam, it is useful to get an overall picture of Vietnamesehouseholds. This section begins by examining the basic characteristics of Vietnamese households, and thenexamines how those characteristics are related to household welfare.
Characteristics of Vietnamese Households
General descriptive information on Vietnamese households, both for the country as a whole and by geographicregion, is presented in table 2.1. (A map showing the location of these regions appears at the beginning of thisbook.)
Eighty percent of Vietnamese live in rural areas, making it one of the least urbanized countries in the world.Among Vietnam's seven regions, the least urbanized are the Central Highlands and the North−Central Coast, eachwith more than 90 percent of their population living in rural areas. The most urbanized region is the Southeast,which contains Ho Chi Minh City (formerly known as Saigon), Vietnam's largest city. Nearly half of thepopulation in that region resides in urban areas.
Historically, the predominant religion practiced in Vietnam was Buddhism. Yet its current influence appearsrelatively weak−about 60 percent of the population indicates no religious affiliation and only about 27 percentidentify themselves as Buddhist. Christians (Catholics or Protestants) make up about 9 percent of the population,while 2 percent belong to other religious groups. Both Buddhists and Christians are more common in the souththan in the north, probably reflecting the impact of 40 years of socialist ideology in the north. The overwhelmingmajority of the population (about 85 percent) are ethnically Vietnamese (Kinh). The next largest group is theChinese−about 2.5 percent of the population. A variety of other groups each constitute 2 percent or less of thetotal population. The Chinese are heavily concentrated in the south, and several other ethnic groups haverelatively high concentrations in particular regions.
Table 2.1 also characterizes the population according to the occupation of household heads. Vietnam is mostly acountry of farmers, with about 65 percent of the population living in households whose head works in agriculture.This pattern is evident in all regions except the relatively urbanized Southeast. Each of the remaining occupationalcategories comprises 10 percent or less of the total population (when classified by the occupation of the householdhead). Given the prevalence of farm households, it is no surprise that 75 percent of Vietnamese live in householdsin which the head is selfemployed. In light of the socialist tradition, however, it is interesting that 9 percent of thepopulation belongs to households headed by someone working for a private employer; the comparable figure forpublic employment is only 5.5 percent. These data confirm a point made in chapter 1, that even at an early stageof reform Vietnam had a relatively large private sector. Private sector employment is far more prevalent in thesouth than in the north.
In some developing countries, such as India, female−headed households tend to be worse off than those headed bymen. Table 2.1 shows that female−headed households are fairly common in Vietnam, accounting for about 23percent of the population.2 According to VNLSS data, about 45 percent of female heads of household are marriedbut living apart from
Household Welfare and Vietnam's Transition
Household Characteristics and Household Welfare in Vietnam 38
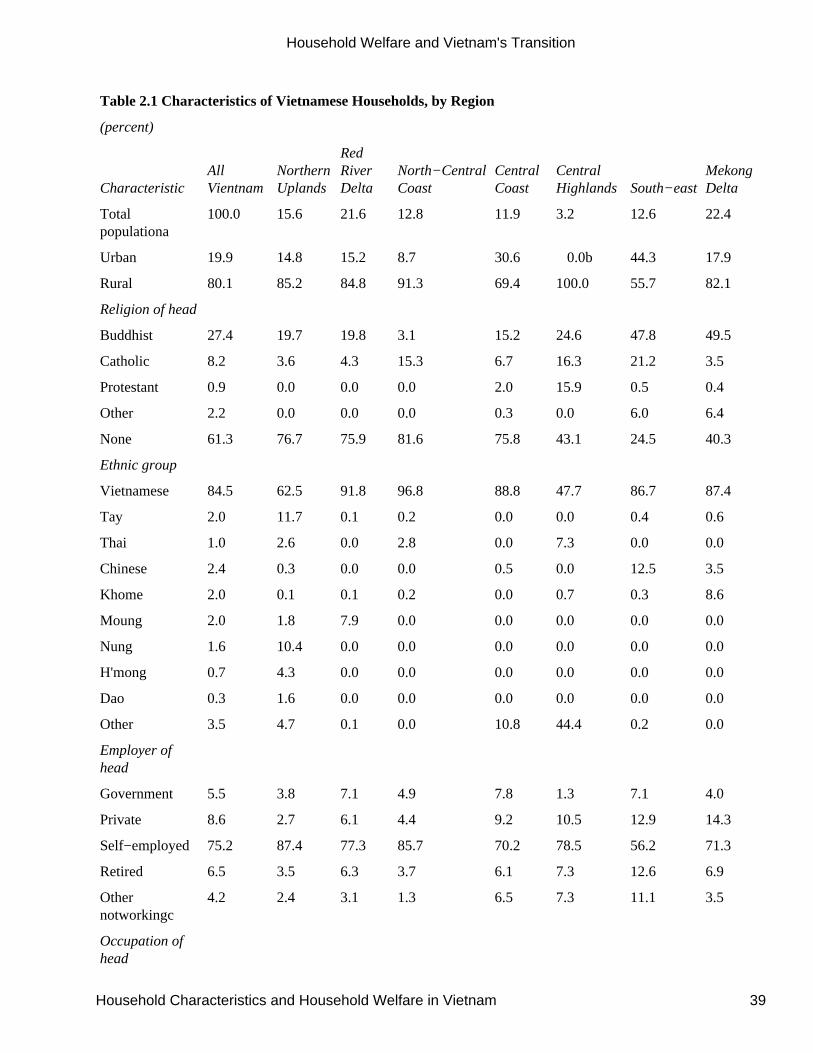
Table 2.1 Characteristics of Vietnamese Households, by Region
(percent)
CharacteristicAllVientnam
NorthernUplands
RedRiverDelta
North−CentralCoast
CentralCoast
CentralHighlands South−east
MekongDelta
Totalpopulationa
100.0 15.6 21.6 12.8 11.9 3.2 12.6 22.4
Urban 19.9 14.8 15.2 8.7 30.6 0.0b 44.3 17.9
Rural 80.1 85.2 84.8 91.3 69.4 100.0 55.7 82.1
Religion of head
Buddhist 27.4 19.7 19.8 3.1 15.2 24.6 47.8 49.5
Catholic 8.2 3.6 4.3 15.3 6.7 16.3 21.2 3.5
Protestant 0.9 0.0 0.0 0.0 2.0 15.9 0.5 0.4
Other 2.2 0.0 0.0 0.0 0.3 0.0 6.0 6.4
None 61.3 76.7 75.9 81.6 75.8 43.1 24.5 40.3
Ethnic group
Vietnamese 84.5 62.5 91.8 96.8 88.8 47.7 86.7 87.4
Tay 2.0 11.7 0.1 0.2 0.0 0.0 0.4 0.6
Thai 1.0 2.6 0.0 2.8 0.0 7.3 0.0 0.0
Chinese 2.4 0.3 0.0 0.0 0.5 0.0 12.5 3.5
Khome 2.0 0.1 0.1 0.2 0.0 0.7 0.3 8.6
Moung 2.0 1.8 7.9 0.0 0.0 0.0 0.0 0.0
Nung 1.6 10.4 0.0 0.0 0.0 0.0 0.0 0.0
H'mong 0.7 4.3 0.0 0.0 0.0 0.0 0.0 0.0
Dao 0.3 1.6 0.0 0.0 0.0 0.0 0.0 0.0
Other 3.5 4.7 0.1 0.0 10.8 44.4 0.2 0.0
Employer ofhead
Government 5.5 3.8 7.1 4.9 7.8 1.3 7.1 4.0
Private 8.6 2.7 6.1 4.4 9.2 10.5 12.9 14.3
Self−employed 75.2 87.4 77.3 85.7 70.2 78.5 56.2 71.3
Retired 6.5 3.5 6.3 3.7 6.1 7.3 12.6 6.9
Othernotworkingc
4.2 2.4 3.1 1.3 6.5 7.3 11.1 3.5
Occupation ofhead
Household Welfare and Vietnam's Transition
Household Characteristics and Household Welfare in Vietnam 39
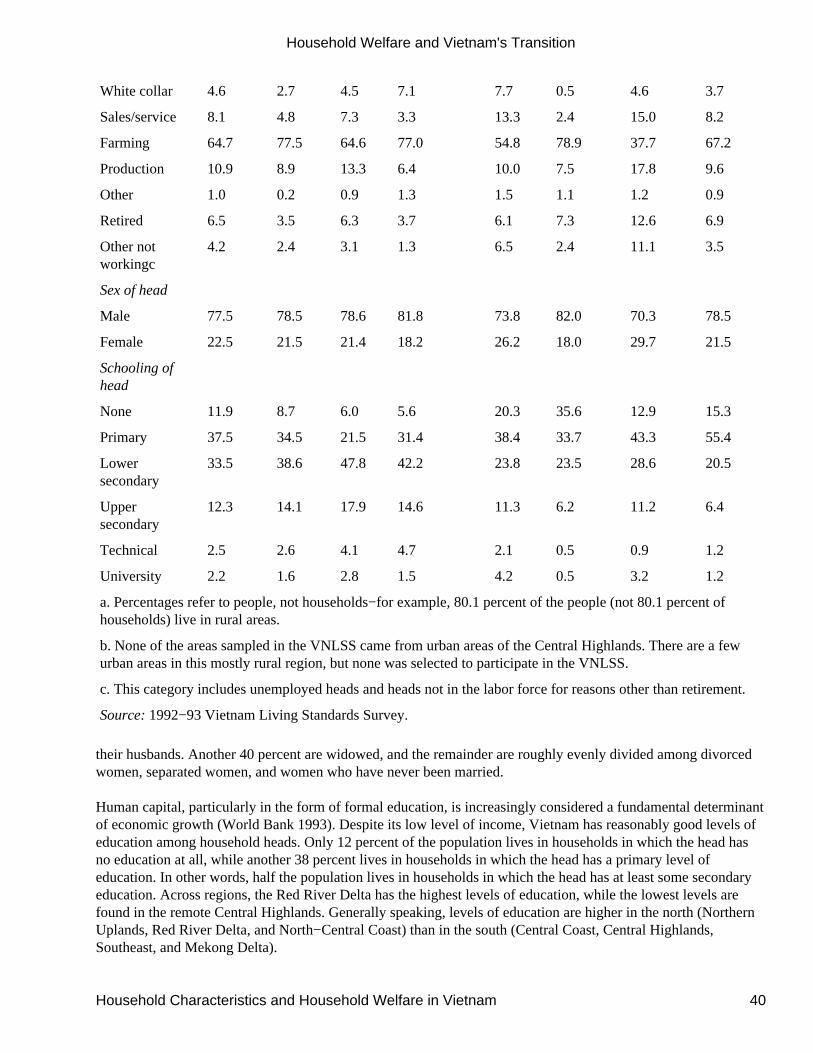
White collar 4.6 2.7 4.5 7.1 7.7 0.5 4.6 3.7
Sales/service 8.1 4.8 7.3 3.3 13.3 2.4 15.0 8.2
Farming 64.7 77.5 64.6 77.0 54.8 78.9 37.7 67.2
Production 10.9 8.9 13.3 6.4 10.0 7.5 17.8 9.6
Other 1.0 0.2 0.9 1.3 1.5 1.1 1.2 0.9
Retired 6.5 3.5 6.3 3.7 6.1 7.3 12.6 6.9
Other notworkingc
4.2 2.4 3.1 1.3 6.5 2.4 11.1 3.5
Sex of head
Male 77.5 78.5 78.6 81.8 73.8 82.0 70.3 78.5
Female 22.5 21.5 21.4 18.2 26.2 18.0 29.7 21.5
Schooling ofhead
None 11.9 8.7 6.0 5.6 20.3 35.6 12.9 15.3
Primary 37.5 34.5 21.5 31.4 38.4 33.7 43.3 55.4
Lowersecondary
33.5 38.6 47.8 42.2 23.8 23.5 28.6 20.5
Uppersecondary
12.3 14.1 17.9 14.6 11.3 6.2 11.2 6.4
Technical 2.5 2.6 4.1 4.7 2.1 0.5 0.9 1.2
University 2.2 1.6 2.8 1.5 4.2 0.5 3.2 1.2
a. Percentages refer to people, not households−for example, 80.1 percent of the people (not 80.1 percent ofhouseholds) live in rural areas.
b. None of the areas sampled in the VNLSS came from urban areas of the Central Highlands. There are a fewurban areas in this mostly rural region, but none was selected to participate in the VNLSS.
c. This category includes unemployed heads and heads not in the labor force for reasons other than retirement.
Source: 1992−93 Vietnam Living Standards Survey.
their husbands. Another 40 percent are widowed, and the remainder are roughly evenly divided among divorcedwomen, separated women, and women who have never been married.
Human capital, particularly in the form of formal education, is increasingly considered a fundamental determinantof economic growth (World Bank 1993). Despite its low level of income, Vietnam has reasonably good levels ofeducation among household heads. Only 12 percent of the population lives in households in which the head hasno education at all, while another 38 percent lives in households in which the head has a primary level ofeducation. In other words, half the population lives in households in which the head has at least some secondaryeducation. Across regions, the Red River Delta has the highest levels of education, while the lowest levels arefound in the remote Central Highlands. Generally speaking, levels of education are higher in the north (NorthernUplands, Red River Delta, and North−Central Coast) than in the south (Central Coast, Central Highlands,Southeast, and Mekong Delta).
Household Welfare and Vietnam's Transition
Household Characteristics and Household Welfare in Vietnam 40
Measuring Household Welfare Using per Capita Consumption Expenditures
For both descriptive and analytical purposes it is convenient to have a single indicator of household welfare alongwhich to measure the well−being of households, even at the cost of some simplification. The most obviouscandidate is household income per capita. Yet income itself may not be the concept one has in mind, becausefamilies with large amounts of savings can draw on them to maintain a relatively high standard of living even iftheir current income is low. Conversely, families that are heavily indebted may have relatively high incomes butlow levels of consumption because part of their income is used to pay off their debts. For these reasonsconsumption, usually measured in terms of household expenditures, is the best single indicator of householdwelfare. In this book we measure household welfare in terms of household consumption per capita.3 In somechapters, however, the focus is on other dimensions of the quality of life−such as health, nutrition, andschooling−that are correlated, though not perfectly, with household consumption.
Because this book makes extensive use of the VNLSS expenditure data to examine household welfare, it isworthwhile to discuss how the total consumption expenditure variable was constructed. (For more details, see theappendix at the end of this chapter.) Total annual household consumption expenditure is the sum of fivecomponents:
Explicit consumption expenditures on food and (nondurable) nonfood items.
Value of food items produced and then consumed by the household.
Value of goods received in−kind from employers (housing, food, clothing).
Estimated rental (use) value of durable goods owned by the household.
Estimated rental value of the dwelling occupied by the household.
The VNLSS household questionnaire asks for household expenditures on 45 different food items, as well as onthe value of foodstuffs produced and consumed by the household. Because the Tet (new year) holiday leads tounusually large expenditures on some food items, additional questions are asked explicitly for Tet and otherholidays. Expenditures on 68 nonfood items are also recorded, though we exclude a few that are not householdconsumption (examples include gifts and insurance). Finally, other parts of the survey questionnaire collect dataon health, education, and utility expenditures.
In some cases workers receive goods or services from their employers in addition to their wages. The VNLSScollects information on such payments for each worker's principal occupation; this is added to explicitconsumption expenditures.4 Durable goods must also be given special treatment, because their durability impliesthat they raise household welfare for several years after their purchase, and thus the purchase value of each goodis not fully "consumed" in the year it is bought. To spread out this consumption over time, information on currentvalue and purchase value are used to calculate depreciation rates. These rates can then be used (along with the realrate of interest) to calculate an annual use value for 13 kinds of durable goods. Finally, the annual rental value ofthe largest durable good, housing, must be calculated. This was done by regressing current estimated resale valueon a variety of dwelling characteristics. Based on a small number of households that actually rented housing at amarket rate, it was assumed that the annual rental value was 3 percent of the current predicted value of thehousing.
Summing all the above components of consumption yields a comprehensive measure of household welfare. Notethat regional prices have been used for these calculations so that the final measure is real consumption. Toaccount for household size, total consumption is divided by household size to obtain per capita household
Household Welfare and Vietnam's Transition
Measuring Household Welfare Using per Capita Consumption Expenditures 41
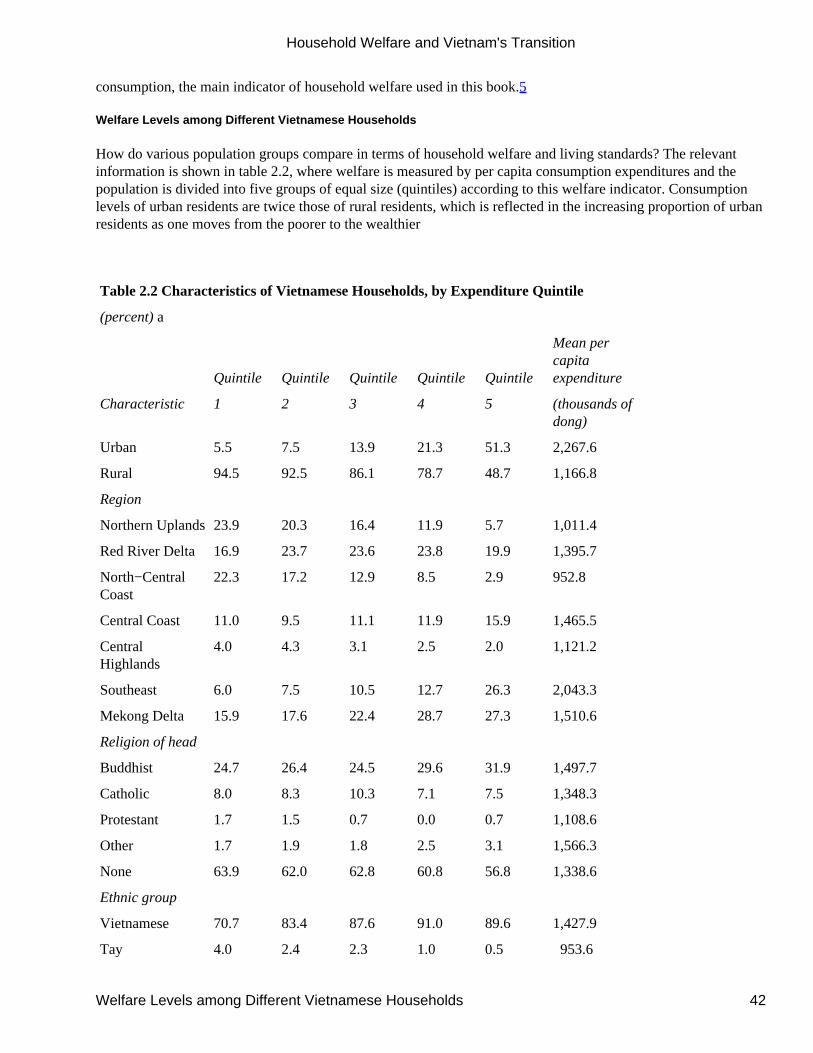
consumption, the main indicator of household welfare used in this book.5
Welfare Levels among Different Vietnamese Households
How do various population groups compare in terms of household welfare and living standards? The relevantinformation is shown in table 2.2, where welfare is measured by per capita consumption expenditures and thepopulation is divided into five groups of equal size (quintiles) according to this welfare indicator. Consumptionlevels of urban residents are twice those of rural residents, which is reflected in the increasing proportion of urbanresidents as one moves from the poorer to the wealthier
Table 2.2 Characteristics of Vietnamese Households, by Expenditure Quintile
(percent) a
Quintile Quintile Quintile Quintile Quintile
Mean percapitaexpenditure
Characteristic 1 2 3 4 5 (thousands ofdong)
Urban 5.5 7.5 13.9 21.3 51.3 2,267.6
Rural 94.5 92.5 86.1 78.7 48.7 1,166.8
Region
Northern Uplands23.9 20.3 16.4 11.9 5.7 1,011.4
Red River Delta 16.9 23.7 23.6 23.8 19.9 1,395.7
North−CentralCoast
22.3 17.2 12.9 8.5 2.9 952.8
Central Coast 11.0 9.5 11.1 11.9 15.9 1,465.5
CentralHighlands
4.0 4.3 3.1 2.5 2.0 1,121.2
Southeast 6.0 7.5 10.5 12.7 26.3 2,043.3
Mekong Delta 15.9 17.6 22.4 28.7 27.3 1,510.6
Religion of head
Buddhist 24.7 26.4 24.5 29.6 31.9 1,497.7
Catholic 8.0 8.3 10.3 7.1 7.5 1,348.3
Protestant 1.7 1.5 0.7 0.0 0.7 1,108.6
Other 1.7 1.9 1.8 2.5 3.1 1,566.3
None 63.9 62.0 62.8 60.8 56.8 1,338.6
Ethnic group
Vietnamese 70.7 83.4 87.6 91.0 89.6 1,427.9
Tay 4.0 2.4 2.3 1.0 0.5 953.6
Household Welfare and Vietnam's Transition
Welfare Levels among Different Vietnamese Households 42
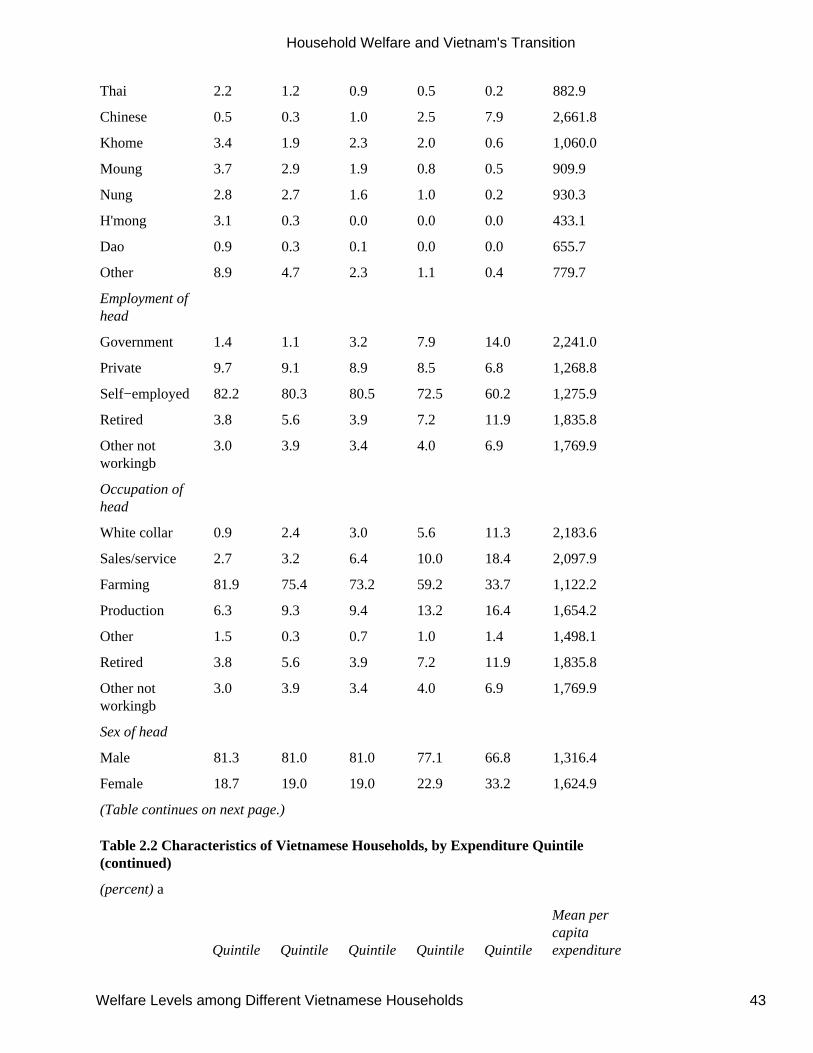
Thai 2.2 1.2 0.9 0.5 0.2 882.9
Chinese 0.5 0.3 1.0 2.5 7.9 2,661.8
Khome 3.4 1.9 2.3 2.0 0.6 1,060.0
Moung 3.7 2.9 1.9 0.8 0.5 909.9
Nung 2.8 2.7 1.6 1.0 0.2 930.3
H'mong 3.1 0.3 0.0 0.0 0.0 433.1
Dao 0.9 0.3 0.1 0.0 0.0 655.7
Other 8.9 4.7 2.3 1.1 0.4 779.7
Employment ofhead
Government 1.4 1.1 3.2 7.9 14.0 2,241.0
Private 9.7 9.1 8.9 8.5 6.8 1,268.8
Self−employed 82.2 80.3 80.5 72.5 60.2 1,275.9
Retired 3.8 5.6 3.9 7.2 11.9 1,835.8
Other notworkingb
3.0 3.9 3.4 4.0 6.9 1,769.9
Occupation ofhead
White collar 0.9 2.4 3.0 5.6 11.3 2,183.6
Sales/service 2.7 3.2 6.4 10.0 18.4 2,097.9
Farming 81.9 75.4 73.2 59.2 33.7 1,122.2
Production 6.3 9.3 9.4 13.2 16.4 1,654.2
Other 1.5 0.3 0.7 1.0 1.4 1,498.1
Retired 3.8 5.6 3.9 7.2 11.9 1,835.8
Other notworkingb
3.0 3.9 3.4 4.0 6.9 1,769.9
Sex of head
Male 81.3 81.0 81.0 77.1 66.8 1,316.4
Female 18.7 19.0 19.0 22.9 33.2 1,624.9
(Table continues on next page.)
Table 2.2 Characteristics of Vietnamese Households, by Expenditure Quintile(continued)
(percent) a
Quintile Quintile Quintile Quintile Quintile
Mean percapitaexpenditure
Household Welfare and Vietnam's Transition
Welfare Levels among Different Vietnamese Households 43
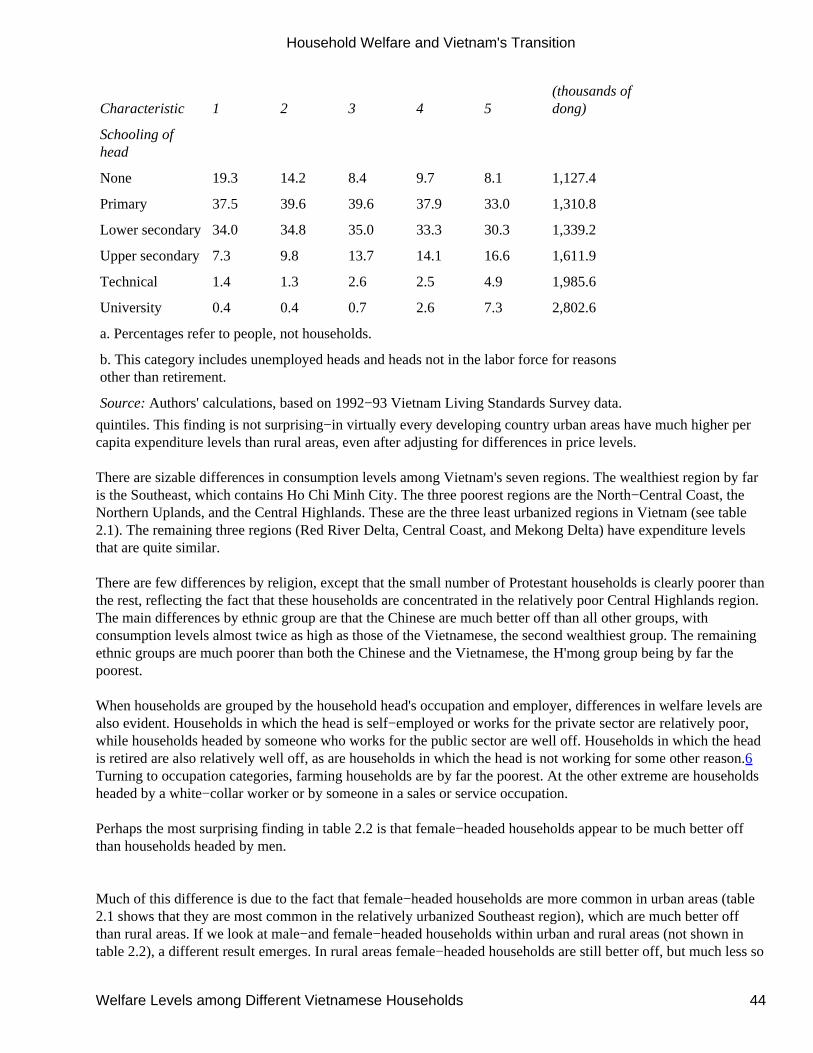
Characteristic 1 2 3 4 5(thousands ofdong)
Schooling ofhead
None 19.3 14.2 8.4 9.7 8.1 1,127.4
Primary 37.5 39.6 39.6 37.9 33.0 1,310.8
Lower secondary34.0 34.8 35.0 33.3 30.3 1,339.2
Upper secondary7.3 9.8 13.7 14.1 16.6 1,611.9
Technical 1.4 1.3 2.6 2.5 4.9 1,985.6
University 0.4 0.4 0.7 2.6 7.3 2,802.6
a. Percentages refer to people, not households.
b. This category includes unemployed heads and heads not in the labor force for reasonsother than retirement.
Source: Authors' calculations, based on 1992−93 Vietnam Living Standards Survey data.
quintiles. This finding is not surprising−in virtually every developing country urban areas have much higher percapita expenditure levels than rural areas, even after adjusting for differences in price levels.
There are sizable differences in consumption levels among Vietnam's seven regions. The wealthiest region by faris the Southeast, which contains Ho Chi Minh City. The three poorest regions are the North−Central Coast, theNorthern Uplands, and the Central Highlands. These are the three least urbanized regions in Vietnam (see table2.1). The remaining three regions (Red River Delta, Central Coast, and Mekong Delta) have expenditure levelsthat are quite similar.
There are few differences by religion, except that the small number of Protestant households is clearly poorer thanthe rest, reflecting the fact that these households are concentrated in the relatively poor Central Highlands region.The main differences by ethnic group are that the Chinese are much better off than all other groups, withconsumption levels almost twice as high as those of the Vietnamese, the second wealthiest group. The remainingethnic groups are much poorer than both the Chinese and the Vietnamese, the H'mong group being by far thepoorest.
When households are grouped by the household head's occupation and employer, differences in welfare levels arealso evident. Households in which the head is self−employed or works for the private sector are relatively poor,while households headed by someone who works for the public sector are well off. Households in which the headis retired are also relatively well off, as are households in which the head is not working for some other reason.6Turning to occupation categories, farming households are by far the poorest. At the other extreme are householdsheaded by a white−collar worker or by someone in a sales or service occupation.
Perhaps the most surprising finding in table 2.2 is that female−headed households appear to be much better offthan households headed by men.
Much of this difference is due to the fact that female−headed households are more common in urban areas (table2.1 shows that they are most common in the relatively urbanized Southeast region), which are much better offthan rural areas. If we look at male−and female−headed households within urban and rural areas (not shown intable 2.2), a different result emerges. In rural areas female−headed households are still better off, but much less so
Household Welfare and Vietnam's Transition
Welfare Levels among Different Vietnamese Households 44
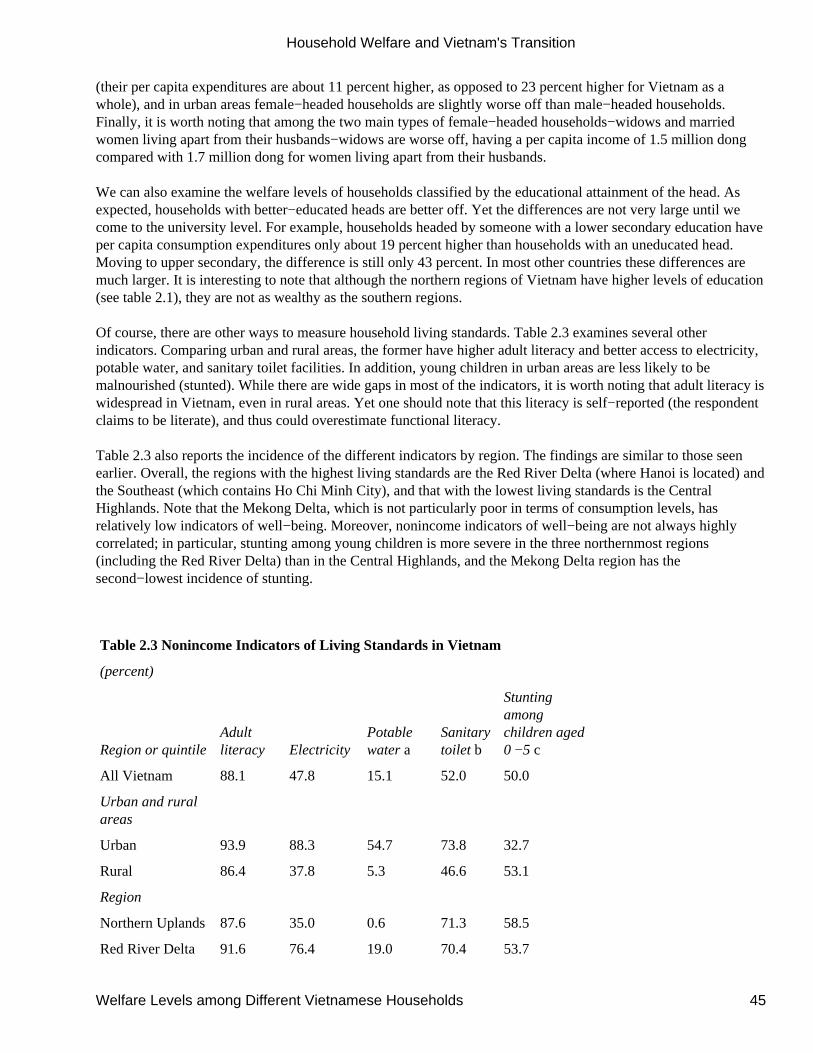
(their per capita expenditures are about 11 percent higher, as opposed to 23 percent higher for Vietnam as awhole), and in urban areas female−headed households are slightly worse off than male−headed households.Finally, it is worth noting that among the two main types of female−headed households−widows and marriedwomen living apart from their husbands−widows are worse off, having a per capita income of 1.5 million dongcompared with 1.7 million dong for women living apart from their husbands.
We can also examine the welfare levels of households classified by the educational attainment of the head. Asexpected, households with better−educated heads are better off. Yet the differences are not very large until wecome to the university level. For example, households headed by someone with a lower secondary education haveper capita consumption expenditures only about 19 percent higher than households with an uneducated head.Moving to upper secondary, the difference is still only 43 percent. In most other countries these differences aremuch larger. It is interesting to note that although the northern regions of Vietnam have higher levels of education(see table 2.1), they are not as wealthy as the southern regions.
Of course, there are other ways to measure household living standards. Table 2.3 examines several otherindicators. Comparing urban and rural areas, the former have higher adult literacy and better access to electricity,potable water, and sanitary toilet facilities. In addition, young children in urban areas are less likely to bemalnourished (stunted). While there are wide gaps in most of the indicators, it is worth noting that adult literacy iswidespread in Vietnam, even in rural areas. Yet one should note that this literacy is self−reported (the respondentclaims to be literate), and thus could overestimate functional literacy.
Table 2.3 also reports the incidence of the different indicators by region. The findings are similar to those seenearlier. Overall, the regions with the highest living standards are the Red River Delta (where Hanoi is located) andthe Southeast (which contains Ho Chi Minh City), and that with the lowest living standards is the CentralHighlands. Note that the Mekong Delta, which is not particularly poor in terms of consumption levels, hasrelatively low indicators of well−being. Moreover, nonincome indicators of well−being are not always highlycorrelated; in particular, stunting among young children is more severe in the three northernmost regions(including the Red River Delta) than in the Central Highlands, and the Mekong Delta region has thesecond−lowest incidence of stunting.
Table 2.3 Nonincome Indicators of Living Standards in Vietnam
(percent)
Region or quintileAdultliteracy Electricity
Potablewater a
Sanitarytoilet b
Stuntingamongchildren aged0 −5 c
All Vietnam 88.1 47.8 15.1 52.0 50.0
Urban and ruralareas
Urban 93.9 88.3 54.7 73.8 32.7
Rural 86.4 37.8 5.3 46.6 53.1
Region
Northern Uplands 87.6 35.0 0.6 71.3 58.5
Red River Delta 91.6 76.4 19.0 70.4 53.7
Household Welfare and Vietnam's Transition
Welfare Levels among Different Vietnamese Households 45
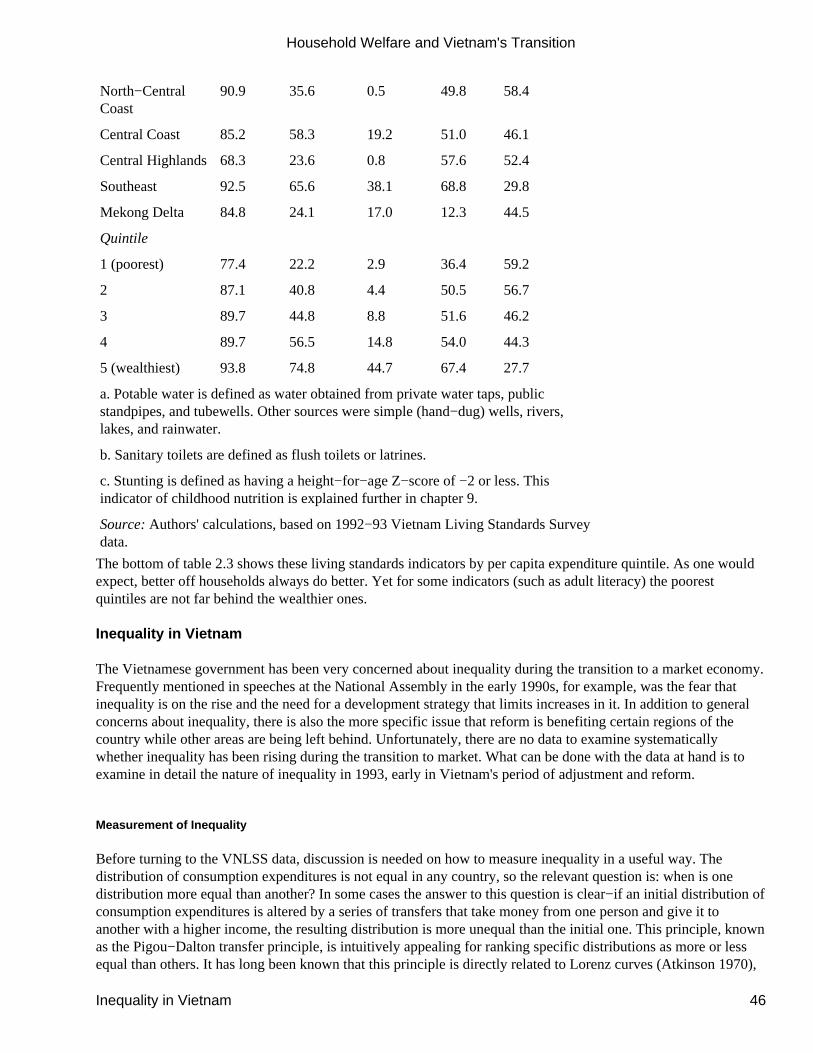
North−CentralCoast
90.9 35.6 0.5 49.8 58.4
Central Coast 85.2 58.3 19.2 51.0 46.1
Central Highlands 68.3 23.6 0.8 57.6 52.4
Southeast 92.5 65.6 38.1 68.8 29.8
Mekong Delta 84.8 24.1 17.0 12.3 44.5
Quintile
1 (poorest) 77.4 22.2 2.9 36.4 59.2
2 87.1 40.8 4.4 50.5 56.7
3 89.7 44.8 8.8 51.6 46.2
4 89.7 56.5 14.8 54.0 44.3
5 (wealthiest) 93.8 74.8 44.7 67.4 27.7
a. Potable water is defined as water obtained from private water taps, publicstandpipes, and tubewells. Other sources were simple (hand−dug) wells, rivers,lakes, and rainwater.
b. Sanitary toilets are defined as flush toilets or latrines.
c. Stunting is defined as having a height−for−age Z−score of −2 or less. Thisindicator of childhood nutrition is explained further in chapter 9.
Source: Authors' calculations, based on 1992−93 Vietnam Living Standards Surveydata.
The bottom of table 2.3 shows these living standards indicators by per capita expenditure quintile. As one wouldexpect, better off households always do better. Yet for some indicators (such as adult literacy) the poorestquintiles are not far behind the wealthier ones.
Inequality in Vietnam
The Vietnamese government has been very concerned about inequality during the transition to a market economy.Frequently mentioned in speeches at the National Assembly in the early 1990s, for example, was the fear thatinequality is on the rise and the need for a development strategy that limits increases in it. In addition to generalconcerns about inequality, there is also the more specific issue that reform is benefiting certain regions of thecountry while other areas are being left behind. Unfortunately, there are no data to examine systematicallywhether inequality has been rising during the transition to market. What can be done with the data at hand is toexamine in detail the nature of inequality in 1993, early in Vietnam's period of adjustment and reform.
Measurement of Inequality
Before turning to the VNLSS data, discussion is needed on how to measure inequality in a useful way. Thedistribution of consumption expenditures is not equal in any country, so the relevant question is: when is onedistribution more equal than another? In some cases the answer to this question is clear−if an initial distribution ofconsumption expenditures is altered by a series of transfers that take money from one person and give it toanother with a higher income, the resulting distribution is more unequal than the initial one. This principle, knownas the Pigou−Dalton transfer principle, is intuitively appealing for ranking specific distributions as more or lessequal than others. It has long been known that this principle is directly related to Lorenz curves (Atkinson 1970),
Household Welfare and Vietnam's Transition
Inequality in Vietnam 46
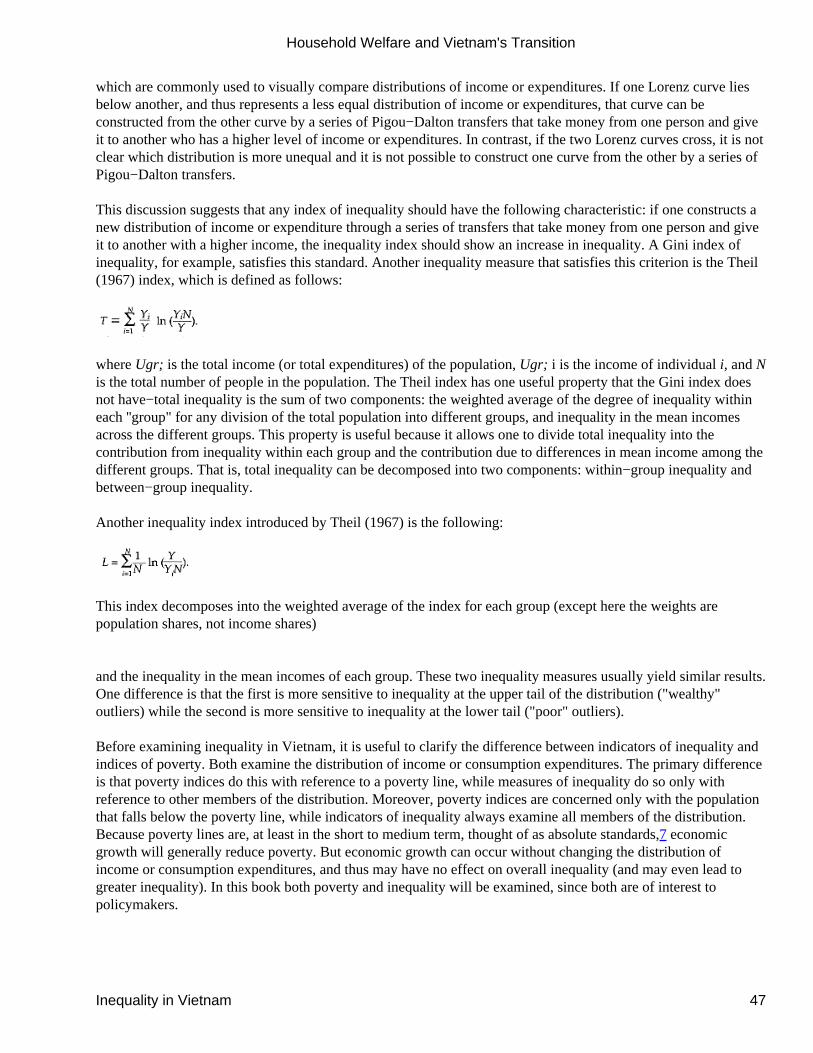
which are commonly used to visually compare distributions of income or expenditures. If one Lorenz curve liesbelow another, and thus represents a less equal distribution of income or expenditures, that curve can beconstructed from the other curve by a series of Pigou−Dalton transfers that take money from one person and giveit to another who has a higher level of income or expenditures. In contrast, if the two Lorenz curves cross, it is notclear which distribution is more unequal and it is not possible to construct one curve from the other by a series ofPigou−Dalton transfers.
This discussion suggests that any index of inequality should have the following characteristic: if one constructs anew distribution of income or expenditure through a series of transfers that take money from one person and giveit to another with a higher income, the inequality index should show an increase in inequality. A Gini index ofinequality, for example, satisfies this standard. Another inequality measure that satisfies this criterion is the Theil(1967) index, which is defined as follows:
where Ugr; is the total income (or total expenditures) of the population, Ugr; i is the income of individual i, and Nis the total number of people in the population. The Theil index has one useful property that the Gini index doesnot have−total inequality is the sum of two components: the weighted average of the degree of inequality withineach ''group" for any division of the total population into different groups, and inequality in the mean incomesacross the different groups. This property is useful because it allows one to divide total inequality into thecontribution from inequality within each group and the contribution due to differences in mean income among thedifferent groups. That is, total inequality can be decomposed into two components: within−group inequality andbetween−group inequality.
Another inequality index introduced by Theil (1967) is the following:
This index decomposes into the weighted average of the index for each group (except here the weights arepopulation shares, not income shares)
and the inequality in the mean incomes of each group. These two inequality measures usually yield similar results.One difference is that the first is more sensitive to inequality at the upper tail of the distribution ("wealthy"outliers) while the second is more sensitive to inequality at the lower tail ("poor" outliers).
Before examining inequality in Vietnam, it is useful to clarify the difference between indicators of inequality andindices of poverty. Both examine the distribution of income or consumption expenditures. The primary differenceis that poverty indices do this with reference to a poverty line, while measures of inequality do so only withreference to other members of the distribution. Moreover, poverty indices are concerned only with the populationthat falls below the poverty line, while indicators of inequality always examine all members of the distribution.Because poverty lines are, at least in the short to medium term, thought of as absolute standards,7 economicgrowth will generally reduce poverty. But economic growth can occur without changing the distribution ofincome or consumption expenditures, and thus may have no effect on overall inequality (and may even lead togreater inequality). In this book both poverty and inequality will be examined, since both are of interest topolicymakers.
Household Welfare and Vietnam's Transition
Inequality in Vietnam 47
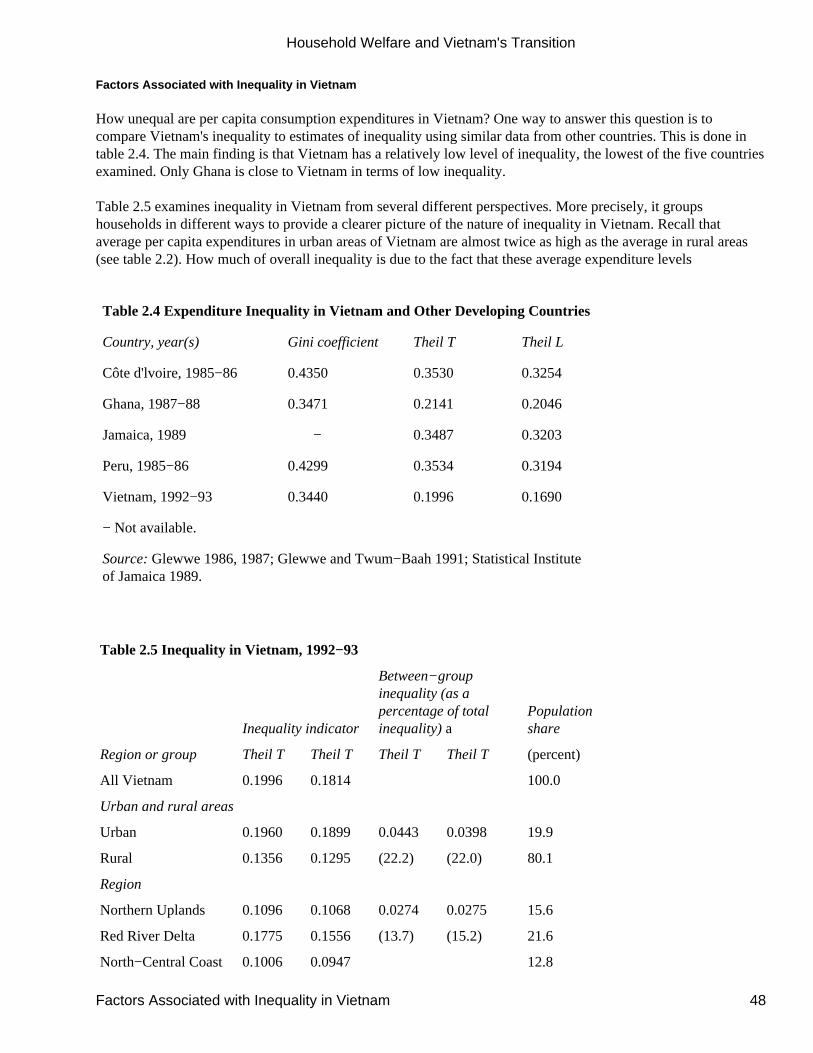
Factors Associated with Inequality in Vietnam
How unequal are per capita consumption expenditures in Vietnam? One way to answer this question is tocompare Vietnam's inequality to estimates of inequality using similar data from other countries. This is done intable 2.4. The main finding is that Vietnam has a relatively low level of inequality, the lowest of the five countriesexamined. Only Ghana is close to Vietnam in terms of low inequality.
Table 2.5 examines inequality in Vietnam from several different perspectives. More precisely, it groupshouseholds in different ways to provide a clearer picture of the nature of inequality in Vietnam. Recall thataverage per capita expenditures in urban areas of Vietnam are almost twice as high as the average in rural areas(see table 2.2). How much of overall inequality is due to the fact that these average expenditure levels
Table 2.4 Expenditure Inequality in Vietnam and Other Developing Countries
Country, year(s) Gini coefficient Theil T Theil L
Côte d'lvoire, 1985−86 0.4350 0.3530 0.3254
Ghana, 1987−88 0.3471 0.2141 0.2046
Jamaica, 1989 − 0.3487 0.3203
Peru, 1985−86 0.4299 0.3534 0.3194
Vietnam, 1992−93 0.3440 0.1996 0.1690
− Not available.
Source: Glewwe 1986, 1987; Glewwe and Twum−Baah 1991; Statistical Instituteof Jamaica 1989.
Table 2.5 Inequality in Vietnam, 1992−93
Inequality indicator
Between−groupinequality (as apercentage of totalinequality) a
Populationshare
Region or group Theil T Theil T Theil T Theil T (percent)
All Vietnam 0.1996 0.1814 100.0
Urban and rural areas
Urban 0.1960 0.1899 0.0443 0.0398 19.9
Rural 0.1356 0.1295 (22.2) (22.0) 80.1
Region
Northern Uplands 0.1096 0.1068 0.0274 0.0275 15.6
Red River Delta 0.1775 0.1556 (13.7) (15.2) 21.6
North−Central Coast 0.1006 0.0947 12.8
Household Welfare and Vietnam's Transition
Factors Associated with Inequality in Vietnam 48
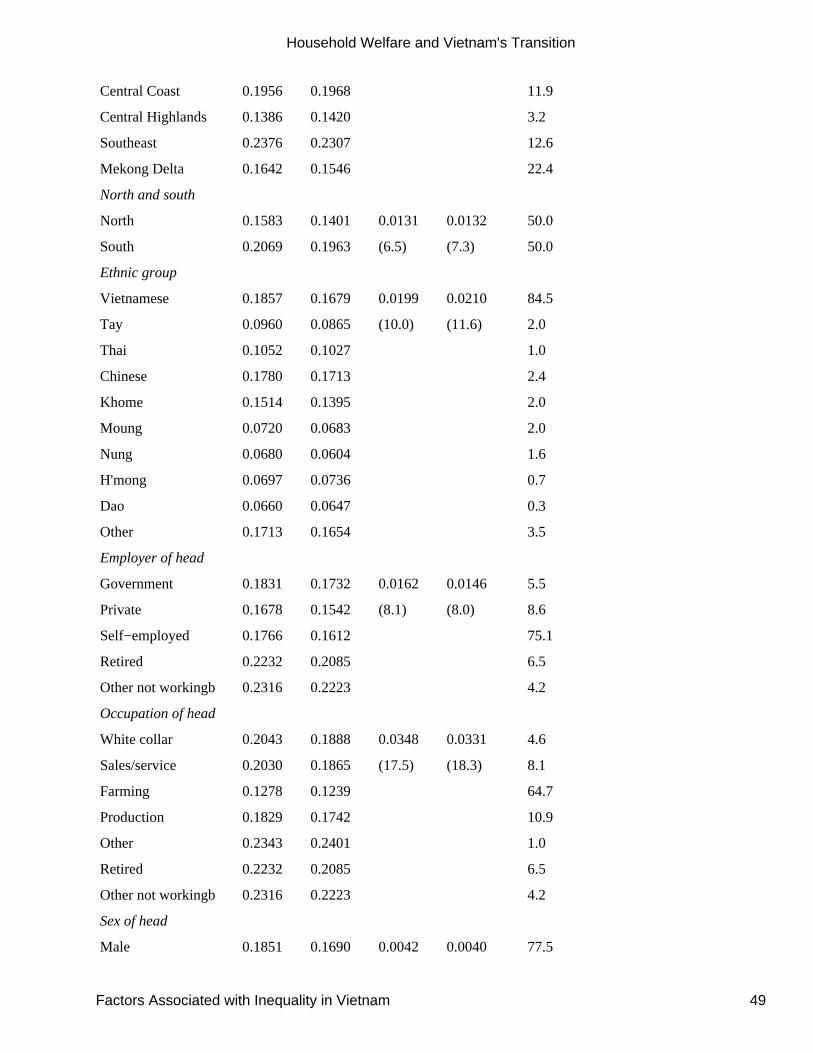
Central Coast 0.1956 0.1968 11.9
Central Highlands 0.1386 0.1420 3.2
Southeast 0.2376 0.2307 12.6
Mekong Delta 0.1642 0.1546 22.4
North and south
North 0.1583 0.1401 0.0131 0.0132 50.0
South 0.2069 0.1963 (6.5) (7.3) 50.0
Ethnic group
Vietnamese 0.1857 0.1679 0.0199 0.0210 84.5
Tay 0.0960 0.0865 (10.0) (11.6) 2.0
Thai 0.1052 0.1027 1.0
Chinese 0.1780 0.1713 2.4
Khome 0.1514 0.1395 2.0
Moung 0.0720 0.0683 2.0
Nung 0.0680 0.0604 1.6
H'mong 0.0697 0.0736 0.7
Dao 0.0660 0.0647 0.3
Other 0.1713 0.1654 3.5
Employer of head
Government 0.1831 0.1732 0.0162 0.0146 5.5
Private 0.1678 0.1542 (8.1) (8.0) 8.6
Self−employed 0.1766 0.1612 75.1
Retired 0.2232 0.2085 6.5
Other not workingb 0.2316 0.2223 4.2
Occupation of head
White collar 0.2043 0.1888 0.0348 0.0331 4.6
Sales/service 0.2030 0.1865 (17.5) (18.3) 8.1
Farming 0.1278 0.1239 64.7
Production 0.1829 0.1742 10.9
Other 0.2343 0.2401 1.0
Retired 0.2232 0.2085 6.5
Other not workingb 0.2316 0.2223 4.2
Sex of head
Male 0.1851 0.1690 0.0042 0.0040 77.5
Household Welfare and Vietnam's Transition
Factors Associated with Inequality in Vietnam 49
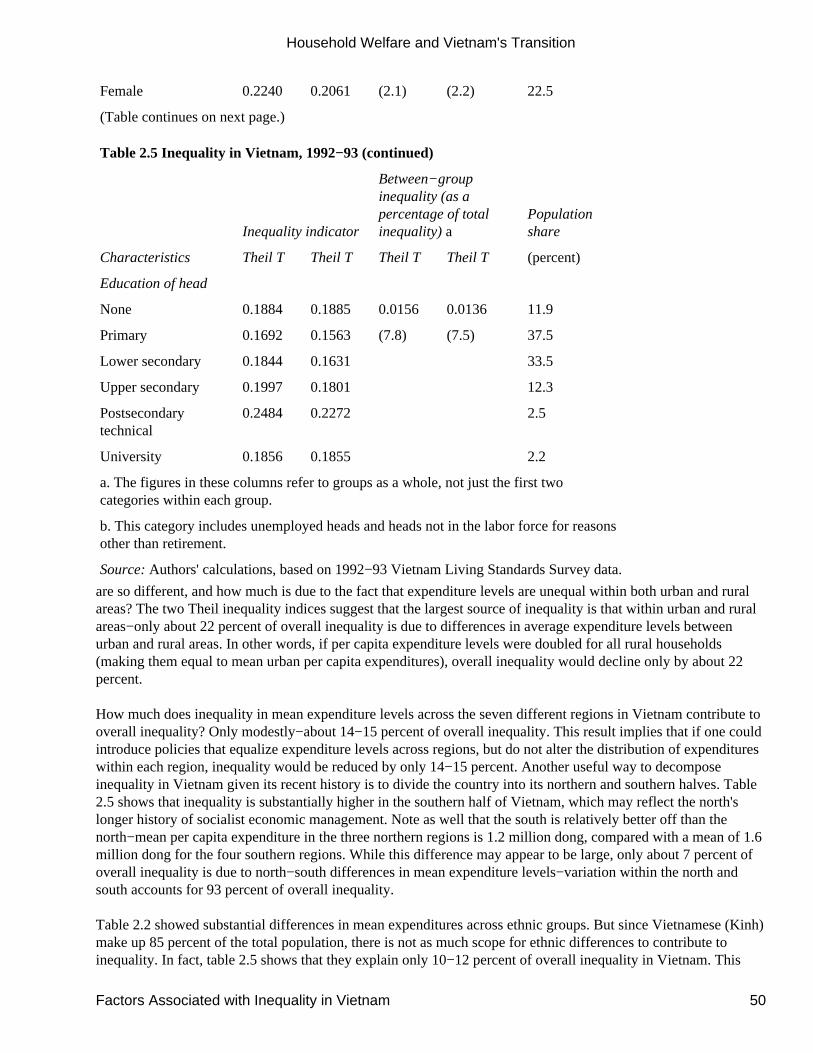
Female 0.2240 0.2061 (2.1) (2.2) 22.5
(Table continues on next page.)
Table 2.5 Inequality in Vietnam, 1992−93 (continued)
Inequality indicator
Between−groupinequality (as apercentage of totalinequality) a
Populationshare
Characteristics Theil T Theil T Theil T Theil T (percent)
Education of head
None 0.1884 0.1885 0.0156 0.0136 11.9
Primary 0.1692 0.1563 (7.8) (7.5) 37.5
Lower secondary 0.1844 0.1631 33.5
Upper secondary 0.1997 0.1801 12.3
Postsecondarytechnical
0.2484 0.2272 2.5
University 0.1856 0.1855 2.2
a. The figures in these columns refer to groups as a whole, not just the first twocategories within each group.
b. This category includes unemployed heads and heads not in the labor force for reasonsother than retirement.
Source: Authors' calculations, based on 1992−93 Vietnam Living Standards Survey data.
are so different, and how much is due to the fact that expenditure levels are unequal within both urban and ruralareas? The two Theil inequality indices suggest that the largest source of inequality is that within urban and ruralareas−only about 22 percent of overall inequality is due to differences in average expenditure levels betweenurban and rural areas. In other words, if per capita expenditure levels were doubled for all rural households(making them equal to mean urban per capita expenditures), overall inequality would decline only by about 22percent.
How much does inequality in mean expenditure levels across the seven different regions in Vietnam contribute tooverall inequality? Only modestly−about 14−15 percent of overall inequality. This result implies that if one couldintroduce policies that equalize expenditure levels across regions, but do not alter the distribution of expenditureswithin each region, inequality would be reduced by only 14−15 percent. Another useful way to decomposeinequality in Vietnam given its recent history is to divide the country into its northern and southern halves. Table2.5 shows that inequality is substantially higher in the southern half of Vietnam, which may reflect the north'slonger history of socialist economic management. Note as well that the south is relatively better off than thenorth−mean per capita expenditure in the three northern regions is 1.2 million dong, compared with a mean of 1.6million dong for the four southern regions. While this difference may appear to be large, only about 7 percent ofoverall inequality is due to north−south differences in mean expenditure levels−variation within the north andsouth accounts for 93 percent of overall inequality.
Table 2.2 showed substantial differences in mean expenditures across ethnic groups. But since Vietnamese (Kinh)make up 85 percent of the total population, there is not as much scope for ethnic differences to contribute toinequality. In fact, table 2.5 shows that they explain only 10−12 percent of overall inequality in Vietnam. This
Household Welfare and Vietnam's Transition
Factors Associated with Inequality in Vietnam 50
finding suggests no major role for
ethnicity in understanding the nature of inequality in Vietnam. The role for differences by religious affiliation (notshown here) is even smaller−they account for less than 1 percent of overall inequality.
Another dimension on which to examine inequality is by employment characteristics of household heads. Table2.2 showed that households headed by self−employed and private sector workers were relatively poor, yet table2.5 shows that the contribution of such differences to overall inequality is not very large−only about 8 percent oftotal inequality. One reason for this is that three−quarters of the population fall into a single group, theself−employed. A larger source of inequality is differences when households are classified by the occupation oftheir heads−about 18 percent of overall inequality is due to such differences. This contribution is relatively largegiven that about 65 percent of the population falls into a single group: households in which the head works inagriculture.
Recall the unexpected finding that female−headed households are substantially better off than male−headed ones.While this difference is not very large, it is worth checking to see the role it plays in overall inequality. Table 2.5shows that this role is minuscule−only about 2 percent of overall inequality is due to differences in the mean percapita expenditures of male− and female−headed households.
The last decomposition of overall inequality is by the education level of the household head. Differences ineducation levels account for about 8 percent of overall inequality. Although this figure may appear to be sizable,it is much smaller than that found in other countries. Decompositions for other countries have yieldedcontributions ranging from 10 percent to 35 percent.8 This result suggests that part of Vietnam's relatively lowinequality may be due to smaller differences in expenditure levels across education groups.9 It also raises theissue of whether there are substantial returns to education in Vietnam−an issue that is taken up in later chapters ofthis book.
Poverty in Vietnam
In general, policymakers care about both inequality and poverty. Yet the relationship between them is complex: itis possible for poverty to decline while inequality remains stable or even rises. Chapter 1 showed that there hasbeen a large decline in poverty in Vietnam over the past decade, regardless of what has happened to thedistribution of income. The forward projections in that chapter also showed that if the recent growth of 8 percentper year continues, poverty will continue to decline, even if inequality remains stable or rises modestly. Theextent to which poverty will continue to decline in the future is an open question, but in any case it is important toset a baseline for future comparisons. This section does so using the 1992−93 VNLSS data.
Measuring Poverty
Poverty means different things to different people. Perhaps the first concept that comes to mind is that poverty isthe lack of a certain minimal income necessary to attain a "decent" standard of living. Poverty may also have awider meaning, encompassing malnutrition, illiteracy, unemployment, substandard housing, and other dimensionsof a low standard of living. One approach to measuring poverty is to define a minimally adequate standard ofliving in terms of a set of "basic needs," such as reasonably good health, adequate calorie intake, access to safedrinking water, and enough schooling to attain functional literacy. One may even include nonmaterial componentssuch as human rights and democratic political processes.
This multidimensional approach, while intuitively appealing, raises as many questions as it answers because manypeople have some of their minimal needs met, but not others, and it is not clear whether such people should be
Household Welfare and Vietnam's Transition
Poverty in Vietnam 51
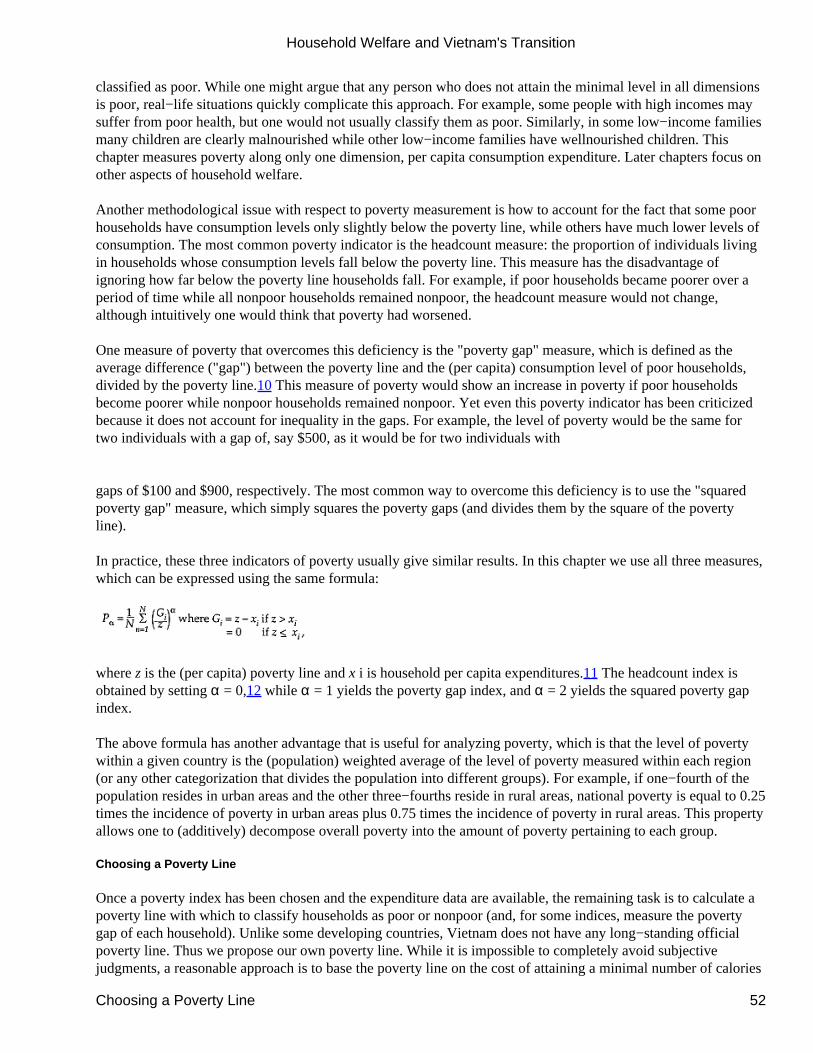
classified as poor. While one might argue that any person who does not attain the minimal level in all dimensionsis poor, real−life situations quickly complicate this approach. For example, some people with high incomes maysuffer from poor health, but one would not usually classify them as poor. Similarly, in some low−income familiesmany children are clearly malnourished while other low−income families have wellnourished children. Thischapter measures poverty along only one dimension, per capita consumption expenditure. Later chapters focus onother aspects of household welfare.
Another methodological issue with respect to poverty measurement is how to account for the fact that some poorhouseholds have consumption levels only slightly below the poverty line, while others have much lower levels ofconsumption. The most common poverty indicator is the headcount measure: the proportion of individuals livingin households whose consumption levels fall below the poverty line. This measure has the disadvantage ofignoring how far below the poverty line households fall. For example, if poor households became poorer over aperiod of time while all nonpoor households remained nonpoor, the headcount measure would not change,although intuitively one would think that poverty had worsened.
One measure of poverty that overcomes this deficiency is the "poverty gap" measure, which is defined as theaverage difference ("gap") between the poverty line and the (per capita) consumption level of poor households,divided by the poverty line.10 This measure of poverty would show an increase in poverty if poor householdsbecome poorer while nonpoor households remained nonpoor. Yet even this poverty indicator has been criticizedbecause it does not account for inequality in the gaps. For example, the level of poverty would be the same fortwo individuals with a gap of, say $500, as it would be for two individuals with
gaps of $100 and $900, respectively. The most common way to overcome this deficiency is to use the "squaredpoverty gap" measure, which simply squares the poverty gaps (and divides them by the square of the povertyline).
In practice, these three indicators of poverty usually give similar results. In this chapter we use all three measures,which can be expressed using the same formula:
where z is the (per capita) poverty line and x i is household per capita expenditures.11 The headcount index isobtained by setting α = 0,12 while α = 1 yields the poverty gap index, and α = 2 yields the squared poverty gapindex.
The above formula has another advantage that is useful for analyzing poverty, which is that the level of povertywithin a given country is the (population) weighted average of the level of poverty measured within each region(or any other categorization that divides the population into different groups). For example, if one−fourth of thepopulation resides in urban areas and the other three−fourths reside in rural areas, national poverty is equal to 0.25times the incidence of poverty in urban areas plus 0.75 times the incidence of poverty in rural areas. This propertyallows one to (additively) decompose overall poverty into the amount of poverty pertaining to each group.
Choosing a Poverty Line
Once a poverty index has been chosen and the expenditure data are available, the remaining task is to calculate apoverty line with which to classify households as poor or nonpoor (and, for some indices, measure the povertygap of each household). Unlike some developing countries, Vietnam does not have any long−standing officialpoverty line. Thus we propose our own poverty line. While it is impossible to completely avoid subjectivejudgments, a reasonable approach is to base the poverty line on the cost of attaining a minimal number of calories
Household Welfare and Vietnam's Transition
Choosing a Poverty Line 52
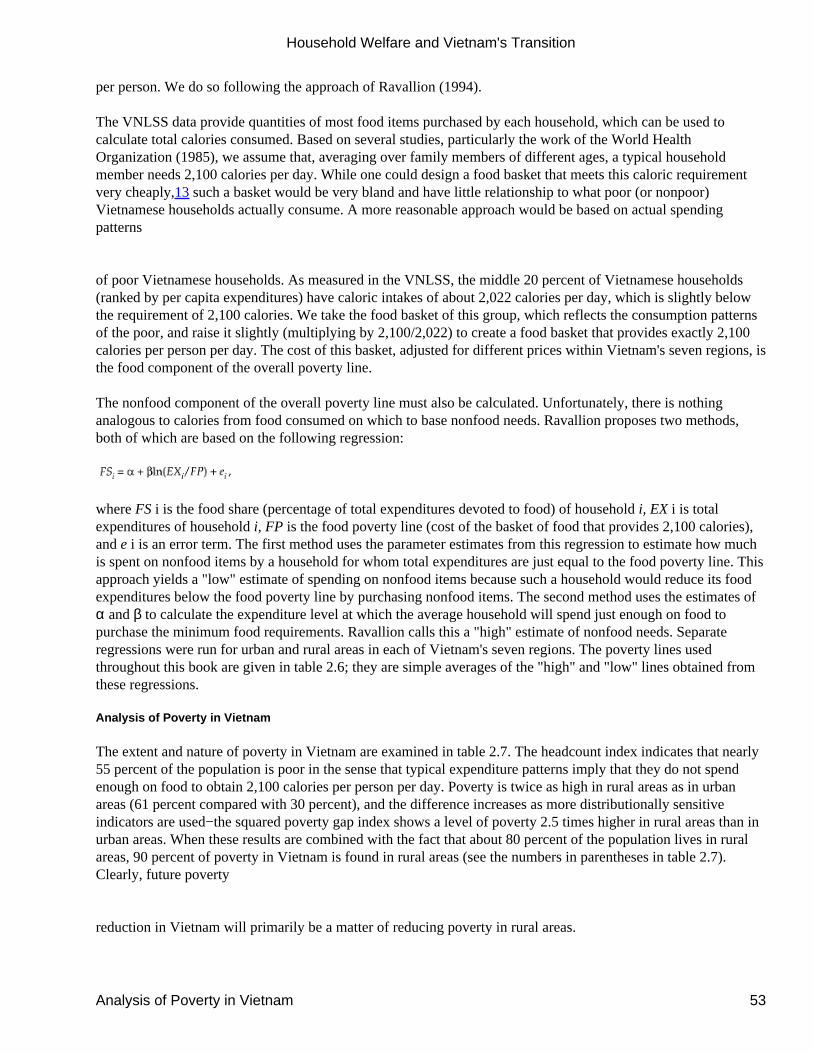
per person. We do so following the approach of Ravallion (1994).
The VNLSS data provide quantities of most food items purchased by each household, which can be used tocalculate total calories consumed. Based on several studies, particularly the work of the World HealthOrganization (1985), we assume that, averaging over family members of different ages, a typical householdmember needs 2,100 calories per day. While one could design a food basket that meets this caloric requirementvery cheaply,13 such a basket would be very bland and have little relationship to what poor (or nonpoor)Vietnamese households actually consume. A more reasonable approach would be based on actual spendingpatterns
of poor Vietnamese households. As measured in the VNLSS, the middle 20 percent of Vietnamese households(ranked by per capita expenditures) have caloric intakes of about 2,022 calories per day, which is slightly belowthe requirement of 2,100 calories. We take the food basket of this group, which reflects the consumption patternsof the poor, and raise it slightly (multiplying by 2,100/2,022) to create a food basket that provides exactly 2,100calories per person per day. The cost of this basket, adjusted for different prices within Vietnam's seven regions, isthe food component of the overall poverty line.
The nonfood component of the overall poverty line must also be calculated. Unfortunately, there is nothinganalogous to calories from food consumed on which to base nonfood needs. Ravallion proposes two methods,both of which are based on the following regression:
where FS i is the food share (percentage of total expenditures devoted to food) of household i, EX i is totalexpenditures of household i, FP is the food poverty line (cost of the basket of food that provides 2,100 calories),and e i is an error term. The first method uses the parameter estimates from this regression to estimate how muchis spent on nonfood items by a household for whom total expenditures are just equal to the food poverty line. Thisapproach yields a "low" estimate of spending on nonfood items because such a household would reduce its foodexpenditures below the food poverty line by purchasing nonfood items. The second method uses the estimates ofα and β to calculate the expenditure level at which the average household will spend just enough on food topurchase the minimum food requirements. Ravallion calls this a "high" estimate of nonfood needs. Separateregressions were run for urban and rural areas in each of Vietnam's seven regions. The poverty lines usedthroughout this book are given in table 2.6; they are simple averages of the "high" and "low" lines obtained fromthese regressions.
Analysis of Poverty in Vietnam
The extent and nature of poverty in Vietnam are examined in table 2.7. The headcount index indicates that nearly55 percent of the population is poor in the sense that typical expenditure patterns imply that they do not spendenough on food to obtain 2,100 calories per person per day. Poverty is twice as high in rural areas as in urbanareas (61 percent compared with 30 percent), and the difference increases as more distributionally sensitiveindicators are used−the squared poverty gap index shows a level of poverty 2.5 times higher in rural areas than inurban areas. When these results are combined with the fact that about 80 percent of the population lives in ruralareas, 90 percent of poverty in Vietnam is found in rural areas (see the numbers in parentheses in table 2.7).Clearly, future poverty
reduction in Vietnam will primarily be a matter of reducing poverty in rural areas.
Household Welfare and Vietnam's Transition
Analysis of Poverty in Vietnam 53
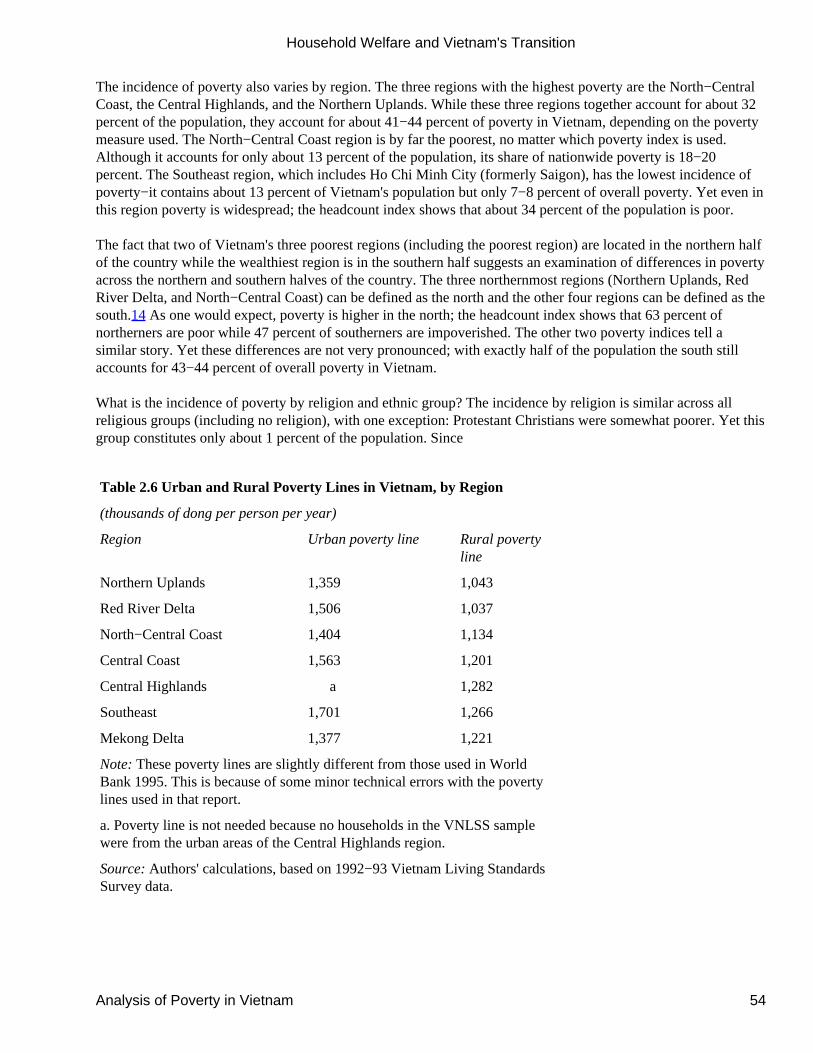
The incidence of poverty also varies by region. The three regions with the highest poverty are the North−CentralCoast, the Central Highlands, and the Northern Uplands. While these three regions together account for about 32percent of the population, they account for about 41−44 percent of poverty in Vietnam, depending on the povertymeasure used. The North−Central Coast region is by far the poorest, no matter which poverty index is used.Although it accounts for only about 13 percent of the population, its share of nationwide poverty is 18−20percent. The Southeast region, which includes Ho Chi Minh City (formerly Saigon), has the lowest incidence ofpoverty−it contains about 13 percent of Vietnam's population but only 7−8 percent of overall poverty. Yet even inthis region poverty is widespread; the headcount index shows that about 34 percent of the population is poor.
The fact that two of Vietnam's three poorest regions (including the poorest region) are located in the northern halfof the country while the wealthiest region is in the southern half suggests an examination of differences in povertyacross the northern and southern halves of the country. The three northernmost regions (Northern Uplands, RedRiver Delta, and North−Central Coast) can be defined as the north and the other four regions can be defined as thesouth.14 As one would expect, poverty is higher in the north; the headcount index shows that 63 percent ofnortherners are poor while 47 percent of southerners are impoverished. The other two poverty indices tell asimilar story. Yet these differences are not very pronounced; with exactly half of the population the south stillaccounts for 43−44 percent of overall poverty in Vietnam.
What is the incidence of poverty by religion and ethnic group? The incidence by religion is similar across allreligious groups (including no religion), with one exception: Protestant Christians were somewhat poorer. Yet thisgroup constitutes only about 1 percent of the population. Since
Table 2.6 Urban and Rural Poverty Lines in Vietnam, by Region
(thousands of dong per person per year)
Region Urban poverty line Rural povertyline
Northern Uplands 1,359 1,043
Red River Delta 1,506 1,037
North−Central Coast 1,404 1,134
Central Coast 1,563 1,201
Central Highlands a 1,282
Southeast 1,701 1,266
Mekong Delta 1,377 1,221
Note: These poverty lines are slightly different from those used in WorldBank 1995. This is because of some minor technical errors with the povertylines used in that report.
a. Poverty line is not needed because no households in the VNLSS samplewere from the urban areas of the Central Highlands region.
Source: Authors' calculations, based on 1992−93 Vietnam Living StandardsSurvey data.
Household Welfare and Vietnam's Transition
Analysis of Poverty in Vietnam 54
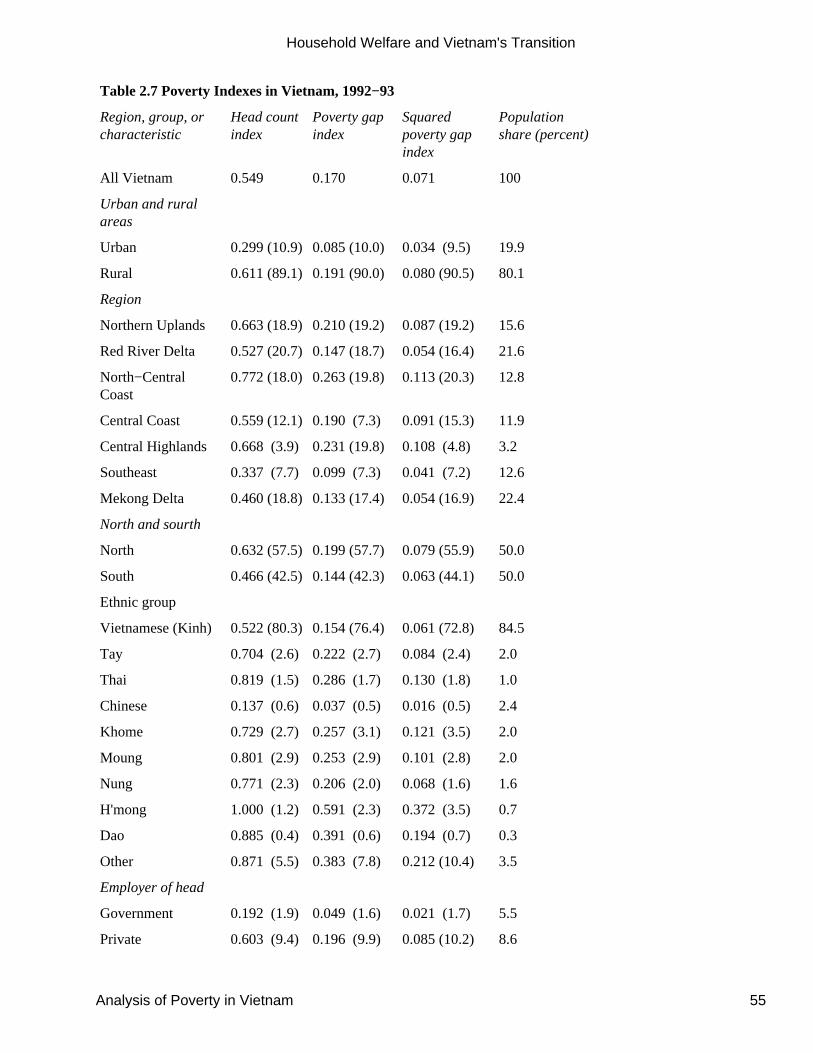
Table 2.7 Poverty Indexes in Vietnam, 1992−93
Region, group, orcharacteristic
Head countindex
Poverty gapindex
Squaredpoverty gapindex
Populationshare (percent)
All Vietnam 0.549 0.170 0.071 100
Urban and ruralareas
Urban 0.299 (10.9) 0.085 (10.0) 0.034 (9.5) 19.9
Rural 0.611 (89.1) 0.191 (90.0) 0.080 (90.5) 80.1
Region
Northern Uplands 0.663 (18.9) 0.210 (19.2) 0.087 (19.2) 15.6
Red River Delta 0.527 (20.7) 0.147 (18.7) 0.054 (16.4) 21.6
North−CentralCoast
0.772 (18.0) 0.263 (19.8) 0.113 (20.3) 12.8
Central Coast 0.559 (12.1) 0.190 (7.3) 0.091 (15.3) 11.9
Central Highlands 0.668 (3.9) 0.231 (19.8) 0.108 (4.8) 3.2
Southeast 0.337 (7.7) 0.099 (7.3) 0.041 (7.2) 12.6
Mekong Delta 0.460 (18.8) 0.133 (17.4) 0.054 (16.9) 22.4
North and sourth
North 0.632 (57.5) 0.199 (57.7) 0.079 (55.9) 50.0
South 0.466 (42.5) 0.144 (42.3) 0.063 (44.1) 50.0
Ethnic group
Vietnamese (Kinh) 0.522 (80.3) 0.154 (76.4) 0.061 (72.8) 84.5
Tay 0.704 (2.6) 0.222 (2.7) 0.084 (2.4) 2.0
Thai 0.819 (1.5) 0.286 (1.7) 0.130 (1.8) 1.0
Chinese 0.137 (0.6) 0.037 (0.5) 0.016 (0.5) 2.4
Khome 0.729 (2.7) 0.257 (3.1) 0.121 (3.5) 2.0
Moung 0.801 (2.9) 0.253 (2.9) 0.101 (2.8) 2.0
Nung 0.771 (2.3) 0.206 (2.0) 0.068 (1.6) 1.6
H'mong 1.000 (1.2) 0.591 (2.3) 0.372 (3.5) 0.7
Dao 0.885 (0.4) 0.391 (0.6) 0.194 (0.7) 0.3
Other 0.871 (5.5) 0.383 (7.8) 0.212 (10.4) 3.5
Employer of head
Government 0.192 (1.9) 0.049 (1.6) 0.021 (1.7) 5.5
Private 0.603 (9.4) 0.196 (9.9) 0.085 (10.2) 8.6
Household Welfare and Vietnam's Transition
Analysis of Poverty in Vietnam 55
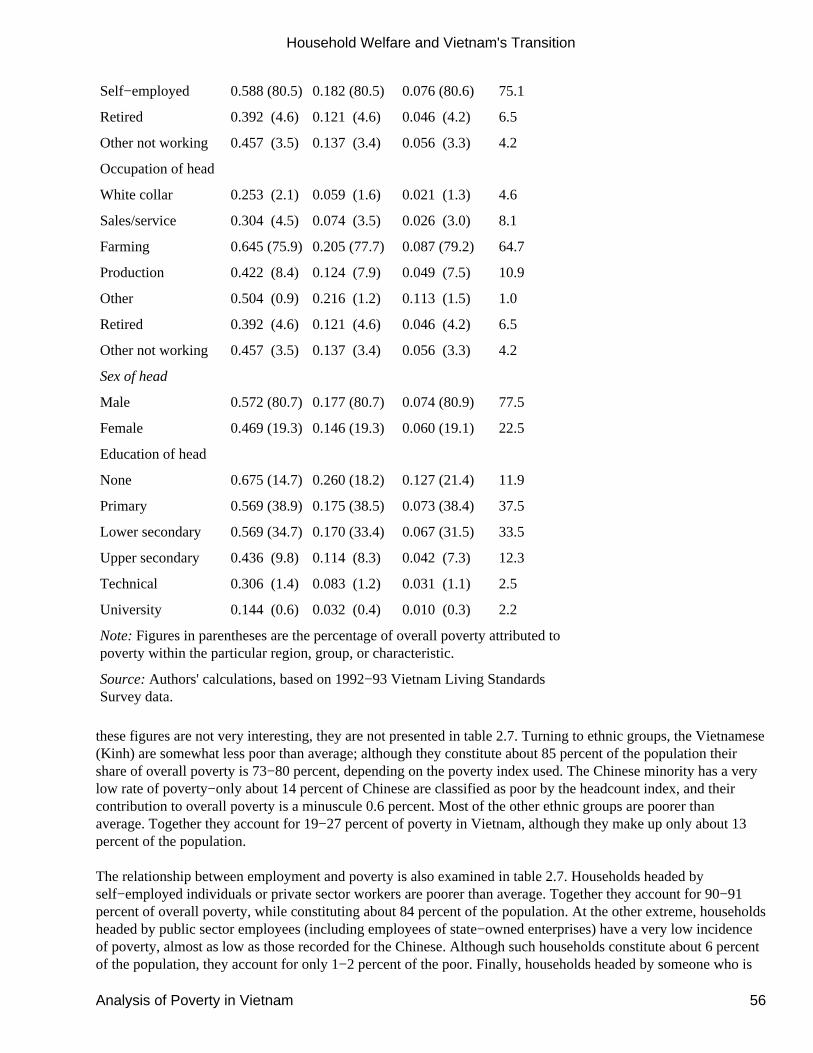
Self−employed 0.588 (80.5) 0.182 (80.5) 0.076 (80.6) 75.1
Retired 0.392 (4.6) 0.121 (4.6) 0.046 (4.2) 6.5
Other not working 0.457 (3.5) 0.137 (3.4) 0.056 (3.3) 4.2
Occupation of head
White collar 0.253 (2.1) 0.059 (1.6) 0.021 (1.3) 4.6
Sales/service 0.304 (4.5) 0.074 (3.5) 0.026 (3.0) 8.1
Farming 0.645 (75.9) 0.205 (77.7) 0.087 (79.2) 64.7
Production 0.422 (8.4) 0.124 (7.9) 0.049 (7.5) 10.9
Other 0.504 (0.9) 0.216 (1.2) 0.113 (1.5) 1.0
Retired 0.392 (4.6) 0.121 (4.6) 0.046 (4.2) 6.5
Other not working 0.457 (3.5) 0.137 (3.4) 0.056 (3.3) 4.2
Sex of head
Male 0.572 (80.7) 0.177 (80.7) 0.074 (80.9) 77.5
Female 0.469 (19.3) 0.146 (19.3) 0.060 (19.1) 22.5
Education of head
None 0.675 (14.7) 0.260 (18.2) 0.127 (21.4) 11.9
Primary 0.569 (38.9) 0.175 (38.5) 0.073 (38.4) 37.5
Lower secondary 0.569 (34.7) 0.170 (33.4) 0.067 (31.5) 33.5
Upper secondary 0.436 (9.8) 0.114 (8.3) 0.042 (7.3) 12.3
Technical 0.306 (1.4) 0.083 (1.2) 0.031 (1.1) 2.5
University 0.144 (0.6) 0.032 (0.4) 0.010 (0.3) 2.2
Note: Figures in parentheses are the percentage of overall poverty attributed topoverty within the particular region, group, or characteristic.
Source: Authors' calculations, based on 1992−93 Vietnam Living StandardsSurvey data.
these figures are not very interesting, they are not presented in table 2.7. Turning to ethnic groups, the Vietnamese(Kinh) are somewhat less poor than average; although they constitute about 85 percent of the population theirshare of overall poverty is 73−80 percent, depending on the poverty index used. The Chinese minority has a verylow rate of poverty−only about 14 percent of Chinese are classified as poor by the headcount index, and theircontribution to overall poverty is a minuscule 0.6 percent. Most of the other ethnic groups are poorer thanaverage. Together they account for 19−27 percent of poverty in Vietnam, although they make up only about 13percent of the population.
The relationship between employment and poverty is also examined in table 2.7. Households headed byself−employed individuals or private sector workers are poorer than average. Together they account for 90−91percent of overall poverty, while constituting about 84 percent of the population. At the other extreme, householdsheaded by public sector employees (including employees of state−owned enterprises) have a very low incidenceof poverty, almost as low as those recorded for the Chinese. Although such households constitute about 6 percentof the population, they account for only 1−2 percent of the poor. Finally, households headed by someone who is
Household Welfare and Vietnam's Transition
Analysis of Poverty in Vietnam 56
retired or not working for some other reason are less likely to be poor than average, though they are not aswell−off as households headed by government workers.
The figures on poverty by the occupation of the head show that households working as farmers (this category alsoincludes fishermen and hunters) are the poorest households in Vietnam. They account for 76−79 percent ofoverall poverty even though they constitute only about 65 percent of the overall population. Clearly, efforts toreduce poverty in rural areas must reach these farming households. Individuals living in households headed bywhite collar workers are least likely to be poor, followed by individuals in households where the head is in a salesor service occupation. Together these two groups cover about 13 percent of the population, but their share inoverall poverty is only 4−7 percent. Households headed by persons employed in production occupations(construction, manufacturing, artisanal work), as well as those headed by someone who is retired or not workingfor some other reason, are less likely to be poor than farming households, but not as fortunate as householdsheaded by white collar or sales and service workers.
In accordance with the figures in table 2.2, female−headed households have lower levels of poverty thanhouseholds headed by males, but the difference is not very large. Still, it is clear that there is no justification fortargeting female−headed households in poverty programs simply because they are headed by women (thoughthere may be other reasons to target some or all of them).
Finally, it is instructive to examine poverty among Vietnamese households according to the education level of thehead. As one would expect,
the higher the level of education, the lower the incidence of poverty, no matter which of the three indices is used.Yet it is worth pointing out that the differences are not large. For example, the incidence of poverty (headcountindex) among individuals in households with an uneducated head is about 68 percent, while that for individuals inhouseholds headed by someone with an upper secondary education (10−12 years of education) is not much lower,about 44 percent. Only when individuals attain postsecondary education do the levels of poverty declinesubstantially. This result suggests that education alone may not be a very effective way to reduce poverty. Therole of education in generating income will be examined in later chapters of this book.
A Closer Examination of Regional Variation
The main finding of this chapter is that there is relatively little inequality in Vietnam, but a large amount ofpoverty. Inequality is low relative to other countries. Furthermore, some specific concerns about inequality are notborne out by the data. For example, the contribution of north−south differences to inequality is not very large, anddifferences in mean incomes among the seven regions are small compared with variation within regions.
The sharpest differences in Vietnam are between urban areas and rural areas. Within rural areas there is asurprising degree of homogeneity in terms of income and poverty. As seen in table 2.8, average real annualexpenditures range from 912,000 dong to 1.4 million dong, and the headcount poverty index ranges from 45percent to 79 percent. This lack of variation belies some of the stereotypes about Vietnam. In particular, there areseveral reasons to expect the south to be richer than the north. The area around Ho Chi Minh City is clearly lesspoor than the rest of Vietnam, as these data have shown. Furthermore, the Mekong Delta is the ''rice basket" ofVietnam. With about one−fifth of the country's population, it pro−
Household Welfare and Vietnam's Transition
A Closer Examination of Regional Variation 57
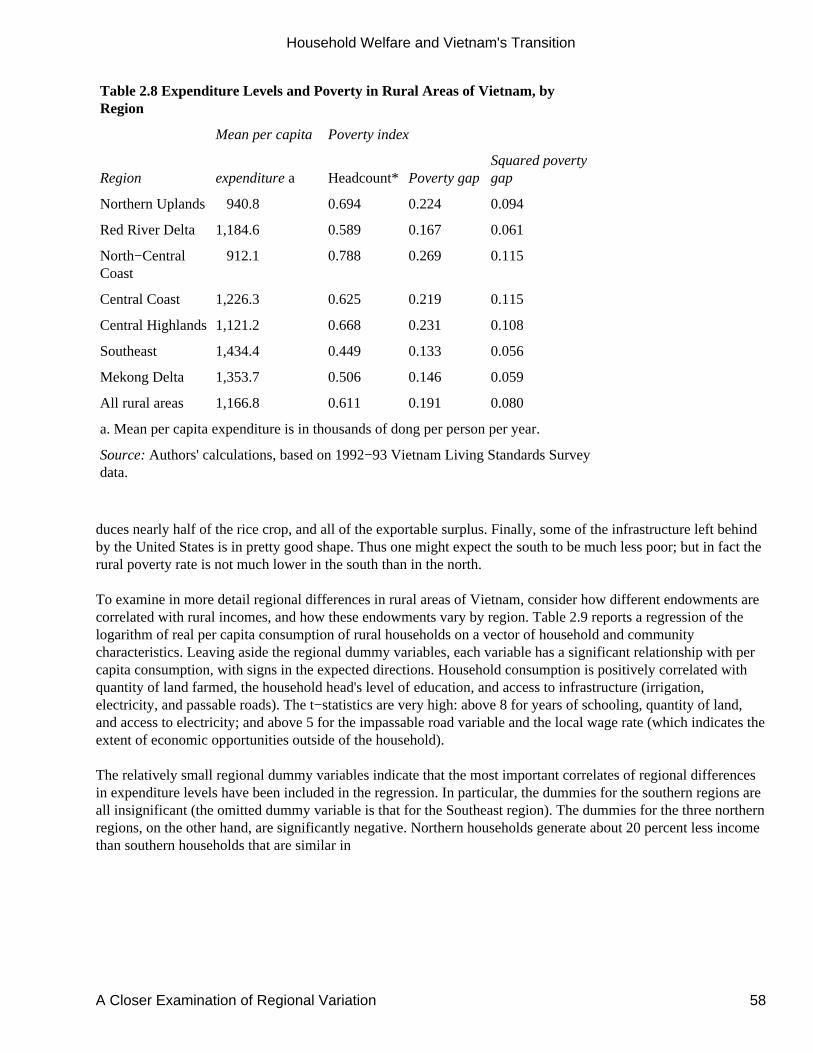
Table 2.8 Expenditure Levels and Poverty in Rural Areas of Vietnam, byRegion
Mean per capita Poverty index
Region expenditure a Headcount* Poverty gapSquared povertygap
Northern Uplands 940.8 0.694 0.224 0.094
Red River Delta 1,184.6 0.589 0.167 0.061
North−CentralCoast
912.1 0.788 0.269 0.115
Central Coast 1,226.3 0.625 0.219 0.115
Central Highlands1,121.2 0.668 0.231 0.108
Southeast 1,434.4 0.449 0.133 0.056
Mekong Delta 1,353.7 0.506 0.146 0.059
All rural areas 1,166.8 0.611 0.191 0.080
a. Mean per capita expenditure is in thousands of dong per person per year.
Source: Authors' calculations, based on 1992−93 Vietnam Living Standards Surveydata.
duces nearly half of the rice crop, and all of the exportable surplus. Finally, some of the infrastructure left behindby the United States is in pretty good shape. Thus one might expect the south to be much less poor; but in fact therural poverty rate is not much lower in the south than in the north.
To examine in more detail regional differences in rural areas of Vietnam, consider how different endowments arecorrelated with rural incomes, and how these endowments vary by region. Table 2.9 reports a regression of thelogarithm of real per capita consumption of rural households on a vector of household and communitycharacteristics. Leaving aside the regional dummy variables, each variable has a significant relationship with percapita consumption, with signs in the expected directions. Household consumption is positively correlated withquantity of land farmed, the household head's level of education, and access to infrastructure (irrigation,electricity, and passable roads). The t−statistics are very high: above 8 for years of schooling, quantity of land,and access to electricity; and above 5 for the impassable road variable and the local wage rate (which indicates theextent of economic opportunities outside of the household).
The relatively small regional dummy variables indicate that the most important correlates of regional differencesin expenditure levels have been included in the regression. In particular, the dummies for the southern regions areall insignificant (the omitted dummy variable is that for the Southeast region). The dummies for the three northernregions, on the other hand, are significantly negative. Northern households generate about 20 percent less incomethan southern households that are similar in
Household Welfare and Vietnam's Transition
A Closer Examination of Regional Variation 58
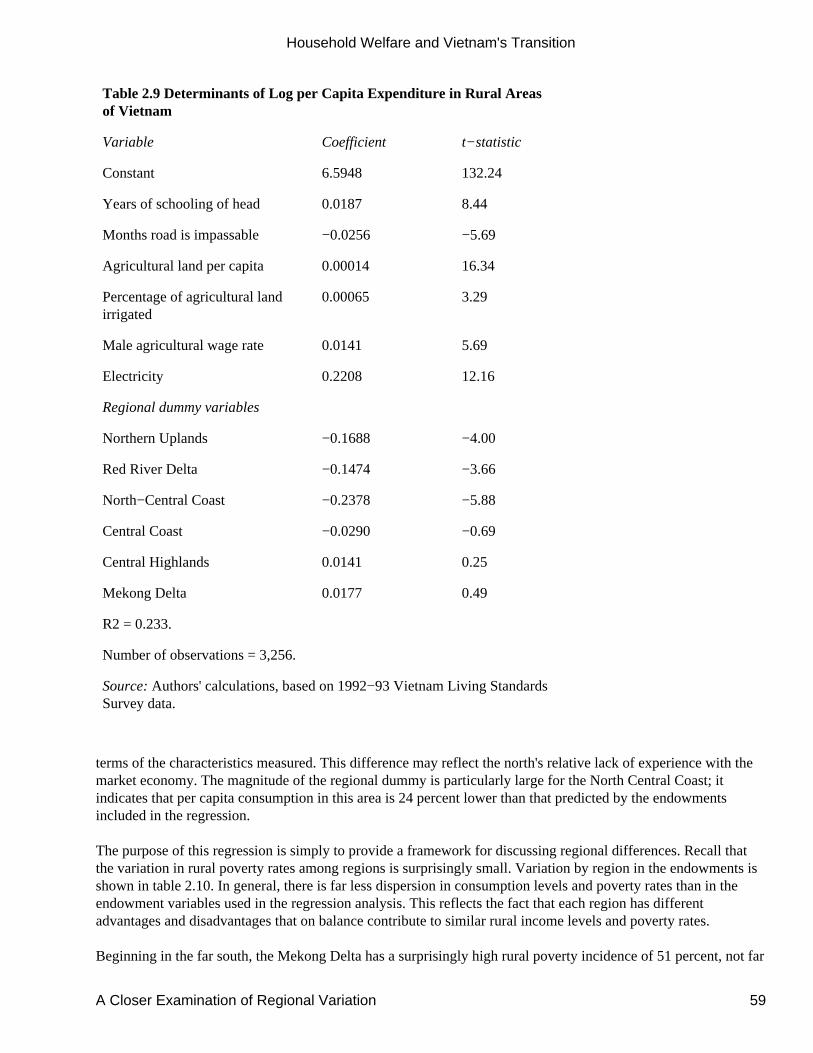
Table 2.9 Determinants of Log per Capita Expenditure in Rural Areasof Vietnam
Variable Coefficient t−statistic
Constant 6.5948 132.24
Years of schooling of head 0.0187 8.44
Months road is impassable −0.0256 −5.69
Agricultural land per capita 0.00014 16.34
Percentage of agricultural landirrigated
0.00065 3.29
Male agricultural wage rate 0.0141 5.69
Electricity 0.2208 12.16
Regional dummy variables
Northern Uplands −0.1688 −4.00
Red River Delta −0.1474 −3.66
North−Central Coast −0.2378 −5.88
Central Coast −0.0290 −0.69
Central Highlands 0.0141 0.25
Mekong Delta 0.0177 0.49
R2 = 0.233.
Number of observations = 3,256.
Source: Authors' calculations, based on 1992−93 Vietnam Living StandardsSurvey data.
terms of the characteristics measured. This difference may reflect the north's relative lack of experience with themarket economy. The magnitude of the regional dummy is particularly large for the North Central Coast; itindicates that per capita consumption in this area is 24 percent lower than that predicted by the endowmentsincluded in the regression.
The purpose of this regression is simply to provide a framework for discussing regional differences. Recall thatthe variation in rural poverty rates among regions is surprisingly small. Variation by region in the endowments isshown in table 2.10. In general, there is far less dispersion in consumption levels and poverty rates than in theendowment variables used in the regression analysis. This reflects the fact that each region has differentadvantages and disadvantages that on balance contribute to similar rural income levels and poverty rates.
Beginning in the far south, the Mekong Delta has a surprisingly high rural poverty incidence of 51 percent, not far
Household Welfare and Vietnam's Transition
A Closer Examination of Regional Variation 59
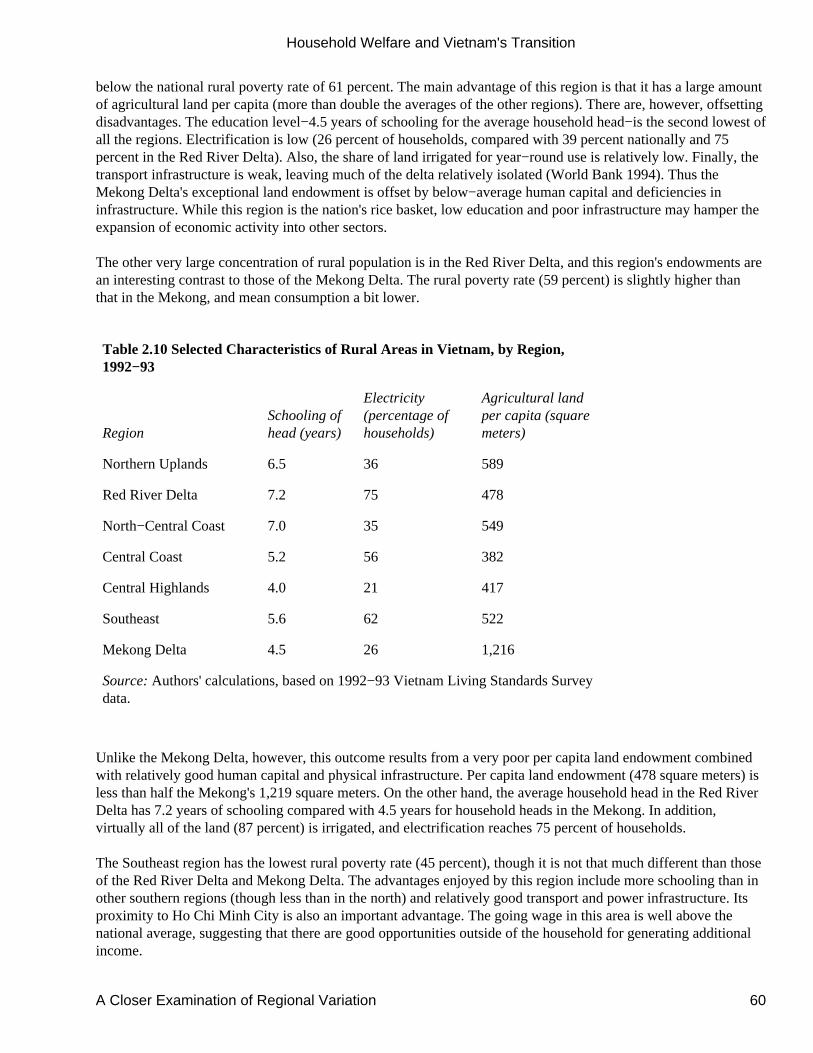
below the national rural poverty rate of 61 percent. The main advantage of this region is that it has a large amountof agricultural land per capita (more than double the averages of the other regions). There are, however, offsettingdisadvantages. The education level−4.5 years of schooling for the average household head−is the second lowest ofall the regions. Electrification is low (26 percent of households, compared with 39 percent nationally and 75percent in the Red River Delta). Also, the share of land irrigated for year−round use is relatively low. Finally, thetransport infrastructure is weak, leaving much of the delta relatively isolated (World Bank 1994). Thus theMekong Delta's exceptional land endowment is offset by below−average human capital and deficiencies ininfrastructure. While this region is the nation's rice basket, low education and poor infrastructure may hamper theexpansion of economic activity into other sectors.
The other very large concentration of rural population is in the Red River Delta, and this region's endowments arean interesting contrast to those of the Mekong Delta. The rural poverty rate (59 percent) is slightly higher thanthat in the Mekong, and mean consumption a bit lower.
Table 2.10 Selected Characteristics of Rural Areas in Vietnam, by Region,1992−93
RegionSchooling ofhead (years)
Electricity(percentage ofhouseholds)
Agricultural landper capita (squaremeters)
Northern Uplands 6.5 36 589
Red River Delta 7.2 75 478
North−Central Coast 7.0 35 549
Central Coast 5.2 56 382
Central Highlands 4.0 21 417
Southeast 5.6 62 522
Mekong Delta 4.5 26 1,216
Source: Authors' calculations, based on 1992−93 Vietnam Living Standards Surveydata.
Unlike the Mekong Delta, however, this outcome results from a very poor per capita land endowment combinedwith relatively good human capital and physical infrastructure. Per capita land endowment (478 square meters) isless than half the Mekong's 1,219 square meters. On the other hand, the average household head in the Red RiverDelta has 7.2 years of schooling compared with 4.5 years for household heads in the Mekong. In addition,virtually all of the land (87 percent) is irrigated, and electrification reaches 75 percent of households.
The Southeast region has the lowest rural poverty rate (45 percent), though it is not that much different than thoseof the Red River Delta and Mekong Delta. The advantages enjoyed by this region include more schooling than inother southern regions (though less than in the north) and relatively good transport and power infrastructure. Itsproximity to Ho Chi Minh City is also an important advantage. The going wage in this area is well above thenational average, suggesting that there are good opportunities outside of the household for generating additionalincome.
Household Welfare and Vietnam's Transition
A Closer Examination of Regional Variation 60
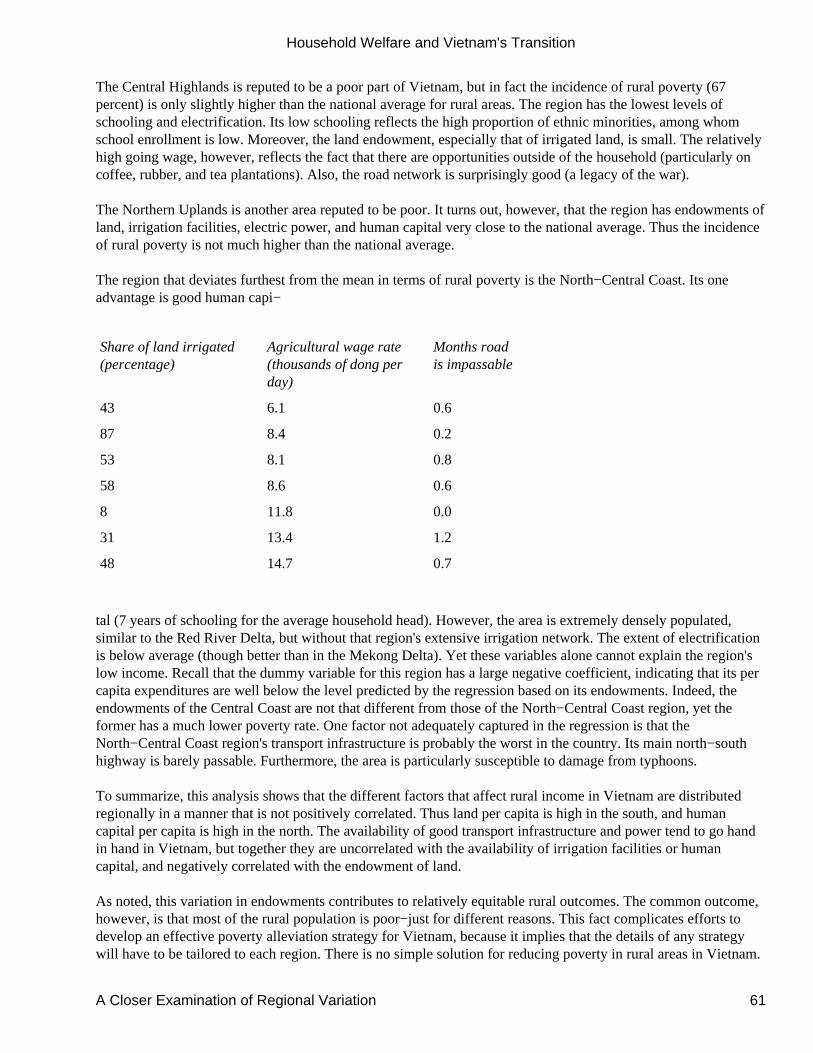
The Central Highlands is reputed to be a poor part of Vietnam, but in fact the incidence of rural poverty (67percent) is only slightly higher than the national average for rural areas. The region has the lowest levels ofschooling and electrification. Its low schooling reflects the high proportion of ethnic minorities, among whomschool enrollment is low. Moreover, the land endowment, especially that of irrigated land, is small. The relativelyhigh going wage, however, reflects the fact that there are opportunities outside of the household (particularly oncoffee, rubber, and tea plantations). Also, the road network is surprisingly good (a legacy of the war).
The Northern Uplands is another area reputed to be poor. It turns out, however, that the region has endowments ofland, irrigation facilities, electric power, and human capital very close to the national average. Thus the incidenceof rural poverty is not much higher than the national average.
The region that deviates furthest from the mean in terms of rural poverty is the North−Central Coast. Its oneadvantage is good human capi−
Share of land irrigated(percentage)
Agricultural wage rate(thousands of dong perday)
Months roadis impassable
43 6.1 0.6
87 8.4 0.2
53 8.1 0.8
58 8.6 0.6
8 11.8 0.0
31 13.4 1.2
48 14.7 0.7
tal (7 years of schooling for the average household head). However, the area is extremely densely populated,similar to the Red River Delta, but without that region's extensive irrigation network. The extent of electrificationis below average (though better than in the Mekong Delta). Yet these variables alone cannot explain the region'slow income. Recall that the dummy variable for this region has a large negative coefficient, indicating that its percapita expenditures are well below the level predicted by the regression based on its endowments. Indeed, theendowments of the Central Coast are not that different from those of the North−Central Coast region, yet theformer has a much lower poverty rate. One factor not adequately captured in the regression is that theNorth−Central Coast region's transport infrastructure is probably the worst in the country. Its main north−southhighway is barely passable. Furthermore, the area is particularly susceptible to damage from typhoons.
To summarize, this analysis shows that the different factors that affect rural income in Vietnam are distributedregionally in a manner that is not positively correlated. Thus land per capita is high in the south, and humancapital per capita is high in the north. The availability of good transport infrastructure and power tend to go handin hand in Vietnam, but together they are uncorrelated with the availability of irrigation facilities or humancapital, and negatively correlated with the endowment of land.
As noted, this variation in endowments contributes to relatively equitable rural outcomes. The common outcome,however, is that most of the rural population is poor−just for different reasons. This fact complicates efforts todevelop an effective poverty alleviation strategy for Vietnam, because it implies that the details of any strategywill have to be tailored to each region. There is no simple solution for reducing poverty in rural areas in Vietnam.
Household Welfare and Vietnam's Transition
A Closer Examination of Regional Variation 61
Appendix: Calculation of Total Household Expenditures
The variable for household consumption expenditures is intended to capture, as accurately as possible, allconsumption of goods and services by each household in the year preceding the interview. The VNLSS containsexpenditure and consumption information on various food and nonfood items. This appendix describes how thisinformation is used to arrive at a measure of household expenditures in the 12 months preceding the interview.
Food Expenditures
Household expenditures on food items is available from sections 11A and 11B of the household questionnaire(in−kind wages received as meals are collected in sections 4B and 4E, but their calculation is described later). InVietnam the lunar new year (Tet) represents a considerable departure from normal spending patterns. Foodexpenditure information during Tet
and other holidays (hereafter simply referred to as Tet) is collected separately in section 11A. Nonholidayexpenditure information is available in section 11B.
It is assumed that Tet expenditures cover a two−week period.15 For 18 food items or categories, information isavailable on the quantity and value of market purchases. For these same foods, information is also available onthe quantity consumed out of home production and the value of this quantity had it been purchased in the market.The data on the value of market purchases and the value of home production consumed by the household areincluded in household expenditures, as described below.
Value of annual market purchases. Section 11B contains nonholiday food expenditure information on 45 fooditems. Data are obtained on the value of purchases made since the first interview, the quantity and value of marketpurchases in the preceding 12 months, and the quantity and value of foods consumed out of home production inthe past 12 months. Information on market purchases in the last 12 months is obtained as follows. Therespondents are asked for the number of months during which market purchases were made. They are then askedfor the number of purchases made during these months. To allow for differences in purchase frequency, bothacross food items and across respondents, respondents can provide information on purchase frequency for one ofsix different recall periods separately for each item. Respondents then provide the information on the averagequantity and value of a typical purchase. This information−months of purchase, number of purchases, recallperiod, and value of a typical purchase−is used to obtain the value of nonholiday market food expenditures in the12 months preceding the interview.
Value of home−produced foods consumed during the year. Information on foodstuffs produced and consumed bythe household is obtained as follows. Respondents are asked for the number of months during which the food itemis consumed, the total quantity consumed (during these months), and the value of such consumption if it were tobe purchased in the market. Calculation of annual expenditures on home production is then done in a mannersimilar to that done for food purchased in the market.
Nonfood Expenditures
Nonfood expenditures include expenditures on clothing, footwear, personal care, entertainment and recreation,transportation, housing supplies, housing, furniture, household appliances, other consumer durables, education,and health. Most of this information is from section 12 of the questionnaire, but some of it also comes fromsections 2,3, and 6.
Household Welfare and Vietnam's Transition
Appendix: Calculation of Total Household Expenditures 62
Daily expenses. Section 12A contains information on 14 frequently purchased nonfood items. These includeexpenditures on cigarettes, tobacco, areca nut, cooking fuel, soap and detergents, and parking fees in the fourweeks preceding the interview. Annual expenditures on these items is obtained by multiplying four−weekexpenditures by 13. The one item excluded from household expenditures is lottery tickets. These expenses areexcluded because they enhance well−being only when a household wins the lottery, and in that case the amountwon is likely to be reflected in increased expenditures on other goods.
Annual expenses. Less frequent nonfood expenditure information is obtained in section 12B. Information isobtained on expenditures in the two weeks since the first interview, as well as in the past 12 months. This sectionincludes expenditures on cloth, ready−made clothing, blankets, footwear, tailoring services, pots and pans,household supplies, housing materials, motorcycle and bicycle tires, tubes and spare parts, public transportationfees, books and stationery, recreation, and taxes. Since annual expenditures are directly available for each item, nocalculations are needed. The following items in this section are excluded because they do not increase economicwell−being: income taxes, security funds, social funds (aging, charity), insurance, gifts, and transfers. Thefollowing items are excluded because spending on them is likely to be reflected in the current value of therelevant consumer durables, expenditures on which are treated separately: purchase materials to build a newhouse, other expenses for building a new house, home repairs and maintenance, tires and spare parts for bicyclesand motorcycles, and maintenance expenses for vehicles other than gasoline and oil.
Consumer durables. Consumer durables provide a flow of services over many years, thus it is misleading toinclude annual expenditures on them to measure a household's standard of living over one year. Excluding theseexpenditures is also inappropriate since they do improve a household's economic well−being. What one wouldlike is a measure of the value of services provided by consumer durables, that is, their "use value" in the 12months preceding the interview. To obtain a measure of "use value" what is needed is the price at which thedurable was purchased, the length of time the household has been in possession of the item, the durable's currentvalue, and the interest rate. Based on these three variables, along with a price index for deriving real values forpurchase price and current value, one can construct a measure of the monetary value of services derived fromconsumer durables. These data are all available from section 12 of the household questionnaire.
One constructs the use value as follows. The first step consists of deriving depreciation rates for each type ofconsumer durable. The relationship between the real value of a good at the time it was bought (VB) and its realvalue at the time of the interview (VT) is:
where t is the number of years since purchase and d is the depreciation rate. Since the survey collects informationon purchase price, resale value at the time of the interview, and year of purchase, it is possible to derive theimplicit depreciation rate for each type of consumer durable for each household. Specifically, the depreciation ratecan be derived from the formula above as:
To minimize the influence of errors and biases in self−reported resale values and purchase prices, the mediandepreciation rate for each type of consumer durable is used. These depreciation rates were calculated using onlyconsumer durables acquired after 1986. This was done because there are no reasonable price indices for earlieryears, which are necessary for converting nominal purchase prices into real values. The second step consists ofusing the depreciation rate along with the real interest rate to obtain the annual use value of a durable good inorder to measure the opportunity cost to the owner of using the good for one year, instead of selling it at thebeginning of the year and investing the money at the real interest rate. Therefore, use value is obtained as:
Household Welfare and Vietnam's Transition
Appendix: Calculation of Total Household Expenditures 63

where 0.05 is an estimate of the real interest rate and VT (1 + d) is the value of the consumer durable 12 monthsbefore the interview.
Utilities. Section 6 contains information on housing characteristics and expenses. Expenditures on electricity andwater are obtained from this section. Similar information is also obtained for household payments for garbagedisposal services. For all of these expenditures, the information reported is scaled up (if the reporting period isless than a year) to obtain annual expenditure figures.
Rent. For households that rent their dwelling, rental expenditures for the year are clearly their housing expenses.For households that live in dwellings they own, the true cost of living in the owned dwelling is not zero, but theopportunity cost of living in that dwelling. If there is a competitive rental market for dwellings, then the rentalamount paid by households that rent their dwelling can likely serve as an accurate measure of the opportunity costof living in similar dwellings. This information can also be used to impute a rent for those who live in dwellingsthey own. The usual procedure is to run a regression of rental values on housing characteristics and then use thecoefficients from such a regression to impute rental values for those who do not rent their dwellings.Unfortunately, in the Vietnamese case it is not possible to use this proce−
dure because only 309 households live in dwellings that they do not own. More important, only 17 of thesehouseholds rent from private persons, that is, parties other than the government and relatives, and almost all ofthese are concentrated in or near Ho Chi Minh City. Thus for all practical purposes there is no competitive rentalmarket for housing in the country. However, a similar approach uses information in section 6 on the value of thedwelling for all households−owners as well as renters. On average, those that rent their dwelling from privatepersons pay an annual rent that is approximately 3 percent of the current value of the dwelling. This ratio is usedas a guide to obtain the "use value" of dwellings. This ratio is also reasonable with respect to the real interest rateprevailing in the economy. Instead of applying this ratio to the reported value of a dwelling, a predicted housingvalue is derived from a regression of housing value on various housing characteristics. The ratio is applied to thatpredicted value, since reported values are likely to have substantial random variation related to respondentknowledge and other factors.
Education and health. Household expenditures on education (including expenditures on foreign language courses)for each household member are obtained in section 2 of the survey. Section 3 contains information on healthexpenses during the 12 months preceding the interview for each member of the household.
In−kind wages. Wages received in−kind are a form of household consumption not measured elsewhere andtherefore should be included in household expenditures. In sections 4B and 4E detailed information is availableon wages and different types of compensations received for primary employment in the seven days preceding theinterview and the 12 months preceding the interview. The latter information is available only when primaryemployment in the 12 months preceding the interview is different from employment in the seven days precedingthe interview. Inkind compensation from secondary employment cannot be included because only total earningsare recorded for secondary employment. Data on in−kind compensation can be reported for different timeperiods−day, week, month, quarter, half−year, and year. This in−kind wage data is annualized on the basis oflabor supply information, that is, by multiplying it by the number of hours, days, or weeks worked in the previousyear.
Notes
1. For a general description of LSMS surveys, see Grosh and Glewwe (1995, 1998).
Household Welfare and Vietnam's Transition
Notes 64
2. The head of household is the person identified by the household members as being the head. In most cases it isthe person who is the main income earner.
3. For further discussion of the relative merits of income and consumption data for measuring household welfare,see Deaton (1997). In the case of Vietnam using income data yields results similar to those obtained usingconsumption data. In particular, the figures in table 2.2 were calculated using income data and all the mainfindings were unchanged.
4. A related issue is the use of publicly provided health and education services, which are subsidized by thegovernment. Calculating the value of these subsidies for each household surveyed in the 1992−93 VNLSS is amajor task and is not done here. However, adding the value of these subsidies to total household consumption isunlikely to change the results because parents who send their children to public schools pay a variety of costs thatare not much lower than the costs of sending children to private schools (see Glewwe and Patrinos 1998), mosthealth consultations are with private providers, and health and education expenditures together account for only8−9 percent of total expenditures.
5. Since some household members, such as children, may have fewer material needs than others, such as adults,we would like to use adult equivalence scales to take this into account when dividing total consumption byhousehold size. Unfortunately, there is no generally accepted method for estimating equivalence scales (Deaton1997), so they are not used. Note that one implication of the lack of credible equivalence scales is that one shouldnot compare households of different sizes to see whether large or small households are better off. To see whetherthe use of equivalence scales affected other types of comparisons, an admittedly arbitrary set of equivalencescales was used to generate "equivalence−scale−adjusted" figures for table 2.2. No major changes were found inany of the results.
6. The other reasons for not working are as follows: about 60 percent were chronically sick or handicapped, about20 percent were engaged in housework, about 8 percent reported that they did not want to work, about 4 percentsaid that no work was available or that they did not know how to look for work, and the rest gave a variety ofother reasons. Note that very few could be classified as unemployed.
7. See Sen (1983) for an attempt to define poverty in relative terms.
8. The following numbers are from the studies cited in table 2.4: Côte d'Ivoire, 32−37 percent; Ghana, 10 percent;Jamaica, 9−11 percent; and Peru, 25 percent.
9. Note that the other country in table 2.4 with a relatively low level of inequality, Ghana, also has a relatively lowcontribution of education to overall inequality.
10. This gap is set to zero for nonpoor households. The average gap includes all the "zero gaps" of nonpoorhouseholds.
11. This class of poverty indices was first introduced by Foster, Greer, and Thorbecke (1984).
Household Welfare and Vietnam's Transition
Notes 65
12. Note that any nonzero number to the power of zero equals one, but zero to the power of zero equals zero.
13. This was first pointed out by Stigler (1945).
14. This division is fairly close to the division of Vietnam into two distinct countries, North Vietnam and SouthVietnam, between 1954 and 1975.
15. Consultations during the questionnaire design stage indicated that this was a reasonable assumption to make.
References
Atkinson, Anthony. 1970. ''On the Measurement of Inequality." Journal of Economic Theory 2(3): 244−63.
Deaton, Angus. 1997. The Analysis of Household Surveys: A Microeconometric Approach to Development Policy.Baltimore, Md.: Johns Hopkins University Press.
Foster, James, Joel Greer, and Erik Thorbecke. 1984. "A Class of Decomposable Poverty Measures."Econometrica 52(3): 761−65.
Glewwe, Paul. 1986. The Distribution of Welfare in Côte d'Ivoire in 1985. Living Standards Measurement StudyWorking Paper 29. Washington, D.C.: World Bank.
_____. 1987. The Distribution of Welfare in Peru in 1985 −86. Living Standards Measurement Study WorkingPaper 132. Washington, D.C.: World Bank.
Glewwe, Paul, and Harry Patrinos. 1998. The Role of the Private Sector in Education in Vietnam: Evidence fromthe 1992 −93 Vietnam Living Standards Survey. Living Standards Measurement Study Working Paper 132.Washington, D.C.: World Bank.
Glewwe, Paul, and Kwaku A. Twum−Baah. 1991. The Distribution of Welfare in Ghana in 1987 −88. LivingStandards Measurement Study Working Paper 75. Washington, D.C.: World Bank.
Grosh, Margaret, and Paul Glewwe. 1995. A Guide to Living Standards Measurement Study Surveys and TheirData Sets. Living Standards Measurement Study Working Paper 120. Washington, D.C.: World Bank.
_____. 1998. "The World Bank's Living Standards Measurement Study Household Surveys." Journal ofEconomic Perspectives 12 (1): 187−96.
Ravallion, Martin. 1994. "Poverty Comparisons." Fundamentals in Pure and Applied Economics 56. Chur,Switzerland: Harwood Academic Press.
Sen, Amartya. 1983. "Poor, Relatively Speaking." Oxford Economic Papers 35(2): 153−69.
Statistical Institute of Jamaica. 1989. "Jamaica Survey of Living Conditions, July 1989." Kingston, Jamaica.
Stigler, George. 1945. "The Cost of Subsistence." Journal of Farm Economics 72: 304−14.
Household Welfare and Vietnam's Transition
References 66
Theil, Henri. 1967. Economics and Information Theory. Amsterdam: North−Holland.
World Bank. 1993. The East Asian Miracle: Economic Growth and Public Policy. New York: Oxford UniversityPress.
_____. 1994. "Viet Nam: Transport Sector Review." Report 12778−VN. East Asia and Pacific Region,Washington, D.C.
_____. 1995. "Viet Nam: Poverty Assessment and Strategy." Report 13442−VN. East Asia and Pacific Region,Washington, D.C.
World Health Organization. 1985. "Energy and Protein Requirements." WHO Technical Report Series 724.Geneva.
3—Agriculture and Rural Poverty in Vietnam
Thomas B. Wiens
The chapter uses the 1992−93 Vietnam Living Standards Survey to help develop a program that will alleviaterural poverty.
Reforming Institutions in Rural Vietnam
Vietnam is unique among transition economies for the thoroughness, speed, and success of its institutionalreforms. The success was particularly manifest in agriculture−domestic supply and demand remained largely inequilibrium while the country transformed overnight from rice importer to major rice exporter. By decree, thegovernment followed the Chinese path of restoring full land use rights and management authority to farmhouseholds, eliminating most powers of the commune or cooperative. Private trade and production swelled tomore than offset contraction of the state sector. In the absence of external assistance, however, this success cameabout at the expense of severe unemployment and net disinvestment (mainly failure to maintain or augmentinfrastructure), which affected urban and industrial areas more than rural areas.
A series of fundamental reforms known as the renovation program (doi moi) were implemented beginning in 1988and were largely complete by the time of the 1992−93 Vietnam Living Standards Survey (World Bank 1993,1994). Those that had the greatest impact on rural areas included:
Dismantling the collective system and returning agriculture to family farming on the basis of long−term leases.
Abandoning administered pricing.
Devaluing the exchange rate and maintaining a managed float,
exposing the farm sector to levels and fluctuations in international prices.
Partitioning the single state bank into sectoral banks, including an agricultural bank offering credit not only tostate enterprises and collectives but also to individual family farms at positive and roughly nondiscriminatory realinterest rates.
Household Welfare and Vietnam's Transition
3— Agriculture and Rural Poverty in Vietnam 67
Reducing the size of public sector employment, including the size of the military, and nearly eliminating directsubsidies to state enterprises, including state farms, resulting in the contraction of wage−earning opportunities forrural families and the return of many dismissed employees to farming.
Giving formal recognition, legal status, and encouragement to the private sector, which absorbed other formerstate employees.
A 1988 Politburo resolution and its implementing regulations made farm households in the cooperative sectorentirely responsible for production and sales decisions, leaving taxes and fees their only obligations to thegovernment. The cooperatives, no longer having direct production management responsibilities, were expected tobecome service agencies assisting farm households. The government retained the law that land could be ownedonly by the state but permitted usufruct rights to assume a significance similar to that of ownership rights innonsocialist countries. Longterm (usually 15 years for agriculture), nontransferable tenure rights were sanctioned,and most farmers in the north received allocations of land (though only a small percentage received formal landuse certificates). In the south, although cooperatives were put in place, most never assumed full control over landtenure or management, and the reforms have generally restored the status quo of private farming.
Despite the nominal lack of transferability, a land market developed secretly in which transactions are notformally registered. A 1993 Land Law passed by the National Assembly formalized and rationalized this processalready under way, by acknowledging the right to sell or lease land, mortgage or inherit land use rights, andreceive compensation for transfers based on market prices, with agricultural land tenure of 20 years for annualcrops and 50 years for perennials (renewable). An ancillary legal framework still had to be developed tomaximize the utility of legalized land use rights and tenure.
A further series of directives facilitated the development of product markets. A directive abolishing internalbarriers to trade was among the earliest liberalizations. No direct legal barriers to entry in domestic wholesale orretail trade remain. Until 1989 prices and procurement of major agricultural commodities were administrativelycontrolled and, following the Soviet and Chinese models, used to subsidize food supplies to urban residents andindustrial workers, and to cover the bureaucracy's large overhead. Subsidies for food supplies were phased out in1988−89, and
grain prices were unified at market rates. Excellent rice harvests since 1988 and sharp reductions of excess stockholdings by farmers and the state eliminated shortages in staple food and put downward pressure on marketprices, facilitating a smooth transition. As state dominance in the marketing system for rice, fertilizer, and mostcash crops diminished, "guidance pricing" relaxed, and private traders resumed their marketing activities,Vietnam became a true market economy.
Until 1990 the Soviet Union was the largest source of finance to Vietnamese farmers. It advanced fertilizer andother inputs to the government, which passed them through to farmers in return for commodities at harvest time.The elimination of this source of national working capital and a drastic contraction of budgetary subsidies to statetrading firms have made liquidity the central problem in the agricultural marketing system. Although state tradingfirms still supply inputs and purchase agricultural products, most trade is now carried out on a cash−and−carrybasis at market prices, and the banking system−particularly the new Agricultural Bank of Vietnam−has becomethe main formal source of working capital. Today the private sector obtains credit largely from personal resourcesand the informal market, supplemented by pass−throughs from the state trading and processing enterprises.Private producers and traders have access to formal credit, but private borrowing from state banks has beenconstrained by collateral requirements and limited branches. Real interest rates of formal sector loans were raisedto positive levels to combat inflation, though they remain well below informal market rates.
Household Welfare and Vietnam's Transition
3— Agriculture and Rural Poverty in Vietnam 68
Characterizing Rural Poverty
The causes of rural poverty include geography−natural endowments, of land and climate that affect agriculturalproductivity, density of settlement, level of infrastructure development, and extent of opportunities outsideagriculture−and household circumstance−different endowments of land and resources such as human andfinancial capital. Separating geographic from household influences and further distinguishing natural fromhuman−made causes of poverty should be helpful in both targeting and specifying an effective strategy to reducepoverty.
This section pays equal attention to geographical and household influences. Where possible, geographic factorsare measured as average characteristics of the sampled communities. Otherwise, the seven regions−groupings ofprovinces based on location and ecological characteristics−are taken as proxies for geographical influences.Household expenditure quintiles are taken as proxies for income and poverty status, and the terms "poor" and"wealthy" are used to describe the lowest and highest household quintiles (although more than half of ruralhouseholds fall below the poverty line).
Location and Economic Environment
Rural poverty is associated with geography (table 3.1). The Northern Uplands, Red River Delta, North−CentralCoast, and Central Coast are the poorest regions, with the North−Central Coast the worst−off of the group. Theranking of the remaining regions depends on the poverty measure−percentage of households in the lowestquintile, average income per household, or per capita food availability. Low land productivity, limitedcommercialization, and lack of off−farm earning opportunities are among the most important factors associatedwith poverty. To provide a context for a disaggregated look at the 1992−93 Vietnam Living Standards Surveysample, some underlying natural influences are enumerated below:1
Northern Uplands. This region is composed of 12 northern provinces with hilly−to−mountainous terrain, mostlyoutside the Red River Delta. The climate is suitable for a wide range of crops, though low sunlight andtemperatures are constraining during January−March, especially at higher altitudes. Except in the lowlands,cropping is extensive, with upland rice, maize, and tubers dominating sloping areas. Poverty is broadly associatedwith three groups: ethnic minorities in remote areas engaged in subsistence production; households whoseholdings of level, irrigable land are small relative to household size, even if sloping or nonirrigable areas arelarger; and former state farm workers or military settlers producing perennials or timber in unproductive orremote areas.
Red River Delta. This region comprises seven provinces, including the municipal provinces of Hanoi andHaiphong. The climate is similar to that of the Northern Uplands, though less constrained by cold wintertemperatures. Much of the farmland is fertile, irrigated alluvial soil, and rice is the main crop (sometimesfollowed by maize, tubers, or cabbage). Water is a constraint in the winter, and drainage a problem in the summer,leading to a low multiple−cropping ratio. A population density
Table 3.1 Rural Poverty's Link to Geography in Vietnam, 1992−93
(thousands of Vietnamese dong)
Region
Percentagein lowestquintile
Ruralincome (perhousehold)
Per capitafoodconsumption
Outputperhectare
Crop sales(perhousehold)
Off−farmwageincome (perhousehold)
Household Welfare and Vietnam's Transition
Characterizing Rural Poverty 69
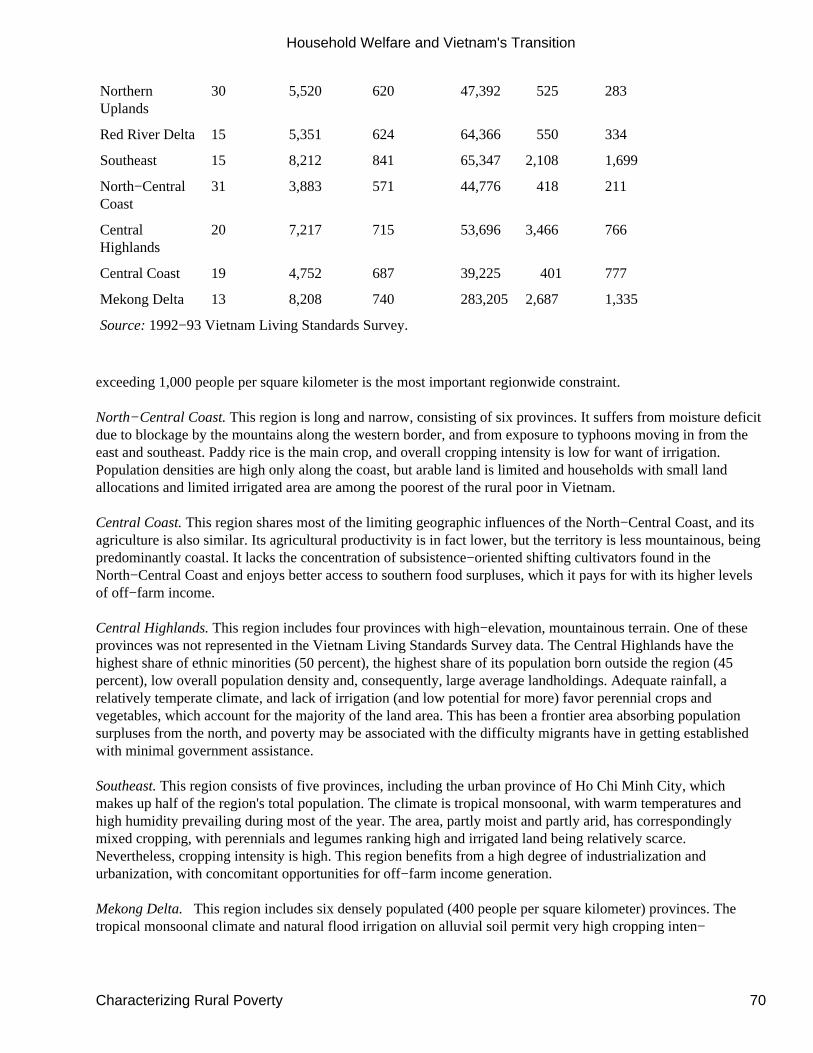
NorthernUplands
30 5,520 620 47,392 525 283
Red River Delta 15 5,351 624 64,366 550 334
Southeast 15 8,212 841 65,347 2,108 1,699
North−CentralCoast
31 3,883 571 44,776 418 211
CentralHighlands
20 7,217 715 53,696 3,466 766
Central Coast 19 4,752 687 39,225 401 777
Mekong Delta 13 8,208 740 283,205 2,687 1,335
Source: 1992−93 Vietnam Living Standards Survey.
exceeding 1,000 people per square kilometer is the most important regionwide constraint.
North−Central Coast. This region is long and narrow, consisting of six provinces. It suffers from moisture deficitdue to blockage by the mountains along the western border, and from exposure to typhoons moving in from theeast and southeast. Paddy rice is the main crop, and overall cropping intensity is low for want of irrigation.Population densities are high only along the coast, but arable land is limited and households with small landallocations and limited irrigated area are among the poorest of the rural poor in Vietnam.
Central Coast. This region shares most of the limiting geographic influences of the North−Central Coast, and itsagriculture is also similar. Its agricultural productivity is in fact lower, but the territory is less mountainous, beingpredominantly coastal. It lacks the concentration of subsistence−oriented shifting cultivators found in theNorth−Central Coast and enjoys better access to southern food surpluses, which it pays for with its higher levelsof off−farm income.
Central Highlands. This region includes four provinces with high−elevation, mountainous terrain. One of theseprovinces was not represented in the Vietnam Living Standards Survey data. The Central Highlands have thehighest share of ethnic minorities (50 percent), the highest share of its population born outside the region (45percent), low overall population density and, consequently, large average landholdings. Adequate rainfall, arelatively temperate climate, and lack of irrigation (and low potential for more) favor perennial crops andvegetables, which account for the majority of the land area. This has been a frontier area absorbing populationsurpluses from the north, and poverty may be associated with the difficulty migrants have in getting establishedwith minimal government assistance.
Southeast. This region consists of five provinces, including the urban province of Ho Chi Minh City, whichmakes up half of the region's total population. The climate is tropical monsoonal, with warm temperatures andhigh humidity prevailing during most of the year. The area, partly moist and partly arid, has correspondinglymixed cropping, with perennials and legumes ranking high and irrigated land being relatively scarce.Nevertheless, cropping intensity is high. This region benefits from a high degree of industrialization andurbanization, with concomitant opportunities for off−farm income generation.
Mekong Delta. This region includes six densely populated (400 people per square kilometer) provinces. Thetropical monsoonal climate and natural flood irrigation on alluvial soil permit very high cropping inten−
Household Welfare and Vietnam's Transition
Characterizing Rural Poverty 70
sity and high productivity in annual crops (mainly rice). On unirrigated areas sugarcane, tropical fruit, and otherperennials are grown. Farm sizes are relatively large, though unequal, permitting substantial commercialsurpluses. Poverty is mainly associated with households' lack of land rights.
Land Quality and Tenure
The limited amount of farmland available to rural households is the main cause of rural poverty in Vietnam. But itis not as important in accounting for interhousehold differences in income in every region. Farm size is largest inthe south, where it is an average of 1.2 hectares in the Central Highlands and 1.0 hectare in the Mekong Delta. Itis little more than one−third of a hectare in the Red River Delta−roughly equal to the cultivated area perhousehold in nearby provinces of south China. Unequal access to land among households in the same area and thecorrelation of land access with poverty is notable in the south, especially in the Mekong Delta, where averagefarm size of the lowest rural quintile (hereafter referred to as poor households) was about 35 percent of that of thehighest quintile (hereafter referred to as wealthy households). In the north, where redistribution in the course ofland reform was quite thorough, wealthy households have smaller farms than poor households, and in the RedRiver Delta farm size varies little across quintiles.
Farm area includes irrigated and nonirrigated land in annual crops, land in perennials, ponds, and land withmiscellaneous uses such as swidden, wooded, idle (or pasture), (newly) reclaimed, and riverbank land. Irrigatedand perennial land, along with ponds (if exploited for raising fish), might be termed "high−productivity land" andthe miscellaneous land as "low−productivity," with nonirrigated annual land lying between the two extremes.However, the impact of variations in natural conditions and farming techniques belies the simplicity of thisdistinction.
Still, these categories are useful in summarily indicating qualitative differences in landholdings by region andacross quintiles. Very little farm area is taken up by low−productivity land in either the Red River or MekongDeltas−most farm area is high−productivity land. On the other hand, the apparent advantages in the NorthernUplands and the Central Highlands of farms that are larger than those of adjacent regions are offset by theirpossession of much low−productivity and little high−productivity land (although upland area devoted tovegetables around Dalat in the Central Highlands, for example, could have extremely high productivity ifappropriate choices as to crops, input levels, technique, and furrow irrigation were made).
Moreover, within the Northern Uplands, Central Coast, and Central Highlands intraregional land qualitydifferences play an important role in accentuating inequality. That is, subsistence or swidden farmers and
immigrants farming reclaimed land in the more remote or inland parts of these regions tend to be among thepoorest households, whereas the wealthiest farm households are either lowlanders with healthy shares of land inirrigated rice or are specialized in perennial cash crops. By contrast, the quality distribution of land is just as equalin the Red River Delta and North−Central Coast as the overall size of holdings, which has implications for thepotential extent of commercialization, specialization, and development of a wage labor market.
The survey distinguished several forms of land tenure:
Allocated land (29 percent of annual, perennial, and forest land),2 which was probably distributed in the courseof decollectivization by cooperatives or state farms under leases of 15 years or more. Hence such land is nearlyabsent in the Southeast and the Mekong Delta.
Long−term−use land (34 percent), which in the north was probably land long allocated for management byindividual families, mainly for vegetables and animal feed. In the south, where most of this type of land is found,households probably had no prerevolutionary claim to it.
Household Welfare and Vietnam's Transition
Land Quality and Tenure 71
Auctioned land (2 percent), found exclusively in the north, where it was retained by cooperatives and auctionedto households for a definite and limited term. Examples include land seasonally flooded, fishponds, and orchards.
Private land (20 percent), which was land that was probably never collectivized, and thus is least common in theRed River Delta and the North−Central Coast.
Land rented in or out (5 percent).
Swidden land (8.5 percent).
Sharecropped land (4 percent), identified for perennial crops only and found only in the south.
In view of past experience in Vietnam, the relationship between the form of tenure and farmers' sense of tenuresecurity may be ambiguous and the enabling legal framework incomplete. It is noteworthy that only about 11percent of land is now held under nominally short−term arrangements. Most of this land is found in the Southeastand the Mekong Delta. Land reportedly farmed under short−term arrangements (not counting swidden) is in fact alarger portion of the total farm area for the wealthy (12 percent) than for the poor (5 percent), and may represent ameans whereby better−off farmers expand their scale of operation. Swidden, on the other hand, is common in theNorthern Uplands, the Central Coast, the Central Highlands, and the Southeast, and most common among thepoor. Finally, reported land sales show no correlation with income, implying that no trend toward landconcentration due to forced sales by the poor is yet observable.
Labor and Dependents
Since poverty is defined here mainly in terms of per capita expenditures, a larger family size should increase thelikelihood of being poor. And indeed it does−wealthy households tend to be one person smaller than poorhouseholds (the correlation with quintile status is −0.14). However, larger households may have greater laborpower, the earnings of which could help offset the cost of dependents.
The dependency ratio of household members to labor power also must be examined. It has a higher negativecorrelation with quintile status (−0.25), and across almost all regions falls from 2.0 for the poorest quintiles to 1.5for the wealthiest. The exception is the Central Highlands, where there is no correlation, probably because youngimmigrant households with few dependents are so prevalent. In these measurements household size has not beenadjusted to consumer equivalents, but labor power is an estimate of potential labor. The dependency ratio usuallyvaries over the life cycle of the household, rising in the childbearing period and falling as children mature.Although the relationship with poverty will not be explored further here, it should be kept in mind that some ofthe variation in per capita expenditures may reflect stages in the household life cycle rather than permanentphenomena.
Labor is a productive resource only if it is occupied, and the small size of farms in Vietnam makes it unlikely thatfarm work will fully employ household labor. Does underemployment or seasonal unemployment contribute torural poverty? By comparing the reported number of on− and off−farm labor days with an estimate of potentiallabor days we can construct a rough index of the underemployment rate of the household.3 It is assumed that timenot absorbed in production could be used for economic benefit in another way. But in fact measuredunderemployment includes women whose time is absorbed in housework and child care, students over 10 yearsold attending school, and the sick or handicapped. Moreover, leisure time (especially of women and youth) mightbe expected to be positively correlated with household income, and might also differ according to regionalculture. Indeed, a tabulation of rural individual responses to Vietnam Living Standards Survey questions aboutunemployment and job seeking implies that either complete or seasonal unemployment or active job searchamong the employed or unemployed are very rare and distributed fairly evenly across quintile groups. For these
Household Welfare and Vietnam's Transition
Labor and Dependents 72
reasons the relationships of this index to geography and quintile status are hard to predict.
Estimated underemployment is strongly negatively correlated with quintile status in the Red River Delta, CentralCoast, Central Highlands, and Southeast but less consistently so elsewhere. In the listed regions, the poorest mayhave 29−54 percent "idle time," and the richest 0−17 percent. Thus inability to fully use their most abundantresource seems to be a clear
handicap of the poor. But the regional differences in underemployment are not obviously related to regionalpoverty rankings. The wealthiest regions have relatively high index values, and the Northern Uplands, one of thepoorest regions, an exceptionally low value, 13 percent compared with 37 percent in the Southeast and 32 percentin the Mekong Delta. In the Northern Uplands the prevalence of swidden and reclamation of formerly forestedland suggests that labor power may constrain farm size, rather than farm size constraining labor absorption. In theMekong Delta a high index value of underemployment (25 percent) among the richest households implies thatvoluntary unemployment is an important explanation.
Rural households in Vietnam generally depend heavily on off−farm wage and self−employment labor tosupplement earnings from farming. The average share of household labor engaged in off−farm wage labor andself−employment ranges from 16 percent in the Northern Uplands to 57 percent in the Southeast, and fallsbetween 27 and 46 percent in other regions. This share is positively correlated with per capita expenditure (r >0.2) in all regions except the Southeast and the Mekong Delta, where many of the poorest households are actuallyor virtually landless, and where on average, the poor devote more than 40 percent of their labor to off−farmactivities. Off−farm activities are least important among the poor in the Northern Uplands and North−CentralCoast (8 and 19 percent of labor power, respectively). Thus it is arguable that off−farm activities are a path towealth accumulation rather than a vent for surplus labor.
No significant relationship was found between the "endowed" laborland ratio (potential family labor divided byfarm size) and either poverty status or percentage of off−farm employment, even controlling for region. Thisresult implies that:
Variations in demand may be more constraining than variations in supply. For example, the poor are concentratedin communities where relatively few individuals possess jobs in nearby factories (presumably because of theabsence of such factories).
To a large extent farm size has been "adjusted" to the potential labor supply through clearing (in swidden areas),reclamation (in newly settled areas, like the Central Highlands), redistribution by the cooperatives or state farms,land rental, or land sale. This is not to say that this adjustment is sufficient to fully employ the household laborforce (except perhaps in the Northern Uplands), but that unequal distribution of land does not account forvariations in dependence on off−farm activities.
Infrastructure
If only because of its prevalence in remote and isolated areas, poverty is correlated with deficiencies ininfrastructure.4 The correlation is apparent
for a number of quantitative indicators within and across regions, although there are anomalies:
Sampled rural communities were usually accessible by road (86 percent), and the exceptions, 11 kilometers awayfrom a road on average, were exclusively found in the Northern Uplands, the North−Central Coast, and theMekong Delta (the Mekong Delta being a unique case, because of the importance of canal and river transport). In
Household Welfare and Vietnam's Transition
Infrastructure 73

all three areas poor communities are on average farther away from the nearest road than are other communities.
Where there are roads, their condition, as measured by the number of months for which the road is impassable,were best in the Red River Delta and the Central Highlands; and within every region except the Mekong Delta,the poorest communities had the worst roads. But roads were seasonally impassable in only 17 percent of allcommunities. And, for these, the roads were impassable for an average of 3.5 months per year.
More than half of all rural communities have local access to public transport, but it is least frequently available tocommunities in the Northern Uplands, the Red River Delta, the North−Central Coast, and the Mekong Delta (thelast relying main on private water transport), and only in the Red River Delta and the Central Coast is accessnegatively correlated with community income levels.
The distance to the nearest source of public transport is greatest in the Northern Uplands, the North−CentralCoast, and the Mekong Delta (6.3−8.4 kilometers away, on average). In the Northern Uplands, the Red RiverDelta, and the Central Coast the poorer communities are usually farthest from public transport.
Electricity is available to some households in 88 percent of rural communities, and to most households in 47percent of communities. Electrification of the majority of households in a community is most common in the RedRiver Delta (81 percent of communities) and least common in the Mekong Delta (16 percent). Except in thatregion, poor communities are less likely than the average to be fully electrified, though the bias is substantial onlyin the Northern Uplands, the Central Coast, and the Central Highlands.
About 65 percent of communities had access to either a permanent or periodic local market, though leastfrequently in the Northern Uplands and the North−Central Coast.
What all this adds up to will be clearer when multivariate relationships have been explored (below). In general,infrastructure deficiencies account in part for the severe poverty in the Northern Uplands and the North−CentralCoast and some of the differences in income among communities within regions.
Farm Production
Most rural income, for all except the wealthiest families, comes from farming. Most farm income is derived fromcrop production, and crop production is dominated by paddy rice production. Nationwide, farmers grow anaverage of 1.6 crops a year on their landholdings (including land in annual and perennial crops)−that is, the areasown or harvested is about 160 percent of the cultivated area (ranging from a low of 81 percent in the CentralHighlands to 208 percent in the Red River Delta). There is no marked difference in cropping intensity by quintile,though in every region the poorest quintile farms less intensively than the second quintile, and in several regionscropping intensity is clearly positively related to income.
Of the cropped area, 77 percent is paddy rice (89 percent of all foodgrains and tubers); only 11 percent is used forvegetables, legumes, and annual cash crops. The poorest farmers are concentrated slightly more on foodgrains andtubers (86 percent) than the richest quintile (81 percent). But the biggest difference between class extremes is inthe share of rice: 76 percent for the poorest quintile versus 95 percent for the richest.
Most of these differences in land allocations among crops and cropping intensity are more a result of climaticfactors than economic choice−more of the poor live in upland areas or the north, and more of the rich live in thewarm, productive south (nationwide, the portion of irrigated farm area varies only from 27 percent for the poorestto 34 percent for the wealthiest families). Insofar as diversification is associated with higher income levels−theportion of sown area devoted to annual crops other than foodgrains and tubers rises from 14 percent to 19 percent,moving from lowest to highest quintile, and the absolute area sown doubles−it occurs within a small portion of
Household Welfare and Vietnam's Transition
Farm Production 74
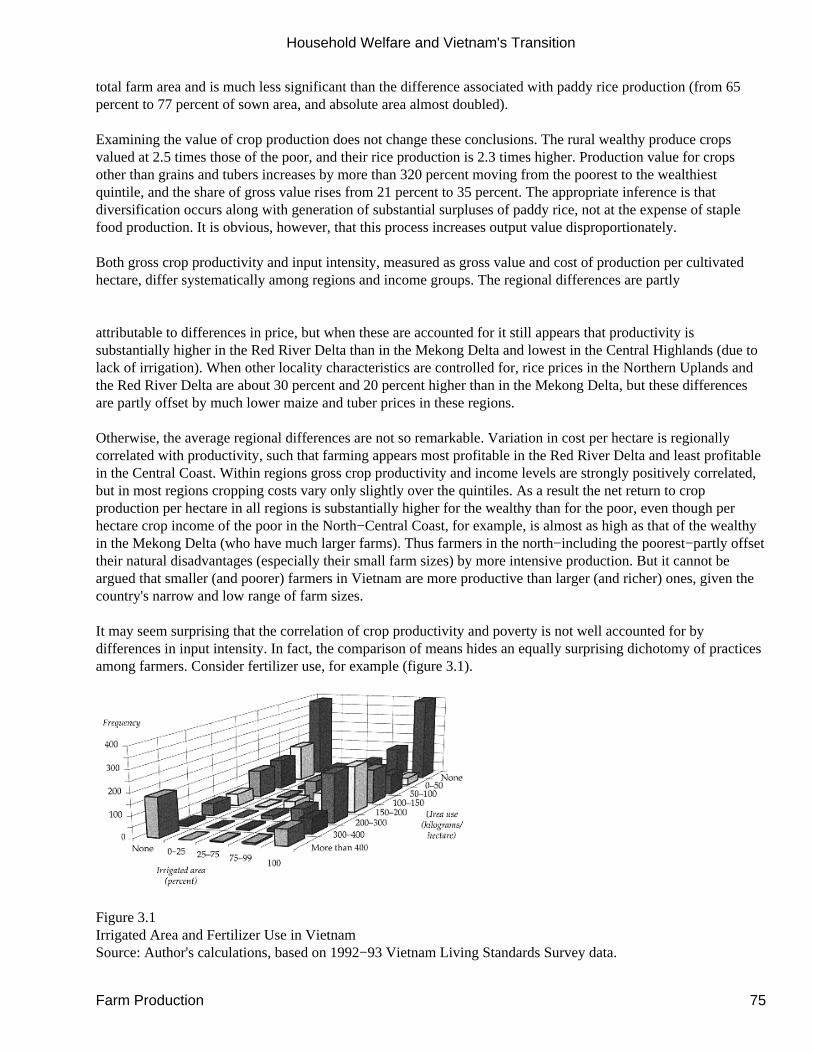
total farm area and is much less significant than the difference associated with paddy rice production (from 65percent to 77 percent of sown area, and absolute area almost doubled).
Examining the value of crop production does not change these conclusions. The rural wealthy produce cropsvalued at 2.5 times those of the poor, and their rice production is 2.3 times higher. Production value for cropsother than grains and tubers increases by more than 320 percent moving from the poorest to the wealthiestquintile, and the share of gross value rises from 21 percent to 35 percent. The appropriate inference is thatdiversification occurs along with generation of substantial surpluses of paddy rice, not at the expense of staplefood production. It is obvious, however, that this process increases output value disproportionately.
Both gross crop productivity and input intensity, measured as gross value and cost of production per cultivatedhectare, differ systematically among regions and income groups. The regional differences are partly
attributable to differences in price, but when these are accounted for it still appears that productivity issubstantially higher in the Red River Delta than in the Mekong Delta and lowest in the Central Highlands (due tolack of irrigation). When other locality characteristics are controlled for, rice prices in the Northern Uplands andthe Red River Delta are about 30 percent and 20 percent higher than in the Mekong Delta, but these differencesare partly offset by much lower maize and tuber prices in these regions.
Otherwise, the average regional differences are not so remarkable. Variation in cost per hectare is regionallycorrelated with productivity, such that farming appears most profitable in the Red River Delta and least profitablein the Central Coast. Within regions gross crop productivity and income levels are strongly positively correlated,but in most regions cropping costs vary only slightly over the quintiles. As a result the net return to cropproduction per hectare in all regions is substantially higher for the wealthy than for the poor, even though perhectare crop income of the poor in the North−Central Coast, for example, is almost as high as that of the wealthyin the Mekong Delta (who have much larger farms). Thus farmers in the north−including the poorest−partly offsettheir natural disadvantages (especially their small farm sizes) by more intensive production. But it cannot beargued that smaller (and poorer) farmers in Vietnam are more productive than larger (and richer) ones, given thecountry's narrow and low range of farm sizes.
It may seem surprising that the correlation of crop productivity and poverty is not well accounted for bydifferences in input intensity. In fact, the comparison of means hides an equally surprising dichotomy of practicesamong farmers. Consider fertilizer use, for example (figure 3.1).
Figure 3.1Irrigated Area and Fertilizer Use in VietnamSource: Author's calculations, based on 1992−93 Vietnam Living Standards Survey data.
Household Welfare and Vietnam's Transition
Farm Production 75
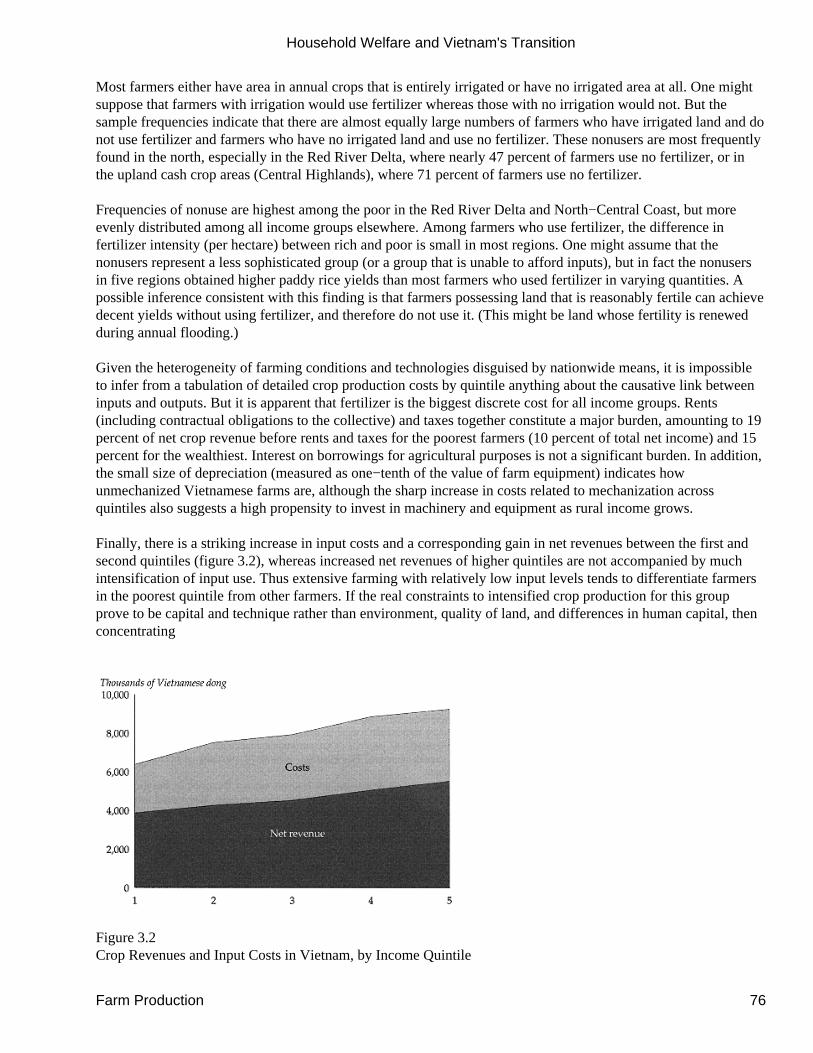
Most farmers either have area in annual crops that is entirely irrigated or have no irrigated area at all. One mightsuppose that farmers with irrigation would use fertilizer whereas those with no irrigation would not. But thesample frequencies indicate that there are almost equally large numbers of farmers who have irrigated land and donot use fertilizer and farmers who have no irrigated land and use no fertilizer. These nonusers are most frequentlyfound in the north, especially in the Red River Delta, where nearly 47 percent of farmers use no fertilizer, or inthe upland cash crop areas (Central Highlands), where 71 percent of farmers use no fertilizer.
Frequencies of nonuse are highest among the poor in the Red River Delta and North−Central Coast, but moreevenly distributed among all income groups elsewhere. Among farmers who use fertilizer, the difference infertilizer intensity (per hectare) between rich and poor is small in most regions. One might assume that thenonusers represent a less sophisticated group (or a group that is unable to afford inputs), but in fact the nonusersin five regions obtained higher paddy rice yields than most farmers who used fertilizer in varying quantities. Apossible inference consistent with this finding is that farmers possessing land that is reasonably fertile can achievedecent yields without using fertilizer, and therefore do not use it. (This might be land whose fertility is renewedduring annual flooding.)
Given the heterogeneity of farming conditions and technologies disguised by nationwide means, it is impossibleto infer from a tabulation of detailed crop production costs by quintile anything about the causative link betweeninputs and outputs. But it is apparent that fertilizer is the biggest discrete cost for all income groups. Rents(including contractual obligations to the collective) and taxes together constitute a major burden, amounting to 19percent of net crop revenue before rents and taxes for the poorest farmers (10 percent of total net income) and 15percent for the wealthiest. Interest on borrowings for agricultural purposes is not a significant burden. In addition,the small size of depreciation (measured as one−tenth of the value of farm equipment) indicates howunmechanized Vietnamese farms are, although the sharp increase in costs related to mechanization acrossquintiles also suggests a high propensity to invest in machinery and equipment as rural income grows.
Finally, there is a striking increase in input costs and a corresponding gain in net revenues between the first andsecond quintiles (figure 3.2), whereas increased net revenues of higher quintiles are not accompanied by muchintensification of input use. Thus extensive farming with relatively low input levels tends to differentiate farmersin the poorest quintile from other farmers. If the real constraints to intensified crop production for this groupprove to be capital and technique rather than environment, quality of land, and differences in human capital, thenconcentrating
Figure 3.2Crop Revenues and Input Costs in Vietnam, by Income Quintile
Household Welfare and Vietnam's Transition
Farm Production 76

Source: Author's calculations, based on 1992−93 Vietnam Living Standards Survey data.
financial assistance and extension on the poorest might prove an economically efficient strategy.
Vietnamese farmers produce first to meet their own consumption requirements and then sell any surpluses.Because of differences between farmgate and retail prices (owing to transport and storage costs, and markups) andvariable availability and pricing of food in the market, a safety−first approach to production planning ispresumably to their advantage. But surplus is slim in the north and among the poor, so crop sales represent themajor part of production in only the Central Highlands, the Southeast, and the Mekong Delta and elsewhereamong the wealthy (figure 3.3). This does not mean that any class of farmers is subsistence−oriented: even thepoorest farmers market nearly 20 percent of their grain production and much higher proportions of the other cropsthey grow. For all quintiles sales of paddy rice account for a remarkably stable 44−49 percent of total crop sales.For the poor, the remainder is made up mainly of low−unit−value staples, vegetables, oilseeds, and perennials,whereas the wealthy tend to market higher−unit−value perennials and fruit.
Even wealthy farmers are surprisingly self−sufficient in food production (nationwide, 43 percent compared with60 percent of the poorest). On average, wealthy farmers can provide their households with a minimum dietarystandard of around 2,100 calories per capita per day (roughly
equivalent to the minimum daily requirement for energy) from their crop production alone, whereas the poorestfarmers provide 1,200 calories. Farmers in the Northern Uplands and the Red River Delta are most self−sufficientin food, regardless of income class, whereas farmers in the Central Highlands (mainly cash crop producers) andthe Southeast (having reliable access to food marketed farther south) rely on the market for the major part of theirfood supplies.
Net Rural Income
The overall income of farm households comprises farm income (crops, livestock, and aquaculture; and processingfor self−consumption) and offfarm income (wages, self−employment, remittances, and other sources such asinterest and rents). The proportions vary by region and income
Household Welfare and Vietnam's Transition
Net Rural Income 77
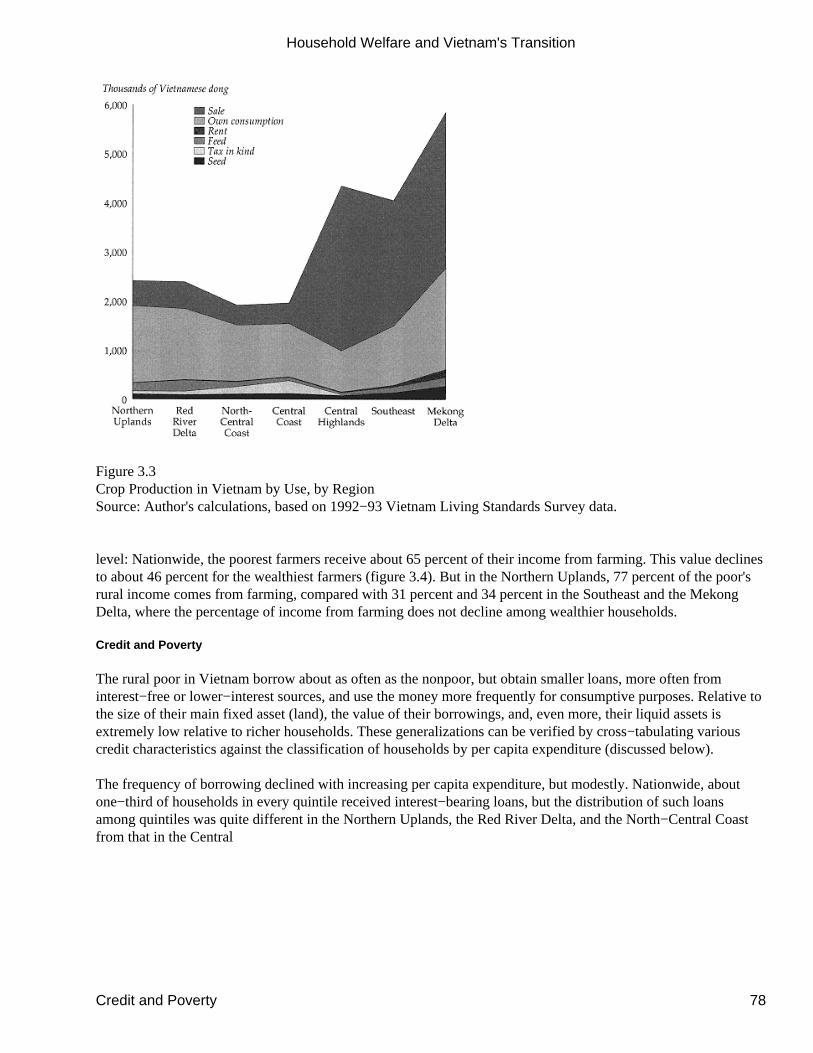
Figure 3.3Crop Production in Vietnam by Use, by RegionSource: Author's calculations, based on 1992−93 Vietnam Living Standards Survey data.
level: Nationwide, the poorest farmers receive about 65 percent of their income from farming. This value declinesto about 46 percent for the wealthiest farmers (figure 3.4). But in the Northern Uplands, 77 percent of the poor'srural income comes from farming, compared with 31 percent and 34 percent in the Southeast and the MekongDelta, where the percentage of income from farming does not decline among wealthier households.
Credit and Poverty
The rural poor in Vietnam borrow about as often as the nonpoor, but obtain smaller loans, more often frominterest−free or lower−interest sources, and use the money more frequently for consumptive purposes. Relative tothe size of their main fixed asset (land), the value of their borrowings, and, even more, their liquid assets isextremely low relative to richer households. These generalizations can be verified by cross−tabulating variouscredit characteristics against the classification of households by per capita expenditure (discussed below).
The frequency of borrowing declined with increasing per capita expenditure, but modestly. Nationwide, aboutone−third of households in every quintile received interest−bearing loans, but the distribution of such loansamong quintiles was quite different in the Northern Uplands, the Red River Delta, and the North−Central Coastfrom that in the Central
Household Welfare and Vietnam's Transition
Credit and Poverty 78
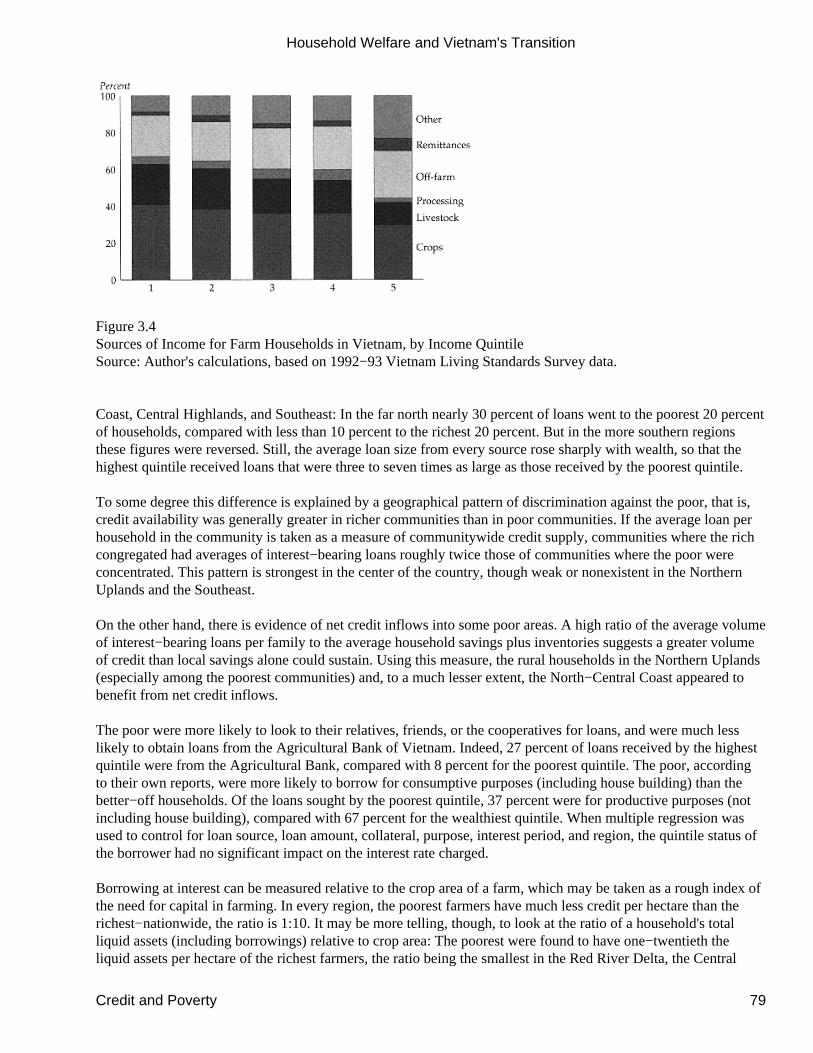
Figure 3.4Sources of Income for Farm Households in Vietnam, by Income QuintileSource: Author's calculations, based on 1992−93 Vietnam Living Standards Survey data.
Coast, Central Highlands, and Southeast: In the far north nearly 30 percent of loans went to the poorest 20 percentof households, compared with less than 10 percent to the richest 20 percent. But in the more southern regionsthese figures were reversed. Still, the average loan size from every source rose sharply with wealth, so that thehighest quintile received loans that were three to seven times as large as those received by the poorest quintile.
To some degree this difference is explained by a geographical pattern of discrimination against the poor, that is,credit availability was generally greater in richer communities than in poor communities. If the average loan perhousehold in the community is taken as a measure of communitywide credit supply, communities where the richcongregated had averages of interest−bearing loans roughly twice those of communities where the poor wereconcentrated. This pattern is strongest in the center of the country, though weak or nonexistent in the NorthernUplands and the Southeast.
On the other hand, there is evidence of net credit inflows into some poor areas. A high ratio of the average volumeof interest−bearing loans per family to the average household savings plus inventories suggests a greater volumeof credit than local savings alone could sustain. Using this measure, the rural households in the Northern Uplands(especially among the poorest communities) and, to a much lesser extent, the North−Central Coast appeared tobenefit from net credit inflows.
The poor were more likely to look to their relatives, friends, or the cooperatives for loans, and were much lesslikely to obtain loans from the Agricultural Bank of Vietnam. Indeed, 27 percent of loans received by the highestquintile were from the Agricultural Bank, compared with 8 percent for the poorest quintile. The poor, accordingto their own reports, were more likely to borrow for consumptive purposes (including house building) than thebetter−off households. Of the loans sought by the poorest quintile, 37 percent were for productive purposes (notincluding house building), compared with 67 percent for the wealthiest quintile. When multiple regression wasused to control for loan source, loan amount, collateral, purpose, interest period, and region, the quintile status ofthe borrower had no significant impact on the interest rate charged.
Borrowing at interest can be measured relative to the crop area of a farm, which may be taken as a rough index ofthe need for capital in farming. In every region, the poorest farmers have much less credit per hectare than therichest−nationwide, the ratio is 1:10. It may be more telling, though, to look at the ratio of a household's totalliquid assets (including borrowings) relative to crop area: The poorest were found to have one−twentieth theliquid assets per hectare of the richest farmers, the ratio being the smallest in the Red River Delta, the Central
Household Welfare and Vietnam's Transition
Credit and Poverty 79
Coast, and the Central Highlands. Thus the distribution across quintiles of household
liquid assets other than interest−bearing loans−that is, savings, inventories, remittances, and interest−free loans−ismuch more unequal than the allocation of interest−bearing credit. Interest−bearing loans represent a much largerportion of the liquid assets of the lower three quintiles of rural households (35−80 percent) than of the richesthouseholds (18 percent).
Promoting Crop Production
The essence of a strategy for reducing rural poverty is setting priorities among possible interventions. Theemphasis may be on production or on directly improving welfare without affecting income−generating potential;on farming or the absorption of farm labor by nonfarm activities; on intensification or resettlement; oncommercialization or improving self−sufficiency; on dismantling discriminatory policies or compensatorymeasures; on public investments or structural reforms. The analysis that follows is intended to shed some light onthe potential for interventions that raise the incomes of the rural poor and the most promising instruments to use.A reasonable place to begin is with farming, in particular, paddy rice farming.
Income from crops accounts for less than half of rural household income, even among the rural poor. The share ofincome from crops, livestock, and fish raising declines over quintile groups (from lowest to highest), whereasnonfarm income sources grow in importance. Yet we could hypothesize that escape from poverty begins with theability of a poor household to generate a surplus of its most basic product. Since most of the poor's cropproduction is absorbed by subsistence requirements, a relatively small increase in food production could lead to alarge percentage increase in marketed surplus. This surplus would ease the household's shortage of financialresources and help satisfy household food requirements−both of which could limit the ability to diversify intoproducts intended mainly for cash sale (surplus grain also provides feed for expanding livestock production) ornonfarm activities. Increased cash income also augments local demand for nonfarm goods and services, enlargingthe scope of opportunity for nonfarm employment or enterprise. According to this theory, then, increasingproduction of paddy rice and other staple foods would have priority in a poverty reduction strategy. But how canthis be done?
The 1992−93 Vietnam Living Standards Survey data provide sufficient information on crop production toeconometrically estimate a paddy rice supply function, as well as a corresponding supply function for on−farmlabor. Extending this supply function will permit an estimate of the determinants of net crop income as a whole,but a paddy rice supply function also allows us to look at prospects for crop diversification.
The Paddy Rice Supply Function
Assume that Vietnamese farm households make several major choices with respect to paddy production: theamount of land to allocate to rice relative to other crops, the amount of household or hired labor to employ inpaddy production, and the amount to invest in current inputs or equipment, all taking into account real wages andrelative crop and input prices, which differ by area.5 Complete and perfect markets are assumed for consumptioncommodities, crops, labor, and current inputs to ensure separability of production and consumption decisions (thisassumption will be challenged below). Levels of other inputs used or influences on production aside from laborand current inputs are decided in advance of the harvest (and are thus exogenous in their relationship with harvestlevels) or not subject to household choice. If the household maximizes a utility function defined over incomesubject to its fixed resources (land and household labor), a set of product supply functions (and a farm laborsupply function, not considered here) can be derived from the optimization conditions (Singh, Squire, and Strauss1986). The supply function for paddy rice would look much like a production function, except that wage rates andinput prices would be used as variables in place of labor and input quantities, and relative price indices for
Household Welfare and Vietnam's Transition
Promoting Crop Production 80
alternative products (composites for annual cash crops, perennial cash crops, fruit, and other food crops) would beincluded.
If the familiar Cobb−Douglas form, which translates into an equation linear in logarithms, is chosen toapproximate the underlying production function, then for ease of estimation and interpretation the supply functionshould also be long−linear in form. This form has the drawback that it is multiplicative in all variables, so that theabsence of any variable (such as nonuse of some exogenous input) implies zero supply or output. This problemhas been remedied by including dummy variables representing instances of nonuse or nonoccurrence, on theassumption that in such instances the intercept of the equation differs but all other coefficients remain the same.Also, a variety of other possible influences on total factor productivity in crop production, such as infrastructure,education, health, and agricultural extension contacts, may be included as independent variables in order to assessthe importance of government investment programs to crop production. These influences enter into the equationsmainly as determinants of the intercept term (which represents total factor productivity)−that is, not in logarithmicform. The equation (before taking logs) is:
where Q is paddy rice production, Y is the intercept term, D i are various dummy variables, X j are cardinalinfluences, w is the wage (with paddy
price as the numeraire), P m are the prices of competing crops and current inputs (paddy price as numeraire), andF n are the fixed (exogenous) factors of production.
The specific variables included in the OLS regression analysis of the supply function, per farm, are:
Paddy rice production (kilograms; in logs), which is the dependent variable.
Mean wage received for nonfarm labor (thousands of dong per workday; in logs).
Cultivated area in annuals and perennials (hectares; in logs).
Percentage of area irrigated.
Mean fertilizer price paid (price in equivalent amounts of paddy sold).
Composite prices for food crops (except paddy), annual cash crops, perennials, and fruit, averaged by community(farmgate value divided by quantity produced, measured in paddy−equivalent).
Dummy variables representing the absence of a price quote in a community because the commodity is not locallyproduced or imported to the community.
Depreciation of farm equipment (10 percent of equipment value; in logs) and other (miscellaneous) expenditureson inputs to cropping, and dummy variables reflecting their absence for some farms.
Number of employees (and employees squared) hired by nearby factories in each community, as a proxy foropportunities for nonagricultural employment.
Distance from the community to the nearest road (and distance squared; both in kilometers).
Household Welfare and Vietnam's Transition
Promoting Crop Production 81
Number of months for which the nearest road is impassable, as a proxy for road condition.
Separate variables for road distance and impassable months in the Mekong Delta, where waterways pose acompetitive alternative to roads.
Labor time adjustment, as a health proxy (100 minus the percentage of labor days lost because of poor health; inlogs).
A dummy variable equal to one if most households in the community have electricity (and equal to zero if noneor a few have electricity).
Dummy variables reflecting the schooling of the household head, ranging from none to post−middle school.
Dummy variables reflecting whether the household had been contacted at least once by an extension source(either government cooperative, nongovernment extension agent, or mass media) and, if so, whether the primarymessage content was the crop season (planting time) or something else.
Dummy for farm size, to test for total factor productivity differences between small and large farms.
Regional dummies (of which only the Mekong Delta proved significant and was retained in all regressions), todistinguish the influence of climatic and other geographic conditions on total factor productivity.
Several permutations of the paddy rice supply function were estimated in order to gain more insight intodifferences across quintile, region, and farm size (table 3.2). The best overall estimates were evaluated formarginal impacts of inputs to clarify the results. The best equation has an R2 of 0.71. What support can such anequation lend to hypotheses about sources of increase in crop supply that might be relevant to an antipovertystrategy?
Labor
If the structural assumptions of the implicit household model are correct, the coefficient on the nonfarm wage rate(in paddy equivalents) should reflect the sensitivity of production decisions to rice prices and the wage rate, andthe influence of increased labor on production. Higher wage rates should attract labor to nonfarm activities,reducing labor's commitment to farming and hence lowering production. The estimated coefficient is indeednegative and statistically significant, but its low magnitude implies that an increase in the real wage of onekilogram rice−equivalent (about 25 percent over the current average wage) would be associated with a fall inproduction of 53 kilograms per hectare (a change of less than 2 percent).
When separate supply functions were estimated for each region, the labor coefficient was no longer statisticallysignificant in any region. Apparently, allocation of labor to crops is insensitive to differences in nonfarm wagesand/or shifts of labor between cropping and other activities would have little impact on crop production. Givenevidence of surplus household labor, these results are not consistent with the supposition that the quantity of laboris a constraint on paddy production, or that intensification of labor use, all else being equal, would have much ofan impact on yields.6 Nor should rural−urban migration be expected to negatively influence food production.7
Land and Irrigation
Recall that a household's cultivated area was assumed to be exogenous (that is, not readily adjusted through arental market), and the portion of area irrigated (adjustable only through previous investments) and regionaldummies were included to account for land quality differences (land quality categories, as officially assessed for
Household Welfare and Vietnam's Transition
Labor 82
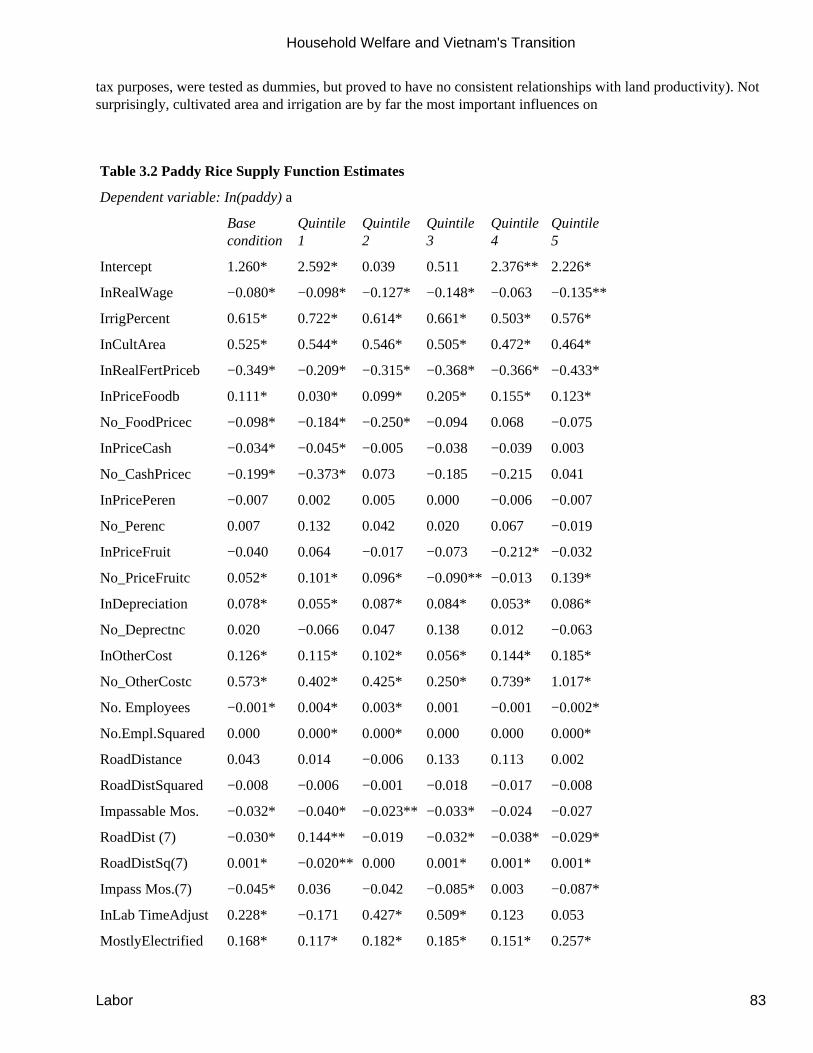
tax purposes, were tested as dummies, but proved to have no consistent relationships with land productivity). Notsurprisingly, cultivated area and irrigation are by far the most important influences on
Table 3.2 Paddy Rice Supply Function Estimates
Dependent variable: In(paddy) a
Basecondition
Quintile1
Quintile2
Quintile3
Quintile4
Quintile5
Intercept 1.260* 2.592* 0.039 0.511 2.376** 2.226*
InRealWage −0.080* −0.098* −0.127* −0.148* −0.063 −0.135**
IrrigPercent 0.615* 0.722* 0.614* 0.661* 0.503* 0.576*
InCultArea 0.525* 0.544* 0.546* 0.505* 0.472* 0.464*
InRealFertPriceb −0.349* −0.209* −0.315* −0.368* −0.366* −0.433*
InPriceFoodb 0.111* 0.030* 0.099* 0.205* 0.155* 0.123*
No_FoodPricec −0.098* −0.184* −0.250* −0.094 0.068 −0.075
InPriceCash −0.034* −0.045* −0.005 −0.038 −0.039 0.003
No_CashPricec −0.199* −0.373* 0.073 −0.185 −0.215 0.041
InPricePeren −0.007 0.002 0.005 0.000 −0.006 −0.007
No_Perenc 0.007 0.132 0.042 0.020 0.067 −0.019
InPriceFruit −0.040 0.064 −0.017 −0.073 −0.212* −0.032
No_PriceFruitc 0.052* 0.101* 0.096* −0.090** −0.013 0.139*
InDepreciation 0.078* 0.055* 0.087* 0.084* 0.053* 0.086*
No_Deprectnc 0.020 −0.066 0.047 0.138 0.012 −0.063
InOtherCost 0.126* 0.115* 0.102* 0.056* 0.144* 0.185*
No_OtherCostc 0.573* 0.402* 0.425* 0.250* 0.739* 1.017*
No. Employees −0.001* 0.004* 0.003* 0.001 −0.001 −0.002*
No.Empl.Squared 0.000 0.000* 0.000* 0.000 0.000 0.000*
RoadDistance 0.043 0.014 −0.006 0.133 0.113 0.002
RoadDistSquared −0.008 −0.006 −0.001 −0.018 −0.017 −0.008
Impassable Mos. −0.032* −0.040* −0.023** −0.033* −0.024 −0.027
RoadDist (7) −0.030* 0.144** −0.019 −0.032* −0.038* −0.029*
RoadDistSq(7) 0.001* −0.020** 0.000 0.001* 0.001* 0.001*
Impass Mos.(7) −0.045* 0.036 −0.042 −0.085* 0.003 −0.087*
InLab TimeAdjust 0.228* −0.171 0.427* 0.509* 0.123 0.053
MostlyElectrified 0.168* 0.117* 0.182* 0.185* 0.151* 0.257*
Household Welfare and Vietnam's Transition
Labor 83
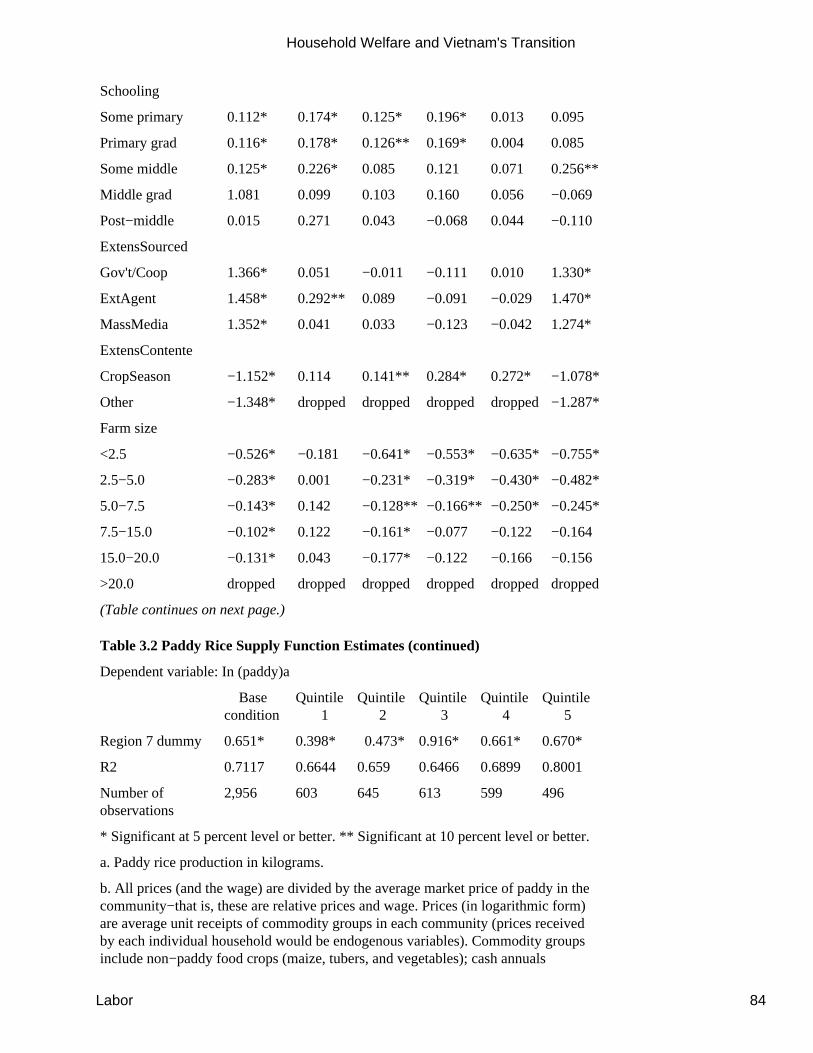
Schooling
Some primary 0.112* 0.174* 0.125* 0.196* 0.013 0.095
Primary grad 0.116* 0.178* 0.126** 0.169* 0.004 0.085
Some middle 0.125* 0.226* 0.085 0.121 0.071 0.256**
Middle grad 1.081 0.099 0.103 0.160 0.056 −0.069
Post−middle 0.015 0.271 0.043 −0.068 0.044 −0.110
ExtensSourced
Gov't/Coop 1.366* 0.051 −0.011 −0.111 0.010 1.330*
ExtAgent 1.458* 0.292** 0.089 −0.091 −0.029 1.470*
MassMedia 1.352* 0.041 0.033 −0.123 −0.042 1.274*
ExtensContente
CropSeason −1.152* 0.114 0.141** 0.284* 0.272* −1.078*
Other −1.348* dropped dropped dropped dropped −1.287*
Farm size
<2.5 −0.526* −0.181 −0.641* −0.553* −0.635* −0.755*
2.5−5.0 −0.283* 0.001 −0.231* −0.319* −0.430* −0.482*
5.0−7.5 −0.143* 0.142 −0.128** −0.166** −0.250* −0.245*
7.5−15.0 −0.102* 0.122 −0.161* −0.077 −0.122 −0.164
15.0−20.0 −0.131* 0.043 −0.177* −0.122 −0.166 −0.156
>20.0 dropped dropped dropped dropped dropped dropped
(Table continues on next page.)
Table 3.2 Paddy Rice Supply Function Estimates (continued)
Dependent variable: In (paddy)a
Basecondition
Quintile 1
Quintile 2
Quintile 3
Quintile 4
Quintile 5
Region 7 dummy 0.651* 0.398* 0.473* 0.916* 0.661* 0.670*
R2 0.7117 0.6644 0.659 0.6466 0.6899 0.8001
Number ofobservations
2,956 603 645 613 599 496
* Significant at 5 percent level or better. ** Significant at 10 percent level or better.
a. Paddy rice production in kilograms.
b. All prices (and the wage) are divided by the average market price of paddy in thecommunity−that is, these are relative prices and wage. Prices (in logarithmic form)are average unit receipts of commodity groups in each community (prices receivedby each individual household would be endogenous variables). Commodity groupsinclude non−paddy food crops (maize, tubers, and vegetables); cash annuals
Household Welfare and Vietnam's Transition
Labor 84
(legumes, sugarcane, fibers, tobacco, and the like); perennials (tea, coffee, rubber,pepper, coconut, and the like); and fruit.
c. Extra dummies are employed equal to I when an input or other variable is absent,and the value of the log of input use is set equal to zero in such a case. Thus it isassumed that the production function, in the absence of that input, differs only in itsintercept and omission of the input term. If farmers use inputs only if needed (forexample, the use fertilizer when natural fertility is insufficient to meet crop needs,or use pesticides only if pests are a problem), this dummy can have a positivecoefficient. Absence of a community price observation for a particular communityimplies that environmental conditions are not ''right" for such a crop at prevailingmarket prices. Thus these dummies may be instruments for environmentalconditions that effect paddy as well.
d. Only the tabulation of (the first) extension contact relating to paddy rice in thepast twelve months is included here.
e. One "message" is what is the right time to plant paddy this year (which may becrucial to organizing irrigation delivery). If that was the main content, the variable isequal to I. If the primary content concerned other aspects of paddy cultivation (forexample, the appropriate seed varieties), the variable is equal to 2. And if there wasno contact (hence no message), the variable is equal to 3. Because of the correlationbe added together to get the net effect of an event with a particular source andcontent.
Source: Author's calculations.
paddy production. Because the market wage rate is well above the value of labor's marginal product, the reversemust be true for land−or else payments for access to land would leave no surplus for the household's survival.
Indeed, the implied value of the marginal product of a hectare of land under cultivation (about two−thirdsirrigated) is estimated to average 2.1 million dong−more than twice what households pay on average for land use.Irrigation adds substantially to land value: the difference in paddy yields between no and full irrigation amounts to2.2 tons per hectare, all else being equal. As paddy area and irrigation status together account for most variation inproduction, equalizing access to these across income groups (largely achieved in the Red River Delta) wouldnearly equalize income from crop cultivation among households. Neither the technical feasibility nor the costs ofincreasing irrigated area have been considered here (see chapter 5), but the gross gains would clearly besubstantial.
Fertilizer and Agrochemicals
We saw earlier that a substantial portion of farmers, especially in the Red River Delta, used no fertilizer yetobtained paddy yields greater than those
of households that used moderate amounts of fertilizer. An alternative specification of the supply function(detailed results not shown) included, among other things, specific fertilizer and pesticide input variables anddummies representing their nonuse. Positive and significant coefficients on the dummies confirmed that farmerswho could avoid using these inputs, perhaps because their land was naturally very fertile (or was replenished byannual flooding) or because there were few local pest problems, were substantially better off than those whocould not (they could achieve higher crop yields at less cost).
On the other hand, for the average farmer the estimated benefit−cost ratio−that is, the value in dong of outputobtained for every dong of additional input−at the sample mean favored increased input use: 3:1 for urea and
Household Welfare and Vietnam's Transition
Fertilizer and Agrochemicals 85
4.7:1 for pesticides. These averages were sufficient to cover the opportunity cost of own or borrowed workingcapital, even at interest rates of 25 percent per month, but not necessarily enough to compensate the farmer forproduction risk. A negative interaction term between fertilizer and irrigation suggests that those farmers whocombined high levels of irrigation and fertilizer use would often be better off cutting back on fertilizer. Phosphaticfertilizers, although heavily used, showed no significant association with paddy yields. Potash is less frequentlyapplied, and widely varying amounts used showed no significant effect on paddy yields−although yields were 8percent lower if no potash was used at all. Evidence from alternative estimates suggested that many farmers wereunsure about optimal fertilizer use, an important area for agrotechnical extension work.
Returning to the best equation, the average price (paddy equivalents) of all fertilizers was the sole instrument forinput prices that could be calculated for most farms. The estimated elasticity coefficient of −0.35 combines theallocative impact of relative price variation with the effect of fertilizer on crop yields. The magnitude of the jointeffect is not trivial: a 50 percent increase in the relative price of fertilizer would reduce paddy yields by about 0.5tons per hectare (a 13 percent decrease at the geometric mean yield of 3.8 tons per hectare). Clearly, the ratio ofthe price of fertilizer to the price of paddy rice is an indicator of incentives that have a powerful effect on cropproduction (the impact on income will be considered below).
Capital Services
The relationship between investments in farm equipment and increased output was measured by the inclusion of(the log of) depreciation (calculated as one−tenth of the value of equipment) and "other costs" associated withmechanization, including transport and electricity fees. Payback in paddy yields to such investments is very high:one Vietnamese dong invested in equipment or related other costs is associated with a gross annual return of 4−5dong worth of paddy, other things being equal. Nevertheless, the average value of all durable farm equipmentamong
sampled farms was only about $5. Mechanization is evidently a means to increase farm income, though notbecause of its labor−saving impact.
Prices of Competing Crops
If farmers are market−oriented, then variation in the relative profitability of different crops should affect paddyrice production (that is, farmers should diversify out of rice if other crops become more profitable). There are twoproblems with such a simple generalization. First, it ignores ownconsumption demand for paddy rice, which maybe relatively price−inelastic. And it ignores the probable wedge between farmgate and retail prices, reflectingtransport costs, uncertainty of market prices and availability, and economies to home storage.8 Such a wedge andthe associated price risks tell us why farmers first meet their own consumption requirements before selling theircrop. Also, inelastic household demand for rice would limit the scope for diversification even if relative riceprices fell.9
The second problem is the implicit assumption that farmers have substantial choice as to how they use their land.But without major investments of labor or cash, most paddy fields are too poorly drained to be suitable for upland(dry land) crops and, vice versa, upland fields lacking irrigation facilities provide very low rice yields. Nor canindividual farms readily diversify independently of their neighbors or public authority, as surface irrigation ordrainage works usually require public investment. Still, there may be some scope for substitution in the mediumto long run. But these econometric estimates do not provide much confirmation. The estimated cross−priceelasticity coefficients are either small, statistically insignificant, or have the wrong sign. The coefficients arelikely influenced by a specification problem: the high−productivity rice growing areas are distant from areas withcomparative advantage in upland, cash, or fruit crops, creating a positive association between high riceproductivity and high prices of other crops.
Household Welfare and Vietnam's Transition
Capital Services 86

Recall that the underlying farm model assumed three dimensions of household choice with respect to paddy riceproduction−choice of crop (area), farm labor input, and investment in other inputs and equipment. The findings tothis point suggest that only the last of these choices may have a substantial impact on rice production. However,small changes in paddy rice area and production could be associated with large changes in area and production ofdiversified crops. Thus the estimates do not necessarily undercut arguments for a diversification strategy. Rather,they suggest that it would have little cost in terms of rice area or output.
Nonfarm Employment
Although variations in the wage rate are shown to have little relationship to variations in on−farm labor use, itmay be that opportunities for non−
farm employment influence farm labor allocation, though (as argued above) the marginal effect on farmproduction would be minimal. Note that, whereas the household model assumed a complete and perfect labormarket, we are now considering the possibility that the labor market does not clear at going wage rates−rather,access to nonfarm labor opportunities is rationed. The number of employees from the community hired by nearbyfactories was included in quadratic form as an instrumental variable reflecting the extent of such opportunities.The coefficients were significant, but the effect small. At the mean, an increase in factory hires of one employeein the community was associated with a loss of only 2 kilograms per hectare of paddy yield. The marginal impactactually turned positive when factories hired more than 250 employees in a community.
Infrastructure
The presence and condition of roads and village electrification should influence the ease and scope of marketing,and availability and timeliness of input supply−factors partly (but not necessarily entirely) reflected in the pricestructure. Electrification should allow farmers to custom process their output, increasing value−added, and alsomight be a proxy for differences in overall levels of commercial activity. The Mekong Delta was distinguishedfrom other regions in looking at roads because of the importance there of canals for transport. Few of the sampledcommunities outside the Mekong Delta did not have road access, and only in the Mekong Delta did therelationship between access and productivity appear significant−a decrease of 81 kilograms per hectare in yieldsfor every kilometer of distance from a road. Poor road condition does matter: yields fall by 92 kilograms perhectare (128 in the Mekong Delta) for every additional month that a road is impassable to vehicles.
Why? Possibly because human transport takes labor away from crop management and timely harvesting, orbecause shortages of inputs or crop losses arise because of impassable roads. (Paved roads also serve as gooddrying, threshing, and winnowing grounds in Vietnam, thus representing a direct input into rice production.) Ruralelectrification is also important: village households that are mostly electrified have yields that are 18 percenthigher than those of unelectrified villages. Why? Electrification enables better control of water, includingfarm−level pumping for irrigation or drainage. It also facilitates threshing.
Health and Education
The proxy for health status is an adjustment to the number of labor days in farming for workdays lost because ofill health (of household head). As hired labor can substitute for sick family labor, albeit with some efficiency loss,and as there may be labor surplus, household models predict little
effect. Indeed, a 1 percent increase in household labor time in farming because of reduced incidence of sickness isassociated with a yield improvement of only 7 kilograms per hectare.
Household Welfare and Vietnam's Transition
Nonfarm Employment 87
The possibility that endogeneity of health with respect to rice productivity influences this estimate cannot be ruledout, although the direct impact of rice productivity on health is probably small. Thus any biases in the estimatedparameters will also be small. As for education, if the household head had received some primary education, aproductivity gain of at least 12 percent was observed. Additional education had little or no association with highercrop productivity in rice farming.
Extension
In evaluating the estimates for extension, the (positive) coefficient on "source" must be combined with the(negative) coefficient on "message" to obtain a measure of total relationship. If the message consists ofinstructions on planting times (which should be well−coordinated to ensure that the irrigation system functionsproperly), the apparent net impact is in the 20−30 percent range. But it is very small for other messages.10Messages delivered by an extension agent other than a government or cooperative functionary have a greatereffect on productivity. The latter appear no more effective than messages delivered by the mass media.
Farm Size
It is often suggested that small farms in less densely populated countries have higher crop yields than large farms,either because small farms are more labor− and input−intensive or because their total factor productivity(measured as the intercept term in the production function) is higher. Earlier we demonstrated that poor farmershave lower gross and net crop productivity and invest less in inputs other than labor. Insofar as poor farmers havesmall farms, this conclusion might be expected to carry over to farm size. Analysis of the paddy rice supplyfunction has to this point indicated that greater labor intensity on small farms is unlikely to generate significantlyhigher crop yields.
The influence of farm size on total factor productivity in rice production was tested more directly by includingdummies for six farm size classes−essentially testing for omitted influences associated with farm size. Theestimates show conclusively that the smallest farm sizes (less than 0.25 hectare) have only about 41 percent of thetotal factor productivity of farms larger than 2.0 hectare, all else being equal, and in general residual (total factor)productivity rises sharply with farm size until 0.50−0.75 hectare is reached. Thereafter, productivity levels off.This tendency holds when quintile is controlled for (by running regressions on quintile subsamples): it isdefinitely the size of the farm, not characteristics associated
with poverty level, that is responsible. But as discussed below, this phenomenon is not so obvious whenproductivity is measured as net income from all crops.
Regional Differences
Independent of everything else accounted for, total factor productivity in the Mekong Delta is considerably higher(92 percent) than that in other regions. And differences among the other six regions are relatively minor. Thisfinding accords with the regional differences in measures of income and productivity, which were not accountedfor by the much smaller differences among means of explanatory variables by region.
Net Value of Crop Output
An alternative to a model specified in terms of physical output of paddy rice is one focusing on net value ofoutput of all crops. This formulation takes into account long−run adjustments within the cropping system andbetween crops and other farm and nonfarm activities. Its main drawback is that this dependent variable issensitive to errors in the more numerous variables (input and output quantities and prices required to calculate netincome), so the error term may be larger. Moreover, aggregation problems are likely to affect the link between
Household Welfare and Vietnam's Transition
Extension 88
theoretical assumptions and the estimated equation, again tending to enlarge the error term. Nearly 200observations had to be dropped because of incomplete data on the components of the dependent variable. Finally,the closer the dependent variable is to household income, the more we need worry about explanatory variablesbeing partly endogenous. On the plus side, the estimated signs of coefficients would leave no doubts about thedirection of effects on net crop income.
Using the same explanatory variables as in the rice supply equation, we find that the results are generallyconsistent with those for that equation (table 3.3). The only differences expected were in the signs of thecoefficients on relative prices of crops that are substitutes for rice, where differences in value−added rates as wellas substitutability and subsistence requirements may affect the net value of crop production, and the signs cannotbe predicted a priori. The (log of) farm price of paddy rice appears in the denominator of all (relative) pricevariables, so its elasticity, calculated as −1 times the sum of all coefficients on prices, is between 0.03 and 0.12.That is, a 10 percent increase in farmgate rice prices, with no change in prices of fertilizer and other crops, wasassociated with only a 0.3 to 1.2 percent increase in net crop income, because of increased use of fertilizers andother inputs (involving offsetting cost increases), limited substitution or intensification possibilities, andsubstitution of rice for upland foodgrains.
Table 3.3 Supply Function for Net Value of Crop Output
Dependent variable: In (net value crops) a
Coefficient t−statistic Coefficient t−statistic
Intercept 0.142 0.266 0.971 1.619
InRealWage −0.026 −0.653 −0.070 −1.734
IrrigPercent 0.209 4.223 0.206 4.124
InCultArea 0.743 29.463 0.682 18.363
InRealFetPriceb −0.152 −3.181 −0.212 −4.404
InPriceFoodb 0.129 4.516 0.125 4.317
No_FoodPricec −0.456 −6.527 −0.447 −6.383
InPriceCash 0.049 3.101 0.047 2.934
No_CashPricec 0.201 1.537 0.195 1.490
InPricePeren 0.020 1.391 0.026 1.818
No_CashPricec −0.034 −0.346 −0.001 −0.013
InPriceFruit −0.079 −1.755 −0.105 −2.310
No_PriceFruitc −0.145 −4.281 −0.146 −4.297
InDepreciation 0.080 5.336 0.082 5.405
No_Deprectnc 0.034 0.654 0.048 0.899
InOtherCost −0.002 −0.152 −0.001 −0.767
No_OtherCostc 0.090 1.176 0.058 0.758
No.Employees 0.000 −0.813 0.000 −0.651
No.Empl.Squared 0.000 2.157 0.000 −1.920
Household Welfare and Vietnam's Transition
Extension 89
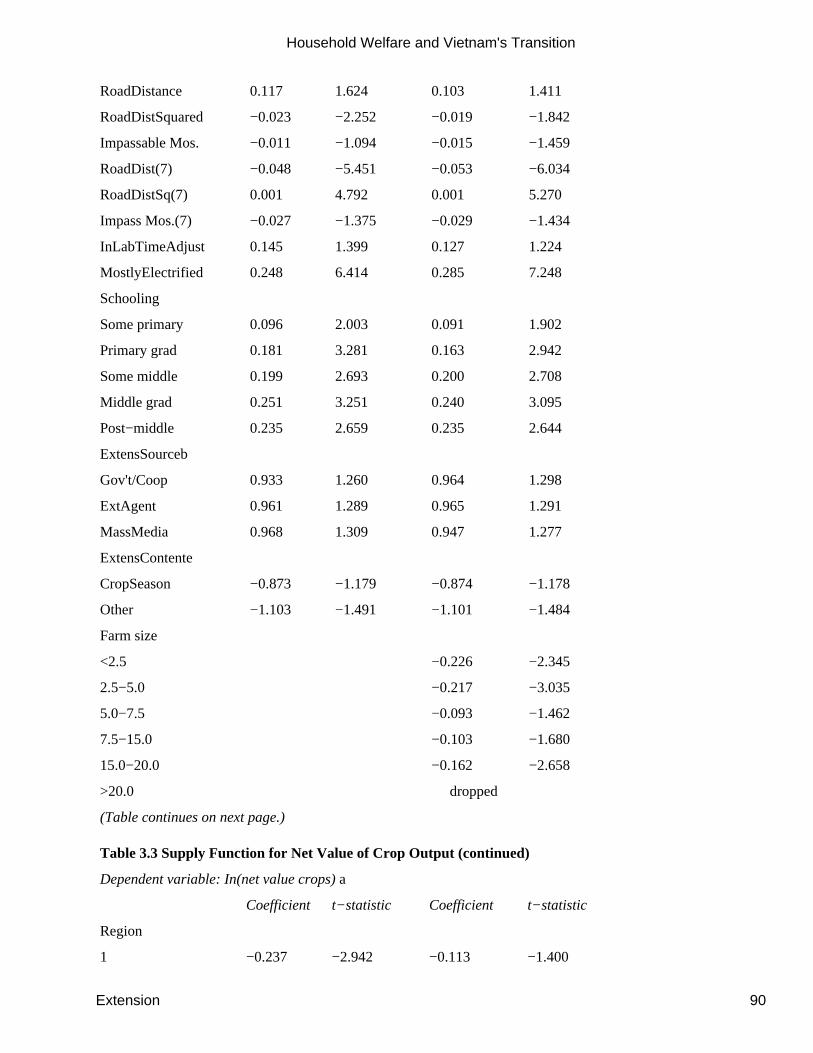
RoadDistance 0.117 1.624 0.103 1.411
RoadDistSquared −0.023 −2.252 −0.019 −1.842
Impassable Mos. −0.011 −1.094 −0.015 −1.459
RoadDist(7) −0.048 −5.451 −0.053 −6.034
RoadDistSq(7) 0.001 4.792 0.001 5.270
Impass Mos.(7) −0.027 −1.375 −0.029 −1.434
InLabTimeAdjust 0.145 1.399 0.127 1.224
MostlyElectrified 0.248 6.414 0.285 7.248
Schooling
Some primary 0.096 2.003 0.091 1.902
Primary grad 0.181 3.281 0.163 2.942
Some middle 0.199 2.693 0.200 2.708
Middle grad 0.251 3.251 0.240 3.095
Post−middle 0.235 2.659 0.235 2.644
ExtensSourceb
Gov't/Coop 0.933 1.260 0.964 1.298
ExtAgent 0.961 1.289 0.965 1.291
MassMedia 0.968 1.309 0.947 1.277
ExtensContente
CropSeason −0.873 −1.179 −0.874 −1.178
Other −1.103 −1.491 −1.101 −1.484
Farm size
<2.5 −0.226 −2.345
2.5−5.0 −0.217 −3.035
5.0−7.5 −0.093 −1.462
7.5−15.0 −0.103 −1.680
15.0−20.0 −0.162 −2.658
>20.0 dropped
(Table continues on next page.)
Table 3.3 Supply Function for Net Value of Crop Output (continued)
Dependent variable: In(net value crops) a
Coefficient t−statistic Coefficient t−statistic
Region
1 −0.237 −2.942 −0.113 −1.400
Household Welfare and Vietnam's Transition
Extension 90
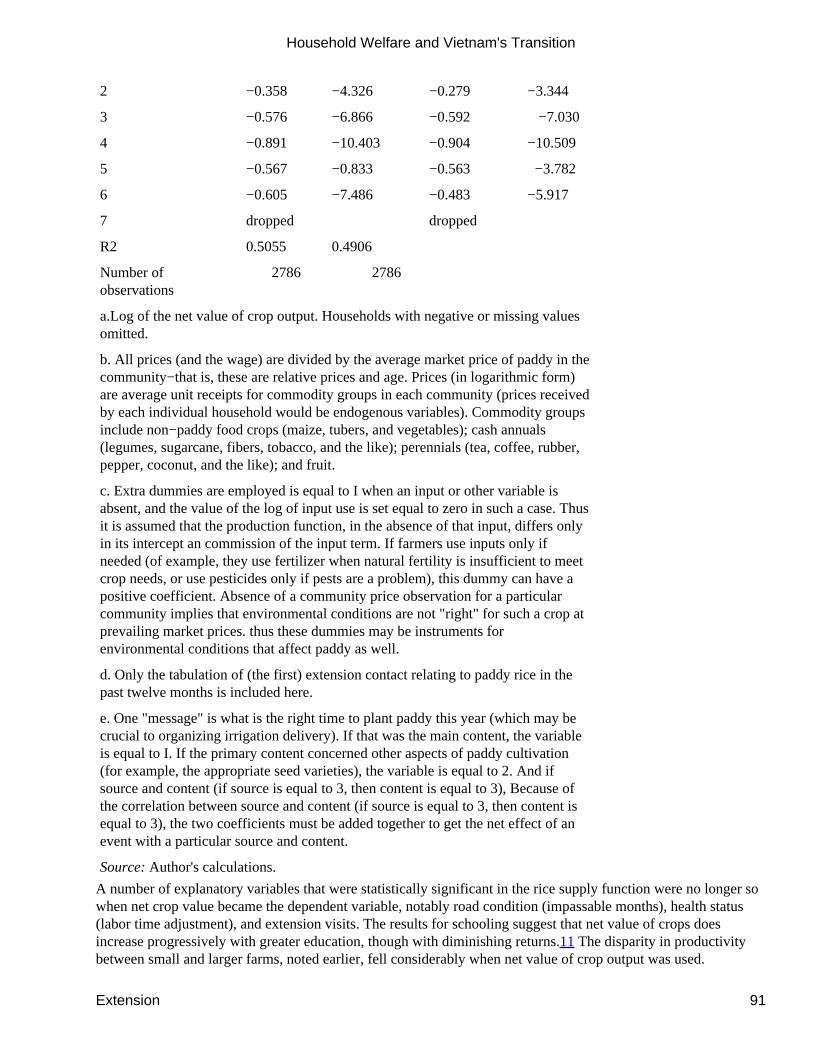
2 −0.358 −4.326 −0.279 −3.344
3 −0.576 −6.866 −0.592 −7.030
4 −0.891 −10.403 −0.904 −10.509
5 −0.567 −0.833 −0.563 −3.782
6 −0.605 −7.486 −0.483 −5.917
7 dropped dropped
R2 0.5055 0.4906
Number ofobservations
2786 2786
a.Log of the net value of crop output. Households with negative or missing valuesomitted.
b. All prices (and the wage) are divided by the average market price of paddy in thecommunity−that is, these are relative prices and age. Prices (in logarithmic form)are average unit receipts for commodity groups in each community (prices receivedby each individual household would be endogenous variables). Commodity groupsinclude non−paddy food crops (maize, tubers, and vegetables); cash annuals(legumes, sugarcane, fibers, tobacco, and the like); perennials (tea, coffee, rubber,pepper, coconut, and the like); and fruit.
c. Extra dummies are employed is equal to I when an input or other variable isabsent, and the value of the log of input use is set equal to zero in such a case. Thusit is assumed that the production function, in the absence of that input, differs onlyin its intercept an commission of the input term. If farmers use inputs only ifneeded (of example, they use fertilizer when natural fertility is insufficient to meetcrop needs, or use pesticides only if pests are a problem), this dummy can have apositive coefficient. Absence of a community price observation for a particularcommunity implies that environmental conditions are not "right" for such a crop atprevailing market prices. thus these dummies may be instruments forenvironmental conditions that affect paddy as well.
d. Only the tabulation of (the first) extension contact relating to paddy rice in thepast twelve months is included here.
e. One "message" is what is the right time to plant paddy this year (which may becrucial to organizing irrigation delivery). If that was the main content, the variableis equal to I. If the primary content concerned other aspects of paddy cultivation(for example, the appropriate seed varieties), the variable is equal to 2. And ifsource and content (if source is equal to 3, then content is equal to 3), Because ofthe correlation between source and content (if source is equal to 3, then content isequal to 3), the two coefficients must be added together to get the net effect of anevent with a particular source and content.
Source: Author's calculations.
A number of explanatory variables that were statistically significant in the rice supply function were no longer sowhen net crop value became the dependent variable, notably road condition (impassable months), health status(labor time adjustment), and extension visits. The results for schooling suggest that net value of crops doesincrease progressively with greater education, though with diminishing returns.11 The disparity in productivitybetween small and larger farms, noted earlier, fell considerably when net value of crop output was used.
Household Welfare and Vietnam's Transition
Extension 91
Encouragement of land transfers, which led to consolidation of smaller farms, thus might have a minor effect oneconomic productivity (and thus incomes of the poor), even though it may raise rice yields. Finally, the regionaldummies indicated greater variation in total factor productivity among regions, all else being equal, than wasindicated by the rice supply equations.
The Cash Farm Economy
The rationale for exploring how to increase crop productivity was a theory of development in which generating asurplus in basic agriculture (food production) would enable the poor to pull themselves out of poverty. It isundoubtedly true that the poorest farmers use a large portion of their crop production for subsistencerequirements, leaving a small portion for sale to generate cash income. It may also be true that growth of mostdiversified farm and nonfarm (nonwage) activities is constrained by shortage of household financial resources andpreoccupation with subsistence requirements. But does it follow that for food crops like paddy rice, a smallincrease in production by the poor can translate to a large percentage increase in cash income and, therefore, thatrelatively small improvements in food production can fuel a "bootstrapping" process in which other farm andnonfarm activities grow in importance relative to food production? We must consider further how improvingfarming (as opposed to expanding nonfarm activities) raises income levels of rural households.
As seen earlier, it is not only the poorest farmers who are self−sufficient in food production−the share ofhousehold food consumption that is self−produced declines only moderately over the quintiles, from 60 percentfor the lowest to 43 percent for the highest. Total family incomes rise across quintiles (by at least 218 percent,from lowest to highest) much more rapidly than the component derived from farming (109 percent) because of theincreased importance of nonfarm activity among higher quintiles. Thus demand for food across quintiles alsoincreases at a rate (163 percent, from lowest to highest) exceeding that of income from farming.
The reverse side of the coin is that for about one−third of farms, farming as a whole (crops, livestock, and basicprocessing) generates a negative cash flow. That is, sales of farm produce are insufficient to cover cash costs. Thedifference is made up from income derived from off−farm sources (wage labor, self−employment, or others).12Again, this phenomenon is relatively stable across quintiles: 27 percent of farmers in the highest quintile havenegative cash flow from farming, compared with 35 percent in the lowest. The cross−sectional relationship maybe better understood by regressing net cash flow (NCF) per hectare on gross value of crops (GVC) per hectare andcrop production cost (CPC) per hectare, yielding the equation (t−statistics in parentheses):
R2 = 0.5. Number of observations = 3,328.
A 1 dong increase in the value (not cash receipts, and holding costs constant) of per hectare crop output isassociated with only a 0.06 dong increase in cash income, whereas a 1 dong increase in the cost per hectare
of crop production is associated with a loss of 0.67 dong in cash income from farming. If this equation werebehavioral (which it clearly is not), it would imply that an extra 1 dong investment in fertilizer that resulted in,say, an additional 5 dong of crop value would end up reducing cash income. But other components of householdincome that have not been held constant in the regression have an elasticity greater than unity with respect to thevalue of crop output value. The greater demand for homeproduced food induced by combined off−farm andon−farm income change exceeds the on−farm income change.
Household Welfare and Vietnam's Transition
The Cash Farm Economy 92

If one held other components of income constant, it is likely that increased crop productivity would generatemuch more cash income than the above equation implies. But the survey indicates that differences in farmproductivity are merely mopped up by increased food demand resulting from growth in cash income fromnonfarm sources. The hypothesis that increased food crop productivity (or, for that matter, gross productionvalue) generates a larger surplus of cash income certainly does not account for the present differences in cashavailability among rural households. Overall, the evidence suggests that nonfarm income affects farm (cash)income through demand for own−produced food, rather than vice versa.
The finding that the self−sufficiency orientation of rural households does not vary with income is puzzling, sinceone would expect that increases in income lead rural households to move into commercial (as opposed tosubsistence) farming. What determines this orientation? One would expect a greater orientation towardself−sufficiency in areas with poor market development or areas with strong comparative advantage in food crops(such as irrigated deltas). Farms with more off−farm income or too little land and farms in areas where cashcropping is advantageous (perhaps because of higher prices) would tend to be less self−sufficient.
These expectations are confirmed by regressions relating the rate of food self−sufficiency to various proxies forthe above relationships. Most of the coefficients have the expected signs and significance for variables indicativeof the extent of market development, reliability, and transport costs (distance from road, number of months theroad is impassable, electrification status, squared distance from public transport, days per month when marketsare open); farm size; extent of nonfarm income; irrigation status; and relative price of cash (nonfood) crops. Astatistically insignificant coefficient on gross value of crops per hectare confirms that increased crop productivityin itself has no effect on self−sufficiency orientation.
Finally, some regional differences remain that are at least partly understandable: the low self−sufficiencyorientation in the Central Highlands (cash crops, but with good access to food supplies from the Mekong Delta)and the Southeast (near Ho Chi Minh City and relatively industrialized); the high self−sufficiency orientation inthe Northern Uplands (mountainous, cut off, and with food deficit), the Red River
Delta, and the North−Central Coast (food deficit regions, distant from the southern surpluses). That the Red RiverDelta has the highest self−sufficiency orientation is at first glance a surprise, as it has a small, if unreliable, foodsurplus, and its marketing infrastructure is not that poor. But the extreme equality of land distribution in thatregion probably means that no one has much in the way of marketable surpluses, dooming the food market (andthe labor market) to a limited role.
Overall, the equation suggests that a process of commercialization−decreased self−sufficiency orientation andcorresponding increases in crop marketing, leading presumably to diversification or specialization and higherfarm productivity−can be spurred mainly by investing in infrastructure that increases market volume andreliability, and decreases marketing costs (and further stimulates growth of nonfarm income−earningopportunities). Interventions intending to raise crop productivity will not have this effect. Greater inequality infarm size, insofar as that results from more freedom to transfer land, might also spur commercialization.
Conclusion
We can summarize with some confidence the promise of various instruments for increasing productivity in cropfarming (and whether greater productivity will raise incomes), given the technologies currently available toVietnamese farmers. Insofar as the structural relationships have not been misspecified by the estimated functions,the following relationships, which may reflect cause and effect, are supported by the analysis so far:
Irrigation has a significant effect on land productivity in cropping, and where land is not yet irrigable, thefeasibility and costs of investments in irrigation merit study.
Household Welfare and Vietnam's Transition
Conclusion 93

Both short−term farm investments in inputs such as fertilizer and long−term investments in farm equipment offerexpected rates of return well in excess of the going interest rates. Attention should be paid to liquidity constraintson farm investment.
The ''price scissors"−the ratio between the price of inputs and the price of outputs (here represented by thefertilizer−rice price ratio)−was an important instrument for manipulating farm incentives under the formeradministrative price system. Any interventions in the price system that affect the scissors can still be expected tohave an impact on crop productivity and net crop income−geographic variations in relative prices of inputs andoutputs show strong association with output variations.
However, a change in the farmgate price of paddy rice relative to prices of inputs and all other crops, whileaffecting paddy production through incentives to use more or less inputs, may have little net effect on farmincomes.
Improvements in infrastructure, such as road access (notably in the Mekong Delta), road condition, andespecially electrification, have a measurable, positive association with rice production and, less conclusively, withnet crop income.
Education levels have a clear association with rice production, primary education being most important for basiccrop yields and secondary education having some additional effect on net income through the development offarm management skills. But the relationship of health to crop production, though statistically significant, appearsminor.
Official extension has a significant association with paddy production, perhaps only because it coordinatesplanting. The current extension system has no measurable relationship with net crop income.
Development of the land market (and growth of off−farm employment opportunities), insofar as it enablesconsolidation of the smallest farms, can be expected to be associated with higher crop yields but less markedlywith higher incomes.
Because of surplus farm labor, developments in the labor market−even substantial increments in off−farm labordemand−are not likely to affect farm productivity or income from farming in the near future. Thus the social rateof return to job−creating investments would likely exceed the private rate of return, because of the gap betweennominal wage and opportunity cost of farm labor.
Households' orientation toward self−sufficiency does not vary with income. Greater farm productivity isabsorbed by higher consumption demand, and does not necessarily increase cash income.
Rural poverty in Vietnam is associated with:
A paucity of productive resources−wealth in the form of land, savings, and other liquid assets, and physicalcapital.
Low−quality resources−lack of irrigation, an unfavorable natural environment, lack of education, lack of (ordistance from) decent public infrastructure.
Lack of access to (or absence of) markets, notably product, input, financial, and off−farm labor markets.
High numbers of dependents relative to productive resources.
Household Welfare and Vietnam's Transition
Conclusion 94
These handicaps are not easily remedied. But they have at various times been characteristics of Vietnam'sneighbors as well−neighbors as different as China and Indonesia have shown that, with sufficient governmentfocus on rural development, a substantial fraction of the rural poor can climb out of poverty. For the poorest,however, short−run prospects are not so optimistic.
It is not difficult to see how individual families escape from poverty. It may involve finding off−farmemployment or succeeding where others fail
in a nonfarming enterprise. Farm income, too, might be boosted by a public irrigation project or access to creditpermitting intensification. But absent major changes in the production environment, growth of agricultural incomeplays a passive or dependent role in a family's escape from poverty. An injection of outside cash income raises thefamily's demand for food, causing it to invest more to intensify its production. But neither agricultural productsales nor net revenues from agriculture will rise very rapidly. This phenomenon is partly the result of factorspeculiar to Vietnam: a high income elasticity of demand for basic foods such as rice, low rural income levels, asmall range of farm sizes, and limited development of marketing infrastructure.
That agriculture development is not the route out of poverty for the individual rural household does not mean thatit is not the key to rural development for the community. Evidence was found that increased agriculturalprosperity in the community augments the demand for nonfarm wage labor and for the products of nonfarmenterprises. Hence some part of agricultural growth clearly spills over into more nonfarm opportunities.
The relationship of credit to poverty and the utility of credit as an instrument for dealing with poverty arecomplex. The poorest households are extremely short of liquidity, even relative to their other meager assets. Theycould presumably use credit productively, but they are much more likely to use it for consumption and may oftenprove reluctant to accept the risks attached to credit bearing market interest rates. The poor benefit in some waysfrom the existing credit system−for example, from cooperatives in poor areas of the north, which supply credit forboth consumption and production; a net inflow of credit into some poor areas; and, through choice or necessity,reliance on interest−free credit sources. On the other hand, the Agricultural Bank of Vietnam, focused as it was onproductive agricultural lending, has subsidized mainly the wealthier classes through reduced interest rates, higherlending volume offered at below−market interest rates, and acceptance of high default rates. We find in theVietnam Living Standards Survey, then, the same dilemmas prevalent in rural credit markets elsewhere, and noready means of using targeted credit to lift the poor out of poverty.
We also must examine the issue of limited demand for household product and labor services. Limited localmarkets are a serious constraint on the household economy in countries like Vietnam, where the pattern ofeconomic growth has been relatively centralized in major cities or particular regions. Centralized economicgrowth often has been a corollary of centralization of political power and fiscal resources, leading, among otherthings, to poorly developed infrastructure in the smaller towns and rural areas. Discriminatory sectoral policiesmay be embedded in the tax and tariff structures, the eligibility criteria for various kinds of government subsidies,and the structure and functioning of product and input markets (an appropriate subject for another study).Dismantling any policies that cause excessive centralization of public and private investment and that
discourage growth of wage labor in both the agricultural and rural nonfarm sector would shift incentives in favorof regional growth of incomes and consumption, and expansion of wage labor and entrepreneurial opportunitiesfor farmers.
Precisely because of the poverty of rural households, income elasticities of demand for rural products such asfood and simple consumption goods are highest away from the capital and industrial centers. Thus higher ruraland small town income translates into expanded markets for raw and processed farm products. Small town
Household Welfare and Vietnam's Transition
Conclusion 95
expansion also translates into off−farm jobs near the smallholdings, in effect relieving the land access constraintby permitting viable household economies based on a mix of farm and nonfarm activities. In short, raising theproductive capacity of the rural poor is not enough−the market for their goods and services must be expandedthrough regional development and labor−absorbing structural change in the rural economy. This strategy can bethought of as one of bringing the market to the poor, as opposed to bringing the goods and services of the ruralpoor to (a distant) market.
Is it possible to narrowly target the poorest groups? Clearly it is possible to identify areas where the poor areconcentrated, such as the poorest regions and, within such regions, the communities most handicapped by lack ofinfrastructure and level, irrigable, good−quality land. Within localities, it is possible to target the smallest farmsizes, although this characteristic is imperfectly correlated with poverty. But is it advisable to do so? Someinvestment programs−such as irrigation, electrification, road building, agrotechnical extension, or postprimaryeducation−would have exceptionally high costs and possibly low returns in poor areas that are remote andmountainous. The poor who are self−sufficiency−oriented and not well integrated into the market economy maybe too risk−averse to access credit programs; moreover, the poor have a higher propensity to consume rather thaninvest their borrowings. And those poor whose farm sizes are very small are not going to use capital asproductively as middle−size farms.
The best compromise, it could be argued, would be a strategy that seeks to create general rural prosperity in broadareas where poverty incidence is high or in areas very near impoverished communities. The objective would be tomake the most efficient use of public funds to generate the greatest possible income increases, accounting for anymultiplier effect, even if firstorder beneficiaries were not the poor. This approach should have the maximumimpact on nonfarm job creation and enlarge the market for higher−value farm and nonfarm products, creatingopportunities for entrepreneurs. Such a strategy should be of substantial benefit to the rural poor without entailingdisproportionate sacrifice to the economy as a whole.
Notes
1. This section draws heavily on World Bank (1994).
2. Definitions of the translated Vietnamese terms are somewhat speculative.
3. Women over 15 were counted as 0.89 adult male equivalents, and children between 10 and 15 as 0.64 adultmale equivalents, based approximately on average market wage rates by age and sex. Each individual wasassumed to offer 300 days a year of potential labor. Family workers engaged in off−farm self−employment wereassumed to work full time when businesses were in operation. Because of errors in assumptions, negativeunderemployment rates are possible and were observed for a few categories of per capita expenditures per region.
4. Although the sampling frame was based on relative population density, particularly isolated communities mayhave been underrepresented in the sample.
5. There is sufficient variation in input and output prices across Vietnam−because of differences in transport anddistribution costs in the context of a poorly developed transport system and newly emerging market distributionsystem−to estimate the impact of price on supply. To eliminate an endogenous element in determining prices paidor received by the individual household (due to quality and timing differences), all price data were averaged overall farms in each community.
Household Welfare and Vietnam's Transition
Notes 96
6. There is one caveat: In these regressions irrigation is accounted for independently. Irrigated crops require muchmore labor than nonirrigated crops. Thus omission of irrigation area (a misspecification) and inclusion ofpotential family labor as an explanatory variable results in a significant and substantial elasticity estimate forlabor. So a labor surplus is conditional on unchanging irrigation area.
7. Until the early 1990s migration in Vietnam was strictly controlled, so there is little scope for analysis ofmigration using the 1992−93 Vietnam Living Standards Survey. After that survey was completed migration isthought to have increased as restrictive controls were removed. Future research on agriculture in Vietnam willneed to incorporate analyses of the relationship between migration and agricultural activities.
8. The existence or size of the wedge cannot be measured from the Living Standards Measurement Survey databecause of unknown quality differences between products sold and purchased, and because of uncertainprocessing losses and conversions between, for example, unmilled and milled rice.
9. Such a wedge implies an imperfect market and a sample with three different types of producers (those with amarketed surplus, a deficit, or neither) who react differently to price changes. Although separability ofconsumption and production decisions applies to the first two types of producer, a common and single supplyfunction, as assumed here, would not be appropriate (see Singh, Squire, and Strauss 1986, 52−54, for furtherdiscussion).
10. One caveat: Farmers differ in their willingness to seek out extension assistance or to act on it if it is suppliedexogenously. Insofar as the former is related to the fact of extension contact, this variable may be a proxy for farmmanagerial ability rather than efficacy of extension work.
11. It seems intuitively plausible that a middle−school education would help farmers master the complexities ofprofitable farm management, but not necessarily lead them to focus on rice yields.
12. This does not imply that these farms produce output whose value is less than that of their inputs. The cashflow figures exclude the value of self−consumption. When the value of self−consumption is included, only asmall percentage of households appear to produce output whose value exceeds that of their inputs.
References
Campell, Robert. 1994. "Consultant's Report." Prepared for the World Bank, Washington, D.C.
Singh, Inderjit, Lyn Squire, and John Strauss, eds. 1986. Agricultural Household Models: Extensions,Applications, and Policy. Baltimore, Md.: Johns Hopkins University Press.
World Bank. 1993. "Viet Nam: Transition to the Market." Report 11902−VN. East Asia and Pacific Region,Washington, D.C.
______. 1994. "Viet Nam: Agricultural Marketing Study." East Asia and Pacific Region, Washington, D.C.
Household Welfare and Vietnam's Transition
References 97
4—Infrastructure and Poverty in Vietnam
Dominique van de Walle
The Vietnamese economy has emerged from a long period during which its ability to undertake socially beneficialinvestments, particularly in infrastructure, was severely constrained. This chapter examines how improvinginfrastructure might affect average living standards and their distribution in Vietnam.
Different arguments can be made as to why basic infrastructure investments in a country such as Vietnam wouldreduce poverty.1 One is that the poor have least access to infrastructure and so will benefit most from newinvestments. If the nonpoor have captured all the benefits of past infrastructure projects and their needs are fullymet, new projects must benefit the poor. Another argument is that the poor are concentrated in sectors of theeconomy where rates of return to infrastructure investments are high. For example, the poor in Vietnam dependheavily on agriculture, where rural infrastructure investments could have high returns.
This chapter attempts to throw light on these arguments by asking, How large and how pro−poor are the gainsfrom investments in infrastructure−specifically irrigation−likely to be? The household data collected in the1992−93 Vietnam Living Standards Survey (VNLSS)−contain much information that is useful for examining thisquestion. The chapter addresses the question in depth only for irrigation. The data have partly influenced thischoice: the attraction of modeling irrigation is that it is household−specific, and so there is ample scope foridentifying interaction effects with other variables and assigning benefits at the household level.
Following the World Bank (1994c), economic infrastructure is here defined to consist of services from publicutilities (sanitation, power, communications, and water supply) and public works (road and transport networksand irrigation and drainage systems). Human infrastructure
(health, education, and nutrition) is briefly mentioned but is not a focus of the discussion. Economic infrastructureservices are often characterized by economies of scale, nonexcludability, problems of information andmonitoring, and externalities in consumption and production. For these reasons and because there may be failuresin related markets (credit, risk, and labor) and distributional objectives, public intervention is often considered tobe necessary (Jimenez 1995). Many of these conditions hold in presentday Vietnam, making arguments forgovernment intervention compelling. But what form that intervention takes−direct provision, subsidization, orregulation−will depend on the type of infrastructure and the nature of the market failure.
Except where noted, the analysis is based on the nationally representative 1992−93 VNLSS. The survey covers4,800 households (23,790 people), of which 3,840 (19,094 people) are rural, and includes a separate questionnaireon the communes in which sampled rural households are found.2 The information collected covers many aspectsof living standards. The household survey touches on access to and use of infrastructure in the context ofhousehold members' activities, income sources, health, education, housing, and so on. The community surveyprovides detailed information on the availability of infrastructure services in each rural household's commune ofresidence. It does not cover urban areas. For certain types of infrastructure, the community survey is the solesource of information in the VNLSS. For others, details are also provided at the household level. But these detailsare often conditional on the household's use and so tend to provide a skewed view of access. For example, forhouseholds that do not report an illness or that report an illness that was not externally treated, the survey revealsnothing about the household's access to health facilities. The commune−level data must also be treated withcaution. Because communes vary in size, the figures do not provide complete information about household accessto infrastructure services. These data were supplemented by a number of field trips to rural areas of the north,center, and south of Vietnam during 1993 and 1994.
Household Welfare and Vietnam's Transition
4— Infrastructure and Poverty in Vietnam 98
Throughout, the chapter uses household consumption expenditure per person as the welfare indicator. Since pricesvary spatially, each household's expenditure is deflated by the region−specific poverty line relative to the nationalpoverty line.3 This provides a measure of household per capita expenditure at what can be termed all−Vietnamprices. All monetary units are also converted into real values in this way. The analysis is thus based on realexpenditure values representing purchasing power parity throughout the country. For the distributional analysis ofirrigation infrastructure and for the figures, individuals are ranked by the converted household per capitaconsumption expenditure and placed in 14 groups defined by per capita expenditure.
The chapter begins by linking household living standards as revealed in the VNLSS with the level of variousinfrastructural services. Using
standard descriptive techniques, an overall picture of the state of infrastructure, and how access varies bystandards of living, is provided. The next section, on crop income, explores in much greater depth one aspect ofinfrastructure−irrigation−and its association with living standards. Here marginal, as opposed to average, effectsof irrigation expansion are estimated and the distributional implications assessed. Farm household crop incomesare modeled as functions of household characteristics, community characteristics, and land, both irrigated andnonirrigated. Estimates of irrigation project costs are also compared with estimated benefits.
Poverty and Infrastructure in Vietnam, 1992−93
This section first looks briefly at the general availability of physical infrastructure in the rural communes to whichhouseholds belong. It then turns to access to drinking water, sewerage and sanitation, irrigation, and energysources for both urban and rural households. Some forms of infrastructure that may have important effects onincome distribution and poverty−notably communication and transport infrastructure, which can integrate poorareas into the market economy and facilitate the mobility of goods and people−cannot be analyzed using theVNLSS. Though little information on Vietnam's communication networks is available from other sources, somedata are available on its transport infrastructure, which is briefly described.
Availability of Physical Infrastructure in Rural Vietnam
About 70 percent of Vietnam's rural population lives in a commune with a passable road, or about 75 percent ofthe rural nonpoor and 67 percent of the rural poor (table 4.1). Using a lower poverty line (arbitrarily set at close totwo−thirds of the national poverty line), 73 percent and 63 percent of those living in nonpoor and poorhouseholds, respectively, live in communes with a passable road.
Infrastructure for social services−schools and clinics−is much more widely accessible than other physicalinfrastructure such as electricity and water. More than 93 percent of the rural population lives in a commune witha clinic, and 88 percent in a commune with a lower secondary school. Every rural commune sampled had aprimary school. Facilities tend to be somewhat more prevalent in the north than in the south (table 4.2).Differences between poor and nonpoor are not large.
Thus, according to the VNLSS, communes tend to be quite well provisioned in at least basic social services. Butthe data also remind us that the quality of social services may leave much to be desired. For example, although allrural communes surveyed report having a primary school, 20 percent of the children who do not attend school saythe reason is that the
school is too far. And 64 percent of communes complain of poor material conditions as the number one problemfacing their primary school.
Household Welfare and Vietnam's Transition
Poverty and Infrastructure in Vietnam, 1992−93 99
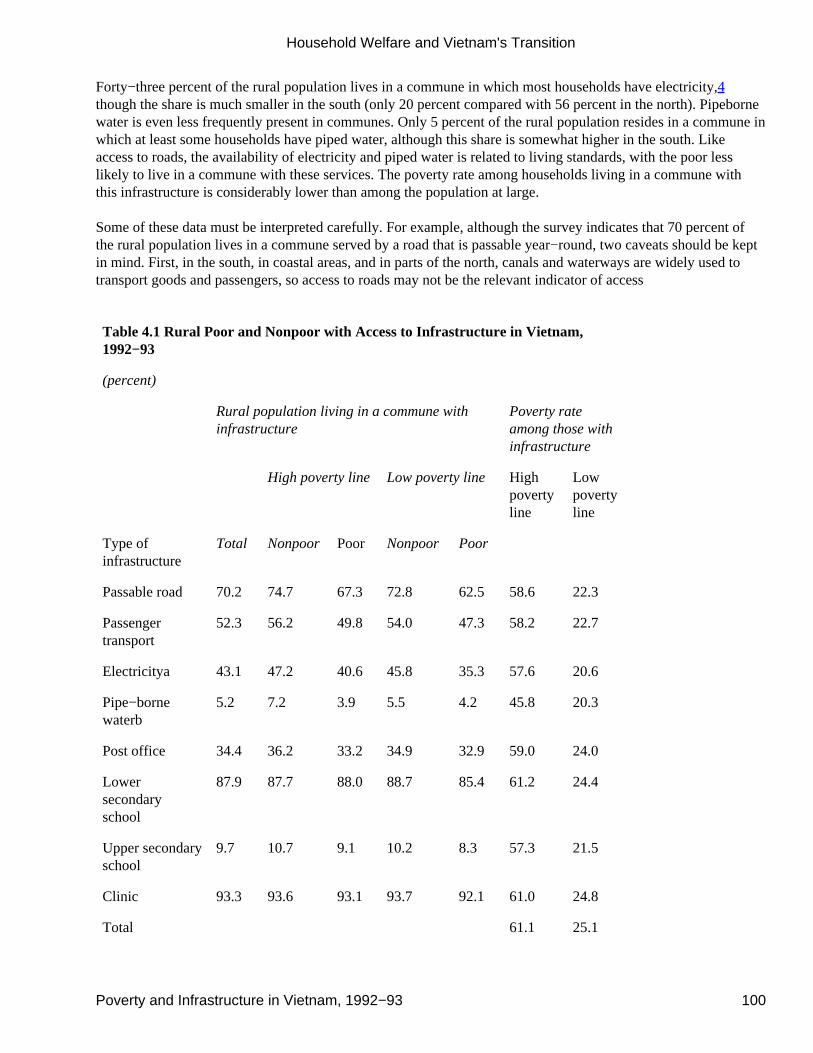
Forty−three percent of the rural population lives in a commune in which most households have electricity,4though the share is much smaller in the south (only 20 percent compared with 56 percent in the north). Pipebornewater is even less frequently present in communes. Only 5 percent of the rural population resides in a commune inwhich at least some households have piped water, although this share is somewhat higher in the south. Likeaccess to roads, the availability of electricity and piped water is related to living standards, with the poor lesslikely to live in a commune with these services. The poverty rate among households living in a commune withthis infrastructure is considerably lower than among the population at large.
Some of these data must be interpreted carefully. For example, although the survey indicates that 70 percent ofthe rural population lives in a commune served by a road that is passable year−round, two caveats should be keptin mind. First, in the south, in coastal areas, and in parts of the north, canals and waterways are widely used totransport goods and passengers, so access to roads may not be the relevant indicator of access
Table 4.1 Rural Poor and Nonpoor with Access to Infrastructure in Vietnam,1992−93
(percent)
Rural population living in a commune withinfrastructure
Poverty rateamong those withinfrastructure
High poverty line Low poverty line Highpovertyline
Lowpovertyline
Type ofinfrastructure
Total Nonpoor Poor Nonpoor Poor
Passable road 70.2 74.7 67.3 72.8 62.5 58.6 22.3
Passengertransport
52.3 56.2 49.8 54.0 47.3 58.2 22.7
Electricitya 43.1 47.2 40.6 45.8 35.3 57.6 20.6
Pipe−bornewaterb
5.2 7.2 3.9 5.5 4.2 45.8 20.3
Post office 34.4 36.2 33.2 34.9 32.9 59.0 24.0
Lowersecondaryschool
87.9 87.7 88.0 88.7 85.4 61.2 24.4
Upper secondaryschool
9.7 10.7 9.1 10.2 8.3 57.3 21.5
Clinic 93.3 93.6 93.1 93.7 92.1 61.0 24.8
Total 61.1 25.1
Household Welfare and Vietnam's Transition
Poverty and Infrastructure in Vietnam, 1992−93 100
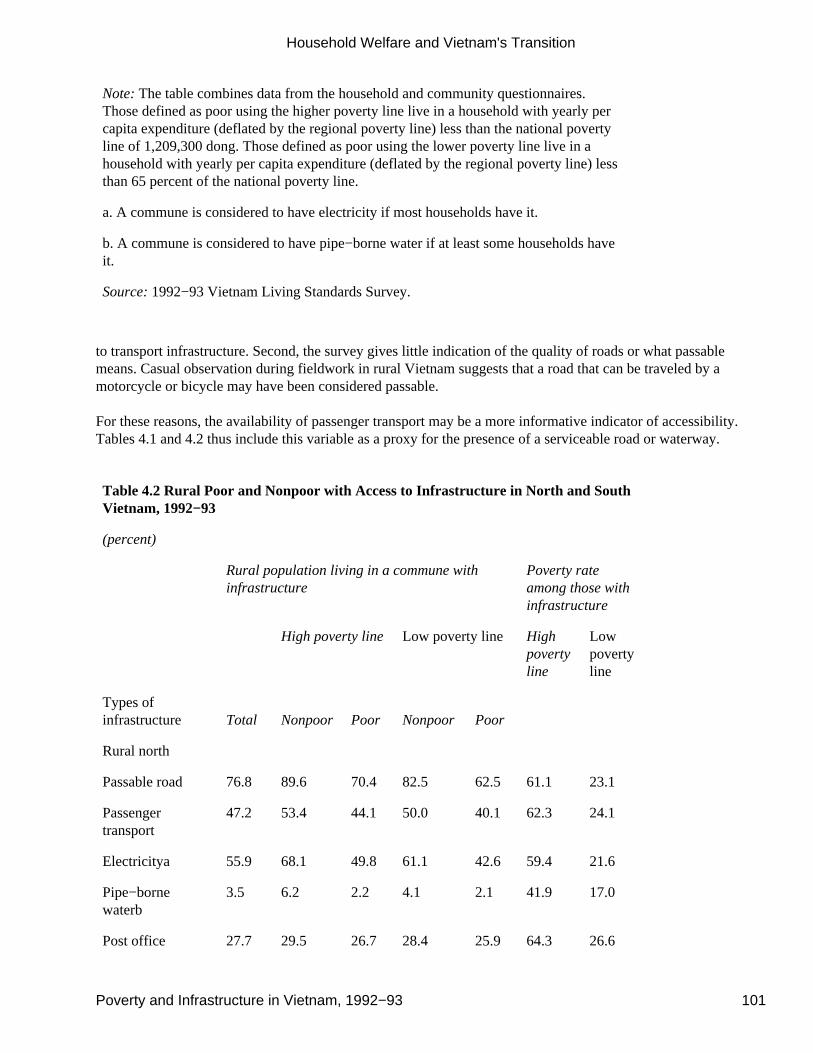
Note: The table combines data from the household and community questionnaires.Those defined as poor using the higher poverty line live in a household with yearly percapita expenditure (deflated by the regional poverty line) less than the national povertyline of 1,209,300 dong. Those defined as poor using the lower poverty line live in ahousehold with yearly per capita expenditure (deflated by the regional poverty line) lessthan 65 percent of the national poverty line.
a. A commune is considered to have electricity if most households have it.
b. A commune is considered to have pipe−borne water if at least some households haveit.
Source: 1992−93 Vietnam Living Standards Survey.
to transport infrastructure. Second, the survey gives little indication of the quality of roads or what passablemeans. Casual observation during fieldwork in rural Vietnam suggests that a road that can be traveled by amotorcycle or bicycle may have been considered passable.
For these reasons, the availability of passenger transport may be a more informative indicator of accessibility.Tables 4.1 and 4.2 thus include this variable as a proxy for the presence of a serviceable road or waterway.
Table 4.2 Rural Poor and Nonpoor with Access to Infrastructure in North and SouthVietnam, 1992−93
(percent)
Rural population living in a commune withinfrastructure
Poverty rateamong those withinfrastructure
High poverty line Low poverty line Highpovertyline
Lowpovertyline
Types ofinfrastructure Total Nonpoor Poor Nonpoor Poor
Rural north
Passable road 76.8 89.6 70.4 82.5 62.5 61.1 23.1
Passengertransport
47.2 53.4 44.1 50.0 40.1 62.3 24.1
Electricitya 55.9 68.1 49.8 61.1 42.6 59.4 21.6
Pipe−bornewaterb
3.5 6.2 2.2 4.1 2.1 41.9 17.0
Post office 27.7 29.5 26.7 28.4 25.9 64.3 26.6
Household Welfare and Vietnam's Transition
Poverty and Infrastructure in Vietnam, 1992−93 101
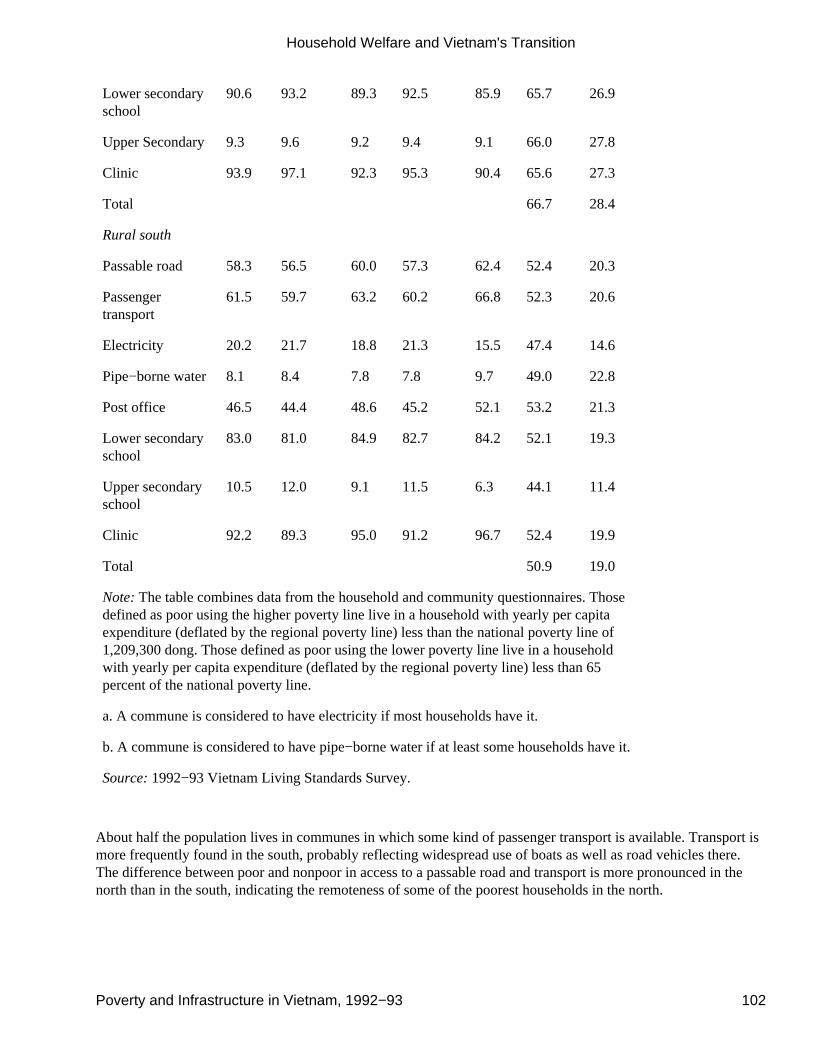
Lower secondaryschool
90.6 93.2 89.3 92.5 85.9 65.7 26.9
Upper Secondary 9.3 9.6 9.2 9.4 9.1 66.0 27.8
Clinic 93.9 97.1 92.3 95.3 90.4 65.6 27.3
Total 66.7 28.4
Rural south
Passable road 58.3 56.5 60.0 57.3 62.4 52.4 20.3
Passengertransport
61.5 59.7 63.2 60.2 66.8 52.3 20.6
Electricity 20.2 21.7 18.8 21.3 15.5 47.4 14.6
Pipe−borne water 8.1 8.4 7.8 7.8 9.7 49.0 22.8
Post office 46.5 44.4 48.6 45.2 52.1 53.2 21.3
Lower secondaryschool
83.0 81.0 84.9 82.7 84.2 52.1 19.3
Upper secondaryschool
10.5 12.0 9.1 11.5 6.3 44.1 11.4
Clinic 92.2 89.3 95.0 91.2 96.7 52.4 19.9
Total 50.9 19.0
Note: The table combines data from the household and community questionnaires. Thosedefined as poor using the higher poverty line live in a household with yearly per capitaexpenditure (deflated by the regional poverty line) less than the national poverty line of1,209,300 dong. Those defined as poor using the lower poverty line live in a householdwith yearly per capita expenditure (deflated by the regional poverty line) less than 65percent of the national poverty line.
a. A commune is considered to have electricity if most households have it.
b. A commune is considered to have pipe−borne water if at least some households have it.
Source: 1992−93 Vietnam Living Standards Survey.
About half the population lives in communes in which some kind of passenger transport is available. Transport ismore frequently found in the south, probably reflecting widespread use of boats as well as road vehicles there.The difference between poor and nonpoor in access to a passable road and transport is more pronounced in thenorth than in the south, indicating the remoteness of some of the poorest households in the north.
Household Welfare and Vietnam's Transition
Poverty and Infrastructure in Vietnam, 1992−93 102
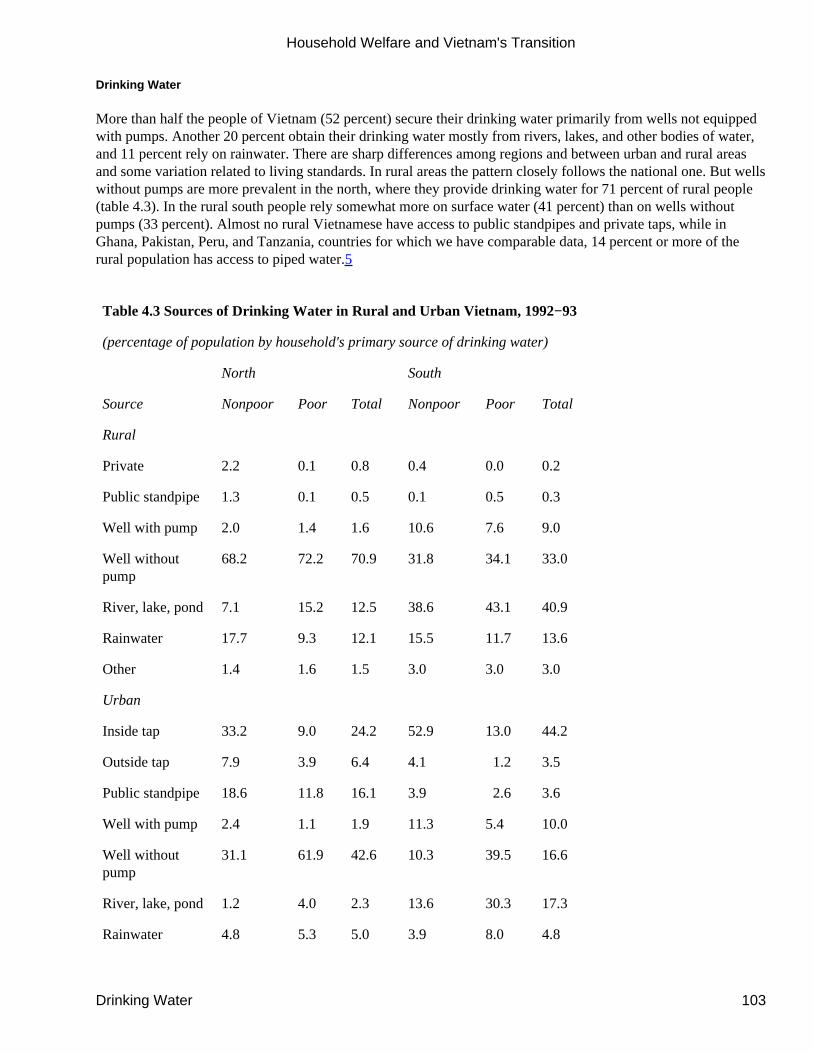
Drinking Water
More than half the people of Vietnam (52 percent) secure their drinking water primarily from wells not equippedwith pumps. Another 20 percent obtain their drinking water mostly from rivers, lakes, and other bodies of water,and 11 percent rely on rainwater. There are sharp differences among regions and between urban and rural areasand some variation related to living standards. In rural areas the pattern closely follows the national one. But wellswithout pumps are more prevalent in the north, where they provide drinking water for 71 percent of rural people(table 4.3). In the rural south people rely somewhat more on surface water (41 percent) than on wells withoutpumps (33 percent). Almost no rural Vietnamese have access to public standpipes and private taps, while inGhana, Pakistan, Peru, and Tanzania, countries for which we have comparable data, 14 percent or more of therural population has access to piped water.5
Table 4.3 Sources of Drinking Water in Rural and Urban Vietnam, 1992−93
(percentage of population by household's primary source of drinking water)
North South
Source Nonpoor Poor Total Nonpoor Poor Total
Rural
Private 2.2 0.1 0.8 0.4 0.0 0.2
Public standpipe 1.3 0.1 0.5 0.1 0.5 0.3
Well with pump 2.0 1.4 1.6 10.6 7.6 9.0
Well withoutpump
68.2 72.2 70.9 31.8 34.1 33.0
River, lake, pond 7.1 15.2 12.5 38.6 43.1 40.9
Rainwater 17.7 9.3 12.1 15.5 11.7 13.6
Other 1.4 1.6 1.5 3.0 3.0 3.0
Urban
Inside tap 33.2 9.0 24.2 52.9 13.0 44.2
Outside tap 7.9 3.9 6.4 4.1 1.2 3.5
Public standpipe 18.6 11.8 16.1 3.9 2.6 3.6
Well with pump 2.4 1.1 1.9 11.3 5.4 10.0
Well withoutpump
31.1 61.9 42.6 10.3 39.5 16.6
River, lake, pond 1.2 4.0 2.3 13.6 30.3 17.3
Rainwater 4.8 5.3 5.0 3.9 8.0 4.8
Household Welfare and Vietnam's Transition
Drinking Water 103
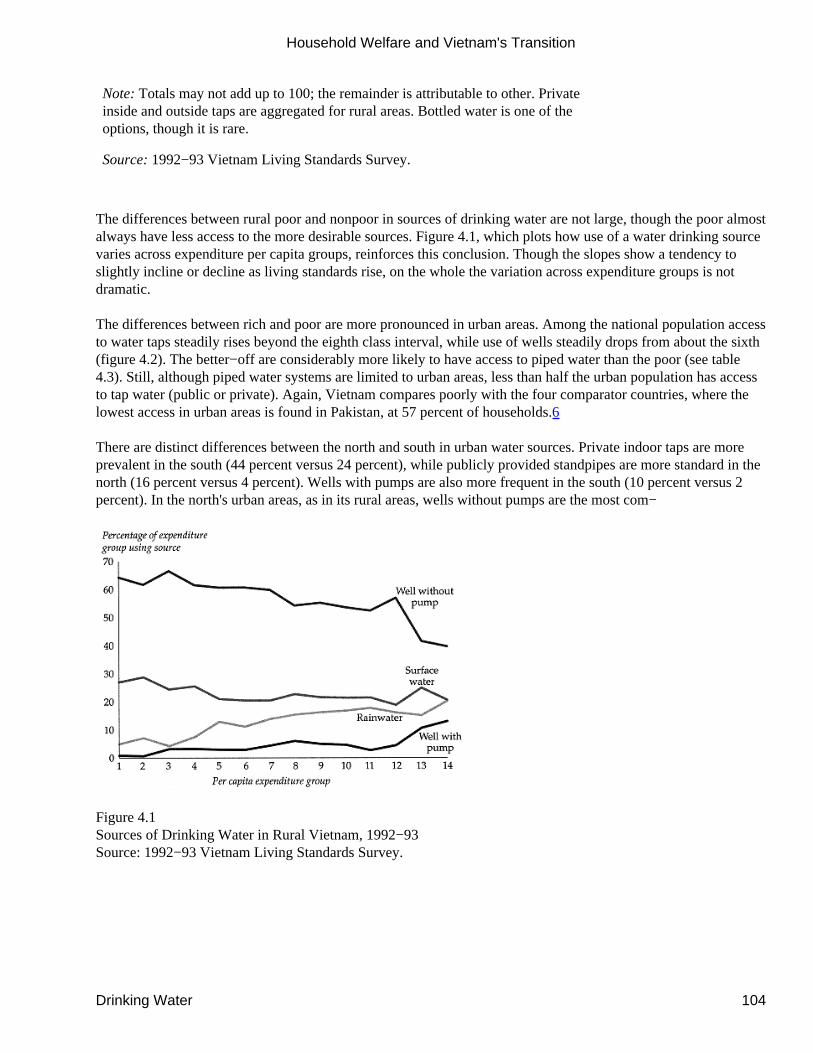
Note: Totals may not add up to 100; the remainder is attributable to other. Privateinside and outside taps are aggregated for rural areas. Bottled water is one of theoptions, though it is rare.
Source: 1992−93 Vietnam Living Standards Survey.
The differences between rural poor and nonpoor in sources of drinking water are not large, though the poor almostalways have less access to the more desirable sources. Figure 4.1, which plots how use of a water drinking sourcevaries across expenditure per capita groups, reinforces this conclusion. Though the slopes show a tendency toslightly incline or decline as living standards rise, on the whole the variation across expenditure groups is notdramatic.
The differences between rich and poor are more pronounced in urban areas. Among the national population accessto water taps steadily rises beyond the eighth class interval, while use of wells steadily drops from about the sixth(figure 4.2). The better−off are considerably more likely to have access to piped water than the poor (see table4.3). Still, although piped water systems are limited to urban areas, less than half the urban population has accessto tap water (public or private). Again, Vietnam compares poorly with the four comparator countries, where thelowest access in urban areas is found in Pakistan, at 57 percent of households.6
There are distinct differences between the north and south in urban water sources. Private indoor taps are moreprevalent in the south (44 percent versus 24 percent), while publicly provided standpipes are more standard in thenorth (16 percent versus 4 percent). Wells with pumps are also more frequent in the south (10 percent versus 2percent). In the north's urban areas, as in its rural areas, wells without pumps are the most com−
Figure 4.1Sources of Drinking Water in Rural Vietnam, 1992−93Source: 1992−93 Vietnam Living Standards Survey.
Household Welfare and Vietnam's Transition
Drinking Water 104
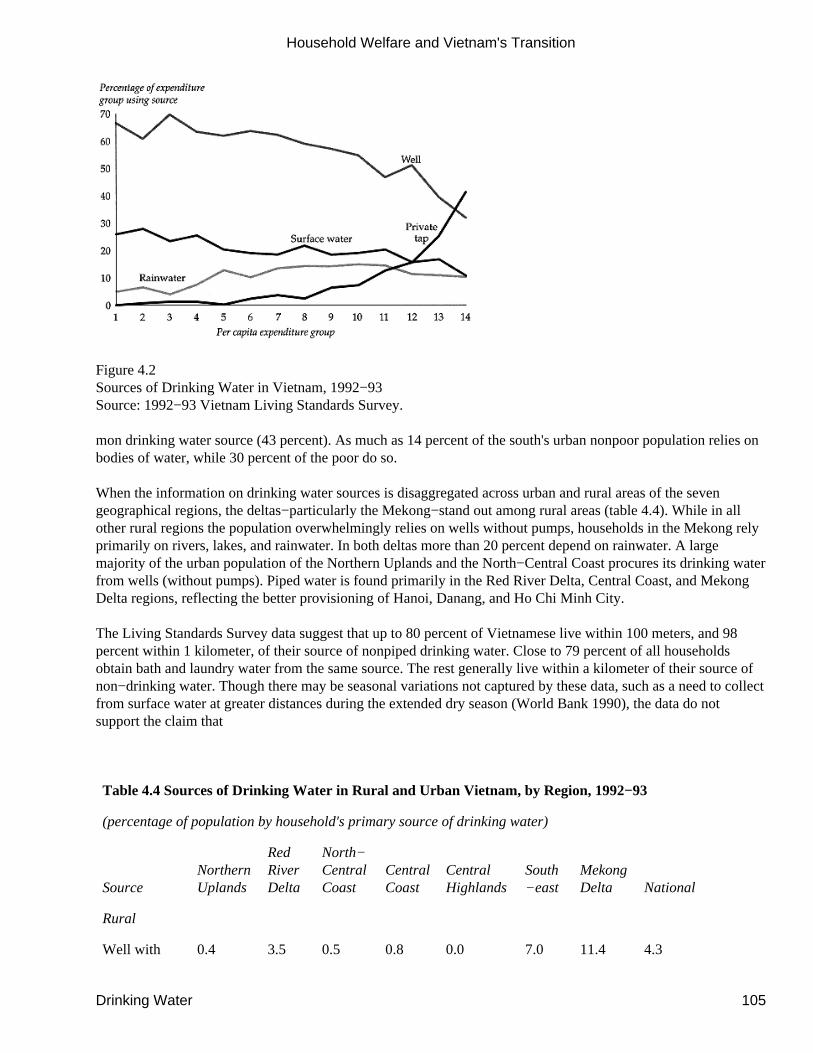
Figure 4.2Sources of Drinking Water in Vietnam, 1992−93Source: 1992−93 Vietnam Living Standards Survey.
mon drinking water source (43 percent). As much as 14 percent of the south's urban nonpoor population relies onbodies of water, while 30 percent of the poor do so.
When the information on drinking water sources is disaggregated across urban and rural areas of the sevengeographical regions, the deltas−particularly the Mekong−stand out among rural areas (table 4.4). While in allother rural regions the population overwhelmingly relies on wells without pumps, households in the Mekong relyprimarily on rivers, lakes, and rainwater. In both deltas more than 20 percent depend on rainwater. A largemajority of the urban population of the Northern Uplands and the North−Central Coast procures its drinking waterfrom wells (without pumps). Piped water is found primarily in the Red River Delta, Central Coast, and MekongDelta regions, reflecting the better provisioning of Hanoi, Danang, and Ho Chi Minh City.
The Living Standards Survey data suggest that up to 80 percent of Vietnamese live within 100 meters, and 98percent within 1 kilometer, of their source of nonpiped drinking water. Close to 79 percent of all householdsobtain bath and laundry water from the same source. The rest generally live within a kilometer of their source ofnon−drinking water. Though there may be seasonal variations not captured by these data, such as a need to collectfrom surface water at greater distances during the extended dry season (World Bank 1990), the data do notsupport the claim that
Table 4.4 Sources of Drinking Water in Rural and Urban Vietnam, by Region, 1992−93
(percentage of population by household's primary source of drinking water)
SourceNorthernUplands
RedRiverDelta
North−CentralCoast
CentralCoast
CentralHighlands
South−east
MekongDelta National
Rural
Well with 0.4 3.5 0.5 0.8 0.0 7.0 11.4 4.3
Household Welfare and Vietnam's Transition
Drinking Water 105
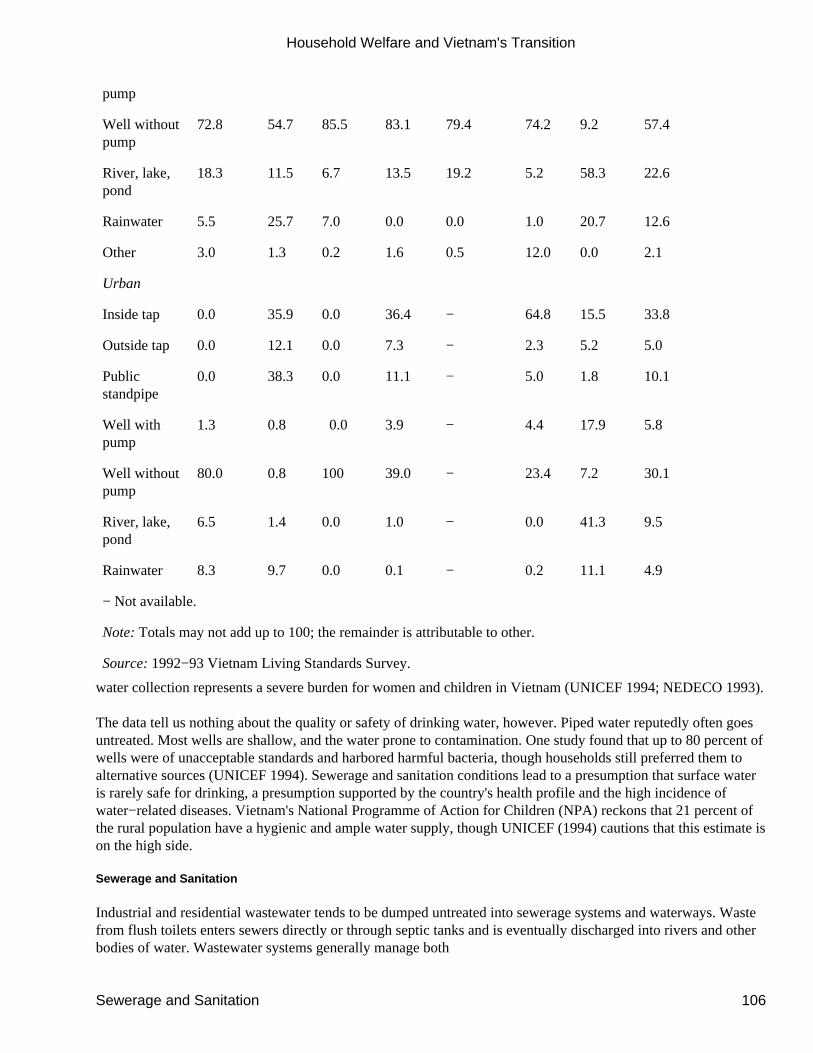
pump
Well withoutpump
72.8 54.7 85.5 83.1 79.4 74.2 9.2 57.4
River, lake,pond
18.3 11.5 6.7 13.5 19.2 5.2 58.3 22.6
Rainwater 5.5 25.7 7.0 0.0 0.0 1.0 20.7 12.6
Other 3.0 1.3 0.2 1.6 0.5 12.0 0.0 2.1
Urban
Inside tap 0.0 35.9 0.0 36.4 − 64.8 15.5 33.8
Outside tap 0.0 12.1 0.0 7.3 − 2.3 5.2 5.0
Publicstandpipe
0.0 38.3 0.0 11.1 − 5.0 1.8 10.1
Well withpump
1.3 0.8 0.0 3.9 − 4.4 17.9 5.8
Well withoutpump
80.0 0.8 100 39.0 − 23.4 7.2 30.1
River, lake,pond
6.5 1.4 0.0 1.0 − 0.0 41.3 9.5
Rainwater 8.3 9.7 0.0 0.1 − 0.2 11.1 4.9
− Not available.
Note: Totals may not add up to 100; the remainder is attributable to other.
Source: 1992−93 Vietnam Living Standards Survey.
water collection represents a severe burden for women and children in Vietnam (UNICEF 1994; NEDECO 1993).
The data tell us nothing about the quality or safety of drinking water, however. Piped water reputedly often goesuntreated. Most wells are shallow, and the water prone to contamination. One study found that up to 80 percent ofwells were of unacceptable standards and harbored harmful bacteria, though households still preferred them toalternative sources (UNICEF 1994). Sewerage and sanitation conditions lead to a presumption that surface wateris rarely safe for drinking, a presumption supported by the country's health profile and the high incidence ofwater−related diseases. Vietnam's National Programme of Action for Children (NPA) reckons that 21 percent ofthe rural population have a hygienic and ample water supply, though UNICEF (1994) cautions that this estimate ison the high side.
Sewerage and Sanitation
Industrial and residential wastewater tends to be dumped untreated into sewerage systems and waterways. Wastefrom flush toilets enters sewers directly or through septic tanks and is eventually discharged into rivers and otherbodies of water. Wastewater systems generally manage both
Household Welfare and Vietnam's Transition
Sewerage and Sanitation 106
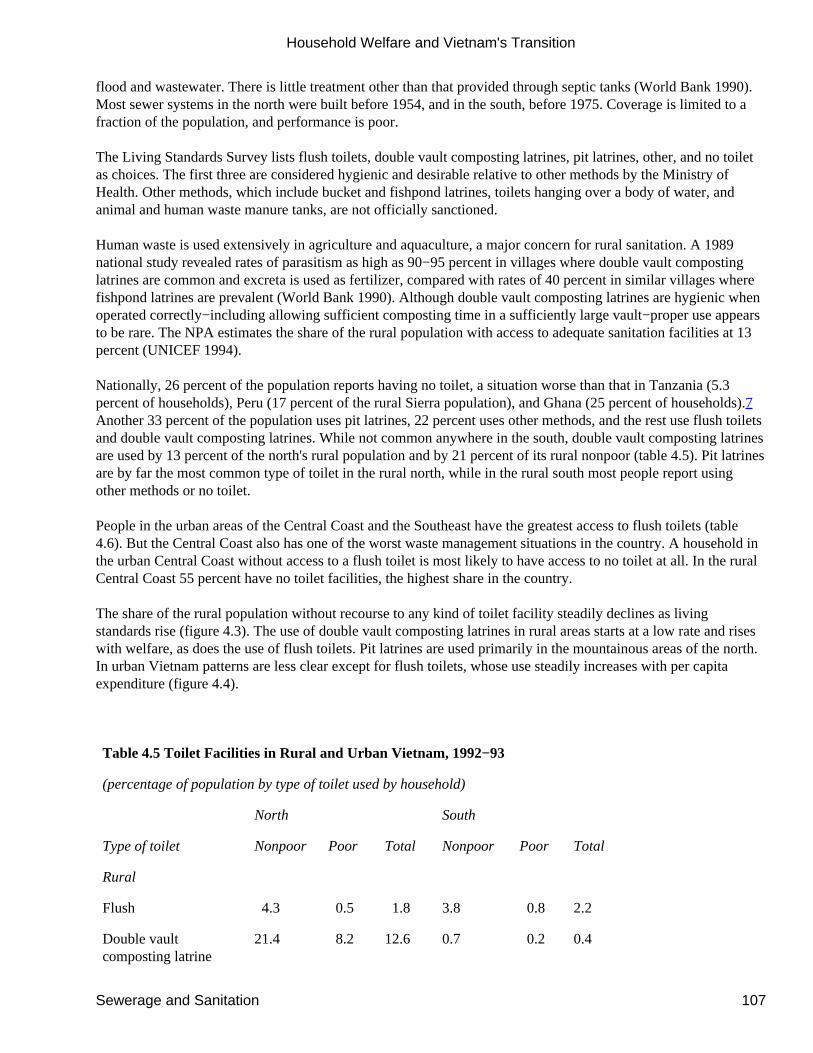
flood and wastewater. There is little treatment other than that provided through septic tanks (World Bank 1990).Most sewer systems in the north were built before 1954, and in the south, before 1975. Coverage is limited to afraction of the population, and performance is poor.
The Living Standards Survey lists flush toilets, double vault composting latrines, pit latrines, other, and no toiletas choices. The first three are considered hygienic and desirable relative to other methods by the Ministry ofHealth. Other methods, which include bucket and fishpond latrines, toilets hanging over a body of water, andanimal and human waste manure tanks, are not officially sanctioned.
Human waste is used extensively in agriculture and aquaculture, a major concern for rural sanitation. A 1989national study revealed rates of parasitism as high as 90−95 percent in villages where double vault compostinglatrines are common and excreta is used as fertilizer, compared with rates of 40 percent in similar villages wherefishpond latrines are prevalent (World Bank 1990). Although double vault composting latrines are hygienic whenoperated correctly−including allowing sufficient composting time in a sufficiently large vault−proper use appearsto be rare. The NPA estimates the share of the rural population with access to adequate sanitation facilities at 13percent (UNICEF 1994).
Nationally, 26 percent of the population reports having no toilet, a situation worse than that in Tanzania (5.3percent of households), Peru (17 percent of the rural Sierra population), and Ghana (25 percent of households).7Another 33 percent of the population uses pit latrines, 22 percent uses other methods, and the rest use flush toiletsand double vault composting latrines. While not common anywhere in the south, double vault composting latrinesare used by 13 percent of the north's rural population and by 21 percent of its rural nonpoor (table 4.5). Pit latrinesare by far the most common type of toilet in the rural north, while in the rural south most people report usingother methods or no toilet.
People in the urban areas of the Central Coast and the Southeast have the greatest access to flush toilets (table4.6). But the Central Coast also has one of the worst waste management situations in the country. A household inthe urban Central Coast without access to a flush toilet is most likely to have access to no toilet at all. In the ruralCentral Coast 55 percent have no toilet facilities, the highest share in the country.
The share of the rural population without recourse to any kind of toilet facility steadily declines as livingstandards rise (figure 4.3). The use of double vault composting latrines in rural areas starts at a low rate and riseswith welfare, as does the use of flush toilets. Pit latrines are used primarily in the mountainous areas of the north.In urban Vietnam patterns are less clear except for flush toilets, whose use steadily increases with per capitaexpenditure (figure 4.4).
Table 4.5 Toilet Facilities in Rural and Urban Vietnam, 1992−93
(percentage of population by type of toilet used by household)
North South
Type of toilet Nonpoor Poor Total Nonpoor Poor Total
Rural
Flush 4.3 0.5 1.8 3.8 0.8 2.2
Double vaultcomposting latrine
21.4 8.2 12.6 0.7 0.2 0.4
Household Welfare and Vietnam's Transition
Sewerage and Sanitation 107
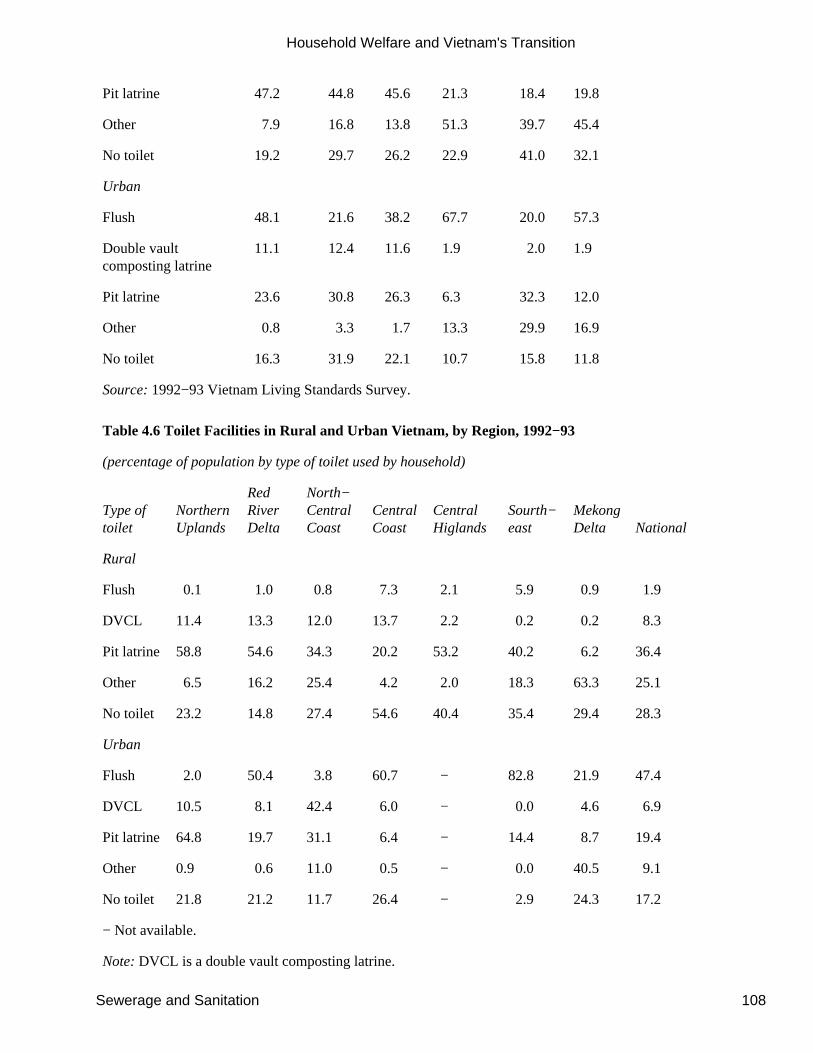
Pit latrine 47.2 44.8 45.6 21.3 18.4 19.8
Other 7.9 16.8 13.8 51.3 39.7 45.4
No toilet 19.2 29.7 26.2 22.9 41.0 32.1
Urban
Flush 48.1 21.6 38.2 67.7 20.0 57.3
Double vaultcomposting latrine
11.1 12.4 11.6 1.9 2.0 1.9
Pit latrine 23.6 30.8 26.3 6.3 32.3 12.0
Other 0.8 3.3 1.7 13.3 29.9 16.9
No toilet 16.3 31.9 22.1 10.7 15.8 11.8
Source: 1992−93 Vietnam Living Standards Survey.
Table 4.6 Toilet Facilities in Rural and Urban Vietnam, by Region, 1992−93
(percentage of population by type of toilet used by household)
Type oftoilet
NorthernUplands
RedRiverDelta
North−CentralCoast
CentralCoast
CentralHiglands
Sourth−east
MekongDelta National
Rural
Flush 0.1 1.0 0.8 7.3 2.1 5.9 0.9 1.9
DVCL 11.4 13.3 12.0 13.7 2.2 0.2 0.2 8.3
Pit latrine 58.8 54.6 34.3 20.2 53.2 40.2 6.2 36.4
Other 6.5 16.2 25.4 4.2 2.0 18.3 63.3 25.1
No toilet 23.2 14.8 27.4 54.6 40.4 35.4 29.4 28.3
Urban
Flush 2.0 50.4 3.8 60.7 − 82.8 21.9 47.4
DVCL 10.5 8.1 42.4 6.0 − 0.0 4.6 6.9
Pit latrine 64.8 19.7 31.1 6.4 − 14.4 8.7 19.4
Other 0.9 0.6 11.0 0.5 − 0.0 40.5 9.1
No toilet 21.8 21.2 11.7 26.4 − 2.9 24.3 17.2
− Not available.
Note: DVCL is a double vault composting latrine.
Household Welfare and Vietnam's Transition
Sewerage and Sanitation 108
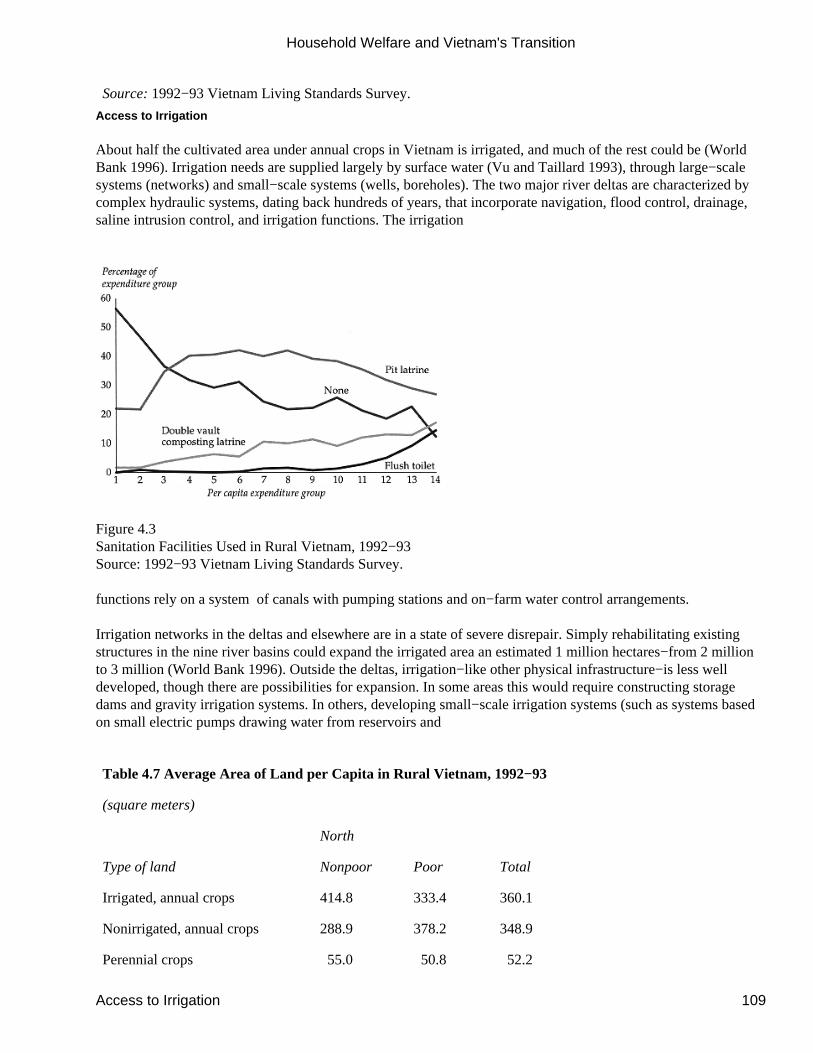
Source: 1992−93 Vietnam Living Standards Survey.
Access to Irrigation
About half the cultivated area under annual crops in Vietnam is irrigated, and much of the rest could be (WorldBank 1996). Irrigation needs are supplied largely by surface water (Vu and Taillard 1993), through large−scalesystems (networks) and small−scale systems (wells, boreholes). The two major river deltas are characterized bycomplex hydraulic systems, dating back hundreds of years, that incorporate navigation, flood control, drainage,saline intrusion control, and irrigation functions. The irrigation
Figure 4.3Sanitation Facilities Used in Rural Vietnam, 1992−93Source: 1992−93 Vietnam Living Standards Survey.
functions rely on a system of canals with pumping stations and on−farm water control arrangements.
Irrigation networks in the deltas and elsewhere are in a state of severe disrepair. Simply rehabilitating existingstructures in the nine river basins could expand the irrigated area an estimated 1 million hectares−from 2 millionto 3 million (World Bank 1996). Outside the deltas, irrigation−like other physical infrastructure−is less welldeveloped, though there are possibilities for expansion. In some areas this would require constructing storagedams and gravity irrigation systems. In others, developing small−scale irrigation systems (such as systems basedon small electric pumps drawing water from reservoirs and
Table 4.7 Average Area of Land per Capita in Rural Vietnam, 1992−93
(square meters)
North
Type of land Nonpoor Poor Total
Irrigated, annual crops 414.8 333.4 360.1
Nonirrigated, annual crops 288.9 378.2 348.9
Perennial crops 55.0 50.8 52.2
Household Welfare and Vietnam's Transition
Access to Irrigation 109
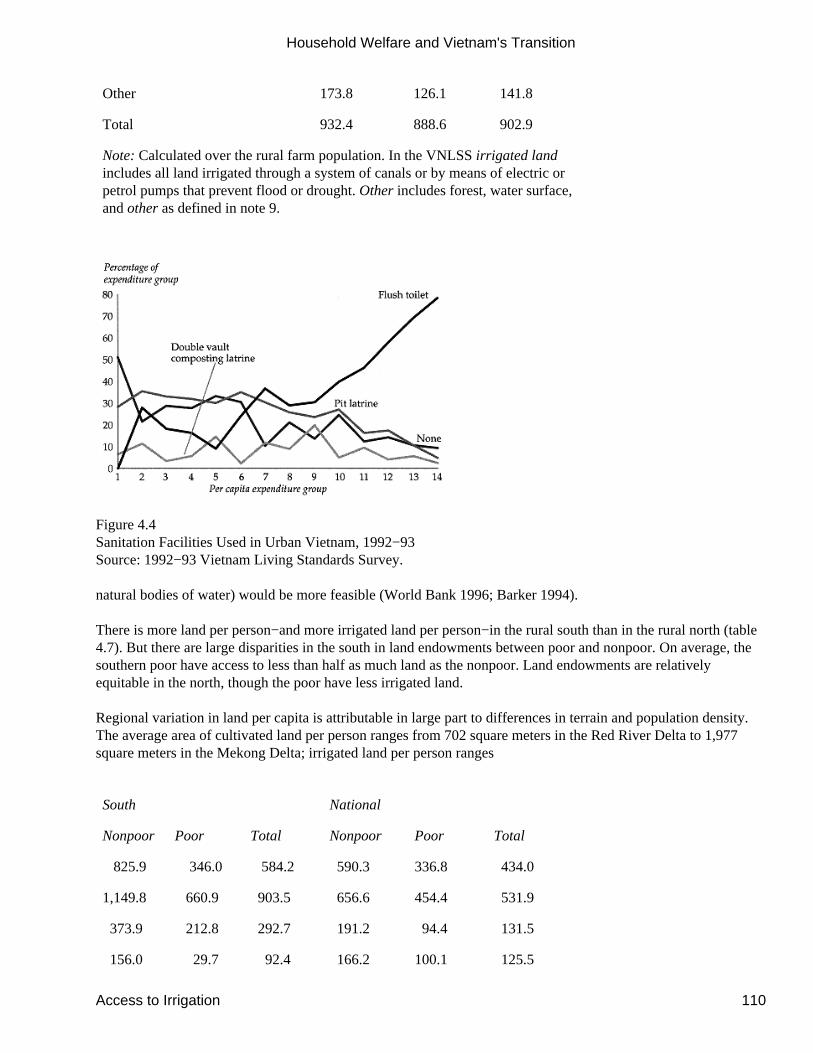
Other 173.8 126.1 141.8
Total 932.4 888.6 902.9
Note: Calculated over the rural farm population. In the VNLSS irrigated landincludes all land irrigated through a system of canals or by means of electric orpetrol pumps that prevent flood or drought. Other includes forest, water surface,and other as defined in note 9.
Figure 4.4Sanitation Facilities Used in Urban Vietnam, 1992−93Source: 1992−93 Vietnam Living Standards Survey.
natural bodies of water) would be more feasible (World Bank 1996; Barker 1994).
There is more land per person−and more irrigated land per person−in the rural south than in the rural north (table4.7). But there are large disparities in the south in land endowments between poor and nonpoor. On average, thesouthern poor have access to less than half as much land as the nonpoor. Land endowments are relativelyequitable in the north, though the poor have less irrigated land.
Regional variation in land per capita is attributable in large part to differences in terrain and population density.The average area of cultivated land per person ranges from 702 square meters in the Red River Delta to 1,977square meters in the Mekong Delta; irrigated land per person ranges
South National
Nonpoor Poor Total Nonpoor Poor Total
825.9 346.0 584.2 590.3 336.8 434.0
1,149.8 660.9 903.5 656.6 454.4 531.9
373.9 212.8 292.7 191.2 94.4 131.5
156.0 29.7 92.4 166.2 100.1 125.5
Household Welfare and Vietnam's Transition
Access to Irrigation 110
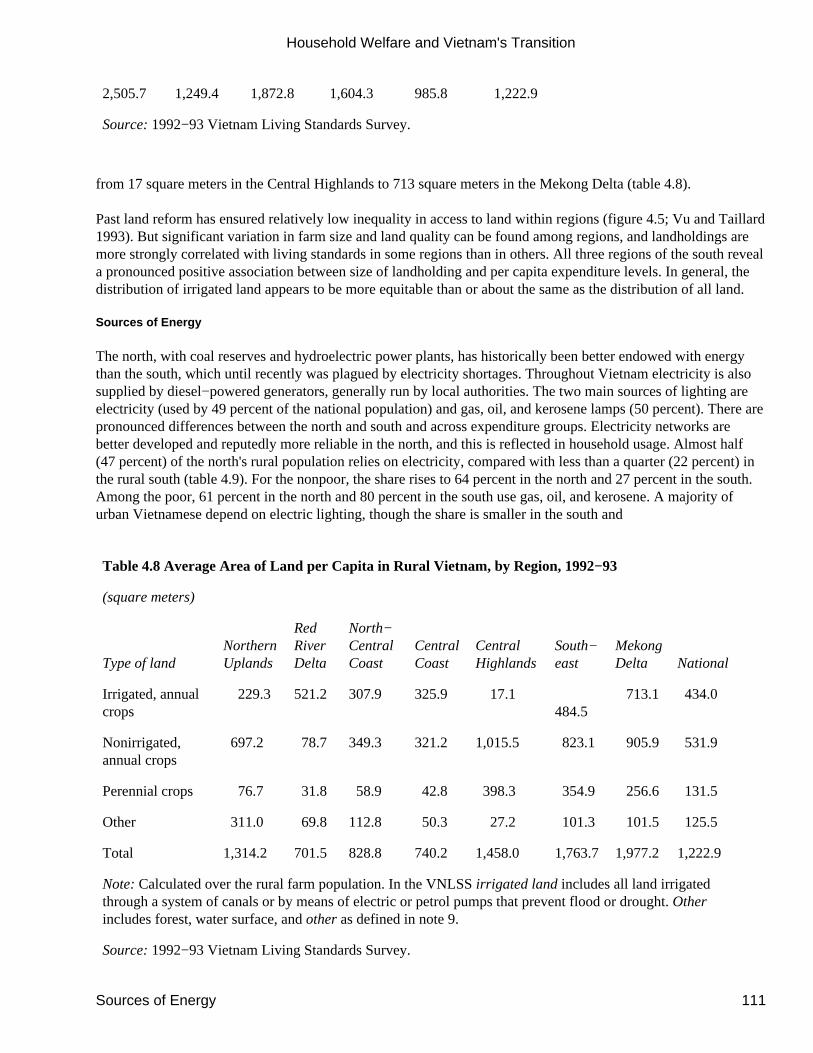
2,505.7 1,249.4 1,872.8 1,604.3 985.8 1,222.9
Source: 1992−93 Vietnam Living Standards Survey.
from 17 square meters in the Central Highlands to 713 square meters in the Mekong Delta (table 4.8).
Past land reform has ensured relatively low inequality in access to land within regions (figure 4.5; Vu and Taillard1993). But significant variation in farm size and land quality can be found among regions, and landholdings aremore strongly correlated with living standards in some regions than in others. All three regions of the south reveala pronounced positive association between size of landholding and per capita expenditure levels. In general, thedistribution of irrigated land appears to be more equitable than or about the same as the distribution of all land.
Sources of Energy
The north, with coal reserves and hydroelectric power plants, has historically been better endowed with energythan the south, which until recently was plagued by electricity shortages. Throughout Vietnam electricity is alsosupplied by diesel−powered generators, generally run by local authorities. The two main sources of lighting areelectricity (used by 49 percent of the national population) and gas, oil, and kerosene lamps (50 percent). There arepronounced differences between the north and south and across expenditure groups. Electricity networks arebetter developed and reputedly more reliable in the north, and this is reflected in household usage. Almost half(47 percent) of the north's rural population relies on electricity, compared with less than a quarter (22 percent) inthe rural south (table 4.9). For the nonpoor, the share rises to 64 percent in the north and 27 percent in the south.Among the poor, 61 percent in the north and 80 percent in the south use gas, oil, and kerosene. A majority ofurban Vietnamese depend on electric lighting, though the share is smaller in the south and
Table 4.8 Average Area of Land per Capita in Rural Vietnam, by Region, 1992−93
(square meters)
Type of landNorthernUplands
RedRiverDelta
North−CentralCoast
CentralCoast
CentralHighlands
South−east
MekongDelta National
Irrigated, annualcrops
229.3 521.2 307.9 325.9 17.1484.5
713.1 434.0
Nonirrigated,annual crops
697.2 78.7 349.3 321.2 1,015.5 823.1 905.9 531.9
Perennial crops 76.7 31.8 58.9 42.8 398.3 354.9 256.6 131.5
Other 311.0 69.8 112.8 50.3 27.2 101.3 101.5 125.5
Total 1,314.2 701.5 828.8 740.2 1,458.0 1,763.7 1,977.2 1,222.9
Note: Calculated over the rural farm population. In the VNLSS irrigated land includes all land irrigatedthrough a system of canals or by means of electric or petrol pumps that prevent flood or drought. Otherincludes forest, water surface, and other as defined in note 9.
Source: 1992−93 Vietnam Living Standards Survey.
Household Welfare and Vietnam's Transition
Sources of Energy 111
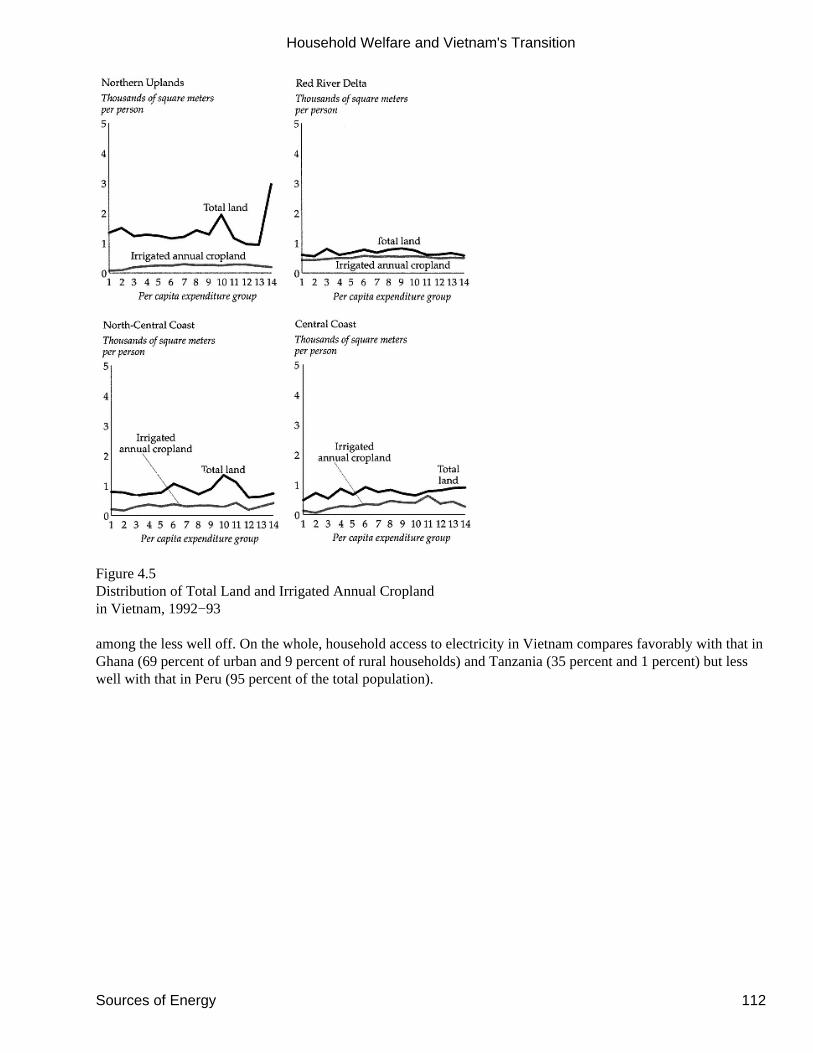
Figure 4.5Distribution of Total Land and Irrigated Annual Croplandin Vietnam, 1992−93
among the less well off. On the whole, household access to electricity in Vietnam compares favorably with that inGhana (69 percent of urban and 9 percent of rural households) and Tanzania (35 percent and 1 percent) but lesswell with that in Peru (95 percent of the total population).
Household Welfare and Vietnam's Transition
Sources of Energy 112
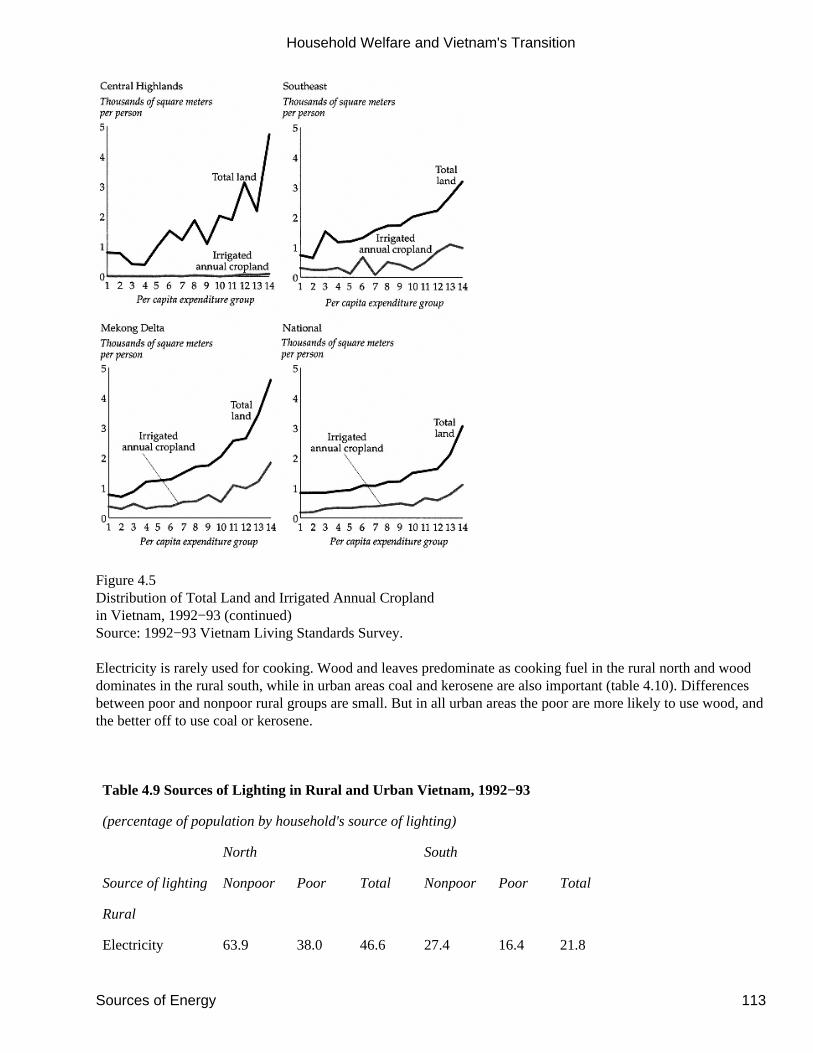
Figure 4.5Distribution of Total Land and Irrigated Annual Croplandin Vietnam, 1992−93 (continued)Source: 1992−93 Vietnam Living Standards Survey.
Electricity is rarely used for cooking. Wood and leaves predominate as cooking fuel in the rural north and wooddominates in the rural south, while in urban areas coal and kerosene are also important (table 4.10). Differencesbetween poor and nonpoor rural groups are small. But in all urban areas the poor are more likely to use wood, andthe better off to use coal or kerosene.
Table 4.9 Sources of Lighting in Rural and Urban Vietnam, 1992−93
(percentage of population by household's source of lighting)
North South
Source of lighting Nonpoor Poor Total Nonpoor Poor Total
Rural
Electricity 63.9 38.0 46.6 27.4 16.4 21.8
Household Welfare and Vietnam's Transition
Sources of Energy 113
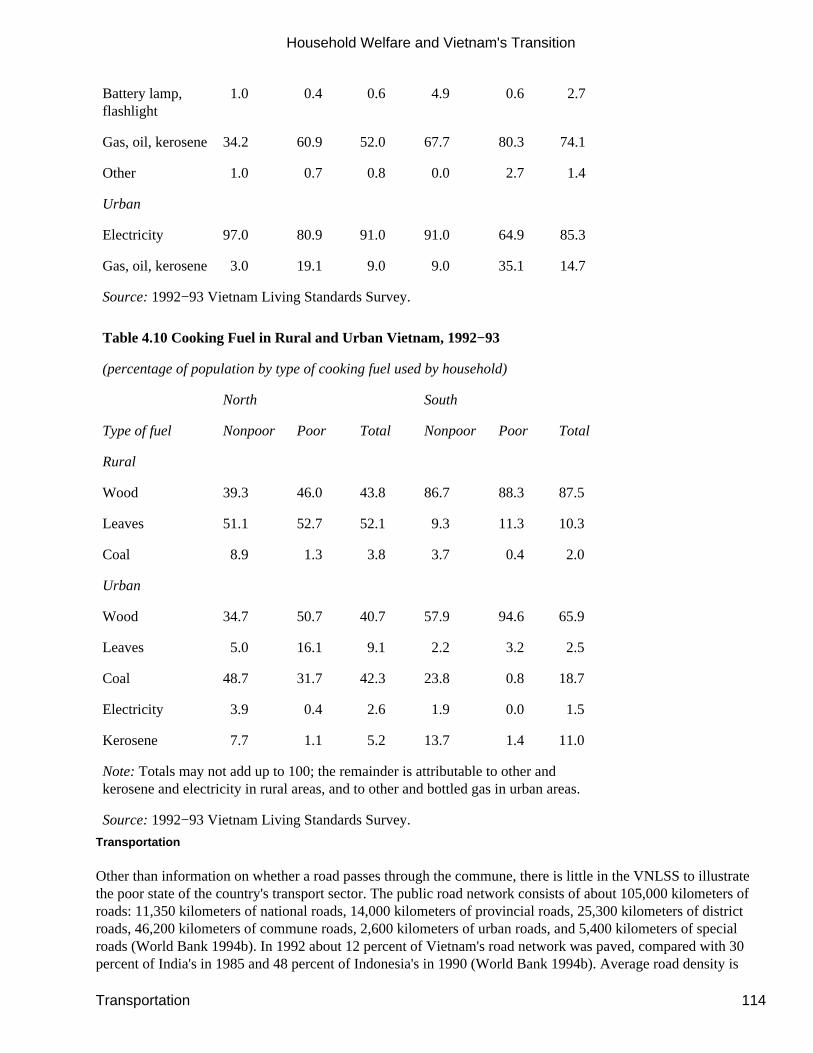
Battery lamp,flashlight
1.0 0.4 0.6 4.9 0.6 2.7
Gas, oil, kerosene 34.2 60.9 52.0 67.7 80.3 74.1
Other 1.0 0.7 0.8 0.0 2.7 1.4
Urban
Electricity 97.0 80.9 91.0 91.0 64.9 85.3
Gas, oil, kerosene 3.0 19.1 9.0 9.0 35.1 14.7
Source: 1992−93 Vietnam Living Standards Survey.
Table 4.10 Cooking Fuel in Rural and Urban Vietnam, 1992−93
(percentage of population by type of cooking fuel used by household)
North South
Type of fuel Nonpoor Poor Total Nonpoor Poor Total
Rural
Wood 39.3 46.0 43.8 86.7 88.3 87.5
Leaves 51.1 52.7 52.1 9.3 11.3 10.3
Coal 8.9 1.3 3.8 3.7 0.4 2.0
Urban
Wood 34.7 50.7 40.7 57.9 94.6 65.9
Leaves 5.0 16.1 9.1 2.2 3.2 2.5
Coal 48.7 31.7 42.3 23.8 0.8 18.7
Electricity 3.9 0.4 2.6 1.9 0.0 1.5
Kerosene 7.7 1.1 5.2 13.7 1.4 11.0
Note: Totals may not add up to 100; the remainder is attributable to other andkerosene and electricity in rural areas, and to other and bottled gas in urban areas.
Source: 1992−93 Vietnam Living Standards Survey.
Transportation
Other than information on whether a road passes through the commune, there is little in the VNLSS to illustratethe poor state of the country's transport sector. The public road network consists of about 105,000 kilometers ofroads: 11,350 kilometers of national roads, 14,000 kilometers of provincial roads, 25,300 kilometers of districtroads, 46,200 kilometers of commune roads, 2,600 kilometers of urban roads, and 5,400 kilometers of specialroads (World Bank 1994b). In 1992 about 12 percent of Vietnam's road network was paved, compared with 30percent of India's in 1985 and 48 percent of Indonesia's in 1990 (World Bank 1994b). Average road density is
Household Welfare and Vietnam's Transition
Transportation 114

low, at 0.32 kilometers per square kilometer of land and 1.6 kilometers per 1,000 inhabitants. Not unexpectedly,density is highest in the two deltas
and lowest in the more mountainous regions. Like the rest of the country's infrastructure, the road network−datinglargely from before the 1970s in the south and before 1954 in the north−is old and in severe disrepair. Thirtypercent of all district and 50 percent of commune roads are impassable during the rainy season. Other transportinfrastructure (inland waterways, ports, the railway system) is also in poor condition (World Bank 1994b).Waterways play an important part in transport, particularly in the river deltas. But of the 40,000 kilometernetwork, only 11,000 kilometers are suitable for river transport because of neglect of dredging and othermaintenance. Lack of bridges and river piers further impedes mobility.
Summary
The present state of physical infrastructure in Vietnam is clearly poor by most standards. Nearly a third of ruralpeople live in communes without a passable road. Nearly half do not have access to passenger transport. Morethan half do not have electricity. Barely half of annual cropland is irrigated. All but 5 percent of the ruralpopulation lives in a commune where no one has access to piped water. There are also marked differences inaccess to infrastructure between urban and rural areas, with urban areas generally favored, as well as amongregions.
The poor tend to have worse access to infrastructure than the nonpoor. But for many types of infrastructure thepoor in rural Vietnam do not have appreciably worse access than the nonpoor: for many types of basicinfrastructure access is equally bad for both groups. Ventures to improve basic infrastructure will notautomatically be redistributive. It cannot be argued that the nonpoor already have adequate basic infrastructureand the poor have none−so that new investments will necessarily benefit the poor.
What do the data imply about the distributional impact of future investments in infrastructure? The answer willdepend on the marginal benefits from infrastructure investments. Take irrigation. If a household's land is fullyirrigated, the marginal benefit to that household from expanding total irrigated area would be zero. A generalexpansion of irrigation would benefit those whose land is not irrigated. If it were true that the rich have fullyirrigated land while the poor do not, the benefits would go to the poor. But while the nonpoor have more irrigatedland than the poor, they also have more nonirrigated land (see table 4.7 and figure 4.5).
Thus undifferentiated irrigation infrastructure would not appear to be an important redistributive instrument; thepoor would benefit but probably less so than the nonpoor.8 But a number of other factors are correlated with themarginal benefits from irrigation. It is often argued, for example, that smaller farms are more productive, somarginal benefits may be higher for the poor. Or it might be argued that marginal benefits will tend to be higherfor those with more human capital, likely to be the not−so−poor. On
balance, it is not clear what the outcome would be. Inferring the potential gains from irrigation usingcross−sectional data thus requires controls for these other factors. To properly address such questions we need togo beyond descriptive analysis and investigate marginal impacts.
Explaining Crop Income
This section undertakes a detailed assessment of the likely distributional impact of an expansion in irrigated landarea. The vast majority of Vietnam's population derives its livelihood from farming (van de Walle 1995a). Theextent to which annual cropland is irrigated and water adequately managed is widely recognized as a key factor inagricultural productivity. As noted, about half of annual cropland in Vietnam is currently under irrigation
Household Welfare and Vietnam's Transition
Summary 115
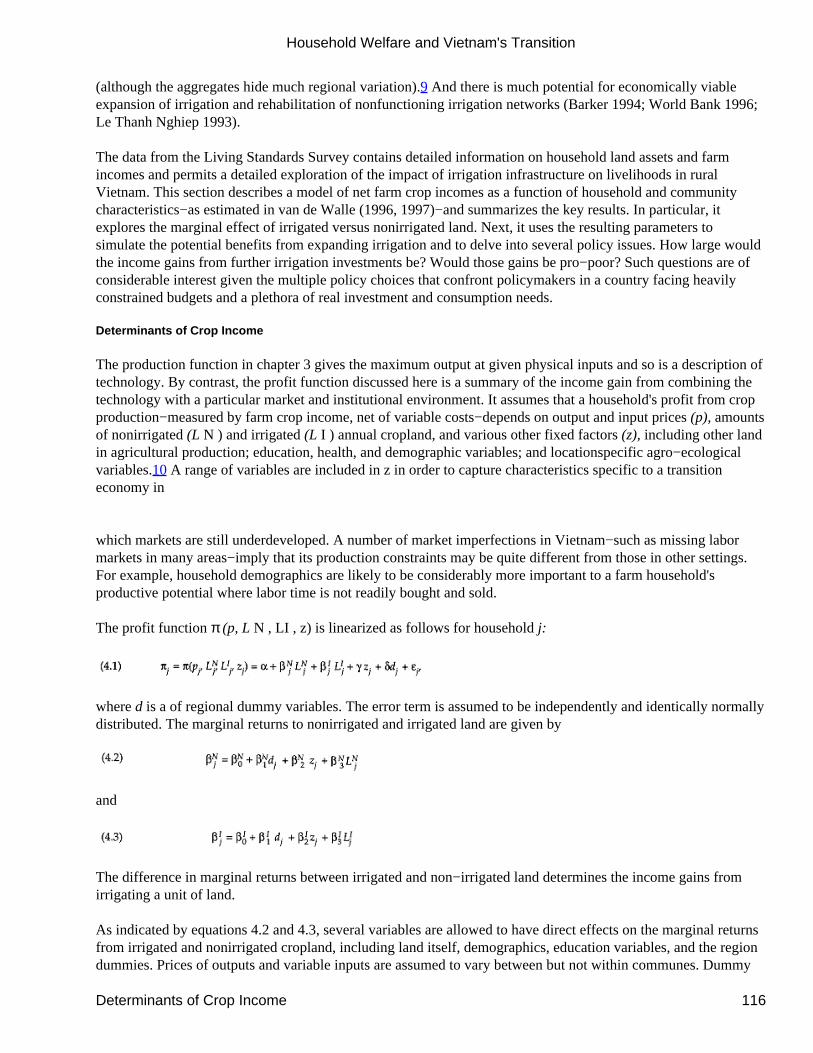
(although the aggregates hide much regional variation).9 And there is much potential for economically viableexpansion of irrigation and rehabilitation of nonfunctioning irrigation networks (Barker 1994; World Bank 1996;Le Thanh Nghiep 1993).
The data from the Living Standards Survey contains detailed information on household land assets and farmincomes and permits a detailed exploration of the impact of irrigation infrastructure on livelihoods in ruralVietnam. This section describes a model of net farm crop incomes as a function of household and communitycharacteristics−as estimated in van de Walle (1996, 1997)−and summarizes the key results. In particular, itexplores the marginal effect of irrigated versus nonirrigated land. Next, it uses the resulting parameters tosimulate the potential benefits from expanding irrigation and to delve into several policy issues. How large wouldthe income gains from further irrigation investments be? Would those gains be pro−poor? Such questions are ofconsiderable interest given the multiple policy choices that confront policymakers in a country facing heavilyconstrained budgets and a plethora of real investment and consumption needs.
Determinants of Crop Income
The production function in chapter 3 gives the maximum output at given physical inputs and so is a description oftechnology. By contrast, the profit function discussed here is a summary of the income gain from combining thetechnology with a particular market and institutional environment. It assumes that a household's profit from cropproduction−measured by farm crop income, net of variable costs−depends on output and input prices (p), amountsof nonirrigated (L N ) and irrigated (L I ) annual cropland, and various other fixed factors (z), including other landin agricultural production; education, health, and demographic variables; and locationspecific agro−ecologicalvariables.10 A range of variables are included in z in order to capture characteristics specific to a transitioneconomy in
which markets are still underdeveloped. A number of market imperfections in Vietnam−such as missing labormarkets in many areas−imply that its production constraints may be quite different from those in other settings.For example, household demographics are likely to be considerably more important to a farm household'sproductive potential where labor time is not readily bought and sold.
The profit function π (p, L N , LI , z) is linearized as follows for household j:
where d is a of regional dummy variables. The error term is assumed to be independently and identically normallydistributed. The marginal returns to nonirrigated and irrigated land are given by
and
The difference in marginal returns between irrigated and non−irrigated land determines the income gains fromirrigating a unit of land.
As indicated by equations 4.2 and 4.3, several variables are allowed to have direct effects on the marginal returnsfrom irrigated and nonirrigated cropland, including land itself, demographics, education variables, and the regiondummies. Prices of outputs and variable inputs are assumed to vary between but not within communes. Dummy
Household Welfare and Vietnam's Transition
Determinants of Crop Income 116
variables for 119 of 200 communes are included in the intercept of the profit function to capture variations inprices and any other spatial, cross−commune variations in omitted or fixed factors such as land and soil quality.The commune dummies will also pick up the influences of geographical and infrastructural variations at thecommune level. (The regression model is described in greater detail, and the full results are presented, in van deWalle 1996.)11
An important concern with cross−sectional regression analysis of this kind is that estimates will be biased becauseof endogenous explanatory variables or omitted variables that are correlated with included variables. A number offactors alleviate this concern here. In many agricultural settings land and irrigation are inputs to productionchosen by the household and therefore endogenous. But in Vietnam household land use rights have generally beenfixed since the 1988 reforms. In the north, communes or cooperatives assigned parcels to households on the basisof family size and number of workers, taking into account land productivity and access to water to ensure equityin both land quality and quantity (Dreyfus 1993; Barker 1994). Between 1988 and the survey period there hadbeen virtually no mobility, investment in irrigation, or land market activity. Thus land and irrigation inputs in thenorth can reasonably be treated as exogenous at the household level. Endogeneity is more likely in the south,where 1988 land assignments essentially restored the distribution prevailing before the country's reunifi−
cation. Still, land market transactions and investments in irrigation in the south have been scarce since 1988. Theanalysis treats land as exogenous in both the south and the north, though the possibility of greater bias in the southneeds to be kept in mind when interpreting the results.
Possible omitted variable bias is more worrying. The regressions control for omitted between−commune variancethrough the commune dummy variables. But there may also be latent heterogeneity in, say, land or soil qualitywithin communes, leading to biased estimates. Testing for this by including land quality variables in theregression revealed no sign of such bias, however, (van de Walle 1997). Again, this could be more of an issue inthe south, where salinity and acidity are common problems in the Mekong Delta, though unobserved in the surveydata. The chapter returns to this point later.
Ordinary least squares is used on a regression sample consisting of 3,049 farm households, including some urbanfarm households.12 The regression results indicate strong, though diminishing, effects of both irrigated andnonirrigated cropland on crop income. Household size has a positive impact on crop incomes, as does itsinteraction with land variables. But the findings also suggest that the importance of the labor market constraintvaries across households and regions, with family labor tending to be a constraining factor in farm production inthe north, but less so in the south, particularly for large irrigated farms in the Mekong Delta.13
Education, particularly primary education, is also found to be of considerable importance to agriculturalproductivity. Interaction effects between education variables and land are generally positive. There are significantcommune fixed effects and significant spatial differences in the effects of irrigated land, nonirrigated land, andother types of land.
Table 4.11 presents the marginal effect on crop incomes of the key included variables, allowing for all interactioneffects. Annual cropland, both irrigated and nonirrigated, and perennial cropland have high significant positiveeffects on crop income. The impact of irrigated land is more than twice that of nonirrigated land. The returns toperennial land are also higher than those to nonirrigated annual land. Other significant marginal effects are fromeducation, particularly of the household head, which has a significant positive impact on crop income, and fromhousehold size. Larger households have higher crop incomes. The finding that family labor continues to play animportant part in agricultural production is a recurrent one.
Household Welfare and Vietnam's Transition
Determinants of Crop Income 117
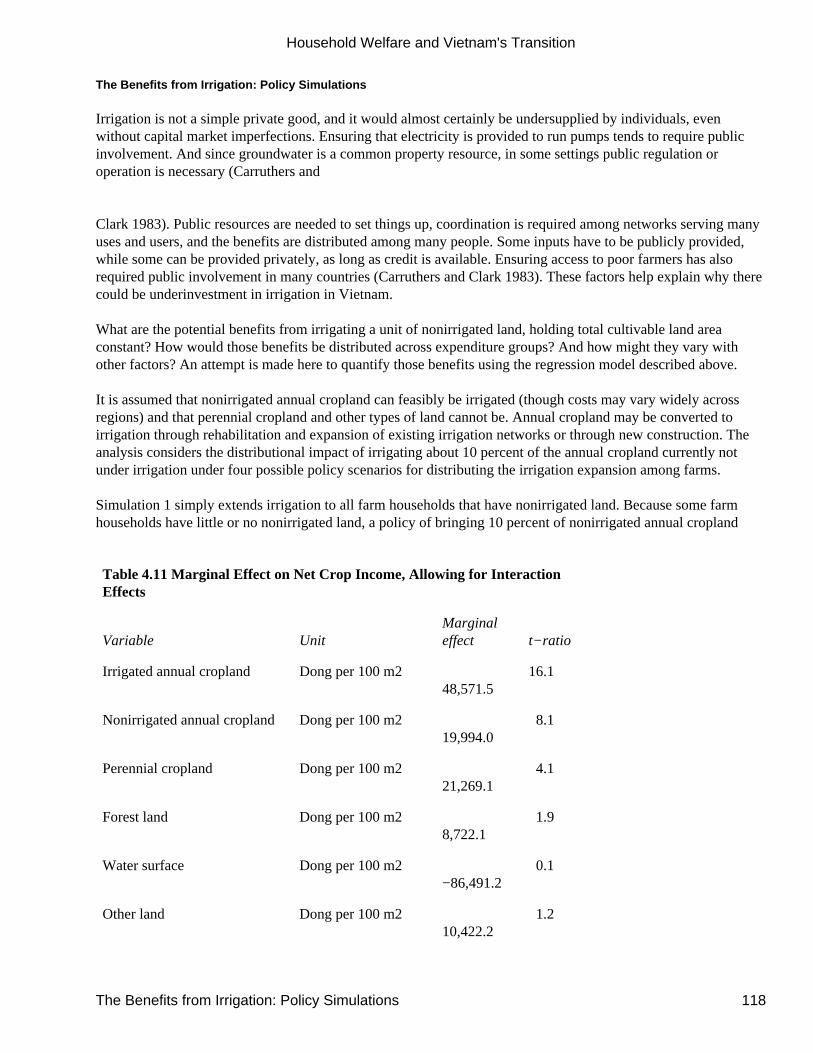
The Benefits from Irrigation: Policy Simulations
Irrigation is not a simple private good, and it would almost certainly be undersupplied by individuals, evenwithout capital market imperfections. Ensuring that electricity is provided to run pumps tends to require publicinvolvement. And since groundwater is a common property resource, in some settings public regulation oroperation is necessary (Carruthers and
Clark 1983). Public resources are needed to set things up, coordination is required among networks serving manyuses and users, and the benefits are distributed among many people. Some inputs have to be publicly provided,while some can be provided privately, as long as credit is available. Ensuring access to poor farmers has alsorequired public involvement in many countries (Carruthers and Clark 1983). These factors help explain why therecould be underinvestment in irrigation in Vietnam.
What are the potential benefits from irrigating a unit of nonirrigated land, holding total cultivable land areaconstant? How would those benefits be distributed across expenditure groups? And how might they vary withother factors? An attempt is made here to quantify those benefits using the regression model described above.
It is assumed that nonirrigated annual cropland can feasibly be irrigated (though costs may vary widely acrossregions) and that perennial cropland and other types of land cannot be. Annual cropland may be converted toirrigation through rehabilitation and expansion of existing irrigation networks or through new construction. Theanalysis considers the distributional impact of irrigating about 10 percent of the annual cropland currently notunder irrigation under four possible policy scenarios for distributing the irrigation expansion among farms.
Simulation 1 simply extends irrigation to all farm households that have nonirrigated land. Because some farmhouseholds have little or no nonirrigated land, a policy of bringing 10 percent of nonirrigated annual cropland
Table 4.11 Marginal Effect on Net Crop Income, Allowing for InteractionEffects
Variable UnitMarginaleffect t−ratio
Irrigated annual cropland Dong per 100 m248,571.5
16.1
Nonirrigated annual cropland Dong per 100 m219,994.0
8.1
Perennial cropland Dong per 100 m221,269.1
4.1
Forest land Dong per 100 m28,722.1
1.9
Water surface Dong per 100 m2−86,491.2
0.1
Other land Dong per 100 m210,422.2
1.2
Household Welfare and Vietnam's Transition
The Benefits from Irrigation: Policy Simulations 118
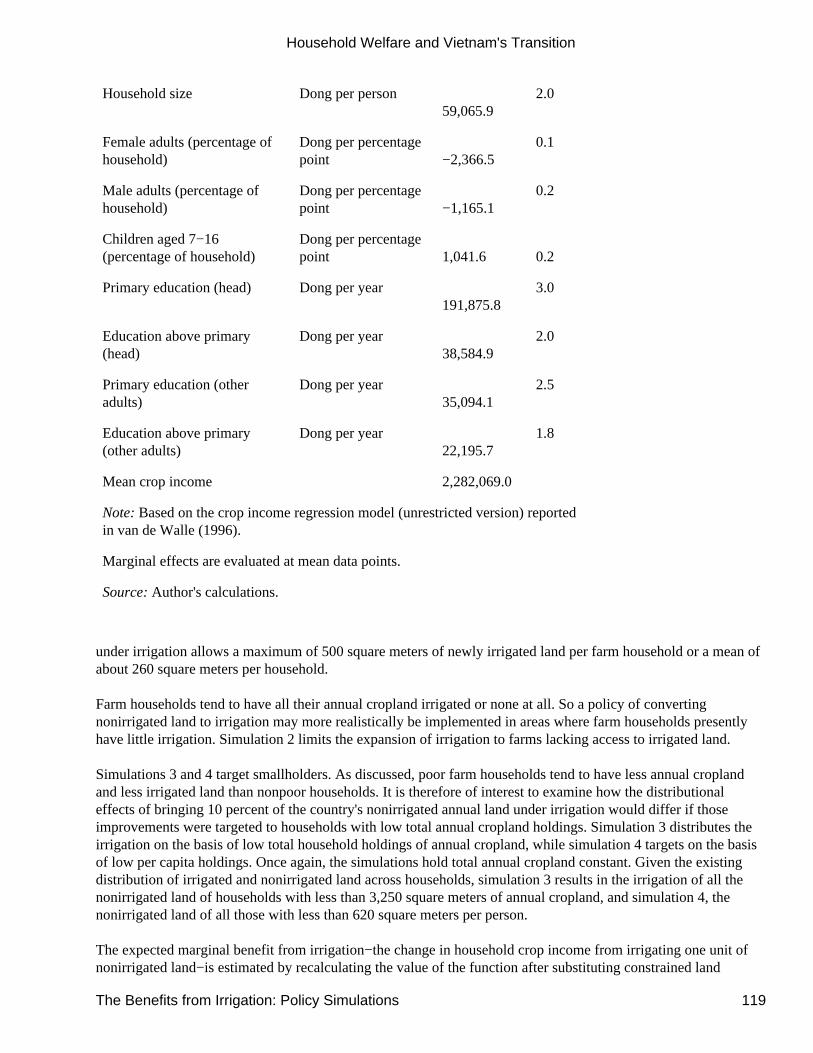
Household size Dong per person59,065.9
2.0
Female adults (percentage ofhousehold)
Dong per percentagepoint −2,366.5
0.1
Male adults (percentage ofhousehold)
Dong per percentagepoint −1,165.1
0.2
Children aged 7−16(percentage of household)
Dong per percentagepoint 1,041.6 0.2
Primary education (head) Dong per year191,875.8
3.0
Education above primary(head)
Dong per year38,584.9
2.0
Primary education (otheradults)
Dong per year35,094.1
2.5
Education above primary(other adults)
Dong per year22,195.7
1.8
Mean crop income 2,282,069.0
Note: Based on the crop income regression model (unrestricted version) reportedin van de Walle (1996).
Marginal effects are evaluated at mean data points.
Source: Author's calculations.
under irrigation allows a maximum of 500 square meters of newly irrigated land per farm household or a mean ofabout 260 square meters per household.
Farm households tend to have all their annual cropland irrigated or none at all. So a policy of convertingnonirrigated land to irrigation may more realistically be implemented in areas where farm households presentlyhave little irrigation. Simulation 2 limits the expansion of irrigation to farms lacking access to irrigated land.
Simulations 3 and 4 target smallholders. As discussed, poor farm households tend to have less annual croplandand less irrigated land than nonpoor households. It is therefore of interest to examine how the distributionaleffects of bringing 10 percent of the country's nonirrigated annual land under irrigation would differ if thoseimprovements were targeted to households with low total annual cropland holdings. Simulation 3 distributes theirrigation on the basis of low total household holdings of annual cropland, while simulation 4 targets on the basisof low per capita holdings. Once again, the simulations hold total annual cropland constant. Given the existingdistribution of irrigated and nonirrigated land across households, simulation 3 results in the irrigation of all thenonirrigated land of households with less than 3,250 square meters of annual cropland, and simulation 4, thenonirrigated land of all those with less than 620 square meters per person.
The expected marginal benefit from irrigation−the change in household crop income from irrigating one unit ofnonirrigated land−is estimated by recalculating the value of the function after substituting constrained land
Household Welfare and Vietnam's Transition
The Benefits from Irrigation: Policy Simulations 119
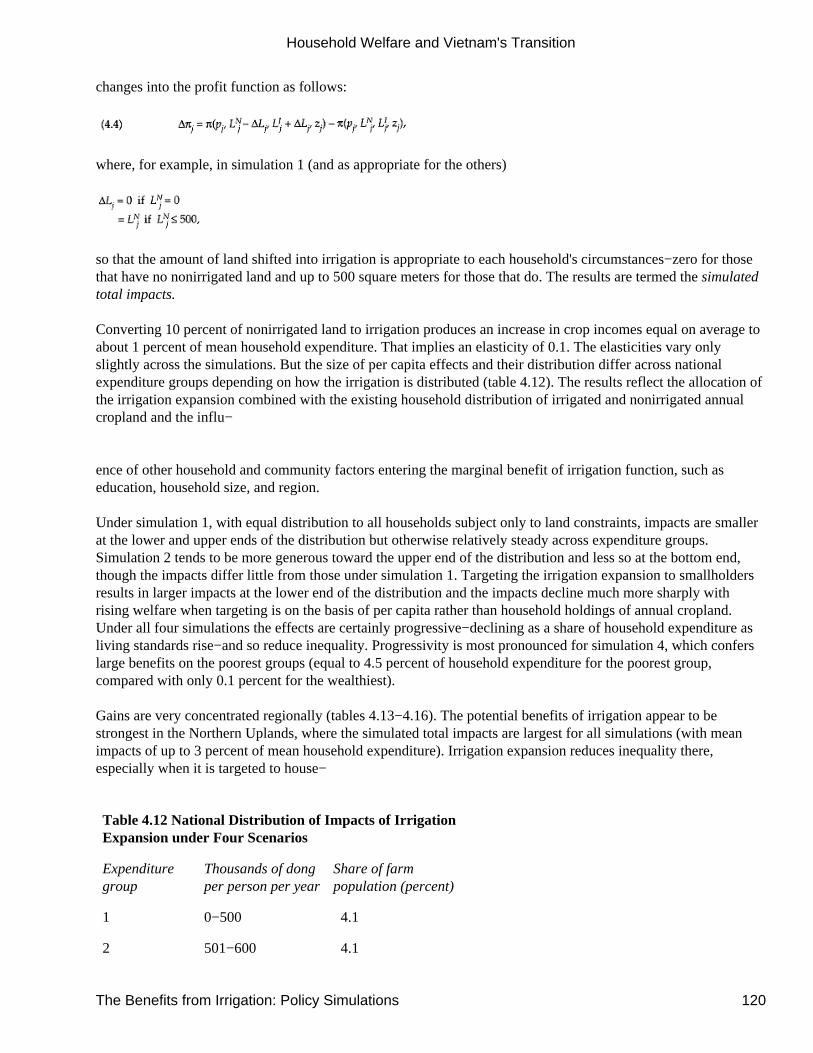
changes into the profit function as follows:
where, for example, in simulation 1 (and as appropriate for the others)
so that the amount of land shifted into irrigation is appropriate to each household's circumstances−zero for thosethat have no nonirrigated land and up to 500 square meters for those that do. The results are termed the simulatedtotal impacts.
Converting 10 percent of nonirrigated land to irrigation produces an increase in crop incomes equal on average toabout 1 percent of mean household expenditure. That implies an elasticity of 0.1. The elasticities vary onlyslightly across the simulations. But the size of per capita effects and their distribution differ across nationalexpenditure groups depending on how the irrigation is distributed (table 4.12). The results reflect the allocation ofthe irrigation expansion combined with the existing household distribution of irrigated and nonirrigated annualcropland and the influ−
ence of other household and community factors entering the marginal benefit of irrigation function, such aseducation, household size, and region.
Under simulation 1, with equal distribution to all households subject only to land constraints, impacts are smallerat the lower and upper ends of the distribution but otherwise relatively steady across expenditure groups.Simulation 2 tends to be more generous toward the upper end of the distribution and less so at the bottom end,though the impacts differ little from those under simulation 1. Targeting the irrigation expansion to smallholdersresults in larger impacts at the lower end of the distribution and the impacts decline much more sharply withrising welfare when targeting is on the basis of per capita rather than household holdings of annual cropland.Under all four simulations the effects are certainly progressive−declining as a share of household expenditure asliving standards rise−and so reduce inequality. Progressivity is most pronounced for simulation 4, which conferslarge benefits on the poorest groups (equal to 4.5 percent of household expenditure for the poorest group,compared with only 0.1 percent for the wealthiest).
Gains are very concentrated regionally (tables 4.13−4.16). The potential benefits of irrigation appear to bestrongest in the Northern Uplands, where the simulated total impacts are largest for all simulations (with meanimpacts of up to 3 percent of mean household expenditure). Irrigation expansion reduces inequality there,especially when it is targeted to house−
Table 4.12 National Distribution of Impacts of IrrigationExpansion under Four Scenarios
Expendituregroup
Thousands of dongper person per year
Share of farmpopulation (percent)
1 0−500 4.1
2 501−600 4.1
Household Welfare and Vietnam's Transition
The Benefits from Irrigation: Policy Simulations 120
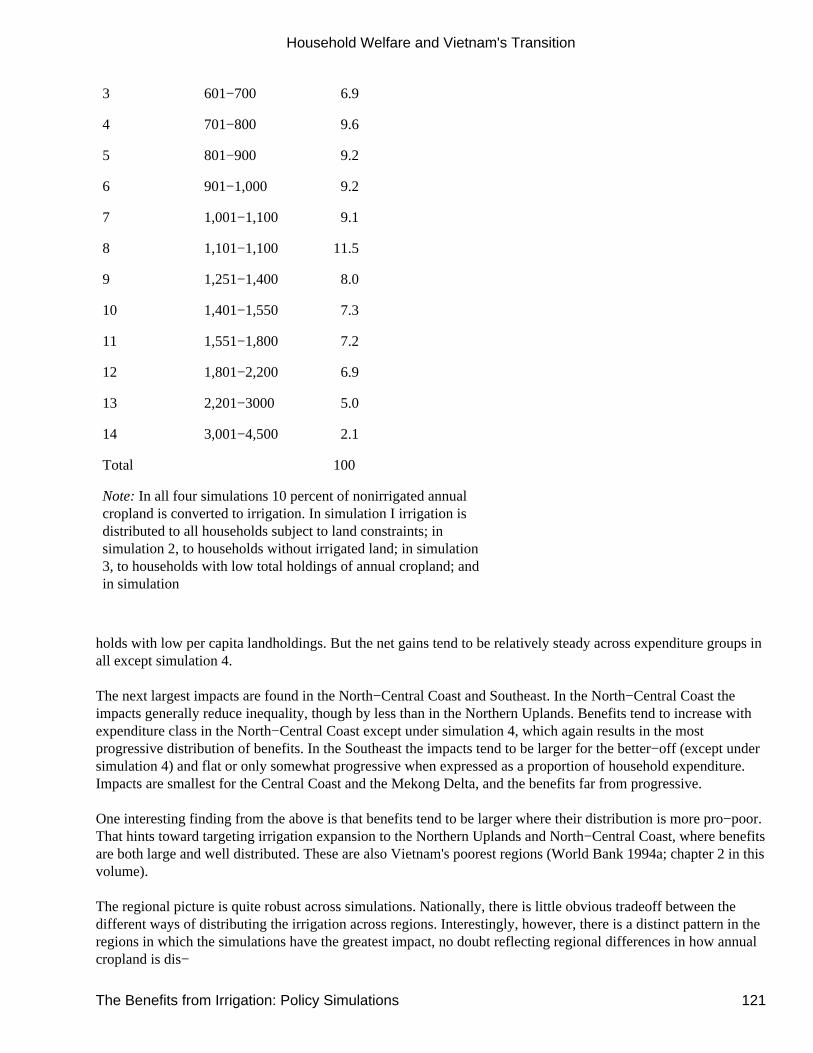
3 601−700 6.9
4 701−800 9.6
5 801−900 9.2
6 901−1,000 9.2
7 1,001−1,100 9.1
8 1,101−1,100 11.5
9 1,251−1,400 8.0
10 1,401−1,550 7.3
11 1,551−1,800 7.2
12 1,801−2,200 6.9
13 2,201−3000 5.0
14 3,001−4,500 2.1
Total 100
Note: In all four simulations 10 percent of nonirrigated annualcropland is converted to irrigation. In simulation I irrigation isdistributed to all households subject to land constraints; insimulation 2, to households without irrigated land; in simulation3, to households with low total holdings of annual cropland; andin simulation
holds with low per capita landholdings. But the net gains tend to be relatively steady across expenditure groups inall except simulation 4.
The next largest impacts are found in the North−Central Coast and Southeast. In the North−Central Coast theimpacts generally reduce inequality, though by less than in the Northern Uplands. Benefits tend to increase withexpenditure class in the North−Central Coast except under simulation 4, which again results in the mostprogressive distribution of benefits. In the Southeast the impacts tend to be larger for the better−off (except undersimulation 4) and flat or only somewhat progressive when expressed as a proportion of household expenditure.Impacts are smallest for the Central Coast and the Mekong Delta, and the benefits far from progressive.
One interesting finding from the above is that benefits tend to be larger where their distribution is more pro−poor.That hints toward targeting irrigation expansion to the Northern Uplands and North−Central Coast, where benefitsare both large and well distributed. These are also Vietnam's poorest regions (World Bank 1994a; chapter 2 in thisvolume).
The regional picture is quite robust across simulations. Nationally, there is little obvious tradeoff between thedifferent ways of distributing the irrigation across regions. Interestingly, however, there is a distinct pattern in theregions in which the simulations have the greatest impact, no doubt reflecting regional differences in how annualcropland is dis−
Household Welfare and Vietnam's Transition
The Benefits from Irrigation: Policy Simulations 121
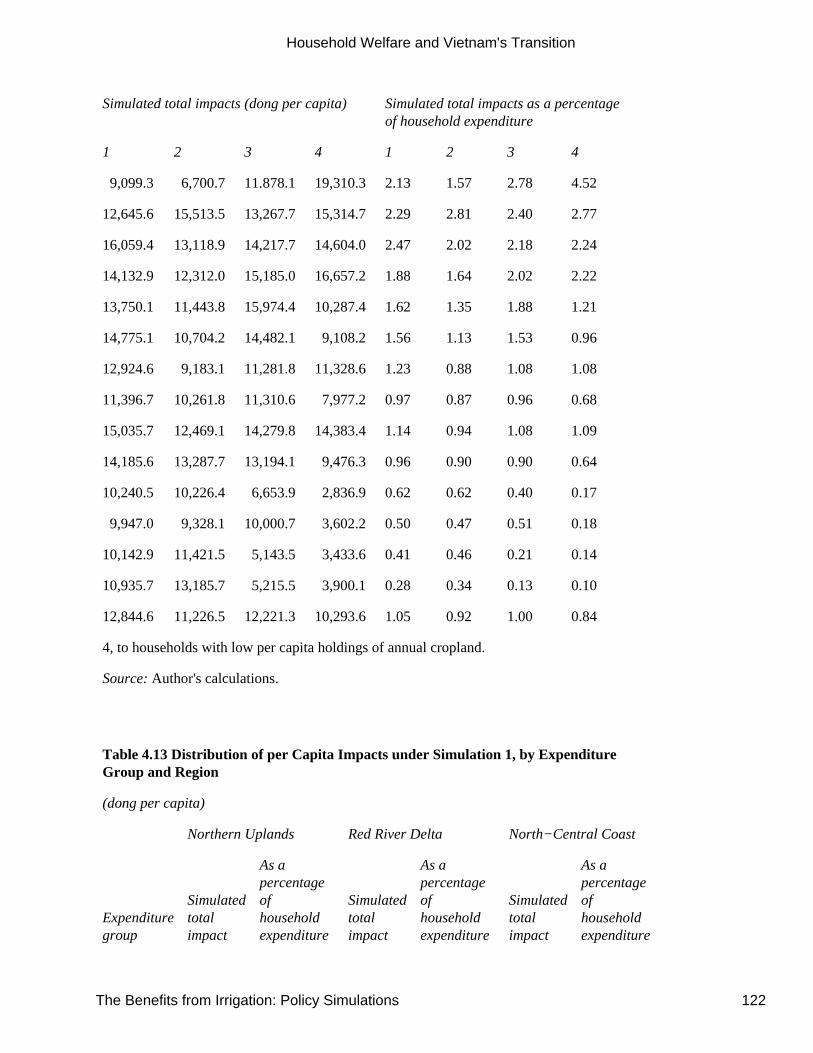
Simulated total impacts (dong per capita) Simulated total impacts as a percentageof household expenditure
1 2 3 4 1 2 3 4
9,099.3 6,700.7 11.878.1 19,310.3 2.13 1.57 2.78 4.52
12,645.6 15,513.5 13,267.7 15,314.7 2.29 2.81 2.40 2.77
16,059.4 13,118.9 14,217.7 14,604.0 2.47 2.02 2.18 2.24
14,132.9 12,312.0 15,185.0 16,657.2 1.88 1.64 2.02 2.22
13,750.1 11,443.8 15,974.4 10,287.4 1.62 1.35 1.88 1.21
14,775.1 10,704.2 14,482.1 9,108.2 1.56 1.13 1.53 0.96
12,924.6 9,183.1 11,281.8 11,328.6 1.23 0.88 1.08 1.08
11,396.7 10,261.8 11,310.6 7,977.2 0.97 0.87 0.96 0.68
15,035.7 12,469.1 14,279.8 14,383.4 1.14 0.94 1.08 1.09
14,185.6 13,287.7 13,194.1 9,476.3 0.96 0.90 0.90 0.64
10,240.5 10,226.4 6,653.9 2,836.9 0.62 0.62 0.40 0.17
9,947.0 9,328.1 10,000.7 3,602.2 0.50 0.47 0.51 0.18
10,142.9 11,421.5 5,143.5 3,433.6 0.41 0.46 0.21 0.14
10,935.7 13,185.7 5,215.5 3,900.1 0.28 0.34 0.13 0.10
12,844.6 11,226.5 12,221.3 10,293.6 1.05 0.92 1.00 0.84
4, to households with low per capita holdings of annual cropland.
Source: Author's calculations.
Table 4.13 Distribution of per Capita Impacts under Simulation 1, by ExpenditureGroup and Region
(dong per capita)
Northern Uplands Red River Delta North−Central Coast
Expendituregroup
Simulatedtotalimpact
As apercentageofhouseholdexpenditure
Simulatedtotalimpact
As apercentageofhouseholdexpenditure
Simulatedtotalimpact
As apercentageofhouseholdexpenditure
Household Welfare and Vietnam's Transition
The Benefits from Irrigation: Policy Simulations 122
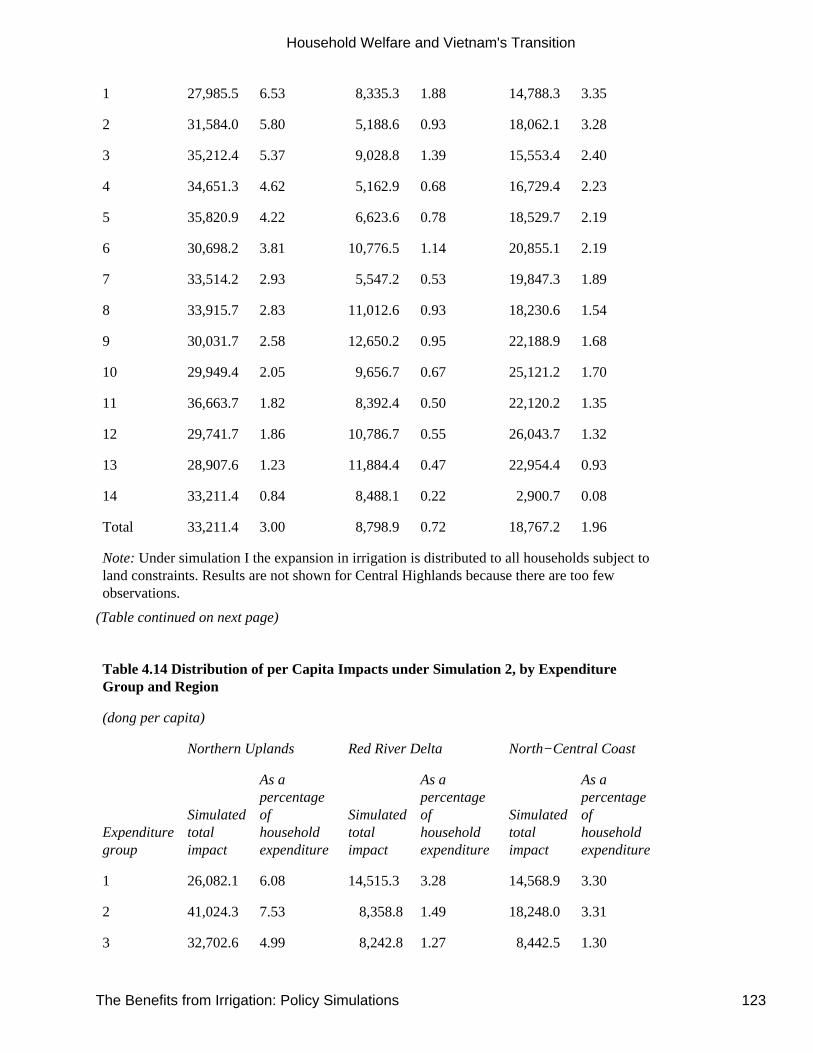
1 27,985.5 6.53 8,335.3 1.88 14,788.3 3.35
2 31,584.0 5.80 5,188.6 0.93 18,062.1 3.28
3 35,212.4 5.37 9,028.8 1.39 15,553.4 2.40
4 34,651.3 4.62 5,162.9 0.68 16,729.4 2.23
5 35,820.9 4.22 6,623.6 0.78 18,529.7 2.19
6 30,698.2 3.81 10,776.5 1.14 20,855.1 2.19
7 33,514.2 2.93 5,547.2 0.53 19,847.3 1.89
8 33,915.7 2.83 11,012.6 0.93 18,230.6 1.54
9 30,031.7 2.58 12,650.2 0.95 22,188.9 1.68
10 29,949.4 2.05 9,656.7 0.67 25,121.2 1.70
11 36,663.7 1.82 8,392.4 0.50 22,120.2 1.35
12 29,741.7 1.86 10,786.7 0.55 26,043.7 1.32
13 28,907.6 1.23 11,884.4 0.47 22,954.4 0.93
14 33,211.4 0.84 8,488.1 0.22 2,900.7 0.08
Total 33,211.4 3.00 8,798.9 0.72 18,767.2 1.96
Note: Under simulation I the expansion in irrigation is distributed to all households subject toland constraints. Results are not shown for Central Highlands because there are too fewobservations.
(Table continued on next page)
Table 4.14 Distribution of per Capita Impacts under Simulation 2, by ExpenditureGroup and Region
(dong per capita)
Northern Uplands Red River Delta North−Central Coast
Expendituregroup
Simulatedtotalimpact
As apercentageofhouseholdexpenditure
Simulatedtotalimpact
As apercentageofhouseholdexpenditure
Simulatedtotalimpact
As apercentageofhouseholdexpenditure
1 26,082.1 6.08 14,515.3 3.28 14,568.9 3.30
2 41,024.3 7.53 8,358.8 1.49 18,248.0 3.31
3 32,702.6 4.99 8,242.8 1.27 8,442.5 1.30
Household Welfare and Vietnam's Transition
The Benefits from Irrigation: Policy Simulations 123
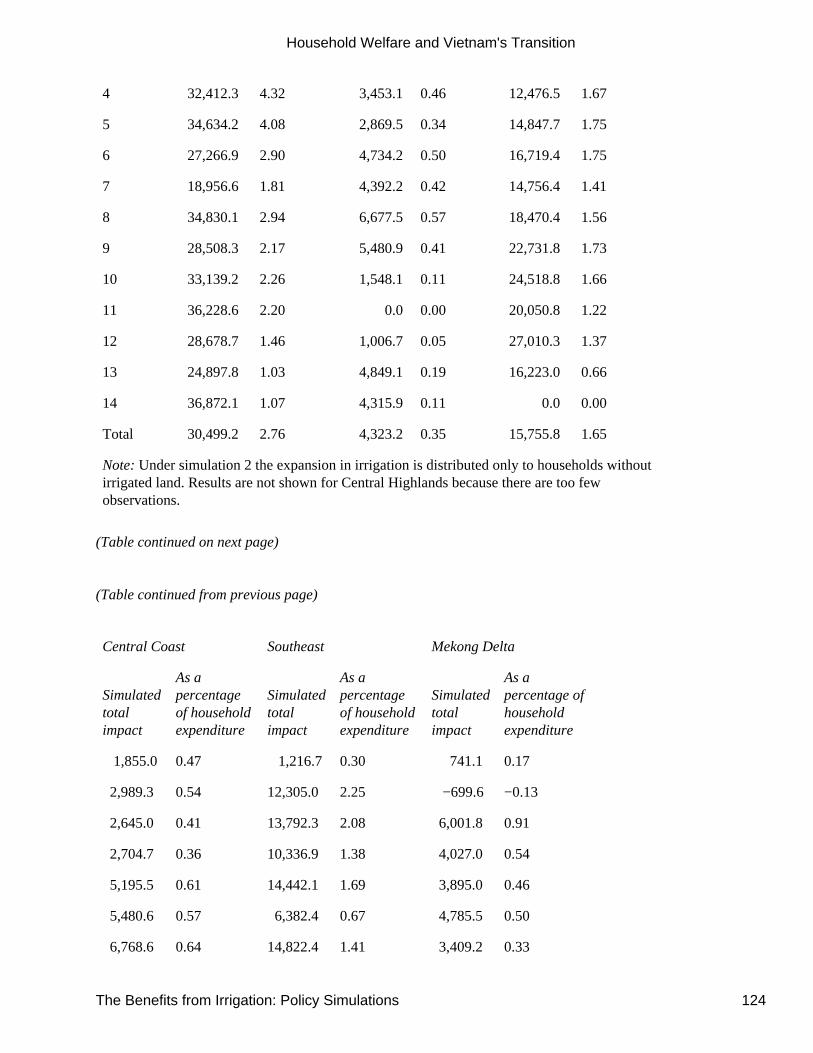
4 32,412.3 4.32 3,453.1 0.46 12,476.5 1.67
5 34,634.2 4.08 2,869.5 0.34 14,847.7 1.75
6 27,266.9 2.90 4,734.2 0.50 16,719.4 1.75
7 18,956.6 1.81 4,392.2 0.42 14,756.4 1.41
8 34,830.1 2.94 6,677.5 0.57 18,470.4 1.56
9 28,508.3 2.17 5,480.9 0.41 22,731.8 1.73
10 33,139.2 2.26 1,548.1 0.11 24,518.8 1.66
11 36,228.6 2.20 0.0 0.00 20,050.8 1.22
12 28,678.7 1.46 1,006.7 0.05 27,010.3 1.37
13 24,897.8 1.03 4,849.1 0.19 16,223.0 0.66
14 36,872.1 1.07 4,315.9 0.11 0.0 0.00
Total 30,499.2 2.76 4,323.2 0.35 15,755.8 1.65
Note: Under simulation 2 the expansion in irrigation is distributed only to households withoutirrigated land. Results are not shown for Central Highlands because there are too fewobservations.
(Table continued on next page)
(Table continued from previous page)
Central Coast Southeast Mekong Delta
Simulatedtotalimpact
As apercentageof householdexpenditure
Simulatedtotalimpact
As apercentageof householdexpenditure
Simulatedtotalimpact
As apercentage ofhouseholdexpenditure
1,855.0 0.47 1,216.7 0.30 741.1 0.17
2,989.3 0.54 12,305.0 2.25 −699.6 −0.13
2,645.0 0.41 13,792.3 2.08 6,001.8 0.91
2,704.7 0.36 10,336.9 1.38 4,027.0 0.54
5,195.5 0.61 14,442.1 1.69 3,895.0 0.46
5,480.6 0.57 6,382.4 0.67 4,785.5 0.50
6,768.6 0.64 14,822.4 1.41 3,409.2 0.33
Household Welfare and Vietnam's Transition
The Benefits from Irrigation: Policy Simulations 124
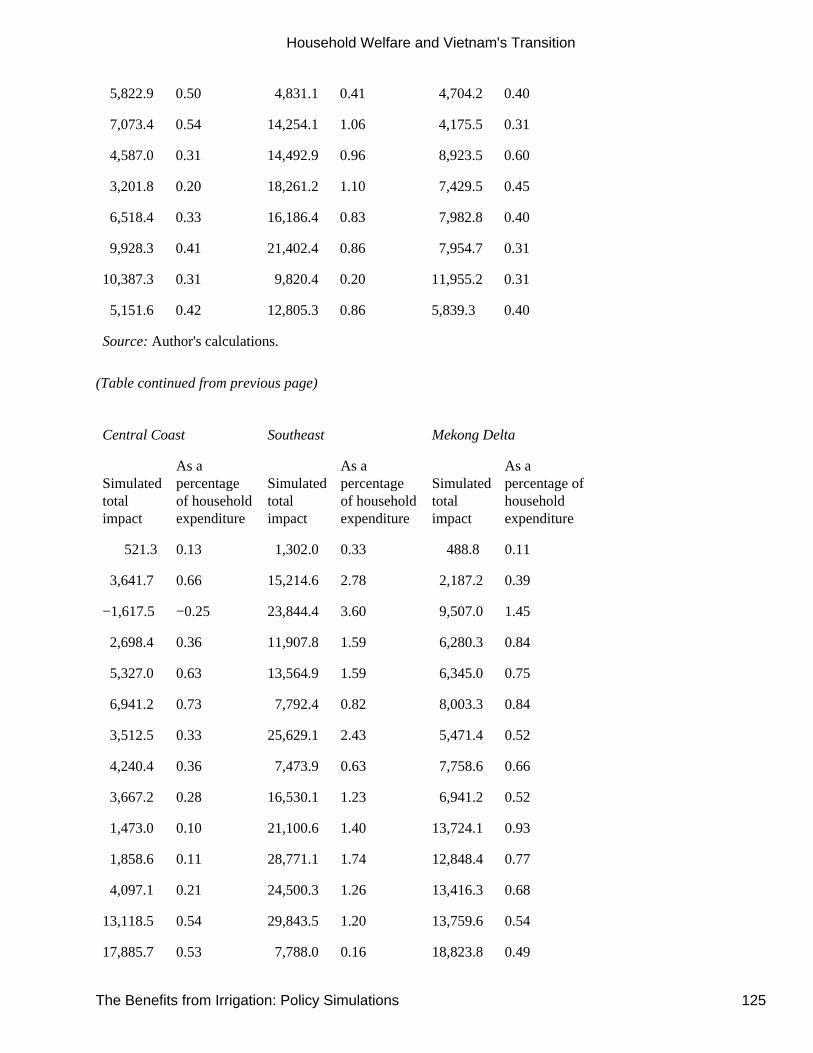
5,822.9 0.50 4,831.1 0.41 4,704.2 0.40
7,073.4 0.54 14,254.1 1.06 4,175.5 0.31
4,587.0 0.31 14,492.9 0.96 8,923.5 0.60
3,201.8 0.20 18,261.2 1.10 7,429.5 0.45
6,518.4 0.33 16,186.4 0.83 7,982.8 0.40
9,928.3 0.41 21,402.4 0.86 7,954.7 0.31
10,387.3 0.31 9,820.4 0.20 11,955.2 0.31
5,151.6 0.42 12,805.3 0.86 5,839.3 0.40
Source: Author's calculations.
(Table continued from previous page)
Central Coast Southeast Mekong Delta
Simulatedtotalimpact
As apercentageof householdexpenditure
Simulatedtotalimpact
As apercentageof householdexpenditure
Simulatedtotalimpact
As apercentage ofhouseholdexpenditure
521.3 0.13 1,302.0 0.33 488.8 0.11
3,641.7 0.66 15,214.6 2.78 2,187.2 0.39
−1,617.5 −0.25 23,844.4 3.60 9,507.0 1.45
2,698.4 0.36 11,907.8 1.59 6,280.3 0.84
5,327.0 0.63 13,564.9 1.59 6,345.0 0.75
6,941.2 0.73 7,792.4 0.82 8,003.3 0.84
3,512.5 0.33 25,629.1 2.43 5,471.4 0.52
4,240.4 0.36 7,473.9 0.63 7,758.6 0.66
3,667.2 0.28 16,530.1 1.23 6,941.2 0.52
1,473.0 0.10 21,100.6 1.40 13,724.1 0.93
1,858.6 0.11 28,771.1 1.74 12,848.4 0.77
4,097.1 0.21 24,500.3 1.26 13,416.3 0.68
13,118.5 0.54 29,843.5 1.20 13,759.6 0.54
17,885.7 0.53 7,788.0 0.16 18,823.8 0.49
Household Welfare and Vietnam's Transition
The Benefits from Irrigation: Policy Simulations 125
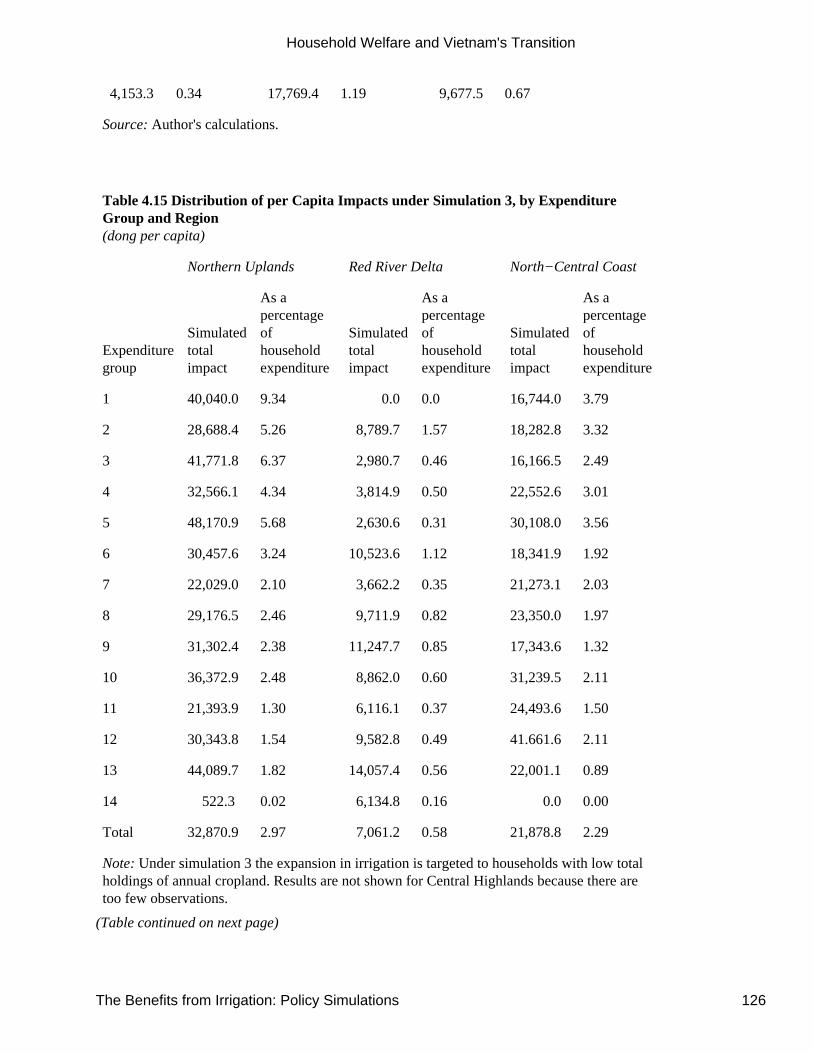
4,153.3 0.34 17,769.4 1.19 9,677.5 0.67
Source: Author's calculations.
Table 4.15 Distribution of per Capita Impacts under Simulation 3, by ExpenditureGroup and Region(dong per capita)
Northern Uplands Red River Delta North−Central Coast
Expendituregroup
Simulatedtotalimpact
As apercentageofhouseholdexpenditure
Simulatedtotalimpact
As apercentageofhouseholdexpenditure
Simulatedtotalimpact
As apercentageofhouseholdexpenditure
1 40,040.0 9.34 0.0 0.0 16,744.0 3.79
2 28,688.4 5.26 8,789.7 1.57 18,282.8 3.32
3 41,771.8 6.37 2,980.7 0.46 16,166.5 2.49
4 32,566.1 4.34 3,814.9 0.50 22,552.6 3.01
5 48,170.9 5.68 2,630.6 0.31 30,108.0 3.56
6 30,457.6 3.24 10,523.6 1.12 18,341.9 1.92
7 22,029.0 2.10 3,662.2 0.35 21,273.1 2.03
8 29,176.5 2.46 9,711.9 0.82 23,350.0 1.97
9 31,302.4 2.38 11,247.7 0.85 17,343.6 1.32
10 36,372.9 2.48 8,862.0 0.60 31,239.5 2.11
11 21,393.9 1.30 6,116.1 0.37 24,493.6 1.50
12 30,343.8 1.54 9,582.8 0.49 41.661.6 2.11
13 44,089.7 1.82 14,057.4 0.56 22,001.1 0.89
14 522.3 0.02 6,134.8 0.16 0.0 0.00
Total 32,870.9 2.97 7,061.2 0.58 21,878.8 2.29
Note: Under simulation 3 the expansion in irrigation is targeted to households with low totalholdings of annual cropland. Results are not shown for Central Highlands because there aretoo few observations.
(Table continued on next page)
Household Welfare and Vietnam's Transition
The Benefits from Irrigation: Policy Simulations 126
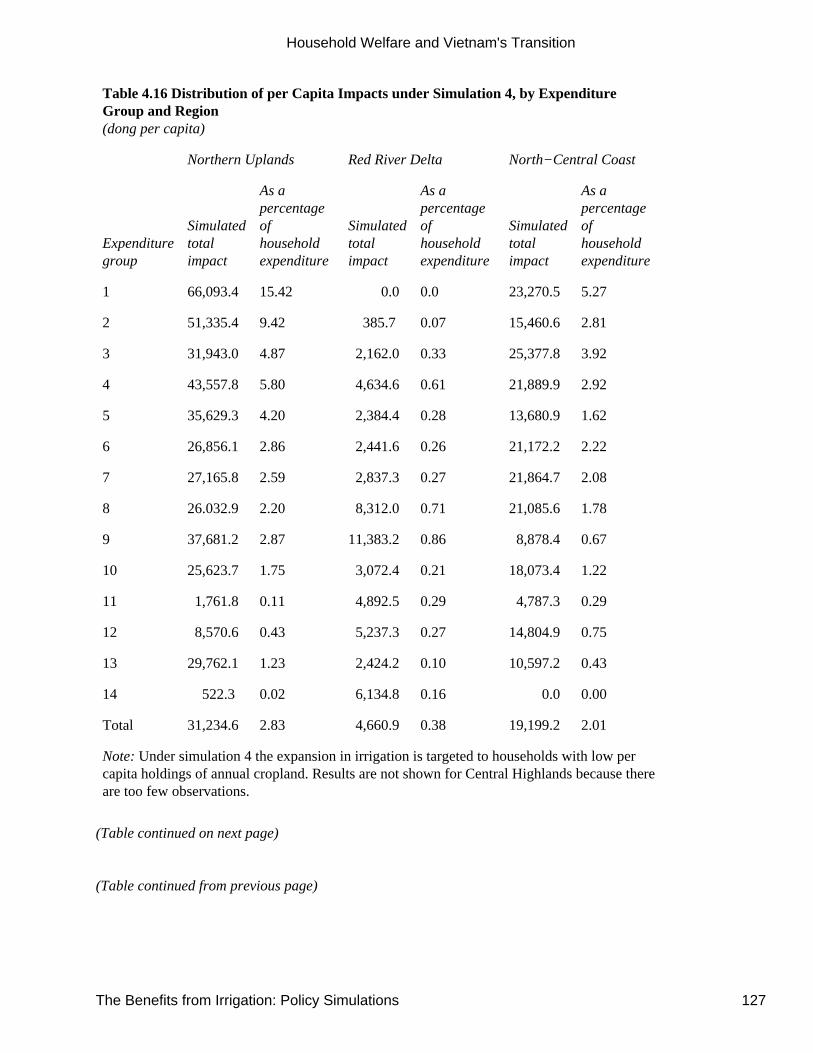
Table 4.16 Distribution of per Capita Impacts under Simulation 4, by ExpenditureGroup and Region(dong per capita)
Northern Uplands Red River Delta North−Central Coast
Expendituregroup
Simulatedtotalimpact
As apercentageofhouseholdexpenditure
Simulatedtotalimpact
As apercentageofhouseholdexpenditure
Simulatedtotalimpact
As apercentageofhouseholdexpenditure
1 66,093.4 15.42 0.0 0.0 23,270.5 5.27
2 51,335.4 9.42 385.7 0.07 15,460.6 2.81
3 31,943.0 4.87 2,162.0 0.33 25,377.8 3.92
4 43,557.8 5.80 4,634.6 0.61 21,889.9 2.92
5 35,629.3 4.20 2,384.4 0.28 13,680.9 1.62
6 26,856.1 2.86 2,441.6 0.26 21,172.2 2.22
7 27,165.8 2.59 2,837.3 0.27 21,864.7 2.08
8 26.032.9 2.20 8,312.0 0.71 21,085.6 1.78
9 37,681.2 2.87 11,383.2 0.86 8,878.4 0.67
10 25,623.7 1.75 3,072.4 0.21 18,073.4 1.22
11 1,761.8 0.11 4,892.5 0.29 4,787.3 0.29
12 8,570.6 0.43 5,237.3 0.27 14,804.9 0.75
13 29,762.1 1.23 2,424.2 0.10 10,597.2 0.43
14 522.3 0.02 6,134.8 0.16 0.0 0.00
Total 31,234.6 2.83 4,660.9 0.38 19,199.2 2.01
Note: Under simulation 4 the expansion in irrigation is targeted to households with low percapita holdings of annual cropland. Results are not shown for Central Highlands because thereare too few observations.
(Table continued on next page)
(Table continued from previous page)
Household Welfare and Vietnam's Transition
The Benefits from Irrigation: Policy Simulations 127
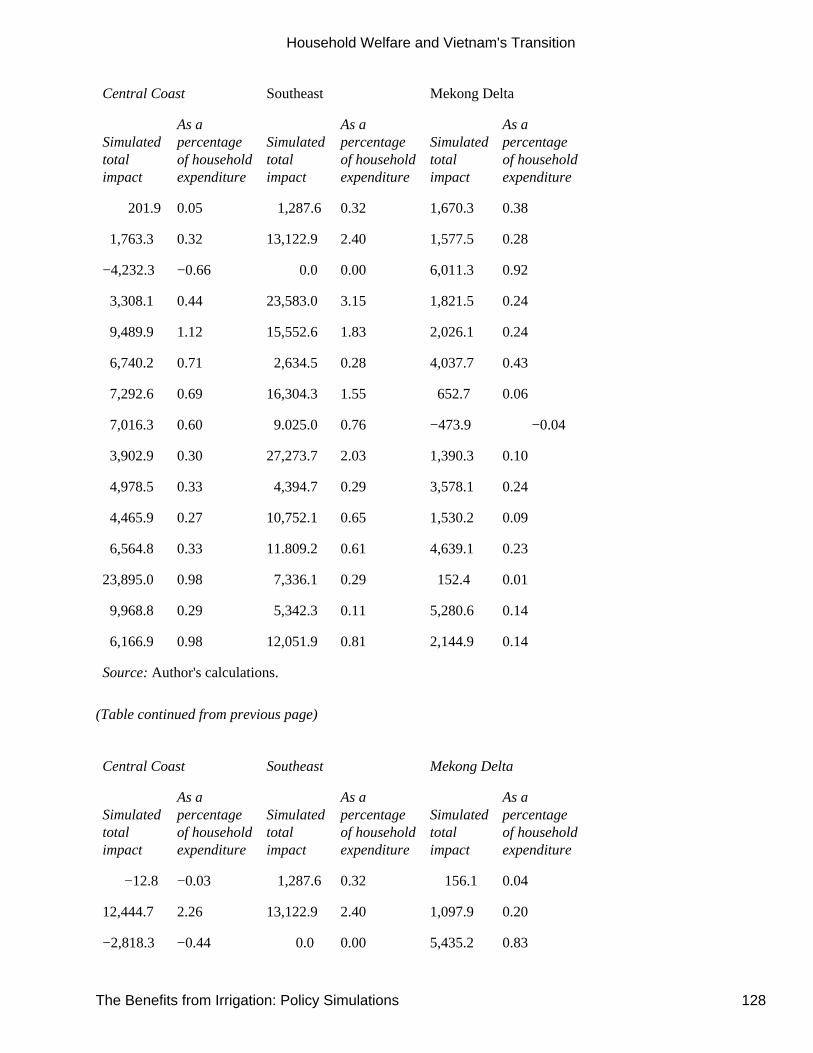
Central Coast Southeast Mekong Delta
Simulatedtotalimpact
As apercentageof householdexpenditure
Simulatedtotalimpact
As apercentageof householdexpenditure
Simulatedtotalimpact
As apercentageof householdexpenditure
201.9 0.05 1,287.6 0.32 1,670.3 0.38
1,763.3 0.32 13,122.9 2.40 1,577.5 0.28
−4,232.3 −0.66 0.0 0.00 6,011.3 0.92
3,308.1 0.44 23,583.0 3.15 1,821.5 0.24
9,489.9 1.12 15,552.6 1.83 2,026.1 0.24
6,740.2 0.71 2,634.5 0.28 4,037.7 0.43
7,292.6 0.69 16,304.3 1.55 652.7 0.06
7,016.3 0.60 9.025.0 0.76 −473.9 −0.04
3,902.9 0.30 27,273.7 2.03 1,390.3 0.10
4,978.5 0.33 4,394.7 0.29 3,578.1 0.24
4,465.9 0.27 10,752.1 0.65 1,530.2 0.09
6,564.8 0.33 11.809.2 0.61 4,639.1 0.23
23,895.0 0.98 7,336.1 0.29 152.4 0.01
9,968.8 0.29 5,342.3 0.11 5,280.6 0.14
6,166.9 0.98 12,051.9 0.81 2,144.9 0.14
Source: Author's calculations.
(Table continued from previous page)
Central Coast Southeast Mekong Delta
Simulatedtotalimpact
As apercentageof householdexpenditure
Simulatedtotalimpact
As apercentageof householdexpenditure
Simulatedtotalimpact
As apercentageof householdexpenditure
−12.8 −0.03 1,287.6 0.32 156.1 0.04
12,444.7 2.26 13,122.9 2.40 1,097.9 0.20
−2,818.3 −0.44 0.0 0.00 5,435.2 0.83
Household Welfare and Vietnam's Transition
The Benefits from Irrigation: Policy Simulations 128
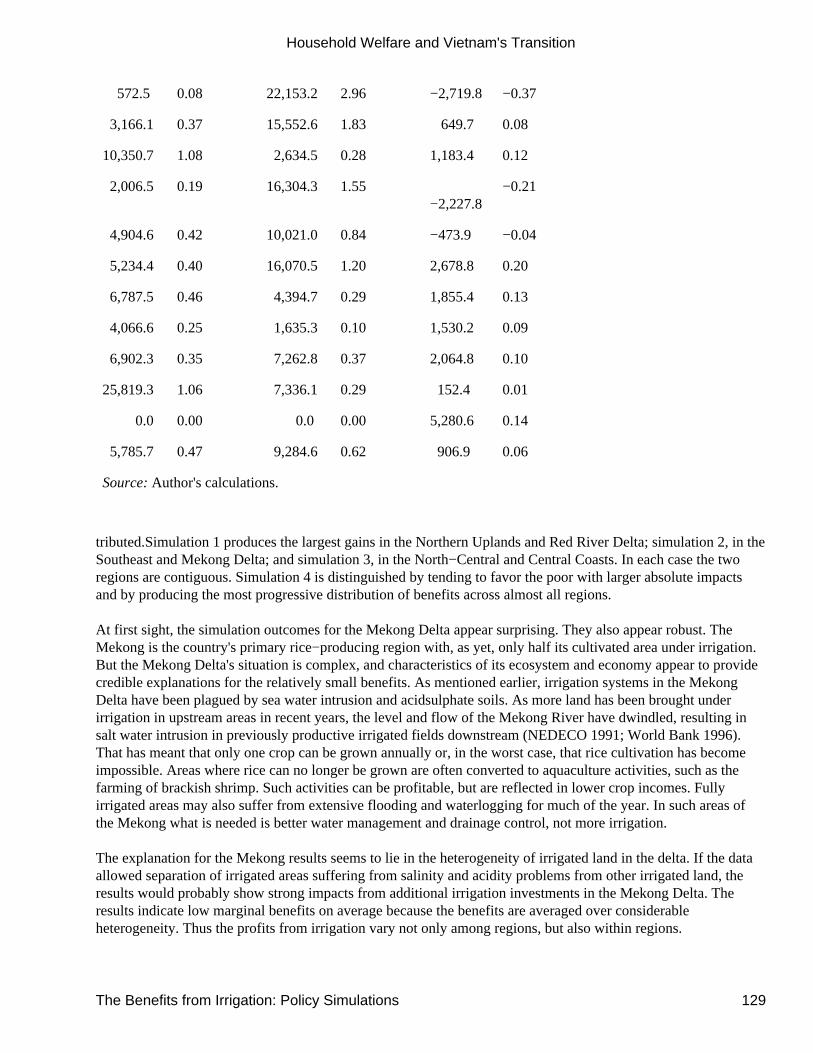
572.5 0.08 22,153.2 2.96 −2,719.8 −0.37
3,166.1 0.37 15,552.6 1.83 649.7 0.08
10,350.7 1.08 2,634.5 0.28 1,183.4 0.12
2,006.5 0.19 16,304.3 1.55−2,227.8
−0.21
4,904.6 0.42 10,021.0 0.84 −473.9 −0.04
5,234.4 0.40 16,070.5 1.20 2,678.8 0.20
6,787.5 0.46 4,394.7 0.29 1,855.4 0.13
4,066.6 0.25 1,635.3 0.10 1,530.2 0.09
6,902.3 0.35 7,262.8 0.37 2,064.8 0.10
25,819.3 1.06 7,336.1 0.29 152.4 0.01
0.0 0.00 0.0 0.00 5,280.6 0.14
5,785.7 0.47 9,284.6 0.62 906.9 0.06
Source: Author's calculations.
tributed.Simulation 1 produces the largest gains in the Northern Uplands and Red River Delta; simulation 2, in theSoutheast and Mekong Delta; and simulation 3, in the North−Central and Central Coasts. In each case the tworegions are contiguous. Simulation 4 is distinguished by tending to favor the poor with larger absolute impactsand by producing the most progressive distribution of benefits across almost all regions.
At first sight, the simulation outcomes for the Mekong Delta appear surprising. They also appear robust. TheMekong is the country's primary rice−producing region with, as yet, only half its cultivated area under irrigation.But the Mekong Delta's situation is complex, and characteristics of its ecosystem and economy appear to providecredible explanations for the relatively small benefits. As mentioned earlier, irrigation systems in the MekongDelta have been plagued by sea water intrusion and acidsulphate soils. As more land has been brought underirrigation in upstream areas in recent years, the level and flow of the Mekong River have dwindled, resulting insalt water intrusion in previously productive irrigated fields downstream (NEDECO 1991; World Bank 1996).That has meant that only one crop can be grown annually or, in the worst case, that rice cultivation has becomeimpossible. Areas where rice can no longer be grown are often converted to aquaculture activities, such as thefarming of brackish shrimp. Such activities can be profitable, but are reflected in lower crop incomes. Fullyirrigated areas may also suffer from extensive flooding and waterlogging for much of the year. In such areas ofthe Mekong what is needed is better water management and drainage control, not more irrigation.
The explanation for the Mekong results seems to lie in the heterogeneity of irrigated land in the delta. If the dataallowed separation of irrigated areas suffering from salinity and acidity problems from other irrigated land, theresults would probably show strong impacts from additional irrigation investments in the Mekong Delta. Theresults indicate low marginal benefits on average because the benefits are averaged over considerableheterogeneity. Thus the profits from irrigation vary not only among regions, but also within regions.
Household Welfare and Vietnam's Transition
The Benefits from Irrigation: Policy Simulations 129

Household Labor Costs
In defining net crop incomes, no deduction was made for labor inputs by household members, largely because ofuncertainty about how to measure the opportunity cost of family labor when alternatives to working on the familyfarm may not be available and there is a labor surplus.14 The possibility remains that irrigated and nonirrigatedland have different labor input requirements and thus that the estimated net gains from irrigation expansion maybe under− or overestimated. Van de Walle (1996) tests the sensitivity of the simulation results to this assumptionabout own−labor
costs by comparing the net marginal effect of irrigating nonirrigated land on the cost of the family labor inputwith the previously calculated net marginal effect on crop incomes.
Van de Walle (1996, 1997) finds that irrigation tends to increase work on the family farm. Convertingnonirrigated land to irrigation raises the market value of family labor time by an estimated 7,279 dong per 100square meters. Subtracting this amount from the average net impact on crop incomes of converting 100 squaremeters of nonirrigated land to irrigation reduces the net gain to 21,299 dong, 25 percent less than the earlierresults. These calculations assume that the shadow wage of family labor equals the full agricultural wage rate andmay considerably overestimate the costs.15 If the opportunity cost of family labor is assumed instead to be halfthe market wage, the gain in farm profit from irrigating 100 square meters of nonirrigated land is 24,939 dong, 13percent less. The earlier results therefore overestimated the marginal effect of irrigation on farm profits by amaximum of 25 percent.
The Cost of Expanding Irrigation
Information on the costs of irrigation expansion is hard to come by, and generalizations across regions and typesof irrigation investments are risky. Nonetheless, even a rough sense of the cost−benefit appraisal can be useful.The costs of large−scale irrigation projects have been estimated by several agencies for different regions ofVietnam. Estimated average costs−including for a World Bank irrigation rehabilitation project in the CentralCoast and a large number of water resource development projects in the Mekong Delta drawn up as part of theMekong Delta Master Plan−fluctuate around 85,000 dong per 100 square meters. Although these are averages forseveral projects, the variance is low.16
For these costs, the estimated model indicates an annual gain in net crop income of about 28,600 dong per 100square meters, falling to 21,300 dong at the maximum shadow wage for family labor. That represents a rate ofreturn of at least 25−35 percent a year, assuming that the project delivers such benefits indefinitely. But evenunder conservative assumptions of a project life of only 10 years and with the maximum shadow wage for familylabor, the rate of return is about 20 percent.17
However, although the variance in costs for the projects reviewed was low, these projects are all located in theriver deltas or the flat central areas of the country and represent a certain type of large−scale irrigationdevelopment. Costs are likely to differ for irrigation projects in the highlands or more isolated regions and forsmaller−scale undertakings. For example, low−lift pumps may have lower initial capital costs but higheroperating costs (Carruthers and Clark 1983). Naturally, site−specific rates of return must be calculated for eachproject and compared with economic appraisals of alternative uses of the resources.18
Conclusion
Vietnam has poor infrastructure and high poverty. These two facts are intimately linked. The nature of theconnections between the two and their implications for the role of infrastructure investments in fighting poverty
Household Welfare and Vietnam's Transition
Household Labor Costs 130
are complex, however, and difficult to disentangle. This chapter has focused on some aspects of the link betweenpoverty and lack of infrastructure using the Vietnam Living Standards Survey.
Access to infrastructure services is poor for most Vietnamese. Rural areas are less well provisioned than urban,and some regions fare worse than others. There are distinct differences between the north and south. There arealso differences among infrastructure services, with the provision of social service facilities generally superior tothat of other physical infrastructure. And there are differences between poor and nonpoor: the provision of pipedwater and electricity reveals considerable disparities. But by and large, basic infrastructure services are generallyinadequate for all groups, though generally worst for the poor. As a result, it cannot be surmised that expandinginvestment in basic infrastructure will primarily benefit the poor. Indeed, there is ample scope for the nonpoor tocapture the lion's share of the direct gains from infrastructure investment in Vietnam.
To assess how investing in infrastructure would affect poverty, it is necessary to examine the distribution of themarginal benefits of specific investments. The chapter focuses on irrigation investments using cross−sectionalvariation to estimate the marginal effects of converting nonirrigated annual cropland to irrigation. It simulates apolicy of irrigating 10 percent of currently nonirrigated annual cropland based on a regression model for cropincome that includes irrigated and nonirrigated land as explanatory variables. The expansion in irrigation isdistributed in four different ways: to all households subject to land constraints, to households without irrigatedland, to households with low total holdings of annual cropland, and to households with low per capita holdings ofannual cropland.
In general, the results suggest that an undifferentiated expansion of irrigation would be redistributive−with higherproportionate income gains going to poorer households. Targeting the irrigation expansion to households withsmall per capita landholdings produces the most progressive distribution of gains as well as the largest benefits forthe poor. The results for all four scenarios show the largest total impacts on net crop incomes−and the mostpro−poor distribution−in Vietnam's two poorest regions, the Northern Uplands and the North−Central Coast.
These substantial potential gains in equity are likely to be accompanied by sizable average rates of return. Evenunder quite conservative assumptions−a project life of only 10 years and family labor inputs valued at the marketwage−the average annual rate of return implied by the estimated gains in farm profits and the investment cost ofirrigation would be about 20 percent. Even larger returns might be possible with a more dif−
ferentiated expansion of irrigation that emphasizes key regions such as the Northern Uplands and withrehabilitation of existing irrigation infrastructure. Conversely, the rate of return would undoubtedly be lower inareas where expanding irrigation is particularly costly.
In a normal setting we wouldn't expect such high rates of return. They may be overestimated. Although tests forbiases were conducted (see van de Walle 1996 and 1997), there may still be omitted quality heterogeneity in land,which could lead to overestimation of the benefits from irrigation with the type of data available. But this is not aparticularly ''normal" setting. High rates of return to irrigation are not implausible in present−day Vietnam,because so little investment in agriculture and rural infrastructure has been possible until recently.
Lack of irrigation infrastructure is clearly not the only constraint to reducing rural poverty in Vietnam. Thequantity and quality of families' human resources also matter greatly. And not only do other important constraintsexist, but these constraints are inextricably bound to the benefits that households can ultimately derive fromirrigation infrastructure. The analysis uncovers important complementarities between education, particularlyprimary education, and the gains from irrigation. Demographics (particularly household size) are also found to bekey. And it can be conjectured that the lack of other infrastructure−roads, electricity, communications−alsoconspires to reduce the benefits that can be garnered from irrigation alone.
Household Welfare and Vietnam's Transition
Household Labor Costs 131
Notes
The author would like to thank Shanta Devarajan, Paul Glewwe, Frannie Humplick, Nauman Ilias, JennieLitvack, Amit Mohindra, Martin Ravallion, Tom Wiens, and three anonymous referees for their help and usefulcomments. Financial assistance from RPO BB67883 is gratefully acknowledged.
1. Links between poverty and infrastructure are discussed in World Bank (1994c), Lipton and Ravallion (1995),and Jimenez (1995). For sector−specific discussions see Howe and Richards (1984), Binswanger, Khandker, andRosenzweig (1993), and Goldstein (1993).
2. Expansion factors are not needed as the survey is self−weighted. The community questionnaire relies oninterviews of village leaders, health care workers, teachers, and local government officials.
3. Regional poverty lines are estimated using the cost−of−basic−needs methodology (Ravallion 1994, anddetailed in World Bank 1994a). Deflating by region−specific poverty lines is an alternative to using a regionalprice index. Because the weighting diagram used in deriving poverty lines tends to be more appropriate to thepoor than that typically used in spatial price indices, deflating by region−specific poverty lines is often preferredfor investigations of poverty.
4. The questionnaire asks whether "most" or "just a few" have electricity.
5. These countries are chosen as comparators because they have Living Standards Measurement Surveys thatfollow the same methodologies used in the 1992−93 Vietnam Living Standards Survey and ask similar questions.The data on access to piped water in rural areas are as follows: Ghana, 13.5 percent of households (1991−92Ghana Living Standards Survey); Tanzania, more than 21.5 percent of households (1993−94 Human ResourcesDevelopment Survey), though this number excludes obtaining water from a neighbor's piped water supply;Pakistan, 15 percent of households (Pakistan Integrated Household Survey 1991−92); and Peru, 43 percent of therural Sierra population (1991 Living Standards Measurement Survey).
6. Results on access to piped water in urban areas are as follows: Ghana, 73.5 percent of households (1991−92Ghana Living Standards Survey); Tanzania, more than 56 percent of households (1993−94 Human ResourcesDevelopment Survey), though this number excludes obtaining water from a neighbor's piped water supply;Pakistan, 57 percent of households (Pakistan Integrated Household Survey 1991−92); and Peru, 91 percent of theurban Sierra population (1991 Living Standards Measurement Survey).
7. Sources are as detailed in note 5.
8. The expected outcome might be different if irrigation could be adequately targeted to the poor, but targetingcan often be difficult and costly (van de Walle 1995b).
9. In addition to annual cropland, households derive agricultural income from perennial cropland (used forperennial tree crops), forest land (natural forest or reforested areas used for seeding young plants and growing
Household Welfare and Vietnam's Transition
Notes 132
forest tree crops), water surface (for raising water products), and other land, which includes vacant lots and baldhills (land managed by households but not cultivated for at least 12 months), virgin land (burnt and fallow land),and other (road and dike sides, river banks, and the like).
10. Net crop incomes are defined as total revenue minus total production costs. Total revenue from agriculturalland production includes all crops evaluated at harvest prices (missing values are replaced by average communityprices), the value of crop by−products consumed or sold (such as thatch, straw, cassava trunks, maize, and jute),land income (rents from other households and government assistance), and income from leasing out farmequipment. Total production costs include hired labor expenses; costs of seeds and young plants; fertilizer,manure, and insecticide costs; animal rental, transport, packaging and storage, equipment rental, repair andmaintenance fees, and fuel oil and electricity costs; an accounting depreciation charge for farm equipment owned(5 percent); taxes and fees to the cooperative (such as for irrigation, crop protection, and plowing); land payments,such as rent for land leased and land taxes paid to the government or cooperative. Transformation of homegrowncrops (such as producing cured tobacco, peanut oil, and rice noodles) is not included, but treated as familyoff−farm enterprises using farm inputs. The opportunity costs of household farm labor also are not included. Thesection on household labor costs discusses the sensitivity of the results to this assumption. Also note that profitsfrom raising livestock are not part of net crop income.
11. Other explanatory variables include household size and composition; gender of the household head; years ofprimary school (grades 0−5) and of any additional education of the household head; years of primary school(grades 0−5) and of any additional education for all other household members over 17; access to various kinds ofland as described in note 9; proportions of annual cropland in various forms of ownership; the stock of householdsavings; and dummy variables for urban residence and whether a household member was ill in the past year.
12. As discussed in van de Walle (1996), a number of functional form specifications were tried. A linear modelwith quadratics in land and education variables was found to perform best. Van de Walle (1996) reports tworegressions−an unrestricted version that contains all the variables and a restricted model in which all variableswith t−statistics below 1 are pruned. All results reported here, including the simulations, are based on theunrestricted model. Full regression details are available from the author.
13. Van de Walle (1996 and 1997) gives supporting evidence for this interpretation. For example, commune−levelwage data suggest that labor markets are better developed in the south. Salinger (1993) provides furthercorroboration of this. The Mekong Delta is characterized by large areas that are either irrigated or not irrigated.As discussed later, irrigation appears to increase the labor input requirement. Labor markets are thus likely tohave developed more fully in areas of the Mekong that have large irrigated farms.
14. Recall that nonfamily labor costs are included.
15. The community survey provides information on prevailing communelevel agricultural wage rates by genderand for children, for a number of tasks. Thus wage rates are not household−specific. And there are many missingdata. Demographic−specific commune mean agricultural wages are formed over all tasks for which wage rates arerecorded and used to value time on all farm tasks by each household member. Missing data at the commune levelare replaced by the regional means for men, women, or children, as appropriate.
Household Welfare and Vietnam's Transition
Notes 133
16. The World Bank project average costs are estimated at about 83,150 dong per 100 square meters whenexcluding consultant costs and physical and price contingencies. The Mekong Master Plan projects average85,830 dong, 87,650 dong, and 87,120 dong per 100 square meters (NEDECO 1993).
17. These are internal rates of return that equate the present value of the stream of benefits over the chosen periodwith initial costs.
18. Proper rates of return would also need to factor in future maintenance and operating costs, which are oftensignificant.
References
Barker, Randolph. 1994. Agricultural Policy Analysis for Transition to a Market−Oriented Economy in Viet Nam:Selected Issues. FAO Economic and Social Development Paper 123. Rome: Food and Agriculture Organization.
Binswanger, Hans P., Shahidur R. Khandker, and Mark R. Rosenzweig. 1993. "How Infrastructure and FinancialInstitutions Affect Agricultural Output and
Investment in India." Journal of Development Economics 41(2): 337−66.
Carruthers, Ian, and Colin Clark. 1983. The Economics of Irrigation. Liverpool: Liverpool University Press.
Dreyfus, Fabrice. 1993. Tradition, Idéologies et Pragmatismes: l'Exemple de la Collectivisation et de laDécollectivisation de l'Agriculture au Viêt−nam du Nord. Montpellier, France: Centre national d'étudesagronomiques des régions chaudes.
Goldstein, Ellen. 1993. "The Impact of Rural Infrastructure on Rural Poverty." World Bank, South Asia Region,Washington, D.C.
Howe, John, and Peter Richards, eds. 1984. Rural Roads and Poverty Alleviation. London: IntermediateTechnology Publications.
Jimenez, Emmanuel. 1995. "Human and Physical Infrastructure: Public Investment and Pricing Policies inDeveloping Countries." In Jere Behrman and T. N.Srinivasan, eds., Handbook of Development Economics. vol. 3.Amsterdam: North Holland.
Le Thanh Nghiep. 1993. "Agricultural Development in Viet Nam: Issues and Proposals for Reform." In MyaThan and Joseph L. H. Tan, eds., Vietnam's Dilemmas and Options: The Challenge of Economic Transition in the1990s. Singapore: Institute of South East Asian Studies.
Lipton, Michael, and Martin Ravallion. 1995. "Poverty and Policy." In Jere Behrman and T. N. Srinivasan, eds.,Handbook of Development Economics. vol. 3. Amsterdam: North Holland.
NEDECO (Netherlands Engineering Consultants). 1991. "Mekong Delta Master Plan: Inception Report."Amsterdam: North Holland.
____. 1993. "Draft Master Plan for the Mekong Delta in Viet Nam: A Perspective for Sustainable Development ofLand and Water Resources." Amsterdam: North Holland.
Household Welfare and Vietnam's Transition
References 134
Ravallion, Martin. 1994. "Poverty Comparisons." Fundamentals in Pure and Applied Economics 56. Chur,Switzerland: Harwood Academic Press.
Salinger, Lynn B. 1993. "Viet Nam's Agricultural Comparative Advantage and Export Potential." Associates forInternational Resources and Development, Cambridge, Mass.
Vietnam State Planning Committee, UNDP (United Nations Development Programme), FAO (Food andAgriculture Organization), and World Bank. 1989. "Viet Nam Agricultural and Food Production Sector Review."Mission report. Hanoi.
UNICEF (United Nations Children's Fund). 1994. Situation Analysis of Women and Children in Viet Nam. Hanoi.
van de Walle, Dominique. 1995a. "Rural Poverty in an Emerging Market Economy: Is Diversification into NonFarm Activities in Rural Viet Nam the Solution?" World Bank, Development Research Group, Washington, D.C.
____. 1995b. "Targeting and Incidence: An Overview of Implications for Research and Policy." In Dominiquevan de Walle and Kimberly Nead, eds., Public Spending and the Poor: Theory and Evidence. Baltimore, Md.:Johns Hopkins University Press.
____. 1996. "Infrastructure and Poverty in Viet Nam." Living Standards Measurement Study Working Paper 121.World Bank, Washington, D.C.
____. 1997. "Human Capital and Labor Market Constraints in Developing Countries: A Case Study of Irrigationin Viet Nam." World Bank, Development Research Group, Washington, D.C.
Vu, Tu Lap, and Christian Taillard. 1993. Atlas du Viet Nam. Montpellier and Paris: Reclus, La DocumentationFrançaise.
World Bank. 1990. "Viet Nam: Water Supply and Sanitation Sector Study." East Asia and Pacific Region,Country Department I, Washington, D.C.
____. 1994a. "Viet Nam: Poverty Assessment and Strategy." Report 13442−VN. East Asia and Pacific Region,Country Department I, Washington, D.C.
____. 1994b. "Viet Nam Transport Sector: Serving an Economy in Transition." Report 12778−VN. East Asia andPacific Region, Country Department I, Washington, D.C.
____. 1994c. World Development Report 1994: Infrastructure for Development. New York: Oxford UniversityPress.
____. 1996. "Viet Nam: Water Resources Sector Review." Report 15041−VN. East Asia and Pacific Region,Country Department I, Washington, D.C.
5—Nonfarm Household Enterprises in Vietnam
Wim P. M. Vijverberg
Household Welfare and Vietnam's Transition
5— Nonfarm Household Enterprises in Vietnam 135
Vietnam is becoming a market−oriented economy. Successive economic reforms have legitimized economicactivity in the private sector and boosted production. Policy initiatives are under way to make state enterpriseseconomically accountable, privatizing some and shutting down those that are unprofitable. Entrepreneurship,markets, and efficiency are popular buzzwords. The government must enhance tax revenue to financegrowth−facilitating programs and find ways to tax the private sector equitably. Furthermore, because populationdensity is high and the labor force is growing rapidly, the country must generate employment in the nonfarmsector, especially in rural areas, to avoid mass migration flows to cities. Such flows would be economicallydisruptive and would likely increase urban poverty and congestion.
Vietnam is counting on the self−employed to contribute to economic growth. Studies have shown that averageself−employment incomes may well exceed average wage earnings (see, for example, Chiswick 1977; Mazumdar1981; Teilhet−Waldorf and Waldorf 1983; Vijverberg 1986; and Speare and Harris 1986), contrary to theperception of self−employment as a low−status, low−income, dead−end career. Mazumdar (1981) and Blau(1986) report workers moving out of wage employment into self−employment, and the self−employed are likelyfound across the whole income distribution, rather than merely at the bottom of it.
This chapter addresses a number of questions concerning the self−employed. First, are they young or old, men orwomen? Are they members of particular ethnic groups? Are they educated? How important are theirself−employment activities to their incomes? We will see that about 60 percent of the self−employed combinetheir entrepreneurial activities with either wage employment or farming activities, and that there are significantmale−female and north−south differences.
Second, do households with nonfarm enterprises have high or low standards of living as measured by per capitaconsumption expenditures? It turns out that the nonfarm self−employed are underrepresented at the bottom of theincome distribution and overrepresented at the top. Also, statistical evidence shows that a more productivehousehold enterprise is associated with a higher standard of living.
Third, how can we characterize family enterprises in the private sector? The enterprises surveyed in the VietnamLiving Standards Survey appear typical of the private sector in Vietnam. About a third of the enterprises are in theretail trade sector, and a little more than a fourth are in manufacturing. Less than half operate year−round. Thesize distribution is extremely skewed, with many small and few large enterprises populating each sector.Importantly, one in seven enterprises reports paying a license tax; one in four pays some other kind of tax. For anhour of family labor the average enterprise yields between 2,000 and 2,600 dong. This figure compares favorablywith the average wage of 1,300 dong.
Fourth, which factors raise incomes of the self−employed, catapulting their households to the top of the livingstandards distribution? Both physical capital (buildings, vehicles, boats, tools, equipment, and so on) andinventory stocks yield substantial returns that may rise as enterprises grow. Also, additional hours of work raiseincomes: people working in nonfarm enterprises are not underemployed, nor is their productivity driven to zero,as some proponents of segmented labor markets believe. Primary schooling does not appear to contribute toenterprise income, but secondary schooling and higher have a fairly small but precisely estimated rate of return,raising incomes by 3.1 percent per year (or between 8,800 and 16,400 dong monthly). There is also a strong ageeffect distinguishing young and elderly workers from those in the 25−55 age range. Women earn about 40 percentless than men in otherwise equivalent enterprises. Part of that gap is explained by the discrepancy in capital andinventory holdings. Still, regional differences in enterprise incomes persist, even controlling for these variables.
Fifth, are women at a disadvantage? Traditionally, women in Vietnam have been extensively involved in marketexchange and family finances (Pelzer 1993, 317−25). The socialist revolution emphasized the employment ofwomen and gender equality. The U.S. presence lowered the female labor force participation rates: in SouthVietnam, women were not as deeply involved in market work as they were in the north. Extended periods of war
Household Welfare and Vietnam's Transition
5— Nonfarm Household Enterprises in Vietnam 136
and the general culture of Southeast Asia have promoted high labor force participation rates for women (Kaufmanand Sen 1993, 236−37). Still, women are at a disadvantage, even if less so than elsewhere in the world. Womenearn less in their family enterprises, in part because they are undercapitalized. And their literacy rates, especiallythose for older women, are lower than for men, and school enrollment of girls is less than that of boys.
The Current Business Environment
The private sector in Vietnam differs in the north and the south. In the northern economy of the late 1950s theprivate sector functioned under the suffocating control of the communist regime. In the mining, trade, transport,handicraft, and manufacturing sectors private enterprises were replaced by public enterprises or absorbed intocooperatives: by the mid−1960s the state controlled the vast majority of economic activity. The official statisticsof 1971 indicate the state's partial retreat from the construction, transport, and trade sectors, with the share of stateenterprises and cooperatives being 78 percent, 83 percent, and 57 percent, respectively (Nguyen Tien Hung 1977,chapter 4). It is also likely that a substantial number of enterprises were engaged in petty production andtrade−they were either unregistered and illegal or registered but small and escaping state regulation and control(Fforde and Paine 1987, 97; Ljunggren 1993, 65−66, 78).
By contrast, the south had a flourishing capitalist system until 1975, though one dependent on U.S. involvement.After the fall of the South Vietnam regime in 1975, the policy focus was to bring the private sector under thepublic umbrella, as was done earlier in the north (Nguyen Tien Hung 1977, chapter 9). In 1976 this policy wasaccelerated (Ljunggren 1993, 59). Traders were severely restricted in the range of commodities they could trade.Larger enterprises were reorganized into state enterprises, and owners received little compensation for their firms'value. Access to factors of production was controlled more tightly (see, for example, Hy Van Luong 1993, 123).Smaller enterprises were turned into cooperatives (Porter 1993, 44). A new currency, the dong, replaced the old,the piaster, with limitations on the amounts that could be exchanged. These limitations affected larger enterprisesmore than smaller ones and allowed for state monitoring and control of private investable cash holdings (NguyenTien Hung 1977, chapter 9).
Official policy toward private initiative in general and the private productive sector in particular started to turn asearly as September 1979 (Beresford 1988, chapter 11; Fforde 1993, 300; Ljunggren 1993, 77−84). Small−scaleproducers were able to sell their wares on a free market, highway checkpoints were closed in order to encourage afree flow of goods transported by private traders, and regulation and licensing procedures were eased. Thesechanges unleashed substantial productive activity−to such an extent that, in 1983, some political leaders blamedprivate traders for inflation and unemployment. The government attempted to curtail private trading with steeptaxes and licensing fees, and revoked the freedom of industrial enterprises to buy and sell outside officialchannels. Efforts to push the larger still−private enterprises into cooperatives continued (Hy Van Luong 1993,119). In 1985 the government implemented another currency change, introducing the new dong, one of which wasexchanged for 10 old dong. The state bank strictly limited the amount of convertible cur−
rency so as to reduce private wealth and cash holdings−a move that therefore sharply restricted black marketactivity (Beresford 1988, 169) and private investment in family enterprises.
By late 1986 it had become clear that the economic performance of the state−controlled sector was so poor that apolicy reform favoring the private sector was inevitable (Porter 1993, 44): the policy of doi moi was born. Smallprivate enterprises with up to 30 employees were now allowed to operate, though with restrictions on the type ofcommodities they could produce. Further regulatory liberalizations took place in 1988 and 1989, and privateenterprises employing up to 1,000 workers sprang up even in the north. In the south businesses that had beennationalized since 1975 were returned to their former owners or relatives of the owners (Turley 1993, 7; Hy VanLuong 1993, 119). Underground enterprises operating in sectors that had been only state monopolies, including
Household Welfare and Vietnam's Transition
The Current Business Environment 137
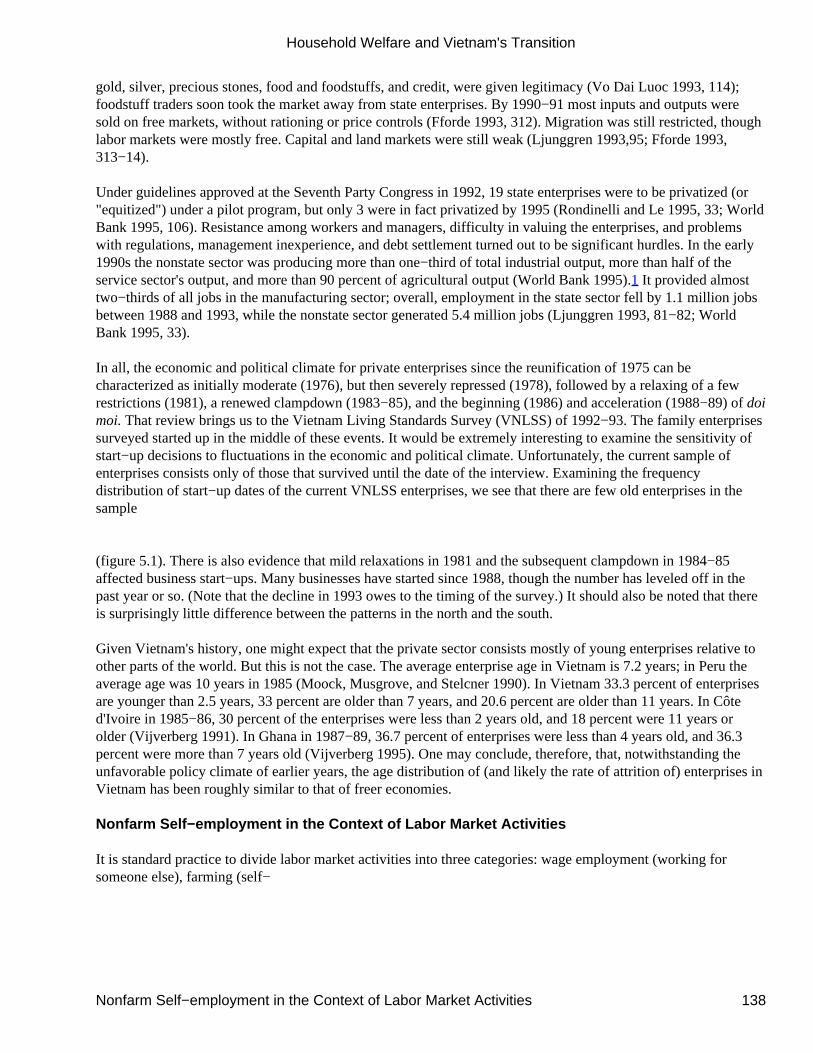
gold, silver, precious stones, food and foodstuffs, and credit, were given legitimacy (Vo Dai Luoc 1993, 114);foodstuff traders soon took the market away from state enterprises. By 1990−91 most inputs and outputs weresold on free markets, without rationing or price controls (Fforde 1993, 312). Migration was still restricted, thoughlabor markets were mostly free. Capital and land markets were still weak (Ljunggren 1993,95; Fforde 1993,313−14).
Under guidelines approved at the Seventh Party Congress in 1992, 19 state enterprises were to be privatized (or"equitized") under a pilot program, but only 3 were in fact privatized by 1995 (Rondinelli and Le 1995, 33; WorldBank 1995, 106). Resistance among workers and managers, difficulty in valuing the enterprises, and problemswith regulations, management inexperience, and debt settlement turned out to be significant hurdles. In the early1990s the nonstate sector was producing more than one−third of total industrial output, more than half of theservice sector's output, and more than 90 percent of agricultural output (World Bank 1995).1 It provided almosttwo−thirds of all jobs in the manufacturing sector; overall, employment in the state sector fell by 1.1 million jobsbetween 1988 and 1993, while the nonstate sector generated 5.4 million jobs (Ljunggren 1993, 81−82; WorldBank 1995, 33).
In all, the economic and political climate for private enterprises since the reunification of 1975 can becharacterized as initially moderate (1976), but then severely repressed (1978), followed by a relaxing of a fewrestrictions (1981), a renewed clampdown (1983−85), and the beginning (1986) and acceleration (1988−89) of doimoi. That review brings us to the Vietnam Living Standards Survey (VNLSS) of 1992−93. The family enterprisessurveyed started up in the middle of these events. It would be extremely interesting to examine the sensitivity ofstart−up decisions to fluctuations in the economic and political climate. Unfortunately, the current sample ofenterprises consists only of those that survived until the date of the interview. Examining the frequencydistribution of start−up dates of the current VNLSS enterprises, we see that there are few old enterprises in thesample
(figure 5.1). There is also evidence that mild relaxations in 1981 and the subsequent clampdown in 1984−85affected business start−ups. Many businesses have started since 1988, though the number has leveled off in thepast year or so. (Note that the decline in 1993 owes to the timing of the survey.) It should also be noted that thereis surprisingly little difference between the patterns in the north and the south.
Given Vietnam's history, one might expect that the private sector consists mostly of young enterprises relative toother parts of the world. But this is not the case. The average enterprise age in Vietnam is 7.2 years; in Peru theaverage age was 10 years in 1985 (Moock, Musgrove, and Stelcner 1990). In Vietnam 33.3 percent of enterprisesare younger than 2.5 years, 33 percent are older than 7 years, and 20.6 percent are older than 11 years. In Côted'Ivoire in 1985−86, 30 percent of the enterprises were less than 2 years old, and 18 percent were 11 years orolder (Vijverberg 1991). In Ghana in 1987−89, 36.7 percent of enterprises were less than 4 years old, and 36.3percent were more than 7 years old (Vijverberg 1995). One may conclude, therefore, that, notwithstanding theunfavorable policy climate of earlier years, the age distribution of (and likely the rate of attrition of) enterprises inVietnam has been roughly similar to that of freer economies.
Nonfarm Self−employment in the Context of Labor Market Activities
It is standard practice to divide labor market activities into three categories: wage employment (working forsomeone else), farming (self−
Household Welfare and Vietnam's Transition
Nonfarm Self−employment in the Context of Labor Market Activities 138
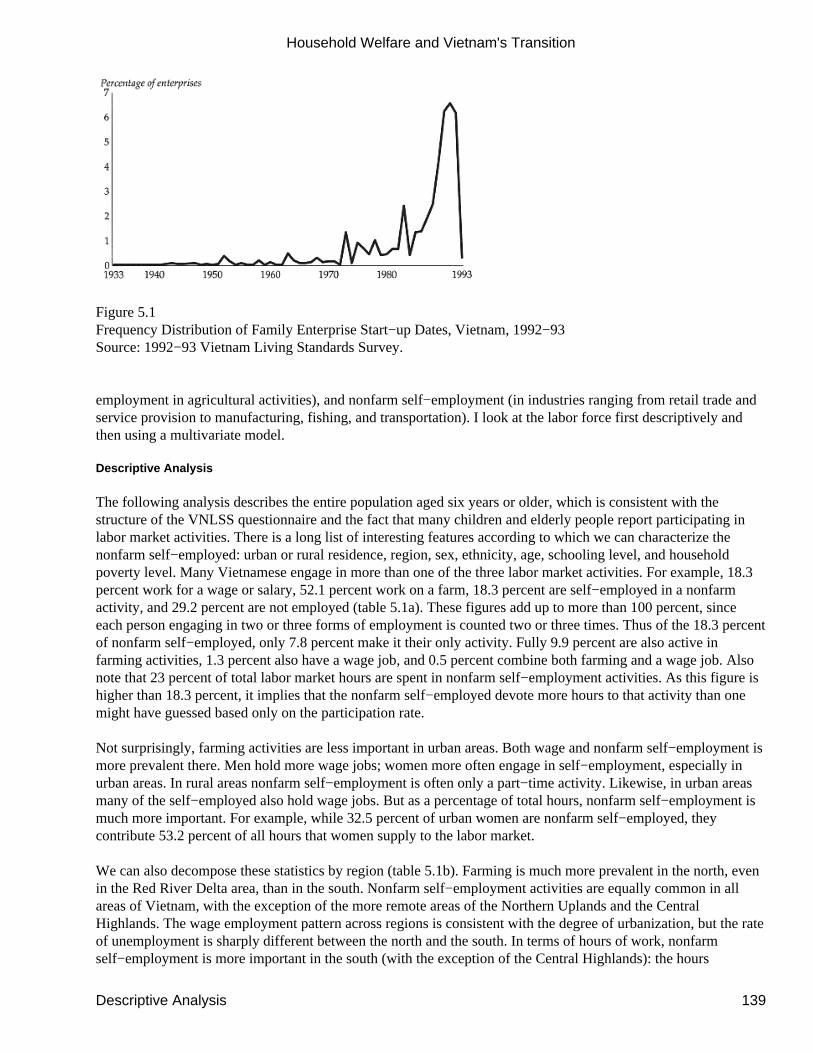
Figure 5.1Frequency Distribution of Family Enterprise Start−up Dates, Vietnam, 1992−93Source: 1992−93 Vietnam Living Standards Survey.
employment in agricultural activities), and nonfarm self−employment (in industries ranging from retail trade andservice provision to manufacturing, fishing, and transportation). I look at the labor force first descriptively andthen using a multivariate model.
Descriptive Analysis
The following analysis describes the entire population aged six years or older, which is consistent with thestructure of the VNLSS questionnaire and the fact that many children and elderly people report participating inlabor market activities. There is a long list of interesting features according to which we can characterize thenonfarm self−employed: urban or rural residence, region, sex, ethnicity, age, schooling level, and householdpoverty level. Many Vietnamese engage in more than one of the three labor market activities. For example, 18.3percent work for a wage or salary, 52.1 percent work on a farm, 18.3 percent are self−employed in a nonfarmactivity, and 29.2 percent are not employed (table 5.1a). These figures add up to more than 100 percent, sinceeach person engaging in two or three forms of employment is counted two or three times. Thus of the 18.3 percentof nonfarm self−employed, only 7.8 percent make it their only activity. Fully 9.9 percent are also active infarming activities, 1.3 percent also have a wage job, and 0.5 percent combine both farming and a wage job. Alsonote that 23 percent of total labor market hours are spent in nonfarm self−employment activities. As this figure ishigher than 18.3 percent, it implies that the nonfarm self−employed devote more hours to that activity than onemight have guessed based only on the participation rate.
Not surprisingly, farming activities are less important in urban areas. Both wage and nonfarm self−employment ismore prevalent there. Men hold more wage jobs; women more often engage in self−employment, especially inurban areas. In rural areas nonfarm self−employment is often only a part−time activity. Likewise, in urban areasmany of the self−employed also hold wage jobs. But as a percentage of total hours, nonfarm self−employment ismuch more important. For example, while 32.5 percent of urban women are nonfarm self−employed, theycontribute 53.2 percent of all hours that women supply to the labor market.
We can also decompose these statistics by region (table 5.1b). Farming is much more prevalent in the north, evenin the Red River Delta area, than in the south. Nonfarm self−employment activities are equally common in allareas of Vietnam, with the exception of the more remote areas of the Northern Uplands and the CentralHighlands. The wage employment pattern across regions is consistent with the degree of urbanization, but the rateof unemployment is sharply different between the north and the south. In terms of hours of work, nonfarmself−employment is more important in the south (with the exception of the Central Highlands): the hours
Household Welfare and Vietnam's Transition
Descriptive Analysis 139
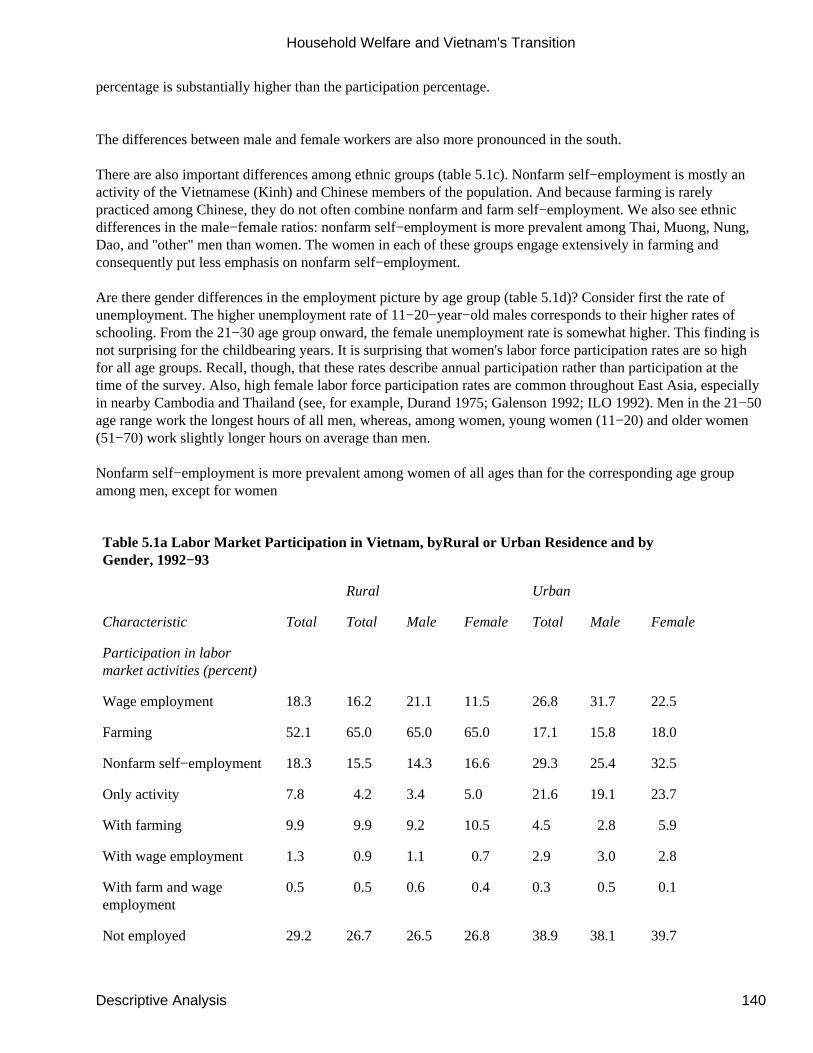
percentage is substantially higher than the participation percentage.
The differences between male and female workers are also more pronounced in the south.
There are also important differences among ethnic groups (table 5.1c). Nonfarm self−employment is mostly anactivity of the Vietnamese (Kinh) and Chinese members of the population. And because farming is rarelypracticed among Chinese, they do not often combine nonfarm and farm self−employment. We also see ethnicdifferences in the male−female ratios: nonfarm self−employment is more prevalent among Thai, Muong, Nung,Dao, and ''other" men than women. The women in each of these groups engage extensively in farming andconsequently put less emphasis on nonfarm self−employment.
Are there gender differences in the employment picture by age group (table 5.1d)? Consider first the rate ofunemployment. The higher unemployment rate of 11−20−year−old males corresponds to their higher rates ofschooling. From the 21−30 age group onward, the female unemployment rate is somewhat higher. This finding isnot surprising for the childbearing years. It is surprising that women's labor force participation rates are so highfor all age groups. Recall, though, that these rates describe annual participation rather than participation at thetime of the survey. Also, high female labor force participation rates are common throughout East Asia, especiallyin nearby Cambodia and Thailand (see, for example, Durand 1975; Galenson 1992; ILO 1992). Men in the 21−50age range work the longest hours of all men, whereas, among women, young women (11−20) and older women(51−70) work slightly longer hours on average than men.
Nonfarm self−employment is more prevalent among women of all ages than for the corresponding age groupamong men, except for women
Table 5.1a Labor Market Participation in Vietnam, byRural or Urban Residence and byGender, 1992−93
Rural Urban
Characteristic Total Total Male Female Total Male Female
Participation in labormarket activities (percent)
Wage employment 18.3 16.2 21.1 11.5 26.8 31.7 22.5
Farming 52.1 65.0 65.0 65.0 17.1 15.8 18.0
Nonfarm self−employment 18.3 15.5 14.3 16.6 29.3 25.4 32.5
Only activity 7.8 4.2 3.4 5.0 21.6 19.1 23.7
With farming 9.9 9.9 9.2 10.5 4.5 2.8 5.9
With wage employment 1.3 0.9 1.1 0.7 2.9 3.0 2.8
With farm and wageemployment
0.5 0.5 0.6 0.4 0.3 0.5 0.1
Not employed 29.2 26.7 26.5 26.8 38.9 38.1 39.7
Household Welfare and Vietnam's Transition
Descriptive Analysis 140
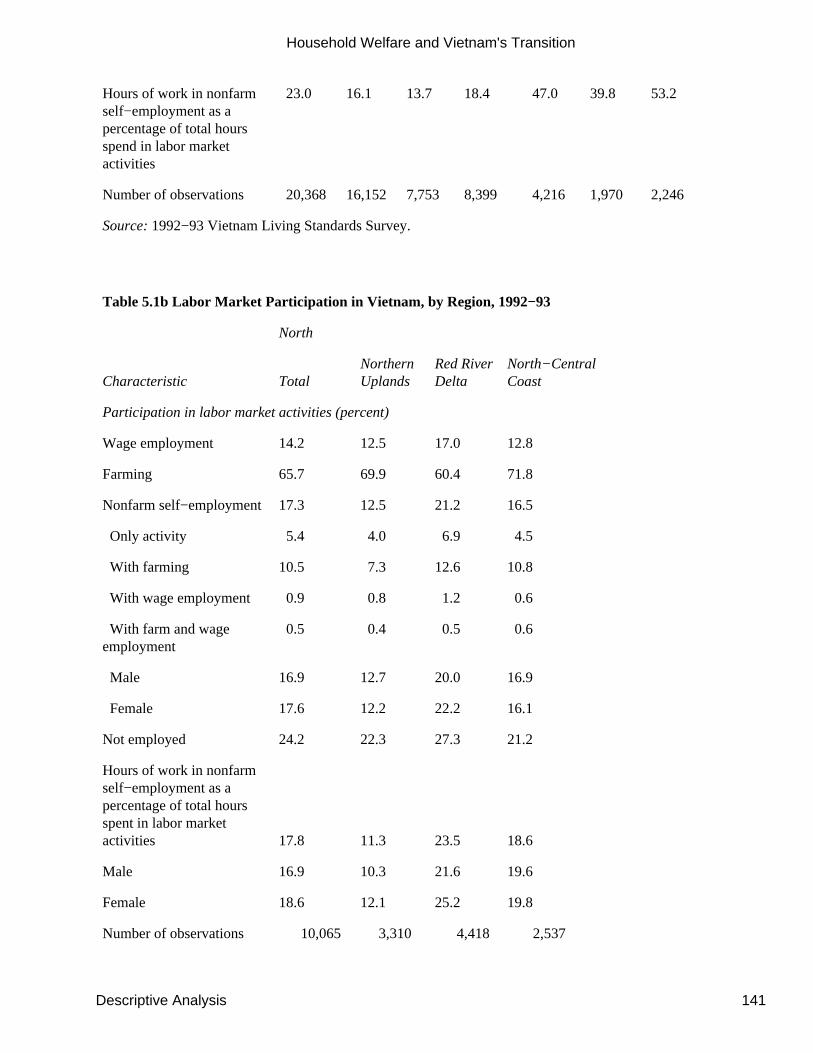
Hours of work in nonfarmself−employment as apercentage of total hoursspend in labor marketactivities
23.0 16.1 13.7 18.4 47.0 39.8 53.2
Number of observations 20,368 16,152 7,753 8,399 4,216 1,970 2,246
Source: 1992−93 Vietnam Living Standards Survey.
Table 5.1b Labor Market Participation in Vietnam, by Region, 1992−93
North
Characteristic TotalNorthernUplands
Red RiverDelta
North−CentralCoast
Participation in labor market activities (percent)
Wage employment 14.2 12.5 17.0 12.8
Farming 65.7 69.9 60.4 71.8
Nonfarm self−employment 17.3 12.5 21.2 16.5
Only activity 5.4 4.0 6.9 4.5
With farming 10.5 7.3 12.6 10.8
With wage employment 0.9 0.8 1.2 0.6
With farm and wageemployment
0.5 0.4 0.5 0.6
Male 16.9 12.7 20.0 16.9
Female 17.6 12.2 22.2 16.1
Not employed 24.2 22.3 27.3 21.2
Hours of work in nonfarmself−employment as apercentage of total hoursspent in labor marketactivities 17.8 11.3 23.5 18.6
Male 16.9 10.3 21.6 19.6
Female 18.6 12.1 25.2 19.8
Number of observations 10,065 3,310 4,418 2,537
Household Welfare and Vietnam's Transition
Descriptive Analysis 141
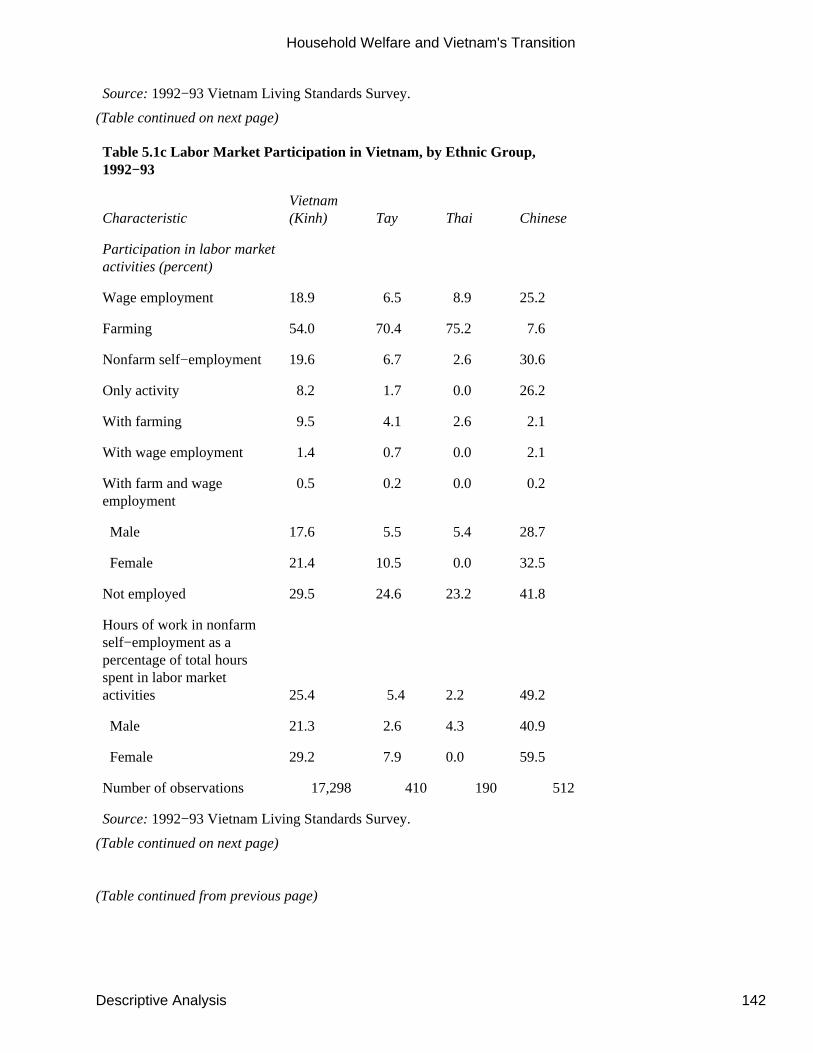
Source: 1992−93 Vietnam Living Standards Survey.
(Table continued on next page)
Table 5.1c Labor Market Participation in Vietnam, by Ethnic Group,1992−93
CharacteristicVietnam(Kinh) Tay Thai Chinese
Participation in labor marketactivities (percent)
Wage employment 18.9 6.5 8.9 25.2
Farming 54.0 70.4 75.2 7.6
Nonfarm self−employment 19.6 6.7 2.6 30.6
Only activity 8.2 1.7 0.0 26.2
With farming 9.5 4.1 2.6 2.1
With wage employment 1.4 0.7 0.0 2.1
With farm and wageemployment
0.5 0.2 0.0 0.2
Male 17.6 5.5 5.4 28.7
Female 21.4 10.5 0.0 32.5
Not employed 29.5 24.6 23.2 41.8
Hours of work in nonfarmself−employment as apercentage of total hoursspent in labor marketactivities 25.4 5.4 2.2 49.2
Male 21.3 2.6 4.3 40.9
Female 29.2 7.9 0.0 59.5
Number of observations 17,298 410 190 512
Source: 1992−93 Vietnam Living Standards Survey.
(Table continued on next page)
(Table continued from previous page)
Household Welfare and Vietnam's Transition
Descriptive Analysis 142
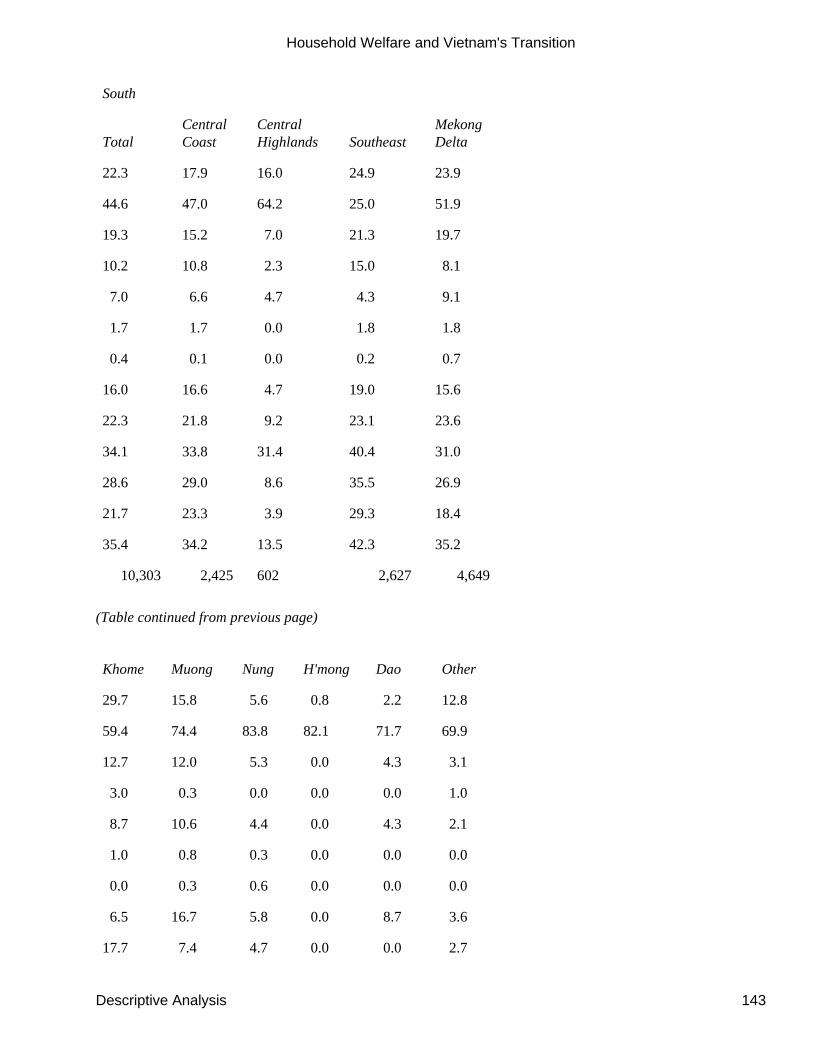
South
TotalCentralCoast
CentralHighlands Southeast
MekongDelta
22.3 17.9 16.0 24.9 23.9
44.6 47.0 64.2 25.0 51.9
19.3 15.2 7.0 21.3 19.7
10.2 10.8 2.3 15.0 8.1
7.0 6.6 4.7 4.3 9.1
1.7 1.7 0.0 1.8 1.8
0.4 0.1 0.0 0.2 0.7
16.0 16.6 4.7 19.0 15.6
22.3 21.8 9.2 23.1 23.6
34.1 33.8 31.4 40.4 31.0
28.6 29.0 8.6 35.5 26.9
21.7 23.3 3.9 29.3 18.4
35.4 34.2 13.5 42.3 35.2
10,303 2,425 602 2,627 4,649
(Table continued from previous page)
Khome Muong Nung H'mong Dao Other
29.7 15.8 5.6 0.8 2.2 12.8
59.4 74.4 83.8 82.1 71.7 69.9
12.7 12.0 5.3 0.0 4.3 3.1
3.0 0.3 0.0 0.0 0.0 1.0
8.7 10.6 4.4 0.0 4.3 2.1
1.0 0.8 0.3 0.0 0.0 0.0
0.0 0.3 0.6 0.0 0.0 0.0
6.5 16.7 5.8 0.0 8.7 3.6
17.7 7.4 4.7 0.0 0.0 2.7
Household Welfare and Vietnam's Transition
Descriptive Analysis 143
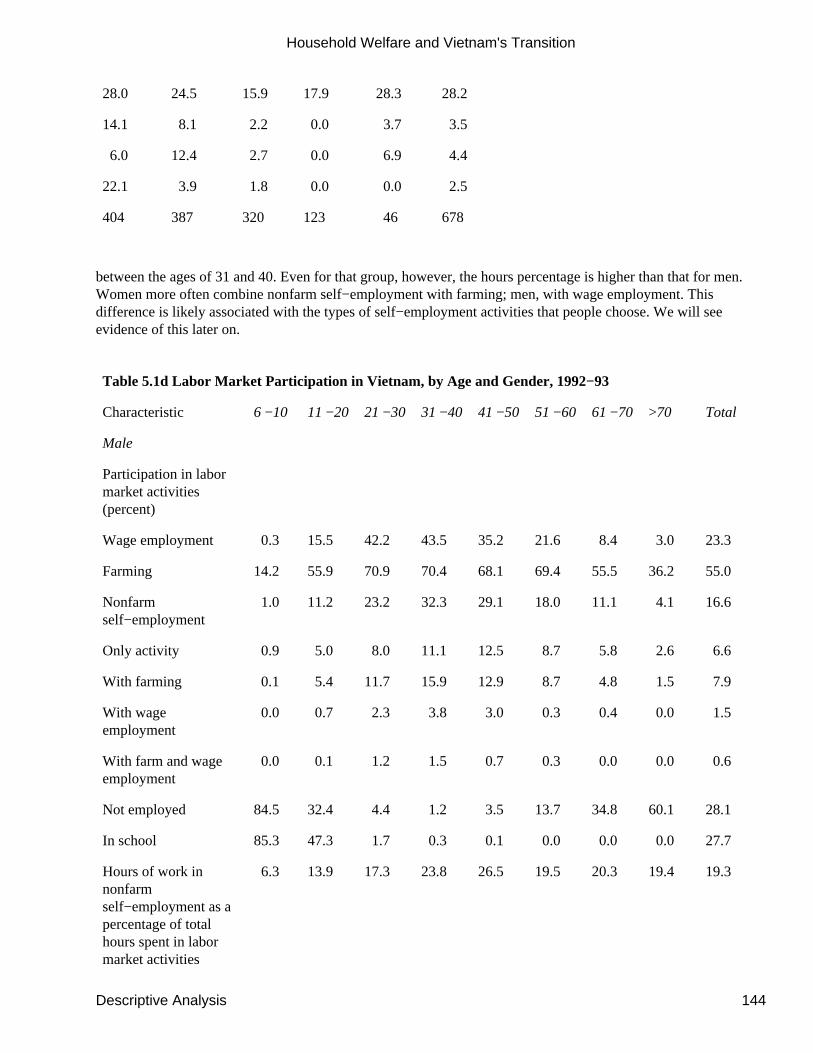
28.0 24.5 15.9 17.9 28.3 28.2
14.1 8.1 2.2 0.0 3.7 3.5
6.0 12.4 2.7 0.0 6.9 4.4
22.1 3.9 1.8 0.0 0.0 2.5
404 387 320 123 46 678
between the ages of 31 and 40. Even for that group, however, the hours percentage is higher than that for men.Women more often combine nonfarm self−employment with farming; men, with wage employment. Thisdifference is likely associated with the types of self−employment activities that people choose. We will seeevidence of this later on.
Table 5.1d Labor Market Participation in Vietnam, by Age and Gender, 1992−93
Characteristic 6 −10 11 −20 21 −30 31 −40 41 −50 51 −60 61 −70 >70 Total
Male
Participation in labormarket activities(percent)
Wage employment 0.3 15.5 42.2 43.5 35.2 21.6 8.4 3.0 23.3
Farming 14.2 55.9 70.9 70.4 68.1 69.4 55.5 36.2 55.0
Nonfarmself−employment
1.0 11.2 23.2 32.3 29.1 18.0 11.1 4.1 16.6
Only activity 0.9 5.0 8.0 11.1 12.5 8.7 5.8 2.6 6.6
With farming 0.1 5.4 11.7 15.9 12.9 8.7 4.8 1.5 7.9
With wageemployment
0.0 0.7 2.3 3.8 3.0 0.3 0.4 0.0 1.5
With farm and wageemployment
0.0 0.1 1.2 1.5 0.7 0.3 0.0 0.0 0.6
Not employed 84.5 32.4 4.4 1.2 3.5 13.7 34.8 60.1 28.1
In school 85.3 47.3 1.7 0.3 0.1 0.0 0.0 0.0 27.7
Hours of work innonfarmself−employment as apercentage of totalhours spent in labormarket activities
6.3 13.9 17.3 23.8 26.5 19.5 20.3 19.4 19.3
Household Welfare and Vietnam's Transition
Descriptive Analysis 144
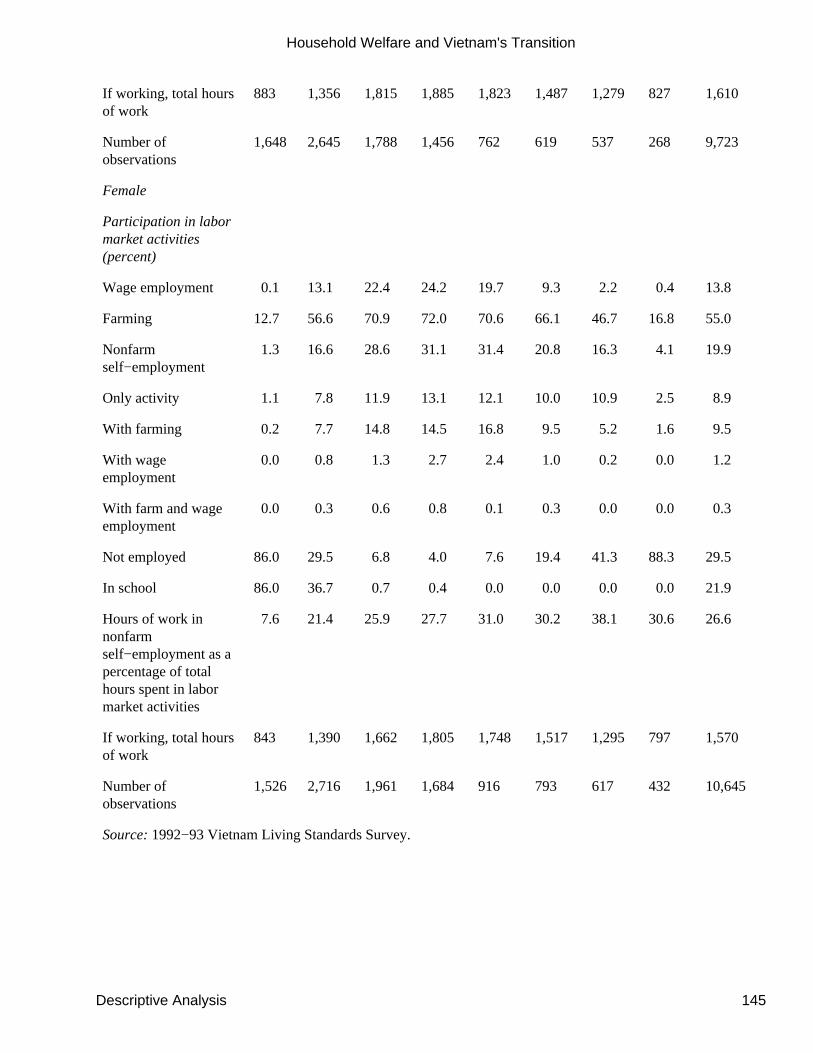
If working, total hoursof work
883 1,356 1,815 1,885 1,823 1,487 1,279 827 1,610
Number ofobservations
1,648 2,645 1,788 1,456 762 619 537 268 9,723
Female
Participation in labormarket activities(percent)
Wage employment 0.1 13.1 22.4 24.2 19.7 9.3 2.2 0.4 13.8
Farming 12.7 56.6 70.9 72.0 70.6 66.1 46.7 16.8 55.0
Nonfarmself−employment
1.3 16.6 28.6 31.1 31.4 20.8 16.3 4.1 19.9
Only activity 1.1 7.8 11.9 13.1 12.1 10.0 10.9 2.5 8.9
With farming 0.2 7.7 14.8 14.5 16.8 9.5 5.2 1.6 9.5
With wageemployment
0.0 0.8 1.3 2.7 2.4 1.0 0.2 0.0 1.2
With farm and wageemployment
0.0 0.3 0.6 0.8 0.1 0.3 0.0 0.0 0.3
Not employed 86.0 29.5 6.8 4.0 7.6 19.4 41.3 88.3 29.5
In school 86.0 36.7 0.7 0.4 0.0 0.0 0.0 0.0 21.9
Hours of work innonfarmself−employment as apercentage of totalhours spent in labormarket activities
7.6 21.4 25.9 27.7 31.0 30.2 38.1 30.6 26.6
If working, total hoursof work
843 1,390 1,662 1,805 1,748 1,517 1,295 797 1,570
Number ofobservations
1,526 2,716 1,961 1,684 916 793 617 432 10,645
Source: 1992−93 Vietnam Living Standards Survey.
Household Welfare and Vietnam's Transition
Descriptive Analysis 145
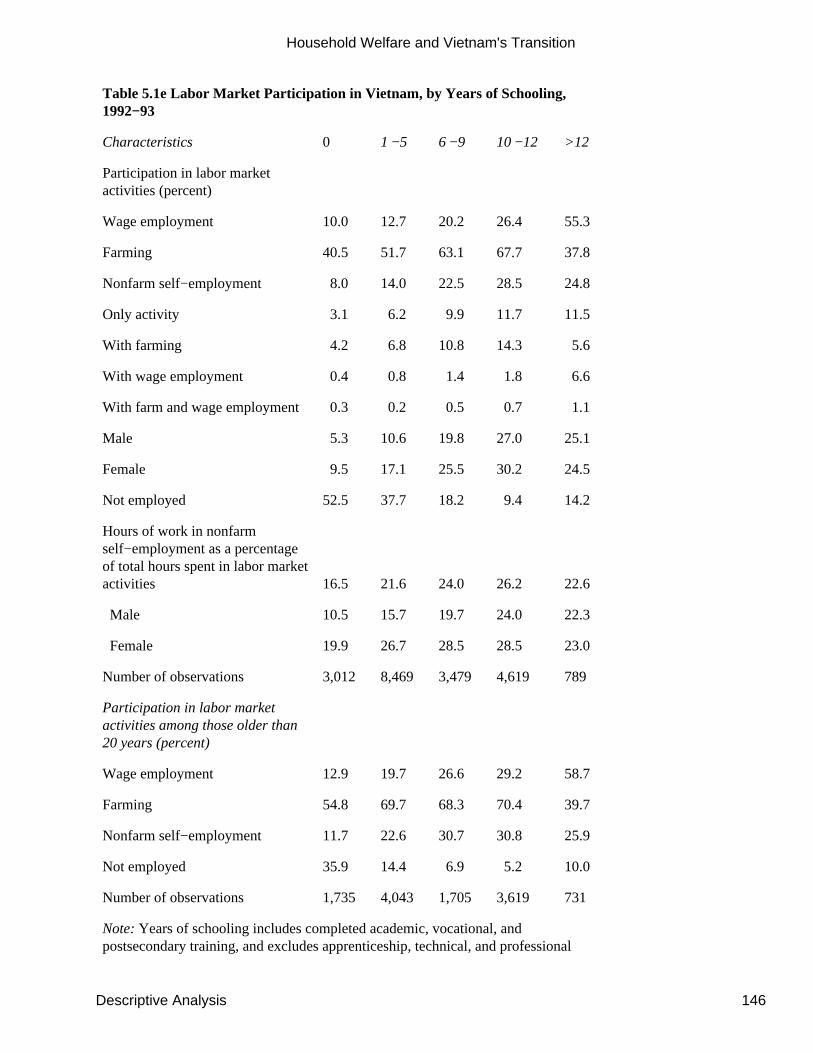
Table 5.1e Labor Market Participation in Vietnam, by Years of Schooling,1992−93
Characteristics 0 1 −5 6 −9 10 −12 >12
Participation in labor marketactivities (percent)
Wage employment 10.0 12.7 20.2 26.4 55.3
Farming 40.5 51.7 63.1 67.7 37.8
Nonfarm self−employment 8.0 14.0 22.5 28.5 24.8
Only activity 3.1 6.2 9.9 11.7 11.5
With farming 4.2 6.8 10.8 14.3 5.6
With wage employment 0.4 0.8 1.4 1.8 6.6
With farm and wage employment 0.3 0.2 0.5 0.7 1.1
Male 5.3 10.6 19.8 27.0 25.1
Female 9.5 17.1 25.5 30.2 24.5
Not employed 52.5 37.7 18.2 9.4 14.2
Hours of work in nonfarmself−employment as a percentageof total hours spent in labor marketactivities 16.5 21.6 24.0 26.2 22.6
Male 10.5 15.7 19.7 24.0 22.3
Female 19.9 26.7 28.5 28.5 23.0
Number of observations 3,012 8,469 3,479 4,619 789
Participation in labor marketactivities among those older than20 years (percent)
Wage employment 12.9 19.7 26.6 29.2 58.7
Farming 54.8 69.7 68.3 70.4 39.7
Nonfarm self−employment 11.7 22.6 30.7 30.8 25.9
Not employed 35.9 14.4 6.9 5.2 10.0
Number of observations 1,735 4,043 1,705 3,619 731
Note: Years of schooling includes completed academic, vocational, andpostsecondary training, and excludes apprenticeship, technical, and professional
Household Welfare and Vietnam's Transition
Descriptive Analysis 146
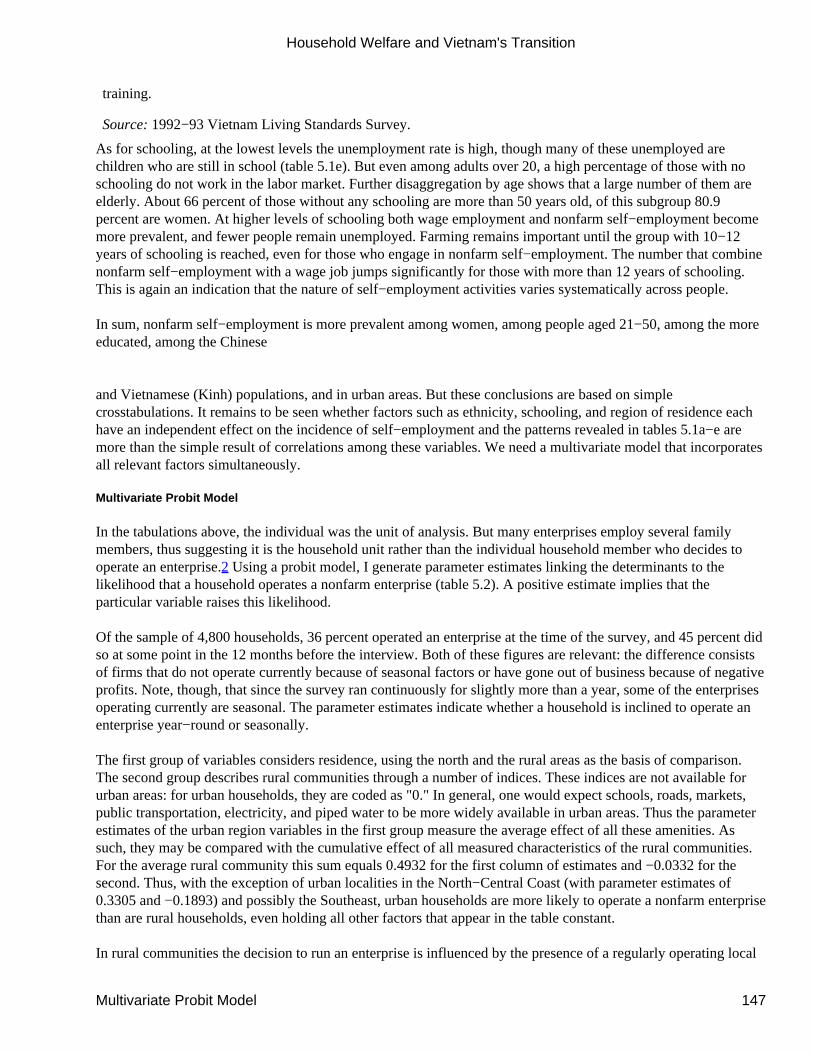
training.
Source: 1992−93 Vietnam Living Standards Survey.
As for schooling, at the lowest levels the unemployment rate is high, though many of these unemployed arechildren who are still in school (table 5.1e). But even among adults over 20, a high percentage of those with noschooling do not work in the labor market. Further disaggregation by age shows that a large number of them areelderly. About 66 percent of those without any schooling are more than 50 years old, of this subgroup 80.9percent are women. At higher levels of schooling both wage employment and nonfarm self−employment becomemore prevalent, and fewer people remain unemployed. Farming remains important until the group with 10−12years of schooling is reached, even for those who engage in nonfarm self−employment. The number that combinenonfarm self−employment with a wage job jumps significantly for those with more than 12 years of schooling.This is again an indication that the nature of self−employment activities varies systematically across people.
In sum, nonfarm self−employment is more prevalent among women, among people aged 21−50, among the moreeducated, among the Chinese
and Vietnamese (Kinh) populations, and in urban areas. But these conclusions are based on simplecrosstabulations. It remains to be seen whether factors such as ethnicity, schooling, and region of residence eachhave an independent effect on the incidence of self−employment and the patterns revealed in tables 5.1a−e aremore than the simple result of correlations among these variables. We need a multivariate model that incorporatesall relevant factors simultaneously.
Multivariate Probit Model
In the tabulations above, the individual was the unit of analysis. But many enterprises employ several familymembers, thus suggesting it is the household unit rather than the individual household member who decides tooperate an enterprise.2 Using a probit model, I generate parameter estimates linking the determinants to thelikelihood that a household operates a nonfarm enterprise (table 5.2). A positive estimate implies that theparticular variable raises this likelihood.
Of the sample of 4,800 households, 36 percent operated an enterprise at the time of the survey, and 45 percent didso at some point in the 12 months before the interview. Both of these figures are relevant: the difference consistsof firms that do not operate currently because of seasonal factors or have gone out of business because of negativeprofits. Note, though, that since the survey ran continuously for slightly more than a year, some of the enterprisesoperating currently are seasonal. The parameter estimates indicate whether a household is inclined to operate anenterprise year−round or seasonally.
The first group of variables considers residence, using the north and the rural areas as the basis of comparison.The second group describes rural communities through a number of indices. These indices are not available forurban areas: for urban households, they are coded as "0." In general, one would expect schools, roads, markets,public transportation, electricity, and piped water to be more widely available in urban areas. Thus the parameterestimates of the urban region variables in the first group measure the average effect of all these amenities. Assuch, they may be compared with the cumulative effect of all measured characteristics of the rural communities.For the average rural community this sum equals 0.4932 for the first column of estimates and −0.0332 for thesecond. Thus, with the exception of urban localities in the North−Central Coast (with parameter estimates of0.3305 and −0.1893) and possibly the Southeast, urban households are more likely to operate a nonfarm enterprisethan are rural households, even holding all other factors that appear in the table constant.
In rural communities the decision to run an enterprise is influenced by the presence of a regularly operating local
Household Welfare and Vietnam's Transition
Multivariate Probit Model 147
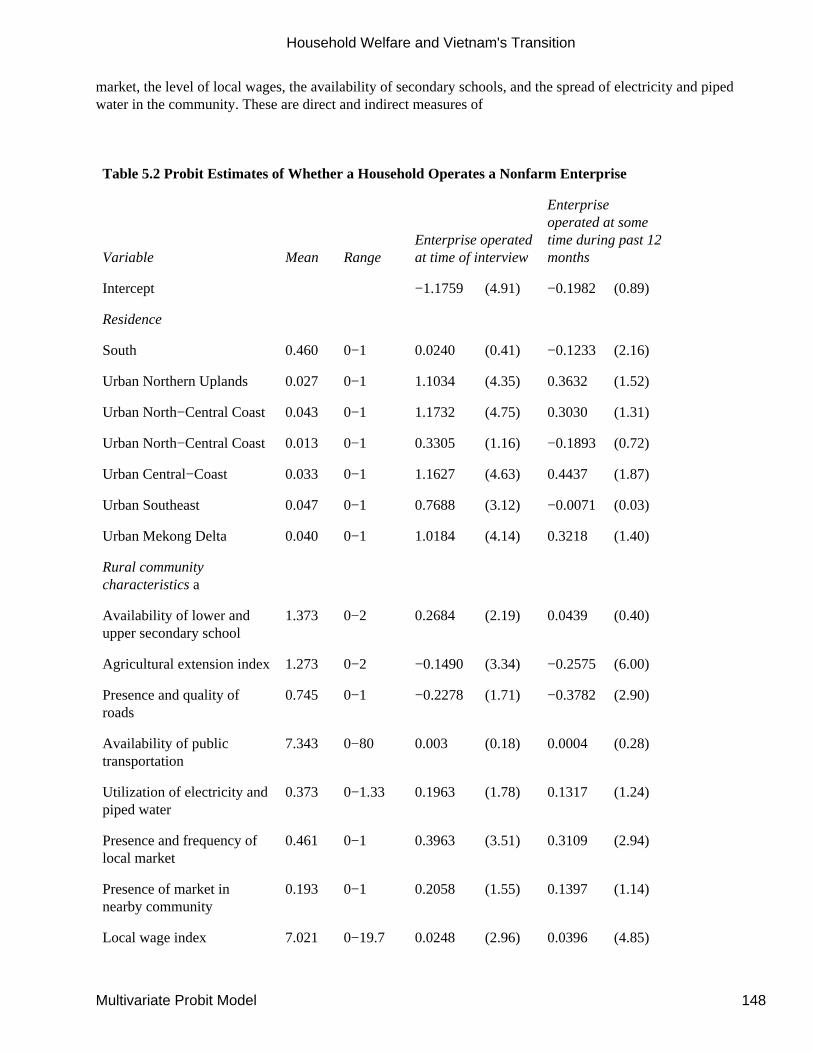
market, the level of local wages, the availability of secondary schools, and the spread of electricity and pipedwater in the community. These are direct and indirect measures of
Table 5.2 Probit Estimates of Whether a Household Operates a Nonfarm Enterprise
Variable Mean RangeEnterprise operatedat time of interview
Enterpriseoperated at sometime during past 12months
Intercept −1.1759 (4.91) −0.1982 (0.89)
Residence
South 0.460 0−1 0.0240 (0.41) −0.1233 (2.16)
Urban Northern Uplands 0.027 0−1 1.1034 (4.35) 0.3632 (1.52)
Urban North−Central Coast 0.043 0−1 1.1732 (4.75) 0.3030 (1.31)
Urban North−Central Coast 0.013 0−1 0.3305 (1.16) −0.1893 (0.72)
Urban Central−Coast 0.033 0−1 1.1627 (4.63) 0.4437 (1.87)
Urban Southeast 0.047 0−1 0.7688 (3.12) −0.0071 (0.03)
Urban Mekong Delta 0.040 0−1 1.0184 (4.14) 0.3218 (1.40)
Rural communitycharacteristics a
Availability of lower andupper secondary school
1.373 0−2 0.2684 (2.19) 0.0439 (0.40)
Agricultural extension index 1.273 0−2 −0.1490 (3.34) −0.2575 (6.00)
Presence and quality ofroads
0.745 0−1 −0.2278 (1.71) −0.3782 (2.90)
Availability of publictransportation
7.343 0−80 0.003 (0.18) 0.0004 (0.28)
Utilization of electricity andpiped water
0.373 0−1.33 0.1963 (1.78) 0.1317 (1.24)
Presence and frequency oflocal market
0.461 0−1 0.3963 (3.51) 0.3109 (2.94)
Presence of market innearby community
0.193 0−1 0.2058 (1.55) 0.1397 (1.14)
Local wage index 7.021 0−19.7 0.0248 (2.96) 0.0396 (4.85)
Household Welfare and Vietnam's Transition
Multivariate Probit Model 148
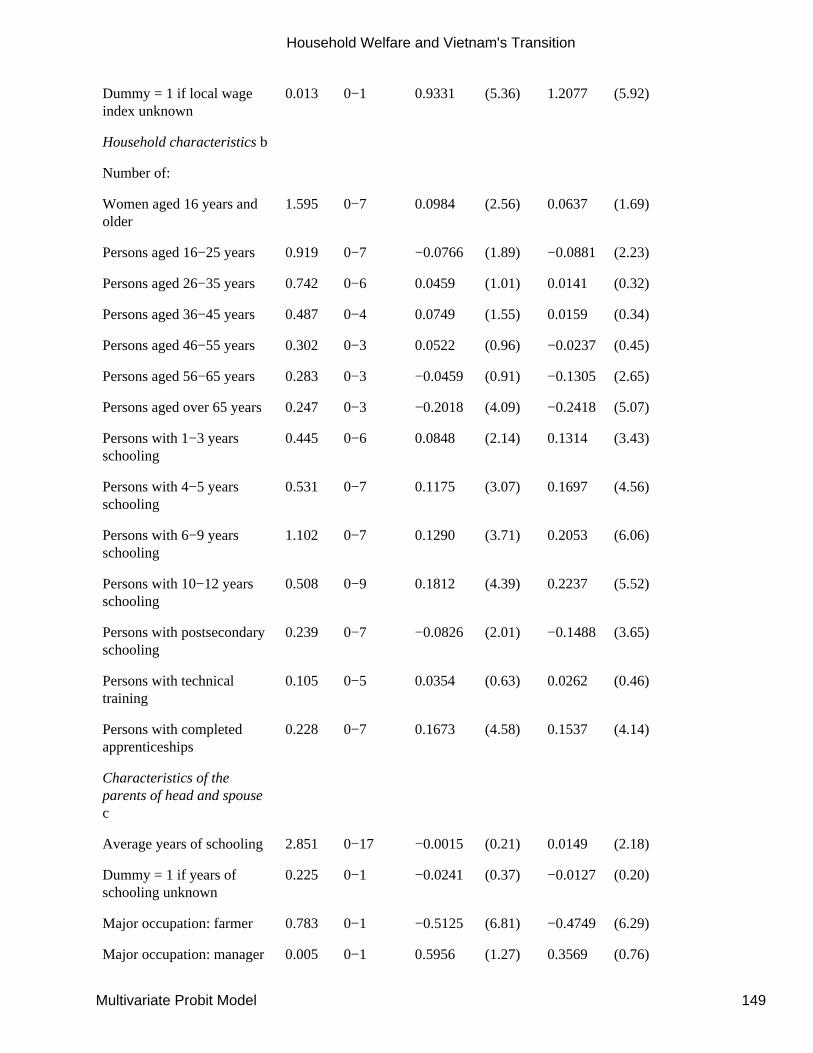
Dummy = 1 if local wageindex unknown
0.013 0−1 0.9331 (5.36) 1.2077 (5.92)
Household characteristics b
Number of:
Women aged 16 years andolder
1.595 0−7 0.0984 (2.56) 0.0637 (1.69)
Persons aged 16−25 years 0.919 0−7 −0.0766 (1.89) −0.0881 (2.23)
Persons aged 26−35 years 0.742 0−6 0.0459 (1.01) 0.0141 (0.32)
Persons aged 36−45 years 0.487 0−4 0.0749 (1.55) 0.0159 (0.34)
Persons aged 46−55 years 0.302 0−3 0.0522 (0.96) −0.0237 (0.45)
Persons aged 56−65 years 0.283 0−3 −0.0459 (0.91) −0.1305 (2.65)
Persons aged over 65 years0.247 0−3 −0.2018 (4.09) −0.2418 (5.07)
Persons with 1−3 yearsschooling
0.445 0−6 0.0848 (2.14) 0.1314 (3.43)
Persons with 4−5 yearsschooling
0.531 0−7 0.1175 (3.07) 0.1697 (4.56)
Persons with 6−9 yearsschooling
1.102 0−7 0.1290 (3.71) 0.2053 (6.06)
Persons with 10−12 yearsschooling
0.508 0−9 0.1812 (4.39) 0.2237 (5.52)
Persons with postsecondaryschooling
0.239 0−7 −0.0826 (2.01) −0.1488 (3.65)
Persons with technicaltraining
0.105 0−5 0.0354 (0.63) 0.0262 (0.46)
Persons with completedapprenticeships
0.228 0−7 0.1673 (4.58) 0.1537 (4.14)
Characteristics of theparents of head and spousec
Average years of schooling 2.851 0−17 −0.0015 (0.21) 0.0149 (2.18)
Dummy = 1 if years ofschooling unknown
0.225 0−1 −0.0241 (0.37) −0.0127 (0.20)
Major occupation: farmer 0.783 0−1 −0.5125 (6.81) −0.4749 (6.29)
Major occupation: manager 0.005 0−1 0.5956 (1.27) 0.3569 (0.76)
Household Welfare and Vietnam's Transition
Multivariate Probit Model 149
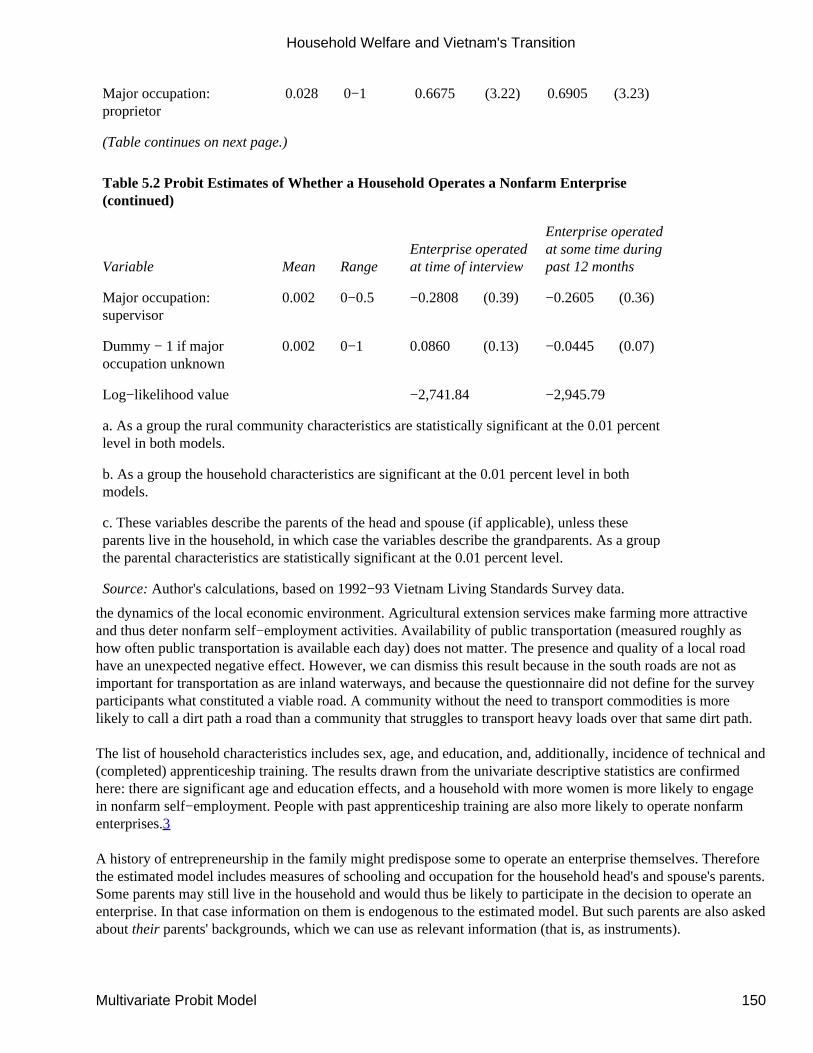
Major occupation:proprietor
0.028 0−1 0.6675 (3.22) 0.6905 (3.23)
(Table continues on next page.)
Table 5.2 Probit Estimates of Whether a Household Operates a Nonfarm Enterprise(continued)
Variable Mean RangeEnterprise operatedat time of interview
Enterprise operatedat some time duringpast 12 months
Major occupation:supervisor
0.002 0−0.5 −0.2808 (0.39) −0.2605 (0.36)
Dummy − 1 if majoroccupation unknown
0.002 0−1 0.0860 (0.13) −0.0445 (0.07)
Log−likelihood value −2,741.84 −2,945.79
a. As a group the rural community characteristics are statistically significant at the 0.01 percentlevel in both models.
b. As a group the household characteristics are significant at the 0.01 percent level in bothmodels.
c. These variables describe the parents of the head and spouse (if applicable), unless theseparents live in the household, in which case the variables describe the grandparents. As a groupthe parental characteristics are statistically significant at the 0.01 percent level.
Source: Author's calculations, based on 1992−93 Vietnam Living Standards Survey data.
the dynamics of the local economic environment. Agricultural extension services make farming more attractiveand thus deter nonfarm self−employment activities. Availability of public transportation (measured roughly ashow often public transportation is available each day) does not matter. The presence and quality of a local roadhave an unexpected negative effect. However, we can dismiss this result because in the south roads are not asimportant for transportation as are inland waterways, and because the questionnaire did not define for the surveyparticipants what constituted a viable road. A community without the need to transport commodities is morelikely to call a dirt path a road than a community that struggles to transport heavy loads over that same dirt path.
The list of household characteristics includes sex, age, and education, and, additionally, incidence of technical and(completed) apprenticeship training. The results drawn from the univariate descriptive statistics are confirmedhere: there are significant age and education effects, and a household with more women is more likely to engagein nonfarm self−employment. People with past apprenticeship training are also more likely to operate nonfarmenterprises.3
A history of entrepreneurship in the family might predispose some to operate an enterprise themselves. Thereforethe estimated model includes measures of schooling and occupation for the household head's and spouse's parents.Some parents may still live in the household and would thus be likely to participate in the decision to operate anenterprise. In that case information on them is endogenous to the estimated model. But such parents are also askedabout their parents' backgrounds, which we can use as relevant information (that is, as instruments).
Household Welfare and Vietnam's Transition
Multivariate Probit Model 150
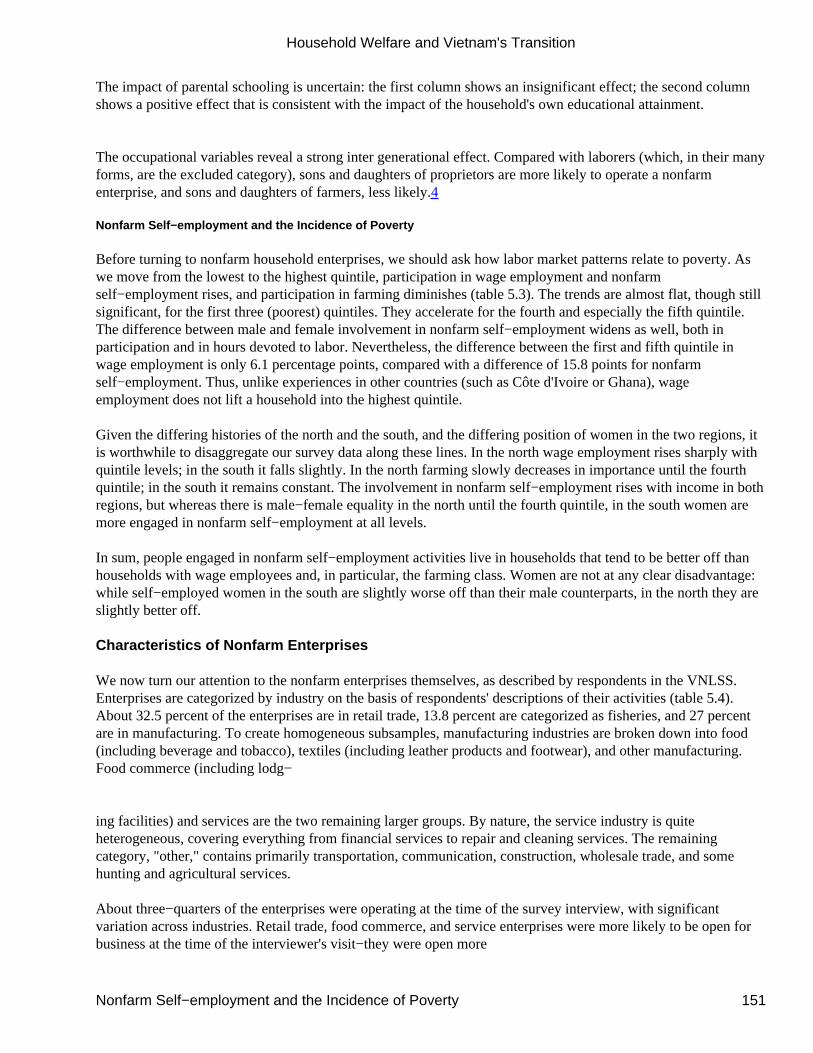
The impact of parental schooling is uncertain: the first column shows an insignificant effect; the second columnshows a positive effect that is consistent with the impact of the household's own educational attainment.
The occupational variables reveal a strong inter generational effect. Compared with laborers (which, in their manyforms, are the excluded category), sons and daughters of proprietors are more likely to operate a nonfarmenterprise, and sons and daughters of farmers, less likely.4
Nonfarm Self−employment and the Incidence of Poverty
Before turning to nonfarm household enterprises, we should ask how labor market patterns relate to poverty. Aswe move from the lowest to the highest quintile, participation in wage employment and nonfarmself−employment rises, and participation in farming diminishes (table 5.3). The trends are almost flat, though stillsignificant, for the first three (poorest) quintiles. They accelerate for the fourth and especially the fifth quintile.The difference between male and female involvement in nonfarm self−employment widens as well, both inparticipation and in hours devoted to labor. Nevertheless, the difference between the first and fifth quintile inwage employment is only 6.1 percentage points, compared with a difference of 15.8 points for nonfarmself−employment. Thus, unlike experiences in other countries (such as Côte d'Ivoire or Ghana), wageemployment does not lift a household into the highest quintile.
Given the differing histories of the north and the south, and the differing position of women in the two regions, itis worthwhile to disaggregate our survey data along these lines. In the north wage employment rises sharply withquintile levels; in the south it falls slightly. In the north farming slowly decreases in importance until the fourthquintile; in the south it remains constant. The involvement in nonfarm self−employment rises with income in bothregions, but whereas there is male−female equality in the north until the fourth quintile, in the south women aremore engaged in nonfarm self−employment at all levels.
In sum, people engaged in nonfarm self−employment activities live in households that tend to be better off thanhouseholds with wage employees and, in particular, the farming class. Women are not at any clear disadvantage:while self−employed women in the south are slightly worse off than their male counterparts, in the north they areslightly better off.
Characteristics of Nonfarm Enterprises
We now turn our attention to the nonfarm enterprises themselves, as described by respondents in the VNLSS.Enterprises are categorized by industry on the basis of respondents' descriptions of their activities (table 5.4).About 32.5 percent of the enterprises are in retail trade, 13.8 percent are categorized as fisheries, and 27 percentare in manufacturing. To create homogeneous subsamples, manufacturing industries are broken down into food(including beverage and tobacco), textiles (including leather products and footwear), and other manufacturing.Food commerce (including lodg−
ing facilities) and services are the two remaining larger groups. By nature, the service industry is quiteheterogeneous, covering everything from financial services to repair and cleaning services. The remainingcategory, "other," contains primarily transportation, communication, construction, wholesale trade, and somehunting and agricultural services.
About three−quarters of the enterprises were operating at the time of the survey interview, with significantvariation across industries. Retail trade, food commerce, and service enterprises were more likely to be open forbusiness at the time of the interviewer's visit−they were open more
Household Welfare and Vietnam's Transition
Nonfarm Self−employment and the Incidence of Poverty 151
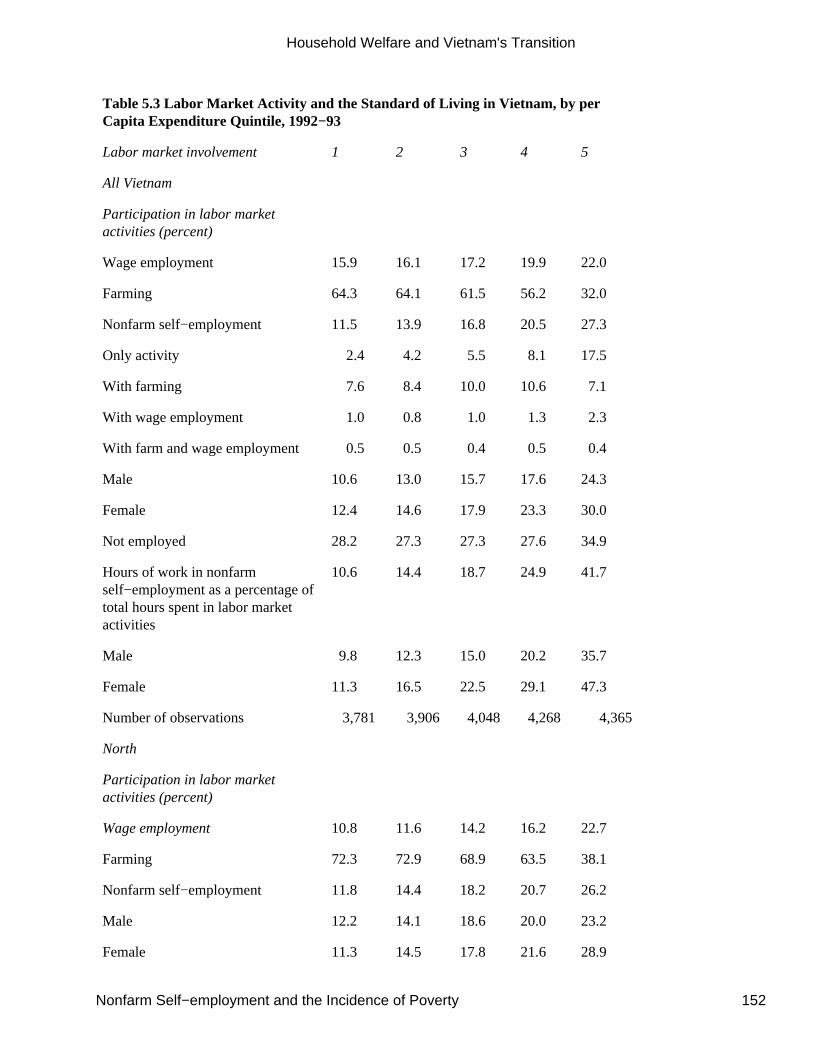
Table 5.3 Labor Market Activity and the Standard of Living in Vietnam, by perCapita Expenditure Quintile, 1992−93
Labor market involvement 1 2 3 4 5
All Vietnam
Participation in labor marketactivities (percent)
Wage employment 15.9 16.1 17.2 19.9 22.0
Farming 64.3 64.1 61.5 56.2 32.0
Nonfarm self−employment 11.5 13.9 16.8 20.5 27.3
Only activity 2.4 4.2 5.5 8.1 17.5
With farming 7.6 8.4 10.0 10.6 7.1
With wage employment 1.0 0.8 1.0 1.3 2.3
With farm and wage employment 0.5 0.5 0.4 0.5 0.4
Male 10.6 13.0 15.7 17.6 24.3
Female 12.4 14.6 17.9 23.3 30.0
Not employed 28.2 27.3 27.3 27.6 34.9
Hours of work in nonfarmself−employment as a percentage oftotal hours spent in labor marketactivities
10.6 14.4 18.7 24.9 41.7
Male 9.8 12.3 15.0 20.2 35.7
Female 11.3 16.5 22.5 29.1 47.3
Number of observations 3,781 3,906 4,048 4,268 4,365
North
Participation in labor marketactivities (percent)
Wage employment 10.8 11.6 14.2 16.2 22.7
Farming 72.3 72.9 68.9 63.5 38.1
Nonfarm self−employment 11.8 14.4 18.2 20.7 26.2
Male 12.2 14.1 18.6 20.0 23.2
Female 11.3 14.5 17.8 21.6 28.9
Household Welfare and Vietnam's Transition
Nonfarm Self−employment and the Incidence of Poverty 152
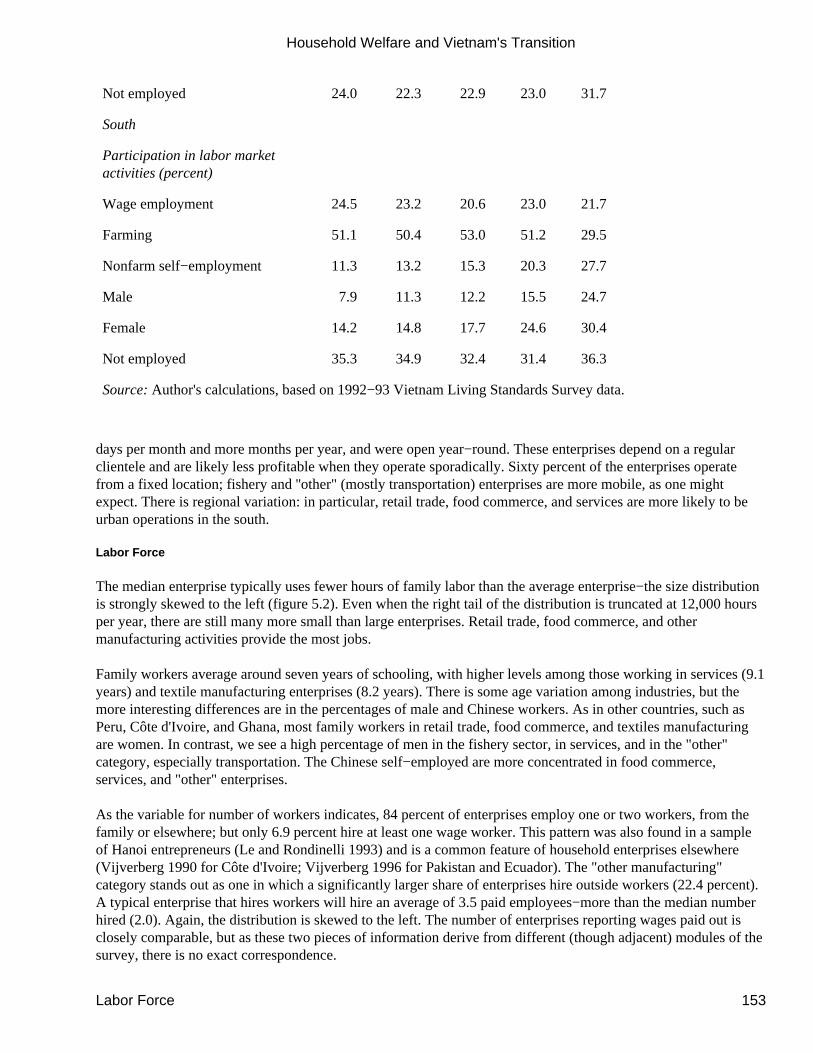
Not employed 24.0 22.3 22.9 23.0 31.7
South
Participation in labor marketactivities (percent)
Wage employment 24.5 23.2 20.6 23.0 21.7
Farming 51.1 50.4 53.0 51.2 29.5
Nonfarm self−employment 11.3 13.2 15.3 20.3 27.7
Male 7.9 11.3 12.2 15.5 24.7
Female 14.2 14.8 17.7 24.6 30.4
Not employed 35.3 34.9 32.4 31.4 36.3
Source: Author's calculations, based on 1992−93 Vietnam Living Standards Survey data.
days per month and more months per year, and were open year−round. These enterprises depend on a regularclientele and are likely less profitable when they operate sporadically. Sixty percent of the enterprises operatefrom a fixed location; fishery and ''other" (mostly transportation) enterprises are more mobile, as one mightexpect. There is regional variation: in particular, retail trade, food commerce, and services are more likely to beurban operations in the south.
Labor Force
The median enterprise typically uses fewer hours of family labor than the average enterprise−the size distributionis strongly skewed to the left (figure 5.2). Even when the right tail of the distribution is truncated at 12,000 hoursper year, there are still many more small than large enterprises. Retail trade, food commerce, and othermanufacturing activities provide the most jobs.
Family workers average around seven years of schooling, with higher levels among those working in services (9.1years) and textile manufacturing enterprises (8.2 years). There is some age variation among industries, but themore interesting differences are in the percentages of male and Chinese workers. As in other countries, such asPeru, Côte d'Ivoire, and Ghana, most family workers in retail trade, food commerce, and textiles manufacturingare women. In contrast, we see a high percentage of men in the fishery sector, in services, and in the "other"category, especially transportation. The Chinese self−employed are more concentrated in food commerce,services, and "other" enterprises.
As the variable for number of workers indicates, 84 percent of enterprises employ one or two workers, from thefamily or elsewhere; but only 6.9 percent hire at least one wage worker. This pattern was also found in a sampleof Hanoi entrepreneurs (Le and Rondinelli 1993) and is a common feature of household enterprises elsewhere(Vijverberg 1990 for Côte d'Ivoire; Vijverberg 1996 for Pakistan and Ecuador). The "other manufacturing"category stands out as one in which a significantly larger share of enterprises hire outside workers (22.4 percent).A typical enterprise that hires workers will hire an average of 3.5 paid employees−more than the median numberhired (2.0). Again, the distribution is skewed to the left. The number of enterprises reporting wages paid out isclosely comparable, but as these two pieces of information derive from different (though adjacent) modules of thesurvey, there is no exact correspondence.
Household Welfare and Vietnam's Transition
Labor Force 153
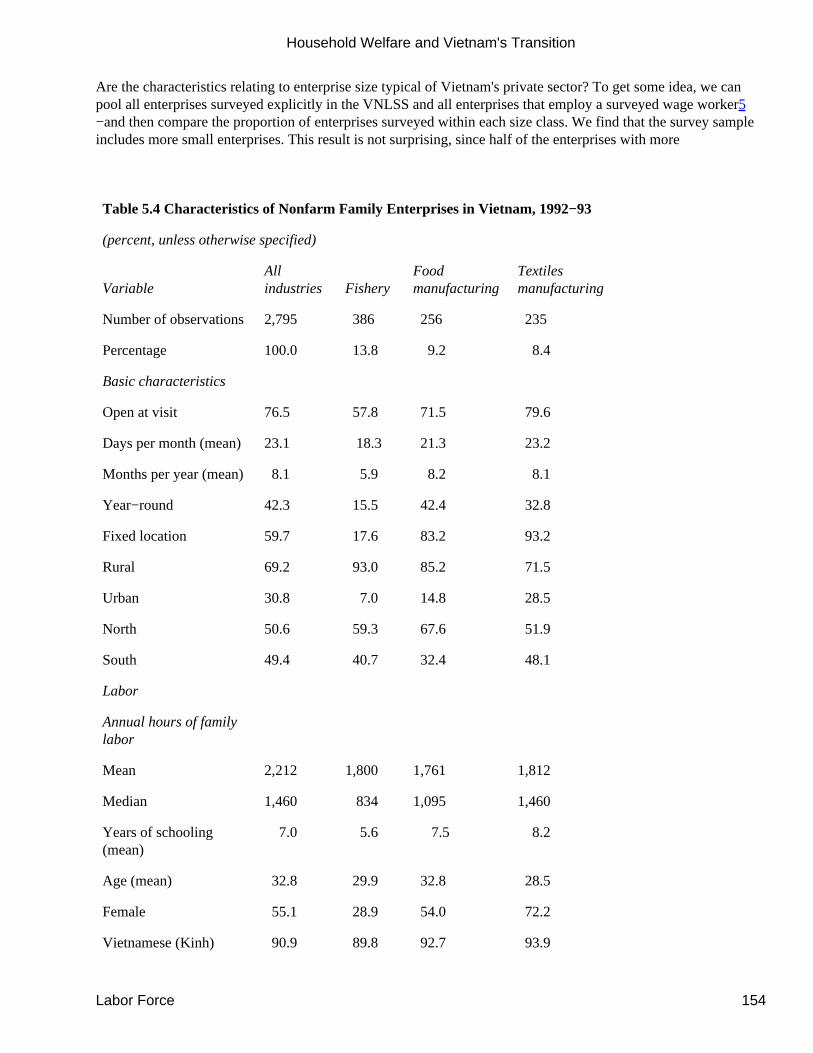
Are the characteristics relating to enterprise size typical of Vietnam's private sector? To get some idea, we canpool all enterprises surveyed explicitly in the VNLSS and all enterprises that employ a surveyed wage worker5−and then compare the proportion of enterprises surveyed within each size class. We find that the survey sampleincludes more small enterprises. This result is not surprising, since half of the enterprises with more
Table 5.4 Characteristics of Nonfarm Family Enterprises in Vietnam, 1992−93
(percent, unless otherwise specified)
VariableAllindustries Fishery
Foodmanufacturing
Textilesmanufacturing
Number of observations 2,795 386 256 235
Percentage 100.0 13.8 9.2 8.4
Basic characteristics
Open at visit 76.5 57.8 71.5 79.6
Days per month (mean) 23.1 18.3 21.3 23.2
Months per year (mean) 8.1 5.9 8.2 8.1
Year−round 42.3 15.5 42.4 32.8
Fixed location 59.7 17.6 83.2 93.2
Rural 69.2 93.0 85.2 71.5
Urban 30.8 7.0 14.8 28.5
North 50.6 59.3 67.6 51.9
South 49.4 40.7 32.4 48.1
Labor
Annual hours of familylabor
Mean 2,212 1,800 1,761 1,812
Median 1,460 834 1,095 1,460
Years of schooling(mean)
7.0 5.6 7.5 8.2
Age (mean) 32.8 29.9 32.8 28.5
Female 55.1 28.9 54.0 72.2
Vietnamese (Kinh) 90.9 89.8 92.7 93.9
Household Welfare and Vietnam's Transition
Labor Force 154
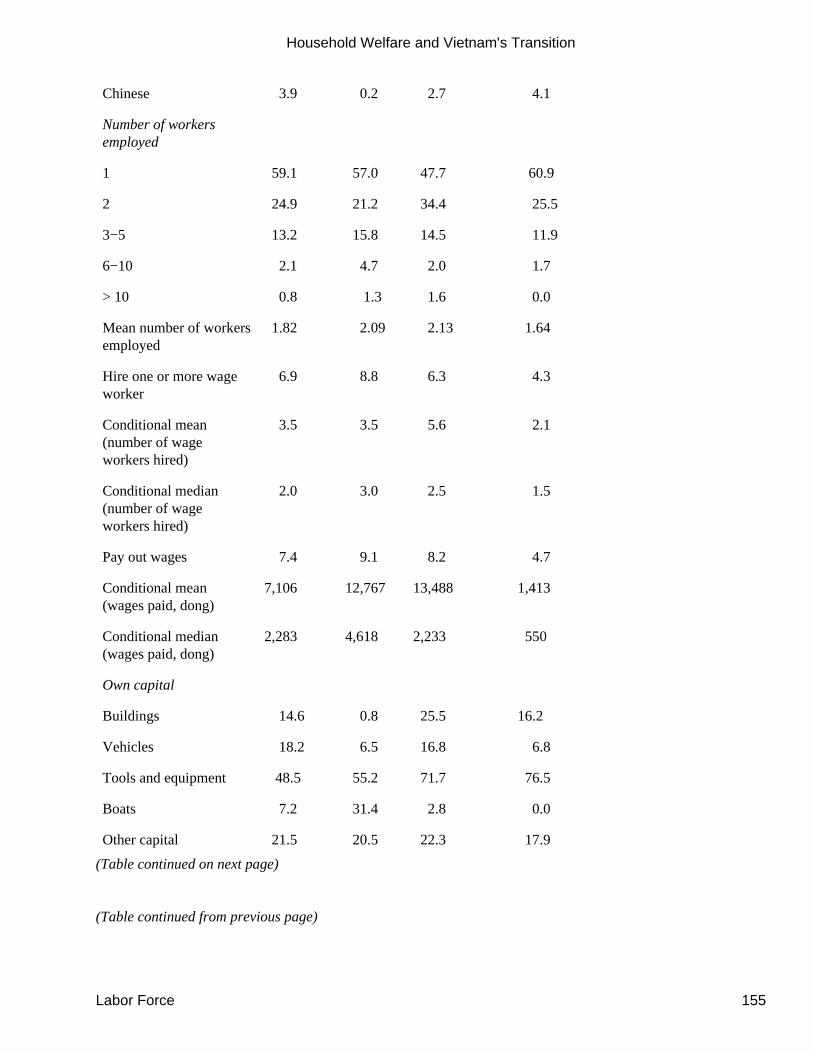
Chinese 3.9 0.2 2.7 4.1
Number of workersemployed
1 59.1 57.0 47.7 60.9
2 24.9 21.2 34.4 25.5
3−5 13.2 15.8 14.5 11.9
6−10 2.1 4.7 2.0 1.7
> 10 0.8 1.3 1.6 0.0
Mean number of workersemployed
1.82 2.09 2.13 1.64
Hire one or more wageworker
6.9 8.8 6.3 4.3
Conditional mean(number of wageworkers hired)
3.5 3.5 5.6 2.1
Conditional median(number of wageworkers hired)
2.0 3.0 2.5 1.5
Pay out wages 7.4 9.1 8.2 4.7
Conditional mean(wages paid, dong)
7,106 12,767 13,488 1,413
Conditional median(wages paid, dong)
2,283 4,618 2,233 550
Own capital
Buildings 14.6 0.8 25.5 16.2
Vehicles 18.2 6.5 16.8 6.8
Tools and equipment 48.5 55.2 71.7 76.5
Boats 7.2 31.4 2.8 0.0
Other capital 21.5 20.5 22.3 17.9
(Table continued on next page)
(Table continued from previous page)
Household Welfare and Vietnam's Transition
Labor Force 155
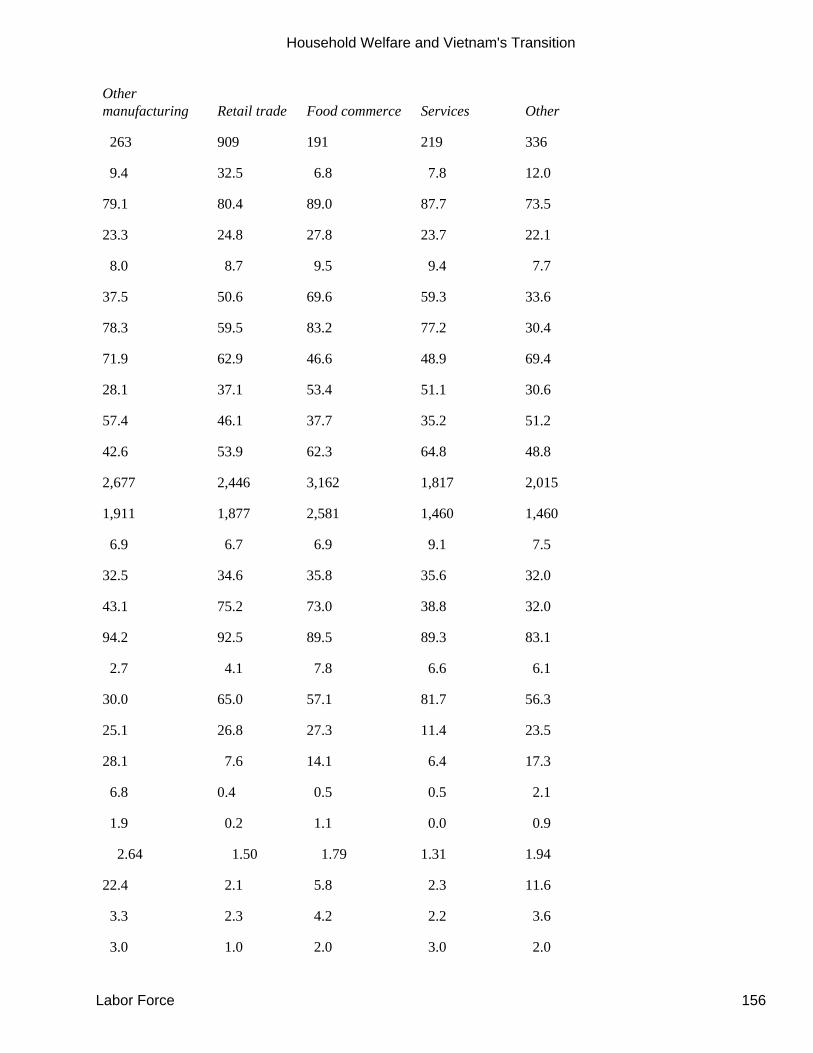
Othermanufacturing Retail trade Food commerce Services Other
263 909 191 219 336
9.4 32.5 6.8 7.8 12.0
79.1 80.4 89.0 87.7 73.5
23.3 24.8 27.8 23.7 22.1
8.0 8.7 9.5 9.4 7.7
37.5 50.6 69.6 59.3 33.6
78.3 59.5 83.2 77.2 30.4
71.9 62.9 46.6 48.9 69.4
28.1 37.1 53.4 51.1 30.6
57.4 46.1 37.7 35.2 51.2
42.6 53.9 62.3 64.8 48.8
2,677 2,446 3,162 1,817 2,015
1,911 1,877 2,581 1,460 1,460
6.9 6.7 6.9 9.1 7.5
32.5 34.6 35.8 35.6 32.0
43.1 75.2 73.0 38.8 32.0
94.2 92.5 89.5 89.3 83.1
2.7 4.1 7.8 6.6 6.1
30.0 65.0 57.1 81.7 56.3
25.1 26.8 27.3 11.4 23.5
28.1 7.6 14.1 6.4 17.3
6.8 0.4 0.5 0.5 2.1
1.9 0.2 1.1 0.0 0.9
2.64 1.50 1.79 1.31 1.94
22.4 2.1 5.8 2.3 11.6
3.3 2.3 4.2 2.2 3.6
3.0 1.0 2.0 3.0 2.0
Household Welfare and Vietnam's Transition
Labor Force 156
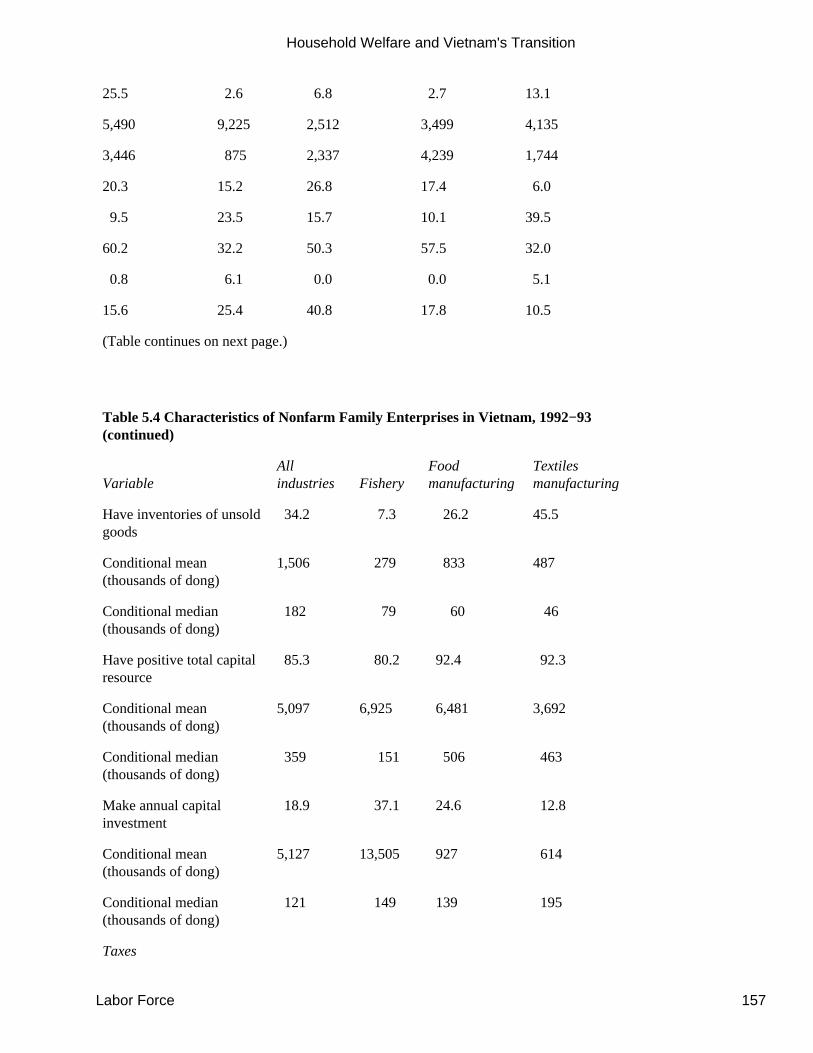
25.5 2.6 6.8 2.7 13.1
5,490 9,225 2,512 3,499 4,135
3,446 875 2,337 4,239 1,744
20.3 15.2 26.8 17.4 6.0
9.5 23.5 15.7 10.1 39.5
60.2 32.2 50.3 57.5 32.0
0.8 6.1 0.0 0.0 5.1
15.6 25.4 40.8 17.8 10.5
(Table continues on next page.)
Table 5.4 Characteristics of Nonfarm Family Enterprises in Vietnam, 1992−93(continued)
VariableAllindustries Fishery
Foodmanufacturing
Textilesmanufacturing
Have inventories of unsoldgoods
34.2 7.3 26.2 45.5
Conditional mean(thousands of dong)
1,506 279 833 487
Conditional median(thousands of dong)
182 79 60 46
Have positive total capitalresource
85.3 80.2 92.4 92.3
Conditional mean(thousands of dong)
5,097 6,925 6,481 3,692
Conditional median(thousands of dong)
359 151 506 463
Make annual capitalinvestment
18.9 37.1 24.6 12.8
Conditional mean(thousands of dong)
5,127 13,505 927 614
Conditional median(thousands of dong)
121 149 139 195
Taxes
Household Welfare and Vietnam's Transition
Labor Force 157
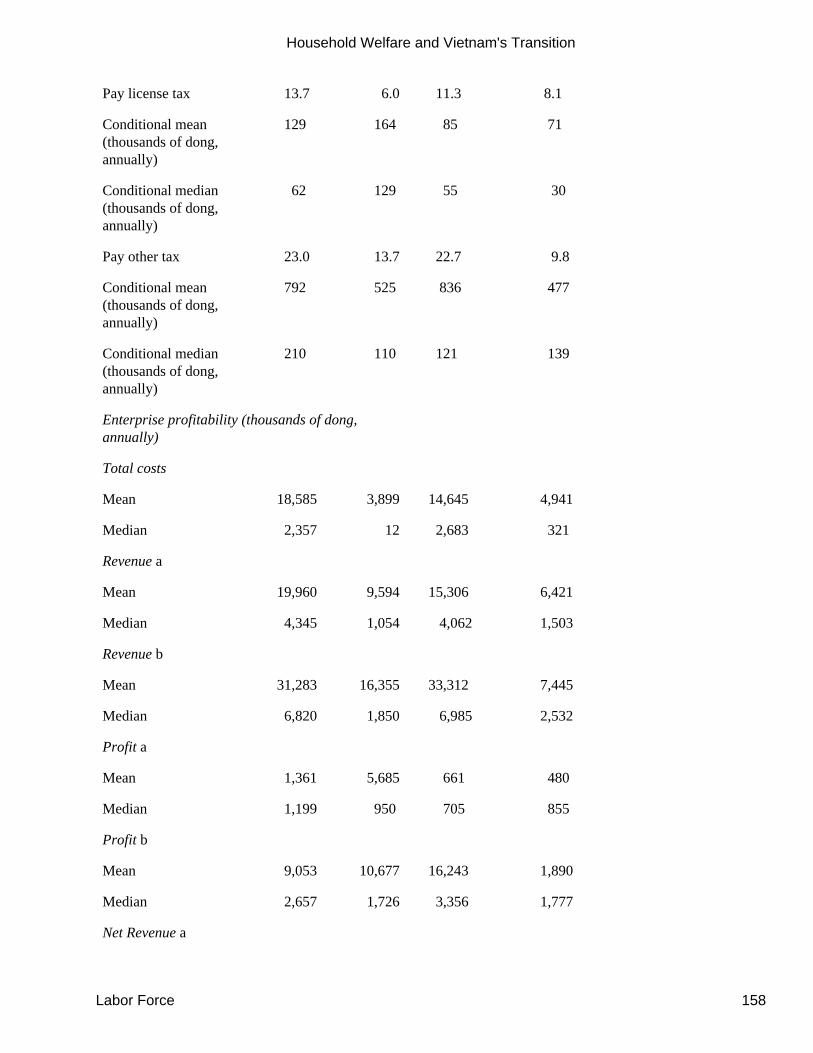
Pay license tax 13.7 6.0 11.3 8.1
Conditional mean(thousands of dong,annually)
129 164 85 71
Conditional median(thousands of dong,annually)
62 129 55 30
Pay other tax 23.0 13.7 22.7 9.8
Conditional mean(thousands of dong,annually)
792 525 836 477
Conditional median(thousands of dong,annually)
210 110 121 139
Enterprise profitability (thousands of dong,annually)
Total costs
Mean 18,585 3,899 14,645 4,941
Median 2,357 12 2,683 321
Revenue a
Mean 19,960 9,594 15,306 6,421
Median 4,345 1,054 4,062 1,503
Revenue b
Mean 31,283 16,355 33,312 7,445
Median 6,820 1,850 6,985 2,532
Profit a
Mean 1,361 5,685 661 480
Median 1,199 950 705 855
Profit b
Mean 9,053 10,677 16,243 1,890
Median 2,657 1,726 3,356 1,777
Net Revenue a
Household Welfare and Vietnam's Transition
Labor Force 158
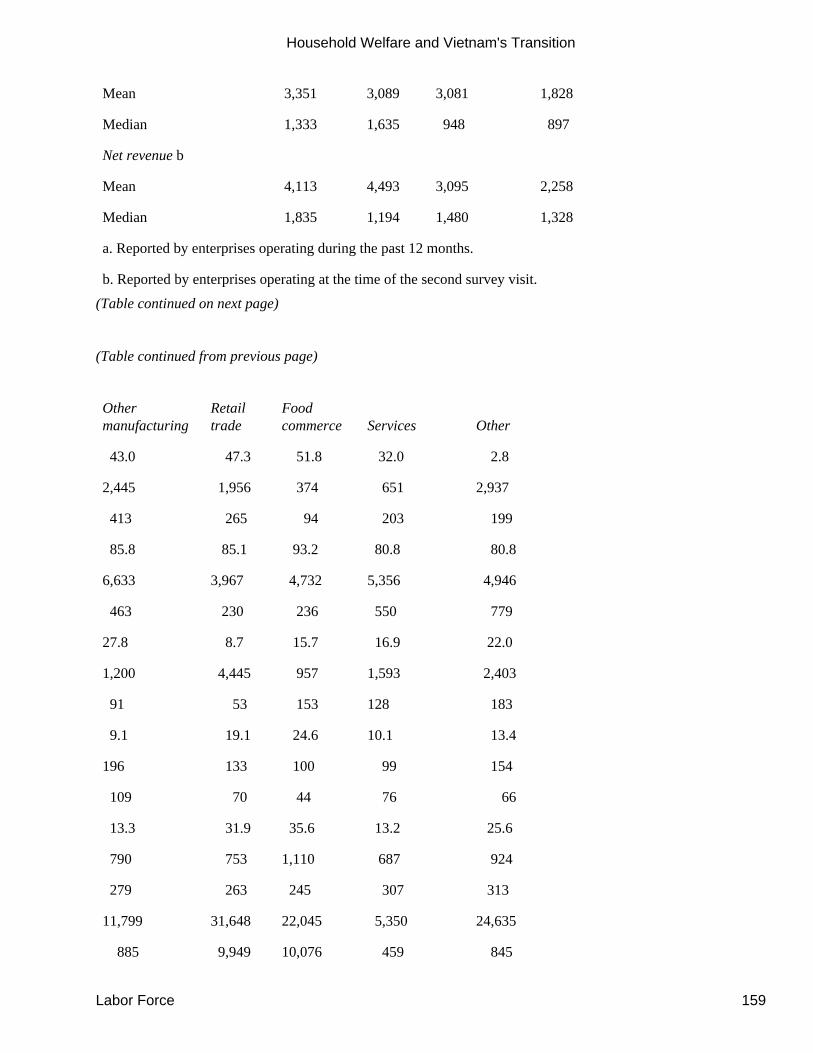
Mean 3,351 3,089 3,081 1,828
Median 1,333 1,635 948 897
Net revenue b
Mean 4,113 4,493 3,095 2,258
Median 1,835 1,194 1,480 1,328
a. Reported by enterprises operating during the past 12 months.
b. Reported by enterprises operating at the time of the second survey visit.
(Table continued on next page)
(Table continued from previous page)
Othermanufacturing
Retailtrade
Foodcommerce Services Other
43.0 47.3 51.8 32.0 2.8
2,445 1,956 374 651 2,937
413 265 94 203 199
85.8 85.1 93.2 80.8 80.8
6,633 3,967 4,732 5,356 4,946
463 230 236 550 779
27.8 8.7 15.7 16.9 22.0
1,200 4,445 957 1,593 2,403
91 53 153 128 183
9.1 19.1 24.6 10.1 13.4
196 133 100 99 154
109 70 44 76 66
13.3 31.9 35.6 13.2 25.6
790 753 1,110 687 924
279 263 245 307 313
11,799 31,648 22,045 5,350 24,635
885 9,949 10,076 459 845
Household Welfare and Vietnam's Transition
Labor Force 159
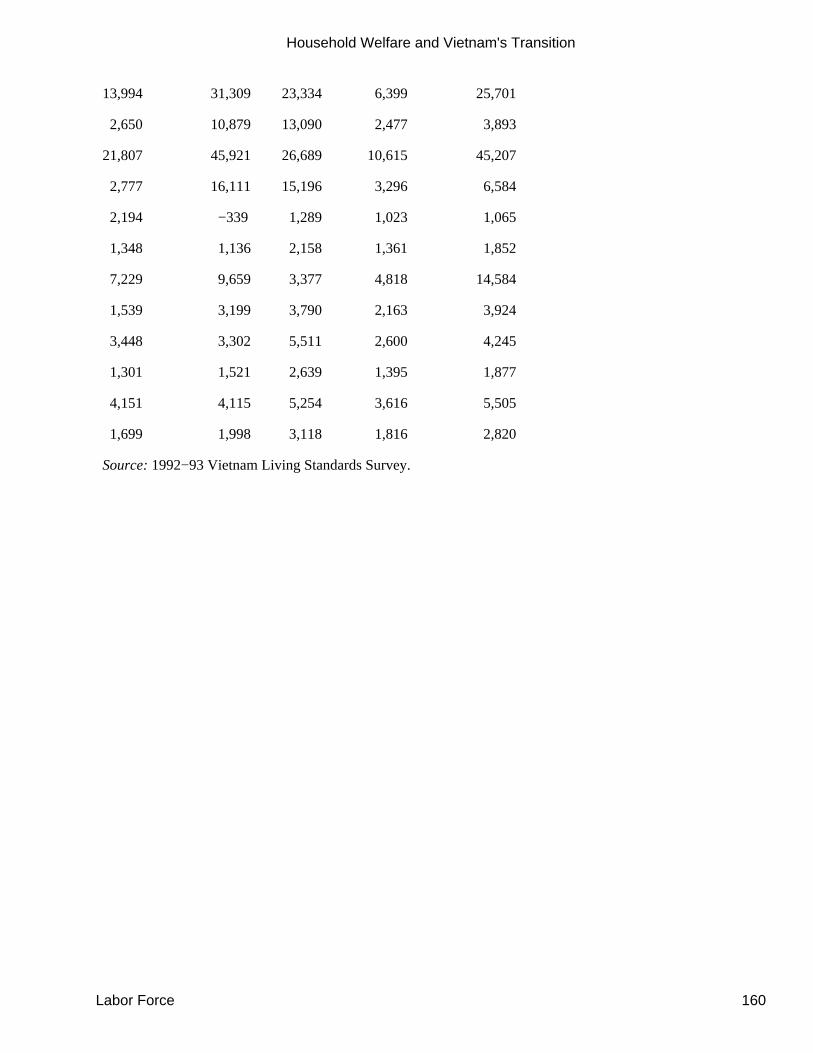
13,994 31,309 23,334 6,399 25,701
2,650 10,879 13,090 2,477 3,893
21,807 45,921 26,689 10,615 45,207
2,777 16,111 15,196 3,296 6,584
2,194 −339 1,289 1,023 1,065
1,348 1,136 2,158 1,361 1,852
7,229 9,659 3,377 4,818 14,584
1,539 3,199 3,790 2,163 3,924
3,448 3,302 5,511 2,600 4,245
1,301 1,521 2,639 1,395 1,877
4,151 4,115 5,254 3,616 5,505
1,699 1,998 3,118 1,816 2,820
Source: 1992−93 Vietnam Living Standards Survey.
Household Welfare and Vietnam's Transition
Labor Force 160
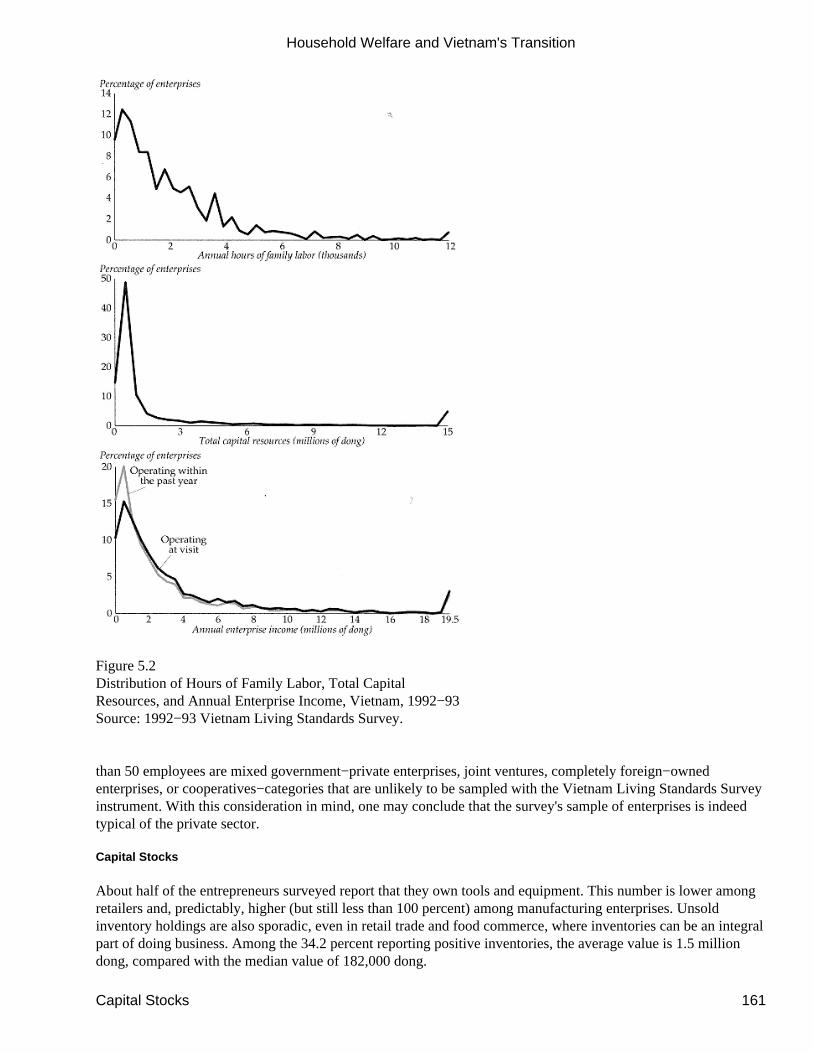
Figure 5.2Distribution of Hours of Family Labor, Total CapitalResources, and Annual Enterprise Income, Vietnam, 1992−93Source: 1992−93 Vietnam Living Standards Survey.
than 50 employees are mixed government−private enterprises, joint ventures, completely foreign−ownedenterprises, or cooperatives−categories that are unlikely to be sampled with the Vietnam Living Standards Surveyinstrument. With this consideration in mind, one may conclude that the survey's sample of enterprises is indeedtypical of the private sector.
Capital Stocks
About half of the entrepreneurs surveyed report that they own tools and equipment. This number is lower amongretailers and, predictably, higher (but still less than 100 percent) among manufacturing enterprises. Unsoldinventory holdings are also sporadic, even in retail trade and food commerce, where inventories can be an integralpart of doing business. Among the 34.2 percent reporting positive inventories, the average value is 1.5 milliondong, compared with the median value of 182,000 dong.
Household Welfare and Vietnam's Transition
Capital Stocks 161
Total capital resource is the sum of total (physical) capital and unsold inventory holdings: 85.3 percent report apositive amount, with a strongly left−skewed distribution (figure 5.2). Every industry contains a few largeenterprises and many small ones, judging size by capital stock. About a fifth of the entrepreneurs surveyed haveinvested in equipment, land, vehicles, or machinery (using the specific phrase of the questionnaire). The averageamount is large compared with the average value of capital stock. But the median value is modest, 121,000 dongannually, considering that this value is the median only among the 18.9 percent of enterprises that made anypurchases.
Taxation
Do enterprises pay taxes? Only 13.7 percent pay a license tax, with the rate rising significantly in the more visibleretail trade (19.1 percent) and food commerce (24.6 percent) industries. The amounts paid are roughly similaracross industries. Only 23 percent of all industries pay other taxes, again with larger proportions of the retail trade(31.9) and food commerce (35.6) sectors paying them. The values of these taxes are more varied than for licensetaxes. As one might expect, larger enterprises are more likely to pay tax. Survey results indicate that among smallenterprises about 3 percent pay a license tax and 10 percent pay other taxes; among large enterprises 40 percentpay a license tax and 50 percent pay other taxes.6
In principle, enterprises are subject to a turnover tax, which has 19 different rates, and a profit tax of between 25and 45 percent depending on the sector. But because many entrepreneurs do not keep books well, this tax is oftenreplaced by a presumptive tax of between 1 percent and 3 percent of sales, which is comparatively low. Inaddition, enterprises may pay land taxes if they are involved in the transfer of land−use rights (although that taxmay not have been in effect when the Living Standards Survey was taken),
import duties, or fees related to licensing new enterprises and changing existing enterprises (World Bank 1995,49−53, 71−75). Because enterprises have a greater incentive to overstate than understate their tax payments andbecause the percentage of tax−paying enterprises is low, small−scale private enterprises seem to be beyond thegrasp of the government of Vietnam. There may also be a perception among small−scale entrepreneurs that thebenefits of legitimacy are outweighed by the cost of complying with complicated registration procedures and thetedious tax code. Simplifying these procedures might well increase tax revenue. Full compliance in the paymentof taxes may not raise license (or other) tax revenue by a factor of seven, or four (as implied by compliance ratesdocumented in the survey), since larger enterprises are already more likely to pay taxes; but a doubling or more ofthe tax revenue should be within the realm of possibility.
Profitability
The VNLSS lists 12 enterprise operating cost categories and reports an average cost of 18.6 million dong and amedian cost of 2.4 million dong over the length of a year. Part of this spread is a result of the fact that someenterprises are in business for only part of the year. Moreover, 8.9 percent of the enterprises report no operatingexpenditures. Sixty percent of these are in the fishery sector.
There are two sales revenue measures. The first category of sales revenue refers to revenue (including paymentsin kind and home−consumed goods) received between the first and second survey visit. Only those enterprisesoperating at the time of the second visit were able to provide that information. The second measure refers totypical monthly sales revenues over the past year. All enterprises operating at some point during the 12 monthsbefore the second visit responded.
Enterprises still operating at the time of the second survey interview received more sales revenue and were moreprofitable. Enterprises in retail trade, food commerce, and the "other" category reported the highest sales, thoughthey also had higher costs. Judging by the mean values, the most profitable enterprises were therefore found in the
Household Welfare and Vietnam's Transition
Taxation 162
food manufacturing, "other," and fishery sectors, with retail trade and other manufacturing following closelybehind. Within the "other" sector, detailed tabulations show that it is mostly the transport sector and especially thewholesalers that fare so well.
There is a substantial discrepancy between profits of currently operating firms (mean 9.1 million dong, median2.7 million dong) and profits of all firms operating during the past year (mean 1.4 million dong, median 1.2million dong). Obviously, an entrepreneur might decide to discontinue operation because a firm has becomeunprofitable. Furthermore, cost and revenue data pertaining to the past 12 months suffer from greater recall errorthan data gathered about events in the two weeks between the sur−
vey visits. Finally, the profit values are subject to considerable uncertainty, since profit is the difference betweensales revenue and operating costs and both of these are measured with some error. The median values of profitsare quite plausible, the mean values less so.
In recognition of these problems, the interviewer also asked the entrepreneurs how much money they had leftafter expenses were paid. This value, combined with payments in kind and the value of home consumption, iscalled "net revenue" in table 5.4. It is the entrepreneur's best guess of the firm's profitability. The differencebetween mean and median values of net revenue again points out a left−skewed distribution (see figure 5.2).Moreover, it is clear that enterprises operating at some point during the year but not during the visit were not asprofitable as those currently operating, as one might well expect. The most profitable enterprises are found in foodcommerce and the "other" category.
Enterprise Performance and Household Poverty
How does the economic well−being of households relate to the performance of their enterprises? Judged by theirlabor inputs, enterprises grow larger as households move into higher quintiles, though the effect is not dramaticuntil they enter the fifth quintile (table 5.5). The relationship between enterprise size and a household's povertylevel is more pronounced when we consider total capital resources or total operating costs. Consider also, though,that some enterprises belonging to poor households in the first or second quintiles are larger than those in thethird, fourth, or even fifth quintiles. Nevertheless, differences in the quintilelevel means are still statisticallysignificant. One exception is the capital investment variable: because of the large standard deviation of thisvariable (not reported here), it is not clear that more prosperous households indeed invest more than poorer ones,even though the means presented here give this impression.
Sales revenue exhibits a rising trend over quintiles. The profit variable rises in its median value, but noise in themeasure for some enterprises distorts the mean value, veiling some of the trend. The net revenue variable is muchsmoother, and thus we shall concentrate on it.
Because our focus is on poverty, we are interested in knowing how important nonfarm enterprises are in meetinghouseholds' income needs. For this, we examine the ratio of a household's income from its nonfarm enterprises toits consumption expenditure. This ratio does not have to equal one for the household to break even, since thehousehold may have other income sources. Further, the calculation contains imputed values for the rental value ofthe residence, the use value of consumer durables, and the value of home−produced consumption items. Thushousehold expenditure is not a good short−term value of a household's cash flow needs−even if it is a goodlong−term value of cash flow needs.
Household Welfare and Vietnam's Transition
Enterprise Performance and Household Poverty 163
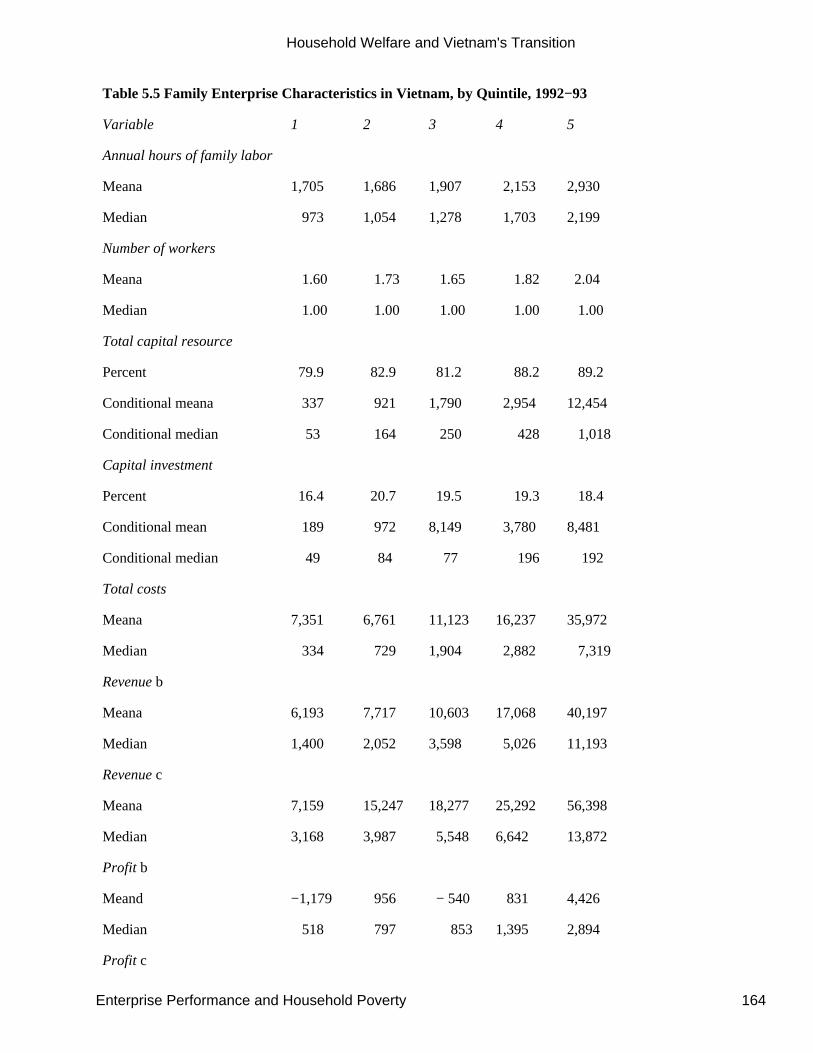
Table 5.5 Family Enterprise Characteristics in Vietnam, by Quintile, 1992−93
Variable 1 2 3 4 5
Annual hours of family labor
Meana 1,705 1,686 1,907 2,153 2,930
Median 973 1,054 1,278 1,703 2,199
Number of workers
Meana 1.60 1.73 1.65 1.82 2.04
Median 1.00 1.00 1.00 1.00 1.00
Total capital resource
Percent 79.9 82.9 81.2 88.2 89.2
Conditional meana 337 921 1,790 2,954 12,454
Conditional median 53 164 250 428 1,018
Capital investment
Percent 16.4 20.7 19.5 19.3 18.4
Conditional mean 189 972 8,149 3,780 8,481
Conditional median 49 84 77 196 192
Total costs
Meana 7,351 6,761 11,123 16,237 35,972
Median 334 729 1,904 2,882 7,319
Revenue b
Meana 6,193 7,717 10,603 17,068 40,197
Median 1,400 2,052 3,598 5,026 11,193
Revenue c
Meana 7,159 15,247 18,277 25,292 56,398
Median 3,168 3,987 5,548 6,642 13,872
Profit b
Meand −1,179 956 − 540 831 4,426
Median 518 797 853 1,395 2,894
Profit c
Household Welfare and Vietnam's Transition
Enterprise Performance and Household Poverty 164
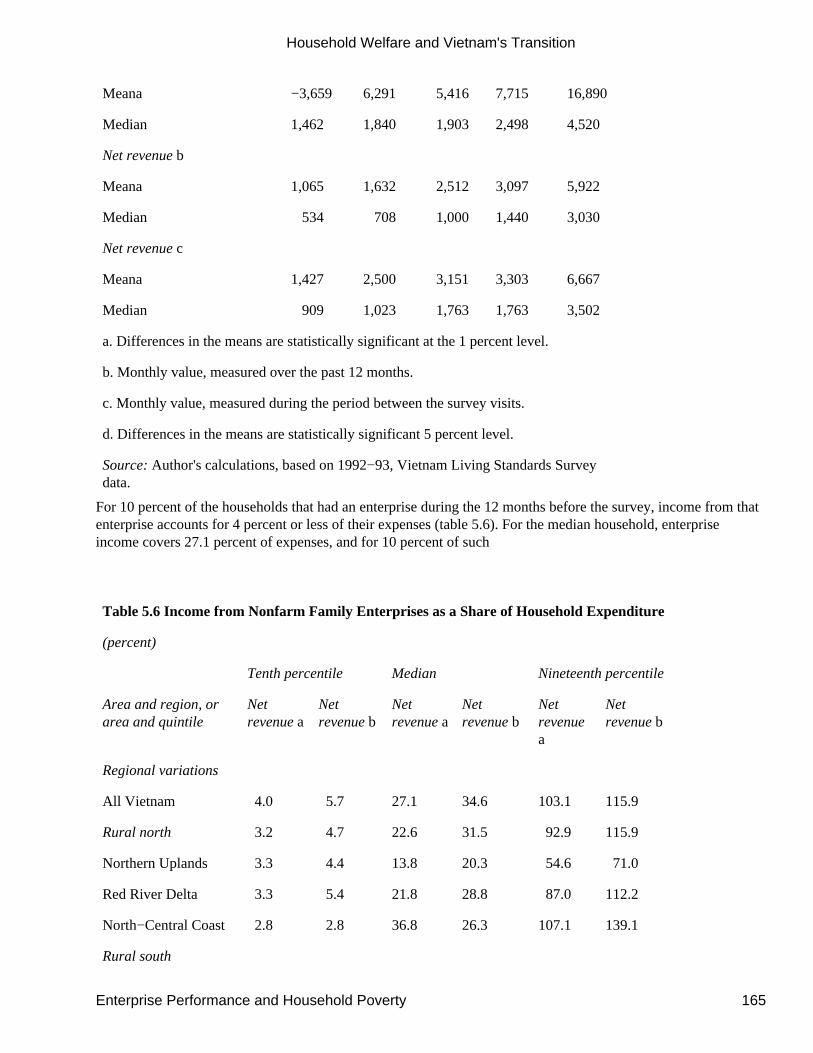
Meana −3,659 6,291 5,416 7,715 16,890
Median 1,462 1,840 1,903 2,498 4,520
Net revenue b
Meana 1,065 1,632 2,512 3,097 5,922
Median 534 708 1,000 1,440 3,030
Net revenue c
Meana 1,427 2,500 3,151 3,303 6,667
Median 909 1,023 1,763 1,763 3,502
a. Differences in the means are statistically significant at the 1 percent level.
b. Monthly value, measured over the past 12 months.
c. Monthly value, measured during the period between the survey visits.
d. Differences in the means are statistically significant 5 percent level.
Source: Author's calculations, based on 1992−93, Vietnam Living Standards Surveydata.
For 10 percent of the households that had an enterprise during the 12 months before the survey, income from thatenterprise accounts for 4 percent or less of their expenses (table 5.6). For the median household, enterpriseincome covers 27.1 percent of expenses, and for 10 percent of such
Table 5.6 Income from Nonfarm Family Enterprises as a Share of Household Expenditure
(percent)
Tenth percentile Median Nineteenth percentile
Area and region, orarea and quintile
Netrevenue a
Netrevenue b
Netrevenue a
Netrevenue b
Netrevenuea
Netrevenue b
Regional variations
All Vietnam 4.0 5.7 27.1 34.6 103.1 115.9
Rural north 3.2 4.7 22.6 31.5 92.9 115.9
Northern Uplands 3.3 4.4 13.8 20.3 54.6 71.0
Red River Delta 3.3 5.4 21.8 28.8 87.0 112.2
North−Central Coast 2.8 2.8 36.8 26.3 107.1 139.1
Rural south
Household Welfare and Vietnam's Transition
Enterprise Performance and Household Poverty 165
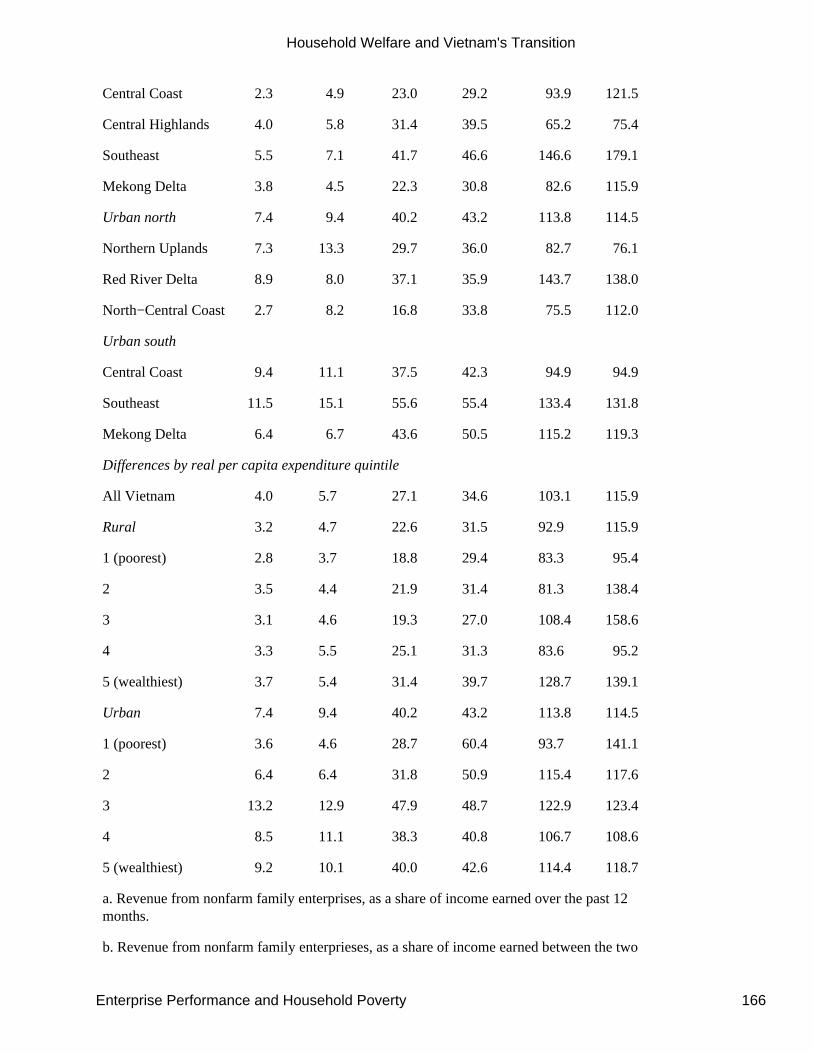
Central Coast 2.3 4.9 23.0 29.2 93.9 121.5
Central Highlands 4.0 5.8 31.4 39.5 65.2 75.4
Southeast 5.5 7.1 41.7 46.6 146.6 179.1
Mekong Delta 3.8 4.5 22.3 30.8 82.6 115.9
Urban north 7.4 9.4 40.2 43.2 113.8 114.5
Northern Uplands 7.3 13.3 29.7 36.0 82.7 76.1
Red River Delta 8.9 8.0 37.1 35.9 143.7 138.0
North−Central Coast 2.7 8.2 16.8 33.8 75.5 112.0
Urban south
Central Coast 9.4 11.1 37.5 42.3 94.9 94.9
Southeast 11.5 15.1 55.6 55.4 133.4 131.8
Mekong Delta 6.4 6.7 43.6 50.5 115.2 119.3
Differences by real per capita expenditure quintile
All Vietnam 4.0 5.7 27.1 34.6 103.1 115.9
Rural 3.2 4.7 22.6 31.5 92.9 115.9
1 (poorest) 2.8 3.7 18.8 29.4 83.3 95.4
2 3.5 4.4 21.9 31.4 81.3 138.4
3 3.1 4.6 19.3 27.0 108.4 158.6
4 3.3 5.5 25.1 31.3 83.6 95.2
5 (wealthiest) 3.7 5.4 31.4 39.7 128.7 139.1
Urban 7.4 9.4 40.2 43.2 113.8 114.5
1 (poorest) 3.6 4.6 28.7 60.4 93.7 141.1
2 6.4 6.4 31.8 50.9 115.4 117.6
3 13.2 12.9 47.9 48.7 122.9 123.4
4 8.5 11.1 38.3 40.8 106.7 108.6
5 (wealthiest) 9.2 10.1 40.0 42.6 114.4 118.7
a. Revenue from nonfarm family enterprises, as a share of income earned over the past 12months.
b. Revenue from nonfarm family enterprieses, as a share of income earned between the two
Household Welfare and Vietnam's Transition
Enterprise Performance and Household Poverty 166
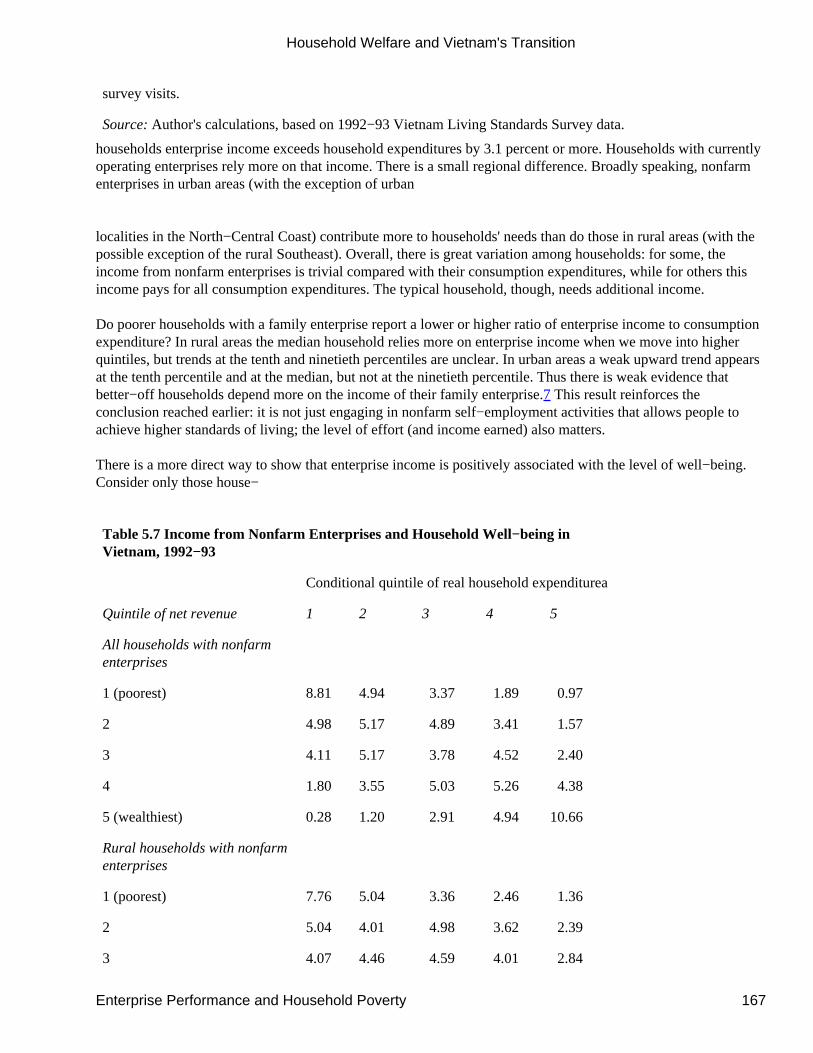
survey visits.
Source: Author's calculations, based on 1992−93 Vietnam Living Standards Survey data.
households enterprise income exceeds household expenditures by 3.1 percent or more. Households with currentlyoperating enterprises rely more on that income. There is a small regional difference. Broadly speaking, nonfarmenterprises in urban areas (with the exception of urban
localities in the North−Central Coast) contribute more to households' needs than do those in rural areas (with thepossible exception of the rural Southeast). Overall, there is great variation among households: for some, theincome from nonfarm enterprises is trivial compared with their consumption expenditures, while for others thisincome pays for all consumption expenditures. The typical household, though, needs additional income.
Do poorer households with a family enterprise report a lower or higher ratio of enterprise income to consumptionexpenditure? In rural areas the median household relies more on enterprise income when we move into higherquintiles, but trends at the tenth and ninetieth percentiles are unclear. In urban areas a weak upward trend appearsat the tenth percentile and at the median, but not at the ninetieth percentile. Thus there is weak evidence thatbetter−off households depend more on the income of their family enterprise.7 This result reinforces theconclusion reached earlier: it is not just engaging in nonfarm self−employment activities that allows people toachieve higher standards of living; the level of effort (and income earned) also matters.
There is a more direct way to show that enterprise income is positively associated with the level of well−being.Consider only those house−
Table 5.7 Income from Nonfarm Enterprises and Household Well−being inVietnam, 1992−93
Conditional quintile of real household expenditurea
Quintile of net revenue 1 2 3 4 5
All households with nonfarmenterprises
1 (poorest) 8.81 4.94 3.37 1.89 0.97
2 4.98 5.17 4.89 3.41 1.57
3 4.11 5.17 3.78 4.52 2.40
4 1.80 3.55 5.03 5.26 4.38
5 (wealthiest) 0.28 1.20 2.91 4.94 10.66
Rural households with nonfarmenterprises
1 (poorest) 7.76 5.04 3.36 2.46 1.36
2 5.04 4.01 4.98 3.62 2.39
3 4.07 4.46 4.59 4.01 2.84
Household Welfare and Vietnam's Transition
Enterprise Performance and Household Poverty 167
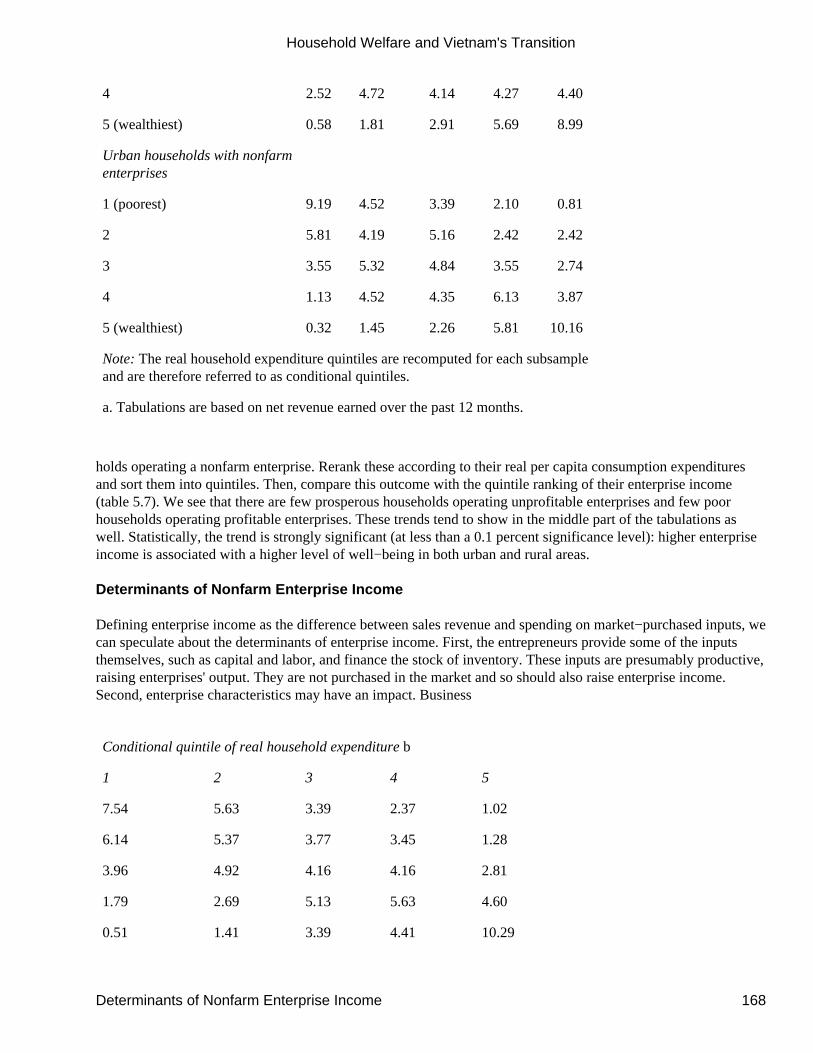
4 2.52 4.72 4.14 4.27 4.40
5 (wealthiest) 0.58 1.81 2.91 5.69 8.99
Urban households with nonfarmenterprises
1 (poorest) 9.19 4.52 3.39 2.10 0.81
2 5.81 4.19 5.16 2.42 2.42
3 3.55 5.32 4.84 3.55 2.74
4 1.13 4.52 4.35 6.13 3.87
5 (wealthiest) 0.32 1.45 2.26 5.81 10.16
Note: The real household expenditure quintiles are recomputed for each subsampleand are therefore referred to as conditional quintiles.
a. Tabulations are based on net revenue earned over the past 12 months.
holds operating a nonfarm enterprise. Rerank these according to their real per capita consumption expendituresand sort them into quintiles. Then, compare this outcome with the quintile ranking of their enterprise income(table 5.7). We see that there are few prosperous households operating unprofitable enterprises and few poorhouseholds operating profitable enterprises. These trends tend to show in the middle part of the tabulations aswell. Statistically, the trend is strongly significant (at less than a 0.1 percent significance level): higher enterpriseincome is associated with a higher level of well−being in both urban and rural areas.
Determinants of Nonfarm Enterprise Income
Defining enterprise income as the difference between sales revenue and spending on market−purchased inputs, wecan speculate about the determinants of enterprise income. First, the entrepreneurs provide some of the inputsthemselves, such as capital and labor, and finance the stock of inventory. These inputs are presumably productive,raising enterprises' output. They are not purchased in the market and so should also raise enterprise income.Second, enterprise characteristics may have an impact. Business
Conditional quintile of real household expenditure b
1 2 3 4 5
7.54 5.63 3.39 2.37 1.02
6.14 5.37 3.77 3.45 1.28
3.96 4.92 4.16 4.16 2.81
1.79 2.69 5.13 5.63 4.60
0.51 1.41 3.39 4.41 10.29
Household Welfare and Vietnam's Transition
Determinants of Nonfarm Enterprise Income 168
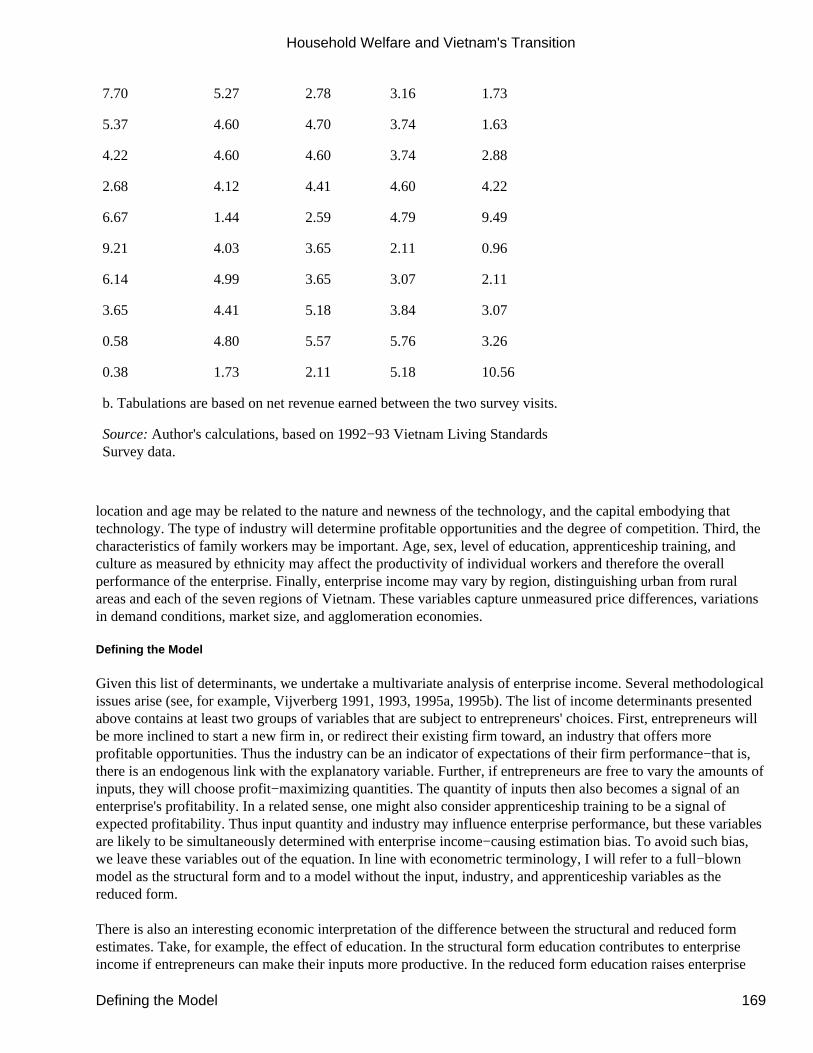
7.70 5.27 2.78 3.16 1.73
5.37 4.60 4.70 3.74 1.63
4.22 4.60 4.60 3.74 2.88
2.68 4.12 4.41 4.60 4.22
6.67 1.44 2.59 4.79 9.49
9.21 4.03 3.65 2.11 0.96
6.14 4.99 3.65 3.07 2.11
3.65 4.41 5.18 3.84 3.07
0.58 4.80 5.57 5.76 3.26
0.38 1.73 2.11 5.18 10.56
b. Tabulations are based on net revenue earned between the two survey visits.
Source: Author's calculations, based on 1992−93 Vietnam Living StandardsSurvey data.
location and age may be related to the nature and newness of the technology, and the capital embodying thattechnology. The type of industry will determine profitable opportunities and the degree of competition. Third, thecharacteristics of family workers may be important. Age, sex, level of education, apprenticeship training, andculture as measured by ethnicity may affect the productivity of individual workers and therefore the overallperformance of the enterprise. Finally, enterprise income may vary by region, distinguishing urban from ruralareas and each of the seven regions of Vietnam. These variables capture unmeasured price differences, variationsin demand conditions, market size, and agglomeration economies.
Defining the Model
Given this list of determinants, we undertake a multivariate analysis of enterprise income. Several methodologicalissues arise (see, for example, Vijverberg 1991, 1993, 1995a, 1995b). The list of income determinants presentedabove contains at least two groups of variables that are subject to entrepreneurs' choices. First, entrepreneurs willbe more inclined to start a new firm in, or redirect their existing firm toward, an industry that offers moreprofitable opportunities. Thus the industry can be an indicator of expectations of their firm performance−that is,there is an endogenous link with the explanatory variable. Further, if entrepreneurs are free to vary the amounts ofinputs, they will choose profit−maximizing quantities. The quantity of inputs then also becomes a signal of anenterprise's profitability. In a related sense, one might also consider apprenticeship training to be a signal ofexpected profitability. Thus input quantity and industry may influence enterprise performance, but these variablesare likely to be simultaneously determined with enterprise income−causing estimation bias. To avoid such bias,we leave these variables out of the equation. In line with econometric terminology, I will refer to a full−blownmodel as the structural form and to a model without the input, industry, and apprenticeship variables as thereduced form.
There is also an interesting economic interpretation of the difference between the structural and reduced formestimates. Take, for example, the effect of education. In the structural form education contributes to enterpriseincome if entrepreneurs can make their inputs more productive. In the reduced form education raises enterprise
Household Welfare and Vietnam's Transition
Defining the Model 169
income through this productive effect and through an allocative effect, reflecting better entrepreneurial choicesabout the quantity of inputs and the industry of specialization. The difference between the two effects thereforerepresents the allocative effect of education.8
A second issue is that household members choose whether or not to operate an enterprise, implying that thesample of enterprises observed in the Living Standards Survey is not randomly distributed among the populationof Vietnam. This may induce estimation bias (Lee 1978; Heckman
1979), with the implication that one could not use the parameter estimates to predict how profitable an enterprisemight be in a randomly selected household. For this survey sample, however, there is no evidence that theparameter estimates are biased.9
A third issue is that economic theory offers no guidance as to whether we should measure enterprise income ashourly, daily, weekly, monthly, or annual values. We do not know what the relevant period of production is, andthis period may vary among enterprises in different industries or even within the same industry. We shall considerboth hourly and monthly values−if the estimated effects are robust, they will show up in both sets of estimates.
A related issue concerns the form of the empirical model. While economic theory suggests that the impact ofinputs is nonlinear because of diminishing returns, it does not mandate one particular form. We shall estimate thehourly income model in a log−linear form with the log of inputs entering quadratically, and a linear monthlyincome model with inputs entering quadratically. It may be that the log−quadratic model is less sensitive tooutliers, a check on the data did not point out outlier problems that resulted from coding errors, however.
Estimating the Model
In the hourly income model the hours of work variable is removed from the list of explanatory variables since it isused to create the explained variable. The following discussion outlines general trends in the estimates. It is usefulto know the mean values of the dependent variables. The average hourly income is 2,560 dong for currentlyoperating enterprises and 2,056 dong for all enterprises operating in the past 12 months; the average monthlyincome is 457,000 dong and 396,000 dong, respectively.
Inputs appear only in the structural form models, and in quadratic form, which makes them more difficult tointerpret. But consider the hourly income regressions, and define ''small," median, and "large" enterprises as thosethat use inputs corresponding to the twenty−fifth, fiftieth, and seventy−fifth percentiles. For currently operatingenterprises the amounts are as follows: for small enterprises, hours = 117 per month, capital = 15,000 dong,inventory = 0; for median enterprises, 213, 193, 0; for large enterprises, 304, 963, 96. For enterprises operatingduring the past 12 months: small, 122, 10, 0; median, 213, 147, 0; and large, 304, 772, 46. According to ourestimates of currently operating enterprises, a 1 percent increase in the capital stock raises hourly income by0.012, 0.082, and 0.092 percent for small, median, and large enterprises, respectively (table 5.8). Results forenterprise operating within the past 12 months are very similar. This result implies that, in a medium−sizeenterprise, 1,000 dong of additional capital generates an increase of about 0.45 dong per hour or 96 dong permonth. Thus the productivity of capital appears higher in larger firms.
Household Welfare and Vietnam's Transition
Estimating the Model 170
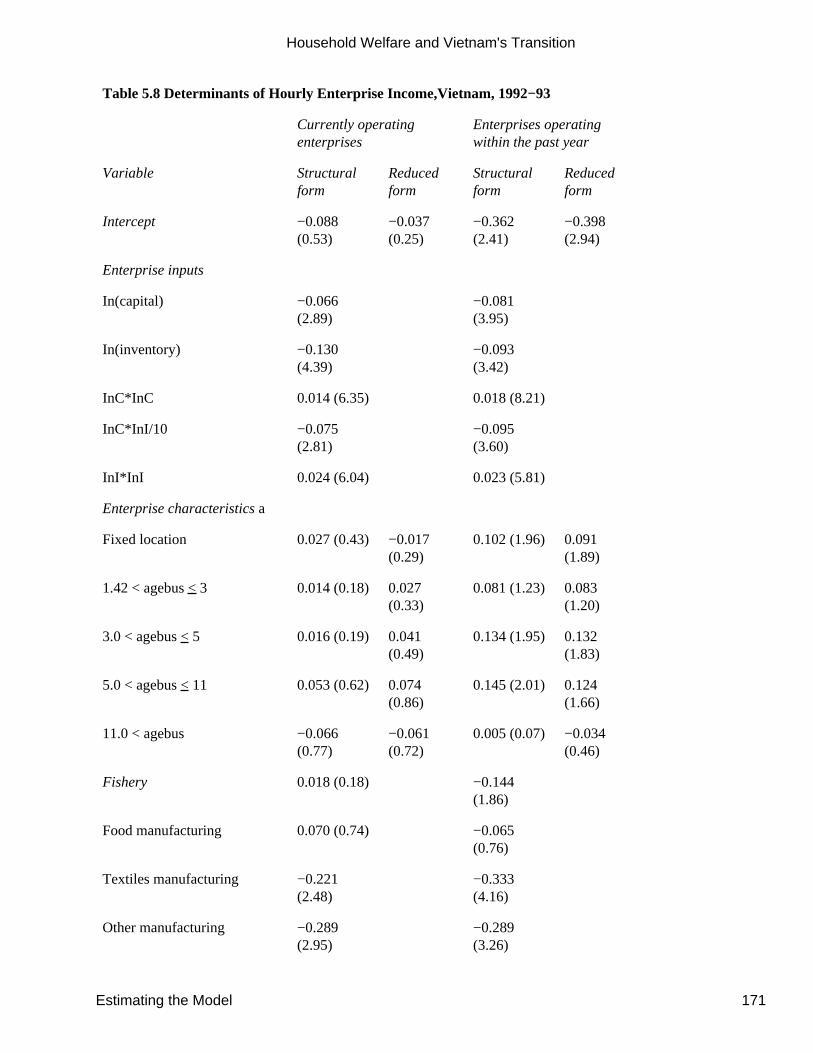
Table 5.8 Determinants of Hourly Enterprise Income,Vietnam, 1992−93
Currently operatingenterprises
Enterprises operatingwithin the past year
Variable Structuralform
Reducedform
Structuralform
Reducedform
Intercept −0.088(0.53)
−0.037(0.25)
−0.362(2.41)
−0.398(2.94)
Enterprise inputs
In(capital) −0.066(2.89)
−0.081(3.95)
In(inventory) −0.130(4.39)
−0.093(3.42)
InC*InC 0.014 (6.35) 0.018 (8.21)
InC*InI/10 −0.075(2.81)
−0.095(3.60)
InI*InI 0.024 (6.04) 0.023 (5.81)
Enterprise characteristics a
Fixed location 0.027 (0.43) −0.017(0.29)
0.102 (1.96) 0.091(1.89)
1.42 < agebus < 3 0.014 (0.18) 0.027(0.33)
0.081 (1.23) 0.083(1.20)
3.0 < agebus < 5 0.016 (0.19) 0.041(0.49)
0.134 (1.95) 0.132(1.83)
5.0 < agebus < 11 0.053 (0.62) 0.074(0.86)
0.145 (2.01) 0.124(1.66)
11.0 < agebus −0.066(0.77)
−0.061(0.72)
0.005 (0.07) −0.034(0.46)
Fishery 0.018 (0.18) −0.144(1.86)
Food manufacturing 0.070 (0.74) −0.065(0.76)
Textiles manufacturing −0.221(2.48)
−0.333(4.16)
Other manufacturing −0.289(2.95)
−0.289(3.26)
Household Welfare and Vietnam's Transition
Estimating the Model 171
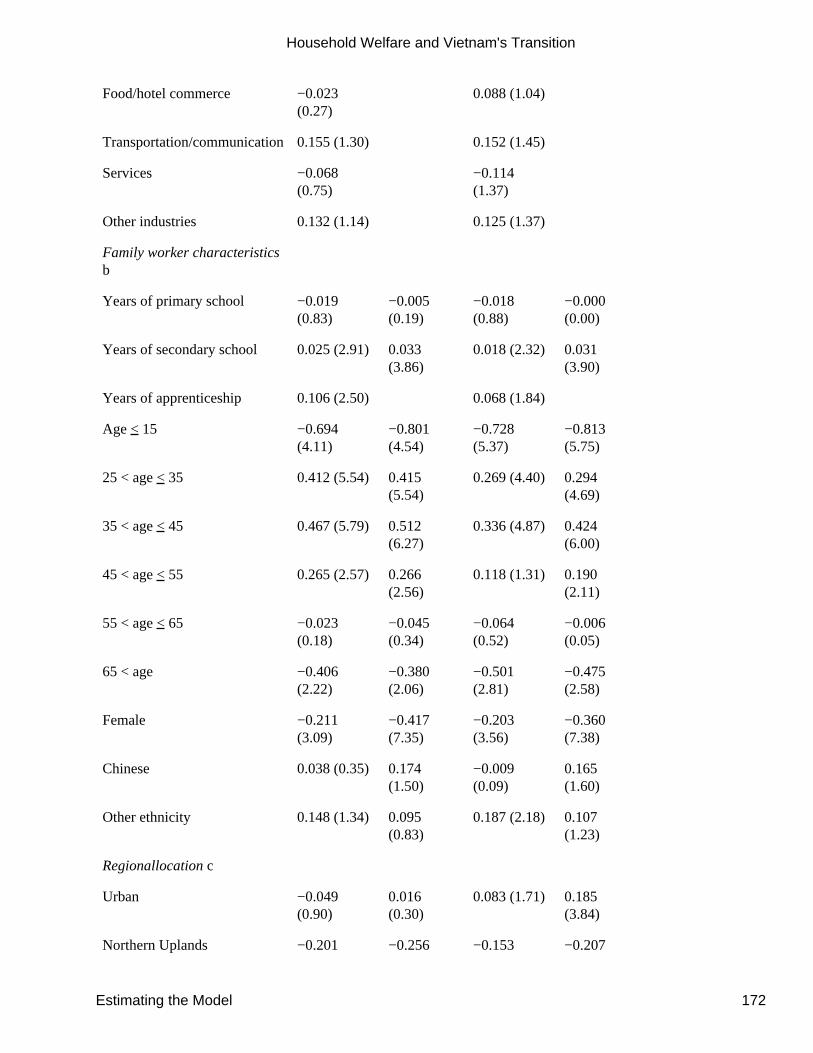
Food/hotel commerce −0.023(0.27)
0.088 (1.04)
Transportation/communication0.155 (1.30) 0.152 (1.45)
Services −0.068(0.75)
−0.114(1.37)
Other industries 0.132 (1.14) 0.125 (1.37)
Family worker characteristicsb
Years of primary school −0.019(0.83)
−0.005(0.19)
−0.018(0.88)
−0.000(0.00)
Years of secondary school 0.025 (2.91) 0.033(3.86)
0.018 (2.32) 0.031(3.90)
Years of apprenticeship 0.106 (2.50) 0.068 (1.84)
Age < 15 −0.694(4.11)
−0.801(4.54)
−0.728(5.37)
−0.813(5.75)
25 < age < 35 0.412 (5.54) 0.415(5.54)
0.269 (4.40) 0.294(4.69)
35 < age < 45 0.467 (5.79) 0.512(6.27)
0.336 (4.87) 0.424(6.00)
45 < age < 55 0.265 (2.57) 0.266(2.56)
0.118 (1.31) 0.190(2.11)
55 < age < 65 −0.023(0.18)
−0.045(0.34)
−0.064(0.52)
−0.006(0.05)
65 < age −0.406(2.22)
−0.380(2.06)
−0.501(2.81)
−0.475(2.58)
Female −0.211(3.09)
−0.417(7.35)
−0.203(3.56)
−0.360(7.38)
Chinese 0.038 (0.35) 0.174(1.50)
−0.009(0.09)
0.165(1.60)
Other ethnicity 0.148 (1.34) 0.095(0.83)
0.187 (2.18) 0.107(1.23)
Regionallocation c
Urban −0.049(0.90)
0.016(0.30)
0.083 (1.71) 0.185(3.84)
Northern Uplands −0.201 −0.256 −0.153 −0.207
Household Welfare and Vietnam's Transition
Estimating the Model 172
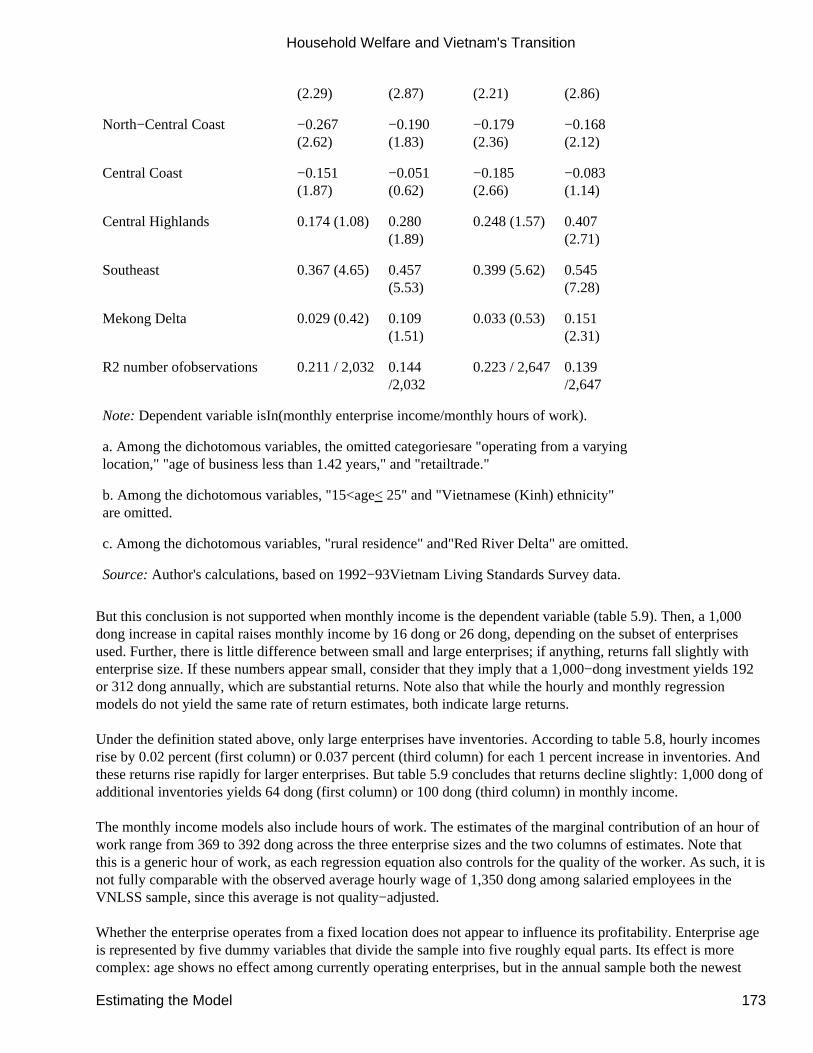
(2.29) (2.87) (2.21) (2.86)
North−Central Coast −0.267(2.62)
−0.190(1.83)
−0.179(2.36)
−0.168(2.12)
Central Coast −0.151(1.87)
−0.051(0.62)
−0.185(2.66)
−0.083(1.14)
Central Highlands 0.174 (1.08) 0.280(1.89)
0.248 (1.57) 0.407(2.71)
Southeast 0.367 (4.65) 0.457(5.53)
0.399 (5.62) 0.545(7.28)
Mekong Delta 0.029 (0.42) 0.109(1.51)
0.033 (0.53) 0.151(2.31)
R2 number ofobservations 0.211 / 2,032 0.144/2,032
0.223 / 2,647 0.139/2,647
Note: Dependent variable isIn(monthly enterprise income/monthly hours of work).
a. Among the dichotomous variables, the omitted categoriesare "operating from a varyinglocation," "age of business less than 1.42 years," and "retailtrade."
b. Among the dichotomous variables, "15<age< 25" and "Vietnamese (Kinh) ethnicity"are omitted.
c. Among the dichotomous variables, "rural residence" and"Red River Delta" are omitted.
Source: Author's calculations, based on 1992−93Vietnam Living Standards Survey data.
But this conclusion is not supported when monthly income is the dependent variable (table 5.9). Then, a 1,000dong increase in capital raises monthly income by 16 dong or 26 dong, depending on the subset of enterprisesused. Further, there is little difference between small and large enterprises; if anything, returns fall slightly withenterprise size. If these numbers appear small, consider that they imply that a 1,000−dong investment yields 192or 312 dong annually, which are substantial returns. Note also that while the hourly and monthly regressionmodels do not yield the same rate of return estimates, both indicate large returns.
Under the definition stated above, only large enterprises have inventories. According to table 5.8, hourly incomesrise by 0.02 percent (first column) or 0.037 percent (third column) for each 1 percent increase in inventories. Andthese returns rise rapidly for larger enterprises. But table 5.9 concludes that returns decline slightly: 1,000 dong ofadditional inventories yields 64 dong (first column) or 100 dong (third column) in monthly income.
The monthly income models also include hours of work. The estimates of the marginal contribution of an hour ofwork range from 369 to 392 dong across the three enterprise sizes and the two columns of estimates. Note thatthis is a generic hour of work, as each regression equation also controls for the quality of the worker. As such, it isnot fully comparable with the observed average hourly wage of 1,350 dong among salaried employees in theVNLSS sample, since this average is not quality−adjusted.
Whether the enterprise operates from a fixed location does not appear to influence its profitability. Enterprise ageis represented by five dummy variables that divide the sample into five roughly equal parts. Its effect is morecomplex: age shows no effect among currently operating enterprises, but in the annual sample both the newest
Household Welfare and Vietnam's Transition
Estimating the Model 173
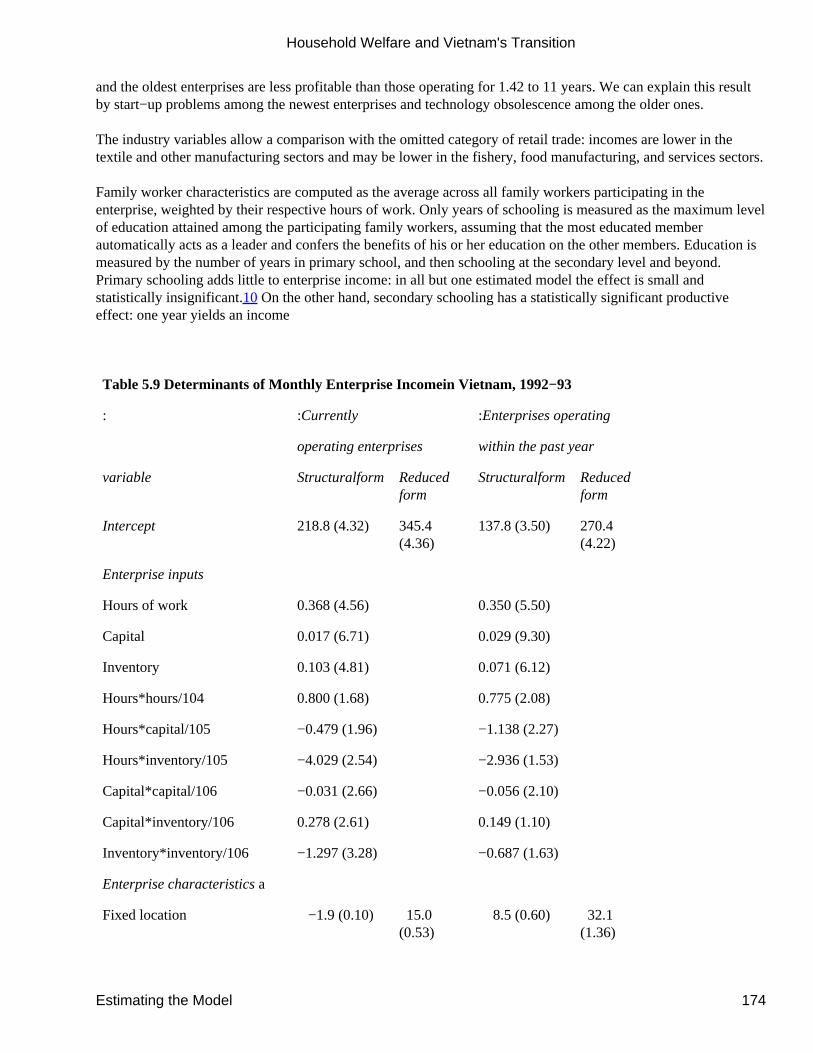
and the oldest enterprises are less profitable than those operating for 1.42 to 11 years. We can explain this resultby start−up problems among the newest enterprises and technology obsolescence among the older ones.
The industry variables allow a comparison with the omitted category of retail trade: incomes are lower in thetextile and other manufacturing sectors and may be lower in the fishery, food manufacturing, and services sectors.
Family worker characteristics are computed as the average across all family workers participating in theenterprise, weighted by their respective hours of work. Only years of schooling is measured as the maximum levelof education attained among the participating family workers, assuming that the most educated memberautomatically acts as a leader and confers the benefits of his or her education on the other members. Education ismeasured by the number of years in primary school, and then schooling at the secondary level and beyond.Primary schooling adds little to enterprise income: in all but one estimated model the effect is small andstatistically insignificant.10 On the other hand, secondary schooling has a statistically significant productiveeffect: one year yields an income
Table 5.9 Determinants of Monthly Enterprise Incomein Vietnam, 1992−93
: :Currently :Enterprises operating
operating enterprises within the past year
variable Structuralform Reducedform
Structuralform Reducedform
Intercept 218.8 (4.32) 345.4(4.36)
137.8 (3.50) 270.4(4.22)
Enterprise inputs
Hours of work 0.368 (4.56) 0.350 (5.50)
Capital 0.017 (6.71) 0.029 (9.30)
Inventory 0.103 (4.81) 0.071 (6.12)
Hours*hours/104 0.800 (1.68) 0.775 (2.08)
Hours*capital/105 −0.479 (1.96) −1.138 (2.27)
Hours*inventory/105 −4.029 (2.54) −2.936 (1.53)
Capital*capital/106 −0.031 (2.66) −0.056 (2.10)
Capital*inventory/106 0.278 (2.61) 0.149 (1.10)
Inventory*inventory/106 −1.297 (3.28) −0.687 (1.63)
Enterprise characteristics a
Fixed location −1.9 (0.10) 15.0(0.53)
8.5 (0.60) 32.1(1.36)
Household Welfare and Vietnam's Transition
Estimating the Model 174
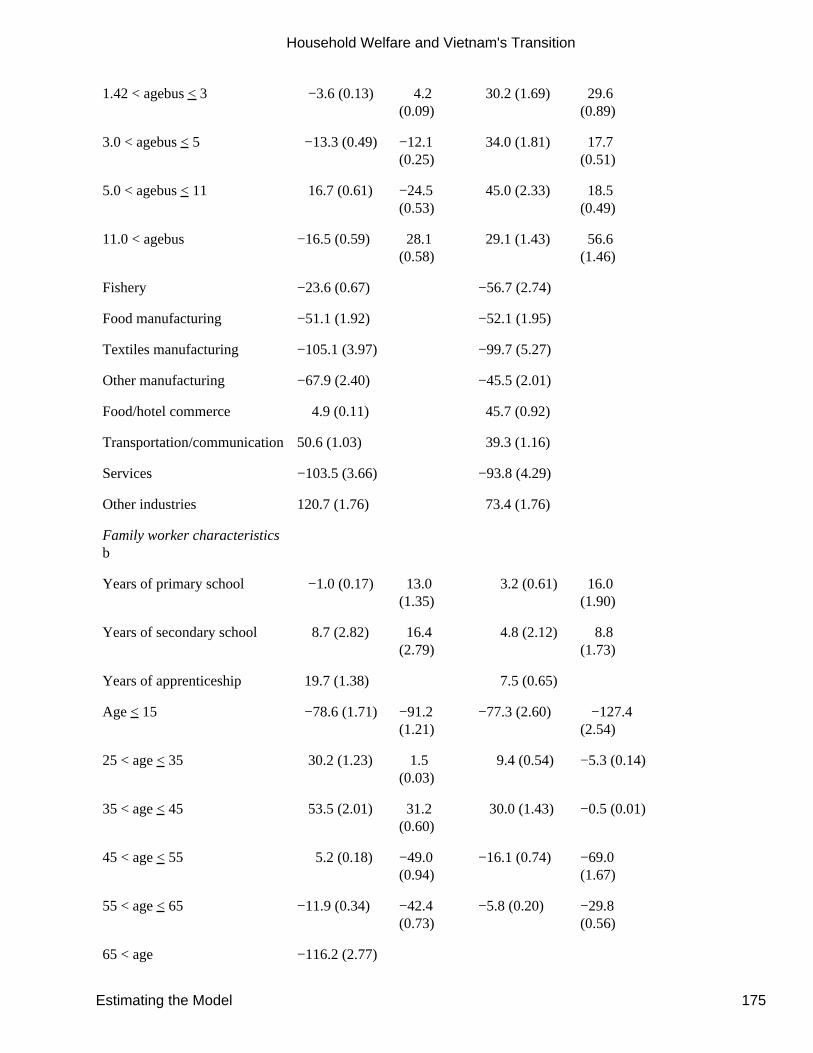
1.42 < agebus < 3 −3.6 (0.13) 4.2(0.09)
30.2 (1.69) 29.6(0.89)
3.0 < agebus < 5 −13.3 (0.49) −12.1(0.25)
34.0 (1.81) 17.7(0.51)
5.0 < agebus < 11 16.7 (0.61) −24.5(0.53)
45.0 (2.33) 18.5(0.49)
11.0 < agebus −16.5 (0.59) 28.1(0.58)
29.1 (1.43) 56.6(1.46)
Fishery −23.6 (0.67) −56.7 (2.74)
Food manufacturing −51.1 (1.92) −52.1 (1.95)
Textiles manufacturing −105.1 (3.97) −99.7 (5.27)
Other manufacturing −67.9 (2.40) −45.5 (2.01)
Food/hotel commerce 4.9 (0.11) 45.7 (0.92)
Transportation/communication50.6 (1.03) 39.3 (1.16)
Services −103.5 (3.66) −93.8 (4.29)
Other industries 120.7 (1.76) 73.4 (1.76)
Family worker characteristicsb
Years of primary school −1.0 (0.17) 13.0(1.35)
3.2 (0.61) 16.0(1.90)
Years of secondary school 8.7 (2.82) 16.4(2.79)
4.8 (2.12) 8.8(1.73)
Years of apprenticeship 19.7 (1.38) 7.5 (0.65)
Age < 15 −78.6 (1.71) −91.2(1.21)
−77.3 (2.60) −127.4(2.54)
25 < age < 35 30.2 (1.23) 1.5(0.03)
9.4 (0.54) −5.3 (0.14)
35 < age < 45 53.5 (2.01) 31.2(0.60)
30.0 (1.43) −0.5 (0.01)
45 < age < 55 5.2 (0.18) −49.0(0.94)
−16.1 (0.74) −69.0(1.67)
55 < age < 65 −11.9 (0.34) −42.4(0.73)
−5.8 (0.20) −29.8(0.56)
65 < age −116.2 (2.77)
Household Welfare and Vietnam's Transition
Estimating the Model 175
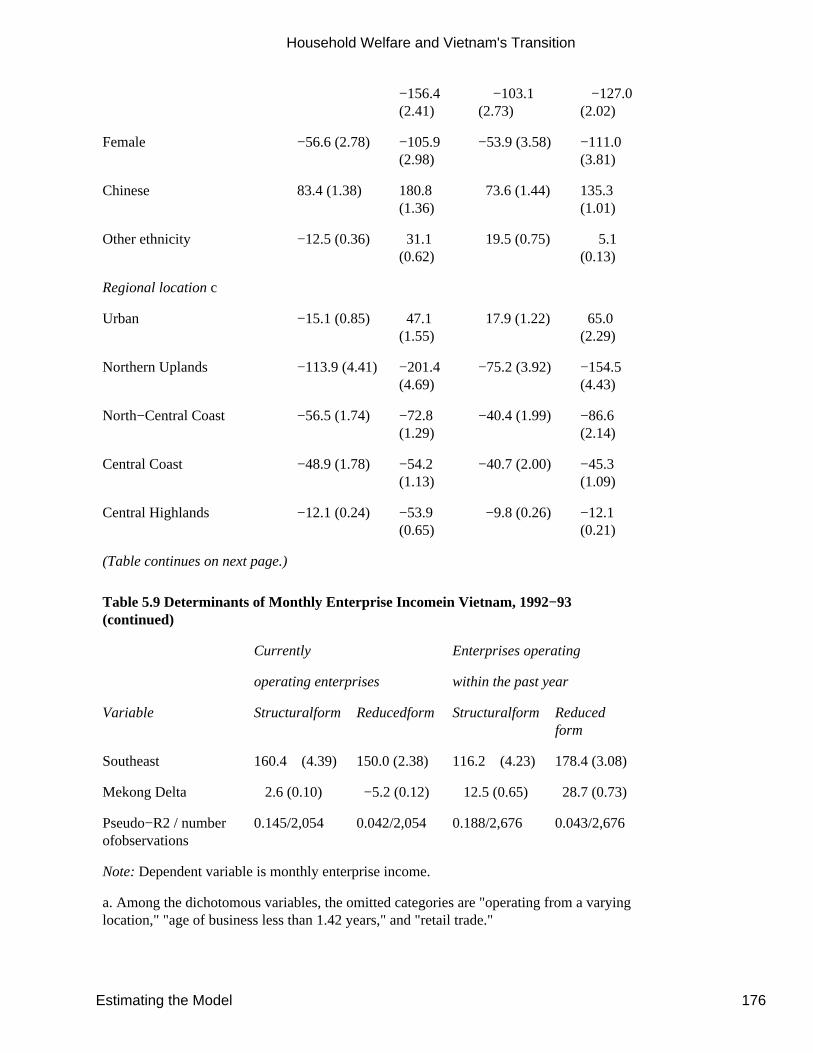
−156.4(2.41)
−103.1(2.73)
−127.0(2.02)
Female −56.6 (2.78) −105.9(2.98)
−53.9 (3.58) −111.0(3.81)
Chinese 83.4 (1.38) 180.8(1.36)
73.6 (1.44) 135.3(1.01)
Other ethnicity −12.5 (0.36) 31.1(0.62)
19.5 (0.75) 5.1(0.13)
Regional location c
Urban −15.1 (0.85) 47.1(1.55)
17.9 (1.22) 65.0(2.29)
Northern Uplands −113.9 (4.41) −201.4(4.69)
−75.2 (3.92) −154.5(4.43)
North−Central Coast −56.5 (1.74) −72.8(1.29)
−40.4 (1.99) −86.6(2.14)
Central Coast −48.9 (1.78) −54.2(1.13)
−40.7 (2.00) −45.3(1.09)
Central Highlands −12.1 (0.24) −53.9(0.65)
−9.8 (0.26) −12.1(0.21)
(Table continues on next page.)
Table 5.9 Determinants of Monthly Enterprise Incomein Vietnam, 1992−93(continued)
Currently Enterprises operating
operating enterprises within the past year
Variable Structuralform Reducedform Structuralform Reducedform
Southeast 160.4 (4.39) 150.0 (2.38) 116.2 (4.23) 178.4 (3.08)
Mekong Delta 2.6 (0.10) −5.2 (0.12) 12.5 (0.65) 28.7 (0.73)
Pseudo−R2 / numberofobservations
0.145/2,054 0.042/2,054 0.188/2,676 0.043/2,676
Note: Dependent variable is monthly enterprise income.
a. Among the dichotomous variables, the omitted categories are "operating from a varyinglocation," "age of business less than 1.42 years," and "retail trade."
Household Welfare and Vietnam's Transition
Estimating the Model 176
b. Among the dichotomous variables, "15<age< 25" and "Vietnamese (Kinh) ethnicity"are omitted.
c. Among the dichotomous variables, "rural residence" and "Red River Delta" are omitted.
Source: Author's calculations, based on 1992−93 Vietnam Living Standards Survey data.
increase of 1.8 to 2.5 percent, or 4,800 to 8,700 dong monthly. The combined productive and allocative effect islarger: about 3.1 percent, or 8,800 to 16,400 dong monthly. With the caveats noted earlier, it appears that theallocative effect of education is roughly the same as its productive effect.
Apprenticeship training and age are two other human capital measures. Apprenticeship training may have apositive impact, but the statistical significance varies among the models. The age effect is measured with a seriesof age dummy variables, allowing a comparison with workers in the 16−25−year−old age group. There is a strongage effect: both the youngest and oldest workers are less productive, as one might expect. Prime−aged (age26−55) workers may be most productive, but the evidence is not robust between the hourly and monthly incomemodels.
Women earn less. That there is both a productive and an allocative effect stands out clearly in the estimates: thestructural form models each show a negative parameter estimate, which doubles when we switch to the reducedform estimates. The doubling implies that men have more favorable enterprise characteristics that are omitted inthe reduced form equation: larger capital stocks (among currently operating enterprises, 4.2 million dong more onaverage), more inventories (on average, 118,000 dong more), industries with higher incomes (more women workin textiles), and more apprenticeship training (0.1 year more). The raw male−female difference in averageearnings is 147,000 dong monthly or 40 percent hourly for currently operating enterprises, and 123,000 dongmonthly and 32 percent hourly for the annual sample. These statistics are similar to the parameter estimates foundin the reduced form models. Therefore, the male−female income gap is not a result of schooling, age, ethnicity,region, or age of enterprises taken as a group, but rather is due in part to allocative choices that households makeinvolving female−run enterprises.
The last group of variables concerns regional location. We compare urban areas against the excluded rural areasand compare each of the six
listed regions against the Red River Delta. There is no clear positive effect of operating in an urban area, as otherstudies have reported (but the income data used here have been deflated with a region/time price index). Incomesin the Southeast are clearly higher than they are in the Red River Delta; those in the Northern Uplands and theNorth−Central Coast and Central Coast are lower. In view of the mean values of the dependent variables, theregional effects are considerable.
Considerations for Public Policy
The economy of Vietnam still has a strong agricultural orientation. The nonagricultural sector is relatively small:one−fourth of those working hold a wage job at some point during the year. About 25 percent of these wageemployees work in the public sector, some in farming, and a similar proportion engages in nonfarmself−employment. This part of the nonagricultural private sector is thriving. Compared with the other enterprisesin this sector, rates of return to capital are high and incomes compare well with the average earnings of wagedworkers. No selectivity bias was found in the empirical model of enterprise income determination, meaning thatthe favorable results generated with the current sample of enterprises should extend to the whole population ofVietnam. Finally, this paper presents evidence of a positive association between the (short−term) productiveperformance of the family enterprise and the household's long−term standard of living.
Household Welfare and Vietnam's Transition
Considerations for Public Policy 177

Taken together, these results imply that market forces provide a favorable environment for expanding nonfarmhousehold enterprises in Vietnam. Thus the main policy recommendation is to remove artificial barriers thatinhibit the formation and expansion of small enterprises. Several specific recommendations can be made:
Registration procedures are cumbersome. A prospective entrepreneur must submit many forms and certificatesthat must be evaluated by several layers of the bureaucracy, taking up to 60 days (World Bank 1995, 49−57).Both the certificates and the application are costly. The agency in charge of this procedure may see itself asadvising inexperienced entrepreneurs, but it is most likely that entrepreneurs prefer a simple business registrationprocedure that assigns them nothing more than a tax identification number. Similarly, entrepreneurs are currentlyrequired to apply for permission to expand or change the focus of their enterprise, which stymies enterprisegrowth.
The government should split the advisory function from the licensing process. It should stimulate privateenterprise by sponsoring community seminars on entrepreneurship and management at introductory and advancedlevels, either directly or through the Vietnam Chamber of Commerce and Industry. Doing so would also
send a clear message of support for private entrepreneurship that would further break down remaining ideologicalinhibitions against free market operations.
Organizing local, consistently operating markets will give households an incentive to start or expand anenterprise; developing transportation and marketing networks will open up more distant markets. Access to amarket raises the probability that a household will operate a nonfarm enterprise. Of the entrepreneurs in the Hanoisample (Le and Rondinelli 1993, 11), three−quarters mentioned as obstacles difficulties with selling their productsin a competitive market, the low level of purchasing power of their potential customers, and the lack of marketinformation. The government should also facilitate business contacts among entrepreneurs (Liedholm and Mead1986; World Bank 1995, 84).
There is some (weak) evidence that availability of utility services (electricity, water) in rural areas is a factor in ahousehold's decision of whether to operate a nonfarm enterprise. In principle, providing reliable utility servicesshould stimulate enterprise start−up and enhance enterprise profitability.
The government could offer subsidies or tax relief as an enticement to start up enterprises. But these initiativesmust be very carefully administered, to avoid substantial distortions in market incentives.
Few family enterprises appear to be paying taxes, either for licenses or in other forms. It may be thatentrepreneurs are put off by the complex registration procedures and the complicated tax code. Abiding by the taxsystem requires substantial bookkeeping efforts. It may also be that enterprises simply do not bother with theserequirements because they can avoid them easily without much probability of retribution. Moreover, one−third ofthe Hanoi sample complained about high and unfair taxes (Le and Rondinelli 1993, 11). The system makes taxevasion appealing, which lowers tax revenue and distorts production incentives because of sectoral differences inrates. A simpler tax structure is needed, and it is important to hold even small enterprises accountable for the taxesthey owe. Tax revenue will also grow if a portion is dedicated to finance public policy initiatives that benefitsmall enterprises. The analysis presented in this chapter suggests that the total tax revenue raised from smallenterprises is likely to at least double if full compliance is achieved.
Facilitating the availability of credit will allow both new and existing enterprises to expand. At present, theprivate sector is at a disadvantage when it comes to credit allocated by state−run banks, and a large portion ofprivate credit is arranged through informal channels (Rondinelli and Le 1995, 34; World Bank 1995, 68). At thesame time, only a small percentage of private savings is held in government banks. The banking sector is notfulfilling its financial inter−
Household Welfare and Vietnam's Transition
Considerations for Public Policy 178
mediation function because people do not trust banks with their savings−which is not surprising, given thegovernment's currency manipulations in the 1980s and the bankruptcy of a number of credit cooperatives in1990−91. Thus facilitating credit availability implies a simple abolishment of discriminatory lending practices anda complex policy of building up the banking sector.
Vietnam's legal structure is still developing. Regulatory changes occur frequently and are not always uniform or,in the eyes of entrepreneurs, fair (World Bank 1995, chapter 3). The economic goal also differs ideologically fromleaders' political goals. All of this creates uncertainty among prospective and active entrepreneurs, and lowersentrepreneurial initiative. Economic stability and security are key to high private sector investment.
Because the legal structure is still developing, there are loopholes in regulations and enforcement. Injusticepersists, which especially hurts the disadvantaged groups of society. It also creates conditions that lead toinequality in income and wealth. It is important that the legal structure become clear, manageable, andenforceable, and that it be put in place soon.
It is easy to find motivations for public policies that give preference to particular regions such as the NorthernUplands, the North−Central Coast, and the Central Coast, where enterprise incomes are lower, even when holdingother factors constant. All of the policy measures listed above could be applied with greater intensity in theregions that are found to be at a greater disadvantage, but facilitating connections with distant markets may have ahigher priority.
In a related sense, stimulating family enterprises in rural areas may well generate the kind of employment thatcould keep people from migrating to the cities. Given Vietnam's high population density and large agriculturalpopulation, this chapter offers encouraging findings that small−scale enterprises are productive and that ruralindustrialization programs can be successful as a result.
This chapter shows the existence of a large male−female enterprise income gap of 40 percent. Half of thisdisappears when we control for factors like capitalization and the type of sector in which the enterprise isengaged. To alleviate this portion of the income gap, policymakers should ensure that women have equal accessto training for diverse careers and to technology, credit, and so on. The other half of the income gap isunexplained−we may refer to this portion of the gap as "discrimination." Some scholars may point out, however,that women may be less efficient because household responsibilities interfere with enterprise activity. To thedegree that discrimination is an issue, policymakers can ensure that female entrepreneurs are not discriminatedagainst in receiving public sector contracts and, furthermore, that there is a receptive legal forum where femaleentrepreneurs can file complaints.
Finally, households with nonfarm enterprises appear at the top of the distribution of the standard of living moreoften than at the bottom. This finding may affect public policy initiatives in two different ways, depending onwhether the overriding goals emphasize economic growth or economic equality. A public policy emphasis onassistance to existing enterprises would satisfy the objectives of growth; if poverty is an overriding concern,policy should focus on the establishment of new enterprises and assistance to the smallest. This chapter giveshope that either type of action will be successful.
Notes
Comments by David Dollar, Paul Glewwe, Jennie Litvack, and several anonymous referees are greatlyappreciated. The author accepts responsibility for any errors in the paper.
Household Welfare and Vietnam's Transition
Notes 179
1. Other sources put the contribution of the nonstate sector at almost one−half of manufacturing output(Ljunggren 1993, 81−82), or at 84 percent of the output in the industrial and commercial sectors combined (Leand Rondinelli 1993, 8). Note that statistics on the nonstate private sector are likely to be inaccurate andincomplete. Because of poor bookkeeping practices, the activity of household enterprises is not captured well inthe statistics, and some productive activity and income is concealed to avoid taxation (World Bank 1995, 24).
2. This assumption is certainly subject to debate, particularly as a bargaining model has recently gainedpopularity. This model views each individual as a separate decisionmaker, rendering household−level outcomesas results of more or less cooperative agreements among household members.
3. One might argue that people take up apprenticeship training in order to prepare themselves to operate their ownenterprise. The variable is included here on the assumption that apprenticeships prepare one for a craft oroccupation and that the decision to engage in this craft through one's own enterprise is made separately.
4. Alternatively, it could be argued that these occupational variables contain information about the economicenvironment that is poorly measured by the other variables and that the parameter estimates reveal environmentalconditions, rather than intergenerational effects. It is not easy to discard this alternative hypothesis. But it isinteresting to note that of the heads and spouses in the VNLSS sample, 28 percent do not currently live wherethey were born and another 23 percent had moved elsewhere for at least 12 months before returning to theirbirthplace. In urban areas 59 percent of heads and spouses on average stated that they were not born where theynow live and that they had spent 44 percent of their life at their current location. Thus, since migration takespeople away from their parents' environment, the estimated effect of the parental occupation variables are morelikely an intergenerational effect.
5. As every person in Vietnam has an equal probability of being sampled by the Living Standards Survey, anenterprise with 100 employees is five times more likely to appear in the sample than an enterprise with 20employees. Thus for enterprises
found through the wage employee sample, the frequency is weighted by the number of people that work thereaccording to the wage employee.
6. Size is defined by net revenue, total revenue, total capital resource, or total physical capital.
7. In Cte d'Ivoire it is the rural households with nonfarm enterprises that tend to be better off than the averagerural household, whereas urban households with an enterprise tend to be worse off than the average urbanhousehold (Vijverberg 1990, 534). Ivorian wage earnings are highly unequal, and poor urban households are morelikely to depend on enterprise earnings. Thus while the analysis of Ivorian households differs in methodology, it isclear that the self−employed in Vietnam are in a better position.
8. Because the structural form is estimated with bias, by implication, the allocative effect (the difference betweenthe reduced and structural parameter estimates) is estimated with bias as well. The direction of this bias is difficultto predict.
Household Welfare and Vietnam's Transition
Notes 180
9. The technique developed by Lee (1978) and Heckman (1979) was applied, using the probit model introducedearlier as the selection model. The parameter estimates of the lambda variable in the enterprise income equationwere statistically insignificant in eight tests, yielding seven t−statistics below 1 and one of 1.61.
10. For only one−fifth of the enterprises is the amount of education less than five years. Thus the effect of primaryschooling is determined by only a small portion of the sample.
References
Beresford, Melanie. 1988. Vietnam: Politics, Economics, and Society. London: Pinter.
Blau, David M. 1986. "Self−Employment, Earnings, and Mobility in Peninsular Malaysia." World Development14(7): 839−52.
Chiswick, Carmel U. 1977. "On Estimating Earnings Functions for LDCs." Journal of Development Economics 4(March): 67−78.
Durand, John D. 1975. The Labor Force in Economic Development: A Comparison of International Census Data,1946 −1966. Princeton, N.J.: Princeton University Press.
Fforde, Adam. 1993. "The Political Economy of 'Reform' in Vietnam: Some Reflections." In Börje Ljunggren,ed., The Challenge of Reform in Indochina. Cambridge, Mass.: Harvard University Press.
Fforde, Adam, and Suzanne H. Paine. 1987. The Limits of National Liberation. London: Croon Helm.
Galenson, Walter. 1992. Labor and Economic Growth in Five Asian Countries. New York: Praeger.
Heckman, James J. 1979. "Sample Selection Bias as a Specification Error." Econometrica 47(1): 153−62.
Hy Van Luong. 1993."The Political Economy of Vietnamese Reforms: A Microscopic Perspective from TwoCeramics Manufacturing Centers." In William S. Turley and Mark Selden, eds., Reinventing VietnameseSocialism. Boulder, Colo.: Westview.
ILO (International Labour Organisation). 1992. Yearbook of Labour Statistics. Geneva: International LabourOffice.
Kaufman, Joan, and Gita Sen. 1993. ''Population, Health, and Gender in Vietnam: Social Policies under theEconomic Reforms." In Börje Ljunggren, ed., The Challenge of Reform in Indochina. Cambridge, Mass.: HarvardUniversity Press.
Le Ngoc Hung, and Dennis A Rondinelli. 1993. "Small Business Development and Economic Transformation inVietnam." Journal of Asian Business 9(4): 1−23.
Lee, Lung−Fei. 1978. "Unionism and Wage Rates: A Simultaneous Equations Model with Qualitative andLimited Dependent Variables." International Economic Review 19(2): 415−34.
Liedholm, Carl, and Donald C. Mead. 1986. "Small−Scale Industry." In Robert J. Berg and Jennifer SeymourWhitaker, eds., Strategies for African Development. Berkeley: University of California Press.
Household Welfare and Vietnam's Transition
References 181
Ljunggren, Börje. 1993. "Market Economies under Communist Regimes: Reform in Vietnam, Laos, andCambodia." In Börje Ljunggren, ed., The Challenge of Reform in Indochina. Cambridge, Mass.: HarvardUniversity Press.
Mazumdar, Dipak. 1981. The Urban Labor Market and Income Distribution. New York: Oxford University Press.
Moock, Peter, Philip Musgrove, and Morton Stelcner. 1990. Education and Earnings in Peru's Informal NonfarmFamily Enterprises. Living Standards Measurement Study Working Paper 64. Washington, D.C.: World Bank.
Nguyen Tien Hung, G. 1977. Economic Development of Socialist Vietnam, 1955 −1980. New York: Praeger.
Pelzer, Kristin. 1993. "Socio−Cultural Dimensions of Renovation in Vietnam: Doi Moi as Dialogue andTransformation in Gender Relations." In William S. Turley and Mark Selden, eds., Reinventing VietnameseSocialism. Boulder, Colo.: Westview.
Porter, Gareth. 1993. Vietnam: The Politics of Bureaucratic Socialism. Ithaca, N.Y.: Cornell University Press.
Rondinelli, Dennis A., and Le Ngoc Hung. 1995. "Creating a New Business Climate in Vietnam: Challenges ofPrivatization and Economic Reform." Business & the Contemporary World 1(25): 39.
Speare, Alden, and John Harris. 1986. "Education, Earnings and Migration in Industry." Economic Developmentand Cultural Change 34(2): 223−44.
Teilhet−Waldorf, Saral, and William H. Waldorf. 1983. "Earnings of Self−Employed in an Informal Sector: ACase Study of Bangkok." Economic Development and Cultural Change 31(3): 587−607.
Turley, William S. 1993. "Introduction." In William S. Turley and Mark Selden, eds., Reinventing VietnameseSocialism. Boulder, Colo.: Westview.
Vijverberg, Wim P. M. 1986. "Consistent Estimates of the Wage Equation When Individuals Choose amongIncome−Earning Activities." Southern Economic Journal 52(4): 1028−42.
____. 1990. "Nonfarm Self−Employment and the Informal Sector in Côte d'Ivoire: A Test of CategoricalIdentity." Journal of Developing Areas 24(4): 523−42.
____. 1991. "Profits from Self−Employment: A Case Study of Côte d'Ivoire." World Development 19(6): 683−96.
____. 1993. "Educational Investments and Returns for Women and Men in Côte d'Ivoire." Journal of HumanResources 28(4): 933−74.
____. 1995. "Returns to Schooling in Non−Farm Self−Employment: An Econometric Case Study of Ghana."World Development 23(7): 1215−27.
____. 1996. "Non−Farm Enterprises in LSS Surveys." University of Texas at Dallas, Department of Economics.
____. 1998. "Schooling, Skills and Income from Non−Farm Self−Employment in Ghana." In Paul Glewwe, ed.,The Economics of School Quality Investments in Developing Countries: An Empirical Study of Ghana. London:Macmillan.
Household Welfare and Vietnam's Transition
References 182
Vo Dai Luoc. 1993. "The Fight Against Inflation: Achievements and Problems." In William S. Turley and MarkSelden, eds., Reinventing Vietnamese Socialism. Boulder, Colo.: Westview.
World Bank. 1995. "Viet Nam: Economic Report on Industrialization and Industrial Policy." Report 14645−VN.East Asia and Pacific Region. Washington, D.C.
6—Private Transfers in Vietnam
Donald Cox, James Fetzer, and Emmanuel Jimenez
Vietnam faces many problems in its transition from socialism to capitalism. Leading policy issues includeprotection of workers laid off from state enterprises, encouragement of domestic savings for capital formation,and development of human capital. Though much of the current policy debate focuses on government or markets,a third institution, the family, is also relevant for Vietnam. Private income transfers between households mightfunction like publicly provided safety nets−for example, in helping to protect displaced workers from theconsequences of unemployment. Parental transfers could help finance investment in human capital, a keydeterminant of economic growth. And incentives for private saving, another channel for economic growth, couldbe affected by private, informal old−age support systems.
There are reasons to believe that private transfers play a greater role in Vietnam than in the transition economiesof Eastern Europe. Vietnam's Confucian heritage and agrarian history have likely strengthened family ties. Andthe command economy has a much shorter history in Vietnam than in, say, Russia, so reliance on state transfersmight be less deeply ingrained. Despite their potential importance for policy, we know little about private transferpatterns in Vietnam because until recently we did not have the requisite household survey data. The 1992−93Vietnam Living Standards Survey (VNLSS) is now available, however, and it contains information necessary forinvestigating private transfers.
This chapter uses the VNLSS to provide a snapshot of private transfer activity. We investigate private transferpatterns along several dimensions, such as age, household resources, household demographics, and regionalcharacteristics. We find that private transfers are substantial and widespread in Vietnam, and that they sometimesfunction like means−tested public transfers. They are targeted to vulnerable groups, such as low−incomehouseholds
or households affected by illness. But they are also given disproportionately to the well−educated. A substantialportion of elderly households receive private transfers, suggesting that they function in part as old−age support.
Each of these patterns is related to the policy concerns listed above, and public transfer schemes should bedesigned taking into account possible private transfer responses. Public transfers can crowd out private transfers,diluting the effectiveness of public income redistribution. Suppose that for altruistic reasons parents aretransferring income to a child living away from home.1 Suddenly the child becomes unemployed. The parentsrespond by increasing their altruistic transfers. Private transfers function like insurance−the child's consumptiondoes not fall as much as his earnings because private transfers fill part of the income shortfall. Now suppose anunemployment insurance system was in place when the child was laid off. Since the child's consumption is partlyinsured by this public program, the parents need not contribute as much support to him. In this way an expansionof public transfers can cause private transfer networks to diminish.
Household Welfare and Vietnam's Transition
6— Private Transfers in Vietnam 183
As a result of this crowding out, the child's parents share in the benefits of the public transfer program because itlessens their burden of support.2 And the child does not reap the full benefits of the program because it causesprivate transfers to fall. Thus the response of private transfers to the expansion of public transfers creates atargeting problem. Part of the benefits of unemployment insurance accrue to parents, who could be from upperincome brackets. Of course, many unemployed people may have no relatives who are willing or able to providehelp. These people benefit fully from unemployment insurance. In addition, public transfer systems enable muchlarger numbers of households to pool risk.
Crowding out can occur with other programs as well.3 Suppose, for example, that a child supports his retiredparents, and then a public pension program is created. The child's burden is eased because his parents now receivepublic transfers−and private transfers are again crowded out by public ones.
A second reason private transfers might be relevant for policy is their possible connection to capital formation andgrowth. Private transfers can vary over the life cycle, especially if capital market imperfections exist. Forexample, if children have difficulty financing their education or on−the−job training, parents may offer privatetransfers. Later in life the children may provide old−age support to parents. The life−cycle dimension of privatetransfers ties them to economic growth. The more private transfers flow from old to young, as opposed to youngto old, the better it is for economic growth. There are a couple of reasons for this. The most obvious connection isthat private transfers targeted toward students enhance the aggregate stock of human capital. But there is a furtherand perhaps more subtle connection between private transfers and economic growth. A strong private old−agesupport system might stifle incentives to save for retirement. So the finding that private transfers are targeted tothe elderly could be
interpreted as a symptom of weak incentives for private saving. While much of the logic of these behavioralmodels is appealing, the actual magnitude and patterns of private transfers are empirical questions.
Description of the Data Set
The VNLSS is well−suited for analyzing private transfer behavior because it contains information about moneyand goods transferred between households, as well as potential determinants of these transfers. Some privatetransfers are measured at the individual level and some at the household level. Since the household is our unit ofanalysis, we aggregate individual transfers to arrive at a household figure.
In the "income" section of the household questionnaire respondents are asked to report on income that thehousehold receives from a variety of sources. In the first section of this module respondents are asked, "Duringthe past 12 months, has any member of your household received money or goods from persons who are notmembers of your household?" If respondents answered yes, they were asked the names of all donors, whichhousehold member received the money, the relationship of the donor to the recipient, where the donor lives,whether part of the transfer was to be repaid, and the amount. Respondents report both cash and in−kind amountsby answering the question, "How much money have household members received from this person in the past 12months, including the value of all payments in kind?"
In the next section of this module respondents are asked a set of questions about income from miscellaneoussources: "What is the value of all income received by members of your household in cash and in kind from[income source] during the past 12 months?" Among the fourteen sources listed were the categories "Gifts,including gifts related to weddings, funerals, birthdays, etc. (money and value in kind)" and "Dowry orinheritance." The structure of the module makes clear that this income comes from other households.
In the next module respondents are asked about loans: "Do you or members of your household owe money orgoods to anyone? ...a relative, friend, etc." Respondents who answer "yes," report the type of creditor
Household Welfare and Vietnam's Transition
Description of the Data Set 184
(moneylender, government bank). Among the possible sources of credit are relatives and other private individuals.We count these loans as transfers. Respondents are asked about loan amounts ("How much money have themembers of the household borrowed from [source] under this loan?") and timing ("In what month and year did thehousehold member borrow this money or these goods?"). Loans make up about 22 percent of the value ofaggregate transfers.
Outflows of private transfers are reported in the final section of the expenditure module. After answering severalquestions concerning detailed expenditure components, respondents are asked: "During the past 12 months, hasany member of your household provided money or goods
to persons who are not members of your household?" If respondents answered yes, they were asked the names ofall donors, which household member gave the money, the relationship of the recipient to the donor, where therecipient lives, whether part of the transfer was to be repaid, and the amount. ("How much money have householdmembers sent to this person in the past 12 months, including the value of all payments in kind?")
Transfers received and transfers given are not strictly comparable because there are more categories for receipts(such as dowries and loans). Transfers from abroad are another source of imbalance between receiving andgiving. We expect reported receipts to exceed gifts.
Respondents are asked to report their income and income received by others in the household. There are fourpossible sources of income:
Wages. Respondents report wage income from primary and secondary jobs held in the seven days prior to thesurvey, and income from other jobs held in the 12 months prior to the survey.
Agricultural operations. A separate section of the VNLSS records information for calculating income fromagriculture. We calculate profit from operation of the farm by subtracting total expenses from total revenues.Total revenues include those from the sale of crops, crop by−products, livestock, and livestock products. Bothcash and barter payments are included in the calculation. Also included are revenues from the rental ofagricultural land and the value of agricultural production consumed. Expenses include payments for agriculturallabor, equipment rental and repairs, fuel, irrigation, fees for land−use rights, and taxes.
Business activities. Households report revenues and expenses associated with up to three family−ownedbusinesses. Revenues include income from the sale of products in the past 12 months (cash and in−kind).Household consumption of business production is counted as revenues. Revenues and expenses are adjusted forpartial ownership by multiplying each by the household's share of a jointly owned business. We did not countexpenditures on buildings and land as expense flows, and instead calculated depreciation expenses for these. Weassumed a service life of 30 years for buildings and land, and one of 10 years for other durables such asequipment. We used straight−line depreciation.
Other. Households are asked to report income from a variety of sources, such as interest income and publictransfers. These questions are contained in a separate module that deals with miscellaneous income sources.Questions about private transfer receipts, discussed above, are also included in this module.
The survey contains several questions about employment status. Those not currently working are asked if theywould like to find a job, and those who are currently employed are asked if they experienced a spell of
unemployment in the past year. The survey also includes questions dealing with the demographic composition ofthe household: the ages and educational attainment of individuals, the number and ages of children, the location of
Household Welfare and Vietnam's Transition
Description of the Data Set 185
the household, and migration history.
We deleted observations with zero or negative income or expenses, and households whose total resources, takingborrowing and saving into account, were grossly inconsistent with their consumption expenditures. For example,we deleted households whose income plus borrowing was less than a third of their total expenditures, or thosewhose resources were more than three times their consumption (see the appendix for details).
Descriptive Evidence
Private transfers in Vietnam are both widespread and significant. One way to gauge the extent of transfers is tolook at total gross transfers received and given.
Scope and Magnitude of Transfers
More than half (51 percent) of the sample received private transfers, and almost three−quarters (72 percent) gavethem (table 6.1). About 38 percent did both, and about 15 percent did neither. We refer to that 15 percent as"others."4
Since some households both gave and received, we characterized households as net donors or net recipientsaccording to whether outflows of private transfers exceeded or fell short of inflows. Forty−two percent of thehouseholds were net recipients and 43 percent were net givers. Twelve percent of net recipients received transfersfrom abroad (see table 6.1).
Participation in making or receiving transfers varies considerably by geographic region. Overall, participationranges from a maximum of slightly more than 90 percent in the Mekong Delta, to 60 percent in the North−CentralCoast.
The Central Coast has the highest incidence of recipients, while the North−Central Coast has the lowest (figure6.1). The Mekong Delta has the highest proportion of givers while the North−Central Coast has the lowest (figure6.2).
Private transfers account for a significant portion of household income.5 For the overall sample, gross transferreceipts make up 12 percent of household income (see table 6.1, column 1).6 The corresponding figure for thesample of net recipients is 26 percent (see table 6.1, column 2). Net transfer receipts for this sample total 23.6percent of household income. On the other side, net donors give away 4.3 percent of their income (see table 6.1,column 3).
Gross transfers received for the whole sample, 775,000 dong, are an order of magnitude higher than transfersgiven, 199,000 dong, but the two
Table 6.1 Characteristics of Households in Vietnam, by Private Transfer Status
CharacteristicAllhouseholds
Netrecipients
Netdonors Other
Income
Income 6,453 6,965 6,849 4,008
Income before public transfers 6,266 6,778 6,629 3,909
Household Welfare and Vietnam's Transition
Descriptive Evidence 186
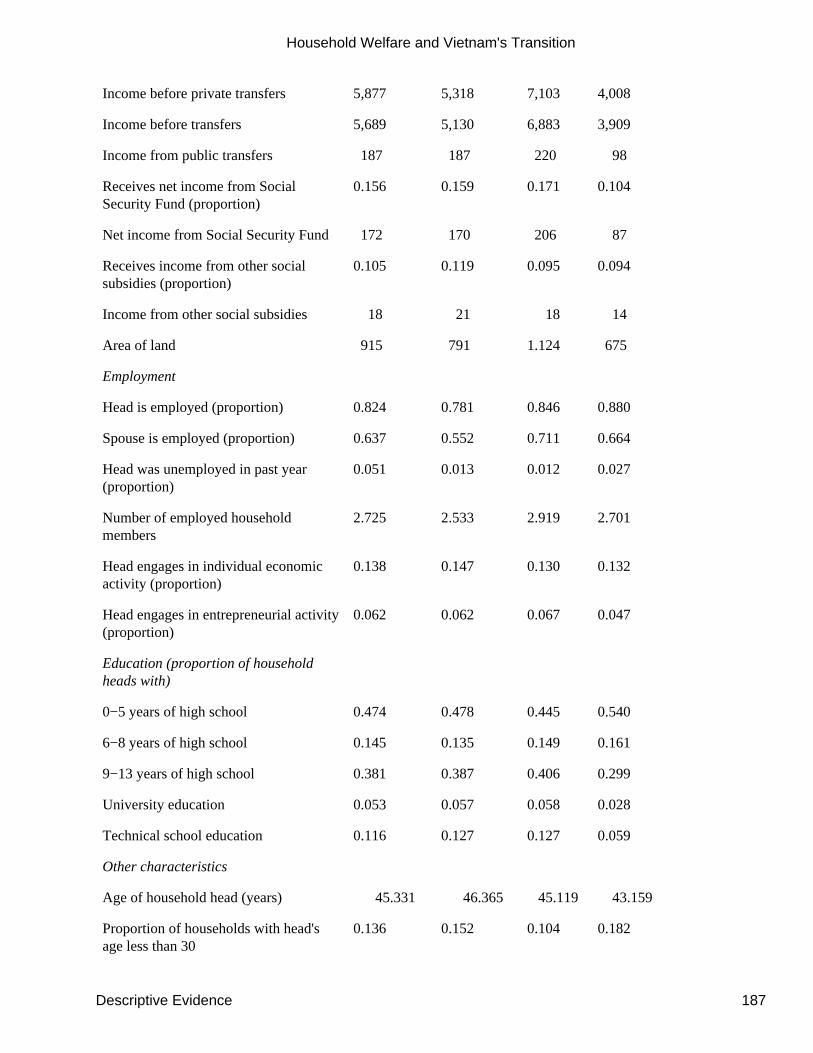
Income before private transfers 5,877 5,318 7,103 4,008
Income before transfers 5,689 5,130 6,883 3,909
Income from public transfers 187 187 220 98
Receives net income from SocialSecurity Fund (proportion)
0.156 0.159 0.171 0.104
Net income from Social Security Fund 172 170 206 87
Receives income from other socialsubsidies (proportion)
0.105 0.119 0.095 0.094
Income from other social subsidies 18 21 18 14
Area of land 915 791 1.124 675
Employment
Head is employed (proportion) 0.824 0.781 0.846 0.880
Spouse is employed (proportion) 0.637 0.552 0.711 0.664
Head was unemployed in past year(proportion)
0.051 0.013 0.012 0.027
Number of employed householdmembers
2.725 2.533 2.919 2.701
Head engages in individual economicactivity (proportion)
0.138 0.147 0.130 0.132
Head engages in entrepreneurial activity(proportion)
0.062 0.062 0.067 0.047
Education (proportion of householdheads with)
0−5 years of high school 0.474 0.478 0.445 0.540
6−8 years of high school 0.145 0.135 0.149 0.161
9−13 years of high school 0.381 0.387 0.406 0.299
University education 0.053 0.057 0.058 0.028
Technical school education 0.116 0.127 0.127 0.059
Other characteristics
Age of household head (years) 45.331 46.365 45.119 43.159
Proportion of households with head'sage less than 30
0.136 0.152 0.104 0.182
Household Welfare and Vietnam's Transition
Descriptive Evidence 187
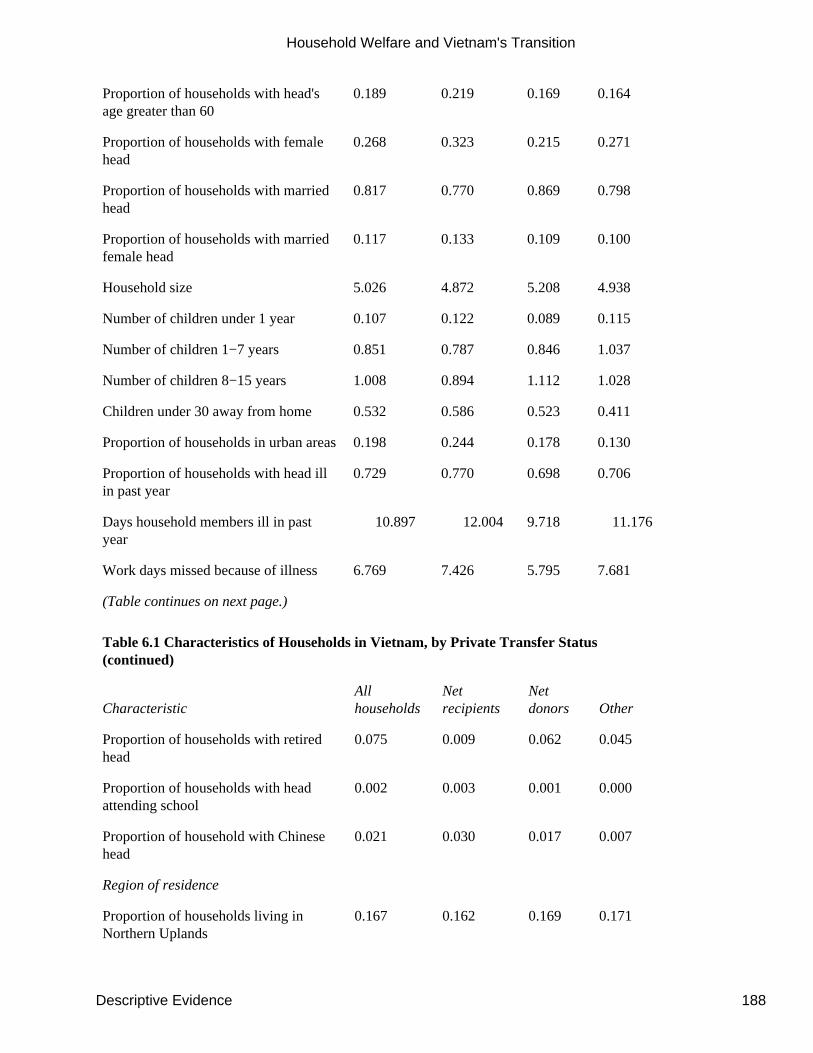
Proportion of households with head'sage greater than 60
0.189 0.219 0.169 0.164
Proportion of households with femalehead
0.268 0.323 0.215 0.271
Proportion of households with marriedhead
0.817 0.770 0.869 0.798
Proportion of households with marriedfemale head
0.117 0.133 0.109 0.100
Household size 5.026 4.872 5.208 4.938
Number of children under 1 year 0.107 0.122 0.089 0.115
Number of children 1−7 years 0.851 0.787 0.846 1.037
Number of children 8−15 years 1.008 0.894 1.112 1.028
Children under 30 away from home 0.532 0.586 0.523 0.411
Proportion of households in urban areas0.198 0.244 0.178 0.130
Proportion of households with head illin past year
0.729 0.770 0.698 0.706
Days household members ill in pastyear
10.897 12.004 9.718 11.176
Work days missed because of illness 6.769 7.426 5.795 7.681
(Table continues on next page.)
Table 6.1 Characteristics of Households in Vietnam, by Private Transfer Status(continued)
CharacteristicAllhouseholds
Netrecipients
Netdonors Other
Proportion of households with retiredhead
0.075 0.009 0.062 0.045
Proportion of households with headattending school
0.002 0.003 0.001 0.000
Proportion of household with Chinesehead
0.021 0.030 0.017 0.007
Region of residence
Proportion of households living inNorthern Uplands
0.167 0.162 0.169 0.171
Household Welfare and Vietnam's Transition
Descriptive Evidence 188
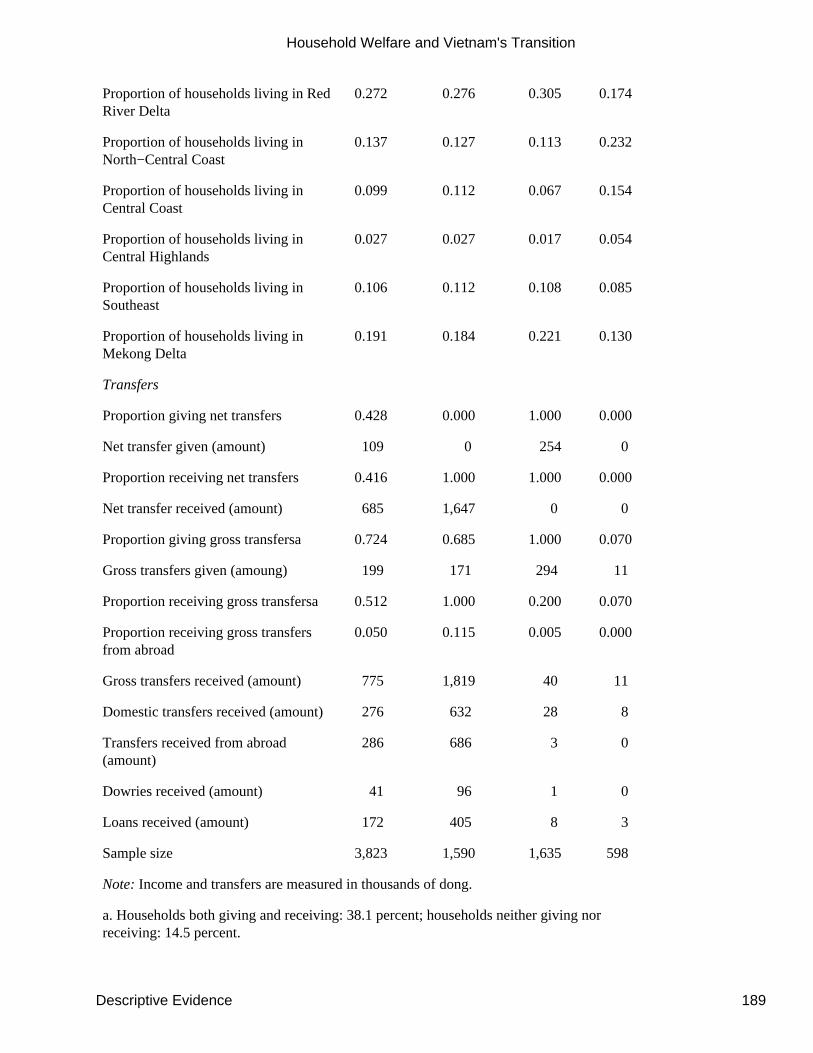
Proportion of households living in RedRiver Delta
0.272 0.276 0.305 0.174
Proportion of households living inNorth−Central Coast
0.137 0.127 0.113 0.232
Proportion of households living inCentral Coast
0.099 0.112 0.067 0.154
Proportion of households living inCentral Highlands
0.027 0.027 0.017 0.054
Proportion of households living inSoutheast
0.106 0.112 0.108 0.085
Proportion of households living inMekong Delta
0.191 0.184 0.221 0.130
Transfers
Proportion giving net transfers 0.428 0.000 1.000 0.000
Net transfer given (amount) 109 0 254 0
Proportion receiving net transfers 0.416 1.000 1.000 0.000
Net transfer received (amount) 685 1,647 0 0
Proportion giving gross transfersa 0.724 0.685 1.000 0.070
Gross transfers given (amoung) 199 171 294 11
Proportion receiving gross transfersa 0.512 1.000 0.200 0.070
Proportion receiving gross transfersfrom abroad
0.050 0.115 0.005 0.000
Gross transfers received (amount) 775 1,819 40 11
Domestic transfers received (amount) 276 632 28 8
Transfers received from abroad(amount)
286 686 3 0
Dowries received (amount) 41 96 1 0
Loans received (amount) 172 405 8 3
Sample size 3,823 1,590 1,635 598
Note: Income and transfers are measured in thousands of dong.
a. Households both giving and receiving: 38.1 percent; households neither giving norreceiving: 14.5 percent.
Household Welfare and Vietnam's Transition
Descriptive Evidence 189
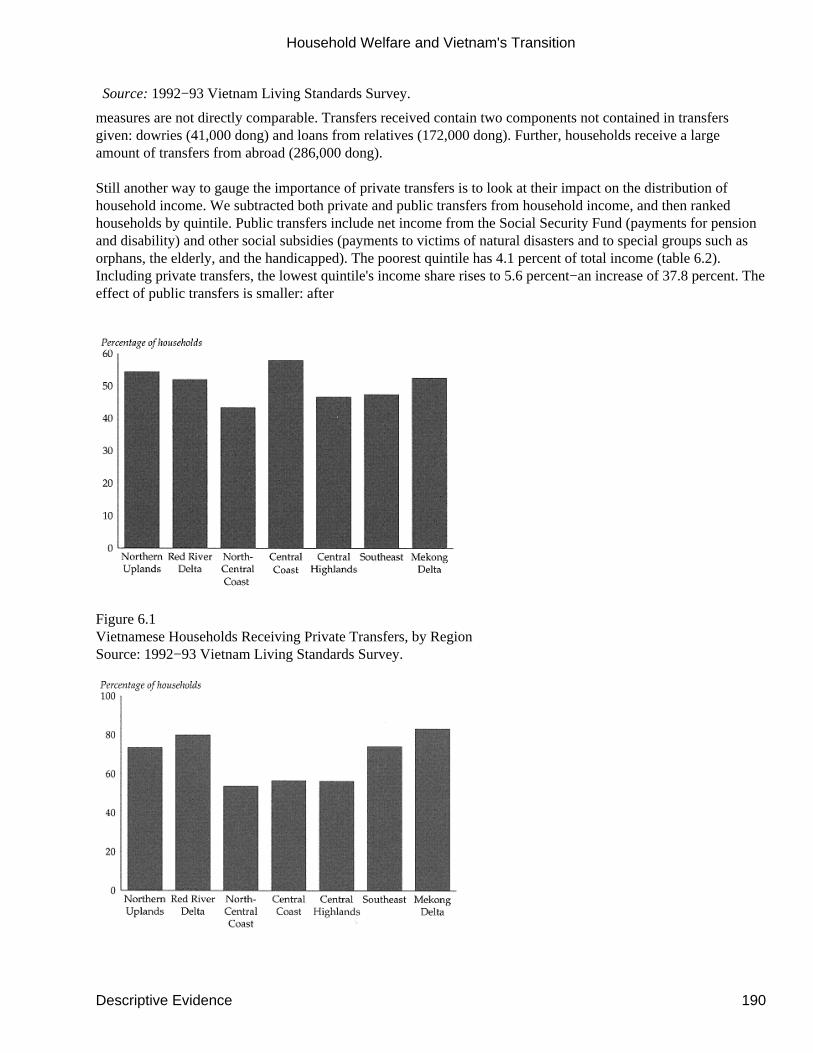
Source: 1992−93 Vietnam Living Standards Survey.
measures are not directly comparable. Transfers received contain two components not contained in transfersgiven: dowries (41,000 dong) and loans from relatives (172,000 dong). Further, households receive a largeamount of transfers from abroad (286,000 dong).
Still another way to gauge the importance of private transfers is to look at their impact on the distribution ofhousehold income. We subtracted both private and public transfers from household income, and then rankedhouseholds by quintile. Public transfers include net income from the Social Security Fund (payments for pensionand disability) and other social subsidies (payments to victims of natural disasters and to special groups such asorphans, the elderly, and the handicapped). The poorest quintile has 4.1 percent of total income (table 6.2).Including private transfers, the lowest quintile's income share rises to 5.6 percent−an increase of 37.8 percent. Theeffect of public transfers is smaller: after
Figure 6.1Vietnamese Households Receiving Private Transfers, by RegionSource: 1992−93 Vietnam Living Standards Survey.
Household Welfare and Vietnam's Transition
Descriptive Evidence 190
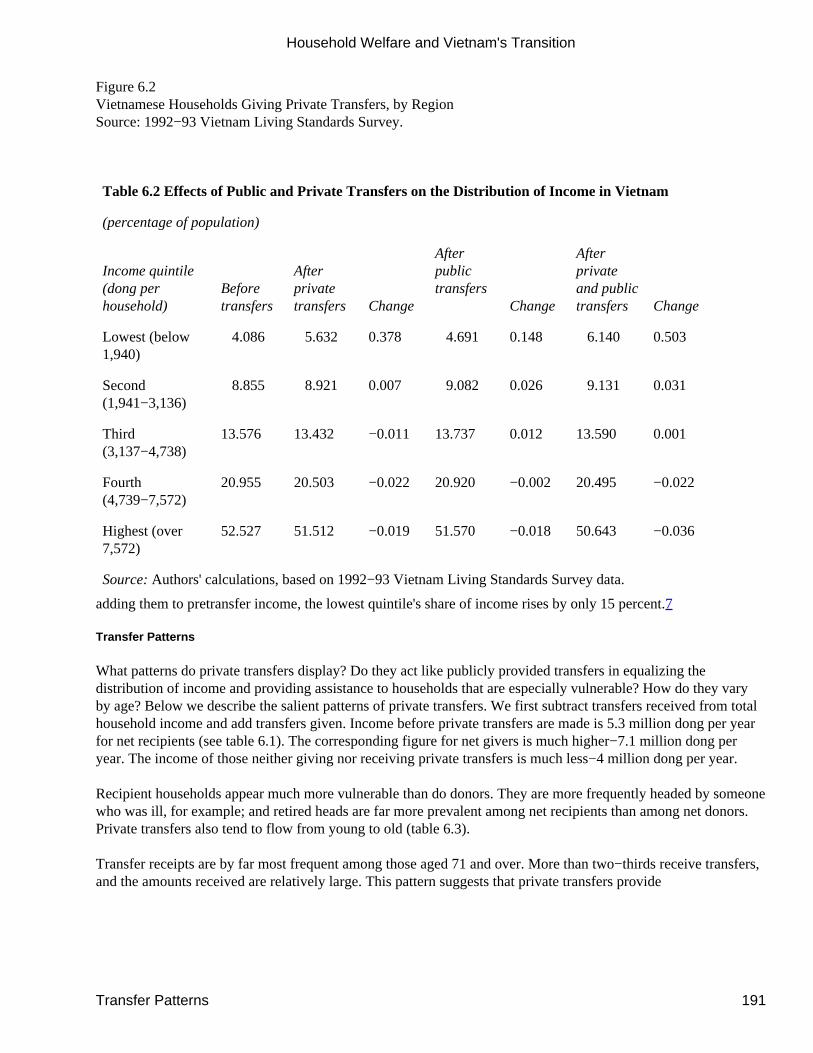
Figure 6.2Vietnamese Households Giving Private Transfers, by RegionSource: 1992−93 Vietnam Living Standards Survey.
Table 6.2 Effects of Public and Private Transfers on the Distribution of Income in Vietnam
(percentage of population)
Income quintile(dong perhousehold)
Beforetransfers
Afterprivatetransfers Change
Afterpublictransfers
Change
Afterprivateand publictransfers Change
Lowest (below1,940)
4.086 5.632 0.378 4.691 0.148 6.140 0.503
Second(1,941−3,136)
8.855 8.921 0.007 9.082 0.026 9.131 0.031
Third(3,137−4,738)
13.576 13.432 −0.011 13.737 0.012 13.590 0.001
Fourth(4,739−7,572)
20.955 20.503 −0.022 20.920 −0.002 20.495 −0.022
Highest (over7,572)
52.527 51.512 −0.019 51.570 −0.018 50.643 −0.036
Source: Authors' calculations, based on 1992−93 Vietnam Living Standards Survey data.
adding them to pretransfer income, the lowest quintile's share of income rises by only 15 percent.7
Transfer Patterns
What patterns do private transfers display? Do they act like publicly provided transfers in equalizing thedistribution of income and providing assistance to households that are especially vulnerable? How do they varyby age? Below we describe the salient patterns of private transfers. We first subtract transfers received from totalhousehold income and add transfers given. Income before private transfers are made is 5.3 million dong per yearfor net recipients (see table 6.1). The corresponding figure for net givers is much higher−7.1 million dong peryear. The income of those neither giving nor receiving private transfers is much less−4 million dong per year.
Recipient households appear much more vulnerable than do donors. They are more frequently headed by someonewho was ill, for example; and retired heads are far more prevalent among net recipients than among net donors.Private transfers also tend to flow from young to old (table 6.3).
Transfer receipts are by far most frequent among those aged 71 and over. More than two−thirds receive transfers,and the amounts received are relatively large. This pattern suggests that private transfers provide
Household Welfare and Vietnam's Transition
Transfer Patterns 191
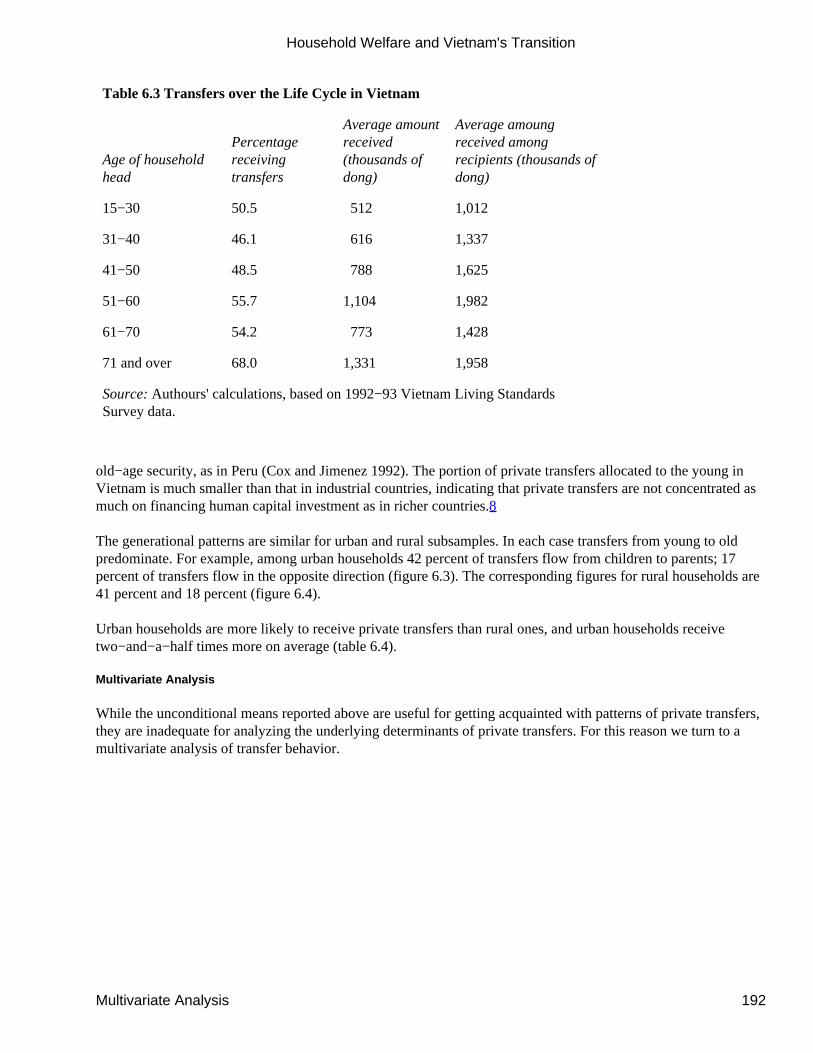
Table 6.3 Transfers over the Life Cycle in Vietnam
Age of householdhead
Percentagereceivingtransfers
Average amountreceived(thousands ofdong)
Average amoungreceived amongrecipients (thousands ofdong)
15−30 50.5 512 1,012
31−40 46.1 616 1,337
41−50 48.5 788 1,625
51−60 55.7 1,104 1,982
61−70 54.2 773 1,428
71 and over 68.0 1,331 1,958
Source: Authours' calculations, based on 1992−93 Vietnam Living StandardsSurvey data.
old−age security, as in Peru (Cox and Jimenez 1992). The portion of private transfers allocated to the young inVietnam is much smaller than that in industrial countries, indicating that private transfers are not concentrated asmuch on financing human capital investment as in richer countries.8
The generational patterns are similar for urban and rural subsamples. In each case transfers from young to oldpredominate. For example, among urban households 42 percent of transfers flow from children to parents; 17percent of transfers flow in the opposite direction (figure 6.3). The corresponding figures for rural households are41 percent and 18 percent (figure 6.4).
Urban households are more likely to receive private transfers than rural ones, and urban households receivetwo−and−a−half times more on average (table 6.4).
Multivariate Analysis
While the unconditional means reported above are useful for getting acquainted with patterns of private transfers,they are inadequate for analyzing the underlying determinants of private transfers. For this reason we turn to amultivariate analysis of transfer behavior.
Household Welfare and Vietnam's Transition
Multivariate Analysis 192
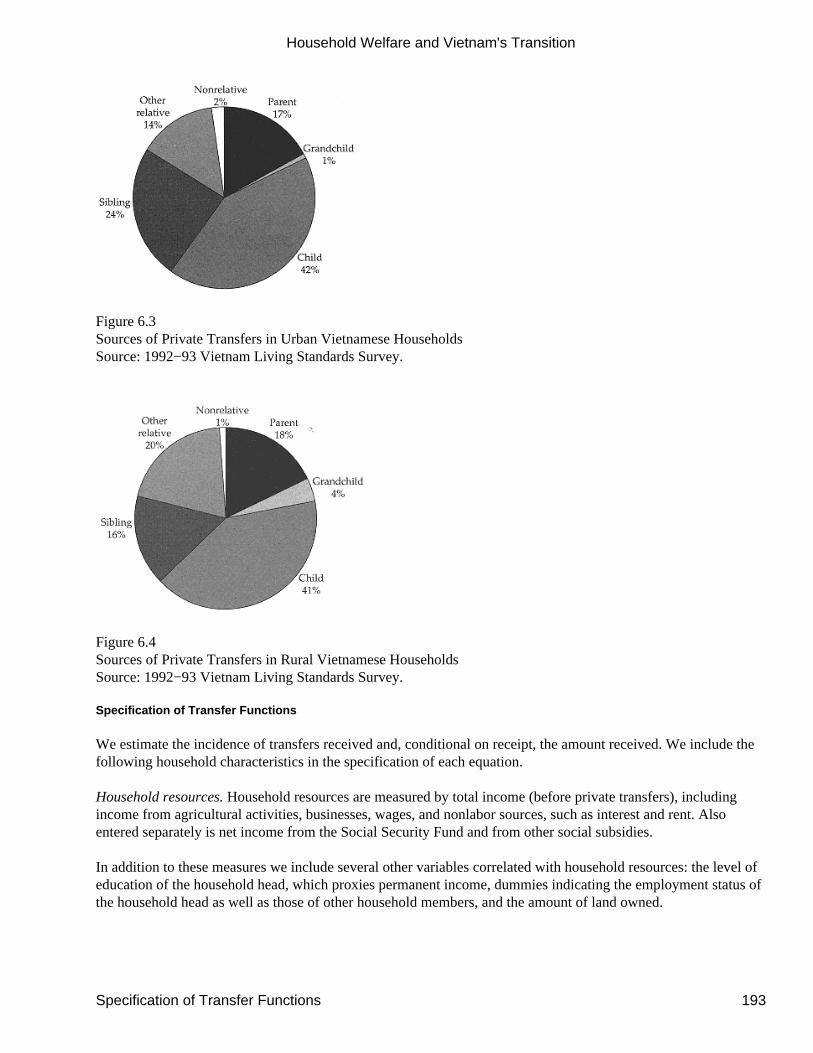
Figure 6.3Sources of Private Transfers in Urban Vietnamese HouseholdsSource: 1992−93 Vietnam Living Standards Survey.
Figure 6.4Sources of Private Transfers in Rural Vietnamese HouseholdsSource: 1992−93 Vietnam Living Standards Survey.
Specification of Transfer Functions
We estimate the incidence of transfers received and, conditional on receipt, the amount received. We include thefollowing household characteristics in the specification of each equation.
Household resources. Household resources are measured by total income (before private transfers), includingincome from agricultural activities, businesses, wages, and nonlabor sources, such as interest and rent. Alsoentered separately is net income from the Social Security Fund and from other social subsidies.
In addition to these measures we include several other variables correlated with household resources: the level ofeducation of the household head, which proxies permanent income, dummies indicating the employment status ofthe household head as well as those of other household members, and the amount of land owned.
Household Welfare and Vietnam's Transition
Specification of Transfer Functions 193
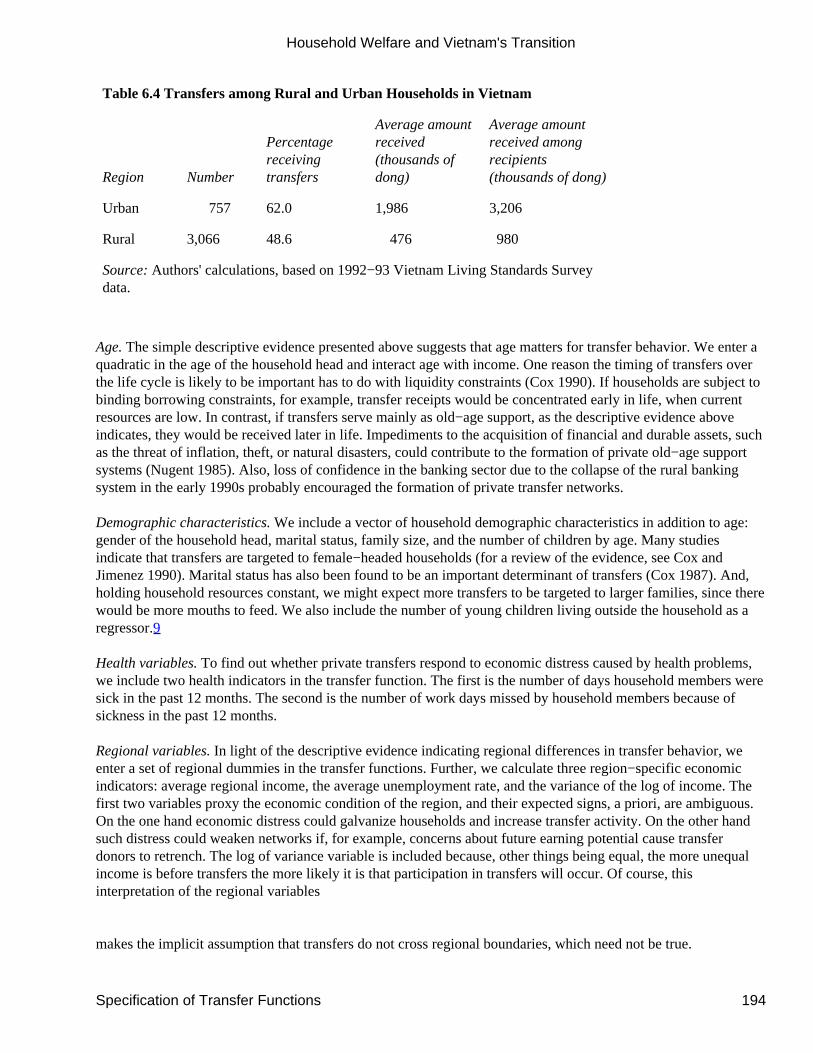
Table 6.4 Transfers among Rural and Urban Households in Vietnam
Region Number
Percentagereceivingtransfers
Average amountreceived(thousands ofdong)
Average amountreceived amongrecipients(thousands of dong)
Urban 757 62.0 1,986 3,206
Rural 3,066 48.6 476 980
Source: Authors' calculations, based on 1992−93 Vietnam Living Standards Surveydata.
Age. The simple descriptive evidence presented above suggests that age matters for transfer behavior. We enter aquadratic in the age of the household head and interact age with income. One reason the timing of transfers overthe life cycle is likely to be important has to do with liquidity constraints (Cox 1990). If households are subject tobinding borrowing constraints, for example, transfer receipts would be concentrated early in life, when currentresources are low. In contrast, if transfers serve mainly as old−age support, as the descriptive evidence aboveindicates, they would be received later in life. Impediments to the acquisition of financial and durable assets, suchas the threat of inflation, theft, or natural disasters, could contribute to the formation of private old−age supportsystems (Nugent 1985). Also, loss of confidence in the banking sector due to the collapse of the rural bankingsystem in the early 1990s probably encouraged the formation of private transfer networks.
Demographic characteristics. We include a vector of household demographic characteristics in addition to age:gender of the household head, marital status, family size, and the number of children by age. Many studiesindicate that transfers are targeted to female−headed households (for a review of the evidence, see Cox andJimenez 1990). Marital status has also been found to be an important determinant of transfers (Cox 1987). And,holding household resources constant, we might expect more transfers to be targeted to larger families, since therewould be more mouths to feed. We also include the number of young children living outside the household as aregressor.9
Health variables. To find out whether private transfers respond to economic distress caused by health problems,we include two health indicators in the transfer function. The first is the number of days household members weresick in the past 12 months. The second is the number of work days missed by household members because ofsickness in the past 12 months.
Regional variables. In light of the descriptive evidence indicating regional differences in transfer behavior, weenter a set of regional dummies in the transfer functions. Further, we calculate three region−specific economicindicators: average regional income, the average unemployment rate, and the variance of the log of income. Thefirst two variables proxy the economic condition of the region, and their expected signs, a priori, are ambiguous.On the one hand economic distress could galvanize households and increase transfer activity. On the other handsuch distress could weaken networks if, for example, concerns about future earning potential cause transferdonors to retrench. The log of variance variable is included because, other things being equal, the more unequalincome is before transfers the more likely it is that participation in transfers will occur. Of course, thisinterpretation of the regional variables
makes the implicit assumption that transfers do not cross regional boundaries, which need not be true.
Household Welfare and Vietnam's Transition
Specification of Transfer Functions 194
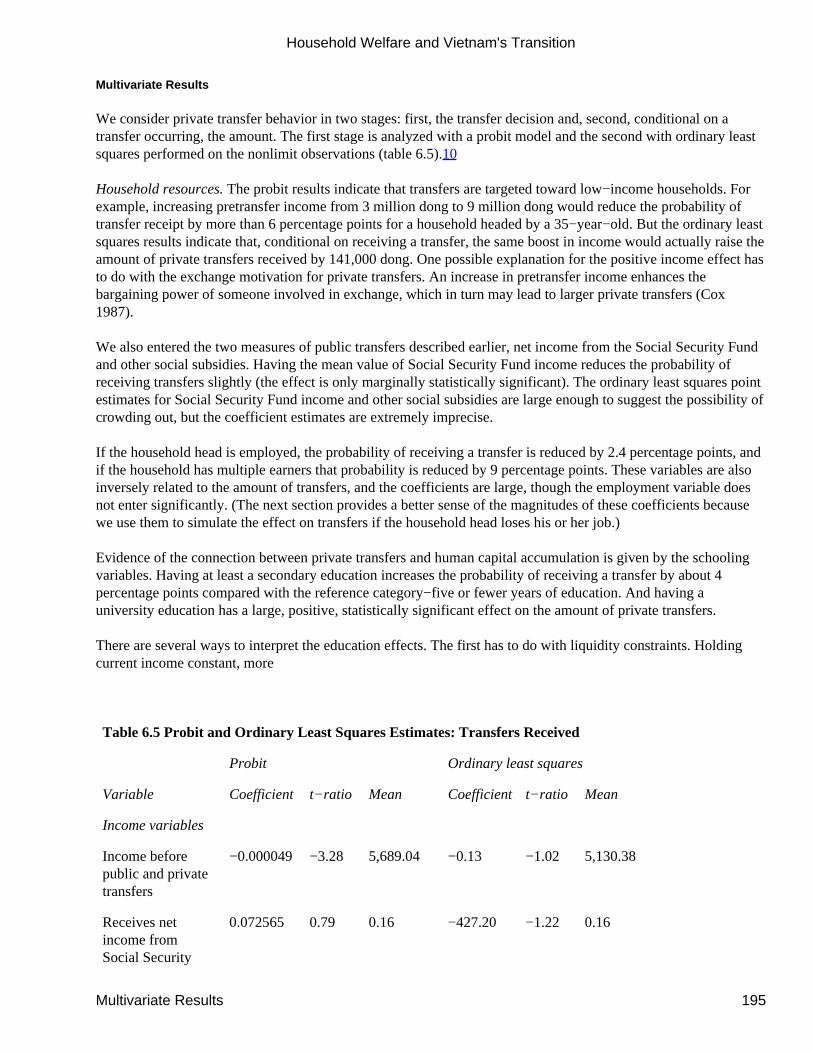
Multivariate Results
We consider private transfer behavior in two stages: first, the transfer decision and, second, conditional on atransfer occurring, the amount. The first stage is analyzed with a probit model and the second with ordinary leastsquares performed on the nonlimit observations (table 6.5).10
Household resources. The probit results indicate that transfers are targeted toward low−income households. Forexample, increasing pretransfer income from 3 million dong to 9 million dong would reduce the probability oftransfer receipt by more than 6 percentage points for a household headed by a 35−year−old. But the ordinary leastsquares results indicate that, conditional on receiving a transfer, the same boost in income would actually raise theamount of private transfers received by 141,000 dong. One possible explanation for the positive income effect hasto do with the exchange motivation for private transfers. An increase in pretransfer income enhances thebargaining power of someone involved in exchange, which in turn may lead to larger private transfers (Cox1987).
We also entered the two measures of public transfers described earlier, net income from the Social Security Fundand other social subsidies. Having the mean value of Social Security Fund income reduces the probability ofreceiving transfers slightly (the effect is only marginally statistically significant). The ordinary least squares pointestimates for Social Security Fund income and other social subsidies are large enough to suggest the possibility ofcrowding out, but the coefficient estimates are extremely imprecise.
If the household head is employed, the probability of receiving a transfer is reduced by 2.4 percentage points, andif the household has multiple earners that probability is reduced by 9 percentage points. These variables are alsoinversely related to the amount of transfers, and the coefficients are large, though the employment variable doesnot enter significantly. (The next section provides a better sense of the magnitudes of these coefficients becausewe use them to simulate the effect on transfers if the household head loses his or her job.)
Evidence of the connection between private transfers and human capital accumulation is given by the schoolingvariables. Having at least a secondary education increases the probability of receiving a transfer by about 4percentage points compared with the reference category−five or fewer years of education. And having auniversity education has a large, positive, statistically significant effect on the amount of private transfers.
There are several ways to interpret the education effects. The first has to do with liquidity constraints. Holdingcurrent income constant, more
Table 6.5 Probit and Ordinary Least Squares Estimates: Transfers Received
Probit Ordinary least squares
Variable Coefficient t−ratio Mean Coefficient t−ratio Mean
Income variables
Income beforepublic and privatetransfers
−0.000049 −3.28 5,689.04 −0.13 −1.02 5,130.38
Receives netincome fromSocial Security
0.072565 0.79 0.16 −427.20 −1.22 0.16
Household Welfare and Vietnam's Transition
Multivariate Results 195
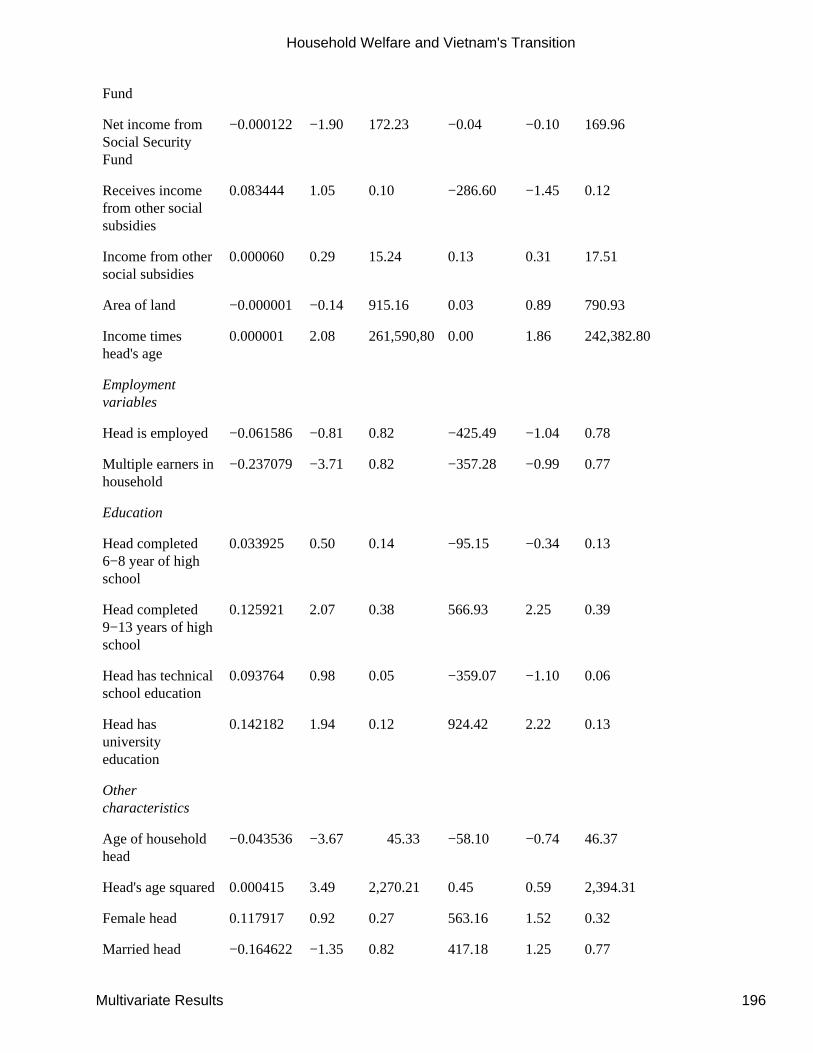
Fund
Net income fromSocial SecurityFund
−0.000122 −1.90 172.23 −0.04 −0.10 169.96
Receives incomefrom other socialsubsidies
0.083444 1.05 0.10 −286.60 −1.45 0.12
Income from othersocial subsidies
0.000060 0.29 15.24 0.13 0.31 17.51
Area of land −0.000001 −0.14 915.16 0.03 0.89 790.93
Income timeshead's age
0.000001 2.08 261,590,80 0.00 1.86 242,382.80
Employmentvariables
Head is employed −0.061586 −0.81 0.82 −425.49 −1.04 0.78
Multiple earners inhousehold
−0.237079 −3.71 0.82 −357.28 −0.99 0.77
Education
Head completed6−8 year of highschool
0.033925 0.50 0.14 −95.15 −0.34 0.13
Head completed9−13 years of highschool
0.125921 2.07 0.38 566.93 2.25 0.39
Head has technicalschool education
0.093764 0.98 0.05 −359.07 −1.10 0.06
Head hasuniversityeducation
0.142182 1.94 0.12 924.42 2.22 0.13
Othercharacteristics
Age of householdhead
−0.043536 −3.67 45.33 −58.10 −0.74 46.37
Head's age squared0.000415 3.49 2,270.21 0.45 0.59 2,394.31
Female head 0.117917 0.92 0.27 563.16 1.52 0.32
Married head −0.164622 −1.35 0.82 417.18 1.25 0.77
Household Welfare and Vietnam's Transition
Multivariate Results 196
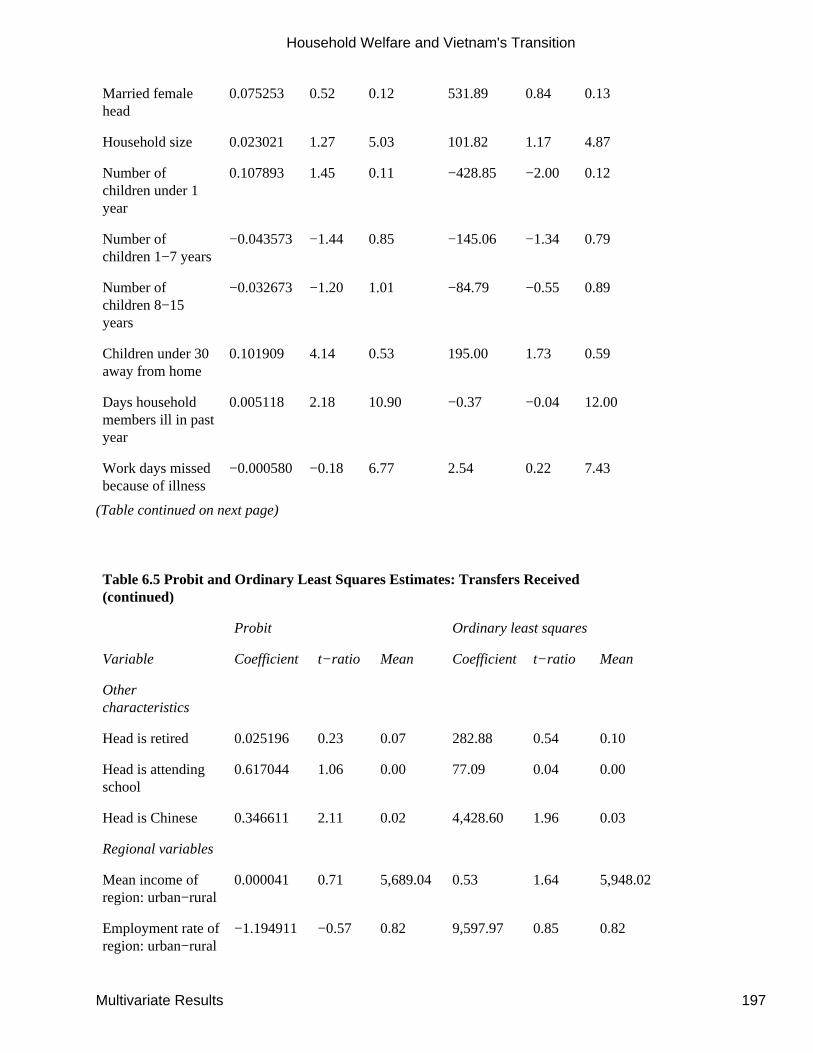
Married femalehead
0.075253 0.52 0.12 531.89 0.84 0.13
Household size 0.023021 1.27 5.03 101.82 1.17 4.87
Number ofchildren under 1year
0.107893 1.45 0.11 −428.85 −2.00 0.12
Number ofchildren 1−7 years
−0.043573 −1.44 0.85 −145.06 −1.34 0.79
Number ofchildren 8−15years
−0.032673 −1.20 1.01 −84.79 −0.55 0.89
Children under 30away from home
0.101909 4.14 0.53 195.00 1.73 0.59
Days householdmembers ill in pastyear
0.005118 2.18 10.90 −0.37 −0.04 12.00
Work days missedbecause of illness
−0.000580 −0.18 6.77 2.54 0.22 7.43
(Table continued on next page)
Table 6.5 Probit and Ordinary Least Squares Estimates: Transfers Received(continued)
Probit Ordinary least squares
Variable Coefficient t−ratio Mean Coefficient t−ratio Mean
Othercharacteristics
Head is retired 0.025196 0.23 0.07 282.88 0.54 0.10
Head is attendingschool
0.617044 1.06 0.00 77.09 0.04 0.00
Head is Chinese 0.346611 2.11 0.02 4,428.60 1.96 0.03
Regional variables
Mean income ofregion: urban−rural
0.000041 0.71 5,689.04 0.53 1.64 5,948.02
Employment rate ofregion: urban−rural
−1.194911 −0.57 0.82 9,597.97 0.85 0.82
Household Welfare and Vietnam's Transition
Multivariate Results 197
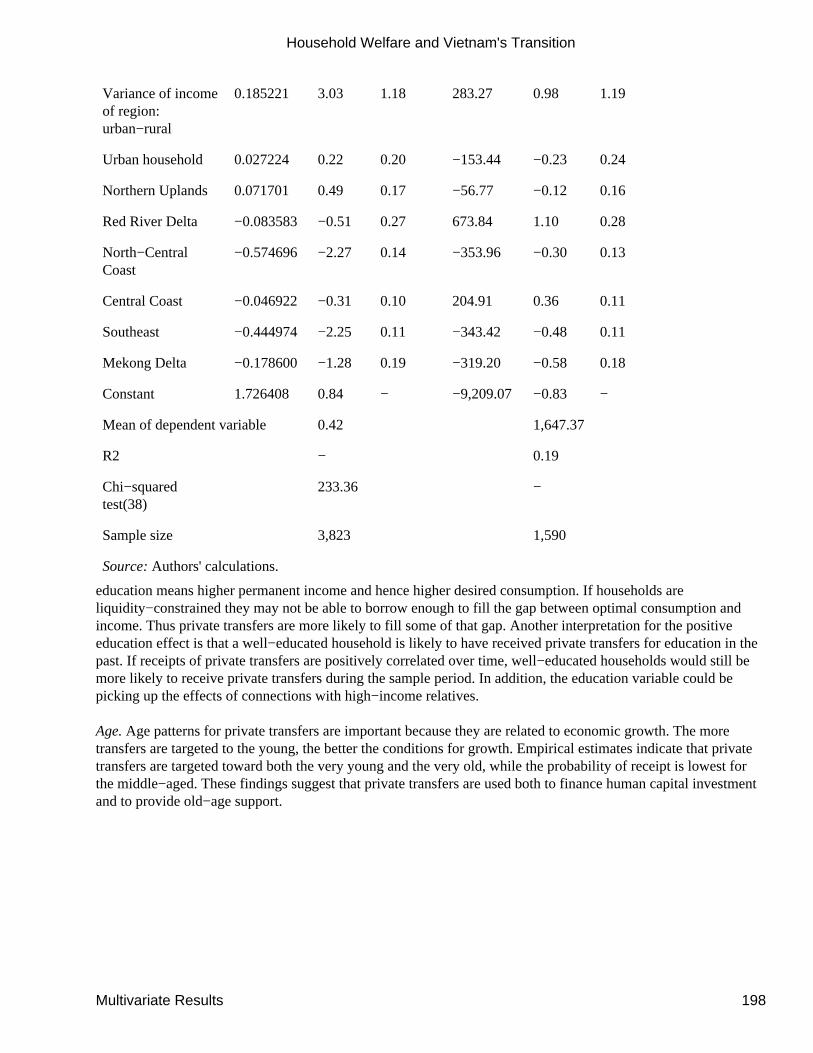
Variance of incomeof region:urban−rural
0.185221 3.03 1.18 283.27 0.98 1.19
Urban household 0.027224 0.22 0.20 −153.44 −0.23 0.24
Northern Uplands 0.071701 0.49 0.17 −56.77 −0.12 0.16
Red River Delta −0.083583 −0.51 0.27 673.84 1.10 0.28
North−CentralCoast
−0.574696 −2.27 0.14 −353.96 −0.30 0.13
Central Coast −0.046922 −0.31 0.10 204.91 0.36 0.11
Southeast −0.444974 −2.25 0.11 −343.42 −0.48 0.11
Mekong Delta −0.178600 −1.28 0.19 −319.20 −0.58 0.18
Constant 1.726408 0.84 − −9,209.07 −0.83 −
Mean of dependent variable 0.42 1,647.37
R2 − 0.19
Chi−squaredtest(38)
233.36 −
Sample size 3,823 1,590
Source: Authors' calculations.
education means higher permanent income and hence higher desired consumption. If households areliquidity−constrained they may not be able to borrow enough to fill the gap between optimal consumption andincome. Thus private transfers are more likely to fill some of that gap. Another interpretation for the positiveeducation effect is that a well−educated household is likely to have received private transfers for education in thepast. If receipts of private transfers are positively correlated over time, well−educated households would still bemore likely to receive private transfers during the sample period. In addition, the education variable could bepicking up the effects of connections with high−income relatives.
Age. Age patterns for private transfers are important because they are related to economic growth. The moretransfers are targeted to the young, the better the conditions for growth. Empirical estimates indicate that privatetransfers are targeted toward both the very young and the very old, while the probability of receipt is lowest forthe middle−aged. These findings suggest that private transfers are used both to finance human capital investmentand to provide old−age support.
Household Welfare and Vietnam's Transition
Multivariate Results 198
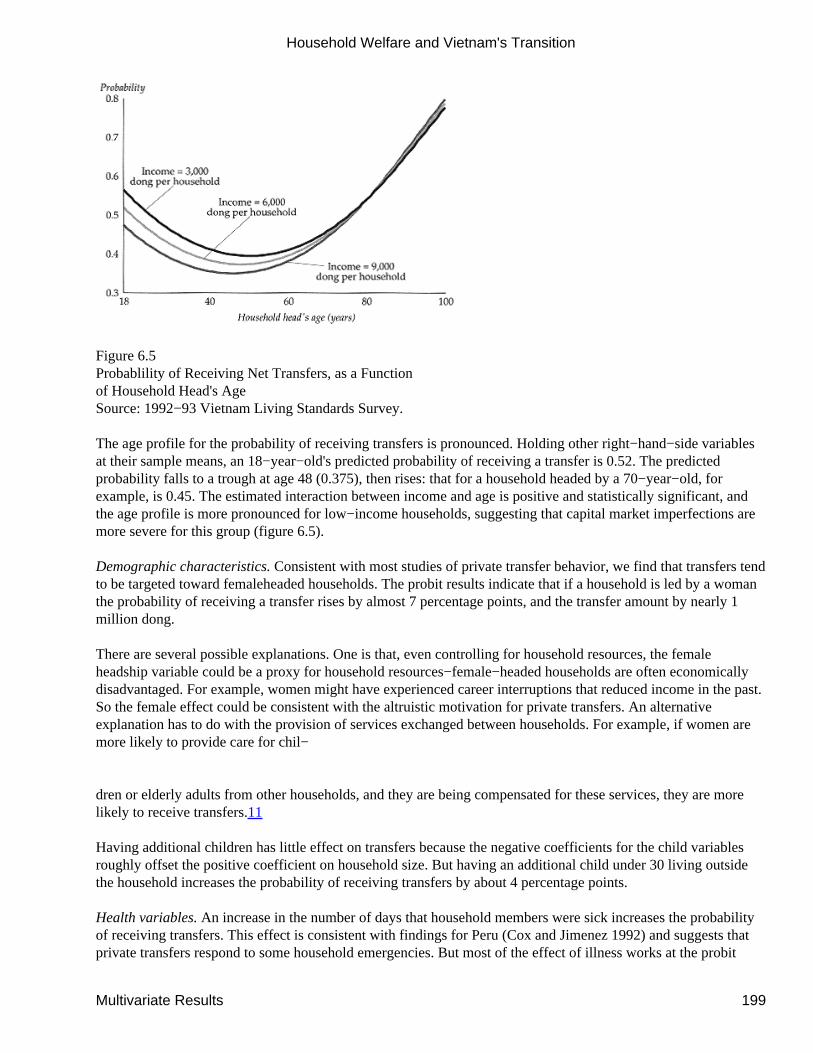
Figure 6.5Probablility of Receiving Net Transfers, as a Functionof Household Head's AgeSource: 1992−93 Vietnam Living Standards Survey.
The age profile for the probability of receiving transfers is pronounced. Holding other right−hand−side variablesat their sample means, an 18−year−old's predicted probability of receiving a transfer is 0.52. The predictedprobability falls to a trough at age 48 (0.375), then rises: that for a household headed by a 70−year−old, forexample, is 0.45. The estimated interaction between income and age is positive and statistically significant, andthe age profile is more pronounced for low−income households, suggesting that capital market imperfections aremore severe for this group (figure 6.5).
Demographic characteristics. Consistent with most studies of private transfer behavior, we find that transfers tendto be targeted toward femaleheaded households. The probit results indicate that if a household is led by a womanthe probability of receiving a transfer rises by almost 7 percentage points, and the transfer amount by nearly 1million dong.
There are several possible explanations. One is that, even controlling for household resources, the femaleheadship variable could be a proxy for household resources−female−headed households are often economicallydisadvantaged. For example, women might have experienced career interruptions that reduced income in the past.So the female effect could be consistent with the altruistic motivation for private transfers. An alternativeexplanation has to do with the provision of services exchanged between households. For example, if women aremore likely to provide care for chil−
dren or elderly adults from other households, and they are being compensated for these services, they are morelikely to receive transfers.11
Having additional children has little effect on transfers because the negative coefficients for the child variablesroughly offset the positive coefficient on household size. But having an additional child under 30 living outsidethe household increases the probability of receiving transfers by about 4 percentage points.
Health variables. An increase in the number of days that household members were sick increases the probabilityof receiving transfers. This effect is consistent with findings for Peru (Cox and Jimenez 1992) and suggests thatprivate transfers respond to some household emergencies. But most of the effect of illness works at the probit
Household Welfare and Vietnam's Transition
Multivariate Results 199
stage; its effect on transfer amounts is negligible.
Regional variables. Of the three region−specific resource measures, only one, the regional variance of income, isstatistically significant.12 Doubling the average log variance of income increases the probability of receiving atransfer by 8.5 percentage points. Two regions stand out as being much different than the others: theNorth−Central Coast and the Northern Uplands. All else being equal, the probability of receiving a transfer is 27percentage points lower in the North−Central Coast than in the Central Highlands, for example. Note that theseconditional region effects contrast with the unconditional ones discussed above.
Some of the variables used as regressors in table 6.5 may not be exogenous to the amount of private transfersreceived. In particular, the amount of transfers a household expects to receive may influence the amount ofincome earned and the probability of the household head being employed. We do not have the data to correctstatistically for this problem. We know of little evidence, however, connecting private transfers and labor supplyincentives in developing countries. Recent evidence indicates that this link is weak in the United States (Joulfaianand Wilhelm 1994). Still, such issues should be kept in mind when interpreting results. Induced labor supplyeffects would strengthen the results, since recipient income coefficients would be influenced in the directionpredicted by greater crowding out.
Private Transfer Effects of Employment Loss
Here we use our empirical results to address the question, ''How might private transfers respond to incomeshortfalls?" The example we consider is one in which the household head, currently earning 3 million dong andliving in a household where someone else also earns 3 million dong, loses his employment and earnings. Supposefurther that this household is average in every respect, except that it is not receiving any private transfers. We usethe esti−
mated probit and ordinary least squares equations to gauge the private transfer response.
The ordinary least squares regression results (second column of table 6.5) indicate that the predicted transferamount for this hypothetical household would be 1.7 million dong, which is not far from the sample averageamong recipients, 1.6 million dong, and more than half of the hypothetical shortfall in earnings. Thesecalculations suggest that the potential for private transfers to cushion the effects of unemployment may be quitelarge.
But what are the chances of becoming unemployed and receiving private transfers as a result? To answer thisquestion we turn to the probit results, which imply that, for our hypothetical household, such an event increasesthe probability of receiving a private transfer by about 4.8 percentage points. Given that the household wasoriginally part of the 58 percent of the sample not receiving transfers (and assuming that there are no fixed effectsin the probability of receiving private transfers), the chance that the household would now receive a transfer is4.8/58 = 8.3 percent. So private transfers are potentially important for alleviating the effects of job loss, butbecause not every household will receive them, their impact in expected value terms is not very large.
Conclusion
We find that private transfers follow patterns suggesting that they are responsive to household resources, age,education, and a variety of other characteristics. Private transfers tend to be targeted toward vulnerablehouseholds: the young, the old, low−income households, and households affected by illness. Private transfers helpequalize the distribution of income. They are also sensitive to regional indicators of living standards.
Household Welfare and Vietnam's Transition
Private Transfer Effects of Employment Loss 200
The finding that patterns of private transfers are often similar to those of means−tested public transfers raises thepossibility that the two are substitutes and that increases in the former could crowd out the latter. The potentialscope for crowding out in Vietnam appears particularly large, since private transfers are widespread. The specterof crowding out presents policymakers with difficult targeting problems. One obvious solution would be to runmeans tests on all forms of income, including private transfers. But implementing such a scheme would likelyprove a formidable challenge. Another avenue would be to focus on transfers that are less prone to crowding out.Measuring differential rates of crowding out of various public programs is a difficult but potentially valuableavenue for future research. For example, Cox and Jimenez (1995) estimate that if an unemployment insurancesystem were introduced in the Philippines, private transfers would fall so much that the intended beneficiaries ofthe program would be scarcely better off. In contrast, they find that the degree of crowding out associated withpensions is much lower.
Another finding that could prove important from a policy perspective is that private transfers are a significantold−age support. Households headed by someone over 70, for example, rely on private transfers for more than 20percent of their income on average. Part of the pattern is surely related to the filial piety inculcated by Confucianteachings. But one consequence may be to discourage life−cycle saving, which in turn could impede capitalformation. Further investigation of the connection between private old−age support and saving incentives is animportant priority for future research.
As Vietnam liberalizes its economy, changes in markets, policies, and institutions will affect the magnitude andcharacteristics of private transfer patterns. We cannot make predictions because we do not have time series data.And even if we did, we would not know the extent of the structural changes. This is yet another area for futureresearch. However, the experience of other countries may be useful in providing some clues as to the direction ofchange. For example, evidence over time from other economies in transition, such as Poland and Russia, indicatethat severe economic dislocations significantly diminish the amounts of private transfers received (Cox, Okrasa,and Jimenez 1997; Cox, Eser, and Jimenez 1997). Thus when household incomes fall because of downturns in themacroeconomy, the private insurance market will fail to protect the poor. This is unlikely to happen in Vietnam inthe immediate future because the country is making the transition to a more market−oriented economy graduallyand the economy is growing. Moreover, a greater portion of private transfers probably originate from overseasand thus may not covary with domestic income.
Over the longer term sustained income growth will likely change institutions more significantly. Improvements incapital markets will obviate the need for private transfers. But these improvements may take a long time. Privatetransfer patterns in the Philippines, which has a per capita income more than four times that of Vietnam, are stillconsistent with attempts to correct for capital market imperfections (Cox and Jimenez 1995). Another institutionalchange may be reform of the pension system. Jensen (1996) estimates that in South Africa, where there was alarge exogenous increase in public pensions for poor black households, there was substantial crowding out, asprivate transfers from migrant children to the elderly declined.
Appendix: Sample Selection Criteria
We deleted observations with unrealistic values for income from the sample. A value for income is consideredunrealistic if it differs greatly from total expenditures. First we measured the total amount of money brought in bythe household, "net inflows." Net inflows comprise real income, the amount received from land sold, otherincome not already included in real income, and the amount the household received from borrowing−all net oftransfers given. Net inflows should not be much greater than total expenditures, except possibly for wealthyhouseholds. Also, net inflows
Household Welfare and Vietnam's Transition
Appendix: Sample Selection Criteria 201
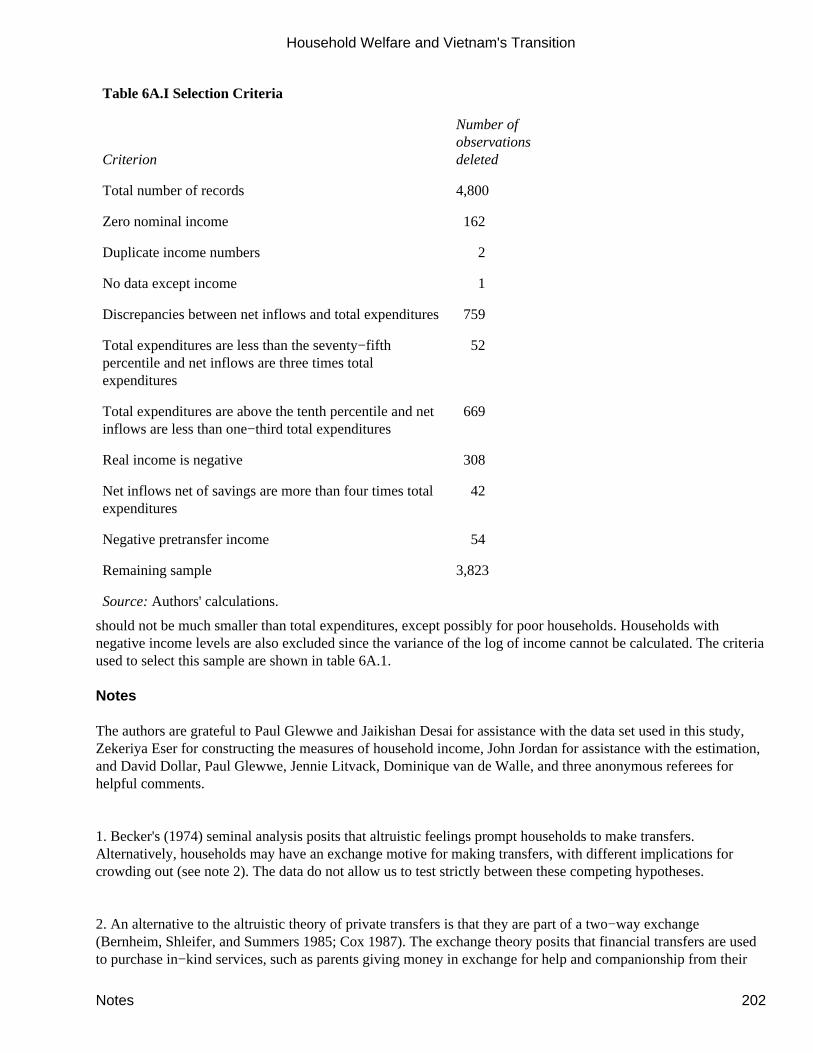
Table 6A.I Selection Criteria
Criterion
Number ofobservationsdeleted
Total number of records 4,800
Zero nominal income 162
Duplicate income numbers 2
No data except income 1
Discrepancies between net inflows and total expenditures 759
Total expenditures are less than the seventy−fifthpercentile and net inflows are three times totalexpenditures
52
Total expenditures are above the tenth percentile and netinflows are less than one−third total expenditures
669
Real income is negative 308
Net inflows net of savings are more than four times totalexpenditures
42
Negative pretransfer income 54
Remaining sample 3,823
Source: Authors' calculations.
should not be much smaller than total expenditures, except possibly for poor households. Households withnegative income levels are also excluded since the variance of the log of income cannot be calculated. The criteriaused to select this sample are shown in table 6A.1.
Notes
The authors are grateful to Paul Glewwe and Jaikishan Desai for assistance with the data set used in this study,Zekeriya Eser for constructing the measures of household income, John Jordan for assistance with the estimation,and David Dollar, Paul Glewwe, Jennie Litvack, Dominique van de Walle, and three anonymous referees forhelpful comments.
1. Becker's (1974) seminal analysis posits that altruistic feelings prompt households to make transfers.Alternatively, households may have an exchange motive for making transfers, with different implications forcrowding out (see note 2). The data do not allow us to test strictly between these competing hypotheses.
2. An alternative to the altruistic theory of private transfers is that they are part of a two−way exchange(Bernheim, Shleifer, and Summers 1985; Cox 1987). The exchange theory posits that financial transfers are usedto purchase in−kind services, such as parents giving money in exchange for help and companionship from their
Household Welfare and Vietnam's Transition
Notes 202
children. A critical difference between the exchange and altruistic theory of transfers is that, with exchange,public transfers need not crowd out private ones. In fact, the exchange theory predicts a possible "crowding in"effect of public transfers. For example, consider the case in which a child receives money from his parents inexchange for periodic help with housework. A windfall increase in public transfers (or income from any othersource) would enhance the child's bargaining position with his parents, possibly resulting in his receiving evenmore money from the parents.
3. Private savings and insurance purchases can also be crowded out by public transfers. For empirical evidencefrom the United States, for example, see Engen and Gruber (1995) for the case of unemployment insurance andprivate savings, and Cutler and Gruber (1996) for a study of public and private insurance. For discussions of theconnection between public transfers and labor supply, see Moffitt (1992) and Sahn and Alderman (1995).
4. We ignore trivial inflows of transfers by imposing a minimum cutoff of 30,000 dong for classifying grosstransfer recipients.
5. Income and transfer figures are adjusted for price differences across regions.
6. Private transfers from other countries are not strictly comparable because of discrepancies in survey methods.With this caveat in mind, note that the corresponding aggregates for private transfers in other countries are asfollows: urban Peru−4 percent (Cox and Jimenez 1992); urban Philippines−12 percent (Cox and Jimenez 1995);Poland−4 percent (Cox, Okrasa, and Jimenez 1997); United States−3.9 percent (Cox 1990).
7. If we focus on the poorest by looking at the bottom 5 percent, we obtain the same qualitative results. Privatetransfers boost income more than public ones do. Private transfers raise this group's share from 0.366 to 1.349.Public transfers raise it from 0.366 to 0.553.
8. Since most Vietnamese finish their formal education by age 18, and most universities in Vietnam are public,few interhousehold transfers are expected to go to students. But private transfers to students are not the only wayto enhance human capital. Transfers enabling young workers to invest in on−the−job training are another form.
9. The VNLSS only records the number of children under age 30 living outside the household.
10. An alternative specification would be to model transfer amounts using Heckman's (1979) generalized tobit.But this specification poses difficult identification problems in the context of private transfer behavior. Inparticular, to identify the generalized tobit, we need one or more variables that are contained in the probit but notin the equation for transfer amounts. Since theories of private transfers provide little guidance for such aspecification, we opt for the simpler framework, while recognizing that our estimates could be subject tosample−selection bias as a result.
11. For further discussion of the connection between female status and exchange−related private transfers in theUnited States, see Cox (1987).
Household Welfare and Vietnam's Transition
Notes 203
12. In the regressions, Central Highlands is the excluded reference variable.
References
Becker, Gary S. 1974. "A Theory of Social Interactions." Journal of Political Economy 82(November/December): 1063−94.
Bernheim, B. Douglas, Andrei Shleifer, and Lawrence H. Summers. 1985 "The Strategic Bequest Motive."Journal of Political Economy 93(December): 1045−76.
Cox, Donald. 1987. "Motives for Private Income Transfers." Journal of Political
Economy 95 (June): 508−46.
_____. 1990. "Intergenerational Transfers and Liquidity Constraints." Quarterly Journal of Economics105(February): 187−217.
Cox, Donald, Zekeriya Eser, and Emmanuel Jimenez. 1997. "Family Safety Nets during Economic Transition: AStudy of Interhousehold Transfers in Russia." In Jeni Klugman, ed., Poverty in Russia: Public Policy and PrivateResponses. EDI Development Studies. Washington, D.C.: World Bank.
Cox, Donald, and Emmanuel Jimenez. 1990. "Social Objectives through Private Transfers: A Review." The WorldBank Research Observer 5(July): 205−18.
_____. 1992. "Social Security and Private Transfers in Developing Countries: The Case of Peru." The World BankEconomic Review 6(1): 155−69.
_____. 1995. "Private Transfers and the Effectiveness of Public Income Redistribution in the Philippines." InDominique van de Walle and Kimberly Nead, eds., Public Spending and the Poor: Theory and Evidence.Baltimore, Md.: The Johns Hopkins University Press.
Cox, Donald, Wlodek Okrasa, and Emmanuel Jimenez. 1997. "Family Safety Nets during Economic Transition:A Case Study of Poland." Review of Income and Wealth 43(June): 191−209.
Cutler, David M., and Jonathan Gruber. 1996. "Does Public Insurance Crowd Out Private Insurance?" QuarterlyJournal of Economics 111(May): 391−430.
Engen, Eric, and Jonathan Gruber. 1995. "Unemployment Insurance and Precautionary Savings." MassachusettsInstitute of Technology, Department of Economics, Cambridge, Mass.
Heckman, James J. 1979. "Sample Selection Bias as a Specification Error." Econometrica 47(January): 153−61.
Jensen, Robert T. 1996. "Public Transfers, Private Transfers and the 'Crowding Out' Hypothesis: Theory andEvidence from South Africa." Princeton University, Department of Economics, Princeton, N.J.
Joulfaian, David, and Mark Wilhelm. 1994. "Inheritance and Labor Supply." Journal of Human Resources29(fall): 1205−34.
Moffitt, Robert. 1992. "Incentive Effects of the U.S. Welfare System: A Review." Journal of Economic Literature30(March): 1−61.
Household Welfare and Vietnam's Transition
References 204
Nugent, Jeffrey. 1985. "The Old−Age Motive for Fertility." Population and Development Review 11(March):75−97.
Sahn, David E., and Harold Alderman. 1995. "Incentive Effects on Labor Supply of Sri Lanka's Rice Subsidy." InDominique van de Walle and Kimberly Nead, eds., Public Spending and the Poor: Theory and Evidence.Baltimore, Md.: Johns Hopkins University Press.
7—School Enrollment and Completion in Vietnam: An Investigation of RecentTrends
Paul Glewwe and Hanan Jacoby
Education is thought to have played a key role in the economic success of the high−performing market economiesof East Asia (World Bank 1993a). If true, that bodes well for Vietnam's long−term growth prospects because itspopulation is relatively well educated. Yet this apparent advantage may have eroded in recent years, as bothpublic and private investment in education have declined substantially. During the initial phase of Vietnam'stransition to a market economy, in the late 1980s and early 1990s, school enrollment rates declined. And schoolquality had begun to deteriorate even earlier, a trend that continued into the initial transition years.
Several important education policy issues in Vietnam require careful study−the declines in enrollment that beganin the late 1980s, poor school quality, the high education costs incurred by households, the role of private schools,and the job opportunities for graduates (see Knowles and others 1996; and World Bank 1995 and 1996 fordetailed discussions). The most visible sign of problems in recent years has been the downward trend inenrollment rates, especially at the secondary level. Declines in enrollment in Vietnam are particularly seriousbecause the government views the public provision of education as a key mechanism for promoting equity. Asdiscussed in chapter 1, the Vietnamese government places a high priority on producing equitable social outcomes.
This chapter investigates the causes of Vietnam's recent decline in school enrollment, an issue that is closelylinked with many other education policy issues. It begins by describing Vietnam's education system and thenexamines recent trends in school enrollment. The rest of the chapter analyzes several possible explanations forthese trends using data from the 1992−93 Vietnam Living Standards Survey (VNLSS).
An Overview of the Current Education System
Formal education has a long history in Vietnam, one that is well over a thousand years old.1 Its current formclearly shows the influence of the French colonial rule from 1858 to 1954. Since the country was unified in 1975,several reforms of the management structure have been undertaken at the national level. During the 1980s fourseparate agencies were responsible for education. These reponsibilities were consolidated in 1987 and again in1990, and since 1990 all education functions have been the responsibility of a single entity, the Ministry ofEducation and Training. While the central government is responsible for policymaking and for supervision of alleducation programs, the day−to−day administration of primary education is carried out at the district or communelevel, and secondary education is administered at the provincial level.
Funding for education is the joint responsibility of all levels. The central government provides teacher andadministrator salaries and funds for scholarships, and local governments provide the remaining funds, such asschool construction costs and "salary enhancements" for teachers. In reality local funding often amounts tofunding by parents. They are expected to purchase books, pencils, and writing materials for their children and also
Household Welfare and Vietnam's Transition
7— School Enrollment and Completion in Vietnam: An Investigation of Recent Trends 205
bear other local funding responsibilities in the form of additional fees.
In principle, children can enter the education system at a relatively young age in Vietnam. In many urban areaschildcare for children up to three years of age is provided in creches, and kindergartens are available for childrenbetween the ages of three and five. Yet in many rural areas creches and kindergartens are not available, soschooling does not begin until enrollment in primary school. The five grades of primary education in Vietnambegin at age six. Students who finish grade 5 go directly to lower secondary school, grades 6−9, with no need topass a formal examination. To successfully complete grade 9, students must pass a formal examination. Studentsmust also pass an entrance examination before they can enter the upper secondary level, grades 10−12. Moststudents who complete lower secondary education do not go on to upper secondary. Those who do must pass yetanother examination at the end of grade 12 to earn an upper secondary diploma.
Some students who complete lower secondary school enter vocational and technical training schools, which offercourses ranging from six months to three years. There are also schools of professional education, which offertraining in agriculture, economic management, medicine and pharmaceuticals, teaching, and the like. These areopen to students with a lower secondary or upper secondary education. Finally, higher education at universitiesand colleges is available for students who successfully complete upper secondary education and pass an entranceexamination.
This chapter is concerned primarily with general education, particularly primary and secondary education. Twoeducation issues of particular
concern in Vietnam are the recent introduction of school fees and the decline in school quality. Until 1989 theofficial policy was to charge no school fees. Schools and teachers were to be fully funded by the government, andtextbooks were to be provided without charge. But funding difficulties in the 1970s and 1980s are said to havereduced school quality in recent years (see World Bank 1993b; and MOET, UNDP, and UNESCO 1992).Buildings deteriorated, textbooks became scarce, and teacher motivation declined as a result of low salaries.Another consequence of scarce funding was increased use of double and even triple shifts in both primary andsecondary schools.
Data on school quality in Vietnam are scarce, and there appears to be no data on changes in school quality overtime. The community questionnaire from the 1992−93 Vietnam Living Standards Survey provides information onschool quality in rural areas. As seen in table 7.1, these data show that 85 percent of rural primary school teachershave had formal teacher training, a respectable share for a country as poor as Vietnam. But student−teacher ratiosat the primary level are somewhat high at 35.
Perhaps more illuminating in table 7.1 are the school problems that communities consider to be the most serious.They cited poor condition of school buildings and inadequate teacher pay as problems in three−fourths of primaryschools and two−thirds of lower secondary schools. They also cited inadequate supplies as a major concern innearly half of primary and lower secondary schools. In general, problems appear most acute at the primary leveland least acute at the upper secondary level. Note that lack of spaces or desks for students is not a major concern;it is the quality of schools, not access to them, that is the problem in rural Vietnam. Indeed, all 120 ruralcommunes sampled in the VNLSS had primary schools, and 88 percent had lower secondary schools.2
In September 1989 Vietnam introduced a system of school fees. Grades 1−3 remained free of charge, but grades4−5 required fees equal to the value of 1 kilogram of rice per month. Lower secondary student fees
Household Welfare and Vietnam's Transition
7— School Enrollment and Completion in Vietnam: An Investigation of Recent Trends 206
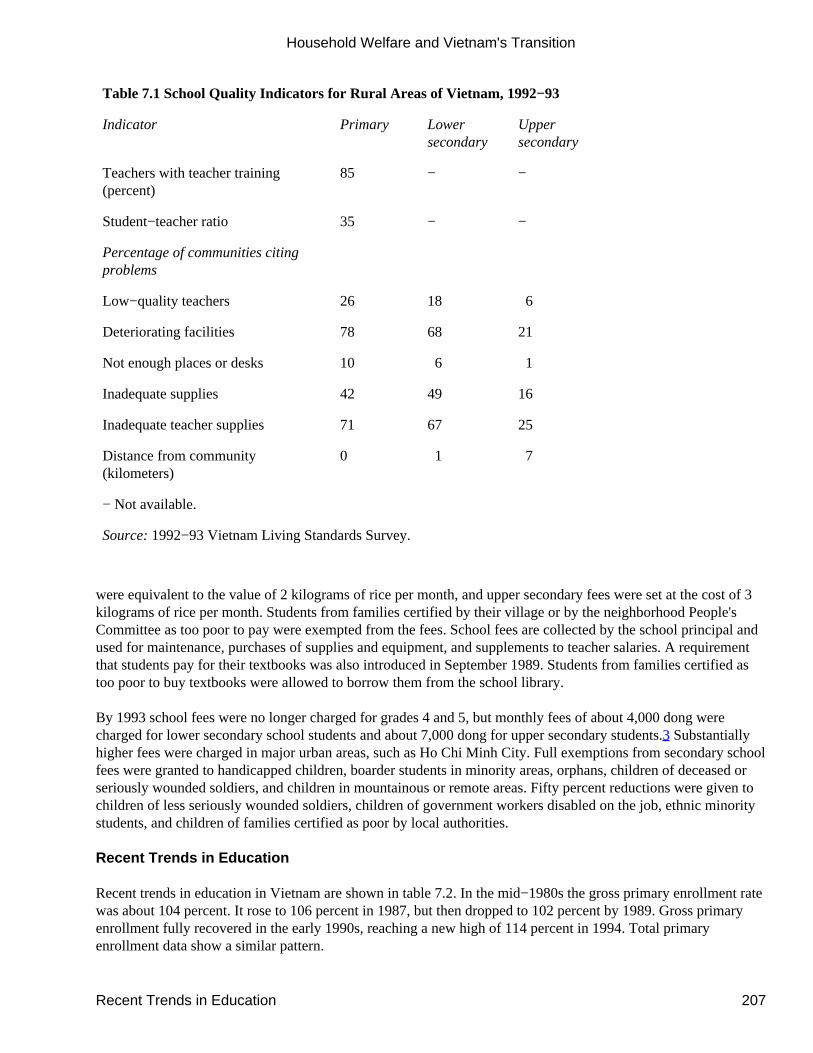
Table 7.1 School Quality Indicators for Rural Areas of Vietnam, 1992−93
Indicator Primary Lowersecondary
Uppersecondary
Teachers with teacher training(percent)
85 − −
Student−teacher ratio 35 − −
Percentage of communities citingproblems
Low−quality teachers 26 18 6
Deteriorating facilities 78 68 21
Not enough places or desks 10 6 1
Inadequate supplies 42 49 16
Inadequate teacher supplies 71 67 25
Distance from community(kilometers)
0 1 7
− Not available.
Source: 1992−93 Vietnam Living Standards Survey.
were equivalent to the value of 2 kilograms of rice per month, and upper secondary fees were set at the cost of 3kilograms of rice per month. Students from families certified by their village or by the neighborhood People'sCommittee as too poor to pay were exempted from the fees. School fees are collected by the school principal andused for maintenance, purchases of supplies and equipment, and supplements to teacher salaries. A requirementthat students pay for their textbooks was also introduced in September 1989. Students from families certified astoo poor to buy textbooks were allowed to borrow them from the school library.
By 1993 school fees were no longer charged for grades 4 and 5, but monthly fees of about 4,000 dong werecharged for lower secondary school students and about 7,000 dong for upper secondary students.3 Substantiallyhigher fees were charged in major urban areas, such as Ho Chi Minh City. Full exemptions from secondary schoolfees were granted to handicapped children, boarder students in minority areas, orphans, children of deceased orseriously wounded soldiers, and children in mountainous or remote areas. Fifty percent reductions were given tochildren of less seriously wounded soldiers, children of government workers disabled on the job, ethnic minoritystudents, and children of families certified as poor by local authorities.
Recent Trends in Education
Recent trends in education in Vietnam are shown in table 7.2. In the mid−1980s the gross primary enrollment ratewas about 104 percent. It rose to 106 percent in 1987, but then dropped to 102 percent by 1989. Gross primaryenrollment fully recovered in the early 1990s, reaching a new high of 114 percent in 1994. Total primaryenrollment data show a similar pattern.
Household Welfare and Vietnam's Transition
Recent Trends in Education 207
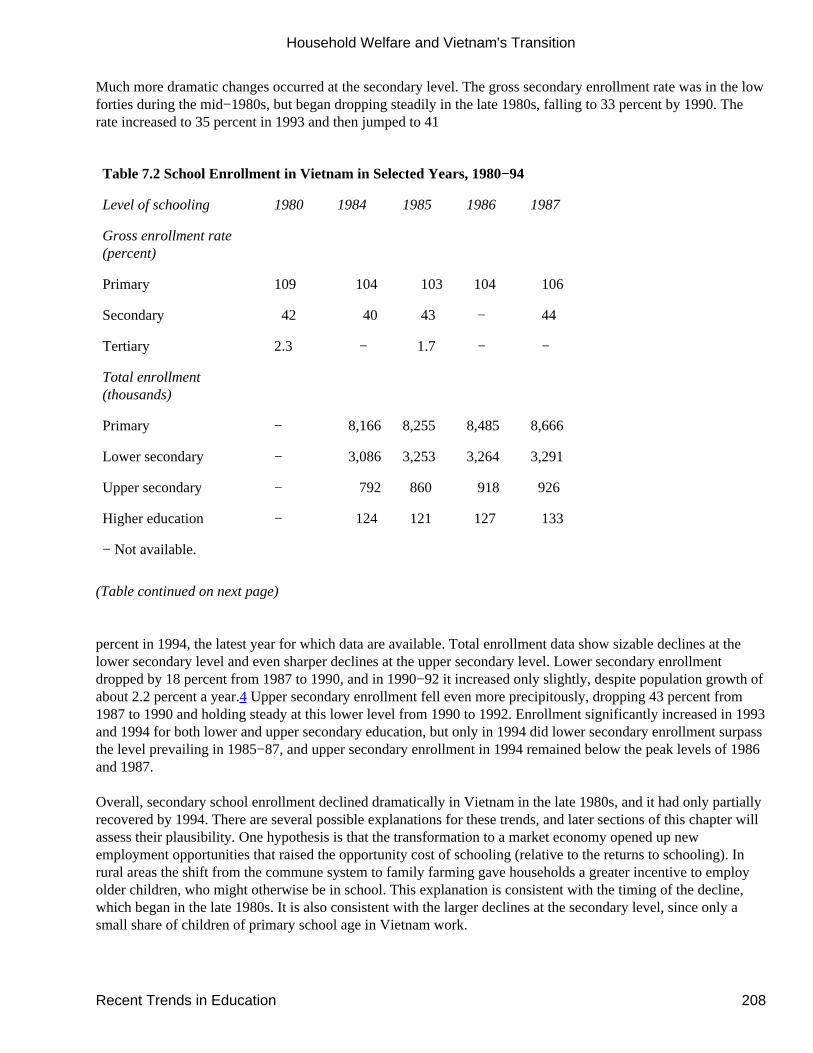
Much more dramatic changes occurred at the secondary level. The gross secondary enrollment rate was in the lowforties during the mid−1980s, but began dropping steadily in the late 1980s, falling to 33 percent by 1990. Therate increased to 35 percent in 1993 and then jumped to 41
Table 7.2 School Enrollment in Vietnam in Selected Years, 1980−94
Level of schooling 1980 1984 1985 1986 1987
Gross enrollment rate(percent)
Primary 109 104 103 104 106
Secondary 42 40 43 − 44
Tertiary 2.3 − 1.7 − −
Total enrollment(thousands)
Primary − 8,166 8,255 8,485 8,666
Lower secondary − 3,086 3,253 3,264 3,291
Upper secondary − 792 860 918 926
Higher education − 124 121 127 133
− Not available.
(Table continued on next page)
percent in 1994, the latest year for which data are available. Total enrollment data show sizable declines at thelower secondary level and even sharper declines at the upper secondary level. Lower secondary enrollmentdropped by 18 percent from 1987 to 1990, and in 1990−92 it increased only slightly, despite population growth ofabout 2.2 percent a year.4 Upper secondary enrollment fell even more precipitously, dropping 43 percent from1987 to 1990 and holding steady at this lower level from 1990 to 1992. Enrollment significantly increased in 1993and 1994 for both lower and upper secondary education, but only in 1994 did lower secondary enrollment surpassthe level prevailing in 1985−87, and upper secondary enrollment in 1994 remained below the peak levels of 1986and 1987.
Overall, secondary school enrollment declined dramatically in Vietnam in the late 1980s, and it had only partiallyrecovered by 1994. There are several possible explanations for these trends, and later sections of this chapter willassess their plausibility. One hypothesis is that the transformation to a market economy opened up newemployment opportunities that raised the opportunity cost of schooling (relative to the returns to schooling). Inrural areas the shift from the commune system to family farming gave households a greater incentive to employolder children, who might otherwise be in school. This explanation is consistent with the timing of the decline,which began in the late 1980s. It is also consistent with the larger declines at the secondary level, since only asmall share of children of primary school age in Vietnam work.
Household Welfare and Vietnam's Transition
Recent Trends in Education 208
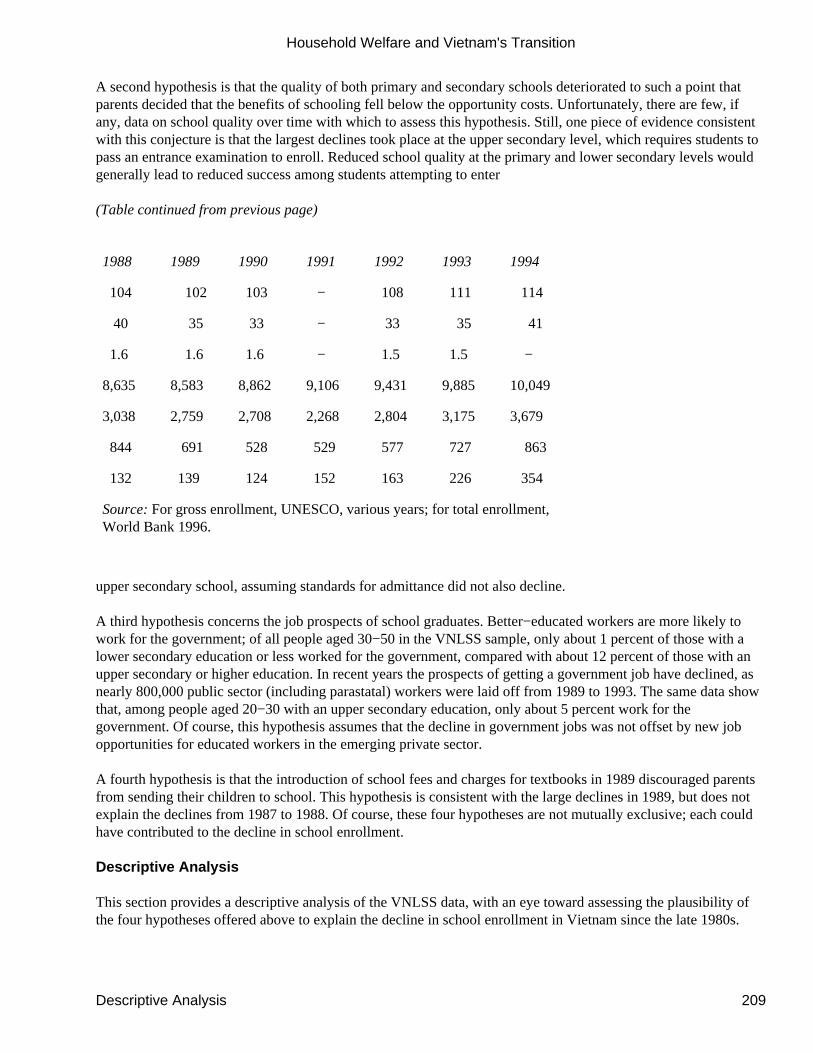
A second hypothesis is that the quality of both primary and secondary schools deteriorated to such a point thatparents decided that the benefits of schooling fell below the opportunity costs. Unfortunately, there are few, ifany, data on school quality over time with which to assess this hypothesis. Still, one piece of evidence consistentwith this conjecture is that the largest declines took place at the upper secondary level, which requires students topass an entrance examination to enroll. Reduced school quality at the primary and lower secondary levels wouldgenerally lead to reduced success among students attempting to enter
(Table continued from previous page)
1988 1989 1990 1991 1992 1993 1994
104 102 103 − 108 111 114
40 35 33 − 33 35 41
1.6 1.6 1.6 − 1.5 1.5 −
8,635 8,583 8,862 9,106 9,431 9,885 10,049
3,038 2,759 2,708 2,268 2,804 3,175 3,679
844 691 528 529 577 727 863
132 139 124 152 163 226 354
Source: For gross enrollment, UNESCO, various years; for total enrollment,World Bank 1996.
upper secondary school, assuming standards for admittance did not also decline.
A third hypothesis concerns the job prospects of school graduates. Better−educated workers are more likely towork for the government; of all people aged 30−50 in the VNLSS sample, only about 1 percent of those with alower secondary education or less worked for the government, compared with about 12 percent of those with anupper secondary or higher education. In recent years the prospects of getting a government job have declined, asnearly 800,000 public sector (including parastatal) workers were laid off from 1989 to 1993. The same data showthat, among people aged 20−30 with an upper secondary education, only about 5 percent work for thegovernment. Of course, this hypothesis assumes that the decline in government jobs was not offset by new jobopportunities for educated workers in the emerging private sector.
A fourth hypothesis is that the introduction of school fees and charges for textbooks in 1989 discouraged parentsfrom sending their children to school. This hypothesis is consistent with the large declines in 1989, but does notexplain the declines from 1987 to 1988. Of course, these four hypotheses are not mutually exclusive; each couldhave contributed to the decline in school enrollment.
Descriptive Analysis
This section provides a descriptive analysis of the VNLSS data, with an eye toward assessing the plausibility ofthe four hypotheses offered above to explain the decline in school enrollment in Vietnam since the late 1980s.
Household Welfare and Vietnam's Transition
Descriptive Analysis 209
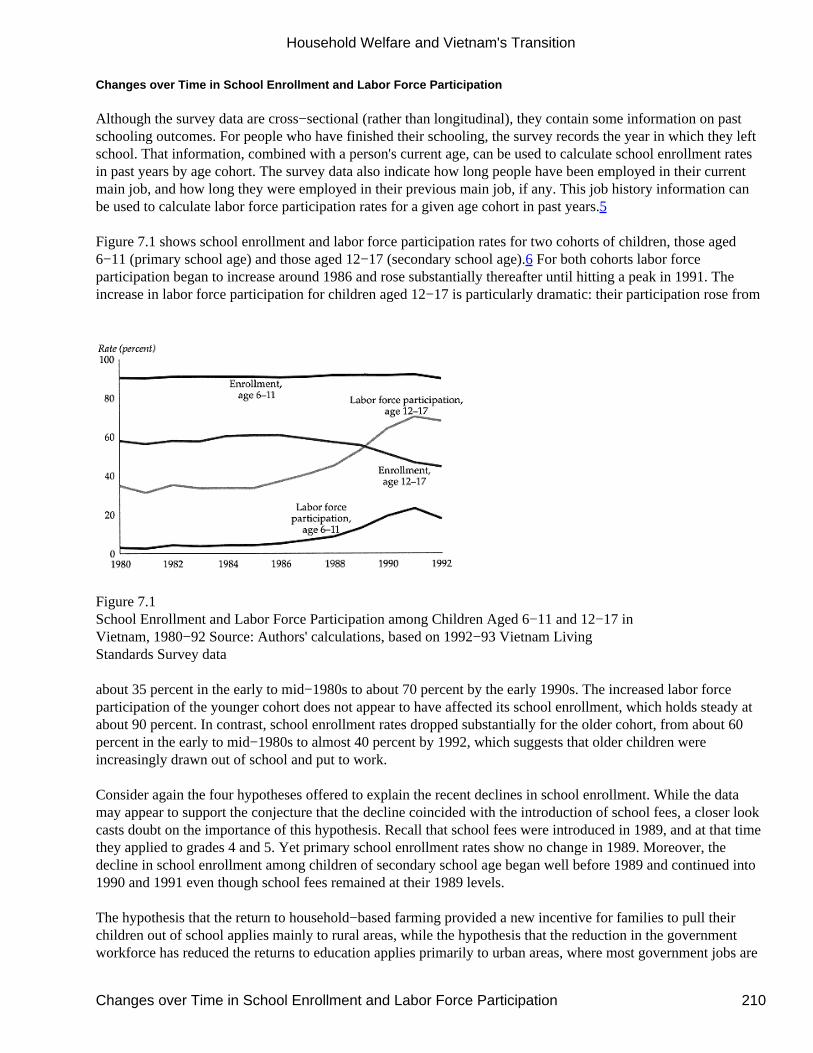
Changes over Time in School Enrollment and Labor Force Participation
Although the survey data are cross−sectional (rather than longitudinal), they contain some information on pastschooling outcomes. For people who have finished their schooling, the survey records the year in which they leftschool. That information, combined with a person's current age, can be used to calculate school enrollment ratesin past years by age cohort. The survey data also indicate how long people have been employed in their currentmain job, and how long they were employed in their previous main job, if any. This job history information canbe used to calculate labor force participation rates for a given age cohort in past years.5
Figure 7.1 shows school enrollment and labor force participation rates for two cohorts of children, those aged6−11 (primary school age) and those aged 12−17 (secondary school age).6 For both cohorts labor forceparticipation began to increase around 1986 and rose substantially thereafter until hitting a peak in 1991. Theincrease in labor force participation for children aged 12−17 is particularly dramatic: their participation rose from
Figure 7.1School Enrollment and Labor Force Participation among Children Aged 6−11 and 12−17 inVietnam, 1980−92 Source: Authors' calculations, based on 1992−93 Vietnam LivingStandards Survey data
about 35 percent in the early to mid−1980s to about 70 percent by the early 1990s. The increased labor forceparticipation of the younger cohort does not appear to have affected its school enrollment, which holds steady atabout 90 percent. In contrast, school enrollment rates dropped substantially for the older cohort, from about 60percent in the early to mid−1980s to almost 40 percent by 1992, which suggests that older children wereincreasingly drawn out of school and put to work.
Consider again the four hypotheses offered to explain the recent declines in school enrollment. While the datamay appear to support the conjecture that the decline coincided with the introduction of school fees, a closer lookcasts doubt on the importance of this hypothesis. Recall that school fees were introduced in 1989, and at that timethey applied to grades 4 and 5. Yet primary school enrollment rates show no change in 1989. Moreover, thedecline in school enrollment among children of secondary school age began well before 1989 and continued into1990 and 1991 even though school fees remained at their 1989 levels.
The hypothesis that the return to household−based farming provided a new incentive for families to pull theirchildren out of school applies mainly to rural areas, while the hypothesis that the reduction in the governmentworkforce has reduced the returns to education applies primarily to urban areas, where most government jobs are
Household Welfare and Vietnam's Transition
Changes over Time in School Enrollment and Labor Force Participation 210
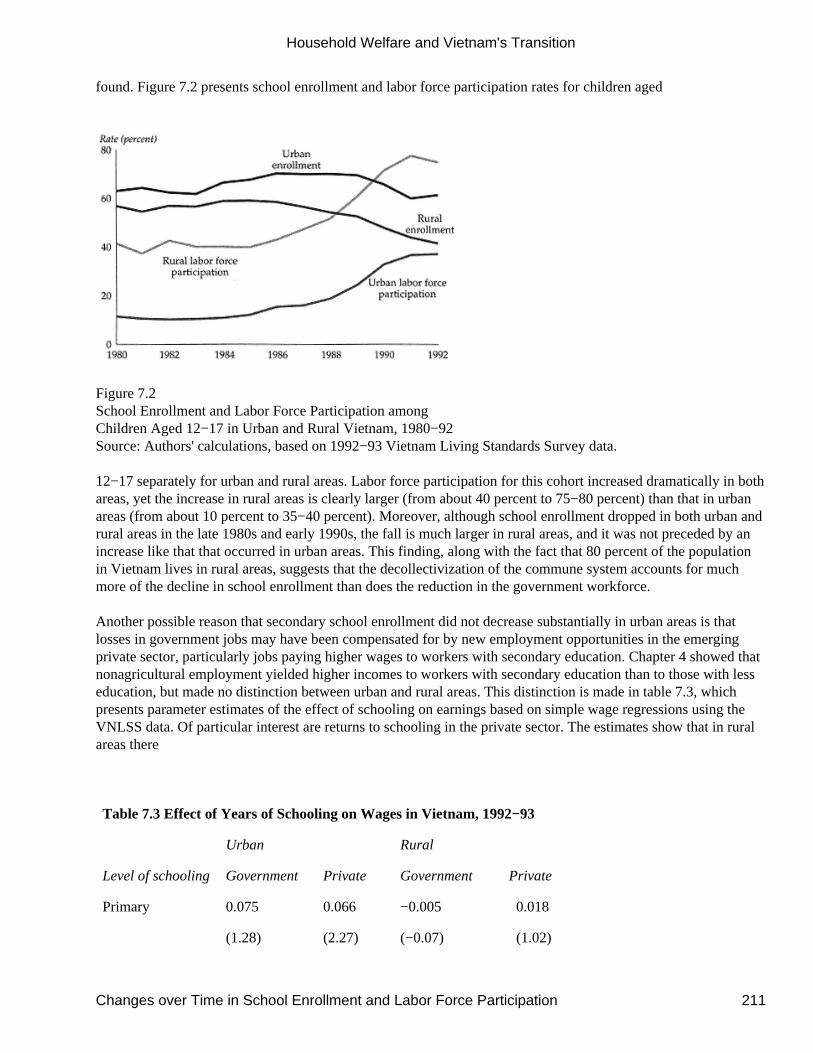
found. Figure 7.2 presents school enrollment and labor force participation rates for children aged
Figure 7.2School Enrollment and Labor Force Participation amongChildren Aged 12−17 in Urban and Rural Vietnam, 1980−92Source: Authors' calculations, based on 1992−93 Vietnam Living Standards Survey data.
12−17 separately for urban and rural areas. Labor force participation for this cohort increased dramatically in bothareas, yet the increase in rural areas is clearly larger (from about 40 percent to 75−80 percent) than that in urbanareas (from about 10 percent to 35−40 percent). Moreover, although school enrollment dropped in both urban andrural areas in the late 1980s and early 1990s, the fall is much larger in rural areas, and it was not preceded by anincrease like that that occurred in urban areas. This finding, along with the fact that 80 percent of the populationin Vietnam lives in rural areas, suggests that the decollectivization of the commune system accounts for muchmore of the decline in school enrollment than does the reduction in the government workforce.
Another possible reason that secondary school enrollment did not decrease substantially in urban areas is thatlosses in government jobs may have been compensated for by new employment opportunities in the emergingprivate sector, particularly jobs paying higher wages to workers with secondary education. Chapter 4 showed thatnonagricultural employment yielded higher incomes to workers with secondary education than to those with lesseducation, but made no distinction between urban and rural areas. This distinction is made in table 7.3, whichpresents parameter estimates of the effect of schooling on earnings based on simple wage regressions using theVNLSS data. Of particular interest are returns to schooling in the private sector. The estimates show that in ruralareas there
Table 7.3 Effect of Years of Schooling on Wages in Vietnam, 1992−93
Urban Rural
Level of schooling Government Private Government Private
Primary 0.075 0.066 −0.005 0.018
(1.28) (2.27) (−0.07) (1.02)
Household Welfare and Vietnam's Transition
Changes over Time in School Enrollment and Labor Force Participation 211
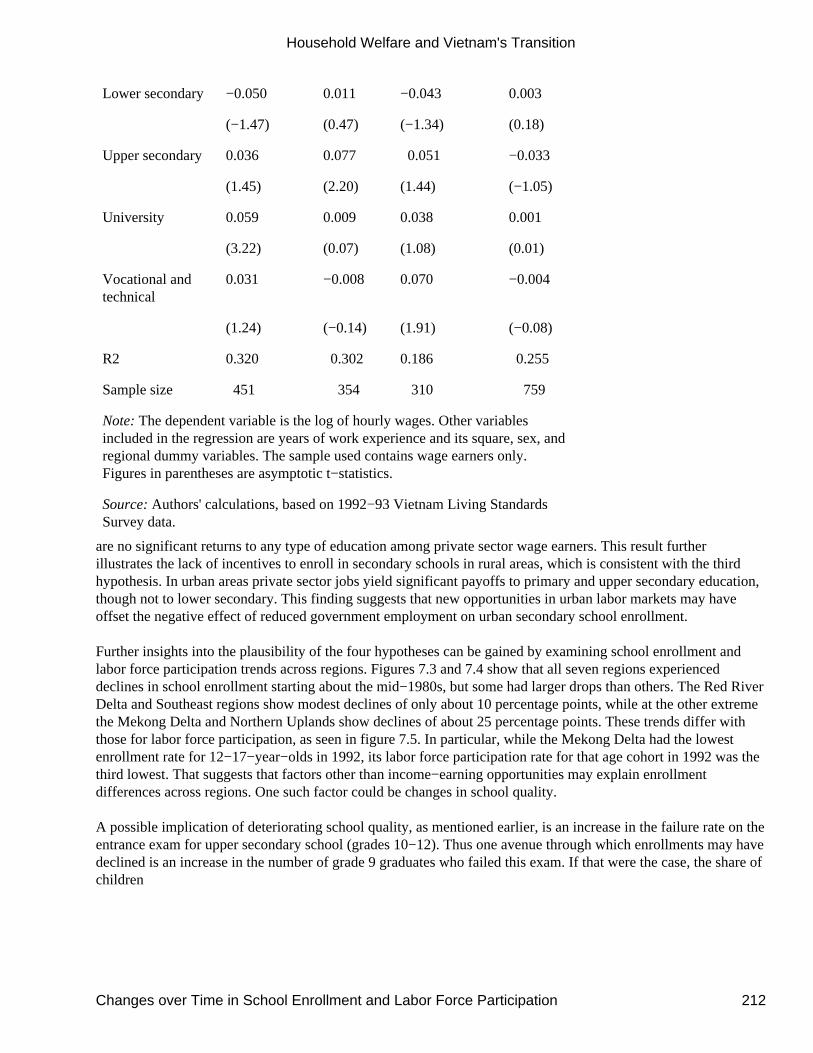
Lower secondary −0.050 0.011 −0.043 0.003
(−1.47) (0.47) (−1.34) (0.18)
Upper secondary 0.036 0.077 0.051 −0.033
(1.45) (2.20) (1.44) (−1.05)
University 0.059 0.009 0.038 0.001
(3.22) (0.07) (1.08) (0.01)
Vocational andtechnical
0.031 −0.008 0.070 −0.004
(1.24) (−0.14) (1.91) (−0.08)
R2 0.320 0.302 0.186 0.255
Sample size 451 354 310 759
Note: The dependent variable is the log of hourly wages. Other variablesincluded in the regression are years of work experience and its square, sex, andregional dummy variables. The sample used contains wage earners only.Figures in parentheses are asymptotic t−statistics.
Source: Authors' calculations, based on 1992−93 Vietnam Living StandardsSurvey data.
are no significant returns to any type of education among private sector wage earners. This result furtherillustrates the lack of incentives to enroll in secondary schools in rural areas, which is consistent with the thirdhypothesis. In urban areas private sector jobs yield significant payoffs to primary and upper secondary education,though not to lower secondary. This finding suggests that new opportunities in urban labor markets may haveoffset the negative effect of reduced government employment on urban secondary school enrollment.
Further insights into the plausibility of the four hypotheses can be gained by examining school enrollment andlabor force participation trends across regions. Figures 7.3 and 7.4 show that all seven regions experienceddeclines in school enrollment starting about the mid−1980s, but some had larger drops than others. The Red RiverDelta and Southeast regions show modest declines of only about 10 percentage points, while at the other extremethe Mekong Delta and Northern Uplands show declines of about 25 percentage points. These trends differ withthose for labor force participation, as seen in figure 7.5. In particular, while the Mekong Delta had the lowestenrollment rate for 12−17−year−olds in 1992, its labor force participation rate for that age cohort in 1992 was thethird lowest. That suggests that factors other than income−earning opportunities may explain enrollmentdifferences across regions. One such factor could be changes in school quality.
A possible implication of deteriorating school quality, as mentioned earlier, is an increase in the failure rate on theentrance exam for upper secondary school (grades 10−12). Thus one avenue through which enrollments may havedeclined is an increase in the number of grade 9 graduates who failed this exam. If that were the case, the share ofchildren
Household Welfare and Vietnam's Transition
Changes over Time in School Enrollment and Labor Force Participation 212
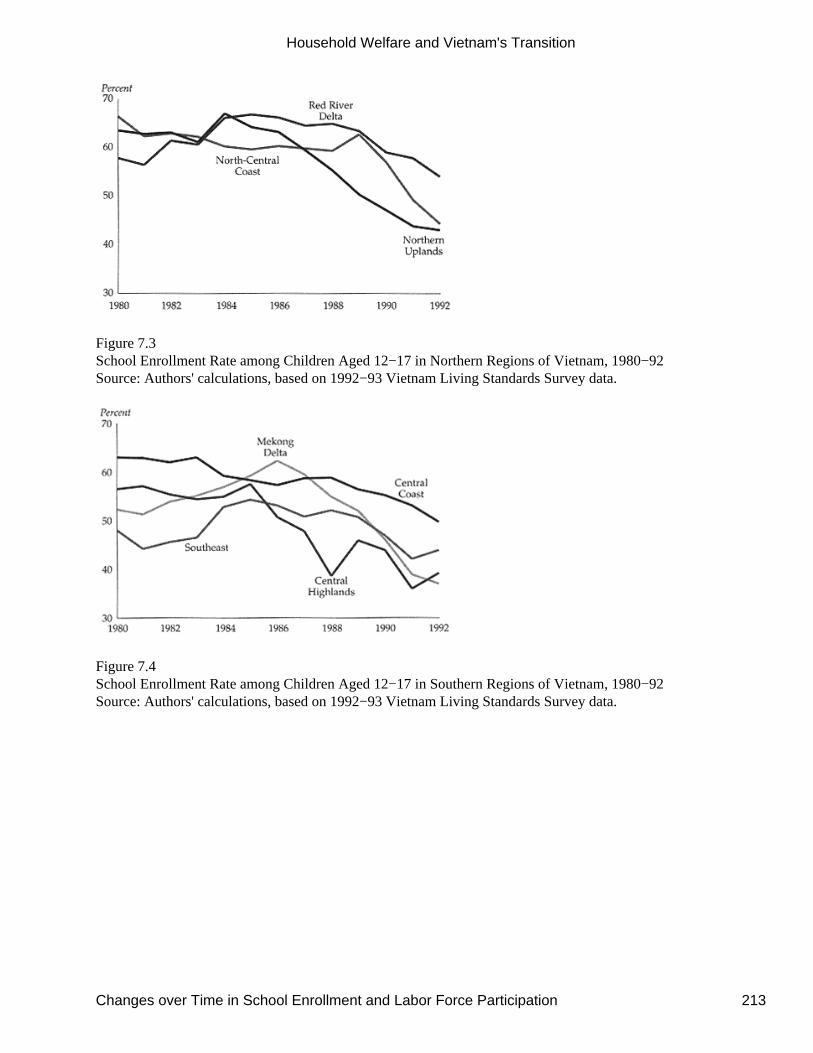
Figure 7.3School Enrollment Rate among Children Aged 12−17 in Northern Regions of Vietnam, 1980−92Source: Authors' calculations, based on 1992−93 Vietnam Living Standards Survey data.
Figure 7.4School Enrollment Rate among Children Aged 12−17 in Southern Regions of Vietnam, 1980−92Source: Authors' calculations, based on 1992−93 Vietnam Living Standards Survey data.
Household Welfare and Vietnam's Transition
Changes over Time in School Enrollment and Labor Force Participation 213
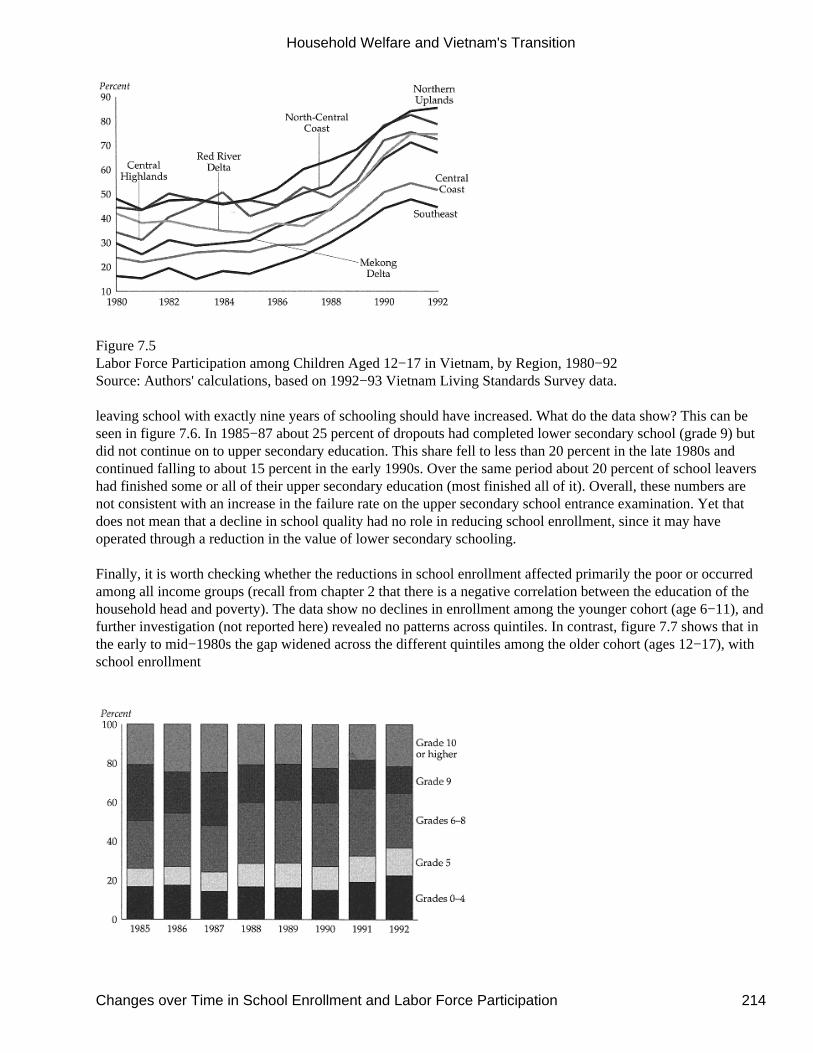
Figure 7.5Labor Force Participation among Children Aged 12−17 in Vietnam, by Region, 1980−92Source: Authors' calculations, based on 1992−93 Vietnam Living Standards Survey data.
leaving school with exactly nine years of schooling should have increased. What do the data show? This can beseen in figure 7.6. In 1985−87 about 25 percent of dropouts had completed lower secondary school (grade 9) butdid not continue on to upper secondary education. This share fell to less than 20 percent in the late 1980s andcontinued falling to about 15 percent in the early 1990s. Over the same period about 20 percent of school leavershad finished some or all of their upper secondary education (most finished all of it). Overall, these numbers arenot consistent with an increase in the failure rate on the upper secondary school entrance examination. Yet thatdoes not mean that a decline in school quality had no role in reducing school enrollment, since it may haveoperated through a reduction in the value of lower secondary schooling.
Finally, it is worth checking whether the reductions in school enrollment affected primarily the poor or occurredamong all income groups (recall from chapter 2 that there is a negative correlation between the education of thehousehold head and poverty). The data show no declines in enrollment among the younger cohort (age 6−11), andfurther investigation (not reported here) revealed no patterns across quintiles. In contrast, figure 7.7 shows that inthe early to mid−1980s the gap widened across the different quintiles among the older cohort (ages 12−17), withschool enrollment
Household Welfare and Vietnam's Transition
Changes over Time in School Enrollment and Labor Force Participation 214
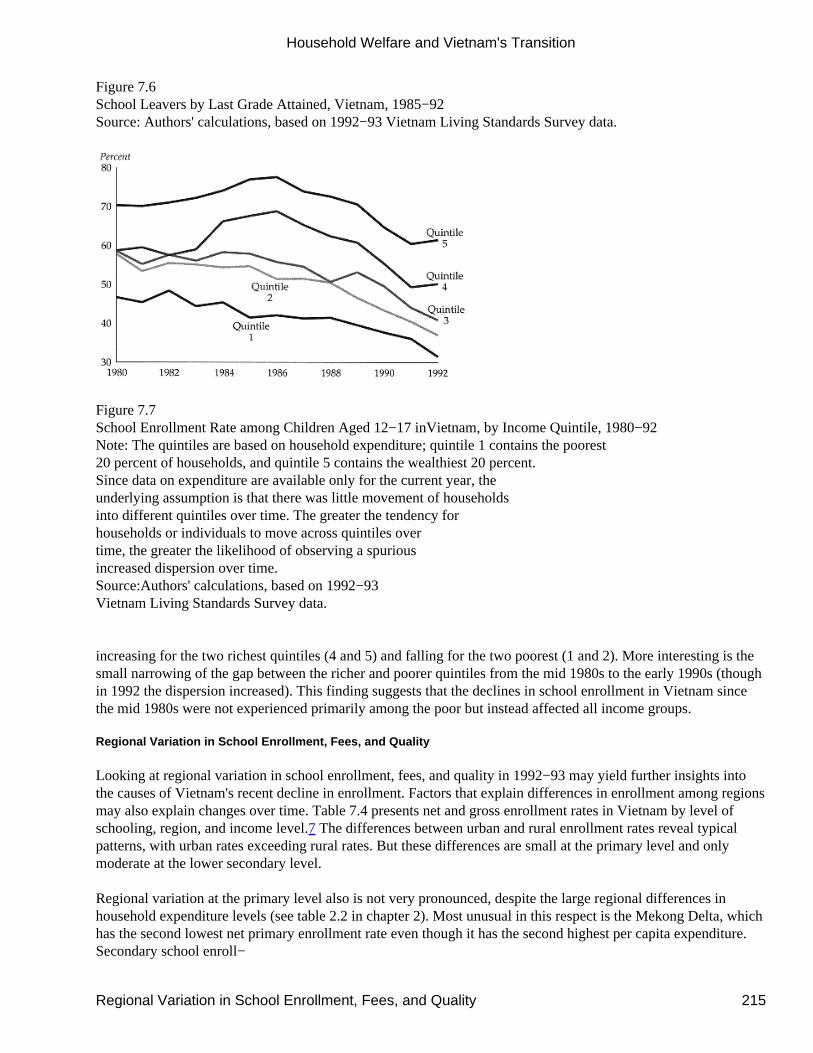
Figure 7.6School Leavers by Last Grade Attained, Vietnam, 1985−92Source: Authors' calculations, based on 1992−93 Vietnam Living Standards Survey data.
Figure 7.7School Enrollment Rate among Children Aged 12−17 inVietnam, by Income Quintile, 1980−92Note: The quintiles are based on household expenditure; quintile 1 contains the poorest20 percent of households, and quintile 5 contains the wealthiest 20 percent.Since data on expenditure are available only for the current year, theunderlying assumption is that there was little movement of householdsinto different quintiles over time. The greater the tendency forhouseholds or individuals to move across quintiles overtime, the greater the likelihood of observing a spuriousincreased dispersion over time.Source:Authors' calculations, based on 1992−93Vietnam Living Standards Survey data.
increasing for the two richest quintiles (4 and 5) and falling for the two poorest (1 and 2). More interesting is thesmall narrowing of the gap between the richer and poorer quintiles from the mid 1980s to the early 1990s (thoughin 1992 the dispersion increased). This finding suggests that the declines in school enrollment in Vietnam sincethe mid 1980s were not experienced primarily among the poor but instead affected all income groups.
Regional Variation in School Enrollment, Fees, and Quality
Looking at regional variation in school enrollment, fees, and quality in 1992−93 may yield further insights intothe causes of Vietnam's recent decline in enrollment. Factors that explain differences in enrollment among regionsmay also explain changes over time. Table 7.4 presents net and gross enrollment rates in Vietnam by level ofschooling, region, and income level.7 The differences between urban and rural enrollment rates reveal typicalpatterns, with urban rates exceeding rural rates. But these differences are small at the primary level and onlymoderate at the lower secondary level.
Regional variation at the primary level also is not very pronounced, despite the large regional differences inhousehold expenditure levels (see table 2.2 in chapter 2). Most unusual in this respect is the Mekong Delta, whichhas the second lowest net primary enrollment rate even though it has the second highest per capita expenditure.Secondary school enroll−
Household Welfare and Vietnam's Transition
Regional Variation in School Enrollment, Fees, and Quality 215
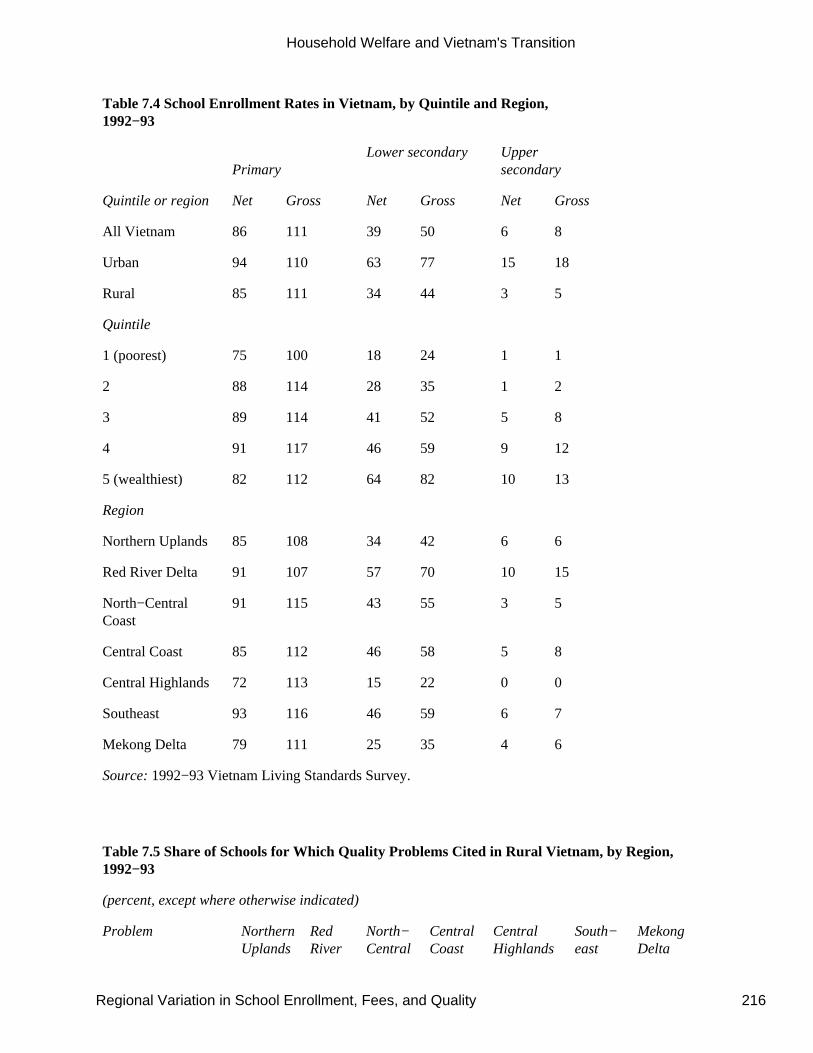
Table 7.4 School Enrollment Rates in Vietnam, by Quintile and Region,1992−93
PrimaryLower secondary Upper
secondary
Quintile or region Net Gross Net Gross Net Gross
All Vietnam 86 111 39 50 6 8
Urban 94 110 63 77 15 18
Rural 85 111 34 44 3 5
Quintile
1 (poorest) 75 100 18 24 1 1
2 88 114 28 35 1 2
3 89 114 41 52 5 8
4 91 117 46 59 9 12
5 (wealthiest) 82 112 64 82 10 13
Region
Northern Uplands 85 108 34 42 6 6
Red River Delta 91 107 57 70 10 15
North−CentralCoast
91 115 43 55 3 5
Central Coast 85 112 46 58 5 8
Central Highlands 72 113 15 22 0 0
Southeast 93 116 46 59 6 7
Mekong Delta 79 111 25 35 4 6
Source: 1992−93 Vietnam Living Standards Survey.
Table 7.5 Share of Schools for Which Quality Problems Cited in Rural Vietnam, by Region,1992−93
(percent, except where otherwise indicated)
Problem NorthernUplands
RedRiver
North−Central
CentralCoast
CentralHighlands
South−east
MekongDelta
Household Welfare and Vietnam's Transition
Regional Variation in School Enrollment, Fees, and Quality 216
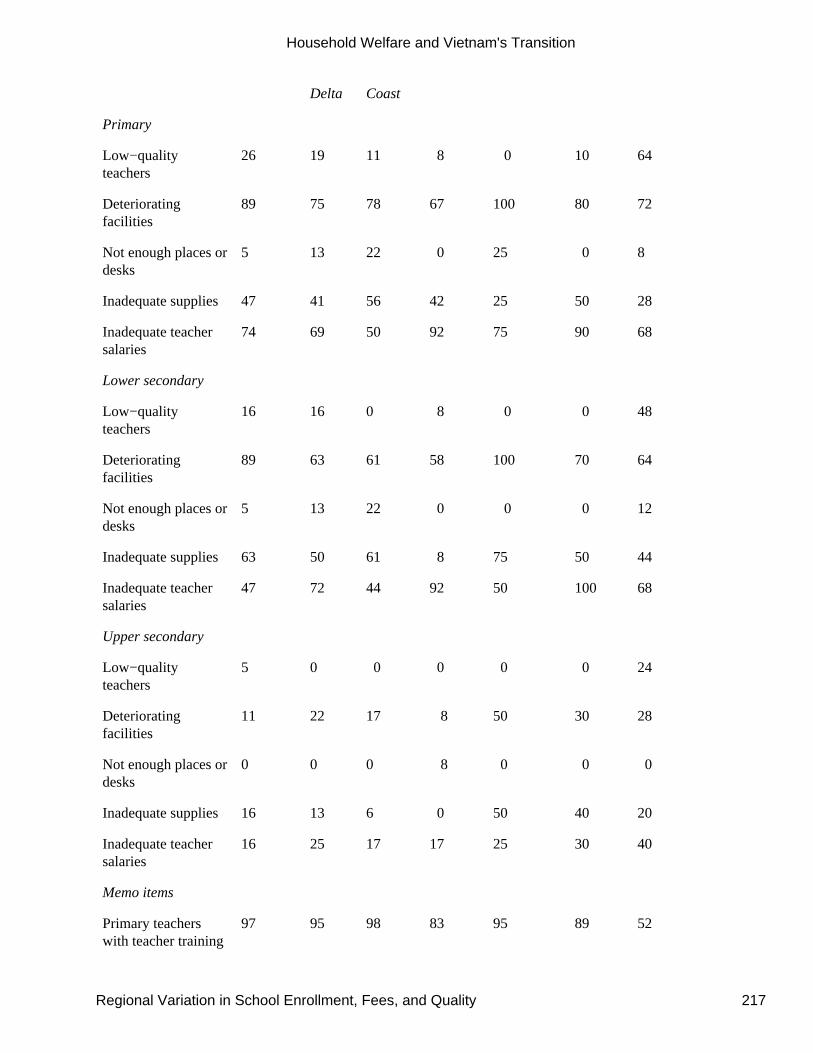
Delta Coast
Primary
Low−qualityteachers
26 19 11 8 0 10 64
Deterioratingfacilities
89 75 78 67 100 80 72
Not enough places ordesks
5 13 22 0 25 0 8
Inadequate supplies 47 41 56 42 25 50 28
Inadequate teachersalaries
74 69 50 92 75 90 68
Lower secondary
Low−qualityteachers
16 16 0 8 0 0 48
Deterioratingfacilities
89 63 61 58 100 70 64
Not enough places ordesks
5 13 22 0 0 0 12
Inadequate supplies 63 50 61 8 75 50 44
Inadequate teachersalaries
47 72 44 92 50 100 68
Upper secondary
Low−qualityteachers
5 0 0 0 0 0 24
Deterioratingfacilities
11 22 17 8 50 30 28
Not enough places ordesks
0 0 0 8 0 0 0
Inadequate supplies 16 13 6 0 50 40 20
Inadequate teachersalaries
16 25 17 17 25 30 40
Memo items
Primary teacherswith teacher training
97 95 98 83 95 89 52
Household Welfare and Vietnam's Transition
Regional Variation in School Enrollment, Fees, and Quality 217

Primarystudent−teacher ratio
31 35 33 36 31 36 38
Source: 1992−93 Vietnam Living Standards Survey, community questionnaire.
ment rates vary much more across regions, and again, enrollment rates in the Mekong Delta are low relative tomean household expenditure, especially at the lower secondary level.
School quality data for rural areas by region and level of schooling are shown in table 7.5.8 In rural areas of theMekong Delta the large share of primary schools that cite poor teacher quality as a problem and the low share ofprimary teachers who have had training both indicate particularly low school quality relative to that in otherregions. Yet the Mekong Delta fares better on other school quality indicators at the primary level. At both lowerand upper secondary levels teacher quality is again cited as a problem much more often in the Mekong Delta, butthe region does not appear worse in other respects.
If teacher quality is a key indicator of school quality, then the low enrollment (relative to the income level) inrural areas of the Mekong Delta may be explained, at least in part, by low teacher quality. This finding alsosuggests that declines in school quality over time may have played an important role in reducing enrollment in thelate 1980s and early 1990s.
Table 7.6 Expenses and School Fees at Public Schools in Vietnam, by Region, 1992−93
(dong per student per year)
Level ofschooling andtype ofexpenses
NorthernUplands
RedRiverDelta
North−CentralCoast
CentralCoast
CentralHighlands
South−east
MekongDelta
Primary
Tuition only
Urban 140 1,679 2,958 2,651 − 55,531 1,134
Rural 95 324 804 1,362 849 5,298 1,981
Tuition, PTA,other
Urban 13,390 72,157 31,166 87,413 − 141,735 40,185
Rural 10,143 16,136 13,284 17,192 19,622 17,972 13,781
All costs
Urban 55,440 137,376 60,375 197,998 − 355,377 196,782
Rural 32,751 40,295 40,545 64,985 67,097 115,389 93,683
School fee(rural only)a
7,131 22,000 13,472 7,042 21,250 19,667 43,629
Household Welfare and Vietnam's Transition
Regional Variation in School Enrollment, Fees, and Quality 218
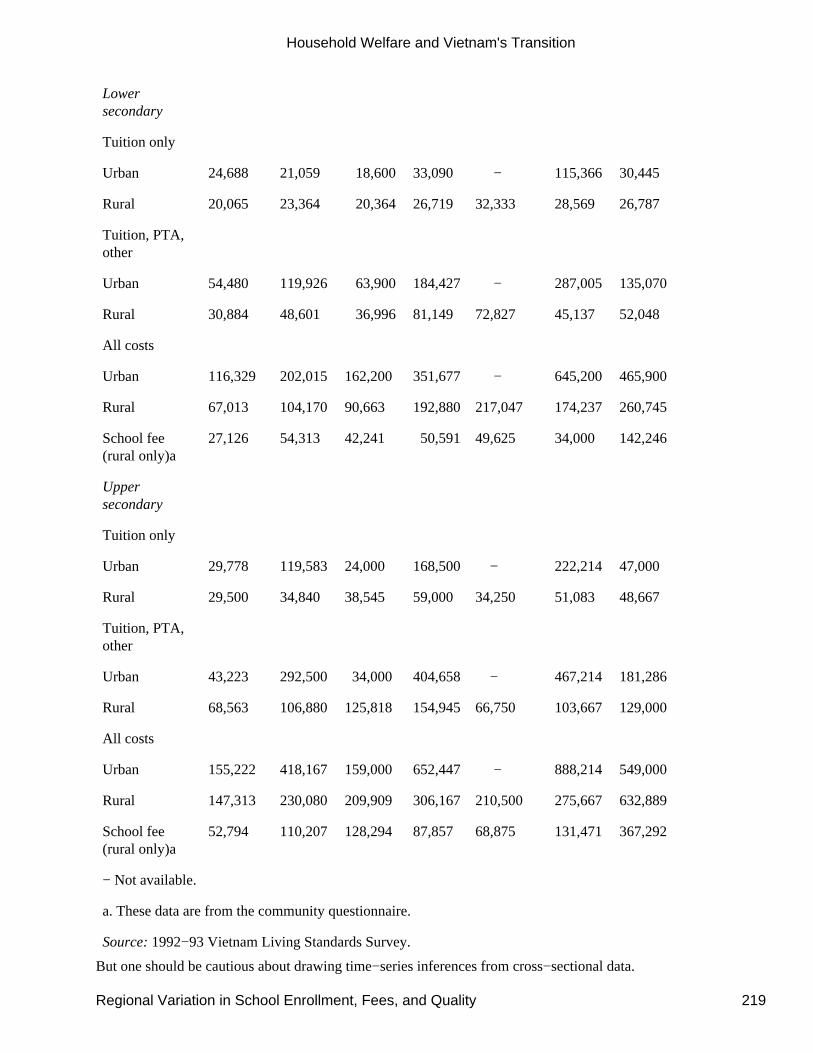
Lowersecondary
Tuition only
Urban 24,688 21,059 18,600 33,090 − 115,366 30,445
Rural 20,065 23,364 20,364 26,719 32,333 28,569 26,787
Tuition, PTA,other
Urban 54,480 119,926 63,900 184,427 − 287,005 135,070
Rural 30,884 48,601 36,996 81,149 72,827 45,137 52,048
All costs
Urban 116,329 202,015 162,200 351,677 − 645,200 465,900
Rural 67,013 104,170 90,663 192,880 217,047 174,237 260,745
School fee(rural only)a
27,126 54,313 42,241 50,591 49,625 34,000 142,246
Uppersecondary
Tuition only
Urban 29,778 119,583 24,000 168,500 − 222,214 47,000
Rural 29,500 34,840 38,545 59,000 34,250 51,083 48,667
Tuition, PTA,other
Urban 43,223 292,500 34,000 404,658 − 467,214 181,286
Rural 68,563 106,880 125,818 154,945 66,750 103,667 129,000
All costs
Urban 155,222 418,167 159,000 652,447 − 888,214 549,000
Rural 147,313 230,080 209,909 306,167 210,500 275,667 632,889
School fee(rural only)a
52,794 110,207 128,294 87,857 68,875 131,471 367,292
− Not available.
a. These data are from the community questionnaire.
Source: 1992−93 Vietnam Living Standards Survey.
But one should be cautious about drawing time−series inferences from cross−sectional data.
Household Welfare and Vietnam's Transition
Regional Variation in School Enrollment, Fees, and Quality 219
Consider now school expenses and fees (table 7.6), beginning with primary schooling. Recall that the officialpolicy in 1993 was to not charge tuition at the primary level, with the possible exception of Ho Chi Minh City(urban areas of the Southeast). Excluding urban areas of the Southeast, mean tuition expenses per child per yearare about 5,000 dong or less. But
adding parent−teacher association (PTA) fees and miscellaneous costs makes primary schooling much moreexpensive, about 10,000−20,000 dong in rural areas and as much as 87,000 dong in urban areas excluding theSoutheast, where the cost is 142,000 dong).9 The cost is even higher after adding the costs of uniforms, books,transportation, and food or lodging−up to 115,000 dong in rural areas and 55,000−197,000 dong in urban areas(again excluding the urban Southeast, where the cost is 355,000 dong). Clearly, low or zero tuition does notnecessarily mean low schooling costs.
At the lower and upper secondary levels tuition is much higher than at the primary level. Recall that officialannual tuition rates for lower secondary were to be about 35,000 dong in rural areas and 45,000 dong in urbanareas (excluding the urban Southeast).10 These rates are somewhat higher than those reported in the VNLSS (seetable 7.6), but the difference could reflect discounts for minorities and poor families. The official upper secondarytuition fees of 60,000 dong in rural areas and 80,000 dong in urban areas are fairly consistent with those reportedin the survey when the exceptions for certain students are taken into account. But in urban areas the mean tuitionpaid exceeded the official fees of 80,000 dong in three of seven regions: Red River Delta, Central Coast, and, asexpected, the Southeast. For the first two regions, the higher−than−expected fees may reflect high tuitions paid inHanoi and Danang.
While tuition is substantial at the lower and upper secondary levels, it still accounts for only part of total costs.When PTA and miscellaneous fees are added, the annual costs for a lower secondary student are 31,000−81,000dong in rural areas and 54,000−184,000 dong in urban areas (excluding the urban Southeast). Adding expensesfor books, uniforms, transportation, and food and lodging almost doubles the cost. Finally, the costs for uppersecondary students are about 50−100 percent higher than those for lower secondary students. These figuressuggest that the decision to charge tuition at the secondary level probably did not raise schooling costs by a largepercentage for most students, which raises further doubt about the hypothesis that school fees explain much of therecent decline in school enrollment.
One aspect of the data in table 7.6 merits particular attention. In each rural commune, the survey communityquestionnaire asked for the cost of attending primary and lower and upper secondary schools. Presumably, thiscost includes only payments directly to the schools, such as tuition and PTA and miscellaneous fees, and excludesgoods purchased in the market, such as books, uniforms, and transportation. From table 7.6 it appears that theschool fee numbers reported in the community questionnaire are generally close to what people in rural areasreported paying for tuition, PTA, and miscellaneous expenses on the household questionnaire. But there are twoexceptions. In the Central Coast households report paying fees substantially higher than the school costs reportedin the community questionnaire at all levels of schooling. In the Mekong Delta the reverse is true; costs asreported in the community questionnaire are about three times what people report paying in
the household questionnaire. This discrepancy is noteworthy because the community questionnaire data supportthe hypothesis that school fees may have caused the particularly large decline in enrollment in the Mekong Delta,while the data from the household questionnaire offer no such support.
Summary
The data on changes in school enrollment over time and regional variations in enrollment offer support for some,but not all, of the hypotheses offered to explain the decline in school enrollment in the late 1980s and early 1990s
Household Welfare and Vietnam's Transition
Summary 220
in Vietnam. The first hypothesis, that the opportunity cost of staying in school rose sharply when communes weredecollectivized, is consistent with the greater decline in enrollment in rural than in urban areas among children ofsecondary school age. The second hypothesis, that decreasing school quality reduced enrollment, is consistentwith current regional variation in teacher quality; in particular, the relatively low enrollment rates in the MekongDelta may reflect its unusually low teacher quality. Yet declines in school quality did not increase the failure rateon the upper secondary school entrance examination. Moreover, school quality is lowest at the primary level, yetprimary enrollment has been much more stable than secondary enrollment.
The third hypothesis, that reduced prospects for government employment led to major reductions in schoolenrollment, is consistent with the modest declines in enrollment in urban areas (where most governmentemployees are located), but does little to explain nationwide trends for a population that is 80 percent rural. Thelast hypothesis, on the role of increased school fees, also garners little support. Not only did the declines in schoolenrollment precede the introduction of school fees, but fees do not appear to be a major part of the direct cost ofschooling. Evidence from regional variation in school fees is mixed at best.
Of course, all the evidence in this section is based on relatively simple descriptive statistics, so the conclusionsdrawn should be regarded as tentative. The following section presents evidence based on regression analysis,which is better suited for disentangling the different factors that determine school enrollment and completiondecisions.
Regression Analysis
Although the descriptive analysis above shed some light on the possible causes of the recent decline in schoolenrollment in Vietnam, there is a limit to what can be learned from cross−tabulations. The next step is tosimultaneously control for the multiple determinants of school enrollment behavior in the context of amultivariate regression. Needless to say, causal inferences should be drawn with caution from a cross−sectionalregression analysis because of the likely presence of unobserved heterogeneity.
Another limitation of cross−sectional data is that only current variables are observed. The constraints householdsfaced when they made their education decisions cannot be observed, except to the extent that they are reflected incurrent data. Longitudinal data would be better suited to the task at hand, but such data are rarely available indeveloping countries, and none exist for Vietnam. Thus the following analysis should be viewed primarily asexploratory−as one that points to areas for future investigation rather than providing a basis for specific policyrecommendations.
This section focuses on lower secondary schooling in rural areas because of the finding that this is the mainsource of the increase in dropouts in Vietnam.11 But it also examines primary school enrollment in rural areas.
An Empirical Model of School Continuation Decisions
Consider a simple economic model of the school continuation decision, such as the choice between completinglower secondary school or dropping out. Without specifying the household's objective function or constraints in aformal model, assume that the continuation decision rule depends on the current costs of schooling, both direct(school fees) and indirect (time) costs, the expected future benefits from schooling, and current householdincome. Current income enters the decision rule under the plausible assumption that households in Vietnam donot have access to perfect capital markets with which to finance their children's schooling; credit−constrainedhouseholds must finance human capital investment at least in part out of current income (see Jacoby 1994).Parental preferences for educated children also influence school enrollment decisions.
Household Welfare and Vietnam's Transition
Regression Analysis 221
The data on the direct costs of schooling (school fees and the like) come from the household survey and, for ruralareas only, the community questionnaire as well, though there are some inconsistencies between the two (asexplained in the preceding section). Time costs could be obtained from the community questionnaire, whichprovides distance to the nearest school at each level when there is no school in the commune.12 But measuringthe value of an hour of a child's time poses a challenge, since few children of school age in the sample work forwages. Instead, the analysis uses commune−level wage rates for adult male agricultural labor, as well ashousehold land holdings, as proxies for the value of children's time.13 Yet land area is also an indicator of wealth,which typically would be positively correlated with the demand for schooling, at least for credit−constrainedhouseholds. This positive correlation should disappear once household income is controlled for, which is doneusing per capita household expenditure. Even so, land may still have an ambiguous effect because it may serve ascollateral for obtaining credit, which would have a positive effect on school enrollment. Finally, the analysisincludes a set of demographic variables to indicate the number of siblings that would be competing with the childin question for household resources.
The expected benefits from schooling are also difficult to capture in cross−sectional data. But the survey datainclude measures of school quality at the commune level, again only for rural areas, which are indicators of thereturns to schooling. The analysis also includes child height−for−age (the standardized Z−score) in the decisionrule for starting primary school, since nutritional status may affect the rate of return to schooling.14 Dummyvariables for parental education and ethnic group are also added to control for preferences for schooling.15Because there are no data on wages or school quality for urban areas, the entire analysis is restricted to rural areas.Recall, however, that 80 percent of Vietnam's population is rural.
A final set of regressors are regional dummy variables. Although these variables are not suggested by economictheory, they are useful because they indicate whether the large regional differences in school continuation ratesobserved at the lower secondary level (see table 7.4) persist after controlling for a broad set of factors. Means andstandard deviations of all these explanatory variables are reported in table 7.7 for two of the four age cohorts usedin the regression analysis (because the descriptive statistics are very similar across cohorts, they are provided onlyfor the youngest and oldest cohorts).
The statistical model used for the school continuation decision follows the sequential probit approach of Mare(1980). That is, separate probit regressions are estimated for each school continuation decision conditional oncompletion of the previous level.16 Note that such a model ignores the possibility that students who complete agiven level are ''better" than students who drop out because of some unobserved factor, such as academic abilityor family preferences for education. Such unobserved heterogeneity could lead to serious selection bias in theestimates. But because the analysis is exploratory, it does not appear worthwhile to undertake the computationallyburdensome solutions to this potential problem (see Lillard and Willis 1994).
Another econometric issue to contend with is the potential endogeneity of household expenditures and childheight−for−age. Families that decide to continue sending their children to school may forgo current consumptionto do so.17 In this sense school continuation may "cause" low consumption. At the same time low consumption(low income) may impede school continuation. This simultaneity would tend to attenuate the expected positiveincome or wealth effect. To avoid possible bias in the parameter estimates, appropriate instrumental variables arerequired. But many instruments that immediately spring to mind, such as farm assets, are likely to be invalid in asubsistence agrarian economy, since they may also reflect the value of children's time. Information is available,however, on income from miscellaneous sources (such as the government social fund, inheritance, and gamblingwinnings) that should be correlated with expenditure but uncorrelated with the income contributed by school agechildren.
Household Welfare and Vietnam's Transition
Regression Analysis 222
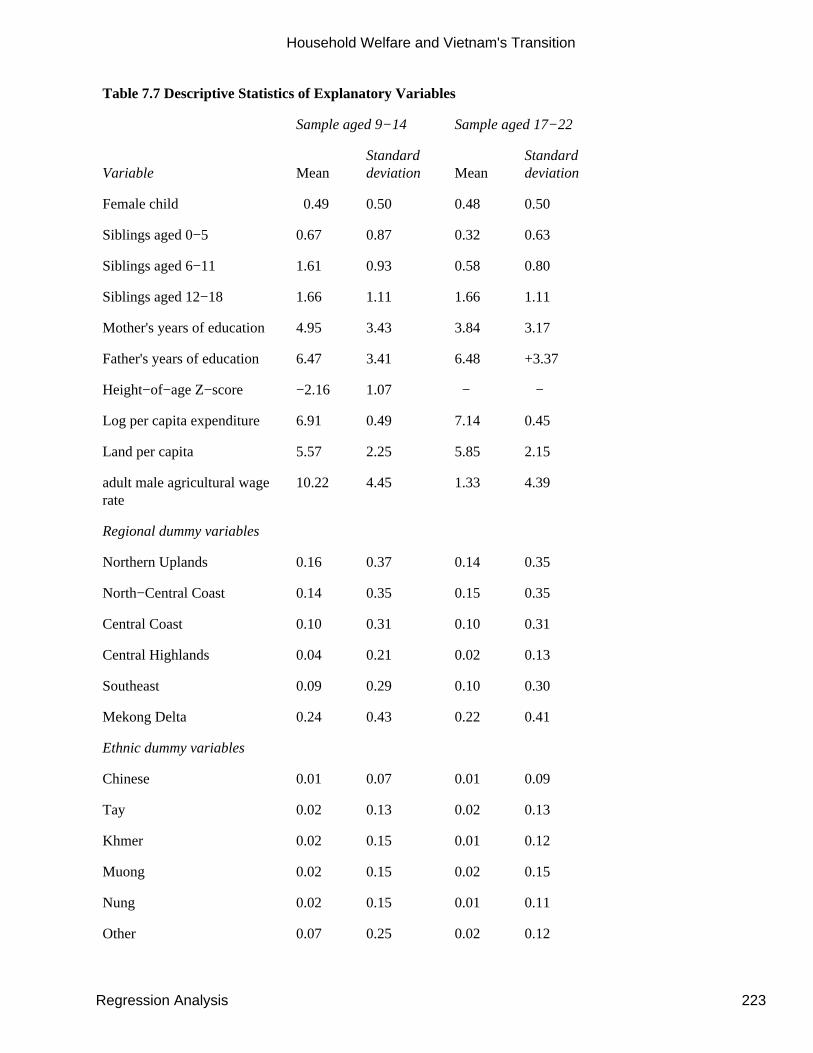
Table 7.7 Descriptive Statistics of Explanatory Variables
Sample aged 9−14 Sample aged 17−22
Variable MeanStandarddeviation Mean
Standarddeviation
Female child 0.49 0.50 0.48 0.50
Siblings aged 0−5 0.67 0.87 0.32 0.63
Siblings aged 6−11 1.61 0.93 0.58 0.80
Siblings aged 12−18 1.66 1.11 1.66 1.11
Mother's years of education 4.95 3.43 3.84 3.17
Father's years of education 6.47 3.41 6.48 +3.37
Height−of−age Z−score −2.16 1.07 − −
Log per capita expenditure 6.91 0.49 7.14 0.45
Land per capita 5.57 2.25 5.85 2.15
adult male agricultural wagerate
10.22 4.45 1.33 4.39
Regional dummy variables
Northern Uplands 0.16 0.37 0.14 0.35
North−Central Coast 0.14 0.35 0.15 0.35
Central Coast 0.10 0.31 0.10 0.31
Central Highlands 0.04 0.21 0.02 0.13
Southeast 0.09 0.29 0.10 0.30
Mekong Delta 0.24 0.43 0.22 0.41
Ethnic dummy variables
Chinese 0.01 0.07 0.01 0.09
Tay 0.02 0.13 0.02 0.13
Khmer 0.02 0.15 0.01 0.12
Muong 0.02 0.15 0.02 0.15
Nung 0.02 0.15 0.01 0.11
Other 0.07 0.25 0.02 0.12
Household Welfare and Vietnam's Transition
Regression Analysis 223
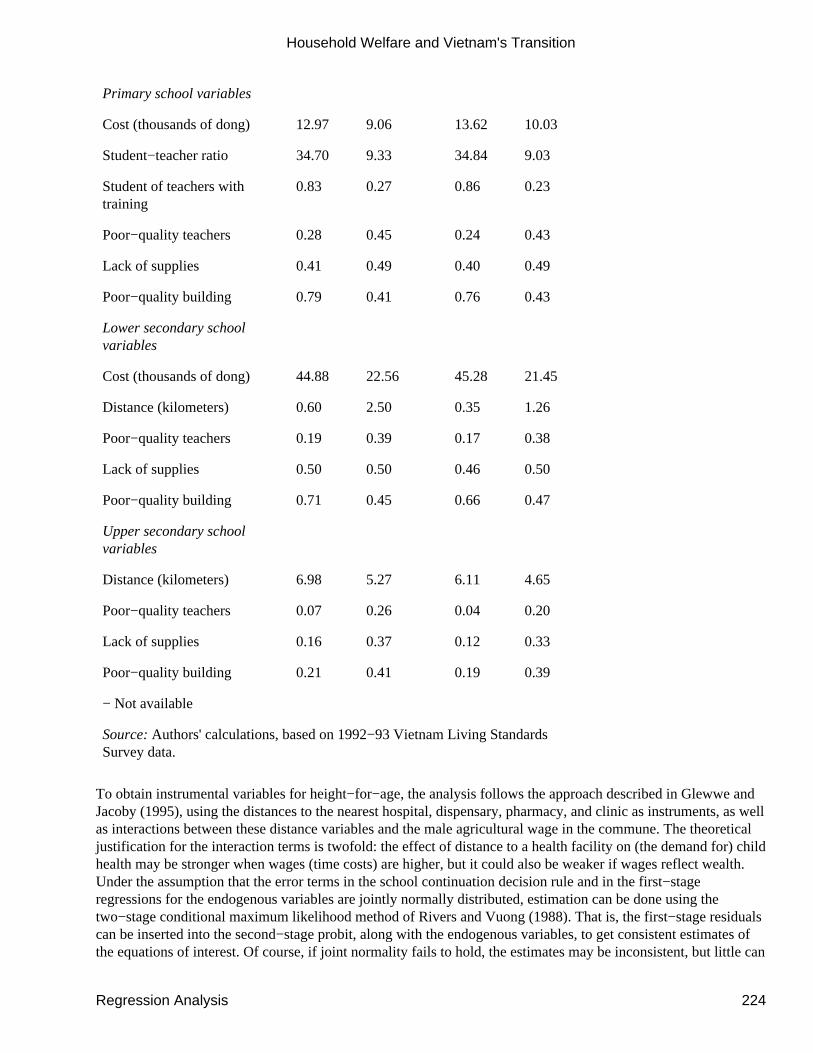
Primary school variables
Cost (thousands of dong) 12.97 9.06 13.62 10.03
Student−teacher ratio 34.70 9.33 34.84 9.03
Student of teachers withtraining
0.83 0.27 0.86 0.23
Poor−quality teachers 0.28 0.45 0.24 0.43
Lack of supplies 0.41 0.49 0.40 0.49
Poor−quality building 0.79 0.41 0.76 0.43
Lower secondary schoolvariables
Cost (thousands of dong) 44.88 22.56 45.28 21.45
Distance (kilometers) 0.60 2.50 0.35 1.26
Poor−quality teachers 0.19 0.39 0.17 0.38
Lack of supplies 0.50 0.50 0.46 0.50
Poor−quality building 0.71 0.45 0.66 0.47
Upper secondary schoolvariables
Distance (kilometers) 6.98 5.27 6.11 4.65
Poor−quality teachers 0.07 0.26 0.04 0.20
Lack of supplies 0.16 0.37 0.12 0.33
Poor−quality building 0.21 0.41 0.19 0.39
− Not available
Source: Authors' calculations, based on 1992−93 Vietnam Living StandardsSurvey data.
To obtain instrumental variables for height−for−age, the analysis follows the approach described in Glewwe andJacoby (1995), using the distances to the nearest hospital, dispensary, pharmacy, and clinic as instruments, as wellas interactions between these distance variables and the male agricultural wage in the commune. The theoreticaljustification for the interaction terms is twofold: the effect of distance to a health facility on (the demand for) childhealth may be stronger when wages (time costs) are higher, but it could also be weaker if wages reflect wealth.Under the assumption that the error terms in the school continuation decision rule and in the first−stageregressions for the endogenous variables are jointly normally distributed, estimation can be done using thetwo−stage conditional maximum likelihood method of Rivers and Vuong (1988). That is, the first−stage residualscan be inserted into the second−stage probit, along with the endogenous variables, to get consistent estimates ofthe equations of interest. Of course, if joint normality fails to hold, the estimates may be inconsistent, but little can
Household Welfare and Vietnam's Transition
Regression Analysis 224
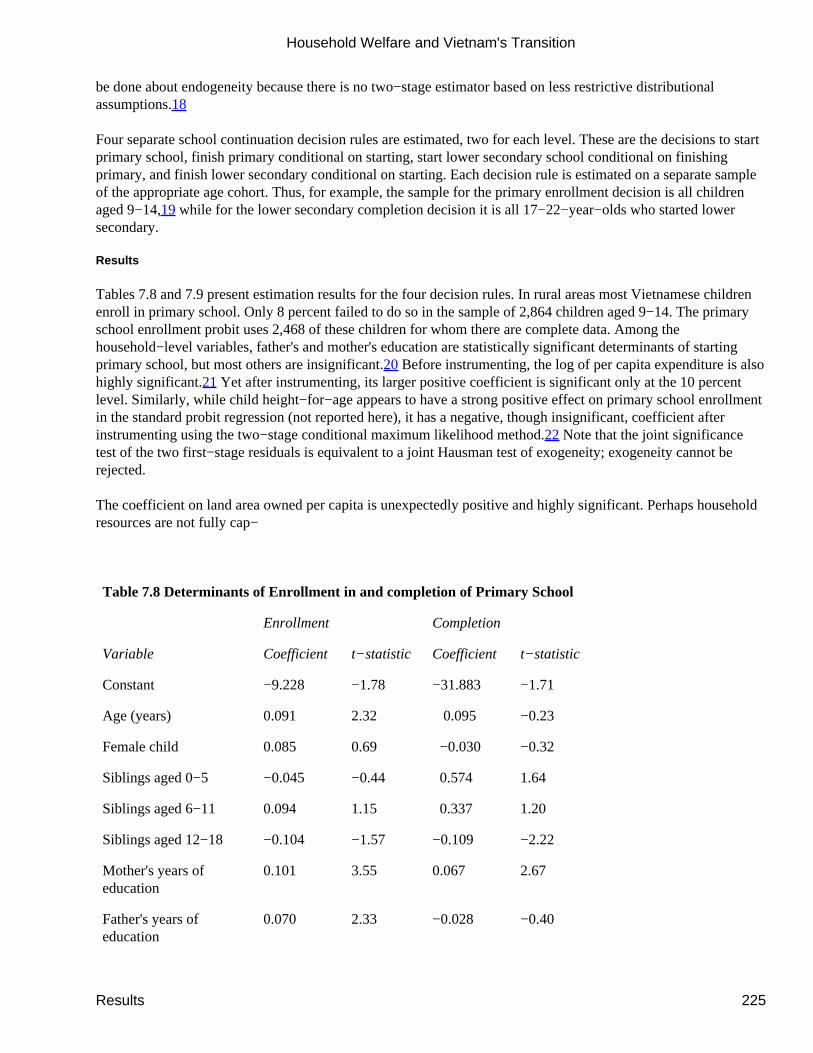
be done about endogeneity because there is no two−stage estimator based on less restrictive distributionalassumptions.18
Four separate school continuation decision rules are estimated, two for each level. These are the decisions to startprimary school, finish primary conditional on starting, start lower secondary school conditional on finishingprimary, and finish lower secondary conditional on starting. Each decision rule is estimated on a separate sampleof the appropriate age cohort. Thus, for example, the sample for the primary enrollment decision is all childrenaged 9−14,19 while for the lower secondary completion decision it is all 17−22−year−olds who started lowersecondary.
Results
Tables 7.8 and 7.9 present estimation results for the four decision rules. In rural areas most Vietnamese childrenenroll in primary school. Only 8 percent failed to do so in the sample of 2,864 children aged 9−14. The primaryschool enrollment probit uses 2,468 of these children for whom there are complete data. Among thehousehold−level variables, father's and mother's education are statistically significant determinants of startingprimary school, but most others are insignificant.20 Before instrumenting, the log of per capita expenditure is alsohighly significant.21 Yet after instrumenting, its larger positive coefficient is significant only at the 10 percentlevel. Similarly, while child height−for−age appears to have a strong positive effect on primary school enrollmentin the standard probit regression (not reported here), it has a negative, though insignificant, coefficient afterinstrumenting using the two−stage conditional maximum likelihood method.22 Note that the joint significancetest of the two first−stage residuals is equivalent to a joint Hausman test of exogeneity; exogeneity cannot berejected.
The coefficient on land area owned per capita is unexpectedly positive and highly significant. Perhaps householdresources are not fully cap−
Table 7.8 Determinants of Enrollment in and completion of Primary School
Enrollment Completion
Variable Coefficient t−statistic Coefficient t−statistic
Constant −9.228 −1.78 −31.883 −1.71
Age (years) 0.091 2.32 0.095 −0.23
Female child 0.085 0.69 −0.030 −0.32
Siblings aged 0−5 −0.045 −0.44 0.574 1.64
Siblings aged 6−11 0.094 1.15 0.337 1.20
Siblings aged 12−18 −0.104 −1.57 −0.109 −2.22
Mother's years ofeducation
0.101 3.55 0.067 2.67
Father's years ofeducation
0.070 2.33 −0.028 −0.40
Household Welfare and Vietnam's Transition
Results 225
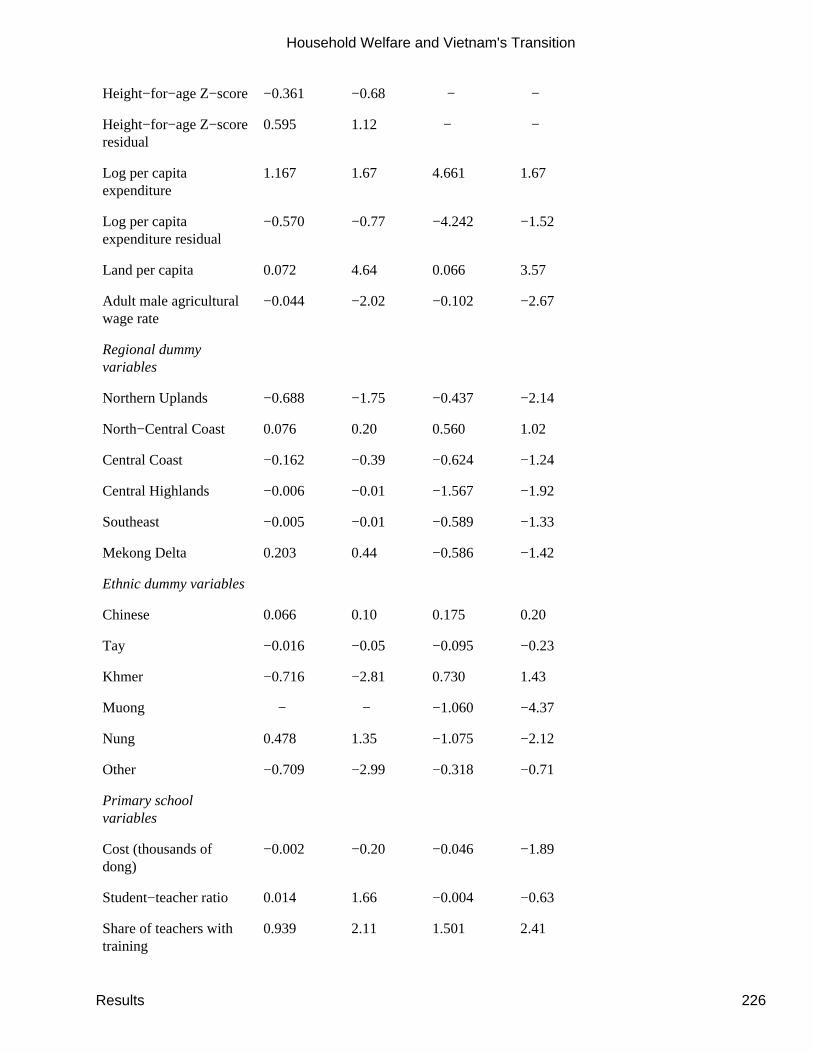
Height−for−age Z−score −0.361 −0.68 − −
Height−for−age Z−scoreresidual
0.595 1.12 − −
Log per capitaexpenditure
1.167 1.67 4.661 1.67
Log per capitaexpenditure residual
−0.570 −0.77 −4.242 −1.52
Land per capita 0.072 4.64 0.066 3.57
Adult male agriculturalwage rate
−0.044 −2.02 −0.102 −2.67
Regional dummyvariables
Northern Uplands −0.688 −1.75 −0.437 −2.14
North−Central Coast 0.076 0.20 0.560 1.02
Central Coast −0.162 −0.39 −0.624 −1.24
Central Highlands −0.006 −0.01 −1.567 −1.92
Southeast −0.005 −0.01 −0.589 −1.33
Mekong Delta 0.203 0.44 −0.586 −1.42
Ethnic dummy variables
Chinese 0.066 0.10 0.175 0.20
Tay −0.016 −0.05 −0.095 −0.23
Khmer −0.716 −2.81 0.730 1.43
Muong − − −1.060 −4.37
Nung 0.478 1.35 −1.075 −2.12
Other −0.709 −2.99 −0.318 −0.71
Primary schoolvariables
Cost (thousands ofdong)
−0.002 −0.20 −0.046 −1.89
Student−teacher ratio 0.014 1.66 −0.004 −0.63
Share of teachers withtraining
0.939 2.11 1.501 2.41
Household Welfare and Vietnam's Transition
Results 226
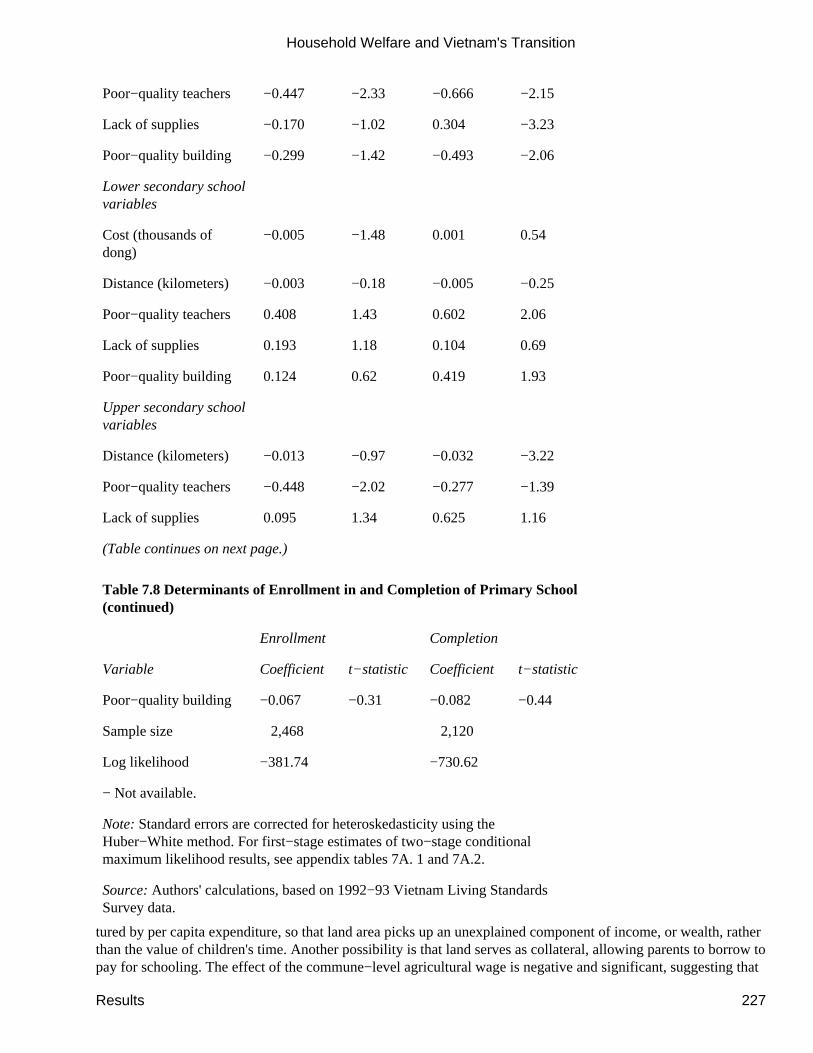
Poor−quality teachers −0.447 −2.33 −0.666 −2.15
Lack of supplies −0.170 −1.02 0.304 −3.23
Poor−quality building −0.299 −1.42 −0.493 −2.06
Lower secondary schoolvariables
Cost (thousands ofdong)
−0.005 −1.48 0.001 0.54
Distance (kilometers) −0.003 −0.18 −0.005 −0.25
Poor−quality teachers 0.408 1.43 0.602 2.06
Lack of supplies 0.193 1.18 0.104 0.69
Poor−quality building 0.124 0.62 0.419 1.93
Upper secondary schoolvariables
Distance (kilometers) −0.013 −0.97 −0.032 −3.22
Poor−quality teachers −0.448 −2.02 −0.277 −1.39
Lack of supplies 0.095 1.34 0.625 1.16
(Table continues on next page.)
Table 7.8 Determinants of Enrollment in and Completion of Primary School(continued)
Enrollment Completion
Variable Coefficient t−statistic Coefficient t−statistic
Poor−quality building −0.067 −0.31 −0.082 −0.44
Sample size 2,468 2,120
Log likelihood −381.74 −730.62
− Not available.
Note: Standard errors are corrected for heteroskedasticity using theHuber−White method. For first−stage estimates of two−stage conditionalmaximum likelihood results, see appendix tables 7A. 1 and 7A.2.
Source: Authors' calculations, based on 1992−93 Vietnam Living StandardsSurvey data.
tured by per capita expenditure, so that land area picks up an unexplained component of income, or wealth, ratherthan the value of children's time. Another possibility is that land serves as collateral, allowing parents to borrow topay for schooling. The effect of the commune−level agricultural wage is negative and significant, suggesting that
Household Welfare and Vietnam's Transition
Results 227
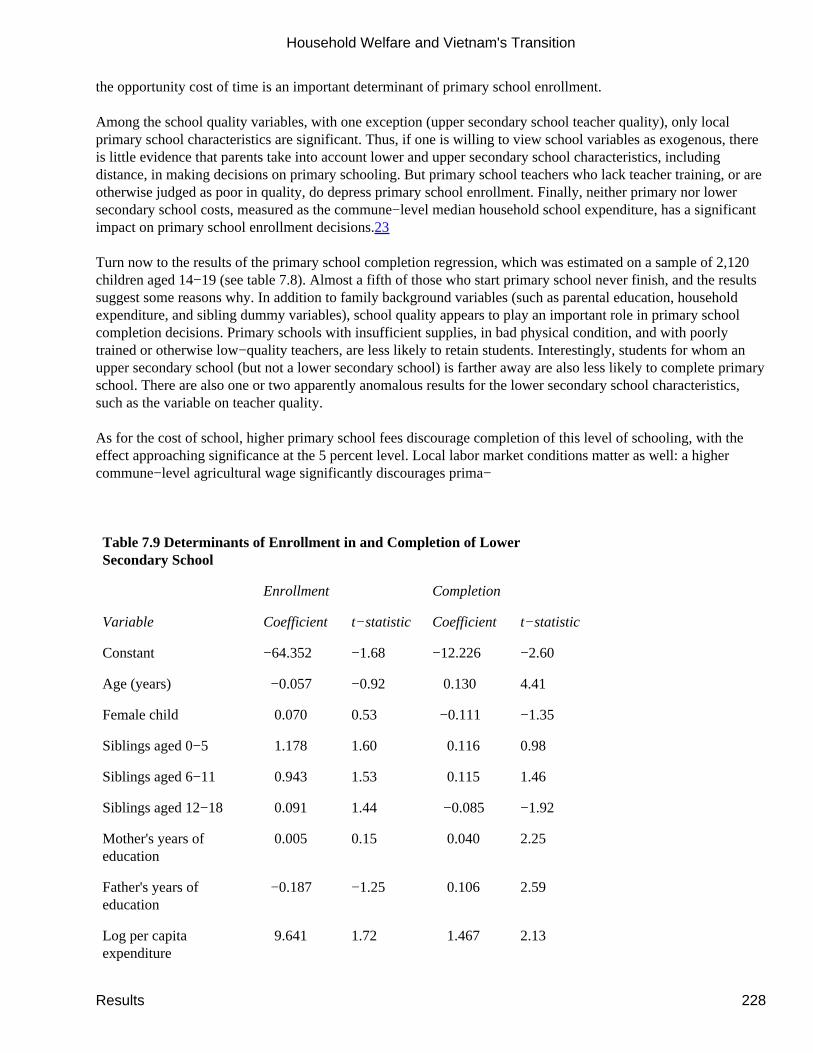
the opportunity cost of time is an important determinant of primary school enrollment.
Among the school quality variables, with one exception (upper secondary school teacher quality), only localprimary school characteristics are significant. Thus, if one is willing to view school variables as exogenous, thereis little evidence that parents take into account lower and upper secondary school characteristics, includingdistance, in making decisions on primary schooling. But primary school teachers who lack teacher training, or areotherwise judged as poor in quality, do depress primary school enrollment. Finally, neither primary nor lowersecondary school costs, measured as the commune−level median household school expenditure, has a significantimpact on primary school enrollment decisions.23
Turn now to the results of the primary school completion regression, which was estimated on a sample of 2,120children aged 14−19 (see table 7.8). Almost a fifth of those who start primary school never finish, and the resultssuggest some reasons why. In addition to family background variables (such as parental education, householdexpenditure, and sibling dummy variables), school quality appears to play an important role in primary schoolcompletion decisions. Primary schools with insufficient supplies, in bad physical condition, and with poorlytrained or otherwise low−quality teachers, are less likely to retain students. Interestingly, students for whom anupper secondary school (but not a lower secondary school) is farther away are also less likely to complete primaryschool. There are also one or two apparently anomalous results for the lower secondary school characteristics,such as the variable on teacher quality.
As for the cost of school, higher primary school fees discourage completion of this level of schooling, with theeffect approaching significance at the 5 percent level. Local labor market conditions matter as well: a highercommune−level agricultural wage significantly discourages prima−
Table 7.9 Determinants of Enrollment in and Completion of LowerSecondary School
Enrollment Completion
Variable Coefficient t−statistic Coefficient t−statistic
Constant −64.352 −1.68 −12.226 −2.60
Age (years) −0.057 −0.92 0.130 4.41
Female child 0.070 0.53 −0.111 −1.35
Siblings aged 0−5 1.178 1.60 0.116 0.98
Siblings aged 6−11 0.943 1.53 0.115 1.46
Siblings aged 12−18 0.091 1.44 −0.085 −1.92
Mother's years ofeducation
0.005 0.15 0.040 2.25
Father's years ofeducation
−0.187 −1.25 0.106 2.59
Log per capitaexpenditure
9.641 1.72 1.467 2.13
Household Welfare and Vietnam's Transition
Results 228
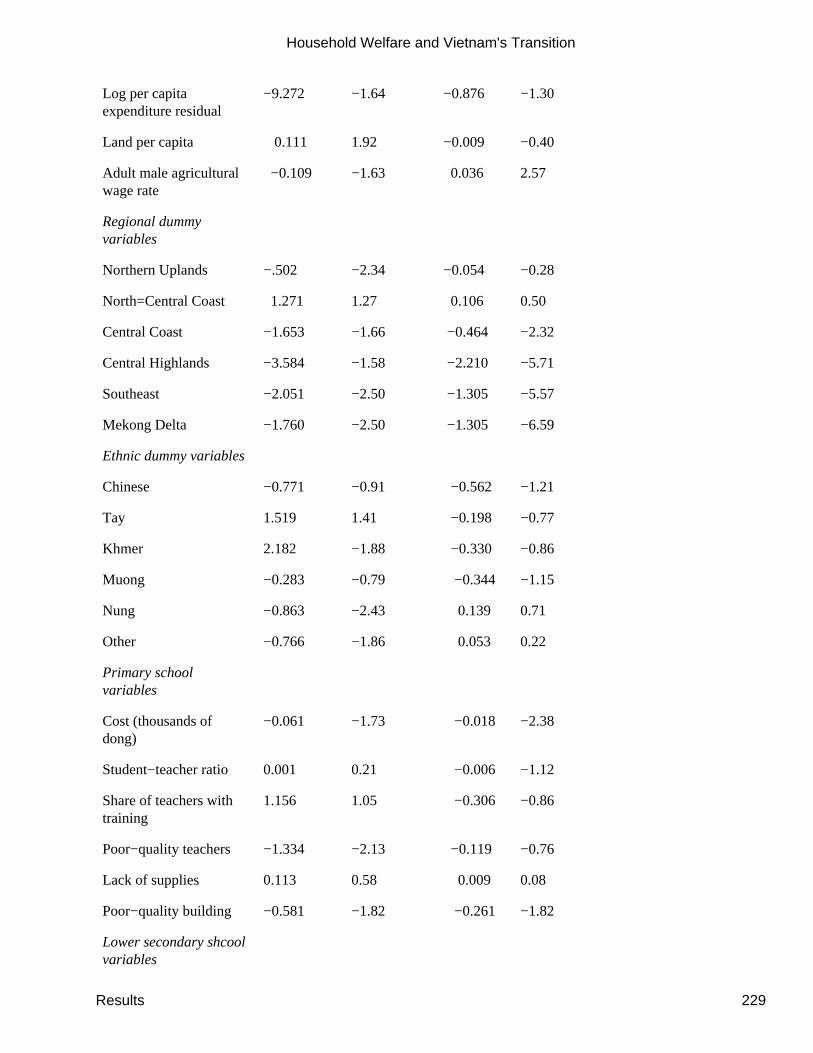
Log per capitaexpenditure residual
−9.272 −1.64 −0.876 −1.30
Land per capita 0.111 1.92 −0.009 −0.40
Adult male agriculturalwage rate
−0.109 −1.63 0.036 2.57
Regional dummyvariables
Northern Uplands −.502 −2.34 −0.054 −0.28
North=Central Coast 1.271 1.27 0.106 0.50
Central Coast −1.653 −1.66 −0.464 −2.32
Central Highlands −3.584 −1.58 −2.210 −5.71
Southeast −2.051 −2.50 −1.305 −5.57
Mekong Delta −1.760 −2.50 −1.305 −6.59
Ethnic dummy variables
Chinese −0.771 −0.91 −0.562 −1.21
Tay 1.519 1.41 −0.198 −0.77
Khmer 2.182 −1.88 −0.330 −0.86
Muong −0.283 −0.79 −0.344 −1.15
Nung −0.863 −2.43 0.139 0.71
Other −0.766 −1.86 0.053 0.22
Primary schoolvariables
Cost (thousands ofdong)
−0.061 −1.73 −0.018 −2.38
Student−teacher ratio 0.001 0.21 −0.006 −1.12
Share of teachers withtraining
1.156 1.05 −0.306 −0.86
Poor−quality teachers −1.334 −2.13 −0.119 −0.76
Lack of supplies 0.113 0.58 0.009 0.08
Poor−quality building −0.581 −1.82 −0.261 −1.82
Lower secondary shcoolvariables
Household Welfare and Vietnam's Transition
Results 229
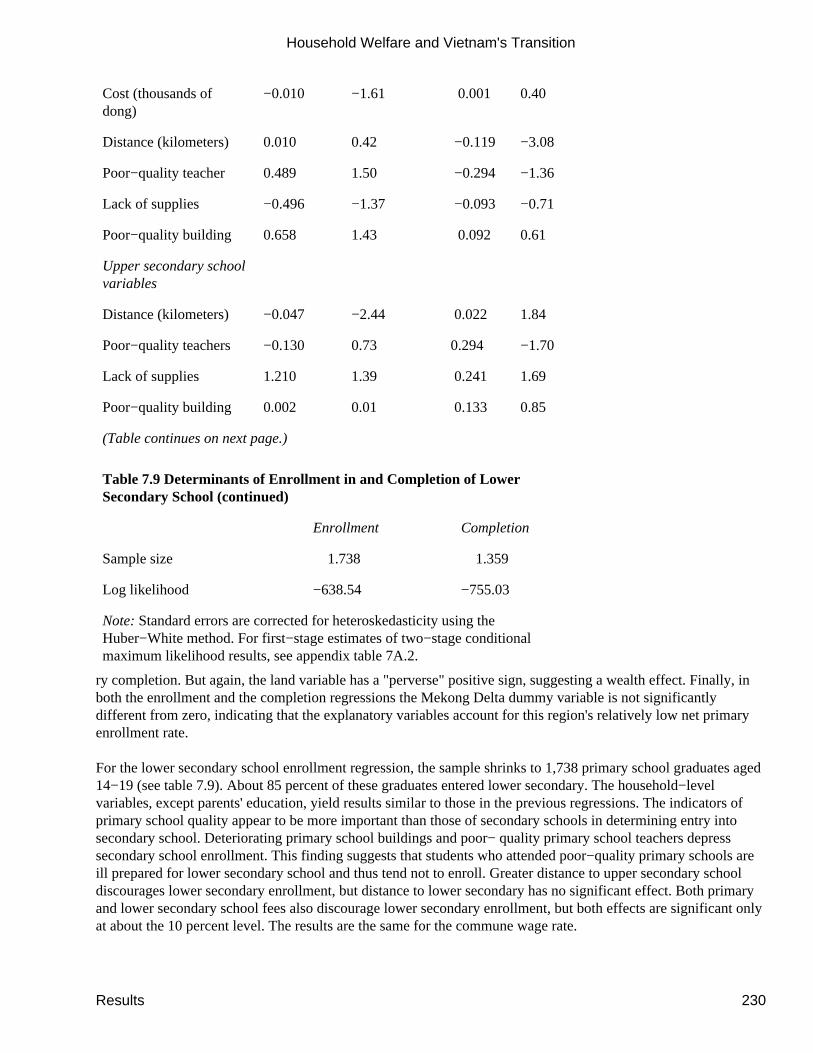
Cost (thousands ofdong)
−0.010 −1.61 0.001 0.40
Distance (kilometers) 0.010 0.42 −0.119 −3.08
Poor−quality teacher 0.489 1.50 −0.294 −1.36
Lack of supplies −0.496 −1.37 −0.093 −0.71
Poor−quality building 0.658 1.43 0.092 0.61
Upper secondary schoolvariables
Distance (kilometers) −0.047 −2.44 0.022 1.84
Poor−quality teachers −0.130 0.73 0.294 −1.70
Lack of supplies 1.210 1.39 0.241 1.69
Poor−quality building 0.002 0.01 0.133 0.85
(Table continues on next page.)
Table 7.9 Determinants of Enrollment in and Completion of LowerSecondary School (continued)
Enrollment Completion
Sample size 1.738 1.359
Log likelihood −638.54 −755.03
Note: Standard errors are corrected for heteroskedasticity using theHuber−White method. For first−stage estimates of two−stage conditionalmaximum likelihood results, see appendix table 7A.2.
ry completion. But again, the land variable has a "perverse" positive sign, suggesting a wealth effect. Finally, inboth the enrollment and the completion regressions the Mekong Delta dummy variable is not significantlydifferent from zero, indicating that the explanatory variables account for this region's relatively low net primaryenrollment rate.
For the lower secondary school enrollment regression, the sample shrinks to 1,738 primary school graduates aged14−19 (see table 7.9). About 85 percent of these graduates entered lower secondary. The household−levelvariables, except parents' education, yield results similar to those in the previous regressions. The indicators ofprimary school quality appear to be more important than those of secondary schools in determining entry intosecondary school. Deteriorating primary school buildings and poor− quality primary school teachers depresssecondary school enrollment. This finding suggests that students who attended poor−quality primary schools areill prepared for lower secondary school and thus tend not to enroll. Greater distance to upper secondary schooldiscourages lower secondary enrollment, but distance to lower secondary has no significant effect. Both primaryand lower secondary school fees also discourage lower secondary enrollment, but both effects are significant onlyat about the 10 percent level. The results are the same for the commune wage rate.
Household Welfare and Vietnam's Transition
Results 230
After controlling for all these factors, lower secondary enrollment in the Mekong Delta is no lower than that inmost of the rest of Vietnam (although it is significantly lower than that in the Red River Delta, the omitted region,and the North−Central Coast). Interestingly, the analysis would have led to the opposite conclusion if householdexpenditure had been treated as an exogenous variable.24 This is true even though the exogeneity of expenditureis hardly rejected (the significance of the Hausman test is exactly 10 percent).
Perhaps of greatest interest are the results of the lower secondary school completion regressions for a sample of17−22−year−olds. More than 40 percent of the 1,359 individuals in the sample do not complete lower secondaryschool. Both parents' education and per capita expenditure (the second even after instrumenting) significantlyencourage completion. By far the most significant of the school variables is distance to the nearest lowersecondary school, which has the expected negative effect on the probability of completion. But distance to thenearest upper secondary
school has the "wrong" sign and is nearly significant at the 5 percent level. The other lower secondary schoolcharacteristics are insignificant.
Oddly, the commune agricultural wage has a strongly significant positive effect on completion rates at the lowersecondary level. Land area per capita has no significant effect. And somewhat implausibly, while lower secondaryschool fees do not attract a significant coefficient, primary school fees significantly discourage lower secondaryschool completion. Finally, note that the regional dummies are strongly jointly significant in this regression, muchmore so than in all the other regressions. This finding suggests that our household− and commune−level variablesdo a relatively poor job in explaining regional differences in lower secondary school completion rates. Moreover,the regional dummies indicate sharply lower secondary school completion in the south of Vietnam.
These regressions, tentative as they are, provide a mixed bag of evidence in support of the four hypotheses on thedecline in school enrollment in Vietnam. If changes in the opportunity cost of children's time are an important partof the story, school enrollment should be lower in areas where agricultural work pays higher wages. The datashow this to be the case at all schooling levels except where one would most expect it, for completion of lowersecondary. The data also support the hypothesis that school quality and availability affect enrollment, sodeteriorating school quality could have contributed to the recent decline. But again, no definitive conclusions onthis score can be drawn from a cross−sectional analysis alone. Finally, support for the school fees hypothesis alsois decidedly mixed. Although the school cost variables are sometimes significant at the 10 percent level,cross−sectional variation in rural school fees explains little of the variation in school enrollment or completionrates. From this evidence, it is hard to conclude that the recent rise in fees precipitated a large decline in schoolenrollment in Vietnam.
Conclusion
While Vietnam has a high average level of education for such a poor country, school enrollment there appears tohave broadly declined during the recent economic transition and subsequent growth. This chapter examinedseveral explanations for this curious decline in enrollment. The evidence suggests that changes in the opportunitycosts of schooling played an important role, particularly in rural areas, where such changes may have resultedfrom the decollectivization of the commune system. The timing of the decline in enrollment and its concentrationin rural areas are consistent with this hypothesis, as are some (but not all) of the cross−sectional regression results.This chapter also found some evidence, particularly from the regression estimates, pointing to the deterioration inschool quality as a cause of the enrollment decline, but the evidence is not always consistent, nor does it alwayshave a firm foundation (due to lack of time−series data
Household Welfare and Vietnam's Transition
Conclusion 231
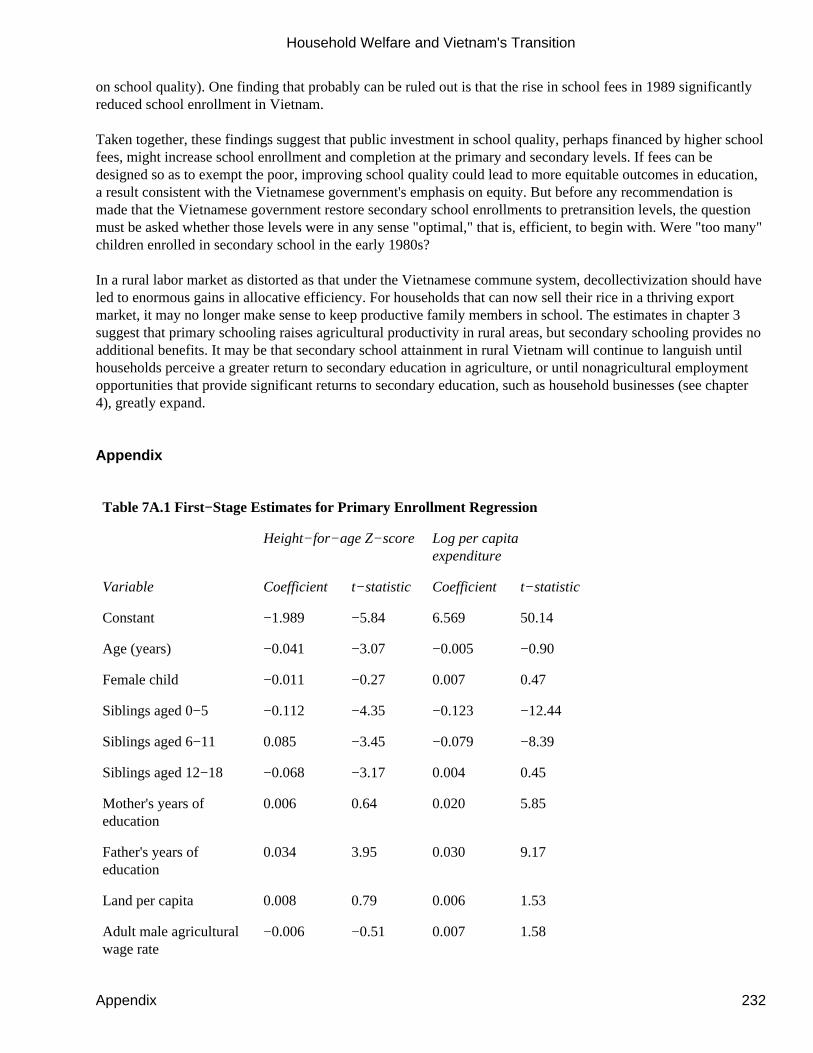
on school quality). One finding that probably can be ruled out is that the rise in school fees in 1989 significantlyreduced school enrollment in Vietnam.
Taken together, these findings suggest that public investment in school quality, perhaps financed by higher schoolfees, might increase school enrollment and completion at the primary and secondary levels. If fees can bedesigned so as to exempt the poor, improving school quality could lead to more equitable outcomes in education,a result consistent with the Vietnamese government's emphasis on equity. But before any recommendation ismade that the Vietnamese government restore secondary school enrollments to pretransition levels, the questionmust be asked whether those levels were in any sense "optimal," that is, efficient, to begin with. Were "too many"children enrolled in secondary school in the early 1980s?
In a rural labor market as distorted as that under the Vietnamese commune system, decollectivization should haveled to enormous gains in allocative efficiency. For households that can now sell their rice in a thriving exportmarket, it may no longer make sense to keep productive family members in school. The estimates in chapter 3suggest that primary schooling raises agricultural productivity in rural areas, but secondary schooling provides noadditional benefits. It may be that secondary school attainment in rural Vietnam will continue to languish untilhouseholds perceive a greater return to secondary education in agriculture, or until nonagricultural employmentopportunities that provide significant returns to secondary education, such as household businesses (see chapter4), greatly expand.
Appendix
Table 7A.1 First−Stage Estimates for Primary Enrollment Regression
Height−for−age Z−score Log per capitaexpenditure
Variable Coefficient t−statistic Coefficient t−statistic
Constant −1.989 −5.84 6.569 50.14
Age (years) −0.041 −3.07 −0.005 −0.90
Female child −0.011 −0.27 0.007 0.47
Siblings aged 0−5 −0.112 −4.35 −0.123 −12.44
Siblings aged 6−11 0.085 −3.45 −0.079 −8.39
Siblings aged 12−18 −0.068 −3.17 0.004 0.45
Mother's years ofeducation
0.006 0.64 0.020 5.85
Father's years ofeducation
0.034 3.95 0.030 9.17
Land per capita 0.008 0.79 0.006 1.53
Adult male agriculturalwage rate
−0.006 −0.51 0.007 1.58
Household Welfare and Vietnam's Transition
Appendix 232
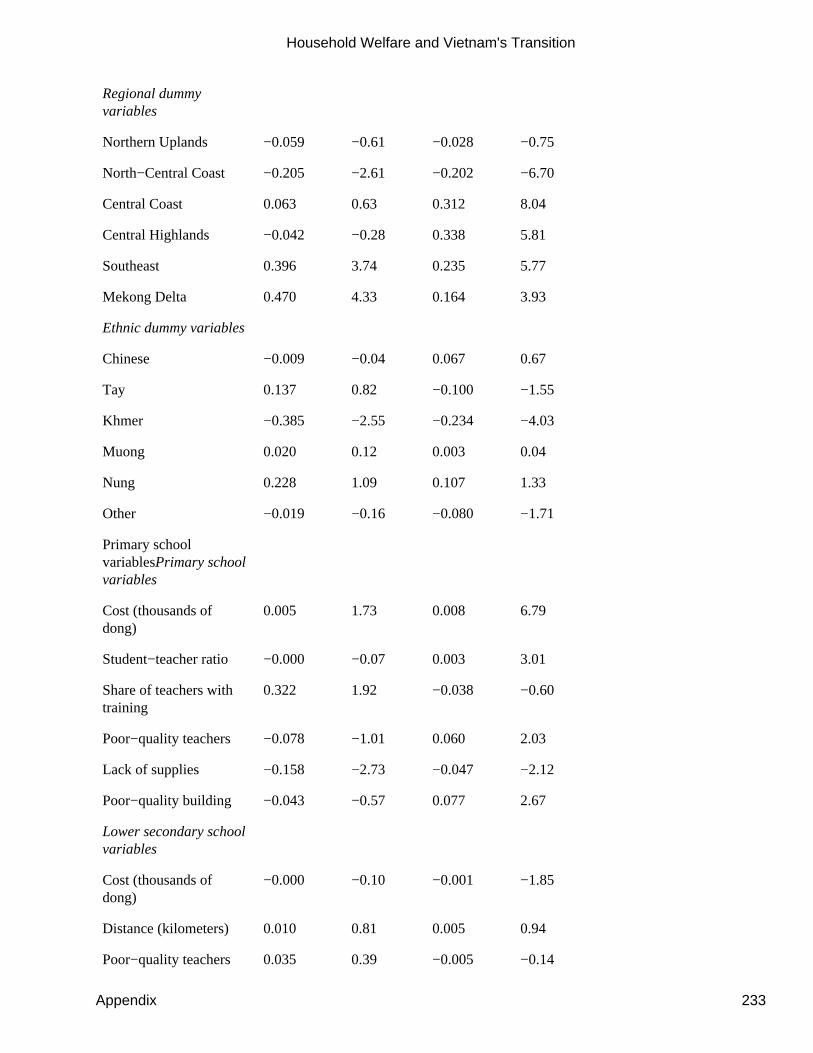
Regional dummyvariables
Northern Uplands −0.059 −0.61 −0.028 −0.75
North−Central Coast −0.205 −2.61 −0.202 −6.70
Central Coast 0.063 0.63 0.312 8.04
Central Highlands −0.042 −0.28 0.338 5.81
Southeast 0.396 3.74 0.235 5.77
Mekong Delta 0.470 4.33 0.164 3.93
Ethnic dummy variables
Chinese −0.009 −0.04 0.067 0.67
Tay 0.137 0.82 −0.100 −1.55
Khmer −0.385 −2.55 −0.234 −4.03
Muong 0.020 0.12 0.003 0.04
Nung 0.228 1.09 0.107 1.33
Other −0.019 −0.16 −0.080 −1.71
Primary schoolvariablesPrimary schoolvariables
Cost (thousands ofdong)
0.005 1.73 0.008 6.79
Student−teacher ratio −0.000 −0.07 0.003 3.01
Share of teachers withtraining
0.322 1.92 −0.038 −0.60
Poor−quality teachers −0.078 −1.01 0.060 2.03
Lack of supplies −0.158 −2.73 −0.047 −2.12
Poor−quality building −0.043 −0.57 0.077 2.67
Lower secondary schoolvariables
Cost (thousands ofdong)
−0.000 −0.10 −0.001 −1.85
Distance (kilometers) 0.010 0.81 0.005 0.94
Poor−quality teachers 0.035 0.39 −0.005 −0.14
Household Welfare and Vietnam's Transition
Appendix 233
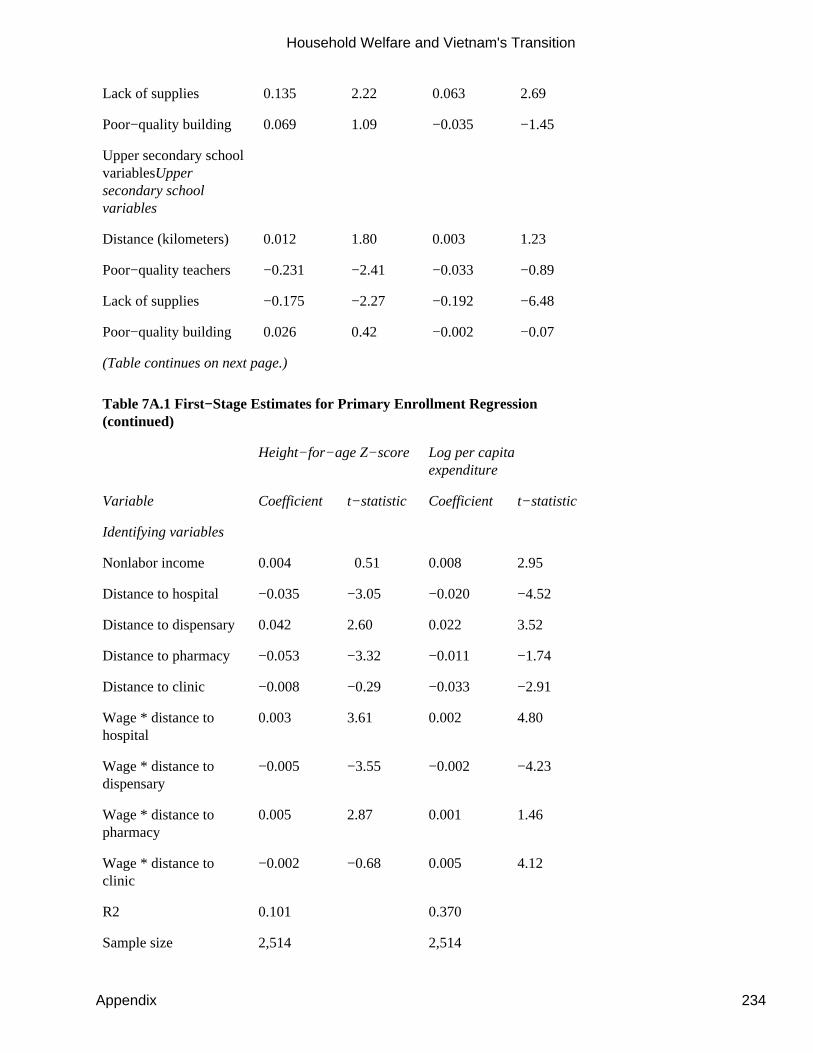
Lack of supplies 0.135 2.22 0.063 2.69
Poor−quality building 0.069 1.09 −0.035 −1.45
Upper secondary schoolvariablesUppersecondary schoolvariables
Distance (kilometers) 0.012 1.80 0.003 1.23
Poor−quality teachers −0.231 −2.41 −0.033 −0.89
Lack of supplies −0.175 −2.27 −0.192 −6.48
Poor−quality building 0.026 0.42 −0.002 −0.07
(Table continues on next page.)
Table 7A.1 First−Stage Estimates for Primary Enrollment Regression(continued)
Height−for−age Z−score Log per capitaexpenditure
Variable Coefficient t−statistic Coefficient t−statistic
Identifying variables
Nonlabor income 0.004 0.51 0.008 2.95
Distance to hospital −0.035 −3.05 −0.020 −4.52
Distance to dispensary 0.042 2.60 0.022 3.52
Distance to pharmacy −0.053 −3.32 −0.011 −1.74
Distance to clinic −0.008 −0.29 −0.033 −2.91
Wage * distance tohospital
0.003 3.61 0.002 4.80
Wage * distance todispensary
−0.005 −3.55 −0.002 −4.23
Wage * distance topharmacy
0.005 2.87 0.001 1.46
Wage * distance toclinic
−0.002 −0.68 0.005 4.12
R2 0.101 0.370
Sample size 2,514 2,514
Household Welfare and Vietnam's Transition
Appendix 234
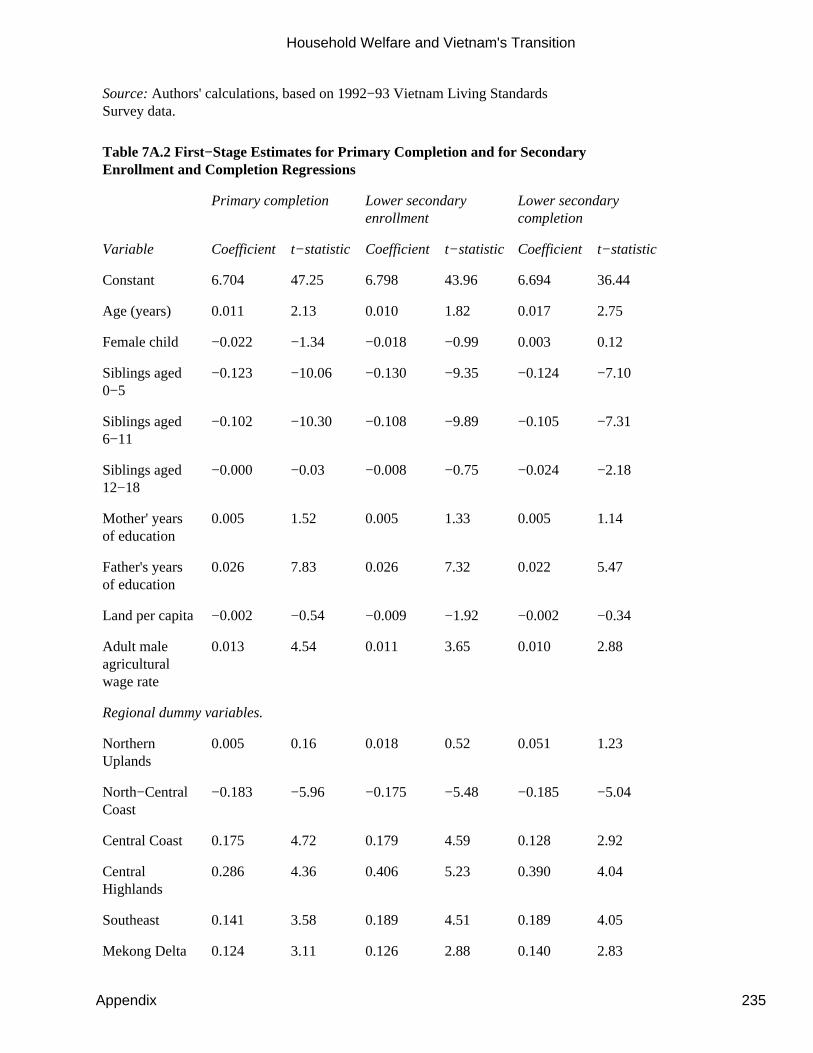
Source: Authors' calculations, based on 1992−93 Vietnam Living StandardsSurvey data.
Table 7A.2 First−Stage Estimates for Primary Completion and for SecondaryEnrollment and Completion Regressions
Primary completion Lower secondaryenrollment
Lower secondarycompletion
Variable Coefficient t−statistic Coefficient t−statistic Coefficient t−statistic
Constant 6.704 47.25 6.798 43.96 6.694 36.44
Age (years) 0.011 2.13 0.010 1.82 0.017 2.75
Female child −0.022 −1.34 −0.018 −0.99 0.003 0.12
Siblings aged0−5
−0.123 −10.06 −0.130 −9.35 −0.124 −7.10
Siblings aged6−11
−0.102 −10.30 −0.108 −9.89 −0.105 −7.31
Siblings aged12−18
−0.000 −0.03 −0.008 −0.75 −0.024 −2.18
Mother' yearsof education
0.005 1.52 0.005 1.33 0.005 1.14
Father's yearsof education
0.026 7.83 0.026 7.32 0.022 5.47
Land per capita −0.002 −0.54 −0.009 −1.92 −0.002 −0.34
Adult maleagriculturalwage rate
0.013 4.54 0.011 3.65 0.010 2.88
Regional dummy variables.
NorthernUplands
0.005 0.16 0.018 0.52 0.051 1.23
North−CentralCoast
−0.183 −5.96 −0.175 −5.48 −0.185 −5.04
Central Coast 0.175 4.72 0.179 4.59 0.128 2.92
CentralHighlands
0.286 4.36 0.406 5.23 0.390 4.04
Southeast 0.141 3.58 0.189 4.51 0.189 4.05
Mekong Delta 0.124 3.11 0.126 2.88 0.140 2.83
Household Welfare and Vietnam's Transition
Appendix 235
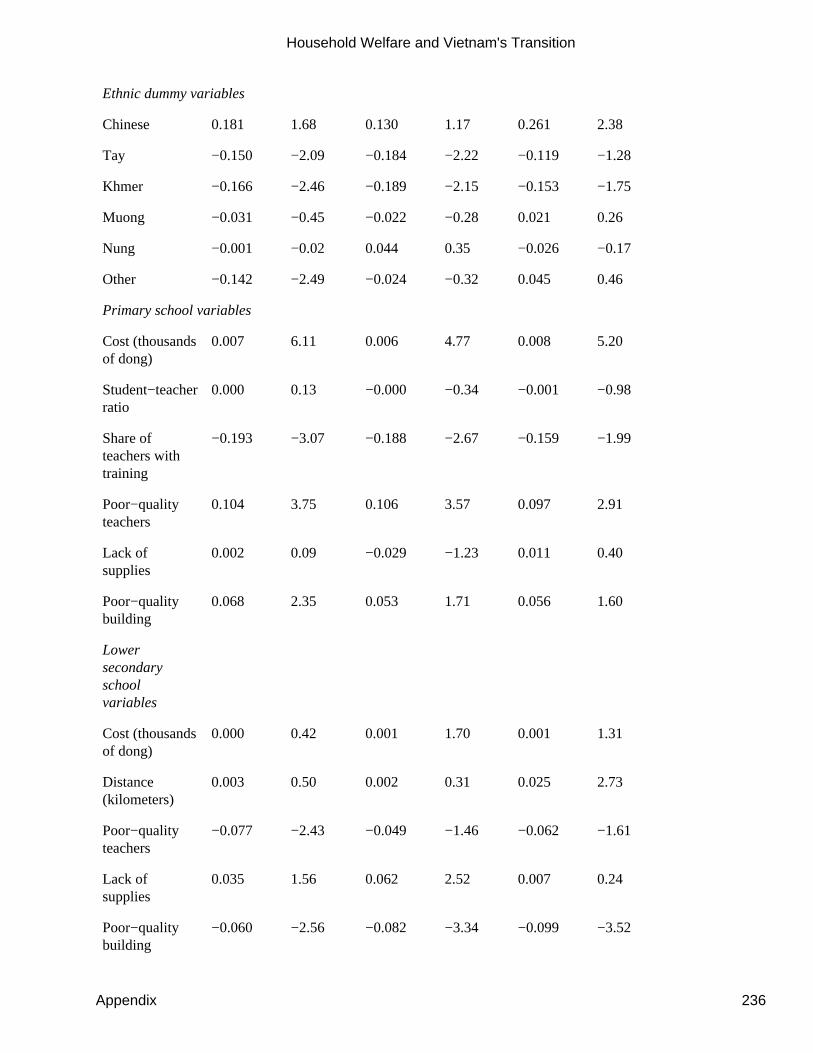
Ethnic dummy variables
Chinese 0.181 1.68 0.130 1.17 0.261 2.38
Tay −0.150 −2.09 −0.184 −2.22 −0.119 −1.28
Khmer −0.166 −2.46 −0.189 −2.15 −0.153 −1.75
Muong −0.031 −0.45 −0.022 −0.28 0.021 0.26
Nung −0.001 −0.02 0.044 0.35 −0.026 −0.17
Other −0.142 −2.49 −0.024 −0.32 0.045 0.46
Primary school variables
Cost (thousandsof dong)
0.007 6.11 0.006 4.77 0.008 5.20
Student−teacherratio
0.000 0.13 −0.000 −0.34 −0.001 −0.98
Share ofteachers withtraining
−0.193 −3.07 −0.188 −2.67 −0.159 −1.99
Poor−qualityteachers
0.104 3.75 0.106 3.57 0.097 2.91
Lack ofsupplies
0.002 0.09 −0.029 −1.23 0.011 0.40
Poor−qualitybuilding
0.068 2.35 0.053 1.71 0.056 1.60
Lowersecondaryschoolvariables
Cost (thousandsof dong)
0.000 0.42 0.001 1.70 0.001 1.31
Distance(kilometers)
0.003 0.50 0.002 0.31 0.025 2.73
Poor−qualityteachers
−0.077 −2.43 −0.049 −1.46 −0.062 −1.61
Lack ofsupplies
0.035 1.56 0.062 2.52 0.007 0.24
Poor−qualitybuilding
−0.060 −2.56 −0.082 −3.34 −0.099 −3.52
Household Welfare and Vietnam's Transition
Appendix 236
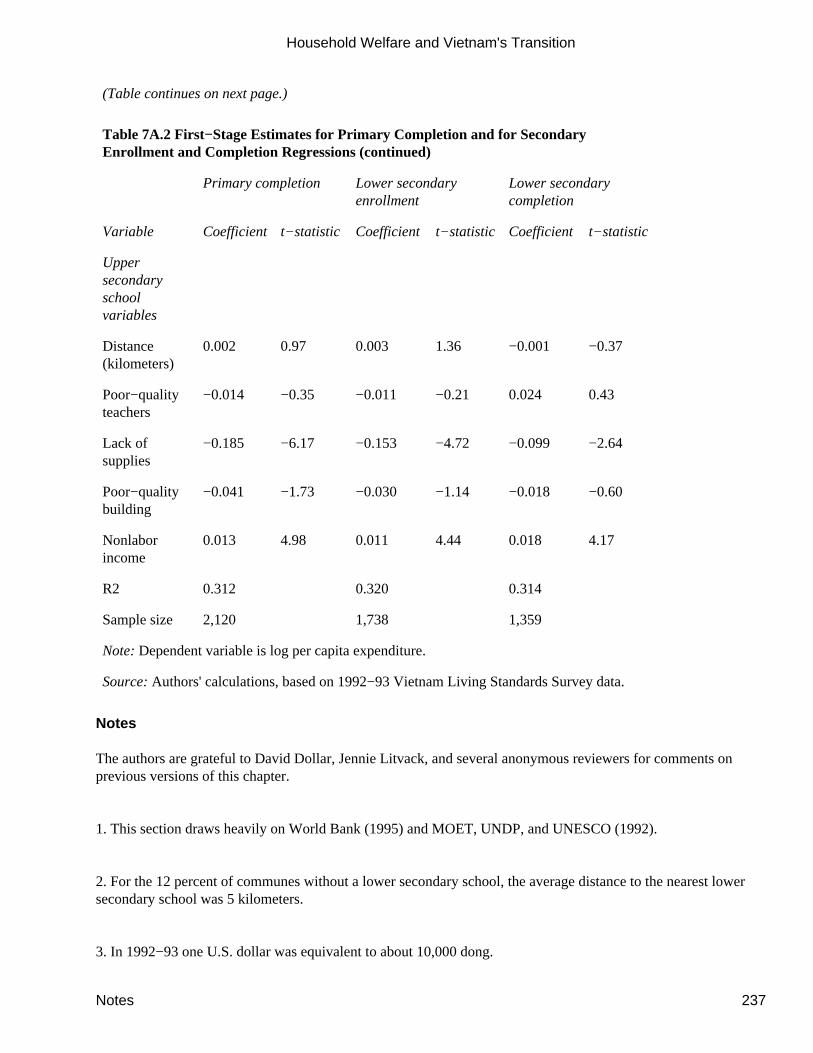
(Table continues on next page.)
Table 7A.2 First−Stage Estimates for Primary Completion and for SecondaryEnrollment and Completion Regressions (continued)
Primary completion Lower secondaryenrollment
Lower secondarycompletion
Variable Coefficient t−statistic Coefficient t−statistic Coefficient t−statistic
Uppersecondaryschoolvariables
Distance(kilometers)
0.002 0.97 0.003 1.36 −0.001 −0.37
Poor−qualityteachers
−0.014 −0.35 −0.011 −0.21 0.024 0.43
Lack ofsupplies
−0.185 −6.17 −0.153 −4.72 −0.099 −2.64
Poor−qualitybuilding
−0.041 −1.73 −0.030 −1.14 −0.018 −0.60
Nonlaborincome
0.013 4.98 0.011 4.44 0.018 4.17
R2 0.312 0.320 0.314
Sample size 2,120 1,738 1,359
Note: Dependent variable is log per capita expenditure.
Source: Authors' calculations, based on 1992−93 Vietnam Living Standards Survey data.
Notes
The authors are grateful to David Dollar, Jennie Litvack, and several anonymous reviewers for comments onprevious versions of this chapter.
1. This section draws heavily on World Bank (1995) and MOET, UNDP, and UNESCO (1992).
2. For the 12 percent of communes without a lower secondary school, the average distance to the nearest lowersecondary school was 5 kilometers.
3. In 1992−93 one U.S. dollar was equivalent to about 10,000 dong.
Household Welfare and Vietnam's Transition
Notes 237

4. The enrollment figure for lower secondary education is extremely low for 1991. It may be erroneous, or it mayreflect some temporary condition that occurred that year.
5. There are two reasons calculations of past labor force participation may be less accurate than those of pastschool enrollment. First, if a person has had more than two consecutive jobs, the data do not show when he or shebegan working; however, this should be less of a problem for relatively young cohorts, whose work experiencedoes not go back very far in time. Second, the school enrollment estimates are based on an answer to a simplequestion about a discrete event (''When did you finish your schooling?"), while labor force participation estimatesare based on one or more questions about years of work experience in current and past jobs that some people mayfind difficult to answer, such as children who gradually began helping on their parents' farm.
6. The official age of primary school attendance is 6−10. Another year has been added because many childrenstart one to two years late and others repeat at least one year of school. Even so, some children aged 12−17 arestill in primary school (though the chapter refers to this age cohort as children of secondary school age).
7. The difference between net and gross enrollment rates is that the former exclude children who are out of theage range of the particular level of schooling, while the latter include all children enrolled at that level, regardlessof age. Thus net rates are almost always lower than gross rates.
8. Recall that school quality data are available only for rural areas.
9. The miscellaneous costs are primarily additional fees for clubs, extra classes, and the like. They excludeexpenses not paid directly to the schools, such as the purchase of books and uniforms, transportation costs, andany food or lodging expenses.
10. These annual figures assume that children pay tuition 10 months per year.
11. This is not to deny that enrollment also declined at the upper secondary level, but the main reason for thisdecline is that more students dropped out at the lower secondary level.
12. The community questionnaire also provides travel times (which are highly correlated with distance), but thisinformation is less useful because some of the travel times are by bicycle or another form of transport while othersare by foot. Moreover, there can be substantial differences in distance among households in the same commune,and this variation is not reflected in the data provided by the community questionnaire.
13. Land area could be correlated with the value of children's time if labor markets are incomplete, or if childlabor is not perfectly substitutable with hired labor.
14. In an earlier study, Glewwe and Jacoby (1995) found that malnourished children in Ghana delay enrollmentinto primary school. It argued that, at the normal age of enrollment, malnourished children have a lower rate ofreturn to schooling than do well−nourished children.
Household Welfare and Vietnam's Transition
Notes 238

15. Ethnic group membership may also affect the returns to schooling if, for example, there is discriminationagainst minorities in the labor market, though this effect should be less important in an economy where 80 percentof the labor force is self−employed.
16. Another statistical model of school attainment is the ordered probit (see Lillard and King 1987; and Glewweand Jacoby 1994). But this model restricts the effect of the regressors to be equal across grade levels, which seemsimplausible for such variables as grade−specific school quality and fees.
17. Even though direct school costs are included in consumption expenditures, indirect costs (particularly forgoneincome from children's employment) would lead to reduced expenditures.
18. Another difficult problem is that both the presence of schools and health clinics and the quality of schools inthe commune may be endogenous, because the government may allocate education expenditures according tounobserved characteristics of students that affect enrollment and completion decisions (see Rosenzweig andWolpin 1986). Data limitations (particularly the lack of longitudinal data) do not allow this issue to be addressed.On a more positive note, migration of households to take advantage of better facilities is unlikely to be an issuesince migration in Vietnam was tightly controlled until the early 1990s.
19. Although in principle children should begin primary school at age six, it is common for some to enter at ageseven and even at age eight. The sample here starts at age nine, by which time almost all decisions to enroll havebeen made; starting at a younger age would confound the enrollment decision with the decision on the age atwhich to enroll, conditional on enrollment.
20. Standard errors are corrected for heteroskedasticity and clustering at the level of the commune using theHuber−White method.
21. The coefficient on log per capita expenditure when all variables are treated as exogenous is 0.581, and thet−statistic is 4.77. These results are not shown in table 7.7.
22. The distance variables and their interactions with the commune−level agricultural wage are highly jointlysignificant in the first−stage regression for height−for−age (F[8, 2468]=4.72). The coefficient on miscellaneousincome in the first−stage regression of household expenditure is also highly significant (t−statistic of 2.95).
23. Using school costs from the community questionnaire produced similarly insignificant results. The school costdata from the household questionnaire are preferred because of the unusually large school costs in the communityquestionnaire for some Mekong Delta communes.
24. When household expenditure is specified as exogenous, the Mekong Delta dummy variable is negative, with at−statistic of −3.42, and the parameter estimate is twice those for the other regional dummy variables.
Household Welfare and Vietnam's Transition
Notes 239
References
Glewwe, Paul, and Hanan Jacoby. 1994. "Student Achievement and Schooling Choice in Low−Income Countries:Evidence from Ghana." Journal of Human Resources 29(3): 843−64.
_____. 1995. "An Economic Analysis of Delayed Primary School Enrollment in a Low−Income Country: TheRole of Early Childhood Nutrition." Review of Economics and Statistics 77(1): 156−69.
Jacoby, Hanan. 1994. "Borrowing Constraints and Progress through School: Evidence from Peru." Review ofEconomics and Statistics 76(1): 151−60.
Knowles, James, Jere Behrman, Benjamin Diokno, and Keith McInnes. 1996. "Key Issues in the Financing ofVietnam's Social Services." Abt Associates, Bethesda, Md.
Lillard, Lee, and Elizabeth King. 1987. "Education Policy and Schooling Attainment in Malaysia and thePhilippines." Economics of Education Review 6: 167−81.
Lillard, Lee, and Robert Willis. 1994. "International Educational Mobility." Journal of Human Resources 29(4):1126−66.
Mare, Robert. 1980. "Social Background and School Continuation Decisions." Journal of the American StatisticalAssociation 75(370): 295−305.
MOET (Ministry of Education and Training), UNDP (United Nations Development Programme), and UNESCO(United Nations Educational, Scientific, and Cultural Organization). 1992. "Vietnam Education and HumanResources Sector Analysis." Hanoi.
Rivers, Douglas, and Quang Vuong. 1988. "Limited Information Estimators and Exogeneity Tests forSimultaneous Probit Models." Journal of Econometrics 39: 347−66.
Rosenzweig, Mark, and Kenneth Wolpin. 1986. "Evaluating the Effects of Optimally Distributed PublicPrograms: Child Health and Family Planning Interventions." American Economic Review 76: 470−82.
UNESCO (United Nations Educational, Scientific, and Cultural Organization). Various years. StatisticalYearbook. Paris.
World Bank. 1993a. The East Asian Miracle: Economic Growth and Public Policy. New York: Oxford UniversityPress.
_____. 1993b. "Vietnam: Transition to the Market." Report 11902−VN. East Asia and Pacific Region,Washington, D.C.
_____. 1995. "Vietnam: Poverty Assessment and Strategy." Report 13442−VN. East Asia and Pacific Region,Washington, D.C.
_____. 1996. "Vietnam: Education Financing Sector Study." East Asia and Pacific Region, Washington, D.C.
Household Welfare and Vietnam's Transition
References 240

8—Access to Health Care during Transition: The Role of the Private Sector inVietnam
Paul Gertler and Jennie Litvack
Vietnam has historically shown a strong commitment to its population's health. Before doi moi (economicreforms) Vietnam financed and delivered medical care publicly. An extensive network of public health carefacilities delivered curative health services free of charge, and health workers and community outreachorganizations provided comprehensive preventive health care. Pharmaceutical supplies were subsidized by theSoviet Union. Relative to the national income level, Vietnam had achieved remarkably good access to health careeven for the poor.
Vietnam's health sector began facing challenges after reunification in 1975, when the vast public health carenetwork in the north was spread throughout the south. The expansion, coupled with the years of weak andsometimes negative growth in the 1980s, strained government's ability to finance the extensive hospital and clinicnetwork as well as the preventive outreach programs at the central, provincial, and district levels. Health servicesat the commune level (basic curative care and preventive care) were financed through commune resources. Butduring the late 1980s the collapse of the cooperatives greatly reduced local financing of commune health centers,limiting their ability to deliver important primary health care services. The collapse of the Soviet Union in 1991resulted in the loss of Vietnam's drug supply system, compounding the financial crisis in the health sector.
In the late 1980s doi moi opened the door to private financing and delivery of health care in hopes of improvinghealth services. In addition, public hospitals and, to a much smaller degree, health centers began charging patientsfor consultations and drugs in order to mobilize private financing for the public sector system. Doctors and nursesopened up private practices, often in parallel with their public practice, and private
pharmacies and drug vendors sprang up throughout the country. The expansion of the private sector occurred veryquickly and with minimal government regulation to ensure quality, especially in pharmaceutical supplies anddispensing practices.
The government hoped that the opening of the private sector coupled with increases in the real budget for thepublic sector health system would reverse the decline in the health sector. This chapter examines the effectivenessof this dual policy as of 1993−in particular, the extent to which private providers are filling gaps left by thecontraction of the public sector in the mid−1980s.1 The analysis draws largely on the Vietnam Living StandardsSurvey (VNLSS) data.
Structure and Performance of the Health Sector
The health status of Vietnam's population is remarkably good compared with that in countries at similar levels ofincome and in neighboring countries enjoying otherwise higher living standards (table 8.1). In 1990 lifeexpectancy in Vietnam was similar to life expectancy in countries with incomes 5−10 times higher (such asMalaysia, the Philippines, and Thailand) and about 10 years longer than that in countries with comparableincomes (such as Bangladesh and India). Similarly, Vietnam's infant and child mortality rates were about halfthose in countries with similar incomes and close to those in much richer countries. Yet Vietnam's health statuswas high relative to that of its neighbors in 1960, suggesting that its gains in health status in the ensuing threedecades were only average for the region.
Household Welfare and Vietnam's Transition
8— Access to Health Care during Transition: The Role of the Private Sector in Vietnam 241
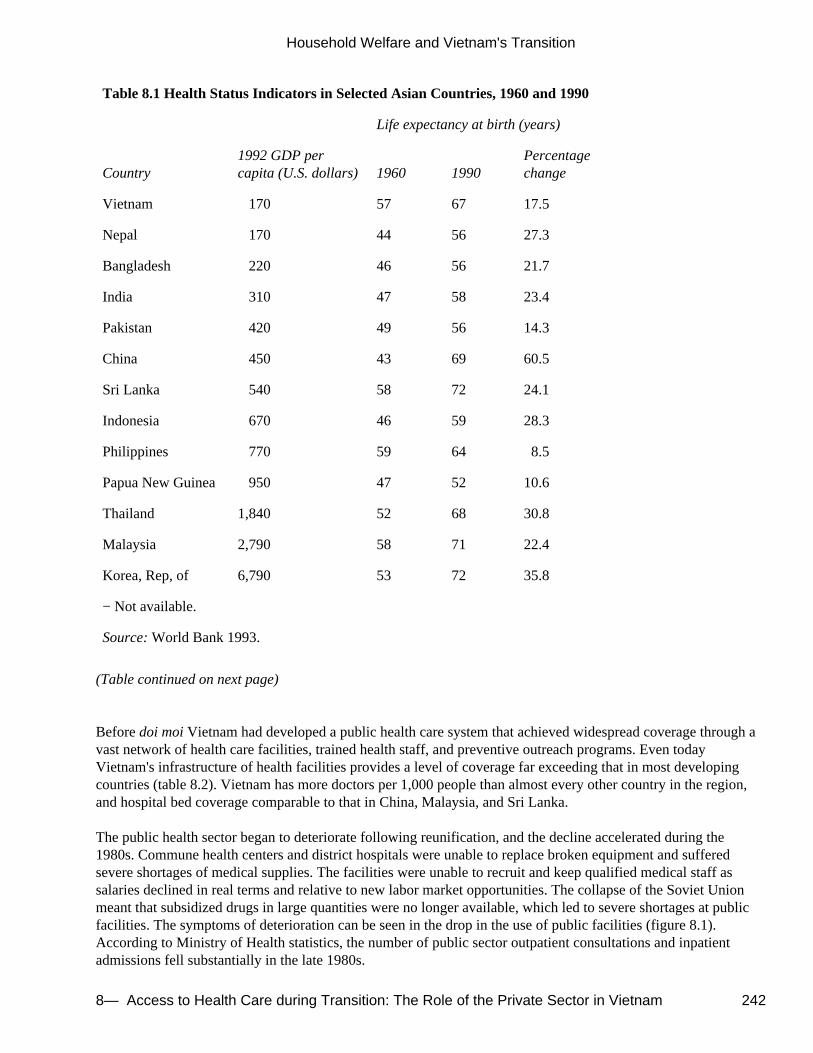
Table 8.1 Health Status Indicators in Selected Asian Countries, 1960 and 1990
Life expectancy at birth (years)
Country1992 GDP percapita (U.S. dollars) 1960 1990
Percentagechange
Vietnam 170 57 67 17.5
Nepal 170 44 56 27.3
Bangladesh 220 46 56 21.7
India 310 47 58 23.4
Pakistan 420 49 56 14.3
China 450 43 69 60.5
Sri Lanka 540 58 72 24.1
Indonesia 670 46 59 28.3
Philippines 770 59 64 8.5
Papua New Guinea 950 47 52 10.6
Thailand 1,840 52 68 30.8
Malaysia 2,790 58 71 22.4
Korea, Rep, of 6,790 53 72 35.8
− Not available.
Source: World Bank 1993.
(Table continued on next page)
Before doi moi Vietnam had developed a public health care system that achieved widespread coverage through avast network of health care facilities, trained health staff, and preventive outreach programs. Even todayVietnam's infrastructure of health facilities provides a level of coverage far exceeding that in most developingcountries (table 8.2). Vietnam has more doctors per 1,000 people than almost every other country in the region,and hospital bed coverage comparable to that in China, Malaysia, and Sri Lanka.
The public health sector began to deteriorate following reunification, and the decline accelerated during the1980s. Commune health centers and district hospitals were unable to replace broken equipment and sufferedsevere shortages of medical supplies. The facilities were unable to recruit and keep qualified medical staff assalaries declined in real terms and relative to new labor market opportunities. The collapse of the Soviet Unionmeant that subsidized drugs in large quantities were no longer available, which led to severe shortages at publicfacilities. The symptoms of deterioration can be seen in the drop in the use of public facilities (figure 8.1).According to Ministry of Health statistics, the number of public sector outpatient consultations and inpatientadmissions fell substantially in the late 1980s.
Household Welfare and Vietnam's Transition
8— Access to Health Care during Transition: The Role of the Private Sector in Vietnam 242
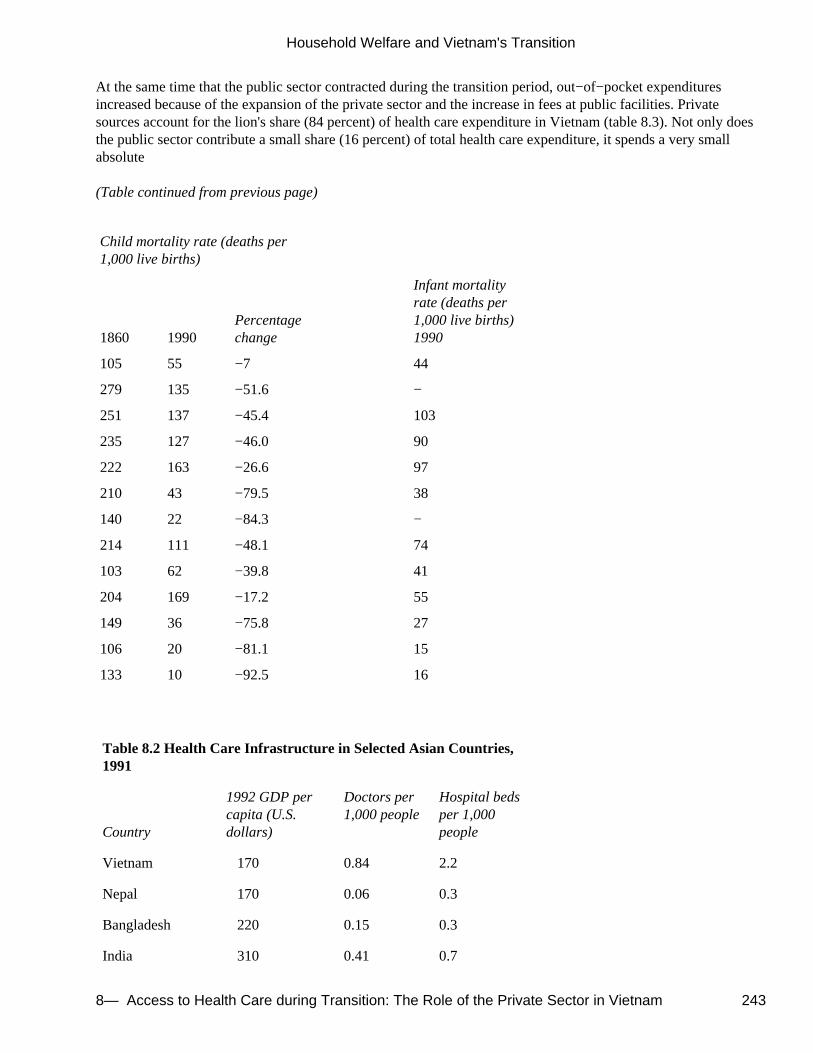
At the same time that the public sector contracted during the transition period, out−of−pocket expendituresincreased because of the expansion of the private sector and the increase in fees at public facilities. Privatesources account for the lion's share (84 percent) of health care expenditure in Vietnam (table 8.3). Not only doesthe public sector contribute a small share (16 percent) of total health care expenditure, it spends a very smallabsolute
(Table continued from previous page)
Child mortality rate (deaths per1,000 live births)
1860 1990Percentagechange
Infant mortalityrate (deaths per1,000 live births)1990
105 55 −7 44
279 135 −51.6 −
251 137 −45.4 103
235 127 −46.0 90
222 163 −26.6 97
210 43 −79.5 38
140 22 −84.3 −
214 111 −48.1 74
103 62 −39.8 41
204 169 −17.2 55
149 36 −75.8 27
106 20 −81.1 15
133 10 −92.5 16
Table 8.2 Health Care Infrastructure in Selected Asian Countries,1991
Country
1992 GDP percapita (U.S.dollars)
Doctors per1,000 people
Hospital bedsper 1,000people
Vietnam 170 0.84 2.2
Nepal 170 0.06 0.3
Bangladesh 220 0.15 0.3
India 310 0.41 0.7
Household Welfare and Vietnam's Transition
8— Access to Health Care during Transition: The Role of the Private Sector in Vietnam 243
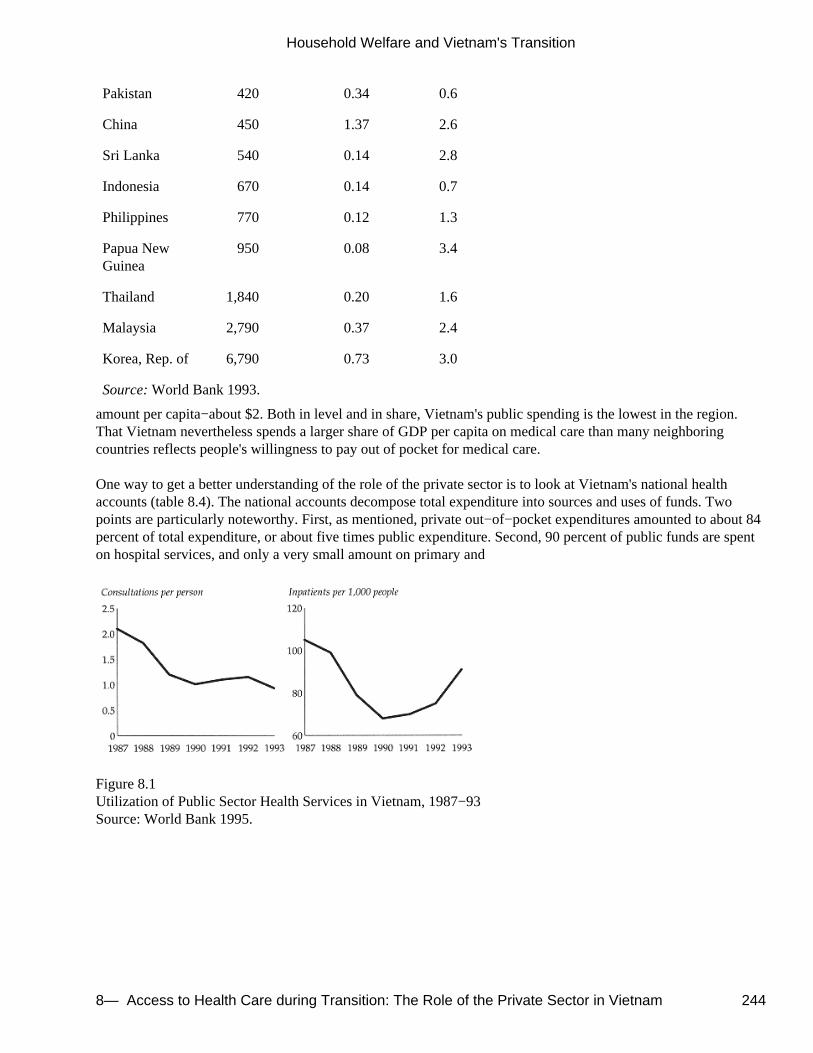
Pakistan 420 0.34 0.6
China 450 1.37 2.6
Sri Lanka 540 0.14 2.8
Indonesia 670 0.14 0.7
Philippines 770 0.12 1.3
Papua NewGuinea
950 0.08 3.4
Thailand 1,840 0.20 1.6
Malaysia 2,790 0.37 2.4
Korea, Rep. of 6,790 0.73 3.0
Source: World Bank 1993.
amount per capita−about $2. Both in level and in share, Vietnam's public spending is the lowest in the region.That Vietnam nevertheless spends a larger share of GDP per capita on medical care than many neighboringcountries reflects people's willingness to pay out of pocket for medical care.
One way to get a better understanding of the role of the private sector is to look at Vietnam's national healthaccounts (table 8.4). The national accounts decompose total expenditure into sources and uses of funds. Twopoints are particularly noteworthy. First, as mentioned, private out−of−pocket expenditures amounted to about 84percent of total expenditure, or about five times public expenditure. Second, 90 percent of public funds are spenton hospital services, and only a very small amount on primary and
Figure 8.1Utilization of Public Sector Health Services in Vietnam, 1987−93Source: World Bank 1995.
Household Welfare and Vietnam's Transition
8— Access to Health Care during Transition: The Role of the Private Sector in Vietnam 244
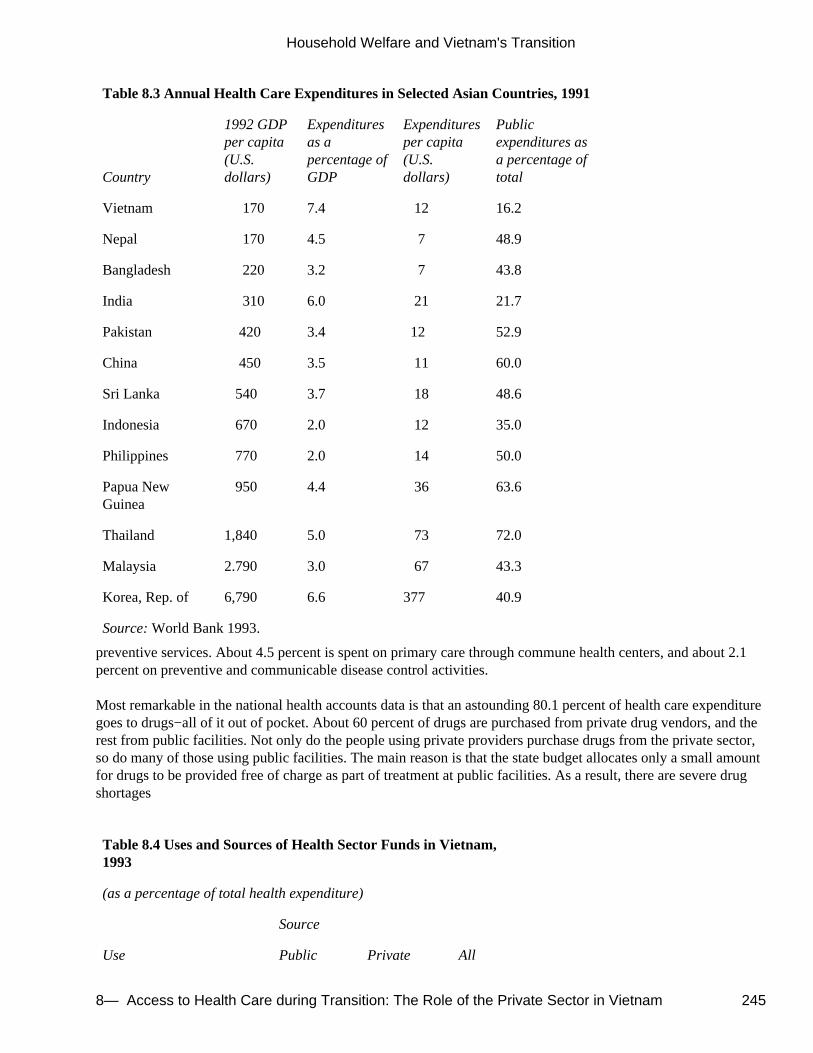
Table 8.3 Annual Health Care Expenditures in Selected Asian Countries, 1991
Country
1992 GDPper capita(U.S.dollars)
Expendituresas apercentage ofGDP
Expendituresper capita(U.S.dollars)
Publicexpenditures asa percentage oftotal
Vietnam 170 7.4 12 16.2
Nepal 170 4.5 7 48.9
Bangladesh 220 3.2 7 43.8
India 310 6.0 21 21.7
Pakistan 420 3.4 12 52.9
China 450 3.5 11 60.0
Sri Lanka 540 3.7 18 48.6
Indonesia 670 2.0 12 35.0
Philippines 770 2.0 14 50.0
Papua NewGuinea
950 4.4 36 63.6
Thailand 1,840 5.0 73 72.0
Malaysia 2.790 3.0 67 43.3
Korea, Rep. of 6,790 6.6 377 40.9
Source: World Bank 1993.
preventive services. About 4.5 percent is spent on primary care through commune health centers, and about 2.1percent on preventive and communicable disease control activities.
Most remarkable in the national health accounts data is that an astounding 80.1 percent of health care expendituregoes to drugs−all of it out of pocket. About 60 percent of drugs are purchased from private drug vendors, and therest from public facilities. Not only do the people using private providers purchase drugs from the private sector,so do many of those using public facilities. The main reason is that the state budget allocates only a small amountfor drugs to be provided free of charge as part of treatment at public facilities. As a result, there are severe drugshortages
Table 8.4 Uses and Sources of Health Sector Funds in Vietnam,1993
(as a percentage of total health expenditure)
Source
Use Public Private All
Household Welfare and Vietnam's Transition
8— Access to Health Care during Transition: The Role of the Private Sector in Vietnam 245
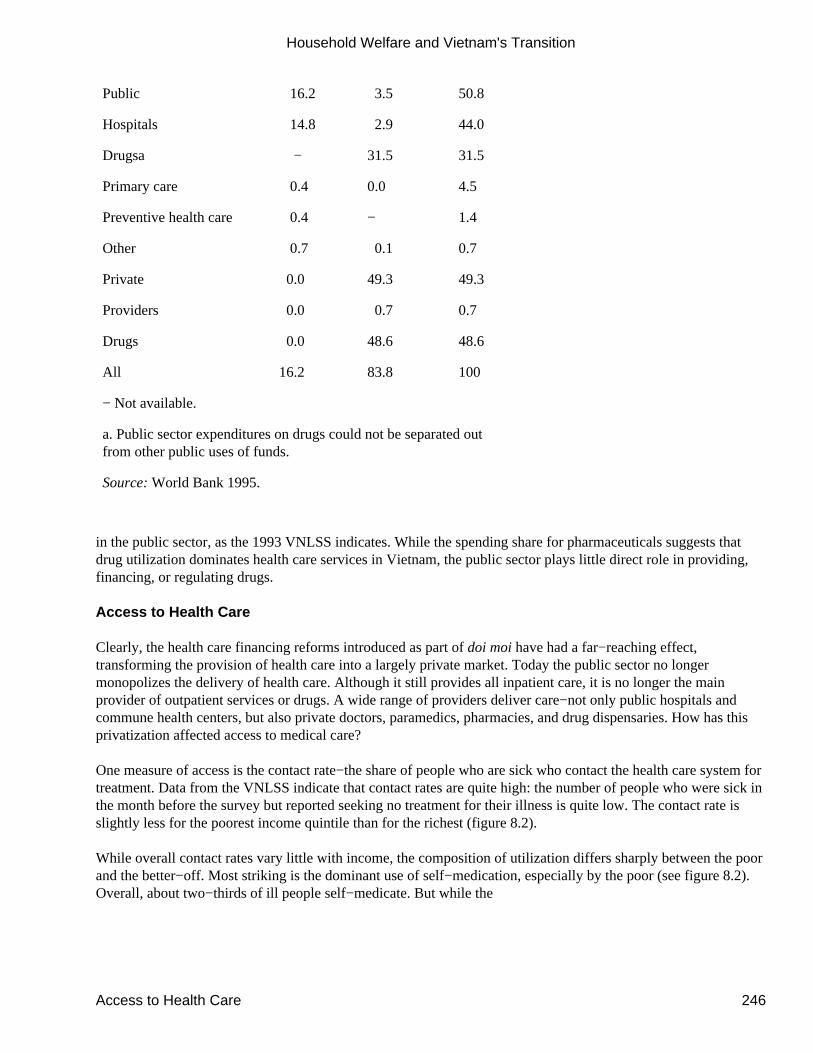
Public 16.2 3.5 50.8
Hospitals 14.8 2.9 44.0
Drugsa − 31.5 31.5
Primary care 0.4 0.0 4.5
Preventive health care 0.4 − 1.4
Other 0.7 0.1 0.7
Private 0.0 49.3 49.3
Providers 0.0 0.7 0.7
Drugs 0.0 48.6 48.6
All 16.2 83.8 100
− Not available.
a. Public sector expenditures on drugs could not be separated outfrom other public uses of funds.
Source: World Bank 1995.
in the public sector, as the 1993 VNLSS indicates. While the spending share for pharmaceuticals suggests thatdrug utilization dominates health care services in Vietnam, the public sector plays little direct role in providing,financing, or regulating drugs.
Access to Health Care
Clearly, the health care financing reforms introduced as part of doi moi have had a far−reaching effect,transforming the provision of health care into a largely private market. Today the public sector no longermonopolizes the delivery of health care. Although it still provides all inpatient care, it is no longer the mainprovider of outpatient services or drugs. A wide range of providers deliver care−not only public hospitals andcommune health centers, but also private doctors, paramedics, pharmacies, and drug dispensaries. How has thisprivatization affected access to medical care?
One measure of access is the contact rate−the share of people who are sick who contact the health care system fortreatment. Data from the VNLSS indicate that contact rates are quite high: the number of people who were sick inthe month before the survey but reported seeking no treatment for their illness is quite low. The contact rate isslightly less for the poorest income quintile than for the richest (figure 8.2).
While overall contact rates vary little with income, the composition of utilization differs sharply between the poorand the better−off. Most striking is the dominant use of self−medication, especially by the poor (see figure 8.2).Overall, about two−thirds of ill people self−medicate. But while the
Household Welfare and Vietnam's Transition
Access to Health Care 246
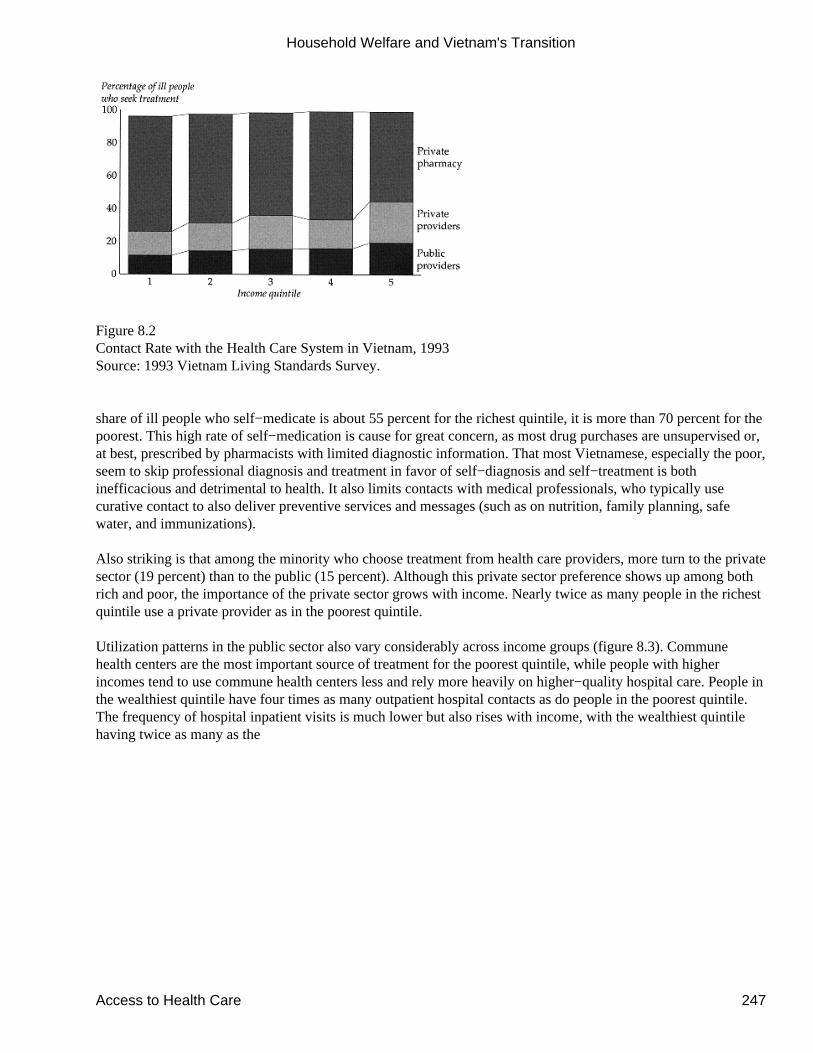
Figure 8.2Contact Rate with the Health Care System in Vietnam, 1993Source: 1993 Vietnam Living Standards Survey.
share of ill people who self−medicate is about 55 percent for the richest quintile, it is more than 70 percent for thepoorest. This high rate of self−medication is cause for great concern, as most drug purchases are unsupervised or,at best, prescribed by pharmacists with limited diagnostic information. That most Vietnamese, especially the poor,seem to skip professional diagnosis and treatment in favor of self−diagnosis and self−treatment is bothinefficacious and detrimental to health. It also limits contacts with medical professionals, who typically usecurative contact to also deliver preventive services and messages (such as on nutrition, family planning, safewater, and immunizations).
Also striking is that among the minority who choose treatment from health care providers, more turn to the privatesector (19 percent) than to the public (15 percent). Although this private sector preference shows up among bothrich and poor, the importance of the private sector grows with income. Nearly twice as many people in the richestquintile use a private provider as in the poorest quintile.
Utilization patterns in the public sector also vary considerably across income groups (figure 8.3). Communehealth centers are the most important source of treatment for the poorest quintile, while people with higherincomes tend to use commune health centers less and rely more heavily on higher−quality hospital care. People inthe wealthiest quintile have four times as many outpatient hospital contacts as do people in the poorest quintile.The frequency of hospital inpatient visits is much lower but also rises with income, with the wealthiest quintilehaving twice as many as the
Household Welfare and Vietnam's Transition
Access to Health Care 247
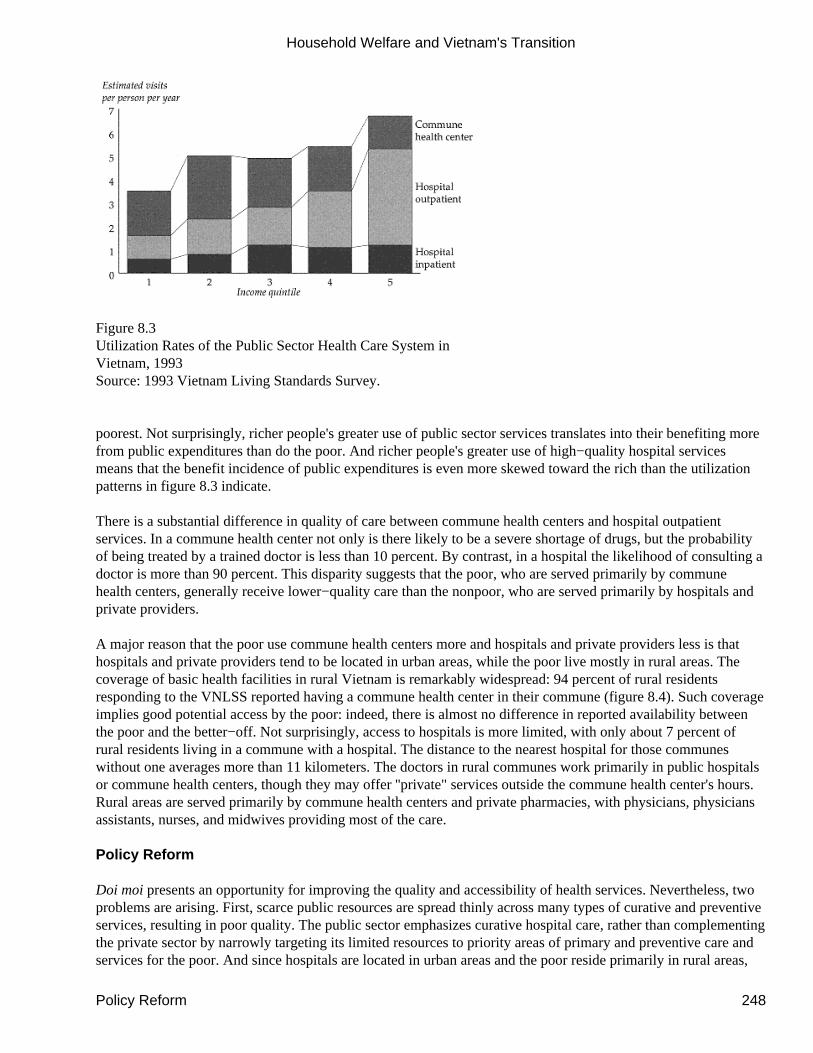
Figure 8.3Utilization Rates of the Public Sector Health Care System inVietnam, 1993Source: 1993 Vietnam Living Standards Survey.
poorest. Not surprisingly, richer people's greater use of public sector services translates into their benefiting morefrom public expenditures than do the poor. And richer people's greater use of high−quality hospital servicesmeans that the benefit incidence of public expenditures is even more skewed toward the rich than the utilizationpatterns in figure 8.3 indicate.
There is a substantial difference in quality of care between commune health centers and hospital outpatientservices. In a commune health center not only is there likely to be a severe shortage of drugs, but the probabilityof being treated by a trained doctor is less than 10 percent. By contrast, in a hospital the likelihood of consulting adoctor is more than 90 percent. This disparity suggests that the poor, who are served primarily by communehealth centers, generally receive lower−quality care than the nonpoor, who are served primarily by hospitals andprivate providers.
A major reason that the poor use commune health centers more and hospitals and private providers less is thathospitals and private providers tend to be located in urban areas, while the poor live mostly in rural areas. Thecoverage of basic health facilities in rural Vietnam is remarkably widespread: 94 percent of rural residentsresponding to the VNLSS reported having a commune health center in their commune (figure 8.4). Such coverageimplies good potential access by the poor: indeed, there is almost no difference in reported availability betweenthe poor and the better−off. Not surprisingly, access to hospitals is more limited, with only about 7 percent ofrural residents living in a commune with a hospital. The distance to the nearest hospital for those communeswithout one averages more than 11 kilometers. The doctors in rural communes work primarily in public hospitalsor commune health centers, though they may offer ''private" services outside the commune health center's hours.Rural areas are served primarily by commune health centers and private pharmacies, with physicians, physiciansassistants, nurses, and midwives providing most of the care.
Policy Reform
Doi moi presents an opportunity for improving the quality and accessibility of health services. Nevertheless, twoproblems are arising. First, scarce public resources are spread thinly across many types of curative and preventiveservices, resulting in poor quality. The public sector emphasizes curative hospital care, rather than complementingthe private sector by narrowly targeting its limited resources to priority areas of primary and preventive care andservices for the poor. And since hospitals are located in urban areas and the poor reside primarily in rural areas,
Household Welfare and Vietnam's Transition
Policy Reform 248
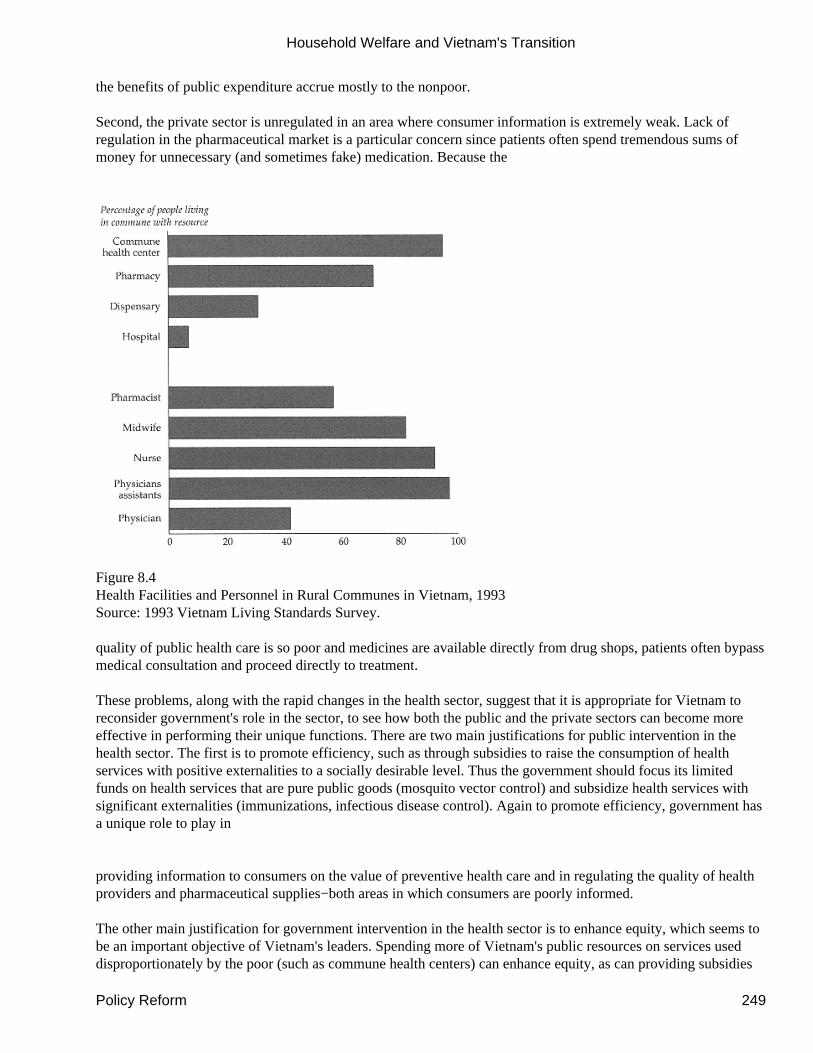
the benefits of public expenditure accrue mostly to the nonpoor.
Second, the private sector is unregulated in an area where consumer information is extremely weak. Lack ofregulation in the pharmaceutical market is a particular concern since patients often spend tremendous sums ofmoney for unnecessary (and sometimes fake) medication. Because the
Figure 8.4Health Facilities and Personnel in Rural Communes in Vietnam, 1993Source: 1993 Vietnam Living Standards Survey.
quality of public health care is so poor and medicines are available directly from drug shops, patients often bypassmedical consultation and proceed directly to treatment.
These problems, along with the rapid changes in the health sector, suggest that it is appropriate for Vietnam toreconsider government's role in the sector, to see how both the public and the private sectors can become moreeffective in performing their unique functions. There are two main justifications for public intervention in thehealth sector. The first is to promote efficiency, such as through subsidies to raise the consumption of healthservices with positive externalities to a socially desirable level. Thus the government should focus its limitedfunds on health services that are pure public goods (mosquito vector control) and subsidize health services withsignificant externalities (immunizations, infectious disease control). Again to promote efficiency, government hasa unique role to play in
providing information to consumers on the value of preventive health care and in regulating the quality of healthproviders and pharmaceutical supplies−both areas in which consumers are poorly informed.
The other main justification for government intervention in the health sector is to enhance equity, which seems tobe an important objective of Vietnam's leaders. Spending more of Vietnam's public resources on services useddisproportionately by the poor (such as commune health centers) can enhance equity, as can providing subsidies
Household Welfare and Vietnam's Transition
Policy Reform 249

targeted to the poor for other health services that are sometimes necessary but may be prohibitively expensive(such as hospitals). The successful mobilization of private resources in Vietnam has allowed a much higher levelof access to health care−especially to drugs−than would be possible with public resources alone, given budgetconstraints. But the provision of public health measures may be suffering, and much of the private carepurchased−especially by the poor−is in the form of self−prescribed drug purchases, which are at best notcost−effective and at worst detrimental to health. The advent of the private health sector represents a significantopportunity to mobilize additional resources and distribute quality health services to a broader range of people.However, unless the role of the public sector is carefully designed to complement that of the private sector,important opportunities to improve health may be forgone. Public support for preventive health measures, publicinformation campaigns about the value of preventive health, and government regulation of the pharmaceuticalsector are all areas to focus government efforts under the new market system.
Targeting Public Expenditure to the Poor
The complementarity of the public and private sectors can be enhanced by better targeting of public subsidies tothe poor. Targeting can be improved by increasing the quality of the facilities the poor are most likely to use−thatis, services for which demand is most income inelastic. Since most of the poor are in rural areas and already havegood access to commune health centers, the government could target public expenditure to the poor by spendingmore to improve the quality of commune health centers (for example, improving personnel, equipment, and theavailability of drugs). In particular, since drugs seem to be the component of health care for which demand isstrongest, ensuring a better drug supply in commune health centers would draw more people in. The people whowould most likely be attracted to the improved facilities are those who live closest−the poor.
The more inelastic the demand for commune health center care, the more effective the targeting of the poor byimproving that care. The income elasticity of demand can be investigated using the VNLSS data.
The theory of the demand for medical care has been widely discussed in the literature (see, for example,Grossman 1970; Manning and others 1987; Behrman and Deolalikar 1988; Gertler and van der Gaag 1990).
Demand is a function of income, money prices, time prices, qualities, individual characteristics that affect healthstatus, and such preferences as education, ethnic group, and religion. In the empirical model used here thecommunity variables are proxied by village−level fixed effects. Income is measured by the value of per capitahousehold consumption. Controls are included for age, gender, ethnicity, and religion.
An important issue in measuring the demand for medical care is that the decision to seek care is different from thedecision on how much care to purchase. The reason is that diagnostic information and a recommendation ontreatment, which affect future demand, are obtained at the first visit. Therefore, the two−part model that hasbecome common in the literature is adopted here (see, for example, Manning and others 1987). In this model theexpected number of visits can be decomposed into the product of the probability of seeking care times theexpected expenditures conditional on seeking care:
,
where X is a set of exogenous explanatory variables.
The two parts of the model were estimated separately for hospital care, commune health center care, privateprovider care, and drug expenditures. The resulting coefficients and standard errors are consistent even if the errorterms between the two equations are correlated (Duan 1983, 1994; Heckman 1990). Since a fixed effectsestimator does not exist for probit models, the first part was estimated using linear probability models. But it wasconfirmed that the probit results matched the linear probability results for the non−fixed effects specification.
Household Welfare and Vietnam's Transition
Targeting Public Expenditure to the Poor 250
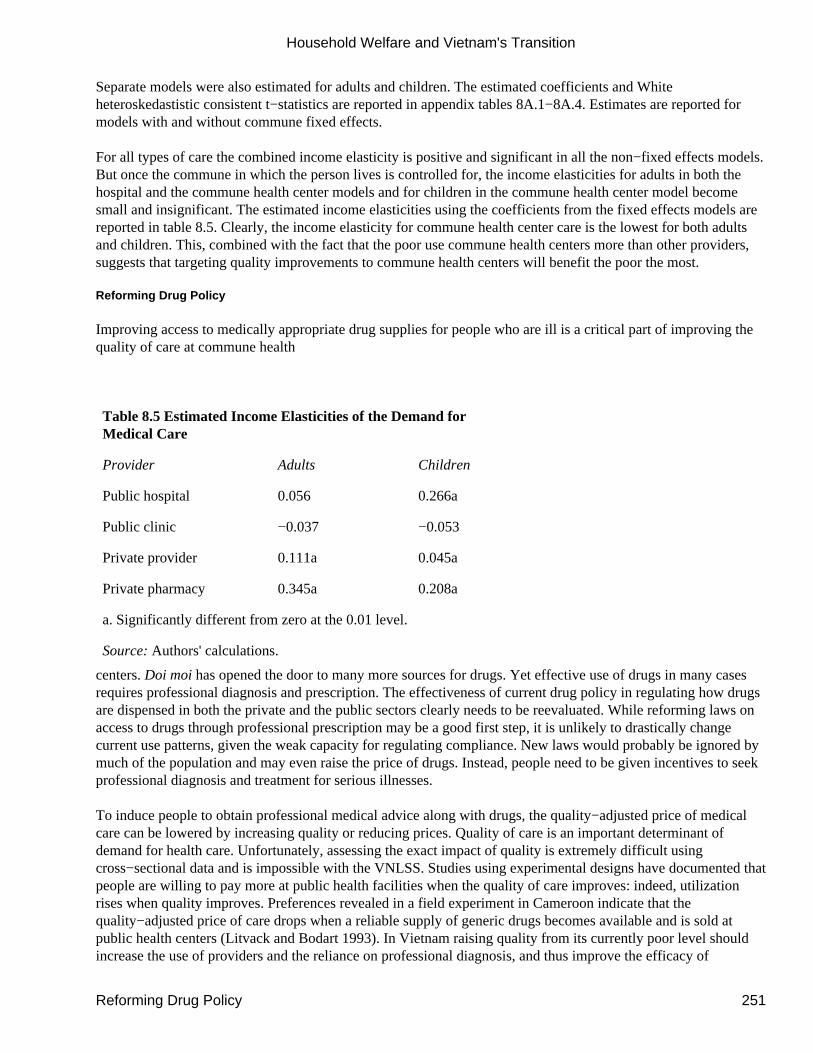
Separate models were also estimated for adults and children. The estimated coefficients and Whiteheteroskedastistic consistent t−statistics are reported in appendix tables 8A.1−8A.4. Estimates are reported formodels with and without commune fixed effects.
For all types of care the combined income elasticity is positive and significant in all the non−fixed effects models.But once the commune in which the person lives is controlled for, the income elasticities for adults in both thehospital and the commune health center models and for children in the commune health center model becomesmall and insignificant. The estimated income elasticities using the coefficients from the fixed effects models arereported in table 8.5. Clearly, the income elasticity for commune health center care is the lowest for both adultsand children. This, combined with the fact that the poor use commune health centers more than other providers,suggests that targeting quality improvements to commune health centers will benefit the poor the most.
Reforming Drug Policy
Improving access to medically appropriate drug supplies for people who are ill is a critical part of improving thequality of care at commune health
Table 8.5 Estimated Income Elasticities of the Demand forMedical Care
Provider Adults Children
Public hospital 0.056 0.266a
Public clinic −0.037 −0.053
Private provider 0.111a 0.045a
Private pharmacy 0.345a 0.208a
a. Significantly different from zero at the 0.01 level.
Source: Authors' calculations.
centers. Doi moi has opened the door to many more sources for drugs. Yet effective use of drugs in many casesrequires professional diagnosis and prescription. The effectiveness of current drug policy in regulating how drugsare dispensed in both the private and the public sectors clearly needs to be reevaluated. While reforming laws onaccess to drugs through professional prescription may be a good first step, it is unlikely to drastically changecurrent use patterns, given the weak capacity for regulating compliance. New laws would probably be ignored bymuch of the population and may even raise the price of drugs. Instead, people need to be given incentives to seekprofessional diagnosis and treatment for serious illnesses.
To induce people to obtain professional medical advice along with drugs, the quality−adjusted price of medicalcare can be lowered by increasing quality or reducing prices. Quality of care is an important determinant ofdemand for health care. Unfortunately, assessing the exact impact of quality is extremely difficult usingcross−sectional data and is impossible with the VNLSS. Studies using experimental designs have documented thatpeople are willing to pay more at public health facilities when the quality of care improves: indeed, utilizationrises when quality improves. Preferences revealed in a field experiment in Cameroon indicate that thequality−adjusted price of care drops when a reliable supply of generic drugs becomes available and is sold atpublic health centers (Litvack and Bodart 1993). In Vietnam raising quality from its currently poor level shouldincrease the use of providers and the reliance on professional diagnosis, and thus improve the efficacy of
Household Welfare and Vietnam's Transition
Reforming Drug Policy 251

treatment.
The first issue is where to improve quality. When households were asked about their perception of the quality ofcare at different providers in the 1996 Vietnam Social Sector Financing Study, most respondents rated the qualityof commune health centers as very poor (Vietnam Government Statistics Office and Asian Development Bank1996). Indeed, respondents ranked self−treatment (most often involving a private pharmacy or drug vendor)higher than commune health centers (Knowles and others 1997). Since commune health centers (and possiblydistrict hospitals) are the most accessible providers for the majority of the population, especially for the poor, andthe quality of care in the facilities is so low, it makes sense to start there. Increasing the quality of communehealth centers not only
would improve the use of drugs, it also would improve the targeting of public subsidies to the poor, since they usethese facilities more than the nonpoor. And as the previous section showed, it is also a good method for targetingsubsidies to the poor because of the low income elasticity for care at commune health centers.
Improving quality in the public sector will require across−the−board investments in human resources, diagnosticequipment, and facilities. But the main problem in commune health centers seems to be access to drugs andappropriate prescribing patterns, as evidenced by the huge expenditures on drugs in the private sector, even by thepoor. The following analysis therefore focuses on improving access to professionally prescribed drugs as a way tolower the quality−adjusted price.
There are two possible ways to lower quality−adjusted prices. The first is to increase spending in commune healthcenters to improve quality−in particular, by enabling the public health system to provide essential drugs to itspatients. Additional resources to offset the increased spending could be obtained by shifting public subsidies fromhospitals to commune health centers. That would require hospitals to raise user fees in order to maintain theircurrent level of spending. But since the poor use few hospital services, these fee increases would be incurredmostly by the rich. To protect the poor from the fee increases, poor patients who receive a referral from communehealth centers could be given a fee waiver for subsequent hospital care. At the margin, shifting subsidies fromhospitals to primary care should increase allocative efficiency.
A policy that involves providing all drugs free of charge would probably result in an excessive marginal publicburden, given the current size and composition of public expenditures in Vietnam. But commune health centerscould ask patients to share the cost of the drugs by paying a fee. As long as the fee for drugs is not so high as todeter use of the health centers, the improved supply of drugs will increase contacts. This policy could serveseveral purposes by increasing contact with the public health centers: it would improve access to proper diagnosisand a full course of therapy, and it would allow the delivery of important preventive services and public healthmessages. But improving the efficacy of public providers' prescribing patterns will also require a considerableeffort (Chalker 1996).
Commune health centers may be able to offer drugs at less than private market prices by procuring low−pricedgeneric drugs. That would increase competition with the private sector and could lead to lower prices in areaswhere profits are excessive. Studies have shown that the price of a drug has little to do with its manufacturing costand far more to do with the competition in the market (Sarmiento 1995). The strong competition alreadycharacterizing the private drug market suggests that low−priced, high−quality drugs in the public sector mightcrowd out the lower end of the private pharmaceutical market.2 That would have both good and badrepercussions. On the positive side, increased competition from the public
sector would make reputation (rather than simply maintaining a stock of medicines) more important in the successof private pharmacies and so could serve as a self−regulating device. Only the pharmacies that offer good advice
Household Welfare and Vietnam's Transition
Reforming Drug Policy 252
and provide efficacious medicines would stay in business. On the negative side, the private sector has proved tobe a reliable supplier of drugs, while the public sector has not. If logistical glitches arise in the publicpharmaceutical supply system and private pharmacies are driven out of business, people could be left withoutaccess to medicines. It is critical to consider and plan all aspects of public supply logistics to ensure a reliablesupply of medicines (Quick and Lainge 1997).
If public health facilities do maintain their own supply of drugs, the critical question is how to finance the supplywithout greatly increasing government subsidies. For many curative drugs, public health facilities can sellcost−effective generics to patients at prices that nearly recover costs and yet are still below market prices. This istrue at commune health centers, which are easily accessible for more than 95 percent of the population. The drugpricing policy could include some cross−subsidization to protect the needy. Vital life−saving medicines could besold at a discount, while nonessential drugs at high demand could be sold at a profit. Wealthy people could becharged more than the poor. And drugs whose consumption involves public health externalities could be furthersubsidized. Such a pricing strategy is often used at religious health facilities. A model for estimating prices basedon such cross−subsidization has been elaborated by Litvack, Shepard, and Quick (1989).
A second way to lower quality−adjusted prices is by reducing out−of−pocket costs for patients. This wouldinvolve providing a discount voucher for private sector drug purchases to those who first go to commune healthcenters. The profit motive would induce private pharmacies to locate close to commune health centers, so thatpeople could purchase drugs at the same time that they seek diagnosis and prescription. But there would need tobe strict regulations against price discrimination based on vouchers. Without such regulations, private providerscould capture the subsidy by charging higher prices for those with vouchers, greatly reducing the benefit to thepatient (Gertler and Solon 1995). There would also need to be additional incentive for private pharmacies toprocure generic drugs; otherwise, they would continue to sell expensive brand−name drugs for which the profitmargin is higher.
One solution considered by some countries is to encourage private pharmacies to charge the same absolutemarkup for the generics as they would for the brand−name drugs. Say the wholesale price of a brand−name drugfor a full course of therapy is $10, while the generic form of the same medicine sells for $2 wholesale. If the retailmarkup for both is $4, the consumer would pay $6 for the generic rather than spend $14 for the brandnamemedicine, and the pharmacy would retain the same profit. As demand increases and the volume of sales rises, theabsolute markups
could be lowered while still maintaining the same overall profits. Just as private pharmaceutical companiesengage in major marketing efforts aimed at retailers and consumers, the government would need to undertake amajor effort to promote generic drugs to private pharmacies and consumers.
Summary and Conclusion
Before doi moi Vietnam financed and delivered medical care entirely through the public sector. A series of factorshave led to deterioration in the quality of care, especially in rural communes, where most of the poor live. Thischapter examined how the reforms changed the role of the public sector in ensuring adequate access. In particular,it examined how well the private sector was able to fill the gaps left by the public sector and identified areaswhere changes in government policy could improve access to and benefits from medical care.
The results show that the private sector has become dominant in both the delivery and the financing of care duringthe transition period. Less than a third of all provider contacts are in the public sector, and more than 80 percent ofexpenditures are out of pocket. But much of the private market activity takes the form of self−diagnosis and drugpurchases from private pharmacies or dispensaries. Indeed, more than two−thirds of illnesses are treated this way.An important concern with treatment without the advice of a medical professional is the accuracy of diagnosis and
Household Welfare and Vietnam's Transition
Summary and Conclusion 253

the efficacy of treatment.
Another finding is that the pattern of public spending benefits the poor the least. Government spending isconcentrated on hospital care, which is used more by the well−off than by the poor. The benefits of spending forhospitals also accrue to the better−off because they live in and around urban areas, where hospitals are located,while the poor live primarily in rural areas, where public care is provided by commune health centers.
Is the private sector filling the gaps created by changes in the delivery of public health care? To some extent itis−though less so for the poor. Doi moi has mobilized private resources to ensure a level of access to care thatwould not have been possible with public resources alone, given budget constraints. But the emergence of theprivate sector is creating another gap. It is facilitating access for the nonpoor to private providers, and access forthe poor to private pharmacies and drug dispensaries, which are supplying medicines where they would nototherwise be available. But the private drug sales are creating a gap by diverting people away from professionaldiagnosis and prescription toward self−diagnosis and self−prescription, a practice that leads to unhealthful drugconsumption patterns in both choice of drugs and dosage. Self−medication for some illnesses not only is notcost−effective and possibly harmful to patients, it also con−
tributes to public health hazards by leading to the development of antibiotic−resistant strains of bacteria.
An obvious policy to improve the use of drugs as well as the targeting of public subsidies to the poor is toincrease the allocation of public resources to the health programs that the poor already use and for which demandis income inelastic. Since most of the poor already have access to commune health centers, public expenditurescould be targeted to the poor by spending more to improve the quality of those facilities. The multivariate analysisprovides some evidence that this policy should increase the use of commune health centers and reduceself−medication by the poor. Thus the policy would provide benefits to those who would not otherwise havesought consultation.
One way to generate the resources to improve health center care would be to reallocate public subsidies awayfrom hospitals. The hospitals would have to raise user fees in order to maintain their current levels of spending.But since the poor use few hospital services, the fee increases would affect mostly the rich. To protect poorpatients from the fee increases, those who receive a referral from a commune health center could be given a feewaiver for subsequent hospital care.
As part of the quality improvement program, the government needs to focus attention on drug policy, to betterregulate how drugs are dispensed in both the private and the public sectors. An essential drugs policy that permitsthe public health system to procure cost−effective generic drugs and offer them to patients in the commune healthcenters would be beneficial. Improving the drug supply at these centers would increase their use and thus improveaccess to proper diagnoses, full courses of therapy, and important preventive services and public health messagesduring curative visits.
Improving the quality of commune health centers requires a financing strategy that ensures a steady supply ofdrugs. For many curative drugs, public health facilities could sell cost−effective generics to patients at prices thatrecover costs and are still below market prices. Since the poor already spend large amounts of money for drugs,they should be willing to pay lower prices while getting professional diagnosis and therapy prescription for free.The drug pricing policy could include some cross−subsidization to protect the needy. Other efforts could helpimprove the quality of commune health centers (such as renovations and new equipment), but they would notaddress the main problem−access to drugs.
The government has already started efforts to improve access to drugs. In 1993 anecdotal evidence from fieldtrips by the authors and from reports of nongovernmental organizations indicated that most public health centers
Household Welfare and Vietnam's Transition
Summary and Conclusion 254
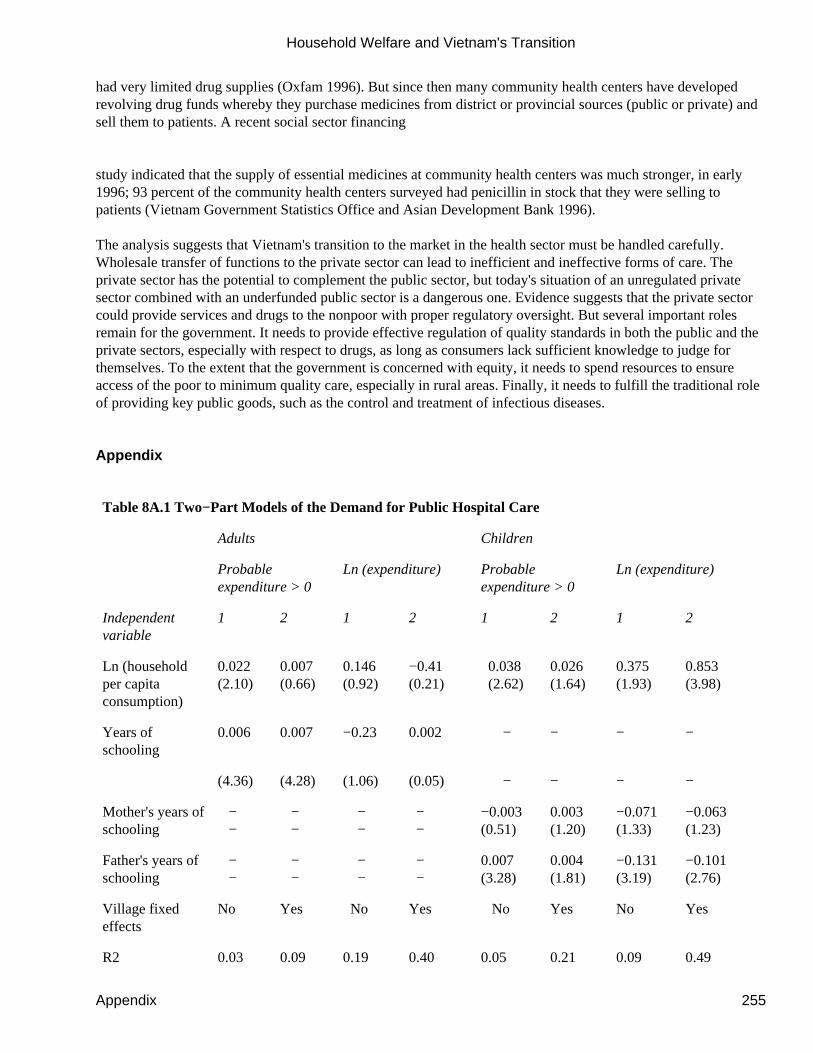
had very limited drug supplies (Oxfam 1996). But since then many community health centers have developedrevolving drug funds whereby they purchase medicines from district or provincial sources (public or private) andsell them to patients. A recent social sector financing
study indicated that the supply of essential medicines at community health centers was much stronger, in early1996; 93 percent of the community health centers surveyed had penicillin in stock that they were selling topatients (Vietnam Government Statistics Office and Asian Development Bank 1996).
The analysis suggests that Vietnam's transition to the market in the health sector must be handled carefully.Wholesale transfer of functions to the private sector can lead to inefficient and ineffective forms of care. Theprivate sector has the potential to complement the public sector, but today's situation of an unregulated privatesector combined with an underfunded public sector is a dangerous one. Evidence suggests that the private sectorcould provide services and drugs to the nonpoor with proper regulatory oversight. But several important rolesremain for the government. It needs to provide effective regulation of quality standards in both the public and theprivate sectors, especially with respect to drugs, as long as consumers lack sufficient knowledge to judge forthemselves. To the extent that the government is concerned with equity, it needs to spend resources to ensureaccess of the poor to minimum quality care, especially in rural areas. Finally, it needs to fulfill the traditional roleof providing key public goods, such as the control and treatment of infectious diseases.
Appendix
Table 8A.1 Two−Part Models of the Demand for Public Hospital Care
Adults Children
Probableexpenditure > 0
Ln (expenditure) Probableexpenditure > 0
Ln (expenditure)
Independentvariable
1 2 1 2 1 2 1 2
Ln (householdper capitaconsumption)
0.022(2.10)
0.007(0.66)
0.146(0.92)
−0.41(0.21)
0.038 (2.62)
0.026(1.64)
0.375(1.93)
0.853(3.98)
Years ofschooling
0.006 0.007 −0.23 0.002 − − − −
(4.36) (4.28) (1.06) (0.05) − − − −
Mother's years ofschooling
− −
− −
− −
− −
−0.003(0.51)
0.003(1.20)
−0.071(1.33)
−0.063(1.23)
Father's years ofschooling
− −
− −
− −
− −
0.007(3.28)
0.004(1.81)
−0.131(3.19)
−0.101(2.76)
Village fixedeffects
No Yes No Yes No Yes No Yes
R2 0.03 0.09 0.19 0.40 0.05 0.21 0.09 0.49
Household Welfare and Vietnam's Transition
Appendix 255
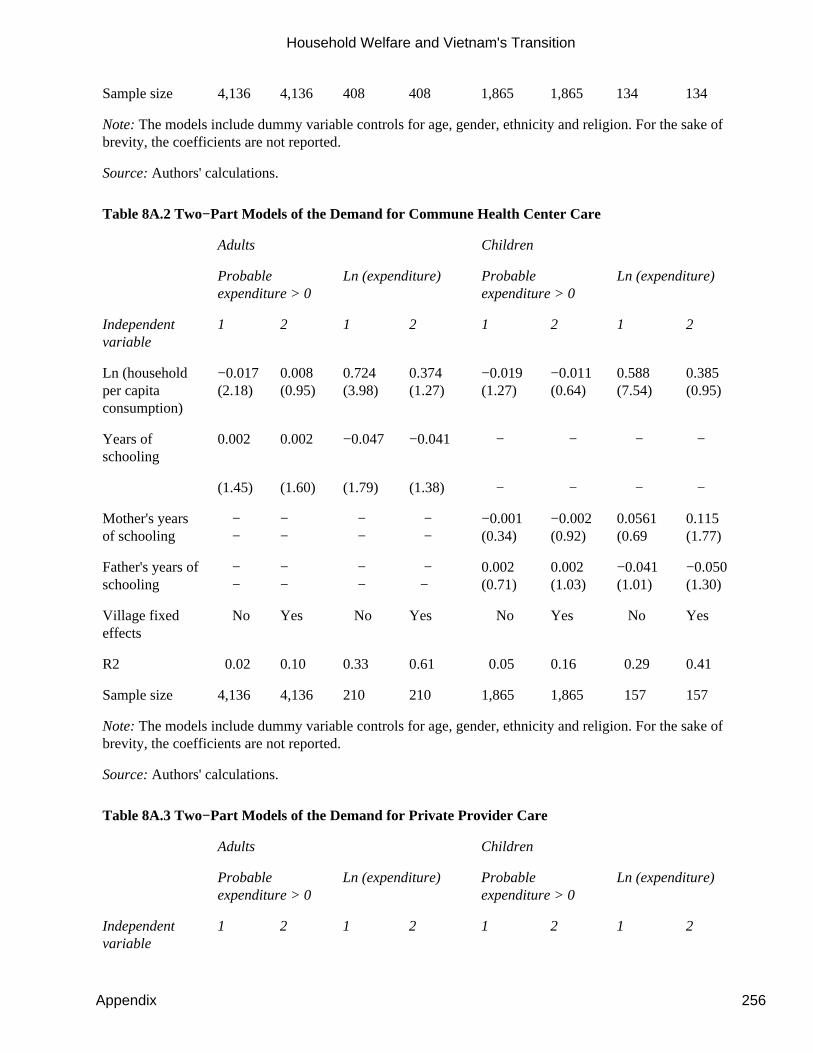
Sample size 4,136 4,136 408 408 1,865 1,865 134 134
Note: The models include dummy variable controls for age, gender, ethnicity and religion. For the sake ofbrevity, the coefficients are not reported.
Source: Authors' calculations.
Table 8A.2 Two−Part Models of the Demand for Commune Health Center Care
Adults Children
Probableexpenditure > 0
Ln (expenditure) Probableexpenditure > 0
Ln (expenditure)
Independentvariable
1 2 1 2 1 2 1 2
Ln (householdper capitaconsumption)
−0.017(2.18)
0.008(0.95)
0.724(3.98)
0.374(1.27)
−0.019(1.27)
−0.011(0.64)
0.588(7.54)
0.385(0.95)
Years ofschooling
0.002 0.002 −0.047 −0.041 − − − −
(1.45) (1.60) (1.79) (1.38) − − − −
Mother's yearsof schooling
− −
−−
− −
− −
−0.001(0.34)
−0.002(0.92)
0.0561(0.69
0.115(1.77)
Father's years ofschooling
− −
−−
− −
− −
0.002(0.71)
0.002(1.03)
−0.041(1.01)
−0.050(1.30)
Village fixedeffects
No Yes No Yes No Yes No Yes
R2 0.02 0.10 0.33 0.61 0.05 0.16 0.29 0.41
Sample size 4,136 4,136 210 210 1,865 1,865 157 157
Note: The models include dummy variable controls for age, gender, ethnicity and religion. For the sake ofbrevity, the coefficients are not reported.
Source: Authors' calculations.
Table 8A.3 Two−Part Models of the Demand for Private Provider Care
Adults Children
Probableexpenditure > 0
Ln (expenditure) Probableexpenditure > 0
Ln (expenditure)
Independentvariable
1 2 1 2 1 2 1 2
Household Welfare and Vietnam's Transition
Appendix 256
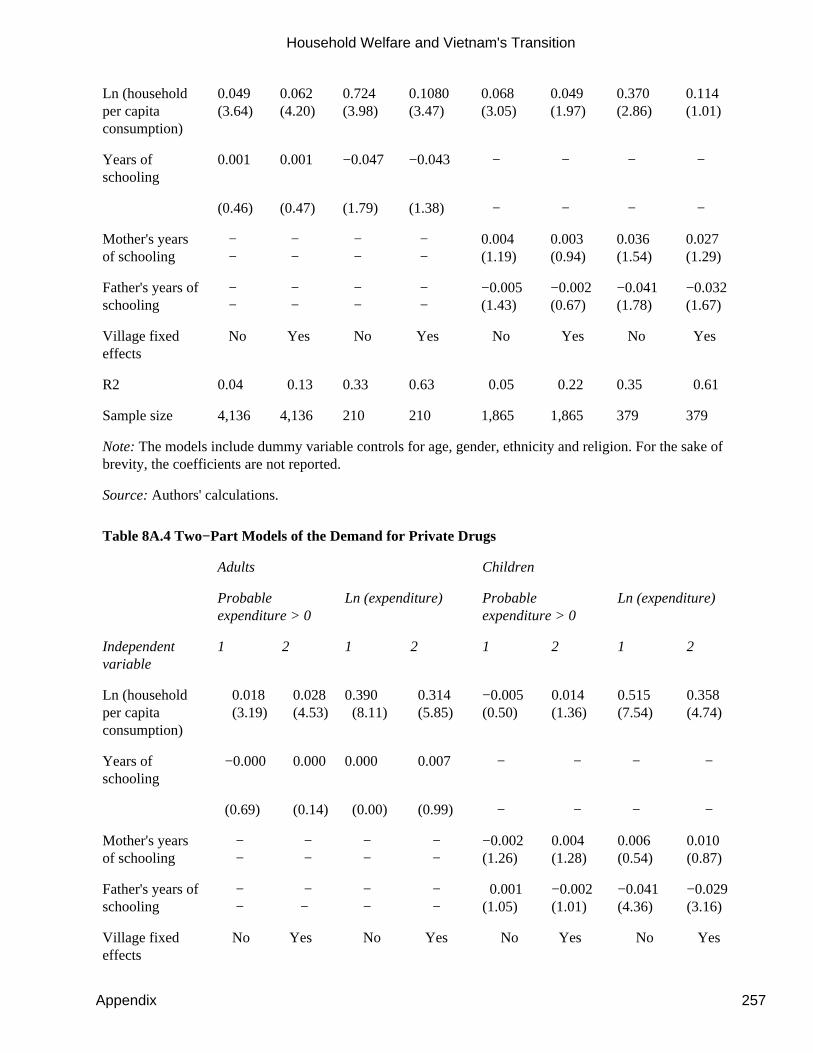
Ln (householdper capitaconsumption)
0.049(3.64)
0.062(4.20)
0.724(3.98)
0.1080(3.47)
0.068(3.05)
0.049(1.97)
0.370(2.86)
0.114(1.01)
Years ofschooling
0.001 0.001 −0.047 −0.043 − − − −
(0.46) (0.47) (1.79) (1.38) − − − −
Mother's yearsof schooling
− −
− −
− −
− −
0.004(1.19)
0.003(0.94)
0.036(1.54)
0.027(1.29)
Father's years ofschooling
− −
− −
− −
− −
−0.005(1.43)
−0.002(0.67)
−0.041(1.78)
−0.032(1.67)
Village fixedeffects
No Yes No Yes No Yes No Yes
R2 0.04 0.13 0.33 0.63 0.05 0.22 0.35 0.61
Sample size 4,136 4,136 210 210 1,865 1,865 379 379
Note: The models include dummy variable controls for age, gender, ethnicity and religion. For the sake ofbrevity, the coefficients are not reported.
Source: Authors' calculations.
Table 8A.4 Two−Part Models of the Demand for Private Drugs
Adults Children
Probableexpenditure > 0
Ln (expenditure) Probableexpenditure > 0
Ln (expenditure)
Independentvariable
1 2 1 2 1 2 1 2
Ln (householdper capitaconsumption)
0.018 (3.19)
0.028 (4.53)
0.390 (8.11)
0.314 (5.85)
−0.005(0.50)
0.014(1.36)
0.515(7.54)
0.358(4.74)
Years ofschooling
−0.000 0.000 0.000 0.007 − − − −
(0.69) (0.14) (0.00) (0.99) − − − −
Mother's yearsof schooling
− −
− −
− −
− −
−0.002(1.26)
0.004(1.28)
0.006(0.54)
0.010(0.87)
Father's years ofschooling
− −
− −
− −
− −
0.001(1.05)
−0.002(1.01)
−0.041(4.36)
−0.029(3.16)
Village fixedeffects
No Yes No Yes No Yes No Yes
Household Welfare and Vietnam's Transition
Appendix 257
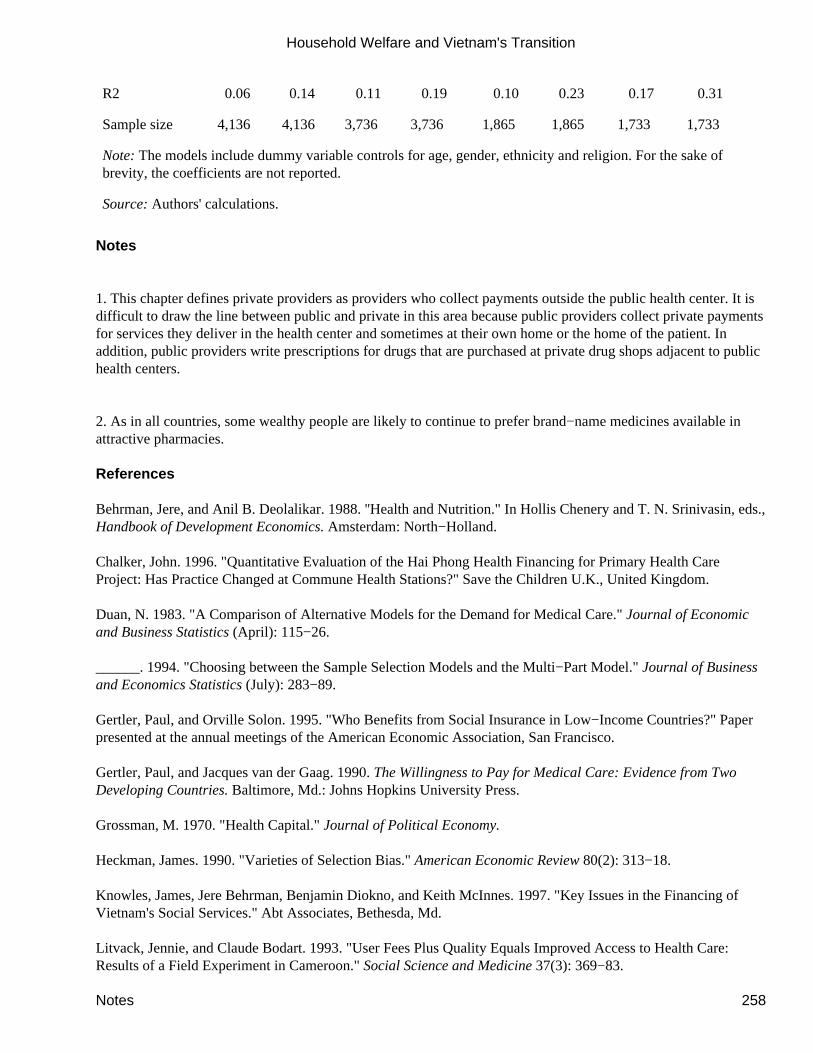
R2 0.06 0.14 0.11 0.19 0.10 0.23 0.17 0.31
Sample size 4,136 4,136 3,736 3,736 1,865 1,865 1,733 1,733
Note: The models include dummy variable controls for age, gender, ethnicity and religion. For the sake ofbrevity, the coefficients are not reported.
Source: Authors' calculations.
Notes
1. This chapter defines private providers as providers who collect payments outside the public health center. It isdifficult to draw the line between public and private in this area because public providers collect private paymentsfor services they deliver in the health center and sometimes at their own home or the home of the patient. Inaddition, public providers write prescriptions for drugs that are purchased at private drug shops adjacent to publichealth centers.
2. As in all countries, some wealthy people are likely to continue to prefer brand−name medicines available inattractive pharmacies.
References
Behrman, Jere, and Anil B. Deolalikar. 1988. ''Health and Nutrition." In Hollis Chenery and T. N. Srinivasin, eds.,Handbook of Development Economics. Amsterdam: North−Holland.
Chalker, John. 1996. "Quantitative Evaluation of the Hai Phong Health Financing for Primary Health CareProject: Has Practice Changed at Commune Health Stations?" Save the Children U.K., United Kingdom.
Duan, N. 1983. "A Comparison of Alternative Models for the Demand for Medical Care." Journal of Economicand Business Statistics (April): 115−26.
______. 1994. "Choosing between the Sample Selection Models and the Multi−Part Model." Journal of Businessand Economics Statistics (July): 283−89.
Gertler, Paul, and Orville Solon. 1995. "Who Benefits from Social Insurance in Low−Income Countries?" Paperpresented at the annual meetings of the American Economic Association, San Francisco.
Gertler, Paul, and Jacques van der Gaag. 1990. The Willingness to Pay for Medical Care: Evidence from TwoDeveloping Countries. Baltimore, Md.: Johns Hopkins University Press.
Grossman, M. 1970. "Health Capital." Journal of Political Economy.
Heckman, James. 1990. "Varieties of Selection Bias." American Economic Review 80(2): 313−18.
Knowles, James, Jere Behrman, Benjamin Diokno, and Keith McInnes. 1997. "Key Issues in the Financing ofVietnam's Social Services." Abt Associates, Bethesda, Md.
Litvack, Jennie, and Claude Bodart. 1993. "User Fees Plus Quality Equals Improved Access to Health Care:Results of a Field Experiment in Cameroon." Social Science and Medicine 37(3): 369−83.
Household Welfare and Vietnam's Transition
Notes 258

Litvack, Jennie, Donald Shepard, and Jonathan Quick. 1989."Setting the Price of Essential Drugs: Necessity andAffordability." Lancet 8659: 376.
Manning, W., J. Newhouse, N. Duan, and others. 1987. "Health Insurance and the Demand for Medical Care."American Economic Review.
Oxfam U.K.−Ireland. 1996. "Report on the Financing and Delivery of Basic Services at the Commune Level inKy Anh, Ha Tinh, Vietnam."
Quick, Jonathan, and Richard Lainge, eds. 1997. Managing Drug Supply: The Selection, Procurement,Distribution, and Use of Pharmaceuticals. Vol. 2. West Hartford, Conn.: Kumarian Press.
Sarmiento, Alvaro Zerdo. 1995. "Alternative Drug Pricing Policies in the Americas." Health Economics andDrugs DAP Series 1. World Health Organization, Geneva.
Vietnam Government Statistics Office and Asian Development Bank. 1996. "Social Sector Financing Study."Hanoi.
World Bank. 1993. World Development Report 1993: Investing in Health. New York: Oxford University Press.
______. 1995. "Vietnam: Poverty Assessment and Strategy." Report 13442−VN. East Asia and Pacific Region,Country Department I, Washington, D.C.
9—Will Vietnam Grow Out of Malnutrition?
Ninez Ponce, Paul Gertler, and Paul Glewwe
Vietnam's transition to a market economy has been very successful, as chapter 1 explained. Yet its transition mayhave created inequalities in income, health, and education. Moreover, Vietnam remains one of the world's poorestcountries. Chapter 2 showed that nearly 55 percent of its 70 million people still lived in poverty in 1993, and 50percent of children age five and under were stunted (had low height for age). Indeed, Vietnamese children areamong the most malnourished in the developing world−though the rate of malnutrition is no worse, and in somecases better, than rates in countries with similarly low income levels. The previous chapter considered health carein general in Vietnam; this chapter looks at child health. In particular, it focuses on child nutritional status asmeasured by child height.
The nutritional status of a country's children is an important barometer of the well−being of its population. Goodnutrition has been positively associated with both cognitive development in early childhood and eventual schoolperformance. Benefits during adulthood include higher labor productivity and longer life expectancy. Theselong−run benefits suggest that improved child nutrition is not only an important objective in its own right but alsocan be regarded as an investment good, because it promotes the subsequent acquisition of human capital and,consequently, future economic growth.
Given these benefits of good nutrition, what guidelines should governments follow in formulating appropriatepolicies to promote it? In particular, when should governments take an active role, and what policies are mosteffective? From the perspective of economic theory, externalities in the form of social benefits are not necessarilythe main reason for government intervention in child nutrition, since poor nutrition is not a contagious dis−
Household Welfare and Vietnam's Transition
9— Will Vietnam Grow Out of Malnutrition? 259
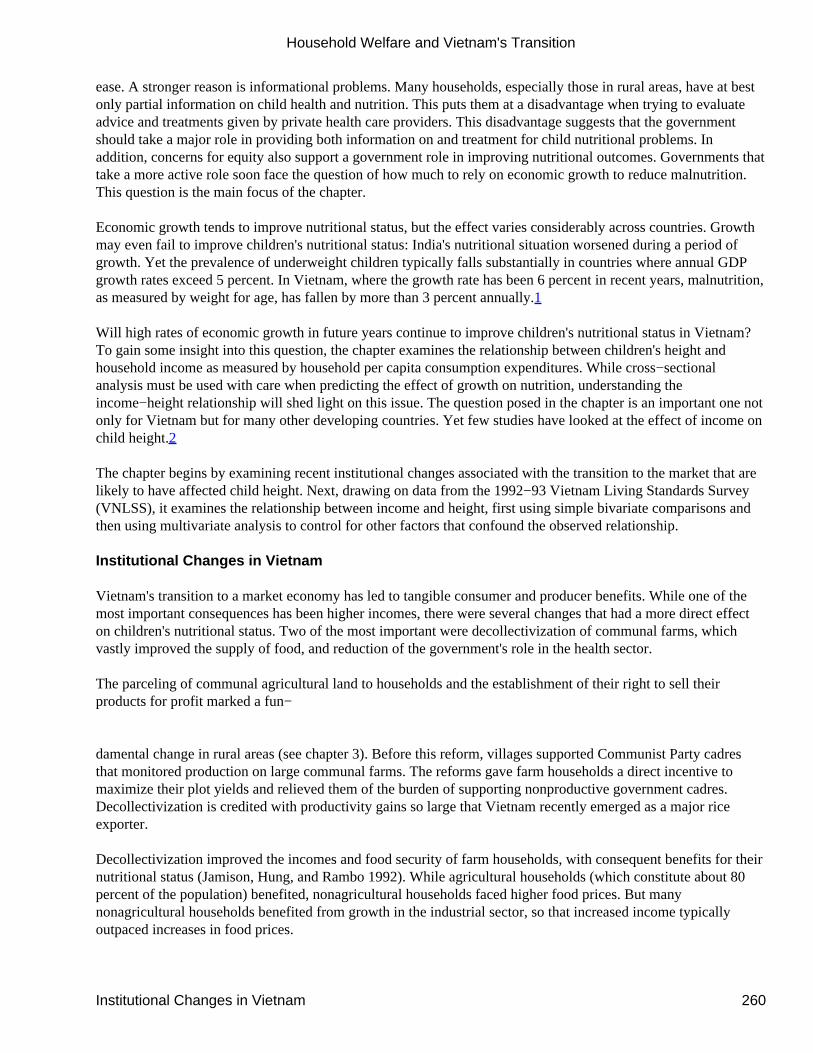
ease. A stronger reason is informational problems. Many households, especially those in rural areas, have at bestonly partial information on child health and nutrition. This puts them at a disadvantage when trying to evaluateadvice and treatments given by private health care providers. This disadvantage suggests that the governmentshould take a major role in providing both information on and treatment for child nutritional problems. Inaddition, concerns for equity also support a government role in improving nutritional outcomes. Governments thattake a more active role soon face the question of how much to rely on economic growth to reduce malnutrition.This question is the main focus of the chapter.
Economic growth tends to improve nutritional status, but the effect varies considerably across countries. Growthmay even fail to improve children's nutritional status: India's nutritional situation worsened during a period ofgrowth. Yet the prevalence of underweight children typically falls substantially in countries where annual GDPgrowth rates exceed 5 percent. In Vietnam, where the growth rate has been 6 percent in recent years, malnutrition,as measured by weight for age, has fallen by more than 3 percent annually.1
Will high rates of economic growth in future years continue to improve children's nutritional status in Vietnam?To gain some insight into this question, the chapter examines the relationship between children's height andhousehold income as measured by household per capita consumption expenditures. While cross−sectionalanalysis must be used with care when predicting the effect of growth on nutrition, understanding theincome−height relationship will shed light on this issue. The question posed in the chapter is an important one notonly for Vietnam but for many other developing countries. Yet few studies have looked at the effect of income onchild height.2
The chapter begins by examining recent institutional changes associated with the transition to the market that arelikely to have affected child height. Next, drawing on data from the 1992−93 Vietnam Living Standards Survey(VNLSS), it examines the relationship between income and height, first using simple bivariate comparisons andthen using multivariate analysis to control for other factors that confound the observed relationship.
Institutional Changes in Vietnam
Vietnam's transition to a market economy has led to tangible consumer and producer benefits. While one of themost important consequences has been higher incomes, there were several changes that had a more direct effecton children's nutritional status. Two of the most important were decollectivization of communal farms, whichvastly improved the supply of food, and reduction of the government's role in the health sector.
The parceling of communal agricultural land to households and the establishment of their right to sell theirproducts for profit marked a fun−
damental change in rural areas (see chapter 3). Before this reform, villages supported Communist Party cadresthat monitored production on large communal farms. The reforms gave farm households a direct incentive tomaximize their plot yields and relieved them of the burden of supporting nonproductive government cadres.Decollectivization is credited with productivity gains so large that Vietnam recently emerged as a major riceexporter.
Decollectivization improved the incomes and food security of farm households, with consequent benefits for theirnutritional status (Jamison, Hung, and Rambo 1992). While agricultural households (which constitute about 80percent of the population) benefited, nonagricultural households faced higher food prices. But manynonagricultural households benefited from growth in the industrial sector, so that increased income typicallyoutpaced increases in food prices.
Household Welfare and Vietnam's Transition
Institutional Changes in Vietnam 260

Vietnam's health sector faced new challenges after reunification in 1975, when the vast public health care networkin the north was extended throughout the south. That expansion, coupled with weak and sometimes negativeeconomic growth in the 1980s, strained the government's ability to finance both its extensive hospital and clinicnetwork and its preventive outreach programs. The collapse of the Soviet Union in 1991 led to the loss ofVietnam's drug supply system, compounding the health sector's financial crisis.
In 1989 the government opened the door to private financing and delivery of health care in the hope of improvinghealth services. In addition, public hospitals and, to a much smaller degree, public health centers began chargingpatients for consultations and drugs in order to raise funds for the public health sector. Doctors and nurses openedprivate practices, often in parallel with their public practice, and private pharmacies and drug vendors sprang upthroughout the country. The private health sector expanded very quickly, with minimal government regulation toensure quality, especially in pharmaceuticals and dispensing practices.
As chapter 8 discussed in detail, the shrinking government role in the health sector affected access, utilization,and quality of health care. Lower use of prenatal services, health education, growth monitoring, andimmunizations may have compromised children's nutritional status. Because households were now required topay all pharmaceutical expenses, poor households became less likely to purchase expensive prescriptions forillnesses and infections that can slow child growth. Thus privatization of the health sector may have offset someor all of the gains in nutritional status due to increased food supply.
The government's child nutrition policies are coordinated by the National Institute of Nutrition. The institute's roleis to set and evaluate goals on nutritional status, but in recent years it has had almost no operating budget toachieve these objectives. In 1992 it set a series of goals to
improve nutritional status by 2000. Although the institute considers stunting (low height−for−age) to beVietnam's most important child nutrition problem, it has never set explicit numerical targets for reducing itsincidence (World Bank 1993, 36). However, it has set an objective to reduce the prevalence of underweightchildren under five from more than 50 percent in 1989 to 25−30 percent by 2000. And the government has set atacit goal of cutting the prevalence of underweight and stunted children by half over the next 10 years. But withno budget allocations for program interventions, it is unclear how these targets will be met other than indirectlythrough economic growth.
Nutritional Status in Vietnam
This section assesses child nutritional status in Vietnam using the height and weight data collected in the 1992−93VNLSS. It begins by explaining how height and weight data can be used to assess nutritional status, and thenexamines the data from Vietnam.
Measuring Nutritional Status
Before turning to the data from the 1992−93 VNLSS, it is useful to discuss how nutritional status can bemeasured using data on children's height and weight, which are commonly referred to as anthropometric data.There are three commonly used indicators of the nutritional status of children based on anthropometric measures:height−for−age, weight−for−height, and weight−for−age (see Healy 1986). The basic intuition behind all of themis that children suffering from inadequate nutrition−whether because of insufficient food intake or a disease thatinterferes with the body's ability to convert food into energy−either grow more slowly or stop growing altogether.Malnourished children may also experience reductions in weight.
Consider a child's height, conditional on his or her age. Each time the child experiences inadequate nutrition, he orshe will stop growing or grow more slowly. When the child's nutritional status improves, normal growth resumes,
Household Welfare and Vietnam's Transition
Nutritional Status in Vietnam 261

but the child is unlikely to catch up to the height that would have been attained if the incidence of poor nutritionhad not occurred. Each time a child experiences poor nutrition, he or she falls further behind in height relative to achild with no such experiences. Thus height−for−age measures a child's cumulative nutritional status since birth.Because it primarily reflects events in the past, it is not a good indicator of current nutritional status.
Weight−for−height measures a child's current nutritional status. In the short run a child with inadequatenutritional intake has not had much time to fall (further) behind in height, but his or her weight could droprelatively quickly. Weight−for−height reveals nothing about past episodes of malnutrition, however, because theweight of children who are currently
receiving adequate nutrition but have suffered from several periods of poor nutrition in the past will have adjustedto their current height. That is, because they are currently receiving adequate nutrition, their weight is in thenormal range for a child of their height.
Weight−for−age reflects both stunting (low height−for−age) and wasting (low weight−for−height). A child who isstunted will have low weight compared with a healthy child of the same age because the stunted child's weight hasadjusted to his or her shorter stature. A child currently experiencing malnutrition would also have lowerweight−for−age. In general, therefore, weight−for−age is less useful than height−for−age and weight−for−heightbecause it does not distinguish between short−term and long−term malnutrition.
All three measures of nutritional status−height−for−age, weight−for−height, and weight−for−age−can beexpressed in terms of Z−scores. This measure indicates, in terms of standard deviations, how far a child'sheight−for−age (or weight−for−height or weight−for−age) is from that of an average healthy child of the sameage (or same height). Height−for−age Z−scores, which are used most often in this chapter, are computed asfollows (see Gibson 1990 for more details):
where H c is the height of a child, H r is the median height of a healthy child of the same age (reference child),and SD r is the standard deviation of the distribution of heights for a reference population of healthy children ofthat age. A Z−score of −2 or below signals malnutrition; in a population of healthy children only 2−3 percentwould have such a low Z−score. A Z−score of −3 or below indicates severe malnutrition, since less than 0.5percent of children in a healthy population would have such a low Z−score.
This chapter follows the standard practice of using the U.S. National Center for Health Statistics (NCHS)reference population, in accordance with the World Health Organization's recommendations for measuringnutritional status (WHO 1983).3 The empirical analysis is restricted to children under age 10 because there isrelatively limited genetic variation in this prepubescent age group (Martorell, Mendoza, and Castillo 1988).
Malnutrition in Vietnam, 1992−93
Figure 9.1 uses the VNLSS data to show that patterns of wasting and stunting in Vietnam are similar to thosefound in other developing countries. Stunting increases rapidly from birth to age two, after which it levels off at ahigh rate of incidence. Wasting peaks in the second year of life, then declines. Both stunting and wasting patternsindicate that poor nutrition is most common during the first two years of life, especially from 6
Household Welfare and Vietnam's Transition
Malnutrition in Vietnam, 1992−93 262
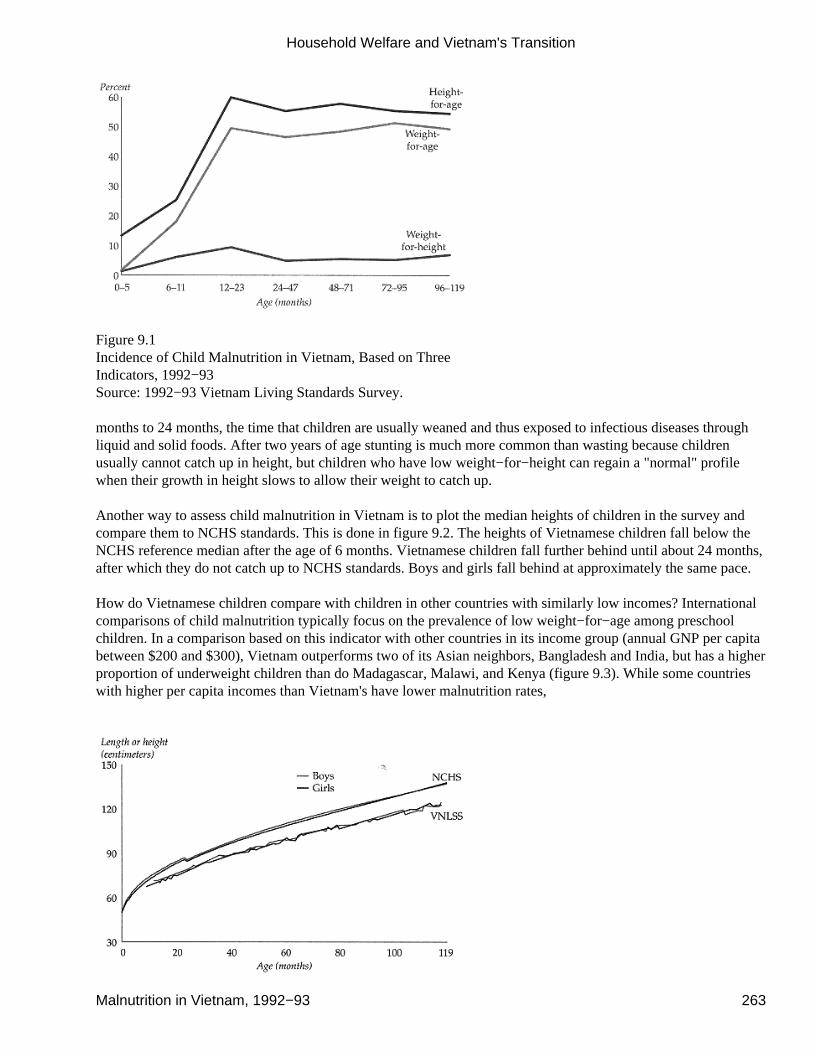
Figure 9.1Incidence of Child Malnutrition in Vietnam, Based on ThreeIndicators, 1992−93Source: 1992−93 Vietnam Living Standards Survey.
months to 24 months, the time that children are usually weaned and thus exposed to infectious diseases throughliquid and solid foods. After two years of age stunting is much more common than wasting because childrenusually cannot catch up in height, but children who have low weight−for−height can regain a "normal" profilewhen their growth in height slows to allow their weight to catch up.
Another way to assess child malnutrition in Vietnam is to plot the median heights of children in the survey andcompare them to NCHS standards. This is done in figure 9.2. The heights of Vietnamese children fall below theNCHS reference median after the age of 6 months. Vietnamese children fall further behind until about 24 months,after which they do not catch up to NCHS standards. Boys and girls fall behind at approximately the same pace.
How do Vietnamese children compare with children in other countries with similarly low incomes? Internationalcomparisons of child malnutrition typically focus on the prevalence of low weight−for−age among preschoolchildren. In a comparison based on this indicator with other countries in its income group (annual GNP per capitabetween $200 and $300), Vietnam outperforms two of its Asian neighbors, Bangladesh and India, but has a higherproportion of underweight children than do Madagascar, Malawi, and Kenya (figure 9.3). While some countrieswith higher per capita incomes than Vietnam's have lower malnutrition rates,
Household Welfare and Vietnam's Transition
Malnutrition in Vietnam, 1992−93 263
Figure 9.2Median Child Height in the U.S. National Center for HealthStatistics and Vietnam Living Standards Survey SamplesNote: The kink at 24 months for the NCHS sample is due to the change in how height ismeasured. Children under 24 months are measured lying down (length), and children 24months and older are measured standing up.Source: 1992−93 Vietnam Living Standards Survey; U.S. National Center of Health Statisticsdata.
such as China and Egypt, others with higher incomes do not have substantially lower rates of child malnutrition,such as Senegal and the Philippines.
Figure 9.3 demonstrates that income is generally associated with lower child malnutrition, but deviations fromthis trend suggest the importance of other factors. One possible explanation for the deviations is the extent ofpublic spending on health and nutrition, which is also shown in figure 9.3. For example, while China has a lowerGNP per capita than the Philippines and Senegal, its malnutrition rate is also lower. This could be attributed toChina's relatively high investment in health: while the Philippines spends 4 percent of its government budget onhealth, and Senegal spends 5 percent, China spends 10 percent. Factors outside the health sector may also play arole. Consider Egypt, which spends only 3 percent of its budget on health yet has the lowest prevalence of childmalnutrition among the countries in figure 9.3. Many other economic and demographic factors−such asagricultural subsidies, women's literacy, and fertility policies−may affect a country's nutritional situation.
Figure 9.3Income, Child Malnutrition, and Public Health Investments in 12Developing Countries, 1989−92Note: Figures in parentheses are the share of public spending on health and nutrition.Source: For Vietnam, 1992−93 Vietnam Living Standards Survey; for all other countries, UnitedNations 1994.
The Relationship between Income and Nutritional Status in Vietnam
This section investigates the relationship between income and nutritional status in Vietnam using data from the1992−93 VNLSS and other sources. It begins with descriptive analysis, examining the correlation betweenincome and nutritional status, then turns to multivariate regression analysis to assess the causal impact of incomeon nutritional status.
Household Welfare and Vietnam's Transition
The Relationship between Income and Nutritional Status in Vietnam 264
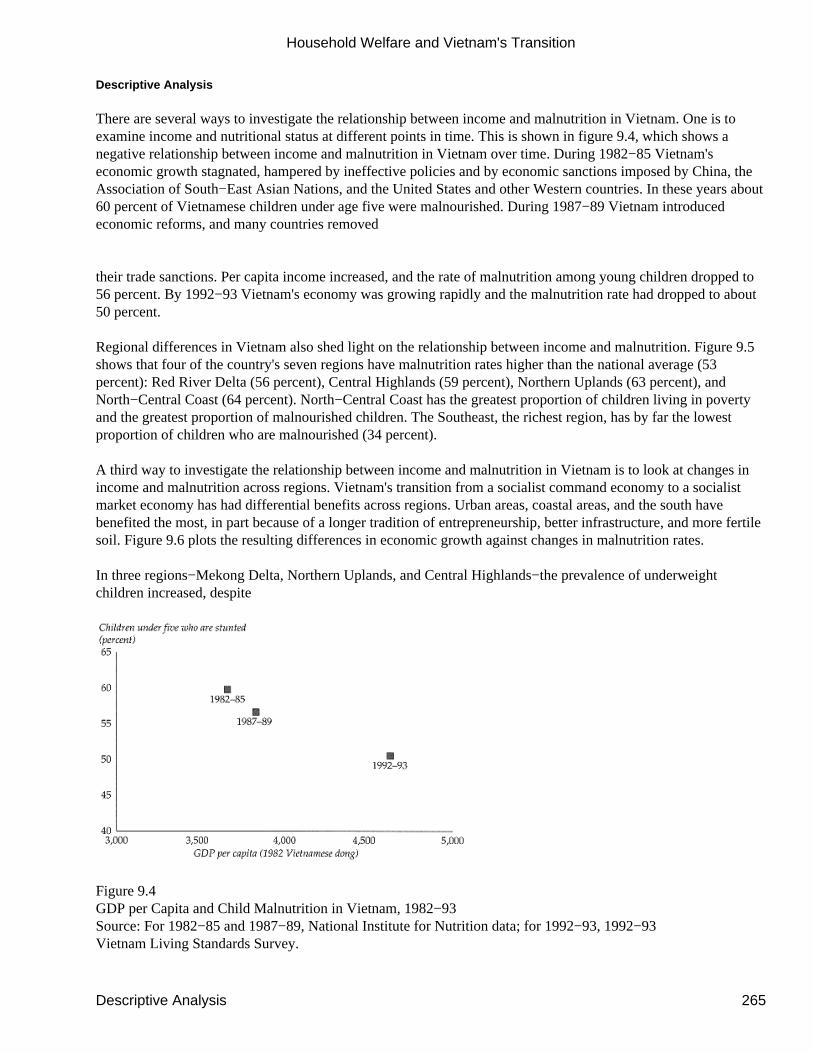
Descriptive Analysis
There are several ways to investigate the relationship between income and malnutrition in Vietnam. One is toexamine income and nutritional status at different points in time. This is shown in figure 9.4, which shows anegative relationship between income and malnutrition in Vietnam over time. During 1982−85 Vietnam'seconomic growth stagnated, hampered by ineffective policies and by economic sanctions imposed by China, theAssociation of South−East Asian Nations, and the United States and other Western countries. In these years about60 percent of Vietnamese children under age five were malnourished. During 1987−89 Vietnam introducedeconomic reforms, and many countries removed
their trade sanctions. Per capita income increased, and the rate of malnutrition among young children dropped to56 percent. By 1992−93 Vietnam's economy was growing rapidly and the malnutrition rate had dropped to about50 percent.
Regional differences in Vietnam also shed light on the relationship between income and malnutrition. Figure 9.5shows that four of the country's seven regions have malnutrition rates higher than the national average (53percent): Red River Delta (56 percent), Central Highlands (59 percent), Northern Uplands (63 percent), andNorth−Central Coast (64 percent). North−Central Coast has the greatest proportion of children living in povertyand the greatest proportion of malnourished children. The Southeast, the richest region, has by far the lowestproportion of children who are malnourished (34 percent).
A third way to investigate the relationship between income and malnutrition in Vietnam is to look at changes inincome and malnutrition across regions. Vietnam's transition from a socialist command economy to a socialistmarket economy has had differential benefits across regions. Urban areas, coastal areas, and the south havebenefited the most, in part because of a longer tradition of entrepreneurship, better infrastructure, and more fertilesoil. Figure 9.6 plots the resulting differences in economic growth against changes in malnutrition rates.
In three regions−Mekong Delta, Northern Uplands, and Central Highlands−the prevalence of underweightchildren increased, despite
Figure 9.4GDP per Capita and Child Malnutrition in Vietnam, 1982−93Source: For 1982−85 and 1987−89, National Institute for Nutrition data; for 1992−93, 1992−93Vietnam Living Standards Survey.
Household Welfare and Vietnam's Transition
Descriptive Analysis 265
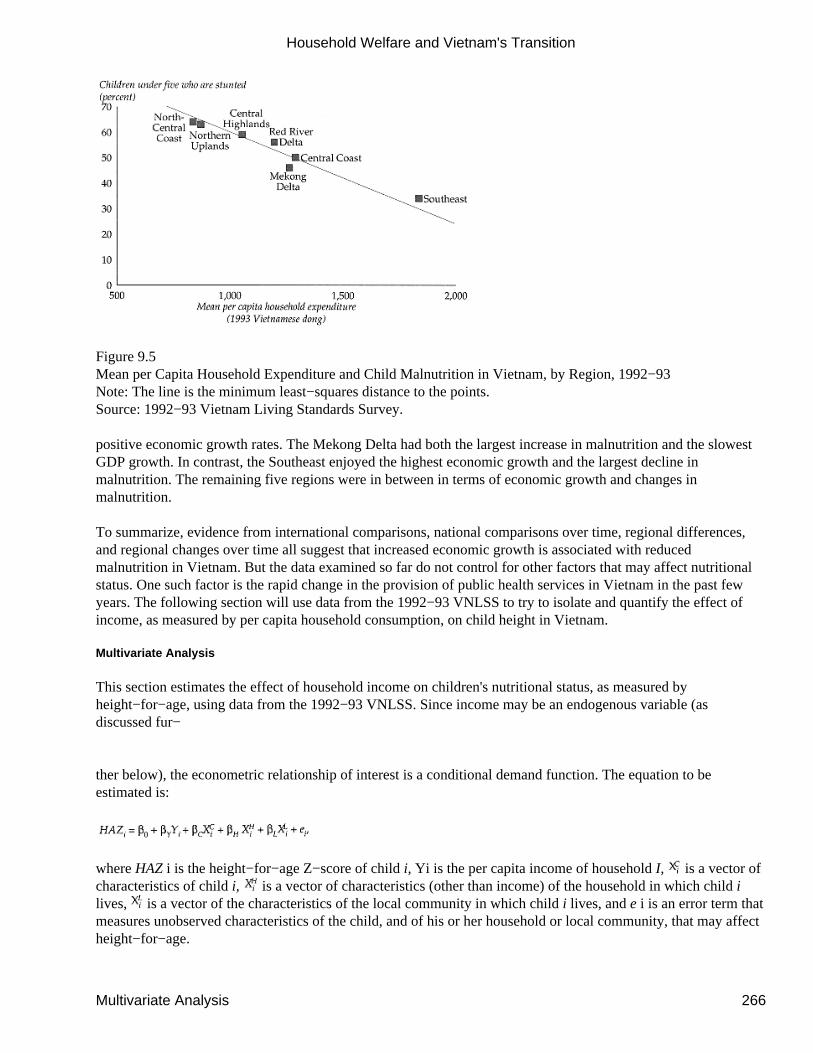
Figure 9.5Mean per Capita Household Expenditure and Child Malnutrition in Vietnam, by Region, 1992−93Note: The line is the minimum least−squares distance to the points.Source: 1992−93 Vietnam Living Standards Survey.
positive economic growth rates. The Mekong Delta had both the largest increase in malnutrition and the slowestGDP growth. In contrast, the Southeast enjoyed the highest economic growth and the largest decline inmalnutrition. The remaining five regions were in between in terms of economic growth and changes inmalnutrition.
To summarize, evidence from international comparisons, national comparisons over time, regional differences,and regional changes over time all suggest that increased economic growth is associated with reducedmalnutrition in Vietnam. But the data examined so far do not control for other factors that may affect nutritionalstatus. One such factor is the rapid change in the provision of public health services in Vietnam in the past fewyears. The following section will use data from the 1992−93 VNLSS to try to isolate and quantify the effect ofincome, as measured by per capita household consumption, on child height in Vietnam.
Multivariate Analysis
This section estimates the effect of household income on children's nutritional status, as measured byheight−for−age, using data from the 1992−93 VNLSS. Since income may be an endogenous variable (asdiscussed fur−
ther below), the econometric relationship of interest is a conditional demand function. The equation to beestimated is:
where HAZ i is the height−for−age Z−score of child i, Yi is the per capita income of household I, is a vector ofcharacteristics of child i, is a vector of characteristics (other than income) of the household in which child ilives, is a vector of the characteristics of the local community in which child i lives, and e i is an error term thatmeasures unobserved characteristics of the child, and of his or her household or local community, that may affectheight−for−age.
Household Welfare and Vietnam's Transition
Multivariate Analysis 266
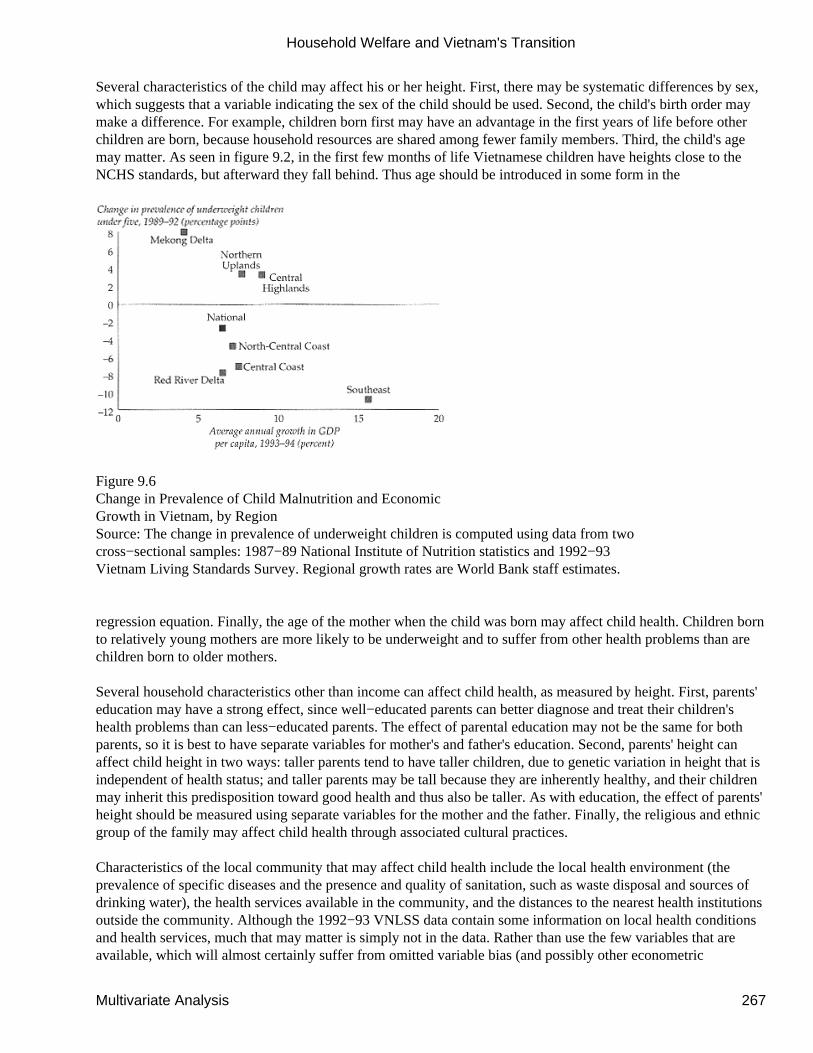
Several characteristics of the child may affect his or her height. First, there may be systematic differences by sex,which suggests that a variable indicating the sex of the child should be used. Second, the child's birth order maymake a difference. For example, children born first may have an advantage in the first years of life before otherchildren are born, because household resources are shared among fewer family members. Third, the child's agemay matter. As seen in figure 9.2, in the first few months of life Vietnamese children have heights close to theNCHS standards, but afterward they fall behind. Thus age should be introduced in some form in the
Figure 9.6Change in Prevalence of Child Malnutrition and EconomicGrowth in Vietnam, by RegionSource: The change in prevalence of underweight children is computed using data from twocross−sectional samples: 1987−89 National Institute of Nutrition statistics and 1992−93Vietnam Living Standards Survey. Regional growth rates are World Bank staff estimates.
regression equation. Finally, the age of the mother when the child was born may affect child health. Children bornto relatively young mothers are more likely to be underweight and to suffer from other health problems than arechildren born to older mothers.
Several household characteristics other than income can affect child health, as measured by height. First, parents'education may have a strong effect, since well−educated parents can better diagnose and treat their children'shealth problems than can less−educated parents. The effect of parental education may not be the same for bothparents, so it is best to have separate variables for mother's and father's education. Second, parents' height canaffect child height in two ways: taller parents tend to have taller children, due to genetic variation in height that isindependent of health status; and taller parents may be tall because they are inherently healthy, and their childrenmay inherit this predisposition toward good health and thus also be taller. As with education, the effect of parents'height should be measured using separate variables for the mother and the father. Finally, the religious and ethnicgroup of the family may affect child health through associated cultural practices.
Characteristics of the local community that may affect child health include the local health environment (theprevalence of specific diseases and the presence and quality of sanitation, such as waste disposal and sources ofdrinking water), the health services available in the community, and the distances to the nearest health institutionsoutside the community. Although the 1992−93 VNLSS data contain some information on local health conditionsand health services, much that may matter is simply not in the data. Rather than use the few variables that areavailable, which will almost certainly suffer from omitted variable bias (and possibly other econometric
Household Welfare and Vietnam's Transition
Multivariate Analysis 267
problems), the analysis gets around these problems by estimating community fixed effects regressions. That is, itassigns a dummy variable to each community that accounts for all community factors, observed and unobserved,that may affect child health. This implies that the estimates of the effect of child and household characteristics areidentified from variation within each community. Since the variable of primary interest is household income,which varies substantially within each community, its effect on child health can be estimated even though theeffect of community variables on child health cannot be identified.
Although most of the child and household variables described above can reasonably be assumed to be exogenous,that is not necessarily so for household income. The measure of income may be correlated with the error term. Anobvious source of endogeneity is the household's labor force participation decision, which may depend on childhealth. Households may put healthier, taller children to work; thus these children would contribute to householdincome. Households may spend more for a smaller child to help the child catch up in growth. And the mother of asickly child may decide not to work in order to care for the child at home.
In all cases the income variable is positively correlated with the error term and thus would tend to overestimatethe effect of household income on children's nutritional status.
Ideally, the analysis would use instrumental variables that are correlated with household income but not with anyof the unobserved household and child characteristics that determine child nutritional status and thus form theerror term in the estimated equation. The analysis uses per capita land availability as the main identifyingvariable. There are conceptual problems with using land if it is bought and sold, since families may buy or sellland in response to their children's health status. But these problems may be less relevant in Vietnam, whereagricultural land was until recently owned by communes. As part of decollectivization, the land was redistributedto commune members for their private use, according to simple rules that had nothing to do with child health.After this distribution, farmland still could not be bought and sold on the open market.
Table 9.1 reports the estimated coefficients and t−statistics for both the urban and rural samples. The estimationmethods include ordinary least squares, commune fixed effects, and, for the rural sample only, instrumentalvariable fixed effects, with land as the identifying instrument for per capita household expenditure. The standarderrors have been corrected to account for the fact that the sample was stratified by commune.
Table 9.2 provides descriptive statistics on all the variables used in the regressions. Both mothers and fathers arerelatively well educated; the vast majority have finished primary school and a third to a half have finished lowersecondary school. More than four−fifths of Vietnamese belong to the Kinh (ethnic Vietnamese) ethnic group; noother ethnic group accounts for more than 2 percent of the population. Most Vietnamese claim no religiousaffiliation, 26 percent are Buddhist, and about 9 percent are Christian. About 30 percent of the children in thesample are the eldest child in the family, which reflects relatively small family sizes for such a poor country.
Turn first to the control variables. Mother's and father's heights are positive and highly significant, as one wouldexpect. More surprising is that parents' education is often not significant, which is at variance with results foundin other countries (see Strauss and Thomas 1995). This result may reflect the fact that most mothers and fathershave at least a primary education. Another explanation may be that parental height captures many backgroundcharacteristics that parental education tends to capture in studies that do not include parental height as anexplanatory variable. Religion, but not ethnicity, is a significant determinant of child's height. The coefficient forage of mother at childbirth is small, but positive and usually significant, which supports the hypothesis thatchildren born to relatively young mothers suffer worse health problems, other things being equal. For any child,being the oldest presents the most favorable outlook for height−for−age in rural areas (but not in urban areas).Finally, age category variables indicate that children in the age group 19−24 months have the lowest
Household Welfare and Vietnam's Transition
Multivariate Analysis 268
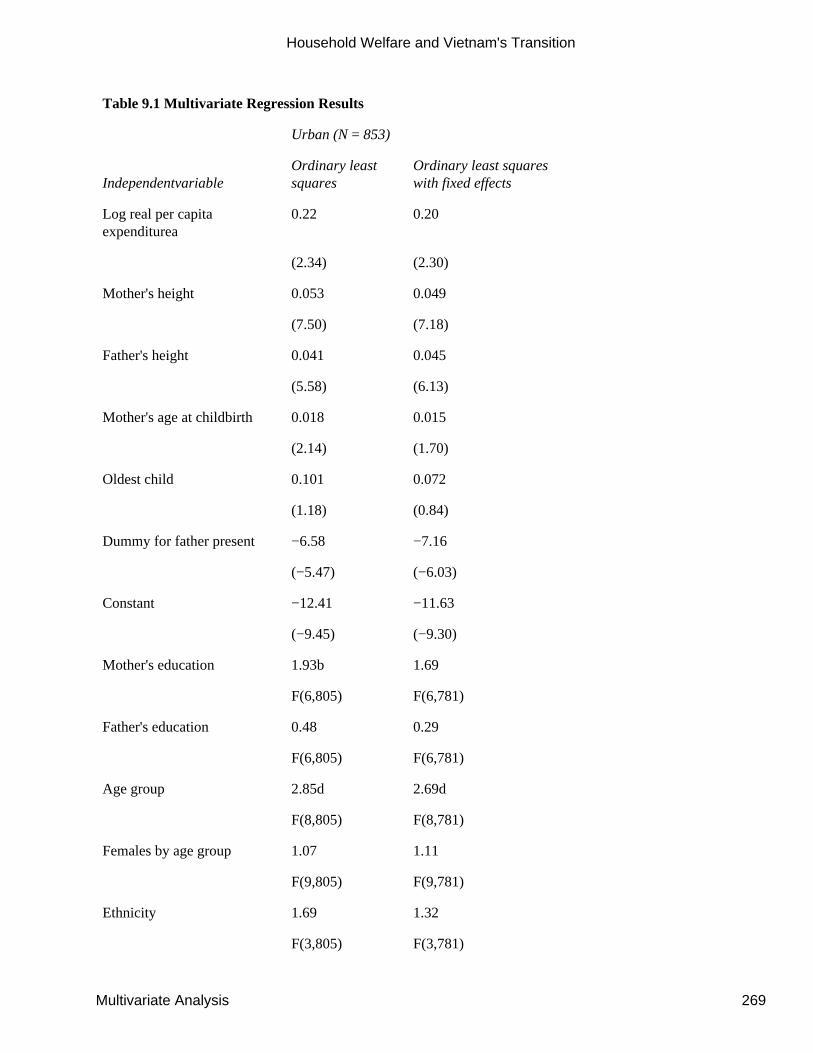
Table 9.1 Multivariate Regression Results
Urban (N = 853)
IndependentvariableOrdinary leastsquares
Ordinary least squareswith fixed effects
Log real per capitaexpenditurea
0.22 0.20
(2.34) (2.30)
Mother's height 0.053 0.049
(7.50) (7.18)
Father's height 0.041 0.045
(5.58) (6.13)
Mother's age at childbirth 0.018 0.015
(2.14) (1.70)
Oldest child 0.101 0.072
(1.18) (0.84)
Dummy for father present −6.58 −7.16
(−5.47) (−6.03)
Constant −12.41 −11.63
(−9.45) (−9.30)
Mother's education 1.93b 1.69
F(6,805) F(6,781)
Father's education 0.48 0.29
F(6,805) F(6,781)
Age group 2.85d 2.69d
F(8,805) F(8,781)
Females by age group 1.07 1.11
F(9,805) F(9,781)
Ethnicity 1.69 1.32
F(3,805) F(3,781)
Household Welfare and Vietnam's Transition
Multivariate Analysis 269
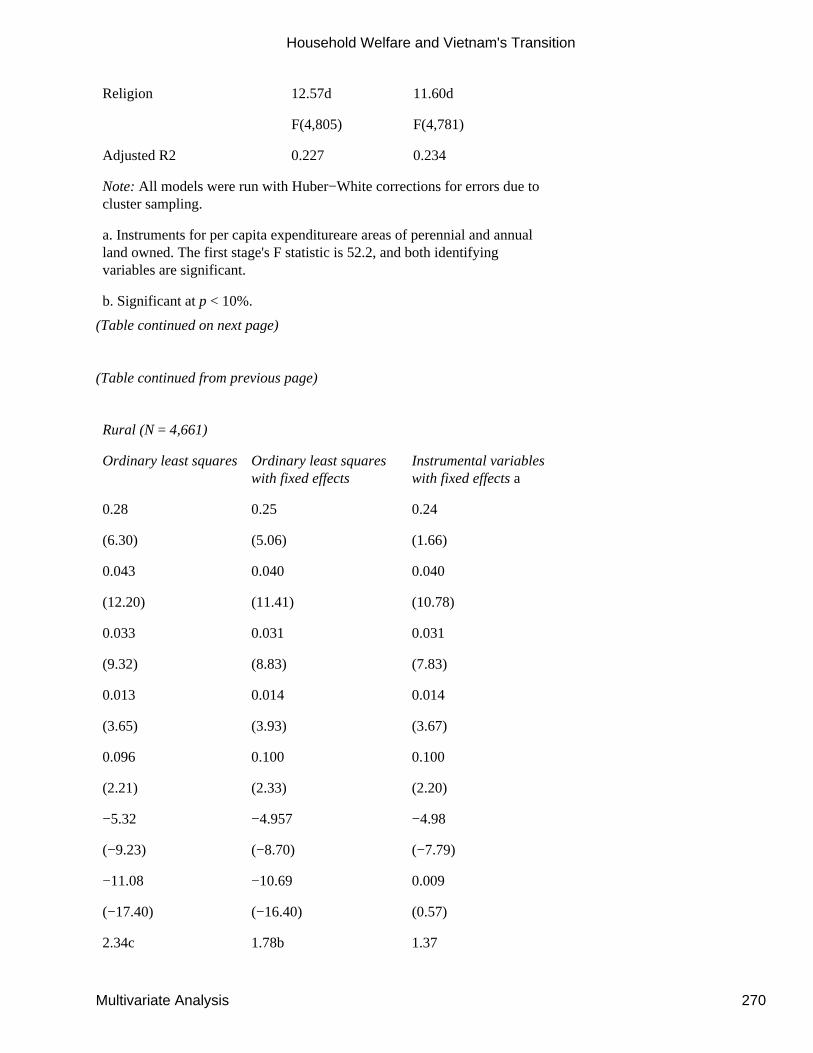
Religion 12.57d 11.60d
F(4,805) F(4,781)
Adjusted R2 0.227 0.234
Note: All models were run with Huber−White corrections for errors due tocluster sampling.
a. Instruments for per capita expenditureare areas of perennial and annualland owned. The first stage's F statistic is 52.2, and both identifyingvariables are significant.
b. Significant at p < 10%.
(Table continued on next page)
(Table continued from previous page)
Rural (N = 4,661)
Ordinary least squaresOrdinary least squareswith fixed effects
Instrumental variableswith fixed effects a
0.28 0.25 0.24
(6.30) (5.06) (1.66)
0.043 0.040 0.040
(12.20) (11.41) (10.78)
0.033 0.031 0.031
(9.32) (8.83) (7.83)
0.013 0.014 0.014
(3.65) (3.93) (3.67)
0.096 0.100 0.100
(2.21) (2.33) (2.20)
−5.32 −4.957 −4.98
(−9.23) (−8.70) (−7.79)
−11.08 −10.69 0.009
(−17.40) (−16.40) (0.57)
2.34c 1.78b 1.37
Household Welfare and Vietnam's Transition
Multivariate Analysis 270
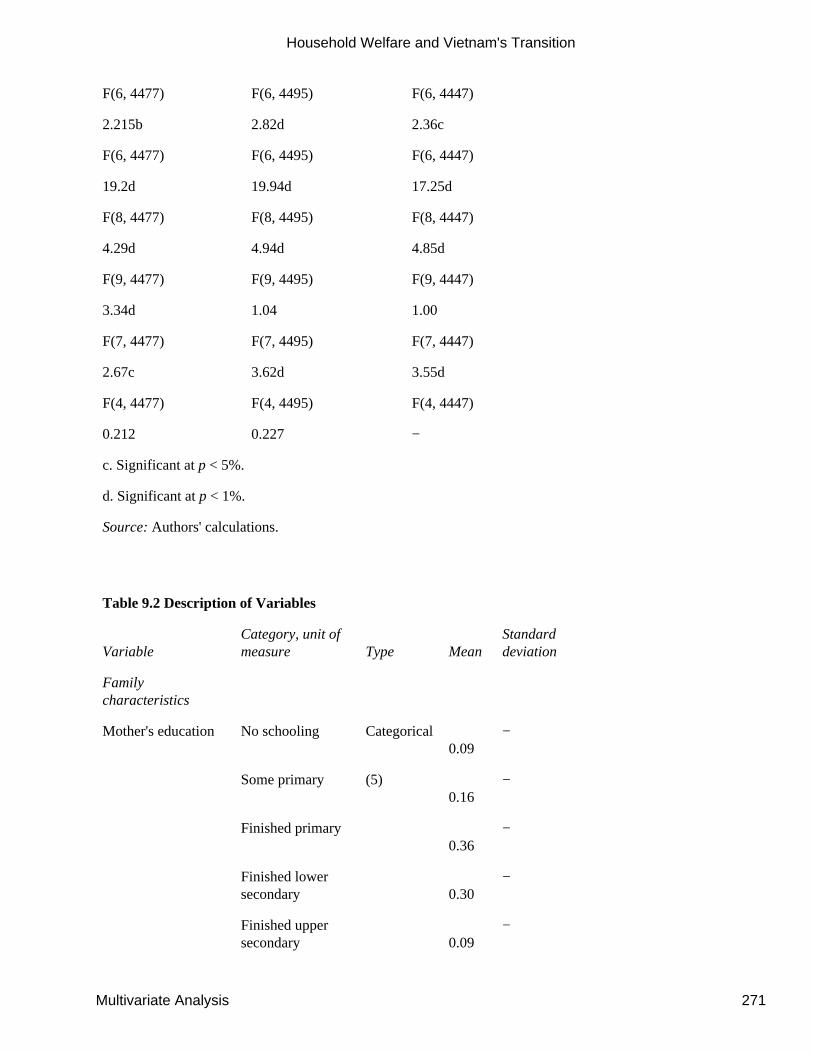
F(6, 4477) F(6, 4495) F(6, 4447)
2.215b 2.82d 2.36c
F(6, 4477) F(6, 4495) F(6, 4447)
19.2d 19.94d 17.25d
F(8, 4477) F(8, 4495) F(8, 4447)
4.29d 4.94d 4.85d
F(9, 4477) F(9, 4495) F(9, 4447)
3.34d 1.04 1.00
F(7, 4477) F(7, 4495) F(7, 4447)
2.67c 3.62d 3.55d
F(4, 4477) F(4, 4495) F(4, 4447)
0.212 0.227 −
c. Significant at p < 5%.
d. Significant at p < 1%.
Source: Authors' calculations.
Table 9.2 Description of Variables
VariableCategory, unit ofmeasure Type Mean
Standarddeviation
Familycharacteristics
Mother's education No schooling Categorical0.09
−
Some primary (5)0.16
−
Finished primary0.36
−
Finished lowersecondary 0.30
−
Finished uppersecondary 0.09
−
Household Welfare and Vietnam's Transition
Multivariate Analysis 271
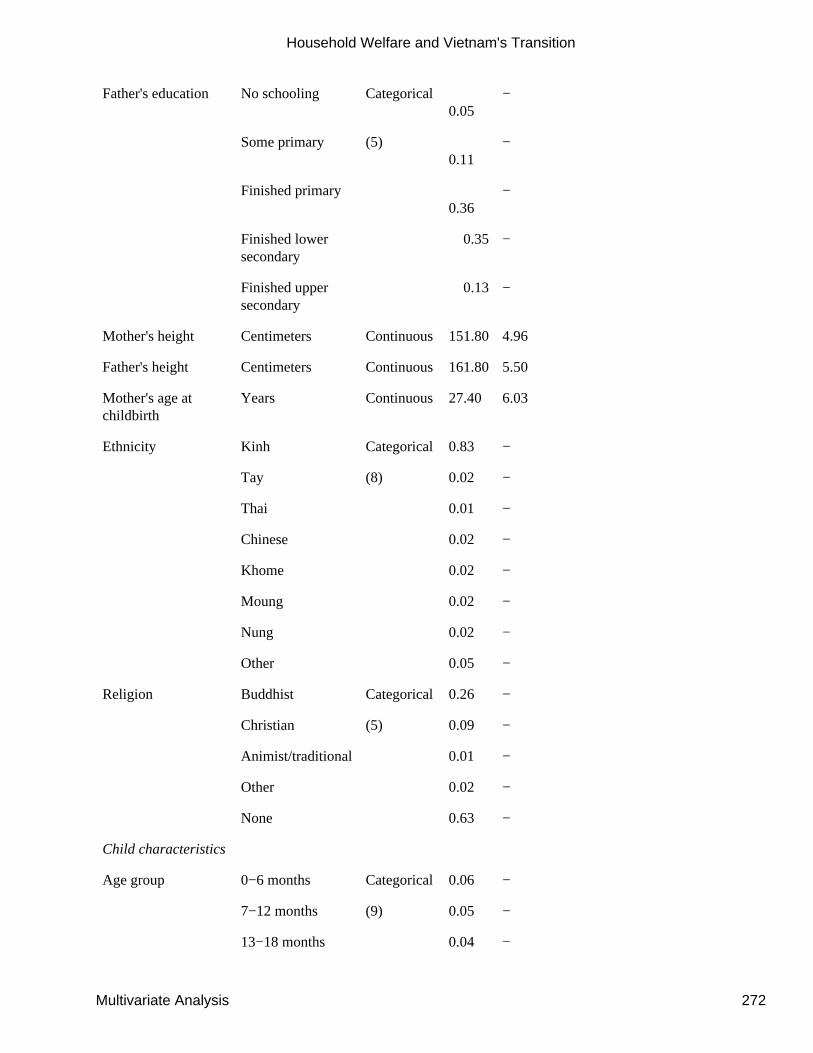
Father's education No schooling Categorical0.05
−
Some primary (5)0.11
−
Finished primary0.36
−
Finished lowersecondary
0.35 −
Finished uppersecondary
0.13 −
Mother's height Centimeters Continuous 151.80 4.96
Father's height Centimeters Continuous 161.80 5.50
Mother's age atchildbirth
Years Continuous 27.40 6.03
Ethnicity Kinh Categorical 0.83 −
Tay (8) 0.02 −
Thai 0.01 −
Chinese 0.02 −
Khome 0.02 −
Moung 0.02 −
Nung 0.02 −
Other 0.05 −
Religion Buddhist Categorical 0.26 −
Christian (5) 0.09 −
Animist/traditional 0.01 −
Other 0.02 −
None 0.63 −
Child characteristics
Age group 0−6 months Categorical 0.06 −
7−12 months (9) 0.05 −
13−18 months 0.04 −
Household Welfare and Vietnam's Transition
Multivariate Analysis 272
19−24 months 0.05 −
25−36 months 0.10 −
37−48 months 0.10 −
49−72 months 0.20 −
73−96 months 0.20 −
97−119 months 0.20 −
Female 1 = female
0 = male Binary 0.51 −
Oldest child 1 = oldest
0 = otherwise Binary 0.30 −
Source: Authors' calculations.
height−for−age Z−score, as would be expected given the data in figure 9.1.
Turn now to the effect of income. The effect is fairly consistent across all the models, with a coefficient rangingfrom 0.20 to 0.28. It is statistically significant for all specifications at standard levels, though the effect in theinstrumental variable fixed effects model for rural areas is significant only at the 10 percent level. The followingsection uses these estimates to project the likely effect of future economic growth on child nutritional status inVietnam.
Economic Growth and Child Growth: Future Prospects
Vietnamese children are among the most malnourished in Asia−indeed, in the entire developing world−in largepart because Vietnam is one of the world's poorest countries. About 53 percent of Vietnamese children age fiveand under are stunted. But institutional changes during the recent transition to the market have improved foodproduction and accelerated economic growth. As Vietnam pulls itself out of poverty, children's nutritional statuswill improve. The question is how fast the nutritional benefits will accrue.
The analysis in the previous section shows that children in higher−income families are less likely to be stunted,suggesting that the prevalence of stunting will decline as economic growth continues in Vietnam. The regressionestimates for the coefficient on income can be used to predict the prevalence of malnutrition from 1994 to 2013for different economic growth scenarios. The proportion of children stunted in 1994, the first year after the baseyear of 1993, can be computed as follows. Recall that children who are deemed stunted are more than 2 standarddeviations below the reference median and thus have a height−for−age Z−score of less than −2. If a 6 percent percapita growth rate is assumed, the effect of growth on nutritional status is calculated by multiplying 6 percent by0.24, the income coefficient from the instrumental variable estimates for rural areas (where 80 percent of thepopulation resides), and adding the product to each child's height−for−age Z−score. This scalar increase moves upthe Z−score for the entire sample, pulling some children out of malnutrition. The malnutrition rate is thencalculated as the percentage of children who have Z−scores of less than −2. This can be continued for 20 years bysequentially adding the scalar increase to the previous year's Z−score and calculating the malnutrition rate foreach year.
Household Welfare and Vietnam's Transition
Economic Growth and Child Growth: Future Prospects 273
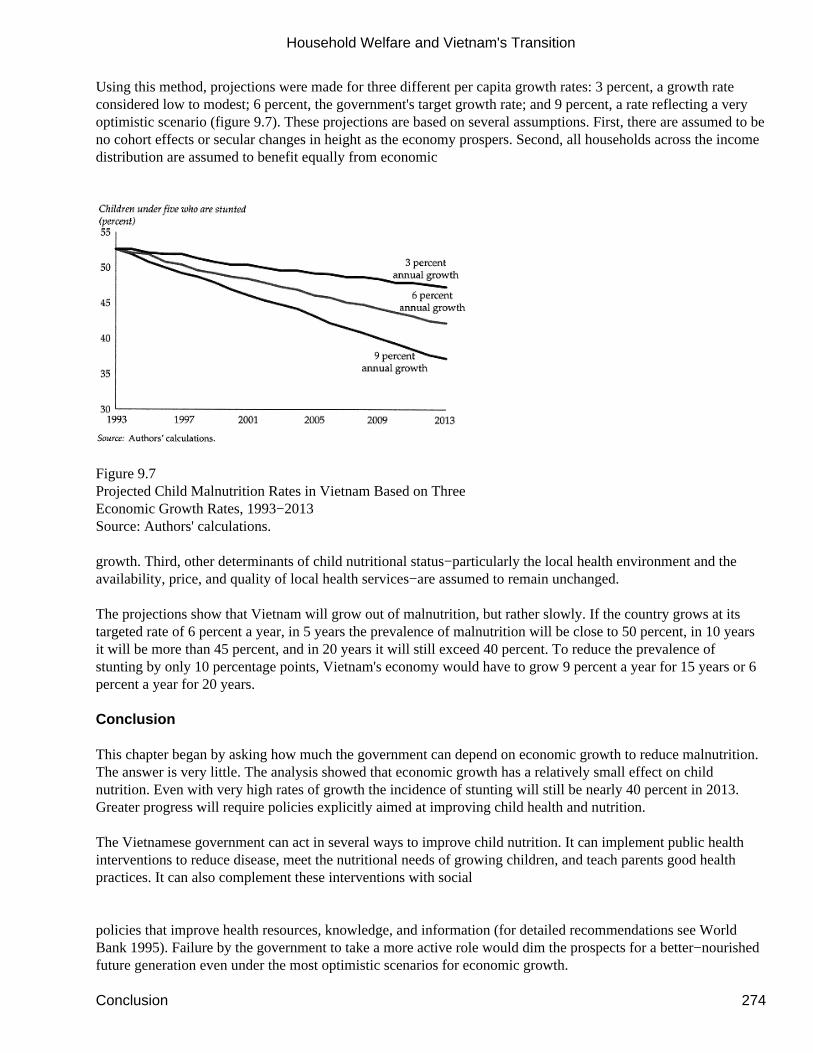
Using this method, projections were made for three different per capita growth rates: 3 percent, a growth rateconsidered low to modest; 6 percent, the government's target growth rate; and 9 percent, a rate reflecting a veryoptimistic scenario (figure 9.7). These projections are based on several assumptions. First, there are assumed to beno cohort effects or secular changes in height as the economy prospers. Second, all households across the incomedistribution are assumed to benefit equally from economic
Figure 9.7Projected Child Malnutrition Rates in Vietnam Based on ThreeEconomic Growth Rates, 1993−2013Source: Authors' calculations.
growth. Third, other determinants of child nutritional status−particularly the local health environment and theavailability, price, and quality of local health services−are assumed to remain unchanged.
The projections show that Vietnam will grow out of malnutrition, but rather slowly. If the country grows at itstargeted rate of 6 percent a year, in 5 years the prevalence of malnutrition will be close to 50 percent, in 10 yearsit will be more than 45 percent, and in 20 years it will still exceed 40 percent. To reduce the prevalence ofstunting by only 10 percentage points, Vietnam's economy would have to grow 9 percent a year for 15 years or 6percent a year for 20 years.
Conclusion
This chapter began by asking how much the government can depend on economic growth to reduce malnutrition.The answer is very little. The analysis showed that economic growth has a relatively small effect on childnutrition. Even with very high rates of growth the incidence of stunting will still be nearly 40 percent in 2013.Greater progress will require policies explicitly aimed at improving child health and nutrition.
The Vietnamese government can act in several ways to improve child nutrition. It can implement public healthinterventions to reduce disease, meet the nutritional needs of growing children, and teach parents good healthpractices. It can also complement these interventions with social
policies that improve health resources, knowledge, and information (for detailed recommendations see WorldBank 1995). Failure by the government to take a more active role would dim the prospects for a better−nourishedfuture generation even under the most optimistic scenarios for economic growth.
Household Welfare and Vietnam's Transition
Conclusion 274
Notes
1. These examples and figures are from United Nations (1994). Although the authors of that report acknowledgethat the figures may exaggerate Vietnam's improvement over time as a result of the uneven quality of data, theyhave no doubt that there has been a remarkable improvement (personal correspondence with John B. Mason,Technical Secretary, ACC/SCN, World Health Organization, Geneva, May 1996).
2. By contrast, there is a large literature on the effect of income on nutrient intake, particularly calorie intake (seeStrauss and Thomas 1995 for a recent review of this literature). The general consensus is that increases in incomedo not lead to large increases in nutrient consumption, which suggests that increased income may also have only amodest effect on child nutritional status.
3. Use of U.S. NCHS standards raises the question of the appropriateness of American growth standards fornon−American populations. While there is some evidence that the mean height of adults of East Asian origin issmaller than the mean heights of adults of European, African, and Indo−Mediterranean ancestry (Evelyth andTanner 1976), most studies that have explored genetic and environmental interactions in the growth of childrenfind that less than 10 percent of the worldwide height variation among children under 10 is due to genetics or race(Martorell and Habicht 1986). Other reasons for using the NCHS standards are practicality and consistency inundertaking normative analysis.
References
Evelyth, Phyllis B., and J. M. Tanner. 1976. Worldwide Variation in Human Growth. Cambridge: CambridgeUniversity Press.
Falkner, Frank, and J. M. Tanner, eds. 1986. Human Growth: A Comprehensive Treatise. 2d ed. New York:Plenum Press.
Gibson, Rosalind. 1990. Principles of Nutritional Assessment. Oxford: Oxford University Press.
Healy, Michael J. 1986. ''Statistics of Growth Standards." In Frank Falkner and J. M. Tanner, eds., HumanGrowth: A Comprehensive Treatise. 2d ed. New York: Plenum Press.
Jamison, Neil L., Nguyen Manh Hung, and A. Terry Rambo. 1992. "The Challenges of Vietnam'sReconstruction." George Mason University, Indochina Institute, Fairfax, Va.
Martorell, Reynaldo, and Jean−Pierre Habicht. 1986. "Growth in Early Childhood in Developing Countries." InFrank Falkner and J. M. Tanner, eds., Human
Growth: A Comprehensive Treatise. 2d ed. New York: Plenum Press.
Martorell, Reynaldo, Fernando Mendoza, and Ricardo Castillo. 1988. "Poverty and Stature in Children." In JohnC. Waterlow, ed., Linear Growth Retardation in Less Developed Countries. Nutrition Workshop Series 14. NewYork: Nestle Vevey/Raven Press.
Strauss, John, and Duncan Thomas. 1995. "Human Resources: Empirical Modeling of Household and FamilyDecisions." In Jere Behrman and T. N. Srinivasan, eds., Handbook of Development Economics. Vol. 3A.
Household Welfare and Vietnam's Transition
Notes 275
Amsterdam: North−Holland.
United Nations. 1994. Update on the Nutrition Situation, 1994. New York.
WHO (World Health Organization). 1983. Measuring Change in Nutritional Status. Geneva.
World Bank. 1993. "Vietnam: Population, Health, and Nutrition Sector Review." East Asia and Pacific Region,Washington, D.C.
_____. 1995. "Vietnam: Poverty Assessment and Strategy." Report 13442−VN. East Asia and Pacific Region,Washington, D.C.
10—Poverty and Fertility in Vietnam
Jaikishan Desai
Do the poor have more children? If so, do they have more children because they are poor, or are they poorbecause they have more children? If they do have more children, is it because they want to or because factorsassociated with poverty prevent them from achieving their family size goals? And how feasible and justifiable is itto make welfare comparisons across individuals when they themselves choose the number of children they haveand when these children yield satisfaction that cannot be completely captured in monetary terms? These are someof the questions that have been the focus of the debate over the past 30−odd years about the relationship betweenpopulation growth and economic development.
In Vietnam concerns about population pressure on scarce land have long been at the top of the agenda, and thecountry has tried to cope with them through long−running family planning programs and attempts at redistributingpopulation. But in recent times these concerns have taken on a new and different dimension as the country movesfrom a centrally planned economic system to one in which markets increasingly determine the allocation ofresources. Coming on the heels of an era in which the state administered agricultural prices, allocated land, andprovided education, health care, and family planning services at greatly subsidized prices, these changes naturallyraise concerns about the future course of human capital formation and population growth.
Vietnam's population continues to grow rapidly. Yet the fertility rate has declined continuously, to probably lessthan three children per woman today, though substantial differences remain between rural and urban areas andamong regions (see Jones 1982; Bannister 1985; and Allman and others 1991). Contraceptive knowledge iswidespread, but prevalence rates for modern methods are comparatively low, at 52 percent. The low preva−
lence rate might be due to the excessive reliance on the intrauterine device (IUD), and the increased push toprovide a wider mix of methods might well raise acceptance rates. Another factor, however, is that while familyplanning services have been virtually free, that can be expected to change as public sector cost recovery andprivate sector provision become important. Changes are already under way in the provision of more general healthservices and in education. Thus the cost−benefit environment of reproductive decisions has been undergoing adramatic transformation for almost a decade, and this change is likely to accelerate in the coming years.
In this changing economic environment, whether the poor are able to meet their reproductive goals is of criticalimportance for government efforts aimed at accelerating growth while minimizing income inequality.Unfortunately, there is little research on fertility determinants in Vietnam. A Demographic and Health Survey was
Household Welfare and Vietnam's Transition
10— Poverty and Fertility in Vietnam 276
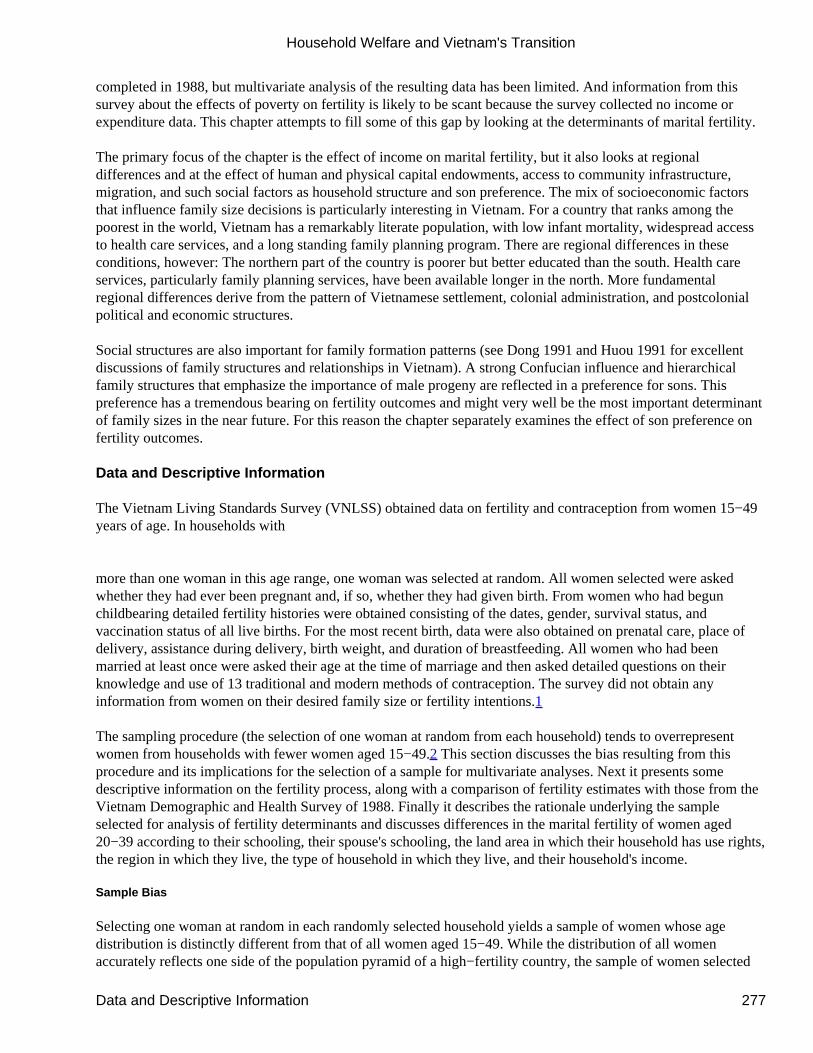
completed in 1988, but multivariate analysis of the resulting data has been limited. And information from thissurvey about the effects of poverty on fertility is likely to be scant because the survey collected no income orexpenditure data. This chapter attempts to fill some of this gap by looking at the determinants of marital fertility.
The primary focus of the chapter is the effect of income on marital fertility, but it also looks at regionaldifferences and at the effect of human and physical capital endowments, access to community infrastructure,migration, and such social factors as household structure and son preference. The mix of socioeconomic factorsthat influence family size decisions is particularly interesting in Vietnam. For a country that ranks among thepoorest in the world, Vietnam has a remarkably literate population, with low infant mortality, widespread accessto health care services, and a long standing family planning program. There are regional differences in theseconditions, however: The northern part of the country is poorer but better educated than the south. Health careservices, particularly family planning services, have been available longer in the north. More fundamentalregional differences derive from the pattern of Vietnamese settlement, colonial administration, and postcolonialpolitical and economic structures.
Social structures are also important for family formation patterns (see Dong 1991 and Huou 1991 for excellentdiscussions of family structures and relationships in Vietnam). A strong Confucian influence and hierarchicalfamily structures that emphasize the importance of male progeny are reflected in a preference for sons. Thispreference has a tremendous bearing on fertility outcomes and might very well be the most important determinantof family sizes in the near future. For this reason the chapter separately examines the effect of son preference onfertility outcomes.
Data and Descriptive Information
The Vietnam Living Standards Survey (VNLSS) obtained data on fertility and contraception from women 15−49years of age. In households with
more than one woman in this age range, one woman was selected at random. All women selected were askedwhether they had ever been pregnant and, if so, whether they had given birth. From women who had begunchildbearing detailed fertility histories were obtained consisting of the dates, gender, survival status, andvaccination status of all live births. For the most recent birth, data were also obtained on prenatal care, place ofdelivery, assistance during delivery, birth weight, and duration of breastfeeding. All women who had beenmarried at least once were asked their age at the time of marriage and then asked detailed questions on theirknowledge and use of 13 traditional and modern methods of contraception. The survey did not obtain anyinformation from women on their desired family size or fertility intentions.1
The sampling procedure (the selection of one woman at random from each household) tends to overrepresentwomen from households with fewer women aged 15−49.2 This section discusses the bias resulting from thisprocedure and its implications for the selection of a sample for multivariate analyses. Next it presents somedescriptive information on the fertility process, along with a comparison of fertility estimates with those from theVietnam Demographic and Health Survey of 1988. Finally it describes the rationale underlying the sampleselected for analysis of fertility determinants and discusses differences in the marital fertility of women aged20−39 according to their schooling, their spouse's schooling, the land area in which their household has use rights,the region in which they live, the type of household in which they live, and their household's income.
Sample Bias
Selecting one woman at random in each randomly selected household yields a sample of women whose agedistribution is distinctly different from that of all women aged 15−49. While the distribution of all womenaccurately reflects one side of the population pyramid of a high−fertility country, the sample of women selected
Household Welfare and Vietnam's Transition
Data and Descriptive Information 277
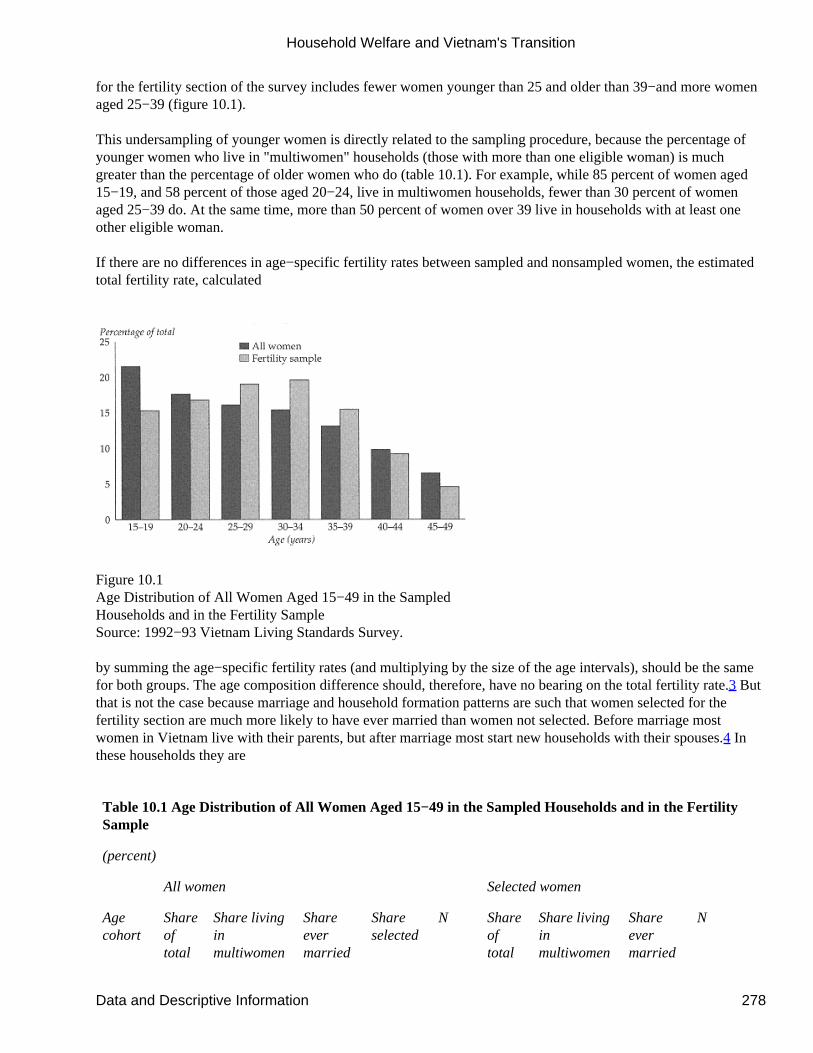
for the fertility section of the survey includes fewer women younger than 25 and older than 39−and more womenaged 25−39 (figure 10.1).
This undersampling of younger women is directly related to the sampling procedure, because the percentage ofyounger women who live in "multiwomen" households (those with more than one eligible woman) is muchgreater than the percentage of older women who do (table 10.1). For example, while 85 percent of women aged15−19, and 58 percent of those aged 20−24, live in multiwomen households, fewer than 30 percent of womenaged 25−39 do. At the same time, more than 50 percent of women over 39 live in households with at least oneother eligible woman.
If there are no differences in age−specific fertility rates between sampled and nonsampled women, the estimatedtotal fertility rate, calculated
Figure 10.1Age Distribution of All Women Aged 15−49 in the SampledHouseholds and in the Fertility SampleSource: 1992−93 Vietnam Living Standards Survey.
by summing the age−specific fertility rates (and multiplying by the size of the age intervals), should be the samefor both groups. The age composition difference should, therefore, have no bearing on the total fertility rate.3 Butthat is not the case because marriage and household formation patterns are such that women selected for thefertility section are much more likely to have ever married than women not selected. Before marriage mostwomen in Vietnam live with their parents, but after marriage most start new households with their spouses.4 Inthese households they are
Table 10.1 Age Distribution of All Women Aged 15−49 in the Sampled Households and in the FertilitySample
(percent)
All women Selected women
Agecohort
Shareoftotal
Share livinginmultiwomen
Shareevermarried
Shareselected
N Shareoftotal
Share livinginmultiwomen
Shareevermarried
N
Household Welfare and Vietnam's Transition
Data and Descriptive Information 278
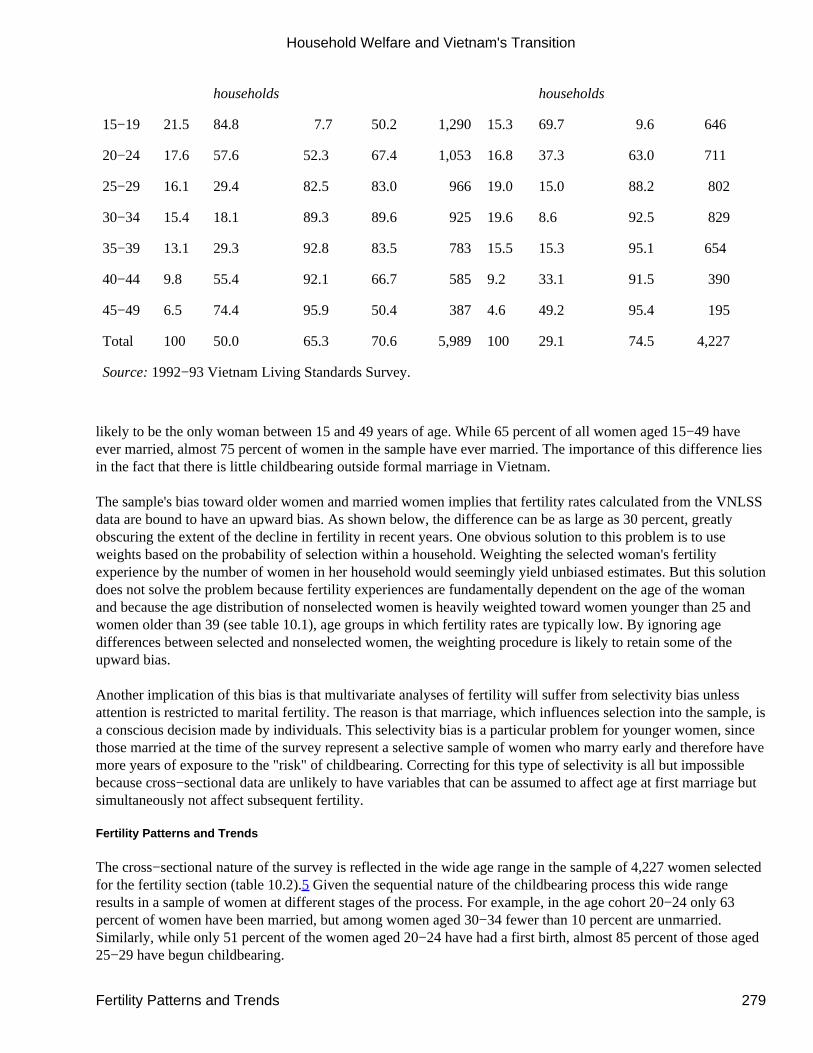
households households
15−19 21.5 84.8 7.7 50.2 1,290 15.3 69.7 9.6 646
20−24 17.6 57.6 52.3 67.4 1,053 16.8 37.3 63.0 711
25−29 16.1 29.4 82.5 83.0 966 19.0 15.0 88.2 802
30−34 15.4 18.1 89.3 89.6 925 19.6 8.6 92.5 829
35−39 13.1 29.3 92.8 83.5 783 15.5 15.3 95.1 654
40−44 9.8 55.4 92.1 66.7 585 9.2 33.1 91.5 390
45−49 6.5 74.4 95.9 50.4 387 4.6 49.2 95.4 195
Total 100 50.0 65.3 70.6 5,989 100 29.1 74.5 4,227
Source: 1992−93 Vietnam Living Standards Survey.
likely to be the only woman between 15 and 49 years of age. While 65 percent of all women aged 15−49 haveever married, almost 75 percent of women in the sample have ever married. The importance of this difference liesin the fact that there is little childbearing outside formal marriage in Vietnam.
The sample's bias toward older women and married women implies that fertility rates calculated from the VNLSSdata are bound to have an upward bias. As shown below, the difference can be as large as 30 percent, greatlyobscuring the extent of the decline in fertility in recent years. One obvious solution to this problem is to useweights based on the probability of selection within a household. Weighting the selected woman's fertilityexperience by the number of women in her household would seemingly yield unbiased estimates. But this solutiondoes not solve the problem because fertility experiences are fundamentally dependent on the age of the womanand because the age distribution of nonselected women is heavily weighted toward women younger than 25 andwomen older than 39 (see table 10.1), age groups in which fertility rates are typically low. By ignoring agedifferences between selected and nonselected women, the weighting procedure is likely to retain some of theupward bias.
Another implication of this bias is that multivariate analyses of fertility will suffer from selectivity bias unlessattention is restricted to marital fertility. The reason is that marriage, which influences selection into the sample, isa conscious decision made by individuals. This selectivity bias is a particular problem for younger women, sincethose married at the time of the survey represent a selective sample of women who marry early and therefore havemore years of exposure to the "risk" of childbearing. Correcting for this type of selectivity is all but impossiblebecause cross−sectional data are unlikely to have variables that can be assumed to affect age at first marriage butsimultaneously not affect subsequent fertility.
Fertility Patterns and Trends
The cross−sectional nature of the survey is reflected in the wide age range in the sample of 4,227 women selectedfor the fertility section (table 10.2).5 Given the sequential nature of the childbearing process this wide rangeresults in a sample of women at different stages of the process. For example, in the age cohort 20−24 only 63percent of women have been married, but among women aged 30−34 fewer than 10 percent are unmarried.Similarly, while only 51 percent of the women aged 20−24 have had a first birth, almost 85 percent of those aged25−29 have begun childbearing.
Household Welfare and Vietnam's Transition
Fertility Patterns and Trends 279
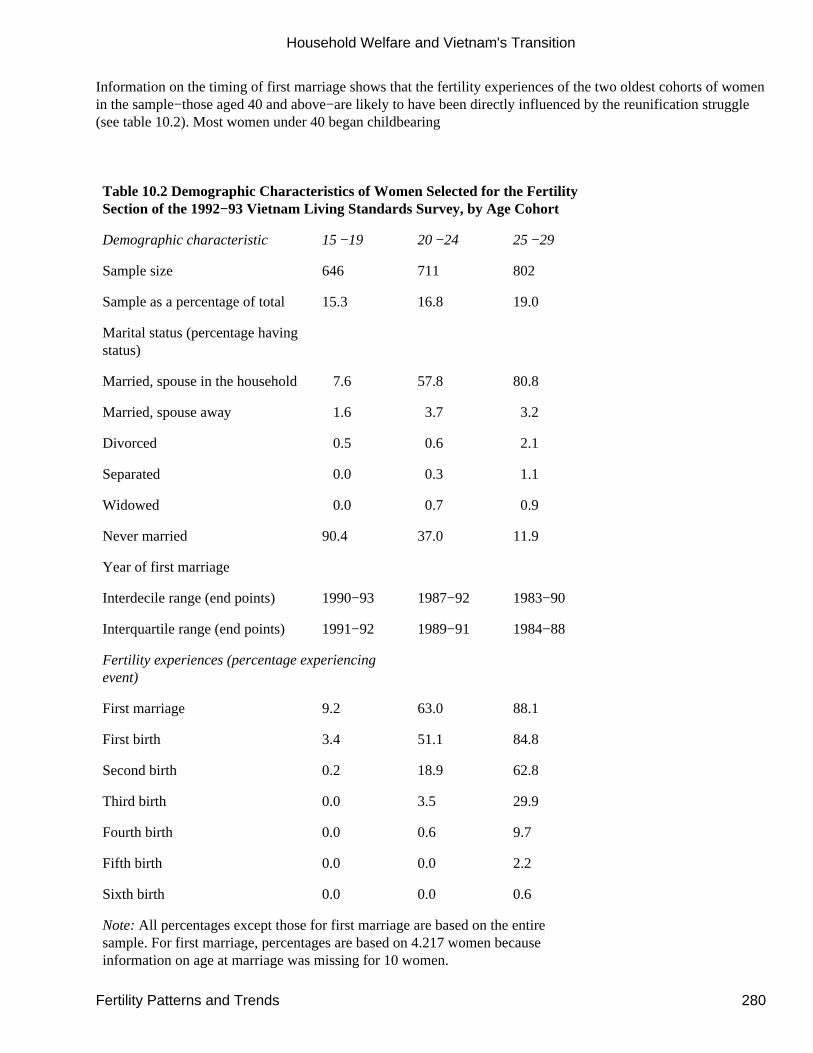
Information on the timing of first marriage shows that the fertility experiences of the two oldest cohorts of womenin the sample−those aged 40 and above−are likely to have been directly influenced by the reunification struggle(see table 10.2). Most women under 40 began childbearing
Table 10.2 Demographic Characteristics of Women Selected for the FertilitySection of the 1992−93 Vietnam Living Standards Survey, by Age Cohort
Demographic characteristic 15 −19 20 −24 25 −29
Sample size 646 711 802
Sample as a percentage of total 15.3 16.8 19.0
Marital status (percentage havingstatus)
Married, spouse in the household 7.6 57.8 80.8
Married, spouse away 1.6 3.7 3.2
Divorced 0.5 0.6 2.1
Separated 0.0 0.3 1.1
Widowed 0.0 0.7 0.9
Never married 90.4 37.0 11.9
Year of first marriage
Interdecile range (end points) 1990−93 1987−92 1983−90
Interquartile range (end points) 1991−92 1989−91 1984−88
Fertility experiences (percentage experiencingevent)
First marriage 9.2 63.0 88.1
First birth 3.4 51.1 84.8
Second birth 0.2 18.9 62.8
Third birth 0.0 3.5 29.9
Fourth birth 0.0 0.6 9.7
Fifth birth 0.0 0.0 2.2
Sixth birth 0.0 0.0 0.6
Note: All percentages except those for first marriage are based on the entiresample. For first marriage, percentages are based on 4.217 women becauseinformation on age at marriage was missing for 10 women.
Household Welfare and Vietnam's Transition
Fertility Patterns and Trends 280
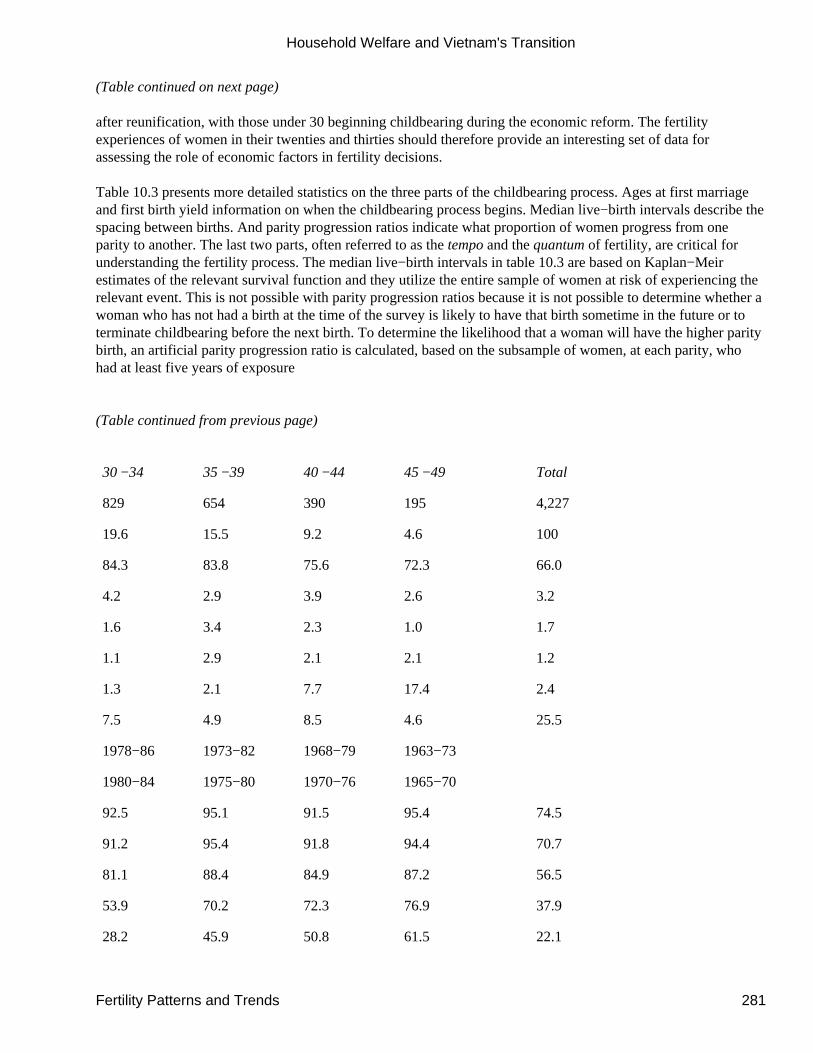
(Table continued on next page)
after reunification, with those under 30 beginning childbearing during the economic reform. The fertilityexperiences of women in their twenties and thirties should therefore provide an interesting set of data forassessing the role of economic factors in fertility decisions.
Table 10.3 presents more detailed statistics on the three parts of the childbearing process. Ages at first marriageand first birth yield information on when the childbearing process begins. Median live−birth intervals describe thespacing between births. And parity progression ratios indicate what proportion of women progress from oneparity to another. The last two parts, often referred to as the tempo and the quantum of fertility, are critical forunderstanding the fertility process. The median live−birth intervals in table 10.3 are based on Kaplan−Meirestimates of the relevant survival function and they utilize the entire sample of women at risk of experiencing therelevant event. This is not possible with parity progression ratios because it is not possible to determine whether awoman who has not had a birth at the time of the survey is likely to have that birth sometime in the future or toterminate childbearing before the next birth. To determine the likelihood that a woman will have the higher paritybirth, an artificial parity progression ratio is calculated, based on the subsample of women, at each parity, whohad at least five years of exposure
(Table continued from previous page)
30 −34 35 −39 40 −44 45 −49 Total
829 654 390 195 4,227
19.6 15.5 9.2 4.6 100
84.3 83.8 75.6 72.3 66.0
4.2 2.9 3.9 2.6 3.2
1.6 3.4 2.3 1.0 1.7
1.1 2.9 2.1 2.1 1.2
1.3 2.1 7.7 17.4 2.4
7.5 4.9 8.5 4.6 25.5
1978−86 1973−82 1968−79 1963−73
1980−84 1975−80 1970−76 1965−70
92.5 95.1 91.5 95.4 74.5
91.2 95.4 91.8 94.4 70.7
81.1 88.4 84.9 87.2 56.5
53.9 70.2 72.3 76.9 37.9
28.2 45.9 50.8 61.5 22.1
Household Welfare and Vietnam's Transition
Fertility Patterns and Trends 281
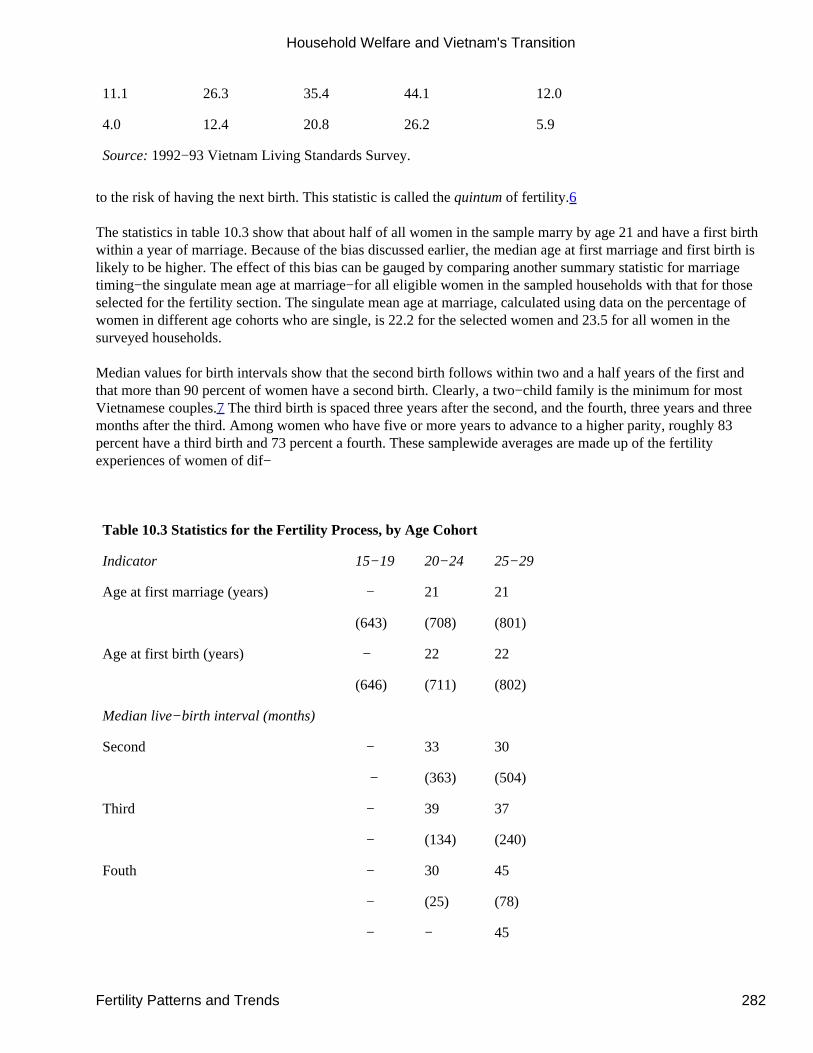
11.1 26.3 35.4 44.1 12.0
4.0 12.4 20.8 26.2 5.9
Source: 1992−93 Vietnam Living Standards Survey.
to the risk of having the next birth. This statistic is called the quintum of fertility.6
The statistics in table 10.3 show that about half of all women in the sample marry by age 21 and have a first birthwithin a year of marriage. Because of the bias discussed earlier, the median age at first marriage and first birth islikely to be higher. The effect of this bias can be gauged by comparing another summary statistic for marriagetiming−the singulate mean age at marriage−for all eligible women in the sampled households with that for thoseselected for the fertility section. The singulate mean age at marriage, calculated using data on the percentage ofwomen in different age cohorts who are single, is 22.2 for the selected women and 23.5 for all women in thesurveyed households.
Median values for birth intervals show that the second birth follows within two and a half years of the first andthat more than 90 percent of women have a second birth. Clearly, a two−child family is the minimum for mostVietnamese couples.7 The third birth is spaced three years after the second, and the fourth, three years and threemonths after the third. Among women who have five or more years to advance to a higher parity, roughly 83percent have a third birth and 73 percent a fourth. These samplewide averages are made up of the fertilityexperiences of women of dif−
Table 10.3 Statistics for the Fertility Process, by Age Cohort
Indicator 15−19 20−24 25−29
Age at first marriage (years) − 21 21
(643) (708) (801)
Age at first birth (years) − 22 22
(646) (711) (802)
Median live−birth interval (months)
Second − 33 30
− (363) (504)
Third − 39 37
− (134) (240)
Fouth − 30 45
− (25) (78)
− − 45
Household Welfare and Vietnam's Transition
Fertility Patterns and Trends 282
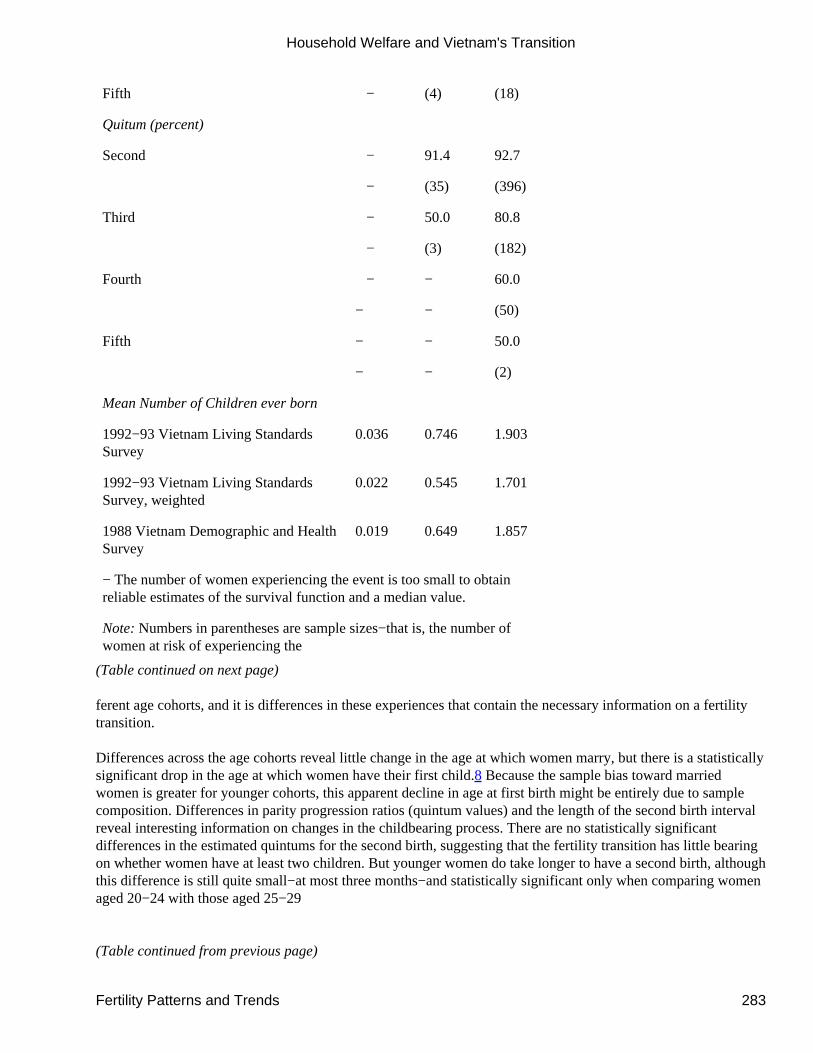
Fifth − (4) (18)
Quitum (percent)
Second − 91.4 92.7
− (35) (396)
Third − 50.0 80.8
− (3) (182)
Fourth − − 60.0
− − (50)
Fifth − − 50.0
− − (2)
Mean Number of Children ever born
1992−93 Vietnam Living StandardsSurvey
0.036 0.746 1.903
1992−93 Vietnam Living StandardsSurvey, weighted
0.022 0.545 1.701
1988 Vietnam Demographic and HealthSurvey
0.019 0.649 1.857
− The number of women experiencing the event is too small to obtainreliable estimates of the survival function and a median value.
Note: Numbers in parentheses are sample sizes−that is, the number ofwomen at risk of experiencing the
(Table continued on next page)
ferent age cohorts, and it is differences in these experiences that contain the necessary information on a fertilitytransition.
Differences across the age cohorts reveal little change in the age at which women marry, but there is a statisticallysignificant drop in the age at which women have their first child.8 Because the sample bias toward marriedwomen is greater for younger cohorts, this apparent decline in age at first birth might be entirely due to samplecomposition. Differences in parity progression ratios (quintum values) and the length of the second birth intervalreveal interesting information on changes in the childbearing process. There are no statistically significantdifferences in the estimated quintums for the second birth, suggesting that the fertility transition has little bearingon whether women have at least two children. But younger women do take longer to have a second birth, althoughthis difference is still quite small−at most three months−and statistically significant only when comparing womenaged 20−24 with those aged 25−29
(Table continued from previous page)
Household Welfare and Vietnam's Transition
Fertility Patterns and Trends 283
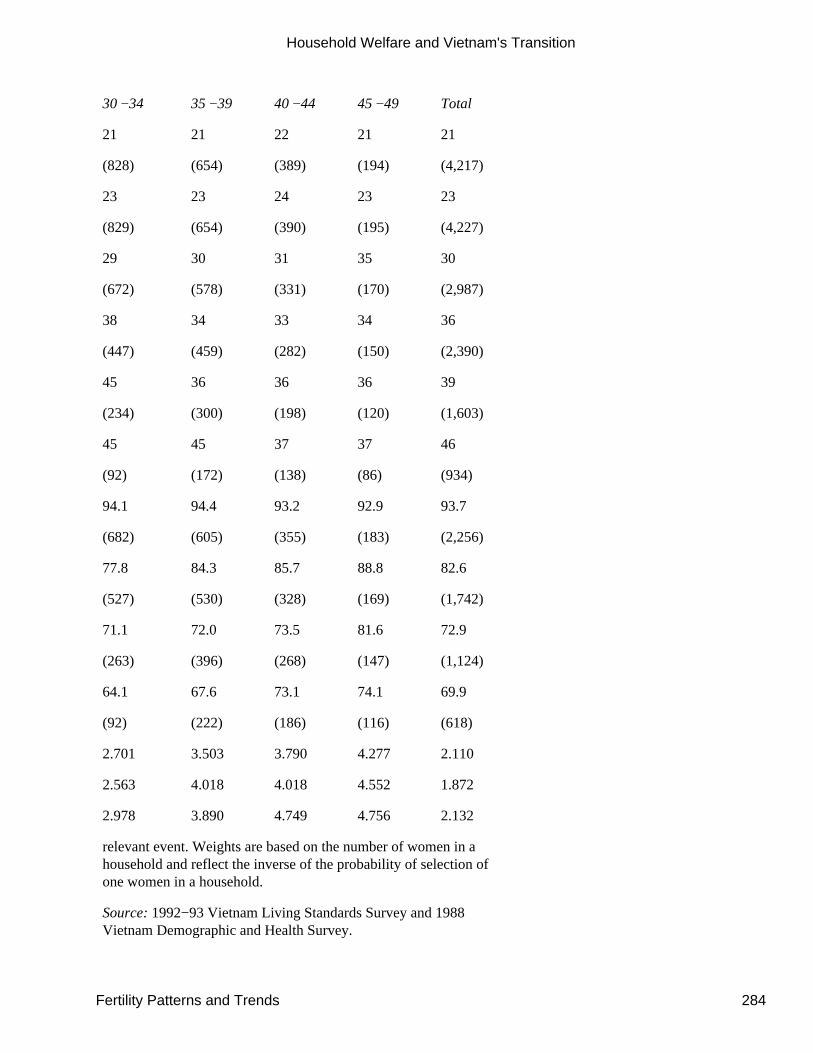
30 −34 35 −39 40 −44 45 −49 Total
21 21 22 21 21
(828) (654) (389) (194) (4,217)
23 23 24 23 23
(829) (654) (390) (195) (4,227)
29 30 31 35 30
(672) (578) (331) (170) (2,987)
38 34 33 34 36
(447) (459) (282) (150) (2,390)
45 36 36 36 39
(234) (300) (198) (120) (1,603)
45 45 37 37 46
(92) (172) (138) (86) (934)
94.1 94.4 93.2 92.9 93.7
(682) (605) (355) (183) (2,256)
77.8 84.3 85.7 88.8 82.6
(527) (530) (328) (169) (1,742)
71.1 72.0 73.5 81.6 72.9
(263) (396) (268) (147) (1,124)
64.1 67.6 73.1 74.1 69.9
(92) (222) (186) (116) (618)
2.701 3.503 3.790 4.277 2.110
2.563 4.018 4.018 4.552 1.872
2.978 3.890 4.749 4.756 2.132
relevant event. Weights are based on the number of women in ahousehold and reflect the inverse of the probability of selection ofone women in a household.
Source: 1992−93 Vietnam Living Standards Survey and 1988Vietnam Demographic and Health Survey.
Household Welfare and Vietnam's Transition
Fertility Patterns and Trends 284
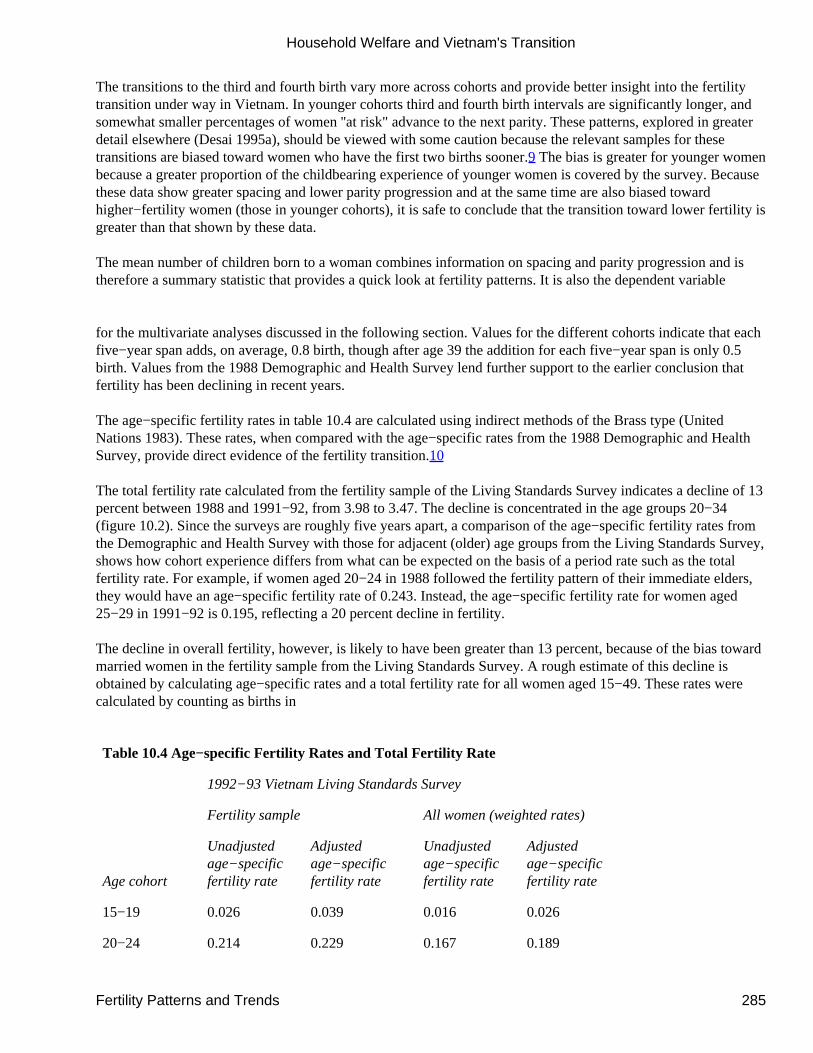
The transitions to the third and fourth birth vary more across cohorts and provide better insight into the fertilitytransition under way in Vietnam. In younger cohorts third and fourth birth intervals are significantly longer, andsomewhat smaller percentages of women ''at risk" advance to the next parity. These patterns, explored in greaterdetail elsewhere (Desai 1995a), should be viewed with some caution because the relevant samples for thesetransitions are biased toward women who have the first two births sooner.9 The bias is greater for younger womenbecause a greater proportion of the childbearing experience of younger women is covered by the survey. Becausethese data show greater spacing and lower parity progression and at the same time are also biased towardhigher−fertility women (those in younger cohorts), it is safe to conclude that the transition toward lower fertility isgreater than that shown by these data.
The mean number of children born to a woman combines information on spacing and parity progression and istherefore a summary statistic that provides a quick look at fertility patterns. It is also the dependent variable
for the multivariate analyses discussed in the following section. Values for the different cohorts indicate that eachfive−year span adds, on average, 0.8 birth, though after age 39 the addition for each five−year span is only 0.5birth. Values from the 1988 Demographic and Health Survey lend further support to the earlier conclusion thatfertility has been declining in recent years.
The age−specific fertility rates in table 10.4 are calculated using indirect methods of the Brass type (UnitedNations 1983). These rates, when compared with the age−specific rates from the 1988 Demographic and HealthSurvey, provide direct evidence of the fertility transition.10
The total fertility rate calculated from the fertility sample of the Living Standards Survey indicates a decline of 13percent between 1988 and 1991−92, from 3.98 to 3.47. The decline is concentrated in the age groups 20−34(figure 10.2). Since the surveys are roughly five years apart, a comparison of the age−specific fertility rates fromthe Demographic and Health Survey with those for adjacent (older) age groups from the Living Standards Survey,shows how cohort experience differs from what can be expected on the basis of a period rate such as the totalfertility rate. For example, if women aged 20−24 in 1988 followed the fertility pattern of their immediate elders,they would have an age−specific fertility rate of 0.243. Instead, the age−specific fertility rate for women aged25−29 in 1991−92 is 0.195, reflecting a 20 percent decline in fertility.
The decline in overall fertility, however, is likely to have been greater than 13 percent, because of the bias towardmarried women in the fertility sample from the Living Standards Survey. A rough estimate of this decline isobtained by calculating age−specific rates and a total fertility rate for all women aged 15−49. These rates werecalculated by counting as births in
Table 10.4 Age−specific Fertility Rates and Total Fertility Rate
1992−93 Vietnam Living Standards Survey
Fertility sample All women (weighted rates)
Age cohort
Unadjustedage−specificfertility rate
Adjustedage−specificfertility rate
Unadjustedage−specificfertility rate
Adjustedage−specificfertility rate
15−19 0.026 0.039 0.016 0.026
20−24 0.214 0.229 0.167 0.189
Household Welfare and Vietnam's Transition
Fertility Patterns and Trends 285
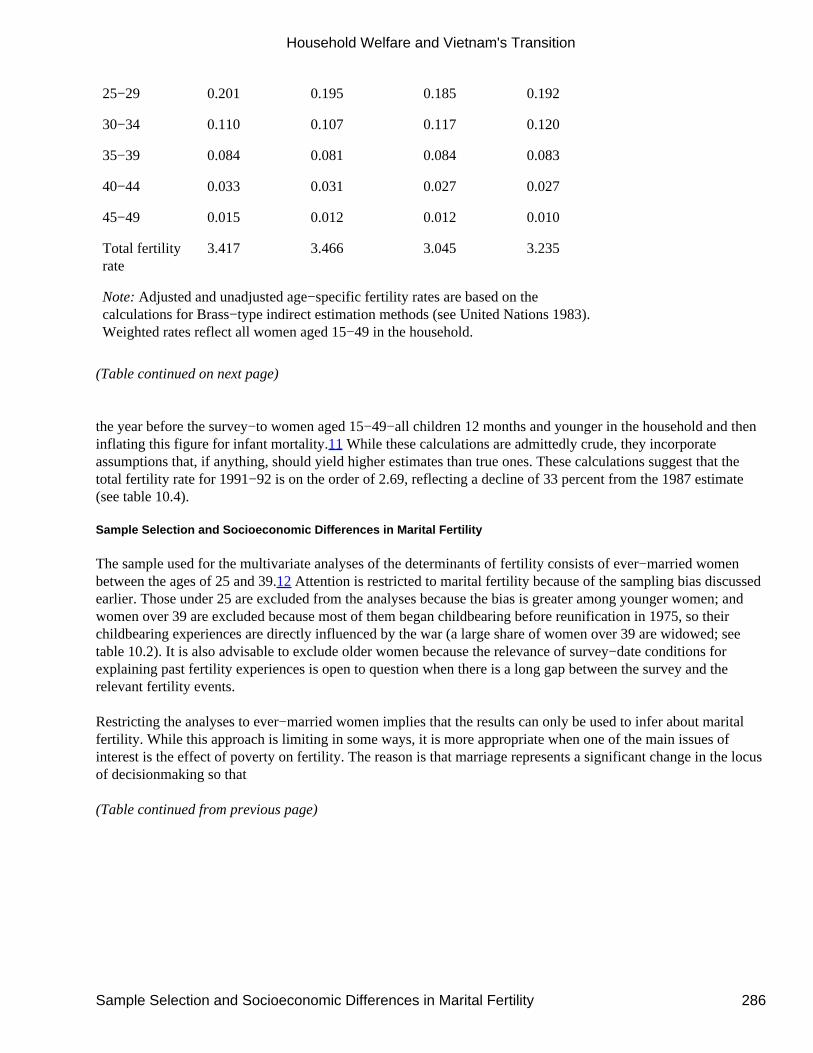
25−29 0.201 0.195 0.185 0.192
30−34 0.110 0.107 0.117 0.120
35−39 0.084 0.081 0.084 0.083
40−44 0.033 0.031 0.027 0.027
45−49 0.015 0.012 0.012 0.010
Total fertilityrate
3.417 3.466 3.045 3.235
Note: Adjusted and unadjusted age−specific fertility rates are based on thecalculations for Brass−type indirect estimation methods (see United Nations 1983).Weighted rates reflect all women aged 15−49 in the household.
(Table continued on next page)
the year before the survey−to women aged 15−49−all children 12 months and younger in the household and theninflating this figure for infant mortality.11 While these calculations are admittedly crude, they incorporateassumptions that, if anything, should yield higher estimates than true ones. These calculations suggest that thetotal fertility rate for 1991−92 is on the order of 2.69, reflecting a decline of 33 percent from the 1987 estimate(see table 10.4).
Sample Selection and Socioeconomic Differences in Marital Fertility
The sample used for the multivariate analyses of the determinants of fertility consists of ever−married womenbetween the ages of 25 and 39.12 Attention is restricted to marital fertility because of the sampling bias discussedearlier. Those under 25 are excluded from the analyses because the bias is greater among younger women; andwomen over 39 are excluded because most of them began childbearing before reunification in 1975, so theirchildbearing experiences are directly influenced by the war (a large share of women over 39 are widowed; seetable 10.2). It is also advisable to exclude older women because the relevance of survey−date conditions forexplaining past fertility experiences is open to question when there is a long gap between the survey and therelevant fertility events.
Restricting the analyses to ever−married women implies that the results can only be used to infer about maritalfertility. While this approach is limiting in some ways, it is more appropriate when one of the main issues ofinterest is the effect of poverty on fertility. The reason is that marriage represents a significant change in the locusof decisionmaking so that
(Table continued from previous page)
Household Welfare and Vietnam's Transition
Sample Selection and Socioeconomic Differences in Marital Fertility 286
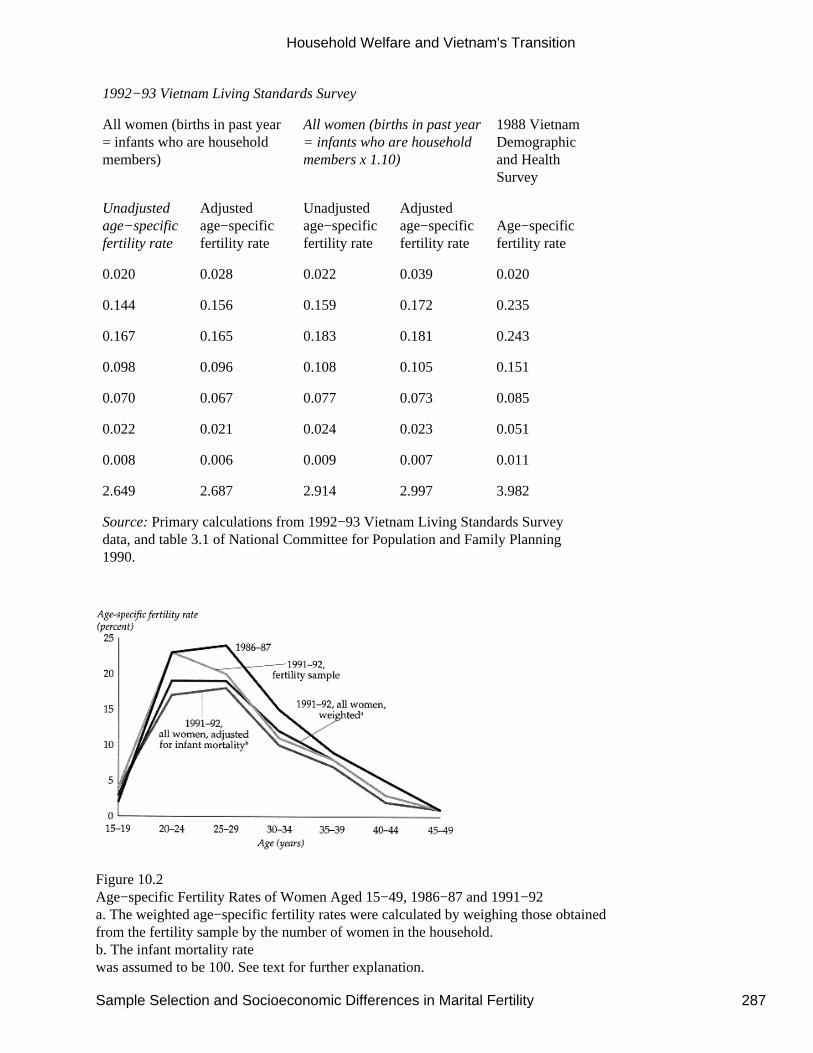
1992−93 Vietnam Living Standards Survey
All women (births in past year= infants who are householdmembers)
All women (births in past year= infants who are householdmembers x 1.10)
1988 VietnamDemographicand HealthSurvey
Unadjustedage−specificfertility rate
Adjustedage−specificfertility rate
Unadjustedage−specificfertility rate
Adjustedage−specificfertility rate
Age−specificfertility rate
0.020 0.028 0.022 0.039 0.020
0.144 0.156 0.159 0.172 0.235
0.167 0.165 0.183 0.181 0.243
0.098 0.096 0.108 0.105 0.151
0.070 0.067 0.077 0.073 0.085
0.022 0.021 0.024 0.023 0.051
0.008 0.006 0.009 0.007 0.011
2.649 2.687 2.914 2.997 3.982
Source: Primary calculations from 1992−93 Vietnam Living Standards Surveydata, and table 3.1 of National Committee for Population and Family Planning1990.
Figure 10.2Age−specific Fertility Rates of Women Aged 15−49, 1986−87 and 1991−92a. The weighted age−specific fertility rates were calculated by weighing those obtainedfrom the fertility sample by the number of women in the household.b. The infant mortality ratewas assumed to be 100. See text for further explanation.
Household Welfare and Vietnam's Transition
Sample Selection and Socioeconomic Differences in Marital Fertility 287

Source: 1988 Vietnam Demographicand Health Survey, and 1992−93 Vietnam Living Standards Survey.
the economic conditions of married women are not comparable with those of unmarried women.13 Measures ofpermanent income or potential income obtained from income or expenditure data in the survey year are notcomparable for married and unmarried women. For married women they can be interpreted in terms of theresource constraints that couples face in making family size and child investment decisions. But for unmarriedwomen they represent resource constraints in their parents' household. While these income measures too areprobably relevant for the family size decisions that men and women make,14 their interpretation in terms of theresource constraints that decisionmakers face is quite different.
Finally, the analyses pay greater attention to differences in rural fertility than in urban. This is partly dictated bythe fact that commune−level data are only available for rural areas, and these variables are critical for identifyingaccess to public infrastructure and the larger economy. But the focus on rural fertility is also driven by the smallsample size available for urban fertility. This is not such a terrible limitation, because the data indicate that thetotal fertility rate in urban areas is close to replacement levels. Pooling the data is not feasible because F−tests forstructural differences in
coefficients (for children ever born) indicate significant differences in the effects of different variables in the twosamples.
Before turning to the regression analysis, it is useful to briefly examine differences in cumulative marital fertilityfor the sample of rural women according to the socioeconomic characteristics of the women and their households(table 10.5). Women's schooling has a large effect on marital fertility, with the number of children ever bornfalling with each additional level of schooling. These differences are less striking for the youngest cohort ofwomen, reflecting the short and almost universal transition from marriage to first birth. The pattern for spouse'sschooling is almost identical. Since the simple correlation between women's schooling years and spouse'sschooling years is 0.6, it will be interesting to see what effect spouse's schooling has once women's schooling istaken into account.
The amount of land to which a household has use rights also has a strong bearing on marital fertility. On thewhole women in households with more land have more children, though those who have no land have higherfertility than those who have some. Women from nuclear households (those with only a household head, his wife,and their own children) have more children. This may reflect the higher income of nuclear households.
There are distinct regional differences in marital fertility, with women in the Central Highlands consistentlyhaving more children. Marital fertility is also high in the rural areas of the Mekong Delta and the NorthernUplands. Households in these regions have larger parcels of land and lower schooling levels, so these fertilitydifferences may simply reflect the effect of those factors. The regression results presented in the following sectionhelp to determine whether there are any residual regional differences after these factors are taken into account.Also interesting are the substantial differences among the three northern regions. Women in the Red River Deltahave the lowest fertility rate, followed by the North−Central Coast and the Northern Uplands. Thus some careneeds to be exercised when making comparisons between the north and the south.
Per capita expenditure, often used as a measure of the standard of living, exhibits a clear inverse relationship withchildren ever born. This is to be expected because fertility has a direct (inverse) effect on per capita expenditure,which is calculated by dividing household expenditure by the number of people in a household. But this inverserelationship should not be interpreted in casual terms as implying that the poor have more children. As discussedbelow, when examining the effects of poverty on fertility, poverty needs to be defined in terms of the potentialincome of individuals.
Household Welfare and Vietnam's Transition
Sample Selection and Socioeconomic Differences in Marital Fertility 288
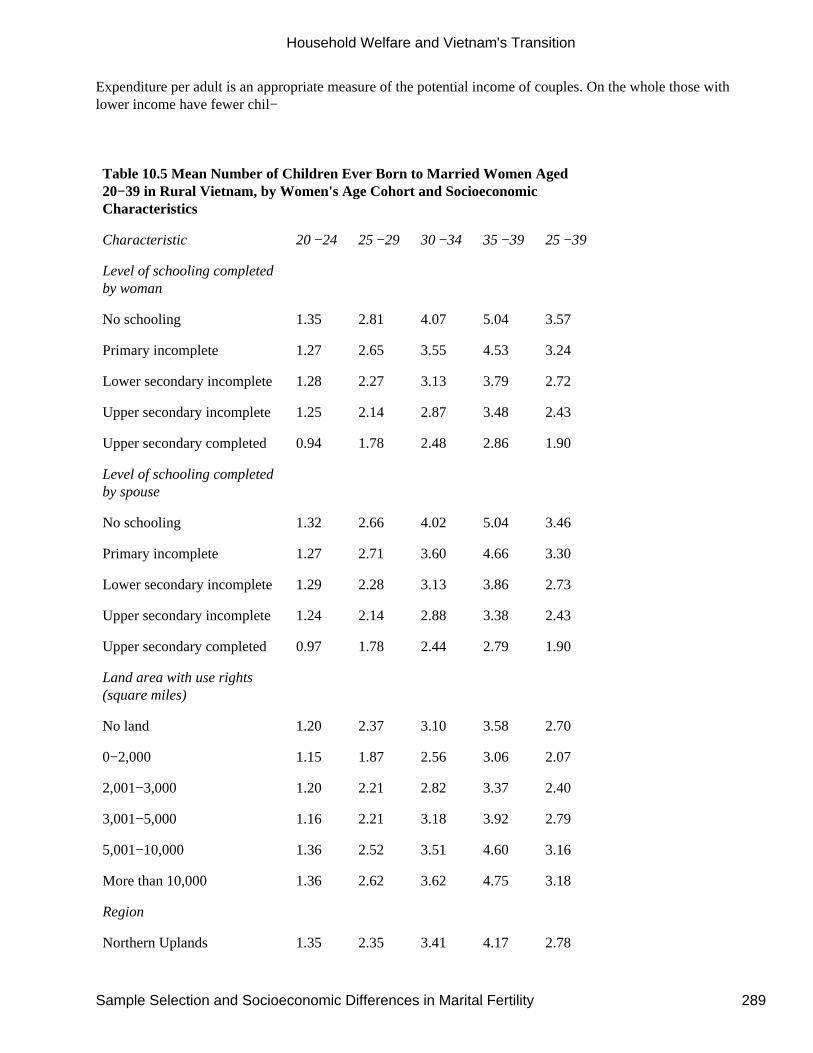
Expenditure per adult is an appropriate measure of the potential income of couples. On the whole those withlower income have fewer chil−
Table 10.5 Mean Number of Children Ever Born to Married Women Aged20−39 in Rural Vietnam, by Women's Age Cohort and SocioeconomicCharacteristics
Characteristic 20 −24 25 −29 30 −34 35 −39 25 −39
Level of schooling completedby woman
No schooling 1.35 2.81 4.07 5.04 3.57
Primary incomplete 1.27 2.65 3.55 4.53 3.24
Lower secondary incomplete 1.28 2.27 3.13 3.79 2.72
Upper secondary incomplete 1.25 2.14 2.87 3.48 2.43
Upper secondary completed 0.94 1.78 2.48 2.86 1.90
Level of schooling completedby spouse
No schooling 1.32 2.66 4.02 5.04 3.46
Primary incomplete 1.27 2.71 3.60 4.66 3.30
Lower secondary incomplete 1.29 2.28 3.13 3.86 2.73
Upper secondary incomplete 1.24 2.14 2.88 3.38 2.43
Upper secondary completed 0.97 1.78 2.44 2.79 1.90
Land area with use rights(square miles)
No land 1.20 2.37 3.10 3.58 2.70
0−2,000 1.15 1.87 2.56 3.06 2.07
2,001−3,000 1.20 2.21 2.82 3.37 2.40
3,001−5,000 1.16 2.21 3.18 3.92 2.79
5,001−10,000 1.36 2.52 3.51 4.60 3.16
More than 10,000 1.36 2.62 3.62 4.75 3.18
Region
Northern Uplands 1.35 2.35 3.41 4.17 2.78
Household Welfare and Vietnam's Transition
Sample Selection and Socioeconomic Differences in Marital Fertility 289
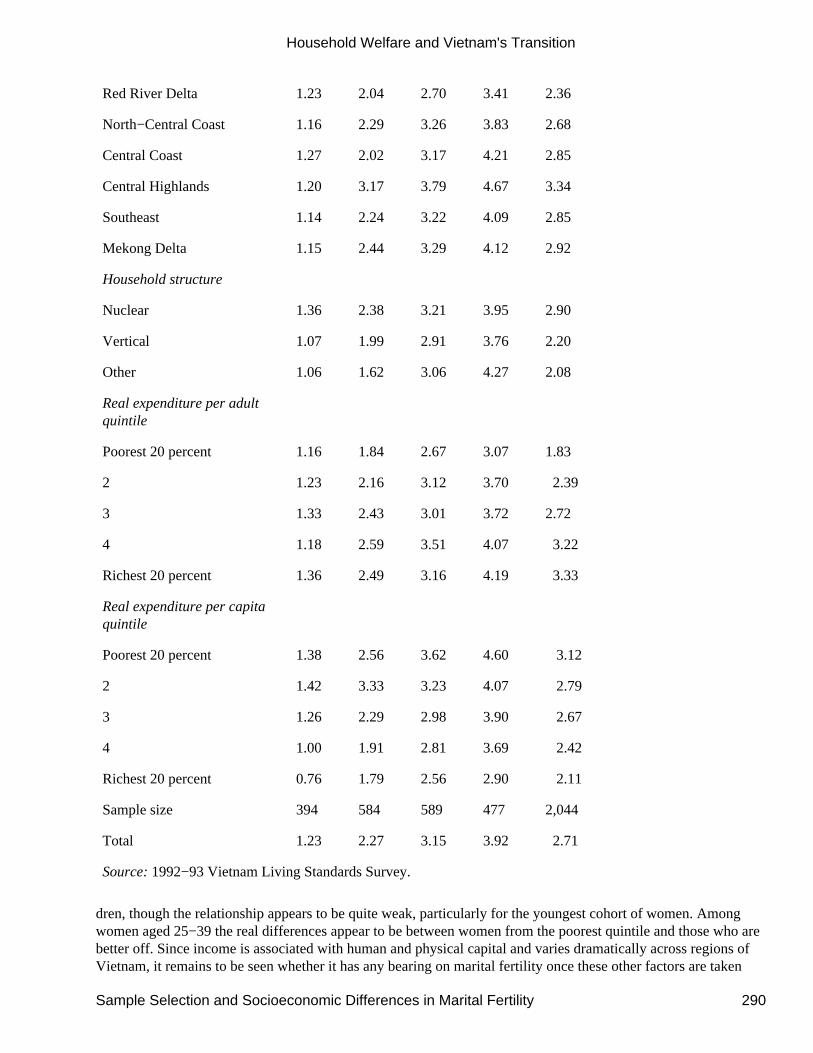
Red River Delta 1.23 2.04 2.70 3.41 2.36
North−Central Coast 1.16 2.29 3.26 3.83 2.68
Central Coast 1.27 2.02 3.17 4.21 2.85
Central Highlands 1.20 3.17 3.79 4.67 3.34
Southeast 1.14 2.24 3.22 4.09 2.85
Mekong Delta 1.15 2.44 3.29 4.12 2.92
Household structure
Nuclear 1.36 2.38 3.21 3.95 2.90
Vertical 1.07 1.99 2.91 3.76 2.20
Other 1.06 1.62 3.06 4.27 2.08
Real expenditure per adultquintile
Poorest 20 percent 1.16 1.84 2.67 3.07 1.83
2 1.23 2.16 3.12 3.70 2.39
3 1.33 2.43 3.01 3.72 2.72
4 1.18 2.59 3.51 4.07 3.22
Richest 20 percent 1.36 2.49 3.16 4.19 3.33
Real expenditure per capitaquintile
Poorest 20 percent 1.38 2.56 3.62 4.60 3.12
2 1.42 3.33 3.23 4.07 2.79
3 1.26 2.29 2.98 3.90 2.67
4 1.00 1.91 2.81 3.69 2.42
Richest 20 percent 0.76 1.79 2.56 2.90 2.11
Sample size 394 584 589 477 2,044
Total 1.23 2.27 3.15 3.92 2.71
Source: 1992−93 Vietnam Living Standards Survey.
dren, though the relationship appears to be quite weak, particularly for the youngest cohort of women. Amongwomen aged 25−39 the real differences appear to be between women from the poorest quintile and those who arebetter off. Since income is associated with human and physical capital and varies dramatically across regions ofVietnam, it remains to be seen whether it has any bearing on marital fertility once these other factors are taken
Household Welfare and Vietnam's Transition
Sample Selection and Socioeconomic Differences in Marital Fertility 290

into account.
Do the Poor Have More Children?
The number of children a woman has is the result of a complex interaction of psychological, social, economic,and biological factors. Individuals make decisions about sexual interaction, family size, composition, and rate ofacquisition of children, but then must also balance these decisions with the biological reality of the reproductiveprocess. The decisionmaking part of the reproductive process is often referred to as the demand for children, andthe biological aspect as the supply of children. Balancing family size desires with the biological reality of thereproductive process is necessary because sexual interaction, quite independent of its being an essential input intothe child production process, is welfare−enhancing. Thus the psychological, social, and economic costs ofcontraception, both modern and traditional, are the third component that determines fertility.
Theoretical Background
Decisions on childbearing are driven by three sets of factors. The first set consists of preferences for the numberand spacing of children, expected expenditures on children, parents' lifestyle, type of contraception, and the like.The second reflects the relative prices−implicit and explicit−of various consumption activities, and the thirdrelates to the income parents can expect to generate over their remaining years. This potential income depends onthe value of the parents' labor time, the nonlabor inputs they use in production, and the prices of outputs theyproduce. Other things equal, those with greater endowments of human and physical capital are likely to havehigher potential incomes, as are those who can obtain inputs at lower cost and sell output at higher prices.
Since the decision on family size has a life−cycle perspective, so should the assessment of who is poor and who isnot. For examining whether the poor have more children or not, the appropriate concept of poverty is thus onebased on potential income. A consumption−based measure is plausible if it is possible to distinguish between theconsumption of the decisionmaker and that of the children within a household. If so, poverty could be defined interms of the consumption of the decisionmakers and the consumption of the children and an examination of thetradeoff between the number of children couples decide to have and their own lifestyles−simi−
lar to explorations of the child quantity−quality tradeoff−would be possible. But this would not be an examinationof the effects of poverty on fertility, because in a life−cycle framework both are simultaneously decided on by thedecisionmakers.
In assessing whether the poor have more children, it is therefore necessary to consider how potential incomeinfluences fertility through each of the three sets of factors outlined above: the demand for children, reproductivecapacity, and contraception. On the demand side, other things equal, we should expect those who have moreincome to want more children. A positive income effect is to be expected since children are normal goods. Butcould there could be reasons to expect those who have less income to want more children, as casual empiricismindicates?
If parents trade off child quality for quantity and the income elasticity of demand for quality is substantiallygreater than that for quantity, parents could be expected to want fewer but higher−quality children as theirincomes increase. Alternatively, if there are substantial differences in the net economic returns parents expect toreceive from their children in future years and these are related to the incomes of parents−in the absence ofchildren's contributions−poorer parents can be expected to want more children. For example, in a land−scarceenvironment with fragmented capital markets, additional family labor may be one of the few avenues foreconomic advancement. Expected support in old age would be important when income−generating capacity isnegligible and capital markets have not allowed an accumulation of savings. But both arguments relate to theshadow price of children, which might be lower for poorer parents. To the extent that the shadow price of children
Household Welfare and Vietnam's Transition
Do the Poor Have More Children? 291

is controlled for, a regression of a fertility variable on a measure of potential income should yield a positivecoefficient.
The effects of potential income on the ability to produce children, or the supply of children, are easier to specify.Higher incomes often imply better nutrition, which can, at least in theory, have a positive effect on fecundity.Conversely, those with lower incomes might have lower fecundity. But research findings suggest that this effect ismeaningful only in extreme circumstances bordering on famine conditions. Higher incomes also are usuallyassociated with greater access to and use of health care facilities, particularly prenatal and postnatal care, andsince these influence the survival chances of the newborn, higher incomes can be expected to be associated withbetter reproductive performance.
Contraceptive use, because of the associated time and out−of−pocket expenses of modern contraception, can beexpected to be greater among those with higher incomes, who therefore are likely to be better equipped to attaintheir reproductive goals. This brief discussion suggests that if proper statistical controls are introduced for the"price" of children, the costs of contraception and health services, the rental costs of capital, and the like, weshould expect to see a positive relationship between income and fertility.
What is the likely relationship between poverty and fertility in rural Vietnam? Several factors should be borne inmind when considering this relationship. The sample chosen for analysis consists of ever−married women whobegan childbearing after reunification in 1975. Because schooling, health care, and family planning services wereextended to the southern part of the country after 1975, differences in access to these services are likely to be lessrelevant for regional differences in fertility. Differences in knowledge of health and family planning practices andin quality of health care might still be important.
Regional differences are relevant not just because the southern part of the country is considerably better off thanthe northern part, but also because the north has higher levels of human capital and a longer history of familyplanning programs. Moreover, there are substantial differences in social structure between the north and the south,deriving partly from historical and partly from political and economic factors. The south has always been more ofa frontier area, with higher land−per−capita ratios. Differences in the way the French administered the north andthe south, and then stark differences between communist North Vietnam and capitalist South Vietnam,contributed to differences in patterns of economic activity and village organization (Jamieson 1993). The socialstructure is likely to be more open (less hierarchical) in the south, and the scope for individual decisionmakingtherefore greater.
Probably more important to the analysis of fertility differences in Vietnam is the effect of state provision ofschooling, health care, and family planning on the cost−benefit calculus of childbearing. The lack of private sectorchoices implies that quality−related price differences were probably unimportant for much of the periodexamined. There have been changes in the past 10 years, but whether these have touched rural areas is open toquestion. Against this background, a positive relationship can be expected between income and fertility evenwithout much control for price differences.
Selection of Variables
The measure of potential income used in this chapter is the log of household expenditure per adult. The householdexpenditure variable is calculated for the 12 months preceding the survey and was deflated by regional priceindices to eliminate the effect of spatial variation in prices (see chapter 2 for details on how this wascalculated).15 Total household expenditure (equal to income less changes in savings and assets) is anotherpossible measure for potential income. But total household expenditure is likely to suffer from greaterheterogeneity over the life cycle, a factor that is relevant because the dependent variable measures cumulativefertility experiences. From figure 10.3, which plots mean values of different measures of potential income against
Household Welfare and Vietnam's Transition
Selection of Variables 292
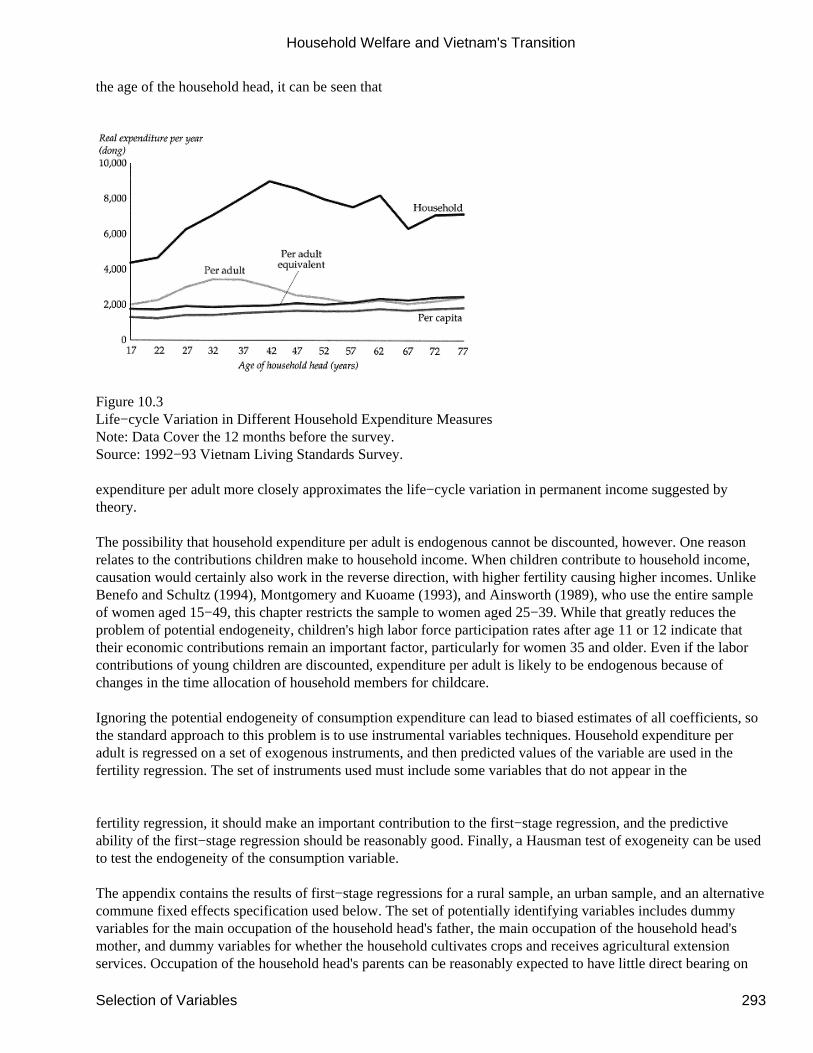
the age of the household head, it can be seen that
Figure 10.3Life−cycle Variation in Different Household Expenditure MeasuresNote: Data Cover the 12 months before the survey.Source: 1992−93 Vietnam Living Standards Survey.
expenditure per adult more closely approximates the life−cycle variation in permanent income suggested bytheory.
The possibility that household expenditure per adult is endogenous cannot be discounted, however. One reasonrelates to the contributions children make to household income. When children contribute to household income,causation would certainly also work in the reverse direction, with higher fertility causing higher incomes. UnlikeBenefo and Schultz (1994), Montgomery and Kuoame (1993), and Ainsworth (1989), who use the entire sampleof women aged 15−49, this chapter restricts the sample to women aged 25−39. While that greatly reduces theproblem of potential endogeneity, children's high labor force participation rates after age 11 or 12 indicate thattheir economic contributions remain an important factor, particularly for women 35 and older. Even if the laborcontributions of young children are discounted, expenditure per adult is likely to be endogenous because ofchanges in the time allocation of household members for childcare.
Ignoring the potential endogeneity of consumption expenditure can lead to biased estimates of all coefficients, sothe standard approach to this problem is to use instrumental variables techniques. Household expenditure peradult is regressed on a set of exogenous instruments, and then predicted values of the variable are used in thefertility regression. The set of instruments used must include some variables that do not appear in the
fertility regression, it should make an important contribution to the first−stage regression, and the predictiveability of the first−stage regression should be reasonably good. Finally, a Hausman test of exogeneity can be usedto test the endogeneity of the consumption variable.
The appendix contains the results of first−stage regressions for a rural sample, an urban sample, and an alternativecommune fixed effects specification used below. The set of potentially identifying variables includes dummyvariables for the main occupation of the household head's father, the main occupation of the household head'smother, and dummy variables for whether the household cultivates crops and receives agricultural extensionservices. Occupation of the household head's parents can be reasonably expected to have little direct bearing on
Household Welfare and Vietnam's Transition
Selection of Variables 293

the fertility of the selected woman, particularly since most of the selected women are the spouse of the householdhead. At the commune level, identifying variables include dummy variables for whether there is a daily orperiodic market in the commune, and commune prices of paddy, urea, and phosphate.16 While these factorsinfluence the earnings of the household, they are unlikely to have a direct effect on the fertility of the selectedwomen.
The instrumenting regressions are reasonably well identified. The coefficients for the dummy variables for themain occupation of the household head's mother and the dummy for periodic markets in the commune aresignificant at the 1 percent level. The coefficient for the real price of phosphatic fertilizer is also significant,though only at the 10 percent level. The results indicate strong life−cycle and household human capital effects,along with significant differences between male−headed and female−headed households of different types.Significant regional differences are also evident, as is the importance of commune−level factors. The model doesreasonably well explaining 32 percent (44 percent for the fixed effects specification) of the variation in householdexpenditure per adult. While one can't be certain that the variable has been purged of all endogeneity, thefirst−stage regressions appear to be adequate. Hausman tests of exogeneity were also conducted, and the resultsare reported in the discussion that follows: it should be borne in mind that the validity of these proceduresdepends on the appropriateness of the zero restrictions imposed on the instrumenting regressions.
The other variables selected for the fertility regressions and their hypothesized effects are as follows. Age of thewoman is included to control for the duration of exposure to childbearing. The survey covers more of the fertilityexperience of older women, so age should be expected to have a positive effect on fertility. Age also representscohort effects, and in a regime of declining fertility at least part of the lower observed fertility of younger womencan be expected to translate to lower completed fertility at some point in time.
Schooling variables are included for both the selected woman and her spouse. For the spouse the variable isspecified in terms of number of
years of schooling, while for the selected woman dummy variables are included for some (but incomplete)primary schooling, some (but incomplete) lower secondary schooling, some (but incomplete) upper secondaryschooling, and more than upper secondary schooling. These dummy variables were constructed on the basis ofgrades completed at the time of the survey, even though they are specified in terms of number of years ofschooling. A dummy variable specification for women's schooling allows more flexible specification of schoolingeffects than a linear or quadratic form.
The effects of women's schooling are widely recognized in the literature on fertility and investment in children'shuman capital. The effects operate through differences in preferences for the number and quality of children,through higher opportunity cost of time spent in childcare, and through higher incomes. These factors influenceboth the number of children women want to have and their willingness to use contraception to control theirfertility. Education effects can also be expected to operate through the biological process (the supply of children)through better use of prenatal care, choice of health facilities for delivery, postnatal care, and health careinvestments in infants.17 It is reasonable to hypothesize that the net effect of women's schooling is negative−thatis, that women with more schooling have lower fertility.
The effects of husband's schooling (and occupation) are often interpreted as income effects, because men typicallyare less involved in child rearing and the opportunity cost of their time thus has a smaller effect on the shadowprice of children. But men's schooling can be expected to have a substantial impact on the adoption and effectiveuse of modern contraception, even though the dominant contraceptive in use in Vietnam, the IUD, is a femalecontraceptive. The total effect of husband's schooling can therefore be positive or negative depending on whetherthe income effect is stronger or whether other effects operating through shadow price and the adoption andeffective use of contraceptives are dominant.
Household Welfare and Vietnam's Transition
Selection of Variables 294
Land area variables are included to assess the effect of physical capital resources on fertility decisions.18 As aproductive resource, land endowments have income effects similar to those from adult human capital, as well asprice effects deriving from the employment opportunities they can provide for family labor.19 The shadow priceeffect depends on labor market conditions, the type of crops cultivated, and the use of mechanized equipment. InVietnam labor hiring varies considerably across the country; half of farmers in the Southeast and Mekong Deltahire labor, but fewer than a fifth of farmers in the northern regions do so. On the whole, land area can be expectedto have a fertility−enhancing effect, though its strength is likely to vary across the country.20
The other variables included in the model attempt to control for social and economic influences on childbearingeither through a modification of individual preferences or through an alteration in the effects of price and
income factors. No a priori hypotheses are proposed for most of these dummy variables, though in some casesclearer effects are definable.
Dummy variables are included for women from vertical and other nonnuclear households. The base groupconsists of nuclear households (70 percent). Vertical households are defined as those with nuclear members and atleast one of the following relatives of the household head: parents, parents−in−law, daughters, sons−in−law, orgrandchildren. Other households is a residual category consisting of households in which some relationships areother than nuclear or vertical. Social pressures may be greater in nonnuclear households, especially since they aremore likely to contain either the eldest or the youngest son of the household head. But it is also possible that thepresence in the household of more than one woman of childbearing age represents a positive support mechanismand a greater pool of childcare knowledge and resources.
Dummy variables are also included for women who were widowed and women who were separated or divorced atthe time of the survey. Here the interpretations are clearer. These marital statuses represent interruptions in theexposure to childbearing risk and should have a negative effect on fertility. While the dummy variable forwidowed women is unambiguously exogenous, that for separated or divorced women should, at leasttheoretically, be viewed as endogenous. But it is treated as exogenous for two reasons. First, even thoughwomen's status in Vietnam has improved substantially in the past three to four decades, social life ismaledominated. Family and social relationships, under the strong influence of Confucian philosophy, emphasize asubordinate role for women. So for women a large share of separations and divorces may represent nonvoluntarymarital states.21 Second, a more practical reason, treating this dummy variable as endogenous requiresdeveloping an instrument for it, and it is all but impossible to find suitable identifying variables for this purpose.Excluding the variable is not an option because correlation with household expenditure would result in a clearomitted−variable bias.
A dummy variable is included for ethnic minorities, which include all non−Kinh and non−Chinese ethnic groupsin Vietnam. Ethnic minorities have significantly higher fertility rates than the Chinese and the majority Kinh andhave been less touched by the economic and social changes of the past 50 years. These groups also havesignificantly lower education, and they are concentrated in certain parts of the country−the Northern Uplands, theCentral Highlands, and the Mekong Delta. The dummy variable attempts to assess whether differences remainafter controlling for education, land area, age, and income. Dummy variables are also included for Buddhists andfor Catholics. Almost two−thirds of Vietnamese state no religious affiliation, and a fourth report that they areBuddhists. No particular effects are hypothesized for these variables.
Finally, to assess whether there are residual regional differences in fertility outcomes, a set of six dummyvariables are used for six of the seven
Household Welfare and Vietnam's Transition
Selection of Variables 295
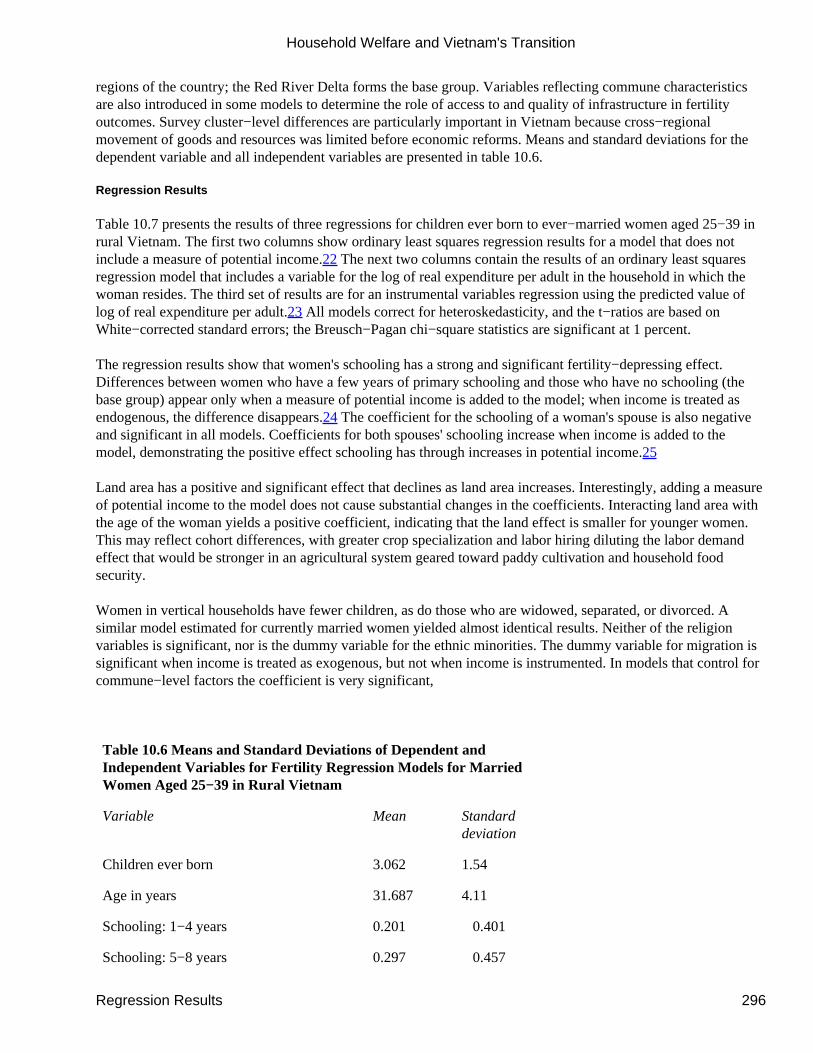
regions of the country; the Red River Delta forms the base group. Variables reflecting commune characteristicsare also introduced in some models to determine the role of access to and quality of infrastructure in fertilityoutcomes. Survey cluster−level differences are particularly important in Vietnam because cross−regionalmovement of goods and resources was limited before economic reforms. Means and standard deviations for thedependent variable and all independent variables are presented in table 10.6.
Regression Results
Table 10.7 presents the results of three regressions for children ever born to ever−married women aged 25−39 inrural Vietnam. The first two columns show ordinary least squares regression results for a model that does notinclude a measure of potential income.22 The next two columns contain the results of an ordinary least squaresregression model that includes a variable for the log of real expenditure per adult in the household in which thewoman resides. The third set of results are for an instrumental variables regression using the predicted value oflog of real expenditure per adult.23 All models correct for heteroskedasticity, and the t−ratios are based onWhite−corrected standard errors; the Breusch−Pagan chi−square statistics are significant at 1 percent.
The regression results show that women's schooling has a strong and significant fertility−depressing effect.Differences between women who have a few years of primary schooling and those who have no schooling (thebase group) appear only when a measure of potential income is added to the model; when income is treated asendogenous, the difference disappears.24 The coefficient for the schooling of a woman's spouse is also negativeand significant in all models. Coefficients for both spouses' schooling increase when income is added to themodel, demonstrating the positive effect schooling has through increases in potential income.25
Land area has a positive and significant effect that declines as land area increases. Interestingly, adding a measureof potential income to the model does not cause substantial changes in the coefficients. Interacting land area withthe age of the woman yields a positive coefficient, indicating that the land effect is smaller for younger women.This may reflect cohort differences, with greater crop specialization and labor hiring diluting the labor demandeffect that would be stronger in an agricultural system geared toward paddy cultivation and household foodsecurity.
Women in vertical households have fewer children, as do those who are widowed, separated, or divorced. Asimilar model estimated for currently married women yielded almost identical results. Neither of the religionvariables is significant, nor is the dummy variable for the ethnic minorities. The dummy variable for migration issignificant when income is treated as exogenous, but not when income is instrumented. In models that control forcommune−level factors the coefficient is very significant,
Table 10.6 Means and Standard Deviations of Dependent andIndependent Variables for Fertility Regression Models for MarriedWomen Aged 25−39 in Rural Vietnam
Variable Mean Standarddeviation
Children ever born 3.062 1.54
Age in years 31.687 4.11
Schooling: 1−4 years 0.201 0.401
Schooling: 5−8 years 0.297 0.457
Household Welfare and Vietnam's Transition
Regression Results 296
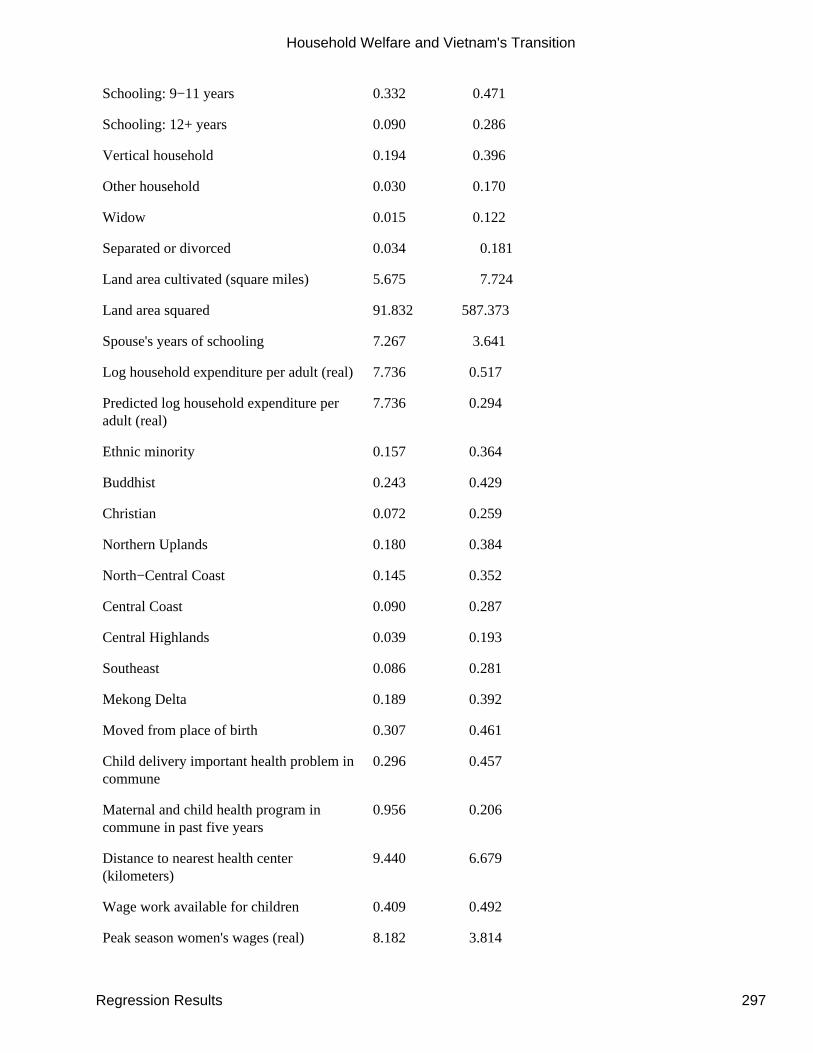
Schooling: 9−11 years 0.332 0.471
Schooling: 12+ years 0.090 0.286
Vertical household 0.194 0.396
Other household 0.030 0.170
Widow 0.015 0.122
Separated or divorced 0.034 0.181
Land area cultivated (square miles) 5.675 7.724
Land area squared 91.832 587.373
Spouse's years of schooling 7.267 3.641
Log household expenditure per adult (real)7.736 0.517
Predicted log household expenditure peradult (real)
7.736 0.294
Ethnic minority 0.157 0.364
Buddhist 0.243 0.429
Christian 0.072 0.259
Northern Uplands 0.180 0.384
North−Central Coast 0.145 0.352
Central Coast 0.090 0.287
Central Highlands 0.039 0.193
Southeast 0.086 0.281
Mekong Delta 0.189 0.392
Moved from place of birth 0.307 0.461
Child delivery important health problem incommune
0.296 0.457
Maternal and child health program incommune in past five years
0.956 0.206
Distance to nearest health center(kilometers)
9.440 6.679
Wage work available for children 0.409 0.492
Peak season women's wages (real) 8.182 3.814
Household Welfare and Vietnam's Transition
Regression Results 297
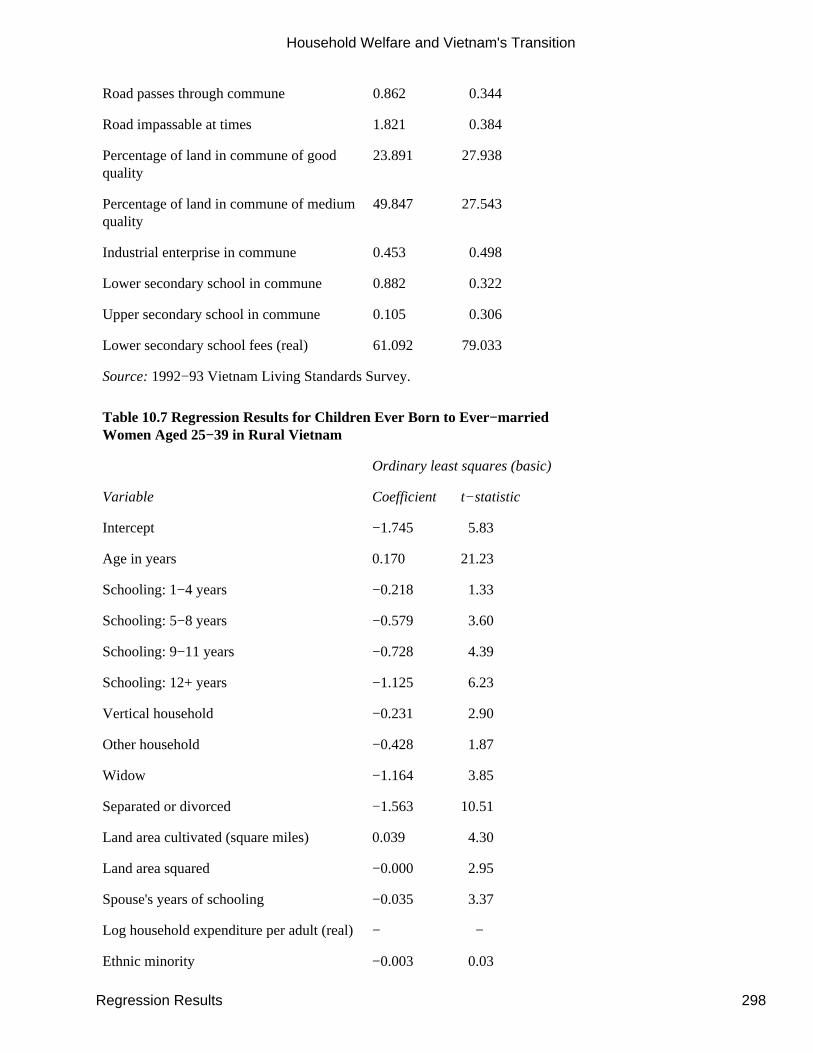
Road passes through commune 0.862 0.344
Road impassable at times 1.821 0.384
Percentage of land in commune of goodquality
23.891 27.938
Percentage of land in commune of mediumquality
49.847 27.543
Industrial enterprise in commune 0.453 0.498
Lower secondary school in commune 0.882 0.322
Upper secondary school in commune 0.105 0.306
Lower secondary school fees (real) 61.092 79.033
Source: 1992−93 Vietnam Living Standards Survey.
Table 10.7 Regression Results for Children Ever Born to Ever−marriedWomen Aged 25−39 in Rural Vietnam
Ordinary least squares (basic)
Variable Coefficient t−statistic
Intercept −1.745 5.83
Age in years 0.170 21.23
Schooling: 1−4 years −0.218 1.33
Schooling: 5−8 years −0.579 3.60
Schooling: 9−11 years −0.728 4.39
Schooling: 12+ years −1.125 6.23
Vertical household −0.231 2.90
Other household −0.428 1.87
Widow −1.164 3.85
Separated or divorced −1.563 10.51
Land area cultivated (square miles) 0.039 4.30
Land area squared −0.000 2.95
Spouse's years of schooling −0.035 3.37
Log household expenditure per adult (real)− −
Ethnic minority −0.003 0.03
Household Welfare and Vietnam's Transition
Regression Results 298
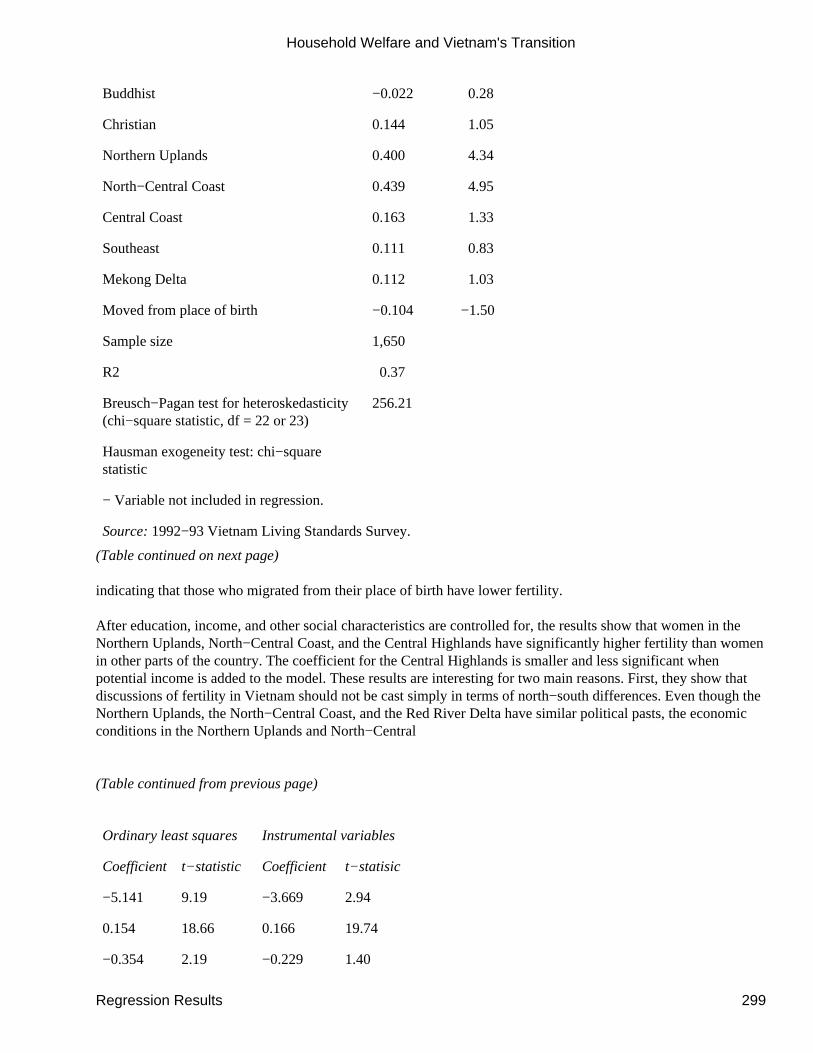
Buddhist −0.022 0.28
Christian 0.144 1.05
Northern Uplands 0.400 4.34
North−Central Coast 0.439 4.95
Central Coast 0.163 1.33
Southeast 0.111 0.83
Mekong Delta 0.112 1.03
Moved from place of birth −0.104 −1.50
Sample size 1,650
R2 0.37
Breusch−Pagan test for heteroskedasticity(chi−square statistic, df = 22 or 23)
256.21
Hausman exogeneity test: chi−squarestatistic
− Variable not included in regression.
Source: 1992−93 Vietnam Living Standards Survey.
(Table continued on next page)
indicating that those who migrated from their place of birth have lower fertility.
After education, income, and other social characteristics are controlled for, the results show that women in theNorthern Uplands, North−Central Coast, and the Central Highlands have significantly higher fertility than womenin other parts of the country. The coefficient for the Central Highlands is smaller and less significant whenpotential income is added to the model. These results are interesting for two main reasons. First, they show thatdiscussions of fertility in Vietnam should not be cast simply in terms of north−south differences. Even though theNorthern Uplands, the North−Central Coast, and the Red River Delta have similar political pasts, the economicconditions in the Northern Uplands and North−Central
(Table continued from previous page)
Ordinary least squares Instrumental variables
Coefficient t−statistic Coefficient t−statisic
−5.141 9.19 −3.669 2.94
0.154 18.66 0.166 19.74
−0.354 2.19 −0.229 1.40
Household Welfare and Vietnam's Transition
Regression Results 299
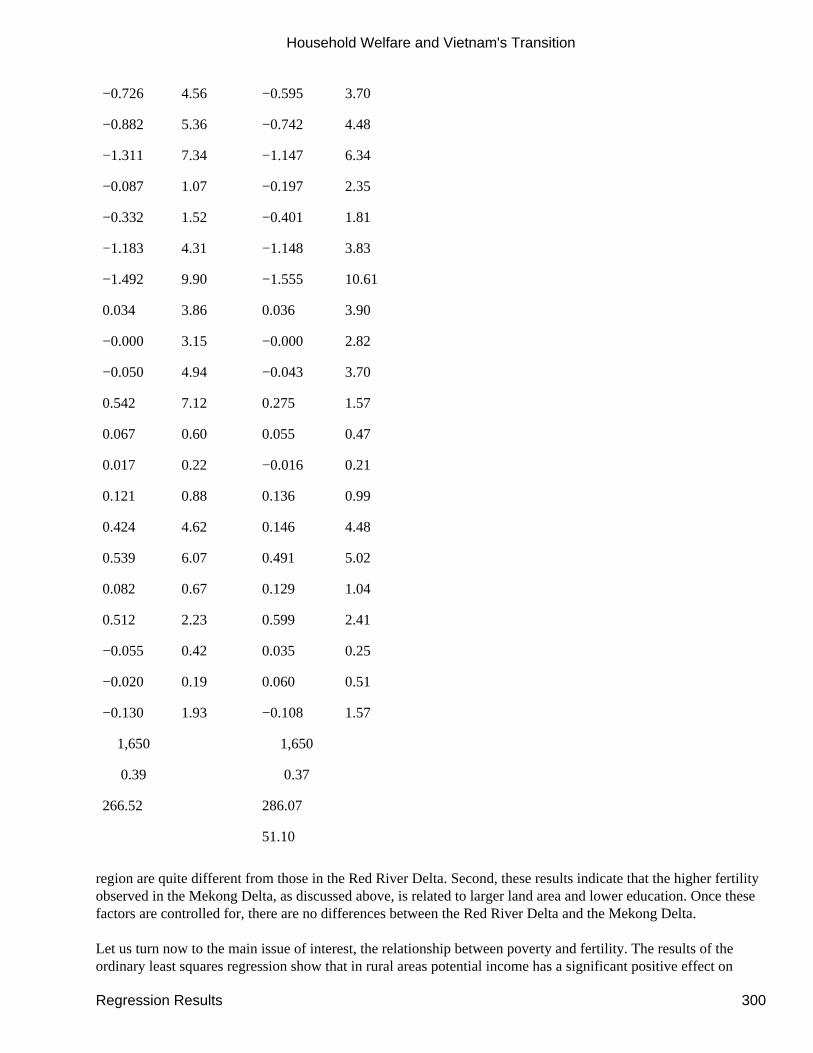
−0.726 4.56 −0.595 3.70
−0.882 5.36 −0.742 4.48
−1.311 7.34 −1.147 6.34
−0.087 1.07 −0.197 2.35
−0.332 1.52 −0.401 1.81
−1.183 4.31 −1.148 3.83
−1.492 9.90 −1.555 10.61
0.034 3.86 0.036 3.90
−0.000 3.15 −0.000 2.82
−0.050 4.94 −0.043 3.70
0.542 7.12 0.275 1.57
0.067 0.60 0.055 0.47
0.017 0.22 −0.016 0.21
0.121 0.88 0.136 0.99
0.424 4.62 0.146 4.48
0.539 6.07 0.491 5.02
0.082 0.67 0.129 1.04
0.512 2.23 0.599 2.41
−0.055 0.42 0.035 0.25
−0.020 0.19 0.060 0.51
−0.130 1.93 −0.108 1.57
1,650 1,650
0.39 0.37
266.52 286.07
51.10
region are quite different from those in the Red River Delta. Second, these results indicate that the higher fertilityobserved in the Mekong Delta, as discussed above, is related to larger land area and lower education. Once thesefactors are controlled for, there are no differences between the Red River Delta and the Mekong Delta.
Let us turn now to the main issue of interest, the relationship between poverty and fertility. The results of theordinary least squares regression show that in rural areas potential income has a significant positive effect on
Household Welfare and Vietnam's Transition
Regression Results 300
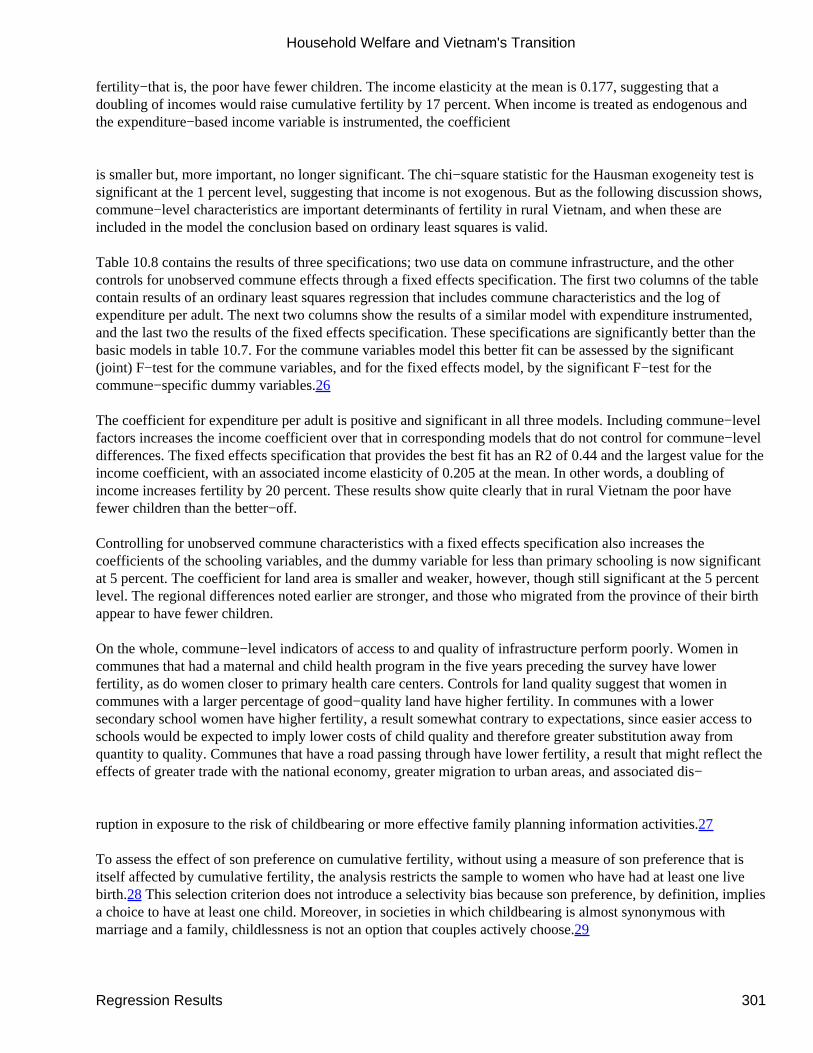
fertility−that is, the poor have fewer children. The income elasticity at the mean is 0.177, suggesting that adoubling of incomes would raise cumulative fertility by 17 percent. When income is treated as endogenous andthe expenditure−based income variable is instrumented, the coefficient
is smaller but, more important, no longer significant. The chi−square statistic for the Hausman exogeneity test issignificant at the 1 percent level, suggesting that income is not exogenous. But as the following discussion shows,commune−level characteristics are important determinants of fertility in rural Vietnam, and when these areincluded in the model the conclusion based on ordinary least squares is valid.
Table 10.8 contains the results of three specifications; two use data on commune infrastructure, and the othercontrols for unobserved commune effects through a fixed effects specification. The first two columns of the tablecontain results of an ordinary least squares regression that includes commune characteristics and the log ofexpenditure per adult. The next two columns show the results of a similar model with expenditure instrumented,and the last two the results of the fixed effects specification. These specifications are significantly better than thebasic models in table 10.7. For the commune variables model this better fit can be assessed by the significant(joint) F−test for the commune variables, and for the fixed effects model, by the significant F−test for thecommune−specific dummy variables.26
The coefficient for expenditure per adult is positive and significant in all three models. Including commune−levelfactors increases the income coefficient over that in corresponding models that do not control for commune−leveldifferences. The fixed effects specification that provides the best fit has an R2 of 0.44 and the largest value for theincome coefficient, with an associated income elasticity of 0.205 at the mean. In other words, a doubling ofincome increases fertility by 20 percent. These results show quite clearly that in rural Vietnam the poor havefewer children than the better−off.
Controlling for unobserved commune characteristics with a fixed effects specification also increases thecoefficients of the schooling variables, and the dummy variable for less than primary schooling is now significantat 5 percent. The coefficient for land area is smaller and weaker, however, though still significant at the 5 percentlevel. The regional differences noted earlier are stronger, and those who migrated from the province of their birthappear to have fewer children.
On the whole, commune−level indicators of access to and quality of infrastructure perform poorly. Women incommunes that had a maternal and child health program in the five years preceding the survey have lowerfertility, as do women closer to primary health care centers. Controls for land quality suggest that women incommunes with a larger percentage of good−quality land have higher fertility. In communes with a lowersecondary school women have higher fertility, a result somewhat contrary to expectations, since easier access toschools would be expected to imply lower costs of child quality and therefore greater substitution away fromquantity to quality. Communes that have a road passing through have lower fertility, a result that might reflect theeffects of greater trade with the national economy, greater migration to urban areas, and associated dis−
ruption in exposure to the risk of childbearing or more effective family planning information activities.27
To assess the effect of son preference on cumulative fertility, without using a measure of son preference that isitself affected by cumulative fertility, the analysis restricts the sample to women who have had at least one livebirth.28 This selection criterion does not introduce a selectivity bias because son preference, by definition, impliesa choice to have at least one child. Moreover, in societies in which childbearing is almost synonymous withmarriage and a family, childlessness is not an option that couples actively choose.29
Household Welfare and Vietnam's Transition
Regression Results 301
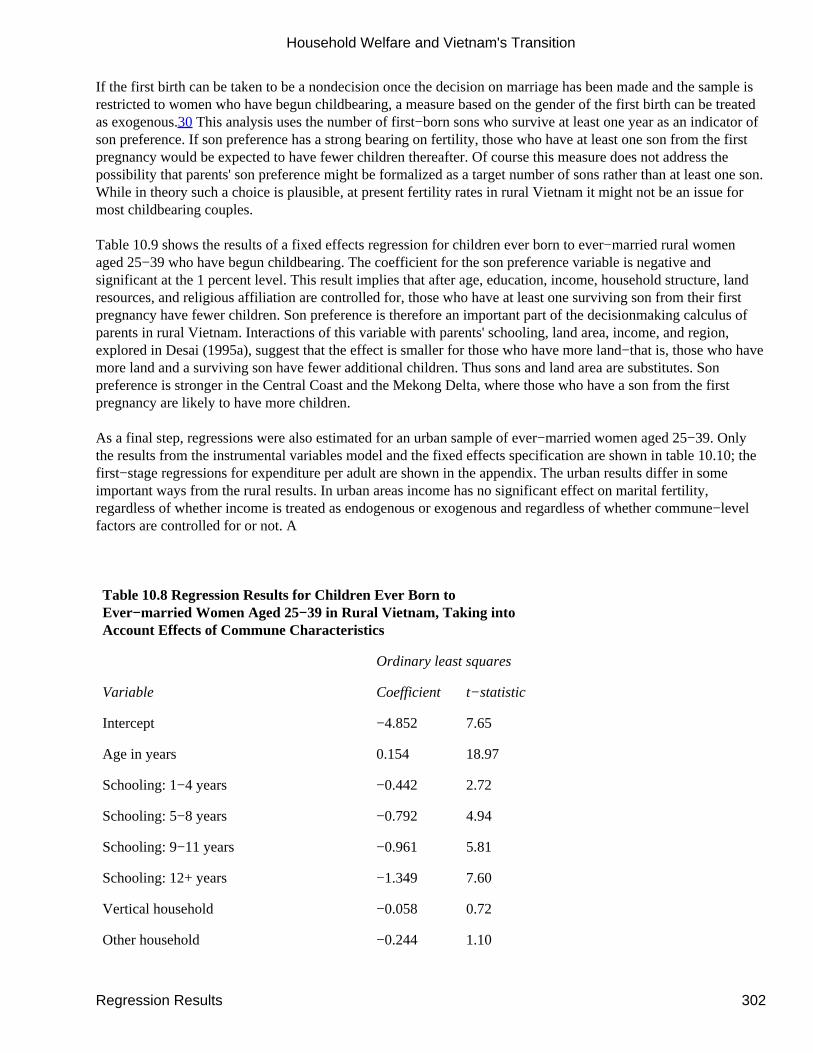
If the first birth can be taken to be a nondecision once the decision on marriage has been made and the sample isrestricted to women who have begun childbearing, a measure based on the gender of the first birth can be treatedas exogenous.30 This analysis uses the number of first−born sons who survive at least one year as an indicator ofson preference. If son preference has a strong bearing on fertility, those who have at least one son from the firstpregnancy would be expected to have fewer children thereafter. Of course this measure does not address thepossibility that parents' son preference might be formalized as a target number of sons rather than at least one son.While in theory such a choice is plausible, at present fertility rates in rural Vietnam it might not be an issue formost childbearing couples.
Table 10.9 shows the results of a fixed effects regression for children ever born to ever−married rural womenaged 25−39 who have begun childbearing. The coefficient for the son preference variable is negative andsignificant at the 1 percent level. This result implies that after age, education, income, household structure, landresources, and religious affiliation are controlled for, those who have at least one surviving son from their firstpregnancy have fewer children. Son preference is therefore an important part of the decisionmaking calculus ofparents in rural Vietnam. Interactions of this variable with parents' schooling, land area, income, and region,explored in Desai (1995a), suggest that the effect is smaller for those who have more land−that is, those who havemore land and a surviving son have fewer additional children. Thus sons and land area are substitutes. Sonpreference is stronger in the Central Coast and the Mekong Delta, where those who have a son from the firstpregnancy are likely to have more children.
As a final step, regressions were also estimated for an urban sample of ever−married women aged 25−39. Onlythe results from the instrumental variables model and the fixed effects specification are shown in table 10.10; thefirst−stage regressions for expenditure per adult are shown in the appendix. The urban results differ in someimportant ways from the rural results. In urban areas income has no significant effect on marital fertility,regardless of whether income is treated as endogenous or exogenous and regardless of whether commune−levelfactors are controlled for or not. A
Table 10.8 Regression Results for Children Ever Born toEver−married Women Aged 25−39 in Rural Vietnam, Taking intoAccount Effects of Commune Characteristics
Ordinary least squares
Variable Coefficient t−statistic
Intercept −4.852 7.65
Age in years 0.154 18.97
Schooling: 1−4 years −0.442 2.72
Schooling: 5−8 years −0.792 4.94
Schooling: 9−11 years −0.961 5.81
Schooling: 12+ years −1.349 7.60
Vertical household −0.058 0.72
Other household −0.244 1.10
Household Welfare and Vietnam's Transition
Regression Results 302
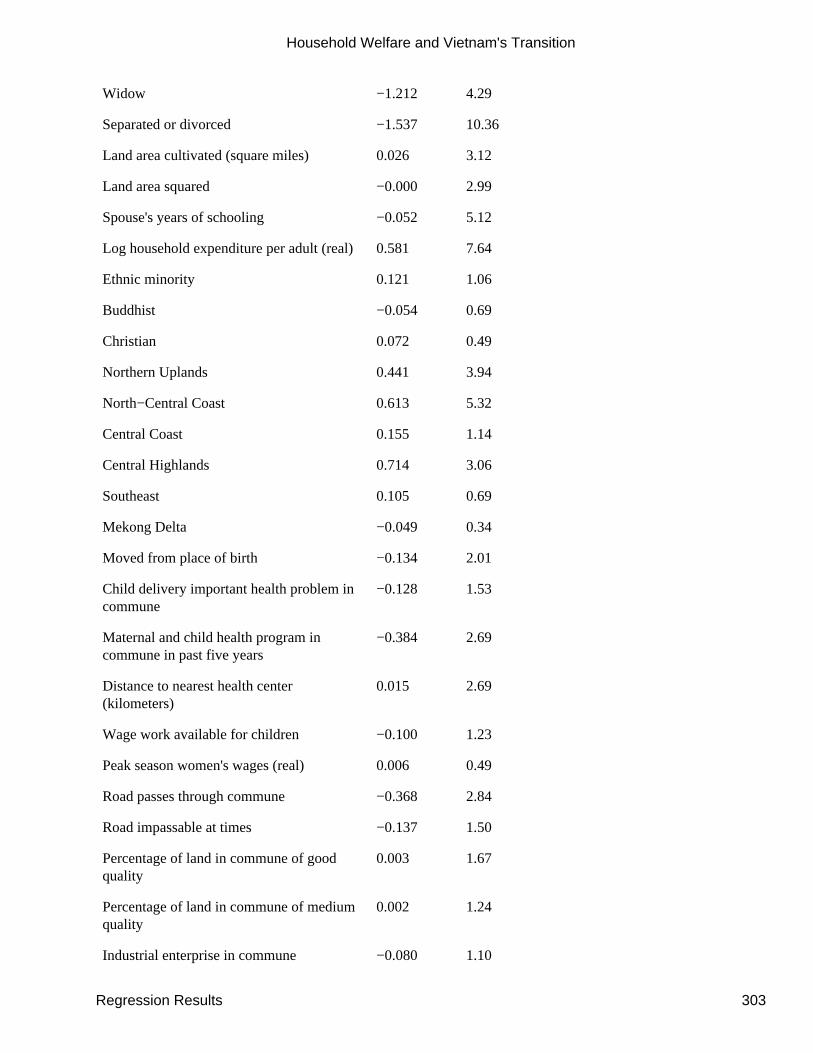
Widow −1.212 4.29
Separated or divorced −1.537 10.36
Land area cultivated (square miles) 0.026 3.12
Land area squared −0.000 2.99
Spouse's years of schooling −0.052 5.12
Log household expenditure per adult (real)0.581 7.64
Ethnic minority 0.121 1.06
Buddhist −0.054 0.69
Christian 0.072 0.49
Northern Uplands 0.441 3.94
North−Central Coast 0.613 5.32
Central Coast 0.155 1.14
Central Highlands 0.714 3.06
Southeast 0.105 0.69
Mekong Delta −0.049 0.34
Moved from place of birth −0.134 2.01
Child delivery important health problem incommune
−0.128 1.53
Maternal and child health program incommune in past five years
−0.384 2.69
Distance to nearest health center(kilometers)
0.015 2.69
Wage work available for children −0.100 1.23
Peak season women's wages (real) 0.006 0.49
Road passes through commune −0.368 2.84
Road impassable at times −0.137 1.50
Percentage of land in commune of goodquality
0.003 1.67
Percentage of land in commune of mediumquality
0.002 1.24
Industrial enterprise in commune −0.080 1.10
Household Welfare and Vietnam's Transition
Regression Results 303
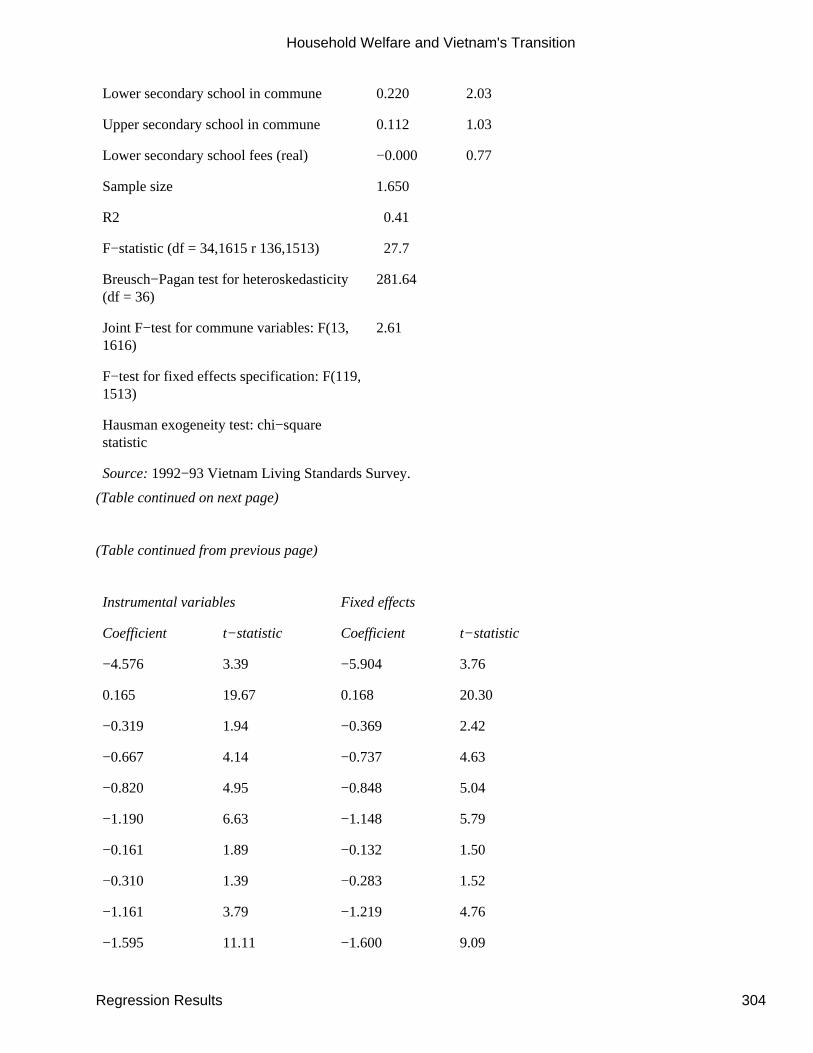
Lower secondary school in commune 0.220 2.03
Upper secondary school in commune 0.112 1.03
Lower secondary school fees (real) −0.000 0.77
Sample size 1.650
R2 0.41
F−statistic (df = 34,1615 r 136,1513) 27.7
Breusch−Pagan test for heteroskedasticity(df = 36)
281.64
Joint F−test for commune variables: F(13,1616)
2.61
F−test for fixed effects specification: F(119,1513)
Hausman exogeneity test: chi−squarestatistic
Source: 1992−93 Vietnam Living Standards Survey.
(Table continued on next page)
(Table continued from previous page)
Instrumental variables Fixed effects
Coefficient t−statistic Coefficient t−statistic
−4.576 3.39 −5.904 3.76
0.165 19.67 0.168 20.30
−0.319 1.94 −0.369 2.42
−0.667 4.14 −0.737 4.63
−0.820 4.95 −0.848 5.04
−1.190 6.63 −1.148 5.79
−0.161 1.89 −0.132 1.50
−0.310 1.39 −0.283 1.52
−1.161 3.79 −1.219 4.76
−1.595 11.11 −1.600 9.09
Household Welfare and Vietnam's Transition
Regression Results 304
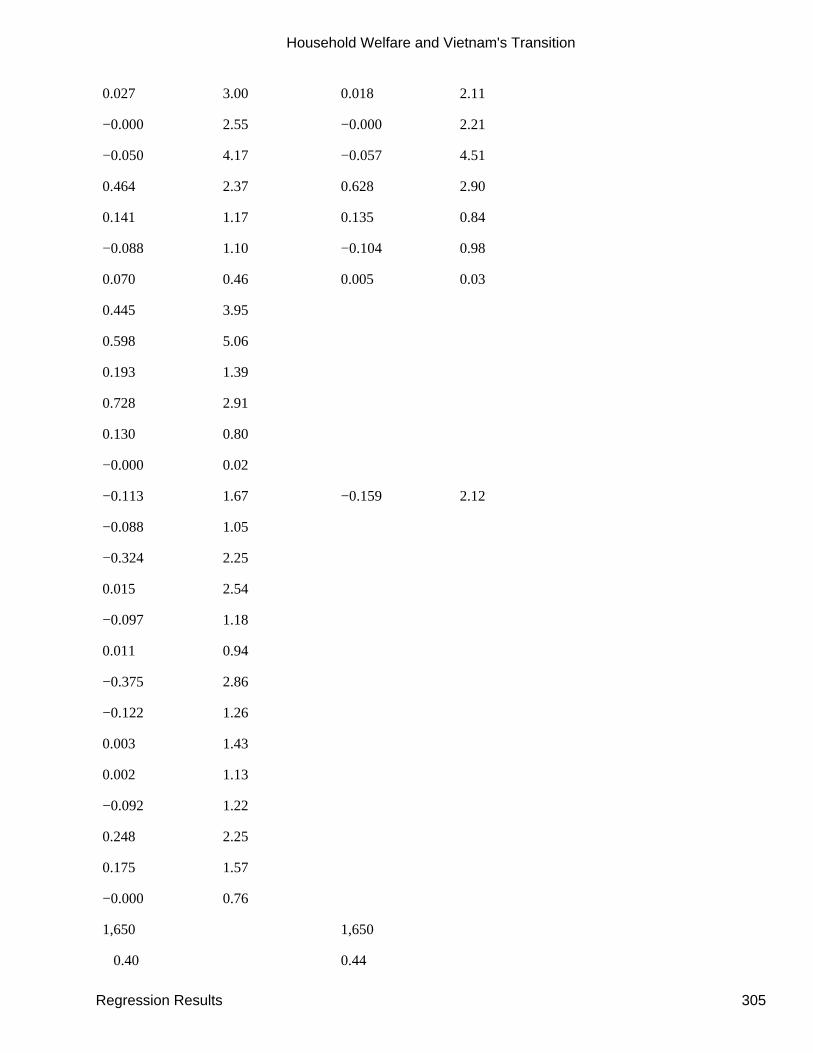
0.027 3.00 0.018 2.11
−0.000 2.55 −0.000 2.21
−0.050 4.17 −0.057 4.51
0.464 2.37 0.628 2.90
0.141 1.17 0.135 0.84
−0.088 1.10 −0.104 0.98
0.070 0.46 0.005 0.03
0.445 3.95
0.598 5.06
0.193 1.39
0.728 2.91
0.130 0.80
−0.000 0.02
−0.113 1.67 −0.159 2.12
−0.088 1.05
−0.324 2.25
0.015 2.54
−0.097 1.18
0.011 0.94
−0.375 2.86
−0.122 1.26
0.003 1.43
0.002 1.13
−0.092 1.22
0.248 2.25
0.175 1.57
−0.000 0.76
1,650 1,650
0.40 0.44
Household Welfare and Vietnam's Transition
Regression Results 305
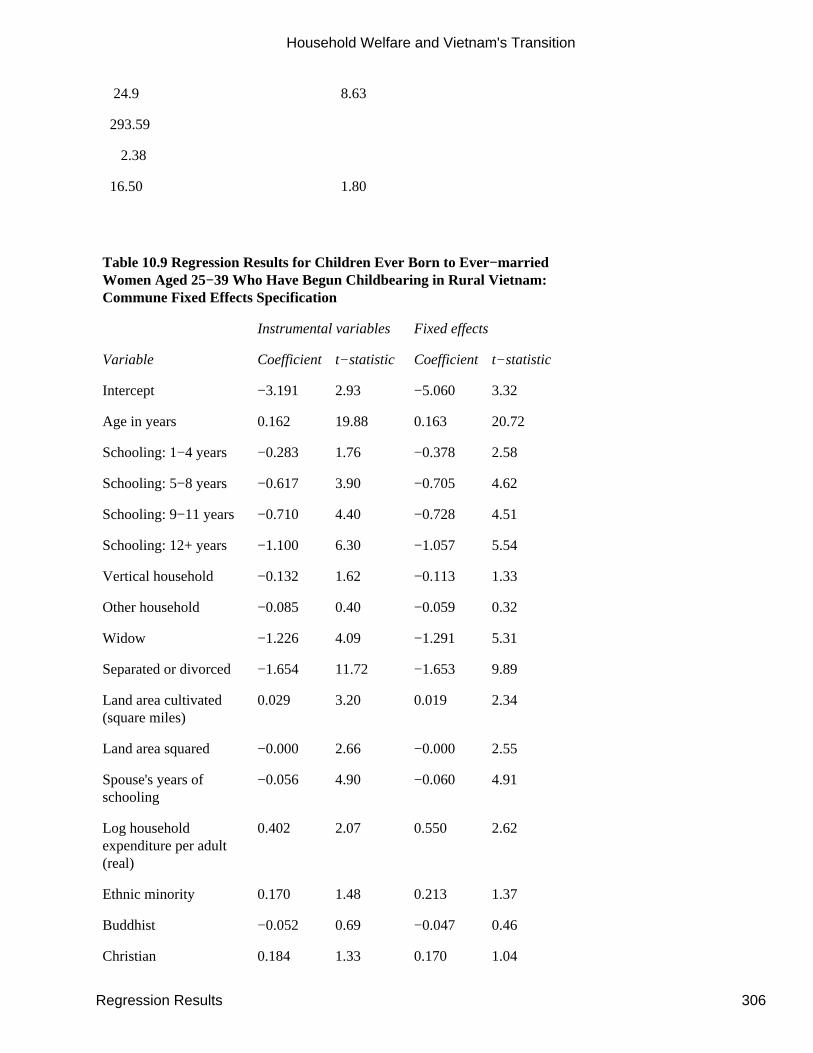
24.9 8.63
293.59
2.38
16.50 1.80
Table 10.9 Regression Results for Children Ever Born to Ever−marriedWomen Aged 25−39 Who Have Begun Childbearing in Rural Vietnam:Commune Fixed Effects Specification
Instrumental variables Fixed effects
Variable Coefficient t−statistic Coefficient t−statistic
Intercept −3.191 2.93 −5.060 3.32
Age in years 0.162 19.88 0.163 20.72
Schooling: 1−4 years −0.283 1.76 −0.378 2.58
Schooling: 5−8 years −0.617 3.90 −0.705 4.62
Schooling: 9−11 years −0.710 4.40 −0.728 4.51
Schooling: 12+ years −1.100 6.30 −1.057 5.54
Vertical household −0.132 1.62 −0.113 1.33
Other household −0.085 0.40 −0.059 0.32
Widow −1.226 4.09 −1.291 5.31
Separated or divorced −1.654 11.72 −1.653 9.89
Land area cultivated(square miles)
0.029 3.20 0.019 2.34
Land area squared −0.000 2.66 −0.000 2.55
Spouse's years ofschooling
−0.056 4.90 −0.060 4.91
Log householdexpenditure per adult(real)
0.402 2.07 0.550 2.62
Ethnic minority 0.170 1.48 0.213 1.37
Buddhist −0.052 0.69 −0.047 0.46
Christian 0.184 1.33 0.170 1.04
Household Welfare and Vietnam's Transition
Regression Results 306
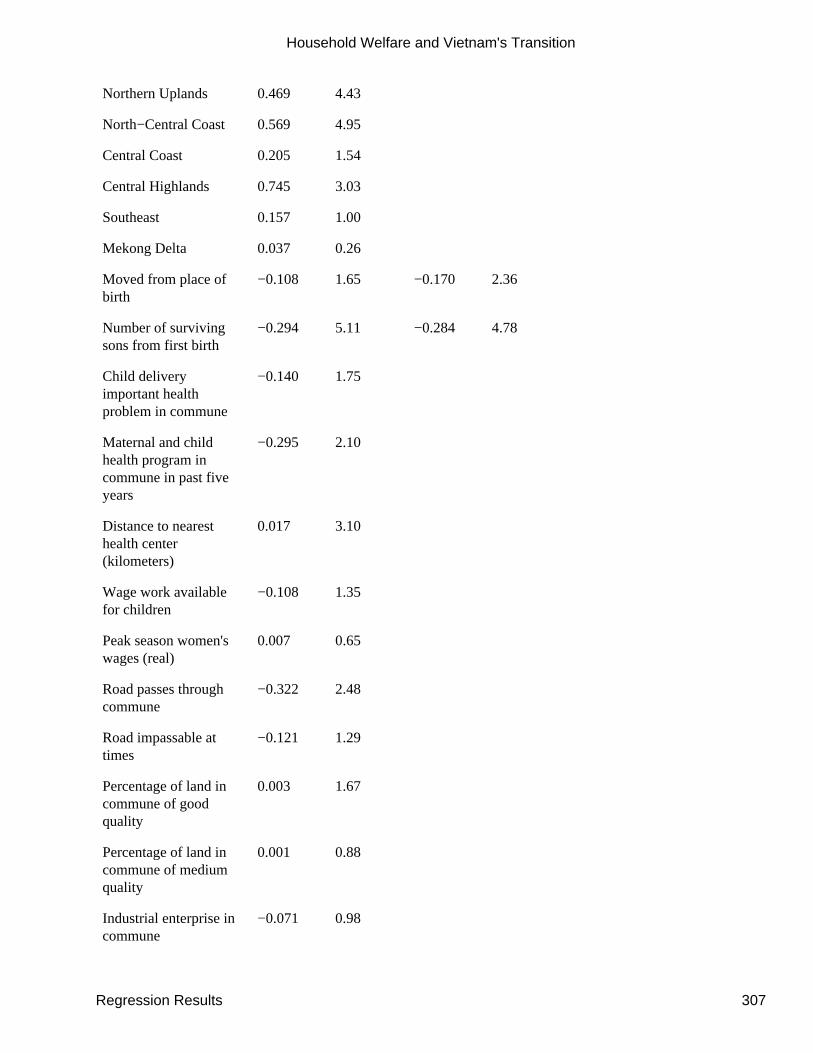
Northern Uplands 0.469 4.43
North−Central Coast 0.569 4.95
Central Coast 0.205 1.54
Central Highlands 0.745 3.03
Southeast 0.157 1.00
Mekong Delta 0.037 0.26
Moved from place ofbirth
−0.108 1.65 −0.170 2.36
Number of survivingsons from first birth
−0.294 5.11 −0.284 4.78
Child deliveryimportant healthproblem in commune
−0.140 1.75
Maternal and childhealth program incommune in past fiveyears
−0.295 2.10
Distance to nearesthealth center(kilometers)
0.017 3.10
Wage work availablefor children
−0.108 1.35
Peak season women'swages (real)
0.007 0.65
Road passes throughcommune
−0.322 2.48
Road impassable attimes
−0.121 1.29
Percentage of land incommune of goodquality
0.003 1.67
Percentage of land incommune of mediumquality
0.001 0.88
Industrial enterprise incommune
−0.071 0.98
Household Welfare and Vietnam's Transition
Regression Results 307
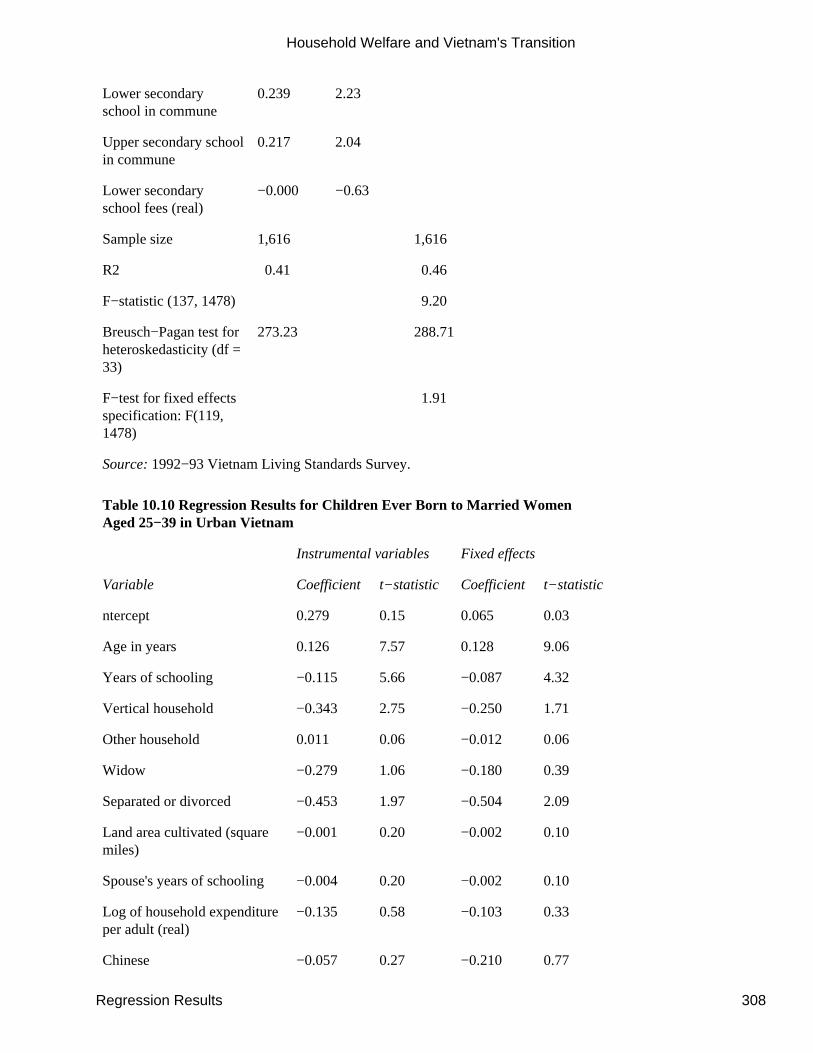
Lower secondaryschool in commune
0.239 2.23
Upper secondary schoolin commune
0.217 2.04
Lower secondaryschool fees (real)
−0.000 −0.63
Sample size 1,616 1,616
R2 0.41 0.46
F−statistic (137, 1478) 9.20
Breusch−Pagan test forheteroskedasticity (df =33)
273.23 288.71
F−test for fixed effectsspecification: F(119,1478)
1.91
Source: 1992−93 Vietnam Living Standards Survey.
Table 10.10 Regression Results for Children Ever Born to Married WomenAged 25−39 in Urban Vietnam
Instrumental variables Fixed effects
Variable Coefficient t−statistic Coefficient t−statistic
ntercept 0.279 0.15 0.065 0.03
Age in years 0.126 7.57 0.128 9.06
Years of schooling −0.115 5.66 −0.087 4.32
Vertical household −0.343 2.75 −0.250 1.71
Other household 0.011 0.06 −0.012 0.06
Widow −0.279 1.06 −0.180 0.39
Separated or divorced −0.453 1.97 −0.504 2.09
Land area cultivated (squaremiles)
−0.001 0.20 −0.002 0.10
Spouse's years of schooling −0.004 0.20 −0.002 0.10
Log of household expenditureper adult (real)
−0.135 0.58 −0.103 0.33
Chinese −0.057 0.27 −0.210 0.77
Household Welfare and Vietnam's Transition
Regression Results 308
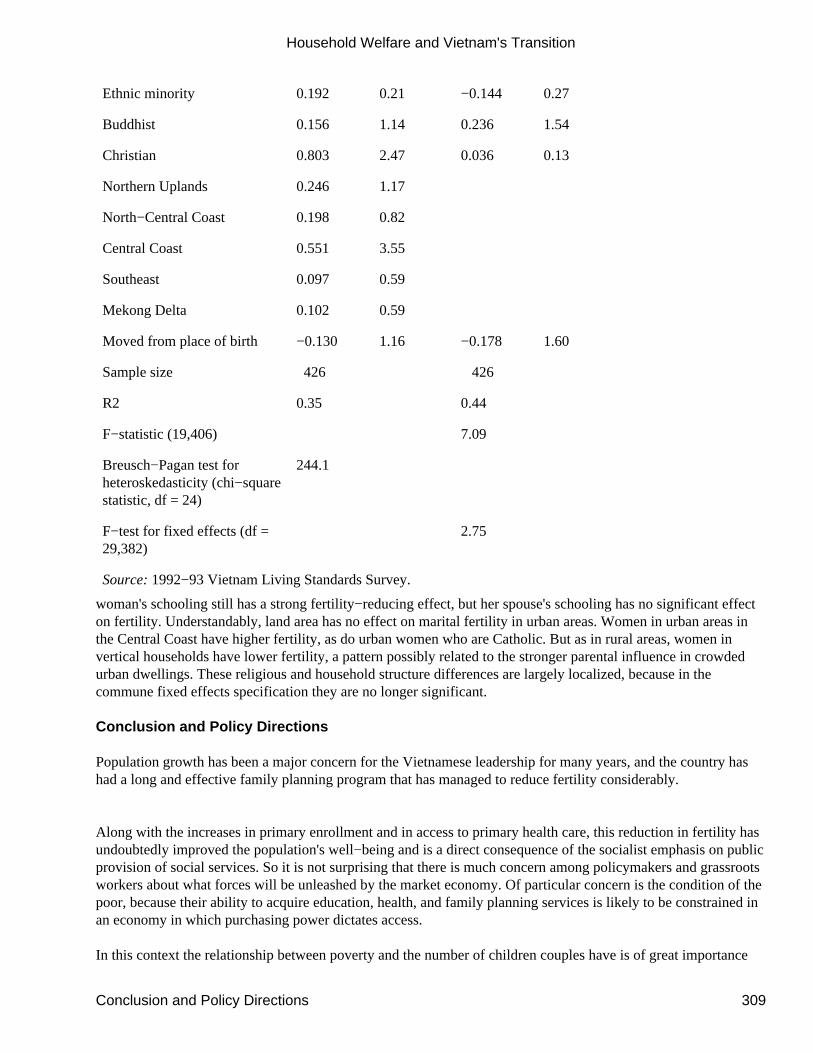
Ethnic minority 0.192 0.21 −0.144 0.27
Buddhist 0.156 1.14 0.236 1.54
Christian 0.803 2.47 0.036 0.13
Northern Uplands 0.246 1.17
North−Central Coast 0.198 0.82
Central Coast 0.551 3.55
Southeast 0.097 0.59
Mekong Delta 0.102 0.59
Moved from place of birth −0.130 1.16 −0.178 1.60
Sample size 426 426
R2 0.35 0.44
F−statistic (19,406) 7.09
Breusch−Pagan test forheteroskedasticity (chi−squarestatistic, df = 24)
244.1
F−test for fixed effects (df =29,382)
2.75
Source: 1992−93 Vietnam Living Standards Survey.
woman's schooling still has a strong fertility−reducing effect, but her spouse's schooling has no significant effecton fertility. Understandably, land area has no effect on marital fertility in urban areas. Women in urban areas inthe Central Coast have higher fertility, as do urban women who are Catholic. But as in rural areas, women invertical households have lower fertility, a pattern possibly related to the stronger parental influence in crowdedurban dwellings. These religious and household structure differences are largely localized, because in thecommune fixed effects specification they are no longer significant.
Conclusion and Policy Directions
Population growth has been a major concern for the Vietnamese leadership for many years, and the country hashad a long and effective family planning program that has managed to reduce fertility considerably.
Along with the increases in primary enrollment and in access to primary health care, this reduction in fertility hasundoubtedly improved the population's well−being and is a direct consequence of the socialist emphasis on publicprovision of social services. So it is not surprising that there is much concern among policymakers and grassrootsworkers about what forces will be unleashed by the market economy. Of particular concern is the condition of thepoor, because their ability to acquire education, health, and family planning services is likely to be constrained inan economy in which purchasing power dictates access.
In this context the relationship between poverty and the number of children couples have is of great importance
Household Welfare and Vietnam's Transition
Conclusion and Policy Directions 309

because couples who have more children usually trade off quantity for quality, investing less in each child. Evenin a transition economy education differences are critical in determining the earnings, productivity, and economicwelfare of households, but these differences are likely to be even more important in a market economy. Thefertility process can therefore lead to an intergenerational carryover of poverty, an issue of concern in a countrythat emphasizes equality.
But the regressions for cumulative fertility in this chapter show that in rural areas the poor have fewer childrenthan the better−off. This positive relationship between income and fertility is to be expected, since children shouldbe normal goods. This relationship conflicts with commonplace expectations that the poor have more childrenbecause the typical definition of who is poor and who is not is based on a per person measure of well−being thatis inappropriate for looking at the effects of poverty on fertility. An appropriate measure of poverty needs to bebased on the adequacy or inadequacy of resources over the life cycle−a measure of potential or permanentincome. While this measure is likely to be closely associated with a per person measure, the relationship is by nomeans perfect.
The regressions also show that women with more schooling have fewer children, as do women whose spouse hasmore schooling. In rural areas the results indicate strong positive effects of land area cultivated and significantregional differences, with higher fertility in the Northern Uplands, the North−Central Coast, and the CentralHighlands. Poor access to infrastructure also raises fertility, suggesting that isolation from information and healthand education services might allow women less control over childbearing.
Son preference remains an important aspect of childbearing decisions in Vietnam. While this chapter has not beenaimed at determining the extent to which economic factors are responsible for the preference for sons, results ofother chapters in this book and an in−depth study of gender in Vietnam (Desai 1995b) suggest that economicfactors are likely to be important. For example, there are substantial differences in earnings between men andwomen even though women work almost as many hours as men, and differences in school enrollment betweengirls and boys have reappeared after being eliminated just a few years ago.
What do these results say about the future course of fertility decline in Vietnam? The fertility rates calculated inthis chapter, though based on a sample biased toward married women, indicate that fertility fell by about 13percent between 1987 and 1992. If the bias is taken into account, the drop in fertility is likely to be as high as 30percent, with the total fertility rate somewhat less than 3. This decline is encouraging, but substantial rural−urbanand regional differences remain: the total fertility rate in rural areas is 3.7, compared with around replacementlevel in urban areas, and the Northern Uplands, the Central Highlands, and the Mekong Delta have significantlyhigher fertility rates than other regions. So while a fertility transition is clearly under way, its future course isuncertain because the cost−benefit environment for childbearing decisions is undergoing tremendous change.
The prereform environment effectively subsidized child rearing through state provision of education, health, andfamily planning services. The evolving environment shifts more of the costs of child rearing to parents. Inaddition, agricultural liberalization is likely to cause greater differentiation in land and labor markets. The newland law gives effective control over land for longer periods and allows transfer of title to other households, andthe emergence of an agricultural labor market is likely to enhance the cost implications of child rearing. Thesechanges in the economic system reward differences in the human capital parents have and the resources they haveaccess to, producing greater differences in household incomes. This should also contribute to greater differencesin childbearing patterns.
The finding that the poor have fewer children raises some concern that as the economy grows, an income effectmight lead to higher fertility, slowing the fertility transition. This income effect might be quite weak, however,because at the same time that incomes are rising, schooling and health care costs and consumption opportunitiesare also increasing. Moreover, fertility has never been as drastically suppressed in Vietnam as it has been in
Household Welfare and Vietnam's Transition
Conclusion and Policy Directions 310
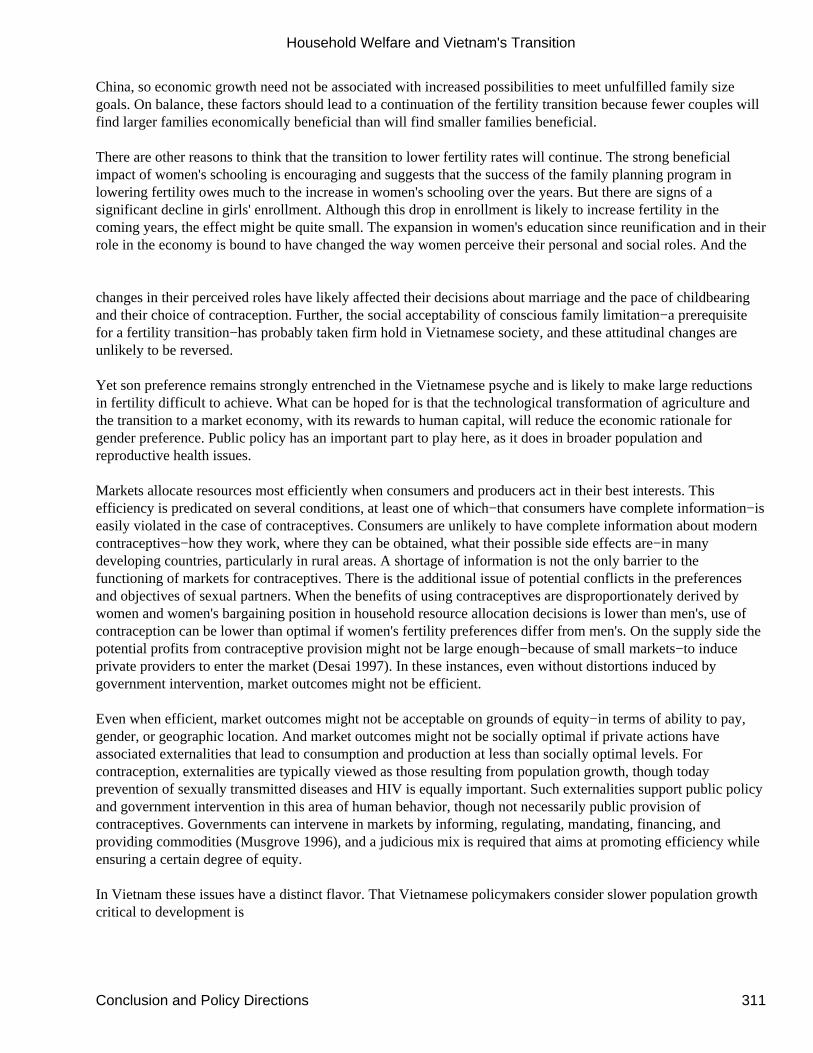
China, so economic growth need not be associated with increased possibilities to meet unfulfilled family sizegoals. On balance, these factors should lead to a continuation of the fertility transition because fewer couples willfind larger families economically beneficial than will find smaller families beneficial.
There are other reasons to think that the transition to lower fertility rates will continue. The strong beneficialimpact of women's schooling is encouraging and suggests that the success of the family planning program inlowering fertility owes much to the increase in women's schooling over the years. But there are signs of asignificant decline in girls' enrollment. Although this drop in enrollment is likely to increase fertility in thecoming years, the effect might be quite small. The expansion in women's education since reunification and in theirrole in the economy is bound to have changed the way women perceive their personal and social roles. And the
changes in their perceived roles have likely affected their decisions about marriage and the pace of childbearingand their choice of contraception. Further, the social acceptability of conscious family limitation−a prerequisitefor a fertility transition−has probably taken firm hold in Vietnamese society, and these attitudinal changes areunlikely to be reversed.
Yet son preference remains strongly entrenched in the Vietnamese psyche and is likely to make large reductionsin fertility difficult to achieve. What can be hoped for is that the technological transformation of agriculture andthe transition to a market economy, with its rewards to human capital, will reduce the economic rationale forgender preference. Public policy has an important part to play here, as it does in broader population andreproductive health issues.
Markets allocate resources most efficiently when consumers and producers act in their best interests. Thisefficiency is predicated on several conditions, at least one of which−that consumers have complete information−iseasily violated in the case of contraceptives. Consumers are unlikely to have complete information about moderncontraceptives−how they work, where they can be obtained, what their possible side effects are−in manydeveloping countries, particularly in rural areas. A shortage of information is not the only barrier to thefunctioning of markets for contraceptives. There is the additional issue of potential conflicts in the preferencesand objectives of sexual partners. When the benefits of using contraceptives are disproportionately derived bywomen and women's bargaining position in household resource allocation decisions is lower than men's, use ofcontraception can be lower than optimal if women's fertility preferences differ from men's. On the supply side thepotential profits from contraceptive provision might not be large enough−because of small markets−to induceprivate providers to enter the market (Desai 1997). In these instances, even without distortions induced bygovernment intervention, market outcomes might not be efficient.
Even when efficient, market outcomes might not be acceptable on grounds of equity−in terms of ability to pay,gender, or geographic location. And market outcomes might not be socially optimal if private actions haveassociated externalities that lead to consumption and production at less than socially optimal levels. Forcontraception, externalities are typically viewed as those resulting from population growth, though todayprevention of sexually transmitted diseases and HIV is equally important. Such externalities support public policyand government intervention in this area of human behavior, though not necessarily public provision ofcontraceptives. Governments can intervene in markets by informing, regulating, mandating, financing, andproviding commodities (Musgrove 1996), and a judicious mix is required that aims at promoting efficiency whileensuring a certain degree of equity.
In Vietnam these issues have a distinct flavor. That Vietnamese policymakers consider slower population growthcritical to development is
Household Welfare and Vietnam's Transition
Conclusion and Policy Directions 311
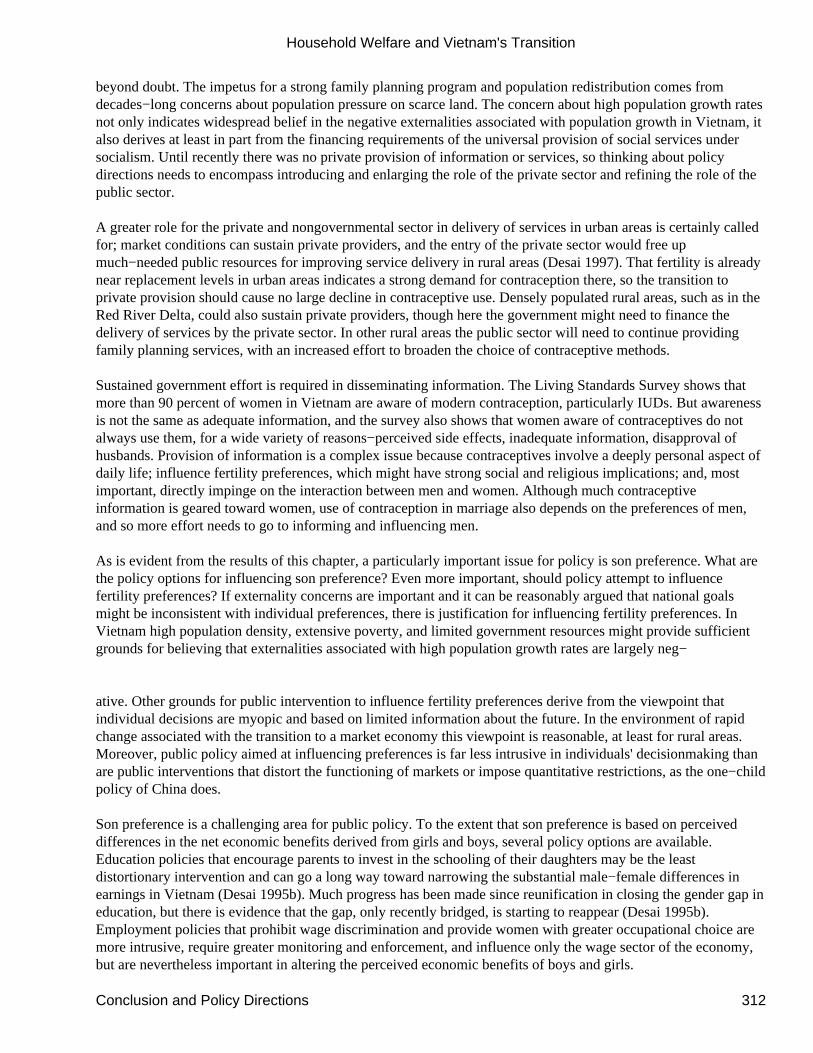
beyond doubt. The impetus for a strong family planning program and population redistribution comes fromdecades−long concerns about population pressure on scarce land. The concern about high population growth ratesnot only indicates widespread belief in the negative externalities associated with population growth in Vietnam, italso derives at least in part from the financing requirements of the universal provision of social services undersocialism. Until recently there was no private provision of information or services, so thinking about policydirections needs to encompass introducing and enlarging the role of the private sector and refining the role of thepublic sector.
A greater role for the private and nongovernmental sector in delivery of services in urban areas is certainly calledfor; market conditions can sustain private providers, and the entry of the private sector would free upmuch−needed public resources for improving service delivery in rural areas (Desai 1997). That fertility is alreadynear replacement levels in urban areas indicates a strong demand for contraception there, so the transition toprivate provision should cause no large decline in contraceptive use. Densely populated rural areas, such as in theRed River Delta, could also sustain private providers, though here the government might need to finance thedelivery of services by the private sector. In other rural areas the public sector will need to continue providingfamily planning services, with an increased effort to broaden the choice of contraceptive methods.
Sustained government effort is required in disseminating information. The Living Standards Survey shows thatmore than 90 percent of women in Vietnam are aware of modern contraception, particularly IUDs. But awarenessis not the same as adequate information, and the survey also shows that women aware of contraceptives do notalways use them, for a wide variety of reasons−perceived side effects, inadequate information, disapproval ofhusbands. Provision of information is a complex issue because contraceptives involve a deeply personal aspect ofdaily life; influence fertility preferences, which might have strong social and religious implications; and, mostimportant, directly impinge on the interaction between men and women. Although much contraceptiveinformation is geared toward women, use of contraception in marriage also depends on the preferences of men,and so more effort needs to go to informing and influencing men.
As is evident from the results of this chapter, a particularly important issue for policy is son preference. What arethe policy options for influencing son preference? Even more important, should policy attempt to influencefertility preferences? If externality concerns are important and it can be reasonably argued that national goalsmight be inconsistent with individual preferences, there is justification for influencing fertility preferences. InVietnam high population density, extensive poverty, and limited government resources might provide sufficientgrounds for believing that externalities associated with high population growth rates are largely neg−
ative. Other grounds for public intervention to influence fertility preferences derive from the viewpoint thatindividual decisions are myopic and based on limited information about the future. In the environment of rapidchange associated with the transition to a market economy this viewpoint is reasonable, at least for rural areas.Moreover, public policy aimed at influencing preferences is far less intrusive in individuals' decisionmaking thanare public interventions that distort the functioning of markets or impose quantitative restrictions, as the one−childpolicy of China does.
Son preference is a challenging area for public policy. To the extent that son preference is based on perceiveddifferences in the net economic benefits derived from girls and boys, several policy options are available.Education policies that encourage parents to invest in the schooling of their daughters may be the leastdistortionary intervention and can go a long way toward narrowing the substantial male−female differences inearnings in Vietnam (Desai 1995b). Much progress has been made since reunification in closing the gender gap ineducation, but there is evidence that the gap, only recently bridged, is starting to reappear (Desai 1995b).Employment policies that prohibit wage discrimination and provide women with greater occupational choice aremore intrusive, require greater monitoring and enforcement, and influence only the wage sector of the economy,but are nevertheless important in altering the perceived economic benefits of boys and girls.
Household Welfare and Vietnam's Transition
Conclusion and Policy Directions 312
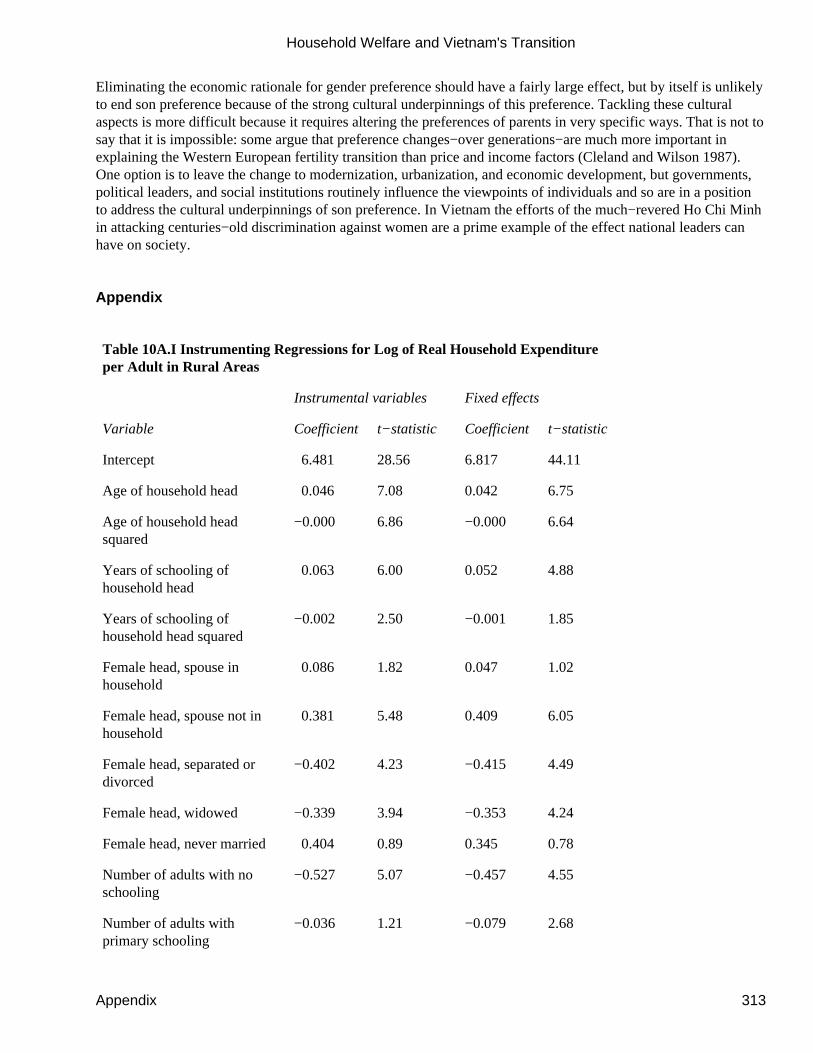
Eliminating the economic rationale for gender preference should have a fairly large effect, but by itself is unlikelyto end son preference because of the strong cultural underpinnings of this preference. Tackling these culturalaspects is more difficult because it requires altering the preferences of parents in very specific ways. That is not tosay that it is impossible: some argue that preference changes−over generations−are much more important inexplaining the Western European fertility transition than price and income factors (Cleland and Wilson 1987).One option is to leave the change to modernization, urbanization, and economic development, but governments,political leaders, and social institutions routinely influence the viewpoints of individuals and so are in a positionto address the cultural underpinnings of son preference. In Vietnam the efforts of the much−revered Ho Chi Minhin attacking centuries−old discrimination against women are a prime example of the effect national leaders canhave on society.
Appendix
Table 10A.I Instrumenting Regressions for Log of Real Household Expenditureper Adult in Rural Areas
Instrumental variables Fixed effects
Variable Coefficient t−statistic Coefficient t−statistic
Intercept 6.481 28.56 6.817 44.11
Age of household head 0.046 7.08 0.042 6.75
Age of household headsquared
−0.000 6.86 −0.000 6.64
Years of schooling ofhousehold head
0.063 6.00 0.052 4.88
Years of schooling ofhousehold head squared
−0.002 2.50 −0.001 1.85
Female head, spouse inhousehold
0.086 1.82 0.047 1.02
Female head, spouse not inhousehold
0.381 5.48 0.409 6.05
Female head, separated ordivorced
−0.402 4.23 −0.415 4.49
Female head, widowed −0.339 3.94 −0.353 4.24
Female head, never married 0.404 0.89 0.345 0.78
Number of adults with noschooling
−0.527 5.07 −0.457 4.55
Number of adults withprimary schooling
−0.036 1.21 −0.079 2.68
Household Welfare and Vietnam's Transition
Appendix 313
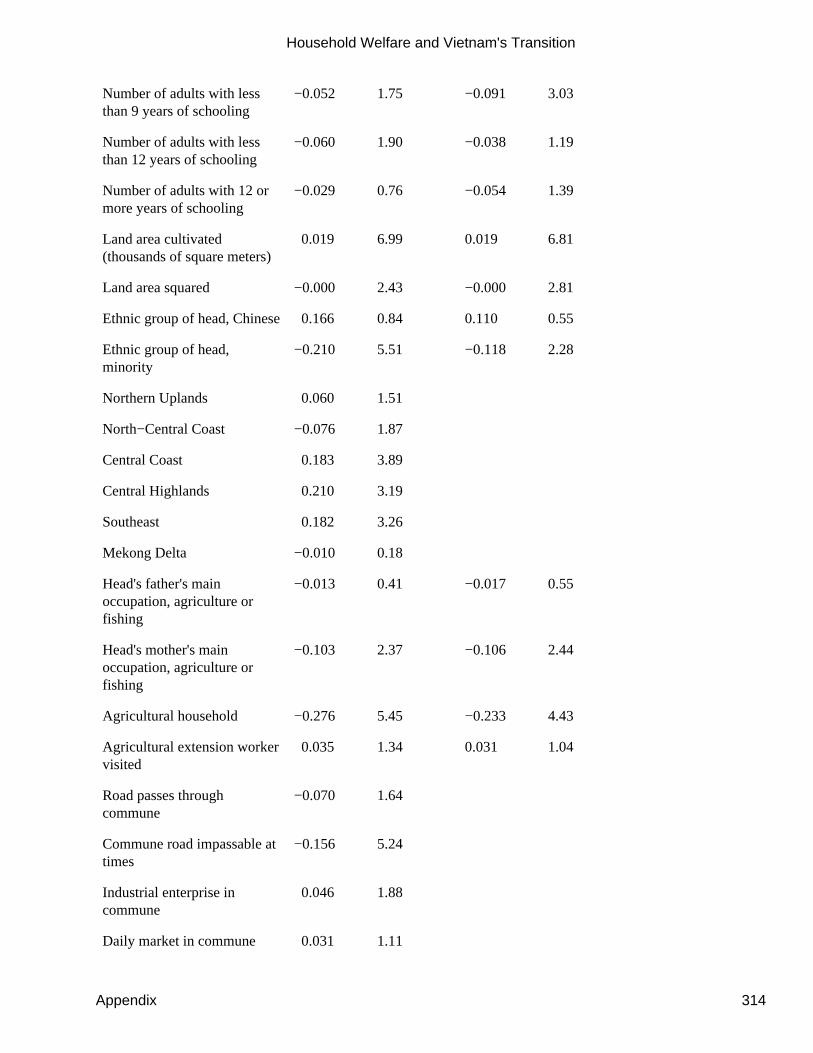
Number of adults with lessthan 9 years of schooling
−0.052 1.75 −0.091 3.03
Number of adults with lessthan 12 years of schooling
−0.060 1.90 −0.038 1.19
Number of adults with 12 ormore years of schooling
−0.029 0.76 −0.054 1.39
Land area cultivated(thousands of square meters)
0.019 6.99 0.019 6.81
Land area squared −0.000 2.43 −0.000 2.81
Ethnic group of head, Chinese 0.166 0.84 0.110 0.55
Ethnic group of head,minority
−0.210 5.51 −0.118 2.28
Northern Uplands 0.060 1.51
North−Central Coast −0.076 1.87
Central Coast 0.183 3.89
Central Highlands 0.210 3.19
Southeast 0.182 3.26
Mekong Delta −0.010 0.18
Head's father's mainoccupation, agriculture orfishing
−0.013 0.41 −0.017 0.55
Head's mother's mainoccupation, agriculture orfishing
−0.103 2.37 −0.106 2.44
Agricultural household −0.276 5.45 −0.233 4.43
Agricultural extension workervisited
0.035 1.34 0.031 1.04
Road passes throughcommune
−0.070 1.64
Commune road impassable attimes
−0.156 5.24
Industrial enterprise incommune
0.046 1.88
Daily market in commune 0.031 1.11
Household Welfare and Vietnam's Transition
Appendix 314
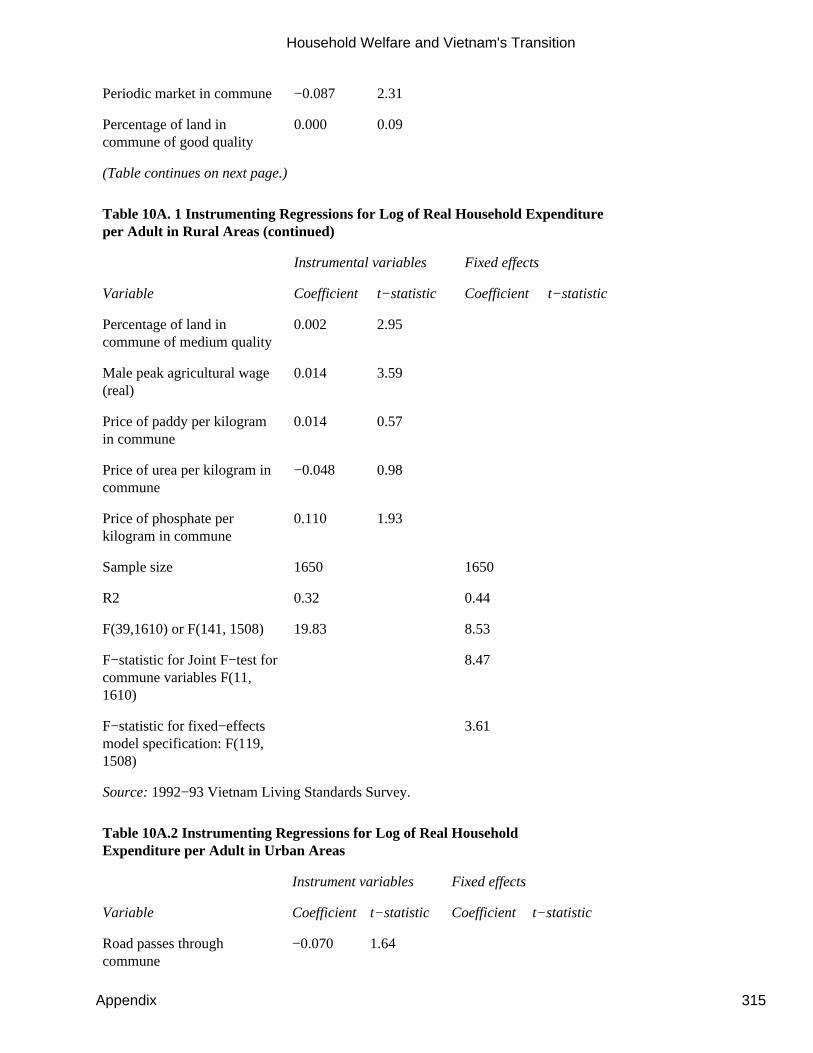
Periodic market in commune −0.087 2.31
Percentage of land incommune of good quality
0.000 0.09
(Table continues on next page.)
Table 10A. 1 Instrumenting Regressions for Log of Real Household Expenditureper Adult in Rural Areas (continued)
Instrumental variables Fixed effects
Variable Coefficient t−statistic Coefficient t−statistic
Percentage of land incommune of medium quality
0.002 2.95
Male peak agricultural wage(real)
0.014 3.59
Price of paddy per kilogramin commune
0.014 0.57
Price of urea per kilogram incommune
−0.048 0.98
Price of phosphate perkilogram in commune
0.110 1.93
Sample size 1650 1650
R2 0.32 0.44
F(39,1610) or F(141, 1508) 19.83 8.53
F−statistic for Joint F−test forcommune variables F(11,1610)
8.47
F−statistic for fixed−effectsmodel specification: F(119,1508)
3.61
Source: 1992−93 Vietnam Living Standards Survey.
Table 10A.2 Instrumenting Regressions for Log of Real HouseholdExpenditure per Adult in Urban Areas
Instrument variables Fixed effects
Variable Coefficient t−statistic Coefficient t−statistic
Road passes throughcommune
−0.070 1.64
Household Welfare and Vietnam's Transition
Appendix 315
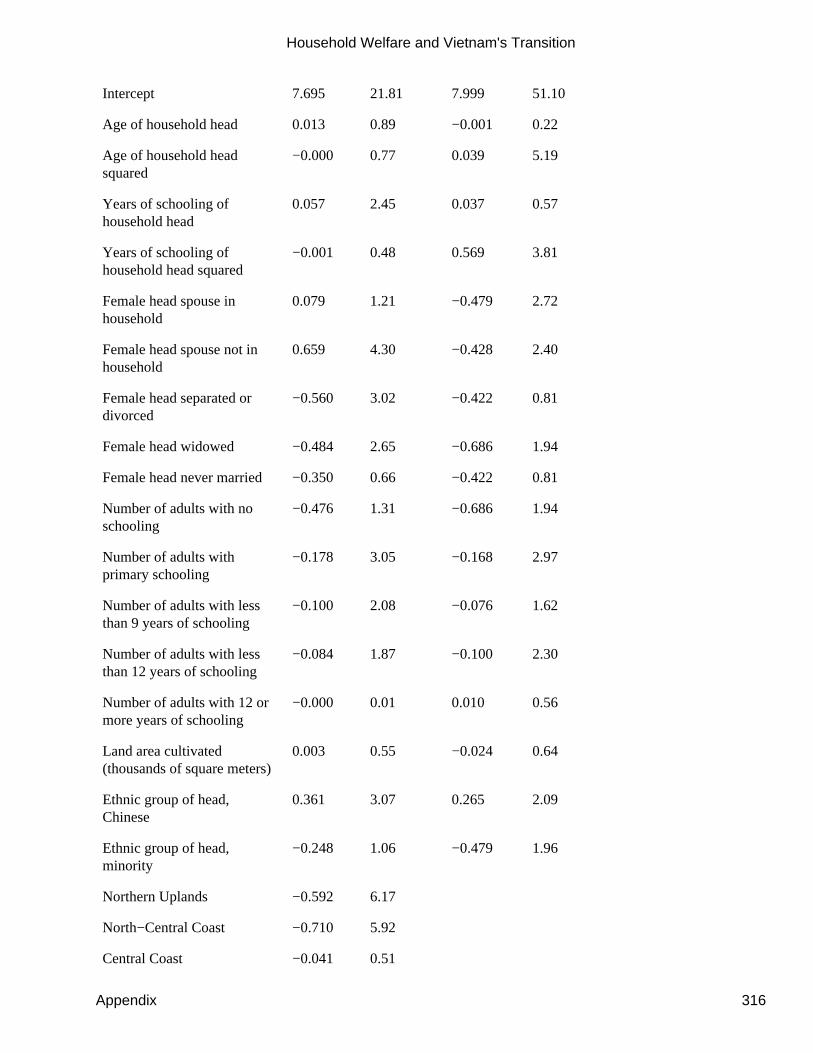
Intercept 7.695 21.81 7.999 51.10
Age of household head 0.013 0.89 −0.001 0.22
Age of household headsquared
−0.000 0.77 0.039 5.19
Years of schooling ofhousehold head
0.057 2.45 0.037 0.57
Years of schooling ofhousehold head squared
−0.001 0.48 0.569 3.81
Female head spouse inhousehold
0.079 1.21 −0.479 2.72
Female head spouse not inhousehold
0.659 4.30 −0.428 2.40
Female head separated ordivorced
−0.560 3.02 −0.422 0.81
Female head widowed −0.484 2.65 −0.686 1.94
Female head never married −0.350 0.66 −0.422 0.81
Number of adults with noschooling
−0.476 1.31 −0.686 1.94
Number of adults withprimary schooling
−0.178 3.05 −0.168 2.97
Number of adults with lessthan 9 years of schooling
−0.100 2.08 −0.076 1.62
Number of adults with lessthan 12 years of schooling
−0.084 1.87 −0.100 2.30
Number of adults with 12 ormore years of schooling
−0.000 0.01 0.010 0.56
Land area cultivated(thousands of square meters)
0.003 0.55 −0.024 0.64
Ethnic group of head,Chinese
0.361 3.07 0.265 2.09
Ethnic group of head,minority
−0.248 1.06 −0.479 1.96
Northern Uplands −0.592 6.17
North−Central Coast −0.710 5.92
Central Coast −0.041 0.51
Household Welfare and Vietnam's Transition
Appendix 316
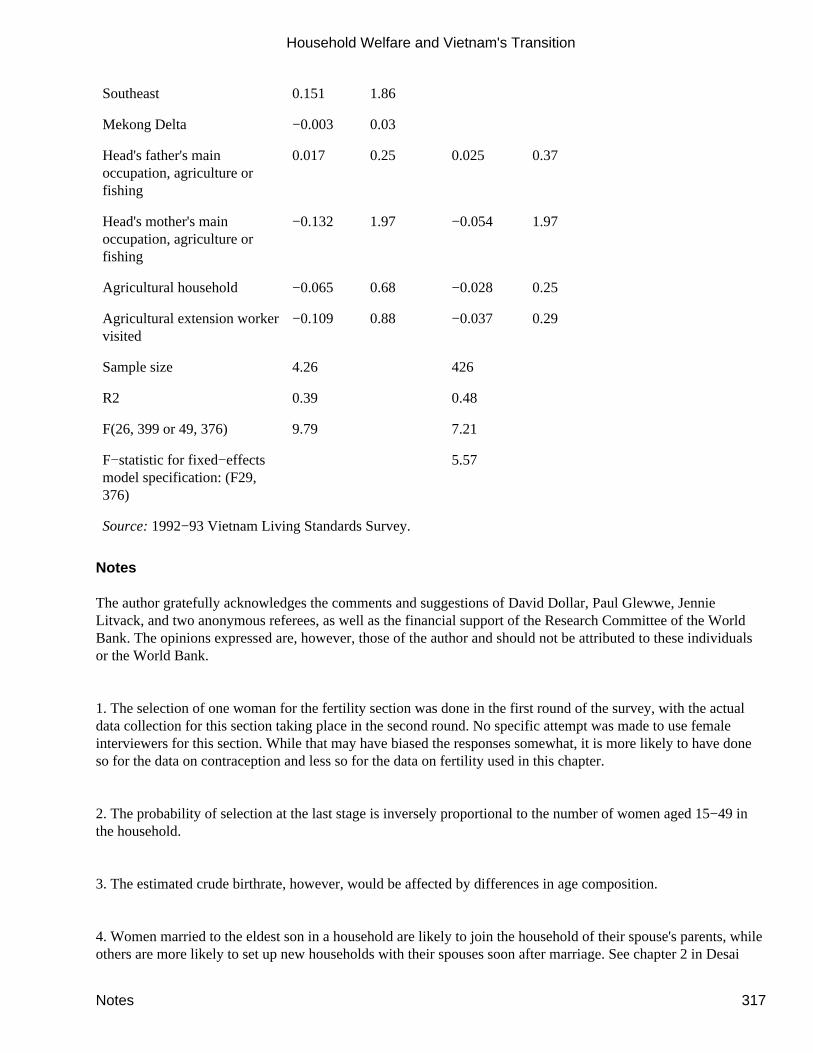
Southeast 0.151 1.86
Mekong Delta −0.003 0.03
Head's father's mainoccupation, agriculture orfishing
0.017 0.25 0.025 0.37
Head's mother's mainoccupation, agriculture orfishing
−0.132 1.97 −0.054 1.97
Agricultural household −0.065 0.68 −0.028 0.25
Agricultural extension workervisited
−0.109 0.88 −0.037 0.29
Sample size 4.26 426
R2 0.39 0.48
F(26, 399 or 49, 376) 9.79 7.21
F−statistic for fixed−effectsmodel specification: (F29,376)
5.57
Source: 1992−93 Vietnam Living Standards Survey.
Notes
The author gratefully acknowledges the comments and suggestions of David Dollar, Paul Glewwe, JennieLitvack, and two anonymous referees, as well as the financial support of the Research Committee of the WorldBank. The opinions expressed are, however, those of the author and should not be attributed to these individualsor the World Bank.
1. The selection of one woman for the fertility section was done in the first round of the survey, with the actualdata collection for this section taking place in the second round. No specific attempt was made to use femaleinterviewers for this section. While that may have biased the responses somewhat, it is more likely to have doneso for the data on contraception and less so for the data on fertility used in this chapter.
2. The probability of selection at the last stage is inversely proportional to the number of women aged 15−49 inthe household.
3. The estimated crude birthrate, however, would be affected by differences in age composition.
4. Women married to the eldest son in a household are likely to join the household of their spouse's parents, whileothers are more likely to set up new households with their spouses soon after marriage. See chapter 2 in Desai
Household Welfare and Vietnam's Transition
Notes 317

(1995b) for more details.
5. The bias toward married women discussed in the previous section should be borne in mind while interpretingall information in this section.
6. Restricting the sample of women in this way is based on an implicit assumption that if a woman intends to haveanother birth, she will do so within five years of the previous one.
7. A two−child family is also the size promoted by the family planning program of the Ministry of Health.
8. Log−rank and Wilcoxon tests for differences in survival functions for age at first birth for women aged 20−39(five−year age cohorts) are significant at 5 percent. These tests also show that there are significant differences inage at first marriage, though this is not apparent from the median values reported in table 10.3. See Desai (1995a)for details.
9. This bias is unrelated to the sampling bias discussed earlier.
10. The fertility rates from the 1987 Demographic and Health Survey appear in table 3.1 of National Committeefor Population and Family Planning (1990). It is not clear whether these are calculated using Brass−type methodsor simply based on information on births (in the reference years) to women interviewed in the survey.
11. The infant mortality rate is assumed to be 100, a value considerably higher than what is widely believed to bethe figure for Vietnam. Since it is not possible to obtain average parities for all women aged 15−49, adjustmentfactors (for adjusting fertility rates calculated on the basis of births in the year before the survey) from the fertilitysample were used. See Desai (1995a) for details.
12. Similar analyses using a larger sample of women aged 20−39 yielded results largely similar to those reportedhere, even though the inclusion of younger women lends a selectivity bias toward early age at marriage.
13. This is particularly the case when, as in Vietnam, women (and men) reside with their parents before marriage,and with their spouse or spouse's parents after marriage. Before marriage women residing with their parentscontribute to household income, but are unlikely to have as much bargaining power in household decisions asafter marriage, when they are either the head of the household or the spouse of the household head.
14. One could argue that resource constraints in the parents' household have an important bearing on theirchildren's fertility preferences and, because of private transfers between parents and children, could also berelevant for the resource constraints of the decisionmaking couple.
15. As Benefo and Schultz (1994) point out, using per capita expenditure or the per adult equivalent is notappropriate because the construction of these measures results in a ''direct feedback effect" of fertility. A measure
Household Welfare and Vietnam's Transition
Notes 318
similar to that used here is also used in other recent analyses of fertility data from Living Standards Surveys(Montgomery and Kouame 1993; Ainsworth 1989).
16. A joint F−test for the commune variables is significant at the 1 percent level.
17. It could be argued that schooling also has a biological effect on fertility through improved nutrition forwomen, but the evidence on the relationship between nutrition and fertility is relatively weak and shows thatexcept in cases of extreme nutritional stress, the nutritional effects are weak if not nonexistent.
18. The land variable refers to the land area to which that the household has use rights, which is not necessarilyequal to the area that a household cultivated in the year before the survey.
19. The appropriate measure of land represents the land endowments to which couples have secure use rights atthe time of the family size decision. Area cultivated at the time of the survey might be a poor proxy forendowments, and suffer from endogeneity problems if there is an active rental market in the region. This is aserious limitation of the labor demand hypothesis of Schutjer and Stokes (1984).
20. Schutjer and Stokes (1984) also hypothesize a separate negative effect deriving from the role of land as asource of income security in old age. This land security hypothesis is based on land ownership and the idea thatland and children might be substitute assets for old age security. In the time span covered by this fertility samplethe security role of land might have been unimportant in Vietnam, because the new land law had not gone intoeffect at the time of the survey and commune land allocations were still very important.
21. Another reason for making this assumption is that the sample is entirely rural, and in rural areas the economicoptions for women are considerably more limited than in urban areas. Some data exploration was conducted toascertain whether fertility, in particular the inability to produce sons, could itself have been a reason for separationor divorce. None of the 56 women in the sample who were separated or divorced was childless, and thecomposition of children born to these women shows no striking imbalance in the sex ratio. So it is unlikely thatchildlessness or inability to produce sons was a reason for separation or divorce.
22. A Poisson regression model, a more appropriate specification since children arrive sequentially and shouldtherefore be represented by a counting process, was also estimated and the results were found to be almostidentical to the ordinary least squares results. Since use of instrumental variables in a Poisson regression contextmight not be appropriate, the more conventional approach of using a normal regression model is followed.
23. Results for the first−stage regression, discussed earlier, are shown in the appendix.
24. As will be clear from the following discussion, a more appropriate specification of the model−one thatcontrols for commune−level unobservables−shows that even those who have a year or two of schooling havesignificantly lower fertility.
Household Welfare and Vietnam's Transition
Notes 319
25. Interacting a woman's years of schooling with those of her spouse does not suggest complementarity orsubstitutability between the two forms of human capital.
26. A random effects specification was also tried but rejected in favor of the fixed effects specification.
27. The variables included in the final set of models are the result of substantial exploratory work that is notreported here.
28. See Haughton and Haughton (1994) for a more complete treatment of son preference in Vietnam.
29. The pattern of universal marriage in many developing countries suggests that while timing of marriage mightbe a choice, whether or not to marry might not be.
30. This of course depends on the assumption that before childbirth parents have no way of knowing the sex ofthe unborn child. At least for Vietnam it is reasonable to assume that modern fetus monitoring technology is notwidely available for the purpose of determining the sex of the child.
References
Ainsworth, Martha. 1989. Socioeconomic Determinants of Fertility in Côte d'Ivoire. Living StandardsMeasurement Study Working Paper 53. Washington, D.C.: World Bank.
Allman, James, and others. 1991. "Fertility and Family Planning in Vietnam." Studies in Family Planning 22(5):308−17.
Bannister, Judith. 1985. "The Population of Vietnam." International Population Reports. U.S. Department ofCommerce, Bureau of the Census, Washington, D.C.
Benefo, Kofi Darkwa, and T. Paul Schultz. 1994. Determinants of Fertility and Child Mortality in Côte d'Ivoireand Ghana. Living Standards Measurement Study Working Paper 103. Washington, D.C.: World Bank.
Cleland, John, and Christopher Wilson. 1987. "Demand Theories of the Fertility Transition: An IconoclasticView." Population Studies 41: 5−30.
Desai, Jaikishan. 1995a. "Fertility and Contraception in Vietnam." World Bank, Africa Region CountryDepartment I, Washington, D.C.
______. 1995b. Vietnam through the Lens of Gender: An Empirical Analysis Using Household Survey Data.Hanoi: United Nations Development Programme.
______. 1997. "The Private Sector in Family Planning Services: Demand and Supply Issues." The POLICYProject. Futures Group International, Washington, D.C.
Dong, Do Thai. 1991. "Modifications of the Traditional Family in the South of Vietnam." In Rita Liljestrom andTuong Lai, eds., Sociological Studies on the Vietnamese Family. Hanoi: Social Sciences Publishing House.
Household Welfare and Vietnam's Transition
References 320
Haughton, Jonathon, and Dominique Haughton. 1994. "Measuring Son Preference in Vietnam: Methodology andEvidence." Northeastern University, Department of Economics, Boston, Mass.
Huou, Tran Dinh. 1991. "Traditional Families in Vietnam and the Influence of Confucianism." In Rita Liljestromand Tuong Lai, eds., Sociological Studies on the Vietnamese Family. Hanoi: Social Sciences Publishing House.
Jamieson, Neil L. 1993. Understanding Vietnam. Berkeley: University of California Press.
Jones, Gavin W. 1982. "Population Trends and Policies in Vietnam." Population and Development Review 8(4):783−810.
Montgomery, Mark R., and Aka Kouame. 1993. "Fertility and Schooling in Côte d'Ivoire: Is There a Tradeoff?"Technical Working Paper 11. World Bank, Africa Technical Department, Human Resources and PovertyDivision, Washington, D.C.
Musgrove, Philip. 1996. Public and Private Roles in Health: Theory and Financing Patterns. World BankDiscussion Paper 339. Washington, D.C.
National Committee for Population and Family Planning. 1990. Vietnam Demographic and Health Survey, 1988.Hanoi.
Schutjer, Wayne A., and C. Shannon Stokes. 1984. "Access to Land and Fertility in Developing Countries." InWayne A. Schutjer and C. Shannon Stokes, eds., Rural Development and Human Fertility. New York:Macmillan.
United Nations. 1983. Manual X: Indirect Techniques for Demographic Estimation. New York.
Appendix—Description of the Vietnam Living Standards Survey (VNLSS)
The Vietnam Living Standards Survey (VNLSS) is a nationwide household survey that was conducted betweenOctober 1992 and October 1993. This appendix provides information on the content of the differentquestionnaires and the overall design of the survey.
Household Questionnaire
The VNLSS used three separate questionnaires: a household questionnaire, a community questionnaire for ruralareas only, and a price questionnaire. Each questionnaire contains several modules (sections), each of whichcollects data on different topics. The household questionnaire collects data on household demographic structure,education, health, employment, migration, housing conditions, fertility, agricultural activities, householdnonagricultural businesses, food expenditures, nonfood expenditures, remittances and other sources of nonlaborincome, savings and loans, and anthropometric (height and weight) measurements. The questionnaire wascompleted in two interviews, two weeks apart. Sections 0−8 were conducted in the first interview, sections 9−14were conducted in the second interview, and section 15 was administered in both interviews. The followingparagraphs briefly describe each section.
Household Welfare and Vietnam's Transition
Appendix— Description of the Vietnam Living Standards Survey (VNLSS) 321
Section 0. Survey Information
The date of the interview, the religion and ethnic group of the household head, the language used by therespondent, and other technical information related to the interview are noted in Section 0A. Section 0Bsummarizes the results of the survey visits−that is, whether a section was
completed on the first or the second visit. Section 0C contains written observations and remarks by theinterviewer and the supervisor; these were not included in the computer files.
Section 1. Household Membership
Section 1A lists the age, sex, marital status, and relation to household head of all people who spent the previousnight in the household's dwelling and for household members who are temporarily away from home. Householdmembers were defined to include "all the people who normally live and eat their meals together in this dwelling."Section 1B collects information on the parents of all household members, including their schooling, occupation,and whether they are alive. Section 1C collects information on children of household members who liveelsewhere and are less than 30 years of age. Children who have died are not included. Information on the age,schooling, and current place of residence of each such child is recorded.
Section 2. Schooling
Data were collected on self−reported literacy and numeracy, school attendance and completion, and currentenrollment for all household members of school age and older. For those who were enrolled in school at the timeof the survey, information was also collected on school attendance, distance and travel time to the school,expenses, and scholarships.
Section 3. Health
In this section data on any illness or injury experienced in the four weeks preceding the date of the interview wereobtained for all household members. For those who reported being ill in the past four weeks, information wasobtained on the duration and type of illness, type of care sought, distance and travel time to the health careprovider, and cost of both the medication and the consultation. All individuals, whether ill or not in the past fourweeks, were asked if they had been ill in the 12 months before the survey and, if so, the total amount they hadspent on health care during those months. Finally, several questions on smoking were asked of all individuals sixyears of age and older.
Section 4. Employment
All individuals age six and older were asked to respond to the economic activity questions in Section 4, beginningwith questions on the nature of their work in the past seven days. For persons who did not work in the past sevendays, data were collected on job search and the reason for not
seeking employment. For those who worked in the past seven days, information was collected on hours worked,length of employment, type of employer, distance and travel time to place of work, money and in−kindcompensation, and benefits. Similar questions were asked for any secondary job in the past seven days. Questionswere asked on search for additional employment, including the kind of work sought. If the main work in the past12 months was different from the main or secondary job during the past seven days, the same information wascollected for that work as well. Type of work and years of experience were collected for any occupation held priorto employment in the main job in the past 12 months. Again, if there was a secondary job in the past 12 monthsdifferent from the other jobs, data on work conditions and compensation were collected. Finally, days and hours
Household Welfare and Vietnam's Transition
Section 0. Survey Information 322
spent doing household chores in the past seven days were collected for each respondent.
Section 5. Migration
All household members aged 15 and older responded to the questions on migration in Section 5. If not born intheir current place of residence, respondents were asked their province of birth and whether their place of birthwas a village, town, or city. The age at which individuals left their place of birth was recorded, as well as the mainreason for leaving. In addition, individuals were asked the main reason for coming to their current place ofresidence, the province they had come from before moving to their current place of residence, and whether theprevious place was a village, town, or city. Finally, respondents were asked how many different places they hadlived for periods of more than three months in their life.
Section 6. Housing
This section contains information on the type of dwelling, housing characteristics, and housing expenses for allhouseholds interviewed. Information was collected on the number of rooms in the dwelling, ownership status,wall material, roof material, water source, toilet type, utility expenses, and square meters of living area.Respondents were also asked for the current resale value of the dwelling. The section also contains information ontype of cooking fuel used and, for households whose primary or secondary cooking fuel was wood, the time anddistance involved in collecting wood.
Section 7. Respondents Chosen for Second Interview
Here the principal respondent for round one was asked to identify the household member who knows the mostabout all the agricultural and livestock activities of the household, the household member who shops for
food, and the household member who knows the most about the other household expenses, income, and savingsof household members. The respondent was also asked to identify the three most important businesses and tradesbelonging to the household, and the household members who know most about them. Finally, a woman wasselected at random from among the women in the household between the ages of 15 and 49 to respond to thefertility module.
Section 8. Fertility
In each household one woman aged 15−49, randomly selected in Section 7, responded to the questions in thissection. If a household contained no woman in this age range, Section 8 was not completed. The selected womanis asked if she had ever been pregnant and, if so, whether she had ever given birth. Women who respond that theyhave are asked the birthdate and sex of all children they have given birth to, including children who died. If thechild is no longer alive, the woman is asked how long the child survived. The woman is asked about the birth andbreast−feeding of her last child, the age at which she was married, and the number of miscarriages she has had.Section 8B gathers information on knowledge, use, source, and cost of six modern and six traditional methods offamily planning.
Section 9. Agropastoral Activities
This section is by far the largest section of the household questionnaire, with many subsections that containinformation on different aspects of agricultural production and related livestock activities−collectively referred toas agropastoral activities. Section 9A collects information on a household's control over land of different tenures.These include land allocated by the commune, auctioned land, privately held land, rented or sharecropped land,swidden land, cultivated water surface, and forest land. Section 9B contains detailed output information for allcrops grown by the household. This information is obtained separately for each crop and includes (in most cases)
Household Welfare and Vietnam's Transition
Section 5. Migration 323
information on quantity produced, value of output, quantity sold in the market, quantity given to the cooperative,quantity kept for seeds, quantity fed to livestock, and quantity given as gifts. Section 9C contains information oncrop by−products. Section 9D obtains detailed crop−specific information on inputs (seeds, manure, fertilizer,insecticides, and so on) and transportation costs. Information on other inputs, such as hired labor and packing andstorage costs, are obtained at an aggregated level for each household. Section 9E contains information on fooditems produced by transforming home−grown crops, if they were subsequently sold. Section 9F collectsinformation on livestock, poultry, and other animals owned by the household. Section 9G collects informa−
tion on animal products, such as milk, eggs, silk, and manure, and section 9H collects similar information forwater animals (fish, shrimp, and so on). Section 9I collects information on extension services for livestock, andsection 9J contains information on livestock expenditures. Finally, sections 9K and 9L collect data on farmimplements and machinery owned by the household, respectively.
Section 10. Nonfarm Self−employment
Section 10 gathers data on household businesses for the three most important enterprises operated by thehousehold. The respondent for each enterprise is the household member most familiar with its operation (asidentified in Section 7). Data are gathered on the ownership, number of employees, and type of employeecompensation for each enterprise. For each business, expenditures over the past 12 months on wages, rawmaterials, and taxes are collected. The respondent is asked how much, in money and goods, was received fromsales and how much of the enterprise's product was consumed by the household since the first interview.Information on ownership, sales, and purchases of assets−buildings, land, vehicles, tools, and other durablegoods−in the past 12 months is also collected.
Section 11. Food Expenses and Home Production
Section 11A records the amounts spent on holidays, primarily Tet (new year) but also January 15, July 15, theAutumn Moon Festival, and Independence Day. The main reason for separating holiday expenses from normalexpenses, a departure from the standard Living Standards Measurement Survey (LSMS) format, is to take intoaccount the fact that in Vietnam Tet often results in significant departures from normal spending patterns. Section11B collects detailed information on market purchases (including those obtained through barter) and consumptionfrom home production for 45 food items. Information is obtained for expenses since the interviewer's first visit.For a longer recall period (12 months) data are obtained on the number of months (in the preceding 12 months)each food item was purchased, the number of times purchases were made during those months, the quantitypurchased each time, and the value per purchase.
Section 12. Nonfood Expenditures and Inventory of Durable Goods
This section collects information on nonfood household expenditures from the household member identified inSection 7 as the one most able to answer nonfood expenditure questions. In Section 12A respondents were askedto recall the amount spent since the first interview (approximately
two weeks) on daily expenses such as lottery tickets, cigarettes, soap, personal care products, cooking fuel,matches and candles, and gasoline. In Section 12B expenditure data, both in the past two weeks and the past 12months, were collected for shoes, cloth, clothing, home repairs, public transport, paper supplies, kitchenequipment, medical services, domestic servants, jewelry, entertainment, and other goods. Purchase price, year ofpurchase, and resale value of durable goods owned were collected in Section 12C. Relation and location of therecipients of remittances sent out from the household are noted in Section 12D (remittances received by thehousehold are recorded in Section 13A).
Household Welfare and Vietnam's Transition
Section 10. Nonfarm Self−employment 324
Section 13. Other Income
Section 13 collects data on money and goods that come into the household as remittances or from other sourcesunrelated to employment, such as employee welfare funds, dowries, sales of consumer durables, rental ofbuildings, and so on.
Section 14. Credit and Savings
Section 14 collects information on the amount of money owed by household members to people or institutionsoutside the household. If money or goods have been borrowed, or borrowed and repaid by any household memberin the past 12 months, information is collected on those loans, including the source and amount of the loan,interest, side payments, collateral, repayment schedule, reason for borrowing, and number of loans from the samesource. The household is asked to list different types of savings, if any, including bank deposits, bonds, cash(dong), U.S. dollars, gold, and value of paddy. The respondent is also asked the total value of all savingsaccounts.
Section 15. Anthropometries
Anthropometric measurements are completed for each household member. Data were collected on weight, height,and arm circumference. It was also noted if female respondents were pregnant or breast−feeding. If a person wasnot measured the reason why is noted.
Community Questionnaire (Rural Areas Only)
A community questionnaire was administered by the team supervisor and completed with the help of localgovernment officials, teachers, health care workers, and knowledgeable farmers. The questionnaire wasadministered only in rural areas. Section 1 (Demographic Information) includes the population of the community,a list of principal ethnic groups and religions,
the age of the community, and whether it has grown in the past five years. Section 2 (Economy and Infrastructure)collects data on the community's principal economic activities and its access to a motorable road, electricity,pipe−borne water, restaurant or food stall, post office, daily market, and public transport. There are also questionson employment, migration for jobs, and the existence of community development projects.
In Section 3 (Education) the community questionnaire asks the distance to primary and middle schools. For up tothree primary schools, and for the nearest lower− and upper−secondary schools, information is obtained onwhether it is public or private, how many classes there are, and when it was built. Enrollment rates and reasonswhy children do not attend school are also collected. Section 4 (Health) collects data on distance and travel timeto the nearest of each of several types of health workers (doctor, nurse, pharmacist, midwife, bonze, andtraditional healer) and each of several types of health facilities (hospital, dispensary, pharmacy, and clinic). Thequestions in Section 5 (Agriculture) include the type of crops grown in the community, how often and when theyare planted and harvested, and how the harvest is generally sold. This section also includes questions on landquality and type, the use of pesticides and irrigation, and the availability of extension services, agriculturalcooperatives, and machinery. Data are also gathered on the local land market and agricultural and nonagriculturalwages in the community.
Price Questionnaire
In rural areas (commune numbers 1 to 120) price data were collected by the team supervisor for 36 food items, 31nonfood items, 9 medicines, 7 insecticides and fertilizers, and 5 types of services from local markets. A separate
Household Welfare and Vietnam's Transition
Section 13. Other Income 325
set of prices is available for urban areas (commune numbers 121 to 150). These were collected by the GeneralStatistical Office as part of a separate effort to construct price indices in Vietnam, and their values are comparableto those of rural prices.
Sample
The remaining sections of this appendix discuss the design of the survey, particularly the sample, surveymanagement, and organization of the field work. The sample covers 4,800 households from all areas of Vietnam.The sample design was self−weighted, so that each household in Vietnam had the same probability of beingselected. The overall sampling frame was stratified into two groups, urban and rural, with sampling carried outseparately in each group (strata). About 20 percent of Vietnamese households live in urban areas, so the samplestratification ensures that 20 percent of selected households come from urban areas. Two lists of all communeswere drawn up (one of urban communes and another of rural communes),
province by province, in ''serpentine" order.1 Within each list communes were selected to ensure that they werespread out evenly among all provinces in Vietnam.
The VNLSS sample design is the following. Within each province in Vietnam, rural areas can be broken downinto districts, and districts can be divided into communes (Xa). Urban areas in all provinces consist of centers ortowns, which are divided into quarters (Quan), and then divided further into communes (Phuong). The totalnumber of communes in Vietnam, both urban and rural, is about 10,000, and the average population in each isabout 6,500. Each survey team covers 32 households in four weeks, 16 households in one area and 16 in anotherarea. For convenience all 32 households were selected from the same commune. This implied that 150 communeshad to be randomly selected (32 × 150 = 4,800), 30 in urban areas and 120 in rural areas. Within urban areascommunes can be further divided into clusters (Cum). Two clusters were selected from which to draw two"workloads" of 16 households (16 from each of the two clusters). The same was done in rural areas, where eachcommune is divided into several villages (Thon). The average size of urban clusters and rural villages is slightlyless than 1,000 households.
The VNLSS sample was drawn in three stages. Because the General Statistical Office in Hanoi knows the currentpopulation of all 10,000 communes in Vietnam (but not of each cluster or village within each commune), 150communes were selected from the 10,000 with a probability of selection proportional to population size. At thesecond stage information was gathered from the 150 selected communes on the population of each cluster (inurban areas) or village (in rural areas), and two clusters or villages were randomly drawn with a probabilityproportional to population size. Finally, the third stage involved randomly selecting 20 households (16 for thesample plus 4 "extras" to serve as replacements if any of the 16 "originals" could not be interviewed) within eachcluster or village from a list of all households within each cluster or village. Note that the first stage of the sampleis based on information from the 1989 Census, but the second and third stages use updated information availablefrom the communes. The first and second stage samples were drawn in Hanoi, while the third stage was drawn inthe field.
Survey Management
The VNLSS was jointly managed by the State Planning Committee (SPC) and the General Statistical Office(GSO) of Vietnam.2 At the highest level of management was a steering committee consisting of four persons−onedirector and three vice directors. Immediately below this committee was a standing committee (also known as the"working group") of six persons, three from the SPC and three from the GSO. The standing committee did muchof the detailed work, such as preparing questionnaires and manuals,
Household Welfare and Vietnam's Transition
Sample 326
organizing training courses, and managing day−to−day survey activities. Both the steering committee and thestanding committee were based in Hanoi.
The survey itself was carried out by 15 teams, each composed of six members: one supervisor, two interviewers,one anthropometrist (anthropometrician), one data entry operator, and one driver. Eight teams were located innorthern Vietnam (either based in Hanoi or in some other major city) and seven teams were based in the midlandsor the south (two based in Da Nang, three in Ho Chi Minh City, and two in the Mekong Delta). As in other LSMS(World Bank) surveys, data entry was done in a decentralized manner (described below), which allowed forinterviewers to return to households to check errors detected by the data entry program.
Organization of Field Work
When a team arrived in a village (rural areas) or cluster (urban areas), the supervisor met with local authorities toexplain the purpose of the survey and distribute materials for publicity and letters to the households selected to besurveyed. The 20 households (16 original and 4 replacement) randomly drawn in each village or cluster wereselected by the supervisor immediately after arriving in the village or cluster, following detailed instructions givenin the supervisor's manual.3 The supervisor also filled out the community and price questionnaires incollaboration with the anthropometrist.
The household questionnaire was completed by the interviewers in two separate interviews. The first visit (round1) covered Sections 0−8, while the second visit covered Sections 9−14. Section 15 (anthropometricmeasurements) was completed by the anthropometrist during both visits. The typical interview time forcompleting half of the questionnaire (one round) was intended to be two to three hours; thus about four to sixhours would be required over two separate visits for one completed household questionnaire. Each teamcompleted 32 household interviews during each four−week period, 16 per team interviewer. Round 1 (Sections0−8) was conducted in one cluster or village in the first week. The next week consisted of completing round 1 inthe other cluster or village in the same commune. In the third week the team returned to the first cluster or villageand completed the remainder of the questionnaire (Sections 9−14) for each household. The same was done in thesecond cluster or village in the fourth week.
The decentralized data entry was done as follows. After completing the first half of the household questionnaire(Sections 0−8) in the first cluster or village during the first week, all 16 half−completed questionnaires were givento the data entry operator located at the team's base, who then entered the data on a personal computer using acustomized data entry program. The data entry program performed range and consistency
checks on all data in the questionnaire and produced reports (lists) of all data for which problems arose. Uponreturning to the first village in the third week to complete the questionnaire (and, similarly, upon returning to thesecond village in the fourth week) discrepancies detected by the data entry program could be corrected. After fourweeks of work were completed in a given cluster or village, the teams either moved to the next commune or tooka one−week break.
Duties of the supervisor also included observing some interviews and randomly revisiting some of the interviewedhouseholds to check the quality of the work done by the interviewer. A complete description of these and othersupervisory tasks are found in the supervisor's manual.
The field work for the VNLSS began in October 1992 and ended in October 1993. Although the first two weekswere difficult, due to the complexity of the survey, work proceeded smoothly thereafter. In addition tosupervisory visits by members of the steering and standing committees, two international consultants madesupervisory visits to all teams in the early months of the survey.
Household Welfare and Vietnam's Transition
Organization of Field Work 327
Notes
1. Serpentine ordering ensures that provinces that are adjacent to each other geographically are adjacent on thelist.
2. In 1995 the State Planning Committee was reorganized and is now called the Ministry of Planning andInvestment.
3. There were also one or two communes in which the villages or clusters themselves needed to be chosen(because the necessary information had not been received in Hanoi in time). In these cases the supervisor alsomade the selection, again following detailed instructions in the supervisor's manual.
Household Welfare and Vietnam's Transition
Notes 328