measuring welfare state performance: three or two worlds of welfare capitalism?
TRANSCRIPT

Luxembourg Income Study Working Paper No. 276
MEASURING WELFARE STATE PERFORMANCE:THREE OR TWO WORLDS OF
WELFARE CAPITALISM?
Paul de BeerCok Vrooman
Jean Marie Wildeboer Schut
Maxwell School of Citizenship and Public AffairsSyracuse University
Syracuse, New York 13244-1020
May 2001
LIS is a division of the Center for the Study of Population, Poverty and PublicPolicy (CEPS)/International Networks for Studies in Technology, Environment,Alternatives, Development (INSTEAD) in Differdange, Luxembourg.

MEASURING WELFARE STATE PERFORMANCE 3
Measuring Welfare State Performance:
three or two worlds of welfare capitalism?
Paul de Beer Cok Vrooman Jean Marie Wildeboer Schut
Social and Cultural Planning Offi ce in the Netherlands The Hague, May 2001

MEASURING WELFARE STATE PERFORMANCE 5
Abstract
This paper examines the well-known classifi cation of welfare regimes by Es-ping-Andersen (1990). First, the institutional characteristics of eleven welfare states are examined by means of a principal components analysis. This analysis confi rms the existence of three types of welfare state, viz. the liberal welfare state (USA, Australia, United Kingdom and Canada), the social-democratic wel-fare state (Sweden, Denmark, Norway) and the corporatist welfare state (Ger-many, Belgium, France). The Netherlands, however, turns out to be a hybrid kind of welfare state, somewhere in between the social democratic and the cor-poratist welfare states.Next, we examine whether these three types of welfare state correspond to a threefold classifi cation in terms of the traditional protective functions of the welfare state. By using LIS-data from the fi rst half of the 1990s we compare eleven welfare states with respect to the degree of income levelling by the social security and tax system, the rate of inequality of disposable household incomes, the level of social welfare (interpreted as a combination of income level and income equality) and the poverty rate. We fi nd that there is indeed a clear divi-ding line between the liberal welfare states on the one hand and the social-democratic and corporatist welfare states on the other. The liberal welfare states perform consistently worse on the indicators for income levelling, income (in)equality and poverty, but not with respect to the level of social welfare. There is however no consistent difference in performance between the social-democratic countries and the corporatist countries. There rather seems to be a combined group of continental European countries, existing of both social-de-mocratic and corporatist welfare states and the hybrid Netherlands, that achieve roughly comparable results in terms of income protection by using quite differ-ent institutions. Hence, although there are indeed three types of welfare state as far as institutional arrangements are concerned, it is better to discern only two types of welfare state with respect to income (re)distribution, social welfare en poverty.

MEASURING WELFARE STATE PERFORMANCE 7
Contents
Abstract
1. Introduction 92. Three worlds of welfare state capitalism, plus the Netherlands 103. Hypotheses and data 134. Income redistribution 165. Income inequality 196. Social welfare 227. Poverty 268. Two or three worlds of welfare state capitalism? 289. The welfare state at the start of the 21st century 32
Annex 1 Decomposition of income redistribution via social security and taxation 34Annex 2 Income inequality indexes 36Annex 3 Inequality rankings for seven inequality indexes 38 References 39Notes 41

MEASURING WELFARE STATE PERFORMANCE 9
1. Introduction
Western welfare states came under heavy fi re in the 1980s and 1990s. Many of the social and economic problems with which Western European countries were grappling were attributed partially, or even primarily, to the inadequate functioning of the welfare state. Whether it comes to the high unemployment level, low level of labour force participation, sluggish economic growth, high burden of taxation and social security charges or the sizeable national debt for each of these problems an accusing fi nger was frequently pointed at the welfare state. Whereas the welfare state had come under criticism in the 1970s for its inability to compensate suffi ciently for the socially undesirable consequences of the free market, in the 1980s and 1990s it was accused of interfering with the smooth operation of market forces. Put differently, from being a solution to the problems of a modern capitalist society, the welfare state itself increasingly was considered the problem, to which a strengthening of market forces was the obvi-ous solution.
The widespread and indeed often justifi ed criticism of the functioning of the welfare state means, however, that the very reason why the welfare state came into being in the fi rst place is at risk of being lost out of sight. Whatever the shortcomings of the present day welfare state may be, it is also undeniable that a free, unregulated market is subject to all sorts of imperfections. One need only refl ect on what a modern society would look like without the institutions and arrangements of the welfare state in order to realize that, had the welfare state not existed, it would have had to be invented after all. A developed modern soci-ety without a welfare state is simply inconceivable. Over the past ten years, the emphasis on the inadequacies of the welfare state has defl ected attention from the fulfi lment of its traditional protective role. The observation that a high proportion of a country’s national income is devoted to social security, or that the distribution of earned income is substantially adjusted, tends to be taken as an indication of the disruptive effect of the welfare state rather than of its success.
This paper focuses on the traditional objectives of the welfare state: protection against loss of income, combatting poverty and limiting social inequality. It has long been known that the extent to which the welfare state fulfi ls these tradi-tional functions varies widely among the wealthy Western countries. For some researchers this has provided grounds for discerning a number of ‘types’ of wel-fare state. In the 1970s, for example, Titmuss distinguished three welfare state models: the residual welfare model, the industrial achievement model and the institutional redistributive model (Titmuss 1974). In the fi rst model the welfare state amounts to no more than a social security net; in the second the welfare state is primarily concerned with the protection of (former) employees; and in

10 MEASURING WELFARE STATE PERFORMANCE
the third the welfare state aims at safeguarding the entire population.The threefold division made more recently by Esping-Andersen in The Three Worlds of Welfare Capitalism (1990) has attracted considerable attention in recent years. Diverging from Titmuss, Esping-Andersen does not base his clas-sifi cation on the traditional protective functions of the welfare state, but on the underlying socio-political relationships and labour market policy. Nevertheless his classifi cation of liberal, corporatist and social-democratic regimes largely corresponds with Titmuss’s three welfare state models.
Esping-Andersen’s distinction between three welfare state regimes is based on ‘ideal types’, and only to a limited extent on an empirical analysis of the dif-ferences and similarities between the various welfare states. This paper tries to chart the actual differences between welfare states on the basis of Esping-Andersen’s criteria. To this end eleven welfare states have been measured in terms of varying aspects. First, we examine the empirical base of Esping-Ander-sen’s typology with respect to the institutional features of the eleven welfare states in the fi rst half of the 1990s. Secondly, we try to establish whether the three types of welfare state correspond to a threefold classifi cation in terms of the traditional protective function of the welfare state with respect to income (re)distribution, social welfare and poverty. Section 2 concentrates on the fi rst question, the categorization of the welfare states on the basis of their institutional characteristics. In section 3 a number of hypothesis with regard to the outcomes of the protective arrangements of the welfare state are formulated. In sections 4 through 7 these hypothesis are sub-jected to empirical tests, using data from the Luxembourg Income Study. Sec-tion 4 compares the welfare states regarding the extent of levelling of income inequality. Section 5 investigates the outcomes of the redistribution policies in terms of inequality of disposable household incomes. In section 6 the level of average income is also taken into account in order to calculate different mea-sures of social welfare. In section 7 the differences in performance with respect to combatting poverty are considered. In section 8 we give an overall assess-ment of the social performance of the different welfare states and try to answer the question whether there are really three types of welfare state. Since the results in the preceding sections refer to the situation at the beginning of the 1990s we fi nish with some refl ections on the relevance of the analyses for assessing the present-day welfare state.
This paper is based on our book On Worlds of Welfare (Wildeboer Schut et al. 2001), published by the Dutch Social and Cultural Planning Offi ce.
2. Three worlds of welfare state capitalism, plus the Netherlands
This section examines the extent to which countries may indeed be clustered into three types on the basis of the institutional features of their welfare state.

MEASURING WELFARE STATE PERFORMANCE 11
This seeks to provide empirical support for the three Esping-Andersen welfare state types. To this end a principal components analysis has been conducted on 58 institutional characteristics of eleven western welfare states, namely Austra-lia, Belgium, Canada, Denmark, France, Germany, the Netherlands, Norway, Sweden, the United Kingdom and the United States. The choice of these coun-tries is based on their central position in Esping-Andersen’s classifi cation, and on the availability of comparative empirical data on income distribution needed for the further analysis in this paper (see below). The institutional characteristics in terms of which the countries have been compared with one another concern the funding of the welfare state (including tax rates and social security contribu-tions), the regulation and structure of the labour market (including the minimum wage, collective agreement coverage rate, labour force participation of women and older people and the share of the service sector in employment), and the level and coverage of the social security provision for old age, surviving depen-dants, children, disability, unemployment and social assistance.
The data used for the empirical institutional analysis are taken from various sources, especially the OECD (1988, 1994a, 1994b, 1995, 1997), the US Depart-ment of Health & Human Services (1991), and Bradshaw et al. (1993). They relate to the early 1990s, because the analysis of income distribution and pov-erty in the remainder of the paper also largely concerns the fi rst half of the 1990s. Moreover, an analysis based on fi gures from the early 1990s is an updatement of the original (limited) analysis of Esping-Andersen (1990), which related to the early 1980s. The application of the non-linear principal compo-nent analysis (Princals or ‘principal components analysis by alternating least squares’) results in an optimal scaling of both the countries and the institutional characteristics, in which countries that share a lot of characteristics get similar scores on the dimensions, while countries that have not much in common are placed far apart. Figure 1 shows the scaling of both the countries and the insti-tutional characteristics.
In broad terms the analysis of these welfare state characteristics confi rms Es-ping-Andersen’s threefold classifi cation, although there are a number of not insignifi cant differences. Sweden, Denmark and Norway form a cluster of social-democratic welfare states. Within this cluster Sweden turns out to share its position as a country which most closely approximates the ideal-type of a social-democratic welfare state with Denmark. Norway has a less pronounced social-democratic regime. These social-democratic welfare states are character-ized by a comprehensive system of social protection. The high level of social services is revealed by, among others, the high replacement rate for unemployed families with children and the relatively high level of the old age and survivors pension schemes. These generous social security benefi ts result in high aver-age and marginal tax rates. The social-democratic countries also spend large amounts on active labour market policies. The labour force participation of women is high, which is facilitated by generous parental leave schemes.

12 MEASURING WELFARE STATE PERFORMANCE
Germany, Belgium and France form a cluster of corporatist welfare states, which it is not possible to rank in terms of ‘purity’. Characteristic for the cor-poratist welfare states are the generous unemployment and disability insurance schemes for (former) employees. The position of the traditional male bread-winner is also safeguarded by the protective services for children and parent-hood, e.g. relatively high child benefi ts and long-term pregnancy, childbirth and parental leave. In the fi eld of labour relations the collective agreement plays a central role. Both the labour participation of women and of older men is much lower than in the social-democratic countries
Figure 1 Scaling of 11 countries and 58 characteristics of welfare institutions (Princals object and category quantifi cations)
CORPORATIST FEATURES:Labour market:- moderate active labour market policy (0.5 - 0.8% GDP)*- low labour participation rate of women aged 25-54 (<65%)*- low labour participation rate of men aged 55-64 <60%)- low labour participation rate of men aged 65+ (<5%)- high coverage of collective labour agreements (>90%)- low share of employment in services sector (<65%)Disability:- risque social: coverage restricted to (certain) employees- risque social: moderate threshold (65-79%)*- risque social: wage related benefits- risque professionel: full wage compensationFunding:- largely financed by contributions of employers/employees (>50%)- no tax allowances for non-working spousesSurviving dependants pensions:- no collective widow insurance for all inhabitants*Occupationalism:- frequent arrangements for particular occupational groups- high level of social protection for civil servants (>$500 per capita)Costs of children:- relatively high family allowances for non-poor couples - relatively low family allowances for poor single parent families- high tax allowance for childrenLeave facilities:- long duration of parental, pregnancy, and childbirth leave (incl. non-paid period>1,5 y)
SOCIAL-DEMOCRATIC FEATURES:Labour market:- intensive active labour market policy (>1.1 % BNP)*- high labour participation rate of women aged 25-54 (>75%)*- large share of employment in health/social work (26-30%)- no statutory minimum wageDisability:- risque social: low threshold (<65%)*Unemployment and social assistance:- high net replacement rate after 5 years unempl., families with children (>71%)- high net replacement rate after 5 years unempl., single parent families (>69%)Funding:- high marginal tax rate breadwinners (62-64%)- high average rate of income tax and social security contributions (>26%)Old age pensions:- high minimum level of public benefits non-ex-employees- high coverage of earnings-related occupational pension schemes (100%)Surviving dependents pensions:- public insurance widows: high flat rate benefit*- no separate public insurance for widows of former employeesCosts of children:- relatively low family allowance poor couples with childrenLeave facilities:- long duration of earnings-related parental, pregnancy, and childbirth leave (>26 weeks)
-2,0
-1,5
-1,0
-0,5
0,0
0,5
1,0
1,5
2,0
-2,0 -1,5 -1,0 -0,5 0,0 0,5 1,0 1,5 2,0
FB
D
NL
N
S
DK
UK
CAN
AUS
USA
(b) Shared corporatist and liberal features (=complement of social-democratic characteristics)**
(a) Shared corporatist and social-democratic features (=complement of liberal characteristics)**
Sources: see appendix
(c) Shared liberal and social-democratic features (=complement of corporatist characteristics)**
* Multiple nominal scaling** For ordinally scaled variables
a
b
c
LIBERAL FEATURES:Labour market:- little active labour market policy (<0,8% GDP)*- moderate labour participation rate women (65-74%)*- large share of employment in wholesale and retail business (>22%)- large share of employment in financial services (>11%)Disability:- risque social: high threshold (>80%)*Funding:- no tax exemptions on labour (at the wage level of an average production worker)- low yield of taxes and social security contributions (<38%)- no or low employers contributions for social security (max. 8%)- low marginal tax rate single persons (<43%)- low marginal tax rate double earners (<42%)Unemployment and social assistance:- short duration of earnings-related unemployment insurance (non means-tested) (max. 1 year)- low net replacement rate at the start of unemployment for wage of 2/3 average production worker (60-69%)- low net replacement rate at the start of unemployment for wage of average production worker (60-69%)- low net replacement rate after 5 years unemployment, single persons (<39%)- low net replacement rate after 5 years unemployment, couples without children (<50%)- high share of means-tested social assistance in total social security spending (>15%)Old age pensions:- public benefits are partially or completely means-tested Surviving dependants pensions:- public insurance widows: low flat rate benefit*- public benefits are partially or completely means-testedCosts of children:- low level of public provisions- low average family allowances (< €140)- family allowance income-related or means-tested- relatively low family allowance for non-poor single parent familiesLeave facilities:- low level of pregnancy benefit (<70% of earnings)- no pregnancy leave for all employed women

MEASURING WELFARE STATE PERFORMANCE 13
The United Kingdom, Canada, Australia and the United States form a liberal Anglo-Saxon cluster. As expected, the United States turns out to be the predomi-nant liberal welfare state, followed at a short distance by Australia. The UK and Canada are at a signifi cantly greater distance from the liberal ideal-type, and also share certain institutional characteristics with the social-democratic welfare states. The social security systems of the liberal countries can in many respects be characterized as ‘residual’. The replacement rate of most benefi ts is relatively low and they have a limited duration. Much emphasis is put on means-tested social assistance schemes. A distinguishing feature of the collectively fi nanced social security for the old age is the relatively low fl at rate benefi t. There are few public facilities for children or parentage. The labour market is hardly regulated at all. Although not many public resources are spend on active labour market policies, the participation rate of women is higher than in the corporatist coun-tries.Classifying the Netherlands provided Esping-Andersen with some problems. Although he is inclined to consider the Netherlands one of the corporatist coun-tries, he recognizes that it also has some social-democratic features. In a recent publication Esping-Andersen acknowledges the fundamental ‘hybrid’ character of the Dutch welfare state: “the Netherlands remain a Janus-headed welfare regime, combining both social democratic and conservative attributes” (Esping-Andersen 1999: 88). The foregoing empirical analysis confi rms this judgement of the Netherlands as a ‘hybrid’ welfare state, roughly half-way between the social-democratic and the corporatist type. On the one hand the Netherlands share the typical social-democratic characteristics of high replacement rates and high tax rates and the low degree of selectivity of the social security system. On the other hand, the fi nancing of social insurance out of levies on employers and employees, the low labour force participation of women and older men and the moderate expenses on active labour market policies are consistent with the typi-cal corporatist welfare states.
On the basis of this analysis of institutional characteristics, three welfare state types may therefore indeed be identifi ed, although the Netherlands does not fi t into that classifi cation. In the remainder of this paper we will examine whether these three welfare state types also refl ect three categories of outcomes with respect to the income protective arrangements of the welfare state.
3. Hypotheses and data
The classifi cation of the eleven welfare states into three clusters plus the Neth-erlands as a hybrid welfare state has been taken as the point of departure for the empirical analysis in the rest of this paper. Whereas the traditional welfare state functions of income protection and income redistribution play a subordi-nate role in Esping-Andersen’s analysis, we focus on the extent to which his typology is also relevant for these functions. We start by formulating a number of hypotheses, broadly coming down to the supposition that the traditional func-

14 MEASURING WELFARE STATE PERFORMANCE
tions of the welfare state are ‘best’ fulfi lled by the social-democratic welfare states and least well by the liberal welfare states, with the corporatist welfare states somewhere in between. The expectation is that within the clusters the countries which approximate the ideal-type most closely will exhibit the most ‘extreme’ scores. In other words, Sweden and Denmark will form one end of the spectrum on the basis of the hypothesis and the United States the other.
The hypotheses tested are:
1. Redistribution: The levelling of the income distribution by means of income transfers through the tax and social security system is the least extensive in the liberal states and the most extensive in the social-democratic states, while the corporatist states occupy an intermediate position.
2. Income inequality:The distribution of disposable household income is most unequal in the liberal states and most equal in the social-democratic states, with the corporatist states following close to, but a little behind the social-democratic states.
3. Social welfare:a. There is a trade-off between the equality of disposable income and the average income level: the more the distribution of disposable income in a country is equalized, the lower its average income level will be.b. In the liberal states the inequality is largest, but the average income level is highest; in the social-democratic states inequality is smallest, but the average income level is much lower; in the corporatist states income inequa- lity is slightly larger than in the social-democratic states, while they have a similar average income level.c. The ranking of the countries with respect to social welfare depends on the weight that is attached to the inequality and the level of disposable income respectively. The more weight is attached to the income distribution, the higher the social welfare ranking of the social-democratic welfare states and the lower the ranking of the liberal states will be.
4. Poverty:The poverty level is highest in the liberal states and lowest in the social-demo-cratic states, while the corporatist countries occupy an intermediate position.
Since the Netherlands are not classifi ed in one of the three welfare state types, but are placed in between the social-democratic and the corporatist countries, it is hypothesized that they also occupy a position between the social-democratic and the corporatist countries with respect to the four aspects of income policy that are tested in the next sections.

MEASURING WELFARE STATE PERFORMANCE 15
As is clear from these hypotheses, the attention is confi ned to the impact of the welfare state on the level and distribution of (disposable) income. Other highly important functions of the welfare state the provision of facilities in the fi eld of health care, care of the elderly, education, housing, child care and so on have been left out of account. Hence, this paper does not pretend to describe the effects of various types of welfare state on all aspects of individual and collec-tive welfare. (The performance of different European welfare states on these other aspects has recently been examined in the report The Netherlands in a European Perspective of the Social and Cultural Planning Offi ce.)
Another limitation of this paper is that the differences in outcomes in relation to the distribution of income, income level and poverty are solely related to the welfare state type. Needless to say, these differences are also affected by many other determinants, such as demographic and economic factors (e.g. population size and growth, age structure, state of the economy and sectoral structure). However, given the limited number of eleven countries on which the necessary income data were available, it has not been possible to conduct a (multivariate) analysis taking account of multiple background characteristics.
The empirical analysis of the income effects of various welfare states has been carried out using data from the Luxembourg Income Study (LIS).1 Most of the analyses were conducted on data from the early 1990s. Data on the mid-1990s were available for only a limited number of countries at the time this research was carried out (Canada, Germany, the Netherlands, Norway, the UK and the US). The LIS agency seeks to promote the comparability of the data as far as pos-sible. Nevertheless the data of various countries have limitations that inhibit effective comparison. This applies in particular to the data of France, Canada and Sweden, which lack data on social security contributions, while the Swed-ish database employs a different household defi nition (treating children aged 18 and over who are living at home as single households). The results for these countries need therefore to be interpreted with some caution. In the case of the Netherlands use was not made of the database forming part of the LIS (SEP, the Socio-Economic Panel of Statistics Netherlands) but of the Income Panel Survey (IPO, again of Statistics Netherlands). This was done because the scale and reliability of the income data provided by the treasury in the IPO guarantee a higher level of precision than the SEP.
The next four sections present the results of the empirical testing of the hypo-theses. The results of the analyses are once more reviewed as a whole in section 8 with the aim to arrive at a more general judgement concerning the usefulness of Esping-Andersen’s three-fold classifi cation for assessing the extent to which welfare states fulfi l their traditional functions.

16 MEASURING WELFARE STATE PERFORMANCE
4. Income redistribution
In a developed welfare state, the income transfers via the system of social secu-rity and the tax system go hand in hand with a substantial redistribution of income from higher to lower income groups. A priori one might expect that the social-democratic welfare states would display the greatest income levelling, followed by the Netherlands and the corporatist welfare states, while such level-ling would be least pronounced in the liberal welfare states (hypothesis 1).
Figure 2 Lorenz curve of primary (earned) income and concentration curves of social security ben-efi ts and gross income, Netherlands, 1996
In this section the redistribution of income is analysed in two steps. In the fi rst step the reduction in inequality of earned income by way of the social security system is calculated. In the second step the reduction in inequality of total gross income (including social benefi ts) by way of the tax system is calculated. Fig-ures 2 and 3 illustrate these two steps in the case of the Netherlands using so-called Lorenz curves and concentration curves (cf. Lambert 1993). The Lorenz curve of earned income in Figure 2 represents the cumulative share in total earned income of the x% of the population with the lowest earned income. The concentration curve of the social security benefi ts refl ects the share of the total
0 10 20 30 40 50 60 70 80 90 1000
10
20
30
40
50
60
70
80
90
100
cumulative share of primary income (%)
Lorenz-curve of primary income
concentration curve of gross income
concentration curve of social security benefits
45 o

MEASURING WELFARE STATE PERFORMANCE 17
outlays on social benefi ts that is received by the x% of the population with the lowest earned income. The fact that this curve is everywhere above the diago-nal (the 45° line) means that the lower income groups receive a higher share of social benefi ts than the higher income groups. I.e. social benefi ts reduce the inequality of the distribution of earned income. This appears from the fact that the concentration curve of gross income, which shows the cumulative share of total gross income of the x% of the population with the lowest earned income, lies above the Lorenz curve of earned income. The area of the segment between the Lorenz curve and the concentration curve of gross income is an indicator of the magnitude of the levelling by the social security system.
Figure 3 shows the redistribution by the tax system and social security contribu-tions. The concentration curve of taxes, i.e. the share of total taxes and social security contributions paid by the x% of the population with the lowest gross income, is below the Lorenz curve of gross income, showing that the Dutch tax system is progressive: the lower income groups pay a smaller part of their gross income in the form of income tax and social security contributions than the higher income groups. The resulting concentration curve of disposable income is therefore closer to the diagonal than the Lorenz-curve of gross income, mea-ning that taxation also contributes to the levelling of the income distribution.
Figure 3 Lorenz curve of gross income and concentration curve of levies and disposable income, Netherlands, 1996
0 10 20 30 40 50 60 70 80 90 1000
10
20
30
40
50%
60
70
80
90
100
cumulative share of gross income (%)
concentration curve of levies
Lorenz-curve of gross income
concentration curve of disposable income
45 o

18 MEASURING WELFARE STATE PERFORMANCE
The size of the income levelling can be measured by means of the Gini coeffi -cient, which is defi ned as twice the area between the Lorenz curve and the diag-onal. The difference between the Gini coeffi cient of the distribution of earned incomes and the Gini of the distribution of gross incomes measures the extent of levelling by the social security system, while the difference between the Gini coeffi cient of the distribution of gross incomes and the Gini of the distribution of disposable incomes measures the amount of levelling by taxation. Table 1 shows the results of these calculations.
Table 1 Redistribution of income Gini coeffi cient reduction of inequality (per-centages)
In all countries income transfers by the social security system are much more important for the levelling of income disparities than taxation. While the tax system does not reduce the inequality of gross income by more than 18% in any country, the levelling of the differences in earned income by social benefi ts even amounts to 19% in the least distributive liberal countries, Australia and the United States. In the other countries the disparities in earned income are reduced by at least a quarter by the social security system. The theoretical expectations, as formulated in the hypothesis with respect to income redistribution, are only partly confi rmed by the empirical analysis. Con-trary to expectations the list is headed not by social-democratic Sweden or Den-mark but by corporatist Belgium and Germany. In Belgium, earned income inequality is reduced by nearly half (46%) by means of taxation and social secu-rity, and in Germany by 42%. In general there seems to be no systematic differ-ence between the social-democratic and the corporatist welfare states. However, it should be noted that the degree of income redistribution via taxation and social security is probably underestimated in the case of Sweden, as no fi gures are available for the social security contributions. In line with the hypothesis, in the liberal welfare states the income differentials
Table 1 Redistribution of income
Gini coefficient reduction of inequality (percentages)earnedincome
gross income
disposableincome
earned � grossincome distr.
gross � disposableincome distr.
earned � disposableincome distr.
Sweden (1992) 0.550 0.343 0.320 38 7 42Denmark (1992) 0.546 0.369 0.328 32 11 40Norway (1995) 0.513 0.380 0.334 26 12 35Netherlands (1996) 0.484 0.335 0.295 31 12 39Germany (1994) 0.550 0.389 0.319 29 18 42Belgium (1992) 0.534 0.348 0.291 35 17 46Canada (1994) 0.509 0.377 0.336 26 11 34United Kingdom (1995) 0.595 0.423 0.379 29 10 36Australia (1989) 0.490 0.398 0.347 19 13 29United States (1994) 0.528 0.430 0.382 19 11 28
Source: LIS, Statistics Netherlands (IPO'96)

MEASURING WELFARE STATE PERFORMANCE 19
are reduced the least by social security and taxation for example by no more than 28% in the United States. In this regard, however, the United Kingdom, with a levelling of 36%, bears more resemblance to a corporatist or social- democratic than to a liberal welfare state.
The fact that the anticipated distinction between the social-democratic and cor-poratist countries does not turn out to exist must primarily be explained by the major infl uence of the size of social security spending on the extent of income redistribution (see Annex 1). On account of the passive nature of the corporat-ist welfare states, many households in these countries are dependent on ben-efi ts. In addition, the ageing of the population affects the size of social security spending. The extent to which social security benefi ts accrue in particular to households with the lowest earned income does not, however, vary substantially between the various countries. The income redistribution by means of taxation and social security contribu-tions is of less signifi cance, so that differences between the countries with respect to the average tax burden and the progressiveness of the levies are of little account for the total levelling of income disparities.
5. Income inequality
The principal hypothesis tested in the analysis of income inequality is that social-democratic welfare states are the least unequal, followed at a short dis-tance by the corporatist group, while the income differentials are widest in the liberal welfare states (hypothesis 2). A complication in testing this hypothesis is that there are many ways of measur-ing income inequality. Different inequality measures do not necessarily result in the same ordering of countries, since they are sensitive to different segments of the income distribution. E.g. the so-called Theil coeffi cient is most sensitive for changes in the tales of the income distribution, while the well-known Gini coeffi cient reacts more strongly to changes in the middle income range. As Jen-kins (1991) remarks: “All inequality measures, even ones related to apparently objective diagrams, inevitably involve value judgments of various kinds, and (...) some of these implicit assumptions are not necessarily desirable.” To over-come the dilemma between either making an arbitrary choice out of the many available inequality measures or overburdening the reader with a lavish amount of inequality fi gures, we have chosen a middle course by summarizing the results of seven different inequality measures. The summary statistics are calcu-lated by means of an analysis of correspondence (Anacor) of a cross table of the seven inequality measures and eighteen observations (for six countries two or more observations are used: apart from an observation around 1990 also obser-vations from the middle of the 1990s). The seven inequality measures used are the Gini coeffi cient, the relative inter quartile distance, the coeffi cient of varia-tion, the variance of log income, the Theil 1 and 2 coeffi cients and the Robin Hood indicator. These coeffi cients are defi ned in Annex 2. The Anacor analysis

20 MEASURING WELFARE STATE PERFORMANCE
results in a fi gure with two dimensions in which countries and inequality mea-sures that have a lot in common are placed close to each other. The fi rst dimen-sion of the fi gure (the x-axis) can be interpretated as a general indicator for the equality or inequality of the income distribution in the respective countries. The second dimension (the y-axis) shows whether some specifi c measures result in a diverging ranking for some particular countries. Annex 3 gives the scores of the countries on the original inequality measures.
The inequality measures are calculated on the basis of two kinds of income dis-tribution. The fi rst is the original unadjusted distribution of disposable house-hold income, as has already been used with respect to the Gini coeffi cient in Table 1. A serious drawback is that this distribution does not tell us much about the comparative welfare of households. For this reason, in comparing household incomes adjustments are often made for differences in size and composition. This is usually done by calculating so-called equivalence scales, which convert household incomes into the ‘equivalent’ income of a single person. A number of methods, both normative and empirical, can be used for determining these equivalence scales (cf. Buhmann et al. 1988). In this paper the (modifi ed) OECD equivalence scale is used. This scale attaches a weight of 1 to the fi rst adult person in a household, a weight of 0.5 to all other adults and a weight of 0.3 to each child. The standardized household income is then calculated by divid-ing the (unstandardized) household income by the sum of these weights. Sub-sequently this standardized household income is attributed to every member of the household in order to get the disposable household income per equivalent adult.
Figure 4 Inequality in disposable household income (non-standardised)a
a Correspondence analysis across seven inequality indicators and 11 countries, various years.
Source: LIS; CBS (IPO'91, '95, '96)
5
3
-0,9
1,1
-1,05 1,35
16
27
4
DK92
S92
equa
l
uneq
ual
N91
NL96NL95
B92
D89
D94F89
CAN91
CAN94 AUS89USA94
USA91
1 = Theil coefficient2 = Theil coefficient (2)3 = Gini coefficient4 = Rel. Interquartile distance 5 = Robin Hood indicator6 = Variation coefficient7 = Variance log(income)
UK91
UK95N95
NL91

MEASURING WELFARE STATE PERFORMANCE 21
a Correspondence analysis across seven inequality indicators and 11 countries, various years.Figure 4 shows the results of the analysis of correspondence of the seven inequality measures for the unstandardized distribution of disposable income, in which no adjustments are made for differences in household size. As indi-cated above, the x-axis can be interpreted as the general dimension of the dif-ferent inequality measures. The y-axis turns out to be dominated by the inter quartile distance, which gives a ranking that diverges from the other inequality measures, especially in the case of Denmark and Sweden. The hypothesis that the social-democratic countries are the most equal, is not confi rmed with respect to the unstandardized income distribution. The Nether-lands and Belgium turn out to display the least inequality, and the United King-dom and the United States the most. In between there is a broad middle group, in which the moderate relative inequality of the Scandinavian countries is at vari-ance with the expectation. The high inequality in the United Kingdom is also not consistent with the assumptions on the basis of the empirical country typology.
Figure 5 Inequality in disposable household income, after apportionment to individuals (standardised)a
After standardizing for differences in household size, and assigning this stan-dardized income to all household members, the hypothesis obtains more support (Figure 5). In this case the Scandinavian countries belong to the least unequal group, Germany and France fi nd themselves in the middle and the Anglo-Saxon countries are the most unequal. As a hybrid welfare state, the Netherlands, as expected, fi nds itself in between the Scandinavian cluster on the one hand and
a Correspondence analysis across seven inequality indicators and 11 countries, various years.
Source: LIS; CBS (IPO'91, '95, '96)
5
3
-1,1
0,7
-0,9 1,5
1
6
2
7
4
DK92
S92
equa
l
NL96NL95
B92
D89
D94
F89
CAN91CAN94
AUS89
USA91
USA94
UK91
UK95
N95
N91
NL91
1 = Theil coefficient2 = Theil coefficient (2)3 = Gini coefficient4 = Rel. Interquartile distance 5 = Robin Hood indicator6 = Variation coefficient7 = Variance log(income)
uneq
ual

22 MEASURING WELFARE STATE PERFORMANCE
Germany and France on the other. Belgium is the most important exception to the expected picture, being the least unequal. Therefore Belgium does not fi t into the expected corporatist pattern. The expectations regarding the ranking within the clusters of countries are not confi rmed, even after standardization and assignment. Within the group of social-democratic welfare states Norway turns out to be no more unequal than Sweden and Denmark when starting from comparable baselines (1991/92). Also, there are wide variations within the cor-poratist welfare states. In fact only Germany fi nds itself in the expected posi-tion within the ranking in terms of inequality, fairly close to the Scandinavian countries. As noted, the lack of inequality places Belgium totally outside the expected pattern while the income inequality in France is so pronounced as to tend towards that of the Anglo-Saxon countries. There is also a wide spread within the group of liberal welfare states. Canada is the least unequal, the United States the most and Australia is in between. Although inequality declined to some extent in the United Kingdom during the 1990s and the UK scores less extremely after standardization and assignment than in the unstandardized dis-tribution, the income contrasts are much greater than one would have expected on the basis of the welfare state characteristics. This can partially be explained by trends during the last two decades. In the 1980s the income differentials in this country widened signifi cantly more than elsewhere. In the early 1980s the income inequality in the United Kingdom, when compared with the other liberal welfare states, was more in line with the theoretical expectation (cf. Gottschalk and Smeeding 1998).
6. Social welfare
The ‘appreciation’ of a welfare state is determined not just by the extent to which it reduces social inequality but also by the consequences this has for the material level of welfare. In the most extreme case, the equalization of all income differentials could result in everyone being equally poor instead of equally rich. In this section the hypothesis is tested that there is a negative correlation (trade-off) between the extent of income inequality and the average level of income, and that the various types of welfare state may be divided into clusters in this regard (hypothesis 3). The idea of a trade-off between equality and effi ciency is among the most perva-sive in neo-classical economics (cf. Okun 1975). A levelling of income dispari-ties reduces fi nancial incentives and consequently leads to a reduction of labour supply and worker effort, which ultimately results in lower production and less economic growth. Hence, a lower level of average real income is the price one has to pay for a levelling of incomes. Although recently the existence of this trade-off between equality and effi ciency has been challenged, both on theoreti-cal and on empirical grounds (cf. Atkinson 1999: 28-35, Perotti 1996, Aghion et al. 1999), the idea that a reduction of income inequality exerts a negative infl u-ence on the general welfare level is still dominant among the economic profes-sion.

MEASURING WELFARE STATE PERFORMANCE 23
Figure 6 Inequality reduction and income level (GDP per capita), circa 1990
The existence of a trade-off between income equality and income level seems to be confi rmed by Figure 6, which shows the relation between the reduction of income inequality by the arrangements of the welfare state and the welfare level. The former is calculated as the relative difference between the Gini coeffi cients of the distribution of gross income and the distribution of disposable income. The indicator for the welfare level is gross domestic product (GDP) per capita, calculated in so-called purchasing power parities, which is generally regarded as the best method to compare the wealth of different countries. The liberal welfare states Canada and the United States reduce the inequality of gross incomes the least, but generally have a higher level of GDP per capita than the more equalized social-democratic and corporatist welfare states. The United Kingdom and Australia do not, however, fi t into this picture: they combine a low degree of income levelling with a GDP per capita that is no higher than that in the corporatist welfare states. The correlation between the levelling of incomes and the level of GDP is -0.48, but it does not differ signifi cantly from zero. The link between income equalization and economic performance disappears entirely if one focuses on the rate of economic growth per head of the popula-tion. Figure 7 shows the relation between the reduction of income inequality and the average rate of real economic growth in the period 1985-1997. It turns out that there is even a small, though not statistically signifi cant positive correla-tion (r=0.28) between the levelling of incomes and the rate of economic growth. Social-democratic and corporatist welfare states such as Denmark, Norway and Germany and the hybrid Netherlands, which are among the most redistributive welfare states, realized a higher rate of economic growth per capita than the less redistributive liberal welfare states. Sweden is an exception to this rule: in terms of economic growth it performed by far the worst in the period 1985-1997.
9.500
10.000
10.500
11.000
11.500
12.000
12.500
13.000
13.500
14.000
14.500
25 30 35 40 45 50
GD
P p
er c
apita
(eur
o)
reduction in income inequality (%)
NL
BDKS
CAN
USA
UK
N
DAUS

24 MEASURING WELFARE STATE PERFORMANCE
Figure 7 Inequality reduction around 1990 and annual economic growth (GDP) 1985-1997
The appreciation of the various combinations of income inequality and income level depends ultimately on normative judgments regarding the importance of both aspects. Two extreme views one could adhere to are the maximean and the maximin option. Maximean means that one only attaches importance to the average level of income, irrespective of the degree of income inequality. Maxi-min is the value judgment advocated in John Rawls’ famous book A theory of justice (in which it is called the ‘difference principle’, by the way; cf. Rawls 1971). It implies that only the level of the lowest income group matters for the evaluation of social welfare.2The maximean option can be interpreted as the result of the absence of any aver-sion towards income differences, while the maximin option is an expression of extreme (one could say infi nite) inequality aversion. Atkinson (1970) has shown that one can defi ne a class of utility functions which are characterized by the inequality aversion parameter , that ranges from zero to infi nite inequality aver-sion. This parameter can also be interpreted as the size of the ‘leak’ in the well-known leaky bucket metaphor of Okun (cf. Okun 1975: 91-95). Because of the trade-off between equality and effi ciency, an income transfer from a person with a high income to a person with a low income can be compared to carrying water in a leaky bucket: part of the income one tries to transfer is spilled on the way from the tax-payer to the benefi t recipient. Suppose one wants to increase the income of a poor person (or household) by 1 Euro by means of an income trans-fer. If one fi nds it acceptable that, in order to achieve this result, one has to tap an amount of q Euro from a tax-payer who earns p times as many as the benefi t-recipient (so the relative size of the leak is (q-1)/q), then the inequality aversion parameter is equal to ln q/ln p.
1,0
1,2
1,4
1,6
1,8
2,0
2,2
2,4
2,6
2,8
3,0
25 30 35 40 45 50
GD
P pe
r cap
ita (%
)
reduction in income inequality (%)
BDK
S
CAN
NL
USA UK
ND
AUS

MEASURING WELFARE STATE PERFORMANCE 25
Now, if one defi nes social welfare as the sum of individual utilities, it is possible to compare different combinations of income inequality and average income level by calculating the so-called equally distributed equivalent income (edei). In the hypothetical case that everyone would receive the same income, the edei is the (average) income level that would result in the same level of social wel-fare as the actual income distribution and income level. The ratio of the edei to the actual average income level therefore indicates the proportion of the aver-age income level one would be prepared to sacrifi ce in order to level the income distribution completely. Given the distribution and level of income, the greater the inequality aversion , the lower the level of the edei will be.Table 2 shows the level of the edei for the eleven countries for different values of the inequality aversion parameter. If inequality aversion is zero the maximean option applies, which means that the edei is equal to the actual average income level. In this case the liberal welfare states are relatively high up the league table of social welfare, with the United States and Canada in fi rst and second place. However, Australia and the United Kingdom perform much worse with a shared eighth and tenth place respectively. If one attaches increasingly more importance to income differentials, i.e. the degree of inequality aversion rises, the liberal welfare states sink in the ranking and the social-democratic welfare states, as well as the Netherlands and Belgium, move up. Nevertheless, as the inequality aversion reaches a value of two, it is Canada that takes the lead. But as the degree of inequality aversion increases even further, initially Norway and ultimately the Netherlands occupies fi rst place in the table.3
The position in the table of typical corporatist welfare states such as Germany and France is not strongly correlated with the degree of inequality aversion. These countries are therefore not designated as the ‘best’ in respect of any single preference concerning the trade-off between income inequality and level of income, but are also never designated as the worst. In Sweden the average level of income is so low that the country remains at the bottom of the list, despite the relatively small income differentials. The same applies to the United King-
Table 2 The equally distributed equivalent income (edei) for different degrees of inequality aversion (in euros of 1990), 1989-1992
degree of inequalityaversion
Sweden(1992)
Denmark(1992)
Norway(1991)
Netherlands(1991)
Germany(1989)
Belgium(1992)
France(1989)
Canada(1991)
UK(1991)
Australia(1989)
US (1991)
0 11,563 13,412 13,912 12,786 14,091 11,219 13,136 16,925 13,170 13,526 18,0310.5 11,019 12,739 13,253 12,204 13,278 10,756 12,251 15,793 11,886 12,491 16,3801 10,470 12,122 12,625 11,665 12,541 10,305 11,403 14,697 10,810 11,516 14,7502 9,286 10,892 11,355 10,648 11,066 9,394 9,809 12,490 9,017 9,662 11,5583 7,932 9,514 9,946 9,537 9,407 8,345 8,014 10,134 7,525 7,785 8,5484 6,548 7,917 8,391 7,942 7,622 6,960 5,997 7,791 6,175 5,852 6,036� 441 556 578 584 527 501 461 548 411 445 440
Source: LIS, Statistics Netherlands (IPO'91)

26 MEASURING WELFARE STATE PERFORMANCE
dom, but then particularly because the income inequality is extremely large and the average level of income moderate. Apart from the UK and Sweden therefore the hypothesis is confi rmed that social welfare is greatest in the liberal welfare states if one has little aversion towards income inequality, and greatest in the social-democratic welfare states if inequality aversion is more pronounced.
7. Poverty
Poverty could be called an ‘essentially contested concept’, since there is an abundance of poverty defi nitions and measures. Some even dispute the useful-ness of talking about poverty in the developed welfare states that are discussed in this paper. Nevertheless, gradually there has grown some consensus that even in rich welfare states a substantial proportion of the population is deprived of essential resources to lead a ‘decent life’, considering the standards that apply in these countries. Because of the disagreement about the ‘right’ way to measure poverty, three poverty measures are used in this section. All measures are so-called head count measures, which only calculate the proportion of the population below a predetermined poverty line, but which pay no attention to the intensity of po-verty (i.e. the average income defi cit of the poor compared to the poverty line) or the income distribution among the poor (see Sen 1981 for a discussion of these alternative poverty measures). The fi rst measure utilizes the internation-ally commonly used OECD poverty threshold, which is equal to half of average disposable household income. This is a purely relative poverty measure, which bypasses the ‘absolute core’ of poverty - falling below the income level at which the customary needs in society are met. Therefore the OECD poverty measure should in fact be considered a specifi c measure of income inequality, focusing on the bottom half of the income distribution. The second measure is an absolute poverty measure, in the sense that it applies the same real income level (in purchasing power parities) to all countries. As a reference level the levels of the Dutch social security or statutory minimum are used as poverty line. (The Dutch statutory minimum amounts to about 1,400 Euro for a couple with to children.) Since a large part of the social security claimants in the Netherlands receive a social benefi t that is exactly equal to the statutory minimum, it matters quite a lot whether or not one includes these households into the number of poor. For this reason two calculations are pre-sented for both a poverty line at 95% and at 105% of the statutory minimum: the former includes only households below the Dutch statutory minimum and the latter also households on (or slightly above) the statutory minimum.The third poverty measure that is used in this section could be called a policy poverty line. It is based on the policy norms for the minimum ‘acceptable’ income that applies in each of the eleven countries separately. In order to count only the households below the poverty line, the actual line is drawn at 95% of the policy norms.
MEASURING WELFARE STATE PERFORMANCE 27
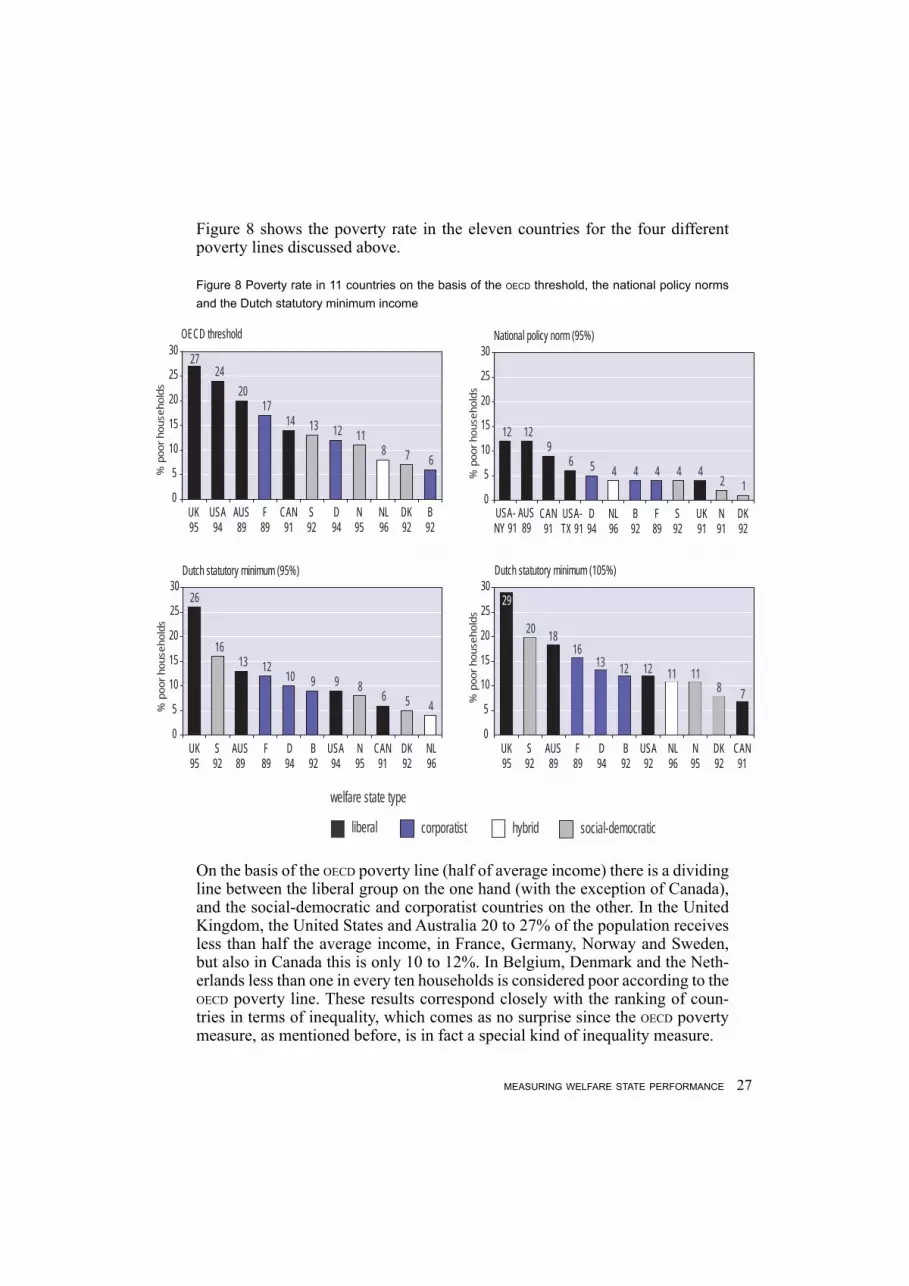
Figure 8 shows the poverty rate in the eleven countries for the four different poverty lines discussed above.
Figure 8 Poverty rate in 11 countries on the basis of the OECD threshold, the national policy norms and the Dutch statutory minimum income
On the basis of the OECD poverty line (half of average income) there is a dividing line between the liberal group on the one hand (with the exception of Canada), and the social-democratic and corporatist countries on the other. In the United Kingdom, the United States and Australia 20 to 27% of the population receives less than half the average income, in France, Germany, Norway and Sweden, but also in Canada this is only 10 to 12%. In Belgium, Denmark and the Neth-erlands less than one in every ten households is considered poor according to the OECD poverty line. These results correspond closely with the ranking of coun-tries in terms of inequality, which comes as no surprise since the OECD poverty measure, as mentioned before, is in fact a special kind of inequality measure.
UK95
S92
AUS89
F89
D94
B92
USA92
NL96
N95
DK92
CAN91
% p
oo
r h
ou
seh
old
s
2018
1613 12 12 11 11
8 7
welfare state type
hybrid social-democratic
29
liberal corporatist
Dutch statutory minimum (105%)
UK95
S92
AUS89
F89
D94
B92
USA94
N95
CAN91
DK92
NL96
0
5
10
15
20
0
5
10
15
20
25
30
25
30
% p
oo
r h
ou
seh
old
s
26
1613 12
10 9 9 86 5 4
Dutch statutory minimum (95%)
USA-NY 91
AUS89
CAN91
USA-TX 91
D94
NL96
B92
F89
S92
UK91
N91
DK92
0
5
10
15
20
25
30
% p
oo
r h
ou
seh
old
s
12 129
6 5 4 4 4 4 42 1
National policy norm (95%)
UK95
USA94
AUS89
F89
CAN91
S92
D94
N95
NL96
DK92
B92
0
5
10
15
20
25
30
% p
oo
r h
ou
seh
old
s
2724
2017
14 13 12 118 7 6
OECD threshold

28 MEASURING WELFARE STATE PERFORMANCE
If the levels of the Dutch social security or statutory minimum are used as po-verty line, the clear distinction between the liberal welfare states on the one hand and the social-democratic and corporatist welfare states on the other hand disappears. Now Canada and, to a lesser extent, the United States also turn out to have relatively low poverty rates. This is due in particular to the high average level of income in these countries, meaning that the Dutch poverty threshold is relatively low below the OECD norm when projected against their income distri-bution.If the poverty line is drawn at 95% of the Dutch statutory minimum the poverty level is the lowest in the Netherlands: only 4% of the population falls below the offi cial minimum income level. Denmark, Canada, Norway, Germany, Belgium and the United States now all have a poverty rate of 10% or less. The number of poor is surprisingly high in Sweden (16%), but this is probably due to the divergent Swedish household defi nition, which considers young adults who still live with their parents as separate - and often quite poor - households. Apart from this, the high Swedish poverty level is presumably also related to the unfa-vourable economic situation and the relatively sharp increase in the number of benefi t claimants in this country during the early 1990s. However, by far the highest poverty level is found in the United Kingdom where one in every four households fi nds itself below the Dutch statutory minimum.If the poverty line is raised to 105% of the Dutch statutory minimum, the po-verty rate increases of course in all countries. This rise is by far the largest in the Netherlands (from 4% to 11%), since all households that receive a minimum benefi t are now considered poor. As a consequence the Netherlands fall to a shared third place, while Canada and Denmark take the lead.
If the policy norms of the countries themselves are used as poverty threshold, the picture is reasonably consistent with Esping-Andersen’s typology. This is in line with the expectation: this poverty line measures more than inequality and is not biassed by the differences in wealth between the countries, whereas this does apply in the case of the Dutch statutory minimum. Poverty is now the lowest in the social-democratic countries and the highest in the liberal countries, with the corporatist countries and the Netherlands in between. The ‘offi cial’ poverty rate in the United Kingdom is however surprisingly low, due to the very low social assistance level in the UK.
8. Two or three worlds of welfare state capitalism?
From the results in the preceding sections it will be evident that the three types of welfare state distinguished by Esping-Andersen only partially represent three types of income protection and income distribution. The only country exhibiting the expected picture in almost all respects is the United States: of the countries investigated the US’s score in the fi eld of income inequality, income levelling and poverty remains one of the lowest. Only if the average level of income also

MEASURING WELFARE STATE PERFORMANCE 29
plays a role (in the case of social welfare and poverty in an absolute sense) does the US move off the bottom. The other countries can be less readily classifi ed. Often a country combines a high score in one fi eld with a low score in other respects. This is illustrated in Table 3, which summarizes the main fi ndings of this paper.
Table 3 Rankinga of the eleven countries investigated in four different areas, circa 1990
In the fi rst column the 11 countries have been ranked by type of welfare state, starting with the two countries that most closely approximate the ideal-type of social-democratic welfare state, namely Sweden and Denmark, and ending with the ‘archetype’ of a liberal welfare state, the United States. The next col-umns show the ranking of the countries in the fi elds of income protection and income redistribution. Number one is the country that performs ‘best’, i.e. which reduces the earned income differentials the most, has the least inequality and has the highest social welfare or the lowest poverty. Number 11 is the coun-try which scores the ‘worst’ in terms of these criteria.
In order to keep the table reasonably comprehensible, no more than three rank-ings have been included in each fi eld. The redistribution table relates to the per-centage difference in inequality between earned and disposable incomes. The degree of inequality relates respectively to the unstandardized disposable house-
Table 3 Rankinga of the eleven countries investigated in four different areas, circa 1990
redistribution equality social welfare lack of povertyRanking on basis ofinstitutionalcharacteristics
% egalization unstandard-ized
standardizedb inequalityaversion
of 0
inequalityaversion
of 2
inequalityaversion
of �
OECD-threshold
nationalpolicy norm
95% Dutchstatutoryminimum
1/2. Sweden 2/3 4 1-3 10 10 9 6 3-7 10
Denmark 4 8 4 6 5 3 2 1 23. Norway 7 6 1-3 4 3 2 4 2 4
4. Netherlands 5 1/2 5 9 6 1 3 3-7 1
5/6/7. Germany 2/3 3 6 3 4 5 5 8 7 Belgium 1 1/2 1-3 11 9 6 1 3-7 5/6 France . 5 8 8 7 7 8 3-7 8
8/9. Canada 8 7 7 2 1 4 7 10 3 United Kingdom 6 11 11 7 11 11 11 3-7 1110. Australia 9 9 9 5 8 8 9 11 911. United States 10 10 10 1 2 10 10 9/11c 5/6a 1 is the highest and 11 the lowest place in the list.b The modified OECD equivalence scale was used to standardize disposable income.c The first figure relates to Texas, the second to New York.
Source: LIS, Statistics Netherlands (IPO'91)

30 MEASURING WELFARE STATE PERFORMANCE
hold income and the standardized household income, assigned to individuals. With respect to social welfare three criteria have been used in Table 3, con- cerning a degree of inequality aversion of 0 (corresponding to the maximean option), 2 (moderate inequality aversion) and infi nity (corresponding to the Rawlsian maximin option) respectively.For the ranking in terms of poverty three of the four criteria used are shown. The fi rst poverty line is the OECD norm of 50% of average disposable income; the second poverty line is 95% of the Dutch statutory minimum; and the third poverty line is based on the national criteria employed in each of the 11 coun-tries examined. A poverty line of 105% of the Dutch minimum is set aside, since - with the exception of the Dutch position - it does not differ much from the poverty line drawn at 95%.
If the various hypotheses with respect to the three types of welfare state were valid, the numbering in each column in the table would rise from top to bottom, i.e. Sweden and Denmark would consistently have the lowest fi gures (i.e. the highest places) and the US one of the highest fi gures (i.e. one of the lowest places). As noted this does generally apply to the US in the four areas investi-gated with the notable exception of social welfare but Sweden and Denmark do not occupy the expected top position in Table 3. With respect to the degree of income redistribution and income inequality Sweden is in the leading group, but in the fi eld of social welfare it is in the bottom half of the list. This is explained in part by the severe recession in Sweden in the early 1990s but also by the fact that children aged 18 and over living at home are regarded as single households in the available database. Denmark scores particularly well in relation to pov-erty, but is at best below the top group in the fi eld of redistribution, inequality and social welfare.
If the three types of welfare state are compared with the ‘hybrid’ Netherlands being considered separately Table 3 does not provide evidence of any systematic difference in performance between the social-democratic and corporatist welfare states. Of the social- democratic welfare states Sweden, as noted, scores relatively well in relation to income redistribution and equality, Denmark in relation to poverty and Norway in relation to social welfare. Within the group of corporatist countries Belgium stands out for the highly levelled income distribution and low relative poverty. In terms of various criteria Germany is in the second rank, especially as regards the (unstandardized) income equality, the degree of income egalization and social welfare. France is often in the middle of the pack and most closely resem-bles the pattern anticipated of a corporatist country.Although no clear line can be drawn between the social-democratic and corpo-ratist welfare states in terms of their performance, there is a clear line between these two types and the liberal welfare states. With the exception of social wel-fare and ‘absolute’ poverty on the basis of the Dutch statutory minimum, the liberal welfare states are nearly always at the bottom of the table. As soon as

MEASURING WELFARE STATE PERFORMANCE 31
the absolute level of income is taken into account, however, the picture changes. The fact that two of the four liberal countries the United States and Canada have a relatively high level of income means that they score well with respect to social welfare and ‘absolute’ poverty. If social welfare is measured solely in terms of the average level of income, the US and Canada in fact head the list. But as soon as one assigns a reasonable weight to the inequality of incomes (an equality aversion of two) Canada is at the top and the US occupies a middle posi-tion. Even if one takes 95% of the Dutch statutory minimum as the poverty line, Canada and the US are in the top half of the league table. With their relatively low average level of income the United Kingdom and Canada do not, however, differ from the social-democratic and corporatist welfare states. These countries consequently also score poorly with respect to social welfare and absolute po-verty.
Since no systematic differences between the social-democratic and corporatist welfare states emerge from the analysis, the Netherlands as a ‘hybrid’ welfare state is not so much in between these two types as in the midst of a joint group of social-democratic and corporatist welfare states. In relation to most of the criteria the Netherlands is just below the top of the table. Only if a high weight is assigned to average income in measuring social welfare is the Netherlands at the back of the pack. If 95% of the Dutch statutory minimum is taken as the poverty line the Netherlands scores the best of all countries. This is not very surprising since social assistance is intended to provide everyone with a minimum standard of living and to minimize the number of households below that minimum. If the poverty line is increased to 105% of the statutory minimum so that (nearly) all households in the Netherlands dependent on a minimum benefi t are regarded as poor, the Netherlands sinks to a shared third place (see Figure 8).
If one compares the various rank orders in Table 3, the ranking of poverty on the basis of the national policy norms corresponds the best with the ranking antici-pated on the basis of the institutional characteristics of the various countries. The social-democratic countries head the list while the liberals bring up the rear (with the exception of the United Kingdom), with the corporatist countries in between. This conclusion is unsurprising to the extent that of the criteria used, the national poverty norms are most closely correlated with the institutional characteristics of the various welfare states. Similarly the ranking on the basis of the standardized income inequality differs little from the expectations, with the exception of Belgium, which scores notably well in this regard. The ranking in terms of social welfare corresponds the least with the sequence from social-democratic via corporatist to liberal types. This is explained by the fact that the level of social welfare depends partially on the (average) level of income in the various countries. Since no account has been taken of differences in income level in the classifi cation of the countries by welfare state type it is not sur-prising that, the more weight is assigned to the level of income, the less the cor-relation between the ranking of countries and the type of welfare state.

32 MEASURING WELFARE STATE PERFORMANCE
To sum up, this paper provides confi rmation of the existence of three types of welfare state, differing from one another in terms of such institutional character-istics as the degree of coverage provided by social security, the level and dura-tion of benefi ts, the degree of selectivity or universality of social security, active labour market policies, the regulation of the labour market and the delinking of living standards and labour market position (de-commodifi cation). Thus, the classifi cation into three welfare state types which Esping-Andersen based on the situation in the early 1980s, has been empirically validated for the early 1990s.
If the attention is focused on the extent to which the welfare state fulfi ls the traditional functions in the fi eld of income (re)distribution and combatting po-verty in the various countries, this three-fold classifi cation is, however, less sat-isfactory. Only in respect of the scale of poverty on the basis of the national criteria and the (standardized) income inequality do the social-democratic coun-tries score the best and the liberal countries the worst, with the corporatist coun-tries somewhere in between. The other criteria in terms of which the functioning of the welfare state has been assessed provide far more ground for a simple division into a liberal Anglo-Saxon type and a continental ‘European’ type. In comparison with the latter countries, the Anglo-Saxon countries are then cha-racterized by limited redistribution via the welfare state, a high level of income inequality and high relative poverty. However, with respect to social welfare two of the Anglo-Saxon countries, Canada and the US, have a relatively high score.
This conclusion is certainly no reason for rejecting Esping-Andersen’s typo-logy. As noted earlier Esping-Andersen did not draw up his typology so much with a view to the traditional income-protection and redistributive functions of the welfare state as to the correlation between the welfare state, social stratifi ca-tion and the labour market. This paper, it should be stressed, was not designed to investigate the relevance of Esping-Andersen’s typology for these aspects of a modern capitalist society. If one is particularly interested in the extent to which welfare states fulfi l the traditional functions of income protection, combatting poverty and reducing income disparities, however, it would be more accurate to speak of two instead of three ‘worlds of welfare state capitalism’.
9. The welfare state at the start of the 21st century
The empirical analysis in this paper largely relates to the situation in the early 1990s. This raises the question as to what extent the results presented above are still valid at the start of the 21st century.In order to obtain some insight into this aspect the performances of the welfare state around 1995 were also investigated in a number of cases. However, the fact that data were not available for both years for all countries means that it is not possible to provide a complete picture of the developments in the fi rst half of the 1990s. Where this comparison is possible, the analyses point to only

MEASURING WELFARE STATE PERFORMANCE 33
limited shifts between around 1990 and 1995. In certain respects the differences between the countries investigated have become smaller. Norway, Germany and the UK have for example moved more towards the middle with regard to income inequality, although the position of the US has become even more extreme. With respect to social welfare the relative position of the Netherlands has improved somewhat while that of Germany and the United Kingdom has deteriorated, primarily on account of differences in the rate of growth of average income. The period under consideration (around fi ve years) is however too short to draw conclusions on this basis concerning structural changes and the relative perfor-mance of the various countries. Changes in the fi rst half of the 1990s are partly determined by the downturn in the economy, both the phasing and the severity of which varied from one country to another. The recession in the fi rst half of the 1990s affected Germany and Sweden particularly badly, the former in the aftermath of the reunifi cation with East Germany, and the latter as a result of the loss of the celebrated Swedish model and joining the EU. By contrast, the Netherlands managed to come through the recession comparatively unscathed.
The available data do not permit any statement to be made about the present situation in comparison with that around 1990. Important changes in the arrange-ments of the welfare state were made in many countries in the 1990s. In the Netherlands, for example, the Sickness Insurance Act was largely privatized, the Disability Insurance Act (WAO) was radically revised, entitlements to survi-ving dependants’ benefi ts were strictly limited and social assistance was decen-tralized (van Praag and Uitterhoeve 1999: 41-50). Considerable shifts similarly took place to a greater or lesser extent in other countries, most pronounced per-haps in the United States where the welfare system (the AFDC) was radically revised. Hence, it is conceivable that the performances of various countries with respect to income inequality, poverty and social welfare consequently differ substantially from those of ten years ago. It is however to be doubted whether the ranking of the countries will have undergone signifi cant changes as a result. From a survey by the OECD (1997) it may be deduced that the rank order of ten countries (largely corresponding with those studied here) with respect to the inequality of disposable income, the poverty rate according to the OECD norm and the size of income transfers to the lowest income group in the mid 1990s differed little from that around 1980.4 Since important institutional changes took place in the 1980s as well, this suggests that the position a country occupies in relation to other countries is comparatively ‘policy resistant’. In other words, a succession of changes to individual arrangements does not appear to alter the structural effects of a par-ticular type of welfare state substantially. Esping-Andersen reached a similar conclusion in more recent publications (Esping-Andersen 1996 and 1999). It seems therefore quite plausible that the present ranking of the eleven welfare states with respect to the four elements of incomes policies will not differ radi-cally from the ranking in Table 3.

34 MEASURING WELFARE STATE PERFORMANCE
Annex 1 Decomposition of income redistribution via social security and taxation
The two steps of the redistribution of income that were discerned in section 4, from earned incomes to gross incomes and from gross incomes to disposable incomes, can be further decomposed as follows (Lambert 1993: 170-201). The difference between the Gini coeffi cients of the distribution of earned incomes and of gross incomes is determined by the regressivity of the social benefi ts and the share of social benefi ts in total gross income. The regressivity index mea-sures the extent to which the lower income groups profi t disproportionally from the social benefi ts (Lambert 1993: 249-255). Since in the process of transferring income from higher to lower income groups some ‘reshuffl ing’ of the ranking of the households may occur, which might result in an overestimation of the redistributive impact of the income transfers, one has to add a correction factor. Formally the levelling by the social security system is equal to (cf. Lambert 1993: 185):
Ge - Gg = (Cg - Gg) + a * (Ge - Cb) (A1)
In this formule Ge is the Gini coeffi cient of earned income, Gg the Gini coef-fi cient of gross income, Cg the concentration coeffi cient of gross income, Cb the concentration coeffi cient of social benefi ts and a the share of social benefi ts in total gross income. The concentration coeffi cient is calculated analogous to the Gini coeffi cient, as twice the area between the concentration curve and the diagonal. The fi rst term captures the effect of reranking.
Likewise the difference between the Gini coeffi cients of the distribution of gross incomes and of disposable incomes is determined by the progressivity of the tax system and the share of taxes and social security contributions in total dispos-able income. Progressivity is defi ned as the extent to which the higher income groups pay a disproportional share of total taxes and social security contribu-tions (Lambert 1993: 175). The formula for the levelling by the tax system then becomes:
Gg - Gd = - (Cd - Gd) + b * (Ct - Gg) (A2)
Gg is the Gini coeffi cient of gross income, Gd the Gini coeffi cient of dispos-able income, Cd the concentration coeffi cient of disposable income, Ct the con-centration coeffi cient of taxes and social security contributions and b the share of taxes and social security contributions in total disposable income. Again, the fi rst term measures the effect of reranking.Tables A1 and A2 present the results of this decomposition as applied to income redistribution in the eleven countries.

MEASURING WELFARE STATE PERFORMANCE 35
Table A1 Decomposition of the redistribution by the social security system from earned income to gross incomea
Gini coefficient inequality reduction contribution of
earnedincome
grossincome absolute
inpercentages
regressivity ofsocial benefits
share of socialbenefits in total
gross income reranking
Sweden (1992) 0.550 0.343 0.207 38 0.806 0.331 -0.059Denmark (1992) 0.546 0.369 0.177 32 0.840 0.250 -0.032Norway (1995) 0.513 0.380 0.133 26 0.818 0.206 -0.021Netherlands (1996) 0.484 0.335 0.149 31 0.887 0.249 -0.072Germany (1994) 0.550 0.389 0.161 29 0.978 0.190 -0.025Belgium (1992) 0.534 0.348 0.185 35 0.884 0.252 -0.024Canada (1994) 0.509 0.377 0.133 26 0.859 0.185 -0.026United Kingdom (1995) 0.595 0.423 0.173 29 0.899 0.218 -0.023Australia (1989) 0.490 0.398 0.091 19 0.936 0.108 -0.010United States (1994) 0.528 0.430 0.098 19 0.880 0.137 -0.022a The product of the regressivity index and the share of social benefits plus the reranking factor is equal to the difference between the Gini coefficient of
earned incomes and of gross incomes (cf. equation A1). Example: in case of Sweden 0.806 x 0.331 - 0.059 = 0.550 - 0.343 = 0.207.
Source: LIS, Statistics Netherlands (IPO'96)
Table A2 Decomposition of the redistribution by the tax system from gross income to disposable incomea
Gini coefficient inequality reduction contribution of
grossincome
disposableincome absolute
inpercentages
progressivity oftaxes
share of taxes intotal disposable
income reranking
Sweden (1992) 0.343 0.320 0.023 7 0.079 0.335 -0.003Denmark (1992) 0.369 0.328 0.042 11 0.098 0.497 -0.007Norway (1995) 0.380 0.334 0.046 12 0.117 0.435 -0.005Netherlands (1996) 0.335 0.295 0.040 12 0.082 0.565 -0.006Germany (1994) 0.389 0.319 0.069 18 0.168 0.501 -0.015Belgium (1992) 0.348 0.291 0.058 17 0.178 0.360 -0.030Canada (1994) 0.377 0.336 0.040 11 0.177 0.242 -0.002United Kingdom (1995) 0.423 0.379 0.044 10 0.169 0.318 -0.006Australia (1989) 0.398 0.347 0.051 13 0.186 0.272 -0.002United States (1994) 0.430 0.382 0.048 11 0.154 0.326 -0.003a The product of the progressivity index and the share of taxes plus the reranking factor is equal to the difference between the Gini coefficient of gross
incomes and of disposable incomes (cf. equation A2). Example: in case of Sweden 0.079 x 0.335 - 0.003 = 0.343 - 0.320 = 0.023.
Source: LIS, Statistics Netherlands (IPO'96)

36 MEASURING WELFARE STATE PERFORMANCE
Annex 2 Income inequality indexes
The seven inequality indexes used in section 5 are:
Theil coefficient (1):
Theil coefficient (2):
Gini coefficient:
relative inter quartile distance:
Robin Hood indicator:
coefficient of variation:
variance of log income:

MEASURING WELFARE STATE PERFORMANCE 37
In these formulas the following symbols are used:
is income;
is the number of households in the population;
is mean income;
is the mean of log income.

38 MEASURING WELFARE STATE PERFORMANCE
Theil (1) Theil (2) Gini Rel.inter quart.dist. Robin Hood Coeff. of variation Var. of log incomeB92 0,135 B92 0,144 B92 0,291 NL91 0,370 NL91 0,207 B92 0,538 NL95 0,291NL91 0,142 NL91 0,144 NL91 0,293 B92 0,379 NL95 0,208 NL95 0,577 NL91 0,292NL95 0,142 NL95 0,144 NL95 0,294 D89 0,384 B92 0,209 NL96 0,581 NL96 0,296NL96 0,143 NL96 0,145 NL96 0,295 NL95 0,388 NL96 0,209 NL91 0,583 B92 0,307S92 0,165 D89 0,175 D89 0,314 D94 0,389 D89 0,223 S92 0,606 D89 0,368D89 0,171 S92 0,177 D94 0,319 NL96 0,391 D94 0,226 CAN94 0,652 DK92 0,381N91 0,179 D94 0,182 S92 0,320 F89 0,404 F89 0,235 CAN91 0,653 S92 0,381D94 0,181 DK92 0,185 N91 0,326 CAN91 0,419 S92 0,236 D89 0,658 D94 0,382DK92 0,181 N91 0,187 DK92 0,328 CAN94 0,434 N91 0,237 N91 0,661 N91 0,395CAN91 0,184 F89 0,193 F89 0,332 AUS89 0,450 CAN91 0,238 AUS89 0,680 F89 0,403CAN94 0,186 CAN91 0,200 CAN91 0,333 N91 0,460 CAN94 0,241 USA91 0,685 N95 0,416F89 0,190 N95 0,200 N95 0,334 S92 0,465 N95 0,242 DK92 0,692 CAN91 0,441AUS89 0,200 CAN94 0,203 CAN94 0,336 N95 0,472 DK92 0,244 F89 0,704 CAN94 0,443N95 0,200 AUS89 0,218 AUS89 0,347 USA91 0,482 AUS89 0,248 D94 0,740 AUS89 0,474USA91 0,214 USA91 0,243 USA91 0,363 USA94 0,498 USA91 0,262 USA94 0,760 UK95 0,479USA94 0,243 UK95 0,244 UK95 0,379 UK95 0,506 UK95 0,273 N95 0,819 UK91 0,520UK95 0,249 UK91 0,259 USA94 0,382 UK91 0,508 UK91 0,276 UK95 0,836 USA91 0,549UK91 0,264 USA94 0,266 UK91 0,384 DK92 0,517 USA94 0,276 UK91 0,948 USA94 0,582
Table A3 Inequality rankings of the unstandardized distribution of disposable household incomes
Theil (1) Theil (2) Gini Rel.inter quart.dist. Robin Hood Coeff. of variation Var. of log incomeB92 0,077 B92 0,079 B92 0,217 N91 0,227 N91 0,150 B92 0,407 N91 0,163S92 0,081 N91 0,083 N91 0,217 N95 0,229 S92 0,151 S92 0,429 B92 0,164N91 0,087 S92 0,085 S92 0,217 S92 0,230 DK92 0,153 N91 0,475 DK92 0,177DK92 0,092 DK92 0,088 DK92 0,221 DK92 0,243 B92 0,154 NL95 0,483 NL95 0,180NL95 0,096 NL95 0,092 N95 0,227 D89 0,253 N95 0,155 NL96 0,486 S92 0,181NL91 0,097 NL91 0,093 NL95 0,238 B92 0,261 D89 0,167 NL91 0,489 NL91 0,182NL96 0,097 NL96 0,093 NL96 0,238 D94 0,268 NL91 0,170 DK92 0,521 NL96 0,183D89 0,108 N95 0,095 NL91 0,239 NL91 0,281 NL95 0,170 CAN94 0,546 N95 0,183N95 0,109 D89 0,101 D89 0,240 NL96 0,282 NL96 0,170 D89 0,548 D89 0,198CAN91 0,127 D94 0,119 D94 0,259 NL95 0,284 D94 0,181 CAN91 0,551 D94 0,235CAN94 0,128 CAN91 0,130 CAN91 0,273 F89 0,309 CAN91 0,193 AUS89 0,584 F89 0,268D94 0,130 CAN94 0,132 CAN94 0,275 CAN91 0,316 F89 0,195 F89 0,622 CAN91 0,272F89 0,139 F89 0,134 F89 0,278 CAN94 0,322 CAN94 0,195 USA91 0,626 CAN94 0,279AUS89 0,143 AUS89 0,147 AUS89 0,291 AUS89 0,370 AUS89 0,208 D94 0,658 AUS89 0,309USA91 0,177 UK95 0,184 USA91 0,329 UK91 0,399 USA91 0,234 N95 0,663 UK91 0,353UK95 0,195 UK91 0,184 UK91 0,330 UK95 0,401 UK91 0,235 USA94 0,702 UK95 0,355UK91 0,201 USA91 0,193 UK95 0,331 USA91 0,407 UK95 0,236 UK95 0,743 USA91 0,427USA94 0,204 USA94 0,216 USA94 0,348 USA94 0,428 USA94 0,248 UK91 0,863 USA94 0,459
Table A4 Inequality rankings of the distribution of disposable household income per equivalent adult (standardization according to OECD method)
Annex 3 Inequality rankings for seven inequality indexes
Tables A3 and A4 present the inequality rankings of 18 observations of the eleven countries
with respect to the seven inequality measures used in section 5.

MEASURING WELFARE STATE PERFORMANCE 39
References
Aghion, Ph., E. Caroli, C. García Peñalosa (1999), ‘Inequality and economic growth: the perspective of the new growth theories’, Journal of Economic Lit-erature 37 (1999) (1615-1660).
Atkinson, A.B. (1970), ‘On the measurement of inequality’, Journal of Eco-nomic Theory 2 (1970) (244-263).
Atkinson, A.B. (1999), The economic consequences of rolling back the welfare state (Munich lectures in economics), Cambridge/London: The MIT Press, 1999.
Bradshaw, J., J. Ditch, H. Holmes and P. Whiteford (1993), Support for chil-dren: a comparison of arrangements in fi fteen countries, London, HMSO, 1993.
Buhmann, P., L. Rainwater, G. Schmaus and T. Smeeding (1988), ‘Equivalence scales, well-being, and poverty: sensitivity estimates across ten countries using the LIS database’, Review of income and wealth 34 (1988) 2.
Esping-Anderen, G. (1990), The three worlds of welfare capitalism, Cambridge: Polity Press, 1990.
Esping-Anderen, G. (ed.) (1996), Welfare states in transition: national adapta-tions in global economics, London: Sage, 1996.
Esping-Andersen, G. (1999), Social foundations of postindustrial economics, Oxford: Oxford University Press, 1999.
Gottschalk, P., and T.M. Smeeding (1988), Empirical evidence on income inequality in industrialized countries, Luxembourg: LIS (LIS Working Paper no. 154).
Jenkins, S. (1991), ‘The measurement of income inequality’, In: L. Osberg (ed.), Economic inequality and poverty, Armonk: M.E. Sharpe, 1991 (3-38).
Lambert, P.J. (1993), The distribution and redistribution of income. A math-ematical analysis (Second edition), Manchester/New York: Manchester Univer-sity Press, 1993.
OECD (1988), Reforming public pensions,. Paris: Organisation for Economic Co-operation and Development, 1988.

40 MEASURING WELFARE STATE PERFORMANCE
OECD (1992), Private pensions and public policy. Paris: Organisation for Eco-nomic Co-operation and Development, 1992.
OECD (1994a), The OECD Jobs Study - evidence and explanations, part I: Labour market trends and underlying forces of change, Paris: Organisation for Eco-nomic Co-operation and Development, 1994.
OECD (1994b), The OECD Jobs Study - evidence and explanations, part II: The adjustment potential of the labour market, Paris: Organisation for Economic Co-operation and Development, 1994.
OECD (1995), The tax/benefi t position of production workers, Paris: Organisation for Economic Co-operation and Development, 1995.
OECD (1997), Making work pay: taxation, benefi ts, employment and unemploy-ment, Paris: Organisation for Economic Co-operation and Development, 1997.
Okun, A.M. (1975), Equality and effi ciency: the big tradeoff, Washington: The Brookings Institution, 1975.
Perotti, R. (1996), ‘Growth, income distribution, and democracy: what the data say’, Journal of Economic Growth 1 (June 1996) (149-187).
Rawls, J. (1971), A theory of justice, Oxford: Oxford University Press, 1971.
Praag, C. van, and W. Uitterhoeve (1999), 25 years of social change in the Neth-erlands. Key data from the Social and Cultural Report 1998, Nijmegen: SUN/SCP, 1999.
Sen, A.K. (1981), Poverty and famines: an essay on entitlement and depriva-tion, Oxford: Oxford University Press, 1981.
Social and Cultural Planning Offi ce (2001), The Netherlands in a European Perspective, Social & Cultural Report 2000, The Hague: Social and Cultural Planning Offi ce, April 2001.
Titmuss, R. (1974), Social policy: an introduction, London: Allen & Unwin, 1974.
US Department of Health & Human Services (Social security administration) (1991), Social security programs throughout the world, Washington, 1991.
Wildeboer Schut, J.M., J.C. Vrooman, and P.T. de Beer (2001), On Worlds of Welfare. Institutions and their effects in eleven welfare states, The Hague: Social and Cultural Planning Offi ce, April 2001.

MEASURING WELFARE STATE PERFORMANCE 41
Notes
1. In accordance with the user agreement for the LIS databases, the following applies for the data from the United Kingdom: ‘Material from FES is Crown Copyright; has been made available by the Offi ce for National Statistics through the ESRC Data Archive; and has been used by permission. Neither the Offi ce for National Statistics nor the ESRC Data Archive bear any responsibility for the analysis or the interpretation of the data reported here.’
2. With respect to income inequality the maximin option is not the most egalitarian principle since, in fact, it allows any amount of income disparity as long as the level of the minimum income cannot be raised. The most extreme position would therefore be to attach only weight to the extent of income inequality, regardless of the average or minimum income level. A reduction of income inequality would then always be preferred, even if it would result in a lower absolute income of the least well-off. Since this section is concerned with the balancing of income inequality and income level, this extreme egalitarian position is left out of consideration.
3. B ecause of the limited reliability of the available income data the edei for infi nite inequality aversion is not cal culated as the minimum income in each database but as the fi rst decile, that is the highest income in the 10% group of poorest households.
4. The correlation between the ranking around 1980 and 1990 with respect to income inequality amounts to 0.88, with respect to poverty to 0.76 and with respect to income transfers to the bottom 30% of the income distribution to 0.66.