hindustan unilever limited making sustainable living commonplace hul investor relations app scan the...
TRANSCRIPT
Hindustan U
nilever Limited
Annual Report 2013-14
ANNUAL REPORT 2013-14
MAKING SUSTAINABLE LIVING COMMONPLACE
HINDUSTAN UNILEVER LIMITEDRegistered Office:Unilever House,B. D. Sawant Marg, Chakala,Andheri (East),Mumbai - 400 099
CIN : L15140MH1933PLC002030
HUL INVESTOR RELATIONS APPScan the code given below to download the HUL Investor Relations App for iOS and Android
WWW.HUL.CO.IN
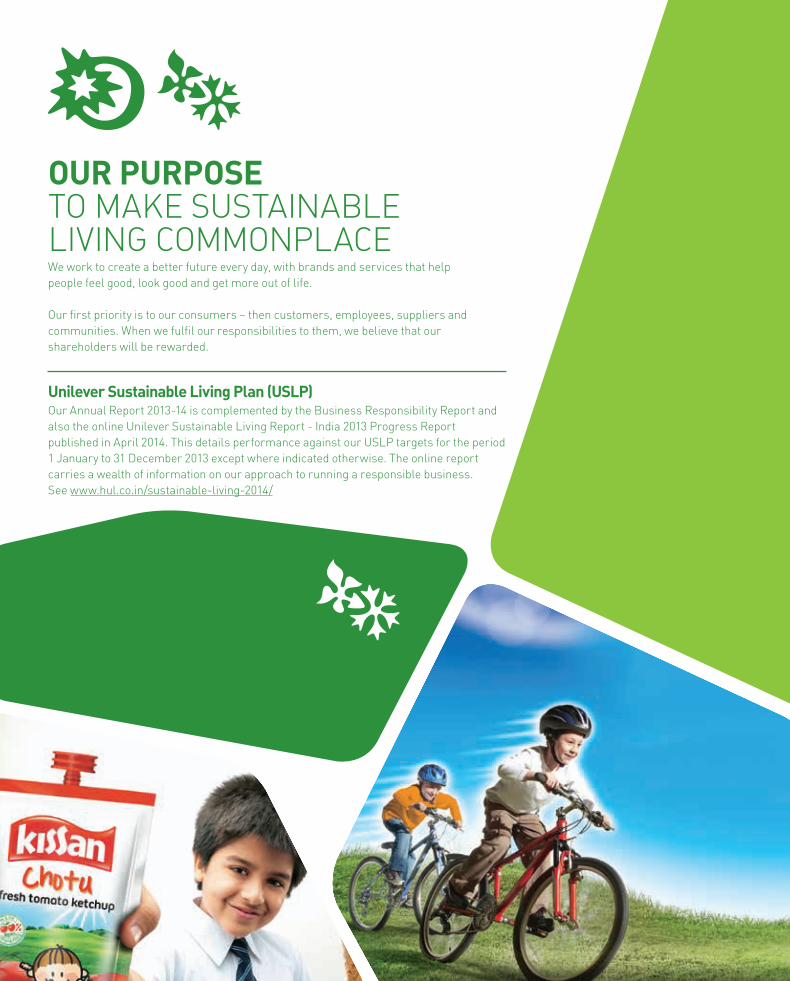
OUR PURPOSE TO MAKE SUSTAINABLE LIVING COMMONPLACEWe work to create a better future every day, with brands and services that help people feel good, look good and get more out of life.
Our first priority is to our consumers – then customers, employees, suppliers and communities. When we fulfil our responsibilities to them, we believe that our shareholders will be rewarded.
Unilever Sustainable Living Plan (USLP)Our Annual Report 2013-14 is complemented by the Business Responsibility Report and also the online Unilever Sustainable Living Report - India 2013 Progress Report published in April 2014. This details performance against our USLP targets for the period 1 January to 31 December 2013 except where indicated otherwise. The online report carries a wealth of information on our approach to running a responsible business. See www.hul.co.in/sustainable-living-2014/
PROJECT SUNLIGHT:HELPING TO CREATEA BRIGHTER FUTUREWe believe there has never been a better time to create a brighter future for our children. A world where no child goes to bed hungry, where every home has clean drinking water and where preventable diseases become a thing of the past. Project Sunlight brings together the work of our brands to help as many people as possible take small sustainable steps that add up to building a world where everyone lives well and within the natural limits of the planet.
Get involved at:www.projectsunlight.co.in
Produced by Hindustan Unilever Limited.Creative Consultants: AICL Communications Limited ([email protected])Printed at HT Burda Media Limited.

While growing our business we will reduce our environmental footprint and increase our positive social impact.
We will lead for responsible growth, inspiring people to take small everyday actions that will add up to a big difference. We will grow by winning shares and building markets everywhere.
WE MEET EVERY DAY NEEDS FOR NUTRITION, HYGIENE AND PERSONAL CARE WITH BRANDS THAT HELP PEOPLE FEEL GOOD, LOOK GOOD AND GET MORE OUT OF LIFE.
Overview 02 Hindustan Unilever at a Glance 04 Financial Performance 05 Performance Trends 06 Chairman’s Letter 07 Board of Directors 08 Our Business Model 10 Our Brands 12 Our People 14 Our Operations 16 Unilever Sustainable Living Plan 18 Awards and Felicitations 20 Management Committee
Reports 21 Notice of the Annual General Meeting 26 Profile of Directors and other
Directorships 30 Directors’ Report and Management Discussion and Analysis 54 Corporate Governance Report 74 Secretarial Standards Report Secretarial Audit Report
Financial Statements
Standalone Financial Statements 76 Balance Sheet 77 Statement of Profit and Loss 78 Cash Flow Statement 80 Notes 124 Independent Auditors’ Report 127 Economic Value Added
Consolidated Financial Statements 128 Balance Sheet 129 Statement of Profit and Loss 130 Cash Flow Statement 132 Notes 162 Independent Auditors’ Report 163 Statement Pursuant to Section 212 164 Subsidiary Companies’ Particulars
Shareholder information 165 Investor Safeguards 166 Corporate Information • Shareholders’Satisfaction Survey 2014 • E-Communication
Registration Form • ProxyForm
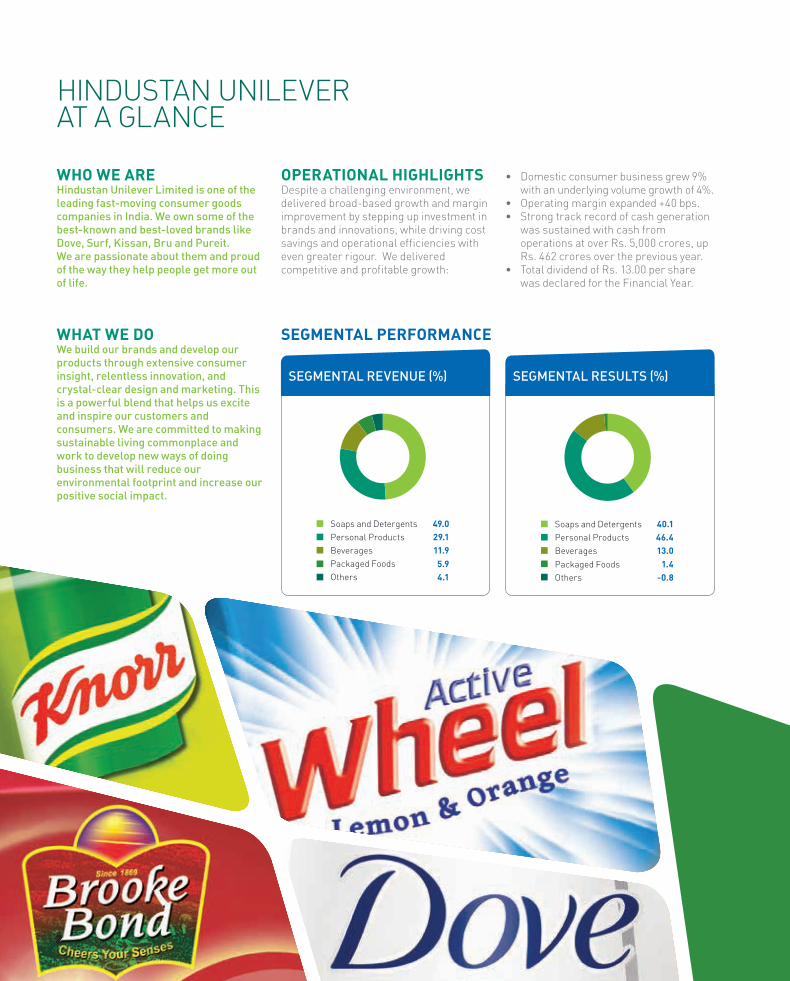
HINDUSTAN UNILEVER AT A GLANCE
OPERATIONAL HIGHLIGHTSDespite a challenging environment, we delivered broad-based growth and margin improvement by stepping up investment in brands and innovations, while driving cost savings and operational efficiencies with even greater rigour. We delivered competitive and profitable growth:
SEGMENTAL PERFORMANCE
SEGMENTAL REVENUE (%)
49.029.111.95.94.1
Soaps and DetergentsPersonal ProductsBeveragesPackaged FoodsOthers
WHO WE AREHindustan Unilever Limited is one of the leading fast-moving consumer goods companies in India. We own some of the best-known and best-loved brands like Dove, Surf, Kissan, Bru and Pureit. We are passionate about them and proud of the way they help people get more out of life.
WHAT WE DOWe build our brands and develop our products through extensive consumer insight, relentless innovation, and crystal-clear design and marketing. This is a powerful blend that helps us excite and inspire our customers and consumers. We are committed to making sustainable living commonplace and work to develop new ways of doing business that will reduce our environmental footprint and increase our positive social impact.
• Domesticconsumerbusinessgrew9%withanunderlyingvolumegrowthof4%.
• Operatingmarginexpanded+40bps.• Strongtrackrecordofcashgeneration
was sustained with cash from operationsatoverRs.5,000crores,upRs. 462 crores over the previous year.
• TotaldividendofRs.13.00persharewas declared for the Financial Year.
Soaps and DetergentsPersonal ProductsBeverages
40.146.413.0
Packaged FoodsOthers
1.4-0.8
SEGMENTAL RESULTS (%)
22
OUR KEY PERFORMANCE INDICATORSWe report our performance against key financial and non-financial performance indicators below. The Directors’ Reportstartingonpage30givesdetailsofourperformanceineach of the business segments and functions. Details of the progress made on the Unilever Sustainable Living Plan (USLP) commitmentsaregivenonthepage16and17.
2013
65,0002012:48,000
No. of Shaktiammas (women Shakti Entrepreneurs) selling our products
2013
80%2012:60%
Tomatoes used in Kissan ketchup sourced sustainably
2013
58 million2012:47Million
People reached with Lifebuoy Handwashing Programme since2010
BETTER LIVELIHOODS SUSTAINABLE SOURCING
HEALTH AND WELL-BEING
NON-FINANCIAL
2013
27%2012:22%
Reduction in CO2 per tonne of production compared to 2008baseline
2013
37%2012:29%
Reduction in water use per tonne of production comparedto2008baseline
2013
>84%2012:77%
Reduction in total waste per tonne of production comparedto2008baseline
2013
352012:31
Factorieswith100%zeronon-hazardouswastetolandfill
MANUFACTURING
FINANCIAL
EPS (BASIC) CASH FROM OPERATIONS
2013-14
Rs. 28,019crores
The domestic consumer businessgrewby9%with4%underlying volume growth in a challenging environment
OPERATING PROFIT
2013-14
Rs. 4,215crores
Operatingprofitgrewby12%with operating margins improving+40bps
2013-14
Rs. 17.88per share
Last year basic EPS: Rs.17.56pershare
2013-14
Rs. 5,000+crores
Cash from operations was up Rs. 462 crores over the previous year
NET REVENUE
Hindustan Unilever at a Glance 3Annual Report 2013-14
FINANCIALPERFORMANCE
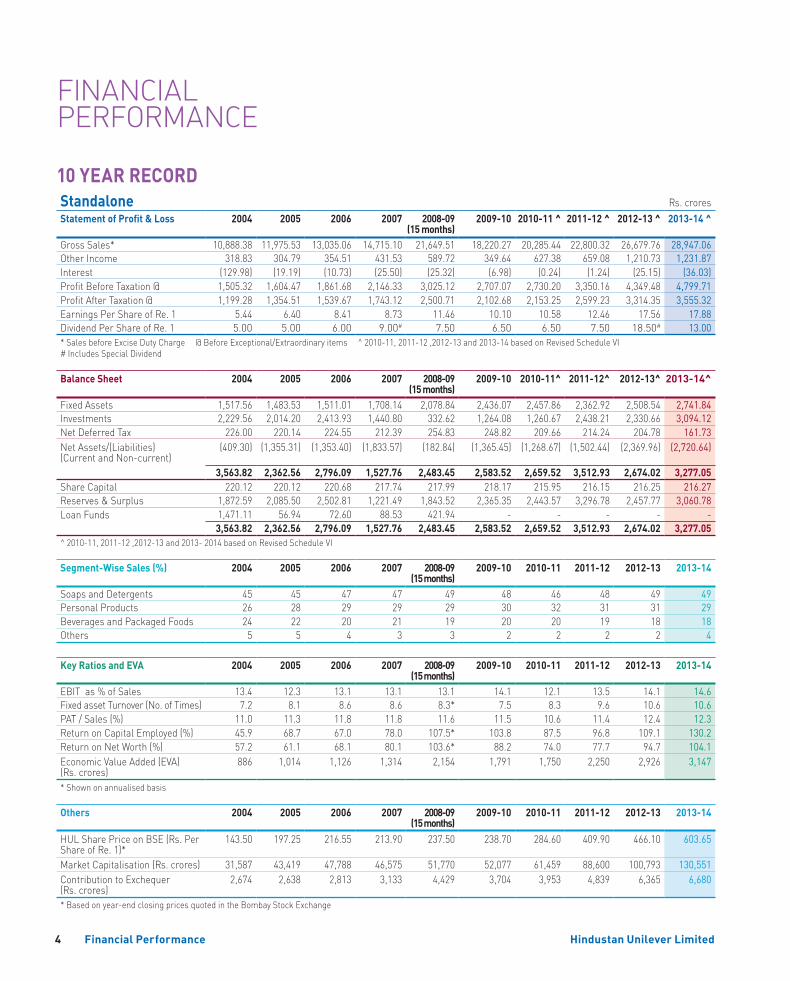
10 YEAR RECORDStandalone Rs. croresStatement of Profit & Loss 2004 2005 2006 2007 2008-09
(15 months)2009-10 2010-11 ^ 2011-12 ^ 2012-13 ^ 2013-14 ^
Gross Sales* 10,888.38 11,975.53 13,035.06 14,715.10 21,649.51 18,220.27 20,285.44 22,800.32 26,679.76 28,947.06 Other Income 318.83 304.79 354.51 431.53 589.72 349.64 627.38 659.08 1,210.73 1,231.87 Interest (129.98) (19.19) (10.73) (25.50) (25.32) (6.98) (0.24) (1.24) (25.15) (36.03)ProfitBeforeTaxation@ 1,505.32 1,604.47 1,861.68 2,146.33 3,025.12 2,707.07 2,730.20 3,350.16 4,349.48 4,799.71 ProfitAfterTaxation@ 1,199.28 1,354.51 1,539.67 1,743.12 2,500.71 2,102.68 2,153.25 2,599.23 3,314.35 3,555.32 EarningsPerShareofRe.1 5.44 6.40 8.41 8.73 11.46 10.10 10.58 12.46 17.56 17.88 DividendPerShareofRe.1 5.00 5.00 6.00 9.00# 7.50 6.50 6.50 7.50 18.50# 13.00 *SalesbeforeExciseDutyCharge @BeforeExceptional/Extraordinaryitems ^2010-11,2011-12,2012-13and2013-14basedonRevisedScheduleVI # Includes Special Dividend
Balance Sheet 2004 2005 2006 2007 2008-09 (15 months)
2009-10 2010-11^ 2011-12^ 2012-13^ 2013-14^
FixedAssets 1,517.56 1,483.53 1,511.01 1,708.14 2,078.84 2,436.07 2,457.86 2,362.92 2,508.54 2,741.84 Investments 2,229.56 2,014.20 2,413.93 1,440.80 332.62 1,264.08 1,260.67 2,438.21 2,330.66 3,094.12 NetDeferredTax 226.00 220.14 224.55 212.39 254.83 248.82 209.66 214.24 204.78 161.73 NetAssets/(Liabilities) (CurrentandNon-current)
(409.30) (1,355.31) (1,353.40) (1,833.57) (182.84) (1,365.45) (1,268.67) (1,502.44) (2,369.96) (2,720.64)
3,563.82 2,362.56 2,796.09 1,527.76 2,483.45 2,583.52 2,659.52 3,512.93 2,674.02 3,277.05 ShareCapital 220.12 220.12 220.68 217.74 217.99 218.17 215.95 216.15 216.25 216.27 Reserves & Surplus 1,872.59 2,085.50 2,502.81 1,221.49 1,843.52 2,365.35 2,443.57 3,296.78 2,457.77 3,060.78 Loan Funds 1,471.11 56.94 72.60 88.53 421.94 - - - - -
3,563.82 2,362.56 2,796.09 1,527.76 2,483.45 2,583.52 2,659.52 3,512.93 2,674.02 3,277.05 ^2010-11,2011-12,2012-13and2013-2014basedonRevisedScheduleVI
Segment-Wise Sales (%) 2004 2005 2006 2007 2008-09(15 months)
2009-10 2010-11 2011-12 2012-13 2013-14
Soaps and Detergents 45 45 47 47 49 48 46 48 49 49Personal Products 26 28 29 29 29 30 32 31 31 29Beverages and Packaged Foods 24 22 20 21 19 20 20 19 18 18Others 5 5 4 3 3 2 2 2 2 4
Key Ratios and EVA 2004 2005 2006 2007 2008-09(15 months)
2009-10 2010-11 2011-12 2012-13 2013-14
EBITas%ofSales 13.4 12.3 13.1 13.1 13.1 14.1 12.1 13.5 14.1 14.6 FixedassetTurnover(No.ofTimes) 7.2 8.1 8.6 8.6 8.3* 7.5 8.3 9.6 10.6 10.6PAT/Sales(%) 11.0 11.3 11.8 11.8 11.6 11.5 10.6 11.4 12.4 12.3 ReturnonCapitalEmployed(%) 45.9 68.7 67.0 78.0 107.5* 103.8 87.5 96.8 109.1 130.2 ReturnonNetWorth(%) 57.2 61.1 68.1 80.1 103.6* 88.2 74.0 77.7 94.7 104.1 Economic Value Added (EVA) (Rs. crores)
886 1,014 1,126 1,314 2,154 1,791 1,750 2,250 2,926 3,147
* Shown on annualised basis
Others 2004 2005 2006 2007 2008-09(15 months)
2009-10 2010-11 2011-12 2012-13 2013-14
HUL Share Price on BSE (Rs. Per ShareofRe.1)*
143.50 197.25 216.55 213.90 237.50 238.70 284.60 409.90 466.10 603.65
MarketCapitalisation(Rs.crores) 31,587 43,419 47,788 46,575 51,770 52,077 61,459 88,600 100,793 130,551 ContributiontoExchequer (Rs. crores)
2,674 2,638 2,813 3,133 4,429 3,704 3,953 4,839 6,365 6,680
*Basedonyear-endclosingpricesquotedintheBombayStockExchange
Financial Performance4 Hindustan Unilever Limited
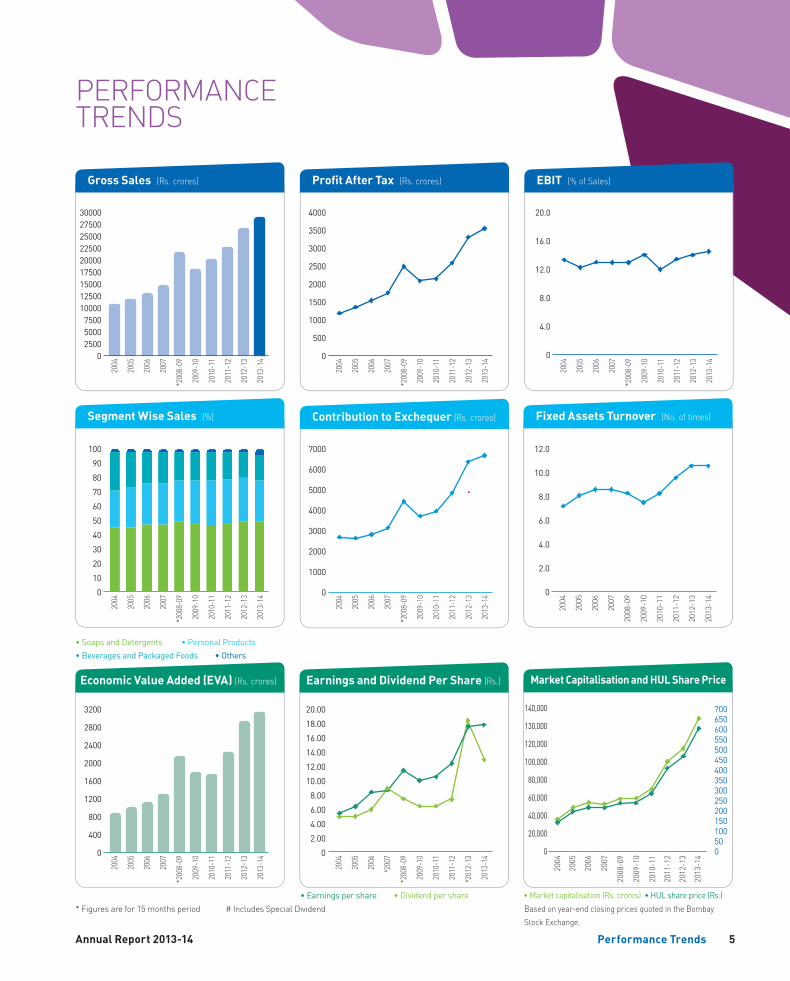
PERFORMANCETRENDS
20.0
16.0
12.0
8.0
4.0
0
2004
2005
2006
2007
*2008-09
2009-10
2010-11
2011-12
2012-13
2013-14
EBIT (%ofSales)
Basedonyear-endclosingpricesquotedintheBombayStockExchange.
20.0018.0016.0014.0012.0010.00
8.006.004.002.00
0
2004
2005
2006
# 2007
*2008-09
2009-10
2010-11
2011-12
# 2012-13
2013-14
•Earningspershare •Dividendpershare
Earnings and Dividend Per Share (Rs.)
*Figuresarefor15monthsperiod #IncludesSpecialDividend
Performance Trends
4000
3500
3000
2500
2000
1500
1000
500
0
2004
2005
2006
2007
*2008-09
2009-10
2010-11
2011-12
2012-13
2013-14
Profit After Tax (Rs. crores)
7000
6000
5000
4000
3000
2000
1000
0
2004
2005
2006
2007
*2008-09
2009-10
2010-11
2011-12
2012-13
2013-14
Contribution to Exchequer (Rs. crores)
3200
2800
2400
2000
1600
1200
800
400
0
2004
2005
2006
2007
*2008-09
2009-10
2010-11
2011-12
2012-13
2013-14
Economic Value Added (EVA) (Rs. crores)
12.0
10.0
8.0
6.0
4.0
2.0
0
2004
2005
2006
2007
2008-09
2009-10
2010-11
2011-12
2012-13
2013-14
Fixed Assets Turnover (No. of times)
•SoapsandDetergents •PersonalProducts •BeveragesandPackagedFoods •Others
100908070605040302010
0
2004
2005
2006
2007
*2008-09
2009-10
2010-11
2011-12
2012-13
2013-14
Segment Wise Sales (%)
300002750025000225002000017500150001250010000
750050002500
0
2004
2005
2006
2007
*2008-09
2009-10
2010-11
2011-12
2012-13
2013-14
Gross Sales (Rs. crores)
•Marketcapitalisation(Rs.crores) •HULshareprice (Rs.)
2004
2005
2006
2007
2008-09
2009-10
2010-11
2011-12
2012-13
2013-14
Market Capitalisation and HUL Share Price
700650600550500450400350300250200150100500
140,000
130,000
120,000
100,000
80,000
60,000
40,000
20,000
0
5Annual Report 2013-14
CHAIRMAN’SSTATEMENT
Dear Shareholders,
The financial year ended March 2014 was another successful year, where despite a challenging environment, our business grew well ahead of competition. Several innovations were launched to meet the emerging needs and aspirations of our consumers. We expanded our reach and further strengthened our distribution so that we can serve our consumers better with our wide range of product offerings. At the same time, we continued to make significant progress on our Unilever Sustainable Living Plan.
During the year, Unilever increased its stakeinyourCompanyfrom52.48%to67.25%throughanopenoffer.Theopenoffer reflects Unilever’s confidence in the long term growth opportunity of the Indian market and more importantly its strong commitment to investing and driving the growth of your Company.
The business environment continued to remain muted. Despite the Indian economy witnessing a slowdown, your Company delivered healthy results. Our domestic consumerbusinessgrewby9%with4%underlying volume growth which was ahead of the market. Profit before interest
expandedourdirectretailreachandstrengthenedourinstoreexecution.WeextendedourPerfectStoresprogrammeto1millionstoresbytheendof2013.Theon-shelf availability in modern trade touched an all-time high with many of our key customers recognising us as the Supplier of Choice.
In2013,wesignificantlyincreasedourShaktinetworkaddingover17,000ShaktiEntrepreneurs (Shaktiammas). Project Shaktinowhasover65,000ShaktiEntrepreneurs complemented by over 50,000Shaktimaans,themalemembersof the Shakti family who distribute Company products on bicycles.
It was once again ‘business unusual on costs’ across the board with significant savings in Supply Chain and Overheads and improvements in the effectiveness of our Trade and Marketing spends. These savings helped to sustain competitive investments behind our brands and deliver a steady improvement in the operating margin.
We made good progress on the Unilever Sustainable Living Plan. In line with our belief of doing well by doing good, we launched the ‘Perfect Village’ programme across eight states. Under this initiative, we created awareness about health and wellbeing among rural consumers and at the same time, improved the availability of our products in these villages. The Lifebuoy Handwashing Programmenowtouches58millionconsumers in India.
Lifebuoy’s ‘Help a Child Reach 5’ Handwashing Programme was launched in Thesgora, a village in Madhya Pradesh, last year. With our interventions, the incidence of diarrhoea dropped significantly. This campaign is now being
andtax(PBIT)grewby12%withPBITmarginimproving40bps.Profitaftertaxbutbeforeexceptionalitems,PAT(bei),grewby7%toRs.3,555croreswithNetProfitatRs.3,867croresgrowing2%.NetProfit growth was impacted by the significant property sale in the previous year. Cash generated from operations at overRs.5,000croresfortheyear, wasupRs. 462 crores over the previous year. With thefinaldividendofRs.7.50pershareproposed by the Board of Directors and an interimdividendofRs.5.50persharealready paid, the total dividend for the financialyearending31 March2014amountstoRs.13.00pershare.
Innovations touched most of our product portfolio and delivered strong growth. We launched a host of innovations across our businesses by leveraging Unilever’s global portfolio of brands, research and technology. SurfExcellaunchedthefirstmain-washliquiddetergentinMay.DomexZero Stain was launched reinstating the cleaningpropertiesofDomex.Inpersonalcare we launched the ‘Best Ever’ Fair & Lovely,Pond’sBB+cream,LakméCCcream and Vaseline Healthy White. Hair Care and Skin Care brands were premiumisedwithLakméPro-Stylist,TRESemméandToni&Guybeingsomeofthe innovations this year. In beverages, green tea was added to the Lipton and Taj Mahal range. Magnum, Unilever’s most premium ice cream brand globally, was launchedinChennaiin2013andhasbeenextendedtomorecitiesthisyear. Pureit,launched the best in class water purifier, PureitUltimaRO+UV.ThedualtechnologyofRO+UVremovesharmfulchemicals like lead, arsenic and mercury, ensuring that the water is always pure and safe for drinking.
In our endeavour to serve the consumers in the farthest corners of India, we further
1
Hindustan Unilever Limited
Overview Reports Financial Statements Shareholder Information
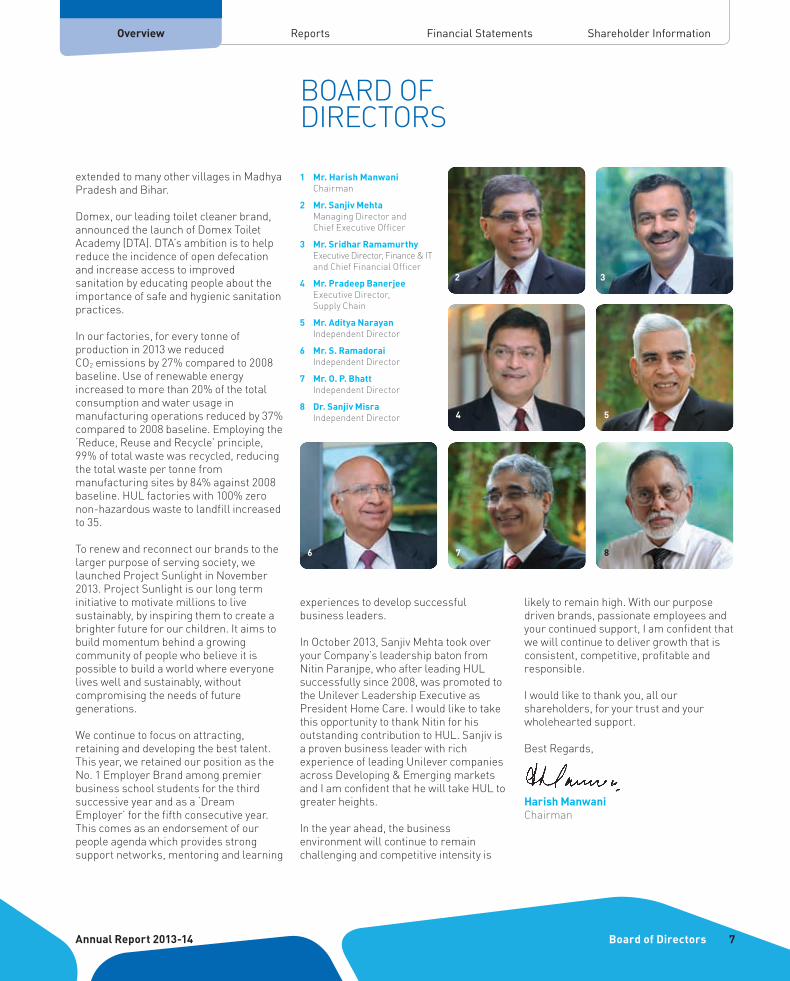
1 Mr. Harish Manwani Chairman
2 Mr. Sanjiv Mehta Managing Director and ChiefExecutiveOfficer
3 Mr. Sridhar Ramamurthy ExecutiveDirector,Finance&IT
and Chief Financial Officer
4 Mr. Pradeep Banerjee ExecutiveDirector,
Supply Chain
5 Mr. Aditya Narayan Independent Director
6 Mr. S. Ramadorai Independent Director
7 Mr. O. P. Bhatt Independent Director
8 Dr. Sanjiv Misra Independent Director
extendedtomanyothervillagesinMadhyaPradesh and Bihar.
Domex,ourleadingtoiletcleanerbrand,announcedthelaunchofDomexToiletAcademy (DTA). DTA’s ambition is to help reduce the incidence of open defecation and increase access to improved sanitation by educating people about the importance of safe and hygienic sanitation practices.
In our factories, for every tonne of productionin2013wereducedCO2 emissionsby27%comparedto2008baseline. Use of renewable energy increasedtomorethan20%ofthetotalconsumption and water usage in manufacturingoperationsreducedby37%comparedto2008baseline.Employingthe‘Reduce, Reuse and Recycle’ principle, 99%oftotalwastewasrecycled,reducingthe total waste per tonne from manufacturingsitesby84%against2008baseline.HULfactorieswith100%zeronon-hazardouswastetolandfillincreasedto35.
To renew and reconnect our brands to the larger purpose of serving society, we launched Project Sunlight in November 2013.ProjectSunlightisourlongterminitiative to motivate millions to live sustainably, by inspiring them to create a brighter future for our children. It aims to build momentum behind a growing community of people who believe it is possible to build a world where everyone lives well and sustainably, without compromising the needs of future generations.
We continue to focus on attracting, retaining and developing the best talent. This year, we retained our position as the No.1EmployerBrandamongpremierbusiness school students for the third successive year and as a ‘Dream Employer’ for the fifth consecutive year. This comes as an endorsement of our people agenda which provides strong support networks, mentoring and learning
876
32
BOARD OF DIRECTORS
experiencestodevelopsuccessfulbusiness leaders.
InOctober2013,SanjivMehtatookoveryour Company’s leadership baton from Nitin Paranjpe, who after leading HUL successfullysince2008,waspromotedtotheUnileverLeadershipExecutiveasPresident Home Care. I would like to take this opportunity to thank Nitin for his outstanding contribution to HUL. Sanjiv is a proven business leader with rich experienceofleadingUnilevercompaniesacross Developing & Emerging markets and I am confident that he will take HUL to greater heights.
In the year ahead, the business environment will continue to remain challenging and competitive intensity is
likely to remain high. With our purpose driven brands, passionate employees and your continued support, I am confident that we will continue to deliver growth that is consistent, competitive, profitable and responsible.
I would like to thank you, all our shareholders, for your trust and your wholehearted support.
Best Regards,
Harish ManwaniChairman
Board of Directors
4 5
7Annual Report 2013-14
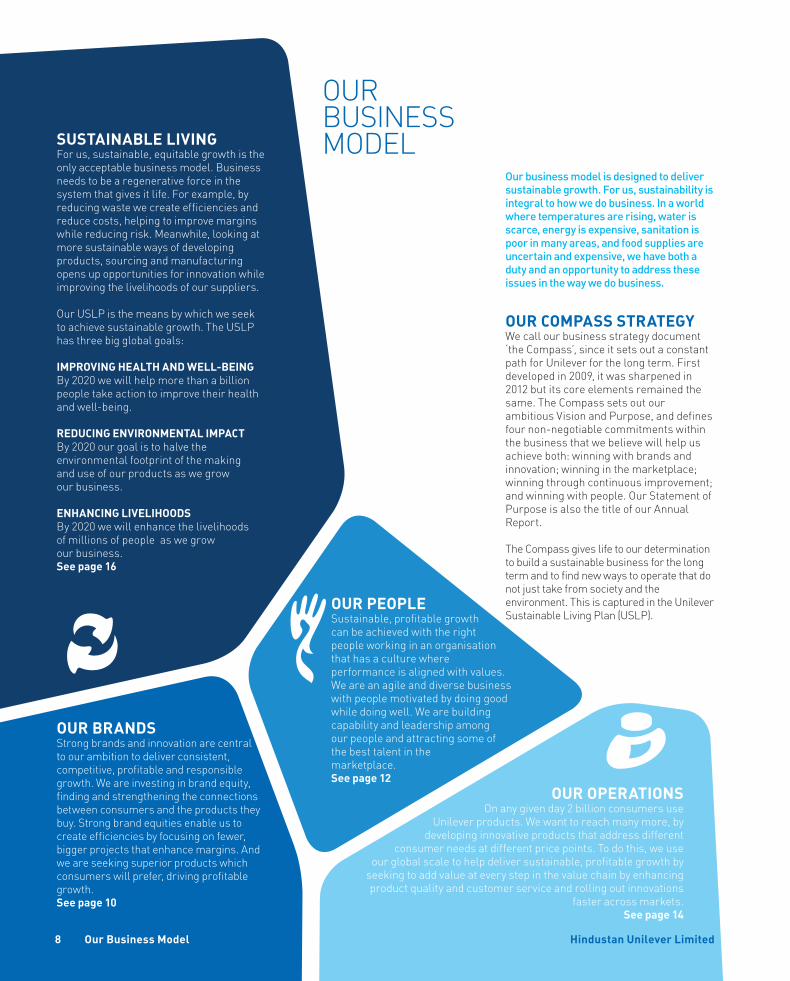
OUR BUSINESS MODEL
Our business model is designed to deliver sustainable growth. For us, sustainability is integral to how we do business. In a world where temperatures are rising, water is scarce, energy is expensive, sanitation is poor in many areas, and food supplies are uncertain and expensive, we have both a duty and an opportunity to address these issues in the way we do business.
OUR COMPASS STRATEGYWe call our business strategy document ‘the Compass’, since it sets out a constant path for Unilever for the long term. First developedin2009,itwassharpenedin2012butitscoreelementsremainedthesame. The Compass sets out our ambitious Vision and Purpose, and defines four non-negotiable commitments within the business that we believe will help us achieve both: winning with brands and innovation; winning in the marketplace; winning through continuous improvement; and winning with people. Our Statement of Purpose is also the title of our Annual Report.
The Compass gives life to our determination to build a sustainable business for the long term and to find new ways to operate that do not just take from society and the environment. This is captured in the Unilever Sustainable Living Plan (USLP).
SUSTAINABLE LIVINGForus,sustainable,equitablegrowthistheonly acceptable business model. Business needs to be a regenerative force in the systemthatgivesitlife.Forexample,byreducing waste we create efficiencies and reduce costs, helping to improve margins while reducing risk. Meanwhile, looking at more sustainable ways of developing products, sourcing and manufacturing opens up opportunities for innovation while improving the livelihoods of our suppliers.
Our USLP is the means by which we seek to achieve sustainable growth. The USLP has three big global goals:
IMPROVING HEALTH AND WELL-BEING By2020wewillhelpmorethanabillionpeople take action to improve their health and well-being.
REDUCING ENVIRONMENTAL IMPACTBy2020ourgoalistohalvetheenvironmental footprint of the making and use of our products as we grow our business.
ENHANCING LIVELIHOODSBy2020wewillenhancethelivelihoods of millions of people as we grow our business. See page 16
OUR OPERATIONSOn any given day 2 billion consumers use
Unilever products. We want to reach many more, by developing innovative products that address different
consumer needs at different price points. To do this, we use our global scale to help deliver sustainable, profitable growth by
seeking to add value at every step in the value chain by enhancing productqualityandcustomerserviceandrollingoutinnovations
faster across markets. See page 14
OUR PEOPLESustainable, profitable growth can be achieved with the right people working in an organisation that has a culture where performance is aligned with values. We are an agile and diverse business with people motivated by doing good while doing well. We are building capability and leadership among our people and attracting some of the best talent in the marketplace. See page 12
OUR BRANDSStrong brands and innovation are central to our ambition to deliver consistent, competitive, profitable and responsible growth.Weareinvestinginbrandequity,finding and strengthening the connections between consumers and the products they buy.Strongbrandequitiesenableustocreate efficiencies by focusing on fewer, bigger projects that enhance margins. And we are seeking superior products which consumers will prefer, driving profitable growth. See page 10
Our Business Model Hindustan Unilever Limited8
Overview Financial Statements Shareholder Information
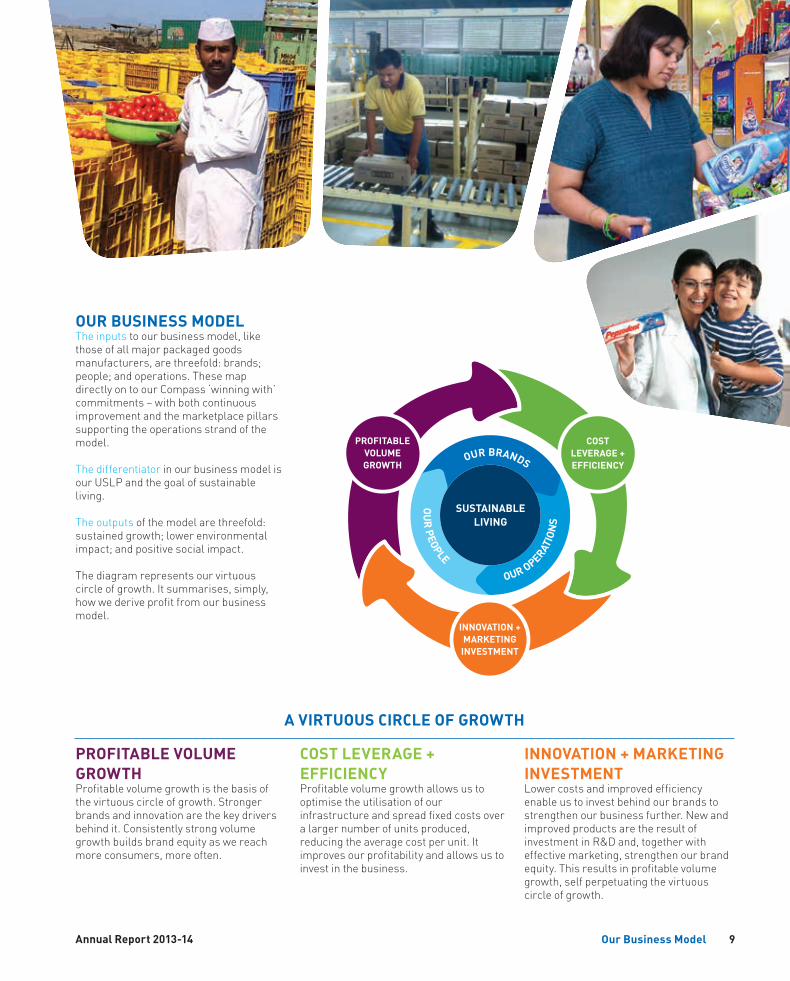
PROFITABLE VOLUME GROWTHProfitable volume growth is the basis of the virtuous circle of growth. Stronger brands and innovation are the key drivers behind it. Consistently strong volume growthbuildsbrandequityaswereachmore consumers, more often.
COST LEVERAGE + EFFICIENCYProfitable volume growth allows us to optimise the utilisation of our infrastructureandspreadfixedcostsovera larger number of units produced, reducing the average cost per unit. It improves our profitability and allows us to invest in the business.
INNOVATION + MARKETING INVESTMENTLower costs and improved efficiency enable us to invest behind our brands to strengthen our business further. New and improved products are the result of investment in R&D and, together with effective marketing, strengthen our brand equity.Thisresultsinprofitablevolumegrowth, self perpetuating the virtuous circle of growth.
OUR BUSINESS MODELThe inputs to our business model, like those of all major packaged goods manufacturers, are threefold: brands; people; and operations. These map directly on to our Compass ‘winning with’ commitments – with both continuous improvement and the marketplace pillars supporting the operations strand of the model.
The differentiator in our business model is our USLP and the goal of sustainable living.
The outputs of the model are threefold: sustained growth; lower environmental impact; and positive social impact.
The diagram represents our virtuous circle of growth. It summarises, simply, how we derive profit from our business model.
A VIRTUOUS CIRCLE OF GROWTH
Our Business Model 9Annual Report 2013-14
OUR BRANDS
anti-aging segment with Youth Infinity and relaunched its fairness range, Perfect Radiance. Pond’s launcheditsBB+creaminIndiawitha360-degreecampaignthatdelivered some outstanding results within the first three months of launch. Digital and new media was leveraged by all our brands to drive salience and engagement.
CONNECTING WITH CONSUMERSPepsodent reached out to half a million consumers through the ‘Call TheExpert’campaignthatencouraged consumers to call trainedPepsodentExpertsonatollfree number and get free advice on oral health and hygiene. The AXE Apollo campaign gave winners a once in-a-lifetime opportunity to visit the NASAspacecentre.Lux’stie-upwithChennaiExpress,througha‘missedcall’ contest, gave consumers a chance to go on ‘a romantic train ride’ with Shah Rukh Khan. This contest received a record 5.5 million calls in just three weeks.
3RosesandRedLabelhighlightedthe goodness of tea that helps improve blood circulation. Lipton Green Tea launched the ‘Feel Light Feel Active’ campaign with actress Anushka Sharma encouraging people to consume a healthier and lighter beverage.
Kissan inspired mothers to make homefoodexcitinganddeliciousforchildren through the innovative ‘Kissan Rolls’ campaign. Knorr Chinese mini meals were sampled in modern trade stores at the check-out counters,creatinghighqualitytrialsof the mealmaker range. Shoppers were delighted to discover how easy it was to ‘re-create restaurant-like experiencesathome’.
DRIVING PREMIUMISATIONIn order to tap the premiumisation opportunity, we launched a host of innovations this year with distinct consumer propositions and benefits. Premium beauty brands like Dove drove the agenda in Hair Care. The TRESemmépropositionof‘Salonlikehair, at home everyday’ accelerated it. HUL also launched Unilever’s premium ice cream brand, Magnum, in Chennai. Backed by a strong 360-degreemultimedialaunchandanexcellent‘go-to-market’execution,thelaunchturnedouttobe a huge success.
LakméreinventeditsSkinCareportfolio with the Pro-stylist range, offering the signature benefit of ‘salonexpertise’.Itforayedintothe
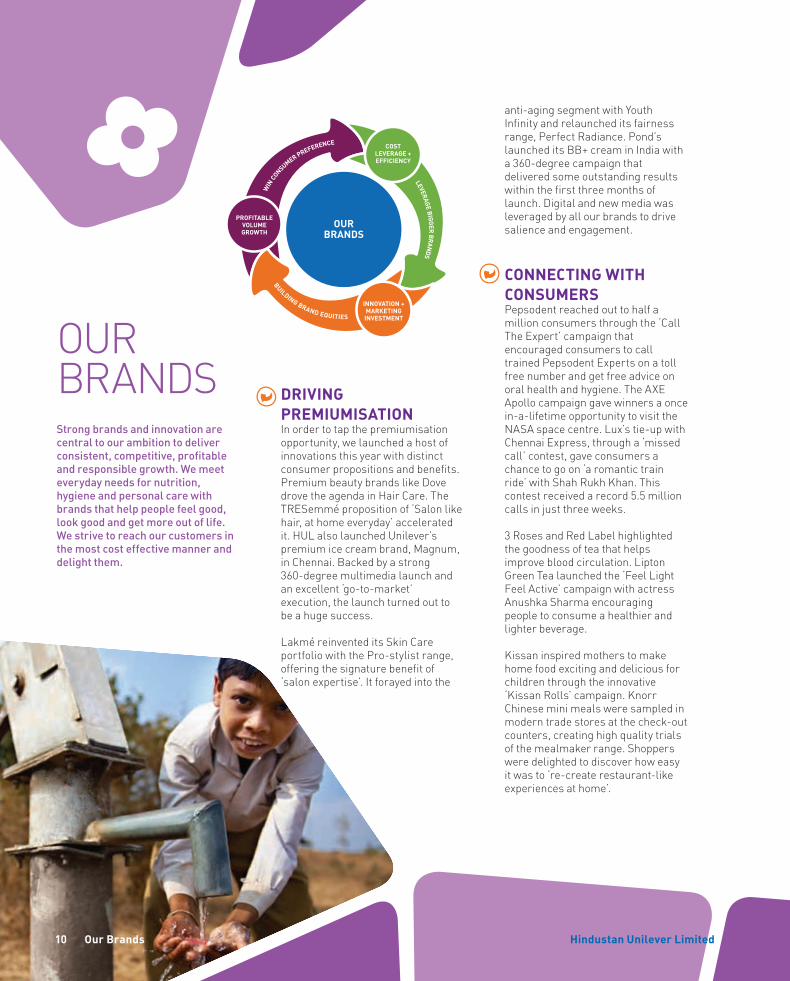
Strong brands and innovation are central to our ambition to deliver consistent, competitive, profitable and responsible growth. We meet everyday needs for nutrition, hygiene and personal care with brands that help people feel good, look good and get more out of life. We strive to reach our customers in the most cost effective manner and delight them.
OURBRANDS
WIN
CONSUMER PREFERENCE
LEVERAGE BIGGER BRAN
DS
BUILDING BRAND EQUITIES
INNOVATION +MARKETINGINVESTMENT
PROFITABLEVOLUMEGROWTH
COSTLEVERAGE +EFFICIENCY
Our Brands Hindustan Unilever Limited10
EXPANDING SHAKTI REACHIn2013,wehad
65,000Shakti Entrepreneurs (Shaktiammas)and50,000Shaktimaansacross16stateswhocovered160,000villagesand reached around 4 million rural households.
REACHING OUR CUSTOMERS: ADDING 1 MILLION STORESExpansionofdistributionreachacross urban and rural markets was one of the key thrust areas. This resulted in the addition of one million storestoourexistingnetwork.
A new low cost distribution model was developed to leverage the increasing penetration of mobile phones among the bottom-of-the-pyramid retailers. Taking orders through tele-calling saved time and led to a significant cut in front end distribution cost. Reduction in servicing cost enabled us to reach more shoppers who purchase from those marginal outlets outside the purview of our traditional distribution model.
PERFECT VILLAGESIn2013,wewentto8,500villagesacross India through school contact and Mohalla programmes. Through these school activities, Lifebuoy educated children on the importance and correct method of handwashing. Pepsodent also educated them on the importance and correct method of brushing teeth. In the Mohalla activity, we demonstrated the benefits of new and emerging categories such as facewash, hair conditioners and fabric conditioners to the women in the village. We touched the lives of over three million consumers in these villages through these programmes. We ensured the availability of these new product categories in the retail outlets of these villages through the Perfect Stores programme.
DRIVING HEALTH AND HYGIENEDomexlaunchedDomexToiletAcademy (DTA) on the occasion of WorldToiletDayonNovember19. The academy aims to build toilets in areas where people do not have access to improved sanitation and face a problem of open defecation.
REDUCING CARBON FOOTPRINTOurfrozendessertsbusinessmovedinto procuring technologically advanced Hydrocarbon (HC) refrigerant-basedfreezerswithazeroozonedepletionpotentialforitsretail operations. Kwality Walls has 37,500HCrefrigerant-basedfreezercabinets in India, which are a significant reduction in our carbon footprint.
Through innovation in packaging of instant coffee and dry foods, we are now on a journey to reduce the use of plastic laminate in our product packaging.
ENHANCING LIVELIHOODSThe65,000ShaktiEntrepreneurs(Shaktiammas)across16statescover160,000villagesandreacharound four million rural households. In2013,wecontinuedourfocusonstabilising the Shakti DMS (a mobile-based mini ERP solution) to help improve the sales and earnings of Shaktiammas.
Project Xpress, our rural distribution alliance with Tata Teleservices for distributing their telecom products through our distribution network, helped in enhancing the earning potential of our partners, including Shaktiammas. We are now nationally distributing telecom products to 75,000telecomoutletsthroughourdistribution network.
DRIVING NEW CATEGORIESThe Perfect Village initiative was conceptualised to drive growth of our brands in rural India. The focus of the programme was to develop the market, driving growth in the Tender Loving Care categories such as hair conditioners, facewashes, body lotions, fabricconditionersandliquidhandwash.LaunchedinMarch2013ineightkeystatesacrossIndia,theproject involved holding ‘Mohalla sessions’ with consumers and educating them about new categories, their benefits and on the right usage. This helps to drive the Unilever Sustainable Living Plan agenda of improving health and hygiene.
Our Brands
OUR BRANDS IN ACTION TO FIND OUT MORE VISIT : WWW.HUL.CO.IN/BRANDS-IN-ACTION/
11Annual Report 2013-14
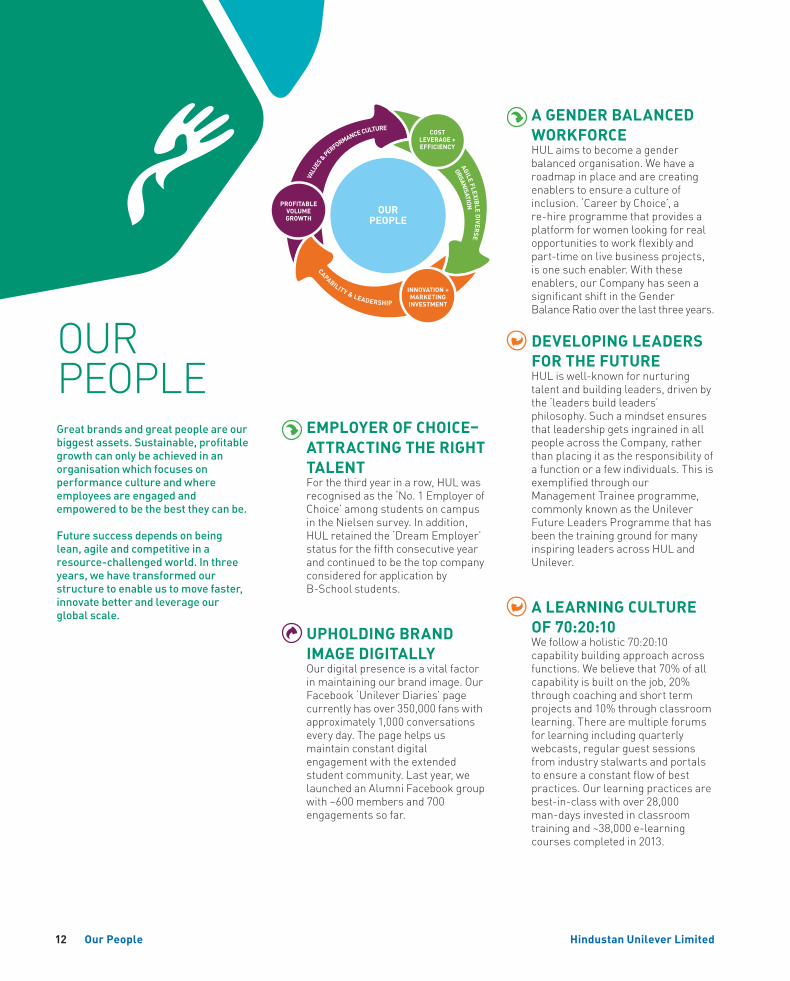
Great brands and great people are our biggest assets. Sustainable, profitable growth can only be achieved in an organisation which focuses on performance culture and where employees are engaged and empowered to be the best they can be.
Future success depends on being lean, agile and competitive in a resource-challenged world. In three years, we have transformed our structure to enable us to move faster, innovate better and leverage our global scale.
OUR PEOPLE
EMPLOYER OF CHOICE– ATTRACTING THE RIGHT TALENTFor the third year in a row, HUL was recognisedasthe‘No.1EmployerofChoice’ among students on campus in the Nielsen survey. In addition, HUL retained the ‘Dream Employer’ status for the fifth consecutive year and continued to be the top company considered for application by B-School students.
UPHOLDING BRAND IMAGE DIGITALLYOur digital presence is a vital factor in maintaining our brand image. Our Facebook ‘Unilever Diaries’ page currentlyhasover350,000fanswithapproximately1,000conversationsevery day. The page helps us maintain constant digital engagementwiththeextendedstudent community. Last year, we launched an Alumni Facebook group with~600membersand700engagements so far.
A GENDER BALANCED WORKFORCEHUL aims to become a gender balanced organisation. We have a roadmap in place and are creating enablers to ensure a culture of inclusion. ‘Career by Choice’, a re-hire programme that provides a platform for women looking for real opportunitiestoworkflexiblyandpart-time on live business projects, is one such enabler. With these enablers, our Company has seen a significant shift in the Gender Balance Ratio over the last three years.
DEVELOPING LEADERS FOR THE FUTUREHUL is well-known for nurturing talent and building leaders, driven by the ‘leaders build leaders’ philosophy. Such a mindset ensures that leadership gets ingrained in all people across the Company, rather than placing it as the responsibility of a function or a few individuals. This is exemplifiedthroughourManagement Trainee programme, commonly known as the Unilever Future Leaders Programme that has been the training ground for many inspiring leaders across HUL and Unilever.
A LEARNING CULTURE OF 70:20:10 Wefollowaholistic70:20:10capability building approach across functions.Webelievethat70%ofallcapabilityisbuiltonthejob,20%through coaching and short term projectsand10%throughclassroomlearning. There are multiple forums forlearningincludingquarterlywebcasts, regular guest sessions from industry stalwarts and portals to ensure a constant flow of best practices. Our learning practices are best-in-classwithover28,000man-days invested in classroom trainingand~38,000e-learningcoursescompletedin2013.
OURPEOPLE
VALU
ES &
PERFORMANCE CULTURE
ORGANISATIONAGILE FLEXIB
LE DIVER
SE
CAPABILITY & LEADERSHIP
INNOVATION +MARKETINGINVESTMENT
PROFITABLEVOLUMEGROWTH
COSTLEVERAGE +EFFICIENCY
Our People12 Hindustan Unilever Limited
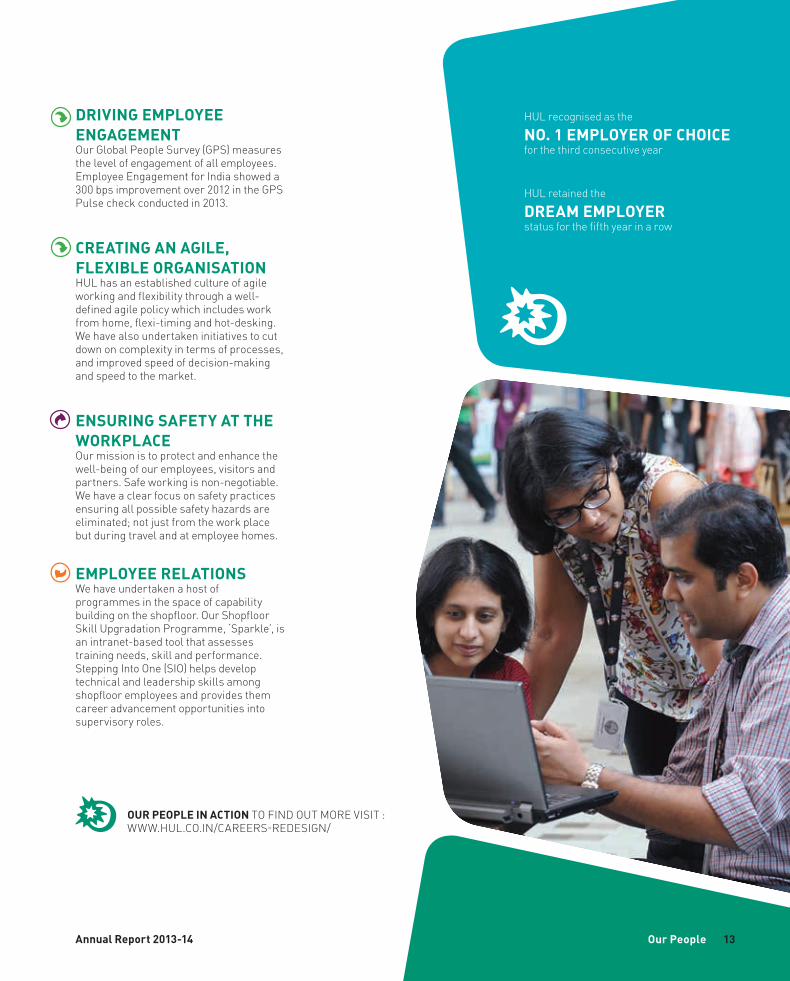
DRIVING EMPLOYEE ENGAGEMENT Our Global People Survey (GPS) measures the level of engagement of all employees. Employee Engagement for India showed a 300bpsimprovementover2012intheGPSPulsecheckconductedin2013.
CREATING AN AGILE, FLEXIBLE ORGANISATION HUL has an established culture of agile workingandflexibilitythroughawell-defined agile policy which includes work fromhome,flexi-timingandhot-desking.We have also undertaken initiatives to cut downoncomplexityintermsofprocesses,and improved speed of decision-making and speed to the market.
ENSURING SAFETY AT THE WORKPLACE Our mission is to protect and enhance the well-being of our employees, visitors and partners. Safe working is non-negotiable. We have a clear focus on safety practices ensuringallpossiblesafetyhazardsareeliminated; not just from the work place but during travel and at employee homes.
EMPLOYEE RELATIONSWe have undertaken a host of programmes in the space of capability building on the shopfloor. Our Shopfloor Skill Upgradation Programme, ‘Sparkle’, is an intranet-based tool that assesses training needs, skill and performance. Stepping Into One (SIO) helps develop technical and leadership skills among shopfloor employees and provides them career advancement opportunities into supervisory roles.
HUL recognised as the
NO. 1 EMPLOYER OF CHOICEfor the third consecutive year
HUL retained the
DREAM EMPLOYERstatus for the fifth year in a row
Our People
OUR PEOPLE IN ACTION TO FIND OUT MORE VISIT : WWW.HUL.CO.IN/CAREERS-REDESIGN/
13Annual Report 2013-14
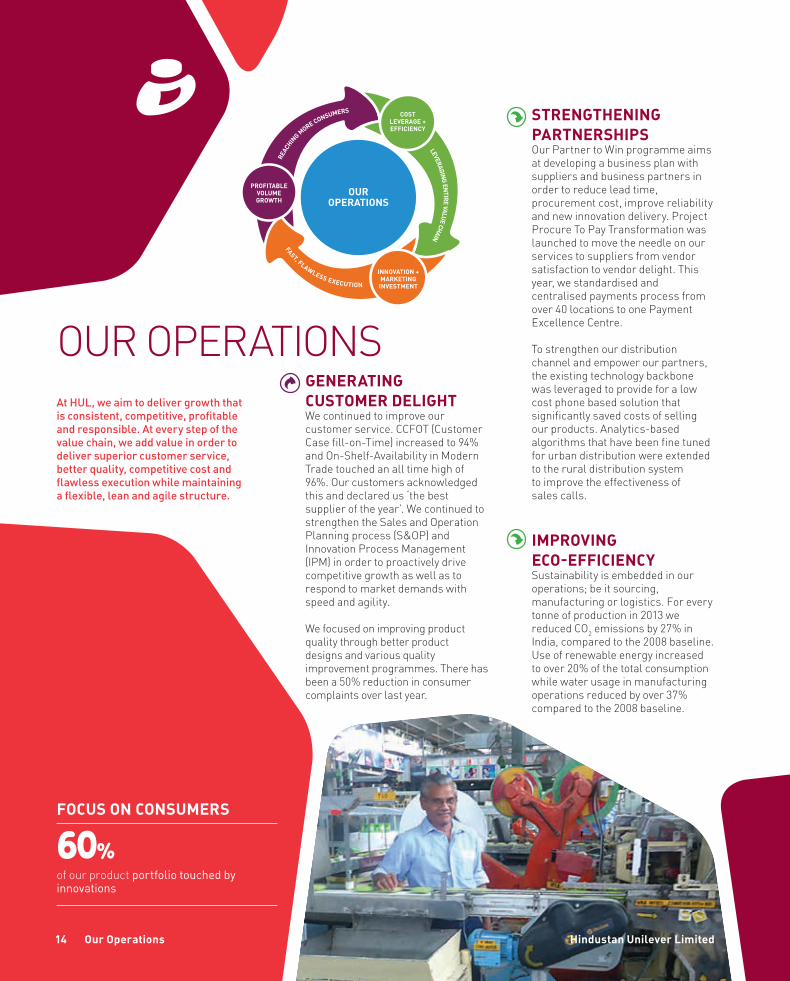
OUR OPERATIONSAt HUL, we aim to deliver growth that is consistent, competitive, profitable and responsible. At every step of the value chain, we add value in order to deliver superior customer service, better quality, competitive cost and flawless execution while maintaining a flexible, lean and agile structure.
STRENGTHENING PARTNERSHIPSOur Partner to Win programme aims at developing a business plan with suppliers and business partners in order to reduce lead time, procurement cost, improve reliability and new innovation delivery. Project Procure To Pay Transformation was launched to move the needle on our services to suppliers from vendor satisfaction to vendor delight. This year, we standardised and centralised payments process from over40locationstoonePaymentExcellenceCentre.
To strengthen our distribution channel and empower our partners, theexistingtechnologybackbonewas leveraged to provide for a low cost phone based solution that significantly saved costs of selling our products. Analytics-based algorithms that have been fine tuned forurbandistributionwereextendedto the rural distribution system to improve the effectiveness of sales calls.
IMPROVING ECO-EFFICIENCYSustainability is embedded in our operations; be it sourcing, manufacturing or logistics. For every tonneofproductionin2013wereduced CO2emissionsby27%inIndia,comparedtothe2008baseline.Use of renewable energy increased toover20%ofthetotalconsumptionwhile water usage in manufacturing operationsreducedbyover37%comparedtothe2008baseline.
GENERATING CUSTOMER DELIGHTWe continued to improve our customer service. CCFOT (Customer Casefill-on-Time)increasedto94%and On-Shelf-Availability in Modern Trade touched an all time high of 96%.Ourcustomersacknowledgedthis and declared us ‘the best supplier of the year’. We continued to strengthen the Sales and Operation Planning process (S&OP) and Innovation Process Management (IPM) in order to proactively drive competitive growth as well as to respond to market demands with speed and agility.
We focused on improving product qualitythroughbetterproductdesignsandvariousqualityimprovement programmes. There has beena50%reductioninconsumercomplaints over last year.
FOCUS ON CONSUMERS
60%of our product portfolio touched by innovations
OUROPERATIONS
REAC
HING M
ORE CONSUMERS
LEVERAGING EN
TIRE VALUE CHAIN
FAST, FLAWLESS EXECUTION
INNOVATION +MARKETINGINVESTMENT
PROFITABLEVOLUMEGROWTH
COSTLEVERAGE +EFFICIENCY
Our Operations Hindustan Unilever Limited14
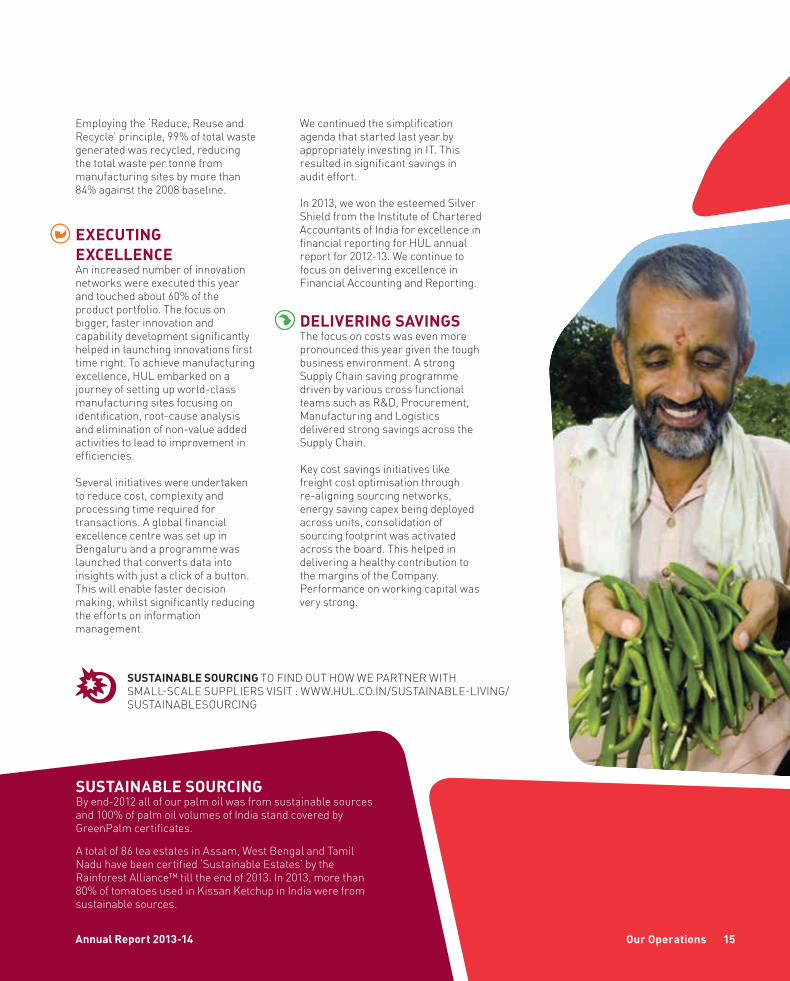
SUSTAINABLE SOURCINGByend-2012allofourpalmoilwasfromsustainablesourcesand100%ofpalmoilvolumesofIndiastandcoveredbyGreenPalm certificates.
Atotalof86teaestatesinAssam,WestBengalandTamilNadu have been certified ‘Sustainable Estates’ by the RainforestAlliance™tilltheendof2013.In2013,morethan80%oftomatoesusedinKissanKetchupinIndiawerefromsustainable sources.
Employing the ‘Reduce, Reuse and Recycle’principle,99%oftotalwastegenerated was recycled, reducing the total waste per tonne from manufacturing sites by more than 84%againstthe2008baseline.
EXECUTING EXCELLENCEAn increased number of innovation networkswereexecutedthisyearandtouchedabout60%oftheproduct portfolio. The focus on bigger, faster innovation and capability development significantly helped in launching innovations first time right. To achieve manufacturing excellence,HULembarkedonajourney of setting up world-class manufacturing sites focusing on identification, root-cause analysis and elimination of non-value added activities to lead to improvement in efficiencies.
Several initiatives were undertaken toreducecost,complexityandprocessingtimerequiredfortransactions. A global financial excellencecentrewassetupinBengaluru and a programme was launched that converts data into insights with just a click of a button. This will enable faster decision making, whilst significantly reducing the efforts on information management.
We continued the simplification agenda that started last year by appropriately investing in IT. This resulted in significant savings in audit effort.
In2013,wewontheesteemedSilverShield from the Institute of Chartered AccountantsofIndiaforexcellenceinfinancial reporting for HUL annual reportfor2012-13.WecontinuetofocusondeliveringexcellenceinFinancial Accounting and Reporting.
DELIVERING SAVINGSThe focus on costs was even more pronounced this year given the tough business environment. A strong Supply Chain saving programme driven by various cross functional teams such as R&D, Procurement, Manufacturing and Logistics delivered strong savings across the Supply Chain.
Key cost savings initiatives like freight cost optimisation through re-aligning sourcing networks, energysavingcapexbeingdeployedacross units, consolidation of sourcing footprint was activated across the board. This helped in delivering a healthy contribution to the margins of the Company. Performance on working capital was very strong.
Our Operations
SUSTAINABLE SOURCING TO FIND OUT HOW WE PARTNER WITH SMALL-SCALESUPPLIERSVISIT:WWW.HUL.CO.IN/SUSTAINABLE-LIVING/SUSTAINABLESOURCING
15Annual Report 2013-14
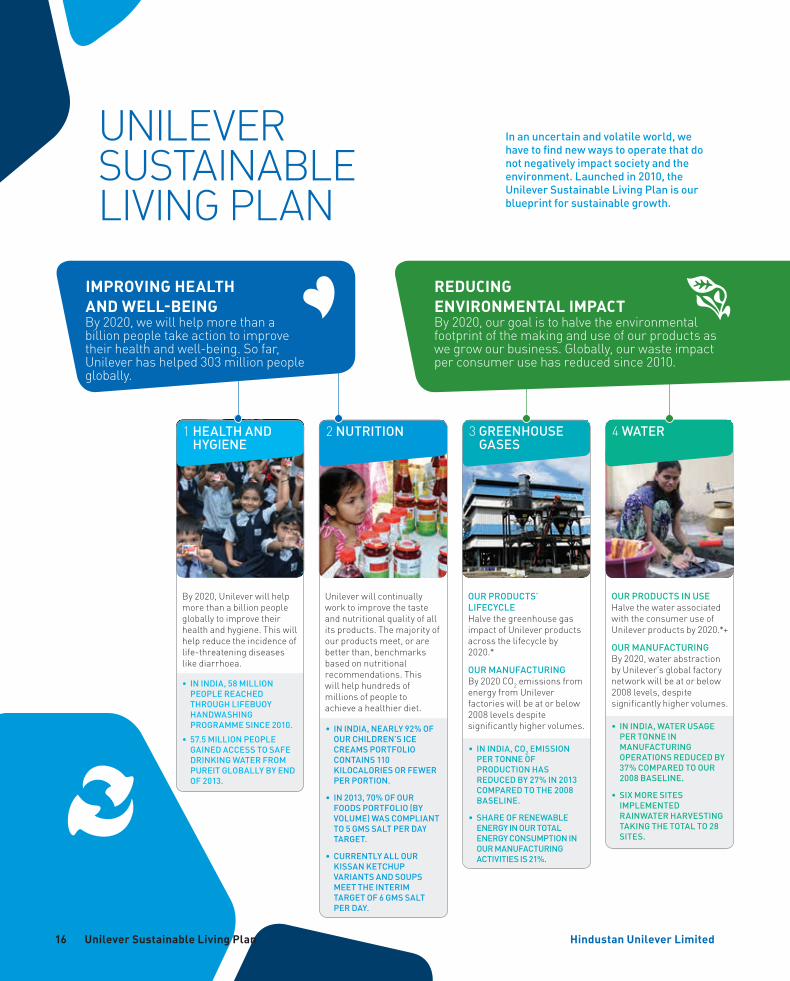
2 NUTRITION1HEALTH AND HYGIENE
Unilever will continually work to improve the taste andnutritionalqualityofallits products. The majority of our products meet, or are better than, benchmarks based on nutritional recommendations. This will help hundreds of millions of people to achieve a healthier diet.
3GREENHOUSE GASES
OUR PRODUCTS’ LIFECYCLE Halve the greenhouse gas impact of Unilever products across the lifecycle by 2020.*
OUR MANUFACTURING By2020CO2 emissions from energy from Unilever factories will be at or below 2008levelsdespitesignificantly higher volumes.
OUR PRODUCTS IN USE Halve the water associated with the consumer use of Unileverproductsby2020.*+
OUR MANUFACTURING By2020,waterabstractionby Unilever’s global factory network will be at or below 2008levels,despitesignificantly higher volumes.
By2020,Unileverwillhelpmore than a billion people globally to improve their health and hygiene. This will help reduce the incidence of life-threatening diseases like diarrhoea.
• IN INDIA, NEARLY 92% OF OUR CHILDREN’S ICE CREAMS PORTFOLIO CONTAINS 110 KILOCALORIES OR FEWER PER PORTION.
• IN 2013, 70% OF OUR FOODS PORTFOLIO (BY VOLUME) WAS COMPLIANT TO 5 GMS SALT PER DAY TARGET.
• CURRENTLY ALL OUR KISSAN KETCHUP VARIANTS AND SOUPS MEET THE INTERIM TARGET OF 6 GMS SALT PER DAY.
• IN INDIA, CO2 EMISSION PER TONNE OF PRODUCTION HAS REDUCED BY 27% IN 2013 COMPARED TO THE 2008 BASELINE.
• SHARE OF RENEWABLE ENERGY IN OUR TOTAL ENERGY CONSUMPTION IN OUR MANUFACTURING ACTIVITIES IS 21%.
• IN INDIA, WATER USAGE PER TONNE IN MANUFACTURING OPERATIONS REDUCED BY 37% COMPARED TO OUR 2008 BASELINE.
• SIX MORE SITES IMPLEMENTED RAINWATER HARVESTING TAKING THE TOTAL TO 28 SITES.
• IN INDIA, 58 MILLION PEOPLE REACHED THROUGH LIFEBUOY HANDWASHING PROGRAMME SINCE 2010.
• 57.5 MILLION PEOPLE GAINED ACCESS TO SAFE DRINKING WATER FROM PUREIT GLOBALLY BY END OF 2013.
UNILEVER SUSTAINABLE LIVING PLAN
In an uncertain and volatile world, we have to find new ways to operate that do not negatively impact society and the environment. Launched in 2010, the Unilever Sustainable Living Plan is our blueprint for sustainable growth.
Unilever Sustainable Living Plan
By2020,wewillhelpmorethanabillion people take action to improve their health and well-being. So far, Unileverhashelped303millionpeopleglobally.
By2020,ourgoalistohalvetheenvironmentalfootprint of the making and use of our products as we grow our business. Globally, our waste impact perconsumerusehasreducedsince2010.
IMPROVING HEALTH AND WELL-BEING
REDUCING ENVIRONMENTAL IMPACT
4 WATER
16 Hindustan Unilever Limited
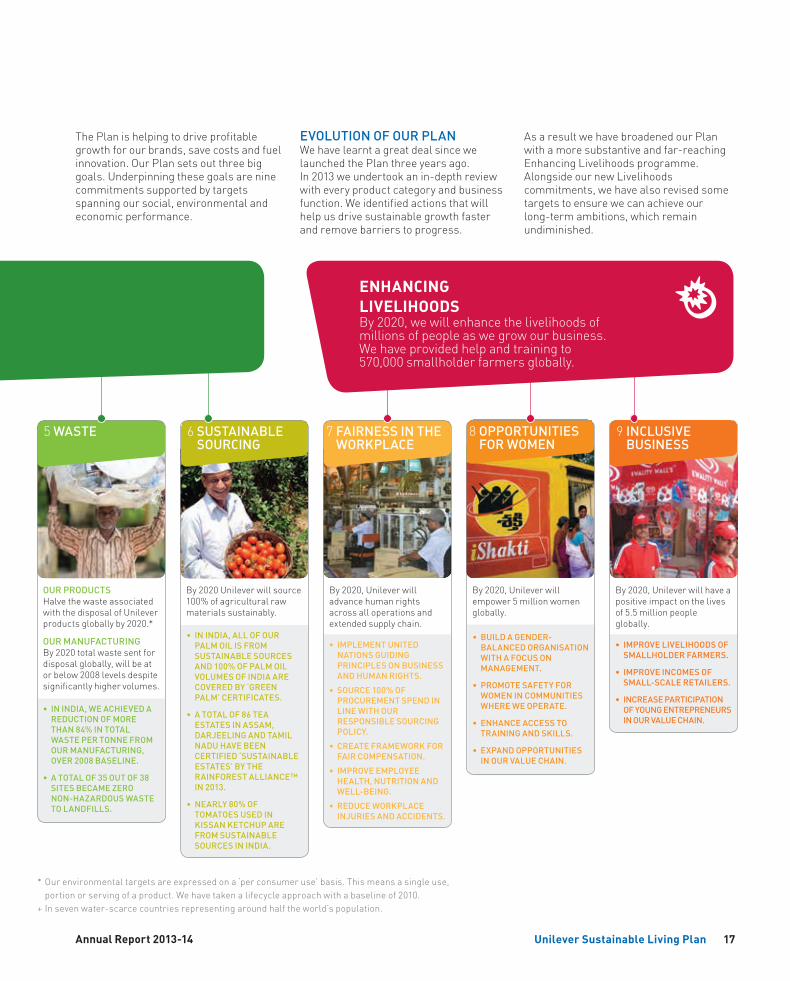
8OPPORTUNITIES FOR WOMEN
5 WASTE
• IMPROVE LIVELIHOODS OF SMALLHOLDER FARMERS.
• IMPROVE INCOMES OF SMALL-SCALE RETAILERS.
• INCREASE PARTICIPATION OF YOUNG ENTREPRENEURS IN OUR VALUE CHAIN.
6 SUSTAINABLE SOURCING
*Ourenvironmentaltargetsareexpressedona‘perconsumeruse’basis.Thismeansasingleuse,portionorservingofaproduct.Wehavetakenalifecycleapproachwithabaselineof2010.
+Insevenwater-scarcecountriesrepresentingaroundhalftheworld’spopulation.
OUR PRODUCTS Halve the waste associated with the disposal of Unilever productsgloballyby2020.*
OUR MANUFACTURING By2020totalwastesentfordisposal globally, will be at orbelow2008levelsdespitesignificantly higher volumes.
By2020Unileverwillsource100%ofagriculturalrawmaterials sustainably.
7FAIRNESS IN THE WORKPLACE
By2020,Unileverwilladvance human rights across all operations and extendedsupplychain.
By2020,Unileverwillempower 5 million women globally.
By2020,Unileverwillhaveapositive impact on the lives of 5.5 million people globally.
• IN INDIA, WE ACHIEVED A REDUCTION OF MORE THAN 84% IN TOTAL WASTE PER TONNE FROM OUR MANUFACTURING, OVER 2008 BASELINE.
• A TOTAL OF 35 OUT OF 38 SITES BECAME ZERO NON-HAZARDOUS WASTE TO LANDFILLS.
• IN INDIA, ALL OF OUR PALM OIL IS FROM SUSTAINABLE SOURCES AND 100% OF PALM OIL VOLUMES OF INDIA ARE COVERED BY ‘GREEN PALM’ CERTIFICATES.
• A TOTAL OF 86 TEA ESTATES IN ASSAM, DARJEELING AND TAMIL NADU HAVE BEEN CERTIFIED ‘SUSTAINABLE ESTATES’ BY THE RAINFOREST ALLIANCE™ IN 2013.
• NEARLY 80% OF TOMATOES USED IN KISSAN KETCHUP ARE FROM SUSTAINABLE SOURCES IN INDIA.
• IMPLEMENT UNITED NATIONS GUIDING PRINCIPLES ON BUSINESS AND HUMAN RIGHTS.
• SOURCE 100% OF PROCUREMENT SPEND IN LINE WITH OUR RESPONSIBLE SOURCING POLICY.
• CREATE FRAMEWORK FOR FAIR COMPENSATION.
• IMPROVE EMPLOYEE HEALTH, NUTRITION AND WELL-BEING.
• REDUCE WORKPLACE INJURIES AND ACCIDENTS.
• BUILD A GENDER-BALANCED ORGANISATION WITH A FOCUS ON MANAGEMENT.
• PROMOTE SAFETY FOR WOMEN IN COMMUNITIES WHERE WE OPERATE.
• ENHANCE ACCESS TO TRAINING AND SKILLS.
• EXPAND OPPORTUNITIES IN OUR VALUE CHAIN.
9 INCLUSIVE BUSINESS
The Plan is helping to drive profitable growth for our brands, save costs and fuel innovation. Our Plan sets out three big goals. Underpinning these goals are nine commitments supported by targets spanning our social, environmental and economic performance.
EVOLUTION OF OUR PLANWe have learnt a great deal since we launched the Plan three years ago. In2013weundertookanin-depthreviewwith every product category and business function. We identified actions that will help us drive sustainable growth faster and remove barriers to progress.
As a result we have broadened our Plan with a more substantive and far-reaching Enhancing Livelihoods programme. Alongside our new Livelihoods commitments, we have also revised some targets to ensure we can achieve our long-term ambitions, which remain undiminished.
Unilever Sustainable Living Plan
By2020,wewillenhancethelivelihoodsofmillions of people as we grow our business. We have provided help and training to 570,000smallholderfarmersglobally.
ENHANCING LIVELIHOODS
17Annual Report 2013-14
2
AWARDS AND FELICITATIONS
OUR BRANDS• HULwasdeclared‘ClientofTheYear’at
Effies2013afterbeingconferredatotalof8awardsincludingthecoveted‘Grand Effie’ for the Lifebuoy Roti Reminder, which was launched during the Mahakumbh mela. Our other brands, Kissan, Bru and Lifebuoy’s ‘Help A Child Reach Five’ campaign, won3Golds,2Silversand2Bronzes.
• AttheGlobalMobileAwards,wewonanaward for the innovative ‘free mobile radio’ service ‘Kan Khajura Teshan’ that has become the biggest radio station in Bihar. This initiative enabled us to reach out to 5 million rural consumers in an otherwise ‘media dark’ region.
• AonHewittrecognisedusintheir2013survey as the Best Employers in India.
• HarishManwaniwashonouredwiththeSingapore Public Service Medal.
• BusinessTodaynamedNitinParanjpeas both the best CEO for an FMCG company as well as the best CEO of an MNC.
• CNBC-TV18’s9thIndiaBusinessLeaderAwards honoured Nitin Paranjpe with the Business Leader of the year Award.
• CNBC-TV18conferredtheBestPerforming CFO award to Sridhar Ramamurthy in the Fast Moving Consumer Goods & Retail at the CFO Awards2012-13.Hewasalsorecognised at Business Today Best CFO Awards.
• UndertheConsumerSectorinthe2013InstitutionalinvestorAll-AsiaExecutiveTeam rankings, Nitin Paranjpe and Sridhar Ramamurthy secured the second spots on the Best CEO and Best CFO lists respectively.
Hindustan Unilever Limited received more than 150 awards and recognitions this year. Some of the key achievements across our brands, operations and people were:
• Wewerenamedthe‘BestMediaClientof the Year’ at India’s prestigious media awards – The Emvies.
• HULwon5Creativeand12MediaAbbyAwardsatGoaFest2013.
• HULwontheBronzeLioninthe‘Charityand Not for Profit’ category at Cannes 2013fortheLifebuoyRotiRemindercampaign.
• Wereceived‘InnovatingforaBetterFuture’ award from CNN-IBN for Pureit.
• HUL’swaterpurifierbrandPureitemerged as the most trusted brand in waterpurifiersinBrandEquity’s2013Most Trusted Brands survey.
OUR PEOPLE• HULemergedastheNo.1Employerof
Choice across all sectors, for the third year in a row, in the Nielsen Campus Track-BSchoolSurveyforthe2014graduating batch of B-School students. We retained the ‘Dream Employer’ status for the 5th year running and continued to be the top company considered for application by B-School students.
1
1 ClientoftheYearatEffies2013
2 Project Sunlight awarded at IAA OliveCrownAwards2014
Awards and Felicitations Hindustan Unilever Limited18
OUR OPERATIONS• HULwasrecognisedbyTheInstituteof
Chartered Accountants of India for excellenceinfinancialreporting and awarded the Silver Shield for best annual report in the Manufacturing sector.
• Barotiwala,KhamgaonandSumerpurunits bagged awards at the prestigious GreenManufacturingExcellenceAwards2013.KhamgaonwontheOverall Leader Award.
• ChhindwaraunitwonGoodGreenGovernance award from Srishti publications; Orai unit was declared the Runners-up in the ‘Process Non-metallic’ category.
• DoomDoomaunitwonGoldforTrainingExcellenceatGreentechHRAward2013.
• TheHULwebsitewasrecognisedastheNo.1PopularInvestorRelationsWebsite globally at the Investor Relations Global Rankings2013.
• MysoreunitreceivedaSilverratinginGreenCo audit conducted by CII.
• SumerpurunitwonSecondprizeattheNational Energy Conservation Award 2013intheSoap&DetergentSector.
CORPORATE• HULwasrecognisedasStarMNCof
theYear2013intheBusinessStandardAwardsforCorporateExcellence.
• HULwasnamedthe‘MultinationalinIndia of the Year’ at AIMA Managing Award2013.
• YourCompanywasranked2ndinFortune’s list of most admired companies in India.
• WeemergedastheNo.4MostRespected Company in India, in a survey conducted by Business World.
SUSTAINABILITY• HULwasrecognisedastheConscious
CapitalistoftheYear2013attheForbesIndia Leadership Awards.
• WewontwoGoldawardsatthe2014IAA Olive Crown awards for Project Sunlight - Green Brand of the Year and Corporate Crusader of the Year.
• HULwonthe2013CorporateSustainability Stewardship Award.
• WewonGoldenPeacockEnvironmentManagement Award.
3 Pradeep Banerjee receives the Business Standard Award for CorporateExcellence
4 Sumerpur Unit receives the National Energy Conservation Award
4
3
Awards and Felicitations 19Annual Report 2013-14
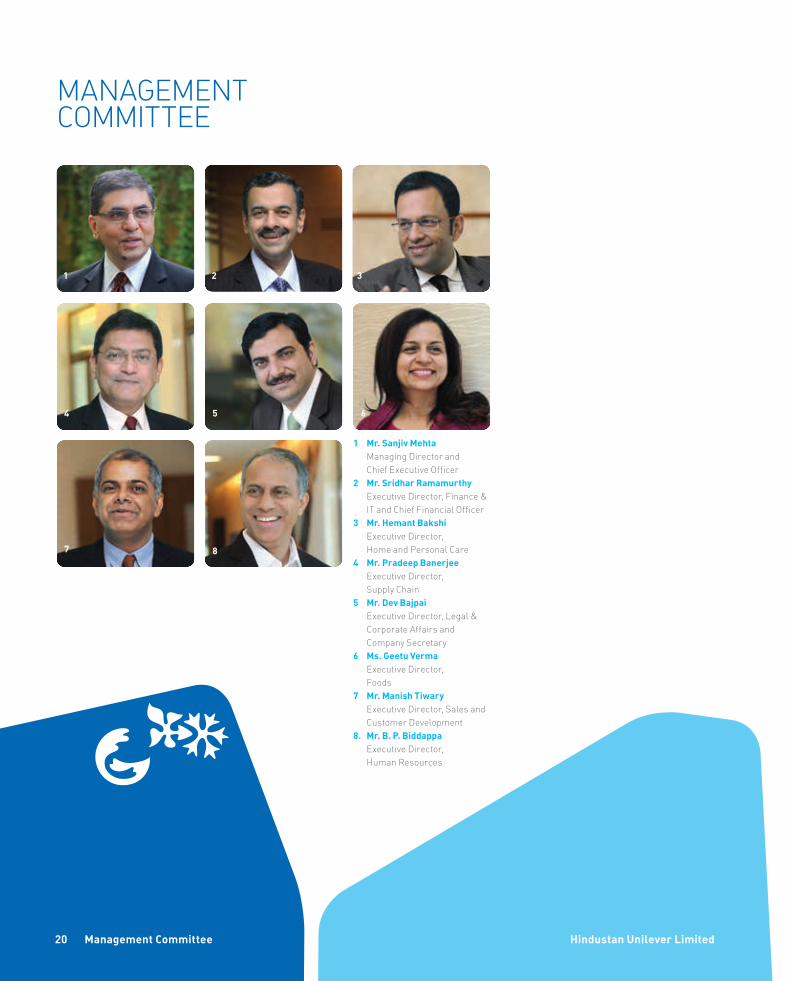
1 Mr. Sanjiv Mehta Managing Director and ChiefExecutiveOfficer2 Mr. Sridhar Ramamurthy ExecutiveDirector,Finance& IT and Chief Financial Officer3 Mr. Hemant Bakshi ExecutiveDirector, Home and Personal Care4 Mr. Pradeep Banerjee ExecutiveDirector,
Supply Chain5 Mr. Dev Bajpai ExecutiveDirector,Legal& Corporate Affairs and
Company Secretary6 Ms. Geetu Verma ExecutiveDirector,
Foods7 Mr. Manish Tiwary ExecutiveDirector,Salesand Customer Development8. Mr. B. P. Biddappa ExecutiveDirector,
Human Resources
1
4
7
2
5 6
8
3
MANAGEMENT COMMITTEE
Management Committee20 Hindustan Unilever Limited
Overview Financial Statements Shareholder InformationReports
Notice NoticePB 21Hindustan Unilever Limited Annual Report 2013-14
Overview Financial Statements Shareholder InformationReports
Registered office: Unilever House, B. D. Sawant Marg, Chakala, Andheri (East), Mumbai - 400 099 CIN: L15140MH1933PLC002030, Web: www.hul.co.in, Email: [email protected], Tel: +91 22 39832285 / 39832452
NOTICEof the Annual General Meeting
Notice is hereby given that the 81st Annual General Meeting of Hindustan Unilever Limited will be held on Monday, 30th June, 2014 at 2.00 p.m. at the Registered Office of the Company at Unilever House, B. D. Sawant Marg, Chakala, Andheri (East), Mumbai - 400 099, to transact the following businesses:
ORDINARY BUSINESS1. To receive, consider and adopt the Audited Statement of
Profit and Loss for the financial year ended 31st March, 2014, the Balance Sheet as at that date and the Reports of the Directors and Auditors thereon.
2. To confirm the payment of Interim Dividend and to declare a Final Dividend on equity shares for the financial year ended 31st March, 2014.
3. To elect and appoint Directors in place of those retiring by rotation.
4. To appoint M/s. BSR & Co. LLP, Chartered Accountants, as Statutory Auditors of the Company in place of M/s. Lovelock & Lewes, the retiring Statutory Auditors, to hold office from the conclusion of this Annual General Meeting, until the conclusion of sixth Annual General Meeting to be held after this meeting, subject to ratification at every Annual General Meeting and to fix their remuneration for the financial year ending 31st March, 2015.
SPECIAL BUSINESS5. To consider and if thought fit, to pass with or without
modification(s), the following resolution as an Ordinary Resolution:
“RESOLVED THAT pursuant to the provisions of Sections 149, 150 and 152 and other applicable provisions, if any, of the Companies Act, 2013 and the Rules made thereunder, read with Schedule IV to the said Act, Mr. Aditya Narayan (DIN : 00012084), Director of the Company who retires by rotation at the Annual General Meeting, be and is hereby appointed as an Independent Director of the Company to hold office for a term upto five consecutive years commencing from 30th June, 2014.”
6. To consider and if thought fit, to pass with or without modification(s), the following resolution as an Ordinary Resolution:
“RESOLVED THAT pursuant to the provisions of Sections 149, 150 and 152 and other applicable provisions, if any, of the Companies Act, 2013 and the Rules made thereunder, read with Schedule IV to the said Act, Mr. S. Ramadorai (DIN : 00000002), Director of the Company who retires by rotation at the Annual General Meeting, be and is hereby appointed as an Independent Director of the Company to hold office for a term upto five consecutive years commencing from 30th June, 2014.”
7. To consider and if thought fit, to pass with or without modification(s), the following resolution as an Ordinary Resolution:
“RESOLVED THAT pursuant to the provisions of Sections 149, 150 and 152 and other applicable provisions, if any, of the Companies Act, 2013 and the Rules made thereunder, read with Schedule IV to the said Act, Mr. O. P. Bhatt (DIN : 00548091), Director of the Company who retires by rotation at the Annual General Meeting, be and is hereby appointed as an Independent Director of the Company to hold office for a term upto five consecutive years commencing from 30th June, 2014.”
8. To consider and if thought fit, to pass with or without modification(s), the following resolution as an Ordinary Resolution:
“RESOLVED THAT pursuant to the provisions of Sections 149, 150 and 152 and other applicable provisions, if any, of the Companies Act, 2013 and the Rules made thereunder, read with Schedule IV to the said Act, Dr. Sanjiv Misra (DIN : 03075797), Director of the Company who retires by rotation at the Annual General Meeting, be and is hereby appointed as an Independent Director of the Company to hold office for a term upto five consecutive years commencing from 30th June, 2014.”
Notice Notice22 23Hindustan Unilever Limited Annual Report 2013-14
Notes:1. An Explanatory Statement pursuant to Section 102 of the
Companies Act, 2013 relating to the Special Businesses to be transacted at the Annual General Meeting (AGM) is annexed hereto.
2. A MEMBER ENTITLED TO ATTEND AND VOTE IS ENTITLED TO APPOINT A PROXY TO ATTEND AND VOTE ON HIS / HER BEHALF AND THE PROXY NEED NOT BE A MEMBER OF THE COMPANY. Pursuant to the provisions of Section 105 of the Companies Act, 2013, a person can act as a proxy on behalf of not more than fifty members and holding in aggregate not more than ten percent of the total Share Capital of the Company. Members holding more than ten percent of the total Share Capital of the Company may appoint a single person as proxy, who shall not act as a proxy for any other Member. The instrument of Proxy, in order to be effective, should be deposited at the Registered Office of the Company, duly completed and signed, not later than 48 hours before the commencement of the meeting. A Proxy Form is annexed to this Report. Proxies submitted on behalf of limited companies, societies, etc., must be supported by an appropriate resolution / authority, as applicable.
3. The Register of Members and Share Transfer Books of the Company will remain closed from Friday, 13th June, 2014 to Monday, 30th June, 2014 (both days inclusive). The book closure dates have been fixed in consultation with the Stock Exchanges.
4. The Final Dividend for the financial year ended 31st March, 2014, as recommended by the Board, if approved by the Members, will be paid on or after Friday, 4th July, 2014 to those Members whose names appear in the Register of Members of the Company as on the book closure dates.
5. In accordance with the Articles of Association of the Company, all Directors (except Mr. Sanjiv Mehta, who has been appointed as the Managing Director for a term of five years effective 10th October, 2013) retire every year and, if eligible, offer themselves for re-appointment at the AGM. Consequent to the elevation of Mr. Sridhar Ramamurthy as the Senior Vice President, Finance for Global Markets, Unilever, he will cease to be a Director of the Company with effect from 30th June, 2014 and will not offer himself for re-appointment. The Company had issued a Postal Ballot Notice dated 24th March, 2014 proposing appointment of Mr. P. B. Balaji as Executive Director, Finance & IT and Chief Financial Officer with effect from 1st July, 2014 to succeed Mr. Sridhar Ramamurthy. The results of the Postal Ballot were declared on 5th May, 2014 and the Special Resolution as set out in the said Postal Ballot Notice has been passed by the Members with an overwhelming majority of 99.76% of votes in favour of the Resolution. The appointment of
Mr. P. B. Balaji as Executive Director, Finance & IT and Chief Financial Officer is subject to requisite approval from the Central Government.
As per the provisions of the Companies Act, 2013, Independent Directors are required to be appointed for a term of upto five consecutive years and are not liable to retire by rotation. Accordingly, resolutions proposing appointment of Independent Directors are given at item nos. 5 to 8. The relevant details of Directors seeking appointment / re-appointment under item no. 3, 5, 6, 7 and 8 of this Notice are provided at page nos. 26 - 29 of the Annual Report.
6. The Company had received Special Notice dated 22nd April, 2014 under Section 140(4) read with Section 115 of the Companies Act, 2013 from Unilever PLC, in its capacity as a Member of the Company recommending appointment of M/s. BSR & Co. LLP, Chartered Accountants, as Statutory Auditors in place of M/s. Lovelock & Lewes, Chartered Accountants, the retiring Statutory Auditors. The change in the Statutory Auditor is proposed in order to remain at the forefront of good governance and in recognition of regulatory changes under the Companies Act, 2013. The Company has sent a copy of the said Special Notice to the retiring Statutory Auditors.
7. Pursuant to Section 101 and Section 136 of the Companies Act, 2013 read with relevant Rules made thereunder, Companies can serve Annual Reports and other communications through electronic mode to those Members who have registered their e-mail address either with the Company or with the Depository. Members who have not registered their e-mail address with the Company can now register the same by submitting a duly filled in ‘E-Communication Registration Form’, available on the website of the Company www.hul.co.in, to M/s. Karvy Computershare Private Limited / Investor Service Department of the Company. Members holding shares in demat form are requested to register their e-mail address with their Depository Participant(s) only. Members of the Company, who have registered their e-mail address, are entitled to receive such communication in physical form upon request.
8. The Notice of AGM, Annual Report and Attendance Slip are being sent in electronic mode to Members whose e-mail IDs are registered with the Company or the Depository Participant(s) unless the Members have registered their request for a hard copy of the same. Physical copy of the Notice of AGM, Annual Report and Attendance Slip are being sent to those Members who have not registered their e-mail IDs with the Company or Depository Participant(s). Members who have received the Notice of AGM, Annual Report and Attendance Slip in electronic mode are requested to print the Attendance Slip and submit a duly
Overview Financial Statements Shareholder InformationReports
Notice Notice22 23Hindustan Unilever Limited Annual Report 2013-14
filled in Attendance Slip at the registration counter to attend the AGM.
9. Pursuant to Section 108 of the Companies Act, 2013, read with the relevant Rules of the Act, the Company is pleased to provide the facility to Members to exercise their right to vote by electronic means. The Members, whose names appear in the Register of Members / list of Beneficial Owners as on Thursday, 12th June, 2014, i.e. the date prior to the commencement of book closure date are entitled to vote on the Resolutions set forth in this Notice. Members who have acquired shares after the despatch of the Annual Report and before the book closure may approach the Company for issuance of the User ID and Password for exercising their right to vote by electronic means. The e-voting period will commence at 9.00 a.m. on Tuesday, 24th June, 2014 and will end at 5.00 p.m. on Thursday, 26th June, 2014. The Company has appointed Mr. S. N. Ananthasubramanian, Practising Company Secretary, to act as the Scrutinizer, for conducting the scrutiny of the votes cast. The Members desiring to vote through electronic mode may refer to the detailed procedure on e-voting given hereinafter.
PROCEDURE FOR E-VOTING I. The Company has entered into an arrangement with
National Securities Depository Limited (NSDL) for facilitating e-voting for AGM. The instructions for e-voting are as under:
(a) In case of Members receiving an e-mail from NSDL:
(i) Open the PDF file ‘HUL e-Voting.pdf’ attached to the e-mail, using your Client ID / Folio No. as password. The PDF file contains your User ID and Password for e-voting. Please note that the Password provided in PDF is an ‘Initial Password’.
(ii) Launch an internet browser and open https://www.evoting.nsdl.com/
(iii) Click on Shareholder - Login.
(iv) Insert ‘User ID’ and ‘Initial Password’ as noted in step (i) above and click ‘Login’.
(v) Password change menu will appear. Change the Password with a new Password of your choice. Please keep a note of the new Password. It is strongly recommended not to share your Password with any person and take utmost care to keep it confidential.
(vi) Home page of e-voting will open. Click on e-Voting - Active Voting Cycles.
(vii) Select ‘EVEN’ of Hindustan Unilever Limited.
(viii) Now you are ready for e-voting as ‘Cast Vote’ page opens.
(ix) Cast your vote by selecting appropriate option and click on ‘Submit’. Click on ‘Confirm’ when prompted.
(x) Upon confirmation, the message ‘Vote cast successfully’ will be displayed.
(xi) Once you have voted on the resolution, you will not be allowed to modify your vote.
(xii) Institutional shareholders (i.e. other than individuals, HUF, NRI, etc.) are required to send scanned copy (PDF/JPG Format) of the relevant Board Resolution/ Authority Letter, along with attested specimen signature of the duly authorised signatory(ies) who are authorised to vote, to the Scrutinizer by an e-mail at [email protected] with a copy marked to [email protected].
(b) In case of Shareholders receiving physical copy of the Notice of AGM and Attendance Slip
(i) Initial Password is provided, as follows, at the bottom of the Attendance Slip.
EVEN(E-Voting Event Number) USER ID PASSWORD
– – –
(ii) Please follow all steps from Sr. No. (ii) to Sr. No. (xii) above, to cast vote.
II. In case of any queries, you may refer to the ‘Frequently Asked Questions’ (FAQs) and ‘e-voting user manual’ available in the downloads section of NSDL’s e-voting website www.evoting.nsdl.com.
III. If you are already registered with NSDL for e-voting then you can use your existing User ID and Password for casting vote.
IV. The voting rights shall be as per the number of equity share held by the Member(s) as on Thursday, 12th June, 2014. Members are eligible to cast vote electronically only if they are holding shares as on that date.
V. The Companies (Management and Administration) Rules, 2014 provides that the electronic voting period shall be completed three days prior to the date of AGM. Accordingly, the voting period shall commence at 9.00 a.m. on Tuesday, 24th June, 2014 and will end at 5.00 p.m. on Thursday, 26th June, 2014. The e-voting module shall be disabled by NSDL at 5.00 p.m. on the same day.
Notice Notice24 25Hindustan Unilever Limited Annual Report 2013-14
VI. The results shall be declared on or after the AGM. The results along with the Scrutinizer’s Report, shall also be placed on the website of the Company.
10. The Register of Directors’ and Key Managerial Personnel and their shareholding maintained under Section 170 of the Companies Act, 2013, the Register of contracts or arrangements in which the Directors are interested under Section 189 of the Companies Act, 2013 and the Certificate from the Auditors of the Company certifying that the ‘2001 HLL Stock Option Plan’, ‘2006 HLL Performance Share Scheme’ and ‘2012 HUL Performance Share Scheme’ are being implemented in accordance with the Securities and Exchange Board of India (Employee Stock Option Scheme and Employee Stock Purchase Scheme) Guidelines, 1999, will be available for inspection at the AGM.
11. Members holding shares in demat form are hereby informed that bank particulars registered with their respective Depository Participant(s), with whom they maintain their demat accounts, will be used by the Company for payment of dividend. The Company or its Registrar cannot act on any request received directly from the Members holding shares in demat form for any change in bank particulars. Members holding shares in demat form are requested to intimate any change in their address and / or bank mandate to their Depository Participants immediately.
12. Members holding shares in physical form are requested to intimate any change of address and / or bank mandate to M/s. Karvy Computershare Private Limited / Investor Service Department of the Company immediately.
13. Members are requested to share their valuable feedback by filling ‘Shareholders’ Satisfaction Survey’ given at the end of this Report. Members can also provide their feedback online, using the ‘Shareholders’ Satisfaction Survey’ form available on the ‘Investor Centre’ page on the website of the Company www.hul.co.in. This feedback will help the Company improve Shareholder Service Standards.
14. Members are requested to note that as per Section 205A of the Companies Act, 1956, dividends not encashed / claimed
within seven years from the date of declaration will be transferred to the Investor Education and Protection Fund (IEPF). After transfer of the said amount to IEPF, no claims in this respect shall lie against IEPF or the Company.
15. The status of dividends remaining unclaimed / unpaid with the respective due dates of transfer to IEPF is provided at page no. 66 of this Annual Report. Members are requested to contact M/s. Karvy Computershare Private Limited / Investor Service Department of the Company for encashing the unclaimed dividends standing to the credit of their account.
16. The Securities and Exchange Board of India has mandated submission of Permanent Account Number (PAN) by every participant in securities market. Members holding shares in demat form are, therefore, requested to submit PAN details to the Depository Participants with whom they have demat accounts. Members holding shares in physical form can submit their PAN details to M/s. Karvy Computershare Private Limited / Investor Service Department of the Company.
17. For convenience of the Members and proper conduct of the meeting, entry to the meeting venue will be regulated by Attendance Slip. Members are requested to sign at the place provided on the Attendance Slip and hand it over at the registration counter.
18. Members desiring any information relating to the accounts are requested to write to the Company well in advance so as to enable the management to keep the information ready.
Registered Office: By Order of the BoardUnilever House,B. D. Sawant Marg,Chakala, Andheri (East),Mumbai - 400 099
Dev Bajpai
Mumbai : 16th May, 2014
Executive Director (Legal & Corporate Affairs) and Company Secretary
Overview Financial Statements Shareholder InformationReports
Notice Notice24 25Hindustan Unilever Limited Annual Report 2013-14
EXPLANATORY STATEMENT
Item No. 5 to 8In accordance with the relevant provisions of the Articles of Association of the Company and the erstwhile provisions of the Companies Act, 1956, Mr. Aditya Narayan, Mr. S. Ramadorai, Mr. O. P. Bhatt and Dr. Sanjiv Misra, Independent Directors were appointed / re-appointed by the Members of the Company in the 80th AGM held on 26th July, 2013. The provisions of the Companies Act, 2013 with respect to appointment and tenure of the Independent Directors have come into effect. As per the said provisions, the Independent Directors shall be appointed for not more than two terms of five years each and shall not be liable to retire by rotation at every AGM.
The Board of Directors of the Company has decided to adopt the provisions with respect to appointment and tenure of Independent Directors which is consistent with the Companies Act, 2013 and the amended Listing Agreement. Accordingly, the Independent Directors will serve for not more than two terms of five years each on the Board of the Company. In the transition to the Companies Act, 2013, which is effective 1st April, 2014, those Independent Directors who have already served for ten or more years will serve for a maximum period of one term of five years. This is consistent with the provisions of Companies Act, 2013. In effect, the transition will be managed by re-appointing such Independent Directors for a period of one more term that does not exceed five years. With the above changes, the Company would not have any upper age limit of retirement of Independent Directors from the Board and their appointment and tenure will be governed by the provisions of Companies Act, 2013.
Mr. Aditya Narayan, Mr. S. Ramadorai, Mr. O. P. Bhatt and Dr. Sanjiv Misra, will retire by rotation at the ensuing AGM as per the erstwhile applicable provisions of the Companies Act, 1956. In terms of Section 149 and any other applicable provisions of the Companies Act, 2013, Mr. Aditya Narayan, Mr. S. Ramadorai, Mr. O. P. Bhatt and Dr. Sanjiv Misra, being eligible, offer themselves for appointment as Independent Directors on
the Board of the Company. In line with the requirements of the Companies Act, 2013, it is therefore proposed to appoint Mr. Aditya Narayan, Mr. S. Ramadorai, Mr. O. P. Bhatt and Dr. Sanjiv Misra, as Independent Directors on the Board of the Company for a term upto five consecutive years, commencing from 30th June, 2014. A brief profile of proposed Independent Directors, including nature of their expertise, is provided at page no. 26 to 29 of this Annual Report.
Notices have been received from Members proposing candidature of the above Directors for the office of Independent Director of the Company. In the opinion of the Board, Mr. Aditya Narayan, Mr. S. Ramadorai, Mr. O. P. Bhatt and Dr. Sanjiv Misra fulfil the conditions specified in the Companies Act, 2013 and the Rules made thereunder for appointment as Independent Directors of the Company. A copy of the draft Letter of Appointment for Independent Directors, setting out terms and conditions of their appointment, is available for inspection at the Registered Office of the Company during business hours on any working day and is also available on the website of the Company www.hul.co.in.
None of the Directors or Key Managerial Personnel of the Company and their relatives, other than Independent Directors for their respective appointment, are concerned or interested, financially or otherwise, in these Resolutions. The Board commends the Ordinary Resolutions as set out at item no. 5 to 8 for approval of the Members.
Registered Office: By Order of the BoardUnilever House,B. D. Sawant Marg,Chakala, Andheri (East),Mumbai - 400 099
Dev Bajpai
Mumbai : 16th May, 2014
Executive Director (Legal & Corporate Affairs) and Company Secretary
Profile of Directors Profile of Directors26 27Hindustan Unilever Limited Annual Report 2013-14
PROFILE OF DIRECTORSand other Directorships
HARISH MANWANI (DIN : 00045160)Mr. Harish Manwani (60) assumed charge as the Non-Executive Chairman of the Company with effect from 1st July, 2005. He is also the Chief Operating Officer of Unilever and a member of Unilever Leadership Executive (ULE).
Mr. Manwani joined the Company in 1976. He joined the Board of the Company in 1995 as a Director responsible for the Personal Products business. In addition, he held regional responsibility as the Category Leader for Personal Products for the then Central Asia & Middle East (CAME) Group.
In 2000, Mr. Manwani moved to UK as Senior Vice President for the Global Hair Care and Oral Care Categories and in early 2001, he was appointed as President - Home & Personal Care (HPC), Latin America Business Group. He has also served as the Chairman of Unilever’s Latin America Advisory Council. In 2004, he was appointed President and CEO of the HPC North America Business Group and in April 2005 was elevated to the Unilever Executive as the President - Asia & Africa. In 2008, Mr. Manwani received the CNBC Asia Business Leader of the Year Award and as a part of the Singapore National Day Awards 2012, Mr. Manwani was conferred the Public Service Medal (Friends of Singapore) by the Singapore Government.
Mr. Manwani is an Honours Graduate from the Mumbai University and holds a Master Degree in Management Studies. He has also attended the Advanced Management Programme (AMP) at Harvard Business School.
Mr. Manwani is a member of the Nomination and Remuneration Committee of the Company.
Directorship in other Companies
Indian School of BusinessWhirlpool CorporationPearson PLCQualcomm Inc.
Membership / Chairmanship of Board Committees in other Companies
Whirlpool Corporation Corporate Governance and Nominating Committee – Member Finance Committee – MemberPearson PLC Nomination Committee – Member
SANJIV MEHTA (DIN : 06699923)Mr. Sanjiv Mehta (53) joined the Board of the Company in October 2013. He is also the Executive Vice President for Unilever in South Asia and a member of Unilever’s Global Market Executive.
Mr. Mehta joined Unilever in October 1992. He has led several Unilever businesses across South Asia, South East Asia and Middle East. He was appointed Chairman and Managing Director of Unilever Bangladesh in 2002. In 2007, he was appointed as Chairman and CEO of Unilever Philippines. In 2008, he took up responsibility as the Chairman of Unilever North Africa and Middle East (NAME), leading a multi country organisation spanning 20 countries in the region.
During his tenure as the head of various Unilever Companies, the business achieved significant success accelerating both growth and profitability. Importantly, he has been instrumental in building leadership talent and substantially strengthening organisational capabilities.
Before joining Unilever, Mr. Mehta worked for Union Carbide India. He is a Commerce graduate and a Chartered Accountant. He has also completed Advanced Management Program from Harvard Business School.
He is a Member of the Nomination and Remuneration Committee, Stakeholders’ Relationship Committee and Corporate Social Responsibility Committee of the Company.
Directorship in other Companies
Kimberly Clark Lever Private LimitedHindustan Unilever FoundationBombay Chamber of Commerce and IndustryBreach Candy Hospital TrustFederation of Indian Chamber of Commerce and Industry
Membership / Chairmanship of Board Committees in other Companies
Nil
ADITYA NARAYAN (DIN : 00012084)Mr. Aditya Narayan (62) began his career as a Management Trainee with ICI India Limited (now Akzo Nobel India Limited) in 1973. He grew through diverse functions and businesses including a role as a Corporate Planning Manager at ICI Group HQ in London. He served as the Managing Director of ICI India during 1996 - 2003 and then as its Non-Executive Chairman over 2003 - 2010. He also served as the President and CEO of BHP Billiton India during 2005 - 2009.
Overview Financial Statements Shareholder InformationReports
Profile of Directors Profile of Directors26 27Hindustan Unilever Limited Annual Report 2013-14
Mr. Narayan is a B. Tech. from IIT Kanpur and also has formal qualifications in Law. He was a Fellow in Interdisciplinary Sciences at the University of Rochester, USA. He was a Commonwealth Scholar at the Manchester Business School in 1991 and a Fellow at the Aspen Institute, Colorado, USA in 1998.
Mr. Narayan joined the Board of the Company as an Independent Director in 2001. He is the Chairman of the Audit Committee and a Member of the Nomination and Remuneration Committee and Corporate Social Responsibility Committee of the Company.
Directorship in other CompaniesLinde India Limited
Membership / Chairmanship of Board Committees in other CompaniesLinde India LimitedAudit Committee – MemberShareholders’ / Investors’ Grievance Committee – Chairman
S. RAMADORAI (DIN : 00000002)Mr. S. Ramadorai (69) has been in public service since February 2011, currently acting as Chairman of National Skill Development Agency (NSDA) in the rank of a Cabinet Minister. The NSDA is a newly formed autonomous body which will coordinate and harmonise the skill development efforts of the Government and the private sector to achieve the skilling targets of the nation. He is also Chairman of the National Skill Development Corporation (NSDC), a Public Private Partnership arm of the Government of India for creating large, for-profit vocational institutions. Mr. Ramadorai continues as the Vice Chairman of Tata Consultancy Services Limited.
In recognition of Mr. Ramadorai’s commitment and dedication to the IT industry he was awarded the Padma Bhushan, India’s third highest civilian honour, in January 2006. In April 2009, he was awarded the CBE (Commander of the Order of the British Empire) by Her Majesty Queen Elizabeth II for his contribution to the Indo-British economic relations.
Mr. Ramadorai’s academic credentials include a Bachelor degree in Physics from Delhi University, a Bachelor of Engineering, degree in Electronics and Telecommunications from Indian Institute of Science, Bengaluru and a Master degree in Computer Science from the University of California, USA. Mr. Ramadorai attended the MIT Sloan School of Management’s highly acclaimed Senior Executive Development Programme in 1993.
Mr. Ramadorai joined the Board of the Company as an Independent Director in May 2002. He is a Member of the Audit Committee and the Chairman of the Nomination and Remuneration Committee of the Company.
Directorship in other Companies
Tata Consultancy Services LimitedTata Industries Limited Tata Technologies LimitedCMC Limited Piramal Enterprises Limited Tata Elxsi Limited Tata Teleservices (Maharashtra) LimitedTata Communications LimitedTata Advanced Systems LimitedAsian Paints LimitedBSE LimitedTata Lockheed Martin Aerostructures LimitedTara Aerospace Systems Limited Air Asia (India) Private LimitedTata Communication International Pte. Limited Tata America International Corporation Computational Research Laboratories Inc.
Membership / Chairmanship of Board Committees in other Companies
Tata Consultancy Services Limited Shareholders’ / Investors’ Grievance Committee – MemberRemuneration Committee – MemberExecutive Committee – MemberEthics and Compliance Committee – Member Risk Management Committee – MemberTata Industries LimitedRemuneration Committee – MemberTata Technologies Limited Audit Committee – MemberCompensation and Remuneration Committee – ChairmanCMC LimitedGovernance Committee – MemberExecutive Committee – ChairmanPiramal Enterprises LimitedNomination and Remuneration Committee – Member
Profile of Directors Profile of Directors28 29Hindustan Unilever Limited Annual Report 2013-14
Tata Elxsi Limited Executive Committee – ChairmanAudit Committee – Member Remuneration Committee – MemberNomination Committee – MemberTata Teleservices (Maharashtra) LimitedAudit Committee – MemberEthics and Compliance Committee – MemberExecutive Committee – MemberTata Communications International Pte. LimitedRemuneration Committee – ChairmanTata Advanced Systems Limited Audit Committee – Chairman Remuneration Committee – ChairmanBSE LimitedAdvisory Committee – ChairmanAudit Committee – MemberShare Allotment and Shareholders’ / Investors’ Grievance Committee – ChairmanTrading and Surveillance Function Committee – ChairmanCompensation Committee – Chairman Public Interest Director Committee – ChairmanDefaulters’ Committee – Member Listing Function Committee – MemberEthics Committee – ChairmanMembership Selection Committee – ChairmanStanding Committee Technology – ChairmanSub-Committee for Monitoring Compliance of suggestion given in SEBI inspection report - ChairmanArbitration Committee - Member
O. P. BHATT (DIN : 00548091)Mr. O. P. Bhatt (63) is the former Chairman of SBI (State Bank of India). In the 36 years that Mr. Bhatt served at SBI, he worked on several important national and international assignments. Mr. Bhatt led SBI through challenging times by capitalising on the bank’s strengths. As Chairman of SBI, he was heading the largest financial group in India, comprising, in addition to SBI, seven associate banks, five international banking subsidiaries and nine financial services companies in India. Under his leadership, SBI rose on the Global List rankings of Fortune 500.
Mr. Bhatt was nominated ‘Banker of the Year’ by Business Standard and CNN – IBN Indian of the Year for Business in 2007. Mr. Bhatt was Chairman of the Indian Banks’ Association. He has also been a part of India’s eco-diplomacy as member of the Indo-US, Indo- Russia and Indo-French CEOs Forum. Presently, he is the Governor on the Board of Centre for Creative Leadership, USA.
Mr. Bhatt holds a Graduate degree in Physics and a Post Graduate degree in English literature (Gold Medal).
Mr. Bhatt was appointed as an Independent Director on the Board of the Company in December 2011. He is a Member of the Audit Committee and Nomination and Remuneration Committee of the Company. He is the Chairman of the Stakeholders’ Relationship Committee and Corporate Social Responsibility Committee of the Company.
Directorship in other Companies
Oil and Natural Gas Corporation LimitedTata Consultancy Services LimitedTata Steel LimitedStandard Chartered PLC, London
Membership / Chairmanship of Board Committees in other Companies
Oil and Natural Gas Corporation LimitedAudit and Ethics Committee – MemberShareholders’ / Investors’ Grievances Committee – MemberProject Appraisal Committee – ChairmanHeath, Safety and Environment Committee – MemberFinancial Management Committee – MemberTata Consultancy Services LimitedAudit Committee – MemberRisk Management Committee – MemberShareholders’ / Investors’ Grievances Committee – MemberTata Steel LimitedAudit Committee – MemberRemuneration Committee – Member
DR. SANJIV MISRA (DIN : 03075797)Dr. Sanjiv Misra (66) is a retired Indian Administrative Services (IAS) officer and a former member of the 13th Finance Commission, a constitutional position with the rank of a Minister of State. Prior to joining the Finance Commission, Dr. Misra has served in a wide range of key positions in the Federal and State Governments, including as Managing Director of the Gujarat Industrial Development Corporation and stints at senior levels in the Government of India in the Cabinet Office, the Ministry of Petroleum, the Ministry of Health & Family Welfare and the Ministry of Finance. He served as a Secretary in the Ministry of Finance till his superannuation.
Dr. Misra has represented India in various international conferences, seminars and negotiations. Till recently, Dr. Misra was a Member of the Advisory Council of the Asian Development
Membership / Chairmanship of Board Committees in other Companies (Contd.)
Overview Financial Statements Shareholder InformationReports
Profile of Directors Profile of Directors28 29Hindustan Unilever Limited Annual Report 2013-14
Bank Institute, Tokyo. He was also a member of the Committee on Fiscal Consolidation (Kelkar Committee) set up by the Finance Minister in August 2012 to chart out a road map for fiscal consolidation for the Indian economy.
Dr. Misra graduated in Economics from St. Stephen’s College, Delhi. He has a Master’s degree in Economics from the Delhi School of Economics, a Master’s degree in Public Administration from John F Kennedy School of Government, Harvard University, USA and a Ph. D. from the Jawaharlal Nehru University, New Delhi. In recognition of exceptional academic strengths and leadership qualities, Dr. Misra was designated as Lucius N Littauer Fellow of 1987 at Harvard University.
Dr. Misra was appointed as an Independent Director on the Board of the Company in April 2013. He is a Member of the Audit Committee and Nomination and Remuneration Committee and Corporate Social Responsibility Committee of the Company.
Directorship in other Companies
Akzo Nobel India LimitedBSE LimitedAxis Bank Limited
Membership / Chairmanship of Board Committees in other Companies
BSE Limited Audit Committee – ChairmanPublic Interest Director Committee – MemberDefaulters’ Committee – MemberEthics Committee – MemberDisciplinary Action Committee – MemberCompensation Committee – MemberOversight Committee (Member Regulation) – MemberOversight Committee (Listing Function) – MemberInspection and Compliance Committee – MemberIPO Committee – MemberAkzo Nobel India Limited Audit Committee – MemberShareholders’ / Investors’ Grievances Committee – ChairmanRemuneration and Nomination Committee – MemberAxis Bank Limited Risk Management Committee - MemberCustomer Service Committee - Member
PRADEEP BANERJEE (DIN : 02985965)Mr. Pradeep Banerjee (55) joined the Company as a Management Trainee in 1980. He has held a series of assignments in Supply Chain, Research & Development and Categories. Mr. Banerjee became the Vice President - Technical (Home & Personal Care) in 2003 and later moved to UK in 2005 as Vice President - Global Supply Chain for Personal Care Category. He served as the Vice President for Global Procurement in Singapore.
Mr. Banerjee was appointed as Executive Director - Supply Chain of the Company in March 2010. He holds a Bachelor degree in Engineering (Chemical) from IIT Delhi.
Directorship in other Companies
Unilever Nepal LimitedUnilever India Exports Limited
Membership / Chairmanship of Board Committees in other CompaniesNil
DIRECTORS’ INTERESTThe Directors of the Company may be deemed to be concerned or interested to the extent of shares held by them in the Company as given in the table below:
Name of the Director No. of Shares % Holding
Harish Manwani 22,130 0.0010Sanjiv Mehta Nil NAAditya Narayan Nil NAS. Ramadorai 35 0.0000O. P. Bhatt Nil NASanjiv Misra Nil NAPradeep Banerjee 26,024 0.0012
Directors’ Report Directors’ Report30 31Hindustan Unilever Limited Annual Report 2013-14
DIRECTORS’ REPORTand Management Discussion and Analysis
To the Members,
Your Company’s Directors are pleased to present the 81st Annual Report of the Company, along with Audited Accounts, for the financial year ended 31st March, 2014.
1. FINANCIAL PERFORMANCE (STANDALONE)
1.1. Results(Rs. crores)
For the year ended 31st March, 2014
For the year ended 31st March, 2013
Revenue from operations, net of excise 28,019.13 25,810.21
Profit before exceptional items and tax 4,799.71 4,349.48
Profit for the year 3,867.49 3,796.67
Dividend (including tax on distributed profits)* (3,272.97) (4,655.68)
Transfer to General Reserve (386.75) (379.67)
Profit & Loss Account balance carried forward 743.05 535.28* In the year 2012-13, the Board of Directors declared a Special Dividend of Rs. 8.00 per Equity Share.
1.2. Category Wise Turnover(Rs. crores)
For the year ended 31st March, 2014
For the year ended 31st March, 2013
Sales Others* Sales Others*Soaps and Detergents 13,460.98 222.43 12,460.96 240.86
Personal Products 7,979.81 141.10 7,309.10 162.56
Beverages 3,275.12 36.74 2,913.67 60.99
Packaged Foods 1,620.75 27.55 1,473.86 31.88
Others (including Exports, Chemicals, Infant Care Products, Water, etc.) 1,071.63 84.67 1,048.79 43.99
TOTAL 27,408.29 512.49 25,206.38 540.28
* Others include service income from operations, relevant to the respective businesses.
Directors’ Report Directors’ Report30 31Hindustan Unilever Limited Annual Report 2013-14
Overview Financial Statements Shareholder InformationReports
2. DIVIDEND
Your Directors are pleased to recommend a Final Dividend of Rs. 7.50 per equity share of face value of Re. 1/- each for the year ended 31st March, 2014. The Interim Dividend of Rs. 5.50 per equity share was paid on 15th November, 2013.
The Final Dividend, subject to approval of Members at the Annual General Meeting on 30th June, 2014, will be paid on or after 4th July, 2014 to the Members whose names appear in the Register of Members, as on the date of book closure, i.e. from Friday, 13th June, 2014 to Monday, 30th June, 2014 (inclusive of both dates). The total dividend for the financial year, including the proposed Final Dividend, amounts to Rs. 13.00 per equity share and will absorb Rs. 3,272.97 crores, including Dividend Distribution Tax of Rs. 461.54 crores.
3. RESPONSIBILITY STATEMENT
The Directors confirm that:• in the preparation of the annual accounts, the applicable
accounting standards have been followed and that no material departures have been made from the same;
• they have selected such accounting policies and appliedthem consistently and made judgments and estimates that are reasonable and prudent, so as to give a true and fair
view of the state of affairs of the Company at the end of the financial year and of the profits of the Company for that period;
• they have taken proper and sufficient care for themaintenance of adequate accounting records in accordance with the provisions of the Companies Act, 1956, for safeguarding the assets of the Company and for preventing and detecting fraud and other irregularities; and
• theyhavepreparedtheannualaccountsonagoingconcernbasis.
MANAGEMENT DISCUSSION AND ANALYSISIn order to avoid duplication between the Directors’ Report and the Management Discussion and Analysis, we present below a composite summary of performance of the various businesses and functions of the Company.
4. ECONOMY AND MARKETS
The year witnessed divergent growth globally, led by strengthening of the US economy, uneven and subdued growth in the Euro area and Japan coupled with a slowdown in Developing & Emerging markets.
1.3. Summarised Profit and Loss Account(Rs. crores)
For the year ended 31st March, 2014
For the year ended 31st March, 2013
Sale of products less excise duty 27,408.29 25,206.38Other operational income 610.84 603.83Total Revenue 28,019.13 25,810.21Operating Costs (23,543.87) (21,806.46)Profit Before Depreciation, Interest, Tax (PBDIT) 4,475.26 4,003.75Depreciation (260.55) (236.02)Profit Before Interest & Tax (PBIT) 4,214.71 3,767.73Other Income (net) 585.00 581.75Profit before exceptional items 4,799.71 4,349.48Exceptional items 228.68 608.40Profit Before Tax (PBT) 5,028.39 4,957.88Taxation (1,160.90) (1,161.21)Profit for the year 3,867.49 3,796.67Basic EPS (Rs.) 17.88 17.56
Directors’ Report Directors’ Report32 33Hindustan Unilever Limited Annual Report 2013-14
In the domestic market, growth continued to be muted with the second successive year of sub 5% GDP growth. The year saw steep currency depreciation in an environment where industrial activity remained in contraction mode, consumption demand continued to weaken, while lacklustre capital goods production pointed to stalled investment demand.
With sluggish growth across the larger economy, further compounded by high consumer inflation and weak sentiment, market growth across FMCG categories moderated throughout the year in both volume and value terms. The discretionary categories and premium segments were particularly under pressure. The operating context for the year was challenging, given the backdrop of a market slowdown, a volatile input cost environment and heightened competitive intensity.
Your Company’s performance for the year 2013-14 has to be viewed in the context of aforesaid economic and market environment.
5. PERFORMANCE OF BUSINESSES AND CATEGORIES
5.1. Home & Personal Care (HPC) The Home & Personal Care (HPC) business consists of Soaps, Detergents, Household Care and Personal Products, which includes categories like Skin Care, Hair Care, Oral Care, Colour Cosmetics and Deodorants. During the year, the HPC business registered robust growth ahead of market.
The opportunity for growth in India continues to be immense across all HPC categories. This fact is also reflected in high levels of competitive intensity in the marketplace. Your Company believes that both unwavering focus on competitive growth in core categories as well as market development to build segments of future are critical for sustained growth and long term value creation. While focusing on the core categories, your Company has also invested significantly in the segments of future, i.e. the segments which are expected to drive future growth.
Rural continues to be a key area of focus for your Company. During the year, your Company reached out to 8,500 villages across India with an ambition to improve the health and hygiene of children, through school contact and Mohalla programmes. At the School Contact Programme, your Company’s brands, Lifebuoy and Pepsodent, encouraged and educated children on the importance and correct method of handwashing and brushing their teeth. In the Mohalla programme, your Company demonstrated to consumers the benefits and usage of new and emerging categories, such as facewash, hair conditioners and fabric conditioners.
In a highly competitive scenario, where new brands and offerings are entering the market almost every quarter, your Company delivered competitive growth, driven by innovation, sharper in-market execution, competitive marketing and trade investments behind the brands. Your Company sustained strong focus on innovation across the portfolio and continued to delight consumers with a range of exciting offerings launched during the year. Your Company has also significantly stepped up investment in Digital Media, which is expected to be the media channel of the future. Your Company continued to leverage and benefit from the inputs received from Unilever across various aspects of the business, including technology, innovation and communication.
Volatile and rapidly changing commodity markets, including vegetable oil and crude oil, coupled with depreciating currency markets continued posing a major challenge during the year. There were also regulatory changes in the space of media availability, leading to more efficient media buying and better deployment of non-TV led media. Even in this challenging environment, your Company delivered profitable growth through robust cost-saving programmes and judicious pricing, without compromising on the competitiveness of brand investments, both in terms of technology as well as advertising and promotion.
5.1.1. Soaps and DetergentsThe Soaps and Detergents segment delivered healthy volume led turnover growth of 8.0% during the year. Further, growth during the year was profitable as segmental profit increased by 10.5%, through a mix of cost savings, supply chain efficiencies and judicious pricing.
Soaps category recorded a very successful year with strong volume growth in a market which saw an overall decline in volumes. The growth was driven by prompt and decisive pricing actions on Lifebuoy, Lux, Breeze and Dove, which gained consumer franchise. These actions were supported by consumer centric activations, effective advertising and sustained high levels of distribution. The growth was witnessed not only in the core bars business, but also in the liquids portfolio, led by Lifebuoy Handwash, where your Company continues to invest behind developing the market through a mix of building penetration and increasing consumption.
Detergents category recorded another year of steady growth with a good balance of price and volume growth. Notwithstanding a challenging economic environment, where category growth slowed and the rate of premiumisation came off, for your Company the performance in the category continued to be led by the premium end. Surf continued to lead category premiumisation with double digit growth, buoyed by the continuing momentum on Surf Excel Easy Wash, since its relaunch in the previous year. The performance in Rin was led by the bars portfolio while powders were re-launched towards the end of the year, with an improved product and new thematic
Directors’ Report Directors’ Report32 33Hindustan Unilever Limited Annual Report 2013-14
Overview Financial Statements Shareholder InformationReports
communication. Wheel’s performance progressively stepped up over the year, with the second half benefiting from the re-launch of the powders portfolio as significant investments were made to deliver a superior formulation resulting in quality enhancement for the segment. The brand was further supported by a range of impactful activation including the Gold Coin programme, which was well received. The emerging market development categories of Machine Wash (with Surf Excel Matic) and Fabric Conditioners (with Comfort) continued to perform well. Besides, your Company also initiated the creation of Detergent Liquid market in India with the launch of Surf Excel Detergent Liquid. Your Company will continue to focus on driving innovations, exercising cost control across the value chain and delivering effective communication to win in the Detergents category.
Household Care category delivered double digit growth during the year on the back of robust volumes. Vim, which continues to delight consumers through superior product quality and strong advertising, is now a Rs. 1000+ crore brand. Innovations, such as the Anti-Germ mix (bar and liquids) and the monthly tub pack, continue to drive consumption and premiumisation in urban India. At the same time, strengthening the presence across key price points in dishwash bars helped reach new consumers in rural India. Domex strengthened the toilet cleaning business through the launch of an innovative product, Domex Zero Stain. The innovation, aimed at hygiene conscious users who have high incidence of stain problem in toilets, has helped fuel brand growth. Domex Toilet Academy (DTA) programme was launched during the year with an aim to eradicate open defecation by building toilets and improving sanitation facilities. Through the right partnerships, DTA is helping promote the importance of safe and hygienic sanitation practices in local communities.
5.1.2. Personal ProductsPersonal Products categories comprise Skin Care, Hair Care, Oral Care, Colour Cosmetics and Deodorants. In a challenging market environment, where the growth of discretionary categories has been particularly under pressure, the Personal Products segment delivered a healthy turnover growth of 9.2%. Segmental profit was up by 6.1%, as your Company continued to invest for competitive growth in its core categories, whilst building the segments of the future.
Skin Care category registered good growth in a slowing market. Fair & Lovely was re-launched with a new mix - the ‘Best Ever’ Fair & Lovely - a product that was tailor-made to deliver superior skin lightening results in India. Fair & Lovely registered a step up in its growth trajectory post the re-launch. Vaseline Healthy White, with a proposition of not just giving moisturisation but also instant and lasting skin whitening, was very successful, resulting in double-digit growth for the brand. Dove and Lakmé also grew very well during the year, powered by strong marketing inputs. Lakmé delivered a strong performance during the year on the back of a range of exciting innovations that were launched. Lakmé
skin forayed into the anti-aging segment with the launch of Youth Infinity skin cream. In addition, under Lakmé, a new Complexion Care (CC) cream was introduced, the Perfect Radiance range was relaunched and the facial cleansing portfolio was revamped with the addition of new Clean Up range. Pond’s launched BB+ cream in India to leverage on the global beauty trend catering to consumers looking for instant optical radiance.
Hair Care delivered a strong year of volume led broad based double digit growth. Dove, Sunsilk and Clinic Plus grew in double digits during the year. The TRESemmé proposition of ‘Salon like hair, at home everyday’ has been well received by consumers. The brand which was introduced in September 2012 has made very good progress and been instrumental in accelerating the premiumisation agenda. The fact that the brand neared the significant milestone of Rs. 100 crores of annual turnover in its very first full year post launch is an example of efficiently leveraging the global Unilever portfolio to win locally with consumers. In addition, your Company launched Toni&Guy, another premium brand from the global Unilever hair portfolio. It is the first time that your Company launched the brand through e-commerce. Going forward, Toni&Guy will be rolled out in select stores across India. Your Company continued to focus on market development by investing strongly behind the emerging high potential hair conditioners segment, thereby growing ahead of the market.
In Oral Care, significant investments were made to sustain competitive position in the category, as competitive intensity stepped up dramatically in the course of the year. Your Company continued to focus on strengthening the Oral Care brands and the portfolio, despite the intense competitive pressure. Pepsodent Germicheck was re-launched during the year with an improved formulation with better germ attack power. Pepsodent also continued to strengthen its expertise and authority credentials through the Expert Protection range and with a strong dental community programme. The growth in Closeup continued to be led by a range of exciting activations. Your Company has also significantly revamped its toothbrushes business model by pruning and sharpening the portfolio during the year.
In the Deodorant portfolio, through Axe, your Company continued to deploy exciting innovations and impactful campaigns. The ‘AXE Blast’ campaign, endorsed by a popular Bollywood youth icon, was well received by consumers. Your Company has strong innovation plans for the forthcoming year in this category. Your Company currently imports a large portion of deodorants in the aerosol form. Unilever is in the process of implementing a project to establish a world class deodorants manufacturing facility in India. This facility will provide a regular supply of high quality deodorant products to cater to markets across the world, including India.
Directors’ Report Directors’ Report34 35Hindustan Unilever Limited Annual Report 2013-14
Lakmé Colours has had an exceptional year with high double digit growth. The reinvention of the brand as ‘Pro-stylist’ across makeup, skin and salon has brought its expert credentials to the forefront through premium innovations in skin care and makeup. In makeup, your Company has launched the 9 to 5 platform - to address working women, many first to market innovations under Absolute like Gel nails and Face Stylist and limited editions like Pop Tints. The premium segment contribution for makeup has grown particularly well in the last two years. The Lakmé brand has seen a step up in investments and all key innovations have been executed through the beauty advisory channel, where expansion of footprint and activation through bringing the brand proposition alive at retail has contributed to the market development. Lakmé has also leveraged the digital communication channel, through ‘how to’ videos, to educate consumers on using makeup and adopting new regimes in skin care.
5.2. Foods & Beverages (F&B) The Foods & Beverages (F&B) portfolio of your Company comprises Tea, Coffee, Processed Foods, Frozen Desserts, Ice Creams, Bakery products and Out of Home operations, including BRU World Café.
During the year, F&B business delivered strong double digit growth in a challenging market context. This was driven by a single minded focus on the core brands and driving market development across key categories. The Packaged Food category continues to represent a significant consumer and business opportunity, given the shifts in the income pyramid, increase in working women, growing health concerns and the need for taste with convenience. Your Company is consistently focused on developing newer offerings that can best fulfil existing and emerging consumer needs. Your Company continues to focus on driving availability and distribution, alongside building salience for its brands and relevance. In addition, your Company is driving upgradation across categories with strong research and development support from Unilever and a deep insight into Indian consumer and customer needs.
5.2.1. BeveragesThe Beverages segment delivered 12.4% turnover growth in the year, well ahead of the market, on the back of a strong double digit performance in Tea. This was accompanied by a significant step up in segmental profits which increased by 22.4%.
At the onset of the year, the Packet Tea market witnessed steep commodity inflation which drove market to volume decline. Despite this environment, your Company delivered competitive and profitable growth. The double digit growth across all brands was driven by a strengthened mix and focused in-market activities.
Your Company drove its five leading brand positions across India, with all brands recording healthy volume growth and growing across major geographies. Across both the premium and
popular price segments, brands grew competitively. Taj Mahal and 3 Roses continued to drive premiumisation and Red Label and Taaza offered unbranded tea users a good mix of superior, great tasting tea and value. Taj Mahal and Lipton continued to grow the tea bags market through market development. Your Company strengthened its position in every segment of tea bags market, particularly flavoured and green tea.
The Instant Coffee market was challenged for growth in the context of steep commodity inflation in the previous year with the accompanying drop in consumption, particularly in the core South markets. In this context, your Company’s focus was to drive back lapsers to the category, through enhanced product experience and market development efforts. Your Company also continued to drive BRU Gold – a premium offering, targeted at new age consumers of coffee in the non-traditional markets. BRU Gold met with good success as the franchise grew competitively ahead of markets.
5.2.2. Packaged FoodsThe Packaged Foods segment of your Company comprises culinary products such as jams, ketchups and squashes under Kissan; soups, soupy noodles and meal makers under Knorr; branded staples (atta and salt) under Annapurna; bakery products under Modern; and frozen desserts / ice creams under Kwality Wall’s and Magnum. The segment delivered 10.0% turnover growth with a segmental profit growing by 65.5% during the year, as your Company continued to drive efficiencies and mix, while continuing to invest in building this business.
Kissan sustained its strong, consistent performance, delivering another year of double digit growth, driven by impactful activation around unlocking everyday relevance. A strong insight of the ‘Tiffin-moment’ being a stress point in the mother’s life resulted in a solution in the form of ‘Kissan Rolls’, where mothers could give their kids healthy vegetables made tastier with Kissan in the form of a roll. This singular message, along with our reiteration of the fact that Kissan is made from 100% tomatoes through ‘Kissanpur’, made Kissan the brand of choice. During the year, Kissan moved up 70 places in India’s Most Trusted Brands. The consumer preference, along with a strong distribution increase across both Ketchup and Jam, resulted in the business growing significantly faster than the market.
The performance of Knorr in the year was led by Soups, with the convenient Instant Soups single serve format doing particularly well. Your Company has increased the focus on core soup markets and ensured that the brand salience is at its highest in these markets. Your Company also invested behind the instant ‘cup-a-soup’ range, as this portfolio is driving growth for the soups category, given its consumer offering of tasty and healthier products, at a very affordable price. Knorr Soupy Noodles was restaged at the start of the year. The Knorr Meal Maker
Directors’ Report Directors’ Report34 35Hindustan Unilever Limited Annual Report 2013-14
Overview Financial Statements Shareholder InformationReports
portfolio was also re-launched and has met with an encouraging initial response.
During the year, your Company focused on growing the Annapurna business profitably. Towards achieving this objective, your Company made sharp choices on the brand’s footprint and improved its cost structure. As a result, there is a significant progress in brand profitability, which now allows your Company to be competitive and invest back in the brand.
Your Company also significantly focused on young nascent experiential marketing. Given that most of the play is in market development categories, it is critical that consumers sample your Company’s products and discover the great taste and convenience that the products offer.
Modern Foods, a portfolio of Bakery Foods, continued its momentum delivering strong double digit growth with improved profitability. Your Company stepped up distribution network in new geographies and this initiative has yielded encouraging results. Key innovations like Oats and Ragi Wheat Bread, festive Cakes and Cookies, coupled with improved operational efficiencies contributed well to the growth and profitability of the Modern Foods business.
During the year, the Frozen Desserts business faced a challenging external environment with slowing discretionary spends and a shorter season. But with long term positive outlook, your Company continued investing behind the distribution expansion and building big brands. Cornetto grew ahead of market on the back of distribution and strong communication. Cornetto also remained at the forefront of your Company’s digital strategy. Cornetto’s Facebook page was adjudged as No.1 in India by an advertising magazine. Magnum, Unilever’s most premium ice cream brand, was test piloted in Chennai during 2013 and met with a very good response. Magnum was rolled out to four more cities in the beginning of 2014. Modern Trade performance has been very good in Ice Creams as your Company strengthened its position in this key channel. During the year, your Company also rolled out Perfect Stores programme, a first for the category and the performance across these stores has been leading overall category growth. Availability and visibility are still the core drivers of the business and your Company continued investing behind them. Your Company is driving efficiencies in the business, particularly in asset management and infrastructure, while stepping up investments behind big impulse brands, viz. Magnum, Cornetto and Paddle Pop.
5.3. WaterPureit is the world’s largest selling range of water purifiers in non-pitcher and non-faucet mount segment. Pureit was ranked as the most trusted brand in water purifiers in Brand Equity’s 2013 Most Trusted Brands Survey. The brand continues to strengthen its position in a slowing and weak consumer durables market.
During the year, Pureit’s new product innovations focused on driving superior functionality and aesthetics at a lower cost, with the launch of Pureit Marvella Slim RO, a premium water purifier at an affordable price. Pureit Marvella Slim RO has helped Pureit strengthen its position in the electric water purifier segment. The launch of ‘Save 3 Gas Cylinders’ communication for storage purifiers was another testimony to Pureit’s pioneering innovativeness in terms of driving market development of water purifiers by establishing cost and convenience advantage over conventional methods of purification. Pureit associated with Miss India World 2013 winners, to spread awareness about the importance of safe drinking water under its ‘Unilever Pureit Protecting Lives Programme’. During the year, your Company focused on widening its distribution reach for its range of purifiers in different retail formats across the country. Substantial progress was made in evolving the Germkill kits business for storage purifiers and also improving in-store execution for the premium range of purifiers. The focus on driving category premiumisation continues with the launch of Pureit Ultima UV + RO towards the end of the year. The product, which by far is the most premium offering from Pureit, offers advanced technology and superior aesthetics met with a very encouraging response from consumers in the early days since its launch.
5.4. Exports Business
FMCG Exports (Unilever India Exports Limited)Unilever India Exports Limited (UIEL) is a wholly owned subsidiary of your Company, engaged in FMCG Exports business. The focus of the FMCG exports operation is two-fold (a) to develop overseas markets by driving distribution of ethnic brands, such as Kissan, BRU, Brooke Bond, Lakmé, Pears among the Indian diaspora in international markets, (b) to effectively provide cross border sourcing of FMCG products to other Unilever companies across the world.
The Home and Personal Care segment in the exports business has witnessed a stable year, driven primarily by Soaps and Hair Care. Brands like Pears have registered healthy growth in the focused markets through strong advertising and activation support and have received strong accolades from the consumers in the UK market. For Unilever sourcing countries, Lifebuoy has delivered double digit growth post its launch across Asian markets. Fair & Lovely and Vaseline Jelly continue to show stable growth in the key geographies of the Middle East. The Foods & Beverages segment of the business witnessed a modest growth. Instant Tea / Packet Tea and premix witnessed strong double digit growth, whereas coffee sales remained steady. The profitability of the overall segment improved significantly with focused cost reduction programmes.
Non-FMCG ExportsIn the specialty business, which continued to be a part of your Company post the demerger of FMCG Exports business to
Directors’ Report Directors’ Report36 37Hindustan Unilever Limited Annual Report 2013-14
UIEL, Rice maintained a flat performance, while continuing to focus on expanding geographies, seeding opportunities and marketing/ brand building initiatives to accelerate growth in the coming years.
Leather (Pond’s Exports Limited) The Leather business performed well with improved operating profitability and robust double digit sales growth. This performance was achieved through new product designs, excellent customer service, world class quality and cost innovations.
5.5. Beauty & Wellness (Lakme Lever Private Limited) Lakme Lever Private Limited (LLPL), a wholly owned subsidiary of the Company, has 225 salons, of which 57 are Company owned / managed and 168 are franchisee salons. LLPL delivered double digit salon growth for the fourth consecutive year, although the market slowed down by consumers pulling back on discretionary spends. Net expansion improved from 8 salons in the previous year to 36 salons in this financial year. Innovations like the Perfect Radiance and Youth Infinity facial rituals have delighted consumers and driven growth. The flagship Lakmé Absolute Salon, which magnifies the backstage experience with professional styling expertise and bespoke beauty rituals, was launched in Mumbai. Your Company will continue to support LLPL to drive growth in this attractive market opportunity.
5.6. Hindustan Unilever NetworkHindustan Unilever Network business consists of three major brands, Aviance (Personal Care), Lever Ayush (Health Care) and Lever Home (Detergents, Household Care and Toothpaste).
The year has been extremely challenging for the entire direct selling industry, including for your Company, due to ambiguity on acceptable norms for direct selling in India. As responsible corporate citizens, your Company has always conducted its business within the framework of Indian law and has recently re-launched its compensation plan to be more competitive. Your Company is reviewing the strategy for this business.
5.7. Kimberly Clark Lever Private Limited (KCL)KCL is a Joint Venture between your Company and Kimberly-Clark Corporation, USA, with infant care diapers as its primary product category. The year witnessed a strong growth delivery by Huggies brand led by Huggies Wonder Pants. The re-launched Huggies Wonder Pants with improved product features and performance had a good growth momentum throughout the year. The low penetration levels in India’s infant care diapers markets offer significant growth potential for this category. This growth opportunity has attracted increased levels of competitive intensity in the recent past with multinationals making significant investments in India.
To participate effectively in this growth opportunity, KCL aims to bring in regular innovations to the market through sustained and appropriate investments in the short to medium term. As a Joint Venture partner, your Company remains committed to this business.
6. CUSTOMER DEVELOPMENT
During the year, your Company has undertaken and delivered several ambitious initiatives to reaffirm its position as a preferred channel partner for over 2,500 redistribution stockists and millions of retailers across the country.
Your Company has always strived to expand distribution to connect the shoppers and brands as widely as possible. During the year, your Company took an ambitious challenge of adding more outlets under its coverage expansion programmes and deployed innovative means, such as tele-calling to ensure sustainability of coverage and profitability of redistribution stockists. This resulted in improving the reach and distribution of the products, making brands more accessible to the shoppers. These initiatives would contribute significantly to the aim of winning in the marketplace in the years to come.
Your Company also undertook the initiative of expanding the number of stores compliant to the Perfect Stores programme, thereby significantly enhancing the quality of execution in the marketplace. The Perfect Stores programme has delivered business benefits in terms of faster growth, and your Company continues to expand the reach of the programme and strengthen the benefits delivered.
Your Company believes that winning with customers is a key enabler for winning in the marketplace and has a strong customer agenda in place to deliver high engagement levels with the customers. To invoke and scale the entrepreneurial spirit of customers and embed it into the ways of working, your Company launched a dedicated programme to identify, fund and rollout innovative business practices of customers. To take this programme further, there are events to provide a common forum for all customers to interact with the senior leadership of the Company, leading to a powerful exchange of ideas and a deep understanding of the customer at all levels in the organisation.
Your Company runs dedicated call centres for distributors as well as retailers, which enable them to connect directly with the Company anytime, thereby achieving world class customer service with a tremendous opportunity for getting customer insights. A mandatory customer immersion for Customer Development team gives them the opportunity to spend more than 50 hours with a variety of distributors and retailers, observing and interacting with them in their milieu to understand their needs better. These various initiatives have helped to keep the
Directors’ Report Directors’ Report36 37Hindustan Unilever Limited Annual Report 2013-14
Overview Financial Statements Shareholder InformationReports
needs of the customer the guiding force for all your Company’s activities.
Modern Trade, the growth channel for future, continues to be a focus area for your Company. Continuous focus on Joint Business Planning, ensuring best in class On Shelf Availability and delivering clutter breaking product launches, was appreciated by Modern Trade customers. Your Company was once again awarded the ‘Best Supplier’ by leading Modern Trade customers.
The year marked the first full year of operation for your Company’s rural distribution alliance with Tata Teleservices for distributing their telecom products through the extensive distribution network of your Company. This alliance has helped in driving your Company’s rural coverage expansion by enhancing the earning potential of our channel partners, including Shaktiammas. Your Company is now nationally distributing telecom products to 75,000 telecom outlets through 550 rural distributors.
Your Company had set up a state of the art Customer Insight and Innovation Centre (CiiC) last year to use insights and technology to gain a deeper understanding of shopper and customer needs. The CiiC was set up leveraging the knowledge and learnings from Unilever CiiC operations, set up previously in other parts of the world. Using technologies like interactive meeting rooms, smartboard, virtual reality, retail lab, eye tracking technology and mobile virtual reality solutions, your Company developed and executed differentiated channel and format strategies for both traditional channels and Modern Trade. CiiC set up by your Company is a unique centre for gathering insights, catering to both General and Modern Trade.
Your Company continues to focus and drive Project Shakti, the initiative for driving social responsibility and sustainability, aimed at enhancing livelihoods and building opportunities for small scale entrepreneurs.
7. SUPPLY CHAIN
Your Company’s supply chain agenda remained focused on improving performance on service, quality and cost. This was delivered with speed and agility in a Supply Chain set-up, with the highest standards of safety and positive environmental impact.
Your Company made significant progress in its vision to deliver customer service excellence and enable sustainable growth. The service delivery standards improved steadily with CCFOT (Customer Case Fill-On-Time) increasing to 94% and Modern Trade OSA (On-Shelf Availability) touching an all time high of 96%. The customers have acknowledged this performance and have rewarded your Company with the best supplier recognitions. Your Company continued to strengthen the Sales and Operation Planning process (S&OP) and Innovation Process Management
(IPM) to respond with speed and agility to the volatile market demands.
Your Company delivered quality improvement across the supply chain by focusing on better product design and implementing various quality improvement programmes. This resulted in 50% reduction in consumer complaints. Levercare helpline capabilities were improved to engage better with consumers.
Your Company has a strong supply chain savings programme, which is driven by various cross functional teams, such as R&D, Procurement, Manufacturing and Logistics. The robust savings programmes were driven through workshops, rigorous monthly reviews, project trackers and a strong ideas’ funnel.
Your Company has started using renewable biomass as a fuel. Your Company is using locally available agri-waste like paddy straw, cotton stalks, sawdust and rice husk as fuel. These are helping local farming community to realise value out of material, which was otherwise wasted and burnt in fields, causing pollution. Besides, small local industries have come up to convert the biomass into briquettes.
Your Company continues to focus on water conservation by reducing ground water abstraction. This is done by lowering process related consumption and reuse of treated effluent through Reverse Osmosis and secondly recharging of ground water table through Rain Water Harvesting, installed at all units. These initiatives, collectively, are helping to improve availability of water for the communities around your Company’s sites.
Your Company progressed well in implementing its long term manufacturing strategy, with efficient capacity creation and introducing new technologies to support volume growth. To achieve manufacturing excellence, your Company has embarked on the journey of World Class Manufacturing. This is an initiative launched across Unilever and your Company is drawing and executing learnings from the global programme, which focuses on identification, root cause analysis and elimination of non- value adding activities. This will lead to further improvement in efficiencies and cost performance. In the sites where the Company has already introduced World Class Manufacturing Programme, it has identified significant cost reduction opportunity in production costs, which are converted into projects and monitored closely.
There has been a 20% improvement in innovation OTIF (On Time in Full) with more than 100 innovation networks being executed during the year, touching about 60% of the product portfolio. The focus on bigger and faster innovation and capability development has significantly helped the Company launch innovations first time right.
The Partner to Win programme, developed by Unilever globally, aims at developing Joint Business Plans with suppliers and business partners. It has resulted in reduced lead time and costs and improved reliability and new innovation delivery.
Directors’ Report Directors’ Report38 39Hindustan Unilever Limited Annual Report 2013-14
8. RESEARCH & DEVELOPMENT
Your Company continues to derive sustainable benefit from the strong foundation and long tradition of Research & Development (R&D), which differentiates it from many others. New products, processes and benefits flow from work done in various Unilever R&D centres across the globe, as well as in the Research Centres in India. The R&D labs in Mumbai and Bengaluru are aligned to Unilever’s global R&D. Many of the projects executed out of these centres are of global relevance, and have a strong focus on regional needs and the overall Developing & Emerging (D&E) world. With world class facilities and a superior science and technology culture, your Company is able to attract the best talent to provide a significant technology differentiation to its products and processes.
Your Company’s R&D programmes are focused on the development of breakthrough and proprietary technologies with innovative consumer propositions. The R&D team of over 750 people comprises highly qualified scientists and technologists working in areas of Home & Personal Care, Foods & Beverages and Water Purification. The R&D group also comprises critical functional capability teams in the areas of Regulatory, Clinicals, Digital R&D, Product & Environment Safety and Open Innovation.
During the year, your Company introduced several innovations in Soaps and Detergents category. In Detergents category, Wheel and Rin were re-launched with enhanced and superior performing product in mass and mid-tier segment, respectively. Surf Excel launched the liquid detergent for fabric cleaning, thus initiating the creation of another sub-category of future. Comfort, the liquid fabric conditioner, continues to do well. In Household Care, Vim liquid launched a new premium anti-bacterial technology offering consumers with dual benefit of superior cleaning and assurance of hygiene in dishwashing. Domex launched its acid based variant under the name of Domex Zero Stain with superior claims like ‘7x Thicker formula’. The category also continues striving efforts to improve health and hygiene through various market development activities across product platforms.
In Skin category, Fair & Lovely successfully defended its 5-crore challenge campaign, demonstrating its product superiority and was re-launched with a ‘Best Ever’ formula, leveraging its advanced multivitamin technology. In addition, a new SPF15 vanishing cream variant, based on breakthrough sunscreen dispersion technology developed in-house, was launched for the first time under Fair & Lovely brand in a revolutionary pump tube – a first at this price point in the market. Vaseline Healthy White was re-launched with a new breakthrough multivitamin plus optics formula giving 4X instant whitening. Rexona was also re-launched with a new winning formula, based on superior skin feel and lathering.
Oral Care witnessed the launch of Pepsodent Germicheck, superior power toothpaste with breakthrough technology that maximises the bioavailability of Triclosan in plaque, thus providing 130% germ attack power compared to benchmark. This product delivers a benefit similar to a premium product, but at an affordable price. Clinical study supporting this technology has been published in the ‘Journal of Clinical Dentistry’ and an application for grant of a patent has also been filed. In the toothbrush segment, Pepsodent Flexi Action was re-launched with level filaments in different colours and a new variant, Pepsodent Sensitive was introduced with tapered filaments.
In Hair Care category, the Dove hair care range was re-launched; in particular, the Intense Repair variant was re-launched with keratin actives to provide superior damage repair and significantly smoother hair. A new split ends rescue variant of Dove shampoo and conditioner was launched that helped reduce split ends formation by four times. New variants of TRESemmé and Sunsilk shampoo and conditioner were launched with novel technology to specifically address problems of frizz and shape retention. TRESemmé range was made more accessible to consumers through the launch of a lower price sachet format. A premium variant of Clinic Plus oil was launched in the market, the product was designed with the right combination of oils, including almond oil, to be light and non-sticky and at the same time provides intense nourishment through rapid penetration into the scalp and hair fibre.
In Deo category, two new variants of Axe deodorant and one new variant of Lux deodorant were launched to widen the fragrance choice for consumers.
In Water business, your Company launched a reverse osmosis based purifier for the mass market ‘Marvella Slim RO’. Your Company also launched Pureit Ultima RO+UV, a highly premium RO and UV based water purifier with a graphic (electronic) display of total dissolved solids level in input and output water and superior aesthetics.
The Foods R&D team focused on achieving a significant increase of the profitability of the Foods product portfolio in combination with a quality increase of product performance as experienced by consumers. This was achieved by applying new technologies and selection of superior raw materials, while maintaining cost levels as same or lower. Two key highlights were: first, the implementation of new tomato ketchup technology under Kissan (India being the first country within Unilever to implement this); second, the top two most selling Knorr soups were reformulated, resulting in an increased margin and scoring significantly superior in consumers’ preference.
The year saw key strategic launches under tea brands contributing to good business growth. Improved product and new packaging were developed for Taaza tea re-launch. A
Directors’ Report Directors’ Report38 39Hindustan Unilever Limited Annual Report 2013-14
Overview Financial Statements Shareholder InformationReports
new masala variant ‘Taaza Masala Chaska’ was launched with a product containing a unique spice mix that received very positive consumer feedback in testing. Taj Mahal tea blend was developed to meet the consumer expectations of ‘perfect balance of strength and flavour’. A specially designed fresh green tea product was introduced under Lipton ‘feel light and active’ proposition. Lipton ice tea powders were restaged in the market with new claims on being more natural, made with real tea and real fruits. In coffee, premium single origin, freeze dried coffee range under BRU was expanded with the launch of a new unique variant, Guatemala. Product improvement for BRU Instant was implemented. Through R&D initiatives, cost savings were also delivered to manage commodity inflation.
In Ice Cream category, global iconic brand Magnum was launched in a test market in Chennai with three flavour variants – Classic, Almond, and Chocolate Truffle. In the Frozen Desserts category, several new variants were launched. These included Fruttare - Apple and Mixed Berry, Carte D’or – Rajbhog and Gajar Halwa, Creamy Delights – Pineapple and Litchi and Paddle Pop Jiggly Jelly.
R&D has further contributed to the Company’s sustainability agenda by enabling significant reduction in packaging material consumption through several material efficiency initiatives. Packaging material usage was reduced by around 115 tonnes across Beverages and Ice Creams. Your Company’s R&D is also working on novel technologies to help save substantial amount of water.
With strong scientific expertise and the potential to deliver high value technologies, India continues to occupy a premier position in Unilever R&D. Your Company is well placed to meet the challenges emanating from the increased competition intensity and the opportunities to drive faster growth on the back of a strong support from R&D as well as brand development capabilities.
Your Company had entered into a Technical Collaboration Agreement (TCA) and a Trade Mark License Agreement (TMLA) with Unilever. The TCA provided for payment of royalty on net sales of specific products, manufactured with technical inputs developed by Unilever. The TMLA provided for the payment of trademark royalty, as a percentage of net sales on specific brands, where Unilever owns the trade mark in India. Given that the pace of innovations and the scope of services have expanded over the years and that Unilever’s global resources are providing greater expertise, superior innovations and scale advantage for all Unilever entities, your Company is enjoying the benefits of an increasing stream of new products and innovations, backed by technology and know-how from Unilever.
Your Company is also receiving support and guidance to drive functional excellence in marketing, supply management, media
buying and IT, among others, which helps your Company to remain competitive and further step-up its overall business performance. Unilever is committed to ensuring that the support in terms of new products, innovations, technologies and services is commensurate with the needs of your Company and enables it to win in the marketplace.
The details of expenditure on scientific research and development at the Company’s in-house R&D facilities eligible for a weighted deduction under Section 35(2AB) of the Income Tax Act, 1961 for the year ended 31st March, 2014, are as follows:• CapitalExpenditure :Rs. 5.64 crores• RevenueExpenditure : Rs.31.22 crores
9. ENVIRONMENT, SAFETY, HEALTH AND ENERGY CONSERVATION
Your Company has a vision of being an ‘Injury Free’ and ‘Zero Environment Incident’ organisation. The Compass, your Company’s strategic framework, integrates Safety as a non-negotiable value. Over the past many years, your Company has been progressing well in terms of reducing injury frequency rates and has improved the safety record in factories and facilities.
The Company has developed safer systems and procedures for work by implementing Core Design principles (e.g. in projects, in facilities design, in process safety, etc.) rolling out up-to-date engineering standards and investing in hardware and safety infrastructure across sites.
Your Company also recognises that design and procedures are effective only when people choose to maintain and follow them. To achieve this objective, a behavioural safety programme BeSafE is being rigorously deployed across the Company. This programme is at the core of your Company’s safety journey and has been created as a customised behavioural safety framework for Unilever, building upon the earlier DuPont model, which your Company had pioneered a decade ago in India. The safety incident rate measured as total recordable frequency rate (TRFR) was 66% of 2008 baseline.
Your Company actively promotes safety beyond the workplace through extensive ‘Safe Travel’ and ‘Beyond Work Safety’ initiatives, involving the employees’ families across all sites. Several prestigious awards have been conferred upon your Company by national and international organisations of repute, both from government and non-government sectors in recognition of your Company’s efforts in the sphere of Safety.
From sourcing to manufacturing or logistics, sustainability is embedded across all operations of your Company. The Company’s environmental footprint is being monitored closely for all aspects of the manufacturing process. Benchmarking is done
Directors’ Report Directors’ Report40 41Hindustan Unilever Limited Annual Report 2013-14
for resources consumed (like water, energy) and gaseous, liquid and solid emissions (like carbon dioxide, sulfur oxides, COD, solid waste). Your Company has worked on the following key areas:• Fossilfuelsarebeingreplacedbybiogenicfuels,wherever
available, through investment in biomass fired boilers, hot air generators and thermic fluid heaters. This has reduced furnace oil, diesel and coal usage in units.
• Thebiogenic fuels also includes theuseof plantwaste /by-products like spent tea leaves and coffee beans as fuel. This enables disposal cost savings besides reducing fossil fuel usage.
• Tie-ups with potential suppliers of renewable sources ofenergy are being explored.
• Latest generation, energy efficient technology, like autosensors, solar powered systems, LED lamps, high efficiency motors, inverter drives, screw compressors are being used.
• Rain Water Harvesting is in place at all manufacturingsites and the Company is now installing Rain Water Reuse facilities in several sites to further reduce water usage.
Your Company has reduced CO2 emissions (per tonne of production) in India by 27% approximately, when compared to 2008 baseline. The use of renewable energy has increased to over 20% of the total consumption. Water consumption in manufacturing operations is reduced by over 37%, when compared to 2008 baseline.
Waste generation is minimised through the application of reduce, reuse and recycle principles across units. Recyclable waste, such as packaging material, empty raw material containers, spent lubricants, batteries, e-waste, project scrap, etc. are systematically segregated and recycled/ reused. Simple but effective facilities like installation of high pressure water jet setup for washing of empty chemicals drums ensure full recovery of material besides safe recycle. Over 99% of total waste is recycled in environment friendly ways. Total waste per tonne from manufacturing sites has reduced by 84% vis-a-vis 2008 baseline.
The information required under Section 217(1)(e) of the Companies Act, 1956, read with the Companies (Disclosure of Particulars in the Report of the Board of Directors) Rules, 1988 with respect to energy conservation is appended hereto and forms a part of this Report.
10. HUMAN RESOURCES
Your Company’s Human Resource agenda for the year was focused on strengthening four key areas: building a robust and diverse talent pipeline, enhancing individual and organisational capabilities for future readiness, driving greater employee
engagement and strengthening employee relations further through progressive people practices at the shopfloor.
Your Company is widely acclaimed for its people development practices and has reinforced its position in this area. This, coupled with the ability to attract best talent, provides a competitive edge to the organisation. According to the Campus Track Business School Survey 2013, conducted by Nielsen, your Company has been chosen as the preferred employer across all sectors for the 2014 graduating batch of B-School students. Your Company has also retained its position as the Dream Employer with students of top business schools for the fifth consecutive year.
Diversity and Inclusion is an important aspect of sustainable business growth and is referred to as Winning Balance. Over the last three years, there has been considerable momentum on this aspect through better appreciation of the business case and greater leadership involvement and engagement. Tools and capabilities like day care, technology that supports agile working, flexible work arrangements through part time working and career by choice programme and inclusiveness workshops have been embedded to enable and drive the Winning Balance. During the year, a Winning Balance Council was also established in the Company, comprising male and female leaders across functions, who champion and lead the plans. Your Company recognises men and women role models, who create a simple, respectful and flexible work environment for their teams, which inspires others to emulate them. With these enablers and focused plans, your Company has witnessed a 10% shift in the gender balance ratio over the last three years.
The Talent and Organisation Assessment was undertaken successfully in 2013 and key business charters based on findings have been institutionalised. These charters are owned by your Company’s leadership team and will take off during 2014. These interventions will allow your Company to have a robust people plan to guide your Company not just for immediate performance, but to also ensure that the Company is future ready.
In addition to building core capabilities in marketing, sales and distribution, your Company is investing in the areas of beauty, foods, rural, digital, e-commerce, customer/ shopper marketing and market development, to win in the future. Your Company has developed comprehensive plans in each of these key areas that are customised to suit the present and future business needs. Besides, your Company has also identified three key behaviours, Growth Mindset, Bias for Action and Consumer and Customer Centricity that will supplement the capabilities to achieve business goals. To drive Bias for Action, your Company has been driving a change in the way it makes decisions by (i) Generating insights, where attention is required (ii) Getting the right leadership attention to road blocks and (iii) Facilitating faster decision making. Project Sunset is an online platform for speedy resolutions of road blocks within the
Directors’ Report Directors’ Report40 41Hindustan Unilever Limited Annual Report 2013-14
Overview Financial Statements Shareholder InformationReports
Company. Your Company also launched ‘Sunset Talks’, a two weeks intensive idea generation campaign on simplification that received overwhelming employee participation and response. To drive Consumer and Customer Centricity, your Company has undertaken multiple initiatives to regularly communicate with and reach out to its consumers and has a well defined programme to capture consumer insights.
Your Company undertook intensive training programmes through a combination of face-to-face and virtual learning approaches. Over 28,000 man-days invested in classroom training and about 38,000 e-learning registrations, indicate that the spirit of ‘learn where you are’ is imbibed in employees of the Company. Your Company is also investing in building capabilities in digital and social media to find new platforms for brands to engage more effectively with Indian consumers.
The Global People Survey is a part of the Unilever employee insight programme, which aims to give voice to the Company’s people and provides a vehicle to make their views heard. The Survey also provides regular, meaningful and actionable feedback to the leaders in the organisation. It has questions spread across several dimensions in the areas, such as Strategic Leadership, Immediate Boss Effectiveness and Engagement. Feedback from this survey forms the basis of holistic engagement plans, which are reviewed regularly. As per the Global People Pulse Survey 2013, engagement in your Company has witnessed a 3% improvement over the last year. There has been recognition of your Company’s People Management and Reward and Recognition practices, which are geared towards building a performance focused culture.
Your Company has been investing in progressive employee relations practices to build capability at the grassroot level. ‘Sparkle’ is a centrally hosted intranet based tool that supports skill mapping, skill assessment, performance assessment, gap analysis and enables training plan identification, which is customised according to the priority areas of each workman. Sparkle has been a pioneering tool in the area of workmen capability development that promotes higher transparency and focused training intervention linked to individual and business needs. The tool has delivered results for over three years, and your Company has successfully completed appraisals, thereby identifying top performers and completing skill gap analysis of over 10,000 workmen online. Sparkle has been recognised as a best practice and adopted for a global roll-out. Business Linked Engagement and TPM Edge programmes continued with full focus and rigour during the year and delivered significant improvement in factory operations.
Information as per Section 217 (2A) of the Companies Act, 1956, read with the Companies (Particulars of Employees) Rules, 1975, forms part of this Report. However, as per the provisions of Section 219(1)(b)(iv) of the Act, the Report and Accounts are
being sent excluding the statement containing the particulars to be provided under Section 217(2A) of the Act. Any Member interested in obtaining such particulars may inspect the same at the Company’s Registered Office or write to the Company Secretary for a copy thereof.
11. INFORMATION TECHNOLOGY (IT)
Your Company continues to invest in IT, leveraging it as a source of competitive advantage. The enterprise wide SAP platform, the backbone of IT, encompasses all core business processes in your Company. It also provides a comprehensive data warehouse with analytical capability that facilitates better and faster decisions. Your Company has leveraged the SAP platform to aid business priorities and improve efficiencies both within the Company as well as by collaborating with suppliers and customers. Your Company is also using latest technology offerings like in-memory computing to significantly improve process efficiencies and unlock time of employees.
Your Company has institutionalised an extensive IT capability for Customer Development function to support front-end execution. All distributors run a standard distributor management system. The sales representatives and field based sales personnel have been equipped with mobility devices for effective and efficient on-ground execution. The available data is mined using analytical tools to fine tune the selling process at each and every outlet. This capability, which has been used for the urban markets has also been extended to rural markets. The existing technology backbone was leveraged to provide for a low cost mobile phone based solution that significantly saved distribution costs.
Your Company is investing in capabilities that will help reach out and engage with end consumers, using low cost mobile technology. These capabilities will not only increase the number of consumers that can be reached, especially in rural areas, but also dramatically change the way in which your Company engages with them in a personalised manner using mobile telephony as a medium. Capabilities that have been built in this area will help your Company learn more about the end users across multiple brands as well as communicate with them directly about customised offers.
IT tools and solutions are being used across the organisation to make employees more productive and efficient. Employees have been equipped with personal computing tools and technologies that allow them to communicate and collaborate more efficiently and in a more agile manner.
Your Company continues to invest in IT infrastructure to support business applications and has leveraged India’s expanded telecom footprint to provide high bandwidth terrestrial links to all
Directors’ Report Directors’ Report42 43Hindustan Unilever Limited Annual Report 2013-14
operating units. Your Company also uses software as a service to provide agile and cost effective IT capabilities in select areas.
As the IT systems and related processes get embedded in the ways of working of the organisation, there is a continuous focus on IT security and reliable disaster recovery management processes to ensure all critical systems are always available. These are periodically reviewed, upgraded and tested for efficacy, adequacy, security and reliability.
12. FINANCE AND ACCOUNTS
Your Company continued to focus on cash generation. The focus on managing optimal levels of inventory, sound business performance, operating efficiencies and cost savings across the organisation helped generate healthy cash flows. Your Company managed investments prudently by deploying cash surplus in a balanced portfolio defined to offer primacy to safety and liquidity of the investments.
The finance function of the Company took a significant step forward by consolidating the work done on Finance Transformation last year to further build capabilities and to get the business future ready. Your Company’s success depends upon being able to decouple transaction volume growth from business growth and thereby reduce the cost, complexity and time of transaction processing. The key building blocks to the transformation programme were Procure to Pay, Zero Based Controls, Record to Report Transformation and My Business Information Projects.
Procure to Pay project aimed to move the needle on services to suppliers from vendor satisfaction to vendor delight. This year, your Company standardised and centralised invoice processing, query management and payments processing from more than 40 locations to one payment excellence centre, thereby delighting business partners. The programme also delivers a capability to steer continuous improvement programmes from the global centre of excellence in Bengaluru, thereby landing a six sigma level efficiency in transactional processes.
Zero Based Controls project completely revamped the traditional control monitoring methods to a cutting edge automated cockpit flagging exceptions to the control environment. This enables exception based monitoring, while tightening the cost of control. This year, your Company standardised the financial controls across geographies, leveraged technology to automate more than half of the key controls and set up a leading edge monitoring and reporting capability in Bengaluru. This now enables a focused review of the risk areas and a constructive effort to remediate the exceptions, if any.
Record to Report Transformation project aims at creating one financial reporting excellence centre at Bengaluru. Your Company has already taken the first step in this journey. Your Company is confident of making significant progress in the times to come, thereby future proofing the organisation. This project will enable faster reporting and accelerate results release to the market.
My Business Information initiative is a stepping stone to the next generation information analytics. This goes with the principle of converting data into information and information into insights seamlessly, at a click, to expedite business decision making. This year, your Company took a giant leap of moving from a multitude of ad hoc reports at multiple places to one centralised information repository, thereby ensuring one version of a report. In parallel, your Company achieved standardisation of reports and over 90% reduction in the number of reports. This means fewer and better quality reports and more time released for investment on value added analysis. Such information on-the-go makes business partnering more effective, simpler and a richer role for finance, while providing relevant information for speedy business decision making.
Your Company continued with various simplification initiatives commenced last year by disproportionately investing in IT. This has resulted in release of time occupied by non-value adding tasks while giving significant savings in audit efforts.
While driving the transformation agenda, your Company’s finance team also continued to focus on delivering excellence on Financial Accounting and Reporting. This year, your Company won the esteemed ‘Silver Shield’ from the Institute of Chartered Accountants of India for excellence in financial reporting for the Annual Report 2012-13. Your Company is committed to increase the efficiency and effectiveness of the finance function in general and core areas of accounting, reporting and controls in particular. This appreciation further strengthens the resolve to raise the bar and set higher standards of excellence, transparency and ease in reporting.
Capital Expenditure during the year was at Rs. 526.50 crores (Rs. 409.34 crores in the previous year).
During the year, your Company has not accepted any fixed deposits and there was no outstanding towards unclaimed deposit payable to depositors as on 31st March, 2014. In terms of the provisions of Investor Education and Protection Fund (Awareness and Protection of Investors) Rules, 2001, Rs. 3.57 crores of unpaid / unclaimed dividends were transferred during the year to the Investor Education and Protection Fund.
Directors’ Report Directors’ Report42 43Hindustan Unilever Limited Annual Report 2013-14
Overview Financial Statements Shareholder InformationReports
Return on Net Worth, Return on Capital Employed and Earnings Per Share (EPS) for the last four years and for the year ended 31st March, 2014, are given below:
Particulars 2009-10 2010-11 2011-12 2012-13 2013-14Return on Net Worth (%) 88.2 74.0 77.7 94.7 104.1Return on Capital Employed (%) 103.8 87.5 96.8 109.1 130.2Basic EPS (after exceptional items) (Rs.) 10.10 10.58 12.46 17.56 17.88
Segment-wise ResultsYour Company has identified five business segments, in line with the Accounting Standard on Segment Reporting (AS-17), which comprise: (i) Soaps and Detergents, (ii) Personal Products, (iii) Beverages, (iv) Packaged Foods, including Culinary, Branded Staples, Frozen Dessert and Ice Cream and (v) Others, including Exports, Chemicals, Water Business, Infant Care Products, etc. The audited financial results of these segments are provided as a part of financial statements.
12.1. Risk and Internal AdequacyYour Company has an elaborate Risk Management procedure, which is based on three pillars: Business Risk Assessment, Operational Controls Assessment and Policy Compliance processes. Some of the risks relate to competitive intensity and cost volatility. Major risks identified by the businesses and functions are systematically addressed through mitigating actions on a continuing basis. These are discussed with both Management Committee and Audit Committee.
The Company’s internal control systems are commensurate with the nature of its business and the size and complexity of its operations. These are routinely tested and certified by Statutory as well as Internal Auditors and cover all offices, factories and key business areas. Significant audit observations and follow up actions thereon are reported to the Audit Committee. The Audit Committee reviews adequacy and effectiveness of the Company’s internal control environment and monitors the implementation of audit recommendations, including those relating to strengthening of the Company’s risk management policies and systems.
Your Company manages cash and cash flow processes assiduously, involving all parts of the business. There was a net cash surplus of Rs. 2,220.97 crores, as on 31st March, 2014. The Company’s low debt equity ratio provides ample scope for gearing the Balance Sheet, should the need arise. Foreign Exchange transactions are fully covered with strict limits placed on the amount of uncovered exposure, if any, at any point in time. There are no materially significant uncovered exchange rate risks in the context of Company’s imports and exports. The Company accounts for mark-to-market gains or losses every quarter end, in line with the requirements of Accounting Standard 11.
13. LEGAL, COMPLIANCE AND BRAND PROTECTION
Your Company continued to focus on the key areas and projects within the legal and compliance functions, which include transiting to a workflow based compliance software tool ‘Self-Compli’. This tool enables compliances to be made and tracked by factories and offices of your Company across the country. In the area of Brand Protection, during the year, your Company has taken significant actions against counterfeits, fakes and other forms of unfair competition, under the Company’s programme of Combating Unfair Competition. The focus on litigation management continued this year with significant number of disposal of litigation recorded, as in past years, and fewer litigations added during the year.
14. MERGERS, ACQUISITIONS, JOINT VENTURES AND DISPOSALS
Consequent to the approval of shareholders in the year 2007, the Company has transferred Marine Exports business to M/s. Gadre Marine Exports Private Limited, as a going concern, pursuant to a Business Purchase Agreement entered between the parties in July 2013.
15. OPEN OFFER
On 30th April, 2013, Unilever PLC as Acquirer along with Unilever NV as person acting in concert made an announcement for Open Offer for acquiring 48.70 crore shares, aggregating to 22.52% of the total Share Capital of the Company, from the public shareholders at the offer price of Rs. 600 per share.
In accordance with the requirements of SEBI (Substantial Acquisition of Shares and Takeovers) Regulations, 2011, a Committee of Independent Directors was constituted by the Board, comprising all Independent Directors of the Company, for providing reasoned recommendation on the Open Offer to the shareholders of the Company. The Independent Directors
Directors’ Report Directors’ Report44 45Hindustan Unilever Limited Annual Report 2013-14
Committee made its recommendation to the shareholders on 18th June, 2013 and the same was published in the newspapers in accordance with requirements of the regulations.
The tendering period of the Open Offer was from 21st June, 2013 to 4th July, 2013. At the end of the tendering period, Unilever acquired additional 31,95,63,398 shares in the Open Offer, thereby increasing the shareholding in the Company from 52.48% to 67.25% of the total Share Capital of the Company.
16. SUSTAINABLE LIVING
Sustainability is at the core of your Company’s way of doing business. It guides your Company on the path to achieve long term success in a world where the battle for resources is escalating. In this direction, Unilever globally has set out the ‘Unilever Sustainable Living Plan’ (USLP), which embeds sustainability in its business model. The USLP sets out to decouple growth from environmental impact, while enhancing positive social impact.
USLP has three big global goals to achieve: • Improving Health andWell-being - By 2020 we will help
more than a billion people take action to improve their health and well-being.
• Reducing Environmental Impact - By 2020 our goal is tohalve the environmental footprint of the making and use of our products as we grow our business.
• Enhancing Livelihoods - By 2020 we will enhance thelivelihoods of millions of people as we grow our business.
The Plan is distinctive:• Itspanstheentireportfolioofbrandsandallcountriesin
which Unilever sells its products.• Ithasasocialandeconomicdimension–yourCompany’s
products make a difference to health and well-being and its business supports the livelihoods of many people.
• When it comes to the environment, yourCompanyworksacross the entire value chain – from the sourcing of raw materials to the delivery of products to the consumers.
In the third year of the Plan, your Company made steady progress to achieve the big goals. Your Company also involved consumers this year to become a part of the USLP community through Project Sunlight www.projectsunlight.co.in launched globally.
In the area of health and hygiene, your Company reached 58 million people through Lifebuoy Handwashing Programme since 2010. In area of sanitation, your Company launched Domex Toilet Academy programme with an aim to eradicate open defecation by building toilets and improving sanitation facilities. The academy made Junapani, a village in Wardha district in Maharashtra, free of open defecation by setting up 80 toilets by the end of 2013. Your
Company made a good progress in its journey to provide safe drinking water through Pureit water purifier. Nearly, 57.5 million lives were protected by Pureit globally by the end of 2013.
In the area of nutrition and health, your Company made a good progress on lowering the levels of salt, trans fat and calories in its portfolio. In 2013, 70% of your Company’s Foods portfolio (by volume) was compliant to 5 gm salt per day target. Currently, all the Kissan ketchup variants and Knorr soups meet the interim target of 6 gm salt per day.
In the area of environmental impact, CO2 emissions per tonne of production reduced by 27% in 2013 compared to the 2008 baseline. Water usage per tonne in your Company’s manufacturing operations reduced by 37% compared to the 2008 baseline. In 2013, of the total 38 sites, 33 sites became zero-discharge sites, an addition of three sites compared to that of last year. Reduction in total waste per tonne from our manufacturing sites was more than 84% over 2008 baseline. More than 99% of total waste was recycled in environment friendly ways.
Under sustainable sourcing, your Company continued to work with suppliers, local government and farmers to sustainably source agricultural raw materials. A total of 86 tea estates in Assam, Darjeeling and Tamil Nadu were certified ‘Sustainable Estates’ by the Rainforest Alliance™ by the end of 2013. Your Company made good progress on sustainable sourcing of fruits and vegetables and sourced 80% of tomatoes used in Kissan Ketchup from sustainable sources in India. 100% of palm oil volumes procured for India was covered by ‘Green Palm’ certificates.
The water conservation initiatives of Hindustan Unilever Foundation (HUF) resulted in the creation of collective and cumulative water potential of more than 24 billion litres. More than 95,000 man-days of labour was created directly due to HUF projects and agriculture production enhanced by more than 3,500 tonnes.
Project Shakti, your Company’s initiative which aims to empower underprivileged women in rural areas has further increased livelihood opportunities for over 17,000 new Shakti Entrepreneurs (Shaktiammas) appointed during the year. Your Company now has 65,000 Shakti Entrepreneurs complemented by over 50,000 Shaktimaans, the male members of Shaktiamma’s family. Your Company continues to empower Shaktiammas, while increasing their family household income. Your Company provided training on basic accounting, selling skills, health & hygiene and relevant IT skills to Shakti Entrepreneurs and equipped them with smartphones which have been enabled with a mini Enterprise Resource Package (ERP). The application provides updates on promotions, offers and facilitates selling to the small retailers, using relevant business insights. These insights help retailers to stock in their outlets suitable products. The initiative has helped Shaktiammas to take and bill orders, manage inventory and drive
Directors’ Report Directors’ Report44 45Hindustan Unilever Limited Annual Report 2013-14
Overview Financial Statements Shareholder InformationReports
better distribution efficiencies in driving their business. These Shakti Entrepreneurs cover over 160,000 villages in 16 states and serve over 4 million households.
In 2013, your Company launched ‘Prabhat’ (Dawn) - a USLP linked programme, which is a part of its long term effort to engage with and contribute to the development of local communities around its manufacturing sites. Prabhat focuses on health and hygiene, livelihoods and water conservation initiatives, which are fully aligned to the USLP priorities. Prabhat was launched in nine manufacturing locations across India – Haridwar, Pondicherry, Silvassa, Khamgaon, Goa, Nasik, Orai, Chhindwara and Etah.
As evident from the above initiatives, your Company’s progress to deliver on USLP has been consistent. In 2013, Unilever undertook an in-depth review with every product category and business function and identified actions that will help drive sustainable growth. This year, your Company has expanded Enhancing Livelihoods to cover three big themes under the pillar – Fairness in the Workplace, Enhancing Women’s Lives and Inclusive Business.
Your Company has shared its progress on Unilever Sustainable Living Plan in India which is made available on the website of the Company, www.hul.co.in. Your Company has also released the Business Responsibility Report that describes the initiatives undertaken in line with the key principles enunciated in the ‘National Voluntary Guidelines on Social, Environmental and Economic Responsibilities of Business’ framed by the Ministry of Corporate Affairs. The report is made available on your Company’s website, www.hul.co.in, and forms a part of this Annual Report. The Business Responsibility Report shall be kept open for inspection at the Registered Office of the Company. If a Member is interested in obtaining a hard copy of the Business Responsibility Report, they may write to the Investor Service Department at the Registered Office of the Company.
17. EMPLOYEE STOCK OPTION PLAN (ESOP)
Details of the shares issued under Employee Stock Option Plan (ESOP), as also the disclosures in compliance with Clause 12 of the Securities and Exchange Board of India (Employee Stock Option Scheme and Employee Stock Purchase Scheme) Guidelines, 1999 (SEBI (ESOP) Guidelines), are set out in the Annexure to this Report. No employee has been issued share options, during the year, equal to or exceeding 1% of the issued capital of the Company at the time of grant.
Pursuant to the approval of the Members at the Annual General Meeting held on 23rd July, 2012, the Company adopted the ‘2012 HUL Performance Share Scheme’ in place of ‘2006 HLL Performance Share Scheme’. The Scheme has been registered with the Income Tax authorities, in compliance with the relevant provisions of SEBI (ESOP) Guidelines. In accordance with the terms of the Performance Share Plan, employees are eligible for
award of conditional rights to receive equity shares of the Company at the face value of Re. 1/- each. These awards will vest only on the achievement of certain performance criteria measured over a period of three years.
Under the said Plan, eligible Managers were given Conditional Performance Grant of shares of Unilever and the Company in the ratio of 52:48, to mirror the shareholding of the Company, where Unilever held 52% shareholding. During the year, the Nomination and Remuneration Committee and the Board of Directors approved the consequential change in ratio of share grant to reflect the new shareholding pattern post open offer by Unilever. The ratio of reward based on performance was accordingly revised to 67:33 instead of 52:48.
During the year, 209 employees, including Whole time Directors, were awarded conditional rights to receive 2,87,573 Equity Shares at the face value of Re. 1/- each. It comprises conditional grants made to eligible managers covering performance period from 2013 to 2015 and from 2014 to 2016.
18. CORPORATE GOVERNANCE
Your Company is renowned for exemplary governance standards since inception and continues to lay a strong emphasis on transparency, accountability and integrity. In 2011, your Company received the National Award for Excellence in Corporate Governance instituted by the Institute of Company Secretaries of India, in recognition of its Corporate Governance practices. In 2012, Investor Relations Global Rankings (IRGR) ranked your Company amongst the top five companies across the globe for Best Corporate Governance. In 2013, at the Asian Centre for Corporate Governance and Sustainability Awards, your Company won the award for Best Audit Committee.
A separate report on Corporate Governance is provided at page no. 54 of this Annual Report, together with a Certificate from the Auditors of the Company regarding compliance of conditions of Corporate Governance as stipulated under Clause 49 of the Listing Agreement with the Stock Exchange(s). A Certificate of the CEO and CFO of the Company in terms of sub-clause(v) of Clause 49 of Listing Agreement, inter alia, confirming the correctness of the financial statements, adequacy of the internal control measures and reporting of matters to the Audit Committee, is also annexed.
The Ministry of Corporate Affairs has made majority of the provisions of the Companies Act, 2013 effective from 1st April, 2014. The new act is a positive step towards strengthening corporate governance regime in the country. Your Company is already in substantial compliance of most of the governance requirements provided under the new law. Your Company has proactively adopted provisions related to formation of Nomination and Remuneration
Directors’ Report Directors’ Report46 47Hindustan Unilever Limited Annual Report 2013-14
Committee and Corporate Social Responsibility Committee, ahead of implementation of the new law. Your Company is committed to embrace the new law in letter and spirit.
During the year, Secretarial Audit and Secretarial Standards Audit were carried out. The detailed reports on the same are given at page nos. 74 and 75 of this Annual Report.
19. OUTLOOK
Global economic indicators are expected to improve, led by positive prospects in advanced economies. Despite a strengthening external demand, uncertainty continues to loom large on the economic horizon of some emerging economies owing to domestic fragilities. The global economic climate continues to be volatile, uncertain and prone to geo-political risks.
For India, economic activity is expected to improve modestly, driven by global economic revival and moderation in inflation. Upside pressures on inflation and consumption, hinge on the vagaries of the monsoon and the pace of revival of the investment climate will determine to a very large extent India’s economic performance, going forward.
FMCG markets are expected to grow; however, uncertain global economic environment, inflation and competitive intensity continue to pose challenges. While the near term conditions pose a challenge for the economy, the medium to longer term secular trends based on rising incomes, aspirations, low consumption levels, etc. are positive and an opportunity for the FMCG sector, in general and for your Company, in particular.
19.1. Cautionary StatementStatements in this Report, particularly those which relate to Management Discussion and Analysis, describing the Company’s objectives, projections, estimates and expectations, may constitute ‘forward looking statements’ within the meaning of applicable laws and regulations and actual results might differ
materially from those either expressed or implied.20. SUBSIDIARY COMPANIES
A statement pursuant to Section 212 of the Companies Act, 1956, relating to Subsidiary Companies, is attached to the Accounts. In terms of General Exemption, under Section 212(8) of the Companies Act, 1956, granted by Ministry of Corporate Affairs vide its circular no. 02/2011 dated 8th February, 2011, and in compliance with the conditions enlisted therein, the Audited Statement of Accounts, Auditors’ Reports thereon and the Reports of the Board of Directors of the Company’s subsidiaries for the financial year ended 31st March, 2014, have not been annexed. The Annual Accounts and related documents of the Subsidiary Companies shall be kept open for inspection at the
Registered Office of the Company. The Company will also make available these documents upon request by any Member of the Company interested in obtaining the same. However, as directed by the said circular, the financial data of the subsidiaries have been furnished under ‘Subsidiary Companies Particulars’ forming part of this Annual Report (refer page no. 164). Further, pursuant to Accounting Standard (AS-21) issued by the Institute of Chartered Accountants of India, Consolidated Financial Statements presented by the Company in this Annual Report include the financial information of its subsidiaries.
21. BOARD OF DIRECTORS
Consequent to his elevation as President, Home Care, Unilever, Mr. Nitin Paranjpe stepped down as Managing Director and Chief Executive Office of your Company. Mr. Sanjiv Mehta was appointed as the Managing Director and Chief Executive Office of your Company to succeed Mr. Nitin Paranjpe with effect from 10th October 2013. Mr. Sanjiv Mehta was appointed as an Additional Director on the Company’s Board with effect from 1st October, 2013 and the Managing Director and Chief Executive Officer with effect from 10th October, 2013, after obtaining requisite approvals of the Members and the Central Government.
The Board places on record its deep sense of appreciation for the outstanding contribution made by Mr. Nitin Paranjpe as the Managing Director and Chief Executive Office of the Company.
Mr. Sridhar Ramamurthy, Executive Director, Finance & IT and Chief Financial Officer, has been elevated as the Senior Vice President, Finance for the Global Markets and he will be part of the Global Markets Executive of Unilever. Consequently, Mr. Sridhar Ramamurthy will cease to be a Director of the Company with effect from 30th June, 2014 and will not offer himself for re-appointment at the forthcoming Annual General Meeting. It is proposed to appoint Mr. P. B. Balaji as Executive Director, Finance & IT and Chief Financial Officer with effect from 1st July, 2014 to succeed Mr. Sridhar Ramamurthy subject to obtaining requisite approvals of the Members and the Central Government.
The Board places on record its appreciation for the distinguished service and contribution made by Mr. Sridhar Ramamurthy as Executive Director, Finance & IT and Chief Financial Officer of the Company.
As per the provisions of the Companies Act, 2013, Independent Directors are required to be appointed for a term of five consecutive years and shall not be liable to retire by rotation. Accordingly, resolutions proposing appointment of Independent Directors form part of the Notice of the Annual General Meeting. All other Directors, except the Managing Director, will retire at the ensuing Annual General Meeting and, being eligible, offer themselves for re-election.
Directors’ Report Directors’ Report46 47Hindustan Unilever Limited Annual Report 2013-14
Overview Financial Statements Shareholder InformationReports
22. MANAGEMENT COMMITTEE
The day-to-day management of the Company is vested with the Management Committee, which is subjected to the overall superintendence and control of the Board. The Management Committee is headed by the Chief Executive Officer and has Functional / Business Heads as its members.
During the year, Mr. Nitin Paranjpe, Managing Director, Chief Executive Officer was elevated to the position of President, Home Care, Unilever and Mr. Sanjiv Mehta succeeded him and joined the Management Committee in his capacity as Managing Director and Chief Executive Officer with effect from 10th October, 2013.
Mr. Sridhar Ramamurthy, Executive Director, Finance & IT and Chief Financial Officer, has been elevated to the position of Senior Vice President, Finance for the Global Markets in Unilever and Mr. P. B. Balaji will join the Management Committee when he joins the Company as Executive Director, Finance & IT and Chief Financial Officer with effect from 1st July, 2014 to succeed Mr. Sridhar Ramamurthy.
23. AUDITORS
The term of office of M/s. Lovelock & Lewes, as Statutory Auditors of the Company will expire with the conclusion of forthcoming Annual General Meeting of the Company. M/s. Lovelock & Lewes has been Statutory Auditors of your Company since 1997.
The Board of Directors of the Company have, subject to approval of the Members, decided to make a change in the Statutory Auditors. This change is in order to remain at the forefront of good governance and in recognition of regulatory changes in India. This change is also in line with the change in auditors for Unilever globally. A special notice has, accordingly, been received from Unilever PLC in its capacity as Member of the Company, proposing a resolution at the forthcoming Annual General Meeting for appointment of M/s. BSR & Co. LLP as Statutory Auditors of the Company in place of the M/s. Lovelock & Lewes, being the retiring Auditor.
A resolution proposing appointment of M/s. BSR & Co. LLP as the Statutory Auditors of the Company pursuant to Section 139 of the Companies Act, 2013 forms part of the Notice.
M/s. Lovelock & Lewes, over many years, have successfully met the challenge that the size and scale of the Company’s operations pose for auditors and have maintained the highest level of governance, rigour and quality in their audit. The Board place on record its appreciation for the services rendered by M/s. Lovelock and Lewes as the Statutory Auditors of the Company.
24. APPRECIATIONS AND ACKNOWLEDGEMENTS
Your Directors place on record their deep appreciation to employees at all levels for their hard work, dedication and commitment. The enthusiasm and unstinting efforts of the employees have enabled the Company to remain as industry leaders.
Your Directors would also like to acknowledge the excellent contribution by Unilever to your Company in providing the latest innovations, technological improvements and marketing inputs across almost all categories, in which it operates. This has enabled the Company to provide higher levels of consumer delight through continuous improvement in existing products and introduction of new products.
The Board places on record its appreciation for the support and co-operation your Company has been receiving from its suppliers, redistribution stockists, retailers, business partners and others associated with the Company as its trading partners. Your Company looks upon them as partners in its progress and has shared with them the rewards of growth. It will be the Company’s endeavour to build and nurture strong links with the trade based on mutuality of benefits, respect for and co-operation with each other, consistent with consumer interests.
The Directors also take this opportunity to thank all Investors, Clients, Vendors, Banks, Government and Regulatory Authorities and Stock Exchanges, for their continued support.
On behalf of the Board
Harish Manwani
Mumbai, 28th April, 2014 Chairman
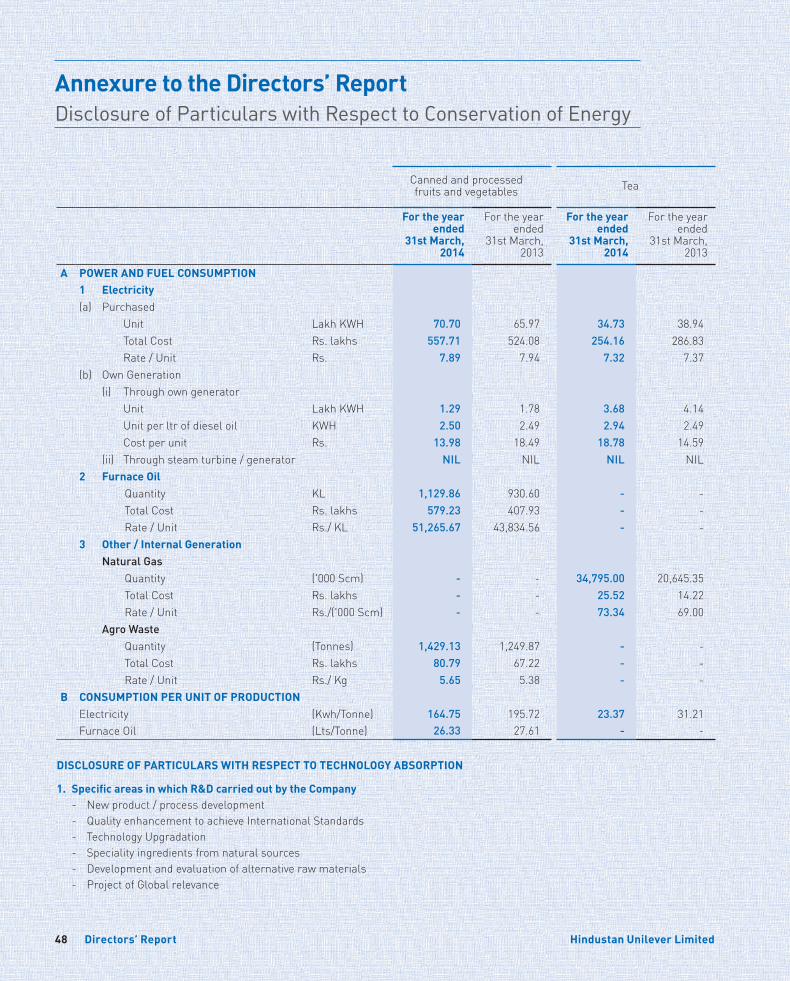
Directors’ Report Directors’ Report48 49Hindustan Unilever Limited Annual Report 2013-14
Canned and processed fruits and vegetables Tea
For the year ended
31st March, 2014
For the year ended
31st March, 2013
For the year ended
31st March, 2014
For the year ended
31st March, 2013
A POWER AND FUEL CONSUMPTION1 Electricity(a) Purchased
Unit Lakh KWH 70.70 65.97 34.73 38.94 Total Cost Rs. lakhs 557.71 524.08 254.16 286.83 Rate / Unit Rs. 7.89 7.94 7.32 7.37
(b) Own Generation(i) Through own generator
Unit Lakh KWH 1.29 1.78 3.68 4.14 Unit per ltr of diesel oil KWH 2.50 2.49 2.94 2.49 Cost per unit Rs. 13.98 18.49 18.78 14.59
(ii) Through steam turbine / generator NIL NIL NIL NIL2 Furnace Oil
Quantity KL 1,129.86 930.60 - -Total Cost Rs. lakhs 579.23 407.93 - -Rate / Unit Rs./ KL 51,265.67 43,834.56 - -
3 Other / Internal GenerationNatural Gas
Quantity ('000 Scm) - - 34,795.00 20,645.35 Total Cost Rs. lakhs - - 25.52 14.22 Rate / Unit Rs./('000 Scm) - - 73.34 69.00
Agro WasteQuantity (Tonnes) 1,429.13 1,249.87 - - Total Cost Rs. lakhs 80.79 67.22 - - Rate / Unit Rs./ Kg 5.65 5.38 - -
B CONSUMPTION PER UNIT OF PRODUCTIONElectricity (Kwh/Tonne) 164.75 195.72 23.37 31.21 Furnace Oil (Lts/Tonne) 26.33 27.61 - -
DISCLOSURE OF PARTICULARS WITH RESPECT TO TECHNOLOGY ABSORPTION
1. Specific areas in which R&D carried out by the Company - New product / process development - Quality enhancement to achieve International Standards - Technology Upgradation - Speciality ingredients from natural sources - Development and evaluation of alternative raw materials - Project of Global relevance
Annexure to the Directors’ Report Disclosure of Particulars with Respect to Conservation of Energy
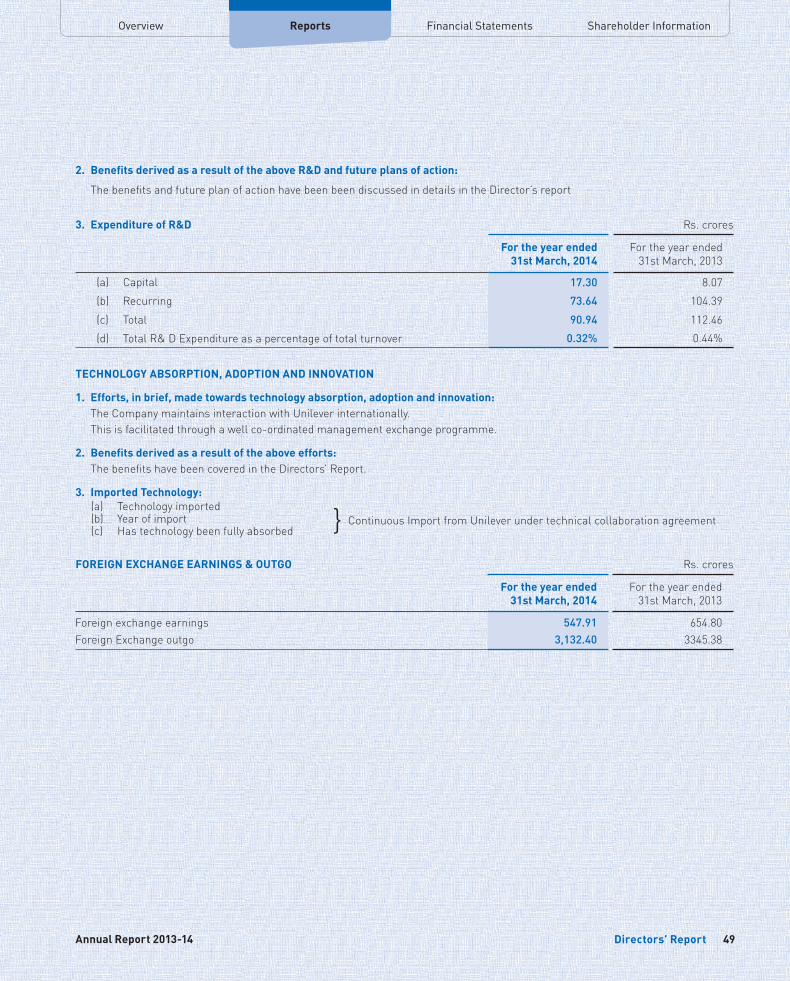
Directors’ Report Directors’ Report48 49Hindustan Unilever Limited Annual Report 2013-14
Overview Financial Statements Shareholder InformationReports
2. Benefits derived as a result of the above R&D and future plans of action:
The benefits and future plan of action have been been discussed in details in the Director’s report
3. Expenditure of R&D Rs. crores
For the year ended31st March, 2014
For the year ended31st March, 2013
(a) Capital 17.30 8.07 (b) Recurring 73.64 104.39(c) Total 90.94 112.46 (d) Total R& D Expenditure as a percentage of total turnover 0.32% 0.44%
TECHNOLOGY ABSORPTION, ADOPTION AND INNOVATION
1. Efforts, in brief, made towards technology absorption, adoption and innovation: The Company maintains interaction with Unilever internationally. This is facilitated through a well co-ordinated management exchange programme.
2. Benefits derived as a result of the above efforts: The benefits have been covered in the Directors’ Report.
3. Imported Technology:(a) Technology imported
} Continuous Import from Unilever under technical collaboration agreement(b) Year of import(c) Has technology been fully absorbed
FOREIGN EXCHANGE EARNINGS & OUTGO Rs. crores
For the year ended31st March, 2014
For the year ended31st March, 2013
Foreign exchange earnings 547.91 654.80 Foreign Exchange outgo 3,132.40 3345.38
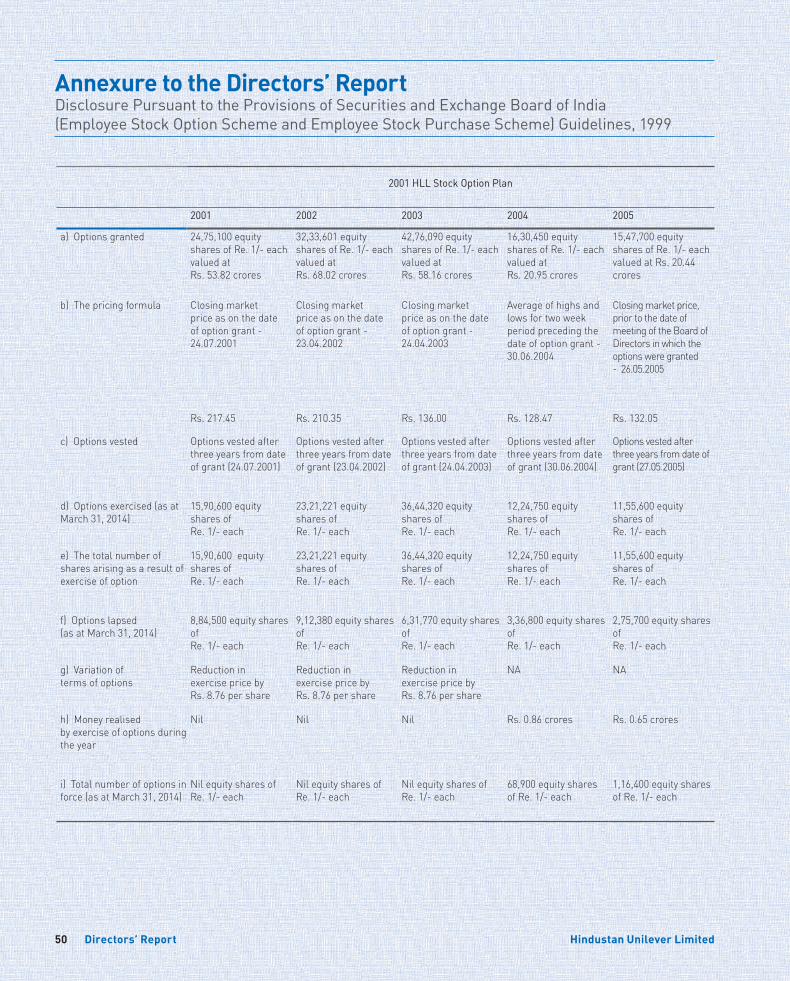
Directors’ Report Directors’ Report50 51Hindustan Unilever Limited Annual Report 2013-14
Annexure to the Directors’ Report Disclosure Pursuant to the Provisions of Securities and Exchange Board of India (Employee Stock Option Scheme and Employee Stock Purchase Scheme) Guidelines, 1999
2001 HLL Stock Option Plan
2001 2002 2003 2004 2005
a) Options granted 24,75,100 equity shares of Re. 1/- each valued at Rs. 53.82 crores
32,33,601 equity shares of Re. 1/- each valued at Rs. 68.02 crores
42,76,090 equity shares of Re. 1/- each valued at Rs. 58.16 crores
16,30,450 equity shares of Re. 1/- each valued at Rs. 20.95 crores
15,47,700 equity shares of Re. 1/- each valued at Rs. 20.44 crores
b) The pricing formula Closing market price as on the date of option grant - 24.07.2001
Closing market price as on the date of option grant - 23.04.2002
Closing market price as on the date of option grant - 24.04.2003
Average of highs and lows for two week period preceding the date of option grant - 30.06.2004
Closing market price, prior to the date of meeting of the Board of Directors in which the options were granted - 26.05.2005
Rs. 217.45 Rs. 210.35 Rs. 136.00 Rs. 128.47 Rs. 132.05
c) Options vested Options vested after three years from date of grant (24.07.2001)
Options vested after three years from date of grant (23.04.2002)
Options vested after three years from date of grant (24.04.2003)
Options vested after three years from date of grant (30.06.2004)
Options vested after three years from date of grant (27.05.2005)
d) Options exercised (as at March 31, 2014)
15,90,600 equity shares of Re. 1/- each
23,21,221 equity shares of Re. 1/- each
36,44,320 equity shares of Re. 1/- each
12,24,750 equity shares of Re. 1/- each
11,55,600 equity shares of Re. 1/- each
e) The total number of shares arising as a result of exercise of option
15,90,600 equity shares of Re. 1/- each
23,21,221 equity shares of Re. 1/- each
36,44,320 equity shares of Re. 1/- each
12,24,750 equity shares of Re. 1/- each
11,55,600 equity shares of Re. 1/- each
f) Options lapsed (as at March 31, 2014)
8,84,500 equity shares of Re. 1/- each
9,12,380 equity shares of Re. 1/- each
6,31,770 equity shares of Re. 1/- each
3,36,800 equity shares of Re. 1/- each
2,75,700 equity shares of Re. 1/- each
g) Variation of terms of options
Reduction in exercise price by Rs. 8.76 per share
Reduction in exercise price by Rs. 8.76 per share
Reduction in exercise price by Rs. 8.76 per share
NA NA
h) Money realised by exercise of options during the year
Nil Nil Nil Rs. 0.86 crores Rs. 0.65 crores
i) Total number of options in force (as at March 31, 2014)
Nil equity shares of Re. 1/- each
Nil equity shares of Re. 1/- each
Nil equity shares of Re. 1/- each
68,900 equity shares of Re. 1/- each
1,16,400 equity shares of Re. 1/- each
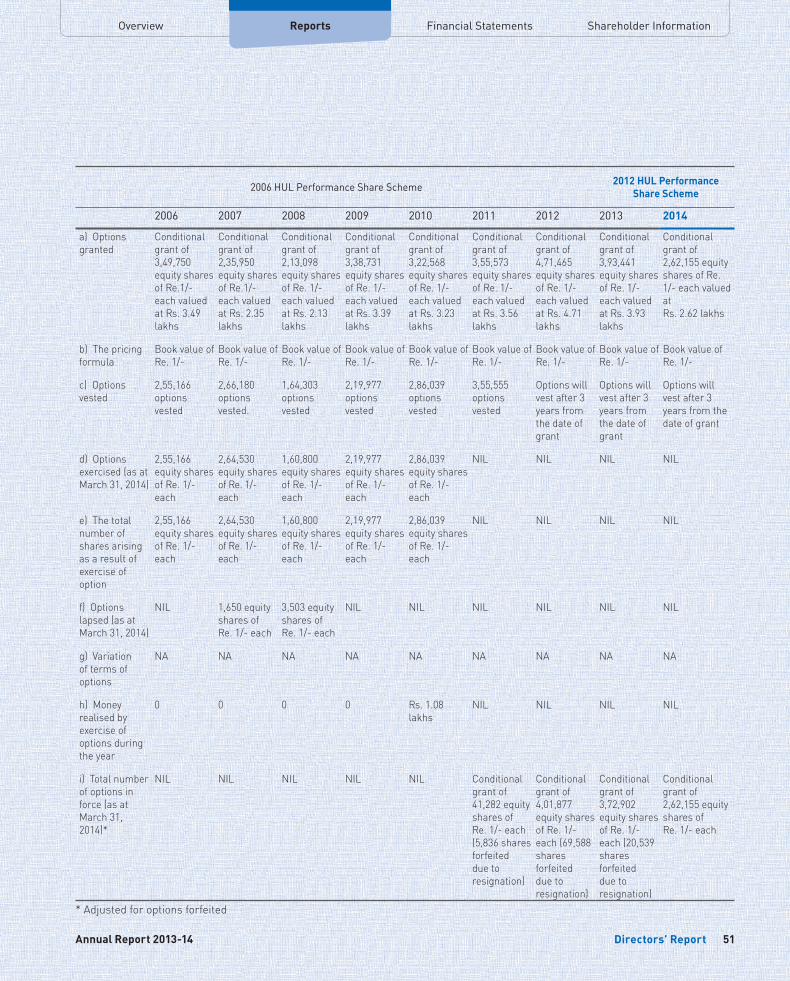
Directors’ Report Directors’ Report50 51Hindustan Unilever Limited Annual Report 2013-14
Overview Financial Statements Shareholder InformationReports
2006 HUL Performance Share Scheme 2012 HUL Performance Share Scheme
2006 2007 2008 2009 2010 2011 2012 2013 2014
a) Options granted
Conditional grant of 3,49,750 equity shares of Re.1/- each valued at Rs. 3.49 lakhs
Conditional grant of 2,35,950 equity shares of Re.1/- each valued at Rs. 2.35 lakhs
Conditional grant of 2,13,098 equity shares of Re. 1/- each valued at Rs. 2.13 lakhs
Conditional grant of 3,38,731 equity shares of Re. 1/- each valued at Rs. 3.39 lakhs
Conditional grant of 3,22,568 equity shares of Re. 1/- each valued at Rs. 3.23 lakhs
Conditional grant of 3,55,573 equity shares of Re. 1/- each valued at Rs. 3.56 lakhs
Conditional grant of 4,71,465 equity shares of Re. 1/- each valued at Rs. 4.71 lakhs
Conditional grant of 3,93,441 equity shares of Re. 1/- each valued at Rs. 3.93 lakhs
Conditional grant of 2,62,155 equity shares of Re. 1/- each valued at Rs. 2.62 lakhs
b) The pricing formula
Book value of Re. 1/-
Book value of Re. 1/-
Book value of Re. 1/-
Book value of Re. 1/-
Book value of Re. 1/-
Book value of Re. 1/-
Book value of Re. 1/-
Book value of Re. 1/-
Book value of Re. 1/-
c) Options vested
2,55,166 options vested
2,66,180 options vested.
1,64,303 options vested
2,19,977 options vested
2,86,039 options vested
3,55,555 options vested
Options will vest after 3 years from the date of grant
Options will vest after 3 years from the date of grant
Options will vest after 3 years from the date of grant
d) Options exercised (as at March 31, 2014)
2,55,166 equity shares of Re. 1/- each
2,64,530 equity shares of Re. 1/- each
1,60,800 equity shares of Re. 1/- each
2,19,977 equity shares of Re. 1/- each
2,86,039 equity shares of Re. 1/- each
NIL NIL NIL NIL
e) The total number of shares arising as a result of exercise of option
2,55,166 equity shares of Re. 1/- each
2,64,530 equity shares of Re. 1/- each
1,60,800 equity shares of Re. 1/- each
2,19,977 equity shares of Re. 1/- each
2,86,039 equity shares of Re. 1/- each
NIL NIL NIL NIL
f) Options lapsed (as at March 31, 2014)
NIL 1,650 equity shares of Re. 1/- each
3,503 equity shares of Re. 1/- each
NIL NIL NIL NIL NIL NIL
g) Variation of terms of options
NA NA NA NA NA NA NA NA NA
h) Money realised by exercise of options during the year
0 0 0 0 Rs. 1.08 lakhs
NIL NIL NIL NIL
i) Total number of options in force (as at March 31, 2014)*
NIL NIL NIL NIL NIL Conditional grant of 41,282 equity shares of Re. 1/- each (5,836 shares forfeited due to resignation)
Conditional grant of 4,01,877 equity shares of Re. 1/- each (69,588 shares forfeited due to resignation)
Conditional grant of 3,72,902 equity shares of Re. 1/- each (20,539 shares forfeited due to resignation)
Conditional grant of 2,62,155 equity shares of Re. 1/- each
* Adjusted for options forfeited
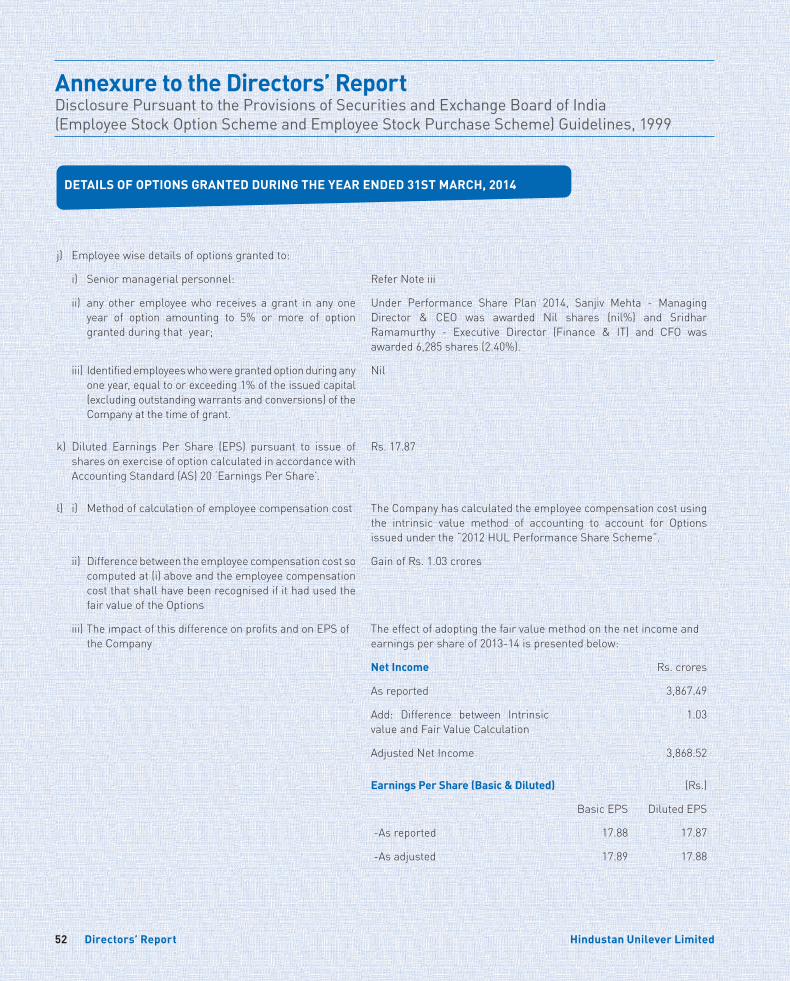
Directors’ Report Directors’ Report52 53Hindustan Unilever Limited Annual Report 2013-14
j) Employee wise details of options granted to:
i) Senior managerial personnel: Refer Note iii
ii) any other employee who receives a grant in any one year of option amounting to 5% or more of option granted during that year;
Under Performance Share Plan 2014, Sanjiv Mehta - Managing Director & CEO was awarded Nil shares (nil%) and Sridhar Ramamurthy - Executive Director (Finance & IT) and CFO was awarded 6,285 shares (2.40%).
iii) Identified employees who were granted option during any one year, equal to or exceeding 1% of the issued capital (excluding outstanding warrants and conversions) of the Company at the time of grant.
Nil
k) Diluted Earnings Per Share (EPS) pursuant to issue of shares on exercise of option calculated in accordance with Accounting Standard (AS) 20 ‘Earnings Per Share’.
Rs. 17.87
l) i) Method of calculation of employee compensation cost The Company has calculated the employee compensation cost using the intrinsic value method of accounting to account for Options issued under the “2012 HUL Performance Share Scheme”.
ii) Difference between the employee compensation cost so computed at (i) above and the employee compensation cost that shall have been recognised if it had used the fair value of the Options
Gain of Rs. 1.03 crores
iii) The impact of this difference on profits and on EPS of the Company
The effect of adopting the fair value method on the net income and earnings per share of 2013-14 is presented below:
Net Income Rs. crores
As reported 3,867.49
Add: Difference between Intrinsic value and Fair Value Calculation
1.03
Adjusted Net Income 3,868.52
Earnings Per Share (Basic & Diluted) (Rs.)
Basic EPS Diluted EPS
-As reported 17.88 17.87
-As adjusted 17.89 17.88
Annexure to the Directors’ Report Disclosure Pursuant to the Provisions of Securities and Exchange Board of India (Employee Stock Option Scheme and Employee Stock Purchase Scheme) Guidelines, 1999
DETAILS OF OPTIONS GRANTED DURING THE YEAR ENDED 31ST MARCH, 2014
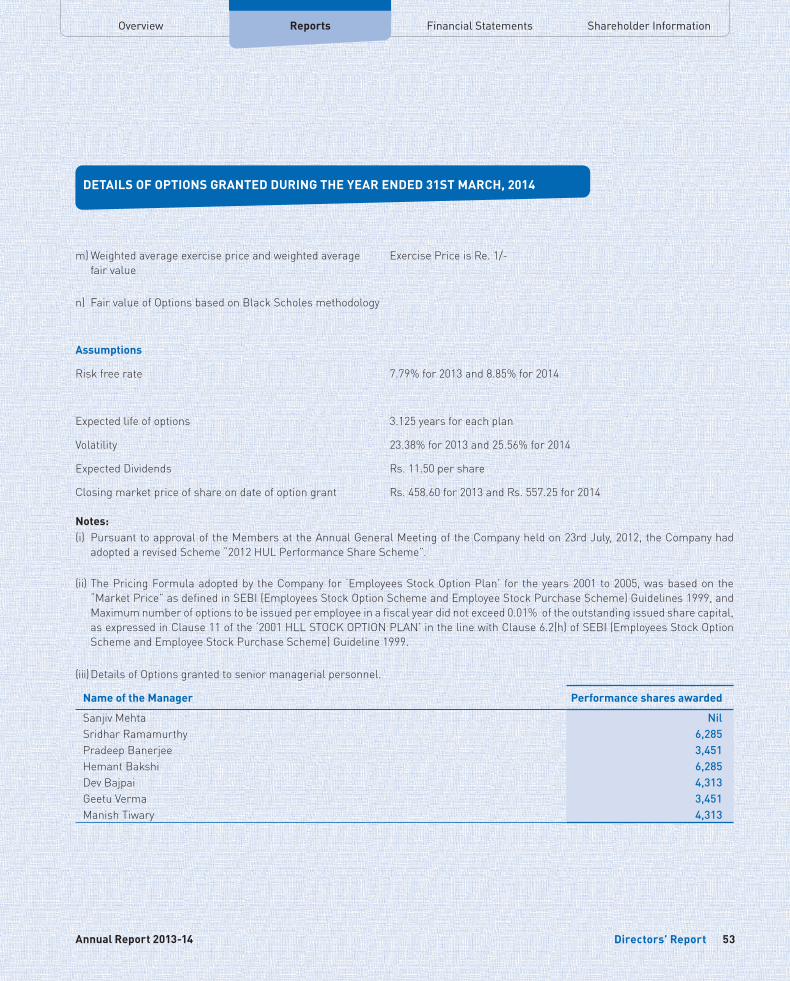
Directors’ Report Directors’ Report52 53Hindustan Unilever Limited Annual Report 2013-14
Overview Financial Statements Shareholder InformationReports
m) Weighted average exercise price and weighted average fair value
Exercise Price is Re. 1/-
n) Fair value of Options based on Black Scholes methodology
Assumptions
Risk free rate 7.79% for 2013 and 8.85% for 2014
Expected life of options 3.125 years for each plan
Volatility 23.38% for 2013 and 25.56% for 2014
Expected Dividends Rs. 11.50 per share
Closing market price of share on date of option grant Rs. 458.60 for 2013 and Rs. 557.25 for 2014
Notes:(i) Pursuant to approval of the Members at the Annual General Meeting of the Company held on 23rd July, 2012, the Company had
adopted a revised Scheme “2012 HUL Performance Share Scheme”.
(ii) The Pricing Formula adopted by the Company for ‘Employees Stock Option Plan’ for the years 2001 to 2005, was based on the “Market Price” as defined in SEBI (Employees Stock Option Scheme and Employee Stock Purchase Scheme) Guidelines 1999, and Maximum number of options to be issued per employee in a fiscal year did not exceed 0.01% of the outstanding issued share capital, as expressed in Clause 11 of the ‘2001 HLL STOCK OPTION PLAN’ in the line with Clause 6.2(h) of SEBI (Employees Stock Option Scheme and Employee Stock Purchase Scheme) Guideline 1999.
(iii) Details of Options granted to senior managerial personnel.
Name of the Manager Performance shares awarded
Sanjiv Mehta NilSridhar Ramamurthy 6,285Pradeep Banerjee 3,451Hemant Bakshi 6,285Dev Bajpai 4,313Geetu Verma 3,451Manish Tiwary 4,313
DETAILS OF OPTIONS GRANTED DURING THE YEAR ENDED 31ST MARCH, 2014
Corporate Governance Corporate Governance54 55Hindustan Unilever Limited Annual Report 2013-14
CORPORATE GOVERNANCE
“I believe that nothing can be greater than a business, however small it may be, that is governed by conscience; and that nothing can be meaner or more petty than a business, however large, governed without honesty and without brotherhood.”
– William Hesketh Lever
Transparency and accountability are the two basic tenets of Corporate Governance. At Hindustan Unilever, we feel proud to belong to a Company whose visionary founders laid the foundation stone for good governance long back and made it an integral principle of the business, as demonstrated in the words above.
Responsible corporate conduct is integral to the way we do our business. Our actions are governed by our values and principles, which are reinforced at all levels within the Company. At Hindustan Unilever, we are committed to doing things the right way which means taking business decisions and acting in a way that is ethical and is in compliance with applicable legislation. Our Code of Business Principles is an extension of our values and reflects our continued commitment to ethical business practices across our operations. We acknowledge our individual and collective responsibilities to manage our business activities with integrity. Our Code of Business Principles inspires us to set standards which not only meet applicable legislation but go beyond in many areas of our functioning.
To succeed, we believe, requires highest standards of corporate behaviour towards everyone we work with, the communities we touch and the environment on which we have an impact. This is our road to consistent, competitive, profitable and responsible growth and creating long term value for our shareholders, our people and our business partners. The above principles have been the guiding force for whatever we do and shall continue to be so in the years to come.
The Board of Directors (‘the Board’) is responsible for and committed to sound principles of Corporate Governance in the Company. The Board plays a crucial role in overseeing how the management serves the short and long term interests of shareholders and other stakeholders. This belief is reflected in our governance practices, under which we strive to maintain an effective, informed and independent Board. We keep our governance practices under continuous review and benchmark ourselves to best practices across the globe.
THE BOARD OF DIRECTORS
The Board of Directors is entrusted with the ultimate responsibility of the management, general affairs, direction and performance of the Company and has been vested with requisite powers, authorities and duties. The Management Committee of the Company is headed by the Managing Director and Chief Executive Officer and has business / functional heads as its members, which looks after the management of the day-to-day affairs of the Company.
CompositionThe Board comprises such number of Non-Executive, Executive and Independent Directors as required under applicable legislation. As on date of this Report, the Board consists of eight Directors comprising one Non-Executive Chairman, four Independent Directors and three Executive Directors. The composition of the Board represents an optimal mix of professionalism, knowledge and experience and enables the Board to discharge its responsibilities and provide effective leadership to the business. The positions of the Chairman of the Board and the Chief Executive Officer of the Company are held by separate individuals, where the Chairman of the Board is a Non-Executive Director. The detailed profiles of the members of the Board of Directors are provided on page nos. 26 to 29 of this Annual Report.
During the year, Dr. R. A. Mashelkar, Independent Director of the Company, upon attaining the age of seventy years, retired from the Board of the Company by not offering himself for re-appointment at the Annual General Meeting, in accordance with the then prevailing policy of the Company.
Mr. Nitin Paranjpe, consequent to his elevation as President, Home Care for Unilever, stepped down as the Managing Director and Chief Executive Officer of the Company. Mr. Sanjiv Mehta was appointed as the Managing Director and Chief Executive Officer
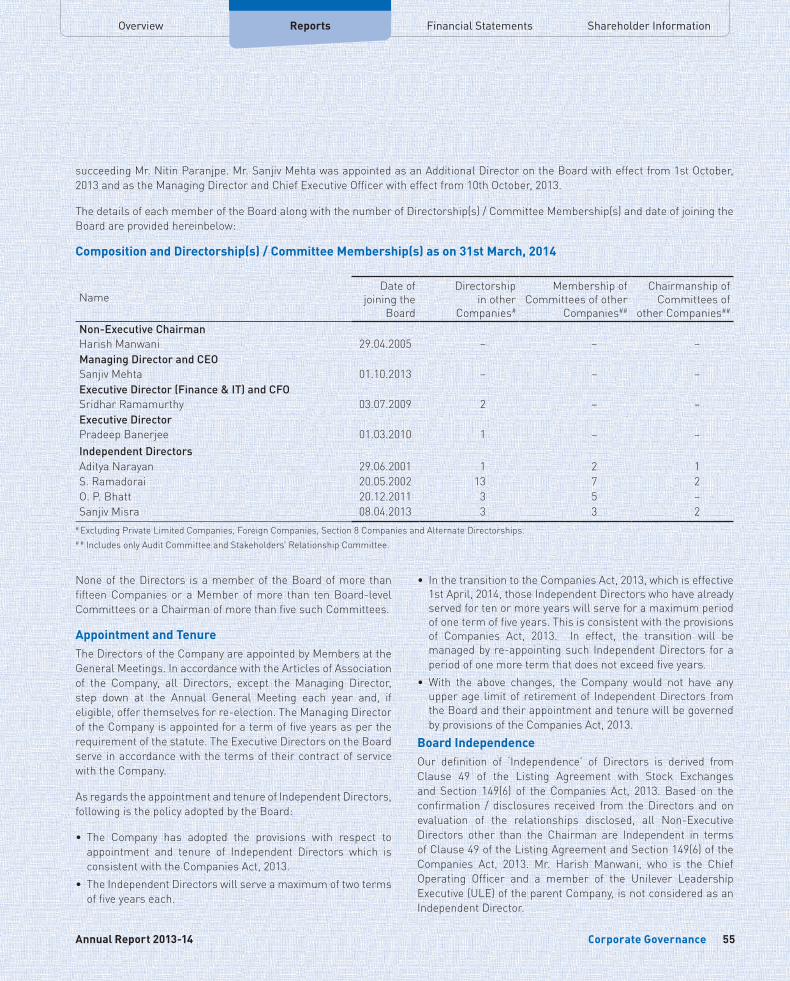
Corporate Governance Corporate Governance54 55Hindustan Unilever Limited Annual Report 2013-14
Overview Financial Statements Shareholder InformationReports
succeeding Mr. Nitin Paranjpe. Mr. Sanjiv Mehta was appointed as an Additional Director on the Board with effect from 1st October, 2013 and as the Managing Director and Chief Executive Officer with effect from 10th October, 2013.
The details of each member of the Board along with the number of Directorship(s) / Committee Membership(s) and date of joining the Board are provided hereinbelow:
Composition and Directorship(s) / Committee Membership(s) as on 31st March, 2014
NameDate of
joining the Board
Directorship in other
Companies#
Membership of Committees of other
Companies##
Chairmanship of Committees of
other Companies##
Non-Executive ChairmanHarish Manwani 29.04.2005 – – –Managing Director and CEOSanjiv Mehta 01.10.2013 – – –Executive Director (Finance & IT) and CFOSridhar Ramamurthy 03.07.2009 2 – –Executive DirectorPradeep Banerjee 01.03.2010 1 – –Independent DirectorsAditya Narayan 29.06.2001 1 2 1S. Ramadorai 20.05.2002 13 7 2O. P. Bhatt 20.12.2011 3 5 –Sanjiv Misra 08.04.2013 3 3 2
# Excluding Private Limited Companies, Foreign Companies, Section 8 Companies and Alternate Directorships.# # Includes only Audit Committee and Stakeholders’ Relationship Committee.
None of the Directors is a member of the Board of more than fifteen Companies or a Member of more than ten Board-level Committees or a Chairman of more than five such Committees.
Appointment and TenureThe Directors of the Company are appointed by Members at the General Meetings. In accordance with the Articles of Association of the Company, all Directors, except the Managing Director, step down at the Annual General Meeting each year and, if eligible, offer themselves for re-election. The Managing Director of the Company is appointed for a term of five years as per the requirement of the statute. The Executive Directors on the Board serve in accordance with the terms of their contract of service with the Company.
As regards the appointment and tenure of Independent Directors, following is the policy adopted by the Board:
• The Company has adopted the provisions with respect to appointment and tenure of Independent Directors which is consistent with the Companies Act, 2013.
• The Independent Directors will serve a maximum of two terms of five years each.
• InthetransitiontotheCompaniesAct,2013,whichiseffective1st April, 2014, those Independent Directors who have already served for ten or more years will serve for a maximum period of one term of five years. This is consistent with the provisions of Companies Act, 2013. In effect, the transition will be managed by re-appointing such Independent Directors for a period of one more term that does not exceed five years.
• With the above changes, the Company would not have anyupper age limit of retirement of Independent Directors from the Board and their appointment and tenure will be governed by provisions of the Companies Act, 2013.
Board IndependenceOur definition of ‘Independence’ of Directors is derived from Clause 49 of the Listing Agreement with Stock Exchanges and Section 149(6) of the Companies Act, 2013. Based on the confirmation / disclosures received from the Directors and on evaluation of the relationships disclosed, all Non-Executive Directors other than the Chairman are Independent in terms of Clause 49 of the Listing Agreement and Section 149(6) of the Companies Act, 2013. Mr. Harish Manwani, who is the Chief Operating Officer and a member of the Unilever Leadership Executive (ULE) of the parent Company, is not considered as an Independent Director.
Corporate Governance Corporate Governance56 57Hindustan Unilever Limited Annual Report 2013-14
Board MeetingsThe Board meets at regular intervals to discuss and decide on Company / business policy and strategy apart from other Board business. The Board / Committee Meetings are pre-scheduled and a tentative annual calendar of the Board and Committee Meetings is circulated to the Directors well in advance to facilitate them to plan their schedule and to ensure meaningful participation in the meetings. However, in case of a special and urgent business need, the Board’s approval is taken by passing resolutions by circulation, as permitted by law, which is confirmed in the subsequent Board meeting.
The notice of Board meeting is given well in advance to all the Directors. Usually, meetings of the Board are held in Mumbai. The Agenda of the Board / Committee meetings is set by the Company Secretary in consultation with the Chairman and the Chief Executive Officer of the Company. The Agenda is circulated a week prior to the date of the meeting. The Agenda for the Board and Committee meetings includes detailed notes on the items to be discussed at the meeting to enable the Directors to take an informed decision.
During the financial year ended 31st March, 2014, seven Board meetings were held on 8th and 9th April, 2013, 29th April, 2013, 3rd May, 2013, 26th July, 2013, 26th October, 2013, 27th January, 2014 and 11th March, 2014. The maximum interval between any two meetings was well within the maximum allowed gap of 120 days.
Board BusinessThe normal business of the Board includes:• framing and overseeing progress of the Company’s annual
plan and operating framework; • framingstrategiesforshapingofportfolioanddirectionofthe
Company and for corporate resource allocation;• reviewingfinancialplansoftheCompany;• reviewingquarterlyandannualbusinessperformanceofthe
Company;• reviewingtheAnnualReportandaccountsforadoptionbythe
Members; • reviewingtheprogressofvariousfunctionsandbusinessesof
the Company;• reviewingthefunctioningoftheBoardanditsCommittees;• reviewingthefunctioningofthesubsidiarycompanies;• considering and approving declaration / recommendation of
dividend;• reviewingandresolvingfatalorseriousaccidentsordangerous
occurrences, any materially significant effluent or pollution problems or significant labour issues, if any;
• reviewing the details of significant development in humanresources and industrial relations front;
• reviewingdetailsofforeignexchangeexposureandstepstakenby the management to limit the risks of adverse exchange rate movement;
• reviewing compliance with all relevant legislations andregulations and litigation status, including materially important show cause, demand, prosecution and penalty notices, if any;
• reviewing Board remuneration policy and individualremuneration packages of Directors;
• advising on corporate restructuring such as merger,acquisition, joint venture or disposals, if any;
• appointingDirectorsontheBoardandManagementCommittee;• reviewing Corporate Social Responsibility policy of the
Company and monitoring implementation thereof; • reviewingdetailsofriskevaluationandinternalcontrols;• reviewingreportsonprogressmadeontheongoingprojects;•monitoringandreviewingBoardEvaluationframework.
Board SupportThe Company Secretary is responsible for collation, review and distribution of all papers submitted to the Board and Committees thereof for consideration. The Company Secretary is also responsible for preparation of the Agenda and convening of the Board and Committee meetings. The Company Secretary attends all the meetings of the Board and its Committees, advises / assures the Board on Compliance and Governance principles and ensures appropriate recording of minutes of the meetings.
With a view to leveraging technology and reducing paper consumption, the Company has adopted a web-based application for transmitting Board / Committee Agenda and Pre-reads. The Directors of the Company receive the Agenda and Pre-reads in electronic form through this application, which can be accessed through Internet or iPads. The application meets high standards of security and integrity that is required for storage and transmission of Board / Committee Agenda and Pre-reads in electronic form.
Independent Directors’ MeetingsThe Independent Directors meet at least once in a quarter, without the presence of Executive Directors or Management representatives. They also have a separate meeting with the Non-Executive Chairman, without any of the Executive Directors being present, to discuss issues and concerns, if any.
The Independent Directors met four times during the financial year ended 31st March, 2014 on 29th April, 2013, 26th July, 2013, 26th October, 2013 and 27th January, 2014. In addition to these formal meetings, interactions outside the Board meetings also take place between the Chairman and Independent Directors.
Corporate Governance Corporate Governance56 57Hindustan Unilever Limited Annual Report 2013-14
Overview Financial Statements Shareholder InformationReports
Board Induction and TrainingUpon appointment, Directors receive a Letter of Appointment setting out in detail, the terms of appointment, duties, responsibilities and expected time commitments. Each newly appointed Director is taken through a formal induction programme. The Company Secretary provides new Directors, both Executive and Non-Executive, with a briefing on their legal and regulatory responsibilities as Directors and the Chief Executive Officer provides a briefing on Company’s current structure and performance of business. The induction for Non-Executive Independent Directors include interactive sessions with Management Committee Members, Business and Functional Heads, visit to market / plant, etc.
The induction process for Directors is designed to:• buildanunderstandingoftheCompany,itsbusinessesandthe
markets and regulatory environments in which it operates;• provideanappreciationoftheirrolesandresponsibilities;• fullyequipthemtoperformtheirrolesontheBoardeffectively;• buildlinkstoUnilever’speopleandbuildanunderstandingof
Unilever’s key relationships.
Strategy Board meetings are held where Business and Functional Heads share with the Board their short term and long term plans, major activities, likely risks and challenges with actions to mitigate them in their respective areas. The Board’s suggestions and comments are incorporated in the business plans of the Company.
Board EvaluationThe Board of Directors has adopted a policy on Board Evaluation. The policy provides for evaluation of the Board, the Committees of the Board and individual Directors, including the Chairman of the Board. As per the Policy, the Company will carry out an evaluation of the performance of the Board as a whole, Board Committees and Directors on an annual basis and the same will be facilitated by an independent consultant once in three years.
COMMITTEES OF THE BOARD
The Board Committees play a crucial role in the governance structure of the Company and have been constituted to deal with specific areas / activities which concern the Company and need a closer review. The Board Committees are set up under the formal approval of the Board to carry out clearly defined roles which are considered to be performed by members of the Board, as a part of good governance practice. The Board supervises the execution of its responsibilities by the Committees and is responsible for their action. The minutes of the meetings of all Committees are placed before the Board for review. The Board
Committees can request special invitees to join the meeting, as appropriate.
The Board has currently established the following statutory and non-statutory Committees.
Audit CommitteeThe Company’s Audit Committee comprises all the four Independent Directors. The Audit Committee is headed by Mr. Aditya Narayan and has Mr. S. Ramadorai, Mr. O. P. Bhatt and Dr. Sanjiv Misra as its members. During the year, upon retirement from the Board, Dr. R. A. Mashelkar ceased to be a member of the Committee. All the members of the Committee have relevant experience in financial matters.
The Audit Committee of the Company is entrusted with the responsibility to supervise the Company’s internal controls and financial reporting process and inter alia performs the following functions:• overseeing the Company’s financial reporting process and
disclosure of financial information to ensure that the financial statements are correct, sufficient and credible;
• recommending the appointment and removal of externalauditors, fixation of audit fee and approval for payment of any other services;
• reviewingwithmanagementthequarterlyandannualfinancialresults before submission to the Board;
• reviewingwithmanagementtheannualfinancialstatementsof the subsidiary companies;
• reviewing theadequacyof internal control systemswith themanagement, external auditors and internal auditor;
• reviewingtheadequacyofinternalauditfunction;• discussingwith internal auditor any significant findings and
reviewing the progress of corrective actions on such issues;• reviewing the findings of any internal investigations by the
internal auditor in matters where there is suspected fraud or irregularity or a failure of internal control systems of a material nature and then reporting such matters to the Board;
• discussingwithexternalauditors,beforetheauditcommences,the nature and scope of audit as well as having post-audit discussions to ascertain areas of concern, if any;
• recommendingtheappointmentandremovalofcostauditors;• reviewingtheCompany’sfinancialandriskmanagementpolicies;• examining reasons forsubstantialdefault in thepayment to
Members (in case of non-payment of declared dividends) and creditors, if any;
• reviewingtheprogressmadeoncasesthatarereportedunderthe Code of Business Principles and Whistle Blower Policy of the Company and the implication of these cases, if any, under the UK Bribery Act, 2011.
Corporate Governance Corporate Governance58 59Hindustan Unilever Limited Annual Report 2013-14
In addition to quarterly meetings for consideration of financial results, special meetings of the Audit Committee are convened. In these meetings, the Audit Committee reviews various businesses / functions, business risk assessment, controls and critical IT applications with implications of security and internal audit and control assurance reports of all the major divisions of the Company. The Audit Committee also reviews the functioning of the Code of Business Principles and Whistle Blower Policy of the Company and cases reported thereunder.
The meetings of Audit Committee are also attended by the Chief Executive Officer, Chief Financial Officer, Statutory Auditors and Internal Auditor as special invitees. The Company Secretary acts as the Secretary to the Committee. The minutes of each Audit Committee meeting are placed and confirmed in the next meeting of the Board. The Audit Committee also meets the internal and external auditors separately, without the presence of Management representatives.
The Audit Committee met six times during the financial year ended 31st March, 2014 on 29th April, 2013, 10th June, 2013, 26th July, 2013, 26th October, 2013, 14th December, 2013 and 27th January, 2014.
Internal Controls and Risk ManagementThe Company has robust systems for internal audit and corporate risk assessment and mitigation. The Company has an independent Control Assurance Department (CAD) assisted by dedicated outsourced audit teams.
The Internal Audit covers all the factories, sales offices, warehouses and centrally controlled businesses and functions, as per the annual plan agreed with the Audit Committee. The audit coverage plan of CAD is approved by the Audit Committee at the beginning of every year. Every quarter, the Audit Committee of the Board is presented with key control issues and actions taken on the issues highlighted in previous report.
Business Risk Assessment procedures have been set in place for self-assessment of business risks, operating controls and compliance with Corporate Policies. There is an ongoing process to track the evolution of risks and delivery of mitigating action plans.
Financial controls review procedures and guidelines are issued by Unilever annually in line with Sarbanes-Oxley (S. 404) requirements. Unit heads are responsible for implementing these procedures to confirm the effectiveness of the financial controls in that unit and to correct any instances of weaknesses identified. In addition, effectiveness of operational and non-financial controls is also reviewed by the unit heads. During the year, financial control environment was streamlined and strengthened with 50% of key controls being automated by further leveraging SAP. These procedures provide the management an assurance on the internal processes and systems.
Nomination and Remuneration CommitteeThe Nomination and Remuneration Committee comprises Mr. S. Ramadorai as the Chairman and Mr. Aditya Narayan, Mr. O. P. Bhatt, Dr. Sanjiv Misra, Mr. Harish Manwani and Mr. Sanjiv Mehta as members of the Committee. During the year, upon retirement from the Board, Dr. R. A. Mashelkar ceased to be a member of the Committee. Consequent to his cessation from the Board of the Company, Mr. Nitin Paranjpe ceased to be a member of the Committee and Mr. Sanjiv Mehta was appointed as a member of the Committee with effect from 10th October, 2013.
The role of Nomination and Remuneration Committee is as follows:• determining / recommending the criteria for appointment of
Executive, Non-Executive and Independent Directors to the Board; • determining / recommending the criteria for qualifications,
positive attributes and independence of Directors; • identifyingcandidateswhoarequalifiedtobecomeDirectors
and who may be appointed in Senior Management and recommending to the Board their appointment and removal;
• reviewing and determining all elements of remunerationpackage of all the Executive Directors, i.e. salary, benefits, bonus, stock options, pension, etc.;
• reviewing and determining fixed component and performancelinked incentives for Directors along with the performance criteria;
• determining policy on service contracts, notice period,severance fees for Directors and Senior Management;
• evaluatingperformanceofeachDirectorandperformanceofthe Board as a whole;
The Committee also plays a role of a Compensation Committee and is responsible for administering the Stock Option Plan and Performance Share Plan of the Company and determining eligibility of employees for stock options.
The Nomination and Remuneration Committee met five times during the financial year ended 31st March, 2014 on 26th July, 2013, 18th September, 2013, 26th October, 2013, 20th February, 2014 and 11th March, 2014.
Board Membership CriteriaThe Board of Directors is collectively responsible for selection of a member on the Board. The Nomination and Remuneration Committee of the Company follows a defined criteria for identifying, screening, recruiting and recommending candidates for election as a Director on the Board. The criteria for appointment to the Board include:• composition of theBoard, which is commensuratewith the
size of the Company, its portfolio, geographical spread and its status as a listed Company;
• desiredageanddiversityontheBoard;
Corporate Governance Corporate Governance58 59Hindustan Unilever Limited Annual Report 2013-14
Overview Financial Statements Shareholder InformationReports
• sizeoftheBoardwithoptimalbalanceofskillsandexperienceand balance of Executive and Non-Executive Directors consistent with the requirements of law;
• professional qualifications, expertise and experience inspecific area of business;
• balanceof skillsandexpertise in viewof theobjectivesandactivities of the Company;
• avoidanceofanypresentorpotentialconflictofinterest;• availability of time and other commitments for proper
performance of duties;• personalcharacteristicsbeinginlinewiththeCompany’svalues,
such as integrity, honesty, transparency, pioneering mindset.
Reward PolicyThe reward philosophy of the Company is to pay market competitive reward with a strong linkage to performance. The reward philosophy is set forth into practice by various policies governing different elements of reward. The intent of all these policies is to ensure that the principles of reward philosophy are followed in entirety, thereby facilitating the Company to recruit and retain the best talent. It also ensures the effective recognition of performance and encourages a focus on achieving superior operational results.
The appointment of Executive Directors is by virtue of their employment with the Company as management employees and therefore, their terms of employment viz. salary, variable pay, service contract, notice period and severance fee, if any, are governed by the applicable policies at the relevant point in time. The reward of the Executive Directors is determined by the Nomination and Remuneration Committee. A fair portion of Executive Directors’ total reward is linked to Company’s performance. This creates alignment with the strategy and business priorities to enhance shareholder value. The total reward package for Executive Directors is intended to be market competitive with a strong linkage to performance in line with the Company’s reward philosophy. The Company has introduced a policy on evaluation of all Directors. The outcome of such process would also be placed before the Nomination and Remuneration
Committee for its consideration before determining the reward for Executive Directors.
The Nomination and Remuneration Committee reviews the total reward annually, taking into account external benchmarks within the context of group and individual performance. In addition, the Company’s Share Plans seek to reward Executive Directors by aligning their deliverables with shareholders’ interests. Pursuant to the approval of Members at the Annual General Meeting held on 23rd July, 2012, the Company adopted ‘2012 HUL Performance Share Scheme’ in place of the ‘2006 Performance Share Scheme’. The revised scheme provided for conditional grant of Performance Shares without charging premium to eligible management employees.
Non-Executive Independent Directors are eligible for sitting fees and commission not exceeding the limits prescribed under the Companies Act, 2013. The remuneration payable to Non-Executive Directors is decided by the Board of Directors subject to the overall approval of Members of the Company.
Independent Directors are currently paid sitting fees of Rs. 20,000/- for attending every meeting of the Board or Committee thereof. In line with the globally accepted governance practices, the Board of Directors adopted a ‘Differential Remuneration Policy’ for Non-Executive Directors’ remuneration. As per the Differential Remuneration Policy, Non-Executive Independent Directors are entitled to fixed commission on profits at the rate of Rs. 15 lakhs for each financial year. In addition, Non-Executive Independent Directors are entitled to a remuneration linked to their attendance at the meetings of the Board or Committees thereof and also on the basis of their position in various Committees of the Board, whether that of a Chairman or a member of the Committee(s).
The remuneration payable to the Independent Directors under the Differential Remuneration Policy shall be within the overall limit of Rs. 150 lakhs, as approved by the Members at the Annual General Meeting held on 26th July, 2013. The criteria adopted by the Company for Differential Remuneration policy is as under:
Rs. lakhsParticulars Commission (p.a.)Fixed Commission:
Base Fixed Commission for Independent Directors 15.00Additional Variable Commission:
Corresponding to the percentage of attendance at all the Board and Committee Meeting(s) 5.00In the capacity of Chairperson of the Committee(s)* 2.00In the capacity of Member of the Committee(s)* 1.00
*Committee includes Audit Committee, Nomination and Remuneration Committee, Stakeholders’ Relationship Committee and Corporate Social Responsibility Committee.
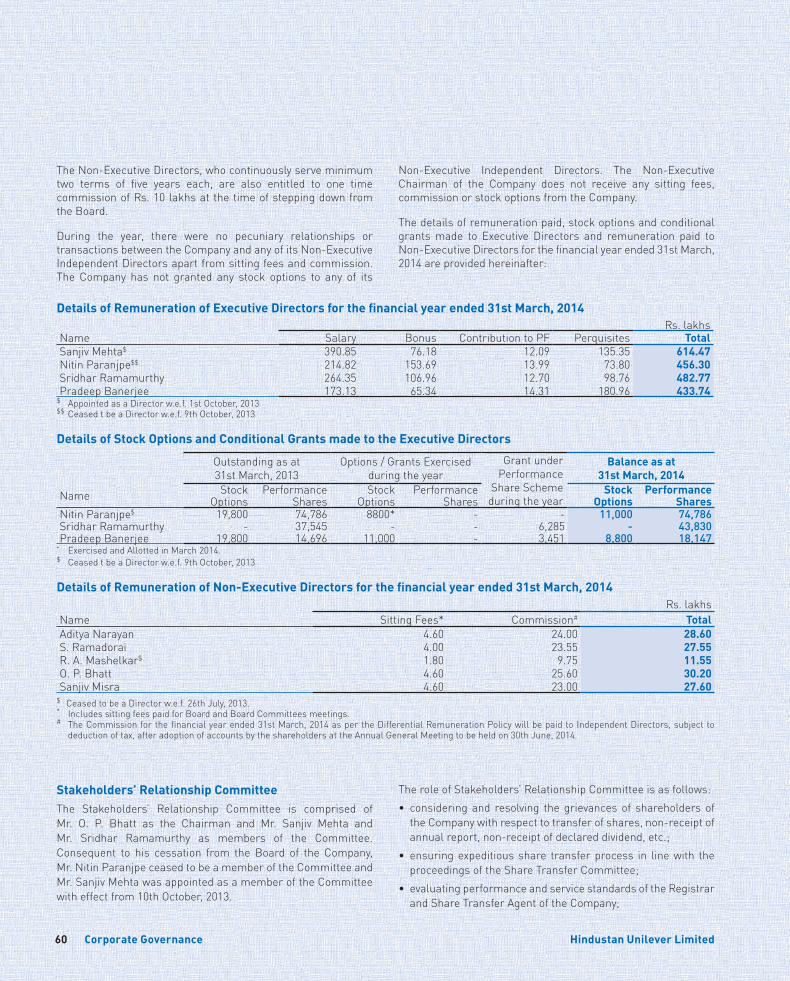
Corporate Governance Corporate Governance60 61Hindustan Unilever Limited Annual Report 2013-14
Details of Remuneration of Executive Directors for the financial year ended 31st March, 2014Rs. lakhs
Name Salary Bonus Contribution to PF Perquisites TotalSanjiv Mehta$ 390.85 76.18 12.09 135.35 614.47 Nitin Paranjpe$$ 214.82 153.69 13.99 73.80 456.30 Sridhar Ramamurthy 264.35 106.96 12.70 98.76 482.77 Pradeep Banerjee 173.13 65.34 14.31 180.96 433.74
$ Appointed as a Director w.e.f. 1st October, 2013$$ Ceased t be a Director w.e.f. 9th October, 2013
Details of Stock Options and Conditional Grants made to the Executive Directors
Outstanding as at 31st March, 2013
Options / Grants Exercised during the year
Grant under Performance
Share Scheme during the year
Balance as at 31st March, 2014
Name StockOptions
Performance Shares
Stock Options
Performance Shares
Stock Options
PerformanceShares
Nitin Paranjpe$ 19,800 74,786 8800* - - 11,000 74,786 Sridhar Ramamurthy - 37,545 - - 6,285 - 43,830 Pradeep Banerjee 19,800 14,696 11,000 - 3,451 8,800 18,147
* Exercised and Allotted in March 2014.$ Ceased t be a Director w.e.f. 9th October, 2013
Details of Remuneration of Non-Executive Directors for the financial year ended 31st March, 2014Rs. lakhs
Name Sitting Fees* Commission# TotalAditya Narayan 4.60 24.00 28.60S. Ramadorai 4.00 23.55 27.55R. A. Mashelkar$ 1.80 9.75 11.55O. P. Bhatt 4.60 25.60 30.20Sanjiv Misra 4.60 23.00 27.60
$ Ceased to be a Director w.e.f. 26th July, 2013.* Includes sitting fees paid for Board and Board Committees meetings.# The Commission for the financial year ended 31st March, 2014 as per the Differential Remuneration Policy will be paid to Independent Directors, subject to
deduction of tax, after adoption of accounts by the shareholders at the Annual General Meeting to be held on 30th June, 2014.
Stakeholders’ Relationship CommitteeThe Stakeholders’ Relationship Committee is comprised of Mr. O. P. Bhatt as the Chairman and Mr. Sanjiv Mehta and Mr. Sridhar Ramamurthy as members of the Committee. Consequent to his cessation from the Board of the Company, Mr. Nitin Paranjpe ceased to be a member of the Committee and Mr. Sanjiv Mehta was appointed as a member of the Committee with effect from 10th October, 2013.
The Non-Executive Directors, who continuously serve minimum two terms of five years each, are also entitled to one time commission of Rs. 10 lakhs at the time of stepping down from the Board.
During the year, there were no pecuniary relationships or transactions between the Company and any of its Non-Executive Independent Directors apart from sitting fees and commission. The Company has not granted any stock options to any of its
Non-Executive Independent Directors. The Non-Executive Chairman of the Company does not receive any sitting fees, commission or stock options from the Company.
The details of remuneration paid, stock options and conditional grants made to Executive Directors and remuneration paid to Non-Executive Directors for the financial year ended 31st March, 2014 are provided hereinafter:
The role of Stakeholders’ Relationship Committee is as follows:• consideringand resolving thegrievancesof shareholdersof
the Company with respect to transfer of shares, non-receipt of annual report, non-receipt of declared dividend, etc.;
• ensuringexpeditiousshare transferprocess in linewith theproceedings of the Share Transfer Committee;
• evaluatingperformanceandservicestandardsoftheRegistrarand Share Transfer Agent of the Company;
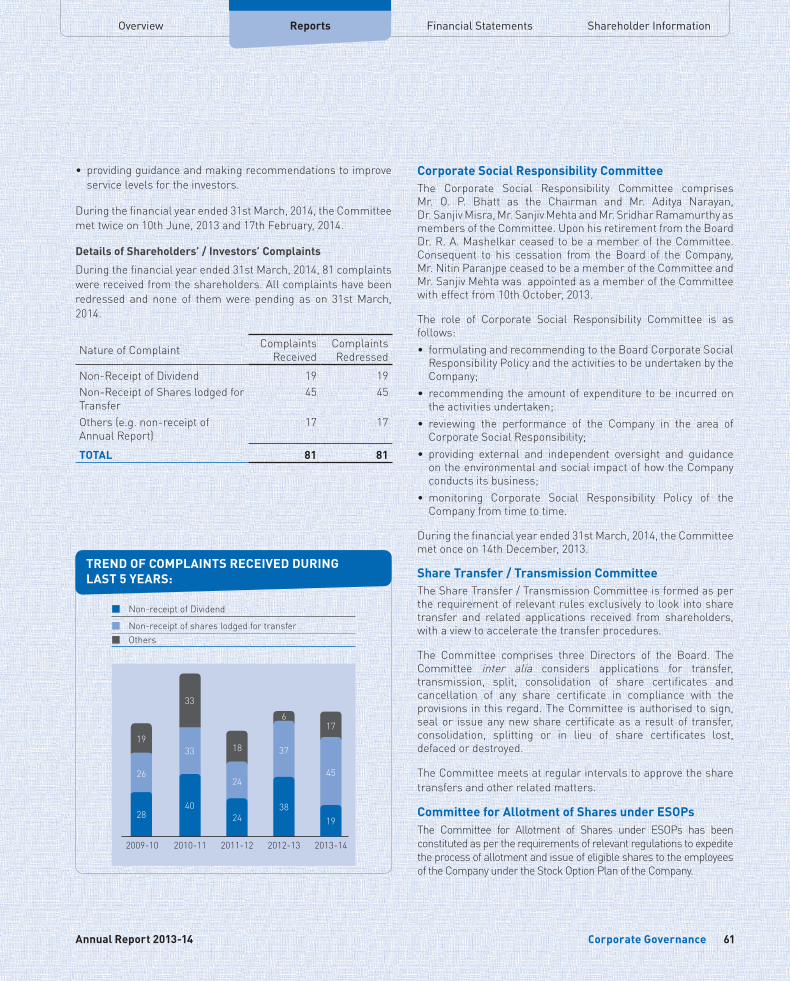
Corporate Governance Corporate Governance60 61Hindustan Unilever Limited Annual Report 2013-14
Overview Financial Statements Shareholder InformationReports
• providingguidanceandmakingrecommendationstoimproveservice levels for the investors.
During the financial year ended 31st March, 2014, the Committee met twice on 10th June, 2013 and 17th February, 2014.
Details of Shareholders’ / Investors’ Complaints
During the financial year ended 31st March, 2014, 81 complaints were received from the shareholders. All complaints have been redressed and none of them were pending as on 31st March, 2014.
Nature of Complaint Complaints Received
Complaints Redressed
Non-Receipt of Dividend 19 19Non-Receipt of Shares lodged for Transfer
45 45
Others (e.g. non-receipt of Annual Report)
17 17
TOTAL 81 81
Corporate Social Responsibility CommitteeThe Corporate Social Responsibility Committee comprises Mr. O. P. Bhatt as the Chairman and Mr. Aditya Narayan, Dr. Sanjiv Misra, Mr. Sanjiv Mehta and Mr. Sridhar Ramamurthy as members of the Committee. Upon his retirement from the Board Dr. R. A. Mashelkar ceased to be a member of the Committee. Consequent to his cessation from the Board of the Company, Mr. Nitin Paranjpe ceased to be a member of the Committee and Mr. Sanjiv Mehta was appointed as a member of the Committee with effect from 10th October, 2013.
The role of Corporate Social Responsibility Committee is as follows:• formulatingandrecommendingtotheBoardCorporateSocial
Responsibility Policy and the activities to be undertaken by the Company;
• recommendingtheamountofexpenditure tobe incurredonthe activities undertaken;
• reviewing the performance of the Company in the area ofCorporate Social Responsibility;
• providing external and independent oversight and guidanceon the environmental and social impact of how the Company conducts its business;
• monitoring Corporate Social Responsibility Policy of theCompany from time to time.
During the financial year ended 31st March, 2014, the Committee met once on 14th December, 2013.
Share Transfer / Transmission CommitteeThe Share Transfer / Transmission Committee is formed as per the requirement of relevant rules exclusively to look into share transfer and related applications received from shareholders, with a view to accelerate the transfer procedures.
The Committee comprises three Directors of the Board. The Committee inter alia considers applications for transfer, transmission, split, consolidation of share certificates and cancellation of any share certificate in compliance with the provisions in this regard. The Committee is authorised to sign, seal or issue any new share certificate as a result of transfer, consolidation, splitting or in lieu of share certificates lost, defaced or destroyed.
The Committee meets at regular intervals to approve the share transfers and other related matters.
Committee for Allotment of Shares under ESOPsThe Committee for Allotment of Shares under ESOPs has been constituted as per the requirements of relevant regulations to expedite the process of allotment and issue of eligible shares to the employees of the Company under the Stock Option Plan of the Company.
Non-receipt of Dividend
Non-receipt of shares lodged for transferOthers
TREND OF COMPLAINTS RECEIVED DURING LAST 5 YEARS:
17
2009-10 2010-11 2011-12 2012-13 2013-14
19
26
2840
24
24
18
6
37
38
33
33
45
19
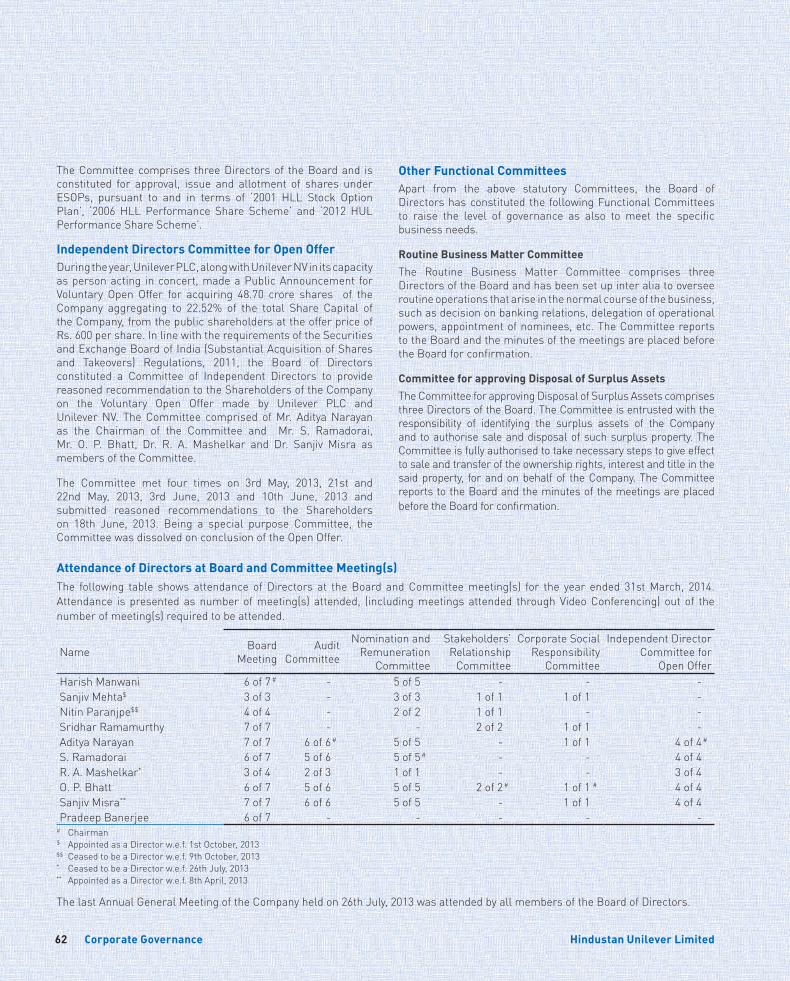
Corporate Governance Corporate Governance62 63Hindustan Unilever Limited Annual Report 2013-14
The Committee comprises three Directors of the Board and is constituted for approval, issue and allotment of shares under ESOPs, pursuant to and in terms of ‘2001 HLL Stock Option Plan’, ‘2006 HLL Performance Share Scheme’ and ‘2012 HUL Performance Share Scheme’.
Independent Directors Committee for Open OfferDuring the year, Unilever PLC, along with Unilever NV in its capacity as person acting in concert, made a Public Announcement for Voluntary Open Offer for acquiring 48.70 crore shares of the Company aggregating to 22.52% of the total Share Capital of the Company, from the public shareholders at the offer price of Rs. 600 per share. In line with the requirements of the Securities and Exchange Board of India (Substantial Acquisition of Shares and Takeovers) Regulations, 2011, the Board of Directors constituted a Committee of Independent Directors to provide reasoned recommendation to the Shareholders of the Company on the Voluntary Open Offer made by Unilever PLC and Unilever NV. The Committee comprised of Mr. Aditya Narayan as the Chairman of the Committee and Mr. S. Ramadorai, Mr. O. P. Bhatt, Dr. R. A. Mashelkar and Dr. Sanjiv Misra as members of the Committee.
The Committee met four times on 3rd May, 2013, 21st and 22nd May, 2013, 3rd June, 2013 and 10th June, 2013 and submitted reasoned recommendations to the Shareholders on 18th June, 2013. Being a special purpose Committee, the Committee was dissolved on conclusion of the Open Offer.
Other Functional CommitteesApart from the above statutory Committees, the Board of Directors has constituted the following Functional Committees to raise the level of governance as also to meet the specific business needs.
Routine Business Matter CommitteeThe Routine Business Matter Committee comprises three Directors of the Board and has been set up inter alia to oversee routine operations that arise in the normal course of the business, such as decision on banking relations, delegation of operational powers, appointment of nominees, etc. The Committee reports to the Board and the minutes of the meetings are placed before the Board for confirmation.
Committee for approving Disposal of Surplus AssetsThe Committee for approving Disposal of Surplus Assets comprises three Directors of the Board. The Committee is entrusted with the responsibility of identifying the surplus assets of the Company and to authorise sale and disposal of such surplus property. The Committee is fully authorised to take necessary steps to give effect to sale and transfer of the ownership rights, interest and title in the said property, for and on behalf of the Company. The Committee reports to the Board and the minutes of the meetings are placed before the Board for confirmation.
Attendance of Directors at Board and Committee Meeting(s)The following table shows attendance of Directors at the Board and Committee meeting(s) for the year ended 31st March, 2014. Attendance is presented as number of meeting(s) attended, (including meetings attended through Video Conferencing) out of the number of meeting(s) required to be attended.
Name Board Meeting
Audit Committee
Nomination and Remuneration
Committee
Stakeholders’ Relationship
Committee
Corporate Social Responsibility
Committee
Independent Director Committee for
Open OfferHarish Manwani 6 of 7 # - 5 of 5 - - -Sanjiv Mehta$ 3 of 3 - 3 of 3 1 of 1 1 of 1 -Nitin Paranjpe$$ 4 of 4 - 2 of 2 1 of 1 - -Sridhar Ramamurthy 7 of 7 - - 2 of 2 1 of 1 -Aditya Narayan 7 of 7 6 of 6 # 5 of 5 - 1 of 1 4 of 4 #S. Ramadorai 6 of 7 5 of 6 5 of 5 # - - 4 of 4R. A. Mashelkar* 3 of 4 2 of 3 1 of 1 - - 3 of 4O. P. Bhatt 6 of 7 5 of 6 5 of 5 2 of 2 # 1 of 1 # 4 of 4Sanjiv Misra** 7 of 7 6 of 6 5 of 5 - 1 of 1 4 of 4Pradeep Banerjee 6 of 7 - - - - -
# Chairman$ Appointed as a Director w.e.f. 1st October, 2013$$ Ceased to be a Director w.e.f. 9th October, 2013* Ceased to be a Director w.e.f. 26th July, 2013 ** Appointed as a Director w.e.f. 8th April, 2013
The last Annual General Meeting of the Company held on 26th July, 2013 was attended by all members of the Board of Directors.
Corporate Governance Corporate Governance62 63Hindustan Unilever Limited Annual Report 2013-14
Overview Financial Statements Shareholder InformationReports
COMPANY POLICIES
Code of Business PrinciplesThe Code of Business Principles (CoBP) is the Company’s statement of values and represents the standard of conduct which all employees are expected to observe in their business endeavors. It forms the benchmark against which the world at large is invited to judge the Company’s activities. The Code reflects the Company’s commitment to principles of integrity, transparency and fairness. The copy of the Code of Business Principles is available on the website of the Company www.hul.co.in.
The Code of Business Principles of the Company, among other things, sets out the rules for dealing with conflict of interest situations. The proposal for appointment of any Senior Management Personnel of the Company to serve as Director, Supervisory Director, Trustee, etc. on outside Board, whether for commercial ventures or for non-profit making bodies, is subject to prior internal approvals.
The Chief Executive Officer (CEO) through the Management Committee and Business / Unit Heads is responsible for ensuring that the Code is understood and implemented throughout the Company. The Code is also applicable to everyone with whom the Company is associated.
The complaints, issues and concerns received under the CoBP framework are duly investigated and reviewed by the CoBP Committee(s). Appropriate actions are taken after completion of investigation. The Company periodically cascades the principles embodied under CoBP across the organisation.
Preventing Conflict of InterestThe Board of Directors is responsible for ensuring that rules are in place to avoid conflict of interest by the Board members. The Board has adopted the Code of Conduct for the members of the Board and Senior Management Team. The Code provides that the Directors are required to avoid any interest in contracts entered into by the Company. If such an interest exists, the Directors are required to make disclosure to the Board and to abstain from discussion, voting or otherwise influencing the decision on any matter in which the concerned Director has or may have such interest. The Code also restricts Directors from accepting any gifts or incentives in their capacity as a Director of the Company, except what is duly authorised under the Company’s Gift Policy.
The members of the Board and the Management Committee annually confirm the compliance of the Code of Conduct to the Board. The Code of Conduct is in addition to the Code of Business
Principles of the Company. A copy of the said Code of Conduct is available on the website of the Company www.hul.co.in. In addition, members of the Board also submit, on an annual basis, the details of individuals to whom they are related and entities in which they hold interest and such disclosures are placed before the Board. Transactions with any of the entities referred above are placed before the Board for approval. Details of all related party transactions are placed before the Audit Committee on an annual basis.
Whistle Blower Policy The Company has adopted a Whistle Blower Policy to provide appropriate avenues to the employees to bring to the attention of the management any issue which is perceived to be in violation of or in conflict with the fundamental business principles of the Company. The Company has provided dedicated e-mail addresses [email protected] and [email protected] for reporting such concerns. Alternatively, employees can also send written communications to the Company. The employees are encouraged to raise any of their concerns by way of whistle blowing and none of the employees have been denied access to the Audit Committee. The Company Secretary is the designated officer for effective implementation of the policy and dealing with the complaints registered under the policy. All cases registered under the Code of Business Principles and the Whistle Blower Policy of the Company, are reported to the Committee of Executive Directors and are subject to the review of the Audit Committee. The Whistle Blower Policy is available on the website of the Company www.hul.co.in.
Share Dealing CodeIn accordance with the Securities and Exchange Board of India (SEBI) (Prohibition of Insider Trading) Regulations, 1992, as amended, the Company has established systems and procedures to restrict insider trading activity and has framed a Share Dealing Code. The Share Dealing Code of the Company is an important governance code to prevent any insider trading activity by dealing in shares of the Company. The Code restricts the Directors of the Company and other specified employees to deal in securities of the Company on the basis of any unpublished price sensitive information, available to them by virtue of their position in the Company.
The objective of this Code is to protect the interest of shareholders at large, to prevent misuse of any price sensitive information and to prevent any insider trading activity by dealing in shares of the Company by its Directors and employees. The Code also prescribes sanction framework and any instance of breach of code is dealt with in accordance with the same. A copy of the Share Dealing Code of the Company is made available to all employees of the Company and compliance of the same is ensured. The Share Dealing Code is available on the website of the Company www.hul.co.in.
Corporate Governance Corporate Governance64 65Hindustan Unilever Limited Annual Report 2013-14
UN Global CompactUnilever is a signatory to the United Nations Global Compact Programme and is fully committed to the principles of the UN Global Compact which cover human rights, labour practices, environment commitment and prevention of corruption in business organisations. The UN Global Compact is a symbol of leadership in a complex business world and provides a forward looking forum in which the United Nations, companies and civil society organisations can come together in an open and transparent dialogue. The Company’s CoBP mechanism upholds these principles in all aspects of its business operations.
AFFIRMATION AND DISCLOSURE
All the members of the Board and the Management Committee have affirmed their compliance with the Code of Conduct as on 31st March, 2014 and a declaration to that effect, signed by the Managing Director and Chief Executive Officer (CEO), is attached and forms part of this Report.
There were no materially significant related party transactions, pecuniary transactions or relationships between the Company and its Directors for the financial year ended 31st March, 2014 that may have a potential conflict with the interests of the Company at large.
All details relating to financial and commercial transactions where Directors may have a pecuniary interest are provided to the Board and the interested Directors neither participate in the discussion nor vote on such matters.
Transactions with related parties, as per requirements of Accounting Standard 18, are disclosed in this Annual Report and they are not in conflict with the interest of the Company at large.
DISCLOSURE OF PENDING CASES / INSTANCES OF NON-COMPLIANCE
There were no instances of penalties and strictures imposed on the Company by the Stock Exchanges or SEBI or any other statutory authority on any matter related to the capital market during the last three years.
During the year, the Company has received a Show Cause Notice from the Securities and Exchange Board of India (SEBI) for alleged violation of the provisions of Regulation 8(3) of the SEBI (Substantial Acquisition of Shares and Takeovers) Regulations, 1997 (SAST Regulations, 1997) with respect to delay in filings in the year 2008 and 2010. The Company has filed an application for compounding the matter with SEBI on 11th February, 2014 and the matter is pending with SEBI for decision on the compounding application.
The Company has been impleaded in certain legal cases related to disputes over title to shares arising in the ordinary course of share transfer operations. However, none of these cases are material in nature, which may lead to material loss or expenditure to the Company.
COMPLIANCE WITH THE GOVERNANCE FRAMEWORK
The Company is in compliance with all mandatory requirements of Clause 49 of the Listing Agreement. In addition, the Company has also adopted the non-mandatory requirements of constitution of the Remuneration Committee and establishing of Whistle Blower mechanism.
SECRETARIAL STANDARDS AND SECRETARIAL AUDIT REPORT
The Company has undertaken Secretarial Standards Audit for the year 2013-14 for audit of secretarial records and procedures followed by the Company in compliance with relevant Secretarial Standards issued by the Institute of Company Secretaries of India. The Secretarial Standards Audit Report is given on page no. 74 of this Report.
The Company has also undertaken Secretarial Audit for the year 2013-14 which, inter alia, includes audit of compliance with the Companies Act, 1956, and the Rules made under the Act along with applicable Sections of the Companies Act, 2013, notified on 12th September, 2013, Listing Agreement and Regulations and Guidelines prescribed by the Securities and Exchange Board of India. The Secretarial Audit Report is given on page nos. 74 and 75 of this Report.
Corporate Governance Corporate Governance64 65Hindustan Unilever Limited Annual Report 2013-14
Overview Financial Statements Shareholder InformationReports
SHAREHOLDER INFORMATION
General Body MeetingsDetails of last three Annual General Meetings and the summary of Special Resolutions passed therein are as under:
Financial year ended Date and Time Venue Special Resolutions Passed31st March, 2011 28th July, 2011
3.30 p.m.Birla Matushri Sabhagar,19, Marine Lines,Mumbai - 400 020
No Special Resolution was passed at this meeting.
31st March, 2012 23rd July, 201210.30 a.m.
Unilever House, B.D. Sawant Marg, Chakala, Andheri (East), Mumbai - 400 099
• Re-appointmentofMr.NitinParanjpeasManagingDirector for another term of five years with effect from 4th April, 2013.
• IncreaseinthemaximumlimitofsalarypayabletoManaging Director(s) of the Company from the existing Rs. 180 lakhs per annum to Rs. 290 lakhs per annum effective 1st April, 2013.
• Adoptionoftherevised‘2012HULPerformanceShareScheme’ in amendment of ‘2006 HLL Performance Share Scheme’.
31st March, 2013 26th July, 20133.30 p.m.
Unilever House, B.D. Sawant Marg, Chakala, Andheri (East), Mumbai - 400 099
• Revision in overall limits of remuneration of Non-Executive Directors, upto a maximum of Rs. 150 lakhs in aggregate or 1% of Net Profits, whichever is lower.
Postal BallotDuring the year, a Special Resolution for appointment of Mr. Sanjiv Mehta as the Managing Director and Chief Executive Officer of the Company with effect from 10th October, 2013 was passed by the Shareholders of the Company through Postal Ballot. The Board had appointed Mr. S. N. Ananthasubramanian, Practising Company Secretary, as the scrutinizer to conduct the Postal Ballot process. The results of the postal ballot were declared on 31st October, 2013. Details of the voting pattern were as under:
Description of ResolutionNo. of total valid Postal Ballot
Forms / e-votes receivedVotes Cast (No. of Shares)
For AgainstApproval for appointment of Mr. Sanjiv Mehta as Managing Director and Chief Executive Officer of the Company.
5,066 172,22,71,204 82,24,078
Accordingly the said Resolution was approved by the shareholders, with requisite and overwhelming majority.
The Company is conducting a Postal Ballot pursuant to Section 192A of the Companies Act, 1956 for appointment of Mr. P. B. Balaji as Executive Director, Finance & IT and Chief Financial Officer of the Company. The Company has sent Postal Ballot notice dated 24th March, 2014 in this regard to all Members. The voting period shall end on the 30th April, 2014 and results shall be announced on 5th May, 2014.
Annual General Meeting 2014
Date Monday, 30th June, 2014Venue Unilever House, B.D. Sawant Marg, Chakala, Andheri (East), Mumbai - 400 099Time 2.00 p.m.Book Closure Dates for Final Dividend Friday, 13th June, 2014 to Monday, 30th June, 2014 (both days inclusive)Last Date of receipt of Proxy Forms Saturday, 28th June, 2014 before 2.00 p.m. at the Registered Office of the Company.
Corporate Governance Corporate Governance66 67Hindustan Unilever Limited Annual Report 2013-14
Calendar of financial year ended 31st March, 2014The meetings of Board of Directors for approval of quarterly financial results during the financial year ended 31st March, 2014 were held on the following dates:
First Quarter Results 26th July, 2013Second Quarter and Half yearly Results 26th October, 2013Third Quarter Results 27th January, 2014Fourth Quarter and Annual Results 28th April, 2014
Tentative Calendar for financial year ending 31st March, 2015The tentative dates of meeting of Board of Directors for consideration of quarterly financial results for the financial year ending 31st March, 2015 are as follows:
First Quarter Results 28th July, 2014Second Quarter and Half yearly Results 27th October, 2014Third Quarter Results 27th January, 2015Fourth Quarter and Annual Results 27th April, 2015
DividendThe Board of Directors at their meeting held on 28th April, 2014, recommended a Final Dividend of Rs. 7.50 per equity share of face value of Re. 1/- each, for the financial year ended 31st March, 2014. Together with Interim Dividend of Rs. 5.50 per
equity share paid on 15th November, 2013, the total dividend for the year works out to Rs. 13.00 per equity share of face value of Re. 1/- each. Final Dividend, if approved by Members, will be paid on or after 4th July, 2014.
Unclaimed DividendsAs per the Companies Act, 1956, dividends that are unclaimed for a period of seven years, statutorily get transferred to the Investor Education and Protection Fund (IEPF) administered by the Central Government and thereafter, cannot be claimed by investors. To ensure maximum disbursement of unclaimed dividend, the Company sends reminders to the concerned investors, before transfer of dividend to IEPF.
The unpaid / unclaimed dividends upto Final Dividend 1995 (39F) had been transferred to the General Revenue Account of the Central Government. The Investors, who have not claimed their dividend for the said period till date, may claim the amount from the Registrar of Companies, Mumbai. Apart from above, the Company has transferred the unpaid dividends upto Interim Dividend of 2006 (51I) to the IEPF. The unclaimed Final Dividend 2006 (i.e. 51F), Interim Dividend of 2007 (i.e. 52I) and Special Dividend of 2007 (52S), is due for transfer in June 2014, August 2014 and November 2014 respectively. In view of this, the Members of the Company, who have not yet encashed their dividend warrant(s) may write to the Company immediately.
Due Dates for Transfer of Unclaimed Dividend to IEPF
Year Dividend
Dividendrate per
share(Rs.)
Date ofDeclaration
Number of WarrantsDividend Amount
(Rs. lakhs)Due Date
IssuedUnclaimedas on 31st
March, 2014% Dividend
Unclaimedas on 31st
March, 2014%
2006 51-F 3.000 18-05-2007 4,14,086 33,046 7.98 66,204.96 279.14 0.42 15-06-20142007 52-I 3.000 29-07-2007 4,11,422 33,045 8.03 66,212.86 274.81 0.42 26-08-20142007 52-S 3.000 31-10-2007 3,85,973 31,351 8.12 66,057.83 278.86 0.42 28-11-20142007 52-F 3.000 04-04-2008 3,64,081 32,798 9.01 65,337.74 273.39 0.42 03-05-20152008-09 53-I 3.500 25-07-2008 3,55,307 29,175 8.21 76,242.09 285.39 0.37 23-08-20152008-09 53-F 4.000 03-07-2009 3,43,946 30,152 8.77 87,202.84 354.38 0.41 31-07-20162009-10 54-I 3.000 31-10-2009 3,37,953 31,378 9.28 65,426.94 266.13 0.41 28-11-20162009-10 54-F 3.500 27-07-2010 3,46,967 30,662 8.84 76,373.00 315.37 0.41 24-08-20172010-11 55-I 3.000 25-10-2010 3,44,009 33,085 9.62 65,463.59 291.54 0.45 22-11-20172010-11 55-F 3.500 28-07-2011 3,28,702 33,486 10.19 75,624.11 351.30 0.46 24-08-20182011-12 56-I 3.500 31-10-2011 3,34,744 34,067 10.18 75,633.80 330.82 0.44 28-11-20182011-12 56-F 4.000 23-07-2012 3,25,470 35,267 10.84 86,471.77 425.73 0.49 21-08-20192012-13 57-I 4.500
26-10-2012 3,26,448 36,731 11.25 2,70,239.97 1,757.20 0.65 24-11-20192012-13 57-S 8.0002012-13 57-F 6.000 26-07-2013 3,18,194 35,618 11.19 1,29,748.34 733.67 0.57 23-08-20202013-14 58-I 5.500 26-10-2013 3,15,436 37,537 11.90 1,18,941.51 715.27 0.60 23-11-2020
F – Final I – Interim S – Special
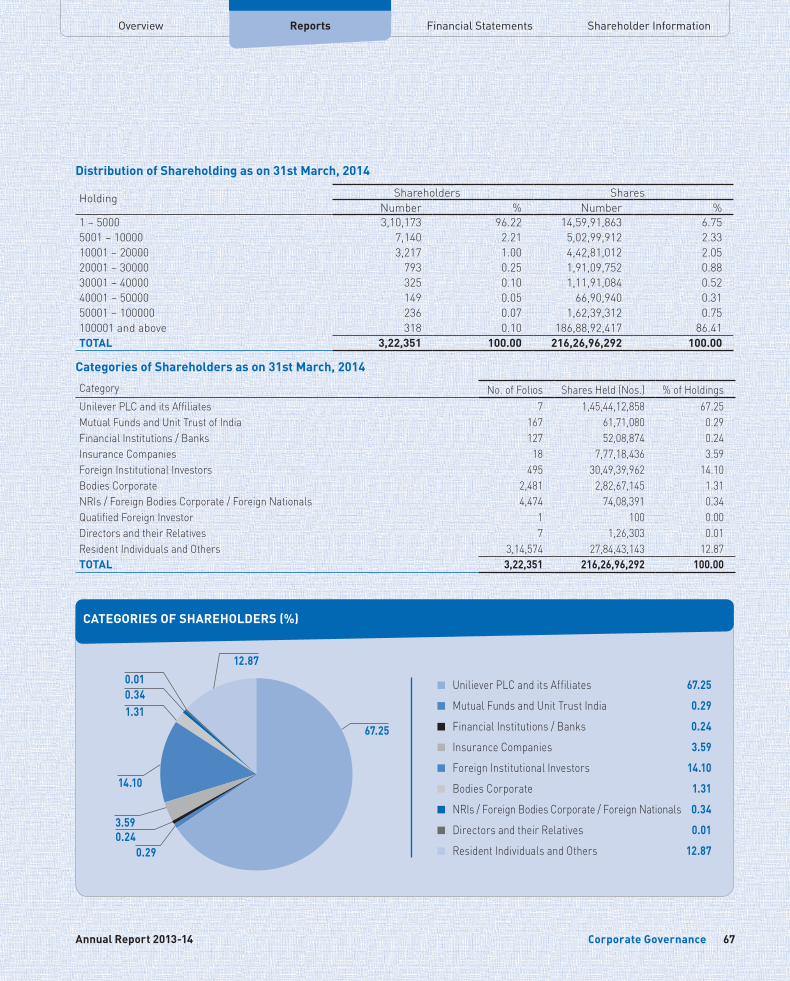
Corporate Governance Corporate Governance66 67Hindustan Unilever Limited Annual Report 2013-14
Overview Financial Statements Shareholder InformationReports
Distribution of Shareholding as on 31st March, 2014
Holding Shareholders SharesNumber % Number %
1 – 5000 3,10,173 96.22 14,59,91,863 6.755001 – 10000 7,140 2.21 5,02,99,912 2.3310001 – 20000 3,217 1.00 4,42,81,012 2.0520001 – 30000 793 0.25 1,91,09,752 0.8830001 – 40000 325 0.10 1,11,91,084 0.5240001 – 50000 149 0.05 66,90,940 0.3150001 – 100000 236 0.07 1,62,39,312 0.75100001 and above 318 0.10 186,88,92,417 86.41TOTAL 3,22,351 100.00 216,26,96,292 100.00
Categories of Shareholders as on 31st March, 2014
Category No. of Folios Shares Held (Nos.) % of HoldingsUnilever PLC and its Affiliates 7 1,45,44,12,858 67.25Mutual Funds and Unit Trust of India 167 61,71,080 0.29Financial Institutions / Banks 127 52,08,874 0.24Insurance Companies 18 7,77,18,436 3.59Foreign Institutional Investors 495 30,49,39,962 14.10Bodies Corporate 2,481 2,82,67,145 1.31NRIs / Foreign Bodies Corporate / Foreign Nationals 4,474 74,08,391 0.34Qualified Foreign Investor 1 100 0.00Directors and their Relatives 7 1,26,303 0.01Resident Individuals and Others 3,14,574 27,84,43,143 12.87TOTAL 3,22,351 216,26,96,292 100.00
Uniliever PLC and its Affiliates 67.25
Mutual Funds and Unit Trust India 0.29
Financial Institutions / Banks 0.24
Insurance Companies 3.59
Foreign Institutional Investors 14.10
Bodies Corporate 1.31
NRIs / Foreign Bodies Corporate / Foreign Nationals 0.34
Directors and their Relatives 0.01
Resident Individuals and Others 12.87
67.25
0.340.01
1.31
14.10
3.590.24
0.29
CATEGORIES OF SHAREHOLDERS (%)
12.87
Corporate Governance Corporate Governance68 69Hindustan Unilever Limited Annual Report 2013-14
Top 10 Shareholders as on 31st March, 2014 (Other than Promoters)
Sr. No. Name Holding %1 Virtus Emerging Markets Opportunities Fund 1,96,91,476 0.912 The New India Assurance Company Limited 1,90,17,349 0.883 Aberdeen Global Indian Equity (Mauritius) Limited 1,87,88,244 0.874 Life Insurance Corporation of India 1,78,74,900 0.835 IIFL Inc Vontobel India Fund 1,72,56,269 0.806 Aberdeen Emerging Markets Fund 1,57,00,443 0.737 Vontobel Fund Emerging Markets Equity 1,30,38,481 0.608 General Insurance Corporation of India 1,29,74,415 0.609 Vanguard Emerging Markets Stock Index Fund 1,25,30,229 0.5810 Aberdeen Global-Emerging Markets Equity Fund 1,23,47,053 0.57
TOTAL 15,92,18,859 7.36
Bifurcation of shares held in physical and demat form as on 31st March, 2014
Particulars No. of Shares %Physical Segment 5,79,14,311 2.68Demat Segment NSDL 207,96,91,486* 96.16*CDSL 2,50,90,495 1.16TOTAL 216,26,96,292 100.00
* includes shares of Unilever PLC and its Affiliates
There are no outstanding GDRs / ADRs / Warrants / Convertible Instruments of the Company.
Listing Details
Name of Stock Exchange Stock CodeBSE Limited (BSE) 500696National Stock Exchange of India Limited (NSE) HINDUNILVRISIN INE030A01027
The listing fee for the financial year ended 31st March, 2014 has been paid to the above Stock Exchanges.
Share Price DataThe monthly high and low prices and volumes of shares of the Company at BSE Limited (BSE) and the National Stock Exchange of India Limited (NSE) for the year ended 31st March, 2014 are as under:
Month BSE NSEHigh Low Volume High Low Volume
Apr-13 597.00 457.90 74,67,299 597.00 457.60 63,992,772May-13 598.00 570.50 28,13,186 597.85 570.35 42,639,578Jun-13 597.65 580.15 50,18,080 598.05 581.10 71,303,182Jul-13 725.00 565.60 1,38,95,321 725.00 582.60 1,05,756,860Aug-13 641.05 578.00 34,21,806 641.40 578.95 39,739,097Sep-13 685.00 606.75 30,81,969 685.00 604.00 25,706,938Oct-13 643.70 587.00 33,50,838 643.90 586.10 37,375,228Nov-13 614.70 569.40 15,23,121 615.00 568.80 18,409,635Dec-13 596.00 551.95 25,13,473 597.85 551.80 26,818,006Jan-14 584.40 536.00 31,35,242 584.90 537.20 32,022,618Feb-14 589.90 543.05 13,93,668 589.65 542.35 19,716,519Mar-14 608.35 542.00 17,71,967 608.85 542.00 25,607,910
Source: BSE and NSE websiteNote: High and low are in rupees per traded share. Volume is the total monthly volume of trade (in numbers) in shares of the Company on the respective Stock Exchange.
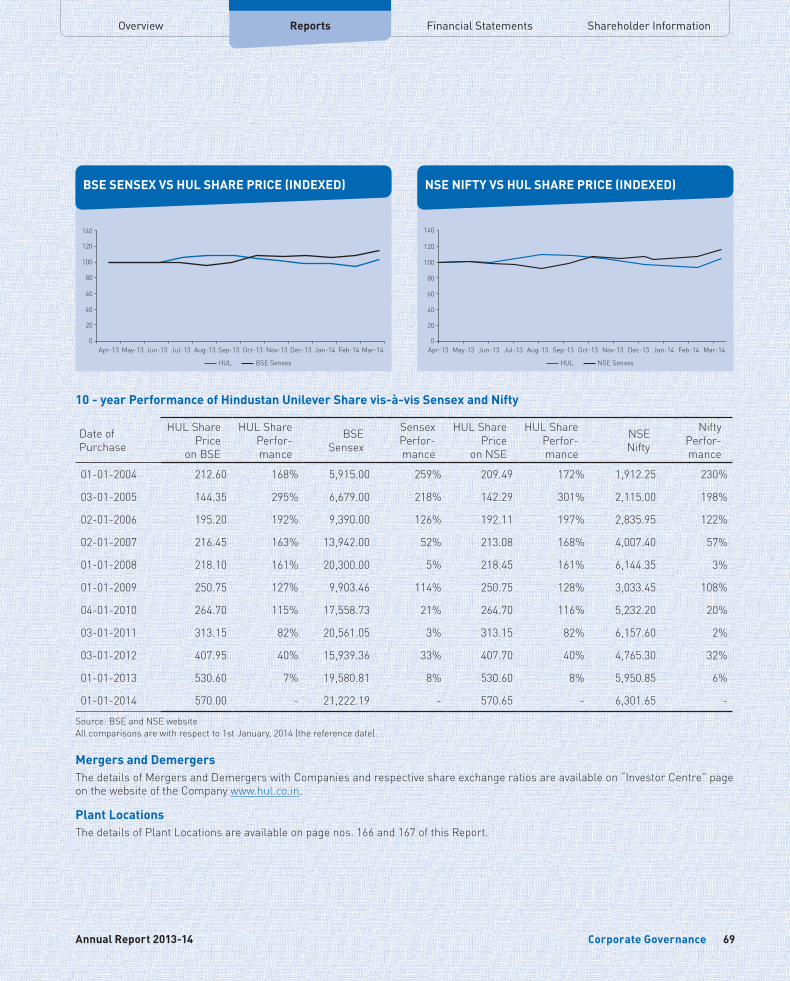
Corporate Governance Corporate Governance68 69Hindustan Unilever Limited Annual Report 2013-14
Overview Financial Statements Shareholder InformationReports
10 - year Performance of Hindustan Unilever Share vis-à-vis Sensex and Nifty
Date of Purchase
HUL Share Price
on BSE
HUL SharePerfor-mance
BSESensex
SensexPerfor-mance
HUL SharePrice
on NSE
HUL SharePerfor-mance
NSENifty
NiftyPerfor-mance
01-01-2004 212.60 168% 5,915.00 259% 209.49 172% 1,912.25 230%
03-01-2005 144.35 295% 6,679.00 218% 142.29 301% 2,115.00 198%
02-01-2006 195.20 192% 9,390.00 126% 192.11 197% 2,835.95 122%
02-01-2007 216.45 163% 13,942.00 52% 213.08 168% 4,007.40 57%
01-01-2008 218.10 161% 20,300.00 5% 218.45 161% 6,144.35 3%
01-01-2009 250.75 127% 9,903.46 114% 250.75 128% 3,033.45 108%
04-01-2010 264.70 115% 17,558.73 21% 264.70 116% 5,232.20 20%
03-01-2011 313.15 82% 20,561.05 3% 313.15 82% 6,157.60 2%
03-01-2012 407.95 40% 15,939.36 33% 407.70 40% 4,765.30 32%
01-01-2013 530.60 7% 19,580.81 8% 530.60 8% 5,950.85 6%
01-01-2014 570.00 - 21,222.19 - 570.65 - 6,301.65 -
Source: BSE and NSE websiteAll comparisons are with respect to 1st January, 2014 (the reference date).
Mergers and DemergersThe details of Mergers and Demergers with Companies and respective share exchange ratios are available on “Investor Centre” page on the website of the Company www.hul.co.in.
Plant LocationsThe details of Plant Locations are available on page nos. 166 and 167 of this Report.
BSE SENSEX VS HUL SHARE PRICE (INDEXED)
140
120
100
80
60
40
20
0Apr-13
HUL BSE Sensex
May-13 Jun-13 Jul-13 Aug-13 Sep-13 Oct-13 Nov-13 Dec-13 Jan-14 Feb-14 Mar-14
NSE NIFTY VS HUL SHARE PRICE (INDEXED)
140
100
80
60
40
20
0Apr-13
HUL NSE Sensex
May-13 Jun-13 Jul-13 Aug-13 Sep-13 Oct-13 Nov-13 Dec-13 Jan-14 Feb-14 Mar-14
120
Corporate Governance Corporate Governance70 71Hindustan Unilever Limited Annual Report 2013-14
COMMUNICATION TO SHAREHOLDERS
Effective communication of information is an essential component of corporate governance. It is a process of sharing information, ideas, thoughts, opinions and plans to all stakeholders which promotes management-shareholder relations. The Company regularly interacts with shareholders through multiple channels of communication such as results announcement, annual report, media releases, Company’s website and subject specific communications.
The quarterly, half yearly and annual results of the Company’s performance are published in leading newspapers such as Times of India and Maharashtra Times. These results are also made available on the website of the Company www.hul.co.in. The website also displays vital information relating to the Company and its performance, official press releases and presentation to analysts. The Company also sends quarterly, half yearly and annual results as well as the notice of the Board Meeting to Members on e-mail.
The Investor Centre of the Company’s website provides more than 50 Frequently Asked Questions on various topics related to transfers and transmission of shares, dematerialisation, nomination, change of address, loss of share certificates, dividend and sub-division of share certificates. In addition, various downloadable forms required to be executed by the shareholders have also been provided on the website of the Company.
The Quarterly Results, Shareholding Pattern and all other corporate communication to the Stock Exchanges are filed through NSE Electronic Application Processing System (NEAPS) and BSE Listing Centre, for dissemination on their respective websites.
Investor ServicesWeb-based Query Redressal SystemMembers may utilise the facility extended by the Registrar and Transfer Agent for redressal of queries. Investors may visit http://karisma.karvy.com and click on “INVESTORS” option for query registration through free identity registration process.
Investors can submit their query in the “QUERIES” option provided on the above website, which would give the grievance a registration number. For accessing the status / response to the query submitted, the grievance registration number can be used at the option “VIEW REPLY” after 24 hours. Investors can continue to put an additional query relating to the case till they get a satisfactory reply.
Investors can provide their feedback on the services provided by the Company and its Registrar and Transfer Agent by filling the Shareholder Satisfaction Survey form available in Investor Centre
on website of the Company at www.hul.co.in. The Shareholder Satisfaction Survey form is also given at the end of this Report.
Alternative Dispute Redressal
ShareholdersLong pending litigations involve significant investment as monetary value of the disputed shares and accrued dividends / other benefits are locked up unutilised till the dispute is settled. Further, in terms of the requirements of the Companies Act, 1956, such dividends / other specified incomes remaining unclaimed / unpaid for a period of seven years are to be credited to the Investor Education and Protection Fund and the Shareholders are not entitled to claim the same thereafter.
Keeping the above in mind, the Company in 2004, pioneered the mechanism of providing an alternate dispute redressal for Shareholders to resolve the shares related disputes pending before the courts / authorities by amicable settlement. The Company had started this unique initiative of organising Alternative Dispute Redressal meetings wherein aggrieved investors come face to face and get a chance to settle their disputes, some of which were pending for years.
The first of such meeting was held in Ahmedabad in 2005 wherein 14 cases were resolved by amicable settlement. Similar such meetings were held in other cities like Mumbai and Kolkata wherein 31 more cases were resolved to the satisfaction of the parties to the dispute. The Company engaged the services of retired Judges to preside over the meeting in order to give a fair view to each case.
A number of Shareholders have availed the benefit of this process and the Company through its various initiatives keeps exploring the possibilities of settling such issues. The process helps the investors in releasing the locked up investment and save their time consumed in contesting legal proceedings. The objective of this process is to facilitate quick resolution of the dispute between the parties.
The Shareholders who are willing to avail the benefits of Alternative Dispute Redressal mechanism may approach the Investor Service Department of the Company at the Registered Office of the Company.
Consumers / CustomersIn line with one of the Company’s key tenets of Consumer and Customer Centricity, the Company commenced a process of resolving consumer and customer disputes and grievances through an alternative disputes redressal mechanism. The Company appointed four retired Judges of different High Courts, one in each region, to act as Ombudsman to hear the Company’s consumers and customers in a bid to resolve long pending disputes. The Ombudsman independently reviews the merits of the complaint and decides on the issue. The Company has taken the view that the decision arrived at such disputes
Corporate Governance Corporate Governance70 71Hindustan Unilever Limited Annual Report 2013-14
Overview Financial Statements Shareholder InformationReports
resolution meetings, while being fully binding on the Company, may not be binding on its consumers and customers and if they choose to continue with litigation, they are free to do so. These meetings were held in all the four regions and achieved reasonable success. The Company believes that such independent dispute resolution mechanism will further reinforce its commitment and credibility with its consumers and also set new benchmarks for the industry.
The Company has also set a consumer care helpline ‘Levercare’, to help consumers reach the Company for their grievances, suggestions, ideas and to help brands reach out to consumers.
Address for CorrespondenceAll shareholders’ correspondence should be forwarded to M/s. Karvy Computershare Private Limited, the Registrar and Transfer Agent of the Company or to the Investor Service Department at the Registered Office of the Company at the addresses mentioned below.The Company’s dedicated e-mail address for Investors’ Complaints and other communications is [email protected]
Karvy Computershare Private LimitedUnit : Hindustan Unilever LimitedPlot No. 17 to 24, Vittal Rao Nagar,Madhapur, Hyderabad - 500 081 Phone : +91 - 40 - 23420815 - 824Fax : +91 - 40 - 23420814E-mail : [email protected] / [email protected] : www.karvy.com
Investor Service DepartmentHindustan Unilever LimitedUnilever House,B. D, Sawant Marg, Chakala,Andheri (East),Mumbai - 400 099Phone : +91 - 22 – 39832285 / 32452Fax : +91 - 22 - 28249457E-mail : [email protected] : www.hul.co.in
Compliance OfficerMr. Dev BajpaiExecutive Director (Legal & Corporate Affairs) and Company SecretaryE-mail : [email protected] Phone : +91 - 22 – 39832557 / 32358 / 32532 / 32312
Loans and advances in the nature of loan to subsidiaries:Information pursuant to Clause 32 of the Listing Agreement
Rs. crores
Name of the Company Balance as at 31st March, 2014
Maximum outstanding during the year
Lakme Lever Private Limited 70.00 70.00Brooke Bond Real Estates Private Limited 15.87 15.87Pond’s Exports Limited 4.50 4.50Aquagel Chemicals Private Limited 114.77 114.77
Corporate Governance Corporate Governance72 73Hindustan Unilever Limited Annual Report 2013-14
To The Board of Directors Hindustan Unilever Limited
We, the undersigned, in our respective capacities as Chief Executive Officer and Chief Financial Officer of Hindustan Unilever Limited (“the Company”), to the best of our knowledge and belief certify that:
(a) We have reviewed the financial statements and the cash flow statement for the financial year ended 31st March, 2014 and based on our knowledge and belief, we state that:
(i) these statements do not contain any materially untrue statement or omit any material fact or contain any statements that might be misleading.
(ii) these statements together present a true and fair view of the Company’s affairs and are in compliance with the existing accounting standards, applicable laws and regulations.
(b) We further state that to the best of our knowledge and belief, there are no transactions entered into by the Company during the year, which are fraudulent, illegal or violative of the Company’s code of conduct.
(c) We hereby declare that all the members of the Board of Directors and Management Committee have confirmed compliance with the Code of Conduct as adopted by the Company.
(d) We are responsible for establishing and maintaining internal controls and for evaluating the effectiveness of the same over the financial reporting of the Company and have disclosed to the Auditors and the Audit Committee, deficiencies in the design or operation of internal controls, if any, of which we are aware and the steps we have taken or propose to take to rectify these deficiencies.
(e) We have indicated, based on our most recent evaluation, wherever applicable, to the Auditors and Audit Committee: (i) significant changes, if any, in the internal control over financial reporting during the year; (ii) significant changes, if any, in the accounting policies made during the year and that the same has been disclosed in the notes
to the financial statements; and (iii) instances of significant fraud of which we have become aware and the involvement therein, if any, of the management or an
employee having significant role in the Company’s internal control system over financial reporting.
Sanjiv Mehta Sridhar Ramamurthy
Mumbai : 28th April, 2014 Managing Director and Chief Executive Officer
Executive Director, Finance & IT and Chief Financial Officer
CHIEF EXECUTIVE OFFICER (CEO) & CHIEF FINANCIAL OFFICER (CFO) CERTIFICATION
Corporate Governance Corporate Governance72 73Hindustan Unilever Limited Annual Report 2013-14
Overview Financial Statements Shareholder InformationReports
AUDITORS’ CERTIFICATE REGARDING COMPLIANCE OF CONDITIONS OF CORPORATE GOVERNANCE
To the Members of Hindustan Unilever Limited
We have examined the compliance of the conditions of Corporate Governance by Hindustan Unilever Limited for the year ended 31st March, 2014, as stipulated in clause 49 of the Listing Agreement of the said Company with the Stock Exchanges in India.
The compliance of the conditions of Corporate Governance is the responsibility of the Company’s management. Our examination was carried out in accordance with the Guidance Note on Certification of Corporate Governance (as stipulated in Clause 49 of the Listing Agreement), issued by the Institute of Chartered Accountants of India and was limited to the procedures and implementation thereof, adopted by the Company for ensuring the compliance of the conditions of Corporate Governance. It is neither an audit nor an expression of an opinion on the financial statements of the Company.
In our opinion and to the best of our information and according to the explanations given to us, we certify that the Company has complied with the conditions of Corporate Governance as stipulated in the above mentioned Listing Agreement.
We state that such compliance is neither an assurance as to the future viability of the Company nor the efficiency or effectiveness with which the management has conducted the affairs of the Company.
For Lovelock & LewesFirm Registration No. 301056EChartered Accountants
Pradip KanakiaPartner
Mumbai : 28th April, 2014 Membership No. 39985
Corporate Governance Corporate Governance74 75Hindustan Unilever Limited Annual Report 2013-14
SECRETARIAL STANDARDS REPORT
SECRETARIAL AUDIT REPORT
The Board of Directors,Hindustan Unilever Limited,Unilever House,B. D. Sawant Marg,Chakala, Andheri (East),Mumbai - 400 099.
We have examined relevant registers, records and documents maintained and made available to us by Hindustan Unilever Limited (“the Company”) for the period commencing from 1st April, 2013 to 31st March, 2014 for compliances of all Secretarial Standards issued by the Institute of Company Secretaries of India (ICSI).
Secretarial Standards issued by ICSI were recommendatory in nature for the period commencing from 1st April, 2013 to 31st March, 2014. The management had voluntarily decided to adhere to these standards and comply with the same. Our examination was limited to procedures and implementation thereof adopted by the Company for ensuring the compliance of Secretarial Standards.
In our opinion and to the best of our information and according to the explanation given to us, we report that the Company has complied with all material aspects of applicable Secretarial Standards issued by ICSI.
S. N. ANANTHASUBRAMANIAN & COCompany Secretaries
S. N. ANANTHASUBRAMANIANDate: 28th April, 2014 ProprietorPlace: Mumbai CP No. 1774
The Board of Directors,Hindustan Unilever Limited,Unilever House,B. D. Sawant Marg,Chakala, Andheri (East),Mumbai - 400 099.
We have examined the registers, records and documents of Hindustan Unilever Limited (“the Company”) for the period commencing from 1st April, 2013 to 31st March, 2014 for compliances of provisions of:1. The Companies Act, 1956 (the Act), applicable sections of
the Companies Act, 2013 effective from 12th September 2013 (“New Act”) and the Rules made thereunder;
2. The Depositories Act, 1996 and the Regulations and Bye-laws framed thereunder;
3. The following Regulations and Guidelines prescribed under the Securities and Exchange Board of India Act, 1992 (‘SEBI Act’):
(a) Securities Exchange Board of India (Substantial Acquisition of Shares and Takeovers) Regulations, 2011;
(b) Securities and Exchange Board of India (Prohibition of Insider Trading) Regulations, 1992;
(c) Securities and Exchange Board of India (Employees Stock Option Scheme and Employees Stock Purchase Scheme) Guidelines, 1999;
(d) Securities and Exchange Board of India (Buyback of Securities) Regulations, 1998.
4. The Securities Contracts (Regulation) Act, 1956 (‘SCRA’) and the Rules made there under; and
5. The Listing Agreements entered into with BSE Limited and National Stock Exchange of India Limited.
Based on our examination and verification of the registers, records and documents produced to us and according to the information and explanations given to us by the Company : -
We report that the Company has, in our opinion, complied with the provisions of the Act/ New Act and the Rules made thereunder and with the Memorandum and Articles of Association of the Company with regard to:
(a) maintenance of various statutory registers and documents and making necessary entries therein;
Corporate Governance Corporate Governance74 75Hindustan Unilever Limited Annual Report 2013-14
Overview Financial Statements Shareholder InformationReports
SECRETARIAL AUDIT REPORT (CONTD.) (b) closure of the Register of Members; (c) forms, returns, documents and resolutions required to
be filed with the Registrar of Companies and Central Government;
(d) service of documents by the Company on its Members and the Registrar of Companies;
(e) notice of Meetings of the Board and Committees thereof;
(f) minutes of the meetings of the Board and Committees thereof including passing of resolutions by circulation;
(g) notice convening the 80th Annual General Meeting held on 26th July, 2013;
(h) minutes of general meetings; (i) approvals of the Members, the Board of Directors, the
Committees of Directors and government authorities, wherever required;
(j) constitution of the Board of Directors / Committee(s) of Directors and appointment, retirement and re-appointment of Directors including the Managing Director and Executive Directors;
(k) payment of remuneration to the Directors including the Managing Director and Executive Directors;
(l) appointment and remuneration of Statutory Auditors and Cost Auditors;
(m) transfer and transmission of the Company’s shares, issue and allotment of shares and issue and delivery of certificate(s) of shares;
(n) declaration and payment of dividends including interim dividend;
(o) transfer of amounts as required under the Act to the Investor Education and Protection Fund;
(p) satisfaction of charges, if any, registered with the Registrar of Companies;
(q) form of balance sheet as prescribed under Part I of Schedule VI to the Act and requirements as to Profit & Loss Account as per Part II of the said Schedule;
(r) contracts, common seal, registered office and publication of name of the Company; and
(s) generally, all other applicable provisions of the Act /the New Act and the Rules made thereunder.
We further report that:(a) the Directors have complied with the requirements as to
disclosure of interests and concerns in contracts and arrangements, shareholdings / debentures holdings and directorships in other companies and interest in other entities;
(b) the Directors have complied with the disclosure requirements in respect of their eligibility of appointment, their being independent and compliance with the Share Dealing Code and Code of Conduct of the Company;
(c) the Company has obtained all necessary approvals under the various provisions of the Act/ New Act;
(d) there was no prosecution initiated against or show cause notice received by the Company and no fines or penalties were imposed on the Company during the year under review under the Companies Act, SEBI Act, SCRA, Depositories Act, Listing Agreement and Rules, Regulations and Guidelines framed under these Acts against the Company, its Directors and Officers.
We further report that the Company has complied with the provisions of the Depositories Act, 1996 and the Bye-laws framed under that Act by the depositories with regard to dematerialisation / rematerialisation of securities and reconciliation of records of dematerialised securities with the securities issued by the Company.
We further report that:(a) the Company has complied with the requirements under
the Listing Agreements entered into with the BSE Limited and the National Stock Exchange of India Limited;
(b) the Company has complied with the provisions of the Securities Exchange Board of India (Substantial Acquisition of Shares and Takeovers) Regulations, 2011 including the provisions with regard to disclosures and maintenance of records required under the Regulations;
(c) the Company has complied with the provisions of the Securities and Exchange Board of India (Prohibition of Insider Trading) Regulations, 1992 including the provisions with regard to disclosures and maintenance of records required under the Regulations;
(d) the Company has complied with the provisions of the Securities and Exchange Board of India (Employee Stock Option Scheme and Employee Stock Purchase Scheme) Guidelines, 1999 with regard to implementation of 2012 HUL Performance Shares Scheme; 2006 HLL Performance Shares Scheme and 2001 HLL Stock Option Plan, grant of options and other related aspects.
S. N. ANANTHASUBRAMANIAN & COCompany Secretaries
S. N. ANANTHASUBRAMANIANDate: 28th April, 2014 ProprietorPlace: Mumbai CP No. 1774
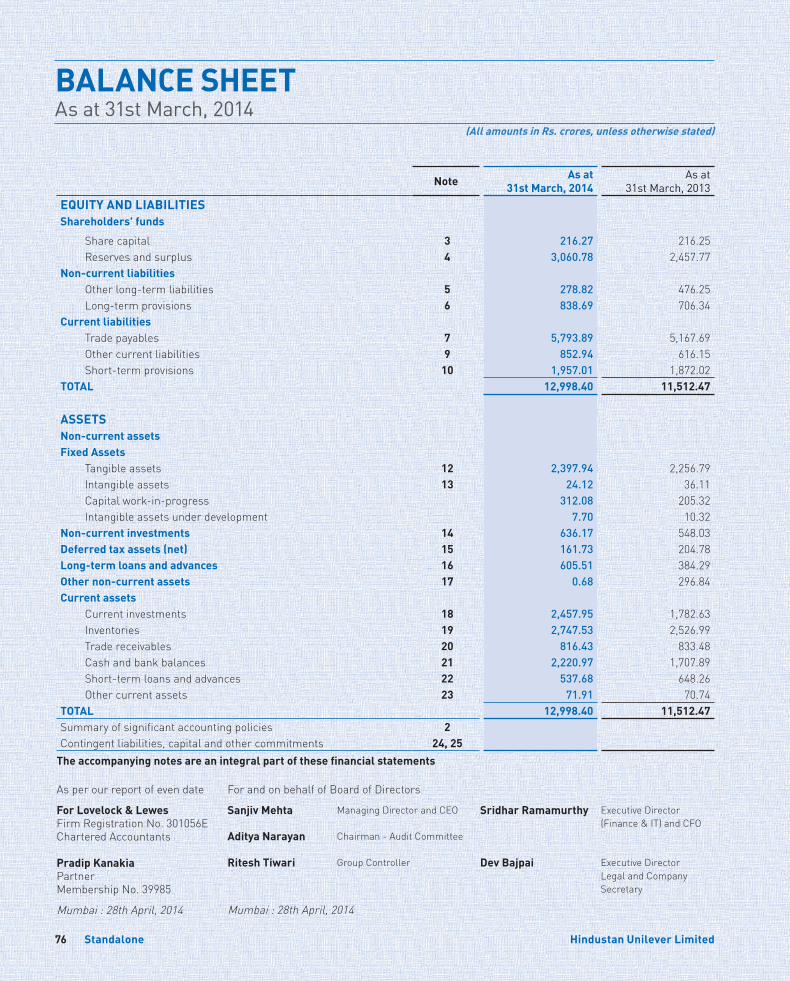
Standalone76 Hindustan Unilever Limited
Note As at 31st March, 2014
As at 31st March, 2013
EQUITY AND LIABILITIESShareholders' funds
Share capital 3 216.27 216.25 Reserves and surplus 4 3,060.78 2,457.77Non-current liabilities Other long-term liabilities 5 278.82 476.25 Long-term provisions 6 838.69 706.34Current liabilities Trade payables 7 5,793.89 5,167.69 Other current liabilities 9 852.94 616.15 Short-term provisions 10 1,957.01 1,872.02TOTAL 12,998.40 11,512.47
ASSETSNon-current assetsFixed Assets Tangible assets 12 2,397.94 2,256.79 Intangible assets 13 24.12 36.11 Capital work-in-progress 312.08 205.32 Intangible assets under development 7.70 10.32Non-current investments 14 636.17 548.03Deferred tax assets (net) 15 161.73 204.78Long-term loans and advances 16 605.51 384.29Other non-current assets 17 0.68 296.84Current assets Current investments 18 2,457.95 1,782.63 Inventories 19 2,747.53 2,526.99 Trade receivables 20 816.43 833.48 Cash and bank balances 21 2,220.97 1,707.89 Short-term loans and advances 22 537.68 648.26 Other current assets 23 71.91 70.74TOTAL 12,998.40 11,512.47Summary of significant accounting policies 2Contingent liabilities, capital and other commitments 24, 25
The accompanying notes are an integral part of these financial statements
BALANCE SHEETAs at 31st March, 2014
(All amounts in Rs. crores, unless otherwise stated)
As per our report of even date
For Lovelock & LewesFirm Registration No. 301056EChartered Accountants
Pradip KanakiaPartnerMembership No. 39985
Mumbai : 28th April, 2014
For and on behalf of Board of Directors
Sanjiv Mehta Managing Director and CEO Sridhar Ramamurthy Executive Director(Finance & IT) and CFO
Aditya Narayan Chairman - Audit Committee
Ritesh Tiwari Group Controller Dev Bajpai Executive DirectorLegal and CompanySecretary
Mumbai : 28th April, 2014
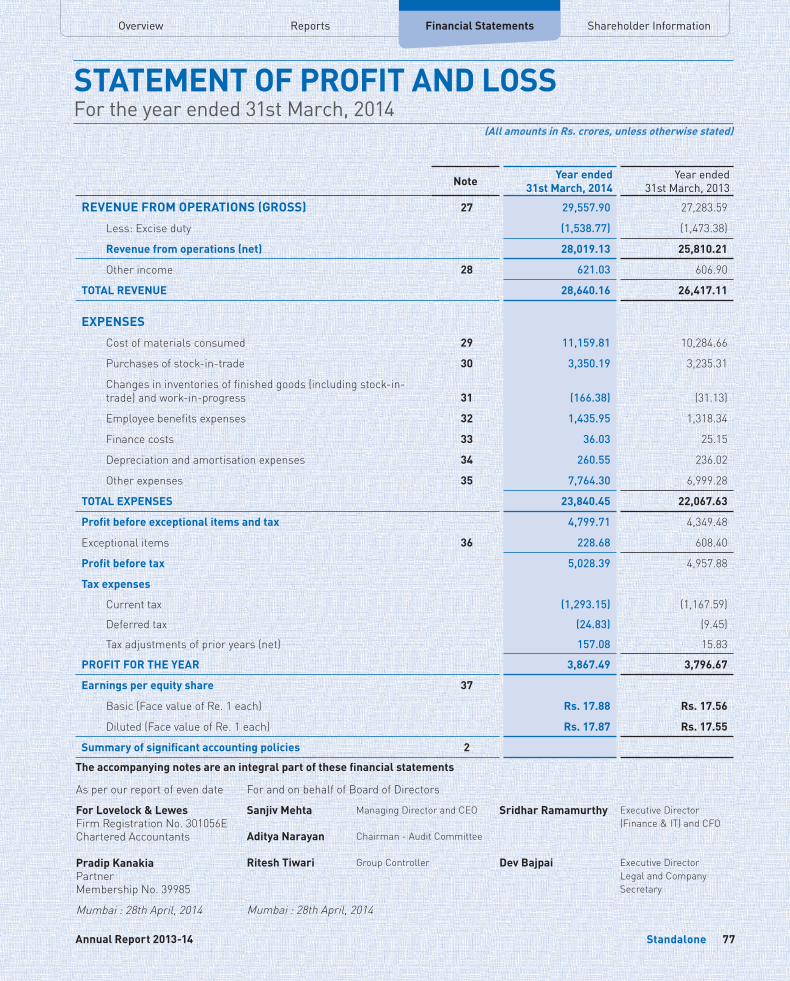
Overview Financial Statements Shareholder InformationReports
Standalone 77Annual Report 2013-14
Note Year ended 31st March, 2014
Year ended 31st March, 2013
REVENUE FROM OPERATIONS (GROSS) 27 29,557.90 27,283.59
Less: Excise duty (1,538.77) (1,473.38)
Revenue from operations (net) 28,019.13 25,810.21
Other income 28 621.03 606.90
TOTAL REVENUE 28,640.16 26,417.11
EXPENSES
Cost of materials consumed 29 11,159.81 10,284.66
Purchases of stock-in-trade 30 3,350.19 3,235.31
Changes in inventories of finished goods (including stock-in-trade) and work-in-progress 31 (166.38) (31.13)
Employee benefits expenses 32 1,435.95 1,318.34
Finance costs 33 36.03 25.15
Depreciation and amortisation expenses 34 260.55 236.02
Other expenses 35 7,764.30 6,999.28
TOTAL EXPENSES 23,840.45 22,067.63
Profit before exceptional items and tax 4,799.71 4,349.48
Exceptional items 36 228.68 608.40
Profit before tax 5,028.39 4,957.88
Tax expenses
Current tax (1,293.15) (1,167.59)
Deferred tax (24.83) (9.45)
Tax adjustments of prior years (net) 157.08 15.83
PROFIT FOR THE YEAR 3,867.49 3,796.67
Earnings per equity share 37
Basic (Face value of Re. 1 each) Rs. 17.88 Rs. 17.56
Diluted (Face value of Re. 1 each) Rs. 17.87 Rs. 17.55
Summary of significant accounting policies 2
The accompanying notes are an integral part of these financial statements
STATEMENT OF PROFIT AND LOSSFor the year ended 31st March, 2014
(All amounts in Rs. crores, unless otherwise stated)
As per our report of even date
For Lovelock & LewesFirm Registration No. 301056EChartered Accountants
Pradip KanakiaPartnerMembership No. 39985
Mumbai : 28th April, 2014
For and on behalf of Board of Directors
Sanjiv Mehta Managing Director and CEO Sridhar Ramamurthy Executive Director(Finance & IT) and CFO
Aditya Narayan Chairman - Audit Committee
Ritesh Tiwari Group Controller Dev Bajpai Executive DirectorLegal and CompanySecretary
Mumbai : 28th April, 2014
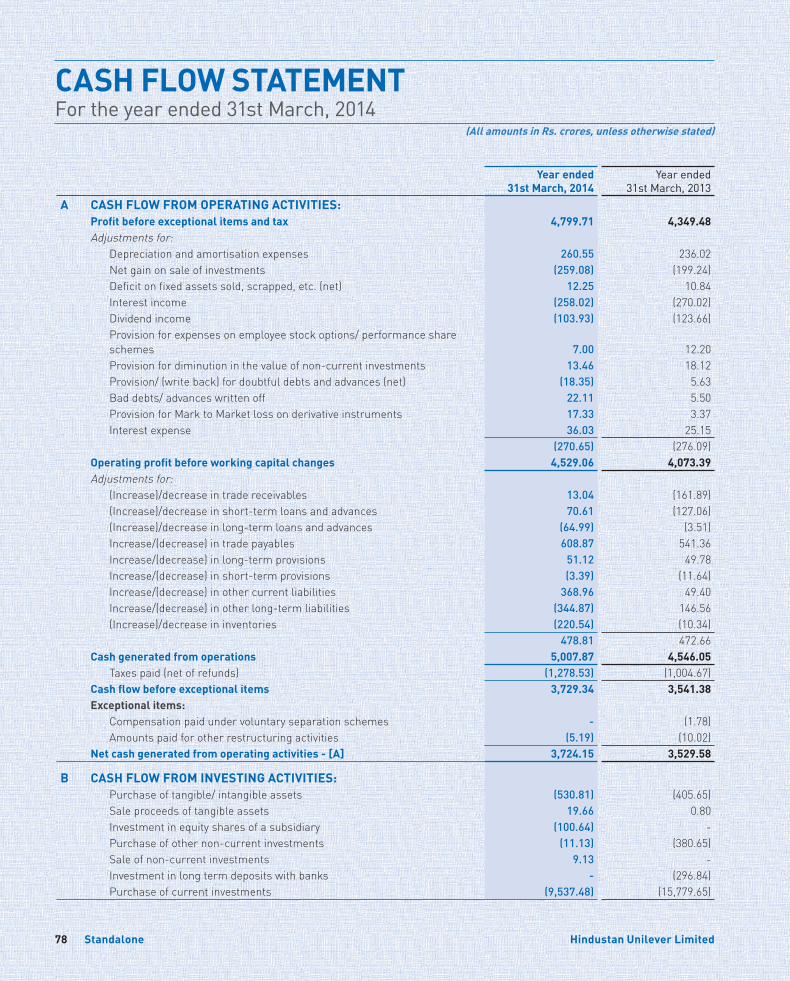
Standalone78 Hindustan Unilever Limited
Year ended 31st March, 2014
Year ended 31st March, 2013
A CASH FLOW FROM OPERATING ACTIVITIES:Profit before exceptional items and tax 4,799.71 4,349.48Adjustments for: Depreciation and amortisation expenses 260.55 236.02 Net gain on sale of investments (259.08) (199.24) Deficit on fixed assets sold, scrapped, etc. (net) 12.25 10.84 Interest income (258.02) (270.02) Dividend income (103.93) (123.66) Provision for expenses on employee stock options/ performance share
schemes 7.00 12.20 Provision for diminution in the value of non-current investments 13.46 18.12 Provision/ (write back) for doubtful debts and advances (net) (18.35) 5.63 Bad debts/ advances written off 22.11 5.50 Provision for Mark to Market loss on derivative instruments 17.33 3.37 Interest expense 36.03 25.15
(270.65) (276.09)Operating profit before working capital changes 4,529.06 4,073.39Adjustments for: (Increase)/decrease in trade receivables 13.04 (161.89) (Increase)/decrease in short-term loans and advances 70.61 (127.06) (Increase)/decrease in long-term loans and advances (64.99) (3.51) Increase/(decrease) in trade payables 608.87 541.36 Increase/(decrease) in long-term provisions 51.12 49.78 Increase/(decrease) in short-term provisions (3.39) (11.64) Increase/(decrease) in other current liabilities 368.96 49.40 Increase/(decrease) in other long-term liabilities (344.87) 146.56 (Increase)/decrease in inventories (220.54) (10.34)
478.81 472.66Cash generated from operations 5,007.87 4,546.05 Taxes paid (net of refunds) (1,278.53) (1,004.67)Cash flow before exceptional items 3,729.34 3,541.38Exceptional items: Compensation paid under voluntary separation schemes - (1.78) Amounts paid for other restructuring activities (5.19) (10.02)
Net cash generated from operating activities - [A] 3,724.15 3,529.58
B CASH FLOW FROM INVESTING ACTIVITIES: Purchase of tangible/ intangible assets (530.81) (405.65) Sale proceeds of tangible assets 19.66 0.80 Investment in equity shares of a subsidiary (100.64) - Purchase of other non-current investments (11.13) (380.65) Sale of non-current investments 9.13 - Investment in long term deposits with banks - (296.84) Purchase of current investments (9,537.48) (15,779.65)
CASH FLOW STATEMENTFor the year ended 31st March, 2014
(All amounts in Rs. crores, unless otherwise stated)
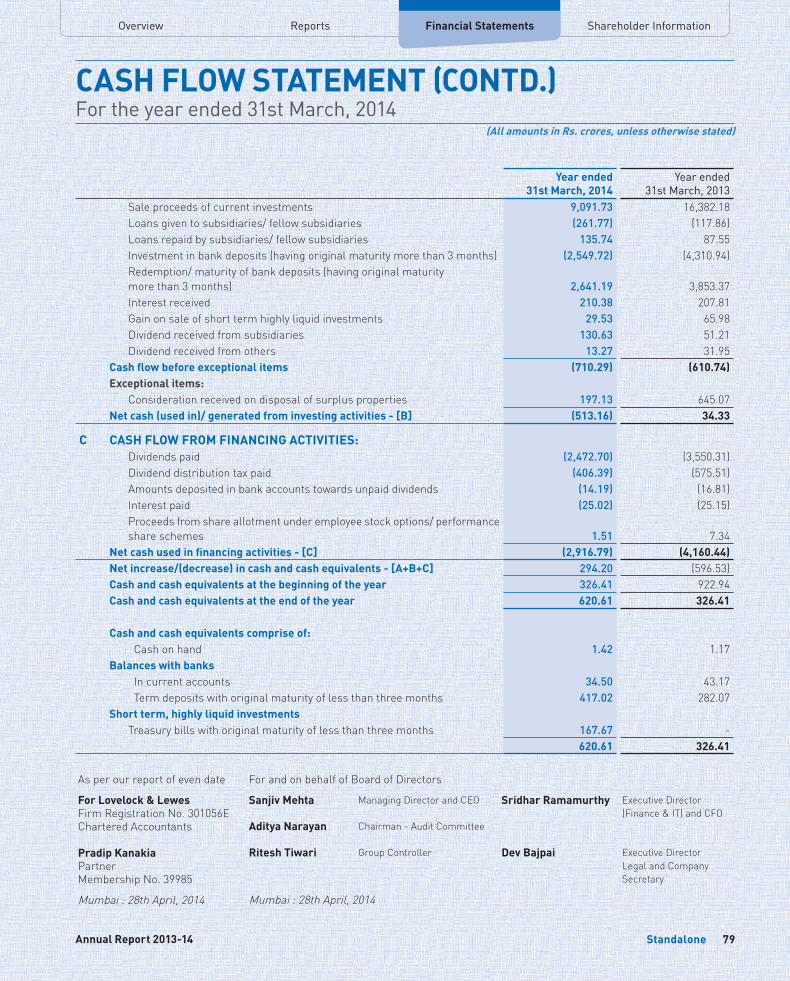
Overview Financial Statements Shareholder InformationReports
Standalone 79Annual Report 2013-14
CASH FLOW STATEMENT (CONTD.)For the year ended 31st March, 2014
(All amounts in Rs. crores, unless otherwise stated)
Year ended 31st March, 2014
Year ended 31st March, 2013
Sale proceeds of current investments 9,091.73 16,382.18 Loans given to subsidiaries/ fellow subsidiaries (261.77) (117.86) Loans repaid by subsidiaries/ fellow subsidiaries 135.74 87.55 Investment in bank deposits (having original maturity more than 3 months) (2,549.72) (4,310.94) Redemption/ maturity of bank deposits (having original maturity
more than 3 months) 2,641.19 3,853.37 Interest received 210.38 207.81 Gain on sale of short term highly liquid investments 29.53 65.98 Dividend received from subsidiaries 130.63 51.21 Dividend received from others 13.27 31.95Cash flow before exceptional items (710.29) (610.74)Exceptional items: Consideration received on disposal of surplus properties 197.13 645.07
Net cash (used in)/ generated from investing activities - [B] (513.16) 34.33
C CASH FLOW FROM FINANCING ACTIVITIES: Dividends paid (2,472.70) (3,550.31) Dividend distribution tax paid (406.39) (575.51) Amounts deposited in bank accounts towards unpaid dividends (14.19) (16.81) Interest paid (25.02) (25.15)
Proceeds from share allotment under employee stock options/ performance
share schemes 1.51 7.34 Net cash used in financing activities - [C] (2,916.79) (4,160.44) Net increase/(decrease) in cash and cash equivalents - [A+B+C] 294.20 (596.53) Cash and cash equivalents at the beginning of the year 326.41 922.94 Cash and cash equivalents at the end of the year 620.61 326.41
Cash and cash equivalents comprise of: Cash on hand 1.42 1.17
Balances with banks In current accounts 34.50 43.17 Term deposits with original maturity of less than three months 417.02 282.07 Short term, highly liquid investments Treasury bills with original maturity of less than three months 167.67 - 620.61 326.41
As per our report of even date
For Lovelock & LewesFirm Registration No. 301056EChartered Accountants
Pradip KanakiaPartnerMembership No. 39985
Mumbai : 28th April, 2014
For and on behalf of Board of Directors
Sanjiv Mehta Managing Director and CEO Sridhar Ramamurthy Executive Director(Finance & IT) and CFO
Aditya Narayan Chairman - Audit Committee
Ritesh Tiwari Group Controller Dev Bajpai Executive DirectorLegal and CompanySecretary
Mumbai : 28th April, 2014
NOTESto the financial statements for the year ended 31st March, 2014
(All amounts in Rs. crores, unless otherwise stated)
Standalone80 Hindustan Unilever Limited
1) COMPANY INFORMATIONHindustan Unilever Limited (the ‘company’) is a public limited company domiciled in India and is listed on the Bombay Stock Exchange (BSE) and the National Stock Exchange (NSE). The company is a market leader in the FMCG business comprising Home and Personal Care (HPC), Foods and Refreshments. The company has manufacturing facilities across the country and Research and Development centres in Mumbai and Bangalore and sells primarily in India through independent distributors and modern trade.
2) SUMMARY OF SIGNIFICANT ACCOUNTING POLICIES2.1. Basis of preparation
These financial statements have been prepared to comply in all material aspects with applicable accounting principles in India, the applicable Accounting Standards notified under Section 211(3C) of the Companies Act, 1956. Pursuant to Circular 15/ 2013 dated 13th September, 2013 read with circular 08/ 2014 dated 4th April, 2014, till the standards of Accounting or any addendum thereto are prescribed by Central Government in consultation and recommendation of the National Financial Reporting Authority, the existing Accounting Standards notified under the Companies Act, 1956 shall continue to apply. Consequently, these financial statements have been prepared to comply in all material aspects with the accounting standards notified under Section 211(3C) [Companies (Accounting Standards) Rules, 2006, as amended] and other relevant provisions of the Companies Act, 1956.
All assets and liabilities have been classified as current or non-current as per the Company’s normal operating cycle and other criteria set out in the Revised Schedule VI to the Companies Act, 1956. Based on the nature of products and the time between acquisition of assets for processing and their realisation in cash and cash equivalents, the Company has ascertained its operating cycle as 12 months for the purpose of current/ non-current classification of assets and liabilities.
Transactions and balances with values below the rounding off norm adopted by the company have been reflected as “0.00” in the relevant notes in these financial statements.
2.2. Revenue recognition
Revenue from sale of goods is recognised when all the significant risks and rewards of ownership in the goods are transferred to the buyer as per the terms of the contract, the Company retains no effective control of the goods transferred to a degree usually associated with ownership and no significant uncertainty exists regarding the amount of the consideration that will be derived from the sale of goods. Sales are recognised net of trade discounts, rebates, sales taxes and excise duties (on goods manufactured and outsourced).
Income from export incentives such as duty drawback and premium on sale of import licenses, and lease license fee are recognised on accrual basis.
Income from services rendered is recognised based on agreements/ arrangements with the customers as the service is performed using the proportionate completion method when no significant uncertainty exists regarding the amount of the consideration that will be derived from rendering the service and is recognised net of service tax, as applicable.
Interest on investments is recognised on a time proportion basis taking into account the amounts invested and the rate of interest.
Dividend income on investments is recognised when the right to receive dividend is established.
2.3. Expenditure
Expenses are accounted on accrual basis.
Revenue expenditure pertaining to research is charged to the Statement of Profit and Loss. Development costs of products are also charged to the Statement of Profit and Loss unless a product’s technical feasibility and other criteria as set out in paragraph 44 of AS 26 – ‘Intangible Assets’ have been established, in which case such expenditure is capitalised. The amount capitalised comprises expenditure that can be directly attributed or allocated on a reasonable and consistent basis to creating, producing and making the asset ready for its intended use. Fixed assets utilised for research and development are capitalised and depreciated in accordance with the policies stated for Tangible Assets.
2.4. Tangible assets
Tangible assets are stated at acquisition cost, net of accumulated depreciation and accumulated impairment losses, if any. Subsequent expenditures related to an item of tangible asset are added to its book value only if they increase the future benefits from the existing asset beyond its previously assessed standard of performance.
Items of tangible assets that have been retired from active use and are held for disposal are stated at the lower of their net book value and net realisable value and are shown separately in the financial statements under “Other current assets”. Any expected loss is recognised immediately in the Statement of Profit and Loss.
Losses arising from the retirement of, and gains or losses arising from disposal of tangible assets which are carried at cost are recognised in the Statement of Profit and Loss.
Depreciation is provided on a pro-rata basis on the straight line method over the estimated useful lives of the assets or at the
Overview Financial Statements Shareholder InformationReports
NOTESto the financial statements for the year ended 31st March, 2014 (Contd.)
(All amounts in Rs. crores, unless otherwise stated)
Standalone 81Annual Report 2013-14
rates prescribed under Schedule XIV to the Companies Act, 1956, whichever is higher. Accordingly,
- computers and related assets, included in office equipment are depreciated over four years;
- leasehold land is amortised over the primary period of the lease;
- certain assets of the cold chain, included in plant and equipment, are depreciated over four/ seven years; and
- vehicles are depreciated over six years.
2.5. Intangible assets
Intangible assets are stated at acquisition cost, net of accumulated amortisation and accumulated impairment losses, if any. Intangible assets are amortised on a straight line basis as per rates mentioned below:
Asset class Rate of amortisationGoodwill 25%Brands/ trademarks 25%Computer software 20%
2.6. Impairment
Assessment for impairment is done at each Balance Sheet date as to whether there is any indication that an asset (tangible and intangible) may be impaired. For the purpose of assessing impairment, the smallest identifiable group of assets that generates cash inflows from continuing use that are largely independent of the cash inflows from other assets or groups of assets is considered as a cash generating unit. If any such indication exists, an estimate of the recoverable amount of the individual asset/ cash generating unit is made.
Assets whose carrying value exceeds their recoverable amount are written down to the recoverable amount by recognising the impairment loss as an expense in the Statement of Profit and Loss. Recoverable amount is higher of an asset’s or cash generating unit’s net selling price and its value in use. Value in use is the present value of estimated future cash flows expected to arise from the continuing use of an asset and from its disposal at the end of its useful life. Assessment is also done at each Balance Sheet date as to whether there is any indication that an impairment loss recognised for an asset in prior accounting periods may no longer exist or may have decreased.
2.7. Investments
Investments are classified into current and non-current investments. Current investments are stated at the lower of cost and fair value. Non-current investments are stated at cost.
A provision for diminution is made to recognise a decline, other than temporary, in the value of non-current investments.
Investments that are readily realisable and are intended to be held for not more than one year from the date on which such investments are made, are classified as “Current investments”. All other investments are classified as “Non-current investments”.
Investment in land and buildings that are not intended to be occupied substantially for use by, or in the operations of the company, have been classified as investment property. Investment properties are carried at cost less accumulated depreciation and accumulated impairment losses, if any. Depreciation on the building component of the investment property is provided in line with the policy on tangible assets.
2.8. Inventories
Inventories are valued at the lower of cost and net realisable value. Cost is computed on a weighted average basis. The net realisable value is the estimated selling price in the ordinary course of business less the estimated costs of completion and estimated costs necessary to make the sale. Finished goods and work-in-progress include all costs of purchases, conversion costs and other costs incurred in bringing the inventories to their present location and condition.
2.9. Trade receivables and Loans and advances
Trade receivables and Loans and advances are stated after making adequate provisions for doubtful balances.
2.10. Provisions and Contingent liabilities
Provisions are recognised when there is a present obligation as a result of a past event, it is probable that an outflow of resources embodying economic benefits will be required to settle the obligation and there is a reliable estimate of the amount of the obligation. Provisions are measured at the best estimate of the expenditure required to settle the present obligation at the balance sheet date and are not discounted to its present value. These are reviewed at each year end date and adjusted to reflect the best current estimate.
Contingent liabilities are disclosed when there is a possible obligation arising from past events, the existence of which will be confirmed only by the occurrence or non occurrence of one or more uncertain future events not wholly within the control of the company or a present obligation that arises from past events where it is either not probable that an outflow of resources will be required to settle the obligation or a reliable estimate of the amount cannot be made.
NOTESto the financial statements for the year ended 31st March, 2014 (Contd.)
(All amounts in Rs. crores, unless otherwise stated)
Standalone82 Hindustan Unilever Limited
2.11. Retirement/ post retirement benefits
Defined contribution plans
Contributions to defined contribution schemes such as employees’ state insurance, labour welfare fund, superannuation scheme, employee pension scheme etc. are charged as an expense based on the amount of contribution required to be made as and when services are rendered by the employees. Company’s provident fund contribution, in respect of certain employees, is made to a government administered fund and charged as an expense to the Statement of Profit and Loss. The above benefits are classified as Defined Contribution Schemes as the company has no further defined obligations beyond the monthly contributions.
Defined benefit plans
In respect of certain employees, provident fund contributions are made to a trust administered by the company. The interest rate payable to the members of the trust shall not be lower than the statutory rate of interest declared by the Central Government under the Employees Provident Funds and Miscellaneous Provisions Act, 1952 and shortfall, if any, shall be made good by the Company. The liability in respect of the shortfall of interest earnings of the Fund is determined on the basis of an actuarial valuation. The Company also provides for retirement/ post-retirement benefits in the form of gratuity, pensions (in respect of certain employees), compensated absences and medical. The Company’s liability towards such defined benefit plans is determined based on valuations, as at the balance sheet date, made by independent actuaries using the projected unit credit method. Actuarial gains and losses in respect of the defined benefit plans are recognised in the Statement of Profit and Loss in the year in which they arise. The classification of the company’s net obligation into current and non- current is as per the actuarial valuation report.
Termination benefits
Termination benefits, in the nature of voluntary retirement benefits or termination benefits arising from restructuring, are recognised in the Statement of Profit and Loss when: a) the company has a present obligation as a result of past event; b) a reliable estimate can be made of the amount of the obligation; and c) it is probable that an outflow of resources embodying economic benefits will be required to settle the obligation.
2.12. Income Taxes
Tax expense for the year comprises current tax and deferred tax.
Current tax is measured at the amount expected to be paid to (recovered from) the taxation authorities using the applicable tax rates and tax laws.
Deferred tax is recognised for all the timing differences, subject to the consideration of prudence in respect of deferred tax assets. Deferred tax assets and liabilities are measured using the tax rates and tax laws that have been enacted or substantively enacted by the Balance Sheet date. Deferred tax assets are recognised and carried forward only to the extent that there is a reasonable certainty that sufficient future taxable income will be available against which such deferred tax assets can be realised. In situations where the Company has unabsorbed depreciation or carry forward tax losses, all deferred tax assets are recognised only if there is virtual certainty supported by convincing evidence that they can be realised against future taxable profits. The carrying amount of deferred tax assets is reviewed at each balance sheet date for any write down or reversal, as considered appropriate.
Current tax assets and current tax liabilities are offset when there is a legally enforceable right to set off the recognised amounts and there is an intention to settle the asset and the liability on a net basis. Deferred tax assets and deferred tax liabilities are offset when there is a legally enforceable right to set off assets against liabilities representing current tax and where the deferred tax assets and deferred tax liabilities relate to taxes on income levied by the same governing taxation laws.
2.13. Foreign currency translations
Foreign currency transactions are accounted for at the exchange rates prevailing at the date of the transaction. Gains and losses resulting from the settlement of such transactions and from the translation of monetary assets and liabilities denominated in foreign currencies are recognised in the Statement of Profit and Loss.
Forward exchange contracts outstanding as at the year end on account of firm commitment transactions are marked to market and the losses, if any are recognised in the Statement of Profit and Loss, and gains are ignored in accordance with the announcement of the Institute of Chartered Accountants of India on ‘Accounting for Derivatives’ issued in March 2008.
2.14. Operating leases
Leases in which a significant portion of the risks and rewards of ownership are retained by the lessor are classified as operating leases. The company is both a lessee and a lessor under such arrangements. Payments and receipts under such leases are charged or credited to the Statement of Profit and Loss on a straight line basis over the primary period of the lease.
2.15. Segment reporting
The accounting policies adopted for segment reporting are in conformity with the accounting policies adopted for the company. Further,
Overview Financial Statements Shareholder InformationReports
NOTESto the financial statements for the year ended 31st March, 2014 (Contd.)
(All amounts in Rs. crores, unless otherwise stated)
Standalone 83Annual Report 2013-14
a) Inter segment revenue has been accounted for based on the transaction price agreed to between segments which is primarily market based.
b) Revenue and expenses have been identified to segments on the basis of their relationship to the operating activities of the segment. Revenue and expenses, which relate to the company as a whole and are not allocable to segments on a reasonable basis, have been included under “Un-allocated corporate expenses net of un-allocated income”.
2.16. Cash and cash equivalents
In the cash flow statement, cash and cash equivalents include cash in hand, term deposits with banks and other short-term highly liquid investments with original maturities of three months or less.
2.17. Earnings per share
Basic earnings per share is calculated by dividing the net profit for the period attributable to equity shareholders by the weighted average number of equity shares outstanding during the period. The weighted average number of equity shares outstanding during the period and for all periods presented is adjusted for events, such as bonus shares, other than the conversion of potential equity shares, that have changed the
number of equity shares outstanding, without a corresponding change in resources. For the purpose of calculating diluted earnings per share, the net profit for the period attributable to equity shareholders and the weighted average number of shares outstanding during the period is adjusted for the effects of all dilutive potential equity shares.
2.18. Employee share based payments
Equity settled stock options granted under “HUL ESOP/ Performance Shares Schemes” are accounted for under the intrinsic value method as per the accounting treatment prescribed by Employee Stock Option Scheme and Employee Stock Purchase Guidelines, 1999, issued by Securities and Exchange Board of India and the Guidance Note on Employee Share-based Payments issued by the Institute of Chartered Accountants of India.
2.19. Use of estimates
The preparation of the financial statements in conformity with the generally accepted accounting principles requires that the management makes estimates and assumptions that affect the reported amounts of assets and liabilities, disclosure of contingent liabilities as at the date of the financial statements, and the reported amounts of revenue and expenses during the reported period. Actual results could differ from those estimates.
3) SHARE CAPITALAs at
31st March, 2014As at
31st March, 2013Authorised2,250,000,000 (March 31, 2013: 2,250,000,000) equity shares of Re. 1 each 225.00 225.00Issued, subscribed and fully paid up2,162,696,292 (March 31, 2013: 2,162,472,310) equity shares of Re. 1 each 216.27 216.25
216.27 216.25
a) Reconciliation of the number of shares
As at 31st March, 2014
Number of sharesAmount
As at 31st March, 2013
Number of sharesAmount
Equity Shares:Balance as at the beginning of the year 2,162,472,310 216.25 2,161,512,492 216.15Add: ESOP shares issued during the year (Refer note 49) 223,982 0.02 959,818 0.10Balance as at the end of the year 2,162,696,292 216.27 2,162,472,310 216.25
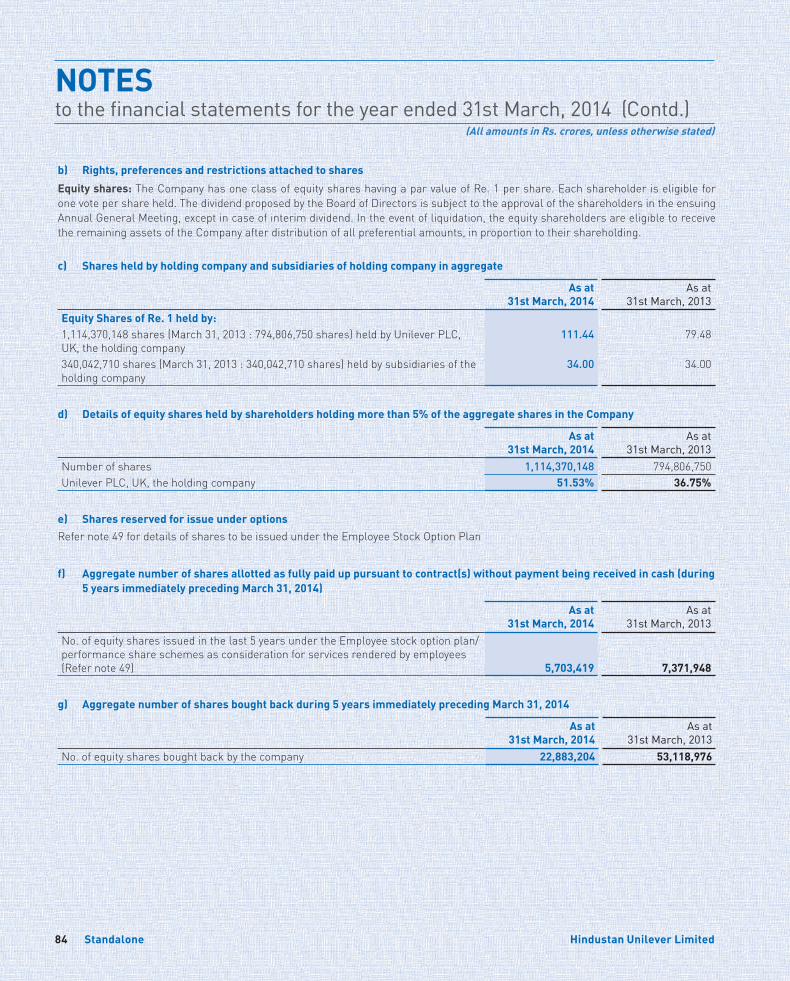
NOTESto the financial statements for the year ended 31st March, 2014 (Contd.)
(All amounts in Rs. crores, unless otherwise stated)
Standalone84 Hindustan Unilever Limited
b) Rights, preferences and restrictions attached to shares
Equity shares: The Company has one class of equity shares having a par value of Re. 1 per share. Each shareholder is eligible for one vote per share held. The dividend proposed by the Board of Directors is subject to the approval of the shareholders in the ensuing Annual General Meeting, except in case of interim dividend. In the event of liquidation, the equity shareholders are eligible to receive the remaining assets of the Company after distribution of all preferential amounts, in proportion to their shareholding.
c) Shares held by holding company and subsidiaries of holding company in aggregate
As at 31st March, 2014
As at 31st March, 2013
Equity Shares of Re. 1 held by:1,114,370,148 shares (March 31, 2013 : 794,806,750 shares) held by Unilever PLC, UK, the holding company
111.44 79.48
340,042,710 shares (March 31, 2013 : 340,042,710 shares) held by subsidiaries of the holding company
34.00 34.00
d) Details of equity shares held by shareholders holding more than 5% of the aggregate shares in the Company
As at 31st March, 2014
As at 31st March, 2013
Number of shares 1,114,370,148 794,806,750Unilever PLC, UK, the holding company 51.53% 36.75%
e) Shares reserved for issue under optionsRefer note 49 for details of shares to be issued under the Employee Stock Option Plan
f) Aggregate number of shares allotted as fully paid up pursuant to contract(s) without payment being received in cash (during 5 years immediately preceding March 31, 2014)
As at 31st March, 2014
As at 31st March, 2013
No. of equity shares issued in the last 5 years under the Employee stock option plan/ performance share schemes as consideration for services rendered by employees (Refer note 49) 5,703,419 7,371,948
g) Aggregate number of shares bought back during 5 years immediately preceding March 31, 2014
As at 31st March, 2014
As at 31st March, 2013
No. of equity shares bought back by the company 22,883,204 53,118,976
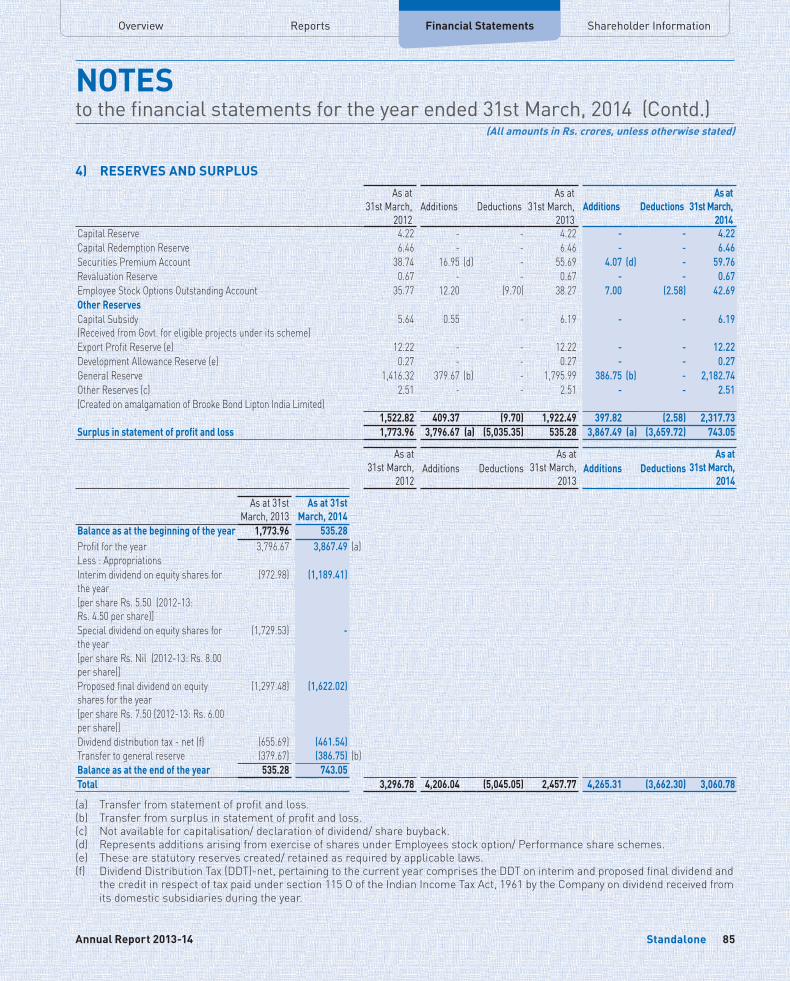
Overview Financial Statements Shareholder InformationReports
NOTESto the financial statements for the year ended 31st March, 2014 (Contd.)
(All amounts in Rs. crores, unless otherwise stated)
Standalone 85Annual Report 2013-14
4) RESERVES AND SURPLUSAs at
31st March, 2012
Additions DeductionsAs at
31st March, 2013
Additions DeductionsAs at
31st March, 2014
Capital Reserve 4.22 - - 4.22 - - 4.22 Capital Redemption Reserve 6.46 - - 6.46 - - 6.46 Securities Premium Account 38.74 16.95 (d) - 55.69 4.07 (d) - 59.76 Revaluation Reserve 0.67 - - 0.67 - - 0.67 Employee Stock Options Outstanding Account 35.77 12.20 (9.70) 38.27 7.00 (2.58) 42.69 Other ReservesCapital Subsidy (Received from Govt. for eligible projects under its scheme)
5.64 0.55 - 6.19 - - 6.19
Export Profit Reserve (e) 12.22 - - 12.22 - - 12.22 Development Allowance Reserve (e) 0.27 - - 0.27 - - 0.27 General Reserve 1,416.32 379.67 (b) - 1,795.99 386.75 (b) - 2,182.74 Other Reserves (c) 2.51 - - 2.51 - - 2.51 (Created on amalgamation of Brooke Bond Lipton India Limited)
1,522.82 409.37 (9.70) 1,922.49 397.82 (2.58) 2,317.73 Surplus in statement of profit and loss 1,773.96 3,796.67 (a) (5,035.35) 535.28 3,867.49 (a) (3,659.72) 743.05
As at 31st March,
2012Additions Deductions
As at 31st March,
2013Additions Deductions
As at 31st March,
2014
As at 31st March, 2013
As at 31st March, 2014
Balance as at the beginning of the year 1,773.96 535.28 Profit for the year 3,796.67 3,867.49 (a)Less : AppropriationsInterim dividend on equity shares for the year
(972.98) (1,189.41)
[per share Rs. 5.50 (2012-13: Rs. 4.50 per share)]Special dividend on equity shares for the year
(1,729.53) -
[per share Rs. Nil (2012-13: Rs. 8.00 per share)]Proposed final dividend on equity shares for the year
(1,297.48) (1,622.02)
[per share Rs. 7.50 (2012-13: Rs. 6.00 per share)]Dividend distribution tax - net (f) (655.69) (461.54)Transfer to general reserve (379.67) (386.75) (b)Balance as at the end of the year 535.28 743.05 Total 3,296.78 4,206.04 (5,045.05) 2,457.77 4,265.31 (3,662.30) 3,060.78
(a) Transfer from statement of profit and loss. (b) Transfer from surplus in statement of profit and loss.(c) Not available for capitalisation/ declaration of dividend/ share buyback.(d) Represents additions arising from exercise of shares under Employees stock option/ Performance share schemes.(e) These are statutory reserves created/ retained as required by applicable laws.(f) Dividend Distribution Tax (DDT)-net, pertaining to the current year comprises the DDT on interim and proposed final dividend and
the credit in respect of tax paid under section 115 O of the Indian Income Tax Act, 1961 by the Company on dividend received from its domestic subsidiaries during the year.
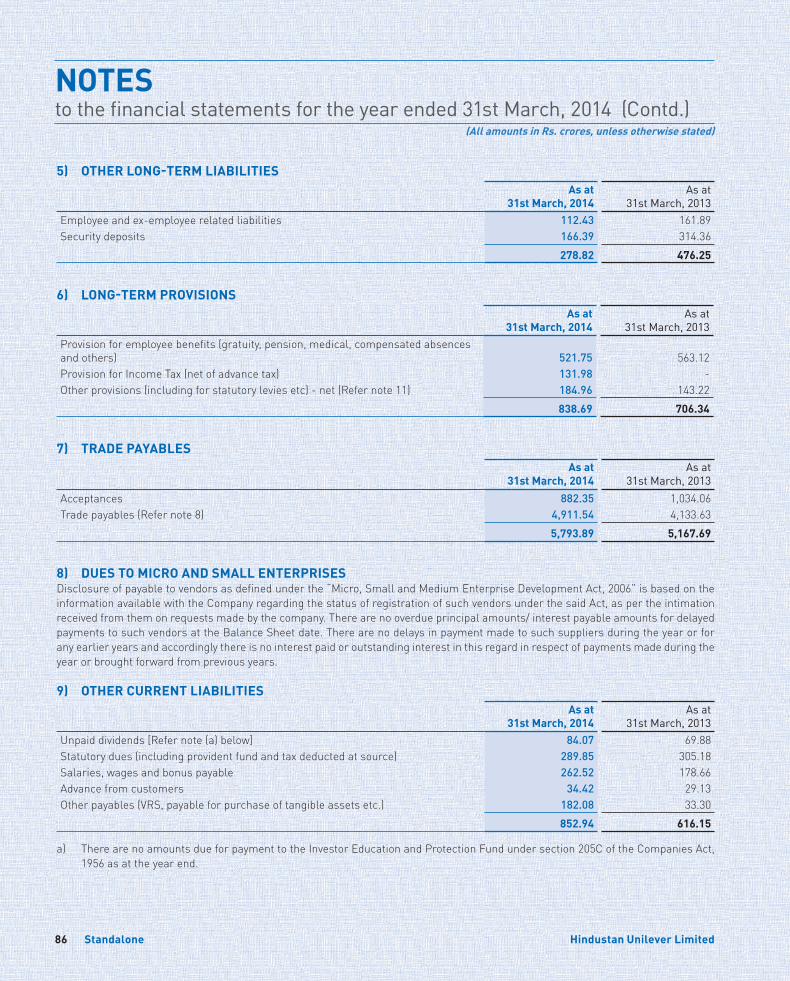
NOTESto the financial statements for the year ended 31st March, 2014 (Contd.)
(All amounts in Rs. crores, unless otherwise stated)
Standalone86 Hindustan Unilever Limited
5) OTHER LONG-TERM LIABILITIESAs at
31st March, 2014As at
31st March, 2013Employee and ex-employee related liabilities 112.43 161.89Security deposits 166.39 314.36
278.82 476.25
6) LONG-TERM PROVISIONSAs at
31st March, 2014As at
31st March, 2013Provision for employee benefits (gratuity, pension, medical, compensated absences and others) 521.75 563.12Provis ion for Income Tax (net of advance tax) 131.98 -Other provisions (including for statutory levies etc) - net (Refer note 11) 184.96 143.22
838.69 706.34
7) TRADE PAYABLESAs at
31st March, 2014As at
31st March, 2013Acceptances 882.35 1,034.06Trade payables (Refer note 8) 4,911.54 4,133.63
5,793.89 5,167.69
8) DUES TO MICRO AND SMALL ENTERPRISES Disclosure of payable to vendors as defined under the “Micro, Small and Medium Enterprise Development Act, 2006” is based on the information available with the Company regarding the status of registration of such vendors under the said Act, as per the intimation received from them on requests made by the company. There are no overdue principal amounts/ interest payable amounts for delayed payments to such vendors at the Balance Sheet date. There are no delays in payment made to such suppliers during the year or for any earlier years and accordingly there is no interest paid or outstanding interest in this regard in respect of payments made during the year or brought forward from previous years.
9) OTHER CURRENT LIABILITIESAs at
31st March, 2014As at
31st March, 2013Unpaid dividends [Refer note (a) below] 84.07 69.88Statutory dues (including provident fund and tax deducted at source) 289.85 305.18Salaries, wages and bonus payable 262.52 178.66Advance from customers 34.42 29.13Other payables (VRS, payable for purchase of tangible assets etc.) 182.08 33.30
852.94 616.15
a) There are no amounts due for payment to the Investor Education and Protection Fund under section 205C of the Companies Act, 1956 as at the year end.
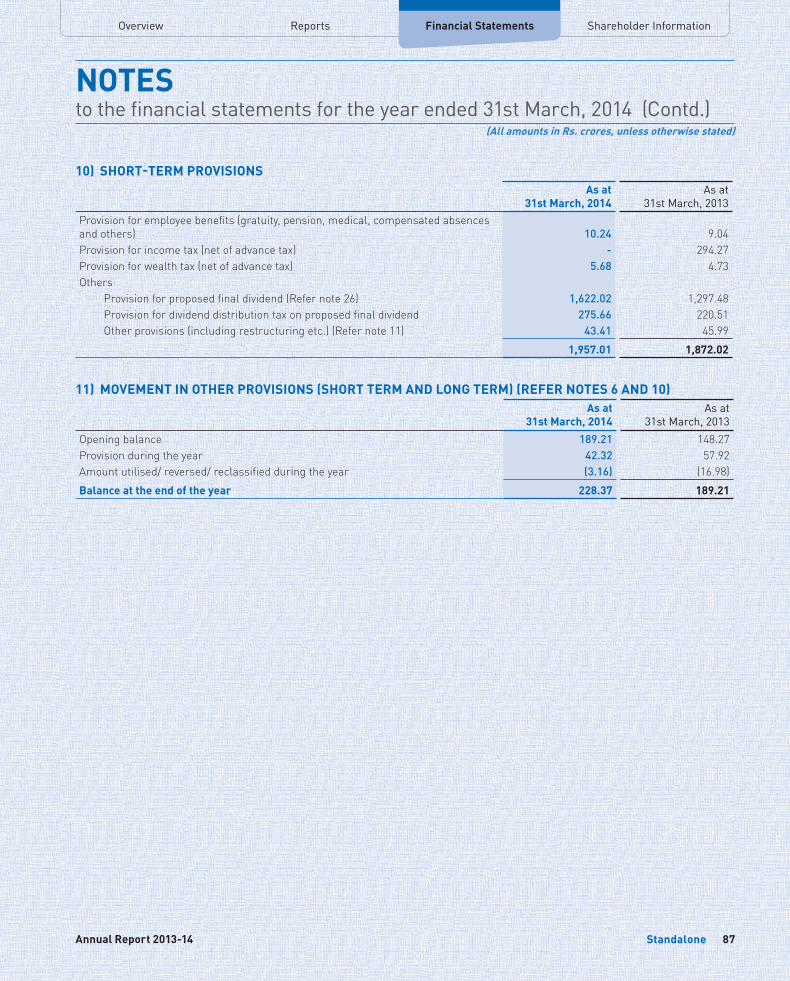
Overview Financial Statements Shareholder InformationReports
NOTESto the financial statements for the year ended 31st March, 2014 (Contd.)
(All amounts in Rs. crores, unless otherwise stated)
Standalone 87Annual Report 2013-14
10) SHORT-TERM PROVISIONSAs at
31st March, 2014As at
31st March, 2013Provision for employee benefits (gratuity, pension, medical, compensated absences and others) 10.24 9.04Provision for income tax (net of advance tax) - 294.27Provision for wealth tax (net of advance tax) 5.68 4.73Others Provision for proposed final dividend (Refer note 26) 1,622.02 1,297.48 Provision for dividend distribution tax on proposed final dividend 275.66 220.51 Other provisions (including restructuring etc.) (Refer note 11) 43.41 45.99
1,957.01 1,872.02
11) MOVEMENT IN OTHER PROVISIONS (SHORT TERM AND LONG TERM) (REFER NOTES 6 AND 10)As at
31st March, 2014As at
31st March, 2013Opening balance 189.21 148.27Provision during the year 42.32 57.92Amount utilised/ reversed/ reclassified during the year (3.16) (16.98)Balance at the end of the year 228.37 189.21
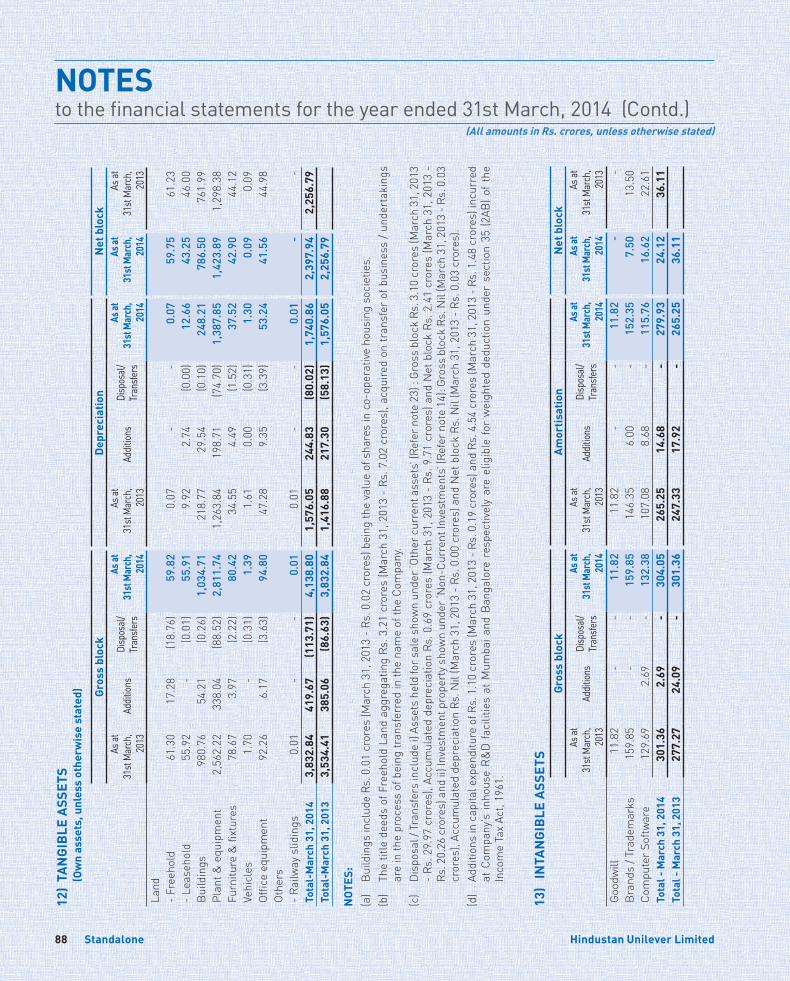
NOTESto the financial statements for the year ended 31st March, 2014 (Contd.)
(All amounts in Rs. crores, unless otherwise stated)
Standalone88 Hindustan Unilever Limited
12)
TAN
GIB
LE A
SSET
S
(Ow
n as
sets
, unl
ess
othe
rwis
e st
ated
) Gros
s bl
ock
Dep
reci
atio
nN
et b
lock
As at
31
st M
arch
, 20
13Ad
ditio
nsDi
spos
al/
Tran
sfers
As at
31
st M
arch
, 20
14
As at
31
st M
arch
, 20
13Ad
ditio
nsDi
spos
al/
Tran
sfers
As at
31
st M
arch
, 20
14
As at
31
st M
arch
, 20
14
As at
31
st M
arch
, 20
13La
nd- F
reeh
old
61.3
017
.28
(18.
76)
59.8
20.
07-
-0.
0759
.75
61.2
3- L
ease
hold
55.9
2-
(0.0
1)55
.91
9.92
2.74
(0.0
0)12
.66
43.2
546
.00
Build
ings
980.
7654
.21
(0.2
6)1,
034.
7121
8.77
29.5
4(0
.10)
248.
2178
6.50
761.
99Pl
ant &
equ
ipm
ent
2,56
2.22
338.
04(8
8.52
)2,
811.
741,
263.
8419
8.71
(74.
70)
1,38
7.85
1,42
3.89
1,29
8.38
Furn
iture
& fi
xtur
es78
.67
3.97
(2.2
2)80
.42
34.5
54.
49(1
.52)
37.5
242
.90
44.1
2Ve
hicl
es1.
70-
(0.3
1)1.
391.
610.
00(0
.31)
1.30
0.09
0.09
Offic
e eq
uipm
ent
92.2
66.
17(3
.63)
94.8
047
.28
9.35
(3.3
9)53
.24
41.5
644
.98
Othe
rs- R
ailw
ay s
lidin
gs0.
01-
-0.
010.
01-
-0.
01-
-To
tal-
Mar
ch 3
1, 2
014
3,83
2.84
419.
67(1
13.7
1)4,
138.
801,
576.
0524
4.83
(80.
02)
1,74
0.86
2,39
7.94
2,25
6.79
Tota
l-M
arch
31,
201
33,
534.
4138
5.06
(86.
63)
3,83
2.84
1,41
6.88
217.
30(5
8.13
)1,
576.
052,
256.
79
NOT
ES:
(a)
Build
ings
incl
ude
Rs. 0
.01
cror
es (M
arch
31,
201
3 - R
s. 0
.02
cror
es) b
eing
the
valu
e of
sha
res
in c
o-op
erat
ive h
ousi
ng s
ocie
ties.
(b)
The
title
dee
ds o
f Fre
ehol
d La
nd a
ggre
gatin
g Rs
. 3.2
1 cr
ores
(Mar
ch 3
1, 2
013
- Rs
. 7.0
2 cr
ores
), ac
quire
d on
tran
sfer
of b
usin
ess
/ und
erta
king
s ar
e in
the
proc
ess
of b
eing
tran
sfer
red
in th
e na
me
of th
e Co
mpa
ny.
(c)
Disp
osal
/ Tr
ansf
ers
incl
ude
i) As
sets
hel
d fo
r sal
e sh
own
unde
r ‘Ot
her c
urre
nt a
sset
s’ (R
efer
not
e 23
) : G
ross
blo
ck R
s. 3
.10
cror
es (M
arch
31,
201
3 -
Rs. 2
9.97
cro
res)
, Acc
umul
ated
dep
reci
atio
n Rs
. 0.6
9 cr
ores
(Mar
ch 3
1, 2
013
- Rs
. 9.7
1 cr
ores
) and
Net
blo
ck R
s. 2
.41
cror
es (M
arch
31,
201
3 -
Rs. 2
0.26
cro
res)
and
ii) I
nves
tmen
t pro
pert
y sho
wn
unde
r ‘N
on-C
urre
nt In
vest
men
ts’ (
Refe
r not
e 14
): Gr
oss
bloc
k Rs
. Nil
(Mar
ch 3
1, 2
013
- Rs.
0.0
3 cr
ores
), Ac
cum
ulat
ed d
epre
ciat
ion
Rs. N
il (M
arch
31,
201
3 - R
s. 0
.00
cror
es) a
nd N
et b
lock
Rs.
Nil
(Mar
ch 3
1, 2
013
- Rs.
0.0
3 cr
ores
).(d
) Ad
ditio
ns in
cap
ital e
xpen
ditu
re o
f Rs.
1.1
0 cr
ores
(Mar
ch 3
1, 2
013
- Rs.
0.1
9 cr
ores
) and
Rs.
4.5
4 cr
ores
(Mar
ch 3
1, 2
013
- Rs.
1.4
8 cr
ores
) inc
urre
d at
Com
pany
’s in
hous
e R&
D fa
cilit
ies
at M
umba
i and
Ban
galo
re r
espe
ctive
ly a
re e
ligib
le fo
r w
eigh
ted
dedu
ctio
n un
der
sect
ion
35 (2
AB) o
f the
In
com
e Ta
x Ac
t, 19
61.
13)
INTA
NG
IBLE
ASS
ETS
Gros
s bl
ock
Amor
tisat
ion
Net
blo
ckAs
at
31st
Mar
ch,
2013
Addi
tions
Disp
osal
/Tr
ansfe
rs
As at
31
st M
arch
, 20
14
As at
31
st M
arch
, 20
13Ad
ditio
nsDi
spos
al/
Tran
sfers
As at
31
st M
arch
, 20
14
As at
31
st M
arch
, 20
14
As at
31
st M
arch
, 20
13Go
odw
ill 1
1.82
- -
11.
82 1
1.82
- -
11.
82 -
-Br
ands
/ Tr
adem
arks
159
.85
- -
159
.85
146
.35
6.0
0 -
152
.35
7.5
0 1
3.50
Com
pute
r Sof
twar
e 1
29.6
9 2
.69
- 1
32.3
8 1
07.0
8 8
.68
- 1
15.7
6 1
6.62
22.
61To
tal -
Mar
ch 3
1, 2
014
301
.36
2.6
9 -
304
.05
265
.25
14.
68 -
279
.93
24.
12 3
6.11
Tota
l - M
arch
31,
201
3 2
77.2
7 2
4.09
- 3
01.3
6 2
47.3
3 1
7.92
- 2
65.2
5 3
6.11
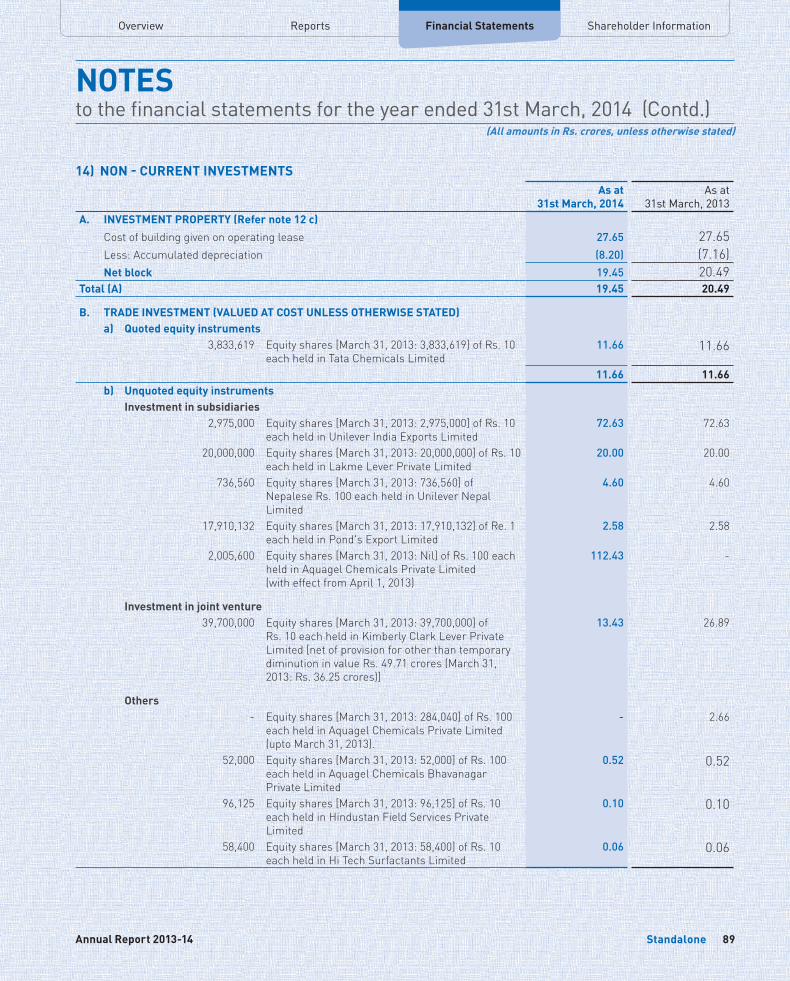
Overview Financial Statements Shareholder InformationReports
NOTESto the financial statements for the year ended 31st March, 2014 (Contd.)
(All amounts in Rs. crores, unless otherwise stated)
Standalone 89Annual Report 2013-14
14) NON - CURRENT INVESTMENTSAs at
31st March, 2014As at
31st March, 2013A. INVESTMENT PROPERTY (Refer note 12 c) Cost of building given on operating lease 27.65 27.65 Less: Accumulated depreciation (8.20) (7.16) Net block 19.45 20.49Total (A) 19.45 20.49
B. TRADE INVESTMENT (VALUED AT COST UNLESS OTHERWISE STATED) a) Quoted equity instruments
3,833,619 Equity shares [March 31, 2013: 3,833,619] of Rs. 10 each held in Tata Chemicals Limited
11.66 11.66
11.66 11.66 b) Unquoted equity instruments Investment in subsidiaries
2,975,000 Equity shares [March 31, 2013: 2,975,000] of Rs. 10 each held in Unilever India Exports Limited
72.63 72.63
20,000,000 Equity shares [March 31, 2013: 20,000,000] of Rs. 10 each held in Lakme Lever Private Limited
20.00 20.00
736,560 Equity shares [March 31, 2013: 736,560] of Nepalese Rs. 100 each held in Unilever Nepal Limited
4.60 4.60
17,910,132 Equity shares [March 31, 2013: 17,910,132] of Re. 1 each held in Pond's Export Limited
2.58 2.58
2,005,600 Equity shares [March 31, 2013: Nil] of Rs. 100 each held in Aquagel Chemicals Private Limited(with effect from April 1, 2013)
112.43 -
Investment in joint venture 39,700,000 Equity shares [March 31, 2013: 39,700,000] of
Rs. 10 each held in Kimberly Clark Lever Private Limited [net of provision for other than temporary diminution in value Rs. 49.71 crores (March 31, 2013: Rs. 36.25 crores)]
13.43 26.89
Others - Equity shares [March 31, 2013: 284,040] of Rs. 100
each held in Aquagel Chemicals Private Limited (upto March 31, 2013).
- 2.66
52,000 Equity shares [March 31, 2013: 52,000] of Rs. 100 each held in Aquagel Chemicals Bhavanagar Private Limited
0.52 0.52
96,125 Equity shares [March 31, 2013: 96,125] of Rs. 10 each held in Hindustan Field Services Private Limited
0.10 0.10
58,400 Equity shares [March 31, 2013: 58,400] of Rs. 10 each held in Hi Tech Surfactants Limited
0.06 0.06
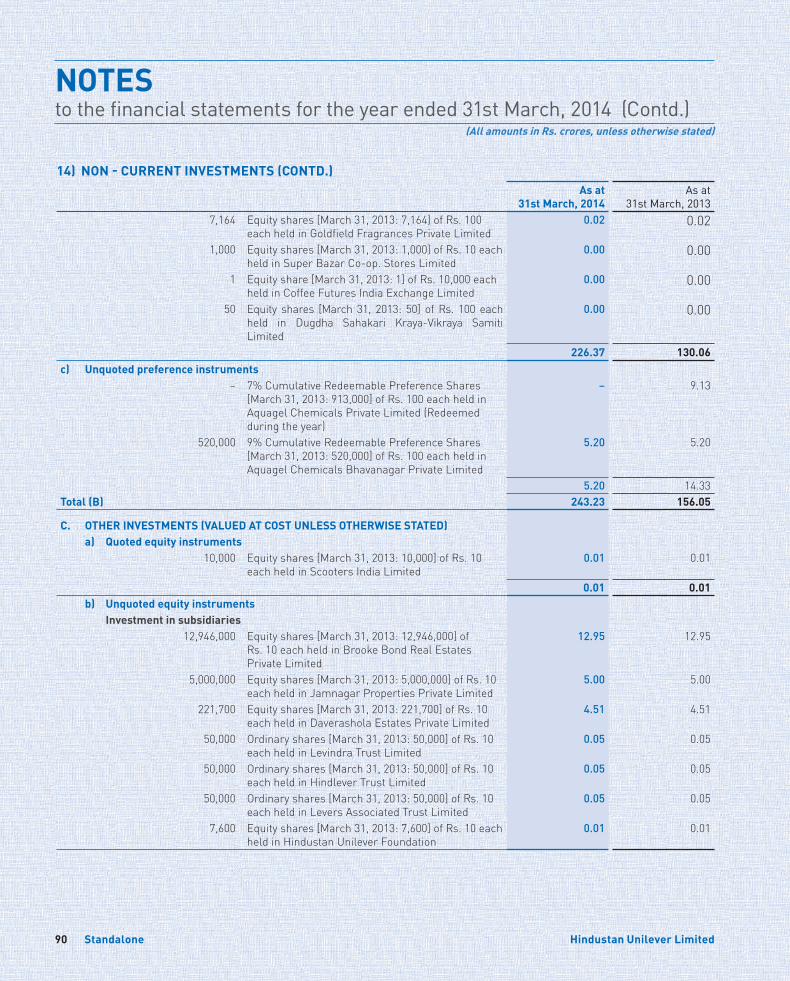
NOTESto the financial statements for the year ended 31st March, 2014 (Contd.)
(All amounts in Rs. crores, unless otherwise stated)
Standalone90 Hindustan Unilever Limited
As at 31st March, 2014
As at 31st March, 2013
7,164 Equity shares [March 31, 2013: 7,164] of Rs. 100 each held in Goldfield Fragrances Private Limited
0.02 0.02
1,000 Equity shares [March 31, 2013: 1,000] of Rs. 10 each held in Super Bazar Co-op. Stores Limited
0.00 0.00
1 Equity share [March 31, 2013: 1] of Rs. 10,000 each held in Coffee Futures India Exchange Limited
0.00 0.00
50 Equity shares [March 31, 2013: 50] of Rs. 100 each held in Dugdha Sahakari Kraya-Vikraya Samiti Limited
0.00 0.00
226.37 130.06c) Unquoted preference instruments
– 7% Cumulative Redeemable Preference Shares [March 31, 2013: 913,000] of Rs. 100 each held in Aquagel Chemicals Private Limited (Redeemed during the year)
– 9.13
520,000 9% Cumulative Redeemable Preference Shares [March 31, 2013: 520,000] of Rs. 100 each held in Aquagel Chemicals Bhavanagar Private Limited
5.20 5.20
5.20 14.33Total (B) 243.23 156.05
C. OTHER INVESTMENTS (VALUED AT COST UNLESS OTHERWISE STATED) a) Quoted equity instruments
10,000 Equity shares [March 31, 2013: 10,000] of Rs. 10 each held in Scooters India Limited
0.01 0.01
0.01 0.01 b) Unquoted equity instruments Investment in subsidiaries
12,946,000 Equity shares [March 31, 2013: 12,946,000] of Rs. 10 each held in Brooke Bond Real Estates Private Limited
12.95 12.95
5,000,000 Equity shares [March 31, 2013: 5,000,000] of Rs. 10 each held in Jamnagar Properties Private Limited
5.00 5.00
221,700 Equity shares [March 31, 2013: 221,700] of Rs. 10 each held in Daverashola Estates Private Limited
4.51 4.51
50,000 Ordinary shares [March 31, 2013: 50,000] of Rs. 10 each held in Levindra Trust Limited
0.05 0.05
50,000 Ordinary shares [March 31, 2013: 50,000] of Rs. 10 each held in Hindlever Trust Limited
0.05 0.05
50,000 Ordinary shares [March 31, 2013: 50,000] of Rs. 10 each held in Levers Associated Trust Limited
0.05 0.05
7,600 Equity shares [March 31, 2013: 7,600] of Rs. 10 each held in Hindustan Unilever Foundation
0.01 0.01
14) NON - CURRENT INVESTMENTS (CONTD.)
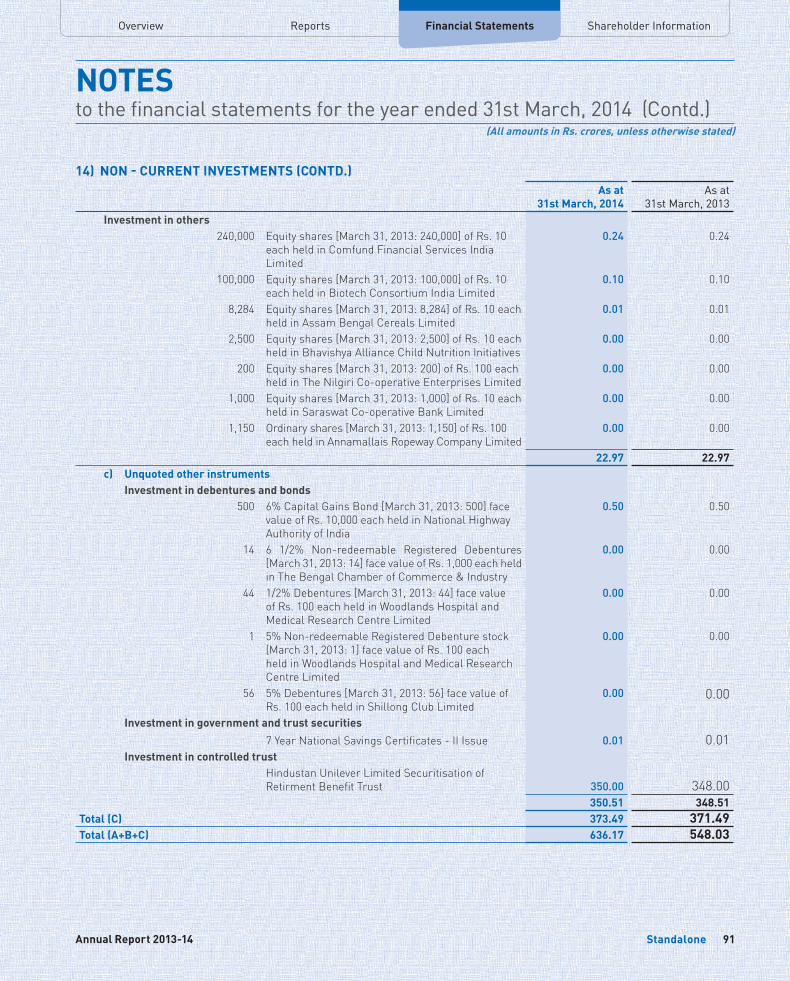
Overview Financial Statements Shareholder InformationReports
NOTESto the financial statements for the year ended 31st March, 2014 (Contd.)
(All amounts in Rs. crores, unless otherwise stated)
Standalone 91Annual Report 2013-14
As at 31st March, 2014
As at 31st March, 2013
Investment in others 240,000 Equity shares [March 31, 2013: 240,000] of Rs. 10
each held in Comfund Financial Services India Limited
0.24 0.24
100,000 Equity shares [March 31, 2013: 100,000] of Rs. 10 each held in Biotech Consortium India Limited
0.10 0.10
8,284 Equity shares [March 31, 2013: 8,284] of Rs. 10 each held in Assam Bengal Cereals Limited
0.01 0.01
2,500 Equity shares [March 31, 2013: 2,500] of Rs. 10 each held in Bhavishya Alliance Child Nutrition Initiatives
0.00 0.00
200 Equity shares [March 31, 2013: 200] of Rs. 100 each held in The Nilgiri Co-operative Enterprises Limited
0.00 0.00
1,000 Equity shares [March 31, 2013: 1,000] of Rs. 10 each held in Saraswat Co-operative Bank Limited
0.00 0.00
1,150 Ordinary shares [March 31, 2013: 1,150] of Rs. 100 each held in Annamallais Ropeway Company Limited
0.00 0.00
22.97 22.97 c) Unquoted other instruments Investment in debentures and bonds
500 6% Capital Gains Bond [March 31, 2013: 500] face value of Rs. 10,000 each held in National Highway Authority of India
0.50 0.50
14 6 1/2% Non-redeemable Registered Debentures [March 31, 2013: 14] face value of Rs. 1,000 each held in The Bengal Chamber of Commerce & Industry
0.00 0.00
44 1/2% Debentures [March 31, 2013: 44] face value of Rs. 100 each held in Woodlands Hospital and Medical Research Centre Limited
0.00 0.00
1 5% Non-redeemable Registered Debenture stock [March 31, 2013: 1] face value of Rs. 100 each held in Woodlands Hospital and Medical Research Centre Limited
0.00 0.00
56 5% Debentures [March 31, 2013: 56] face value of Rs. 100 each held in Shillong Club Limited
0.00 0.00
Investment in government and trust securities7 Year National Savings Certificates - II Issue 0.01 0.01
Investment in controlled trustHindustan Unilever Limited Securitisation of Retirment Benefit Trust 350.00 348.00
350.51 348.51Total (C) 373.49 371.49Total (A+B+C) 636.17 548.03
14) NON - CURRENT INVESTMENTS (CONTD.)
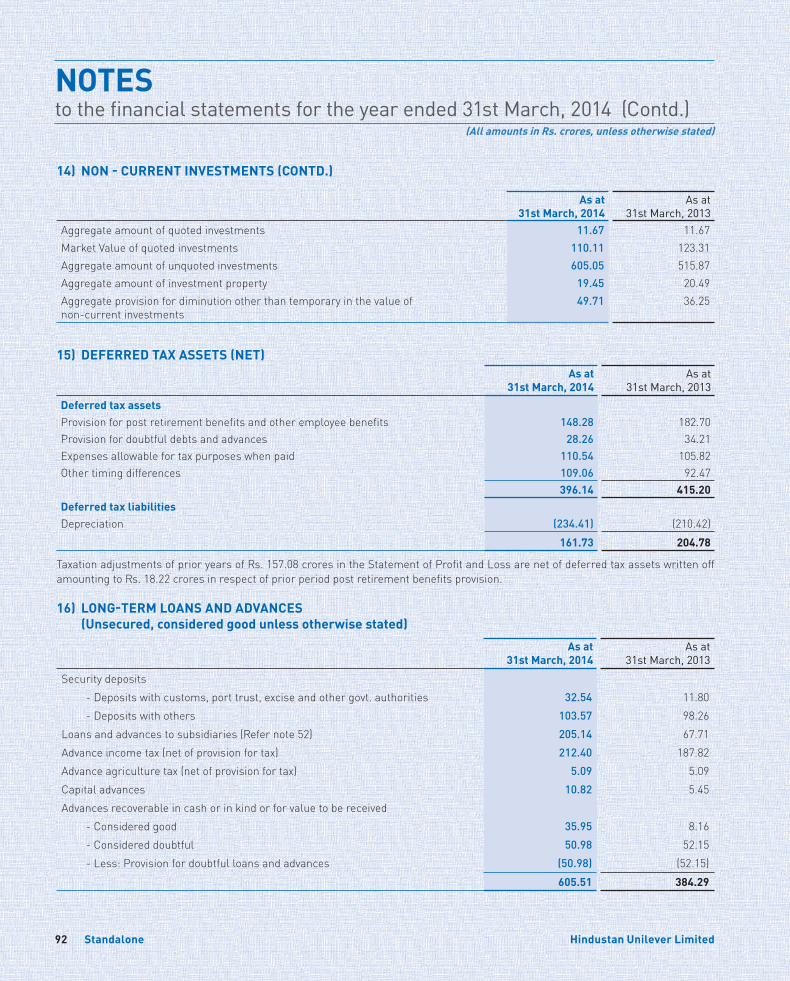
NOTESto the financial statements for the year ended 31st March, 2014 (Contd.)
(All amounts in Rs. crores, unless otherwise stated)
Standalone92 Hindustan Unilever Limited
As at 31st March, 2014
As at 31st March, 2013
Aggregate amount of quoted investments 11.67 11.67Market Value of quoted investments 110.11 123.31Aggregate amount of unquoted investments 605.05 515.87Aggregate amount of investment property 19.45 20.49Aggregate provision for diminution other than temporary in the value of non-current investments
49.71 36.25
15) DEFERRED TAX ASSETS (NET)As at
31st March, 2014As at
31st March, 2013Deferred tax assetsProvision for post retirement benefits and other employee benefits 148.28 182.70Provision for doubtful debts and advances 28.26 34.21Expenses allowable for tax purposes when paid 110.54 105.82Other timing differences 109.06 92.47
396.14 415.20Deferred tax liabilitiesDepreciation (234.41) (210.42)
161.73 204.78
Taxation adjustments of prior years of Rs. 157.08 crores in the Statement of Profit and Loss are net of deferred tax assets written off amounting to Rs. 18.22 crores in respect of prior period post retirement benefits provision.
16) LONG-TERM LOANS AND ADVANCES (Unsecured, considered good unless otherwise stated)
As at 31st March, 2014
As at 31st March, 2013
Security deposits - Deposits with customs, port trust, excise and other govt. authorities 32.54 11.80 - Deposits with others 103.57 98.26Loans and advances to subsidiaries (Refer note 52) 205.14 67.71Advance income tax (net of provision for tax) 212.40 187.82Advance agriculture tax (net of provision for tax) 5.09 5.09Capital advances 10.82 5.45Advances recoverable in cash or in kind or for value to be received - Considered good 35.95 8.16 - Considered doubtful 50.98 52.15 - Less: Provision for doubtful loans and advances (50.98) (52.15)
605.51 384.29
14) NON - CURRENT INVESTMENTS (CONTD.)
Overview Financial Statements Shareholder InformationReports
NOTESto the financial statements for the year ended 31st March, 2014 (Contd.)
(All amounts in Rs. crores, unless otherwise stated)
Standalone 93Annual Report 2013-14
17) OTHER NON-CURRENT ASSETSAs at
31st March, 2014As at
31st March, 2013Long term deposits with banks with original maturity of more than twelve months 0.68 296.84
0.68 296.84
18) CURRENT INVESTMENTS (with original maturity between 3 months and 12 months) (At cost or market value, whichever is less)
As at 31st March, 2014
As at 31st March, 2013
QuotedGovernment securities
Treasury bills of face value aggregating Rs. 1,776.44 crores (March 31, 2013 - Rs. 251.99 crores)
1,707.95 243.98
Certificates of depositICICI Bank of the face value of Rs. Nil (March 31, 2013 - Rs. 40 crores)
- 38.65
Mutual FundsICICI Prudential Mutual Fund-Units ICICI Prudential Liquid - Super IP - Growth - Nil units (March 31, 2013: 41,016,140 units)
- 650.00
UTI Mutual Fund - Units UTI Liquid Fund - Cash Plan - IP - Growth - Nil units (March 31, 2013: 568,421 units)
- 100.00
UTI Mutual Fund - Units UTI Liquid Fund - Cash Plan - Direct - Growth - 2,618,552 units. (March 31, 2013: 2,082,207 units)
550.00 400.00
Birla Sun Life Cash Plus - Growth Direct Plan - Nil units (March 31, 2013: 186,51,959 units)
- 350.00
DWS Insta Cash Plus Fund - Direct Plan - Growth - 12,019,029 units (March 31, 2013: Nil units)
200.00 -
2,457.95 1,782.63
Aggregate amount of quoted investments 2,457.95 1,782.63
Market value of quoted investments 2,482.54 1,859.47
19) INVENTORIES (At the lower of cost and net realisable value)
As at 31st March, 2014
As at 31st March, 2013
Raw materials [includes in transit: Rs. 46.21 crores, (March 31, 2013: Rs. 17.50 crores)] 885.04 819.70Packing materials 126.98 133.11Work-in-progress (Refer note 40) 318.34 226.96Finished goods [includes in transit: Rs. 51.20 crores (March 31, 2013: Rs. 46.70 crores)] (Refer note 39)
1,344.83 1,280.66
Stores and spares 72.34 66.56 2,747.53 2,526.99
Finished goods include stock-in-trade, as both are stocked together
NOTESto the financial statements for the year ended 31st March, 2014 (Contd.)
(All amounts in Rs. crores, unless otherwise stated)
Standalone94 Hindustan Unilever Limited
20) TRADE RECEIVABLES (Unsecured unless otherwise stated)
As at 31st March, 2014
As at 31st March, 2013
Considered good Outstanding for a period exceeding six months from the date they are due for payment 34.80 22.69 Others 781.63 810.79Considered doubtful Outstanding for a period exceeding six months from the date they are due for payment 36.13 53.31 Less: Provision for doubtful debts (36.13) (53.31)
816.43 833.48
21) CASH AND BANK BALANCESAs at
31st March, 2014As at
31st March, 2013A. Cash and cash equivalents
Cash on hand 1.42 1.17 Balances with banks
In current accounts 34.50 43.17 Term deposits with original maturity of less than three months 417.02 282.07
Short term, highly liquid investments Treasury bills with original maturity of less than three months 167.67 -
Total (A) 620.61 326.41B. Other bank balances
Term deposit with original maturity of more than three months but less than twelve months [including lien and margin money deposits Rs. 2.69 crores (March 31, 2013: Rs. 1.39 crores)]
1,219.97 1,311.60
Long term deposit with maturity of more than three months but less than twelve months from the balance sheet date
296.32 -
Unpaid dividend account 84.07 69.88Total (B) 1,600.36 1,381.48
Total (A+B) 2,220.97 1,707.89
22) SHORT-TERM LOANS AND ADVANCES (Unsecured, considered good unless otherwise stated)
As at 31st March, 2014
As at 31st March, 2013
Current account balances with group companies and joint venture 96.05 105.61Advances recoverable in cash or in kind or for value to be received 273.49 408.86Others loans and advances CENVAT receivable 124.08 97.83 VAT credit receivable 44.06 35.96
537.68 648.26
Overview Financial Statements Shareholder InformationReports
NOTESto the financial statements for the year ended 31st March, 2014 (Contd.)
(All amounts in Rs. crores, unless otherwise stated)
Standalone 95Annual Report 2013-14
23) OTHER CURRENT ASSETS (Unsecured, considered good unless otherwise stated)
As at 31st March, 2014
As at 31st March, 2013
Income accrued on investments 0.04 4.10 Income accrued on deposits 58.31 42.86 Tangible assets held for sale (at lower of cost and net realisable value) (Refer note 12 c) 13.56 23.78
71.91 70.74
24) CONTINGENT LIABILITIES As at
31st March, 2014As at
31st March, 2013
Claims against the company not acknowledged as debts
Income tax matters 545.90 468.56 Sales tax matters - Rs. 52.84 crores (March 31, 2013 - Rs. 51.72 crores) net of tax 80.05 78.35 Excise duty, service tax and customs duty matters - Rs. 132.61 crores (March
31, 2013 - Rs. 93.71 crores) net of tax 200.89 141.96
Other matters including claims related to employees/ ex-employees, property related demands, etc - Rs. 45.74 crores (March 31, 2013 - Rs. 52.81 crores) net of tax
69.29 80.00
(a) It is not practicable for the company to estimate the timings of cash outflows, if any, in respect of the above pending resolution of the respective proceedings.
(b) The company does not expect any reimbursements in respect of the above contingent liabilities.
(c) Future cash outflows in respect of the above are determinable only on receipt of judgements/ decisions pending with various forums/ authorities.
25) CAPITAL AND OTHER COMMITMENTSAs at
31st March, 2014As at
31st March, 2013(a) Capital commitments Estimated value of contracts in capital account remaining to be executed and
not provided for (net of capital advances) 95.07 125.34
(b) Other commitments During the year, the company has issued letters of undertakings to provide need
based financial support to its following wholly owned subsidiaries: a) Brooke Bond Real Estate Private Limited b) Lakme Lever Private Limited c) Daverashola Estates Private Limited d) Jamnagar Properties Private Limited e) Aquagel Chemicals Private Limited f) Pond’s Exports Limited
95.07 125.34
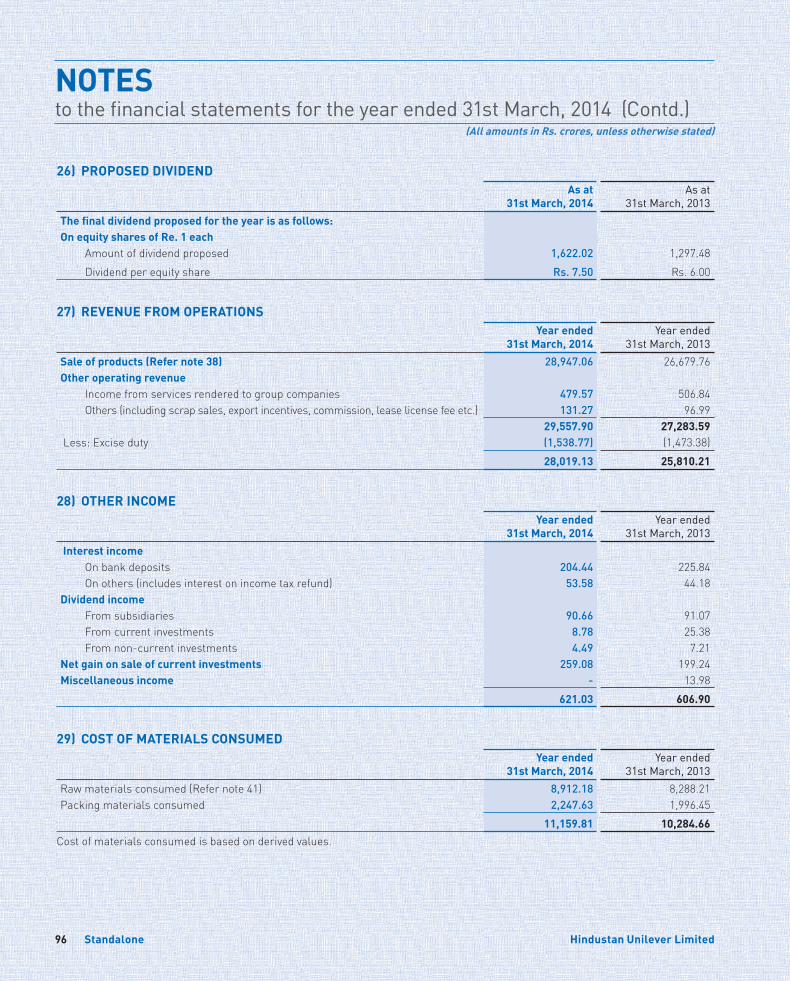
NOTESto the financial statements for the year ended 31st March, 2014 (Contd.)
(All amounts in Rs. crores, unless otherwise stated)
Standalone96 Hindustan Unilever Limited
26) PROPOSED DIVIDENDAs at
31st March, 2014As at
31st March, 2013The final dividend proposed for the year is as follows:On equity shares of Re. 1 each Amount of dividend proposed 1,622.02 1,297.48 Dividend per equity share Rs. 7.50 Rs. 6.00
27) REVENUE FROM OPERATIONSYear ended
31st March, 2014Year ended
31st March, 2013Sale of products (Refer note 38) 28,947.06 26,679.76Other operating revenue Income from services rendered to group companies 479.57 506.84 Others (including scrap sales, export incentives, commission, lease license fee etc.) 131.27 96.99
29,557.90 27,283.59 Less: Excise duty (1,538.77) (1,473.38)
28,019.13 25,810.21
28) OTHER INCOMEYear ended
31st March, 2014Year ended
31st March, 2013 Interest income On bank deposits 204.44 225.84 On others (includes interest on income tax refund) 53.58 44.18Dividend income From subsidiaries 90.66 91.07 From current investments 8.78 25.38 From non-current investments 4.49 7.21Net gain on sale of current investments 259.08 199.24Miscellaneous income - 13.98
621.03 606.90
29) COST OF MATERIALS CONSUMEDYear ended
31st March, 2014Year ended
31st March, 2013Raw materials consumed (Refer note 41) 8,912.18 8,288.21Packing materials consumed 2,247.63 1,996.45
11,159.81 10,284.66Cost of materials consumed is based on derived values.
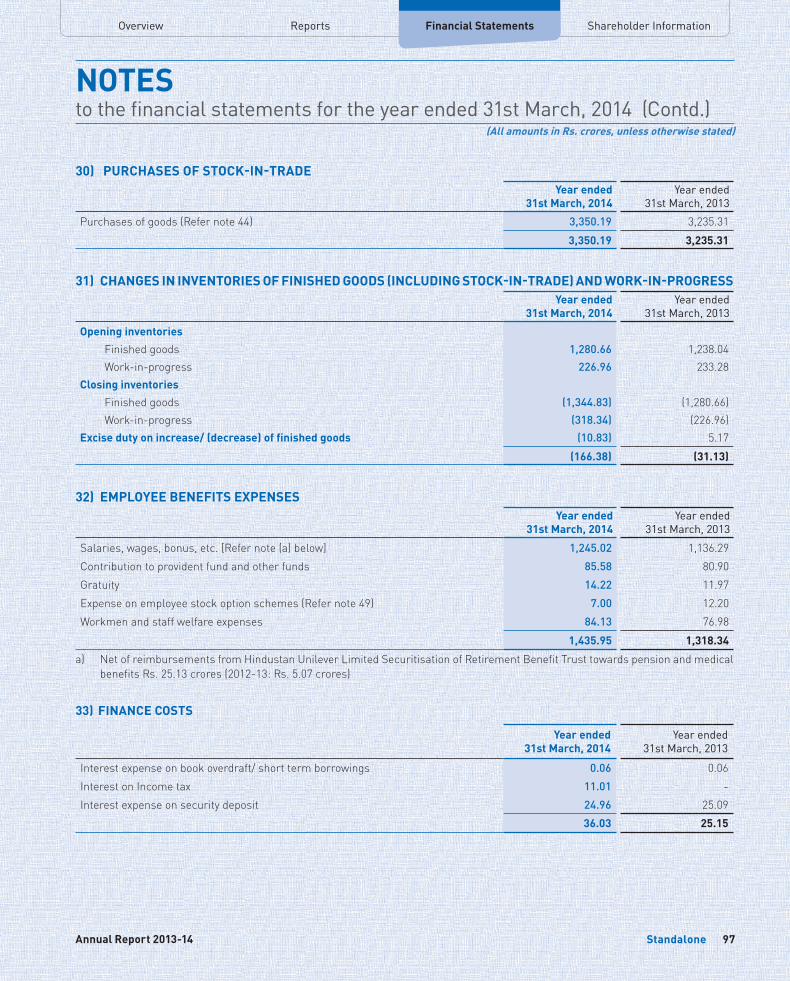
Overview Financial Statements Shareholder InformationReports
NOTESto the financial statements for the year ended 31st March, 2014 (Contd.)
(All amounts in Rs. crores, unless otherwise stated)
Standalone 97Annual Report 2013-14
30) PURCHASES OF STOCK-IN-TRADEYear ended
31st March, 2014Year ended
31st March, 2013
Purchases of goods (Refer note 44) 3,350.19 3,235.313,350.19 3,235.31
31) CHANGES IN INVENTORIES OF FINISHED GOODS (INCLUDING STOCK-IN-TRADE) AND WORK-IN-PROGRESSYear ended
31st March, 2014Year ended
31st March, 2013
Opening inventories Finished goods 1,280.66 1,238.04 Work-in-progress 226.96 233.28Closing inventories Finished goods (1,344.83) (1,280.66) Work-in-progress (318.34) (226.96)Excise duty on increase/ (decrease) of finished goods (10.83) 5.17
(166.38) (31.13)
32) EMPLOYEE BENEFITS EXPENSESYear ended
31st March, 2014Year ended
31st March, 2013
Salaries, wages, bonus, etc. [Refer note (a) below] 1,245.02 1,136.29Contribution to provident fund and other funds 85.58 80.90Gratuity 14.22 11.97Expense on employee stock option schemes (Refer note 49) 7.00 12.20Workmen and staff welfare expenses 84.13 76.98
1,435.95 1,318.34
a) Net of reimbursements from Hindustan Unilever Limited Securitisation of Retirement Benefit Trust towards pension and medical benefits Rs. 25.13 crores (2012-13: Rs. 5.07 crores)
33) FINANCE COSTS
Year ended 31st March, 2014
Year ended 31st March, 2013
Interest expense on book overdraft/ short term borrowings 0.06 0.06 Interest on Income tax 11.01 - Interest expense on security deposit 24.96 25.09
36.03 25.15
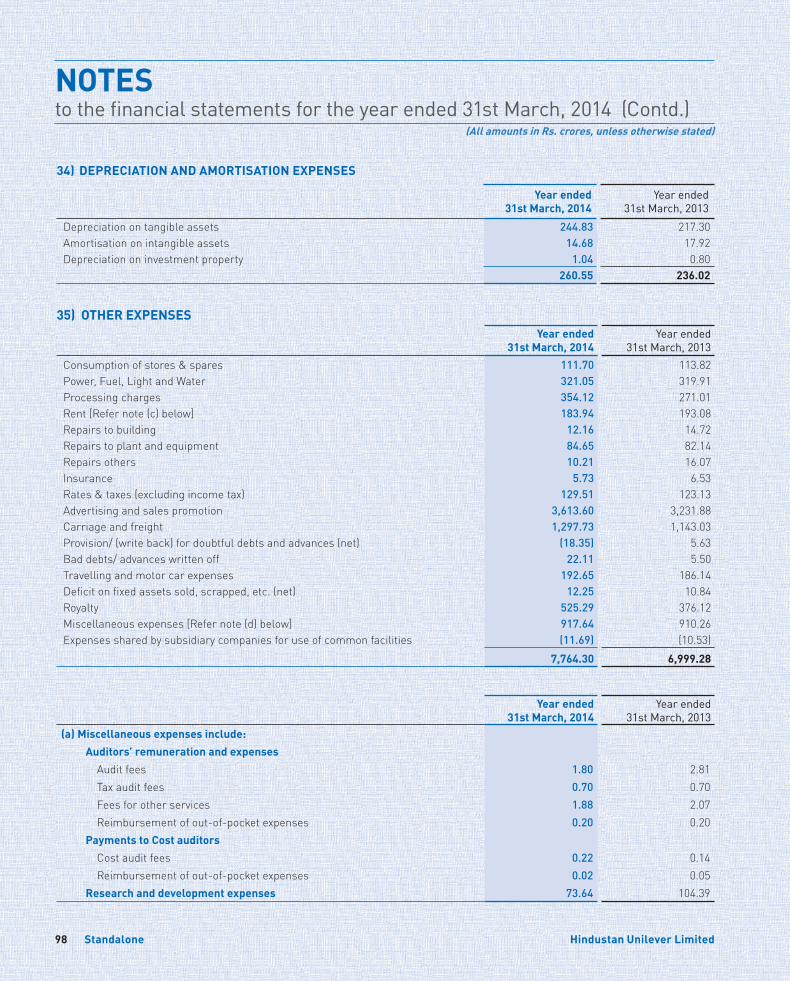
NOTESto the financial statements for the year ended 31st March, 2014 (Contd.)
(All amounts in Rs. crores, unless otherwise stated)
Standalone98 Hindustan Unilever Limited
34) DEPRECIATION AND AMORTISATION EXPENSES
Year ended 31st March, 2014
Year ended 31st March, 2013
Depreciation on tangible assets 244.83 217.30 Amortisation on intangible assets 14.68 17.92 Depreciation on investment property 1.04 0.80
260.55 236.02
35) OTHER EXPENSES Year ended
31st March, 2014Year ended
31st March, 2013 Consumption of stores & spares 111.70 113.82 Power, Fuel, Light and Water 321.05 319.91 Processing charges 354.12 271.01 Rent [Refer note (c) below] 183.94 193.08 Repairs to building 12.16 14.72 Repairs to plant and equipment 84.65 82.14 Repairs others 10.21 16.07 Insurance 5.73 6.53 Rates & taxes (excluding income tax) 129.51 123.13 Advertising and sales promotion 3,613.60 3,231.88 Carriage and freight 1,297.73 1,143.03 Provision/ (write back) for doubtful debts and advances (net) (18.35) 5.63 Bad debts/ advances written off 22.11 5.50 Travelling and motor car expenses 192.65 186.14 Deficit on fixed assets sold, scrapped, etc. (net) 12.25 10.84 Royalty 525.29 376.12 Miscellaneous expenses [Refer note (d) below] 917.64 910.26 Expenses shared by subsidiary companies for use of common facilities (11.69) (10.53)
7,764.30 6,999.28
Year ended 31st March, 2014
Year ended 31st March, 2013
(a) Miscellaneous expenses include: Auditors’ remuneration and expenses Audit fees 1.80 2.81 Tax audit fees 0.70 0.70 Fees for other services 1.88 2.07 Reimbursement of out-of-pocket expenses 0.20 0.20 Payments to Cost auditors Cost audit fees 0.22 0.14 Reimbursement of out-of-pocket expenses 0.02 0.05 Research and development expenses 73.64 104.39
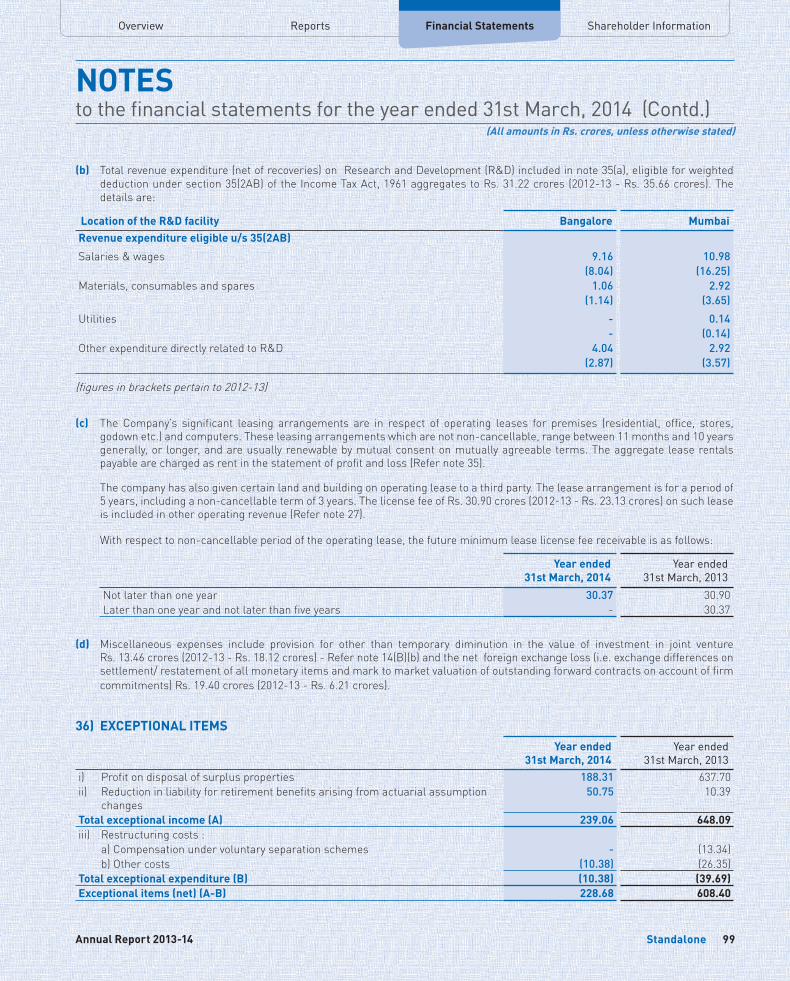
Overview Financial Statements Shareholder InformationReports
NOTESto the financial statements for the year ended 31st March, 2014 (Contd.)
(All amounts in Rs. crores, unless otherwise stated)
Standalone 99Annual Report 2013-14
(b) Total revenue expenditure (net of recoveries) on Research and Development (R&D) included in note 35(a), eligible for weighted deduction under section 35(2AB) of the Income Tax Act, 1961 aggregates to Rs. 31.22 crores (2012-13 - Rs. 35.66 crores). The details are:
Location of the R&D facility Bangalore MumbaiRevenue expenditure eligible u/s 35(2AB)
Salaries & wages 9.16 10.98 (8.04) (16.25)
Materials, consumables and spares 1.06 2.92 (1.14) (3.65)
Utilities - 0.14 - (0.14)
Other expenditure directly related to R&D 4.04 2.92 (2.87) (3.57)
(figures in brackets pertain to 2012-13)
(c) The Company’s significant leasing arrangements are in respect of operating leases for premises (residential, office, stores, godown etc.) and computers. These leasing arrangements which are not non-cancellable, range between 11 months and 10 years generally, or longer, and are usually renewable by mutual consent on mutually agreeable terms. The aggregate lease rentals payable are charged as rent in the statement of profit and loss (Refer note 35).
The company has also given certain land and building on operating lease to a third party. The lease arrangement is for a period of 5 years, including a non-cancellable term of 3 years. The license fee of Rs. 30.90 crores (2012-13 - Rs. 23.13 crores) on such lease is included in other operating revenue (Refer note 27).
With respect to non-cancellable period of the operating lease, the future minimum lease license fee receivable is as follows:
Year ended 31st March, 2014
Year ended 31st March, 2013
Not later than one year 30.37 30.90 Later than one year and not later than five years - 30.37
(d) Miscellaneous expenses include provision for other than temporary diminution in the value of investment in joint venture Rs. 13.46 crores (2012-13 - Rs. 18.12 crores) - Refer note 14(B)(b) and the net foreign exchange loss (i.e. exchange differences on settlement/ restatement of all monetary items and mark to market valuation of outstanding forward contracts on account of firm commitments) Rs. 19.40 crores (2012-13 - Rs. 6.21 crores).
36) EXCEPTIONAL ITEMSYear ended
31st March, 2014Year ended
31st March, 2013i) Profit on disposal of surplus properties 188.31 637.70 ii) Reduction in liability for retirement benefits arising from actuarial assumption
changes 50.75 10.39
Total exceptional income (A) 239.06 648.09 iii) Restructuring costs :
a) Compensation under voluntary separation schemes - (13.34)b) Other costs (10.38) (26.35)
Total exceptional expenditure (B) (10.38) (39.69)Exceptional items (net) (A-B) 228.68 608.40
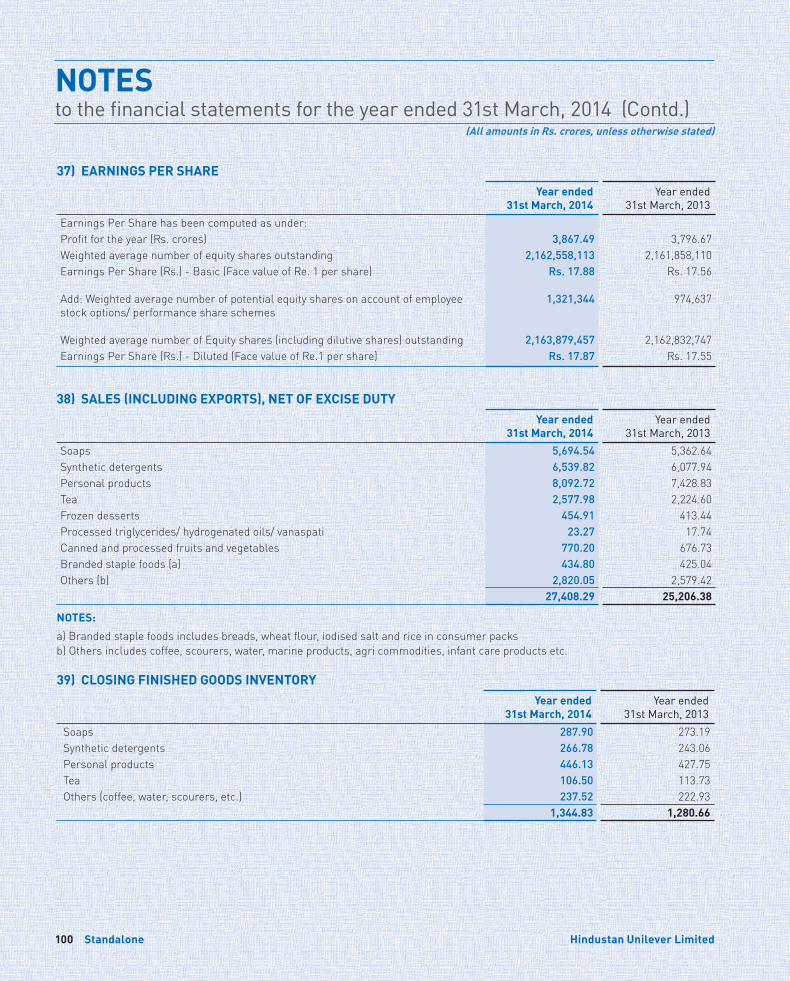
NOTESto the financial statements for the year ended 31st March, 2014 (Contd.)
(All amounts in Rs. crores, unless otherwise stated)
Standalone100 Hindustan Unilever Limited
37) EARNINGS PER SHARE Year ended
31st March, 2014Year ended
31st March, 2013Earnings Per Share has been computed as under:Profit for the year (Rs. crores) 3,867.49 3,796.67 Weighted average number of equity shares outstanding 2,162,558,113 2,161,858,110 Earnings Per Share (Rs.) - Basic (Face value of Re. 1 per share) Rs. 17.88 Rs. 17.56
Add: Weighted average number of potential equity shares on account of employee stock options/ performance share schemes
1,321,344 974,637
Weighted average number of Equity shares (including dilutive shares) outstanding 2,163,879,457 2,162,832,747 Earnings Per Share (Rs.) - Diluted (Face value of Re.1 per share) Rs. 17.87 Rs. 17.55
38) SALES (INCLUDING EXPORTS), NET OF EXCISE DUTY Year ended
31st March, 2014Year ended
31st March, 2013Soaps 5,694.54 5,362.64Synthetic detergents 6,539.82 6,077.94Personal products 8,092.72 7,428.83Tea 2,577.98 2,224.60Frozen desserts 454.91 413.44Processed triglycerides/ hydrogenated oils/ vanaspati 23.27 17.74Canned and processed fruits and vegetables 770.20 676.73Branded staple foods (a) 434.80 425.04Others (b) 2,820.05 2,579.42
27,408.29 25,206.38
NOTES:
a) Branded staple foods includes breads, wheat flour, iodised salt and rice in consumer packs b) Others includes coffee, scourers, water, marine products, agri commodities, infant care products etc.
39) CLOSING FINISHED GOODS INVENTORY Year ended
31st March, 2014Year ended
31st March, 2013 Soaps 287.90 273.19 Synthetic detergents 266.78 243.06 Personal products 446.13 427.75 Tea 106.50 113.73 Others (coffee, water, scourers, etc.) 237.52 222.93
1,344.83 1,280.66
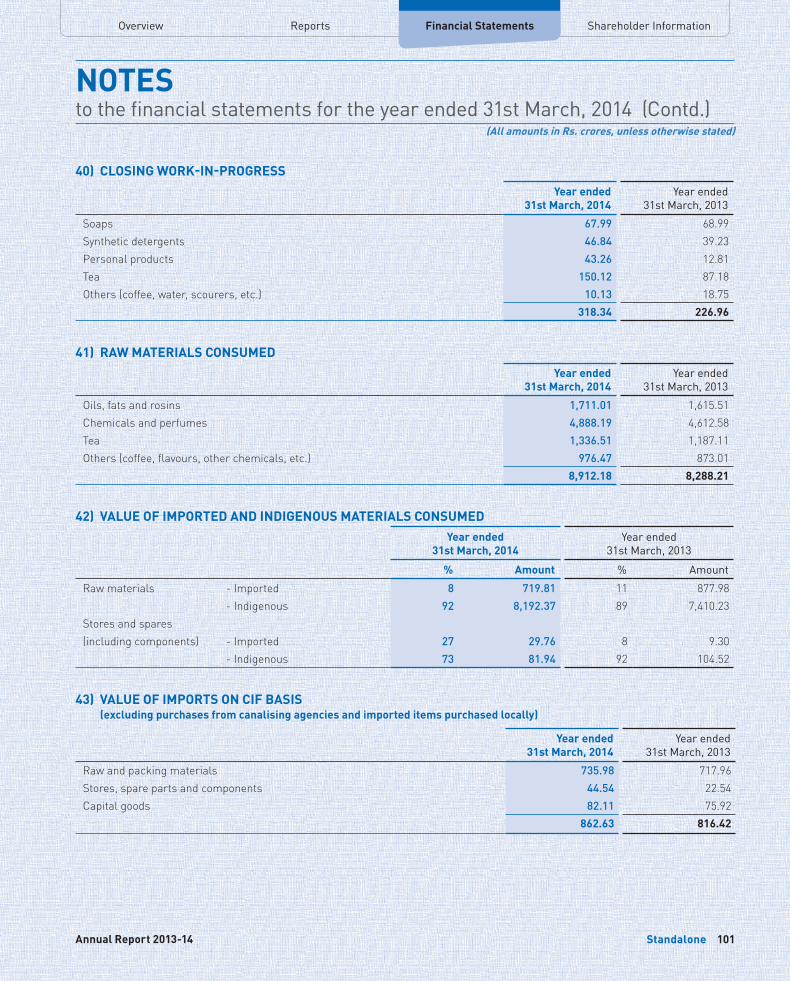
Overview Financial Statements Shareholder InformationReports
NOTESto the financial statements for the year ended 31st March, 2014 (Contd.)
(All amounts in Rs. crores, unless otherwise stated)
Standalone 101Annual Report 2013-14
40) CLOSING WORK-IN-PROGRESS Year ended
31st March, 2014Year ended
31st March, 2013
Soaps 67.99 68.99 Synthetic detergents 46.84 39.23 Personal products 43.26 12.81 Tea 150.12 87.18 Others (coffee, water, scourers, etc.) 10.13 18.75
318.34 226.96
41) RAW MATERIALS CONSUMED Year ended
31st March, 2014Year ended
31st March, 2013
Oils, fats and rosins 1,711.01 1,615.51 Chemicals and perfumes 4,888.19 4,612.58 Tea 1,336.51 1,187.11 Others (coffee, flavours, other chemicals, etc.) 976.47 873.01
8,912.18 8,288.21
42) VALUE OF IMPORTED AND INDIGENOUS MATERIALS CONSUMED Year ended
31st March, 2014Year ended
31st March, 2013
% Amount % Amount
Raw materials - Imported 8 719.81 11 877.98 - Indigenous 92 8,192.37 89 7,410.23
Stores and spares (including components) - Imported 27 29.76 8 9.30
- Indigenous 73 81.94 92 104.52
43) VALUE OF IMPORTS ON CIF BASIS (excluding purchases from canalising agencies and imported items purchased locally)
Year ended 31st March, 2014
Year ended 31st March, 2013
Raw and packing materials 735.98 717.96 Stores, spare parts and components 44.54 22.54 Capital goods 82.11 75.92
862.63 816.42
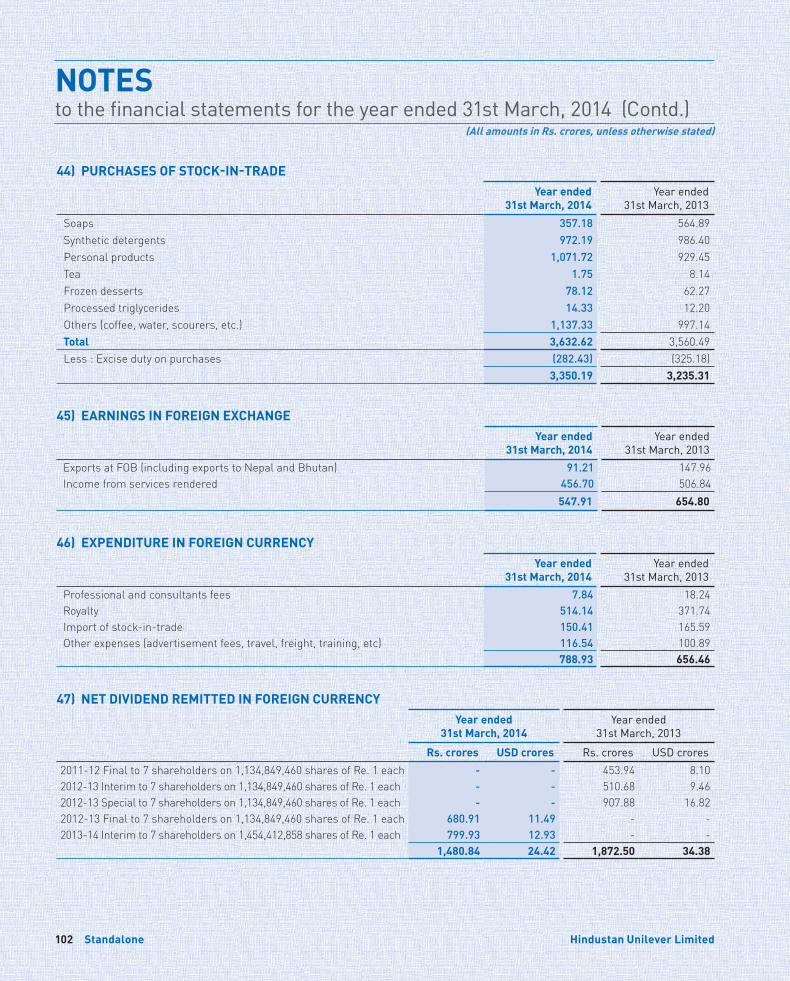
NOTESto the financial statements for the year ended 31st March, 2014 (Contd.)
(All amounts in Rs. crores, unless otherwise stated)
Standalone102 Hindustan Unilever Limited
44) PURCHASES OF STOCK-IN-TRADE Year ended
31st March, 2014Year ended
31st March, 2013
Soaps 357.18 564.89 Synthetic detergents 972.19 986.40 Personal products 1,071.72 929.45 Tea 1.75 8.14 Frozen desserts 78.12 62.27 Processed triglycerides 14.33 12.20 Others (coffee, water, scourers, etc.) 1,137.33 997.14 Total 3,632.62 3,560.49 Less : Excise duty on purchases (282.43) (325.18)
3,350.19 3,235.31
45) EARNINGS IN FOREIGN EXCHANGE
Year ended 31st March, 2014
Year ended 31st March, 2013
Exports at FOB (including exports to Nepal and Bhutan) 91.21 147.96 Income from services rendered 456.70 506.84
547.91 654.80
46) EXPENDITURE IN FOREIGN CURRENCY Year ended
31st March, 2014Year ended
31st March, 2013 Professional and consultants fees 7.84 18.24 Royalty 514.14 371.74 Import of stock-in-trade 150.41 165.59 Other expenses (advertisement fees, travel, freight, training, etc) 116.54 100.89
788.93 656.46
47) NET DIVIDEND REMITTED IN FOREIGN CURRENCY Year ended
31st March, 2014Year ended
31st March, 2013
Rs. crores USD crores Rs. crores USD crores 2011-12 Final to 7 shareholders on 1,134,849,460 shares of Re. 1 each - - 453.94 8.10 2012-13 Interim to 7 shareholders on 1,134,849,460 shares of Re. 1 each - - 510.68 9.46 2012-13 Special to 7 shareholders on 1,134,849,460 shares of Re. 1 each - - 907.88 16.82 2012-13 Final to 7 shareholders on 1,134,849,460 shares of Re. 1 each 680.91 11.49 - - 2013-14 Interim to 7 shareholders on 1,454,412,858 shares of Re. 1 each 799.93 12.93 - -
1,480.84 24.42 1,872.50 34.38
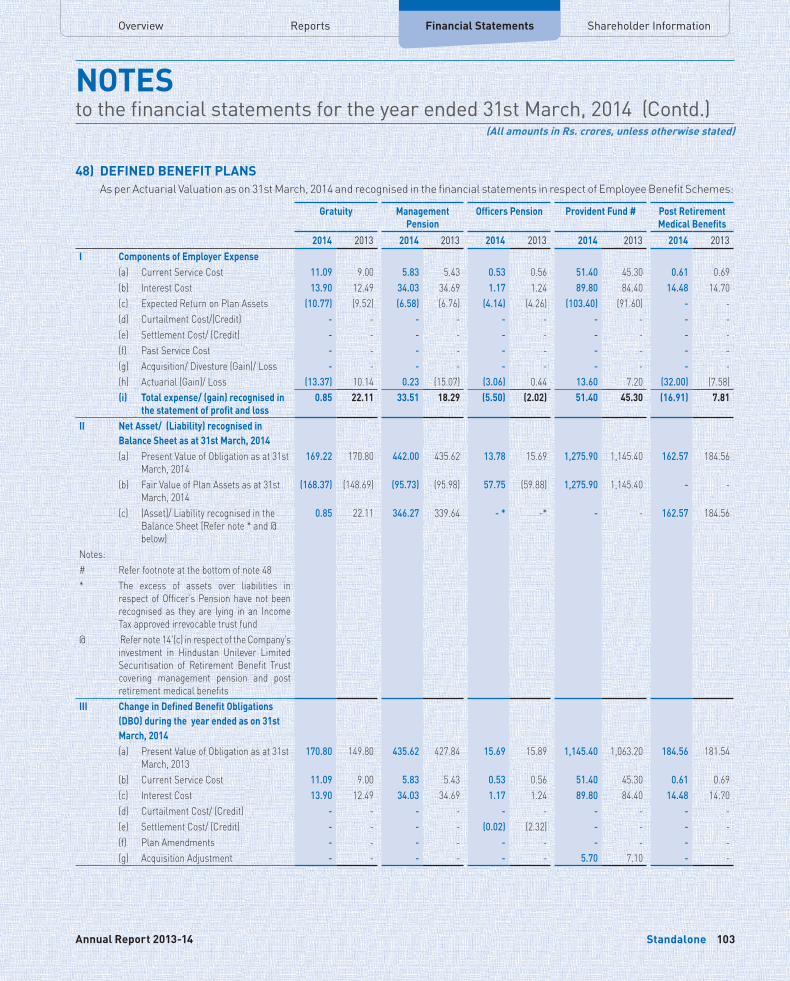
Overview Financial Statements Shareholder InformationReports
NOTESto the financial statements for the year ended 31st March, 2014 (Contd.)
(All amounts in Rs. crores, unless otherwise stated)
Standalone 103Annual Report 2013-14
48) DEFINED BENEFIT PLANS As per Actuarial Valuation as on 31st March, 2014 and recognised in the financial statements in respect of Employee Benefit Schemes:
Gratuity Management Pension
Officers Pension Provident Fund # Post Retirement Medical Benefits
2014 2013 2014 2013 2014 2013 2014 2013 2014 2013I Components of Employer Expense
(a) Current Service Cost 11.09 9.00 5.83 5.43 0.53 0.56 51.40 45.30 0.61 0.69 (b) Interest Cost 13.90 12.49 34.03 34.69 1.17 1.24 89.80 84.40 14.48 14.70 (c) Expected Return on Plan Assets (10.77) (9.52) (6.58) (6.76) (4.14) (4.26) (103.40) (91.60) - - (d) Curtailment Cost/(Credit) - - - - - - - - - - (e) Settlement Cost/ (Credit) - - - - - - - - - - (f) Past Service Cost - - - - - - - - - - (g) Acquisition/ Divesture (Gain)/ Loss - - - - - - - - - - (h) Actuarial (Gain)/ Loss (13.37) 10.14 0.23 (15.07) (3.06) 0.44 13.60 7.20 (32.00) (7.58)(i) Total expense/ (gain) recognised in
the statement of profit and loss0.85 22.11 33.51 18.29 (5.50) (2.02) 51.40 45.30 (16.91) 7.81
II Net Asset/ (Liability) recognised in Balance Sheet as at 31st March, 2014(a) Present Value of Obligation as at 31st
March, 2014 169.22 170.80 442.00 435.62 13.78 15.69 1,275.90 1,145.40 162.57 184.56
(b) Fair Value of Plan Assets as at 31st March, 2014
(168.37) (148.69) (95.73) (95.98) 57.75 (59.88) 1,275.90 1,145.40 - -
(c) (Asset)/ Liability recognised in the Balance Sheet (Refer note * and @ below)
0.85 22.11 346.27 339.64 - * -* - - 162.57 184.56
Notes: # Refer footnote at the bottom of note 48* The excess of assets over liabilities in
respect of Officer’s Pension have not been recognised as they are lying in an Income Tax approved irrevocable trust fund
@ Refer note 14’(c) in respect of the Company’s investment in Hindustan Unilever Limited Securitisation of Retirement Benefit Trust covering management pension and post retirement medical benefits
III Change in Defined Benefit Obligations (DBO) during the year ended as on 31st March, 2014(a) Present Value of Obligation as at 31st
March, 2013 170.80 149.80 435.62 427.84 15.69 15.89 1,145.40 1,063.20 184.56 181.54
(b) Current Service Cost 11.09 9.00 5.83 5.43 0.53 0.56 51.40 45.30 0.61 0.69 (c) Interest Cost 13.90 12.49 34.03 34.69 1.17 1.24 89.80 84.40 14.48 14.70 (d) Curtailment Cost/ (Credit) - - - - - - - - - - (e) Settlement Cost/ (Credit) - - - - (0.02) (2.32) - - - - (f) Plan Amendments - - - - - - - - - - (g) Acquisition Adjustment - - - - - - 5.70 7.10 - -
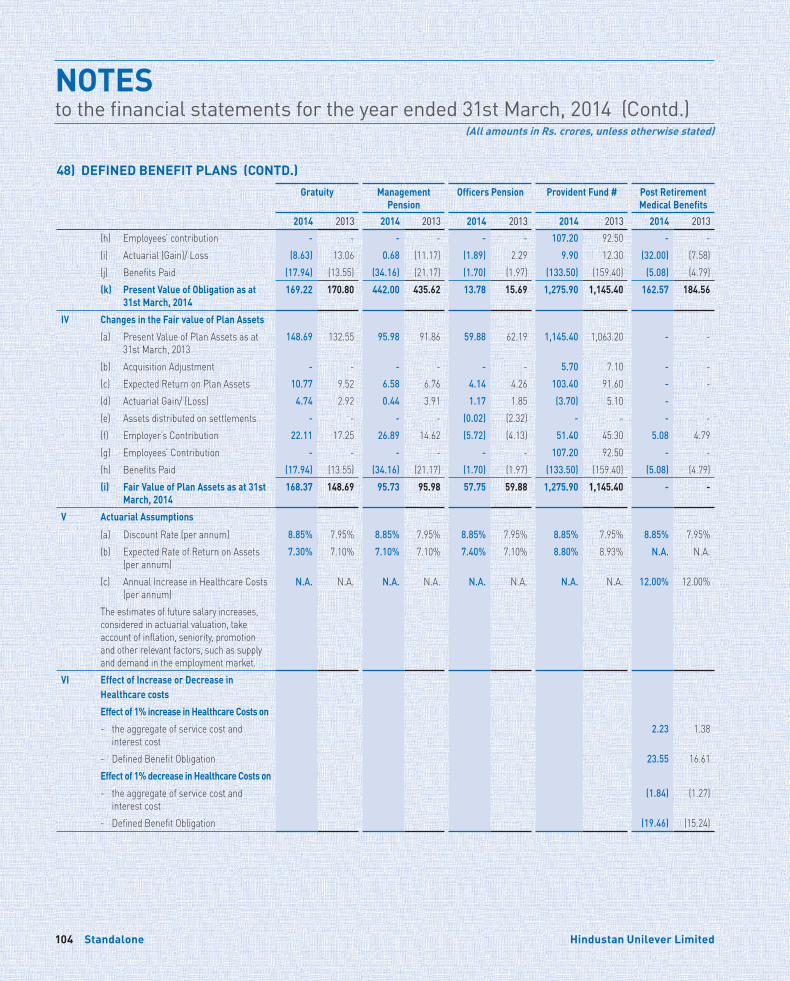
NOTESto the financial statements for the year ended 31st March, 2014 (Contd.)
(All amounts in Rs. crores, unless otherwise stated)
Standalone104 Hindustan Unilever Limited
Gratuity Management Pension
Officers Pension Provident Fund # Post Retirement Medical Benefits
2014 2013 2014 2013 2014 2013 2014 2013 2014 2013(h) Employees’ contribution - - - - - - 107.20 92.50 - - (i) Actuarial (Gain)/ Loss (8.63) 13.06 0.68 (11.17) (1.89) 2.29 9.90 12.30 (32.00) (7.58)(j) Benefits Paid (17.94) (13.55) (34.16) (21.17) (1.70) (1.97) (133.50) (159.40) (5.08) (4.79)(k) Present Value of Obligation as at
31st March, 2014169.22 170.80 442.00 435.62 13.78 15.69 1,275.90 1,145.40 162.57 184.56
IV Changes in the Fair value of Plan Assets
(a) Present Value of Plan Assets as at 31st March, 2013
148.69 132.55 95.98 91.86 59.88 62.19 1,145.40 1,063.20 - -
(b) Acquisition Adjustment - - - - - - 5.70 7.10 - - (c) Expected Return on Plan Assets 10.77 9.52 6.58 6.76 4.14 4.26 103.40 91.60 - - (d) Actuarial Gain/ (Loss) 4.74 2.92 0.44 3.91 1.17 1.85 (3.70) 5.10 -
(e) Assets distributed on settlements - - - - (0.02) (2.32) - - - - (f) Employer’s Contribution 22.11 17.25 26.89 14.62 (5.72) (4.13) 51.40 45.30 5.08 4.79 (g) Employees’ Contribution - - - - - - 107.20 92.50 - - (h) Benefits Paid (17.94) (13.55) (34.16) (21.17) (1.70) (1.97) (133.50) (159.40) (5.08) (4.79)(i) Fair Value of Plan Assets as at 31st
March, 2014168.37 148.69 95.73 95.98 57.75 59.88 1,275.90 1,145.40 - -
V Actuarial Assumptions
(a) Discount Rate (per annum) 8.85% 7.95% 8.85% 7.95% 8.85% 7.95% 8.85% 7.95% 8.85% 7.95%(b) Expected Rate of Return on Assets
(per annum)7.30% 7.10% 7.10% 7.10% 7.40% 7.10% 8.80% 8.93% N.A. N.A.
(c) Annual Increase in Healthcare Costs (per annum)
N.A. N.A. N.A. N.A. N.A. N.A. N.A. N.A. 12.00% 12.00%
The estimates of future salary increases, considered in actuarial valuation, take account of inflation, seniority, promotion and other relevant factors, such as supply and demand in the employment market.
VI Effect of Increase or Decrease in Healthcare costs
Effect of 1% increase in Healthcare Costs on
- the aggregate of service cost and interest cost
2.23 1.38
- Defined Benefit Obligation 23.55 16.61 Effect of 1% decrease in Healthcare Costs on
- the aggregate of service cost and interest cost
(1.84) (1.27)
- Defined Benefit Obligation (19.46) (15.24)
48) DEFINED BENEFIT PLANS (CONTD.)
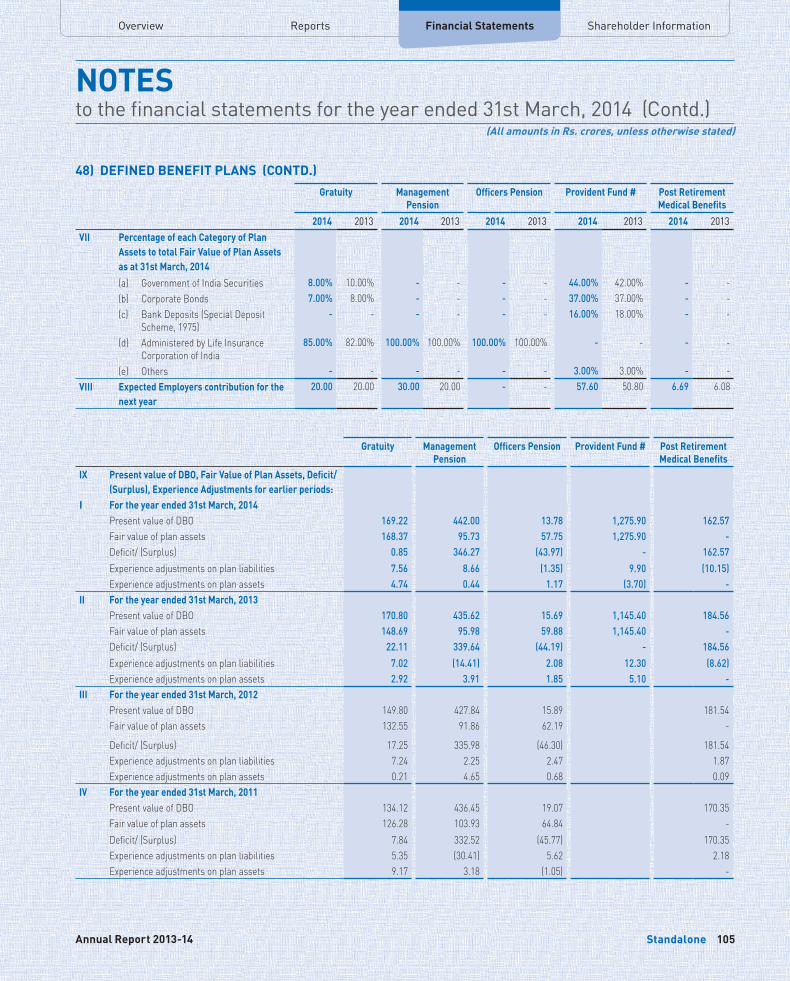
Overview Financial Statements Shareholder InformationReports
NOTESto the financial statements for the year ended 31st March, 2014 (Contd.)
(All amounts in Rs. crores, unless otherwise stated)
Standalone 105Annual Report 2013-14
48) DEFINED BENEFIT PLANS (CONTD.)Gratuity Management
PensionOfficers Pension Provident Fund # Post Retirement
Medical Benefits2014 2013 2014 2013 2014 2013 2014 2013 2014 2013
VII Percentage of each Category of Plan Assets to total Fair Value of Plan Assets as at 31st March, 2014(a) Government of India Securities 8.00% 10.00% - - - - 44.00% 42.00% - -(b) Corporate Bonds 7.00% 8.00% - - - - 37.00% 37.00% - -(c) Bank Deposits (Special Deposit
Scheme, 1975)- - - - - - 16.00% 18.00% - -
(d) Administered by Life Insurance Corporation of India
85.00% 82.00% 100.00% 100.00% 100.00% 100.00% - - - -
(e) Others - - - - - - 3.00% 3.00% - -VIII Expected Employers contribution for the
next year 20.00 20.00 30.00 20.00 - - 57.60 50.80 6.69 6.08
Gratuity Management Pension
Officers Pension Provident Fund # Post Retirement Medical Benefits
IX Present value of DBO, Fair Value of Plan Assets, Deficit/ (Surplus), Experience Adjustments for earlier periods:
I For the year ended 31st March, 2014Present value of DBO 169.22 442.00 13.78 1,275.90 162.57Fair value of plan assets 168.37 95.73 57.75 1,275.90 -Deficit/ (Surplus) 0.85 346.27 (43.97) - 162.57Experience adjustments on plan liabilities 7.56 8.66 (1.35) 9.90 (10.15)Experience adjustments on plan assets 4.74 0.44 1.17 (3.70) -
II For the year ended 31st March, 2013Present value of DBO 170.80 435.62 15.69 1,145.40 184.56Fair value of plan assets 148.69 95.98 59.88 1,145.40 -Deficit/ (Surplus) 22.11 339.64 (44.19) - 184.56Experience adjustments on plan liabilities 7.02 (14.41) 2.08 12.30 (8.62)Experience adjustments on plan assets 2.92 3.91 1.85 5.10 -
III For the year ended 31st March, 2012Present value of DBO 149.80 427.84 15.89 181.54Fair value of plan assets 132.55 91.86 62.19 -
Deficit/ (Surplus) 17.25 335.98 (46.30) 181.54Experience adjustments on plan liabilities 7.24 2.25 2.47 1.87Experience adjustments on plan assets 0.21 4.65 0.68 0.09
IV For the year ended 31st March, 2011Present value of DBO 134.12 436.45 19.07 170.35Fair value of plan assets 126.28 103.93 64.84 -Deficit/ (Surplus) 7.84 332.52 (45.77) 170.35Experience adjustments on plan liabilities 5.35 (30.41) 5.62 2.18Experience adjustments on plan assets 9.17 3.18 (1.05) -
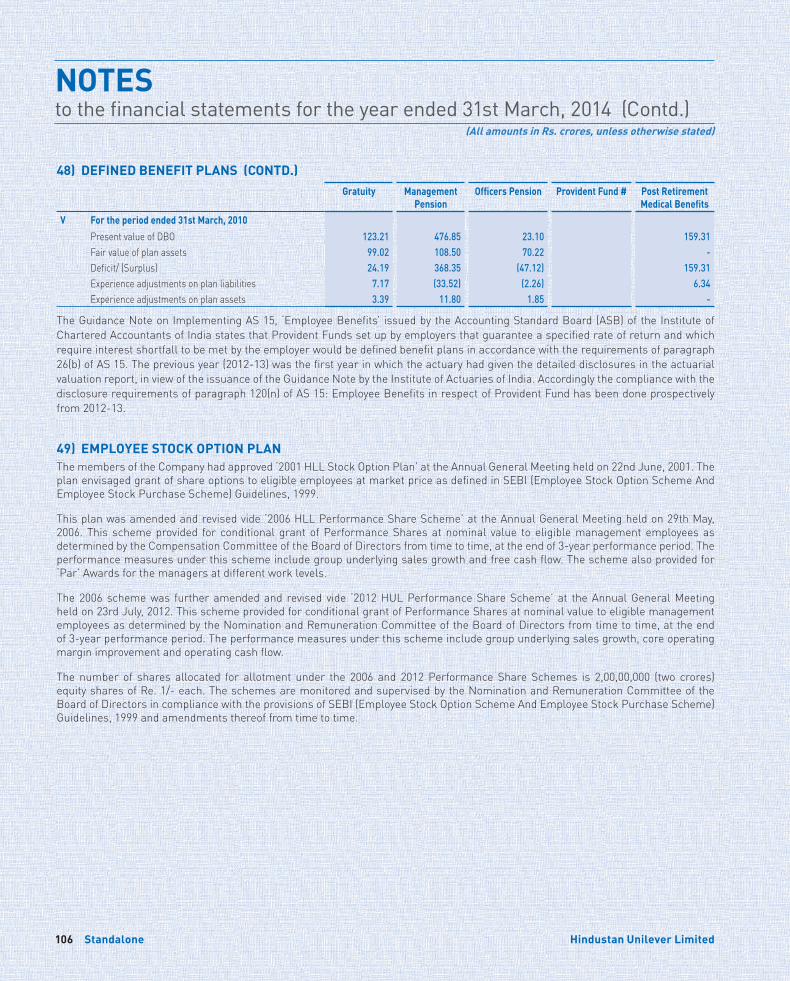
NOTESto the financial statements for the year ended 31st March, 2014 (Contd.)
(All amounts in Rs. crores, unless otherwise stated)
Standalone106 Hindustan Unilever Limited
Gratuity Management Pension
Officers Pension Provident Fund # Post Retirement Medical Benefits
V For the period ended 31st March, 2010Present value of DBO 123.21 476.85 23.10 159.31Fair value of plan assets 99.02 108.50 70.22 -Deficit/ (Surplus) 24.19 368.35 (47.12) 159.31Experience adjustments on plan liabilities 7.17 (33.52) (2.26) 6.34Experience adjustments on plan assets 3.39 11.80 1.85 -
The Guidance Note on Implementing AS 15, ‘Employee Benefits’ issued by the Accounting Standard Board (ASB) of the Institute of Chartered Accountants of India states that Provident Funds set up by employers that guarantee a specified rate of return and which require interest shortfall to be met by the employer would be defined benefit plans in accordance with the requirements of paragraph 26(b) of AS 15. The previous year (2012-13) was the first year in which the actuary had given the detailed disclosures in the actuarial valuation report, in view of the issuance of the Guidance Note by the Institute of Actuaries of India. Accordingly the compliance with the disclosure requirements of paragraph 120(n) of AS 15: Employee Benefits in respect of Provident Fund has been done prospectively from 2012-13.
49) EMPLOYEE STOCK OPTION PLANThe members of the Company had approved ‘2001 HLL Stock Option Plan’ at the Annual General Meeting held on 22nd June, 2001. The plan envisaged grant of share options to eligible employees at market price as defined in SEBI (Employee Stock Option Scheme And Employee Stock Purchase Scheme) Guidelines, 1999.
This plan was amended and revised vide ‘2006 HLL Performance Share Scheme’ at the Annual General Meeting held on 29th May, 2006. This scheme provided for conditional grant of Performance Shares at nominal value to eligible management employees as determined by the Compensation Committee of the Board of Directors from time to time, at the end of 3-year performance period. The performance measures under this scheme include group underlying sales growth and free cash flow. The scheme also provided for ‘Par’ Awards for the managers at different work levels.
The 2006 scheme was further amended and revised vide ‘2012 HUL Performance Share Scheme’ at the Annual General Meeting held on 23rd July, 2012. This scheme provided for conditional grant of Performance Shares at nominal value to eligible management employees as determined by the Nomination and Remuneration Committee of the Board of Directors from time to time, at the end of 3-year performance period. The performance measures under this scheme include group underlying sales growth, core operating margin improvement and operating cash flow.
The number of shares allocated for allotment under the 2006 and 2012 Performance Share Schemes is 2,00,00,000 (two crores) equity shares of Re. 1/- each. The schemes are monitored and supervised by the Nomination and Remuneration Committee of the Board of Directors in compliance with the provisions of SEBI (Employee Stock Option Scheme And Employee Stock Purchase Scheme) Guidelines, 1999 and amendments thereof from time to time.
48) DEFINED BENEFIT PLANS (CONTD.)
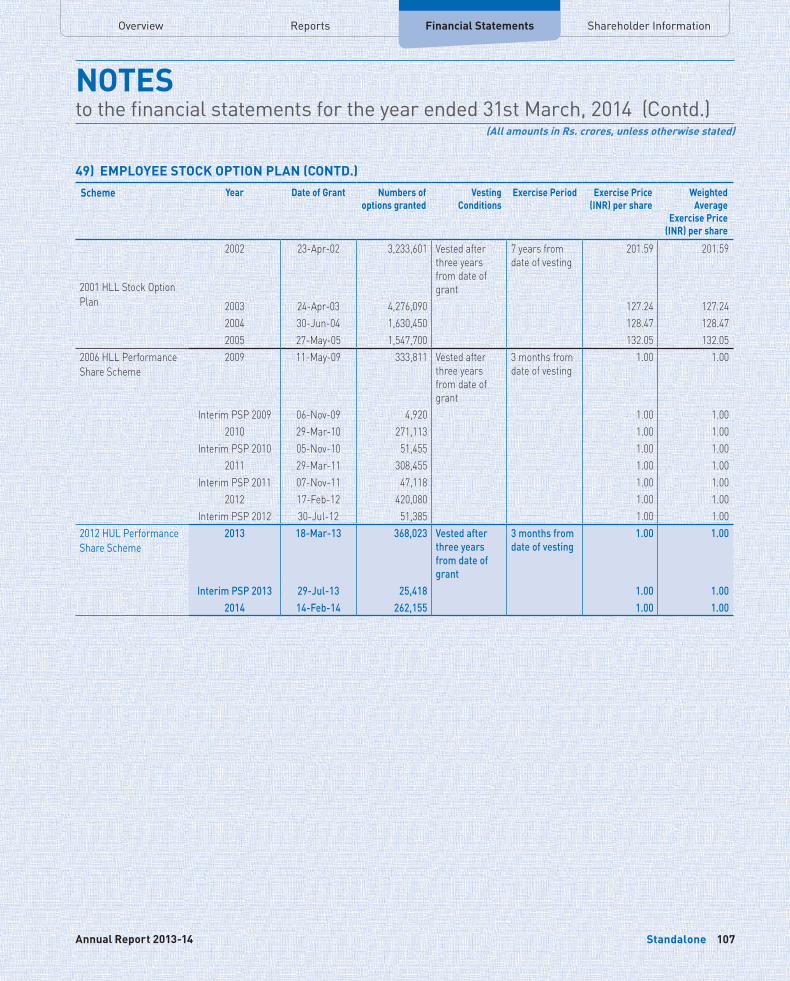
Overview Financial Statements Shareholder InformationReports
NOTESto the financial statements for the year ended 31st March, 2014 (Contd.)
(All amounts in Rs. crores, unless otherwise stated)
Standalone 107Annual Report 2013-14
Scheme Year Date of Grant Numbers of options granted
Vesting Conditions
Exercise Period Exercise Price (INR) per share
Weighted Average
Exercise Price (INR) per share
2001 HLL Stock Option Plan
2002 23-Apr-02 3,233,601 Vested after three years from date of grant
7 years from date of vesting
201.59 201.59
2003 24-Apr-03 4,276,090 127.24 127.24 2004 30-Jun-04 1,630,450 128.47 128.47 2005 27-May-05 1,547,700 132.05 132.05
2006 HLL Performance Share Scheme
2009 11-May-09 333,811 Vested after three years from date of grant
3 months from date of vesting
1.00 1.00
Interim PSP 2009 06-Nov-09 4,920 1.00 1.00 2010 29-Mar-10 271,113 1.00 1.00
Interim PSP 2010 05-Nov-10 51,455 1.00 1.00 2011 29-Mar-11 308,455 1.00 1.00
Interim PSP 2011 07-Nov-11 47,118 1.00 1.00 2012 17-Feb-12 420,080 1.00 1.00
Interim PSP 2012 30-Jul-12 51,385 1.00 1.00 2012 HUL Performance Share Scheme
2013 18-Mar-13 368,023 Vested after three years from date of grant
3 months from date of vesting
1.00 1.00
Interim PSP 2013 29-Jul-13 25,418 1.00 1.00 2014 14-Feb-14 262,155 1.00 1.00
49) EMPLOYEE STOCK OPTION PLAN (CONTD.)
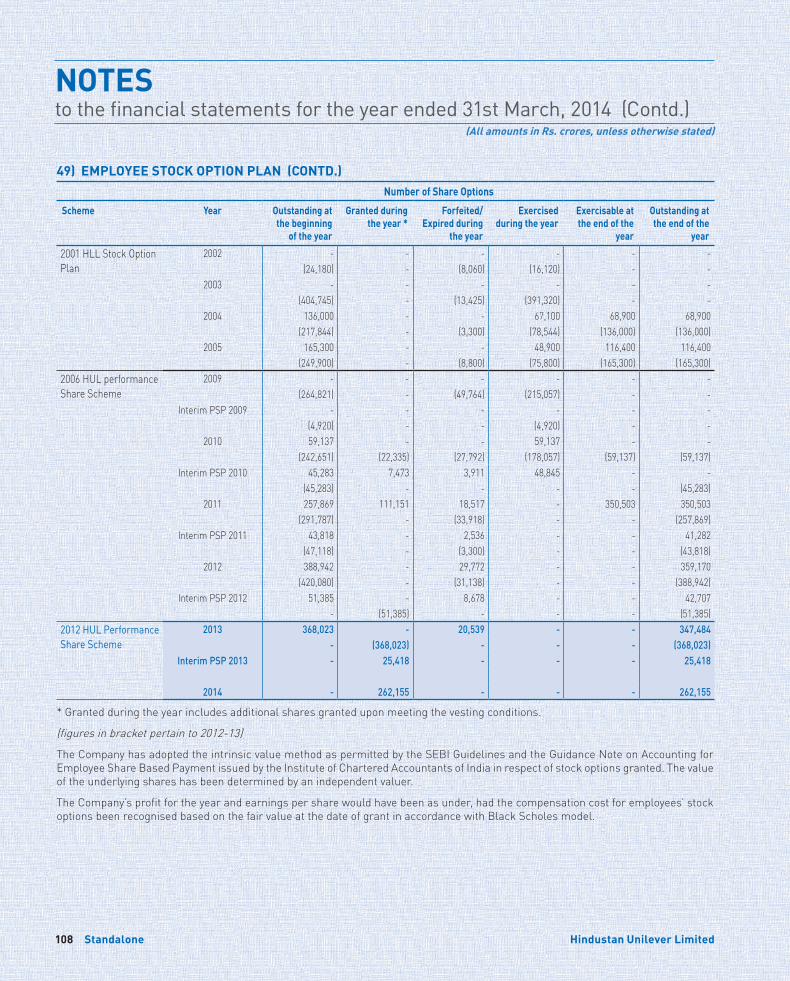
NOTESto the financial statements for the year ended 31st March, 2014 (Contd.)
(All amounts in Rs. crores, unless otherwise stated)
Standalone108 Hindustan Unilever Limited
49) EMPLOYEE STOCK OPTION PLAN (CONTD.)Number of Share Options
Scheme Year Outstanding at the beginning
of the year
Granted during the year *
Forfeited/Expired during
the year
Exercised during the year
Exercisable at the end of the
year
Outstanding at the end of the
year
2001 HLL Stock Option Plan
2002 - - - - - - (24,180) - (8,060) (16,120) - -
2003 - - - - - - (404,745) - (13,425) (391,320) - -
2004 136,000 - - 67,100 68,900 68,900 (217,844) - (3,300) (78,544) (136,000) (136,000)
2005 165,300 - - 48,900 116,400 116,400 (249,900) - (8,800) (75,800) (165,300) (165,300)
2006 HUL performance Share Scheme
2009 - - - - - - (264,821) - (49,764) (215,057) - -
Interim PSP 2009 - - - - - - (4,920) - - (4,920) - -
2010 59,137 - - 59,137 - - (242,651) (22,335) (27,792) (178,057) (59,137) (59,137)
Interim PSP 2010 45,283 7,473 3,911 48,845 - - (45,283) - - - - (45,283)
2011 257,869 111,151 18,517 - 350,503 350,503 (291,787) - (33,918) - - (257,869)
Interim PSP 2011 43,818 - 2,536 - - 41,282 (47,118) - (3,300) - - (43,818)
2012 388,942 - 29,772 - - 359,170 (420,080) - (31,138) - - (388,942)
Interim PSP 2012 51,385 - 8,678 - - 42,707 - (51,385) - - - (51,385)
2012 HUL Performance Share Scheme
2013 368,023 - 20,539 - - 347,484 - (368,023) - - - (368,023)
Interim PSP 2013 - 25,418 - - - 25,418
2014 - 262,155 - - - 262,155
* Granted during the year includes additional shares granted upon meeting the vesting conditions.
(figures in bracket pertain to 2012-13)
The Company has adopted the intrinsic value method as permitted by the SEBI Guidelines and the Guidance Note on Accounting for Employee Share Based Payment issued by the Institute of Chartered Accountants of India in respect of stock options granted. The value of the underlying shares has been determined by an independent valuer.
The Company’s profit for the year and earnings per share would have been as under, had the compensation cost for employees’ stock options been recognised based on the fair value at the date of grant in accordance with Black Scholes model.
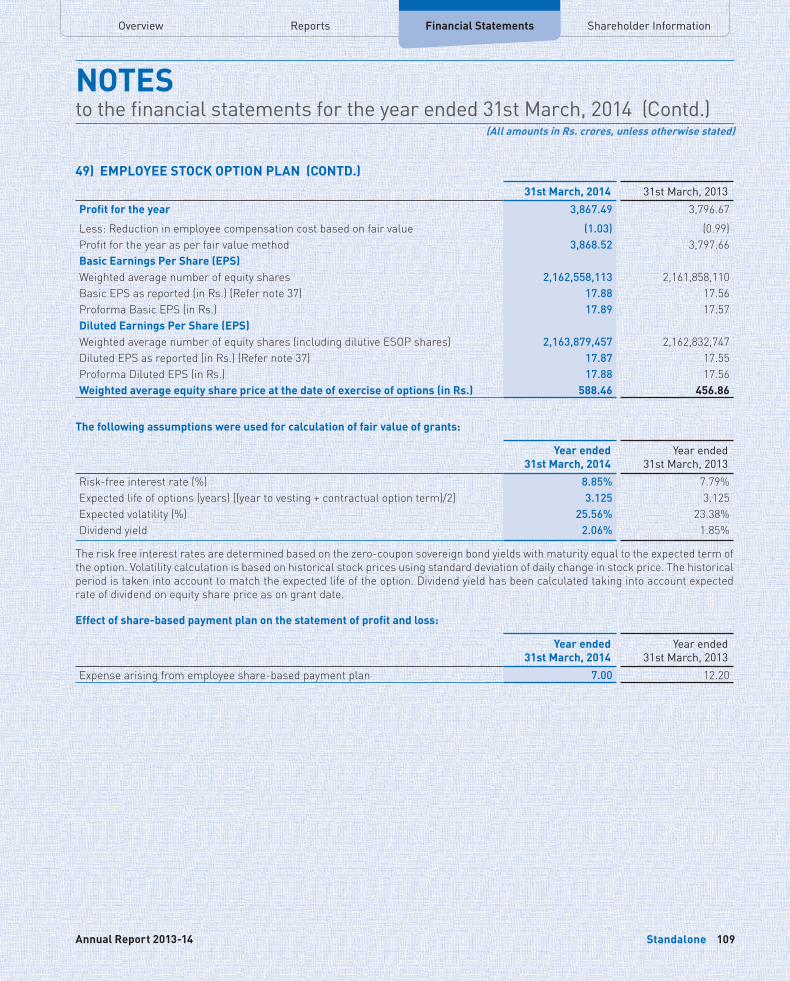
Overview Financial Statements Shareholder InformationReports
NOTESto the financial statements for the year ended 31st March, 2014 (Contd.)
(All amounts in Rs. crores, unless otherwise stated)
Standalone 109Annual Report 2013-14
49) EMPLOYEE STOCK OPTION PLAN (CONTD.) 31st March, 2014 31st March, 2013
Profit for the year 3,867.49 3,796.67Less: Reduction in employee compensation cost based on fair value (1.03) (0.99)Profit for the year as per fair value method 3,868.52 3,797.66Basic Earnings Per Share (EPS)Weighted average number of equity shares 2,162,558,113 2,161,858,110Basic EPS as reported (in Rs.) (Refer note 37) 17.88 17.56Proforma Basic EPS (in Rs.) 17.89 17.57Diluted Earnings Per Share (EPS)Weighted average number of equity shares (including dilutive ESOP shares) 2,163,879,457 2,162,832,747Diluted EPS as reported (in Rs.) (Refer note 37) 17.87 17.55Proforma Diluted EPS (in Rs.) 17.88 17.56Weighted average equity share price at the date of exercise of options (in Rs.) 588.46 456.86
The following assumptions were used for calculation of fair value of grants:
Year ended 31st March, 2014
Year ended 31st March, 2013
Risk-free interest rate (%) 8.85% 7.79%Expected life of options (years) [(year to vesting + contractual option term)/2] 3.125 3.125 Expected volatility (%) 25.56% 23.38%Dividend yield 2.06% 1.85%
The risk free interest rates are determined based on the zero-coupon sovereign bond yields with maturity equal to the expected term of the option. Volatility calculation is based on historical stock prices using standard deviation of daily change in stock price. The historical period is taken into account to match the expected life of the option. Dividend yield has been calculated taking into account expected rate of dividend on equity share price as on grant date.
Effect of share-based payment plan on the statement of profit and loss:
Year ended 31st March, 2014
Year ended 31st March, 2013
Expense arising from employee share-based payment plan 7.00 12.20
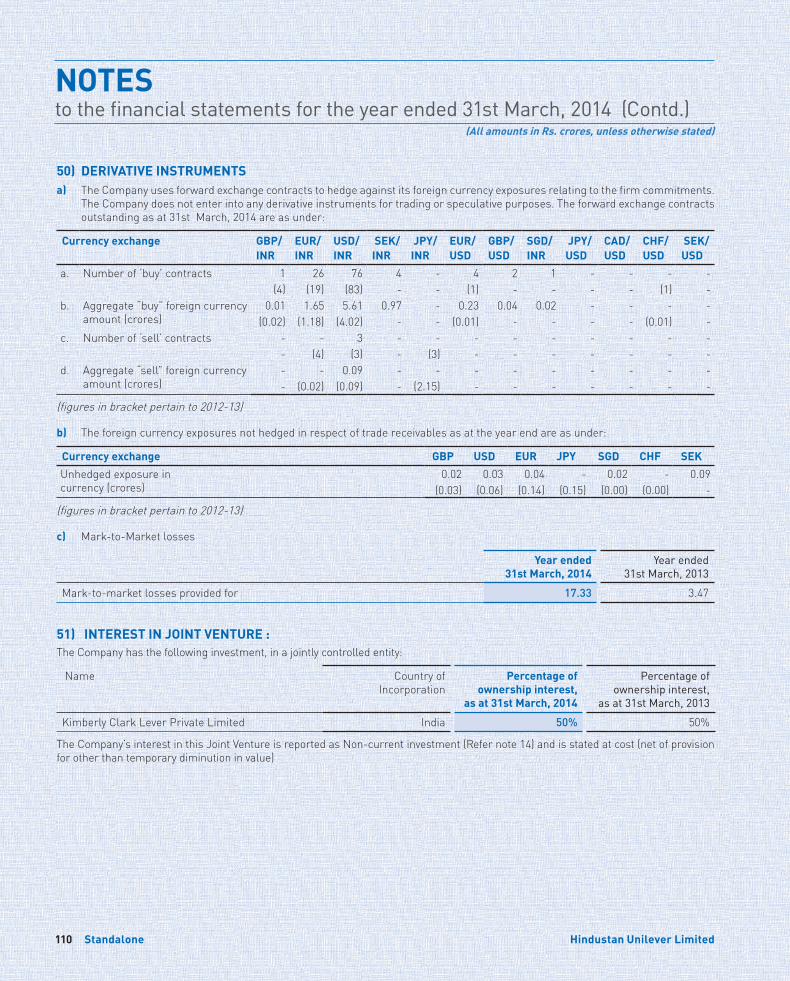
NOTESto the financial statements for the year ended 31st March, 2014 (Contd.)
(All amounts in Rs. crores, unless otherwise stated)
Standalone110 Hindustan Unilever Limited
50) DERIVATIVE INSTRUMENTSa) The Company uses forward exchange contracts to hedge against its foreign currency exposures relating to the firm commitments.
The Company does not enter into any derivative instruments for trading or speculative purposes. The forward exchange contracts outstanding as at 31st March, 2014 are as under:
Currency exchange GBP/INR
EUR/INR
USD/INR
SEK/INR
JPY/INR
EUR/USD
GBP/USD
SGD/INR
JPY/USD
CAD/USD
CHF/USD
SEK/USD
a. Number of ‘buy’ contracts 1 26 76 4 - 4 2 1 - - - - (4) (19) (83) - - (1) - - - - (1) -
b. Aggregate “buy” foreign currency amount (crores)
0.01 1.65 5.61 0.97 - 0.23 0.04 0.02 - - - - (0.02) (1.18) (4.02) - - (0.01) - - - - (0.01) -
c. Number of ‘sell’ contracts - - 3 - - - - - - - - - - (4) (3) - (3) - - - - - - -
d. Aggregate “sell” foreign currency amount (crores)
- - 0.09 - - - - - - - - - - (0.02) (0.09) - (2.15) - - - - - - -
(figures in bracket pertain to 2012-13)
b) The foreign currency exposures not hedged in respect of trade receivables as at the year end are as under:
Currency exchange GBP USD EUR JPY SGD CHF SEK Unhedged exposure incurrency (crores)
0.02 0.03 0.04 - 0.02 - 0.09 (0.03) (0.06) (0.14) (0.15) (0.00) (0.00) -
(figures in bracket pertain to 2012-13)
c) Mark-to-Market losses
Year ended 31st March, 2014
Year ended 31st March, 2013
Mark-to-market losses provided for 17.33 3.47
51) INTEREST IN JOINT VENTURE : The Company has the following investment, in a jointly controlled entity:
Name Country of Incorporation
Percentage of ownership interest,
as at 31st March, 2014
Percentage of ownership interest,
as at 31st March, 2013
Kimberly Clark Lever Private Limited India 50% 50%
The Company’s interest in this Joint Venture is reported as Non-current investment (Refer note 14) and is stated at cost (net of provision for other than temporary diminution in value)
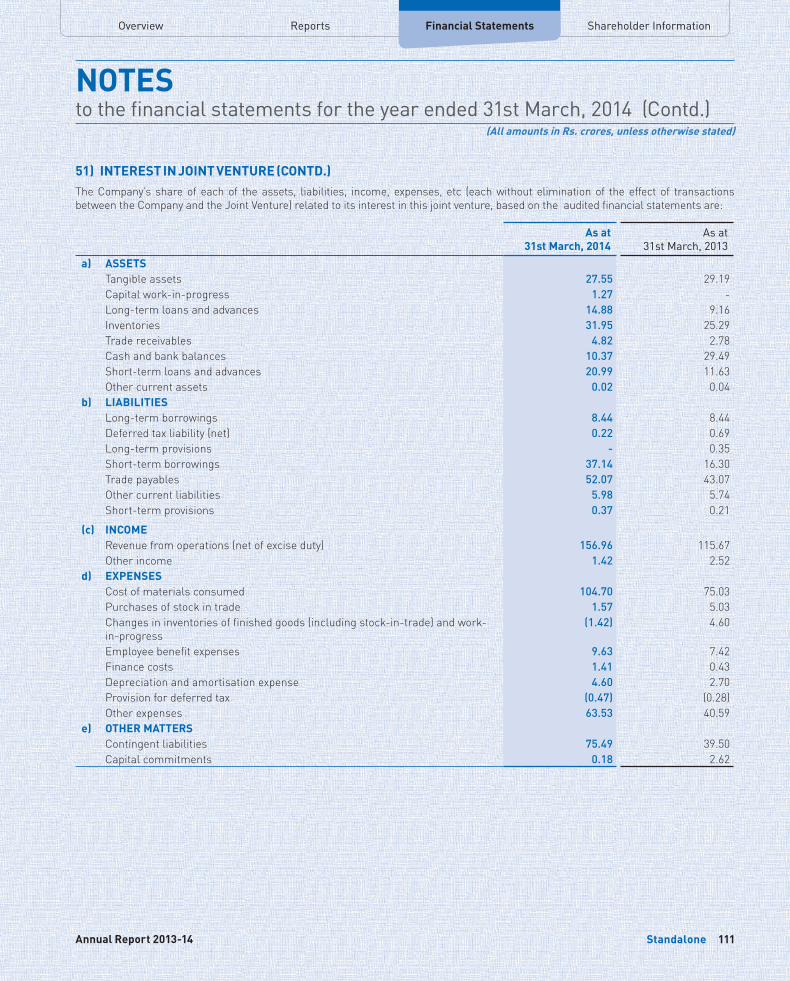
Overview Financial Statements Shareholder InformationReports
NOTESto the financial statements for the year ended 31st March, 2014 (Contd.)
(All amounts in Rs. crores, unless otherwise stated)
Standalone 111Annual Report 2013-14
The Company’s share of each of the assets, liabilities, income, expenses, etc (each without elimination of the effect of transactions between the Company and the Joint Venture) related to its interest in this joint venture, based on the audited financial statements are:
As at 31st March, 2014
As at 31st March, 2013
a) ASSETS Tangible assets 27.55 29.19 Capital work-in-progress 1.27 - Long-term loans and advances 14.88 9.16 Inventories 31.95 25.29 Trade receivables 4.82 2.78 Cash and bank balances 10.37 29.49 Short-term loans and advances 20.99 11.63 Other current assets 0.02 0.04
b) LIABILITIES Long-term borrowings 8.44 8.44 Deferred tax liability (net) 0.22 0.69 Long-term provisions - 0.35 Short-term borrowings 37.14 16.30 Trade payables 52.07 43.07 Other current liabilities 5.98 5.74 Short-term provisions 0.37 0.21
(c) INCOME Revenue from operations (net of excise duty) 156.96 115.67 Other income 1.42 2.52
d) EXPENSES Cost of materials consumed 104.70 75.03 Purchases of stock in trade 1.57 5.03 Changes in inventories of finished goods (including stock-in-trade) and work-in-progress
(1.42) 4.60
Employee benefit expenses 9.63 7.42 Finance costs 1.41 0.43 Depreciation and amortisation expense 4.60 2.70 Provision for deferred tax (0.47) (0.28)Other expenses 63.53 40.59
e) OTHER MATTERS Contingent liabilities 75.49 39.50 Capital commitments 0.18 2.62
51) INTEREST IN JOINT VENTURE (CONTD.)
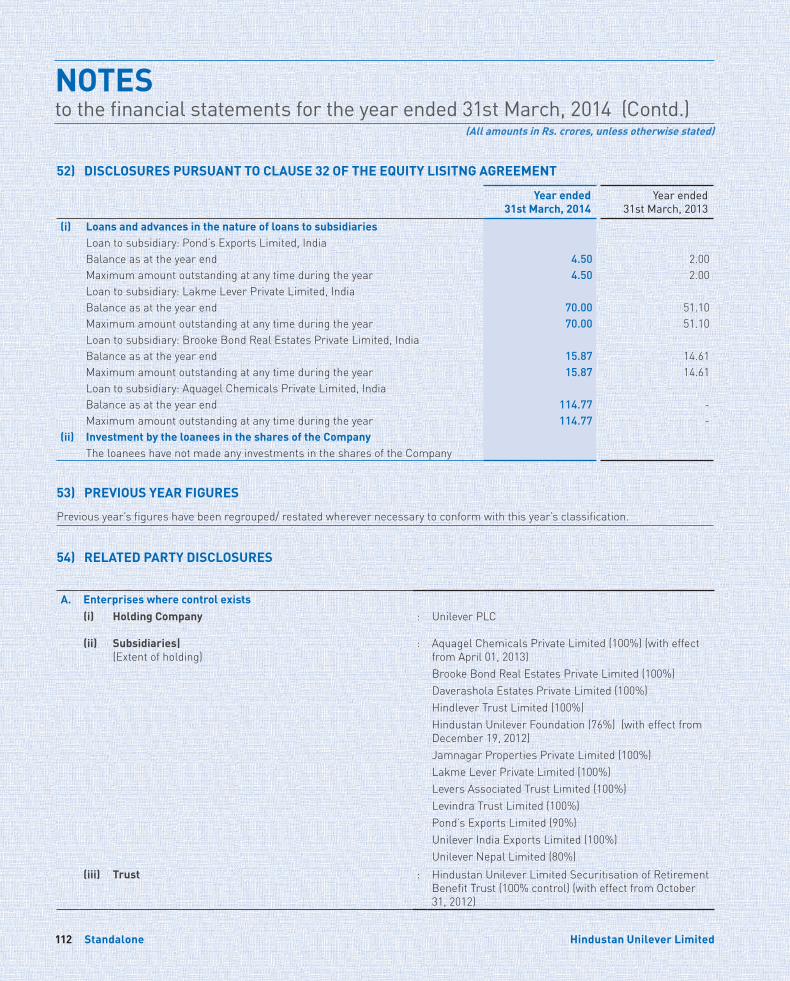
NOTESto the financial statements for the year ended 31st March, 2014 (Contd.)
(All amounts in Rs. crores, unless otherwise stated)
Standalone112 Hindustan Unilever Limited
52) DISCLOSURES PURSUANT TO CLAUSE 32 OF THE EQUITY LISITNG AGREEMENT
Year ended 31st March, 2014
Year ended 31st March, 2013
(i) Loans and advances in the nature of loans to subsidiariesLoan to subsidiary: Pond’s Exports Limited, IndiaBalance as at the year end 4.50 2.00 Maximum amount outstanding at any time during the year 4.50 2.00 Loan to subsidiary: Lakme Lever Private Limited, IndiaBalance as at the year end 70.00 51.10 Maximum amount outstanding at any time during the year 70.00 51.10 Loan to subsidiary: Brooke Bond Real Estates Private Limited, IndiaBalance as at the year end 15.87 14.61 Maximum amount outstanding at any time during the year 15.87 14.61 Loan to subsidiary: Aquagel Chemicals Private Limited, IndiaBalance as at the year end 114.77 - Maximum amount outstanding at any time during the year 114.77 -
(ii) Investment by the loanees in the shares of the CompanyThe loanees have not made any investments in the shares of the Company
53) PREVIOUS YEAR FIGURES
Previous year’s figures have been regrouped/ restated wherever necessary to conform with this year’s classification.
54) RELATED PARTY DISCLOSURES
A. Enterprises where control exists(i) Holding Company : Unilever PLC
(ii) Subsidiaries| (Extent of holding)
: Aquagel Chemicals Private Limited (100%) (with effect from April 01, 2013)Brooke Bond Real Estates Private Limited (100%)Daverashola Estates Private Limited (100%)Hindlever Trust Limited (100%)Hindustan Unilever Foundation (76%) (with effect from December 19, 2012)Jamnagar Properties Private Limited (100%)Lakme Lever Private Limited (100%)Levers Associated Trust Limited (100%)Levindra Trust Limited (100%)Pond’s Exports Limited (90%)Unilever India Exports Limited (100%)Unilever Nepal Limited (80%)
(iii) Trust : Hindustan Unilever Limited Securitisation of Retirement Benefit Trust (100% control) (with effect from October 31, 2012)
Overview Financial Statements Shareholder InformationReports
NOTESto the financial statements for the year ended 31st March, 2014 (Contd.)
(All amounts in Rs. crores, unless otherwise stated)
Standalone 113Annual Report 2013-14
B. Other Related Parties with whom the company had transactions during the year(i) Fellow Subsidiaries : Brooke Bond Assam Estates Limited
Brooke Bond Group LimitedBrooke Bond South India Estates LimitedConopco, Inc.Corporativo Unilever de Mexico, S.de R.L. de C.V. (merged)Glidat Strauss LimitedLever International Marine SupLipton Soft Drinks Ireland LimitedMascolo Brothers LimitedOOO Unilever RusP.T. Unilever Indonesia, Tbk.Tigi Holdings LimitedTigi Linea International B.V.UL Research & Development VlaaUnilever (Malaysia) Holdings Sdn BhdUnilever ASCC AGUnilever Asia Private LimitedUnilever AustralasiaUnilever Australia LimitedUnilever Bangladesh LimitedUnilever Brasil LimitedUnilever Business and Marketing Support AGUnilever Canada IncUnilever Canada-Food SolutionsUnilever Chile SAUnilever China LimitedUnilever De Argentina SAUnilever Deutschland Produktions GmbH & Co. OHGUnilever Employment Services B.V.Unilever Europe ITUnilever Gulf Free Zone Establishment, ArabiaUnilever Industries Private LimitedUnilever Italy Holdings SrlUnilever JapanUnilever KoreaUnilever Lipton Ceylon LimitedUnilever Mashreq International CompanyUnilever N.V.Unilever Overseas Holdings AGUnilever Overseas Holdings B.V.Unilever Pakistan Limited
54) RELATED PARTY DISCLOSURES (CONTD.)
NOTESto the financial statements for the year ended 31st March, 2014 (Contd.)
(All amounts in Rs. crores, unless otherwise stated)
Standalone114 Hindustan Unilever Limited
54) RELATED PARTY DISCLOSURES (CONTD.)
Unilever Philippines , Inc.Unilever Research and Development Vlaardingen B.V.Unilever Research Laboratory Port SunlightUnilever Sanayi ve Ticaret Türk A.S.Unilever Services (Hefei) Co .LimitedUnilever Singapore PTE LTDUnilever SNGUnilever South Africa (Pty) LimitedUnilever South Central Europe S.R.LUnilever Sri Lanka LimitedUnilever Supply Chain Company AGUnilever Thai Services LimitedUnilever Thai Trading LimitedUnilever U.K. Central Resources LimitedUnilever UK & CN Holdings LimitedUnilever United States, Inc.Unilever Ventures India Advisory Private LtdUnilever Vietnam International Company LimitedUnilever Zimbabwe (Pvt) LimitedWalls (China) Co. Limited
(ii) Joint Ventures : Kimberly Clark Lever Private Limited
(iii) Key Management Personnel : BP Biddappa (with effect from February 1, 2013)Dev BajpaiGeetu Verma Hemant Bakshi Leena Nair (up to January 31, 2013)Manish Tiwary Nitin Paranjpe (up to October 9, 2013)Pradeep BanerjeeSanjiv Mehta (with effect from October 1, 2013)Sridhar Ramamurthy
(iv) Other (Non Executive Chairman) : Harish Manwani
(v) Employees’ Benefit Plans where there is significant influence
: Hind Lever Gratuity FundThe Hind Lever Pension FundThe Union Provident Fund
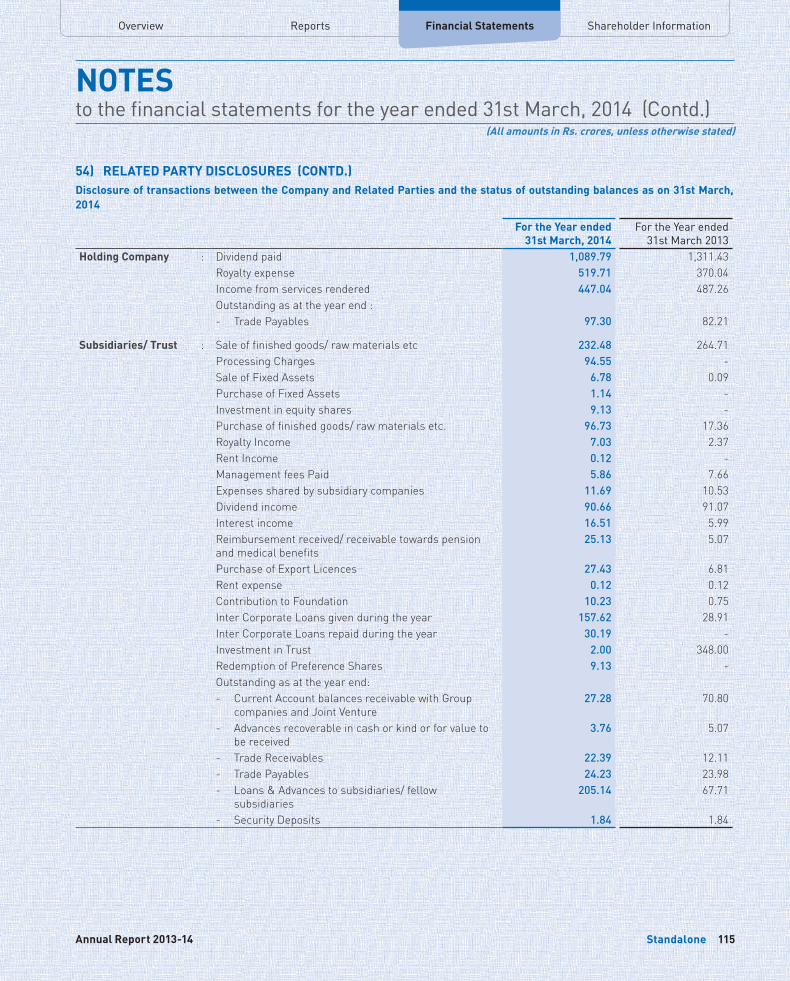
Overview Financial Statements Shareholder InformationReports
NOTESto the financial statements for the year ended 31st March, 2014 (Contd.)
(All amounts in Rs. crores, unless otherwise stated)
Standalone 115Annual Report 2013-14
54) RELATED PARTY DISCLOSURES (CONTD.)Disclosure of transactions between the Company and Related Parties and the status of outstanding balances as on 31st March, 2014
For the Year ended 31st March, 2014
For the Year ended 31st March 2013
Holding Company : Dividend paid 1,089.79 1,311.43 Royalty expense 519.71 370.04 Income from services rendered 447.04 487.26 Outstanding as at the year end : - Trade Payables 97.30 82.21
Subsidiaries/ Trust : Sale of finished goods/ raw materials etc 232.48 264.71 Processing Charges 94.55 - Sale of Fixed Assets 6.78 0.09 Purchase of Fixed Assets 1.14 - Investment in equity shares 9.13 - Purchase of finished goods/ raw materials etc. 96.73 17.36 Royalty Income 7.03 2.37 Rent Income 0.12 - Management fees Paid 5.86 7.66 Expenses shared by subsidiary companies 11.69 10.53 Dividend income 90.66 91.07 Interest income 16.51 5.99 Reimbursement received/ receivable towards pension and medical benefits
25.13 5.07
Purchase of Export Licences 27.43 6.81 Rent expense 0.12 0.12 Contribution to Foundation 10.23 0.75 Inter Corporate Loans given during the year 157.62 28.91 Inter Corporate Loans repaid during the year 30.19 - Investment in Trust 2.00 348.00 Redemption of Preference Shares 9.13 - Outstanding as at the year end: - Current Account balances receivable with Group
companies and Joint Venture 27.28 70.80
- Advances recoverable in cash or kind or for value to be received
3.76 5.07
- Trade Receivables 22.39 12.11 - Trade Payables 24.23 23.98 - Loans & Advances to subsidiaries/ fellow
subsidiaries 205.14 67.71
- Security Deposits 1.84 1.84
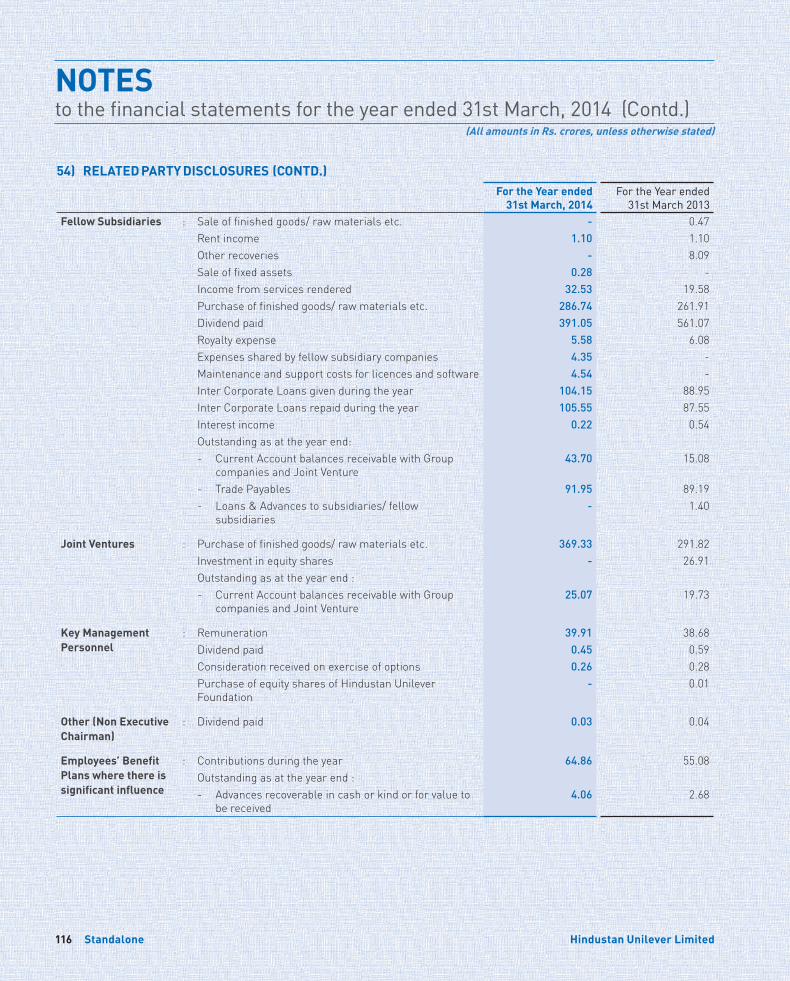
NOTESto the financial statements for the year ended 31st March, 2014 (Contd.)
(All amounts in Rs. crores, unless otherwise stated)
Standalone116 Hindustan Unilever Limited
For the Year ended 31st March, 2014
For the Year ended 31st March 2013
Fellow Subsidiaries : Sale of finished goods/ raw materials etc. - 0.47 Rent income 1.10 1.10 Other recoveries - 8.09 Sale of fixed assets 0.28 - Income from services rendered 32.53 19.58 Purchase of finished goods/ raw materials etc. 286.74 261.91 Dividend paid 391.05 561.07 Royalty expense 5.58 6.08 Expenses shared by fellow subsidiary companies 4.35 - Maintenance and support costs for licences and software 4.54 - Inter Corporate Loans given during the year 104.15 88.95 Inter Corporate Loans repaid during the year 105.55 87.55 Interest income 0.22 0.54 Outstanding as at the year end: - Current Account balances receivable with Group
companies and Joint Venture 43.70 15.08
- Trade Payables 91.95 89.19 - Loans & Advances to subsidiaries/ fellow
subsidiaries - 1.40
Joint Ventures : Purchase of finished goods/ raw materials etc. 369.33 291.82 Investment in equity shares - 26.91 Outstanding as at the year end : - Current Account balances receivable with Group
companies and Joint Venture 25.07 19.73
Key Management Personnel
: Remuneration 39.91 38.68 Dividend paid 0.45 0.59 Consideration received on exercise of options 0.26 0.28 Purchase of equity shares of Hindustan Unilever Foundation
- 0.01
Other (Non Executive Chairman)
: Dividend paid 0.03 0.04
Employees’ Benefit Plans where there is significant influence
: Contributions during the year 64.86 55.08 Outstanding as at the year end : - Advances recoverable in cash or kind or for value to
be received 4.06 2.68
54) RELATED PARTY DISCLOSURES (CONTD.)
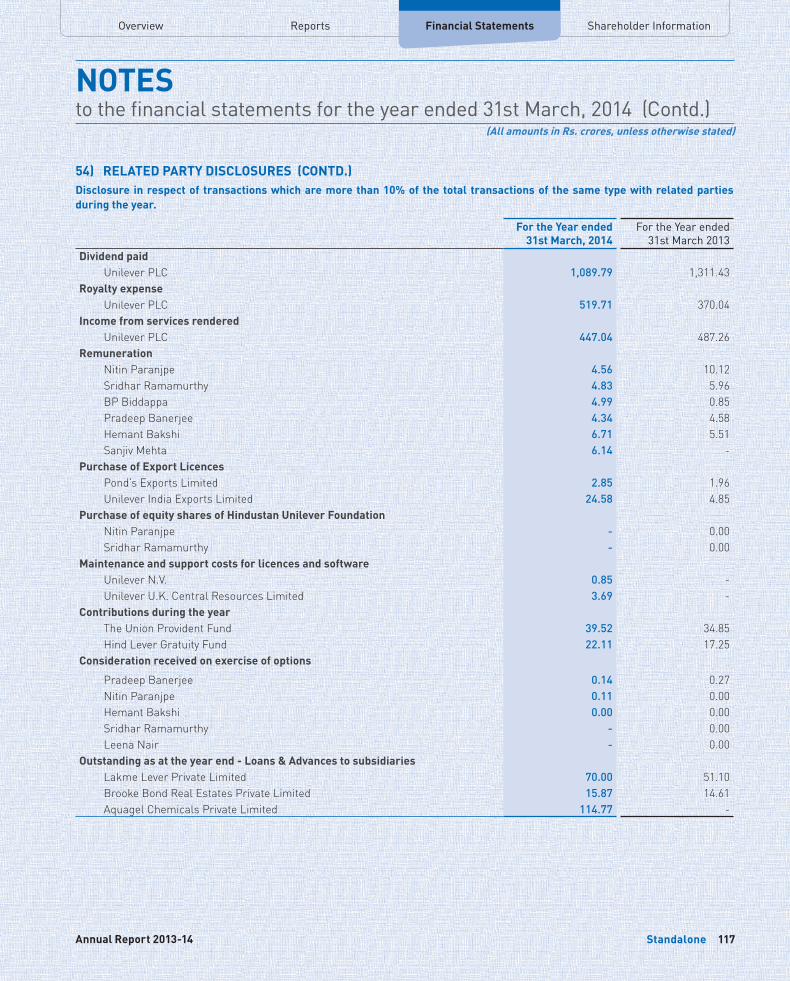
Overview Financial Statements Shareholder InformationReports
NOTESto the financial statements for the year ended 31st March, 2014 (Contd.)
(All amounts in Rs. crores, unless otherwise stated)
Standalone 117Annual Report 2013-14
54) RELATED PARTY DISCLOSURES (CONTD.)Disclosure in respect of transactions which are more than 10% of the total transactions of the same type with related parties during the year.
For the Year ended 31st March, 2014
For the Year ended 31st March 2013
Dividend paidUnilever PLC 1,089.79 1,311.43
Royalty expenseUnilever PLC 519.71 370.04
Income from services renderedUnilever PLC 447.04 487.26
RemunerationNitin Paranjpe 4.56 10.12 Sridhar Ramamurthy 4.83 5.96 BP Biddappa 4.99 0.85 Pradeep Banerjee 4.34 4.58 Hemant Bakshi 6.71 5.51 Sanjiv Mehta 6.14 -
Purchase of Export LicencesPond’s Exports Limited 2.85 1.96 Unilever India Exports Limited 24.58 4.85
Purchase of equity shares of Hindustan Unilever FoundationNitin Paranjpe - 0.00 Sridhar Ramamurthy - 0.00
Maintenance and support costs for licences and softwareUnilever N.V. 0.85 - Unilever U.K. Central Resources Limited 3.69 -
Contributions during the yearThe Union Provident Fund 39.52 34.85 Hind Lever Gratuity Fund 22.11 17.25
Consideration received on exercise of options
Pradeep Banerjee 0.14 0.27 Nitin Paranjpe 0.11 0.00 Hemant Bakshi 0.00 0.00 Sridhar Ramamurthy - 0.00 Leena Nair - 0.00
Outstanding as at the year end - Loans & Advances to subsidiariesLakme Lever Private Limited 70.00 51.10 Brooke Bond Real Estates Private Limited 15.87 14.61 Aquagel Chemicals Private Limited 114.77 -
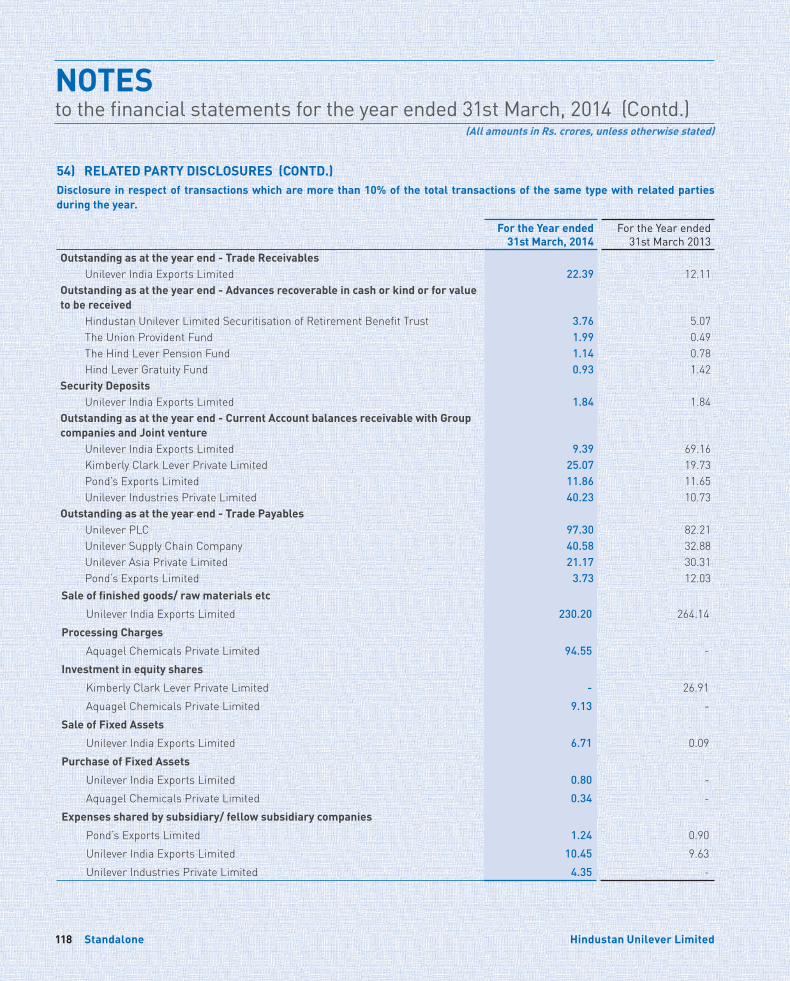
NOTESto the financial statements for the year ended 31st March, 2014 (Contd.)
(All amounts in Rs. crores, unless otherwise stated)
Standalone118 Hindustan Unilever Limited
54) RELATED PARTY DISCLOSURES (CONTD.)Disclosure in respect of transactions which are more than 10% of the total transactions of the same type with related parties during the year.
For the Year ended 31st March, 2014
For the Year ended 31st March 2013
Outstanding as at the year end - Trade ReceivablesUnilever India Exports Limited 22.39 12.11
Outstanding as at the year end - Advances recoverable in cash or kind or for value to be received
Hindustan Unilever Limited Securitisation of Retirement Benefit Trust 3.76 5.07 The Union Provident Fund 1.99 0.49 The Hind Lever Pension Fund 1.14 0.78 Hind Lever Gratuity Fund 0.93 1.42
Security DepositsUnilever India Exports Limited 1.84 1.84
Outstanding as at the year end - Current Account balances receivable with Group companies and Joint venture
Unilever India Exports Limited 9.39 69.16 Kimberly Clark Lever Private Limited 25.07 19.73 Pond’s Exports Limited 11.86 11.65 Unilever Industries Private Limited 40.23 10.73
Outstanding as at the year end - Trade PayablesUnilever PLC 97.30 82.21 Unilever Supply Chain Company 40.58 32.88 Unilever Asia Private Limited 21.17 30.31 Pond’s Exports Limited 3.73 12.03
Sale of finished goods/ raw materials etc
Unilever India Exports Limited 230.20 264.14 Processing Charges
Aquagel Chemicals Private Limited 94.55 - Investment in equity shares
Kimberly Clark Lever Private Limited - 26.91 Aquagel Chemicals Private Limited 9.13 -
Sale of Fixed Assets
Unilever India Exports Limited 6.71 0.09 Purchase of Fixed Assets
Unilever India Exports Limited 0.80 - Aquagel Chemicals Private Limited 0.34 -
Expenses shared by subsidiary/ fellow subsidiary companies
Pond’s Exports Limited 1.24 0.90 Unilever India Exports Limited 10.45 9.63 Unilever Industries Private Limited 4.35 -
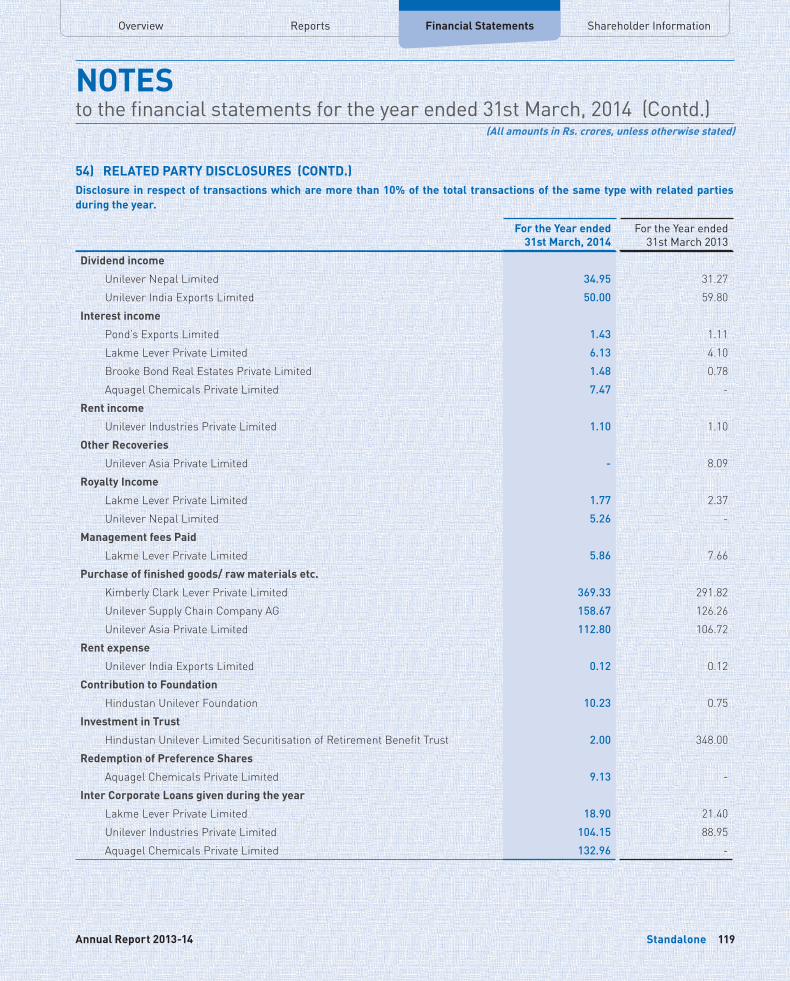
Overview Financial Statements Shareholder InformationReports
NOTESto the financial statements for the year ended 31st March, 2014 (Contd.)
(All amounts in Rs. crores, unless otherwise stated)
Standalone 119Annual Report 2013-14
Dividend income
Unilever Nepal Limited 34.95 31.27 Unilever India Exports Limited 50.00 59.80
Interest income
Pond’s Exports Limited 1.43 1.11 Lakme Lever Private Limited 6.13 4.10 Brooke Bond Real Estates Private Limited 1.48 0.78 Aquagel Chemicals Private Limited 7.47 -
Rent income
Unilever Industries Private Limited 1.10 1.10 Other Recoveries
Unilever Asia Private Limited - 8.09 Royalty Income
Lakme Lever Private Limited 1.77 2.37 Unilever Nepal Limited 5.26 -
Management fees Paid
Lakme Lever Private Limited 5.86 7.66 Purchase of finished goods/ raw materials etc.
Kimberly Clark Lever Private Limited 369.33 291.82 Unilever Supply Chain Company AG 158.67 126.26 Unilever Asia Private Limited 112.80 106.72
Rent expense
Unilever India Exports Limited 0.12 0.12 Contribution to Foundation
Hindustan Unilever Foundation 10.23 0.75 Investment in Trust
Hindustan Unilever Limited Securitisation of Retirement Benefit Trust 2.00 348.00 Redemption of Preference Shares
Aquagel Chemicals Private Limited 9.13 - Inter Corporate Loans given during the year
Lakme Lever Private Limited 18.90 21.40 Unilever Industries Private Limited 104.15 88.95 Aquagel Chemicals Private Limited 132.96 -
54) RELATED PARTY DISCLOSURES (CONTD.)Disclosure in respect of transactions which are more than 10% of the total transactions of the same type with related parties during the year.
For the Year ended 31st March, 2014
For the Year ended 31st March 2013
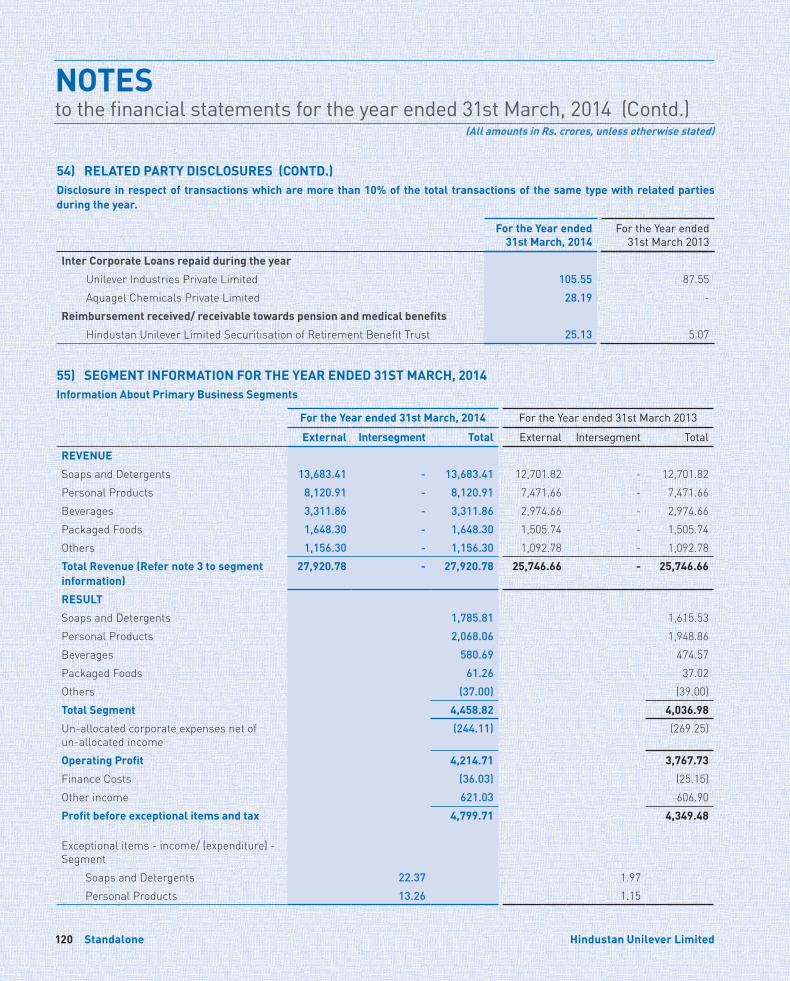
NOTESto the financial statements for the year ended 31st March, 2014 (Contd.)
(All amounts in Rs. crores, unless otherwise stated)
Standalone120 Hindustan Unilever Limited
Inter Corporate Loans repaid during the year
Unilever Industries Private Limited 105.55 87.55 Aquagel Chemicals Private Limited 28.19 -
Reimbursement received/ receivable towards pension and medical benefits
Hindustan Unilever Limited Securitisation of Retirement Benefit Trust 25.13 5.07
55) SEGMENT INFORMATION FOR THE YEAR ENDED 31ST MARCH, 2014Information About Primary Business Segments
For the Year ended 31st March, 2014 For the Year ended 31st March 2013
External Intersegment Total External Intersegment Total
REVENUE
Soaps and Detergents 13,683.41 - 13,683.41 12,701.82 - 12,701.82 Personal Products 8,120.91 - 8,120.91 7,471.66 - 7,471.66 Beverages 3,311.86 - 3,311.86 2,974.66 - 2,974.66 Packaged Foods 1,648.30 - 1,648.30 1,505.74 - 1,505.74 Others 1,156.30 - 1,156.30 1,092.78 - 1,092.78 Total Revenue (Refer note 3 to segment information)
27,920.78 - 27,920.78 25,746.66 - 25,746.66
RESULT
Soaps and Detergents 1,785.81 1,615.53 Personal Products 2,068.06 1,948.86 Beverages 580.69 474.57 Packaged Foods 61.26 37.02 Others (37.00) (39.00)Total Segment 4,458.82 4,036.98
Un-allocated corporate expenses net of un-allocated income
(244.11) (269.25)
Operating Profit 4,214.71 3,767.73
Finance Costs (36.03) (25.15)Other income 621.03 606.90 Profit before exceptional items and tax 4,799.71 4,349.48
Exceptional items - income/ (expenditure) - Segment
Soaps and Detergents 22.37 1.97 Personal Products 13.26 1.15
54) RELATED PARTY DISCLOSURES (CONTD.)Disclosure in respect of transactions which are more than 10% of the total transactions of the same type with related parties during the year.
For the Year ended 31st March, 2014
For the Year ended 31st March 2013
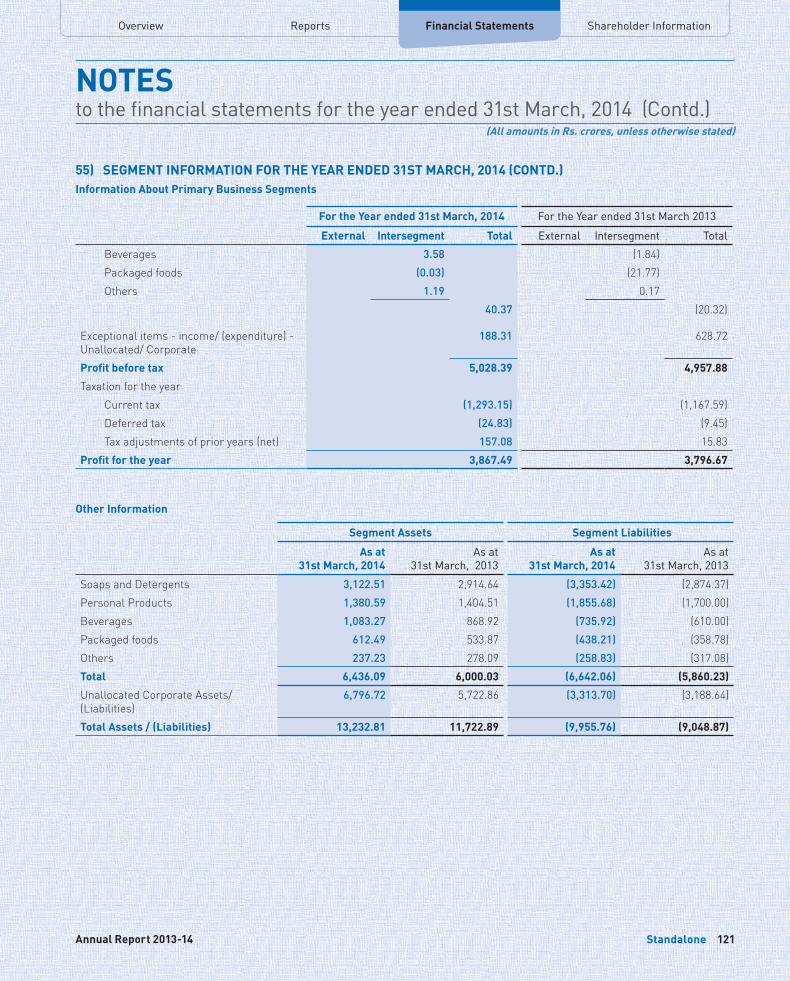
Overview Financial Statements Shareholder InformationReports
NOTESto the financial statements for the year ended 31st March, 2014 (Contd.)
(All amounts in Rs. crores, unless otherwise stated)
Standalone 121Annual Report 2013-14
55) SEGMENT INFORMATION FOR THE YEAR ENDED 31ST MARCH, 2014 (CONTD.)Information About Primary Business Segments
For the Year ended 31st March, 2014 For the Year ended 31st March 2013
External Intersegment Total External Intersegment Total
Beverages 3.58 (1.84)Packaged foods (0.03) (21.77)Others 1.19 0.17
40.37 (20.32)
Exceptional items - income/ (expenditure) - Unallocated/ Corporate
188.31 628.72
Profit before tax 5,028.39 4,957.88
Taxation for the yearCurrent tax (1,293.15) (1,167.59)Deferred tax (24.83) (9.45)Tax adjustments of prior years (net) 157.08 15.83
Profit for the year 3,867.49 3,796.67
Other Information
Segment Assets Segment Liabilities
As at 31st March, 2014
As at 31st March, 2013
As at 31st March, 2014
As at 31st March, 2013
Soaps and Detergents 3,122.51 2,914.64 (3,353.42) (2,874.37)Personal Products 1,380.59 1,404.51 (1,855.68) (1,700.00)Beverages 1,083.27 868.92 (735.92) (610.00)Packaged foods 612.49 533.87 (438.21) (358.78)Others 237.23 278.09 (258.83) (317.08)Total 6,436.09 6,000.03 (6,642.06) (5,860.23)
Unallocated Corporate Assets/ (Liabilities)
6,796.72 5,722.86 (3,313.70) (3,188.64)
Total Assets / (Liabilities) 13,232.81 11,722.89 (9,955.76) (9,048.87)
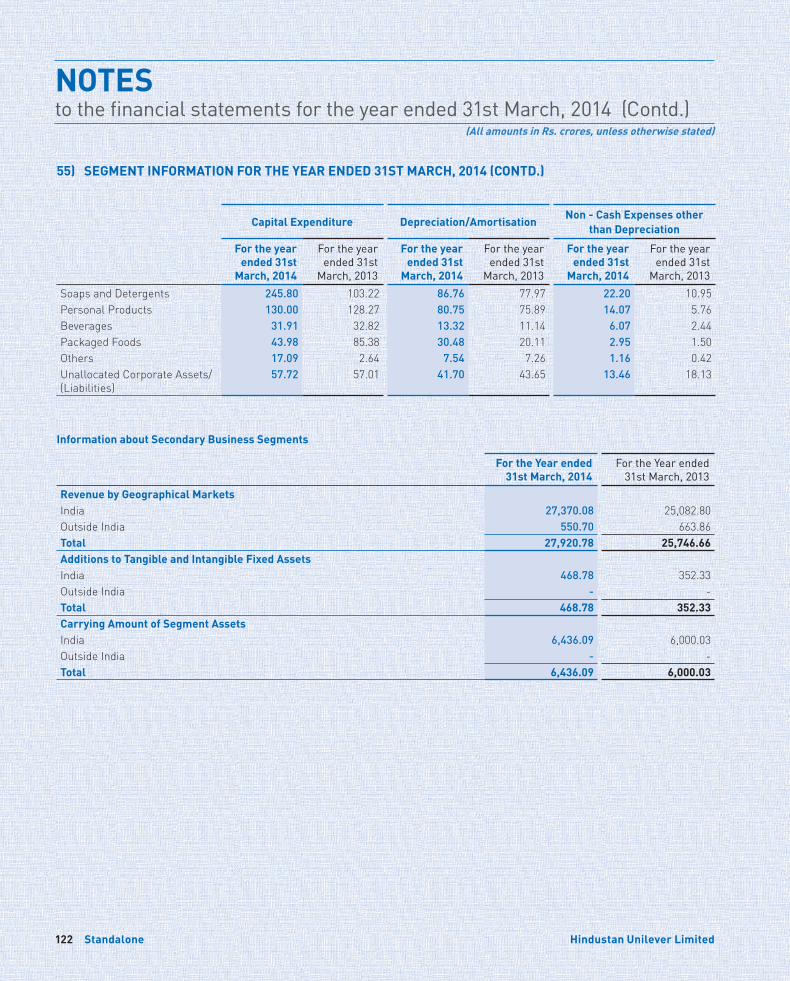
NOTESto the financial statements for the year ended 31st March, 2014 (Contd.)
(All amounts in Rs. crores, unless otherwise stated)
Standalone122 Hindustan Unilever Limited
Capital Expenditure Depreciation/AmortisationNon - Cash Expenses other
than Depreciation
For the year ended 31st
March, 2014
For the year ended 31st
March, 2013
For the year ended 31st
March, 2014
For the year ended 31st
March, 2013
For the year ended 31st
March, 2014
For the year ended 31st
March, 2013Soaps and Detergents 245.80 103.22 86.76 77.97 22.20 10.95 Personal Products 130.00 128.27 80.75 75.89 14.07 5.76 Beverages 31.91 32.82 13.32 11.14 6.07 2.44 Packaged Foods 43.98 85.38 30.48 20.11 2.95 1.50 Others 17.09 2.64 7.54 7.26 1.16 0.42 Unallocated Corporate Assets/ (Liabilities)
57.72 57.01 41.70 43.65 13.46 18.13
Information about Secondary Business Segments
For the Year ended 31st March, 2014
For the Year ended 31st March, 2013
Revenue by Geographical MarketsIndia 27,370.08 25,082.80 Outside India 550.70 663.86 Total 27,920.78 25,746.66 Additions to Tangible and Intangible Fixed Assets India 468.78 352.33 Outside India - - Total 468.78 352.33 Carrying Amount of Segment Assets India 6,436.09 6,000.03 Outside India - - Total 6,436.09 6,000.03
55) SEGMENT INFORMATION FOR THE YEAR ENDED 31ST MARCH, 2014 (CONTD.)
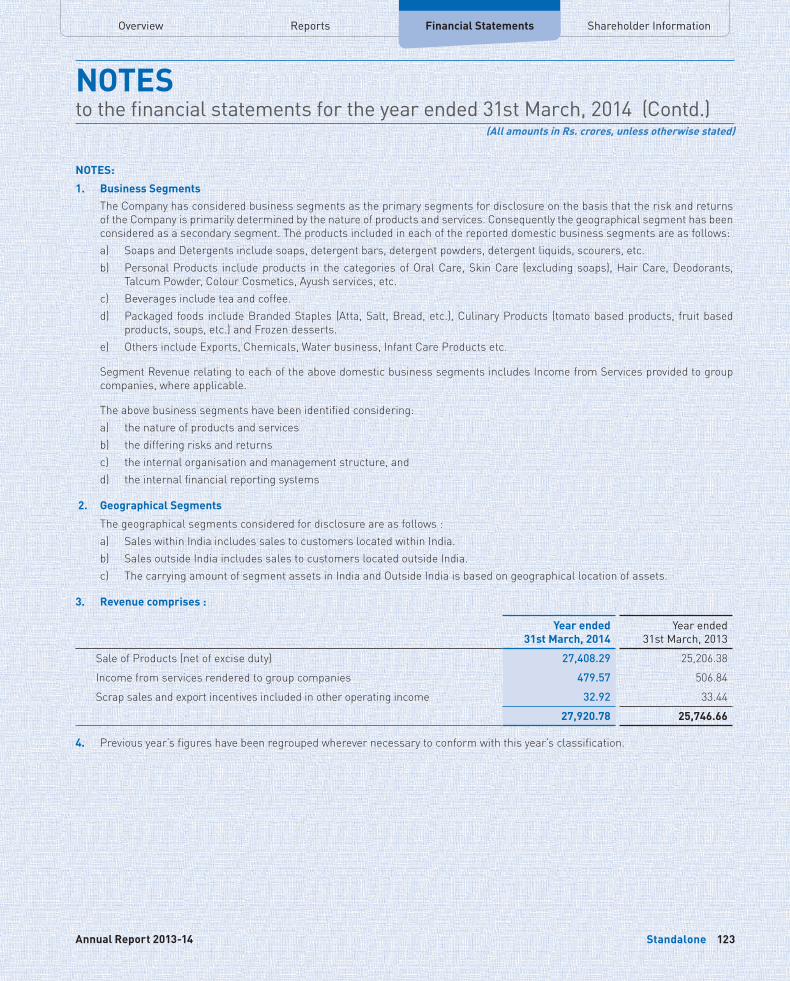
Overview Financial Statements Shareholder InformationReports
NOTESto the financial statements for the year ended 31st March, 2014 (Contd.)
(All amounts in Rs. crores, unless otherwise stated)
Standalone 123Annual Report 2013-14
NOTES:
1. Business Segments The Company has considered business segments as the primary segments for disclosure on the basis that the risk and returns
of the Company is primarily determined by the nature of products and services. Consequently the geographical segment has been considered as a secondary segment. The products included in each of the reported domestic business segments are as follows:a) Soaps and Detergents include soaps, detergent bars, detergent powders, detergent liquids, scourers, etc. b) Personal Products include products in the categories of Oral Care, Skin Care (excluding soaps), Hair Care, Deodorants,
Talcum Powder, Colour Cosmetics, Ayush services, etc.c) Beverages include tea and coffee.d) Packaged foods include Branded Staples (Atta, Salt, Bread, etc.), Culinary Products (tomato based products, fruit based
products, soups, etc.) and Frozen desserts. e) Others include Exports, Chemicals, Water business, Infant Care Products etc.
Segment Revenue relating to each of the above domestic business segments includes Income from Services provided to group companies, where applicable.
The above business segments have been identified considering:a) the nature of products and services b) the differing risks and returns c) the internal organisation and management structure, andd) the internal financial reporting systems
2. Geographical Segments
The geographical segments considered for disclosure are as follows : a) Sales within India includes sales to customers located within India. b) Sales outside India includes sales to customers located outside India. c) The carrying amount of segment assets in India and Outside India is based on geographical location of assets.
3. Revenue comprises :
Year ended 31st March, 2014
Year ended 31st March, 2013
Sale of Products (net of excise duty) 27,408.29 25,206.38 Income from services rendered to group companies 479.57 506.84 Scrap sales and export incentives included in other operating income 32.92 33.44
27,920.78 25,746.66
4. Previous year’s figures have been regrouped wherever necessary to conform with this year’s classification.
Standalone124 Hindustan Unilever Limited
INDEPENDENT AUDITORS’ REPORTto the Members of Hindustan Unilever Limited
REPORT ON THE FINANCIAL STATEMENTS1. We have audited the accompanying financial statements
of Hindustan Unilever Limited (the “Company”), which comprise the Balance Sheet as at March 31, 2014, and the Statement of Profit and Loss and Cash Flow Statement for the year then ended, and a summary of significant accounting policies and other explanatory information, which we have signed under reference to this report.
MANAGEMENT’S RESPONSIBILITY FOR THE FINANCIAL STATEMENTS2. The Company’s Management is responsible for the
preparation of these financial statements that give a true and fair view of the financial position, financial performance and cash flows of the Company in accordance with the Accounting Standards notified under ‘the Companies Act, 1956’ of India (the “Act”) read with the General Circular 15/ 2013 dated September 13, 2013 of the Ministry of Corporate Affairs in respect of Section 133 of the Companies Act, 2013. This responsibility includes the design, implementation and maintenance of internal control relevant to the preparation and presentation of the financial statements that give a true and fair view and are free from material misstatement, whether due to fraud or error.
AUDITORS’ RESPONSIBILITY3. Our responsibility is to express an opinion on these financial
statements based on our audit. We conducted our audit in accordance with the Standards on Auditing and other applicable authoritative pronouncements issued by the Institute of Chartered Accountants of India. Those Standards require that we comply with ethical requirements and plan and perform the audit to obtain reasonable assurance about whether the financial statements are free from material misstatement.
4. An audit involves performing procedures to obtain audit evidence, about the amounts and disclosures in the financial statements. The procedures selected depend on the auditors’ judgment, including the assessment of the risks of material misstatement of the financial statements, whether due to fraud or error. In making those risk assessments, the auditors consider internal control relevant to the Company’s preparation and fair presentation of the financial statements in order to design audit procedures that are appropriate in the circumstances, but not for the purpose of expressing an opinion on the effectiveness of the entity’s internal control. An audit also includes evaluating the appropriateness of accounting policies used and the reasonableness of the accounting estimates made by Management, as well as evaluating the overall presentation of the financial statements.
5. We believe that the audit evidence we have obtained is sufficient and appropriate to provide a basis for our audit opinion.
OPINION6. In our opinion, and to the best of our information and
according to the explanations given to us, the accompanying financial statements give the information required by the Act in the manner so required and give a true and fair view in conformity with the accounting principles generally accepted in India:
(a) in the case of the Balance Sheet, of the state of affairs of the Company as at March 31, 2014;
(b) in the case of the Statement of Profit and Loss, of the profit for the year ended on that date; and
(c) in the case of the Cash Flow Statement, of the cash flows for the year ended on that date.
REPORT ON OTHER LEGAL AND REGULATORY REQUIREMENTS7. As required by ‘the Companies (Auditor’s Report) Order,
2003’, as amended by ‘the Companies (Auditor’s Report) (Amendment) Order, 2004’, issued by the Central Government of India in terms of sub-section (4A) of section 227 of the Act (hereinafter referred to as the “Order”), and on the basis of such checks of the books and records of the Company as we considered appropriate and according to the information and explanations given to us, we give in the Annexure a statement on the matters specified in paragraphs 4 and 5 of the Order.
8. As required by section 227(3) of the Act, we report that: (a) We have obtained all the information and explanations
which, to the best of our knowledge and belief, were necessary for the purpose of our audit;
(b) In our opinion, proper books of account as required by law have been kept by the Company so far as appears from our examination of those books;
(c) The Balance Sheet, Statement of Profit and Loss, and Cash Flow Statement dealt with by this report are in agreement with the books of account;
(d) In our opinion, the Balance Sheet, Statement of Profit and Loss, and Cash Flow Statement dealt with by this report comply with the Accounting Standards notified under the Act read with the General Circular 15/ 2013 dated September 13, 2013 of the Ministry of Corporate Affairs in respect of Section 133 of the Companies Act, 2013;
(e) On the basis of written representations received from the directors as on March 31, 2014, and taken on record by the Board of Directors, none of the directors is disqualified as on March 31, 2014, from being appointed as a director in terms of clause (g) of sub-section (1) of section 274 of the Act.
For Lovelock & LewesFirm Registration Number: 301056EChartered Accountants
Pradip KanakiaPartner
Mumbai: April 28, 2014 Membership Number: 39985
Overview Financial Statements Shareholder InformationReports
Standalone 125Annual Report 2013-14
Overview Financial Statements Shareholder InformationReports
ANNEXURE TO AUDITORS’ REPORTReferred to in paragraph 7 of the Auditors’ Report of even date to the members of Hindustan Unilever Limited on the financial statements as of and for the year ended March 31, 2014
1. (a) The Company is maintaining proper records showing full particulars, including quantitative details and situation, of fixed assets.
(b) The fixed assets are physically verified by the Management according to a phased programme designed to cover all the items over a period of two years which, in our opinion, is reasonable having regard to the size of the Company and the nature of its assets. Pursuant to the programme, a portion of the fixed assets has been physically verified by the Management during the year and no material discrepancies have been noticed on such verification.
(c) In our opinion, and according to the information and explanations given to us, a substantial part of fixed assets has not been disposed off by the Company during the year.
2. (a) The inventory (excluding stocks with third parties) has been physically verified by the Management during the year. In respect of inventory lying with third parties, these have substantially been confirmed by them. In our opinion, the frequency of verification is reasonable.
(b) In our opinion, the procedures of physical verification of inventory followed by the Management are reasonable and adequate in relation to the size of the Company and the nature of its business.
(c) On the basis of our examination of the inventory records, in our opinion, the Company is maintaining proper records of inventory. The discrepancies noticed on physical verification of inventory as compared to book records were not material.
3. The Company has neither granted nor taken any loans, secured or unsecured, to/ from companies, firms or other parties covered in the register maintained under section 301 of the Act. Therefore, the provisions of Clause 4(iii)[(b), (c), (d), (f) and (g)] of the said Order are not applicable to the Company.
4. In our opinion, and according to the information and explanations given to us, there is an adequate internal control system commensurate with the size of the Company and the nature of its business for the purchase of inventory and fixed assets and for the sale of goods and services. Further, on the basis of our examination of the books and records of the Company, and according to the information and explanations given to us, we have neither come across, nor have been informed of, any continuing failure to correct major weaknesses in the aforesaid internal control system.
5. (a) According to the information and explanations given to us, we are of the opinion that the particulars of all contracts or arrangements that need to be entered into the register maintained under section 301 of the Companies Act, 1956 have been so entered.
(b) In our opinion, and according to the information and explanations given to us, the transactions made in pursuance of such contracts or arrangements and exceeding the value of Rupees Five Lakhs in respect of any party during the year have been made at prices which are reasonable having regard to the prevailing market prices at the relevant time.
6. The Company has not accepted any deposits from the public within the meaning of sections 58A and 58AA of the Act and the rules framed there under.
7. In our opinion, the Company has an internal audit system commensurate with its size and the nature of its business.
8. We have broadly reviewed the books of account maintained by the Company in respect of products where, pursuant to the rules made by the Central Government of India, the maintenance of cost records has been prescribed under clause (d) of sub-section (1) of section 209 of the Act, and are of the opinion that, prima facie, the prescribed accounts and records have been made and maintained. We have not, however, made a detailed examination of the records with a view to determine whether they are accurate or complete.
9. (a) According to the information and explanations given to us and the records of the Company examined by us, in our opinion, the Company is generally regular in depositing undisputed statutory dues in respect of provident fund, employees’ state insurance, sales tax, service tax, customs duty, excise duty and tax deducted at source, and is regular in depositing undisputed statutory dues, including investor education and protection fund, income tax, wealth tax, and other material statutory dues, as applicable, with the appropriate authorities.
(b) According to the information and explanations given to us and the records of the Company examined by us, there are no dues of wealth tax which have not been deposited on account of any dispute. The particulars of dues of income tax, sales tax, service tax, customs duty and excise duty as at March 31, 2014 which have not been deposited on account of a dispute, are as follows:
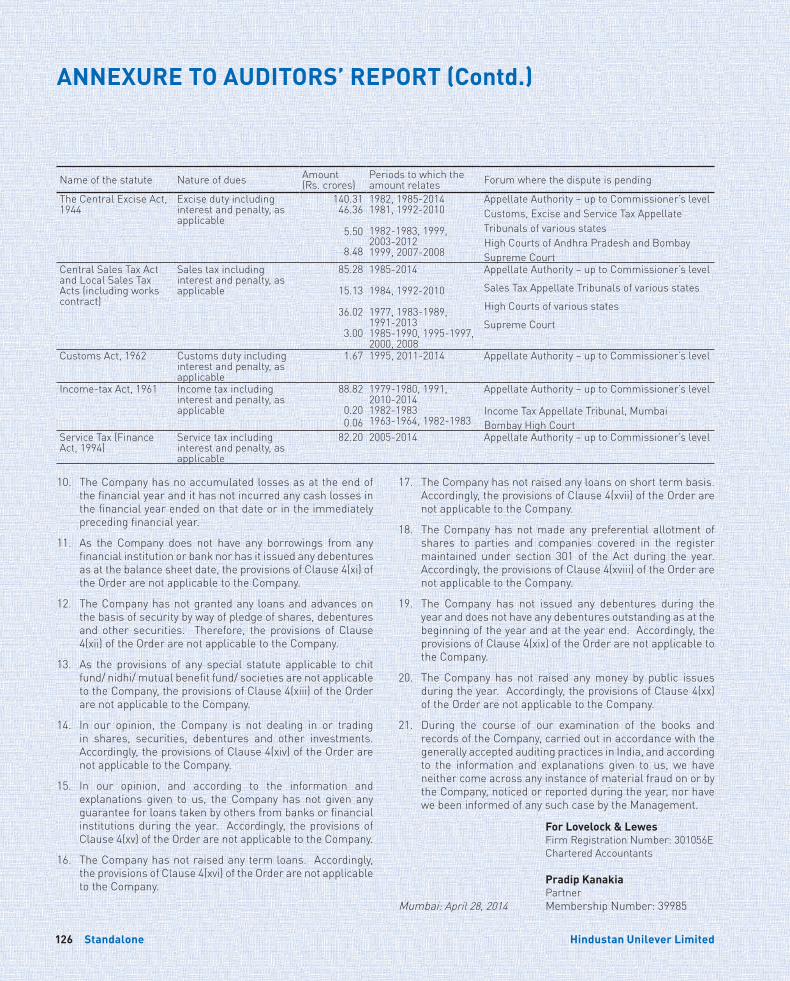
Standalone126 Hindustan Unilever Limited
Name of the statute Nature of dues Amount (Rs. crores)
Periods to which the amount relates Forum where the dispute is pending
The Central Excise Act, 1944
Excise duty including interest and penalty, as applicable
140.31 46.36
5.50
8.48
1982, 1985-20141981, 1992-2010
1982-1983, 1999, 2003-2012 1999, 2007-2008
Appellate Authority – up to Commissioner’s levelCustoms, Excise and Service Tax Appellate Tribunals of various statesHigh Courts of Andhra Pradesh and BombaySupreme Court
Central Sales Tax Act and Local Sales Tax Acts (including works contract)
Sales tax including interest and penalty, as applicable
85.28
15.13
36.02
3.00
1985-2014
1984, 1992-2010
1977, 1983-1989, 1991-20131985-1990, 1995-1997, 2000, 2008
Appellate Authority – up to Commissioner’s level
Sales Tax Appellate Tribunals of various states
High Courts of various states
Supreme Court
Customs Act, 1962 Customs duty including interest and penalty, as applicable
1.67 1995, 2011-2014 Appellate Authority – up to Commissioner’s level
Income-tax Act, 1961 Income tax including interest and penalty, as applicable
88.82
0.20 0.06
1979-1980, 1991, 2010-20141982-19831963-1964, 1982-1983
Appellate Authority – up to Commissioner’s level
Income Tax Appellate Tribunal, MumbaiBombay High Court
Service Tax (Finance Act, 1994)
Service tax including interest and penalty, as applicable
82.20 2005-2014 Appellate Authority – up to Commissioner’s level
ANNEXURE TO AUDITORS’ REPORT (Contd.)
10. The Company has no accumulated losses as at the end of the financial year and it has not incurred any cash losses in the financial year ended on that date or in the immediately preceding financial year.
11. As the Company does not have any borrowings from any financial institution or bank nor has it issued any debentures as at the balance sheet date, the provisions of Clause 4(xi) of the Order are not applicable to the Company.
12. The Company has not granted any loans and advances on the basis of security by way of pledge of shares, debentures and other securities. Therefore, the provisions of Clause 4(xii) of the Order are not applicable to the Company.
13. As the provisions of any special statute applicable to chit fund/ nidhi/ mutual benefit fund/ societies are not applicable to the Company, the provisions of Clause 4(xiii) of the Order are not applicable to the Company.
14. In our opinion, the Company is not dealing in or trading in shares, securities, debentures and other investments. Accordingly, the provisions of Clause 4(xiv) of the Order are not applicable to the Company.
15. In our opinion, and according to the information and explanations given to us, the Company has not given any guarantee for loans taken by others from banks or financial institutions during the year. Accordingly, the provisions of Clause 4(xv) of the Order are not applicable to the Company.
16. The Company has not raised any term loans. Accordingly, the provisions of Clause 4(xvi) of the Order are not applicable to the Company.
17. The Company has not raised any loans on short term basis. Accordingly, the provisions of Clause 4(xvii) of the Order are not applicable to the Company.
18. The Company has not made any preferential allotment of shares to parties and companies covered in the register maintained under section 301 of the Act during the year. Accordingly, the provisions of Clause 4(xviii) of the Order are not applicable to the Company.
19. The Company has not issued any debentures during the year and does not have any debentures outstanding as at the beginning of the year and at the year end. Accordingly, the provisions of Clause 4(xix) of the Order are not applicable to the Company.
20. The Company has not raised any money by public issues during the year. Accordingly, the provisions of Clause 4(xx) of the Order are not applicable to the Company.
21. During the course of our examination of the books and records of the Company, carried out in accordance with the generally accepted auditing practices in India, and according to the information and explanations given to us, we have neither come across any instance of material fraud on or by the Company, noticed or reported during the year, nor have we been informed of any such case by the Management.
For Lovelock & LewesFirm Registration Number: 301056EChartered Accountants
Pradip KanakiaPartner
Mumbai: April 28, 2014 Membership Number: 39985
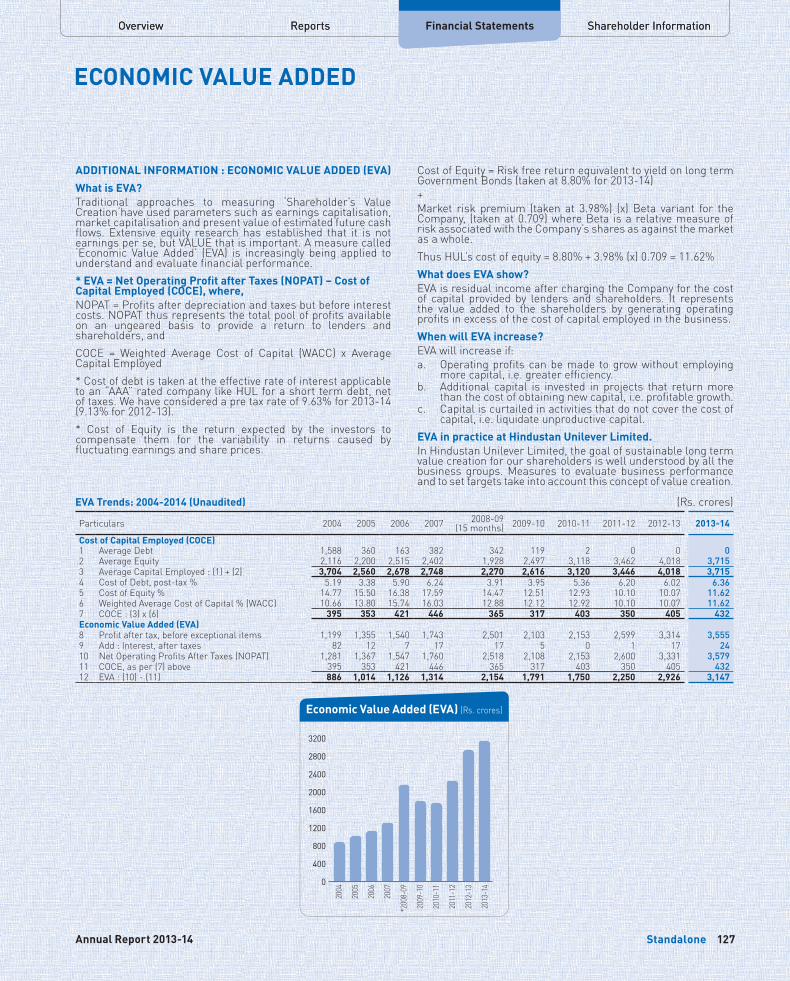
Overview Financial Statements Shareholder InformationReports
Standalone 127Annual Report 2013-14
Overview Financial Statements Shareholder InformationReports
ECONOMIC VALUE ADDED
ADDITIONAL INFORMATION : ECONOMIC VALUE ADDED (EVA)What is EVA?Traditional approaches to measuring ‘Shareholder’s Value Creation‘have used parameters such as earnings capitalisation, market capitalisation and present value of estimated future cash flows. Extensive equity research has established that it is not earnings per se, but VALUE that is important. A measure called ‘Economic Value Added’ (EVA) is increasingly being applied to understand and evaluate financial performance.* EVA = Net Operating Profit after Taxes (NOPAT) – Cost of Capital Employed (COCE), where,NOPAT = Profits after depreciation and taxes but before interest costs. NOPAT thus represents the total pool of profits available on an ungeared basis to provide a return to lenders and shareholders, andCOCE = Weighted Average Cost of Capital (WACC) x Average Capital Employed* Cost of debt is taken at the effective rate of interest applicable to an “AAA” rated company like HUL for a short term debt, net of taxes. We have considered a pre tax rate of 9.63% for 2013-14 (9.13% for 2012-13).* Cost of Equity is the return expected by the investors to compensate them for the variability in returns caused by fluctuating earnings and share prices.
Cost of Equity = Risk free return equivalent to yield on long term Government Bonds (taken at 8.80% for 2013-14)+Market risk premium (taken at 3.98%) (x) Beta variant for the Company, (taken at 0.709) where Beta is a relative measure of risk associated with the Company’s shares as against the market as a whole.Thus HUL’s cost of equity = 8.80% + 3.98% (x) 0.709 = 11.62%What does EVA show?EVA is residual income after charging the Company for the cost of capital provided by lenders and shareholders. It represents the value added to the shareholders by generating operating profits in excess of the cost of capital employed in the business.When will EVA increase?EVA will increase if:a. Operating profits can be made to grow without employing
more capital, i.e. greater efficiency.b. Additional capital is invested in projects that return more
than the cost of obtaining new capital, i.e. profitable growth.c. Capital is curtailed in activities that do not cover the cost of
capital, i.e. liquidate unproductive capital.EVA in practice at Hindustan Unilever Limited.In Hindustan Unilever Limited, the goal of sustainable long term value creation for our shareholders is well understood by all the business groups. Measures to evaluate business performance and to set targets take into account this concept of value creation.
EVA Trends: 2004-2014 (Unaudited) (Rs. crores)
Particulars 2004 2005 2006 2007 2008-09 (15 months) 2009-10 2010-11 2011-12 2012-13 2013-14
Cost of Capital Employed (COCE) 1 Average Debt 1,588 360 163 382 342 119 2 0 0 02 Average Equity 2,116 2,200 2,515 2,402 1,928 2,497 3,118 3,462 4,018 3,7153 Average Capital Employed : (1) + (2) 3,704 2,560 2,678 2,748 2,270 2,616 3,120 3,446 4,018 3,7154 Cost of Debt, post-tax % 5.19 3.38 5.90 6.24 3.91 3.95 5.36 6.20 6.02 6.365 Cost of Equity % 14.77 15.50 16.38 17.59 14.47 12.51 12.93 10.10 10.07 11.626 Weighted Average Cost of Capital % (WACC) 10.66 13.80 15.74 16.03 12.88 12.12 12.92 10.10 10.07 11.627 COCE : (3) x (6) 395 353 421 446 365 317 403 350 405 432Economic Value Added (EVA)8 Profit after tax, before exceptional items 1,199 1,355 1,540 1,743 2,501 2,103 2,153 2,599 3,314 3,5559 Add : Interest, after taxes 82 12 7 17 17 5 0 1 17 2410 Net Operating Profits After Taxes (NOPAT) 1,281 1,367 1,547 1,760 2,518 2,108 2,153 2,600 3,331 3,57911 COCE, as per (7) above 395 353 421 446 365 317 403 350 405 43212 EVA : (10) - (11) 886 1,014 1,126 1,314 2,154 1,791 1,750 2,250 2,926 3,147
3200
2800
2400
2000
1600
1200
800
400
0
20
04
20
05
20
06
20
07
*200
8-09
200
9-10
201
0-11
201
1-12
201
2-13
201
3-14
Economic Value Added (EVA) (Rs. crores)
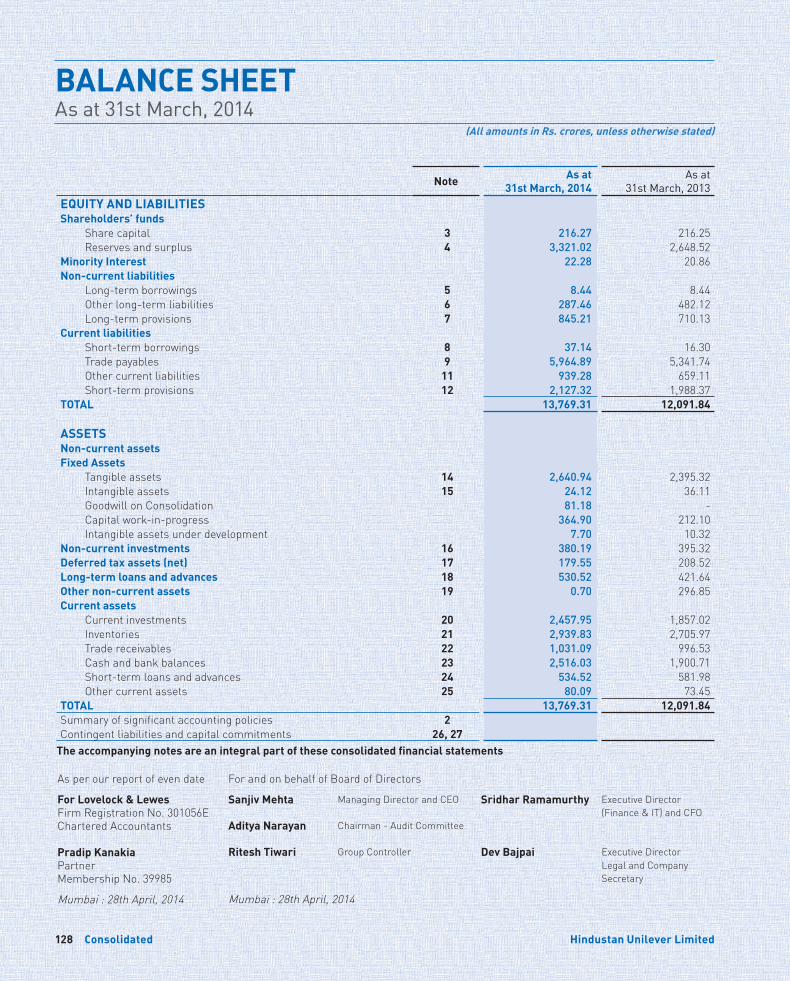
Consolidated Consolidated128 129Hindustan Unilever Limited Annual Report 2013-14
Note As at 31st March, 2014
As at 31st March, 2013
EQUITY AND LIABILITIESShareholders’ funds Share capital 3 216.27 216.25 Reserves and surplus 4 3,321.02 2,648.52 Minority Interest 22.28 20.86 Non-current liabilities Long-term borrowings 5 8.44 8.44 Other long-term liabilities 6 287.46 482.12 Long-term provisions 7 845.21 710.13 Current liabilities Short-term borrowings 8 37.14 16.30 Trade payables 9 5,964.89 5,341.74 Other current liabilities 11 939.28 659.11 Short-term provisions 12 2,127.32 1,988.37 TOTAL 13,769.31 12,091.84
ASSETSNon-current assetsFixed Assets Tangible assets 14 2,640.94 2,395.32 Intangible assets 15 24.12 36.11 Goodwill on Consolidation 81.18 - Capital work-in-progress 364.90 212.10 Intangible assets under development 7.70 10.32 Non-current investments 16 380.19 395.32 Deferred tax assets (net) 17 179.55 208.52 Long-term loans and advances 18 530.52 421.64 Other non-current assets 19 0.70 296.85 Current assets Current investments 20 2,457.95 1,857.02 Inventories 21 2,939.83 2,705.97 Trade receivables 22 1,031.09 996.53 Cash and bank balances 23 2,516.03 1,900.71 Short-term loans and advances 24 534.52 581.98 Other current assets 25 80.09 73.45 TOTAL 13,769.31 12,091.84 Summary of significant accounting policies 2 Contingent liabilities and capital commitments 26, 27
The accompanying notes are an integral part of these consolidated financial statements
BALANCE SHEETAs at 31st March, 2014
(All amounts in Rs. crores, unless otherwise stated)
As per our report of even date
For Lovelock & LewesFirm Registration No. 301056EChartered Accountants
Pradip KanakiaPartnerMembership No. 39985
Mumbai : 28th April, 2014
For and on behalf of Board of Directors
Sanjiv Mehta Managing Director and CEO Sridhar Ramamurthy Executive Director(Finance & IT) and CFO
Aditya Narayan Chairman - Audit Committee
Ritesh Tiwari Group Controller Dev Bajpai Executive DirectorLegal and CompanySecretary
Mumbai : 28th April, 2014
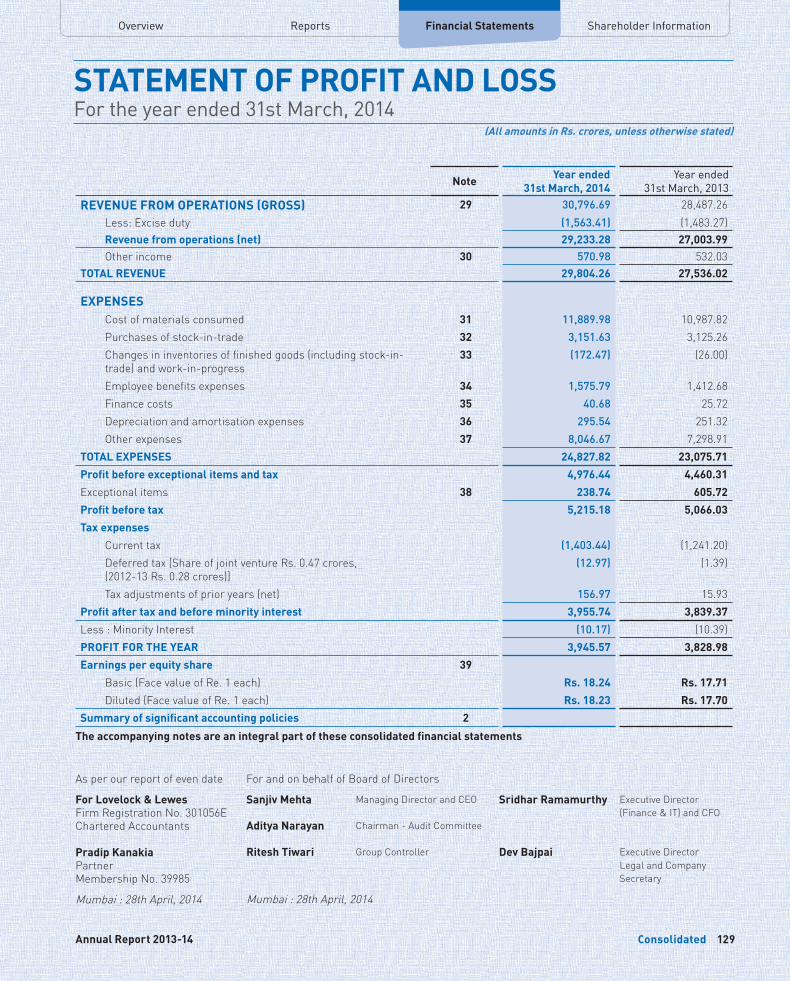
Overview Financial Statements Shareholder InformationReports
Consolidated Consolidated128 129Hindustan Unilever Limited Annual Report 2013-14
Note Year ended 31st March, 2014
Year ended 31st March, 2013
REVENUE FROM OPERATIONS (GROSS) 29 30,796.69 28,487.26 Less: Excise duty (1,563.41) (1,483.27) Revenue from operations (net) 29,233.28 27,003.99 Other income 30 570.98 532.03 TOTAL REVENUE 29,804.26 27,536.02
EXPENSES Cost of materials consumed 31 11,889.98 10,987.82 Purchases of stock-in-trade 32 3,151.63 3,125.26 Changes in inventories of finished goods (including stock-in-
trade) and work-in-progress 33 (172.47) (26.00)
Employee benefits expenses 34 1,575.79 1,412.68 Finance costs 35 40.68 25.72 Depreciation and amortisation expenses 36 295.54 251.32 Other expenses 37 8,046.67 7,298.91 TOTAL EXPENSES 24,827.82 23,075.71 Profit before exceptional items and tax 4,976.44 4,460.31 Exceptional items 38 238.74 605.72 Profit before tax 5,215.18 5,066.03 Tax expenses Current tax (1,403.44) (1,241.20) Deferred tax [Share of joint venture Rs. 0.47 crores,
(2012-13 Rs. 0.28 crores)] (12.97) (1.39)
Tax adjustments of prior years (net) 156.97 15.93 Profit after tax and before minority interest 3,955.74 3,839.37 Less : Minority Interest (10.17) (10.39)PROFIT FOR THE YEAR 3,945.57 3,828.98 Earnings per equity share 39 Basic (Face value of Re. 1 each) Rs. 18.24 Rs. 17.71 Diluted (Face value of Re. 1 each) Rs. 18.23 Rs. 17.70 Summary of significant accounting policies 2
The accompanying notes are an integral part of these consolidated financial statements
STATEMENT OF PROFIT AND LOSSFor the year ended 31st March, 2014
(All amounts in Rs. crores, unless otherwise stated)
As per our report of even date
For Lovelock & LewesFirm Registration No. 301056EChartered Accountants
Pradip KanakiaPartnerMembership No. 39985
Mumbai : 28th April, 2014
For and on behalf of Board of Directors
Sanjiv Mehta Managing Director and CEO Sridhar Ramamurthy Executive Director(Finance & IT) and CFO
Aditya Narayan Chairman - Audit Committee
Ritesh Tiwari Group Controller Dev Bajpai Executive DirectorLegal and CompanySecretary
Mumbai : 28th April, 2014
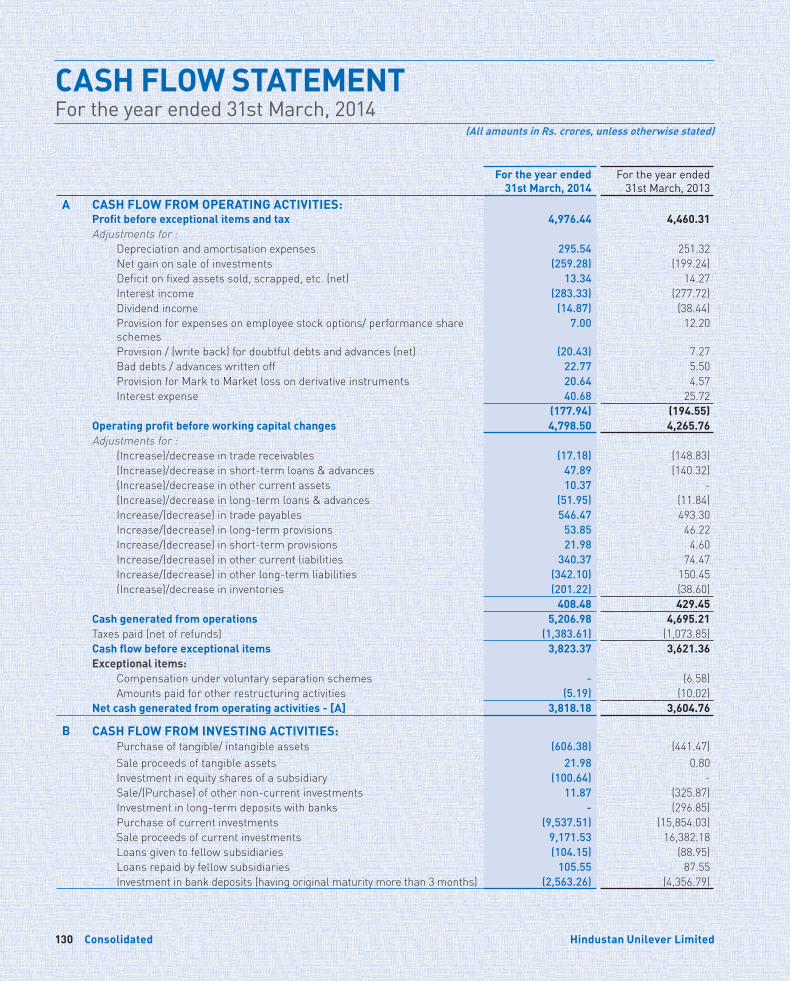
Consolidated Consolidated130 131Hindustan Unilever Limited Annual Report 2013-14
For the year ended 31st March, 2014
For the year ended 31st March, 2013
A CASH FLOW FROM OPERATING ACTIVITIES:Profit before exceptional items and tax 4,976.44 4,460.31 Adjustments for : Depreciation and amortisation expenses 295.54 251.32 Net gain on sale of investments (259.28) (199.24) Deficit on fixed assets sold, scrapped, etc. (net) 13.34 14.27 Interest income (283.33) (277.72) Dividend income (14.87) (38.44) Provision for expenses on employee stock options/ performance share
schemes 7.00 12.20
Provision / (write back) for doubtful debts and advances (net) (20.43) 7.27 Bad debts / advances written off 22.77 5.50 Provision for Mark to Market loss on derivative instruments 20.64 4.57 Interest expense 40.68 25.72
(177.94) (194.55)Operating profit before working capital changes 4,798.50 4,265.76 Adjustments for : (Increase)/decrease in trade receivables (17.18) (148.83) (Increase)/decrease in short-term loans & advances 47.89 (140.32) (Increase)/decrease in other current assets 10.37 - (Increase)/decrease in long-term loans & advances (51.95) (11.84) Increase/(decrease) in trade payables 546.47 493.30 Increase/(decrease) in long-term provisions 53.85 46.22 Increase/(decrease) in short-term provisions 21.98 4.60 Increase/(decrease) in other current liabilities 340.37 74.47 Increase/(decrease) in other long-term liabilities (342.10) 150.45 (Increase)/decrease in inventories (201.22) (38.60)
408.48 429.45 Cash generated from operations 5,206.98 4,695.21 Taxes paid (net of refunds) (1,383.61) (1,073.85)Cash flow before exceptional items 3,823.37 3,621.36 Exceptional items: Compensation under voluntary separation schemes - (6.58) Amounts paid for other restructuring activities (5.19) (10.02)Net cash generated from operating activities - [A] 3,818.18 3,604.76
B CASH FLOW FROM INVESTING ACTIVITIES: Purchase of tangible/ intangible assets (606.38) (441.47) Sale proceeds of tangible assets 21.98 0.80 Investment in equity shares of a subsidiary (100.64) - Sale/(Purchase) of other non-current investments 11.87 (325.87) Investment in long-term deposits with banks - (296.85) Purchase of current investments (9,537.51) (15,854.03) Sale proceeds of current investments 9,171.53 16,382.18 Loans given to fellow subsidiaries (104.15) (88.95) Loans repaid by fellow subsidiaries 105.55 87.55 Investment in bank deposits (having original maturity more than 3 months) (2,563.26) (4,356.79)
CASH FLOW STATEMENTFor the year ended 31st March, 2014
(All amounts in Rs. crores, unless otherwise stated)
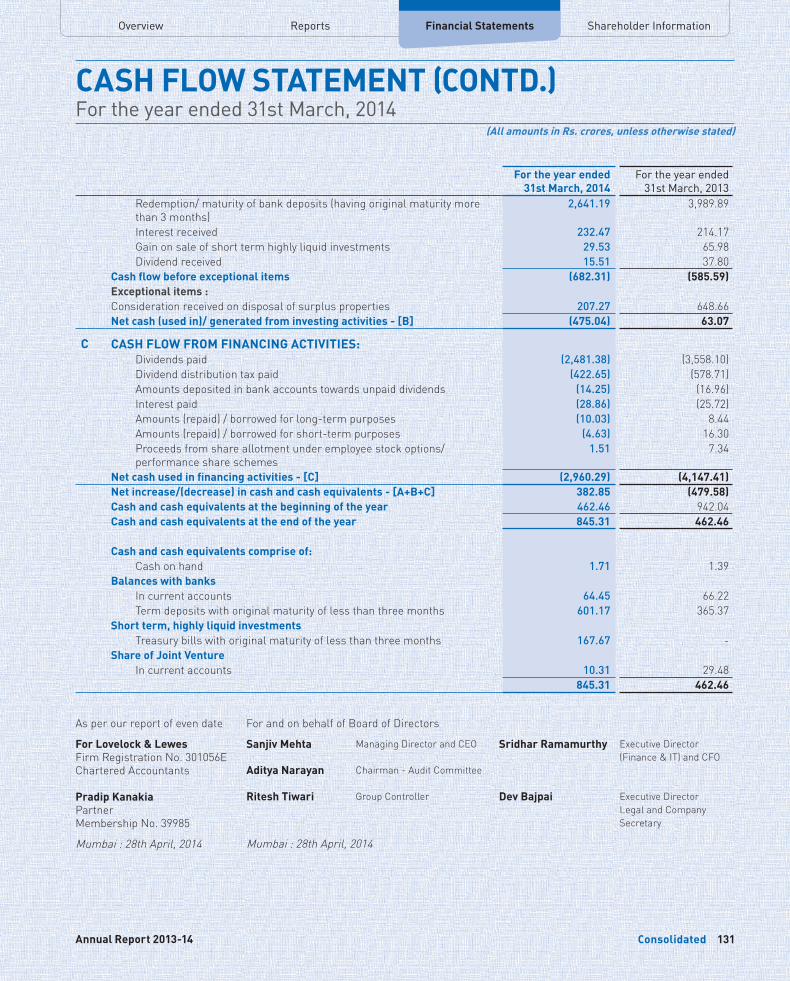
Overview Financial Statements Shareholder InformationReports
Consolidated Consolidated130 131Hindustan Unilever Limited Annual Report 2013-14
For the year ended 31st March, 2014
For the year ended 31st March, 2013
Redemption/ maturity of bank deposits (having original maturity more than 3 months)
2,641.19 3,989.89
Interest received 232.47 214.17 Gain on sale of short term highly liquid investments 29.53 65.98 Dividend received 15.51 37.80 Cash flow before exceptional items (682.31) (585.59)Exceptional items :Consideration received on disposal of surplus properties 207.27 648.66 Net cash (used in)/ generated from investing activities - [B] (475.04) 63.07
C CASH FLOW FROM FINANCING ACTIVITIES: Dividends paid (2,481.38) (3,558.10) Dividend distribution tax paid (422.65) (578.71) Amounts deposited in bank accounts towards unpaid dividends (14.25) (16.96) Interest paid (28.86) (25.72) Amounts (repaid) / borrowed for long-term purposes (10.03) 8.44 Amounts (repaid) / borrowed for short-term purposes (4.63) 16.30 Proceeds from share allotment under employee stock options/
performance share schemes 1.51 7.34
Net cash used in financing activities - [C] (2,960.29) (4,147.41)Net increase/(decrease) in cash and cash equivalents - [A+B+C] 382.85 (479.58)Cash and cash equivalents at the beginning of the year 462.46 942.04 Cash and cash equivalents at the end of the year 845.31 462.46
Cash and cash equivalents comprise of: Cash on hand 1.71 1.39 Balances with banks In current accounts 64.45 66.22 Term deposits with original maturity of less than three months 601.17 365.37 Short term, highly liquid investments Treasury bills with original maturity of less than three months 167.67 - Share of Joint Venture In current accounts 10.31 29.48
845.31 462.46
CASH FLOW STATEMENT (CONTD.)For the year ended 31st March, 2014
(All amounts in Rs. crores, unless otherwise stated)
As per our report of even date
For Lovelock & LewesFirm Registration No. 301056EChartered Accountants
Pradip KanakiaPartnerMembership No. 39985
Mumbai : 28th April, 2014
For and on behalf of Board of Directors
Sanjiv Mehta Managing Director and CEO Sridhar Ramamurthy Executive Director(Finance & IT) and CFO
Aditya Narayan Chairman - Audit Committee
Ritesh Tiwari Group Controller Dev Bajpai Executive DirectorLegal and CompanySecretary
Mumbai : 28th April, 2014
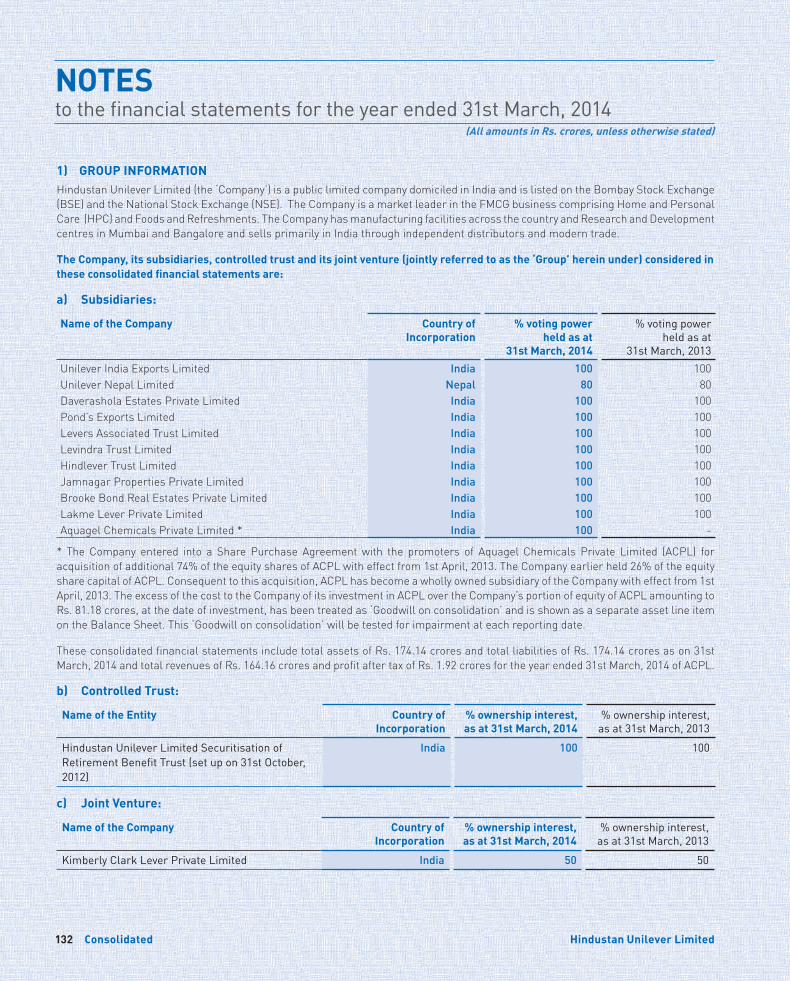
Consolidated Consolidated132 133Hindustan Unilever Limited Annual Report 2013-14
NOTESto the financial statements for the year ended 31st March, 2014
(All amounts in Rs. crores, unless otherwise stated)
1) GROUP INFORMATION Hindustan Unilever Limited (the ‘Company’) is a public limited company domiciled in India and is listed on the Bombay Stock Exchange (BSE) and the National Stock Exchange (NSE). The Company is a market leader in the FMCG business comprising Home and Personal Care (HPC) and Foods and Refreshments. The Company has manufacturing facilities across the country and Research and Development centres in Mumbai and Bangalore and sells primarily in India through independent distributors and modern trade.
The Company, its subsidiaries, controlled trust and its joint venture (jointly referred to as the ‘Group’ herein under) considered in these consolidated financial statements are:
a) Subsidiaries:
Name of the Company Country of Incorporation
% voting power held as at
31st March, 2014
% voting power held as at
31st March, 2013Unilever India Exports Limited India 100 100Unilever Nepal Limited Nepal 80 80Daverashola Estates Private Limited India 100 100Pond’s Exports Limited India 100 100Levers Associated Trust Limited India 100 100Levindra Trust Limited India 100 100Hindlever Trust Limited India 100 100Jamnagar Properties Private Limited India 100 100Brooke Bond Real Estates Private Limited India 100 100Lakme Lever Private Limited India 100 100Aquagel Chemicals Private Limited * India 100 -
* The Company entered into a Share Purchase Agreement with the promoters of Aquagel Chemicals Private Limited (ACPL) for acquisition of additional 74% of the equity shares of ACPL with effect from 1st April, 2013. The Company earlier held 26% of the equity share capital of ACPL. Consequent to this acquisition, ACPL has become a wholly owned subsidiary of the Company with effect from 1st April, 2013. The excess of the cost to the Company of its investment in ACPL over the Company’s portion of equity of ACPL amounting to Rs. 81.18 crores, at the date of investment, has been treated as ‘Goodwill on consolidation’ and is shown as a separate asset line item on the Balance Sheet. This ‘Goodwill on consolidation’ will be tested for impairment at each reporting date.
These consolidated financial statements include total assets of Rs. 174.14 crores and total liabilities of Rs. 174.14 crores as on 31st March, 2014 and total revenues of Rs. 164.16 crores and profit after tax of Rs. 1.92 crores for the year ended 31st March, 2014 of ACPL.
b) Controlled Trust:
Name of the Entity Country of Incorporation
% ownership interest, as at 31st March, 2014
% ownership interest, as at 31st March, 2013
Hindustan Unilever Limited Securitisation of Retirement Benefit Trust (set up on 31st October, 2012)
India 100 100
c) Joint Venture:
Name of the Company Country of Incorporation
% ownership interest, as at 31st March, 2014
% ownership interest, as at 31st March, 2013
Kimberly Clark Lever Private Limited India 50 50
Overview Financial Statements Shareholder InformationReports
Consolidated Consolidated132 133Hindustan Unilever Limited Annual Report 2013-14
NOTESto the financial statements for the year ended 31st March, 2014 (Contd.)
(All amounts in Rs. crores, unless otherwise stated)
2) SUMMARY OF SIGNIFICANT ACCOUNTING POLICIES2.1. Basis of preparation
These consolidated financial statements have been prepared to comply in all material aspects with applicable accounting principles in India, the applicable Accounting Standards notified under Section 211(3C) of the Companies Act, 1956. Pursuant to Circular 15/ 2013 dated 13th September, 2013 read with circular 08/ 2014 dated 4th April, 2014, till the standards of Accounting or any addendum thereto are prescribed by Central Government in consultation and recommendation of the National Financial Reporting Authority, the existing Accounting Standards notified under Section 211(3C) [Companies (Accounting Standards) Rules, 2006, as amended] and in particular Accounting Standard 21 (AS 21) - ‘Consolidated Financial Statements’ and Accounting Standard 27 (AS 27) - ‘Financial Reporting of Interest in Joint Venture’.
The financial statements of the Company, its subsidiaries, controlled trust and the joint venture (on a proportionate basis) have been combined on a line-by-line basis by adding together the book values of like items of assets, liabilities, income and expenses. Intra group balances and intra group transactions and resulting unrealised profits are eliminated in full. Unrealised losses resulting from intra group transactions are also eliminated unless cost cannot be recovered.
The consolidated financial statements have been prepared using uniform accounting policies for like transactions and other events in similar circumstances.
All assets and liabilities have been classified as current or non-current as per the Group’s normal operating cycle and other criteria set out in the Revised Schedule VI to the Companies Act, 1956.
Based on the nature of products and the time between acquisition of assets for processing and their realisation in cash and cash equivalents, the Group has ascertained its operating cycle as 12 months for the purpose of current/ non-current classification of assets and liabilities.
Transactions and balances with values below the rounding off norm adopted by the Group have been reflected as “0.00” in the relevant notes in these consolidated financial statements.
2.2. Revenue recognition
Revenue from sale of goods is recognised when all the significant risks and rewards of ownership in the goods are transferred to the buyer as per the terms of the contract, the Group retains no effective control of the goods transferred to a degree usually associated with ownership and no significant uncertainty exists regarding the amount of the consideration that will be derived
from the sale of goods. Sales are recognised net of trade discounts, rebates, sales taxes and excise duties (on goods manufactured and outsourced).
Income from export incentives such as duty drawback and premium on sale of import licences, and lease license fee are recognised on accrual basis.
Income from Property Development Activity is recognised in terms of arrangements with developers, where applicable.
Income from services rendered is recognised based on agreements/ arrangements with the customers as the service is performed using the proportionate completion method when no significant uncertainty exists regarding the amount of the consideration that will be derived from rendering the service and is recognised net of service tax, as applicable.Interest on investments is recognised on a time proportion basis taking into account the amounts invested and the rate of interest.
Dividend income on investments is recognised when the right to receive dividend is established.
2.3. Expenditure
Expenses are accounted on accrual basis.
Revenue expenditure pertaining to research is charged to the Statement of Profit and Loss. Development costs of products are also charged to the Statement of Profit and Loss unless a product’s technical feasibility and other criteria set out in paragraph 44 of AS 26 – ‘Intangible assets’ have been established, in which case such expenditure is capitalised. The amount capitalised comprises expenditure that can be directly attributed or allocated on a reasonable and consistent basis to creating, producing and making the asset ready for its intended use. Fixed assets utilised for research and development are capitalised and depreciated in accordance with the policies stated for Tangible Assets.
2.4. Tangible assets
Tangible assets are stated at acquisition cost, net of accumulated depreciation and accumulated impairment losses, if any. Subsequent expenditures related to an item of tangible asset are added to its book value only if they increase the future benefits from the existing asset beyond its previously assessed standard of performance.
Items of tangible assets that have been retired from active use and are held for disposal are stated at the lower of their net book value and net realisable value and are shown separately in the financial statements under “Other current assets”. Any expected loss is recognised immediately in the Statement of Profit and Loss.
Consolidated Consolidated134 135Hindustan Unilever Limited Annual Report 2013-14
NOTESto the financial statements for the year ended 31st March, 2014 (Contd.)
(All amounts in Rs. crores, unless otherwise stated)
Losses arising from the retirement of, and gains or losses arising from disposal of tangible assets which are carried at cost are recognised in the Statement of Profit and Loss.
Depreciation is provided on a pro-rata basis on the straight line method over the estimated useful lives of the assets or at the rates prescribed under Schedule XIV to the Companies Act, 1956, whichever is higher. Accordingly,
- computers and related assets, included in office equipment are depreciated over four years;
- leasehold land is amortised over the primary period of the lease;
- certain assets of the cold chain, included in plant and equipment, are depreciated over four/ seven years;
- vehicles are depreciated over six years; and - certain assets lying at salons and training centre, included
in plant and equipment, furniture and fixtures and office equipment, are depreciated over five to nine years.
2.5. Intangible assets
Intangible assets are stated at acquisition cost, net of accumulated amortisation and accumulated impairment losses, if any. Intangible assets are amortised on the straight line basis as per rates mentioned below:
Asset class Rate of amortisationGoodwill 25%Brands/ trademarks 25%Computer software 20%
2.6. Impairment
Assessment for impairment is done at each Balance Sheet date as to whether there is any indication that an asset (tangible and intangible) may be impaired. For the purpose of assessing impairment, the smallest identifiable group of assets that generates cash inflows from continuing use that are largely independent of the cash inflows from other assets or groups of assets is considered as a cash generating unit. If any such indication exists, an estimate of the recoverable amount of the individual asset/ cash generating unit is made. Assets whose carrying value exceeds their recoverable amount are written down to the recoverable amount by recognising the impairment loss as an expense in the Statement of Profit and Loss. Recoverable amount is higher of an asset’s or cash generating unit’s net selling price and its value in use. Value in use is the present value of estimated future cash flows expected to arise from the continuing use of an asset and from its disposal at the end of its useful life. Assessment is also done at each Balance Sheet date as to whether there is any indication that an impairment
loss recognised for an asset in prior accounting periods may no longer exist or may have decreased.
2.7. Investments
Investments are classified into current and non-current investments. Current investments are stated at the lower of cost and fair value. Non-current investments are stated at cost. A provision for diminution is made to recognise a decline, other than temporary, in the value of non-current investments.
Investments that are readily realisable and are intended to be held for not more than one year from the date on which such investments are made, are classified as “Current investments”. All other investments are classified as “Non-current investments”.
Investment in land and buildings that are not intended to be occupied substantially for use by, or in the operations of the company, have been classified as investment property. Investment properties are carried at cost less accumulated depreciation and accumulated impairment losses, if any. Depreciation on the building component of the investment property is provided in line with the policy on tangible assets.
2.8. Interests in Joint Ventures
Interests in Jointly controlled entities (incorporated Joint Venture) are accounted for using proportionate consolidation method.
2.9. Inventories
Inventories are valued at the lower of cost and net realisable value. Cost is computed on a weighted average basis. The net realisable value is the estimated selling price in the ordinary course of business less the estimated costs of completion and estimated costs necessary to make the sale. Finished goods and work-in-progress include all costs of purchases, conversion costs and other costs incurred in bringing the inventories to their present location and condition.
2.10. Trade receivables and Loans and Advances
Trade receivables and Loans and advances are stated after making adequate provisions for doubtful balances.
2.11. Provisions and Contingent liabilities
Provisions are recognised when there is a present obligation as a result of a past event, it is probable that an outflow of resources embodying economic benefits will be required to settle the obligation and there is a reliable estimate of the amount of the obligation. Provisions are measured at the best estimate of the expenditure required to settle the present obligation at the balance sheet date and are not discounted to its present value. These are reviewed at each year end date and adjusted to reflect the best current estimate.
Overview Financial Statements Shareholder InformationReports
Consolidated Consolidated134 135Hindustan Unilever Limited Annual Report 2013-14
NOTESto the financial statements for the year ended 31st March, 2014 (Contd.)
(All amounts in Rs. crores, unless otherwise stated)
Contingent liabilities are disclosed when there is a possible obligation arising from past events, the existence of which will be confirmed only by the occurrence or non occurrence of one or more uncertain future events not wholly within the control of the Group or a present obligation that arises from past events where it is either not probable that an outflow of resources will be required to settle the obligation or a reliable estimate of the amount cannot be made.
2.12. Retirement / Post Retirement Benefits
Defined contribution plans
Contributions to defined contribution schemes such as employees’ state insurance, labour welfare fund, superannuation scheme, employee pension scheme etc. are charged as an expense based on the amount of contribution required to be made as and when services are rendered by the employees. Group’s provident fund contribution, in respect of certain Schemes as the group has no further defined obligations beyond the monthly contributions.
Defined benefit plans
In respect of certain employees, provident fund contributions are made to a trust administered by the Group. The interest rate payable to the members of the trust shall not be lower than the statutory rate of interest declared by the Central Government under the Employees Provident Funds and Miscellaneous Provisions Act, 1952 and shortfall, if any, shall be made good by the Group. The liability in respect of the shortfall of interest earnings of the Fund is determined on the basis of an actuarial valuation. The Group also provides for retirement/ post-retirement benefits in the form of gratuity, pensions (in respect of certain employees), compensated absences and medical. The Group’s liability towards such defined benefit plans is determined based on valuations, as at the balance sheet date, made by independent actuaries using the projected unit credit method. Actuarial gains and losses in respect of the defined benefit plans are recognised in the Statement of Profit and Loss in the year in which they arise. The classification of the Group’s net obligation into current and non- current is as per the actuarial valuation report.
Termination benefits
Termination benefits, in the nature of voluntary retirement benefits or termination benefits arising from restructuring, are recognised in the Statement of Profit and Loss when: a) the Group has a present obligation as a result of past event; b) a reliable estimate can be made of the amount of the obligation; and c) it is probable that an outflow of resources embodying economic benefits will be required to settle the obligation.
2.13. Income Taxes
Tax expense for the year comprises current tax and deferred tax.
Current tax is measured at the amount expected to be paid to (recovered from) the taxation authorities using the applicable tax rates.
Deferred tax is recognised for all the timing differences, subject to the consideration of prudence in respect of deferred tax assets. Deferred tax assets and liabilities are measured using the tax rates and tax laws that have been enacted or substantively enacted by the Balance Sheet date. Deferred tax assets are recognised and carried forward only to the extent that there is a reasonable certainty that sufficient future taxable income will be available against which such deferred tax assets can be realised. In situations where the Group has unabsorbed depreciation or carry forward tax losses, all deferred tax assets are recognised only if there is virtual certainty supported by convincing evidence that they can be realised against future taxable profits. The carrying amount of deferred tax assets is reviewed at each balance sheet date for any write down or reversal, as considered appropriate.
Current tax assets and current tax liabilities are offset when there is a legally enforceable right to set off the recognised amounts and there is an intention to settle the asset and the liability on a net basis. Deferred tax assets and deferred tax liabilities are offset when there is a legally enforceable right to set off assets against liabilities representing current tax and where the deferred tax assets and deferred tax liabilities relate to taxes on income levied by the same governing taxation laws.
2.14. Foreign currency translations
Foreign currency transactions are accounted for at the exchange rates prevailing at the date of the transaction. Gains and losses resulting from the settlement of such transactions and from the translation of monetary assets and liabilities denominated in foreign currencies are recognised in the Statement of Profit and Loss.
Forward exchange contracts outstanding as at the year end on account of firm commitment transactions are marked to market and the losses, if any are recognised in the Statement of Profit and Loss and gains are ignored in accordance with the Announcement of the Institute of Chartered Accountants of India on ‘Accounting for Derivatives’ issued in March 2008.
2.15. Operating leases
Leases in which a significant portion of the risks and rewards of ownership are retained by the lessor are classified as operating leases. The Group is both a lessee and a lessor under such
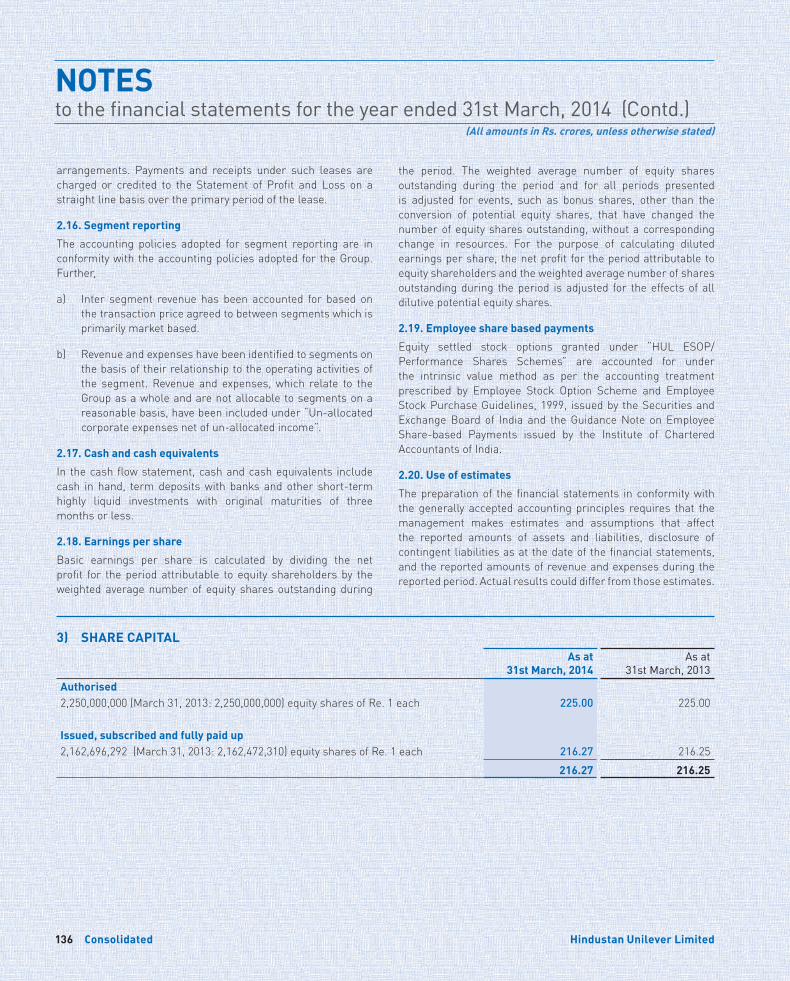
Consolidated Consolidated136 137Hindustan Unilever Limited Annual Report 2013-14
NOTESto the financial statements for the year ended 31st March, 2014 (Contd.)
(All amounts in Rs. crores, unless otherwise stated)
arrangements. Payments and receipts under such leases are charged or credited to the Statement of Profit and Loss on a straight line basis over the primary period of the lease.
2.16. Segment reporting
The accounting policies adopted for segment reporting are in conformity with the accounting policies adopted for the Group. Further,
a) Inter segment revenue has been accounted for based on the transaction price agreed to between segments which is primarily market based.
b) Revenue and expenses have been identified to segments on the basis of their relationship to the operating activities of the segment. Revenue and expenses, which relate to the Group as a whole and are not allocable to segments on a reasonable basis, have been included under “Un-allocated corporate expenses net of un-allocated income”.
2.17. Cash and cash equivalents
In the cash flow statement, cash and cash equivalents include cash in hand, term deposits with banks and other short-term highly liquid investments with original maturities of three months or less.
2.18. Earnings per share
Basic earnings per share is calculated by dividing the net profit for the period attributable to equity shareholders by the weighted average number of equity shares outstanding during
the period. The weighted average number of equity shares outstanding during the period and for all periods presented is adjusted for events, such as bonus shares, other than the conversion of potential equity shares, that have changed the number of equity shares outstanding, without a corresponding change in resources. For the purpose of calculating diluted earnings per share, the net profit for the period attributable to equity shareholders and the weighted average number of shares outstanding during the period is adjusted for the effects of all dilutive potential equity shares.
2.19. Employee share based payments
Equity settled stock options granted under “HUL ESOP/ Performance Shares Schemes” are accounted for under the intrinsic value method as per the accounting treatment prescribed by Employee Stock Option Scheme and Employee Stock Purchase Guidelines, 1999, issued by the Securities and Exchange Board of India and the Guidance Note on Employee Share-based Payments issued by the Institute of Chartered Accountants of India.
2.20. Use of estimates
The preparation of the financial statements in conformity with the generally accepted accounting principles requires that the management makes estimates and assumptions that affect the reported amounts of assets and liabilities, disclosure of contingent liabilities as at the date of the financial statements, and the reported amounts of revenue and expenses during the reported period. Actual results could differ from those estimates.
3) SHARE CAPITALAs at
31st March, 2014As at
31st March, 2013Authorised2,250,000,000 (March 31, 2013: 2,250,000,000) equity shares of Re. 1 each 225.00 225.00
Issued, subscribed and fully paid up2,162,696,292 (March 31, 2013: 2,162,472,310) equity shares of Re. 1 each 216.27 216.25
216.27 216.25
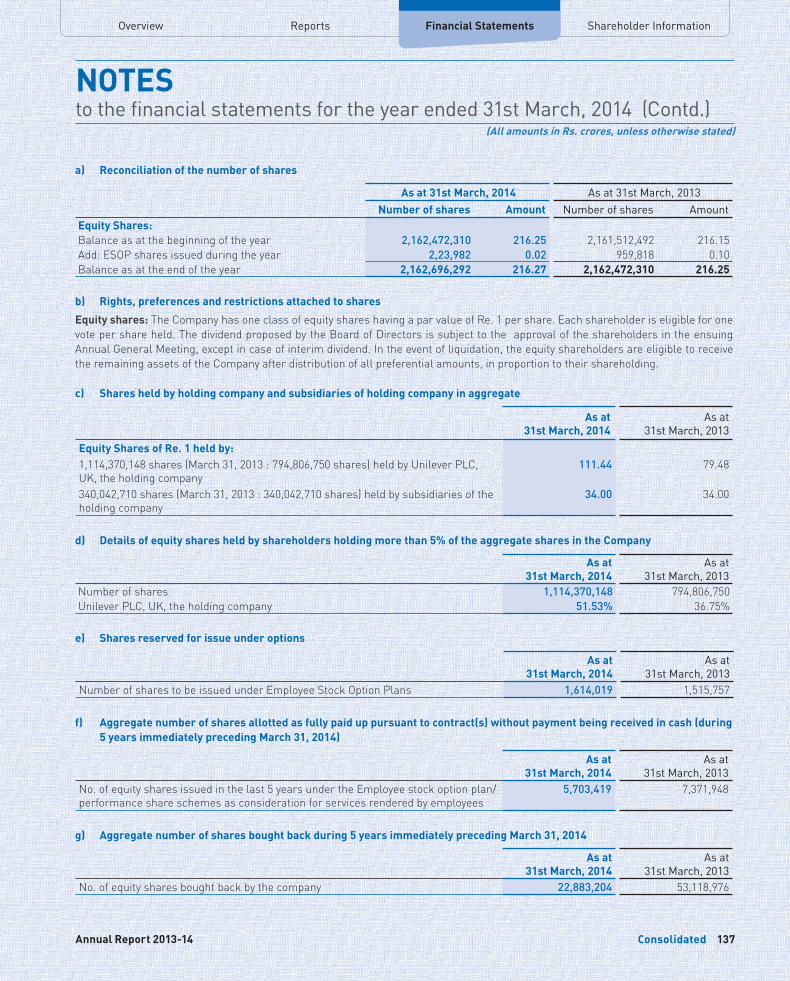
Overview Financial Statements Shareholder InformationReports
Consolidated Consolidated136 137Hindustan Unilever Limited Annual Report 2013-14
NOTESto the financial statements for the year ended 31st March, 2014 (Contd.)
(All amounts in Rs. crores, unless otherwise stated)
a) Reconciliation of the number of shares
As at 31st March, 2014 As at 31st March, 2013Number of shares Amount Number of shares Amount
Equity Shares:Balance as at the beginning of the year 2,162,472,310 216.25 2,161,512,492 216.15Add: ESOP shares issued during the year 2,23,982 0.02 959,818 0.10Balance as at the end of the year 2,162,696,292 216.27 2,162,472,310 216.25
b) Rights, preferences and restrictions attached to shares
Equity shares: The Company has one class of equity shares having a par value of Re. 1 per share. Each shareholder is eligible for one vote per share held. The dividend proposed by the Board of Directors is subject to the approval of the shareholders in the ensuing Annual General Meeting, except in case of interim dividend. In the event of liquidation, the equity shareholders are eligible to receive the remaining assets of the Company after distribution of all preferential amounts, in proportion to their shareholding.
c) Shares held by holding company and subsidiaries of holding company in aggregate
As at 31st March, 2014
As at 31st March, 2013
Equity Shares of Re. 1 held by:1,114,370,148 shares (March 31, 2013 : 794,806,750 shares) held by Unilever PLC, UK, the holding company
111.44 79.48
340,042,710 shares (March 31, 2013 : 340,042,710 shares) held by subsidiaries of the holding company
34.00 34.00
d) Details of equity shares held by shareholders holding more than 5% of the aggregate shares in the Company
As at 31st March, 2014
As at 31st March, 2013
Number of shares 1,114,370,148 794,806,750Unilever PLC, UK, the holding company 51.53% 36.75%
e) Shares reserved for issue under options
As at 31st March, 2014
As at 31st March, 2013
Number of shares to be issued under Employee Stock Option Plans 1,614,019 1,515,757
f) Aggregate number of shares allotted as fully paid up pursuant to contract(s) without payment being received in cash (during 5 years immediately preceding March 31, 2014)
As at 31st March, 2014
As at 31st March, 2013
No. of equity shares issued in the last 5 years under the Employee stock option plan/ performance share schemes as consideration for services rendered by employees
5,703,419 7,371,948
g) Aggregate number of shares bought back during 5 years immediately preceding March 31, 2014
As at 31st March, 2014
As at 31st March, 2013
No. of equity shares bought back by the company 22,883,204 53,118,976
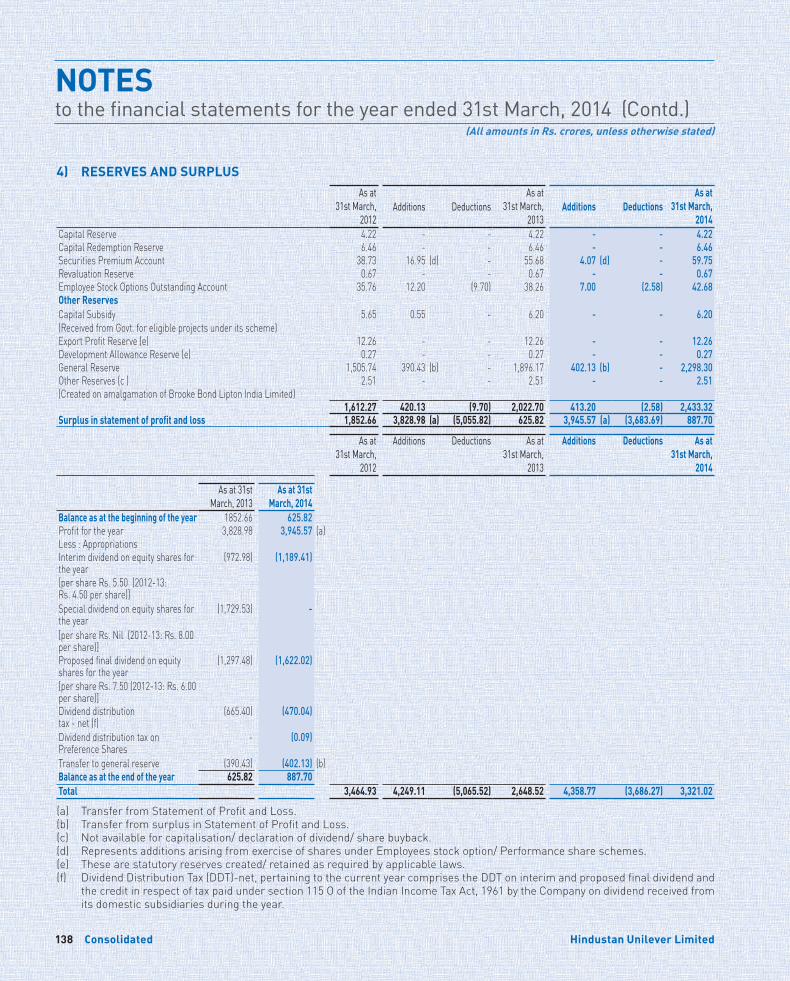
Consolidated Consolidated138 139Hindustan Unilever Limited Annual Report 2013-14
NOTESto the financial statements for the year ended 31st March, 2014 (Contd.)
(All amounts in Rs. crores, unless otherwise stated)
4) RESERVES AND SURPLUSAs at
31st March, 2012
Additions DeductionsAs at
31st March, 2013
Additions DeductionsAs at
31st March, 2014
Capital Reserve 4.22 - - 4.22 - - 4.22 Capital Redemption Reserve 6.46 - - 6.46 - - 6.46 Securities Premium Account 38.73 16.95 (d) - 55.68 4.07 (d) - 59.75 Revaluation Reserve 0.67 - - 0.67 - - 0.67 Employee Stock Options Outstanding Account 35.76 12.20 (9.70) 38.26 7.00 (2.58) 42.68 Other ReservesCapital Subsidy (Received from Govt. for eligible projects under its scheme)
5.65 0.55 - 6.20 - - 6.20
Export Profit Reserve (e) 12.26 - - 12.26 - - 12.26 Development Allowance Reserve (e) 0.27 - - 0.27 - - 0.27 General Reserve 1,505.74 390.43 (b) - 1,896.17 402.13 (b) - 2,298.30 Other Reserves (c ) 2.51 - - 2.51 - - 2.51 (Created on amalgamation of Brooke Bond Lipton India Limited)
1,612.27 420.13 (9.70) 2,022.70 413.20 (2.58) 2,433.32 Surplus in statement of profit and loss 1,852.66 3,828.98 (a) (5,055.82) 625.82 3,945.57 (a) (3,683.69) 887.70
As at 31st March,
2012
Additions Deductions As at 31st March,
2013
Additions Deductions As at 31st March,
2014
As at 31st March, 2013
As at 31st March, 2014
Balance as at the beginning of the year 1852.66 625.82 Profit for the year 3,828.98 3,945.57 (a)Less : AppropriationsInterim dividend on equity shares for the year
(972.98) (1,189.41)
[per share Rs. 5.50 (2012-13: Rs. 4.50 per share)]Special dividend on equity shares for the year
(1,729.53) -
[per share Rs. Nil (2012-13: Rs. 8.00 per share)]Proposed final dividend on equity shares for the year
(1,297.48) (1,622.02)
[per share Rs. 7.50 (2012-13: Rs. 6.00 per share)]Dividend distribution tax - net (f)
(665.40) (470.04)
Dividend distribution tax on Preference Shares
- (0.09)
Transfer to general reserve (390.43) (402.13) (b)Balance as at the end of the year 625.82 887.70 Total 3,464.93 4,249.11 (5,065.52) 2,648.52 4,358.77 (3,686.27) 3,321.02
(a) Transfer from Statement of Profit and Loss.(b) Transfer from surplus in Statement of Profit and Loss. (c) Not available for capitalisation/ declaration of dividend/ share buyback.(d) Represents additions arising from exercise of shares under Employees stock option/ Performance share schemes.(e) These are statutory reserves created/ retained as required by applicable laws.(f) Dividend Distribution Tax (DDT)-net, pertaining to the current year comprises the DDT on interim and proposed final dividend and
the credit in respect of tax paid under section 115 O of the Indian Income Tax Act, 1961 by the Company on dividend received from its domestic subsidiaries during the year.
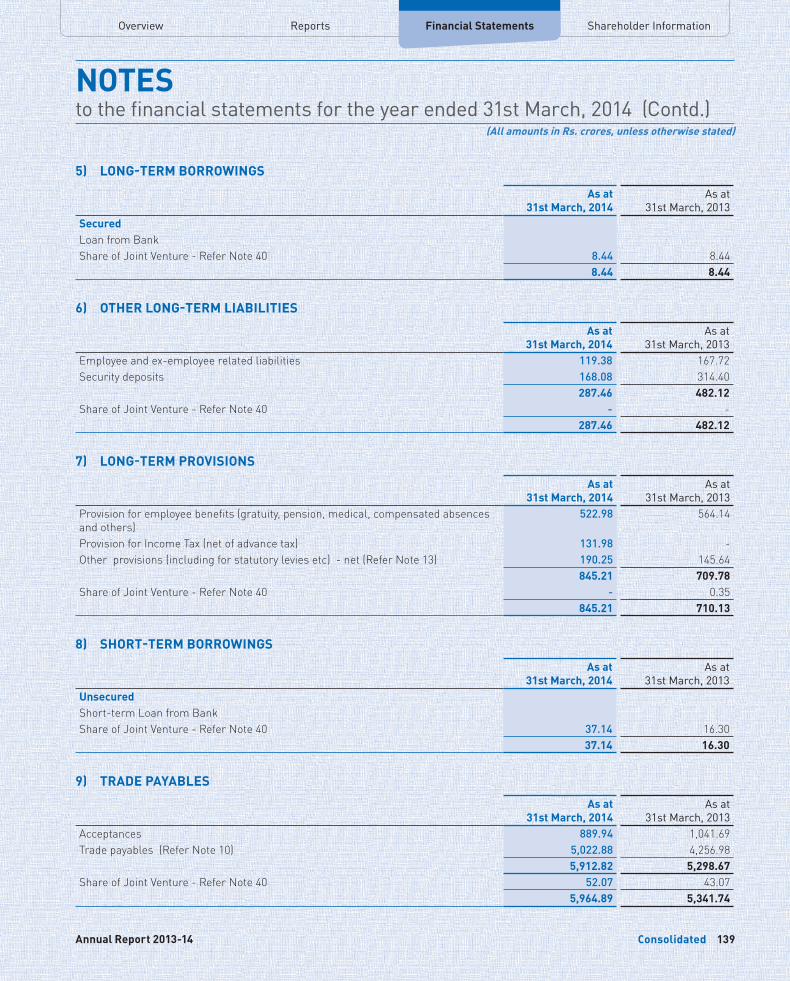
Overview Financial Statements Shareholder InformationReports
Consolidated Consolidated138 139Hindustan Unilever Limited Annual Report 2013-14
NOTESto the financial statements for the year ended 31st March, 2014 (Contd.)
(All amounts in Rs. crores, unless otherwise stated)
5) LONG-TERM BORROWINGS
As at 31st March, 2014
As at 31st March, 2013
SecuredLoan from BankShare of Joint Venture - Refer Note 40 8.44 8.44
8.44 8.44
6) OTHER LONG-TERM LIABILITIES
As at 31st March, 2014
As at 31st March, 2013
Employee and ex-employee related liabilities 119.38 167.72 Security deposits 168.08 314.40
287.46 482.12 Share of Joint Venture - Refer Note 40 - -
287.46 482.12
7) LONG-TERM PROVISIONS
As at 31st March, 2014
As at 31st March, 2013
Provision for employee benefits (gratuity, pension, medical, compensated absences and others)
522.98 564.14
Provision for Income Tax (net of advance tax) 131.98 - Other provisions (including for statutory levies etc) - net (Refer Note 13) 190.25 145.64
845.21 709.78 Share of Joint Venture - Refer Note 40 - 0.35
845.21 710.13
8) SHORT-TERM BORROWINGS
As at 31st March, 2014
As at 31st March, 2013
UnsecuredShort-term Loan from BankShare of Joint Venture - Refer Note 40 37.14 16.30
37.14 16.30
9) TRADE PAYABLES
As at 31st March, 2014
As at 31st March, 2013
Acceptances 889.94 1,041.69 Trade payables (Refer Note 10) 5,022.88 4,256.98
5,912.82 5,298.67 Share of Joint Venture - Refer Note 40 52.07 43.07
5,964.89 5,341.74
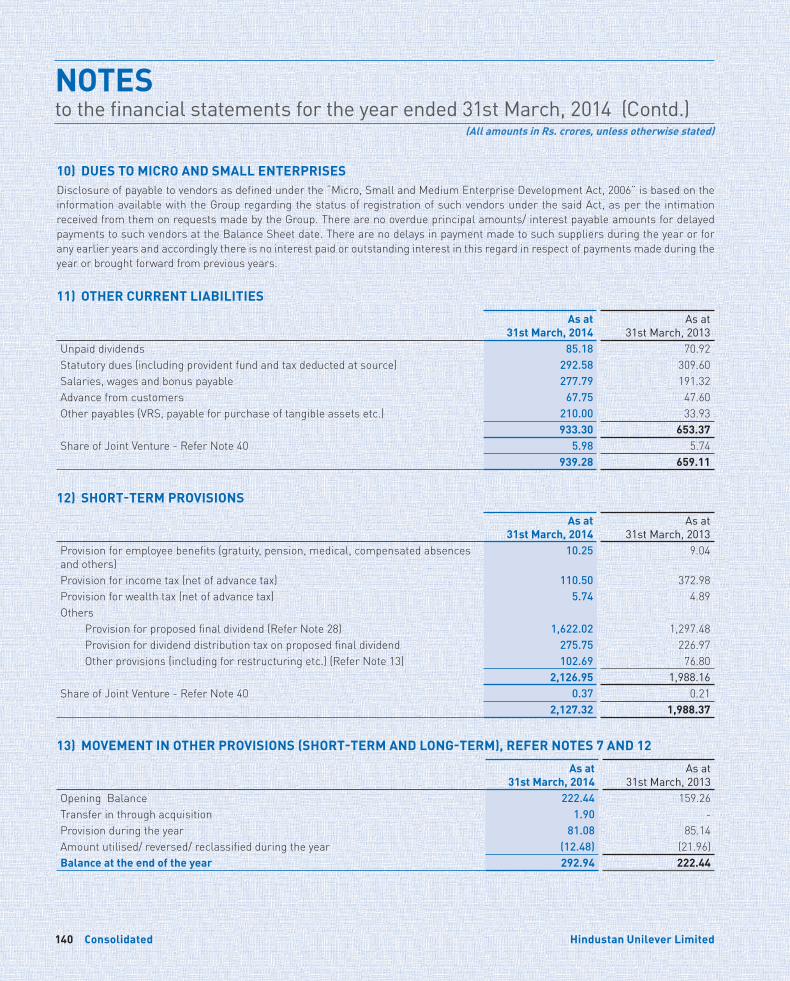
Consolidated Consolidated140 141Hindustan Unilever Limited Annual Report 2013-14
NOTESto the financial statements for the year ended 31st March, 2014 (Contd.)
(All amounts in Rs. crores, unless otherwise stated)
10) DUES TO MICRO AND SMALL ENTERPRISESDisclosure of payable to vendors as defined under the “Micro, Small and Medium Enterprise Development Act, 2006” is based on the information available with the Group regarding the status of registration of such vendors under the said Act, as per the intimation received from them on requests made by the Group. There are no overdue principal amounts/ interest payable amounts for delayed payments to such vendors at the Balance Sheet date. There are no delays in payment made to such suppliers during the year or for any earlier years and accordingly there is no interest paid or outstanding interest in this regard in respect of payments made during the year or brought forward from previous years.
11) OTHER CURRENT LIABILITIES
As at 31st March, 2014
As at 31st March, 2013
Unpaid dividends 85.18 70.92 Statutory dues (including provident fund and tax deducted at source) 292.58 309.60 Salaries, wages and bonus payable 277.79 191.32 Advance from customers 67.75 47.60 Other payables (VRS, payable for purchase of tangible assets etc.) 210.00 33.93
933.30 653.37 Share of Joint Venture - Refer Note 40 5.98 5.74
939.28 659.11
12) SHORT-TERM PROVISIONS
As at 31st March, 2014
As at 31st March, 2013
Provision for employee benefits (gratuity, pension, medical, compensated absences and others)
10.25 9.04
Provision for income tax (net of advance tax) 110.50 372.98 Provision for wealth tax (net of advance tax) 5.74 4.89 Others Provision for proposed final dividend (Refer Note 28) 1,622.02 1,297.48 Provision for dividend distribution tax on proposed final dividend 275.75 226.97 Other provisions (including for restructuring etc.) (Refer Note 13) 102.69 76.80
2,126.95 1,988.16 Share of Joint Venture - Refer Note 40 0.37 0.21
2,127.32 1,988.37
13) MOVEMENT IN OTHER PROVISIONS (SHORT-TERM AND LONG-TERM), REFER NOTES 7 AND 12
As at 31st March, 2014
As at 31st March, 2013
Opening Balance 222.44 159.26 Transfer in through acquisition 1.90 - Provision during the year 81.08 85.14 Amount utilised/ reversed/ reclassified during the year (12.48) (21.96)Balance at the end of the year 292.94 222.44
Overview Financial Statements Shareholder InformationReports
Consolidated Consolidated140 141Hindustan Unilever Limited Annual Report 2013-14
NOTESto the financial statements for the year ended 31st March, 2014 (Contd.)
(All amounts in Rs. crores, unless otherwise stated)
14)
TAN
GIB
LE A
SSET
S
(Ow
n as
sets
, unl
ess
othe
rwis
e st
ated
) Gros
s bloc
kDe
prec
iation
Net b
lock
As at
31
st Ma
rch,
2013
Add
itions
Tr
ansfe
r in
thro
ugh
acqu
isitio
n
Disp
osals
/ Tr
ansfe
rs
As at
31
st Ma
rch,
2014
As at
31
st Ma
rch,
2013
Add
itions
Tr
ansfe
r in
thro
ugh
acqu
isitio
n
Disp
osals
/ Tr
ansfe
rs
As at
31
st Ma
rch,
2014
As at
31
st Ma
rch,
2014
As at
31
st Ma
rch,
2013
Land
- F
reeho
ld 76
.66
17.28
1.
12
(18.7
6) 76
.30
0.07
-
- -
0.07
76
.23
76.59
- L
ease
hold
56.48
-
- (0
.01)
56.47
10
.19
2.86
-
(0.00
) 13
.05
43.42
46
.29
Buil
dings
1,
029.8
2 62
.12
44.02
(3
.14)
1,13
2.82
235.4
8 34
.38
18.43
(1
.08)
287.2
1 84
5.61
794.3
4 Pl
ant &
equip
ment
2,71
5.86
380.2
3 17
3.30
(93.8
5) 3,
175.5
4 1,
367.4
3 22
1.37
118.6
8 (7
9.61)
1,62
7.87
1,54
7.67
1,34
8.43
Furn
iture
& fix
tures
94
.01
10.79
0.
47
(3.55
) 10
1.72
41.00
6.
43
0.44
(1
.96)
45.91
55
.81
53.01
Ve
hicles
1.
86
- 0.
10
(0.41
) 1.
55
1.76
0.
01
0.09
(0
.41)
1.45
0.
10
0.10
Of
fice e
quipm
ent
99.72
7.
66
0.98
(4
.00)
104.3
6 52
.35
10.17
0.
93
(3.64
) 59
.81
44.55
47
.37
Othe
rs -
Railw
ay si
dings
0.
01
- -
- 0.
01
0.01
-
- -
0.01
-
- To
tal
4,07
4.42
478.0
8 21
9.99
(123
.72)
4,64
8.77
1,70
8.29
275.2
2 13
8.57
(86.7
0) 2,
035.3
8 2,
613.3
9 2,
366.1
3 Sh
are of
Joint
Ventu
re - R
efer N
ote 40
47
.43
3.03
-
(0.09
) 50
.37
18.24
4.
60
- (0
.02)
22.82
27
.55
29.19
To
tal -
Mar
ch 31
, 201
4 4,
121.8
5 48
1.11
219.9
9 (1
23.81
) 4,
699.1
4 1,
726.5
3 27
9.82
138.5
7 (8
6.72)
2,05
8.20
2,64
0.94
2,39
5.32
Tota
l - M
arch
31, 2
013
3,78
9.36
427.0
1 -
(94.5
2) 4,
121.8
5 1,
556.4
5 23
2.60
- (6
2.52)
1,72
6.53
2,39
5.32
NOT
ES :
(a)
Build
ings
incl
ude
Rs. 0
.01
cror
es (M
arch
31,
201
3 - R
s. 0
.02
cror
es) b
eing
the
valu
e of
sha
res
in c
o-op
erat
ive h
ousi
ng s
ocie
ties.
(b)
The
title
dee
ds o
f Fre
ehol
d La
nd a
ggre
gatin
g Rs
. 7.6
7 c
rore
s (M
arch
31,
201
3 - R
s. 1
1.48
cro
res)
, acq
uire
d on
tran
sfer
of b
usin
ess/
und
erta
king
s ar
e in
the
proc
ess
of b
eing
tran
sfer
red
in th
e na
me
of th
e Gr
oup.
(c
) Tr
ansf
er in
thro
ugh
acqu
isiti
on re
pres
ents
tang
ible
ass
ets
of A
CPL,
whi
ch w
as a
cqui
red
by th
e Co
mpa
ny d
urin
g th
e ye
ar (R
efer
Not
e 1)
.(d
) Di
spos
als/
Tra
nsfe
rs in
clud
e i)
Asse
ts h
eld
for
sale
sho
wn
unde
r ‘O
ther
Cu
rren
t Ass
ets’
(ref
er N
ote
25) :
Gro
ss b
lock
Rs.
3.1
0 cr
ores
(Mar
ch 3
1, 2
013
- Rs
. 30.
10 c
rore
s), A
ccum
ulat
ed d
epre
ciat
ion
Rs.0
. 69
cror
es (M
arch
31,
201
3 -
Rs. 9
.75
cror
es) a
nd N
et b
ook
valu
e Rs
. 2.4
1 cr
ores
(Mar
ch 3
1, 2
013
- Rs
. 20.
35 c
rore
s) a
nd ii
) Inv
estm
ent P
rope
rty s
how
n un
der ‘
Non
-Cur
rent
Inve
stm
ents
’ (re
fer n
ote
16):
Gros
s bl
ock
Rs. N
IL (M
arch
31,
201
3 - R
s. 0
.03
cror
es),
Accu
mul
ated
dep
reci
atio
n Rs
.NIL
(Mar
ch 3
1, 2
013
- Rs.
NIL
) and
Net
blo
ck R
s. N
IL (M
arch
31,
201
3 - R
s. 0
.03
cror
es).
(e)
Und
er th
e Gu
dalu
r Jan
mam
Est
ates
(Abo
litio
n an
d Co
nver
sion
into
Ryo
twar
i) Ac
t, 19
69, t
he ri
ght a
nd ti
tle to
cer
tain
leas
ehol
d la
nd m
ay b
e al
tere
d at
a la
ter
date
, the
nat
ure
and
effe
ct o
f whi
ch c
anno
t be
asce
rtai
ned
at p
rese
nt. H
owev
er, a
ppro
pria
te s
teps
hav
e be
en ta
ken
to p
rote
ct th
e Gr
oup’
s in
tere
st.
(f)
Impa
irmen
t cha
rge
of R
s. 0
.68
cror
es (
Mar
ch 3
1, 2
013
- Rs.
NIL
) on
plan
t and
equ
ipm
ent h
as b
een
incl
uded
in d
epre
ciat
ion
char
ge a
s th
e Gr
oup’
s sh
are
of
join
t ven
ture
.
15)
INTA
NG
IBLE
ASS
ETS
Gros
s bloc
kAm
ortis
ation
Net b
lock
As at
31
st Ma
rch,
2013
Add
itions
Tr
ansfe
r in
thro
ugh
acqu
isitio
n
Disp
osals
/ Tr
ansfe
rs
As at
31
st Ma
rch,
2014
As at
31
st Ma
rch,
2013
Add
itions
Tr
ansfe
r in
thro
ugh
acqu
isitio
n
Disp
osals
/ Tr
ansfe
rs
As at
31
st Ma
rch,
2014
As at
31
st Ma
rch,
2014
As at
31
st Ma
rch,
2013
Good
will
6.34
-
- -
6.34
6.
34
- -
- 6.
34
- -
Bra
nds/T
rade
marks
15
9.85
- -
- 15
9.85
146.3
5 6.
00
- -
152.3
5 7.
50
13.50
Co
mpute
r Soft
ware
129.6
9 2.6
9 -
- 13
2.38
107.0
8 8.
68
- -
115.7
6 16
.62
22.61
To
tal -
Mar
ch 31
, 201
4 29
5.88
2.69
-
- 29
8.57
259.7
7 14
.68
- -
274.4
5 24
.12
36.11
To
tal -
Mar
ch 31
, 201
3 27
1.79
24.09
-
- 29
5.88
241.8
5 17
.92
- -
259.7
7 36
.11
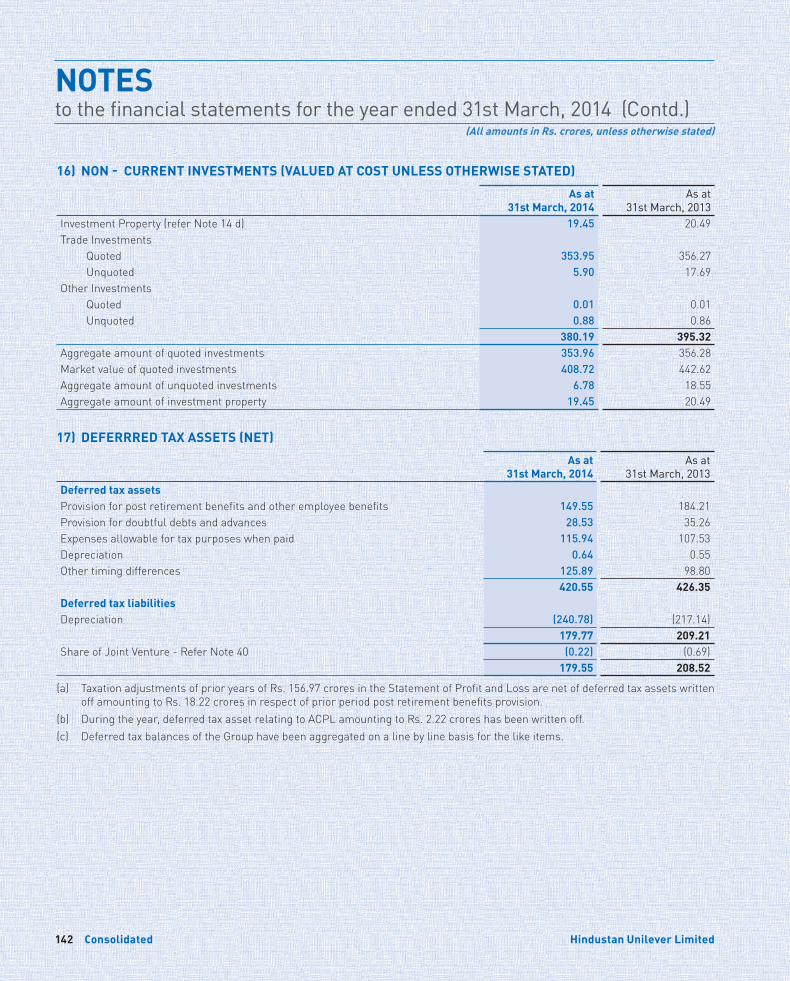
Consolidated Consolidated142 143Hindustan Unilever Limited Annual Report 2013-14
NOTESto the financial statements for the year ended 31st March, 2014 (Contd.)
(All amounts in Rs. crores, unless otherwise stated)
16) NON - CURRENT INVESTMENTS (VALUED AT COST UNLESS OTHERWISE STATED)
As at 31st March, 2014
As at 31st March, 2013
Investment Property (refer Note 14 d) 19.45 20.49 Trade Investments Quoted 353.95 356.27 Unquoted 5.90 17.69 Other Investments Quoted 0.01 0.01 Unquoted 0.88 0.86
380.19 395.32 Aggregate amount of quoted investments 353.96 356.28 Market value of quoted investments 408.72 442.62 Aggregate amount of unquoted investments 6.78 18.55 Aggregate amount of investment property 19.45 20.49
17) DEFERRRED TAX ASSETS (NET)
As at 31st March, 2014
As at 31st March, 2013
Deferred tax assetsProvision for post retirement benefits and other employee benefits 149.55 184.21 Provision for doubtful debts and advances 28.53 35.26 Expenses allowable for tax purposes when paid 115.94 107.53 Depreciation 0.64 0.55 Other timing differences 125.89 98.80
420.55 426.35 Deferred tax liabilitiesDepreciation (240.78) (217.14)
179.77 209.21 Share of Joint Venture - Refer Note 40 (0.22) (0.69)
179.55 208.52
(a) Taxation adjustments of prior years of Rs. 156.97 crores in the Statement of Profit and Loss are net of deferred tax assets written off amounting to Rs. 18.22 crores in respect of prior period post retirement benefits provision.
(b) During the year, deferred tax asset relating to ACPL amounting to Rs. 2.22 crores has been written off.(c) Deferred tax balances of the Group have been aggregated on a line by line basis for the like items.
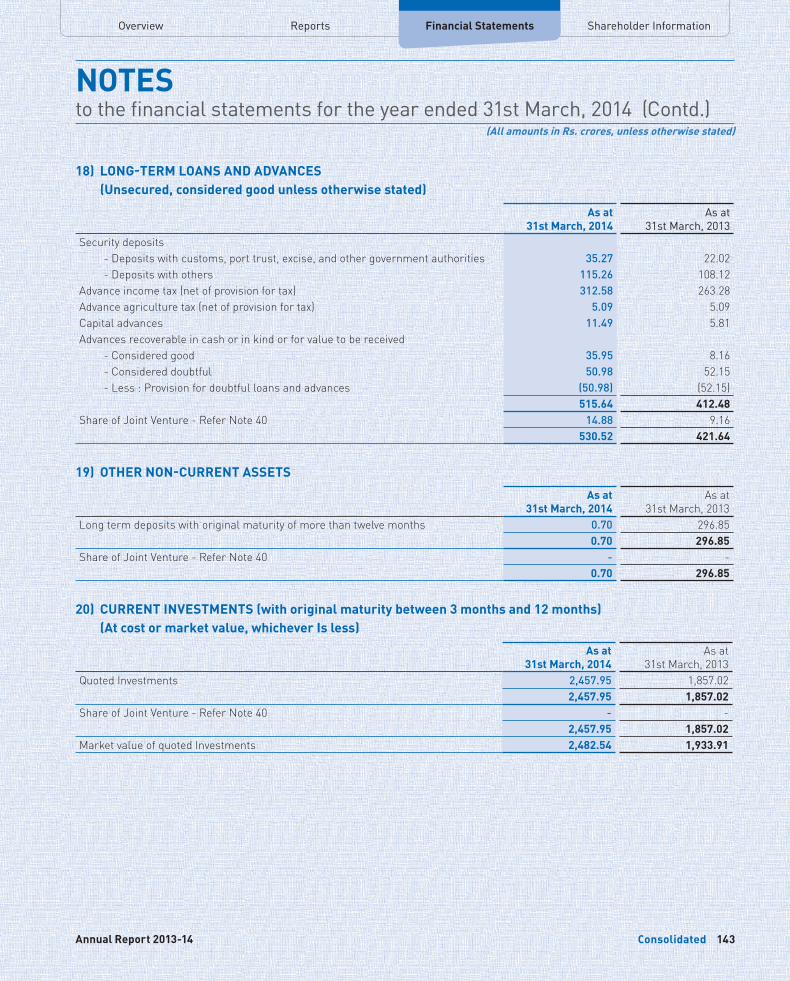
Overview Financial Statements Shareholder InformationReports
Consolidated Consolidated142 143Hindustan Unilever Limited Annual Report 2013-14
NOTESto the financial statements for the year ended 31st March, 2014 (Contd.)
(All amounts in Rs. crores, unless otherwise stated)
18) LONG-TERM LOANS AND ADVANCES (Unsecured, considered good unless otherwise stated)
As at 31st March, 2014
As at 31st March, 2013
Security deposits - Deposits with customs, port trust, excise, and other government authorities 35.27 22.02 - Deposits with others 115.26 108.12 Advance income tax (net of provision for tax) 312.58 263.28 Advance agriculture tax (net of provision for tax) 5.09 5.09 Capital advances 11.49 5.81 Advances recoverable in cash or in kind or for value to be received - Considered good 35.95 8.16 - Considered doubtful 50.98 52.15 - Less : Provision for doubtful loans and advances (50.98) (52.15)
515.64 412.48 Share of Joint Venture - Refer Note 40 14.88 9.16
530.52 421.64
19) OTHER NON-CURRENT ASSETS
As at 31st March, 2014
As at 31st March, 2013
Long term deposits with original maturity of more than twelve months 0.70 296.85 0.70 296.85
Share of Joint Venture - Refer Note 40 - - 0.70 296.85
20) CURRENT INVESTMENTS (with original maturity between 3 months and 12 months) (At cost or market value, whichever Is less)
As at 31st March, 2014
As at 31st March, 2013
Quoted Investments 2,457.95 1,857.02 2,457.95 1,857.02
Share of Joint Venture - Refer Note 40 - - 2,457.95 1,857.02
Market value of quoted Investments 2,482.54 1,933.91
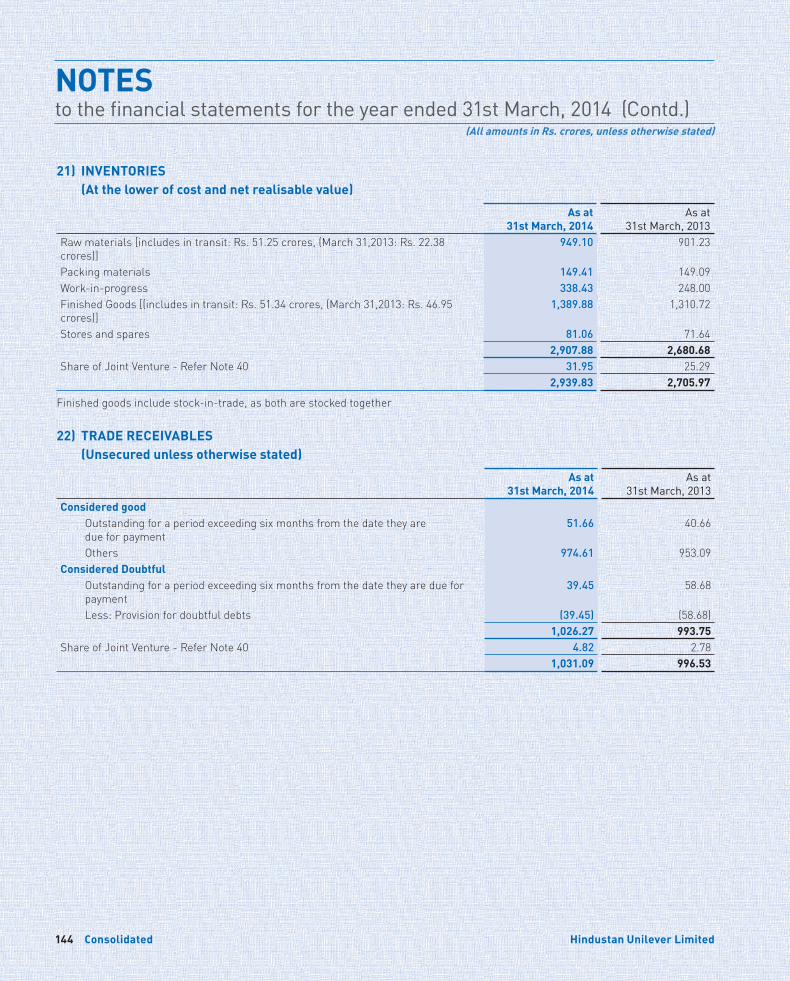
Consolidated Consolidated144 145Hindustan Unilever Limited Annual Report 2013-14
NOTESto the financial statements for the year ended 31st March, 2014 (Contd.)
(All amounts in Rs. crores, unless otherwise stated)
21) INVENTORIES (At the lower of cost and net realisable value)
As at 31st March, 2014
As at 31st March, 2013
Raw materials [includes in transit: Rs. 51.25 crores, (March 31,2013: Rs. 22.38 crores)]
949.10 901.23
Packing materials 149.41 149.09 Work-in-progress 338.43 248.00 Finished Goods [(includes in transit: Rs. 51.34 crores, (March 31,2013: Rs. 46.95 crores)]
1,389.88 1,310.72
Stores and spares 81.06 71.64 2,907.88 2,680.68
Share of Joint Venture - Refer Note 40 31.95 25.29 2,939.83 2,705.97
Finished goods include stock-in-trade, as both are stocked together
22) TRADE RECEIVABLES (Unsecured unless otherwise stated)
As at 31st March, 2014
As at 31st March, 2013
Considered good Outstanding for a period exceeding six months from the date they are
due for payment 51.66 40.66
Others 974.61 953.09 Considered Doubtful Outstanding for a period exceeding six months from the date they are due for
payment 39.45 58.68
Less: Provision for doubtful debts (39.45) (58.68) 1,026.27 993.75
Share of Joint Venture - Refer Note 40 4.82 2.78 1,031.09 996.53
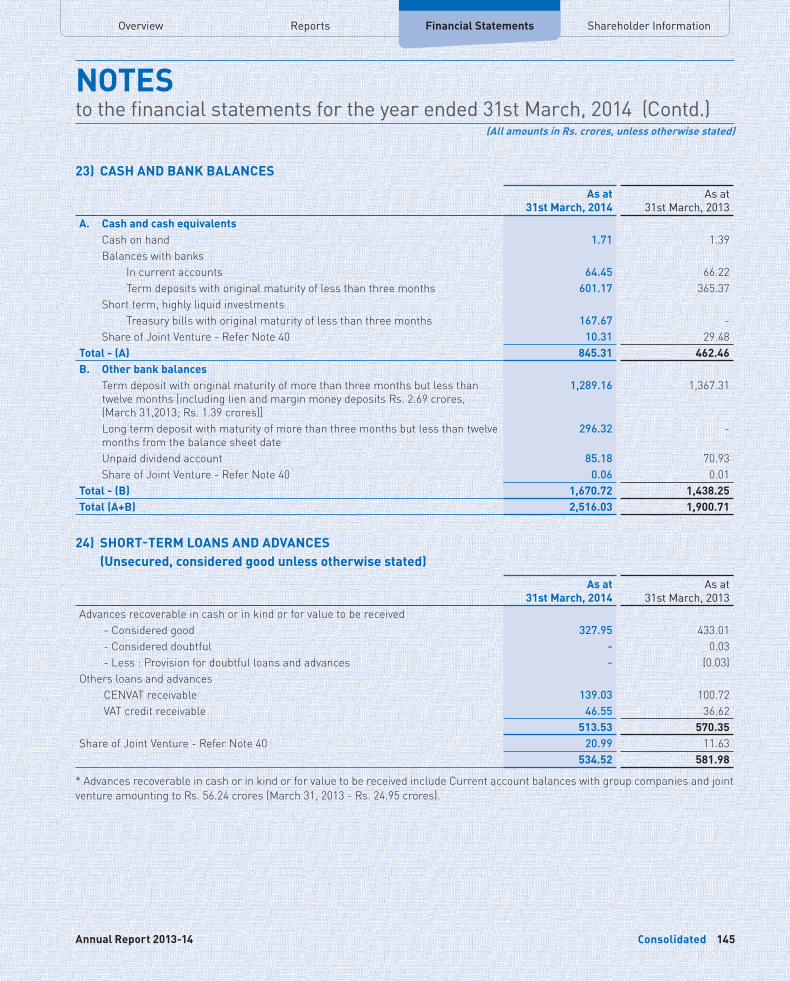
Overview Financial Statements Shareholder InformationReports
Consolidated Consolidated144 145Hindustan Unilever Limited Annual Report 2013-14
NOTESto the financial statements for the year ended 31st March, 2014 (Contd.)
(All amounts in Rs. crores, unless otherwise stated)
23) CASH AND BANK BALANCES
As at 31st March, 2014
As at 31st March, 2013
A. Cash and cash equivalentsCash on hand 1.71 1.39 Balances with banks In current accounts 64.45 66.22 Term deposits with original maturity of less than three months 601.17 365.37 Short term, highly liquid investments Treasury bills with original maturity of less than three months 167.67 - Share of Joint Venture - Refer Note 40 10.31 29.48
Total - (A) 845.31 462.46 B. Other bank balances
Term deposit with original maturity of more than three months but less than twelve months [including lien and margin money deposits Rs. 2.69 crores, (March 31,2013; Rs. 1.39 crores)]
1,289.16 1,367.31
Long term deposit with maturity of more than three months but less than twelve months from the balance sheet date
296.32 -
Unpaid dividend account 85.18 70.93 Share of Joint Venture - Refer Note 40 0.06 0.01
Total - (B) 1,670.72 1,438.25 Total (A+B) 2,516.03 1,900.71
24) SHORT-TERM LOANS AND ADVANCES (Unsecured, considered good unless otherwise stated)
As at 31st March, 2014
As at 31st March, 2013
Advances recoverable in cash or in kind or for value to be received - Considered good 327.95 433.01 - Considered doubtful - 0.03 - Less : Provision for doubtful loans and advances - (0.03)Others loans and advances CENVAT receivable 139.03 100.72 VAT credit receivable 46.55 36.62
513.53 570.35 Share of Joint Venture - Refer Note 40 20.99 11.63
534.52 581.98
* Advances recoverable in cash or in kind or for value to be received include Current account balances with group companies and joint venture amounting to Rs. 56.24 crores (March 31, 2013 - Rs. 24.95 crores).
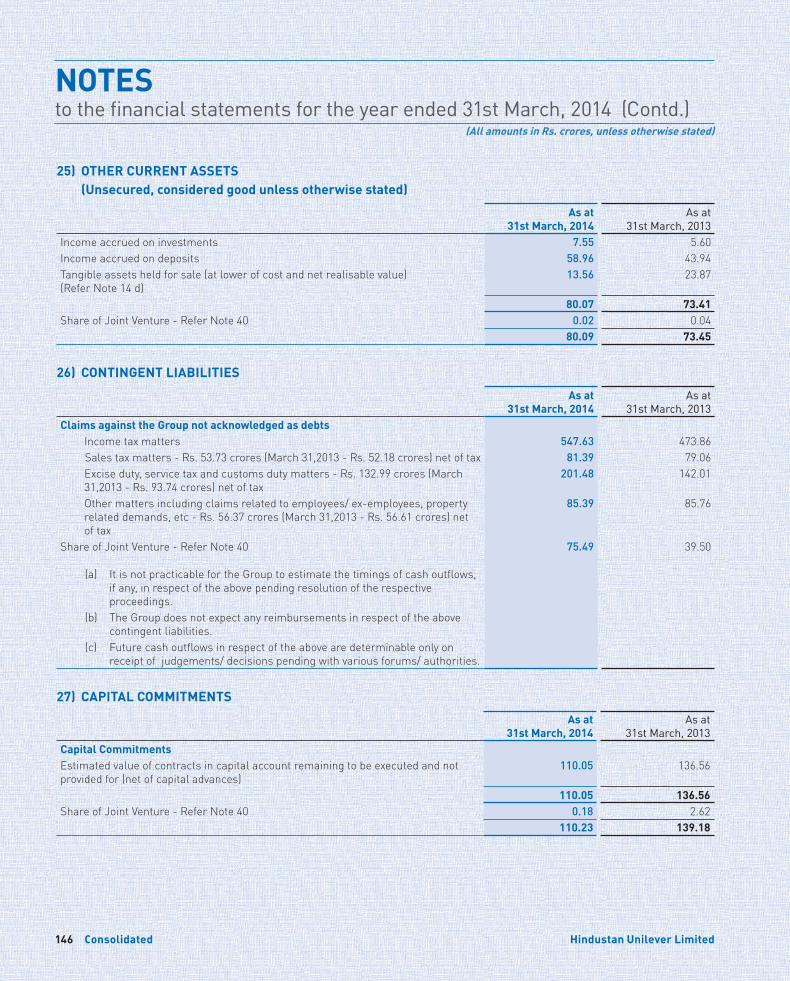
Consolidated Consolidated146 147Hindustan Unilever Limited Annual Report 2013-14
NOTESto the financial statements for the year ended 31st March, 2014 (Contd.)
(All amounts in Rs. crores, unless otherwise stated)
25) OTHER CURRENT ASSETS (Unsecured, considered good unless otherwise stated)
As at 31st March, 2014
As at 31st March, 2013
Income accrued on investments 7.55 5.60 Income accrued on deposits 58.96 43.94 Tangible assets held for sale (at lower of cost and net realisable value) (Refer Note 14 d)
13.56 23.87
80.07 73.41 Share of Joint Venture - Refer Note 40 0.02 0.04
80.09 73.45
26) CONTINGENT LIABILITIES
As at 31st March, 2014
As at 31st March, 2013
Claims against the Group not acknowledged as debtsIncome tax matters 547.63 473.86 Sales tax matters - Rs. 53.73 crores (March 31,2013 - Rs. 52.18 crores) net of tax 81.39 79.06 Excise duty, service tax and customs duty matters - Rs. 132.99 crores (March 31,2013 - Rs. 93.74 crores) net of tax
201.48 142.01
Other matters including claims related to employees/ ex-employees, property related demands, etc - Rs. 56.37 crores (March 31,2013 - Rs. 56.61 crores) net of tax
85.39 85.76
Share of Joint Venture - Refer Note 40 75.49 39.50
(a) It is not practicable for the Group to estimate the timings of cash outflows, if any, in respect of the above pending resolution of the respective proceedings.
(b) The Group does not expect any reimbursements in respect of the above contingent liabilities.
(c) Future cash outflows in respect of the above are determinable only on receipt of judgements/ decisions pending with various forums/ authorities.
27) CAPITAL COMMITMENTS
As at 31st March, 2014
As at 31st March, 2013
Capital CommitmentsEstimated value of contracts in capital account remaining to be executed and not provided for (net of capital advances)
110.05 136.56
110.05 136.56 Share of Joint Venture - Refer Note 40 0.18 2.62
110.23 139.18
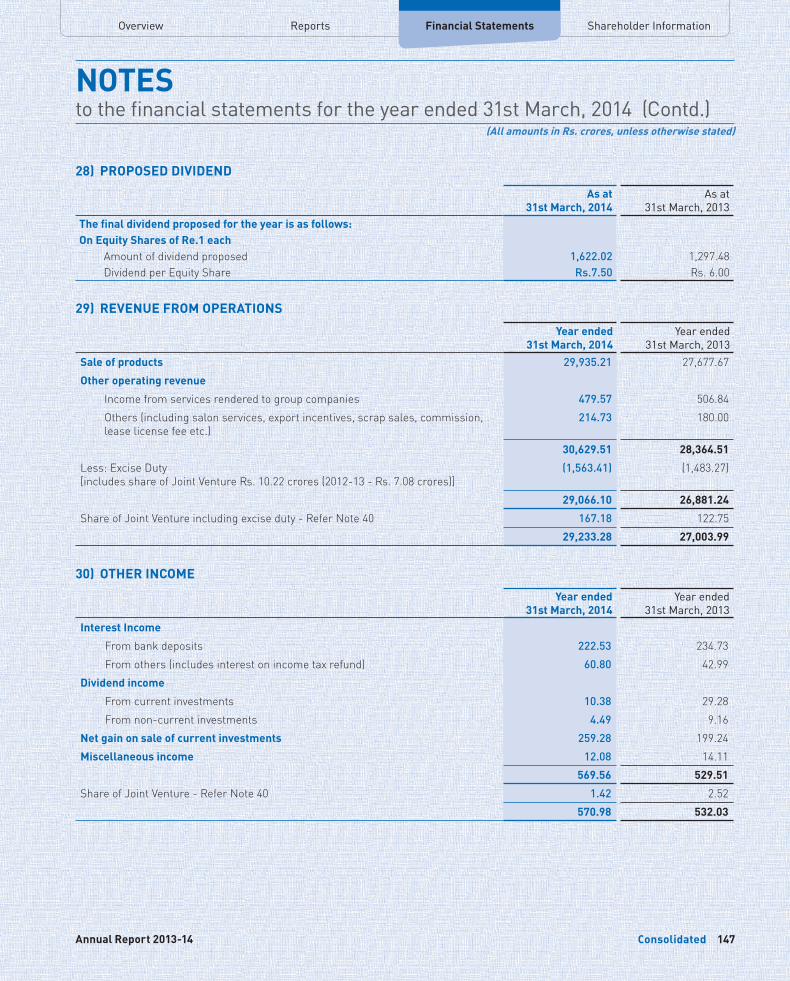
Overview Financial Statements Shareholder InformationReports
Consolidated Consolidated146 147Hindustan Unilever Limited Annual Report 2013-14
NOTESto the financial statements for the year ended 31st March, 2014 (Contd.)
(All amounts in Rs. crores, unless otherwise stated)
28) PROPOSED DIVIDEND
As at 31st March, 2014
As at 31st March, 2013
The final dividend proposed for the year is as follows:On Equity Shares of Re.1 each Amount of dividend proposed 1,622.02 1,297.48 Dividend per Equity Share Rs.7.50 Rs. 6.00
29) REVENUE FROM OPERATIONS
Year ended 31st March, 2014
Year ended 31st March, 2013
Sale of products 29,935.21 27,677.67 Other operating revenue
Income from services rendered to group companies 479.57 506.84 Others (including salon services, export incentives, scrap sales, commission, lease license fee etc.)
214.73 180.00
30,629.51 28,364.51
Less: Excise Duty [includes share of Joint Venture Rs. 10.22 crores (2012-13 - Rs. 7.08 crores)]
(1,563.41) (1,483.27)
29,066.10 26,881.24
Share of Joint Venture including excise duty - Refer Note 40 167.18 122.75 29,233.28 27,003.99
30) OTHER INCOME
Year ended 31st March, 2014
Year ended 31st March, 2013
Interest Income
From bank deposits 222.53 234.73 From others (includes interest on income tax refund) 60.80 42.99 Dividend income
From current investments 10.38 29.28 From non-current investments 4.49 9.16 Net gain on sale of current investments 259.28 199.24 Miscellaneous income 12.08 14.11
569.56 529.51
Share of Joint Venture - Refer Note 40 1.42 2.52 570.98 532.03
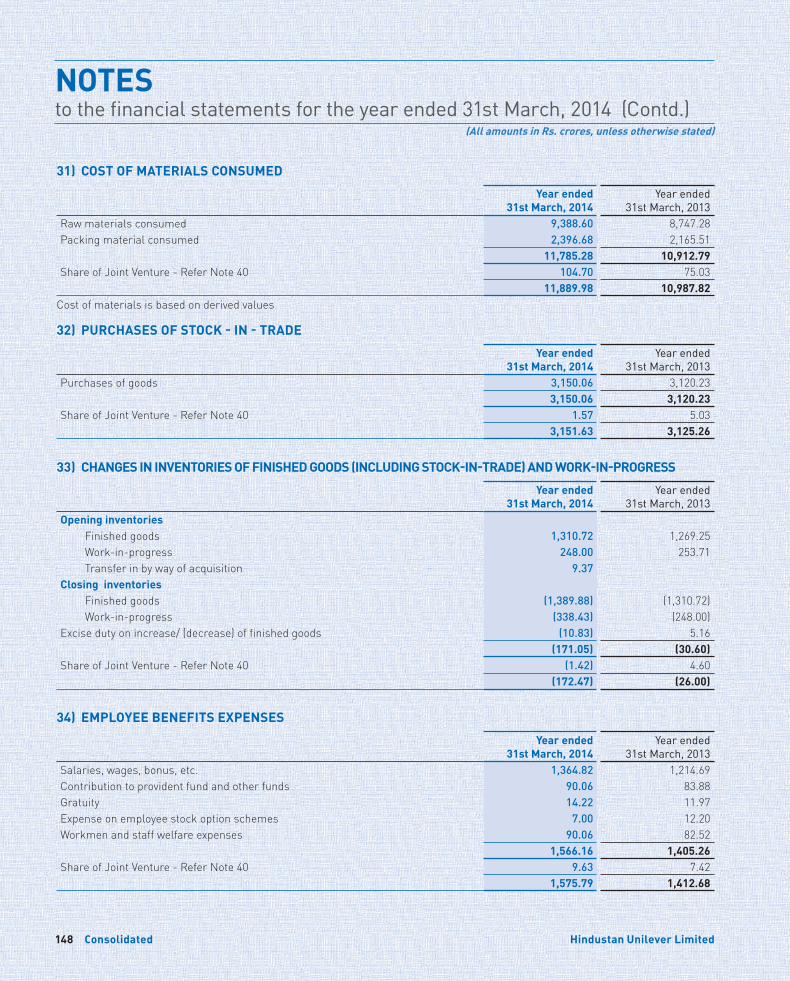
Consolidated Consolidated148 149Hindustan Unilever Limited Annual Report 2013-14
NOTESto the financial statements for the year ended 31st March, 2014 (Contd.)
(All amounts in Rs. crores, unless otherwise stated)
31) COST OF MATERIALS CONSUMED
Year ended 31st March, 2014
Year ended 31st March, 2013
Raw materials consumed 9,388.60 8,747.28 Packing material consumed 2,396.68 2,165.51
11,785.28 10,912.79 Share of Joint Venture - Refer Note 40 104.70 75.03
11,889.98 10,987.82 Cost of materials is based on derived values
32) PURCHASES OF STOCK - IN - TRADE
Year ended 31st March, 2014
Year ended 31st March, 2013
Purchases of goods 3,150.06 3,120.23 3,150.06 3,120.23
Share of Joint Venture - Refer Note 40 1.57 5.03 3,151.63 3,125.26
33) CHANGES IN INVENTORIES OF FINISHED GOODS (INCLUDING STOCK-IN-TRADE) AND WORK-IN-PROGRESS
Year ended 31st March, 2014
Year ended 31st March, 2013
Opening inventories Finished goods 1,310.72 1,269.25 Work-in-progress 248.00 253.71 Transfer in by way of acquisition 9.37 Closing inventories Finished goods (1,389.88) (1,310.72) Work-in-progress (338.43) (248.00)Excise duty on increase/ (decrease) of finished goods (10.83) 5.16
(171.05) (30.60)Share of Joint Venture - Refer Note 40 (1.42) 4.60
(172.47) (26.00)
34) EMPLOYEE BENEFITS EXPENSES
Year ended 31st March, 2014
Year ended 31st March, 2013
Salaries, wages, bonus, etc. 1,364.82 1,214.69 Contribution to provident fund and other funds 90.06 83.88 Gratuity 14.22 11.97 Expense on employee stock option schemes 7.00 12.20 Workmen and staff welfare expenses 90.06 82.52
1,566.16 1,405.26 Share of Joint Venture - Refer Note 40 9.63 7.42
1,575.79 1,412.68
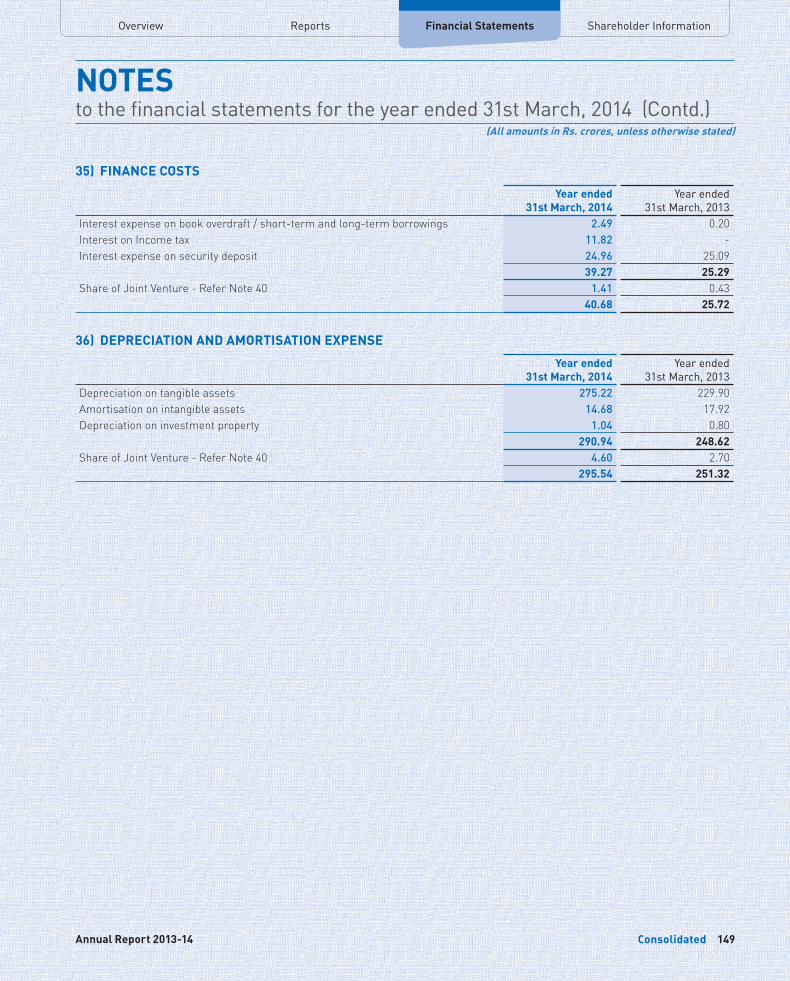
Overview Financial Statements Shareholder InformationReports
Consolidated Consolidated148 149Hindustan Unilever Limited Annual Report 2013-14
NOTESto the financial statements for the year ended 31st March, 2014 (Contd.)
(All amounts in Rs. crores, unless otherwise stated)
35) FINANCE COSTS
Year ended 31st March, 2014
Year ended 31st March, 2013
Interest expense on book overdraft / short-term and long-term borrowings 2.49 0.20 Interest on Income tax 11.82 - Interest expense on security deposit 24.96 25.09
39.27 25.29 Share of Joint Venture - Refer Note 40 1.41 0.43
40.68 25.72
36) DEPRECIATION AND AMORTISATION EXPENSE
Year ended 31st March, 2014
Year ended 31st March, 2013
Depreciation on tangible assets 275.22 229.90 Amortisation on intangible assets 14.68 17.92 Depreciation on investment property 1.04 0.80
290.94 248.62 Share of Joint Venture - Refer Note 40 4.60 2.70
295.54 251.32
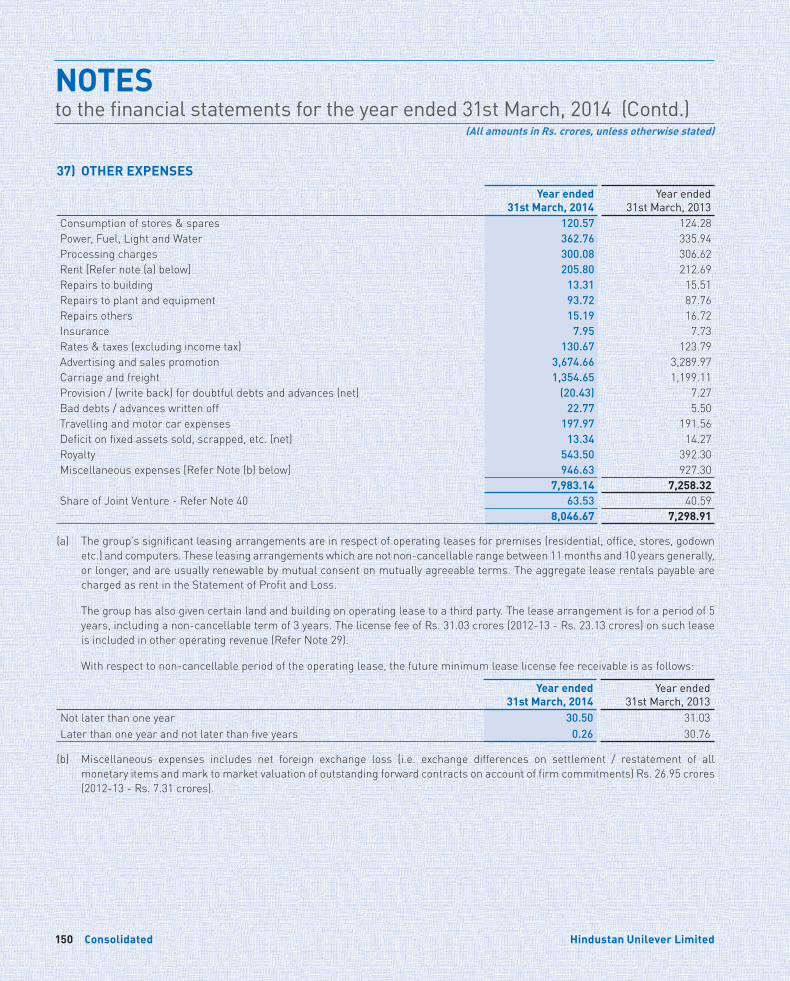
Consolidated Consolidated150 151Hindustan Unilever Limited Annual Report 2013-14
NOTESto the financial statements for the year ended 31st March, 2014 (Contd.)
(All amounts in Rs. crores, unless otherwise stated)
37) OTHER EXPENSES
Year ended 31st March, 2014
Year ended 31st March, 2013
Consumption of stores & spares 120.57 124.28 Power, Fuel, Light and Water 362.76 335.94 Processing charges 300.08 306.62 Rent [Refer note (a) below] 205.80 212.69 Repairs to building 13.31 15.51 Repairs to plant and equipment 93.72 87.76 Repairs others 15.19 16.72 Insurance 7.95 7.73 Rates & taxes (excluding income tax) 130.67 123.79 Advertising and sales promotion 3,674.66 3,289.97 Carriage and freight 1,354.65 1,199.11 Provision / (write back) for doubtful debts and advances (net) (20.43) 7.27 Bad debts / advances written off 22.77 5.50 Travelling and motor car expenses 197.97 191.56 Deficit on fixed assets sold, scrapped, etc. (net) 13.34 14.27 Royalty 543.50 392.30 Miscellaneous expenses [Refer Note (b) below] 946.63 927.30
7,983.14 7,258.32 Share of Joint Venture - Refer Note 40 63.53 40.59
8,046.67 7,298.91
(a) The group’s significant leasing arrangements are in respect of operating leases for premises (residential, office, stores, godown etc.) and computers. These leasing arrangements which are not non-cancellable range between 11 months and 10 years generally, or longer, and are usually renewable by mutual consent on mutually agreeable terms. The aggregate lease rentals payable are charged as rent in the Statement of Profit and Loss.
The group has also given certain land and building on operating lease to a third party. The lease arrangement is for a period of 5 years, including a non-cancellable term of 3 years. The license fee of Rs. 31.03 crores (2012-13 - Rs. 23.13 crores) on such lease is included in other operating revenue (Refer Note 29).
With respect to non-cancellable period of the operating lease, the future minimum lease license fee receivable is as follows:
Year ended 31st March, 2014
Year ended 31st March, 2013
Not later than one year 30.50 31.03 Later than one year and not later than five years 0.26 30.76
(b) Miscellaneous expenses includes net foreign exchange loss (i.e. exchange differences on settlement / restatement of all monetary items and mark to market valuation of outstanding forward contracts on account of firm commitments) Rs. 26.95 crores (2012-13 - Rs. 7.31 crores).
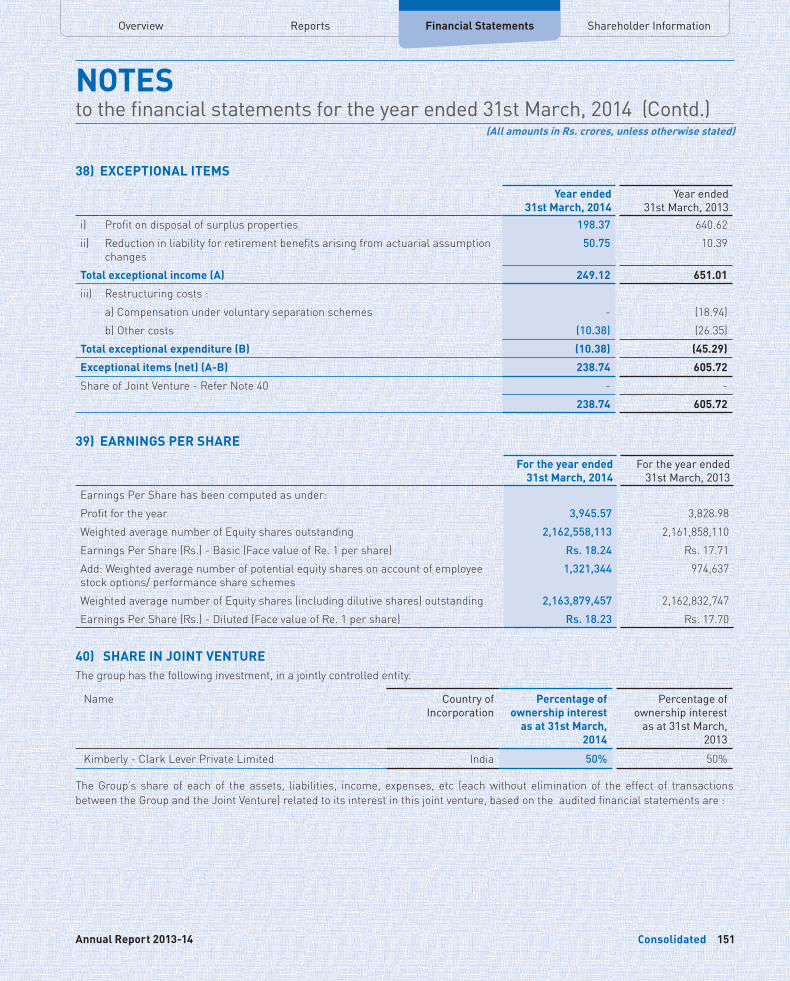
Overview Financial Statements Shareholder InformationReports
Consolidated Consolidated150 151Hindustan Unilever Limited Annual Report 2013-14
NOTESto the financial statements for the year ended 31st March, 2014 (Contd.)
(All amounts in Rs. crores, unless otherwise stated)
38) EXCEPTIONAL ITEMS
Year ended 31st March, 2014
Year ended 31st March, 2013
i) Profit on disposal of surplus properties 198.37 640.62 ii) Reduction in liability for retirement benefits arising from actuarial assumption
changes 50.75 10.39
Total exceptional income (A) 249.12 651.01
iii) Restructuring costs : a) Compensation under voluntary separation schemes - (18.94)b) Other costs (10.38) (26.35)
Total exceptional expenditure (B) (10.38) (45.29)
Exceptional items (net) (A-B) 238.74 605.72
Share of Joint Venture - Refer Note 40 - - 238.74 605.72
39) EARNINGS PER SHARE
For the year ended 31st March, 2014
For the year ended 31st March, 2013
Earnings Per Share has been computed as under:Profit for the year 3,945.57 3,828.98Weighted average number of Equity shares outstanding 2,162,558,113 2,161,858,110Earnings Per Share (Rs.) - Basic (Face value of Re. 1 per share) Rs. 18.24 Rs. 17.71Add: Weighted average number of potential equity shares on account of employee stock options/ performance share schemes
1,321,344 974,637
Weighted average number of Equity shares (including dilutive shares) outstanding 2,163,879,457 2,162,832,747Earnings Per Share (Rs.) - Diluted (Face value of Re. 1 per share) Rs. 18.23 Rs. 17.70
40) SHARE IN JOINT VENTURE The group has the following investment, in a jointly controlled entity.
Name Country of Incorporation
Percentage of ownership interest
as at 31st March, 2014
Percentage of ownership interest
as at 31st March, 2013
Kimberly - Clark Lever Private Limited India 50% 50%
The Group’s share of each of the assets, liabilities, income, expenses, etc (each without elimination of the effect of transactions between the Group and the Joint Venture) related to its interest in this joint venture, based on the audited financial statements are :
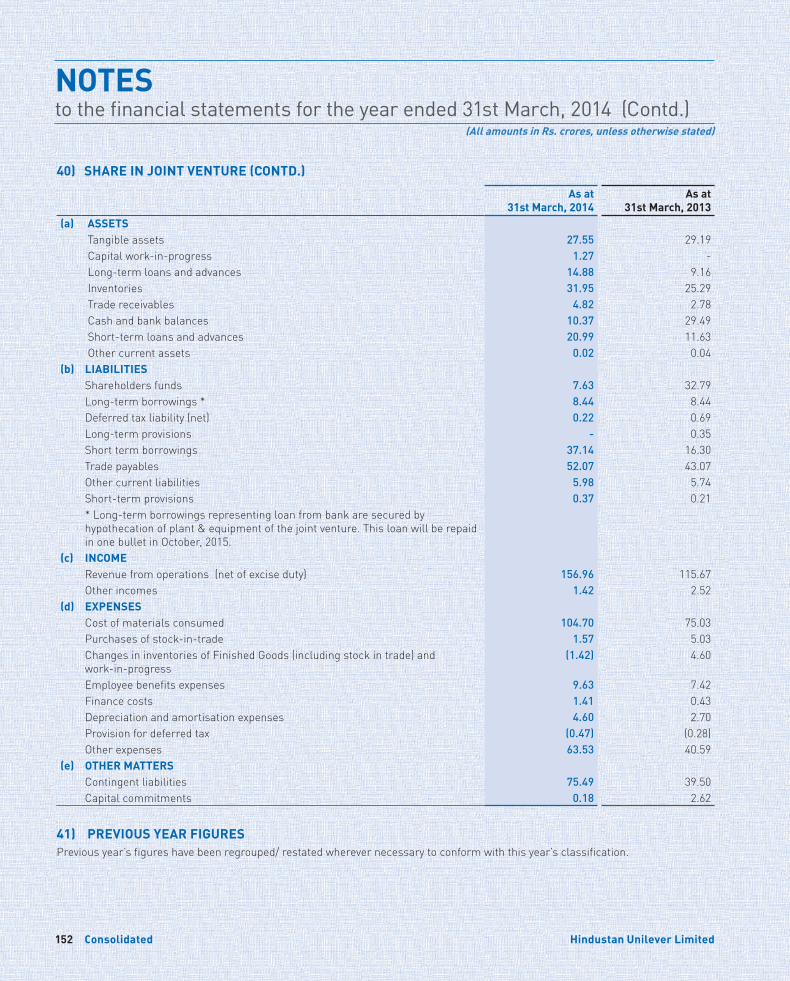
Consolidated Consolidated152 153Hindustan Unilever Limited Annual Report 2013-14
NOTESto the financial statements for the year ended 31st March, 2014 (Contd.)
(All amounts in Rs. crores, unless otherwise stated)
40) SHARE IN JOINT VENTURE (CONTD.)
As at 31st March, 2014
As at 31st March, 2013
(a) ASSETS Tangible assets 27.55 29.19 Capital work-in-progress 1.27 - Long-term loans and advances 14.88 9.16 Inventories 31.95 25.29 Trade receivables 4.82 2.78 Cash and bank balances 10.37 29.49 Short-term loans and advances 20.99 11.63 Other current assets 0.02 0.04
(b) LIABILITIES Shareholders funds 7.63 32.79 Long-term borrowings * 8.44 8.44 Deferred tax liability (net) 0.22 0.69 Long-term provisions - 0.35 Short term borrowings 37.14 16.30 Trade payables 52.07 43.07 Other current liabilities 5.98 5.74 Short-term provisions 0.37 0.21 * Long-term borrowings representing loan from bank are secured by hypothecation of plant & equipment of the joint venture. This loan will be repaid in one bullet in October, 2015.
(c) INCOME Revenue from operations (net of excise duty) 156.96 115.67 Other incomes 1.42 2.52
(d) EXPENSES Cost of materials consumed 104.70 75.03 Purchases of stock-in-trade 1.57 5.03 Changes in inventories of Finished Goods (including stock in trade) and work-in-progress
(1.42) 4.60
Employee benefits expenses 9.63 7.42 Finance costs 1.41 0.43 Depreciation and amortisation expenses 4.60 2.70 Provision for deferred tax (0.47) (0.28)Other expenses 63.53 40.59
(e) OTHER MATTERS Contingent liabilities 75.49 39.50 Capital commitments 0.18 2.62
41) PREVIOUS YEAR FIGURES Previous year’s figures have been regrouped/ restated wherever necessary to conform with this year’s classification.
Overview Financial Statements Shareholder InformationReports
Consolidated Consolidated152 153Hindustan Unilever Limited Annual Report 2013-14
NOTESto the financial statements for the year ended 31st March, 2014 (Contd.)
(All amounts in Rs. crores, unless otherwise stated)
42) RELATED PARTY DISCLOSURES
A. Enterprises where control exists
(i) Holding Company : Unilever PLC
B. Other Related Parties with whom the Group had transactions during the year
(i) Fellow Subsidiaries : Al Gurg Unilever LlcBesan- Besin Sanayi Ve Ticaret A.S.Binzagar Lever LimitedBrooke Bond Assam Estates LimitedBrooke Bond Group LimitedBrooke Bond South India Estates LimitedConopco, IncCorporativo Unilever De Mexico, S.De R.L. De C.V. (Merged)Ebu - Unilever CanadaElida Nepal (Pvt) Ltd.Glidat Strauss LimitedLever International Marine SupLipton Soft Drinks Ireland LimitedMascolo Brothers LimitedOOO Unilever RusP.T. Unilever Indonesia, Tbk.Royal Estates Tea CompanyTigi Holdings LimitedTigi Linea International B.V.Tigi Liniea, LPUl Research & Development VlaaUnilever - IstanbulUnilever Skin GdcUnilever AlgerieUnilever Andina Colombia LimitedUnilever ASCC AGUnilever Asia Private LimitedUnilever AustralasiaUnilever Australia LimitedUnilever Bangladesh LtdUnilever Brasil LimitedUnilever Business And Marketing Support AGUnilever Canada Inc
Consolidated Consolidated154 155Hindustan Unilever Limited Annual Report 2013-14
NOTESto the financial statements for the year ended 31st March, 2014 (Contd.)
(All amounts in Rs. crores, unless otherwise stated)
42) RELATED PARTY DISCLOSURES (CONTD.) (i) Fellow Subsidiaries (Contd.) Unilever Canada-Food Solutions
Unilever Caribbean LimitedUnilever Ceylon LimitedUnilever Chile Unilever China LimitedUnilever Cote D’ivoireUnilever De Argentina SAUnilever De Mexico S De RLUnilever Deutschland Produktions Gmbh & Co. OHGUnilever Employment Services B.V.Unilever Europe IT Unilever Gulf Free Zone Establishment, ArabiaUnilever Hong Kong LimitedUnilever Hpc USAUnilever IndonesiaUnilever Industries Private LimitedUnilever Iran (Private Joint Stock Company)Unilever Israel Marketing LimitedUnilever IstanbulUnilever Italy Holdings SrlUnilever JapanUnilever Kenya LimitedUnilever KoreaUnilever Lipton Ceylon LimitedUnilever Maghreb Exports SA,TunisiaUnilever (Malaysia) Holdings Sdn BhdUnilever Market DevelopmentUnilever Mashreq International CompanyUnilever MexicoUnilever Mozambique LDAUnilever N.V.Unilever Nigeria Plc.Unilever Overseas Holdings AGUnilever Overseas Holdings B.V.Unilever Pakistan LimitedUnilever Philippines, IncUnilever Research and Development Vlaardingen B.V.Unilever Research Laboratory Port SunlightUnilever Sanayi Ve Ticaret Turk A.S
Overview Financial Statements Shareholder InformationReports
Consolidated Consolidated154 155Hindustan Unilever Limited Annual Report 2013-14
NOTESto the financial statements for the year ended 31st March, 2014 (Contd.)
(All amounts in Rs. crores, unless otherwise stated)
42) RELATED PARTY DISCLOSURES (CONTD.)Unilever Services (Hefei) Co. LimitedUnilever Singapore PTE LimitedUnilever SNG, RussiaUnilever South Africa (Pty.) LimitedUnilever South Central Europe S.R.LUnilever Sri Lanka LimitedUnilever Supply Chain Company AGUnilever Taiwan LimitedUnilever Thai Services LimitedUnilever Thai Trading LimitedUnilever Trading LLCUnilever U.K. Central Resources LimitedUnilever Uganda LimitedUnilever UK & CN Holdings LimitedUnilever United States, Inc.Unilever Ventures India Advisory Private LimitedUnilever Vietnam International Company LimitedUnilever Zimbabwe (Pvt) LimitedWalls (China) Co. Limited
(ii) Joint Ventures : Kimberly Clark Lever Private Limited
(iii) Key Management Personnel : BP Biddappa (with effect from February 1, 2013)Dev BajpaiGeetu Verma Hemant Bakshi Leena Nair (up to January 31, 2013)Manish Tiwary Nitin Paranjpe (up to October 9, 2013)Pradeep BanerjeeSanjiv Mehta (with effect from October 1, 2013)Sridhar Ramamurthy
(iv) Other (Non Executive Chairman) : Harish Manwani
(v) Employees’ Benefit Plans where there is significant influence
: Hind Lever Gratuity FundThe Hind Lever Pension FundThe Union Provident Fund
(vi) Controlled Entity (Sec 25. Company) : Hindustan Unilever Foundation
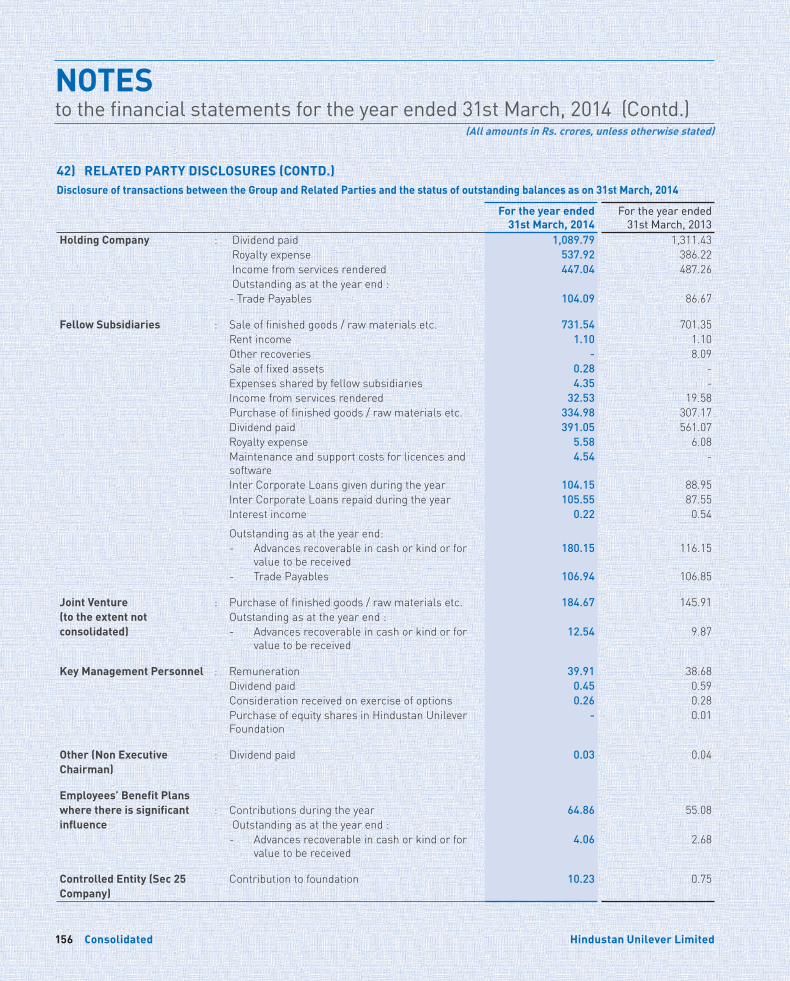
Consolidated Consolidated156 157Hindustan Unilever Limited Annual Report 2013-14
NOTESto the financial statements for the year ended 31st March, 2014 (Contd.)
(All amounts in Rs. crores, unless otherwise stated)
42) RELATED PARTY DISCLOSURES (CONTD.)Disclosure of transactions between the Group and Related Parties and the status of outstanding balances as on 31st March, 2014 For the year ended
31st March, 2014For the year ended
31st March, 2013Holding Company : Dividend paid 1,089.79 1,311.43
Royalty expense 537.92 386.22 Income from services rendered 447.04 487.26 Outstanding as at the year end : - Trade Payables 104.09 86.67
Fellow Subsidiaries : Sale of finished goods / raw materials etc. 731.54 701.35 Rent income 1.10 1.10 Other recoveries - 8.09 Sale of fixed assets 0.28 - Expenses shared by fellow subsidiaries 4.35 - Income from services rendered 32.53 19.58 Purchase of finished goods / raw materials etc. 334.98 307.17 Dividend paid 391.05 561.07 Royalty expense 5.58 6.08 Maintenance and support costs for licences and software
4.54 -
Inter Corporate Loans given during the year 104.15 88.95 Inter Corporate Loans repaid during the year 105.55 87.55 Interest income 0.22 0.54 Outstanding as at the year end: - Advances recoverable in cash or kind or for
value to be received 180.15 116.15
- Trade Payables 106.94 106.85
Joint Venture (to the extent not consolidated)
: Purchase of finished goods / raw materials etc. 184.67 145.91 Outstanding as at the year end : - Advances recoverable in cash or kind or for
value to be received 12.54 9.87
Key Management Personnel : Remuneration 39.91 38.68 Dividend paid 0.45 0.59 Consideration received on exercise of options 0.26 0.28 Purchase of equity shares in Hindustan Unilever Foundation
- 0.01
Other (Non Executive Chairman)
: Dividend paid 0.03 0.04
Employees’ Benefit Plans where there is significant influence
: Contributions during the year 64.86 55.08 Outstanding as at the year end : - Advances recoverable in cash or kind or for
value to be received 4.06 2.68
Controlled Entity (Sec 25 Company)
Contribution to foundation 10.23 0.75
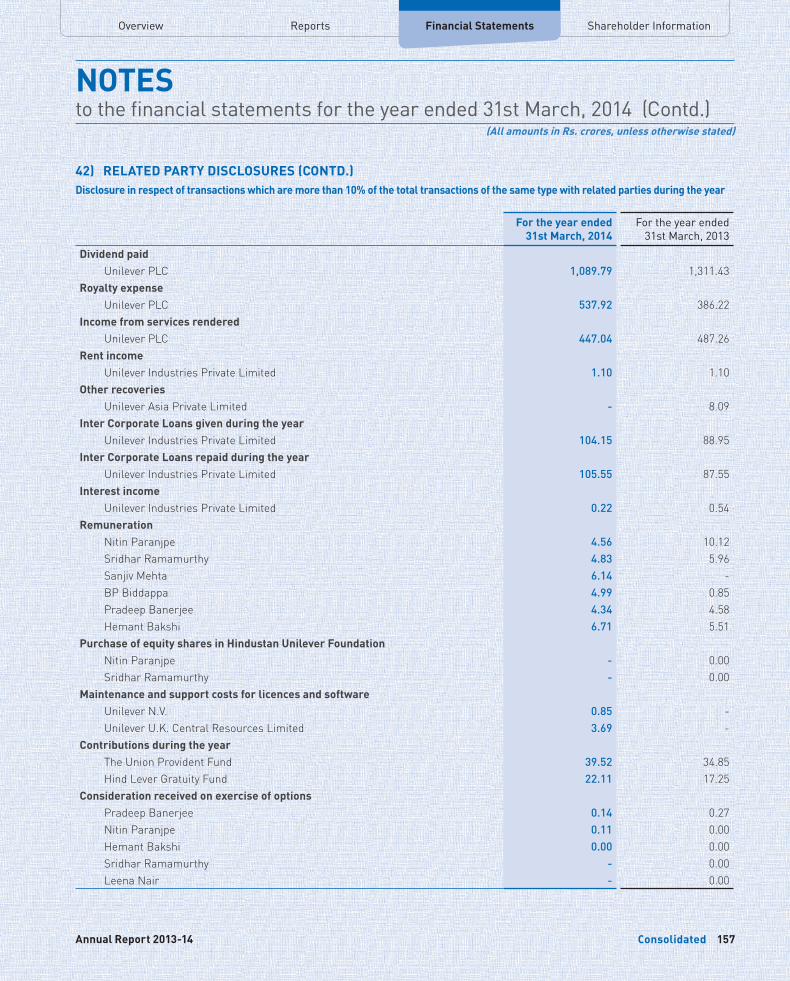
Overview Financial Statements Shareholder InformationReports
Consolidated Consolidated156 157Hindustan Unilever Limited Annual Report 2013-14
NOTESto the financial statements for the year ended 31st March, 2014 (Contd.)
(All amounts in Rs. crores, unless otherwise stated)
42) RELATED PARTY DISCLOSURES (CONTD.)Disclosure in respect of transactions which are more than 10% of the total transactions of the same type with related parties during the year
For the year ended 31st March, 2014
For the year ended 31st March, 2013
Dividend paid Unilever PLC 1,089.79 1,311.43 Royalty expense Unilever PLC 537.92 386.22 Income from services rendered Unilever PLC 447.04 487.26 Rent income Unilever Industries Private Limited 1.10 1.10 Other recoveries Unilever Asia Private Limited - 8.09 Inter Corporate Loans given during the year Unilever Industries Private Limited 104.15 88.95 Inter Corporate Loans repaid during the year Unilever Industries Private Limited 105.55 87.55 Interest income Unilever Industries Private Limited 0.22 0.54 Remuneration Nitin Paranjpe 4.56 10.12 Sridhar Ramamurthy 4.83 5.96 Sanjiv Mehta 6.14 - BP Biddappa 4.99 0.85 Pradeep Banerjee 4.34 4.58 Hemant Bakshi 6.71 5.51 Purchase of equity shares in Hindustan Unilever Foundation Nitin Paranjpe - 0.00 Sridhar Ramamurthy - 0.00Maintenance and support costs for licences and software Unilever N.V. 0.85 - Unilever U.K. Central Resources Limited 3.69 - Contributions during the year The Union Provident Fund 39.52 34.85 Hind Lever Gratuity Fund 22.11 17.25 Consideration received on exercise of options Pradeep Banerjee 0.14 0.27 Nitin Paranjpe 0.11 0.00 Hemant Bakshi 0.00 0.00 Sridhar Ramamurthy - 0.00 Leena Nair - 0.00
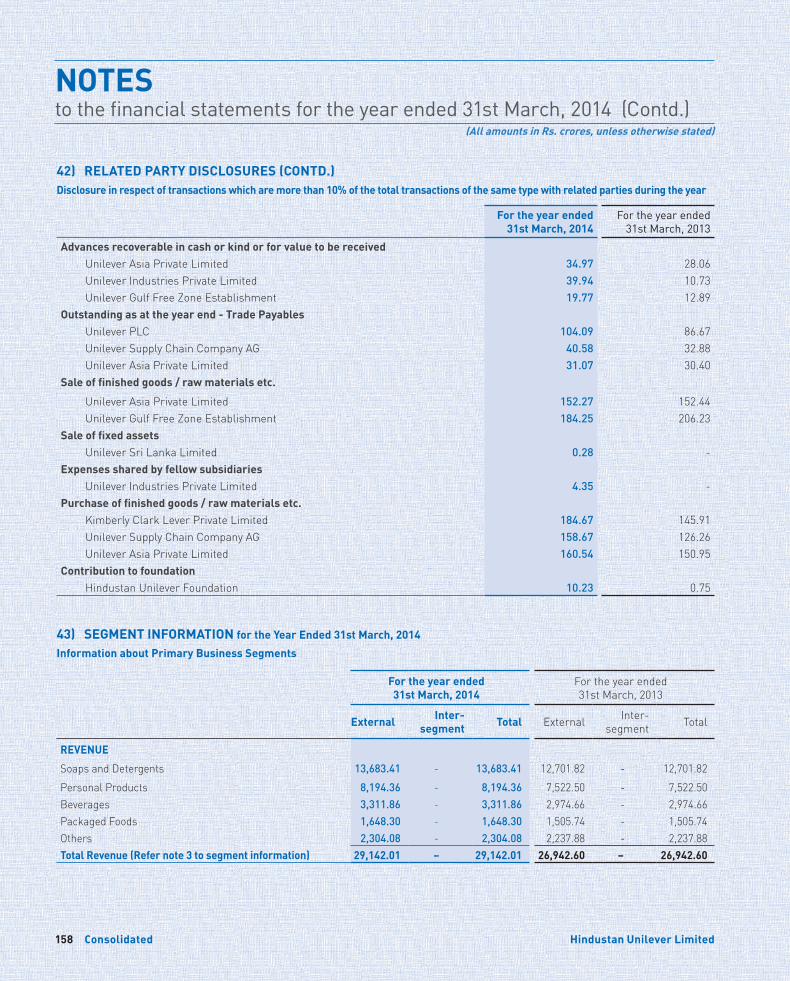
Consolidated Consolidated158 159Hindustan Unilever Limited Annual Report 2013-14
NOTESto the financial statements for the year ended 31st March, 2014 (Contd.)
(All amounts in Rs. crores, unless otherwise stated)
42) RELATED PARTY DISCLOSURES (CONTD.)Disclosure in respect of transactions which are more than 10% of the total transactions of the same type with related parties during the year
For the year ended 31st March, 2014
For the year ended 31st March, 2013
Advances recoverable in cash or kind or for value to be received Unilever Asia Private Limited 34.97 28.06 Unilever Industries Private Limited 39.94 10.73 Unilever Gulf Free Zone Establishment 19.77 12.89 Outstanding as at the year end - Trade Payables Unilever PLC 104.09 86.67 Unilever Supply Chain Company AG 40.58 32.88 Unilever Asia Private Limited 31.07 30.40 Sale of finished goods / raw materials etc.
Unilever Asia Private Limited 152.27 152.44 Unilever Gulf Free Zone Establishment 184.25 206.23 Sale of fixed assets Unilever Sri Lanka Limited 0.28 - Expenses shared by fellow subsidiaries Unilever Industries Private Limited 4.35 - Purchase of finished goods / raw materials etc. Kimberly Clark Lever Private Limited 184.67 145.91 Unilever Supply Chain Company AG 158.67 126.26 Unilever Asia Private Limited 160.54 150.95 Contribution to foundation Hindustan Unilever Foundation 10.23 0.75
43) SEGMENT INFORMATION for the Year Ended 31st March, 2014
Information about Primary Business Segments
For the year ended 31st March, 2014
For the year ended 31st March, 2013
External Inter- segment Total External Inter-
segment Total
REVENUE
Soaps and Detergents 13,683.41 - 13,683.41 12,701.82 - 12,701.82 Personal Products 8,194.36 - 8,194.36 7,522.50 - 7,522.50 Beverages 3,311.86 - 3,311.86 2,974.66 - 2,974.66 Packaged Foods 1,648.30 - 1,648.30 1,505.74 - 1,505.74 Others 2,304.08 - 2,304.08 2,237.88 - 2,237.88 Total Revenue (Refer note 3 to segment information) 29,142.01 – 29,142.01 26,942.60 – 26,942.60
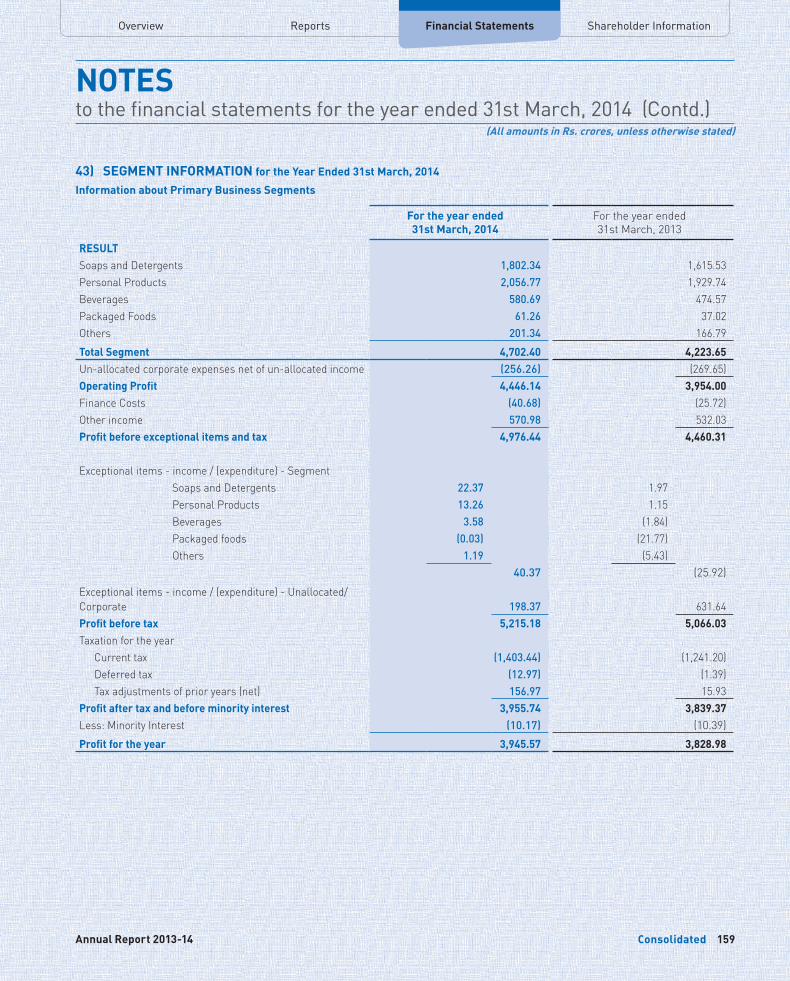
Overview Financial Statements Shareholder InformationReports
Consolidated Consolidated158 159Hindustan Unilever Limited Annual Report 2013-14
NOTESto the financial statements for the year ended 31st March, 2014 (Contd.)
(All amounts in Rs. crores, unless otherwise stated)
For the year ended 31st March, 2014
For the year ended 31st March, 2013
RESULTSoaps and Detergents 1,802.34 1,615.53 Personal Products 2,056.77 1,929.74 Beverages 580.69 474.57 Packaged Foods 61.26 37.02 Others 201.34 166.79 Total Segment 4,702.40 4,223.65 Un-allocated corporate expenses net of un-allocated income (256.26) (269.65)Operating Profit 4,446.14 3,954.00 Finance Costs (40.68) (25.72)Other income 570.98 532.03 Profit before exceptional items and tax 4,976.44 4,460.31
Exceptional items - income / (expenditure) - Segment Soaps and Detergents 22.37 1.97 Personal Products 13.26 1.15 Beverages 3.58 (1.84) Packaged foods (0.03) (21.77) Others 1.19 (5.43)
40.37 (25.92)Exceptional items - income / (expenditure) - Unallocated/Corporate 198.37 631.64Profit before tax 5,215.18 5,066.03Taxation for the year Current tax (1,403.44) (1,241.20) Deferred tax (12.97) (1.39) Tax adjustments of prior years (net) 156.97 15.93 Profit after tax and before minority interest 3,955.74 3,839.37 Less: Minority Interest (10.17) (10.39)Profit for the year 3,945.57 3,828.98
43) SEGMENT INFORMATION for the Year Ended 31st March, 2014
Information about Primary Business Segments
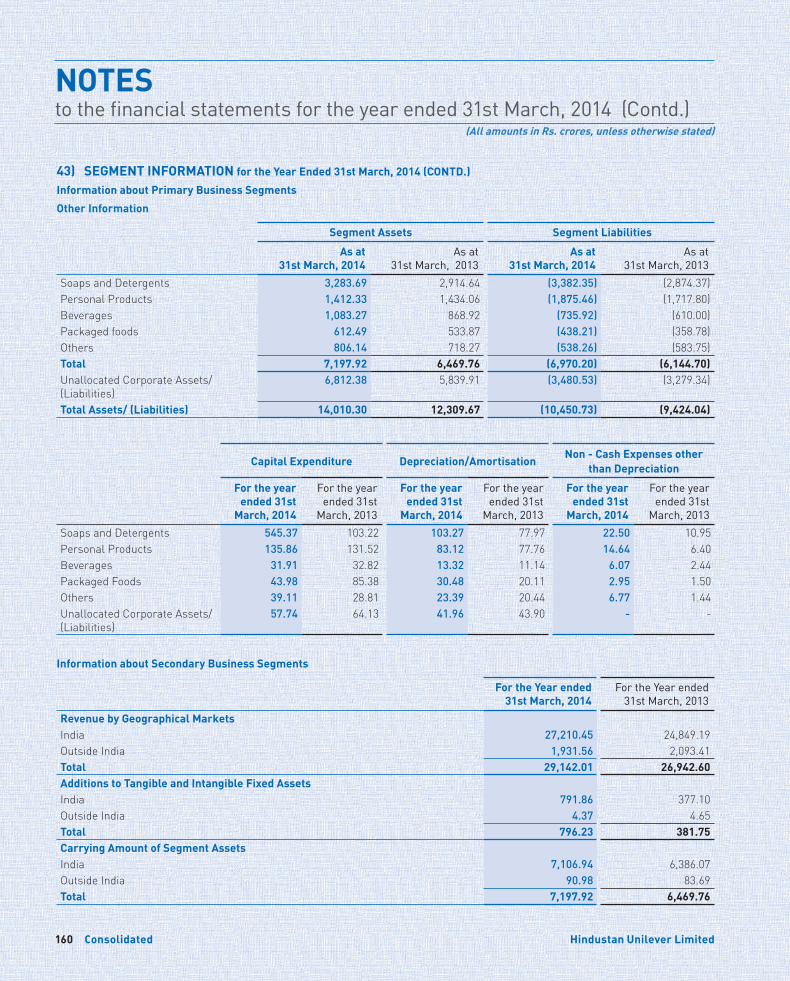
Consolidated Consolidated160 161Hindustan Unilever Limited Annual Report 2013-14
NOTESto the financial statements for the year ended 31st March, 2014 (Contd.)
(All amounts in Rs. crores, unless otherwise stated)
Segment Assets Segment Liabilities
As at 31st March, 2014
As at 31st March, 2013
As at 31st March, 2014
As at 31st March, 2013
Soaps and Detergents 3,283.69 2,914.64 (3,382.35) (2,874.37)Personal Products 1,412.33 1,434.06 (1,875.46) (1,717.80)Beverages 1,083.27 868.92 (735.92) (610.00)Packaged foods 612.49 533.87 (438.21) (358.78)Others 806.14 718.27 (538.26) (583.75)Total 7,197.92 6,469.76 (6,970.20) (6,144.70)Unallocated Corporate Assets/ (Liabilities)
6,812.38 5,839.91 (3,480.53) (3,279.34)
Total Assets/ (Liabilities) 14,010.30 12,309.67 (10,450.73) (9,424.04)
Capital Expenditure Depreciation/AmortisationNon - Cash Expenses other
than Depreciation
For the year ended 31st
March, 2014
For the year ended 31st
March, 2013
For the year ended 31st
March, 2014
For the year ended 31st
March, 2013
For the year ended 31st
March, 2014
For the year ended 31st
March, 2013Soaps and Detergents 545.37 103.22 103.27 77.97 22.50 10.95 Personal Products 135.86 131.52 83.12 77.76 14.64 6.40 Beverages 31.91 32.82 13.32 11.14 6.07 2.44 Packaged Foods 43.98 85.38 30.48 20.11 2.95 1.50 Others 39.11 28.81 23.39 20.44 6.77 1.44 Unallocated Corporate Assets/ (Liabilities)
57.74 64.13 41.96 43.90 - -
Information about Secondary Business Segments
For the Year ended 31st March, 2014
For the Year ended 31st March, 2013
Revenue by Geographical MarketsIndia 27,210.45 24,849.19 Outside India 1,931.56 2,093.41 Total 29,142.01 26,942.60Additions to Tangible and Intangible Fixed Assets India 791.86 377.10 Outside India 4.37 4.65 Total 796.23 381.75 Carrying Amount of Segment Assets India 7,106.94 6,386.07 Outside India 90.98 83.69 Total 7,197.92 6,469.76
43) SEGMENT INFORMATION for the Year Ended 31st March, 2014 (CONTD.)
Information about Primary Business Segments
Other Information
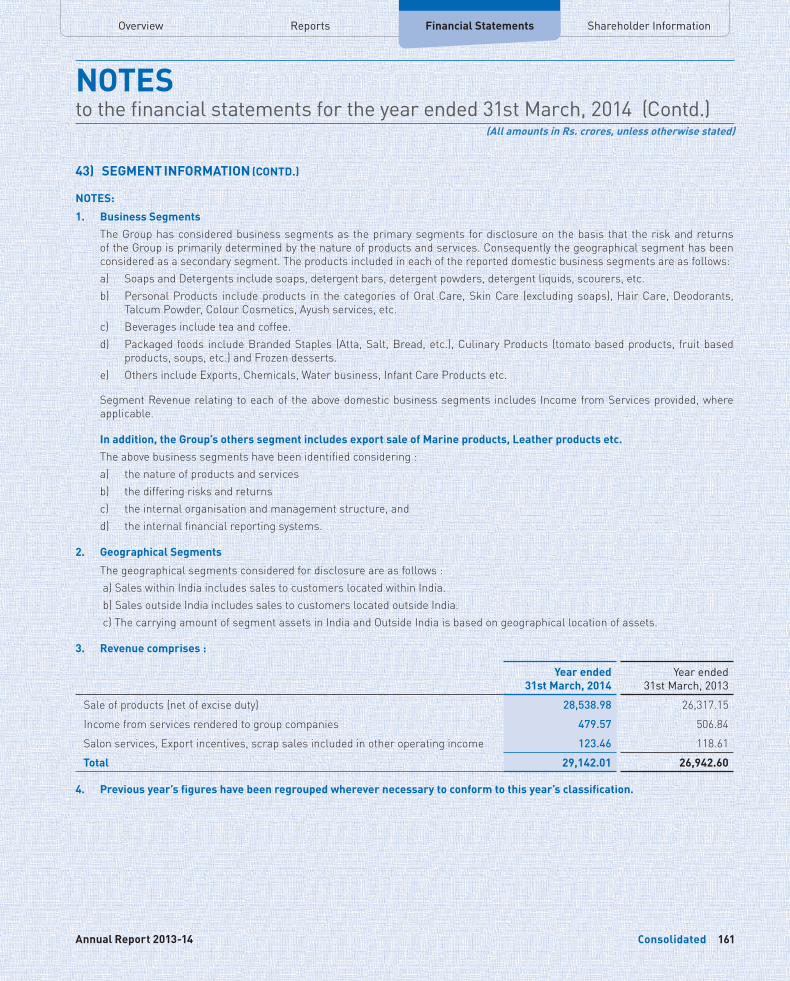
Overview Financial Statements Shareholder InformationReports
Consolidated Consolidated160 161Hindustan Unilever Limited Annual Report 2013-14
NOTESto the financial statements for the year ended 31st March, 2014 (Contd.)
(All amounts in Rs. crores, unless otherwise stated)
NOTES:
1. Business Segments The Group has considered business segments as the primary segments for disclosure on the basis that the risk and returns
of the Group is primarily determined by the nature of products and services. Consequently the geographical segment has been considered as a secondary segment. The products included in each of the reported domestic business segments are as follows:a) Soaps and Detergents include soaps, detergent bars, detergent powders, detergent liquids, scourers, etc. b) Personal Products include products in the categories of Oral Care, Skin Care (excluding soaps), Hair Care, Deodorants,
Talcum Powder, Colour Cosmetics, Ayush services, etc.c) Beverages include tea and coffee.d) Packaged foods include Branded Staples (Atta, Salt, Bread, etc.), Culinary Products (tomato based products, fruit based
products, soups, etc.) and Frozen desserts.e) Others include Exports, Chemicals, Water business, Infant Care Products etc.
Segment Revenue relating to each of the above domestic business segments includes Income from Services provided, where applicable.
In addition, the Group’s others segment includes export sale of Marine products, Leather products etc. The above business segments have been identified considering :
a) the nature of products and services b) the differing risks and returns c) the internal organisation and management structure, andd) the internal financial reporting systems.
2. Geographical Segments
The geographical segments considered for disclosure are as follows : a) Sales within India includes sales to customers located within India. b) Sales outside India includes sales to customers located outside India. c) The carrying amount of segment assets in India and Outside India is based on geographical location of assets.
3. Revenue comprises :
Year ended 31st March, 2014
Year ended 31st March, 2013
Sale of products (net of excise duty) 28,538.98 26,317.15 Income from services rendered to group companies 479.57 506.84 Salon services, Export incentives, scrap sales included in other operating income 123.46 118.61 Total 29,142.01 26,942.60
4. Previous year’s figures have been regrouped wherever necessary to conform to this year’s classification.
43) SEGMENT INFORMATION (CONTD.)
Consolidated162 Hindustan Unilever Limited
INDEPENDENT AUDITORS’ REPORTon the Consolidated Financial Statements of Hindustan Unilever Limited
To the Board of Directors of Hindustan Unilever Limited 1. We have audited the accompanying consolidated financial
statements (the “Consolidated Financial Statements”) of Hindustan Unilever Limited (“the Company”) and its subsidiaries, controlled trust and its jointly controlled entity; hereinafter referred to as the “Group” (refer Note 1 to the attached consolidated financial statements) which comprise the consolidated Balance Sheet as at March 31, 2014, the consolidated Statement of Profit and Loss and the consolidated Cash Flow Statement for the year then ended, and a summary of significant accounting policies and other explanatory information which we have signed under reference to this report.
MANAGEMENT’S RESPONSIBILITY FOR THE CONSOLIDATED FINANCIAL STATEMENTS 2. The Company’s Management is responsible for the
preparation of these consolidated financial statements that give a true and fair view of the consolidated financial position, consolidated financial performance and consolidated cash flows of the Group in accordance with accounting principles generally accepted in India. This responsibility includes the design, implementation and maintenance of internal control relevant to the preparation and presentation of the consolidated financial statements that give a true and fair view and are free from material misstatement, whether due to fraud or error.
AUDITORS’ RESPONSIBILITY 3. Our responsibility is to express an opinion on these
consolidated financial statements based on our audit. We conducted our audit in accordance with the Standards on Auditing and other applicable authoritative pronouncements issued by the Institute of Chartered Accountants of India. Those Standards require that we comply with ethical requirements and plan and perform the audit to obtain reasonable assurance about whether the consolidated financial statements are free from material misstatement.
4. An audit involves performing procedures to obtain audit evidence about the amounts and disclosures in the consolidated financial statements. The procedures selected depend on the auditors’ judgement, including the assessment of the risks of material misstatement of the consolidated financial statements, whether due to fraud or error. In making those risk assessments, the auditors consider internal control relevant to the Company’s preparation and fair presentation of the consolidated financial statements in order to design audit procedures that are appropriate in the circumstances, but not for the purpose of expressing an opinion on the effectiveness of the group’s internal control. An audit also includes evaluating the appropriateness of accounting policies used and the reasonableness of the accounting estimates made by
Management, as well as evaluating the overall presentation of the consolidated financial statements.
5. We believe that the audit evidence we have obtained is sufficient and appropriate to provide a basis for our audit opinion.
OPINION6. We report that the consolidated financial statements
have been prepared by the Company’s Management in accordance with the requirements of Accounting Standard (AS) 21 – Consolidated Financial Statements and Accounting Standard (AS) 27 – Financial Reporting of Interests in Joint Ventures notified under the Companies Act, 1956 read with the General Circular 15/ 2013 dated September 13, 2013 of the Ministry of Corporate Affairs in respect of Section 133 of the Companies Act, 2013.
7. Based on our audit and on consideration of reports of other auditors on separate financial statements and on the other financial information of the components of the Group as referred to in paragraph 8 below, and to the best of our information and according to the explanations given to us, in our opinion, the accompanying consolidated financial statements give a true and fair view in conformity with the accounting principles generally accepted in India:
(a) in the case of the consolidated Balance Sheet, of the state of affairs of the Group as at March 31, 2014;
(b) in the case of the consolidated Statement of Profit and Loss, of the profit for the year ended on that date; and
(c) in the case of the consolidated Cash Flow Statement, of the cash flows for the year ended on that date.
OTHER MATTER8. We did not audit the financial statements of one subsidiary
and one jointly controlled entity included in the consolidated financial statements, which constitute total assets of Rs. 327.51 crores and net assets of Rs. 85.82 crores as at March 31, 2014, total revenue of Rs. 456.15 crores, net profit Rs. 25.68 crores and net cash outflows amounting to Rs. 18.15 crores for the year then ended. These financial statements and other financial information have been audited by other auditors whose reports have been furnished to us, and our opinion on the consolidated financial statements to the extent they have been derived from such financial statements is based solely on the report of such other auditors.
For Lovelock & LewesFirm Registration Number: 301056EChartered Accountants
Pradip KanakiaPartner
Mumbai: April 28, 2014 Membership Number: 39985
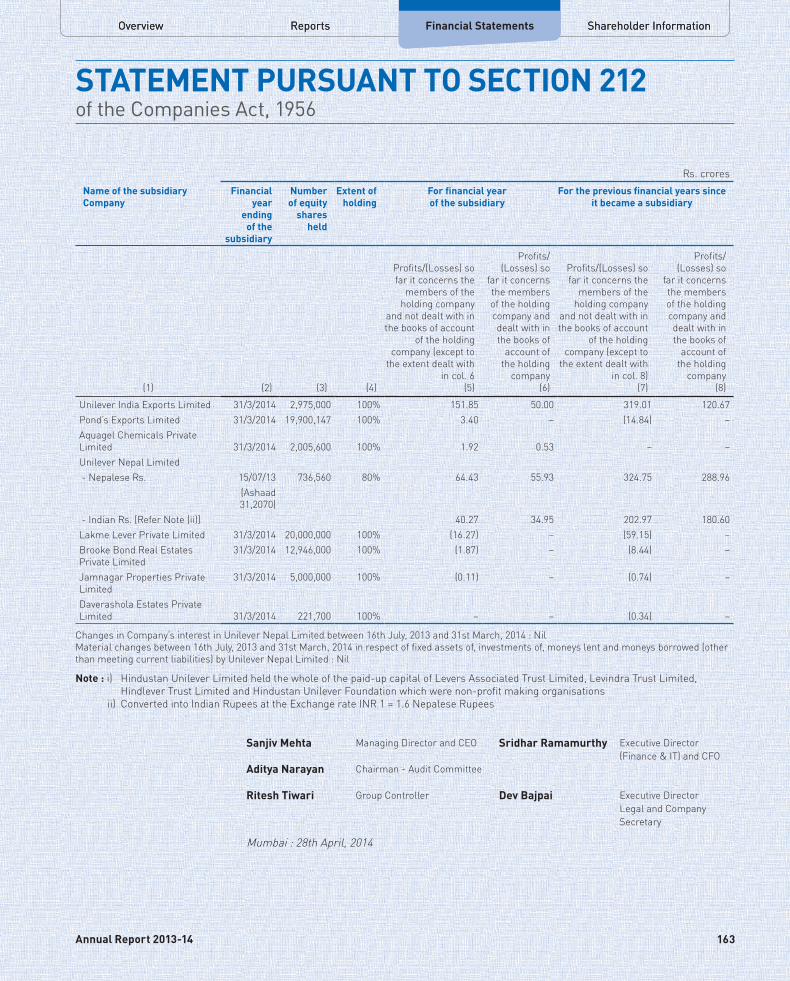
Overview Financial Statements Shareholder InformationReports
163Annual Report 2013-14
Overview Financial Statements Shareholder InformationReports
STATEMENT PURSUANT TO SECTION 212of the Companies Act, 1956
Rs. croresName of the subsidiary Company
Financial year
ending of the
subsidiary
Number of equity
shares held
Extent of holding
For financial year of the subsidiary
For the previous financial years since it became a subsidiary
(1) (2) (3) (4)
Profits/(Losses) so far it concerns the
members of the holding company
and not dealt with in the books of account
of the holding company (except to
the extent dealt with in col. 6
(5)
Profits/ (Losses) so
far it concerns the members of the holding company and dealt with in the books of
account of the holding
company(6)
Profits/(Losses) so far it concerns the
members of the holding company
and not dealt with in the books of account
of the holding company (except to
the extent dealt with in col. 8)
(7)
Profits/ (Losses) so
far it concerns the members of the holding company and dealt with in the books of
account of the holding
company(8)
Unilever India Exports Limited 31/3/2014 2,975,000 100% 151.85 50.00 319.01 120.67 Pond’s Exports Limited 31/3/2014 19,900,147 100% 3.40 – (14.84) – Aquagel Chemicals Private Limited 31/3/2014 2,005,600 100% 1.92 0.53 – – Unilever Nepal Limited - Nepalese Rs. 15/07/13 736,560 80% 64.43 55.93 324.75 288.96
(Ashaad 31,2070)
- Indian Rs. [Refer Note (ii)] 40.27 34.95 202.97 180.60Lakme Lever Private Limited 31/3/2014 20,000,000 100% (16.27) – (59.15) –Brooke Bond Real Estates Private Limited
31/3/2014 12,946,000 100% (1.87) – (8.44) –
Jamnagar Properties Private Limited
31/3/2014 5,000,000 100% (0.11) – (0.74) –
Daverashola Estates Private Limited 31/3/2014 221,700 100% – – (0.34) –
Changes in Company’s interest in Unilever Nepal Limited between 16th July, 2013 and 31st March, 2014 : Nil Material changes between 16th July, 2013 and 31st March, 2014 in respect of fixed assets of, investments of, moneys lent and moneys borrowed (other than meeting current liabilities) by Unilever Nepal Limited : Nil
Note : i) Hindustan Unilever Limited held the whole of the paid-up capital of Levers Associated Trust Limited, Levindra Trust Limited, Hindlever Trust Limited and Hindustan Unilever Foundation which were non-profit making organisations
ii) Converted into Indian Rupees at the Exchange rate INR 1 = 1.6 Nepalese Rupees
Sanjiv Mehta Managing Director and CEO Sridhar Ramamurthy Executive Director(Finance & IT) and CFO
Aditya Narayan Chairman - Audit Committee
Ritesh Tiwari Group Controller Dev Bajpai Executive DirectorLegal and CompanySecretary
Mumbai : 28th April, 2014
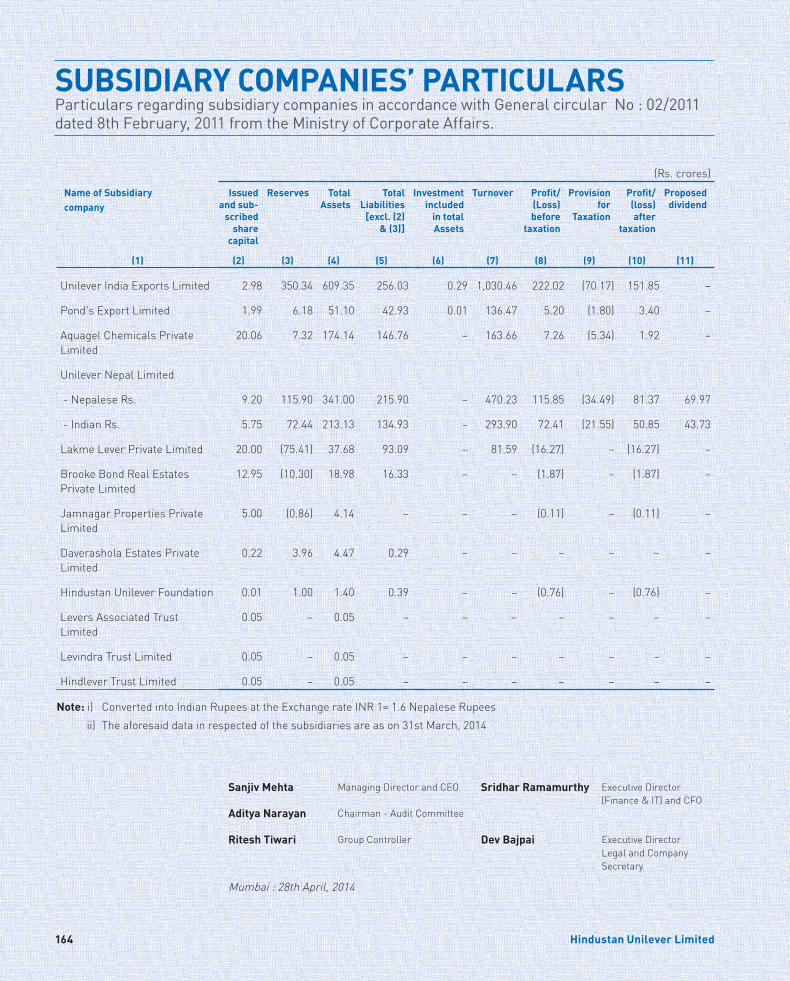
164 Hindustan Unilever Limited
SUBSIDIARY COMPANIES’ PARTICULARSParticulars regarding subsidiary companies in accordance with General circular No : 02/2011 dated 8th February, 2011 from the Ministry of Corporate Affairs.
(Rs. crores)Name of Subsidiary company
Issued and sub-
scribed share
capital
Reserves Total Assets
Total Liabilities
[excl. (2) & (3)]
Investment included
in total Assets
Turnover Profit/ (Loss) before
taxation
Provision for
Taxation
Profit/ (loss) after
taxation
Proposed dividend
(1) (2) (3) (4) (5) (6) (7) (8) (9) (10) (11)
Unilever India Exports Limited 2.98 350.34 609.35 256.03 0.29 1,030.46 222.02 (70.17) 151.85 –
Pond's Export Limited 1.99 6.18 51.10 42.93 0.01 136.47 5.20 (1.80) 3.40 –
Aquagel Chemicals Private Limited
20.06 7.32 174.14 146.76 – 163.66 7.26 (5.34) 1.92 –
Unilever Nepal Limited
- Nepalese Rs. 9.20 115.90 341.00 215.90 – 470.23 115.85 (34.49) 81.37 69.97
- Indian Rs. 5.75 72.44 213.13 134.93 – 293.90 72.41 (21.55) 50.85 43.73
Lakme Lever Private Limited 20.00 (75.41) 37.68 93.09 – 81.59 (16.27) – (16.27) –
Brooke Bond Real Estates Private Limited
12.95 (10.30) 18.98 16.33 – – (1.87) – (1.87) –
Jamnagar Properties Private Limited
5.00 (0.86) 4.14 – – – (0.11) – (0.11) –
Daverashola Estates Private Limited
0.22 3.96 4.47 0.29 – – – – – –
Hindustan Unilever Foundation 0.01 1.00 1.40 0.39 – – (0.76) – (0.76) –
Levers Associated Trust Limited
0.05 – 0.05 – – – – – – –
Levindra Trust Limited 0.05 – 0.05 – – – – – – –
Hindlever Trust Limited 0.05 – 0.05 – – – – – – –
Note: i) Converted into Indian Rupees at the Exchange rate INR 1= 1.6 Nepalese Rupees ii) The aforesaid data in respected of the subsidiaries are as on 31st March, 2014
Sanjiv Mehta Managing Director and CEO Sridhar Ramamurthy Executive Director(Finance & IT) and CFO
Aditya Narayan Chairman - Audit Committee
Ritesh Tiwari Group Controller Dev Bajpai Executive DirectorLegal and CompanySecretary
Mumbai : 28th April, 2014
Overview Financial Statements Shareholder InformationReports
Consolidated 165Annual Report 2013-14
Overview Financial Statements Shareholder InformationReports
In order to serve you better and prevent risks associated with dealing in securities, we request you to follow the general safeguards as detailed hereunder:
Demat / Exchange
To avail the benefits of holding shares in demat form, Members are requested to convert their physical holdings to demat / electronic form through a Depository Participant (DP) of their choice. Holding securities in demat form helps investors to get immediate transfer of securities, without payment of stamp duty. The Company also offers help to its Members to demat their physical shares. Share certificates of face value of Rs. 10/- are no longer tradeable in the market and will not be accepted by the DPs for demat. Members who still hold Share Certificates with a face value of Rs. 10/- each are therefore requested to forward the same to M/s. Karvy Computershare Private Limited (the Registrar), along with a request letter signed by all the holders for exchange of Share Certificate(s). The exchanged Share Certificate(s) of face value of Re. 1/- will help you to demat your shares expeditiously.
Registration of Nomination and NECS Mandate
Members holding shares in physical form are requested to register Nomination in their folio(s) by sending duly completed Nomination Form to the Registrar / Investor Service Department of the Company. Members who have not registered their NECS Mandate are requested to send their NECS Mandate Form to the Registrar / Investor Service Department of the Company or to their DP, as the case may be. For any change in bank particulars either due to banker having migrated their operations to core banking solutions or merged with another bank, Members are requested to register a fresh NECS Mandate with the revised bank particulars.
Unclaimed Dividend
Members having unclaimed dividends are requested to send their requests to the Registrar / Investor Service Department of the Company for issuance of fresh Demand Drafts. To ensure maximum disbursement of unclaimed dividends, the Company also sends reminders to the relevant Investors, before transfer of dividends to Investor Education and Protection Fund (IEPF).
E-Communication
To receive Company related information and communication promptly, Members are requested to register / update their e-mail addresses with the Company by sending duly completed E-Communication Registration Form, which is available at the end of this Annual Report. Members who hold shares in demat form can request their DP to update the e-mail address in their records. The Companies Act, 2013 and Rules framed thereunder governing e-communication have been notified and the Company shall be sending notice, documents, financial statements, etc. through electronic mode to the Members who have provided their email address to the Company or Depository Participants. Members may send request for hard copy of such notices, documents, financial statements, etc. to the Registrar / Investor Service Department of the Company.
Consolidation of Multiple Folios
Members are requested to consolidate their shareholdings under multiple folios, to save themselves from the burden of receiving multiple communications as also to facilitate one point tracking of all corporate benefits on their shares.
PAN Requirement for Transfer of Shares in Physical Form
SEBI has mandated submission of Permanent Account Number (PAN) for securities market transactions and off market / private transactions involving transfer of shares of listed companies in physical form. Therefore, it shall be mandatory for the transferee(s) to furnish a copy of their PAN card to the Registrar / Investor Service Department of the Company for registration of such transfers. Members / Investors are, therefore, requested to take note of the same and submit their PAN card copy to the Registrar / Investor Service Department of the Company.
General Safeguards
• Please send Share Certificate(s) and high value dividend warrants / cheques / demand drafts by registered post or courier so as to avoid loss of document in transit.
• Exercise due diligence and notify any change in address, stay abroad or demise of any shareholder as soon as possible to the Company or DP, as the case may be.
• Deal only with SEBI registered intermediaries and obtain a valid Contract Note / Confirmation Memo from the broker / sub-broker, within 24 hours of execution of the trade.
• Do not disclose your Folio Nos. / DP ID and Client ID to any unknown person.
• Do not hand over signed blank transfer deeds, delivery instruction slips to any unknown person.
• Do not leave your demat account dormant for long.
• Obtain periodic statement of holdings from the concerned DP and verify the holdings periodically.
Hindustan Unilever LimitedUnilever House, B. D. Sawant MargChakala, Andheri (East)Mumbai - 400 099.Phone : +91 - 22 – 39832285 / 32452Fax : +91 - 22 - 28249457E-mail : [email protected] : www.hul.co.in
Unit : Hindustan Unilever LimitedPlot No. 17 to 24, Vittal Rao Nagar, MadhapurHyderabad - 500 081.Phone : +91 - 40 - 23420815 - 824Fax : +91 - 40 - 23420814E-mail : [email protected] / [email protected] : www.karvy.com
For further information on Investor Safeguards, Frequently Asked Questions and Related Forms, please visit the ‘Investor Centre’ page on the website of the Company www.hul.co.in.
KARVY COMPUTERSHARE PRIVATE LIMITEDINVESTOR SERVICE DEPARTMENT
INVESTOR SAFEGUARDS
Investor Safeguards 165Annual Report 2013-14
Corporate Information166 Hindustan Unilever Limited
CORPORATE INFORMATION
REGISTERED OFFICE
Unilever House, B. D. Sawant Marg, Chakala, Andheri (East), Mumbai – 400 099.
BANKERS
SOLICITORS
Crawford Bayley & Co., Mumbai
AUDITORS
Lovelock & Lewes, Mumbai
Bank of AmericaBank of BarodaBank of IndiaCitibank N.A.Deutsché BankHDFC Bank
Hongkong & Shanghai Banking CorporationICICI Bank Indian BankPunjab National BankRoyal Bank of Scotland Standard Chartered Bank
State Bank of HyderabadState Bank of IndiaSyndicate BankUnion Bank of India
PLANT LOCATIONS
NORTHERN REGIONBAROTIWALAKhasra No. 94-96, 355-409, Village Balyana, Barotiwala IA, Tehsil Kasauli, District Solan - 174 103, Himachal Pradesh
NALAGARH• Hudbust No. 143, Khasra No. 182 / 183 / 187/1, Village
Kiralpur, Near Nalagarh Fire Station, Tehsil - Nalagarh, District Solan - 174 101, Himachal Pradesh
• Khasra No. 1350 – 1318, Bhatoli Kalan, Hill Top Industrial Area, Jharmajri, Tehsil Nalagarh, District Solan - 173 295, Himachal Pradesh
HARIDWARPlot No. 1, Sector 1A, Integrated Industrial Estate, Ranipur, Haridwar - 249 403, Uttarakhand
RAJPURAA-5, Phase ll-B, Focal Point, Rajpura - 140 401, Punjab
ETAH G. T. Road, Etah – 207 001, Uttar Pradesh
ORAIA-1, UPSIDC Industrial Area, Orai, District, Jalaun - 285 001, Uttar PradeshSUMERPURA-1, UPSIDC Industrial Area, Bharua, Sumerpur, Hamirpur - 210 502, Uttar Pradesh
EASTERN REGIONTINSUKIADag No. 21 of 122 FS Grants, Mouza - Tingrai, Off NH No. 37, Doom Dooma Industrial Estate, District Tinsukia - 786 151, Assam
HALDIAPO Durgachak, Haldia - 721 602, Midnapore, West Bengal
KOLKATA• 1, Transport Depot Road, Kolkata - 700 088, West Bengal• 63, Garden Reach, Kolkata - 700 024, West Bengal• P10 Taratola Road, Kolkata - 700 088, West Bengal
Corporate Information 167
PLANT LOCATIONS (CONTD.)
WESTERN REGIONKHAMGAONC-9, MIDC, Khamgaon, District Buldhana - 444 303, Maharashtra
CHIPLUNB-7/17, Lote Parshuram MIDC, Khed Taluka, District Ratnagiri, Chiplun – 415 722, Maharashtra
MUMBAIAarey Milk Colony, Goregaon, Mumbai – 400 065, Maharashtra
NASIKPlot No. A-8/9, MIDC, Malegaon, Sinnar - 422 103, Nasik Maharashtra
SILVASSA• Survey No.151/1/1, Village Dapada, Khanvel Road,
Silvassa - 396 230, Dadra and Nagar Havelli• Survey No.907, Kilwali Road, Amli Village, Near
Gandhidham Bus Stop, Silvassa - 396 230, Dadra and Nagar Havelli
GOAPlot Nos. 128 - 139 & 324 - 326, Kundaim Industrial Estate, Kundaim – 403 115, Goa
CHHINDWARA5/6 KM Stone, Narsinghpur Road, Lehgadua, Chhindwara - 480 002, Madhya Pradesh
SOUTHERN REGIONBANGALORESuburb Stage-II, Yashwantpur, Bangalore – 560 022, Karnataka
COCHIN• Ernakulam North PO, Tatapuram, Cochin - 682 014,
Kerala• Edapally, Cochin – 682 024, Kerala
HOSURPlot No.50 & 51, SIPCOT Industrial Complex, Hosur - 635 126, Tamilnadu
HYDERABADUppal Kalan, Hyderabad – 500 039, Andhra Pradesh
CHENNAIC.P.T. Campus, Tharamani, Chennai – 600 113, Tamilnadu
MANGALORESultan Battery Road, Boloor, Mangalore – 575 003, Karnataka
MYSOREPlot No. 424, Hebbal Industrial Area, Mysore – 570 016, Karnataka
PONDICHERRY• Off NH 45A, Vadamangalam, Pondicherry - 605 102• No. 3, Cuddalore Main Road, Kirumambakkam,
Pondicherry – 605 702.
Overview Financial Statements Shareholder InformationReports
Annual Report 2013-14

NOTES

169
NOTES

NOTES
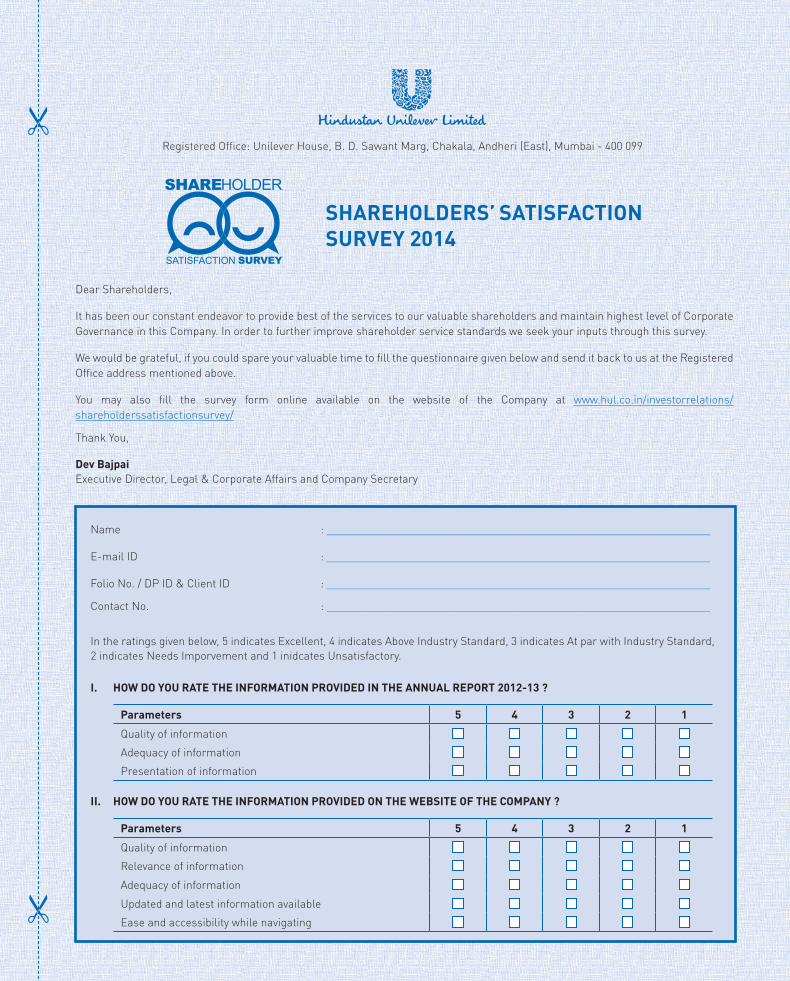
Dear Shareholders,
It has been our constant endeavor to provide best of the services to our valuable shareholders and maintain highest level of Corporate Governance in this Company. In order to further improve shareholder service standards we seek your inputs through this survey.
We would be grateful, if you could spare your valuable time to fill the questionnaire given below and send it back to us at the Registered Office address mentioned above.
You may also fill the survey form online available on the website of the Company at www.hul.co.in/investorrelations/shareholderssatisfactionsurvey/
Thank You,
Dev BajpaiExecutive Director, Legal & Corporate Affairs and Company Secretary
Name : __________________________________________________________________
E-mail ID : __________________________________________________________________
Folio No. / DP ID & Client ID : __________________________________________________________________
Contact No. : __________________________________________________________________
In the ratings given below, 5 indicates Excellent, 4 indicates Above Industry Standard, 3 indicates At par with Industry Standard, 2 indicates Needs Imporvement and 1 inidcates Unsatisfactory.
I. HOW DO YOU RATE THE INFORMATION PROVIDED IN THE ANNUAL REPORT 2012-13 ?
Parameters 5 4 3 2 1
Quality of informationAdequacy of informationPresentation of information
II. HOW DO YOU RATE THE INFORMATION PROVIDED ON THE WEBSITE OF THE COMPANY ?
Parameters 5 4 3 2 1
Quality of information Relevance of informationAdequacy of informationUpdated and latest information available Ease and accessibility while navigating
Registered Office: Unilever House, B. D. Sawant Marg, Chakala, Andheri (East), Mumbai - 400 099
SHAREHOLDERS’ SATISFACTIONSURVEY 2014
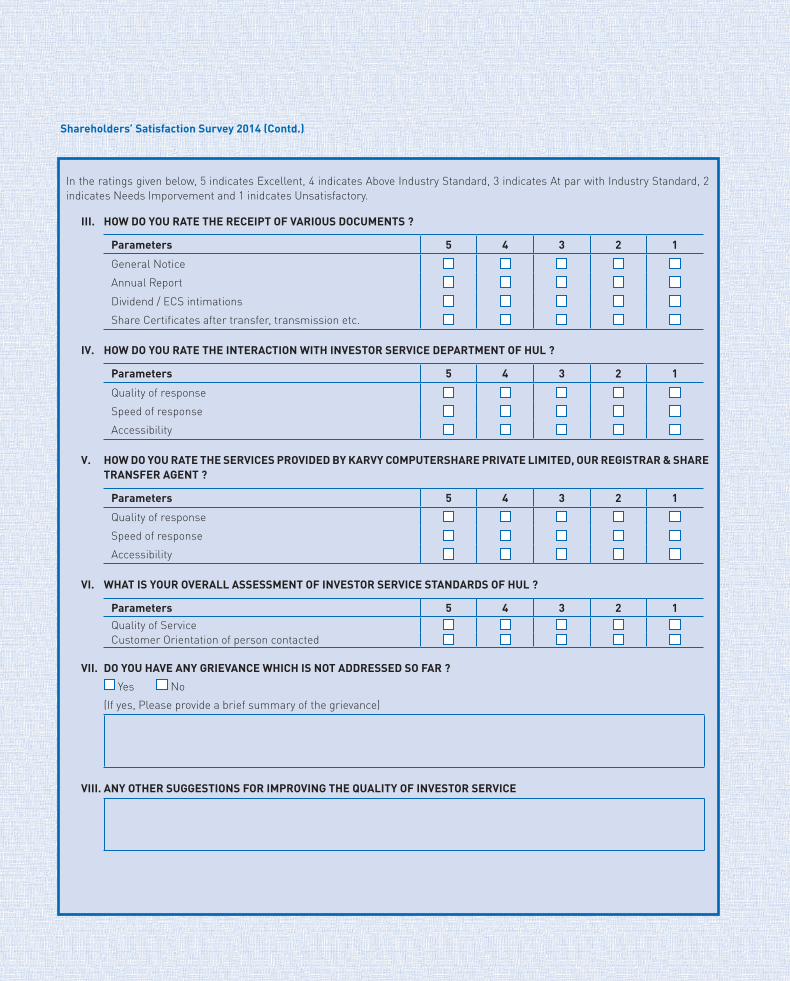
Shareholders’ Satisfaction Survey 2014 (Contd.)
In the ratings given below, 5 indicates Excellent, 4 indicates Above Industry Standard, 3 indicates At par with Industry Standard, 2 indicates Needs Imporvement and 1 inidcates Unsatisfactory.
III. HOW DO YOU RATE THE RECEIPT OF VARIOUS DOCUMENTS ?
Parameters 5 4 3 2 1
General NoticeAnnual ReportDividend / ECS intimationsShare Certificates after transfer, transmission etc.
IV. HOW DO YOU RATE THE INTERACTION WITH INVESTOR SERVICE DEPARTMENT OF HUL ?
Parameters 5 4 3 2 1
Quality of responseSpeed of response Accessibility
V. HOW DO YOU RATE THE SERVICES PROVIDED BY KARVY COMPUTERSHARE PRIVATE LIMITED, OUR REGISTRAR & SHARE TRANSFER AGENT ?
Parameters 5 4 3 2 1
Quality of responseSpeed of response Accessibility
VI. WHAT IS YOUR OVERALL ASSESSMENT OF INVESTOR SERVICE STANDARDS OF HUL ?
Parameters 5 4 3 2 1Quality of Service Customer Orientation of person contacted
VII. DO YOU HAVE ANY GRIEVANCE WHICH IS NOT ADDRESSED SO FAR ?
Yes No(If yes, Please provide a brief summary of the grievance)
VIII. ANY OTHER SUGGESTIONS FOR IMPROVING THE QUALITY OF INVESTOR SERVICE
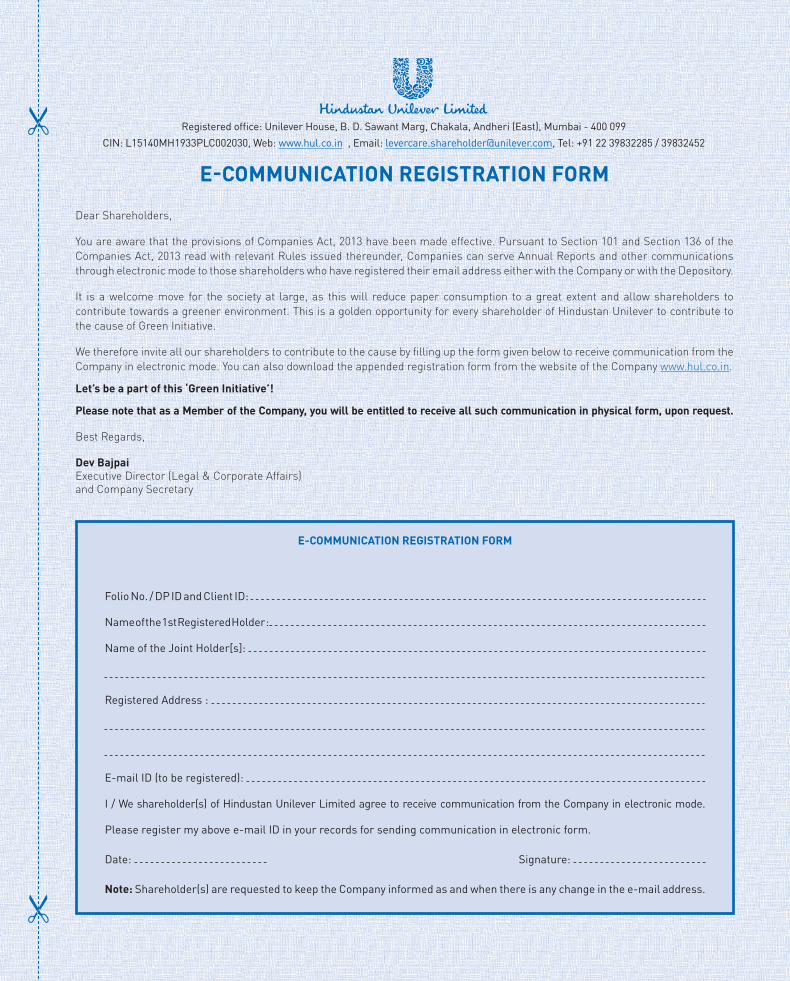
E-COMMUNICATION REGISTRATION FORM
Dear Shareholders,
You are aware that the provisions of Companies Act, 2013 have been made effective. Pursuant to Section 101 and Section 136 of the Companies Act, 2013 read with relevant Rules issued thereunder, Companies can serve Annual Reports and other communications through electronic mode to those shareholders who have registered their email address either with the Company or with the Depository.
It is a welcome move for the society at large, as this will reduce paper consumption to a great extent and allow shareholders to contribute towards a greener environment. This is a golden opportunity for every shareholder of Hindustan Unilever to contribute to the cause of Green Initiative.
We therefore invite all our shareholders to contribute to the cause by filling up the form given below to receive communication from the Company in electronic mode. You can also download the appended registration form from the website of the Company www.hul.co.in.
Let’s be a part of this ‘Green Initiative’!
Please note that as a Member of the Company, you will be entitled to receive all such communication in physical form, upon request.
Best Regards,
Dev BajpaiExecutive Director (Legal & Corporate Affairs) and Company Secretary
E-COMMUNICATION REGISTRATION FORM
Folio No. / DP ID and Client ID:
Name of the 1st Registered Holder :
Name of the Joint Holder[s]:
Registered Address :
E-mail ID (to be registered):
I / We shareholder(s) of Hindustan Unilever Limited agree to receive communication from the Company in electronic mode.
Please register my above e-mail ID in your records for sending communication in electronic form.
Date: Signature:
Note: Shareholder(s) are requested to keep the Company informed as and when there is any change in the e-mail address.
Registered office: Unilever House, B. D. Sawant Marg, Chakala, Andheri (East), Mumbai - 400 099CIN: L15140MH1933PLC002030, Web: www.hul.co.in , Email: [email protected], Tel: +91 22 39832285 / 39832452

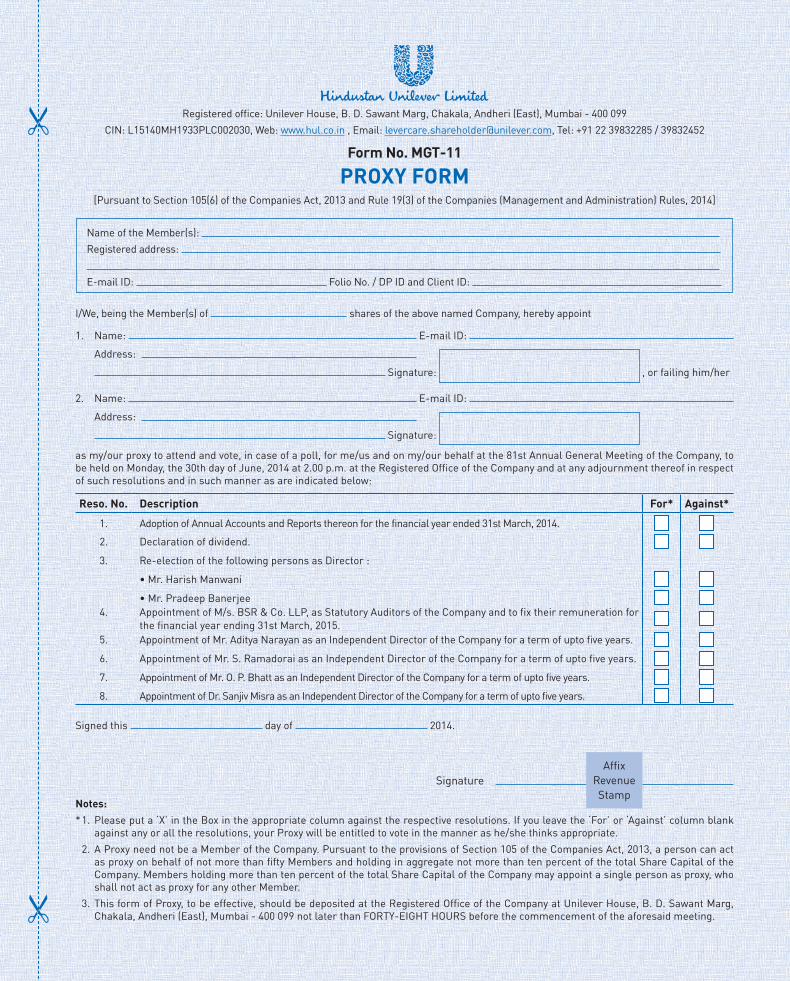
Name of the Member(s): Registered address:
E-mail ID: Folio No. / DP ID and Client ID:
I/We, being the Member(s) of shares of the above named Company, hereby appoint
1. Name: E-mail ID:
Address:
Signature: , or failing him/her
2. Name: E-mail ID:
Address:
Signature:
as my/our proxy to attend and vote, in case of a poll, for me/us and on my/our behalf at the 81st Annual General Meeting of the Company, to be held on Monday, the 30th day of June, 2014 at 2.00 p.m. at the Registered Office of the Company and at any adjournment thereof in respect of such resolutions and in such manner as are indicated below:
Reso. No. Description For* Against*
1. Adoption of Annual Accounts and Reports thereon for the financial year ended 31st March, 2014.2. Declaration of dividend.
3. Re-election of the following persons as Director :
• Mr. Harish Manwani
• Mr. Pradeep Banerjee4. Appointment of M/s. BSR & Co. LLP, as Statutory Auditors of the Company and to fix their remuneration for
the financial year ending 31st March, 2015.5. Appointment of Mr. Aditya Narayan as an Independent Director of the Company for a term of upto five years.
6. Appointment of Mr. S. Ramadorai as an Independent Director of the Company for a term of upto five years.
7. Appointment of Mr. O. P. Bhatt as an Independent Director of the Company for a term of upto five years.
8. Appointment of Dr. Sanjiv Misra as an Independent Director of the Company for a term of upto five years.
Signed this day of 2014.
Notes: * 1. Please put a ‘X’ in the Box in the appropriate column against the respective resolutions. If you leave the ‘For’ or ‘Against’ column blank
against any or all the resolutions, your Proxy will be entitled to vote in the manner as he/she thinks appropriate. 2. A Proxy need not be a Member of the Company. Pursuant to the provisions of Section 105 of the Companies Act, 2013, a person can act
as proxy on behalf of not more than fifty Members and holding in aggregate not more than ten percent of the total Share Capital of the Company. Members holding more than ten percent of the total Share Capital of the Company may appoint a single person as proxy, who shall not act as proxy for any other Member.
3. This form of Proxy, to be effective, should be deposited at the Registered Office of the Company at Unilever House, B. D. Sawant Marg, Chakala, Andheri (East), Mumbai - 400 099 not later than FORTY-EIGHT HOURS before the commencement of the aforesaid meeting.
Registered office: Unilever House, B. D. Sawant Marg, Chakala, Andheri (East), Mumbai - 400 099CIN: L15140MH1933PLC002030, Web: www.hul.co.in , Email: [email protected], Tel: +91 22 39832285 / 39832452
Form No. MGT-11
PROXY FORM[Pursuant to Section 105(6) of the Companies Act, 2013 and Rule 19(3) of the Companies (Management and Administration) Rules, 2014]
Signature Affix
RevenueStamp


OUR PURPOSE TO MAKE SUSTAINABLE LIVING COMMONPLACEWe work to create a better future every day, with brands and services that help people feel good, look good and get more out of life.
Our first priority is to our consumers – then customers, employees, suppliers and communities. When we fulfil our responsibilities to them, we believe that our shareholders will be rewarded.
Unilever Sustainable Living Plan (USLP)Our Annual Report 2013-14 is complemented by the Business Responsibility Report and also the online Unilever Sustainable Living Report - India 2013 Progress Report published in April 2014. This details performance against our USLP targets for the period 1 January to 31 December 2013 except where indicated otherwise. The online report carries a wealth of information on our approach to running a responsible business. See www.hul.co.in/sustainable-living-2014/
PROJECT SUNLIGHT:HELPING TO CREATEA BRIGHTER FUTUREWe believe there has never been a better time to create a brighter future for our children. A world where no child goes to bed hungry, where every home has clean drinking water and where preventable diseases become a thing of the past. Project Sunlight brings together the work of our brands to help as many people as possible take small sustainable steps that add up to building a world where everyone lives well and within the natural limits of the planet.
Get involved at:www.projectsunlight.co.in
Produced by Hindustan Unilever Limited.Creative Consultants: AICL Communications Limited ([email protected])Printed at HT Burda Media Limited.
Hindustan U
nilever Limited
Annual Report 2013-14
ANNUAL REPORT 2013-14
MAKING SUSTAINABLE LIVING COMMONPLACE
HINDUSTAN UNILEVER LIMITEDRegistered Office:Unilever House,B. D. Sawant Marg, Chakala,Andheri (East),Mumbai - 400 099
CIN : L15140MH1933PLC002030
HUL INVESTOR RELATIONS APPScan the code given below to download the HUL Investor Relations App for iOS and Android
WWW.HUL.CO.IN