high school home economics studentsâ•Ž perceptions of subject
TRANSCRIPT
University of Nebraska - Lincoln University of Nebraska - Lincoln
DigitalCommons@University of Nebraska - Lincoln DigitalCommons@University of Nebraska - Lincoln
Theses, Dissertations, & Student Scholarship: Agricultural Leadership, Education & Communication Department
Agricultural Leadership, Education & Communication Department
Spring 5-1989
High School Home Economics Students’ Perceptions of Subject High School Home Economics Students’ Perceptions of Subject
Matter Needs in Home Economics Curriculum Matter Needs in Home Economics Curriculum
Dixie J. Torres
Follow this and additional works at: https://digitalcommons.unl.edu/aglecdiss
Part of the Other Public Affairs, Public Policy and Public Administration Commons
Torres, Dixie J., "High School Home Economics Students’ Perceptions of Subject Matter Needs in Home Economics Curriculum" (1989). Theses, Dissertations, & Student Scholarship: Agricultural Leadership, Education & Communication Department. 74. https://digitalcommons.unl.edu/aglecdiss/74
This Article is brought to you for free and open access by the Agricultural Leadership, Education & Communication Department at DigitalCommons@University of Nebraska - Lincoln. It has been accepted for inclusion in Theses, Dissertations, & Student Scholarship: Agricultural Leadership, Education & Communication Department by an authorized administrator of DigitalCommons@University of Nebraska - Lincoln.
1 I
1
1
"' , I
~
~
I -.J
.~
I J
., ,
-!
i J
j -.J
r .~
J '~
i .~
] -. . J
]
'1 J
The
HIGH SCHOOL HOME ECONOMICS STUDENTS'
PERCEPrIONS OF SUBJECT MATTER NEEDS
IN HOME ECONOMICS CURRICULUM
Dixie J. Torres
A THESIS
Presented to the Faculty of
Graduate College in the University of Nebraska
In Partial Fulfillment of Requirements
For the Degree of Master of Science
Major: Interdepartmental Area of Home Economics
Under the Supervision of Julie M. Johnson
Lincoln, Nebraska
May, 1989
J J J J J J
J ]
]
J
J
]
]
J J ]
J "]
]
HIGH SCHOOL HOME ECONOMICS STUDENTS'
PERCEPTIONS OF SUBJECT MATTER NEEDS
IN HOME ECONOMICS CURRICULUM
Dixie Jane Torres, M.S.
University of Nebraska, 1989
Adviser: Julie M. Johnson
The purpose of this research was to identify subject
matter areas and specific concepts in home economics which
senior high school home economics students consider
important. Comparisons were first made between students'
perceptions and the perceptions of parents, both
economically disadvantaged and non-economically
disadvantaged. In addition, comparisons were made between
students' perceptions of subject matter and specific
concepts needed and what home economics teachers perceive
is emphasized in their teaching.
Questionnaires were mailed to home economics teachers
in 22 schools from the six class sizes of schools in
economically depressed Nebraska counties. The
questionnaire was completed by 174 home economics
students. Respondents were asked to indicate the extent
to which 136 concepts in eight subject matter areas were
important for students.
Data were analyzed using frequencies, means, analysis
of variance, and £ tests, with Tukey-(HSD) follow-up
procedures. Significant differences (~<.05) among
J .J
J J
J
J
.J
. J
J J J J
] 1 ~
students of various school sizes existed between Class A
and Class C schools in the subject matter areas of Child
Development/ Parenting and Basic Employability. Overall
conceptual means of subject matter areas indicated that
students perceived Child Development/Parenting, Basic
Employability, and Family Relationships to be most
important to students. Management and Other Processes,
Housing/Home Furnishings, Consumer Education, Food and
Nutrition, and Clothing and Textiles followed in order of
importance for students .
These data were compared with data from Johnson's
(1986) study of parents' and data from Vance's (1987)
study of home economics teachers. Significant differences
at the ~<.05 level were found to exist between students
and all other groups in the subject matter area of
Management and other Processes. Six of the remaining
subject matter areas showed significant differences
between students and one or more of the other groups.
Significant differences between students and one or both
groups of parents were found in 89 (65%) of the 136
concepts. Differences between students and teachers
occurred in 82 (60%) of the concepts. Teachers,
educators and curriculum developers should evaluate
curriculum content by considering the perceptions of all
groups to better meet the needs of students.
J J l
J ]
]
]
]
]
J
J J J ]
J
l
TABLE OF CONTENTS
CHAPTER
I. INTRODUCTION
Statement of the 'Problem Research Questions Definition of Terms Purpose of Study Assumptions . Delimitations . Limitations .. Significance of the Study
II. REVIEW OF LITERATURE
Societal Conditions Reflected in Curriculum Reform .............. .
Participatory Decision Making Roles in Curriculum Design ...
Home Economics Curriculum Changes in Response to Societal Conditions and
Participatory Decision Making . . . Home Economics Curriculum Reform Home Economics Addresses Needs of Youth Student Participation in Home Economics
Curriculum
Summary
III. DESIGN OF STUDY
Null Hypotheses Null Hypotheses la Null Hypotheses Ib Null Hypotheses 2a Null Hypotheses 2b Null Hypotheses 3
Population . . . Selection of Sample and Procedures for
Collecting Data .
Design of the Instrument Nebraska Home Economics
Instrument . . . . . Needs Assessment . . . . . . . .
Instrument for Home Economics Teachers' Perceptions of What Is Taught
Instrument for this Study . Procedure for Collecting Data Analysis of Data ..... .
PAGE
1
4 5 6 8 8 9
10 10
12
12
15
19 19 17
23
25
27
29 29 29 29 30 30 30
31
32
32
33 34 35 35
J J ]
J ]
J J ]
]
]
]
]
]
]
J J J ]
]
IV. FINDINGS . . . . . . . . . . . . . . Characteristics of High School Home
Economics Students ......... . Students' Perceptions of Curriculum Content
Differences among students' perceptions Perceptions of subject matter areas Perceptions of students and
parents--Specific Concepts Child Development and Parenting Basic Employability Skills Family Relationships . . . . . Management and Other Processes Housing and Home Furnishings Consumer Education Foods and Nutrition ..... Clothing and Textiles . . . .
Differences between students and teachers Child Development and Parenting Basic Employability Skills Family Relationships . . . . . Management and Other Processes Housing and Home Furnishings Consumer Education Food and Nutrition .... Clothing and Textiles . . .
Students' Perceptions of Amount Teachers Consider Students' Ideas
Summary . . . . . . .
V. SUMMARY, CONCLUSIONS, AND RECOMMENDATIONS
Summary . . . . . . Purpose of Study
Research Questions Procedures ... Findings from Descriptive Statistical
Analysis ........... . Findings from Analysis of Variance Findings from ~ Test . . . Students' Perceptions of Amount Teachers
Consider Students' Ideas Conclusions and Discussion
Characteristics of Students Curriculum Content ...
Subject matter areas Concepts within subject matter areas
Perceptions of Amount Teachers Consider Students Ideas
Recommendations .
37
37 38 41 43
49 49 51 54 56 58 60 62 65 67 68 68 70 73 75 77 79 81
83
85
88
87 92
93 94
96 97
101
102 102 103 103 104 107
116 117
;J II]
--] '-J '-J f
J r r] r] r] IJ ']
I ~]
J
J
] I
I - ... ~
Specific Curriculum Recommendations . Recommendations for Other Educators . Recommendations for Further Research
REFERENCES
APPENDICES
APPENDIX A - Initial Cover Letters A-I Letter to Teachers in One-Teacher
Departments " . A-2 Letter to Teachers
Departments A-3 Return Postcard
in Two-Teacher
APPENDIX B - List of Participating Schools
APPENDIX C - Questionnaire .
APPENDIX D - Information for Teachers D-l Cover Letter . . . .
D-2 Directions to Teachers for Administering Questionnaire
APPENDIX E - Follow-Up Postcards E-l Post Card 1 E-2 Post Card 2
APPENDIX F - Computer Programs
APPENDIX G - Expanded Statistical Tables
Summaries of Analysis of Variance: G--l Subject Matter Areas/School Size G--2 Subject Matter Areas by Groups G--3 Child Development/Parenting G--4 Basic Employability .. . G--5 Family Relationships ... . G--6 Management and Other Processes G--7 Housing/Home Furnishings G--8 Consumer Education G--9 Food & Nutrition G-I0 Clothing & Textiles Summaries of ~ Test: G-ll Child Development/Parenting G-12 Basic Employability .... G-13 Family Relationships G-14 Management and Other Processes G-15 Housing/Home Furnishings G-16 Consumer Education G-17 Food & Nutrition G-18 Clothing & Textiles
117 121 122
123
126
127
128
129 130
131
133
142 143
144
146 147 148
149
151
152 153 154 155 156 157 158 159 160 161
162 163 164 165 166 167 168 169
J J 1 -J ]
]
]
]
-,
J
]
]
]
J J J
I
J
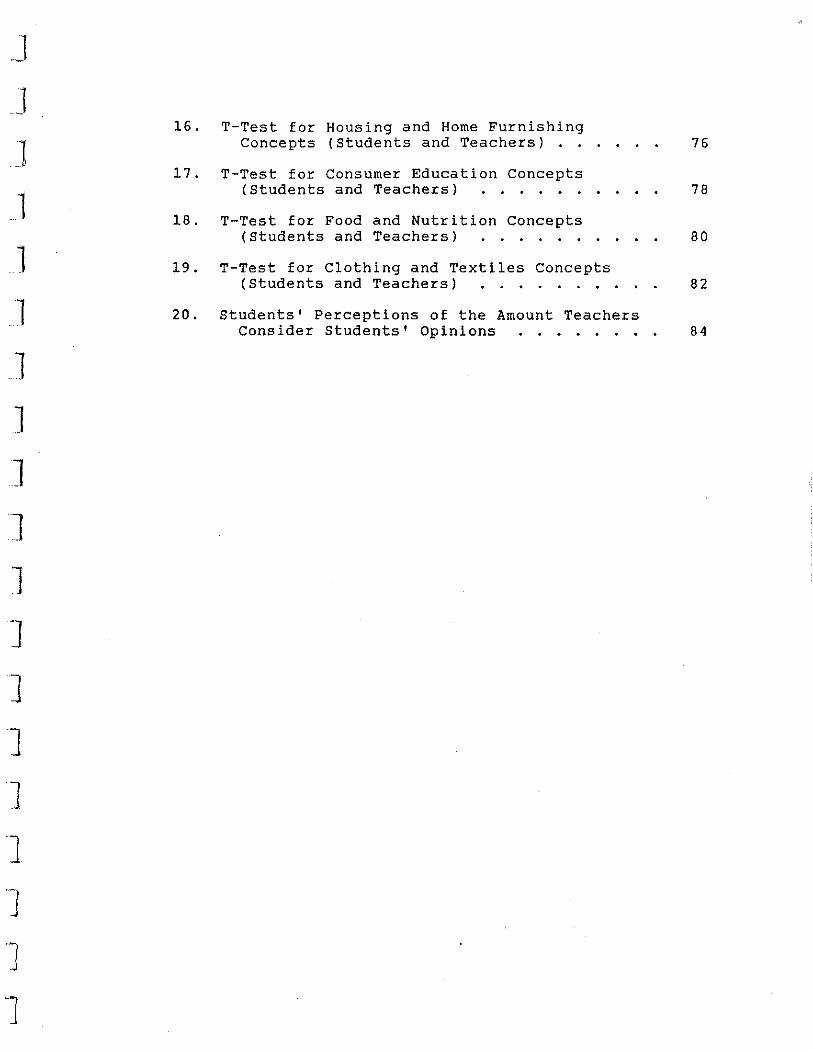
LIST OF TABLES
TABLE PAGE
1. School Sizes and Student Characteristics . .. 39
2. Summary of Analysis of Variance (ANOVA) Tests for Subject Matter Areas by School Size 42
3. Analysis of Variance (ANOVA) Tests for Subject Matter Areas by Groups . . . . . 46
4. Analysis of Variance (ANOVA) Tests for Child Development and Parenting Concepts by Groups 50
5. Analysis of Variance (ANOVA) Tests for Basic Employability Skills Concepts by Groups 52
6. Analysis of Variance (ANOVA) Tests for Family Relationships Concepts by Groups 55
7. Analysis of Variance (ANOVA) Tests for Management and Other Processes by Groups 57
8. Analysis of Variance (ANOVA) Tests for Housing and Horne Furnishings Concepts by Groups 59
9. Analysis of Variance (ANOVA) Tests for Consumer Education Concepts by Groups .. .... 61
10. Analysis of Variance (ANOVA) Tests for Food and Nutrition Concepts by Groups .. .... 63
11. Analysis of Variance (ANOVA) Tests for Clothing and Textiles Concepts by Groups 66
12. T-Test for Child Development and Parenting Concepts (Students and Teachers) . . . . 69
13. T-Test for Basic Employability Skills Concepts (Students and Teachers) .......... 71
14. T-Test for Family Relationships Concepts
15.
(Students and Teachers) ....... 72
T-Test for Management and Other Process Concepts (Students and Teachers) ... 74
J J J
]
1
J ]
]
]
]
]
]
]
]
J
J J
16.
17.
18.
T-Test for Housing and Home Furnishing Concepts (Students and Teachers) ..
T-Test for Consumer Education Concepts (Students and Teachers) ..... .
T-Test for Food and Nutrition Concepts (Students and Teachers) ..... .
19. T-Test for Clothing and Textiles Concepts (Students and Teachers) .....
20. Students' Perceptions of the Amount Teachers Consider Students' Opinions ...... .
76
78
80
82
84
J J J J J J J J J ,1
J ]
J J j
,1
J 1 J
ACKNOWLEDGEMENTS
It is difficult to acknowledge all who have made this
research project possible. However, I will mention those
individuals who were especially supportive throughout this
study.
First, a big thank you to my adviser, Dr. Julie M.
Johnson, who guided me through all the stages of organizing,
developing, writing and rewriting. Her expertise,
recommendations, and time shared have contributed to my
achieving a goal that had seemed impossible.
Secondly, I would like to thank the other two members
of my research committee, Melinda Holcombe and Dr. Roy
Dillon. The time given for reading the manuscript and
questioning methods as well as the encouragement to begin a
difficult task have been most helpful.
I also want to acknowledge numerous unnamed
individuals, teachers who gave their class time for
administering a survey and students who shared their
perceptions about home economics content. Their
participation was the most essential part of this study.
Finally, I want to thank my husband, Louis, and
daughter, Sheila. Their understanding and love was
constant.
Dixie J. Torres
J J
J J J J ]
]
]
]
J J J J ]
]
1
1
CHAPTER I
Introduction
School curriculum changes have been subject to debate
at times when societal conditions or technological
advancements have raised questions about how education
addresses the needs of youth. In 1983, the National
Commission on Excellence in Education reported on the
condition of public education in its report A Nation at
Risk. This report identified major learning gaps in the
areas of math, science, reading and writing. Further
supporting the Commission's findings were lower student
Scholastic Aptitude Test (SAT) scores, a knowledge
measurement used as a basis for entrance into many United
States colleges and universities. Specific curriculum
changes were quick to appear and could be seen by many as
the logical means for improving the deficiencies. Course
credits needed for high school graduation were increased in
response to college entrance requirements being made more
difficult. Computer literacy courses were added so young
people would be prepared to live in a technological society.
Additionally, state departments of education developed basic
skills competencies in reading, writing and computation.
Many would say that these curriculum changes have
improved the quality of learning; but others would disagree,
11.·. j
J J J ]
]
J ]
]
]
]
]
]
]
]
]
]
]
]
saying the curriculum changes give more emphasis to the
subject areas of science, math and computer science at the
expense of equally important subject areas like home
economics, agricultural science, and technical education.
One critic, Sava (1987), has said that making a curriculum
tougher does not maintain student enthusiasm for learning.
Instead, he believes that a smarter curriculum is needed to
take advantage of students' needs and interests and elicit
learning from those needs and interests.
Although students' needs and interests are a major
factor for developing curriculum in all subject areas,
there are other factors which are also important. Societal
conditions, cultural influences, and educational goals
ought to be evaluated as they specifically relate to
students' needs. According to Apple (1983), identifying
students' needs is the responsibility of all those
concerned:
students.
teachers, parents, concerned citizens, and even
Identifying the needs that each group perceives
important is the responsibility of researchers and/or
curriculum developers if curriculum is to be changed to
address all areas of need.
One subject that has been in a process of curriculum
2
change nationwide is home economics. Traditionally, home
economics has been a subject that addresses the needs of the
individual and the family within a society and its culture
1
J
1
1
1
J
J J ]
]
J ]
]
]
]
]
J 1:
l:
3
for an improved quality of life. This guiding principle has
not changed and probably will not change. However, as home
economics curriculum is developed in each state across the
nation, it must be made flexible enough so as to be adapted
to students' needs within a changing society.
Nebraska is one state which has been developing the
home economics curriculum to specifically meet the needs of
students. Identifying needs related to preparation for
employment is also a key aspect of the Carl D. Perkins
Vocational Education Act. Researchers have gathered data
about different groups' perceptions of students' needs in
home economics. Johnson (1986) identified significant
differences in parents' perceptions, both economically
disadvantaged and non-economically disadvantaged, of student
needs in home economics. Also, significant differences were
shown to exist in the perceptions social service
professionals had about student needs in home economics and
the perceptions of both economically disadvantaged parents
and non-economically disadvantaged parents.
Vance (1987) conducted a similar study about home
economics teachers' perceptions of what they emphasize in
their teaching. Significant differences were shown to exist
between home economics teachers' perceptions of what they
perceive is taught and the perceptions of economically
disadvantaged parents, non-economically disadvantaged
J J ,]
J J J ] ] ]
]
J ]
parents, and social service professionals about what home
economics students need to know.
Since there are significant differences in the
perceptions of parents, both economically disadvantaged and
non-economically disadvantaged, social services
professionals, and teachers, the question arises as to what
4
students themselves perceive their home economics curriculum
needs to be, especially since students' needs and interests
ought to be a factor in developing curriculum for a quality
education. Are the students' perceptions of their needs,
particularly in home economics, different from what parents'
perceive their needs to be? Do students' perceptions of
home economics curriculum needs differ from what home
economics teachers perceive as important content in their
teaching? These are questions asked by school
administrators, home economics curriculum developers, and
home economics teachers and educators.
Statement of Problem
The purpose of this research was to: (al identify
senior high school home economics students' perceptions of
curriculum needs in home economics subject matter areas,
(bl compare the perceptions of students from each of the six
school class sizes of home economics curriculum needs,
(cl compare students' perceptions with what economically
J J 5
J disadvantaged parents and non-economically disadvantaged
parents' perceive students should be taught, (d) compare
J students' perceptions with high school home economics
teachers' perceptions of subject matter areas they emphasize
in their teaching, and, (e) identify students' perceptions
J of the amount of participation they have in selecting
curriculum content.
Research Questions
J The following research questions were identified as a
J means to examine the problem:
la. What differences exist between senior high school
home economics students' perceptions of the importance of
subject matter areas in home economics curriculum and the
,] perceptions of parents, both economically disadvantaged and
non-economically disadvantaged?
lb. What differences exist between senior high school
home economics students' perceptions of the importance of
specific concepts within subject matter areas in home
<1 economics curriculum and the perceptions of parents, both
J economically disadvantaged and non-economically
disadvantaged?
J 2a. What differences exist in senior high school home
economics students' perceptions of the importance of subject
matter areas in home economics curriculum and those which
] high school home economics teachers perceive they teach?
-J-,J
.-
.-
., I
, J
J ]
]
]
l I t
I
6
2b. What differences exist between senior high school
home economics students' perceptions of the importance of
specific concepts within home economics curriculum and those
which high school home economics teachers perceive they
teach?
3. What amount of participation do senior high school
home economics students perceive they have in choosing the
home economics subject matter and specific concepts they can
learn?
4. What differences exist among senior high school
home economics students from different school sizes
regarding their perceptions of the home economics subject
matter they believe to be important?
Definition of Terms
1. Home Economics--A course for students in grades
seven through twelve that prepares them to be informed
consumers, homemakers and family members.
2. Subject matter areas--Specific content or courses
included in a home economics curriculum: Child Development
and Parenting, Basic Employability, Family Relationships,
Management and Other Processes, Housing and Home
Furnishings, Consumer Education, Food and Nutrition, and
Clothing and Textiles.
3. Concepts--Specific topics within the subject
matter areas.
J J J ']
l
4. Curriculum--A course of study for a particular
field.
5. Teachers--Home economics teachers in senior high
schools in Nebraska.
6. Economically disadvantaged parents--Parents of
Nebraska public school students who received Free and
Reduced School Lunch Meals in 1986.
7
7. Non-economically disadvantaged parents--Parents of
Nebraska public school students who did not receive Free and
Reduced School Lunch Meals in 1986.
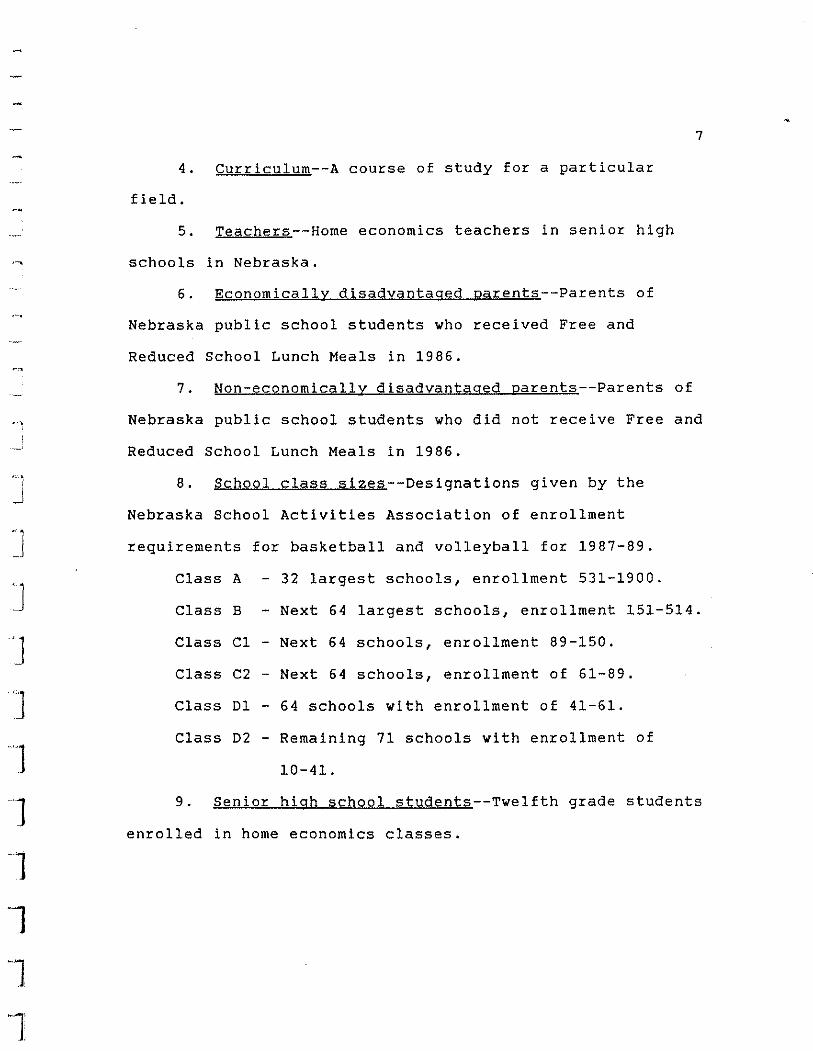
8. School class sizes--Oesignations given by the
Nebraska School Activities Association of enrollment
requirements for basketball and volleyball for 1987-89.
Class A - 32 largest schools, enrollment 531-1900.
Class B - Next 64 largest schools, enrollment 151-514.
Class Cl - Next 64 schools, enrollment 89-150.
Class C2 - Next 64 schools, enrollment of 61-89.
Class Dl - 64 schools with enrollment of 41-61.
Class 02 - Remaining 71 schools with enrollment of
10-41.
9. Senior high school students--Twelfth grade students
enrolled in home economics classes.
•
! I
d
8
Purpose of StudY
The specific objectives for this study will be:
1. To identify curriculum subject matter areas and
specific concepts in home economics which senior high school
students consider important.
2. To determine the differences between senior high
school students' perceptions of subject matter and specific
concepts needed in home economics curriculum and the needs
both economically disadvantaged and non-economically
disadvantaged parents perceive as important.
3. TD determine the differences between senior high
school students' perceptions of subject matter and specific
concepts needed in the home economics curriculum and what
home economics teachers perceive they teach.
4. To identify the extent of participation students
perceive they have in choosing the home economics subject
matter and specific concepts they learn.
Assumptions
For the purpose of this study, the following
assumptions are made:
1. The survey instrument used to measure concepts is
reliable and valid.
2. The procedures used to identify senior high school
home economics students are valid and provide a
J
9
representative sample of students from each of the six class
sizes of schools.
3. The students who completed the questionnaires
accurately recorded their perceptions.
4. Comparisons can be made between students',
parents', and teachers' perceptions of the importance of
home economics curriculum content.
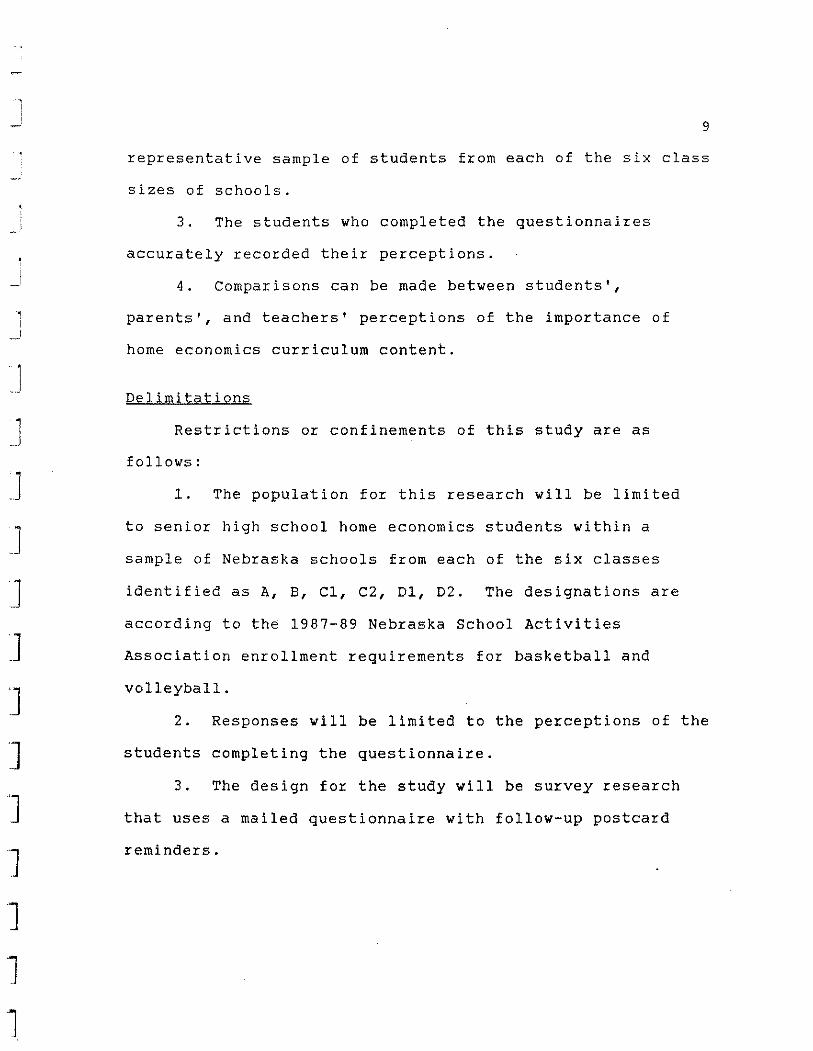
Delimitations
Restrictions or confinements of this study are as
follows:
1. The population for this research will be limited
to senior high school home economics students within a
sample of Nebraska schools from each of the six classes
identified as A, B, CI, C2, DI, D2. The designations are
according to the 1987-89 Nebraska School Activities
Association enrollment requirements for basketball and
volleyball.
2. Responses will be limited to the perceptions of the
students completing the questionnaire.
3. The design for the study will be survey research
that uses a mailed questionnaire with follow-up postcard
reminders.
J J J J
J J J ]
]
]
]
]
]
:1 ]
-]
-J
l l
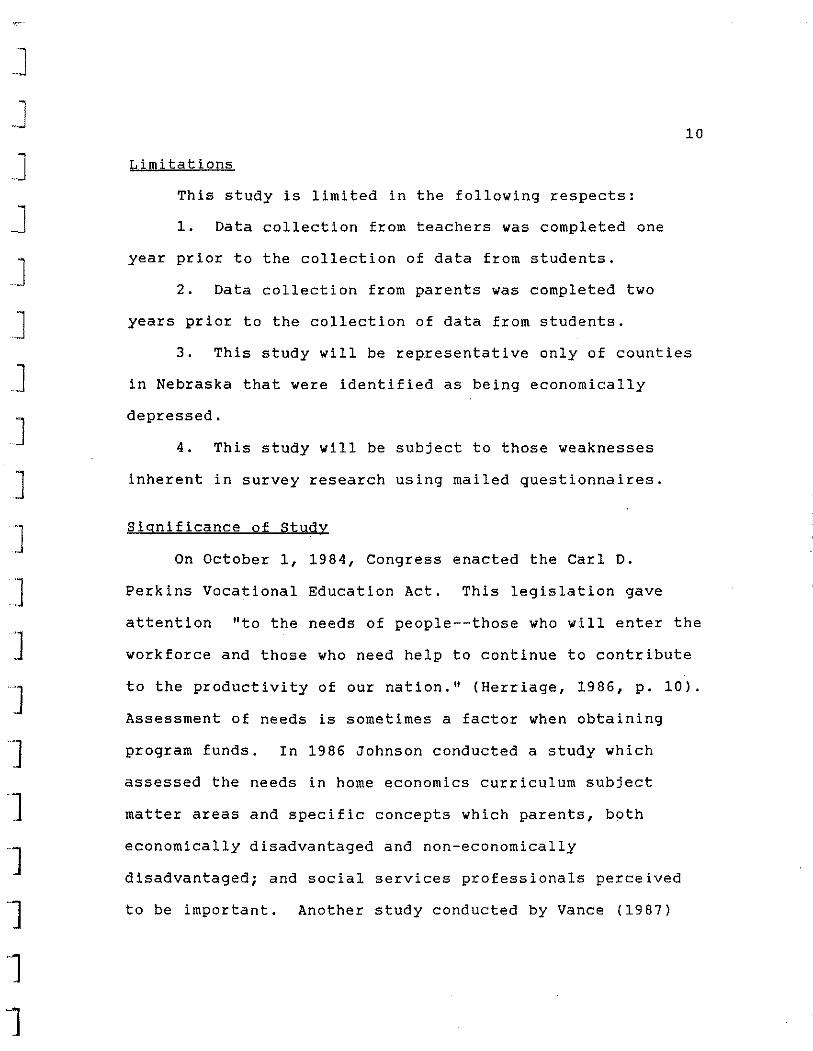
Limitations
This study is limited in the following respects:
1. Data collection from teachers was completed one
year prior to the collection of data from students.
2. Data collection from parents was completed two
years prior to the collection of data from students.
10
3. This study will be representative only of counties
in Nebraska that were identified as being economically
depressed.
4. This study will be subject to those weaknesses
inherent in survey research using mailed questionnaires.
Significance of Study
On October 1, 1984, Congress enacted the Carl D.
Perkins Vocational Education Act. This legislation gave
attention "to the needs of people--those who will enter the
workforce and those who need help to continue to contribute
to the productivity of our nation." (Herriage, 1986, p. 10).
Assessment of needs is sometimes a factor when obtaining
program funds. In 1986 Johnson conducted a study which
assessed the needs in home economics curriculum subject
matter areas and specific concepts which parents, both
economically disadvantaged and non-economically
disadvantaged; and social services professionals perceived
to be important. Another study conducted by Vance (1987)
11
assessed horne economics teachers' perceptions of subject
matter areas emphasized in their teaching.
This study will complete another aspect of the needs
assessment process--identifying students' perceptions of
horne economics curriculum subject matter and specific
concepts needed, comparing them with both economically
disadvantaged and non-economically disadvantaged parents'
perceptions, as well as teachers' perceptions of horne
economics curriculum subject matter and specific concepts
they emphasize in their teaching. Teachers will be able to
~
plan curriculum better when all groups' perceptions of needs
are known.
i .J
"l
• .J
"l
....
"l
J
]
]
]
]
]
J
"
i
]
J J J J ]
]
]
]
]
]
]
CHAPTER II
Review of Literature
The review of literature will present the curriculum
development issues in three sections: (1) societal
conditions reflected in curriculum reform; (2) participatory
decision making roles in curriculum design; (3) home
economics curriculum changes in response to societal
conditions and participatory decision making.
Societal Conditions Reflected in Curriculum Reform
Following the release of the report A Nation at Risk in
1983, politicians, school administrators and educators
evaluated what appeared to be ineffective and inefficient
learning systems. Researchers like Goodlad (1983) in a Place Called School and Boyer (1983) in Highschool agreed
with some of the findings in A Nation at Risk, but disagreed
with others. The curriculum developers responded quickly by
implementing changes in the subject requirements for math,
science, computer science, reading, and writing in the
belief that these reforms would raise student Scholastic
Aptitude (SAT) test scores. However, improved scores has
not been apparent. Critics of curriculum change say that
education is not being creative in its approach. The
school curriculum changes made have not focused on the root
"
J ]
13
] causes of learning problems. In addition, young people are
1 ill-prepared to cope with societal pressures demonstrated in
the increased incidence of teen pregnancy, teen alcoholism
and teen suicide.
One major school district, Anchorage, Alaska, has gone
] beyond the common reform of making courses harder. Keitz
(1987), Executive Director for Curriculum and Instruction, ! j reported on the rationale and methods used to prioritize
] specific skills of critical thinking, human relations,
personal and social skills in that district's curriculum.
] That district made this response as a result of changing
societal conditions in the aging population, family
J structures, economic bases and environmental conditions.
] Dator (1986) would expand these root causes which
curriculums should address to " ... the rapid technological
J development and diffusion, ... population changes,
... restructing of the global political economy ... " (p.2).
] The key to coping with these societal issues, according to
] Dator, would be to "actively and energetically cooperate
with others to work towards inventing and creating a true
] society of care." (p. 13).
Apple (1983) has complicated the societal change
] possibilities within which educators must be prepared to
interact. He refers to the conservative and extremist
1 religious groups who will try to eliminate anything
1 1
__ ,
" " i ~
--....) )
, , I
.,.il
i ...,.I:
]
,]
,]
]
]
]
]
]
14
un-American or having basic human value, identified by some
as "secular humanism." Further compounding these issues
will be business and organized labor putting on pressure for
teaching job-related skills. In an attempt to make
curriculum less oriented toward controversial issues, state
departments of education will standardize curriculum content
by adopting textbooks that are consistent with identified
goals. However, Apple emphasizes that no one group should
control curricular decisions, and continues his explanation
that: "In an interdependent society, the curriculum should
encourage cooperation and the testing of each individual's
ideas against those of others." (p. 325).
Another view expressed by Wagner (1987) shows that
educators have social responsibilities for educational
excellence. Two of these responsibilities would be
(1) " ... educate for informed citizenship" (p. 101), and
(2) "more deeply understand the interests, needs and
concerns of students." (p. 103). A primary goal for
education, then, would be to educate young people through a
democratic process as a means of preserving democracy.
Welsh (1986) would concur with Wagner's perspective as
he questions the intent of many types of reform to which
reference has already been made. He believes the most
creative and talented students are bored and indifferent
15
because they have not been adequately motivated. Welsh
characterizes the need for change in this way:
" We have to find ways to make schools more
exciting, useful and--yes--relevant to
young people. Otherwise schools will
continue to be of secondary importance ",-
in their lives. (p.57).
With societal conditions making adaptation more difficult
and curriculum critics saying that educational reforms have
not addressed the real problems, what are the solutions to
] the curriculum dilemma?
J Participatory Decision Making Roles in Curriculum Design
Curriculum development is an on-going process which
J seeks to initiate change in learning processes that will
make a more literate society. Politicians, business and
labor leaders, school administrators, and curriculum
developers all see themselves as significant participants in
the curriculum decision making process. The results of a
-] national curriculum developers survey conducted by Martin,
Saif, & Thiel (1987) reported that "at least two thirds of
the respondents thought that administrators, supervisors,
-] teachers, students, the board of education, parents, and
community representatives should be involved in curriculum
development." (p. 46).
]
According to the same study conducted by Martin, et.
al., all groups identified earlier have input into the
curriculum. The bar graph used in this study to show
amounts of specific groups' participation indicates four
degrees of participation: not at all, very little, some,
and heavily involved. Students are shown to have very
little participation in curriculum development. This
represents less involvement than parents and significantly
less than other groups. Even though districts support
16
parent participation, in actuality "Parents had little input
into the curriculum process in 88 percent of the districts."
(p. 47). In the majority of cases, as might be expected,
teachers had a significant role in curriculum development
and implementation. The findings in this research support
the ideas of'a majority of the authors referred to earlier
as to who should be involved in curriculum development. But
what seems surprising is that those people whose needs must
be addressed in any curriculum change are the ones who are
among the least involved in the curriculum decision making
processes. When only 12 percent of the districts surveyed
showed an active parent involvement and' an even less student
involvement, questions could be raised as to whether
education is accomplishing the social responsibility that
Wagner (1987) believed was necessary to preserve democracy--
, .
J J 'J
1 J J 1 1 a,',',',. ~
1I~'1' • ~\
17
an active involvement of all members concerned in a
democratic decision making process.
Murray (1986) describes the unique role of students as
"participatory democracy" which would accomplish the goal in
this way:
The first prerequisite for participating seems
to be the recognition that I have a unique claim,
a stake, a self-interest, and that having a claim
has intrinsic value, prior, separate and distinct
from my worth as a competent worker/achiever. If
that claim is perceived by me to be in jeopardy,
or under threat from others, I must be able to
count on and learn how to work a recognized
mechanism for protecting and/or promoting it.
(p.409).
Beyer (1988) would support this concept by saying that
"participatory democracy" would create a dialogue among
students and between students and teachers as to the form
and content of a common enterprise within which all groups
are actively engaged.
Another alternative to participatory democracy would
be an educational partnership described by Seeley (1984):
Therefore, we must redirect our attention,
make learning our primary goal, and recognize
the student - not the teacher or the school -
18
] is the prime producer of what we want. Once
we have done this, we will recognize that it
J is not simply more, or even better, services
J on which we should focus our reform efforts,
but rather the relationships between the
J services and the students. We will also see
that students relate to schools not as
J isolated individuals, but as members of
J families, peer groups, and communities.
Therefore, productive educational
] relationships must take into account the
variety of relationships that students
] experience. (p.386).
] The one over-arching theme in these concepts relates to
students having some responsibility for directing their
] learning to meet their needs. In Sava's (1987) view,
changes of this type would be "student-centered" rather than
"curriculum-centered." Consequently, students would be more
likely to accept ownership for their learning because the
curriculum is relevant to their needs and interests. The
additional benefit for society would be student
participation in a democratic process that preserves the
democracy overall.
.J
.J
J J J J J ]
]
J J J
2 J
J ~ I
1 ~.
Home Economics Curriculum Changes in Response to
Societal Conditions and Participatory Decision Making
19
By clarifying the relationship of student needs in a
curriculum and student participation in the curriculum
development process, attention can be given to a specific
subject area, namely home economics. A close examination of
these relationships as they pertain to home economics
curriculum development in Nebraska would provide credence to
maintaining and even strengthening that curriculum in all
schools. These relationships will be discussed in the
section which follows.
Home Economics Curriculum Reform
Following the release of A Nation at Risk report in
1983, many reforms were initiated in the subject areas that
had been identified as needing greater emphasis in the
curriculum. The subjects of math, science, and computer
science were made tougher and course requirements were
increased. School budgets were adjusted to allow these
subject areas funds for up-dating materials. As a result,
vocational education courses and fine arts were placed in a
vulnerable position. Home economics as a subject area is an
example. Many schools cut expenditures for specific courses
and, in some cases, eliminated the entire curriculum. This
was further complicated by the elimination of federal
funding for vocational programs.
J
J J
J
J ]
J J J J ]
]
"]
]
J J 1 ~.' ,..11
), ~ik
20
Consequently, home economics educators questioned their
own viability. Rather than giving in to the questioned need
for home economics programs, leaders in the field were
forced to re-examine their roots and the rationale for their
existence. Home economics professionals found direction in
the mission statement researched and developed by noted
educators Brown and Paolucci (1978):
The mission of Home Economics is to enable
families, both as individual units and generally
as a social institution, to build and maintain
systems of action which lead (1) to maturing in
individual self-formation and (2) to enlightened,
cooperative participation in the crit,ique and
formulation of social goals and means for
accomplishing them. (p. 46, 47)
Brown (1980) continued to research the historical
aspects of home economics and developed a philosophical base
from which home economics education should develop
curriculum. The focus of Brown's concept of what home
economics curriculum ought to be was directed toward
individual needs within the social system of the family.
Following Brown's publication establishing a curriculum
ba·se for home economics educat ion, the profess ion as a whole
developed a coalition statement in 1985, "A Quest for
Quality: Consumer and Homemaking Education in the 80's."
21
The emphasis again was directed at the subject matter areas
and the processes for learning them; namely, developing
attitudes whereby a person could make informed choices
within the family unit and within society as a whole.
Home Economics Addresses Needs of Youth
Home economics educators were spreading the message to
the nation. The content within home economics as a subject
could address the needs of youth in a changing society.
Jorgenson & Haley (1985) identified societal problems which
home economics education could address, specifically:
functional illiteracy, family abuse, adolescent pregnancy,
economic/social problems of changing family structures,
alcohol/drug abuse, ethnic diversity, and an aging
population.
Even though these issues need to be addressed broadly
in an entire school curriculum, home economics subject
matter areas are especially unique and suited to them. A
specific quotation from Jorgenson & Haley (1985) shows their
agreement:
Home economists can assist others in adapting
to change. As our political, social economic,
and technological systems change, home economists
are needed who will promote quality of life for
families and individuals. (p. 99).
, I
J
l "
J J J
.J :]
J J 1 --] t
J J J J J ]
22
Wilcosz (1986) has emphasized the uniqueness of
secondary home economics by referring to processes which
many home economics curriculum developers are
incorporating. She identifies the ideas as (1) recognizing
individual well-being within the home and family; (2)
developing self-forming persons; (3) reducing discepancies
between basic human goals and social/economic realities
which prevent their accomplishment; (4) using family action
systems to accomplish valued ends; and, (5) learning
critical thinking and practical reasoning skills that are
related to the family/human action systems. Additionally,
Wilcosz (1985) would stress how this ultimate goal of
schooling can partly be accomplished within the home
economics curriculum:
The GOAL of schooling needs to focus on
helping students develop a genuine concern
for the individual. Recognizing the shared
nature of most of our problems and entering
into mutually-enhancing, growth-producing
relations with others are necessary conditions
for the full development of critical mindedness.
Critical thought is thus enabled to move outward
into the realm of political action--an important
facet of living ethically and becoming genuinely
human. (p. 4).
J
J
J J
J J J J ]
J J ]
]
"]
]
]
OJ
J J
23
Dagenais (1987) would support this view of schooling as
it specifically relates to home economics:
Through our curricula we can expand our students
minds to provide them with the broader thinking
capacities that they need to make educated
decisions. We can and do adapt our curriculum
to meet the perennial problems of everyday life,
so our focus may change but our mission remains
the same. (p. 129).
It is evident, then that home economics curriculum can and
does address the needs of youth in relation to societal
conditions. But to what extent are those youth themselves
able to participate in the curriculum decision making
process with subject matter areas and the specific concepts
they perceive they need to know?
student Participation in Home Economics Curriculum
Spitze (1985) visited 190 home economics classrooms in
40 high schools in different parts of the nation. From her
observations of the strengths and weaknesses of specific
curriculums, she was prompted to make several
recommendations. Of importance here was that there ought to
be: "More active involvement of students--physically,
intellectually, and emotionally--in their own learning
activities." (p. 11). Riggers (1985) would voice a similar
-,
J
J J J J J J ]
]
] ~]
l ],
1 . ,i;;j-'
25
matter areas they emphasize in their teaching. Significant
differences existed when Johnson's and Vance's data were
analyzed. To date, no data has been collected to compare
with Johnson's and Vance's data regarding Nebraska senior
high school home economics students' perceptions of their
needs in home economics subject matter areas. Consequently,
the research for this study will complete another facet of
the home economics needs assessment process.
Summary
The review of literature has shown that meeting student
needs in school curriculum requires addressing the societal
conditions within which young people are now living and will
live in the future. One way for making curriculum more
effective is through a participatory decision making process
which involves all concerned people, including the board of
education, administrators, supervisors, teachers, students,
parents, and community representatives. Students who
participate in the curriculum decision making process will
become more responsible for their own learning and the goal
of education can be met more effectively.
Research by Johnson (1986) and Vance (1987) has shown
that differences exist as to what students need to know and
what is being emphasized in home economics subject matter
areas as perceived by parents, both economically
, ,
'1
]
:J
J J ]
]
]
J ~J
l l
26
disadvantaged and non-economically disadvantaged; social
service professionals; and home economics teachers. Further
research is needed to identify students' perceptions of what
their needs are in home economics subject matter areas.
J
1
J
:J
J ]
J J J ,
CHAPTER III
Design of Study
Several factors about the effectiveness of curriculum
have been established; specifically, (1) participatory
decision making which includes all concerned people -
teachers, curriculum developers, concerned citizens, parents
and students - is essential; (2) curriculum needs to address
issues of a changing society that focuses on needs which
young people find relevant; and, (3) participation in the
democratic process of school helps achieve the goal of
educating for citizenship in a democratic society.
Vance (1987) and Johnson (1986) have studied subject
matter areas considered important in the home economics
curriculum. Vance's study identified the subject matter
areas and specific concepts high school home economics
teachers perceive they emphasize in their teaching.
Johnson's study identified the importance of home economics
subject matter areas as perceived by social service
professionals and parents, both economically disadvantaged
and non-economically disadvantaged.
The present study was developed to identify senior high
school students' perceptions of curriculum subject matter
areas and specific concepts they consider important.
•
, .. J
J ]
]
]
]
]
]
]
]
J J J J '-' ..
28
The research questions to be addressed in this study were:
la. What differences exist between senior high school
home economics students' perceptions of the importance of
subject matter areas in home economics curriculum and the
perceptions of parents, both economically disadvantaged and
non-economically disadvantaged?
lb. What differences exist between senior high school
home economics students' perceptions of the importance of
specific concepts within subject matter areas in home
economics curriculum and the perceptions of parents, both
economically disadvantaged and non-economically
disadvantaged?
2a. What differences exist in senior high school home
economics students' perceptions of the importance of
subject matter areas in home economics curriculum and those
which high school home economics teachers perceive they
teach?
2b. What differences exist between senior high school
home economics students' perceptions of the importance of
specific concepts withiin home economics curriculum and
those which high school home economics feachers perceive
they teach?
3. What amount of participation do senior high
school home economics students perceive they have in
J
-J
-J -J J J ]
J
J ]
I
J
J J ] ~
J ~~
30
subject matter areas needed in home economics curriculum and
home economics teachers' perceptions of what they teach.
Null Hypothesis 2b. There are no significant
differences among senior high school home economics
students' perceptions of the importance of specific concepts
within subject matter areas in home economics curriculum and
home economics teachers' perceptions of what they teach.
Null Hypothesis 3. There are no significant
differences among the students' perceptions of the
importance of home economics ~ubject matter areas from each
of the different class sizes of schools.
Population
The population for this study was senior (twelfth
grade) students in home economics classes from Nebraska high
schools in disadvantaged counties. These counties,
based on the Nebraska state Department of Vocational
Education's classification of economically depressed
counties, were the same random sample of economically
depressed counties used ln Johnson's study. Schools within
these counties were randomly selected from each of the six
school sizes A, B, CI, C2, Dl, D2. These classifications
were made according to school enrollment size by the
Nebraska School Activities Association for a school's
]
]
J ]
~J
]
J ~J
J :J -]
J J J ]
31
participation in basketball and volleyball sports during the
1987-89 school years.
Selection of sample and Procedures for Collecting Data
The following methods were used to select the subjects
for this study:
1. Johnson identified economically depressed counties
in Nebraska using the Nebraska State Department of
Vocational Education's classification of these areas.
2. All public schools in the economically depressed
Nebraska counties used by Johnson were identified according
to the six class designations from the 1987-89 Nebraska
School Activities Association, i.e. classes A, B, Cl, C2,
Dl, D2.
3. A ten percent sample of each of the six classes of
public schools in the economically disadvantaged counties
used in Johnson's study was the basis for selecting home
economics students in Nebraska senior high schools.
4. A letter describing the research project and
requesting cooperation was mailed to the home economics
teacher or home economics department chairperson in each of
the selected schools (see Appendix A). Teachers were asked
to complete a postage paid postcard and return it to the
researcher indicating willingness to participate in the
project. The total number of senior home economics students
1
.~
I
J i
J
]
J J ]
J J ]
J )
~ L ).t t
32
in the specific school was also identified. If a card had
not been returned within two weeks, a personal call was made
to the teacher to verify receipt of the letter and whether
they were willing to participate.
5. A total of 22 schools indicated their willingness
to participate. (see Appendix B).
6. For the purposes of this study, a random sample of
one half the senior home economics student population from
the 22 schools was deemed adequate. Home economics teachers
from each school were sent instructions on how to select a
random sample of senior students from their classes.
Design of the Instrument
A questionnaire similar to that used by Johnson for the
Nebraska Needs Assessment was adapted by this researcher.
The format and basic concepts used in the questionnaire were
the same as those used in Johnson's and Vance's studies.
Nebraska Home Economics Needs Assessment instrument.
Johnson designed the Nebraska Home Economics Assessment
instrument to measure parents' and agency representatives'
perceptions of the importance of specific home economics
subject matter concepts for high school students. That
instrument used a Likert-type scale where parents and agency
representatives circled the appropriate number to indicate
their response to the question: How important is this
J J J J J J J J ]
]
]
]
]
]
]
]
]
J
33
content for students? Possible responses were:
5 = essential, 4 = very important, 3 = important,
2 = little importance, and 1 = not important. A total of
136 concepts were divided into these content areas:
Consumer Education (17 concepts), Management & other
Processes (9 concepts), Basic Employability Skills
(10 concepts), Food & Nutrition (19 concepts), Housing and
Home Furnishings (20 concepts), Child Development and
Parenting (21 concepts), Family Relationships (22 concepts),
and Clothing and Textiles (18 concepts). A section
requested personal information which included demographic
information about the respondents. A panel of home
economics subject matter specialists and members of an
advisory council then reviewed and validated the
questionnaire.
Instrument for home economics teachers' perceptions of
what is being taught. Vance (1988) adapted the
questionnaire used by Johnson. Teachers from schools in the
same economically depressed counties used in Johnson's study
as well as teachers from schools in non-economically
depressed counties were surveyed about the amount of
emphasis specific concepts in home economics subject matter
areas had in their course/program. The Likert-type scale
was modified to direct answers towards concepts being
---taught. The eliciting question was: To what extent is this
, "1
I
']
J ]
]
]
]
J J ] ' ~ ,
o.'{·'
Jl Ii 01~\.;:,,;i;J:b'
34
concept taught in your classroom (included in your
curriculum plan)? Possible responses were: 1 = not
included in my course/program, 2 = included but not
emphasized-has little importance in my course/program,
3 = included but only somewhat emphasized-has some
importance in my course/program, 4 = moderately emphasized-
is very important in my course/program, and 5 = emphasized
a great deal-is an essential concept in my course/program.
The eight subject matter areas and 136 concepts remained the
same.
Instrument for this study. A questionnaire was adapted
from Johnson's instrument (see Appendix C). The eliciting
questions for the 136 concepts and the possible responses
using the Likert-type scale were the same as those used by
Johnson. The directions were modified for the student
population. For example, the student was asked: "How
important is this content for students?" Possible choices
were: 5 = essential, 4 = very important, 3 = important,
2 = little importance, 1 = not important. A section for
personal information was developed by the researcher to
identify sex of student, the number of semesters enrolled in
home economics courses, and the student's perception of how
much teachers listened to student opinion for subject matter
areas to be studied.
J J J
J J J J J J J ]
J J j
J
J -J
l -J
Procedure for Collecting Data
Data for this study were collected in the following
manner:
35
1. Instructions for teachers were developed for
randomly selecting one-half the high school seniors in their
home economics classes. These instructions, directions for
administering the survey, and the questionnaires were sent
to the designated teachers (see Appendix D). A postcard was
sent in advance of the parcel to alert teachers of its
arrival (see Appendix E).
2. One week after the parcel of surveys were sent, a
follow-up postcard was mailed reminding teachers to complete
the data collection and thanking them for their part in the
process (see Appendix E). All survey parcels were returned
and completed except for one school. Unforeseen
circumstances prohibited the teacher from taking the survey.
Analysis of Data
The data were obtained from the 174 surveys completed
by high school seniors in home economics classes from 22
public schools in Nebraska. These schools represented ten
percent of the six school Classes A, B, C1, C2, Dl, D2
within the disadvantaged counties used in Johnson's study.
Classes C1, C2, D1, and D2 were collapsed into two groups to
equalize group size and facilitate the analysis. This
.. ,-.
. ,.J
]
]
l
information was entered into the University of Nebraska
Control Data Center using the statistical Package for
Social Sciences, 10th Edition (SPSSX Institute, Inc.,
1986). Descriptive analyses were done to determine
frequencies and means of home economics concepts students
perceived they should know and frequencies and percentages
of personal data. Oneway analysis of variance (ANOVA) was
36
used to determine if the importance of subject matter areas
was significantly different among students in different
school sizes. This procedure was also used to identify
whether or not significant differences in subject matter
areas and specific concepts were evident among groups of
students, economically disadvantaged parents, and non
economically disadvantaged parents. The Tukey-Honestly
Significant Difference (HSD) procedure was used to identify
where the differences occurred. The ~ test was used to
determine if significant differences existed between
students' perceptions of the importance of home economics
subject matter and specific concepts and teachers'
perceptions of what they emphasize in their teaching. All
of these procedures were used to p~ovide data for the
hypotheses posed in this study.
, .JJ
J J J
J J J .]
]
]
]
]
]
1
CHAPTER IV
Findings
The research for this study was designed to measure
senior high school home economics students' perceptions of
the importance of home economics subject matter in Nebraska
high schools. A Questionnaire for students was sent to home
economics teachers in schools randomly selected from the six
classes of schools from economically depressed counties.
Students identified their perception of the importance of
136 specific home economics doncepts in eight subject matter
areas.
Characteristics of High School Home Economics Students
The subjects used for this study were senior high
school home economics students from public schools in
economically depressed Nebraska counties. A ten percent
sample of schools was randomly selected from each of the six
classes of public schools, sizes A, B, Cl, C2, Dl, D2, in
the economically depressed counties used in Johnson's
(1986) Needs Assessment. Four groups,. Cl, C2, Dl, D2, were
then collapsed into two groups to equalize group sizes and
facilitate analysis.
Using descriptive statistics to describe the data, the
researcher found several characteristics evident among
/
J J
J ]
]
J .] ,
J J ,]
]
,]
J ]
]
"]
J ~ )
<i, \'
o ~ , .~~~::::
38
senior high school home economics students. Table 1 shows
the number of schools and students represented in each class
size of school as well as the percentage of students from
the class size in relation to the total respondents in the
study. Two of the 22 schools were Class A schools with 86
respondents. This represented 49.4% of the 174 respondents.
Class B schools included four schools with 29 (16.7%) of the
respondents. For Class C schools, eight schools
participated with 23 (13.2%) respondents while eight schools
participated in Class D with j6 (20.7%) respondents.
Additionally, of the 174 respondents, 133 (76.4%) were
female and 39 (22.5%) were male.
The number of semesters students had enrolled in home
economics courses was quite evenly distributed among the
possible choices. Thirty-seven students (21.3%) had
taken 1-2 semesters; 43 students (24.7%) had taken 3-4
semesters; 36 students (20.7%) had taken 5-6 semesters;
and, 56 students (32.2%) had 7 or more semesters.
students' Perceptions of Curriculum Content
The remainder of this chapter will report findings
related to the research questions:
lao What differences exist between senior high school
home economics students' perceptions of the importance of
subject matter areas in home economics curriculum and the
/
J J J J ]
J ]
]
]
]
J ]
]
]
OJ
'J
1 ]
1 r;:;.§~;;;;,
Table 1
School Sizes and Student Characteristics
Characteristics
School Size (Number of Schools)
Class A (N = 2) Class B (N = 4) Class C (N = 8) Class D (N = 8)
Sex of Student
Male Female No Response
Total
Total
Number of Semesters/ Home Economics Courses
1 - 2 3 - 4 5 - 6 7 - or more No Response
Total
N
86 29 23 36
174
39 133
2
174
37 43 36 56
2
174
%
49.4 16.7 13.2 20.7
100.0
22.5 76.4 1.1
100.0
21. 3 24.7 20.7 32.2 1.1
100.0
/
39
J J J J J ]
]
J ]
J ]
40
perceptions of parents, both economically disadvantaged and
non-economically disadvantaged?
lb. What differences exist between senior high school
home economics students' perceptions of the importance of
specific concepts within subject matter areas in home
economics curriculum and the perceptions of parents, both
economically disadvantaged and non-economically
disadvantaged?
2a. What differences exist in senior high school home
economics students' perceptions of the importance of
subject matter areas in home economics curriculum and those
which high school home economics teachers perceive they
teach?
2b. What differences exist between senior high school
home economics students' perceptions of the importance of
specific concepts within home economics curriculum and those
which high school home economics teachers perceive they
teach?
3. What amount of participation do senior high school
home economics students perceive they have in choosing the
home economics subject matter and specific concepts they can
learn?
4. What differences exist among senior high school
home economics students from different school sizes
regarding their perceptions of the home economics subject /
J J ]
]
]
]
J J ]
]
]
]
'J ] '-1
j
], .. .
~ ..• '. ,II
41
matter and specific concepts they believe students ought
to know?
Differences among students' perceptions
In order to determine if students from each class size
of school were homogeneous, research question 4 will be
addressed first. The following null hypothesis directed the
statistical treatment for research question 4:
Null Hypothesis 3. There are no significant
differences among students' perceptions of the importance
of home economics subject matter areas from each of the
different class sizes of schools.
The hypothesis was tested by analyzing the scores given
by students in each of the four class sizes of schools for
each of the eight subject matter areas. Students were asked
the eliciting question "How important is this content for
students?" Scores were based on a Likert-type scale
indicating the extent to which each concept was perceived to
be important for students to know (1 = not important, 2 =
little importance, 3 = important, 4 = very important, 5 =
essential). When each concept was subjected to an analysis
of variance test to determine whether or not significant
differences (R<.05) existed between the means, significant
differences were found between the Class A and Class C
school sizes for two of the eight subject matter areas.
\
J J J J J J ,i I
-"JI
]
:I . _] •
Jl ]
]
J
Table 2
Summary of Analysis of Variance (ANOVA) Test forSubiect Matter Areas by School Size
Subject Matter Area (Number of Concepts)
Child Dev./Parenting Management ( 9 ) Family Relationships
(21 )
(22 ) Clothing/Textiles (18) Consumer Education (17) Basic Employability (10) Housing/Horne Furn. (20) Food & Nutr.i t i on (19)
Class A
N=86 Mean
4.l1a 3.67 3.86 3.26 3.40 3.97a 3.44 3.32
Class B
N=29 Mean
3.97ab 3.46 3.71 3.45 3.37 3.78ab 3.45 3.31
Class C
N=23 Mean
3.59b 3.47 3.47 3.21 3.40 3.60b 3.35 3.24
Class D
N=36 Mean
3.92ab 3.74 3.73 3.31 3.47 3.98ab 3.42 3.31
42
Note. Scores were assigned as follows: 1 = not important, 2 = little importance, 3 = important, 4 = very important, 5 = essential. *Means with different letters (a,b) were significantly different at the five percent level in the Tukey-HSD test. ()Numerals in parentheses represent the number of concepts in each of the subject matter areas .
/
]
"]
]
J
I)
, '"
'K"J
~I
43
Table 2 shows that two areas where differences existed were
Child Development/Parenting (tis = 4.11, 3.59), and Basic
Employability (tis = 3.97, 3.60). In both situations the
means of Class A schools were higher than the means of Class
C schools. Although these differences existed, they did not
represent a majority of the differences possible among the
students perceptions from the different class size schools.
Therefore, the null hypothesis for Class A and C schools for
subject matter areas Child Development/Parenting and Basic
Employability is rejected but accepted for all other schools
and subject matter areas.
Perceptions of subject matter areas
In order to address research questions la, and 2a,
mean scores of concepts within each subject matter area were
combined to form an overall mean. Data collected from
parents, both economically disadvantaged and non-
economically disadvantaged, for Johnson's Needs Assessment
study were combined and compared with data from students.
Additionally, data collected from teachers for Vance's
study of home economics teachers' perceptions of what is
being taught were also combined and compared with the other
groups. The teachers in Vance's study were asked a
different eliciting question: "What amount of emphasis does
this concept have in the curriculum you teach?" The subject
/
J J
44
-] matter areas and the 136 concepts in the questionnaire
remained the same. The following null hypotheses directed
1 - the statistical treatment for research questions La and 2a:
J Null Hypothesis lao There are no significant
differences among high school home economics students'
J perceptions of the importance of home economics subject
matter areas needed within home economics curriculum and the
-J perceptions of parents, both economically disadvantaged and
] non-economically disadvantaged.
Null Hypothesis 2a. There are no significant
J differences among senior high school students' perceptions
of the importance of home economics subject matter areas
] - )
needed in home economics curriculum and home economics
, teachers' perceptions of what they teach.
J) Hypotheses la and 2a were tested by examining the
~
.1 ~)
differences in the overall means for each of the eight
subject matter areas. Overall means for each subject matter
J area were subjected to an analysis of variance test to
~I JJ
determine whether significant differences existed among the
means for each group. The Tukey-HSD follow-up procedure was
-I ]
implemented to determine which group means were
significantly different for each subject matter area.
1 Table 3 uses two different ways to express differences
] between groups for subject matter areas. The first way is
by color coding. Colored bars represent significant
J \
d i i ~~
~;
J ]
]
.J
J
1
J1
L. i] I'
Ii
lJ
45
differences between the students and all other groups
(pink), significant differences between students and
teachers (green), and significant differences between the
students and economically disadvantaged parents (yellow),
and significant differences between students and non-
economically disadvantaged parents (orange).
Lower case letters (a, b, and c) are used to show all
significant differences (~<.05) between groups, including
significant differences between the teachers, the
economically disadvantaged parents and the non-economically
disadvantaged parents. Means with different letters are
significantly different. For example, if the mean for the
student group has an "a" after it and the mean for the
teacher group has an "a", there is no significant difference
between each group. However, if the economically
disadvantaged parents' mean has a "b", there is a
significant difference between the economically
disadvantaged parents' and the students' and teachers'
means. If the non-economically disadvantaged parents' mean
is followed by an nab", there is no significant difference
between the non-economically disadvantaged parents' mean and
all other groups.
By examining Table 3, it can be seen that significant
differences (~<.05) were found between students and all
\
J J J
J J J
J
J J -, i
'';
",I
, "i
""I
j [ 1
; I JJ
]j
Table 3
Summary of Analysis of Variance (ANOVA) test for Subject Matter Areas by Groups
46
Subject Matter Areas (Number of Concepts)
Parents Students Teachers Econ. Non-Econ.
Disadv. Disadv. N=174 N=45 N=187 N=208 Mean
"CI1.ild. Dev ,jPigenting(2l) ;3. Q.8a ~~{5.'N:V;EitiplPlya·b i 1 lty, .. f1'OJ .', ··il,~·8'\l·ij,., Family Relationships (22) 3.76ab Management (9) 3.62a i!iollsing/Hol)l~Ellrn. (20). 3 ... ~3a ~¢:j;j$\ttme;~'~·Ea·Ubatio IT (17).····· 3,."41'a i'fGH».i2b·*".~\lu,t~j,.t+0n·'L1·9·)· .,.' .'",,·3,,·,3 iL·a· . \.!li !lttj,tJl.i:rr'ili::~'.\'I\'e xti 1 es . '.+·1:8,),'.", ,···.t:3·;;;;3.o.lilo
Mean Mean
4.03<3, .. , , .. 3.94a 3",,4.3,!llt\"· .,4, •••. 0·6" 3.75ab 3.83a 3.97b 3.92b
,3 .. 42Ci3 .. 42a 3.52~& 3.83b
.. J.,.3 .... 7.!5,Q .. , .•. ,.3. .6.7, b ... ·.·,·3.,'.·7;];ia·.·· 3,.4 4a.c
Mean
3.73b., 3.9;3<!!~ 3.65b 3.82b 3.14bi 3 .65@~
..,3 .. · .• 4,4,~"', 3.;,JA~i~i
Note. Scores were assigned as follows: 1 = not important/ not included, 2 = little importance/not emphasized, 3 = important/somewhat emphasized, 4 = very important/ moderately emphasized, 5 = essential/greatly emphasized. *Means with different letters (a,b/c) were significantly different at the five percent level in the Tukey-HSD test. ()Numerals in parentheses represent the number of concepts in each of the subject matter areas.
Key
Tables are color coded to show significant difference between:
= Students and all other groups -= Students and Teachers
i= Students and Both Groups of Parents = Students and Econ. Disadv. Parents = Students and Non-Econ. Disadv. Parents
J ]
J ]
:J
'J
J J
J
J
J J .~
J
Ji
]
47
other groups in one subject matter area. Differences were
also found between students and both groups of parents in
two of the eight subject matter areas. Three subject matter
areas had significant differences between students and one
group of parents or the other. Two subject matter areas
had significant differences between students and teachers.
students' subject matter means (Ms 3.30 to 3.98) shown
on Table 3 indicate that students perceived all areas to be
important to very important for students to know. The
means for students' perceptions rated Child Development/
Parenting (tl = 3.98) as very important. Basic Employability
(tl = 3.89), Family Relationships (tl = 3.76), and Management
(tl = 3.62) ranked in the upper areas of important. The
overall mean for Housing/Home Furnishings (M = 3.43) and
Consumer Education (tl = 3.41) ranked more than important for
students to know. The two lowest subject matter areas of
Food and Nutrition (M = 3.31) and Clothing and Textiles
(M = 3.30) were similar in the amount of importance.
students' perceptions were significantly different (R<.05)
than all other groups in the subject matter area of
Management (tls = 3.62, 3.97, 3.92, 3.82). In fact, all
groups, except students, perceived Management to be of
greater importance. Significant differences were shown to
exist with one, two or three groups in six of the seven
remaining subject matter areas.
J J ]
]
]
]
J ]
]
]
]
]
]
],
~i 1 :\(, , .. ';'1' ; .' "
Significant differences (~<.05) were found between
students and both groups of parents in the subject matter
area of Consumer Education (lis = 3.41,3.83, 3.65). The
subject matter areas of Child Development/Parenting
(tis = 3.98, 3.73), Housing/Home Furnishings (tis = 3.43,
3.14), reflected significant differences (~<.05) between
students and non-economically disadvantaged parents while
the subject matter area of Food and Nutrition (tis = 3.31,
3.67) reflected differences between students and
economically disadvantaged pirents. Consequently, Null
Hypothesis 1a was rejected for those areas which revealed
significant differences among parents and students and
accepted where no differences were found. The specific
differences as to concepts within the subject matter areas
will be examined in more detail when differences with each
group are reported.
Significant differences (~<.05) were also found to
exist between students and teachers in the subject matter
areas of Basic Employability (tis = 3.89, 3.43), Food and
Nutrition (tis = 3.31, 3.75), and Clothing and Textiles
(tis = 3.30, 3.71). In addition, students perceived the
subject matter areas of Foods and Nutrition and Clothing
and Textiles to be lower in importance than what teachers
perceived they emphasize. Therefore, Null Hypothesis 2a
was rejected for those subject matter areas where
I
48
]
J J J ~J
~]
]
J ]
]
]
]
J 1 1 J ]
~ J
49
differences existed between teachers and students and
accepted for those subject matter areas where no
differences occurred.
Perceptions of Students and Parents--Specific Concepts
Findings related to students' and parents' perceptions
of the importance of specific concepts in each of the
subject matter areas in home economics will be reviewed in
the order of students' overall mean ranking of the subject
matter areas. Null Hypothesis 1b directed the statistical
treatment for research question 1b: There are no
significant differences among senior high school home
economics students' perceptions of the importance of
specific concepts within subject matter areas in home
economics curriculum and the perceptions of parents, both
economically disadvantaged and non-economically
disadvantaged. Tables 4 - 11 will be used to report these
findings.
Child Development and Parenting. Child Development and
Parenting (tl = 3.98) was the subject matter area which
students ranked first with the highest overall mean score.
By examining Table 4, it can be seen that significant
differences (~<.05) existed between both parent groups,
economically disadvantaged and non-economically
disadvantaged, in the concept selecting child-rearing
]
]
]
,]
]
,]
J ,]
,]
]
,]
]
']
']
']
50
Table 4
Analysis of Variance (ANOVA) Tests for Child Development and Parenting Concepts by Groups
Concepts
~lhj;h control ,§lhild .. abuse "Cqnception/birth process Responsibilities of parenting Present choices/future ~ii4L§;!li!l0[if;~ l".·sib..a id .. ::;; i; ;'" . Readiness to be a parent l£!Jl",iq@g~!;(ph¥s,:i caib/sDc 1a1/ etc •. ),'
9'·
~eve lop,!\\§\n.11; Parenting/self-esteem :pelect~I1g daycare/nursery
[$'C'ho.o'ls;¢rvi ce$" ~onflicting views/raising
;ch.i,ldrem
students
N = 174 Mean
4.33a '4-: .. 31a ' ;.:, ):, 4.25a 4.20 4.14 4,,,Jl;3a' 4.12 4 .ilJ013i:·.
4.03 4.01a
3.97a
Parents Econ.
Disadv. N = 187
Mean
4.13ab 4.2,9a 4.18ab 4.27 4.12 4.20a 4.25
'. ·4 . .'07ab
4.03 3.98a
3.82a
Non-Econ. Disadv. N = 208
Mean
3.92b 4.06b 3.99b. 4.25 4.13 3.87b 4.25 3.8Sb:
4.00 3.59b
3.54b
Developing' morals 3.95 3.99 3.91 m;".nMj[,'~'i\?nme;nt;u:( ho.miei,)1e1ighbor,hood.). ;3,,; 9.1"", 3.8 7a·. 3 . 64b Decision making/family planning 3.88 3.93 3.85 ~'iij};!l~~full~I,,'li!itl1jl~&jl\lMJi:~!I~ltl~_~~ff.~.
~!",;a.ct;ic$\!i Nutrition/child health Creativity in children Heredity "g~.):,enting affects socIety tg.ocial/cul tural influencel3
:2IL.parenting Commun-i','ty .. ,Services,.',"""'.!- i'_'\J \ n;\'·
3.81ab 3.77 3 /7..613 3.72a 3 .. ·.70a,
3.91a 3.79 3 .• 63a 3.52ab 3 .. 58a
3·.48a
3.70b 3.61 3.30b 3.40b 3.25b!
3 .. 07b
Note. Scores were assigned as follows: 1 = not important, 2 = little importance, 3 = important, 4 = very important, 5 = essential. *Means with different letters (a,b,c) were significantly different at the five percent level in the Tukey-HSD test.
Key Tables are color coded to show significant difference between:
- Students and Both Groups of Parents = Students and Econ. Disadv. Parents = Students and Non-Econ. Disadv. Parents
/
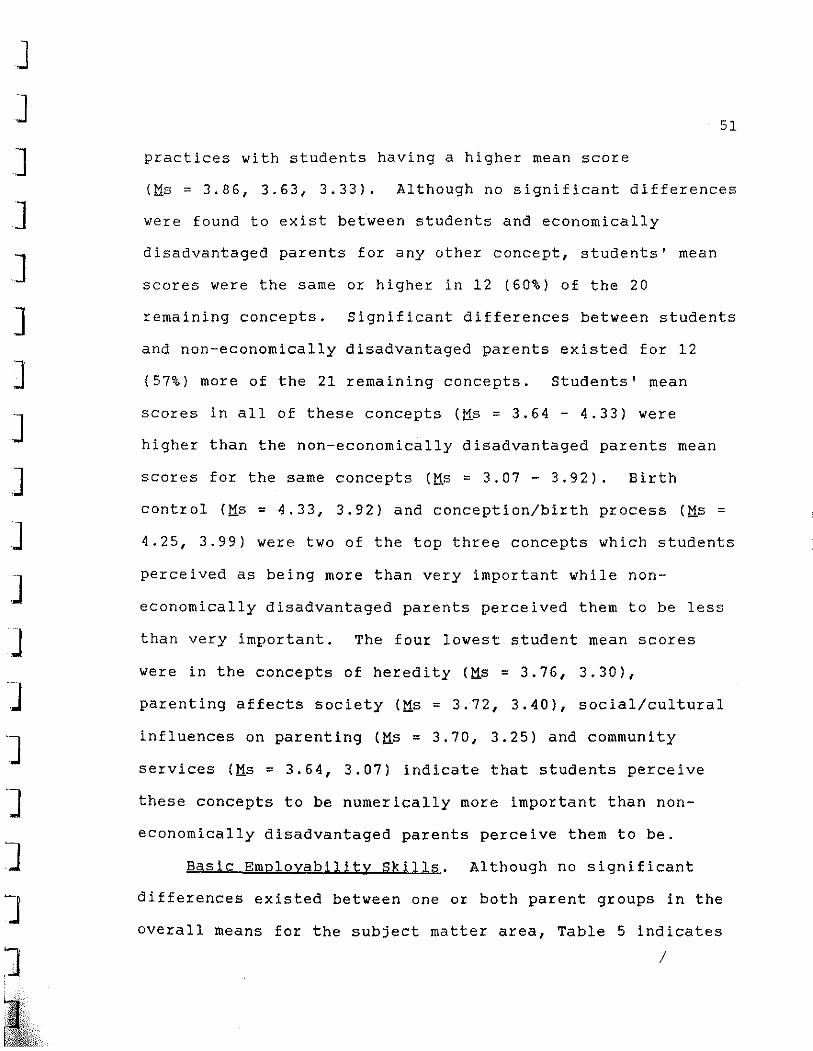
J J ]
]
]
]
J ]
J J ]
J J J "J
J J J
51
practices with students having a higher mean score
(tls = 3.86, 3.63, 3.33). Although no significant differences
were found to exist between students and economically
disadvantaged parents for any other concept, students' mean
scores were the same or higher in 12 (60%) of the 20
remaining concepts. Significant differences between students
and non-economically disadvantaged parents existed for 12
(57%) more of the 21 remaining concepts. Students' mean
scores in all of these concepts (tis = 3.64 - 4.33) were
higher than the non-economically disadvantaged parents mean
scores for the same concepts (tls = 3.07 - 3.92). Birth
control (tis = 4.33, 3.92) and conception/birth process (tis =
4.25, 3.99) were two of the top three concepts which students
perceived as being more than very important while non
economically disadvantaged parents perceived them to be less
than very important. The four lowest student mean scores
were in the concepts of heredity (tls = 3.76, 3.30),
parenting affects society (tis = 3.72, 3.40), social/cultural
influences on parenting (tis = 3.70, 3.25) and community
services (tis = 3.64, 3.07) indicate that students perceive
these concepts to be numerically more important than non
economically disadvantaged parents perceive them to be.
Basic Employability Skills. Although no significant
differences existed between one or both parent groups in the
overall means for the subject matter area, Table 5 indicates
/
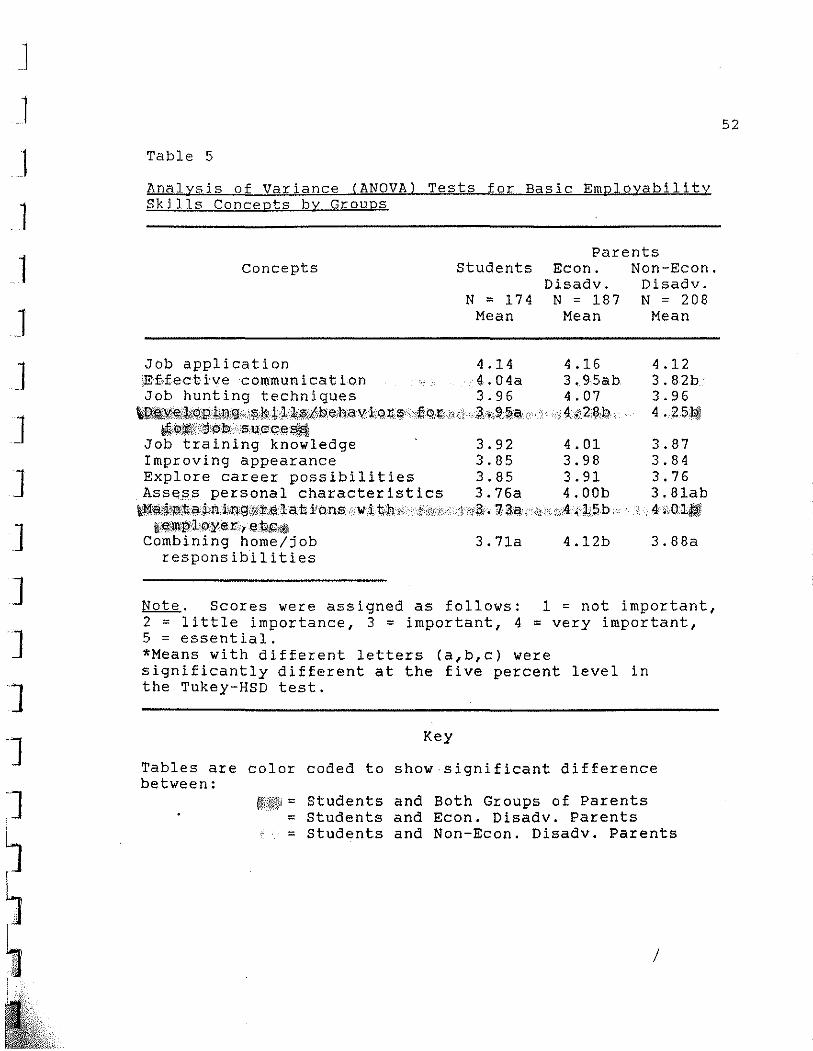
J
J J 1 1 J J J J ]
]
]
Table 5
Analysis of Variance CANOVA) Tests for Basic Employability Skills Concepts by Groups
Parents Concepts Students Econ. Non-Econ.
Disadv. Disadv. N = 174 N = 187
Mean Mean
Job application 4.14 4.16 ,EMectivecommunication 4.04a 3.95ab Job hunting techniques 3.96 4.07
~~~)i(~Jil:tQJ?~J!i)i'!l",§,~~;LiI\§N:M3I.eha yi,q ll:§'fi·Q,t., /! (j ·.a~:.~,li!~·, 4: ,~2.?,j). , ~;Q;l!!1,,\d;p'b"· 'l;i1.1G:c43.~
Job training knowledge 3.92 4.01 Improving appearance 3.85 3.98 Explore career possibilities 3.85 3.91 Ass~ss personal characteristics 3.76a 4.00b
t!!'!l~~$:trC\l,,j;,n.i'·l.1'9Jj~,!:ll at i o.ns." ( w i t·h".,b;~,ji··n"i:!j. 7 3 a l' ,·.~e ,.;4, li 5 b,. . Wi·~;:Ill'p·lp.yer·.,e:R.&;0t!\
Combining home/job respons ibil i ties
3.71a 4.l2b
N = 208 Mean
4.12 3.82b 3.96 4 .25l;ll
3.87 3.84 3.76 3.81ab 4 I,Qlt!\i!
3.88a
Note. Scores were assigned as follows: 1 = not important, 2 = little importance, 3 = important, 4 = very important, 5 = essential. *Means with different letters (a,b,c) were significantly different at the five percent level in the Tukey-HSD test.
Key
Tables are color coded to show significant difference between:
fti~~~i = Students = Students = Students
and and and
Both Gro1.1ps of Parents Econ. Disadv. Parents Non-Econ. Disadv. Parents
J
52
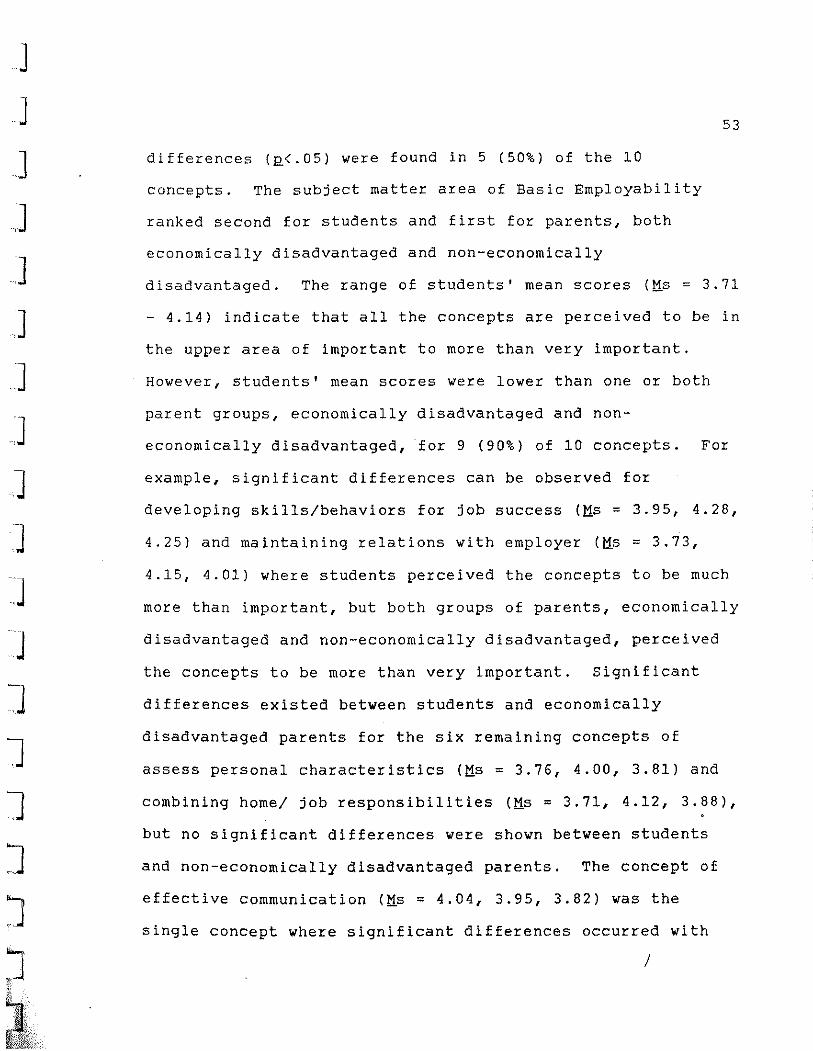
J J J J J ]
J ]
]
.]
.]
J J l l J J J l~
,; ,:.
~~~~,\ !~,§M{bb
differences (g<.05) were found in 5 (50%) of the 10
concepts. The subject matter area of Basic Employability
ranked second for students and first for parents, both
economically disadvantaged and non-economically
53
disadvantaged. The range of students' mean scores (tis = 3.71
- 4.14) indicate that all the concepts are perceived to be in
the upper area of important to more than very important.
However, students' mean scores were lower than one or both
parent groups, economically disadvantaged and non
economically disadvantaged,for 9 (90%) of 10 concepts. For
example, significant differences can be observed for
developing skills/behaviors for job success (tis = 3.95, 4.28,
4.25) and maintaining relations with employer (tis = 3.73,
4.15, 4.01) where students perceived the concepts to be much
more than important, but both groups of parents, economically
disadvantaged and non-economically disadvantaged, perceived
the concepts to be more than very important. significant
differences existed between students and economically
disadvantaged parents for the six remaining concepts of
assess personal characteristics (tis = 3.76, 4.00, 3.81) and
combining home/ job responsibilities (tis = 3.71, 4.12, 3.88),
but no significant differences were shown between students
and non-economically disadvantaged parents. The concept of
effective communication (tis = 4.04, 3.95, 3.82) was the
single concept where significant differences occurred with
/
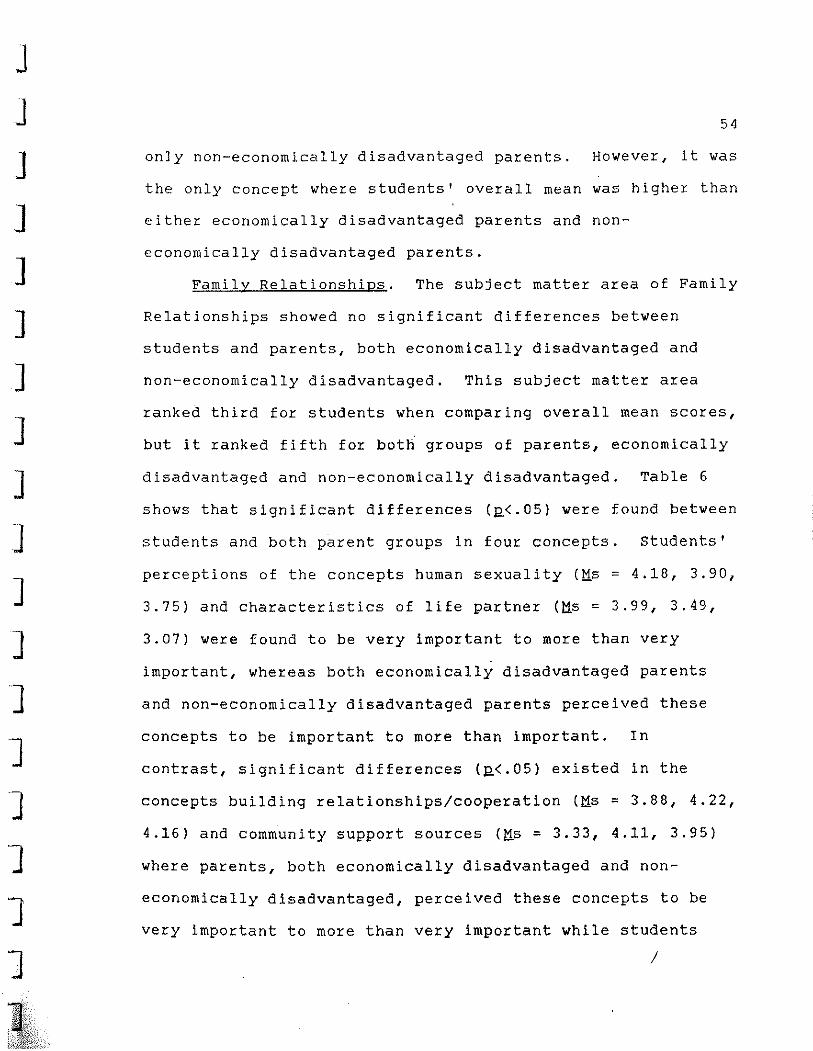
J J ]
]
]
]
]
]
]
]
]
]
]
]
]
]
J J lIt ~,;Ik:;;>,
54
only non-economically disadvantaged parents. However, it was
the only concept where students' overall mean was higher than
either economically disadvantaged parents and non-
economically disadvantaged parents.
Family Relationships. The subject matter area of Family
Relationships showed no significant differences between
students and parents, both economically disadvantaged and
non-economically disadvantaged. This subject matter area
ranked third for students when comparing overall mean scores,
but it ranked fifth for bot~ groups of parents, economically
disadvantaged and non-economically disadvantaged. Table 6
shows that significant differences (~<.05) were found between
students and both parent groups in four concepts. Students'
perceptions of the concepts human sexuality (tis = 4.18, 3.90,
3.75) ahd characteristics of life partner (tis = 3.99, 3.49,
3.07) were found to be very important to more than very
important, whereas both economically disadvantaged parents
and non-economically disadvantaged parents perceived these
concepts to be important to more than important. In
contrast, significant differences (~<.05) existed in the
concepts building relationships/cooperation (tis = 3.88, 4.22,
4.16) and community support sources (tis = 3.33, 4.11, 3.95)
where parents, both economically disadvantaged and non-
economically disadvantaged, perceived these concepts to be
very important to more than very important while students
/
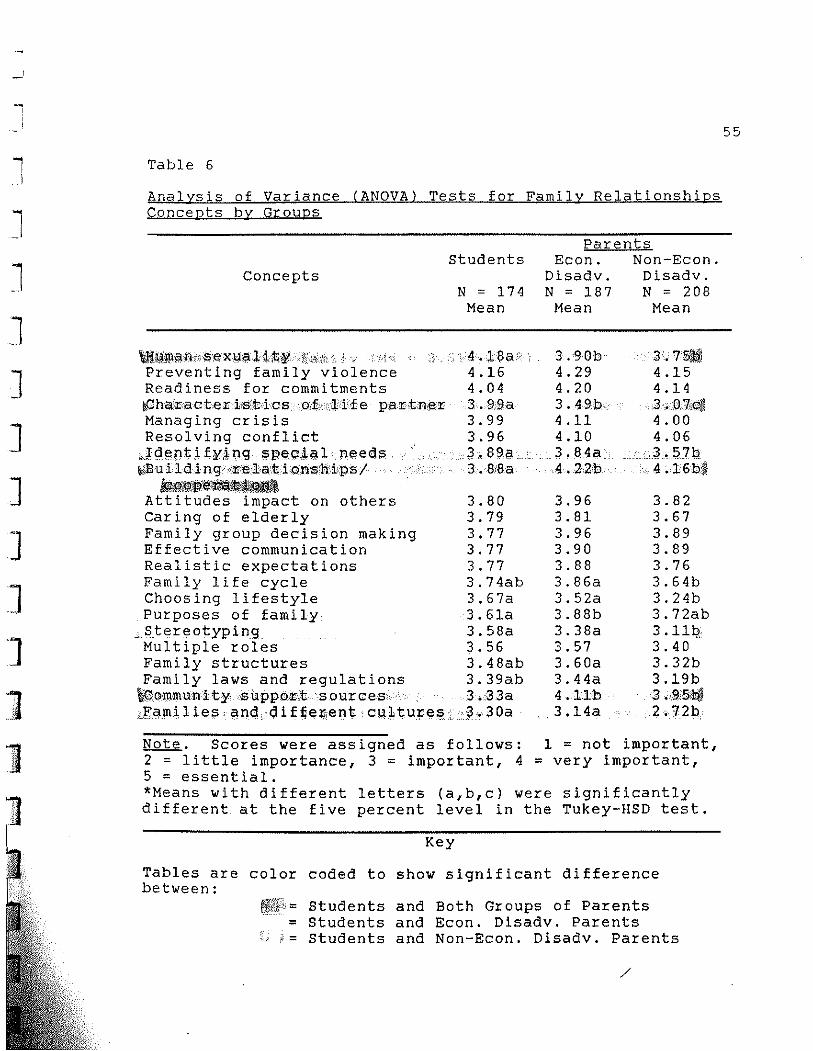
-'
-,
l J J J J ]
]
]
]
]
j, -~
]i.' 1
Table 6
Analysis of Variance (ANOVA) Tests for Family Relationships Concepts by Groups
Parents Students Econ. Non-Econ.
Concepts Disadv. Disadv. N = 174 N = 187 N = 208
Mean Mean Mean
~i,lilii!Cgni"'$e xu;;il;i:l;¥;! i.i Hi, Preventing family violence Readiness for commitments
'i.':4.l8a, 4.16 4.04 3.9,9a 3.99 3.96
I;.C ha'rac te r i,s,tic s· .p,f!,'i.l Lf e par tl);e r Managing crisis Resolving conflict .J~entify'ng specAgl needs ~iBu ildi n giilfElila.ti.ons!hd"ps/
~il!!:t\!ijili~l~)~;!lll.
1J:..89<! 3 .• 8'8a
Attitudes impact on others 3.80 Caring of elderly 3.79 Family group decision making 3.77 Effective communication 3.77 Realistic expectations 3.77 Family life cycle 3.74ab Choosing lifestyle 3.67a Purposes of family 3. 61a
,-stereotyping 3. 58a Mul tiple roles 3.56 Family structures 3.48ab Family laws and regulations 3.39ab ~O'mm\HlitysuPP.0'it;t" s our.ces 3 .i.3 3a "Eamil ies ' <!n~,d i ffellient cu;Ltu+,es .. 3,. 30a
3.90b 4.29 4.20 3.49b,. 4.l1 4.10 3.!14a. 4.22b
3.96 3.81 3.96 3.90 3.88 3.86a 3.52a 3.88b 3.38a 3.57 3.60a 3.44a 4.11b 3.14a
3.75~ 4.15 4.14 3'07;~ 4.00 4.06
;.J.S?];! 4.16b*
3.82 3.67 3.89 3.89 3.76 3.64b 3.24b 3.72ab 3. l1l;c 3.40 3.32b 3.19b 3,i.9.5;Qi 2.72b.
Note. Scores were assigned as follows: 1 = not important, 2 = little importance, 3 = important, 4 = very important, 5 = essential. *Means with different letters (a,b,c) were significantly different at the five percent level in the Tukey-HSD test.
Key
Tables are color coded to show significant difference between:
I£~;:i= Students and Both Groups of Parents = Students and Econ. Disadv. Parents
" P = Students and Non-Econ. Disadv. Parents
/
55
J
J
J -J
~J
J
J ]
]
,J
J 'J
J J I j
I
J
]
perceived them to be more than important. Significant
differences were shown to exist between students and non-
economically disadvantaged parents in the concepts
identifying special needs (tis = 3.89, 3.57), stereotyping
56
(tis = 3.58, 3.11), as well as families and different cultures
(tis = 3.30, 2.72) where students' means were higher than
purposes of the family (tis = 3.61, 3.88).
Management and Other Processes. The subject matter
which students ranked fourth was Management and Other
Processes. It was the only"subject matter which showed
significant differences between students and each of the
groups, teachers and parents, both economically disadvantaged
and non-economically disadvantaged. Table 7 shows that for
each of the nine concepts, students perceived the concepts to
be important to very important (tis = 3.02 - 4.04) although
students' means were still lower than parents', both
economically disadvantaged and non-economically
disadvantaged. Significant differences (R<.05) existed
between students and parents, both economically disadvantaged
and non-economically disadvantaged, in the four concepts
attitude/responsible for decisions (tis = 4.04, 4.35, 4.27),
ability to make decisions/solve problems (Ms = 3.81, 4.09,
4.10), managing personal/family resources (tis = 3.74, 4.11,
4.06). In addition, students' perceptions were shown to be
significantly different from the perceptions of economically
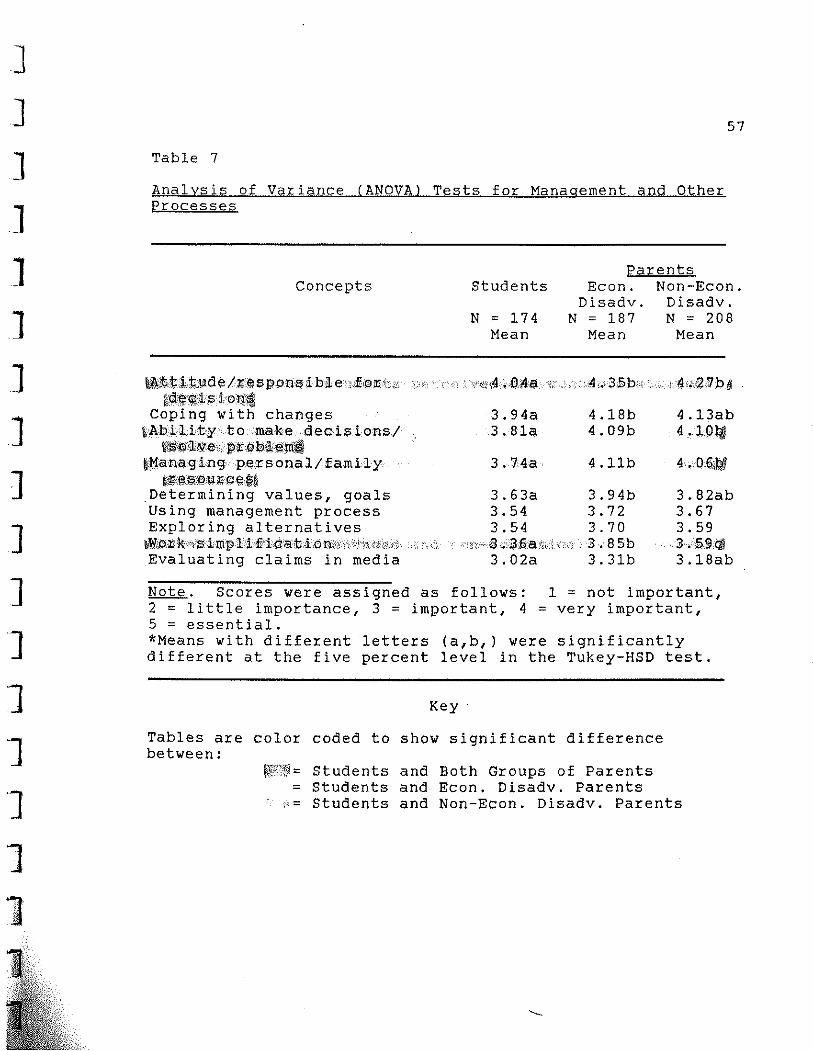
]
J ]
]
]
]
]
]
]
]
]
]
"]
]
1 "]
11 .I
57
Table 7
Analysis of Variance (ANOVA) Tests for Management and Other Processes
concepts
1l\:!!:f,:I;:M;;\;ldel.:I1es pon~;t b'iL e idi'oil1b: ~cii'~<ji;:ision~
Coping with changes wAbilitytomakedec is ions/
1\\$~ilwecJ!)j:li)biLePl~ !t!1ana,ging personal/family
~i!it&:Q.(l.\lil1P:(l@~ Determining values, goals Using management process Exploring alternatives wl'l:l1)rk~isimpl'ifi'iaa(t;i ,On,';) ''''br(1)','' Evaluating claims in media
Parents students
N = 174 Mean
3.94a 3.81a
3.74a
Econ. Disadv.
N = 187 Mean
4.l8b 4.09b
4.llb
3.63a 3.94b 3.54 3.72 3.54 3.70
'(,.',·B.;d~:fraiii! c.'.' ;3,' 8 5b 3.02a 3.31b
Non-Econ. Disadv. N = 208
Mean
4.l3ab 4.10qJ
4.06l!il1
3.82ab 3.67 3.59
.3.;$J~Q1 3.l8ab
Note. Scores were assigned as follows: 1 = not important, 2 = little importance, 3 = important, 4 = very important, 5 = essential. *Means with different letters (a,b,) were significantly different at the five percent level in the Tukey-HSD test.
Key
Tables are color coded to show significant difference between:
""",." S t d t !!&!';~J = U ens = Students
,; = Students
and and and
Both Groups of Parents Econ. Disadv. Parents Non-Econ. Disadv. Parents
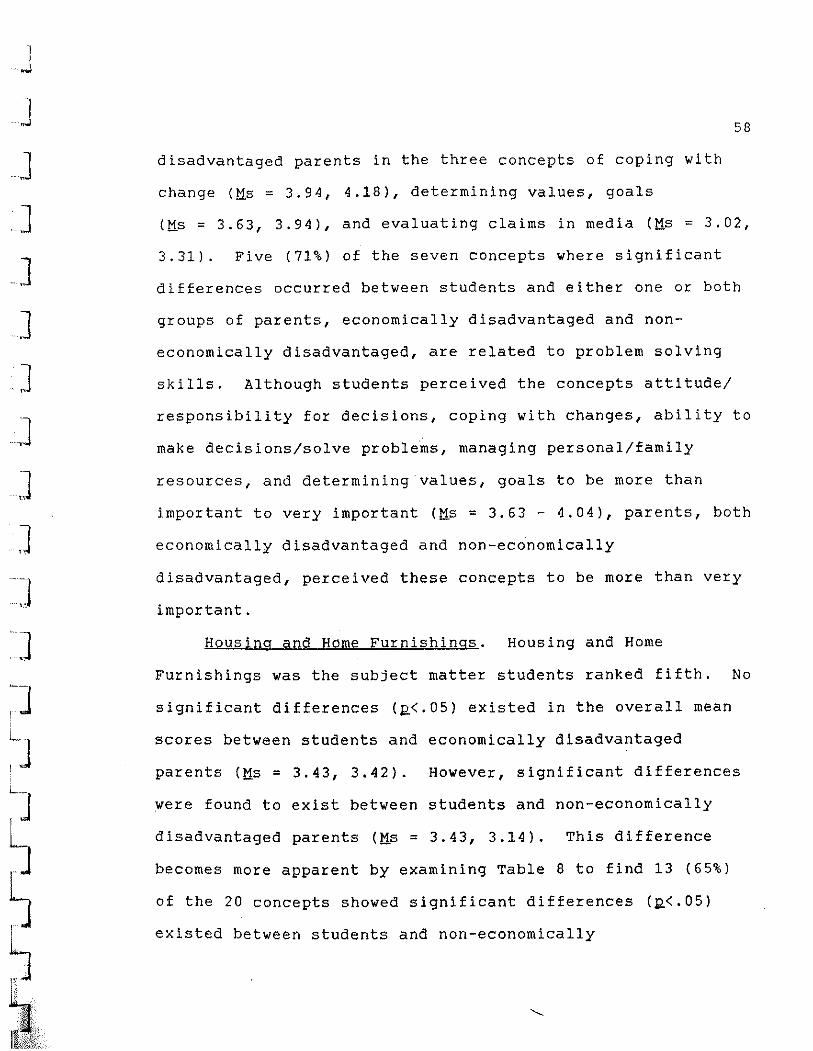
1 .~
J J -~
-J ]
-J -J J J -J -]
~J L
!J L
J
58
disadvantaged parents in the three concepts of coping with
change (tis = 3.94, 4.18), determining values, goals
(tis = 3.63, 3.94), and evaluating claims in media (tis = 3.02,
3.31). Five (71%) of the seven concepts where significant
differences occurred between students and either one or both
groups of parents, economically disadvantaged and non
economically disadvantaged, are related to problem solving
skills. Although students perceived the concepts attitude/
responsibility for decisions, coping with changes, ability to
make decisions/solve problems, managing personal/family
resources, and determining values, goals to be more than
important to very important (tis = 3.63 - 4.04), parents, both
economically disadvantaged and non-economically
disadvantaged, perceived these concepts to be more than very
important.
Housing and HOme Furnishings. Housing and Home
Furnishings was the subject matter students ranked fifth. No
significant differences (~<.05) existed in the overall mean
scores between students and economically disadvantaged
parents (Ms = 3.43, 3.42). However, significant differences
were found to exist between students and non-economically
disadvantaged parents (Ms = 3.43, 3.14). This difference
becomes more apparent by examining Table 8 to find 13 (65%)
of the 20 concepts showed significant differences (~<.05)
existed between students and non-economically
J ]
]
]
]
]
]
]
]
]
]
]
]
]
]
J J
Table 8
Analysis of Variance (ANOVA) Tests for Housing and Home Furnishings Concepts by Groups
Parents Concepts Students Econ. Non-Econ.
Disadv. Disadv. N = 174 N = 187 N = 208
Financial/legal aspects of owning/renting
Making home safe ~electing housing Evaluating home comfort/ ~rivacy/security ,
,Legal rights/influencing cnange ~urchasing home furnishings Caring for home ~onserving energy ,Selecting furnishings/equipment ~se decision making in"housing lW'J1i\f;l'ue;I'l'oe'J;;,Cl:Eh6\:H3 in g '0 h
fii%;!:l:g>j;;)li g ua 1 s If gll\i.l~ Identify/evaluate house info.
;Pecarating(limited budget Housing,' alte'rnatives· ,'19 Adapt ing housing/furni'ihings
,for special needs ,Goals/sj;andards/values/
resources influence housing ~QoVe~nrnent.'and housing Storage principles ~,\;l;J,tu';J:;e/hou;s i ng £lltu;r:e
,;Ne ighborhood
Mean
3.94ab
3.86ab 3.f30ac 3.6801
3.6301 3.59a 3.57 3.55a 3.5201 3.45a $;,43a
3.40a 3.3501 3.33a 3.$001
3.28a
3.03a 3.01ab 2,99a 2.8401
Mean
4.06a
4.04a 3.65bc 3.58a
3.58a 3.58a 3.62 4.03b 3.4901 3.45a
"3.09b
3.28ab 3.44a 3.17a 2.23a
3.09ab
3.09a 3.2201 2.69b 2.8901
Mean
3.84b
3.76b 3.44b 3.34b
3.23b 3.35b 3.44 3.66a 3.20b 3.21b 2. 83~&
3.08b 3.06b 2.88b 2.84b
2.92b
2.74b 3.00b 2. 43~ 2.58b
Note. Scores were assigned as follows: 1 = not important, 2 = little importance, 3 = important, 4 = very important, 5 = essential. *Means with different letters (a,b,c) were significantly different at the five percent level in the Tukey-HSD test.
Key Tables are color coded to show significant difference between:
= Students and Both Groups of Parents = Students and Econ. Disadv. Parents = Students and Non-Econ. Disadv. Parents
59

J J J J ']
']
]
]
J 1 1 ]
] ' JI
60
disadvantaged parents. Ten of these concepts (tis = 2.84 -
3.80) showed students' means to be higher than non
economically disadvantaged parents' (tis = 2.43 -3.44). With
the exception of two concepts, students' perceived the
concepts to be important to very important (tis = 3.01 -
3.94). Significant differences (g<.05) were found to exist
between students and economically disadvantaged parents in
the concept of conserving energy (tis = 3.55, 4.03).
Significant differences were also shown between students and
parents, both economically d~sadvantaged and non-economically
disadvantaged, for the concepts of influence of housing on
individuals/families (tis = 3.43, 3.09, 2.83) and culture/
housing future (tis = 2.99,2.69,2.43). In both concepts,
stUdents perceived it to be more important than parents.
Consumer Education. Students ranked the subject matter
of Consumer Education sixth among the eight subject matter
areas. Although the overall mean for students in this area
is lowest of all groups, significant differences were only
shown to exist between students and economically
disadvantaged parents. However, a closer examination of the
17 concepts on Table 9 shows that significant differences
(g<.05) exist between students and parents, both economically
disadvantaged and non-economically disadvantaged, in 9 (53%)
of the concepts: budgeting (tis = 4.03, "4.52, 4.52), managing
checking account (tis = 4.02, 4.60, 4.60), financial records
\
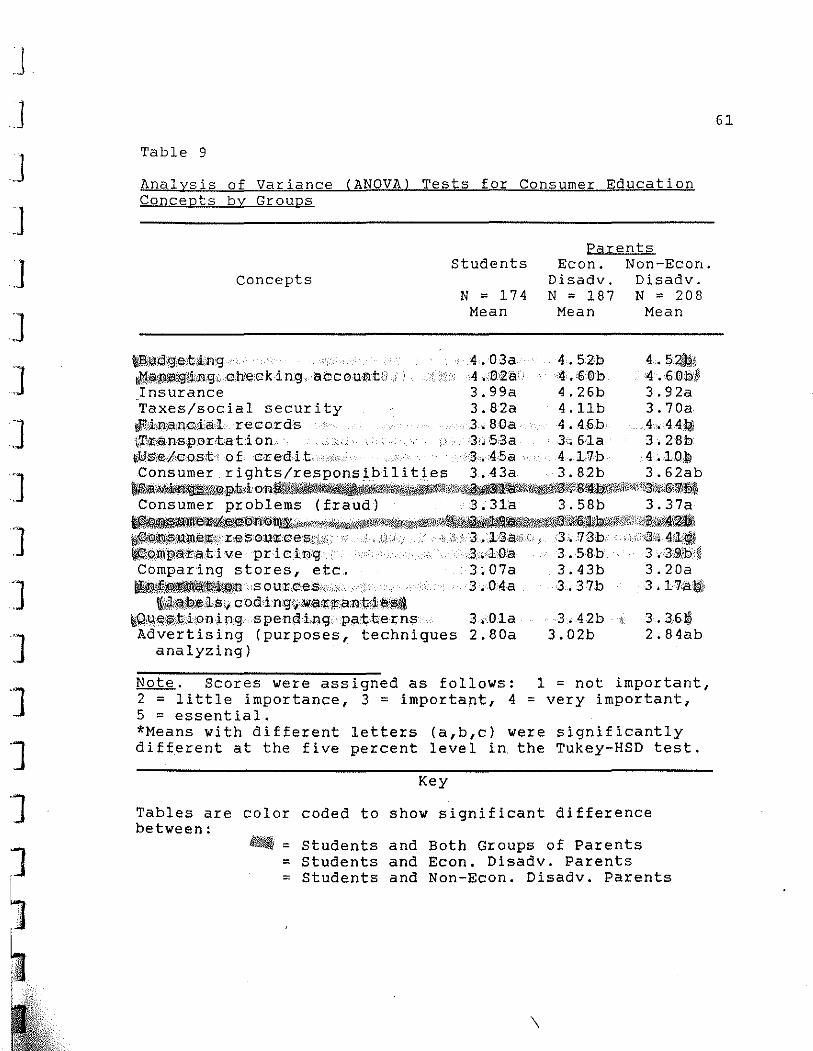
J J J ]
]
]
]
]
]
]
]
]
"]
"]
Table 9
Analysis of Variance (ANOVAl Tests for Consumer Education Concepts by Groups
Concepts
Parents Students Econ. Non-Econ.
Disadv. Disadv. N = 174 N = 187 N = 208
Mean Mean Mean
~)l!!@,g,e!t.wng 4.0 3 a 4 . 52b 4 • 5 4Iii~ lIl;iiiilllilli!1ilil'itn.:gvGn:elcking,accoU<!!ltGi.) )'4 .'£12al' ,4 .'60b '4.60,fu'~ Insurance 3.99a 4.26b 3.92a Taxes/social security 3.82a 4.11b 3.70a jllilna,nclii.a,iL. records 3.80a 4. 4.6,fu 4,,441lJ \Til$;ans'j?or,tati on ,3:,53a .3.; 6·1a 3.28b uWs,e)/.e·ostlo.f credit3,45a 4.1c7b 4.10b Consumer rights/responsibilitles 3.43a 3.82b 3.62ab ~","_~~iW,t;),io1'l~_~MI!:4\i~~~.;!,Jg~8~,!'\1"'i#)~~ril)®8. Consumer problems (fraud) 3.31a 3.58b 3.37a
~~1l;:1l".iLel:tP)h\lti'''_,,?)4i;,''I&'liJi!ill!\\tlti)!()')ll%\I''iJ\Wimii~~*A1lI~lY}¥~i\\GVlk%liWfAm ~~~il?)i1Rmft:l;qr)eSoiu~'ceSLlB).,q)i " ,,),))1.3 •.. 1)31'11() '.' ,3,'7:8b ii.)Ii3i.Ail'lj ~o,mpa)t:·ative prici'n'g3".ll·0'a 3.58b 3 . .3)9Ib)~ Comparing stores, etc. 3.07a 3.43b 3.20a !IJilmlt~,i!~'l1lsour,c.es)" 3,04a3. 37b 3 .17a~
\li,\\I-~'l!>~.ls(; cod)i'ng9,;w<il;)!jI1a)nt4~)li?j ~Oi\le.Pii\l';iloning. spen¢!Lngpi3.tterns 3,01a 3.42b )
3.02b 3.36~ 2.84ab AdvertiSing (purposes, techniques 2.80a
analyzing)
Note. Scores were assigned as follows: 1 = not important, 2 = little importance, 3 = important, 4 = very important, 5 = essential. *Means with different letters (a,b,c) were significantly different at the five percent level in. the Tukey-HSD test.
Key
Tables are color coded to show significant difference between:
Students = Students = Students
and and and
Both Groups of Parents Econ. Disadv. Parents Non-Econ. Disadv. Parents
\
61
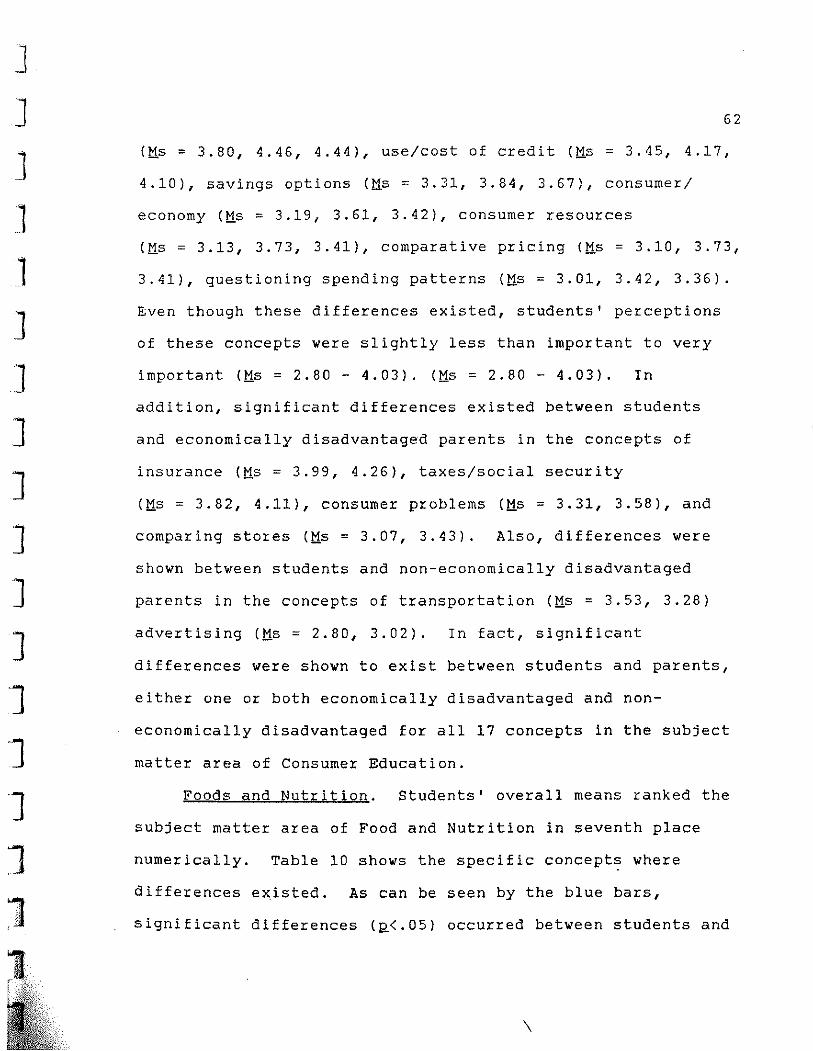
]
]
J ]
]
J J ]
]
]
]
]
]
]
]
J 1
62
01s = 3.80, 4.46, 4.44), use/cost of credit (l1s = 3.45, 4.17,
4.10), savings options (tis = 3.31, 3.84, 3.67), consumer/
economy (tis = 3.19, 3.61, 3.42), consumer resources
(tis = 3.13, 3.73, 3.41), comparative pricing (tis = 3.10, 3.73,
3.41), questioning spending patterns (tis = 3.01, 3.42, 3.36).
Even though these differences existed, students' perceptions
of these concepts were slightly less than important to very
important (tis = 2.80 - 4.03). (!is = 2.80 - 4.03). In
addition, significant differences existed between students
and economically disadvantaged parents in the concepts of
insurance (!is = 3.99, 4.26), taxes/social security
(!is = 3.82, 4.11), consumer problems (!is = 3.31, 3.58), and
comparing stores (!is = 3.07, 3.43). Also, differences were
shown between students and non-economically disadvantaged
parents in the concepts of transportation (!is = 3.53, 3.28)
advertising (!is = 2.80, 3.02). In fact, significant
differences were shown to exist between students and parents,
either one or both economically disadvantaged and non
economically disadvantaged for all 17 concepts in the subject
matter area of Consumer Education.
Foods and Nutrition. Students' overall means ranked the
subject matter area of Food and Nutrition in seventh place
numerically. Table 10 shows the specific concept~ where
differences existed. As can be seen by the blue bars,
significant differences (R<.05) occurred between students and
\
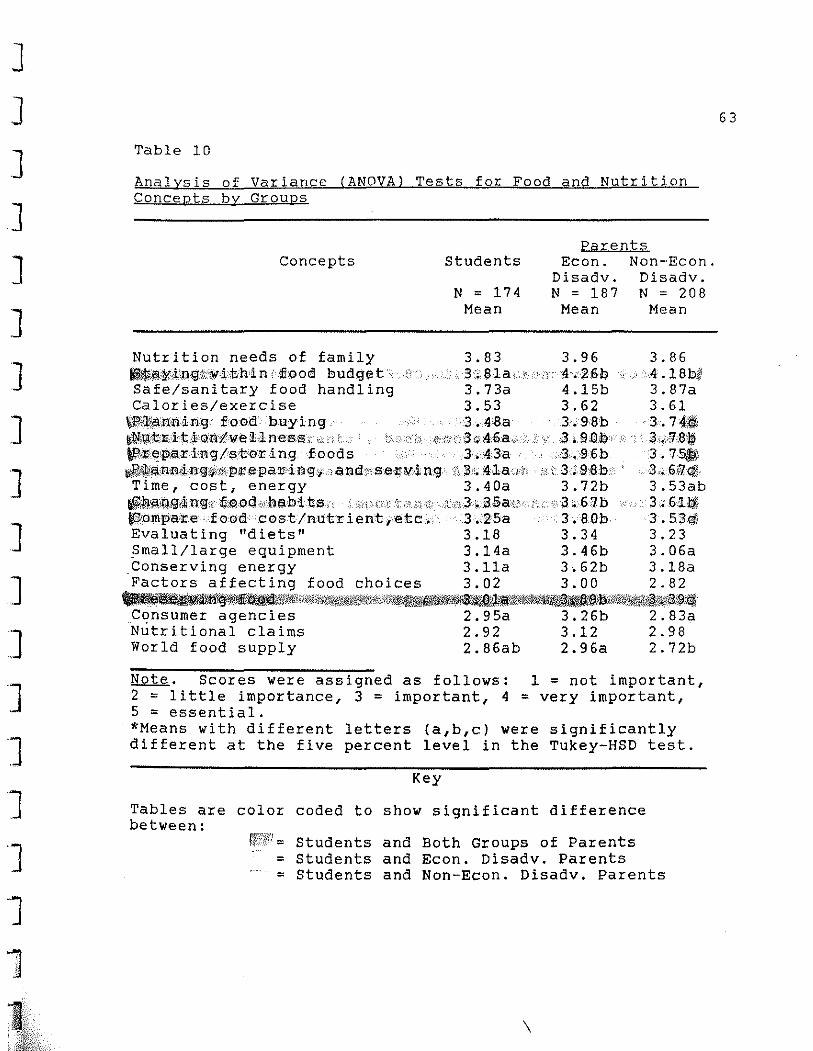
]
]
]
]
]
]
]
]
]
]
]
]
]
]
]
']
J 11 ,
Table 10
Analysis of Variance IANOVA) Tests for Food and Nutrition Concepts by Groups
Concepts students
N = 174 Mean
Parents Econ. Non-Econ.
Disadv. Disadv. N = 187 N = 208
Mean Mean
Nutrition needs of family 3.S3 3.96 3.86 ~,I!l,I>¥.;i.{!gbwi..;Ir;hin : If La ad budg-~t' il. 3:iS1a,.i!;·': 4.26l:;>·,4 .1Sb~ Safe/sanitary food handling 3.73a 4.15b 3.87a Calories/exercise 3.53 3.62 3.61
~Pi'll,a:!1.'l'ling food buying 3.4'Sa 3.9Sb ·3. HI@, ~ti;li!t'l1it.iQ1'l0we!blne;ss.i ,.1·,: :';, {.ii:;;3"A.6a.'.:·' \' 3l9Do", 3.q·7:6:1§ ~¥E:pa'ri'l'lg/sto:r ingfoods 3,43a3·,960 3. 75f/1l1 1!!'1.4!#;!,nl!!l<i;.1'lgl,,:lipace palfdng:;.; andnseiJiIl'j. 1'1.g Xi 3'. 4·1a(th xv: 3:1.9:8.0' 3 .... 6{fJ~, Time, cost, energy 3.40a 3.72b 3.53ab ~i!!!;<l.'O}!li~.ng.Y £:liloo·;,: ha:b'its.;; ·C'. :1\:, "''1',3. ,13&at: ,," .,'. "h6 7 b 3,,6ll»5 ~ompare food cost/nutr ient,'etc. 3 •. 25a 3 .80b3. 53~ Evaluating "diets" 3.1S 3.34 3.23 Small/large equipment 3.14a 3.46b 3.06a .Conserving energy 3.11a 3.62b 3.1Sa Factors affecting food choices 3.02 3.00 2.82
~'f~~~.:Iii!ii,,*\ij"'i\if"f(lt~';!;h'Jlk':i'l~~ll':"~~~~1Mi __ ~~1:t1%i1_i@£~~;9;~ Consumer agencies 2.95a 3.26b 2.83a Nutritional claims 2.92 3.12 2.98 World food supply 2.S6ab 2.96a 2.72b
Note. Scores were assigned as follows: 1 = not impartant, 2 = little impartance, 3 = impartant, 4 = very impartant, 5 = essential. *Means with different letters (a,b,c) were significantly different at the five percent level in the Tukey-HSD test.
Key
Tables are color coded to. show s ignif icant difference between:
= Students and Bath Graups af Parents = Students and Econ. Disadv. Parents = Students ano Nan-Ecan. Disadv. Parents
\
63
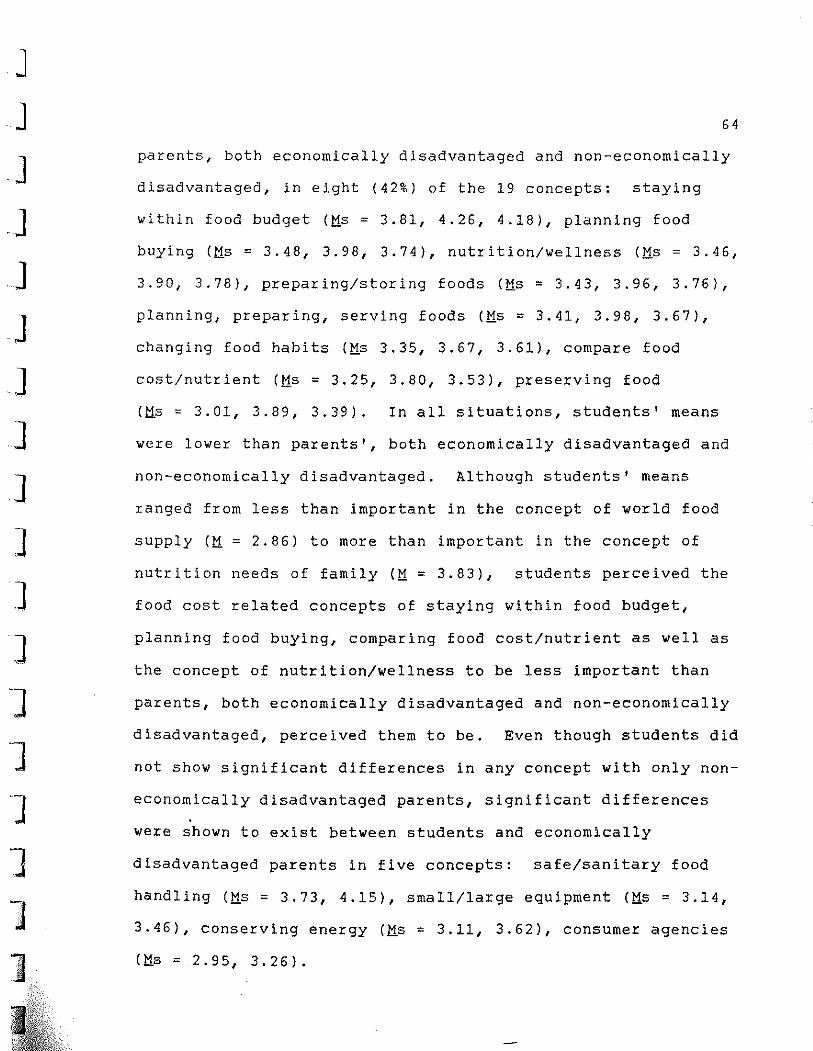
J J J J ]
J J ]
]
]
]
]
]
]
]
1 ]
]' ':'
64
parents, both economically disadvantaged and non-economically
disadvantaged, in eight (42%) of the 19 concepts: staying
",ithin food budget O:1s = 3.81, 4.26, 4.18), planning food
buying (tis = 3.48, 3.98, 3.74), nutrition/",ellness (tis = 3.46,
3.90, 3.78), preparing/storing foods (tis = 3.43, 3.96, 3.76),
planning, preparing, serving foods (tis = 3.41, 3.98, 3.67),
changing food habits (tis 3.35, 3.67, 3.61), compare food
cost/nutrient (tis = 3.25, 3.80, 3.53), preserving food
(tis = 3.01, 3.89, 3.39). In all situations, students' means
",ere lo",er than parents', both economically disadvantaged and
non-economically disadvantaged. Although students' means
ranged from less than important in the concept of world food
supply (ti = 2.86) to more than important in the concept of
nutrition needs of family (ti = 3.83), students perceived the
food cost related concepts of staying within food budget,
planning food buying, comparing food cost/nutrient as well as
the concept of nutrition/",ellness to be less important than
parents, both economically disadvantaged and non-economically
disadvantaged, perceived them to be. Even though students did
not sho", significant differences in any concept with only non-
economically disadvantaged parents, significant differences
",ere sho",n to exist bet",een students and economically
disadvantaged parents in five concepts: safe/sanitary food
handling (tis = 3.73, 4.15), small/large equipment (tis = 3.14,
3.46), conserving energy (tis = 3.11, 3.62), consumer agencies
(tis = 2.95, 3.26).
J J J J J J J J ]
J ]
]
]
]
]
"]
J ]
65
Clothing and Textiles. Students' overall means for the
subject matter area of Clothing and Textiles ranked it last
for the eight subject matter areas even though no significant
differences (R<.05) existed between students and parents, both
economically disadvantaged and non-economically disadvantaged.
However, Table 11 shows that significant differences existed
between students and parents, both economically disadvantaged
and non-economically disadvantaged, in only one (6%) of the 18
concepts, choosing clothing/budget (Ms = 3.59, 3.95, 3.83).
It can also be observed that 'significant differences existed
between students and economically disadvantaged parents in six
(33%) concepts: maintaining clothing (Ms = 3.65, 3.99), using
information on clothing (Ms = 3.35, 3.62), sewing for self and
family (Ms = 3.27, 3.57), equipment for construction/
maintenance (Ms = 3.25, 3.62), altering and recycling clothing
(Ms = 3.14, 3.46), altering patterns (M = 3.13, 3.38).
Additionally, significant differences between students and
non-economically disadvantaged parents occurred in four
concepts: consumer rights/clothing purchases (Ms = 3.31,
2.90), fads and .fashion (Ms = 3.31, 2.81), reasons for
clothing choices (Ms = 3.23, 2.85), advertising and clothing ..
choices (Ms = 3.17, 2.77). A total of 11 (61%) of 18 concepts
showed significant differences between students and parents,
either one or both economically disadvantaged and non-
economically disadvantaged.
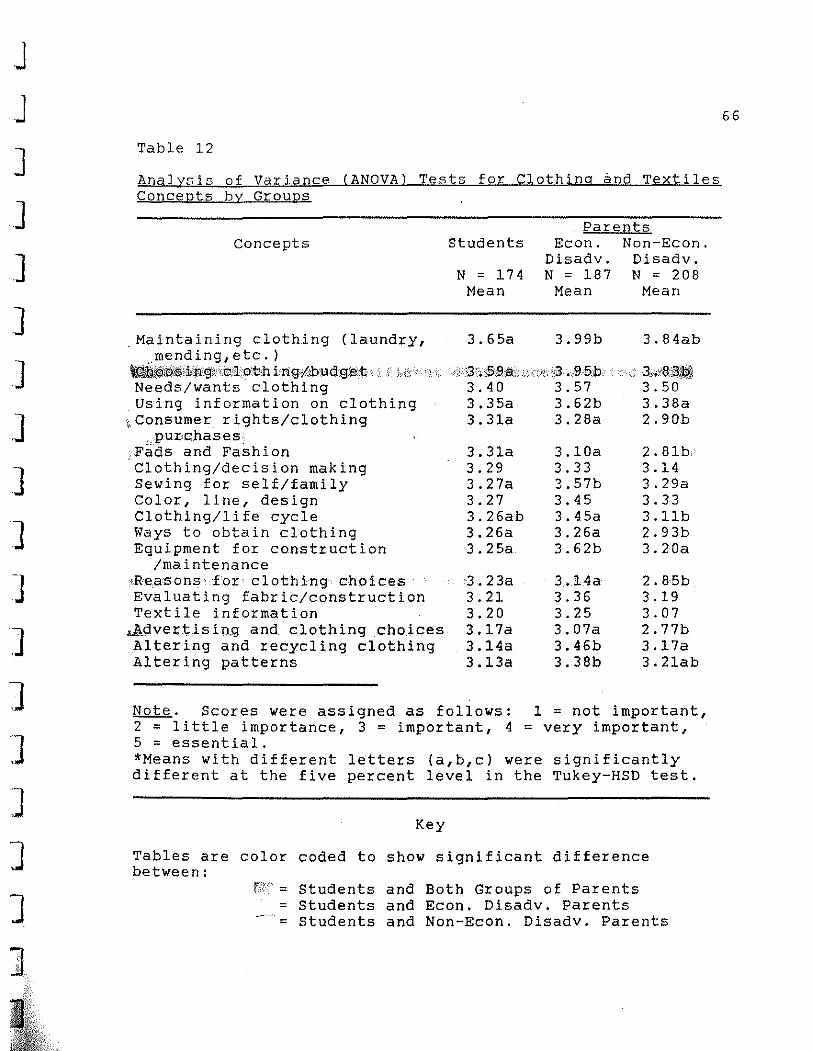
J J ]
J ]
]
]
]
]
]
]
]
]
]
]
]
]
Table 12
AnalYGis of Variance (ANOVA) Tests for Clothing and Textiles Concepts by Groups
Concepts
Maintaining clothing (laundry, mending,etc.)
\\\!i~:;Pl$;j,;iP'€ll; HJlp"bh htg,y'rb'udg,'e;!J; , (j ii;: "i.
Needs/wants clothing Using information on clothing
,Consumer rights/clothing .. pur,chases.
(Fids and Fashion Clothing/decision making Sewing for self/family Color, line, design Clothing/life cycle Ways to obtain clothing Equipment for construction
/maintenance ,Re.asons for clothing choice.s Evaluating fabric/construction Textile information
..AdverJ:ising and. clothing choices Altering and recycling clothing Altering patterns
Students
N = 174 Mean
3.65a
."'\3h,!5:,9:a'" ;',j
3.40 3.35a 3.31a
3.31a 3.29 3.27a 3.27 3.26ab 3.26a 3.25a
3.23a 3.21 3.20 3.17a 3.14a 3.13a
Parents Econ.
Disadv. N = 187
Mean
3.99b
,;:,,,,,3 .,,9c5.b, 3.57 3.62b 3.28a
3.10a 3.33 3.57b 3.45 3.45a 3.26a 3.62b
3..14a 3.36 3.25 3.07a 3.46b 3.38b
Non-Econ. Disadv. N = 208
Mean
3.84ab
. .. ,( 3 .. ,.A;I:~l!!i!i 3.50 3.38a 2.90b
2.81b 3.14 3.29a 3.33 3.11b 2.93b 3.20a
2.8Sb 3.19 3.07 2.77b 3.17a 3.21ab
Note. Scores were assigned as follows: 1 = not important, 2 = little importance, 3 = important, 4 = very important, 5 = essential. *Means with different letters (a,b,c) were significantly different at the five percent level in the Tukey-HSD test.
Key
Tables are color coded to show significant difference between:
= Students and Both Groups of Parents = Students and Econ. Disadv. Parents = Students and Non-Econ. Disadv. Parents
66
J J J J ]
]
]
]
]
]
]
]
-J
J J J J
67
A review of Tables 4 - II, will demonstrate that
significant differences existed between students and parents,
either one or both economically disadvantaged and non
economically disadvantaged, in 89 (65%) of the 136 concepts
within the eight home economics subject matter areas. No
significant differences were found in 47 (35%) of the 136
concepts. As a result, Null Hypothesis Ib was rejected for
those concepts where significant differences existed and
accepted for those concepts where no significant differences
existed.
Differences between students and teachers.
Data collected from teachers for Vance's (1987) study of
home economics teachers perceptions of what is being taught
were combined and compared with data from students. The
teachers in Vance's study were asked a different eliciting
question: "How much emphasis does this concept have in the
curriculum?" The eight subject matter areas and the 136
concepts remained the same. The following null hypothesis
directed the statistical treatment for research question 2b:
Null Hypothesis 2b. There are no significant differences
among senior high school home economics students' perceptions
of the importance of specific home economics concepts needed
within home economics curriculum and home economics teachers'
perceptions of what they emphasize in their teaching.
J J J J ]
]
]
]
]
]
]
]
"J
J l J J 1 1 ~
68
The hypothesis was tested by analyzing the ratings given
to each concept by each of the two groups. Ratings based on a
Likert-type scale indicated the extent to which concepts ought
to be included in the home economics curriculum (students'
perceptions) or the extent to which concepts were taught in
the classroom (teachers' perceptions). Each concept was
subjected to a t test to determine whether or not significant
differences existed between the means for each group at the
~<.05 level. This represents significant differences in 82
(60%) of the 136 concepts. T~bles 12 - 19 will be used to
report the findings related to. the concepts considered
important within each subject matter area. Concepts listed on
the tables have been abbreviated.
Child Development and Parenting. Child Development and
Parenting (ll = 3.98) was the subject matter area receiving
the highest overall mean from students. Table 12 shows that
10 of 21 concepts in this area had conceptual means of 4.00
or above. Although the subject matter area means of students
and teachers (Ms = 3.98, 4.03) did not show significant
differences, significant differences were found in 13 (62%) of
the 21 concepts. The concepts of child abuse (lls = 4.31,
3.76), conception/birth process (lls = 4.25, 4.61),
responsibilities of parenting (lls = 4.20, 4.89), present
choices/future (lls = 4.14, 4.58), safety/first aid (Ms = 4.13,
3.40), readiness to be a parent (lls = 4.12, 4.80), child
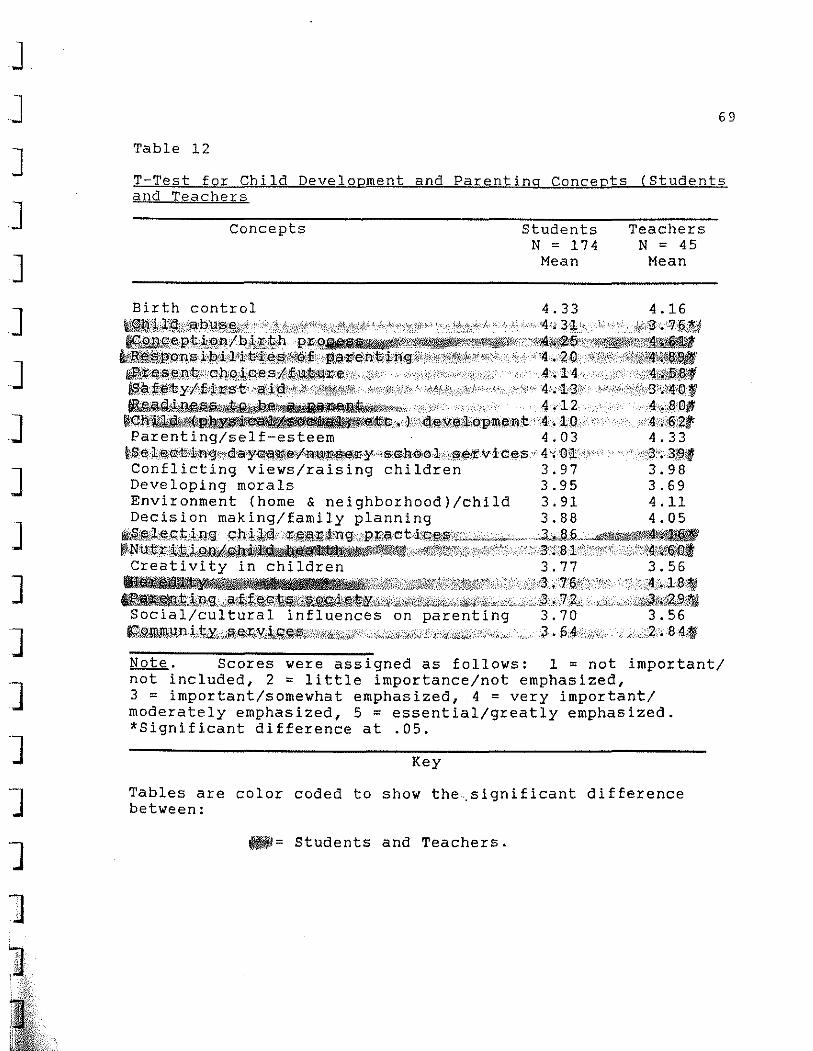
J J ]
J
J ]
]
]
]
]
]
]
]
]
J
J ]
69
Table 12
T-Test for Child Development and Parenting Concepts (Students and Teachers
Concepts Students N = 174
Mean
Teachers N = 45
Mean
Birth control 4.33 4.16 ttl~'1~t~:i.a~g~l~~~<bq~~)lrt,-~~ ,\j :~,'>s\:f::;.~dfi -j'f:,,:._:,:~~'~/?:i"l:!'-' "i-, +, ";',','::, tr;· ':.' .i,. '" ,'ii;' \"" '4 :~. 3'~.~~, _ t,; ).;. c,' ."J§~ija:i~ J'lfl/§id lI%2.:a£l,e'Pk,k:@jp/b)",~~h "pL'~ ill mml!!B'~~1!mi'ilBi""1!""~'1t'i"\1$lli~~'i;,,,(_>$t{:ilf~~
Qj,q;g~llf;P'0'ns·.j;p'iJ!\~"ty4'5!.~:!l\'Rl!i!\;!§,.,·(j":£!.$ieFl't;'i,:\,!g~iC(,i',"h"Y4·i " """i.'" i, .".', 4,·.·. t2,Q,·,.'iJi'''ii ·"~fi!il(l[;l,!'t.~_ ~fi!\S~Q\t;'cb:Q;~pes/i4J.~,i!;lllil:i'e.(, ',i,. 4.14 'i4@$f.!J# li:~~ii!iY'A'fij~L~h'~£!\i~ii;:,0;':i';)i;~;FT;";; '. ;"",;,1$, 4'i);.3!i, 'i"" ,iili3ii!;t4'J\l·~ ~~ImiilMiIQlii~A~w\N"i4 .12 ,4.if!iO' I!Gll'!~~~.dl\l.~l;:.!J":G\lil'MlllQlL:O'pmeiQ\t 'i4. lQ" 'A,,:i6:i2i" Parenting/self-esteem 4.03 4.33
t:S'elie'~1Vi:i;$i~0::d'a'y{'!l~~~V:.l<t~~~¥'i"s®h,G")l. '.lil.lil!:ti V i ees " 4\ 'Cll',';,' ' . ,,·t3";3~!f Conflicting views/raising children 3.97 3.98 Developing morals 3.95 3.69 Environment (home & neighborhood)/child 3.91 4.11 Decision making/family planning 3.88 4.05
~~ilc,~,<:;t.i.:Jlg· <:;,ht:kQ .• ····J;',!a~ll;@"J''l9.··,,·P·;rzt.ae t,i!g!i'Jf;'w=''''--'i~,. ... "..3.",JH;.".,,~~~ Ill!N'U;P,r,,~ll4ilW~~_',,;::%t;i!~!'1;\r;,i:,,'i:""! ;' "'.3,,':8.1':',"':)"'" ······'·,.t!:4,i).!:f!i1iD1 Creativity in children 3.77 3.56
-'f!i!IlI!'!!!!""""""""'l'!I(®'W 'ffl 'I ,t! II" ,. W""""""''"''~'!''<''''''''''"'''' "·,'··,·.·~...,'6,'·'.'.·",·, ",A, 1 0,* .. , ~.Iilnll!.~lJl'~ ~W;Ii? I!'!WfIl ill ) ~ u !lIt ~ il~h5<il:\';n,;;'.;'>;,~ir(i;l%('({i'::f.::,~·'.·:f:\,P:5{");.;;1':',,'::';"":,' :\,:;\~i';',;),,,.- L',_ i_".:.;>;'<'-,-,;,_ "i'::;".';'~'.' "Y"1jfj
~.k.QRI"8i'!ttj~,~g::ti'§li"'''~~WJ~~J¥:;"j,~''''i,Ji''2'"·'''i'''''!;x.:,,:~Lii",.:" •. ::i~:,,7.g::. ,,;kS:"'i"il~.#;~@,~ Social/cultural influences on parenting 3.70 3.56 IQQURP~ik¥.,:(;p':,~J;,iY,ii:\il\§l:l?~i",,{"6tt.;;l!i'i"· ,',i'.:,:';',';::)C ..... '#ii<:,;it/iiii .. ". ,,, '., .;3 .• P,il"ici,,;,8 i4,~
Note. Scores were assigned as follows: 1 = not important/ not included, 2 = little importance/not emphasized, 3 = important/somewhat emphasized, 4 = very important/ moderately emphasized, 5 = essential/greatly emphasized. *Significant difference at .05.
Key
Tables are color coded to show the.significant difference between:
~= Students and Teachers.
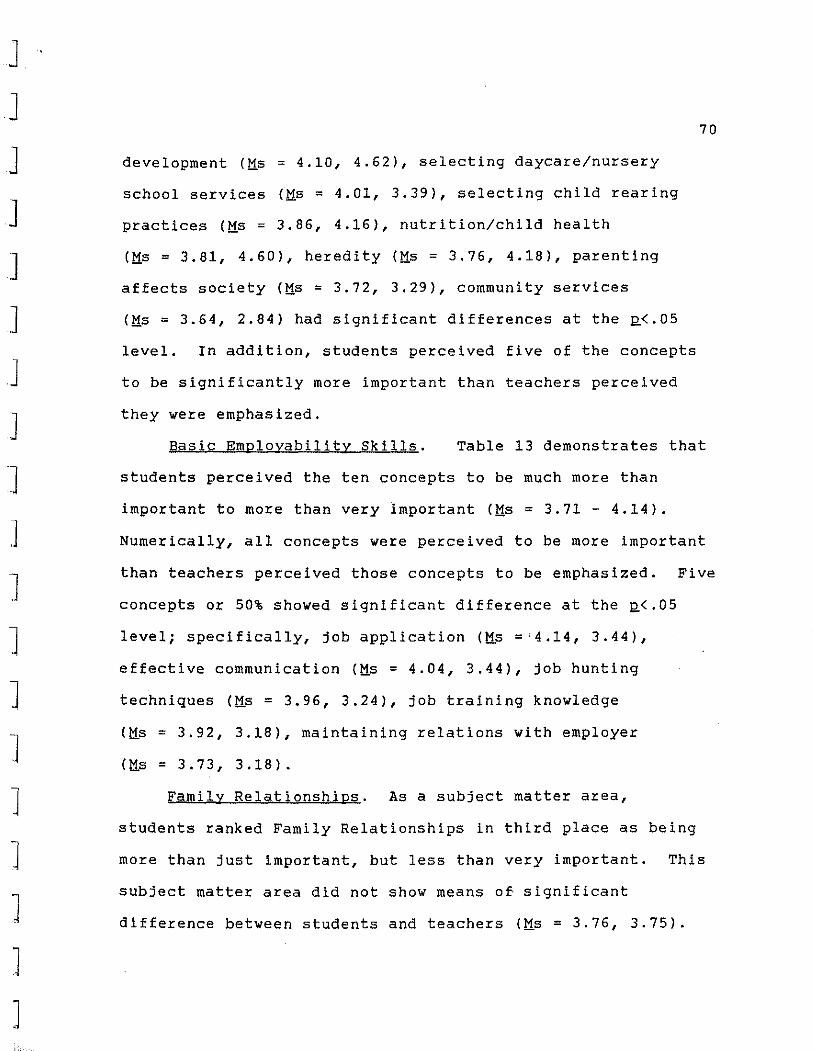
J
J
J ]
]
]
J J ]
]
1
J J 1 1 J ]
]
] "~'"'.
development (tls = 4.10, 4.62), selecting daycare/nursery
school services (tls = 4.01, 3.39), selecting child rearing
practices (tls = 3.86, 4.16), nutrition/child health
(tls = 3.81, 4.60), heredity (tls = 3.76, 4.18), parenting
affects society (tls = 3.72, 3.29), community services
(tls = 3.64, 2.84) had significant differences at the ~<.05
level. In addition, students perceived five of the concepts
to be significantly more important than teachers perceived
they were emphasized.
70
Basic Employability Skills. Table 13 demonstrates that
students perceived the ten concepts to be much more than
important to more than very important (tls = 3.71 - 4.14).
Numerically, all concepts were perceived to be more important
than teachers perceived those concepts to be emphasized. Five
concepts or 50% showed significant difference at the ~<.05
level; specifically, job application (tls ='4.14, 3.44),
effective communication (tls = 4.04, 3.44), job hunting
techniques (tls = 3.96, 3.24), job training knowledge
(tls = 3.92, 3.18), maintaining relations with employer
(tls = 3.73, 3.18).
Family Relationships. As a subject matter area,
students ranked Family Relationships in third place as being
more than just important, but less than very important. This
subject matter area did not show means of significant
difference between students and teachers (tls = 3.76, 3.75).
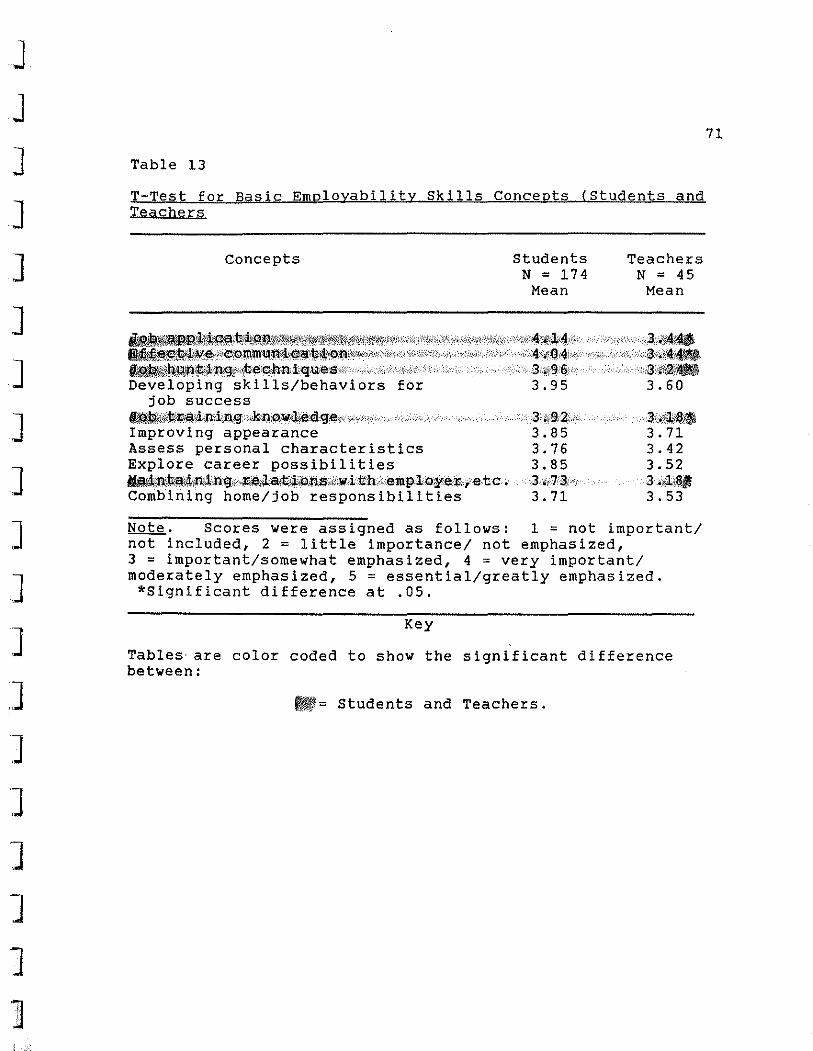
J J ]
]
]
]
]
J ]
]
]
]
]
]
]
]
J J ]
',1,
i-
Table 13
T-Test for Basic Employability Skills Concepts (Students and Teachers
Concepts Students N = 174
Mean
Teachers N = 45
Mean
~A!14~l;i~t~~,~~iij:"iii'i~i~<l1~!!'\'!'l¥~f~,~i~'\\"'i""'ii""",i"i'"",1",,'!,,1\,,"'!' ""i?'''''''~'4",ii """i""",,'i3ii'~,4;~. ~~~J1i~;II'lil"Ji,ei01t1111<ti!il'l'ii~i~\iliini!i,"'''i''''iii'',i\,a'''i,' ','I,,""'" "" ,,' ,i'4",,,oQi4h,,,, ""'" ii",,;?;? ',ii~4i;4_ fM!I!"'lIl[l4!,~~~<R9f,,,t.e!~1I,i,(\J'Uie$""""i, i,i,I"!' 3,,,S!~ii' ',3i~2i_ Developing skills/behaviors for 3.95 3.60
job success .::li!~tj:t1~'/'1li"m,@"'ik'n~,~,e&,g~\!I"'\i"i'i'" '" ,", Improving appearance Assess personal characteristics Explore career possibilities ~jr)lj;ia,@'JI1ii,ng,~41,ai~iQn$;k,,,,,i thi",emp,lo;¥e'r",'et c' • Combining home/job responsibilities
,', "'" 3"i",9;2ii" 3.85 3.76 3.85 3 ",73v! 3.71
, ,,,,'.:'~'8""" "'".~.>.A~
3.71 3.42 3.52 a'hiLl&, 3.53
Note. Scores were assigned as follows: 1 = not important/ not included, 2 = little importance/ not emphasized, 3 = important/somewhat emphasized, 4 = very important/ moderately emphasized,S = essential/greatly emphasized. *Significant difference at .05.
Key
Tables are color coded to show the significant difference between:
~= Students and Teachers.
71
]
]
]
]
]
]
]
]
]
]
]
]
J J J J J J
Table 14
T-Test for Family Relationships Concepts (Students and Teachers)
Concepts Students N = 174
Mean
Teachers N = 45
Mean
Human sexuality 4.18 4.16 4iclEY;;li!\it'~~:jl;@;~~!ikt:11iImli"il;y";~;M;!j"j,~!iI,11\?~'I;'. , ;,I'i·j·, ·"dk"I;#.Vi'( I; • ti:;~~ .~,~,aIOip.e;I?I?··;·f or····. ·Q;91!Hll'i·t 1!t(:llJl;jj;,c,,,~., ..... .,.~".,., ...• _,...~~"'J#~~";j;lllilllli&~_ Managing crisis 3.99 3.84 "~1fIra cteri~~~"f;fi!1f!.a{(!:t ne.:!; '.' . ·';/;;};·;ik,9/~.;, . ';h(Qj~~~ Resolving c~~'flict ••.•• ,'i., ". .... 3.96 3.96
ii1il@~l'l;t~;tlMt~1!li9\jI?PI7;\!i;;j,\lw,4,;i:/l'lieie;~la\:(i , ···.'·2~, .• ;~f1!1 ~ill!~~~I)I!I;I"~e;l11iljt;4%Pi!i\·~!i!_~*P;lllie.·.l<1!\i/j;;.~9{!\tA%j;fWli' "iii .,' il';j(;jn§~·'illL;;*i&idJM¥jili4i.;;3'Fl;":ii Attitudes impact on others 3.80 3.91
t!if,l\l\lii'lli\!silil!.Q4i/\1:!eilig:¥:~il;'?Yft';!"·;ill;!1iiii{ii'i';li;.,!,;!,."t ,iili;I,. ,.o'il:.'j Realistic expectations 3.77 4.00
l!l'll;'\@'j.!iIi~~ii!'i1;;1IiIi!Ili!\liW/!'li~~\'\i~)!jlb;)~';K'i;:?;'.) i •.. · .. "';;li%;%li'41i1i;;~;·Wl;; til(;?:!fiIftili:'Jlz~~Wfi£Wlj:~'iii;)'i.;;4i"J/2'2,~ Family group decision making 3.77 3.44 ~llWi~~j.I',\4Jiil;41.!ili;;41!Y!ll);e",\';!i'ii~i;jI+/>!d",k.· ,', .';'.~NillAi;;i"'/.'·.'j)/')·";·i'4/ ..•. ~'lliJ Choosing lifestyle 3.67 3.60 ~Hm~le,$';\,;·Q,~;f·'Jl;&ro;i«,\ti¥"0il{4'&f&"il>';"*("·"'·· .'. .,;·." .. l.';1 i .·L .f"!.i",4,~;.,~,;l;..;ib;;;;;; HW,;;.;;1.,,1,:?@~ Stereotyping 3.58 3.38 Multiple roles 3.56 3.84 '1l)c1l\.\ll\j,;1·v.·j§·@r,uc.pure.s " ···"··i;'·' ,3;;";1;8.;; ';~:;" C,\;;;;.;4;.",;2;Qii!/ ~~_i';;;;~*i~;§;,;a~~';i_,;~~~tl\\l.ns ·;;l;l .;.fOC; .H2.lllli1';;, ;"X;g;;i!~);i!,IM:l;·%;;. "'~;fl1;;;;'· 'w,!3;/,,;{}llllrf ~oo;y:n;Ai;t;y .. )$,w]H!!.o r.·t,.;';!?;.@!I?/lHJ;e.:;;./ •... 3 .• 3;$ ··;.l 4. 511 ~!Illi~~\4;ii!?;'itiili!1l~;;;;;g~4!..t_1!iIil;ttil'i,!illJ!1'l :p:\;ll::e;$; ,-' • ··3 .• ;3'0;2.;.6¥
Note. Scores were assigned as follows: 1 = not important/ not included, 2 = little importance/ not emphasized, 3 = important/somewhat emphasized, 4 = very important/ moderately emphasized,S = essential/greatly emphasized. *Significant difference at .05.
Key
Tables are color coded to show the significant difference between:
~~= Students and Teachers.
72
J J J J ]
]
J J J ]
]
]
OJ
J J ]
]
]
1 I,~
However, Table 14 demonstrates that 13 (59.1%) of the 22
concepts in this subject matter did show significant
differences between students and teachers. The six concepts
73
preventing family violence (tis = 4.16, 3.62), characteristics
of life partner (tis = 3.99, 3.00), identifying special needs
(tis = 3.89, 2.96), caring for elderly (tis = 3.79, 3.07),
family laws and regulations (tis = 3.39, 2.80), families and
different cultures (tis = 3.30, 2.62) were perceived by
students to be more important than what teachers perceived
they emphasized while the seven concepts readiness for
commitment (tis = 4.04, 4.62), building relationships/
cooperation (tis = 3.88, 4.33), effective communication
(tis = 3.77, 4.22), family life cycle (tis = 3.74, 4.18),
purposes of family (tis = 3.61, 4.29) family structures
(tis = 3.48, 4.20), community support sources (tis = 3.33, 4.51)
were perceived by students to be less important than teachers
perceived they emphasized.
Management and Other Processes. Students' mean scores
ranked the subject matter of Management and Other Processes
numerically in fourth place among the eight subject matter
areas with a perception of it being more than important for
students (ti = 3.62) while teachers perceived this subject
matter as moderately emphasized (ti = 3.97). Significant
difference between the groups occurred at the R<.OS level.
Table 15 demonstrates the differences in means between
]
]
]
]
J ]
]
]
]
]
]
]
"]
"]
"]
"]
1
Table 15
T-Test for Management and Other Processes Concepts (Students and Teachers
Concepts
~iM'.i~,:t!lJ¢l,e / r.es;p,;Q"lsib,iJ,~;;(iii'o r· ·Ol'p·i.si on s Coping with changes
~~J'l.,i.!i!;i~;if.~;;to';;mlil.i",.e iii.' diegA~4.0 ns;;' .. ; ... 11l~\l!;>;illI;ll~ki~'!!'i~lwJ;~.
Managing personal/family resources
Students N = 174
Mean
.. ,;4i,OA 3.94
;1,3;;~.8..1.
3.74
Teachers N = 45
Mean
4.361j1 3.73 4.3,;!l~
4.02 ~l&~Wiliili!.i!i;l!!'iI-;~:il-iil),f!l;1i'·llilikMi§l~:f,\j:~fil;!?;i\'i!;'IiiI·; .. i.;."'". ';;\ii;;:· • .i' Y,i" • ;;ii 1': i·.,,;caililP',~i;';;'" ."',,,. 1';",i4 :., 3;1,1;4 .m;"'i.pa,;;or.;"",:",;,.;al.t.g'·" .. n."'J>ihMe,~j!i'i,;. 3.· .. ··., •. ;.5 .•. 4.· ... ;.: i ,4,)'.' .A: .. "" ~,~, '''",._, __ .",,'rI',,~''i'Zl'''' .. "_. ___ "~.~"~_,,,,,<,, __ }_~_",_,,,~,,.,,_._ " _ _ ~'J.t_
~ii\i91@imef~!;~..m;,jj\@~,~i1l;§;li<':;:.; iii';;;';i'';'"';!'';''' h ,,~'!;~,~iil·:i>;i:;llij!j;.' ,@ : •. !it~ Work simplification 3.36 3.47 Evaluating claims in media 3.02 3.22
Note. Scores were assigned as follows: 1 = not important/ not included, 2 = little importance/not emphasized, 3 = important/somewhat emphasized, 4 = very important/ moderately emphasized, 5 = essential/greatly emphasized. *Significant difference at .05.
Key
Tables are color coded to show the significant difference between:
~= Students and Teachers.
74
]
]
]
]
] ]
]
]
]
]
]
] -]
J J J 1 1;,' ,
i
1
75
students and teachers as to the importance of the 9 concepts.
students' perceptions showed all concepts (tis = 3.02 - 4.04)
to be important to very important for students to know. In
eight of the concepts students' mean scores were numerically
lower than teachers' mean scores. The one concept where
students had a higher mean score than teachers was coping with
change (tis = 3.94, 3.73), but significant differences between
the two groups did not occur. The highest mean score for
students' perceptions was the concept attitude/responsible for
decisions (tis = 4.04, 4.36). 'This concept as well as the four
concepts ability to make decisions/solve problems (tis = 3.81,
4.38), determining values, goals (tis = 3.63, 4.31), exploring
alternatives (tis = 3.54, 4.24), using management process
(tis = 3.54, 3.96) showed significant differences with teachers
at the ~<.05 level.
Housing & Home Furnishings. The subject matter area of
Housing and Home Furnishings showed no significant
differences (~<.05) between students and teachers (tis = 3.43,
3.42). However, Table 16 indicates significant differences
existed between students and teachers in eleven concepts:
evaluating home comfort/privacy/secority (tis = 3.68, 4.00),
legal rights/influencing change (tis = 3.63, 2.75), caring for
home (tis = 3.57, 2.91), selecting home furnishings/equipment
(tis = 3.52, 4.07), using decion making in housing (tis = 3.45,
3.84), housing alternatives (tis = 3.33, 4.47), goals/
J J J J J J J J J ]
]
J ]
]
]
J ]
]1' l'
!~; ~.
Table 16
T Test for Housing and Home Furnishings Concepts (Students' and Teachers)
Concepts
Financial/legal aspects of owning /renting
Students N = 174
Mean
3.94
Teachers N = 45
Mean
4.13
Making home safe 3.86 3.62 Selecting housing 3.80 3.78 .'i,\ll.J:)i!!illi~~f!.(g§M!W9.m~rJl\itf;).m.!'ljig'1iI:t.·/'Pir.it"Yi§i\ll:~/§eiQ!.\(\%'ij:o/M;n.i~·.~1!t8;i?Xi,;.i;i~;;;;;i.i.~.i.,m:(jf li:i\il',g;~J.jiil1hji9'il!lii:,~/j;'!'1·fii!;il;!.eX!(;lji·!!).giqn§'!'Iig·.!1 . .· ..... i···· ..••. i .. gii'~i7.t~ Purchasing furniture/home furnishings 3.59 3.82
!Mi,,i};·~iQ·g'ii'idi:,grbl;,b;@:!l\e·"):;'i!ji){.·"ii .. >;i " .i··"::ii£\i~'ii.q"':'i ;:)l·;;;,9.iilill Conserving energy 3.55 3.49
Al!3§)).:.e",.t;;@;:nigi.'iXl':ii~eJig;f:!4ri:Oiiilli.t\'i·n,g·.s.xLellliUii;pm.en·,t· .. ;!I'i"OBAI £Wi$@,1:1;giii1'lit'lil!iiii'@;~L~iiill\i'I,*3l)'n,g· ... i.n;'.I!l,g,\1iI~~il1Iii,gii·'· . x, F'ii'.*N;';i3i>Y4i@,~4,~0.iii.;'3i;,;tli:\\!1i Influence of housing on individuals/ 3.43 3.50
/family 3.40 3.35
3.09 3.51
Identifying/evaluating house information Decorating/limited budget tt9qsAniJ1'i.il).iMie};·l'ljik\:;'~¥ie§i;i" .• ··;i., .... ' ,.; "'" ;>';~,)a~~~$:£1i!~~\~'~;' .:!\~ ",-,,',,;!\Aj;~1,~-4fZ',itJ Adapting housing/furnishings for
special needs Mi!(Q:$il\si/$'j;;la'I)'!ij!./il,;r;;I:ili$>*,~'lilil'uiesi/1l!e'So ur;des ....••
influence housing
3.30 2.98
fa"·ve ""n·-·e·n.",~.".""", •• h·""'·"i;.~.,.,·.i.·" ",,,,. . Co·.... .'" ""'. i.: ..• ·.; ... , .. '., .. 'p" .... i .• Ii .... ,.n ...... }."' ...•. '.' .. , ... ', ....... :. '2.:""'.' .•.. :o ..... '* .... ;f} •• """.;.·",:,·."· .... ",,,, •• !,,,,',,,'!"·,U',,,i,,.."'i,,,·it· .. ,,;,:,,.:...,., .. ' .. . ,Iii< , .. y... """" 'Ii
li~'~~~'~'At~~~:~=~;=:i;~:~i~ ,,' .. ,;: .... " . .i •. ·.., ..• i',;;~)~~'~;~~.;......:i:.t:,' ii~\j,.8.hF:l9,E1&q;R\'k,,·.H.·;. :/i'e;, •• ·i.::"·r"j';"·'i·,i. ...... ;;: .,., .. 4'iM!lki .., .. ·,;.;;L •. ~
Note. Scores were assigned as follows: 1 = not important/ not included, 2 = little importance/ not emphasized, 3 = important/somewhat emphasized, 4 = very important/ moderately emphasized, 5 = essential/greatly emphasized. *Significant difference at .05.
Key
Tables are color coded to show the significant difference between:
~~ = Students and Teachers
76
J J ]
]
J J ]
]
] ]
] ]
J J J J 1 1 ]
standards/ values/resources influence housing (tis = 3.28,
4.38), government and housing (tis = 3.03, 2.09), storage
principles (tis = 3.01, 3.58), culture/housing future (tis =
2.99, 2.47), neighborhood (tis = 2.84, 1.91). Students
perceived all concepts to be important to very important
77
(tis = 2.99 - 3.94) and they perceived five concepts to be more
important than what teachers perceived they emphasized these
concepts. In contrast, students perceived 10 concepts to be
less important than teachers.
Consumer Education. The subject matter area of Consumer
Education ranked sixth in students' perceptions of importance
(ti = 3.41) and no significant difference was shown with
teachers (ti = 3.52). However, Table 17 demonstrates the range
of students' mean scores in the seventeen concepts to be
important to very important (tis = 2.80 - 4.03). It also shows
significant differences existed between students' perceptions
and teachers' perceptions in 11 of the 17 concepts. Students
perceived the five concepts insurance (tis = 3.99, 3.31),
taxes, social security (tis = 3.82, 2.57), financial records
(tis = 3.80, 3.33), transportation (Ms = 3.53, 2.89), and
consumer/economy (tis = 3.19, 2.76) to be more important for
students to know than teachers' perceptions of what they
emphasized. The six remaining concepts showing significant
differences between students and teachers identified students'
perceptions of importance to be lower than teachers'
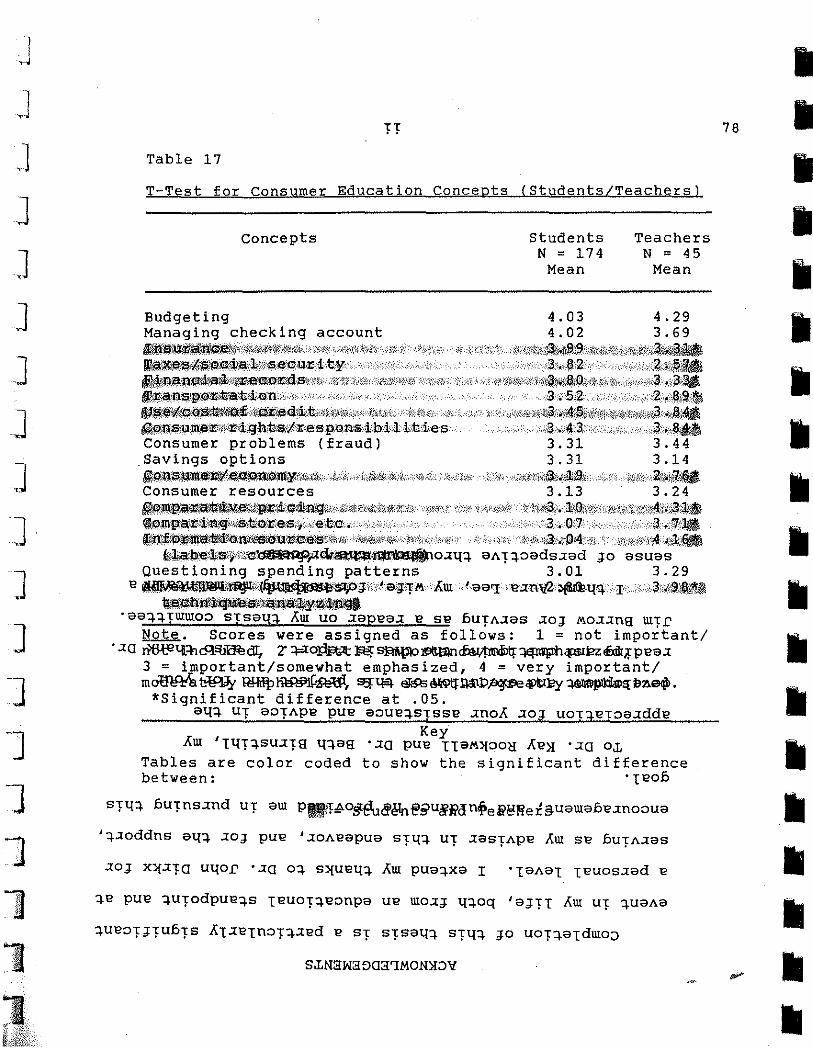
J
J J ]
]
]
]
]
]
]
]
]
]
l J
n
Table 17
T-Test for Consumer Education Concepts (Students/Teachers)
Concepts
Budgeting Managing checking account
Students N = 174
Mean
4.03 4.02
Teachers N = 45
Mean
4.29 3.69
~1M.'tl"~1}J&~:\*\i<'R\iS¥fJ:'4:$)E'-:"'2>If!;'''+'~~"n',i~,~,.t,:,;:i:1,:Y; . ',';(}:-f\'?-': ~;:i /·~f,:f*{~"~k,d)J;5h·r\{·!;'Ri~d;'{iih~t,~"i~~ i\Iil~¢i$}ti'lii;~.~¥IiI\i1&\j~,e'Q,ua:,i,ty"""" .... y." '" ·,,3\.d~\2., .. , . "'."".:4i'''',il£l j}~~l;liraj:."O)~'«~m-ids*·it$.'" '"T"''&-r'i ,,"Ai, -"'til",\ll'I.~' # -:"')I/, '0.': ,p,t'~Y-:; >'{ -\s~i~Jli\%'U:\\\t:f,~4iWf,~{£)<%'d!&\f?fk;:,;"";~+"'f,,;~,;,,a.:-.. ,..;,;~.':. ~iw.~~:p:$.1I'~~\tlili,e;n';"'jl ..•. :'.'.;.:: ..... '.' '..", .... ·,.3.;;5,2 ··....2 .• oll,,\1;t! If~~~¢~~i~~e,d~~;b::iiiil~'~~g\h~,,\::.",'$~'it;i.+( ~:·'},)··~%~'{,-"":ft¥:"; '-',I_-:'~, } 'L;\/j;l:;?k":f%'~'ii.i;4'i5;g'lqf'i~:i~&;\'fi¥'~W~'ilgf\;3;-:~\a~ OO!~O~il;\.p\'$'d!i;{,··\1t··:i,q·nibsi!«lr.els.p,o.ns·,iIi.b;i.\lLtHi,es.. ···\3.};;4\3· .. }.}. ,",h.·.·j· ..• ;i}.,.,,-,l,*i Consumer problems (fraud) 3.3l 3.44 Savings options 3.31 3.14 "J.l);n~:n;m~~~n~mi¥<r,~:K,t;\;,:'k/t;";iis>f~,ti;-~_oi;i\,:?.', .',;#*<{~,:; ,'Yi;t·thiY,' J..:,{~\ ')i)0~liW;j){;~fJ;;~6J0"'; ; X,\,~\':> -MSi:l,:;,o:2~{~~~. Consumer resources 3.13 3.24 '~)m;:la~~~Jt.t_1i~,_~n~Oh"i*1>!;1:hr:L~t';I;lHf,dn:,:;~,:, -4Tf::'t: '.: "(i:),'i'-!{i.~fO;i'; '_:t:;h-tM3}.':10Jli";'5.k;i\I)%;);M'i?f!1~~~"'.w:~ia$. t.PJIl'l!1a'Jti\i,tl;<jl,,,'S,t\o,l!;eSi1\'.i.:e·tl:c •• :.""';;" •• ; .... " .... ".: 3.QQ·· ·';'i·· . ,,,,.,,,3;,.'1'].+. ~~rttJ.~.tb;n'it_'t:S1H1«!\e;S1}~if;~;i;-~;;iM;~~tf"*'i;>,:~~d(i':<:x-tH:I"/' , ,:> ,;,;>:t:i' . 'IMp,,;a?~~Gt4rd\i:·'/, ;', ;: 1j~\::V::}3!\J;4",'~ilt.
/i4;·;;liP:e;Jhsit\j;~dU'l~,a~~lji~!i_*\O;n.(~ a1\ T~oads.:!ad JO asuas Questioning spending patterns 3.01 3.29
E ~1lIIl"~ii(~1IlPJ;,;fa'J'T/o\ 'Aut ./,aa'1·· 'EanV2,~.l.{q:"''I'',;;,<~:ilit9,?&,~ ~n!L~$i%:lil~~-'Z(r~
·aa~~TututoO sTsal.{l Aut uo aapEaa E SE DUT1\aas aOJ 1oI0a.:!ng utTE Note. Scores were assigned as follows: 1 = not important/
• aa ~q:nc:lSUmar. 2::j=t~ J!:e!: ~J!3ltaln~~.fSIm:<ExilIiFPEaa 3 = important/somewhat emphasized, 4 = very important/ m~~ RHrTt>~(~, s:'ft:Fl- EiJ3:6~ll<tt:t>Mt3e~lily~bn~.
*Significant difference at .05. al.{~ uT aOT1\pE PUE aouE~sTSSE anoA aOJ UOT1EToaaddE
Key Aut '1l.{T~sUaTg l.{~ag ·aa PUE 11alol~oo~ AE~ ·aa 0ili
Tables are color coded to show the significant difference between: ·1EOD
sTl.{~ DUTnsand uT aut P~T~O~~~~~u§~dn~e~~RetsuautaDEanooua
'~.:!oddns al.{~ aOJ pUE 'a01\EapUa STl.{~ uT aaST1\pE Aut SE DUT1\aaS
aOJ x~aTa Ul.{OE ·aa o~ S~UEl.{~ Aut pua~xa I ·1a1\a1 1Euos.:!ad E
~E PUE ~UTodpUE~S 1EuoT~Eonpa UE utoaJ l.{~oq 'aJT1 Aut uT ~ua1\a
~uEOTJTUDTS A1aE1noT~.:!Ed E sT sTsal.{~ sTl.{~ JO uOT~a1duto~
78
• • • • II .. .. II .. .. II II .. .. .. .. .. .. ..
J J ]
J J ]
]
]
]
]
]
]
]
J ]
]
017
6£
L£
L£
SI:
££
61:
rn 79
perceptions in the concepts use/cost of credit (tis = 3.45,
3.84), consumer rights/responsibilities (tis = 3.43, 3.84),
comparative pricing (tis = 3.10, 4.31), comparing stores (tis =
3.07, 3.71), information sources (tis = 3.04, 4.16), and
advertising (tis = 2.80, 3.98).
Food and Nutrition. The subject matter area of Food and
Nutrition ranked seventh of the eight subject matter areas.
students perceived this area to be less important
than other all groups, but the significant difference was
greatest between students and teachers (tis = 3.31, 3.75).
st~dents.pereeived·l? ~a8~& ~~1~ae'a8 ~ptea~be less u01~o~Js1~~S qo£ uo sa~oos u~aw La61 '11
important than what teachers perceived they emphasized. · . . . • . . . . . . dno~D ~oT~d 'SA dno~D ~~ada~ Students' mean SSQO'8UWm~~ qmgham $ba~$eQ~rsg6bea~6cores
£o~ the tw~ ~o~cepts'con3umer agencie&nQ~ MaQ.9~ 2.33) and dno~D ~~ada~ :uo1~o~Js1~~S ~xa~uo~ uo sa~oos u~aw '6 world food supply (tis = 2.86, 2.11), even though students • • • • • • • • • • • • • • • • • • 1:661' SA La61 ~ao&6d~~baB. twao~Qoe~~~~~smQx~~U~a q~~~~o~~ ~~@W19 c~ncepts.
It'can'be observed'on Table lS·that ~tfide~~~~~e~~ived all 'SA dno~D ~Bada~ :uo1~o~Js1~BS qo£ uo sa~oos u~aw 'L concepts to range in importance from less than important to · . . . . . . . . . . . . . . . . . . . dno~D M.aN lessAt~~~yadM~ort§~e1~M§m~G2q9£,u9.~~~qoSSq~~~fica~t
differen~e'(~<:OS) 'was'snown'in 11'otae~lco~~e~~§, namely, _ dno~D ~Bada~ :U01~OBJs1~BS qo£ uo sa~oos UBaw 's
safe/sanitary food handling (tis = 3.73, 4.51),calories/ .. .. .. .. .. .. .. .. .. .. .. .. .. .. .. .. .. .. Z661" SA La6!
exerei~O~~~a~?~3, :'¥~4~~a~I~nH~EgU~ooa~Bu'iHga¥tis ; 17 3.48,
4.27T, 'nLitiit:icin/wellness (tis'; j.46;. 4.31P6o~f~~1irin9/stOring TTB 1:661 'La61 :suo1suam1G qo£ uO sa~o S uBiw t
foods
3.41,
(tis = 3.43, 3.98), planninq prepa~inq, and serv~ng (tis = ~uamn~~su1 ma~1-09 aq~ mO~J pa~ndmoo saT~os 1:
4.56), time, cost, energy comgarisons (Ms = 3.49t 4.42), . . • . . . saT~OS SGr ~q~ J sa1~1T1qefTa~
S:3:'IHV.L dO .LSI'I
• • I
• • • • • • • • • • • • • • • •
I I I
• I
• • • • • • • • • • • • • •
"'"
as
CHAPTER 1
INTRODUCTION
Problem statement s~aq~ea~ pue s4uapn4S =~~
The University of Nebraska cooperative Exten~@~~4aq a~ua~aJJlp 4ue~1JluolS aq4 ~oqs 0 4 papo~ ~010~ a~e salqe~
Division's long-standing mission has been to implement . Xax
educational programs focused on agriculture, natural
1
resources and home economi.~:e ,c~1!PW:mg~ ftfarJJ8Ffl'uofS'.?ve 'pazlseqdma Xl4ea~o/le14uassa, = S 'pazl s eqdwa X~~l~~apom al,a4~:¥iUd1i\1e!?lfaRrQgfallltlJa'!l!%~~~~~~/~±'otl\tre= tf
'paz!seydma 4ou/a~ue4~odmJ_YI3_~L1._~.k .~~~~h~U~_~QU nu~<I1!"f'q:d-@aJ feer:t~~8t IBJolSl,e pWf) {s'~'MlI'M~'J,f-e~a :t"d~~ugP'~f6N the
iI~iiil1'lii~a.te,., .•. Ne~g-a~ka Exi.;;~l'lpiQI'l.'J:"~c.el'lt.J,¥i,,:;-~Kill~fcf.f1lvJtpSoJ?~i\?~f:~~v
iJ';i~,~anni~w p~~~~SS~S~~? i t§oJ:"g~I'l+II~~.t.~~~~~~~~:~~~~~~'a ~~~"",~~,~1Q9;4~~!\~~~st~~~~~,.~~f~~ ~~i':'if8~~'Ei6riii~:!~ddTal;)J'iihd"~C6Rijn\fei'i~~wt!~fa~1$;~mf~:''f
=:~~~t"f~?:~~·~~gJ~r~3.~;~·~j!§~.~~.:§~.i~i~~:~ti:~ttllflo'e;;:I~;~E= ~~T,"I;Ua,~~;~~'~JlJrg •• th'?",,,~~gP~~~.~.~~ •• ~:f1~~~g~.1~=~on
"'~'9"*' .. '11i'ir;'Wi. . !." . '. '*'."I)IJ;;". '. "'#.,'.fl¥i •• ··".'.' ..•. ,¥£ifd •• J;1%"""'."'i!l'li\\'"',"'.~..' 'P!.lIIl\W"' .• ,i~1Il:1r .. iIiI.'*.i'i.~'#;""""".'''''jl.+'r,~~. ,,~ ""'it· t'··· , .. l' -Seal "'11.' eeff'E."t· . 8itt:'~sl:)1~'C'llriy;;~ri''tiie'<' . . 'S'6' £. n,Q,).onllE t',,£ e,.. . !;""~,,, '."""""., .. '9J'WID'6'!f",.e.tlf.f''jt6qg;filD"tf'~'j!'e'€l'~;;r'd'\l !Ji.t.·f: •• ·tti?1l:t~""ig~§~~h f'5l?"tile""ig'!)o "§"{'if6t''eal@it§f'~fii[fi11,jj!~~mf~ 'IfI..£ 'Z',v "."2 V .. ,.."f ,<"11' Ii" £'.' .". .... . " . .'"·,i,"",,,.;, "w,', .. " .. ".' "i"*W'!·'ilDUi'\li\lntq"'i'@:Gi.0g!ii .. lD.tlj''Via;u·li'tiY@ fI!ii'ViCi'i\fi.lf,\t· ·b~"'p!~t!idhed.!'it6iibt~El.1!·\itfieteHI'rtl·]:~!~~~¥~~i es ~tl:'§"il7"\" ....., .. 'ftC' E,','" , ...... ·····.·,'.Fi,· ""'",," '''J.Vi'··''lDU']!i~flIi!i!iiii!f*i1!li1!j ~A~~Pinl'§';lfajjfiii"Si'''t
S6'M the peoblle£ it serves, As tHe£iln(iiee\i'@Jar\tItpk1i"oA.~S zo'v (S'£ Xl1we~ JO spaau U0141~4nN
change. Extension program priorities, organizational
uea~ructureS1,eW!d external relationships must also change" SV = N vLt = N s~a4~~cloper~~~ension system strategi@4P~tng Council,
1991, p, v), (s~aq;)eaJ:.
pUA?c~~ A:ElS+,d <a;l ~bre'il'1 GP iiUilit@UExtl@t¥sli.QAl IDlIV5:a;uQ)1s
other than Nebraska's have also implemented new ~ mq~ed
['.' , ~ "-
[.
[
[
[
[
[
[
[
[
[
[
[
[
[
[ ~A
L
,]
]
]
]
]
]
]
]
]
]
]
]
]
J J 1 1
comparing food cost/nutrient (tis = 3.25, 4.13), evaluating
"diets" (tis = 3.18, 3.59) and conserving energy (tis = 3.11,
3.51), factors affecting food choices (tis = 3.02, 3.84).
In each case the students' mean scores were lower than
teachers' mean scores.
81
Clothing and Textiles. Students overall mean scores
numerically ranked the subject matter area of Clothing and
Textiles last among the subject matter areas with a
significant difference lower in overall importance than
teachers' perceptions of the amount emphasized (tis = 3.30,
3.71). This subject matter area with 18 concepts showed
significant differences between students and teachers in 12
(67%) of the concepts, eleven of which students' means were
lower than teachers' means: needs/wants clothing (tis = 3.40,
3.78), using information on clothing labels (tis = 3.35, 4.04),
fads and fashion (tis = 3.31, 3.91), clothing/decision making
(tis = 3.29, 3.73), color, line, design (tis = 3.27, 4.40),
sewing for self/family (tis = 3.27, 4.31), clothing/life cycle
(tis = 3.26, 2.76), reasons for clothing choices (tis = 3.23,
3.71), evaluating fabric and construction (tis = 3.21, 4.23),
textile information (tis = 3.20, 4.09), advertising and
clothing choices (tis = 3.17, 3.67), altering patterns (tis = 3.13, 3.53). It can also be noted by examining means on Table
19 that students' means were lower than teachers' means in 15
(83%) of the 18 concepts. Contrasts with the greatest
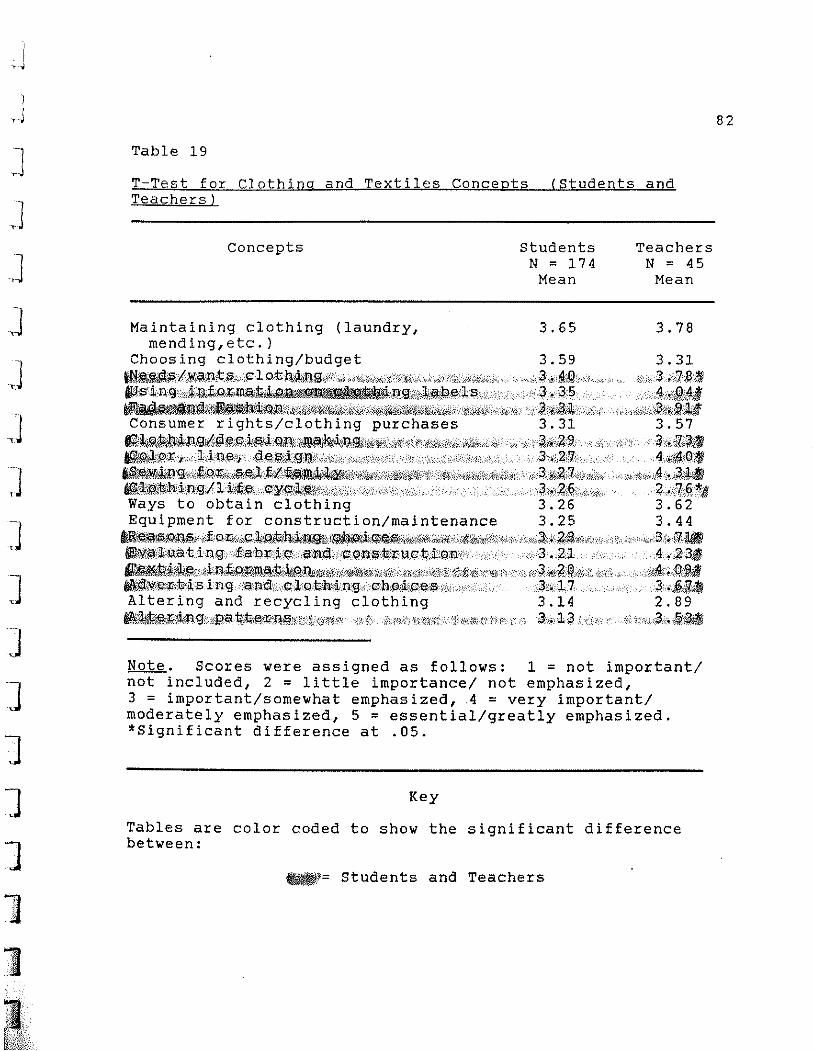
]
J ,]
]
J ]
,]
]
J ]
]
]
J J "'it -J
]
I: ";j;5,\i\-:,.::
Table 19
T-Test for Clothing and Textiles Concepts (Students and Teachers)
Concepts
Maintaining clothing (laundry, mending,etc.)
Students N = 174
Mean
3.65
Choosing clothing/budget 3.59 tNii;,~p;/,"Uil)n,t,?,,/pl.o,t/1;!l4ngfi?""\f"fii'f;;{,;:i,e ~'fff,,',f,'~j;i).'i,*;;' """"c3f;",,~;f) ,·i,.." f, i!!',S'ing;dii;lJ);f;.ok.m§i~~~P,9Hii;iliHl\\l?,!i"l:?,;""'",, ""'c3 i' 35 f!f'~~i;~;;H)?f,;s;,¢;;%~w.~~4@!:i0~~,:::_6:::::\~*i.~~~~~iiii(~~h<&<;w:~J'!",:~:;\~,i ,.:,:t ,4rtt>i!l· "-,A;-:{,
Consumer rights/clothing purchases 3.31 ~ik~~'iiiXl,}J,I4jj!@jQ.;,iI~<;,iQJ'lij;&llliil\l)ijT;l:filfi%Afl;""tr,,;, 1'Ji!"i;i'''~'''i?~.,;;, 4" """,' f,f ::3,,>',;;\,9" "," ~~;g,r;'I"" ,""t;n,e;'ii",g'@Ji.!;;j;,g,J;l;i;;J;;,;,;,>""·" ";'; ,if,f ,',;; "f" ' 3""2,'l,,,
Teachers N = 45
Mean
3.78
3.31 :;,3".,iUiHM
A,\\~j~i j,.j"""\f,·\?:i\\,~\a:1
3.57 A:; .3\i.(<<~~~~
4.ii~Oi~ ~~p:g;';"4iJi;l)l1;,g,§i§tJ;'ifili!'i_~#I,lMtki,jt!&j"A;i.i;ri.itfW;,fl;,',2'H;.hl,',;;!lk,1iiii&'#) ';,/f'3;,,,;,4;;7,),,,, i.if , ""'i"''';~,i4 ':,!3f~ ai!i\\1l1tjj..l'din:gi/liid1:e;",g\¥cIl!iiL~\icv/;,!",j""'fi;;'" "''';,'..;"i,,! j;3,;";2i~j,,;';,*;,,, 2,."rt,9:'~1 Ways to obtain clothing 3.26 3.62 Equipment for construction/maintenance 3.25 3.44
.1!il.1ii/il,\Ii?,<n;!i;M,,;f,O'1;(/,,· .. q;il.Wlwt1hti,\~~',!~~if4t!i",f;"'i'%'j;;iliim:1"f",ii";i,, !fff3;,;,2fi\l,,;, ,,, ,,;, ,,; 'i""" "f,3;,';'fl,,~ ~'Wi!I'i!1;U(ivtjng"fa'br:ic',,;ainOi,;Cq'l'l'~':l!:,rllcti:\1li!iF' .,;3 • 2,~ 4'.,ii!3S ~Pl4i!k~' '1,\;r:h4;,'9i~\m~t:~}!1$*"';'i!:_~f,1I':"iK';"k:Y"'1"k1~:I1i{o:,'''f'i '\i ,'c~,"Jll;@,,:%;t, ,i, (, ".i»~"""(\);'~' ~ii!\v>'~'r;Ji1pics in 9 "a'np",GJ,.o,t1l'l':~:n'g,."c,b;(iilj;i:PiMi!i.'< 'i"" . ,3,,,,173,,;,jj!i&'~ Altering and recycling clothing 3.14 2.89 ~~::sk~~~:g-f.'-~11;:>~ ~;'~~,~~;fi:>ti',;':i:f."};~1!- ;;'':t·:i;\: -~\A't.(.J') l,-tY:~;f,t (:1\8,il'ri~:'t i"f f~ '(' {-. 3\;,., :a. 3 i,-(''k;:, '( f, 1::',,\,1-';.3,-.::., ~,jJ~
Note. Scores were assigned as follows: 1 = not important/ not included, 2 = little importance/ not emphasized, 3 = important/somewhat emphasized, 4 = very important/ moderately emphasized~ 5 = essential/greatly emphasized. *Significant difference at .05.
Key
Tables are color coded to show the significant difference between:
~= Students and Teachers
82
,J
J ,J
J J J J
]
J
J J J
J J ] ~ .-
numerical differences can be seen in the concepts of color,
line, design, sewing for self/family, evaluating fabric and
construction, and textile information.
An examination of Tables 13 - 19 will show that
significant differences existed between senior high school
home economics students perceptions of the importance of
specific concepts in home economics curriculum and the
perceptions of high school home economics teachers in what
they emphasize in their teaching for 83 (61%) of the 136
83
concepts. No significant differences existed in 53 (39%) of
the concepts. Therefore, Null Hypothesis 2b was rejected for
those concepts within subject matter areas where significant
differences existed and rejected for those concepts within
subject matter areas where no differences existed.
students' Perceptions of Amount Teachers Consider Students'
Ideas
The final question students were asked was related to
research question 4: What amount of participation do senior
high school home economics students perceive they have in
choosing the home economics subject matter and specific
concepts they can learn? Students were asked to circle a
number from one to five to indicate how much they believed
teachers allowed students to choose the content in home
economics subject matter areas: 1 = teachers never consider
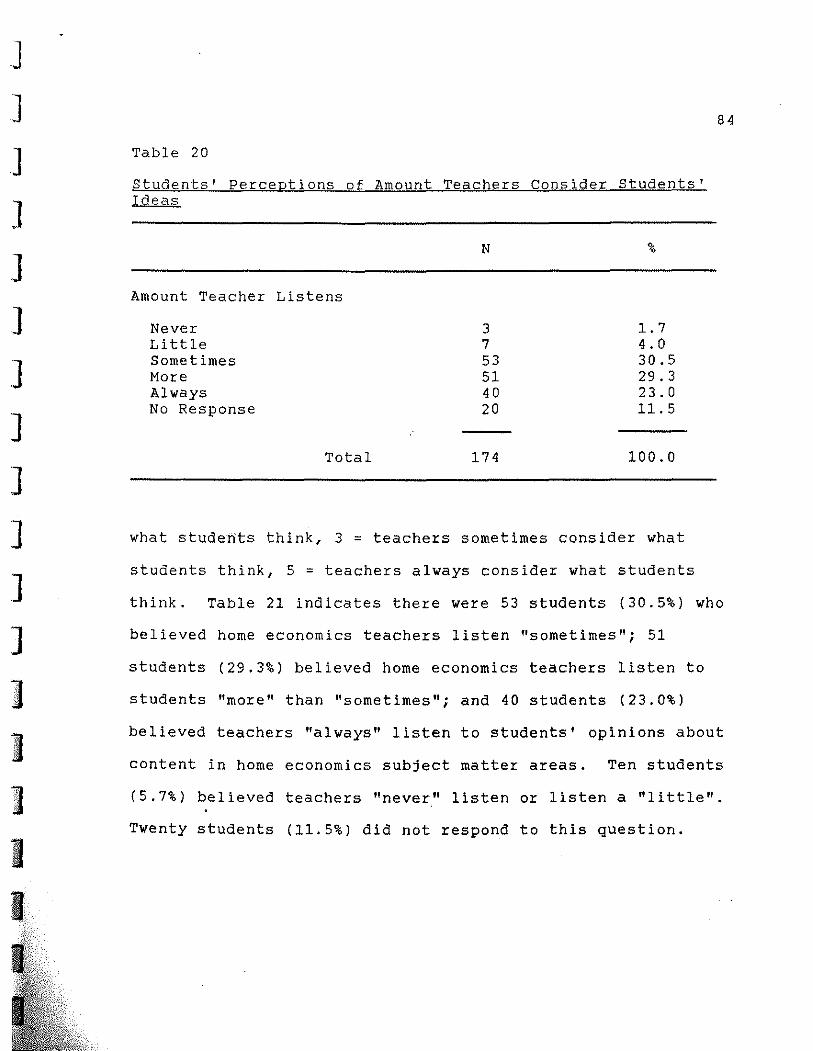
J ]
]
]
]
]
]
]
]
]
]
]
)
I': {~
,
Table 20
students' Perceptions of Amount Teachers Consider Students' Ideas
Amount Teacher Listens
Never Li ttle Sometimes More Always No Response
Total
N
3 7 53 51 40 20
174
%
1.7 4.0 30.5 29.3 23.0 1l.5
100.0
what studehts think, 3 = teachers sometimes consider what
students think, 5 = teachers always consider what students
84
think. Table 21 indicates there were 53 students (30.5%) who
believed home economics teachers listen "sometimes"; 51
students (29.3%) believed home economics teachers listen to
students "more" than "sometimes"; and 40 students (23.0%)
believed teachers "always" listen to students' opinions about
content in home economics subject matter areas. Ten students
(5.7%) believed teachers "never" listen or listen a "little".
Twenty students (11.5%) did not respond to this question.
J J J.
J J ]
J J ]
]
]
]
J J J J l' "
85
summary
In summation, the research findings have shown three
significant characteristics to be true of high school senior
home economics students who participated in this study.
First, the 174 respondents were distributed among four class
sizes of schoo.1s: Class A had 86 repondents, Class B had 29
respondents, Class Chad 23 respondents and Class D had 36
respondents. Secondly, 39 (22.5%) of the students were male
while 133 (76.4%) were female. Finally, the number of
semesters home economics couises were taken showed 37
students had 1-2 semesters, 43 students had 3-4 semesters, 36
students had 5-6 semesters, and 56 students had taken 7-or
more semesters of home economics courses.
An analysis of variance (ANOVA) test was used to
determine if significant differences existed among students
from schools of different class sizes. Significant
differences (~<.05) were found to exist among students from
Class A and Class C schools in the subject matter areas of
Child Development/Parenting (tis = 4.11, 3.59), and Basic
Employability Skills (tis = 3.97, 3.60). However, there were
no significant differences shown among students from any
other class sizes of schools for any other subject matter
area.
Students' mean scores were compared with the mean scores
of teachers and parents, both economically disadvantaged and
.J
J J ]
]
]
]
]
]
]
]
]
]
]
]
) ]
86
non-economically disadvantaged, using an analysis of variance
(ANOVA) test. Significant differences (Q<.05) were found
between students and all other groups in one (12.5%) of the
eight subject matter areas. In the subject matter area of
Management (tis = 3.62, 3.97, 3.92, 3.82), all other groups
perceived it to be more important than students' perceived it
to be. Six (75%) of the remaining subject matter areas
showed significant differences between students and one or
more of the other groups.
Students' mean scores for the 136 concepts were also
compared with the mean scores of parents, both economically
disadvantaged and non-economically disadvantaged, and the
mean scores of teachers. A visual examination of the color
codes used for Tables 4 - 19 will demonstrate the significant
differences between students' perceptions of the importance
of specific concepts within horne economics subject matter
areas and all other groups. Significant differences (Q<.05)
are shown between students and parents, either one or both
economically disadvantaged and non-economically
disadvantaged, for 89 (65%) of the 136 concepts. This
represents 30 (22%) concepts color coded blue for differences
between students and both groups of parents, 24 (18%)
concepts color coded yellow for differences between students
and economically disadvantaged parents, and 35 (26%)
concepts color coded orange for differences between students
J
J
J
J ]
J
J ]
,]
]
]
]
J J ]
]
1
and non-economically disadvantaged parents. Significant
differences between students and teachers are shown for 83
(61%) of the 136 concepts.
87
The last research question asked for students'
perceptions of the amount of participation senior high school
students have in choosing the home economics subject matter
and specific concepts they can learn. More than thirty
percent of the students indicated teachers sometimes consider
what they think. A similar number of students indicated
teachers consider what students think more than sometimes,
and nearly one-quarter of the students indicated teachers
always consider what they think.
J J
J J J J J
J ]
]
]
]
]
] .•.. 1 ,
]1 }
1 1
CHAPTER V
Sum~ary, Conclusions, and Recommendations
The informatipn in this chapter includes three major
sections. The first part is a summary of the study followed
by the conclusions based on the findings. Lastly, the
recommendations for the practical application of those
findings are discussed with the possibilities for further
study.
Summary
School curriculum changes are frequent and on-going.
These changes are education's response to criticism that the
quality of young people's learning does not prepare them to
meet the challenges of a technological society. Most
curriculum changes are made by increasing graduation
requirements, making subject matter more comprehensive, and
requiring all students to take computer literacy courses.
Curriculum changes of this type have occurred and are
continuing to occur in education following the 1983 report
A Nation at Risk by the National Commission on Excellence in
Education and lower student scores on the Scholastic
Aptitude Test (SAT).
Although the curriculum changes described have given
greater emphasis to subject areas of science, math and
J J J J ]
J J J J J J J J J .]
]
]
89
computer science, many curriculum developers believe these
changes are education's best response to a national learning
problem. While these changes may appear to be a logical
means of resolving student learning problems, the monetary
funds needed for new or expanded programs was not available.
Consequently, monies may have been taken from programs such
as home economics, agricultural science and technology
education (also known as industrial arts) that were cut back
or eliminated altogether. Those programs were believed by
some to be less important in meeting student learning needs
for a changing society than programs in math, science or
computer literacy.
Even though curriculum developers believed increased
graduation requirements and tougher course work for students
was education's best response to a national learning
problem, the changes have not occurred without criticism.
Some critics such as Goodlad (1983) and Boyer (1983)
demonstrated in their research findings that schools have
not been creative in providing for changes that would
eliminate inefficient and ineffective learning systems.
Another critic, Sava (1987), does not believe that a tougher
curriculum maintains student enthusiasm for learning.
Welsh (1986) and Wagner (1987) would concur that learning
must be more relevant to young people if they are to be
challenged to meet the needs of a changing society. Murray
J
J
J ]
]
]
J ]
]
]
J 1 ]
]
1 1
90
(1986) and Beyer (1988) would present the concept of
"participatory democracy" as a means for inciting student
enthusiasm for learning. They believe if students have a
more significant role in their own learning, they will find
the learning more relevant and applicable to their lives.
In this way, the curriculum would be identified by Sava as
"student-centered" rather than "curriculum-centered." This
means that students would be more likely to accept ownership
for their learning. Additionally, Wagner (1987) would view
the active participation in the democratic process as a
means for meeting education's primary goal.
Since the home economics curriculum has been one of the
victims of funding cuts in many school systems, home
economics professionals and educators alike have recognized
that this program can have relevance to young people who
must be prepared to cope with the changing societal problems
that have their roots in the family system. Brown and
Paolucci (1978) characterized the mission of home economics
as a way of enabling families to create means whereby
individuals might become self-forming and enlightened to the
extent that they can participate cooperatively in the
criticism, formation, and means for accomplishing broad
social goals relevant to families.
Home economics educators realized anew that the subject
matter included in the home economics curriculum was
J ]
]
]
]
]
]
]
]
]
]
J J J J I I
91
uniquely suited to meeting the needs of young people and
helping them achieve more responsible citizenship within a
changing society. The 1985 coalition statement by horne
economics professionals identified the specific consumer and
homemaking subject matter areas and learning processes that
were unique in design for helping students become the self
forming individuals Brown and Paolucci referred to in the
mission statement. Jorgenson & Haley (1985) and Wilcosz
(1986) expanded on the specific ways that horne economics
subject matter can contribute to the thinking and reasoning
ability of individuals within the changing social and
economic elements of a technological society.
Although the subject matter of home economics is
designed to meet the needs of students by helping them to
adapt to the changes in society, information about the
extent to which students actually participate in the
curriculum decision making process did not demonstrate that
this was occurring. After visiting 190 horne economics
classrooms in different parts of the nation, Spitze (1985)
was prompted to recommend that students be given a more
active role in their learning activities.
If curriculum is to be developed to meet the needs of
students, assessment of student needs will be a requirement
before decision making of the content necessary for subject
matter areas can be achieved. With the enactment of the
J J ]
]
]
]
J J ]
]
]
]
J J J ]
1 1
92
Carl D. Perkins Vocational Education Act in 1984, funds for
vocational programs were made available which gave attention
to identifying people's needs. However, identifying student
needs and interests is a necessary qualifying component for
program funds.
Johnson (1986) developed a needs assessment instrument
which measured the level of student needs within specific
concepts of the secondary home economics curriculum as
perceived by parents, both economically disadvantaged and
non-economically disadvantaged, and social service agency
representatives. Vance (1987) used a similar survey
instrument measuring the same concepts to assess home
economics teachers' perceptions of what they emphasize in
their teaching. However, the same instrument has not been
used to conduct a needs assessment related to students'
perceptions of their needs in home economics curriculum.
Purpose of study
The purpose of this research was to: (1) identify
curriculum subject matter areas and specific concepts in
home economics which senior high school home economics
students consider important; (2) determine the differences
between senior high school home economics students'
perceptions of subject matter and specific concepts needed
in home economics curriculum and the perceptions of parents,
]
]
]
]
]
]
]
]
] ]
]
]
]
" ] .•.....
]
1 I
93
both economically disadvantaged and non-economically
disadvantaged; (3) determine the differences between senior
high school home economics students' perceptions of subject
matter and specific concepts needed in the home economics
curriculum and what home economics teachers perceive they
teach; and, (4) identify the extent of participation
students perceive they have in choosing the home economics
subject matter and specific concepts they learn.
Research Questions
The research questions addressed in this study were:
lao What differences exist between senior high school
home economics students' perceptions of the importance of
subject matter areas in home economics curriculum and the
perceptions of parents, both economically disadvantaged and
non-economically disadvantaged?
lb. What differences exist between senior high school
home economics students' perceptions of the importance of
specific concepts within subject matter areas in home
economics curriculum and the perceptions of parents, both
economically disadvantaged and non-economically
disadvantaged?
2a. What differences exist in senior high school home
economics students' perceptions of the importance of
subject matter areas in home economics curriculum and those
]
J ,]
]
]
]
J ]
]
]
]
J ]
]
]
]
J J 1
. -li;i.~;;-:. ".:.-~."
which high school home economics teachers perceive they
teach?
94
2b. What differences exist between senior high school
home economics students' perceptions of the importance of
specific concepts within home economics curriculum and
those which high school home economics teachers perceive
they teach?
3. What amount of participation do senior high
school home economics students perceive they have in
choosing the home economics subject matter and specific
concepts they can learn?
4. What differences exist among senior high school
home economics students from different school sizes
regarding their perceptions of the home economics subject
matter they believe to be important?
Procedures
A ten percent random sample of schools from each of
the six classes of public schools in economically depressed
Nebraska counties was the basis for selecting senior high
school home economics students. Home economics teachers in
these schools were asked to participate in the study by
administering a questionnaire to one-half the seniors in
their home economics classes. A total of 174 senior high
school home economics students from 22 schools participated
J J ]
]
,]
]
]
]
]
] ]
] ]
]
]
1 1
95
by responding to questions about the amount of need they
perceived 136 concepts ought to have in eight home economics
subject matter areas. The survey instrument used was
adapted by the researcher from Johnson's (1986) needs
assessment study. Additional information was requested
about the sex of the student, the number of semesters
enrolled in home economics courses, and the amount of
participation students perceived they had in choosing
curriculum content.
After the returned questionnaires were coded, the
information was entered into the computer. The statistical ,
package (SPSSX), provided by the University, allowed the
researcher to use descriptive statistics, analysis of
variance and the Tukey-HSD follow-up procedure as well as
the ~ test to analyze data.
The data collected were used to describe students'
perceptions of how important the 136 home economics concepts
in eight subject matter areas are for students to know.
Descriptive statistics (frequencies, percentages, and means)
were used to describe this data which was then subjected to
an analysis of variance test to determine if significant
differences existed between groups of students from each of
the four classes of schools.
The next procedure was to use data from Johnson's
(1986) Home Economics Needs Assessment study about the
]
J ]
]
]
:J
]
]
]
]
]
]
]
]
]
]
1
96
perceptions of parents, both economically disadvantaged and
non-economically disadvantaged, as to how important 136
concepts in eight home economics subject matter areas are
for high school students to know. The analysis of variance
procedure was used to examine the perceptions of the
students, the economically disadvantaged parents, and the
non-economically disadvantaged parents. When significant
differences were found, the Tukey-HSD follow-up procedure
was used to determine which groups were significantly
different from students at the R<.05 level.
In addition, the ~ test was used to determine if
significant differences existed between students'
perceptions of the importance of home economics concepts
within the subject matter areas and what home economics
teachers perceive they emphasize in their teaching.
Findings from Descriptive Statistical Analysis
A summary of the descriptive information follows:
1. The 22 participating schools and the 174
respondents were divided as follows among the four class
sizes of schools: Class A had two participating schools
with 86 (49.4%) respondents; Class B had four schools with
29 (16.7%) respondents; Class C had eight schools with 23
(13.2%) respondents; and Class D had eight schools with 36
(20.7%) respondents.
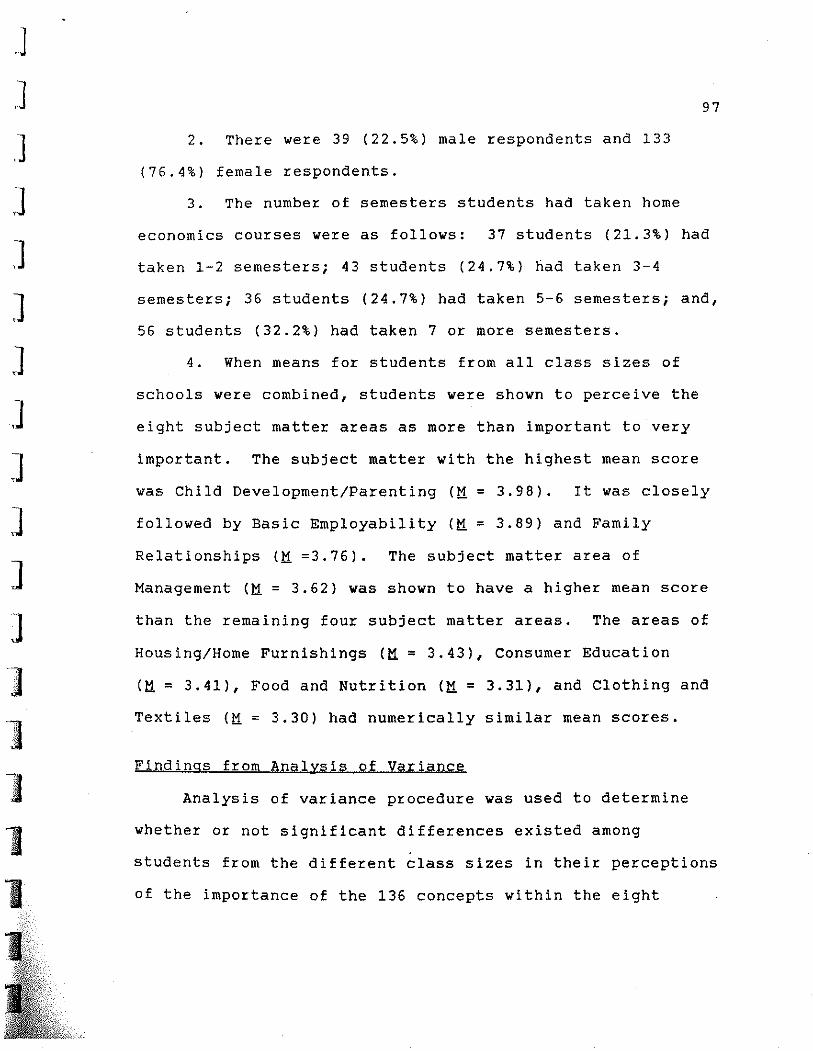
,J
,J
,J
,J
~]
J J J J J ]
] ~ ~
~ ~
11
1 1
97
2. There were 39 (22.5%) male respondents and 133
(76.4%) female respondents.
3. The number of semesters students had taken home
economics courses were as follows: 37 students (21.3%) had
taken 1-2 semesters; 43 students (24.7%) had taken 3-4
semesters; 36 students (24.7%) had taken 5-6 semesters; and,
56 students (32.2%) had taken 7 or more semesters.
4. When means for students from all class sizes of
schools were combined, students were shown to perceive the
eight subject matter areas as more than important to very
important. The subject matter with the highest mean score
was Child Development/Parenting (M = 3.98). It was closely
followed by Basic Employability (M = 3.89) and Family
Relationships (M =3.76). The subject matter area of
Management (M = 3.62) was shown to have a higher mean score
than the remaining four subject matter areas. The areas of
Housing/Home Furnishings (M = 3.43), Consumer Education
(M = 3.41), Food and Nutrition (M = 3.31), and Clothing and
Textiles (M = 3.30) had numerically similar mean scores.
Findings from Analysis of Variance
Analysis of variance procedure was used to determine
whether or not significant differences existed among
students from the different class sizes in their perceptions
of the importance of the 136 concepts within the eight
J J J J ~]
J J J J J ]
J ".1.C ~
b ] •.
..
l' t
1
98
subject matter areas. Significant differences (~<.05)
among students from each of the four class sizes of schools
were found to exist between Class A and Class C schools in
the subject matter areas of Child Development/Parenting
(tls = 4.11, 3.59) and Basic Employability (tls = 3.97, 3.60).
No significant differences were found among any other class
size school in any other subject matter area. Therefore,
Null Hypothesis 3 for Class A and C schools for subject
matter areas Child Development/Parenting and Basic
Employability was rejected but accepted for all other
schools and subject matter areas.
The Tukey-HSD procedure was applied when differences
were significant using all groups and each subject matter
area and concept. The following results were evident:
1. Students' perceptions were significantly different
from all other groups (economically disadvantaged parents,
non-economically disadvantaged parents, and home economics
teachers) at the ~<.05 level for the subject matter area of
Management. Differences between students and teachers
existed for the subject matter area of Basic Employability.
In the subject matter area of Consumer Education, students
overall means were significantly different from both
economically disadvantaged and non-economically
disadvantaged parents. Differences existed between students
and one group of parents for Child Development/Parenting and
,J
J J J ]
]
J ] ]
]
]
]
1 ]'
!
; ]
1
1
Housing and Home Furnishings (non-economically
disadvantaged), and Food and Nutrition (economically
disadvantaged). The subject matter area of Clothing and
99
Textiles showed significant differences between students and
teachers as well as non-economically disadvantaged parents.
No significant differences were found between students and
any other group for the area of Family Relationships.
Therefore, Null Hypothesis la was rejected for those areas
where differences existed and accepted for those areas where
no differences existed. In addition, Null Hypothesis 2a was
rejected for those areas where differences existed and
accepted for those areas where no differences existed.
2. Students' perceptions were significantly different
from all parents' at the R<.05 level for one (5%) concept in
the Child Development and Parenting area, two (20%) concepts
in the Basic Employability area, four (18%) concepts in the
Family Relationships area, four (44%) concepts in the
Management area, two (10%) concepts in the Housing and Home
Furnishings area, eight (47%) concepts in the Consumer
Education area, eight (42%) concepts in the Food and
Nutrition area, and one (6%) concept in the Clothing and
Textiles area. This represented a total of 30 (22%)
concepts showing significant differences between students'
perceptions and both economically disadvantaged and non
economically disadvantaged parents.
]
]
J J ]
]
J J ]
]
J J "]
J 1 ]
11 ; I
1
100
3. Students' perceptions were significantly different
from economically disadvantaged parents at the ~<.05 level
for one (5%) concept in the area of Child Development/
Parenting, four (40%) concepts in the Basic Employability
area, five (23%) concepts in the Family Relationships area,
seven (77%) concepts in the Management area, three (15%)
concepts in the Housing and Home Furnishings area, fifteen
(88%) concepts in the Consumer Education area, thirteen
(68%) concepts in the Food and Nutrition area, and six (34%)
concepts in the Clothing and Textiles area.
A total of 54 (40%) concepts showed significant
difference at the ~<.05 level between perceptions of
students and economically disadvantaged parents.
Perceptions for 24 (18%) concepts were significantly
different from economically disadvantaged parents but were
not significantly different from non-economically
disadvantaged parents.
4. Students' perceptions showed significant difference
at the ~<.05 level from non-economic~lly disadvantaged
parents for thirteen (62%) concepts in Child Development/
Parenting, three (30%) concepts in Basic Employability,
eighteen (36%) concepts in Family Relationships, four (44%)
concepts in Management, fifteen (75%) concepts in Housing
and Home Furnishings, nine (53%) concepts in Consumer
]
]
]
]
]
]
J .]
,]
,j
J
, J
..., .J
1 1 1: . 1".
;. ,:*ii~;-\'i'"
101
Education, eight (42%) concepts in Food and Nutrition, and
five (28%) concepts in Clothing and Textiles.
Of the total 136 concepts, significant difference at
the ~<.05 level existed between students' perceptions and
non-economically disadvantaged parents in 65 (48%) concepts.
Of these 65 concepts, 35 (26%) were significantly different
for non-economically disadvantaged parents, but not
significantly different from economically disadvantaged
parents. Only 47 (35%) concepts showed no significant
difference between students' perceptions and the perceptions
of parents, both economically disadvantaged and non
economically disadvantaged parents. Therefore, Null
Hypothesis 1b was rejected for those concepts where
significant differences existed and accepted for those
concepts where no differences existed.
Findings from T Test
1. Differences existed at the ~<.05 level between
students' perceptions of the importance of 136 home
economics concepts and teachers' perceptions of what is
taught for thirteen (62%) concepts in Child Development/
Parenting, five (50%) concepts in Basic Employability
Skills, five (55%) concepts in Management and Other
Processes, thirteen (59%) concepts for Housing and Home
Furnishings, eleven (65%) concepts in Consumer Education,
]
J ]
J ]
]
]
]
]
]
]
]
]
') I .. : ;
1 1
102
thirteen (69%) concepts in Food and Nutrition, and twelve
(67%) concepts in Clothing and Textiles. This represents a
total of 83 (61%) concepts showed differences between
students' perceptions and teachers' perceptions.
Consequently, Null Hypothesis 2b was rejected for those
concepts where significant differences existed and accepted
for those concepts where no significant differences
existed.
students' Perceptions of Amount Teachers Consider Students'
Ideas
Of the 174 respondents, 53 students (30.5%) indicated
teachers sometimes consider what they think, 51 students
(29.3%) indicated teachers listen more than sometimes, and
40 students (23.0%) believed teachers always listen to
students' opinions. Ten students (5.7%) indicated teachers
never listen while twenty students (11.5%) did not respond.
Conclusions and Discussion
The information in this study adds to the existing body
of knowledge related to home economics curriculum. However,
the conclusions and discussion of this study are specific
only to senior home economics students in public schools in
economically depressed counties in Nebraska.
]
]
]
]
]
]
]
]
]
]
]
]
1 1 1 1
103
Characteristics of Students
There were a total of 174 students that responded to
the questionnaire, 133 (76.4%) female and 39 (22.5%) male.
It is apparent that females are more likely to enroll in
home economics courses than males. The traditional belief
that skills learned in home economics classes are more
typically needed for young women may still persist in many
schools.
The amount of home economics courses students had
taken was quite evenly distributed among four categories:
specifically, 37 students (21.3%) had taken 1-2 semesters,
43 students (24.7%) had taken 3-4 semesters, 36 students
(20.7%) had taken 5-6 semesters, and 56 students (32.2%)
had taken 7 or more semesters. These data would show that
high school students who enroll in home economics courses
will do so beyond one year or two semesters since 135
students (77.6%) had taken 3 or more semesters.
Curriculum content
The research for this study was designed to measure
students' perceptions of the importance of 136 concepts
within eight home economics subject matter areas while the
the research in Johnson's (1986) was designed to measure
parents, both economically disadvantaged and non
economically disadvantaged, and social service agency
J
J
J ]
]
]
]
]
]
]
J ]
J J ]
J ]
]
104
representatives' perceptions of how important those
concepts were for students to study. Vance's (1987) study
was designed to measure home economics teachers' perceptions
of the subject matter and concepts they emphasized. Even
though the eliciting questions were not the same in Vance's
study, the researcher assumed the findings of the three
studies could be compared because (a) the samples for all
three studies were drawn from economically depressed
Nebraska counties, (b) identical concepts and subject matter
areas were used for the three studies, (c) similar Likert
type scales were designed for use in rating the concepts in
each study, and (d) the wording/phrasing of the possible
response's . in the scales was simi lar.
Subject matter areas. Based on findings related to
Null Hypothesis 3, students perceptions of the importance of
concepts within the eight subject matter areas did not show
significant differences between students from different
school sizes in a majority of the situations. However,
significant differences at the ~<.05 level were found among
students from Class A and Class C schools for the subject
matter areas of Child Development/Parenting and Basic
Employability. Since the mean scores were numerically
higher for Class A students than for Class C students', it
would appear that the concepts within these subject matter
areas are of greater concern to the Class A students. Since
J J J J J ]
J J J J ]
]
~ ~
~ ~
~ ~
)
105
the students in Class A schools are usually from urban
environments, they may have experienced or are more aware of
possibile family problems in these areas than students in
Class C schools who may be from rural environments. Their
concerns of caring for children and maintaining a job would
be demonstrated in identifying these as areas students need
to know.
Based on findings related to Null Hypothesis la,
students' perceptions of subject matter areas showed
significant differences between both economically
disadvantaged parents and non-economically disadvantaged
parents for the subject matter areas of Management and
Consumer Education. In both areas, students' overall mean
scores were numerically lower than parents' mean scores.
Comprehension of the need to know these subject matter
concepts may not have been made relevant enough for
students. Also, students may not be aware of how this
subject matter is integrated throughout other home economics
subject matter areas and may not be aware of how important
it is to those areas.
The subject matter area of Food and Nutrition was
perceived by students to be less important than what
economically disadvantaged parents perceived it to be. The
possibility exists that economically disadvantaged parents
have experienced a wide range of issues and problems
J J J J J ]
]
]
]
]
]
]
1 1 ~ ~
]' ~ ~
1
related to food resources and recognize the importance of
that knowledge to maintaining health and well-being.
However, students have not found those issues to be as
relevant to their immediate needs.
Students perceived the subject matter areas of Child
106
Development/Parenting and Housing and Home Furnishings to be
more important than non-economically disadvantaged parents
perceived them to be. It would appear that since students'
overall mean scores ranked Child Development/Parenting
numerically higher than all other areas, students consider
these issues to be very relevant to their needs. Perhaps
the higher mean score in Housing and Home Furnishings
reflects their desire to be on their own.
Based on findings related to Null Hypothesis 2a,
significant differences between students and teachers were
found in four subject matter areas. Students' overall mean
scores for the importance of Basic Employability Skills
ranked this subject matter area significantly higher than
teachers. Perhaps they feel the need to get a job to
support their future education or to begin work immediately
after high school. Conversely, students' perceive the
subject matter areas of Management, Food and Nutrition, and
Clothing and Textiles to be less important than what
teachers perceive they emphasize. The areas of Food and
Nutrition as well as Clothing and Textiles represents two
J
J
J J
J
J J
J ]
J ]
]
107
areas that Spitze (1985) observed being taught most
frequently in the home economics classroom. An irony exists
in this situation if students have experienced more home
economics content in these areas but do not consider them to
be as important as what teachers emphasize. Home economics
teachers have often said that their students want to cook
and sew; therefore, they include these traditional areas.
Evidence from this study does not support this perception.
Concepts within subject matter areas. Many significant
differences existed in students' perceptions of concepts
within subject matter areas, but this discussion addresses
only those concepts which appear to need the most
consideration. In the subject matter area of Child
Development/Parenting, students' mean scores placed the
concepts of birth control and conception/birth process as
more than very important. Even though both economically
disadvantaged parents and non-economically disadvantaged
parents perceived these concepts to very important,
students' means scores identified these issues
significantly more important than what non-economically
disadvantaged parents perceived them to be. In addition,
students perceived the concept of human sexuality in the
subject matter area of Family Relationships to be of similar
importance as the related concept of birth control in the
Child Development/Parenting subject matter area. However,
J J J ]
J J ]
]
]
]
]
]
' ... 1. ~
]
]
J
108
significant differences existed with both economically
disadvantaged and non-economically disadvantaged parents in
this instance. No significant differences occurred between
students and teachers in either of these concepts. Perhaps
teachers are closer to the kinds of situations students
must face on these issues and may recognize why students
need to know about them.
In the respective subject matter areas of Child
Development/Parenting and Family Relationships, students
perceived the related concepts of child abuse and
preventing family violence to be very important concepts for
students to know. Significant differences were evident
between students and non-economically disadvantaged parents
whereas no significant difference existed between students
and economically disadvantaged parents. Despite the fact
that all three groups perceived these concepts to be very
important, it would seem that this concept would be
moderately to greatly emphasized by home economics
teachers. Teachers' lower combined mean scores in both
concepts do not demonstrate this to be true.
Another factor worth observing Child Development/
Parenting, is that significant differences existed between
students and non-economically disadvantaged parents for 62%
of the concepts while differences existed between students
and economically disadvantaged parents for only 5% of the
]
]
J ]
]
]
]
]
]
]
]
]
]
] ", -] ..•..
~ . 1',
1
109
concepts. But it may also be noted that students' mean
scores were higher than both groups of parents for two
thirds of the concepts. However, students' mean scores were
more likely to be lower than what teachers perceived they
emphasized the concept, except for four concepts. The
concepts selecting daycare/nursery school services, safety/
first aid, parenting affects society, and community services
showed students' perceptions of these concepts to be much
more important than what teachers perceived they emphasized.
Students may recognize that today's society has a higher
percentage of young mothers in the nation's current work
force than in earlier times. Consequently, they may
consider these issues to be relevant to problems they may
face when they have their own families. It would seem that
teachers need to emphasize these concepts more in order to
meet students needs.
Although no significant differences were identified
among all groups mean scores for the subject matter area of
Family Relationships, there were some concepts where
differences existed that relate to the changes in society.
Students' and parents' mean scores were higher than
teachers' mean scores for the concepts caring of elderly and
family laws and regulations. Horne economics teachers might
place more emphasis on these concepts than they do
presently because of the interest of parents and students.
]
]
]
]
]
]
]
]
]
]
]
]
1 ~
1·· ~ ~
1 I
Even though the subject matter area of Basic
Employability Skills showed no significant differences
between students and both economically disadvantaged and
110
non-economically disadvantaged parents, there were
differences in specific concepts. In the four concepts of
developing skills/behaviors for job success, assess
personal characteristics, maintaining relations with
employer, and combining home/job responsibilities, students'
overall means were lower than both groups of parents.
Perhaps parents understand the importance of these concepts
because of their own life experiences. The concept of
effective communication was the single concept which
students perceived to be more important than both groups of
parents, but significant differences were present between
students and non-economically disadvantaged parents.
Students' overall mean scores demonstrated that
students perceive the nine concepts for the subject matter
area of Basic Employability Skills to be more important than
teachers' perceptions of what they emphasize in their
teaching. Significant differences occurred in the five
concepts job application, effective communication, job
hunting techniques, job training knowledge, and maintaining
relations with employer. A question might be raised as to
whether or not financial cutbacks in vocational home
economics programs have influenced the amount of emphasis
J ]
J J ] ]
]
] ]
]
] ]
]
1 ] .....•. , \
1
111
home economics teachers place on these concepts. If these
concepts are included in other curriculum areas, home
economics teachers may not wish to duplicate these skills.
Teachers may need to work cooperatively with other
vocational education teachers to insure their inclusion in
the school curriculum.
The subject matter area of Management and other
Processes showed students' perceptions of this area to be
significantly different from teachers and parents, both
economically disadvantaged and non-economically
disadvantaged. By looking at the nine specific concepts, it
can be noted that students' mean scores were lower than
parents' scores. Significant differences occurred between
both groups for the four concepts of attitude/ responsible
for decisions, ability to make decisions/ solve problems,
managing personal/family resources, ahd work
simplification. The concepts of coping with changes,
determining values, goals, and evaluating claims in media
showed differences between students and economically
disadvantaged parents. Differences occurred between
students and teachers for some of the same concepts.
Again, students' perceived these concepts to be more
important than teachers' with the exception of the concept
coping with change. Although no significant difference was
shown in this area, students perceived this concept to be of
J j
J J J J J J ]
J ]
J -.)& i
I I
112
more importance than what teachers emphasized. What seems
surprising is the fact that all the concepts related to
specific problem solving skills showed differences between
students and all other groups. It would appear that
students do not recognize the implications for using these
basic skills to resolve the problems inherent in other home
economics subject matter areas like Child Development/
Parenting and Family Relationships. For example, dealing
with issues of child abuse and family violence (which
students had perceived were more important than teachers)
requires understanding and application of problem solving
skills.
Concepts in the subject matter area of Housing and Home
Furnishings identify significant differences in students'
perceptions and parents' perceptions. Eighty percent of the
20 concepts showed differences between students and either
one or both groups of parents. Seventy-five percent of.
these differences were between students and non-economically
disadvantaged parents. The fact that students perceived all
these concepts to be more important than the non-
economically disadvantaged parents, may leave questions as
to why the differences exist. Could it be that students are
more knowledgeable than parents about future housing issues
or simply more concerned about their own future housing
choices?
]
] ]
]
]
]
]
]
]
]
]
]
]
J J ] ~
. , 1 )
113
Although fewer significant differences existed between
students and teachers, the concepts of evaluating home
comfort/privacy/security, using decision making in housing,
housing alternatives, goals/standards/values/resources
influence housing, which are related to basic problem
solving skills, showed that teachers perceived these
concepts to be emphasized more than students perceived them
to be important. In contrast, students perceived the
concepts legal rights/influencing change, government and
housing, culture/housing future, and neighborhood to be more
important for them to know than what teachers emphasized in
their teaching. These issues, which are characteristic of
changing social conditions, are relevant to students' future
lives. perhaps home economics teachers have not emphasized
these issues as strongly as other concepts in this subject
matter because they may think these conce.pts are included in
other curriculum areas, such as government or modern
problems.
All seventeen concepts in the subject matter area of
Consumer Education showed significant differences between
students and parents, either one or both economically
disadvantaged and non-economically disadvantaged. In
comparison with teachers perceptions, significant
differences were identified in 59 percent of the concepts.
Students perceived the concepts of budgeting and use/cost of
J J J J J ]
] ]
]
]
]
]
] ]
]
J
114
credit less important than all other groups. Basic problem
solving skills, such as included in the subject matter area
of Management and Other Processes, are fundamental to these
same issues. It would seem that students might recognize
the relevance of these concepts more than seems a~parent in
their responses. One might question how teachers might make
these concepts more relevant to students. Spitze (1985) and \
others might suggest that if students were more actively
involved in their own learning choices, they might become
more enthusiastic about their learning and recognize the
application of those concepts to their lives.
The concepts in the subject matter area of Food and
Nutrition showed students perceive the majority of these
concepts to be much less important than both groups of
parents. The largest number of differences were between
students and economically disadvantaged parents who
perceived all the concepts in this subject matter area to be
more important than students.
In comparing students and teachers for the same Food
and Nutrition concepts, students perceived all but two
concepts to be much less important than teachers perceive
they emphasize. Students perceived the concepts of consumer
agencies and world food supply to be. significantly more
important than teachers. The fact that students perceive
the problem solving concepts of planning food buying,
} ]
]
]
]
]
]
]
]
]
]
]
' .•.. ~ 1,'. ~
l' ~ "
1
planning, preparing, and serving as well as time, cost,
energy comparisons as much less important than teachers
perceive they emphasize demonstrates another subject area
where students may not recognize the level of importance
that teachers and parents place on these concepts.
115
Although more differences were shown between students
and economically disadvantaged parents in the amount of
importance specific concepts should have in the subject
matter area of Clothing and Textiles, overall mean scores
of non-economically disadvantaged parents were lower than
students for nine of the eighteen concepts. A significant
difference existed in four of those concepts; namely,
consumer rights/clothing purchases, fads and fashion,
reasons for clothing choices, and advertising and clothing
choices. Students may be more conscious and aware than
parents of fashion trends because of their need to fit in
with their peers. They may also recognize the importance
of media advertising in identifying those trends. The
differences between students and economically disadvantaged
parents were most evident in concepts that also related to
the basic problem solving skills; specifically, maintaining
clothing, choosing clothing/budget, and using information on
clothing. This parent group perceived these concepts to be
much more important than students pe~ceived them to be.
]
]
]
]
]
]
]
]
]
]
]
]
]
Ii·'·.? y;,
,I: )
1 W
116
The amount of importance that teachers perceive they
emphasize these clothing concepts show that most concepts
are somewhat emphasized to moderately emphasized. With the
exception of the concepts of choosing clothing/budget,
clothing/life cycle, altering and recycling clothing,
students' means were lower than teachers' means.
Perceptions of Amount Teachers Consider Students Ideas
A final question students were asked was: What amount
of participation do senior high school horne economics
students perceive they have in choosing the horne economics
subject matter and specific concepts they can learn?
Students seemed to have more positive than negative
responses to this question since 52.3% of the total
respondents answered that horne economics teachers considered
"more" or "always" what students think, and 30.5%
respondents answered that teachers "sometimes" considered
what students think. Of those remaining, only 5.7% of the
total respondents characterized home economics teachers as
considering "little" or "never" what students think about
the content of horne economics subject matter areas. This
information appears to show that students perceive their
home economics teachers as often taking into consideration
what their students' opinions are about curriculum content.
An interesting question to consider is why in this research
differences occur between what teachers emphasized and what
J J J J J J ] ]
J ] ]
] ]
] ' I '
1
117
students thought were important, when students' perceptions
show that teachers considered their opinions for learning
home economics content.
Recommendations
On the basis of the review of literature and findings
of this research, several recommendations are made for
practical application by classroom teachers, other
educators, and possibilities for further study.
Specific Curriculum Recommendations
What relationship does this research information have
to changing home economics curriculum content? First, the
recommendations made can identify areas where curriculum
changes may be needed. Second, teachers can use these
findings in conjunction with other research findings to
suppor~, defend, or justify home economics curriculum
content. Finally, teachers can use these recommendations as
a springboard for dialogue among all significant groups
about the needs and changes in home economics curriculum
content.
As to specific changes, teachers might look at some of
the most common differences between students and all other
groups. Students' perceptions that many of tha concepts
were less important than what other groups perceived them to
be have roots in the problem solving concepts for all the
J J ] ]
]
]
]
]
~J
J J -]
J J J ] ]
J ]
118
subject matter areas. Those that are basic to the subject
matter area of Management and Other Processes reappear in
all other subject matter areas but in a slightly different
form. Even though students perceived some related problem
solving concepts, such as child abuse in the subject matter
area of Child Development/Parenting, to be more important
for them to know than teachers or parents, both
economically disadvantaged and non-economically
disadvantaged, students' responses about the importance of
basic problem solving concepts in Management and Other
Processes, are not viewed at a similar level of importance.
perhaps the clue may be that these concepts need to be
presented in a more relevant manner so students better
recognize the relationship to their present lives. Dagenais
(1987) would identify the relevant application of concepts
to students' lives as a major goal for excellence in horne
economics education. Murray (1986) and Beyer (1988) would
see student participation in a democratic process of
curriculum decisions as a way of making learning more
relevant.
The concepts which are also related to current social
conditions like child abuse and selecting daycare/nursery
.school services in the subject matter area of Child
Development/Parenting are perceived to be more important
than teachers perceive they emphasize. Perhaps this is
J J J J ]
]
]
] ]
J ]
J J ]
J ]
J ]
J
119
another example of why teachers' need to update the
curriculum to meet the needs of a changing society as Vance
(1987) recommended in the study of teachers' perceptions of
students' needs. Even though administrators and school
boards make the overall decisions about curriculum changes,
it is usually the home economics teachers who must consider
the needs of all people in developing curriculum.
Considering teachers', parents' and all interested groups'
perceptions of students' needs includes considering the
specific needs of the students with whom they are most
closely involved. It also means recognizing the changing
conditions of society which will most affect students'
future lives.
The subject matter areas and concepts that teachers
might emphasize more to meet students' perceived needs are
as follows:
Child Development/Parenting
1) Child abuse 3) Selecting daycare/
nursery school services
Basic Employability
1) Job application 3) Job hunting techniques
Family Relationships
2) Safety/first aid 4) Parenting affects society
2) Effective communication 4) Job training knowledge
1) Preventing family 2) Characteristics of life partner violence
3) Identifying special needs 4) Caring for elderly
l .J
]
]
]
]
]
]
]
]
J ]
]
]
j
]
J J J J
120
Management and Other Processes
Although students' mean scores ranked this subject matter area fourth, no concept was as important as what teachers emphasized. It may be that this subject matter area needs to be more relevant to students' perceived needs.
Housing and Home Furnishings
1) Legal rights/ influencing change
3) Government and housing
Consumer Education
1) Insurance 3) Financial records
Foods and Nutrition
1) Consumer agencies
Clothing and Textiles
1 )
3 )
Choosing clothing budget
Altering and recycling clothing
2) Caring for home
4) Culture/housing future
2) Taxes/social security 3) Transportation
2) World food supply
2) Clothing/life cycle
Recommendation 1. A summary of this research should be
made available to teachers in economically depressed
Nebraska counties. Teachers should use the summary to help
evaluate present curriculum and plan changes to better meet
the needs of students. Guidance could be provided for
making changes.
Recommendation 2. Teachers might also use this
research as a means for increased communication among all
groups involved in curriculum decision making; specifically,
] ~
J
J ]
]
] ]
J ]
J 1 1 I
121
administrators, school boards, advisory councils, parents,
the general public, and especially the students they serve.
Recommendation 3. Teachers may also recognize the
value of conducting their own local student survey with a
similar instrument.
Recommendations for Other Educators
Recommendation 1. Teacher educators should be made
aware of the significant differences between students',
teachers', and parents' perceptions. Teacher educators need
to reassess what is being taught to pre-service and in
service teachers. These teachers may need extra guidance
in planning and developing curriculum content to more
closely meet the needs of their students. The research
indicates that many of the concepts in the subject matter
areas of Foods and Nutrition and Clothing and Textiles is
not as important to students as the amount of emphasis that
teachers perceive they emphasize them.
Recommendation 2. Individuals who plan teacher update
experiences should be made aware of the role they play in
curriculum development. They have responsibility for
guiding teachers and helping them understand and coordinate
the perceptions of needs; i.e., students, teachers, parents
and others; for curriculum development.
I J
]
]
]
]
] ]
]
]
] .]
]
J -]
1 ]: .• ~
•
)
Recommendations for Further Research
Recommendation 1. Research related to senior high
school home economics students' perceptions of what home
economics curriculum content they need to know should be
replicated in counties other than economically depressed
122
Nebraska counties. Comparisons could then be made between
students from the economically depressed counties and the
non-economically depressed counties to see if results are
consistent.
Recommendation 2. Replications of this study should be
done in other geographic areas (metropolitan areas, other
states, or other parts of the country).
Recommendation 3. Research related to the perceptions
of other groups (administrators, guidance counselors, and
senior high school graduates') of the amount of importance
the 136 concepts have in the home economics curriculum
should be done. Questions on the survey instrument may need
to be adapted for the different groups and comparisons made
with other groups.
Recommendation 4. Other vocational areas (business,
vocational agriculture, and technical education) could use
this study as a model to do similar investigations.
J J J J J 1 J ]
J
1 <1
,~J
J J --J
-I
J
1 J
123
REFERENCES
Apple, M.W. (1983). Curriculum in the year 2000: Tensions
and possibilities. Phi Delta Kappan. ~ (5), 321~326.
Beyer, L.E. (1988). Can schools further democratic
practices? Theory Into Practice, 27 (4), 262-269.
'Brown, M.M. (1980). What is home economics education?
Minneapolis, MN: University of Minnesota.
Brown, M.M., & Paolucci, B. (1979). Home Economics: A
Definition. Washington, DC: American Home Economics
Association.
Dagenais, R. (1987). Home economics education: A
profession at risk in a nation at risk? Illinois
Teacher of Home Economics, 1Q (4), 129, 133.
Dator, J.A. (1986). Futures of a caring society. What's
New in Home Economics, 21 (5), 2, 13.
Herriage, P.A. (1986). A look at the law. What's New in
Home Economics, £l (5), 10.
Johnson, J.M. (1986). Nebraska Home Economics Needs
Assessment. (Project Report.) Lincoln, NE: University
of Nebraska.
Jorgenson, S.R., & Haley, E.G. (1985). Future families in a
nation at risk: The promise and potential of home
economics. Illinois Teacher of Home Economics, ~ (3),
94-99.
]
]
]
]
J J ]
]
]
]
]
]
·1· !:
1 1
Keitz, R. (1987). Integrating curriculum for tomorrow's
students. Educational Leadership, ~ (4), 68-70.
Martin, D.S., Saif, P.S., & Theil, L. (1987). Curriculum
development: Who is involved and how? Educational
Leadership, ~ (4), 40-48.
124
Murray, P.V. (1986). Educating for participatory democracy
in the effective school. Education, ~ (4), 409-412.
Nebraska School Activities Association (1987). The
Activities Bulletin, ~ (7), 4-10.
Riggers, M.L. (1985). Content or process? How to meet
the challenge. What's New in Home Economics? ~ (3),
2, 14.
Sava, S.G. (1987). Holding on to student enthusiasm.
Education Digest, ~ (7), 28-31.
Seeley, D.S. (1984). Educational partnership and the
dilemmas of school reform. Phi Delta Kappan, ~
(6), 383-388.
Spitze, H.T. (1985). Observations in forty high
schools: Is our nation at risk? Journal of Home
Economlcs, 11 (3), 7-11.
Vance, K.L. (1987). Home economics teachers' perceptions
of what is being taught compared with parents' and
agency representatives' perceptions of what should be
taught. Unpublished master's thesis, University of
Nebraska, Lincoln, NE.
I .. ]
]
] ] I j
]
] ]
J ]
J J
I
125
Wagner, T. (1987). Educating for excellence on an
endangered planet. In A. Molnar (Ed.), Social issues
and education: Challenge and responsibility. (pp. 101-
112). Alexandria, Va: Association for Supervision and.
Curriculum Development.
Welsh, P. (1986). What reform? Educational Leadership, ~
(1), 56-62.
Wilcosz, J.R. (1985). New movements in curriculum theory
and practice. What's New in Home Economics, 2Q (3), 4.
Wilcosz, J.R. (1986). Need for educational excellence in a
future oriented society. Illinois Teacher of Home
Economics, ~ (3), 109-112.
J J J J J J ]
,]
J ,]
]
J ]
]
]
"]
]J. M,
APPENDICES

J ]
]
]
J ]
]
]
]
]
]
]
]
]
]
")
11
APPENDIX A
Initial Cover Letters
J J ]
]
]
]
]
]
]
]
,]
]
], , ,
"]
1
128
Appendix A-I Letter to Teachers in One-Teacher Departments
"
University of Nebraska Uncoln
College of Home Economics
Dear Home Economics Teacher:
Oepaltrnent 01 CoMumer Science
"'" Education 123 Home EeononUes Building Uncoln. NE 695 93-0801
March 15, 1988
I am writing to request your assistance In taking a survey of high school seniors in home economics this semeste:.
As part of the requirements for my masters thesis research, I would like to collect data about senior home economics students' pe:ceptions of their needs In high school home economics subject matter areas.
I am enclosinq a stamped postcard with this letter for you to ·complete regarding your wLlllngness to partlclpate In this survey and information about the number of seniors in your home economics classes. If you do not know an exac~ number of senior students In specific classes, please give an estimate of seniors in your classes this semester. Please :eturn the postcard by April 1, 1988 if pos3ible.
After I have received this information; I will mall the survey materials and directions for administering them. I will very much appreCiate your promptness In having them completed and returned to me for analysis.
If you should have questions regardIng this survey, please contact me after 5:00 p.m. at (402) 488-7664 (home) or my Graduate Advisor, Or. Julie M. Johnson, before 5:00 p.~. at (4·02) 472-2923.
Thank you for your cooperation.
Dixie Torres Home Economics Teacher Adams High School
Julie M. Johnson, Ph.D. Assistant Professor GradUate Advisor
University of Neoraska-Unc:oln University of Nebraska at Omaha University of Nebraska Medical Center
J
J .J
J .]
]
J .]
.]
]
]
]
]
]
]
129
Appendix A-2 Letter to Teachers in Two-Teacher Departments
"
University of Nebraska Uncoln
College of Home Economics
Dear Home Economics Teacher:
Oepanment of Consumer Sd&nC8 and edUcation
123 Hom. Eeonormc::s Budding Lincoln. NE 68583+0801
March 15, 1933
I am writing to request your assistance In taking a survey of high school seniors In home economics this semester .
As part of the requirements for my masters thesis research, I yould like to collect data about senior home economics students' perceptions of their needs In high school home economics subject matter areas.
I am enclosIng a stamped postcard with this letter for you to complete regarding your willingness to participate In th-ts survey and information about the number of seniors in your home economics classes. If there Is more than one teacher in your ,department, count the seniors in their classes as well. If you do not knov an exact number of senior stUdents in specific classes, please give an estimate of seniors in your school this semester. Please return the postcard by April 1, 1988 if possibl ••
After I have received this information, I will mail the survey materials and directions for administering them. I vill very much appreciate your promptness In having them completed and returned to me for analysis.
If you should have questions regarding this survey, please contact me after 5:00 p.m. at (402) 483-7664 (home) or my Graduate Advisor, Dr. JUlie'M. Johnson, before 5:00 p.m. at (402) 472-2923.
Thank you for your cooperation.
Dixie Torres Home Economics Teacher Adams HIgh School
Julie M. Juhn$on, Ph.D. Assistant Professor Gradua,te Advisor
Univef$ity 01 Neoraska-Uncoln University 01 Nebraska at Omaha University 01 Nebraska Medical Center
]
]
J J ]
]
]
J ]
]
]
Appendix A-3 Return Postcard
_______ yes, I will be happy to have my students participate in this survey.
_______ .No, I will not .be able to have my students participate in this survey even though the research soun'ds interesting.
If yes, indicate tllo followinn:
_______ !low mnny seniors do you have in all your classes?
130
J J J J J J ]
]
]
,]
]
]
]
]
]
]
]
]
APPENDIX B
List of Participating Schools
]
]
]
]
]
]
]
]
]
]
]
]
]
]
]
J J
J 1.,.· .. · Jl
AppendIx B List of ~articipating Schools
Class Size and Participating Schools
Class A
Omaha Burke Bellevue Ea·sL
Class Cl
Albion Creighton Community Logan View Sandy Creek
Class Dl
Arnold Elgin Lewiston Palmer Stratton
Class B
Broken Bow Falls City Nebraska City Wayne
Class C2
Chappell Hemingford Oxford Winnebago
Class 02
Bruning Lyman Petersburg
132
J J J J J J J J J J J J ]
"]
-]
]
1 1 1
_,/i{(
'ti§lr~~',::
APPENDIX C
Questionnaire
J J J J J ]
]
]
]
]
J J ]
]
]
Directions:
SENIOR SECONDARY STUD&VTS NEBRASKA HOME ECONOMICS NEEDS SURVEY
As a senior enrolled in a high school home economics class, you may have learned about housing, child development, consumer education, family relations, clothing, textiles, home furnishIngs, food, nutrition, and/or management. You may have also learned a number of valuable processes such as communication, critical thinking, problem solving. and decision making. This survey is designed to measure the importance of specific home economics content taught in high school home economics programs. Please ~ the appropriate number vhich expresses how important you think each item is for high school students. You should answer all questions even though you may not have studied all the topics in your class. All of your answers will be kept in strict confidence and will.no,t influence your class grade.
How important is this content for students?
S • Essential
4 • Very Important
3 - Important 2 • Little Importance
1 • Not Important
A. Consumer Education
1. Consumer rights and responsibilities
2. The relationship between .the consumer and the econocy (supply and demand, inflation and recession)
3. The availability of consumer resources (Extension, Better Business Bureau, Social Services)
4. Developing and staying within a budget
s. Managi~a checking account
6. Financial record keeping
7. Comparing savings options (interest, accessibility, convenience)
8. Use and cost of credit
9. Insurance (health, auto, life, disability, home)
10. Taxes and social security
11. Transportation (purchasing, leaSing, cost of operation, maintencance, insurance)
12. Consumer information sources (labels, product coding, warranties, guarantees, magazines)
13. Comparative pricing (unit pricing, brand names)
14. Advertising (purposes. techniques used, analyzing claims)
1
1 2 3 4 5
1 2 3 4 5
1 234 5
1 234 5 1 234 5
1 234 5
12345
12345
1 2 3 4 5
1 234 5
12345
12345
12345
1 234 5
134
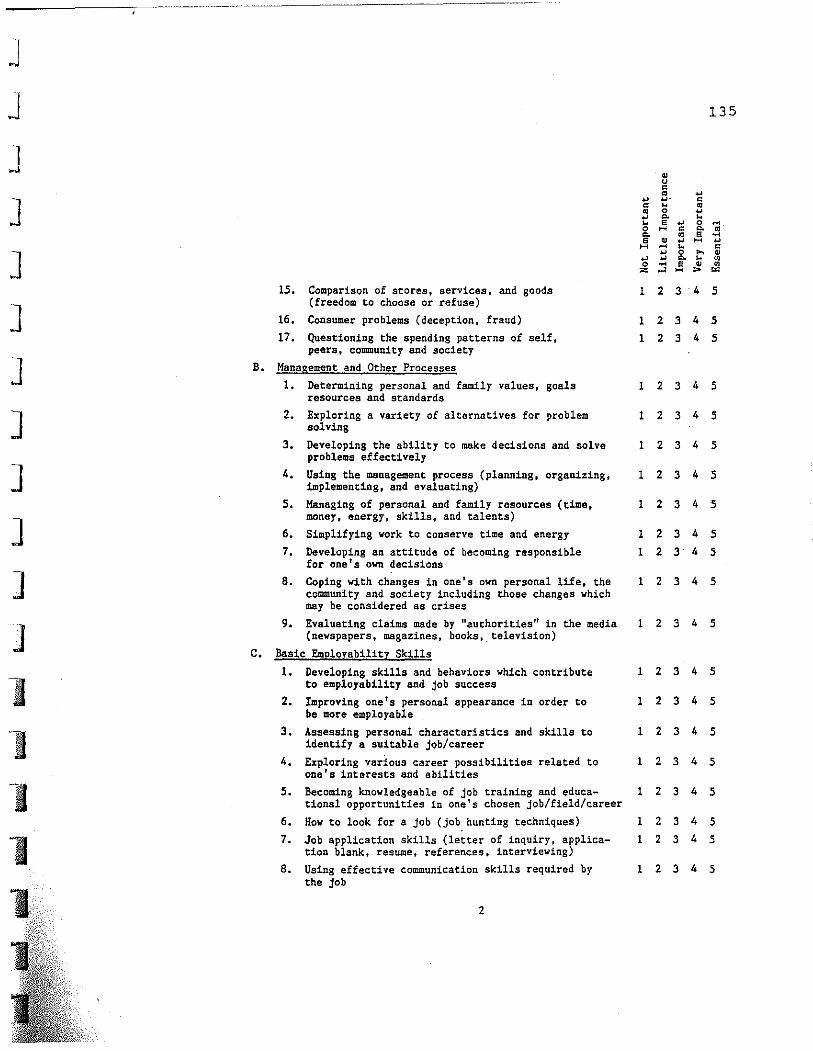
J J J J ]
]
]
]
]
]
]
1
15. Comparison of stores, services. and goods (freedom to choose or refuse)
16. Consumer problems (deception, fraud)
17. Questioning the spending patterns of self, peers, community and society
B. Management and Other Processes
1. Determining personal and family values, goals resources and standards
2. Exploring a variety of alternatives for problem solVing
3. Developing the ability to make decisions and solve problems effectively
4. Using the management process (planning, organizing, implementing, and evaluating)
5. Managing of personal and family resources (time, money, energy, skills, and talents)
6. Simplifying work to conserve time and energy
7. Developing an attitude of becoming responsible for onets own deciSions
8. Coping with changes in one's own personal life, the community and society including those changes which may be considered as crises
9. Evaluating claims made by "authorities" in the media (newspapers, magazines, books. television)
C. Basic Employability Skills
l~ Developing skills and behaviors which contribute to employability and job success
2~ Improving one's personal appearance in order to be more employable
3. Assessing personal characteristics and skills to identify 8 suitable job/career
4. Exploring various career possibilities related to one's interests and abilities
5. BeCOming knowledgeable of job training and educationsl opportunities in one's chosen job/field/career
6. How to look for a job (job hunting techniques)
7. Job application skills (letter of inquiry, application blank, resume, references, interviewing)
8. Using effective communication skills required by the job
2
135
1 2 3 4 5
1 2 3 4 5
1 2 3 4 5
1 2 3 4 5
1 2 3 4 5
1 2 3 4 5
1 2 3 4 5
1 2 3 4 5
1 2 3 4 5
1 2 3 4 5
1 2 3 4 5
1 2 3 4 5
1 2 3 4 5
1 2 3 4 5
1 2 3 4 5
1 2 3 4 5
1 2 3 4 5
1 2 3 4 5
1 2 3 4 5
1 2 3 4 5
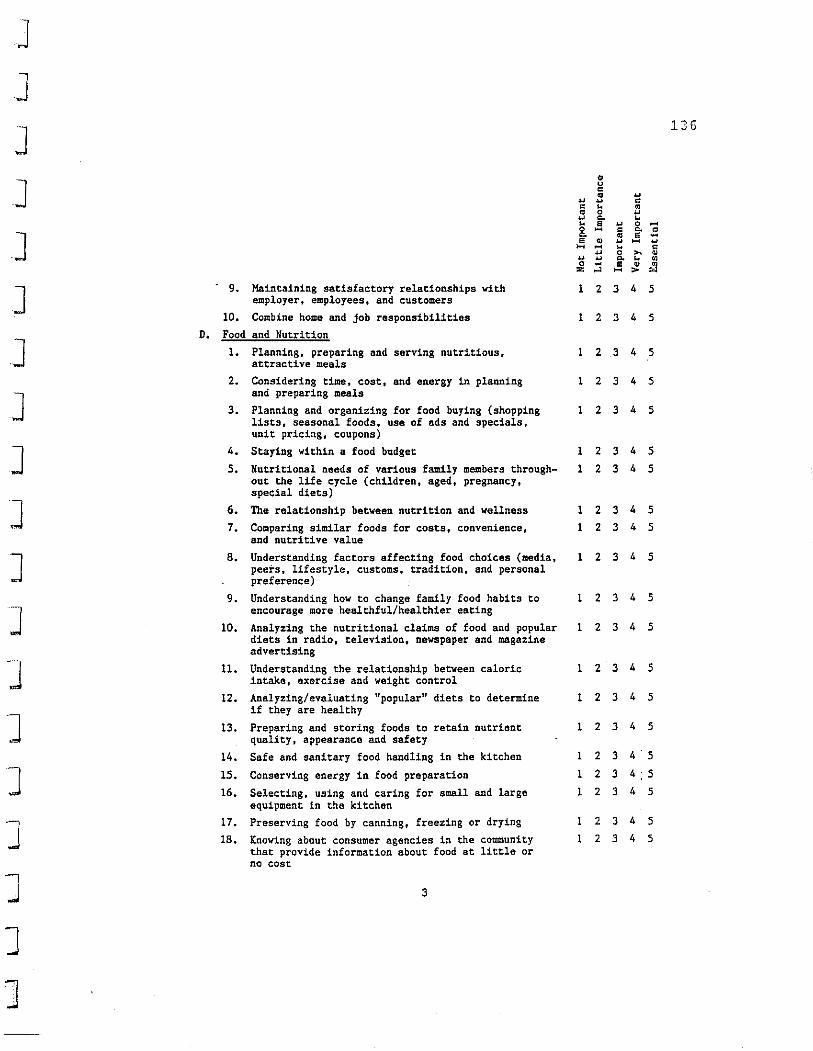
J J
J 136
J • u c
~ • ~ ~ c
c ... • • 0 ~ ~ ~ ... ... • ~ 0 ~
] 0 ~ c ~ • ~ • • ~ e • ~ ~ ~ ~ ~ ... c ~
~ 0 ~ • ~ 0. ... • 0 ~ • • ~ '" ,.., ~ >
J 9. Maintaining satisfactory relationships rith 1 2 3 4 5 employer, employees, and customers
10. Combine home and job responsibilities 1 2 3 4 5
D. Food and Nutrition
J 1. Planning, preparing and serving nutritious, 1 2 3 4 5 attractive meals
2. Considering time, cost. and energy in planning 1 2 3 4 5
J and preparing meals
3. Planning and organizing for food buying (shopping 1 2 3 4 5 lists, seasonal foods. use of ads and specials, unit pricing, coupons)
J 4. Staying within a food budget 1 2 3 4 5
5. Nutritional needs of various family members through- 1 2 3 4 5 out the life cycle (children, aged, pregnancy, special diets)
] 6. The relationship between nutrition and wallness 1 2 3 4 5
7. Comparing similar foods for costs. convenience, 1 2 3 4 5 and nutritive value
] 8. Understanding factors affecting food choices (media, 1 2 3 4 5 peers. lifestyle, customs, tradition, and personal preference)
9. Understanding how to change family food habits to 1 2 3 4 5
] encourage more healthful/healthier eating
10. Analyzing the nutritional claims of food and popular 1 2 3 4 5 diets in radio, television. newspaper and magazine advertising
J 11. Understanding the relationship between caloric 1 2 3 4 5 intake, exercise and weight control
12. Analyzing/evaluating "popular" diets to determine 1 2 3 4 5
J 1f they are healthy
13. Preparing and storing foods to retain nutrient 1 2 3 4 5 quality, appearance and safety
14. Safe and sanitary food handling in the kitchen 1 2 3 4 5
J 15. Conserving energy in food preparation 1 2 3 4 '5
16. Selecting, using and caring for small and large 1 2 3 4 5 equipment in the kitchen
J 17. Preserving food by canning, freezing or drying 2 3 4 5
18. Knowing about consumer agencies in the community 1 2 3 4 5 that provide information about food at little or no cost
J 3
J J
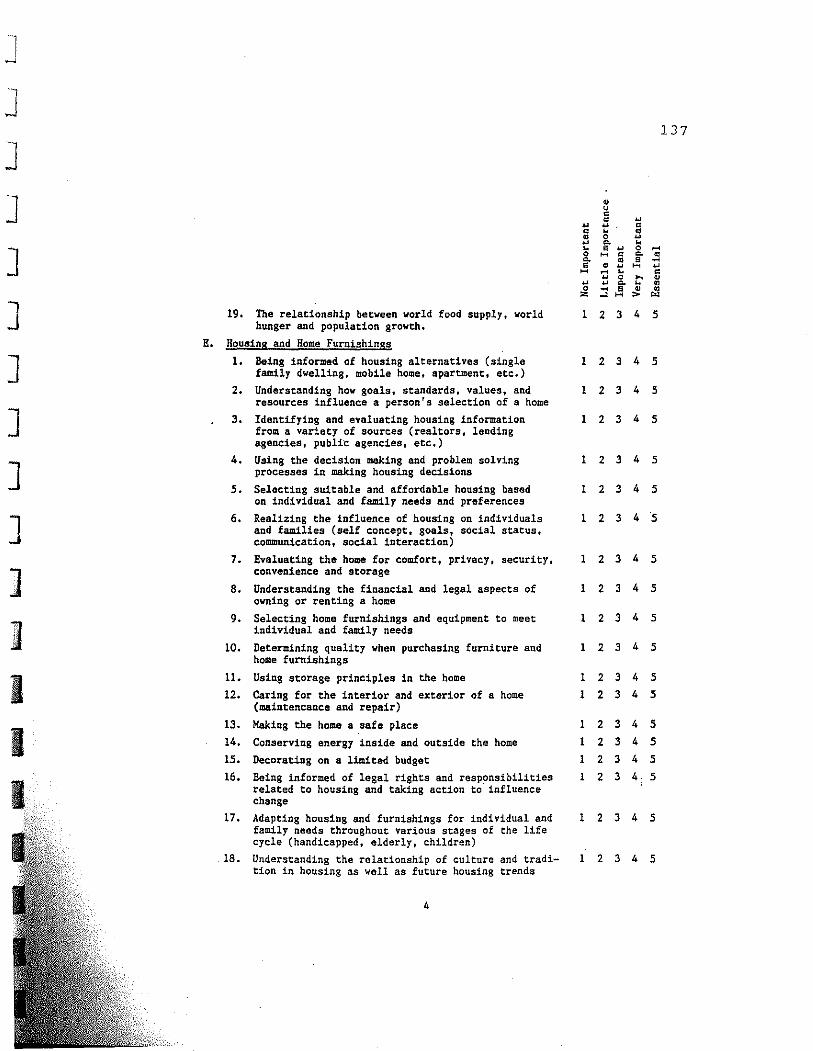
J J ]
]
]
]
]
]
]
I I
19. The relationship between world food supply, world hunger and population growth.
E. Housing and Home Furnishings
1. Being informed of housing alternatives (single family dwelling, mobile home, apartment, etc.)
2. Understanding how goals. standards, values, and resources influence a person's selection of a home
3. Identifying and evaluating housing information from a variety of sources (realtors, lending agencies, publl'c agencies. etc.)
4. Using the decision making and problem solving processes in making housing decisions
S. Selecting suitable and affordable housing based on individual and family needs and preferences
6. Realizing the influence of housing on individuals and families (self concept, goals, social status. communication, social interaction)
7. Evaluating the home for comfort, privacy, security, convenience and storage
8. Understanding the financial and legal aspects of owning or renting a home
9. Selecting home furnishings and equipment to meet individual and family needs
10. Determining quality ~hen purchasing furniture and home furnishings
11. Using storage principles in the home
12. Caring for the interior and exterior of a home (maintencance and repair)
13. Making the home a safe place
14. Conserving energy inside and outside the home
15. Decorating on a limited budget
16. Being informed of legal rights and resp~nsibilities related to housing and taking action to influence change
17. Adapting housing and furnishings for individual and family needs throughout various stages of the life cycle (handicapped, elderly, children)
18. Understanding the relationship of culture and tradition in housing as well as future housing trends
4
1 2 J 4 5
1 2 3 4 5
1 2 J 4 5
1 2 J 4 5
1 2 3 4 5
1 2 J 4 5
1 2 J 4 5
1 2 J 4 5
1 2 J 4 5
1 2 3 4 5
1 2 3 4 5
1 234 5 1 2 3 4 5
1 2 3 4 5
1 2 3 4 5
1 2 3 4 5
1 2 3 4. 5
1 2 J 4 5
1 2 3 4 5
137
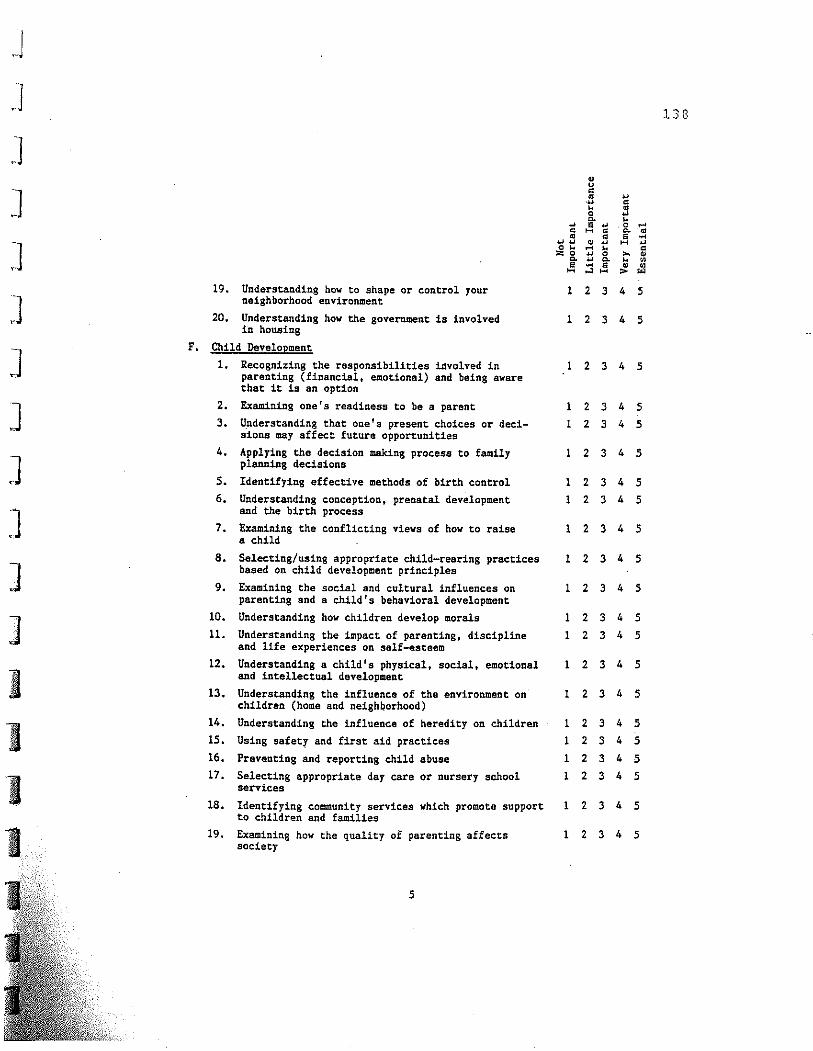
J J 138
.] • u
.] • ., • ,., • .. • 0 ., ~ ..
~ • ... ,0 ... • ~ • ~ • • • • ....
.] ., ., • ., ~ ., 0 .. ... .. • '" 0
., 0 ,., • ~ ., ~ .. w • .... • • w ~ oJ ~ > ""
19. Understanding hoy to shape or control your 1 2 3 4 5
] neighborhood environment
20. Understanding how the government is involved 1 2 3 4 5 in housing
.] F • Child Develo~ment
1. Recognizing the responsibilities idvolved in 2 3 4 5 parenting (financial, emotional) and being aware that it is an option
] 2. Examining one's readiness to be a parent 1 2 3 4 5 3. ~nderstand1ng that one's present choices or deci- 1 2 3 4 5
sions may affect future opportunities
4. Applying the decision making process to family 1 2 3 4 5
J planning decisions
5. Identifying effective methods of birth control 1 2 3 4 5 6. Understanding conception, prenatal development 1 2 3 4 5
] and the birth process
7. Examining the conflicting views of how to raise 1 2 3 4 5 • child
8. Selecting/using appropriate child-rearing practices 1 2 3 4 5
] based on child development principles
9. Examining the social and cultural influences on 1 2 3 4 5 parenting and a child's behavioral development
1 10. Understanding how children develop morals 1 2 3 4 5
11. Understanding the impact of parenting, discipline 1 2 3 4 5 and life experiences on self-esteem
12. Understanding a child's physical, social, emotional 1 2 3 4 5
1 and intellectual development
13. Understanding the influence of the environment on 1 2 3 4 5 children (home and neighborhood)
'I 14. Understanding the influence of heredity on children 1 2 3 4 5 15. USing safetr and first aid practices 1 2 3 4 5
16. Preventing and reporting child abuse 1 2 3 4 5
1 17. Selecting appropriate day care or nursery school 1 2 3 4 5
services
18. Identifying community services which promote support 1 2 3 4 5 to children and families
1 19. Examining how the quality of parenting affects 1 2 3 4 5 society
5
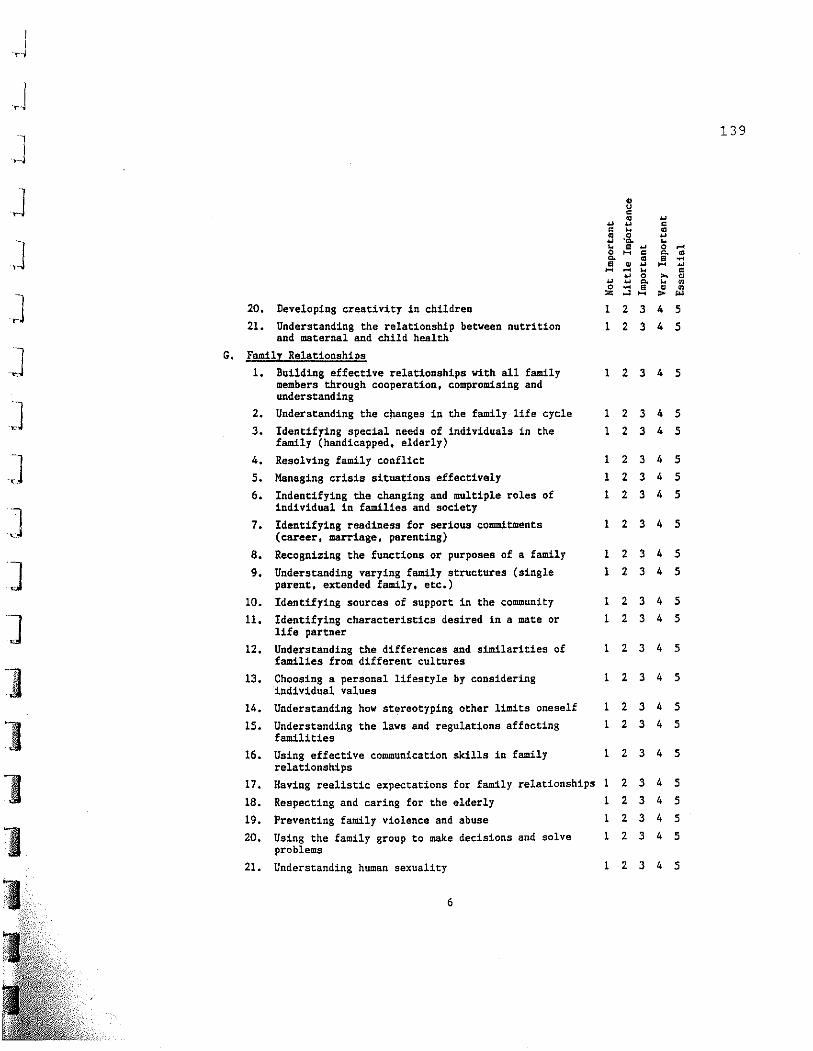
J J J
]
]
]
]
]
]
]
]
"I
20. Developing creativity in children
21. Understanding the relationship between nutrition and maternal and child health
G. Family Relationships
1. Building effective relationships with sll family members through cooperation, compromising and understanding
2. Understanding the c~nges in the family life cycle
3. Identifying special needs of individuals in the family (handicapped. elderly)
4. Resolving family conflict
5. Managing crisis situations effectively
6. Indenti£ying the changing and multiple roles of individual in families and society
7. Identifying readiness for serious commitments (career, marriage, parenting)
8. Recognizing the functions or purposes of a family
9. Understanding varying family structures (single parent, extended family, etc.)
10. Identifying sources of support in the community
11. Identifying characteristics desired in a mate or life partner
12. Understanding the differences and similarities of families from different cultures
13. Choosing a personal lifestyle by considering individual values
14. Understanding how stereotyping other limits oneself
15. Understanding the laws and regulations affecting famil1ties
16. Using effective communication skills in family relationships
12345
1 2 3 4 5
12345
1 2 3 4 5
1 2 3 4 5
1 234 5 1 2 3 4 5
1 2 3 4 5
1 234 5
1 2 3 4 5
1 2 3 4 5
1 2 345 1 2 345
1 234 5
1 2 345
1 234 5
1 2 3 4 5
1 234 5
17.
18.
Having realistic expectations for family relationships 1 2 3 4 5
234 5 Respecting and caring for the elderly
19. Preventing family violence and abuse
20. Using the family group to make decisions and solve problems
21. Understanding human sexuality
6
1
1 234 5
1 2 3 4 5
1 2 3 4 5
139
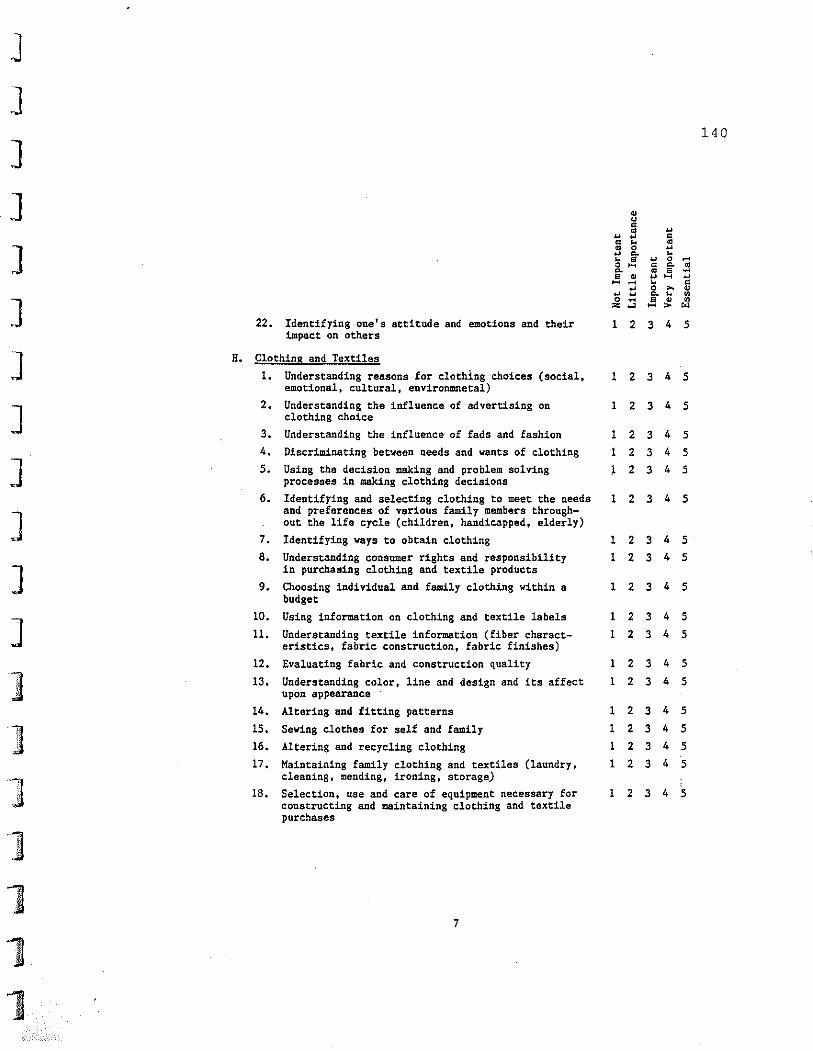
J J
140
]
] • u c
" = " " c c " •
] • 0 " " c. " " • " 0 ~ 0 H C C. • '" • • ~ • • " H " H ~ " • " 0 ~ • " " Co " 0
] 0 ~ a • 0
'" ... H> '" 22. Identifying one's attitude and emotions and their 1 2 3 4 5
impact on others
J H. ClothinS and Textiles
1- Understanding reasons for clothing choices (social, 1 2 3 4 5 emotional. cultural, environmnetal)
] 2. Understanding the influence of advertising on 1 2 3 4 5
clothing choice
3. Understanding the influence of fads and fashion 1 2 3 4 5
4. Discriminating between needs and wants of clothing 1 2 3 4 5
J 5. Using the decision making and problem solving 1 2 3 4 5 processes in making clothing decisions
6. Identifying and selecting clothing to meet the needs 1 2 3 4 5
J and preferences of various family members through-out the life cycle (children. handicapped, elderly)
7. Identifying ways to obtain clothing 1 2 3 4 5
8. Understanding consumer rights and responsibility 1 2 3 4 5
] in purchasing clothing and textile products
9. Choosing individual and family clothing within a 1 2 3 4 5 budget
] 10. Using information on clothing and textile labels 1 2 3 4 5
11. Understanding textile information (fiber charact- 1 2 3 4 5 eristics, fabric construction, fabric finishes)
12. Evaluating fabric and construction quality 1 2 3 4 5
] 13. Understanding color, line and design and its affect 1 2 3 4 5 i' , upon appearance
14. Altering and fitting patterns 1 2 3 4 5
] 15. Sewing clothes for self and family 1 2 3 4 5 ,. 16. Altering and recycling clothing 1 2 3 4 5
17. Maintaining family clothing and textiles (laundry, 1 2 3 4 5
] cleaning, mending, ironing, storage) ,
r 18. Selection, use and care of equipment necessary for 1 2 3 4 5 constructing and maintaining clothing and textile purchases
] ;.~
1 7
1 1
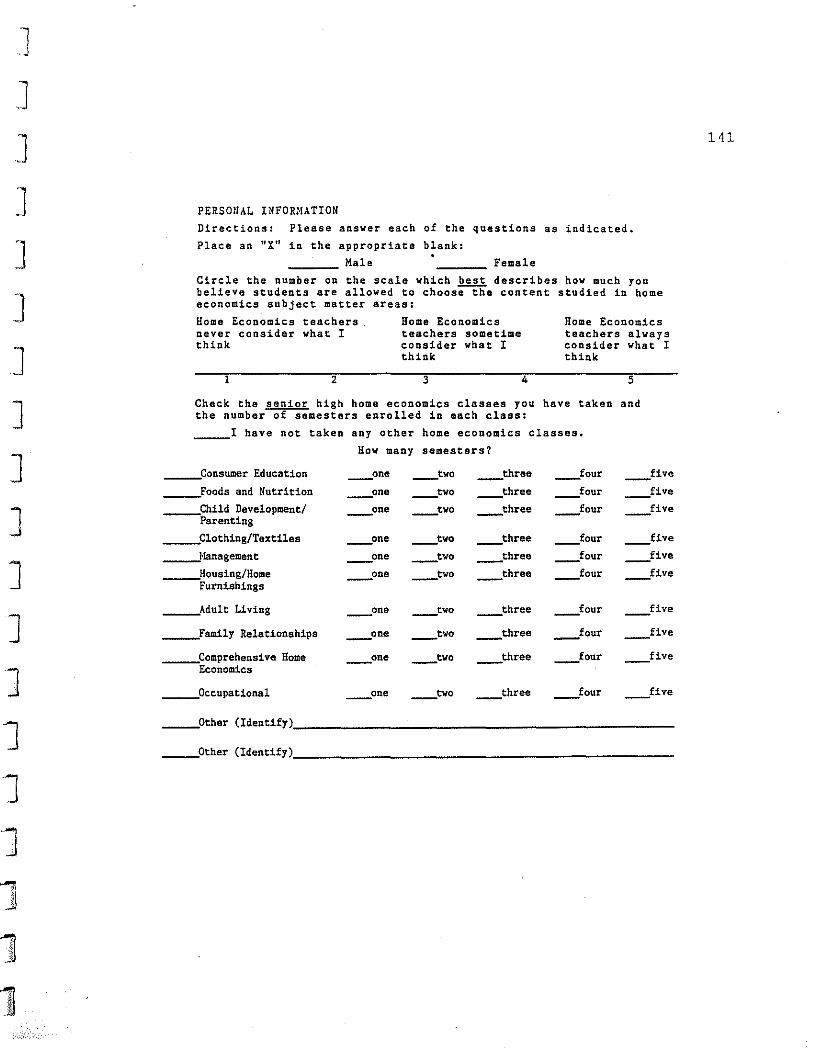
]
]
]
]
]
]
]
]
]
]
]
]
]
J J ""'m j1 ,
1
PERSotlAL INFORMATION
Directions: Please answer each of the questions as indicated.
Place an "X~ in the appropriate blank:
Male Female
Circle the number on the scale which best describes believe students are allowed to choose-the content economics subject matter areas:
how much you studied in home
Home Economics teachers. never consider what I think
1 2
Home Economics teachers sometime consider what I think
3 4
Home Economics teachers always consider what I think
5
Check the senior high home economics classes you have taken and the number of semesters enrolled in each class:
_____ 1 have Dot taken any other home economics classes.
How many semesters?
______ Consumer Education ____ one ____ two ____ three ____ four __ five
_____ Foods and Nutrition _one ____ two ____ three ____ four __ five
____ Child Development/ ____ one ____ two ____ three _four ____ five Parenting
_____ Clothing/Textiles ____ one ____ tva __ three ----four __ five
______ rmnagement ____ one ____ two ___ three ____ four __ five
_____ Housing/Home ____ one ____ two ___ three ____ four __ five Furnishings
____ Adult Living ____ one ____ two ____ three ____ four ____ five
_____ Family Relationships ___ on. ____ two ____ three _four ____ five
______ Comprehensive Home ____ one ____ two ____ three ____ four __ five
Economics
____ Occupational ____ one ____ two ____ three ____ four __ five
_____ Other (Identify)
_____ Other (Identify)
141
-, I ...
1 ... ] I J -,
J
]
]
]
]
]
]
")
]
}I
APPENDIX D
Information for Teachers
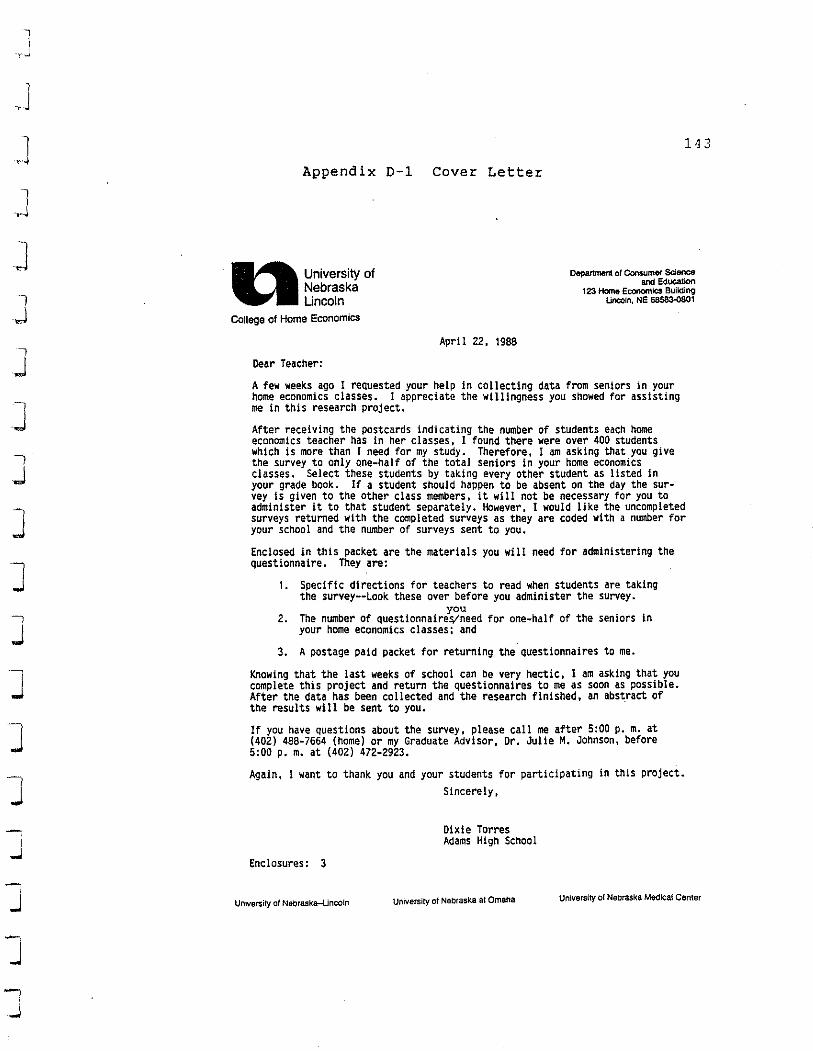
J 1
,J
J ] 1 J
J ] -, J
]
]
]
]
]
J J
113
Appendix D-1 Cover Letter
a University of Nebraska Uncoln
COJlege of Home Economics
~ of ConsumEIf' Science and EducatiOn
123 Home EconomiCs Building Uncoln, NE 68583-0801
April 22. 1988
Dear Teacher:
A few weeks ago 1 requested your help in collecting data from seniors in your home economics classes. I appreciate the willingness you showed for assisting me in this research project.
After receiving the postcards indicating the number of students each home economics teacher has in her classes. I found there were over 400 students which is more than I need for my study. Therefore. I am asking that you give the survey to only one-half of the total seniors in your home economics classes. Select these students by taking every other student as listed In your grade book. If a student Should happen to be absent on the day the survey is given to the other class members. it will not be necessary for you to administer it to that student separately. However. I would like the uncompleted surveys returned with the completed surveys as they are coded with a number for your school and the number of surveys sent to you.
Enclosed in this packet are the materials you will need for administering the questionnaire. They are:
1. Specific directions for teachers to read when students are taking the surveY--Look these over before you administer the survey.
you 2. The number of Questionnaire~need for one-half of the seniors in
your home economics classes; and
3. A postage paid packet for returning the questionnaires to me.
Knowing that the last weeks of school can be very hectic. I am asking that you complete this project and return the questionnaires to me as soon as possible. After the data has been collected and the research finished. an abstract of the results will be Sent to you. .
If you have Questions about the survey. please call me after 5:00 p. m. at (402) 488-7664 (home) or my Graduate Advisor. Or. Julie M. Johnson. before 5:00 p. m. at (402) 472-2923.
Again. I want to thank you and your students for participating in this project.
Enclosures: 3
University 01 Nebraska-linco!n
Sincerely.
Dixie Torres Adams High School
University of Nebraska al Omaha University of Nebraska Medical Center
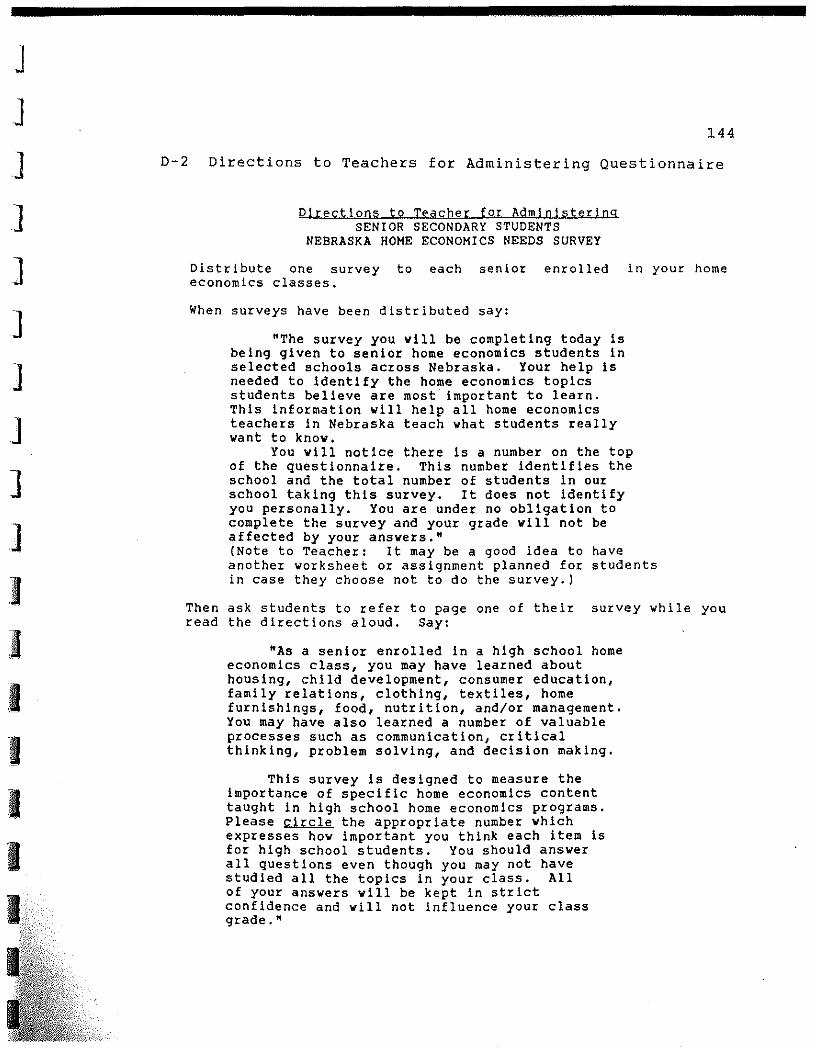
J ]
]
]
J ]
.]
]
]
J I I I I I
144
D-2 Directions to Teachers for Administering Questionnaire
Directions to Teacher for Administering SENIOR SECONDARY STUDENTS
NEBRASKA HOME ECONOMICS NEEDS SURVEY
Distribute one survey to each senior enrolled in your home economics classes.
When surveys have been distributed say:
"The survey you viII be completing today is being given to senior home economics students in selected schools across Nebraska. Your help is needed to identify the home economics topics students believe are most important to learn. This information viII help all home economics teachers in Nebraska teach what students really want to know.
You will notice there is a number on the top of the questionnaire. This number identifies the school and the total number of students in our school taking this survey. It does not identify you personally. You are under no obligation to complete the survey and your grade viII not be affected by your answers." (Note to Teacher: It may be a good idea to have another worksheet or assignment planned for students in case they choose not to do the survey.)
Then ask students to refer to page one of their survey while you read the directions aloud. Say:
"As a senior enrolled in a high school home economics class, you may have learned about housing, child development, consumer education, family relations, clothing, textiles, home furnishings, food, nutrition, and/or management. You may have also learned a number of valuable processes such as communication, critical thinking, problem solving, and decision making.
This survey is designed to measure the importance of specific home economics content taught in high school home economics programs. Please circle the appropriate number which expresses how important you think each item is for high school students. You should answer all questions even though you may not have studied all the topics in your class. All of your answers will be kept in strict confidence and will not influence your class grade."
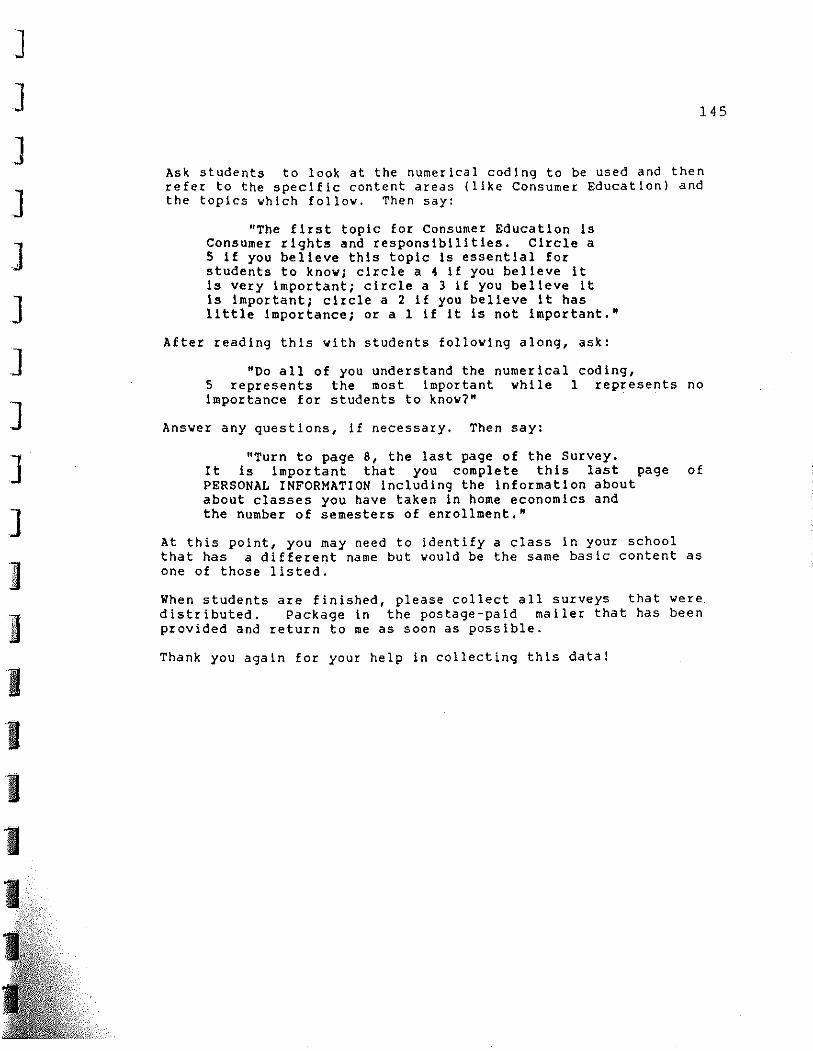
J ]
]
J J ]
]
]
]
J ~ JI
~ . ~
I 1 1 I
145
Ask students to look at the numerical coding to be used and then refer to the specific content areas (like Consumer Education) and the topics yhich folloy. Then say:
"The first topic for Consumer Education is Consumer rights and responsibilities. Circle a 5 if you believe this topic is essential for students to knoy; circle a 4 if you believe it is very important; circle a 3 if you believe it is important; circle a 2 if you believe it has little importance; or a 1 if it is not important."
After reading this yith students folloying along, ask:
"Do all of you understand the numerical coding, 5 represents the most important yhile 1 represents no importance for students to knoy?"
Ansyer any questions, if necessary. Then say:
"Turn to page 8, the last page of the Survey. It is important that you complete this last page of PERSONAL INFORMATION including the information about about classes you have taken in home economics and the number of semesters of enrollment."
At this point, you may need to identify a class in your school that has a different name but vould be the same basic content as one of those listed.
When students are finished, please collect all surveys that yere distributed. Package in the postage-paid mailer that has been provided and return to me as soon as possible .
Thank you again for your help in collecting this data!
J
J ]
]
]
]
]
]
]
]
11 .!it
1 --. -. 1
1 1 1 -.
APPENDIX E
Follow-up Postcards
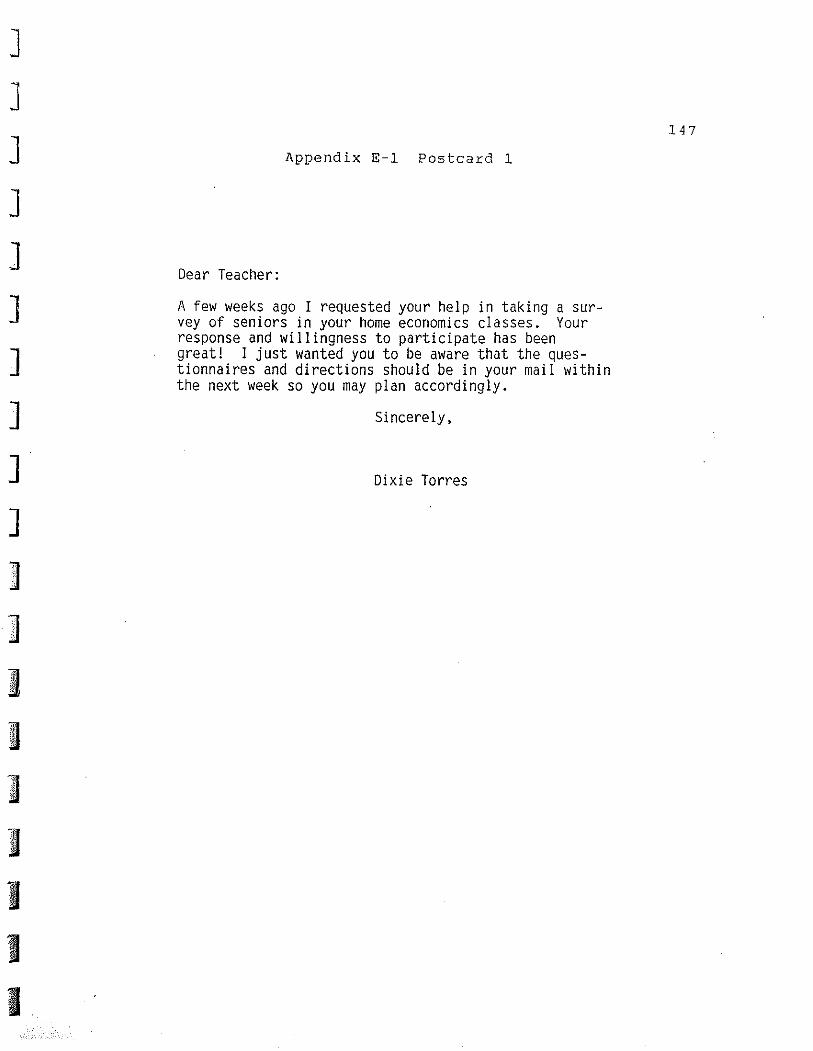
]
]
]
J J ]
]
]
]
]
]
J .. . \
I I 11 .. .I
I I I
Appendix E-l Postcard 1
Dear Teacher:
A few weeks ago I requested your help in taking a survey of seniors in your home economics classes. Your response and willingness to participate has been great! I just wanted you to be aware that the questionnaires and directions should be in your mail within the next week so you may plan accordingly.
Sincerely,
Dixie Torres
147
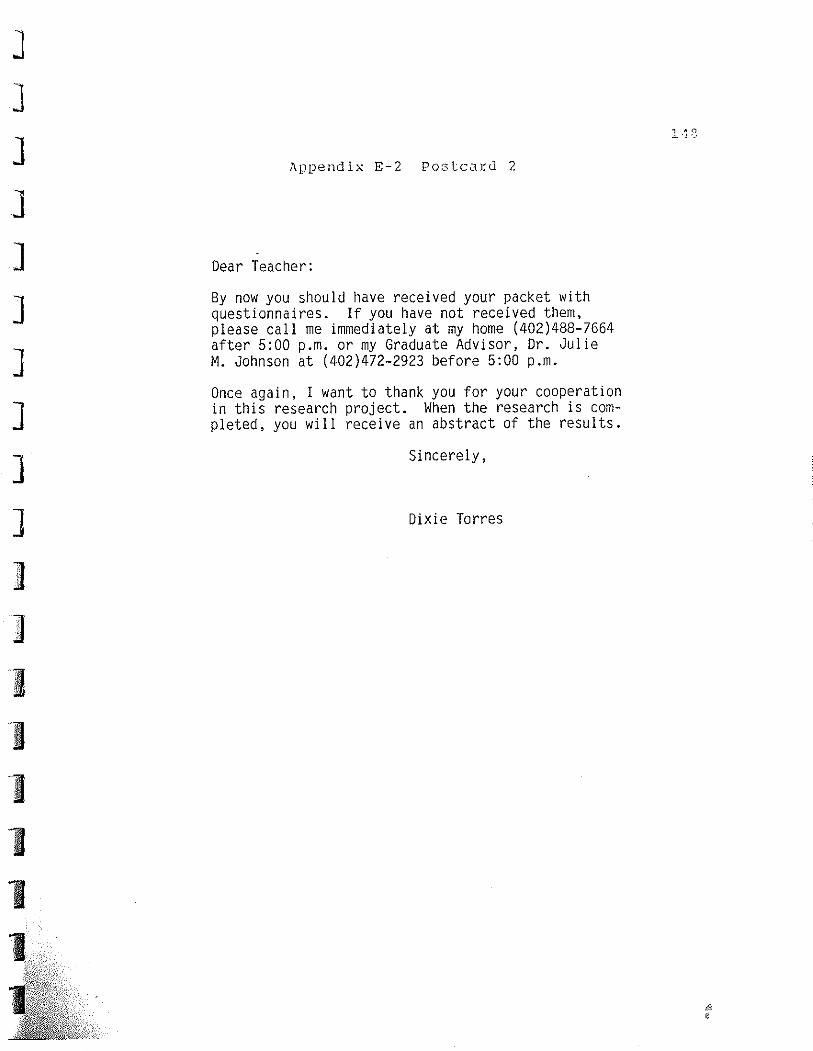
J ]
]
]
]
]
]
]
]
]
1 1
~ppendix E-2 Postcard 2
Dear Teacher:
By now you should have received your packet with questionnaires. If you have not received them, please call me immediately at my home (402)488-7664 after 5:00 p.m. or my Graduate Advisor, Dr. Julie M. Johnson at (402)472-2923 before 5:00 p.m.
Once again, I want to thank you for your cooperation in this research project. When the research is completed, you will receive an abstract of the results.
Sincerely,
Dixie Torres
J J J ]
]
]
]
J ]
]
]
]
J ~1 I
]a
-. -I
.. "I
APPENDIX E
computer Programs
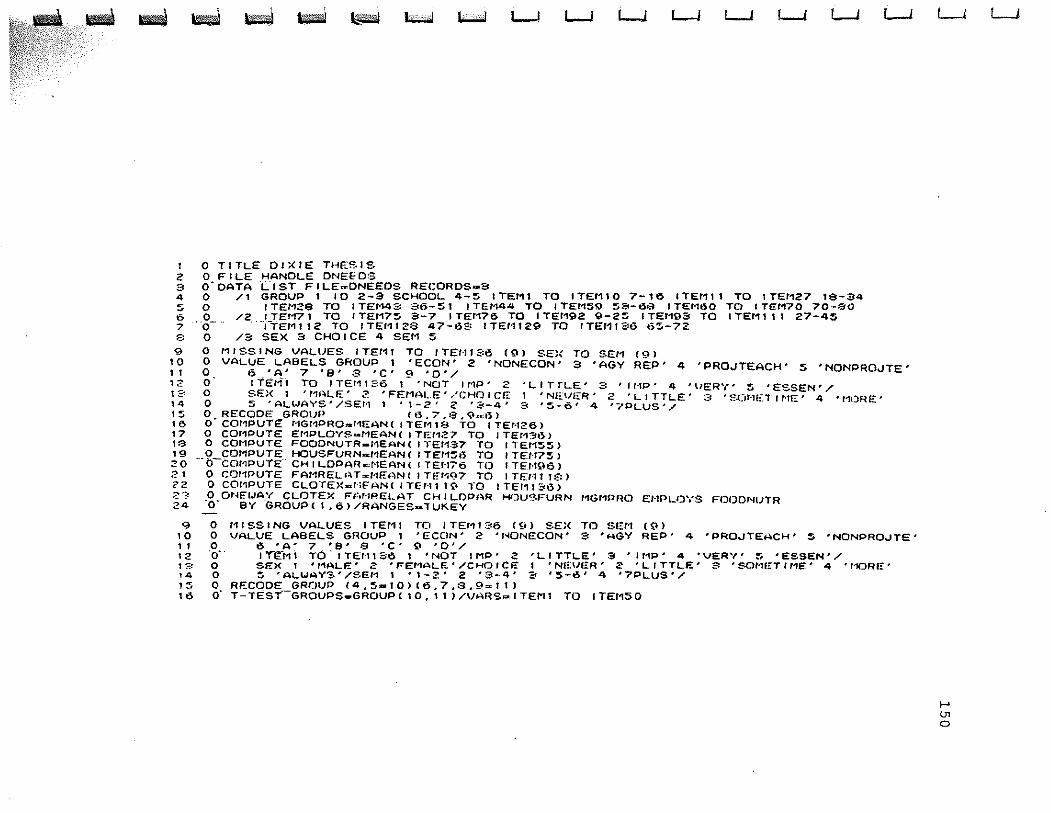
-
I 2
'" 4 s
- - .. ~
o TITLE DIXIE THESIS HANDLE DNEE=DS
\",>1 Lo-.-J
CIST FILE_DNEEDS RECORDS_Eo
L-J L-J '-J L-J L.1 L.1 L..J
o FILE O·DATA o /1 o
GROUP 1 10 2-3 SCHOOL 4-~ ITEMl TO ITEr110 7-'~ ITEM11 TO ITEr127 19-34 I TE''1Ze TO I TEr448 8t;,-S 1 I TEt144 TO I TEt1S9 :sEt-613 I TEl'lt'50 TO I TEt170 '70--$'0
6 .. 0 __ 7 0
o 8
/2 I TEr171 TO I TEr17~ 3-7 I TEt176 TO I TEr192 O-ZS I TEr10Qa TO I TEf." t 1 2'7-4!i ··-i-TEt1112 TO ITEr11Z$ 47-tlE: ITEt'112-o TO ITEr1tE1u t)~-72
/3 SEX 8 CHOICE 4 SEt1 S
L..J
... 10 1 I 12
o 11 J ~·S I NG VALUES I TEt11 TO I TEI-' f ~:6 (9) ~.E}{ TO SEI., (9) o VALUE LABELS GROUP 1 'ECON' 2 'NONECON' "' 'AGY REP' 4 'PRO~TEACH' S 'NONPRO~TE' o 6~Ai7'B'8'C'9'O'/
1 ~: 14 ,~
'" 17 ,:3 19 20 21 ,2 2';': 24
o I TEJ11 TO I TEl., 1 ::::6 1 'NOT IMP' .:. • LIT fLE' 3 • 1"lP' 4 • \/ERY' ~ • ESSEN' / o SE}< 1 • '"J~LE' 2. • FEr1/\LE' /GHO I CE 1 • NEVER' 2 • LITTLE' 3 • ~:.or·'ET r "1E' 4 • f1!)RE:' o J 'ALWAYS'/SEI1 1 . 1-2' 2 '8-4' 8 '~-6' 4 '7PLUS'/ o RECQDE GROUP (t3. '7 • 13.9 .. ,1'5) 0- COf1PUTe: r-1Gr1PRQ"",r1EAN ( I TEr118 TO I TEr·t26) o COJ1PUTE Er'!PLD'(S .. t1EAN ( I TEt1Z"7 TO I TEt13t3) o cOr1PUTE FOOONUTR_t'lEAN ( I TEt137 TO 11" Er1~:;) o COf1PUTE HOUSFURf\h:d1EAN ( , TEt1St"S TO I TEN75 )
-- O-COf'lPU'tE"" CH I LDPARc;r·tEAN( I TEr-176 T"() I TENQ6) o CQr1PUTE FA'1REL~~T='-lEI~N( I TF.t-;g7 TO I TENt T:::) o COC'lPUTE CLOTEK ... r"iF AN ( I TE '"11 19 ,'0 I TEt11 B6) o ONF.tJAY CLOTE;< FI=,'"lP.ELAT CH I LDPI\R Ht)l)~:'FURN f1Gr1PHtl Et-lPLOYS F(::lODNlJTR '0- B'( "GROUP ( 1 .6) /RANGES_l UKEY
9 0 '11 SS I NG VALUES I TEt11 TO I TEl1l 36 ('9) S"-E!< TO $1'::'1 (9) 10 0 VALUE LABELS GROUP 1 'ECON' 2 'NQNECON' S 'AGY REP' 4 'PROJTEACH' S , NONPROJTE, 11 0 6 'A' 7 'S'.a 'c' g '0'/ 12 '0-" I Y-EM 1 TO" I TEJ" t SI5 1 ' NOT IMP' 2 ' L I TTl-E' ::. 'I f1P' 4 ' VER',' ~ , ESSEN' / 19 0 SfD< 1 ' ,"ALE' 2 ' FE'''ALF..' /CHO f Cft f 1 N(:;\ll.::R· 2 ' L J TTL£' $I 'SOf1E"T' r1E ~ 4 • ''1f"JRf£ 1
14 0 ~ 'ALWAY$'/SEM 1 '1-2' 2 19-4' 3 '5-6' 4 '7~LUS'/
15 0 RECODE GROUP (4.5-tO)(6,7,8,9=t1) 10 O' T-TEST-GROUPS_GROUP( 10. 11 )/VARS""ITEM1 TO ITEf15D
L..J
..... tJ1 a
LJ
J J
151
J J ]
]
]
]
] APPENDIX G
] Expanded Statistical Tables
I f~
/
j /
/ t~
I J I 1 1 1
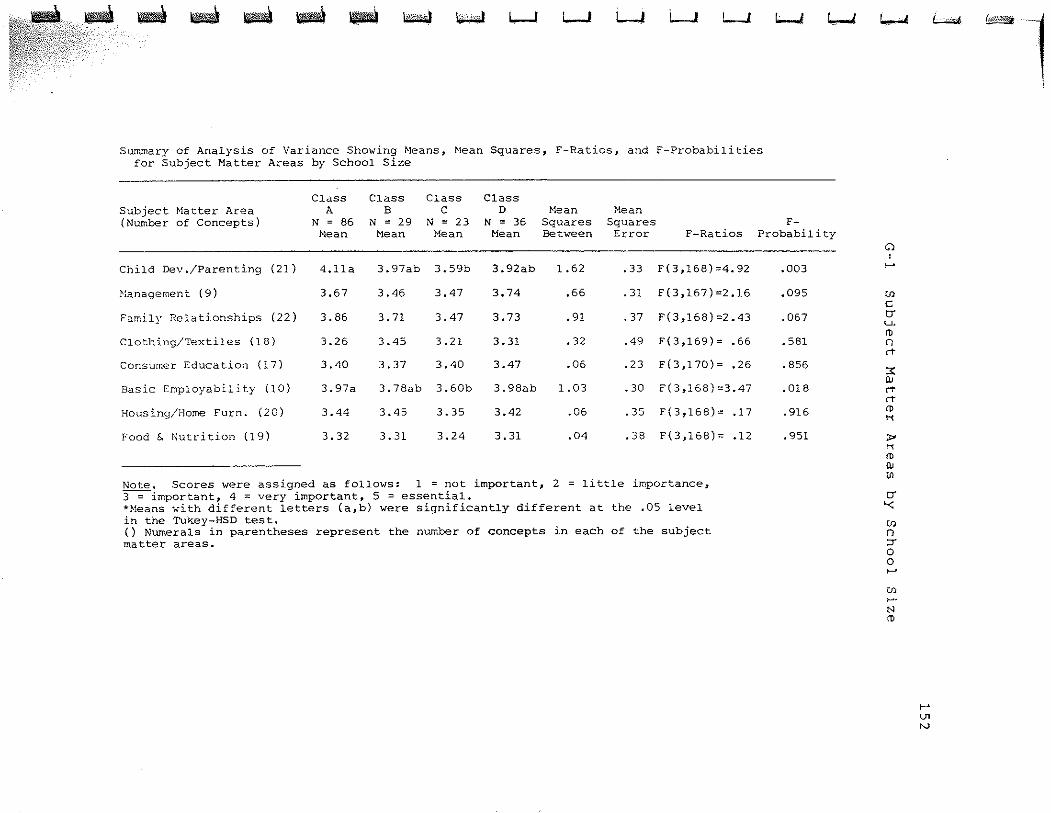
- - - - - iw*,1 i.~" ~ I...-J L......,I L...J L......,I L-....J L-....J
Summary of Analysis of Variance Showing Neans, Hean Squares, F-Ratios, and F-Probabilities for Subject Matter Areas by School Size
Subject Hatter Area (Number of Concepts)
Child Dev./Parenting (21)
l':anagernen t (9)
family Relationships (22)
Clothing/Textiles (18)
Consumer Education (17)
Basic Employability (10)
Housing/Home Furn. (20)
Food & Nutrition (19)
Class A
N = 86 Hean
4.11a
3.67
3.86
3.26
3.40
3.97a
3.44
3.32
Class B
N = 29 Mean
Class C
N = 23 Mean
3.97ab 3.59b
3.46 3.47
3.71 3.47
3.45 3.21
3.37 3.40
3.78ab 3.60b
3.45 3.35
3.31 3.24
Class D
N = 36 Mean
3.92ab
3.74
3.73
3.31
3.47
3.98ab
3.42
3.31
Hean Mean Squares Squares Between Error F-Ratios
1.62
.66
.91
.32
.06
1.03
.06
.04
.33 F(3,168)=4.92
.31 F(3,167)=2.16
.37 F(3,168)=2.43
.49 F(3,169)= .66
.23 F(3,170)= .26
.30 F(3,168)=3.47
.35 F(3,168)= .17
.38 F(3,168)= .12
Note. Scores were assigned as follows: 1 = not important, 2 = little importance, 3 = important, 4 = very important,S = essential. *Means with different letters (a,b) were significantly different at the .05 level in the Tukey-HSD test. () Numerals in parentheses represent the number of concepts in each of the subject matter areas.
FProbability
.003
.095
.067
.581
.856
.018
.916
.951
~
G"l I
f-
(!)
" tJ" u. m n rt
3:: llJ rt IT m H
>'
" m llJ Ul
tJ" '< (J)
n :T o o I--'
(J) ~.
N m
fen N
~ f$.
1
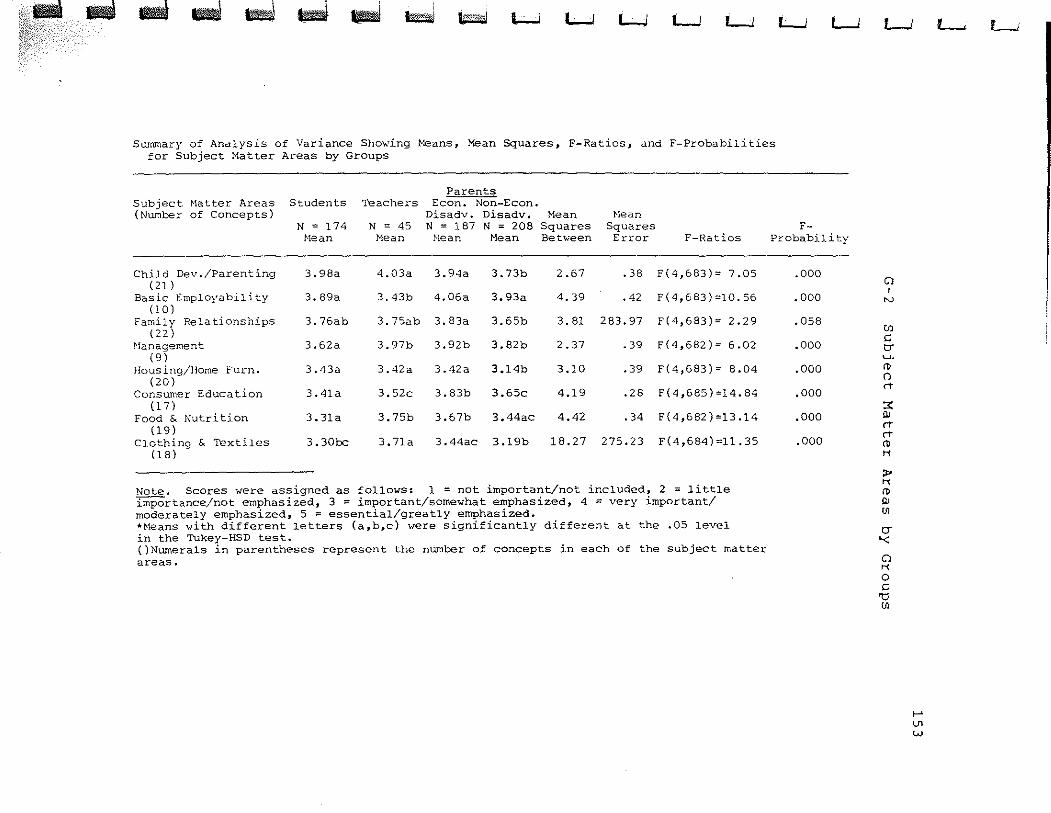
..A..1~ wal ~ .J .~ IF''i1! L--I L.I L....J L...J L...J
Swnrnary of Analysis of Variance Shov.ring l'1eans, Mean Squares, F-Ratios, and F-Probabilities for Subject Natter Areas by Groups
Subject Hatter Areas Students (Number of Concepts)
N 174
Parents Teachers Ecan. Non-Ecan.
Disadv. Disadv. N = 45 N = 187 N = 208
Nean t-lean Squares Squares
L...J L....i
F-Hean Mean Bean Mean Between Error F-Ratios Probability
Child Dev./Parenting (21 )
Bas ic J:":mployabil i ty (10)
Family Relationships (22)
l'fanagement (9 )
Housing/Home Furn. (20)
Consumer Education (17 )
Food & Nutrition (19 )
Clothing & Textiles (18)
3.98a 4.03a 3.94a 3.73b
3.89a 3.43b 4.06a 3.93a
3.76ab 3.75ab 3.83a 3.65b
3.62a 3.97b 3.92b 3.82b
3.43a 3.42a 3.42a 3.l4b
3.41a 3.52c 3.83b 3.65c
3.3la 3.75b 3.67b 3.44ac
3.30l:c 3.7la 3.44ac 3.l9b
2.67 .38 F(4,683)= 7.05
4.39 .42 F(4,683) =10. 56
3.81 283.97 F(4,683)= 2.29
2.37 .39 F(4,682) = 6.02
3.10 .39 F(4,683)= 8.04
4.19 .28 F(4,685)=14.84
4.42 .34 F(4,682)=13.14
18.27 275.23 F(4,684)=1l.35
Note. Scores were assigned as follows: 1 = not important/not included, 2 = little importance/not emphasized, 3 = important/somewhat emphasized, 4 = very important/ moderately emphasized, 5 = essential/greatly emphasized. *Means with different letters (a,b,c) were significantly different at the .05 level in the Tukey-HSD test. ()Numerals in parentheses represent the number of concepts in each of the subject matter areas.
.000
.000
.058
.000
.000
.000
.000
.000
l.-.J
Cl , N
'" C tJ" u. (J)
()
n-
:<:
'" n-n-(J)
H
;,. H (J)
'" {Jl
tJ" '<
Cl H 0 c '0 {Jl
..... en w
'---' L..i
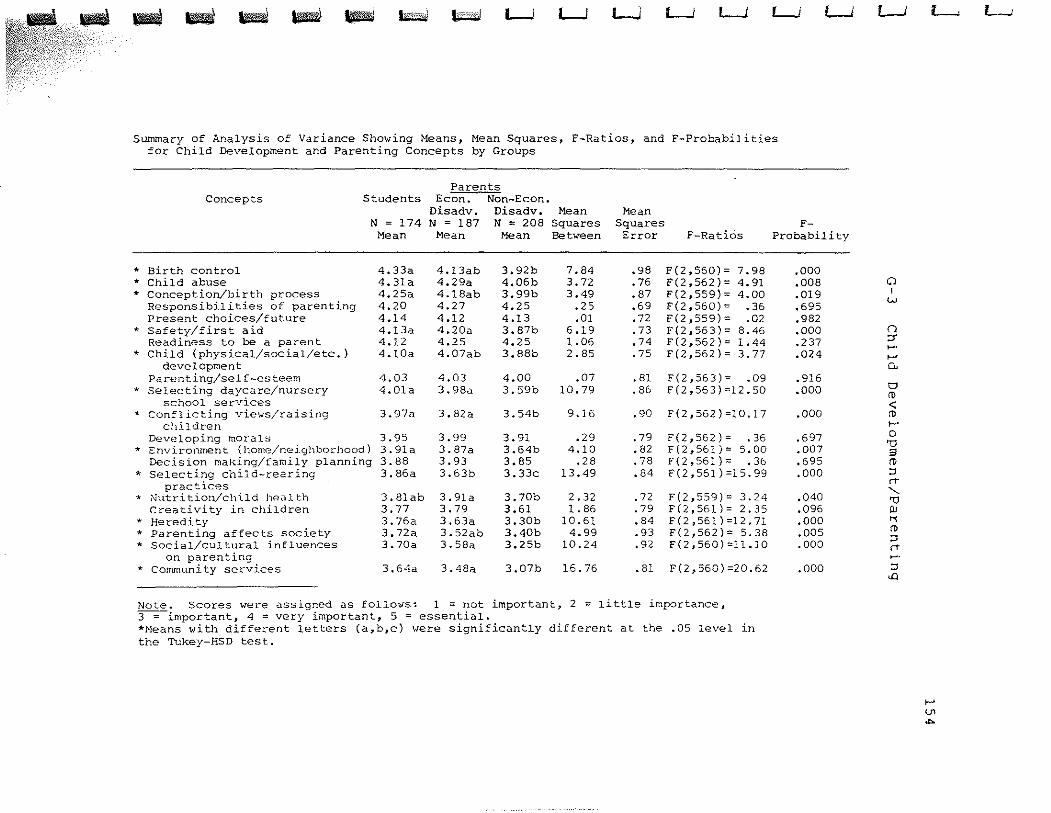
.. .. - - - h",~ij1 11"",1 L-.! L..J LJ L-.! LJ LJ LJ
Summary of Analysis of Variance Showing Means, Mean Squares, F-Ratios, and F-Probabilities for Child Development and Parenting Concepts by Groups
Concepts Students
N = 174 Mean
* Birth control * Child abuse * Conception/birth process
Responsibilities of parenting Present choices/future
* Safety/first aid Readiness to be a parent
* Child (physical/social/etc.) development
Parenting/self-esteem * Selecting daycare/nursery
school services * Conflicting views/raising
children Developing morals
* Enviromnent (home/neighborhood) Dec is ion mal(ing/family planning
* Selecting child-rearing practices
* Nutrition/chi.ld health Creativity in children
* Heredi ty * Parenting affects society * social/cultural influences
on parenting * Co~nunity services
4.33a 4.31a 4.25a 4.20 4.14 4.13a 4.12 4.l0a
4.03 4.01a
3.97<1
3.95 3.91a 3.88 3.86a
3.81ab 3.77 3.76a 3.72a 3.70a
3.64a
Parents Ecan. Non-Ecan.
Disadv. Disadv. N = 187 N = 208
Mean
4.13ab 4.29a 4.18ab 4.27 4.12 4.20a 4.25 4.07ab
4.03 3.98a
3.82a
3.99 3.87a 3.93 3.63b
3.91a 3.79 3.63a 3.52ab 3.58a
3.48a
Mean
3.92b 4.06b 3.99b 4.25 4.13 3.87b 4.25 3.88b
4.00 3.59b
3.54b
3.91 3.64b 3.85 3.33c
3.70b 3.61 3.30b 3.40b 3.25b
3.07b
Mean Squares Between
7.84 3.72 3.49
.25
.01 6.19 1.06 2.85
.07 10.79
9.16
.29 4.10
.28 13.49
2.32 1. 86
10.61 4.99
10.24
16.76
Mean Squares
Error
.98
.76
.87
.69
.72
.73
.74
.75
.81
.86
.90
.79
.82
.78
.84
.72
.79
.84
.93
.92
.81
F-Ratios
F(2,560)= F(2,562)= F(2,559)= F(2,560)= F(2,559)= F(2,563)= F(2,562)= F(2,562)=
7.98 4.91 4.00
.36
.02 8.46 1.44 3.77
F(2,563)= .09 F(2,563)=12.50
F(2,562) =10.17
F(2,562)= .36 F(2,561l= 5.00 F(2,561)= .36 F(2,561) =15. 99
F(2,559)= 3.24 F(2,561)= 2.35 F(2 ,561) =12.71 F(2,562)= 5.38 F(2,560)=11.10
F(2,560)=20.62
Note. Scores were assigned as follovs! 1 = not important, 2 = little importance, 3 = important, 4 = very important, 5 = essential. *Heans with different letters (a,b,c) were significantly different at the .05 level in the Tukey-HSD test.
FProbability
.000
.008
.019
.695
.982
.000
.237
.024
.916
.000
.000
.697
.007
.695
.000
.040
.096
.000
.005
.000
.000
l-J
Cl I
W
() ::Y ~.
>-' Q,
o ro < ro >-' o 'tJ
'" ro :l rT
" 'U OJ
" ro :l rT ~'
:l cO
L-..,
>-' IJ1 ...
'--'
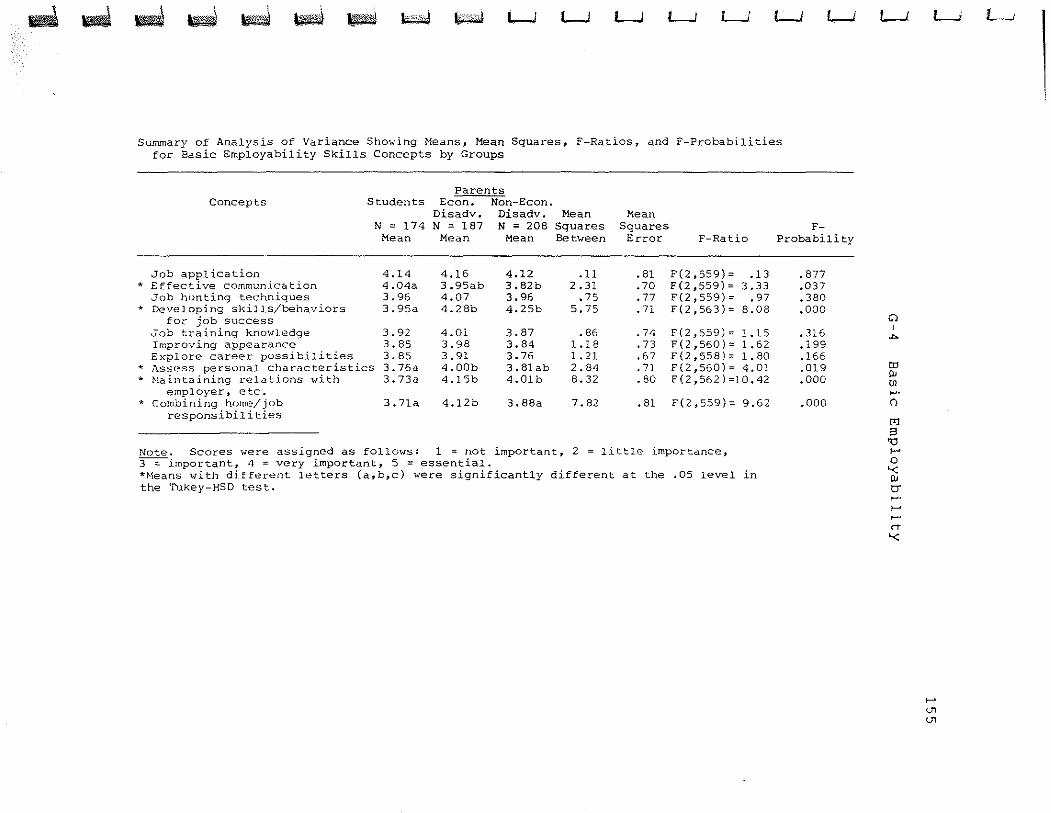
~--~ ~-- I~"'''jll 11""''''( L.-.I L.-.I L-...I L-...I L-1 L-...I L..J
Summary of Analysis of Variance Showing Means, Mean Squares, F-Ratios, and F-Probabilities for Basic Employability Skills Concepts by Groups
Parents Concepts Students Ecan. Non-Ecan.
Disadv. Disadv. Mean Mean N = 174 N = 187 N = 208 Squares Squares
Mean Mean Mean Between Error F-Ratio
Job application 4.14 4.16 4.12 .Il .81 F(2,SS9)= .13 * Effective communication 4.04a 3.95ab 3.82b 2.31 .70 F(2,SS9)= 3.33
Job hunting techniques 3.96 4.07 3.96 .75 .77 F(2,SS9)= .97 * Developing skills/behaviors 3.95a 4.28b 4.25b 5.75 .71 F(2,S63)= 8.08
for job success Job training knowledge 3.92 4.01 3.87 .86 .74 F(2,SS9)= LIS Improving appearance 3.85 3.98 3.84 1.18 .73 F(2,560)= 1.62 Explore career possibilities 3.85 3.91 3.76 1. 21 .67 F(2,558)= 1.80
.., Assess personal chcJ.racteristics 3.76a 4.00b 3.81 ab 2.84 .71 F(2,560)= 4.01 * Naintaining l-elations with 3.73a 4.15b 4.01b 8.32 .80 F(2,562)=10.42
employer, etc. * Combining horne/job 3.71a 4.12b 3.88a 7.82 .81 F(2,559)= 9.62
responsibilities
Note. Scores were assigned as follow~: 1 = not important, 2 = little importance, ~itnportant, <'1 = very important, 5 = essential. *Neans with diffel-ent letters (a,b,c) were significantly different at the .05 level in the Tukey-HSD test.
FProbability
.877
.037
.380
.000
.316
.199
.166
.019
.000
.000
L..J
C) I ....
to
'" '" ~. ()
tTl S '0 >-' o '<
'" rr ~,
>-" ~.
rt
'<
L..J
f-" en en
L-.I
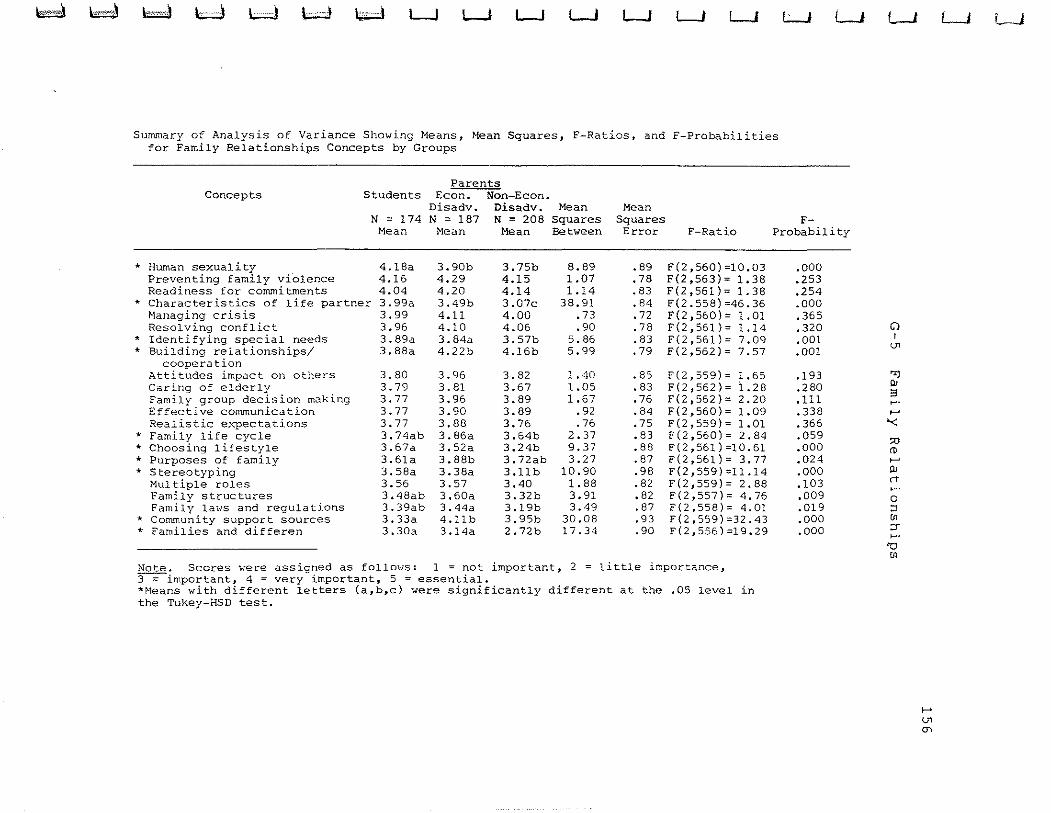
~ ~ Id Ld LJ l=J I;;d L..J L-l L-.J LJ L-.J LJ LJ
SU1TUTIary of Analysis of Variance Showing Means, Nean Squares, F-Ratios, and F-Probabilities for Family Relationships Concepts by Groups
Parents Concepts Students Ecan. Non-Econ.
Disadv. Disadv. Mean Mean N = 174 N = 187 N = 208 Squares Squares
LJ L.J
F-Mean Mean Mean Between Error F-Ratio Probability
* Human sexuality 4.18a 3.90b 3.75b 8.89 .89 F(2,560)=10.03 Preventing family violence 4.16 4.29 4.15 1.07 .78 F(2,563)= 1.38 Readiness for commitments 4.04 4.20 4.14 1.14 .83 F(2,56l)= 1.38
* Characteristics of life partner 3.99a 3.49b 3.07c 38.91 .84 F(2.558)=46.36 Managing crisis 3.99 4.11 4.00 .73 .n F(2,560)= 1.01 Resolving conflict 3.96 4.10 4.06 .90 .78 F(2,561)= 1.14
• Identifying special needs 3.89a 3.84a 3.57b 5.86 .83 F(2,56l)= 7.09 * Building relationships/ 3.88a 4.22b 4.16b 5.99 .79 F(2,562)= 7.57
cooperation Attitudes impact on others 3.80 3.96 3.82 1.40 .85 F(2,S59)= 1.65 Caring of elderly 3.79 3.81 3.67 1.05 .83 F(2,S62)= 1.28 Family group decision making 3.77 3.96 3.89 1.67 .76 F(2,562)= 2.20 Effective communication 3.77 3.90 3.89 .92 .84 F(2,560)= 1.09 Realistic expectations 3.77 3.88 3.76 .76 .75 F(2,559)= 1.01
* Family life cycle 3.74ab 3.86a 3.64b 2.37 .83 F(2,560)= 2.84 * Choosing lifestyle 3.67a 3.52a 3.24b 9.37 .88 F(2,561) =10.61 * Purposes of family 3.61a 3.88b 3. nab 3.27 .87 F(2,56!) = 3.77 * Stereotyping 3.58a 3.38a 3.11b 10.90 .98 F(2,559)=11.14
Mul tiple roles 3.56 3.57 3.40 1. 88 .82 F(2,559)= 2.88 Family structures 3.48ab 3.60a 3.32b 3.91 .82 F(2,557)= 4.76 Family lat-ls and regula tions 3.39ab 3.44a 3.19b 3.49 .87 F(2,558)= 4.01
* community support sources 3.33a 4.11b 3.95b 30.08 .93 F(2,559)=32.43 * Families and differen 3.30a 3.14a 2. nb 17.34 .90 F(2,556)=19.29
Note. Scores were assigned as fo110\1S: 1 = not important, 2 = little importance, 3 = important, 4 = very important, 5 = essential. *t'leans with different letters (a,b,c) were significantly different at the .05 level in the Tukey-HSD test.
.000
.253
.254
.000
.365
.320
.001 .001
.193
.280
.111
.338
.366
.059
.000
.024
.000
.103 .009 .019 .000 .000
L..1
CJ I
'" "l
'" ;3 ~.
..... '< :;0 ro ..... Il; IT ~.
C ::J [JI
:T ~.
'0 [JI
>-' en en
L.j L-J
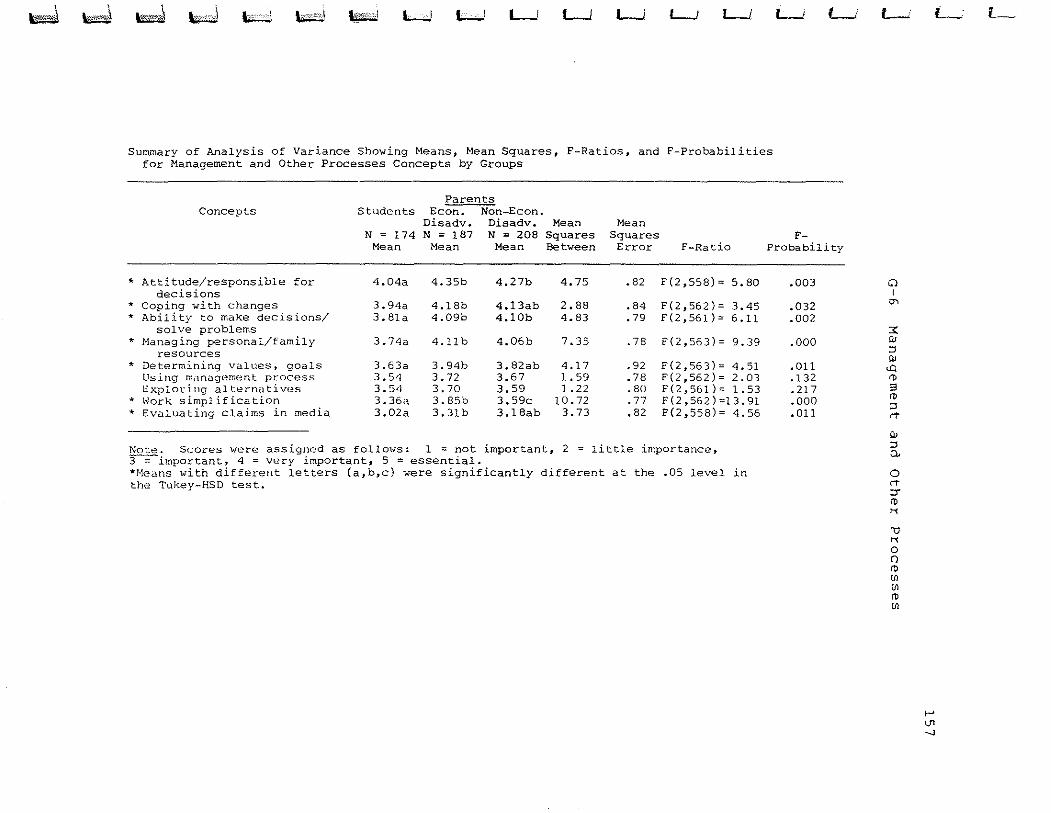
~ \"'w~ ""'~,.\ \F,,,j \,i \r""""\ \!!e""i L..J ~ L..J ~ L..J L..J L..J
Summary of Analysis of Variance Showing Means, Mean Squares, F-Ratios, and F-Probabilities for Management and Other Processes Concepts by Groups
Parents concepts Students Eeen. Non-Eean.
Disadv. Disadv. Mean Mean N = 174 N = 187 N = 208 Squares Squares
L..i L-i
F-Mean Mean Mean Between Error F-Ratio Probability
* Attitude/responsible for decisions
* coping with changes * Ability to make decisions/
solve problems * Managing personal/family
resources * Determining values, goals
Using milni:lgement pt'ocess E:xplol.-ing alternatives
* Work simplification * Evaluating claims in media
4.04a 4.35b
3.94a 4.18b 3.81a 4.09b
3.74a 4.11b
3.63a 3.94b 3.5/j 3.72 3. 5~1 3.70 3.36a 3.85b 3.02a 3.31b
4.27b 4.75 .82 F(2,558)= 5.80
4.13ab 2.88 .84 F(2,562)= 3.45 4.10b 4.83 .79 F(2,561)= 6.11
4.06b 7.35 .78 ,(2,563)= 9.39
3.82ab 4.17 .92 F(2,563)= 4.51 3.67 1. 59 .78 F(2,562)= 2.03 3.59 1. 22 .80 F(2,561)= 1.53 3.59c 10.72 .77 F(2,562)=13.91 3.18ab 3.73 .82 F(2,558)= 4.56
Note. Scores were assigned as fol10\.;s: 1 = not important, 2 = little importance, 3 = important, 4 = very important, 5 = essential. *Means with different letters (a,b,c) were significantly different at the .05 level in the Tu)<.ey-HSD test.
.003
.032
.002
.000
.011
.132
.217
.000
.011
L-J
Cl I
'" ::<:
'" ::J
'" "" !l> 3 !l> ::J rt
'" ::J Q.
o rt ::r !l>
" '1J
" o () !l> (IJ (IJ
ro (IJ
'--
f-' (J>
--J
'--
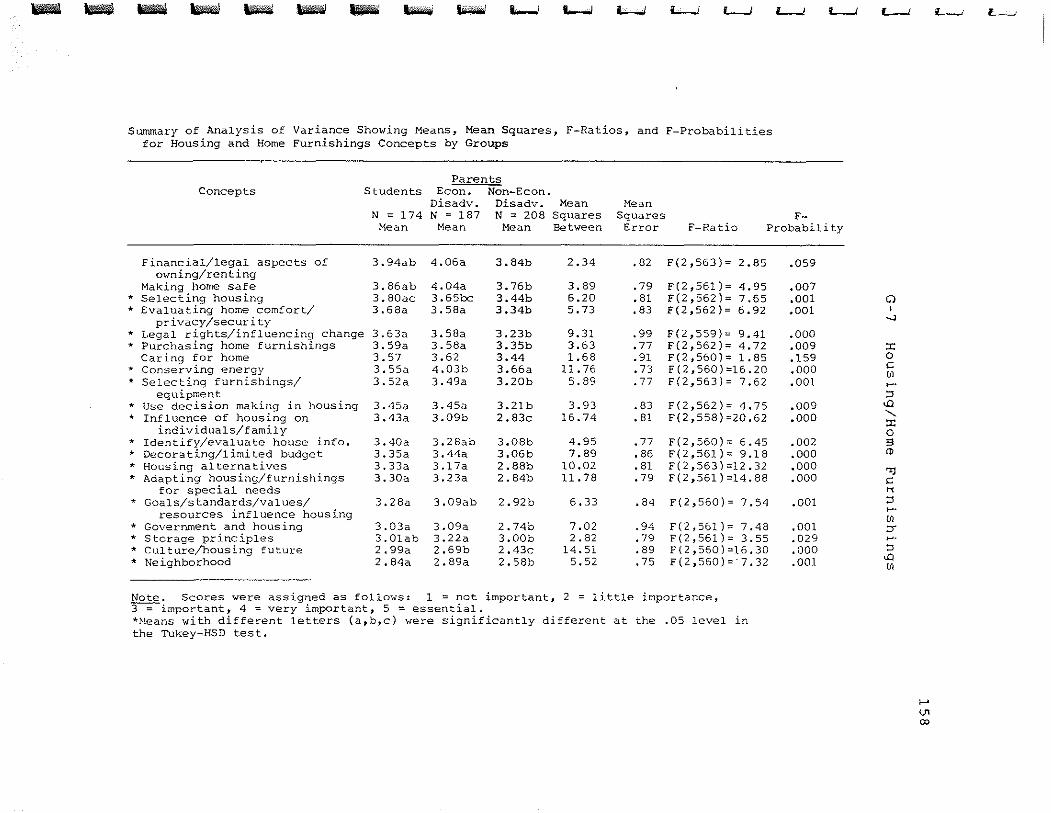
.. .. - ~ _1"1 - - 1,,'''>1' '"',*w, '--' '--' ~ L-! '---!
Summary of Analysis of Variance Showing Means, Mean Squares, F-Ratios, and F-Probabilities for Housing and Home Furnishings Concepts by Groups
Parents Concepts Students Ecou. I'lion-Econ.
'---! '---!
N = 174 Mean
Disadv. N = 187
Mean
Disadv. N = 208
Mean
Mean Squares Between
Mean Squares
Error F-Ratio F
Probability
Financial/legal aspects of owning/renting
I'laking home safe * Selecting housing * Evaluating home comfort/
privacy/security * Legal rights/influencing change * Purchasing home furnishings
Caring for home * Conserving energy * Selecting furnishings/
equipment * Use decision making in housing * Influence of housing on
individuals/family * Identify/evaluate house info. * Decorating/limited budget * Housi.ng alternatives * Adapting housing/furnishings
for special needs * Goals/standards/values/
resources influence housing * Government and housing * Storage principles * Culture/housing future * Neighborhood
3.94ab
3.86ab 3.80ac 3.68a
3.63. 3.59a 3.57 3.55. 3.52a
3.4Sil 3.43a
3.40a 3.35a 3.33a 3.30a
3.28.
3.03a 3.01ab 2.99a 2.84a
4.06a
4.04a 3.65bc 3.58a
3.58a 3.58a 3.62 4.03b 3.49a
3.45<1 3.09b
3.28a.b 3.44a 3.1703. 3.23a
3.09ab
3.09a 3.22a 2.69b 2.89a
3.84b
3.76b 3.44b 3.34b
3.23b 3.35b 3.44 3.66a 3.20b
3.21b 2.83c
3.08b 3.06b 2.88b 2.84b
2.92b
2.74b 3.00b 2.43c 2.58b
2.34
3.89 6.20 5.73
9.31 3.63 1.68
11. 76 5.89
3.93 16.74
4.95 7.89
10.02 11.78
6.33
7.02 2.82
14.51 5.52
.82
.79
.81
.83
.99
.77
.91 .73 .77
.83
.81
.77
.86
.81
.79
.84
.94
.79
.89
.75
F(2,563)= 2.85
F(2,561)= 4.95 F(2,562)= 7.65 F(2,562)= 6.92
F(2,559)= 9.41 F(2,562)= 4.72 F(2,560)= 1.85 F(2,560)=16.20 F(2,563)= 7.62
F(2,562)= 4.75 F(2,558)=20.62
F(2,560)= 6.45 F(2,561)= 9.18 F(2,563)=12.32 F(2,561}=14.88
F(2,560)= 7.54
F(2,561)= 7.48 F(2,561)= 3.55 F(2,560)=16.30 F(2,560)=-7.32
Note. Scores were assigned as follows: 1 = not important, 2 = little importance, 3 = important, 4 = very important, 5 = essential. *Heans with different letters (a,b,c) were significantly different at the .05 level in the Tukey-HSD test.
.059
.007
.001 .001
.000
.009
.159
.000
.001
.009
.000
.002
.000
.000
.000
.001
.001
.029
.000
.001
L-J
Q I
-..J
:I: o c 0' ~-
::J
"" "-::r: o 3 <1>
"l c
" ::J ~.
Ul ::r ~-
::J
"" Ul
f-' (Jl
co
f--,- L--t'
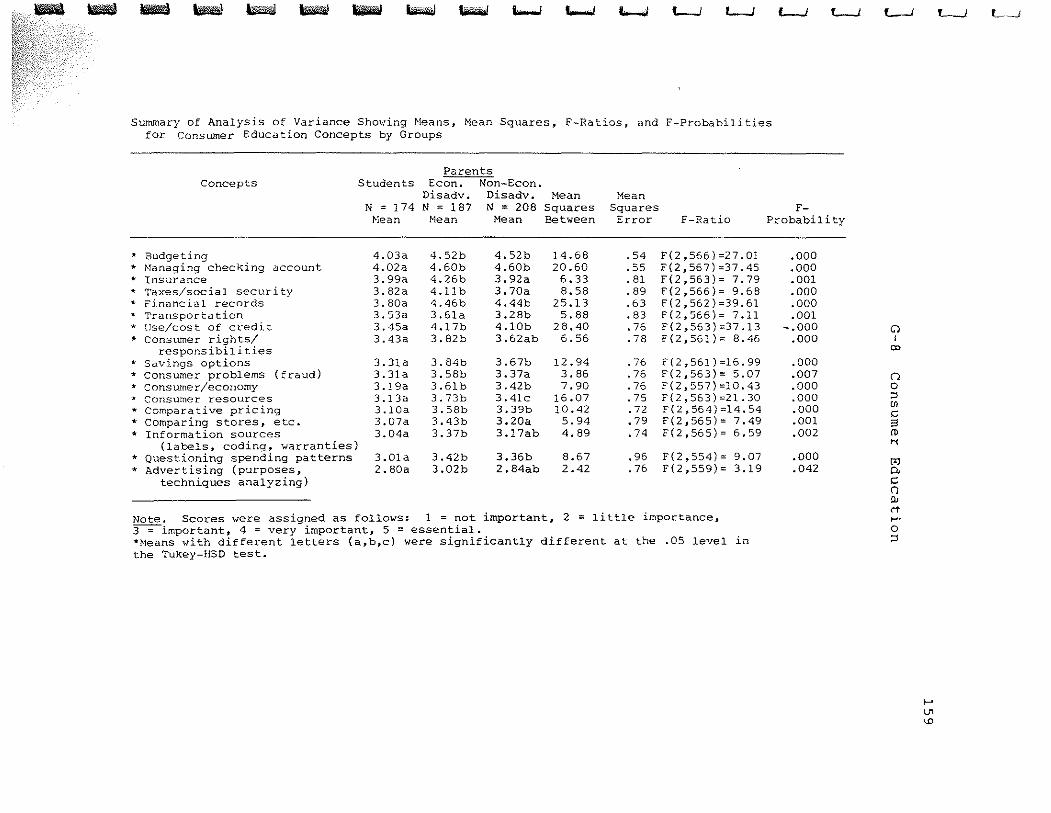
.. .. - .,. - - liiiiiiiI ~ t....-i t....-i I.,.......J '--J '--J
Summary of Analysis of Variance ShO'l;'ing !'leans, Mean Squares, F-Ratios, and F-Probabilities for Consumer Education Concepts by Groups
Parents concepts Students Ecan. Non-Eean.
Disadv. Disadv. Mean Mean N = 174 N = 187 N = 208 Squares Squares
'--J '--J
F-t-iean Hean Mean Between Error F-Ratio Probabil i ty
.. Budgeting 4.03a 4.52b 4.52b 14.68 .54 F(2,566)=27.01 * Hanaging checking account 4.02a 4.60b 4.60b 20.60 .55 F(2,567)=37.45 * Insurance 3.99a 4.26b 3.92a 6.33 .81 F(2,563)= 7.79 1< Taxes/social security 3.82a 4.11 b 3.70a 8.58 .89 F(2,566)= 9.68 * Financial records 3.80a 4.46b 4.44b 25.13 .63 F(2,562)=39.61 * Transporta tion 3.53a 3.61a 3.28b 5.88 .83 F(2,566)= 7.11 * llse/cost of credit 3.45a 4.17b 4.10b 28.40 .76 F(2,563) =37 .13 * Consumer rights/ 3.43a 3.82b 3.62ab 6.56 .78 F(2,561)= 8.46
responsibilities * Savings options 3.31a 3.84b 3.67b 12.94 .76 F(2,561)=16.99 * Consumer problems (fraud) 3.31a 3.58b 3.37a 3.86 .76 F(2,563)= 5.07 * Consumer/economy 3.lga 3.61b 3.42b 7.90 .76 F(2,557)=10.43 * Consumer resources 3.13a 3.73b 3.41c 16.07 .75 F(2,563)=21.30 * Comparative pricing 3.10a 3.58b 3.39b 10.42 .72 F(2,564)=14.54 * Comparing stores, etc. 3.07a 3.43b 3.20a 5.94 .79 F(2,565)= 7.49 * Information sources 3.04a 3.37b 3.17ab 4.89 .74 F(2,565)= 6.59
(labels, coding, warranties) * Questioning spending patterns 3.01a 3.42b 3.36b 8.67 .96 F(2,554)= 9.07 * Advertising (purposes, 2. BOa 3.02b 2.84ab 2.42 .76 F(2,559)= 3.19
techniques analyzing)
Note. Scores were assigned as follows: 1 = not important, 2 = little importance, 3 = important, 4 = very important,S = essential. *Means with different letters (a,b,c) were significantly different at the .05 level in the Tukey-HSD test.
.000
.000
.001
.000
.000
.001 -.000
.000
.000
.007
.000
.000
.000
.001
.002
.000
.042
L-J
Cl I
(X>
o o
'" (f)
c 3 ro " t"l 0,
c n
'" rr ~.
o :J
,.... V1
'"
'---.J L-.J
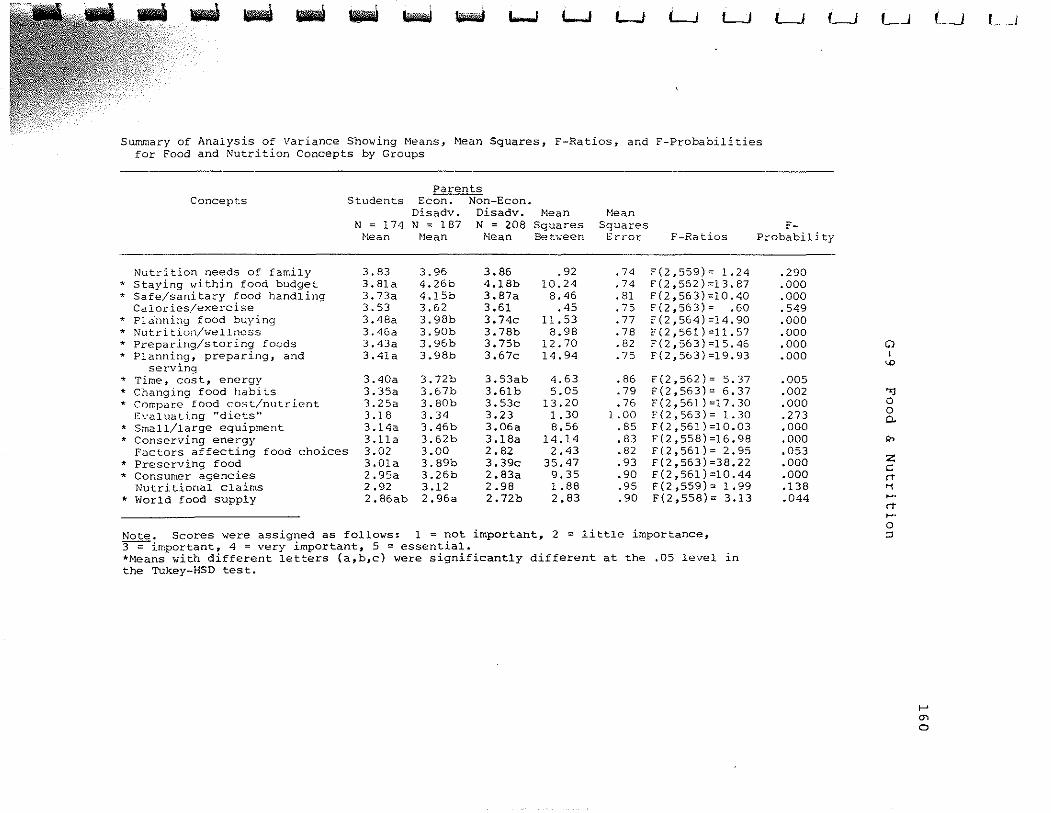
.. .. - - - - L.....I t.....J t.....J t.....J L.J L.J LJ
Summary of Analysis of variance Showing Means, Mean Squares, F-Ratios, and F-Probabilities for Food and Nutrition Concepts by Groups
Parents Concepts Students Econ. I~on-Econ.
Nutrition needs of family * Staying within food budget * Safe/sanitary food handling
Cal 01- ies/exerc ise * Plunning food buying * Nlltri tiO(l/Hellncss * Pl-eparing/storing foods ... Planning, preparing, and
serving ~ Time, cost, energy * Changing food habits * Compar.e food cost/nutri.ent
Evaluating "diets" * Small/large equipment :I: Conserving energy
Factors affecting food choices * Preserving food * Consumer agencies
Nutritional claims * World food supply
Disadv. N=174N=187
Nean t'lean
3.83 3.81 a 3.73a 3.53 3.48a 3.46a 3.43a 3.41a
3.40a 3.35a "3.2Sa 3.18 3.14a 3.lla 3.02 3.01a 2.95a 2.92 2.86ab
3.96 4.26b 4.15b 3.62 3.98b 3.90b J.96b 3.98b
3.72b 3.67b 3.80b 3.34 3.46b 3.62b 3.00 3.89b 3.26b 3.12 2.96a
Disadv. Nean N = 208 Squares
Hean Beb;een
J.86 4.18b 3.87a 3.61 3.74c 3.78b 3.75b 3.67c
3.53ab 3.61b 3.53c 3.23 3.06a 3.18a 2.82 3.39c 2.83a 2.98 2.72b
.92 10.24
8.46 .45
11.53 8.98
12.70 14.94
4.63 5.05
13.20 1.30 8.56
14.14 2.43
35.47 9.35 1.88 2.83
Nean Squares
Error
.74
.74
.81
.75
.77
.78
.82
.75
.86
.79
.76 1.00
.85
.83
.82
.93
.90
.95
.90
F-Ratios
F(2,559)= 1.24 F(2,562)=13.87 F(2,563)=10.40 F(2,563)= .60 F(2 ,564) =14. 90 F(2 ,561) =11. 57 F( 2,563) =15.46 F(2,563)=19.93
F(2,562)= 5.37 F(2,563)= 6.37 F (2,561 ) =1 7 • 30 F(2,563)= 1.30 F(2,561)=10.03 F(2,558)=16.98 F(2,56l)= 2.95 F(2,563)=38.22 F(2,561)=10.44 F(2,559)= 1.99 F(2,558)= 3.13
Note. Scores were assigned as follows: 1 = not important~ 2 = little importance~ 3 = important, 4 = very important~ 5 = essential. *Means with different letters (a,b,c) were significantly different at the .05 level in the Tukey-HSD test.
FProbabili ty
.290
.000
.000
.549
.000
.000
.000
.000
.005
.002
.000
.273
.000
.000
.053
.000
.000
.138
.044
'--.J
Cl I
'" "'l o o 0.
",
z c: IT
" ~. IT ~.
o :J
f-" en a
LJ L.J
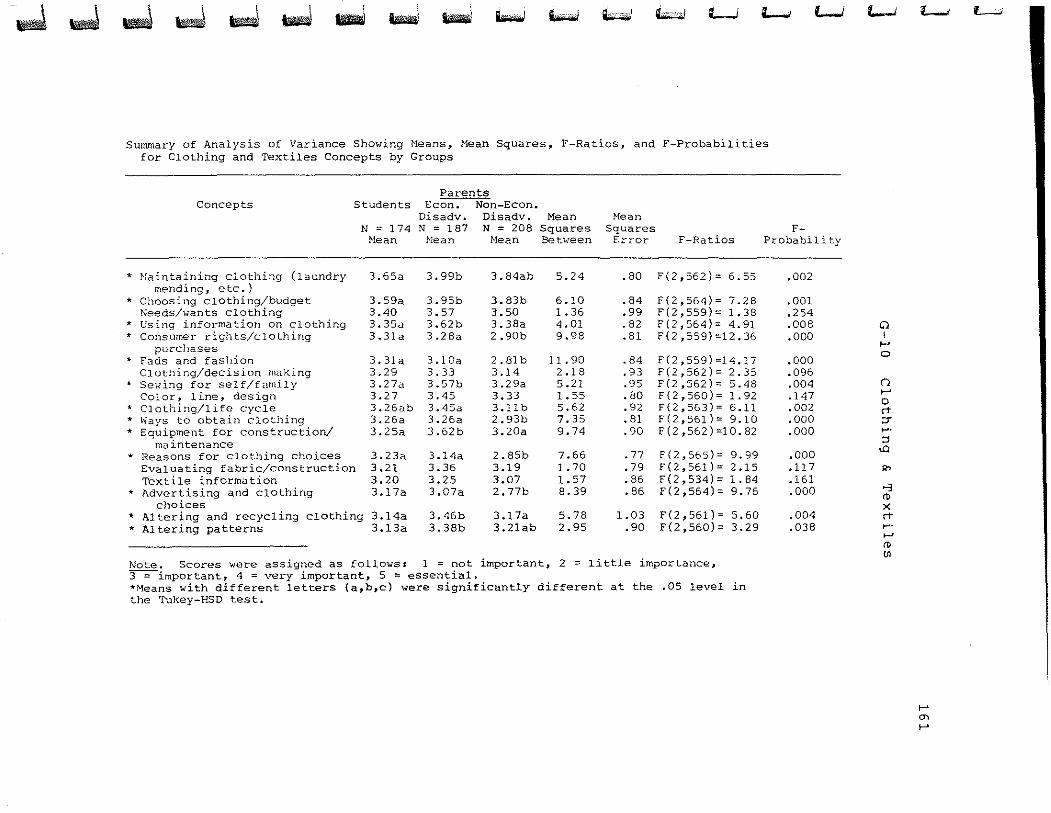
... ~ .J ~ .J ..J ~ .. ~ .. ~ ~ Q""iid 1/.0-·,,·,1 L...J L...J L-i
Summary of Analysis of Variance Showing Heans, Mean Squares, F-Ratios, and F-Probabilities for Clothing and Textiles Concepts by Groups
Concepts Students
* Naintaining clothing (laundry mending, etc.)
* Choosing clothing/budget Needs/wants clothing
* Using information on Clothing * Consumer rights/clothing
purchases * Fads and fashion
Clothing/decision making * Sewing for self/family
Color, line, design * Clothing/life cycle * l'I"ays to obtain clothing * Equipment for construction/
muintenance * Reasons far clothing choices
Evaluating fabric/construction Textile information
* Advertising and Clothing choices
N = 174 Hean
3.65a
3.59a 3.40 3.35a 3.31a
3.31a 3.29 3.27a 3.27 3.26ab 3.Z6a 3.25a
3.23a 3.21 3.20 3.17a
* Altering and recycling Clothing 3.14a * Altering patterns 3.13a
Parents Econ. Non-Ecan.
Disadv. Disadv. N = 187 N = 208
Nean
3.99b
3.95b 3.57 3.62b 3.28a
3.IOa 3.33 3.57b 3.45 3.45a 3.26a 3.62b
3.14a 3.36 3.25 3.07a
3.46b 3.38b
Nean
3.84ab
3.83b 3.50 3.38a 2.90b
2.81 b 3.14 3.29a 3.33 3.llb 2.93b 3.20a
2.85b 3.19 3.07 2.77b
3.17a 3.21ab
Mean Squares Bet'..'een
5.24
6.10 1. 36 4.01 9.98
11.90 2.18 5.21 1.55 5.62 7.35 9.74
7.66 1. 70 1. 57 8.39
5.78 2.95
Hean Squares
Error
.80
.84
.99
.82
.81
.84
.93
.95
.80
.92
.81
.90
.77
.79
.86
.86
1.03 .90
F-Ratios
F(2,56Z}= 6.55
F(2,564)= 7.28 F(2,559)= 1.38 F(2,564)= 4.91 F(2,559)=12.36
F(2,559) =14.17 F(2,562)= 2.35 F(2 ,562) = 5.48 F(2,560)= 1.92 F(2,563)= 6.11 F(2,561)= 9.10 F(2,562)=10.82
F(2,565)= 9.99 F(2,56!l= 2.15 F(2,534)= 1.84 F(2,564)= 9.76
F(2,561)= 5.60 F(2,560)= 3.29
Note. Scores were assigned as follows: 1 = not important, 2 = little importance, 3 = important, 4 = very important, 5 = essential. *Means with different letters (a,b,c) were significantly different at the .05 level in the Tukey-HSD test.
FProbability
.002
.001
.254
.008
.000
.000
.096 .004 .147 .002 .000 .000
.000
.117
.161 .000
.004
.038
f.,.....J
Cl I .... o
(l .... o IT or ,... :l
<0
'" "Cl ct> X IT ~ . .... (l)
'"
l-.J
.... 0)
I-'
~
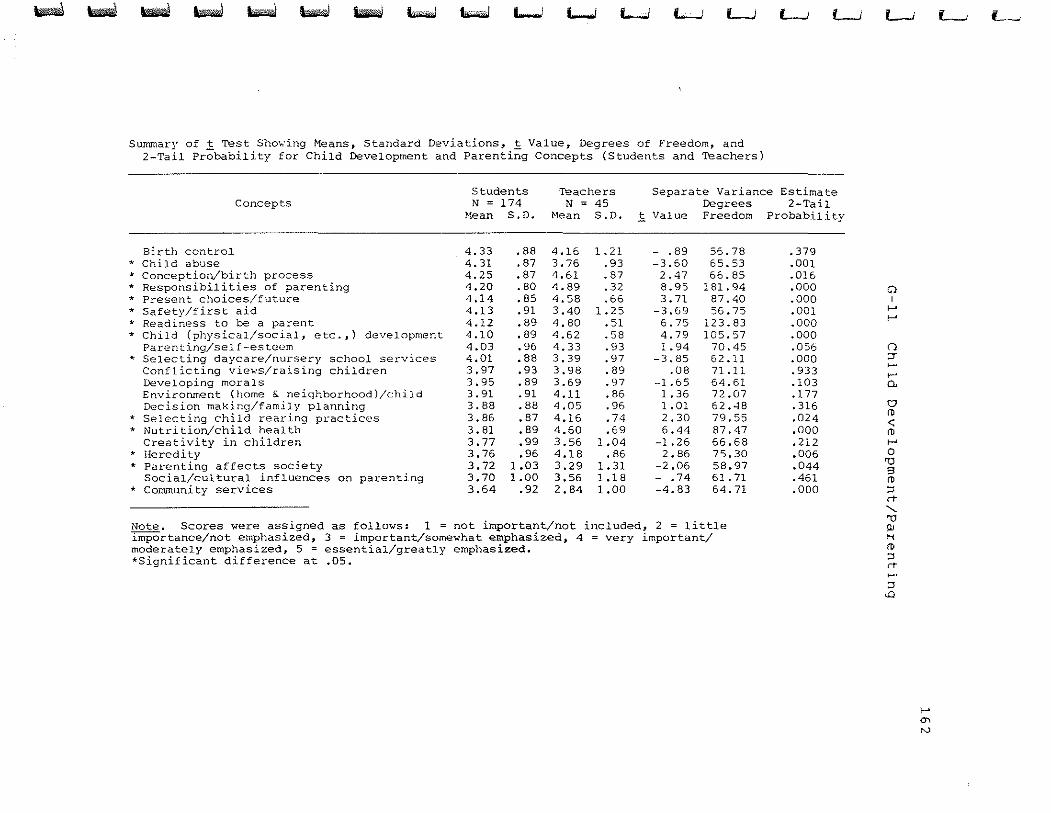
~ ~ ~ ~ ~ ~ ~ i~c-'! ","",.,I L-! L-! L.......J L-..J '-.J
Summary of .! Test Sho;·:ing Heans, Standard Deviations, !:. Value, Degrees of Freedom, and 2-Tail Probability for Child Development and Parenting Concepts (Students and Teachers)
L-..J L...J
concepts Students N = 174
Bean S,D.
Teachers N = 45
Hean S.D.
Separate Variance Degrees
Estimate 2-Tail
Probabil i ty
Birth control * Child abuse * Conception/birth process * Responsibilities of parenting * Present choices/future * Safety/first aid * Readiness to be a parent ... Child (physical/social, etc.,) development
Parenting/self-esteem * Selecting daycare/nursery school services
Conflicting vie'\o!s/raising children Developing morals Environment (home &. neighborhood)/child Decision making/family planning
* Selecting child rearing practices * Nutrition/child heal th
Creativity in children * Heredity *" Parenting affects society
Social/cultural influences on parenting * Community services
4.33 4.31 4.25 4.20 4.14 4.13 4.12 4.10 4.03 4.01 3.97 3.95 3.91 3.88 3.86 3.81 3.77 3.76 3.72 3.70 3.64
.88
.87
.87
.80
.85
.91
.89
.89
.96
.88
.93
.89
.91
.88
.87
.89
.99
.96 1.03 1.00
.92
4.16 3.76 4.61 4.89 4.58 3.40 4.80 4.62 4.33 3.39 3.98 3.69 4.11 4.05 4.16 4.60 3.56 4.18 3.29 3.56 2.84
1. 21 .93 .87 .32 .66
1.25 .51 .58 .93 .97 .89 .97 .86 .96 .74 .69
1.04 .86
1.31 1.18 1.00
1. Value Freedom
~ .89 ~3.60
2.47 8.95 3.71
~3.69
6.75 4.79 1.94
~3.85
.08 -1.65 1.36 1.01 2.30 6.44 ~1.26
2.86 ~2.06
- .74 ~4.83
56.78 65.53 66.85
181.94 87.40 56.75
123.83 105.57
70.45 62.11 71.11 64.61 72 .07 62.48 79.55 87.47 66.68 75.30 58.97 61.71 64.71
Note. Scores were assigned as follows: 1 = not important/not included, 2 = little importance/not emphasized, 3 = important/somewhat emphasized, 4 = very important/ moderately emphasized, 5 = essential/greatly emphasized. *Significant difference at .05.
.379
.001
.016
.000
.000
.001
.000
.000
.056
.000
.933
.103
.177
.316
.024
.000
.212
.006
.044
.461
.000
L-.;
Cl I
f-' f-'
() :r ~.
r" 0.
t:J CO < CO r" o '0 ;3 (1)
'" IT ''0 ~ H CO
'" IT ~.
'" <0
f-'
'" N
L.." L~
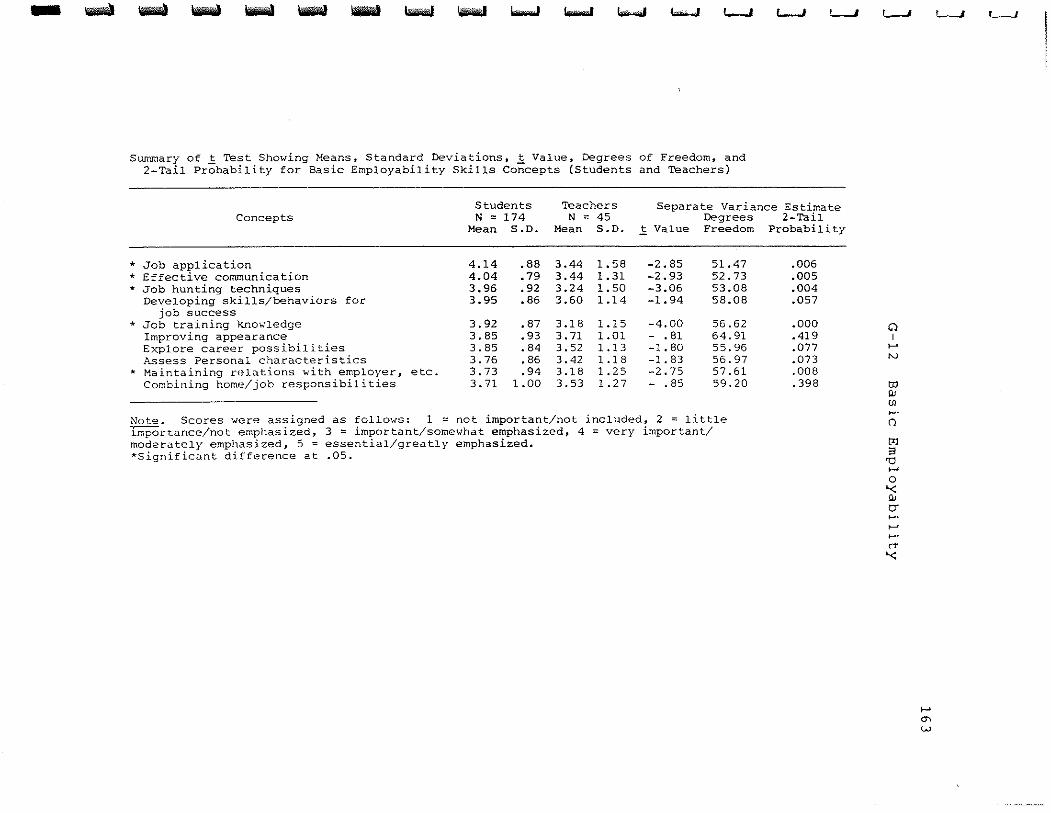
- WiliiiIIiI \iliiliIiii\ \iliiliIiii\ laW \iiii;W IUd \iiiiiid .. ........ ........ ""'-' I.oo-J t-..I
Summary of ~ Test Showing Means, Standard Deviations, l Value, Degrees of Freedom, and 2-Tail Probability for Basic Employability Skills Concepts (Students and Teachers)
t-..I L-..J
Students Teachers Separate Variance Estimate Concepts N = 174 N = 45 Degrees
Mean S.D. Mean S.D. .1 Value Freedom
* Job application 4.14 .88 3.44 1.58 -2.85 51.47 * Effective communication 4.04 .79 3.44 1. 31 -2.93 52.73 * Job hunting techniques 3.96 .92 3.24 1.50 -3.06 53.08
Developing skills/behaviors for 3.95 .86 3.60 1.14 -1.94 58.08 job success
* Job training knowledge 3.92 .87 3.18 1.15 -4.00 56.62 Improving appearance 3.85 .93 3.71 1.01 - .81 64.91 Explore career possibilities 3.85 .84 3.52 1.13 -1. 80 55.96 Assess Personal characteristics 3.76 .86 3.42 1.18 -1.83 56.97
* Maintaining n~l<ltions with employer, etc. 3.73 .94 3.18 1.25 -2.75 57.61 Combining home/job responsibilities 3.71 1.00 3.53 1.27 - .85 59.20
Note. Scores were assigned as follmvs: 1 == not important/not included, 2 = little Ifi1PQrtance/not emphasized, 3 = important/somewhat emphasized, 4 = very important/ moderately emphasized, 5 = essential/greatly emphasized. *Significant difference at .05.
2-Tail Probability
.006
.005
.004
.057
.000
.419
.077
.073
.008
.398
L--J
G) I .... '" to OJ Ul ~.
()
l'l
" '0 '-' o '< OJ v ~ . .... ~.
rt '<
.... '" w
L-..J 1--1
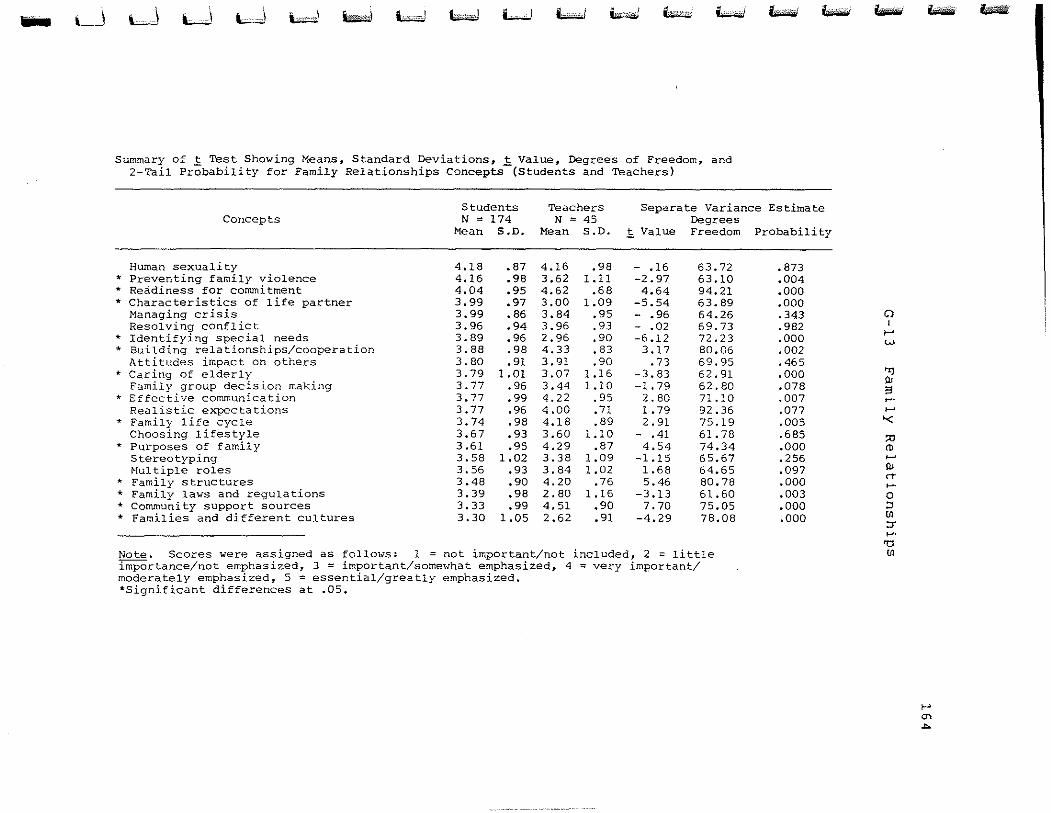
.. LJ 1
Ld o ' LJ ~ 1,..00.,.,.1 ,,,,,o,=J ,'I .,.,,0 • .,1 L.J kd br,..! I ... ",,' t.-i
Summary of t Test Showing Means, Standard Deviations, t Value, Degrees of Freedom, and 2-Tail Probability for Family Relationships concepts-(Students and Teachers)
~ ""-
Students N = 174
Mean S.D.
Teachers Separate Variance Estimate Concepts N = 45 Degrees
Mean S.D. ~ Value Freedom Probability
Human sexuality * Preventing family violence * Readiness for commitment * Characteristics of life partner
Managing crisis Resolving conflict
* Identifying special needs * Building relationships/cooperation
Attitudes impact on others * Caring of elderly
Family group decision making * Effective communication
Realistic expectations * Family life CYCle
Choosing lifestyle * Purposes of family
Stereotyping Hultiple roles
* Family structures * Family laws and regulations * community support sources * Families and different cultures
4.18 4.16 4.04 3.99 3.99 3.96 3.89 3.88 3.80 3.79 3.77 3.77 3.77 3.74 3.67 3.61 3.58 3.56 3.48 3.39 3.33 3.30
.87
.98
.95
.97
.86
.94
.96
.98
.91 1.01
.96
.99 .96 .98 .93 .95
1.02 .93 .90 .98 .99
1.05
4.16 3.62 4.62 3.00 3.84 3.96 2.96 4.33 3.91 3.07 3.44 4.22 4.00 4.18 3.60 4.29 3.38 3.84 4.20 2.80 4.51 2.62
.98 loll
.68 1.09
.95
.93
.90
.83
.90 1.16 1.10
.95
.71
.89 1.10
.87 1.09 1.02
.76 1.16
.90
.91
- .16 -2.97 4.64
-5.54 - .96 - .02 -6.12
3.17 .73
.,3.83 -1.79
2.80 1. 79 2.91
- .41 4.54
-LIS 1.68 5.46
-3.13 7.70
-4.29
63.72 63.10 94.21 63.89 64.26 69.73 72.23 80.06 69.95 62.91 62.80 71.10 92.36 75.19 61.78 74.34 65.67 64.65 80.78 61.60 75.05 78.08
Note. Scores were assigned as fol101-1S: 1 = not important/not inCluded, 2 = little importance/not emphasized, 3 = important/someHhat emphasized, 4 = very important/ moderately emphasized, 5 = essential/greatly emphasized. *Significant differences at .05.
.873
.004
.000
.000
.343
.982
.000
.002
.465
.000
.078
.007
.077
.005
.685
.000
.256
.097
.000
.003
.000
.000
~
C) 1
..... W
"l ~ S ~o
..... '< :0 C1> ..... ~ n~o
o ::J
'" ::r ~.
'0
'"
i.iU
>-' 0'>
""
~
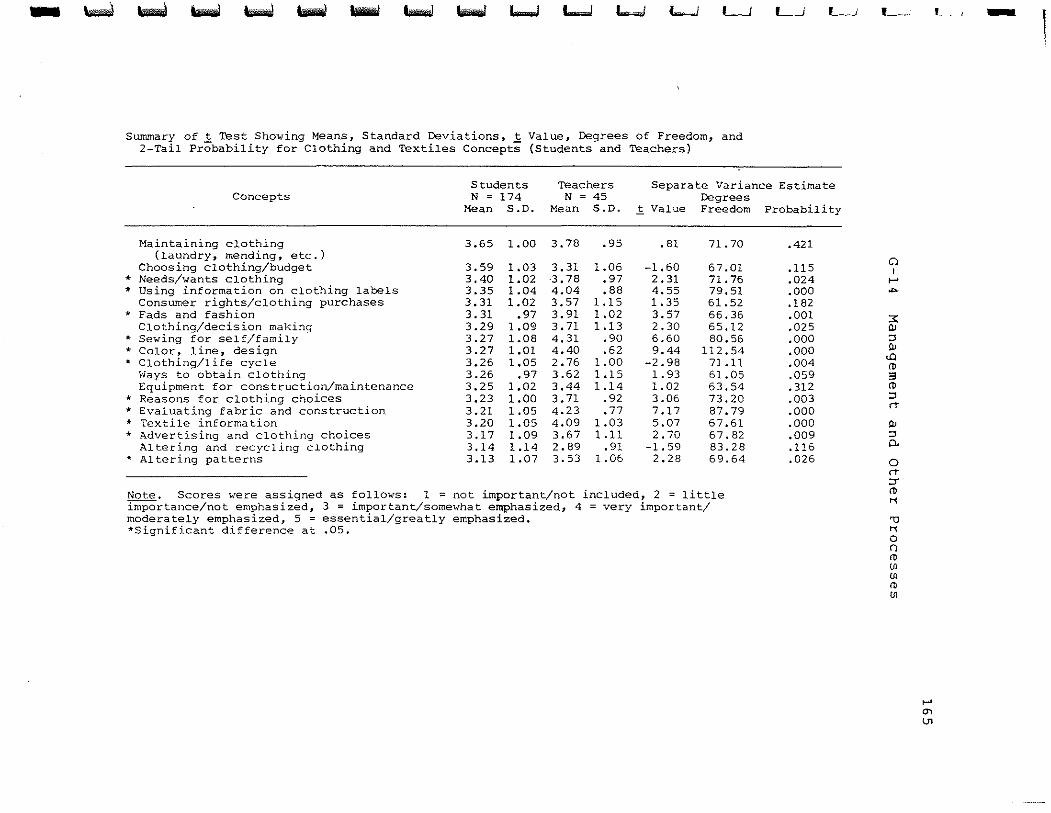
- ~ ~ '-oil -...l bIiiiIII ~ '-' '-' 1........1 1........1 t-..J f-..I L-1
Summary of 1 Test Showing Means, Standard Deviations, 1 Value, Degrees of Freedom, and 2-Tail Probability for Clothing and Textiles Concepts (Students and Teachers)
L-1 L--.>'
Students Teachers Separate Variance Estimate Concepts N = 174 N = 45 Degrees
Mean S.D. Mean S.D. !. Value Freedom
Maintaining clothing 3.65 1.00 3.78 .95 .81 71.70 (laundry, mending, etc.)
Choosing clothing/budget 3.59 1.03 3.31 1.06 -1.60 67.01 * Needs/wants Clothing 3.40 1.02 '3.78 .97 2.31 7l.76 * Using information on clothing labels 3.35 1.04 4.04 .88 4.55 79.51
Consumer rights/clothing purchases 3.31 1.02 3.57 1.15 1.35 61.52 * Fads and fashion 3.31 .97 3.91 1.02 3.57 66.36
Clothing/decision making 3.29 1.09 3.71 1.13 2.30 65.12 * Sewing for self/family 3.27 1.08 4.31 .90 6.60 80.56 * Color, line, design 3.27 1.01 4.40 .62 9.44 112.54 * Clothing/life cycle 3.26 1.05 2.76 1.00 -2.98 71.11
Ways to obtain clothing 3.26 .97 3.62 1.15 1.93 61.05 Equipment for construction/maintenance 3.25 1.02 3.44 1.14 1.02 63.54
* Reasons for clothing choices 3.23 1.00 3.71 .92 3.06 73.20 * Evaluating fabric and construction 3.21 1.05 4.23 .77 7.17 87.79 * Texti le informa tion 3.20 1.05 4.09 1.03 5.07 67.61 * Advertising and clothing choices 3.17 1.09 3.67 1.11 2.70 67.82
Altering and recycling clothing 3.14 1.14 2.89 .91 -1. 59 83.28 * Altering patterns 3.13 1.07 3.53 1.06 2.28 69.64
Note. Scores were assigned as follows: 1; not important/not included, 2 = little importance/not emphasized, 3 ; important/somevhat emphasized, 4 ; very important/ moderately emphasized, 5 = essential/greatly emphasized. *Significant difference at .05.
Probability
.421
.115
.024
.000
.182
.001
.025
.000
.000
.004
.059 .312 .003 .000 .000 .009 .116 .026
L-,
Cl I
t-" ... 3: OJ ::> OJ
<0
'" ;3
'" ::> IT
OJ ::> 0.
o IT ::;
'" " 'lJ
" o ()
'" Ul Ul (!)
til
t-" 0'\ Ul
I. -
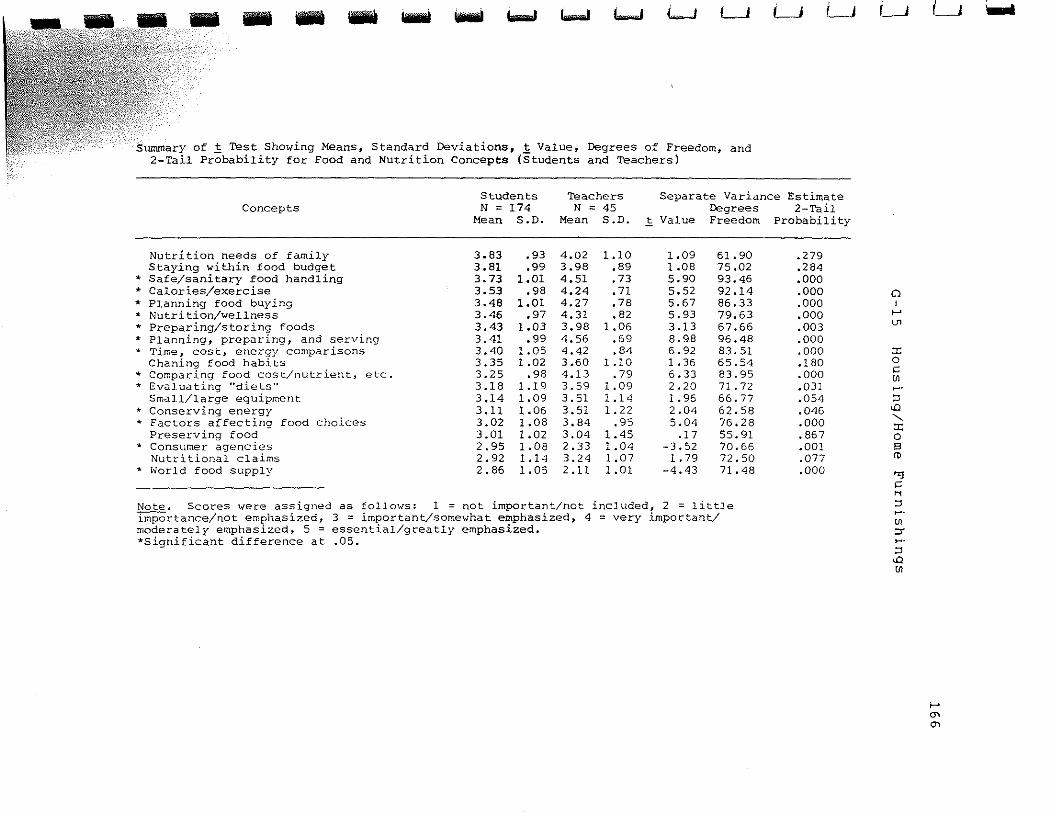
- - - - - - """"'" t-J 1..-.1 ~ LJ
Summary of ! Test Showing Means, Standard Deviations, 1 Value, Degrees of Freedom, and 2-Tail Probability for Food and Nutrition Concepts (Students and Teachers)
LJ I----.-J
Students Teachers Separate Variance Estimate Concepts N = 174 N = 45 Degrees
Mean S.D. Mean S.D. 1. Value Freedom
Nutrition needs of family 3.83 .93 4.02 1.10 1.09 6]. 90 Staying within food budget 3.81 .99 3.98 .89 1.08 75.02
* Safe/sanitary food handling 3.73 1.01 4.51 .73 5.90 93.46 * Calories/exercise 3.53 .98 4.24 .71 5.52 92.14 * Planning food buying 3.48 1.01 4.27 .78 5.67 86.33 * Nutrition/wellness 3.46 .97 4.31 .82 5.93 79.63 * Preparing/storing foods 3.43 ],03 3.98 1.06 3.13 67.66 * Planning, preparing, and serving 3.41 .99 4.56 .69 8.98 96.48 * Time, cost, energy comparisons 3.40 ],05 4.42 .84 6.92 83.51
Chaning food habits 3.35 1.02 3.60 1.10 1.36 65.54 * Comparing food cost/nutrient, etc. 3.25 .98 4.13 .79 6.33 83.95 * Evaluating "diets" 3.18 1.19 3.59 1.09 2.20 71.72
Small/large equipment 3.14 ],09 3.51 1.14 ].96 66.77 * Conserving energy 3.11 1.06 3.51 1.22 2.04 62.58 * E'actors affecting food choices 3.02 1.08 3.84 .95 5.04 76.28
Preserving food 3.01 1.02 3.04 1.45 .17 55.91 * Consumer agencies 2.95 1.08 2.33 1.04 -3.52 70.66
Nutritional claims 2.92 1.14 3.24 1.07 1. 79 72.50 * Horld food supply 2.86 1.05 2.11 1. 01 -4.43 7! .48
Note. Scores were assigned as follows: 1 = not important/not included, 2 = little importance/not emphasized, 3 ;::: important/somewhat emphasized, 4 = very important/ moderately emphasized, 5 = essential/greatly emphasized. *Significant difference at .05.
2-Tail Probability
.279
.284
.000
.000
.000
.000
.003
.000
.000
.180
.000
.031
.054
.046
.000
.867
.001
.077
.000
i----.-J
C) I
f-' en
:r: o c
'" ~. ::l <il ":r: o s ill
'TJ c H ::l ~.
Ul ::r ~.
::l <il
'"
I~
f-'
'" '"
...
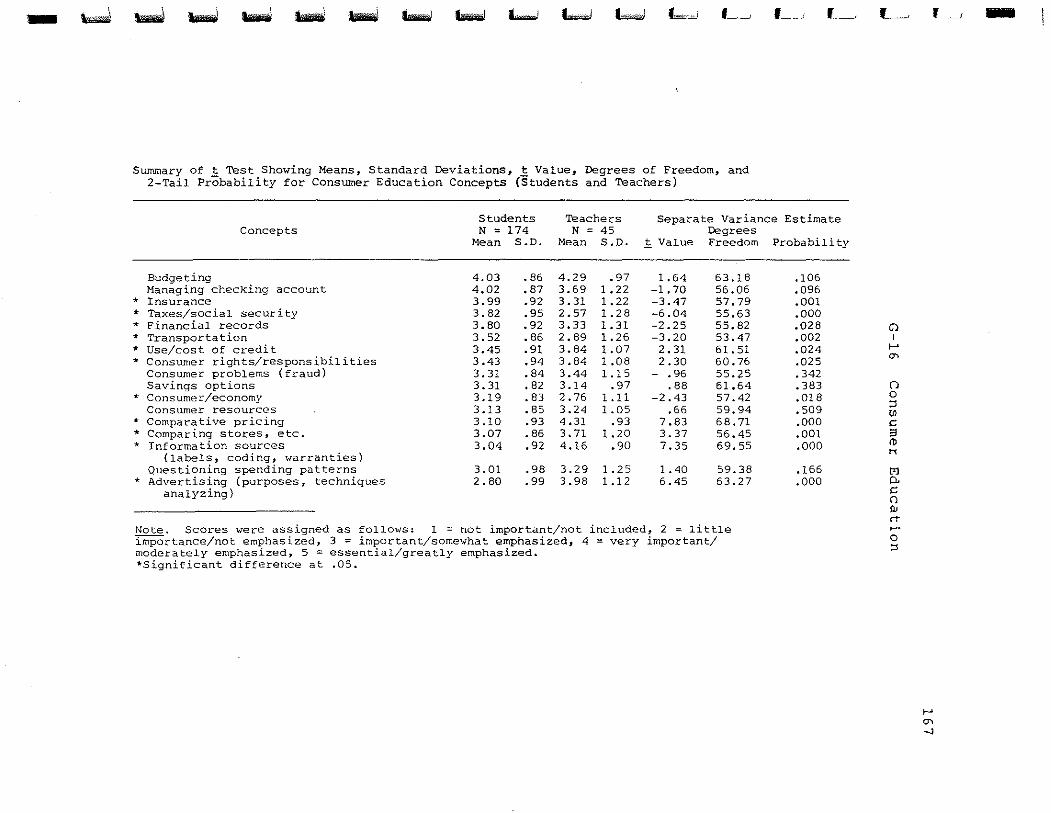
- ~ ~ ~ ~ ~ -- -- ~ ~ t.-.J ~ ~ L~
Summary of 1 Test Showing Means, Standard Deviations, ~ Value, Degrees of Freedom, and 2-Tail Probability for Consumer Education Concepts (Students and Teachers)
L~_, 1-,
Students Teachers Separate Variance Estimate Concepts N = 174 N = 45 Degrees
Mean S.D. Mean S.D. .i Value Freedom
Budgeting 4.03 .86 4.29 .97 1.64 63.18 Managing checking account 4.02 .87 3.69 1.22 -1.70 56.06
* Insurance 3.99 .92 3.31 1.22 -3.47 57.79 * Taxes/social security 3.82 .95 2.57 1.28 -6.04 55.63 * Financial records 3.80 .92 3.33 1. 31 -2.25 55.82 * Transportation 3.52 .86 2.89 1.26 -3.20 53.47 * Use/cost of credit 3.45 .91 3.84 1.07 2.31 61. 51 * Consumer rights/responsibilities 3.43 .94 3.84 1.08 2.30 60.76
Consumer problems (fraud) 3.31 .84 3.44 1.15 - .96 55.25 Savings options 3.31 ,82 3.14 .97 .88 61.64
* Consumer/economy 3.19 .83 2.76 1.11 -2.43 57.42 Consumer resources 3.13 .85 3.24 1.05 .66 59.94
* Comparative pricing 3.10 .93 4.31 .93 7.83 68.71 * Comparing stores, etc. 3.07 .86 3.71 1.20 3.37 56.45 * Information sources 3.04 .92 4.16 .90 7.35 69.55
(labels, coding, warranties) Questioning spending patterns 3.01 .98 3.29 1.25 1.40 59.38
* Advertising (purposes, techniques 2.80 .99 3.98 1.12 6.45 63.27 analyzing)
Note. Scores were assigned as follows: 1 = not important/not included, 2 = little importance/not emphasized, 3 = important/somewhat emphasized, 4 = very important/ moderately emphasized, 5 = essential/greatly emphasized. *Significant difference at .05.
Probability
.106
.096
.001
.000
.028
.002
.024
.025
.342
.383
.018
.509
.000
.001
.000
.166
.000
f~,
Cl 1 .... '" () o :J
'" C S <1> N
trI 0. C n OJ rT ~.
o :J
,
.... '" ....,
-
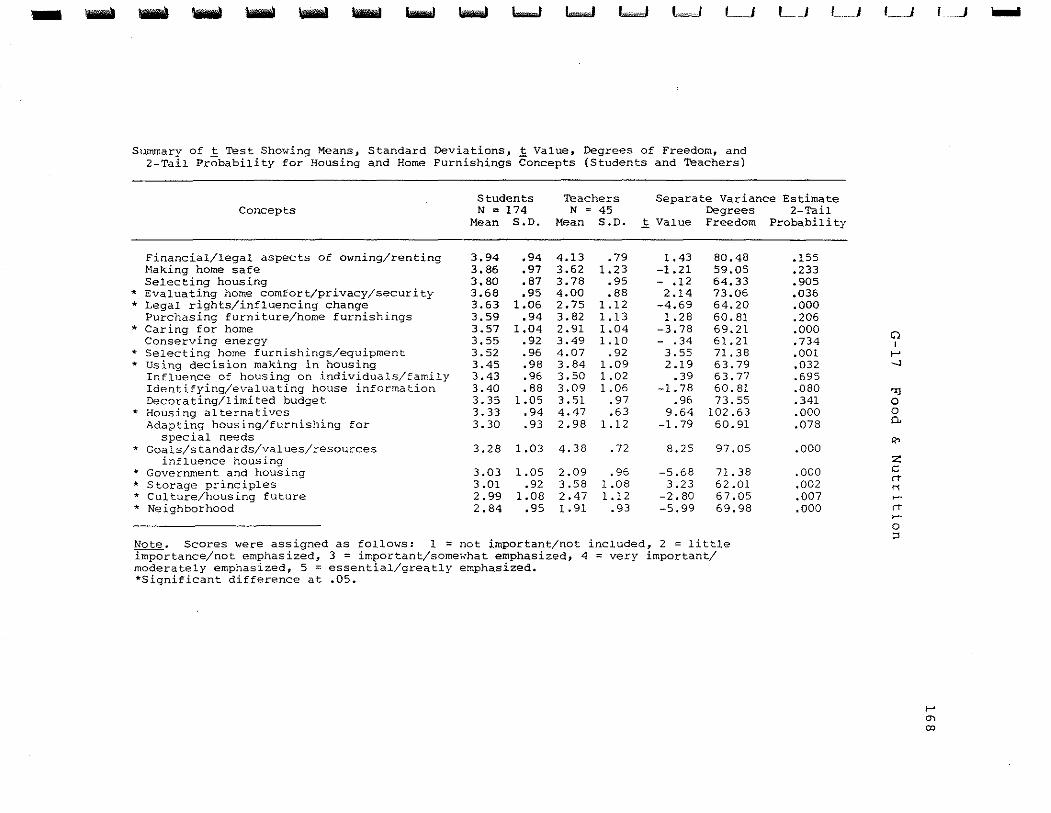
- ~ ~ IiIIIIIiiI IiIIIIIiiI UIiIIil UIiIIil '-' '-' '-' '-' I-J L .. I LJ
Summary of ~ Test Showing Means, Standard Deviations, i Value, Degrees of Freedom, and 2-Tail Probability for Housing and Home Furnishings Concepts (Students and Teachers)
L.J L ... J
Students N = 174
Mean S.D.
Teachers N = 45
Mean S.D.
Separate Variance Estimate Concepts Degrees 2-Tail
~ Value Freedom Probability
Financial/legal aspects of owning/renting Making home safe Selecting housing
... Evaluating home comfort/privacy/security * Legal rights/influencing change
Purchasing furniture/home furnishings * Caring for horne
Conserving energy ... Selecting home furnishings/equipment ... Using decision making in housing
Influence of housing on individuals/family Identifying/evaluating house information Decorating/limited budget
* Housing alternatives Adapting housing/furnishing for
special needs * Goals/standards/values/resources
influence housing * Government and housing * Storage principles * Culture/housing future * Neighborhood
3.94 3.86 3.80 3.68 3.63 3.59 3.57 3.55 3.52 3.45 3.43 3.40 3.35 3.33 3.30
3.28
3.03 3.01 2.99 2.84
.94
.97
.87
.95 1.06
.94 1.04
.92
.96
.98
.96
.88 1.05
.94
.93
1.03
1.05 .92
1.08 .95
4.13 3.62 3.78 4.00 2.75 3.82 2.91 3.49 4.07 3.84 3.50 3.09 3.51 4.47 2.98
4.38
2.09 3.58 2.47 1.91
.79 1.23
.95
.88 1.12 1.13 1.04 1.10
.92 1.09 1.02 1.06
.97
.63 1.12
.72
.96 1.08 1.12
.93
1.43 -1.21 - .12 2.14
-4.69 1. 28
-3.78 - .34
3.55 2.19
.39 -1.78
.96 9.64
-1.79
8.25
-5.68 3.23
-2.80 -5.99
80.48 59.05 64.33 73.06 64.20 60.81 69.21 61. 21 71. 38 63.79 63.77 60.81 73.55
102.63 60.91
97.05
71.38 62.01 67.05 69.98
Note. Scores were assigned as follows: 1 = not important/not included 7 2 = little importance/not emphasized 7 3 = important/some,.[hat emphasized, 4 = very important/ moderately emphasized, 5 = essential/greatly emphasized. *Significant difference at .05.
.155
.233
.905
.036
.000
.206
.000
.734
.001
.032
.695
.080
.341
.000
.078
.000
.000
.002
.007
.000
!~
Cl I
..... -J
"l o o 0.
'" Z C rt H ~.
rt ~.
o "
I-' en CD
! . ....J ....
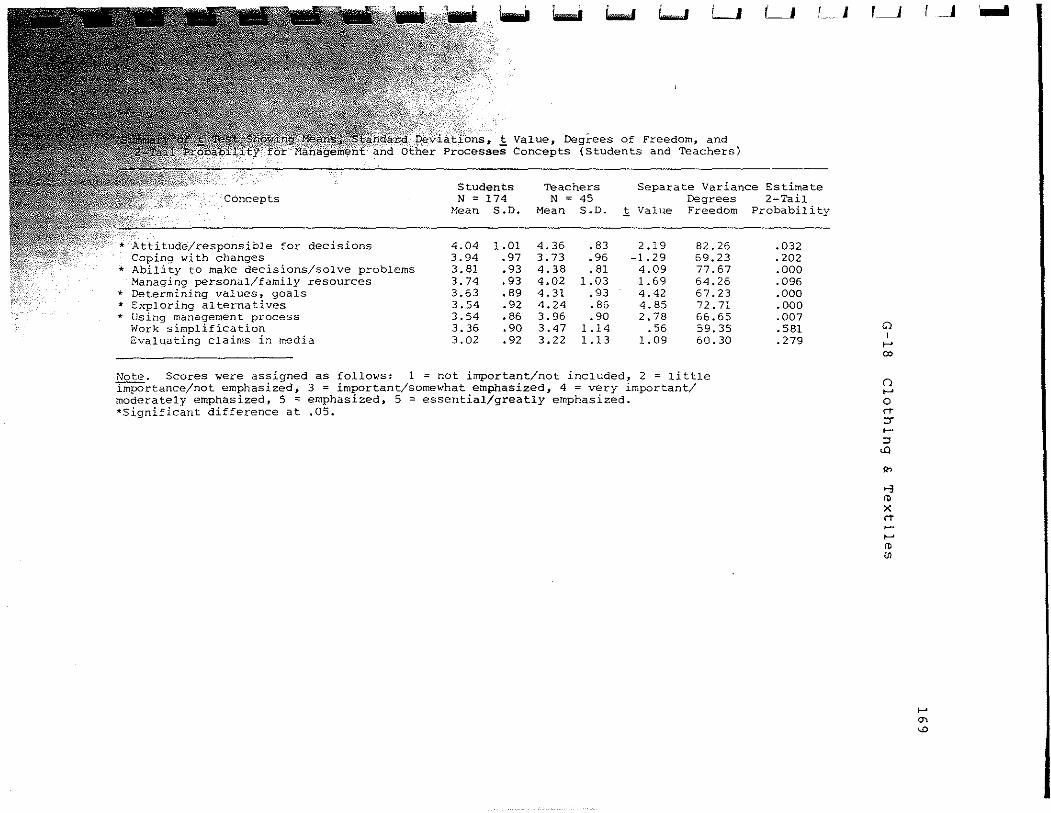
1..1 ~ i.-.J i-..J LJ
t Value, Degrees of Freedom, and Processes Concepts (Students and Teachers)
LI f_ I
Students Teachers Separate Variance Estimate Concepts
* Attitude/responsible for decisions Coping with changes
* Ability to make decisions/solve problems Managing personal/family resources
* Determining values, goals * Exploring alternatives * Using management process
Work simplification Evaluating claims in media
N ~ 174 Mean S.D.
4.04 1.01 3.94 .97 3.81 .93 3.74 .93 3.63 .89 3.54 .92 3.54 .86 3.36 .90 3.02 .92
N = 45 Degrees Mean S.D. ! Value Freedom
4.36 .83 2.19 82.26 3.73 .96 -1.29 59.23 4.38 .81 4.09 77.67 4.02 1.03 1.69 64.26 4.31 .93 4.42 67.23 4.24 .86 4.85 72.71 3.96 .90 2.78 66.65 3.47 1.14 .56 59.35 3.22 1.13 1. 09 60.30
Note. Scores were assigned as follows: 1 = not important/not included, 2 = little importance/not emphasized, 3 = important/somewhat emphasized, 4 = very important/ moderately emphasized, 5 = emphasized, 5 = essential/greatly emphasized. *Significant difference at .05.
2-Tail Probability
.032
.202
.000
.096
.000
.000
.007
.581
.279
r~
Cl I ,...
(»
()
'-' o rT ::r .... ::l
<D
'" ..., ." X rT .... '-' III
'"
r .--.1
,... '" '"'
...