high fat diet increased serum glutamate dehydrogenase
TRANSCRIPT
Minnesota State University, Mankato Minnesota State University, Mankato
Cornerstone: A Collection of Scholarly Cornerstone: A Collection of Scholarly
and Creative Works for Minnesota and Creative Works for Minnesota
State University, Mankato State University, Mankato
All Graduate Theses, Dissertations, and Other Capstone Projects
Graduate Theses, Dissertations, and Other Capstone Projects
2014
High Fat Diet Increased Serum Glutamate Dehydrogenase more High Fat Diet Increased Serum Glutamate Dehydrogenase more
than Chronic Acetaminophen Dosing in Female Mice than Chronic Acetaminophen Dosing in Female Mice
Elizabeth Ruth Behmer Minnesota State University - Mankato
Follow this and additional works at: https://cornerstone.lib.mnsu.edu/etds
Part of the Biochemistry Commons, Food Science Commons, and the Nutritional Epidemiology
Commons
Recommended Citation Recommended Citation Behmer, E. R. (2014). High Fat Diet Increased Serum Glutamate Dehydrogenase more than Chronic Acetaminophen Dosing in Female Mice [Master’s thesis, Minnesota State University, Mankato]. Cornerstone: A Collection of Scholarly and Creative Works for Minnesota State University, Mankato. https://cornerstone.lib.mnsu.edu/etds/370/
This Thesis is brought to you for free and open access by the Graduate Theses, Dissertations, and Other Capstone Projects at Cornerstone: A Collection of Scholarly and Creative Works for Minnesota State University, Mankato. It has been accepted for inclusion in All Graduate Theses, Dissertations, and Other Capstone Projects by an authorized administrator of Cornerstone: A Collection of Scholarly and Creative Works for Minnesota State University, Mankato.
High Fat Diet Increased Serum Glutamate Dehydrogenase more than
Chronic Acetaminophen Dosing in Female Mice
By
Elizabeth R. Behmer
A Thesis Submitted in Partial Fulfillment of the
Requirements for the Degree of
Master of Science
In
Biology
Minnesota State University, Mankato
Mankato, Minnesota
December 2014
High Fat Diet Increased Serum Glutamate Dehydrogenase more than
Chronic Acetaminophen Dosing in Female Mice
By Elizabeth R. Behmer
This thesis has been examined and approved by the following members of the
student’s committee.
______________________________________________
Dr. Steven D. Mercurio, Advisor
______________________________________________
Dr. Michael Bentley, Committee Member
______________________________________________
Dr. David Sharlin, Committee Member
ACKNOWLEDGEMENTS
I would like to thank my adviser and the members of my committee for their
tireless efforts in helping me revise, edit, and complete this thesis. I would not have
completed this project without their encouragement and advice throughout the
research process.
I would also like to thank Minnesota State University—Mankato for the use
of their facilities to conduct my research. Specifically, I thank Dr. Timothy Secott for
the use of his microspectrometer and software. I also thank Brent Pearson for his
work in the Animal Facilities lab and who answered my countless questions
regarding my research mice.
I thank Rachael Swedberg and Richard Sinn for their assistance during the
dosing procedure of my experiment. Their persistence and patience allowed us to
attain a correct dosing technique for the mice.
Finally, I thank my husband who encouraged, uplifted, and motivated me
throughout the entire process of designing an experiment, setting up the protocol,
and completing the writing of my thesis to attain this degree.
ABSTRACT
High Fat Diet Increased Serum Glutamate Dehydrogenase more than Chronic Acetaminophen Dosing in Female Mice
Elizabeth R. Behmer, M.S. Biology
Minnesota State University, Mankato December 2014
This laboratory study examined the effects of acetaminophen overdose in
normal fed and high-fat fed female mice. Forty female mice were placed on normal
and high-fat diets at 4 weeks old. When the mice were significantly different in
weight (between 6 and 9 months old), half the mice were dosed with
acetaminophen. These mice were daily given an overdose of acetaminophen for 14
days. The dose used was 300 mg/kg mouse (LD50 = 338 mg/kg). The control group
was given 10 µl water/g mouse.
Levels of serum glutamate dehydrogenase (GDH) were measured to indicate
liver damage. GDH is released from liver mitochondria indicating mitochondrial
damage and toxicity. Based on a two-way ANOVA, the mean GDH levels were
significantly higher in the high-fat diet mice groups (p <0.001). This suggests
damage to liver mitochondria due to high-fat diet alone.
Liver weights of all female mice groups were documented and statistically
analyzed and showed significant difference between diet groups (p <0.001) and
diet*treatment groups (p = 0.026). Visible fat content in all livers was also analyzed
and showed significant difference between diet groups (p <0.001) and treatment
(acetaminophen or control) groups (p = 0.001).
v
TABLE OF CONTENTS
LIST OF TABLES ........................................................................................................................... vii
LIST OF FIGURES ......................................................................................................................... viii
Chapter Page
I. INTRODUCTION ............................................................................................................. 1
II. LITERATURE REVIEW ................................................................................................. 5
Background ....................................................................................................... 5
Obesity-induced Steatosis............................................................................ 6
Mitochondrial Dysfunction ........................................................... 6
Female versus Male .......................................................................... 10
Acetaminophen-induced Hepatotoxicity ............................................... 12
Mitochondrial Dysfunction ........................................................... 12
Female versus Male .......................................................................... 15
Justification for this Study ........................................................................... 18
III. MATERIALS AND METHODS ..................................................................................... 19
Animals and Experimental Protocols ...................................................... 19
Timeline .............................................................................................................. 21
Extraction of Blood Serum for Liver Enzymes ..................................... 23
Liver Storage and Data Collection ............................................................ 24
Handling of Mice Post-analysis .................................................................. 24

vi
Protocols and Statistical Analysis ............................................................. 25
IV. RESULTS ........................................................................................................................... 26
Measurement of GDH Activity .................................................................... 26
LSD Multiple Comparisons—GDH Activity ........................................... 27
Liver Analysis of Weight and Fat Visibility ........................................... 29
LSD Multiple Comparisons—Liver Weight and Fat Visibility ........ 33
V. DISCUSSION ..................................................................................................................... 35
LITERATURE CITED ................................................................................................................... 45
vii
LIST OF TABLES
Table Page
1. Children’s Tylenol® dosage chart .......................................................................... 3
2. GDH Activity Levels of treatment groups ............................................................. 26
3. GDH Activity Levels (mU/ml) of all 23 mice ....................................................... 29
4. Mean and Standard Deviation of Liver Weights ................................................ 30
5. Mean and Standard Deviation of Fat Visibility................................................... 31
6. Studies of APAP-induced liver injury and NAFLD ............................................ 41
viii
LIST OF FIGURES
Figure Page
1. Pathway of cirrhosis by Reactive Oxygen Species (ROS) ............................... 9
2. Pathways of Acetaminophen Metabolism ............................................................ 13
3. Experimental design setup ........................................................................................ 20
4. Comparison of mice and human ages .................................................................... 22
5. Ages of experimental design setup ......................................................................... 23
6. Bar Graph of Mean GDH Activity ............................................................................. 28
7. Examples of liver visible fat content ...................................................................... 32
8. GDH Activity vs. Liver Weight................................................................................... 37
1
Chapter I
INTRODUCTION
Acetaminophen (APAP) overdose is the leading cause of calls to the Poison
Control Center in the United States. Overdose of this drug also accounts for 50% of
all liver failure in the U.S. APAP overdose accounts for over 55,000 hospital visits,
2,600 emergency room visits, and over 450 deaths About half of these deaths are
the result of intentional overdose while the other half is the result of accidental
overdose (Lee, 2004).
Other factors, such as obesity, play a significant role in increasing the
likelihood of liver damage while taking acetaminophen. This is due to the damaging
effects of acetaminophen on mitochondria in a fatty liver (Aubert and Delannoy,
2012; Zimmerman, 1995). The combination of acetaminophen overdose and fatty
liver may pose unintentional hazards to the health of its users.
The known disease associated with fat accumulation in the liver is called
nonalcoholic fatty liver disease (NAFLD) (Duvnjak, 2007). Fatty liver disease has
been seen in 70-80% of obese individuals. NAFLD may lead to insulin resistance,
cirrhosis or scaring of the liver, metabolic syndrome and type 2 diabetes (Farrell,
2006; Ozturk, 2014).
Obesity has risen greatly in adolescents over the past several years. Obesity
in children aging from 6-11 years old increased from 7% in 1980 to 18% in 2010
2
(Ogden et al., 2010). In 2010, 1 out of 3 children was obese and thought to have
NAFLD (Ogden et al., 2010; National Center for Health Statistics, 2011).
The increase rise in obesity has shown affect the age of onset of puberty in
both males and females (Wagner et al., 2012). When compared to males, it is
evidently clear that female adolescents reach puberty earlier in response to obesity
(Ozturk, 2014). Liver failure from overdose of acetaminophen has also specifically
affected women (Ferguson et al., 1977). Therefore, the danger of acetaminophen
and obesity toxicity may be especially harmful to females and their liver function.
Specifically, the liver plays a role in puberty and can greatly alter puberty
onset if damaged. Eren and colleagues (2009) found that liver damage can cause
precocious puberty (early puberty) in females. Liver damage can affect secretion of
testosterone, follicle-stimulating hormone (FSH), and luteinizing hormone (LH), all
hormones necessary for puberty to occur (Eren et al., 2009).
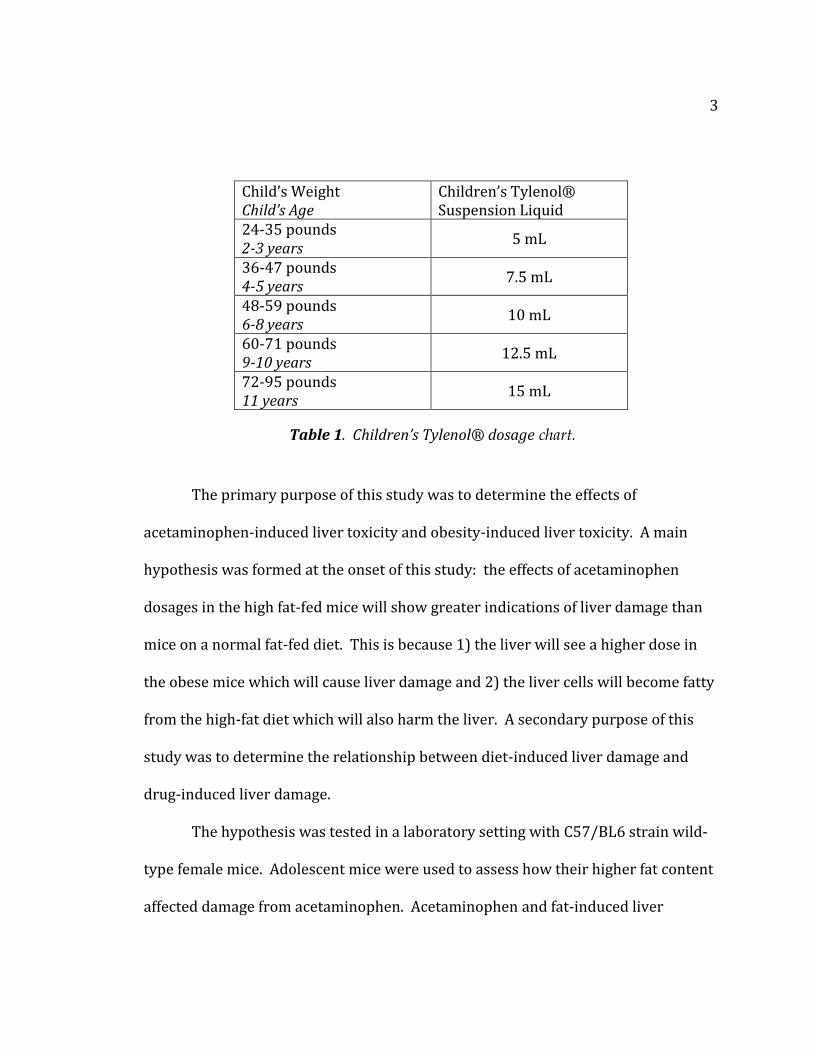
Most acetaminophen is given orally. For example, Children’s Tylenol® gives
its recommended acetaminophen dose based on weight. As a result, young, obese
females being administered acetaminophen at higher dosages may be at greater risk
for liver damage. Table 1 shows the dosage chart for Children’s Tylenol®, also
known as acetaminophen (Tylenol.com - Children's Dosage Guide, 2013). The
children’s ages are associated with their average weights. Concerned parents may
accidentally provide an overdose of acetaminophen for an overweight child.
3
Child’s Weight Child’s Age
Children’s Tylenol® Suspension Liquid
24-35 pounds 2-3 years
5 mL
36-47 pounds 4-5 years
7.5 mL
48-59 pounds 6-8 years
10 mL
60-71 pounds 9-10 years
12.5 mL
72-95 pounds 11 years
15 mL
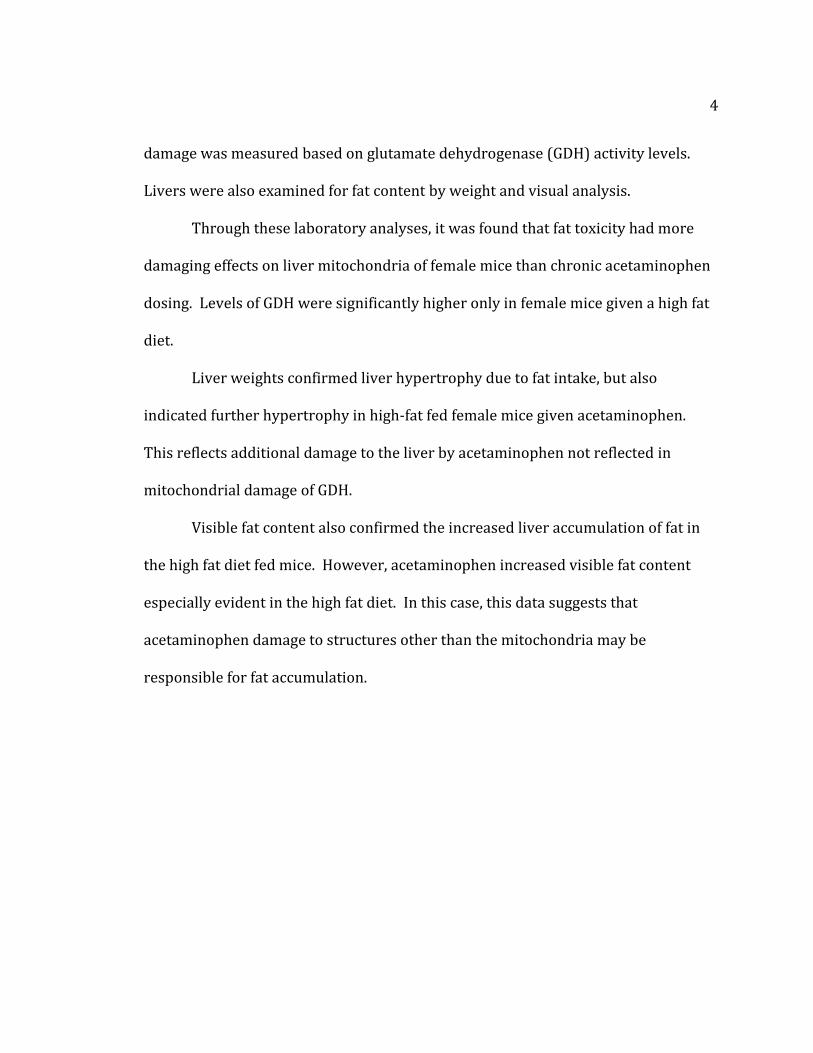
The primary purpose of this study was to determine the effects of
acetaminophen-induced liver toxicity and obesity-induced liver toxicity. A main
hypothesis was formed at the onset of this study: the effects of acetaminophen
dosages in the high fat-fed mice will show greater indications of liver damage than
mice on a normal fat-fed diet. This is because 1) the liver will see a higher dose in
the obese mice which will cause liver damage and 2) the liver cells will become fatty
from the high-fat diet which will also harm the liver. A secondary purpose of this
study was to determine the relationship between diet-induced liver damage and
drug-induced liver damage.
The hypothesis was tested in a laboratory setting with C57/BL6 strain wild-
type female mice. Adolescent mice were used to assess how their higher fat content
affected damage from acetaminophen. Acetaminophen and fat-induced liver
Table 1. Children’s Tylenol® dosage chart.
4
damage was measured based on glutamate dehydrogenase (GDH) activity levels.
Livers were also examined for fat content by weight and visual analysis.
Through these laboratory analyses, it was found that fat toxicity had more
damaging effects on liver mitochondria of female mice than chronic acetaminophen
dosing. Levels of GDH were significantly higher only in female mice given a high fat
diet.
Liver weights confirmed liver hypertrophy due to fat intake, but also
indicated further hypertrophy in high-fat fed female mice given acetaminophen.
This reflects additional damage to the liver by acetaminophen not reflected in
mitochondrial damage of GDH.
Visible fat content also confirmed the increased liver accumulation of fat in
the high fat diet fed mice. However, acetaminophen increased visible fat content
especially evident in the high fat diet. In this case, this data suggests that
acetaminophen damage to structures other than the mitochondria may be
responsible for fat accumulation.
5
Chapter II
LITERATURE REVIEW
Background
Acetaminophen is considered a safe, “over the counter” analgesic used to
relieve pain in children and adults. However, acetaminophen is known to cause
liver injury with overdose (Shivbalan et al., 2010) as well as with a maximum
recommended dosage (Michaut and Moreau, 2014). Misuse of this drug, both
intentional and by accident, is the leading cause of acute liver failure in the United
States (Myers et al., 2008).
Acetaminophen-induced liver toxicity is much more likely in people with
alcohol problems, other underlying liver disease, and those having an unintentional
overdose of the drug (Myers et al., 2008). The severity of acetaminophen-induced
liver injury may also be enhanced with nonalcoholic fatty liver disease (NAFLD),
which refers to liver damage associated with obesity (Michaut and Moreau, 2014).
Specifically as our nation’s children, and especially females, grow up obese,
their risk of drug overdose associated with NAFLD may have profound damaging
effects on their livers. The mechanisms involved with obesity-induced liver toxicity
and acetaminophen-induced liver toxicity, as associated with female adolescents,
will be described in subsequent sections.
6
Obesity-induced Steatosis
Mitochondrial Dysfunction. With the prevalence of obesity rising in
young adults, taking acetaminophen may result in higher doses to achieve pain
relief, even though the dosage will be the same based on weight. Fat can
accumulate in liver cells and have damaging effects similar to those of
acetaminophen and its toxic metabolites.
Specifically, non-alcoholic fatty liver disease (NAFLD) has increased over the
last 30 years (Ozturk, 2014) and is now viewed as the most common form of liver disease
in children and adolescents (Schwimmer, 2006). This disease is associated with type 2
diabetes, cardiovascular disease, and liver cancer (Barshop, 2008).
NAFLD includes many diseases that can range from simple steatosis
(hepatic fat accumulation) to non-alcoholic steatohepatitis (NASH). NASH is
shown by lipid accumulation associated with liver cell inflammation, injury, and
fibrosis. NASH may progress to cirrhosis and end-state liver disease. Alkhouri
and colleagues (2014) showed that children with NASH may be at an increased
risk for cardiovascular diseases as well.
Steatosis is specifically fat accumulation in liver cells. The accumulation
of triglycerides in hepatocytes is known to be the first severe attack in the
progress of liver disease (Berlanga, Alba et al., 2014). This fat accumulation can
inhibit β-oxidation of fatty acids, causing cell death and increased fatty acid
synthesis. Increased fatty acid synthesis is due to the increased regulation of
7
lipogenic pathways in the liver, which are pathways which store energy as fat
(Sudheer and King, 2008; Eaton and Zaitoun, 1996).
Ji and colleagues (2014) examined how overfeeding during sensitive
developmental periods increases the risk of obesity later in life. Their group looked at the
relationship among postnatal nutrition, lipid metabolism, and NAFLD progression during
development. They used litters of mice pups and put them on a high-fat diet beginning at
21 days old. According to their study, at 16 weeks old, the high-fat groups showed
obesity and insulin resistance. They concluded that overfeeding during development
contributed to NAFLD through the up-regulation of hepatic lipogenesis, which is the
accumulation of fat storage in liver cells (Ji et al., 2014).
In summary, fat accumulation will begin with steatosis and ultimately result
in cirrhosis (scarring of liver tissue) and liver cancer if not treated effectively. The
progression of liver damage was outlined by Reddy and colleagues (2006). They
showed with models how fat deposition causes liver enlargement. After liver
enlargement, scar tissues forms in the liver causing fibrosis and liver injury. Liver
fibrosis may lead to cirrhosis, which involves the physical hardening of liver tissue,
causing it to become completely dysfunctional (Reddy, 2006).
The process of liver steatosis begins with the accumulation of triglycerides in
hepatocytes. Fat cells, or adipocytes, fill up the hepatocytes so that the adipocytes
fill almost the entire liver cell. This can be seen as macrovesicular (large vesicle) or
microvesicular (small vesicle) fat droplets in hepatocytes (Reddy, 2006). Fatty acid
overload in hepatocytes induces microsomal cytochrome P-450 (CYP2E1) and fatty
8
acid oxidation systems which create reactive oxygen species (ROS). These ROS
result in oxidative stress of mitochondria leading to their destruction (Rao, 2004).
Oxidative stress causes the release of several cytokines including TNF-α by
hepatocytes (Day, 1998).
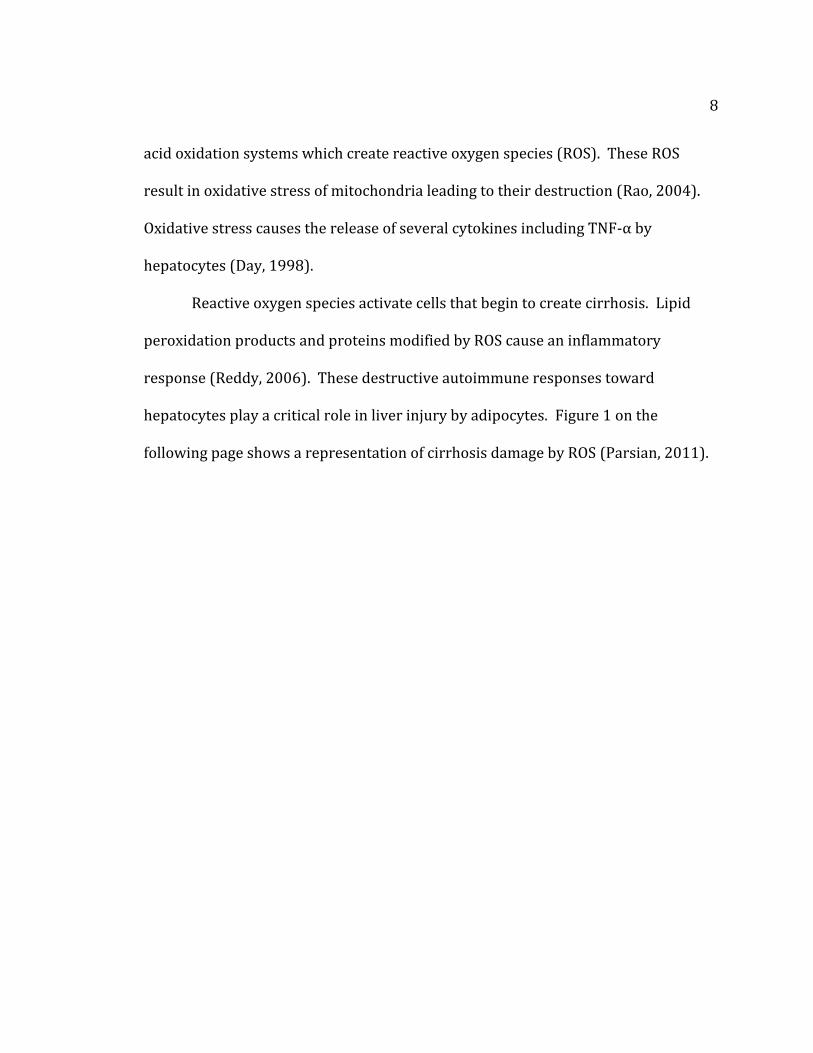
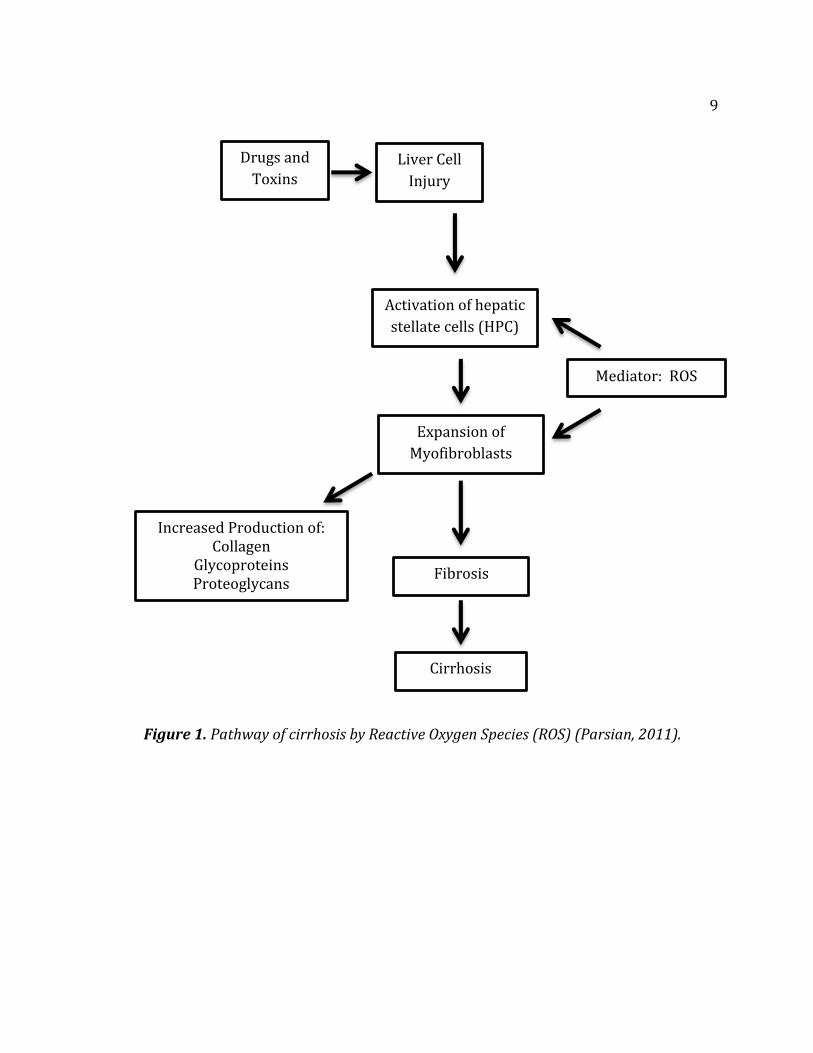
Reactive oxygen species activate cells that begin to create cirrhosis. Lipid
peroxidation products and proteins modified by ROS cause an inflammatory
response (Reddy, 2006). These destructive autoimmune responses toward
hepatocytes play a critical role in liver injury by adipocytes. Figure 1 on the
following page shows a representation of cirrhosis damage by ROS (Parsian, 2011).
9
Figure 1. Pathway of cirrhosis by Reactive Oxygen Species (ROS) (Parsian, 2011).
Liver Cell
Injury
Mediator: ROS
Drugs and
Toxins
Activation of hepatic
stellate cells (HPC)
Expansion of
Myofibroblasts
Cirrhosis
Fibrosis
Increased Production of: Collagen
Glycoproteins Proteoglycans
10
Female vs. Male. In 2010, about 1 in 5,000 children experienced early
puberty. Research has shown that an earlier age of puberty corresponds to
increased incidences of obesity. For example, in 1965 about 5% of children were
obese. In 2010, 18% of children were obese (Ogden et al., 2010).
Obesity may have a different effect on adolescent males. Boys who are obese
may enter puberty at a later stage. Vandewalle and colleagues (2014) studied sex
steroid levels in obese adolescent males. They found that testosterone levels were
lower in obese males at puberty, but skeletal maturation and estradiol were
increased in obese boys at the beginning of puberty (Vandewalle et al., 2014). This
suggests that estradiol contributes to the advancement of skeletal maturation, but
the low levels of testosterone may delay puberty in adolescent boys.
Research has also shown that obesity may play a role in the age a female
enters puberty (Ozturk, 2014; Addo et al., 2014). In girls who enter puberty earlier
than 8 years of age, it is considered precocious puberty. Dr. Addo and colleagues
suggest a link between early puberty in girls and obesity. Their research looked at
hormone level concentrations in obese females entering puberty. They found that
preadolescent weight gain lowered the age of Luteinizing Hormone (LH) onset. LH
is needed for puberty to occur, and higher levels of LH were seen earlier in obese
females indicating earlier puberty onset.
Dr. Addo and colleagues (2014) also showed that the link between obesity
and early puberty was not only seen in white Caucasian females, but in female girls
from all ethnic groups. Using the rise of LH as their maker, their research showed
11
that the age of puberty onset among obese females was first seen in non-Hispanic
black girls at 10.08 years, followed by Mexican-American girls at 10.64 years, and at
10.66 years for non-Hispanic white.
Vannucci and colleagues researched eating disorders including binge eating
during puberty. Their research suggested that puberty is a critical risk period when
binge eating behaviors found in boys and girls may attribute to weight gain, body
shape concerns, and more frequent food consumption (Vannucci et al., 2014).
In summary, obesity has obvious effects on females entering puberty early.
Studies have shown how overeating can contribute to obesity and detrimentally
affect females during important developmental phases of their lives. Growing up
obese may even affect their ability to reproduce as adults (Lai et al., 2014). Pre-
puberty females growing up obese may enter puberty earlier, and they also may
have compromised liver function because of increased fat storage in their liver cells.
12
Acetaminophen-induced Hepatotoxicity
Mitochondrial Dysfunction. As previously stated, acetaminophen is mainly
used as an analgesic medicine for pain and fever relief (Casarett et al., 1980; McGill
et al., 2012). When taken orally, most of acetaminophen is converted to non-toxic
metabolites by Phase-II drug metabolism reactions through conjugation with sulfate
and glucuronide (Casarett et al., 1980). However, at high doses, acetaminophen
produces a toxic metabolite, N-acetyl-p-benzoquinone imine (NAPQI) by means of
cytochrome P-450 enzymes (specifically CYP2E1) in the liver (Aubert and Delannoy,
2012). A small percentage of NAPQ1 is detoxified by glutathione (GSH). Glutathione
is a tripeptide antioxidant that protects cells against oxidative damage from reactive
oxygen species, and it also plays a crucial role in detoxifying various drugs including
acetaminophen (Botta et al., 2009).
Additional NAPQ1 from high doses of APAP depletes the liver of GSH (Ben-
Shachar and Yifei, 2012). The depletion of GSH allows the toxic metabolite, NAPQ1,
to further harm the liver by damaging the mitochondria (Jaeschke and Gores, 2002).
In fact, one method of treatment for acetminophen overdose is the administration of
N-acetylcysteine (NAC). NAC increases GSH synthesis in the liver, helping to
eliminate excess NAPQ1 (Shayiq et al., 1999).
Figure 2 shows the pathways of acetaminophen metabolism in the liver
(Marshall and Bangert, 1995). Acetaminophen is safely conjugated through
glucuronidation and sulfation to lead to non-toxic metabolites. Glucuronidation is
the addition of a glucuronic acid to a substrate group. This addition makes the

13
compound more water-soluble and able to be eliminated by the body. Sulfation is
the addition of a sulfate to a substrate group. Sulfation makes the compound less
toxic as well.
NAPQ1 can be safely detoxified with GSH when there is no acetaminophen
overdose. In situations of acetaminophen overdose, GSH is depleted, and NAPQ1
continues to react with mitochondrial proteins and harm the liver as it overwhelms
the acetaminophen metabolism system (Marshall and Bangert, 1995).
Figure 2. Pathways of Acetaminophen Metabolism (Marshall and Bangert, 1995).
NAPQ1
Sulfation
Acetaminophen
Glucuronidation
N-Hydroxylation
and
rearrangement
(CYP-mediated)
GSH conjugation
Toxic reactions with mitochondrial
proteins and liver damage.

14
The toxic metabolite, NAPQ1, has been shown to bind to mitochondrial
proteins which lead to mitochondrial oxidative stress and dysfunction (Bait et al.,
2006; Jaeschke, H. 1990; Jaeschke et al., 2012). The binding of NAPQ1 causes the
inner matrix of the mitochondria to swell and pore opening in the mitochondrial
membrane. This swelling leads to membrane lysis (Placke et al., 1987). Also, pore
opening results in the destruction of membrane potential and loss of ATP synthesis,
which will eventually lead to necrosis of the hepatocytes (Kon et al., 2004).
The increased permeability and lysis of the mitochondrial membrane
releases enzymes from the inner matrix such as glutamate dehydrogenase (GDH)
(Zhang et al., 2010). GDH is a mitochondrial enzyme needed for urea synthesis in
the liver (Placke et al., 1987). Elevated levels of GDH indicate mitochondrial
dysfunction and damage due to NAPQ1 (Antoine et al., 2010).
The mitochondria of a cell are responsible for making ATP to generate
energy for the processes of a cell. Specifically this process of generating ATP is
called β-oxidation. NAPQ1 not only disrupts the membrane of the mitochondria to
cause lysis, but directly inhibits β-oxidation by damaging the mitochondria itself
(McGill et al., 2012; Russmann et al, 2009). A decrease in cellular ATP will directly
cause necrosis, cell death, of hepatocytes (liver cells).
Another level of liver damage is seen by elevated levels of tumor necrosis
factor—alpha (TNF-alpha) (Jaeschke and Gores, 2002). TNF-alpha is released as an
immune response in an attempt to kill cells when they recognize imminent damage.
15
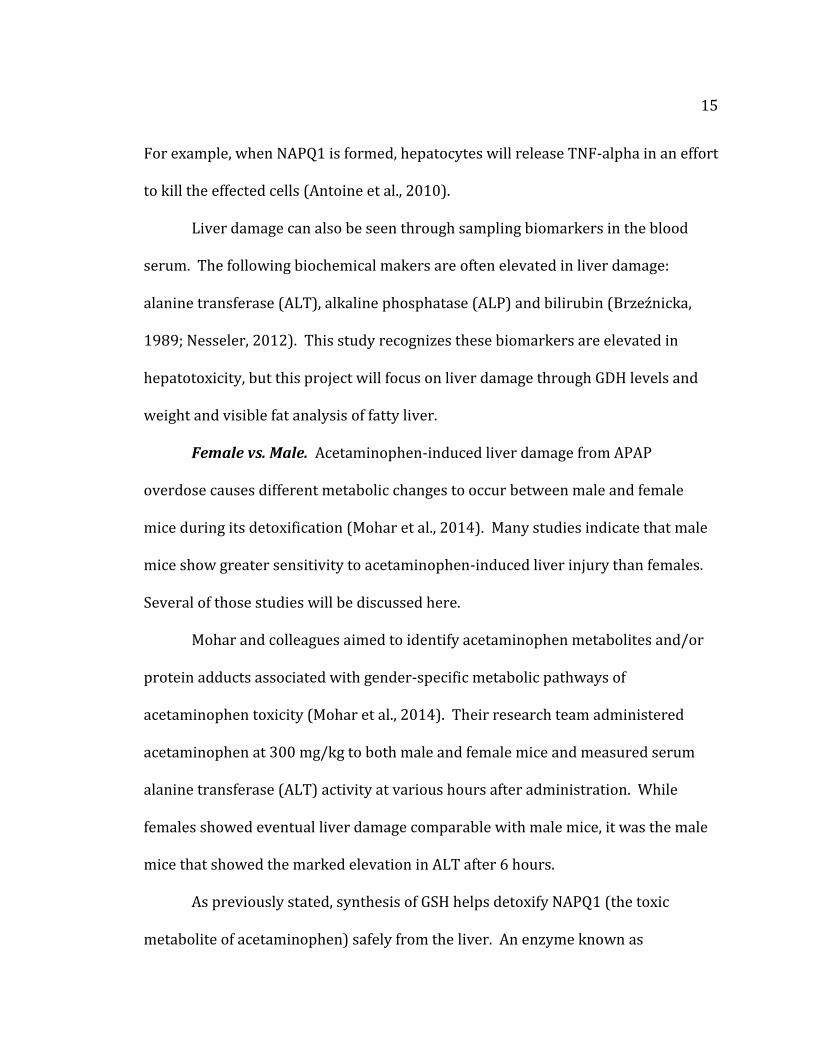
For example, when NAPQ1 is formed, hepatocytes will release TNF-alpha in an effort
to kill the effected cells (Antoine et al., 2010).
Liver damage can also be seen through sampling biomarkers in the blood
serum. The following biochemical makers are often elevated in liver damage:
alanine transferase (ALT), alkaline phosphatase (ALP) and bilirubin (Brzeźnicka,
1989; Nesseler, 2012). This study recognizes these biomarkers are elevated in
hepatotoxicity, but this project will focus on liver damage through GDH levels and
weight and visible fat analysis of fatty liver.
Female vs. Male. Acetaminophen-induced liver damage from APAP
overdose causes different metabolic changes to occur between male and female
mice during its detoxification (Mohar et al., 2014). Many studies indicate that male
mice show greater sensitivity to acetaminophen-induced liver injury than females.
Several of those studies will be discussed here.
Mohar and colleagues aimed to identify acetaminophen metabolites and/or
protein adducts associated with gender-specific metabolic pathways of
acetaminophen toxicity (Mohar et al., 2014). Their research team administered
acetaminophen at 300 mg/kg to both male and female mice and measured serum
alanine transferase (ALT) activity at various hours after administration. While
females showed eventual liver damage comparable with male mice, it was the male
mice that showed the marked elevation in ALT after 6 hours.
As previously stated, synthesis of GSH helps detoxify NAPQ1 (the toxic
metabolite of acetaminophen) safely from the liver. An enzyme known as

16
glutamate-cysteine ligase is the rate-limiting step in GSH synthesis (Botta et al,
2009). Botta and colleagues showed male mice induced to overexpression of
glutamate-cysteine ligase to be more resistant to acetaminophen-induced liver
injury. This is because an overexpression of glutamate-cysteine ligase would
increase GSH synthesis. Since people vary in their glutamate-cysteine ligase activity,
this enzyme may help in determining the sensitivity of humans to acetaminophen
induced liver in jury. In summary, Botta and colleagues discovered a clear inverse
relationship between glutamate-cysteine ligase activity and serum ALT levels after
acetaminophen treatment in male mice. They showed that the more activity of
glutamate-cysteine ligase increased synthesis of GSH, helping to eliminate NAPQ1
from the liver and thus decreasing serum ALT levels (a clear indication of liver
damage). This relationship was not shown in female mice, suggesting that male
mice are more sensitive to acetaminophen-induced liver damage (Botta et al., 2009).
McConnachie and collegues (2007) showed that male mice demonstrated
greater acetaminophen-induced hepatotoxicity than female mice. Their group also
looked at glutamate-cysteine ligase as the rate limiting step in GSH biosynthesis.
McConnachie showed that treatment with N-acetylcysteine (NAC), which also helps
synthesize GSH, lessened the effects of acetaminophen overdose. Ultimately further
studies must be done to understand the roles of gender and glutamate-cysteine
ligase activity in acetaminophen-induced liver toxicity in mice (McConnachie et al.,
2007).
17
Furthermore, acetaminophen overdose not only harms the liver, but also the
kidneys. Not surprisingly, Hu and colleagues (1993) found increased renal necrosis
induced by APAP in male mice compared to female mice (Hu et al., 1993).
Acetaminophen and its metabolism in the body to toxic metabolites has obvious
effects on various parts of the body.
It should be noted that acetaminophen overdose causes damage in both male
and female mice, but the current research shows males being more sensitive to its
metabolic pathways and apparent toxicity. Because current research focuses on
male mice, female mice and their acetaminophen sensitively may be overlooked.
Further research must be done in order to find the differences of acetaminophen-
induced liver toxicity in both males and females.
18
Justification for this Study
The intent of this study was to recognize the need for further analysis
concerning liver damage due to acetaminophen overdose in obese female
adolescents. Both males and females show obvious liver damage from
acetaminophen overdose. Current research shows male mice being more sensitive
to the toxic effects of acetaminophen. Adolescents, especially female, may be
overlooked in scientific studies because of these results. Because of an obese
female’s early entry into puberty, the female gender should be further studied in
regards to obesity and acetaminophen toxicity.
Countless obesity studies and experiments are being carried out in labs.
They are being done for good reason because of the 33% of Americans who are
obese and the damaging affects to all parts of the body due to obesity, not just the
liver. Obesity may be especially damaging to developing bodies in adolescents
(Ji et al., 2014).
This study looks specifically at liver damage in regards to drug overdose.
Acetaminophen overdose is the leading cause of acute liver failure, both by
intentional usage and by accident (Myers et al., 2008). One can understand the
potential for serious liver damage when an obese female adolescent overdoses on
acetaminophen.
19
Chapter III
MATERIALS AND METHODS
The basic experimental design involved setting up 2 groups of mice, half on a
normal diet (ND) and half on a high-fat diet (HFD). Half of each diet group was then
dosed with acetaminophen (APAP) while the other control group was dosed with
water. Blood serum levels were analyzed for glutamate dehydrogenase (GDH)
activity. Livers were weighed for fatty content as well as analyzed for visible fat
analysis. The mice used in this study received Institutional Animal Care and Use
Committee approval on October 3, 2012 (IACUC approval Number: #12-06).
Animals and Experimental Protocols
Forty (40), C57/BL6 strain wild-type female mice were used in this study.
The mice were taken from a breeding colony in which the males were used for a
separate obesity study. All female mice were bred and housed locally in the Animal
Care Facility at Minnesota State University, Mankato. They were housed at standard
laboratory conditions (22°C for a 12-hour light and 12-hour dark cycle) with free
access to rodent feed and water.
After four weeks of normal feeding, half (20) of the mice were placed on a
high-fat (11%) diet while the other half (20) remained on the normal (4%) diet. The
mice were fed and carefully observed for 30-40 weeks.
20
The mice were weighed daily, and these weights (in grams) were
documented until the mice in the two groups (normal and high-fat diet) were
significantly different in weight. Significant difference in weight between the two
groups was seen between 30-40 weeks from time of birth.
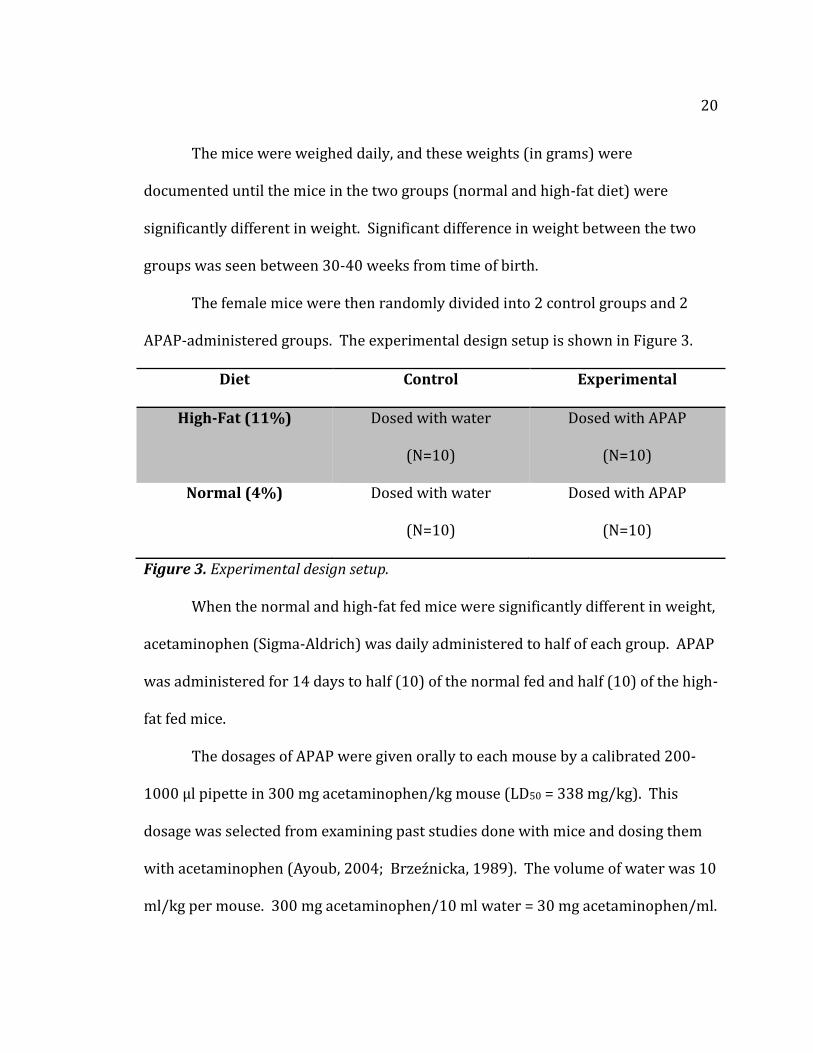
The female mice were then randomly divided into 2 control groups and 2
APAP-administered groups. The experimental design setup is shown in Figure 3.
Diet Control Experimental
High-Fat (11%) Dosed with water
(N=10)
Dosed with APAP
(N=10)
Normal (4%) Dosed with water
(N=10)
Dosed with APAP
(N=10)
Figure 3. Experimental design setup.
When the normal and high-fat fed mice were significantly different in weight,
acetaminophen (Sigma-Aldrich) was daily administered to half of each group. APAP
was administered for 14 days to half (10) of the normal fed and half (10) of the high-
fat fed mice.
The dosages of APAP were given orally to each mouse by a calibrated 200-
1000 µl pipette in 300 mg acetaminophen/kg mouse (LD50 = 338 mg/kg). This
dosage was selected from examining past studies done with mice and dosing them
with acetaminophen (Ayoub, 2004; Brzeźnicka, 1989). The volume of water was 10
ml/kg per mouse. 300 mg acetaminophen/10 ml water = 30 mg acetaminophen/ml.
21
The mice were dosed as 10 µl per gram mouse with weights between 20-50
g/mouse = 200-500 µl APAP administered per mouse.
The dose was very close to a lethal dose, so the mice were carefully
monitored based on their appearance, movement, and food and water intake.
Specifically, any mice that showed evidence of lack of grooming, and no movement
when prodded with a finger were examined carefully. If any mouse became sick
(eyes nearly shut but not asleep, labored breathing, few movements when prodded,
and/or fur clearly not groomed), they were to be euthanized by CO2. Fortunately,
the mice in this design did not become sick during the dosing procedure.
At the end of the dosing period (14 days), the mice were euthanized by CO2.
They were then dissected, and each specific mouse’s blood was collected for
analysis. Livers were photographed, weighed, and split in two. Half of each liver
was frozen for future analysis and the other half was saved in 10% formalin
solution.
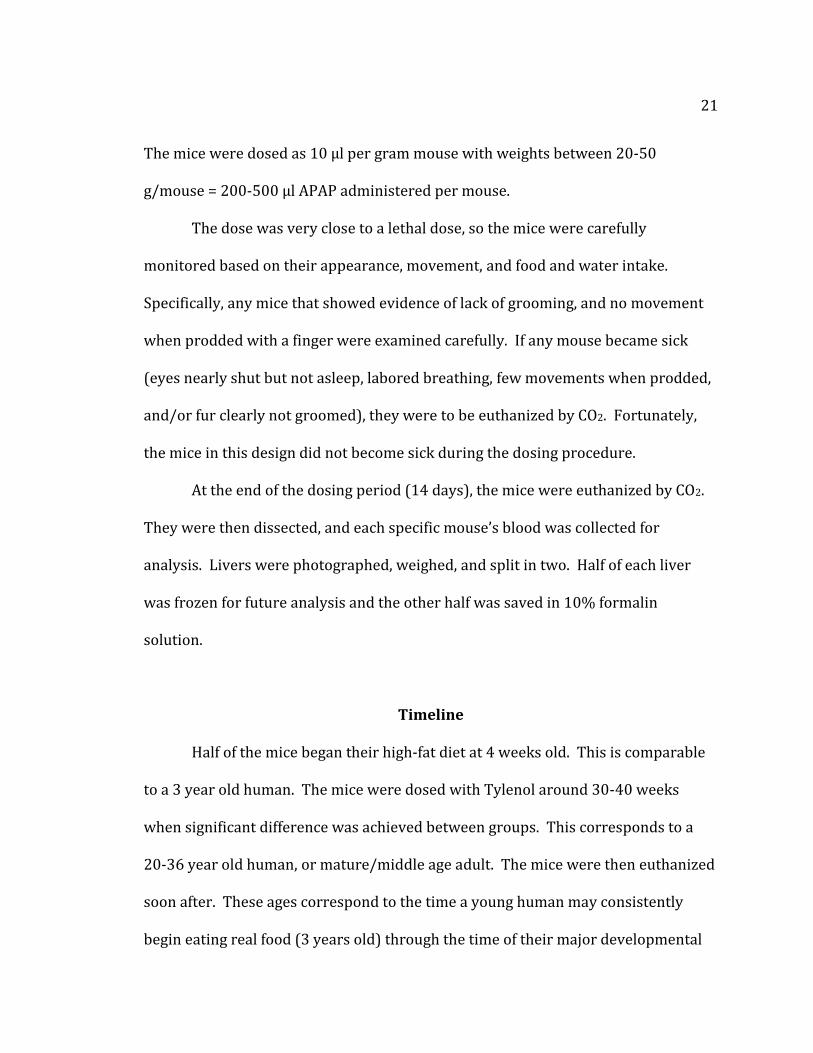
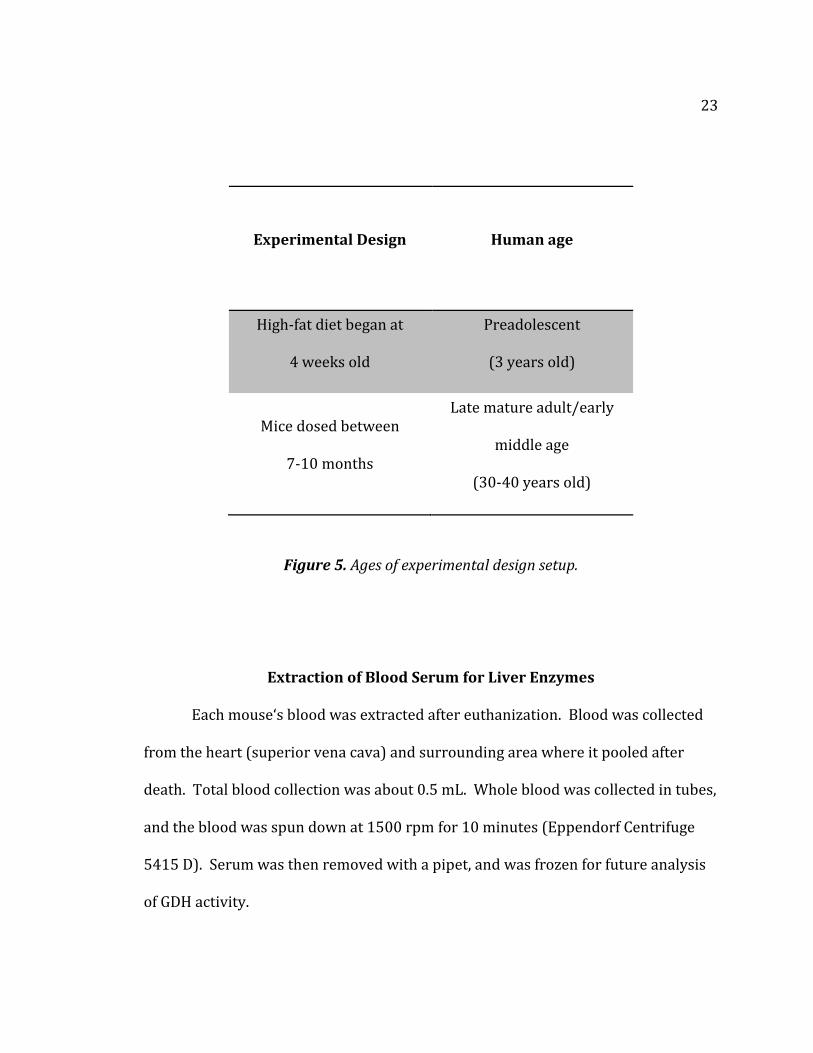
Timeline
Half of the mice began their high-fat diet at 4 weeks old. This is comparable
to a 3 year old human. The mice were dosed with Tylenol around 30-40 weeks
when significant difference was achieved between groups. This corresponds to a
20-36 year old human, or mature/middle age adult. The mice were then euthanized
soon after. These ages correspond to the time a young human may consistently
begin eating real food (3 years old) through the time of their major developmental

22
changes: puberty and sexual maturity. Figures 4 and 5 below shows the
comparison between mouse and human ages (Flurkey, 2007). The experimental
design of this project was developed to show the detrimental effects of
acetaminophen and obesity in developing females, ages 3 to middle age.
Mice Life Phase
Time period
(human female age)
Sexually mature 35 days
(10-14 years)
Mature adult 3-6 months
(18-35 years)
Middle age 10-15 months
(36-55 years)
Old age 18-24 months
(>55 years)
Figure 4. Comparison of mice and human ages (Flurkey, 2007).
23
Figure 5. Ages of experimental design setup.
Extraction of Blood Serum for Liver Enzymes
Each mouse‘s blood was extracted after euthanization. Blood was collected
from the heart (superior vena cava) and surrounding area where it pooled after
death. Total blood collection was about 0.5 mL. Whole blood was collected in tubes,
and the blood was spun down at 1500 rpm for 10 minutes (Eppendorf Centrifuge
5415 D). Serum was then removed with a pipet, and was frozen for future analysis
of GDH activity.
Experimental Design
Human age
High-fat diet began at
4 weeks old
Preadolescent
(3 years old)
Mice dosed between
7-10 months
Late mature adult/early
middle age
(30-40 years old)
24
Liver Storage and Data Collection
After blood was collected, mice livers were removed, photographed, weighed,
and split in halves. The liver’s visible fat content was determined on a scale of 1, 2,
or 3 (no fat, some fat, mostly fat). Any changes in color were noted as well
(yellowing instead of brown). This was done partially blinded, meaning the livers
were taken from known diet groups, but specific mice were not known and whether
they had been dosed with acetaminophen or water.
Half of the liver was fixed in formalin (10%) for a separate project in
histopathological evaluation. The other half was frozen at -20 degrees C and held
for future biochemical analysis.
Handling of Mice Post-analysis
All mice were euthanized at the end of the 14 days of dosing with carbon
dioxide (CO2) in a controlled environment. After the mice were dissected, livers and
blood were extracted, and the carcasses were then frozen.
Mice that were not given acetaminophen were disposed of by freezing and
calling Environmental Health for disposal of non-hazardous animals. Those mice
given the acetaminophen were properly labeled with the accurate amount of drug
dose given. This labeling also included the number of days the mice received the
drug, which allowed Environmental Health to decide whether they should be
considered a hazard needing special handling. The Environmental Health team
came and collected the control mice and those mice dosed with acetaminophen.
25
Protocols and Statistical Analysis
A glutamate dehydrogenase (GDH) activity assay kit (BioVision, Catalog
#K729-100) was used to test for elevated levels of GDH in the serum. A
microspectrometer (Thermo Electron Corporation, Multiskan Spectrum) took four
450 nm readings at 3 minutes, 30 minutes, 60 minutes, and 90 minutes. This
occurred at an incubation temperature of 37°C. A NADH Standard curve was
established to calculate GDH activity using the following equation:
𝐺𝐷𝐻 𝐴𝑐𝑡𝑖𝑣𝑖𝑡𝑦 = 𝐵
(𝑇×𝑉)× 𝑆𝑎𝑚𝑝𝑙𝑒 𝐷𝑖𝑙𝑢𝑡𝑖𝑜𝑛 𝐹𝑎𝑐𝑡𝑜𝑟𝑦 =
𝑛𝑚𝑜𝑙
𝑚𝑖𝑛
𝑚𝑙=
𝑚𝑈
𝑚𝑙
Where: B is the NADH amount from Standard Curve (in nmol).
T is the time incubated (in min).
V is the sample volume added into the reaction well (in nmol).
All statistical analyses were made using IBM SPSS Statistics 22. Unless
otherwise noted, statistical significance was accepted for any parameter where p ≤
0.05.
The number of mice in each treatment group (N) decreased in the GDH
activity results. This was because the microspectrometer froze after 4 hours, losing
the data of several of the mice. Also, many wells did not show readings of GDH
activity. However, the number of mice (N) for each group in regards to liver weight
and fat visibility were the same (55 in total).
26
Chapter IV
RESULTS
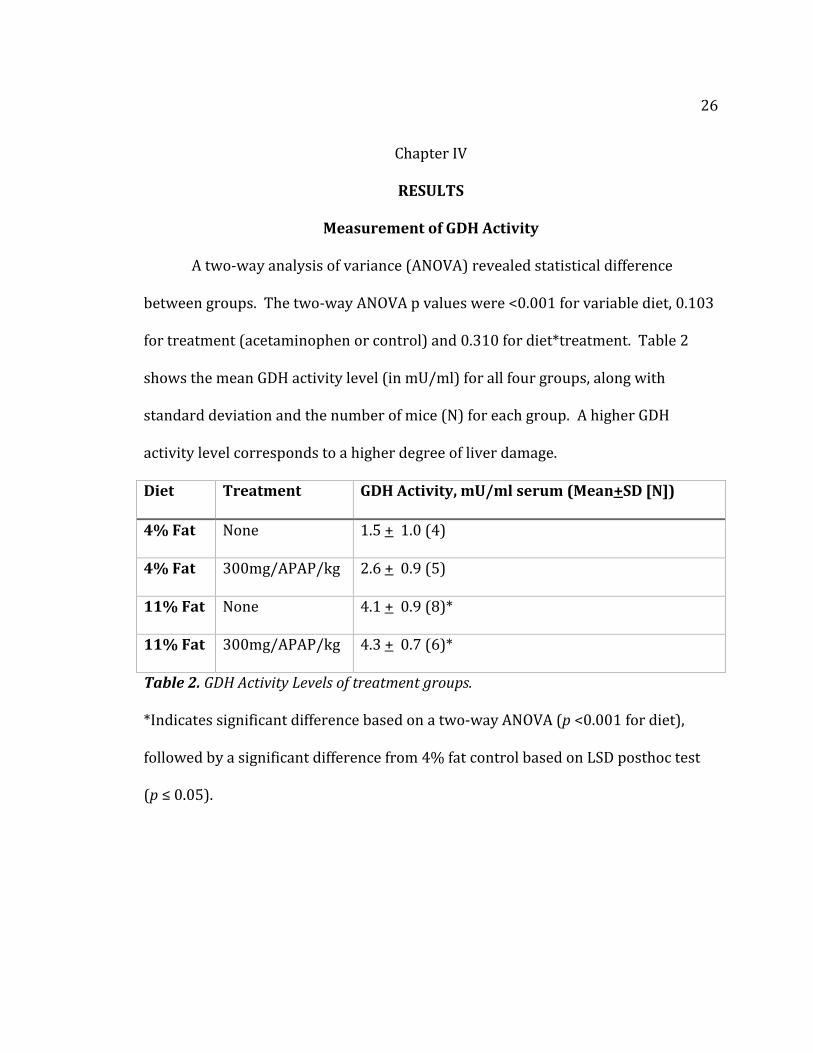
Measurement of GDH Activity
A two-way analysis of variance (ANOVA) revealed statistical difference
between groups. The two-way ANOVA p values were <0.001 for variable diet, 0.103
for treatment (acetaminophen or control) and 0.310 for diet*treatment. Table 2
shows the mean GDH activity level (in mU/ml) for all four groups, along with
standard deviation and the number of mice (N) for each group. A higher GDH
activity level corresponds to a higher degree of liver damage.
Diet
Treatment GDH Activity, mU/ml serum (Mean+SD [N])
4% Fat
None 1.5 + 1.0 (4)
4% Fat
300mg/APAP/kg 2.6 + 0.9 (5)
11% Fat
None 4.1 + 0.9 (8)*
11% Fat
300mg/APAP/kg 4.3 + 0.7 (6)*
Table 2. GDH Activity Levels of treatment groups. *Indicates significant difference based on a two-way ANOVA (p <0.001 for diet),
followed by a significant difference from 4% fat control based on LSD posthoc test
(p ≤ 0.05).
27
Least Significant Difference (LSD) Multiple Comparisons—GDH Activity
Statistical difference (p ≤ 0.05) was seen between diet groups regarding GDH
activity levels (p <0.001). This led to a LSD posthoc test showing differences
between diet groups.
Significant difference was seen between the 4% and 11% diet groups dosed
with water (p <0.001). Significant difference was also seen between the 4% and
11% diet groups dosed with acetaminophen (p = 0.004). This data reveals damage
done to the liver due to high fat diet alone.
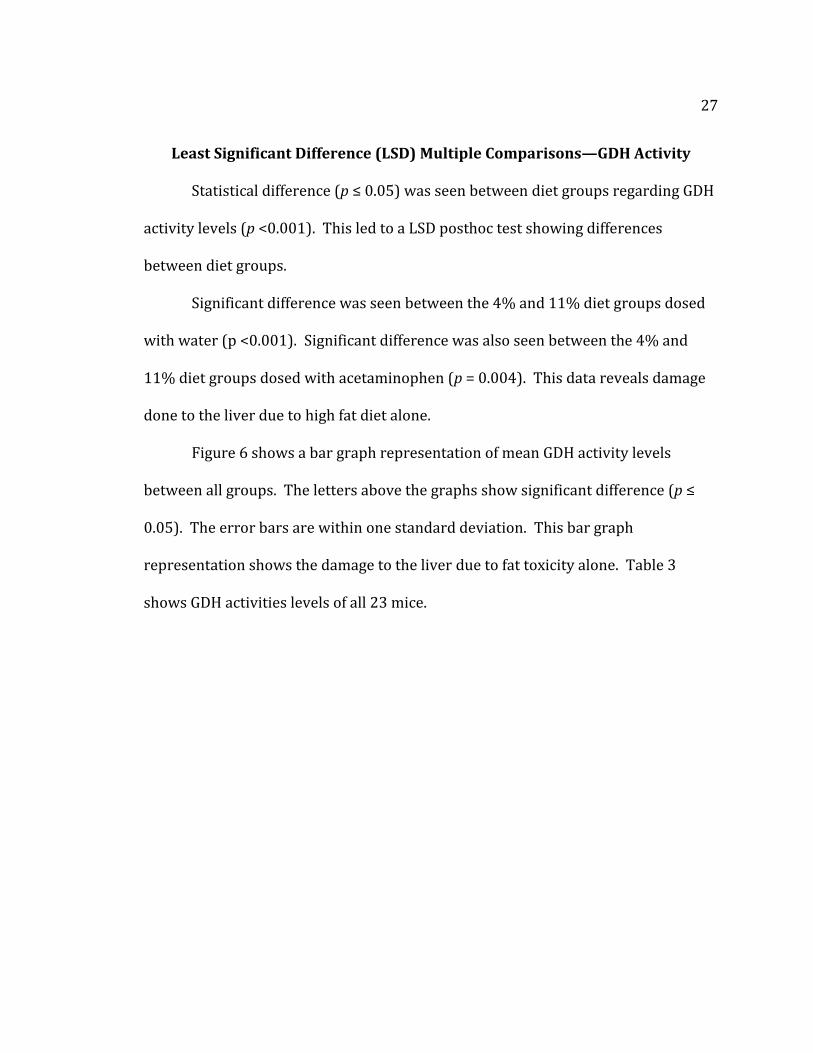
Figure 6 shows a bar graph representation of mean GDH activity levels
between all groups. The letters above the graphs show significant difference (p ≤
0.05). The error bars are within one standard deviation. This bar graph
representation shows the damage to the liver due to fat toxicity alone. Table 3
shows GDH activities levels of all 23 mice.
28
Figure 6. Bar Graph of Mean GDH Activity.
GDH Activity
Me
an
GD
H
Act
ivit
y
(mU
/m
l)
11% Fat N = 8
4% Fat +APAP N = 5
4% Fat N = 4
11% +APAP N= 6
Experimental Group Error Bars: +/- 1 S.D.
a
a
b b

29
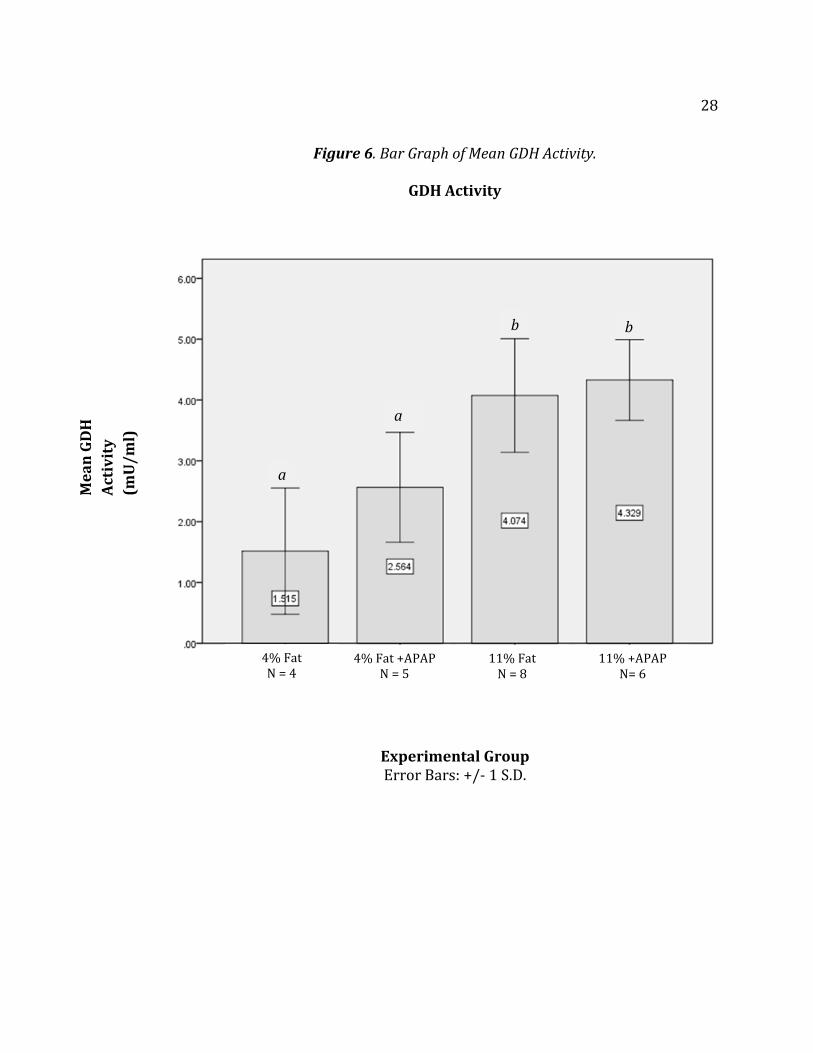
Table 3. GDH Activity Levels (mU/ml) of all 23 mice.
Normal -APAP Normal +APAP High Fat-APAP High Fat + APAP
0.95739454 3.985120792 5.843517106 5.201545501
0.367926794 2.87117698 4.10633287 3.566746173
2.640560239 1.922861595 4.600608543 3.738020826
2.096108212 2.298972945 4.697737161 5.021282775
1.742616247 3.502247025 4.285562328
3.479635549 4.160252484
3.047995956
3.310211657
Liver Analysis of Weight and Fat Visibility
A two-way analysis of variance (ANOVA) revealed statistical difference
between groups regarding liver weight and fat visibility. The mouse livers were
analyzed by weight (in grams) and by a visible weight analysis based on a scale of 1,
2, or 3 (no visible fat content, some fat, or mostly fatty liver).
The two-way ANOVA p values for liver weight were <0.001 for variable diet,
0.066 for treatment (acetaminophen or control) and 0.026 for diet*treatment
interaction.
30
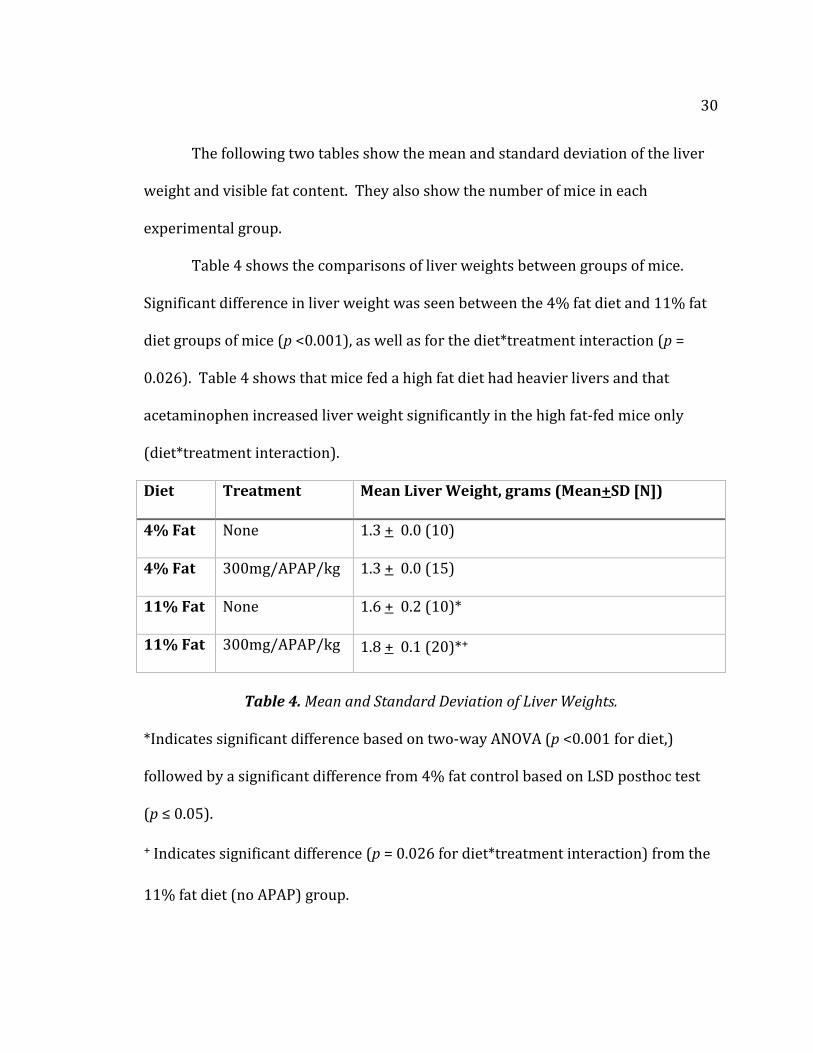
The following two tables show the mean and standard deviation of the liver
weight and visible fat content. They also show the number of mice in each
experimental group.
Table 4 shows the comparisons of liver weights between groups of mice.
Significant difference in liver weight was seen between the 4% fat diet and 11% fat
diet groups of mice (p <0.001), as well as for the diet*treatment interaction (p =
0.026). Table 4 shows that mice fed a high fat diet had heavier livers and that
acetaminophen increased liver weight significantly in the high fat-fed mice only
(diet*treatment interaction).
Diet
Treatment Mean Liver Weight, grams (Mean+SD [N])
4% Fat
None 1.3 + 0.0 (10)
4% Fat
300mg/APAP/kg 1.3 + 0.0 (15)
11% Fat
None 1.6 + 0.2 (10)*
11% Fat
300mg/APAP/kg 1.8 + 0.1 (20)*+
Table 4. Mean and Standard Deviation of Liver Weights.
*Indicates significant difference based on two-way ANOVA (p <0.001 for diet,)
followed by a significant difference from 4% fat control based on LSD posthoc test
(p ≤ 0.05).
+ Indicates significant difference (p = 0.026 for diet*treatment interaction) from the
11% fat diet (no APAP) group.
31
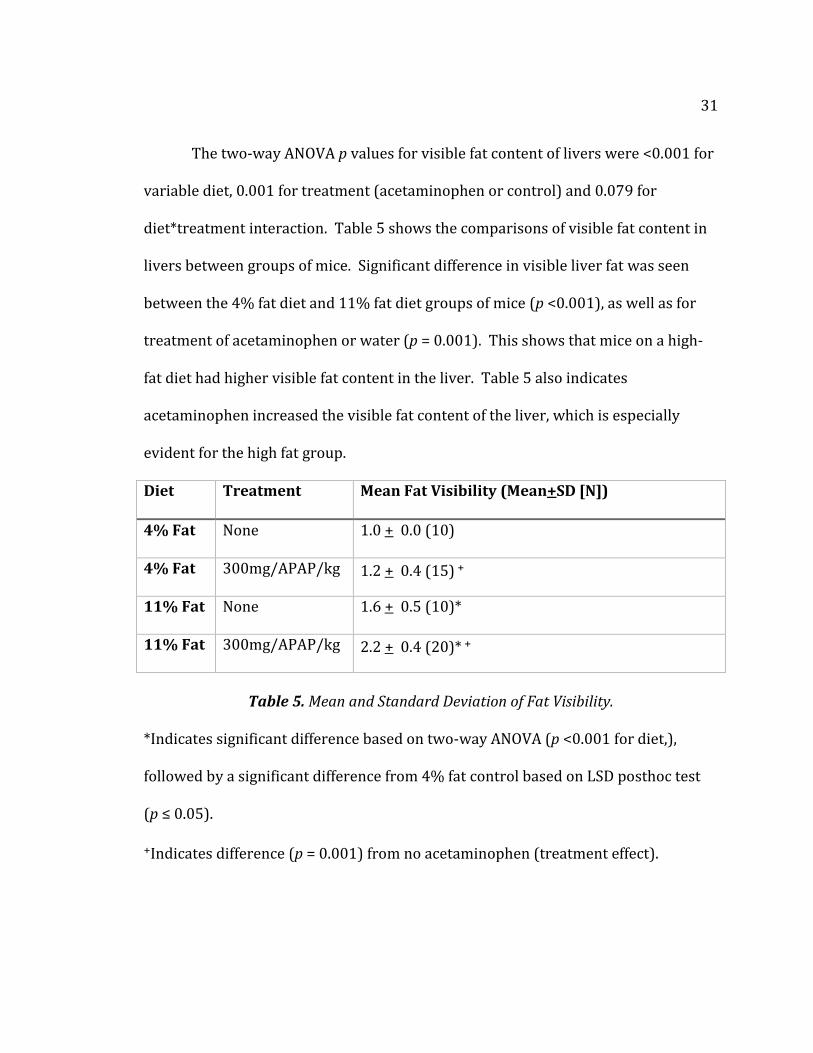
The two-way ANOVA p values for visible fat content of livers were <0.001 for
variable diet, 0.001 for treatment (acetaminophen or control) and 0.079 for
diet*treatment interaction. Table 5 shows the comparisons of visible fat content in
livers between groups of mice. Significant difference in visible liver fat was seen
between the 4% fat diet and 11% fat diet groups of mice (p <0.001), as well as for
treatment of acetaminophen or water (p = 0.001). This shows that mice on a high-
fat diet had higher visible fat content in the liver. Table 5 also indicates
acetaminophen increased the visible fat content of the liver, which is especially
evident for the high fat group.
Diet
Treatment Mean Fat Visibility (Mean+SD [N])
4% Fat
None 1.0 + 0.0 (10)
4% Fat
300mg/APAP/kg 1.2 + 0.4 (15) +
11% Fat
None 1.6 + 0.5 (10)*
11% Fat
300mg/APAP/kg 2.2 + 0.4 (20)* +
Table 5. Mean and Standard Deviation of Fat Visibility.
*Indicates significant difference based on two-way ANOVA (p <0.001 for diet,),
followed by a significant difference from 4% fat control based on LSD posthoc test
(p ≤ 0.05).
+Indicates difference (p = 0.001) from no acetaminophen (treatment effect).
32
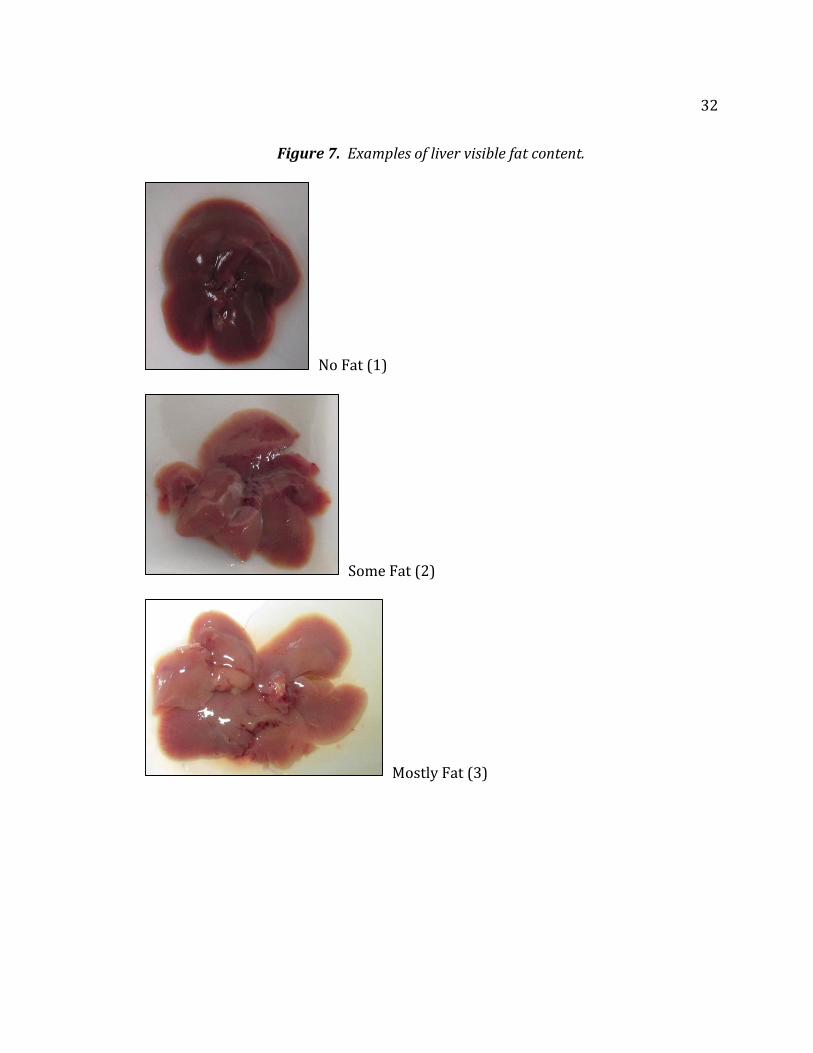
Figure 7. Examples of liver visible fat content.
No Fat (1)
Some Fat (2)
Mostly Fat (3)
33
Least Significant Difference (LSD) Multiple Comparisons—Liver Weight and
Fat Visibility
Significant difference in liver weights was shown between diet groups (p
<0.001) and between diet*treatment groups (p = 0.026). This led to a LSD posthoc
test showing specific differences between diet groups and diet*treatment groups
regarding liver weight.
Significant difference in liver weight was shown between the 4% and 11%
diet groups dosed with water (p <0.001) and between the 4% and 11% diet groups
dosed with acetaminophen (p <0.001). Significant difference in liver weight was
also shown between the 11% diet group dosed with water and the 11% diet group
dosed with acetaminophen (p <0.001). This indicates a difference in liver weight
due to diet as well as diet*treatment with acetaminophen.
Significant difference in visible fat content was shown between diet groups
(p <0.001) and between treatment groups (p = 0.001). This led to a LSD posthoc test
showing specific differences between diet groups and treatment groups regarding
visible fat content. Significant difference in visible fat content was shown between
the 4% and 11% diet groups dosed with water (p = 0.001) and between the 4% and
11% diet groups dosed with acetaminophen (p <0.001).
Significant difference in visible fat content was shown between the 4% group
dosed with water and the 4% group dosed with acetaminophen (p <0.001).
Significant difference was also seen between the 11% group dosed with water and

34
the 11% group dosed with acetaminophen (p <0.001). This indicates a difference in
visible fat content due to diet as well as treatment with water or acetaminophen.
35
Chapter V
DISCUSSION
The primary purpose of this study was to determine the effects of
acetaminophen-induced liver toxicity and obesity-induced liver toxicity. The
hypothesis of this study was: the effects of acetaminophen dosages in the high fat-
fed mice will show greater indications of liver damage than mice on a normal fat-fed
diet. This is because (1) the liver will see a higher dose in the obese mice which will
cause liver damage and (2) the liver cells will become fatty from the high-fat diet
which will also harm the liver. A secondary purpose of this study was to determine
the relationship between diet-induced liver damage and drug-induced liver damage.
The hypothesis was partially accepted due to the significant damage seen on
the high-fat fed mice livers from the GDH activity assay. Damage to liver
mitochondria releases GDH, so that a higher GDH activity level signifies higher levels
of liver damage. Higher levels of GDH activity were seen in the high-fat diet mice
groups.
However, in this study there was no significant difference in GDH activity
levels between treatment groups (water vs. APAP) and diet*treatment groups. This
indicates damage was done to the liver due to high fat diet alone.
Other studies have shown damage to the liver by measuring GDH levels in
the overdose of acetaminophen. McGill and colleagues researched the mechanisms
of acetaminophen toxicity in humans. Their group found biomarker levels of
36
mitochondrial damage (GDH levels and mitochondrial DNA) and nuclear DNA
fragments were increased in plasma levels from APAP-overdose human patients
(2012). McGill and colleagues tested blood samples from 40 patients, 20 with ALT
levels of 1,000 U/l or more (signifying increased APAP toxicity) and 20 with ALT
levels of less than 1,000 U/l (signifying less or none APAP toxicity). They used blood
samples from 6 healthy volunteers as controls. The mean age of their study was 38
years old with the majority of their patients being female. Overall, the average GDH
activity (signifying its release after mitochondrial membrane lysis from necrotic
cells) was increased in the APAP-overdose patients.
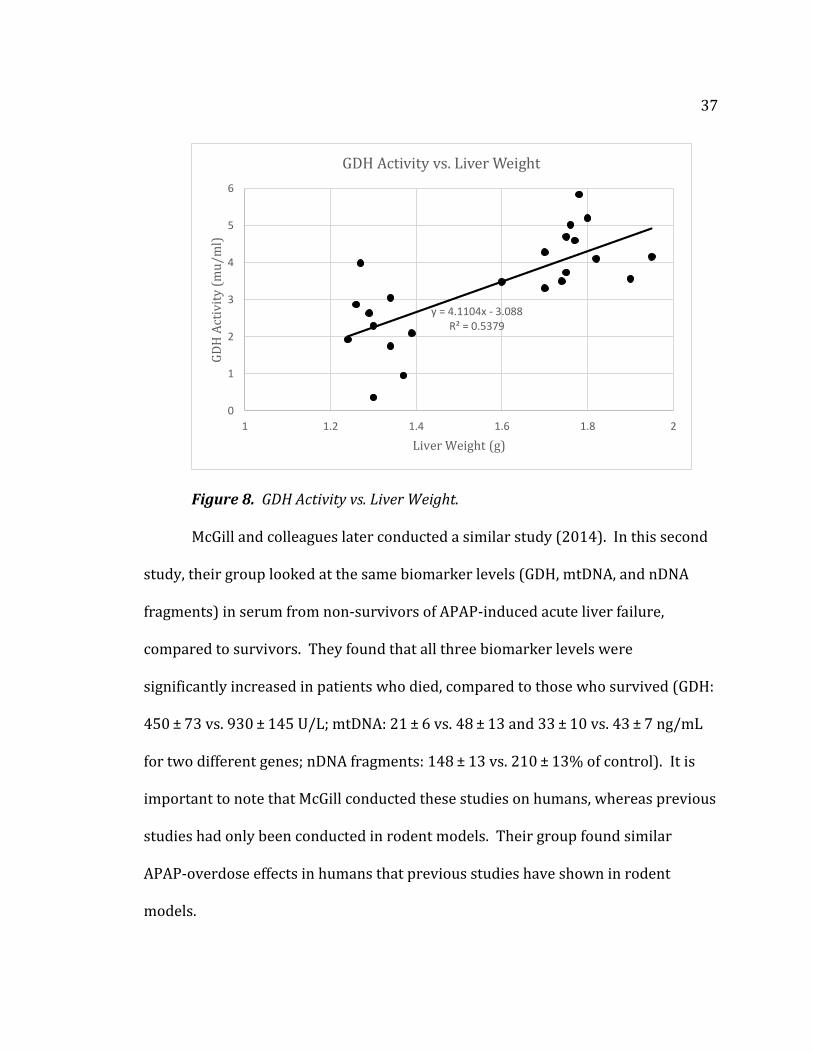
Figure 8 is a scatter plot representation of GDH activity levels plotted versus
liver weights. This shows the general relationship of an increased liver weight
corresponding to an increased GDH activity level. While the GDH activity level is
related primarily to mitochondrial dysfunction, it is interesting to note the
relationship between the two variables.
37
Figure 8. GDH Activity vs. Liver Weight.
McGill and colleagues later conducted a similar study (2014). In this second
study, their group looked at the same biomarker levels (GDH, mtDNA, and nDNA
fragments) in serum from non-survivors of APAP-induced acute liver failure,
compared to survivors. They found that all three biomarker levels were
significantly increased in patients who died, compared to those who survived (GDH:
450 ± 73 vs. 930 ± 145 U/L; mtDNA: 21 ± 6 vs. 48 ± 13 and 33 ± 10 vs. 43 ± 7 ng/mL
for two different genes; nDNA fragments: 148 ± 13 vs. 210 ± 13% of control). It is
important to note that McGill conducted these studies on humans, whereas previous
studies had only been conducted in rodent models. Their group found similar
APAP-overdose effects in humans that previous studies have shown in rodent
models.
y = 4.1104x - 3.088R² = 0.5379
0
1
2
3
4
5
6
1 1.2 1.4 1.6 1.8 2
GD
H A
ctiv
ity
(m
u/m
l)
Liver Weight (g)
GDH Activity vs. Liver Weight
38
The work of McGill and colleagues demonstrated that the mitochondria are
important players in the mechanisms of APAP hepatotoxicity in humans. Serum
GDH, mtDNA, and nDNA fragments will provide useful information in predicting
patient outcome after APAP overdose (2014).
The most surprising result of the present study was the increased GDH
activity seen in the high-fat fed diet control group dosed with water. This implies
that significant damage was done to the liver due to high-fat diet, or obesity, alone.
Other research has looked at the effects of high-fat diet, non-alcoholic fatty liver
disease and acetaminophen overdose.
Nguyen and colleagues researched APAP overdose in patients with non-
alcoholic fatty liver disease, NAFLD (2008). In their study, patients with NAFLD
who were hospitalized with APAP overdose had more than a seven-fold higher
prevalence of liver injury when compared to those patients without NAFLD. In
summary, Nguyen and colleagues found that severe acute liver injury after APAP
overdose was increased with NAFLD and alcoholic liver disease.
Another study done by Myers and Shaheen (2009) analyzed the same
database surrounding APAP overdose in patients with NAFLD, as well as taking into
account differences in overdose circumstances. Their study supported the work
done by Nguyen (2008) in finding increased levels of liver damage from NALFD
patients with APAP overdose.
Acetaminophen overdose is associated with not just liver damage, but also
damage to other organs, including the kidneys. Corcoran and Wong (1987) showed
39
how obesity was an extreme risk factor in increasing liver and kidney damage in the
obese fed rat. They showed how increased obesity was directly associated with
increased toxicity in not only the liver, but also the kidney as well. Further interest
may to investigate acetaminophen’s metabolism in the hepatic-renal function of
obese individuals.
Both studies by Nguyen (2008) and Myers (2009) implied increased liver
damage due to NAFLD in acetaminophen overdose patients. However, it is still
unclear whether obesity enhances the severity of liver damage alone. Mechanisms
involving the extent of liver damage due to obesity should be further studied to
investigate liver damage of APAP-overdose patients due to obesity alone. The
present study would suggest that obesity alone does in fact harm the liver just as
much as damage from by acetaminophen overdose.
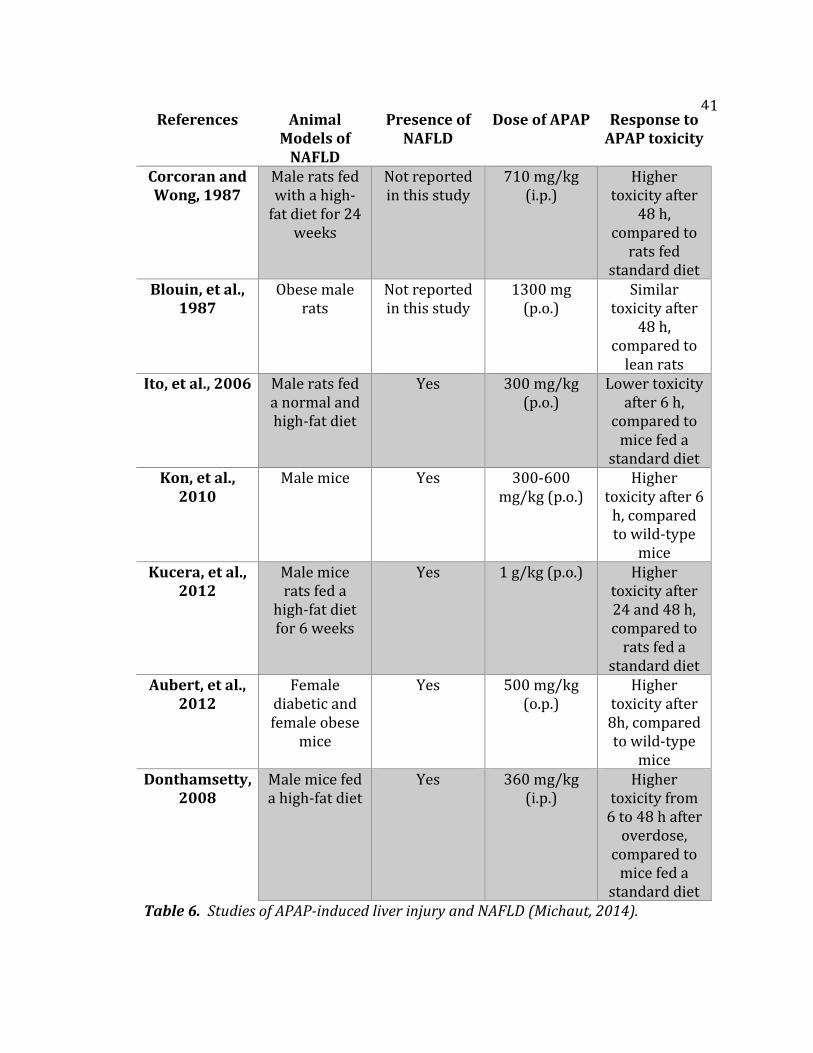
The table on the following page summarizes several studies identifying
APAP-induced acute liver injury in different animal models taking into account
normal diet, high-fat diet, and the presence of NAFLD (Michaut, 2014). Four of the
studies showed that the presence of NAFLD was related with higher liver injury
after a single APAP overdose (Kon, et al., 2010; Kucera et al., 2012; Aubert et al.,
2012; and Donthamsetty, 2008).
These studies showed the presence of NAFLD in obese individuals increased
the risk of APAP-induced liver injury. Two studies showed similar or lower APAP
hepatotoxicity in some rodent models of obesity (Blouin, et al., 1987; Ito, et al.,
2006).
40
It seems that APAP-induced liver injury in an obese individual depends on a
balance between several metabolic factors. These factors can be protective such as
higher APAP glucuronidation and volume of distribution, and lower absorption rate
of NAPQ1. Other metabolic factors can be destructive such as increasing hepatic
production of NAPQ1, or the decrease in detoxification of NAPQ1 by lowering GSH
stores (Michaut, 2014).
Further studies must look at the mechanisms behind obesity-induced liver
toxicity as the present study showed there is significant damage done to the liver by
high-fat diet alone.
41
Table 6. Studies of APAP-induced liver injury and NAFLD (Michaut, 2014).
References Animal Models of
NAFLD
Presence of NAFLD
Dose of APAP Response to APAP toxicity
Corcoran and Wong, 1987
Male rats fed with a high-
fat diet for 24 weeks
Not reported in this study
710 mg/kg (i.p.)
Higher toxicity after
48 h, compared to
rats fed standard diet
Blouin, et al., 1987
Obese male rats
Not reported in this study
1300 mg (p.o.)
Similar toxicity after
48 h, compared to
lean rats Ito, et al., 2006 Male rats fed
a normal and high-fat diet
Yes 300 mg/kg (p.o.)
Lower toxicity after 6 h,
compared to mice fed a
standard diet Kon, et al.,
2010 Male mice Yes 300-600
mg/kg (p.o.) Higher
toxicity after 6 h, compared to wild-type
mice Kucera, et al.,
2012 Male mice rats fed a
high-fat diet for 6 weeks
Yes 1 g/kg (p.o.) Higher toxicity after 24 and 48 h, compared to
rats fed a standard diet
Aubert, et al., 2012
Female diabetic and female obese
mice
Yes 500 mg/kg (o.p.)
Higher toxicity after 8h, compared to wild-type
mice Donthamsetty,
2008 Male mice fed a high-fat diet
Yes 360 mg/kg (i.p.)
Higher toxicity from
6 to 48 h after overdose,
compared to mice fed a
standard diet
42
Studies have shown that weight and fatty liver content correlate to increased
levels of disease in obese individuals (Horvath et al., 2014; Faghihzadeh et al., 2014).
Faghihzadeh and colleagues showed that administering resveratrol decreased liver
weight, serum liver enzymes, inflammatory markers, hepatic steatosis and fibrosis.
The administration of resveratrol, as well as modifying lifestyle and eating habits,
was shown to decrease signs of liver damage including fatty liver (2014). Our
present study suggests that increased liver weight and signs of fat in the liver would
correspond to a higher level of liver disease.
Horvath and colleagues studied how the liver ages in response to obesity.
Their group found specific signs of aging, including liver weight and fat visibility, to
increase the age of the liver leading to liver disease, such as NAFLD, earlier in life.
Their research suggests that liver aging due to obesity alone is accelerated due to
processes occurring in the liver involving oxidative stress and energy metabolism
(2014).
Our present study would confirm that obesity does in fact age the liver by
showing signs of fatty liver (increased weight and visible fat) and leading to further
disease. Horvath and colleagues would propose that oxidative stress and changes in
energy metabolism of liver cells would increase the fat content of the liver (2014).
Acetaminophen overdose is a dangerous problem in developing males and
females. Most studies use male rodent models, where female models may be
overlooked as an important model to use to view how hepatotoxicity and fat toxicity
affects development.
43
The present study showed that high-fat diet alone damages liver
mitochondria shown through the increased levels of GDH in high-fat diet groups.
This may be especially true for female developing bodies. However, the present
study did not show difference in GDH levels, and mitochondria damage, between
acetaminophen-dosed and water-dosed mice groups, as previous research has
shown. Several factors could have been the cause of this discrepancy and would
require further study:
1. The mice were dosed orally (p.o.) and the exact dosage of
acetaminophen may have been altered due to dosing techniques.
2. The mice used in the present study were female. Previous research
has shown that male mice show greater sensitivity to acetaminophen-
induced liver injury than females (Mohar et al., 2014).
The first experiment of measuring GHD levels reflected the effects of high-fat
diet on the mice, and the damage done to liver mitochondria due to fat alone. A
high-fat diet most likely damaged female mice liver mitochondria due to lipid
accumulation and possible inflammatory effects. This study showed that
acetaminophen was less toxic in female mice and was not sufficient in these
experiments to show leakage of GDH.
The second measurement of liver weights indicated that acetaminophen
exacerbated liver hypertrophy in the high fat group only. The damage done to
cytoplasmic structures such as the endoplasmic reticulum, etc. may be responsible
for this effect which is not reflected in the leakage of GDH by the mitochondria.
44
The third measurement of fat accumulation in livers caused by
acetaminophen is likely a damage-induced steatosis and was clearly evident in the
high-fat diet groups. This confirms and augments the liver weight analysis.
In summary, these different measured parameters (GHD, liver weight, visible
fat) signaled different damaging effects in the liver. They all indicated obesity is
very problematic for liver function (significant diet category). The differences in
liver weight indicated additionally that obesity may increase acetaminophen toxicity
(diet*treatment interaction category). The liver fat visibility test indicated that fat
accumulation in the liver increased by abusing acetaminophen (treatment alone
category).
Fat toxicity may be extremely harmful on adolescent female bodies. This
study proved the damaging effects done to the liver due to fat toxicity alone.
Previous research suggests that administering acetaminophen incorrectly (based on
weight or other reasons) would also be toxic to the liver.
Further research may look into the toxicological effects of fat on the female
liver, as well as other organ systems. Since females have a higher percentage body
fat than males, implications to the female reproductive system may also be a point
of examination for future research. In particular, if an individual is overweight and
female, the severity of fat toxicity throughout the body may be largely understudied
and overlooked.
45
Literature Cited
1. Addo, O. Yaw, Miller, Bradley S., Lee, Peter A., Hediger, Mary L., and Himes, John
H. 2014. Age of Hormonal onset of Puberty based on Luteinizing Hormone,
Inhibin B, and Body Composition in Preadolescent U.S. girls. Pediatric Research
Accepted for publication May 30, 2014.
2. Alkhouri, Naim, Eng, Katharien, Lopez, Rocio, and Nobili, Valerio. 2014. Non-
high-density lipoprotein cholesterol (non-HDL-C) levels in children with
nonalcoholic fatty liver disease (NAFLD). Springerplus Published online Aug. 5,
2014.
3. Antoine, D.J., Dear, J.W., and Lewis, P.S. 2013. Mechanistic Biomarkers Provide
Early and Sensitive Detection of Acetaminophen-Induced Acute Liver Injury at
First Presentation to Hospital. Hepatology 58.2: 777-787.
4. Aubert, J., Begrichem K., and Delannoy, M. 2012. Differences in Early
Acetaminophen Hepatotoxicity between Obese ob/ob and db/db Mice.
Pharmacology and Experimental Therapeutics 342.3: 676-87.
5. Ayoub, S. S. 2004. Acetaminophen-induced Hypothermia in Mice is mediated by a
Prostaglandin Endoperoxide Synthase 1 Gene-derived Protein. Proceedings of
the National Academy of Sciences 101.30: 11165-1169.
6. Bajt, M. L., C. Cover, J. J. Lemasters, and Jaeschke, H.. 2006. Nuclear Translocation
of Endonuclease G and Apoptosis-Inducing Factor during Acetaminophen-
Induced Liver Cell Injury. Toxicological Sciences 94.1: 217-25.
46
7. Barshop, N.J., Sirlin, C.B., Schwimmer, J.B., and Lavine, J.E. 2008. Review article:
“Epidemiology, Pathogenesis and Potential Treatments of Pediatric Non-
alcoholic Fatty Liver Disease.” Alimentary Pharmacology and Therapeutics
Journal 28: 13-24.
8. Ben-Shachar, Rotem, and Chen, Yifei. 2012. The Biochemistry of Acetaminophen
Hepatotoxicity and Rescue: A Mathematical Model. Theoretical Biology and
Medical Modelling 9.55.
9. Berlanga, Alba, Guiu-Jurado, Esther, Porras, José Antonio, and Auguet, Teresa.
2014. Molecular pathways in non-alcoholic fatty liver disease. Journal of Clinical
and Experimental Gastroenterology 7:221-239.
10. Blouin, R.A., Dickson, P., and McNamara, P.J. 1987. Phenobarbital induction and
acetaminophen hepatotoxicity: resistance in the obese Zucker rodent. Journal of
Pharmacology and Experimental Therapy 243: 565–570.
11. Botta, D., Shi, S., White, C.C., and Dabrowski, M.J. 2009. Acetaminophen-induced
liver injury is attenuated in male glutamate-cysteine ligase transgenic mice.
Journal of Biological Chemistry 281.39: 28865-28875.
12. Brzeźnicka, E. A., and Piotrowski, J.K. 1989. Dynamics of Glutathione Levels in
Liver and Indicatory Enzymes in Serum in Acetaminophen Intoxication in Mice.
Polish Journal of Occupational Medicine 2.1: 15-22.
13. Casarett, Louis J., John Doull, Curtis D. Klaassen, and Amdur, Mary O. Casarett
and Doull's Toxicology: The Basic Science of Poisons. New York: Macmillan,
1980.
47
14. Corcoran, G.B., Wong, B.K. 1987. Obesity as a risk factor in drug-induced organ
injury: increased liver and kidney damage by acetaminophen in the obese
overfed rat. Journal of Pharmacology and Experimental Therapeutics 241: 921–
927.
15. Day, C.P. and James, O.F. 1998. Steatohepatitis: A Tale of Two “Hits”?
Gastroenterology 114: 842–845.
16. Donthamsetty, S., Bhave, V.S., Mitra, M.S. 2008. Nonalcoholic steatohepatitic
(NASH) mice are protected from higher hepatotoxicity of acetaminophen upon
induction of PPARalpha with clofibrate. Toxicology and Applied Pharmacology
230: 327–337.
17. Duvnjak, Marko, and Lerotic, I. 2007. Pathogenesis and Management Issues for
Nonalcoholic Fatty Liver Disease. World Journal of Gastroenterology 13.34: 4539-
4550.
18. Eaton, S., and Zaitoun, A.M. 1996. Beta-Oxidation in Human Alcoholic and Non-
alcoholic Hepatic Steatosis. Clinical Science 90.4: 307-13.
19. Eren, Erdal. 2009. A Rare Cause of Precocious Puberty: Hepatoblastoma. Journal
of Clinical Resident Pediatric Endocrinology 1.6: 281-283.
20. Farrell, Geoffrey C. and Larter, C.Z. 2006. Nonalcoholic fatty liver disease: From
steatosis to cirrhosis. Hepatology 42: S99-S112.
21. Faghihzadah, F., Adibi, P., and Hekmatdoos, A. 2014. Resveratrol
supplementation improves inflammatory biomarkers in patients with
nonalcoholic fatty liver disease. Nutrition Research. Epub ahead of print.
48
22. Ferguson, D.R., S.K. Synder, and Cameron, A.J. 1977. Hepatotoxicity in
acetaminophen poisoning. Mayo Clinic Proceedings 52: 246-248.
23. Flurkey, K., Currer, J.M., and Harrison, D.E. 2007. “The Mouse in Aging Research.”
In The Mouse in Biomedical Research 2nd Edition. Fox, J.G., et al, editors.
American College Laboratory Animal Medicine (Elsevier), Burlington, MA. pp.
637–672.
24. Horvath, Steve, Wiebke, Erhard, and Brosch, Mario. 2014. Obesity accelerates
epigenetic aging of human liver. Proceedings of the National Academy of Sciences.
Epub ahead of print.
25. Ito Y, Abril E.R., and Bethea, N.W., 2006. Dietary steatotic liver attenuates
acetaminophen hepatotoxicity in mice. Microcirculation13:19-27.
26. Jaeschke, H. 1990. Glutathione Disulfide Formation and Oxidant Stress during
Acetaminophen-induced Hepatotoxicity in Mice in Vivo: The Protective Effect of
Allopurniol. Journal of Theoretical & Experimental Pharmacology 255.3: 935-
41.
27. Jaeschke, Hartmut, and Gores, Gregory J. 2002. Mechanisms of Hepatoxicity.
Toxicological Sciences 65.2: 166-76.
28. Jaeschke, M., M. R. McGill, and Ramachandran, A. 2012. Oxidant Stress,
Mitochondria, and Cell Death Mechanisms in Drug-induced Liver Injury: Lessons
Learned from Acetaminophen Hepatotoxicity. Drug Metabolism Reviews 44.1: 86-
106.

49
29. Ji, C., Dai, Y., Jiang. W., and Liu, J. 2014. Postnatal overfeeding promotes early
onset and exaggeration of high-fat diet-induced nonalcoholic fatty liver disease
through disordered hepatic lipid metabolism in rats. Journal of Nutritional
Biology 14 (Epub ahead of print).
30. Kon, K., Ikejima, K., and Okumura, K. 2010. Diabetic KK-A(y) mice are highly
susceptible to oxidative hepatocellular damage induced by acetaminophen. The
American Journal of Physiology—Gastrointestinal and Liver Physiology 299: G329-
G337.
31. Kon K., Kim J.S., Jaeschke H., and Lemasters, J.J. 2004. Mitochondrial permeability
transition in acetaminophen-induced necrosis and apoptosis of cultured mouse
hepatocytes. Hepatology 40:1170–1179.
32. Kucera, O., Rousar, T., Stankova, P. 2012. Susceptibility of rat non-alcoholic fatty
liver to the acute toxic effect of acetaminophen. Journal of Gastronenterology and
Hepatology 27: 323-330.
33. Lai, Hao, Xiao, Jia, Yu, Quixiao, and Zhang, Chenglu. 2014. High-fat Diet Induces
Significant Metabolic Disorders in a Mouse Model of Polycystic Ovary Syndrome.
Biology of Reproduction Published on August 6, 2014.
34. Lee, William M. 2004. Acetaminophen and the U.S. Acute Liver Failure Study
Group: Lowering the Risks of Hepatic Failure. Hepatology 40.1: 6-9.
35. Marshall, William J., and Bangert, S.K. Clinical Biochemistry: Metabolic and
Clinical Aspects. New York: Churchill Livingstone, 1995.
50
36. McConnachie, LA, Mohar, I, and Hudson, F.N. 2007. Glutamate cysteine ligase
modifier subunit deficiency and gender as determinants of acetaminophen-
induced hepatotoxicity in mice. Toxicology Science 99.2: 628-636.
37. McGill, Mitchell R., Matthew R. Sharpe, and Williams, C. David. 2012. The
Mechanism Underlying Acetaminophen-induced Hepatotoxicity in Humans and
Mice Involves Mitochondrial Damage and Nuclear DNA Fragmentation. Journal of
Clinical Investigations 122.4 (2012): 1574-583.
38. Michaut, A. and Moreau, C. 2014. Acetaminophen-induced Liver Injury in Obesity
and Nonalcoholic Fatty Liver Disease. Liver International e171-e179.
39. Mohar, Isaac, Stamper, Brendan, and Rademacher, P.M. 2014. Acetaminophen-
induced liver damage in mice is associated with gender-specific adduction of
peroxiredoxin-6. Redox Biology 2:377-387.
40. Myers, R.P., Shaheen, A.A., Li, B, Dean, S., and Quan, H. 2008. Impact of Liver
Disease, Alcohol Abuse, and Unintentional Ingestion on the Outcomes of
Acetaminophen Overdose. Clinical Gastroenterology and Hepatology 6.8: 918-
925.
41. Myers, R.P., Shaheen, A.A. 2009. Hepatitis C alcohol abuse, and unintentional
overdoses are risk factors for acetaminophen-related hepatotoxicity. Hepatology
49: 1399–13400.
51
42. National Center for Health Statistics. “Health, United States, 2010: With Special
Features on Death and Dying.” Hyattsville, MD; U.S. Department of Health and
Human Services.
43. Nesseler, Nicolas, and Launey, Yoann. 2012. Clinical Review: The Liver in Sepsis.
Critical Care 16.235.
44. Nguyen, G.C., Sam J., and Thuluvath, P.J. 2008. Hepatitis C is a predictor of acute
liver injury among hospitalizations for acetaminophen overdose in the United
States: a nationwide analysis. Hepatology 48: 1336-1341.
45. Ogden, C. L., Carroll, M. D., Curtin, L. R., Lamb, M. M., and Flegal, K. M. 2010.
Prevalence of High Body Mass Index in US Children and Adolescents, 2007-2008.
JAMA: The Journal of the American Medical Association 303.3: 242-49.
46. Ozturk, Yesim. 2014. Fatty Liver in Childhood. World Journal of Hepatology 6.1:
33-40.
47. Parsian, Hadi. 2011. Comparison of Five Liver Fibrosis Indexes with Serum
Levels of Laminin and N Terminal Peptide of Procollagen Type III in Chronic
Hepatitis Patients. In Pathology, “Liver Bioposy.” Takahashi, Hirokazu, editor.
Medicine. 6 September 2011.
48. Placke, M.E., Ginsbery, G.L., and Wyand, D.S. 1987. Ultrastructural Changes
during Acute Acetaminophen-induced Hepatotoxicity in the Mouse: A Time and
Dose Study. Toxicology Pathology 15.4: 431-38.
49. Rao, M.S. and Reddy, J.K. 2004. PPARα in the Pathogenesis of Fatty Liver Disease.
Hepatology 40: 783–786.
52
50. Reddy, Janardan K. 2006. Lipid Metabolism and Liver Inflammation. Fatty Liver
Disease and Fatty Acid Oxidation. American Journal of Physiology –
Gastrointestinal and Liver Physiology 290: G852-G858.
51. Russmann, Stefan, Kullak-Ublick, Gerd A, and Grattagliano, Ignazio. 2009.
Current Concepts of Mechanisms in Drug-Induced Hepatotoxicity. Current
Medicinal Chemistry 16.23: 3041-053.
52. Schwimmer, J.B., Deutsch, R., Kahen, T., Lavine, J.E., Stanley, C., and Behling, C.
2006. Prevalence of fatty liver in children and adolescents. Pediatrics 118.13:
1388-1393.
53. Shayiq, Rass M., Roberts, Dean W., Rothstein, Kenneth, Snawder, John E., Benson,
Wayne, and Ma, Xiang. 1999. Repeat Exposure to Incremental Doses of
Acetaminophen Provides Protection against Acetaminophen-induced Lethality in
Mice: An Explanation for High Acetaminophen Dosage in Humans without
Hepatic Injury. Hepatology 29.2: 451-63.
54. Shivbalan, S., Sathiyasekeran, M., Thomas, K. 2010 Therapeutic Misadventure
with Paracetamol in Children. Indian Journal of Pharmacology 42:6: 412-415.
55. Sudheer, K.M. and King, A.L. 2008. Mitochondrial Dysfunction and Oxidative
Stress in the Pathogenesis of Alcohol and Obesity Induced Fatty Liver Diseases.
Free Radical Biology and Medicine 44.4: 1259-1272.
56. "Tylenol.com - Children's Dosage Guide | Tylenol." 2013. Tylenol.com -
Children's Dosage Guide | Tylenol. McNeil Consumer Healthcare Division. Web.
09 Mar. 2013.
53
57. Vandewalle, S., Taes, Y., Van Helvoirt, M., and P. Debode. 2014. Sex steroids in
relation to sexual and skeletal maturation in obese male adolescents. Journal of
Clinical Endocrinology and Metabolism 99.8: 2977-2985.
58. Vannucci, A., Tanofsky-Kraff, M., and Ranzenhofer, L.M. 2014. Puberty and the
manifestations of loss of control eating in children and adolescents. International
Journal of Eating Disorders Published online May 30, 2014.
59. Wagner, I. V., Sabin, M. A., and Pfaffle, R. W. 2012. Effects of Obesity on
Human Sexual Development. Nature Reviews Endocrinology 8.4: 246-54.
60. Zhang, Qin, Kiyoshi Itagaki, and Carl J. Hauser. 2010. Mitochondrial DNA is
released by shock and activates neutrophils via p38 map-kinase. Shock 34:53-59.
61. Zimmerman, H. 1995. Acetaminophen (paracetamol) Hepatotoxicity with
Regular Intake of Alcohol: Analysis of Instances of Therapeutic Misadventure.
Hepatology 22.3: 767-73.