high energy positrons and the wmap haze from exciting dark matter
TRANSCRIPT
arX
iv:0
802.
2922
v2 [
astr
o-ph
] 2
8 Ju
l 200
8
High Energy Positrons and the WMAP Haze from Exciting Dark Matter
Ilias Cholis,1, ∗ Lisa Goodenough,1, † and Neal Weiner1, ‡
1Center for Cosmology and Particle Physics, Department of Physics, New York University, New York, NY 10003(Dated: July 28, 2008)
We consider the signals of positrons and electrons from “exciting” dark matter (XDM) annihi-
lation. Because of the light (mφ<∼ 1 GeV) force carrier φ into which the dark matter states can
annihilate, the electrons and positrons are generally very boosted, yielding a hard spectrum, inaddition to the low energy positrons needed for INTEGRAL observations of the galactic center. Weconsider the relevance of this scenario for HEAT, PAMELA and the WMAP “haze,” focusing on
light (mφ<∼ 2mπ) φ bosons, and find that significant signals can be found for all three, although
significant signals generally require high dark matter densities. We find that measurements of thepositron fraction are generally insensitive to the halo model, but do suffer significant astrophysicaluncertainties. We discuss the implications for upcoming PAMELA results.
I. INTRODUCTION
An overwhelming amount of evidence has established cold dark matter (CDM) as the standard paradigm for themissing matter of the universe. Beginning with early observations of velocity dispersions of galaxies in clusters [1], andlater measurements of galactic rotation curves [2, 3], CDM has been supported by numerous additional observations.These include strong lensing of background galaxies [4], x-ray emission from galaxy clusters [5], the combination ofCMB and type Ia supernovae data [6], measurements of the distributions of galaxies [7, 8], as well as the highlyremarkable recent study of the bullet cluster [9].
The nature of this dark matter remains an open question. Measurements of the CMB, the need for early structuregrowth, and the success of big-bang nucleosynthesis rule out baryonic matter as being the dark matter, necessitatinga new particle beyond the standard model. One of the most appealing of these is the thermal WIMP, whose relicabundance has a simple relation with the annihilation cross section. Specifically, for thermal s-wave freezeout, onehas [10]
Ωh2 = 0.1 ×
(
2.5 × 10⁻²⁶ cm3s−1
〈σann |v|〉
)
f(m) (1)
where f(m) is a logarithmically varying function of mass, with f(500 GeV) = 1. Because 〈σann |v|〉 = 2.5 ×10⁻²⁶ cm3s−1 is a cross section appropriate for a weak scale particle, a scale already suggested by the hierarchyproblem, we have strong motivation to consider a WIMP with a mass in the range of a few hundred GeV.
A. Indirect Detection of Dark Matter
Indirect detection involves observing either the annihilation products of dark matter or the decay products ofunstable states. These products include positrons, photons, anti-protons, neutrinos, and anti-nuclei. Searches areoften made for the anti-particles, because their astrophysical backgrounds tend to be smaller than those of particles.Though the DM annihilation cross-sections are generally small, if the density of dark matter particles is large, asis believed to be the case in the center of the Galaxy, then the annihilation rate can be large enough to produceobservable effects. Currently experiments are underway to detect neutrinos (AMANDA [11], IceCube [12]) fromannihilation of dark matter captured in the Earth and Sun, and to detect anti-particles (PAMELA [13]) and photons(GLAST [14], HESS [15], INTEGRAL [16]) from dark matter annihilation in the Galactic halo.
In many theories of SUSY dark matter, the dark matter particles are Majorana fermions that annihilate throughprocesses such as χχ −→ f f . Annihilations to heavy fermions are favored over those to the light fermions, becausethe cross-section is proportional to m2
f . Therefore, the e+ and e− spectra are generally soft. This can make the DM
∗Electronic address: [email protected]†Electronic address: [email protected]‡Electronic address: [email protected]

2
signal difficult to detect, as the Galactic background spectra for electrons and positrons are largest at low energiesand are currently not precisely understood. For this reason, a theory of dark matter that produces a hard spectrumis perhaps the best chance for an observable indirect detection signal from electron and positrons.
Recently, a number of different experiments have made measurements which are consistent with excesses in positronsand/or electrons that may be indicative of a dark matter signal. Two of these (HEAT and the WMAP haze) areindicative of high energy particles, whereas the results of INTEGRAL/SPI are indicative of low energy particles.
In this paper, we will explore the possibility that a single source can produce all of these signals, specifically the“exciting dark matter” (XDM) proposal. We will focus on the cases most favorable for achieving high energy positronsignals, in which the annihilation products of the WIMP are lighter than about 250 MeV, and decay either into µ+µ−
or e+e− pairs. In the next section, we will review the evidence for excess electronic activity which may arise fromdark matter. We then will describe the XDM scenario, and how it produces large quantities of high energy electronsand positrons. We describe the calculation of observable positron fraction and synchrotron signals in section IV. Insection V we present our results. We find the XDM can easily explain both the HEAT excess as well as the WMAPhaze, although significant signals tend to require large densities of dark matter. We find a wide range of spectrathat may be found at PAMELA, including very hard positron spectra arising from the highly boosted annihilationproducts of XDM. Finally, in section VI, we conclude.
II. SIGNALS FROM POSITRONS AND ELECTRONS
Positrons and electrons are the products of dark matter annihilation in numerous theories of WIMP dark matter,so their careful study could prove fruitful in the quest to understand the nature of dark matter. The existence ofelectrons and positrons can be observed directly through a measurement of their particle fluxes, or indirectly throughthe measurement of their associated radiation, including γ-rays resulting from their annihilation and synchrotronradiation.
1. Direct Measurement of e+ and e− Spectra
Direct measurements of e+ and e− spectra have been done in several balloon-borne cosmic ray experiments, mostrecently in HEAT2000 and CAPRICE98 [17]. PAMELA, a satellite experiment, is currently taking data. (Note: Manyexperiments state their results for the ratio e+/(e+ + e−), the positron fraction, to eliminate some systematic errorsin the measurements of the individual fluxes.) Cosmic ray electrons and positrons are of two varieties: “primary”particles created by astrophysical sources, and “secondary particles” produced through the interactions of primarieswith gas in the interstellar medium (ISM). Above 100 MeV the primary positron flux due to standard astrophysicalsources is thought to be negligible [18], while the secondary flux behaves like an inverse power law. Therefore, thepositron background signal is small at large energies, which makes the positron signal a promising candidate forobserving new physics.
For instance, the balloon-borne HEAT (High-Energy Antimatter Telescope) experiment flew twice in the mid-1990’s,and measured the individual and combined energy spectra of electrons and positrons [19]. From these measurementsthe positron fraction was determined for the energy range from 1 to 50 GeV. The HEAT results suggest that forenergies larger than 10 GeV an excess in the positron flux above that expected from pure secondary productioncannot be ruled out [19]. There may exist sources that give rise to primary positrons with energies above 10 GeV.Additionally, there appears to be some structure in the positron fraction above 7 GeV that a pure secondary spectrumcannot explain [20].
An important experiment which will clarify the results of HEAT is PAMELA. The Payload for Antimatter MatterExploration and Light-nuclei Astrophysics experiment is a satellite-borne apparatus launched in 2006 that is currentlymeasuring the energy spectra of many cosmic ray particle species, including electrons, positrons, protons, anti-protons,and light nuclei. One of the stated primary objectives of the experiment is to search for evidence of annihilationsof dark matter particles by measuring the electron and positron energy spectra in the energy range from 50 MeV to270 GeV [13]. PAMELA will extend the measurement of the positron fraction out to an energy almost an order ofmagnitude larger than that achieved by the HEAT experiment. Additionally, the PAMELA results will be based onvery high statistics, approximately 105 e+ per year [13]. Initial high energy results from the PAMELA experimentare expected soon.

3
2. High Energy Positron and Electron Signals in Synchrotron Radiation
In addition to directly detecting the cosmic ray positrons, one can detect γ-rays coming from electron-positronannihilation and synchrotron radiation coming from electrons and positrons propagating through the galactic magneticfield. An excess of either of these radiation signals could indicate the existence of dark matter annihilations. Theformer is generally a measure of stopped or low energy positrons, while the latter is a measure of higher energy(multi-GeV) positrons and electrons.
Let us begin by considering the possibility of synchrotron radiation. The Wilkinson Microwave Anisotropy Probe(WMAP), launched in 2001, measured the microwave emission at five frequencies, 22.5, 32.7, 40.6, 60.7, and 93.1GHz, over the full sky. Multiple frequency measurements were necessary to separate Galactic foreground signals, eachwith a unique spectrum and spatial distribution, from the Cosmic Microwave Background (CMB) signal.
Using the one-year data from WMAP released in 2003, Finkbeiner identified the microwave emission due to the threewell-understood Galactic signals, thermal radiation from dust, free-free (bremsstrahlung) radiation, and synchrotronradiation from high-energy electrons (accelerated by supernovae shocks) spiraling in the Galactic magnetic field, andadditional emission due to spinning dust [21]. His analysis indicated that there is excess emission, not correlatedwith any of the known Galactic foregrounds, that is distributed with approximate radial symmetry within ∼ 20
of the Galactic center and that decreases rapidly with projected distance from the Galactic center. He called thisexcess microwave emission the “haze” and argued that it is consistent with synchrotron emission from high-energyelectrons and positrons created in the center of the Galaxy [22]. One explanation for the presence of these electronsand positrons in the inner Galaxy is that they are produced by annihilating dark matter [22, 23].
3. INTEGRAL/SPI
The strongest gamma-ray line signal from our galaxy comes from electron-positron annihilation [24]. The SPIimaging spectrometer aboard ESA’s INTernational Gamma-Ray Astrophysics Laboratory (INTEGRAL) gamma-raysatellite observatory has measured the 511 keV line coming from direct annihilation of e+e− pairs and decay ofpara-positronium, as well as the continuum spectrum from the 3-photon decay of ortho-positronium. Both signalsare strongest within a few degrees of the Galactic center, indicating that this region has the largest concentrationof electron-positron annihilation [24]. The 511 keV emission from the bulge has ellipsoidal symmetry about theGalactic center with an angular extension of 6.5+1.1
−0.9 (FWHM) in longitude and 5.1+0.8−0.8 (FWHM) in latitude [24].
The flux from the bulge at 511 keV is (7.04 ± 0.32) × 10−4 ph cm−2 s−1, while the emission from the disk is(1.41 ± 0.17) × 10−3 ph cm−2 s−1 [24].
It is presently a great challenge for conventional astrophysical sources, such as cosmic ray interactions with theISM, neutron stars, black holes, supernovae, low mass x-ray binaries, and pulsars, to explain the INTEGRAL signal,although, with myriad uncertainties, they may prove to be responsible. Recently, it was noted that the disk componentof positron emission, in particular, was likely due in large part to LMXBs [25], although it is still uncertain whethersuch objects can provide a significant piece of the bulge emission.
A very appealing possibility is that the excess arises in some fashion from dark matter. However, such explanationsare challenging, because the INTEGRAL signal is inconsistent with injected positrons at energies much higher thana few MeV [26, 27, 28]. As such, we cannot simply identify these positrons with annihilation products of weak-scaledark matter.
III. EXCITING DARK MATTER (XDM)
Theories of “light” dark matter, for example scalar dark matter [29, 30, 31], with masses in the MeV range well belowthe weak scale, as well as decaying dark matter scenarios [32, 33], have been proposed to explain the INTEGRAL signal.However, these theories are ad hoc to some degree from a particle physics perspective. An alternative explanationfor the INTEGRAL signal with a weak scale dark matter particle arises in the scenario of “exciting” dark matter(XDM) [34]. XDM proposes that the electron-positron pairs needed to explain the INTEGRAL signal are created inthe decay of an excited state of WIMP dark matter. The theory contains a weak scale dark matter particle χ withan excited state χ∗ that has an energy at least 2me above that of the ground state. The coupling of the pseudo-Diracdark matter particle to standard model particles is through a light scalar particle φ, mφ ∼ .1− 1 GeV, which couplesto the Higgs. The decay of the excited state into the ground state can result in the emission of an e+e− pair.
The energy needed for the excitation process comes from the kinetic energy of the WIMPs; a 500 GeV particlewith a speed of 500 km/s has a kinetic energy greater than me. XDM can account for the creation of 3 × 1042 e+e−
pairs per second in the Galactic bulge, enough to explain the INTEGRAL γ-ray signal. Although the model requires

4
large scattering cross sections, and cuspy halos, it is an intriguing suggestion that allows one to generate low energypositrons from weak-scale dark matter particles. Beyond particles produced from excitation and subsequent decayof WIMPs, additional signals of XDM arise through annihilation of χ into φ, which proceeds through the processesshown in Fig. 1.
χ
χ
χ φ
φ
φ
χ
χ φ
φ
FIG. 1: Diagrams contributing to annihilation of χ.
Since present-day dark matter is moving very slowly (β ∼ 10−3), only s-wave processes are relevant for indirectdetection in the halo (at least for thermal dark matter). Since we are motivated by possible existing signals, it isimportant to consider whether XDM can produce models with significant s-wave annihilations. This is not a trivialpoint. Although XDM functions as a Dirac fermion at freezeout, where the splitting between χ and χ∗ is small,in the present universe, by assumption, only χ is present. This is a Majorana fermion, and thus to annihilate vias-wave, must be put into a state with CP = -1 (see the discussion in [35]). As a consequence, Majorana XDM cannotannihilate into two identical real φ particles. However, relatively minor modifications can allow this annihilation toproceed via s-wave. In particular, we can allow O(1) CP violation in the dark matter sector, or we can promote φto a complex scalar. In models of XDM where the dark matter is a Dirac fermion with an excited state (in analogywith hadrons), no such modifications are necessary. In any event, the modifications to the model in [34] needed togenerate s-wave annihilations are small, so the resulting differences in the signals in question are small.
Since mχ ≫ mφ, the φ particles come out boosted by a factor of γ =mχ
mφ. The φs can then decay into SM particles
through their mixing with the Higgs. For mφ < 2me, φ can only decay into two photons. For 2me < mφ < 2mµ, thedecay can proceed through two channels, φ −→ γγ and φ −→ e−e+. The decay of φ to two γs is due to one loopspin-0, spin-1/2 and spin-1 contributions. These almost cancel giving a branching ratio (B.R.) for φ −→ γγ of at most14% in that energy region [36]. In the energy range 2mµ < mφ < 2mπ0 , the channel φ −→ µ−µ+ becomes relevant,and since the branching ratio of φ to f f goes as m2
f , the decay φ −→ µ−µ+ completely dominates over φ −→ e−e+.
In this energy range the decay of φ into 2 photons is negligible [36]. Above the threshold energy 2mπ0 , the channel toneutral pions is opened. For φ masses above 2mπ± , it has been shown that the B.R.s for the processes φ −→ π−π+
and φ −→ 2π0 cannot be ignored [37, 38, 39]. For a 1 GeV φ the B.R. for φ −→ µ−µ+ is ≈ 20% [36] while for thedecays to πs it is ≈ 40%. For mφ > 1 GeV decay channels to heavier mesons appear. The work presented in thispaper investigates the mass range 2me < mφ < 2mπ. We leave other mass ranges for future work.
We considered two distinct cases for the mass of mφ: mφ = 0.1 GeV, for which the B.R. for φ −→ e−e+ is ∼= 90%,and mφ = 0.25 GeV, for which the B.R. for decay to µ+ and µ− is ∼= 100%. In both scenarios, the resulting spectra forthe electrons and positrons are much harder than typical e+e− spectra coming from weak scale WIMP annihilation.The positron fraction has a characteristic bump that starts around 6 GeV. (The precise location of the peak dependson the masses of χ and φ.) There is evidence for additional structure around this energy in the HEAT measurementsof the positron fraction; XDM provides an explanation for this. The presence of additional high energy e+e− pairsfrom XDM annihilation in the center of the Galaxy would give rise to additional synchrotron radiation as they spiralthrough the Galactic magnetic field. In this way XDM provides an explanation for the excess microwave emission,the “haze” [22], observed by WMAP.
IV. CALCULATIONS
We have calculated the local positron fraction e+/(e+ + e−) up to energies of 1 TeV and the local synchrotronradiation due to dark matter for the haze frequencies, 22.5, 32.7, 40.6, 60.7, and 93.1 GHz, using GALPROP [40]

5
version 50p [72]. The ratio calculation requires knowledge of the local primary and secondary positron and electronspectra, as well as the contributions to both local spectra from dark matter particle annihilations. The contribution tothe positron fraction from XDM annihilation is significant only for energies above ∼5 GeV, so our starting assumptionis that the background fraction should fit well the HEAT data at energies below ∼5 GeV. We calculated our backgroundratio in agreement with the first five HEAT data points and required the total positron fraction to fit well all nineHEAT data points. In light of prelimary PAMELA data on positrons below 10 GeV, we also fit to those, as well.We predict the results of the PAMELA experiment for the positron fraction in the XDM scenario. Additionally, wecompare our calculation of the XDM synchrotron radiation to the “haze”.
A. The Injection Spectra for e+ e− Arising from DM Annihilation
The annihilation process for XDM is through the intermediate φ particle. The φ mixes with the Higgs allowing itto decay into the final state fermions. We consider two scenarios. The first is the “direct” decay channel, in whichthe annihilation proceeds directly into e+ e− pairs, which occurs for mφ < 2mµ. For 2mµ
<∼ mφ
<∼ 2mπ0 we have the
“muon” decay channel, where φ decays to muons, which in turn produce electrons and positrons. Higher mass φ candecay into pions, kaons, and other hadrons. We defer the analysis of these scenarios to a future paper. For the directchannel, the injection spectrum is flat (see Fig. 2(a)), while for the muon channel it is somewhat softer (see Fig. 2(b)).We give the details and formulae in Appendix A.
0
0.005
0.01
0.015
0.02
0 100 200 300 400 500
dP/d
E
Energy (GeV)
Injection Spectrummφ = .1 GeV
mχ= 50 GeV
mχ= 250 GeV
mχ= 500 GeV
(a)Direct decay channel
0
0.005
0.01
0.015
0.02
0 100 200 300 400 500
dP/d
E
Energy (GeV)
Injection Spectrummφ = .25 GeV
mχ= 50 GeV
mχ= 250 GeV
mχ= 500 GeV
(b)Muon decay channel
FIG. 2: Injection spectra of positrons.
It is important to note that these light particles produce few γ-rays directly, and are kinematically incapable ofproducing anti-protons, which are a strong constraint on these models. The absence of indications of anti-protonexcesses may be indicative of such a light mediator producing a positron signal.
The GALPROP code of Moskalenko and Strong calculates cosmic ray propagation through the Galaxy by solvingthe propagation equation numerically on a grid [40]. The spatial dynamics include diffusion resulting from cosmic raysscattering on MHD waves, and convection on Galactic winds [41]. In momentum space, diffusive re-acceleration, theresult of stochastic acceleration due to scattering on MHD waves, and energy loss from ionization, bremsstrahlung,inverse Compton scattering and synchrotron radiation are included [40, 41]. Using the most recent measurements ofthe source abundances for the primary species (nuclei, electrons and γ-rays), GALPROP propagates the primariesthrough the Galaxy, then iteratively computes the resulting spallation source functions for all species, and propagatesthe equivalent full, primary + secondary, source function for each species until a converging result is obtained [42].GALPROP assumes free escape of the particles as the spatial boundary condition [43]. For our calculations, we useda 2-dimensional spatial grid (and a one dimensional energy grid), and assumed cylindrical symmetry as well as mirrorsymmetry with respect to the Galactic plane.
Through the galdef file, the parameter input file, the code allows for considerable freedom in the choice of manyastrophysical parameters, including the primary electron injection spectrum, the diffusion coefficient, and the strengthof re-acceleration. We used the “conventional” model of CR production and propagation as used by Abdo et al. [44]as the starting point for our choice of parameters. The conventional model calculates the local proton and electron

6
TABLE I: Parameters of the primary electron spectrum for fits to HEAT
vA Injection Index Break Rigidity Electron Flux Norm.(km/s) Below Break Rigidity (MV) (cm−2sr−1s−1MeV−1)
0 1.60 4.0 × 10³ 0.2488 × 10⁻⁹
20 2.10 6.0 × 10³ 0.2612 × 10⁻⁹
35 2.15 4.0 × 10³ 0.2887 × 10⁻⁹
spectra in agreement with the locally measured values [45]. For a given choice of Alfven velocity, we varied only fourphysical parameters to fit the low energy HEAT data, specifically, the energy of the break in the primary electronspectrum (Break Rigidity), the injection index below and above the break, and the overall flux normalization (seeTable I). We also vary one calculational parameter, the energy grid spacing, in our calculations of the positronfraction.
B. Dark Matter Density Functions (Halo Profiles)
In order to understand the dependence of the signals upon halo models, we performed our calculations using threedifferent halo profiles:
ρ(r) = ρ0
rc
r
1
(1 + rrc
)2N.F.W. Profile [46]
ρ(r) = ρ0
r2c + R2
⊙
r2c + r2
Isothermal Profile [40]
ρ(r) = ρ0 exp[−2
α(rα − Rα
⊙
rα−2
)] Merritt Profile [47].
Here R⊙ = 8.5 kpc is the solar distance from the Galactic center, r2 = R2 + z2 is the spherical radial coordinate,.13 ≤ α ≤ .22 [73] is the Merritt parameter which defines the cuspiness of the profile, and r−2 = 25 kpc is the radiusat which the logarithmic slope of the Merritt profile is -2. rc is the core radius and ρ0 is the local value of the darkmatter mass density. The values of these parameters for the three profiles are listed in Table II. See Fig. 3 for acomparison of these three DM density profiles. We limited ourselves to these three halo models, which arise undervarious assumptions and circumstances, and did not consider theoretically unmotivated profiles, such as a flat haloprofile. The Merritt profile, being the cuspiest, is generally the best for generating the INTEGRAL signal from XDM.The isothermal profile provides a theoretical simplification, which is often employed for analyzing, for example, directdetection limits.
TABLE II: Parameters of the dark matter density profiles
Model rc (kpc)N.F.W. 20.0Isothermal 2.8Merritt 25.0
C. The Electron and Positron Backgrounds
The background positron fraction is given by
e+secondary
e+secondary + e−primary + e−secondary
.

7
0
2
4
6
8
10
1 2 3 4 5 6 7 8 9D
ark
Mat
ter
Den
sity
(G
eV c
m-3
)
Radial Distance from GC (kpc)
NFW
Isothermal
Merritt (α = 0.17)
FIG. 3: Dark Matter density profiles.
The primary positron spectrum is taken to be zero, as it is negligible in comparison with the secondary spectrum.The sources of the primary e− spectrum are believed to include supernovae remnants and pulsars, though their exactnature is unclear. Additionally, there is uncertainty in the primary e− spectrum itself, particularly at energies below10 GeV, where the effect of solar modulation is to attenuate the spectrum at lower energies. However, it is generallyagreed that for the energy range of interest to us, 1 GeV to 1 TeV, the spectrum is well described by a power lawE−α with an index α that increases at higher energies. The GALPROP code provides the freedom to modify theprimary electron injection spectrum. Inputs into GALPROP include constant values of α in three energy regions, thetwo energies defining these regions, the normalization of the electron flux, and the energy at which this normalizationholds.
Secondary positrons and electrons are created in the interactions of primary CR protons and Helium as theypropagate through the Galaxy. p-p and p-He collisions result in charged pions and kaons, which give rise to electronsand positrons through the decays K± → π± + π0, K± → µ± + νµ, π± → µ± + νµ, and µ± → e± + νµ + νe. Thesecondary positron and electron spectra are equal to one another by CP invariance of weak decays [48].
We used a standard least-squares fit of the calculated background ratio to the first five HEAT data points. Thebackgrounds are shown in Fig. 4. It is clear from the figure that the backgrounds are very sensitive to the choice ofparameters for the primary electron spectrum. In spite of the differences in the backgrounds, as we show later, thereare common features in the total positron fraction. As a consistency check on our backgrounds, we calculated theresulting local H and He fluxes and compared them to the measured fluxes at the top of the atmosphere [49, 50, 51].We had good agreement for both spectra for energies above a few hundred MeV. It is important to note that differencesin the low energy background carry over to high energies, and thus lead to differences in the positron fraction at highenergies.
D. The Positron Fraction
We calculated the total positron fraction [74] for each of the three backgrounds, vA = 0, 20, and 35 km/sec,varying the following parameters as described: five dark matter halo profiles, N.F.W., Isothermal, Merritt(α = 0.13),Merritt(α = 0.17), and Merritt(α = 0.22); five DM masses, mχ= 50, 100, 250, 500, and 800 GeV; and two decaychannels, direct and muon, corresponding to mφ = .1 and .25 GeV, respectively. We fit the total fraction to all ninepoints of the HEAT data using a least squares fitting routine with the annihilation cross-section as the fit parameter.As stated previously, a value of the thermally averaged annihilation cross-section 〈σann |v|〉 that gives the correct DMrelic abundance is roughly 2.5 × 10⁻²⁶ cm2s−1. However, because the physical signal, in particular for high energypositrons, is dominated by the local density, we quote our results in terms of the physically relevant parameter
⟨
ρ2σv⟩
.
Inhomogeneities in the dark matter density can lead to additional “boost” factors, b =⟨
ρ2⟩
/ 〈ρ〉2. Based on
present halo simulations, a reasonable value for a boost factor for gamma ray production in the halo is b <∼ 3, although
extrapolations to smaller scales maybe allow boosts as large as 13 [52]. Here, we are interested in two separate signals,both from the inner region of the halo, and it is not yet clear what a reasonable boost factor is. However, it is morelikely that clumps are tidally destroyed in the region closer to the galactic center, thus we expect, for reasonable

8
0.1
1 10P
ositr
on F
ract
ion
Energy (GeV)
Positron-Electron Ratio Backgrounds
vA = 0 km/s, χ2 = 6.51
vA = 20 km/s, χ2 = 3.97
vA = 35 km/s, χ2 = 1.30
HEAT Data
FIG. 4: Positron fraction backgrounds for vA = 0, vA = 20, and vA = 35 km/s. The χ2 quoted is for the fit to the five lowestenergy points.
scenarios, that a larger boost factor would arise for the positrons produced away from the GC, i.e. those relevantfor HEAT and PAMELA, than for positrons produced near the GC, i.e. those relevant for the haze. That said,uncertainties in the galactic magnetic field and halo profile can also play an important role in the haze signal, so theboost factor that we report here is still uncertain.
E. DM Synchrotron Radiation
The calculation of the synchrotron radiation due to e+e− pairs arising from dark matter annihilation is unencum-bered by the complications of the background fluxes, since the dark matter contribution is completely independentof the contributions from standard astrophysical sources. We fit the calculated intensity for 22.5 GHz synchrotronradiation to the 29 haze data points extending over 6 - 34 from the Galactic Center using the annihilation cross-section and a constant offset as fit parameters. (The inner 5 are masked due to the bright dust emission.) Becausewe only expect dark matter to dominate roughly the inner 15, and because the overall normalization of the haze issomewhat uncertain, we fit the existing data to a dark matter component, plus a constant offset. This, then, preventsthe 15 − 35 region from dominating the fit.
F. Uncertainties
A given model generally makes a very robust prediction for the primary positron injection spectra once all kinemat-ical elements are specified (specifically, dark matter masses and the masses of the annihilation products). However,when converting these injection spectra into observed rates and spectra at an experiment such as PAMELA, thereare many uncertainties that must be considered.
1. DM Halo Uncertainties
The amplitude of the signal is first and foremost determined by the cross section and the density of the dark matterρ0, entering in the form ρ2
0 〈σ |v|〉. While a thermal WIMP will generally have a cross section 2 − 3 × 10⁻²⁶cm3s−1,non-thermal WIMPs can have significantly higher cross sections giving higher rates at HEAT and PAMELA and forthe WMAP haze [53, 54, 55].
The local dark-matter-produced positron signal at the highest energies is simply determined by the local densityof dark matter. This is because high energy positrons propagate a very short distance before losing much of theirenergy. A 300 GeV positron, for instance, typically drops to e−1 × 300 GeV in a distance of ∼ 300 pc. Consequently,the signal for HEAT and PAMELA is relatively insensitive to the broad shape of the halo, but is very sensitive to thelocal value of ρ0.
9
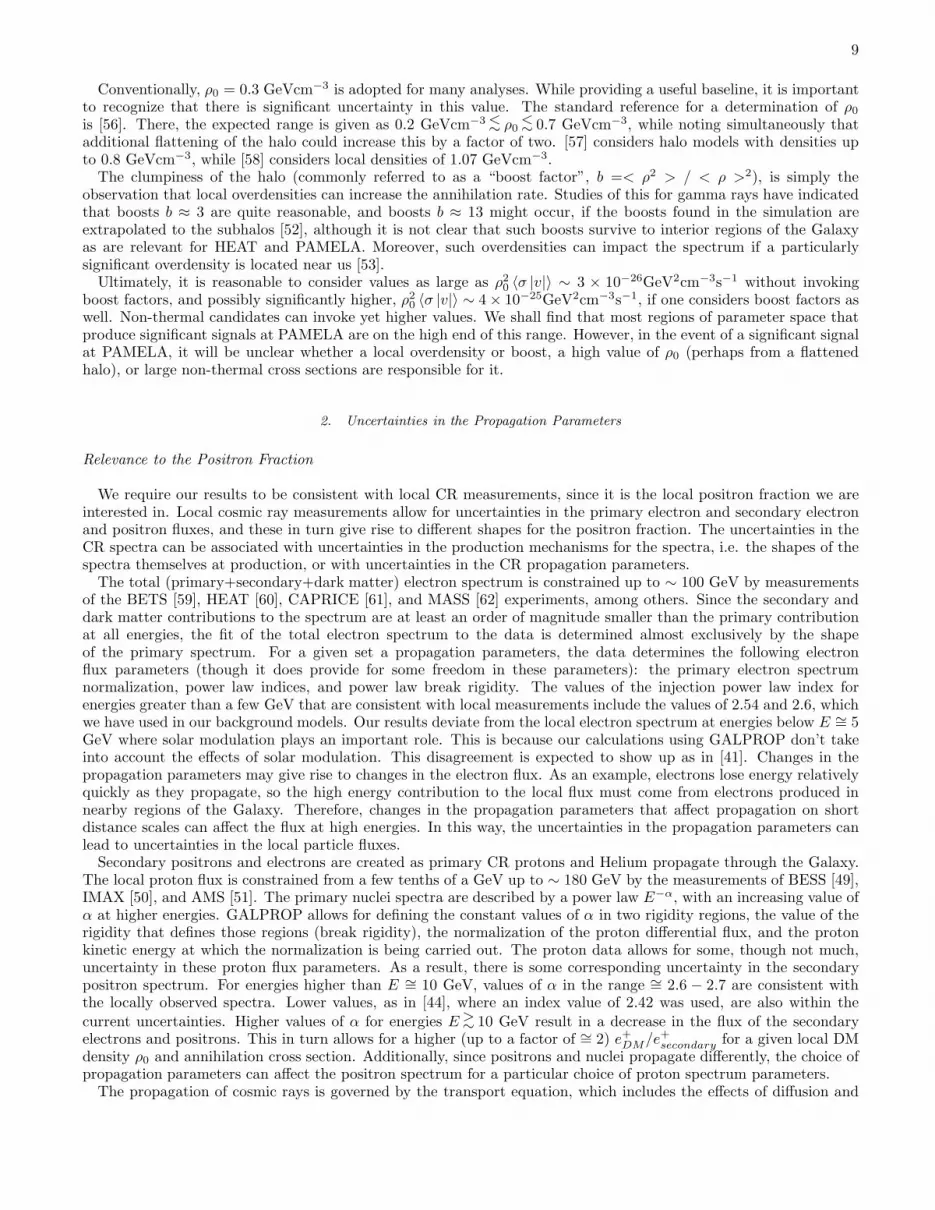
Conventionally, ρ0 = 0.3 GeVcm−3 is adopted for many analyses. While providing a useful baseline, it is importantto recognize that there is significant uncertainty in this value. The standard reference for a determination of ρ0
is [56]. There, the expected range is given as 0.2 GeVcm−3 <∼ ρ0
<∼ 0.7 GeVcm−3, while noting simultaneously that
additional flattening of the halo could increase this by a factor of two. [57] considers halo models with densities upto 0.8 GeVcm−3, while [58] considers local densities of 1.07 GeVcm−3.
The clumpiness of the halo (commonly referred to as a “boost factor”, b =< ρ2 > / < ρ >2), is simply theobservation that local overdensities can increase the annihilation rate. Studies of this for gamma rays have indicatedthat boosts b ≈ 3 are quite reasonable, and boosts b ≈ 13 might occur, if the boosts found in the simulation areextrapolated to the subhalos [52], although it is not clear that such boosts survive to interior regions of the Galaxyas are relevant for HEAT and PAMELA. Moreover, such overdensities can impact the spectrum if a particularlysignificant overdensity is located near us [53].
Ultimately, it is reasonable to consider values as large as ρ20 〈σ |v|〉 ∼ 3 × 10⁻²⁶GeV2cm−3s−1 without invoking
boost factors, and possibly significantly higher, ρ20 〈σ |v|〉 ∼ 4 × 10⁻²⁵GeV2cm−3s−1, if one considers boost factors as
well. Non-thermal candidates can invoke yet higher values. We shall find that most regions of parameter space thatproduce significant signals at PAMELA are on the high end of this range. However, in the event of a significant signalat PAMELA, it will be unclear whether a local overdensity or boost, a high value of ρ0 (perhaps from a flattenedhalo), or large non-thermal cross sections are responsible for it.
2. Uncertainties in the Propagation Parameters
Relevance to the Positron Fraction
We require our results to be consistent with local CR measurements, since it is the local positron fraction we areinterested in. Local cosmic ray measurements allow for uncertainties in the primary electron and secondary electronand positron fluxes, and these in turn give rise to different shapes for the positron fraction. The uncertainties in theCR spectra can be associated with uncertainties in the production mechanisms for the spectra, i.e. the shapes of thespectra themselves at production, or with uncertainties in the CR propagation parameters.
The total (primary+secondary+dark matter) electron spectrum is constrained up to ∼ 100 GeV by measurementsof the BETS [59], HEAT [60], CAPRICE [61], and MASS [62] experiments, among others. Since the secondary anddark matter contributions to the spectrum are at least an order of magnitude smaller than the primary contributionat all energies, the fit of the total electron spectrum to the data is determined almost exclusively by the shapeof the primary spectrum. For a given set a propagation parameters, the data determines the following electronflux parameters (though it does provide for some freedom in these parameters): the primary electron spectrumnormalization, power law indices, and power law break rigidity. The values of the injection power law index forenergies greater than a few GeV that are consistent with local measurements include the values of 2.54 and 2.6, whichwe have used in our background models. Our results deviate from the local electron spectrum at energies below E ∼= 5GeV where solar modulation plays an important role. This is because our calculations using GALPROP don’t takeinto account the effects of solar modulation. This disagreement is expected to show up as in [41]. Changes in thepropagation parameters may give rise to changes in the electron flux. As an example, electrons lose energy relativelyquickly as they propagate, so the high energy contribution to the local flux must come from electrons produced innearby regions of the Galaxy. Therefore, changes in the propagation parameters that affect propagation on shortdistance scales can affect the flux at high energies. In this way, the uncertainties in the propagation parameters canlead to uncertainties in the local particle fluxes.
Secondary positrons and electrons are created as primary CR protons and Helium propagate through the Galaxy.The local proton flux is constrained from a few tenths of a GeV up to ∼ 180 GeV by the measurements of BESS [49],IMAX [50], and AMS [51]. The primary nuclei spectra are described by a power law E−α, with an increasing value ofα at higher energies. GALPROP allows for defining the constant values of α in two rigidity regions, the value of therigidity that defines those regions (break rigidity), the normalization of the proton differential flux, and the protonkinetic energy at which the normalization is being carried out. The proton data allows for some, though not much,uncertainty in these proton flux parameters. As a result, there is some corresponding uncertainty in the secondarypositron spectrum. For energies higher than E ∼= 10 GeV, values of α in the range ∼= 2.6 − 2.7 are consistent withthe locally observed spectra. Lower values, as in [44], where an index value of 2.42 was used, are also within the
current uncertainties. Higher values of α for energies E >∼ 10 GeV result in a decrease in the flux of the secondary
electrons and positrons. This in turn allows for a higher (up to a factor of ∼= 2) e+DM/e+
secondary for a given local DMdensity ρ0 and annihilation cross section. Additionally, since positrons and nuclei propagate differently, the choice ofpropagation parameters can affect the positron spectrum for a particular choice of proton spectrum parameters.
The propagation of cosmic rays is governed by the transport equation, which includes the effects of diffusion and

10
energy losses, among other things. We chose to hold fixed the energy loss mechanisms provided in the GALPROPcode. However, in addition to varying the parameters associated with re-acceleration, we varied the following diffusionparameters: the diffusion zone length 2zmax (the perpendicular distance from the Galactic plane at which free escapeof cosmic rays is assumed), and the energy-dependent diffusion coefficient, specifically through its normalization,break rigidity, and power law index above and below the break.
Mechanisms for re-acceleration of charged particles within the halo are well motivated, but still poorly understood.In order to provide some sense of the effects of this uncertainty, we employed three different values of Alfven velocity,a parameter describing the strength of diffusive re-acceleration. (The Alfven velocity relates the spatial diffusioncoefficient to the momentum-space diffusion coefficient.) In our calculations we take vA = 0 km/s corresponding to nore-acceleration, and vA = 20 km/s and 35 km/s corresponding to the inclusion of re-acceleration in CR propagation.These values have been used extensively in the literature [63] and are within the acceptable range of values [64, 65]. Theeffect of re-acceleration is to shift the flux of electrons and positrons to higher energies. In our calculations, significantcontributions to the fluxes occurred only for energies well below 20 GeV, nonetheless, we often see differences in thehigh energy positron fraction when varying vA. This arises as follows: our primary and secondary fluxes in the lowenergy range of the HEAT data are highly dependent on the value of the Alfven velocity. In order to fit our threebackgrounds to the first five HEAT data points, as previously described, we varied the primary electron spectrumthrough the low energy power law index, the break energy of this index, and the normalization. (The values of theseparameters for the three backgrounds are listed in Table I.) The changes in the low energy background then carry
over to high energies, and thus lead to variations in the positron fraction at E >∼ 20 GeV.
The GALPROP code provides for an energy-dependent spatial diffusion coefficient Dxx defined as:
Dxx = βD0xx
(
R
Drigid br
)Dg
(2)
where R is the rigidity of the particles, β = v/c, D0xx is the diffusion coefficient divided by β at rigidity Drigid br, andthe index Dg can take the value Dg1 for R < Drigid br and a different different value Dg2 for R > Drigid br [43]. For agiven zmax and re-accleration strength, the diffusion coefficient is determined by fitting the Boron-to-Carbon (B/C)ratio to local measurements. In general, an overall decrease in the diffusion coefficient gives an enhancement in theflux of low energy electrons and positrons, while having little effect on the proton spectrum. This effect provides foradditional uncertainty in the secondary positron spectrum; the fits to the proton data can be maintained for manyvariations on the secondary positron spectrum.
In the models presented here we use D0xx = 5.8×1028cm2s−1. Increasing the value of D0xx results in an increase inthe ratio e+
DM/e+secondary at the energies of interest to us, E >
∼ 100 GeV, but for values of D0xx>∼ 6− 7× 1028cm2s−1
with Drigid br∼= few GeV, serious inconsistencies arise between the calculated electron flux and the local electron flux,
unless we choose a smaller power law index for the primary electron spectrum for energies above a few GeV.For energies where the XDM positron contribution becomes comparable to the secondary positron flux, the power
law index Dg is significant. Values between Dg = 1/3 (corresponding to Kolmogorov turbulence) and Dg = 1/2(corresponding to Kraichnan turbulence) are considered reasonable [43, 66]. Increasing Dg from 1/3 to 1/2 can increasee+
DM/e+secondary up to a factor of 2. However, to be consistent with the local proton and CR nuclei measurements, the
primary proton power las index must be decreased in the region of energies higher than E ∼= 10GeV. This cancels thegain in e+
DM/e+secondary by about the same factor.
The diffusion zone width 2zmax can take on a range of values. The allowed values for propagation models that includere-acceleration and for those models with both no re-acceleration and no convection are in the range 4 < zmax < 12kpc [67]. Increasing the diffusion zone width allows fewer particles to escape from the confines of the Galaxy, soparticles from farther away are able to make their way to our location in the Galaxy. As mentioned earlier, electronsand positrons lose energy rapidly as they propagate. The result is that the flux of low energy electrons and positronsis enhanced. The positron flux at energies E >
∼ 100GeV is affected negligibly, as the highly energetic positrons wemeasure come from a sphere with a much smaller radius than the diffusion zone width.
Relevance to Synchrotron Radiation (The Haze)
Since the emissivity of synchrotron radiation at a specific frequency is proportional to the magnetic field, the mostdominant parameter determining the shape of the synchrotron spectrum, apart from the DM halo profile, is themagnetic field. A reasonable value for the local magnetic field is B ∼= 3 µG with 5 µG being within the limits.For the center of the Galaxy, values within the range of 5 − 20 µG are acceptable. Little can be said about theparametric dependence of the intergalactic magnetic field on z, the vertical distance from the galactic plane, or onthe radial distance R from the center of the Galaxy at z = 0. We considered, as in [44], a magnetic field of the form
B = Ble−
R−R⊙Rc e−
zzc , where Bl is the local value of the B-field, and Rc and zc are the characteristic scales of the

11
B-field, taken to be 10 kpc and 2 kpc, respectively. We took the local value of the magnetic field to be 5 µG. Morehomogeneous magnetic fields have been used in the literature [23].
The synchrotron spectrum also depends on the CR diffusion parameters. A smaller diffusion coefficient suppressesthe diffusion of e+ and e−, thus they remain inside the diffusion zone for longer, yielding larger synchrotron fluxes.Because the synchrotron radiation at the Haze frequencies gets it’s dominant contribution from e+ and e− withenergies above a few GeV, the dependence of the diffusion coefficient on the rigidity at high energies can have a smalleffect on the synchrotron flux. Since the Haze is in the region of ∼= 6 − 15 degrees in latitude or r ∼= 0.9 − 2.3 kpcfrom the center of the Galaxy, varying the diffusion zone width above z ∼= 4 kpc doesn’t have significant effects onthe shape of the synchrotron radiation as a function of latitude.
Additionally, varying the ratio of the energy density in the magnetic field to the energy density in the radiationfield Umag/Urad, which is equal to the ratio of energy loss of high energy e+e− through synchrotron radiation to thatthrough inverse Compton scattering, has an affect on the synchroton radiation produced [54]. A larger value of Urad
results in faster depletion of the number of high energy e+e− pairs, while lower values can yield a stronger haze signal.
V. RESULTS
A. Baseline Models
In order to determine the sensitivity of the signal to various unknown variables, such as particle mass and halomodel, we consider a particular baseline or “canonical” model about which to vary. We have two canonical models, onewithout and one with re-acceleration. The model without re-acceleration is described by the conventional parameterset discussed previously with mχ = 250 GeV and with a Merritt halo profile with α = 0.17 (the middle value in theacceptable range of values). These parameters are chosen because they generate a sufficiently large positron signal toexplain the INTEGRAL excess [34]. Fig. 5 shows our results for our canonical model with no re-acceleration.
For a scenario with re-acceleration, we consider the same particle mass and profile and take vA = 35 km/s. SeeFig. 6 for the results of our canonical model with re-acceleration. An Alfven velocity of 35 km/s is reasonable, andwe find that this value yields the smallest differences between the needed cross sections for the haze and HEAT, fora given mχ (see Appendix B). The cross-sections differ at most by a factor of about 2 for vA = 35 km/s (see TablesVIII and IX), while for vA = 20 km/s they more often than not differ by factors of 3 and higher (see Tables VIand IX). Throughout the following discussion, the behavior of other models is very similar to that of the canonicalmodels, unless otherwise noted. We refer the reader to the tables in Appendix B for a listing of the best-fit values forρ20 〈σ |v|〉 and the corresponding χ2 values for all models studied.The plots of the positron fraction include the HEAT data with error bars as calculated by the HEAT collaboration
[19]. The synchrotron radiation plots include the haze data as calculated by Dobler and Finkbeiner in [68], based onWMAP measurements taken directly south of the Galactic Center. The data are in bins separated by 1 degree inlatitude with a width of 20 degrees in longitude l ∈ [−10, 10].
B. Positron Fraction
With the results from PAMELA on the horizon, the positron production from dark matter is clearly an importantavenue to pursue. However, the positron fraction contains numerous uncertainties, both in the background and in theshape of the DM signal, should there be one. In this section, we discuss a number of the different parameters andtheir effects on the positron fraction signal.
1. Decay Channel Dependence
The signals are noticeably different for energies close to mχ for the two different decay channels, that is for thedifferent mass ranges of the mediator φ. See Fig. 7. The bump in the positron fraction, characteristic of the hardXDM e+e− spectra, has a larger maximum value for the direct decay channel. Moreover, in the muon channel theratio starts its drop to the background value at a lower energy, so that the high energy fall-off is more gradual. Thesefeatures can be understood by comparing the injection spectra for the two decay channels as shown in Fig. 2. Theflat distribution of the direct channel takes on a larger value at high energies than does the distribution of the muonchannel. More e+e− pairs produced at high energies give rise to a larger positron fraction at these energies. This alsoresults in a smaller best-fit cross-section for the direct channel.

12
0.01
0.1
1
1 10 100
Pos
itron
Fra
ctio
n
Energy (GeV)
Direct ChannelMerritt (α = 0.17)vA = 0 km/s
Background
mχ= 250 GeV, ρ02<σ|v|> = 2.50 x 10⁻²⁶ GeV2 cm-3 s-1
HEAT Data
(a)Positron fraction, direct decay channel
0
1
2
3
4
5
6
7
5 10 15 20 25 30 35
Inte
nsity
(10
-20 e
rg/s
ec/H
z/cm
2 /sr)
Latitudinal Radial Distance from GC (degrees)
Direct ChannelMerritt (α = 0.17)vA = 0 km/s
mχ= 250 GeV, ρ02<σ|v|> = 6.77 x 10⁻²⁶ GeV2 cm-3 s-1
Haze Data
(b)Synchrotron radiation, direct decay channel
0.01
0.1
1
1 10 100
Pos
itron
Fra
ctio
n
Energy (GeV)
Muon ChannelMerritt (α = 0.17)vA = 0 km/s
Background
mχ= 250 GeV, ρ02<σ|v|> = 3.15 x 10⁻²⁶ GeV2 cm-3 s-1
HEAT Data
(c)Positron fraction, muon decay channel
0
1
2
3
4
5
6
7
5 10 15 20 25 30 35
Inte
nsity
(10
-20 e
rg/s
ec/H
z/cm
2 /sr)
Latitudinal Radial Distance from GC (degrees)
Muon ChannelMerritt (α = 0.17)vA = 0 km/s
mχ = 250 GeV, ρ02<σ|v|> = 9.26 x 10⁻²⁶ GeV2 cm-3 s-1
Haze Data
(d)Synchrotron radiation, muon decay channel
FIG. 5: Canonical models for vA = 0 km/s.
2. mχ Dependence
As mentioned previously, the decay of the boosted φ particle directly to light fermions results in a hard positronspectrum. This gives rise to a characteristic enhancement in the positron fraction at energies above 5 GeV. Themaximum in the positron fraction occurs at an energy that depends on the mass of χ and the decay channel; forexample, for no re-acceleration and mχ = 250, GeV the maximum occurs at ∼ 140 GeV for the direct channel, andat ∼ 50 GeV for the muon channel. The rapid, high energy fall-off of the positron fraction for the direct channelprovides a way to determine mχ. For the case with no re-acceleration, the high energy fall-off of the positron fractionoccurs at ∼ mχ (see Fig. 8(a)), while for the case with re-acceleration, the fall-off occurs at an energy larger than mχ
and that depends on the strength of the re-acceleration (see Fig. 8(c)). Fig. 8 shows the dependence of the ratio onmχ for both the direct and muon decay channels for both the no re-acceleration and the re-acceleration cases.
As the mass of χ increases, the best-fit cross-section correspondingly increases. This arises from the lower numberdensity, nχ = ρχ/mχ, for fixed dark matter density. However, because higher energy particles can propagate farther, agiven energy bin for HEAT is sensitive to a larger volume as one increases the energy range of the injection spectrum.This partially compensates for the decreased number density, but significantly larger cross sections are still requiredfor higher DM masses.

13
0.01
0.1
1
1 10 100
Pos
itron
Fra
ctio
n
Energy (GeV)
Direct ChannelMerritt (α = 0.17)vAlfven = 35 km/s
Background
mχ= 250 GeV, ρ02<σ|v|> = 8.26 x 10⁻²⁶ GeV2 cm-3 s-1
HEAT Data
(a)Positron fraction, direct decay channel
0
1
2
3
4
5
6
7
5 10 15 20 25 30 35
Inte
nsity
(10
-20 e
rg/s
ec/H
z/cm
2 /sr)
Latitudinal Radial Distance from GC (degrees)
Direct ChannelMerritt (α = 0.17)vA = 35 km/s
mχ= 250 GeV, ρ02<σ|v|> = 6.72 x 10⁻²⁶ GeV2 cm-3 s-1
Haze Data
(b)Synchrotron radiation, direct decay channel
0.01
0.1
1
1 10 100
Pos
itron
Fra
ctio
n
Energy (GeV)
Direct ChannelMerritt (α = 0.17)vAlfven = 35 km/s
Background
mχ= 250 GeV, ρ02<σ|v|> = 10.23 x 10⁻²⁶ GeV2 cm-3 s-1
HEAT Data
(c)Positron fraction, muon decay channel
0
1
2
3
4
5
6
7
5 10 15 20 25 30 35
Inte
nsity
(10
-20 e
rg/s
ec/H
z/cm
2 /sr)
Latitudinal Radial Distance from GC (degrees)
Muon ChannelMerritt (α = 0.17)vA = 35 km/s
mχ= 250 GeV, ρ02<σ|v|> = 8.96 x 10⁻²⁶ GeV2 cm-3 s-1
Haze Data
(d)Synchrotron radiation, muon decay channel
FIG. 6: Canonical models for vA = 35 km/s.
3. Dependence on Halo Profile
The positron fraction is fairly robust with respect to the halo profile. This is what we would expect, as the localpositron fraction at high energies depends mainly on the e+e− pairs produced nearby. Electrons and positrons loseenergy very quickly through a variety of mechanisms as they travel through the Galaxy, so the fluxes of electrons andpositrons that we measure locally at energies larger than 1 GeV are produced fairly nearby. Since the DM profiles arevery similar at our location in the Galaxy, we expect the fluxes of DM-produced particles to be similar. Fig. 9 showsthe positron fraction for all five halo models. The e+e− ratios are virtually indistinguishable, and this is true for allvalues of mχ, though we emphasize that the cross-sections are different. As the Merritt parameter α increases, thecross-section increases. This is easily understood, as α is inversely related to the cuspiness of the profile. A smallerDM density results in fewer e+e− pairs produced, requiring a larger cross-section to make the fit to the HEAT data.
4. Dependence on Alfven Velocity
Fig. 10 shows the positron fraction for the two different values of non-zero vA studied, 20 km/s and 35 km/s. Itappears that the re-acceleration parameter vA has a strong affect on the positron fraction, and one might concludethat this is due to an underlying effect on the dark matter contribution to the ratio. However, the plots are misleading.As mentioned earlier, the effect of re-acceleration on the particle fluxes is small at energies above about 10 GeV, sothe dark matter contribution to the positron fraction above 10 GeV is the same regardless of the value of vA. The

14
0.01
0.1
1
1 10
Pos
itron
Fra
ctio
n
Energy (GeV)
Merritt (α= 0.17)mχ= 50 GeVvA = 0 km/s
Background
Direct Channel, ρ02<σ|v|> = 0.16 x 10⁻²⁶ GeV2 cm-3 s-1
Muon Channel, ρ02<σ|v|> = 0.30 x 10⁻²⁶ GeV2 cm-3 s-1
HEAT Data
(a)vA = 0 km/s, mχ = 50 GeV
0.01
0.1
1
1 10 100
Pos
itron
Fra
ctio
n
Energy (GeV)
Merritt (α= 0.17)mχ= 250 GeVvA = 0 km/s
Background
Direct Channel, ρ02<σ|v|> = 2.50 x 10⁻²⁶ GeV2 cm-3 s-1
Muon Channel, ρ02<σ|v|> = 3.15 x 10⁻²⁶ GeV2 cm-3 s-1
HEAT Data
(b)vA = 0 km/s, mχ = 250 GeV
0.01
0.1
1
1 10
Pos
itron
Fra
ctio
n
Energy (GeV)
Merritt (α= 0.17)mχ= 50 GeVvA = 35 km/s
Background
Direct Channel, ρ02<σ|v|> = 0.48 x 10⁻²⁶ GeV2 cm-3 s-1
Muon Channel, ρ02<σ|v|> = 1.01 x 10⁻²⁶ GeV2 cm-3 s-1
HEAT Data
(c)vA = 35 km/s, mχ = 50 GeV
0.01
0.1
1
1 10 100
Pos
itron
Fra
ctio
n
Energy (GeV)
Merritt (α = 0.17)mχ= 250 GeVvA = 35 km/s
Background
Direct Channel, ρ02<σ|v|> = 8.26 x 10⁻²⁶ GeV2 cm-3 s-1
Muon Channel, ρ02<σ|v|> = 10.23 x 10⁻²⁶ GeV2 cm-3 s-1
HEAT Data
(d)vA = 35 km/s, mχ = 250 GeV
FIG. 7: Positron fraction for direct decay (2me < mφ < 2mµ) and muon decay (2mµ ≤ mφ < 2mπ0) channels.
differences in the ratios at high energies as shown in Fig. 10 are due to the differences in the backgrounds at thoseenergies (see Fig. 4). The background positron ratio, which depends on the primary electron flux and secondaryelectron and positron fluxes, is determined by fitting the data at energies below about 7 GeV to the first five HEATdata points. Re-acceleration has a significant effect on particle fluxes at these energies, so to fit the data for differentvalues of vA, we must vary the primary electron flux through its power law index, the break rigidity of this index, andthe normalization of the flux. (The secondary fluxes are also affected by re-acceleration, but we don’t directly varythese through the inputs to GALPROP.) As the strength of re-acceleration increases, the power law index and fluxnormalization must increase to maintain the fit to data (see Table I). The changes in the background at low energiesnecessary to fit to the HEAT data come with corresponding changes in the background at high energies. It is theresulting differences in the background positron fraction at high energies that give rise to the differences in the totalpositron fraction at those energies.
5. Implications for PAMELA
Soon, results from PAMELA should provide data for high energy positrons up to ∼ 270 GeV. It is somewhat naturalthat if the HEAT excess is, in fact, arising from dark matter, that PAMELA should see additional signals. Exceptfor extremely light particles, the increased sensitivity and statistics of the PAMELA experiment should improve theunderstanding of this situation. Whether we can claim a signal as a discovery of dark matter we shall return to in amoment. However, even absent the HEAT signal, the haze motivates us to consider what might be seen at PAMELA.

15
0.01
0.1
1
1 10 100 1000
Pos
itron
Fra
ctio
n
Energy (GeV)
Direct ChannelMerritt (α = 0.17)vA = 0 km/s
Background
mχ= 50 GeV, ρ02<σ|v|> = 0.16 x 10⁻²⁶ GeV2 cm-3 s-1
mχ= 100 GeV, ρ02<σ|v|> = 0.50 x 10⁻²⁶ GeV2 cm-3 s-1
mχ= 250 GeV, ρ02<σ|v|> = 2.50 x 10⁻²⁶ GeV2 cm-3 s-1
mχ= 500 GeV, ρ02<σ|v|> = 9.60 x 10⁻²⁶ GeV2 cm-3 s-1
mχ= 800 GeV, ρ02<σ|v|> = 23.33 x 10⁻²⁶ GeV2 cm-3 s-1
HEAT Data
(a)Direct decay channel, vA = 0 km/s
0.01
0.1
1
1 10 100 1000
Pos
itron
Fra
ctio
n
Energy (GeV)
Muon ChannelMerritt (α = 0.17)vA = 0 km/s
Background
mχ= 50 GeV, ρ02<σ|v|> = 0.30 x 10⁻²⁶ GeV2 cm-3 s-1
mχ= 100 GeV, ρ02<σ|v|> = 0.83 x 10⁻²⁶ GeV2 cm-3 s-1
mχ= 250 GeV, ρ02<σ|v|> = 3.15 x 10⁻²⁶ GeV2 cm-3 s-1
mχ= 500 GeV, ρ02<σ|v|> = 10.34 x 10⁻²⁶ GeV2 cm-3 s-1
mχ= 800 GeV, ρ02<σ|v|> = 24.66 x 10⁻²⁶ GeV2 cm-3 s-1
HEAT Data
(b)Muon decay channel, vA = 0 km/s
0.01
0.1
1
1 10 100 1000
Pos
itron
Fra
ctio
n
Energy (GeV)
Direct ChannelMerritt (α = 0.17)vA = 35 km/s
Background
mχ= 50 GeV, ρ02<σ|v|> = 0.48 x 10⁻²⁶ GeV2 cm-3 s-1
mχ= 100 GeV, ρ02<σ|v|> = 1.60 x 10⁻²⁶ GeV2 cm-3 s-1
mχ= 250 GeV, ρ02<σ|v|> = 8.26 x 10⁻²⁶ GeV2 cm-3 s-1
mχ= 500 GeV, ρ02<σ|v|> = 31.25 x 10⁻²⁶ GeV2 cm-3 s-1
mχ= 800 GeV, ρ02<σ|v|> = 77.44 x 10⁻²⁶ GeV2 cm-3 s-1
HEAT Data
(c)Direct decay channel, vA = 35 km/s
0.01
0.1
1
1 10 100 1000
Pos
itron
Fra
ctio
n
Energy (GeV)
Muon ChannelMerritt (α = 0.17)vA = 35 km/s
Background
mχ= 50 GeV, ρ02<σ|v|> = 1.01 x 10⁻²⁶ GeV2 cm-3 s-1
mχ= 100 GeV, ρ02<σ|v|> = 2.64 x 10⁻²⁶ GeV2 cm-3 s-1
mχ= 250 GeV, ρ02<σ|v|> = 10.23 x 10⁻²⁶ GeV2 cm-3 s-1
mχ= 500 GeV, ρ02<σ|v|> = 33.78 x 10⁻²⁶ GeV2 cm-3 s-1
mχ= 800 GeV, ρ02<σ|v|> = 79.26 x 10⁻²⁶ GeV2 cm-3 s-1
HEAT Data
(d)Muon decay channel, vA = 35 km/s
FIG. 8: mχ dependence of positron fraction.
Let us assume that the haze is, in fact, arising from dark matter annihilations as we describe here. A simpleexamination of the tables in Appendix B shows that the cross sections that explain the haze are in general comparableto or larger than the cross sections needed to generate a signal consistent with HEAT. Consequently, for a wide rangeof parameters, a strong signal would be expected at PAMELA, if the scenario as described explains the haze.
We show representative data for PAMELA in Figs. 11 and 12. In Fig. 11 we consider two cases, mχ = 50 and250 GeV, and present predictions for the PAMELA results after three years of data collection using the previouslydiscussed backgrounds fit to the HEAT data. In Fig. 12 we present similar predictions for mχ = 250 GeV usingdifferent backgrounds fit to the preliminary PAMELA data [69]. For these backgrounds, the parameters defining theprimary electron and proton injection spectra and the propagation parameters, e.g. the diffusion coefficient and thestrength of re-acceleration, are listed in Table III. The backgrounds are in agreement with the local measurements ofthe electron and proton flux data as well as the B/C ratio data.
It is clear that for the higher mass situation (see Figs. 11(c), 11(d), and 12), regardless of whether one includesre-acceleration or not, a strong signal should be seen, which would be difficult to ascribe to uncertainties in thebackground. There appears to be some degeneracy in the data between lighter mass candidates and the decaychannel considered. In particular, because the muon channel does not have a hard cutoff, it may be difficult toestablish the mass of the WIMP with any accuracy. Additionally, it may be difficult to distinguish electron frommuon decay channels if the energy cutoff is above the PAMELA threshold.
For lighter mass particles, the situation is not as clear. For instance, if we consider the situation without significantre-acceleration, it is impossible to claim discovery of a 50 GeV WIMP at PAMELA in this scenario, while with re-acceleration it is. This arises simply from the shape of the assumed primary electron spectrum, which gives rise to

16
0.01
0.1
1
1 10 100
Pos
itron
Fra
ctio
n
Energy (GeV)
Direct Channelmχ = 250 GeVvA = 0 km/s
Background
NFW, ρ02<σ|v|> = 2.71 x 10⁻²⁶ GeV2 cm-3 s-1
Isothermal, ρ02<σ|v|> = 2.46 x 10⁻²⁶ GeV2 cm-3 s-1
Merritt (α= 0.13), ρ02<σ|v|> = 2.21 x 10⁻²⁶ GeV2 cm-3 s-1
Merritt (α= 0.17), ρ02<σ|v|> = 2.50 x 10⁻²⁶ GeV2 cm-3 s-1
Merritt (α= 0.22), ρ02<σ|v|> = 2.69 x 10⁻²⁶ GeV2 cm-3 s-1
HEAT Data
(a)Direct decay channel, vA = 0 km/s
0.01
0.1
1
1 10 100
Pos
itron
Fra
ctio
n
Energy (GeV)
Muon Channelmχ = 250 GeVvA = 0 km/s
Background
NFW, ρ02<σ|v|> = 3.42 x 10⁻²⁶ GeV2 cm-3 s-1
Isothermal, ρ02<σ|v|> = 3.26 x 10⁻²⁶ GeV2 cm-3 s-1
Merritt (α= 0.13), ρ02<σ|v|> = 2.86 x 10⁻²⁶ GeV2 cm-3 s-1
Merritt (α= 0.17), ρ02<σ|v|> = 3.15 x 10⁻²⁶ GeV2 cm-3 s-1
Merritt (α= 0.22), ρ02<σ|v|> = 3.38 x 10⁻²⁶ GeV2 cm-3 s-1
HEAT Data
(b)Muon decay channel, vA = 0 km/s
0.01
0.1
1
1 10 100
Pos
itron
Fra
ctio
n
Energy (GeV)
Direct Channelmχ= 250 GeVvA = 35 km/s
Background
NFW, ρ02<σ|v|> = 8.75 x 10⁻²⁶ GeV2 cm-3 s-1
Isothermal, ρ02<σ|v|> = 8.38 x 10⁻²⁶ GeV2 cm-3 s-1
Merritt (α = 0.13), ρ02<σ|v|> = 7.19 x 10⁻²⁶ GeV2 cm-3 s-1
Merritt (α = 0.17), ρ02<σ|v|> = 8.26 x 10⁻²⁶ GeV2 cm-3 s-1
Merritt (α = 0.22), ρ02<σ|v|> = 8.88 x 10⁻²⁶ GeV2 cm-3 s-1
HEAT Data
(c)Direct decay channel, vA = 35 km/s
0.01
0.1
1
1 10 100
Pos
itron
Fra
ctio
n
Energy (GeV)
Muon Channelmχ= 250 GeVvA = 35 km/s
Background
NFW, ρ02<σ|v|> = 10.96 x 10⁻²⁶ GeV2 cm-3 s-1
Isothermal, ρ02<σ|v|> = 10.78 x 10⁻²⁶ GeV2 cm-3 s-1
Merritt (α = 0.13), ρ02<σ|v|> = 9.14 x 10⁻²⁶ GeV2 cm-3 s-1
Merritt (α = 0.17), ρ02<σ|v|> = 10.23 x 10⁻²⁶ GeV2 cm-3 s-1
Merritt (α = 0.22), ρ02<σ|v|> = 11.10 x 10⁻²⁶ GeV2 cm-3 s-1
HEAT Data
(d)Muon decay channel, vA = 35 km/s
FIG. 9: Positron fraction for all halo models for mχ = 250 GeV.
0.01
0.1
1
1 10 100
Pos
itron
Fra
ctio
n
Energy (GeV)
Direct ChannelMerritt (α = 0.17)mχ= 250 GeV
ρ02<σ|v|> = 2.56 x 10⁻²⁶ GeV2 cm-3 s-1, vAlfven = 20 km/s
ρ02<σ|v|> = 8.26 x 10⁻²⁶ GeV2 cm-3 s-1, vAlfven = 35 km/s
HEAT Data
(a)Direct decay channel
0.01
0.1
1
1 10 100
Pos
itron
Fra
ctio
n
Energy (GeV)
Muon ChannelMerritt (α = 0.17)mχ= 250 GeV
ρ02<σ|v|> = 10.77 x 10⁻²⁶ GeV2 cm-3 s-1, vAlfven = 20 km/s
ρ02<σ|v|> = 10.23 x 10⁻²⁶ GeV2 cm-3 s-1, vAlfven = 35 km/s
HEAT Data
(b)Muon decay channel
FIG. 10: vA dependence of the positron fraction.

17
the background spectrum. For re-acceleration, the background is lower, so the dark matter component needed to fitthe HEAT data is larger than that for no re-acceleration. Therefore, the signal in the re-acceleration case is larger.Discovery may still be possible for lighter mass particles in a scenario with no re-acceleration as measurements ofother cosmic rays pin down additional astrophysical parameters, and as the low energy positron and electron spectraare established.
Fig. 13 shows our predicted PAMELA results for mχ = 250 GeV for two different values of mφ, 212 MeV and 269MeV, the limits of the range of φ masses for which the decay into muons is the dominant decay channel. The decaythough a lighter scalar mediator with the same value of ρ2
0 〈σ |v|〉 results in a positron fraction with a larger peakvalue and a faster decline to the background value. These differences in signal are small for large values of mχ and ourbackgrounds and cannot be distinguished by PAMELA. However, for smaller values of mχ and a different backgroundratio these differences are more pronounced and possibly distinguishable.
We want to emphasize that the background is dependent on the choice of propagation parameters, even within theconstraints of local CR data. However, regardless of the differences in the background, we show that a significantsignal can be seen at PAMELA for mχ ≤ 250 GeV with values of ρ2
0 〈σ |v|〉 of the the order 10−26 GeV2cm−3s−1.
0.01
0.1
1
1 10
Pos
itron
Fra
ctio
n
Energy (GeV)
Expected PAMELA Resultsmχ = 50 GeVMerritt (α = 0.17)vAlfven = 0 km/s
Background
Direct Channel, ρ02<σ|v|> = 0.16 x 10⁻²⁶ GeV2 cm-3 s-1
Muon Channel, ρ02<σ|v|> = 0.30 x 10⁻²⁶ GeV2 cm-3 s-1
HEAT Data
(a)mχ = 50 GeV, vA = 0 km/s
0.01
0.1
1
1 10
Pos
itron
Fra
ctio
n
Energy (GeV)
Expected PAMELA Resultsmχ = 50 GeVMerritt (α = 0.17)vAlfven = 35 km/s
Background
Direct Channel, ρ02<σ|v|> = 0.48 x 10⁻²⁶ GeV2 cm-3 s-1
Muon Channel, ρ02<σ|v|> = 1.01 x 10⁻²⁶ GeV2 cm-3 s-1
HEAT Data
(b)mχ = 50 GeV, vA = 35 km/s
0.01
0.1
1
1 10 100
Pos
itron
Fra
ctio
n
Energy (GeV)
Expected PAMELA Resultsmχ = 250 GeVMerritt (α = 0.17)vAlfven = 0 km/s
Background
Direct Channel, ρ02<σ|v|> = 2.50 x 10⁻²⁶ GeV2 cm-3 s-1
Muon Channel, ρ02<σ|v|> = 3.15 x 10⁻²⁶ GeV2 cm-3 s-1
HEAT Data
(c)mχ = 250 GeV, vA = 0 km/s
0.01
0.1
1
1 10 100
Pos
itron
Fra
ctio
n
Energy (GeV)
Expected PAMELA Resultsmχ = 250 GeVMerritt (α = 0.17)vAlfven = 35 km/s
Background
Direct Channel, ρ02<σ|v|> = 8.26 x 10⁻²⁶ GeV2 cm-3 s-1
Muon Channel, ρ02<σ|v|> = 10.23 x 10⁻²⁶ GeV2 cm-3 s-1
HEAT Data
(d)mχ = 250 GeV, vA = 35 km/s
FIG. 11: Predictions for the PAMELA experiment results in the XDM scenario.
C. DM Synchrotron Component
1. Decay Channel Dependence
While the different decay channels lead to quite distinct results for the positron fraction, the differences in thesynchrotron radiation for the direct and muon channels are more subtle. See Fig. 14. The muon channel produces

18
0.01
0.1
1
1 10 100
Pos
itron
Fra
ctio
n
Energy (GeV)
Expected PAMELA Resultsmχ = 250 GeVMerritt (α = 0.17)vAlfven = 0 km/s
Background
Direct Channel, ρ02<σ|v|> = 3.09 x 10⁻²⁶ GeV2 cm-3 s-1
Muon Channel, ρ02<σ|v|> = 3.97 x 10⁻²⁶ GeV2 cm-3 s-1
Preliminary Pamela Data
(a)mχ = 250 GeV, vA = 0 km/s
0.01
0.1
1
1 10 100
Pos
itron
Fra
ctio
n
Energy (GeV)
Expected PAMELA Resultsmχ = 250 GeVMerritt (α = 0.17)vAlfven = 20 km/s
Background
Direct Channel, ρ02<σ|v|> = 1.12 x 10⁻²⁶ GeV2 cm-3 s-1
Muon Channel, ρ02<σ|v|> = 1.60 x 10⁻²⁶ GeV2 cm-3 s-1
Preliminary Pamela Data
(b)mχ = 250 GeV, vA = 20 km/s
FIG. 12: Predictions for the PAMELA experiment results in the XDM scenario using the preliminary PAMELA data.
0.01
0.1
1
1 10 100
Pos
itron
Fra
ctio
n
Energy (GeV)
Expected PAMELA Resultsmχ= 250 GeVMuon ChannelMerritt (α = 0.17)vAlfven = 20 km/s
Background
mφ= 212 MeV, ρ02<σ|v|> = 1.60 x 10⁻²⁶ GeV2 cm-3 s-1
mφ= 269 MeV, ρ02<σ|v|> = 1.60 x 10⁻²⁶ GeV2 cm-3 s-1
Preliminary Pamela Data
FIG. 13: Dependence of the predictions for the PAMELA experiment results on mφ.
TABLE III: GALDEF parameters for the background fits to preliminary PAMELA data
vA = 0 km/s vA = 20 km/sElectron Injection Index Below Lower Break Rigidity 1.80 2.18Electron Injection Index Above Lower Break Rigidity 2.60 2.54Electron Injection Index Above Upper Break Rigidity 5.00 5.00Electron Lower Break Rigidity (MV) 3.0 × 10³ 3.0 × 10³
Electron Upper Break Rigidity (MV) 1.0 × 10⁹ 1.0 × 10⁹
Electron Flux Normalization (cm−2sr−1s−1MeV−1) 0.2760 × 10⁻⁹ 0.2148 × 10⁻⁹
Nucleus Injection Index Below Break Rigidity 1.90 1.98Nucleus Injection Index Above Break Rigidity 2.60 2.42Nucleus Break Rigidity (MV) 20.0 × 10³ 9.0 × 10³
Proton Flux Normalization (cm−2sr−1s−1MeV−1) 4.41 × 10⁻⁹ 4.41 × 10⁻⁹
zmax (kpc) (half of Diffusion Zone Width) 10.0 10.0Diffusion Coefficient Normalization (×1028cm2s−1) 5.80 × 1028 5.80 × 1028
Diffusion Coefficient Index Below Break Rigidity 0.34 0.34Diffusion Coefficient Index Above Break Rigidity 0.40 0.40Diffusion Coefficient Break Rigidity (MV) 6.0 × 10³ 1.0 × 10³
19
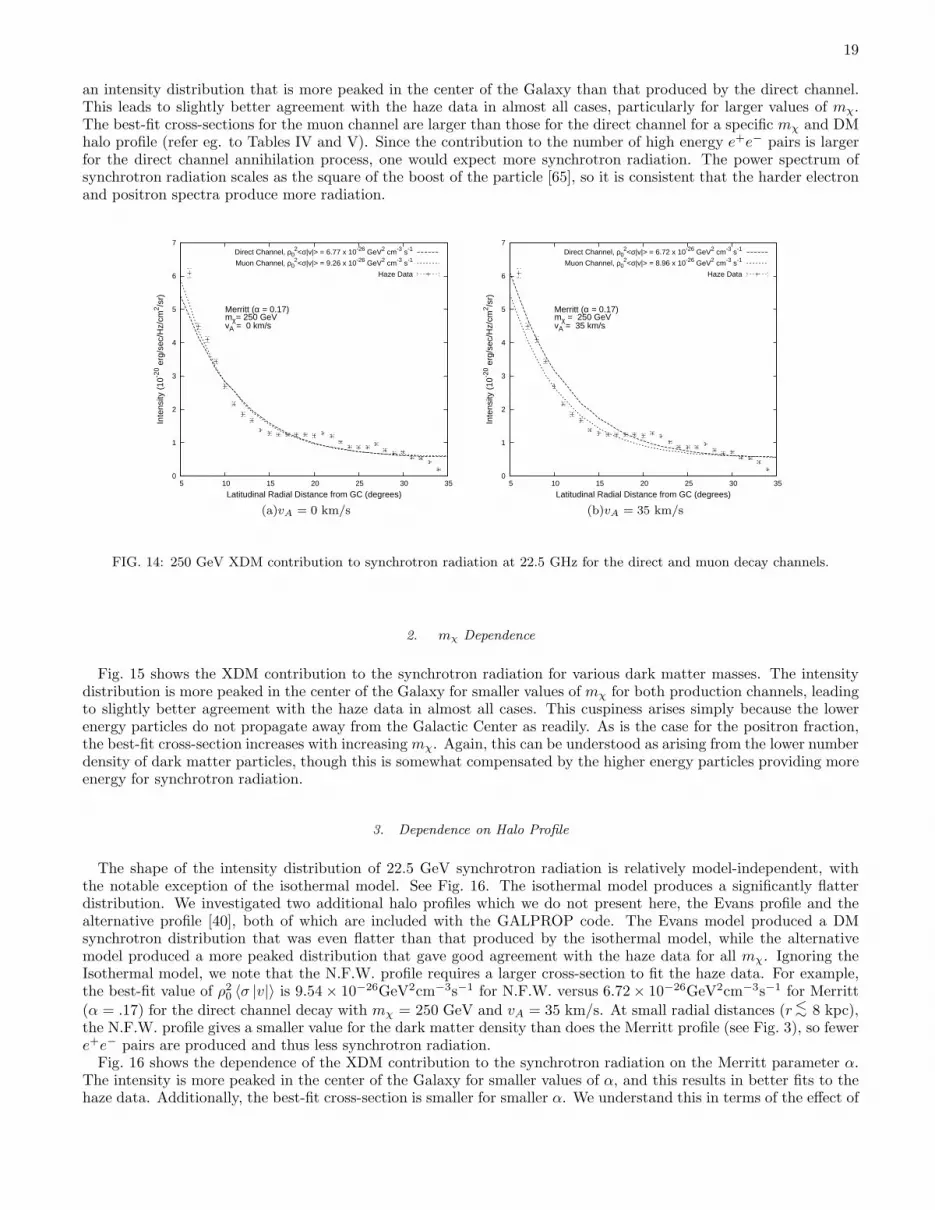
an intensity distribution that is more peaked in the center of the Galaxy than that produced by the direct channel.This leads to slightly better agreement with the haze data in almost all cases, particularly for larger values of mχ.The best-fit cross-sections for the muon channel are larger than those for the direct channel for a specific mχ and DMhalo profile (refer eg. to Tables IV and V). Since the contribution to the number of high energy e+e− pairs is largerfor the direct channel annihilation process, one would expect more synchrotron radiation. The power spectrum ofsynchrotron radiation scales as the square of the boost of the particle [65], so it is consistent that the harder electronand positron spectra produce more radiation.
0
1
2
3
4
5
6
7
5 10 15 20 25 30 35
Inte
nsity
(10
-20 e
rg/s
ec/H
z/cm
2 /sr)
Latitudinal Radial Distance from GC (degrees)
Merritt (α = 0.17)mχ= 250 GeVvA = 0 km/s
Direct Channel, ρ02<σ|v|> = 6.77 x 10⁻²⁶ GeV2 cm-3 s-1
Muon Channel, ρ02<σ|v|> = 9.26 x 10⁻²⁶ GeV2 cm-3 s-1
Haze Data
(a)vA = 0 km/s
0
1
2
3
4
5
6
7
5 10 15 20 25 30 35In
tens
ity (
10-2
0 erg
/sec
/Hz/
cm2 /s
r)Latitudinal Radial Distance from GC (degrees)
Merritt (α = 0.17)mχ = 250 GeVvA = 35 km/s
Direct Channel, ρ02<σ|v|> = 6.72 x 10⁻²⁶ GeV2 cm-3 s-1
Muon Channel, ρ02<σ|v|> = 8.96 x 10⁻²⁶ GeV2 cm-3 s-1
Haze Data
(b)vA = 35 km/s
FIG. 14: 250 GeV XDM contribution to synchrotron radiation at 22.5 GHz for the direct and muon decay channels.
2. mχ Dependence
Fig. 15 shows the XDM contribution to the synchrotron radiation for various dark matter masses. The intensitydistribution is more peaked in the center of the Galaxy for smaller values of mχ for both production channels, leadingto slightly better agreement with the haze data in almost all cases. This cuspiness arises simply because the lowerenergy particles do not propagate away from the Galactic Center as readily. As is the case for the positron fraction,the best-fit cross-section increases with increasing mχ. Again, this can be understood as arising from the lower numberdensity of dark matter particles, though this is somewhat compensated by the higher energy particles providing moreenergy for synchrotron radiation.
3. Dependence on Halo Profile
The shape of the intensity distribution of 22.5 GeV synchrotron radiation is relatively model-independent, withthe notable exception of the isothermal model. See Fig. 16. The isothermal model produces a significantly flatterdistribution. We investigated two additional halo profiles which we do not present here, the Evans profile and thealternative profile [40], both of which are included with the GALPROP code. The Evans model produced a DMsynchrotron distribution that was even flatter than that produced by the isothermal model, while the alternativemodel produced a more peaked distribution that gave good agreement with the haze data for all mχ. Ignoring theIsothermal model, we note that the N.F.W. profile requires a larger cross-section to fit the haze data. For example,the best-fit value of ρ2
0 〈σ |v|〉 is 9.54 × 10⁻²⁶GeV2cm−3s−1 for N.F.W. versus 6.72 × 10⁻²⁶GeV2cm−3s−1 for Merritt
(α = .17) for the direct channel decay with mχ = 250 GeV and vA = 35 km/s. At small radial distances (r <∼ 8 kpc),
the N.F.W. profile gives a smaller value for the dark matter density than does the Merritt profile (see Fig. 3), so fewere+e− pairs are produced and thus less synchrotron radiation.
Fig. 16 shows the dependence of the XDM contribution to the synchrotron radiation on the Merritt parameter α.The intensity is more peaked in the center of the Galaxy for smaller values of α, and this results in better fits to thehaze data. Additionally, the best-fit cross-section is smaller for smaller α. We understand this in terms of the effect of

20
0
1
2
3
4
5
6
7
5 10 15 20 25 30 35
Inte
nsity
(10
-20 e
rg/s
ec/H
z/cm
2 /sr)
Latitudinal Radial Distance from GC (degrees)
Direct ChannelMerritt (α = 0.17)vA = 0 km/s
mχ= 50 GeV, ρ02<σ|v|> = 0.53 x 10⁻²⁶ GeV2 cm-3 s-1
mχ= 250 GeV, ρ02<σ|v|> = 6.77 x 10⁻²⁶ GeV2 cm-3 s-1
mχ= 500 GeV, ρ02<σ|v|> = 26.24 x 10⁻²⁶ GeV2 cm-3 s-1
Haze Data
(a)Direct decay channel, vA = 0 km/s
0
1
2
3
4
5
6
7
8
5 10 15 20 25 30 35
Inte
nsity
(10
-20 e
rg/s
ec/H
z/cm
2 /sr)
Latitudinal Radial Distance from GC (degrees)
Muon ChannelMerritt (α = 0.17)vA = 0 km/s
mχ= 100 GeV, ρ02<σ|v|> = 2.27 x 10⁻²⁶ GeV2 cm-3 s-1
mχ= 250 GeV, ρ02<σ|v|> = 9.26 x 10⁻²⁶ GeV2 cm-3 s-1
mχ= 500 GeV, ρ02<σ|v|> = 28.50 x 10⁻²⁶ GeV2 cm-3 s-1
Haze Data
(b)Muon decay channel, vA = 0 km/s
0
1
2
3
4
5
6
7
5 10 15 20 25 30 35
Inte
nsity
(10
-20 e
rg/s
ec/H
z/cm
2 /sr)
Latitudinal Radial Distance from GC (degrees)
Direct ChannelMerritt (α = 0.17)vA = 35 km/s
mχ= 50 GeV, ρ02<σ|v|> = 0.46 x 10⁻²⁶ GeV2 cm-3 s-1
mχ= 250 GeV, ρ02<σ|v|> = 6.72 x 10⁻²⁶ GeV2 cm-3 s-1
mχ= 500 GeV, ρ02<σ|v|> = 25.90 x 10⁻²⁶ GeV2 cm-3 s-1
Haze Data
(c)Direct decay channel, vA = 35 km/s
0
1
2
3
4
5
6
7
5 10 15 20 25 30 35
Inte
nsity
(10
-20 e
rg/s
ec/H
z/cm
2 /sr)
Latitudinal Radial Distance from GC (degrees)
Muon ChannelMerritt (α = 0.17)vA = 35 km/s
mχ= 50 GeV, ρ02<σ|v|> = 2.21 x 10⁻²⁶ GeV2 cm-3 s-1
mχ= 250 GeV, ρ02<σ|v|> = 8.96 x 10⁻²⁶ GeV2 cm-3 s-1
mχ= 500 GeV, ρ02<σ|v|> = 27.65 x 10⁻²⁶ GeV2 cm-3 s-1
Haze Data
(d)Muon decay channel, vA = 35 km/s
FIG. 15: mχ dependence of XDM contribution to synchrotron radiation at 22.5 GHz.
the parameter on the shape of the Merritt profile; a profile with smaller α is more cuspy. The additional contributionto synchrotron radiation in the center of the galaxy for the cuspier profile reduces the cross-section necessary for agood fit to the haze. Note that the constant offset in our fitting (see Section IVE) compensates for the reduction atlarger galactic angles.
4. Dependence on Alfven Velocity
Re-acceleration has a significant effect on the particle fluxes only below about 10 GeV, so the intensity distributionsof synchrotron radiation for different values of vA are identical. The effects of re-acceleration on the positron fraction athigh energies came about from changes to the background ratio. Since the DM synchrotron component is independentof the background e+e− fluxes, the effects of re-acceleration are minimal. A comparison of the cross sections fordifferent values of vA in Appendix B shows that the best-fit values are essentially identical.
VI. CONCLUSIONS
Dark matter remains an elusive component of the matter in the universe. Nonetheless, there are reasons for optimismthat we may soon, if not already, have indications from astrophysics as to its nature. Hints from the WMAP haze

21
0
1
2
3
4
5
6
7
5 10 15 20 25 30 35
Inte
nsity
(10
-20 e
rg/s
ec/H
z/cm
2 /sr)
Latitudinal Radial Distance from GC (degrees)
Direct Channelmχ = 250 GeVvA = 0 km/s
NFW, ρ02<σ|v|> = 9.71 x 10⁻²⁶ GeV2 cm-3 s-1
Isothermal, ρ02<σ|v|> = 15.47 x 10⁻²⁶ GeV2 cm-3 s-1
Merritt (α = 0.13), ρ02<σ|v|> = 3.94 x 10⁻²⁶ GeV2 cm-3 s-1
Merritt (α = 0.17), ρ02<σ|v|> = 6.77 x 10⁻²⁶ GeV2 cm3 s-1
Merritt (α = 0.22), ρ02<σ|v|> = 11.28 x 10⁻²⁶ GeV2 cm-3 s-1
Haze Data
(a)Direct decay channel, vA = 0 km/s
0
1
2
3
4
5
6
7
5 10 15 20 25 30 35
Inte
nsity
(10
-20 e
rg/s
ec/H
z/cm
2 /sr)
Latitudinal Radial Distance from GC (degrees)
Muon Channelmχ = 250 GeVvA = 0 km/s
NFW, ρ02<σ|v|> = 13.12 x 10⁻²⁶ GeV2 cm-3 s-1
Isothermal, ρ02<σ|v|> = 19.78 x 10⁻²⁶ GeV2 cm-3 s-1
Merritt (α = 0.13), ρ02<σ|v|> = 5.46 x 10⁻²⁶ GeV2 cm-3 s-1
Merritt (α = 0.17), ρ02<σ|v|> = 9.26 x 10⁻²⁶ GeV2 cm-3 s-1
Merritt (α = 0.22), ρ02<σ|v|> = 14.93 x 10⁻²⁶ GeV2 cm-3 s-1
Haze Data
(b)Muon decay channel, vA = 0 km/s
0
1
2
3
4
5
6
7
5 10 15 20 25 30 35
Inte
nsity
(10
-20 e
rg/s
ec/H
z/cm
2 /sr)
Latitudinal Radial Distance from GC (degrees)
Direct Channelmχ= 250 GeVvA = 35 km/s
NFW, ρ02<σ|v|> = 9.54 x 10⁻²⁶ GeV2 cm-3 s-1
Isothermal, ρ02<σ|v|> = 15.92 x 10⁻²⁶ GeV2 cm-3 s-1
Merritt (α = 0.13), ρ02<σ|v|> = 3.98 x 10⁻²⁶ GeV2 cm-3 s-1
Merritt (α = 0.17), ρ02<σ|v|> = 6.72 x 10⁻²⁶ GeV2 cm-3 s-1
Merritt (α = 0.22), ρ02<σ|v|> = 11.20 x 10⁻²⁶ GeV2 cm-3 s-1
Haze Data
(c)Direct decay channel, vA = 35 km/s
0
1
2
3
4
5
6
7
5 10 15 20 25 30 35
Inte
nsity
(10
-20 e
rg/s
ec/H
z/cm
2 /sr)
Latitudinal Radial Distance from GC (degrees)
Muon Channelmχ= 250 GeVvA = 35 km/s
NFW, ρ02<σ|v|> = 12.90 x 10⁻²⁶ GeV2 cm-3 s-1
Isothermal, ρ02<σ|v|> = 19.67 x 10⁻²⁶ GeV2 cm-3 s-1
Merritt (α = 0.13), ρ02<σ|v|> = 5.38 x 10⁻²⁶ GeV2 cm-3 s-1
Merritt (α = 0.17), ρ02<σ|v|> = 8.96 x 10⁻²⁶ GeV2 cm-3 s-1
Merritt (α = 0.22), ρ02<σ|v|> = 14.85 x 10⁻²⁶ GeV2 cm-3 s-1
Haze Data
(d)Muon decay channel, vA = 35 km/s
FIG. 16: XDM contribution to synchrotron radiation at 22.5 GHz for various halo profiles.
and from excess positrons in the HEAT experiment both suggest new primary sources for high energy positrons andelectrons. One explanation would be annihilating dark matter.
We have considered the implications of “exciting” dark matter for these experiments and for the future results fromPAMELA, and have found that the HEAT excess, as well as the haze, both arise naturally in this framework. Becausethe dark matter annihilates into a light state which then decays directly or indirectly to electrons and positrons, theresulting e+e− particles are highly boosted, and thus more relevant for experiment. In this way XDM falls into abroader framework of “secluded” dark matter [70] where the annihilation products of the WIMP are not SM statesthemselves, but do couple to SM states. Some interesting avenues to consider include a broader range of states intowhich φ can decay and an expanded model framework. We will pursue these in future work.
If local dark matter densities are high (ρ0 ∼ 1 GeV cm−3), the natural range of s-wave cross sections (〈σann |v|〉 ∼2.5× 10⁻²⁶ cm3s−1) needed to explain the appropriate relic abundance also yields signals in agreement with the hazeand HEAT, and with significant implications for PAMELA. It is important to note that in this scenario one needn’tresort to large astrophysical boosts to explain HEAT, and that in most cases, the cross section which explains thehaze has a significant signal at PAMELA. In particular, if one restricts oneself to the range of parameters which alsoexplain the INTEGRAL signal (namely mχ
>∼ 400 GeV), if XDM explains the haze, a PAMELA signal is expected for
the halo models we consider here.Many of the uncertainties associated with the signal arise from the uncertainty in the primary electron spectrum,
i.e. its shape and normalization. Measuring the e+e− fluxes at PAMELA, as well as other cosmic ray observables,should reduce some of the astrophysical uncertainties, which should help to establish the significance of the signalbeyond what we can discuss here. However, it is clear that PAMELA, with its measurements that are dominantly
22
sensitive to the local environment, will not be able to significantly distinguish between the halo models we consideredhere. In the event of a clear signal, however, PAMELA should be able to make some statement of the mass of thedark matter particle, even if just a lower bound.
In conclusion, we have found that XDM provides a simple framework for explaining all existing astrophysicalelectronic anomalies: the low energy INTEGRAL 511 keV line from positron annihilation, the multi-GeV HEATpositron excess, and the possible multi-GeV electron and positron source generating the WMAP haze. Such signalsall lie naturally within the same parameter range, and, in fact, the light mediator necessary for the success of XDMimplies, in general, highly boosted annihilation products, which contribute to the significance of the haze and HEATsignals. Upcoming results from PAMELA should shed light on whether this scenario is realized in nature.
Acknowledgments
It is a pleasure to acknowledge very useful conversations with Doug Finkbeiner, Igor Moskalenko, Nikhil Padmanhaban,Andrew Strong, Aaron Pierce and Dan Phalen. NW is supported by NSF CAREER grant PHY-0449818, and IC, LGand NW are supported by DOE OJI grant # DE-FG02-06ER41417.

23
0
0.005
0.01
0.015
0.02
0.025
0.03
0.035
0.04
0 10 20 30 40 50 60dP
/dE
Energy (MeV)
Michel Spectrum
FIG. 17: Energy spectrum of electrons and positrons from muon decay.
APPENDIX A: “MUON” DECAY CHANNEL SPECTRA
The probability density for electrons and positrons created via the direct channel is a uniform distribution given by
f(E) =1
Emax − Emin
=1
mχ
2(1 + Λ) −
mχ
2(1 − Λ)
=1
mχΛ(A1)
where
Λ =
√
(m2χ − m2
φ)(m2φ − (2me)2)
mχmφ
.
For mχ ≫ mφ ≫ me this reduces to
f(E) ≈1
mχ
.
The spectrum for the muon channel is a bit more involved. The distribution of injection energies for the final stateelectrons and positrons is the convolution of the spectrum of the positrons in the muon frame with the spectrum ofthe muons in the Galaxy, or DM, frame. The positron spectrum resulting from muon decay has been well-studiedand is known as the Michel spectrum [71]. It is given by (ignoring radiative corrections)
f(E, Emax) = NE2 (3
2Emax − E) (A2)
where N is a normalization factor and Emax =mµ
2is the endpoint of the spectrum. It is shown in Fig. 17.
The spectrum for the muons in the DM frame is identical to that for the positrons in the direct channel (seeEq. (A1)) with the replacement me → mµ. The convolution of the two spectra was done numerically. The injectionspectra for e+ e− pairs produced via both channels for mφ = 0.1 GeV and mχ = 0.25 GeV are shown in Fig. 2.
With the following approximations, me = 0 and γ1 > 10 (see below), valid for the φ and χ masses of interest tous, the injection spectrum for the muon channel can be calculated analytically. In this case the probability density isgiven by

24
f(E) =[ 5
6W
( 1
(γ2 − γ1)ln(
γ2
γ1
))
+E2
W 3
(
−3
8γ32
−3
16γ21(γ2 − γ1)
−3γ1
8γ32(γ2 − γ1)
+9
16γ22(γ2 − γ1)
)
+E3
W 4
( 1
12γ42
+γ1
12γ42(γ2 − γ1)
−1
9γ32(γ2 − γ1)
+1
36γ31(γ2 − γ1)
)]
Θ(2Wγ1 − E)
+[ 1
W
( 5
6γ2
−49
36(γ2 − γ1)+
5
6(γ2 − γ1)ln(
2γ2W
E) +
5γ1
6γ2(γ2 − γ1)
)
+E2
W 3
( −3
8γ32
−3γ1
8γ32(γ2 − γ1)
+9
16γ22(γ2 − γ1)
)
+E3
W 4
( 1
12γ42
+γ1
12γ42(γ2 − γ1)
−1
9γ32(γ2 − γ1)
)]
Θ(E − 2Wγ1) Θ(2Wγ2 − E),
where
W =mµ
2, γ1 =
mχ
2mµ
(
1 −
√
1 −(2mµ
mφ
)2
√
1 −(mφ
mχ
)2)
, and γ2 =mχ
mµ
− γ1 .

25
APPENDIX B: BEST FIT PARAMETERS
Halo Model Mχ(GeV) ρ20 〈σHZ |v|〉 χ2
HZ ρ20 〈σHT |v|〉 χ2
HT
(×10−26GeV2cm−3s−1) (×10−26GeV2cm−3s−1)
N.F.W. 50 0.75 683 0.17 8.48100 2.04 728 0.53 8.64250 9.71 784 2.71 8.75500 37.26 811 10.38 8.77800 92.79 827 2.013 25.97
Isothermal 50 1.11 980 0.17 8.48100 3.11 1036 0.52 8.65250 15.47 1038 2.46 8.80500 60.81 1017 9.84 8.84800 153.96 1001 24.61 8.87
Mrt α = 0.13 50 0.30 689 0.14 8.44100 0.85 696 0.45 8.52250 3.94 739 2.21 8.57500 14.88 769 8.16 8.57800 36.72 787 19.44 8.57
Mrt α = 0.17 50 0.53 687 0.16 8.45100 1.44 723 0.50 8.58250 6.77 776 2.50 8.67500 26.24 804 9.60 8.69800 64.80 820 23.33 8.70
Mrt α = 0.22 50 0.85 723 0.18 8.49100 2.35 778 0.54 8.65250 11.28 830 2.69 8.77500 43.84 850 10.56 8.80800 109.73 861 26.35 8.81
TABLE IV: Table of best-fit values of ρ20 〈σ |v|〉 and corresponding χ2 for the direct decay channel, mφ = .1 GeV, for vA = 0
km/sec. We give separately the best-fit values for ρ20 〈σHZ |v|〉 in units of 10−26GeV2cm−3s−1 to the haze data at 22.5 GHz and
ρ20 〈σHT |v|〉 to the HEAT data. We also give the corresponding χ2
HZ =P
χ2 for 29 data points of the haze and χ2HT =
P
χ2
for 9 data points of the HEAT positron fraction.

26
Halo Model Mχ(GeV) ρ20 〈σHZ |v|〉 χ2
HZ ρ20 〈σHT |v|〉 χ2
HT
(×10−26GeV2cm−3s−1) (×10−26GeV2cm−3s−1)
N.F.W. 50 3.28 687 0.34 8.52100 4.35 666 0.88 8.31250 13.12 715 3.42 8.56500 38.91 755 10.98 8.69800 94.66 779 26.50 8.74
Isothermal 50 4.96 797 0.31 8.55100 6.41 921 0.85 8.32250 19.78 1017 3.26 8.57500 63.49 1036 10.83 8.73800 150.78 1034 25.21 8.79
Mrt α = 0.13 50 1.41 812 0.27 8.62100 1.82 700 0.74 8.35250 5.46 689 2.86 8.47500 16.78 713 9.33 8.55800 38.59 734 21.44 8.57
Mrt α = 0.17 50 2.27 721 0.30 8.55100 3.02 677 0.83 8.32250 9.26 711 3.15 8.51500 28.50 747 10.34 8.63800 67.01 771 24.66 8.67
Mrt α = 0.22 50 3.79 682 0.34 8.52100 4.88 696 0.90 8.32250 14.93 762 3.38 8.57500 47.15 804 10.72 8.71800 110.42 825 26.80 8.77
TABLE V: As table IV, but for the muon decay channel, mφ = .25 GeV, for vA = 0 km/sec.

27
Halo Model Mχ(GeV) ρ20 〈σHZ |v|〉 χ2
HZ ρ20 〈σHT |v|〉 χ2
HT
(×10−26GeV2cm−3s−1) (×10−26GeV2cm−3s−1)
N.F.W. 50 0.74 684 0.18 7.07100 2.03 729 0.56 7.23250 9.64 784 2.83 7.35500 37.16 812 11.18 7.37800 92.10 827 27.57 7.37
Isothermal 50 1.09 980 0.17 7.02100 3.09 1035 0.53 7.19250 15.25 1037 2.80 7.37500 60.50 1017 10.62 7.42800 153.24 1001 26.40 7.45
Mrt α = 0.13 50 0.30 689 0.14 7.24100 0.83 697 0.45 7.25250 3.94 739 2.16 7.26500 14.82 769 8.16 7.23800 36.58 788 20.11 7.20
Mrt α = 0.17 50 0.51 687 0.16 7.11100 1.42 723 0.52 7.21250 6.70 777 2.56 7.30500 26.02 804 9.85 7.30800 64.53 821 24.67 7.29
Mrt α = 0.22 50 0.85 724 0.18 7.06100 2.34 778 0.56 7.23250 11.20 830 2.86 7.37500 43.60 851 11.23 7.39800 109.71 861 28.33 7.40
TABLE VI: As table IV, but for the direct decay channel, mφ = .1 GeV, for vA = 20 km/sec.

28
Halo Model Mχ(GeV) ρ20 〈σHZ |v|〉 χ2
HZ ρ20 〈σHT |v|〉 χ2
HT
(×10−26GeV2cm−3s−1) (×10−26GeV2cm−3s−1)
N.F.W. 50 3.29 687 0.31 7.60100 4.23 667 0.87 6.99250 13.16 715 3.55 7.14500 40.88 756 11.84 7.29800 94.06 780 27.53 7.35
Isothermal 50 4.86 798 0.28 7.63100 6.32 921 0.83 6.97250 19.71 1018 3.47 7.10500 62.87 1036 11.32 7.28800 149.70 1033 27.66 7.36
Mrt α = 0.13 50 1.36 803 0.24 7.79100 1.79 700 0.68 7.23250 5.28 691 2.84 7.21500 16.90 715 9.42 7.26800 38.19 735 21.99 7.26
Mrt α = 0.17 50 2.29 722 0.27 7.70100 3.01 678 0.80 7.08250 9.15 711 3.29 7.14500 28.51 748 10.77 7.26800 66.53 771 25.13 7.29
Mrt α = 0.22 50 3.65 681 0.30 7.59100 4.86 696 0.86 6.98250 14.78 763 3.59 7.14500 47.52 804 12.12 7.30800 109.65 825 28.27 7.36
TABLE VII: As table IV, but for the muon decay channel, mφ = .25 GeV, for vA = 20 km/sec.

29
Halo Model Mχ(GeV) ρ20 〈σHZ |v|〉 χ2
HZ ρ20 〈σHT |v|〉 χ2
HT
(×10−26GeV2cm−3s−1) (×10−26GeV2cm−3s−1)
N.F.W. 50 0.74 684 0.56 8.16100 2.04 730 1.73 9.73250 9.54 785 8.75 10.61500 36.90 812 34.39 10.77800 91.75 827 85.77 10.82
Isothermal 50 1.09 980 0.56 7.94100 3.03 1035 1.66 9.72250 15.92 1036 8.38 10.97500 59.98 1017 32.83 11.35800 151.42 1001 82.61 11.52
Mrt α = 0.13 50 0.27 688 0.42 8.36100 0.83 698 1.44 9.01250 3.98 745 7.19 9.24500 15.04 772 26.28 9.18800 35.55 792 64.22 9.16
Mrt α = 0.17 50 0.46 687 0.48 8.11100 1.41 724 1.60 9.35250 6.72 777 8.26 10.03500 25.90 805 31.25 10.13800 64.45 821 77.44 10.18
Mrt α = 0.22 50 0.75 725 0.52 8.13100 2.34 780 1.74 9.80250 11.20 830 8.88 10.79500 43.46 851 34.80 11.01800 108.90 861 86.89 11.10
TABLE VIII: As table IV, but for the direct decay channel, mφ = .1 GeV, for vA = 35 km/sec.

30
Halo Model Mχ(GeV) ρ20 〈σHZ |v|〉 χ2
HZ ρ20 〈σHT |v|〉 χ2
HT
(×10−26GeV2cm−3s−1) (×10−26GeV2cm−3s−1)
N.F.W. 50 3.23 683 1.10 8.81100 4.32 667 2.90 7.17250 12.90 716 10.96 9.11500 40.36 757 36.53 10.22800 93.78 780 86.62 10.58
Isothermal 50 4.77 799 1.10 8.50100 6.27 921 2.80 6.91250 19.67 1017 10.78 9.03500 62.40 1035 34.65 10.40800 149.14 1033 83.94 10.91
Mrt α = 0.13 50 1.31 798 0.87 10.47100 2.30 699 2.32 8.11250 5.38 690 9.14 8.73500 16.42 714 30.11 9.20800 37.70 736 70.83 9.29
Mrt α = 0.17 50 2.21 717 1.01 9.29100 2.98 677 2.64 7.41250 8.96 713 10.23 8.88500 27.65 750 33.78 9.78800 65.47 772 79.26 10.04
Mrt α = 0.22 50 3.68 680 1.14 8.63100 4.86 696 2.90 7.08250 14.85 763 11.10 9.16500 46.66 805 36.72 10.35800 109.12 826 87.69 10.76
TABLE IX: As table IV, but for the muon decay channel, mφ = .25 GeV, for vA = 35 km/sec.
[1] F. Zwicky, Helv. Phys. Acta 6, 110 (1933).[2] V. C. Rubin, N. Thonnard, and J. Ford, W. K., Astrophys. J. 238, 471 (1980).[3] V. C. Rubin, D. Burstein, J. Ford, W. K., and N. Thonnard, Astrophys. J. 289, 81 (1985).[4] J. A. Tyson, G. P. Kochanski, and I. P. Dell’Antonio, Astrophys. J. 498, L107 (1998), astro-ph/9801193.[5] R.-Y. Cen and J. P. Ostriker, Astrophys. J. 429, 4 (1994), astro-ph/9404012.[6] D. N. Spergel et al. (WMAP), Astrophys. J. Suppl. 170, 377 (2007), astro-ph/0603449.[7] S. Cole et al. (The 2dFGRS), Mon. Not. Roy. Astron. Soc. 362, 505 (2005), astro-ph/0501174.[8] M. Tegmark et al. (SDSS), Phys. Rev. D74, 123507 (2006), astro-ph/0608632.[9] D. Clowe et al., Astrophys. J. 648, L109 (2006), astro-ph/0608407.
[10] E. W. Kolb and M. S. Turner, The early universe (Frontiers in Physics, Reading, MA: Addison-Wesley, 1990).[11] J. Ahrens et al. (AMANDA), Phys. Rev. D66, 032006 (2002), astro-ph/0202370.[12] J. Ahrens et al. (IceCube), Astropart. Phys. 20, 507 (2004), astro-ph/0305196.[13] P. Picozza et al., Astropart. Phys. 27, 296 (2007), astro-ph/0608697.[14] N. Gehrels and P. Michelson, Astropart. Phys. 11, 277 (1999).[15] J. A. Hinton (The HESS), New Astron. Rev. 48, 331 (2004), astro-ph/0403052.[16] G. Weidenspointner et al. (2006), astro-ph/0601673.[17] G. Barbiellini et al., Astron. Astrophys. 309, L15 (1996).[18] R. J. Protheroe, Astrophys. J. 254, 391 (1982).[19] S. W. Barwick et al. (HEAT), Astrophys. J. 482, L191 (1997), astro-ph/9703192.[20] S. Coutu et al., Astropart. Phys. 11, 429 (1999), astro-ph/9902162.[21] D. P. Finkbeiner, Astrophys. J. 614, 186 (2004), astro-ph/0311547.[22] D. P. Finkbeiner (2004), astro-ph/0409027.[23] D. Hooper, D. P. Finkbeiner, and G. Dobler, Phys. Rev. D76, 083012 (2007), arXiv:0705.3655 [astro-ph].[24] G. Weidenspointner et al. (2007), astro-ph/0702623.[25] G. Weidenspointner et al., Nature 451, 159 (2008).[26] J. F. Beacom, N. F. Bell, and G. Bertone, Phys. Rev. Lett. 94, 171301 (2005), astro-ph/0409403.

31
[27] P. Jean et al., Astron. Astrophys. 445, 579 (2006), astro-ph/0509298.[28] J. F. Beacom and H. Yuksel, Phys. Rev. Lett. 97, 071102 (2006), astro-ph/0512411.[29] C. Boehm and P. Fayet, Nucl. Phys. B683, 219 (2004), hep-ph/0305261.[30] C. Boehm, D. Hooper, J. Silk, M. Casse, and J. Paul, Phys. Rev. Lett. 92, 101301 (2004), astro-ph/0309686.[31] D. Hooper and K. M. Zurek (2008), arXiv:0801.3686 [hep-ph].[32] D. Hooper and L.-T. Wang, Phys. Rev. D70, 063506 (2004), hep-ph/0402220.[33] M. Pospelov and A. Ritz, Phys. Lett. B651, 208 (2007), hep-ph/0703128.[34] D. P. Finkbeiner and N. Weiner, Phys. Rev. D76, 083519 (2007), astro-ph/0702587.[35] M. Drees and M. M. Nojiri, Phys. Rev. D47, 376 (1993), hep-ph/9207234.[36] J. F. Gunion, H. E. Haber, G. L. Kane, and S. Dawson (1990), perseus Publishing, Cambridge, MA.[37] M. B. Voloshin and V. I. Zakharov, Phys. Rev. Lett. 45, 688 (1980).[38] M. B. Voloshin, Sov. J. Nucl. Phys. 44, 478 (1986).[39] B. Grinstein, L. J. Hall, and L. Randall, Phys. Lett. B211, 363 (1988).[40] I. V. Moskalenko and A. W. Strong, Phys. Rev. D60, 063003 (1999), astro-ph/9905283.[41] A. W. Strong, I. V. Moskalenko, and V. S. Ptuskin, Ann. Rev. Nucl. Part. Sci. 57, 285 (2007), astro-ph/0701517.[42] A. W. Strong and I. V. Moskalenko (1999), astro-ph/9906228.[43] A. W. Strong, I. V. Moskalenko, and V. S. Ptuskin, GALPROP C++ v.50: Explanatory Supplement (2006).[44] A. A. Abdo et al., Astrophys. J. 658, L33 (2007), astro-ph/0611691.[45] A. W. Strong, I. V. Moskalenko, and O. Reimer, Astrophys. J. 613, 962 (2004), astro-ph/0406254.[46] J. F. Navarro, C. S. Frenk, and S. D. M. White, Astrophys. J. 462, 563 (1996), astro-ph/9508025.[47] D. Merritt, J. F. Navarro, A. Ludlow, and A. Jenkins, Astrophys. J. 624, L85 (2005), astro-ph/0502515.[48] S. R. Kelner, F. A. Aharonian, and V. V. Bugayov, Phys. Rev. D74, 034018 (2006), astro-ph/0606058.[49] T. Sanuki et al., Astrophys. J. 545, 1135 (2000), astro-ph/0002481.[50] W. Menn et al., Astrophys. J. 533, 281 (2000).[51] J. Alcaraz et al. (AMS), Phys. Lett. B490, 27 (2000).[52] J. Diemand, M. Kuhlen, and P. Madau, Astrophys. J. 657, 262 (2007), astro-ph/0611370.[53] D. Hooper and G. D. Kribs, Phys. Rev. D70, 115004 (2004), hep-ph/0406026.[54] P. Grajek, G. Kane, D. J. Phalen, A. Pierce, and S. Watson (2008), 0807.1508.[55] M. Nagai and K. Nakayama (2008), 0807.1634.[56] E. I. Gates, G. Gyuk, and M. S. Turner, Astrophys. J. 449, L123 (1995), astro-ph/9505039.[57] L. Bergstrom, P. Ullio, and J. H. Buckley, Astropart. Phys. 9, 137 (1998), astro-ph/9712318.[58] A. Bottino, F. Donato, N. Fornengo, and S. Scopel (2008), 0806.4099.[59] S. Torii et al., Astrophys. J. 559, 973 (2001).[60] M. A. DuVernois et al., Astrophys. J. 559, 296 (2001).[61] M. Boezio et al., Astrophys. J 532, 653 (2000).[62] C. Grimani et al., Astron. Astrophys. 392, 287 (2002).[63] A. W. Strong and I. V. Moskalenko (1999), astro-ph/9903370.[64] I. V. Moskalenko, Private communication (2007).[65] R. Schlickeiser, Cosmic Ray Astrophysics (Springer, 2002).[66] D. Hooper and J. Silk, Phys. Rev. D71, 083503 (2005), hep-ph/0409104.[67] A. W. Strong and I. V. Moskalenko, Astrophys. J. 509, 212 (1998), astro-ph/9807150.[68] G. Dobler and D. P. Finkbeiner (2007), arXiv:0712.1038 [astro-ph].[69] C. de Blois (France), Le xxth rencontres de blois - challenges in particle astrophysics.[70] M. Pospelov, A. Ritz, and M. B. Voloshin (2007), arXiv:0711.4866 [hep-ph].[71] L. Michel, Proc. Phys. Soc. A63, 514 (1950).[72] GALPROP and the resource files we employed are available at http://galprop.stanford.edu .[73] The range of values 0.13 < α < 0.22 corresponds to that allowed by simulations done by [47].[74] We calculate the positron fraction, instead of the absolute particle fluxes, for comparison with experimental results, which
are often presented as the fraction to reduce systematic errors.
Explaining PAMELA and WMAP data through coannihilations in extended SUGRA with collider implications
Exciting understanding in Pompeii through on-site parallel interaction with dual time virtual models