hierarchical clustering analysis of crime rate
TRANSCRIPT
Hierarchical Clustering Analysis of Crime Rate
1M.M. Kembe,
2A.A. Onoja,
3O.C. Ogundare
1Benue State University, Makurdi,
2University of Jos, Jos Nigeria,
3University of Jos, Jos Nigeria
Abstract: Cluster analysis search for patterns in a data set and is done by grouping the
(multivariate) observations into clusters. The goal is to find an optimal grouping for which the
observations or objects within each cluster are similar, but the clusters are dissimilar to each
other. One hopes to find the natural groupings in the data, groupings that make sense to the
researcher. The hierarchical clustering method uses the distance matrix to build a treelike
diagram, called a dendrogram. In a bid to proffer solution to the problems of crime which has
bedeviled Plateau state’s social and economic development, the hierarchical cluster technique
was employed as a powerful multivariate statistical tool to analyze crime rate in these local
government areas based on similarities in the crime rate recorded from 2004-2014 to provide
appropriate formation of military deployment and security tips for such areas. This study uses
the Hierarchical Clustering technique to examined the crimes committed on the Plateau and
recommend that more security personnel should be deployed to the localities like Angwan Rogo,
Angwan Rukuba, Gangare, Odus Bauchi Ringroad, Jenta, Fobor, Apata, Dilimi Yandoya and
Bukuru. This is to help maintain and build a lasting peace on the land of Plateau especially in
this contemporary time when Terrorism and other crimes are distorting civic rest, destabilizing
peace and economies of nations. The Study also recommended that the government should
encourage the youth in such localities by providing social amenities, employment opportunities
and peaceful campaign programs and sensitization of these communities on the need for a
peaceful coexistence.
Keywords: Crime Rate, Hierarchical clustering technique, Dendrogram

1.0 Introduction
The prevalence of crime in Jos south, Jos North and Jos east local government areas has
undoubtedly slowed down all forms of development in Plateau State. There have been jingles in
most radio and television stations in the state on the status quo, one of which states that “social
and economic development can only thrive an atmosphere of peace, let’s give peace a chance”.
The oscillation of crime in recent times has been attributed to several factors which include
illiteracy, unemployment, poverty, high state of urban-rural drift in search of greener pasture and
ultimately as an aftermath of incessant crisis in these local government areas, as there is high rate
of illegal possession of arms, cattle rustling, among others. In a bid to proffer solution to this
problem which has bedeviled the state’s social and economic development, the hierarchical
cluster technique was employed as a powerful multivariate statistical tool to analyze crime rate in
these local government areas based on similarities in the crime rate recorded from 2004-2014 to
provide appropriate formation of military deployment and security tips for such areas.
2.0 Review Literature
Vander Walt et al (1985) refer to crime as wide range activities, which include violent personal
crimes, property crimes, organized crimes and political crimes. They further distinguished
between crimes defined in a no juridical sense. Juridical (legally) crime is a contravention of the
law, to which a punishment is attached and imposed by the state. In other words, crime is an act
which is forbidden by the law, and if detected, is likely to be punished. Non-juridical
(criminological) crime can be viewed as an act of anti-social behavior which influences the life
of the individual, his/her community and society at large. (Van Velzen, 1998) described crime in
a non-juridical sense as an anti-social act entailing a threat to and a breach or violation of the
stability and security of a community and its individual members. Society is a network of
interacting persons, groups and institutions. Interaction involves establishing relations between
these individuals, groups and institutions. Crime is an act which violates these social relations
and it is this violation which harms the individual and society at large. Therefore crime in its
non-juridical sense (that is, when it is perceived as a personal threat) leads to feelings of fear and
mistrust. Literally, a criminal is a frustrated person who emerges in the society and violates the
law. Vander Walt et al (1989) distinguished between a criminal defined juridical and a criminal
defined in a non-juridical sense. Juridical (legally), a criminal is a person who has been found
guilty and punished. There are basically two main categories of crime, that is violence crime
(murder, assault, rape, abduction, etc) and property crime (theft, all other forms of theft, house
breaking, robbery and other forms of robbery vandalism, arson and so on) in relation to socio-
economic development. Brown et al (1996) argue that people mostly fear violent crimes (such as
murder, rape, robbery and assault). Victims may be deeply angered when they are swindled or
their houses are broken into, but these emotions pale in comparison to the fear death or serious
injury that can be inflicted by a violent crime. Crime has tended to undermine the importance of

development. Many people have been violently victimized in the past in this country, either by
means of murder, attempted murder, robbery, rape, assault, and so on.
In cluster analysis the search for patterns in a data set is done by grouping the (multivariate)
observations into clusters. The goal is to find an optimal grouping for which the observations or
objects within each cluster are similar, but the clusters are dissimilar to each other. One hopes to
find the natural groupings in the data, groupings that make sense to the researcher. In cluster
analysis, neither the number of groups nor the groups themselves are known in advance. To
group the observations into clusters, many techniques begin with similarities between all pairs of
observations. In many cases the similarities are based on some measure of distance. Other cluster
methods use a preliminary choice for cluster centers or a comparison of within- and between-
cluster variability. It is also possible to cluster the variables, in which case the similarity could be
a correlation. Clusters can be graphically represented by plotting the observations. If there are
only two variables (p = 2), we can be do this in a scatter plot. For p > 2, we can plot the data in
two dimensions using principal components or biplots. For an example of a principal component
plot, in which four clear groupings of points can be observed. Another approach to plotting is
provided by projection pursuit, which seeks two-dimensional projections that reveal clusters
[Friedman and Tukey (1974); Huber (1985); Sibson (1984); Jones and Sibson (1987); Yenyukov
(1988); Posse (1990); Nason (1995); Ripley (1996)]. Hierarchical clustering technique has also
been referred to as classification, pattern recognition (specifically, unsupervised learning), and
numerical taxonomy. The techniques of hierarchical clustering have been extensively applied to
data in many fields, such as medicine, psychiatry, sociology, criminology, anthropology,
archaeology, geology, geography, remote sensing, market research, economics, and engineering.
Quantitative variables shall be basically considered. According to Duran and Odell (1974),
Jensen (1969), and Seber (1984), hierarchical methods and other clustering algorithms represent
an attempt to find “good” clusters in the data using a computationally efficient technique. It is
not generally feasible to examine all possible clustering possibilities for a data set, especially a
large one. The number of ways of partitioning a set of n items into g clusters is given by:
This can be approximated by which is large even for moderate values of n and g for a set
of n items is . Hence, hierarchical methods and other approaches permit one to
search for a reasonable solution without having to look at all possible arrangements. As noted
above, hierarchical clustering algorithms involve a sequential process. In each step of the
agglomerative hierarchical approach, an observation or a cluster of observations is merged into
another cluster. In this process, the number of clusters shrinks and the clusters themselves grow
larger. Start with n clusters (individual items) and end with one single cluster containing the
entire data set. An alternative approach, called the divisive method, starts with a single cluster
containing all n items and partitions a cluster into two clusters at each step. The end result of the

divisive approach is n clusters of one item each. Agglomerative methods are more commonly
used than divisive methods. In either type of hierarchical clustering, a decision must be made as
to the optimal number of clusters. At each step of an agglomerative hierarchical approach, the
two closest clusters are merged into a single new cluster. The process is therefore irreversible in
the sense that any two items that are once lumped together in a cluster cannot be separated later
in the procedure; any early mistakes cannot be corrected. Similarly, in a divisive hierarchical
method, items cannot be moved to other clusters. An optional approach is to carry out a
hierarchical procedure followed by a partitioning procedure in which items can be moved from
one cluster to another. Since an agglomerative hierarchical procedure combines the two closest
clusters at each step, one must consider the question of measuring the similarity or dissimilarity
of two clusters. Different approaches to measuring distance between clusters give rise to
different hierarchical methods.
3.0 Methods
Ayila (2004) defined research methods as the process of arriving at a dependable solution to
problems through a planned systematic collection, analysis and interpretation of data.
3.1 Hierarchical Cluster Analysis
The hierarchical clustering method uses the distance matrix to build a treelike diagram, called a
dendrogram. In the beginning, all individual objects are considered as clusters with one object,
that is, itself. If there are N objects, then there will be Nclusters. Then, the two objects with the
closest distance are selected and combined into a single cluster. Now the number of clusters are
changed from n to N − 1. Then we compute the distances between other objects to the newly
formed cluster. This distance calculation is based on one of the linkage methods, such as single
linkage, complete linkage, etc. After this, update the distance matrix. Now there are n − 1
clusters, so the new distance matrix will be a (N− 1) (N− 1) matrix. This process is continued.
At each step of this process, the number of clusters is reduced by 1. Finally, all objects are
combined into one cluster. Their mutual relationship is expressed by the dendrogram. Then
examine the shape of dendrogram and decide how many clusters are there in the whole
population and which objects should be included in each cluster. Specifically, the following step-
by-step procedure is adopted:
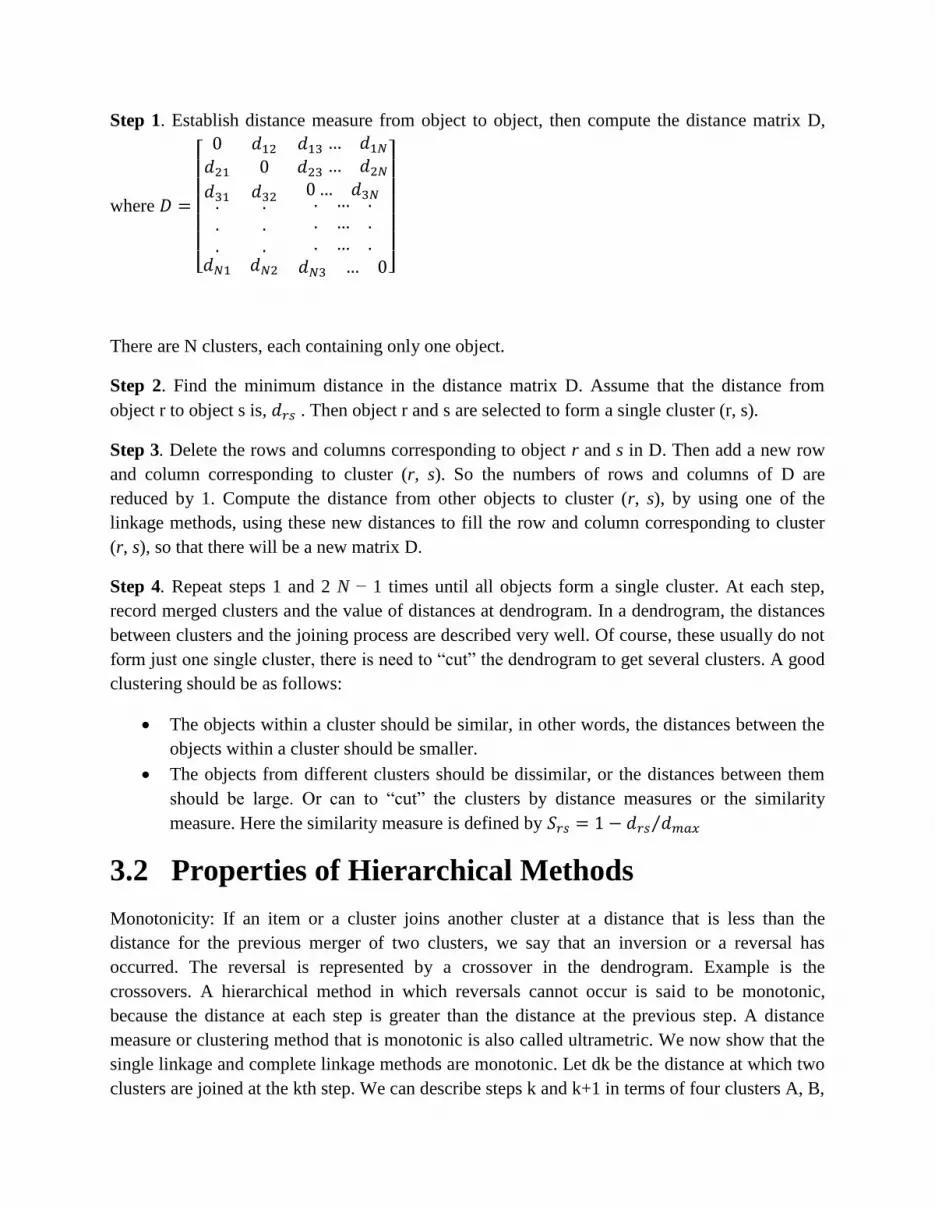
Step 1. Establish distance measure from object to object, then compute the distance matrix D,
where
There are N clusters, each containing only one object.
Step 2. Find the minimum distance in the distance matrix D. Assume that the distance from
object r to object s is, . Then object r and s are selected to form a single cluster (r, s).
Step 3. Delete the rows and columns corresponding to object r and s in D. Then add a new row
and column corresponding to cluster (r, s). So the numbers of rows and columns of D are
reduced by 1. Compute the distance from other objects to cluster (r, s), by using one of the
linkage methods, using these new distances to fill the row and column corresponding to cluster
(r, s), so that there will be a new matrix D.
Step 4. Repeat steps 1 and 2 N − 1 times until all objects form a single cluster. At each step,
record merged clusters and the value of distances at dendrogram. In a dendrogram, the distances
between clusters and the joining process are described very well. Of course, these usually do not
form just one single cluster, there is need to “cut” the dendrogram to get several clusters. A good
clustering should be as follows:
The objects within a cluster should be similar, in other words, the distances between the
objects within a cluster should be smaller.
The objects from different clusters should be dissimilar, or the distances between them
should be large. Or can to “cut” the clusters by distance measures or the similarity
measure. Here the similarity measure is defined by
3.2 Properties of Hierarchical Methods
Monotonicity: If an item or a cluster joins another cluster at a distance that is less than the
distance for the previous merger of two clusters, we say that an inversion or a reversal has
occurred. The reversal is represented by a crossover in the dendrogram. Example is the
crossovers. A hierarchical method in which reversals cannot occur is said to be monotonic,
because the distance at each step is greater than the distance at the previous step. A distance
measure or clustering method that is monotonic is also called ultrametric. We now show that the
single linkage and complete linkage methods are monotonic. Let dk be the distance at which two
clusters are joined at the kth step. We can describe steps k and k+1 in terms of four clusters A, B,
C, and D. Suppose D(A, B) is less than the distance between any other pair among these four
clusters, so that A and B are joined at step k to form AB. Then dk = D(A, B) < min{D(A,C),
D(B,C), D(C, D)}.
Contraction or Dilation: this can be considered as the characteristics of the distances or
proximities between the original points. As clusters form, the properties of this space of distances
may be altered somewhat. A clustering method that does not alter the spatial properties is
referred to by Lance and Williams (1967) as space-conserving. A method that is not space
conserving may either contract or dilate the space. A method is space-contracting if newly
formed clusters appear to move closer to individual observations, so that an individual item tends
to join an existing cluster rather than join with another individual item to form a new cluster.
This tendency is also called chaining. A method is space-dilating if newly formed clusters appear
to move away from individual observations, so that individual items tend to form new clusters
rather than join existing clusters. In this case, clusters appear to be more distinct than they are.
Dubien and Warde (1979) described the spatial properties as follows. Suppose that the distances
among three clusters satisfy D(A, B) < D(A,C) < D(B,C). Then a cluster method is space-
conserving if D(A,C) < D(AB,C) < D(B,C). A method is space-contracting if the first inequality
does not hold and space-dilating if the second inequality does not hold.
3.3 Assumptions
The likelihood distance measure assumes that variables that formed the hierarchical cluster
model are independent. Further, each continuous variable is also assumed to have a normal
(Gaussian) distribution, and each categorical variable is assumed to have a multinomial
distribution. Empirical internal testing indicates that the procedure is fairly robust to violations of
both the assumption of independence and the distributional assumptions, but one should try to be
conscious of how well these assumptions are met. However, the data used for this research work
were collected from Three Local Government Areas Nigerian Police Divisions of Plateau State
from 2004-2014.
4.0 Analysis of Data
The data for this research work were analyzed using the Predictive Analytical Software (PASW)
IBM Version 20.


4.1 Interpretation of Results
The Vertical Icicle Plot is the ordering of Cluster cases from Yantrailer, Fobor, in that order to
Angwan Rogo. These cases can be cross check on the dendrogram which keep the cases close
together; it kind of takes a cluster and keeps the cases together on the dendrogram. The top
cluster, Middle cluster and the end cluster are all on the Icicle plot, the essence of the icicle plot
is to keep all the cases together. To interpret the icicle plot, the vertical columns is use to keep
track of the progression of the clustering. For each of these cases there is a vertical column that is
as the column is short it demonstrate were the clusters have been joined. The first two to get join
are Jenta and Odus Ringroad, follow by Maijuju and Dilimi Yandoya , Bukuru and Gangare and
so on. The last two joining will be represented by the tallest column which is the group that
contain Dadin Kowa and the group that contain Bauchi Road. The dendrogram is the pictorial
representation of the clusters to see how well they are joined. Cluster one consist of six cases
which are Angwan rogo, Angwan Rukuba, Bukuru, Gangare, Kabong, Zawan, Cluster two
consist of one case which is Dadinkowa, cluster three consist of five cases which are Angware,
Jenta, Apata, Bauchi Road and Odus Ringroad and cluster four consist of four cases which are
Maijuju, Fobor, Yantrailer, and Dilimi Yandoya it can be worth noting that cluster three and four
are more closer together than the other clusters. From the Scree plot it can be seen that the crime
data is quadratic in nature with stage 15 at the peak of the graph. The ward method cluster
membership is used to form the frequency table showing the distribution of all the clusters with
cluster one having 37.5% and cluster 2 having the lowest percentage about 6.3%. The ANOVA
table above showed the entire crime rate committed on Plateau from Murder down to Cattle
Rustling. All the crime cases except Burglary having the p-value of p = 0.087 which is greater
than the p-value p = 0.05 are significant at the 5% level of significance.
4.2 Discussion of Results
From the results of the analysis above it can be worth noting that hierarchical clustering analysis
is a powerful multivariate tool that can classify multivariate statistical data based on their
similarities. It identifies hidden factors that cannot be account for. From the result of the
Dendrogram it can be seen that cluster one which consist of six cases via: Angwan Rogo,
Angwan Rukuba, Bukuru, Gangare, Kabong, Zawan have a lot of similarities in their crime rate,
and these cases call for security attention to tackle the uprising of crime in such localities, places
like Angwan Rukuba, Angwan Rogo, Gangare, Kabong and Bukuru have been known in past
and recent times for high rate of crime such as rape, Murder, Assault, Drug abuse and Cattle
rustling. Cluster two which consist of just one case which is Dadinkowa has been known in the
past and recent times for it peaceful coexistence between all the clans, tribes and religious
entities, cohabiting, living together in peace and harmony, this place witness low crime rate this
is in-line with the publications made by the peace and conflict resolution, University of Jos
(2014) which awarded the locality for its peaceful coexistence on the Plateau. Cluster three
which consist of five localities via: Angware, Jenta, Apata, Bauchi Road and Odus Ringroad also
calls for more security redeployment in such areas, these localities in the past and present have
been known for high rate of rape, Murder especially Campus occultism, Prostitution, drug abuse,
Robbery activities and burglary, these localities have in time past proven notorious in its dealings
and calls for security attention especially the joint task force operation. Cluster four which
consist of Maijuju, Fobor, Yantrailer, and Dilimi Yandoya also are similar in its mode of crime
operations, these localities in the past and present have been known for prevalent cases of Man
Assault, Robbery and Murder, these localities have threaten the lasting peace on the Plateau, and
calls for more security operations in such places. From the ANOVA table above it can be seen
that all the various kinds of crimes committed on the Plateau via: Murder, Rape, Robbery,
Assault, Drug abuse, Cattle rustling are all significant that is having a p-value greater than p-
value of p = 0.05 which means they are all significantly committed on the land of Plateau but
Burglary is not significant on the land of Plateau, this does not imply that it is not committed in
the land but it is done in relative small scale compare to the other crimes.
4.3 Conclusion and Recommendation
In recommendation this study has examined the crimes committed on the Plateau and
recommend that more security personnel should be deployed to the localities like Angwan Rogo,
Angwan Rukuba, Gangare, Odus Bauchi Ringroad, Jenta, Fobor, Apata, Dilimi Yandoya and
Bukuru. This is to help maintain and build a lasting peace on the land of Plateau especially in
this contemporary time when Terrorism and other crimes are distorting civic rest, destabilizing
peace and economies of nations. Also the government of the day should encourage the youth in
such localities by providing social amenities, employment opportunities and peaceful campaign
programs and sensitization of these communities on the need for a peaceful coexistence.
REFERENCES
Brown, S.E., Esbensen F and Geis G. 1996 Criminology: Explaining Crime and its Context, 2nd
edition, Cincinnati; Aderson Publishers.
Dubien, J. L. and Warde, W. D. (1979), “A Mathematical Comparison of the Members of an
infinite Family of Agglomerative Clustering Algorithms,” Canadian Journal of Statistics, 7, 29–
38
Duran, B. S., and Odell, P. L. (1974), “Cluster Analysis: a Survey,” Lecture Notes in Economics
and Mathematical Systems, New York: Springer-Verlag.
Friedman, J. H., and Tukey, J. W. (1974), “A Projection Pursuit Algorithm for Exploratory Data
Analysis,” IEEE Transactions on Component Parts, 9, 881–890.

Huber, P. J. (1985), “Projection Pursuit,” Annals of Statistics, 13, 435–525.
Jensen, R. E. (1969), “A Dynamic Programming Algorithm for Cluster Analysis,” Operations
Research, 12, 1034–1057.
Jones, M. C., and Sibson, R. (1987), “What is Projection Pursuit?” Journal of the Royal
Statistical Society, 150, 1–36.
Lance, G. N., and Williams,W. T. (1967), “A General Theory of Classificatory Sorting
Strategies: I. Hierarchical Systems,” Computer Journal, 9, 373–380.
Nason, G. (1995), “Three-dimensional Projection Pursuit,” Journal of Applied Statistics, 44(4),
411–430.
Posse, C. (1990), “An Effective Two-dimensional Projection Pursuit Algorithm, Communications
in Statistics: Simulation and Computation, 19, 1143–1164.
Ripley, B. D. (1996), Pattern Recognition and Neural Networks, Cambridge: Cambridge
University Press.
Seber, G. A. F. (1984), Multivariate Observations, New York: Wiley.
Sibson, R. (1984), “Present Position and Potential Developments: Some Personal Views.
Multivariate analysis (with discussion),” Journal of the Royal Statistical Society, Series A, 147,
198–207.
Vander Walt P.J., Cronje G., and Smith B.F. 1985: Criminology: An Introduction Pretoria
Haum.
Van Velzen F.A. 1998: Fear of Crime. A Socio-Criminological Investigation. Unpublished D.
Phil Thesis, Kwa Dlangezwa, University of Zululand.
Yenyukov, I. S. (1988), “Detecting Structures by Means of Projection Pursuit,” Compstat, 88,
47– 58.